 NYSE: NAV 33 rd Annual Gabelli & Co. Auto Aftermarket Symposium November 2, 2009 |
 2 NYSE: NAV Safe Harbor Statement Information provided and statements contained in this presentation that are not purely historical are forward-looking statements within the meaning of Section 27A of the Securities Act of 1933, as amended, Section 21E of the Securities Exchange Act of 1934, as amended, and the Private Securities Litigation Reform Act of 1995. Such forward-looking statements only speak as of the date of this presentation and the Company assumes no obligation to update the information included in this presentation. Such forward-looking statements include information concerning our possible or assumed future results of operations, including descriptions of our business strategy. These statements often include words such as “believe,” “expect,” “anticipate,” “intend,” “plan,” “estimate,” or similar expressions. These statements are not guarantees of performance or results and they involve risks, uncertainties, and assumptions. For a further description of these factors, see “Risk Factors – Risks Relating to Navistar and its Markets” as set forth in the Prospectus Supplement, dated October 22, 2009, filed pursuant to Rule 424(b)(5) with respect to Registration Statement No. 333-162588. Although we believe that these forward-looking statements are based on reasonable assumptions, there are many factors that could affect our actual financial results or results of operations and could cause actual results to differ materially from those in the forward-looking statements. All future written and oral forward-looking statements by us or persons acting on our behalf are expressly qualified in their entirety by the cautionary statements contained or referred to above. Except for our ongoing obligations to disclose material information as required by the federal securities laws, we do not have any obligations or intention to release publicly any revisions to any forward-looking statements to reflect events or circumstances in the future or to reflect the occurrence of unanticipated events. |
 3 NYSE: NAV Other Cautionary Notes • The financial information herein contains audited and unaudited information and has been prepared by management in good faith and based on data currently available to the Company. • Certain Non-GAAP measures are used in this presentation to assist the reader in understanding our core manufacturing business. We believe this information is useful and relevant to assess and measure the performance of our core manufacturing business as it illustrates manufacturing performance without regard to selected historical legacy costs (i.e. pension and other postretirement costs). It also excludes financial services and other expenses that may not be related to the core manufacturing business. Management often uses this information to assess and measure the performance of our operating segments. A reconciliation to the most appropriate GAAP number is included in the appendix of this presentation. |
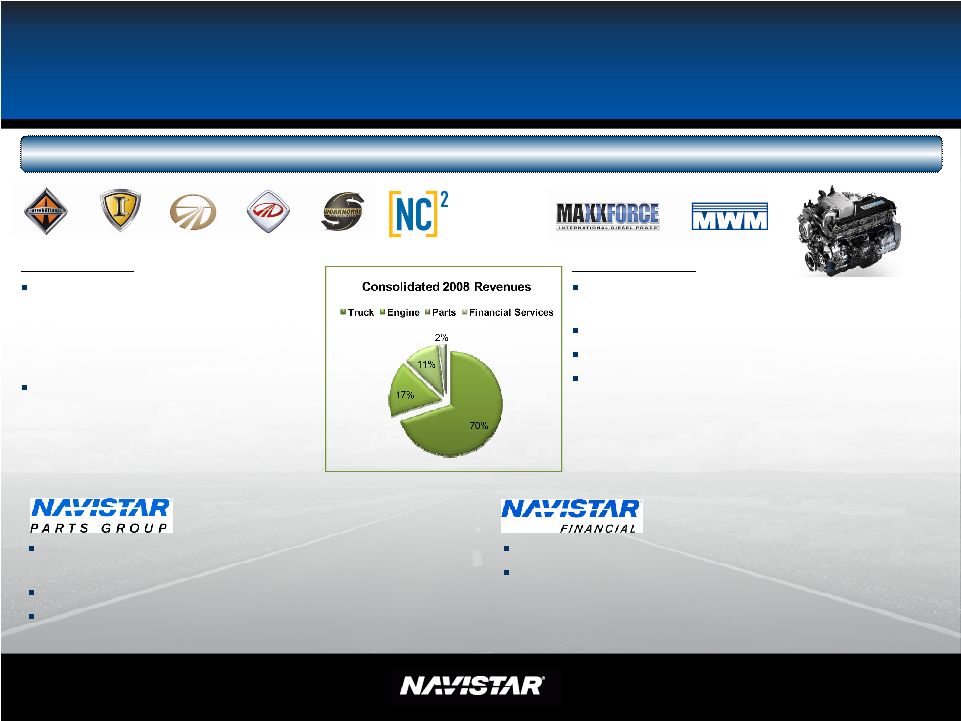 NYSE: NAV Company Overview 4 Founded over 100 years ago, Navistar’s 2008 revenues were $14.7 billion Truck Group North American market share leader with regional and long-haul class 8 trucks, recreational vehicles, class 6-7 trucks, buses, military vehicles and severe service trucks Products, parts and services sold through an extensive dealer network in North America, Brazil and more than 90 other countries globally Engine Group Engine manufacturer of mid-range and heavy-duty diesel engines Products sold directly to major global OEMs Manufacturing locations in U.S. and Brazil Industries and applications include: agriculture, industrial, buses, commercial on- highway trucks, consumer vehicles, military, marine vessels and commercial off-highway vehicles Distribution business that provides high-margin and non-cyclical earnings Strong growth in revenue and earnings Most extensive distribution channel in truck and mid- range diesel Wholesale – floor planning for dealers Financing for retail customers |
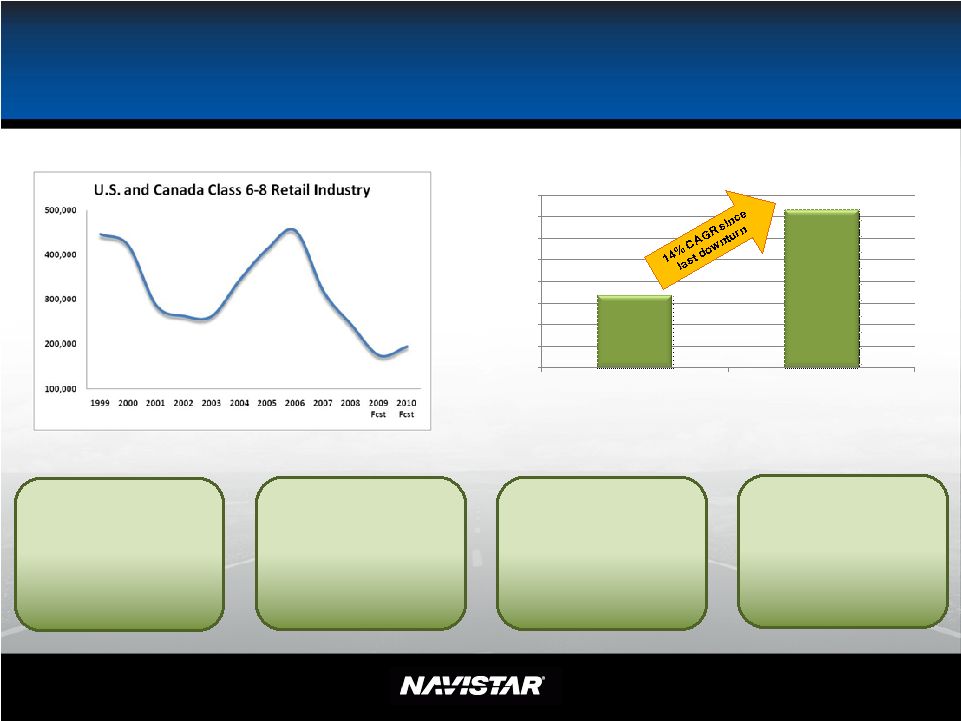
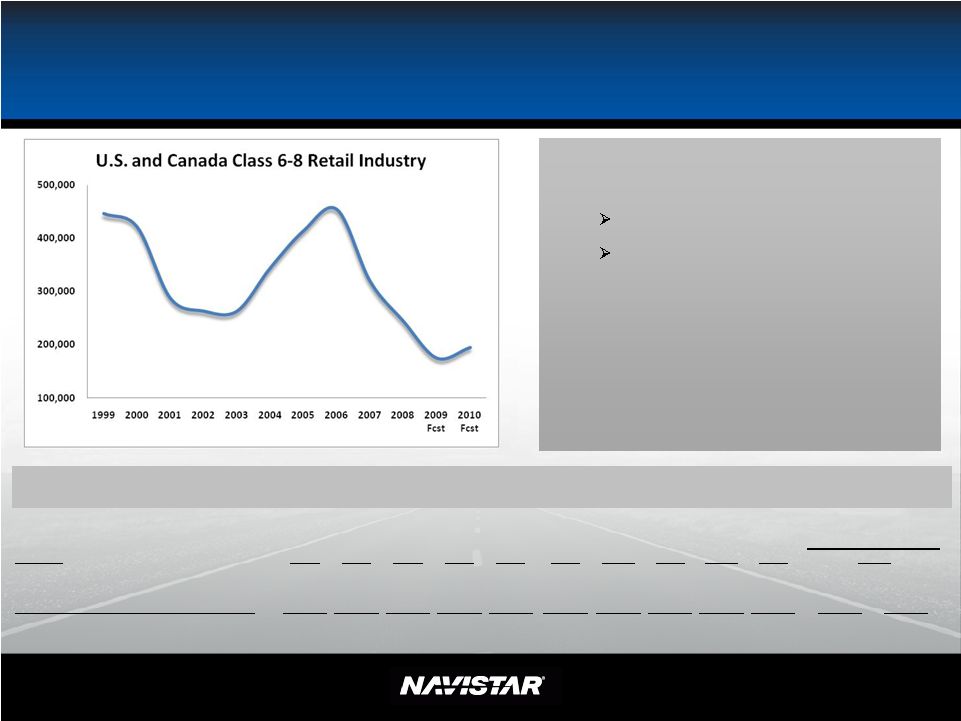 NYSE: NAV Guidance – Industry Landscape Guidance • Class 6-8 Truck Industry 2009: 165K to 185K 2010: 175K to 215K • Engine shipments – 245K to 265K • Parts – segment revenues expected to be ~$2.2B to $2.3B • Financial Services — profitable Note: Industry guidance includes military orders sold to the U.S. 5 Industry FY99 FY00 FY01 FY02 FY03 FY04 FY 05 FY06 FY 07 FY08 School Bus 33,800 33,900 27,900 27,400 29,200 26,200 26,800 28,200 24,500 24,400 21,000 23,000 Class 6-7 - Medium 126,000 129,600 96,000 72,700 74,900 99,200 104,600 110,400 88,500 59,600 34,000 42,000 Combined Class 8 (Heavy & Severe Service) 286,000 258,300 163,700 163,300 159,300 219,300 282,900 316,100 206,000 160,100 110,000 120,000 Total Industry Demand 445,800 421,800 287,600 263,400 263,400 344,700 414,300 454,700 319,000 244,100 165,000 185,000 FY 09 Historical Information United States and Canadian Class 6-8 Truck Industry - Retail Sales Volume Current 2009 Actual Guidance |
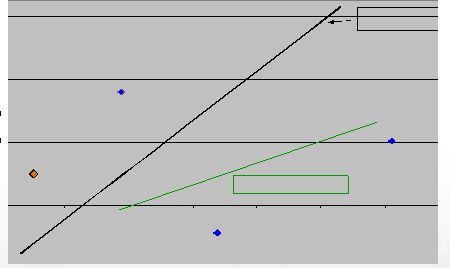
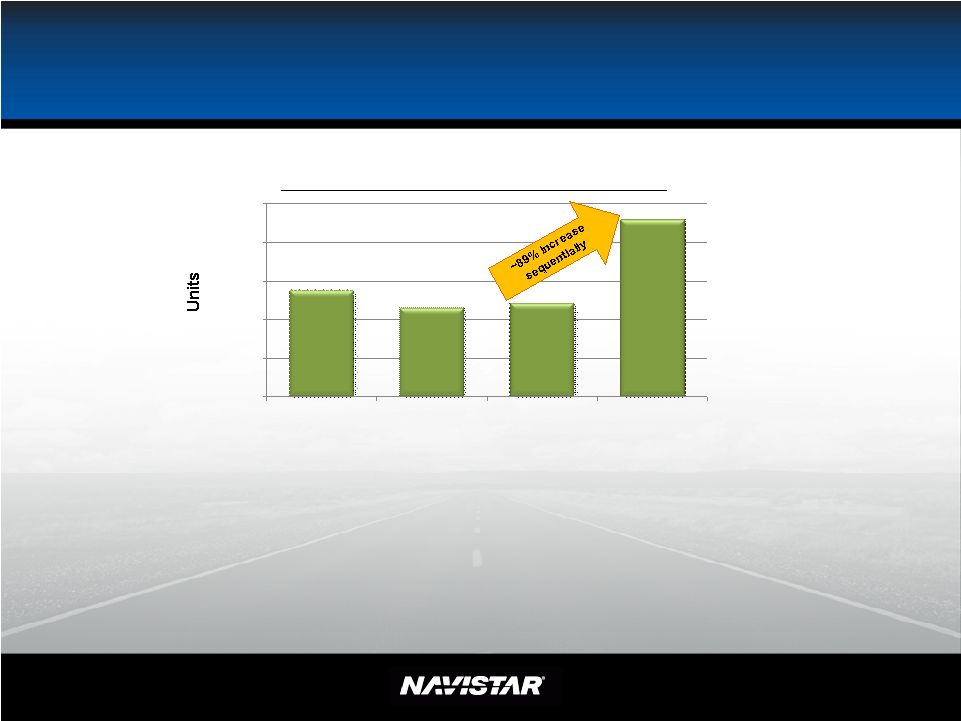 6 NYSE: NAV 0 5,000 10,000 15,000 20,000 25,000 1Q09 2Q09 3Q09 4Q09 Est Navistar’s FY 2009 Order Receipt Data • Bus and Medium are filled thru calendar year end • Severe Service and Heavy – Limited availability in December • Quoting activity – Up FY 2009 Order receipt (U.S. & Canada) |
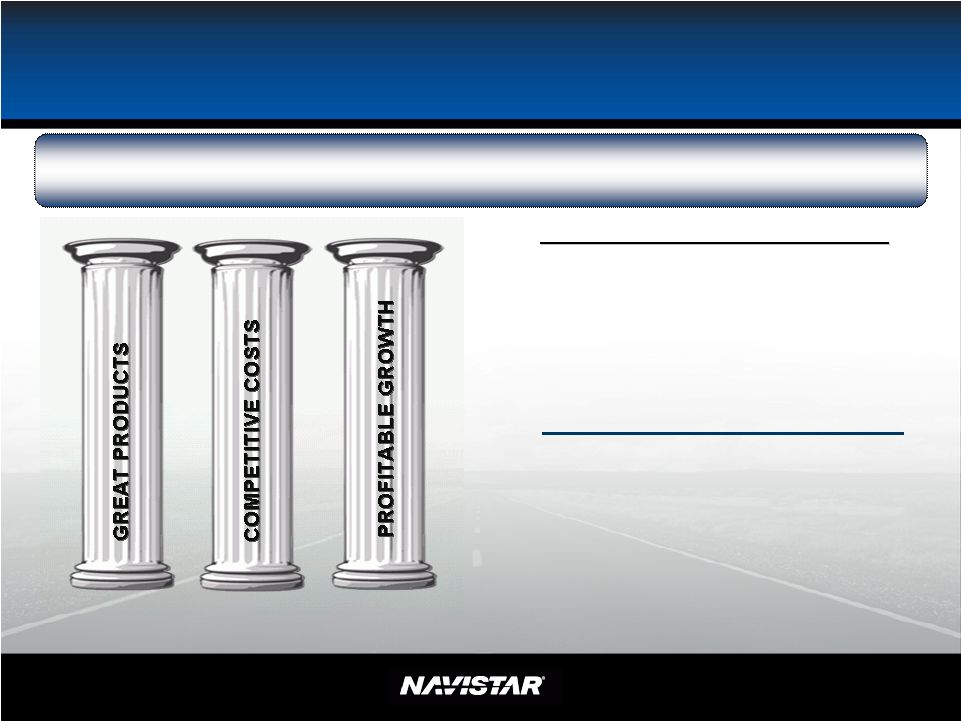 NYSE: NAV We expect our strategy will enable us to deliver our 2009 goals and BEYOND 7 Leveraging what we have and what others have built Controlling our Destiny Original FY 2009 Goals Original FY 2009 Goals • $15+ Billion Revenue* • $1.6 Billion Manufacturing Segment Profit* • Improve cost structure while developing synergistic niche businesses with richer margins • Improve conversion rate of operating income into net income • Reduce impact of cyclicality – Grow Parts – Non-Traditional/Expansion Markets *Note: This slide is for illustrative purposes only. |
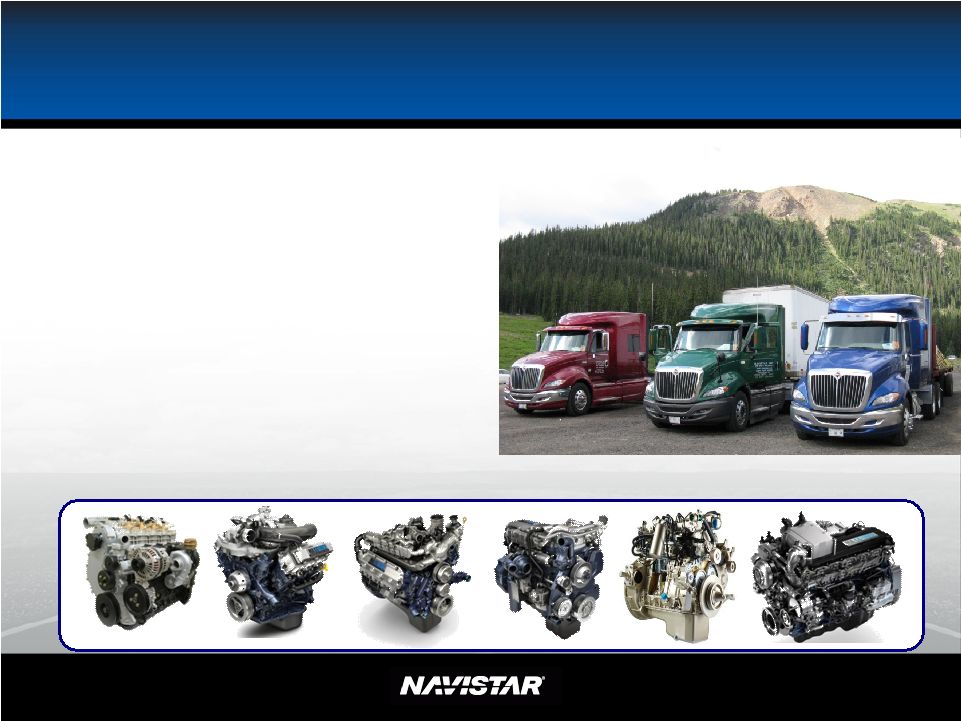
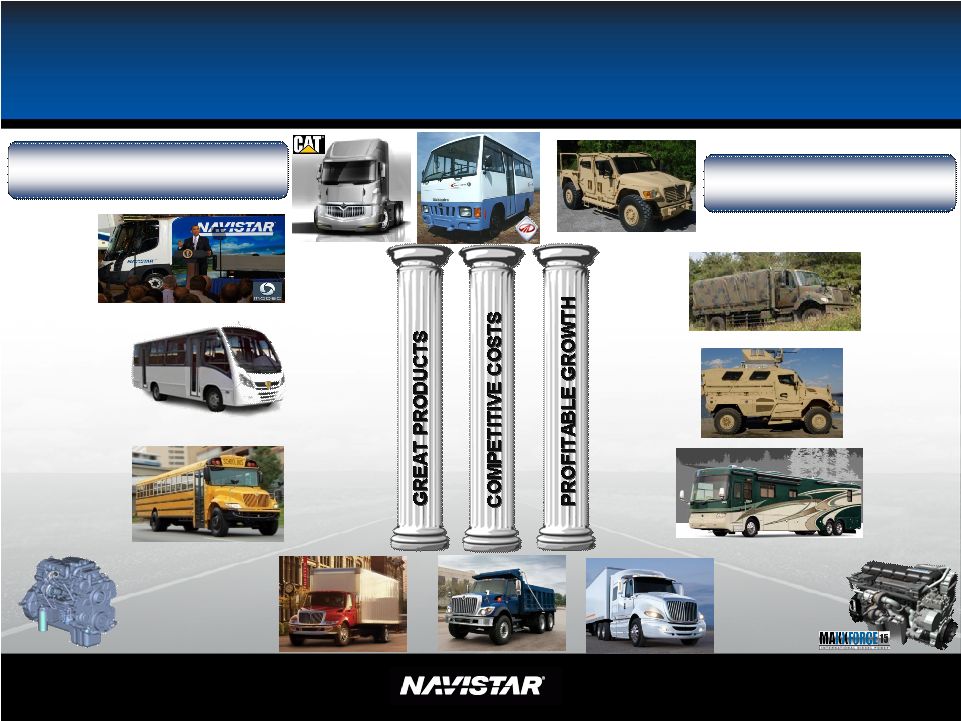
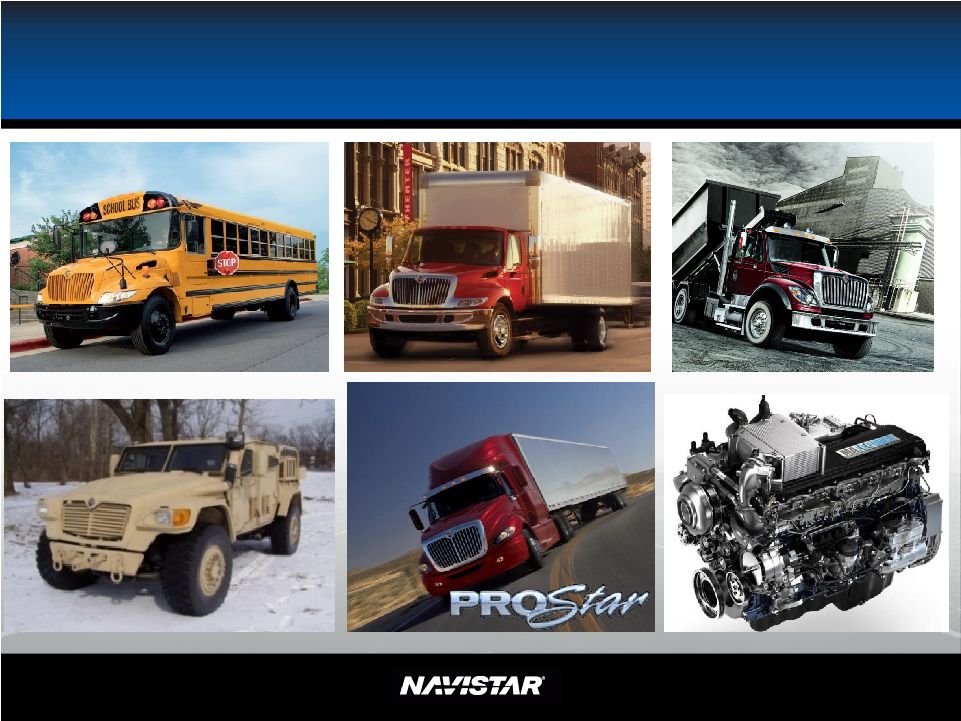 NYSE: NAV Great Products 8 |
 NYSE: NAV Competitive Cost Structure – Overall goal is to continuously seek the needed quality at the best price Strategic initiatives ProStar ® MaxxForce ® Big Bore 11L/13L/15L Scale Strategic partnerships Mahindra International South America CAT Global sourcing Design cost reduction Commodities cost reduction and containment Manufacturing cost structure 9 Key Component of COGS Below the Line |
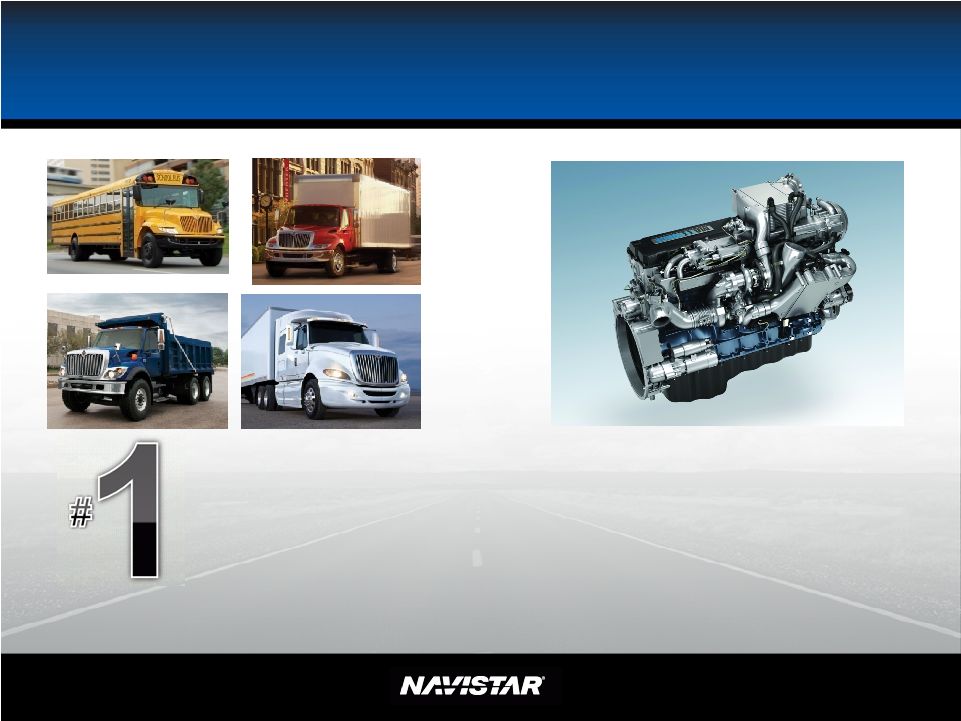
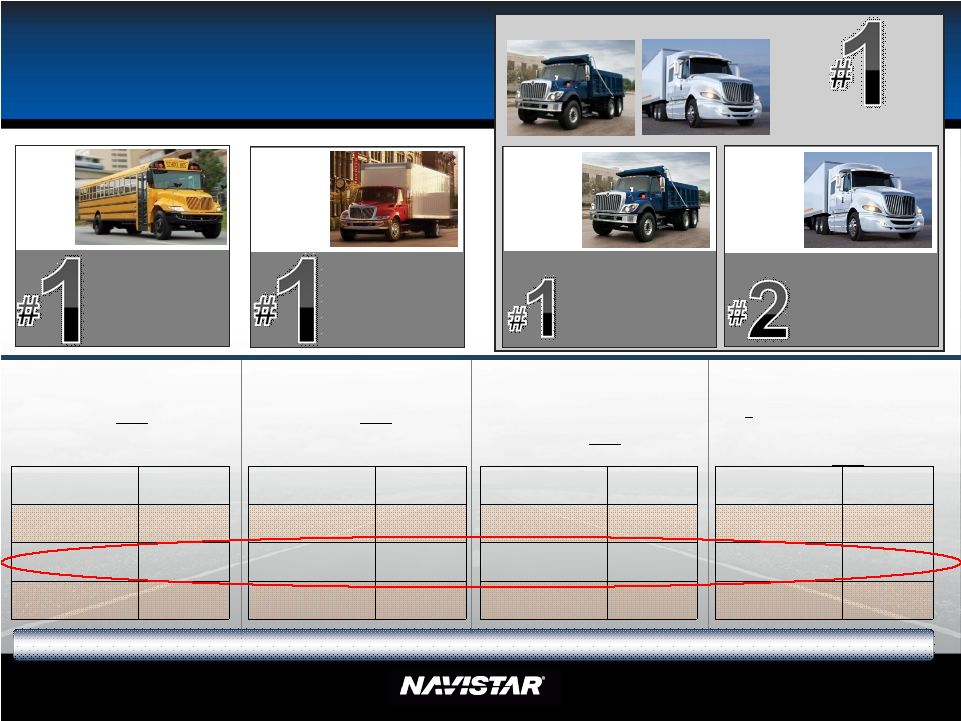 NYSE: NAV Medium Truck Great Products 61% Market Share 3Q09 35% Market Share 3Q09 33% Market Share 3Q09 Severe Service Truck* Heavy Truck 29% Market share 3Q09 • #2 in YTD July Market Share • Executing on strategy New Products (ProStar ® , LoneStar ® ) • MaxxForce ® EGR engines • #1 In Market Share despite industry consolidation • MaxxForce ® EGR engines • #1 in Market Share • A leader in Medium Hybrid • MaxxForce ® EGR engines • #1 in Market Share • 3 straight year of increasing market share • MaxxForce ® EGR engines FY07 60% FY08 55% 3Q09 61% YTD JUL 59% *Note: Excludes U.S. Military deliveries. School Bus & Combined Class 6-8 Market Share – FY07: 26%; FY08: 29%; 3Q09: 36%; YTD JUL: 33% FY07 36% FY08 36% 3Q09 35% YTD JUL 35% FY07 25% FY08 27% 3Q09 33% YTD JUL 34% FY07 15% FY08 19% 3Q09 29% YTD JUL 25% Class 8* 30% Market Share 3Q09 School Bus 10 rd |
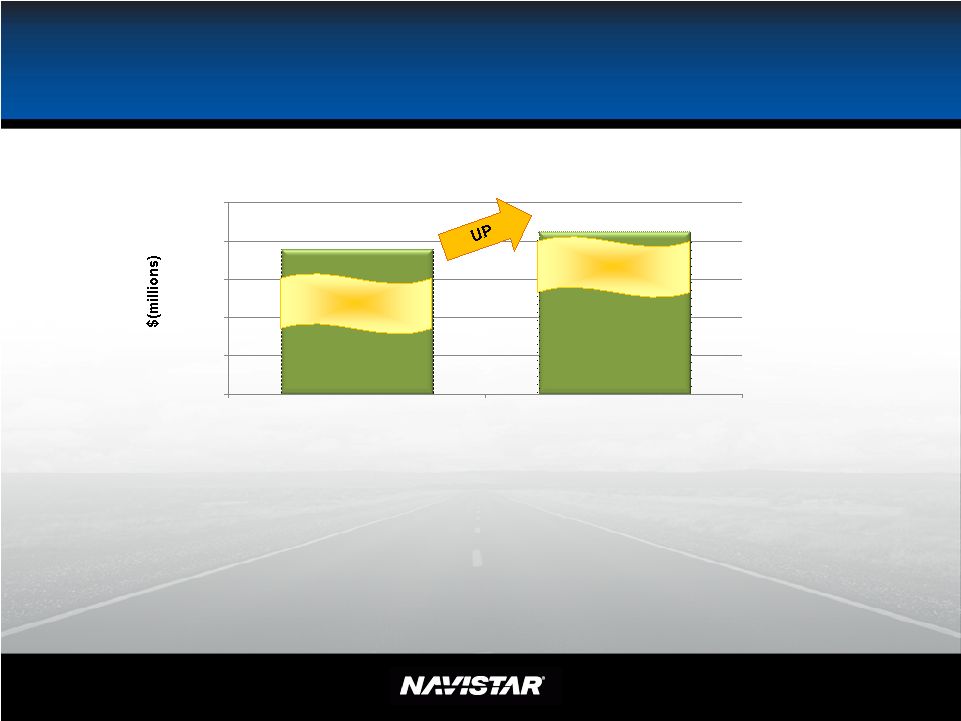
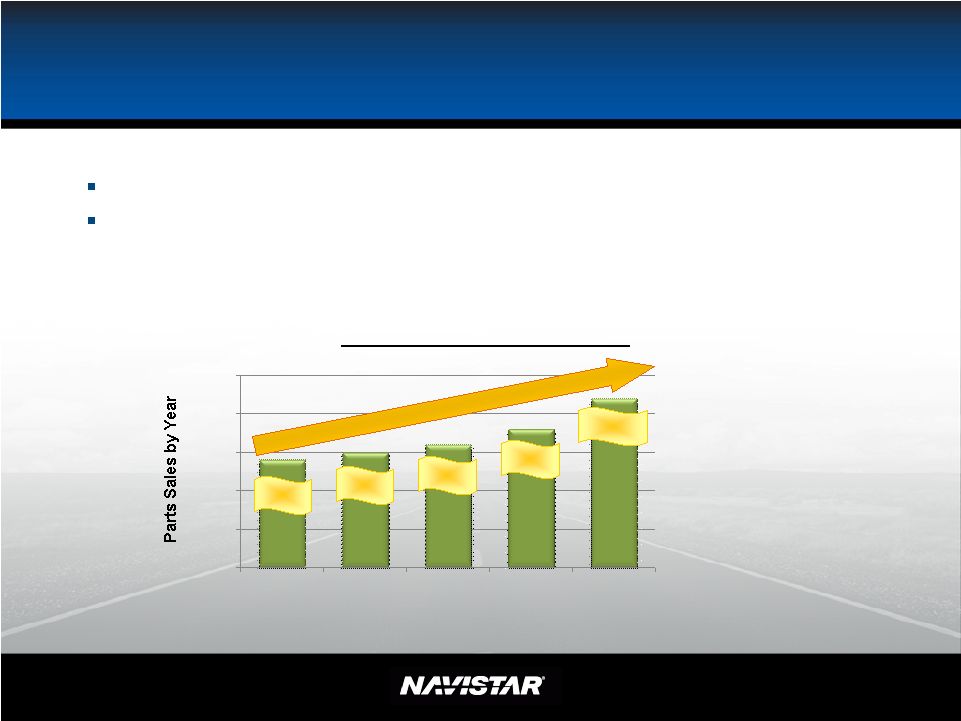 NYSE: NAV $0.0 $0.5 $1.0 $1.5 $2.0 $2.5 FY 2005 FY 2006 FY 2007 FY 2008 FY 2009 Fcst Profitable Growth – Parts 2008 Parts sales up 17% (as compared to 2007) – profit up 63% July 31, 2009 YTD Parts sales up 25% (compared to July 31 st 2008) – profit up 100% Parts Sales ($ in billions) $1.5 $1.6 $1.8 $1.4 $2.2-$2.3 11 |
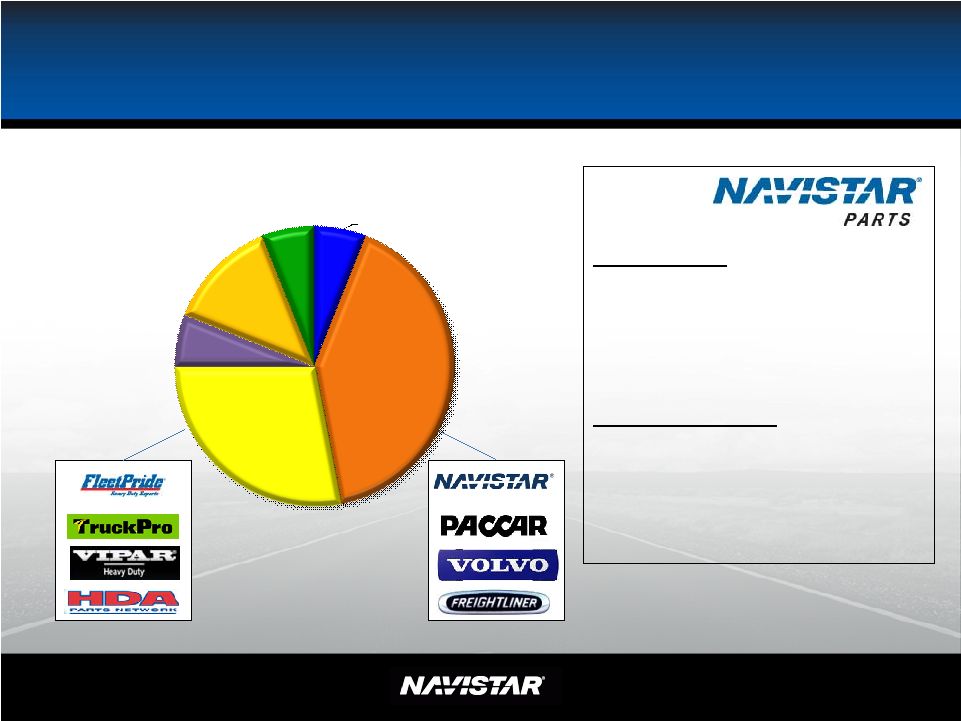 NYSE: NAV Parts – Competitive Landscape 12 Strengths: •Dealer network •National accounts •Proprietary parts Opportunities: •Customer reach •Customer experience •Lean Engine Distributors, 6% Truck Dealer, 41% HDD/Specialist, 28% Auto Parts, 6% Independent Garages, 13% Other, 6% 2008 Aftermarket Point of Sale (Retail) Source: MacKay – 2008 Heavy Duty parts Aftermarket Monitor & Forecast Service. U.S. market only, total value of chart is $13.273B |
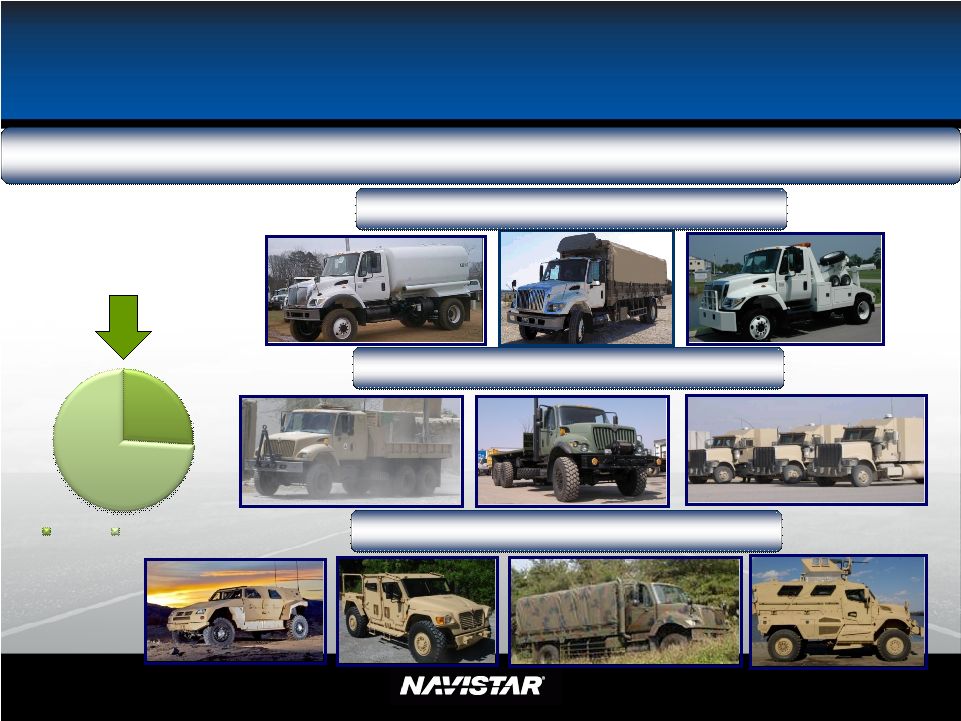 13 NYSE: NAV Profitable Growth – Navistar Defense More than 21K Units invoiced from 2005 through July 2009 26% 74% MRAP COTS Based Commercial Off The Shelf (COTS) COTS with Military Features True Tactical Wheeled Vehicles We believe the military business (including parts) is sustainable at ~$2 billion annually |
  14 NYSE: NAV Controlling Our Destiny 200 250 300 350 400 450 Original $1.6B Goal @ 414.5kunits 2006 Actual 2007 Actual 2008 Actual (excl. Impairment) 2009 Estimate (excl. Ford) HistoricalROE Targets FY 2009 Sales and Revenue ($ Millions) Q109 $2,970 Q209 $2,808 Q309 $2,506 Q409 Goal* $2,700 to $3,200 *As shown on the 3 rd Quarter Earnings Call Traditional Industry Volume (Thousands of Units) |
 NYSE: NAV $0 $100 $200 $300 $400 $500 FY 2008 FY 2009 Investing While Controlling Our Destiny Engineering and product development costs $380 ~$400 - $450 • Diverse revenue stream that is profitable throughout the truck cycle • Able to keep investing for future • Most have reduced R&D investment 15 |
 NYSE: NAV Continuous Improvement Results in Continuous Leadership 16 July YTD Combined Market Share 33% Advanced EGR In-Cylinder NOx Reduction |
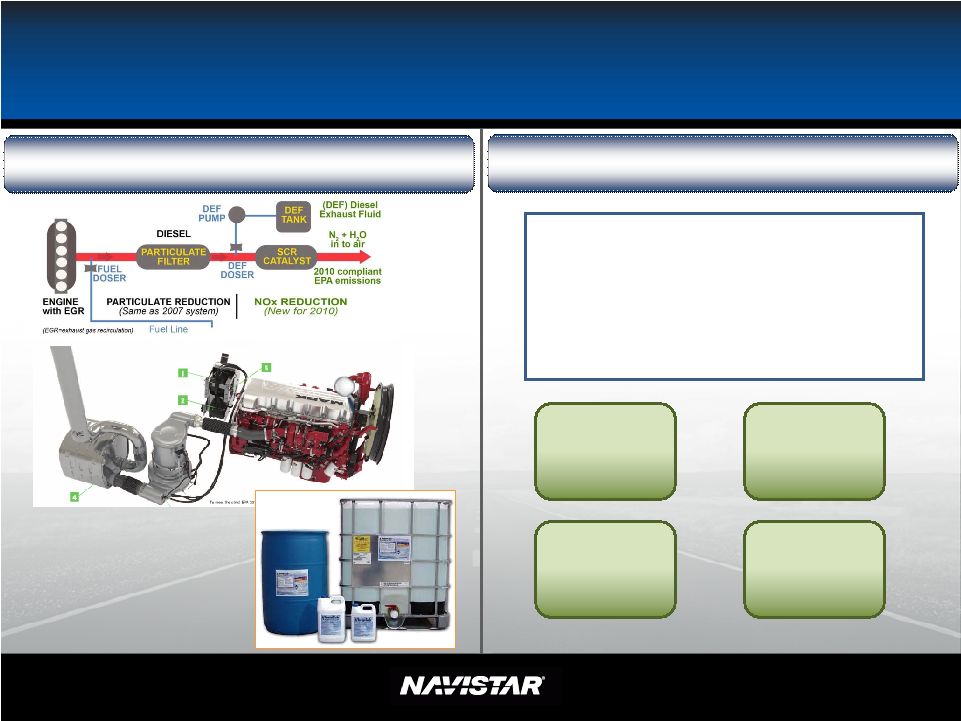 NYSE: NAV Actions in 2009 for 2010 and Beyond 2010 Emission Strategy 17 Intentionally left blank because this is what customers currently do Easy for operators Easy to understand Easy to maintain Dealer and customer friendly Navistar’s “customer friendly” 2010 solution The competitor’s 2010 urea-based solution |
 18 NYSE: NAV Navistar Believes the Truck/Engine Manufacturer Should Accept the Responsibility for Emissions Compliance and Not Burden the Customer • EPA reviews test data • Navistar demonstrates compliance in test engines over useful life of engine in real world applications • EPA conducts end of line random audits • Customer subject to in-use compliance verification • Process not defined as of yet by EPA but likely to emanate • Weights laws weigh stations • Hours of service driver logs • Safety regulations OSHA reviews • Emissions compliance ?? |
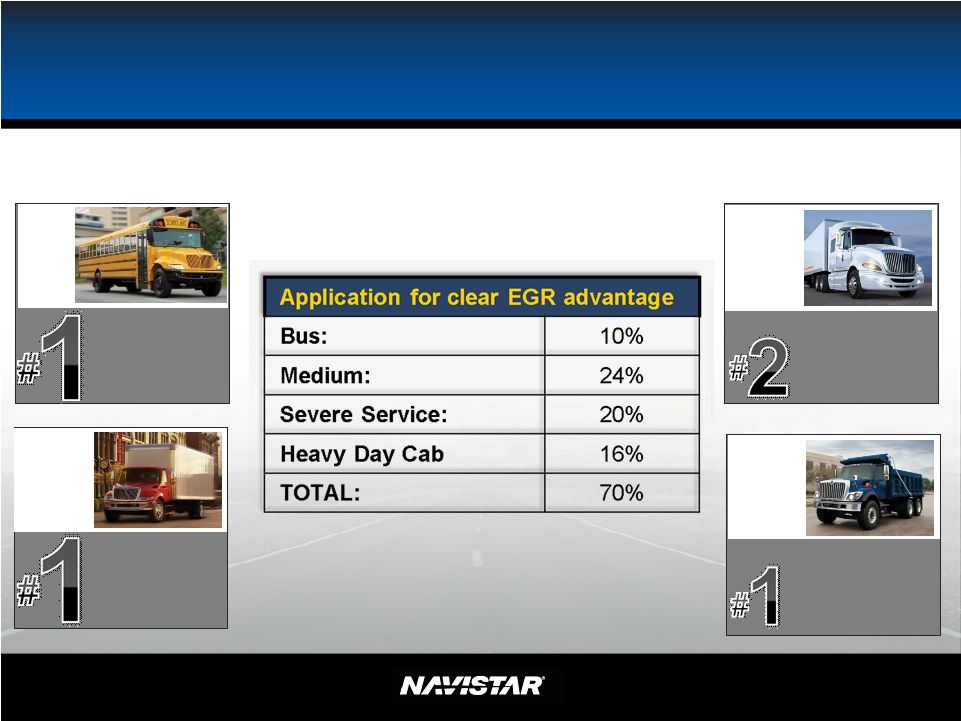 NYSE: NAV Advanced EGR Gives Us a Competitive Advantage 19 61% Market Share 3Q09 School Bus 35% Market Share 3Q09 33% Market Share 3Q09 Severe Service Truck* Heavy Truck 29% Market share 3Q09 Medium Truck 2009 Industry : Heavy Day Cab – 16% Heavy Sleeper – 30% *Note: Excludes U.S. Military deliveries. |
 NYSE: NAV 2010 Emission Strategy Status • Taking orders on 2010 emission vehicles • All engines will be between .4 and .5 NOx • Engine durability testing is on track and plan to over-test and stress many parts of the system • In most cases, vehicles will have equal to better fuel economy than 2009 vehicles • Base engine will have less heat than 2009 engines • ProStar ® vehicle weight will be reduced by 600 lbs. • MaxxForce ® 13L will have over 1,000 lbs. of weight advantage vs. a competitive 15L SCR engine 20 2010 emission strategy on/ahead of schedule |
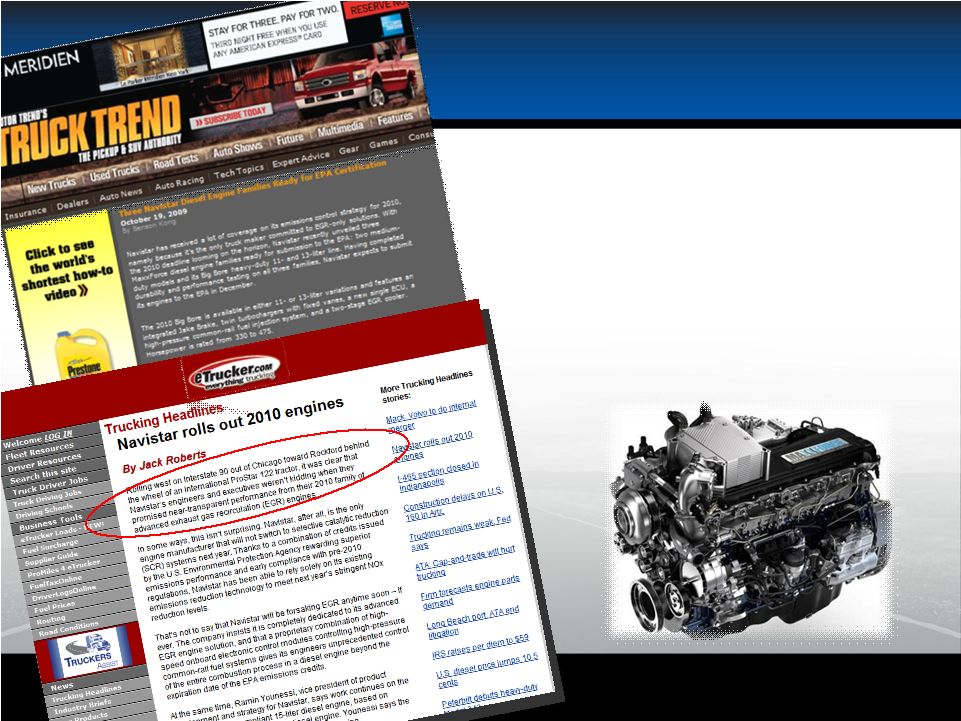 NYSE: NAV 21 “Rolling west on Interstate 90 out of Chicago toward Rockford behind the wheel of an International ProStar 122 tractor, it was clear that Navistar’s engineers and executives weren’t kidding when they promised near-transparent performance from their 2010 family of advanced exhaust gas recirculation (EGR) engines.” Media Ride and Drive |
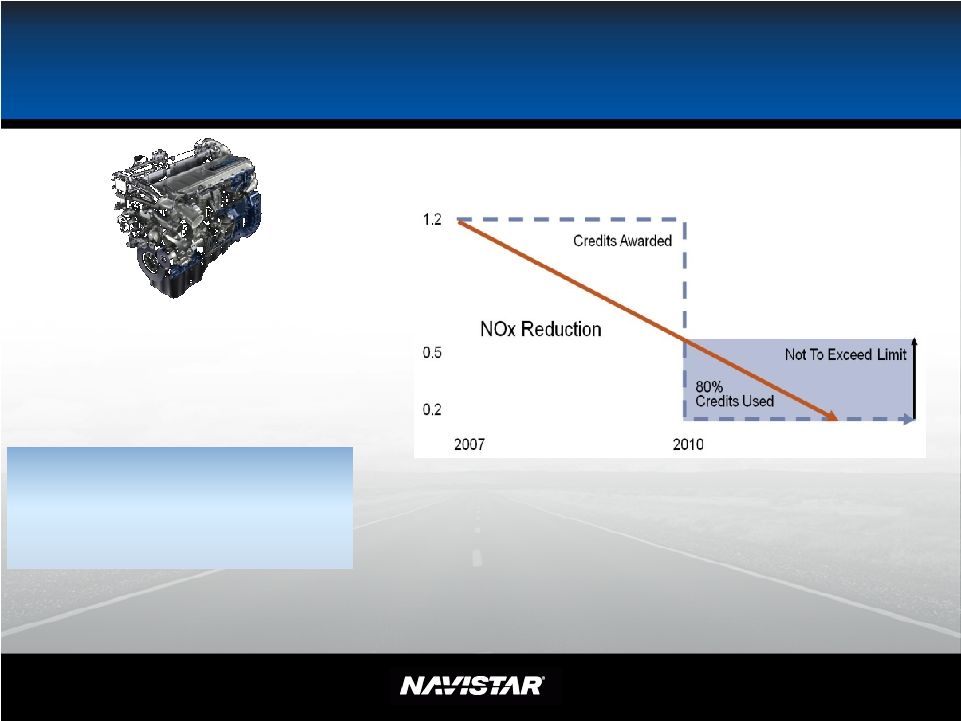 NYSE: NAV We Are Responsible for Emissions Development Strategy: Provide time for technology progress EPA rewards providers for cleaning up the environment sooner Advanced EGR provides the platform for continued emissions improvement The best technology will continue to improve… More complete burn Twin turbochargers 22 |
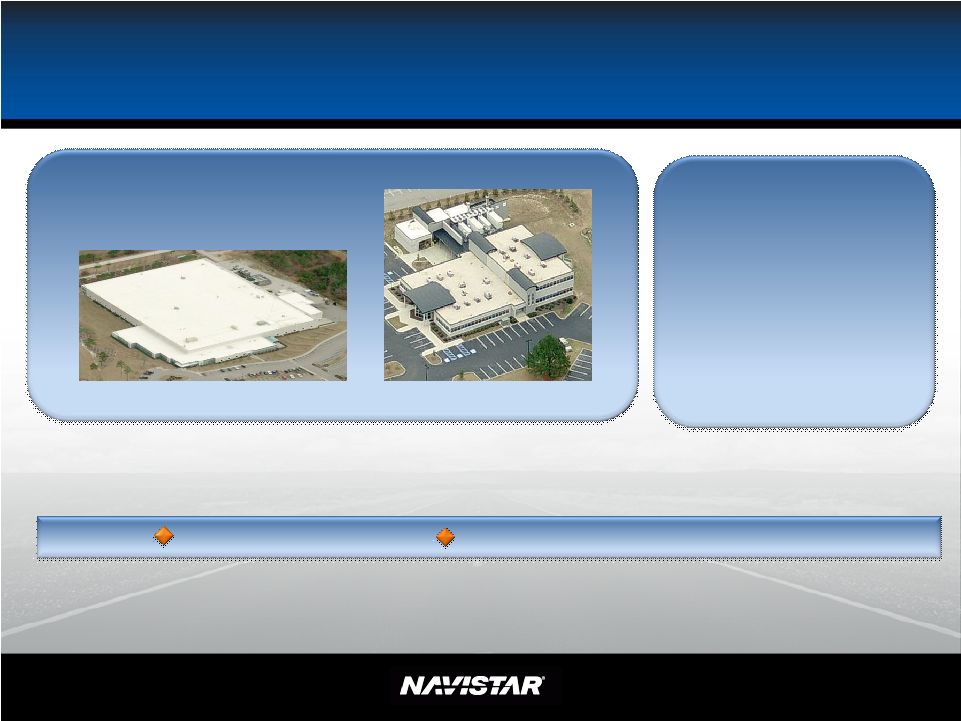 NYSE: NAV Controlling Our Destiny Investing in Fuel Systems 23 • Skilled workforce • Engineering staff • Intellectual property Core Competency Fuel Systems Plant R&D Center Physical Assets Control Cost Control Technology |
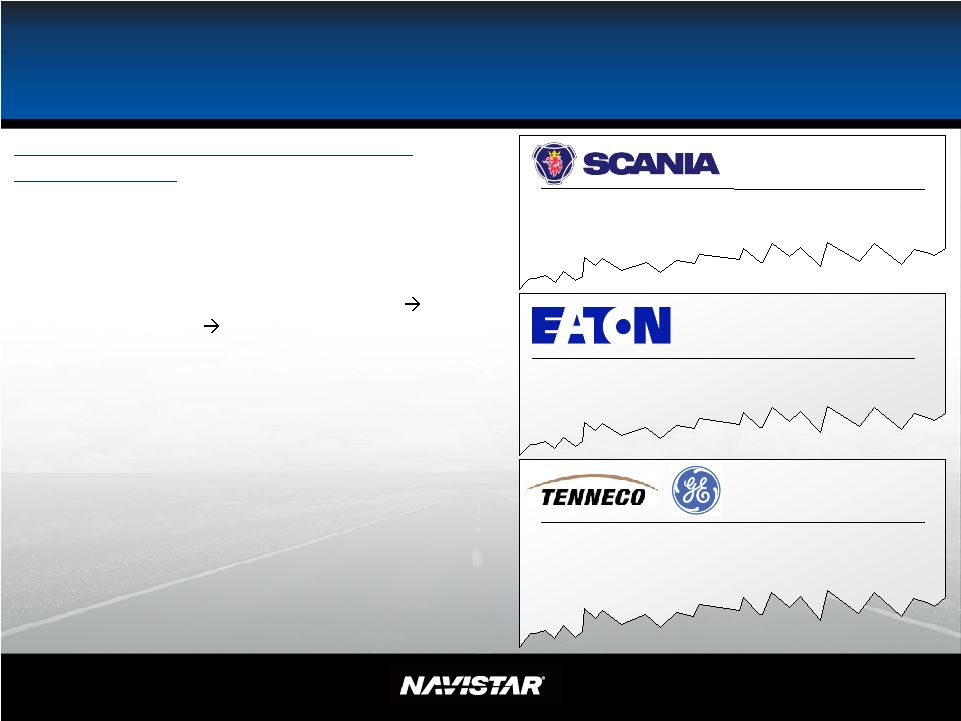 NYSE: NAV Customer Friendly Solutions 24 TENNECO and GE Transportation to Develop Hydrocarbon-SCR Technology for Diesel Emission Aftertreatment 4 February 2009 Eaton Evaluates Unique Emission Control Technology 22 June 2006 Alternative technology advancement to achieve 0.2 NOx 1.In-cylinder Combustion Improvement (EGR approach) a) Advanced fuel system (high injection pressure), air/EGR system, and advanced control, advanced vehicle cooling b) Brake thermal efficiency improvement better fuel economy less heat rejection 2.Advanced NOx after treatment system (Customer friendly and controlled by the OEM) a) Dual function DPF, NOx reduction diesel Particulate filter (“NPF” Navistar naming) with the following options i. Gas ammonia injection ii. Hydrocarbon injection b) Hydrocarbon or Hydrogen Injection - Lean NOx Trap (LNT) 3.Powertrain integration (Hybridization and advanced transmission technology (longer term)) 17 July 2008 Scania: EGR cost effective and convenient. Just add diesel! |
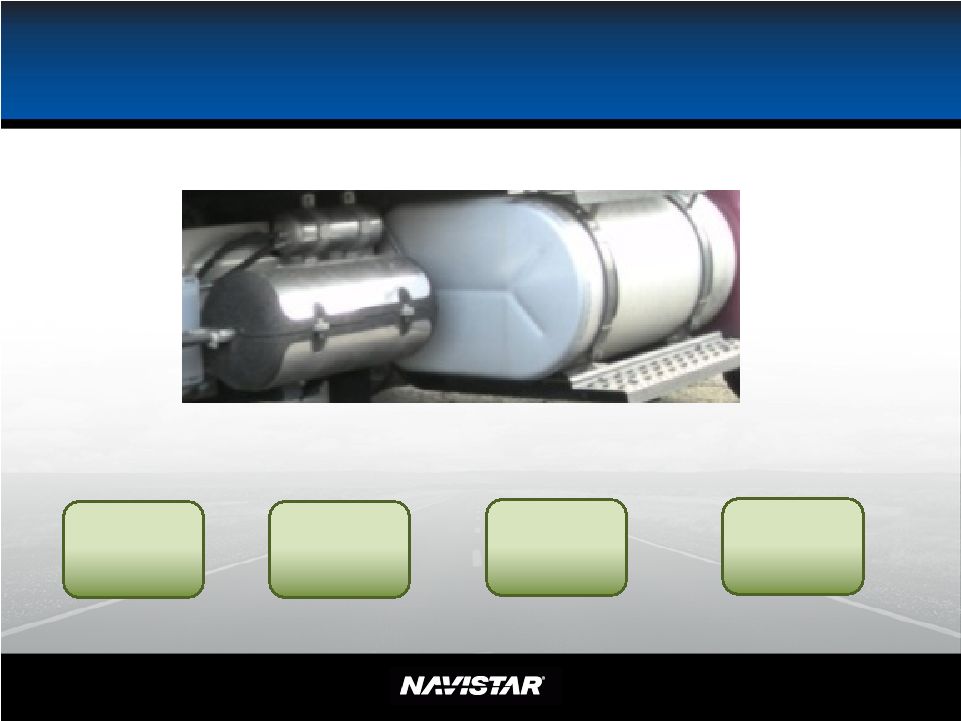 NYSE: NAV Controlling Our Destiny and Leveraging Our Assets in Customer Friendly Solutions “Another Dial” in Future 25 Solid NH3 cartridge Easy for operators Easy to understand Easy to maintain Dealer and customer friendly |
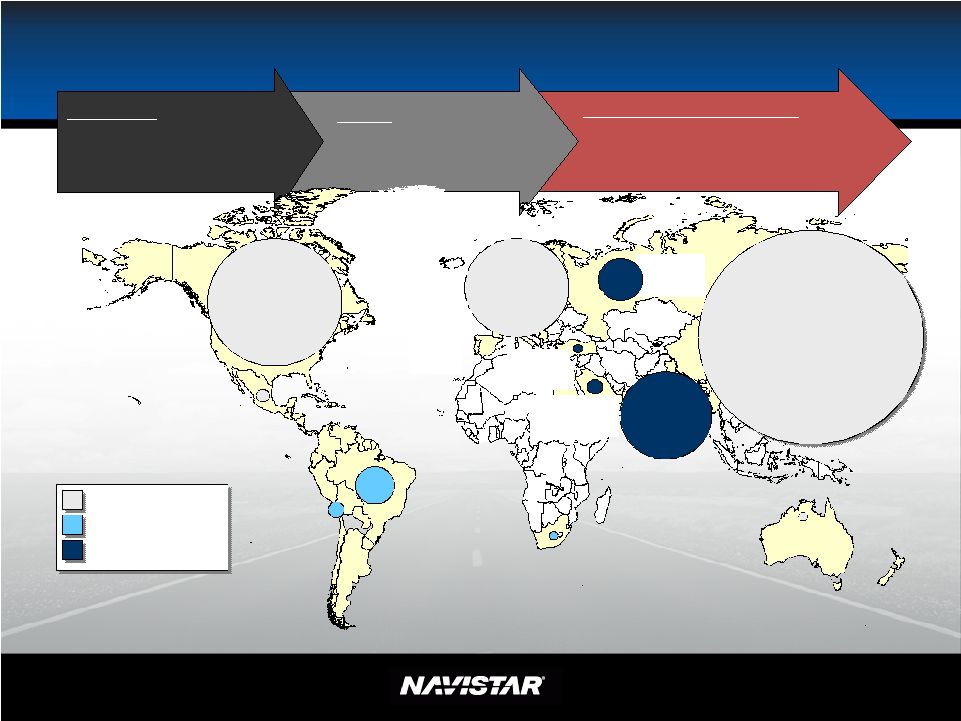 26 NYSE: NAV Profitable Growth CATJV & China Partner Partnership for global growth including expansion into China MNAL Growth through partnership with Mahindra for India and exports EXPORTS Opportunistic exports of current North America products Australia South Africa India* Mercosur Other LA 30,000 335,000 129,000 22,000 25,000 54,000 North America 443,000 Western Europe 345,000 China 746,000 Turkey Middle East 53,000 Russia 147,000 Mexico 44,000 Note: Includes Medium and Heavy Trucks >6T only Source: JD Power; Monitor Analysis, Mahindra Data (*India >3.5T) Low Growth Medium Growth High Growth |
 NYSE: NAV Profitable Growth – Current and Future Opportunities 27 |
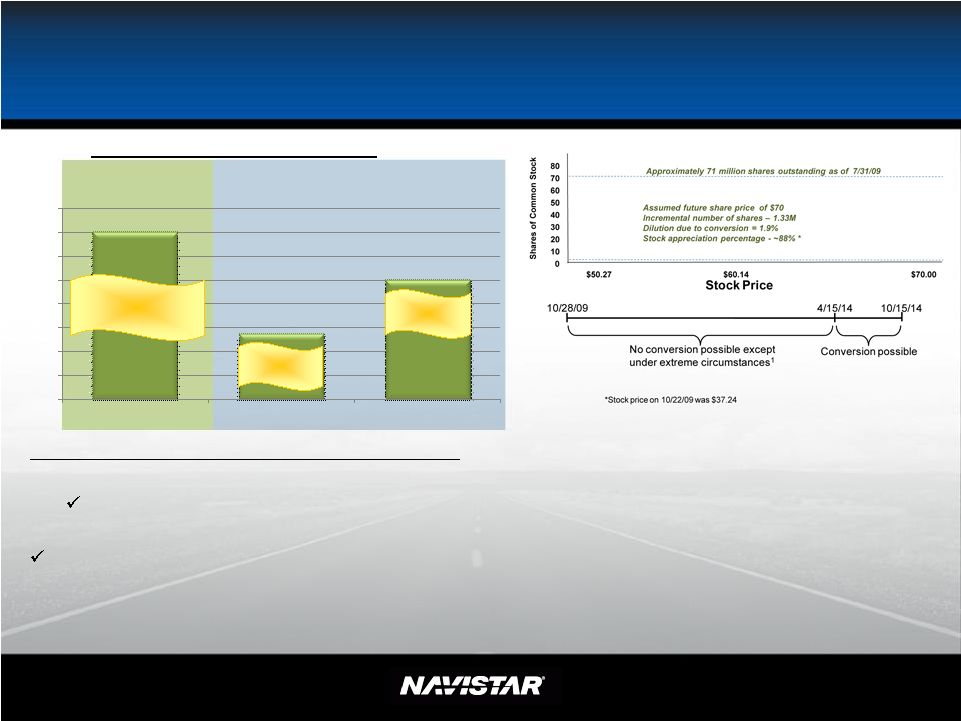 Capital Structure Provides Flexibility and Stability 28 Manufacturing $1.57 Billion Debt Deal Summary: • $1 billion senior notes due 2021 at 8.25% per annum Ability to buyback $50 million per year •$570 million senior subordinated convertible notes at 3% per annum No economic dilution unless average stock price at or above $60.14 within last six months Selected Debt Maturities ($ in Millions) Shares of Common Stock $0 $200 $400 $600 $800 $1,000 $1,200 $1,400 $1,600 2010 2014 2021 Expected to be complete by Calendar Year End Completed Completed NFC Manufacturing Holders may convert the Convertible Notes into common stock of the Company, par value $0.10 per share (“Common Stock”), at any time on or after April 15, 2014. Holders may also convert their Convertible Notes at their option prior to April 15, 2014, under the following circumstances: (1) during any fiscal quarter commencing after January 31, 2010, if the last reported sale price of the Common Stock for at least 20 trading days (whether or not consecutive) during a period of 30 consecutive trading days ending on the last trading day of the preceding fiscal quarter is greater than or equal to 130% of the applicable conversion price on each such trading day; (2) during the five business day period after any five consecutive trading day period (the “Measurement Period”) in which the trading price per $1,000 principal amount of notes for each trading day of that Measurement Period was less than 98% of the product of the last reported sale price of the Common Stock and the applicable conversion rate on each such trading day; or (3) upon the occurrence of specified corporate events. The conversion rate will initially be 19.8910 shares of Common Stock per $1,000 principal amount of Convertible Notes (equivalent to an initial conversion price of approximately $50.27 per share of Common Stock). 1 NYSE: NAV |
 NYSE: NAV $0 $2,000 $4,000 $6,000 $8,000 $10,000 $12,000 $14,000 $16,000 2002 2008 Revenues Summary – Strategy Is Working 29 Great products with leading market positions Diverse revenue stream that is profitable throughout the truck cycle Positioned for rebound in cycle and global growth opportunities Strong liquidity and capital structure |
 NYSE: NAV Summary Advanced EGR In-Cylinder NOx Reduction 30 Controlling our destiny Leveraging what we have and what others have built |
 NYSE: NAV SEC Regulation G 31 U.S. and Canada industry 165K 185K Sales and revenues, net $11.5 $12.0 Manufacturing segment profit (excludes asset impairment, Ford settlement, & related charges) $350 $450 Asset impairment, Ford settlement, & related charges Manufacturing segment profit $350 $450 Below the line items ($500) ($330) Income (Loss) before income tax $1,100 $1,270 ($170) ($70) NA $15+ ($Millions) ($Millions) $1,600 Target @ Current Industry 414.5K ($Billions) ~($520) $1,600 NA ($Billions) FY 2009 Guidance on $1.6B Mfg Segment Profit Line Original Target @ 414.5K Industry This regulation G slide corresponds with the data found in the chart on slide 15 |
 NYSE: NAV SEC Regulation G – Fiscal Year Comparison 32 Earnings Guidance (See 8K filed on October 20th, 2009) The company’s guidance for net income including and excluding the Ford settlement and related charges for its fiscal year ending October 31, 2009, is expected to be in the mid to low end of the range that was stated on September 10, 2009 during the 3 quarter analyst call. The softness in the U.S. and Canadian truck and bus markets was also referenced on that 3 quarter call and that continued softness has resulted in lower manufacturing segment profit compared to the September 10, 2009 guidance that is expected to be offset by better than expected performance in corporate SG&A and other below the line items. Further, the current guidance does not include certain potential asset impairments, such as those that may arise from developments in our Canadian operations or the potential write-off of certain unamortized debt issuance costs from the company’s 2007 term loan that will be triggered as a result of the refinancing. This presentation is not in accordance with, or an alternative for, U.S. generally accepted accounting principles (GAAP). The non-GAAP financial information presented herein should be considered supplemental to, and not as a substitute for, or superior to, financial measures calculated in accordance with GAAP. However, we believe that non-GAAP reporting, giving effect to the adjustments shown in the reconciliation above, provides meaningful information and therefore we use it to supplement our GAAP reporting by identifying items that may not be related to the core manufacturing business. Management often uses this information to assess and measure the performance of our operating segments. We have chosen to provide this supplemental information to investors, analysts and other interested parties to enable them to perform additional analyses of operating results, to illustrate the results of operations giving effect to the non-GAAP adjustments shown in the above reconciliations and to provide an additional measure of performance. FY 2008 FY 2007 FY 2006 Estimated As Reported As Reported As Reported Ford Settlement Impacts U.S. and Canada industry 165K 185K 165K 185K ($Billions) ($Billions) ($Billions) Sales and revenues, net $11.0 $11.5 $11.0 $11.5 $14.7 $12.3 $14.2 ($Millions) ($Millions) ($Millions) ($Millions) Manufacturing segment profit * (excludes asset impairment, Ford settlement, & related charges) $710 $735 NA $710 $735 $1,114 $426 $838 Asset impairment, Ford settlement, & related charges ~ $175 ($395) NA NA Manufacturing segment profit * $710 $735 $175 $885 $910 $719 $426 $838 Below the line items $0 ($528) ($499) ($443) Income (Loss) excluding income tax $225 $250 $175 $400 $425 $191 ($73) $395 Income tax benefit (expense) ~ ($3) ($57) ($47) ($94) Net income (loss) $182 $207 $172 $354 $379 $134 ($120) $301 Diluted earnings (loss) per share ($'s) $2.55 $2.85 $2.40 $4.95 $5.25 $1.82 ($1.70) $4.12 Weighted average shares outstanding: diluted ~72M 73.2M 70.3M 74.5M Memo - professional fees included in below the line items ($40) ($30) ($40) ($30) ($154) ($224) ($70) * Includes: minority interest in net income of subsidiaries of ($7)M, net of tax; extraordinary gain of $23M, net of tax ~72M ~72M ~($485) ~($43) ~($46) ($Millions) ($Millions) ($Billions) ($Billions) FY 2009 Non GAAP Goal Goal Without Ford Settlement With Ford Settlement ~($485) NA ~$175 rd rd |