 NYSE: NAV Investor & Analyst Day Melrose Park Tuesday, January 25, 2011 Exhibit 99.1 |
 NYSE: NAV Safe Harbor Statement Information provided and statements contained in this presentation that are not purely historical are forward-looking statements within the meaning of Section 27A of the Securities Act of 1933, as amended, Section 21E of the Securities Exchange Act of 1934, as amended, and the Private Securities Litigation Reform Act of 1995. Such forward-looking statements only speak as of the date of this presentation and the Company assumes no obligation to update the information included in this presentation. Such forward-looking statements include information concerning our possible or assumed future results of operations, including descriptions of our business strategy. These statements often include words such as “believe,” “expect,” “anticipate,” “intend,” “plan,” “estimate,” or similar expressions. These statements are not guarantees of performance or results and they involve risks, uncertainties, and assumptions. For a further description of these factors, see Item 1A, Risk Factors, included within our Form 10-K for the year ended October 31, 2010, which was filed on December 21, 2010. Although we believe that these forward-looking statements are based on reasonable assumptions, there are many factors that could affect our actual financial results or results of operations and could cause actual results to differ materially from those in the forward-looking statements. All future written and oral forward-looking statements by us or persons acting on our behalf are expressly qualified in their entirety by the cautionary statements contained or referred to above. Except for our ongoing obligations to disclose material information as required by the federal securities laws, we do not have any obligations or intention to release publicly any revisions to any forward- looking statements to reflect events or circumstances in the future or to reflect the occurrence of unanticipated events. |
 NYSE: NAV Other Cautionary Notes • The financial information herein contains audited and unaudited information and has been prepared by management in good faith and based on data currently available to the Company. • Certain Non-GAAP measures are used in this presentation to assist the reader in understanding our core manufacturing business. We believe this information is useful and relevant to assess and measure the performance of our core manufacturing business as it illustrates manufacturing performance without regard to selected historical legacy costs (i.e. pension and other postretirement costs). It also excludes financial services and other expenses that may not be related to the core manufacturing business. Management often uses this information to assess and measure the performance of our operating segments. A reconciliation to the most appropriate GAAP number is included in the appendix of this presentation. |
 NYSE: NAV Dan Ustian Chairman, President and Chief Executive Officer 4 |
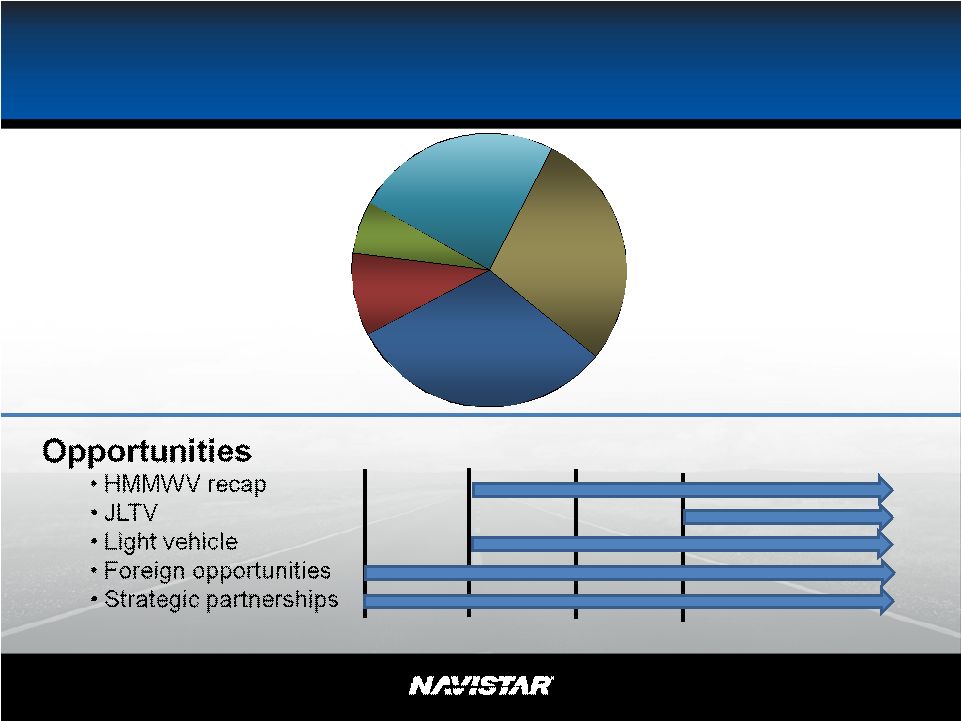
 NYSE: NAV Agenda • Jack Allen, President, N.A. Truck Group • Archie Massicotte, President, Navistar Defense • Eric Tech, President, Engine Group • Dee Kapur, President, Truck Group • A.J. Cederoth, EVP & CFO • Q&A • Product and Technology Tour 5 |
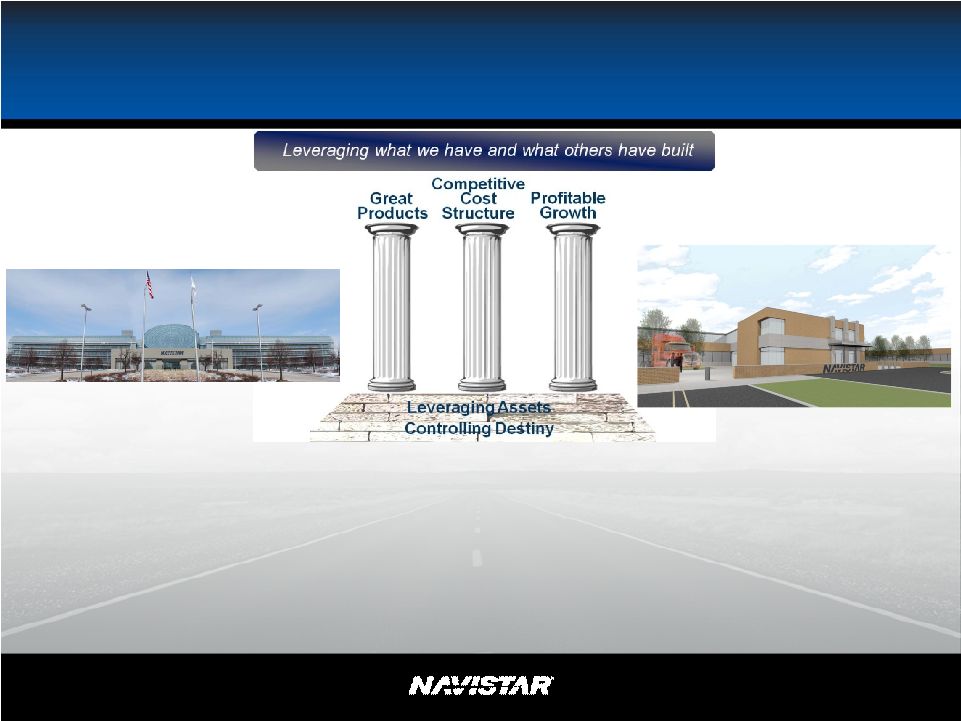
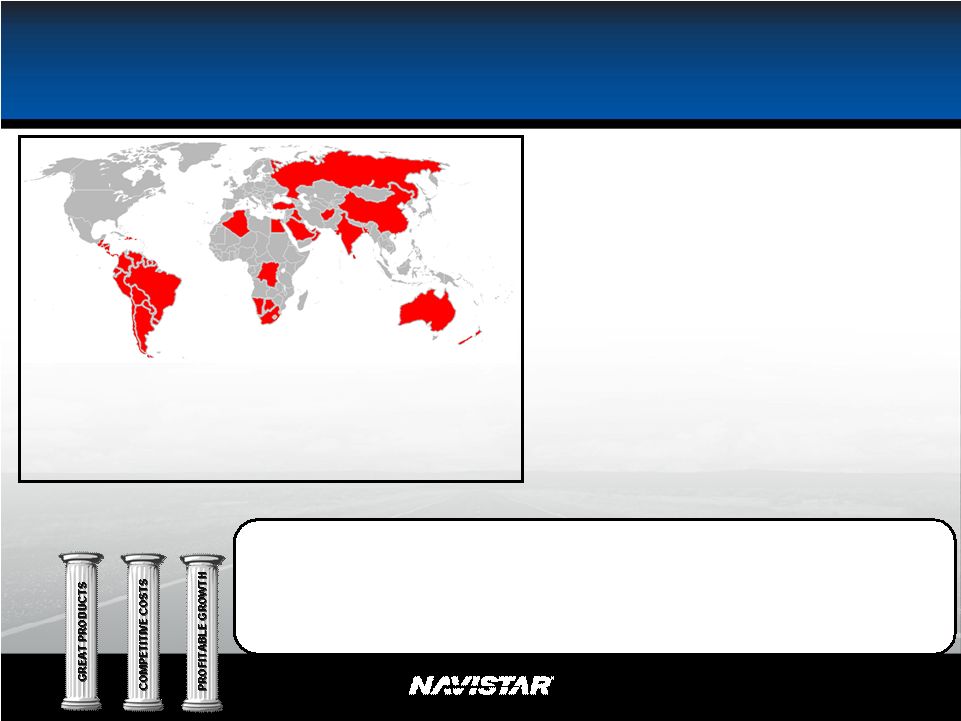
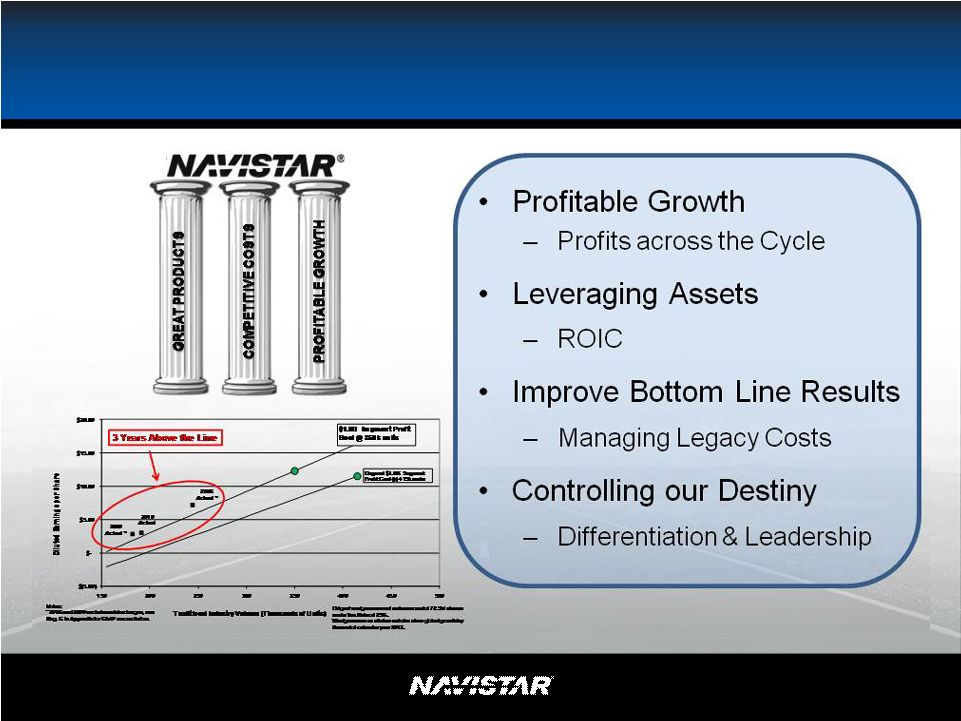
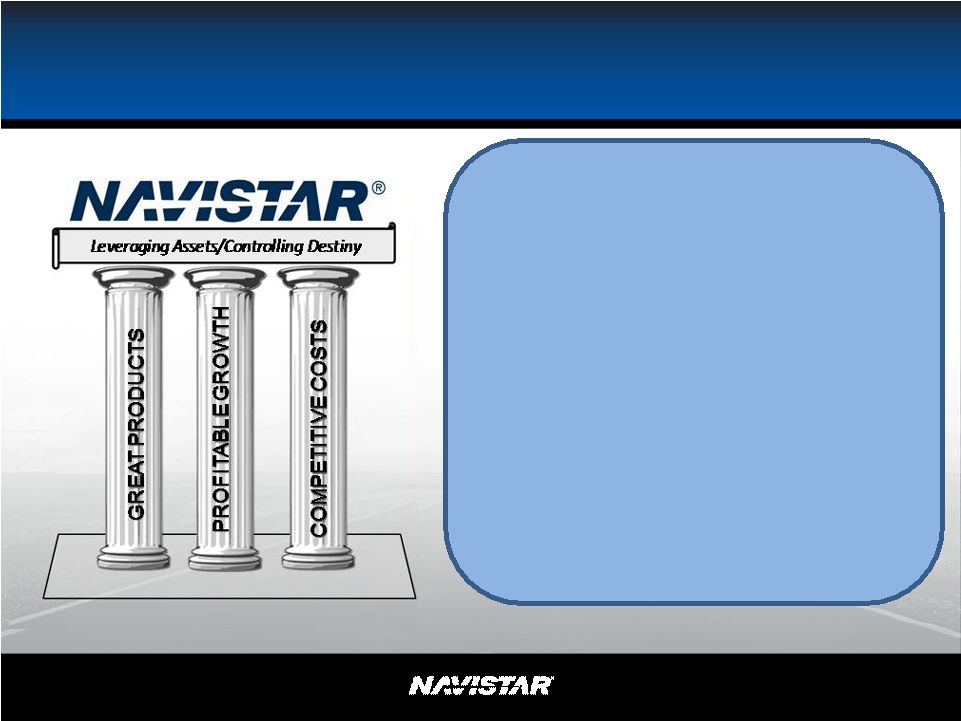
 NYSE: NAV Strategy: Leveraging What We Have and What Others Have Built 6 Note: This slide includes information presented on a non-GAAP basis. Please see Reg G in the Appendix and A. J. Cederoth’s section for a reconciliation of revenue. |
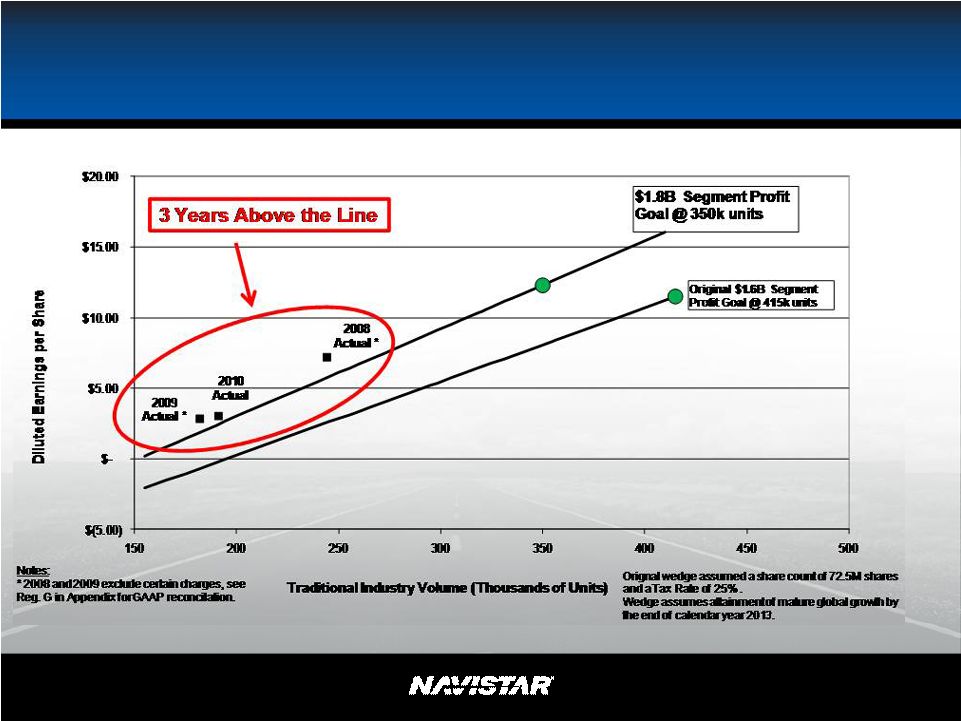 NYSE: NAV Consistent Earnings 7 Note: This slide contains non-GAAP information, please see the Reg G in appendix for detailed reconciliation. |
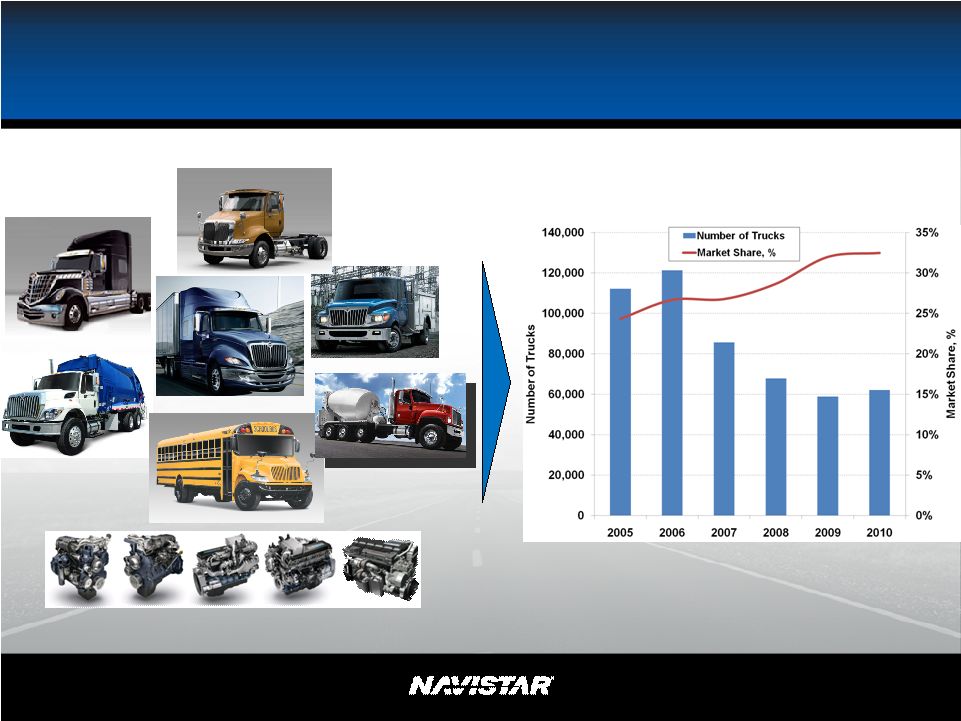
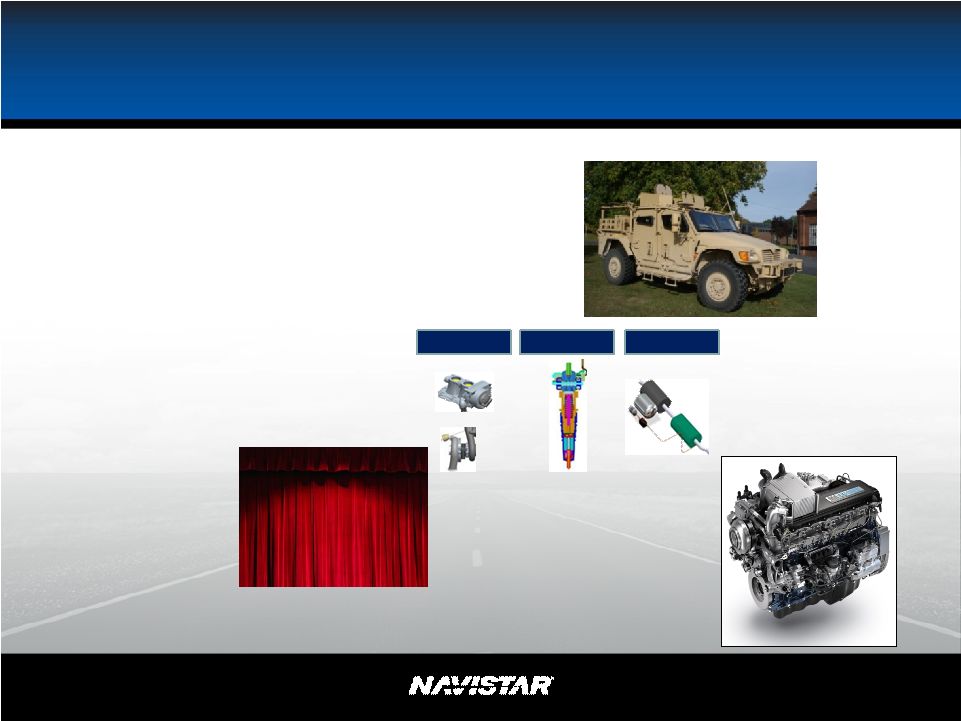
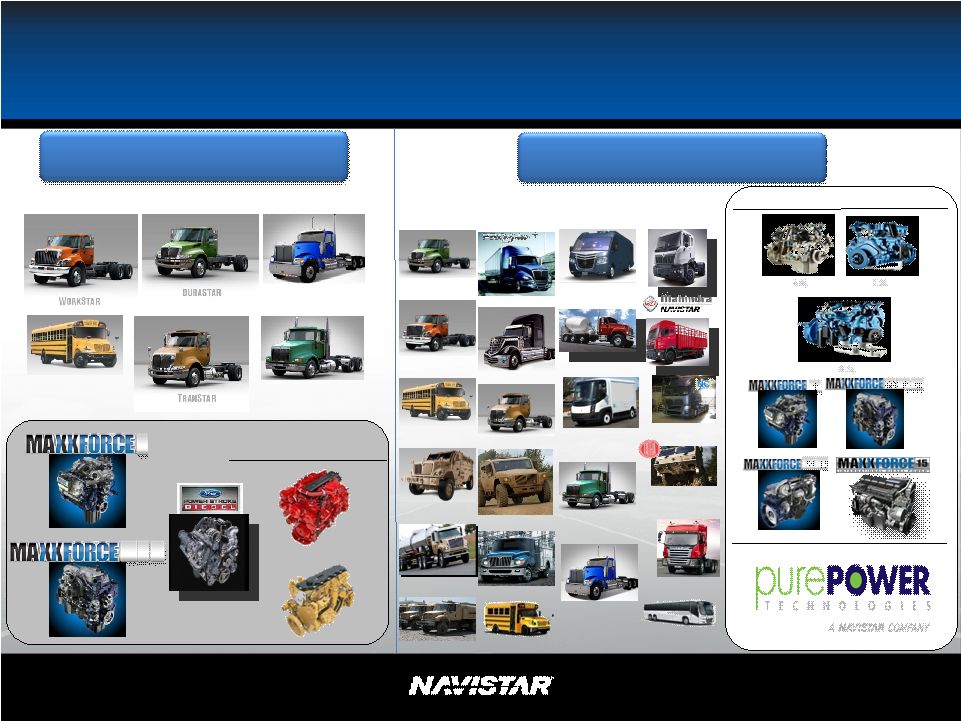 NYSE: NAV Purchased Engines 7 7 DT DT 9 9 10 10 9900 SCHOOL BUS 9200 / 9400 Global Powertrain 7.2L 9.3L 4.8L 9 10 DT 7 11 13 2007 Product Offerings Leader in Products, Technology and Innovation 2011 Product Offerings – Well Positioned For the Future 8 |
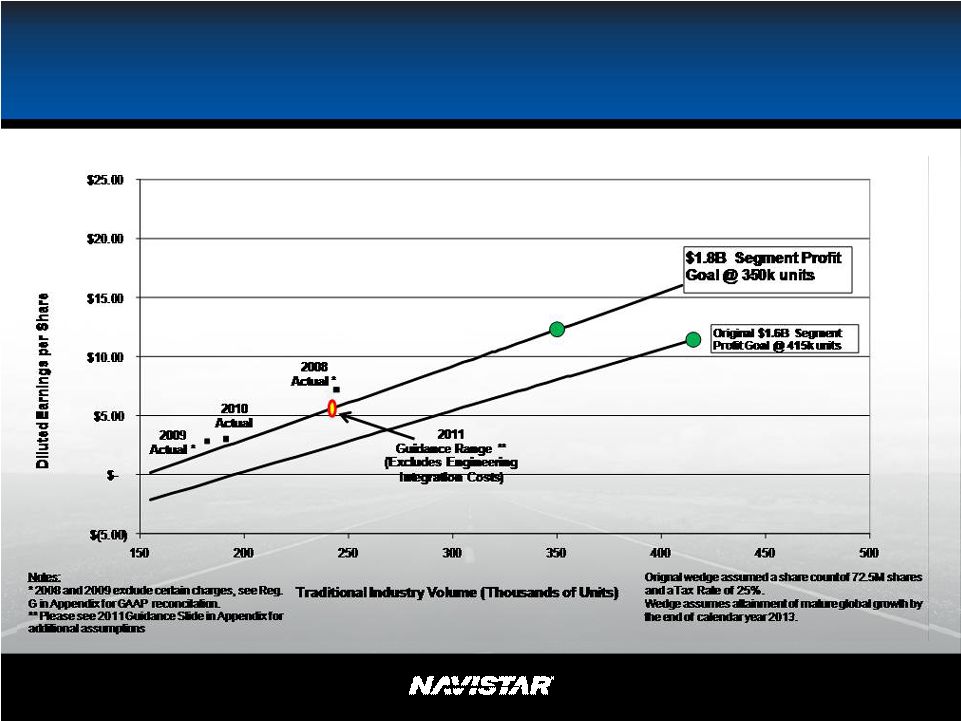
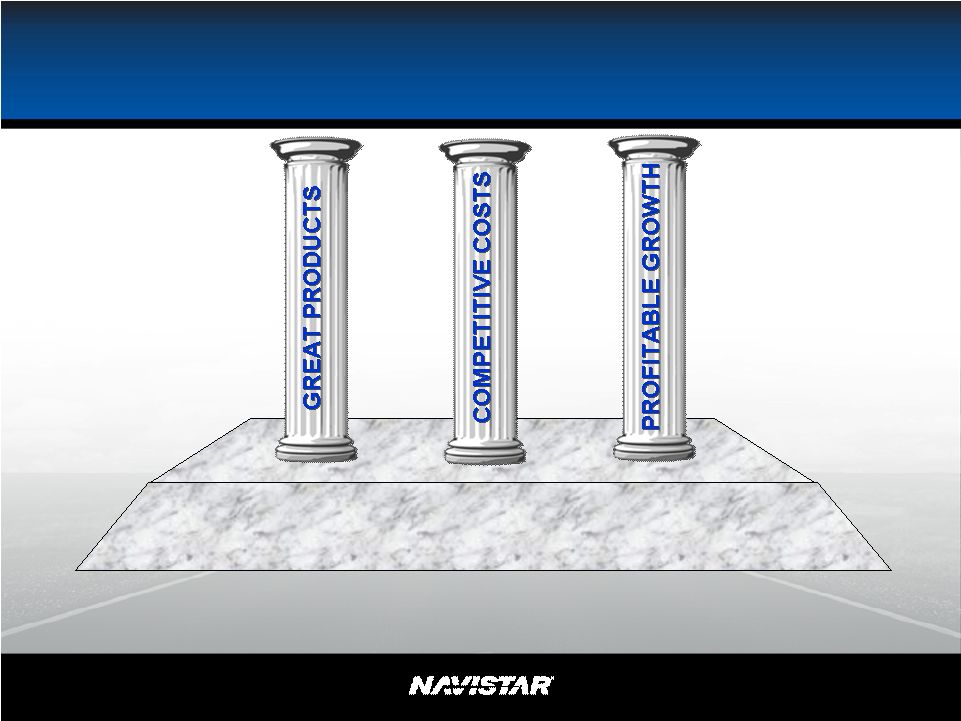
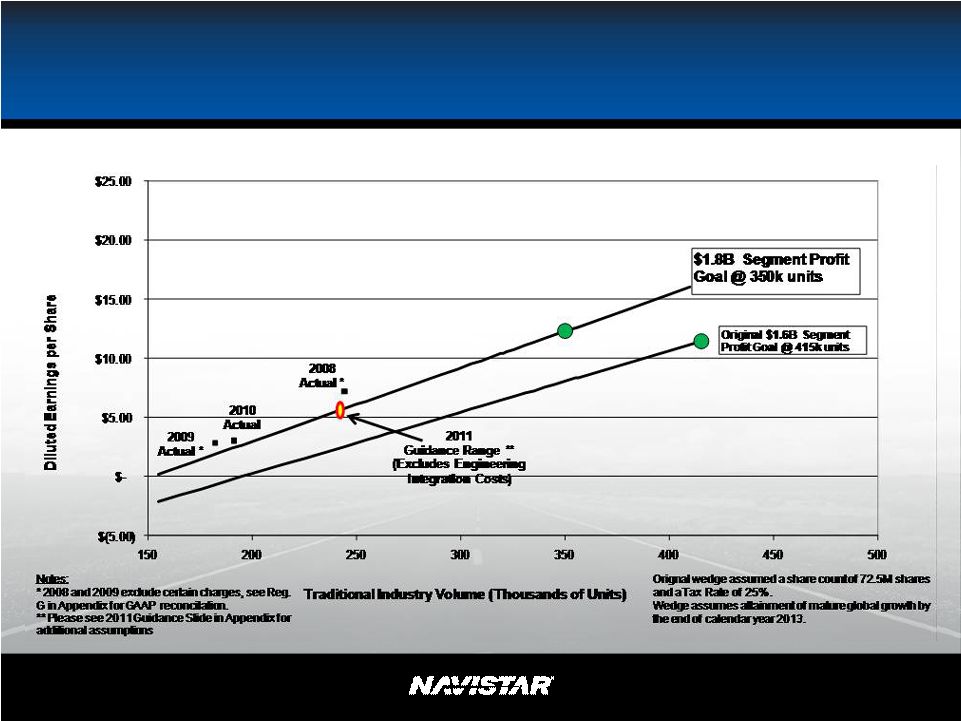
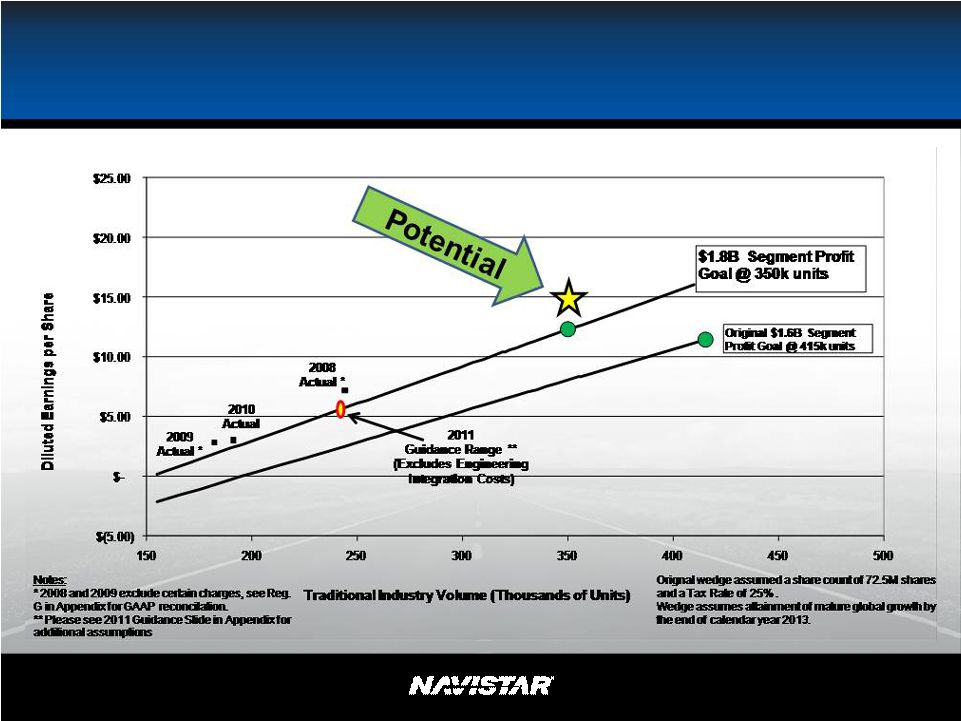
 NYSE: NAV Competitive Cost Competitive Cost Structure Structure Profitable Profitable Growth Growth Great Great Products Products • 15L • Cat North America • Global Cab over 2011 Actions to Complete Strategy • Flexible Manufacturing • Suppliers • Market share/Scale • Global • Bus – Global • Parts – Big Bore $20 Billion with $1.8 Manufacturing Segment Profit at 350K Unit Industry 9 Note: Please see 2011 Guidance Slide in Appendix for additional assumptions. |
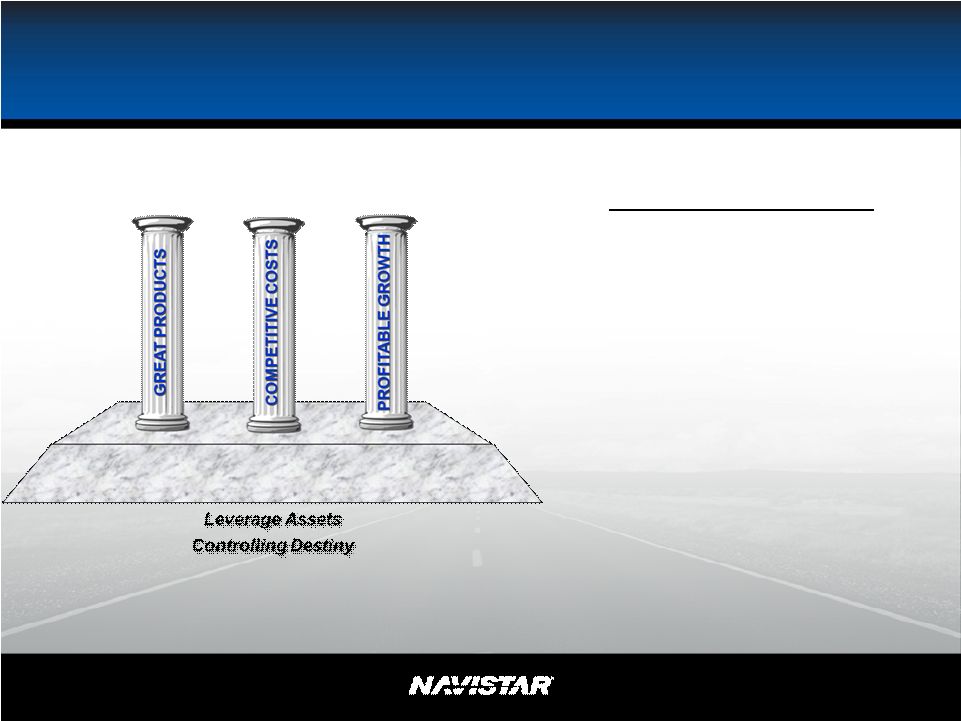
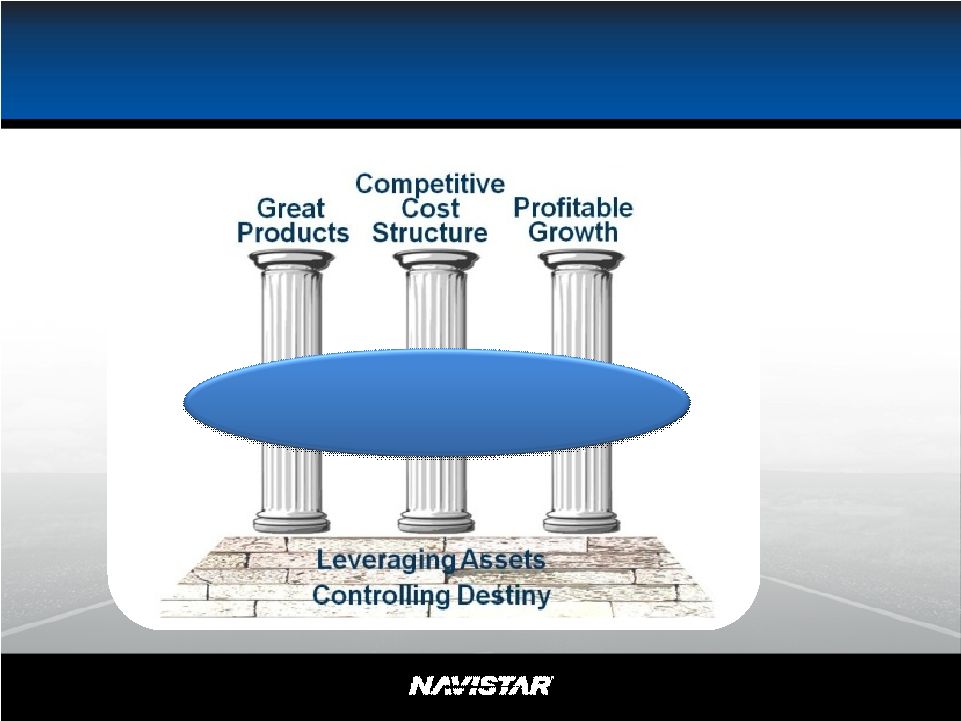 NYSE: NAV Strategic Framework Remains Intact DIFFERENTIATION & LEADERSHIP 10 |
 NYSE: NAV Differentiate and Leadership • 2010 Emissions • Flexible Manufacturing • 13L vs. 15L • Ride and Performance • Dealer • Military MaxxForce MaxxForce ® ® 13 13 11 Navistar’s dealer distribution network |
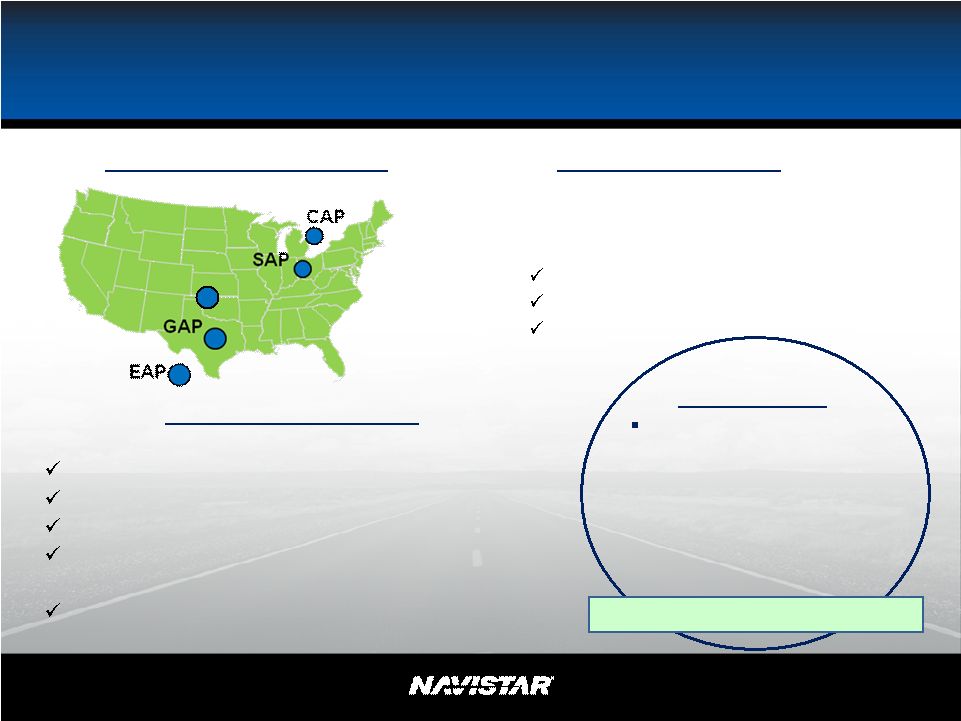
 NYSE: NAV Protect Shareholder Value • Trucks and Engines • Flexible Manufacturing 12 Controlling Destiny Leveraging Assets • Minimize Change - EGR • Huntsville • 13L 11 13 EAP GAP CAP SAP TBP HEP CBP MPP Navistar’s manufacturing locations |
 NYSE: NAV Continued Success in 2011 13 Note: Please see 2011 Guidance Slide in Appendix for additional assumptions. |
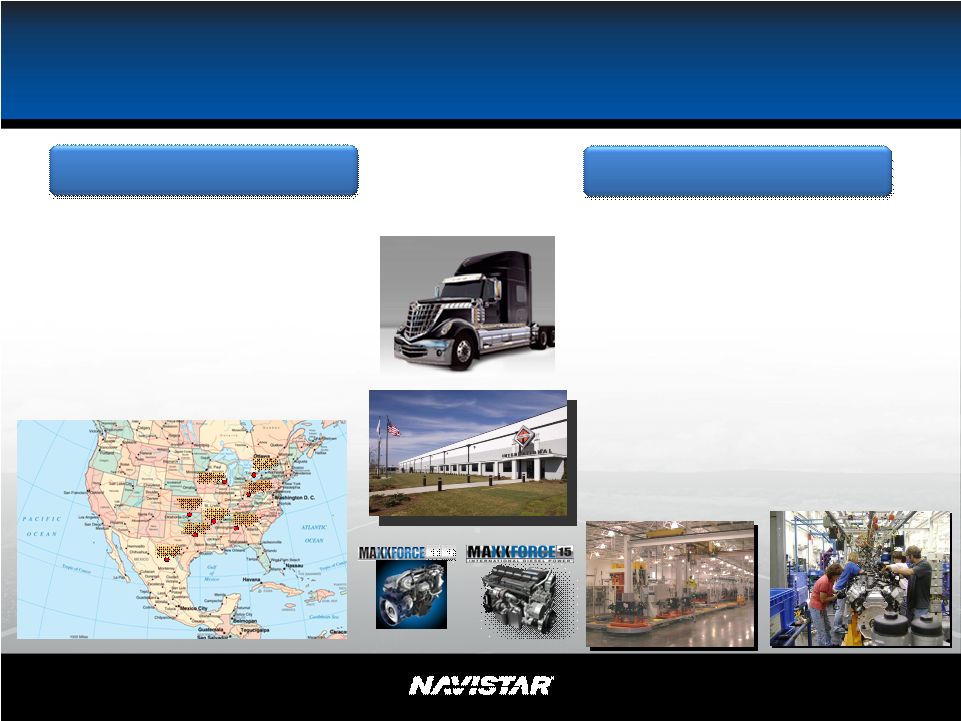
 NYSE: NAV Integration 14 Melrose Park Melrose Park Lisle Lisle Lisle • 90 acres and 1.2M sq. ft. • $700-800M original cost to Lucent (our cost is $34M plus upgrades) Benefits • Integration • Tax incentives ~$100M • $60 - $80M cost reductions |
 NYSE: NAV Jack Allen President, North America Truck Group 15 |
 NYSE: NAV North American Truck Strategy • Great Products Leadership and Differentiation • Costs Scale / Labor / Manufacturing • Growth Market Share, New Markets, New Business 10% Return on Sales 16 |
 NYSE: NAV Strong Actions During Recession Lead to Success in Core North America Market Recovery 17 Source: Ward’s Automotive |
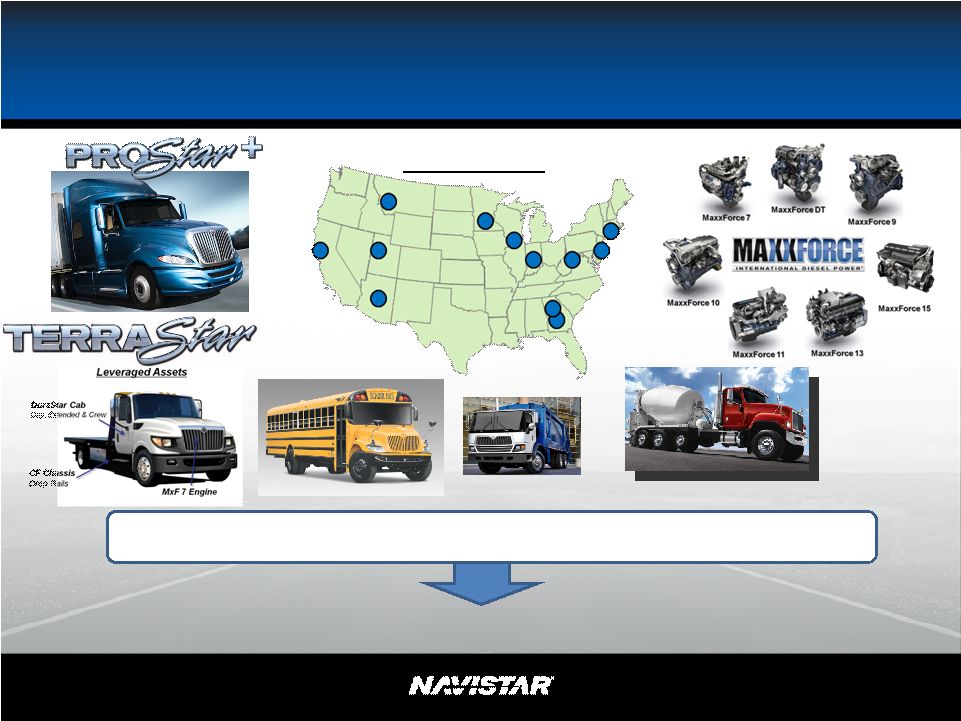
 NYSE: NAV Integrated Truck and Engines Broadest Integrated Application Based Product Line Source: Ward’s Automotive 18 |
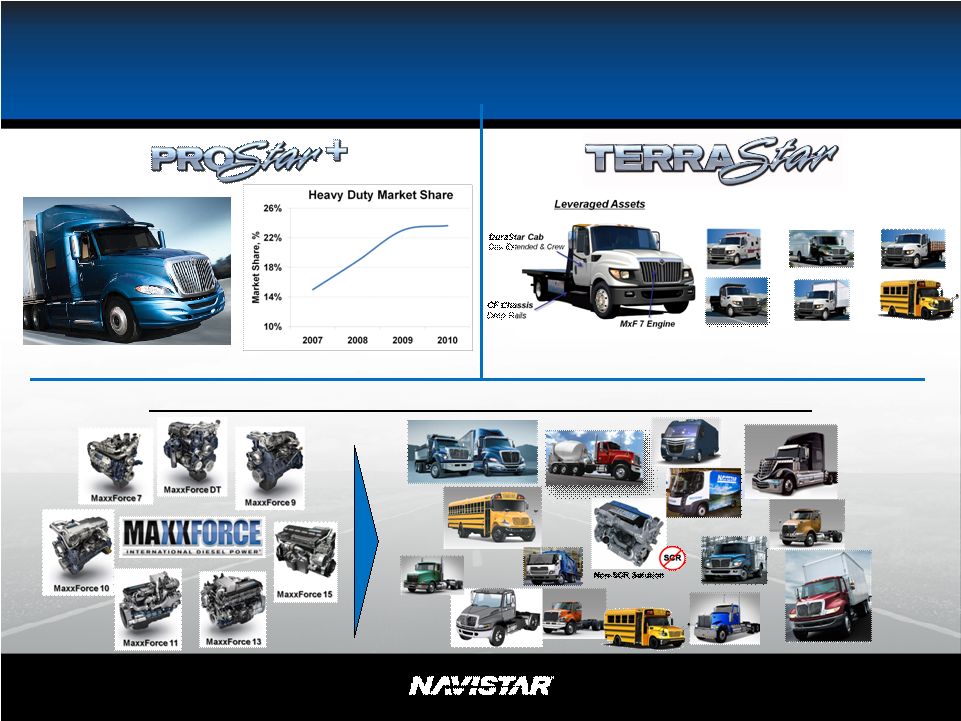
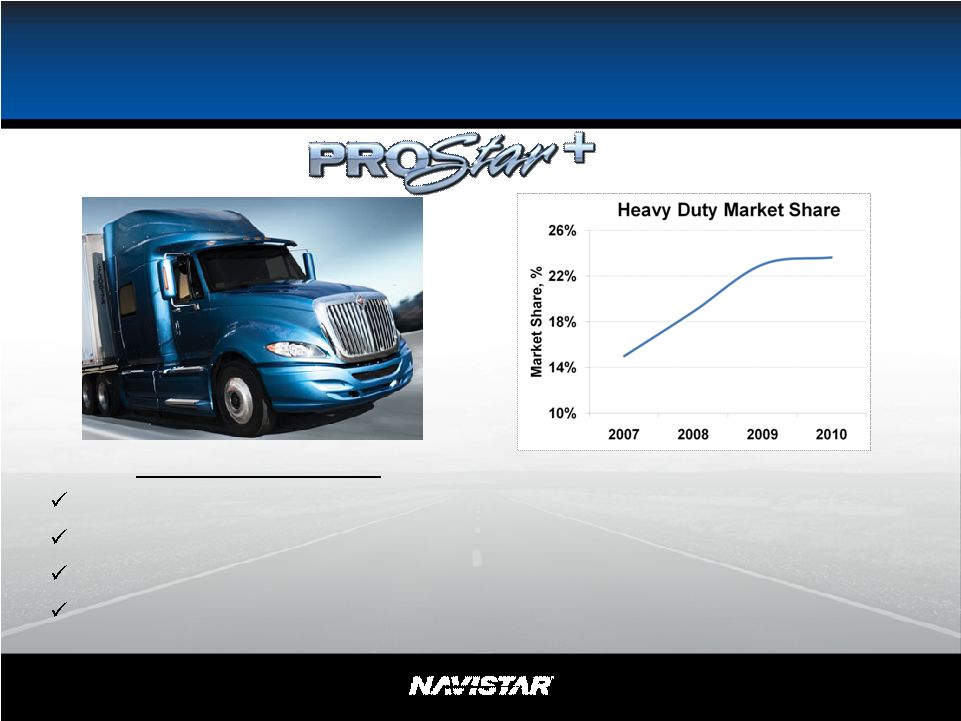 NYSE: NAV Products – New and Differentiated Market Advantages Leading in fuel economy Lightest weight Driver comfort and ride/handling EGR for customer convenience, cost, quality Over 50,000 ProStar’s on the road today Source: Ward’s Automotive 19 |
 NYSE: NAV Products – New and Differentiated 60,000 unit Class 4/5 market – 20% share goal Commercial alternative to pick-up truck Leverage Assets – 6 months to market EGR based MF7 engine 3,000 in 2011; 12,000 mature Crew cab, 4x4, gas engine 20 |
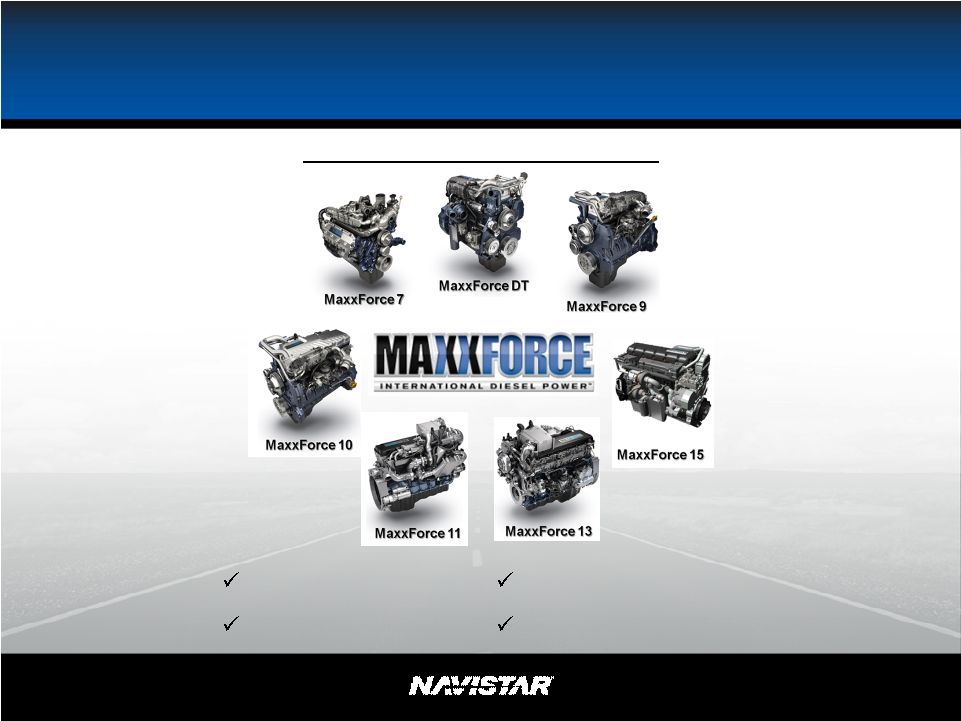 NYSE: NAV Products – New and Differentiated MaxxForce ® Engines Family Lightweight Fuel efficient High performance Advanced EGR 21 |
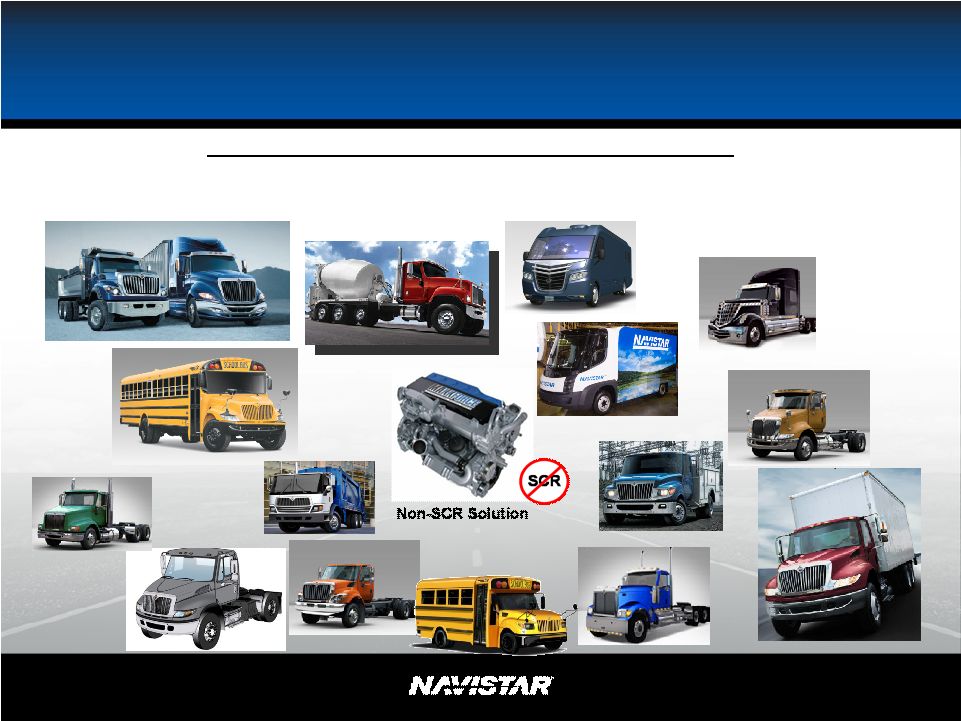 NYSE: NAV Products – New and Differentiated Broadest Application Based Product Line Class 4 – 8 Integrated Engines and Trucks Class 4/5, Medium, School Bus, Severe Service, Sleepers, Regional Haul, Niches 22 |
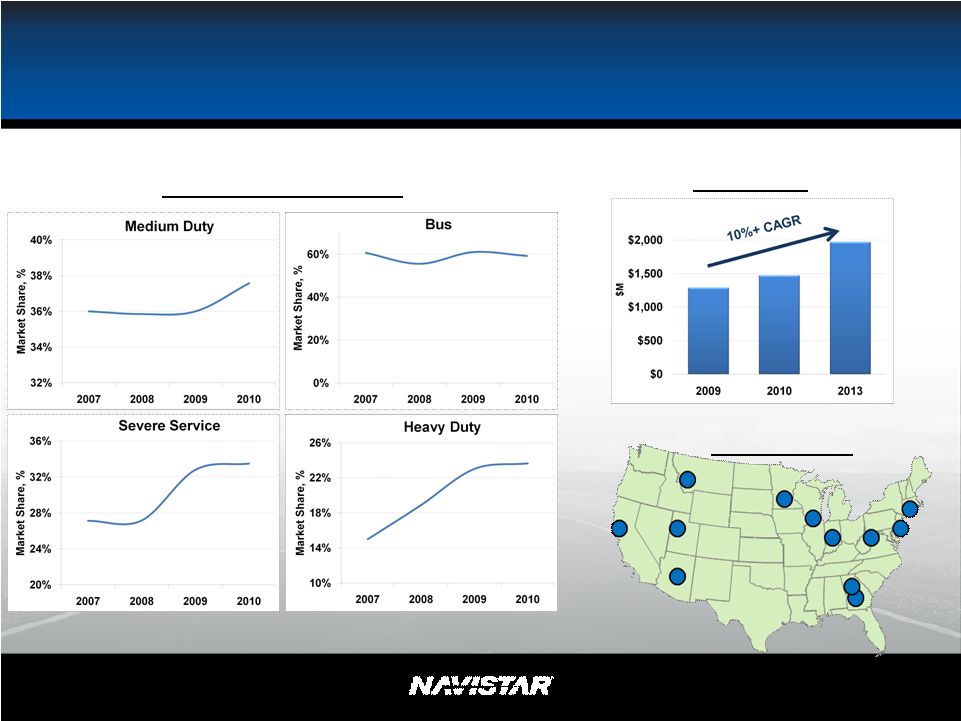 NYSE: NAV Results Market Share Growth New Dealers North America Part Sales Source: Ward’s Automotive 23 (U.S., Canada, Mexico and Uptime Parts, excludes Military) |
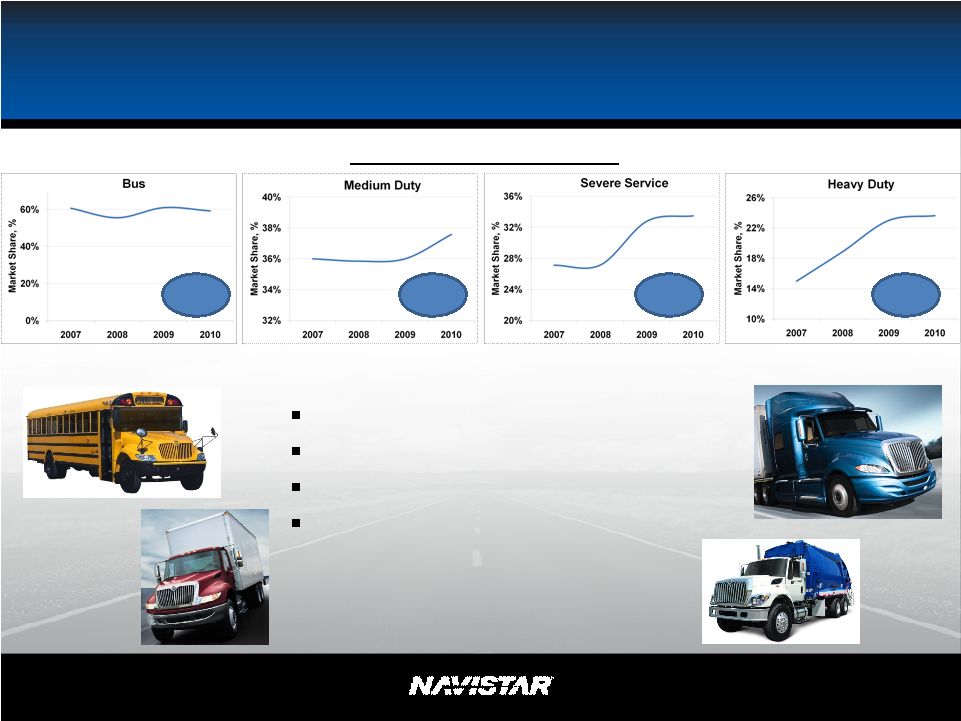 NYSE: NAV Results Market Share Growth Great products EGR preference Dealer advantage Broad customer applications #2 24 ~+2pp ~+6pp ~+9pp Steady #1 #1 #1 |
 NYSE: NAV Results North America Parts Sales Recent Successes Customer reach Product breadth Market share growth Future Opportunities MaxxForce ® engines TerraStar™ New businesses Improving fleet utilization 25 (U.S., Canada, Mexico and Uptime Parts, excludes Military) |
 NYSE: NAV Results New Dealers Distribution Network • Investments to strengthen the best dealer network in the industry • 12 new dealers in key major market areas • Solid experience from proven leaders in truck and related industries… Freightliner, Volvo, Mack, Caterpillar, Peterbilt, Sterling 26 |
 NYSE: NAV North America Truck Strategy Leverage Assets Controlling Destiny 27 |
 NYSE: NAV Cost Reduction • Fully flexible – common platforms and common manufacturing processes • Optimized lowest cost in industry Logistics - Menlo Inbound / Outbound freight Assembly cost New Labor Agreement • Improved Springfield competitiveness 2 tier wages Temporary workers for market fluctuations Profit sharing eliminated Model build flexibility • Ft. Wayne closure Integrated product development: R&D, engineering purchasing, manufacturing in Chicago Material Cost Global Sourcing – MNAL - India – JAC - China – MWM – South America – Escobedo - Mexico • Commodity Mitigation Manufacturing Flexibility TAP Manufacturing Cost 28 JAC JV pending government approval Common Platform = Scale |
 NYSE: NAV Results • Improved margins and lowered break-even volume – 2010 material cost – 2010 manufacturing costs – Favorable customer and product mix • Contained warranty cost and SG&A • Converted company owned DealCor locations to private ownership > $200M 29 |
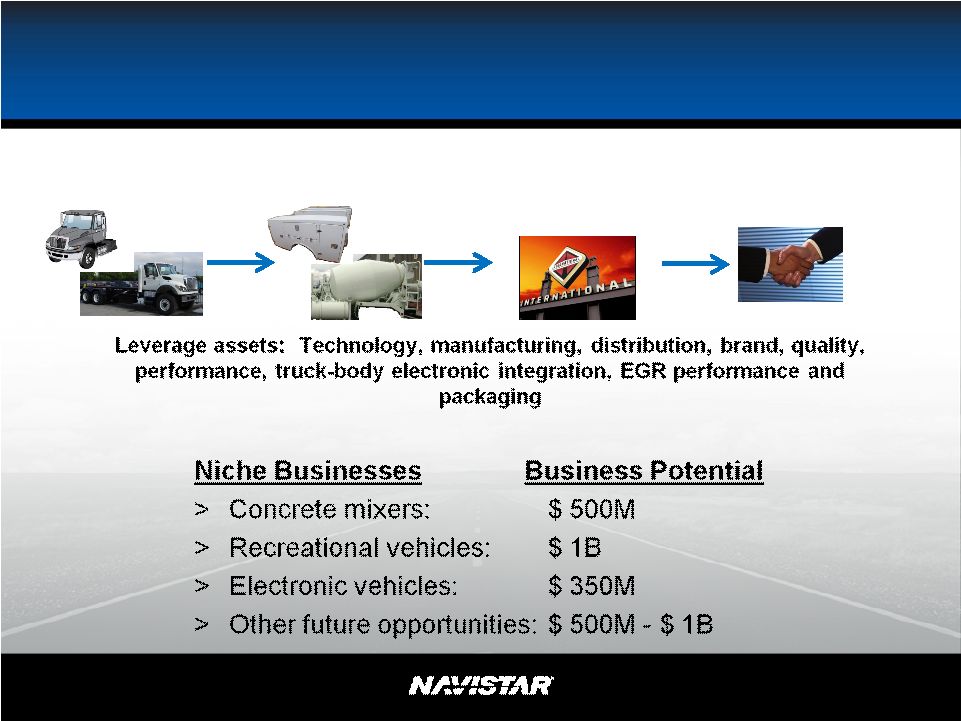 NYSE: NAV Investing in Adjacent Niche Businesses Strategy: Create Value by Providing Integrated Truck and Bodies -- Control Destiny -- Trucks Bodies Dealers Customers 30 |
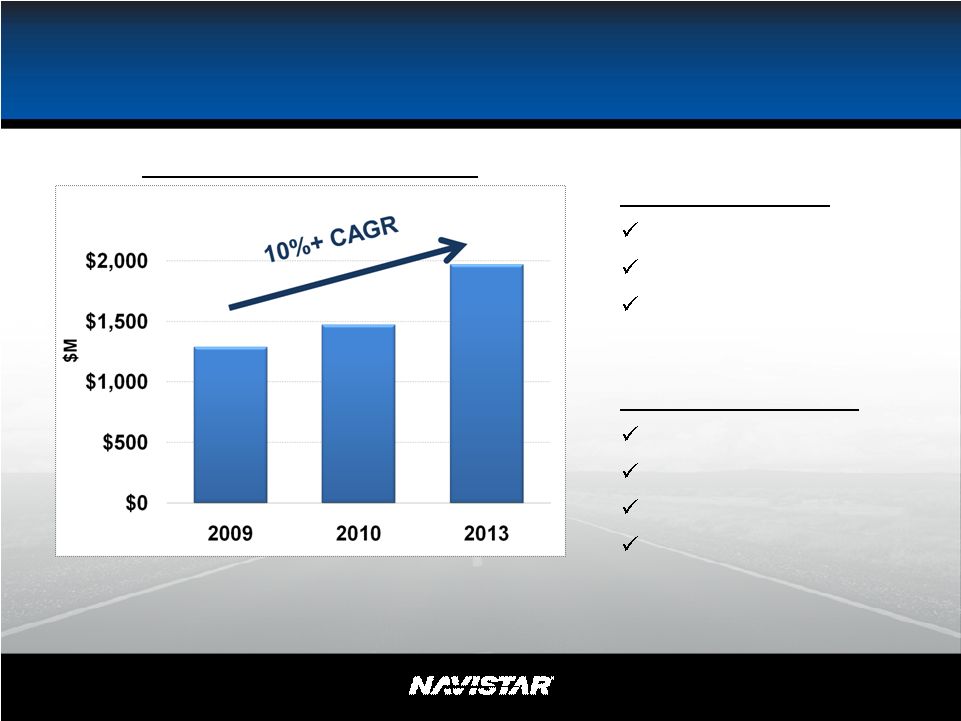
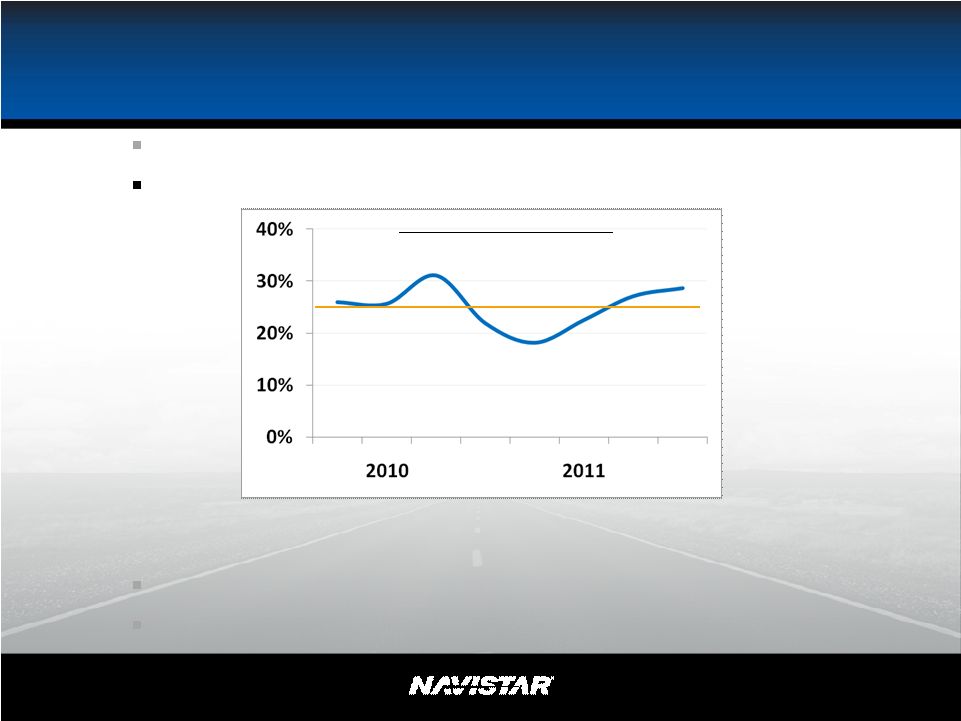
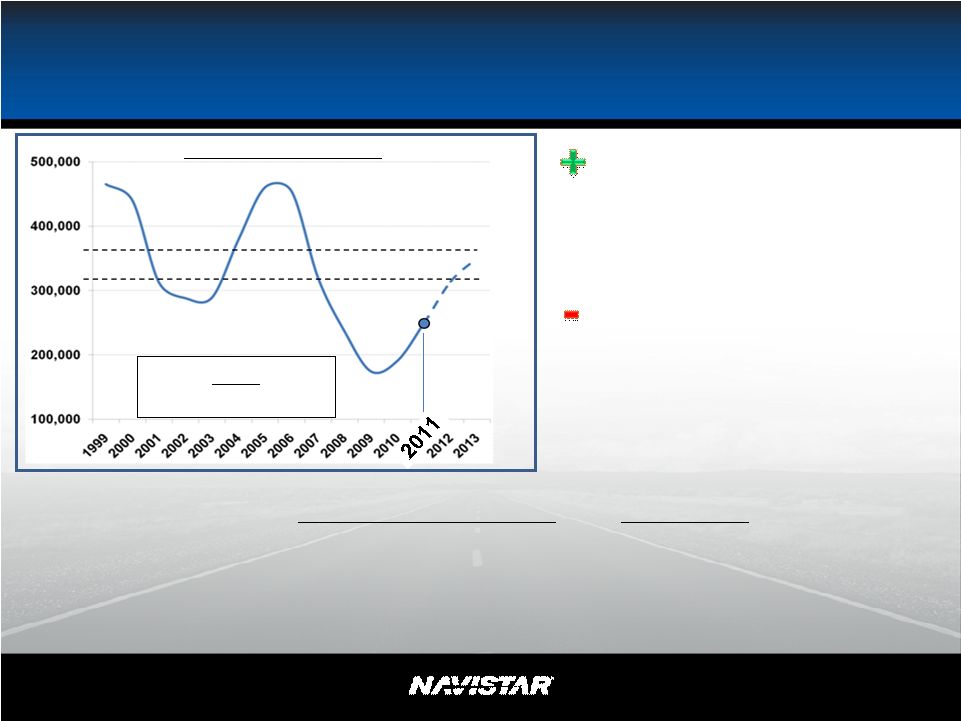 NYSE: NAV Market Recovering 2009 $ 5.4 $ - $ 6.1 $ 0.3 2011 $ 8 - $ 9 < $ 1.0 *@350k $11 - $12 $ 1 - $ 3 Anticipated Revenue from Core** Business, $B Niche Business*** Revenue, $B Freight levels Fleet Age Used Truck Values, Inventory Cost Pressures - Emissions Decreased Government Spending Fleet Failures **Core is defined as U.S. and Canada Class 6-8, Truck and School Bus ***Excludes DealCor, UTO, Mexico, BDT Traditional Industry Normal Range 31 2011 240k to 260k 25% - 35% * |
 NYSE: NAV Positioned for Profit and Growth in Market Recovery Improving Margins and Lowering Breakeven Volumes Growing market share in all segments Investing in New Products and Adjacent Niche Markets Improving Distribution 32 |
 NYSE: NAV Improving Margins and Lowering Breakeven Volumes Growing market share in all segments Investing in New Products and Adjacent Niche Markets Improving Distribution Positioned for Profit and Growth in Market Recovery In a Class 8 industry of 166,000 for 2011, need 40,600 Sales Current Built + Orders = 16,000+ (40%) 33 Class 8 Market Share Q1 Q2 Q3 Q4 Q1 Q2 Q3 Q4 |
 NYSE: NAV Positioned for Profit and Growth in Market Recovery Improving Margins and Lowering Breakeven Volumes Growing market share in all segments Investing in New Products and Adjacent Niche Markets Improving Distribution 34 |
 NYSE: NAV Archie Massicotte President, Navistar Defense 35 |
 NYSE: NAV $1.5 - $2 Billion – Sustainable 30,000+ Units 2008 2009 2010 2011+ > $2B > $2B > $2B $1.5-$2.0B 36 |
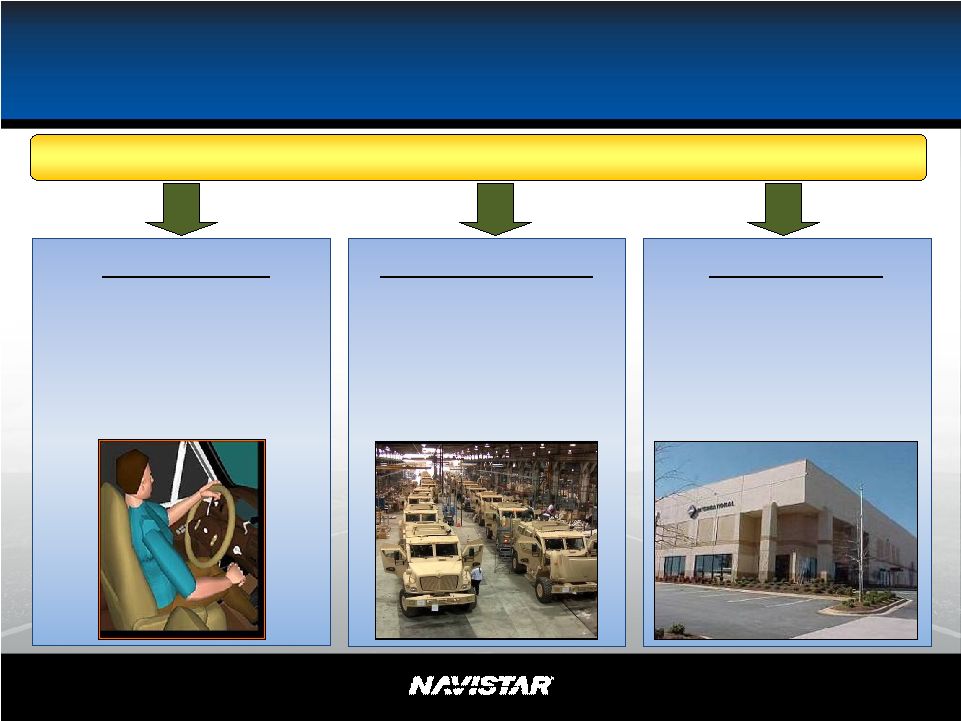 NYSE: NAV Military Differentiation – Leveraging Commercial Expertise SUSTAINMENT • 1,100 locations worldwide • 80 plus locations in 70 countries MANUFACTURING • Extremely flexible assembly facilities to meet urgent requirements ENGINEERING • 3,000 Engineers • Designed for assembly • Rapid response • Global resources/capabilities – Suppliers integrated into design ENABLERS FOR OUR SUCCESS ENABLERS FOR OUR SUCCESS 37 |
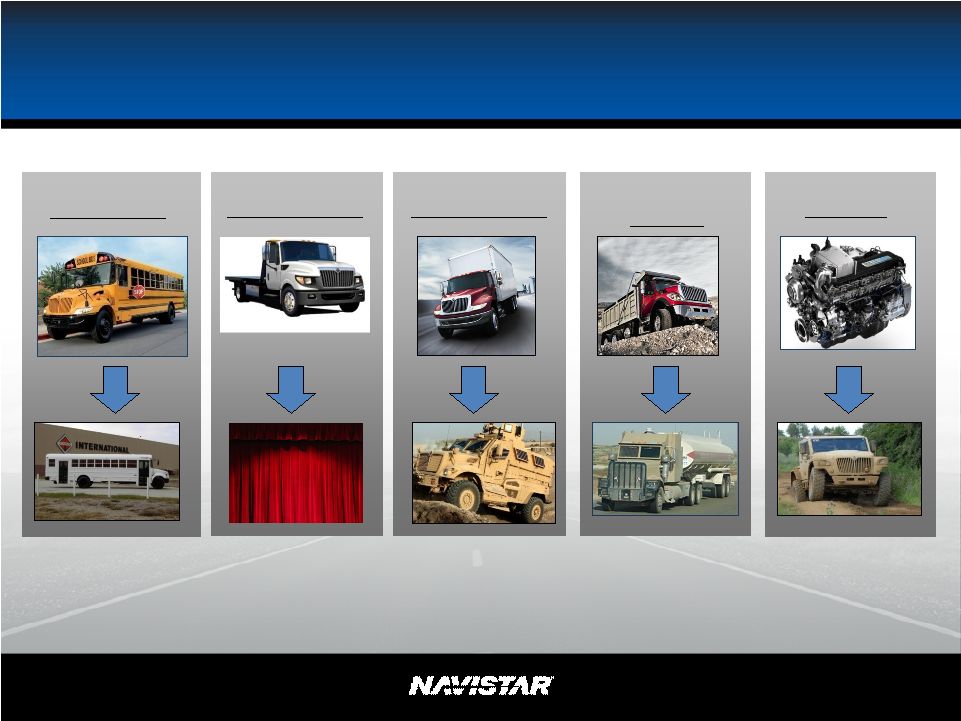 NYSE: NAV School Bus Class 6 and 7 Combined Class 8 Engines Class 4 and 5 Existing Platforms + Survivability Solutions = Success Existing Platforms + Survivability Solutions = Success Navistar Defense Leveraging Commercial Platforms 38 |
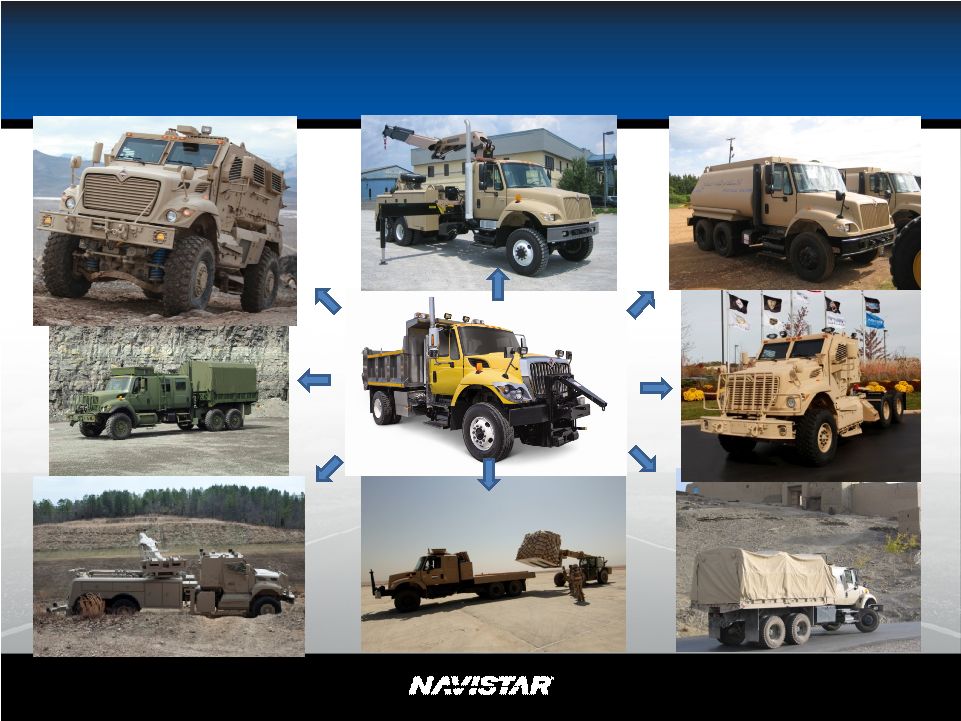 NYSE: NAV Leveraging Commercial Platforms 39 |
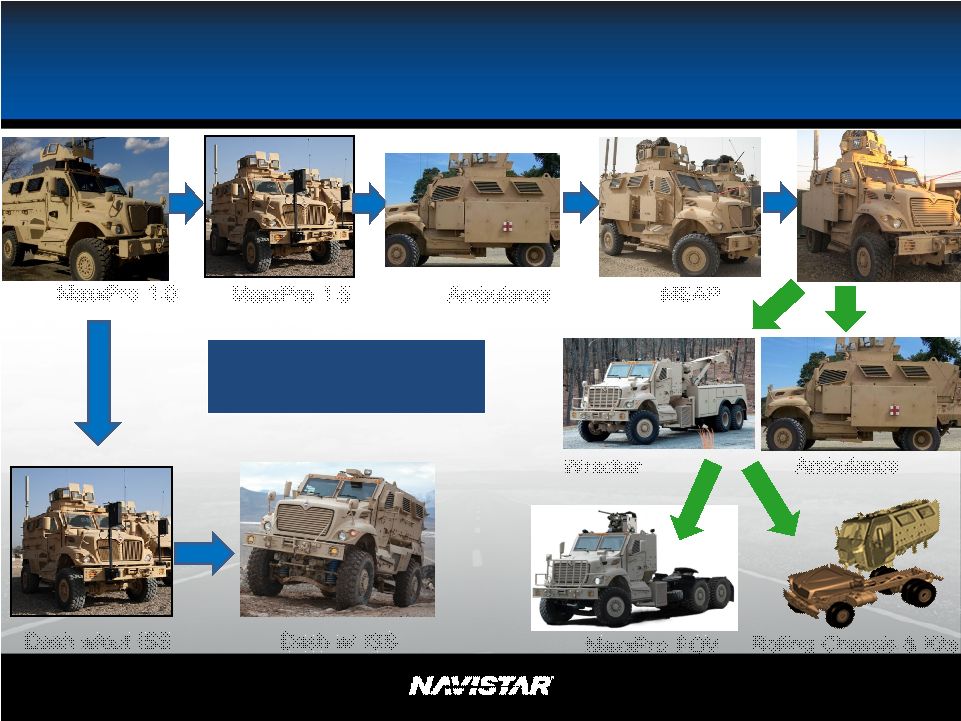 NYSE: NAV “Don’t be a traditional defense contractor.” Dash w/ ISS MaxxPro 1.5 MaxxPro 1.0 Dash w/out ISS MEAP Ambulance Ambulance Wrecker MaxxPro FOV Rolling Chassis & Kits Leveraging Military Platforms 40 |
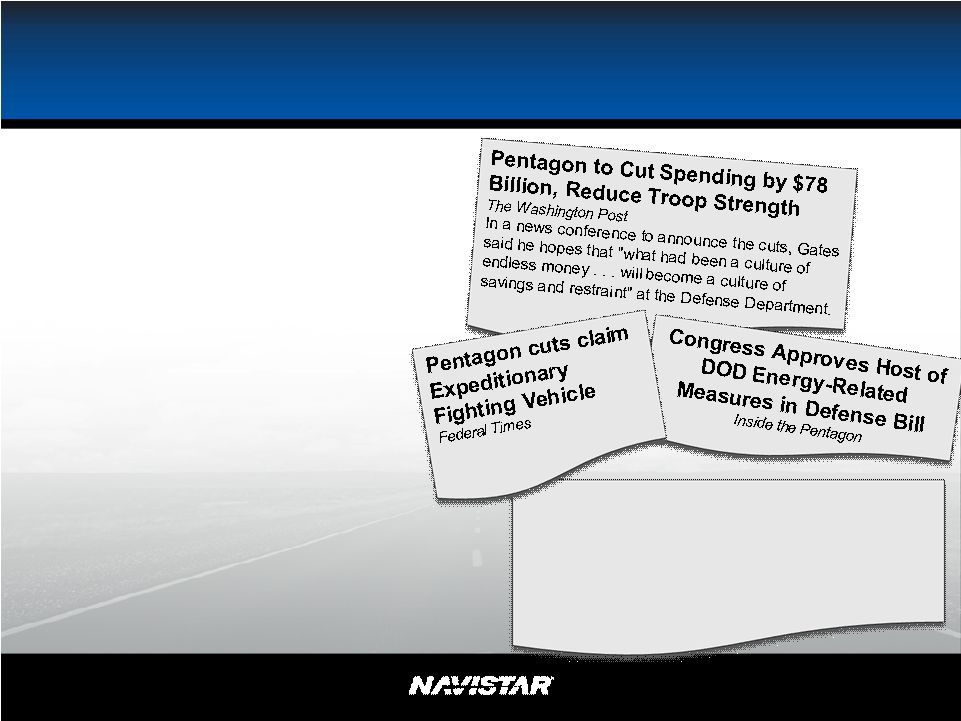 NYSE: NAV DOD Budget DOD Preps For 'Worst Of All Possible' FY-11 Budget Scenarios Inside Defense A year-long CR, said the senior Pentagon official, “wouldn't destroy the republic, but it would certainly be inconsistent with what we're trying to do in terms of smart management of the department.” Era of Efficiency •New programs may be affected •Government will look to industry for: - Higher quality - Lower cost - Quicker development •Sustainment of existing vehicle fleets will continue (increase) 41 |
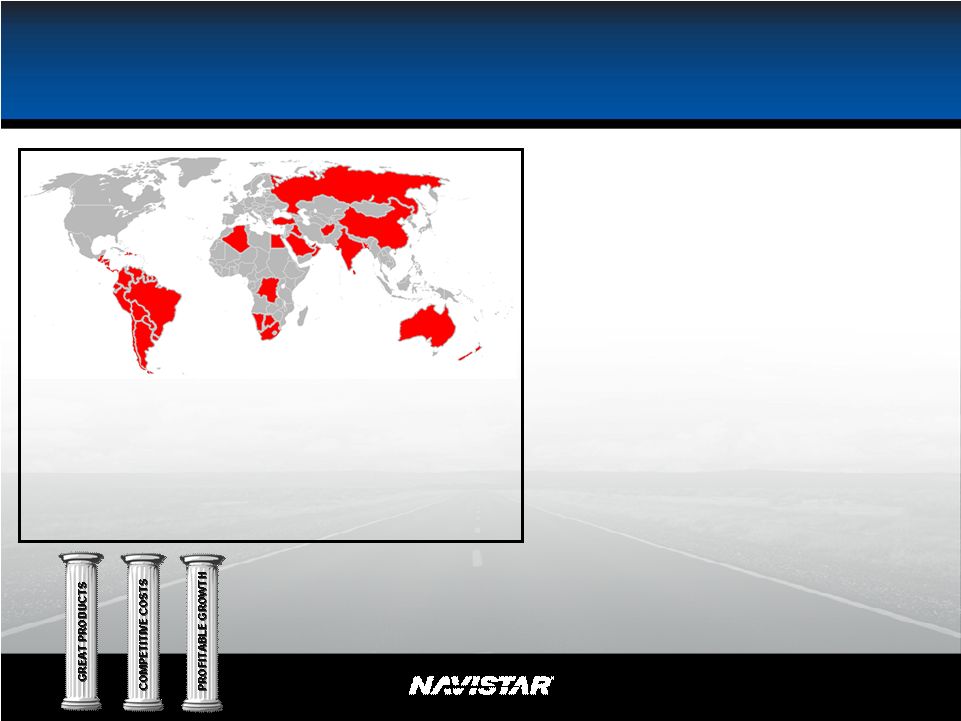
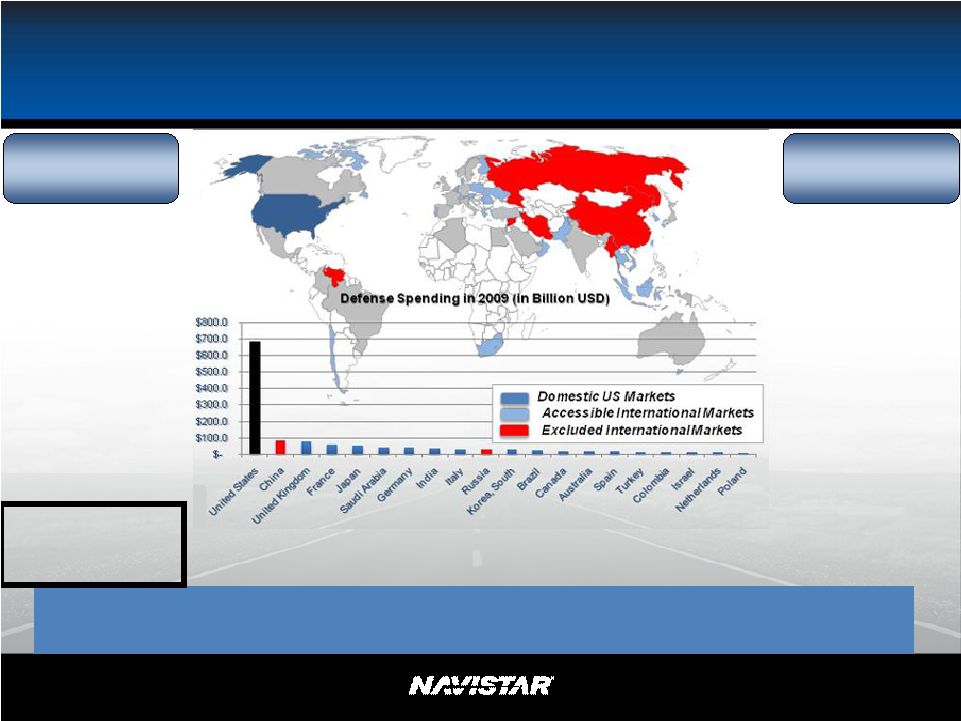 NYSE: NAV Top 15 Countries International Market Global Defense Budgets 1. China 2. United Kingdom 3. France 4. Japan 5. Saudi Arabia 6. Germany 7. India 8. Italy 9. Russia 10. S. Korea 11. Brazil 12. Canada 13. Australia 14. Spain 15. Turkey Iran Colombia Israel Netherlands Poland Taiwan Greece Singapore United Arab Emirates Sweden Norway Pakistan Egypt Algeria Belgium Thailand Switzerland Oman Chile Denmark • Slowing U.S. Defense budgets, but ND participates in 26 countries • Tighter budgets provide advantages to commercially-based contractors Copyright © Jane’s Information Group Inc., 2010. All rights reserved. Next in Rank 42 Current Business Discussions Future Opportunities Excluded Markets |
 NYSE: NAV Afghanistan FMS MaxxPro ® Afghan National Army MXT (UK Husky) MaxxPro ® Wrecker Afghan National Police Dash w/ DXM / MaxxPro ® Variants 43 |
 NYSE: NAV Navistar Defense Projected Revenue 44 2011 2012 2013 2014+ 2011 Revenue $1.5 to $2.0B Base Plan U.S. and FMS Vehicles Direct Foreign Vehicles Services Capability Insertion Parts |
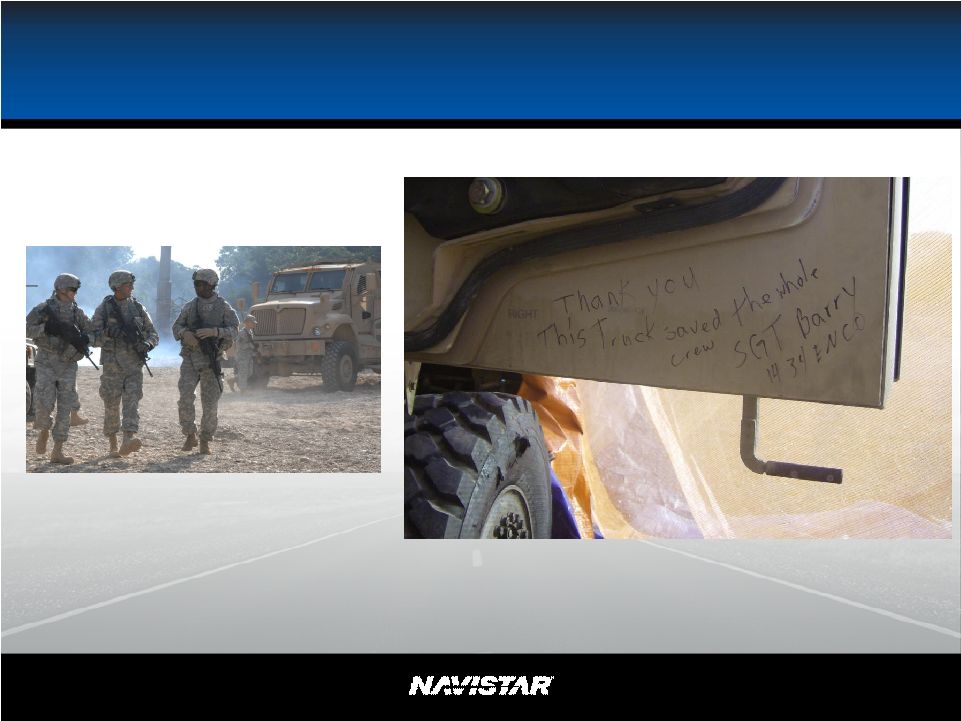 NYSE: NAV Navistar Defense We act like our customers lives depend on us. Because they do.. 45 |
 NYSE: NAV Eric Tech President, Engine Group 46 |
 NYSE: NAV Diversification and Growth 47 Leading Commercial Diesel Engine Producer Initiated Diversification Strategy Begin Life Without Ford Balanced Diversification Achieved 2007 2010 2013 Future |
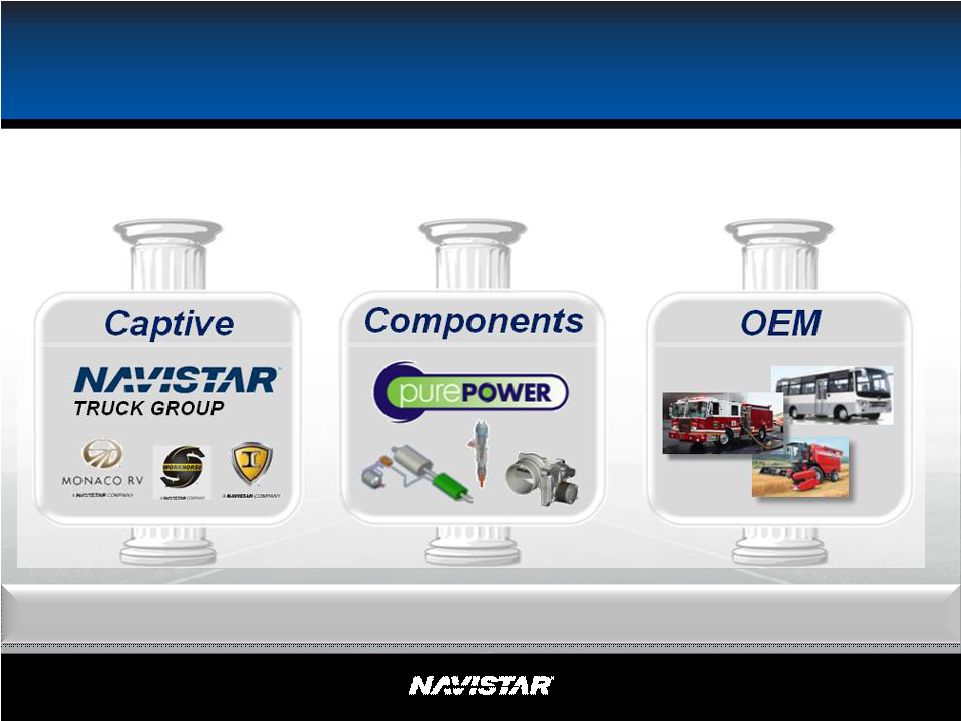
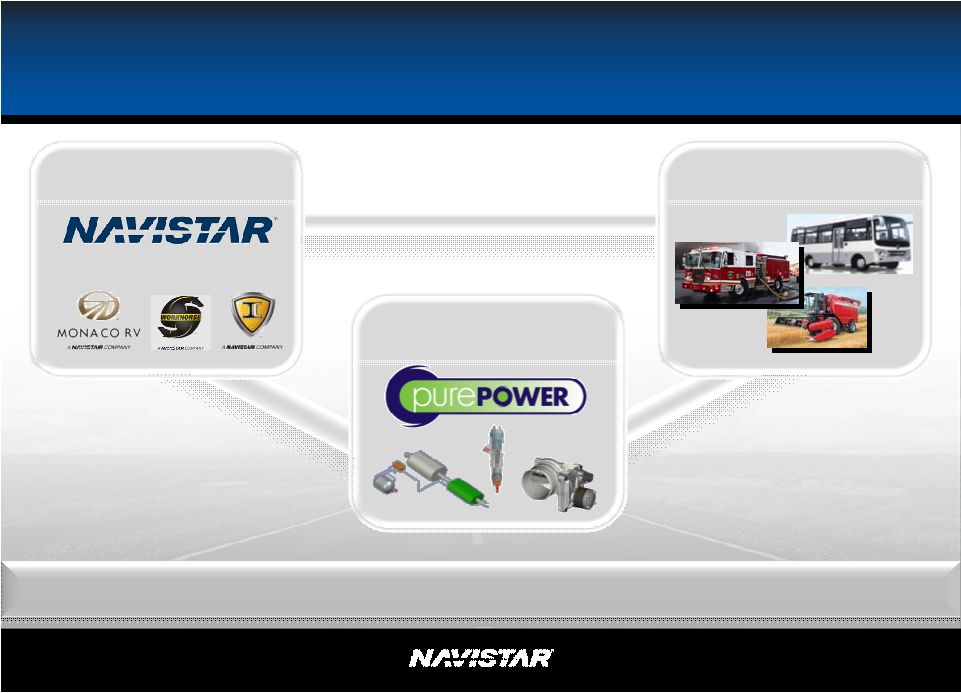 NYSE: NAV Three Businesses In One 48 TRUCK GROUP OEM Captive Operating From Three Perspectives Components |
   NYSE: NAV Captive: Supporting Navistar Truck 49 100K Growth Drivers • North American Market Recovery • Global Truck Growth • Expanded Product Range • Competitive Advantage Value to Navistar Truck • Product Differentiation • Full Range of Engines & Parts • Competitive Cost Structure 300K+ |
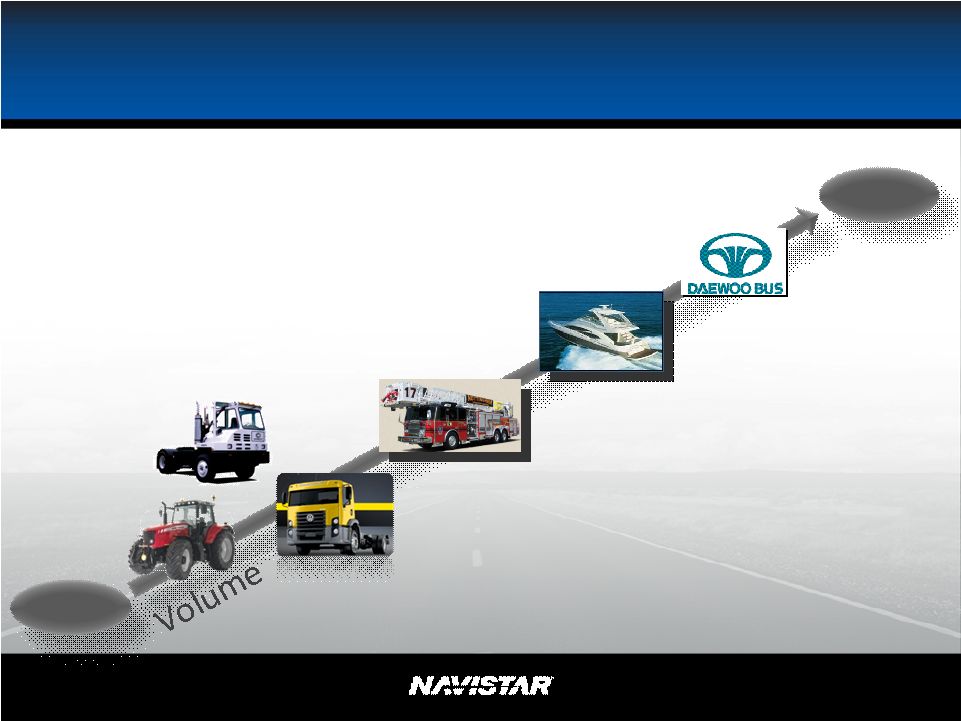   NYSE: NAV OEM: Delivering Profitable Growth 50 Growth Drivers • North American OEM Penetration • Continued Brazil Growth • Global OEM Penetration • Higher Off-Road Penetration Value to Navistar • Higher Niche Market Profit • Growth from Existing Assets • Lower Risk Thru Diversification 150K 300K+ |
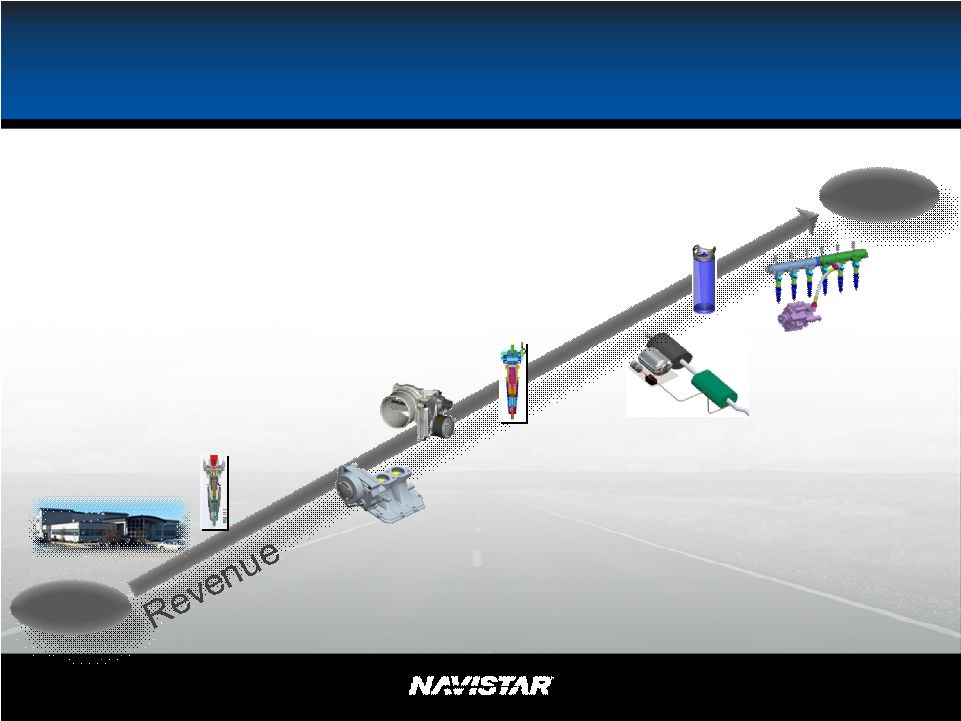 NYSE: NAV Pure Power Technologies (PPT): Controlling Our Destiny 51 Growth Drivers • Expanded Product Portfolio • Greater Life-Cycle Value Captured • Accelerated OEM Penetration • Move to Adjacent Markets Value to Navistar • Competitive Advantage • Competitive Cost Structure • Profitable New Market Growth $250M ~ $1B Next Gen Fuel System 3000 + Bar 2700 Bar |
 NYSE: NAV Beyond Transformation 52 First Half 2011 Moving Beyond • Ramping-Up with Market • Final Product Launches • Replacing Ford with OEM • Investing in PPT • NA Market Recovery • Production Efficiencies • OEM Sales Accelerating • PPT Sales Accelerating Improved Cost Structure Increased Volume Improved Profitability |
 NYSE: NAV Engine Group Strategy Controlling Our Destiny Profitable Growth Great Products 53 Leveraging Our Assets |
 NYSE: NAV Dee Kapur President, Truck Group 54 |
 NYSE: NAV Global Picture: What we said 55 Note: This slide includes information presented on a non-GAAP basis. Please see Reg G in the Appendix and A. J. Cederoth’s section for a reconciliation of revenue. |
 NYSE: NAV Global Picture: What We Said Last Year • Leading products tailored to specific global markets • Integrated powertrain • Leveraging Navistar technology • Lean and efficient • ~1.5M target market • 10-20% share • 150-300K vehicles • $3-5B revenue 56 |
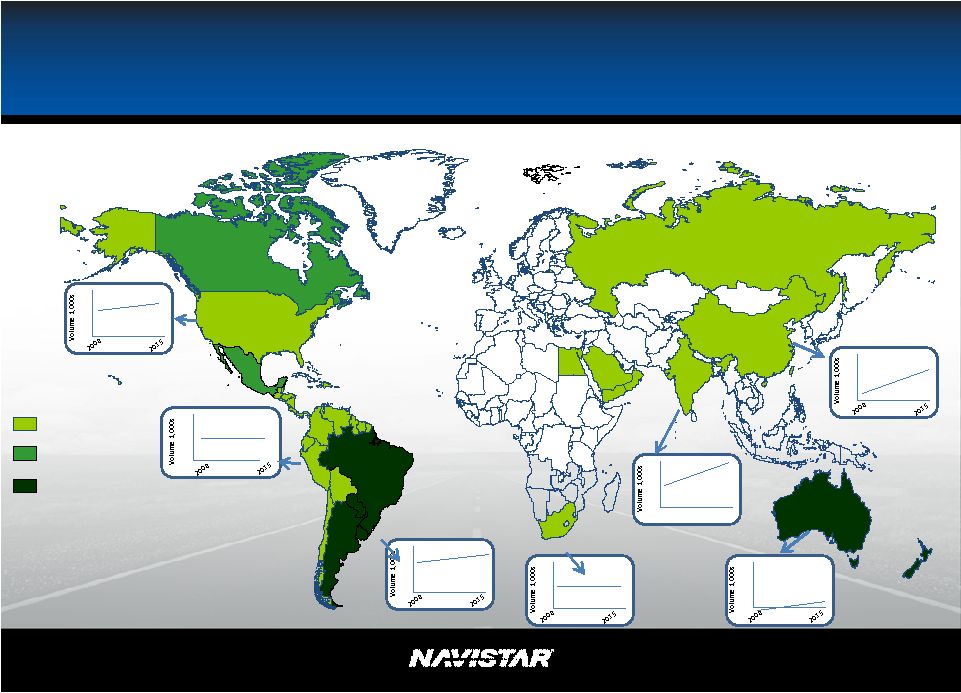 NYSE: NAV Australia South Africa Middle East India Russia Mercosur Other LA Mexico China North America 5% - 7% 8% - 10% > 10% Global Markets and Margins 57 NOTE: Average EBIT margin per region based on competitive annual reports and “World Truck Manufacturers” average operating margins of major truck manufacturers 2003-2008. 0 100 200 0 300 600 0 20 40 0 225 375 0 750 1,200 0 20 40 0 40 80 |
 NYSE: NAV 58 Leverage strategy/thinking/investment Global Growth Global Growth Leveraging our Leadership New Dealers |
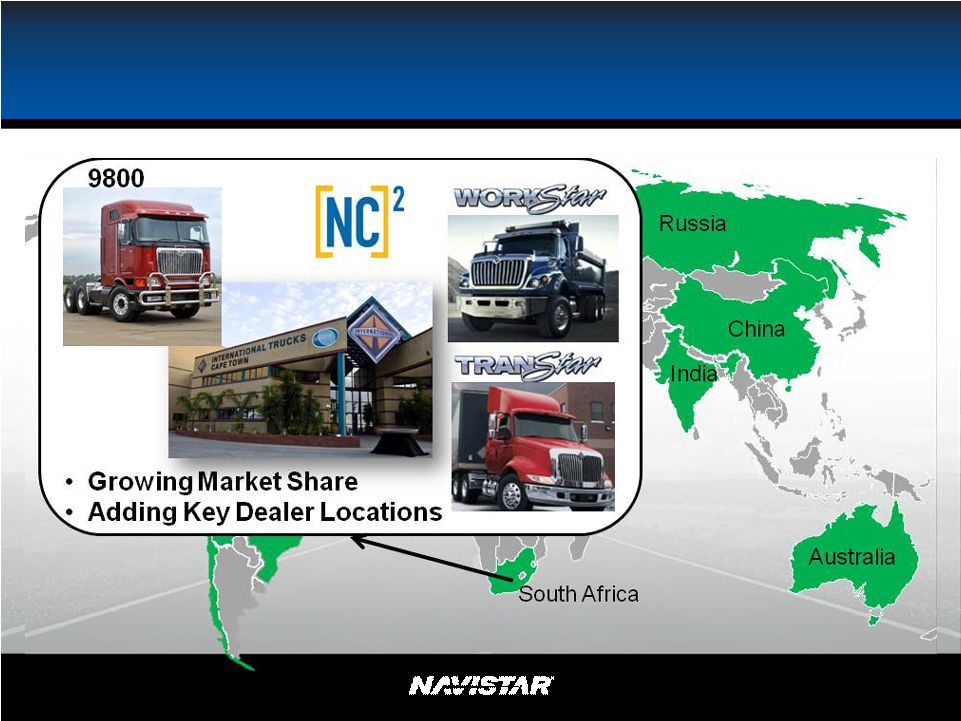
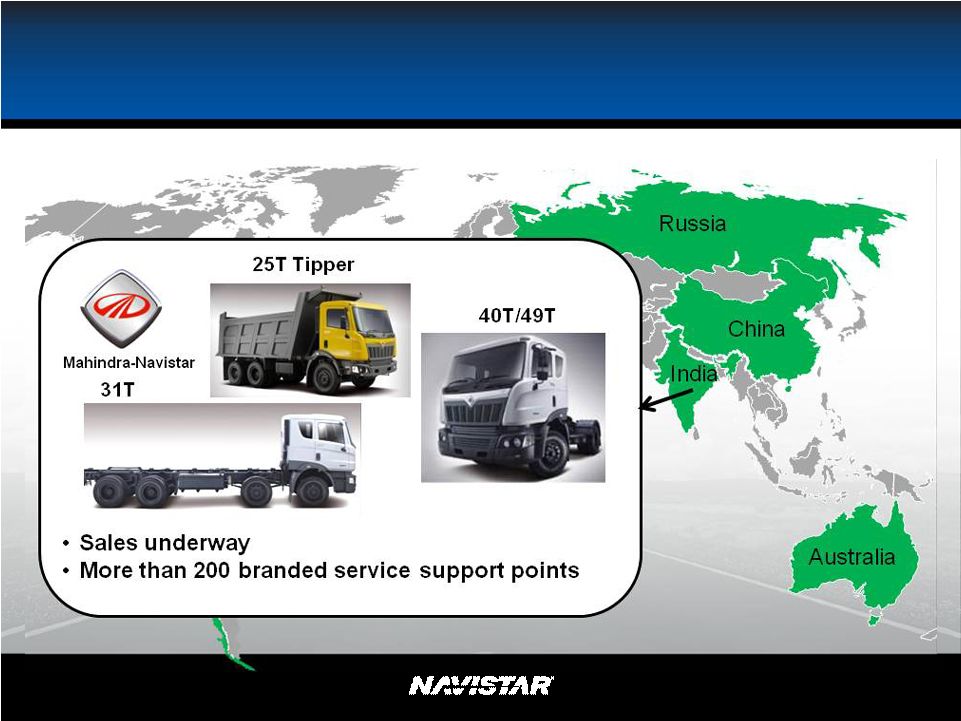
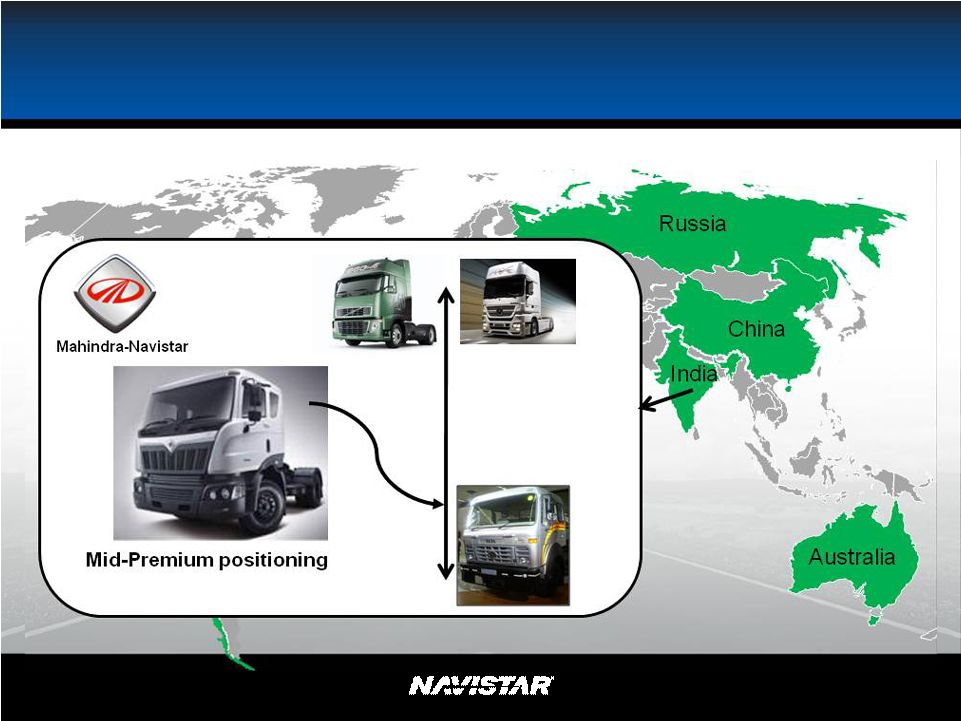
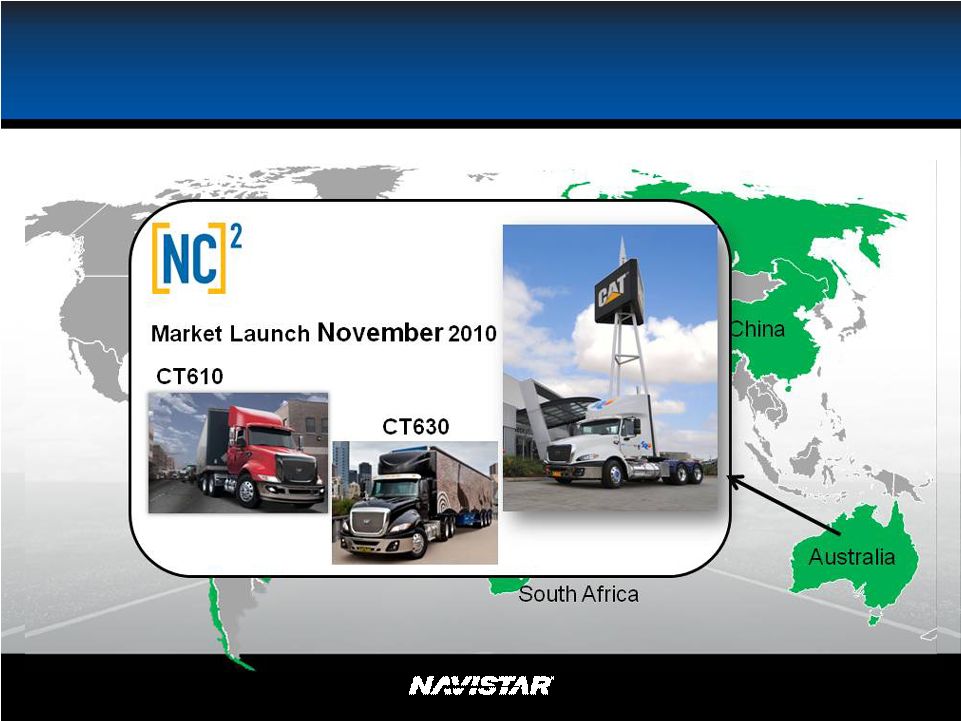
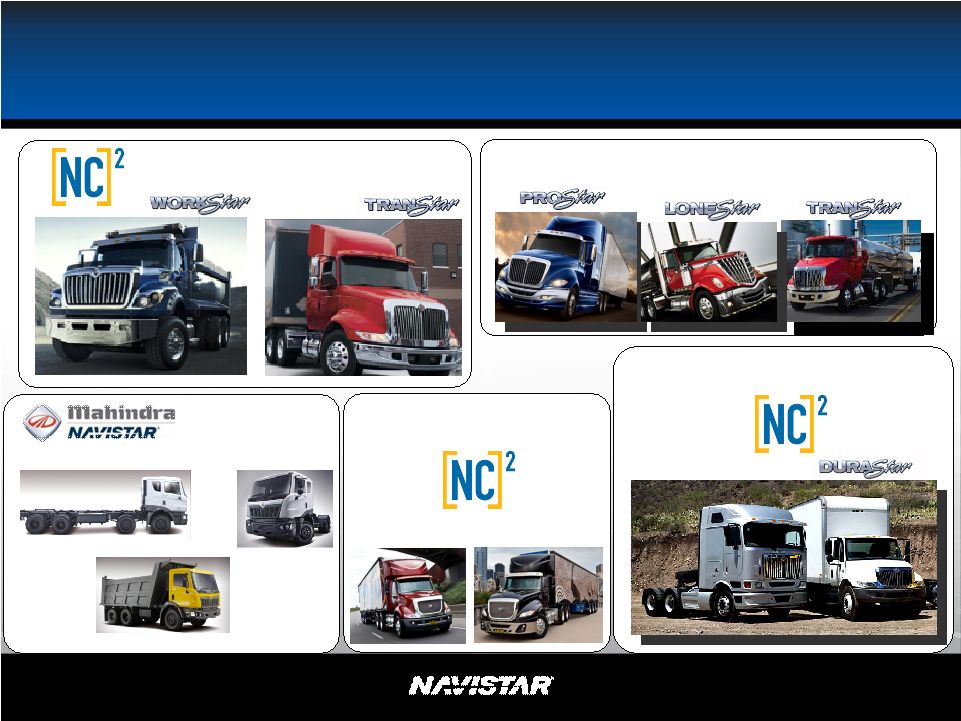 NYSE: NAV India India Latin America Latin America 40T/49T 25T Tipper 31T South Africa South Africa Leveraging Assets: Differentiated Products Australia Australia CT630 CT610 Brazil Brazil 9800 59 |
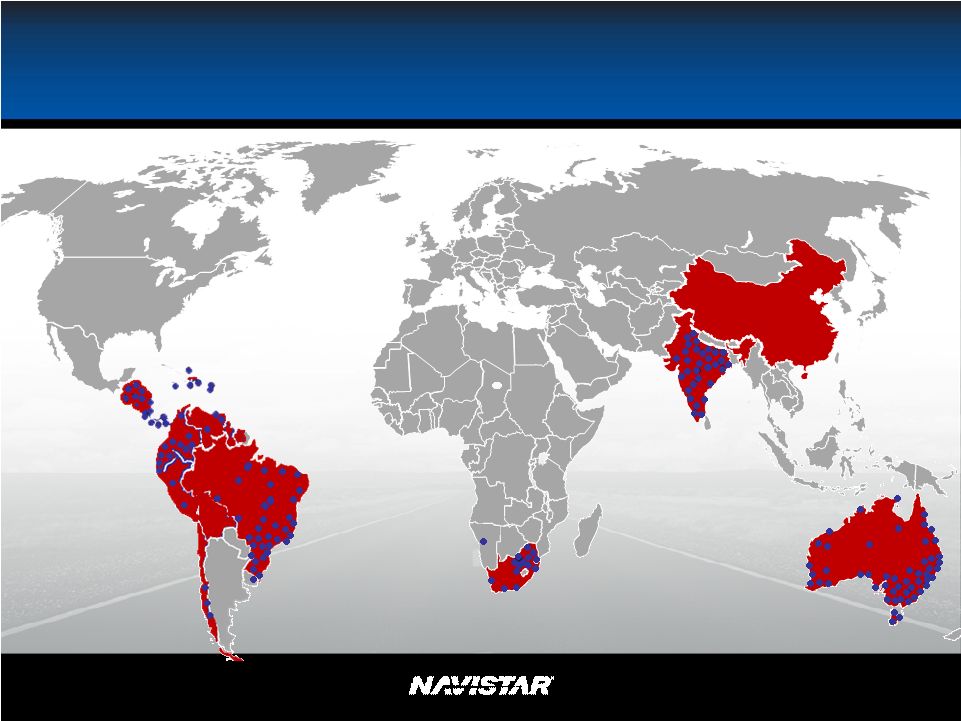 NYSE: NAV Leveraging Assets: Differentiated Distribution 60 Currently 410 Branded Sales or Service Points |
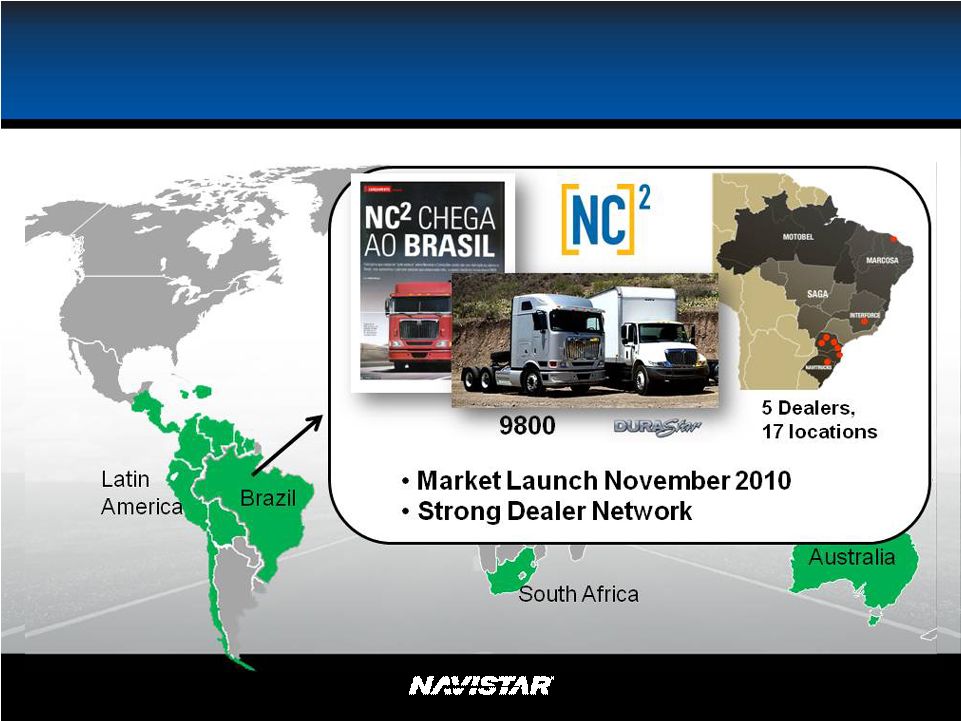 NYSE: NAV Brazil 61 |
 NYSE: NAV South Africa 62 |
 NYSE: NAV India 63 |
 NYSE: NAV India 64 |
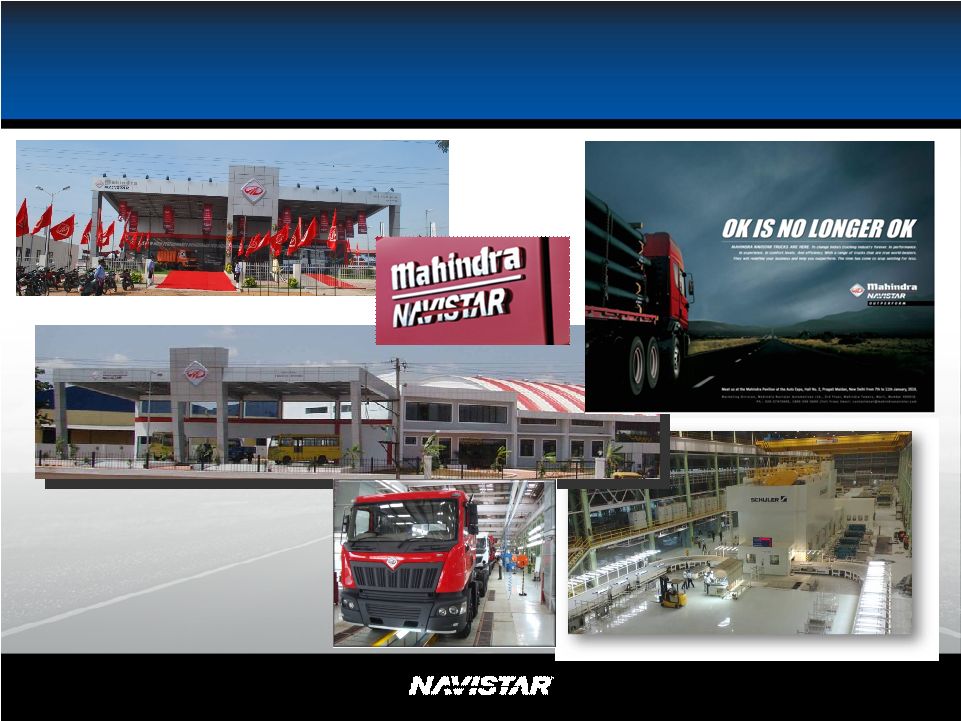 NYSE: NAV Mahindra-Navistar: Reset the Standard 65 HyderabAd BangalorE |
 NYSE: NAV Australia 66 |
 NYSE: NAV Australia 67 |
 NYSE: NAV China 68 |
 NYSE: NAV Latin America 69 |
                 NYSE: NAV Global Bus 70 Non-Mercosur Latin America •Leverage Escobedo production •Transmillennium bid in February •Significant order backlog Argentina Uruguay Chile Mercosur Markets •Installing chassis assembly line at Neobus in Brasil •Introducing integrated bus in April |
 NYSE: NAV Global Picture of Success: 3-5 Years • Consistent overall strategy • Leading products tailored to specific markets • Leveraging Navistar and partners • ~1.5 million target market • 10-20% share • 150-300K vehicles • $3-5 billion revenue 71 2010 2013 2011 2012 Volumes: Profitability: 16,000 Investing Global Cab-over CAT COE Vocational China JV Parts growth 125,000+ Significant returns 35,000 Breakeven |
 NYSE: NAV A. J. Cederoth Executive Vice President & Chief Financial Officer 72 |
 NYSE: NAV Strategy - Leveraging What We Have and What Others Have Built Note: This slide contains non-GAAP information, please see the Reg G in appendix for detailed reconciliation. 73 |
 NYSE: NAV 2011 Key Items Note: This slide contains non-GAAP information, please see the Reg G in appendix for detailed reconciliation. 74 2011 Business Drivers • Industry Recovering (240K – 260K) • Maintain Market Share – Back-end Loaded • Military $1.5B - $2.0B Revenue • RV Low Industry / New Products • Global Investing to Profitable • Engine OEM - SA, 12+ New Customers • 15L Launch • Engineering Similar to 2010 2011 One-Time Items • Engineering Integration • Manufacturing • Valuation Allowance |
 NYSE: NAV 2010 to 2011 Note: Please see 2011 Guidance Slide in Appendix for additional assumptions. 75 |
 NYSE: NAV Continued Success in 2011 Note: Please see 2011 Guidance Slide in Appendix for additional assumptions. 76 |
   NYSE: NAV Revenue Potential $20B $ Billions $ Billions GAAP Revenue Non-GAAP Revenue Non-Consolidated Revenue (Navistar Share) Consolidated Revenue Total Revenue $20B N.A. Revenue - $15B Global Revenue - $5B Note: Please see 2011 Guidance Slide in Appendix for additional assumptions. 77 $14B $17B - $18B $0 $5 $10 $15 $20 $25 FY 2011 N. America Industry Core Business Growth OEM Engine & Other Business Growth Contingency Future $2B - $3B $0 $5 $10 $15 $20 $25 FY 2011 Mahindra NC2 Contingency Non-GAAP *Includes Navistar’s share of revenue from non-consolidated entities * * * |
 NYSE: NAV Segment Profit Potential: $1.8B at Peak Note: Please see 2011 Guidance Slide in Appendix for additional assumptions. 78 $1.0B $1.8B $0 $500 $1,000 $1,500 $2,000 $2,500 FY 2011 N. America Core OEM Engine & Other Global Contingency Future |
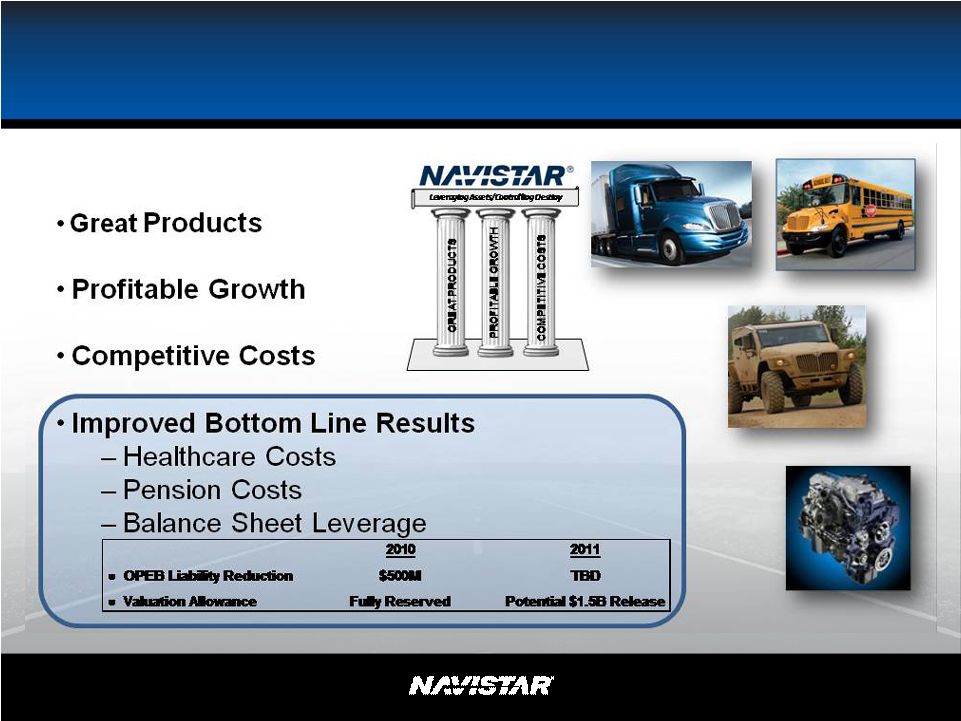 NYSE: NAV Driving Bottom Line Results 79 |
 NYSE: NAV Maximizing Shareholder Value • Consistent Earnings – From a Sustainable Strategy – With Predictable Results • Create Positive Cash Flow – Fund Growth Internally – Improve the Balance Sheet • Growth – Future Potential 80 |
 NYSE: NAV Differentiation & Leadership 81 |
 NYSE: NAV ROIC – Leveraging Our Assets 82 Capital Current Potential Investment Revenue Revenue Integrated Engines (Big Bore) < $150M + / - + + Military ~ $0M ~ $2.0B ~ $2.0B Global < $200M < $1.0B > $3.0B Pure Power Technologies < $10M < $100M ~ $1.0B Niches - RV's < $50M ~ $500M > $2.0B - Mixers - CAT |
 NYSE: NAV What’s Next Note: Please see 2011 Guidance Slide in Appendix for additional assumptions. 83 |
 NYSE: NAV 2011 Objectives More Breakthroughs Technologies • Military vehicle survivability • Emissions • Fuel economy • Performance/Ride Business • EGNR • Parts • Other Air System Fuel System A/T System MaxxForce MaxxForce ® ® 13 13 |
 NYSE: NAV Q & A 85 |
 NYSE: NAV Appendix 86 |
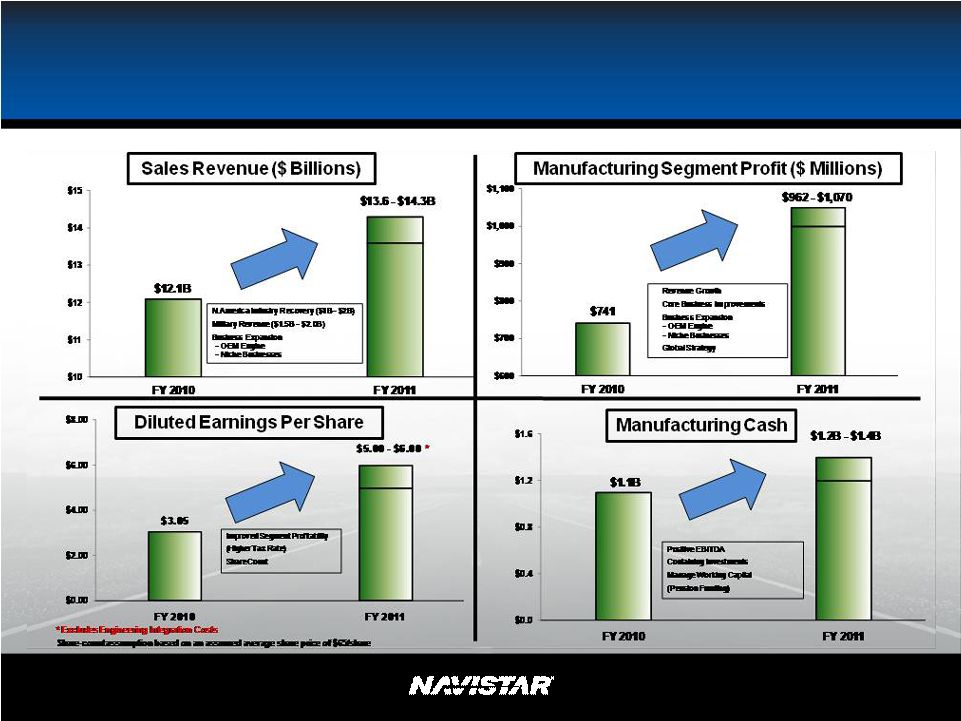
 NYSE: NAV 2011 Guidance *This slide contains non-GAAP information, please see the Reg G in appendix for detailed reconciliation. Guidance ** FY2010 includes $10M ($0.14) of cost for UAW agreement *** 2011 Guidance does not include Engineering Integration Impact or potential Valuation Allowance release 2011 2010 Actual Truck Industry Units 240,000 to 260,000 191,300 Revenue ($ Billions) $13.6 to $14.3 $12.1 ($ Millions (excluding EPS)) Mfg. Segment Profit* $962 to $1,070 $741 Below the line items* $(500) to $(515) $(496) Profit Excluding Tax $462 to $555 $246 Net Income attributable to NIC $388 to $466 $223 Tax Rate 16% to 17% 9.4% Diluted EPS attributable to NIC $5.00 to $6.00 $3.05** # of shares ~77.6M 73.2M Cash ($ Billions) $1.2 to $1.4 $1.1 87 |
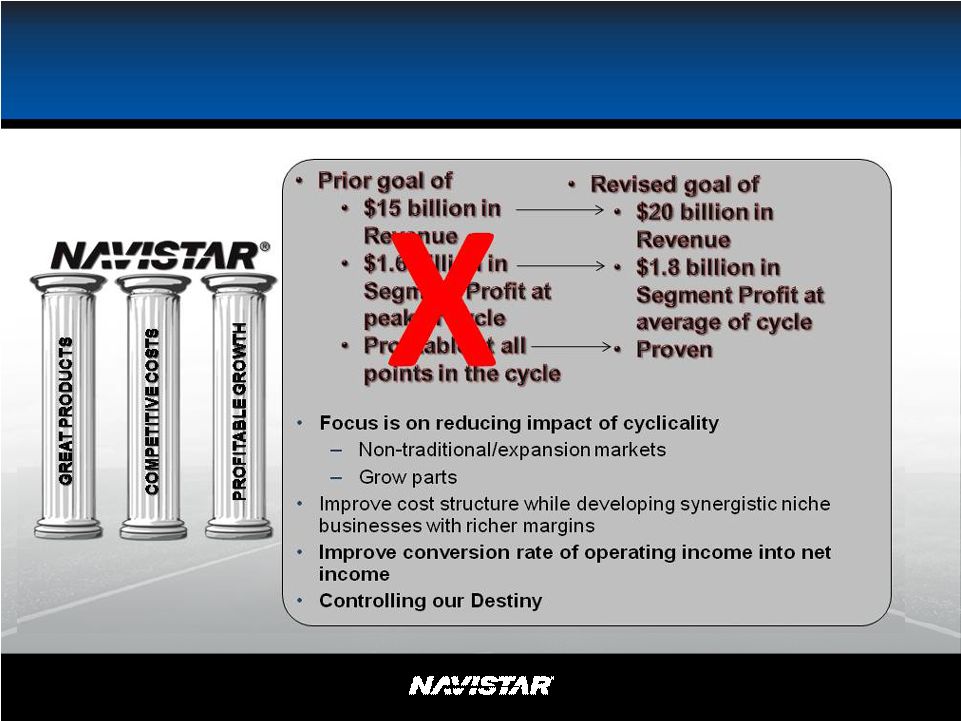
 NYSE: NAV SEC Regulation G – Fiscal Year Comparison Manufacturing Segment Profit is not in accordance with, or an alternative for, U.S. generally accepted accounting principles (GAAP). The non-GAAP financial information presented herein should be considered supplemental to, and not as a substitute for, or superior to, financial measures calculated in accordance with GAAP. However, we believe that non-GAAP reporting, giving effect to the adjustments shown in the reconciliation above, provides meaningful information and therefore we use it to supplement our GAAP reporting by identifying items that may not be related to the core manufacturing business. Management often uses this information to assess and measure the performance of our operating segments. We have chosen to provide this supplemental information to investors, analysts and other interested parties to enable them to perform additional analyses of operating results, to illustrate the results of operations giving effect to the non-GAAP adjustments shown in the above reconciliations and to provide an additional measure of performance. 88 Note: This slide includes information presented on a non-GAAP basis. Please see Reg G in the Appendix and A. J. Cederoth’s section for a reconciliation of revenue. 2009 Future Original Target @ 414.5k Industry Revised Target @ 350k Industry U.S. and Canada Industry 414,500 350,000 ($billions) Sales and revenues, net $15 + $20 + ($millions) Manufacturing segment profit $1,600 $1,780 Below the line items (500) (590) Income excluding income tax 1,100 1,190 Income tax expense (275) (298) Net Income attributable to Navistar International Corporation (NIC) $825 $892 Diluted earnings per share attributable to NIC $11.46 $12.31 Weighted average shares outstanding: diluted (millions) ~72.5 ~72.5 |
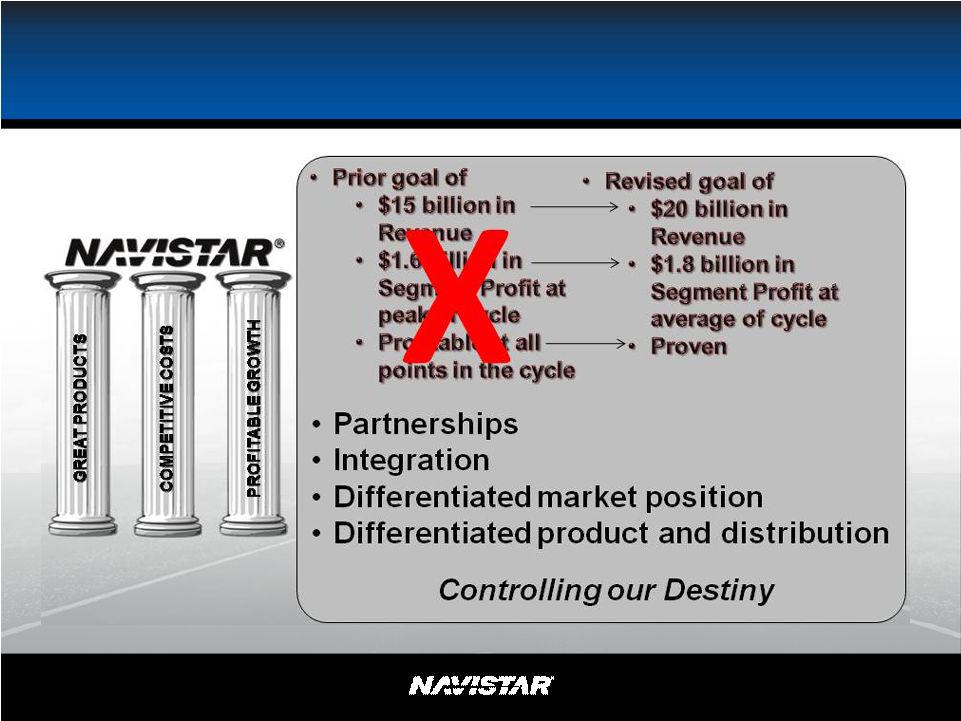
 NYSE: NAV SEC Regulation G – Fiscal Year Comparison This presentation is not in accordance with, or an alternative for, U.S. generally accepted accounting principles (GAAP). The non-GAAP financial information presented herein should be considered supplemental to, and not as a substitute for, or superior to, financial measures calculated in accordance with GAAP. However, we believe that non-GAAP reporting, giving effect to the adjustments shown in the reconciliation above, provides meaningful information and therefore we use it to supplement our GAAP reporting by identifying items that may not be related to the core manufacturing business. Management often uses this information to assess and measure the performance of our operating segments. We have chosen to provide this supplemental information to investors, analysts and other interested parties to enable them to perform additional analyses of operating results, to illustrate the results of operations giving effect to the non-GAAP adjustments shown in the above reconciliations and to provide an additional measure of performance. 89 2009 2008 Non GAAP Non GAAP Non GAAP Non GAAP As Reported Non GAAP Non GAAP As Reported Non GAAP Non GAAP As Reported Without All Impacts Other Impacts Without UAW Impacts UAW Impacts With Impacts Without Impacts Impacts With Impacts Without Impacts Impacts With Impacts U.S. and Canada Industry 191,300 181,800 244,100 ($billions) Sales and revenues, net 12.1 $ 11.6 $ 14.7 $ ($millions) Manufacturing segment profit * (excluding items listed below) 725 $ - $ 725 $ - $ 725 $ 707 $ - $ 707 $ 1,088 $ - $ 1,088 $ Ford settlement net of related charges - 27 27 - 27 - 160 160 - (37) (37) UAW Expenses - - - (11) (11) - - - - - - Impairment of property, plant and equipment - - - - - - (31) (31) - (358) (358) Manufacturing segment profit 725 27 752 (11) 741 707 129 836 1,088 (395) 693 Below the line items (excluding items listed below) (496) $ - $ (496) $ - $ (496) $ (468) - (468) (502) - (502) UAW Expenses - - - 1 1 - - - - - - Write-off of debt issuance cost - - - - - - (11) (11) - - - Below the line items (496) - (496) 1 (495) (468) (11) (479) (502) - (502) Income (loss) excluding income tax 229 27 256 (10) 246 239 118 357 586 (395) 191 Income tax benefit (expense) (23) - (23) - (23) (34) (3) (37) (58) 1 (57) Net Income (loss) attributable to Navistar International Corporation 206 $ 27 $ 233 $ (10) $ 223 $ 205 $ 115 $ 320 $ 528 $ (394) $ 134 $ Diluted earnings (loss) per share ($'s) attributable to Navistar International Corporation 2.82 $ 0.37 $ 3.19 $ (0.14) $ 3.05 $ 2.86 $ 1.60 $ 4.46 $ 7.21 $ (5.39) $ 1.82 $ Weighted average shares outstanding: diluted (millions) 73.2 73.2 73.2 73.2 73.2 71.8 71.8 73.2 73.2 * Includes: non-controlling interest in net income of subsidiaries net of tax; extraordinary gain net of tax 2010 |
 NYSE: NAV SEC Regulation G – Fiscal Year Comparison This presentation is not in accordance with, or an alternative for, U.S. generally accepted accounting principles (GAAP). The non-GAAP financial information presented herein should be considered supplemental to, and not as a substitute for, or superior to, financial measures calculated in accordance with GAAP. However, we believe that non-GAAP reporting, giving effect to the adjustments shown in the reconciliation above, provides meaningful information and therefore we use it to supplement our GAAP reporting by identifying items that may not be related to the core manufacturing business. Management often uses this information to assess and measure the performance of our operating segments. We have chosen to provide this supplemental information to investors, analysts and other interested parties to enable them to perform additional analyses of operating results, to illustrate the results of operations giving effect to the non-GAAP adjustments shown in the above reconciliations and to provide an additional measure of performance. 90 2011 2011 Guidance U.S. and Canada Industry 240,000 260,000 240,000 260,000 ($billions) Sales and revenues, net 13.6 $ 14.3 $ 13.6 $ 14.3 $ ($millions) Manufacturing segment profit * (excluding items listed below) 962 $ 1,070 $ 962 $ 1,070 $ Engineering Integration Costs (67) (67) Manufacturing segment profit 962 1,070 895 1,003 Below the line items (excluding items listed below) (500) (515) (500) (515) Engineering Integration Costs (10) (10) Below the line items (500) (515) (510) (525) Income (loss) excluding income tax 462 555 385 478 Income tax benefit (expense) (74) (90) (74) (90) Net Income (loss) attributable to Navistar International Corporation 388 $ 466 $ 311 $ 388 $ Diluted earnings (loss) per share ($'s) attributable to Navistar International Corporation 5.00 $ 6.00 $ 4.00 $ 5.00 $ Weighted average shares outstanding: diluted (millions) ~ 77.6 ~ 77.6 ~ 77.6 ~ 77.6 * Includes: non-controlling interest in net income of subsidiaries, net of tax. Guidance Adjusted for Engineering Integration |