NYSE: NAV 1 2 Quarter 2011 Earnings Call June 7, 2011 nd 2nd Quarter 2011 Earnings Presentation June 7, 2011 EXHIBIT 99.2 |
NYSE: NAV 2 2 Safe Harbor Statement Information provided and statements contained in this presentation that are not purely historical are forward-looking statements within the meaning of Section 27A of the Securities Act of 1933, as amended, Section 21E of the Securities Exchange Act of 1934, as amended, and the Private Securities Litigation Reform Act of 1995. Such forward-looking statements only speak as of the date of this presentation and the Company assumes no obligation to update the information included in this presentation. Such forward-looking statements include information concerning our possible or assumed future results of operations, including descriptions of our business strategy. These statements often include words such as “believe,” “expect,” “anticipate,” “intend,” “plan,” “estimate,” or similar expressions. These statements are not guarantees of performance or results and they involve risks, uncertainties, and assumptions. For a further description of these factors, see Item 1A, Risk Factors, included within our Form 10-K for the year ended October 31, 2010, which was filed on December 21, 2010. Although we believe that these forward-looking statements are based on reasonable assumptions, there are many factors that could affect our actual financial results or results of operations and could cause actual results to differ materially from those in the forward-looking statements. All future written and oral forward-looking statements by us or persons acting on our behalf are expressly qualified in their entirety by the cautionary statements contained or referred to above. Except for our ongoing obligations to disclose material information as required by the federal securities laws, we do not have any obligations or intention to release publicly any revisions to any forward- looking statements to reflect events or circumstances in the future or to reflect the occurrence of unanticipated events. 2 Quarter 2011 Earnings Call June 7, 2011 nd |
NYSE: NAV 3 3 Other Cautionary Notes • The financial information herein contains audited and unaudited information and has been prepared by management in good faith and based on data currently available to the Company. • Certain Non-GAAP measures are used in this presentation to assist the reader in understanding our core manufacturing business. We believe this information is useful and relevant to assess and measure the performance of our core manufacturing business as it illustrates manufacturing performance without regard to selected historical legacy costs (i.e. pension and other postretirement costs). It also excludes financial services and other expenses that may not be related to the core manufacturing business or underlying results. Management often uses this information to assess and measure the performance of our operating segments. A reconciliation to the most appropriate GAAP number is included in the appendix of this presentation. 2 Quarter 2011 Earnings Call June 7, 2011 nd |
4 nd 2 Quarter 2011 Earnings Call June 7, 2011 Results While Building • Q2 financials • Strategic update • Driving shareowner value Continued Success in 2011 Adjusted Diluted EPS attributable to NIC - $5.50-$6.00 Note: This slide contains non-GAAP information, please see the REG G in appendix for a detailed reconciliation. 2011 FY Guidance does not include Engineering Integration Impact or potential Valuation Allowance release. Flexible Manufacturing Strategy NYSE: NAV 4 |
NYSE: NAV 5 5 Product Introductions/Launches MaxxPro ® Dash Ambulance TerraStar™ 4x4 Sloped Nose WorkStar ® CAT CT660 – Introduced at ConExpo in March ProStar+ ® with MaxxForce ® 15 PayStar ® with MaxxForce ® 15 LoneStar ® with MaxxForce ® 13 MN25 Tankers at Work 2 Quarter 2011 Earnings Call June 7, 2011 nd EPA /CARB certification – MaxxForce ® DT lowered from 0.50 to 0.39 NOx – MaxxForce ® 9/10 lowered from 0.50 to 0.45 NOx – MaxxForce ® 15 MaxxForce ® 15 |
NYSE: NAV 6 6 $0.60 $1.02 $0.00 $0.20 $0.40 $0.60 $0.80 $1.00 $1.20 Q2 2010 Q2 2011 Strategy - Leveraging What We Have and What Others Have Built Note: This slide contains non-GAAP information, please see the REG G in appendix for a detailed reconciliation. 2011 FY Guidance does not include Engineering Integration Impact or potential Valuation Allowance release. Key Takeaways for Q2 Truck production volume up ~34% Q2 over Q1 Class 8 Market Share better than initially expected Prior period warranty includes expense of $27 million/diluted EPS effect of $0.34 Expect to perform at high end of guidance FY 2011 Q1 Q2 1H Truck Industry Units 51,700 61,200 112,900 Revenue ($Billions) $2.7 $3.4 $6.1 Adj. Mfg. Segment Profit* ($Millions) $98 $171 $269 Adj. Diluted EPS Attributable to NIC* $0.18 $1.02 $1.22 *** Weighted average shares outstanding (Diluted) 75.9 78.6** 77.3 MaxxPro ® Tractor *Excludes 2011 Engineering Integration Costs and includes $0.34 of prior period warranty adjustment **Guidance based off 77.6M shares Quarterly Adjusted Diluted Earnings Per Share * *** YTD Earnings Per Share (EPS) of $1.22 will not equal the sum of Q1 EPS ($0.18) and Q2 EPS ($1.02) 2 Quarter 2011 Earnings Call June 7, 2011 nd |
NYSE: NAV 7 $2,385 $2,848 $358 $507 $0 $500 $1,000 $1,500 $2,000 $2,500 $3,000 $3,500 $4,000 Q2 2010 Q2 2011 Base Military $298 $390 $60 $117 $0 $100 $200 $300 $400 $500 $600 Q2 2010 Q2 2011 Truck Parts 16,000 17,400 5,400 8,200 0 5,000 10,000 15,000 20,000 25,000 30,000 Q2 2010 Q2 2011 Traditional Expansionary Q2 2011 Information Consolidated Revenues ($ in millions) Quarterly Truck Chargeouts Quarterly Engine Shipments Military Revenues ($ in millions) 21,400 25,600 $358 $507 $2,743 $3,355 21,500 27,900 34,600 37,100 0 10,000 20,000 30,000 40,000 50,000 60,000 70,000 Q2 2010 Q2 2011 All Other OEM Sales South America 56,100 65,000 2 Quarter 2011 Earnings Call June 7, 2011 nd |
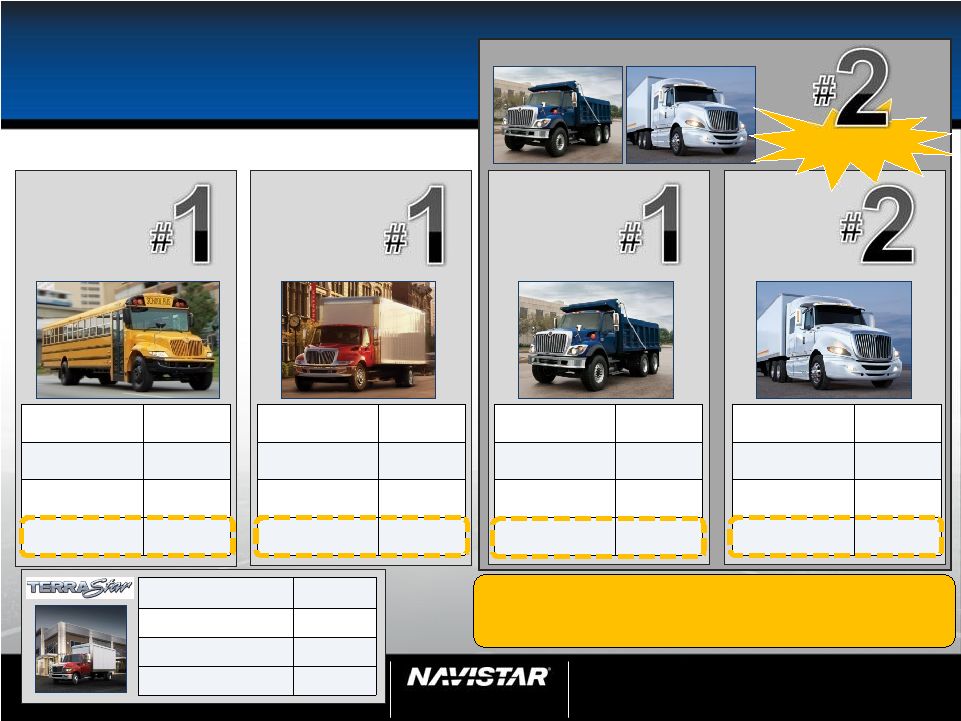
NYSE: NAV Medium Truck Great Products – Market Share Severe Service Truck Heavy Truck FY09 61% FY10 59% Q2 11 45% YTD11 48% FY09 35% FY10 38% Q2 11 36% YTD11 36% FY09 34% FY10 33% Q2 11 33% YTD11 31% FY09 25% FY10 24% Q2 11 16% YTD11 16% Class 8 School Bus (U.S. & Canada) School Bus & Combined Class 6-8 Market Share – FY09: 34%; 34%; FY10: 33%; 33%; YTD11: 26% 26% Note: Market Share based on brand and Severe Service Truck market share excludes military 20% Market Share Q2 11 Class 4-5 YTD11 Industry 17K Navistar 549 Market Share ~3% 8 2 Quarter 2011 Earnings Call June 7, 2011 nd |
9 U.S. and Canada Heavy Strategy – Maintain ~25% Class 8 Share Severe Service Truck Heavy Truck Combined Class 8 Attributes •Fuel •Durability •Weight •Driver performance ProStar ® with MaxxForce ® 13 WorkStar ® with MaxxForce ® 13 FY2010 1Q - 2Q 2011 ProStar ® with MaxxForce ® 15 2 Half 2011 Sloped Nose WorkStar ® PayStar ® with MaxxForce ® 15 LoneStar ® with 500HP MaxxForce ® 13 9900 with MaxxForce ® 15 CAT CT660 Class 8 Strategy What We’ve Said • Convert to proprietary U.S. and Canada diesel engine • Transition industry from 15L to 13L • Customer experience during transition will drive increased second half momentum 2 Quarter 2011 Earnings Call June 7, 2011 nd nd NYSE: NAV 9 |
NYSE: NAV 10 10 Combined Class 8 1 st Half 2 nd Half FY2011 Industry 75K 96K – 109K 171K - 184K Navistar 15K 27K - 31K 42K - 46K Market Share ~19% ~28% ~25% Note: Market Share based on brand and Severe Service Truck market share excludes military 2011 U.S. and Canada Combined Class 8 Strategy – Maintain ~25% Class 8 Share Key Takeaways/What’s Next? • Launch of derivative products to complete line-up • Truck production split 95% - 13L 5% - 15L • 15L impact will be weighted toward 4 th quarter ProStar+ ® with MaxxForce ® 15 LoneStar ® with MaxxForce ® 13 Industry FY02 FY03 FY04 FY 05 FY06 FY 07 FY08 FY09 FY10 School Bus 27,400 29,200 26,200 26,800 28,200 24,500 24,400 22,600 20,900 16,500 18,000 Class 6-7 - Medium 72,700 74,900 99,200 104,600 110,400 88,500 59,600 39,800 46,400 52,500 58,000 Combined Class 8 (Heavy & Severe Service) 163,300 159,300 219,300 282,900 316,100 206,000 152,600 112,000 124,000 171,000 184,000 Total Industry Demand 263,400 263,400 344,700 414,300 454,700 319,000 236,600 174,400 191,300 240,000 260,000 FY 11 Actual Guidance Historical Information United States and Canadian Class 6-8 Truck Industry - Retail Sales Volume 2 Quarter 2011 Earnings Call June 7, 2011 nd |
NYSE: NAV 11 11 2011 Global Truck South America • Colombia • Brazil Peru Mexico Global Units FY 2010 FY 2011 Mexico 5,000 6,000 Latin America/ Australia/ South America 3,000 10,000 Key Takeaways • Global units are expected to increase by >60% from the first half to the second half of this year • Balance global growth with supplier capacity Australia 2 Quarter 2011 Earnings Call June 7, 2011 nd 9800 & DuraStar ® TranStar ® WorkStar ® CT610/CT630 ProStar ® 40T Currently 410 Branded Sales or Service Points |
NYSE: NAV 2 Quarter 2011 Earnings Call June 7, 2011 nd Navistar Defense Sustainable Revenue 2008 2009 2010 2011+ > $2B > $2B > $2B ~$1.9B 12 Units since 2005 |
NYSE: NAV 13 13 Navistar Defense Recent Wins 250 MaxxPro ® Dash Ambulances 160 Buses 265 GTTs RPG Net Dash and Recovery FSR MaxxPro ® Dash 2 Quarter 2011 Earnings Call June 7, 2011 nd |
NYSE: NAV 14 14 • Moving from focused facilities to flexible manufacturing to minimize logistics cost • School bus: All assembly in Tulsa • Huntsville: Ability to produce V8/I6/DT engines on same line • Labor agreement Competitive Cost Structure Completed Actions Next Steps to increase Shareholder Value • Leveraging assets • Integrated Product Development Center 1 Half 2 Half Fiscal Year 2011 UAW one time impacts ($7M) $0 ($7M) Manufacturing Flexibility Efficiency $33M ~$50M ~$80M Product Development ($266M) ($240M- $260M) (>$500M) 2 Quarter 2011 Earnings Call June 7, 2011 nd st nd |
NYSE: NAV 15 $0 $2 $4 $6 $8 $10 $12 $14 $16 YTD Full Year Guidance $0.0 $1.0 $2.0 $3.0 $4.0 $5.0 $6.0 $7.0 YTD Full Year Guidance FY 2011 Guidance Navistar Consolidated Revenues ($ in Billions) Navistar Adjusted Diluted EPS YTD $6.1 Guidance $13.6 – $14.3 1 st Half 2 nd Half Fiscal Year 2011 Traditional NA Industry 113K 147K 260K Class 8 Market Share 19% ~28% ~25% Engine Profitability ($6M) ~$100M ~$100M OEM Diesels 73K ~86K >150K Military Revenues $840M >$1B ~$1.9B UAW One Time Impacts ($7M) $0 ($7M) Manufacturing Flexibility Efficiency $33M ~$50M ~$80M Product Development ($266M) ($240M-$260M) (>$500M) Parts Segment Growth >10% CAGR YTD $1.22** Guidance $5.50 – $6.00** *Composed mostly of NC2 & MNAL JV Note: This slide contains non-GAAP information, please see the REG G in appendix for a detailed reconciliation. 2011 FY Guidance does not include Engineering Integration Impact or potential Valuation Allowance release. **Excludes 2011 Engineering Integration Costs GLOBAL 1 st Half 2 nd Half Fiscal Year 2011 Equity/loss from non- consolidated affiliates* ($33M) ($10M-$15M) ($40M- $50M) Global units (incl. Legacy, NC² & MNAL) 9K ~20K ~29K 2 Quarter 2011 Earnings Call June 7, 2011 nd |
16 Results While Building • Q2 financials • Strategic update • Driving shareowner value Continued Success in 2011 Adjusted Diluted EPS attributable to NIC - $5.50-$6.00 Note: This slide contains non-GAAP information, please see the REG G in appendix for a detailed reconciliation. 2011 FY Guidance does not include Engineering Integration Impact or potential Valuation Allowance release. 2 Quarter 2011 Earnings Call June 7, 2011 nd NYSE: NAV 16 Flexible Manufacturing Strategy |
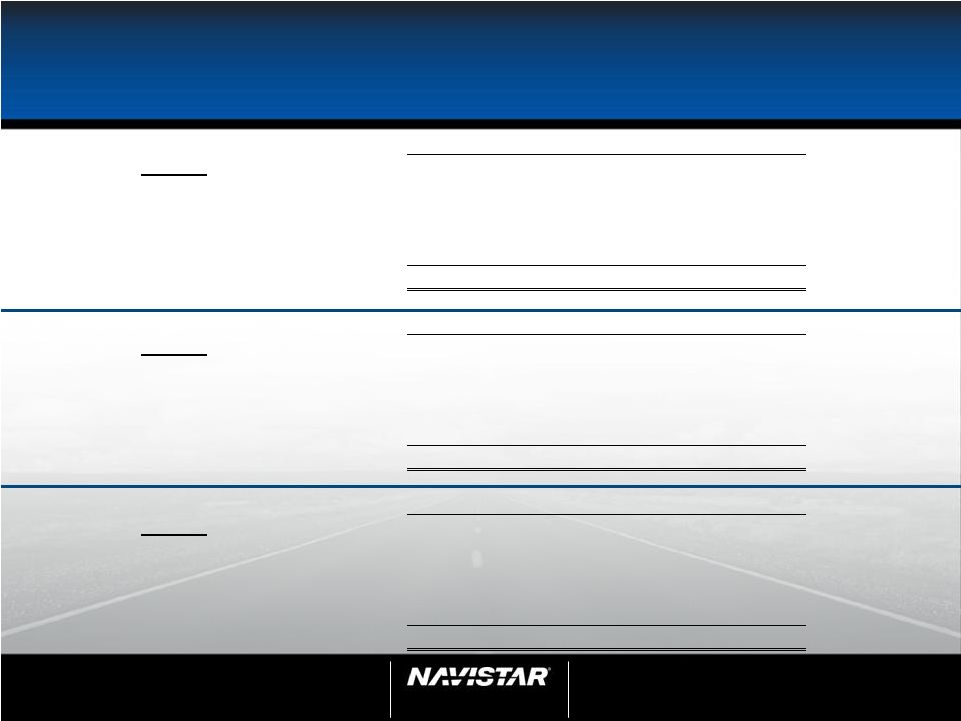
NYSE: NAV 17 17 Q2 Manufacturing Cash Update Note: This slide contains non-GAAP information, please see the Reg G in appendix for detailed reconciliation. Note: Capital Expenditures includes ~$16M related to Integrated Product Development center 2 Quarter 2011 Earnings Call June 7, 2011 nd ($ millions) January 31, 2011 ending manufacturing cash and marketable securities 1 $762 Adjusted manufacturing EBITDA $151 Change in net working capital 2 $228 Capital expenditures ($90) Other cash flows $28 April 30, 2011 ending manufacturing cash and marketable securities 1 $1,079 Forecasted October 31, 2011 ending manufacturing cash and marketable securities $1.2B to $1.4B 1 Includes cash from the consolidation of minority interests 2 NWC = A/R, Inventory, Other Current Assets, A/P & Other Current Liabilities |
18 Navistar Financial Corporation • Q2 2011 profitability of $40M, YTD profitability of $72M • Liquidity is strong: $517M total availability as of 4/30/11 – Retail securitization in April increased liquidity $118M and reduced borrowing costs • Retail portfolio originations and balances will continue to decline as Navistar Capital (new GE Capital program) handles new acquisitions • Service leverage stable (6:1) Retail Notes Bank Facility • $810M facility – Funding for retail notes, wholesale notes, retail accounts, and dealer open accounts – Matures December 2012 On balance sheet • Situation as of Apr 30, 2011 – $1.1B funding facility (NFSC) – $350M available • NFSC wholesale trust – Bank conduit portion matures August 2011 – Public portions mature January 2012 and October 2012 On balance sheet • Broader product offering • Enhanced ability to support large fleets • Better access to less expensive capital Note: profitability relates to total financial services Leveraging Assets & Controlling Our Destiny 2 Quarter 2011 Earnings Call June 7, 2011 nd NYSE: NAV 18 |
NYSE: NAV 19 Truck /Bus Production Facilities: SAP, GAP, EAP, TBP 0 5,000 10,000 15,000 20,000 25,000 30,000 35,000 40,000 45,000 Q1 Q2 Q3 Q4 0 5,000 10,000 15,000 20,000 25,000 30,000 1H 2H Medium Combined Class 8 0 50 100 150 200 250 300 350 Q1 Q2 Q3 Q4 Operating Days 2011 Update Worldwide Truck Chargeouts 1 st half – 498 days 2 nd half – 572 days • Medium production expected to increase 10- 15% in the 2 nd half • Combined Class 8 production expected to be up >40% OEM Engine Sales (excludes inter-company shipments) 1 st half – 73K units 2 nd half – 86K units U.S. and Canada Truck Production Note: Worldwide Truck Charge outs include towables. There are approximately 4,000 forecasted units in FY 2011. 0 5,000 10,000 15,000 20,000 25,000 30,000 35,000 40,000 45,000 50,000 2011 Actuals 2011 Actuals 2011 Forecast 2011 Forecast Q1 Q2 Q3 Q4 Traditional Expansionary Towables 2 Quarter 2011 Earnings Call June 7, 2011 nd |
NYSE: NAV 20 20 Results – Vehicle Integration Drives Profitable Growth Drivers of Success Market share growth – ProStar ® success Product breadth – Big Bore engines Customer reach – dealer engagement (U.S., Canada, Mexico, excludes Military) Parts Segment Three Months Ended April 30: ($ in millions) 2011 2010 $ change % change Total Sales $562 $447 $115 26% Segment $74 $58 $16 28% North American Parts Sales Parts Financial Information 2 Quarter 2011 Earnings Call June 7, 2011 nd $0 $500 $1,000 $1,500 $2,000 2009 2010 2011 Fcst |
NYSE: NAV 21 21 Competitive Cost Structure Controlling our Destiny Note: Costs related to steel, precious metals, resins, and petroleum products Commodities Market Profile 2009 Average 2010 High March 11 (data shown in Q1) May 2011 Sheet steel ($/short ton) $482 $699 $861 $810 Scrap steel ($/long ton) $260 $473 $480 $490 Crude oil ($/bbl) $62 $91 $95 $101 Platinum ($/troy oz.) $1,203 $1,754 $1,829 $1,792 Natural Rubber ($/lb) $0.82 $2.25 $2.34 $2.10 Copper ($/lb) $2.41 $4.23 $4.55 $4.05 2011 Actions • Navistar has mitigated a significant portion of 2011 market risk – Systematic hedging – Supplier negotiations – Commodity surcharges • Within a range, commodity volatility has been factored into 2011 guidance • Focus on FY2012 • Pricing Actions 2 Quarter 2011 Earnings Call June 7, 2011 nd |
NYSE: NAV 22 FY 04 -- 04' EPA FY 07 -- 07 EPA FY 08 -- 07' EPA FY 09 -- 07 EPA FY 9/10 -- 10 EPA Current Build Est FY 07 FY 08 FY 09 FY 10 Current Build Est Warranty Big Bore Engine Shipments By Year Key Takeaways • Prior period cost associated with previous generation products / customer satisfaction • Warranty expense will grow as engine population expands Base Engine – Midrange Diesels Truck – ProStar ® Launch Years Launch Years 0 2,000 4,000 6,000 8,000 10,000 12,000 14,000 FY2008 FY2009 FY2010 YTD2011 2 Quarter 2011 Earnings Call June 7, 2011 nd |
NYSE: NAV 23 23 FY 2011 Guidance • Industry remains strong – Full Year 240K to 260K – 1 st half ~226K 2 nd half ~300K (annualized) • Market Share – Growing with experience – Product performance • Fuel economy • Quality – 15L Engine • Challenges – Commodities – contained – Product investments • Global business – Completing investments – Volumes are growing – Export is very strong *composed mostly of NC 2 & MNAL JV 1 st Half 2 nd Half Fiscal Year 2011 Traditional NA Industry 113K 147K 260K Class 8 Market Share 19% ~28% ~25% Engine Profitability ($6M) ~$100M ~$100M OEM Diesels 73K ~86K >150K Military Revenues $840M >$1B ~$1.9B UAW One Time Impacts ($7M) $0 ($7M) Manufacturing Flexibility Efficiency $33M ~$50M ~$80M Product Development ($266M) ($240M-$260M) (>$500M) Parts Segment Growth >10% CAGR GLOBAL 1 st Half 2 nd Half Fiscal Year 2011 Equity/loss from non- consolidated affiliates* ($33M) ($10M-$15M) ($40M-$50M) Global units (incl. Legacy, NC² & MNAL) 9K ~20K ~29K Deliver on our commitments • Expect high side of EPS guidance • FY 2011 manufacturing cash and marketable securities: $1.2B to $1.4 B 2 Quarter 2011 Earnings Call June 7, 2011 nd |
NYSE: NAV 24 24 Driving Shareholder Value Deliver on our commitments • Expect high side of EPS guidance • FY 2011 manufacturing cash - $1.2B to $1.4B Not Included: •Engineering Integration Costs •Valuation Allowance •Mfg Footprint Rationalization 2 Quarter 2011 Earnings Call June 7, 2011 nd $(5.00) $- $5.00 $10.00 $15.00 $20.00 $25.00 150 200 250 300 350 400 450 500 Current wedge asumes attainment of mature global growth by the end of calendar year 2013 . Original wedge assumed a share count of 72.5M shares and a Tax Rate of 25%. 2009 Actual * Notes: *2008 and 2009 exclude certain charges, see Reg. Traditional Industry Volume (Thousands of Units) G in Appendix for GAAP reconcilation **Please see 2011 Guidance Slide in Appendix for additional assumptions 2010 Actual 2008 Actual * Original $1.6B Segment Profit Goal @ 415k units $1.8B Segment Profit Goal @ 350k units |
Appendix 2 Quarter 2011 Earnings Call June 7, 2011 nd NYSE: NAV 25 |
NYSE: NAV 26 26 2011 Guidance ** FY2010 includes $10M ($0.14) of cost for UAW agreement *** 2011 Guidance does not include Engineering Integration Impact or potential Valuation Allowance release 2010 Actual Guidance *** 2 Quarter 2011 Earnings Call June 7, 2011 nd *This slide contains non-GAAP information, please see the Reg G in appendix for detailed reconciliation. Truck Industry Units 191,300 240,000 to 260,000 Revenue ($ Billions) $12.1 $13.6 to $14.3 ($ Millions (excluding EPS)) Adj. Mfg. Segment Profit* $741 $995 to $1,070 Fin. Services, Corporate, Elims* $(496) $(520) to $(550) Adj. Profit Excluding Tax* $246 $475 to $520 Adj. Net Income attributable to NIC* $223 $427 to $465 Tax Rate 9.4% 10% to 11% Adj. Diluted EPS attributable to NIC* $3.05** $5.50 to $6.00 Number of diluted shares 73.2M ~77.6M Cash ($ Billions) $1.1 $1.2 to $1.4 |
NYSE: NAV 27 27 Market Share – U.S. & Canada School Bus and Class 6-8 2 Quarter 2011 Earnings Call June 7, 2011 nd Navistar Q1 Q2 Q3 Q4 Full Year Q1 Q2 Q3 Q4 Full Year Q1 Q2 Q3 Q4 Full Year Bus (School) 56% 60% 61% 66% 61% 60% 63% 52% 59% 59% 51% 45% 48% Medium (Class 6-7) 30% 39% 33% 39% 35% 33% 44% 36% 37% 38% 36% 36% 36% Heavy (LH & RH) 24% 23% 29% 24% 25% 23% 22% 30% 20% 24% 17% 16% 16% Severe Service 32% 36% 33% 33% 34% 34% 35% 35% 29% 33% 29% 33% 31% Combined Class 8 26% 27% 30% 27% 28% 26% 26% 31% 22% 26% 19% 20% 19% Combined Market Share 30% 35% 36% 36% 34% 31% 35% 34% 30% 33% 26% 26% 26% 2011 Market Share — U.S. & Canada School Bus and Class 6-8 2010 2009 |
NYSE: NAV 28 28 Worldwide Truck Chargeouts Fiscal year 2009 Q1 Q2 Q3 Q4 Full Year 2009 BUS 2,700 3,100 3,500 4,500 13,800 MEDIUM 3,200 3,400 2,700 3,700 13,000 HEAVY 6,100 3,200 4,500 5,300 19,100 SEVERE 2,800 2,700 2,800 2,600 10,900 TOTAL 14,800 12,400 13,500 16,100 56,800 MILITARY (U.S. & Foreign) 2,500 2,100 1,200 2,000 7,800 EXPANSIONARY 2,400 1,900 2,300 4,600 11,200 WORLD WIDE TRUCK 19,700 16,400 17,000 22,700 75,800 Fiscal year 2010 Q1 Q2 Q3 Q4 Full Year 2010 BUS 3,100 3,100 2,300 3,900 12,400 MEDIUM 3,900 5,300 3,900 5,400 18,500 HEAVY 5,200 4,600 6,400 5,400 21,600 SEVERE 3,100 3,000 1,800 2,800 10,700 TOTAL 15,300 16,000 14,400 17,500 63,200 MILITARY (U.S. & Foreign) 900 900 1,600 1,200 4,600 EXPANSIONARY 3,900 4,500 4,600 6,100 19,100 WORLD WIDE TRUCK 20,100 21,400 20,600 24,800 86,900 Fiscal year 2011 Q1 Q2 Q3 Q4 Full Year 2011 BUS 2,000 2,100 4,100 MEDIUM 4,600 7,200 11,800 HEAVY 4,700 5,200 9,900 SEVERE 2,300 2,900 5,200 TOTAL 13,600 17,400 0 0 31,000 MILITARY (U.S. & Foreign) 600 700 1,300 EXPANSIONARY 5,300 7,500 12,800 WORLD WIDE TRUCK 19,500 25,600 0 0 45,100 2 Quarter 2011 Earnings Call June 7, 2011 nd |
NYSE: NAV 29 29 World Wide Engine Shipments Navistar Q1 Q2 Q3 Q4 Full Year OEM sales - South America 19,400 22,500 26,100 31,200 99,200 Ford sales - U.S. and Canada 12,600 26,400 22,900 39,600 101,500 Other OEM sales 4,500 2,400 1,800 2,600 11,300 Intercompany sales 14,400 12,600 12,800 17,500 57,300 Total Shipments 50,900 63,900 63,600 90,900 269,300 Navistar Q1 Q2 Q3 Q4 Full Year OEM sales - South America 30,700 34,600 33,600 33,900 132,800 Ford sales - U.S. and Canada 24,700 200 - - 24,900 Other OEM sales 2,000 3,600 3,700 4,900 14,200 Intercompany sales 16,400 17,700 15,600 18,800 68,500 Total Shipments 73,800 56,100 52,900 57,600 240,400 Navistar Q1 Q2 Q3 Q4 Full Year OEM sales - South America 27,200 37,100 64,300 Ford sales - U.S. and Canada - - Other OEM sales 4,500 4,400 8,900 Intercompany sales 17,300 23,500 40,800 Total Shipments 49,000 65,000 - - 114,000 2011 2010 2009 2 Quarter 2011 Earnings Call June 7, 2011 nd |
NYSE: NAV 30 30 Order Receipts – U.S. & Canada Percentage Percentage 2011 2010 Change Change 2011 2010 Change Change 2,000 1,900 100 5 3,500 3,500 0 0 6,800 2,300 4,500 196 14,400 9,400 5,000 53 Class 8 heavy trucks 9,300 6,900 2,400 35 17,000 13,100 3,900 30 Class 8 severe service trucks 3,700 2,700 1,000 37 6,500 6,100 400 7 21,800 13,800 8,000 58 41,400 32,100 9,300 29 13,000 9,600 3,400 35 23,500 19,200 4,300 22 Total "Traditional" Markets Combined Class 8 (Heavy and Severe Service) "Traditional" Markets School buses Class 6 and 7 medium trucks Six Months Ended April 30, Three Months Ended April 30, 2 Quarter 2011 Earnings Call June 7, 2011 nd |
NYSE: NAV 31 31 Supplemental Information - Truck - 5,000 10,000 15,000 20,000 25,000 30,000 35,000 40,000 Analyst Day 2011 Actuals Analyst Day 2011 Actuals Analyst Day Analyst Day Q1 Q2 Q3 Q4 Traditional Expansionary Towables Worldwide Truck Chargeouts 2 Quarter 2011 Earnings Call June 7, 2011 nd |
NYSE: NAV 32 32 U.S. and Canada Dealer Stock Inventory* *Includes U.S. and Canada Class 4-8 and school bus inventory, but does not include U.S. IC Bus or Workhorse Custom Chassis inventory. 2 Quarter 2011 Earnings Call June 7, 2011 nd Excludes the US portion of IC Bus |
NYSE: NAV 33 33 Frequently Asked Questions Q1: What is in your Dealcor debt? A: Dealcor debt is comprised of wholesale (floor plan) financing and also retail financing on lease and rental fleets for company owned dealers. Q2: How many Dealcor dealers did you have as of April 30, 2011? A: Of our 271 primary NAFTA dealers, we have ownership interest in 9 DealCor dealers as of April 30, 2011. We expect to further reduce our number of Dealcor dealers in 2011. Q3: How are your dealers doing? A: The operational and financial strength of our industry leading dealer network continues to improve in all areas of the business, in parallel with the overall improvement in the North American truck market. We continue to add new dealers to the distribution network, attracted by the breadth of our product lines and significant opportunities in major markets. Considerable investments in facility upgrades and acquisitions have also been completed in the last several months by aggressive and growth oriented existing dealers; further strengthening our footprint, service capabilities and accessibility to our customers. Q4: What kind of rates do you charge your dealers and customers? A: Generally, our rates vary (those with higher credit risk have always had to pay higher interest rates) and are usually in line with the market. Q5: How do you fund your wholesale business? A: We primarily finance our wholesale portfolio through traditional private or public securitizations, and through our bank facility. 2 Quarter 2011 Earnings Call June 7, 2011 nd |
NYSE: NAV 34 34 Frequently Asked Questions Q6: How is your NFC portfolio performing? A: Repossessions, past due accounts and losses peaked in 2008 and have continued to show improvement since then. NFC’s retail portfolio in the U.S. is expected to reduce significantly in size now that Navistar Capital, the new GE Capital retail program, is financing retail customers. Performance of this portfolio improved considerably in 2010 and in the first half of 2011. Q7: What is your total amount of capacity at NFC? A: Total availability in our U.S. funding facilities is more than $517M as of April 30, 2011. Q8: What is included in Financial Services Segment Profit, Corporate and Eliminations? A: Financial Services Segment Profit, Corporate and Eliminations, as presented, consist of the Finance Services segment and Corporate and Eliminations as shown in the Segment Reporting footnote of our annual and quarterly reports (10K & 10Q). The primary drivers of Corporate and Eliminations are Corporate SG&A, pension and OPEB expense excluding amounts allocated to the segments, annual incentive, manufacturing interest expense, and the elimination of intercompany sales and profit between segments. Q9: What is the status of the retail financing alliance with GE Capital in the United States? A: Navistar Capital – the alliance we formed with GE Capital to support the sale of Navistar products – is off to a great start and progressing consistent with expectations. 2 Quarter 2011 Earnings Call June 7, 2011 nd |
NYSE: NAV 35 35 Frequently Asked Questions Q10: How will the changing DOD budget affect Navistar in FY 2011? A: Navistar continues to pursue a number of U.S. and foreign military opportunities and is confident in its annual $2 billion revenue goal. In addition, the company now has more than 30,000 vehicles in operation throughout the world. These vehicles will require parts and sustainment support throughout their lifecycles. Q11: How does the latest Ground Combat Vehicle (GCV) program announcement affect Navistar? A: Navistar was not originally part of the GCV program and is not currently one of the three bidders participating in the program. Q12: What are your margins for military vehicles? A: We do not break margins out specific to our military vehicles. These numbers are reported as part of our Truck Group financials. Q13: What is the current Joint Light Tactical Vehicle (JLTV) program status? A: As part of the Technology Development (TD) phase, Navistar and BAE continue to participate in the second phase of the JLTV program. Proposals for the Engineering and Manufacturing Development (EMD) stage are expected in late FY2011. Two teams will then be selected to compete in the EMD phase. 2 Quarter 2011 Earnings Call June 7, 2011 nd |
NYSE: NAV 36 36 Frequently Asked Questions Q14: How does your Class 8 industry compare to ACT Research? A: Q15: What were the 2010 emissions requirements? A: Through the use of credits manufacturers can go to a maximum of 0.50g NOx if they reduced earlier with advanced technology; manufacturers need to be at 0.20g NOx if they chose not to introduce advanced technologies to reduce their emissions earlier. For many years Navistar introduced cleaner emission engines than the EPA required, so we were able to generate some credit before we needed to go to the 0.20g NOx standard. 2 Quarter 2011 Earnings Call June 7, 2011 nd Reconciliation to ACT 2011 ACT* 210,500 CY to FY adjustment (20,000) Other misc. specialty vehicles Included in ACT (8,500) Total (ACT comparable Class 8 to Navistar) 182,000 Navistar Industry Retail Deliveries Combined Class 8 Trucks** 177,500** Navistar difference from ACT: 4,500 2.5% *Source: ACT N.A. Commercial Vehicle Outlook - May, 2011 **See table on bottom of slide 10 U.S. and Canadian Class 8 Truck Sales |
NYSE: NAV 37 37 Frequently Asked Questions Q16: What is Navistar doing to meet the 0.20g NOx emissions when its credits are depleted? A: Navistar remains committed to its strategy of providing solutions that let customers focus on their business, not emissions regulations. Solutions under development are multi-pronged and include our prime path of in-cylinder solutions along with application-specific solutions such as the Amminex metal ammine-based NOx reductant delivery system which Navistar announced in December 2009. We submitted an application for the 0.20g NOx 13L EGR engine to the EPA. Q17: What is the current net operating loss total, and why is there still a valuation allowance against deferred tax assets? A: The Company has U.S. federal net operating losses (NOLs) available with an undiscounted cash value totaling $161 million as of October 31, 2010. In addition, we have state NOLs valued at $85 million and foreign NOLs valued at $85 million, for a total undiscounted cash value of $331 million. A substantial portion of these NOL assets are subject to a valuation allowance. In addition to the deferred tax assets attributable to the NOLs, we have other deferred tax assets arising from temporary book-tax differences subject to a valuation allowance, for a total balance of deferred tax assets subject to a valuation allowance of $1.8 billion. Under U.S. GAAP rules, when the Company is able to demonstrate sufficient earnings (both historically and in the future) to absorb these future deductions, the Company will release its valuation allowances. If U.S. operations continue to improve, we believe that the Company may release all or a portion of its U.S. valuation allowance in the next twelve months. The release of our U.S. valuation allowance would not directly impact our U.S. cash tax payments, which are expected to remain low until such time as we have exhausted our NOLs and tax credits. 2 Quarter 2011 Earnings Call June 7, 2011 nd |
NYSE: NAV 38 38 Frequently Asked Questions Q18: How has recent tax legislation affected Navistar? A: The Worker, Homeownership, and Business Assistance Act of 2009 provided an opportunity to carry back alternative minimum tax net operating losses from the Company’s 2010 fiscal year and to receive a refund of alternative minimum tax (AMT) payments. The Company received its refund of $29 million of AMT credits in fiscal year 2011 as a result of this legislation. The Tax Relief, Unemployment Insurance Reauthorization, and Job Creation Act of 2010 extends current tax rules in several areas, which if not extended, could have adversely impacted the Company’s tax results. In addition, the Act allows businesses to fully depreciate qualifying property purchased through the end of 2011 (50% first year depreciation for purchases in 2012), which will benefit both Navistar and its customers. Q19: How will $1.8 billion of deferred tax assets be used to offset future taxable income? A: Simply put, deferred tax assets represent the value of future tax deductions attributable to items that have already been expensed or deducted for book purposes. The most commonly understood component of deferred tax assets is the value of our net operating losses, which will serve to immediately reduce taxable income in the future. In addition, we have several other major components of deferred taxes which will reduce taxable income in the future. For example, the Company has accrued significant OPEB, pension and other employee benefit expenses during prior years based on expected payments to be made in the future. As these payments are made, the Company will realize tax deductions to offset future taxable income. 2 Quarter 2011 Earnings Call June 7, 2011 nd |
NYSE: NAV 39 39 Frequently Asked Questions 2 Quarter 2011 Earnings Call June 7, 2011 nd Q20: How does vertical integration of a big bore engine impact warranty? A: With the transition to 100% MaxxForce ® engines we will assume an increased responsibility for engine warranty, which was previously absorbed by our suppliers and reflected in our material costs. The impact of this change will increase warranty expense and decrease material costs. Q21: Why is your warranty expense higher year over year? A: Our warranty costs have been higher than the respective prior year periods primarily as a result of increased intercompany volumes due to the use of all MaxxForce ® engines in our North America product offering. In addition, we recognized a $27 million increase in adjustments to pre-existing warranties primarily related to various authorized field campaigns in our Truck segment and changes in our estimated warranty costs per unit on 2007 emission standard engines in our Engine segment. Through the first and second quarters of 2011, we have seen favorable performance on our 2010 engines compared to previous launches and expected performance. Q22: What are your expected 2011 and beyond pension funding requirements? A: Current forecasts indicate that we may need to contribute approximately $144 million in 2011. Future contributions are dependent upon a number of factors, principally the changes in values of plan assets, changes in interest rates, and the impact of any funding relief currently under consideration. We currently expect that from 2012 through 2013, the Company will be required to contribute at least $193 million per year to the plans, depending on asset performance and discount rates. |
NYSE: NAV 40 40 Frequently Asked Questions 2 Quarter 2011 Earnings Call June 7, 2011 nd Q23: What is your expected 2011 pension and OPEB GAAP expense? A: Assuming no further containment actions and no curtailment events, we anticipate 2011 pension and OPEB GAAP expense will not exceed 2010 levels. Q24: What causes the variance between manufacturing cash interest payments and GAAP interest expense? A: The main variance between cash and GAAP interest results from our manufacturing segment’s $1 billion of senior unsecured high yield notes and $570 million of senior subordinated convertible notes. As a result of this issuance, future manufacturing interest expense will be higher than cash interest payments due to the amortization of debt issuance costs which are amortized over the life of each note ($36 million), amortization of the original issue discount of the high yield notes ($37 million) and amortization of the embedded call option in the convertible notes ($114 million). The timing of interest payments also impacts this variance on a quarterly basis, but not on a fiscal year basis. |
NYSE: NAV 41 41 Frequently Asked Questions Q25: What are the $225 million of Recovery Zone Facility Revenue Bonds (RZFBs) Series 2010 due October 15, 2040 being used for? A: We are using the proceeds to invest in our product development strategy and our HQ consolidation. Great products are a key pillar of our three pronged strategy. Streamlining and improving our product development processes will continue to provide competitive advantages for us in the marketplace. The funding from the RZFBs will allow us to consolidate many facilities into a new facility and make necessary renovations to that facility. Additionally we will invest in an existing facility, which includes investments in equipment and technology that will help us create and improve our product development process and thus shareholder value. Q26: Why did you use Recovery Zone Facility Bond (RZFB) financing? A: The RZFBs are a cost effective, long-term form of capital that is complementary to our capital structure. The bonds have a 30 year maturity and a fixed rate coupon of 6.50% per annum. They are callable at par any time after 10 years (October 15, 2020). Issuing bonds in the tax-exempt market gave us exposure to a new source of investors that we wouldn’t otherwise have access to if not for the RZFB program. 2 Quarter 2011 Earnings Call June 7, 2011 nd |
NYSE: NAV 42 42 Frequently Asked Questions Q27: What should we assume for capital expenditures in fiscal 2011? A: We plan to continue capital spending within the traditionally guided range of $250 - $350 million for products and development. There is capital spending related to Engineering Integration not included in the range that is fully funded through the RZFBs. Q28: What are the differences between the accounting vs. economic dilution on your convertible debt? A: Please see the presentation on the IR website (http://ir.navistar.com/dilution.cfm ) entitled Dilution overview resulting from the Convertible Notes issued on October 2009. Q29: Why are the convertible debt holders now able to convert their notes? A: The indenture in our convertible notes contains a provision that allows the note holders to convert anytime during the following fiscal quarter should the price of Navistar’s common stock close 130% above the conversion price for any 20 day period (consecutive or non-consecutive) out of the last 30 consecutive day trading period of each fiscal quarter. Our fiscal quarter ended on April 30, 2011; the conversion price of the notes is $50.274 per share of Navistar’s common stock; 130% of the conversion price equals $65.356 per share of Navistar’s common stock. Since Navistar’s common stock closed above $65.356 per share for more than 20 trading days during the 30 consecutive trading day period ending on April 30, 2011, the note holders now have the right to convert their notes any time from May 2, 2011 through July 31, 2011. 2 Quarter 2011 Earnings Call June 7, 2011 nd |
NYSE: NAV 43 43 Frequently Asked Questions We do not expect any note holders to convert as it would be uneconomical to convert because by converting, the note holders would sacrifice all future coupon payments and forego the intrinsic value of the embedded call option contained in the convertible notes. If a note holder chooses to convert, Navistar has the right to satisfy the conversion through 3 different methods: cash settlement, share settlement or combination settlement. A combination settlement allows Navistar to settle the principal amount in cash and the remaining value to be settled in shares (plus cash in lieu of fractional shares). However, if the note holder chooses to convert and Navistar chooses to settle via a combination settlement, then there is a 40 trading day observation period to determine the value to be settled in shares, so the note holder will not receive the cash and shares for almost two months after the conversion notice is received. If Navistar’s common stock does not close above $65.356 per share for any 20 day trading period (consecutive or non-consecutive) during the 30 day consecutive trading day period for any future fiscal quarter end, then the note holders would no longer have the right to convert their notes in the subsequent quarter unless this threshold is triggered once again in the future. Q30: Why have the convertible notes that are due in October 2014 been reclassified from long-term debt to current debt? A: As mentioned in the question above, the convertible note holders now have the right to convert their notes through July 31, 2011. Under GAAP, since note holders have the right to convert, the debt must be classified as a current liability. Since we do not expect any note holders to convert, this is not expected to have any cash impact to Navistar. If the notes are no longer convertible after July 31, 2011, then the notes will be reclassified from current to long-term debt. 2 Quarter 2011 Earnings Call June 7, 2011 nd |
NYSE: NAV 44 44 ($ in millions) Note: Manufacturing cash flow is a non-GAAP presentation. See SEC Reg G – non-GAAP reconciliation. Manufacturing Cash Flow 2 Quarter 2011 Earnings Call June 7, 2011 nd Beginning Mfg. Cash 1 Balance Fiscal 2009 Fiscal 2010 Q1 - 2011 Q2 2011 October 31, 2008 $777 October 31, 2009 $1,152 October 31, 2010 $1,100 January 31, 2011 $762 Approximate Cash Flows: From Operations 534 409 (214) 386 Dividends from NFC 0 0 0 0 From Investing / (Cap Ex) (284) (350) (113) (83) From Financing / (Debt Pay Down) 36 (110) (13) 8 Exchange Rate Effect 9 (1) 2 6 Net Cash Flow $295 ($52) ($338) $317 Blue Diamond Consolidation $80 $0 $0 $0 Ending Mfg. Cash 1 Balance Fiscal 2009 YTD - FY 2010 Q1 - 2011 Q2 2011 October 31, 2009 2 $1,152 October 31, 2010 $1,100 January 31, 2011 $762 April 30, 2011 $1,079 1 Cash = Cash, Cash Equivalents & Marketable Securities 2 Includes cash from the consolidation of minority interests |
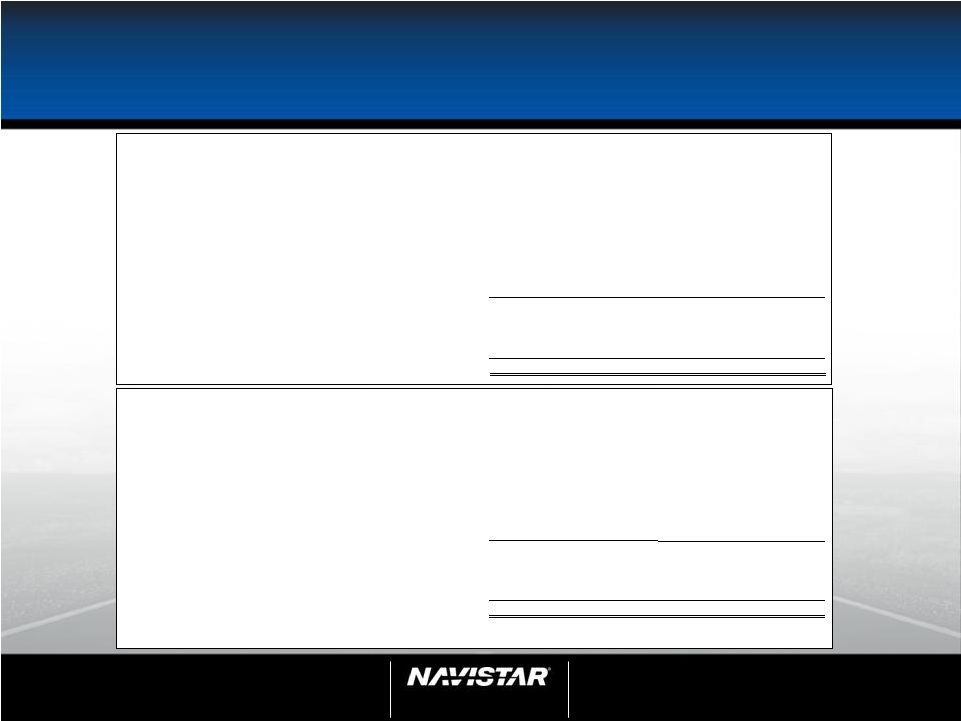
NYSE: NAV 45 45 Outstanding Debt Balances April 31, October 31, (in millions) 2011 2010 Manufacturing operations 8.25% Senior Notes, due 2021, net of unamortized discount of $34 and $35 million at respective dates 966 965 3.0% Senior Subordinated Convertible Notes, due 2014, net of unamortized discount of $84 and $94 million at the respective dates 486 476 Debt of majority-owned dealerships 93 66 Financing arrangements and capital lease obligations 166 221 Loan Agreement related to 6.5% Tax Exempt Bonds, due 2040 225 225 Other 33 33 Total manufacturing operations debt 1,969 1,986 Less: Current portion (619) (145) Net long-term manufacturing operations debt 1,350 1,841 Financial services operations Asset-backed debt issued by consolidated SPEs, at variable rates, due serially through 2018 1,769 1,731 Bank revolvers, at fixed and variable rates, due dates from 2012 through 2018 942 974 Commercial paper, at variable rates, due serially through 2012 55 67 Borrowings secured by operating and finance leases, at various rates, due serially through 2017 88 112 Total financial services operations debt 2,854 2,884 Less: Current portion (751) (487) Net long-term financial services operations debt 2,103 2,397 2 Quarter 2011 Earnings Call June 7, 2011 nd |
NYSE: NAV 46 46 SEC Regulation G Non-GAAP Reconciliation Manufacturing Segment Results: We believe manufacturing segment results, which includes the segment results of our Truck, Engine, and Parts reporting segments, provide meaningful information of our core manufacturing business and therefore we use it to supplement our GAAP reporting by identifying items that may not be related to the core manufacturing business. Management often uses this information to assess and measure the performance of our operating segments. We have chosen to provide this supplemental information to investors, analysts and other interested parties to enable them to perform additional analyses of operating results, to illustrate the results of operations giving effect to the non-GAAP adjustments shown in the below reconciliation, and to provide an additional measure of performance. Adjusted Net Income and Diluted Earnings Per Share Attributable To Navistar International Corporation and Adjusted Manufacturing Segment Profit: We believe that adjusted net income, diluted earnings per share attributable to Navistar International Corporation, and adjusted manufacturing segment profit excluding engineering integration costs, certain restructuring costs, and certain impairment charges, which are not considered to be part of our ongoing business, improve the comparability of year to year results and are representative of our underlying performance. We have chosen to provide this supplemental information to investors, analysts, and other interested parties to enable them to perform additional analyses of operating results, to illustrate the results of operations giving effect to the non-GAAP adjustments shown in the below reconciliations, and to provide an additional measure of performance. 2 Quarter 2011 Earnings Call June 7, 2011 nd The financial measures presented below are unaudited and not in accordance with, or an alternative for, financial measures presented in accordance with U.S. generally accepted accounting principles (GAAP). The non-GAAP financial information presented herein should be considered supplemental to, and not as a substitute for, or superior to, financial measures calculated in accordance with GAAP. |
NYSE: NAV 47 47 SEC Regulation G Non-GAAP Reconciliation Adjusted Manufacturing Earnings Before Interest, Income Taxes, Depreciation, and Amortization (“EBITDA”): Adjusted manufacturing segment EBITDA is defined as our consolidated net income (loss) from continuing operations minus the net income (loss) from our financial services operations plus interest expense, income taxes, and depreciation and amortization. EBITDA is a measure commonly used and is presented to aid in developing an understanding of the ability of our operations to generate cash for debt service and taxes, as well as cash for investments in working capital, capital expenditures, and other liquidity needs. This information is presented as a supplement to the other data provided because it provides information which we believe is useful to investors for additional analysis. EBITDA should not be considered in isolation or as a substitute for net income, cash flows from operating activities or other consolidated operations, or cash flow statement data prepared in accordance with GAAP, or as a measure of our profitability or liquidity as determined in accordance with GAAP. Manufacturing Cash Flow and Manufacturing Cash, Cash Equivalents, and Marketable Securities: Manufacturing cash flow is used and is presented to aid in developing an understanding of the ability of our operations to generate cash for debt service and taxes, as well as cash for investments in working capital, capital expenditures and other liquidity needs. This information is presented as a supplement to the other data provided because it provides information which we believe is useful to investors for additional analysis. Our manufacturing cash flow is prepared with manufacturing marketable securities being treated as a cash equivalent. Manufacturing cash, cash equivalents, and marketable securities represents the Company’s consolidated cash, cash equivalents, and marketable securities excluding cash, cash equivalents, and marketable securities of our financial services operations. We include marketable securities with our cash and cash equivalents when assessing our liquidity position as our investments are highly liquid in nature. We have chosen to provide this supplemental information to investors, analysts and other interested parties to enable them to perform additional analyses of operating results, to illustrate the results of operations giving effect to the non-GAAP adjustments shown in the below reconciliation, and to provide an additional measure of performance. 2 Quarter 2011 Earnings Call June 7, 2011 nd |
NYSE: NAV 48 48 SEC Regulation G – EPS vs. Traditional Industry Original Target Revised Target U.S. & Canada Industry 414,500 350,000 Sales and Revenues, Net (A) $15 + $20 + Diluted earnings per share attributable to Navistar International Corporation $ 11.46 $ 12.31 Approximate diluted weighted shares outstanding ~ 72.5 ~ 72.5 (Dollars in Millions) Net income (loss) attributable to Navistar International Corporation $ 825 $ 892 Less: Financial services segment profit, Corporate and eliminations, and income taxes (775) (888) Manufacturing segment profit $ 1,600 $ 1,780 2 Quarter 2011 Earnings Call June 7, 2011 nd (A) Revised Target sales and revenues, net – Projections based on $17-18B of GAAP revenue and $2-3B of Non-GAAP revenue related to Navistar's share of non-consolidated affiliates. |
NYSE: NAV 49 49 SEC Regulation G 2 Quarter 2011 Earnings Call June 7, 2011 nd Three Months Ended April 30, 2011 ($ millions) Net income (loss) attributable to NIC $74 Add back income taxes $5 Income before income taxes $79 Less equity income from financial service operations ($40) Income before income taxes and equity income from financial service operations $39 Add back manufacturing interest expense $38 Manufacturing EBIT $77 Add back manufacturing depreciation and amortization 1 $74 Adjusted manufacturing EBITDA $151 1 Includes depreciation of equipment leased to others and excludes debt issuance cost/discount amortization Navistar International Corporation (Manufacturing operations with financial services operations on a pre-tax equity basis) |
NYSE: NAV 50 50 SEC Regulation G – 2011 Guidance 2 Quarter 2011 Earnings Call June 7, 2011 nd (A) Engineering integration costs relate to the consolidation of our truck and engine engineering operations as well as the move of our world headquarters. We continue to develop plans for efficient transitions related to these activities and the optimization of our operations and management structure. We expect to incur approximately $77 million of engineering integration costs in fiscal 2011 with approximately $67 million of the costs to be recognized by our manufacturing segment and approximately $10 million of corporate charges. (B) Approximate diluted weighted shares outstanding based on assumed average share price of $65 per share during the period. Lower Upper (Dollars in Millions, except per share data) Net income attributable to Navistar International Corporation 350 388 77 77 Adjusted net income attributable to Navistar International Corporation 427 465 Less: Income taxes (48) (55) Adjusted Profit Excluding Tax 475 520 Diluted earnings per share attributable to Navistar International Corporation 4.50 5.00 1.00 1.00 Adjusted diluted earnings per share attributable to Navistar International Corporation 5.50 6.00 77.6 77.6 Lower Upper (Dollars in Millions) Net income (loss) attributable to Navistar International Corporation 350 388 Less: Financial services segment profit, Corporate and eliminations, and income taxes (578) (615) Manufacturing segment profit 928 1,003 67 67 Adjusted manufacturing segment profit 995 1,070 Fiscal 2011 guidance: adjusted net income and diluted earnings per share attributable to Navistar International Corporation reconciliation: Fiscal 2011 guidance: manufacturing segment profit and adjusted manufacturing segment profit reconciliation: $ $ $ $ $ $ $ $ $ $ $ $ $ $ Plus: Engineering integration costs Approximate diluted weighted shares outstandin Plus: Engineering integration costs (A) (A) (B) Effect of adjustments on diluted earnings per share attributable to Navistar International Corporation |
NYSE: NAV 51 51 SEC Regulation G – Fiscal Year Comparison 2009 2008 (Dollars in Millions, except per share data) Net income (loss) attributable to Navistar International Corporation $ 320 $ 134 Plus: Ford settlement, restructuring and related charges (benefits) (A) (157) 36 Impairment of property, plant, and equipment (B) 31 358 Write-off of debt issuance costs (C) 11 - Adjusted net income attributable to Navistar International Corporation $ 205 $ 528 Adjusted diluted earnings per share attributable to Navistar International Corporation $ 2.86 $ 7.21 Diluted weighted shares outstanding 71.8 73.2 2010 2009 2008 (Dollars in Millions, except per share data) Net income attributable to Navistar International Corporation $ 223 $ 320 $ 134 Less: Income taxes (23) (37) (57) Profit Excluding Tax $ 246 $ 357 $ 191 Less: Financial services segment profit (loss) 95 40 (24) Corporate and eliminations (590) (519) (478) Manufacturing segment profit 741 836 693 Plus: Ford settlement, restructuring and related charges (benefits) (A) - (160) 37 Impairment of property, plant, and equipment (B) - 31 358 Adjusted manufacturing segment profit $ 741 $ 707 $ 1,088 Adjusted net income and diluted earnings per share attributable to Navistar International Corporation reconciliation: Manufacturing segment profit and adjusted manufacturing segment profit reconciliation: 2 Quarter 2011 Earnings Call June 7, 2011 nd (A) Ford settlement, restructuring and related charges (benefits) include the impact of our settlement with Ford in 2009 as well as charges and benefits recognized related to restructuring activity at our Indianapolis Casting Corporation and Indianapolis Engine Plant. The charges and benefits were recognized in our Engine segment with the exception of $3 million of income tax expense and $1 million of income tax benefit related to the settlement in 2009 and 2008 respectively. (B) Impairment of property, plant, and equipment in 2008 are related to impairments to the asset groups in the Engine segment’s VEE Business Unit. The 2009 impairments relate to charges recognized by the Truck segment for impairments related to asset groups at our Chatham and Conway facilities (C) The write-off of debt issuance costs in 2009 relate to charges related to the Company’s refinancing. |
NYSE: NAV 52 52 SEC Regulation G – Manufacturing Cash Fiscal Year Comparison 2 Quarter 2011 Earnings Call June 7, 2011 nd Manufacturing cash, cash equivalents, and marketable securities reconciliation: (Dollars in Millions) April 30, 2011 October 31, 2010 October 31, 2009 October 31, 2008 Manufacturing segment cash and cash equivalents 361 $ 534 $ 1,152 $ 775 $ Financial services segment cash and cash equivalents 29 51 60 86 Consolidated cash and cash equivalents 390 $ 585 $ 1,212 $ 861 $ Manufacturing marketable securities (A) Financial services segment marketable securities 718 $ 566 $ - $ 2 $ Consolidated marketale securities 20 20 - - 738 $ 586 $ - $ 2 $ Manufacturing segment cash and cash equivalents 361 $ 534 $ 1,152 $ 775 $ Manfuacturing marketable securities 718 566 - 2 Manufacturing segment cash, cash equivalents and marketable securities 1,079 $ 1,100 $ 1,152 $ 777 $ (A) Manufacturing marketable securities as of October 31, 2008 of $2 million were included in Other current assets for financial reporting. |
NYSE: NAV 53 53 SEC Regulation G – Manufacturing Cash 2 Quarter 2011 Earnings Call June 7, 2011 nd Manufacturing Operations Financial Services Operations Adjustments Condensed Consolidated Cash Flows (Dollars in Millions) For the year ended October 31, 2009 Cash flows from operations $ 534 $ 704 $ - $ 1,238 Cash flows from investing / capital expenditures (284) 50 22 (212) Cash flows from financing / debt pay down 36 (780) (20) (764) Effect of exchange rate changes 9 - - 9 Net cash flows $ 295 $ (26) $ 2 $ 271 Blue Diamond Consolidation 80 - - 80 Beginning cash, cash equivalents and marketable securities balance 777 86 (2) 861 Ending cash, cash equivalents and marketable securities balance $ 1,152 $ 60 $ - $ 1,212 Manufacturing Operations Financial Services Operations Adjustments Condensed Consolidated Cash Flows (Dollars in Millions) For the year ended October 31, 2010 Cash flows from operations $ 409 $ 698 $ - $ 1,107 Cash flows from investing / capital expenditures (350) 492 (576) (434) Cash flows from financing / debt pay down (110) (1,180) (10) (1,300) Effect of exchange rate changes (1) 1 - - Net cash flows $ (52) $ 11 $ (586) $ (627) Blue Diamond Consolidation - - - - Beginning cash, cash equivalents and marketable securities balance 1,152 60 - 1,212 Ending cash, cash equivalents and marketable securities balance $ 1,100 $ 71 $ (586) $ 585 Manufacturing segment cash flow reconciliation: Manufacturing segment cash flow reconciliation: |
NYSE: NAV 54 54 SEC Regulation G – Manufacturing Cash 2 Quarter 2011 Earnings Call June 7, 2011 nd Manufacturing Operations Financial Services Operations Adjustments Condensed Consolidated Cash Flows (Dollars in Millions) For the six months ended April 30, 2011 Cash flows from operations $ 172 $ 54 $ - $ 226 Cash flows from investing / capital expenditures (196) (26) (152) (374) Cash flows from financing / debt pay down (5) (53) (58) Effect of exchange rate changes 8 3 - 11 Net cash flows $ (21) $ (22) $ (152) $ (195) Blue Diamond Consolidation - - - - Beginning cash, cash equivalents and marketable securities balance 1,100 71 (586) 585 Ending cash, cash equivalents and marketable securities balance $ 1,079 $ 49 $ (738) $ 390 Manufacturing Operations Financial Services Operations Adjustments Condensed Consolidated Cash Flows (Dollars in Millions) For the three months ended April 30, 2011 Cash flows from operations $ 386 $ (165) $ - $ 221 Cash flows from investing / capital expenditures: (83) (26) (328) (437) Cash flows from financing / debt pay down 8 191 - 199 Effect of exchange rate changes 6 2 - 8 Net cash flows $ 317 $ 2 $ (328) $ (9) Blue Diamond Consolidation - - - - Beginning cash, cash equivalents and marketable securities balance 762 47 (410) 399 Ending cash, cash equivalents and marketable securities balance $ 1,079 $ 49 $ (738) $ 390 Manufacturing segment cash flow reconciliation: Manufacturing segment cash flow reconciliation: |
NYSE: NAV 55 55 SEC Regulation G – Three and six months ended April 30, 2011 and 2010 (A) Engineering integration costs relate to the consolidation of our truck and engine engineering operations as well as the move of our world headquarters. Engineering integration costs include restructuring charges for activities at our Fort Wayne facility of $1 million and $19 million for the three and six months ended April 30, 2011, respectively. The restructuring charges recorded are based on restructuring plans that have been committed to by management and are, in part, based upon management's best estimates of future events. Changes to the estimates may require future adjustments to the restructuring liabilities. We also incurred an additional $5 million and $7 million of other related costs for the three and six months ended April 30, 2011, respectively. Operations included in our manufacturing segment recognized $3 million and $21 million of the engineering integration costs for the three and six months ended April 30, 2011, respectively. We continue to develop plans for efficient transitions related to these activities and the optimization of our operations and management structure. For fiscal 2011, we expect to incur approximately $50 million of additional charges related to these activities. (B) Ford restructuring and related charges (benefits) are charges and benefits recognized in 2010 related to restructuring activity at our Indianapolis Casting Corporation and Indianapolis Engine Plant. In the first quarter of 2010, the Company recognized $17 million of restructuring benefits related to restructuring activity at these locations. The restructuring benefit primarily related to the settlement of a portion of our other contractual costs for $16 million within the restructuring liability. The charges were included in Restructuring charges in our Engine segment. 2 Quarter 2011 Earnings Call June 7, 2011 nd 2011 2010 2011 2010 (Dollars in Millions, except per share data) Net income (loss) attributable to Navistar International Corporation $ 74 $ 43 $ 68 $ 62 Plus: Engineering integration costs (A) 6 - 26 - Ford restructuring and related charges (benefits) (B) - - - (17) Adjusted net income attributable to Navistar International Corporation $ 80 $ 43 $ 94 $ 45 Diluted earnings (loss) per share attributable to Navistar International Corporation $ 0.93 $ 0.60 $ 0.87 $ 0.86 Effect of adjustments on diluted earnings per share attributable to Navistar International Corporation 0.09 - 0.35 (0.24) Adjusted diluted earnings per share attributable to Navistar International Corporation $ 1.02 $ 0.60 $ 1.22 $ 0.62 Diluted weighted shares outstanding 78.6 72.8 77.3 72.4 2011 2010 2011 2010 (Dollars in Millions) Net income (loss) attributable to Navistar International Corporation $ 74 $ 43 $ 68 $ 62 Less: Financial services segment profit $ 40 $ 16 $ 72 $ 28 Corporate and eliminations (129) (132) (247) (285) Income taxes (5) 10 (5) 2 Manufacturing segment profit 168 149 248 317 Plus: Engineering integration costs (A) 3 - 21 - Ford restructuring and related charges (benefits) (B) - - - (17) Adjusted manufacturing segment profit $ 171 $ 149 $ 269 $ 300 Adjusted net income and diluted earnings per share attributable to Navistar International Three Months Ended April 30, Six Months Ended April 30, Manufacturing segment profit and adjusted manufacturing segment profit reconciliation: Three Months Ended April 30, Six Months Ended April 30, Corporation reconciliation: |
NYSE: NAV 56 56 SEC Regulation G – Q1 2011 vs. Q1 2010 Comparison (A) Engineering integration costs relate to the consolidation of our truck and engine engineering operations as well as the move of our world headquarters. Engineering integration costs include restructuring charges for activities at our Fort Wayne facility of $18 million for the three months ended January 31, 2011. The restructuring charges recorded are based on restructuring plans that have been committed to by management and are, in part, based upon management's best estimates of future events. Changes to the estimates may require future adjustments to the restructuring liabilities. We also incurred an additional $2 million of other related costs for the three months ended January 31, 2011. Operations included in our manufacturing segment recognized $18 million of the engineering integration costs for the three months ended January 31, 2011. We continue to develop plans for efficient transitions related to these activities and the optimization of our operations and management structure. For fiscal 2011, we expect to incur approximately $50 million of additional charges related to these activities. (B) Ford restructuring and related charges (benefits) are charges and benefits recognized in 2010 related to restructuring activity at our Indianapolis Casting Corporation and Indianapolis Engine Plant. In the first quarter of 2010, the Company recognized $17 million of restructuring benefits related to restructuring activity at these locations. The restructuring benefit primarily related to the settlement of a portion of our other contractual costs for $16 million within the restructuring liability. The charges were included in Restructuring charges in our Engine segment. 2 Quarter 2011 Earnings Call June 7, 2011 nd 2011 2010 (Dollars in Millions, except per share data) Net income (loss) attributable to Navistar International Corporation $ (6) $ 19 Plus: Engineering integration costs (A) 20 - Ford restructuring and related charges (benefits) (B) - (17) Adjusted net income attributable to Navistar International Corporation $ 14 $ 2 Diluted earnings (loss) per share attributable to Navistar International Corporation $ (0.08) $ 0.26 Effect of adjustments on diluted earnings per share attributable to Navistar International Corporation 0.27 (0.23) Adjusted diluted earnings per share attributable to Navistar International Corporation $ 0.18 $ 0.03 Diluted weighted shares outstanding (C) 75.9 72.1 2011 2010 (Dollars in Millions) Net income (loss) attributable to Navistar International Corporation $ (6) $ 19 Less: Financial services segment profit $ 32 $ 12 Corporate and eliminations (118) (153) Income taxes - (8) Manufacturing segment profit 80 168 Plus: Engineering integration costs (A) 18 - Ford restructuring and related charges (benefits) (B) - (17) Adjusted manufacturing segment profit $ 98 $ 151 Adjusted net income and diluted earnings per share attributable to Navistar International Three Months Ended January 31, Manufacturing segment profit and adjusted manufacturing segment profit reconciliation: Three Months Ended January 31, Corporation reconciliation: |