3rd Quarter 2011 Earnings Presentation September 7, 2011 NYSE: NAV 1 Exhibit 99.2 3 Quarter 2011 Earnings Call Sept. 7, 2011 rd |
NYSE: NAV 2 3 Quarter 2011 Earnings Call Sept. 7, 2011 2 rd Safe Harbor Statement Information provided and statements contained in this presentation that are not purely historical are forward-looking statements within the meaning of Section 27A of the Securities Act of 1933, as amended, Section 21E of the Securities Exchange Act of 1934, as amended, and the Private Securities Litigation Reform Act of 1995. Such forward-looking statements only speak as of the date of this presentation and the Company assumes no obligation to update the information included in this presentation. Such forward-looking statements include information concerning our possible or assumed future results of operations, including descriptions of our business strategy. These statements often include words such as “believe,” “expect,” “anticipate,” “intend,” “plan,” “estimate,” or similar expressions. These statements are not guarantees of performance or results and they involve risks, uncertainties, and assumptions. For a further description of these factors, see Item 1A, Risk Factors, included within our Form 10-K for the year ended October 31, 2010, which was filed on December 21, 2010, and Part II, Item 1A, Risk Factors, included within our Form 10-Q for the period ended July 31, 2011, which was filed on September 7, 2011. Although we believe that these forward- looking statements are based on reasonable assumptions, there are many factors that could affect our actual financial results or results of operations and could cause actual results to differ materially from those in the forward-looking statements. All future written and oral forward-looking statements by us or persons acting on our behalf are expressly qualified in their entirety by the cautionary statements contained or referred to above. Except for our ongoing obligations to disclose material information as required by the federal securities laws, we do not have any obligations or intention to release publicly any revisions to any forward-looking statements to reflect events or circumstances in the future or to reflect the occurrence of unanticipated events. |
3 Quarter 2011 Earnings Call Sept. 7, 2011 rd NYSE: NAV Other Cautionary Notes • The financial information herein contains audited and unaudited information and has been prepared by management in good faith and based on data currently available to the Company. • Certain Non-GAAP measures are used in this presentation to assist the reader in understanding our core manufacturing business. We believe this information is useful and relevant to assess and measure the performance of our core manufacturing business as it illustrates manufacturing performance without regard to selected historical legacy costs (i.e. pension and other postretirement costs). It also excludes financial services and other items that may not be related to the core manufacturing business or underlying results. Management often uses this information to assess and measure the performance of our operating segments. A reconciliation to the most appropriate GAAP number is included in the appendix of this presentation. 3 |
NYSE: NAV 4 4 3 Quarter 2011 Earnings Call Sept. 7, 2011 rd Agenda • Current truck environment • 3 rd quarter results • Progress to longer term strategy and shareholder value • Balance sheet and return on capital Leveraging Assets/Controlling Destiny |
2011 Industry Status Class 8 Age of Fleet Retail Sales Source: ACT 3 Quarter 2011 Earnings Call Sept. 7, 2011 rd NYSE: NAV 5 5 Industry School Bus 18,000 15,000 18,000 Class 6-7 - Medium 52,500 58,000 60,000 67,000 Combined Class 8 (Heavy & Severe Service) 171,000 184,000 165,000 175,000 Total Industry Demand 240,000 260,000 240,000 260,000 FY 2012 Preliminary Guidance 275,000 310,000 FY 11 FY 11 Industry Projection United States and Canadian Class 6-8 Truck Industry - Retail Sales Volume Original Guidance As shown 08/10/11 100,000 200,000 300,000 400,000 500,000 1999 2000 2001 2002 2003 2004 2005 2006 2007 2008 2009 2010 2011 U.S. and Canada Class 6-8 Retail Industry 6.0 16,500 |
NYSE: NAV 6 6 3 Quarter 2011 Earnings Call Sept. 7, 2011 rd Freight and Trucking Update |
3 Quarter 2011 Earnings Call Sept. 7, 2011 rd NYSE: NAV 7 7 Used Truck Environment 5 Year Old Sleeper - Retail • Used truck market devalued as much as 50% in 2008/2009 • Today – Recovery has collected nearly 100% of the devaluation • ProStar ® – Spec for Spec commands highest residual value in its class $15,000 $20,000 $25,000 $30,000 $35,000 $40,000 $45,000 1st 2nd 3rd 4th 1st 2nd 3rd 4th 1st 2nd 3rd 4th 1st 2nd 3rd 4th 1st 2nd 3rd 4th 1st 2nd 3rd 4th 1st 2nd 3rd 4th 1st 2nd 2004 2005 2006 2007 2008 2009 2010 2011 Retail |
NYSE: NAV 8 8 3 Quarter 2011 Earnings Call Sept. 7, 2011 rd Supplier Constraints – Rate of Change • Retail Sales • Other markets Latin America truck shipments ~3,000 in 2010 ~11,000 in 2011 Mexico industry South America Class 6-8 Retail Sales FY 2010 Q1 2011 Q2-Q4 2011 Actual/Expected 194K 52K ~200K Annualized NA 208K ~264K Industry rate of change: up ~30% in 2 half of year nd |
NYSE: NAV 9 9 3 Quarter 2011 Earnings Call Sept. 7, 2011 rd Status of Industry Commodity Cost Note: Costs related to steel, precious metals, resins, and petroleum products Commodities Market Profile 2009 Average 2010 High March 11 (data shown in Q1) July 2011 Sheet steel ($/short ton) $482 $699 $861 $713 Scrap steel ($/long ton) $260 $473 $480 $510 Crude oil ($/bbl) $62 $91 $95 $98 Platinum ($/troy oz.) $1,203 $1,754 $1,829 $1,760 Natural Rubber ($/lb) $0.82 $2.25 $2.34 $2.07 Copper ($/lb) $2.41 $4.23 $4.55 $4.46 2011 Actions • Navistar has mitigated a significant portion of 2011 market risk Systematic hedging Supplier negotiations Commodity surcharges • Within a range, commodity volatility has been factored into 2011 guidance • Focus on FY2012 • Pricing Actions |
NYSE: NAV 10 10 3 Quarter 2011 Earnings Call Sept. 7, 2011 rd Trucking Industry Environment Summary • 2011 Sales as expected • Supplier constraints Limit Class 8 Costly Short term • Medium growth slowed pending economy • Opportunity – highway bill • Commodity cost – high but stable |
NYSE: NAV 11 3 rd Quarter 2011 Earnings Call Sept. 7, 2011 11 Q3 Financials & Operational Information Note: This slide contains non-GAAP information; please see the REG G in appendix for a detailed reconciliation. Key Takeaways for Q3 • Revenue increase • Product development* Q3 2011 was $132M compared to $113M in Q3 2010 • Inventory – higher due to parts shortages/rate of production change • Production of big bore ~800 per week FY 2011 Q3 2010 Q3 2011 Change Truck Chargeouts 20,600 28,900 8,300 Revenue ($Billions) $3.2 $3.5 $0.3 Adj. Mfg. Segment Profit ($Millions) $268 $158 ($110) Adj. Diluted EPS Attributable to NIC** $1.44 $0.79 ($0.65) Weighted average shares outstanding (Diluted) 74.3 76.8 2.5 Quarterly Adjusted Diluted Earnings Per Share Revenue – Q3 ‘11 over Q3 ‘10 U.S. & Canada Truck ~$500M Military ~($500)M Global Truck ~$150M Engine ~$100M Parts ~$75M Total ~$325M *Excludes engineering integration costs, restructuring of North American manufacturing operations, and impact of release of portion of income tax valuation allowance **Excludes impact of Ford restructuring and related charges (benefits). $1.44 $0.79 $0.00 $0.20 $0.40 $0.60 $0.80 $1.00 $1.20 $1.40 $1.60 Q3 2010 Q3 2011 Recovery of commercial truck volume Military – full year on track, expect higher Q4 revenue Strengthen global legacy business |
NYSE: NAV 12 NYSE: NAV 3 Quarter 2011 Earnings Call Sept. 7, 2011 rd 14,900 20,100 5,700 8,800 0 5,000 10,000 15,000 20,000 25,000 30,000 35,000 Q3 2010 Q3 2011 Traditional Expansionary $785 $272 $49 $68 $0 $100 $200 $300 $400 $500 $600 $700 $800 $900 Q3 2010 Q3 2011 Truck Parts 19,300 26,000 33,600 38,200 0 10,000 20,000 30,000 40,000 50,000 60,000 70,000 Q3 2010 Q3 2011 All Other OEM Sales South America Q3 Financials & Operational Information Consolidated Revenues ($ in millions) Quarterly Truck Chargeouts Quarterly Engine Shipments Military Revenues ($ in millions) $834 $340 52,900 64,200 20,600 28,900 $3,221 $3,537 $0 $500 $1,000 $1,500 $2,000 $2,500 $3,000 $3,500 $4,000 Q3 2010 Q3 2011 |
3 Quarter 2011 Earnings Call Sept. 7, 2011 rd NYSE: NAV Medium Truck Great Products – Market Share Severe Service Truck Heavy Truck Class 8 School Bus (U.S. & Canada) School Bus & Combined Class 6-8 Market Share – FY09: 36%; FY10: 34%; YTD11: 27% 21% Market Share Q311 13 FY09 FY10 Q311 YTD11 61% 59% 47% 48% FY09 FY10 Q311 YTD11 35% 38% 46% 40% 43% 40% 36% 34% FY09 FY10 Q311 YTD11 FY09 FY10 Q311 YTD11 25% 24% 17% 17% Class 4-5 Industry Navistar Market Share YTD11 26K 1K ~4% As of Q3 2011 we have changed the methodology of how traditional units are categorized and prior periods have been restated. We now define our “traditional” markets to include U.S. and Canada School bus and Class 6 through 8 medium and heavy truck. We classify militarized commercial vehicles sold to the U.S. and Canadian militaries as Class 8 severe service within our “traditional” markets for consistency with industry reporting. Additionally, bus industry may include some of our competitors’ commercial and RV chassis, which we exclude. |
14 14 NYSE: NAV 3 Quarter 2011 Earnings Call Sept. 7, 2011 rd Great Products – Growing Market Share with Increased Customer Experience (U.S. & Canada) Class 6-7 Combined Class 8 10% 0% 10% 20% 30% 40% 50% 60% Nov- Mar Apr- Jul Nov- Mar Apr- Jul 19% 22% 35% 44% • Convert to proprietary U.S. and Canada diesel engine • Transition industry from 15L to 13L • Customer experience during transition will drive increased second half momentum Class 8 Strategy What We’ve Said |
15 15 NYSE: NAV 3 Quarter 2011 Earnings Call Sept. 7, 2011 rd Continue to Broaden Product Offering Severe Service Heavy ProStar ® with MaxxForce ® 15 Sloped Nose WorkStar ® MaxxForce ® 11/13 PayStar ® with MaxxForce ® 15 LoneStar ® with 500HP MaxxForce ® 13 9900 with MaxxForce ® 15 CAT CT660 Combined Class 8 Available now Expected Q1 2012 |
16 16 NYSE: NAV 3 Quarter 2011 Earnings Call Sept. 7, 2011 rd Heavy Duty Recognition MaxxForce ® Wins Best Class 8 Heavy Duty Engine “MaxxForce ® engines rank highest in customer …. perform particularly well in four of eight factors: engine reliability and dependability, engine warranty, vibration at idle and average fuel economy.” JDPA Press Release, 9/1/11 Best Class 8 Truck, Pick Up & Delivery International ® brand trucks rank highest in customer satisfaction Scoring highest in all six categories measured: – Engine – Cost of Operation – Warranty – Cab and Body – Ride/Handling/Braking – Transmission satisfaction The J.D. power and Associates 2011 U.S. heavy-Duty Truck Engine and Transmission Study |
17 17 NYSE: NAV 3 Quarter 2011 Earnings Call Sept. 7, 2011 rd Used Truck Environment 5 Year Old Sleeper - Retail Independent Value Guides – 2009 Model Year $56,500 $57,000 $57,500 $58,000 $58,500 $59,000 $59,500 $60,000 $60,500 $61,000 $61,500 International ProStar Competitor A Competitor B Competitor C $15,000 $20,000 $25,000 $30,000 $35,000 $40,000 $45,000 1st 2nd 3rd 4th 1st 2nd 3rd 4th 1st 2nd 3rd 4th 1st 2nd 3rd 4th 1st 2nd 3rd 4th 1st 2nd 3rd 4th 1st 2nd 3rd 4th 1st 2nd 2004 2005 2006 2007 2008 2009 2010 2011 Retail • Used truck market devalued as much as 50% in 2008/2009 • Today – Recovery has collected nearly 100% of the devaluation • ProStar ® – Spec for Spec commands highest residual value in its class |
18 18 NYSE: NAV 3 Quarter 2011 Earnings Call Sept. 7, 2011 rd • $5.00 - $6.00 adjusted EPS • Q4 2011 – Revenue up ~$1B – Revenue North America Truck chargeouts up 30% Q4 2011 over Q3 2011 Latin America increases ~200% Military will be ~$700 million – Cost JV investments down Manufacturing in place Supplier constraints Full production rate of Big Bore engine – Manufacturing segment profit Assumptions for 4Q 2011 FY 2011 July YTD Full Year Guidance Truck Industry Units 182,500 240K – 260K Revenue ($Billions) $9.6 $13.6 – $14.1 Adj. Diluted EPS Attributable to NIC* $2.01 $5.00 – $6.00 Weighted average shares outstanding (Diluted) 77.1 77.6 *Excludes 2011 Engineering Integration costs, valuation allowance release and manufacturing footprint rationalization costs. Note: Guidance based off 77.6M shares FY 2011 EPS Drivers: Supplier constraints (-) Customer mix/Fleets (-) Product development (-) Manufacturing segment profit change ~($100)M Financial services + Annual incentive compensation + Corporate items ~$100M+ Adj. Diluted EPS Attributable to NIC $5.00 - $6.00 Note: This slide contains non-GAAP information; please see the REG G in appendix for a detailed reconciliation. 2011 FY Guidance does not include engineering integration costs, restructuring of N.A. manufacturing operations, or income tax valuation allowance release. |
19 NYSE: NAV 3 Quarter 2011 Earnings Call Sept. 7, 2011 rd Maximize Profit While Protecting Markets Balance needs of customers with supplier capacity As reported on 6/7/2011 in Q2 presentation: Updated Outlook: Combined Class 8 FY2011 Revised FY2011 Industry 171K - 184K 165K - 175K Navistar 42K - 46K 38K - 40K Market Share ~25% ~23% - 24% Global Truck: Latin America & Caribbean U.S. and Canada Combined Class 8 Retail Sales ProStar ® TranStar ® WorkStar ® Mixer 10,000 – 11,500 3,000 5,000 0 2,000 4,000 6,000 8,000 10,000 12,000 FY 2010 FY 2011 YTD July FY 2011 FCST 13.0% 18.6% Market Share YTD FY2010 YTD FY2011 (This represents retail deliveries) |
20 20 NYSE: NAV 3 Quarter 2011 Earnings Call Sept. 7, 2011 rd • Moving from focused facilities to flexible manufacturing to minimize logistics cost • School bus: All assembly in Tulsa • Huntsville: Ability to produce V8/I6/DT engines on same line • Labor agreement Competitive Cost Structure Completed Actions Next Steps to Increase Shareholder Value • Leveraging assets • Integrated Product Development Center • Announced restructuring of truck plants: Chatham, Monaco & Workhorse Approximately $200 Million Saved Since FY2009 |
3 Quarter 2011 Earnings Call Sept. 7, 2011 rd NYSE: NAV 21 21 Differentiated Global Distribution GLOBAL YTD July FY 2011 Equity/loss from non- consolidated affiliates ($55M) ($10M-$15M) ($65M-$70M) Total Global – including legacy business Profitable Currently 410 branded sales or service points 4 Quarter th |
3 Quarter 2011 Earnings Call Sept. 7, 2011 rd NYSE: NAV 22 22 Parts Segment Information (U.S., Canada, Mexico, excludes Military) Parts Segment Three Months Ended July 31: ($ in millions) 2011 2010 $ change % change Total Sales $516 $440 $76 17% Segment Profit $70 $52 $18 35% North American Parts Sales Parts Financial Information ProStar+ ® with MaxxForce ® 15 LoneStar ® with MaxxForce ® 13 MaxxForce ® 15 $0 $500 $1,000 $1,500 $2,000 2009 2010 2011 Fcst |
Navistar Defense • Era of efficiency - government will look to industry for: • Higher quality • Lower cost • Quicker development • Sustainment of existing vehicle fleets will continue (increase) 2008 2009 2010 2011 > $2B > $2B > $2B ~$1.9B School Bus Class 6 and 7 Combined Class 8 Engines NYSE: NAV 23 23 3 Quarter 2011 Earnings Call Sept. 7, 2011 rd |
NYSE: NAV 24 24 3 Quarter 2011 Earnings Call Sept. 7, 2011 rd Humvee Recap • Recap supports a FY12 Light Tactical Vehicle fleet decision • Program is complementary to JLTV and MATV - Army: 60,000 units recap potential beginning in FY13 - USMC: 3,400 unit potential beginning in FY13 JLTV – Joint Light Tactical Vehicle MATV – MRAP (Mine Resistant Ambush Protection) All-Terrain Vehicle |
3 Quarter 2011 Earnings Call Sept. 7, 2011 rd NYSE: NAV 25 2011 Analyst Day 2011 Analyst Day Today Today 2011 Business Drivers 2011 Business Drivers • Industry recovering (240K – 260K) • Industry (240K – 260K) Heavy , Class 6-7 • Maintain Market Share – Back-end loaded • Maintain Market Share – Back-end loaded • Military $1.5B - $2.0B Revenue • Military – ~$1.9B Revenue • Global Investing to profitable • “Total” Global – Profitable • 15L Launch • 15L Launch – Launched in March • Engineering Slightly up • Engineering – Slightly up • Engine segment profitability - ~$100M (back end loaded) • Engine segment profitability - (back end loaded) • Manufacturing segment margin ~ $1 B • Manufacturing segment margin less than $1B • Adjusted EPS - $5.00 to $6.00 • Adjusted EPS - $5.00 to $6.00 • Manufacturing Cash - $1.2B - $1.4B • Manufacturing Cash - $1.2B - $1.4B 2011 One-Time Items 2011 One-Time Items • Engineering Integration • Engineering Integration – on track • Manufacturing • Manufacturing – Chatham, Monaco and Workhorse • Valuation Allowance • Valuation Allowance What We Said: - Convert 15L to 13L - Convert all customers to proprietary engine - Implement EGR Note: This slide contains non-GAAP information; please see the REG G in appendix for a detailed reconciliation. 2011 FY Guidance does not include engineering integration costs, restructuring of N.A. manufacturing operations, or income tax valuation allowance release. |
3 Quarter 2011 Earnings Call Sept. 7, 2011 rd NYSE: NAV 26 26 A. J. Cederoth – EVP & CFO Leveraging Assets/Controlling Destiny • Q3 Balance Sheet • Capital Structure • Summary |
3 Quarter 2011 Earnings Call Sept. 7, 2011 rd NYSE: NAV 27 27 Manufacturing Cash Update • Q3 manufacturing cash= $1,013M driven by EBITDA & Working Capital – Q3 2010 $757M • Cash balance forecasted to grow in Q4 – Improved EBITDA – Working Capital Cash Messages Manufacturing Cash – Q3 Only Full Year Cash Guidance: $1.2B-$1.4B ($ millions) Consolidated Net Income - Q3 Only 1,400 $ Subtract: VA/Taxes (1,463) Subtract: Income from Financial Services (30) Add back: Restructuring of N.A. MFG Operations 122 Add back: Depreciation/Amortization 76 Add back: Interest 38 Adjusted MFG EBITDA - Q3 Only 143 $ Change in Net Working Capital (9) Capital Expenditures (106) Intercompany & Other (94) Net Cash Flow - Q3 Only (66) $ Beginning MFG Cash Balance - April 30, 2011 1,079 $ Ending MFG Cash Balance - July 31, 2011 1,013 $ Note: This slide contains non-GAAP information; please see the REG G in appendix for a detailed reconciliation. |
3 Quarter 2011 Earnings Call Sept. 7, 2011 rd NYSE: NAV 28 28 0.0% 1.0% 2.0% 3.0% 4.0% 5.0% 6.0% 7.0% $0 $5 $10 $15 $20 $25 $30 $35 Loss Loss Percentage Navistar Financial – Optimizing ROIC • Financial services segment profit Q3 2011: $30M July YTD 2011: $102M • Liquidity is strong: $622M total availability as of 7/31/11 Variable funding facility for dealer financing renewed to July 2012 • Service leverage improving (5:1) *Repo amounts equal loan value at time of repossession. Jul’11 YTD is annualized. NFC U. S. only. Historical Portfolio Performance* **Losses & Percentages are rolling 12 months. NFC U. S. only. Return on Capital Loss on Receivables** 0.0% 0.2% 0.4% 0.6% 0.8% 1.0% 1.2% 1.4% 1.6% 1.8% $0 $20 $40 $60 $80 $100 $120 $140 $160 $180 Repossessions Past Due Percentage $0.0 $0.5 $1.0 $1.5 $2.0 $2.5 $3.0 $3.5 $4.0 $4.5 $5.0 2008 2009 2010 2011 Q3 Serviced Assets |
3 Quarter 2011 Earnings Call Sept. 7, 2011 rd NYSE: NAV 29 29 Manufacturing Strategy ~$200M saved since FY 2009 • Chatham – GAAP charges of $85M to $125M, cash charges of $70M to $81M – Lowers future cost by additional $5M to10M per year • Custom Products – Chassis/RV business – GAAP charges of $71M to $81M, cash charges of $11M to $21M – Consolidating – efficiencies across business lines – Streamlining cost structure/leverage existing facilities – Lowers future cost by $15M annually • Evaluate opportunities as strategy continues to evolve |
3 Quarter 2011 Earnings Call Sept. 7, 2011 rd NYSE: NAV 30 30 Valuation Allowance Release • 2008-2010 profits at bottom of cycle – Progress toward our strategic objectives (FY11) • $1.5B increase in shareholder’s equity – Positive shareholder equity • Low cash tax rate through 2013/2014 Note: This slide contains non-GAAP information; please see the REG G in appendix for a detailed reconciliation. 2008 and 2009 excluded certain charges, 2011 FY Guidance does not include engineering integration costs, restructuring of N.A. manufacturing operations, or income tax valuation allowance release. 100,000 200,000 300,000 400,000 500,000 1999 2000 2001 2002 2003 2004 2005 2006 2007 2008 2009 2010 2011 U.S. and Canada Class 6-8 Retail Industry $(5.00) $- $5.00 $10.00 $15.00 $20.00 $25.00 150 200 250 300 350 400 450 500 Traditional Industry Volume (Thousands of Units) Original segment profit goal assumed a share count of 72.5M shares and a tax rate of 25% . 2009 Actual 2010 Actual 2008 Actual Original $1.6B Segment Profit Goal @ 415k units $1.8B Segment Profit Goal @ 350k units |
3 Quarter 2011 Earnings Call Sept. 7, 2011 rd NYSE: NAV 31 31 Capital Structure Leveraging Assets/Controlling Destiny |
3 Quarter 2011 Earnings Call Sept. 7, 2011 rd NYSE: NAV 32 32 Investing in the Strategy At $15 to $20+ Billion Company (Normal Industry) At $7 to $8 Billion Company Total (‘01 – ’05) $1,423M Total (‘06 – ’10) $1,103M *Capital expenditures excluding equity investments |
3 Quarter 2011 Earnings Call Sept. 7, 2011 rd NYSE: NAV 33 33 $175M share repurchase program to be initiated and executed over the upcoming months Capital Structure Actions • Expand strategic focus ... from primarily Investing to also Returning Value to our shareholders • Using excess liquidity to: – Improve shareholder returns – Manage long-term liabilities |
3 Quarter 2011 Earnings Call Sept. 7, 2011 rd NYSE: NAV 34 34 Assumptions for 4Q 2011 FY 2011 July YTD Full Year Guidance Truck Industry Units 182,500 240K – 260K Revenue ($Billions) $9.6 $13.6 – $14.1 Adj. Diluted EPS Attributable to NIC* $2.01 $5.00 – $6.00 Weighted average shares outstanding (Diluted) 77.1 77.6 *Excludes 2011 Engineering Integration costs, valuation allowance release and manufacturing footprint rationalization costs. Note: Guidance based off 77.6M shares FY 2011 EPS Drivers: Supplier constraints (-) Customer mix/Fleets (-) Product development (-) Manufacturing segment profit change ~($100)M Financial services + Annual incentive compensation + Corporate items ~$100M+ Adj. Diluted EPS Attributable to NIC $5.00 - $6.00 Note: This slide contains non-GAAP information; please see the REG G in appendix for a detailed reconciliation. 2011 FY Guidance does not include engineering integration costs, restructuring of N.A. manufacturing operations, or income tax valuation allowance release. • $5.00 - $6.00 adjusted EPS • Q4 2011 – Revenue up ~$1B – Revenue North America Truck chargeouts up 30% Q4 2011 over Q3 2011 Latin America increases ~200% Military will be ~$700 million – Cost JV investments down Manufacturing in place Supplier constraints Full production rate of Big Bore engine – Manufacturing segment profit |
3 Quarter 2011 Earnings Call Sept. 7, 2011 rd NYSE: NAV 35 35 Positioned to Succeed 2010 2011 2012 2013+ N. A. Truck • Industry low • Investing in integration • Industry low • Focus on product acceptance • Industry recovery • Derivative products Continuous improvement Military ~$2.0B ~$1.9B $1.5 to $2.0B with possible next level of breakthrough Expansionary Global Investment Breakeven Profitable Continuous growth Diesel Engines • Transition away from Ford • Focus on emissions Investing in products and markets Leveraging core investments to capture growth opportunities Parts Effective growth strategy • Improving channel execution Realize benefits of Truck and Engine strategy 2011 Revenues Diversified Mfg. Revenue |
3 Quarter 2011 Earnings Call Sept. 7, 2011 rd NYSE: NAV 36 36 Driving Shareholder Value $(5.00) $- $5.00 $10.00 $15.00 $20.00 $25.00 150 200 250 300 350 400 450 500 2009 Actual 2010 Actual 2008 Actual Original $1.6B Segment Profit Goal @ 415kunits $1.8B Segment Profit Goal @ 350k units 2011 Results • Differentiation and leadership • Deliver customer value - Fuel economy with EGR - Convert 15L to 13L • Focus on cost structure - Flexible manufacturing - Integrated product development • Invest in global growth • Adjusted EPS ($5.00 to $6.00) 2012 and Future • Differentiated product offering • Strong core North America business • Sustainable military business – $1.5B - $2.0B Revenue • Growing global truck • Expanded engine and parts business Note: This slide contains non-GAAP information; please see the REG G in appendix for a detailed reconciliation. 2008 and 2009 excluded certain charges, 2011 FY Guidance does not include engineering integration costs, restructuring of N.A. manufacturing operations, or income tax valuation allowance release. Traditional Industry Volume (Thousands of Units) Original segment profit goal assumed a share count of 72.5M shares and a tax rate of 25% . |
3 Quarter 2011 Earnings Call Sept. 7, 2011 rd NYSE: NAV 37 Appendix |
3 Quarter 2011 Earnings Call Sept. 7, 2011 rd NYSE: NAV 38 38 Navistar Financial Corporation • Q3 2011 profitability of $30M, YTD profitability of $102M • Liquidity is strong: $622M total availability as of 7/31/11 Variable funding facility for dealer financing renewed to July 2012 • Retail portfolio originations and balances will continue to decline as Navistar Capital (new GE Capital program) handles new acquisitions • Service leverage improving (5:1) Note: Profitability relates to total financial services Leveraging Assets & Controlling Our Destiny • $809M facility – Funding for retail notes, wholesale notes, retail accounts, and dealer open accounts – Matures December 2012 On balance sheet • Situation as of July 31, 2011 – $1.1B funding facility (NFSC) – $390M available • NFSC wholesale trust – Variable portion matures July 2012 – Public portions mature January 2012 and October 2012 On balance sheet • Broader product offering • Enhanced ability to support large fleets • Better access to less expensive capital Retail Notes Bank Facility Dealer Floor Plan |
3 Quarter 2011 Earnings Call Sept. 7, 2011 rd NYSE: NAV 39 39 2011 Guidance * FY2010 includes $10M ($0.14) of cost for UAW agreement. Note: This slide contains non-GAAP information; please see the REG G in appendix for a detailed reconciliation. 2011 FY Guidance does not include engineering integration costs, restructuring of N.A. manufacturing operations, or income tax valuation allowance release. Truck Industry Units 191,300 240,000 to 260,000 Revenue ($ Billions) $12.1 $13.6 to $14.1 ($ Millions (excluding EPS)) Adj. Mfg. Segment Profit $741 $850 to $950 Fin. Services, Corporate, Elims $(496) $(420) to $(425) Adj. Profit Excluding Tax $246 $430 to $525 Adj. Net Income attributable to NIC $223 $388 to $465 Adj. Tax Rate 9.4% 10% to 11% Adj. Diluted EPS attributable to NIC $3.05* $5.00 to $6.00 Number of diluted shares 73.2M ~77.6M Cash ($ Billions) $1.1 $1.2 to $1.4 2010 Actual Guidance |
3 Quarter 2011 Earnings Call Sept. 7, 2011 rd NYSE: NAV 40 40 Market Share – U.S. & Canada School Bus and Class 6-8 Traditional Market Share Q1 Q2 Q3 Q4 Full Year Q1 Q2 Q3 Q4 Full Year Q1 Q2 Q3 Q4 YTD School buses 56% 60% 63% 64% 61% 60% 61% 53% 60% 59% 51% 45% 47% 48% Class 6 and 7 medium trucks 30% 39% 33% 39% 35% 33% 44% 36% 37% 38% 36% 36% 46% 40% Class 8 heavy trucks 24% 24% 29% 24% 25% 23% 22% 30% 20% 24% 17% 16% 17% 17% Class 8 severe service trucks 40% 46% 41% 47% 43% 40% 40% 39% 40% 40% 33% 32% 36% 34% Combined Class 8 29% 32% 33% 32% 31% 28% 28% 32% 25% 28% 20% 19% 21% 20% Total Traditional Market Share 32% 37% 37% 38% 36% 32% 35% 35% 32% 34% 27% 26% 29% 27% 2011 Market Share - U.S. & Canada School Bus and Class 6-8 2010 2009 As of Q3 2011 we have changed the methodology of how traditional units are categorized and prior periods have been restated. We now define our “traditional” markets to include U.S. and Canada School bus and Class 6 through 8 medium and heavy truck. We classify militarized commercial vehicles sold to the U.S. and Canadian militaries as Class 8 severe service within our “traditional” markets for consistency with industry reporting. Additionally, bus industry may include some of our competitors’ commercial and RV chassis, which we exclude. |
3 Quarter 2011 Earnings Call Sept. 7, 2011 rd NYSE: NAV 41 41 Worldwide Truck Chargeouts FISCAL YEAR 2009 Q1 Q2 Q3 Q4 YTD BUS 2,700 3,100 3,400 4,600 13,800 MEDIUM 3,200 3,300 2,700 3,800 13,000 HEAVY 6,100 3,300 4,500 5,200 19,100 SEVERE 4,200 4,400 3,900 4,700 17,200 TOTAL 16,200 14,100 14,500 18,300 63,100 NON-TRADITIONAL MILITARY 1,100 400 0 100 1,600 EXPANSIONARY 2,400 1,900 2,500 4,300 11,100 WORLD WIDE TRUCK 19,700 16,400 17,000 22,700 75,800 FISCAL YEAR 2010 Q1 Q2 Q3 Q4 YTD BUS 3,100 3,000 2,400 3,900 12,400 MEDIUM 3,900 5,300 3,900 5,400 18,500 HEAVY 5,200 4,600 6,400 5,400 21,600 SEVERE 3,900 3,800 2,200 4,100 14,000 TOTAL 16,100 16,700 14,900 18,800 66,500 NON-TRADITIONAL MILITARY 100 200 1,000 100 1,400 EXPANSIONARY 3,900 4,500 4,700 6,000 19,100 WORLD WIDE TRUCK 20,100 21,400 20,600 24,900 87,000 FISCAL YEAR 2011 Q1 Q2 Q3 Q4 YTD BUS 2,100 2,000 2,200 6,300 MEDIUM 4,600 7,200 7,400 19,200 HEAVY 4,700 5,200 6,800 16,700 SEVERE 2,700 3,200 3,700 9,600 TOTAL 14,100 17,600 20,100 0 51,800 NON-TRADITIONAL MILITARY 100 400 200 700 EXPANSIONARY 5,300 7,600 8,600 21,500 WORLD WIDE TRUCK 19,500 25,600 28,900 0 74,000 As of Q3 2011 we have changed the methodology of how traditional units are categorized and prior periods have been restated. We now define our “traditional” markets to include U.S. and Canada School bus and Class 6 through 8 medium and heavy truck. We classify militarized commercial vehicles sold to the U.S. and Canadian militaries as Class 8 severe service within our “traditional” markets for consistency with industry reporting. |
3 Quarter 2011 Earnings Call Sept. 7, 2011 rd NYSE: NAV 42 42 World Wide Engine Shipments Navistar Q1 Q2 Q3 Q4 YTD OEM sales - South America 19,400 22,500 26,100 31,200 99,200 Ford sales - U.S. and Canada 12,600 26,400 22,900 39,600 101,500 Other OEM sales 4,500 2,400 1,800 2,600 11,300 Intercompany sales 14,400 12,600 12,800 17,500 57,300 Total Shipments 50,900 63,900 63,600 90,900 269,300 Navistar Q1 Q2 Q3 Q4 YTD OEM sales - South America 30,700 34,600 33,600 33,900 132,800 Ford sales - U.S. and Canada 24,700 200 - - 24,900 Other OEM sales 2,000 3,600 3,700 4,900 14,200 Intercompany sales 16,400 17,700 15,600 18,800 68,500 Total Shipments 73,800 56,100 52,900 57,600 240,400 Navistar Q1 Q2 Q3 Q4 YTD OEM sales - South America 27,200 37,100 38,200 102,500 Ford sales - U.S. and Canada - - - - Other OEM sales 4,500 4,400 3,700 12,600 Intercompany sales 17,300 23,500 22,300 63,100 Total Shipments 49,000 65,000 64,200 - 178,200 2009 2010 2011 |
3 Quarter 2011 Earnings Call Sept. 7, 2011 rd NYSE: NAV 43 43 Order Receipts – U.S. & Canada As of Q3 2011 we have changed the methodology of how traditional units are categorized and prior periods have been restated. We now define our “traditional” markets to include U.S. and Canada School bus and Class 6 through 8 medium and heavy truck. We classify militarized commercial vehicles sold to the U.S. and Canadian militaries as Class 8 severe service within our “traditional” markets for consistency with industry reporting. Order Receipts: U.S. & Canada (Units) Three Months Ended Nine Months Ended July 31, Percentage July 31, Percentage 2011 2010 Change Change 2011 2010 Change Change "Traditional" Markets School buses 2,700 1,100 1,600 145 6,300 4,600 1,700 37 Class 6 and 7 medium trucks 6,800 3,000 3,800 127 21,200 12,500 8,700 70 Class 8 heavy trucks 6,200 3,000 3,200 107 23,200 16,100 7,100 44 Class 8 severe service trucks 3,100 2,200 900 41 10,000 10,200 (200) (2) Total "Traditional" Markets 18,800 9,300 9,500 102 60,700 43,400 17,300 40 Combined Class 8 (Heavy and Severe Service) 9,300 5,200 4,100 79 33,200 26,300 6,900 26 |
3 Quarter 2011 Earnings Call Sept. 7, 2011 rd NYSE: NAV 44 44 Supplemental Information - Truck Worldwide Truck Chargeouts - 5,000 10,000 15,000 20,000 25,000 30,000 35,000 40,000 Analyst Day 2011 Actuals Analyst Day 2011 Actuals Analyst Day 2011 Actuals Analyst Day Q1 Q2 Q3 Q4 Traditional Expansionary Towables As of Q3 2011 we have changed the methodology of how traditional units are categorized and prior periods have been restated. We now define our “traditional” markets to include U.S. and Canada School bus and Class 6 through 8 medium and heavy truck. We classify militarized commercial vehicles sold to the U.S. and Canadian militaries as Class 8 severe service within our “traditional” markets for consistency with industry reporting. |
3 Quarter 2011 Earnings Call Sept. 7, 2011 rd NYSE: NAV 45 45 U.S. and Canada Dealer Stock Inventory* *Includes U.S. and Canada Class 4-8 and school bus inventory, but does not include U.S. IC Bus or Workhorse Custom Chassis inventory. - 1,000 2,000 3,000 4,000 5,000 6,000 7,000 8,000 9,000 10,000 11,000 12,000 13,000 |
3 Quarter 2011 Earnings Call Sept. 7, 2011 rd NYSE: NAV 46 46 Frequently Asked Questions Q1: What is in your Dealcor debt? A: Dealcor debt is comprised of wholesale (floor plan) financing and also retail financing on lease and rental fleets for company owned dealers. Q2: How many Dealcor dealers did you have as of July 31, 2011? A: Q3: How are your dealers doing? A: Q4: What kind of rates do you charge your dealers and customers? A: Q5: How do you fund your wholesale business? A: We primarily finance our wholesale portfolio through traditional private or public securitizations, and through our bank facility. Q6: How is your NFC portfolio performing? A: Of our 272 primary NAFTA dealers, we have ownership interest in 8 DealCor dealers as of July 31, 2011. We expect to further reduce our number of Dealcor dealers in 4Q 2011. The operational and financial strength of our industry leading dealer network continues to improve in all areas of the business, in parallel with the overall improvement in the North American truck market. We continue to add new dealers to the distribution network, attracted by the breadth of our product lines and significant opportunities in major markets. Considerable investments in facility upgrades and acquisitions have also been completed in the last several months by aggressive and growth oriented existing dealers; further strengthening our footprint, service capabilities and accessibility to our customers. Generally, our rates vary (those with higher credit risk have always had to pay higher interest rates) and are usually in line with the market. Repossessions, past due accounts and losses peaked in 2008 and have continued to show improvement since then. NFC’s retail portfolio in the U.S. is expected to reduce significantly in size now that Navistar Capital, the new GE Capital retail program, is financing retail customers. Performance of this portfolio improved considerably in 2010 and throughout 2011. |
3 Quarter 2011 Earnings Call Sept. 7, 2011 rd NYSE: NAV 47 47 Frequently Asked Questions Q7: What is your total amount of capacity at NFC? A: Total availability in our U.S. funding facilities is more than $622M as of July 31, 2011. Q8: What is the status of the retail financing alliance with GE Capital in the United States? A: Navistar Capital – the alliance we formed with GE Capital to support the sale of Navistar products – is off to a great start and progressing consistent with expectations. Q9: What is included in Financial Services Segment Profit, Corporate and Eliminations? A: Financial Services Segment Profit, Corporate and Eliminations, as presented, consist of the Finance Services segment and Corporate and Eliminations as shown in the Segment Reporting footnote of our annual and quarterly reports (10K & 10Q). The primary drivers of Corporate and Eliminations are Corporate SG&A, pension and OPEB expense excluding amounts allocated to the segments, annual incentive, manufacturing interest expense, and the elimination of intercompany sales and profit between segments. Q10: What is the status of the Humvee Recap program? A: A final request for proposals is expected in the coming weeks. Navistar intends to respond. Requirements will address vulnerabilities exposed during combat operations in Iraq and Afghanistan. The program will allow the vehicles to stay battle ready until Joint Light Tactical Vehicles (JLTV) are fielded. Q11: How will the changing DOD budget affect Navistar in FY 2011? A: Navistar continues to pursue a number of U.S. and foreign military opportunities and is confident in its annual $1.5 to $2 billion revenue goal. In addition, the company now has more than 32,000 vehicles in operation throughout the world. These vehicles will require parts and sustainment support throughout their lifecycles. Q12: What are your margins for military vehicles? A: We do not break margins out specific to our military vehicles. These numbers are reported as part of our Truck segment financials. |
3 Quarter 2011 Earnings Call Sept. 7, 2011 rd NYSE: NAV 48 48 Frequently Asked Questions Q13: What is the current Joint Light Tactical Vehicle (JLTV) program status? A: Navistar and BAE continue to participate in the JLTV program. Proposals for the Engineering and Manufacturing Development (EMD) stage are expected in late FY2011. Two teams will then be selected to compete in the EMD phase. Q14: How does your Class 8 industry compare to ACT Research? A: Q15: What were the 2010 emissions requirements? A: Through the use of credits manufacturers can go to a maximum of 0.50g NOx if they reduced earlier with advanced technology; manufacturers need to be at 0.20g NOx if they chose not to introduce advanced technologies to reduce their emissions earlier. For many years Navistar introduced cleaner emission engines than the EPA required, so we were able to generate some credit before we needed to go to the 0.20g NOx standard. Q16: What is Navistar doing to meet the 0.20g NOx emissions when its credits are depleted? A: Navistar remains committed to its strategy of providing solutions that let customers focus on their business, not emissions regulations. Our primary path continues to be Advanced EGR. This technology is proving extremely viable providing fuel economy and performance on par with the best SCR competitors. Customer acceptance is excellent with over 60,000 vehicles built at 0.5 grams NOx or better. As we develop 0.20g NOx capability our goal of continuing to improve performance and fuel economy at this emissions level is being realized. Reconciliation to ACT 2011 ACT* 205,700 CY to FY adjustment (20,891) Other misc. specialty vehicles Included in ACT (8,500) Total (ACT comparable Class 8 to Navistar) 176,309 Navistar Industry Retail Deliveries Combined Class 8 Trucks** 170,000** Navistar difference from ACT: 6,309 3.6% *Source: ACT N.A. Commercial Vehicle Outlook - Aug, 2011 **See table on bottom of slide 5 U.S. and Canadian Class 8 Truck Sales |
3 Quarter 2011 Earnings Call Sept. 7, 2011 rd NYSE: NAV 49 49 Frequently Asked Questions Q17: Why has the Company decided to release a significant portion of its domestic valuation allowance? A: The Company has evaluated a variety of criteria, both objective and subjective, and has concluded that a significant portion of its U.S. valuation allowance attributable to deferred tax assets should be released in Q3 based on its judgment that (on a more likely than not basis) it will realize the value of these deferred tax assets in the future. That judgment considered, among other things, the Company’s ability to deliver profitability in a depressed market, as well as its confidence in the future profitability of its U.S. operations. Q18: What is the current balance of net operating losses as compared to other deferred tax assets? A: The Company has U.S. federal net operating losses (NOLs) with an undiscounted cash value totaling $161 million as of October 31, 2010. In addition, it has state NOLs valued at $85 million and foreign NOLs valued at $85 million, for a total undiscounted cash value of $331 million. In addition to NOLs, the Company has other deferred tax assets of $1.5 billion resulting in total deferred tax assets of approximately $1.8 billion. Q19: How will the release of $1.5 billion of deferred tax valuation allowance impact future cash tax payments? A: The release of $1.5 billion of valuation allowance will have no impact on U.S. cash tax payments. We expect to continue to take advantage of NOLs and tax credits through 2013/2014. Q20: What is our expected tax rate in the future? A: Our USGAAP tax rate in 2012 forward assumes a 30%+ effective tax rate. This may be impacted by discrete events (e.g., settlement of tax audits) or by future changes in tax legislation. Q21: How has recent tax legislation affected Navistar? A: The Worker, Homeownership, and Business Assistance Act of 2009 provided an opportunity to carry back alternative minimum tax net operating losses from the Company’s 2010 fiscal year and to receive a refund of alternative minimum tax (AMT) payments. The Company received its cash refund of $29 million of AMT credits in fiscal year 2011 as a result of this legislation. The Tax Relief, Unemployment Insurance Reauthorization, and Job Creation Act of 2010 extended current tax rules in several areas, which if not extended, could have adversely impacted the Company’s tax results. In addition, the Act allows businesses to fully depreciate qualifying property purchased through the end of 2011 (50% first year depreciation for purchases in 2012), which will benefit both Navistar and its customers. |
NYSE: NAV 50 50 3 Quarter 2011 Earnings Call Sept. 7, 2011 rd Frequently Asked Questions Q22: How will $1.8 billion of deferred tax assets be used to offset future taxable income? A: Simply put, deferred tax assets represent the value of future tax deductions attributable to items that have already been expensed or deducted for book purposes. The most commonly understood component of deferred tax assets is the value of our net operating losses, which will serve to immediately reduce taxable income in the future. In addition, we have several other major components of deferred taxes which will reduce taxable income in the future. For example, the Company has accrued significant OPEB, pension and other employee benefit expenses during prior years based on expected payments to be made in the future. As these payments are made, the Company will realize tax deductions to offset future taxable income. Q23: When do you expect to exhaust your NOLs and tax credits? A: We will likely take advantage of NOLs and credits through 2013/2014. Q24: How does vertical integration of a big bore engine impact warranty? A: With the transition to 100% MaxxForce ® engines we will assume an increased responsibility for engine warranty, which was previously absorbed by our suppliers and reflected in our material costs. The impact of this change will increase warranty expense and decrease material costs. Q25: Why is your warranty expense higher year over year? A: Our warranty costs have been higher than the respective prior year periods primarily as a result of increased intercompany volumes due to the use of all MaxxForce ® engines in our North America product offering. Through the first three quarters of 2011, we have seen favorable performance on our 2010 emission compliant engines compared to previous launches and expected performance. |
51 51 NYSE: NAV 3 Quarter 2011 Earnings Call Sept. 7, 2011 rd Frequently Asked Questions Q26: What are your expected 2011 and beyond pension funding requirements? A: Current forecasts indicate that we may need to contribute approximately $133 million in 2011 to our US and Canadian pension plans (“the Plan”). Future contributions are dependent upon a number of factors, principally the changes in values of plan assets, changes in interest rates, and the impact of any funding relief currently under consideration. We currently expect that from 2012 through 2014, the Company will be required to contribute at least $150 million per year to the Plan, depending on asset performance and discount rates. Q27: What is your expected 2011 pension and OPEB GAAP expense? A: Assuming no further containment actions and no further curtailment events, we anticipate 2011 pension and OPEB GAAP expense will not exceed 2010 levels. Q28: What causes the variance between manufacturing cash interest payments and GAAP interest expense? A: The main variance between cash and GAAP interest results from our manufacturing segment’s $1 billion of senior unsecured high yield notes and $570 million of senior subordinated convertible notes. As a result of this issuance, future manufacturing interest expense will be higher than cash interest payments due to the amortization of debt issuance costs which are amortized over the life of each note ($36 million), amortization of the original issue discount of the high yield notes ($37 million) and amortization of the embedded call option in the convertible notes ($114 million). The timing of interest payments also impacts this variance on a quarterly basis, but not on a fiscal year basis. Q29: What are the $225 million of Recovery Zone Facility Bonds (RZFBs) Series 2010 due October 15, 2040 being used for? A: We are using the proceeds to invest in our product development strategy and our HQ consolidation. Great products are a key pillar of our three pronged strategy. Streamlining and improving our product development processes will continue to provide competitive advantages for us in the marketplace. The funding from the RZFBs will allow us to consolidate many facilities into a new facility and make necessary renovations to that facility. Additionally we will invest in an existing facility, which includes investments in equipment and technology that will help us create and improve our product development process and thus shareholder value. |
NYSE: NAV 52 52 3 Quarter 2011 Earnings Call Sept. 7, 2011 rd Frequently Asked Questions Q30: Why did you use Recovery Zone Facility Bond (RZFB) financing? A: The RZFBs are a cost effective, long-term form of capital that is complementary to our capital structure. The bonds have a 30 year maturity and a fixed rate coupon of 6.50% per annum. They are callable at par any time after 10 years (October 15, 2020). Issuing bonds in the tax-exempt market gave us exposure to a new source of investors that we wouldn’t otherwise have access to if not for the RZFB program. Q31: What should we assume for capital expenditures in fiscal 2011? A: We plan to continue capital spending within the traditionally guided range of $250 - $350 million for products and development. There is capital spending related to Engineering Integration not included in the range that is funded through the RZFBs. Q32: What are the differences between the accounting vs. economic dilution on your convertible debt? A: Please see the presentation on the IR website (http://ir.navistar.com/dilution.cfm) entitled Dilution overview resulting from the Convertible Notes issued on October 2009. |
53 53 NYSE: NAV 3 Quarter 2011 Earnings Call Sept. 7, 2011 rd Frequently Asked Questions Q33: Why are the convertible debt holders no longer able to convert their notes? A: The indenture in our convertible notes contains a provision that allows the note holders to convert anytime during the following fiscal quarter should the price of Navistar’s common stock close 130% above the conversion price for any 20 day period (consecutive or non-consecutive) out of the last 30 consecutive day trading period of each fiscal quarter. Our fiscal second quarter ended on April 30, 2011; the conversion price of the notes is $50.274 per share of Navistar’s common stock; 130% of the conversion price equals $65.356 per share of Navistar’s common stock. Since Navistar’s common stock closed above $65.356 per share for more than 20 trading days during the 30 consecutive trading day period ending on April 30, 2011, the note holders had the right to convert their notes any time from May 2, 2011 through July 31, 2011. A very small minority of note holders chose to convert their notes during the conversion period. Navistar has opted to settle the conversion in cash instead of shares, therefore there is a 40 trading day observation period to determine the value that will be remitted in cash, so the note holders will not receive the cash for almost two months after their respective conversion notices were received. So far during the various 40 trading day observation periods, Navistar’s share price has traded at an average price well below the conversion price of $50.27, therefore the note holders will receive less than the $1,000 par value per note. If the average of Navistar’s share price during the 40 trading day observation period continues to trade below $50.27, Navistar will retire the debt at less than the issuance price and record a gain on the extinguishment of debt in the fourth quarter (however, this gain will be somewhat offset by the acceleration of certain debt issuance costs that had previously been amortized over the life of the notes). Navistar’s common stock did not close above $65.356 per share for any 20 day trading period (consecutive or non-consecutive) during the 30 day consecutive trading day period ending July 31, 2011, therefore the note holders no longer have the right to convert their notes, however that threshold could be triggered once again in the future. |
54 54 NYSE: NAV 3 Quarter 2011 Earnings Call Sept. 7, 2011 rd Frequently Asked Questions Q34: Why have the convertible notes that are due in October 2014 been reclassified from current debt to long-term debt? A: As mentioned in the question above, the convertible note holders had the right to convert their notes through July 31, 2011. Under GAAP, since note holders had the right to convert, the debt was required to be classified as a current liability in the second quarter. Since the threshold mentioned in the above question was not triggered in the third quarter ending July 31, 2011, the notes no longer became convertible after July 31, 2011, therefore the notes were reclassified from current to long-term debt. Q35: What is happening with the EPA lawsuit? A: We presently have two lawsuits filed against the EPA calling into question the validity of the EPA certification of SCR systems due to the fact that they can operate at much higher emissions levels in the real world than is recorded in their test cell results submitted for certification. Q36: Are you ready for the 2013 GHG regulation? A: Yes, Navistar will be ready to meet the standards when they go into effect January 2014. As a leader in fuel efficiency and in delivering innovative technologies, such as hybrids, plug-in hybrids and electric vehicles, our current approach is to consistently deliver the most fuel-efficient vehicles to our customers. Our customer-focused approach aligns Navistar with the intent of the new proposed GHG rule, and provides us with a strong basis for meeting the new standards. Q37: How are you addressing the 2014 GHG regulations? A: Navistar is currently conducting a more in-depth review of this complex rule to better understand the specific impacts (i.e., costs of the product, how we will implement it, etc.) it will have on our customers and the operation of our business. As such, it is too early in that review to provide specifics around how we will address the 2014 GHG regulations. What we can say is that Navistar is always investing in new technologies designed to achieve maximum fuel economy for our customers. So these new GHG standards will not change our standard way of operating our business. |
55 55 NYSE: NAV 3 Quarter 2011 Earnings Call Sept. 7, 2011 rd Outstanding Debt Balances July 31, 2011 October 31, 2010 (in millions) Manufacturing operations 8.25% Senior Notes, due 2021, net of unamortized discount of $33 million and $35 million at the respective dates $ 967 $ 965 3.0% Senior Subordinated Convertible Notes, due 2014, net of unamortized discount of $79 million and $94 million at the respective dates 491 476 Debt of majority-owned dealerships 109 66 Financing arrangements and capital lease obligations 123 221 Loan Agreement related to 6.5% Tax Exempt Bonds, due 2040 225 225 Other 41 33 Total manufacturing operations debt 1,956 1,986 Less: Current portion 102 145 Net long-term manufacturing operations debt $ 1,854 $ 1,841 Financial services operations Asset-backed debt issued by consolidated SPEs, at variable rates, due serially through 2018 $ 1,553 $ 1,731 Bank revolvers, at fixed and variable rates, due dates from 2012 through 2018 876 974 Commercial paper, at variable rates, due serially through 2012 91 67 Borrowings secured by operating and finance leases, at various rates, due serially through 2017 79 112 Total financial services operations debt 2,599 2,884 Less: Current portion 652 487 Net long-term financial services operations debt $ 1,947 $ 2,397 |
56 56 NYSE: NAV 3 Quarter 2011 Earnings Call Sept. 7, 2011 rd SEC Regulation G Non-GAAP Reconciliation We believe manufacturing segment results, which includes the segment results of our Truck, Engine, and Parts reporting segments, provide meaningful information of our core manufacturing business and therefore we use it to supplement our GAAP reporting by identifying items that may not be related to the core manufacturing business. Management often uses this information to assess and measure the performance of our operating segments. We have chosen to provide this supplemental information to investors, analysts and other interested parties to enable them to perform additional analyses of operating results, to illustrate the results of operations giving effect to the non-GAAP adjustments shown in the below reconciliation, and to provide an additional measure of performance. Manufacturing Segment Results: The financial measures presented below are unaudited and not in accordance with, or an alternative for, financial measures presented in accordance with U.S. generally accepted accounting principles (GAAP). The non-GAAP financial information presented herein should be considered supplemental to, and not as a substitute for, or superior to, financial measures calculated in accordance with GAAP. We believe that adjusted net income, diluted earnings per share attributable to Navistar International Corporation, and adjusted manufacturing segment profit excluding certain adjustments which are not considered to be part of our ongoing business, improve the comparability of year to year results and are representative of our underlying performance. We have chosen to provide this supplemental information to investors, analysts, and other interested parties to enable them to perform additional analyses of operating results, to illustrate the results of operations giving effect to the non-GAAP adjustments shown in the below reconciliations, and to provide an additional measure of performance. Adjusted Net Income and Diluted Earnings Per Share Attributable To Navistar International Corporation and Adjusted Manufacturing Segment Profit: |
57 57 NYSE: NAV 3 Quarter 2011 Earnings Call Sept. 7, 2011 rd SEC Regulation G Non-GAAP Reconciliation Adjusted Manufacturing Earnings Before Interest, Income Taxes, Depreciation, and Amortization (“EBITDA”): Adjusted manufacturing segment EBITDA is defined as our consolidated net income (loss) from continuing operations minus the net income (loss) from our financial services operations plus interest expense, income taxes, and depreciation and amortization, adjusted to exclude certain items that may not be related to the core manufacturing business. EBITDA is a measure commonly used and is presented to aid in developing an understanding of the ability of our operations to generate cash for debt service and taxes, as well as cash for investments in working capital, capital expenditures, and other liquidity needs. This information is presented as a supplement to the other data provided because it provides information which we believe is useful to investors for additional analysis. EBITDA should not be considered in isolation or as a substitute for net income, cash flows from operating activities or other consolidated operations, or cash flow statement data prepared in accordance with GAAP, or as a measure of our profitability or liquidity as determined in accordance with GAAP. Manufacturing Cash Flow and Manufacturing Cash, Cash Equivalents, and Marketable Securities: Manufacturing cash flow is used and is presented to aid in developing an understanding of the ability of our operations to generate cash for debt service and taxes, as well as cash for investments in working capital, capital expenditures and other liquidity needs. This information is presented as a supplement to the other data provided because it provides information which we believe is useful to investors for additional analysis. Our manufacturing cash flow is prepared with manufacturing marketable securities being treated as a cash equivalent. Manufacturing cash, cash equivalents, and marketable securities represents the Company’s consolidated cash, cash equivalents, and marketable securities excluding cash, cash equivalents, and marketable securities of our financial services operations. We include marketable securities with our cash and cash equivalents when assessing our liquidity position as our investments are highly liquid in nature. We have chosen to provide this supplemental information to investors, analysts and other interested parties to enable them to perform additional analyses of operating results, to illustrate the results of operations giving effect to the non-GAAP adjustments shown in the below reconciliation, and to provide an additional measure of performance. |
58 58 NYSE: NAV 3 Quarter 2011 Earnings Call Sept. 7, 2011 rd SEC Regulation G – EPS vs. Traditional Industry (A) Revised Target sales and revenues, net – Projections based on $17-18B of GAAP revenue and $2-3B of Non-GAAP revenue related to Navistar's share of non-consolidated affiliates. Original Target Revised Target U.S. & Canada Industry 414,500 350,000 Sales and Revenues, Net (A) $15 + $20 + Diluted earnings per share attributable to Navistar International Corporation $ 11.46 $ 12.31 Approximate diluted weighted shares outstanding ~ 72.5 ~ 72.5 (Dollars in Millions) Net income (loss) attributable to Navistar International Corporation $ 825 $ 892 Less: Financial services segment profit, Corporate and eliminations, and income taxes (775) (888) Manufacturing segment profit $ 1,600 $ 1,780 |
59 59 NYSE: NAV 3 Quarter 2011 Earnings Call Sept. 7, 2011 rd SEC Regulation G 1 Navistar International Corporation (Manufacturing operations with financial services operations on a pre-tax equity basis) Three Months Ended July 31, 2011 ($ millions) Net income (loss) attributable to NIC $ 1,400 Less income tax benefit (1,463) Add back restructuring of N.A. MFG Operations 122 Income before income tax benefit and restructuring charges $ 59 Less equity income from financial service operations (30) Income before income tax benefit, restructuring charges, and equity income from financial service operations $ 29 Add back manufacturing interest expense 38 Manufacturing EBIT $ 67 Add back manufacturing depreciation and amortization 76 Adjusted manufacturing EBITDA $ 143 Includes depreciation of equipment leased to others and excludes debt issuance cost/discount amortization 1 |
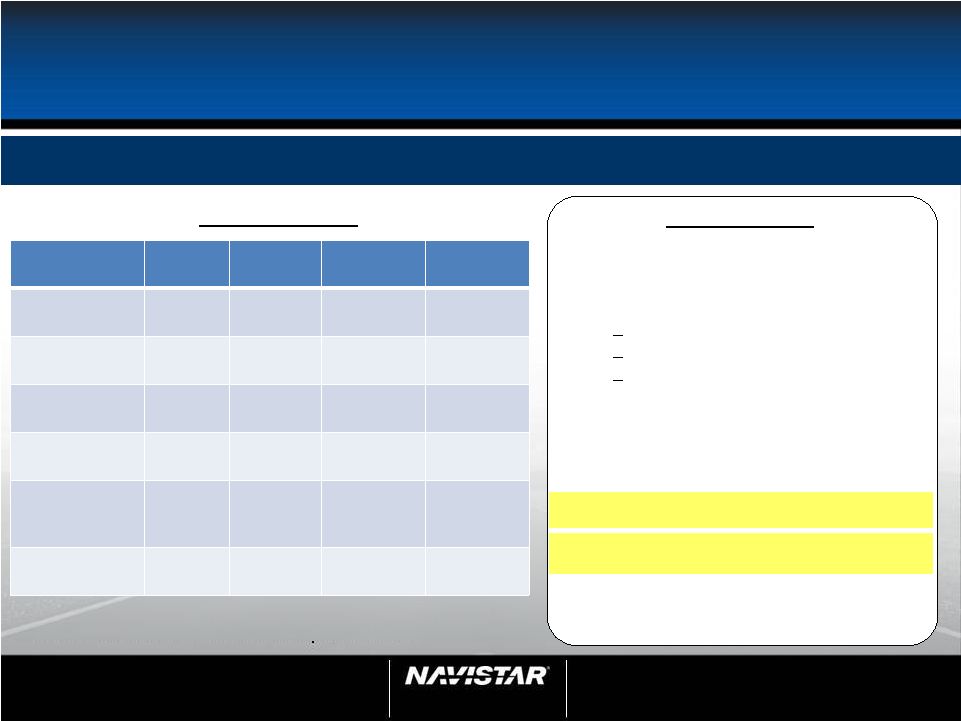
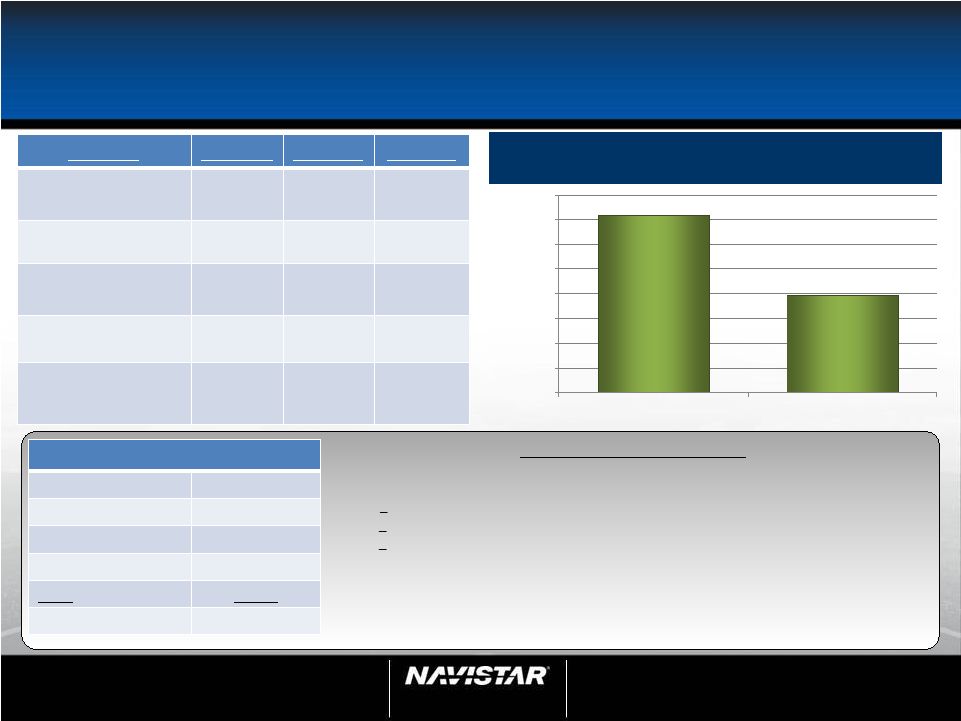
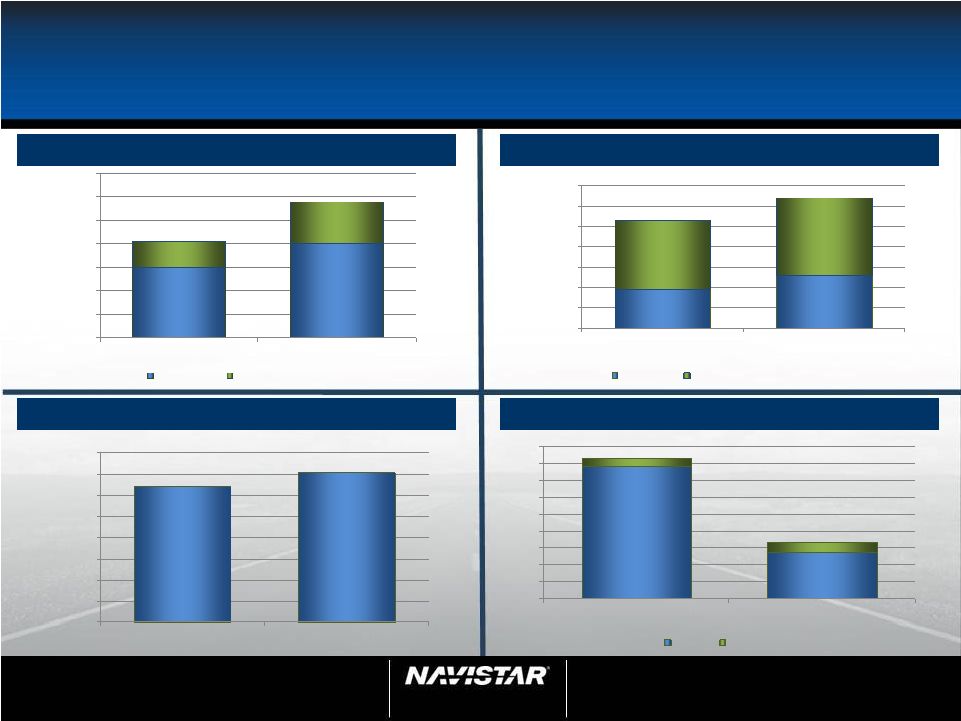
60 60 NYSE: NAV 3 Quarter 2011 Earnings Call Sept. 7, 2011 rd SEC Regulation G – 2011 Guidance (A) Engineering integration costs relate to the consolidation of our truck and engine engineering operations as well as the move of our world headquarters. We continue to develop plans for efficient transitions related to these activities and the optimization of our operations and management structure. We expect to incur approximately $77 million of engineering integration costs in fiscal 2011 with approximately $67 million of the costs to be recognized by our manufacturing segment and approximately $10 million of corporate charges. (B) Restructuring of North American manufacturing operations are charges primarily related to our plans to close our Chatham, Ontario heavy truck plant and Workhorse chassis plant in Union City, Indiana, and to significantly scale back operations at our Monaco recreational vehicle headquarters and motor coach manufacturing plant in Coburg, Oregon. We expect to incur $100 million to $140 million of restructuring, impairment and related charges in fiscal 2011 with approximately $3 million of corporate charges and the remainder of the costs to be recognized by our manufacturing segments. (C) In the third quarter of 2011, the Company recognized an income tax benefit of $1.476 billion from the release of a portion of our income tax valuation allowance. (D) Adjusted income tax expense excludes the income tax benefit from the release of a portion of our income tax valuation allowance and incremental income taxes that may result from this partial release of the income tax valuation allowance. (E) Approximate diluted weighted shares outstanding based on assumed average share price of $65 per share during the period. Lower Upper (in millions, except per share data) Net income attributable to Navistar International Corporation 1,647 1,764 Plus: Engineering integration costs (A) 77 77 Restructuring of North American manufacturing operations (B) 140 100 Less: Income tax valuation allowance release (C) 1,476 1,476 Adjusted net income attributable to Navistar International Corporation $ 388 $ 465 Plus: Adjusted income tax expense (D) 42 60 Adjusted Profit Excluding Tax $ 430 $ 525 Diluted earnings per share attributable to Navistar International Corporation $ 21.13 $ 22.13 Effect of adjustments on diluted earnings per share attributable to Navistar International Corporation (16.13) (16.13) Adjusted diluted earnings per share attributable to Navistar International Corporation $ 5.00 $ 6.00 Approximate diluted weighted shares outstanding (E) 77.6 77.6 Lower Upper (in millions) Net income (loss) attributable to Navistar International Corporation $ 1,647 $ 1,764 Less: Financial services segment profit, Corporate and eliminations, and income taxes 1,004 981 Manufacturing segment profit 643 783 Engineering integration costs (A) 67 67 Restructuring of North American manufacturing operations (B) 137 100 Adjusted manufacturing segment profit $ 847 $ 950 Fiscal 2011 guidance: adjusted net income and diluted earnings per share attributable to Navistar International Corporation reconciliation: Fiscal 2011 guidance: manufacturing segment profit and adjusted manufacturing segment profit reconciliation: |
3 Quarter 2011 Earnings Call Sept. 7, 2011 rd NYSE: NAV 61 61 SEC Regulation G – Fiscal Year Comparison 2009 2008 (Dollars in Millions, except per share data) Net income (loss) attributable to Navistar International Corporation $ 320 $ 134 Plus: Ford settlement, restructuring and related charges (benefits) (A) (157) 36 Impairment of property, plant, and equipment (B) 31 358 Write-off of debt issuance costs (C) 11 - Adjusted net income attributable to Navistar International Corporation $ 205 $ 528 Adjusted diluted earnings per share attributable to Navistar International Corporation $ 2.86 $ 7.21 Diluted weighted shares outstanding 71.8 73.2 2010 2009 2008 (Dollars in Millions, except per share data) Net income attributable to Navistar International Corporation $ 223 $ 320 $ 134 Less: Income taxes (23) (37) (57) Profit Excluding Tax $ 246 $ 357 $ 191 Less: Financial services segment profit (loss) 95 40 (24) Corporate and eliminations (590) (519) (478) Manufacturing segment profit 741 836 693 Plus: Fordsettlement, restructuring and related charges (benefits) (A) - (160) 37 Impairment of property, plant, and equipment (B) - 31 358 Adjusted manufacturing segment profit $ 741 $ 707 $ 1,088 Adjusted net income and diluted earnings per share attributable to Navistar International Corporation reconciliation: Manufacturing segment profit and adjusted manufacturing segment profit reconciliation: (A) Ford settlement, restructuring and related charges (benefits) include the impact of our settlement with Ford in 2009 as well as charges and benefits recognized related to restructuring activity at our Indianapolis Casting Corporation and Indianapolis Engine Plant. The charges and benefits were recognized in our Engine segment with the exception of $3 million of income tax expense and $1 million of income tax benefit related to the settlement in 2009 and 2008 respectively. (B) Impairment of property, plant, and equipment in 2008 are related to impairments to the asset groups in the Engine segment’s VEE Business Unit. The 2009 impairments relate to charges recognized by the Truck segment for impairments related to asset groups at our Chatham and Conway facilities (C) The write-off of debt issuance costs in 2009 relate to charges related to the Company’s refinancing. |
3 Quarter 2011 Earnings Call Sept. 7, 2011 rd NYSE: NAV 62 62 Manufacturing marketable securities SEC Regulation G – Manufacturing Cash Fiscal Year Comparison Manufacturing cash, cash equivalents, and marketable securities reconciliation: (Dollars in Millions) July 31, 2011 October 31, 2010 October 31, 2009 October 31, 2008 Manufacturing segment cash and cash equivalents $ 413 $ 534 $ 1,152 $ 775 Financial services segment cash and cash equivalents 31 51 60 86 Consolidated cash and cash equivalents $ 444 $ 585 $ 1,212 $ 861 $ 600 $ 566 $ - $ 2 Financial services segment marketable securities 20 20 - - Consolidated marketale securities $ 620 $ 586 $ - $ 2 Manufacturing segment cash and cash equivalents $ 413 $ 534 $ 1,152 $ 775 Manfuacturing marketable securities 600 566 - 2 Manufacturing segment cash, cash equivalents and marketable securities $ 1,013 $ 1,100 $ 1,152 $ 777 (A) Manufacturing marketable securities as of October 31, 2008 of $2 million were included in Other current assets for financial reporting. (A) |
3 Quarter 2011 Earnings Call Sept. 7, 2011 rd NYSE: NAV 63 63 SEC Regulation G – Manufacturing Cash Manufacturing Operations Financial Services Operations Adjustments Condensed Consolidated Cash Flows (Dollars in Millions) For the year ended October 31, 2009 Cash flows from operations 534 704 - 1,238 Cash flows from investing / capital expenditures (284) 50 22 (212) Cash flows from financing / debt pay down 36 (780) (20) (764) Effect of exchange rate changes 9 - - 9 Net cash flows 295 (26) 2 271 Blue Diamond Consolidation 80 - - 80 Beginning cash, cash equivalents and marketable securities balance 777 86 (2) 861 Ending cash, cash equivalents and marketable securities balance 1,152 60 - 1,212 Manufacturing Operations Financial Services Operations Adjustments Condensed Consolidated Cash Flows (Dollars in Millions) For the year ended October 31, 2010 Cash flows from operations 409 698 - 1,107 Cash flows from investing / capital expenditures (350) 492 (576) (434) Cash flows from financing / debt pay down (110) (1,180) (10) (1,300) Effect of exchange rate changes (1) 1 - - Net cash flows (52) 11 (586) (627) Blue Diamond Consolidation - - - - Beginning cash, cash equivalents and marketable securities balance 1,152 60 - 1,212 Ending cash, cash equivalents and marketable securities balance 1,100 71 (586) 585 Manufacturing segment cash flow reconciliation: Manufacturing segment cash flow reconciliation: $ $ $ $ $ $ $ $ $ $ $ $ $ $ $ $ $ $ $ $ $ $ $ $ |
3 Quarter 2011 Earnings Call Sept. 7, 2011 rd NYSE: NAV 64 64 SEC Regulation G – Manufacturing Cash Manufacturing segment cash flow reconciliation: Manufacturing Operations Financial Services Operations Adjustments Condensed Consolidated Cash Flows (Dollars in Millions) For the nine months ended July 31, 2011 Cash flows from operations $ 236 $ 303 $ - $ 539 Cash flows from investing / capital expenditures (325) (11) (34) (370) Cash flows from financing / debt pay down (5) (312) - (317) Effect of exchange rate changes 7 - - 7 Net cash flows $ (87) $ (20) $ (34) $ (141) Blue Diamond Consolidation - - - - Beginning cash, cash equivalents and marketable securities balance 1,100 71 (586) 585 Ending cash, cash equivalents and marketable securities balance $ 1,013 $ 51 $ (620) $ 444 Manufacturing segment cash flow reconciliation: Manufacturing Operations Financial Services Operations Adjustments Condensed Consolidated Cash Flows (Dollars in Millions) For the three months ended July 31, 2011 Cash flows from operations $ 64 $ 249 $ - $ 313 Cash flows from investing / capital expenditures: (129) 15 118 4 Cash flows from financing / debt pay down - (259) - (259) Effect of exchange rate changes (1) (3) - (4) Net cash flows $ (66) $ 2 $ 118 $ 54 Blue Diamond Consolidation - - - - Beginning cash, cash equivalents and marketable securities balance 1,079 49 (738) 390 Ending cash, cash equivalents and marketable securities balance $ 1,013 $ 51 $ (620) $ 444 |
3 Quarter 2011 Earnings Call Sept. 7, 2011 rd NYSE: NAV 65 65 SEC Regulation G – Three and nine months ended July 31, 2011 and 2010 See following slide for explanation of adjustments. 2011 2010 2011 2010 Revised (A) Revised (A) (in millions, except per share data) Net income (loss) attributable to Navistar International Corporation $ 1,400 $ 117 $ 1,468 $ 179 Plus: Engineering integration costs (B) 15 - 41 - Restructuring of North American manufacturing operations (C) 122 - 122 - Ford restructuring and related charges (benefits) (D) - (10) - (27) Less: Income tax valuation allowance release (E) 1,476 - 1,476 - Adjusted net income attributable to Navistar International Corporation $ 61 $ 107 $ 155 $ 152 2011 2010 2011 2010 Revised (A) Revised (A) (in millions) Diluted earnings (loss) per share attributable to Navistar International Corporation $ 18.24 $ 1.56 $ 19.04 $ 2.44 Effect of adjustments on diluted earnings per share attributable to Navistar International Corporation (17.45) (0.12) (17.03) (0.36) Adjusted diluted earnings per share attributable to Navistar International Corporation $ 0.79 $ 1.44 $ 2.01 $ 2.08 Diluted weighted shares outstanding 76.8 74.3 77.1 73.1 Adjusted net income attributable to Navistar International Corporation reconciliation: Adjusted diluted earnings per share attributable to Navistar International Corporation reconciliation: Three Months Ended July 31, Nine Months Ended July 31, Three Months Ended July 31, Nine Months Ended July 31, |
3 Quarter 2011 Earnings Call Sept. 7, 2011 rd NYSE: NAV 66 66 SEC Regulation G – Three and nine months ended July 31, 2011 and 2010 – (Continued) (A) Net income attributable to Navistar International Corporation has been revised to reflect a retrospective change in accounting principle. See Note 1, Summary of significant accounting policies of our Form 10Q for additional information. (B) Engineering integration costs relate to the consolidation of our truck and engine engineering operations as well as the move of our world headquarters. These costs include restructuring charges for activities at our Fort Wayne facility of $4 million and $23 million for the three and nine months ended July 31, 2011, respectively. The restructuring charges recorded are based on restructuring plans that have been committed to by management and are based upon management's best estimates of future events. Changes to the estimates may require future adjustments to the restructuring liabilities. We also incurred an additional $11 million and $18 million of other related costs for the three and nine months ended July 31, 2011, respectively. Our manufacturing segment recognized $12 million and $33 million of the engineering integration costs for the three and nine months ended July 31, 2011, respectively. For the remainder of 2011, we expect to incur approximately $36 million of additional charges related to these activities and between $80 million and $110 million of additional charges in 2012.We continue to develop plans for efficient transitions related to these activities and the optimization of our operations and management structure. (C) Restructuring of North American manufacturing operations are charges primarily related to our plans to close our Chatham, Ontario heavy truck plant and Workhorse chassis plant in Union City, Indiana, and to significantly scale back operations at our Monaco recreational vehicle headquarters and motor coach manufacturing plant in Coburg, Oregon. These costs include restructuring charges of $53 million and related charges of $5 million for the three and nine months ended July 31, 2011. The restructuring and related charges recorded are based on restructuring plans that have been committed to by management and are based upon management's best estimates of future events. Changes to the estimates may require future adjustments to the restructuring liabilities. In addition, the Company recognized $64 million of impairment charges related to certain intangible assets and property plant and equipment primarily related to these facilities. The Truck segment recognized $119 million of restructuring of North American manufacturing operation charges for the three and nine months ended July 31, 2011. We expect to incur $40 million to $90 million of additional charges in future periods related to these activities. (D) Ford restructuring and related charges (benefits) are charges and benefits recognized in 2010 related to restructuring activity at our Indianapolis Casting Corporation and Indianapolis Engine Plant. The net benefits were included in Restructuring charges in our Engine segment. (E) In the third quarter of 2011, the Company recognized an income tax benefit of $1.476 billion from the release of a portion of our income tax valuation allowance. Adjustments included in the above schedule have not been adjusted to reflect their income tax effect as the adjustments are intended to represent the impact on the Company’s consolidated statement of operations without the incremental income tax effect that would result from the release of the income tax valuation allowance. The charges related to our Canadian operations would not be impacted as a full income tax valuation allowance remains for Canada. In addition, on a non-GAAP basis no incremental income tax for the three and nine months ended July 31, 2011 is presented because the cumulative impact from the increased effective tax rate was offset by the tax benefit from restructuring and impairment charges in the quarter. |
3 Quarter 2011 Earnings Call Sept. 7, 2011 rd NYSE: NAV 67 67 SEC Regulation G – Manufacturing Segment Profit Three and nine months ended July 31, 2011 and 2010 (A) Net income attributable to Navistar International Corporation has been revised to reflect a retrospective change in accounting principle. See Note 1, Summary of significant accounting policies of our Form 10Q for additional information. (B) Engineering integration costs relate to the consolidation of our truck and engine engineering operations as well as the move of our world headquarters. These costs include restructuring charges for activities at our Fort Wayne facility of $4 million and $23 million for the three and nine months ended July 31, 2011, respectively. The restructuring charges recorded are based on restructuring plans that have been committed to by management and are based upon management's best estimates of future events. Changes to the estimates may require future adjustments to the restructuring liabilities. We also incurred an additional $11 million and $18 million of other related costs for the three and nine months ended July 31, 2011, respectively. Our manufacturing segment recognized $12 million and $33 million of the engineering integration costs for the three and nine months ended July 31, 2011, respectively. For the remainder of 2011, we expect to incur approximately $36 million of additional charges related to these activities and between $80 million and $110 million of additional charges in 2012.We continue to develop plans for efficient transitions related to these activities and the optimization of our operations and management structure. (C) Restructuring of North American manufacturing operations are charges primarily related to our plans to close our Chatham, Ontario heavy truck plant and Workhorse chassis plant in Union City, Indiana, and to significantly scale back operations at our Monaco recreational vehicle headquarters and motor coach manufacturing plant in Coburg, Oregon. These costs include restructuring charges of $53 million and related charges of $5 million for the three and nine months ended July 31, 2011. The restructuring and related charges recorded are based on restructuring plans that have been committed to by management and are based upon management's best estimates of future events. Changes to the estimates may require future adjustments to the restructuring liabilities. In addition, the Company recognized $64 million of impairment charges related to certain intangible assets and property plant and equipment primarily related to these facilities. The Truck segment recognized $119 million of restructuring of North American manufacturing operation charges for the three and nine months ended July 31, 2011. We expect to incur $40 million to $90 million of additional charges in future periods related to these activities. (D) Ford restructuring and related charges (benefits) are charges and benefits recognized in 2010 related to restructuring activity at our Indianapolis Casting Corporation and Indianapolis Engine Plant. The net benefits were included in Restructuring charges in our Engine segment. Manufacturing segment profit and adjusted manufacturing segment profit 2011 2010 2011 2010 Revised (A) Revised (A) (in millions) Net income (loss) attributable to Navistar International Corporation $ 1,400 $ 117 $ 1,468 $ 179 Less: Financial services segment profit 30 33 102 61 Corporate and eliminations (120) (175) (367) (460) Income tax benefit (expense) 1,463 (19) 1,458 (17) Manufacturing segment profit $ 27 $ 278 $ 275 $ 595 Plus: Engineering integration costs (B) 12 - 33 - Restructuring of North American manufacturing operations (C) 119 - 119 - Ford restructuring and related charges (benefits) (D) - (10) - (17) Adjusted manufacturing segment profit $ 158 $ 268 $ 427 $ 578 Three Months Ended July 31, Nine Months Ended July 31, |