Exhibit 99.1 |
Gabelli 35th Annual Automotive
Aftermarket Symposium
October 31st, 2011
For More than 175 years
we’ve been helping people from every corner of the world
move the goods that move the welfare of entire nations.
NYSE: NAV
1
|
Safe Harbor Statement & Other Cautionary Notes
Information provided and statements contained in this presentation that are not purely historical are forward-looking statements within the meaning of Section 27A of the Securities Act of 1933, as amended, Section 21E of the Securities Exchange Act of 1934, as amended, and the Private Securities Litigation Reform Act of 1995. Such forward-looking statements only speak as of the date of this presentation and the Company assumes no obligation to update the information included in this presentation. Such forward-looking statements include information concerning our possible or assumed future results of operations, including descriptions of our business strategy. These statements often include words such as “believe,” “expect,” “anticipate,” “intend,” “plan,” “estimate,” or similar expressions. These statements are not guarantees of performance or results and they involve risks, uncertainties, and assumptions. For a further description of these factors, see Item 1A, Risk Factors, included within our Form 10-K for the year ended October 31, 2010, which was filed on December 21, 2010, and Part II, Item 1A, Risk Factors, included within our Form 10-Q for the period ended July 31, 2011, which was filed on September 7, 2011. Although we believe that these forward-looking statements are based on reasonable assumptions, there are many factors that could affect our actual financial results or results of operations and could cause actual results to differ materially from those in the forward-looking statements. All future written and oral forward-looking statements by us or persons acting on our behalf are expressly qualified in their entirety by the cautionary statements contained or referred to above. Except for our ongoing obligations to disclose material information as required by the federal securities laws, we do not have any obligations or intention to release publicly any revisions to any forward-looking statements to reflect events or circumstances in the future or to reflect the occurrence of unanticipated events.
The financial information herein contains audited and unaudited information and has been prepared by management in good faith and based on data currently available to the Company.
Certain Non-GAAP measures are used in this presentation to assist the reader in understanding our core manufacturing business. We believe this information is useful and relevant to assess and measure the performance of our core manufacturing business as it illustrates manufacturing performance without regard to selected historical legacy costs (i.e. pension and other postretirement costs). It also excludes financial services and other items that may not be related to the core manufacturing business or underlying results. Management often uses this information to assess and measure the performance of our operating segments. A reconciliation to the most appropriate GAAP number is included in the appendix of this presentation.
2
NYSE: NAV
|
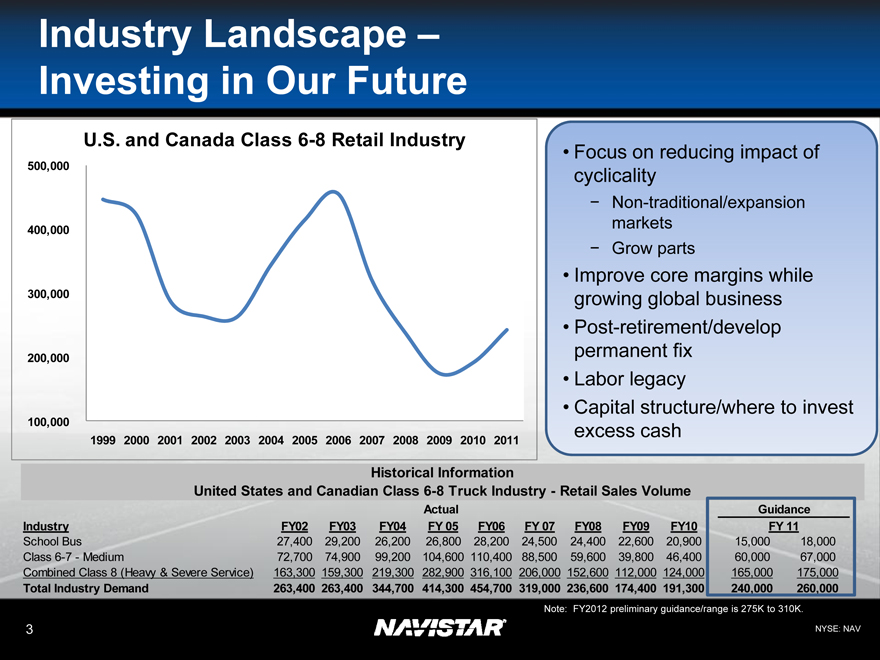
Industry Landscape – Investing in Our Future
U.S. and Canada Class 6-8 Retail Industry
500,000 400,000 300,000 200,000 100,000
1999 2000 2001 2002 2003 2004 2005 2006 2007 2008 2009 2010 2011
• Focus on reducing impact of cyclicality
– Non-traditional/expansion markets
– Grow parts
• Improve core margins while growing global business
• Post-retirement/develop permanent fix
• Labor legacy
• Capital structure/where to invest excess cash
Historical Information
United States and Canadian Class 6-8 Truck Industry - Retail Sales Volume
Actual Guidance
Industry FY02 FY03 FY04 FY 05 FY06 FY 07 FY08 FY09 FY10 FY 11
School Bus 27,400 29,200 26,200 26,800 28,200 24,500 24,400 22,600 20,900 15,000 18,000
Class 6-7 - Medium 72,700 74,900 99,200 104,600 110,400 88,500 59,600 39,800 46,400 60,000 67,000
Combined Class 8 (Heavy & Severe Service) 163,300 159,300 219,300 282,900 316,100 206,000 152,600 112,000 124,000 165,000 175,000
Total Industry Demand 263,400 263,400 344,700 414,300 454,700 319,000 236,600 174,400 191,300 240,000 260,000
Note: FY2012 preliminary guidance/range is 275K to 310K.
NYSE: NAV
3
|
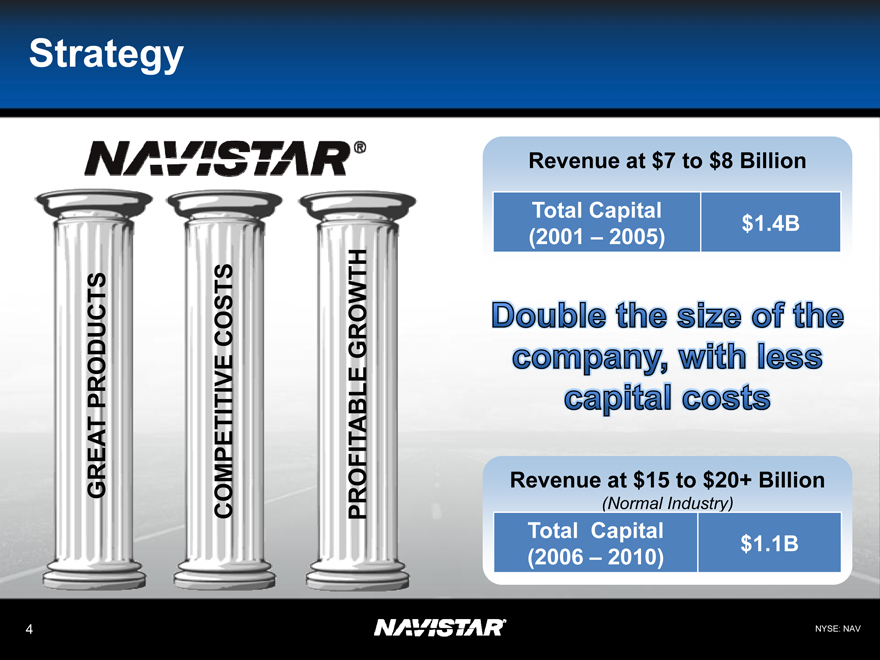
Strategy
GREAT PRODUCTS
COMPETITIVE COSTS
PROFITABLE GROWTH
Revenue at $7 to $8 Billion
Total Capital $1.4B
(2001 – 2005)
Double the Size of the company, with less capital costs
Revenue at $15 to $20+ Billion
(Normal Industry)
Total Capital $1.1B
(2006 – 2010)
4
NYSE: NAV
|
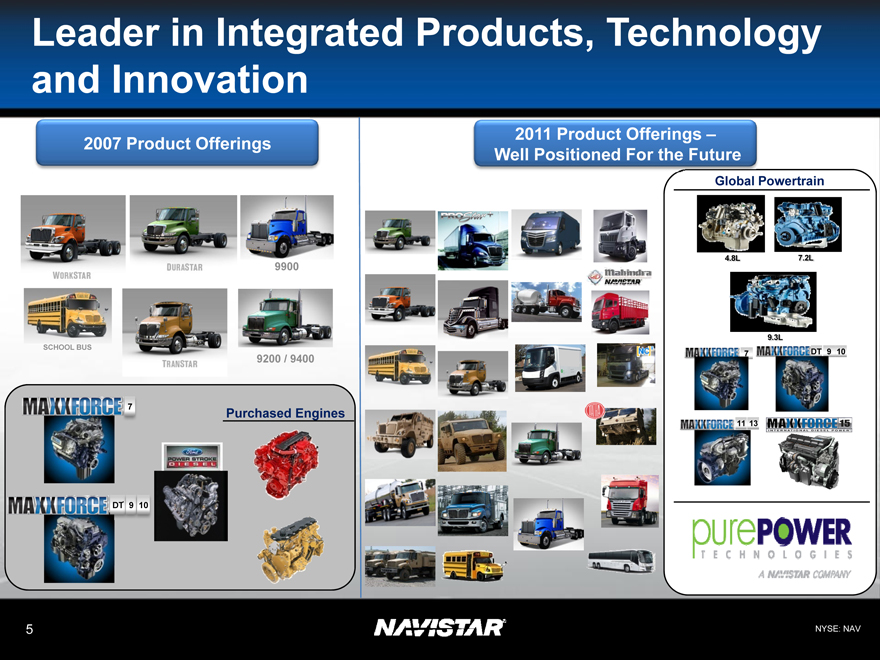
Leader in Integrated Products, Technology and Innovation
2007 Product Offerings
7
Purchased Engines
DT 9 10
2011 Product Offerings –Well Positioned For the Future
Global Powertrain
4.8L
7.2L
9.3L
7
DT 9 10
11 13
5
NYSE: NAV
|
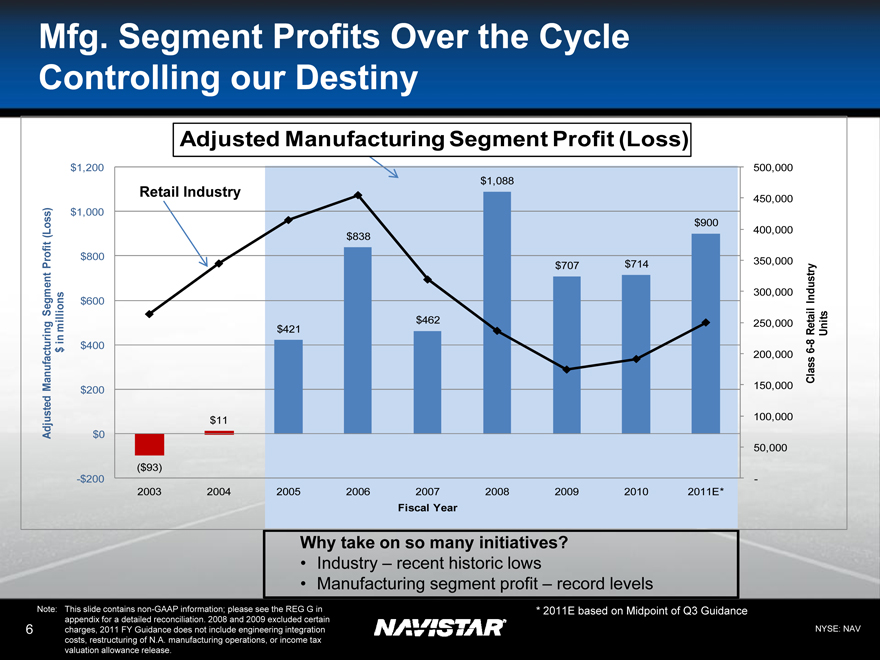
Mfg. Segment Profits Over the Cycle Controlling our Destiny
Adjusted Manufacturing Segment Profit (Loss)
Adjusted Manufacturing Segment Profit (Loss) $ in millions
$1,200 $1,000 $800 $600 $400 $200 $0
-$200
Retail Industry
($93)
$11
$421
$838
$462
$1,088
$707
$714
$900
2003 2004 2005 2006 2007 2008 2009 2010 2011E*
Fiscal Year
500,000 450,000 400,000 350,000 300,000 250,000 200,000 150,000 100,000 50,000 -
Class 6-8 Retail Industry Units
Why take on so many initiatives?
• Industry – recent historic lows
• Manufacturing segment profit – record levels
6
Note: This slide contains non-GAAP information; please see the REG G in appendix for a detailed reconciliation. 2008 and 2009 excluded certain charges, 2011 FY Guidance does not include engineering integration costs, restructuring of N.A. manufacturing operations, or income tax valuation allowance release.
* 2011E based on Midpoint of Q3 Guidance
NYSE: NAV
|
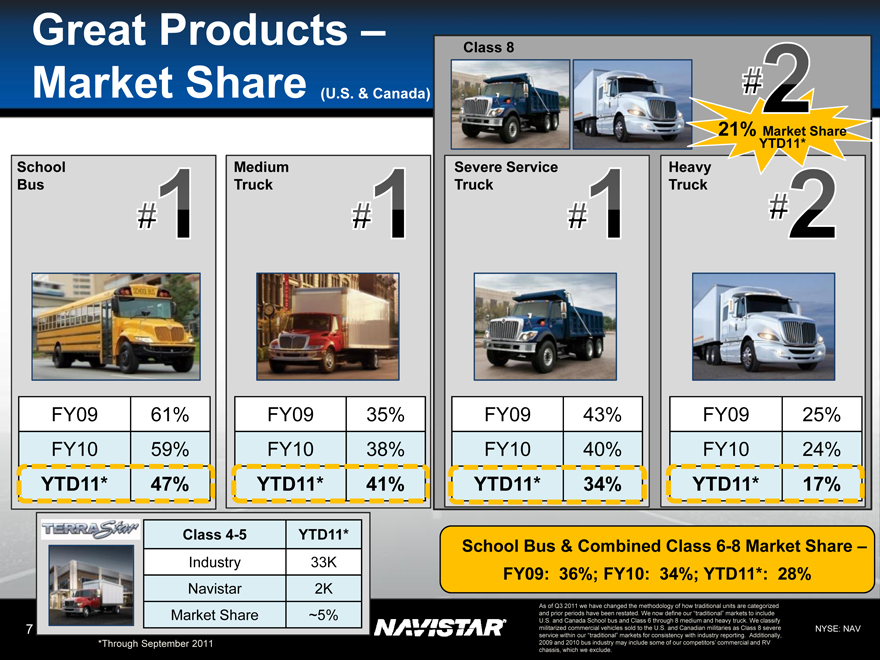
Great Products –
Market Share (U.S. & Canada)
Class 8
21% YTD11* Market Share
School Bus
Medium Truck
Severe Service Truck
Heavy Truck
FY09 61%
FY10 59%
YTD11* 47%
FY09 35%
FY10 38%
YTD11* 41%
FY09 43%
FY10 40%
YTD11* 34%
FY09 25%
FY10 24%
YTD11* 17%
Class 4-5 YTD11*
Industry 33K
Navistar 2K
Market Share ~5%
School Bus & Combined Class 6-8 Market Share –FY09: 36%; FY10: 34%; YTD11*: 28%
7
*Through September 2011
As of Q3 2011 we have changed the methodology of how traditional units are categorized and prior periods have been restated. We now define our “traditional” markets to include U.S. and Canada School bus and Class 6 through 8 medium and heavy truck. We classify
militarized commercial vehicles sold to the U.S. and Canadian militaries as Class 8 severe service within our “traditional” markets for consistency with industry reporting. Additionally, 2009 and 2010 bus industry may include some of our competitors’ commercial and RV chassis, which we exclude.
NYSE: NAV
|
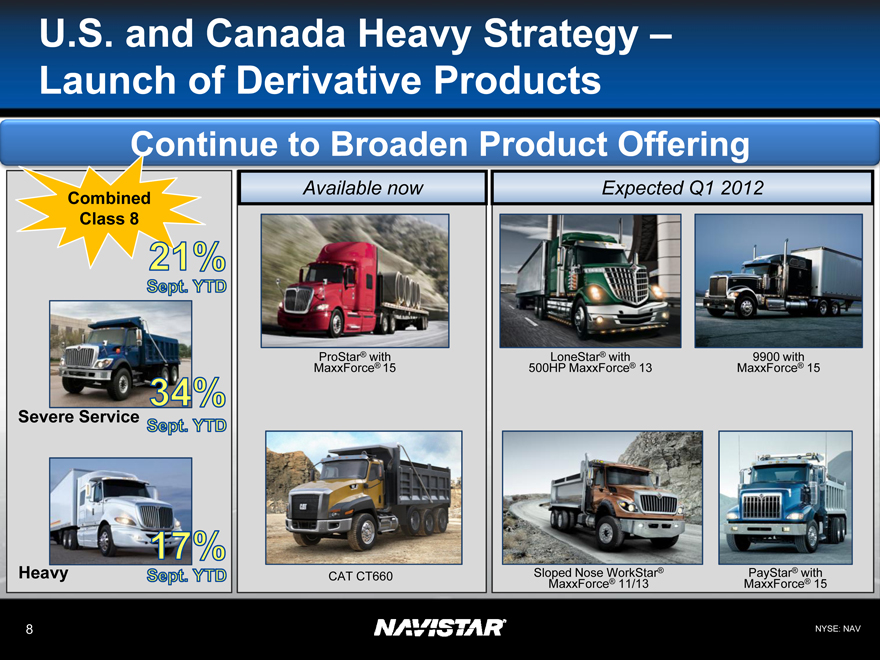
U.S. and Canada Heavy Strategy –Launch of Derivative Products
Continue to Broaden Product Offering
Combined Class 8
Severe Service
Heavy
Available now
Expected Q1 2012
ProStar® with MaxxForce® 15
LoneStar® with 500HP MaxxForce® 13
MaxxForce 9900 with ® 15
CAT CT660
Sloped Nose WorkStar® MaxxForce® 11/13
PayStar® with MaxxForce® 15
8
NYSE: NAV
|
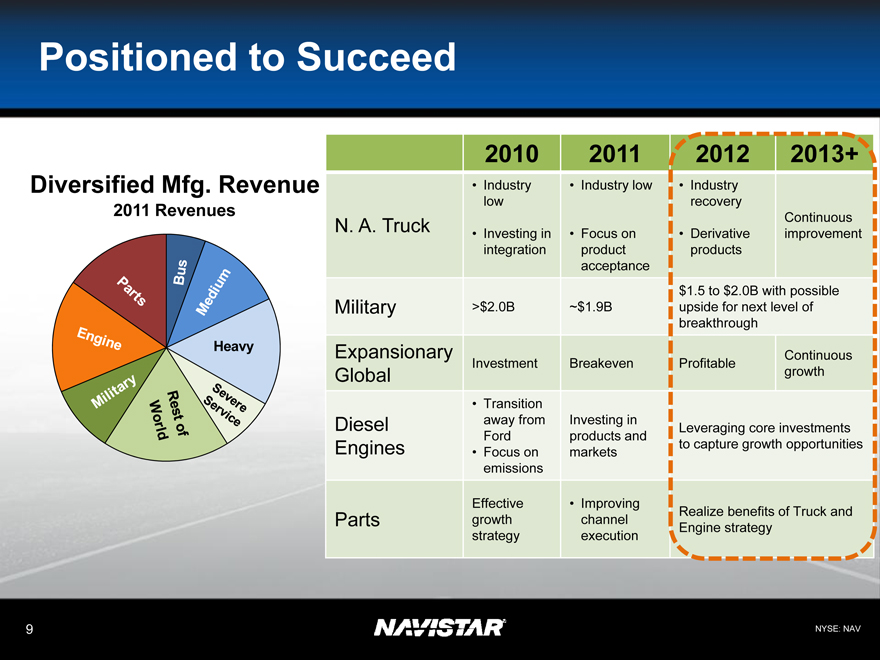
Positioned to Succeed
Diversified Mfg. Revenue
2011 Revenues
2010 2011 2012 2013+
• Industry • Industry low • Industry
low recovery
N. A. Truck Continuous
• Investing in • Focus on • Derivative improvement
integration product products
acceptance
$1.5 to $2.0B with possible
Military >$2.0B ~$1.9B upside for next level of
breakthrough
Expansionary Continuous
Investment Breakeven Profitable
Global growth
• Transition
Diesel away from Investing in Leveraging core investments
Ford products and
Engines • Focus on markets to capture growth opportunities
emissions
Effective • Improving
Parts growth channel Engine Realize strategy benefits of Truck and
strategy execution
9
NYSE: NAV
|
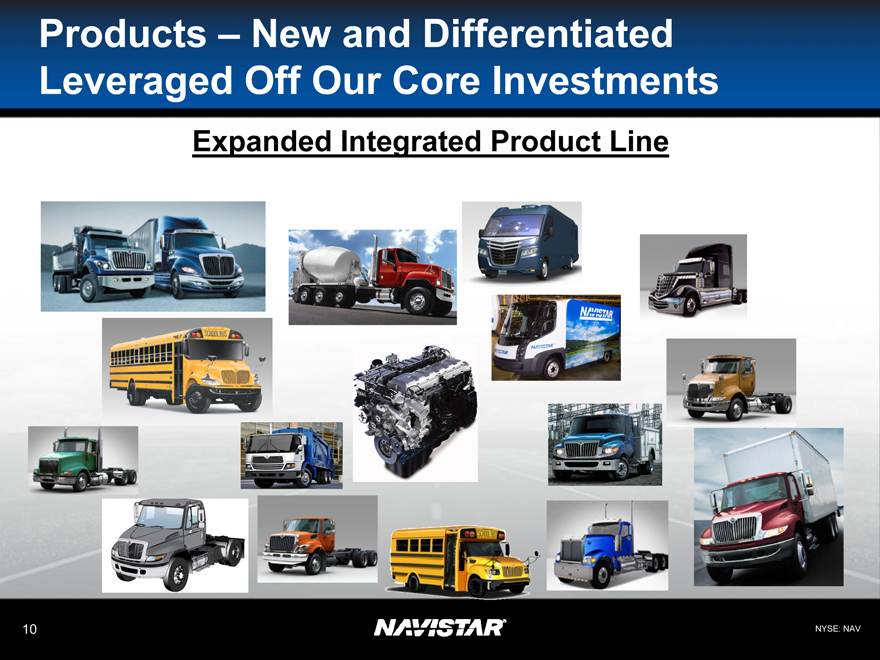
Products – New and Differentiated Leveraged Off Our Core Investments
Expanded Integrated Product Line
10
NYSE: NAV
|
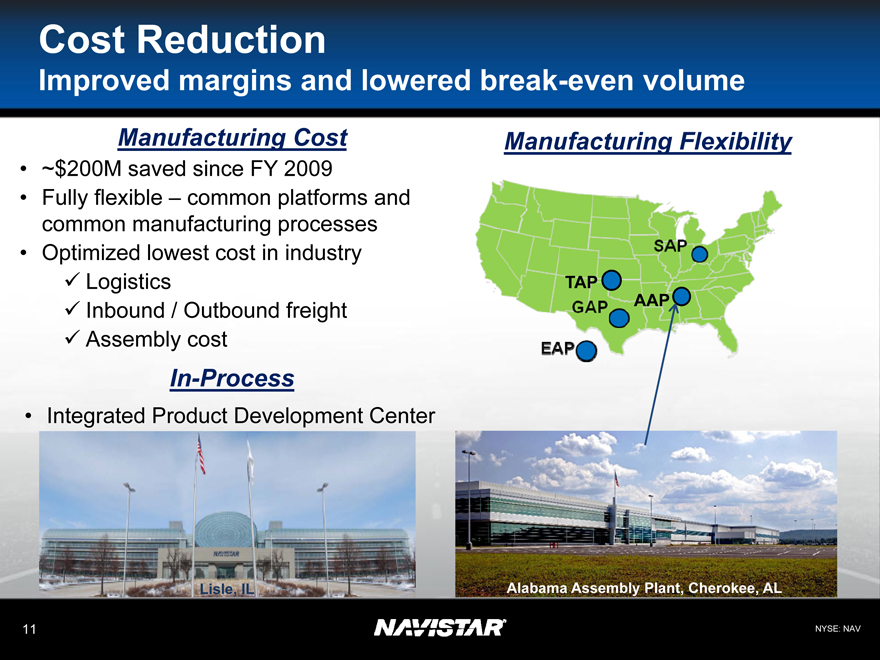
Cost Reduction
Improved margins and lowered break-even volume
Manufacturing Cost
• ~$200M saved since FY 2009
• Fully flexible – common platforms and common manufacturing processes
• Optimized lowest cost in industry
Logistics
Inbound / Outbound freight
Assembly cost
In-Process
• Integrated Product Development Center
Manufacturing Flexibility
SAP TAP AAP GAP EAP
Alabama Assembly Plant, Cherokee, AL
11
NYSE: NAV
|
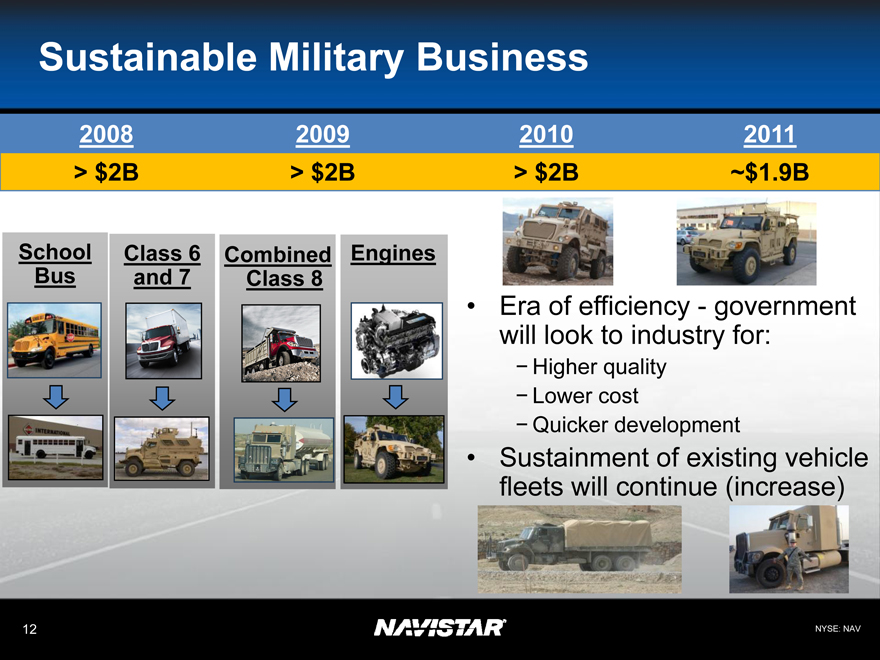
Sustainable Military Business
2008 2009 2010 2011
> $2B > $2B > $2B ~$1.9B
School Class 6 Combined Engines
Bus and 7 Class 8
Era of efficiency - government will look to industry for:
Higher quality
Lower cost
Quicker development
Sustainment of existing vehicle fleets will continue (increase)
12
NYSE: NAV
|
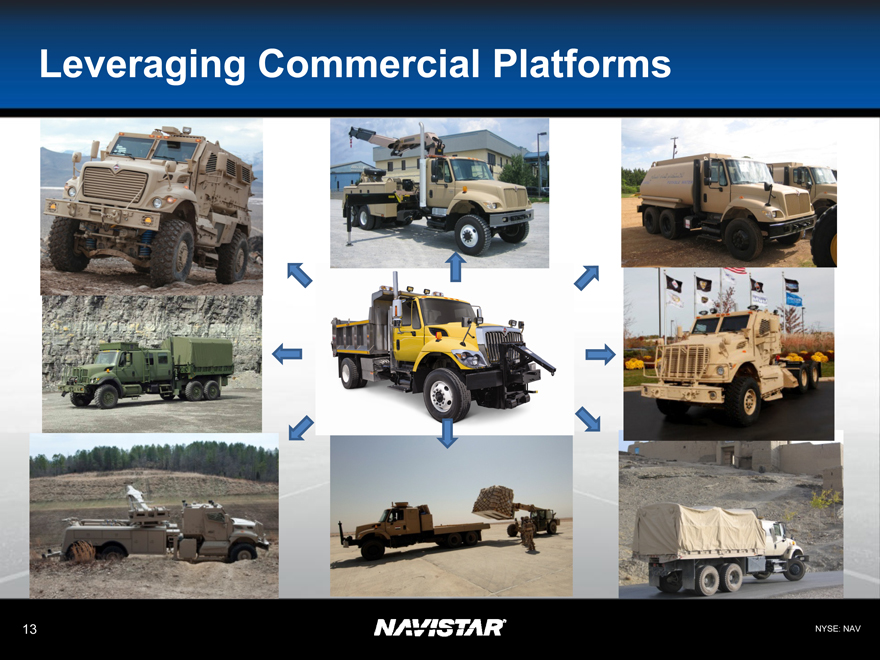
Leveraging Commercial Platforms
13
NYSE: NAV
|
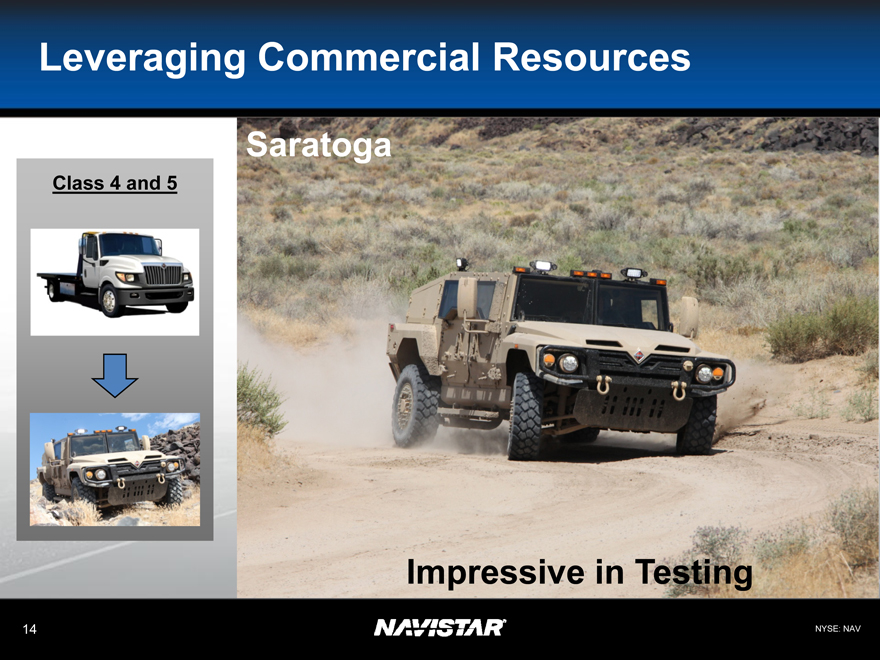
Leveraging Commercial Resources
Class 4 and 5
Saratoga
Impressive in Testing
14
NYSE: NAV
|
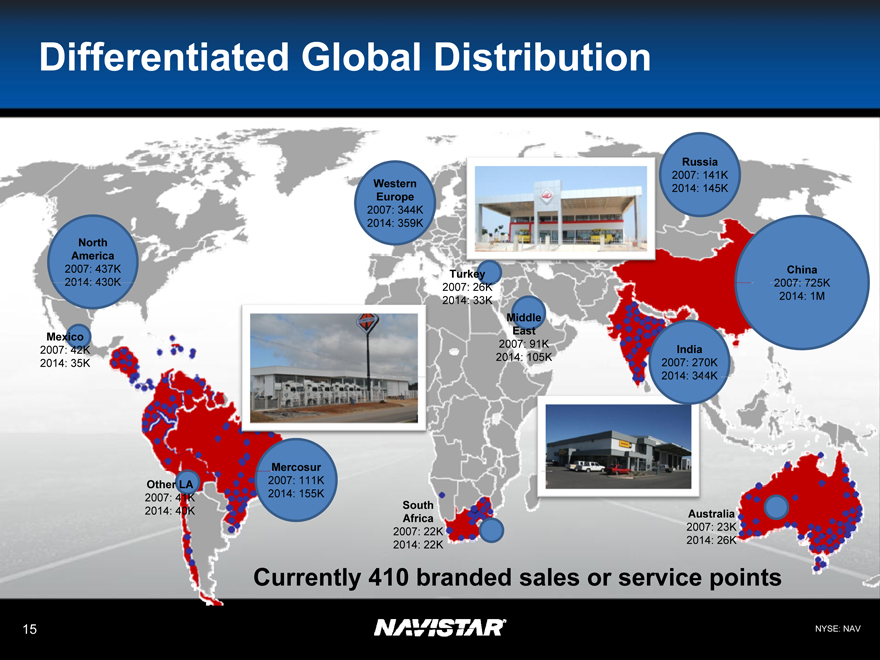
Differentiated Global Distribution
North America
2007: 437K
2014: 430K
Mexico
2007: 42K 2014: 35K
Other LA
2007: 41K 2014: 40K
Mercosur
2007: 111K 2014: 155K
Western Europe
2007: 344K 2014: 359K
Turkey
2007: 26K 2014: 33K
Middle East
2007: 91K 2014: 105K
South Africa
2007: 22K 2014: 22K
Russia
2007: 141K
2014: 145K
India
2007: 270K 2014: 344K
China
2007: 725K
2014: 1M
Australia
2007: 23K 2014: 26K
Currently 410 branded sales or service points
15
NYSE: NAV
|
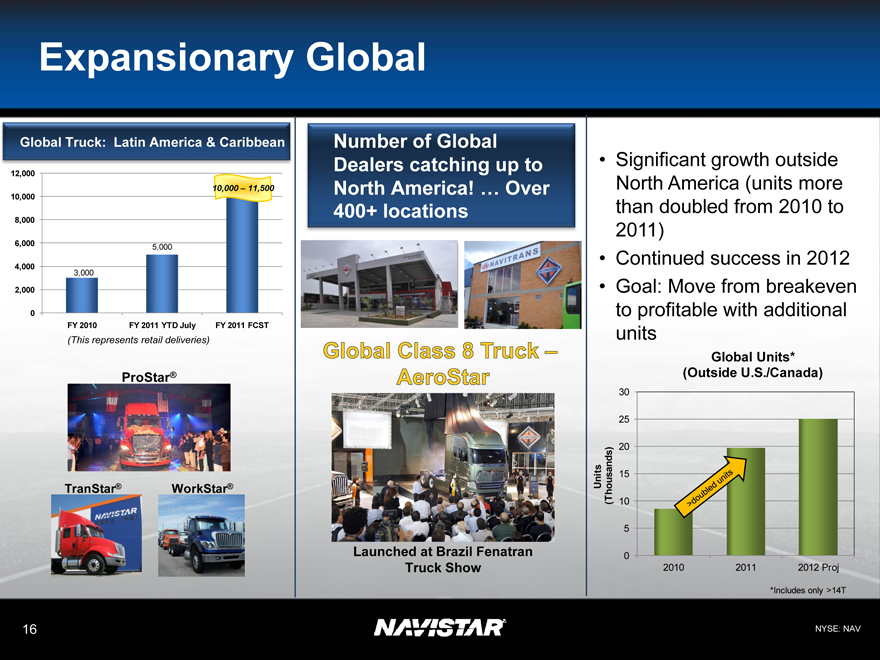
Expansionary Global
Global Truck: Latin America & Caribbean
12,000 10,000 8,000 6,000 4,000 2,000 0
3,000
5,000
10,000 – 11,500
FY 2010 FY 2011 YTD July FY 2011 FCST
(This represents retail deliveries)
ProStar®
TranStar®
WorkStar®
Number of Global Dealers catching up to North America! … Over 400+ locations
Global Class 8 Truck – AeroStar
Launched at Brazil Fenatran Truck Show
• Significant growth outside
North America (units more than doubled from 2010 to 2011)
• Continued success in 2012
• Goal: Move from breakeven to profitable with additional units
Global Units* (Outside U.S./Canada)
Units (Thousands)
30 25 20 15 10 5 0
2010 2011 2012 Proj
*Includes only >14T
16
NYSE: NAV
|
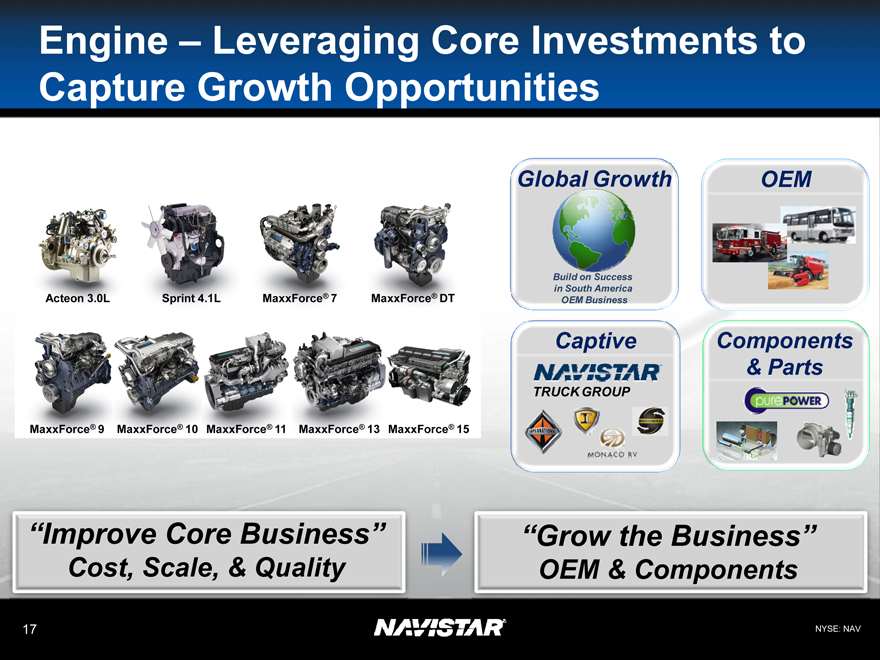
Engine – Leveraging Core Investments to Capture Growth Opportunities
Acteon 3.0L Sprint 4.1L MaxxForce® 7 MaxxForce® DT
MaxxForce® 9 MaxxForce® 10 MaxxForce® 11 MaxxForce® 13 MaxxForce® 15
Global Growth
Build on Success in South America OEM Business
OEM
Captive
TRUCK GROUP
Components
& Parts
“Improve Core Business” Cost, Scale, & Quality
“Grow the Business” OEM & Components
17
NYSE: NAV
|
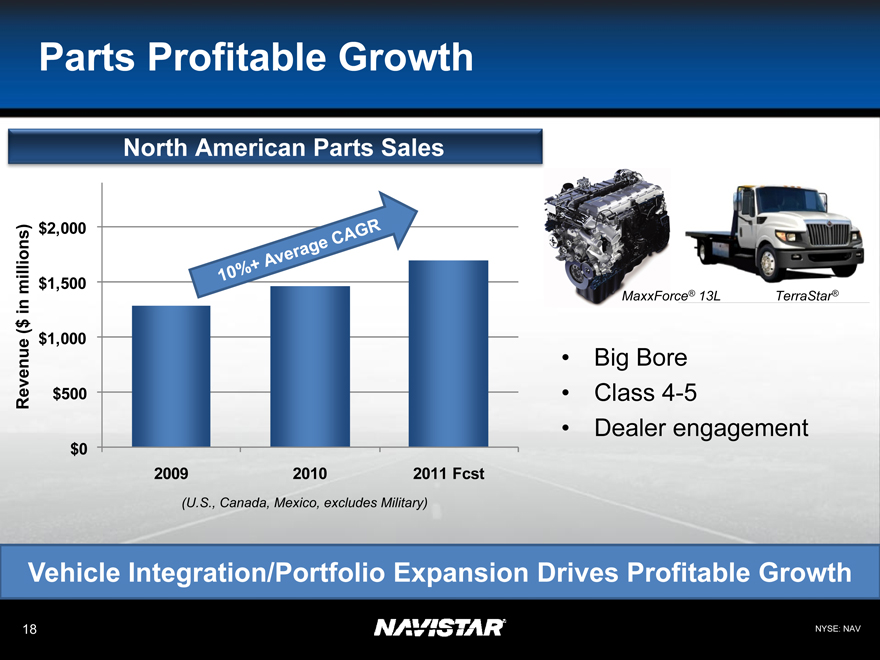
Parts Profitable Growth
North American Parts Sales
Revenue (in $ millions)
$2,000 $1,500 $1,000 $500 $0
2009 2010 2011 Fcst
(U.S., Canada, Mexico, excludes Military)
10%+ Average CAGR
MaxxForce® 13L TerraStar®
• Big Bore
• Class 4-5
• Dealer engagement
Vehicle Integration/Portfolio Expansion Drives Profitable Growth
18
NYSE: NAV
|
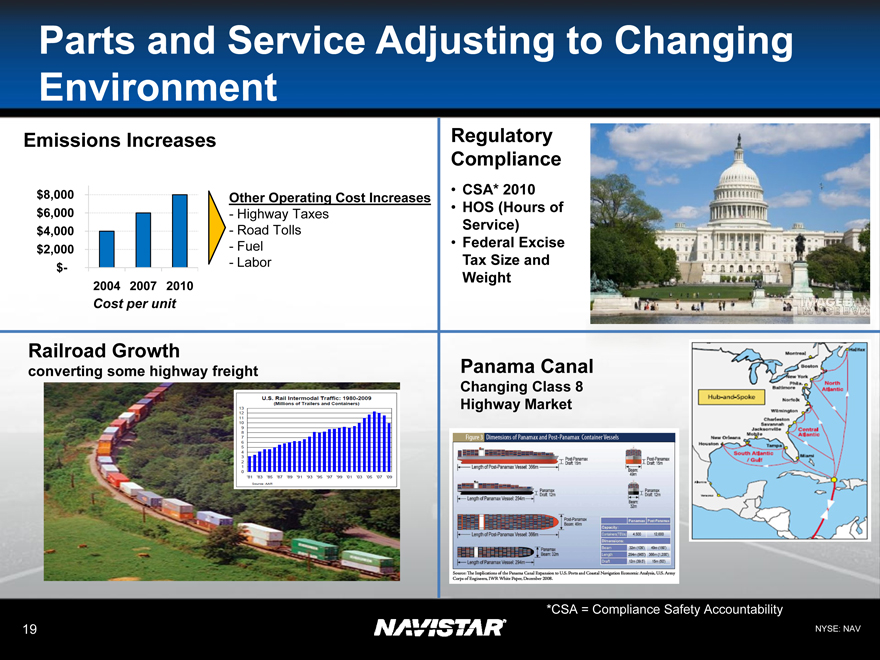
Parts and Service Adjusting to Changing Environment
Emissions Increases
$8,000 $6,000 $4,000 $2,000 $-
Other Operating Cost Increases
- Highway Taxes
- Road Tolls
- Fuel
- Labor
2004 2007 2010
Cost per unit
Regulatory Compliance
• CSA* 2010
• HOS (Hours of Service)
• Federal Excise Tax Size and Weight
Railroad Growth
converting some highway freight
Panama Canal
Changing Class 8 Highway Market
*CSA = Compliance Safety Accountability
19
NYSE: NAV
|
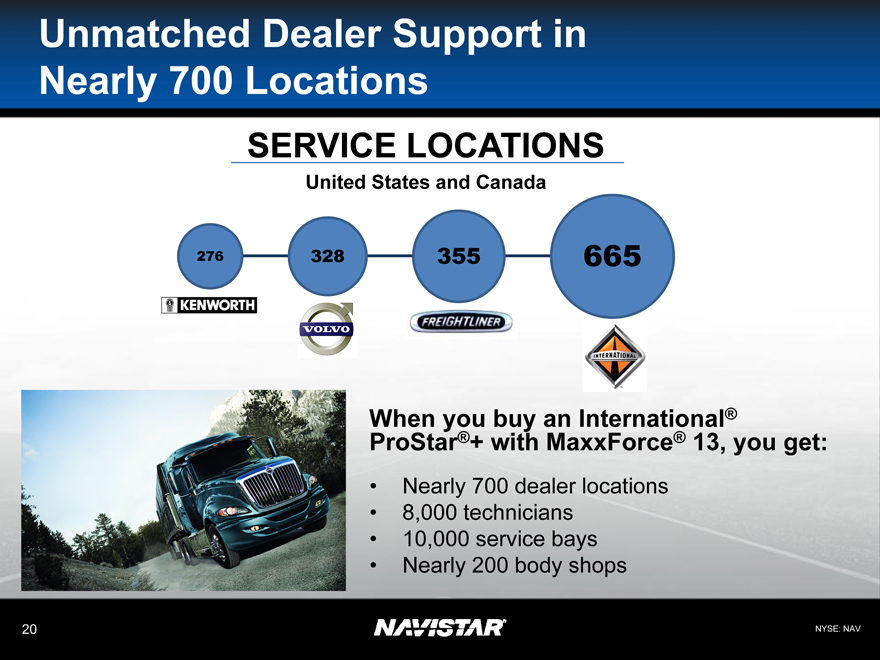
Unmatched Dealer Support in Nearly 700 Locations
SERVICE LOCATIONS
United States and Canada
276 328 355 665
When you buy an International® ProStar®+ with MaxxForce® 13, you get:
• Nearly 700 dealer locations
• 8,000 technicians
• 10,000 service bays
• Nearly 200 body shops
20
NYSE: NAV
|
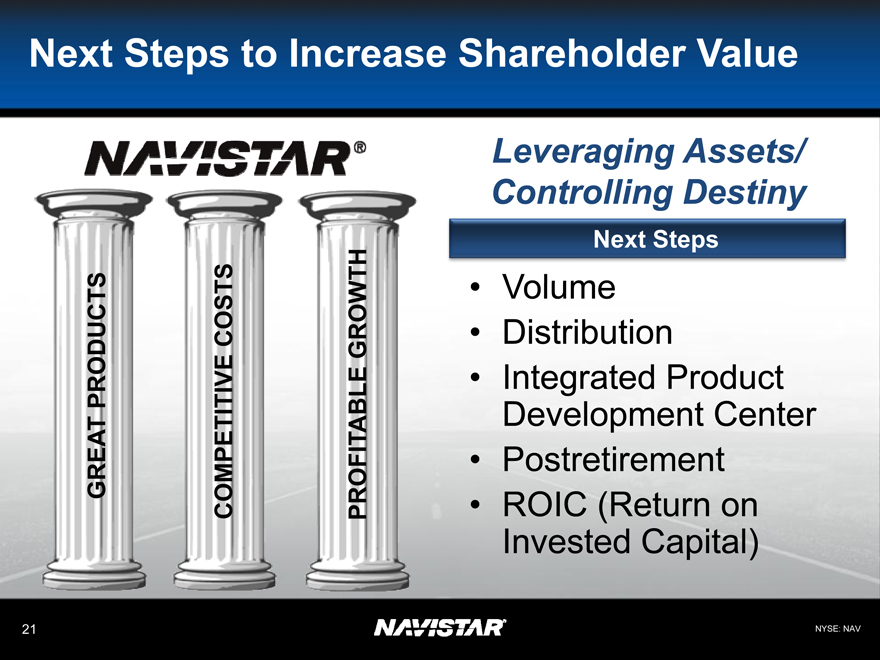
Next Steps to Increase Shareholder Value
GREAT PRODUCTS
COMPETITIVE COSTS
PROFITABLE GROWTH
Leveraging Assets/ Controlling Destiny
Next Steps
• Volume
• Distribution
• Integrated Product Development Center
• Postretirement
• ROIC (Return on Invested Capital)
21
NYSE: NAV
|
ROIC (Return of Invested Capital)
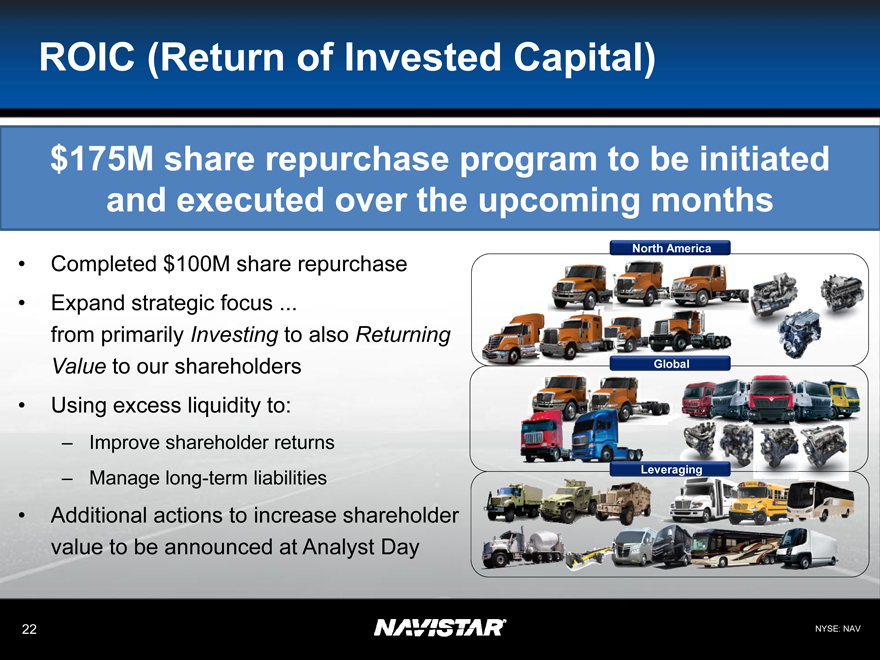
$175M share repurchase program to be initiated and executed over the upcoming months
• Completed $100M share repurchase
• Expand strategic focus... from primarily Investing to also Returning Value to our shareholders
• Using excess liquidity to:
– Improve shareholder returns
– Manage long-term liabilities
• Additional actions to increase shareholder value to be announced at Analyst Day
North America
Global
Leveraging
22
NYSE: NAV
|
Driving Shareholder Value
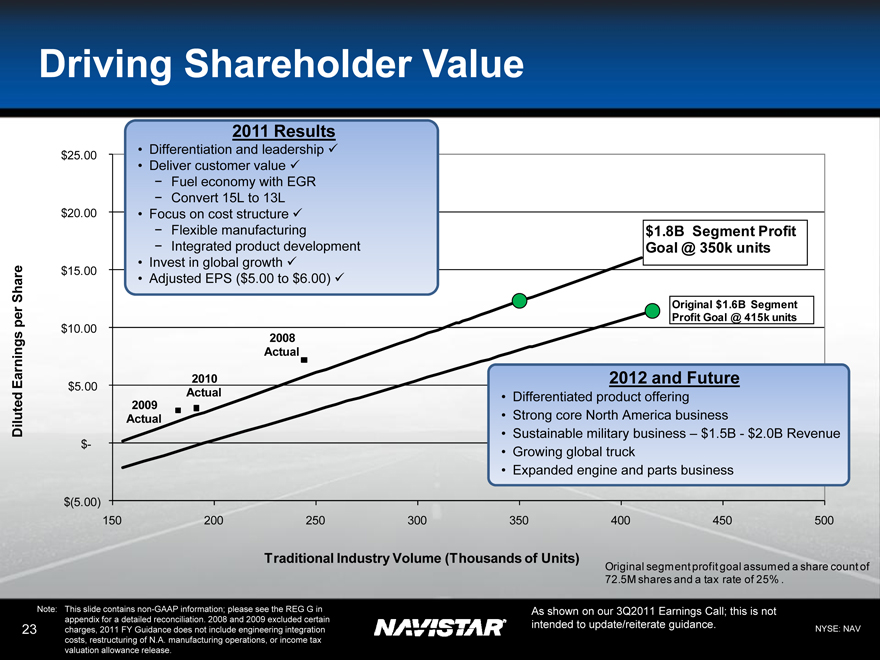
Diluted Earnings per Share
$25.00
$20.00
$15.00
$10.00
$5.00 $-
$(5.00)
150 200 250 300 350 400 450 500
2011 Results
• Differentiation and leadership
• Deliver customer value
Fuel economy with EGR
Convert 15L to 13L
• Focus on cost structure
Flexible manufacturing
Integrated product development
• Invest in global growth
• Adjusted EPS ($5.00 to $6.00)
$1.8B Segment Profit Goal @ 350k units
Original $1.6B Segment Profit Goal @ 415k units
2008 Actual
2010 Actual
2009 Actual
2012 and Future
• Differentiated product offering
• Strong core North America business
• Sustainable military business – $1.5B—$2.0B Revenue
• Growing global truck
• Expanded engine and parts business
Traditional Industry Volume (Thousands of Units)
Original segment profit goal assumed a share count of 72.5M shares and a tax rate of 25% .
Note: This slide contains non-GAAP information; please see the REG G in appendix for a detailed reconciliation. 2008 and 2009 excluded certain charges, 2011 FY Guidance does not include engineering integration costs, restructuring of N.A. manufacturing operations, or income tax valuation allowance release.
As shown on our 3Q2011 Earnings Call; this is not intended to update/reiterate guidance.
23
NYSE: NAV
|
Appendix
24
NYSE: NAV
|
Navistar Financial Corporation
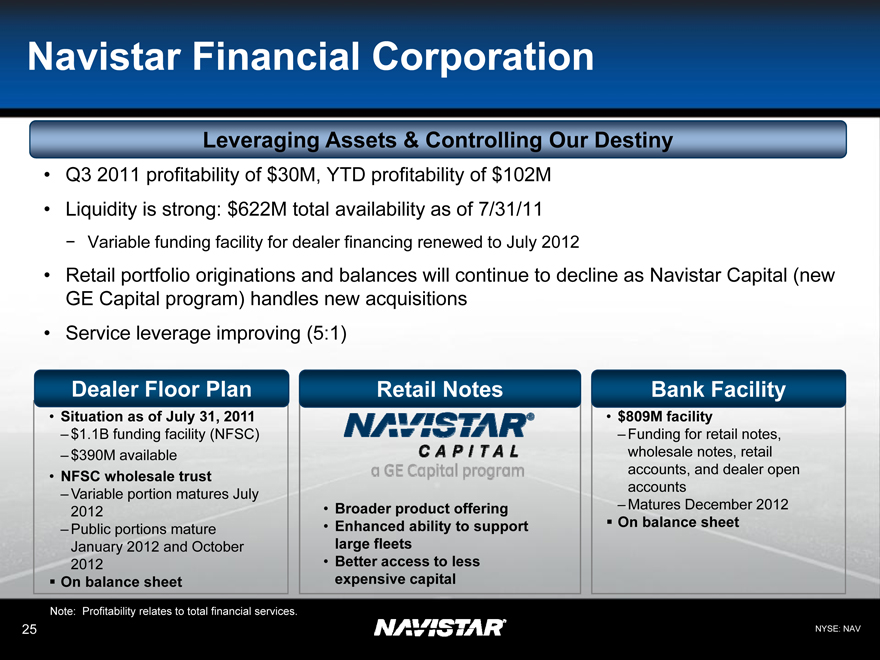
Leveraging Assets & Controlling Our Destiny
• Q3 2011 profitability of $30M, YTD profitability of $102M
• Liquidity is strong: $622M total availability as of 7/31/11
Variable funding facility for dealer financing renewed to July 2012
• Retail portfolio originations and balances will continue to decline as Navistar Capital (new GE Capital program) handles new acquisitions
• Service leverage improving (5:1)
Dealer Floor Plan
• Situation as of July 31, 2011
– $1.1B funding facility (NFSC)
– $390M available
• NFSC wholesale trust
– Variable portion matures July 2012
– Public portions mature January 2012 and October 2012
• On balance sheet
Retail Notes
• Broader product offering
• Enhanced ability to support large fleets
• Better access to less expensive capital
Bank Facility
• $809M facility
– Funding for retail notes, wholesale notes, retail accounts, and dealer open accounts
– Matures December 2012
• On balance sheet
Note: Profitability relates to total financial services.
25
NYSE: NAV
|
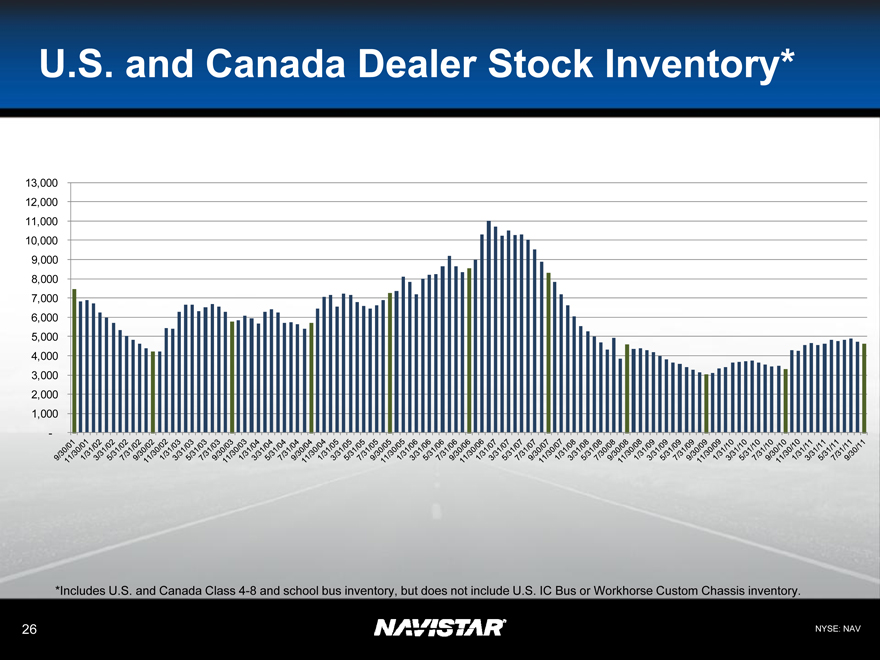
U.S. and Canada Dealer Stock Inventory*
13,000 12,000 11,000 10,000 9,000 8,000 7,000 6,000 5,000 4,000 3,000 2,000 1,000 -
9/30/01 11/30/01 1/31/02 3/31/02 5/31/02 7/31/02 9/30/02 11/30/02 1/31/03 3/31/03 5/31/03 7/31/03 9/30/03 11/30/03 1/31/04 3/31/04 5/31/04 7/31/04 9/30/04 11/30/04 1/31/05 3/31/05 5/31/05 7/31/05 9/30/05 11/30/05 1/31/06 3/31/06 5/31/06 7/31/06 9/30/06
11/30/06 1/31/07 3/31/07 5/31/07 7/31/07 9/30/07 11/30/07 1/31/08 3/31/08 5/31/08 7/30/08 9/30/08 11/30/08 1/31/09 3/31/09 5/31/09 7/31/09 9/30/09 11/30/09 1/31/10 3/31/10 5/31/10 7/31/10 9/30/10 11/30/10
1/31/11
3/31/11
5/31/11
7/31/11
9/30/11
*Includes U.S. and Canada Class 4-8 and school bus inventory, but does not include U.S. IC Bus or Workhorse Custom Chassis inventory.
26
NYSE: NAV
|
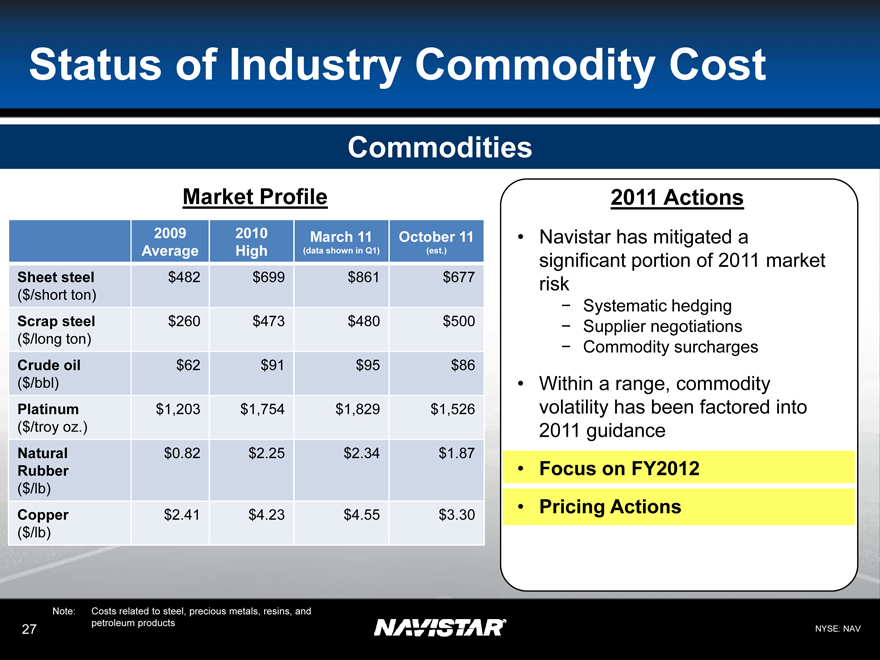
Status of Industry Commodity Cost
Commodities
Market Profile
2009 2010 March 11 October 11
Average High(data shown in Q1)(est.)
Sheet steel $482 $699 $861 $677
($/short ton)
Scrap steel $260 $473 $480 $500
($/long ton)
Crude oil $62 $91 $95 $86
($/bbl)
Platinum $1,203 $1,754 $1,829 $1,526
($/troy oz.)
Natural $0.82 $2.25 $2.34 $1.87
Rubber
($/lb)
Copper $2.41 $4.23 $4.55 $3.30
($/lb)
2011 Actions
• Navistar has mitigated a significant portion of 2011 market risk
—Systematic hedging
—Supplier negotiations
—Commodity surcharges
• Within a range, commodity volatility has been factored into 2011 guidance
• Focus on FY2012
• Pricing Actions
Note: Costs related to steel, precious metals, resins, and petroleum products
27
NYSE: NAV
|
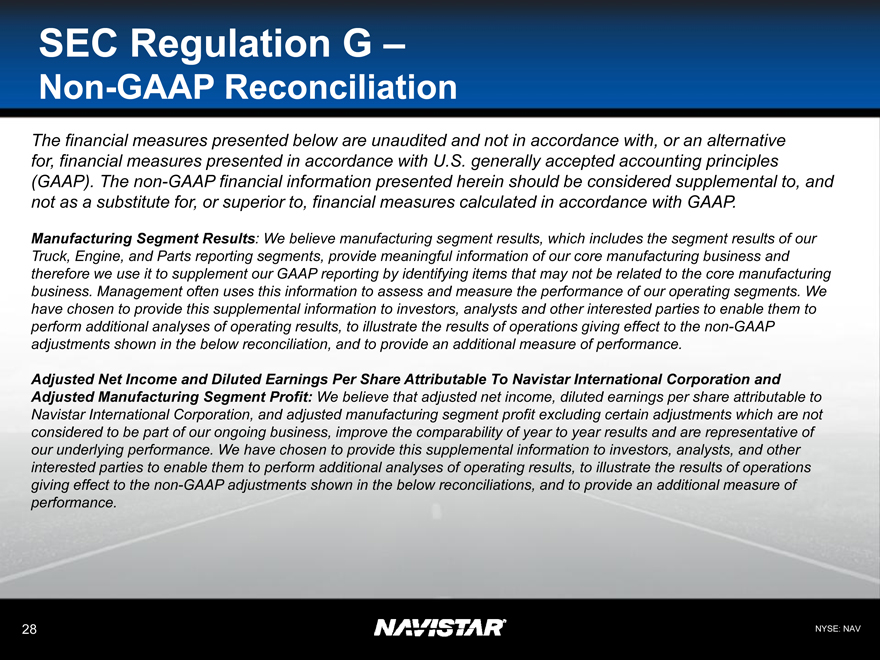
SEC Regulation G –
Non-GAAP Reconciliation
The financial measures presented below are unaudited and not in accordance with, or an alternative for, financial measures presented in accordance with U.S. generally accepted accounting principles (GAAP). The non-GAAP financial information presented herein should be considered supplemental to, and not as a substitute for, or superior to, financial measures calculated in accordance with GAAP.
Manufacturing Segment Results: We believe manufacturing segment results, which includes the segment results of our Truck, Engine, and Parts reporting segments, provide meaningful information of our core manufacturing business and therefore we use it to supplement our GAAP reporting by identifying items that may not be related to the core manufacturing business. Management often uses this information to assess and measure the performance of our operating segments. We have chosen to provide this supplemental information to investors, analysts and other interested parties to enable them to perform additional analyses of operating results, to illustrate the results of operations giving effect to the non-GAAP adjustments shown in the below reconciliation, and to provide an additional measure of performance.
Adjusted Net Income and Diluted Earnings Per Share Attributable To Navistar International Corporation and Adjusted Manufacturing Segment Profit: We believe that adjusted net income, diluted earnings per share attributable to Navistar International Corporation, and adjusted manufacturing segment profit excluding certain adjustments which are not considered to be part of our ongoing business, improve the comparability of year to year results and are representative of our underlying performance. We have chosen to provide this supplemental information to investors, analysts, and other interested parties to enable them to perform additional analyses of operating results, to illustrate the results of operations giving effect to the non-GAAP adjustments shown in the below reconciliations, and to provide an additional measure of performance.
28
NYSE: NAV
|
SEC Regulation G –
Non-GAAP Reconciliation
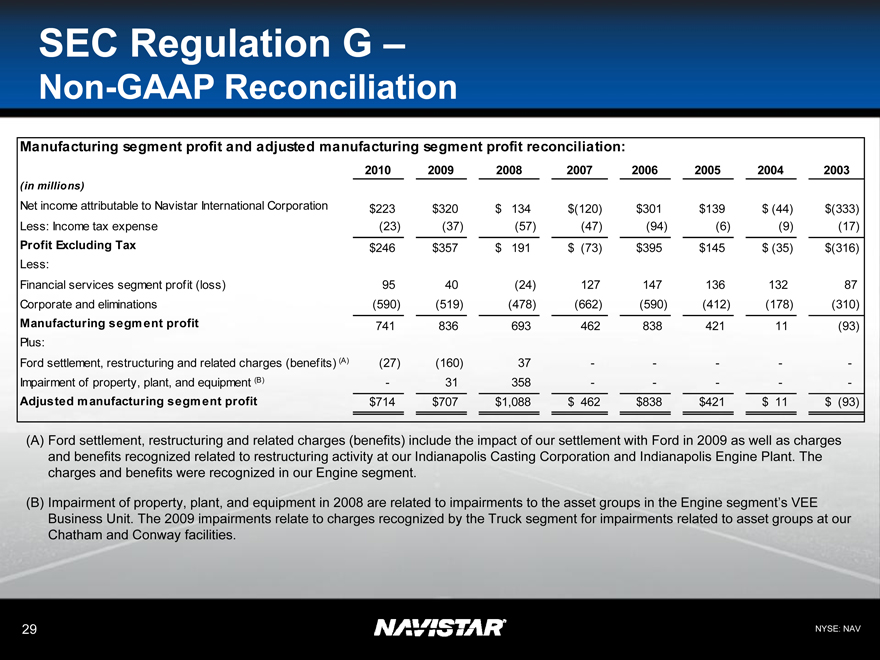
Manufacturing segment profit and adjusted manufacturing segment profit reconciliation:
2010 2009 2008 2007 2006 2005 2004 2003
(in millions)
Net income attributable to Navistar International Corporation $223 $320 $ 134 $(120) $301 $139 $ (44) $(333)
Less: Income tax expense(23)(37)(57)(47)(94)(6)(9)(17)
Profit Excluding Tax $246 $357 $ 191 $ (73) $395 $145 $ (35) $(316)
Less:
Financial services segment profit (loss) 95 40(24) 127 147 136 132 87
Corporate and eliminations(590)(519)(478)(662)(590)(412)(178)(310)
Manufacturing segment profit 741 836 693 462 838 421 11(93)
Plus:
Ford settlement, restructuring and related charges (benefits) (A)(27)(160) 37- - - - -
Impairment of property, plant, and equipment (B) - 31 358- - - - -
Adjusted manufacturing segment profit $714 $707 $1,088 $ 462 $838 $421 $ 11 $ (93)
(A) Ford settlement, restructuring and related charges (benefits) include the impact of our settlement with Ford in 2009 as well as charges and benefits recognized related to restructuring activity at our Indianapolis Casting Corporation and Indianapolis Engine Plant. The charges and benefits were recognized in our Engine segment.
(B) Impairment of property, plant, and equipment in 2008 are related to impairments to the asset groups in the Engine segment’s VEE Business Unit. The 2009 impairments relate to charges recognized by the Truck segment for impairments related to asset groups at our Chatham and Conway facilities.
29
NYSE: NAV
|
SEC Regulation G –
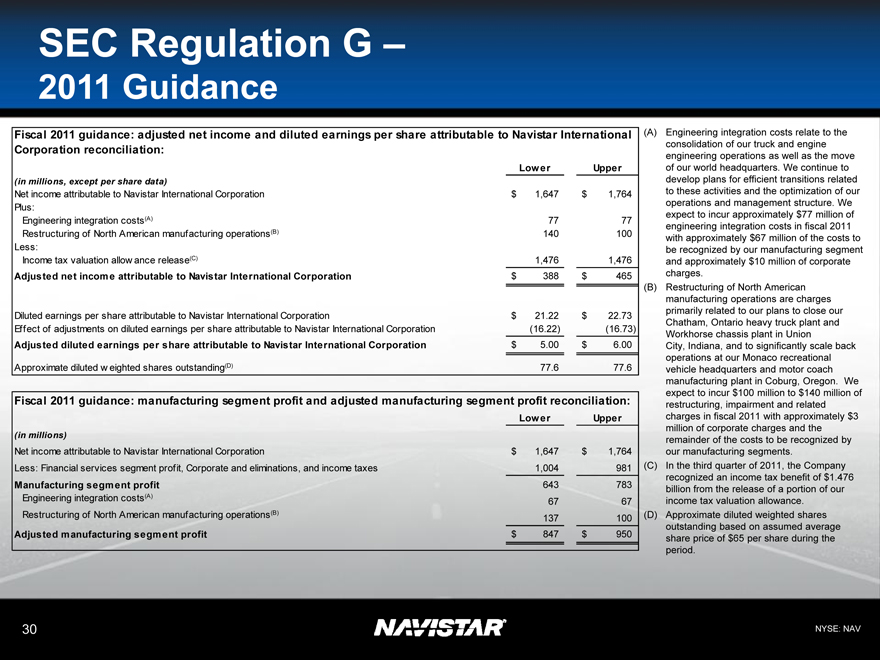
2011 Guidance
Fiscal 2011 guidance: adjusted net income and diluted earnings per share attributable to Navistar International
Corporation reconciliation:
Lower Upper
(in millions, except per share data)
Net income attributable to Navistar International Corporation $ 1,647 $ 1,764
Plus:
Engineering integration costs(A) 77 77
Restructuring of North American manufacturing operations(B) 140 100
Less:
Income tax valuation allowance release(C) 1,476 1,476
Adjusted net income attributable to Navistar International Corporation $ 388 $ 465
Diluted earnings per share attributable to Navistar International Corporation $ 21.22 $ 22.73
Effect of adjustments on diluted earnings per share attributable to Navistar International Corporation(16.22)(16.73)
Adjusted diluted earnings per share attributable to Navistar International Corporation $ 5.00 $ 6.00
Approximate diluted weighted shares outstanding(D) 77.6 77.6
Fiscal 2011 guidance: manufacturing segment profit and adjusted manufacturing segment profit reconciliation:
Lower Upper
(in millions)
Net income attributable to Navistar International Corporation $ 1,647 $ 1,764
Less: Financial services segment profit, Corporate and eliminations, and income taxes 1,004 981
Manufacturing segment profit 643 783
Engineering integration costs(A) 67 67
Restructuring of North American manufacturing operations(B) 137 100
Adjusted manufacturing segment profit $ 847 $ 950
(A) Engineering integration costs relate to the consolidation of our truck and engine engineering operations as well as the move of our world headquarters. We continue to develop plans for efficient transitions related to these activities and the optimization of our operations and management structure. We expect to incur approximately $77 million of engineering integration costs in fiscal 2011 with approximately $67 million of the costs to be recognized by our manufacturing segment and approximately $10 million of corporate charges.
(B) Restructuring of North American manufacturing operations are charges primarily related to our plans to close our Chatham, Ontario heavy truck plant and Workhorse chassis plant in Union City, Indiana, and to significantly scale back operations at our Monaco recreational vehicle headquarters and motor coach manufacturing plant in Coburg, Oregon. We expect to incur $100 million to $140 million of restructuring, impairment and related charges in fiscal 2011 with approximately $3 million of corporate charges and the remainder of the costs to be recognized by our manufacturing segments.
(C) In the third quarter of 2011, the Company recognized an income tax benefit of $1.476 billion from the release of a portion of our income tax valuation allowance.
(D) Approximate diluted weighted shares outstanding based on assumed average share price of $65 per share during the period.
NYSE: NAV
30
|
SEC Regulation G –
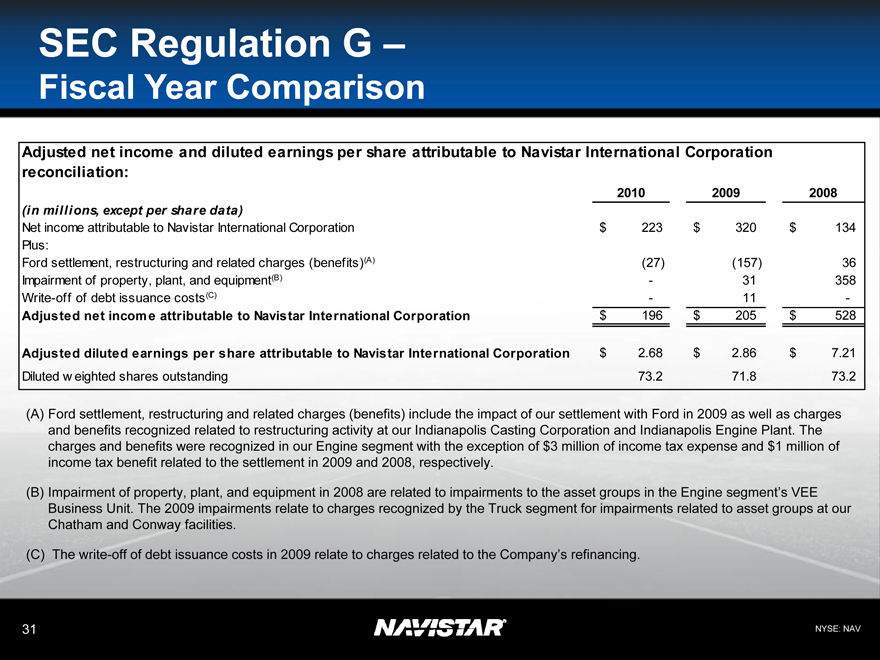
Fiscal Year Comparison
Adjusted net income and diluted earnings per share attributable to Navistar International Corporation reconciliation:
2010 2009 2008
(in millions, except per share data)
Net income attributable to Navistar International Corporation $ 223 $ 320 $ 134
Plus:
Ford settlement, restructuring and related charges (benefits)(A) (27) (157) 36
Impairment of property, plant, and equipment(B) - 31 358
Write-off of debt issuance costs(C) - 11 -
Adjusted net income attributable to Navistar International Corporation $ 196 $ 205 $ 528
Adjusted diluted earnings per share attributable to Navistar International Corporation $ 2.68 $ 2.86 $ 7.21
Diluted weighted shares outstanding 73.2 71.8 73.2
(A) Ford settlement, restructuring and related charges (benefits) include the impact of our settlement with Ford in 2009 as well as charges and benefits recognized related to restructuring activity at our Indianapolis Casting Corporation and Indianapolis Engine Plant. The charges and benefits were recognized in our Engine segment with the exception of $3 million of income tax expense and $1 million of income tax benefit related to the settlement in 2009 and 2008, respectively.
(B) Impairment of property, plant, and equipment in 2008 are related to impairments to the asset groups in the Engine segment’s VEE Business Unit. The 2009 impairments relate to charges recognized by the Truck segment for impairments related to asset groups at our Chatham and Conway facilities.
(C) The write-off of debt issuance costs in 2009 relate to charges related to the Company’s refinancing.
31
NYSE: NAV
|
SEC Regulation G –
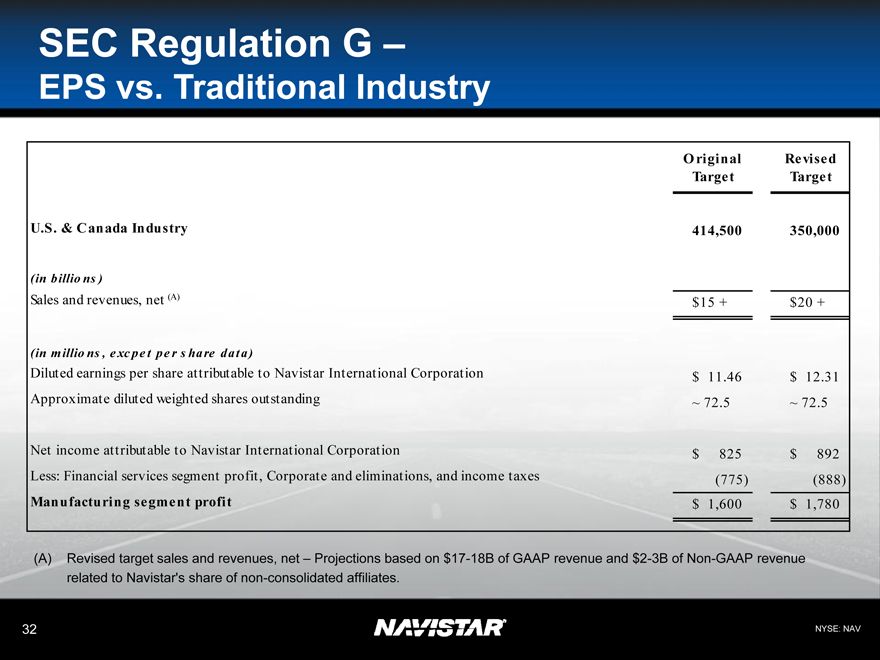
EPS vs. Traditional Industry
Original Revised
Target Target
U.S. & Canada Industry 414,500 350,000
(in billions)
Sales and revenues, net (A) $15 + $20 +
(in millions, excpet per share data)
Diluted earnings per share attributable to Navistar International Corporation $ 11.46 $ 12.31
Approximate diluted weighted shares outstanding ~ 72.5 ~ 72.5
Net income attributable to Navistar International Corporation $ 825 $ 892
Less: Financial services segment profit, Corporate and eliminations, and income taxes(775)(888)
Manufacturing segment profit $ 1,600 $ 1,780
(A) Revised target sales and revenues, net – Projections based on $17-18B of GAAP revenue and $2-3B of Non-GAAP revenue related to Navistar’s share of non-consolidated affiliates.
32
NYSE: NAV
