 4th Quarter 2011 Earnings Presentation December 20, 2011 Exhibit 99.2 |
 NYSE: NAV 2 2 Safe Harbor Statement Information provided and statements contained in this presentation that are not purely historical are forward-looking statements within the meaning of Section 27A of the Securities Act of 1933, as amended, Section 21E of the Securities Exchange Act of 1934, as amended, and the Private Securities Litigation Reform Act of 1995. Such forward-looking statements only speak as of the date of this presentation and the Company assumes no obligation to update the information included in this presentation. Such forward-looking statements include information concerning our possible or assumed future results of operations, including descriptions of our business strategy. These statements often include words such as “believe,” “expect,” “anticipate,” “intend,” “plan,” “estimate,” or similar expressions. These statements are not guarantees of performance or results and they involve risks, uncertainties, and assumptions. For a further description of these factors, see Item 1A, Risk Factors, included within our Form 10-K for the year ended October 31, 2011, which was filed on December 20, 2011, Although we believe that these forward-looking statements are based on reasonable assumptions, there are many factors that could affect our actual financial results or results of operations and could cause actual results to differ materially from those in the forward-looking statements. All future written and oral forward-looking statements by us or persons acting on our behalf are expressly qualified in their entirety by the cautionary statements contained or referred to above. Except for our ongoing obligations to disclose material information as required by the federal securities laws, we do not have any obligations or intention to release publicly any revisions to any forward- looking statements to reflect events or circumstances in the future or to reflect the occurrence of unanticipated events. |
 NYSE: NAV 3 4th Quarter 2011 Earnings Call Dec. 20, 2011 3 Other Cautionary Notes • The financial information herein contains audited and unaudited information and has been prepared by management in good faith and based on data currently available to the Company. • Certain Non-GAAP measures are used in this presentation to assist the reader in understanding our core manufacturing business. We believe this information is useful and relevant to assess and measure the performance of our core manufacturing business as it illustrates manufacturing performance without regard to selected historical legacy costs (i.e. pension and other postretirement costs). It also excludes financial services and other items that may not be related to the core manufacturing business or underlying results. Measures may also be adjusted to exclude certain adjustments which are not considered to be part of our ongoing business and are not representative of our underlying performance. Management often uses this information to assess and measure the underlying performance of our operating segments. We have chosen to provide this supplemental information to investors, analysts, and other interested parties to enable them to perform additional analyses of operating results. The Non-GAAP numbers are reconciled to the most appropriate GAAP number is in the appendix of this presentation. |
 NYSE: NAV 4 4th Quarter 2011 Earnings Call Dec. 20, 2011 4 Agenda • 2011 results • 4 th quarter results • Progress to longer term strategy and shareholder value • Balance sheet and return on capital |
 NYSE: NAV 5 4th Quarter 2011 Earnings Call Dec. 20, 2011 5 Actual Results vs. Guidance 2010 Actual 2011 Actual (adjusted non-GAAP) 2011 Guidance Revenue (Billions) $12.1 $14.0 $13.6 – $14.1 Manufacturing Segment Profit (Millions) $741 $882 $850 – $950 Profit Excluding Tax (Millions) $246 $471 $430 – $525 Net Income (Millions) $223 $402 $388 – $465 Diluted EPS $3.05 $5.28 $5.00 – $6.00 Note: This slide contains non-GAAP information; please see the REG G in appendix for a detailed reconciliation. • Supplier constraints mostly clear • Balanced supplier constraints with Latin America demand vs. U.S. demand • OPEB ruling — $9M • Adjusted tax rate ~15% vs. 10% in guidance |
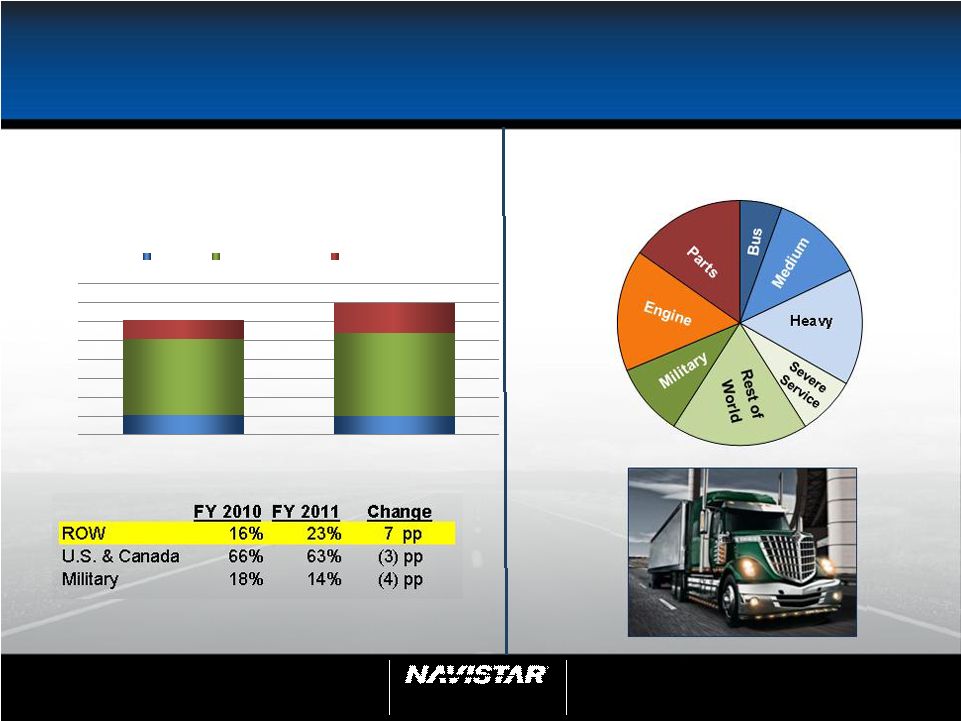 NYSE: NAV 6 4th Quarter 2011 Earnings Call Dec. 20, 2011 6 $2,151 $1,985 $8,034 $8,835 $1,960 $3,138 $- $2,000 $4,000 $6,000 $8,000 $10,000 $12,000 $14,000 $16,000 FY 2010 FY 2011 Revenue By Geographic Region Military U.S. & Canada ROW Revenue Growth and 2011 Highlights $12,145 $13,958 ($ in millions) Diversified Mfg. Revenue FY2011 Actual Revenues |
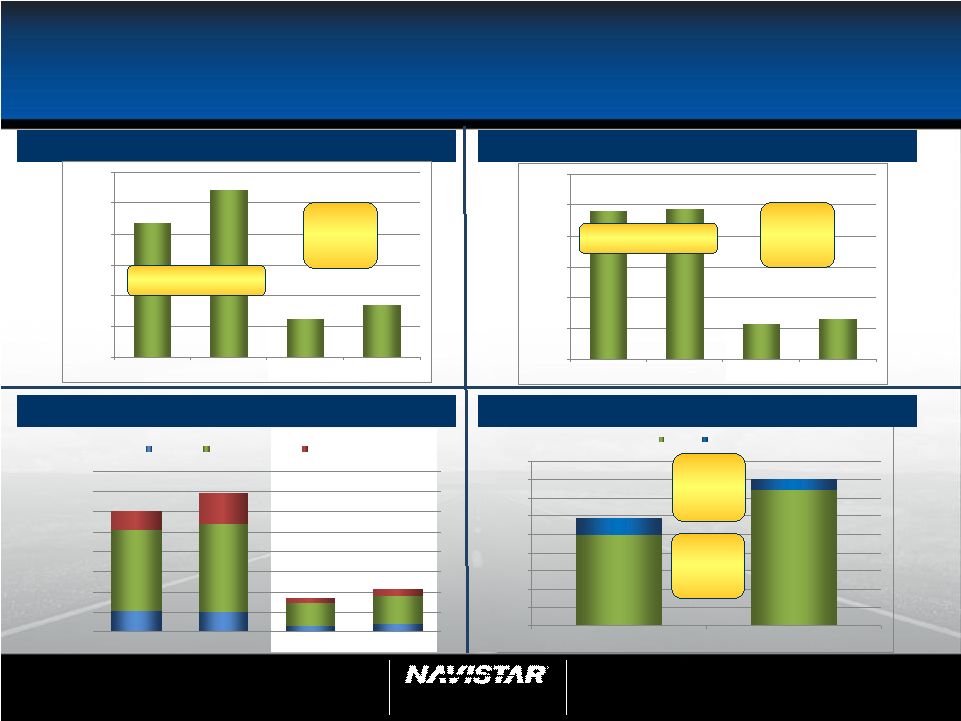
 NYSE: NAV 7 4th Quarter 2011 Earnings Call Dec. 20, 2011 7 Q4 & Full Year Financial Information: Profitable at all points in the cycle Q4 & Yearly Adj. Manufacturing Segment Profit ($ in millions) Q4 & Yearly Earnings Per Share (2011 = adjusted non-GAAP) Q4 & Yearly Adj. Manufacturing Segment Profit as a % of Total Revenue Q4 & Full Year ($ in millions) FY2010 FY2011 Q4 2010 Q4 2011 Military Revenue $2,151 $1,985 $591 $805 Truck $1,820 $1,655 $495 $745 Parts $331 $330 $96 $60 World Wide Chargeouts 87,000 108,400 24,900 34,400 Engine Volume 240,400 243,600 57,600 65,400 Product Development* $464 $515 $126 $115 *excludes engineering integration $3.05 $5.28 $0.61 $3.37 $- $1.00 $2.00 $3.00 $4.00 $5.00 $6.00 FY 2010 FY 2011 Q4 2010 Q4 2011 $741 $882 $146 $455 $- $100 $200 $300 $400 $500 $600 $700 $800 $900 $1,000 FY 2010 FY 2011 Q4 2010 Q4 2011 Note: This slide contains non-GAAP information; please see the REG G in appendix for a detailed reconciliation. 6.1% 6.3% 4.3% 10.5% 0.0% 2.0% 4.0% 6.0% 8.0% 10.0% 12.0% FY 2010 FY 2011 Q4 2010 Q4 2011 |
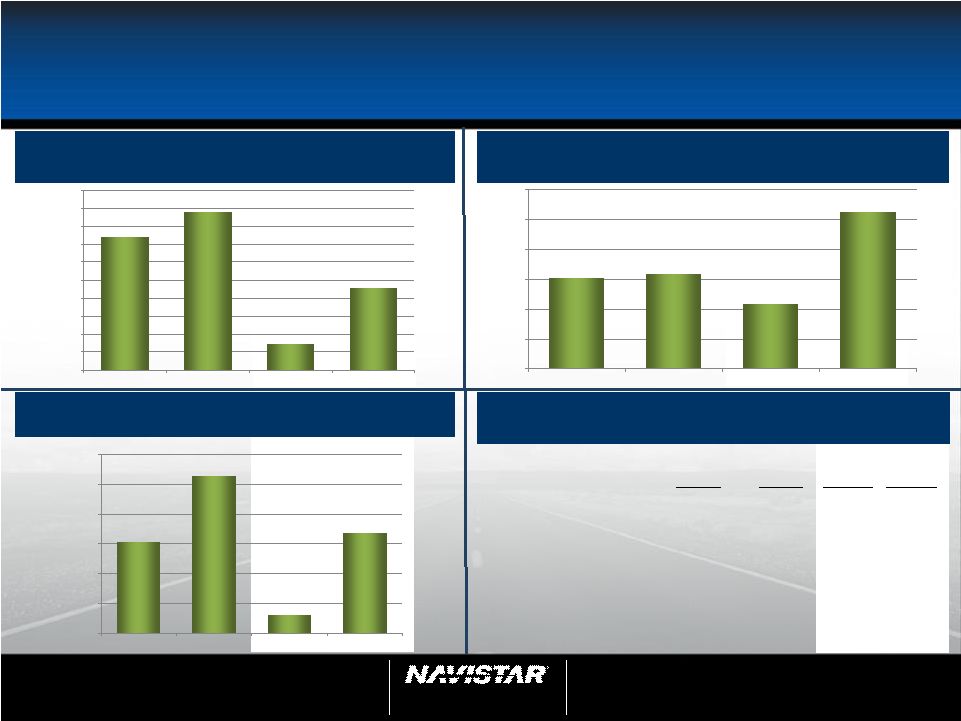
 NYSE: NAV 8 4th Quarter 2011 Earnings Call Dec. 20, 2011 Q4 and Full Year Operational Results Consolidated Revenues ($ in millions) Yearly and Quarterly Truck Chargeouts Yearly and Quarterly Engine Shipments 87,000 108,400 24,900 34,400 0 20,000 40,000 60,000 80,000 100,000 120,000 FY 2010 FY 2011 Q4 2010 Q4 2011 Chargeouts increased 25% Chargeouts increased 38% 240,400 243,600 57,600 65,400 0 50,000 100,000 150,000 200,000 250,000 300,000 FY 2010 FY 2011 Q4 2010 Q4 2011 Shipments increased 14% Engine shipments increased 1% $2,151 $1,985 $591 $805 $8,034 $8,835 $2,282 $2,811 $1,960 $3,138 $499 $707 $- $2,000 $4,000 $6,000 $8,000 $10,000 $12,000 $14,000 $16,000 FY 2010 FY 2011 Q4 2010 Q4 2011 Military U.S. & Canada ROW $12,145 $13,958 $3,372 $4,323 $495 $745 $96 0 100 200 300 400 500 600 700 800 900 Q4 2010 Q4 2011 Truck Parts $591 $805 $60 Military Revenues ($ in millions) Truck Revenues increased 51% Parts Revenues decreased 38% |
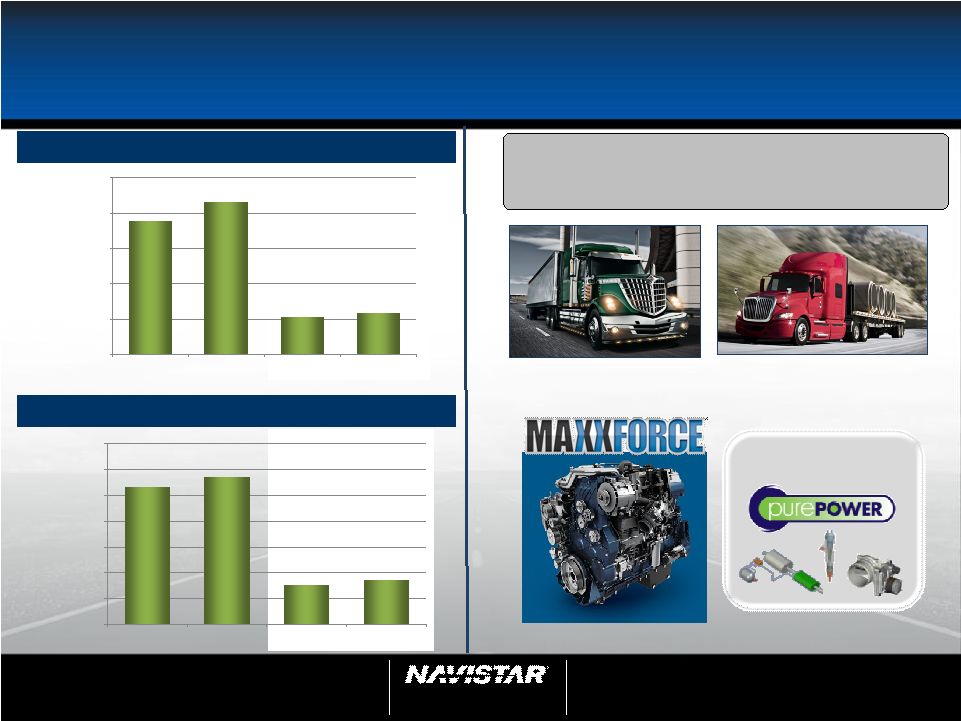
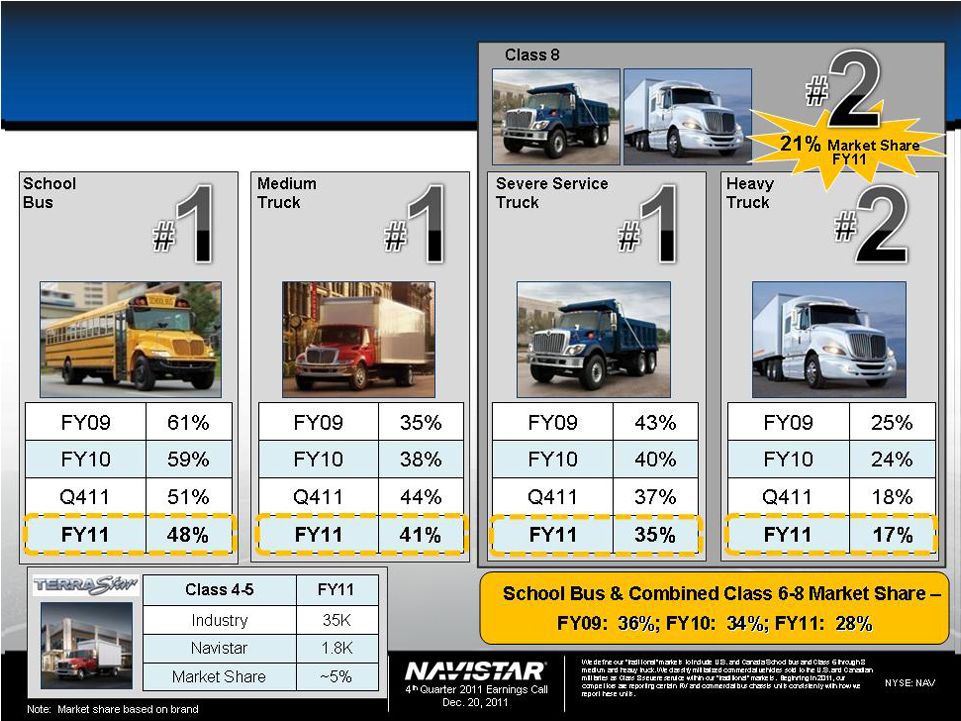 Great Products – Market Share (U.S. & Canada) 9 |
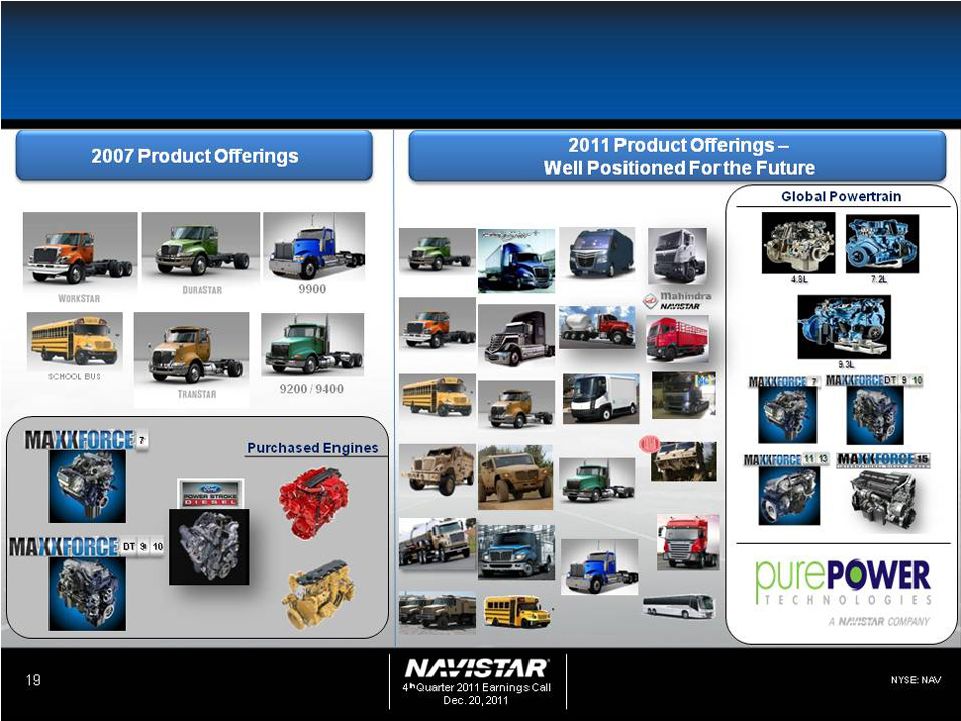
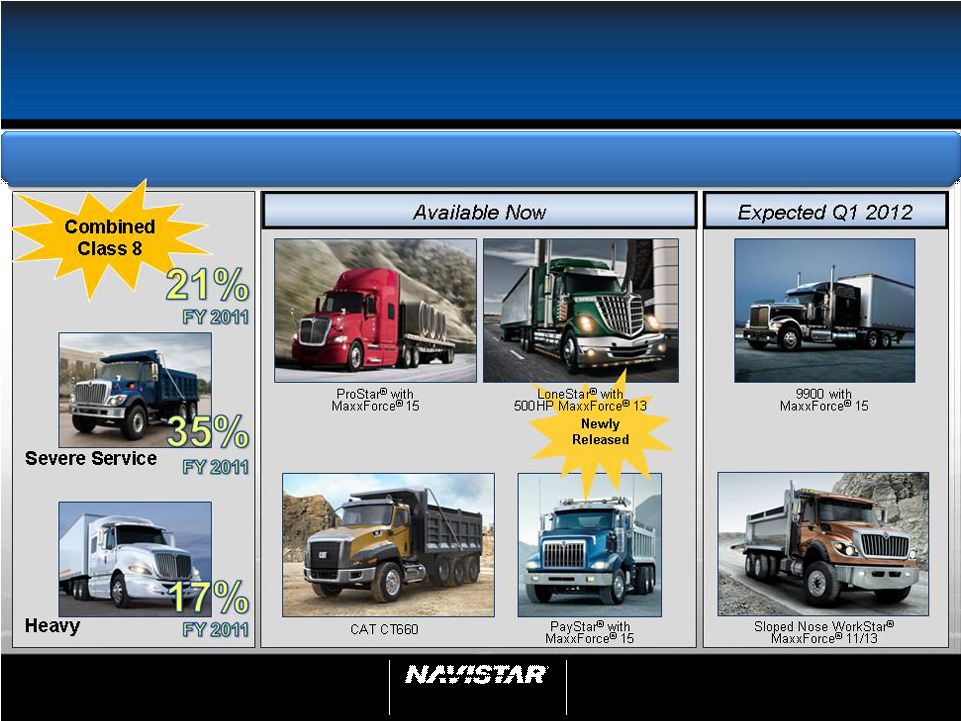 NYSE: NAV 10 4th Quarter 2011 Earnings Call Dec. 20, 2011 10 Continue to Broaden Product Offering U.S. and Canada Heavy Strategy – Launch of Derivative Products |
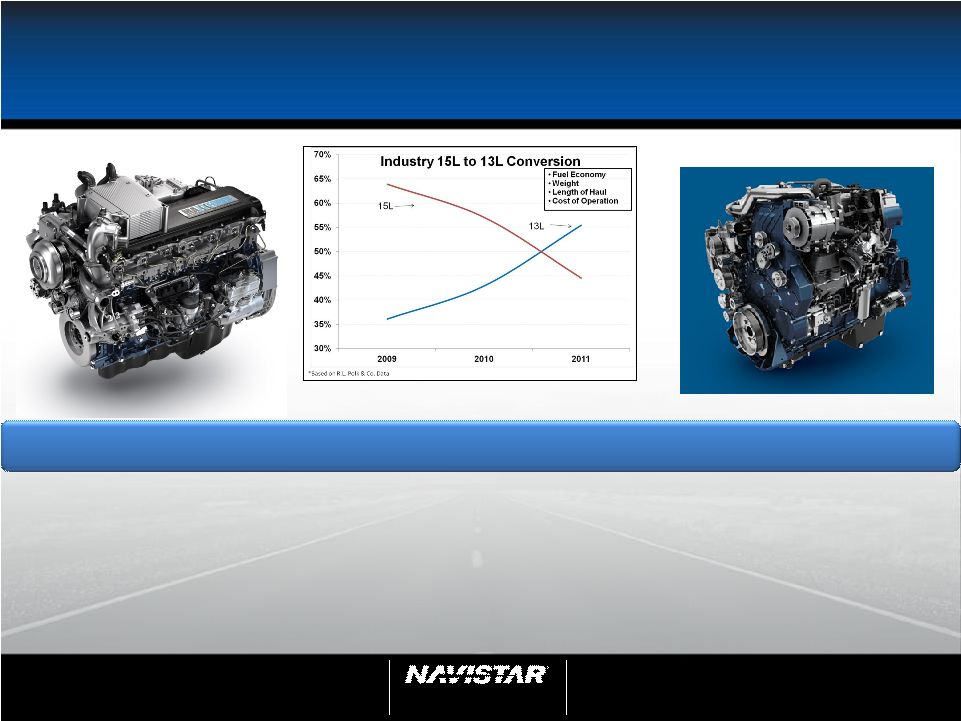 NYSE: NAV 11 4th Quarter 2011 Earnings Call Dec. 20, 2011 11 Industry has Shifted to 13L Engines “We used to be a 100% big-bore company, but we’ve been changing that recently to where, by the end of this year, we’ll be 45% in the 13-liter range. We look at this as adding up to 800 more pounds of freight, because the smaller engines weigh 600 to 800 pounds less than a 15-liter.” -VP Maintenance, Fleet A “We’re converting our entire fleet of 240 tractors from 15-liters to 13-liters. We ran tests before deciding. We’ve got 100 13- liters so far, and they’re operating great, at good fuel savings.” -Director of OTR Maintenance, Fleet B 13L 13L 15L 15L Source: Global Intelligence Alliance, R.L. Polk & Co. Navistar has led the conversion from 15L to 13L engines |
 NYSE: NAV 12 4th Quarter 2011 Earnings Call Dec. 20, 2011 12 Over $3 Billion in Global Revenue • ROW external engine sales of $1.6B • Record year Latin America (Units) (This represents retail deliveries) TranStar ® WorkStar ® ProStar ® Rest of World (ROW) Engine** - 2,000 4,000 6,000 8,000 10,000 12,000 FY 2010 FY 2011 3,000 >10,000 Global Truck Units* (Outside U.S./Canada) 40T/49T 25T Tipper 0 20,000 40,000 60,000 80,000 100,000 120,000 140,000 160,000 FY 2009 FY 2010 FY 2011 CT610 CT630 **This chart only reflects unit sales in South America. |
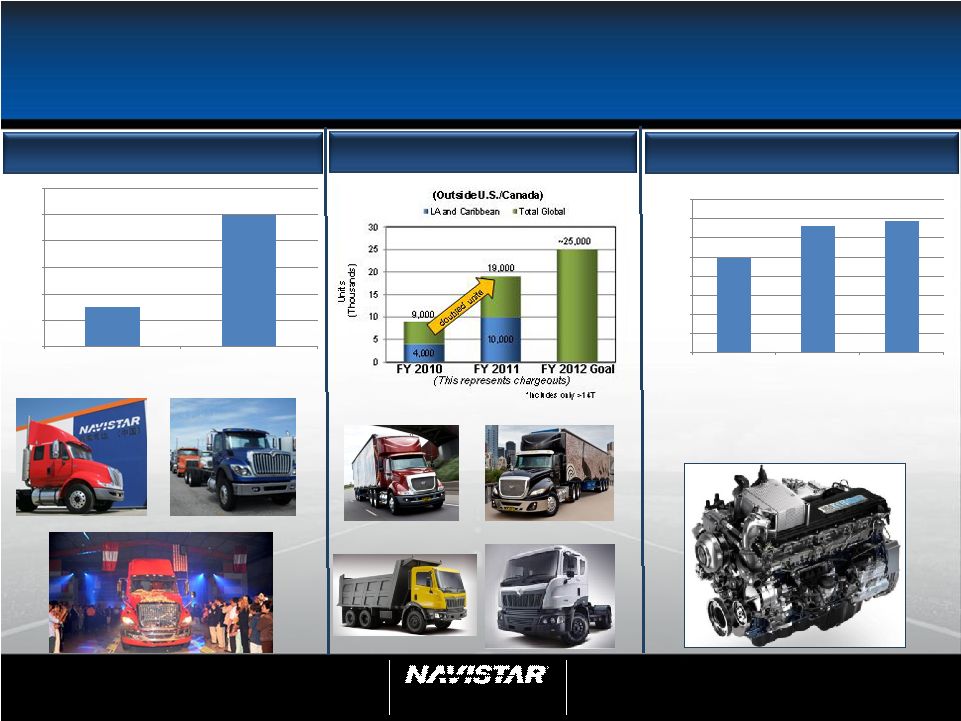
 NYSE: NAV 13 4th Quarter 2011 Earnings Call Dec. 20, 2011 13 RPG Net System Technical Support Sustainment Sustainable Military Business 2008 2009 2010 2011 > $2B > $2B > $2B ~$2B MilCOTS TACOM FSRs MXT MRAP Family of Vehicles ATX |
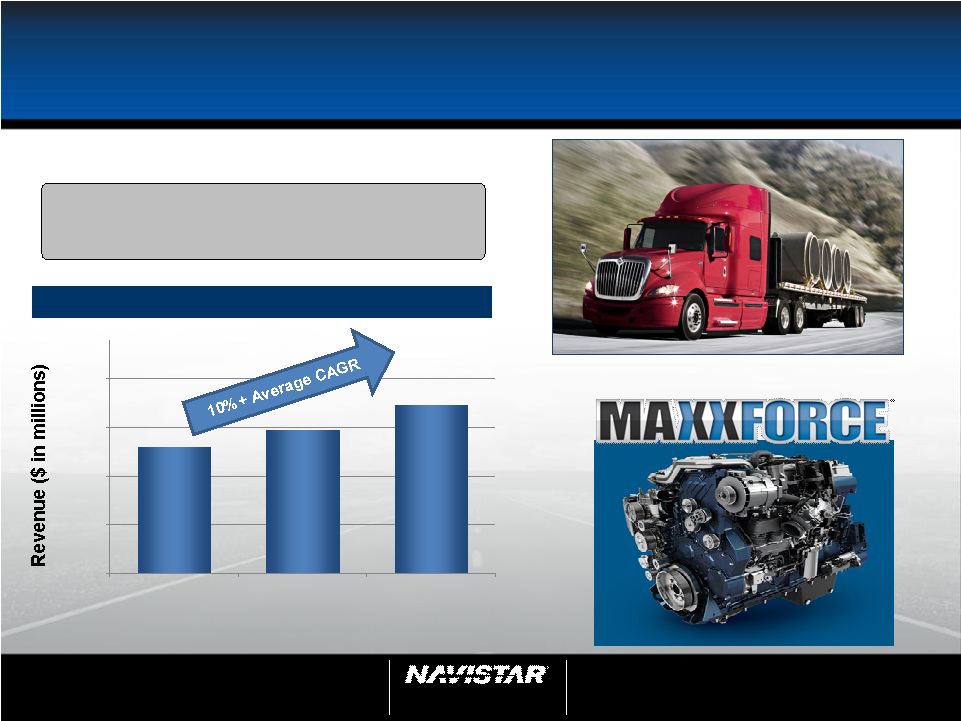
 NYSE: NAV 14 4 th Quarter 2011 Earnings Call Dec. 20, 2011 Parts Growth - Q4 and Full Year Financials Record Sales in 2011 Segment Profit ($ in millions) Yearly and Quarterly Revenues ($ in millions) ProStar+ ® with MaxxForce ® 15 LoneStar ® with MaxxForce ® 13 Components MaxxForce ® 15 $1,885 $2,155 $531 $582 $- $500 $1,000 $1,500 $2,000 $2,500 FY 2010 FY 2011 Q4 2010 Q4 2011 $266 $287 $77 $87 $- $50 $100 $150 $200 $250 $300 $350 FY 2010 FY 2011 Q4 2010 Q4 2011 Realize benefits of Truck and Engine integration strategy |
 NYSE: NAV 15 4th Quarter 2011 Earnings Call Dec. 20, 2011 Prior Guidance Prior Guidance FY 2011 Actual FY 2011 Actual 2011 Business Drivers 2011 Business Drivers • Industry recovering (240K – 260K) • Industry (262K) Heavy , Class 6-7 • Maintain Market Share – back-end loaded • Market share – Medium up, SS up, Long haul still improving • Military $1.5B - $2.0B Revenue • Military – ~$2.0B Revenue • Global investing to profitable • “Total” Global – breakeven • 15L launch • 15L Launch – launched in March • Engineering slightly up • Engineering – up • Engine segment profitability – ~$100M (back end loaded) • Engine segment profitability – $84M • Adjusted manufacturing segment profit – $1 B • Adjusted manufacturing segment profit – $882M • Tax rate – guidance was 10%-11% • Tax rate – actual ~15% • Adjusted EPS – $5.00 to $6.00 • Adjusted EPS – $5.28 • Manufacturing Cash – $1.2B - $1.4B • Manufacturing Cash – $1.2B (includes $125M share repurchase) 2011 One-Time Items 2011 One-Time Items • Engineering integration • Engineering integration – on track • Manufacturing • Manufacturing – Chatham, Monaco and Workhorse • Valuation allowance • Valuation allowance • OPEB ruling What We Said: Note: This slide contains non-GAAP information; please see the REG G in appendix for a detailed reconciliation. Note: Manufacturing Cash = Cash and cash equivalents plus marketable securities from the manufacturing operations |
 NYSE: NAV 16 4th Quarter 2011 Earnings Call Dec. 20, 2011 16 A. J. Cederoth – EVP & CFO • Year-end Balance Sheet • Strategy • Manufacturing Segment Profit • Thoughts for FY 2012 |
 NYSE: NAV 17 4th Quarter 2011 Earnings Call Dec. 20, 2011 17 Manufacturing Cash & Financing Actions • Parent Company (NIC) - Asset Backed Loan (ABL) – Increased from $200M to $355M – 5-year deal maturing in November 2016 • Financial Services (NFC) – Bank Facility - New 5-year $840M bank credit facility • Share Repurchase Program – $125M of shares repurchased in FY 2011 – ~3.7M shares repurchased in CY 2011 through December 20th Financing Actions Manufacturing Cash – Q4 Only Note: This slide contains non-GAAP information; please see the REG G in appendix for a detailed reconciliation. ($ in millions) Adjusted MFG EBITDA – Q4 Only $ 346 Change in Net Working Capital 175 Capital Expenditures (138) Share Repurchases (114) Intercompany & Other (96) Net Cash Flow – Q4 Only $ 173 Beginning MFG Cash Balance – July 31, 2011 $ 1,013 Ending MFG Cash Balance – October 31, 2011 $ 1,186 |
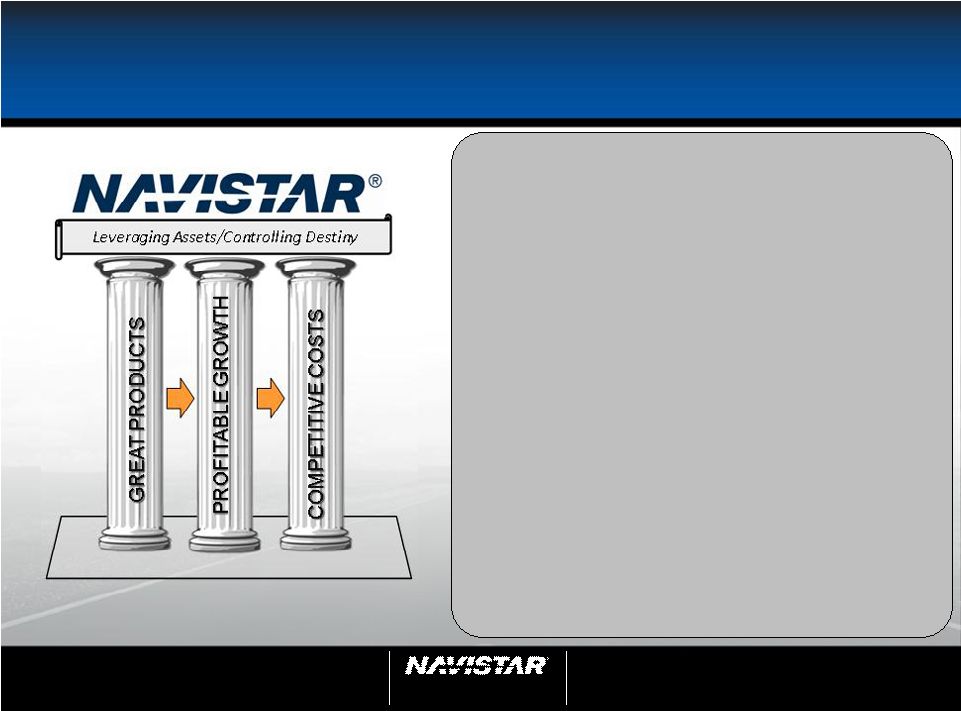
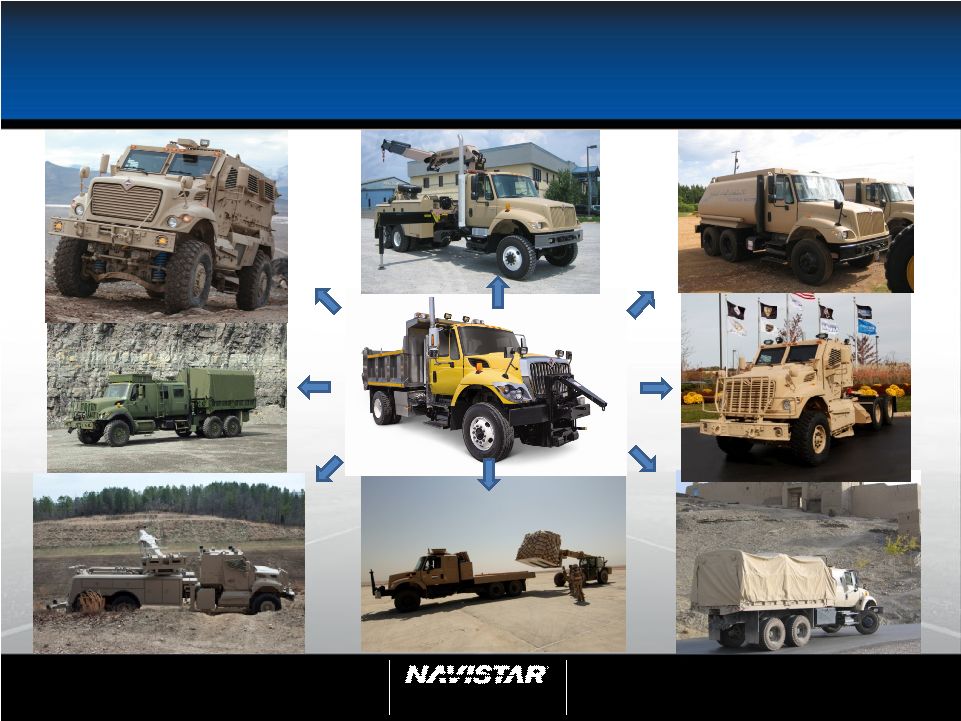
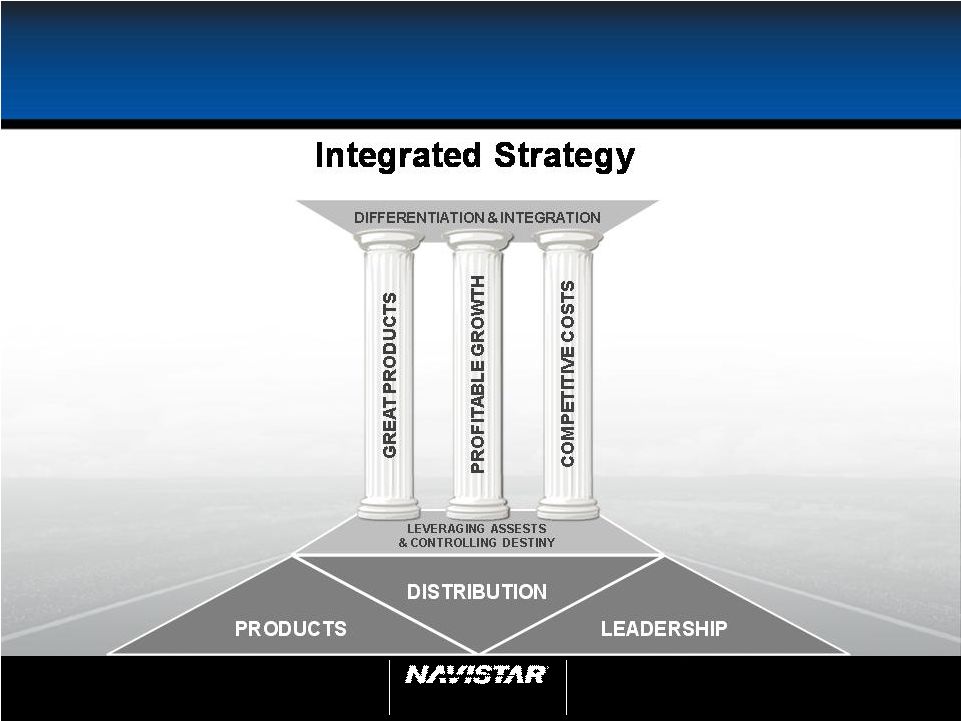 NYSE: NAV 18 4th Quarter 2011 Earnings Call Dec. 20, 2011 18 Strategy: Leveraging What We Have and What Others Have Built |
 Leader in Integrated Products, Technology and Innovation |
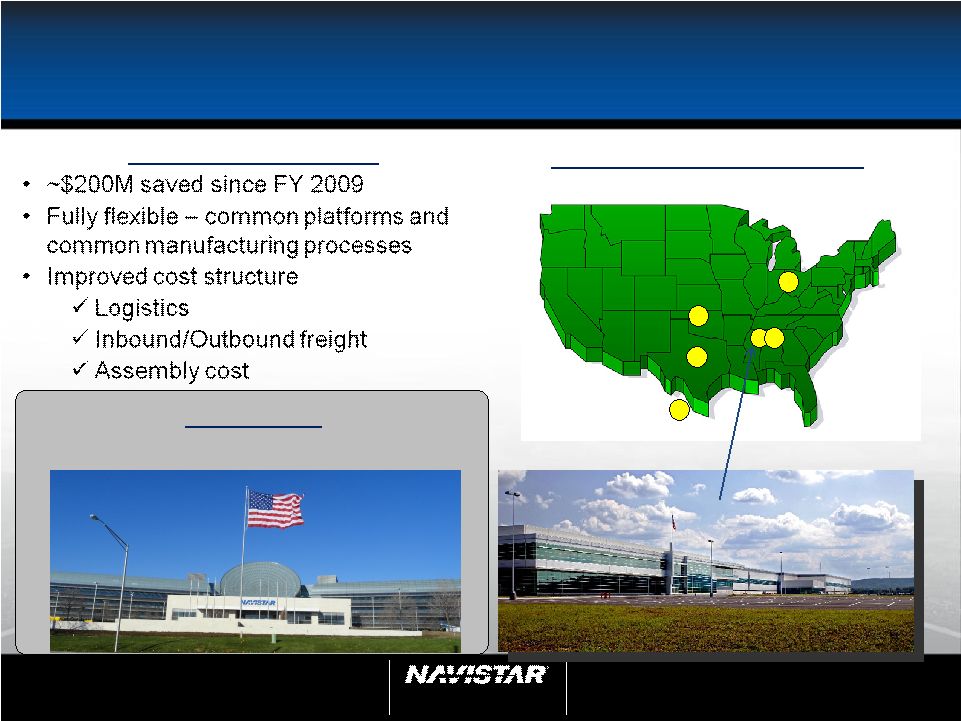 NYSE: NAV 20 4th Quarter 2011 Earnings Call Dec. 20, 2011 20 Cost Reduction Improved margins and lowered break-even volume Manufacturing Flexibility Manufacturing Cost Alabama Assembly Plant, Cherokee, AL Lisle, IL • Integrated Product Development Center In-Process AAP TAP GAP EAP SAP HEP |
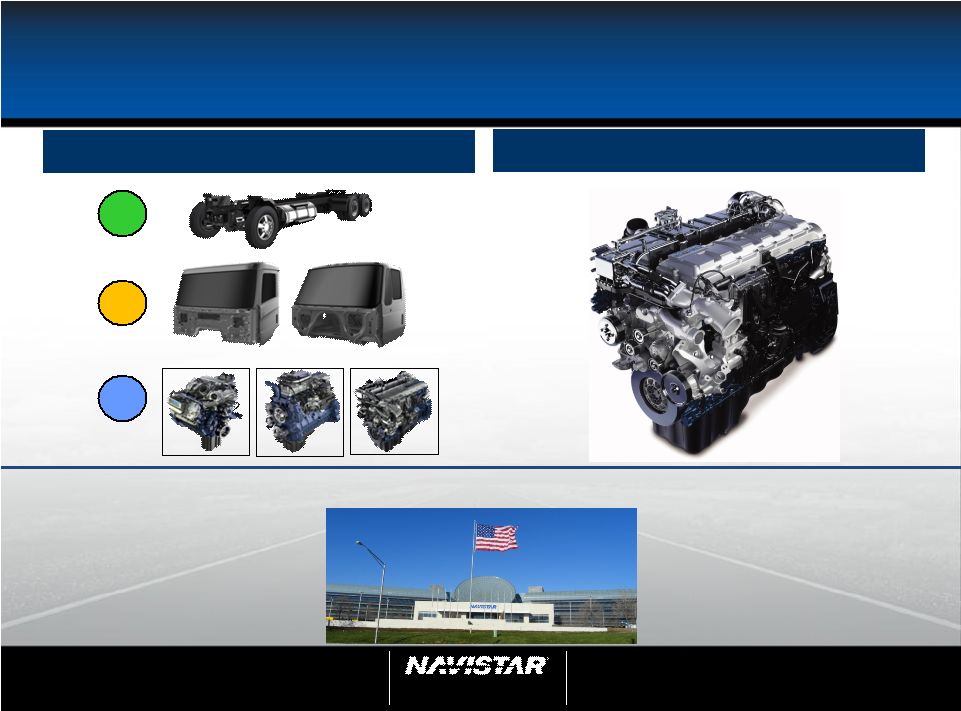 NYSE: NAV 21 4th Quarter 2011 Earnings Call Dec. 20, 2011 21 Competitive Cost Structure Leveraging Assets/Controlling Destiny 2 1 3 Scale 1-2-3 Big Bore Engines 21 Integrated Product Development Integrated Product Development |
 NYSE: NAV 22 4th Quarter 2011 Earnings Call Dec. 20, 2011 22 Leveraging our Assets and Integration |
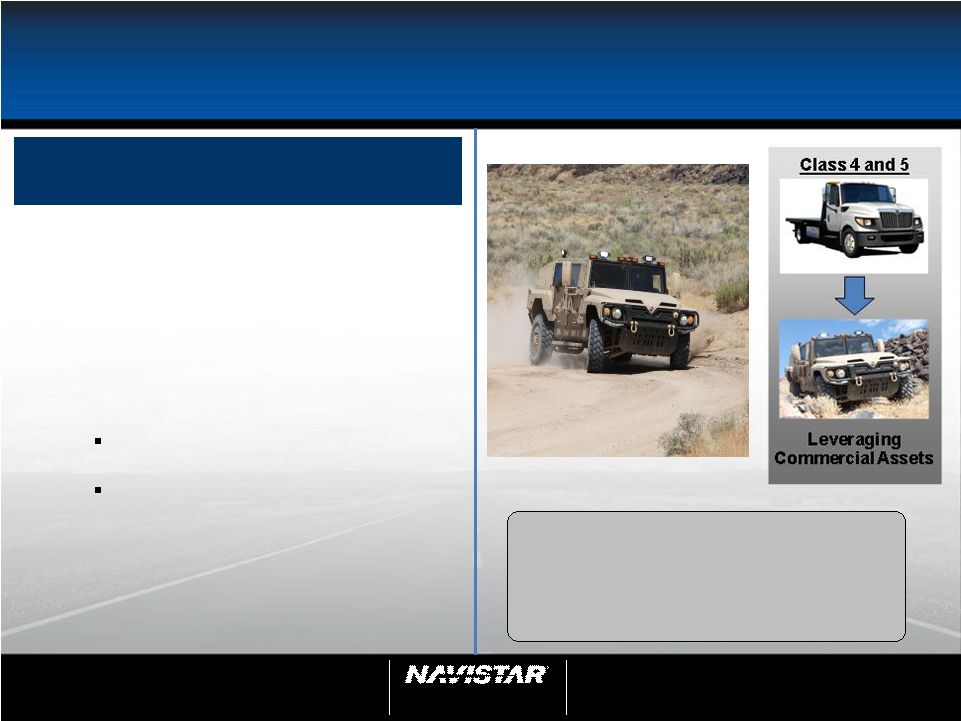 NYSE: NAV 23 4th Quarter 2011 Earnings Call Dec. 20, 2011 23 Leveraging our Assets and Integration Impressive in Testing Saratoga – production ready Positioned for dealing with budget constraints • Era of efficiency - government will look to industry for: – Higher quality – Lower cost – Quicker development • Opportunities - ND participates in 26 countries and growing Afghan Security Forces (9,000+ units already in service) Middle East (Saudi Arabia, Iraq, etc.) - Sustainment of existing vehicle fleets will continue (increase) - Field service reps./parts and service - Reset Opportunities HMMWV MECV - Production 2013 JLTV - Production 2018 JLTV – Joint Light Tactical Vehicle MATV – MRAP (Mine Resistant Ambush Protection) All-Terrain Vehicle HMMWV MECV – High Mobility Multipurpose Wheeled Vehicle Modernized Expanded Capacity Vehicle |
 NYSE: NAV 24 4th Quarter 2011 Earnings Call Dec. 20, 2011 24 $0 $500 $1,000 $1,500 $2,000 2009 2010 2011 Parts – Positioned for Continued Growth (U.S., Canada, Mexico, excludes Military) North American Parts Sales ProStar+ ® with MaxxForce ® 15 Integrated Product Development Integrated Product Development Realize benefits of Truck and Engine integration strategy |
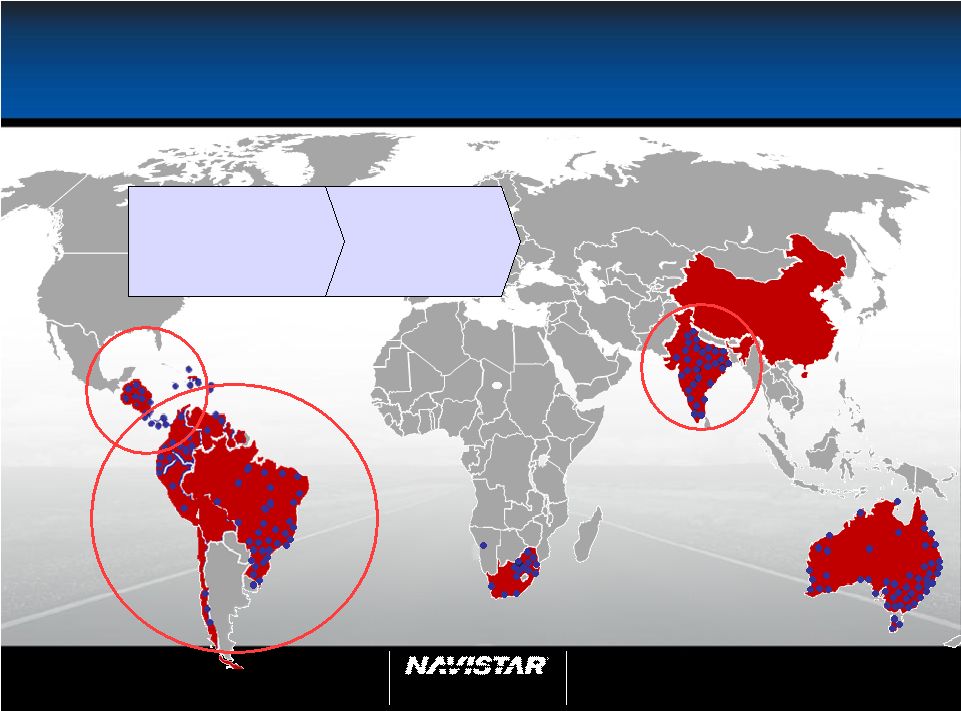 NYSE: NAV 25 4th Quarter 2011 Earnings Call Dec. 20, 2011 25 Global Growth 2011 471 Dealers & Service Points 2007 ~35 Active Dealers |
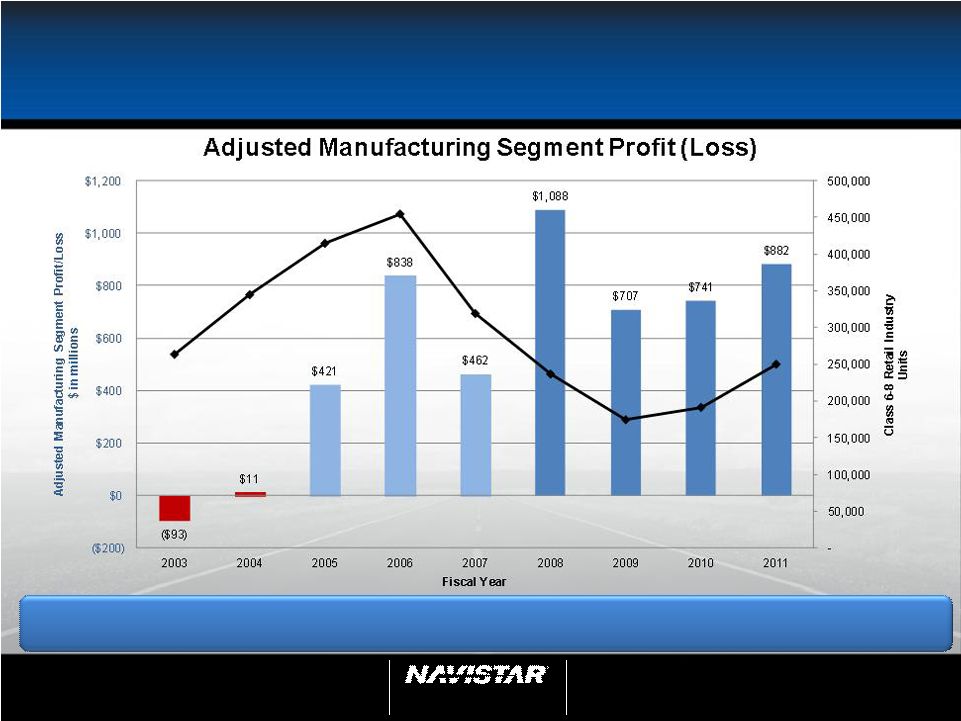 NYSE: NAV 26 4th Quarter 2011 Earnings Call Dec. 20, 2011 26 Adjusted Manufacturing Segment Profit Improved segment profit on lower retail industry volume Note: This slide contains non-GAAP information; please see the REG G in appendix for a detailed reconciliation. |
 NYSE: NAV 27 4th Quarter 2011 Earnings Call Dec. 20, 2011 27 Thoughts for FY 2012 2011 Actual (Adjusted Non- GAAP) 2012 - Outlook Revenue (in Billions) $14.0 • Industry expands – 275-310K • Global Revenue – increasing • Military/Defense spending Manufacturing segment profit (in Millions) $882 • Core businesses – margin improvement • Parts – continued growth • Global business profitability Profit excluding tax (in Millions) $471 • OPEB – cost increasing • NFC – normalized earnings Net income (in Millions) $402 • Tax rate – GAAP vs. cash Diluted EPS $5.28 • Updated at Analyst Day Note: This slide contains non-GAAP information; please see the REG G in appendix for a detailed reconciliation. |
 NYSE: NAV 28 4th Quarter 2011 Earnings Call Dec. 20, 2011 28 Navistar’s Investor & Analyst Day Investor & Analyst Day Reservation Required The U.S. Department of Treasury's Office of Foreign Asset Control (“OFAC”) requires Navistar to screen all potential foreign visitors to its U.S. facilities. If you are a non-U.S. citizen, an additional form needs to be filled out and returned no later than 1/11/2012. Wed., Feb. 1, 2012 Integrated Product Development Center 2701 Navistar Dr., Lisle, IL 10:30 a.m. – 3:00 p.m. CST Webcast will begin at 11 a.m. CST Lunch & Presentation with Q&A Reservation Required by 1/11/2012 RSVP with Suzanne Sorensen at Suzanne.Sorensen@Navistar.com |
 NYSE: NAV 29 4th Quarter 2011 Earnings Call Dec. 20, 2011 Appendix |
 NYSE: NAV 30 4th Quarter 2011 Earnings Call Dec. 20, 2011 30 Market Share – U.S. & Canada School Bus and Class 6-8 Traditional Market Share Q1 Q2 Q3 Q4 Full Year Q1 Q2 Q3 Q4 Full Year Q1 Q2 Q3 Q4 Full Year School buses 56% 60% 63% 64% 61% 60% 61% 53% 60% 59% 49% 45% 48% 51% 48% Class 6 and 7 medium trucks 30% 39% 33% 39% 35% 33% 44% 36% 37% 38% 36% 36% 46% 44% 41% Class 8 heavy trucks 24% 24% 29% 24% 25% 23% 22% 30% 20% 24% 17% 16% 17% 18% 17% Class 8 severe service trucks 40% 46% 41% 47% 43% 40% 40% 39% 40% 40% 33% 32% 36% 37% 35% Combined Class 8 29% 32% 33% 32% 31% 28% 28% 32% 25% 28% 20% 19% 21% 22% 21% Total Traditional Market Share 32% 37% 37% 38% 36% 32% 35% 35% 32% 34% 27% 26% 29% 29% 28% 2011 Market Share - U.S. & Canada School Bus and Class 6-8 2010 2009 We define our “traditional” markets to include U.S. and Canada School bus and Class 6 through 8 medium and heavy truck. We classify militarized commercial vehicles sold to the U.S. and Canadian militaries as Class 8 severe service within our “traditional” markets. Beginning in 2011, our competitors are reporting certain RV and commercial bus chassis units consistently with how we report these units. |
 NYSE: NAV 31 4th Quarter 2011 Earnings Call Dec. 20, 2011 31 Worldwide Truck Chargeouts We define our “traditional” markets to include U.S. and Canada School bus and Class 6 through 8 medium and heavy truck. We classify militarized commercial vehicles sold to the U.S. and Canadian militaries as Class 8 severe service within our “traditional” markets. FISCAL YEAR 2009 Q1 Q2 Q3 Q4 FULL YEAR BUS 2,700 3,100 3,400 4,600 13,800 MEDIUM 3,200 3,300 2,700 3,800 13,000 HEAVY 6,100 3,300 4,500 5,200 19,100 SEVERE 4,200 4,400 3,900 4,700 17,200 TOTAL 16,200 14,100 14,500 18,300 63,100 NON-TRADITIONAL MILITARY 1,100 400 0 100 1,600 EXPANSIONARY 2,400 1,900 2,500 4,300 11,100 WORLD WIDE TRUCK 19,700 16,400 17,000 22,700 75,800 FISCAL YEAR 2010 Q1 Q2 Q3 Q4 FULL YEAR BUS 3,100 3,000 2,400 3,900 12,400 MEDIUM 3,900 5,300 3,900 5,400 18,500 HEAVY 5,200 4,600 6,400 5,400 21,600 SEVERE 3,900 3,800 2,200 4,100 14,000 TOTAL 16,100 16,700 14,900 18,800 66,500 NON-TRADITIONAL MILITARY 100 200 1,000 100 1,400 EXPANSIONARY 3,900 4,500 4,700 6,000 19,100 WORLD WIDE TRUCK 20,100 21,400 20,600 24,900 87,000 FISCAL YEAR 2011 Q1 Q2 Q3 Q4 FULL YEAR BUS 2,100 2,000 2,200 2,900 9,200 MEDIUM 4,600 7,200 7,400 7,900 27,100 HEAVY 4,700 5,200 6,800 9,000 25,700 SEVERE 2,700 3,200 3,700 3,700 13,300 TOTAL 14,100 17,600 20,100 23,500 75,300 NON-TRADITIONAL MILITARY 100 400 200 700 1,400 EXPANSIONARY 5,300 7,600 8,600 10,200 31,700 WORLD WIDE TRUCK 19,500 25,600 28,900 34,400 108,400 |
 NYSE: NAV 32 4th Quarter 2011 Earnings Call Dec. 20, 2011 32 World Wide Engine Shipments Navistar Q1 Q2 Q3 Q4 Full Year OEM sales - South America 19,400 22,500 26,100 31,200 99,200 Ford sales - U.S. and Canada 12,600 26,400 22,900 39,600 101,500 Other OEM sales 4,500 2,400 1,800 2,600 11,300 Intercompany sales 14,400 12,600 12,800 17,500 57,300 Total Shipments 50,900 63,900 63,600 90,900 269,300 Navistar Q1 Q2 Q3 Q4 Full Year OEM sales - South America 30,700 34,600 33,600 33,900 132,800 Ford sales - U.S. and Canada 24,700 200 - - 24,900 Other OEM sales 2,000 3,600 3,700 4,900 14,200 Intercompany sales 16,400 17,700 15,600 18,800 68,500 Total Shipments 73,800 56,100 52,900 57,600 240,400 Navistar Q1 Q2 Q3 Q4 Full Year OEM sales - South America 27,200 37,100 38,200 36,100 138,600 Ford sales - U.S. and Canada - - - - - Other OEM sales 4,500 4,400 3,700 3,600 16,200 Intercompany sales 17,300 23,500 22,300 25,700 88,800 Total Shipments 49,000 65,000 64,200 65,400 243,600 2011 2010 World Wide Engine Shipments 2009 |
 NYSE: NAV 33 4th Quarter 2011 Earnings Call Dec. 20, 2011 33 Order Receipts – U.S. & Canada Percentage Percentage 2011 2010 Change Change 2011 2010 Change Change 2,300 3,200 (900) (28) 8,600 7,800 800 10 6,800 5,200 1,600 31 28,000 17,700 10,300 58 Class 8 heavy trucks 6,400 4,100 2,300 56 29,600 20,200 9,400 47 Class 8 severe service trucks 3,100 3,100 0 0 13,100 13,300 (200) (2) 18,600 15,600 3,000 19 79,300 59,000 20,300 34 9,500 7,200 2,300 32 42,700 33,500 9,200 27 October 31, Order Receipts: U.S. & Canada (Units) Three Months Ended October 31, Total "Traditional" Markets Combined Class 8 (Heavy and Severe Service) "Traditional" Markets School buses Class 6 and 7 medium trucks We define our “traditional” markets to include U.S. and Canada School bus and Class 6 through 8 medium and heavy truck. We classify militarized commercial vehicles sold to the U.S. and Canadian militaries as Class 8 severe service within our “traditional” markets. |
 NYSE: NAV 34 4th Quarter 2011 Earnings Call Dec. 20, 2011 34 Navistar Financial Corporation • Profitability strong: Q4 2011 $27M, YTD $129M - Lower SG&A, improved portfolio quality, improved Mexico performance • Long term liquidity in place/better terms - New 5-year $840M bank credit facility - New 2-year $224M wholesale securitization • Lower leverage: service leverage of 5:1 and declining as GE Capital alliance sources retail originations Retail Notes Bank Facility • $840M facility refinanced in December 2011, maturity extended from 2012 to 2016 – Funding for retail notes, wholesale notes, retail accounts, and dealer open accounts On balance sheet • Situation as of Oct 31, 2011 – $1.1B funding facility (NFSC) – $170M available • NFSC wholesale trust – Variable portion matures July 2012 – Public portions mature October 2012 and October 2013 On balance sheet • Broader product offering • Enhanced ability to support large fleets • Better access to less expensive capital Note: profitability relates to total financial services Leveraging Assets & Controlling Our Destiny |
 NYSE: NAV 35 4th Quarter 2011 Earnings Call Dec. 20, 2011 35 Supplemental Information - Truck Worldwide Truck Chargeouts - 20,000 40,000 60,000 80,000 100,000 120,000 140,000 Analyst Day 2011 Actuals Analyst Day 2011 Actuals Analyst Day 2011 Actuals Analyst Day 2011 Actuals Analyst Day 2011 Actuals Q1 Q2 Q3 Q4 Full year Total Traditional Markets Expansion Markets Towables We define our “traditional” markets to include U.S. and Canada School bus and Class 6 through 8 medium and heavy truck. We classify militarized commercial vehicles sold to the U.S. and Canadian militaries as Class 8 severe service within our “traditional” markets. |
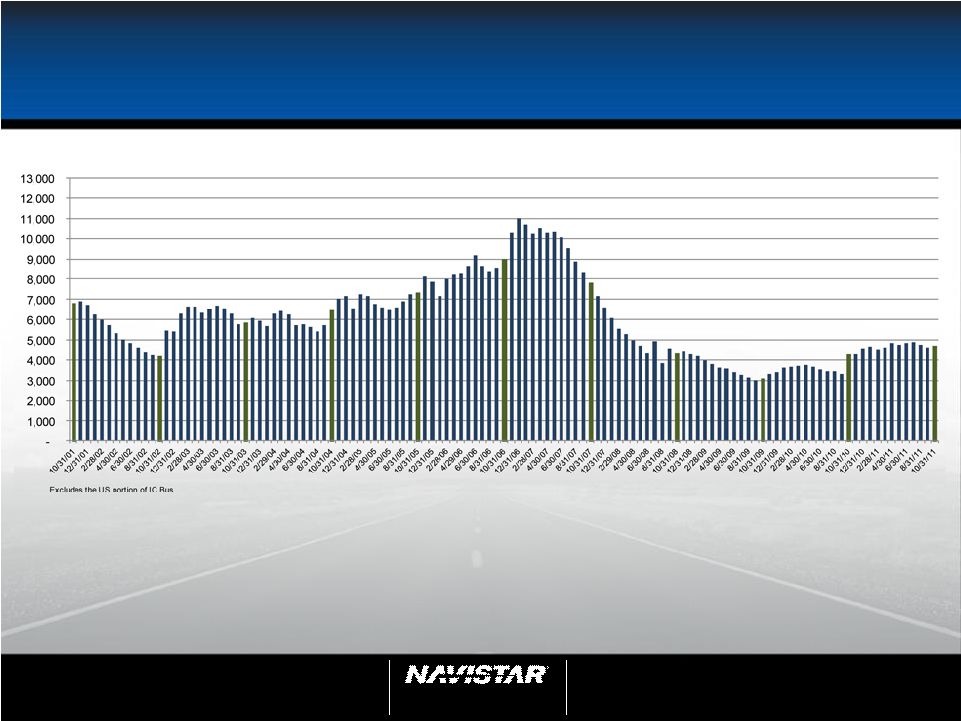 NYSE: NAV 36 4th Quarter 2011 Earnings Call Dec. 20, 2011 36 U.S. and Canada Dealer Stock Inventory* *Includes U.S. and Canada Class 4-8 and school bus inventory, but does not include U.S. IC Bus or Workhorse Custom Chassis inventory. |
 NYSE: NAV 37 4th Quarter 2011 Earnings Call Dec. 20, 2011 37 Frequently Asked Questions Q1: What is in your Dealcor debt? A: Dealcor debt is comprised of wholesale (floor plan) financing and also retail financing on lease and rental fleets for company owned dealers. Q2: How many Dealcor dealers did you have as of October 31, 2011? A: Of our 275 primary NAFTA dealers, we have ownership interest in 7 DealCor dealers as of October 31, 2011. Q3: How are your dealers doing? A: The operational and financial strength of our industry leading dealer network continues to improve in all areas of the business. We continue to add new dealers to the distribution network, attracted by the breadth of our product lines and significant opportunities in major markets. Considerable investments in facility upgrades and acquisitions have also been completed throughout the year by aggressive and growth oriented existing dealers; further strengthening our footprint, service capabilities and accessibility to our customers. Additional fixed operational demand, as a result of our proprietary engine lineup, has resulted in significant investments across the network in technicians, tooling and hours of service expansion. Q4: What kind of rates do you charge your dealers and customers? A: Generally, our rates vary (those with higher credit risk have always had to pay higher interest rates) and are usually in line with the market. Q5: How do you fund your wholesale business? A: We primarily finance our wholesale portfolio through traditional private or public securitizations, and through our bank facility. Q6: How is your NFC portfolio performing? A: Performance of this portfolio continued to improve in 2011. NFC’s retail portfolio in the U.S. is in run-off mode now that Navistar Capital, the new GE Capital retail program, is financing retail customers. |
 NYSE: NAV 38 4th Quarter 2011 Earnings Call Dec. 20, 2011 38 Frequently Asked Questions Q7: What is your total amount of capacity at NFC? A: Total availability in our U.S. funding facilities is currently $551M after giving effect to the November 2011 wholesale securitization and the December 2011 bank credit facility refinancing. Q8: What is the status of the retail financing alliance with GE Capital in the United States? A: Navistar Capital – the alliance we formed with GE Capital to support the sale of Navistar products – is progressing consistent with expectations. Q9: What is included in Financial Services Segment Profit, Corporate and Eliminations? A: Financial Services Segment Profit, Corporate and Eliminations, as presented, consist of the Finance Services segment and Corporate and Eliminations as shown in the Segment Reporting footnote of our annual and quarterly reports (10K & 10Q). The primary drivers of Corporate and Eliminations are Corporate SG&A, pension and OPEB expense excluding amounts allocated to the segments, annual incentive, manufacturing interest expense, and the elimination of intercompany sales and profit between segments. Q10: What is the status of the HMMWV MECV (Modernized Expanded Capacity Vehicle) program? A: A draft request for proposals (RFP) has been issued. Requirements will address vulnerabilities exposed during combat operations in Iraq and Afghanistan. The program is intended to allow vehicles to stay battle ready until Joint Light Tactical Vehicles (JLTV) are fielded. Q11: What is the current Joint Light Tactical Vehicle (JLTV) program status? A: A revised draft RFP has been issued for the JLTV program. On November 18, 2011, a JLTV industry day was held to receive feedback from industry on the draft. Q12: What are your margins for military vehicles? A: We do not break margins out specific to our military vehicles. These numbers are reported as part of our Truck segment financials. |
 NYSE: NAV 39 4th Quarter 2011 Earnings Call Dec. 20, 2011 39 Frequently Asked Questions Q13: How will the changing DOD budget affect Navistar in FY 2012? A: The coming year will present its challenges, but Navistar’s commercial expertise may be an advantage when the Department of Defense is asked to do more with less. In addition, the company continues to pursue a number of foreign military opportunities, especially in the Middle East, where defense spending is growing. Finally, the company has a fleet of more than 32,000 vehicles in operation in 26 countries. These vehicles will require parts and sustainment support throughout their lifecycles. This includes more than 9,000 vehicles operating with Afghan Security Forces. Q14: How does your Class 8 industry compare to ACT Research? A: Q15: What were the 2010 emissions requirements? A: Through the use of credits manufacturers can go to a maximum of 0.50g NOx if they reduced earlier with advanced technology; manufacturers need to be at 0.20g NOx if they chose not to introduce advanced technologies to reduce their emissions earlier. For many years Navistar introduced cleaner emission engines than the EPA required, so we were able to generate some credit before we needed to go to the 0.20g NOx standard. Reconciliation to ACT 2011 ACT* 200,800 CY to FY adjustment (20,400) Other misc. specialty vehicles Included in ACT (5,500) Total (ACT comparable Class 8 to Navistar) 174,900 Navistar Industry Retail Deliveries Combined Class 8 Trucks** 179,000 Navistar difference from ACT: (4,100) -2.3% *Source: ACT N.A. Commercial Vehicle Outlook - Dec, 2011 **Actual FY 2011 U.S. and Canadian Class 8 Truck Sales |
 NYSE: NAV 40 4th Quarter 2011 Earnings Call Dec. 20, 2011 40 Frequently Asked Questions Q16: Why has the Company released a significant portion of its domestic valuation allowance? A: The Company has evaluated a variety of criteria, both objective and subjective, and has concluded that a significant portion of its U.S. valuation allowance attributable to deferred tax assets should be released in 2011 based on its judgment that (on a more likely than not basis) it will realize the value of these deferred tax assets in the future. That judgment considered, among others things, the Company’s recent history of its ability to deliver profits in a depressed market, as well its confidence in the future profitability of its U.S. operations. Q17: How will the release of the valuation allowance affect future tax expense? A: As we have previously indicated, in future years we would anticipate average effective tax rates in the low 30% range going forward. Q18: How will the release of $1.5 billion of deferred tax valuation allowance impact future cash tax payments? A: The release of $1.5 billion of valuation allowance does not impact U.S. cash tax payments. Our future U.S. cash tax payments will continue to remain low for the next 3-4 years as we are able to offset our taxes by NOLs and credits. Our foreign tax payments are likely to increase as we continue our growth in foreign locations, particularly Mexico and Brazil. Q19: What is the current balance of net operating losses as compared to other deferred tax assets? A: As of October 31, 2011 the Company has U.S. federal net operating losses (NOLs) valued at $126 million, state NOLs valued at $79 million and foreign NOLs valued at $102 million, for a total undiscounted cash value of $307 million. In addition to NOLs, the Company has accumulated tax credits of $208 million and other deferred tax assets of $1.8 billion resulting in total deferred tax assets of approximately $2.3 billion. |
 NYSE: NAV 41 4th Quarter 2011 Earnings Call Dec. 20, 2011 41 Frequently Asked Questions Q20: When do you expect to exhaust your NOLs and tax credits? A: We expect to be able to offset future taxable income by NOLs and tax credits for the next 3-4 years, which will keep our cash tax payments low in the near term. Q21: How will $2.3 billion of deferred tax assets be used to offset future taxable income? A: Simply put, deferred tax assets represent the value of future tax deductions attributable to items that have already been expensed or deducted for book purposes. The most commonly understood component of deferred tax assets is the value of our net operating losses, which will serve to immediately reduce taxable income in the future. In addition, we have several other major components of deferred taxes which will reduce taxable income in the future. For example, the Company has accrued significant OPEB, pension and other employee benefit expenses during prior years based on expected payments to be made in the future. As these payments are made, the Company will realize tax deductions to offset future taxable income. Q22: How has recent tax legislation affected Navistar? A: The Worker, Homeownership, and Business Assistance Act of 2009 provided an opportunity to carry back alternative minimum tax (AMT) net operating losses from the Company’s 2010 fiscal year and to receive a refund of AMT payments. The Company received its cash refund of $29 million of AMT credits in fiscal year 2011 as a result of this legislation. The Tax Relief, Unemployment Insurance Reauthorization, and Job Creation Act of 2010 extended various tax rules in several areas, which if not extended, could have adversely impacted the Company’s tax results. In addition, the Act allows businesses to fully depreciate qualifying property purchased through the end of 2011 (50% first year depreciation for purchases in 2012), which benefited both Navistar and its customers. Q23: How would future tax proposals to reduce U.S. tax rates impact Navistar? A: While our current tax liabilities would decrease in the future, because of our large balance of deferred tax assets we would incur a one-time adverse impact to our P&L to reset/reduce our deferred tax balances to the lower statutory rates. We estimate that for every 1% reduction in tax rate, our one time tax expense would approximate $50 million. |
 NYSE: NAV 42 4th Quarter 2011 Earnings Call Dec. 20, 2011 42 Frequently Asked Questions Q24: How does vertical integration of a big bore engine impact warranty? A: With the transition to 100% MaxxForce ® engines we will assume an increased responsibility for engine warranty, which was previously absorbed by our suppliers and reflected in our material costs. The impact of this change will increase warranty expense and decrease material costs. Q25: Why is your warranty expense higher year over year? A: Our warranty costs have been higher than the respective prior year periods primarily as a result of increased intercompany volumes due to the use of all MaxxForce ® engines in our North America product offering. Throughout 2011, we have seen favorable performance on our 2010 emission compliant engines compared to previous launches and expected performance. Q26: What are your expected 2012 and beyond pension funding requirements? A: Current forecasts indicate that we may need to contribute approximately $187 million in 2012 to our U.S. and Canadian pension plans (“the Plan”). Future contributions are dependent upon a number of factors, principally the changes in values of plan assets, changes in interest rates, and the impact of any funding relief currently under consideration. We currently expect that from 2013 through 2015, the Company will be required to contribute at least $170 million per year to the Plan, depending on asset performance and discount rates. Q27: What is your expected 2012 pension and OPEB GAAP expense? A: Fiscal 2012 pension and OPEB GAAP expense is currently estimated at approximately $200 million based on the October 31, 2011 measurement of obligations and assets, which is slightly higher than 2011 actual expense. Q28: What causes the variance between manufacturing cash interest payments and GAAP interest expense? A: The main variance between cash and GAAP interest results from our manufacturing segment’s $1 billion of senior unsecured high yield notes and $570 million of senior subordinated convertible notes. As a result of this issuance, future manufacturing interest expense will be higher than cash interest payments due to the amortization of debt issuance costs which are amortized over the life of each note ($36 million), amortization of the original issue discount of the high yield notes ($37 million) and amortization of the embedded call option in the convertible notes ($114 million). The timing of interest payments also impacts this variance on a quarterly basis, but not on a fiscal year basis. |
 NYSE: NAV 43 4th Quarter 2011 Earnings Call Dec. 20, 2011 43 Frequently Asked Questions Q29: What are the $225 million of Recovery Zone Facility Bonds (RZFBs) Series 2010 due October 15, 2040 being used for? A: We are using the proceeds to invest in our product development strategy and our headquarter consolidation. Great products are a key pillar of our three pronged strategy. Streamlining and improving our product development processes will continue to provide competitive advantages for us in the marketplace. The funding from the RZFBs will allow us to consolidate many facilities into a new facility and make necessary renovations to that facility. Additionally we will invest in an existing facility, which includes investments in equipment and technology that will help us create and improve our product development process and thus shareholder value. Q30: Why did you use Recovery Zone Facility Bond (RZFB) financing? A: The RZFBs are a cost effective, long-term form of capital that is complementary to our capital structure. The bonds have a 30 year maturity and a fixed rate coupon of 6.50% per annum. They are callable at par any time after 10 years (October 15, 2020). Issuing bonds in the tax-exempt market gave us exposure to a new source of investors that we wouldn’t otherwise have access to if not for the RZFB program. Q31: What should we assume for capital expenditures in fiscal 2012? A: We plan to continue capital spending within the traditionally guided range of $250 - $350 million for products and development. There is capital spending related to Engineering Integration not included in the range that is funded through the RZFBs. Q32: What are the differences between the accounting vs. economic dilution on your convertible debt? A: Please see the presentation on the IR website (http://ir.navistar.com/dilution.cfm) entitled Dilution overview resulting from the Convertible Notes issued on October 2009. |
 NYSE: NAV 44 4th Quarter 2011 Earnings Call Dec. 20, 2011 44 Frequently Asked Questions Q33: Why are the convertible debt holders no longer able to convert their notes? A: The indenture in our convertible notes contains a provision that allows the note holders to convert anytime during the following fiscal quarter should the price of Navistar’s common stock close 130% above the conversion price for any 20 day period (consecutive or non-consecutive) out of the last 30 consecutive day trading period of each fiscal quarter. Our fiscal second quarter ended on April 30, 2011; the conversion price of the notes is $50.274 per share of Navistar’s common stock; 130% of the conversion price equals $65.356 per share of Navistar’s common stock. Since Navistar’s common stock closed above $65.356 per share for more than 20 trading days during the 30 consecutive trading day period ending on April 30, 2011, the note holders had the right to convert their notes any time from May 2, 2011 through July 31, 2011. A very small minority of note holders chose to convert their notes during the conversion period. Navistar opted to settle the conversion in cash instead of shares, therefore there was a 40 trading day observation period to determine the value that was remitted in cash, so the note holders did not receive the cash for almost two months after their respective conversion notices were received. Navistar’s common stock did not close above $65.356 per share for 20 trading days (consecutive or non-consecutive) during the 30 day consecutive trading day period ending October 31, 2011, therefore the note holders do not have the right to convert their notes, however that threshold could be triggered once again in the future. Q34: Are you ready for the 2013 GHG regulation? A: Yes, Navistar will be ready to meet the standards when they go into effect January 2014. As a leader in fuel efficiency and in delivering innovative technologies, such as hybrids, plug-in hybrids and electric vehicles, our current approach is to consistently deliver the most fuel-efficient vehicles to our customers. Our customer-focused approach aligns Navistar with the intent of the new proposed GHG rule, and provides us with a strong basis for meeting the new standards. Q35: How are you addressing the 2014 GHG regulations? A: Navistar is currently conducting a more in-depth review of this complex rule to better understand the specific impacts (i.e., costs of the product, how we will implement it, etc.) it will have on our customers and the operation of our business. As such, it is too early in that review to provide specifics around how we will address the 2014 GHG regulations. What we can say is that Navistar is always investing in new technologies designed to achieve maximum fuel economy for our customers. So these new GHG standards will not change our standard way of operating our business. |
 NYSE: NAV 45 4th Quarter 2011 Earnings Call Dec. 20, 2011 45 Status of Industry Commodity Cost Note: Costs related to steel, precious metals, resins, and petroleum products Commodities Market Profile 2009 Average 2010 High March 2011 Average (data shown in Q1) November 2011 Average Sheet steel ($/short ton) $482 $699 $861 $610 Scrap steel ($/long ton) $260 $473 $480 $458 Crude oil ($/bbl) $62 $91 $95 $97 Platinum ($/troy oz.) $1,203 $1,754 $1,829 $1,597 Natural Rubber ($/lb) $0.82 $2.25 $2.34 $1.55 Copper ($/lb) $2.41 $4.23 $4.55 $3.50 2011 Actions • Navistar has mitigated a significant portion of 2011 market risk – Systematic hedging – Supplier negotiations – Commodity surcharges • Focus on FY2012 • Pricing Actions |
 NYSE: NAV 46 4th Quarter 2011 Earnings Call Dec. 20, 2011 46 Outstanding Debt Balances 2011 2010 (in millions) Manufacturing operations 8.25% Senior Notes, due 2021, net of unamortized discount of $33 and $35 at the respective dates $ 967 $ 965 3.0% Senior Subordinated Convertible Notes, due 2014, net of unamortized discount of $73 and $94 at the respective dates 497 476 Debt of majority-owned dealerships 94 66 Financing arrangements and capital lease obligations 118 221 Loan Agreement related to 6.5% Tax Exempt Bonds, due 2040 225 225 Promissory Note 40 — Other 39 33 Total manufacturing operations debt 1,980 1,986 Less: Current portion 99 145 Net long-term manufacturing operations debt $ 1,881 $ 1,841 Financial services operations Asset-backed debt issued by consolidated SPEs, at variable rates, due serially through 2018 $ 1,664 $ 1,731 Bank revolvers, at fixed and variable rates, due dates from 2012 through 2018 1,072 974 Commercial paper, at variable rates, due serially through 2012 70 67 Borrowings secured by operating and finance leases, at various rates, due serially through 2017 70 112 Total financial services operations debt 2,876 2,884 Less: Current portion 1,280 487 Net long-term financial services operations debt $ 1,596 $ 2,397 |
 SEC Regulation G Non-GAAP Reconciliation The financial measures presented below are unaudited and not in accordance with, or an alternative for, financial measures presented in accordance with U.S. generally accepted accounting principles (GAAP). The non-GAAP financial information presented herein should be considered supplemental to, and not as a substitute for, or superior to, financial measures calculated in accordance with GAAP. Manufacturing Segment Results: We believe manufacturing segment results, which includes the segment results of our Truck, Engine, and Parts reporting segments, provide meaningful information of our core manufacturing business and therefore we use it to supplement our GAAP reporting by identifying items that may not be related to the core manufacturing business. Management often uses this information to assess and measure the performance of our operating segments. We have chosen to provide this supplemental information to investors, analysts and other interested parties to enable them to perform additional analyses of operating results, to illustrate the results of operations giving effect to the non-GAAP adjustments shown in the below reconciliation, and to provide an additional measure of performance. Adjusted Net Income and Diluted Earnings Per Share Attributable To Navistar International Corporation and Adjusted Manufacturing Segment Profit: We believe that adjusted net income, diluted earnings per share attributable to Navistar International Corporation, and adjusted manufacturing segment profit excluding certain adjustments which are not considered to be part of our ongoing business, improve the comparability of year to year results and are representative of our underlying performance. We have chosen to provide this supplemental information to investors, analysts, and other interested parties to enable them to perform additional analyses of operating results, to illustrate the results of operations giving effect to the non-GAAP adjustments shown in the below reconciliations, and to provide an additional measure of performance. Adjusted Manufacturing Earnings Before Interest, Income Taxes, Depreciation, and Amortization (“EBITDA”): Adjusted manufacturing segment EBITDA is defined as our consolidated net income (loss) from continuing operations minus the net income (loss) from our financial services operations plus interest expense, income taxes, and depreciation and amortization, adjusted to exclude certain items that may not be related to the core manufacturing business. EBITDA is a measure commonly used and is presented to aid in developing an understanding of the ability of our operations to generate cash for debt service and taxes, as well as cash for investments in working capital, capital expenditures, and other liquidity needs. This information is presented as a supplement to the other data provided because it provides information which we believe is useful to investors for additional analysis. EBITDA should not be considered in isolation or as a substitute for net income, cash flows from operating activities or other consolidated operations, or cash flow statement data prepared in accordance with GAAP, or as a measure of our profitability or liquidity as determined in accordance with GAAP. Manufacturing Cash Flow and Manufacturing Cash, Cash Equivalents, and Marketable Securities: Manufacturing cash flow is used and is presented to aid in developing an understanding of the ability of our operations to generate cash for debt service and taxes, as well as cash for investments in working capital, capital expenditures and other liquidity needs. This information is presented as a supplement to the other data provided because it provides information which we believe is useful to investors for additional analysis. Our manufacturing cash flow is prepared with marketable securities being treated as a cash equivalent. Manufacturing cash, cash equivalents, and marketable securities represents the Company’s consolidated cash, cash equivalents, and marketable securities excluding cash, cash equivalents, and marketable securities of our financial services operations. We include marketable securities with our cash and cash equivalents when assessing our liquidity position as our investments are highly liquid in nature. We have chosen to provide this supplemental information to investors, analysts and other interested parties to enable them to perform additional analyses of operating results, to illustrate the results of operations giving effect to the non-GAAP adjustments shown in the below reconciliation, and to provide an additional measure of performance. 47 |
 NYSE: NAV 4th Quarter 2011 Earnings Call Dec. 20, 2011 SEC Regulation G – 2011 Guidance (A) Engineering integration costs relate to the consolidation of our truck and engine engineering operations as well as the move of our world headquarters. (B) Restructuring of North American manufacturing operations are charges primarily related to our plans to close our Chatham, Ontario heavy truck plant and Workhorse chassis plant in Union City, Indiana, and to significantly scale back operations at our Monaco recreational vehicle headquarters and motor coach manufacturing plant in Coburg, Oregon. (C) In the third quarter of 2011, the Company recognized an income tax benefit of $1.476 billion from the release of a portion of our income tax valuation allowance. (D) Adjusted income tax expense excludes the income tax benefit from the release of a portion of our income tax valuation allowance and incremental income taxes that may result from this partial release of the income tax valuation allowance. (E) Approximate diluted weighted shares outstanding based on assumed average share price of $65 per share during the period. 48 |
 NYSE: NAV 49 4th Quarter 2011 Earnings Call Dec. 20, 2011 49 SEC Regulation G Navistar International Corporation (Manufacturing operations with financial services operations on a pre-tax equity basis) Three Months Ended October 31, 2011 ($ millions) Net income (loss) attributable to NIC $ 255 Less income tax benefit (12) Add back restructuring of N.A. MFG Operations 5 Income before income tax benefit and restructuring charges $ 248 Less equity income from financial service operations (13) Income before income tax benefit, restructuring charges, and equity income from financial service operations $ 235 Add back manufacturing interest expense 36 Manufacturing EBIT $ 271 Add back manufacturing depreciation and amortization1 75 Adjusted manufacturing EBITDA $ 346 1 Includes depreciation of equipment leased to others and excludes debt issuance cost/discount amortization |
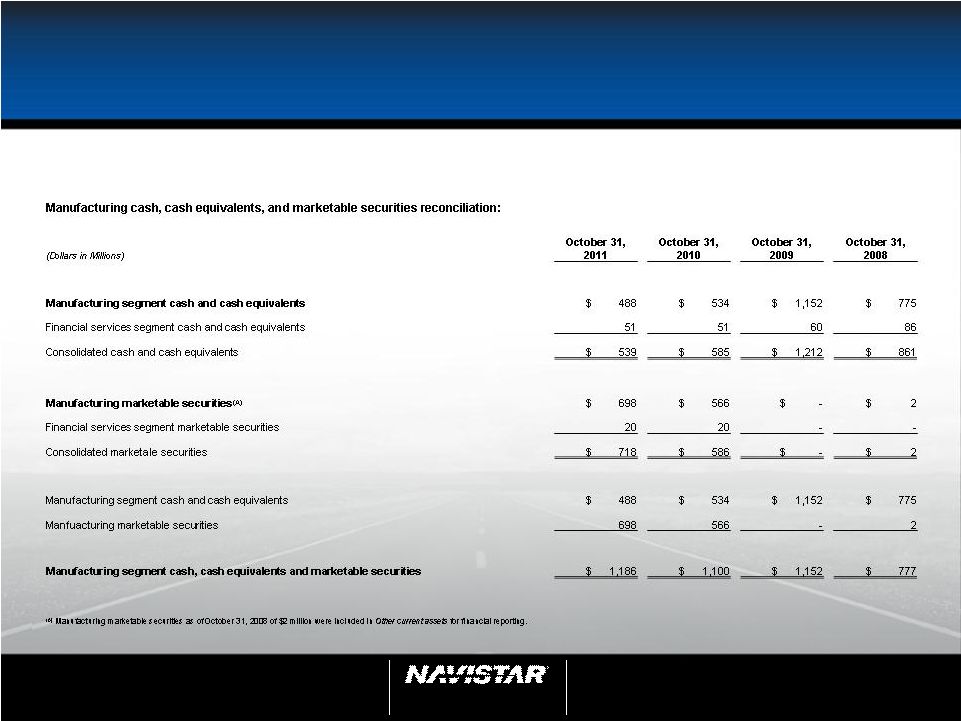 NYSE: NAV 50 4th Quarter 2011 Earnings Call Dec. 20, 2011 50 SEC Regulation G – Manufacturing Cash Fiscal Year Comparison |
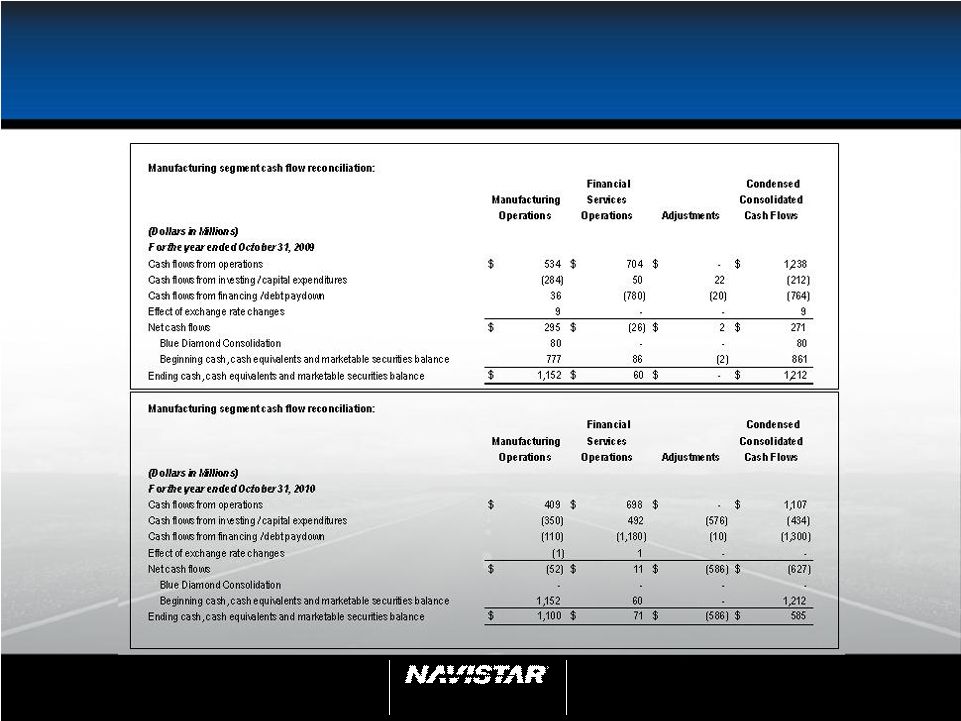 NYSE: NAV 51 4th Quarter 2011 Earnings Call Dec. 20, 2011 51 SEC Regulation G – Manufacturing Cash |
 NYSE: NAV 52 4th Quarter 2011 Earnings Call Dec. 20, 2011 52 SEC Regulation G – Manufacturing Cash Manufacturing segment cash flow reconciliation: Manufacturing Operations Financial Services Operations Adjustments Condensed Consolidated Cash Flows (Dollars in Millions) For the twelve months ended October 31, 2011 Cash flows from operations $ 680 $ 200 $ - $ 880 Cash flows from investing / capital expenditures (485) (206) (132) (823) Cash flows from financing / debt pay down (106) 6 - (100) Effect of exchange rate changes (3) - - (3) Net cash flows $ 86 $ - $ (132) $ (46) Blue Diamond Consolidation - - - - Beginning cash, cash equivalents and marketable securities balance 1,100 71 (586) 585 Ending cash, cash equivalents and marketable securities balance $ 1,186 $ 71 $ (718) $ 539 Manufacturing segment cash flow reconciliation: Manufacturing Operations Financial Services Operations Adjustments Condensed Consolidated Cash Flows (Dollars in Millions) For the three months ended October 31, 2011 Cash flows from operations $ 444 $ (103) $ - $ 341 Cash flows from investing / capital expenditures: (160) (195) (98) (453) Cash flows from financing / debt pay down (101) 318 - 217 Effect of exchange rate changes (10) - - (10) Net cash flows $ 173 $ 20 $ (98) $ 95 Blue Diamond Consolidation - - - - Beginning cash, cash equivalents and marketable securities balance 1,013 51 (620) 444 Ending cash, cash equivalents and marketable securities balance $ 1,186 $ 71 $ (718) $ 539 |
 NYSE: NAV 53 4th Quarter 2011 Earnings Call Dec. 20, 2011 53 SEC Regulation G – Adjusted Net Income and Diluted EPS - Three Months and Year Ended October 31, 2011 See following slide for explanation of adjustments. Three Months Ended October 31, 2011 For the Year Ended October 31, 2011 (in millions, except per share data) Net income (loss) attributable to Navistar International Corporation $ 255 $ 1,723 Plus: Engineering integration costs (A) 23 64 Restructuring of North American manufacturing operations (B) 5 127 Medicare Part D ruling (C) 15 15 Less: Income tax valuation allowance release, net (D) 51 1,527 Adjusted net income attributable to Navistar International Corporation $ 247 $ 402 For the Year Ended October 31, 2011 (in millions) Diluted earnings (loss) per share attributable to Navistar International Corporation $ 3.48 $ 22.64 Effect of adjustments on diluted earnings per share attributable to Navistar International Corporation (0.11) (17.36) Adjusted diluted earnings per share attributable to Navistar International Corporation $ 3.37 $ 5.28 Diluted weighted shares outstanding 73.2 76.1 Three Months Ended October 31, 2011 Adjusted net income attributable to Navistar International Corporation reconciliation: Adjusted diluted earnings per share attributable to Navistar International Corporation reconciliation: |
 NYSE: NAV 54 4th Quarter 2011 Earnings Call Dec. 20, 2011 54 SEC Regulation G – Adjusted Net Income and Diluted EPS - Three Months and Year Ended October 31, 2011 – (Continued) (A) Engineering integration costs relate to the consolidation of our truck and engine engineering operations as well as the move of our world headquarters. These costs include restructuring charges for activities at our Fort Wayne facility of $6 million and $29 million for the three months and year ended October 31, 2011, respectively. We also incurred an additional $17 million and $35 million of other related costs for the three months and year ended October 31, 2011, respectively. Our manufacturing segment recognized $18 million and $51 million of the engineering integration costs for the three months and year ended October 31, 2011, respectively. (B) Restructuring of North American manufacturing operations are charges primarily related to our plans to close our Chatham, Ontario heavy truck plant and Workhorse chassis plant in Union City, Indiana, and to significantly scale back operations at our Monaco recreational vehicle headquarters and motor coach manufacturing plant in Coburg, Oregon. These costs include restructuring charges of $5 million and $58 million for the three months and year ended October 31, 2011. We also incurred $5 million of other related costs for the year ended October 31, 2011. In addition, the Company recognized $64 million of impairment charges related to certain intangible assets and property plant and equipment primarily related to these facilities. The Truck segment recognized $5 million and $124 million of restructuring of North American manufacturing operation charges for the three months and year ended October 31, 2011. (C) In the fourth quarter of 2011, the Company had an unfavorable ruling related to a 2010 administrative change the Company made to the prescription drug program under the OPEB plan affecting plan participants who are Medicare eligible. As a result the Company recognized approximately $15 million of expense for postretirement benefits. (D) In the third quarter of 2011, we recognized an income tax benefit of $1.476 billion from the release of a portion of our income tax valuation allowance. In the fourth quarter of 2011, we recognized an additional income tax benefit of $61 million related to the release of a portion of our income tax valuation allowance. As domestic earnings are now taxable with the release of the income tax valuation allowance we recognized $10 million of domestic income tax expense for 2011 that would not have been recognized had we not released a portion of the income tax valuation allowance. The $10 million of domestic income taxes were netted against the total benefit of $1.537 billion from the release of a portion of the income tax valuation allowance. In addition, the other adjustments included in the table above have not been adjusted to reflect their income tax effect as the adjustments are intended to represent the impact on the Company's Consolidated Statement of Operations without the incremental income tax effect that would result from the release of the income tax valuation allowance. The charges related to our Canadian operations would not be impacted as a full income tax valuation allowance remains for Canada. |
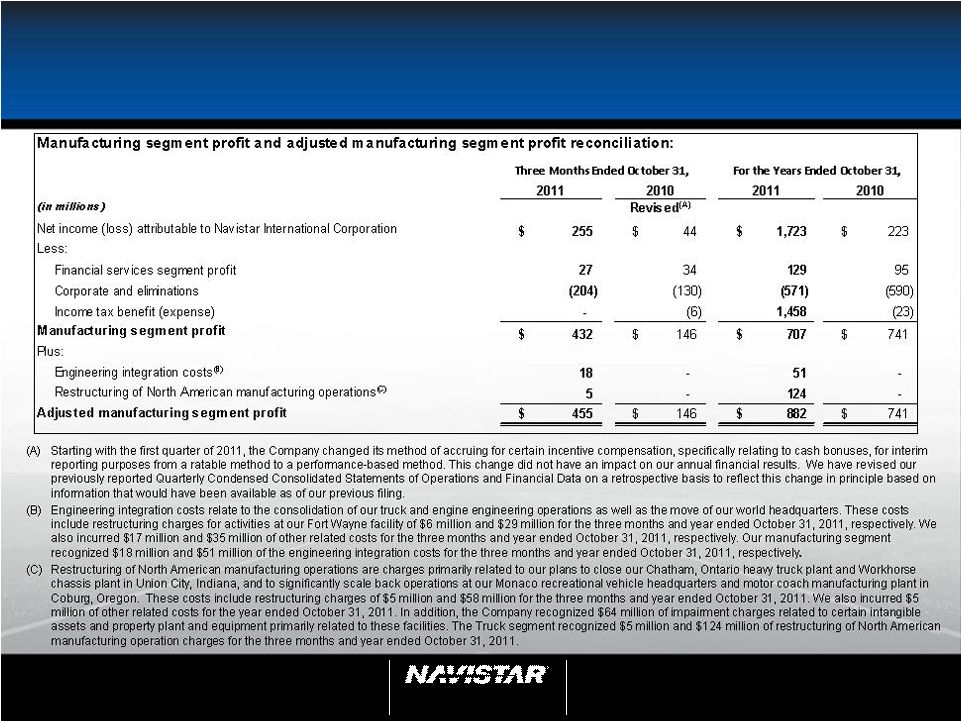 NYSE: NAV 55 4th Quarter 2011 Earnings Call Dec. 20, 2011 55 SEC Regulation G – Adjusted Manufacturing Segment Profit - Three Months and Years Ended October 31, 2011 and 2010 |
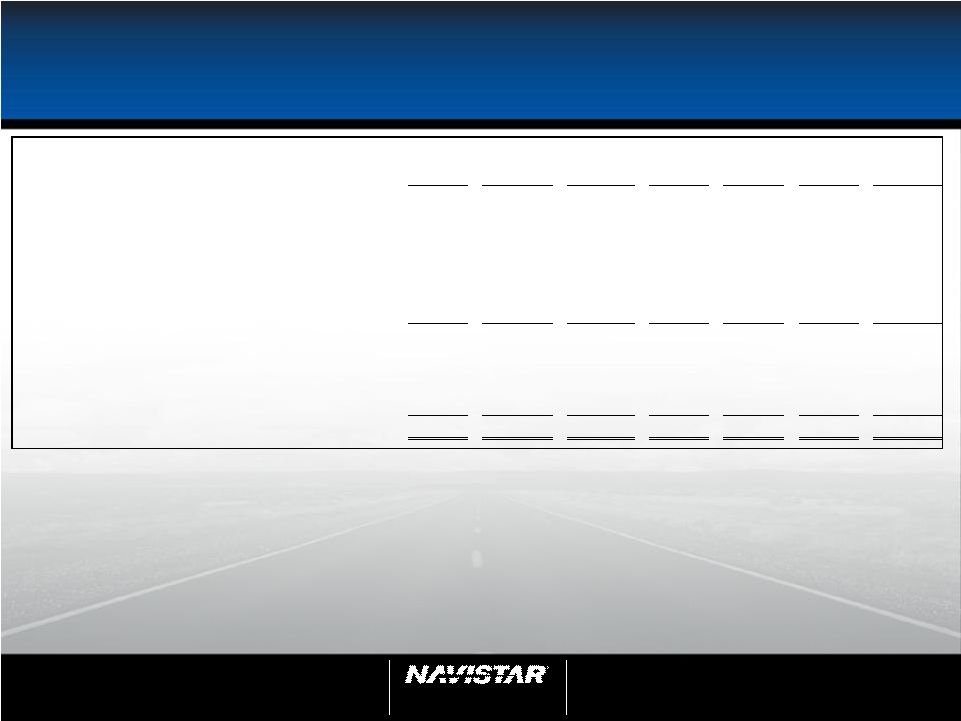 NYSE: NAV 56 4th Quarter 2011 Earnings Call Dec. 20, 2011 56 SEC Regulation G – Adjusted Manufacturing Segment Profit – 2003 - 2009 (A) Ford settlement, restructuring and related charges (benefits) include the impact of our settlement with Ford in 2009 as well as charges and benefits recognized related to restructuring activity at our Indianapolis Casting Corporation and Indianapolis Engine Plant. The charges and benefits were recognized in our Engine segment. (B) Impairment of property, plant, and equipment in 2008 are related to impairments to the asset groups in the Engine segment’s VEE Business Unit. The 2009 impairments relate to charges recognized by the Truck segment for impairments related to asset groups at our Chatham and Conway facilities. 2009 2008 2007 2006 2005 2004 2003 (in millions) Net income (loss) attributable to Navistar International Corporation $320 $ 134 $ (120) $301 $ 139 $ (44) $ (333) Less: Financial services segment profit (loss) 40 (24) 127 147 136 132 87 Corporate and eliminations (519) (478) (662) (590) (412) (178) (310) Income tax benefit (expense) (37) (57) (47) (94) (6) (9) (17) Manufacturing segment profit $836 $ 693 $ 462 $838 $ 421 $ 11 $ (93) Plus: Ford settlement, restructuring and related charges (benefits) (A) (160) 37 - - - - - Impairment of property, plant, and equipment (B) 31 358 - - - - - Adjusted manufacturing segment profit $707 $1,088 $ 462 $838 $ 421 $ 11 $ (93) Manufacturing segment profit and adjusted manufacturing segment profit reconciliation: |
 NYSE: NAV 57 4th Quarter 2011 Earnings Call Dec. 20, 2011 57 SEC Regulation G – Adjusted Net Income excluding income tax - Year Ended October 31, 2011 (A) In the third quarter of 2011, we recognized an income tax benefit of $1.476 billion from the release of a portion of our income tax valuation allowance. In the fourth quarter of 2011, we recognized an additional income tax benefit of $61 million related to the release of a portion of our income tax valuation allowance. As domestic earnings are now taxable with the release of the income tax valuation allowance we recognized $10 million of domestic income tax expense for 2011 that would not have been recognized had we not released a portion of the income tax valuation allowance. The $10 million of domestic income taxes were netted against the total benefit of $1.537 billion from the release of a portion of the income tax valuation allowance. For the Year Ended October 31, 2011 (in millions) Income tax (benefit) $ (1,458) Income tax valuation allowance release, net (A) 1,527 Adjusted income tax expense $ 69 Adjusted net income attributable to Navistar International Corporation $ 402 Adjusted income tax expense 69 Adjusted net income attributable to Navistar International Corporation excluding adjusted income tax $ 471 Adjusted net income attributable to Navistar International Corporation reconciliation excluding income tax: |