 NYSE: NAV 3 QUARTER 2012 EARNINGS PRESENTATION September 6, 2012 Exhibit 99.2 RD |
 2 NYSE: NAV Safe Harbor Statement Information provided and statements contained in this report that are not purely historical are forward-looking statements within the meaning of Section 27A of the Securities Act of 1933, as amended, Section 21E of the Securities Exchange Act of 1934, as amended, and the Private Securities Litigation Reform Act of 1995. Such forward-looking statements only speak as of the date of this report and the company assumes no obligation to update the information included in this report. Such forward-looking statements include information concerning our possible or assumed future results of operations, including descriptions of our business strategy. These statements often include words such as “believe,” “expect,” “anticipate,” “intend,” “plan,” “estimate,” or similar expressions. These statements are not guarantees of performance or results and they involve risks, uncertainties, and assumptions. For a further description of these factors, see the risk factors set forth in our filings with the Securities and Exchange Commission, including our annual report on Form 10-K for the fiscal year ended October 31, 2011 and quarterly reports for fiscal 2012. Although we believe that these forward-looking statements are based on reasonable assumptions, there are many factors that could affect our actual financial results or results of operations and could cause actual results to differ materially from those in the forward-looking statements. All future written and oral forward-looking statements by us or persons acting on our behalf are expressly qualified in their entirety by the cautionary statements contained or referred to above. Except for our ongoing obligations to disclose material information as required by the federal securities laws, we do not have any obligations or intention to release publicly any revisions to any forward-looking statements to reflect events or circumstances in the future or to reflect the occurrence of unanticipated events. |
 3 NYSE: NAV Other Cautionary Notes • The financial information herein contains audited and unaudited information and has been prepared by management in good faith and based on data currently available to the Company. • Certain non-GAAP measures are used in this presentation to assist the reader in understanding our core manufacturing business. We believe this information is useful and relevant to assess and measure the performance of our core manufacturing business as it illustrates manufacturing performance without regard to selected historical legacy costs (i.e. pension and other postretirement costs). It also excludes financial services and other items that may not be related to the core manufacturing business or underlying results. Measures may also be adjusted to exclude certain adjustments which are not considered to be part of our ongoing business and are not representative of our underlying performance. Management often uses this information to assess and measure the underlying performance of our operating segments. We have chosen to provide this supplemental information to investors, analysts, and other interested parties to enable them to perform additional analyses of operating results. The non-GAAP numbers are reconciled to the most appropriate GAAP number is in the appendix of this presentation. |
 4 NYSE: NAV Lewis Campbell, Executive Chairman and CEO • Why Navistar? • Accelerate actions on: – Quality – Aligning cost with revenues – SG&A reduction actions • Return on invested capital • Maximize cash flow to improve balance sheet |
 5 NYSE: NAV 2012 3 rd Quarter Results Note: This slide contains non-GAAP information; please see the REG G in appendix for a detailed reconciliation. * Attributable to Navistar International Corporation 2012 Q3 Actual GAAP 2012 Q3 Actual Adjusted Non-GAAP Revenue (Billions) $3.3 $3.3 Manufacturing Segment Profit (Loss) (Millions) $(4) $21 Loss Before Tax (Millions) $(100) $(74) Net Income (Loss)* (Millions) $84 $(14) Diluted Earnings (Loss) Per Share* $1.22 $(0.20) |
 6 NYSE: NAV 2012 Q3 vs. 2011 Q3 Note: This slide contains non-GAAP information; please see the REG G in appendix for a detailed reconciliation. * Attributable to Navistar International Corporation 2012 Q3 Actual Adjusted Non-GAAP 2011 Q3 Actual Adjusted Non-GAAP Revenue $3.3 $3.5 Manufacturing Segment Profit (Millions) $21 $157 Profit (Loss) Before Tax (Millions) $(74) $82 Net Income (Loss)* (Millions) $(14) $31 Diluted Earnings (Loss) Per Share* $(0.20) $0.40 (Billions) |
 7 NYSE: NAV Navistar Financial Corporation Note: Profitability relates to total financial services • Profitability strong in 2012: $22M in Q3, $75M YTD Expected to decline as U.S. retail loan portfolio runs off due to G.E. Capital alliance • Increased liquidity $745M U.S. availability as of July 31, 2012 Consolidated retail securitizations achieving lower fixed borrowing rate Variable funding facility for dealer financing renewed to August 2013 and increased to $750M • Service leverage of 3.7 to 1 and declining as GE Capital alliance sources retail originations $1.7B since inception Retail Notes Bank Facility • $840M facility refinanced in December 2011, maturity extended from 2012 to 2016 • Funding for retail notes, wholesale notes, retail accounts, and dealer open accounts • On balance sheet • Situation as of July 31, 2012 • $1.1B funding facility (NFSC) • $320M available • NFSC wholesale trust • Variable portion matures August 2013 • Public portions mature October 2012 and October 2013 • On balance sheet • Broader product offering • Enhanced ability to support large fleets • Better access to less expensive capital Dealer Floor Plan |
 8 NYSE: NAV 2012 Manufacturing Cash Update Note: This slide contains non-GAAP information, please see the Reg G in appendix for detailed reconciliation. ($ millions) April 30, 2012 ending manufacturing cash and marketable securities 1 681 $ Manufacturing EBITDA (16) 2 29 Capital expenditures (76) Intercompany and other 9 July 31, 2012 ending manufacturing cash and marketable securities 1 627 $ Plus: Funded Term Loan 1,000 $ Less: Pay down existing ABL facility (238) Less: Transaction expenses and other (39) Net cash flows 723 $ July 31, 2012 ending pro forma manufacturing cash and marketable securities 1 1,350 $ October 31, 2012 forecasted ending manufacturing cash and marketable securities 1 $875-$1,025 1 Includes cash from the consolidation of minority interests 2 NWC = A/R, Inventory, Other Current Assets, A/P & Other Current Liabilities Pro forma Manufacturing Cash Change in net working capital |
 NYSE: NAV Troy Clarke, President & COO DRIVE TO DELIVER |
 10 NYSE: NAV Drive To Deliver Material Procurement Quality/Warranty Manufacturing SG&A PD/Engineering Market Share Truck Engine Parts Revenue Price Realization Growth Clear P&L Accountability |
 11 NYSE: NAV Drive To Deliver First Things First • SCR based clean engine strategy • Dialogue with EPA/CARB – Create pathway to certification – Recognize the importance of NCPs/credits during transition • Strengthen Cummins relationship – Cummins Emission Solution-SCR system for MaxxForce ® 11L/13L – Cummins ISX-15L • Hit the ‘Pause’ button – EGR development |
 12 NYSE: NAV SCR Based Clean Engine Strategy • MaxxForce ® 11L/13L transition – Sales supported by emission credits – California +9 states – Sales supported by NCPs – 40 states – First units with SCR aftertreatment delivered in April 2013 • Cummins ISX – 15L transition – 300 unit customer deliveries in December 2012 – Regular production beginning January 2013 |
 13 NYSE: NAV Drive To Deliver • Focus our attention to North American truck, engine and parts • Evaluate under performing parts of our business via an ROIC based strategic analysis • Right size cost structure • Change the organization to be: faster, more efficient, and more focused • Drive ‘functional’ excellence – Material procurement – Quality/Warranty – Manufacturing – capacity utilization – SG&A – PD/Engineering – Market share Turnaround/Business Plan |
 14 Medium Truck Market Share Severe Service Truck Heavy Truck FY10 59% FY11 49% Q3’12 47% YTD ‘12 48% FY10 38% FY11 41% Q3’12 36% YTD ‘12 33% FY10 40% FY11 35% Q3’12 30% YTD ‘12 30% FY10 24% FY11 17% Q3’12 15% YTD ‘12 16% Class 8 School Bus (U.S. & Canada) 18% Market Share Q3’12 Class 4-5 YTD ’12 Industry 33K Navistar 2,000 Market Share ~6% We define our “traditional” markets to include U.S. and Canada School bus and Class 6 through 8 medium and heavy truck. We classify militarized commercial vehicles sold to the U.S. and Canadian militaries as Class 8 severe service within our “traditional” markets. Beginning in 2011, our competitors are reporting certain RV and commercial bus chassis units consistently with how we report these units. Our “traditional” markets include CAT-branded units sold to Caterpillar under our North America supply agreement. School Bus & Combined Class 6-8 Market Share – FY10: 34%; 34%; FY11: 28%; 28%; Q3‘12: 24%; 24%; YTD‘12: 23% |
 15 NYSE: NAV LOW HIGH ROIC Based Strategic Analysis Grow/Sell Grow Close/Sell Improve STRATEGIC FIT |
 16 NYSE: NAV Structural Cost Reductions on Track • Appropriate cost structure – Size business to realistic volume assumptions with NCPs at $3,775 per unit – Reduce discretionary spending – Affordable program spending • Target for structural costs $150-$175M reduction from Q3 YTD levels – Voluntary Separation Plan (VSP) – Completed – Involuntary Reduction in Force (RIF) – Q4 – Potential for more actions in Q4 |
 17 NYSE: NAV Drive To Deliver • EPA - Final Rule approved • SCR based clean engine solution on track – MaxxForce ® 11L/13L – ISX 15L • Affordable business plan created • ROIC focus – Manage capital expenditures – Working capital discipline – ROIC strategic asset analysis • Structural cost reductions underway – Manufacturing capacity utilization assessment – Lean organization progressing Q3 Progress Summary |
 18 NYSE: NAV Summary |
 NYSE: NAV APPENDIX |
 20 NYSE: NAV $272 $191 $68 $62 $- $50 $100 $150 $200 $250 $300 $350 $400 Q3 2011 Q3 2012 Truck Parts 64,200 52,200 0 10,000 20,000 30,000 40,000 50,000 60,000 70,000 Q3 2011 Q3 2012 28,900 27,100 0 5,000 10,000 15,000 20,000 25,000 30,000 35,000 Q3 2011 Q3 2012 Q3 Year Over Year Operational Results Consolidated Revenues ($ in millions) Quarterly Truck Chargeouts Quarterly Engine Shipments Charge outs decreased 6% Military Revenues ($ in millions) Engine shipments decreased 19% Truck Revenues decreased 30% Parts Revenues decreased 9% $3,537 $3,319 $340 $253 $340 $253 $2,306 $2,320 $891 $746 $- $500 $1,000 $1,500 $2,000 $2,500 $3,000 $3,500 $4,000 Q3 2011 Q3 2012 Military U.S. & Canada ROW |
 21 NYSE: NAV 21 Q3 Year Over Year Financial Information Q3 Adj. Manufacturing Segment Profit ($ in millions) Q3 Adj. Earnings (Loss) Per Share Q3 Adj. Net Income (Loss) ($ in millions) Note: This slide contains non-GAAP information; please see the REG G in appendix for a detailed reconciliation. $157 $21 $0 $20 $40 $60 $80 $100 $120 $140 $160 $180 Q3 2011 Q3 2012 $0.40 $(0.20) -$0.30 -$0.20 -$0.10 $0.00 $0.10 $0.20 $0.30 $0.40 $0.50 Q3 2011 Q3 2012 $31 $(14) -$20.0 -$15.0 -$10.0 -$5.0 $0.0 $5.0 $10.0 $15.0 $20.0 $25.0 $30.0 $35.0 Q3 2011 Q3 2012 |
 22 NYSE: NAV Supplemental Information – Truck Worldwide Truck Chargeouts 0 5,000 10,000 15,000 20,000 25,000 30,000 35,000 Actual Actual Actual Forecast Q1 Q2 Q3 Q4 Traditional Expansionary Towables We define our “traditional” markets to include U.S. and Canada School bus and Class 6 through 8 medium and heavy truck. We classify militarized commercial vehicles sold to the U.S. and Canadian militaries as Class 8 severe service within our “traditional” markets. Our “traditional” markets include CAT-branded units sold to Caterpillar under our North America supply agreement. |
 23 NYSE: NAV Market Share – U.S. & Canada School Bus and Class 6-8 Traditional Market Share Q1 Q2 Q3 Q4 Full Year Q1 Q2 Q3 Q4 Full Year Q1 Q2 Q3 Q4 Full Year School buses 60% 63% 53% 61% 59% 49% 45% 47% 53% 49% 48% 48% 47% Class 6 and 7 medium trucks 33% 44% 36% 36% 38% 36% 36% 46% 44% 41% 27% 36% 36% Class 8 heavy trucks 23% 22% 30% 20% 24% 17% 16% 17% 18% 17% 17% 15% 15% Class 8 severe service trucks 40% 41% 38% 40% 40% 33% 32% 36% 37% 35% 31% 30% 30% Combined Class 8 28% 28% 32% 25% 28% 21% 19% 21% 22% 21% 19% 18% 18% Total Traditional Market Share 33% 35% 35% 32% 34% 27% 26% 29% 29% 28% 22% 24% 24% Market Share - U.S. & Canada School Bus and Class 6-8 2010 2011 2012 We define our “traditional” markets to include U.S. and Canada School bus and Class 6 through 8 medium and heavy truck. We classify militarized commercial vehicles sold to the U.S. and Canadian militaries as Class 8 severe service within our “traditional” markets. Beginning in 2011, our competitors are reporting certain RV and commercial bus chassis units consistently with how we report these units. Our “traditional” markets include CAT-branded units sold to Caterpillar under our North America supply agreement. |
 24 NYSE: NAV Worldwide Truck Chargeouts We define our “traditional” markets to include U.S. and Canada School bus and Class 6 through 8 medium and heavy truck. We classify militarized commercial vehicles sold to the U.S. and Canadian militaries as Class 8 severe service within our “traditional” markets. Our “traditional” markets include CAT- branded units sold to Caterpillar under our North America supply agreement. FISCAL YEAR 2010 Q1 Q2 Q3 Q4 FULL YEAR BUS 3,100 3,000 2,400 3,900 12,400 MEDIUM 3,900 5,300 3,900 5,400 18,500 HEAVY 5,200 4,600 6,400 5,400 21,600 SEVERE 3,900 3,800 2,200 4,100 14,000 TOTAL 16,100 16,700 14,900 18,800 66,500 NON-TRADITIONAL MILITARY 100 200 1,000 100 1,400 EXPANSIONARY 3,900 4,500 4,700 6,000 19,100 WORLDWIDE TRUCK 20,100 21,400 20,600 24,900 87,000 FISCAL YEAR 2011 Q1 Q2 Q3 Q4 FULL YEAR BUS 2,100 2,000 2,200 2,900 9,200 MEDIUM 4,600 7,200 7,400 7,900 27,100 HEAVY 4,700 5,200 6,800 9,000 25,700 SEVERE 2,700 3,200 3,700 3,700 13,300 TOTAL 14,100 17,600 20,100 23,500 75,300 NON-TRADITIONAL MILITARY 100 400 200 700 1,400 EXPANSIONARY 5,300 7,600 8,600 10,200 31,700 WORLDWIDE TRUCK 19,500 25,600 28,900 34,400 108,400 FISCAL YEAR 2012 Q1 Q2 Q3 Q4 FULL YEAR BUS 1,700 2,600 2,900 7,200 MEDIUM 4,300 7,100 5,800 17,200 HEAVY 8,000 7,200 6,300 21,500 SEVERE 3,300 3,600 3,600 10,500 TOTAL 17,300 20,500 18,600 - 56,400 NON-TRADITIONAL MILITARY 200 400 500 1,100 EXPANSIONARY 7,400 7,500 8,000 22,900 WORLDWIDE TRUCK 24,900 28,400 27,100 - 80,400 |
 25 NYSE: NAV Worldwide Engine Shipments Navistar Q1 Q2 Q3 Q4 Full Year OEM sales - South America 30,700 34,600 33,600 33,900 132,800 Ford sales - U.S. and Canada 24,700 200 - - 24,900 Other OEM sales 2,000 3,600 3,700 4,900 14,200 Intercompany sales 16,400 17,700 15,600 18,800 68,500 Total Shipments 73,800 56,100 52,900 57,600 240,400 Navistar Q1 Q2 Q3 Q4 Full Year OEM sales - South America 27,200 37,100 38,200 36,100 138,600 Other OEM sales 4,500 4,400 3,700 3,600 16,200 Intercompany sales 17,300 23,500 22,300 25,700 88,800 Total Shipments 49,000 65,000 64,200 65,400 243,600 Navistar Q1 Q2 Q3 Q4 Full Year OEM sales - South America 24,100 25,300 28,600 78,000 Other OEM sales 2,200 2,000 3,000 7,200 Intercompany sales 21,600 23,400 20,600 65,600 Total Shipments 47,900 50,700 52,200 - 150,800 World Wide Engine Shipments 2010 2011 2012 |
 26 NYSE: NAV Order Receipts – U.S. & Canada 2012 2011 Change 2,500 2,700 (200) 4,000 6,800 (2,800) Class 8 heavy trucks 5,000 6,200 (1,200) Class 8 severe service trucks 3,100 3,100 - 14,600 18,800 (4,200) 8,100 9,300 (1,200) Order Receipts: U.S. & Canada (Units) Three Months Ended July 31, Total "Traditional" Markets Combined Class 8 (Heavy and Severe Service) "Traditional" Markets School buses Class 6 and 7 medium trucks We define our “traditional” markets to include U.S. and Canada School bus and Class 6 through 8 medium and heavy truck. We classify militarized commercial vehicles sold to the U.S. and Canadian militaries as Class 8 severe service within our “traditional” markets. Our “traditional” markets include CAT-branded units sold to Caterpillar under our North America supply agreement. |
 27 NYSE: NAV 27 U.S. and Canada Dealer Stock Inventory* *Includes U.S. and Canada Class 4-8 and school bus inventory, but does not include U.S. IC Bus or Workhorse Custom Chassis inventory. |
 28 NYSE: NAV Frequently Asked Questions Q1: What is in your Dealcor debt? A: Dealcor debt is comprised of wholesale (floor plan) financing and also retail financing on lease and rental fleets for company owned dealers. Q2: How many Dealcor dealers did you have as of July 31, 2012? A: Of our 270 primary NAFTA dealers, we have ownership interest in five Dealcor dealers as of July 31, 2012. Q3: How are your dealers doing? A: Our industry leading dealer network continues to excel in nearly all operational and financial aspects of their business. Considerable investments continue in facility upgrades, hours of service, technician training, tooling and inventory. Additional fixed operations and facility preparedness, concentrated on the increasing focus on our ever expanding customer base and the continued acceptance of CNG and LNG, continues for many of our domestic and Canadian dealers. Q4: What kind of rates do you charge your dealers and customers? A: Generally, our rates vary (those with higher credit risk have always had to pay higher interest rates) and are usually in line with the market. Q5: How do you fund your wholesale business? A: We primarily finance our wholesale portfolio through NFC, funded with traditional private or public securitizations, and through NFC’s bank facility. Q6: How is your NFC portfolio performing? A: NFC‘s wholesale portfolio has not experienced any credit losses in 2012. NFC’s retail notes portfolio in the U.S. is in run-off mode now that Navistar Capital, the new GE Capital retail program, is financing retail customers. Q7: What is your total amount of capacity at NFC? A: As of July 31, 2012, total availability in our U.S. funding facilities is $745 million. Q8: What is the status of the retail financing alliance with GE Capital in the United States? A: Navistar Capital – the alliance we formed with GE Capital in the United States to support the sale of Navistar products – is progressing consistent with expectations. Since its inception in 2010, the alliance has funded more than $1.7 billion in retail financings. |
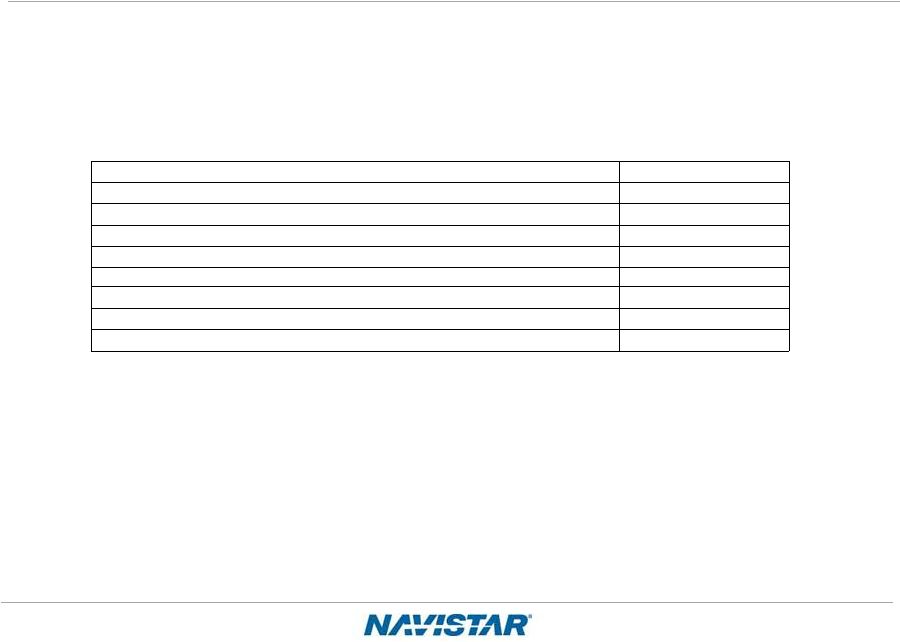
 29 NYSE: NAV Frequently Asked Questions Q9: What is included in Corporate and Eliminations? A: The primary drivers of Corporate and Eliminations are Corporate SG&A, pension and OPEB expense (excluding amounts allocated to the segments), annual incentive, manufacturing interest expense, and the elimination of intercompany sales and profit between segments. Q10: How will the changing Department of Defense (DoD) budget affect Navistar in FY 2012? A: The coming year will present challenges, but Navistar’s commercial expertise may be an advantage when the DoD is asked to “do more with less”. In addition, the Company continues to pursue a number of foreign military opportunities, especially in the Middle East, where defense spending is growing. Finally, the Company has a fleet of more than 34,000 vehicles in operation in approximately 26 countries, including more than 9,000 vehicles operating with Afghan Security Forces. These vehicles will require parts and sustainment support throughout their lifecycles. Q11: How does your FY 2012 Class 8 industry compare to ACT Research? A: Q12: What is included in your equity in loss of non-consolidated affiliates? A: Equity in loss of non-consolidated affiliates is derived from our ownership interests in partially-owned affiliates that are not consolidated, and is primarily comprised of continued investment and start-up losses associated with our Mahindra joint ventures. Reconciliation to ACT 2012 ACT* 232,000 CY to FY adjustment 2,500 Other misc. specialty vehicles Included in ACT (3,500) Total (ACT comparable Class 8 to Navistar) 231,000 Navistar Industry Retail Deliveries Combined Class 8 Trucks 216,500 Navistar difference from ACT: 14,500 ~7% *Source: ACT N.A. Commercial Vehicle Outlook - August, 2012 U.S. and Canadian Class 8 Truck Sales |
 30 NYSE: NAV 30 Frequently Asked Questions Q13: What is your net income attributable to non-controlling interests? A: Net income attributable to non-controlling interests is the result of the consolidation of subsidiaries in which we do not own 100%, and is primarily comprised of Ford's non-controlling interest in our Blue Diamond Parts joint venture. Q14: What is your expectation for future cash tax payments? A: Our cash tax payments will remain low in through 2013 and will gradually increase as we exhaust available net operating losses (NOLs) and tax credits in the future years. Q15: What is the current balance of net operating losses as compared to other deferred tax assets? A: As of October 31, 2011 the Company has U.S. federal NOLs valued at $126 million, state NOLs valued at $79 million and foreign NOLs valued at $102 million, for a total undiscounted cash value of $307 million. In addition to NOLs, the Company has accumulated tax credits of $208 million and other deferred tax assets of $1.5 billion resulting in net deferred tax assets of approximately $2 billion. Q16: How will $2 billion of deferred tax assets be used to offset future taxable income? A: Simply put, deferred tax assets represent the value of future tax deductions attributable to items that have already been expensed or deducted for book purposes. The most commonly understood component of deferred tax assets is the value of our net operating losses, which will serve to immediately reduce taxable income in the future. In addition, we have several other major components of deferred taxes which will reduce taxable income in the future. For example, the Company has accrued significant OPEB, pension and other employee benefit expenses during prior years based on expected payments to be made in the future. As these payments are made, the Company will realize tax deductions to offset future taxable income. Q17: How would future tax proposals to reduce U.S. tax rates impact Navistar? A: While lower tax rates would favorably impact future tax expense, because of the Company’s large balance of deferred tax assets we would incur a one-time adverse impact to our P&L to reset/reduce our deferred tax balances to the lower statutory rates. We estimate that for every 1% reduction in tax rates, we would incur an immediate, one-time tax increase of $50 million. Q18: What are your expected 2012 and beyond pension funding requirements? A: Current forecasts indicate that we may need to contribute approximately $157 million in 2012 to our U.S. and Canadian pension plans. Future contributions are dependent upon a number of factors, principally the changes in values of plan assets, changes in interest rates and the impact of any funding relief currently under consideration. We currently expect that from 2013 through 2015, the Company will be required to contribute at least $141 million per year in aggregate to the Plans, depending on asset performance and discount rates. This is lower than our previously reported expectations due to the impact of the Moving Ahead for Progress in the 21st Century Act which was enacted in July 2012. |
 31 NYSE: NAV 31 Frequently Asked Questions Q19: What causes the variance between manufacturing cash interest payments and GAAP interest expense? A: The main variance between cash and GAAP interest results from our manufacturing segment’s $1 billion of senior unsecured high yield notes and $570 million of senior subordinated convertible notes. As a result of this issuance, manufacturing interest expense is higher than cash interest payments due to the amortization of debt issuance costs which are amortized over the life of each note, amortization of the original issue discount of the high yield notes and amortization of the embedded call option in the convertible notes. The timing of interest payments also impacts the overall variance on a quarterly basis, but not on a fiscal year basis. Q20: What should we assume for capital expenditures in fiscal 2012? A: We plan to continue capital spending within the traditionally guided range of $250 million to $350 million for products and development. Capital spending related to Engineering Integration is funded through the RZFBs and is not included in that range. Q21: What are the differences between the accounting vs. economic dilution on your convertible debt? A: Please see the presentation on the IR website (http://ir.navistar.com/dilution.cfm) entitled Dilution overview resulting from the Convertible Notes issued on October 2009. Q22: Why are the convertible debt holders no longer able to convert their notes? A: The indenture in our convertible notes contains a provision that allows the note holders to convert anytime during the following fiscal quarter should the price of Navistar’s common stock close 130% above the conversion price for any 20 day period (consecutive or non-consecutive) out of the last 30 consecutive day trading period of each fiscal quarter. The conversion price of the notes is $50.274 per share of Navistar’s common stock and 130% of the conversion price equals $65.356 per share of Navistar’s common stock. Since Navistar’s common stock closed above $65.356 per share for more than 20 trading days during the 30 consecutive trading day period ending on April 30, 2011, the note holders had the right to convert their notes any time from May 2, 2011 through July 31, 2011. A very small minority of note holders chose to convert their notes during the conversion period. Navistar opted to settle the conversion in cash instead of shares, therefore there was a 40 trading day observation period to determine the value that was remitted in cash, so the note holders did not receive the cash for almost two months after their respective conversion notices were received. Navistar’s common stock did not close above $65.356 per share for 20 trading days (consecutive or non-consecutive) during the 30 day consecutive trading day period ending July 31, 2012, therefore the note holders do not have the right to convert their notes, however that threshold could be triggered once again in the future. |
 32 NYSE: NAV 32 Frequently Asked Questions Q23: A: 8.25% Senior Notes due November 1, 2021 $900 million 3.0% Senior Subordinated Convertible Notes due October 15, 2014 $570 million Debt of majority owned dealerships (various maturity dates) $75 million Financing arrangements and capital lease obligations (various maturity dates) $146 million Loan Agreement related to the 6.5% Tax Exempt Bonds due October 1, 2040 $225 million Asset-Based Revolving Credit Facility due November 1, 2016 $238 million Promissory Note due September 30, 2015 $33 million Other (various maturity dates) $43 million Total $2,230 million The amounts and maturity dates are as follows (the values shown below are the amounts due and exclude the accounting impact of any OID or bifurcation), however the chart below does not reflect the new $1 billion term loan entered into on August 17, 2012 nor using a portion of the $1 billion term loan proceeds to repay the $238 million outstanding under the Asset Based Revolving Credit Facility: For the manufacturing debt currently outstanding in your most recent financial statement filings, what are the respective maturity dates and principal amounts outstanding? |
 33 NYSE: NAV 33 Manufacturing Cash Flow Beginning Mfg. Cash1 Balance Fiscal 2010 Fiscal 2011 Q1 2012 Q2 2012 Q3 2012 October 31, 2009 $1,152 October 31, 2010 $1,100 October 31, 2011 $1,186 January 31, 2012 $837 April 30, 2012 $681 Approximate Cash Flows: From Operations 409 680 (142) (72) (78) From Investing / (Cap Ex) (350) (485) (125) (75) (81) From Financing / (Debt Pay Down) (110) (106) (85) (2) 110 Exchange Rate Effect (1) (3) 3 (7) (5) Net Cash Flow ($52) $86 ($349) ($156) ($54) Ending Mfg. Cash1 Balance: October 31, 2010 $1,100 October 31, 2011 $1,186 January 31, 2012 $837 April 30, 2012 $681 July 31, 2012 $627 1Cash = Cash, Cash Equivalents & Marketable Securities 2Includes cash from the consolidation of minority interests |
 34 NYSE: NAV 34 Outstanding Debt Balances July 31, October 31, 2012 2011 $ 872 $ 967 514 497 75 94 146 118 225 225 33 40 238 - 43 39 2,146 1,980 356 99 $ 1,790 $ 1,881 $ 1,299 $ 1,664 857 1,072 53 70 57 70 2,266 2,876 1,060 1,280 $ 1,206 $ 1,596 (in millions) Manufacturing operations 8.25% Senior Notes, due 2021, net of unamortized discount of $28 and $33 at the respective dates …………………….. 3.0% Senior Subordinated Convertible Notes, due 2014, net of unamortized discount of $56 and $73, respectively …….. Debt of majority-owned dealerships …………………………………………………………………………………………………. Financing arrangements and capital lease obligations …………………………………………………………………………… Loan Agreement related to 6.5% Tax Exempt Bonds, due 2040………………………………………………………………… Promissory Note ………………………………………………………………………………………………………………………. Asset-Based Credit Facility ………………………………………………………………………………………………………….. Other ……………………………………………………………………………………………………………………………………. Total manufacturing operations debt ……………………………………………………………………………………………… Less: Current portion …………………………………………………………………………………………………………………. Net long-term manufacturing operations debt ………………………………………………………………………………….. Financial services operations Asset-backed debt issued by consolidated SPEs, at fixed and variable rates, due serially through 2019 …………………. Bank revolvers, at fixed and variable rates, due dates from 2013 through 2017……………………………………………….. Commercial paper, at variable rates, due serially through 2012 …………………………………………………………………. Borrowings secured by operating and finance leases, at various rates, due serially through 2017 …………………………. Total financial services operations debt …………………………………………………………………………………………. Less: Current portion …………………………………………………………………………………………………………………. Net long-term financial services operations debt ………………………………………………………………………………. |
 35 NYSE: NAV 35 SEC Regulation G Non-GAAP Reconciliation The financial measures presented below are unaudited and not in accordance with, or an alternative for, financial measures presented in accordance with U.S. generally accepted accounting principles (GAAP). The non-GAAP financial information presented herein should be considered supplemental to, and not as a substitute for, or superior to, financial measures calculated in accordance with GAAP. Manufacturing Segment Results: segments, provide meaningful information of our core manufacturing business and therefore we use it to supplement our GAAP reporting by identifying items that may not be related to the core manufacturing business. Management often uses this information to assess and measure the performance of our operating segments. We have chosen to provide this supplemental information to investors, analysts and other interested parties to enable them to perform additional analyses of operating results, to illustrate the results of operations giving effect to the non-GAAP adjustments shown in the below reconciliation, and to provide an additional measure of performance. Adjusted Net Income and Diluted Earnings Per Share Attributable To Navistar International Corporation and Adjusted Manufacturing Segment Profit: We believe that adjusted net income, diluted earnings per share attributable to Navistar International Corporation, and adjusted manufacturing segment profit excluding certain adjustments which are not considered to be part of our ongoing business, improve the comparability of year to year results and are representative of our underlying performance. We have chosen to provide this supplemental information to investors, analysts, and other interested parties to enable them to perform additional analyses of operating results, to illustrate the results of operations giving effect to the non-GAAP adjustments shown in the below reconciliations, and to provide an additional measure of performance. Manufacturing Earnings Before Interest, Income Taxes, Depreciation, and Amortization (“EBITDA”): consolidated net income (loss) from continuing operations minus the net income (loss) from our financial services operations plus interest expense, income taxes, and depreciation and amortization. EBITDA is a measure commonly used and is presented to aid in developing an understanding of the ability of our operations to generate cash for debt service and taxes, as well as cash for investments in working capital, capital expenditures, and other liquidity needs. This information is presented as a supplement to the other data provided because it provides information which we believe is useful to investors for additional analysis. EBITDA should not be considered in isolation or as a substitute for net income, cash flows from operating activities or other consolidated operations, or cash flow statement data prepared in accordance with GAAP, or as a measure of our profitability or liquidity as determined in accordance with GAAP. Manufacturing Cash Flow and Manufacturing Cash, Cash Equivalents, and Marketable Securities: aid in developing an understanding of the ability of our operations to generate cash for debt service and taxes, as well as cash for investments in working capital, capital expenditures and other liquidity needs. This information is presented as a supplement to the other data provided because it provides information which we believe is useful to investors for additional analysis. Our manufacturing cash flow is prepared with marketable securities being treated as a cash equivalent. Manufacturing cash, cash equivalents, and marketable securities represents the Company’s consolidated cash, cash equivalents, and marketable securities excluding cash, cash equivalents, and marketable securities of our financial services operations. We include marketable securities with our cash and cash equivalents when assessing our liquidity position as our investments are highly liquid in nature. We have chosen to provide this supplemental information to investors, analysts and other interested parties to enable them to perform additional analyses of operating results, to illustrate the results of operations giving effect to the non-GAAP adjustments shown in the below reconciliation, and to provide an additional measure of performance. We believe manufacturing segment results, which includes the segment results of our Truck, Engine, and Parts reporting Manufacturing segment EBITDA is defined as our Manufacturing cash flow is used and is presented to |
 36 NYSE: NAV 36 SEC Regulation G – Manufacturing EBITDA Three Months Ended July 31, 2012 ($ millions) Net income attributable to NIC 84 $ Less income tax benefit (204) Loss before income tax benefit (120) $ Less equity income from financial service operations (13) Loss before income tax benefit and equity income from financial service operations (133) $ Add back manufacturing interest expense 40 Manufacturing EBIT (93) $ Add back manufacturing depreciation and amortization¹ 77 Manufacturing EBITDA (16) $ 1 Includes depreciation of equipment leased to others and excludes debt issuance cost/discount amortization Navistar International Corporation (Manufacturing operations with financial services operations on a pre-tax equity basis) |
 37 NYSE: NAV 37 SEC Regulation G – Manufacturing Cash Fiscal Year Comparison Manufacturing cash, cash equivalents, and marketable securities reconciliation: (Dollars in Millions) July 31, 2012 October 31, 2011 October 31, 2010 October 31, 2009 Manufacturing segment cash and cash equivalents 488 $ 488 $ 534 $ 1,152 $ Financial services segment cash and cash equivalents 59 51 51 60 Consolidated cash and cash equivalents 547 $ 539 $ 585 $ 1,212 $ Manufacturing marketable securities 139 $ 698 $ 566 $ - $ Financial services segment marketable securities 20 20 20 - Consolidated marketable securities 159 $ 718 $ 586 $ - $ Manufacturing segment cash and cash equivalents 488 $ 488 $ 534 $ 1,152 $ Manufacturing marketable securities 139 698 566 - Manufacturing segment cash, cash equivalents and marketable securities 627 $ 1,186 $ 1,100 $ 1,152 $ |
 38 NYSE: NAV 38 SEC Regulation G – Manufacturing Cash Manufacturing Operations Financial Services Operations Adjustments Condensed Consolidated Cash Flows ($ in Millions) For the year ended October 31, 2010 Cash flows from operations 409 698 - 1,107 Cash flows from investing / capital expenditures (350) 492 (576) (434) Cash flows from financing / debt pay down (110) (1,180) (10) (1,300) Effect of exchange rate changes (1) 1 - - Net cash flows (52) 11 (586) (627) Blue Diamond Consolidation - - - - Beginning cash, cash equivalents and marketable securities balance 1,152 60 - 1,212 Ending cash, cash equivalents and marketable securities balance 1,100 71 (586) 585 Manufacturing segment cash flow reconciliation: Manufacturing Operations Financial Services Operations Adjustments Condensed Consolidated Cash Flows ($ in Millions) For the year ended October 31, 2011 Cash flows from operations 680 200 - 880 Cash flows from investing / capital expenditures (485) (206) (132) (823) Cash flows from financing / debt pay down (106) 6 - (100) Effect of exchange rate changes (3) - - (3) Net cash flows 86 - (132) (46) Blue Diamond Consolidation - - - - Beginning cash, cash equivalents and marketable securities balance 1,100 71 (586) 585 Ending cash, cash equivalents and marketable securities balance 1,186 71 (718) 539 Manufacturing segment cash flow reconciliation: |
 39 NYSE: NAV 39 SEC Regulation G – Manufacturing Cash Manufacturing Operations Financial Services Operations Adjustments Condensed Consolidated Cash Flows ($ in Millions) For the nine months ended July 31, 2012 Cash flows from operations (292) 638 - 346 Cash flows from investing / capital expenditures (281) (2) 559 276 Cash flows from financing / debt pay down 23 (630) - (607) Effect of exchange rate changes (9) 2 - (7) Net cash flows (559) 8 559 8 Blue Diamond Consolidation - - - - Beginning cash, cash equivalents and marketable securities balance 1,186 71 (718) 539 Ending cash, cash equivalents and marketable securities balance 627 79 (159) 547 Manufacturing segment cash flow reconciliation: Manufacturing Operations Financial Services Operations Adjustments Condensed Consolidated Cash Flows ($ in Millions) For the three months ended July 31, 2012 Cash flows from operations (78) 375 - 297 Cash flows from investing / capital expenditures (81) (146) 178 (49) Cash flows from financing / debt pay down 110 (207) - (97) Effect of exchange rate changes (5) 1 - (4) Net cash flows (54) 23 178 147 Blue Diamond Consolidation - - - - Beginning cash, cash equivalents and marketable securities balance 681 56 (337) 400 Ending cash, cash equivalents and marketable securities balance 627 79 (159) 547 Manufacturing segment cash flow reconciliation: |
 40 NYSE: NAV 40 SEC Regulation G – Adjusted Net Income and Diluted EPS – Three Months Ended July 31, 2012 and 2011 See notes at slide 42. Adjusted net income (loss) attributable to Navistar International Corporation and adjusted diluted earnings (loss) per share attributable to Navistar International Corporation reconciliation: 2012 2011 ($ in millions, except per share data) Net income attributable to Navistar International Corporation $ 84 $ 1,400 Plus: Engineering integration costs, net of tax (A) (5) 5 Restructuring of North American manufacturing operations, net of tax (B) (14) 102 Adjustments to pre-existing warranties, net of tax (C) (81) - Charges for non-conformance penalties, net of tax (D) 2 - Less: Net impact of valuation allowance release (E) - 1,476 Adjusted net income (loss) attributable to Navistar International Corporation $ (14) $ 31 Diluted loss per share attributable to Navistar International Corporation $ 1.22 $ 18.24 Effect of adjustments on diluted loss per share attributable to Navistar International Corporation (1.42) (17.84) Adjusted diluted earnings (loss) per share attributable to Navistar International Corporation $ (0.20) $ 0.40 Diluted weighted shares outstanding 68.9 76.8 Three Months Ended July 31, |
 41 NYSE: NAV 41 SEC Regulation G – Adjusted Manufacturing Segment Profit Before Tax – Three Months Ended July 31, 2012 and 2011 See notes at slide 42. Manufacturing segment profit (loss) and adjusted manufacturing segment profit reconciliation: 2012 2011 ($ in millions) Net income attributable to Navistar International Corporation $ 84 $ 1,400 Less: Financial services segment profit 22 30 Corporate and eliminations (130) (120) Income tax benefit 196 1,463 Manufacturing segment profit (loss) (4) 27 Plus: Engineering integration costs (A) 15 11 Restructuring of North American manufacturing operations (B) - 119 Charges for non-conformance penalties (D) 10 - Adjusted manufacturing segment profit $ 21 $ 157 Profit (loss) before tax and adjusted profit (loss) before tax reconciliation: 2012 2011 ($ in millions) Loss before tax $ (100) $ (54) Plus: Engineering integration costs (A) 16 14 Restructuring of North American manufacturing operations (B) - 122 Charges for non-conformance penalties (D) 10 - Adjusted profit (loss) before tax $ (74) $ 82 Three Months Ended July 31, Three Months Ended July 31, |
 42 NYSE: NAV 42 SEC Regulation G – Notes (A) Engineering integration costs relate to the consolidation of our truck and engine engineering operations, as well as the relocation of our world headquarters. For the three months ended July 31, 2012, the charges included restructuring charges of $3 million and other related costs of $13 million, with an associated income tax benefit of $21 million. For the three months ended July 31, 2011, the charges included restructuring charges of $4 million and other related costs of $10 million, with an associated income tax benefit of $9 million. Our manufacturing operations, primarily our Truck segment, recognized charges of $15 million relating to these actions in the three months ended July 31, 2012 compared to $11 million in the three months ended July 31, 2011. (B) Restructuring of North American manufacturing operations are charges primarily related to our ongoing restructuring plans related to our plans to close our Chatham, Ontario heavy truck plant and WCC chassis plant in Union City, Indiana, and to significantly scale back operations at our Monaco recreational vehicle headquarters and motor coach manufacturing plant in Coburg, Oregon. In the second quarter of 2012, the Company incurred charges of $38 million for impairments of certain intangible assets. For the three months ended July 31, 2012, the associated tax impact of the adjustment was an income tax benefit of $14 million. For the three months ended July 31, 2011, the charges, which primarily impacted the Truck segment, included restructuring charges of $53 million, impairment charges of $64 million related to certain intangible assets and property and equipment, and other charges of $5 million, and the tax impact of these charges was income tax benefit of $20 million. (C) During the first and second quarters of 2012, the Company incurred charges of $123 million and $104 million, respectively, for adjustments to pre- existing warranties. For the three months ended July 31, 2012, the associated tax impact of the adjustments was an income tax benefit of $81 million. (D) In the three months ended July 31, 2012, the Company recorded charges totaling $10 million for NCPs for certain 13L engine sales that did not comply with emission standards, recognized in the Engine segment. The tax impact of the adjustment was an income tax benefit of $8 million. (E) In the nine months ended July 31, 2012, we recognized an income tax benefit of $181 million in the second quarter of 2012 from the release of a significant portion of our income tax valuation allowance on our Canadian deferred tax assets. In the three months ended July 31, 2011, we recognized an income tax benefit of $1.476 billion in the third quarter of 2011 from the release of a significant portion of our income tax valuation allowance on our domestic deferred tax assets. The above items described in notes A through D, have been adjusted to reflect the impact of income taxes which are calculated based on the respective periods estimated annual effective tax rate. The income tax impact of the adjustments reflects the impact of a change in the quarter to the Company's estimated annual effective tax rate. The change is the result of updates to the amounts and jurisdictional mix of our 2012 forecasted results. The tax impact of the adjustments may be adjusted for future changes in the estimated annual effective tax rate. |