NYSE: NAV 4 TH QUARTER 2012 EARNINGS PRESENTATION December 19, 2012 Exhibit 99.2 |
2 NYSE: NAV 4Q 2012 Earnings – 12/19/2012 Safe Harbor Statement Information provided and statements contained in this report that are not purely historical are forward-looking statements within the meaning of Section 27A of the Securities Act of 1933, as amended, Section 21E of the Securities Exchange Act of 1934, as amended, and the Private Securities Litigation Reform Act of 1995. Such forward-looking statements only speak as of the date of this report and the Company assumes no obligation to update the information included in this report. Such forward-looking statements include information concerning our possible or assumed future results of operations, including descriptions of our business strategy. These statements often include words such as “believe,” “expect,” “anticipate,” “intend,” “plan,” “estimate,” or similar expressions. These statements are not guarantees of performance or results and they involve risks, uncertainties, and assumptions. For a further description of these factors, see the risk factors set forth in our filings with the Securities and Exchange Commission, including our annual report on Form 10-K for the fiscal year ended October 31, 2012. Although we believe that these forward-looking statements are based on reasonable assumptions, there are many factors that could affect our actual financial results or results of operations and could cause actual results to differ materially from those in the forward-looking statements. All future written and oral forward-looking statements by us or persons acting on our behalf are expressly qualified in their entirety by the cautionary statements contained or referred to above. Except for our ongoing obligations to disclose material information as required by the federal securities laws, we do not have any obligations or intention to release publicly any revisions to any forward- looking statements to reflect events or circumstances in the future or to reflect the occurrence of unanticipated events. |
3 NYSE: NAV 4Q 2012 Earnings – 12/19/2012 Other Cautionary Notes The financial information herein contains audited and unaudited information and has been prepared by management in good faith and based on data currently available to the Company. Certain non-GAAP measures are used in this presentation to assist the reader in understanding our core manufacturing business. We believe this information is useful and relevant to assess and measure the performance of our core manufacturing business as it illustrates manufacturing performance without regard to selected historical legacy costs (i.e. pension and other postretirement costs). It also excludes financial services and other items that may not be related to the core manufacturing business or underlying results. Management often uses this information to assess and measure the underlying performance of our operating segments. We have chosen to provide this supplemental information to investors, analysts, and other interested parties to enable them to perform additional analyses of operating results. The non-GAAP numbers are reconciled to the most appropriate GAAP number in the appendix of this presentation. |
4 NYSE: NAV 4Q 2012 Earnings – 12/19/2012 Agenda • 2012 Progress on Key Areas of Focus Lewis Campbell • Warranty Troy Clarke • 2012 4 th Quarter and Full Year Results A. J. Cederoth • Drive to Deliver Troy Clarke • 2013 Key Areas of Focus and Near-Term Priorities Lewis Campbell |
NYSE: NAV Lewis Campbell, Executive Chairman and CEO 2012 PROGRESS ON KEY AREAS OF FOCUS |
6 NYSE: NAV 4Q 2012 Earnings – 12/19/2012 • Cash • ISX launch on schedule • Valuation allowance • Quality • ROIC actions 4 th Quarter Actions |
7 4Q 2012 Earnings – 12/19/2012 • • Quality Quality • • Cost Cost • • Sense of Urgency Sense of Urgency • • Great Products Great Products • • Customer Satisfaction Customer Satisfaction • • People People Near-Term Priorities Drive to Deliver Drive to Deliver Deliver Our 2013 Plans Hit Our Launches Improve Quality |
NYSE: NAV Troy Clarke, President & COO WARRANTY |
9 NYSE: NAV 4Q 2012 Earnings – 12/19/2012 Q4 FY10 Q4 FY11 Q4 FY12* Q4 FY13* Quarterly Average HD Engine # of repairs for the first 12 months Q4 FY10 Q4 FY11 Q4 FY12* Q4 FY13* Quarterly Average HD Vehicle # of repairs for the first 12 months • NOT more issues • Fixes are more expensive than anticipated • Data from larger populations of vehicles in service pointed to an unresolved issue • More effort required to ensure engine robustness – Field campaign in process Warranty Overall quality… Overall quality… continues to improve Primary driver for increase in Primary driver for increase in warranty warranty * Forecasted |
10 NYSE: NAV 4Q 2012 Earnings – 12/19/2012 Warranty • New calibrations improved performance and uptime • Again not more issues; but costlier hardware fixes • Once fixes have been identified and solutions validated, field campaigns may be required • Customer satisfaction improving – this is our TOP PRIORITY Engine launches have been a challenge across industry Engine launches have been a challenge across industry Bottom Line – Trucks and Engines are getting better, we have fixed a lot of issues |
NYSE: NAV A. J. Cederoth, Executive Vice President & CFO 2012 4 TH QUARTER AND FULL YEAR RESULTS |
12 NYSE: NAV 4Q 2012 Earnings – 12/19/2012 Pre-Existing Warranty Expense Summary • $149M for adjustments to Pre- Existing Warranties in Q4 and $404M in 2012 – Field campaigns – True-up for actual expenses • Cost/repair > estimates Warranty Cash Summary • Expect cash to be greater than expense in 2013 • Impact of cash will be spread over several years and is factored into our forecast $(51) $(895) $(488) $(413) $(416) $(322) $(310) $(404) $(79) ($1,000) ($900) ($800) ($700) ($500) ($400) ($300) ($200) ($100) $0 2010 2011 2012 Expense Cash ($600) Warranty Expense vs. Cash |
13 NYSE: NAV 4Q 2012 Earnings – 12/19/2012 • This decision is complex and based on weighting both the positive and negative evidence – heavily relying upon the negative historical performance, not based on our future outlook of the business • $2.0 billion reserve recorded as tax expense* • Non-cash accounting charge • Does not impair ability to use tax benefits in future • Strategy remains on track Tax Valuation * Excludes reversal of $233M in Q1-Q3 for domestic tax benefits. |
14 NYSE: NAV 4Q 2012 Earnings – 12/19/2012 4 th Quarter Actions Improve Future Profitability Actual 4Q 2012 Estimated 2013 Estimated 2014 Run Rate ($ million) P&L Impact Cash Impact P&L Impact Cash Impact P&L Impact Functional Cost/ Restructuring ($73) ($16) $175 $118 $175+ Garland Assembly Plant ($4) $- ($10-$25) $- $35 Rationalized Investments ($31) ($2) TBD Positive Positive |
15 NYSE: NAV 4Q 2012 Earnings – 12/19/2012 2012 Manufacturing Cash Update Mid-point of FY guidance (as shown on 9/6/2012) $950 Equity Issuance – net of fees and expenses $192 NAV Defense Receivable $175 Commercial Truck Net Working Capital Improvement $188 2012 Year End Manufacturing Cash Balance* $1,505 $ in millions * Year end cash balance includes marketable securities. Note: This slide contains non-GAAP information; please see the REG G in appendix for a detailed reconciliation. Fiscal Year End Balances* $0 $200 $400 $600 $800 $1,000 $1,200 $1,400 $1,600 FY 2008 FY 2009 FY 2010 FY 2011 FY 2012 |
16 NYSE: NAV 4Q 2012 Earnings – 12/19/2012 2012 4 th Quarter and Full Year Results * Attributable to Navistar International Corporation 2012 Q4 GAAP FY 2012 GAAP Revenue (Billions) $3.3 $12.9 Manufacturing Segment Profit (Loss) (Millions) $(371) $(642) Profit (Loss) Before Tax (Millions) $(566) $(1,182) Net Profit (Loss) * (Millions) $(2,769) $(3,010) Diluted Profit (Loss) Per Share* $(40.13) $(43.56) |
17 NYSE: NAV 4Q 2012 Earnings – 12/19/2012 Manufacturing Segment • Truck – Material costs increased by $91M – Engineering and SG&A increased by $76M • Engine - profitability declined due: – Warranty – MWM business lower by $160M • Parts – Lower Volume, higher material cost – Postive pricing Manufacturing Segment Profit & Corporate Corporate & Eliminations • Corporate spending was lower year over year • Postretirement cost higher • Q4 Restructuring Q4 GAAP Full Year GAAP ($ in millions) 2012 2011 2012 2011 Truck $(160) $287 $(320) $336 Engine $(287) $58 $(562) $84 Parts $76 $87 $240 $287 Total Manufacturing Segment Profit (Loss) $(371) $432 $(642) $707 Corporate & Eliminations $(224) $(204) $(679) $(571) |
18 NYSE: NAV 4Q 2012 Earnings – 12/19/2012 Navistar Financial Corporation • FY 2012 segment profit of $91 million vs. $129 million in FY 2011 • Wholesale financing renewal – Completed • $959 million of available capacity • Debt/Equity Leverage: 3:1 Evaluating dividends |
19 NYSE: NAV 4Q 2012 Earnings – 12/19/2012 • Results below expectations; redirecting strategy – Clean engine strategy • Product quality is improving – Supporting customers and dealers • Liquidity is strong - $1.5 billion – Raised capital to support product transition 2012 Recap |
20 NYSE: NAV 4Q 2012 Earnings – 12/19/2012 $533 $582 $668 $762 $837 $- $200 $400 $600 $800 $1,000 $1,200 2008 2009 2010 2011 2012 2013 Forecast 2013 Q1 Manufacturing Cash Update 2012 Year End Manufacturing Cash Balance* $1,505 Corporate EBITDA $(50) - $50 Maintenance CapEx/Cash Interest/Pension/OPEB Funding $(215) Change in Net Working Capital – Lower production volumes $(200) Debt Payments $(40) Restructuring Cash $(50) 2013 Q1 Manufacturing Cash Balance* $950 - $1,050 $ in millions * Cash balance includes marketable securities. Note: This slide contains non-GAAP information; please see the REG G in appendix for a detailed reconciliation. Q1 Ending Balances* |
21 NYSE: NAV 4Q 2012 Earnings – 12/19/2012 Summary • Improving market share • Cost Reductions 2014 • Class 8 industry – 215K Quality Sense of Urgency Great Products Customer Satisfaction People Cost |
NYSE: NAV Troy Clarke, President & COO DRIVE TO DELIVER |
23 NYSE: NAV 4Q 2012 Earnings – 12/19/2012 A Leader in Several Commercial Vehicle Segments U.S. and Canada School Bus & Class 6-8: 23% Market Share FY2012: ~47% Note: Based on market share position determined by brand Market Share FY2012: ~33% Market Share FY2012: ~30% Market Share FY2012: ~15% Market Share Trailing Six Months: ~47% Market Share Trailing Six Months: ~30% Market Share Trailing Six Months: ~35% Market Share Trailing Six Months: ~14% |
24 NYSE: NAV 4Q 2012 Earnings – 12/19/2012 • Clear P&L accountability across our business units • Strong emphasis on functional excellence • Organizational changes to align senior leadership for clear accountability – Material procurement – Product launches – Quality – Manufacturing • Functional excellence – Leader of North American truck and parts also heads up sales and marketing – Leader of global initiatives is responsible for quality – Chief procurement officer is responsible for driving our Lean initiatives – Head of Defense business is also responsible for Manufacturing – Product development is integrated with product planning Drive To Deliver |
ProStar with 15L ISX FY2012 FY2013 Sep Oct Nov Dec Jan Feb Mar “We are in Production” Ahead of Schedule Hit Our Launches – Critical Product Introduction Milestones 25 NYSE: NAV 4Q 2012 Earnings – 12/19/2012 Test Units 11/12 1 production build unit 12/11 Volume production 12/14 OK to Ship st |
26 NYSE: NAV 4Q 2012 Earnings – 12/19/2012 Hit Our Launches – Critical Product Introduction Milestones ProStar with MaxxForce 13L SCR 13L with SCR on Track • 5 million mile test program • Same proven SCR after-treatment system used with ISX • Minimal engine hardware changes New program launch process • Use of advanced engineering processes making milestones possible • New quality system improving first time quality FY2012 FY2013 Sep Oct Nov Dec Jan Feb Mar Apr May Jun Jul Aug MaxxForce 13L MaxxForce 13L with SCR with SCR Test Units 1/10 Submit for EPA certification 3/05 Start Lead Unit Production 4/30 OK To Ship |
27 NYSE: NAV 4Q 2012 Earnings – 12/19/2012 Driving Financial Improvement • Working capital • SG&A – VSP/RIF • Product development • Fixed and variable manufacturing • Garland closure Structural Cost Actions All actions to achieve above goal are complete; Additional savings identified • Discontinue non-related engineering programs • Discontinue MaxxForce 15L • Sale of equity interest in Mahindra JV Capable partner Capital focus needs to be allocated to business opportunities with more immediate returns • Focus on the core North America Truck, Engine & Parts businesses Return on Invested Capital (ROIC) |
Drive to Deliver Summary • A lot has been accomplished this past quarter Quality - customer satisfaction Functional excellence Launches ROIC Structural cost actions • Momentum will be evident as 2013 progresses • Stay tuned next quarter for updates on the “Drive to Deliver” accomplishments 28 NYSE: NAV 4Q 2012 Earnings – 12/19/2012 |
NYSE: NAV Lewis Campbell, Executive Chairman and CEO 2013 KEY AREAS OF FOCUS & NEAR-TERM PRIORITIES |
• • Quality Quality • • Cost Cost • • Sense of Urgency Sense of Urgency • • Great Products Great Products • • Customer Satisfaction Customer Satisfaction • • People People Near-Term Priorities 30 Drive to Deliver Drive to Deliver Improve Quality Hit Our Launches Deliver Our 2013 Plans 30 NYSE: NAV 4Q 2012 Earnings – 12/19/2012 |
31 NYSE: NAV 4Q 2012 Earnings – 12/19/2012 Key Metrics Focused on Creating Shareholder Value and Incentivizing/Retaining Employees Note: Additional detail will be provided in our 2013 Proxy. Incentive goals are subject to shareholder approval. 2013 Incentive Goals: • Achieve our operating plans • Improve our profits and cash flow • Hit our launch dates with appropriate quality metrics • Reduce our SG&A • Improve our ROIC |
9/6 – Announced ROIC focused strategy 11/15 – First saleable ProStar with ISX to roll off line Drive to Deliver Progress 8/27 – Announced U.S. Voluntary Separation Package results and need for Reduction In Force as part of goal to reduce costs by $150M- $175M. 10/31 completion date Launch ProStar with MxF13 SCR in April 12/11 – Regular production of ProStar with ISX engines 10/23 – Cummins contract finalized 9/6 – Realigned Senior Leadership – weekly meetings. Established daily cash management report and manufacturing excellence system August September October November December January April 8/30 – EPA issued final ruling 10/8 – Company adds two new board members: Vincent J. Intrieri and Mark H. Rachesky August September October November December January April August September October November December January April 10/24 – ROIC update - elimination of MxF15 Equity offering; confirmed cash guidance 10/27 – Board approves annual incentive plans that tie to increasing shareholder value 10/16 – Board approves 2013 operating plan and addition of John C. Pope to BOD 10/30 – Announced closure of Garland facility 10/26 – Brazil restructuring complete; approx. 700 jobs eliminated 8/27 – Lewis Campbell named Executive Chairman and CEO 12/10 – Company adds new board member: Samuel J. Merksamer 12/18 – Announced intent to sell India equity to Mahindra 9/6 – 3Q Earnings call 12/19 – 4Q Earnings call 12/14 – “OK to ship”- five days ahead of schedule 32 NYSE: NAV 4Q 2012 Earnings – 12/19/2012 |
Summary 2014 33 NYSE: NAV 4Q 2012 Earnings – 12/19/2012 Quality Cost Sense of Urgency Great Products Customer Satisfaction People Improve Quality Hit Our Launches Deliver Our 2013 Plans Drive to Deliver |
Ample liquidity to manage through this transitional year 2014 Summary 34 NYSE: NAV 4Q 2012 Earnings – 12/19/2012 Quality Cost Sense of Urgency Great Products Customer Satisfaction People |
Questions? 35 NYSE: NAV 4Q 2012 Earnings – 12/19/2012 |
NYSE: NAV APPENDIX |
37 NYSE: NAV Navistar Financial Corporation • Increased liquidity Total U.S. availability of $959M as of October 31, 2012 Consolidated retail securitizations, lower fixed borrowing rate • Variable funding facility for dealer floor plan increased to $750M, $450M available as of October 31, 2012 • Bank facility availability of $460M as of October 31, 2012 Retail Notes Bank Facility • $840M facility refinanced in December 2011, maturity extended from 2012 to 2016 – Funding for retail notes, wholesale notes, retail accounts, and dealer open accounts • On balance sheet • NFSC wholesale trust – $974M funding facility – Variable portion matures August 2013 – Public portion matures October 2013 • On balance sheet • Broader product offering • Enhanced ability to support large fleets • Better access to less expensive capital 4Q 2012 Earnings – 12/19/2012 Dealer Floor Plan |
Q4 and Full Year Operational Results Consolidated Revenues ($ in millions) Yearly and Quarterly Truck Chargeouts Yearly and Quarterly Engine Shipments Military Revenues ($ in millions) NYSE: NAV 38 4Q 2012 Earnings – 12/19/2012 |
Supplemental Information – Truck Worldwide Truck Chargeouts 0 5,000 10,000 15,000 20,000 25,000 30,000 35,000 Actual Actual Actual Actual Q1 Q2 Q3 Q4 Traditional Expansionary Towables 4Q 2012 Earnings – 12/19/2012 39 NYSE: NAV We define our “traditional” markets to include U.S. and Canada School bus and Class 6 through 8 medium and heavy truck. We classify militarized commercial vehicles sold to the U.S. and Canadian militaries as Class 8 severe service within our “traditional” markets. Our “traditional” markets include CAT-branded units sold to Caterpillar under our North America supply agreement. |
40 NYSE: NAV 4Q 2012 Earnings – 12/19/2012 Market Share – U.S. & Canada School Bus and Class 6-8 We define our “traditional” markets to include U.S. and Canada School bus and Class 6 through 8 medium and heavy truck. We classify militarized commercial vehicles sold to the U.S. and Canadian militaries as Class 8 severe service within our “traditional” markets. Beginning in 2011, our competitors are reporting certain RV and commercial bus chassis units consistently with how we report these units. Our “traditional” markets include CAT-branded units sold to Caterpillar under our North America supply agreement. Traditional Market Share Q1 Q2 Q3 Q4 Full Year Q1 Q2 Q3 Q4 Full Year Q1 Q2 Q3 Q4 Full Year School buses 60% 63% 53% 61% 59% 49% 45% 47% 53% 49% 48% 48% 47% 47% 47% Class 6 and 7 medium trucks 33% 44% 36% 36% 38% 36% 36% 46% 44% 41% 27% 36% 36% 34% 33% Class 8 heavy trucks 23% 22% 30% 20% 24% 17% 16% 17% 18% 17% 17% 15% 15% 13% 15% Class 8 severe service trucks 40% 41% 38% 40% 40% 33% 32% 36% 37% 35% 31% 30% 30% 30% 30% Combined Class 8 28% 28% 32% 25% 28% 21% 19% 21% 22% 21% 19% 18% 18% 17% 18% Total Traditional Market Share 33% 35% 35% 32% 34% 27% 26% 29% 29% 28% 22% 24% 24% 22% 23% 2010 2011 2012 Market Share U.S. & Canada School Bus and Class 6-8 |
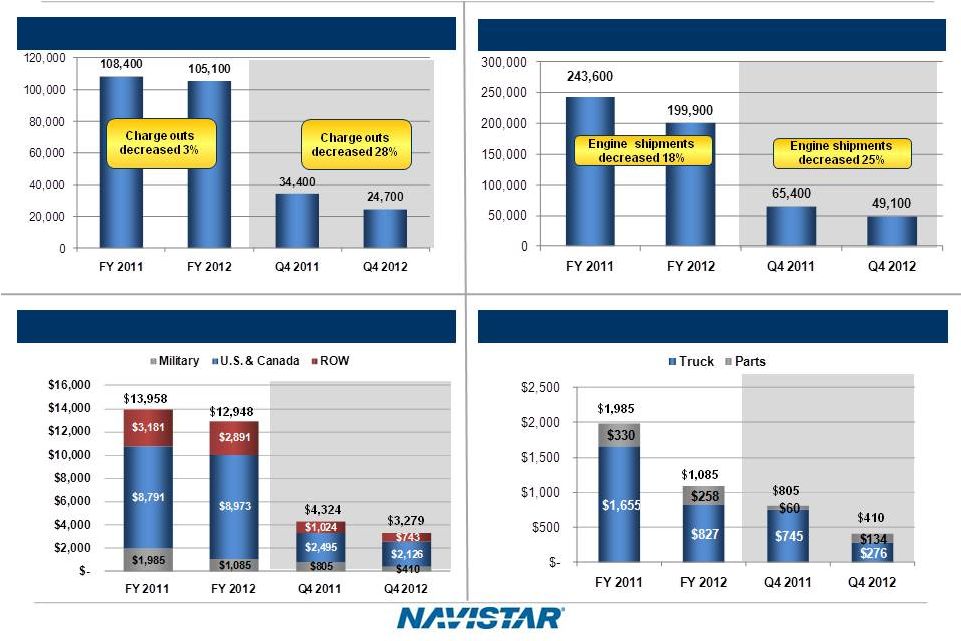
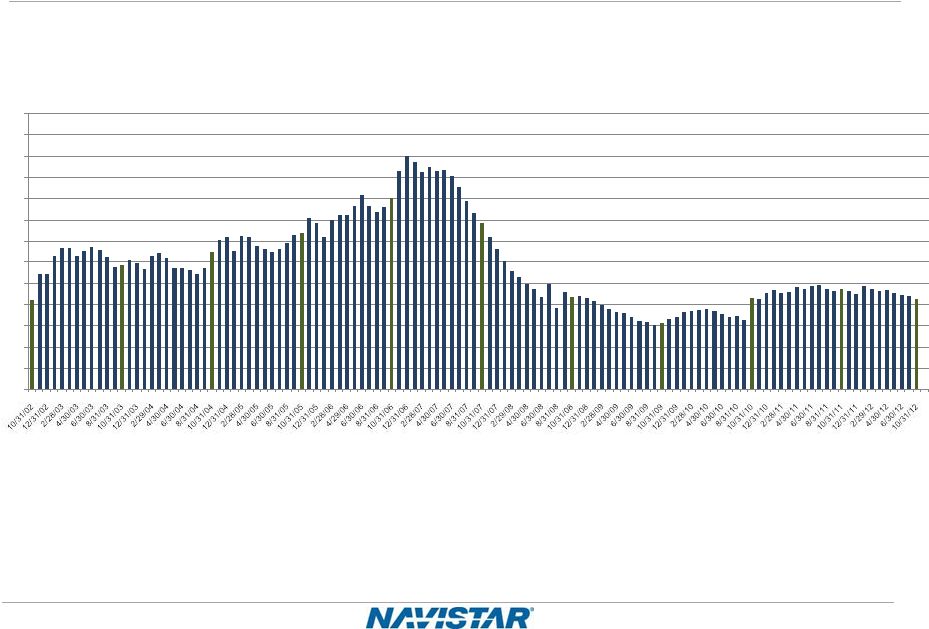
41 NYSE: NAV 4Q 2012 Earnings – 12/19/2012 Worldwide Truck Chargeouts We define our “traditional” markets to include U.S. and Canada School bus and Class 6 through 8 medium and heavy truck. We classify militarized commercial vehicles sold to the U.S. and Canadian militaries as Class 8 severe service within our “traditional” markets. Our “traditional” markets include CAT- branded units sold to Caterpillar under our North America supply agreement. FISCAL YEAR 2010 Q1 Q2 Q3 Q4 FULL YEAR BUS 3,100 3,000 2,400 3,900 12,400 MEDIUM 3,900 5,300 3,900 5,400 18,500 HEAVY 5,200 4,600 6,400 5,400 21,600 SEVERE 3,900 3,800 2,200 4,100 14,000 TOTAL 16,100 16,700 14,900 18,800 66,500 NON-TRADITIONAL MILITARY 100 200 1,000 100 1,400 EXPANSIONARY 3,900 4,500 4,700 6,000 19,100 WORLDWIDE TRUCK 20,100 21,400 20,600 24,900 87,000 FISCAL YEAR 2011 Q1 Q2 Q3 Q4 FULL YEAR BUS 2,100 2,000 2,200 2,900 9,200 MEDIUM 4,600 7,200 7,400 7,900 27,100 HEAVY 4,700 5,200 6,800 9,000 25,700 SEVERE 2,700 3,200 3,700 3,700 13,300 TOTAL 14,100 17,600 20,100 23,500 75,300 NON-TRADITIONAL MILITARY 100 400 200 700 1,400 EXPANSIONARY 5,300 7,600 8,600 10,200 31,700 WORLDWIDE TRUCK 19,500 25,600 28,900 34,400 108,400 FISCAL YEAR 2012 Q1 Q2 Q3 Q4 FULL YEAR BUS 1,700 2,600 2,900 2,500 9,700 MEDIUM 4,300 7,100 5,800 4,700 21,900 HEAVY 8,000 7,200 6,300 5,600 27,100 SEVERE 3,300 3,600 3,600 3,100 13,600 TOTAL 17,300 20,500 18,600 15,900 72,300 NON-TRADITIONAL MILITARY 200 400 500 500 1,600 EXPANSIONARY 7,400 7,500 8,000 8,300 31,200 WORLDWIDE TRUCK 24,900 28,400 27,100 24,700 105,100 |
42 NYSE: NAV 4Q 2012 Earnings – 12/19/2012 Worldwide Engine Shipments Q1 Q2 Q3 Q4 Full Year OEM sales - South America 30,700 34,600 33,600 33,900 132,800 Ford sales - U.S. and Canada 24,700 200 - - 24,900 Other OEM sales 2,000 3,600 3,700 4,900 14,200 Intercompany sales 16,400 17,700 15,600 18,800 68,500 Total Shipments 73,800 56,100 52,900 57,600 240,400 Q1 Q2 Q3 Q4 Full Year OEM sales - South America 27,200 37,100 38,200 36,100 138,600 Other OEM sales 4,500 4,400 3,700 3,600 16,200 Intercompany sales 17,300 23,500 22,300 25,700 88,800 Total Shipments 49,000 65,000 64,200 65,400 243,600 Q1 Q2 Q3 Q4 Full Year OEM sales - South America 24,100 25,300 28,600 28,700 106,700 Other OEM sales 2,200 2,000 3,000 2,900 10,100 Intercompany sales 21,600 23,400 20,600 17,500 83,100 Total Shipments 47,900 50,700 52,200 49,100 199,900 World Wide Engine Shipments 2010 2011 2012 |
43 NYSE: NAV 4Q 2012 Earnings – 12/19/2012 Order Receipts – U.S. & Canada We define our “traditional” markets to include U.S. and Canada School bus and Class 6 through 8 medium and heavy truck. We classify militarized commercial vehicles sold to the U.S. and Canadian militaries as Class 8 severe service within our “traditional” markets. Our “traditional” markets include CAT-branded units sold to Caterpillar under our North America supply agreement. Percentage Percentage 2012 2011 Change Change 2012 2011 Change Change 3,100 2,300 800 35% 10,900 8,600 2,300 27% 4,600 6,800 (2,200) -32% 20,300 28,000 (7,700) -28% Class 8 heavy trucks 3,800 6,400 (2,600) -41% 22,500 29,600 (7,100) -24% Class 8 severe service trucks 2,400 3,100 (700) -23% 12,500 13,100 (600) -5% 13,900 18,600 (4,700) -25% 66,200 79,300 (13,100) -17% 6,200 9,500 (3,300) -35% 35,000 42,700 (7,700) -18% Twelve Months Ended October 31, Order Receipts: U.S. & Canada (Units) Three Months Ended October 31, Total "Traditional" Markets Combined Class 8 (Heavy and Severe Service) "Traditional" Markets School buses Class 6 and 7 medium trucks |
44 NYSE: NAV 4Q 2012 Earnings – 12/19/2012 U.S. and Canada Dealer Stock Inventory* *Includes U.S. and Canada Class 4-8 and school bus inventory, but does not include U.S. IC Bus or Workhorse Custom Chassis inventory. - 1,000 2,000 3,000 4,000 5,000 6,000 7,000 8,000 9,000 10,000 11,000 12,000 13,000 |
45 NYSE: NAV 4Q 2012 Earnings – 12/19/2012 Frequently Asked Questions Q1: What is in your Dealcor debt? A: Dealcor debt is comprised of wholesale (floor plan) financing and also retail financing on lease and rental fleets for company owned dealers. Q2: How many Dealcor dealers did you have as of October 31, 2012? How many points of service do you have now, in addition to retail outlets in Mexico and the rest of the world? A: Of our 269 primary NAFTA dealers, we have ownership interest in five Dealcor dealers as of October 31, 2012. We currently have 784 retail outlets in U.S. and Canada, 86 retail outlets in Mexico and 292 in the rest of the world. Q3: How are your dealers doing? A: Our industry leading dealer network continues to make substantial investments in facility upgrades, expansions and acquisitions. Channel-wide focus on expanding hours of service, technician training, tooling and a re-engagement with their respective Cummins distributors in anticipation of our expanded engine line-up and enhancement of our big bore emissions solutions continues at a rapid pace. Financial performance across the distribution network in all significant aspects of operations continues to remain strong. Q4: What kind of rates do you charge your dealers and customers? A: Generally, our rates vary (those with higher credit risk have always had to pay higher interest rates) and are usually in line with the market. Q5: How do you fund your wholesale business? A: We primarily finance our wholesale portfolio through NFC, which uses traditional private or public securitizations and a bank credit facility. Q6: How is your NFC portfolio performing? A: NFC’s wholesale portfolio has not experienced any credit losses in 2012. NFC’s retail notes portfolio in the U.S. is in run-off mode now that Navistar Capital, the new GE Capital retail program, is financing retail customers. Q7: What is your total amount of capacity at NFC? A: As of October 31, 2012, total availability in our U.S. funding facilities is $959 million. Q8: What is the status of the retail financing alliance with GE Capital in the United States? A: Navistar Capital – the alliance we formed with GE Capital in the United States to support the sale of Navistar products – is progressing consistent with expectations. Since its inception in 2010, the alliance has funded more than $1.9 billion in retail financings. |
46 NYSE: NAV 4Q 2012 Earnings – 12/19/2012 Frequently Asked Questions Q9: What is included in Corporate and Eliminations? A: The primary drivers of Corporate and Eliminations are Corporate SG&A, pension and OPEB expense (excluding amounts allocated to the segments), annual incentive, manufacturing interest expense, and the elimination of intercompany sales and profit between segments. Q10: How will the changing Department of Defense (DoD) budget affect Navistar in FY 2013? A: We ended FY 2012 with approximately $1.1 billion in military revenues and based on the current environment we expect military revenues for FY 2013 to be approximately $750 million. The coming year will present challenges, but Navistar’s commercial expertise may be an advantage when the DoD is asked to “do more with less.” In addition, the Company continues to pursue a number of foreign military opportunities. Finally, the Company has a fleet of more than 34,000 vehicles in operation in approximately 26 countries, including more than 9,000 vehicles operating with Afghan Security Forces. These vehicles will require parts and sustainment support throughout their lifecycles. Q11: How would Sequestration impact Navistar? A: The full impact of Sequestration is still not known. While we will likely see some impact to the number of defense orders if the fiscal cliff is not addressed, our business structure and product portfolio lessen the risk. Q12: How does your FY 2013 Class 8 industry compare to ACT Research? A: Q13: What is included in your equity in loss of non-consolidated affiliates? A: Equity in loss of non-consolidated affiliates is derived from our ownership interests in partially-owned affiliates that are not consolidated, and is primarily comprised of continued investment and start-up losses associated with our Mahindra joint ventures. Reconciliation to ACT 2013 ACT* 227,500 CY to FY adjustment (4,500) Other misc. specialty vehicles Included in ACT (3,500) Total (ACT comparable Class 8 to Navistar) 219,500 Navistar Industry Retail Deliveries Combined Class 8 Trucks 215,000 Navistar difference from ACT: 4,500 2% *Source: ACT N.A. Commercial Vehicle Outlook - December, 2012 U.S. and Canadian Class 8 Truck Sales |
47 NYSE: NAV 47 4Q 2012 Earnings – 12/19/2012 Frequently Asked Questions Q14: What is your net income attributable to non-controlling interests? A: Net income attributable to non-controlling interests is the result of the consolidation of subsidiaries in which we do not own 100%, and is primarily comprised of Ford's non-controlling interest in our Blue Diamond Parts joint venture. Q15: Why did the Company establish an additional valuation allowance on its domestic deferred tax assets in the fourth quarter of 2012? A: On a quarterly basis, we are required to evaluate the need to establish a valuation allowance for our deferred tax assets based on our assessment of whether it is more likely than not that current or deferred tax benefits will be realized through the generation of future taxable income. We give appropriate consideration to all available evidence, both positive and negative, in assessing the need for a valuation allowance. In the fourth quarter of 2012 we concluded that with the continued deterioration of our domestic performance and additional significant warranty charges, there was not sufficient objective evidence of our ability to realize the benefits of domestic deferred tax assets on a more likely than not basis and accordingly established a full domestic valuation allowance. Q16: How will the establishment of the valuation allowance affect future tax expense? A: In the foreseeable future, our tax expense will be limited to our significant foreign locations. Therefore, our effective tax rate could be impacted and distortive in comparison to our peers without a valuation allowance. Q17: What is your expectation for future cash tax payments? A: Our cash tax payments will remain low in 2013 and will gradually increase as we exhaust available net operating losses (NOLs) and tax credits in the future years. Q18: What is the current balance of net operating losses as compared to other deferred tax assets? A: As of October 31, 2012 the Company has U.S. federal NOLs valued at $319 million, state NOLs valued at $95 million, and foreign NOLs valued at $169 million, for a total undiscounted cash value of $583 million. In addition to NOLs, the Company has accumulated tax credits of $218 million and other deferred tax assets of $2.1 billion resulting in net deferred tax assets before valuation allowances of approximately $2.9 billion. Of this amount, $2.7 billion is subject to a valuation allowance at the end of FY2012. Q19: What are your expected 2013 and beyond pension funding requirements? A: Future contributions are dependent upon a number of factors, principally the changes in values of plan assets, changes in interest rates and the impact of any funding relief currently under consideration. In 2013, we expect to contribute $166 million to meet the minimum required contributions for all plans. We currently expect that from 2014 through 2016, the Company will be required to contribute at least $200 million per year in to the Plans, depending on asset performance and discount rates. This is lower than our previously reported expectations due to the impact of the Moving Ahead for Progress in the 21st Century Act which was enacted in July 2012. |
48 NYSE: NAV 48 4Q 2012 Earnings – 12/19/2012 Frequently Asked Questions Q20: What causes the variance between manufacturing cash interest payments and GAAP interest expense? A: Manufacturing GAAP interest expense is higher than cash interest payments due to the amortization of debt issuance costs which are amortized over the life of our $1 billion of senior unsecured high yield notes, $1 billion senior secured term loan and $570 million of senior subordinated convertible notes, amortization of the original issue discount of the high yield notes and amortization of the embedded call option in the convertible notes. The timing of interest payments also impacts the overall variance on a quarterly basis, but not on a fiscal year basis. Q21: What is the change in interest expense year over year? A: Interest expense will increase by approximately $80 million. Q22: What should we assume for capital expenditures in FY2013? A: We plan to continue capital spending within the traditionally guided range of $250 million to $350 million for products and development although we expect to be at the lower end of the range. Capital spending related to Engineering Integration is funded through the RZFBs and is not included in that range. Q23: What are the differences between the accounting vs. economic dilution on your convertible debt? A: Please see the presentation on the IR website (http://ir.navistar.com/dilution.cfm) entitled Dilution overview resulting from the Convertible Notes issued on October 2009. |
49 NYSE: NAV 49 4Q 2012 Earnings – 12/19/2012 Frequently Asked Questions Q24: For the manufacturing debt currently outstanding in your most recent financial statement filings, what are the respective maturity dates and principal amounts outstanding? A: The amounts and maturity dates are as follows (the values shown below are the amounts due and exclude the accounting impact of any OID or bifurcation): Senior Secured Term Loan Credit Facility, due July 16, 2014 $1,000 million 8.25% Senior Notes due November 1, 2021 $900 million 3.0% Senior Subordinated Convertible Notes due October 15, 2014 $570 million Debt of majority owned dealerships (various maturity dates) $60 million Financing arrangements and capital lease obligations (various maturity dates) $140 million Loan Agreement related to the 6.5% Tax Exempt Bonds due October 1, 2040 $225 million Promissory Note due September 30, 2015 $30 million Other (various maturity dates) $67 million Total $2,992 million |
50 NYSE: NAV 4Q 2012 Earnings – 12/19/2012 Manufacturing Cash Flow Beginning Mfg. Cash1 Balance Fiscal 2010 Fiscal 2011 Q1 2012 Q2 2012 Q3 2012 Q4 2012 October 31, 2009 $1,152 October 31, 2010 $1,100 October 31, 2011 $1,186 January 31, 2012 $837 April 30, 2012 $681 July 31, 2012 $627 Approximate Cash Flows: From Operations 409 680 (142) (72) (78) (6) From Investing / (Cap Ex) (350) (485) (125) (75) (81) (81) From Financing / (Debt Pay Down) (110) (106) (85) (2) 110 954 Exchange Rate Effect (1) (3) 3 (7) (5) 11 Net Cash Flow ($52) $86 ($349) ($156) ($54) $878 Ending Mfg. Cash1 Balance: October 31, 2010 $1,100 October 31, 2011 $1,186 January 31, 2012 $837 April 30, 2012 $681 July 31, 2012 $627 October 31, 2012 $1,505 1Cash = Cash, Cash Equivalents & Marketable Securities 2Includes cash from the consolidation of minority interests |
51 NYSE: NAV 51 4Q 2012 Earnings – 12/19/2012 Outstanding Debt Balances October 31, October 31, 2012 2011 (in millions) Manufacturing operations Senior Secured Term Loan Credit Facility, due 2014, net of unamortized discount of $9…………………………………….. $ 991 - 8.25% Senior Notes, due 2021, net of unamortized discount of $28 and $33, respectively ………………………………….. 872 $ 967 3.0% Senior Subordinated Convertible Notes, due 2014, net of unamortized discount of $50 and $73, respectively …….. 520 497 Debt of majority-owned dealerships …………………………………………………………………………………………………. 60 94 Financing arrangements and capital lease obligations …………………………………………………………………………… 140 118 Loan Agreement related to 6.5% Tax Exempt Bonds, due 2040………………………………………………………………… 225 225 Promissory Note ………………………………………………………………………………………………………………………. 30 40 Other ……………………………………………………………………………………………………………………………………. 67 39 Total manufacturing operations debt ……………………………………………………………………………………………… 2,905 1,980 Less: Current portion …………………………………………………………………………………………………………………. 172 99 Net long-term manufacturing operations debt ………………………………………………………………………………….. $ 2,733 $ 1,881 Financial services operations Asset-backed debt issued by consolidated SPEs, at fixed and variable rates, due serially through 2019 …………………. $ 994 $ 1,664 Bank revolvers, at fixed and variable rates, due dates from 2013 through 2019 ……………………………………………….. 763 1,072 Commercial paper, at variable rates, due serially through 2013 …………………………………………………………………. 31 70 Borrowings secured by operating and finance leases, at various rates, due serially through 2017 …………………………. 78 70 Total financial services operations debt …………………………………………………………………………………………. 1,866 2,876 Less: Current portion …………………………………………………………………………………………………………………. 1,033 1,280 Net long-term financial services operations debt ………………………………………………………………………………. $ 833 $ 1,596 |
52 NYSE: NAV 4Q 2012 Earnings – 12/19/2012 SEC Regulation G – Manufacturing Cash Fiscal Year Comparison Manufacturing cash, cash equivalents, and marketable securities reconciliation: (Dollars in Millions) October 31, 2012 October 31, 2011 October 31, 2010 October 31, 2009 Manufacturing segment cash and cash equivalents 1,059 $ 488 $ 534 $ 1,152 $ Financial services segment cash and cash equivalents 28 51 51 60 Consolidated cash and cash equivalents 1,087 $ 539 $ 585 $ 1,212 $ Manufacturing marketable securities 446 $ 698 $ 566 $ - $ Financial services segment marketable securities 20 20 20 - Consolidated marketable securities 466 $ 718 $ 586 $ - $ Manufacturing segment cash and cash equivalents 1,059 $ 488 $ 534 $ 1,152 $ Manufacturing marketable securities 446 698 566 - Manufacturing segment cash, cash equivalents and marketable securities 1,505 $ 1,186 $ 1,100 $ 1,152 $ |
53 NYSE: NAV 4Q 2012 Earnings – 12/19/2012 SEC Regulation G – Manufacturing Cash Manufacturing Operations Financial Services Operations Adjustments Condensed Consolidated Cash Flows (Dollars in Millions) For the year ended October 31, 2010 Cash flows from operations 409 698 - 1,107 Cash flows from investing / capital expenditures: (350) 492 (576) (434) Cash flows from financing / debt pay down (110) (1,180) (10) (1,300) Effect of exchange rate changes (1) 1 - - Net cash flows (52) 11 (586) (627) Beginning cash, cash equivalents and marketable securities balance 1,152 60 - 1,212 Ending cash, cash equivalents and marketable securities balance 1,100 71 (586) 585 For the year ended October 31, 2011 Cash flows from operations 680 200 - 880 Cash flows from investing / capital expenditures: (485) (206) (132) (823) Cash flows from financing / debt pay down (106) 6 - (100) Effect of exchange rate changes (3) - - (3) Net cash flows 86 - (132) (46) Beginning cash, cash equivalents and marketable securities balance 1,100 71 (586) 585 Ending cash, cash equivalents and marketable securities balance 1,186 71 (718) 539 Manufacturing segment cash flow reconciliation: |
54 NYSE: NAV 4Q 2012 Earnings – 12/19/2012 SEC Regulation G – Manufacturing Cash Manufacturing Operations Financial Services Operations Adjustments Condensed Consolidated Cash Flows (Dollars in Millions) For the twelve months ended October 31, 2012 Cash flows from operations (298) 908 - 610 Cash flows from investing / capital expenditures: (362) 108 252 (2) Cash flows from financing / debt pay down 977 (1,040) - (63) Effect of exchange rate changes 2 1 - 3 Net cash flows 319 (23) 252 548 Beginning cash, cash equivalents and marketable securities balance 1,186 71 (718) 539 Ending cash, cash equivalents and marketable securities balance 1,505 48 (466) 1,087 For the three months ended October 31, 2012 Cash flows from operations (6) 270 - 264 Cash flows from investing / capital expenditures: (81) 110 (307) (278) Cash flows from financing / debt pay down 954 (410) - 544 Effect of exchange rate changes 11 (1) - 10 Net cash flows 878 (31) (307) 540 Beginning cash, cash equivalents and marketable securities balance 627 79 (159) 547 Ending cash, cash equivalents and marketable securities balance 1,505 48 (466) 1,087 Manufacturing segment cash flow reconciliation: |
55 NYSE: NAV 4Q 2012 Earnings – 12/19/2012 SEC Regulation G – See notes at slide 57 & 58 Significant items included within our results: 2012 2011 2012 2011 ($ in millions) Engineering integration costs (A) 9 23 66 64 Restructuring of North American manufacturing operations (B) 7 5 45 127 Cost-reduction actions and other strategic initiatives (C) 73 - 73 - (D) 149 - 404 - Charges for non-conformance penalties (E) 14 - 34 - Impact of Medicare Part D legal ruling (F) - 15 - 15 Net impact of income tax valuation allowances (G) 2,206 (51) 1,785 (1,527) Diluted weighted shares outstanding 69.0 73.2 69.1 76.1 Three Months Ended October 31, For the Year Ended October 31, Adjustments to pre-existing warranties Significant Items – Three Months and Year Ended October 31, 2012 and 2011 |
56 NYSE: NAV 4Q 2012 Earnings – 12/19/2012 SEC Regulation G – Manufacturing Segment Profit – Three Months and Year Ended October 31, 2012 and 2011 Manufacturing segment profit (loss) and adjusted manufacturing segment profit (loss) reconciliation: 2012 2011 2012 2011 ($ in millions) Net income (loss) attributable to Navistar International Corporation $ (2,769) $ 255 $(3,010) $ 1,723 Less: Financial services segment profit �� 16 27 91 129 Corporate and eliminations (224) (204) (679) (571) Income tax benefit (expense) (2,190) - (1,780) 1,458 Manufacturing segment profit (loss) $ (371) $ 432 $ (642) $ 707 Three Months Ended October 31, For the Year Ended October 31, |
57 NYSE: NAV 4Q 2012 Earnings – 12/19/2012 (A) Engineering integration costs relate to the consolidation of our truck and engine engineering operations, as well as the relocation of our world headquarters. For the three months ended October 31, 2012, the charges included other related costs of $9 million, of which $8 was recognized within our manufacturing operations by our Truck segment. For the three months ended October 31, 2011, the charges included restructuring charges of $6 million and other related costs of $17 million, of which $19 was recognized within our manufacturing operations, primarily by our Truck segment. For the year ended October 31, 2012, the charges included restructuring charges of $23 million and other related costs of $43 million, of which $42 million was recognized within our manufacturing operations, primarily by our Truck and Engine segments. For the year ended October 31, 2011, the charges included restructuring charges of $29 million and other related costs of $35 million, of which $51 was recognized within our manufacturing operations, primarily by our Truck segment. (B) Restructuring of North American manufacturing operations are impairment charges, restructuring charges, and other related charges that are the result of our continued efforts to restructure and rationalize our manufacturing operations in an effort to optimize our cost structure. The Company committed to plans for the restructuring of certain North American manufacturing operations, including the closure of its Chatham, Ontario heavy truck plant and actions related to Workhorse Custom Chassis and Monaco RV recreational vehicles operations. In the fourth quarter of 2012, the Company announced its plan to cease operations and close its Garland, Texas truck manufacturing operations in the first half of 2013. For the three months ended October 31, 2012 and 2011, the charges included restructuring charges of $7 million and $5 million, respectively, recognized within our manufacturing operations by our Truck segment. For the year ended October 31, 2012, the charges included charges of $45 million recognized within our manufacturing operations by our Truck and Engine segments, of which $38 million related to the impairment of certain intangible assets. For the year ended October 31, 2011, the charges included charges of $58 million, impairment charges of $64 million related to certain intangible assets and property and equipment, and $5 million of other related costs, of which $124 million was recognized by our manufacturing operations by our Truck segment. The charges for the three months and year ended October 31, 2012 include $4 million related to the pending closure of our Garland, Texas truck manufacturing operations. (C) In the fourth quarter of 2012, we announced actions to control spending across the Company with targeted reductions of certain costs. For the three months and year ended October 31, 2012, the charges included restructuring charges of $73 million. Of the restructuring charges, $57 million was recognized within our manufacturing operations, primarily by our Truck and Engine segments. SEC Regulation G – Notes |
58 NYSE: NAV 4Q 2012 Earnings – 12/19/2012 (D) During 2012, we recognized adjustments to pre-existing warranties that were significantly larger than our historical experience. For the three months and year ended October 31, 2012, we incurred charges of $149 million and $404 million, respectively, for adjustments to pre-existing warranties. (E) For the three months and year ended October 31, 2012, we recorded charges of $14 million and $34 million, respectively, for NCPs for certain 13L engine sales. These charges were recognized by our Engine segment. (F) In the fourth quarter of 2011, we had an unfavorable ruling related to a 2010 administrative change that we made to the prescription drug program under our OPEB plan affecting plan participants who are Medicare eligible. The charges were recognized within Corporate. (G) During the three months ended October 31, 2012, we recognized an income tax expense of $1.973 billion for the increase in our income tax valuation allowance on our U.S. deferred tax assets, as well as an income tax expense of $233 million relating to the reversal of income tax benefits recorded during the first nine months of 2012. For the year ended October 31, 2012, we also recognized an income tax benefit of $189 million from the release of a significant portion of our valuation allowance on our Canadian deferred tax assets in the second quarter of 2012. SEC Regulation G – Notes In the third quarter of 2011, we recognized an income tax benefit of $1.476 billion from the release of a portion of our income tax valuation allowance on our U.S. deferred tax assets. For the three months ended October 31, 2011, we recognized an additional income tax benefit of $61 million related to the release of a portion of our income tax valuation allowance. As domestic earnings were taxable upon the release of the income tax valuation allowance, we recognized $10 million of domestic income tax expense in the three months and year ended October 31, 2011 that would not have been recognized had we not released a portion of the income tax valuation allowance. The $10 million of domestic income taxes were netted against the benefit of $61 million and $1.537 billion from the release of a portion of the income tax valuation allowance for the three months and year ended October 31, 2012, respectively. |
59 NYSE: NAV 4Q 2012 Earnings – 12/19/2012 ROIC Definition (PBT 1 + Mfg Interest + Implied Interest on Operating Leases) X (1-Cash Tax Rate) Paid-in-Capital – Treasury Stock + Retained Earnings 2 + Book Value of Operating Leases + Book Value of Mfg Debt 3 – Mfg Cash 4 1 – Excludes significant items items such as restructuring, impairments, and engineering integration expenses 2 – If an Accumulated Deficit exists, then it will not be included in the calculation 3 – Excludes Financial Services Operation debt 4 – Manufacturing Cash includes Cash and cash equivalents + Marketable securities |