 Q1 EARNINGS PRESENTATION March 5, 2014 Exhibit 99.2 |
 2 NYSE: NAV Q1 2014 Earnings – 3/5/2014 Safe Harbor Statement Information provided and statements contained in this report that are not purely historical are forward- looking statements within the meaning of Section 27A of the Securities Act of 1933, as amended, Section 21E of the Securities Exchange Act of 1934, as amended, and the Private Securities Litigation Reform Act of 1995. Such forward-looking statements only speak as of the date of this report and the Company assumes no obligation to update the information included in this report. Such forward- looking statements include information concerning our possible or assumed future results of operations, including descriptions of our business strategy. These statements often include words such as “believe,” “expect,” “anticipate,” “intend,” “plan,” “estimate,” or similar expressions. These statements are not guarantees of performance or results and they involve risks, uncertainties, and assumptions. For a further description of these factors, see the risk factors set forth in our filings with the Securities and Exchange Commission, including our annual report on Form 10-K for the fiscal year ended October 31, 2013. Although we believe that these forward-looking statements are based on reasonable assumptions, there are many factors that could affect our actual financial results or results of operations and could cause actual results to differ materially from those in the forward-looking statements. All future written and oral forward-looking statements by us or persons acting on our behalf are expressly qualified in their entirety by the cautionary statements contained or referred to above. Except for our ongoing obligations to disclose material information as required by the federal securities laws, we do not have any obligations or intention to release publicly any revisions to any forward-looking statements to reflect events or circumstances in the future or to reflect the occurrence of unanticipated events. |
 3 NYSE: NAV Q1 2014 Earnings – 3/5/2014 Other Cautionary Notes The financial information herein contains audited and unaudited information and has been prepared by management in good faith and based on data currently available to the Company. Certain non-GAAP measures are used in this presentation to assist the reader in understanding our core manufacturing business. We believe this information is useful and relevant to assess and measure the performance of our core manufacturing business as it illustrates manufacturing performance without regard to selected historical legacy costs (i.e. pension and other postretirement costs). It also excludes financial services and other items that may not be related to the core manufacturing business or underlying results. Management often uses this information to assess and measure the underlying performance of our operating segments. We have chosen to provide this supplemental information to investors, analysts, and other interested parties to enable them to perform additional analyses of operating results. The non-GAAP numbers are reconciled to the most appropriate GAAP number in the appendix of this presentation. |
 NYSE: NAV 1 QUARTER 2014 RESULTS Troy Clarke, President & CEO * * * * * * * * * * * * ST |
 5 NYSE: NAV Q1 2014 Earnings – 3/5/2014 Agenda Q1 Overview Troy Clarke Financial Results Walter Borst Drive to Deliver Update Jack Allen Summary Troy Clarke |
 6 NYSE: NAV Q1 2014 Earnings – 3/5/2014 Transformation: Guiding Principles & Priorities 2013 2014 • Leading Vehicle Uptime • Driving a Lean Enterprise • EBITDA Margin Expansion • Profitable Market Share • Quality • Cost • Sense of Urgency • Great Products • Customer Satisfaction • People Turnaround: • Improve Quality • Hit our Launches • Deliver 2013 Plans • Sales Momentum |
 7 NYSE: NAV Q1 2014 Earnings – 3/5/2014 • Continued to hit our cash guidance • Beat our Q1 adjusted EBITDA guidance • Engine restructuring • Focus on product and quality • Sales momentum • Continued structural cost savings • Pace of change will accelerate 1 Quarter Summary st |
 NYSE: NAV FINANCIAL RESULTS Walter Borst, Executive Vice President & CFO * * * * * * * * * * * * |
 9 NYSE: NAV Q1 2014 Earnings – 3/5/2014 Income Statement Summary Note: This slide contains non-GAAP information; please see the REG G in appendix for a detailed reconciliation. (A) Amounts attributable to Navistar International Corporation. $ in millions, except per share Quarters Ended January 31 2014 2013 Traditional Chargeouts 11,500 13,100 Sales and Revenues $ 2,208 $ 2,637 EBITDA $ (110) $ 57 Income (Loss) from Continuing Operations, Net of Tax (A) (249) (114) Diluted Loss Per Share from Continuing Operations (A) $ (3.07) $ (1.42) |
 10 NYSE: NAV Q1 2014 Earnings – 3/5/2014 Q1 2014 Segment Results Segment Results: North America Truck $ (207) $ (101) North America Parts 104 117 Global Operations (33) (10) Financial Services 23 22 Quarters Ended January 31 2014 2013 |
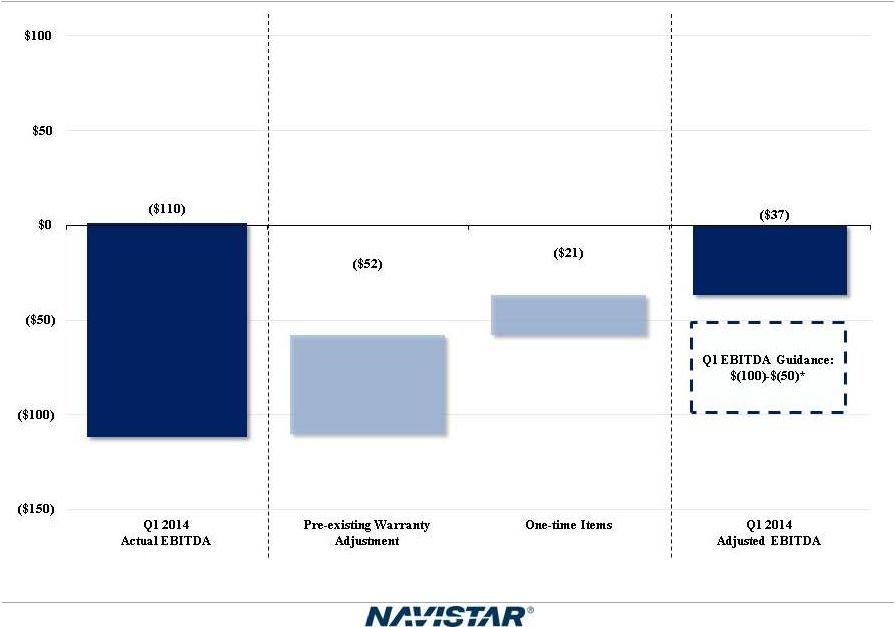 11 NYSE: NAV Q1 2014 Earnings – 3/5/2014 Q1 2014 EBITDA vs. Guidance $ in millions Note: This slide contains non-GAAP information; please see the REG G in appendix for a detailed reconciliation. * Excluding pre-existing warranty and one-time items. |
 12 Q1 2014 Earnings – 3/5/2014 Q1 2014 Manufacturing Cash Update $ in millions * Cash balance includes marketable securities. **Guidance as provided on 12/20/2013. Note: This slide contains non-GAAP information; please see the REG G in appendix for a detailed reconciliation. Guidance** Actual 4Q 2013 Manufacturing Cash Balance* $1,523 $1,523 Consolidated EBITDA (100)-(50) (110) Capex / Cash Interest / Pension & OPEB Funding (154) (125) Change in Net Working Capital / Debt Payments / Other (269)-(219) (189) 1Q 2014 Manufacturing Cash Balance $1,000 - $1,100 $1,099 |
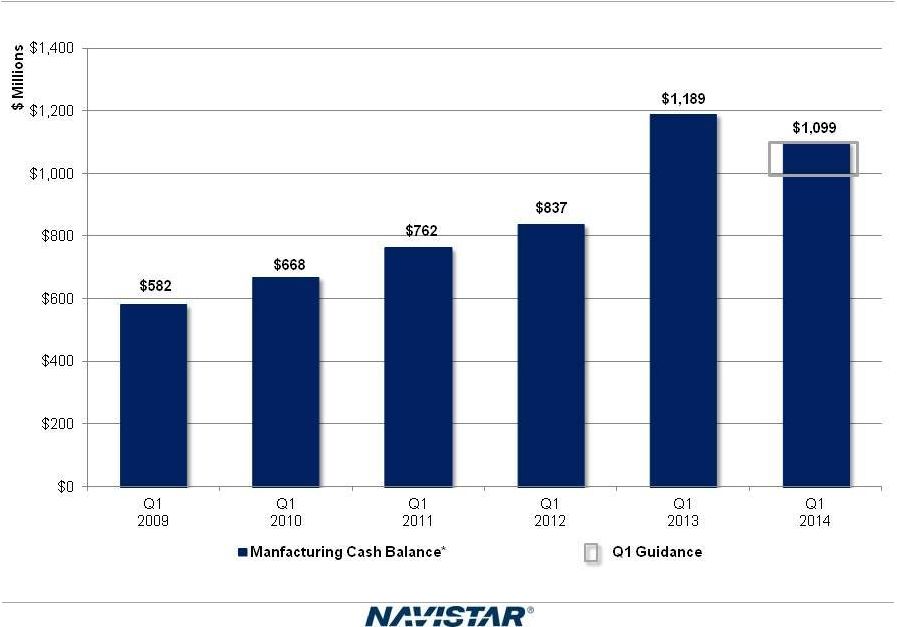 Q1 2014 Earnings – 3/5/2014 Q1 Manufacturing Cash Balances* * Cash balance includes marketable securities. Note: This slide contains non-GAAP information; please see the REG G in appendix for a detailed reconciliation. 13 NYSE: NAV |
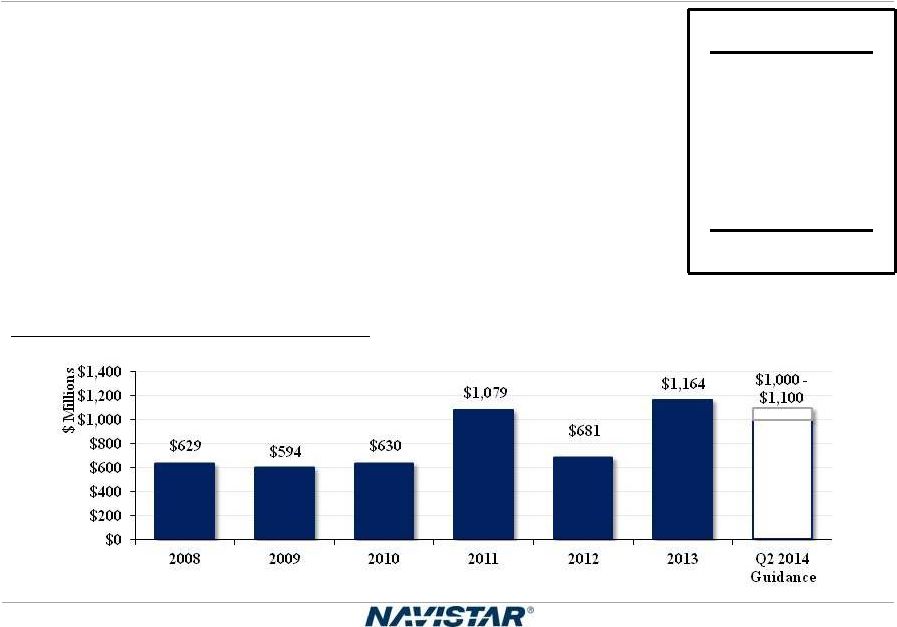 14 Q1 2014 Earnings – 3/5/2014 Guidance: Q2 2014 Manufacturing Cash $ in millions * Cash balance includes marketable securities. ** Excluding one-time items and pre-existing warranty Note: This slide contains non-GAAP information; please see the REG G in appendix for a detailed reconciliation. Q2 Manufacturing Cash Balances* (millions) Guidance Q1 2014 Manufacturing Cash Balance* $1,099 Consolidated EBITDA** $25-$75 Capex/Cash Interest/Pension & OPEB Funding ($136) Change in Net Working Capital/Debt Payments/Other $12-$62 Q2 2014 Manufacturing Cash Balance* $1,000-$1,100 |
 15 NYSE: NAV Q1 2014 Earnings – 3/5/2014 Long-term EBITDA Goals 4 Pronged Action Plan to Improve EBITDA Volume Material Structural Warranty increase cost savings cost savings cost reductions 2013 Actual 2014 2015 Exiting & Long-term Class 6 - 8 & Bus industry 301,300 300 - 335,000 325 - 350,000 Class 6 - 8 & Bus combined market share 18% 21% 22 - 24% Material cost Decrease 5% decrease Structural cost savings $330 million Additional $175 million < 10% of sales Warranty expense Decrease 4% decrease EBITDA Margin 8 – 10 % |
 16 NYSE: NAV Q1 2014 Earnings – 3/5/2014 • Adjusted EBITDA better than Q1 guidance • Manufacturing cash met guidance for the sixth consecutive quarter • Long-term EBITDA goals on track Summing It Up |
 NYSE: NAV DRIVE TO DELIVER Jack Allen, Executive Vice President & COO |
 18 NYSE: NAV Q1 2014 Earnings – 3/5/2014 Q1 Summary • Operational Progress – New SCR based products continue to improve – No new warranty news • 2014 Outlook – Class 8 industry of 220,000 to 230,000 retail sales – Navistar Market share goal of 21% Class 6-8 |
 19 Q1 2014 Earnings – 3/5/2014 • Class 6/7 retail market share at 22% in January and 17% for Q1 • Class 8 retail market share 18% in January and 14% for Q1 • Combined share (including bus) 20% in January and 16% for Q1 • February truck orders 67% above Q1 levels and March off to a good start • Class 6-8 backlog was up 56% year over year. • North America production expected to be up 25% to 30% in Q2 versus Q1 and 20% to 25% year over year. Market Share NYSE: NAV |
 20 NYSE: NAV Q1 2014 Earnings – 3/5/2014 2014 American Truck Dealers’ Trucks of the Year Industry Recognition TerraStar 4x4 ProStar with Cummins ISX |
 21 NYSE: NAV Q1 2014 Earnings – 3/5/2014 • Multiple steps to improve product line and cost structure – Introduced ISX and MaxxForce 13 SCR in all Class 8 trucks – Cummins ISB added to Class 6/7 trucks and school bus – Consolidated mid-range engine manufacturing • Addition of SCR to the MaxxForce 9/10, production begins Summer 2014 • Optimal blend of proprietary and purchased engines for future Engine Restructuring |
 22 NYSE: NAV Q1 2014 Earnings – 3/5/2014 • Used Truck: Strong performance in Q1 • Manufacturing: Enterprise-wide lean initiatives • Global: Impacted by lower volumes in Brazil Drive to Deliver Progress in Q1 2014 |
 NYSE: NAV SUMMARY Troy Clarke, President & CEO # # # # # # # # |
 24 NYSE: NAV Q1 2014 Earnings – 3/5/2014 • Class 8 industry of 220,000 - 230,000 • 2014 Class 6-8 and Bus share to be 21% • Structural cost reductions of $175 million • Driving material cost reductions to offset cost of SCR • Additional $1,400 of cost takeout on 13 liter SCR entering 2015 • Manufacturing cost savings of $50 - $60 million • 8-10% EBITDA run rate goal by end of 2015 2014 Milestones |
 NYSE: NAV APPENDIX # # # # # # # |
 26 NYSE: NAV Q1 2014 Earnings – 3/5/2014 Navistar Financial Corporation Highlights • Financial Services Segment profit of $23 million for Q1 • Total U.S. financing availability of $744 million as of January 31, 2014 • Debt/Equity Leverage of 2.4:1 as of January 31, 2014 Retail Notes Bank Facility • $840 million facility ($500 million revolver and $340 million term loan matures in December 2016) – Funding for retail notes, wholesale notes, retail accounts, and dealer open accounts • On balance sheet • NFSC wholesale trust as of January 2014 – $950 million funding facility – Variable portion matures September 2014 – Term portions mature January 2015 and September 2015 • On balance sheet • Broader product offering • Enhanced ability to support large fleets • Better access to less expensive capital |
 27 Q1 2014 Earnings – 3/5/2014 A Leader in Several Commercial Vehicle Segments Class 6/7 Medium-Duty Retail Market Share: Q1 2014: 17% Q4 2013: 20% Retail Market Share - U.S. and Canada Class 6-8: Class 8 Severe Service Retail Market Share: Q1 2014: 19% Q4 2013: 20% Class 8 Heavy Retail Market Share: Q1 2014: 12% Q4 2013: 14% Combined Class 8 Retail Market Share: Q1 2014: 14% Q4 2013: 16% January 31, 2014 October 31, 2013 July 31, 2013 April 30, 2013 January 31, 2013 Traditional Markets (U.S. and Canada) Class 6 and 7 medium trucks 17 % 20 % 24 % 26 % 25 % Class 8 heavy trucks 12 % 14 % 12 % 12 % 11 % Class 8 severe service trucks 19 % 20 % 18 % 22 % 26 % Combined Class 8 trucks 14 % 16 % 14 % 15 % 14 % NYSE: NAV |
 28 NYSE: NAV Q1 2014 Earnings – 3/5/2014 Worldwide Truck Chargeouts We define chargeouts as trucks that have been invoiced to customers. The units held in dealer inventory represent the principal difference between retail deliveries and chargeouts. This table summarizes our approximate worldwide chargeouts from our continuing operations. We define our “traditional” markets to include U.S. and Canada School bus and Class 6 through 8 medium and heavy truck. Our “traditional” markets include CAT-branded units sold to Caterpillar under our North America supply agreement. (A) The units in the first quarter of 2013 have been recast to include all militarized units. (B) Includes chargeouts related to Blue Diamond Truck ("BDT") of 2,400 units and 2,300 units during the first quarter of 2014 and 2013, respectively. (C) In the first quarter of 2013, chargeouts excludes: (i) 400 RV towables units, which was related to the Bison Coach trailer business sold in October 2013, and (ii) 200 units related to Monaco and WCC, both of which have been classified as discontinued operations. Three Months Ended January 31, (in units) 2014 2013 Change % Change Traditional Markets (U.S. and Canada) School buses 1,900 2,000 (100) (5 )% Class 6 and 7 medium trucks 3,200 4,100 (900) (22 )% Class 8 heavy trucks 4,500 4,600 (100) (2 )% Class 8 severe service trucks 1,900 2,400 (500) (21 )% Total Traditional markets 11,500 13,100 (1,600) (12 )% Military vehicles (A) — 300 (300) (100 )% Expansion markets (B) 5,500 6,600 (1,100) (17 )% Total worldwide units (C) 17,000 20,000 (3,000) (15 )% Combined Class 8 trucks 6,400 7,000 (600) (9 )% |
 29 NYSE: NAV Q1 2014 Earnings – 3/5/2014 Worldwide Engine Shipments Three Months Ended January 31, (in units) 2014 2013 Change % Change OEM sales-South America 21,700 25,700 (4,000) (16)% Intercompany sales 9,500 16,400 (6,900) (42)% Other OEM sales 1,500 1,900 (400) (21)% Total sales 32,700 44,000 (11,300) (26)% Engine Shipments |
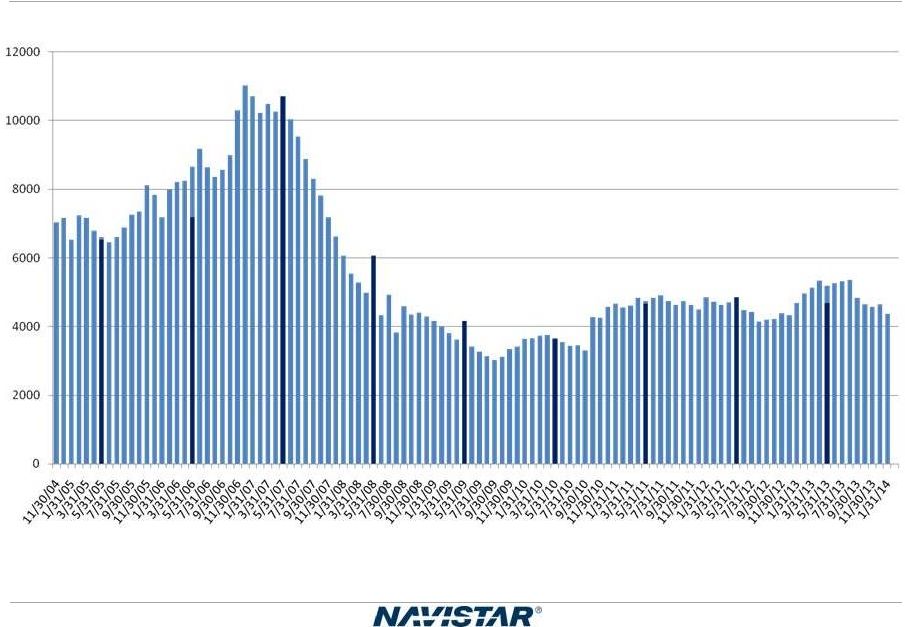 30 NYSE: NAV Q1 2014 Earnings – 3/5/2014 U.S. and Canada Dealer Stock Inventory* *Includes U.S. and Canada Class 4-8 and school bus inventory, but does not include U.S. IC Bus. Excludes the US portion of IC Bus |
 31 NYSE: NAV Q1 2014 Earnings – 3/5/2014 Frequently Asked Questions Q1: What is included in Corporate and Eliminations? A: The primary drivers of Corporate and Eliminations are Corporate SG&A, pension and OPEB expense (excluding amounts allocated to the segments), annual incentive, manufacturing interest expense, and the elimination of intercompany sales and profit between segments. Q2: What is included in your equity in loss of non-consolidated affiliates? A: Equity in loss of non-consolidated affiliates is derived from our ownership interests in partially-owned affiliates that are not consolidated. Q3: What is your net income attributable to non-controlling interests? A: Net income attributable to non-controlling interests is the result of the consolidation of subsidiaries in which we do not own 100%, and is primarily comprised of Ford's non-controlling interest in our Blue Diamond Parts joint venture. Q4: What are your expected 2014 and beyond pension funding requirements? A: Future contributions are dependent upon a number of factors, principally the changes in values of plan assets, changes in interest rates and the impact of any funding relief currently under consideration. In 2013, we contributed $165 million to meet the minimum required contributions for all plans. We expect to contribute $198 million to our pension plans in 2014. We currently expect that in 2015 through 2017, the company will be required to contribute at least $174 million per year to our pension plans, depending on asset performance and discount rates. |
 32 NYSE: NAV Q1 2014 Earnings – 3/5/2014 Frequently Asked Questions Q5: What is your expectation for future cash tax payments? A: Our cash tax payments will remain low in 2014 and will gradually increase as we utilize available net operating losses (NOLs) and tax credits in the future years. Q6: What is the current balance of net operating losses as compared to other deferred tax assets? A: As of October 31, 2013 the Company has deferred tax assets for U.S. federal NOLs valued at $546 million, state NOLs valued at $117 million, and foreign NOLs valued at $177 million, for a total undiscounted cash value of $840 million. In addition to NOLs, the Company has deferred tax assets for accumulated tax credits of $259 million and other deferred tax assets of $1.8 billion resulting in net deferred tax assets before valuation allowances of approximately $2.9 billion. Of this amount, $2.7 billion is subject to a valuation allowance at the end of FY2013. Q7: How does your FY 2014 Class 8 industry outlook compare to ACT Research? A: Reconciliation to ACT - Retail Sales ACT* CY to FY adjustment Total (ACT comparable Class 8 to Navistar) Reconciliation to ACT - Retail Sales ACT* CY to FY adjustment Total (ACT comparable Class 8 to Navistar) Navistar Industry Retail Deliveries Combined Class 8 Trucks 220,000 230,000 Navistar difference from ACT 19,442 9,442 *Source: ACT N.A. Commercial Vehicle Outlook - February 2014 8.8% 4.1% U.S. and Canadian Class 8 Truck Sales 2013 215,039 (2,358) 212,681 2014 244,500 (5,058) 239,442 |
 33 NYSE: NAV Q1 2014 Earnings – 3/5/2014 Frequently Asked Questions Q8: What is your manufacturing interest expense for Fiscal Year 2014? A: Manufacturing interest for 2014 is forecasted at approximately $270 million. Q9: What should we assume for capital expenditures in Fiscal Year 2014? A: Capital expenditures were $167 million for FY 2013, which is lower than our traditionally guided capital spending range of $200 to $300 million for product development. We expect capital expenditures of approximately $150 million in FY 2014. |
 34 NYSE: NAV Q1 2014 Earnings – 3/5/2014 Outstanding Debt Balances $ in millions (in millions) January 31, 2014 October 31, 2013 Manufacturing operations Senior Secured Term Loan Credit Facility, as Amended, due 2017, net of unamortized discount of $4 for both periods $ 693 $ 693 8.25% Senior Notes, due 2021, net of unamortized discount of $22 for both periods 1,178 1,178 3.00% Senior Subordinated Convertible Notes, due 2014, net of unamortized discount of $19 and $26, respectively 551 544 4.50% Senior Subordinated Convertible Notes, due 2018, net of unamortized discount of $22 and $23, respectively 178 177 Debt of majority-owned dealerships 46 48 Financing arrangements and capital lease obligations 70 77 Loan Agreement related to 6.5% Tax Exempt Bonds, due 2040 225 225 Promissory Note 18 20 Financed lease obligations 219 218 Other 34 39 Total Manufacturing operations debt 3,212 3,219 Less: Current portion 662 658 Net long-term Manufacturing operations debt $ 2,550 $ 2,561 (in millions) January 31, 2014 October 31, 2013 Financial Services operations Asset-backed debt issued by consolidated SPEs, at fixed and variable rates, due serially through 2019 $ 752 $ 778 Bank revolvers, at fixed and variable rates, due dates from 2014 through 2019 820 1,018 Commercial paper, at variable rates, program matures in 2015 22 21 Borrowings secured by operating and finance leases, at various rates, due serially through 2018 58 49 Total Financial Services operations debt 1,652 1,866 Less: Current portion 597 505 Net long-term Financial Services operations debt $ 1,055 $ 1,361 |
 35 NYSE: NAV Q1 2014 Earnings – 3/5/2014 SEC Regulation G Non-GAAP Reconciliation The financial measures presented below are unaudited and not in accordance with, or an alternative for, financial measures presented in accordance with U.S. generally accepted accounting principles (GAAP). The non-GAAP financial information presented herein should be considered supplemental to, and not as a substitute for, or superior to, financial measures calculated in accordance with GAAP. Manufacturing Segment Results: We believe manufacturing segment results, which includes the segment results of our North America Truck, North America Parts, and Global Operations reporting segments, provide meaningful information of our core manufacturing business and therefore we use it to supplement our GAAP reporting by identifying items that may not be related to the core manufacturing business. Management often uses this information to assess and measure the performance of our operating segments. We have chosen to provide this supplemental information to investors, analysts and other interested parties to enable them to perform additional analyses of operating results, to illustrate the results of operations giving effect to the non-GAAP adjustments shown in the below reconciliation, and to provide an additional measure of performance. Earnings (loss) Before Interest, Income Taxes, Depreciation, and Amortization (“EBITDA”): We define EBITDA as our consolidated net income (loss) from continuing operations attributable to Navistar International Corporation, net of tax, plus manufacturing interest expense, income taxes, and depreciation and amortization. We believe EBITDA provides meaningful information to the performance of our business and therefore we use it to supplement our GAAP reporting. We have chosen to provide this supplemental information to investors, analysts and other interested parties to enable them to perform additional analyses of operating results. Adjusted EBITDA: We believe that adjusted EBITDA, which excludes certain identified items that we do not considered to be part of our ongoing business, improves the comparability of year to year results, and is representative of our underlying performance. Management uses this information to assess and measure the performance of our operating segments. We have chosen to provide this supplemental information to investors, analysts and other interested parties to enable them to perform additional analyses of operating results, to illustrate the results of operations giving effect to the non-GAAP adjustments shown in the below reconciliations, and to provide an additional measure of performance. Manufacturing Cash Flow and Manufacturing Cash, Cash Equivalents, and Marketable Securities: Manufacturing cash flow is used and is presented to aid in developing an understanding of the ability of our operations to generate cash for debt service and taxes, as well as cash for investments in working capital, capital expenditures and other liquidity needs. This information is presented as a supplement to the other data provided because it provides information which we believe is useful to investors for additional analysis. Our manufacturing cash flow is prepared with marketable securities being treated as a cash equivalent. Manufacturing cash, cash equivalents, and marketable securities represents the Company’s consolidated cash, cash equivalents, and marketable securities excluding cash, cash equivalents, and marketable securities of our financial services operations. We include marketable securities with our cash and cash equivalents when assessing our liquidity position as our investments are highly liquid in nature. We have chosen to provide this supplemental information to investors, analysts and other interested parties to enable them to perform additional analyses of operating results, to illustrate the results of operations giving effect to the non-GAAP adjustments shown in the below reconciliation, and to provide an additional measure of performance. |
 36 NYSE: NAV Q1 2014 Earnings – 3/5/2014 SEC Regulation G Non-GAAP Reconciliations Manufacturing segment cash and cash equivalents and marketable securities reconciliation: 2012 2013 2014 (in millions) Jan. 31, Apr. 30 Jan. 31, Apr. 30 Oct. 31, Jan. 31, Manufacturing Operations: Cash and cash equivalents $ 418 $ 364 $ 438 $ 465 $ 727 $ 503 Marketable securities 419 317 751 699 796 596 Manufacturing Cash and cash equivalents and Marketable securities $ 837 $ 681 $ 1,189 $ 1,164 $ 1,523 $ 1,099 Financial Services Operations: Cash and cash equivalents $ 70 $ 36 $ 59 $ 40 $ 28 $ 46 Marketable securities 20 20 20 34 34 34 Financial Services Cash and cash equivalents and Marketable securities $ 90 $ 56 $ 79 $ 74 $ 62 $ 80 Consolidated Balance Sheet Cash and cash equivalents $ 488 $ 400 $ 497 $ 505 $ 755 $ 549 Marketable securities 439 337 771 733 830 630 Consolidated Cash and cash equivalents and Marketable securities $ 927 $ 737 $ 1,268 $ 1,238 $ 1,585 $ 1,179 |
 37 NYSE: NAV Q1 2014 Earnings – 3/5/2014 SEC Regulation G Non-GAAP Reconciliations Manufacturing segment cash and cash equivalents and marketable securities reconciliation: 2008 2009 2010 2011 (in millions) Apr. 30 Jan. 31, Apr. 30 Jan. 31, Apr. 30 Jan. 31, Apr. 30 Manufacturing Operations: Cash and cash equivalents $ 591 $ 433 $ 594 $ 618 $ 455 $ 372 $ 361 Marketable securities 38 149 — 50 175 390 718 Manufacturing Cash and cash equivalents and Marketable securities $ 629 $ 582 $ 594 $ 668 $ 630 $ 762 $ 1,079 Financial Services Operations: Cash and cash equivalents $ 84 $ 64 $ 124 $ 72 $ 53 $ 27 $ 29 Marketable securities — — — — — 20 20 Financial Services Cash and cash equivalents and Marketable securities $ 84 $ 64 $ 124 $ 72 $ 53 $ 47 $ 49 Consolidated Balance Sheet Cash and cash equivalents $ 675 $ 497 $ 718 $ 690 $ 508 $ 399 $ 390 Marketable securities 38 149 — 50 175 410 738 Consolidated Cash and cash equivalents and Marketable securities $ 713 $ 646 $ 718 $ 740 $ 683 $ 809 $ 1,128 |
 38 NYSE: NAV Q1 2014 Earnings – 3/5/2014 SEC Regulation G Non-GAAP Reconciliations Earnings (loss) before interest, taxes, depreciation, and amortization ("EBITDA") reconciliation Quarters Ended January 31, (in millions) 2014 2013 Loss from continuing operations attributable to NIC, net of tax (249) (114) Plus: Depreciation and amortization expense 86 100 Manufacturing interest expense (A) 65 56 Less: Income tax benefit (expense) 12 (15) EBITDA $ (110) $ 57 Quarters Ended January 31, (in millions) 2014 2013 Interest expense $ 82 $ 74 Less: Financial services interest expense 17 18 Manufacturing interest expense $ 65 $ 56 Adjusted EBITDA reconciliation : (A) Manufacturing interest expense is the net interest expense primarily generated for borrowings that support the manufacturing and corporate operations, adjusted to eliminate intercompany interest expense with our Financial Services segment. The following table reconciles Manufacturing interest expense to the consolidated interest expense: (in millions) Quarters Ended January 31, 2013 EBITDA (reconciled above) $ (110) Less significant items of: Adjustments to pre-existing warranties (A) $ 52 Asset impairments charges (B) 18 Restructuring charges 3 73 Adjusted EBITDA $ (37) |
 39 NYSE: NAV Q1 2014 Earnings – 3/5/2014 Significant Items Included Within Our Results (A) Adjustments to pre-existing warranties reflect changes in our estimate of warranty costs for products sold in prior periods. Such adjustments typically occur when claims experience deviates from historic and expected trends. Our warranty liability is generally affected by component failure rates, repair costs, and the timing of failures. Future events and circumstances related to these factors could materially change our estimates and require adjustments to our liability. In addition, new product launches require a greater use of judgment in developing estimates until historical experience becomes available. (B) In the first quarter of 2014, the Company concluded it had a triggering event related to potential sales of assets requiring assessment of impairment for certain intangible and long-lived assets in the North America Truck segment. As a result, the North America Truck segment recognized asset impairment charges of $18 million. (C) In the first quarter of 2013, the North America Truck segment recognized $25 million of charges for accelerated deprecation, which consisted of $13 million for certain assets related to the discontinuation of our MaxxForce 15L engine and $12 million for certain assets related to the closure of our Garland Facility. (D) As a result of the legal settlement with Deloitte and Touche LLP in December 2012, the Company received cash proceeds of $35 million in the first quarter of 2013. Quarter Ended January 31, (in millions) 2014 2013 Expense (income): Adjustments to pre-existing warranties (A) $ 52 $ 40 Asset impairment charges (B) 18 — Restructuring charges 3 2 Accelerated depreciation (C) — 25 Legal settlement (D) — (35) The above items did not have a material impact on taxes due to the valuation allowances on our U.S. deferred tax assets, which was established in the fourth quarter of 2012. |