Q3 EARNINGS PRESENTATION September 03, 2014 Exhibit 99.2 |
2 NYSE: NAV Q3 2014 Earnings – 9/03/2014 Safe Harbor Statement Information provided and statements contained in this report that are not purely historical are forward-looking statements within the meaning of Section 27A of the Securities Act of 1933, as amended, Section 21E of the Securities Exchange Act of 1934, as amended, and the Private Securities Litigation Reform Act of 1995. Such forward-looking statements only speak as of the date of this report and the Company assumes no obligation to update the information included in this report. Such forward-looking statements include information concerning our possible or assumed future results of operations, including descriptions of our business strategy. These statements often include words such as “believe,” “expect,” “anticipate,” “intend,” “plan,” “estimate,” or similar expressions. These statements are not guarantees of performance or results and they involve risks, uncertainties, and assumptions. For a further description of these factors, see the risk factors set forth in our filings with the Securities and Exchange Commission, including our annual report on Form 10-K for the fiscal year ended October 31, 2013 and our quarterly report on Form 10-Q for the quarter ended July 31, 2014. Although we believe that these forward-looking statements are based on reasonable assumptions, there are many factors that could affect our actual financial results or results of operations and could cause actual results to differ materially from those in the forward-looking statements. All future written and oral forward-looking statements by us or persons acting on our behalf are expressly qualified in their entirety by the cautionary statements contained or referred to above. Except for our ongoing obligations to disclose material information as required by the federal securities laws, we do not have any obligations or intention to release publicly any revisions to any forward-looking statements to reflect events or circumstances in the future or to reflect the occurrence of unanticipated events. |
3 NYSE: NAV Q3 2014 Earnings – 9/03/2014 Other Cautionary Notes The financial information herein contains audited and unaudited information and has been prepared by management in good faith and based on data currently available to the Company. Certain non-GAAP measures are used in this presentation to assist the reader in understanding our core manufacturing business. We believe this information is useful and relevant to assess and measure the performance of our core manufacturing business as it illustrates manufacturing performance without regard to selected historical legacy costs (i.e. pension and other postretirement costs). It also excludes financial services and other items that may not be related to the core manufacturing business or underlying results. Management often uses this information to assess and measure the underlying performance of our operating segments. We have chosen to provide this supplemental information to investors, analysts, and other interested parties to enable them to perform additional analyses of operating results. The non-GAAP numbers are reconciled to the most appropriate GAAP number in the appendix of this presentation. |
3 QUARTER 2014 RESULTS Troy Clarke, President & CEO RD NYSE: NAV |
5 NYSE: NAV Q3 2014 Earnings – 9/03/2014 Agenda Q3 Overview Troy Clarke Financial Results Walter Borst Drive to Deliver Update Jack Allen Summary Troy Clarke |
6 NYSE: NAV Q3 2014 Earnings – 9/03/2014 Transformation: Drive to Deliver: Guiding Principles & Priorities 2013 2014 • Leading Vehicle Uptime • Driving a Lean Enterprise • EBITDA Margin Expansion • Profitable Market Share • Quality • Cost • Sense of Urgency • Great Products • Customer Satisfaction • People Turnaround: • Improve Quality • Hit our Launches • Deliver 2013 Plans • Sales Momentum |
7 NYSE: NAV Q3 2014 Earnings – 9/03/2014 • Reported income from continuing operations before taxes for the first time since 2011 • Exceeded Q3 adjusted EBITDA guidance • Hit our cash guidance • Revising Class 6-8 and Bus industry forecast upwards • Increased backlog, production, and chargeout levels year-over-year • Raising structural cost savings target • Challenging economy in Brazil • Making progress towards exiting 2015 at our 8-10% adjusted EBITDA margin goal 3rd Quarter Summary |
FINANCIAL RESULTS Walter Borst, Executive Vice President & CFO |
9 Q3 2014 Earnings – 9/03/2014 NYSE: NAV Income Statement Summary Note: This slide contains non-GAAP information; please see the REG G in appendix for a detailed reconciliation. (A) Amounts attributable to Navistar International Corporation. $ in millions, except per share Quarters Ended July 31, 2014 2013 Traditional Chargeouts 16,300 14,800 Sales and Revenues $2,844 $2,861 EBITDA $142 ($74) Income (Loss) from Continuing Operations Before Income Taxes $21 ($211) Income (Loss) from Continuing Operations, Net of Tax (A) ($3) ($237) Diluted Loss Per Share from Continuing Operations (A) ($0.04) ($2.94) |
10 NYSE: NAV Q3 2014 Earnings – 9/03/2014 Q3 2014 EBITDA $ in millions Note: This slide contains non-GAAP information; please see the REG G in appendix for a detailed reconciliation. * Excluding pre-existing warranty and one-time items. * $142 $133 $29 ($20) $0 $20 $40 $60 $80 $100 $120 $140 $160 $180 $200 Q3 2014 Actual EBITDA Pre- existing Warranty Adjustment One- time Items Q3 2014 Adjusted EBITDA Q3 Guidance $75-$125M |
Q3 2014 Segment Results Segment Results: North America Truck ($12) ($143) North America Parts $127 $98 Global Operations ($2) ($22) Financial Services $24 $23 Quarters Ended July 31, 2014 2013 $ in millions 11 Q3 2014 Earnings – 9/03/2014 NYSE: NAV |
12 Q3 2014 Earnings – 9/03/2014 Q3 2014 Manufacturing Cash Update $ in millions * Cash balance includes marketable securities. **Guidance as provided on 6/5/2014 Note: This slide contains non-GAAP information; please see the REG G in appendix for a detailed reconciliation. Guidance** Actual Q2 2014 Manufacturing Cash Balance* $1,060 $1,060 Consolidated Adjusted EBITDA $75 - $125 $133 Capex/Cash Interest/Pension & OPEB Funding ($125) - ($175) ($124) Change in Net Working Capital/Debt Payments/Other ($60) - $40 $29 Q3 2014 Manufacturing Cash Balance* $1,098 Memo: Adjusted Q3 2014 Manufacturing Cash Balance* (Amount excludes $90 million NFC intercompany loan) $950 - $1,050 $1,008 |
13 Guidance: Q4 2014 Manufacturing Cash $ in millions * Cash balance includes marketable securities. ** Excluding one-time items and pre-existing warranty Note: This slide contains non-GAAP information; please see the REG G in appendix for a detailed reconciliation. Guidance Q3 2014 Manufacturing Cash Balance* $1,098 Consolidated Adjusted EBITDA** $115 - $165 Capex/Cash Interest/Pension & OPEB Funding ($170) - ($185) Change in Net Working Capital/Debt Payments/Other ($43) - $22 Q4 2014 Manufacturing Cash Balance* $1,000 - $1,100 Q4 Manufacturing Cash Balances* $777 $1,152 $1,100 $1,186 $1,505 $1,523 $1,000 - $1,100 $0 $250 $500 $750 $1,000 $1,250 $1,500 $1,750 2008 2009 2010 2011 2012 2013 Q4 2014 Guidance Q3 2014 Earnings – 9/03/2014 |
14 NYSE: NAV Q3 2014 Earnings – 9/03/2014 Drive to Deliver Metrics (millions) 0% 2% 4% 6% 8% 10% 12% 1Q13 2Q13 3Q13 4Q13 1Q14 2Q14 3Q14 Warranty Expense % Manufacturing Revenue - 2% - 1% 0% 1% 2% 3% 4% 5% 1Q13 2Q13 3Q13 4Q13 1Q14 2Q14 3Q14 Adjusted EBITDA Margin 10% 11% 12% 13% 14% 15% 16% 17% 1Q13 2Q13 3Q13 4Q13 1Q14 2Q14 3Q14 Structural Costs % Manufacturing Revenue $2,100 $2,200 $2,300 $2,400 $2,500 $2,600 $2,700 $2,800 $2,900 1Q13 2Q13 3Q13 4Q13 1Q14 2Q14 3Q14 Manufacturing Revenue |
15 NYSE: NAV Q3 2014 Earnings – 9/03/2014 Long-term EBITDA Goals 4 Pronged Action Plan to Improve EBITDA Volume Material Structural Warranty increase cost savings cost savings cost reductions 2013 Actual Initial 2014 Guidance* 2015 Exiting & Long-term* Class 6 - 8 & Bus industry 301,300 300 – 335,000 325 - 350,000 Class 6 - 8 & Bus combined market share 18% 21% 22 - 24% Material cost Decrease 5% decrease Structural cost savings $330 million Additional $175 million < 10% of sales Warranty expense Decrease 4 ppt decrease Adjusted EBITDA Margin 8 – 10 % * As shown in the fourth quarter earnings presentation on 12/20/13 G G G G R |
16 NYSE: NAV Q3 2014 Earnings – 9/03/2014 • Q3 Actuals – Income from continuing operations before tax – Adjusted EBITDA beat guidance • Q4 Projections – Adjusted EBITDA and cash guidance builds upon Q3 results • Long-term adjusted EBITDA goals on track Summing It Up |
DRIVE TO DELIVER Jack Allen, Executive Vice President & COO NYSE: NAV |
Warranty spend and expense continue to come down • • • Warranty Estimated *EGR Engines built from 2010 through 2012. Lower cost per repair Better quality of newer engines Fewer 2010-12 EGR engines in their warranty period 60,000 80,000 100,000 120,000 140,000 160,000 180,000 Nov-10 Nov-11 Nov-12 Nov-13 Nov-14 Nov-15 Nov-16 Navistar EGR Engines* Big Bore HD BB HD Extended MD I-6 LD V8 0 20,000 40,000 $130 $140 $150 $160 $170 $180 $190 Q1 FY13 Q2 FY13 Q3 FY13 Q4 FY13 Q1 FY14 Q2 FY14 Q3 FY14 Actual Warranty Spend (millions) 18 NYSE: NAV Q3 2014 Earnings – 9/03/2014 Estimated |
• Material • Manufacturing • SG&A • Engineering • Warranty Expense Cost Improvements 19 NYSE: NAV Q3 2014 Earnings – 9/03/2014 LOWER BREAKEVEN |
U.S. and Canada Class 6-8 Retail Market Share Launched ProStar with Cummins ISX Launched ProStar with MaxxForce 13L with SCR Launched WorkStar with MaxxForce 9/10 SCR Launched DuraStar with MaxxForce 9/10 SCR Launched DuraStar with Cummins ISB 0% 5% 10% 15% 20% 25% 30% 35% Q1 2012 Q2 2012 Q3 2012 Q4 2012 Q1 2013 Q2 2013 Q3 2013 Q4 2013 Q1 2014 Q2 2014 Q3 2014 Severe Service Class 8 0% 2% 4% 6% 8% 10% 12% 14% 16% 18% Q1 2012 Q2 2012 Q3 2012 Q4 2012 Q1 2013 Q2 2013 Q3 2013 Q4 2013 Q1 2014 Q2 2014 Q3 2014 Heavy Truck Class 8 0% 2% 4% 6% 8% 10% 12% 14% 16% 18% 20% Q1 2012 Q2 2012 Q3 2012 Q4 2012 Q1 2013 Q2 2013 Q3 2013 Q4 2013 Q1 2014 Q2 2014 Q3 2014 Class 8 Combined 0% 5% 10% 15% 20% 25% 30% 40% 35% Q1 2012 Q2 2012 Q3 2012 Q4 2012 Q1 2013 Q2 2013 Q3 2013 Q4 2013 Q1 2014 Q2 2014 Q3 2014 Medium Truck Class 6/7 20 |
Parts Business and Used Truck Update Used Trucks Parts Business Providing Used Truck Customers with a New Truck Experience Strong Year-over-Year N.A. Parts Sales 4% Q3 ‘13 Q3 ‘14 21 |
OnCommand Connection OnCommand Connection is the industry’s first and only remote diagnostics system that works with all existing Telematics devices. Improves Uptime by … Reduces en-route events by proactively identifying issues Turns Unscheduled Failures into Planned Repairs & Maintenance Improves Routing Efficiency to the Nearby Service Providers Enables more efficient Diagnostics & Repairs 1. 2. 3. 4. 22 |
NYSE: NAV Q3 2014 Earnings – 9/03/2014 Drive to Deliver Progress in Q3 2014 DRIVE TO DELIVER 23 |
SUMMARY Troy Clarke, President & CEO NYSE: NAV |
NYSE: NAV Q3 2014 Earnings – 9/03/2014 • Q4: – Chargeouts: Up year-over-year – Manufacturing cash balance: $1.0 to $1.1 billion – Adjusted EBITDA guidance: $115 to $165 million • Full Year 2014: – Class 8 industry: Revised to 235,000 to 240,000 – Market share: Improving – Structural cost savings: Increased to $300 million – Manufacturing cost savings: $50 to $60 million • 2015: – Additional $1,400 cost takeout on 13-liter SCR entering 2015 – Exiting 2015 at our 8-10% adjusted EBITDA margin goal 2014 Milestones and Expectations 25 |
NYSE: NAV APPENDIX |
NYSE: NAV Q3 2014 Earnings – 9/03/2014 Navistar Financial Corporation Highlights • Financial Services Segment profit of $24 million for Q3, $71 million YTD • Total U.S. financing availability of $464 million as of July 31, 2014 • Financial Services Debt/Equity Leverage of 2.9:1 • Retail accounts funding facility of $100 million re-established in May 2014 Retail Notes Bank Facility • $840 million facility ($500 million revolver and $340 million term loan matures in December 2016) – Funding for retail notes, wholesale notes, retail accounts, and dealer open accounts • On balance sheet • NFSC wholesale trust as of July 2014 – $950 million funding facility – Variable portion matures March 2015 – Term portions mature January 2015 and September 2015 • On balance sheet • Broader product offering • Enhanced ability to support large fleets • Better access to less expensive capital Dealer Floor Plan 27 |
NYSE: NAV Q3 2014 Earnings – 9/03/2014 A Leader in Several Commercial Vehicle Segments Class 6/7 Medium-Duty Retail Market Share: Retail Market Share - U.S. and Canada Class 6-8: Class 8 Severe Service Retail Market Share: Class 8 Heavy Retail Market Share: Combined Class 8 Retail Market Share: Q3 2014: 20% Q2 2014: 26% Q3 2014: 15% Q2 2014: 17% Q3 2014: 14% Q2 2014: 14% Q3 2014: 14% Q2 2014: 15% 28 |
NYSE: NAV Q3 2014 Earnings – 9/03/2014 Worldwide Truck Chargeouts We define chargeouts as trucks that have been invoiced to customers. The units held in dealer inventory represent the principal difference between retail deliveries and chargeouts. This table summarizes our approximate worldwide chargeouts from our continuing operations. We define our “traditional” markets to include U.S. and Canada School bus and Class 6 through 8 medium and heavy truck. Our “traditional” markets include CAT-branded units sold to Caterpillar under our North America supply agreement. (A) All periods presented have been recast to include all militarized units. (B) Includes chargeouts related to Blue Diamond Truck ("BDT") of 3,100 units and 2,800 units during the three months ended July 31, 2014 and 2013, respectively, and 7,600 and 6,700 units during the nine months ended July 31, 2014 and 2013. (C) Excludes: (i) RV towables of 1,500 units during the first nine months ended July 31, 2013, which were related to the Bison Coach trailer business sold in October 2013, and (ii) 300 units and 800 units during the three and nine months ended July 31, 2013, respectively, related to Monaco and WCC, both of which have been classified as discontinued operations. 29 |
30 Worldwide Engine Shipments Engine Shipments Q3 2014 Earnings – 9/03/2014 30 |
U.S. and Canada Dealer Stock Inventory* *Includes U.S. and Canada Class 4-8 and school bus inventory, but does not include U.S. IC Bus. Excludes the US portion of IC Bus 31 |
NYSE: NAV Q3 2014 Earnings – 9/03/2014 Frequently Asked Questions Q1: What is included in Corporate and Eliminations? A: The primary drivers of Corporate and Eliminations are Corporate SG&A, pension and OPEB expense (excluding amounts allocated to the segments), annual incentive, manufacturing interest expense, and the elimination of intercompany sales and profit between segments. Q2: What is included in your equity in loss of non-consolidated affiliates? A: Equity in loss of non-consolidated affiliates is derived from our ownership interests in partially-owned affiliates that are not consolidated. Q3: What is your net income attributable to non-controlling interests? A: Net income attributable to non-controlling interests is the result of the consolidation of subsidiaries in which we do not own 100%, and is primarily comprised of Ford's non-controlling interest in our Blue Diamond Parts joint venture. Q4: What are your expected 2014 and beyond pension funding requirements? A: Future contributions are dependent upon a number of factors, principally the changes in values of plan assets, changes in interest rates and the impact of any funding relief currently under consideration. For the nine months ended July 31, 2014, we contributed $98 million to meet the minimum required contributions for all plans. In August 2014, the Highway and Transportation Funding Act of 2014, which included an extension of the pension funding interest rate relief, was signed into law. As a result, we lowered our funding expectations. We now expect to contribute an additional $66 million during the remainder of 2014. We currently expect that from 2015 through 2017, the Company will be required to contribute at least $100 million per year to the plans, depending on asset performance and discount rates. 32 |
NYSE: NAV Q3 2014 Earnings – 9/03/2014 Frequently Asked Questions Q5: What is your expectation for future cash tax payments? A: Our cash tax payments will remain low in 2014 and will gradually increase as we utilize available net operating losses (NOLs) and tax credits in future years. Q6: What is the current balance of net operating losses as compared to other deferred tax assets? A: As of October 31, 2013 the Company has deferred tax assets for U.S. federal NOLs valued at $546 million, state NOLs valued at $117 million, and foreign NOLs valued at $177 million, for a total undiscounted cash value of $840 million. In addition to NOLs, the Company has deferred tax assets for accumulated tax credits of $259 million and other deferred tax assets of $1.8 billion resulting in net deferred tax assets before valuation allowances of approximately $2.9 billion. Of this amount, $2.7 billion is subject to a valuation allowance at the end of FY2013. Q7: How does your FY 2014 Class 8 industry outlook compare to ACT Research? A: Reconciliation to ACT - Retail Sales ACT* CY to FY adjustment Total (ACT comparable Class 8 to Navistar) Navistar Industry Retail Deliveries Combined Class 8 Trucks 235,000 240,000 Navistar difference from ACT 13,497 8,497 *Source: ACT N.A. Commercial Vehicle Outlook - August 2014 5.7% 3.5% Reconciliation to ACT - Retail Sales ACT* CY to FY adjustment Total (ACT comparable Class 8 to Navistar) (10,303) U.S. and Canadian Class 8 Truck Sales 2014 258,800 272,753 248,497 2015 272,000 753 33 |
NYSE: NAV Q3 2014 Earnings – 9/03/2014 Frequently Asked Questions Q8: What is your manufacturing interest expense for Fiscal Year 2014? A: Manufacturing interest for 2014 is forecasted to be less than $250 million. In comparison, interest expense was $251 million for FY 2013. Q9: What should we assume for capital expenditures in Fiscal Year 2014? A: In the beginning of FY 2014 we expected capital expenditures to be less than $150 million. Through the first nine months of 2014, capital expenditures were $57 million. In comparison, capital expenditures were $167 million for FY 2013. 34 |
NYSE: NAV Q3 2014 Earnings – 9/03/2014 Outstanding Debt Balances 35 |
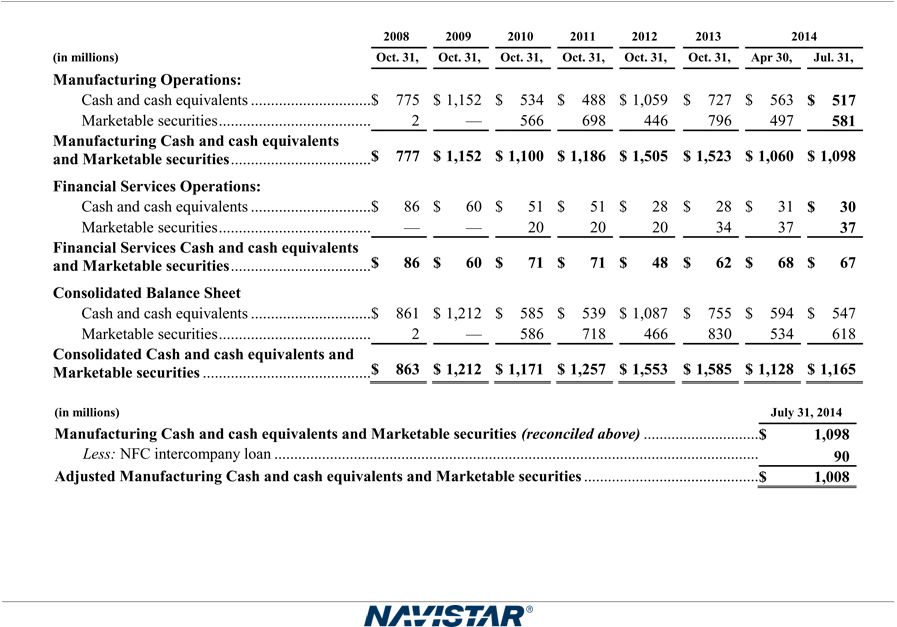
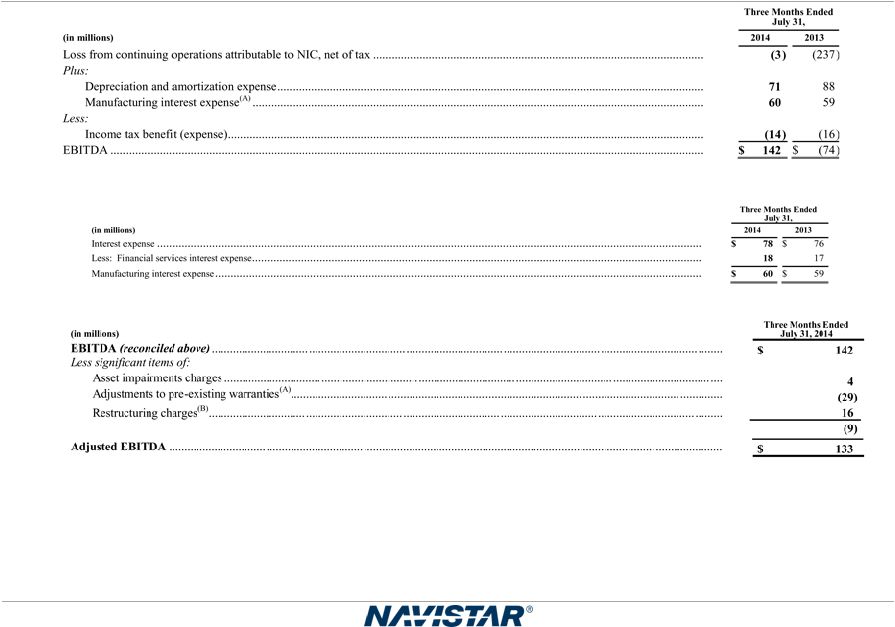
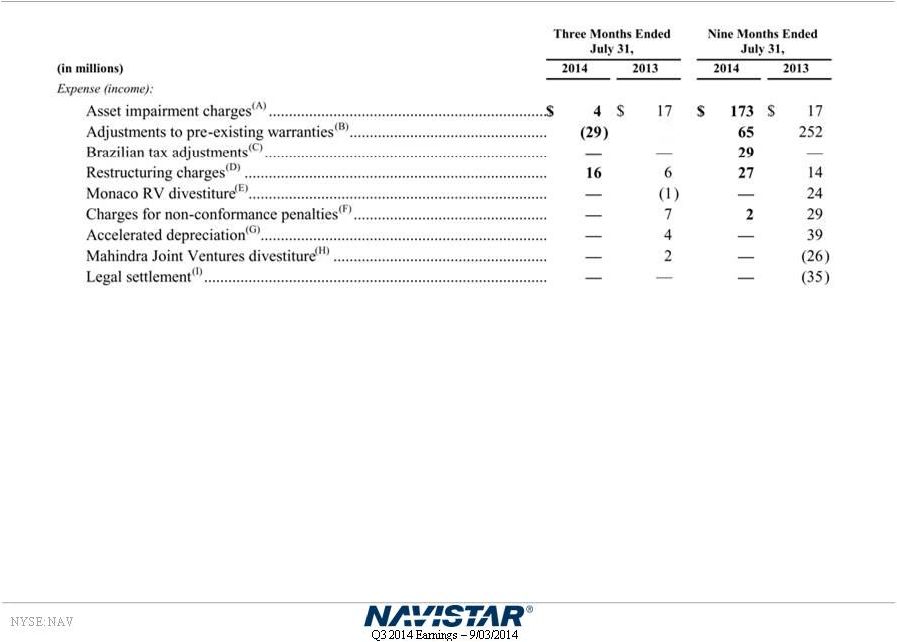
NYSE: NAV Q3 2014 Earnings – 9/03/2014 SEC Regulation G Non-GAAP Reconciliation SEC Regulation G Non-GAAP Reconciliation The financial measures presented below are unaudited and not in accordance with, or an alternative for, financial measures presented in accordance with U.S. generally accepted accounting principles ("GAAP"). The non-GAAP financial information presented herein should be considered supplemental to, and not as a substitute for, or superior to, financial measures calculated in accordance with GAAP and are reconciled to the most appropriate GAAP number below. Earnings (loss) Before Interest, Income Taxes, Depreciation, and Amortization (“EBITDA”): We define EBITDA as our consolidated net income (loss) from continuing operations attributable to Navistar International Corporation, net of tax, plus manufacturing interest expense, income taxes, and depreciation and amortization. We believe EBITDA provides meaningful information to the performance of our business and therefore we use it to supplement our GAAP reporting. We have chosen to provide this supplemental information to investors, analysts and other interested parties to enable them to perform additional analyses of operating results. Adjusted EBITDA: We believe that adjusted EBITDA, which excludes certain identified items that we do not consider to be part of our ongoing business, improves the comparability of year to year results, and is representative of our underlying performance. Management uses this information to assess and measure the performance of our operating segments. We have chosen to provide this supplemental information to investors, analysts and other interested parties to enable them to perform additional analyses of operating results, to illustrate the results of operations giving effect to the non-GAAP adjustments shown in the below reconciliations, and to provide an additional measure of performance. Manufacturing Cash, Cash Equivalents, and Marketable Securities: Manufacturing cash, cash equivalents, and marketable securities represents the Company’s consolidated cash, cash equivalents, and marketable securities excluding cash, cash equivalents, and marketable securities of our financial services operations. We include marketable securities with our cash and cash equivalents when assessing our liquidity position as our investments are highly liquid in nature. We have chosen to provide this supplemental information to investors, analysts and other interested parties to enable them to perform additional analyses of our ability to meet our operating requirements, capital expenditures, equity investments, and financial obligations. Structural costs consists of Selling, general and administrative expenses and Engineering and product development costs. 36 |
NYSE: NAV Q3 2014 Earnings – 9/03/2014 SEC Regulation G Non-GAAP Reconciliations Manufacturing segment cash and cash equivalents and marketable securities reconciliation: 37 |
NYSE: NAV Q3 2014 Earnings – 9/03/2014 SEC Regulation G Non-GAAP Reconciliations Earnings (loss) before interest, taxes, depreciation, and amortization ("EBITDA") reconciliation Adjusted EBITDA reconciliation: (A) Manufacturing interest expense is the net interest expense primarily generated for borrowings that support the manufacturing and corporate operations, adjusted to eliminate intercompany interest expense with our Financial Services segment. The following table reconciles Manufacturing interest expense to the consolidated interest expense: (A) Adjustments to pre-existing warranties reflect changes in our estimate of warranty costs for products sold in prior periods. Such adjustments typically occur when claims experience deviates from historic and expected trends. Our warranty liability is generally affected by component failure rates, repair costs, and the timing of failures. Future events and circumstances related to these factors could materially change our estimates and require adjustments to our liability. In addition, new product launches require a greater use of judgment in developing estimates until historical experience becomes available. In the third quarter of 2014, we recognized a benefit for adjustments to pre-existing warranties of $(29) million, or (0.36) per diluted share. The benefit is comprised of a benefit for changes in estimates of $(59) million, partially offset by a $30 million correction of prior-period errors primarily related to pre-existing warranties. (B) In the third quarter of 2014, we incurred restructuring charges of $16 million. The Company recognized charges of $14 million related to the 2011 closure of its Chatham, Ontario plant, based on a ruling received from the Financial Services Tribunal in Ontario, Canada. In addition, in the first nine months of 2014, the Company incurred restructuring charges related to cost reduction actions that included a reduction-in-force in the U.S. The above items did not have a material impact on taxes due to the valuation allowances on our U.S. deferred tax assets, which was established in the fourth quarter of 2012. 38 |
Significant Items Included Within Our Results (A) In the first nine months of 2014, the company recorded asset impairment charges of $173 million. During the second quarter of 2014 we recognized a non- cash charge of $149 million for the impairment of certain intangible assets of our Brazilian engine reporting unit. Due to slower than expected growth in the Brazilian economy causing declines in actual and forecasted results, we tested the goodwill of our Brazilian engine reporting unit and trademark for potential impairment. As a result, we determined that the entire $142 million balance of goodwill and $7 million of trademark were impaired. In the first and second quarter of 2014, the Company concluded it had a triggering event related to potential sales of assets requiring assessment of impairment for certain intangible and long-lived assets in the North America Truck segment. As a result, certain amortizing intangible assets and long-lived assets were determined to be fully impaired, resulting in an impairment charge of $19 million that was recognized in the nine months ended July 31, 2014. (B) Adjustments to pre-existing warranties reflect changes in our estimate of warranty costs for products sold in prior periods. Such adjustments typically occur when claims experience deviates from historic and expected trends. Our warranty liability is generally affected by component failure rates, repair costs, and the timing of failures. Future events and circumstances related to these factors could materially change our estimates and require adjustments to our liability. In addition, new product launches require a greater use of judgment in developing estimates until historical experience becomes available. In the third quarter of 2014, we recognized a benefit for adjustments to pre-existing warranties of $(29) million, or (0.36) per diluted share. The benefit is comprised of a benefit for changes in estimates of $(59) million, partially offset by a $30 million correction of prior-period errors primarily related to pre-existing warranties. 39 48 |
NYSE: NAV Q3 2014 Earnings – 9/03/2014 Significant Items Included Within Our Results (C) During the second quarter of 2014, our evaluation of the realizability of our Brazilian deferred tax assets resulted in a determination that a valuation allowance was required, due to a deterioration of operating performance in Brazil and an increase in net operating loss carryforwards. As a result, we recorded an income tax expense of $29 million, reflecting the establishment of the valuation allowance, and the tax impact of the impairment of certain intangible assets. (D) In the third quarter and first nine months of 2014, we incurred restructuring charges of $16 million and $27 million. In the third quarter of 2014, the Company recognized charges of $14 million related to the 2011 closure of its Chatham, Ontario plant, based on a ruling received from the Financial Services Tribunal in Ontario Canada. In addition, in the third quarter and first nine months of 2014, the Company incurred restructuring charges related to cost reduction actions that included a reduction-in-force in the U.S. (E) In May 2013, we divested substantially all of our interest in these operations of Monaco for approximately $19 million of cash. As a result of the divestiture, in the second quarter of 2013, we recorded charges of $25 million relating to the impairment of certain assets and the expected loss from the divestiture, which is included in the Loss from discontinued operations. (F) The North America Truck segment recorded charges for non-conformance penalties, primarily for certain 13L engine sales. (G) In the third quarter and first nine months of 2013, the company recorded charges for accelerated depreciation of $4 million and $39 million, respectively. Of these amounts $20 million related to certain assets related to the closure of our Garland Facility and $19 million, of which $4 million was recognized in the third quarter of 2013, primarily related to certain assets affected by the discontinuation of certain engine programs, particularly the MaxxForce 15L. All charges were recognized by the North American Truck segment (H) In the second quarter of 2013, the Company sold its stake in the Mahindra Joint Ventures to Mahindra for $33 million and recognized a gain of $28 million, all of which impacted the Global Operations segment. (I) As a result of the legal settlement with Deloitte and Touche LLP in December 2012, the Company received cash proceeds of $35 million in the first quarter of 2013. The above items, except for the Brazilian tax adjustments, did not have a material impact on taxes due to the valuation allowances on our U.S. deferred tax assets, which was established in the fourth quarter of 2012. 40 |