generally strong performers across the board at a national level. Partly due to the weakening credit environment, healthcare and higher education bonds tended to be underperformers by comparison, as were bonds in the IDR/PCR sector (industrial development revenue bonds and pollution control revenue bonds).
All five of the top performing bonds in the Delaware Tax-Free Idaho Fund were pre-refunded during the fiscal year, which provided a price pop for the bonds. For example, a Puerto Rico Highway and Transportation Authority revenue bond was refunded, taking it from a bond with a long maturity (2033) to one being called in six years (2013) and improving the bond’s credit quality from a BBB+ rated bond secured by revenues largely from fuel sales taxes to a AAA rated bond secured by escrowed U.S. Treasury securities. The shortened duration and improved credit quality provided the boost to the bond’s price.
The Fund’s worst performers were credit-related bonds, which experienced greater price volatility as their prices dropped below par. With each upward tick in interest rates, the price of these bonds declined more rapidly as discounts than when they were priced above par. The weaker relative performance of these bonds was a combination of the widening of credit spreads and the impact of the crossover to a discount price. An A1 rated Idaho Housing revenue bond was one of these bonds. It started the fiscal year with a premium price, which reflected the price sensitivity of its 2015 call date. As interest rates rose and credit spreads widened, the price of this bond moved below par and each subsequent downward move reflected the sensitivity of its 2026 final maturity date.
While issuance of new bonds nationally increased at a healthy clip (up 26% calendar-year to date), issuance in New York was up modestly (5.7%) for the first seven months of the fiscal year (source: Bond Buyer).
In general, short and intermediate-term bonds performed fairly well on the year. Pre-refunded bonds (bonds where the interest is paid from the proceeds of a new bond issue, held in escrow in U.S. Treasury securities) were generally strong performers across the board at a national level. Partly due to the weakening credit environment, healthcare and higher education bonds tended to be underperformers by comparison, as were bonds in the IDR/PCR sector (industrial development revenue bonds and pollution control revenue bonds).
All five of the top performing bonds in Delaware Tax-Free New York Fund were pre-refunded during the fiscal year, which provided a price pop for the bonds. For example, a New York State Dormitory Authority revenue bond issued for the North Shore/Long Island Jewish Medical Center was refunded, taking it from a bond with a long maturity (2033) to one being called in six years (2013)
and improving the bond’s credit quality from an A3 rated bond secured by revenues from the hospital system to a AAA rated bond secured by escrowed U.S. Treasury securities. The shortened duration and improved credit quality provided the boost to the bond’s price.
The Fund’s worst performers were credit-related bonds, which experienced greater price volatility as their prices dropped below par. With each upward tick in interest rates, the price of these bonds declined more rapidly as discounts than when they were priced above par. The weaker relative performance of these bonds was a combination of the widening of credit spreads and the impact of the crossover to a discount price. A BBB- rated Cattaraugus County, N.Y., Industrial Development Agency revenue bond issued for St. Bonaventure University was one of these bonds. It started the fiscal year with a premium price, which reflected the price sensitivity of its 2016 call date. As interest rates rose and credit spreads widened, the price of this bond moved below par and each subsequent downward move reflected the sensitivity of its 2031 final maturity date.
Fixed Income Glossary
Basis point: 1/100 of a percentage point, or 0.01%. Basis points are often used to measure changes in, or differences between, yields.
Bond: A debt security, like an IOU, issued by a company, municipality, or government agency. In return for lending money to the issuer, a bond buyer generally receives fixed periodic interest payments and repayment of the loan amount on a specified maturity date.
Bond ratings: Evaluations of creditworthiness by independent agencies such as Moody’s, Standard & Poor’s, and Fitch. Rating may range from Aaa or AAA (highest quality) to D (lowest quality). Bonds rated Baa/BBB or better are considered investment grade. Bonds rated Ba/BB or lower are noninvestment grade and commonly known as junk bonds, or high yield bonds.
Callable bond: A bond that may be redeemed at the request of the issuer prior to the stated maturity date.
Coupon rate: The interest rate that is paid to the investor over the life of the bond.
Duration: A measurement of a fixed income investment’s sensitivity to changes in interest rates. The larger the number, the greater the likely price change for a given change in interest rates.
Fed funds rate: The percentage of interest that banks charge to lend money to each other. The rate, which fluctuates, is a good indicator of general interest rate trends.
Maturity: The length of time until a bond issuer must repay the underlying loan principal to the bondholder.
Par value: The face value of a bond. It is also referred to as the principle value. When a bond reaches maturity, the holder receives this value, regardless of what was paid for the bond.
Pre-refunded bonds: Bonds that have been refinanced and are secured by U.S. Treasury bonds, held in an escrow account.
Tax-exempt bond: Exempt from federal or state income tax, state taxes, or local property tax.
Treasury yield curve: This is a curve on a graph that depicts the difference between short- and long-term bond yields across the duration spectrum. It is used as a benchmark for other debt in the market, such as mortgage rates or bank lending rates. It is also used to assess broad market trends, as well as potential changes in economic output and growth.
Municipal Bonds
Legacy bond: Bond bought in previous periods and has been held in the portfolio.
Municipal bond: Bond issued by every level of municipality in order to raise capital for day-to-day activities and special specific projects. The bonds pay interest that is typically exempt from federal income taxes and is also generally exempt from state and local income taxes.
Primary market: The broker-controlled, new-issue market. When a municipal bond is purchased in the primary market, the proceeds go to the municipality.
Secondary markets: Known as the aftermarket, or resale market. A bond exchange occurs between a buying investor and a selling investor, not from the issuer. Interest payments from the municipality are passed on to the new owner.
7
Performance summary
Delaware Tax-Free Arizona Fund
The performance data quoted represent past performance; past performance does not guarantee future results. Investment return and principal value will fluctuate so your shares, when redeemed, may be worth more or less than their original cost. Please obtain the performance data for the most recent month end by calling 800 523-1918 or visiting our Web site at www.delawareinvestments.com/performance. Current performance may be lower or higher than the performance data quoted.
You should consider the investment objectives, risks, charges, and expenses of the investment company carefully before investing. The Delaware Tax-Free Arizona Fund prospectus contains this and other important information about the investment company. Please request a prospectus through your financial advisor or by calling 800 523-1918 or visiting our Web site at www.delawareinvestments.com. Read the prospectus carefully before you invest or send money.
A rise or fall in interest rates can have a significant impact on bond prices and the net asset value (NAV) of the Fund. Funds that invest in bonds may lose their value as interest rates rise, and an investor may lose principal.
Effective July 16, 2007, portfolio management responsibilities for the Fund changed. Current managers are listed in this report. Please see the prospectus, as supplemented, which contains important information regarding the investment manager for the Fund.
| Fund performance | | | | |
| Average annual total returns | | | | |
| Through Aug. 31, 2007 | 1 year | 5 years | 10 years | Lifetime |
| Class A (Est. April, 1, 1991) | | | | |
| Excluding sales charge | +1.63% | +3.76% | +4.62% | +5.92% |
| Including sales charge | -2.91% | +2.82% | +4.14% | +5.63% |
| |
| Class B (Est. March 10, 1995) | | | | |
| Excluding sales charge | +0.78% | +2.97% | +3.99% | +4.80% |
| Including sales charge | -3.12% | +2.71% | +3.99% | +4.80% |
| |
| Class C (Est. May 26, 1994) | | | | |
| Excluding sales charge | +0.77% | +2.98% | +3.85% | +4.53% |
| Including sales charge | -0.20% | +2.98% | +3.85% | +4.53% |
Returns reflect the reinvestment of all distributions and any applicable sales charges as noted in the following paragraphs. Performance for Class B and C shares, excluding sales charges, assumes either that contingent deferred sales charges did not apply or that the investment was not redeemed.
An expense limitation was in effect for all classes during the periods shown in the Fund performance chart and in the Performance of a $10,000 investment chart on the next page. Performance would have been lower had the expense limitation not been in effect.
The Fund offers Class A, B, and C shares. Class A shares are sold with a maximum front-end sales charge of up to 4.50% and have an annual distribution and service fee of up to 0.25% of average daily net assets. Class B shares are sold with a contingent deferred sales charge that declines from 4.00% to zero depending on the period of time the shares are held. Class B shares will automatically convert to Class A shares on a quarterly basis approximately eight years after purchase. They are also subject to an annual distribution and service fee of 1.00% of average daily net assets. Ten-year and lifetime performance figures for Class B shares reflect conversion to Class A shares after eight years.
Effective at the close of business on May 31, 2007, no new or subsequent investments are allowed in Class B shares of the Delaware Investments® Family of Funds, except through a reinvestment of dividends or capital gains or permitted exchanges. Please see the prospectus supplement for additional information.
Class C shares are sold with a contingent deferred sales charge of 1.00% if redeemed during the first 12 months. They are also subject to an annual distribution and service fee of 1.00% of average daily net assets.
Please see the fee table in the prospectus and your financial professional for a more complete explanation of sales charges.
Management has contracted to reimburse expenses and/or waive its management fees through Dec. 31, 2007, as described in the most recent prospectus. The most recent prospectus designated the Fund’s net expense ratios for Class A, B, and C shares as 0.75%, 1.50%, and 1.50%, respectively. Total operating expenses for Class A, B, and C shares were designated as 0.90%, 1.65%, and 1.65%, respectively.
The performance table above and the graph on the next page do not reflect the deduction of taxes the shareholder would pay on Fund distributions or redemptions of Fund shares.
Substantially all dividend income derived from tax-free funds is exempt from federal income tax. Some income may be subject to the federal alternative minimum tax that applies to certain investors. Capital gains, if any, are taxable.
Funds that invest primarily in a specific state may be more susceptible to the economic, regulatory, and other factors of that state than funds that invest more broadly.
8
| Fund basics |
| As of Aug. 31, 2007 |
| |
| Fund objective |
| The Fund seeks as high a level of current income exempt from federal income tax and from the state personal income tax of Arizona, as is consistent with preservation of capital. |
| |
| Total Fund net assets |
| $146 million |
| |
| Number of holdings |
| 81 |
| Fund start date | | |
| April 1, 1991 | | |
| |
| Nasdaq symbols | CUSIPs |
| Class A | VAZIX | 928916204 |
| Class B | DVABX | 928928639 |
| Class C | DVACX | 928916501 |
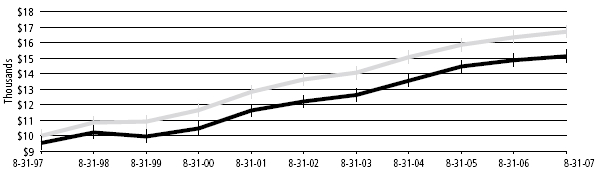
Performance of a $10,000 Investment
Average annual total returns from Aug. 31, 1997, through Aug. 31, 2007
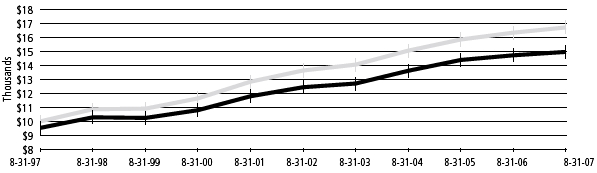
| | | | Starting value (Aug. 31, 1997) | | Ending value (Aug. 31, 2007) |
| Lehman Brothers Municipal Bond Index | | $10,000 | | $16,738 |
| Delaware Tax-Free Arizona Fund — Class A Shares | | $9,550 | | $14,983 |
Chart assumes $10,000 invested on Aug. 31, 1997, and includes the effect of a 4.50% front-end sales charge and the reinvestment of all distributions.
Performance of other Fund classes will vary due to different charges and expenses.
The chart also assumes $10,000 invested in the Lehman Brothers Municipal Bond Index as of Aug. 31, 1997. Lehman Brothers Municipal Bond Index generally tracks the performance of municipal bonds. An index is unmanaged and does not reflect the costs of operating a mutual fund, such as the costs of buying, selling, and holding securities. You cannot invest directly in an index.
Past performance is not a guarantee of future results.
(continues) 9
Performance summary
Delaware Tax-Free California Fund
The performance data quoted represent past performance; past performance does not guarantee future results. Investment return and principal value will fluctuate so your shares, when redeemed, may be worth more or less than their original cost. Please obtain the performance data for the most recent month end by calling 800 523-1918 or visiting our Web site at www.delawareinvestments.com/performance. Current performance may be lower or higher than the performance data quoted.
You should consider the investment objectives, risks, charges, and expenses of the investment company carefully before investing. The Delaware Tax-Free California Fund prospectus contains this and other important information about the investment company. Please request a prospectus through your financial advisor or by calling 800 523-1918 or visiting our Web site at www.delawareinvestments.com. Read the prospectus carefully before you invest or send money.
A rise or fall in interest rates can have a significant impact on bond prices and the net asset value (NAV) of the Fund. Funds that invest in bonds may lose their value as interest rates rise, and an investor may lose principal.
Effective July 16, 2007, portfolio management responsibilities for the Fund changed. Current managers are listed in this report. Please see the prospectus, as supplemented, which contains important information regarding the investment manager for the Fund.
| Fund performance | | | | |
| Average annual total returns | | | | |
| Through Aug. 31, 2007 | 1 year | 5 years | 10 years | Lifetime |
| Class A (Est. March 2, 1995) | | | | |
| Excluding sales charge | +0.51% | +4.42% | +5.18% | +5.98% |
| Including sales charge | -4.03% | +3.46% | +4.70% | +5.59% |
| |
| Class B (Est. Aug. 23, 1995) | | | | |
| Excluding sales charge | -0.15% | +3.64% | +4.54% | +5.58% |
| Including sales charge | -4.02% | +3.38% | +4.54% | +5.58% |
| |
| Class C (Est. April 9, 1996) | | | | |
| Excluding sales charge | -0.24% | +3.65% | +4.41% | +5.10% |
| Including sales charge | -1.20% | +3.65% | +4.41% | +5.10% |
Returns reflect the reinvestment of all distributions and any applicable sales charges as noted in the following paragraphs. Performance for Class B and C shares, excluding sales charges, assumes either that contingent deferred sales charges did not apply or that the investment was not redeemed.
An expense limitation was in effect for all classes during the periods shown in the Fund performance chart and in the Performance of a $10,000 investment chart on the next page. Performance would have been lower had the expense limitation not been in effect.
The Fund offers Class A, B, and C shares. Class A shares are sold with a maximum front-end sales charge of up to 4.50% and have an annual distribution and service fee of up to 0.25% of average daily net assets. Class B shares are sold with a contingent deferred sales charge that declines from 4.00% to zero depending on the period of time the shares are held. Class B shares will automatically convert to Class A shares on a quarterly basis approximately eight years after purchase. They are also subject to an annual distribution and service fee of 1.00% of average daily net assets. Ten-year and lifetime performance figures for Class B shares reflect conversion to Class A shares after eight years.
Effective at the close of business on May 31, 2007, no new or subsequent investments are allowed in Class B shares of the Delaware Investments® Family of Funds, except through a reinvestment of dividends or capital gains or permitted exchanges. Please see the prospectus supplement for additional information.
Class C shares are sold with a contingent deferred sales charge of 1.00% if redeemed during the first 12 months. They are also subject to an annual distribution and service fee of 1.00% of average daily net assets.
Please see the fee table in the prospectus and your financial professional for a more complete explanation of sales charges.
Management has contracted to reimburse expenses and/or waive its management fees through Dec. 31, 2007, as described in the most recent prospectus. The most recent prospectus designated the Fund’s net expense ratios for Class A, B, and C shares as 0.88%, 1.63%, and 1.63%, respectively. Total operating expenses for Class A, B, and C shares were designated as 0.97%, 1.72%, and 1.72%, respectively.
The performance table above and the graph on the next page do not reflect the deduction of taxes the shareholder would pay on Fund distributions or redemptions of Fund shares.
Substantially all dividend income derived from tax-free funds is exempt from federal income tax. Some income may be subject to the federal alternative minimum tax that applies to certain investors. Capital gains, if any, are taxable.
Funds that invest primarily in a specific state may be more susceptible to the economic, regulatory, and other factors of that state than funds that invest more broadly.
10
| Fund basics |
| As of Aug. 31, 2007 |
| |
| Fund objective |
| The Fund seeks as high a level of current income exempt from federal income tax and from the state personal income tax of California, as is consistent with preservation of capital. |
| |
| Total Fund net assets |
| $99 million |
| |
| Number of holdings |
| 87 |
| Fund start date | | |
| March 2, 1995 | | |
| |
| Nasdaq symbols | CUSIPs |
| Class A | DVTAX | 928928829 |
| Class B | DVTFX | 928928811 |
| Class C | DVFTX | 928928795 |
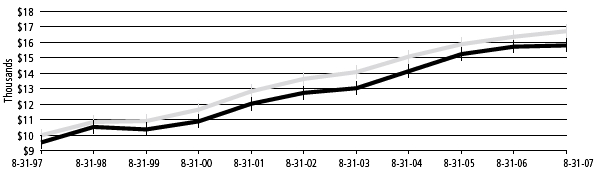
Performance of a $10,000 Investment
Average annual total returns from Aug. 31, 1997, through Aug. 31, 2007
| | | Starting value (Aug. 31, 1997) | | Ending value (Aug. 31, 2007) |
| Lehman Brothers Municipal Bond Index | | $10,000 | | $16,738 |
| Delaware Tax-Free California Fund — Class A Shares | | $9,550 | | $15,815 |
Chart assumes $10,000 invested on Aug. 31, 1997, and includes the effect of a 4.50% front-end sales charge and the reinvestment of all distributions.
Performance of other Fund classes will vary due to different charges and expenses.
The chart also assumes $10,000 invested in the Lehman Brothers Municipal Bond Index as of Aug. 31, 1997. Lehman Brothers Municipal Bond Index generally tracks the performance of municipal bonds. An index is unmanaged and does not reflect the costs of operating a mutual fund, such as the costs of buying, selling, and holding securities. You cannot invest directly in an index.
Past performance is not a guarantee of future results.
(continues) 11
Performance summary
Delaware Tax-Free Colorado Fund
The performance data quoted represent past performance; past performance does not guarantee future results. Investment return and principal value will fluctuate so your shares, when redeemed, may be worth more or less than their original cost. Please obtain the performance data for the most recent month end by calling 800 523-1918 or visiting our Web site at www.delawareinvestments.com/performance. Current performance may be lower or higher than the performance data quoted.
You should consider the investment objectives, risks, charges, and expenses of the investment company carefully before investing. The Delaware Tax-Free Colorado Fund prospectus contains this and other important information about the investment company. Please request a prospectus through your financial advisor or by calling 800 523-1918 or visiting our Web site at www.delawareinvestments.com. Read the prospectus carefully before you invest or send money.
A rise or fall in interest rates can have a significant impact on bond prices and the net asset value (NAV) of the Fund. Funds that invest in bonds may lose their value as interest rates rise, and an investor may lose principal.
Effective July 16, 2007, portfolio management responsibilities for the Fund changed. Current managers are listed in this report. Please see the prospectus, as supplemented, which contains important information regarding the investment manager for the Fund.
| Fund performance | | | | |
| Average annual total returns | | | | |
| Through Aug. 31, 2007 | 1 year | 5 years | 10 years | Lifetime |
| Class A (Est. April 23, 1987) | | | | |
| Excluding sales charge | +1.38% | +3.93% | +4.58% | +6.42% |
| Including sales charge | -3.18% | +2.98% | +4.10% | +6.18% |
| |
| Class B (Est. March 22, 1995) | | | | |
| Excluding sales charge | +0.53% | +3.13% | +3.95% | +4.81% |
| Including sales charge | -3.35% | +2.87% | +3.95% | +4.81% |
| |
| Class C (Est. May 6, 1994) | | | | |
| Excluding sales charge | +0.53% | +3.15% | +3.81% | +4.59% |
| Including sales charge | -0.44% | +3.15% | +3.81% | +4.59% |
Returns reflect the reinvestment of all distributions and any applicable sales charges as noted in the following paragraphs. Performance for Class B and C shares, excluding sales charges, assumes either that contingent deferred sales charges did not apply or that the investment was not redeemed.
An expense limitation was in effect for all classes during the periods shown in the Fund performance chart and in the Performance of a $10,000 investment chart on the next page. Performance would have been lower had the expense limitation not been in effect.
The Fund offers Class A, B, and C shares. Class A shares are sold with a maximum front-end sales charge of up to 4.50% and have an annual distribution and service fee of up to 0.25% of average daily net assets. Class B shares are sold with a contingent deferred sales charge that declines from 4.00% to zero depending on the period of time the shares are held. Class B shares will automatically convert to Class A shares on a quarterly basis approximately eight years after purchase. They are also subject to an annual distribution and service fee of 1.00% of average daily net assets. Ten-year and lifetime performance figures for Class B shares reflect conversion to Class A shares after eight years.
Effective at the close of business on May 31, 2007, no new or subsequent investments are allowed in Class B shares of the Delaware Investments® Family of Funds, except through a reinvestment of dividends or capital gains or permitted exchanges. Please see the prospectus supplement for additional information.
Class C shares are sold with a contingent deferred sales charge of 1.00% if redeemed during the first 12 months. They are also subject to an annual distribution and service fee of 1.00% of average daily net assets.
Please see the fee table in the prospectus and your financial professional for a more complete explanation of sales charges.
Management has contracted to reimburse expenses and/or waive its management fees through Dec. 31, 2007, as described in the most recent prospectus. The most recent prospectus designated the Fund’s net expense ratios for Class A, B, and C shares as 0.93%, 1.68%, and 1.68%, respectively. Total operating expenses for Class A, B, and C shares were designated as 0.94%, 1.69%, and 1.69%, respectively.
The performance table above and the graph on the next page do not reflect the deduction of taxes the shareholder would pay on Fund distributions or redemptions of Fund shares.
Substantially all dividend income derived from tax-free funds is exempt from federal income tax. Some income may be subject to the federal alternative minimum tax that applies to certain investors. Capital gains, if any, are taxable.
Funds that invest primarily in a specific state may be more susceptible to the economic, regulatory, and other factors of that state than funds that invest more broadly.
12
| Fund basics |
| As of Aug. 31, 2007 |
| |
| Fund objective |
| The Fund seeks as high a level of current income exempt from federal income tax and from the state personal income tax of Colorado, as is consistent with preservation of capital. |
| |
| Total Fund net assets |
| $262 million |
| |
| Number of holdings |
| 95 |
| Fund start date | | |
| April 23, 1987 | | |
| |
| Nasdaq symbols | CUSIPs |
| Class A | VCTFX | 928920107 |
| Class B | DVBTX | 928928787 |
| Class C | DVCTX | 92907R101 |
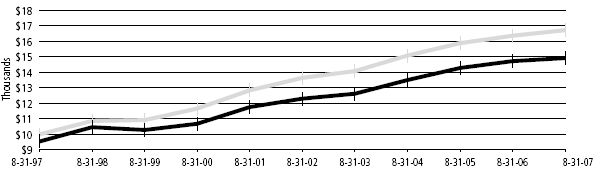
Performance of a $10,000 Investment
Average annual total returns from Aug. 31, 1997, through Aug. 31, 2007
| | | | Starting value (Aug. 31, 1997) | | Ending value (Aug. 31, 2007) |
| Lehman Brothers Municipal Bond Index | | $10,000 | | $16,738 |
| Delaware Tax-Free Colorado Fund — Class A Shares | | $9,550 | | $14,927 |
Chart assumes $10,000 invested on Aug. 31, 1997, and includes the effect of a 4.50% front-end sales charge and the reinvestment of all distributions.
Performance of other Fund classes will vary due to different charges and expenses.
The chart also assumes $10,000 invested in the Lehman Brothers Municipal Bond Index as of Aug. 31, 1997. Lehman Brothers Municipal Bond Index generally tracks the performance of municipal bonds. An index is unmanaged and does not reflect the costs of operating a mutual fund, such as the costs of buying, selling, and holding securities. You cannot invest directly in an index.
Past performance is not a guarantee of future results.
(continues) 13
Performance summary
Delaware Tax-Free Idaho Fund
The performance data quoted represent past performance; past performance does not guarantee future results. Investment return and principal value will fluctuate so your shares, when redeemed, may be worth more or less than their original cost. Please obtain the performance data for the most recent month end by calling 800 523-1918 or visiting our Web site at www.delawareinvestments.com/performance. Current performance may be lower or higher than the performance data quoted.
You should consider the investment objectives, risks, charges, and expenses of the investment company carefully before investing. The Delaware Tax-Free Idaho Fund prospectus contains this and other important information about the investment company. Please request a prospectus through your financial advisor or by calling 800 523-1918 or visiting our Web site at www.delawareinvestments.com. Read the prospectus carefully before you invest or send money.
A rise or fall in interest rates can have a significant impact on bond prices and the net asset value (NAV) of the Fund. Funds that invest in bonds may lose their value as interest rates rise, and an investor may lose principal.
Effective July 16, 2007, portfolio management responsibilities for the Fund changed. Current managers are listed in this report. Please see the prospectus, as supplemented, which contains important information regarding the investment manager for the Fund.
| Fund performance | | | | |
| Average annual total returns | | | | |
| Through Aug. 31, 2007 | 1 year | 5 years | 10 years | Lifetime |
| Class A (Est. Jan. 4, 1995) | | | | |
| Excluding sales charge | +2.27% | +4.04% | +4.67% | +5.80% |
| Including sales charge | -2.34% | +3.09% | +4.19% | +5.42% |
| |
| Class B (Est. March 16, 1995) | | | | |
| Excluding sales charge | +1.51% | +3.26% | +4.03% | +4.90% |
| Including sales charge | -2.42% | +2.99% | +4.03% | +4.90% |
| |
| Class C (Est. Jan. 11, 1995) | | | | |
| Excluding sales charge | +1.51% | +3.27% | +3.90% | +4.96% |
| Including sales charge | +0.53% | +3.27% | +3.90% | +4.96% |
Returns reflect the reinvestment of all distributions and any applicable sales charges as noted in the following paragraphs. Performance for Class B and C shares, excluding sales charges, assumes either that contingent deferred sales charges did not apply or that the investment was not redeemed.
An expense limitation was in effect for all classes during the periods shown in the Fund performance chart and in the Performance of a $10,000 investment chart on the next page. Performance would have been lower had the expense limitation not been in effect.
The Fund offers Class A, B, and C shares. Class A shares are sold with a maximum front-end sales charge of up to 4.50% and have an annual distribution and service fee of 0.25% of average daily net assets. Class B shares are sold with a contingent deferred sales charge that declines from 4.00% to zero depending on the period of time the shares are held. Class B shares will automatically convert to Class A shares on a quarterly basis approximately eight years after purchase. They are also subject to an annual distribution and service fee of 1.00% of average daily net assets. Ten-year and lifetime performance figures for Class B shares reflect conversion to Class A shares after eight years.
Effective at the close of business on May 31, 2007, no new or subsequent investments are allowed in Class B shares of the Delaware Investments® Family of Funds, except through a reinvestment of dividends or capital gains or permitted exchanges. Please see the prospectus supplement for additional information.
Class C shares are sold with a contingent deferred sales charge of 1.00% if redeemed during the first 12 months. They are also subject to an annual distribution and service fee of 1.00% of average daily net assets.
Please see the fee table in the prospectus and your financial professional for a more complete explanation of sales charges.
Management has contracted to reimburse expenses and/or waive its management fees through Dec.31, 2007, as described in the most recent prospectus. The most recent prospectus designated the Fund’s net expense ratios for Class A, B, and C shares as 0.85%, 1.60%, and 1.60%, respectively. Total operating expenses for Class A, B, and C shares were designated as 0.98%, 1.73%, and 1.73%, respectively.
The performance table above and the graph on the next page do not reflect the deduction of taxes the shareholder would pay on Fund distributions or redemptions of Fund shares.
Substantially all dividend income derived from tax-free funds is exempt from federal income tax. Some income may be subject to the federal alternative minimum tax that applies to certain investors. Capital gains, if any, are taxable.
Funds that invest primarily in a specific state may be more susceptible to the economic, regulatory, and other factors of that state than funds that invest more broadly.
14
| Fund basics |
| As of Aug. 31, 2007 |
| |
| Fund objective |
| The Fund seeks as high a level of current income exempt from federal income tax and from the state personal income tax of Idaho, as is consistent with preservation of capital. |
| |
| Total Fund net assets |
| $87 million |
| |
| Number of holdings |
| 79 |
| Fund start date | | |
| Jan. 4, 1995 | | |
| |
| Nasdaq symbols | CUSIPs |
| Class A | VIDAX | 928928704 |
| Class B | DVTIX | 928928746 |
| Class C | DVICX | 928928803 |
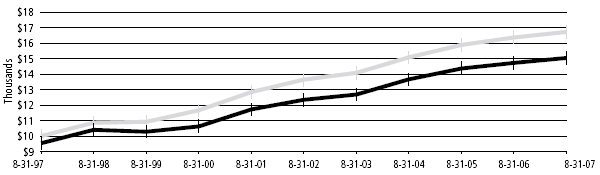
Performance of a $10,000 Investment
Average annual total returns from Aug. 31, 1997, through Aug. 31, 2007
| | | | Starting value (Aug. 31, 1997) | | Ending value (Aug. 31, 2007) |
| Lehman Brothers Municipal Bond Index | | $10,000 | | $16,738 |
| Delaware Tax-Free Idaho Fund — Class A Shares | | $9,550 | | $15,056 |
Chart assumes $10,000 invested on Aug. 31, 1997, and includes the effect of a 4.50% front-end sales charge and the reinvestment of all distributions.
Performance of other Fund classes will vary due to different charges and expenses.
The chart also assumes $10,000 invested in the Lehman Brothers Municipal Bond Index as of Aug. 31, 1997. Lehman Brothers Municipal Bond Index generally tracks the performance of municipal bonds. An index is unmanaged and does not reflect the costs of operating a mutual fund, such as the costs of buying, selling, and holding securities. You cannot invest directly in an index.
Past performance is not a guarantee of future results.
(continues) 15
Performance summary
Delaware Tax-Free New York Fund
The performance data quoted represent past performance; past performance does not guarantee future results. Investment return and principal value will fluctuate so your shares, when redeemed, may be worth more or less than their original cost. Please obtain the performance data for the most recent month end by calling 800 523-1918 or visiting our Web site at www.delawareinvestments.com/performance. Current performance may be lower or higher than the performance data quoted.
You should consider the investment objectives, risks, charges, and expenses of the investment company carefully before investing. The Delaware Tax-Free New York Fund prospectus contains this and other important information about the investment company. Please request a prospectus through your financial advisor or by calling 800 523-1918 or visiting our Web site at www.delawareinvestments.com. Read the prospectus carefully before you invest or send money.
A rise or fall in interest rates can have a significant impact on bond prices and the net asset value (NAV) of the Fund. Funds that invest in bonds may lose their value as interest rates rise, and an investor may lose principal.
Effective July 16, 2007, portfolio management responsibilities for the Fund changed. Current managers are listed in this report. Please see the prospectus, as supplemented, which contains important information regarding the investment manager for the Fund.
| Fund performance | | | | |
| Average annual total returns | | | | |
| Through Aug. 31, 2007 | 1 year | 5 years | 10 years | Lifetime |
| Class A (Est. Nov. 6, 1987) | | | | |
| Excluding sales charge | +1.75% | +4.40% | +4.74% | +6.07% |
| Including sales charge | -2.86% | +3.44% | +4.26% | +5.82% |
| |
| Class B (Est. Nov. 14, 1994) | | | | |
| Excluding sales charge | +0.99% | +3.61% | +4.12% | +4.70% |
| Including sales charge | -2.91% | +3.35% | +4.12% | +4.70% |
| |
| Class C (Est. April 26, 1995) | | | | |
| Excluding sales charge | +0.99% | +3.63% | +3.97% | +4.03% |
| Including sales charge | +0.02% | +3.63% | +3.97% | +4.03% |
Returns reflect the reinvestment of all distributions and any applicable sales charges as noted in the following paragraphs. Performance for Class B and C shares, excluding sales charges, assumes either that contingent deferred sales charges did not apply or that the investment was not redeemed.
An expense limitation was in effect for all classes during the periods shown in the Fund performance chart and in the Performance of a $10,000 investment chart on the next page. Performance would have been lower had the expense limitation not been in effect.
The Fund offers Class A, B, and C shares. Class A shares are sold with a maximum front-end sales charge of up to 4.50% and have an annual distribution and service fee of up to 0.25% of average daily net assets. Class B shares are sold with a contingent deferred sales charge that declines from 4.00% to zero depending on the period of time the shares are held. Class B shares will automatically convert to Class A shares on a quarterly basis approximately eight years after purchase. They are also subject to an annual distribution and service fee of 1.00% of average daily net assets. Ten-year and lifetime performance figures for Class B shares reflect conversion to Class A shares after eight years.
Effective at the close of business on May 31, 2007, no new or subsequent investments are allowed in Class B shares of the Delaware Investments® Family of Funds, except through a reinvestment of dividends or capital gains or permitted exchanges. Please see the prospectus supplement for additional information.
Class C shares are sold with a contingent deferred sales charge of 1.00% if redeemed during the first 12 months. They are also subject to an annual distribution and service fee of 1.00% of average daily net assets.
Please see the fee table in the prospectus and your financial professional for a more complete explanation of sales charges.
Management has contracted to reimburse expenses and/or waive its management fees through Dec. 31, 2007, as described in the most recent prospectus. The most recent prospectus designated the Fund’s net expense ratios for Class A, B, and C shares as 0.65%, 1.40%, and 1.40%, respectively. Total operating expenses for Class A, B, and C shares were designated as 1.09%, 1.84%, and 1.84%, respectively.
The performance table above and the graph on the next page do not reflect the deduction of taxes the shareholder would pay on Fund distributions or redemptions of Fund shares.
Substantially all dividend income derived from tax-free funds is exempt from federal income tax. Some income may be subject to the federal alternative minimum tax that applies to certain investors. Capital gains, if any, are taxable.
Funds that invest primarily in a specific state may be more susceptible to the economic, regulatory, and other factors of that state than funds that invest more broadly.
16
| Fund basics |
| As of Aug. 31, 2007 |
| |
| Fund objective |
| The Fund seeks as high a level of current income exempt from federal income tax and from the state of New York, personal income tax, as is consistent with preservation of capital. |
| |
| Total Fund net assets |
| $19 million |
| |
| Number of holdings |
| 50 |
| Fund start date | | |
| November 6, 1987 | | |
|
| Nasdaq symbols | CUSIPs |
| Class A | FTNYX | 928928274 |
| Class B | DVTNX | 928928266 |
| Class C | DVFNX | 928928258 |
Performance of a $10,000 Investment
Average annual total returns from Aug. 31, 1997, through Aug. 31, 2007
| | | | Starting value (Aug. 31, 1997) | | Ending value (Aug. 31, 2007) |
| Lehman Brothers Municipal Bond Index | | $10,000 | | $16,738 |
| Delaware Tax-Free New York Fund — Class A Shares | | $9,550 | | $15,158 |
Chart assumes $10,000 invested on Aug. 31, 1997, and includes the effect of a 4.50% front-end sales charge and the reinvestment of all distributions.
Performance of other Fund classes will vary due to different charges and expenses.
The chart also assumes $10,000 invested in the Lehman Brothers Municipal Bond Index as of Aug. 31, 1997. Lehman Brothers Municipal Bond Index generally tracks the performance of municipal bonds. An index is unmanaged and does not reflect the costs of operating a mutual fund, such as the costs of buying, selling, and holding securities. You cannot invest directly in an index.
Past performance is not a guarantee of future results.
17
Disclosure of Fund expenses
For the period March 1, 2007 to August 31, 2007
As a shareholder of a Fund, you incur two types of costs: (1) transaction costs, including sales charges (loads) on purchase payments, reinvested dividends, or other distributions; redemption fees; and exchange fees; and (2) ongoing costs, including management fees; distribution and/or service (12b-1) fees; and other Fund expenses. These following examples are intended to help you understand your ongoing costs (in dollars) of investing in a Fund and to compare these costs with the ongoing costs of investing in other mutual funds.
The examples are based on an investment of $1,000 invested at the beginning of the period and held for the entire period March 1, 2007 to August 31, 2007.
Actual Expenses
The first section of the tables shown, “Actual Fund Return,” provides information about actual account values and actual expenses. You may use the information in this section of the table, together with the amount you invested, to estimate the expenses that you paid over the period. Simply divide your account value by $1,000 (for example, an $8,600 account value divided by $1,000 = 8.6), then multiply the result by the number in the first section under the heading entitled “Expenses Paid During Period” to estimate the expenses you paid on your account during this period.
Hypothetical Example for Comparison Purposes
The second section of the tables shown, “Hypothetical 5% Return,” provides information about hypothetical account values and hypothetical expenses based on the Funds’ actual expense ratios and an assumed rate of return of 5% per year before expenses, which is not the Funds’ actual return. The hypothetical account values and expenses may not be used to estimate the actual ending account balance or expenses you paid for the period. You may use this information to compare the ongoing costs of investing in the Fund and other funds. To do so, compare this 5% hypothetical example with the 5% hypothetical examples that appear in the shareholder reports of the other funds.
Please note that the expenses shown in the tables are meant to highlight your ongoing costs only and do not reflect any transactional costs, such as sales charges (loads), redemption fees, or exchange fees. Therefore, the second section of each table is useful in comparing ongoing costs only, and will not help you determine the relative total costs of owning different funds. In addition, if these transactional costs were included, your costs would have been higher. The Fund’s expenses shown in the tables reflect fee waivers in effect. The expenses shown in each table assume reinvestment of all dividends and distributions.
“Expenses Paid During Period” are equal to the Funds’ annualized expense ratios, multiplied by the average account value over the period, multiplied by the 184/365 (to reflect the one-half year period).
Delaware Tax-Free Arizona Fund
Expense Analysis of an Investment of $1,000
| | | | | | | | Expenses |
| | Beginning | | Ending | | | | Paid During |
| | Account | | Account | | Annualized | | Period |
| | Value | | Value | | Expense | | 3/1/07 to |
| | | 3/1/07 | | 8/31/07 | | Ratio | | 8/31/07 |
| Actual Fund Return | | | | | | | | |
| Class A | | $1,000.00 | | $989.90 | | 0.75% | | $3.76 |
| Class B | | 1,000.00 | | 985.20 | | 1.50% | | 7.51 |
| Class C | | 1,000.00 | | 985.20 | | 1.50% | | 7.51 |
| Hypothetical 5% Return (5% return before expenses) |
| Class A | | $1,000.00 | | $1,021.42 | | 0.75% | | $3.82 |
| Class B | | 1,000.00 | | 1,017.64 | | 1.50% | | 7.63 |
| Class C | | 1,000.00 | | 1,017.64 | | 1.50% | | 7.63 |
Delaware Tax-Free California Fund
Expense Analysis of an Investment of $1,000
| | | | | | | | Expenses |
| | Beginning | | Ending | | | | Paid During |
| | Account | | Account | | Annualized | | Period |
| | Value | | Value | | Expense | | 3/1/07 to |
| | | 3/1/07 | | 8/31/07 | | Ratio | | 8/31/07 |
| Actual Fund Return | | | | | | | | |
| Class A | | $1,000.00 | | $973.80 | | 0.88% | | $4.38 |
| Class B | | 1,000.00 | | 971.10 | | 1.63% | | 8.10 |
| Class C | | 1,000.00 | | 970.20 | | 1.63% | | 8.09 |
| Hypothetical 5% Return (5% return before expenses) |
| Class A | | $1,000.00 | | $1,020.77 | | 0.88% | | $4.48 |
| Class B | | 1,000.00 | | 1,016.99 | | 1.63% | | 8.29 |
| Class C | | 1,000.00 | | 1,016.99 | | 1.63% | | 8.29 |
18
Delaware Tax-Free Colorado Fund
Expense Analysis of an Investment of $1,000
| | | | | | | | Expenses |
| | Beginning | | Ending | | | | Paid During |
| | Account | | Account | | Annualized | | Period |
| | Value | | Value | | Expense | | 3/1/07 to |
| | | 3/1/07 | | 8/31/07 | | Ratio | | 8/31/07 |
| Actual Fund Return | | | | | | | |
| Class A | | $1,000.00 | | $985.60 | | 0.93% | | $4.65 |
| Class B | | 1,000.00 | | 981.00 | | 1.68% | | 8.39 |
| Class C | | 1,000.00 | | 981.00 | | 1.68% | | 8.39 |
| Hypothetical 5% Return (5% return before expenses) |
| Class A | | $1,000.00 | | $1,020.52 | | 0.93% | | $4.74 |
| Class B | | 1,000.00 | | 1,016.74 | | 1.68% | | 8.54 |
| Class C | | 1,000.00 | | 1,016.74 | | 1.68% | | 8.54 |
Delaware Tax-Free Idaho Fund
Expense Analysis of an Investment of $1,000
| | | | | | | | Expenses |
| | Beginning | | Ending | | | | Paid During |
| | Account | | Account | | Annualized | | Period |
| | Value | | Value | | Expense | | 3/1/07 to |
| | | 3/1/07 | | 8/31/07 | | Ratio | | 8/31/07 |
| Actual Fund Return | | | | | | | |
| Class A | | $1,000.00 | | $995.30 | | 0.85% | | $4.27 |
| Class B | | 1,000.00 | | 991.60 | | 1.60% | | 8.03 |
| Class C | | 1,000.00 | | 991.60 | | 1.60% | | 8.03 |
| Hypothetical 5% Return (5% return before expenses) |
| Class A | | $1,000.00 | | $1,020.92 | | 0.85% | | $4.33 |
| Class B | | 1,000.00 | | 1,017.14 | | 1.60% | | 8.13 |
| Class C | | 1,000.00 | | 1,017.14 | | 1.60% | | 8.13 |
Delaware Tax-Free New York Fund
Expense Analysis of an Investment of $1,000
| | | | | | | | Expenses |
| | Beginning | | Ending | | | | Paid During |
| | Account | | Account | | Annualized | | Period |
| | Value | | Value | | Expense | | 3/1/07 to |
| | | 3/1/07 | | 8/31/07 | | Ratio | | 8/31/07 |
| Actual Fund Return | | | | | | | |
| Class A | | $1,000.00 | | $987.10 | | 0.85% | | $4.26 |
| Class B | | 1,000.00 | | 983.40 | | 1.60% | | 8.00 |
| Class C | | 1,000.00 | | 984.30 | | 1.60% | | 8.00 |
| Hypothetical 5% Return (5% return before expenses) |
| Class A | | $1,000.00 | | $1,020.92 | | 0.85% | | $4.33 |
| Class B | | 1,000.00 | | 1,017.14 | | 1.60% | | 8.13 |
| Class C | | 1,000.00 | | 1,017.14 | | 1.60% | | 8.13 |
19
Sector allocations and credit quality breakdowns
As of August 31, 2007
Sector designations may be different than the sector designations presented in other Fund materials.
Delaware Tax-Free Arizona Fund | | |
| | Percentage |
| Sector | | of Net Assets |
| Municipal Bonds | | 98.16% | |
| Corporate Revenue Bonds | | 4.19% | |
| Education Revenue Bonds | | 5.97% | |
| Electric Revenue Bonds | | 4.34% | |
| Escrowed to Maturity Bonds | | 0.56% | |
| Health Care Revenue Bonds | | 8.30% | |
| Housing Revenue Bonds | | 1.77% | |
| Lease Revenue Bonds | | 12.47% | |
| Local General Obligation Bonds | | 5.72% | |
| Pre-Refunded Bonds | | 28.38% | |
| Special Tax Revenue Bonds | | 4.68% | |
| State General Obligation Bonds | | 4.28% | |
| Transportation Revenue Bonds | | 12.78% | |
| Water & Sewer Revenue Bonds | | 4.72% | |
| Short-Term Investments | | 0.51% | |
| Total Value of Securities | | 98.67% | |
| Receivables and Other Assets Net of Liabilities | | 1.33% | |
| Total Net Assets | | 100.00% | |
| | |
| Credit Quality Breakdown | | | |
| (as a % of fixed income investments) | | | |
| AAA | | 78.38% | |
| AA | | 3.27% | |
| A | | 7.41% | |
| BBB | | 10.94% | |
| Total | | 100.00% | |
Delaware Tax-Free California Fund | | |
| | Percentage |
| Sector | | of Net Assets |
| Municipal Bonds | | 97.00% | |
| Corporate Revenue Bonds | | 1.34% | |
| Education Revenue Bonds | | 15.16% | |
| Health Care Revenue Bonds | | 10.21% | |
| Housing Revenue Bonds | | 7.91% | |
| Lease Revenue Bonds | | 7.33% | |
| Local General Obligation Bonds | | 14.77% | |
| Pre-Refunded Bonds | | 19.38% | |
| Resource Recovery Revenue Bonds | | 4.09% | |
| Special Tax Revenue Bonds | | 2.68% | |
| State General Obligation Bonds | | 4.83% | |
| Transportation Revenue Bonds | | 4.11% | |
| Water & Sewer Revenue Bonds | | 5.19% | |
| Short-Term Investments | | 0.66% | |
| Money Market Instruments | | 0.05% | |
| Variable Rate Demand Notes | | 0.61% | |
| Total Value of Securities | | 97.66% | |
| Receivables and Other Assets Net of Liabilities | | 2.34% | |
| Total Net Assets | | 100.00% | |
| | |
| Credit Quality Breakdown | | | |
| (as a % of fixed income investments) | | | |
| AAA | | 46.08% | |
| AA | | 8.66% | |
| A | | 22.62% | |
| BBB | | 11.47% | |
| Non Rated | | 11.17% | |
| Total | | 100.00% | |
20
Sector designations may be different than the sector designations presented in other Fund materials.
Delaware Tax-Free Colorado Fund | |
| Percentage |
| Sector | of Net Assets |
| Municipal Bonds | 98.31% | |
| Education Revenue Bonds | 15.86% | |
| Electric Revenue Bonds | 2.50% | |
| Escrowed to Maturity Bonds | 2.27% | |
| Health Care Revenue Bonds | 14.20% | |
| Housing Revenue Bonds | 1.45% | |
| Lease Revenue Bonds | 4.63% | |
| Local General Obligation Bonds | 16.91% | |
| Pre-Refunded Bonds | 24.05% | |
| Special Tax Revenue Bonds | 3.03% | |
| State General Obligation Bonds | 3.66% | |
| Transportation Revenue Bonds | 8.58% | |
| Water & Sewer Revenue Bonds | 1.17% | |
| Short-Term Investments | 0.74% | |
| Money Market Instruments | 0.36% | |
| Variable Rate Demand Notes | 0.38% | |
| Total Value of Securities | 99.05% | |
| Receivables and Other Assets Net of Liabilities | 0.95% | |
| Total Net Assets | 100.00% | |
| | |
| Credit Quality Breakdown | | |
| (as a % of fixed income investments) | | |
| AAA | 44.76% | |
| AA | 21.48% | |
| A | 8.08% | |
| BBB | 16.01% | |
| B | 0.73% | |
| Non Rated | 8.94% | |
| Total | 100.00% | |
Delaware Tax-Free Idaho Fund | | |
| Percentage |
| Sector | of Net Assets |
| Municipal Bonds | 95.66% | |
| Corporate Revenue Bonds | 7.23% | |
| Education Revenue Bonds | 15.76% | |
| Escrow to Maturity Bonds | 2.10% | |
| Health Care Revenue Bonds | 4.07% | |
| Housing Revenue Bonds | 8.25% | |
| Lease Revenue Bonds | 7.32% | |
| Local General Obligation Bonds | 22.57% | |
| Pre-Refunded Bonds | 10.05% | |
| Special Tax Revenue Bonds | 8.73% | |
| State General Obligation Bonds | 3.87% | |
| Transportation Revenue Bonds | 3.16% | |
| Water & Sewer Revenue Bonds | 2.55% | |
| Short-Term Investments | 3.90% | |
| Money Market Instruments | 1.04% | |
| Variable Rate Demand Notes | 2.86% | |
| Total Value of Securities | 99.56% | |
| Receivables and Other Assets Net of Liabilities | 0.44% | |
| Total Net Assets | 100.00% | |
| | |
| Credit Quality Breakdown | | |
| (as a % of fixed income investments) | | |
| AAA | 61.15% | |
| AA | 8.39% | |
| A | 4.42% | |
| BBB | 16.73% | |
| BB | 2.99% | |
| Non Rated | 6.32% | |
| Total | 100.00% | |
(continues) 21
Sector designations may be different than the sector designations presented in other Fund materials.
| Delaware Tax-Free New York Fund | | |
| Percentage |
| Sector | of Net Assets |
| Municipal Bonds | 94.09% | |
| Corporate Revenue Bonds | 7.69% | |
| Education Revenue Bonds | 16.74% | |
| Electric Revenue Bonds | 2.11% | |
| Health Care Revenue Bonds | 11.01% | |
| Housing Revenue Bonds | 1.24% | |
| Lease Revenue Bonds | 8.81% | |
| Local General Obligation Bonds | 6.78% | |
| Pre-Refunded Bonds | 20.64% | |
| Special Tax Revenue Bonds | 7.21% | |
| State General Obligation Bonds | 1.33% | |
| Transportation Revenue Bonds | 6.53% | |
| Water & Sewer Revenue Bonds | 4.00% | |
| Short-Term Investments | 4.18% | |
| Total Value of Securities | 98.27% | |
| Receivables and Other Assets Net of Liabilities | 1.73% | |
| Total Net Assets | 100.00% | |
| | |
| Credit Quality Breakdown | | |
| (as a % of fixed income investments) | | |
| AAA | 33.88% | |
| AA | 23.19% | |
| A | 19.25% | |
| BBB | 19.20% | |
| BB | 0.72% | |
| Non Rated | 3.76% | |
| Total | 100.00% | |
22
Statements of net assets
Delaware Tax-Free Arizona Fund
August 31, 2007
| Principal | | |
| | Amount | | Value |
| Municipal Bonds – 98.16% | | | |
| Corporate Revenue Bonds – 4.19% | | | |
| Maricopa County Pollution Control | | | |
| (Palo Verde Project) Series A | | | |
| 5.05% 5/1/29 (AMBAC) | $6,000,000 | | $ 6,100,440 |
| | | 6,100,440 |
| Education Revenue Bonds – 5.97% | | | |
| Arizona State University | | | |
| Certificates of Participation | | | |
| (Research Infrastructure Project) | | | |
| 5.00% 9/1/30 (AMBAC) | 3,000,000 | | 3,050,489 |
| Glendale Industrial Development | | | |
| Authority Revenue (Midwestern | | | |
| University) 5.00% 5/15/31 | 1,050,000 | | 1,041,274 |
| Northern Arizona University | | | |
| Certificates of Participation | | | |
| (Northern Arizona University | | | |
| Research Project) | | | |
| 5.00% 9/1/30 (AMBAC) | 1,500,000 | | 1,528,215 |
| Pima County Industrial Development | | | |
| Authority Educational Revenue | | | |
| (Tucson Country Day School Project) | | | |
| 5.00% 6/1/37 | 1,000,000 | | 895,590 |
| South Campus Group Student | | | |
| Housing Revenue (University of | | | |
| Arizona - South Campus Project) | | | |
| 5.625% 9/1/35 (MBIA) | 1,000,000 | | 1,069,420 |
| Tucson Industrial Development | | | |
| Authority (University of Arizona - | | | |
| Marshall Foundation) Series B | | | |
| 5.00% 7/15/27 (AMBAC) | 1,000,000 | | 1,016,790 |
| University of Arizona Certificates of | | | |
| Participation (University of | | | |
| Arizona Project) Series A | | | |
| 5.125% 6/1/21 (AMBAC) | 85,000 | | 88,777 |
| | | 8,690,555 |
| Electric Revenue Bonds – 4.34% | | | |
| Energy Management Services | | | |
| (University of Arizona - Main Campus) | | | |
| 5.25% 7/1/17 (MBIA) | 1,500,000 | | 1,585,965 |
| Puerto Rico Electric Power Authority | | | |
| Revenue Series TT 5.00% 7/1/37 | 1,000,000 | | 999,160 |
| Salt River Project Agricultural | | | |
| Improvement & Power District | | | |
| Electric System Revenue | | | |
| Series A 5.00% 1/1/31 | 1,700,000 | | 1,718,904 |
| Series B 5.00% 1/1/31 (MBIA) | 2,000,000 | | 2,024,120 |
| | | 6,328,149 |
| Escrowed to Maturity Bonds – 0.56% | | | |
| Maricopa County School District #14 | | | |
| (Creighton School Improvement | | | |
| Project of 1990) Series C | | | |
| 6.50% 7/1/08 (FGIC) | 455,000 | | 465,460 |
| Phoenix Street & Highway Revenue | | | |
| (Senior Lien) 6.50% 7/1/09 (AMBAC) | 350,000 | | 353,647 |
| | | 819,107 |
| Health Care Revenue Bonds – 8.30% | | | |
| Glendale Industrial Development | | | |
| Authority Hospital Revenue | | | |
| 5.00% 12/1/35 | 1,000,000 | | 911,980 |
| 5.00% 12/1/42 | 2,500,000 | | 2,226,825 |
| Maricopa County Industrial | | | |
| Development Authority Revenue | | | |
| (Catholic Healthcare West) Series A | | | |
| 5.25% 7/1/32 | 1,250,000 | | 1,250,375 |
| 5.50% 7/1/26 | 1,000,000 | | 1,023,050 |
| (Mayo Clinic) 5.00% 11/15/36 | 1,000,000 | | 1,005,180 |
| (Senior Living Healthcare) | | | |
| 5.00% 8/20/35 (GNMA) | 1,000,000 | | 1,001,010 |
| University Medical Center | | | |
| Hospital Revenue | | | |
| 5.00% 7/1/24 | 800,000 | | 779,952 |
| 5.00% 7/1/35 | 2,000,000 | | 1,875,760 |
| Yavapai County Industrial | | | |
| Development Authority Revenue | | | |
| (Yavapai Regional Medical Center) | | | |
| Series A 5.25% 8/1/21 (RADIAN) | 2,000,000 | | 2,011,000 |
| | | 12,085,132 |
| Housing Revenue Bonds – 1.77% | | | |
| Pima County Industrial Development | | | |
| Authority Single Family | | | |
| Housing Revenue Series A-1 | | | |
| 6.125% 11/1/33 | | | |
| (GNMA) (FNMA) (FHLMC) (AMT) | 20,000 | | 20,190 |
| Series B-1 6.10% 5/1/31 | | | |
| (GNMA) (AMT) | 55,000 | | 55,510 |
| Yuma Industrial Development | | | |
| Authority Multifamily Revenue | | | |
| Series A 6.10% 9/20/19 | | | |
| (GNMA) (AMT) | 2,340,000 | | 2,509,510 |
| | | 2,585,210 |
| Lease Revenue Bonds – 12.47% | | | |
| Arizona Game & Fish Department & | | | |
| Community Beneficial Interest | | | |
| Certificates (Administration | | | |
| Building Project) 5.00% 7/1/32 | 1,300,000 | | 1,305,902 |
| Marana Property Municipal Facilities | | | |
| Revenue 5.00% 7/1/28 (AMBAC) | 575,000 | | 583,821 |
| Maricopa County Industrial | | | |
| Development Authority | | | |
| Correctional Contract | | | |
| Revenue (Phoenix West Prison) | | | |
| 5.375% 7/1/22 (ACA) | 1,000,000 | | 1,005,830 |
| Phoenix Industrial Development | | | |
| Authority Lease Revenue | | | |
| (Capitol Mall II, LLC Project) | | | |
| 5.00% 9/15/28 (AMBAC) | 4,000,000 | | 4,049,280 |
| Pinal County Certificates of Participation | | | |
| 5.00% 12/1/29 | 1,300,000 | | 1,281,020 |
| 5.125% 6/1/21 (AMBAC) | 4,675,000 | | 4,839,793 |
(continues) 23
Statements of net assets
Delaware Tax-Free Arizona Fund
| Principal | | |
| | Amount | | Value |
| Municipal Bonds (continued) | | | |
| Lease Revenue Bonds (continued) | | | |
| Puerto Rico Public Buildings Authority | | | |
| Revenue (Guaranteed Government | | | |
| Facilities) | | | |
| Series D 5.25% 7/1/27 | $ 470,000 | | $ 479,908 |
| Series D 5.25% 7/1/36 | 270,000 | | 273,715 |
| Series I 5.25% 7/1/33 | 500,000 | | 510,170 |
| Salt River Project Arizona Agricultural | | | |
| Improvement & Power District | | | |
| Certificates of Participation | | | |
| 5.00% 12/1/18 (MBIA) | 1,500,000 | | 1,556,580 |
| University of Arizona Certificates | | | |
| of Participation | | | |
| Series B 5.00% 6/1/31 (AMBAC) | 2,250,000 | | 2,280,668 |
| | | 18,166,687 |
| Local General Obligation Bonds – 5.72% | | | |
| Cochise County Unified School | | | |
| District #68 7.50% 7/1/10 (FGIC) | 1,000,000 | | 1,101,250 |
| DC Ranch Community Facilities | | | |
| 5.00% 7/15/27 (AMBAC) | 1,000,000 | | 1,019,810 |
| Flagstaff Aspen Place Sawmill | | | |
| Improvement District | | | |
| 5.00% 1/1/32 | 1,350,000 | | 1,303,830 |
| ¶Gila County Unified School District #10 | | | |
| (Payson Project of 2006) Series A | | | |
| 5.25% 7/1/27 (AMBAC) | 1,000,000 | | 966,240 |
| Marana Tangerine Farm Improvement | | | |
| District Revenue 4.60% 1/1/26 | 1,000,000 | | 913,430 |
| Maricopa County School District #14 | | | |
| (Creighton School Improvement | | | |
| Project of 1990) Series C | | | |
| 6.50% 7/1/08 (FGIC) | 545,000 | | 557,666 |
| Phoenix Variable Purpose Series B | | | |
| 5.00% 7/1/27 | 2,435,000 | | 2,475,567 |
| | | 8,337,793 |
| §Pre-Refunded Bonds – 28.38% | | | |
| Arizona Board of Regents | | | |
| (Northern Arizona University) | | | |
| 5.00% 6/1/34-12 (FGIC) | 1,000,000 | | 1,057,210 |
| Certificates of Participation | | | |
| (University of Arizona - Main | | | |
| Campus) Series 2000 A-1 | | | |
| 5.125% 6/1/25-11 (AMBAC) | 1,250,000 | | 1,311,225 |
| Arizona Transportation Board | | | |
| Highway Revenue Series B | | | |
| 5.25% 7/1/22-12 | 1,000,000 | | 1,069,120 |
| Glendale Industrial Development | | | |
| Authority Revenue (Midwestern | | | |
| University) Series A | | | |
| 5.875% 5/15/31-11 | 1,000,000 | | 1,081,530 |
| Mesa Industrial Development | | | |
| Authority Revenue (Discovery | | | |
| Health Systems) Series A | | | |
| 5.625% 1/1/29-10 (MBIA) | 9,000,000 | | 9,473,219 |
| Mohave County Community College | | | |
| District Revenue (State Board of Directors) | | |
| 6.00% 3/1/20-10 (MBIA) | 1,000,000 | | 1,055,300 |
| Phoenix Industrial Development | | | |
| Authority Lease Revenue | | | |
| (Capitol Mall, LLC Project) | | | |
| 5.50% 9/15/27-10 (AMBAC) | 5,000,000 | | 5,261,500 |
| Phoenix Industrial Development | | | |
| Authority Multifamily | | | |
| Housing Revenue | | | |
| (Ventana Palms Apartments) | | | |
| Series A | | | |
| 6.15% 10/1/29-09 (MBIA) | 510,000 | | 544,104 |
| 6.20% 10/1/34-09 (MBIA) | 940,000 | | 1,003,788 |
| Puerto Rico Commonwealth Highway & | | | |
| Transportation Authority | | | |
| Revenue Series K | | | |
| 5.00% 7/1/35-15 | 750,000 | | 804,923 |
| Puerto Rico Commonwealth | | | |
| Public Improvement Revenue | | | |
| 5.125% 7/1/30-11 (FSA) | 770,000 | | 810,671 |
| Series A 5.00% 7/1/27-12 | 1,000,000 | | 1,059,960 |
| Series A 5.125% 7/1/31-11 | 1,705,000 | | 1,795,058 |
| Puerto Rico Electric Power Authority | | | |
| Revenue Series NN | | | |
| 5.00% 7/1/32-13 (MBIA) | 2,500,000 | | 2,662,925 |
| Puerto Rico Public Buildings | | | |
| Authority Revenue | | | |
| (Guaranteed Government | | | |
| Facilities) Series D | | | |
| 5.25% 7/1/27-12 | 1,280,000 | | 1,361,472 |
| 5.25% 7/1/36-12 | 730,000 | | 776,465 |
| Scottsdale Industrial Development | | | |
| Authority Hospital Revenue | | | |
| (Scottsdale Healthcare) | | | |
| 5.70% 12/1/21-11 | 500,000 | | 542,315 |
| Southern Arizona Capital | | | |
| Facilities Finance Revenue | | | |
| (University of Arizona Project) | | | |
| 5.10% 9/1/33-12 (MBIA) | 3,250,000 | | 3,459,788 |
| Surprise Municipal Property Excise Tax | | | |
| Revenue 5.70% 7/1/20-09 (FGIC) | 3,000,000 | | 3,130,830 |
| University of Arizona Certificates of | | | |
| Participation | | | |
| (University of Arizona Parking & | | | |
| Student Housing) | | | |
| 5.75% 6/1/19-09 (AMBAC) | 1,000,000 | | 1,034,850 |
| (University of Arizona Project) | | | |
| Series A 5.125% 6/1/21-12 (AMBAC) | 915,000 | | 972,288 |
| Series B 5.125% 6/1/22-12 (AMBAC) | 1,000,000 | | 1,060,820 |
| | | 41,329,361 |
| Special Tax Revenue Bonds – 4.68% | | | |
| Arizona Tourism & Sports Authority | | | |
| Tax Revenue (Multipurpose | | | |
| Stadium Facilities) Series A | | | |
| 5.00% 7/1/28 (MBIA) | 2,500,000 | | 2,548,575 |
| 5.00% 7/1/31 (MBIA) | 1,500,000 | | 1,526,850 |
24
| Principal | | | |
| | Amount | | Value | |
| Municipal Bonds (continued) | | | | |
| Special Tax Revenue Bonds (continued) | | | | |
| ¶Phoenix Civic Improvement | | | | |
| Corporation Distribution Revenue | | | | |
| (Civic Plaza) Series B | | | | |
| 5.50% 7/1/31 (FGIC) | $ 1,500,000 | | $ 1,213,020 | |
| San Luis Civic Improvement Municipal | | | | |
| Facilities Excise Tax Revenue | | | | |
| 5.00% 7/1/38 (XLCA) | 1,500,000 | | 1,524,690 | |
| | | 6,813,135 | |
| State General Obligation Bonds – 4.28% | | | | |
| Puerto Rico Commonwealth Public | | | | |
| Improvement Refunding Series A | | | | |
| 5.50% 7/1/19 | 1,300,000 | | 1,414,439 | |
| Unrefunded Balance Series A | | | | |
| 5.125% 7/1/30 (FSA) | 480,000 | | 490,392 | |
| 5.125% 7/1/31 | 3,370,000 | | 3,393,051 | |
| Virgin Islands Public Finance | | | | |
| Authority (Gross Receipts Taxes) | | | | |
| 5.00% 10/1/31 (ACA) | 1,000,000 | | 930,500 | |
| | | 6,228,382 | |
| Transportation Revenue Bonds – 12.78% | | | | |
| Arizona State Transportation Board | | | | |
| Highway Revenue Series A | | | | |
| 5.00% 7/1/23 | 1,000,000 | | 1,034,130 | |
| Phoenix Civic Improvement Airport | | | | |
| Revenue Series B | | | | |
| 5.25% 7/1/27 (FGIC) (AMT) | 1,000,000 | | 1,014,620 | |
| 5.25% 7/1/32 (FGIC) (AMT) | 10,300,000 | | 10,408,665 | |
| Puerto Rico Commonwealth Highway & | | | | |
| Transportation Authority Revenue | | | | |
| Series N 5.25% 7/1/39 (FGIC) | 1,000,000 | | 1,091,160 | |
| Tucson Airport Authority Revenue | | | | |
| (Senior Lien) Series 2001 | | | | |
| 5.35% 6/1/31 (AMBAC) (AMT) | 5,000,000 | | 5,069,650 | |
| | | 18,618,225 | |
| Water & Sewer Revenue Bonds – 4.72% | | | | |
| Glendale Water & Sewer Revenue | | | | |
| (Senior Lien) 5.00% 7/1/28 (AMBAC) | 2,000,000 | | 2,034,260 | |
| Phoenix Civic Improvement | | | | |
| Wastewater Systems Revenue | | | | |
| (Junior Lien) | | | | |
| 5.00% 7/1/24 (FGIC) | 1,000,000 | | 1,017,360 | |
| 5.00% 7/1/26 (FGIC) | 3,750,000 | | 3,817,350 | |
| | | 6,868,970 | |
| Total Municipal Bonds | | | | |
| (cost $139,655,132) | | | 142,971,146 | |
| | |
| Number of | | | |
| | Shares | | | |
| Short-Term Investments – 0.51% | | | | |
| Money Market Instruments – 0.51% | | | | |
| Federated Arizona Municipal Cash Trust | 750,316 | | 750,316 | |
| Total Short-Term Investments | | | | |
| (cost $750,316) | | | 750,316 | |
| Total Value of Securities – 98.67% | | | | |
| (cost $140,405,448) | | | $143,721,462 | |
| Receivables and Other Assets | | | | |
| Net of Liabilities – 1.33% | | | 1,930,740 | |
| Net Assets Applicable to 13,159,379 | | | | |
| Shares Outstanding – 100.00% | | | $145,652,202 | |
| | |
| Net Asset Value – Delaware Tax-Free Arizona Fund | | | | |
| Class A ($125,636,501 / 11,353,091 Shares) | | | | $11.07 | |
| Net Asset Value – Delaware Tax-Free Arizona Fund | | | | |
| Class B ($12,407,182 / 1,120,391 Shares) | | | | $11.07 | |
| Net Asset Value – Delaware Tax-Free Arizona Fund | | | | |
| Class C ($7,608,519 / 685,897 Shares) | | | | $11.09 | |
| | |
| Components of Net Assets at August 31, 2007: | | | | |
| Shares of beneficial interest | | | | |
| (unlimited authorization – no par) | | | $144,591,326 | |
| Distributions in excess of net investment income | | | (25 | ) |
| Accumulated net realized loss on investments | | | (2,255,113 | ) |
| Net unrealized appreciation of investments | | | 3,316,014 | |
| Total net assets | | | $145,652,202 | |
§ | Pre-Refunded Bonds. Municipals that are generally backed or secured by U.S. Treasury bonds. For Pre-Refunded Bonds, the stated maturity is followed by the year in which the bond is pre-refunded. See Note 8 in “Notes to Financial Statements.” |
| | |
| ¶ | Step coupon bond. Indicates security that has a zero coupon that remains in effect until a predetermined date at which time the stated interest rate becomes effective. |
Summary of Abbreviations:
ACA — Insured by American Capital Access
AMBAC — Insured by the AMBAC Assurance Corporation
AMT — Subject to Alternative Minimum Tax
FGIC — Insured by the Financial Guaranty Insurance Company
FHLMC — Insured by the Federal Home Loan Mortgage Corporation
FNMA — Insured by Federal National Mortgage Association
FSA — Insured by Financial Security Assurance
GNMA — Insured by Government National Mortgage Association
MBIA — Insured by the Municipal Bond Insurance Association
RADIAN — Insured by Radian Asset Assurance
XLCA — Insured by XL Capital Assurance
| Net Asset Value and Offering Price Per Share – | |
| Delaware Tax-Free Arizona Fund | |
| Net asset value Class A (A) | $11.07 |
| Sales charge (4.50% of offering price) (B) | 0.52 |
| Offering price | $11.59 |
(A) | Net asset value per share, as illustrated, is the amount which would be paid upon redemption or repurchase of shares. |
| | |
(B) | See the current prospectus for purchases of $100,000 or more. |
See accompanying notes
(continues) 25
Statements of net assets
Delaware Tax-Free California Fund
August 31, 2007
| Principal | | |
| | Amount | | Value |
| Municipal Bonds – 97.00% | | | |
| Corporate Revenue Bonds – 1.34% | | | |
| Golden State Tobacco Securitization | | | |
| Settlement Revenue (Asset-Backed | | | |
| Senior Notes) Series A-1 | | | |
| 5.125% 6/1/47 | $1,500,000 | | $ 1,329,615 |
| | | 1,329,615 |
| Education Revenue Bonds – 15.16% | | | |
| California Educational Facilities | | | |
| Authority Revenue | | | |
| (Claremont Graduate University) | | | |
| Series A 5.00% 3/1/37 | 1,000,000 | | 977,370 |
| (University of the Pacific) | | | |
| 5.25% 5/1/34 | 1,000,000 | | 1,010,030 |
| 5.75% 11/1/30 (MBIA) | 310,000 | | 326,061 |
| (Woodbury University) | | | |
| 5.00% 1/1/36 | 1,000,000 | | 923,840 |
| California Municipal Finance | | | |
| Authority Educational Revenue | | | |
| (American Heritage Foundation | | | |
| Project) Series A 5.25% 6/1/36 | 1,000,000 | | 938,660 |
| (University Students Co-op | | | |
| Association) 5.00% 4/1/37 | 1,000,000 | | 922,520 |
| California Public Works Board Lease | | | |
| Revenue (Various Universities of | | | |
| California Projects) | | | |
| Series D 5.00% 5/1/30 | 1,000,000 | | 1,016,810 |
| Series F 5.00% 11/1/29 | 1,000,000 | | 1,013,460 |
| California Statewide Communities | | | |
| Development Authority Revenue | | | |
| (California Baptist University | | | |
| Project) Series A 5.50% 11/1/38 | 1,000,000 | | 971,620 |
| (Viewpoint School Project) | | | |
| 5.75% 10/1/33 (ACA) | 1,000,000 | | 1,016,500 |
| (Windrush School Project) | | | |
| 5.50% 7/1/37 | 1,000,000 | | 966,520 |
| California Statewide Communities | | | |
| Development Authority Student | | | |
| Housing Revenue | | | |
| (East Campus Apartments, LLC) | | | |
| Series A 5.625% 8/1/34 (ACA) | 1,000,000 | | 1,004,630 |
| (Irvine, LLC-UCI East) | | | |
| 5.00% 5/15/38 | 1,000,000 | | 919,960 |
| San Diego County Certificates of | | | |
| Participation (University of San | | | |
| Diego) 5.375% 10/1/41 | 1,000,000 | | 1,014,940 |
| University of California Revenue | | | |
| 5.00% 5/15/33 (FSA) | 2,000,000 | | 2,045,000 |
| | | 15,067,921 |
| Health Care Revenue Bonds – 10.21% | | | |
| Abag Finance Authority of California | | | |
| (Nonprofit Corporations - San | | | |
| Diego Hospital Association) | | | |
| Series A 6.125% 8/15/20 | 1,250,000 | | 1,300,450 |
| California Health Facilities Financing | | | |
| Authority Revenue | | | |
| (Catholic Healthcare West) | | | |
| Series G 5.25% 7/1/23 | 1,000,000 | | 1,017,720 |
| (Nevada Methodist) | | | |
| 5.00% 7/1/36 | 1,075,000 | | 1,061,176 |
| (The Episcopal Home) | | | |
| Series A 5.30% 2/1/32 (RADIAN) | 2,000,000 | | 1,984,200 |
| California Infrastructure & Economic | | | |
| Development Bank Revenue | | | |
| (Kaiser Hospital Associates I, LLC) | | | |
| Series A 5.55% 8/1/31 | 1,000,000 | | 1,023,350 |
| California Statewide Communities | | | |
| Development Authority Revenue | | | |
| (Health Facilities - Adventist | | | |
| Health) Series A 5.00% 3/1/35 | 2,000,000 | | 1,954,700 |
| (Presbyterian Homes) Series A | | | |
| 4.875% 11/15/36 | 1,000,000 | | 902,220 |
| (Valleycare Health Systems) | | | |
| Series A 5.125% 7/15/31 | 1,000,000 | | 909,080 |
| | | 10,152,896 |
| Housing Revenue Bonds – 7.91% | | | |
| California Department of Veteran | | | |
| Affairs Home Purpose Revenue | | | |
| Series A 4.60% 12/1/28 | 2,000,000 | | 1,905,440 |
| California Statewide Communities | | | |
| Development Authority | | | |
| Multifamily Housing Revenue | | | |
| (Citrus Gardens Apartments) | | | |
| Series D1 5.375% 7/1/32 | 1,800,000 | | 1,822,950 |
| (Silver Ridge Apartments) | | | |
| Series H 5.80% 8/1/33 (FNMA) | | | |
| (AMT) (LOC, Fannie Mae) | 1,000,000 | | 1,034,870 |
| Palm Springs Mobile Home Park | | | |
| Revenue (Sahara Mobile Home | | | |
| Park) Series A 5.75% 5/15/37 | 1,000,000 | | 1,005,140 |
| Santa Clara County Multifamily | | | |
| Housing Authority Revenue | | | |
| (Rivertown Apartments Project) | | | |
| Series A 5.85% 8/1/31 (AMT) | 1,000,000 | | 1,034,340 |
| Ventura County Area Multifamily | | | |
| Housing Authority Revenue | | | |
| (Glen Oaks Apartments) | | | |
| Series A 6.35% 7/20/34 (GNMA) | 983,000 | | 1,059,143 |
| | | 7,861,883 |
| Lease Revenue Bonds – 7.33% | | | |
| California Public Works Board Lease | | | |
| Revenue | | | |
| (Department of Corrections) | | | |
| Series A 5.00% 3/1/27 (AMBAC) | 1,000,000 | | 1,017,920 |
| Series C 5.25% 6/1/28 | 1,500,000 | | 1,539,630 |
| (Department of General | | | |
| Services - Butterfield) | | | |
| Series A 5.25% 6/1/30 | 1,000,000 | | 1,027,780 |
26
| Principal | | |
| | Amount | | Value |
| Municipal Bonds (continued) | | | |
| Lease Revenue Bonds (continued) | | | |
| Franklin-McKinley School District | | | |
| Certificates of Participation | | | |
| (Financing Project) | | | |
| Series B 5.00% 9/1/27 (AMBAC) | $1,060,000 | | $ 1,079,228 |
| San Diego County Certificates of | | | |
| Participation 5.75% 7/1/31 (MBIA) | 1,000,000 | | 1,061,760 |
| San Juan Basin Authority (Ground | | | |
| Water Recovery Project) | | | |
| 5.00% 12/1/34 (AMBAC) | 1,000,000 | | 1,014,530 |
| ^San Mateo Unified High School | | | |
| District Certificates of | | | |
| Participation Capital Appreciation | | | |
| (Partnership Phase I Projects) | | | |
| Series B 5.00% 12/15/43 | | | |
| (AMBAC) | 1,000,000 | | 541,830 |
| | | 7,282,678 |
| Local General Obligation Bonds – 14.77% | | | |
| ^Anaheim School District Election | | | |
| 2002 4.58% 8/1/25 (MBIA) | 1,250,000 | | 519,788 |
| Commerce Joint Powers | | | |
| Financing Authority Revenue | | | |
| (Redevelopment Projects) | | | |
| Series A 5.00% 8/1/28 (RADIAN) | 1,000,000 | | 937,090 |
| Culver City Redevelopment Agency | | | |
| (Tax Allocation - Redevelopment | | | |
| Project) Series A | | | |
| 5.00% 11/1/25 (AMBAC) | 1,000,000 | | 1,022,590 |
| Fairfield-Suisun Unified School | | | |
| District Election 2002 | | | |
| 5.50% 8/1/28 (MBIA) | 500,000 | | 533,855 |
| Fremont Community Facilities District #1 | | | |
| (Special Tax Pacific Commons) | | | |
| 5.375% 9/1/36 | 1,000,000 | | 982,700 |
| Jurupa Community Services Special | | | |
| Tax Facilities District #19 (Eastvale) | | | |
| 5.00% 9/1/36 | 500,000 | | 454,240 |
| La Quinta Redevelopment Agency | | | |
| (Tax Allocation - Redevelopment | | | |
| Project Area #1) | | | |
| Series A 5.10% 9/1/31 (AMBAC) | 2,000,000 | | 2,046,120 |
| Lake Elsinore Public Financing | | | |
| Authority (Tax Allocation) Series A | | | |
| 5.50% 9/1/30 | 1,000,000 | | 1,010,440 |
| Lammersville School District | | | |
| Community Facilities District | | | |
| #2002 (Mountain House) | | | |
| 5.125% 9/1/35 | 500,000 | | 470,995 |
| Lawndale Elementary School District | | | |
| Series B 5.00% 8/1/32 (FSA) | 1,000,000 | | 1,018,660 |
| Los Angeles Unified School District | | | |
| Series A-2 4.25% 1/1/28 (FGIC) | 1,000,000 | | 905,010 |
| Modesto Special Tax Community | | | |
| Facilities District #04-1 Village 2 | | | |
| 5.15% 9/1/36 | 1,000,000 | | 943,350 |
| Poway Redevelopment Agency Tax | | | |
| Allocation 5.75% 6/15/33 (MBIA) | 270,000 | | 288,889 |
| Poway Unified School District Special | | | |
| Tax Community Facilities District #6 | | | |
| 5.60% 9/1/33 | 1,000,000 | | 1,006,860 |
| Roseville Westpark Special Tax Public | | | |
| Community Facilities District #1 | | | |
| 5.25% 9/1/37 | 500,000 | | 482,090 |
| San Bernardino County Special Tax | | | |
| Community Facilities District | | | |
| #2002-1 5.90% 9/1/33 | 2,000,000 | | 2,052,380 |
| | | 14,675,057 |
| §Pre-Refunded Bonds – 19.38% | | | |
| California Educational Facilities | | | |
| Authority Revenue | | | |
| (Pepperdine University) Series A | | | |
| 5.50% 8/1/32-09 | 1,000,000 | | 1,034,570 |
| (University of the Pacific) | | | |
| 5.75% 11/1/30-10 (MBIA) | 690,000 | | 734,947 |
| California Department Water | | | |
| Resources Power Supply Revenue | | | |
| Series A 5.375% 5/1/21-12 | 2,000,000 | | 2,166,999 |
| California State 5.00% 2/1/33-14 | 1,000,000 | | 1,069,790 |
| Golden State Tobacco Securitization | | | |
| Settlement Revenue | | | |
| (Asset-Backed Senior Notes) | | | |
| Series B 5.50% 6/1/43-13 | | | |
| (RADIAN) | 1,000,000 | | 1,079,880 |
| 5.625% 6/1/33-13 | 1,000,000 | | 1,086,250 |
| Oakland Industrial Revenue | | | |
| (Harrison Foundation) Series B | | | |
| 6.00% 1/1/29-10 (AMBAC) | 1,300,000 | | 1,370,499 |
| Poway Redevelopment Agency Tax | | | |
| Allocation | | | |
| 5.75% 6/15/33-10 (MBIA) | 1,130,000 | | 1,226,412 |
| Puerto Rico Commonwealth | | | |
| Highway & Transportation | | | |
| Authority Revenue Series K | | | |
| 5.00% 7/1/45-15 | 1,500,000 | | 1,609,845 |
| Riverside County Redevelopment | | | |
| Agency Tax Allocation (Jurupa | | | |
| Valley Project) | | | |
| 5.25% 10/1/35-11 (AMBAC) | 1,590,000 | | 1,718,455 |
| San Diego County Certificates of | | | |
| Participation (The Burnham | | | |
| Institute) 6.25% 9/1/29-09 | 1,000,000 | | 1,059,310 |
| San Diego School District Series E | | | |
| 5.00% 7/1/28-13 (FSA) | 2,000,000 | | 2,119,580 |
| San Francisco Bay Area Rapid | | | |
| Transit District Sales Tax Revenue | | | |
| 5.125% 7/1/36-11 (AMBAC) | 740,000 | | 780,715 |
| Sequoia Unified High School District | | | |
| Election 2001 | | | |
| 5.125% 7/1/31-11 (FSA) | 1,000,000 | | 1,072,480 |
(continues) 27
Statements of net assets
Delaware Tax-Free California Fund
| Principal | | | |
| | Amount | | Value | |
| Municipal Bonds (continued) | | | | |
| §Pre-Refunded Bonds (continued) | | | | |
| Southern California Logistics | | | | |
| Airport Authority Tax Allocation | | | | |
| 6.50% 12/1/31-11 | $1,000,000 | | $ 1,126,140 | |
| | | 19,255,872 | |
| Resource Recovery Revenue Bonds – 4.09% | | | | |
| Salinas Valley Solid Waste | | | | |
| Authority Revenue | | | | |
| 5.25% 8/1/27 (AMBAC) (AMT) | 2,000,000 | | 2,034,540 | |
| 5.25% 8/1/31 (AMBAC) (AMT) | 2,000,000 | | 2,029,300 | |
| | | 4,063,840 | |
| Special Tax Revenue Bonds – 2.68% | | | | |
| Palm Drive Health Care District Parcel | | | | |
| Tax Revenue 5.25% 4/1/30 | 2,000,000 | | 1,891,220 | |
| Puerto Rico Financing Sales Tax | | | | |
| Revenue Series A 5.25% 8/1/57 | 500,000 | | 512,210 | |
| San Francisco Bay Area Rapid Transit | | | | |
| Financing Authority Tax Revenue | | | | |
| 5.125% 7/1/36 (AMBAC) | 260,000 | | 262,863 | |
| | | 2,666,293 | |
| State General Obligation Bonds – 4.83% | | | | |
| California Variable Purposes | | | | |
| 5.00% 8/1/35 | 1,000,000 | | 1,004,180 | |
| 5.50% 11/1/33 | 2,000,000 | | 2,093,920 | |
| California Veterans Series BJ | | | | |
| 5.70% 12/1/32 (AMT) | 640,000 | | 646,522 | |
| Puerto Rico Public Buildings | | | | |
| Authority Revenue (Guaranteed | | | | |
| Government Facilities) | | | | |
| Series I 5.50% 7/1/23 | 1,000,000 | | 1,056,690 | |
| | | 4,801,312 | |
| Transportation Revenue Bonds – 4.11% | | | | |
| Port of Oakland Revenue Series L | | | | |
| 5.375% 11/1/27 (FGIC) (AMT) | 1,000,000 | | 1,030,350 | |
| Sacramento County Airport | | | | |
| System Revenue Series A | | | | |
| 5.00% 7/1/32 (FSA) | 1,000,000 | | 1,014,500 | |
| San Diego Redevelopment Agency | | | | |
| (Centre City Redevelopment | | | | |
| Project) Series A 6.40% 9/1/25 | 1,000,000 | | 1,029,760 | |
| San Jose Airport Revenue Series A | | | | |
| 5.00% 3/1/31 (FGIC) | 1,000,000 | | 1,011,020 | |
| | | 4,085,630 | |
| Water & Sewer Revenue Bonds – 5.19% | | | | |
| Banning Utilities Authority Water | | | | |
| Enterprise Revenue Refunding & | | | | |
| Improvements | | | | |
| 5.25% 11/1/35 (FGIC) | 1,000,000 | | 1,050,780 | |
| California Department of Water | | | | |
| Resources Systems Revenue | | | | |
| (Central Valley Project) | | | | |
| Series X 5.00% 12/1/29 (FGIC) | 1,000,000 | | 1,014,670 | |
| Clovis Public Financing Authority | | | | |
| Wastewater Revenue | | | | |
| 5.25% 8/1/30 (MBIA) | 1,000,000 | | 1,048,430 | |
| Metropolitan Water District of | | | | |
| Southern California Waterworks | | | | |
| Authority Revenue Series B-1 | | | | |
| 5.00% 10/1/36 (FGIC) | 1,000,000 | | 1,011,090 | |
| Sacramento County Sanitation | | | | |
| District Financing Authority | | | | |
| Revenue 5.00% 12/1/36 (FGIC) | 1,000,000 | | 1,029,570 | |
| | | 5,154,540 | |
| Total Municipal Bonds | | | | |
| (cost $95,381,721) | | | 96,397,537 | |
| | |
| Number | | | |
| | of Shares | | | |
| Short-Term Investments – 0.66% | | | | |
| Money Market Instruments – 0.05% | | | | |
| Federated California Municipal Cash Trust | 53,190 | | 53,190 | |
| | | 53,190 | |
| | |
| Principal | | | |
| Amount | | | |
| •Variable Rate Demand Notes – 0.61% | | | | |
| East Bay Municipal Utilities District | | | | |
| Water System Revenue Series B-2 | | | | |
| 3.86% 6/1/38 (XLCA) | $600,000 | | 600,000 | |
| | | 600,000 | |
| Total Short-Term Investments | | | | |
| (cost $653,190) | | | 653,190 | |
| | |
| Total Value of Securities – 97.66% | | | | |
| (cost $96,034,911) | | | 97,050,727 | |
| Receivables and Other Assets | | | | |
| Net of Liabilities – 2.34% | | | 2,323,064 | |
| Net Assets Applicable to 9,017,138 | | | | |
| Shares Outstanding – 100.00% | | | $99,373,791 | |
| | |
| Net Asset Value – Delaware Tax-Free California Fund | | | |
| Class A ($76,536,645 / 6,948,935 Shares) | | | $11.01 | |
| Net Asset Value – Delaware Tax-Free California Fund | | | |
| Class B ($9,383,722 / 848,566 Shares) | | | | $11.06 | |
| Net Asset Value – Delaware Tax-Free California Fund | | | |
| Class C ($13,453,424 / 1,219,637 Shares) | | | $11.03 | |
| | |
| Components of Net Assets at August 31, 2007: | | | |
| Shares of beneficial interest | | | | |
| (unlimited authorization – no par) | | | $99,223,949 | |
| Undistributed net investment income | | | 1,300 | |
| Accumulated net realized loss on investments | | (867,274 | ) |
| Net unrealized appreciation of investments | | | 1,015,816 | |
| Total net assets | | | $99,373,791 | |
28
| | |
^ | Zero coupon security. The rate shown is the yield at the time of purchase. |
| | |
§ | Pre-Refunded Bonds. Municipals that are generally backed or secured by U.S. Treasury bonds. For Pre-Refunded Bonds, the stated maturity is followed by the year in which the bond is pre-refunded. See Note 8 in “Notes to Financial Statements.” |
| | |
• | Variable rate security. The rate shown is the rate as of August 31, 2007. |
Summary of Abbreviations:
ACA — Insured by American Capital Access
AMBAC — Insured by the AMBAC Assurance Corporation
AMT — Subject to Alternative Minimum Tax
FGIC — Insured by the Financial Guaranty Insurance Company
FNMA — Insured by Federal National Mortgage Association
FSA — Insured by Financial Security Assurance
GNMA — Insured by Government National Mortgage Association
LOC — Letter of Credit
MBIA — Insured by the Municipal Bond Insurance Association
RADIAN — Insured by Radian Asset Assurance
XLCA — Insured by XL Capital Assurance
| Net Asset Value and Offering Price Per Share – | |
| Delaware Tax-Free California Fund | |
| Net asset value Class A (A) | $11.01 |
| Sales charge (4.50% of offering price) (B) | 0.52 |
| Offering price | $11.53 |
(A) | Net asset value per share, as illustrated, is the amount which would be paid upon redemption or repurchase of shares. |
| | |
(B) | See the current prospectus for purchases of $100,000 or more. |
See accompanying notes
(continues) 29
Statements of net assets
Delaware Tax-Free Colorado Fund
August 31, 2007
| Principal | | |
| | Amount | | Value |
| Municipal Bonds – 98.31% | | | |
| Education Revenue Bonds – 15.86% | | | |
| Boulder County Development | | | |
| Revenue (University Corporation | | | |
| for Atmospheric Research) | | | |
| 5.00% 9/1/33 (MBIA) | $1,000,000 | | $ 1,010,570 |
| 5.00% 9/1/35 (AMBAC) | 2,000,000 | | 2,022,720 |
| Colorado Educational & Cultural | | | |
| Facilities Authority Revenue | | | |
| (Charter School Project) | | | |
| 5.50% 5/1/36 (XLCA) | 2,280,000 | | 2,389,189 |
| (Johnson & Wales University Project) | | | |
| Series A 5.00% 4/1/28 (XLCA) | 1,000,000 | | 1,014,300 |
| (Liberty Common Charter School | | | |
| Project) 5.125% 12/1/33 (XLCA) | 2,740,000 | | 2,794,197 |
| (Montessori Districts Charter | | | |
| School Projects) 6.125% 7/15/32 | 5,590,000 | | 5,721,533 |
| (Pinnacle Charter School Project) | | | |
| 5.00% 6/1/33 (XLCA) | 2,170,000 | | 2,196,322 |
| (Regis University Project) | | | |
| 5.00% 6/1/22 (RADIAN) | 1,820,000 | | 1,791,881 |
| (Renaissance Charter School | | | |
| Project) 6.75% 6/1/29 | 2,000,000 | | 1,873,480 |
| (University of Northern Colorado | | | |
| Student Housing Project) | | | |
| 5.125% 7/1/37 (MBIA) | 7,500,000 | | 7,581,300 |
| (Woodrow Wilson Charter School | | | |
| Project) 5.25% 12/1/34 (XLCA) | 1,960,000 | | 2,028,130 |
| Colorado School Mines | | | |
| Auxiliary Facilities Revenue | | | |
| 5.00% 12/1/37 (AMBAC) | 3,130,000 | | 3,159,954 |
| University of Colorado Enterprise | | | |
| System Revenue | | | |
| Series A 5.00% 6/1/30 (AMBAC) | 3,155,000 | | 3,245,990 |
| Series A Refunding 5.375% 6/1/26 | 1,000,000 | | 1,036,090 |
| University of Puerto Rico Revenue | | | |
| Series Q 5.00% 6/1/36 | 3,750,000 | | 3,718,613 |
| | | 41,584,269 |
| Electric Revenue Bonds – 2.50% | | | |
| Colorado Springs Utilities Revenue | | | |
| Series A 5.00% 11/15/29 | 5,000,000 | | 5,053,450 |
| Puerto Rico Electric Power Authority | | | |
| Revenue Series TT 5.00% 7/1/37 | 1,500,000 | | 1,498,740 |
| | | 6,552,190 |
| Escrowed to Maturity Bonds – 2.27% | | | |
| Colorado Health Facilities Authority | | | |
| Revenue (Catholic Health | | | |
| Initiatives) Series A 5.50% 3/1/32 | 5,000,000 | | 5,278,700 |
| Galleria Metropolitan District | | | |
| 7.25% 12/1/09 | 645,000 | | 665,576 |
| | | 5,944,276 |
| Health Care Revenue Bonds – 14.20% | | | |
| Colorado Health Facilities | | | |
| Authority Revenue | | | |
| •(Adventist Health Project) | | | |
| Series D 5.25% 11/15/35 | 4,000,000 | | 4,018,520 |
| (Catholic Health Initiatives) | | | |
| Series A 4.75% 9/1/40 | 3,000,000 | | 2,818,650 |
| (Christian Living Community | | | |
| Project) Series A 5.75% 1/1/37 | 1,500,000 | | 1,427,580 |
| (Covenant Retirement | | | |
| Communities) Series A | | | |
| 5.50% 12/1/33 (RADIAN) | 5,000,000 | | 5,035,750 |
| (Evangelical Lutheran) | | | |
| 5.00% 6/1/35 | 2,000,000 | | 1,849,000 |
| Series A 5.25% 6/1/34 | 2,750,000 | | 2,652,183 |
| (Parkview Medical Center) | | | |
| 5.00% 9/1/25 | 1,000,000 | | 990,640 |
| (Porter Place) Series A | | | |
| 6.00% 1/20/36 (GNMA) | 5,000,000 | | 5,179,249 |
| (Vail Valley Medical Center | | | |
| Project) 5.80% 1/15/27 | 3,475,000 | | 3,517,604 |
| Delta County Memorial Hospital | | | |
| District Enterprise Revenue | | | |
| 5.35% 9/1/17 | 4,000,000 | | 4,045,760 |
| Denver Health & Hospital Authority | | | |
| Healthcare Revenue Series A | | | |
| 4.75% 12/1/36 | 2,500,000 | | 2,127,550 |
| Mesa County Residential Care | | | |
| Facilities Mortgage Revenue | | | |
| (Hilltop Community Resources) | | | |
| Series A 5.375% 12/1/28 | | | |
| (RADIAN) | 2,000,000 | | 2,004,800 |
| University of Colorado Hospital | | | |
| Authority Revenue Series A | | | |
| 5.00% 11/15/37 | 1,690,000 | | 1,567,238 |
| | | 37,234,524 |
| Housing Revenue Bonds – 1.45% | | | |
| Colorado Housing & Finance | | | |
| Authority Revenue (Multifamily | | | |
| Housing Insured Mortgage) | | | |
| Series A-3 6.25% 10/1/26 (FHA) | 140,000 | | 142,817 |
| Series C-3 6.15% 10/1/41 | 1,590,000 | | 1,631,181 |
| Denver City & County Multifamily | | | |
| Federal Housing Authority Revenue | | | |
| (Insured Mortgage Loan - Garden | | | |
| Court) 5.40% 7/1/39 (FHA) | 2,000,000 | | 2,022,580 |
| | | 3,796,578 |
| Lease Revenue Bonds – 4.63% | | | |
| Colorado Educational & Cultural | | | |
| National Conference of State | | | |
| Legislatures Office Building | | | |
| Facilities Authority Revenue | | | |
| 5.25% 6/1/21 | 2,000,000 | | 2,032,460 |
| Conejos & Alamosa Counties School | | | |
| District #11J Certificates of | | | |
| Participation 6.50% 4/1/11 | 820,000 | | 820,763 |
| Denver Convention Center Hotel | | | |
| Authority Revenue Series A | | | |
| 5.00% 12/1/35 (XLCA) | 3,000,000 | | 3,031,680 |
30
| Principal | | |
| | Amount | | Value |
| Municipal Bonds (continued) | | | |
| Lease Revenue Bonds (continued) | | | |
| El Paso County Certificates of | | | |
| Participation (Detention Facilities | | | |
| Project) Series B | | | |
| 5.00% 12/1/27 (AMBAC) | $1,500,000 | | $ 1,524,105 |
| Fremont County Certificates of | | | |
| Participation Refunding & | | | |
| Improvement Series A | | | |
| 5.25% 12/15/24 (MBIA) | 3,045,000 | | 3,200,660 |
| Puerto Rico Public Buildings | | | |
| Authority Revenue (Guaranteed | | | |
| Government Facilities) | | | |
| Series I 5.25% 7/1/33 | 1,500,000 | | 1,530,510 |
| | | 12,140,178 |
| Local General Obligation Bonds – 16.91% | | | |
| Adams County School District #14 | | | |
| 5.125% 12/1/31 (FSA) | 1,500,000 | | 1,558,215 |
| Arapahoe County Water & | | | |
| Wastewater Public Improvement | | | |
| District Refunding Series A | | | |
| 5.125% 12/1/32 (MBIA) | 4,500,000 | | 4,575,195 |
| Bowles Metropolitan District | | | |
| 5.00% 12/1/33 (FSA) | 2,500,000 | | 2,531,925 |
| Denver West Metropolitan District | | | |
| 5.00% 12/1/33 (RADIAN) | 4,000,000 | | 3,687,080 |
| Douglas County School District #1 | | | |
| Building (Douglas & Elbert | | | |
| Counties) Series B | | | |
| 5.125% 12/15/25 (FSA) | 2,000,000 | | 2,055,280 |
| Eagle Bend Metropolitan District #2 | | | |
| 5.00% 12/1/35 (RADIAN) | 3,000,000 | | 2,794,020 |
| El Paso County School District #2 | | | |
| (Harrison) 5.00% 12/1/27 (MBIA) | 2,115,000 | | 2,152,922 |
| Garfield County School District #2 | | | |
| 5.00% 12/1/25 (FSA) | 3,280,000 | | 3,389,610 |
| La Plata County School District | | | |
| #9-R (Durango) | | | |
| 5.125% 11/1/24 (MBIA) | 1,000,000 | | 1,033,270 |
| Lincoln Park Metropolitan District | | | |
| 7.75% 12/1/26 | 2,500,000 | | 2,654,550 |
| Loveland Special Improvements | | | |
| District #1 7.50% 7/1/29 | 5,540,000 | | 6,125,523 |
| Meridian Metropolitan District Series A | | | |
| 5.00% 12/1/31 (RADIAN) | 7,000,000 | | 6,507,199 |
| North Range Metropolitan | | | |
| District #1 4.50% 12/15/31 (ACA) | 1,500,000 | | 1,248,375 |
| District #2 5.50% 12/15/37 | 1,200,000 | | 1,049,688 |
| Saddle Rock Colorado Metropolitan | | | |
| District 5.35% 12/1/31 (RADIAN) | 1,580,000 | | 1,553,314 |
| Sand Creek Metropolitan District | | | |
| Refunding & Improvement | | | |
| 5.00% 12/1/31 (XLCA) | 500,000 | | 508,410 |
| Vista Ridge Metropolitan District | | | |
| Refunding & Improvement | | | |
| (Limited Tax) Series A | | | |
| 5.125% 12/1/40 (RADIAN) | 1,000,000 | | 920,160 |
| | | 44,344,736 |
| §Pre-Refunded Bonds – 24.05% | | | |
| Aurora Certificates of Participation | | | |
| 5.50% 12/1/30-10 (AMBAC) | 8,000,000 | | 8,442,959 |
| Boulder County Hospital Revenue | | | |
| (Development Longmont United | | | |
| Hospital Project) | | | |
| 5.60% 12/1/27-07 (RADIAN) | 1,250,000 | | 1,266,050 |
| 6.00% 12/1/30-10 (RADIAN) | 5,000,000 | | 5,349,550 |
| Burlingame Multifamily Housing | | | |
| Revenue Series A | | | |
| 6.00% 11/1/29-09 (MBIA) | 1,250,000 | | 1,320,138 |
| Colorado Educational & Cultural | | | |
| Facilities Authority Revenue | | | |
| (Core Knowledge Charter School | | | |
| Project) 7.00% 11/1/29-09 | 1,000,000 | | 1,066,640 |
| (Littleton Academy Charter School | | | |
| Project) 6.125% 1/15/31-12 | 2,000,000 | | 2,190,220 |
| (Pinnacle Charter School Project) | | | |
| 6.00% 12/1/21-11 | 1,750,000 | | 1,905,033 |
| (Stargate Charter School Project) | | | |
| 6.125% 5/1/33-13 | 2,000,000 | | 2,230,080 |
| (University of Denver Project) | | | |
| 5.375% 3/1/23-11 (AMBAC) | 2,000,000 | | 2,110,921 |
| Series A 5.00% 3/1/27-12 (MBIA) | 5,000,000 | | 5,272,500 |
| Colorado Springs Revenue | | | |
| (Colorado College Project) | | | |
| 5.375% 6/1/32-09 | 2,570,000 | | 2,667,043 |
| Denver Health & Hospital Authority | | | |
| Healthcare Revenue Series A | | | |
| 5.375% 12/1/28-08 (ACA) | 2,770,000 | | 2,850,912 |
| E-470 Public Highway Authority | | | |
| Revenue Series A | | | |
| 5.75% 9/1/35-10 (MBIA) | 3,100,000 | | 3,336,096 |
| El Paso County Certificates of | | | |
| Participation (Judicial Building | | | |
| Project) Series A | | | |
| 5.00% 12/1/27-12 (AMBAC) | 2,000,000 | | 2,125,380 |
| El Paso County School District #49 | | | |
| (Falcon) 5.50% 12/1/21-11 (FGIC) | 3,580,000 | | 3,834,681 |
| Fremont County School | | | |
| District #1 (Canon City) | | | |
| 5.00% 12/1/24-13 (MBIA) | 1,735,000 | | 1,851,245 |
| Garfield Pitkin & Eagle County School | | | |
| District #1 (Roaring Fork) | | | |
| Series A 5.00% 12/15/27-14 (FSA) | 1,500,000 | | 1,612,095 |
| North Range Metropolitan District #1 | | | |
| 7.25% 12/15/31-11 | 3,390,000 | | 3,794,664 |
| Pueblo County Certificates of | | | |
| Participation 6.50% 12/1/24-10 | 5,460,000 | | 5,924,590 |
| University of Colorado Hospital | | | |
| Authority Revenue Series A | | | |
| 5.60% 11/15/31-11 | 3,650,000 | | 3,902,179 |
| | | 63,052,976 |
| Special Tax Revenue Bonds – 3.03% | | | |
| Baptist Road Rural Transportation | | | |
| Authority Sales & Use Tax Revenue | | | |
| 5.00% 12/1/26 | 2,000,000 | | 1,856,220 |
(continues) 31
Statements of net assets
Delaware Tax-Free Colorado Fund
| Principal | | | |
| | Amount | | Value | |
| Municipal Bonds (continued) | | | | |
| Special Tax Revenue Bonds (continued) | | | | |
| Park Meadows Business Improvement | | | | |
| District Shared Sales Tax Revenue | | | | |
| 5.30% 12/1/27 | $ 950,000 | | $ 875,159 | |
| 5.35% 12/1/31 | 720,000 | | 653,285 | |
| Puerto Rico Commonwealth | | | | |
| Infrastructure Financing Authority | | | | |
| Revenue Series B 5.00% 7/1/46 | 1,200,000 | | 1,180,908 | |
| South Suburban Park & Recreation | | | | |
| District (Golf Course & Ice Arena | | | | |
| Facility) 6.00% 11/1/15 | 2,330,000 | | 2,355,886 | |
| Westminster Golf Course | | | | |
| 5.55% 12/1/23 (RADIAN) | 1,000,000 | | 1,023,900 | |
| | | 7,945,358 | |
| State General Obligation Bonds – 3.66% | | | | |
| Puerto Rico Commonwealth | | | | |
| Series A 5.25% 7/1/30 | 2,000,000 | | 2,045,960 | |
| Series B 5.00% 7/1/35 | 500,000 | | 496,620 | |
| Puerto Rico Government | | | | |
| Development Bank (Senior Notes) | | | | |
| Series B 5.00% 12/1/14 | 1,000,000 | | 1,051,860 | |
| Puerto Rico Commonwealth | | | | |
| Public Improvement Series A | | | | |
| 5.25% 7/1/21 | 4,000,000 | | 4,138,680 | |
| Virgin Islands Public Finance | | | | |
| Authority (Gross Receipts Taxes) | | | | |
| 5.00% 10/1/31 (ACA) | 2,000,000 | | 1,861,000 | |
| | | 9,594,120 | |
| Transportation Revenue Bonds – 8.58% | | | | |
| Denver City & County Airport Revenue | | | | |
| Series A 5.00% 11/15/25 (FGIC) | 2,000,000 | | 2,051,040 | |
| Series B 5.00% 11/15/33 (XLCA) | 4,000,000 | | 4,051,840 | |
| Series E 5.25% 11/15/23 (MBIA) | 5,000,000 | | 5,062,550 | |
| Northwest Parkway Public Highway | | | | |
| Authority Revenue Series A | | | | |
| 5.25% 6/15/41 (FSA) | 11,100,000 | | 11,319,225 | |
| | | 22,484,655 | |
| Water & Sewer Revenue Bonds – 1.17% | | | | |
| Ute Utility Water Conservancy District | | | | |
| Revenue 5.75% 6/15/20 (MBIA) | 2,900,000 | | 3,072,260 | |
| | | 3,072,260 | |
| Total Municipal Bonds | | | | |
| (cost $250,921,679) | | | 257,746,120 | |
| | |
| Number of | | | |
| | Shares | | | |
| Short-Term Investments – 0.74% | | | | |
| Money Market Instruments – 0.36% | | | | |
| Dreyfus Cash Management Fund | 930,844 | | 930,844 | |
| | | 930,844 | |
| | | | | |
| Principal | | | |
| Amount | | | |
| •Variable Rate Demand Notes – 0.38% | | | | |
| Colorado Health Facilities Authority | | | | |
| Revenue (Sisters Charity Health | | | | |
| Systems) Series B 4.05% 12/1/38 | $ 1,000,000 | | 1,000,000 | |
| | | 1,000,000 | |
| Total Short-Term Investments | | | | |
| (cost $1,930,844) | | | 1,930,844 | |
| | |
| Total Value of Securities – 99.05% | | | | |
| (cost $252,852,523) | | | 259,676,964 | |
| Receivables and Other Assets | | | | |
| Net of Liabilities – 0.95% | | | 2,495,841 | |
| Net Assets Applicable to 24,441,863 | | | | |
| Shares Outstanding – 100.00% | | | $262,172,805 | |
| | |
| Net Asset Value – Delaware Tax-Free Colorado Fund | | | |
| Class A ($246,695,068 / 23,001,202 Shares) | | | $10.73 | |
| Net Asset Value – Delaware Tax-Free Colorado Fund | | | |
| Class B ($5,326,153 / 496,264 Shares) | | | $10.73 | |
| Net Asset Value – Delaware Tax-Free Colorado Fund | | | |
| Class C ($10,151,584 / 944,397 Shares) | | | $10.75 | |
| | |
| Components of Net Assets at August 31, 2007: | | | |
| Shares of beneficial interest | | | | |
| (unlimited authorization – no par) | | | $263,193,386 | |
| Distributions in excess of net investment income | | (46 | ) |
| Accumulated net realized loss on investments | | (7,844,976 | ) |
| Net unrealized appreciation of investments | | 6,824,441 | |
| Total net assets | | | $262,172,805 | |
• | Variable rate security. The rate shown is the rate as of August 31, 2007. |
| | |
§ | Pre-Refunded Bonds. Municipals that are generally backed or secured by U.S. Treasury bonds. For Pre-Refunded Bonds, the stated maturity is followed by the year in which the bond is pre-refunded. See Note 8 in “Notes to Financial Statements.” |
Summary of Abbreviations:
ACA — Insured by American Capital Access
AMBAC — Insured by the AMBAC Assurance Corporation
FGIC — Insured by the Financial Guaranty Insurance Company
FHA — Insured by the Federal Housing Administration
FSA — Insured by Financial Security Assurance
GNMA — Insured by Government National Mortgage Association
MBIA — Insured by the Municipal Bond Insurance Association
RADIAN — Insured by Radian Asset Assurance
XLCA — Insured by XL Capital Assurance
32
| | |
| Net Asset Value and Offering Price Per Share – | |
| Delaware Tax-Free Colorado Fund | |
| Net asset value Class A (A) | $10.73 |
| Sales charge (4.50% of offering price) (B) | 0.51 |
| Offering price | $11.24 |
(A) | Net asset value per share, as illustrated, is the amount which would be paid upon redemption or repurchase of shares. |
| | |
(B) | See the current prospectus for purchases of $100,000 or more. |
See accompanying notes
(continues) 33
Statements of net assets
Delaware Tax-Free Idaho Fund
August 31, 2007
| Principal | | |
| | Amount | | Value |
| Municipal Bonds – 95.66% | | | |
| Corporate Revenue Bonds – 7.23% | | | |
| Meridian Economic Industrial | | | |
| Development Revenue (Hi-Micro | | | |
| Project) 5.85% 8/15/11 (AMT) | $1,250,000 | | $ 1,251,525 |
| Nez Perce County Pollution Control | | | |
| Revenue (Potlatch Corporation | | | |
| Project) 6.00% 10/1/24 | 2,535,000 | | 2,553,024 |
| Power County Pollution Control | | | |
| Revenue (FMC Project) | | | |
| 5.625% 10/1/14 | 2,475,000 | | 2,516,382 |
| | | 6,320,931 |
| Education Revenue Bonds – 15.76% | | | |
| Boise City Independent School | | | |
| District 5.00% 8/1/24 (FSA) | 1,500,000 | | 1,569,795 |
| Boise State University Revenue | | | |
| 5.00% 4/1/17 (AMBAC) | 500,000 | | 527,545 |
| 5.00% 4/1/18 (FGIC) | 1,500,000 | | 1,572,030 |
| 5.375% 4/1/22 (FGIC) | 15,000 | | 15,766 |
| Series A 4.25% 4/1/32 (MBIA) | 2,250,000 | | 2,046,735 |
| Idaho State University Revenue | | | |
| Refunding & Improvement | | | |
| 5.00% 4/1/20 (FSA) | 1,130,000 | | 1,172,036 |
| 5.00% 4/1/23 (FSA) | 2,115,000 | | 2,170,814 |
| North Idaho College Dormitory | | | |
| Housing Certificates of | | | |
| Participation 6.45% 10/1/16 | 1,000,000 | | 1,001,290 |
| University of Idaho | | | |
| (General Refunding) Series A | | | |
| 5.00% 4/1/21 (AMBAC) | 1,150,000 | | 1,196,679 |
| (Student Fee Housing | | | |
| Improvements Project) | | | |
| 5.25% 4/1/31 (FGIC) | 2,195,000 | | 2,262,605 |
| University of Puerto Rico | | | |
| Series Q 5.00% 6/1/36 | 250,000 | | 247,908 |
| | | 13,783,203 |
| Escrow to Maturity Bonds – 2.10% | | | |
| Puerto Rico Commonwealth | | | |
| Infrastructure Financing | | | |
| Authority Revenue Series A | | | |
| 5.375% 10/1/24 | 1,750,000 | | 1,837,955 |
| | | 1,837,955 |
| Health Care Revenue Bonds – 4.07% | | | |
| Idaho Health Facilities Authority | | | |
| Hospital Revenue (Idaho Elks | | | |
| Rehabilitation Hospital Project) | | | |
| 5.30% 7/15/18 | 625,000 | | 626,688 |
| 5.45% 7/15/23 | 2,000,000 | | 2,001,500 |
| Idaho Health Facilities Authority | | | |
| Revenue (Portneuf Medical Center | | | |
| Project) Series A 5.00% 9/1/35 | | | |
| (RADIAN) | 1,000,000 | | 931,690 |
| | | 3,559,878 |
| Housing Revenue Bonds – 8.25% | | | |
| Idaho Housing Agency Single Family | | | |
| Mortgage Revenue | | | |
| Series A 6.05% 7/1/13 | | | |
| (AMBAC) (FHA) (VA) (AMT) | 40,000 | | 40,676 |
| Series A 6.10% 7/1/16 | | | |
| (FHA) (VA) (AMT) | 50,000 | | 50,871 |
| Series A-1 6.85% 7/1/12 (AMT) | 5,000 | | 5,122 |
| Series B 6.45% 7/1/15 | | | |
| (FHA) (VA) (AMT) | 20,000 | | 20,206 |
| Series C-2 6.35% 7/1/15 (AMT) | 20,000 | | 20,019 |
| Series E 6.35% 7/1/15 | | | |
| (FHA) (AMT) | 50,000 | | 50,049 |
| Series E-1 6.60% 7/1/11 | 5,000 | | 5,111 |
| Series G-2 6.15% 7/1/15 | | | |
| (FHA) (VA) (AMT) | 185,000 | | 188,313 |
| Series I 5.45% 1/1/39 (AMT) | 1,000,000 | | 1,009,590 |
| Idaho Housing & Finance | | | |
| Association Single Family | | | |
| Mortgage Revenue | | | |
| Series A Class III | | | |
| 4.875% 7/1/26 (AMT) | 1,000,000 | | 957,150 |
| Series B Class I | | | |
| 5.00% 7/1/37 (AMT) | 1,000,000 | | 957,380 |
| Series C Class III | | | |
| 5.35% 1/1/25 (AMT) | 310,000 | | 307,557 |
| Series D Class III | | | |
| 5.45% 7/1/23 (AMT) | 1,190,000 | | 1,192,963 |
| Series E Class III | | | |
| 4.875% 1/1/26 (AMT) | 1,470,000 | | 1,408,010 |
| Series E Class III | | | |
| 5.00% 1/1/28 (AMT) | 1,000,000 | | 1,004,070 |
| | | 7,217,087 |
| Lease Revenue Bonds – 7.32% | | | |
| Blaine School District #61 | | | |
| Certificate of Participation | | | |
| 5.00% 7/30/10 (AMBAC) | 750,000 | | 775,545 |
| Boise City Certificate of | | | |
| Participation 5.375% 9/1/20 | | | |
| (FGIC) (AMT) | 2,100,000 | | 2,158,443 |
| Boise City Revenue Series A | | | |
| 5.375% 12/1/31 (MBIA) | 500,000 | | 522,220 |
| Idaho State Building Authority Revenue | | | |
| Series A 5.00% 9/1/21 (MBIA) | 1,150,000 | | 1,162,374 |
| Series A 5.00% 9/1/43 (XLCA) | 1,000,000 | | 1,012,220 |
| Series B 5.00% 9/1/21 (MBIA) | 750,000 | | 775,928 |
| | | 6,406,730 |
| Local General Obligation Bonds – 22.57% | | | |
| Ada & Canyon Counties Joint School | | | |
| District #2 Meridian (School Board | | | |
| Guaranteed Program) | | | |
| 4.75% 2/15/20 | 1,000,000 | | 1,027,460 |
| 5.00% 7/30/20 | 2,155,000 | | 2,236,308 |
| 5.125% 7/30/19 | 1,005,000 | | 1,052,918 |
| 5.50% 7/30/16 | 1,305,000 | | 1,451,904 |
34
| Principal | | |
| | Amount | | Value |
| Municipal Bonds (continued) | | | |
| Local General Obligation Bonds (continued) | | | |
| Bannock County School District #025 | | | |
| (Pocatello Idaho School Board | | | |
| Guaranteed Program) | | | |
| 5.00% 8/15/15 | $1,040,000 | | $ 1,111,895 |
| 5.00% 8/15/16 | 1,100,000 | | 1,170,521 |
| Boise Urban Renewal Agency | | | |
| Parking Revenue (Tax Increment) | | | |
| Series A 6.125% 9/1/15 | 1,685,000 | | 1,712,634 |
| Series B 6.125% 9/1/15 | 1,380,000 | | 1,402,632 |
| Bonner County Local Improvement | | | |
| District #93-1 | | | |
| 6.50% 4/30/08 | 110,000 | | 110,299 |
| 6.50% 4/30/10 | 60,000 | | 60,153 |
| Canyon County School | | | |
| District #132 Caldwell | | | |
| 5.00% 7/30/15 (FGIC) | 2,000,000 | | 2,150,380 |
| Coeur D’Alene Local Improvement | | | |
| District #6 | | | |
| Series 1995 6.00% 7/1/09 | 85,000 | | 85,484 |
| Series 1996 6.05% 7/1/10 | 90,000 | | 90,530 |
| Series 1997 6.10% 7/1/12 | 40,000 | | 40,238 |
| Series 1998 6.10% 7/1/14 | 45,000 | | 45,253 |
| Lemhi County 5.20% 8/1/27 (FSA) | 2,145,000 | | 2,206,218 |
| Nampa Idaho 5.00% 8/1/21 (FGIC) | 2,475,000 | | 2,577,985 |
| Power & Cassia Counties Joint | | | |
| School District #381 | | | |
| (American Falls) 5.00% 8/1/17 | 1,155,000 | | 1,205,127 |
| | | 19,737,939 |
| §Pre-Refunded Bonds – 10.05% | | | |
| Boise State University Revenue | | | |
| Refunding & Improvement | | | |
| 5.125% 4/1/31-12 (FGIC) | 1,000,000 | | 1,060,620 |
| 5.375% 4/1/22-12 (FGIC) | 985,000 | | 1,055,014 |
| Idaho Health Facilities Authority | | | |
| Revenue (Bonner General | | | |
| Hospital Project) | | | |
| 6.50% 10/1/28-07 | 1,500,000 | | 1,533,090 |
| Puerto Rico Commonwealth | | | |
| Highway & Transportation | | | |
| Authority Revenue | | | |
| Series D 5.25% 7/1/38-12 | 1,000,000 | | 1,067,750 |
| Series G 5.00% 7/1/33-13 | 1,310,000 | | 1,391,141 |
| Puerto Rico Commonwealth Public | | | |
| Improvement Revenue Series A | | | |
| 5.125% 7/1/31-11 | 1,010,000 | | 1,063,348 |
| Puerto Rico Electric Power | | | |
| Authority Revenue | | | |
| Series II 5.25% 7/1/31-12 | 1,000,000 | | 1,079,350 |
| Series NN 5.125% 7/1/29-13 | 500,000 | | 535,830 |
| | | 8,786,143 |
| Special Tax Revenue Bonds – 8.73% | | | |
| Idaho Board Bank Authority | | | |
| Revenue Series B | | | |
| 4.125% 9/15/36 (MBIA) | 755,000 | | 670,840 |
| 5.00% 9/15/30 (MBIA) | 725,000 | | 749,759 |
| Puerto Rico Sales Tax Financing | | | |
| Series A 5.25% 8/1/57 | 2,000,000 | | 2,048,840 |
| Puerto Rico Commonwealth | | | |
| Highway & Transportation | | | |
| Authority Revenue | | | |
| Series W 5.50% 7/1/15 | 175,000 | | 188,626 |
| Series Y 5.00% 7/1/36 | 2,000,000 | | 2,151,339 |
| Virgin Islands Public Finance | | | |
| Authority Revenue | | | |
| (Senior Lien-Matching Fund | | | |
| Loan Note) Series A | | | |
| 5.25% 10/1/20 | 500,000 | | 510,945 |
| 5.25% 10/1/21 | 500,000 | | 509,150 |
| 5.25% 10/1/24 | 800,000 | | 807,496 |
| | | 7,636,995 |
| State General Obligation Bonds – 3.87% | | | |
| Puerto Rico Commonwealth | | | |
| Public Improvement | | | |
| (Unrefunded Balance) | | | |
| Series A 5.125% 7/1/31 | 2,315,000 | | 2,330,835 |
| Puerto Rico Public Buildings | | | |
| Authority Revenue (Guaranteed | | | |
| Government Facility) | | | |
| Series I 5.50% 7/1/23 | 1,000,000 | | 1,056,690 |
| | | 3,387,525 |
| Transportation Revenue Bonds – 3.16% | | | |
| Idaho Housing & Finance | | | |
| Association Highway Trust | | | |
| 5.00% 7/15/24 (MBIA) | 2,000,000 | | 2,077,580 |
| Puerto Rico Commonwealth | | | |
| Highway & Transportation | | | |
| Authority Revenue | | | |
| Series G 5.00% 7/1/33 | 690,000 | | 687,475 |
| | | 2,765,055 |
| Water & Sewer Revenue Bonds – 2.55% | | | |
| Moscow Sewer Revenue | | | |
| 5.00% 11/1/22 (FSA) | 2,175,000 | | 2,232,572 |
| | | 2,232,572 |
| Total Municipal Bonds | | | |
| (cost $82,622,157) | | | 83,672,013 |
| |
| Number of | | |
| | Shares | | |
| Short-Term Investments – 3.90% | | | |
| Money Market Instruments – 1.04% | | | |
| Dreyfus Cash Management Fund | 915,414 | | 915,414 |
| | | 915,414 |
(continues) 35
Statements of net assets
Delaware Tax-Free Idaho Fund
| Principal | | | |
| | Amount | | Value | |
| Short-Term Investments (continued) | | | | |
| •Variable Rate Demand Notes – 2.86% | | | | |
| Idaho Health Facilities Authority | | | | |
| Revenue (St. Luke’s Medical | | | | |
| Center Project) | | | | |
| 3.98% 7/1/30 (FSA) | $2,500,000 | | $ 2,500,000 | |
| | | 2,500,000 | |
| Total Short-Term Investments | | | | |
| (cost $3,415,414) | | | 3,415,414 | |
| | |
| Total Value of Securities – 99.56% | | | | |
| (cost $86,037,571) | | | 87,087,427 | |
| Receivables and Other Assets | | | | |
| Net of Liabilities – 0.44% | | | 381,202 | |
| Net Assets Applicable to 7,768,129 | | | | |
| Shares Outstanding – 100.00% | | | $87,468,629 | |
| | |
| Net Asset Value – Delaware Tax-Free Idaho Fund | | | |
| Class A ($69,931,197 / 6,209,342 Shares) | | | $11.26 | |
| Net Asset Value – Delaware Tax-Free Idaho Fund | | | |
| Class B ($6,002,874 / 533,937 Shares) | | | $11.24 | |
| Net Asset Value – Delaware Tax-Free Idaho Fund | | | |
| Class C ($11,534,558 / 1,024,850 Shares) | | | $11.25 | |
| | |
| Components of Net Assets at August 31, 2007: | | | |
| Shares of beneficial interest | | | | |
| (unlimited authorization – no par) | | | $86,818,606 | |
| Distributions in excess of net investment income | | (11,253 | ) |
| Accumulated net realized loss on investments | | (388,580 | ) |
| Net unrealized appreciation of investments | | 1,049,856 | |
| Total net assets | | | $87,468,629 | |
§ | Pre-Refunded Bonds. Municipals that are generally backed or secured by U.S. Treasury bonds. For Pre-Refunded Bonds, the stated maturity is followed by the year in which the bond is pre-refunded. See Note 8 in “Notes to Financial Statements.” |
| | |
• | Variable rate security. The rate shown is the rate as of August 31, 2007. |
Summary of Abbreviations:
AMBAC — Insured by the AMBAC Assurance Corporation
AMT — Subject to Alternative Minimum Tax
FGIC — Insured by the Financial Guaranty Insurance Company
FHA — Insured by the Federal Housing Administration
FSA — Insured by Financial Security Assurance
MBIA — Insured by the Municipal Bond Insurance Association
RADIAN — Insured by Radian Asset Assurance
VA — Insured by the Veterans Administration
XLCA — Insured by XL Capital Assurance
| Net Asset Value and Offering Price Per Share – | |
| Delaware Tax-Free Idaho Fund | |
| Net asset value Class A (A) | $11.26 |
| Sales charge (4.50% of offering price) (B) | 0.53 |
| Offering price | $11.79 |
(A) | Net asset value per share, as illustrated, is the amount which would be paid upon redemption or repurchase of shares. |
| | |
(B) | See current prospectus for purchases of $100,000 or more. |
See accompanying notes
36
Statements of net assets
Delaware Tax-Free New York Fund
August 31, 2007
| Principal | | |
| | Amount | | Value |
| Municipal Bonds – 94.09% | | | |
| Corporate Revenue Bonds – 7.69% | | | |
| New York City Industrial | | | |
| Development Agency Revenue | | | |
| (Brooklyn Navy Yard Cogen | | | |
| Partners) 5.75% 10/1/36 (AMT) | $450,000 | | $ 450,162 |
| New York Energy Research & | | | |
| Development Authority Pollution | | | |
| Control Revenue | | | |
| (Central Hudson Gas) Series A | | | |
| 5.45% 8/1/27 (AMBAC) | 500,000 | | 517,830 |
| Suffolk County Industrial | | | |
| Development Agency Revenue | | | |
| (Keyspan-Port Jefferson Energy | | | |
| Center) 5.25% 6/1/27 (AMT) | 500,000 | | 502,420 |
| | | 1,470,412 |
| Education Revenue Bonds – 16.74% | | | |
| Albany Industrial Development | | | |
| Agency Civic Facilities Revenue | | | |
| (Albany Law School) Series A | | | |
| 5.00% 7/1/31 | 250,000 | | 237,790 |
| (Brighter Choice Charter School) | | | |
| Series A 5.00% 4/1/37 | 250,000 | | 223,963 |
| Amherst Industrial Development | | | |
| Agency Civic Facilities Revenue | | | |
| (UBF Faculty Student Housing) | | | |
| Series A 5.75% 8/1/30 (AMBAC) | 200,000 | | 213,044 |
| Cattaraugus County Industrial | | | |
| Development Agency Civic | | | |
| Facilities Revenue | | | |
| (St. Bonaventure University | | | |
| Project) Series A 5.10% 5/1/31 | 250,000 | | 233,855 |
| Dutchess County Industrial | | | |
| Development Agency (Marist | | | |
| College) 5.00% 7/1/20 | 500,000 | | 507,035 |
| New York City Industrial | | | |
| Development Agency Civic | | | |
| Facilities Revenue | | | |
| (Vaughn College Aeronautics) | | | |
| Series B 5.25% 12/1/36 | 150,000 | | 135,803 |
| New York Dormitory Authority | | | |
| Revenue | | | |
| (Columbia University) | | | |
| Series A 5.00% 7/1/23 | 500,000 | | 513,704 |
| (Pratt Institute) 6.00% 7/1/20 | | | |
| (RADIAN) | 500,000 | | 524,364 |
| Series B 7.50% 5/15/11 | 155,000 | | 168,987 |
| ¶Non-State Supported Debt | | | |
| (University of Rochester) Series A | | | |
| 4.375% 7/1/20 | 250,000 | | 206,575 |
| Seneca County Industrial | | | |
| Development Agency Civic | | | |
| Facilities Revenue | | | |
| (Chiropractic College) | | | |
| 5.00% 10/1/27 | 250,000 | | 234,183 |
| | | 3,199,303 |
| Electric Revenue Bonds – 2.11% | | | |
| Long Island Power Authority Electric | | | |
| Systems Revenue Series B | | | |
| 5.00% 12/1/35 | 400,000 | | 403,212 |
| | | 403,212 |
| Health Care Revenue Bonds – 11.01% | | | |
| East Rochester Housing Authority | | | |
| Revenue (Senior Living - Woodland | | | |
| Village Project) 5.50% 8/1/33 | 200,000 | | 187,422 |
| New York Dormitory Authority Revenue | | | |
| (Chapel Oaks) 5.45% 7/1/26 | | | |
| (LOC, Allied Irish Bank) | 450,000 | | 460,008 |
| (Mental Health) Series D | | | |
| 5.90% 2/15/12 | 25,000 | | 25,537 |
| (Millard Fillmore Hospital) | | | |
| 5.375% 2/1/32 (AMBAC) (FHA) | 450,000 | | 459,473 |
| (Winthrop South Nassau | | | |
| Hospital) Series B 5.50% 7/1/23 | 500,000 | | 505,044 |
| Suffolk County Industrial | | | |
| Development Agency | | | |
| Continuing Care Retirement | | | |
| Community Revenue | | | |
| (Jeffersons Ferry Project) | | | |
| 5.00% 11/1/28 | 500,000 | | 466,259 |
| | | 2,103,743 |
| Housing Revenue Bonds – 1.24% | | | |
| New York City Housing | | | |
| Development Multifamily | | | |
| Housing Revenue Series G-1 | | | |
| 4.875% 11/1/39 (AMT) | 250,000 | | 237,468 |
| | | 237,468 |
| Lease Revenue Bonds – 8.81% | | | |
| Battery Park City Authority Revenue | | | |
| Series A 5.00% 11/1/26 | 250,000 | | 257,263 |
| New York City Industrial | | | |
| Development Agency Civic | | | |
| Facility Revenue (American | | | |
| National Red Cross Project) | | | |
| 5.00% 2/1/36 (AMBAC) | 500,000 | | 510,485 |
| New York City Industrial | | | |
| Development Agency Revenue | | | |
| (Queens Baseball Stadium | | | |
| Project - Pilot) | | | |
| 4.75% 1/1/42 (AMBAC) | 200,000 | | 194,218 |
| (Yankee Stadium Project - Pilot) | | | |
| 4.75% 3/1/46 (MBIA) | 200,000 | | 192,616 |
| Tobacco Settlement Financing | | | |
| Revenue (Asset-Backed) | | | |
| Series B-1C 5.50% 6/1/21 | 500,000 | | 529,330 |
| | | 1,683,912 |
| Local General Obligation Bonds – 6.78% | | | |
| New York City | | | |
| Series C 5.375% 11/15/27 | 310,000 | | 313,869 |
| Series D 5.00% 11/1/34 | 500,000 | | 505,305 |
| Series J 5.25% 6/1/28 | 460,000 | | 475,511 |
| | | 1,294,685 |
(continues) 37
Statements of net assets
Delaware Tax-Free New York Fund
| Principal | | |
| | Amount | | Value |
| Municipal Bonds (continued) | | | |
| §Pre-Refunded Bonds – 20.64% | | | |
| Albany Parking Authority Revenue | | | |
| Series A 5.625% 7/15/25-11 | $ 280,000 | | $ 303,036 |
| Metropolitan Transportation | | | |
| Authority Revenue (Dedicated Tax) | | | |
| Series A 6.125% 4/1/17-10 (FGIC) | 1,000,000 | | 1,062,099 |
| New York City | | | |
| Series C 5.375% 11/15/27-07 | 140,000 | | 141,844 |
| Series J 5.25% 6/1/28-13 | 40,000 | | 43,129 |
| New York Dormitory Authority | | | |
| Revenue (North Shore Long | | | |
| Island Jewish Group Project) | | | |
| 5.50% 5/1/33-13 | 500,000 | | 543,869 |
| Series B 7.50% 5/15/11-09 | 130,000 | | 139,918 |
| Puerto Rico Commonwealth | | | |
| Highway & Transportation | | | |
| Authority Revenue Series Y | | | |
| 5.50% 7/1/36-16 | 475,000 | | 528,490 |
| Puerto Rico Electric Power | | | |
| Authority Revenue | | | |
| Series II 5.25% 7/1/31-12 | 500,000 | | 539,674 |
| Series NN 5.125% 7/1/29-13 | 600,000 | | 642,997 |
| | | 3,945,056 |
| Special Tax Revenue Bonds – 7.21% | | | |
| New York Sales Tax Asset | | | |
| Receivables Series A | | | |
| 5.25% 10/15/27 (AMBAC) | 500,000 | | 525,250 |
| Puerto Rico Sales Tax Financing | | | |
| Revenue Series A 5.25% 8/1/57 | 325,000 | | 332,937 |
| Schenectady Metroplex | | | |
| Development Authority Revenue | | | |
| Series A 5.375% 12/15/21 | 500,000 | | 519,755 |
| | | 1,377,942 |
| State General Obligation Bonds – 1.33% | | | |
| Puerto Rico Commonwealth | | | |
| Series B 5.25% 7/1/32 | 250,000 | | 254,848 |
| | | 254,848 |
| Transportation Revenue Bonds – 6.53% | | | |
| Albany Parking Authority Revenue | | | |
| Series A 5.625% 7/15/25 | 220,000 | | 229,390 |
| New York City Industrial | | | |
| Development Agency Special | | | |
| Airport Facilities | | | |
| (JFK Airis Project) Series A | | | |
| 5.50% 7/1/28 (AMT) | 500,000 | | 490,540 |
| Onondaga County Industrial | | | |
| Development Authority Revenue | | | |
| (Subordinated Air Cargo Project) | | | |
| 7.25% 1/1/32 (AMT) | 500,000 | | 527,840 |
| | | 1,247,770 |
| Water & Sewer Revenue Bonds – 4.00% | | | |
| New York City Municipal Finance | | | |
| Authority Water & Sewer | | | |
| System Revenue | | | |
| Series A 5.125% 6/15/34 | 500,000 | | 509,090 |
| Series B 5.00% 6/15/36 | 250,000 | | 254,880 |
| | | 763,970 |
| Total Municipal Bonds | | | |
| (cost $17,597,145) | | | $17,982,321 |
| | | | |
| Short-Term Investments – 4.18% | | | |
| •Variable Rate Demand Notes – 4.18% | | | |
| Dutchess County Industrial | | | |
| Development Agency Civic | | | |
| Facilities Revenue (Trinity - Pawling | | | |
| School) 3.94% 2/1/18 | 200,000 | | 200,000 |
| New York City 3.94% 8/1/19 | 600,000 | | 600,000 |
| Total Short-Term Investments | | | |
| (cost $800,000) | | | 800,000 |
| |
| Total Value of Securities – 98.27% | | | |
| (cost $18,397,145) | | | 18,782,321 |
| Receivables and Other Assets | | | |
| Net of Liabilities – 1.73% | | | 329,722 |
| Net Assets Applicable to 1,856,346 | | | |
| Shares Outstanding – 100.00% | | | $19,112,043 |
| |
| Net Asset Value – Delaware Tax-Free New York Fund | | |
| Class A ($14,816,768 / 1,438,442 Shares) | | | $10.30 |
| Net Asset Value – Delaware Tax-Free New York Fund | | |
| Class B ($2,164,014 / 210,533 Shares) | | | | $10.28 |
| Net Asset Value – Delaware Tax-Free New York Fund | | |
| Class C ($2,131,261 / 207,371 Shares) | | | | $10.28 |
| |
| Components of Net Assets at August 31, 2007: | | |
| Shares of beneficial interest | | | |
| (unlimited authorization – no par) | | | $18,892,950 |
| Distributions in excess of net investment income | | (655) |
| Accumulated net realized loss on investments | | (165,428) |
| Net unrealized appreciation of investments | | | 385,176 |
| Total net assets | | | $19,112,043 |
| ¶ | Step coupon bond. Indicates security that has a zero coupon that remains in effect until a predetermined date at which time the stated interest rate becomes effective. |
| | |
§ | Pre-Refunded Bonds. Municipals that are generally backed or secured by U.S. Treasury bonds. For Pre-Refunded Bonds, the stated maturity is followed by the year in which the bond is pre-refunded. See Note 8 in “Notes to Financial Statements.” |
| | |
• | Variable rate security. The rate shown is the rate as of August 31, 2007. |
Summary of Abbreviations:
AMBAC — Insured by the AMBAC Assurance Corporation
AMT — Subject to Alternative Minimum Tax
FGIC — Insured by the Financial Guaranty Insurance Company
FHA — Insured by the Federal Housing Administration
LOC — Letter of Credit
MBIA — Insured by the Municipal Bond Insurance Association
RADIAN — Insured by Radian Asset Assurance
38
| | |
| Net Asset Value and Offering Price Per Share – | |
| Delaware Tax-Free New York Fund | |
| Net asset value Class A (A) | $10.30 |
| Sales charge (4.50% of offering price) (B) | 0.49 |
| Offering price | $10.79 |
(A) | Net asset value per share, as illustrated, is the amount which would be paid upon redemption or repurchase of shares. |
| | |
(B) | See the current prospectus for purchases of $100,000 or more. |
See accompanying notes
39
Statements of operations
Year Ended August 31, 2007
| | Delaware | | Delaware | | Delaware | | Delaware | | Delaware | |
| | Tax-Free | | Tax-Free | | Tax-Free | | Tax-Free | | Tax-Free | |
| | Arizona | | California | | Colorado | | Idaho | | New York | |
| | Fund | | Fund | | Fund | | Fund | | Fund | |
| Investment Income: | | | | | | | | | | | |
| Interest | | $ 7,375,739 | | $ 5,195,753 | | $ 14,148,357 | | $ 4,021,947 | | $ 926,074 | |
| | | | | | | | | | | | |
| Expenses: | | | | | | | | | | | |
| Management fees | | 757,507 | | 586,688 | | 1,508,241 | | 463,237 | | 103,447 | |
| Distribution expenses – Class A | | 322,506 | | 201,611 | | 644,058 | | 161,558 | | 35,753 | |
| Distribution expenses – Class B | | 147,147 | | 123,032 | | 65,479 | | 72,174 | | 25,224 | |
| Distribution expenses – Class C | | 78,097 | | 136,831 | | 101,259 | | 123,119 | | 19,745 | |
| Dividend disbursing and transfer agent fees and expenses | | 69,042 | | 43,911 | | 139,540 | | 45,969 | | 14,629 | |
| Accounting and administration expenses | | 60,600 | | 42,668 | | 109,690 | | 33,690 | | 7,523 | |
| Trustees’ fees and benefits | | 27,034 | | 18,459 | | 48,427 | | 14,694 | | 3,270 | |
| Legal fees | | 25,948 | | 19,726 | | 39,705 | | 14,621 | | 3,460 | |
| Audit and tax | | 19,202 | | 17,484 | | 24,487 | | 16,412 | | 13,517 | |
| Reports and statements to shareholders | | 16,668 | | 12,404 | | 30,122 | | 3,940 | | 2,397 | |
| Registration fees | | 13,324 | | 11,744 | | 6,286 | | 4,571 | | 8,457 | |
| Custodian fees | | 7,025 | | 5,386 | | 16,243 | | 7,163 | | 2,311 | |
| Insurance fees | | 3,795 | | 2,800 | | 6,964 | | 2,239 | | 509 | |
| Pricing fees | | 3,308 | | 3,402 | | 3,632 | | 2,706 | | 2,081 | |
| Consulting fees | | 2,834 | | 1,992 | | 5,163 | | 1,325 | | 344 | |
| Trustees’ expenses | | 555 | | 389 | | 1,002 | | 284 | | 66 | |
| Dues and services | | 383 | | 317 | | 1,053 | | 270 | | 62 | |
| Taxes (other than taxes on income) | | 37 | | 27 | | 391 | | 18 | | 26 | |
| | 1,555,012 | | 1,228,871 | | 2,751,742 | | 967,990 | | 242,821 | |
| Less expenses absorbed or waived | | (233,342 | ) | (84,269 | ) | (49,923 | ) | (97,940 | ) | (58,612 | ) |
| Less expense paid indirectly | | (2,211 | ) | (1,592 | ) | (811 | ) | (339 | ) | (1,316 | ) |
| Total operating expenses | | 1,319,459 | | 1,143,010 | | 2,701,008 | | 869,711 | | 182,893 | |
| Net Investment Income | | 6,056,280 | | 4,052,743 | | 11,447,349 | | 3,152,236 | | 743,181 | |
| | | | | | | | | | | | |
| Net Realized and Unrealized Gain (Loss) on Investments: | | | | | | | | | | | |
| Net realized gain (loss) on investments | | 490,852 | | (115,067 | ) | 1,009,130 | | 16,031 | | 62,452 | |
| Net change in unrealized appreciation/depreciation of investments | | (4,262,046 | ) | (3,513,338 | ) | (8,914,311 | ) | (1,398,888 | ) | (521,401 | ) |
| Net Realized and Unrealized Loss on Investments | | (3,771,194 | ) | (3,628,405 | ) | (7,905,181 | ) | (1,382,857 | ) | (458,949 | ) |
| | | | | | | | | | | | |
| Net Increase in Net Assets Resulting from Operations | | $ 2,285,086 | | $ 424,338 | | $ 3,542,168 | | $ 1,769,379 | | $ 284,232 | |
See accompanying notes
40
Statements of changes in net assets
| | Delaware Tax-Free | | Delaware Tax-Free |
| | Arizona Fund | | California Fund |
| |
| | Year Ended | | Year Ended |
| | 8/31/07 | | 8/31/06 | | 8/31/07 | | 8/31/06 |
| Increase (Decrease) in Net Assets from Operations: | | | | | | | | | | | | | | | |
| Net investment income | $ | 6,056,280 | | | $ | 6,300,495 | | | $ | 4,052,743 | | | $ | 3,593,780 | |
| Net realized gain (loss) on investments | | 490,852 | | | | 43,501 | | | | (115,067 | ) | | | 54,668 | |
| Net change in unrealized appreciation/depreciation of investments | | (4,262,046 | ) | | | (2,942,259 | ) | | | (3,513,338 | ) | | | (645,995 | ) |
| Net increase in net assets resulting from operations | | 2,285,086 | | | | 3,401,737 | | | | 424,338 | | | | 3,002,453 | |
| |
| Dividends and Distributions to Shareholders from: | | | | | | | | | | | | | | | |
| Net investment income: | | | | | | | | | | | | | | | |
| Class A | | (5,301,244 | ) | | | (5,426,852 | ) | | | (3,215,450 | ) | | | (2,700,721 | ) |
| Class B | | (493,503 | ) | | | (591,776 | ) | | | (394,961 | ) | | | (520,644 | ) |
| Class C | | (261,558 | ) | | | (281,867 | ) | | | (442,332 | ) | | | (372,415 | ) |
| | | (6,056,305 | ) | | | (6,300,495 | ) | | | (4,052,743 | ) | | | (3,593,780 | ) |
| |
| Capital Share Transactions: | | | | | | | | | | | | | | | |
| Proceeds from shares sold: | | | | | | | | | | | | | | | |
| Class A | | 14,817,310 | | | | 10,957,142 | | | | 22,710,407 | | | | 24,239,523 | |
| Class B | | 42,624 | | | | 142,404 | | | | 156,402 | | | | 930,739 | |
| Class C | | 1,326,619 | | | | 1,220,741 | | | | 3,562,422 | | | | 4,270,651 | |
| |
| Net asset value of shares issued upon reinvestment of dividends | | | | | | | | | | | | | | | |
| and distributions: | | | | | | | | | | | | | | | |
| Class A | | 2,683,432 | | | | 2,827,580 | | | | 1,801,612 | | | | 1,330,584 | |
| Class B | | 254,872 | | | | 284,984 | | | | 248,614 | | | | 319,486 | |
| Class C | | 151,832 | | | | 181,106 | | | | 301,848 | | | | 245,798 | |
| | | 19,276,689 | | | | 15,613,957 | | | | 28,781,305 | | | | 31,336,781 | |
| Cost of shares repurchased: | | | | | | | | | | | | | | | |
| Class A | | (20,096,086 | ) | | | (14,796,665 | ) | | | (21,163,745 | ) | | | (9,948,784 | ) |
| Class B | | (3,954,487 | ) | | | (2,670,968 | ) | | | (5,609,946 | ) | | | (4,420,476 | ) |
| Class C | | (1,800,542 | ) | | | (1,720,211 | ) | | | (2,686,047 | ) | | | (1,449,969 | ) |
| | | (25,851,115 | ) | | | (19,187,844 | ) | | | (29,459,738 | ) | | | (15,819,229 | ) |
| Increase (decrease) in net assets derived from capital share transactions | | (6,574,426 | ) | | | (3,573,887 | ) | | | (678,433 | ) | | | 15,517,552 | |
| Net Increase (Decrease) in Net Assets | | (10,345,645 | ) | | | (6,472,645 | ) | | | (4,306,838 | ) | | | 14,926,225 | |
| |
| Net Assets: | | | | | | | | | | | | | | | |
| Beginning of year | | 155,997,847 | | | | 162,470,492 | | | | 103,680,629 | | | | 88,754,404 | |
| End of year1 | $ | 145,652,202 | | | $ | 155,997,847 | | | $ | 99,373,791 | | | $ | 103,680,629 | |
| |
| 1 Including undistributed (distributions in excess of) net investment income | $ | (25 | ) | | $ | — | | | $ | 1,300 | | | $ | 1,300 | |
See accompanying notes
(continues) 41
Statements of changes in net assets
| | Delaware Tax-Free | | Delaware Tax-Free |
| | Colorado Fund | | Idaho Fund |
| |
| | Year Ended | | Year Ended |
| | 8/31/07 | | 8/31/06 | | 8/31/07 | | 8/31/06 |
| Increase (Decrease) in Net Assets from Operations: | | | | | | | | | | | | | | | |
| Net investment income | $ | 11,447,349 | | | $ | 12,314,501 | | | $ | 3,152,236 | | | $ | 3,239,586 | |
| Net realized gain (loss) on investments | | 1,009,130 | | | | 450,227 | | | | 16,031 | | | | (101,210 | ) |
| Net change in unrealized appreciation/depreciation of investments | | (8,914,311 | ) | | | (4,436,948 | ) | | | (1,398,888 | ) | | | (1,375,994 | ) |
| Net increase in net assets resulting from operations | | 3,542,168 | | | | 8,327,780 | | | | 1,769,379 | | | | 1,762,382 | |
| |
| Dividends and Distributions to Shareholders from: | | | | | | | | | | | | | | | |
| Net investment income: | | | | | | | | | | | | | | | |
| Class A | | (10,862,047 | ) | | | (11,609,299 | ) | | | (2,530,731 | ) | | | (2,474,619 | ) |
| Class B | | (226,901 | ) | | | (336,062 | ) | | | (228,879 | ) | | | (299,166 | ) |
| Class C | | (350,030 | ) | | | (361,239 | ) | | | (389,967 | ) | | | (463,351 | ) |
| | | (11,438,978 | ) | | | (12,306,600 | ) | | | (3,149,577 | ) | | | (3,237,136 | ) |
| |
| Capital Share Transactions: | | | | | | | | | | | | | | | |
| Proceeds from shares sold: | | | | | | | | | | | | | | | |
| Class A | | 12,562,366 | | | | 13,799,363 | | | | 14,990,872 | | | | 10,429,777 | |
| Class B | | 21,748 | | | | 33,782 | | | | 572,489 | | | | 124,022 | |
| Class C | | 1,895,269 | | | | 2,039,444 | | | | 887,588 | | | | 1,701,162 | |
| |
| Net asset value of shares issued upon reinvestment of dividends | | | | | | | | | | | | | | | |
| and distributions: | | | | | | | | | | | | | | | |
| Class A | | 6,872,419 | | | | 7,376,964 | | | | 1,630,892 | | | | 1,606,348 | |
| Class B | | 123,164 | | | | 204,522 | | | | 138,424 | | | | 185,231 | |
| Class C | | 249,264 | | | | 246,055 | | | | 241,640 | | | | 289,646 | |
| | | 21,724,230 | | | | 23,700,130 | | | | 18,461,905 | | | | 14,336,186 | |
| Cost of shares repurchased: | | | | | | | | | | | | | | | |
| Class A | | (24,077,528 | ) | | | (28,843,934 | ) | | | (8,413,693 | ) | | | (8,767,129 | ) |
| Class B | | (2,883,605 | ) | | | (2,239,852 | ) | | | (2,488,934 | ) | | | (3,139,497 | ) |
| Class C | | (1,658,066 | ) | | | (1,361,492 | ) | | | (2,840,485 | ) | | | (3,967,817 | ) |
| | | (28,619,199 | ) | | | (32,445,278 | ) | | | (13,743,112 | ) | | | (15,874,443 | ) |
| Increase (decrease) in net assets derived from capital share transactions | | (6,894,969 | ) | | | (8,745,148 | ) | | | 4,718,793 | | | | (1,538,257 | ) |
| Net Increase (Decrease) in Net Assets | | (14,791,779 | ) | | | (12,723,968 | ) | | | 3,338,595 | | | | (3,013,011 | ) |
| |
| Net Assets: | | | | | | | | | | | | | | | |
| Beginning of year | | 276,964,584 | | | | 289,688,552 | | | | 84,130,034 | | | | 87,143,045 | |
| End of year1 | $ | 262,172,805 | | | $ | 276,964,584 | | | $ | 87,468,629 | | | $ | 84,130,034 | |
| |
| 1 Including distributions in excess of net investment income | $ | (46 | ) | | $ | — | | | $ | (11,253 | ) | | $ | (11,301 | ) |
See accompanying notes
42
| | | Delaware Tax-Free | |
| | | New York Fund | |
| |
| | | Year Ended | |
| | 8/31/07 | | 8/31/06 |
| Increase (Decrease) in Net Assets from Operations: | | | | | | | |
| Net investment income | $ | 743,181 | | | $ | 722,866 | |
| Net realized gain (loss) on investments | | 62,452 | | | | (4,673 | ) |
| Net change in unrealized appreciation/depreciation of investments | | (521,401 | ) | | | (211,649 | ) |
| Net increase in net assets resulting from operations | | 284,232 | | | | 506,544 | |
| |
| Dividends and Distributions to Shareholders from: | | | | | | | |
| Net investment income: | | | | | | | |
| Class A | | (590,536 | ) | | | (574,553 | ) |
| Class B | | (85,737 | ) | | | (100,697 | ) |
| Class C | | (66,908 | ) | | | (47,616 | ) |
| | | (743,181 | ) | | | (722,866 | ) |
| |
| Capital Share Transactions: | | | | | | | |
| Proceeds from shares sold: | | | | | | | |
| Class A | | 2,521,809 | | | | 2,071,330 | |
| Class B | | 33,616 | | | | 333,088 | |
| Class C | | 494,335 | | | | 1,263,939 | |
| |
| Net asset value of shares issued upon reinvestment of dividends | | | | | | | |
| and distributions: | | | | | | | |
| Class A | | 415,794 | | | | 402,764 | |
| Class B | | 35,753 | | | | 42,018 | |
| Class C | | 26,806 | | | | 39,921 | |
| | | 3,528,113 | | | | 4,153,060 | |
| Cost of shares repurchased: | | | | | | | |
| Class A | | (1,282,643 | ) | | | (1,930,227 | ) |
| Class B | | (712,045 | ) | | | (500,844 | ) |
| Class C | | (407,314 | ) | | | (122,713 | ) |
| | | (2,402,002 | ) | | | (2,553,784 | ) |
| Increase in net assets derived from capital share transactions | | 1,126,111 | | | | 1,599,276 | |
| Net Increase in Net Assets | | 667,162 | | | | 1,382,954 | |
| |
| Net Assets: | | | | | | | |
| Beginning of year | | 18,444,881 | | | | 17,061,927 | |
| End of year1 | $ | 19,112,043 | | | $ | 18,444,881 | |
| |
| 1 Including distributions in excess of net investment income | $ | (655 | ) | | $ | (655 | ) |
See accompanying notes
43
Financial highlights
Delaware Tax-Free Arizona Fund Class A
Selected data for each share of the Fund outstanding throughout each period were as follows:
| | Year Ended |
| | 8/31/07 | | | 8/31/06 | | | 8/31/05 | | | 8/31/04 | | | 8/31/03 | |
| Net asset value, beginning of period | $11.350 | | | $11.560 | | | $11.410 | | | $11.160 | | | $11.530 | |
| |
| Income (loss) from investment operations: | | | | | | | | | | | | | | |
| Net investment income | 0.465 | | | 0.467 | | | 0.468 | | | 0.469 | | | 0.502 | |
| Net realized and unrealized gain (loss) on investments | (0.280 | ) | | (0.210 | ) | | 0.174 | | | 0.308 | | | (0.253 | ) |
| Total from investment operations | 0.185 | | | 0.257 | | | 0.642 | | | 0.777 | | | 0.249 | |
| |
| Less dividends and distributions from: | | | | | | | | | | | | | | |
| Net investment income | (0.465 | ) | | (0.467 | ) | | (0.468 | ) | | (0.469 | ) | | (0.502 | ) |
| Net realized gain on investments | — | | | — | | | (0.024 | ) | | (0.058 | ) | | (0.117 | ) |
| Total dividends and distributions | (0.465 | ) | | (0.467 | ) | | (0.492 | ) | | (0.527 | ) | | (0.619 | ) |
| |
| Net asset value, end of period | $11.070 | | | $11.350 | | | $11.560 | | | $11.410 | | | $11.160 | |
| |
| Total return1 | 1.63% | | | 2.31% | | | 5.74% | | | 7.09% | | | 2.17% | |
| |
| Ratios and supplemental data: | | | | | | | | | | | | | | |
| Net assets, end of period (000 omitted) | $125,636 | | | $131,468 | | | $134,874 | | | $122,436 | | | $129,683 | |
| Ratio of expenses to average net assets | 0.76% | | | 0.76% | | | 0.80% | | | 0.90% | | | 0.86% | |
| Ratio of expenses to average net assets | | | | | | | | | | | | | | |
| prior to expense limitation and expense paid indirectly | 0.91% | | | 0.91% | | | 0.91% | | | 0.90% | | | 0.91% | |
| Ratio of net investment income to average net assets | 4.11% | | | 4.12% | | | 4.07% | | | 4.14% | | | 4.37% | |
| Ratio of net investment income to average net assets | | | | | | | | | | | | | | |
| prior to expense limitation and expense paid indirectly | 3.96% | | | 3.97% | | | 3.96% | | | 4.14% | | | 4.32% | |
| Portfolio turnover | 9% | | | 8% | | | 3% | | | 19% | | | 29% | |
| |
| 1 Total investment return is based on the change in net asset value of a share during the period and assumes reinvestment of dividends and distributions at net asset value and does not reflect the impact of a sales charge. Total investment return reflects waivers and payment of fees by the manager, as applicable. Performance would have been lower had the expense limitation not been in effect. |
See accompanying notes
44
Delaware Tax-Free Arizona Fund Class B
Selected data for each share of the Fund outstanding throughout each period were as follows:
| | Year Ended |
| | 8/31/07 | | | 8/31/06 | | | 8/31/05 | | | 8/31/04 | | | 8/31/03 | |
| Net asset value, beginning of period | $11.360 | | | $11.570 | | | $11.420 | | | $11.170 | | | $11.540 | |
| |
| Income (loss) from investment operations: | | | | | | | | | | | | | | |
| Net investment income | 0.380 | | | 0.382 | | | 0.382 | | | 0.384 | | | 0.416 | |
| Net realized and unrealized gain (loss) on investments | (0.290 | ) | | (0.210 | ) | | 0.174 | | | 0.308 | | | (0.253 | ) |
| Total from investment operations | 0.090 | | | 0.172 | | | 0.556 | | | 0.692 | | | 0.163 | |
| |
| Less dividends and distributions from: | | | | | | | | | | | | | | |
| Net investment income | (0.380 | ) | | (0.382 | ) | | (0.382 | ) | | (0.384 | ) | | (0.416 | ) |
| Net realized gain on investments | — | | | — | | | (0.024 | ) | | (0.058 | ) | | (0.117 | ) |
| Total dividends and distributions | (0.380 | ) | | (0.382 | ) | | (0.406 | ) | | (0.442 | ) | | (0.533 | ) |
| |
| Net asset value, end of period | $11.070 | | | $11.360 | | | $11.570 | | | $11.420 | | | $11.170 | |
| |
| Total return1 | 0.78% | | | 1.54% | | | 4.95% | | | 6.28% | | | 1.41% | |
| |
| Ratios and supplemental data: | | | | | | | | | | | | | | |
| Net assets, end of period (000 omitted) | $12,407 | | | $16,413 | | | $19,005 | | | $13,355 | | | $14,666 | |
| Ratio of expenses to average net assets | 1.51% | | | 1.51% | | | 1.55% | | | 1.65% | | | 1.61% | |
| Ratio of expenses to average net assets | | | | | | | | | | | | | | |
| prior to expense limitation and expense paid indirectly | 1.66% | | | 1.66% | | | 1.66% | | | 1.65% | | | 1.66% | |
| Ratio of net investment income to average net assets | 3.36% | | | 3.37% | | | 3.32% | | | 3.39% | | | 3.62% | |
| Ratio of net investment income to average net assets | | | | | | | | | | | | | | |
| prior to expense limitation and expense paid indirectly | 3.21% | | | 3.22% | | | 3.21% | | | 3.39% | | | 3.57% | |
| Portfolio turnover | 9% | | | 8% | | | 3% | | | 19% | | | 29% | |
| |
| 1 Total investment return is based on the change in net asset value of a share during the period and assumes reinvestment of dividends and distributions at net asset value and does not reflect the impact of a sales charge. Total investment return reflects waivers and payment of fees by the manager, as applicable. Performance would have been lower had the expense limitation not been in effect. |
See accompanying notes
(continues) 45
Financial highlights
Delaware Tax-Free Arizona Fund Class C
Selected data for each share of the Fund outstanding throughout each period were as follows:
| | Year Ended |
| | 8/31/07 | | | 8/31/06 | | | 8/31/05 | | | 8/31/04 | | | 8/31/03 | |
| Net asset value, beginning of period | $11.380 | | | $11.580 | | | $11.430 | | | $11.180 | | | $11.550 | |
| |
| Income (loss) from investment operations: | | | | | | | | | | | | | | |
| Net investment income | 0.380 | | | 0.381 | | | 0.382 | | | 0.384 | | | 0.415 | |
| Net realized and unrealized gain (loss) on investments | (0.290 | ) | | (0.200 | ) | | 0.174 | | | 0.308 | | | (0.253 | ) |
| Total from investment operations | 0.090 | | | 0.181 | | | 0.556 | | | 0.692 | | | 0.162 | |
| |
| Less dividends and distributions from: | | | | | | | | | | | | | | |
| Net investment income | (0.380 | ) | | (0.381 | ) | | (0.382 | ) | | (0.384 | ) | | (0.415 | ) |
| Net realized gain on investments | — | | | — | | | (0.024 | ) | | (0.058 | ) | | (0.117 | ) |
| Total dividends and distributions | (0.380 | ) | | (0.381 | ) | | (0.406 | ) | | (0.442 | ) | | (0.532 | ) |
| |
| Net asset value, end of period | $11.090 | | | $11.380 | | | $11.580 | | | $11.430 | | | $11.180 | |
| |
| Total return1 | 0.77% | | | 1.63% | | | 4.94% | | | 6.27% | | | 1.40% | |
| |
| Ratios and supplemental data: | | | | | | | | | | | | | | |
| Net assets, end of period (000 omitted) | $7,609 | | | $8,117 | | | $8,591 | | | $6,651 | | | $8,544 | |
| Ratio of expenses to average net assets | 1.51% | | | 1.51% | | | 1.55% | | | 1.65% | | | 1.61% | |
| Ratio of expenses to average net assets | | | | | | | | | | | | | | |
| prior to expense limitation and expense paid indirectly | 1.66% | | | 1.66% | | | 1.66% | | | 1.65% | | | 1.66% | |
| Ratio of net investment income to average net assets | 3.36% | | | 3.37% | | | 3.32% | | | 3.39% | | | 3.62% | |
| Ratio of net investment income to average net assets | | | | | | | | | | | | | | |
| prior to expense limitation and expense paid indirectly | 3.21% | | | 3.22% | | | 3.21% | | | 3.39% | | | 3.57% | |
| Portfolio turnover | 9% | | | 8% | | | 3% | | | 19% | | | 29% | |
| |
| 1 Total investment return is based on the change in net asset value of a share during the period and assumes reinvestment of dividends and distributions at net asset value and does not reflect the impact of a sales charge. Total investment return reflects waivers and payment of fees by the manager, as applicable. Performance would have been lower had the expense limitation not been in effect. |
See accompanying notes
46
Delaware Tax-Free California Fund Class A
Selected data for each share of the Fund outstanding throughout each period were as follows:
| | Year Ended |
| | 8/31/07 | | | 8/31/06 | | | 8/31/05 | | | 8/31/04 | | | 8/31/03 | |
| Net asset value, beginning of period | $11.400 | | | $11.490 | | | $11.110 | | | $10.750 | | | $11.010 | |
| |
| Income (loss) from investment operations: | | | | | | | | | | | | | | |
| Net investment income | 0.454 | | | 0.450 | | | 0.462 | | | 0.518 | | | 0.537 | |
| Net realized and unrealized gain (loss) on investments | (0.390 | ) | | (0.090 | ) | | 0.380 | | | 0.360 | | | (0.260 | ) |
| Total from investment operations | 0.064 | | | 0.360 | | | 0.842 | | | 0.878 | | | 0.277 | |
| |
| Less dividends and distributions from: | | | | | | | | | | | | | | |
| Net investment income | (0.454 | ) | | (0.450 | ) | | (0.462 | ) | | (0.518 | ) | | (0.537 | ) |
| Total dividends and distributions | (0.454 | ) | | (0.450 | ) | | (0.462 | ) | | (0.518 | ) | | (0.537 | ) |
| |
| Net asset value, end of period | $11.010 | | | $11.400 | | | $11.490 | | | $11.110 | | | $10.750 | |
| |
| Total return1 | 0.51% | | | 3.24% | | | 7.72% | | | 8.34% | | | 2.51% | |
| |
| Ratios and supplemental data: | | | | | | | | | | | | | | |
| Net assets, end of period (000 omitted) | $76,537 | | | $75,995 | | | $60,744 | | | $24,797 | | | $22,169 | |
| Ratio of expenses to average net assets | 0.89% | | | 0.88% | | | 0.84% | | | 0.50% | | | 0.50% | |
| Ratio of expenses to average net assets | | | | | | | | | | | | | | |
| prior to expense limitation and expense paid indirectly | 0.97% | | | 0.97% | | | 1.06% | | | 0.96% | | | 0.93% | |
| Ratio of net investment income to average net assets | 3.98% | | | 3.97% | | | 4.03% | | | 4.72% | | | 4.84% | |
| Ratio of net investment income to average net assets | | | | | | | | | | | | | | |
| prior to expense limitation and expense paid indirectly | 3.90% | | | 3.88% | | | 3.81% | | | 4.26% | | | 4.41% | |
| Portfolio turnover | 21% | | | 14% | | | 11% | | | 48% | | | 56% | |
| |
| 1 Total investment return is based on the change in net asset value of a share during the period and assumes reinvestment of dividends and distributions at net asset value and does not reflect the impact of a sales charge. Total investment return reflects waivers and payment of fees by the manager. Performance would have been lower had the expense limitation not been in effect. |
See accompanying notes
(continues) 47
Financial highlights
Delaware Tax-Free California Fund Class B
Selected data for each share of the Fund outstanding throughout each period were as follows:
| | Year Ended |
| | 8/31/07 | | | 8/31/06 | | | 8/31/05 | | | 8/31/04 | | | 8/31/03 | |
| Net asset value, beginning of period | $11.440 | | | $11.530 | | | $11.160 | | | $10.790 | | | $11.050 | |
| |
| Income (loss) from investment operations: | | | | | | | | | | | | | | |
| Net investment income | 0.368 | | | 0.365 | | | 0.377 | | | 0.436 | | | 0.453 | |
| Net realized and unrealized gain (loss) on investments | (0.380 | ) | | (0.090 | ) | | 0.370 | | | 0.370 | | | (0.260 | ) |
| Total from investment operations | (0.012 | ) | | 0.275 | | | 0.747 | | | 0.806 | | | 0.193 | |
| |
| Less dividends and distributions from: | | | | | | | | | | | | | | |
| Net investment income | (0.368 | ) | | (0.365 | ) | | (0.377 | ) | | (0.436 | ) | | (0.453 | ) |
| Total dividends and distributions | (0.368 | ) | | (0.365 | ) | | (0.377 | ) | | (0.436 | ) | | (0.453 | ) |
| |
| Net asset value, end of period | $11.060 | | | $11.440 | | | $11.530 | | | $11.160 | | | $10.790 | |
| |
| Total return1 | (0.15% | ) | | 2.46% | | | 6.80% | | | 7.60% | | | 1.73% | |
| |
| Ratios and supplemental data: | | | | | | | | | | | | | | |
| Net assets, end of period (000 omitted) | $9,384 | | | $14,918 | | | $18,254 | | | $14,530 | | | $16,165 | |
| Ratio of expenses to average net assets | 1.64% | | | 1.63% | | | 1.59% | | | 1.25% | | | 1.25% | |
| Ratio of expenses to average net assets | | | | | | | | | | | | | | |
| prior to expense limitation and expense paid indirectly | 1.72% | | | 1.72% | | | 1.81% | | | 1.71% | | | 1.68% | |
| Ratio of net investment income to average net assets | 3.23% | | | 3.22% | | | 3.28% | | | 3.97% | | | 4.09% | |
| Ratio of net investment income to average net assets | | | | | | | | | | | | | | |
| prior to expense limitation and expense paid indirectly | 3.15% | | | 3.13% | | | 3.06% | | | 3.51% | | | 3.66% | |
| Portfolio turnover | 21% | | | 14% | | | 11% | | | 48% | | | 56% | |
| |
| 1 Total investment return is based on the change in net asset value of a share during the period and assumes reinvestment of dividends and distributions at net asset value and does not reflect the impact of a sales charge. Total investment return reflects waivers and payment of fees by the manager. Performance would have been lower had the expense limitation not been in effect. |
See accompanying notes
48
Delaware Tax-Free California Fund Class C
Selected data for each share of the Fund outstanding throughout each period were as follows:
| | Year Ended |
| | 8/31/07 | | | 8/31/06 | | | 8/31/05 | | | 8/31/04 | | | 8/31/03 | |
| Net asset value, beginning of period | $11.420 | | | $11.500 | | | $11.130 | | | $10.760 | | | $11.020 | |
| |
| Income (loss) from investment operations: | | | | | | | | | | | | | | |
| Net investment income | 0.368 | | | 0.365 | | | 0.377 | | | 0.436 | | | 0.454 | |
| Net realized and unrealized gain (loss) on investments | (0.390 | ) | | (0.080 | ) | | 0.370 | | | 0.370 | | | (0.260 | ) |
| Total from investment operations | (0.022 | ) | | 0.285 | | | 0.747 | | | 0.806 | | | 0.194 | |
| |
| Less dividends and distributions from: | | | | | | | | | | | | | | |
| Net investment income | (0.368 | ) | | (0.365 | ) | | (0.377 | ) | | (0.436 | ) | | (0.454 | ) |
| Total dividends and distributions | (0.368 | ) | | (0.365 | ) | | (0.377 | ) | | (0.436 | ) | | (0.454 | ) |
| |
| Net asset value, end of period | $11.030 | | | $11.420 | | | $11.500 | | | $11.130 | | | $10.760 | |
| |
| Total return1 | (0.24% | ) | | 2.56% | | | 6.81% | | | 7.62% | | | 1.74% | |
| |
| Ratios and supplemental data: | | | | | | | | | | | | | | |
| Net assets, end of period (000 omitted) | $13,453 | | | $12,768 | | | $9,756 | | | $5,595 | | | $7,013 | |
| Ratio of expenses to average net assets | 1.64% | | | 1.63% | | | 1.59% | | | 1.25% | | | 1.25% | |
| Ratio of expenses to average net assets | | | | | | | | | | | | | | |
| prior to expense limitation and expense paid indirectly | 1.72% | | | 1.72% | | | 1.81% | | | 1.71% | | | 1.68% | |
| Ratio of net investment income to average net assets | 3.23% | | | 3.22% | | | 3.28% | | | 3.97% | | | 4.09% | |
| Ratio of net investment income to average net assets | | | | | | | | | | | | | | |
| prior to expense limitation and expense paid indirectly | 3.15% | | | 3.13% | | | 3.06% | | | 3.51% | | | 3.66% | |
| Portfolio turnover | 21% | | | 14% | | | 11% | | | 48% | | | 56% | |
| |
| 1 Total investment return is based on the change in net asset value of a share during the period and assumes reinvestment of dividends and distributions at net asset value and does not reflect the impact of a sales charge. Total investment return reflects waivers and payment of fees by the manager. Performance would have been lower had the expense limitation not been in effect. |
See accompanying notes
(continues) 49
Financial highlights
Delaware Tax-Free Colorado Fund Class A
Selected data for each share of the Fund outstanding throughout each period were as follows:
| | Year Ended |
| | 8/31/07 | | | 8/31/06 | | | 8/31/05 | | | 8/31/04 | | | 8/31/03 | |
| Net asset value, beginning of period | $11.040 | | | $11.200 | | | $11.070 | | | $10.830 | | | $11.080 | |
| |
| Income (loss) from investment operations: | | | | | | | | | | | | | | |
| Net investment income | 0.464 | | | 0.488 | | | 0.495 | | | 0.510 | | | 0.527 | |
| Net realized and unrealized gain (loss) on investments | (0.310 | ) | | (0.160 | ) | | 0.130 | | | 0.240 | | | (0.250 | ) |
| Total from investment operations | 0.154 | | | 0.328 | | | 0.625 | | | 0.750 | | | 0.277 | |
| |
| Less dividends and distributions from: | | | | | | | | | | | | | | |
| Net investment income | (0.464 | ) | | (0.488 | ) | | (0.495 | ) | | (0.510 | ) | | (0.527 | ) |
| Total dividends and distributions | (0.464 | ) | | (0.488 | ) | | (0.495 | ) | | (0.510 | ) | | (0.527 | ) |
| |
| Net asset value, end of period | $10.730 | | | $11.040 | | | $11.200 | | | $11.070 | | | $10.830 | |
| |
| Total return1 | 1.38% | | | 3.03% | | | 5.78% | | | 7.04% | | | 2.52% | |
| |
| Ratios and supplemental data: | | | | | | | | | | | | | | |
| Net assets, end of period (000 omitted) | $246,695 | | | $258,773 | | | $270,149 | | | $276,534 | | | $299,528 | |
| Ratio of expenses to average net assets | 0.94% | | | 0.93% | | | 0.94% | | | 0.95% | | | 0.99% | |
| Ratio of expenses to average net assets | | | | | | | | | | | | | | |
| prior to expense limitation and expense paid indirectly | 0.96% | | | 0.94% | | | 0.94% | | | 0.95% | | | 0.99% | |
| Ratio of net investment income to average net assets | 4.22% | | | 4.43% | | | 4.46% | | | 4.63% | | | 4.76% | |
| Ratio of net investment income to average net assets | | | | | | | | | | | | | | |
| prior to expense limitation and expense paid indirectly | 4.20% | | | 4.42% | | | 4.46% | | | 4.63% | | | 4.76% | |
| Portfolio turnover | 12% | | | 8% | | | 8% | | | 13% | | | 30% | |
| |
| 1 Total investment return is based on the change in net asset value of a share during the period and assumes reinvestment of dividends and distributions at net asset value and does not reflect the impact of a sales charge. Total investment return reflects waivers and payment of fees by the manager, as applicable. Performance would have been lower had the expense limitation not been in effect. |
See accompanying notes
50
Delaware Tax-Free Colorado Fund Class B
Selected data for each share of the Fund outstanding throughout each period were as follows:
| | Year Ended |
| | 8/31/07 | | | 8/31/06 | | | 8/31/05 | | | 8/31/04 | | | 8/31/03 | |
| Net asset value, beginning of period | $11.050 | | | $11.200 | | | $11.080 | | | $10.830 | | | $11.090 | |
| |
| Income (loss) from investment operations: | | | | | | | | | | | | | | |
| Net investment income | 0.382 | | | 0.405 | | | 0.412 | | | 0.427 | | | 0.444 | |
| Net realized and unrealized gain (loss) on investments | (0.320 | ) | | (0.150 | ) | | 0.120 | | | 0.250 | | | (0.260 | ) |
| Total from investment operations | 0.062 | | | 0.255 | | | 0.532 | | | 0.677 | | | 0.184 | |
| |
| Less dividends and distributions from: | | | | | | | | | | | | | | |
| Net investment income | (0.382 | ) | | (0.405 | ) | | (0.412 | ) | | (0.427 | ) | | (0.444 | ) |
| Total dividends and distributions | (0.382 | ) | | (0.405 | ) | | (0.412 | ) | | (0.427 | ) | | (0.444 | ) |
| |
| Net asset value, end of period | $10.730 | | | $11.050 | | | $11.200 | | | $11.080 | | | $10.830 | |
| |
| Total return1 | 0.53% | | | 2.35% | | | 4.89% | | | 6.34% | | | 1.66% | |
| |
| Ratios and supplemental data: | | | | | | | | | | | | | | |
| Net assets, end of period (000 omitted) | $5,326 | | | $8,221 | | | $10,370 | | | $12,411 | | | $13,108 | |
| Ratio of expenses to average net assets | 1.69% | | | 1.68% | | | 1.69% | | | 1.70% | | | 1.74% | |
| Ratio of expenses to average net assets | | | | | | | | | | | | | | |
| prior to expense limitation and expense paid indirectly | 1.71% | | | 1.69% | | | 1.69% | | | 1.70% | | | 1.74% | |
| Ratio of net investment income to average net assets | 3.47% | | | 3.68% | | | 3.71% | | | 3.88% | | | 4.01% | |
| Ratio of net investment income to average net assets | | | | | | | | | | | | | | |
| prior to expense limitation and expense paid indirectly | 3.45% | | | 3.67% | | | 3.71% | | | 3.88% | | | 4.01% | |
| Portfolio turnover | 12% | | | 8% | | | 8% | | | 13% | | | 30% | |
| |
| 1 Total investment return is based on the change in net asset value of a share during the period and assumes reinvestment of dividends and distributions at net asset value and does not reflect the impact of a sales charge. Total investment return reflects waivers and payment of fees by the manager, as applicable. Performance would have been lower had the expense limitation not been in effect. |
See accompanying notes
(continues) 51
Financial highlights
Delaware Tax-Free Colorado Fund Class C
Selected data for each share of the Fund outstanding throughout each period were as follows:
| | Year Ended |
| | 8/31/07 | | | 8/31/06 | | | 8/31/05 | | | 8/31/04 | | | 8/31/03 | |
| Net asset value, beginning of period | $11.070 | | | $11.220 | | | $11.090 | | | $10.850 | | | $11.100 | |
| |
| Income (loss) from investment operations: | | | | | | | | | | | | | | |
| Net investment income | 0.382 | | | 0.405 | | | 0.413 | | | 0.427 | | | 0.444 | |
| Net realized and unrealized gain (loss) on investments | (0.320 | ) | | (0.150 | ) | | 0.130 | | | 0.240 | | | (0.250 | ) |
| Total from investment operations | 0.062 | | | 0.255 | | | 0.543 | | | 0.667 | | | 0.194 | |
| |
| Less dividends and distributions from: | | | | | | | | | | | | | | |
| Net investment income | (0.382 | ) | | (0.405 | ) | | (0.413 | ) | | (0.427 | ) | | (0.444 | ) |
| Total dividends and distributions | (0.382 | ) | | (0.405 | ) | | (0.413 | ) | | (0.427 | ) | | (0.444 | ) |
| |
| Net asset value, end of period | $10.750 | | | $11.070 | | | $11.220 | | | $11.090 | | | $10.850 | |
| |
| Total return1 | 0.53% | | | 2.34% | | | 4.99% | | | 6.23% | | | 1.74% | |
| |
| Ratios and supplemental data: | | | | | | | | | | | | | | |
| Net assets, end of period (000 omitted) | $10,152 | | | $9,971 | | | $9,170 | | | $9,579 | | | $8,606 | |
| Ratio of expenses to average net assets | 1.69% | | | 1.68% | | | 1.69% | | | 1.70% | | | 1.74% | |
| Ratio of expenses to average net assets | | | | | | | | | | | | | | |
| prior to expense limitation and expense paid indirectly | 1.71% | | | 1.69% | | | 1.69% | | | 1.70% | | | 1.74% | |
| Ratio of net investment income to average net assets | 3.47% | | | 3.68% | | | 3.71% | | | 3.88% | | | 4.01% | |
| Ratio of net investment income to average net assets | | | | | | | | | | | | | | |
| prior to expense limitation and expense paid indirectly | 3.45% | | | 3.67% | | | 3.71% | | | 3.88% | | | 4.01% | |
| Portfolio turnover | 12% | | | 8% | | | 8% | | | 13% | | | 30% | |
| |
| 1 Total investment return is based on the change in net asset value of a share during the period and assumes reinvestment of dividends and distributions at net asset value and does not reflect the impact of a sales charge. Total investment return reflects waivers and payment of fees by the manager, as applicable. Performance would have been lower had the expense limitation not been in effect. |
See accompanying notes
52
Delaware Tax-Free Idaho Fund Class A
Selected data for each share of the Fund outstanding throughout each period were as follows:
| Year Ended |
| | 8/31/07 | | | 8/31/06 | | | 8/31/05 | | | 8/31/04 | | | 8/31/03 | |
| Net asset value, beginning of period | $ | 11.450 | | | $ | 11.630 | | | $ | 11.490 | | | $ | 11.140 | | | $ | 11.320 | |
| | | | | | | | | | | | | | | | | | | | |
| Income (loss) from investment operations: | | | | | | | | | | | | | | | | | | | |
| Net investment income | | 0.448 | | | | 0.449 | | | | 0.452 | | | | 0.478 | | | | 0.497 | |
| Net realized and unrealized gain (loss) on investments | | (0.190 | ) | | | (0.180 | ) | | | 0.140 | | | | 0.353 | | | | (0.181 | ) |
| Total from investment operations | | 0.258 | | | | 0.269 | | | | 0.592 | | | | 0.831 | | | | 0.316 | |
| |
| Less dividends and distributions from: | | | | | | | | | | | | | | | | | | | |
| Net investment income | | (0.448 | ) | | | (0.449 | ) | | | (0.452 | ) | | | (0.481 | ) | | | (0.496 | ) |
| Total dividends and distributions | | (0.448 | ) | | | (0.449 | ) | | | (0.452 | ) | | | (0.481 | ) | | | (0.496 | ) |
| |
| Net asset value, end of period | $ | 11.260 | | | $ | 11.450 | | | $ | 11.630 | | | $ | 11.490 | | | $ | 11.140 | |
| |
| Total return1 | | 2.27% | | | | 2.40% | | | | 5.25% | | | | 7.58% | | | | 2.81% | |
| |
| Ratios and supplemental data: | | | | | | | | | | | | | | | | | | | |
| Net assets, end of period (000 omitted) | $ | 69,931 | | | $ | 62,808 | | | $ | 60,554 | | | $ | 55,572 | | | $ | 51,682 | |
| Ratio of expenses to average net assets | | 0.86% | | | | 0.85% | | | | 0.87% | | | | 0.97% | | | | 0.93% | |
| Ratio of expenses to average net assets | | | | | | | | | | | | | | | | | | | |
| prior to expense limitation and expense paid indirectly | | 0.98% | | | | 0.98% | | | | 0.98% | | | | 0.97% | | | | 1.00% | |
| Ratio of net investment income to average net assets | | 3.92% | | | | 3.95% | | | | 3.92% | | | | 4.21% | | | | 4.36% | |
| Ratio of net investment income to average net assets | | | | | | | | | | | | | | | | | | | |
| prior to expense limitation and expense paid indirectly | | 3.80% | | | | 3.82% | | | | 3.81% | | | | 4.21% | | | | 4.29% | |
| Portfolio turnover | | 8% | | | | 15% | | | | 27% | | | | 13% | | | | 18% | |
| |
| 1 Total investment return is based on the change in net asset value of a share during the period and assumes reinvestment of dividends and distributions at net asset value and does not reflect the impact of a sales charge. Total investment return reflects waivers and payment of fees by the manager, as applicable. Performance would have been lower had the expense limitation not been in effect. |
See accompanying notes
(continues) 53
Financial highlights
Delaware Tax-Free Idaho Fund Class B
Selected data for each share of the Fund outstanding throughout each period were as follows:
| Year Ended |
| | 8/31/07 | | | 8/31/06 | | | 8/31/05 | | | 8/31/04 | | | 8/31/03 | |
| Net asset value, beginning of period | | $11.430 | | | | $11.610 | | | | $11.480 | | | | $11.130 | | | | $11.310 | |
| |
| Income (loss) from investment operations: | | | | | | | | | | | | | | | | | | | |
| Net investment income | | 0.363 | | | | 0.364 | | | | 0.366 | | | | 0.393 | | | | 0.412 | |
| Net realized and unrealized gain (loss) on investments | | (0.190 | ) | | | (0.180 | ) | | | 0.130 | | | | 0.353 | | | | (0.181 | ) |
| Total from investment operations | | 0.173 | | | | 0.184 | | | | 0.496 | | | | 0.746 | | | | 0.231 | |
| |
| Less dividends and distributions from: | | | | | | | | | | | | | | | | | | | |
| Net investment income | | (0.363 | ) | | | (0.364 | ) | | | (0.366 | ) | | | (0.396 | ) | | | (0.411 | ) |
| Total dividends and distributions | | (0.363 | ) | | | (0.364 | ) | | | (0.366 | ) | | | (0.396 | ) | | | (0.411 | ) |
| |
| Net asset value, end of period | | $11.240 | | | | $11.430 | | | | $11.610 | | | | $11.480 | | | | $11.130 | |
| |
| Total return1 | | 1.51% | | | | 1.64% | | | | 4.39% | | | | 6.79% | | | | 2.05% | |
| |
| Ratios and supplemental data: | | | | | | | | | | | | | | | | | | | |
| Net assets, end of period (000 omitted) | | $6,003 | | | | $7,892 | | | | $10,911 | | | | $13,044 | | | | $16,801 | |
| Ratio of expenses to average net assets | | 1.61% | | | | 1.60% | | | | 1.62% | | | | 1.72% | | | | 1.68% | |
| Ratio of expenses to average net assets | | | | | | | | | | | | | | | | | | | |
| prior to expense limitation and expense paid indirectly | | 1.73% | | | | 1.73% | | | | 1.73% | | | | 1.72% | | | | 1.75% | |
| Ratio of net investment income to average net assets | | 3.17% | | | | 3.20% | | | | 3.17% | | | | 3.46% | | | | 3.61% | |
| Ratio of net investment income to average net assets | | | | | | | | | | | | | | | | | | | |
| prior to expense limitation and expense paid indirectly | | 3.05% | | | | 3.07% | | | | 3.06% | | | | 3.46% | | | | 3.54% | |
| Portfolio turnover | | 8% | | | | 15% | | | | 27% | | | | 13% | | | | 18% | |
| |
| 1 Total investment return is based on the change in net asset value of a share during the period and assumes reinvestment of dividends and distributions at net asset value and does not reflect the impact of a sales charge. Total investment return reflects waivers and payment of fees by the manager, as applicable. Performance would have been lower had the expense limitation not been in effect. |
See accompanying notes
54
Delaware Tax-Free Idaho Fund Class C
Selected data for each share of the Fund outstanding throughout each period were as follows:
| Year Ended |
| | 8/31/07 | | | 8/31/06 | | | 8/31/05 | | | 8/31/04 | | | 8/31/03 | |
| Net asset value, beginning of period | $ | 11.440 | | | $ | 11.630 | | | $ | 11.490 | | | $ | 11.130 | | | $ | 11.310 | |
| |
| Income (loss) from investment operations: | | | | | | | | | | | | | | | | | | | |
| Net investment income | | 0.363 | | | | 0.364 | | | | 0.366 | | | | 0.393 | | | | 0.413 | |
| Net realized and unrealized gain (loss) on investments | | (0.190 | ) | | | (0.190 | ) | | | 0.140 | | | | 0.362 | | | | (0.181 | ) |
| Total from investment operations | | 0.173 | | | | 0.174 | | | | 0.506 | | | | 0.755 | | | | 0.232 | |
| |
| Less dividends and distributions from: | | | | | | | | | | | | | | | | | | | |
| Net investment income | | (0.363 | ) | | | (0.364 | ) | | | (0.366 | ) | | | (0.395 | ) | | | (0.412 | ) |
| Total dividends and distributions | | (0.363 | ) | | | (0.364 | ) | | | (0.366 | ) | | | (0.395 | ) | | | (0.412 | ) |
| |
| Net asset value, end of period | $ | 11.250 | | | $ | 11.440 | | | $ | 11.630 | | | $ | 11.490 | | | $ | 11.130 | |
| |
| Total return1 | | 1.51% | | | | 1.56% | | | | 4.47% | | | | 6.87% | | | | 2.05% | |
| |
| Ratios and supplemental data: | | | | | | | | | | | | | | | | | | | |
| Net assets, end of period (000 omitted) | $ | 11,535 | | | $ | 13,430 | | | $ | 15,678 | | | $ | 15,041 | | | $ | 16,296 | |
| Ratio of expenses to average net assets | | 1.61% | | | | 1.60% | | | | 1.62% | | | | 1.72% | | | | 1.68% | |
| Ratio of expenses to average net assets | | | | | | | | | | | | | | | | | | | |
| prior to expense limitation and expense paid indirectly | | 1.73% | | | | 1.73% | | | | 1.73% | | | | 1.72% | | | | 1.75% | |
| Ratio of net investment income to average net assets | | 3.17% | | | | 3.20% | | | | 3.17% | | | | 3.46% | | | | 3.61% | |
| Ratio of net investment income to average net assets | | | | | | | | | | | | | | | | | | | |
| prior to expense limitation and expense paid indirectly | | 3.05% | | | | 3.07% | | | | 3.06% | | | | 3.46% | | | | 3.54% | |
| Portfolio turnover | | 8% | | | | 15% | | | | 27% | | | | 13% | | | | 18% | |
| |
| 1 Total investment return is based on the change in net asset value of a share during the period and assumes reinvestment of dividends and distributions at net asset value and does not reflect the impact of a sales charge. Total investment return reflects waivers and payment of fees by the manager, as applicable. Performance would have been lower had the expense limitation not been in effect. |
See accompanying notes
(continues) 55
Financial highlights
Delaware Tax-Free New York Fund Class A
Selected data for each share of the Fund outstanding throughout each period were as follows:
| Year Ended |
| | 8/31/07 | | | 8/31/06 | | | 8/31/05 | | | 8/31/04 | | | 8/31/03 | |
| Net asset value, beginning of period | $ | 10.550 | | | $ | 10.700 | | | $ | 10.470 | | | $ | 10.220 | | | $ | 10.340 | |
| |
| Income (loss) from investment operations: | | | | | | | | | | | | | | | | | | | |
| Net investment income | | 0.435 | | | | 0.449 | | | | 0.453 | | | | 0.479 | | | | 0.484 | |
| Net realized and unrealized gain (loss) on investments | | (0.250 | ) | | | (0.150 | ) | | | 0.230 | | | | 0.250 | | | | (0.120 | ) |
| Total from investment operations | | 0.185 | | | | 0.299 | | | | 0.683 | | | | 0.729 | | | | 0.364 | |
| |
| Less dividends and distributions from: | | | | | | | | | | | | | | | | | | | |
| Net investment income | | (0.435 | ) | | | (0.449 | ) | | | (0.453 | ) | | | (0.479 | ) | | | (0.484 | ) |
| Total dividends and distributions | | (0.435 | ) | | | (0.449 | ) | | | (0.453 | ) | | | (0.479 | ) | | | (0.484 | ) |
| |
| Net asset value, end of period | $ | 10.300 | | | $ | 10.550 | | | $ | 10.700 | | | $ | 10.470 | | | $ | 10.220 | |
| |
| Total return1 | | 1.75% | | | | 2.90% | | | | 6.65% | | | | 7.26% | | | | 3.56% | |
| |
| Ratios and supplemental data: | | | | | | | | | | | | | | | | | | | |
| Net assets, end of period (000 omitted) | $ | 14,817 | | | $ | 13,519 | | | $ | 13,153 | | | $ | 11,523 | | | $ | 11,436 | |
| Ratio of expenses to average net assets | | 0.79% | | | | 0.65% | | | | 0.66% | | | | 0.50% | | | | 0.50% | 2 |
| Ratio of expenses to average net assets | | | | | | | | | | | | | | | | | | | |
| prior to expense limitation and expense paid indirectly | | 1.10% | | | | 1.09% | | | | 1.12% | | | | 1.02% | | | | 1.05% | |
| Ratio of net investment income to average net assets | | 4.13% | | | | 4.28% | | | | 4.29% | | | | 4.60% | | | | 4.65% | |
| Ratio of net investment income to average net assets | | | | | | | | | | | | | | | | | | | |
| prior to expense limitation and expense paid indirectly | | 3.82% | | | | 3.84% | | | | 3.83% | | | | 4.08% | | | | 4.10% | |
| Portfolio turnover | | 14% | | | | 20% | | | | 13% | | | | 26% | | | | 64% | |
| |
| 1 Total investment return is based on the change in net asset value of a share during the period and assumes reinvestment of dividends and distributions at net asset value and does not reflect the impact of a sales charge. Total investment return reflects waivers and payment of fees by the manager. Performance would have been lower had the expense limitation not been in effect. |
| 2 Ratio for the year ended August 31, 2003, including fees paid indirectly in accordance with the Securities and Exchange Commission rules was 0.51%. |
See accompanying notes
56
Delaware Tax-Free New York Fund Class B
Selected data for each share of the Fund outstanding throughout each period were as follows:
| Year Ended |
| | 8/31/07 | | | 8/31/06 | | | 8/31/05 | | | 8/31/04 | | | 8/31/03 | |
| Net asset value, beginning of period | $ | 10.530 | | | $ | 10.670 | | | $ | 10.450 | | | $ | 10.200 | | | $ | 10.330 | |
| |
| Income (loss) from investment operations: | | | | | | | | | | | | | | | | | | | |
| Net investment income | | 0.357 | | | | 0.370 | | | | 0.374 | | | | 0.401 | | | | 0.406 | |
| Net realized and unrealized gain (loss) on investments | | (0.250 | ) | | | (0.140 | ) | | | 0.220 | | | | 0.250 | | | | (0.130 | ) |
| Total from investment operations | | 0.107 | | | | 0.230 | | | | 0.594 | | | | 0.651 | | | | 0.276 | |
| |
| Less dividends and distributions from: | | | | | | | | | | | | | | | | | | | |
| Net investment income | | (0.357 | ) | | | (0.370 | ) | | | (0.374 | ) | | | (0.401 | ) | | | (0.406 | ) |
| Total dividends and distributions | | (0.357 | ) | | | (0.370 | ) | | | (0.374 | ) | | | (0.401 | ) | | | (0.406 | ) |
| |
| Net asset value, end of period | $ | 10.280 | | | $ | 10.530 | | | $ | 10.670 | | | $ | 10.450 | | | $ | 10.200 | |
| |
| Total return1 | | 0.99% | | | | 2.23% | | | | 5.77% | | | | 6.47% | | | | 2.69% | |
| |
| Ratios and supplemental data: | | | | | | | | | | | | | | | | | | | |
| Net assets, end of period (000 omitted) | | $2,164 | | | | $2,858 | | | | $3,023 | | | | $2,858 | | | | $3,238 | |
| Ratio of expenses to average net assets | | 1.54% | | | | 1.40% | | | | 1.41% | | | | 1.25% | | | | 1.25% | 2 |
| Ratio of expenses to average net assets | | | | | | | | | | | | | | | | | | | |
| prior to expense limitation and expense paid indirectly | | 1.85% | | | | 1.84% | | | | 1.87% | | | | 1.77% | | | | 1.80% | |
| Ratio of net investment income to average net assets | | 3.38% | | | | 3.53% | | | | 3.54% | | | | 3.85% | | | | 3.90% | |
| Ratio of net investment income to average net assets | | | | | | | | | | | | | | | | | | | |
| prior to expense limitation and expense paid indirectly | | 3.07% | | | | 3.09% | | | | 3.08% | | | | 3.33% | | | | 3.35% | |
| Portfolio turnover | | 14% | | | | 20% | | | | 13% | | | | 26% | | | | 64% | |
| |
| 1 Total investment return is based on the change in net asset value of a share during the period and assumes reinvestment of dividends and distributions at net asset value and does not reflect the impact of a sales charge. Total investment return reflects waivers and payment of fees by the manager. Performance would have been lower had the expense limitation not been in effect. |
| 2 Ratio for the year ended August 31, 2003, including fees paid indirectly in accordance with the Securities and Exchange Commission rules was 1.26%. |
See accompanying notes
(continues) 57
Financial highlights
Delaware Tax-Free New York Fund Class C
Selected data for each share of the Fund outstanding throughout each period were as follows:
| Year Ended |
| | 8/31/07 | | | 8/31/06 | | | 8/31/05 | | | 8/31/04 | | | 8/31/03 | |
| Net asset value, beginning of period | $ | 10.530 | | | $ | 10.670 | | | $ | 10.450 | | | $ | 10.200 | | | $ | 10.320 | |
| |
| Income (loss) from investment operations: | | | | | | | | | | | | | | | | | | | |
| Net investment income | | 0.357 | | | | 0.370 | | | | 0.376 | | | | 0.401 | | | | 0.406 | |
| Net realized and unrealized gain (loss) on investments | | (0.250 | ) | | | (0.140 | ) | | | 0.220 | | | | 0.250 | | | | (0.120 | ) |
| Total from investment operations | | 0.107 | | | | 0.230 | | | | 0.596 | | | | 0.651 | | | | 0.286 | |
| |
| Less dividends and distributions from: | | | | | | | | | | | | | | | | | | | |
| Net investment income | | (0.357 | ) | | | (0.370 | ) | | | (0.376 | ) | | | (0.401 | ) | | | (0.406 | ) |
| Total dividends and distributions | | (0.357 | ) | | | (0.370 | ) | | | (0.376 | ) | | | (0.401 | ) | | | (0.406 | ) |
| |
| Net asset value, end of period | $ | 10.280 | | | $ | 10.530 | | | $ | 10.670 | | | $ | 10.450 | | | $ | 10.200 | |
| |
| Total return1 | | 0.99% | | | | 2.23% | | | | 5.80% | | | | 6.47% | | | | 2.79% | |
| |
| Ratios and supplemental data: | | | | | | | | | | | | | | | | | | | |
| Net assets, end of period (000 omitted) | | $2,131 | | | | $2,068 | | | | $886 | | | | $2,329 | | | | $2,828 | |
| Ratio of expenses to average net assets | | 1.54% | | | | 1.40% | | | | 1.41% | | | | 1.25% | | | | 1.25% | 2 |
| Ratio of expenses to average net assets | | | | | | | | | | | | | | | | | | | |
| prior to expense limitation and expense paid indirectly | | 1.85% | | | | 1.84% | | | | 1.87% | | | | 1.77% | | | | 1.80% | |
| Ratio of net investment income to average net assets | | 3.38% | | | | 3.53% | | | | 3.54% | | | | 3.85% | | | | 3.90% | |
| Ratio of net investment income to average net assets | | | | | | | | | | | | | | | | | | | |
| prior to expense limitation and expense paid indirectly | | 3.07% | | | | 3.09% | | | | 3.08% | | | | 3.33% | | | | 3.35% | |
| Portfolio turnover | | 14% | | | | 20% | | | | 13% | | | | 26% | | | | 64% | |
| |
| 1 Total investment return is based on the change in net asset value of a share during the period and assumes reinvestment of dividends and distributions at net asset value and does not reflect the impact of a sales charge. Total investment return reflects waivers and payment of fees by the manager. Performance would have been lower had the expense limitation not been in effect. |
| 2 Ratio for the year ended August 31, 2003, including fees paid indirectly in accordance with the Securities and Exchange Commission rules was 1.26%. |
See accompanying notes
58
Notes to financial statements
Delaware Multi-state Funds
August 31, 2007
Voyageur Mutual Funds is organized as a Delaware statutory trust and offers five series: Delaware Minnesota High-Yield Municipal Bond Fund, Delaware National High-Yield Municipal Bond Fund, Delaware Tax-Free California Fund, Delaware Tax-Free Idaho Fund and Delaware Tax-Free New York Fund. Voyageur Mutual Funds II is organized as a Delaware statutory trust and offers one series: Delaware Tax-Free Colorado Fund. Voyageur Insured Funds is organized as a Delaware statutory trust and offers one series: Delaware Tax-Free Arizona Fund (formerly, Delaware Tax-Free Arizona Insured Fund). Voyageur Mutual Funds, Voyageur Mutual Funds II, and Voyageur Insured Funds are individually referred to as a Trust and collectively as Trusts. These financial statements and related notes pertain to Delaware Tax-Free Arizona Fund, Delaware Tax-Free California Fund, Delaware Tax-Free Colorado Fund, Delaware Tax-Free Idaho Fund and Delaware Tax-Free New York Fund (each referred to as a Fund or collectively as Funds). The above Trusts are open-end investment companies. The Funds are considered non-diversified under the Investment Company Act of 1940, as amended, and offer Class A, Class B, and Class C shares. Class A shares are sold with a front-end sales charge of up to 4.50%. Class A share purchases of $1,000,000 or more will incur a contingent deferred sales charge (CDSC) of 1% if redeemed during the first year and 0.50% during the second year, provided that Delaware Distributors, L.P. (DDLP) paid a financial advisor a commission on the purchase of those shares. Class B shares are sold with a CDSC that declines from 4% to zero depending upon the period of time the shares are held. Class B shares will automatically convert to Class A shares on a quarterly basis approximately eight years after purchase. Class C shares are sold with a CDSC of 1%, if redeemed during the first 12 months. Effective at the close of business on May 31, 2007, the Funds no longer accept new purchases of Class B shares other than dividend reinvestments and certain permitted exchanges.
The investment objective of the Funds is to seek as high a level of current income exempt from federal income tax and personal income tax in their respective states, as is consistent with preservation of capital.
1. Significant Accounting Policies
The following accounting policies are in accordance with U.S. generally accepted accounting principles and are consistently followed by the Funds.
Security Valuation — Long-term debt securities are valued by an independent pricing service and such prices are believed to reflect the fair value of such securities. Short-term debt securities having less than 60 days to maturity are valued at amortized cost, which approximates market value. Open-end investment companies are valued at their published net asset value. Other securities and assets for which market quotations are not readily available are valued at fair value as determined in good faith under the direction of each Fund’s Board of Trustees. In determining whether market quotations are readily available or fair valuation will be used, various factors will be taken into consideration, such as market closures, aftermarket trading, or significant events after local market trading (e.g., government actions or pronouncements, trading volume or volatility on markets, exchanges among dealers, or news events).
In September 2006, the Financial Accounting Standards Board (FASB) issued FASB Statement No. 157 “Fair Value Measurements” (Statement 157). Statement 157 establishes a framework for measuring fair value in generally accepted accounting principles, clarifies the definition of fair value within that framework, and expands disclosures about the use of fair value measurements. Statement 157 is intended to increase consistency and comparability among fair value estimates used in financial reporting. Statement 157 is effective for fiscal years beginning after November 15, 2007. Management does not expect the adoption of Statement 157 to have an impact on the amounts reported in the financial statements.
Federal Income Taxes — Each Fund intends to continue to qualify for federal income tax purposes as a regulated investment company and make the requisite distributions to shareholders. Accordingly, no provision for federal income taxes has been made in the financial statements.
On July 13, 2006, the FASB released FASB Interpretation No. 48 “Accounting for Uncertainty in Income Taxes” (FIN 48). FIN 48 provides guidance for how uncertain tax positions should be recognized, measured, presented, and disclosed in the financial statements. FIN 48 requires the evaluation of tax positions taken or expected to be taken in the course of preparing the Funds’ tax returns to determine whether the tax positions are “more-likely-than-not” of being sustained by the applicable tax authority. Tax positions not deemed to meet the more-likely-than-not threshold would be recorded as a tax benefit or expense in the current year. Adoption of FIN 48 is required for fiscal years beginning after December 15, 2006 and is to be applied to all open tax years as of the effective date. Securities and Exchange Commission (SEC) guidance allows implementing FIN 48 in the Funds’ net asset value calculations as late as the Funds’ last net asset value calculation in the first required financial statement reporting period. As a result, the Funds will incorporate FIN 48 in their semiannual report on February 29, 2008. Although the Funds’ tax positions are currently being evaluated, management does not expect the adoption of FIN 48 to have a material impact on the Funds’ financial statements.
Class Accounting — Investment income and common expenses are allocated to the classes of each Fund on the basis of “settled shares” of each class in relation to the net assets of each Fund. Realized and unrealized gain (loss) on investments are allocated to the various classes of each Fund on the basis of daily net assets of each class. Distribution expenses relating to a specific class are charged directly to that class.
Use of Estimates — The preparation of financial statements in conformity with U.S. generally accepted accounting principles requires management to make estimates and assumptions that affect the reported amounts of assets and liabilities at the date of the financial statements and the reported amounts of revenues and expenses during the reporting period. Actual results could differ from those estimates.
(continues) 59
Notes to financial statements
Delaware Multi-state Funds
1. Significant Accounting Policies (continued)
Other — Expenses directly attributable to the Funds are charged directly to the Funds. Other expenses common to various funds within the Delaware Investments® Family of Funds are generally allocated amongst such funds on the basis of average net assets. Management fees and some other expenses are paid monthly. Security transactions are recorded on the date the securities are purchased or sold (trade date) for financial reporting purposes. Costs used in calculating realized gains and losses on the sale of investment securities are those of the specific securities sold. Interest income is recorded on the accrual basis. Discounts and premiums are amortized to interest income over the lives of the respective securities. Each Fund declares dividends daily from net investment income and pays such dividends monthly and declares and pays distributions from net realized gain on investments, if any, annually.
The Funds receive earnings credits from their custodian when positive cash balances are maintained, which are used to offset custody fees. The expense paid under this arrangement is included in custodian fees on the Statements of operations with the corresponding expense offset shown as “expense paid indirectly.”
2. Investment Management, Administration Agreements and Other Transactions with Affiliates
In accordance with the terms of its respective investment management agreement, each Fund pays Delaware Management Company (DMC), a series of Delaware Management Business Trust and the investment manager, an annual fee, which is calculated based on each Fund’s average daily net assets as follows:
| | Delaware Tax-Free | | Delaware Tax-Free | | Delaware Tax-Free | | Delaware Tax-Free | | Delaware Tax-Free |
| | Arizona Fund | | California Fund | | Colorado Fund | | Idaho Fund | | New York Fund |
| On the first $500 million | | 0.500% | | 0.550% | | 0.550% | | 0.550% | | 0.550% |
| On the next $500 million | | 0.475% | | 0.500% | | 0.500% | | 0.500% | | 0.500% |
| On the next $1.5 billion | | 0.450% | | 0.450% | | 0.450% | | 0.450% | | 0.450% |
| In excess of $2.5 billion | | 0.425% | | 0.425% | | 0.425% | | 0.425% | | 0.425% |
DMC has contractually agreed to waive that portion, if any, of its management fee and reimburse each Fund to the extent necessary to ensure that annual operating expenses, exclusive of taxes, interest, brokerage fees, inverse floater expenses, 12b-1 plan expenses, certain insurance costs and non-routine expenses or costs including, but not limited to, those relating to reorganizations, litigation, certain Trustee retirement plan expenses, conducting shareholder meetings, and liquidations, do not exceed specified percentages of average daily net assets as shown below:
| | Delaware Tax-Free | | Delaware Tax-Free | | Delaware Tax-Free | | Delaware Tax-Free | | Delaware Tax-Free |
| | Arizona Fund | | California Fund | | Colorado Fund | | Idaho Fund | | New York Fund |
| Operating expense limitation as | | | | | | | | | | |
| a percentage of average | | | | | | | | | | |
| daily net assets (per annum) | | 0.50% | | 0.63% | | 0.68% | | 0.60% | | 0.40% |
| Expiration date | | 12/30/06 | | 12/30/06 | | 12/30/06 | | 12/30/06 | | 12/30/06 |
| |
| Effective December 31, 2006 | | | | | | | | | | |
| operating expense limitation as | | | | | | | | | | |
| a percentage of average | | | | | | | | | | |
| daily net assets (per annum) | | 0.50% | | 0.63% | | 0.68% | | 0.60% | | 0.60% |
| Expiration date | | 12/31/07 | | 12/31/07 | | 12/31/07 | | 12/31/07 | | 12/31/07 |
Delaware Service Company, Inc. (DSC), an affiliate of DMC, provided accounting, administration, dividend disbursing and transfer agent services. Each Fund pays DSC a monthly fee computed at the annual rate of 0.04% of each Fund’s average daily net assets for accounting and administration services. Each Fund pays DSC a monthly fee based on the number of shareholder accounts for dividend disbursing and transfer agent services.
Pursuant to a distribution agreement and distribution plan, each Fund pays DDLP, the distributor and an affiliate of DMC, an annual distribution and service fee not to exceed 0.25% of the average daily net assets of the Class A shares and 1.00% of the average daily net assets of the Class B and C shares.
60
2. Investment Management, Administration Agreements and Other Transactions with Affiliates (continued)
At August 31, 2007, each Fund had liabilities payable to affiliates as follows:
| | Delaware Tax-Free | | Delaware Tax-Free | | Delaware Tax-Free | | Delaware Tax-Free | | Delaware Tax-Free |
| | Arizona Fund | | California Fund | | Colorado Fund | | Idaho Fund | | New York Fund |
| Investment management | | | | | | | | | | |
| fee payable to DMC | | $51,628 | | | $50,197 | | | $120,716 | | | $30,711 | | | $2,153 | |
| Dividend disbursing, transfer | | | | | | | | | | |
| agent, accounting and | | | | | | | | | | |
| administration fee and other | | | | | | | | | | |
| expenses payable to DSC | | 10,309 | | | 7,066 | | | 20,289 | | | 6,598 | | | 1,865 | |
| Distribution fee payable to DDLP | | 43,809 | | | 35,951 | | | 65,881 | | | 29,583 | | | 6,736 | |
| Other expenses payable to | | | | | | | | | | |
| DMC and affiliates* | | 5,874 | | | 6,868 | | | 12,086 | | | 5,306 | | | 1,391 | |
*DMC, as part of its administrative services, pays operating expenses on behalf of each Fund and is reimbursed on a periodic basis. Such expenses include items such as printing of shareholder reports, fees for audit, legal and tax services, registration fees and trustees’ fees.
As provided in the investment management agreement, each Fund bears the cost of certain legal and tax services, including internal legal and tax services provided to each Fund by DMC and/or its affiliates’ employees. For the year ended August 31, 2007, each Fund was charged for internal legal and tax services provided by DMC and/or its affiliates’ employees as follows:
| Delaware Tax-Free | | Delaware Tax-Free | | Delaware Tax-Free | | Delaware Tax-Free | | Delaware Tax-Free |
| Arizona Fund | | California Fund | | Colorado Fund | | Idaho Fund | | New York Fund |
| $7,204 | | $5,085 | | $13,038 | | $4,009 | | $897 |
For the year ended August 31, 2007, DDLP earned commissions on sales of Class A shares for each Fund as follows:
| Delaware Tax-Free | | Delaware Tax-Free | | Delaware Tax-Free | | Delaware Tax-Free | | Delaware Tax-Free |
| Arizona Fund | | California Fund | | Colorado Fund | | Idaho Fund | | New York Fund |
| $20,029 | | $17,559 | | $26,578 | | $25,923 | | $7,927 |
For the year ended August 31, 2007, DDLP received CDSC commissions on redemptions of each Fund’s Class A, Class B, and Class C shares, and these commissions were entirely used to offset up-front commissions previously paid by DDLP to broker-dealers on sales of those shares. The amounts received were as follows:
| | | Delaware Tax-Free | | Delaware Tax-Free | | Delaware Tax-Free | | Delaware Tax-Free | | Delaware Tax-Free |
| | | Arizona Fund | | California Fund | | Colorado Fund | | Idaho Fund | | New York Fund |
| Class A | | $ 47 | | | $45,723 | | | $ — | | | $ — | | | $ — | |
| Class B | | 19,365 | | | 22,736 | | | 3,964 | | | 11,042 | | | 2,143 | |
| Class C | | 398 | | | 103 | | | 657 | | | 53 | | | 87 | |
Trustees’ fees and benefits include expenses accrued by the Funds for each Trustee’s retainer, per meeting fees and retirement benefits. Independent Trustees with over five years of uninterrupted service were eligible to participate in a retirement plan that provided for the payment of benefits upon retirement. The amount of the retirement benefit was determined based on factors set forth in the plan, including the number of years of service. On November 16, 2006, the Board of Trustees of the Funds unanimously voted to terminate the retirement plan. Payments equal to the net present value of the earned benefits were made in 2007 to those independent Trustees so entitled. The retirement benefit payouts were as follows:
| Delaware Tax-Free | | Delaware Tax-Free | | Delaware Tax-Free | | Delaware Tax-Free | | Delaware Tax-Free |
| Arizona Fund | | California Fund | | Colorado Fund | | Idaho Fund | | New York Fund |
| | $19,419 | | $13,082 | | $34,628 | | $10,469 | | $2,324 |
Certain officers of DMC, DSC and DDLP are officers and/or trustees of the Trust. These officers and trustees are paid no compensation by the Funds.
(continues) 61
Notes to financial statements
Delaware Multi-state Funds
3. Investments
For the year ended August 31, 2007, the Funds made purchases and sales of investment securities other than short-term investments as follows:
| | Delaware Tax-Free | | Delaware Tax-Free | | Delaware Tax-Free | | Delaware Tax-Free | | Delaware Tax-Free |
| | Arizona Fund | | California Fund | | Colorado Fund | | Idaho Fund | | New York Fund |
| Purchases | | $ | 14,077,674 | | | $ | 21,510,898 | | | $ | 33,543,549 | | | $ | 8,838,905 | | | $ | 2,677,240 | |
| Sales | | | 20,054,737 | | | | 21,960,398 | | | | 41,565,536 | | | | 6,944,611 | | | | 2,549,358 | |
At August 31, 2007, the cost of investments and unrealized appreciation (depreciation) for federal income tax purposes for each Fund were as follows:
| | Delaware Tax-Free | | Delaware Tax-Free | | Delaware Tax-Free | | Delaware Tax-Free | | Delaware Tax-Free |
| | Arizona Fund | | California Fund | | Colorado Fund | | Idaho Fund | | New York Fund |
| Cost of investments | | $ | 140,405,448 | | | $ | 96,034,911 | | | $ | 252,820,346 | | | $ | 86,022,243 | | | $ | 18,397,145 | |
| Aggregate unrealized appreciation | | $ | 4,556,994 | | | $ | 2,695,223 | | | $ | 10,450,826 | | | $ | 1,770,338 | | | $ | 582,467 | |
| Aggregate unrealized depreciation | | | (1,240,980 | ) | | | (1,679,407 | ) | | | (3,594,208 | ) | | | (705,154 | ) | | | (197,291 | ) |
| Net unrealized appreciation | | $ | 3,316,014 | | | $ | 1,015,816 | | | $ | 6,856,618 | | | $ | 1,065,184 | | | $ | 385,176 | |
4. Dividend and Distribution Information
Income and long-term capital gain distributions are determined in accordance with federal income tax regulations, which may differ from U.S. generally accepted accounting principles. Additionally, net short-term gains on sales of investment securities are treated as ordinary income for federal income tax purposes. The tax character of dividends and distributions paid during the years ended August 31, 2007 and 2006 was as follows:
| | Delaware Tax-Free | | Delaware Tax-Free | | Delaware Tax-Free | | Delaware Tax-Free | | Delaware Tax-Free |
| | Arizona Fund | | California Fund | | Colorado Fund | | Idaho Fund | | New York Fund |
| Year Ended 8/31/07 | | | | | | | | | | |
| Tax-exempt income | | $6,056,305 | | $4,052,743 | | $11,438,978 | | $3,149,577 | | $743,181 |
| |
| Year Ended 8/31/06 | | | | | | | | | | |
| Tax-exempt income | | $6,300,495 | | $3,593,780 | | $12,306,600 | | $3,237,136 | | $722,866 |
5. Components of Net Assets on a Tax Basis
As of August 31, 2007, the components of net assets on a tax basis were as follows:
| | Delaware Tax-Free | | Delaware Tax-Free | | Delaware Tax-Free | | Delaware Tax-Free | | Delaware Tax-Free |
| | Arizona Fund | | California Fund | | Colorado Fund | | Idaho Fund | | New York Fund |
| Shares of beneficial interest | | $ | 144,591,326 | | | $ | 99,223,949 | | | $ | 263,193,386 | | | $ | 86,818,606 | | | $ | 18,892,950 | |
| Distributions payable | | | (146,913 | ) | | | (98,972 | ) | | | (276,001 | ) | | | (81,529 | ) | | | (18,729 | ) |
| Undistributed tax-exempt income | | | 146,888 | | | | 100,272 | | | | 275,955 | | | | 70,276 | | | | 18,074 | |
| Post-October losses | | | — | | | | (198,994 | ) | | | — | | | | (5,171 | ) | | | — | |
| Capital loss carryforwards | | | (2,255,113 | )* | | | (668,280 | ) | | | (7,877,153 | ) | | | (398,737 | ) | | | (165,428 | ) |
| Unrealized appreciation of | | | | | | | | | | | | | | | | | | | | |
| investments | | | 3,316,014 | | | | 1,015,816 | | | | 6,856,618 | | | | 1,065,184 | | | | 385,176 | |
| Net assets | | $ | 145,652,202 | | | $ | 99,373,791 | | | $ | 262,172,805 | | | $ | 87,468,629 | | | $ | 19,112,043 | |
*The amount of this loss which can be utilized in subsequent years is subject to an annual limitation in accordance with the Internal Revenue Code due to a Fund merger in 2005.
The differences between book basis and tax basis components of net assets are primarily attributable to tax deferral of losses on wash sales and tax treatment of market discount and premium on debt instruments.
Post-October losses represent losses realized on investment transactions from November 1, 2006 through August 31, 2007 that, in accordance with federal income tax regulations, each Fund has elected to defer and treat as having arisen in the following fiscal year.
62
5. Components of Net Assets on a Tax Basis (continued)
For financial reporting purposes, capital accounts are adjusted to reflect the tax character of permanent book/tax differences. Reclassifications are primarily due to tax treatment of market discount on certain debt instruments. Results of operations and net assets were not affected by these reclassifications. For the year ended August 31, 2007, the Funds recorded the following reclassifications:
| | Delaware Tax-Free | | Delaware Tax-Free |
| | Colorado Fund | | Idaho Fund |
| Distributions in excess of net investment income | | $(8,417) | | $(2,611) |
| Accumulated net realized gain (loss) | | 8,417 | | 2,611 |
For federal income tax purposes, capital loss carryforwards may be carried forward and applied against future capital gains. Capital loss carryforwards remaining at August 31, 2007 will expire as follows:
| | Delaware Tax-Free | | Delaware Tax-Free | | Delaware Tax-Free | | Delaware Tax-Free | | Delaware Tax-Free |
| Year of Expiration | | | Arizona Fund | | California Fund | | Colorado Fund | | Idaho Fund | | New York Fund |
| 2008 | | $ | 494,969 | | | $ | — | | | $ | — | | | $ | — | | | $ | — | |
| 2009 | | | — | | | | 662,241 | | | | 1,044,895 | | | | 151,477 | | | | 165,428 | |
| 2010 | | | — | | | | — | | | | — | | | | 166,949 | | | | — | |
| 2011 | | | 78,759 | | | | 6,039 | | | | — | | | | — | | | | — | |
| 2012 | | | 1,681,385 | | | | — | | | | 4,571,043 | | | | — | | | | — | |
| 2013 | | | — | | | | — | | | | 57,695 | | | | — | | | | — | |
| 2014 | | | — | | | | — | | | | 2,203,520 | | | | 23,435 | | | | — | |
| 2015 | | | — | | | | — | | | | — | | | | 56,876 | | | | — | |
| Total | | $ | 2,255,113 | | | $ | 668,280 | | | $ | 7,877,153 | | | | 398,737 | | | | 165,428 | |
For the year ended August 31, 2007, the Funds utilized capital loss carryforwards as follows:
| | Delaware Tax-Free | | Delaware Tax-Free | | Delaware Tax-Free | | Delaware Tax-Free |
| | Arizona Fund | | California Fund | | Colorado Fund | | New York Fund |
| Capital loss carryforward utilized | | $490,852 | | $83,927 | | $1,009,130 | | $50,932 |
(continues) 63
Notes to financial statements
Delaware Multi-state Funds
6. Capital Shares
Transactions in capital shares were as follows:
| | Delaware Tax-Free | | Delaware Tax-Free | | Delaware Tax-Free |
| | Arizona Fund | | California Fund | | Colorado Fund |
| | Year Ended | | Year Ended | | Year Ended |
| | 8/31/07 | | 8/31/06 | | 8/31/07 | | 8/31/06 | | 8/31/07 | | 8/31/06 |
| Shares sold: | | | | | | | | | | | | | | | | | | |
| Class A | | 1,310,222 | | | 971,193 | | | 1,994,358 | | | 2,142,834 | | | 1,137,342 | | | 1,253,924 | |
| Class B | | 3,752 | | | 12,623 | | | 13,600 | | | 81,632 | | | 1,966 | | | 3,073 | |
| Class C | | 117,465 | | | 107,731 | | | 311,172 | | | 376,829 | | | 171,332 | | | 184,841 | |
| |
| Shares issued upon reinvestment of dividends and distributions: | | | | | | | | | | | | | | | | | | |
| Class A | | 237,386 | | | 249,650 | | | 158,530 | | | 117,718 | | | 624,637 | | | 669,689 | |
| Class B | | 22,522 | | | 25,147 | | | 21,767 | | | 28,142 | | | 11,169 | | | 18,549 | |
| Class C | | 13,407 | | | 15,949 | | | 26,532 | | | 21,715 | | | 22,616 | | | 22,293 | |
| | 1,704,754 | | | 1,382,293 | | | 2,525,959 | | | 2,768,870 | | | 1,969,062 | | | 2,152,369 | |
| |
| Shares repurchased: | | | | | | | | | | | | | | | | | | |
| Class A | | (1,775,471 | ) | | (1,309,086 | ) | | (1,870,154 | ) | | (881,647 | ) | | (2,190,306 | ) | | (2,621,749 | ) |
| Class B | | (350,624 | ) | | (236,154 | ) | | (490,356 | ) | | (389,023 | ) | | (260,676 | ) | | (203,332 | ) |
| Class C | | (158,370 | ) | | (151,943 | ) | | (236,524 | ) | | (128,171 | ) | | (150,438 | ) | | (123,594 | ) |
| | (2,284,465 | ) | | (1,697,183 | ) | | (2,597,034 | ) | | (1,398,841 | ) | | (2,601,420 | ) | | (2,948,675 | ) |
| Net increase (decrease) | | (579,711 | ) | | (314,890 | ) | | (71,075 | ) | | 1,370,029 | | | (632,358 | ) | | (796,306 | ) |
| | Delaware Tax-Free | | Delaware Tax-Free |
| | Idaho Fund | | New York Fund |
| | Year Ended | | Year Ended |
| | 8/31/07 | | 8/31/06 | | 8/31/07 | | 8/31/06 |
| Shares sold: | | | | | | | | | | | | |
| Class A | | 1,316,463 | | | 909,746 | | | 239,258 | | | 197,010 | |
| Class B | | 49,968 | | | 10,946 | | | 3,253 | | | 31,881 | |
| Class C | | 78,260 | | | 148,802 | | | 47,036 | | | 121,329 | |
| |
| Shares issued upon reinvestment of dividends and distributions: | | | | | | | | | | | | |
| Class A | | 142,848 | | | 140,782 | | | 39,485 | | | 38,341 | |
| Class B | | 12,137 | | | 16,261 | | | 3,399 | | | 4,007 | |
| Class C | | 21,162 | | | 25,408 | | | 2,551 | | | 3,813 | |
| | 1,620,838 | | | 1,251,945 | | | 334,982 | | | 396,381 | |
| |
| Shares repurchased: | | | | | | | | | | | | |
| Class A | | (736,545 | ) | | (770,258 | ) | | (121,595 | ) | | (183,809 | ) |
| Class B | | (218,716 | ) | | (276,018 | ) | | (67,503 | ) | | (47,738 | ) |
| Class C | | (248,413 | ) | | (348,933 | ) | | (38,590 | ) | | (11,772 | ) |
| | (1,203,674 | ) | | (1,395,209 | ) | | (227,688 | ) | | (243,319 | ) |
| Net increase (decrease) | | 417,164 | | | (143,264 | ) | | 107,294 | | | 153,062 | |
64
6. Capital Shares (continued)
For the years ended August 31, 2007 and 2006, the following shares and value were converted from Class B to Class A shares. The amounts are included in Class B redemptions and Class A subscriptions in the tables on the previous page and the Statements of changes in net assets.
| | | Year Ended | | Year Ended |
| | | 8/31/07 | | 8/31/06 |
| | | Class B | | Class A | | | | Class B | | Class A | | |
| | | Shares | | Shares | | Value | | Shares | | Shares | | Value |
| Delaware Tax-Free Arizona Fund | | 90,057 | | 90,103 | | $1,014,108 | | 71,582 | | 71,646 | | $ 812,252 |
| Delaware Tax-Free California Fund | | 190,729 | | 191,399 | | 2,178,747 | | 166,547 | | 167,211 | | 1,896,023 |
| Delaware Tax-Free Colorado Fund | | 100,172 | | 100,189 | | 1,109,632 | | 101,489 | | 101,560 | | 1,116,940 |
| Delaware Tax-Free Idaho Fund | | 96,877 | | 96,752 | | 1,103,521 | | 62,906 | | 62,842 | | 719,818 |
| Delaware Tax-Free New York Fund | | 16,346 | | 16,311 | | 172,008 | | 17,055 | | 17,007 | | 178,055 |
7. Line of Credit
Each Fund, along with certain other funds in the Delaware Investments® Family of Funds (the Participants), participates in a $225,000,000 revolving line of credit facility to be used for temporary or emergency purposes as an additional source of liquidity to fund redemptions of investor shares. The Participants are charged an annual commitment fee, which is allocated across the Participants on the basis of each Participant’s allocation of the entire facility. The Participants may borrow up to a maximum of one third of their net assets under the agreement. The Funds had no amounts outstanding as of August 31, 2007, or at any time during the year then ended.
8. Credit and Market Risk
The Funds concentrate their investments in securities issued by municipalities. The value of these investments may be adversely affected by new legislation within the states, regional or local economic conditions, and differing levels of supply and demand for municipal bonds. Many municipalities insure repayment for their obligations. Although bond insurance reduces the risk of loss due to default by an issuer, such bonds remain subject to the risk that value may fluctuate for other reasons and there is no assurance that the insurance company will meet its obligations. These securities have been identified in the Statements of net assets.
The Funds may invest in advanced refunded bonds, escrow secured bonds or defeased bonds. Under current federal tax laws and regulations, state and local government borrowers are permitted to refinance outstanding bonds by issuing new bonds. The issuer refinances the outstanding debt to either reduce interest costs or to remove or alter restrictive covenants imposed by the bonds being refinanced. A refunding transaction where the municipal securities are being refunded within 90 days from the issuance of the refunding issue is known as a “current refunding”. Advance refunded bonds are bonds in which the refunded bond issue remains outstanding for more than 90 days following the issuance of the refunding issue. In an advance refunding, the issuer will use the proceeds of a new bond issue to purchase high grade interest bearing debt securities which are then deposited in an irrevocable escrow account held by an escrow agent to secure all future payments of principal and interest and bond premium of the advance refunded bond. Bonds are “escrowed to maturity” when the proceeds of the refunding issue are deposited in an escrow account for investment sufficient to pay all of the principal and interest on the original interest payment and maturity dates.
Bonds are considered “pre-refunded” when the refunding issue’s proceeds are escrowed only until a permitted call date or dates on the refunded issue with the refunded issue being redeemed at the time, including any required premium. Bonds become “defeased” when the rights and interests of the bondholders and of their lien on the pledged revenues or other security under the terms of the bond contract and are substituted with an alternative source of revenues (the escrow securities) sufficient to meet payments of principal and interest to maturity or to the first call dates. Escrowed secured bonds will often receive a rating of AAA from Moody’s Investors Service, Inc., Standard & Poor’s Ratings Group, and/or Fitch Ratings due to the strong credit quality of the escrow securities and the irrevocable nature of the escrow deposit agreement.
Each Fund may invest up to 15% of its total assets in illiquid securities, which may include securities with contractual restrictions on resale, securities exempt from registration under Rule 144A of the Securities Act of 1933, as amended, and other securities which may not be readily marketable. The relative illiquidity of these securities may impair each Fund from disposing of them in a timely manner and at a fair price when it is necessary or desirable to do so. While maintaining oversight, each Fund’s Board of Trustees has delegated to DMC the day-to-day functions of determining whether individual securities are liquid for purposes of each Fund’s limitation on investments in illiquid assets. At August 31, 2007, there were no Rule 144A securities and no securities have been determined to be illiquid under each Fund’s Liquidity Procedures.
9. Contractual Obligations
The Funds enter into contracts in the normal course of business that contain a variety of indemnifications. The Funds’ maximum exposure under these arrangements is unknown. However, the Funds have not had prior claims or losses pursuant to these contracts. Management has reviewed the Funds’ existing contracts and expects the risk of loss to be remote.
(continues) 65
Notes to financial statements
Delaware Multi-state Funds
10. Termination of New Purchases of Class B Shares
As of the close of business on May 31, 2007, each Fund in the Delaware Investments® Family of Funds no longer accepts new or subsequent investments in Class B shares of the funds, other than a reinvestment of dividends or capital gains or permitted exchanges. Existing shareholders of Class B shares may continue to hold their Class B shares, reinvest dividends into Class B shares, and exchange their Class B shares of one Delaware Investments® Fund (each a Fund) for Class B shares of another Fund, as permitted by existing exchange privileges. Existing Class B shareholders wishing to make subsequent purchases in a Fund’s shares will be permitted to invest in other classes of the Fund, subject to that class’ pricing structure and eligibility requirements, if any.
For Class B shares outstanding as of May 31, 2007 and Class B shares acquired upon reinvestment of dividends or capital gains, all Class B share attributes, including the CDSC schedules, conversion to Class A schedule, and distribution and service (12b-1) fees, will continue in their current form. However, as of the close of business on May 31, 2007, reinvestment of redeemed shares with respect to Class B shares (which, as described in the prospectus, permits you to reinvest within 12 months of selling your shares and have any CDSC you paid on such shares credited back to your account) has been discontinued. In addition, because the Fund’s or their distributors’ ability to assess certain sales charges and fees is dependent on the sale of new shares, the termination of new purchases of Class B shares could ultimately lead to the elimination and/or reduction of such sales charges and fees. The Funds may not be able to provide shareholders with advance notice of the reduction in these sales charges and fees. You will be notified via a Prospectus Supplement if there are any changes to any attributes, sales charges, or fees.
11. Tax Information (Unaudited)
The information set forth below is for each Fund’s fiscal year as required by federal laws. Shareholders, however, must report distributions on a calendar year basis for income tax purposes, which may include distributions for portions of two fiscal years of a fund. Accordingly, the information needed by shareholders for income tax purposes will be sent to them in January of each year. Please consult your tax advisor for proper treatment of this information.
For the fiscal year ended August 31, 2007, each Fund designates distributions paid during the year as follows:
| | | (A) | | | | |
| | | Long Term | | (B) | | |
| | | Capital Gains | | Tax-Exempt | | Total |
| | | Distributions | | Distributions | | Distributions |
| | | (Tax Basis) | | (Tax Basis) | | (Tax Basis) |
| Delaware Tax-Free Arizona Fund | | 0% | | 100% | | 100% |
| Delaware Tax-Free California Fund | | 0% | | 100% | | 100% |
| Delaware Tax-Free Colorado Fund | | 0% | | 100% | | 100% |
| Delaware Tax-Free Idaho Fund | | 0% | | 100% | | 100% |
| Delaware Tax-Free New York Fund | | 0% | | 100% | | 100% |
(A) and (B) are based on a percentage of each Fund’s total distributions.
66
Report of independent
registered public accounting firm
To the Shareholders and Board of Trustees
Voyageur Insured Funds — Delaware Tax-Free Arizona Fund
Voyageur Mutual Funds — Delaware Tax-Free California Fund, Delaware Tax-Free Idaho Fund, and Delaware Tax-Free New York Fund
Voyageur Mutual Funds II — Delaware Tax-Free Colorado Fund
We have audited the accompanying statements of net assets of Delaware Tax-Free Arizona Fund (the sole series of Voyageur Insured Funds), Delaware Tax-Free California Fund, Delaware Tax-Free Idaho Fund, and Delaware Tax-Free New York Fund (three of the series constituting Voyageur Mutual Funds) and Delaware Tax-Free Colorado Fund (the sole series of Voyageur Mutual Funds II) (the “Funds”) as of August 31, 2007, and the related statements of operations for the year then ended, the statements of changes in net assets for each of the two years in the period then ended, and the financial highlights for each of the five years in the period then ended. These financial statements and financial highlights are the responsibility of the Funds’ management. Our responsibility is to express an opinion on these financial statements and financial highlights based on our audits.
We conducted our audits in accordance with the standards of the Public Company Accounting Oversight Board (United States). Those standards require that we plan and perform the audit to obtain reasonable assurance about whether the financial statements and financial highlights are free of material misstatement. We were not engaged to perform an audit of the Funds’ internal control over financial reporting. Our audits included consideration of internal control over financial reporting as a basis for designing audit procedures that are appropriate in the circumstances, but not for the purpose of expressing an opinion on the effectiveness of the Funds’ internal control over financial reporting. Accordingly, we express no such opinion. An audit also includes examining, on a test basis, evidence supporting the amounts and disclosures in the financial statements and financial highlights, assessing the accounting principles used and significant estimates made by management, and evaluating the overall financial statement presentation. Our procedures included confirmation of securities owned as of August 31, 2007, by correspondence with the custodian and brokers or by other appropriate auditing procedures where replies from brokers were not received. We believe that our audits provide a reasonable basis for our opinion.
In our opinion, the financial statements and financial highlights referred to above present fairly, in all material respects, the financial position of the Delaware Tax-Free Arizona Fund of Voyageur Insured Funds, the Delaware Tax-Free California Fund, Delaware Tax-Free Idaho Fund, and Delaware Tax-Free New York Fund of Voyageur Mutual Funds, and Delaware Tax-Free Colorado Fund of Voyageur Mutual Funds II at August 31, 2007, the results of their operations for the year then ended, the changes in their net assets for each of the two years in the period then ended, and their financial highlights for each of the five years in the period then ended, in conformity with U.S. generally accepted accounting principles.

Philadelphia, Pennsylvania
October 18, 2007
67
Other Fund information (unaudited)
Delaware Multi-state Funds
Board Consideration of Delaware Tax-Free Arizona Fund, Delaware Tax-Free California Fund, Delaware Tax-Free Colorado Fund, Delaware Tax-Free Idaho Fund, and Delaware Tax-Free New York Fund Investment Advisory Agreements
At a meeting held on May 16–17, 2007 (Annual Meeting), the Board of Trustees (Board), including a majority of disinterested or independent Trustees, approved the renewal of the Investment Advisory Agreements for the Delaware Tax-Free Arizona Fund, Delaware Tax-Free California Fund, Delaware Tax-Free Colorado Fund, Delaware Tax-Free Idaho Fund and Delaware Tax-Free New York Fund (each, a “Fund” and collectively, the “Funds”). In making its decision, the Board considered information furnished throughout the year at regular Board meetings, including reports detailing Fund performance, investment strategies and expenses, as well as information prepared specifically in connection with the renewal of the investment advisory contracts. Information furnished specifically in connection with the renewal of the Investment Advisory Agreements with Delaware Management Company (DMC) included materials provided by DMC and its affiliates (Delaware Investments) concerning, among other things, the level of services provided to the Funds, the costs of such services to the Funds, economies of scale and the financial condition and profitability of Delaware Investments. In addition, in connection with the Meeting, the Board separately received and reviewed in mid-January 2007 independent historical and comparative reports prepared by Lipper Inc. (“Lipper”), an independent statistical compilation organization. The Lipper reports compared each Fund’s investment performance and expenses with those of other comparable mutual funds. The Board requested and received certain information regarding management’s policy with respect to advisory fee levels and its philosophy with respect to breakpoints; the structure of portfolio manager compensation; the investment manager’s profitability; and any constraints or limitations on the availability of securities in certain investment styles which might inhibit DMC’s ability to fully invest in accordance with Fund policies.
In considering information relating to the approval of each Fund’s advisory agreement, the independent Trustees received assistance and advice from and met separately with independent counsel. While attention was given to all information furnished, the following discusses under separate headings the primary factors taken into account by the Board in its contract renewal considerations.
Nature, Extent, and Quality of Service. Consideration was given to the services provided by Delaware Investments to the Funds and their shareholders. In reviewing the nature, extent and quality of services, the Board emphasized reports furnished to it throughout the year at regular Board Meetings covering matters such as the relative performance of the Funds, compliance of portfolio managers with the investment policies, strategies and restrictions for the Funds, the compliance of management personnel with the Code of Ethics adopted throughout the Delaware Investments® Family of Funds complex and the adherence to fair value pricing procedures as established by the Board. The Board noted that it was pleased with the current staffing of the Funds’ investment advisor and the emphasis placed on research in the investment process. Favorable consideration was given to DMC’s efforts to maintain, and in some instances increase, financial and human resources committed to fund matters. The Board also considered the transfer agent and shareholder services provided to Fund shareholders by Delaware Investments’ affiliate, Delaware Service Company, Inc. (DSC), noting DSC’s commitment to maintain a high level of service and the continuing expenditures by Delaware Investments to improve the delivery of shareholder services. During 2006, management conducted extensive research into alternatives that could further improve the quality and cost of delivering investment accounting services to the Funds. The Board noted the extent of benefits provided to Fund shareholders for being part of the Delaware Investments Family of Funds, including the privilege to exchange fund investments between the same class of shares without a sales charge, the ability to reinvest Fund dividends into other funds and the privilege to combine holdings in other funds to obtain a reduced sales charge. The Board was satisfied with the nature, extent and quality of the overall services provided by Delaware Investments.
Investment Performance. The Board considered the investment performance of DMC and the Funds. The Board placed significant emphasis on the investment performance of the Funds in view of its importance to shareholders. While consideration was given to performance reports and discussions with portfolio managers at Board meetings throughout the year, particular weight was given to the Lipper reports furnished for the Annual Meeting. The Lipper reports prepared for each Fund showed the investment performance of its Class A shares in comparison to a group of similar funds as selected by Lipper (Performance Universe). A fund with the best performance ranked first, and a fund with the poorest ranked last. The highest/best performing 25% of funds in the Performance Universe make up the first quartile; the next 25% — the second quartile; the next 25% — the third quartile; and the poorest/worst performing 25% of funds in the Performance Universe make up the fourth quartile. Comparative annualized performance for the Funds was shown for the past one-, three-, five-, and ten-year periods ended December 31, 2006. The Board also considered comparative annualized performance for the Funds for the same periods ended October 31, 2006. The performance comparison presented below is based upon the December 31, 2006 information. The Board noted its objective that each Fund’s performance for the periods considered be at or above the median of its Performance Universe. The following paragraphs summarize the performance results for the Funds and the Board’s view of such performance.
Delaware Tax-Free Arizona Fund — The Performance Universe for the Fund consisted of the Fund and all retail and institutional Arizona municipal debt funds as selected by Lipper. The Lipper report comparison showed that the Fund’s total return for the one- and three-year periods was in the second quartile of its Performance Universe. The report further showed that the Fund’s total return for the five- and 10-year periods was in the first quartile. The Board was satisfied with performance.
Delaware Tax-Free California Fund — The Performance Universe for the Fund consisted of the Fund and all retail and institutional California municipal debt funds as selected by Lipper. The Lipper report comparison showed that the Fund’s total return for the one-, three-, five-, and 10-year periods was in the first quartile of its Performance Universe. The Board commended performance.
68
Board Consideration of Delaware Tax-Free Arizona Fund, Delaware Tax-Free California Fund, Delaware Tax-Free Colorado Fund, Delaware Tax-Free Idaho Fund, and Delaware Tax-Free New York Fund Investment Advisory Agreements (continued)
Delaware Tax-Free Colorado Fund — The Performance Universe for the Fund consisted of the Fund and all retail and institutional Colorado municipal debt funds as selected by Lipper. The Lipper report comparison showed that the Fund’s total return for the one- and three-year periods was in the first quartile of its Performance Universe. The report further showed that the Fund’s total return for the five- and 10-year periods was in the second quartile. The Board was satisfied with performance.
Delaware Tax-Free Idaho Fund — The Performance Universe for the Fund consisted of the Fund and all retail and institutional other state municipal debt funds as selected by Lipper. The Lipper report comparison showed that the Fund’s total return for the one-year period was in the second quartile of its Performance Universe. The report further showed that the Fund’s total return for the three-, five-, and 10-year periods was in the first quartile. The Board was satisfied with performance.
Delaware Tax-Free New York Fund — The Performance Universe for the Fund consisted of the Fund and all retail and institutional New York municipal debt funds as selected by Lipper. The Lipper report comparison showed that the Fund’s total return for the one-, three-, and five-year periods was in the first quartile of its Performance Universe. The report further showed that the Fund’s total return for the 10-year period was in the second quartile. The Board was satisfied with performance.
Comparative Expenses. The Board considered expense comparison data for the Delaware Investments® Family of Funds as of October 31, 2006. Management provided the Board with information on pricing levels and fee structures for the Funds. The Board focused particularly on the comparative analysis of the effective management fees and total expense ratios of each Fund and the effective management fees and expense ratios of a group of similar funds as selected by Lipper (Expense Group). In reviewing comparative costs, each Fund’s contractual management fee and the actual management fee incurred by the Fund were compared with the contractual management fees (assuming all funds in the Expense Group were similar in size to the Fund) and actual management fees (as reported by each fund) of other funds within the Expense Group, taking into account any applicable breakpoints and fee waivers. Each Fund’s total expenses were also compared with those of its Expense Group. The Lipper total expenses, for comparative consistency, were shown by Lipper for Class A shares and compared total expenses including 12b-1 and non-12b-1 service fees. The Board also considered fees paid to Delaware Investments for non-management services. The Board noted its objective to limit each Fund’s total expense ratio to an acceptable range as compared to the median of the Expense Group. The following paragraphs summarize the expense results for the Funds and the Board’s view of such expenses.
Delaware Tax-Free Arizona Fund — The expense comparisons for the Fund showed that its actual management fee and total expenses were in the quartile with the second highest expenses of its Expense Group. The Board noted that the Fund’s management fee and total expenses were not in line with the Board’s objective. In evaluating the Fund’s expenses, the Board considered waivers in place through December 2007 and recent initiatives implemented by management, such as the outsourcing of certain transfer agency services, creating an opportunity for a reduction in expenses. The Board was satisfied with management’s efforts to improve the Fund’s total expense ratio and bring it in line with the Board’s objective.
Delaware Tax-Free California Fund — The expense comparisons for the Fund showed that its actual management fee was in the quartile with the lowest expenses of its Expense Group and its total expenses were in the quartile with the second lowest expenses of its Expense Group. The Board was satisfied with the management fees and total expenses of the Fund in comparison to its Expense Group as shown in the Lipper report.
Delaware Tax-Free Colorado Fund — The expense comparisons for the Fund showed that its actual management fee and total expenses were in the second highest expense quartiles of its Expense Group. The Board noted that the Fund’s total expenses were not in line with the Board’s objective. In evaluating the total expenses, the Board considered waivers in place through December 2007 and recent initiatives implemented by management, such as the outsourcing of certain transfer agency services, creating an opportunity for a reduction in expenses. The Board was satisfied with management’s efforts to improve the Fund’s total expense ratio and bring it in line with the Board’s objective.
Delaware Tax-Free Idaho Fund — The expense comparisons for the Fund showed that its actual management fee and total expenses were in the quartile with the second lowest expenses of its Expense Group. The Board was satisfied with the management fee and total expenses of the Fund in comparison to its Expense Group as shown in the Lipper report.
Delaware Tax-Free New York Fund — The expense comparisons for the Fund showed that its actual management fee and total expenses were in the quartile with the lowest expenses of its Expense Group. The Board was satisfied with the management fee and total expenses of the Fund in comparison to its Expense Group as shown in the Lipper report.
(continues) 69
Other Fund information (unaudited)
Delaware Multi-state Funds
Board Consideration of Delaware Tax-Free Arizona Fund, Delaware Tax-Free California Fund, Delaware Tax-Free Colorado Fund, Delaware Tax-Free Idaho Fund, and Delaware Tax-Free New York Fund Investment Advisory Agreements (continued)
Management Profitability. The Board considered the level of profits realized by Delaware Investments in connection with the operation of the Funds. In this respect, the Board reviewed the Investment Management Profitability Analysis that addressed the overall profitability of Delaware Investments’ business in providing management and other services to each of the individual funds and the Delaware Investments® Family of Funds as a whole. Specific attention was given to the methodology followed in allocating costs for the purpose of determining profitability. Management stated that the level of profits of Delaware Investments, to a certain extent, reflected operational cost savings and efficiencies initiated by Delaware Investments. The Board considered Delaware Investments’ efforts to improve services provided to fund shareholders and to meet additional regulatory and compliance requirements resulting from recent Securities and Exchange Commission initiatives. The Board also considered the extent to which Delaware Investments might derive ancillary benefits from fund operations, including the potential for procuring additional business as a result of the prestige and visibility associated with its role as service provider to the Delaware Investments Family of Funds and the benefits from allocation of fund brokerage to improve trading efficiencies. The Board found that the management fees were reasonable in light of the services rendered and the level of profitability of Delaware Investments.
Economies of Scale. The Trustees considered whether economies of scale are realized by Delaware Investments as each Fund’s assets increase and the extent to which any economies of scale are reflected in the level of management fees charged. The Trustees took into account the standardized advisory fee pricing and structure, approved by the Board and shareholders and again reviewed by the Board this year, which includes breakpoints. Breakpoints in the advisory fee occur when the advisory fee rate is reduced on assets in excess of specified levels. This results in a lower advisory fee than would otherwise be the case on all assets when those asset levels specified are exceeded. The Board noted that the fee under each Fund’s management contract fell within the standard structure. Although the Funds have not reached a size at which they can take advantage of breakpoints, the Board recognized that each Fund’s fee was structured so that when the Fund grows, economies of scale may be shared.
Fund management
Joseph R. Baxter
Senior Vice President, Head of Municipal Bond Department, Senior Portfolio Manager
Mr. Baxter is the head of the municipal bond department and is responsible for setting the department’s investment strategy. He is also a co-portfolio manager of the firm’s municipal bond funds and several client accounts. Before joining Delaware Investments in 1999, he held investment positions with First Union, most recently as a municipal portfolio manager with the Evergreen Funds. Mr. Baxter received a bachelor’s degree in finance and marketing from LaSalle University.
Robert F. Collins, CFA
Senior Vice President, Senior Portfolio Manager
Mr. Collins is a member of the firm’s municipal fixed income portfolio management team with primary responsibility for portfolio construction and strategic asset allocation. He is a co-portfolio manager of several of the firm’s municipal bond funds and client accounts. Prior to joining Delaware Investments in 2004, he spent five years as a co-manager of the municipal portfolio management group within PNC Advisors, where he oversaw the tax-exempt investments of high net worth and institutional accounts. Before that, he headed the municipal fixed income team at Wilmington Trust, where he managed funds and high net worth accounts. Mr. Collins earned a bachelor’s degree in economics from Ursinus College, and he is also a former president of The Financial Analysts of Wilmington, Delaware.
Stephen J. Czepiel
Senior Vice President, Portfolio Manager
Mr. Czepiel is a member of the firm’s municipal fixed income portfolio management team with primary responsibility for portfolio construction and strategic asset allocation. He is a co-portfolio manager of several of the firm’s municipal bond funds and client accounts. In addition, he is the head of the municipal bond trading staff. He joined Delaware Investments in July 2004 as a senior bond trader. Previously, he was vice president at both Mesirow Financial and Loop Capital Markets. He began his career in the securities industry in 1982 as a municipal bond trader at Kidder Peabody and now has more than 20 years of experience in the municipal securities industry. Mr. Czepiel earned his bachelor’s degree in finance and economics from Duquesne University.
70
Board of trustees/directors
and officers addendum
Delaware Investments® Family of Funds
A mutual fund is governed by a Board of Trustees/Directors (“Trustees”), which has oversight responsibility for the management of a fund’s business affairs. Trustees establish procedures and oversee and review the performance of the investment manager, the distributor, and others who perform services for the fund. The independent fund trustees, in particular, are advocates for shareholder interests. Each trustee has served in that capacity since he or she was elected to or appointed to the Board of Trustees, and will continue to serve until his or her retirement or the election of a new trustee in his or her place. The following is a list of the Trustees and Officers with certain background and related information.
| | | | | Number of | |
| | | | | Portfolios in Fund | Other |
| Name, | | | | Complex Overseen | Directorships |
| Address, | Position(s) | Length of | Principal Occupation(s) | by Trustee | Held by |
| and Birth Date | Held with Fund(s) | Time Served | During Past 5 Years | or Officer | Trustee or Officer |
| Interested Trustees | | | | | |
| Patrick P. Coyne1 | Chairman, | Chairman and Trustee | Patrick P. Coyne has served in | 82 | Director — |
| 2005 Market Street | President, | since August 16, 2006 | various executive capacities | | Kaydon Corp. |
| Philadelphia, PA | Chief Executive | | at different times at | | |
| 19103 | Officer, and | President and | Delaware Investments.2 | | |
| | Trustee | Chief Executive Officer | | | |
| April 14, 1963 | | since August 1, 2006 | | | |
| Independent Trustees | | | | | |
| Thomas L. Bennett | Trustee | Since | Private Investor — | 82 | Director — |
| 2005 Market Street | | March 2005 | (March 2004–Present) | | Bryn Mawr |
| Philadelphia, PA | | | | | Bank Corp. (BMTC) |
| 19103 | | | Investment Manager — | | (April 2007–Present) |
| | | | Morgan Stanley & Co. | | |
| October 4, 1947 | | | (January 1984–March 2004) | | |
| John A. Fry | Trustee | Since | President — | 82 | Director — |
| 2005 Market Street | | January 2001 | Franklin & Marshall College | | Community Health |
| Philadelphia, PA | | | (June 2002–Present) | | Systems |
| 19103 | | | | | |
| | | | Executive Vice President — | | Director — |
| May 28, 1960 | | | University of Pennsylvania | | Allied Barton |
| | | | (April 1995–June 2002) | | Security Holdings |
| Anthony D. Knerr | Trustee | Since | Founder and Managing Director — | 82 | None |
| 2005 Market Street | | April 1990 | Anthony Knerr & Associates | | |
| Philadelphia, PA | | | (Strategic Consulting) | | |
| 19103 | | | (1990–Present) | | |
| |
| December 7, 1938 | | | | | |
| Lucinda S. Landreth | Trustee | Since | Chief Investment Officer — | 82 | None |
| 2005 Market Street | | March 2005 | Assurant, Inc. | | |
| Philadelphia, PA | | | (Insurance) | | |
| 19103 | | | (2002–2004) | | |
| |
| June 24, 1947 | | | | | |
| Ann R. Leven | Trustee | Since | Consultant — | 82 | Director and |
| 2005 Market Street | | October 1989 | ARL Associates | | Audit Committee |
| Philadelphia, PA | | | (Financial Planning) | | Chairperson — Andy |
| 19103 | | | (1983–Present) | | Warhol Foundation |
| |
| November 1, 1940 | | | | | Director and Audit |
| | | | | | Committee Chair — |
| | | | | | Systemax, Inc. |
(continues) 71
| | | | | Number of | |
| | | | | Portfolios in Fund | Other |
| Name, | | | | Complex Overseen | Directorships |
| Address, | Position(s) | Length of | Principal Occupation(s) | by Trustee | Held by |
| and Birth Date | Held with Fund(s) | Time Served | During Past 5 Years | or Officer | Trustee or Officer |
| Independent Trustees (continued) | | | | |
| Thomas F. Madison | Trustee | Since | President and Chief | 82 | Director — |
| 2005 Market Street | | May 19973 | Executive Officer — | | CenterPoint Energy |
| Philadelphia, PA | | | MLM Partners, Inc. | | |
| 19103 | | | (Small Business Investing | | Director and Audit |
| | | | and Consulting) | | Committee Chair — |
| February 25, 1936 | | | (January 1993–Present) | | Digital River, Inc. |
| |
| | | | | | Director and Audit |
| | | | | | Committee Member — |
| | | | | | Rimage |
| | | | | | Corporation |
| |
| | | | | | Director — Valmont |
| | | | | | Industries, Inc. |
| Janet L. Yeomans | Trustee | Since | Treasurer | 82 | None |
| 2005 Market Street | | April 1999 | (January 2006–Present) | | |
| Philadelphia, PA | | | Vice President — Mergers & Acquisitions | | |
| 19103 | | | (January 2003–January 2006), and | | |
| | | | Vice President | | |
| | | (July 1995–January 2003) | | |
| | | 3M Corporation | | |
| July 31, 1948 | | | | | |
| | | | Ms. Yeomans has held | | |
| | | | various management positions | | |
| | | | at 3M Corporation since 1983. | | |
| J. Richard Zecher | Trustee | Since | Founder — | 82 | Director and Audit |
| 2005 Market Street | | March 2005 | Investor Analytics | | Committee Member — |
| Philadelphia, PA | | | (Risk Management) | | Investor Analytics |
| 19103 | | | (May 1999–Present) | | |
| | | | | | Director and Audit |
| July 3, 1940 | | | Founder — | | Committee Member — |
| | | | Sutton Asset Management | | Oxigene, Inc. |
| | | | (Hedge Fund) | | |
| | | | (September 1996–Present) | | |
| Officers | | | | | |
| David F. Connor | Vice President, | Vice President since | David F. Connor has served as | 82 | None4 |
| 2005 Market Street | Deputy General | September 2000 | Vice President and Deputy | | |
| Philadelphia, PA | Counsel, and Secretary | and Secretary | General Counsel of | | |
| 19103 | | since | Delaware Investments | | |
| | | October 2005 | since 2000. | | |
| December 2, 1963 | | | | | |
| David P. O’Connor | Senior Vice | Senior Vice President, | David P. O’Connor has served in | 82 | None4 |
| 2005 Market Street | President, | General Counsel, and | various executive and legal | | |
| Philadelphia, PA | General Counsel, | Chief Legal Officer | capacities at different times | | |
| 19103 | and Chief | since | at Delaware Investments. | | |
| | Legal Officer | October 2005 | | | |
| February 21, 1966 | | | | | |
| Richard Salus | Senior | Chief Financial | Richard Salus has served in | 82 | None4 |
| 2005 Market Street | Vice President | Officer since | various executive capacities | | |
| Philadelphia, PA | and | November 2006 | at different times at | | |
| 19103 | Chief Financial | | Delaware Investments. | | |
| | Officer | | | | |
| October 4, 1963 | | | | | |
| 1 Patrick P. Coyne is considered to be an “Interested Trustee” because he is an executive officer of the Fund’s(s’) investment advisor. |
| 2 Delaware Investments is the marketing name for Delaware Management Holdings, Inc. and its subsidiaries, including the Fund’s(s’) investment advisor, principal underwriter, and its transfer agent. |
| 3 In 1997, several funds managed by Voyageur Fund Managers, Inc. (the “Voyageur Funds”) were incorporated into the Delaware Investments Family of Funds. Mr. Madison served as a director of the Voyageur Funds from 1993 until 1997. |
| 4 David F. Connor, David P. O’Connor, and Richard Salus serve in similar capacities for the six portfolios of the Optimum Fund Trust, which have the same investment advisor, principal underwriter, and transfer agent as the registrant. |
The Statement of Additional Information for the Fund(s) includes additional information about the Trustees and Officers and is available, without charge, upon request by calling 800 523-1918.
72
About the organization
This annual report is for the information of Delaware Tax-Free Arizona Fund, Delaware Tax-Free California Fund, Delaware Tax-Free Colorado Fund, Delaware Tax-Free Idaho Fund, and Delaware Tax-Free New York Fund shareholders, but it may be used with prospective investors when preceded or accompanied by a current prospectus for Delaware Tax-Free Arizona Fund, Delaware Tax-Free California Fund, Delaware Tax-Free Colorado Fund, Delaware Tax-Free Idaho Fund, and Delaware Tax-Free New York Fund and the Delaware Investments® Performance Update for the most recently completed calendar quarter. The prospectus sets forth details about charges, expenses, investment objectives, and operating policies of the investment company. You should read the prospectus carefully before you invest. The figures in this report represent past results that are not a guarantee of future results. The return and principal value of an investment in the Fund will fluctuate so that shares, when redeemed, may be worth more or less than their original cost.
| Board of trustees Patrick P. Coyne
Chairman, President, and
Chief Executive Officer
Delaware Investments Family of Funds
Philadelphia, PA Thomas L. Bennett
Private Investor
Rosemont, PA John A. Fry
President
Franklin & Marshall College
Lancaster, PA Anthony D. Knerr
Founder and Managing Director
Anthony Knerr & Associates
New York, NY Lucinda S. Landreth
Former Chief Investment Officer
Assurant, Inc.
Philadelphia, PA Ann R. Leven
Consultant
ARL Associates
New York, NY Thomas F. Madison
President and Chief Executive Officer
MLM Partners, Inc.
Minneapolis, MN Janet L. Yeomans
Vice President and Treasurer
3M Corporation
St. Paul, MN J. Richard Zecher
Founder
Investor Analytics
Scottsdale, AZ | Affiliated officers David F. Connor
Vice President, Deputy General Counsel,
and Secretary
Delaware Investments Family of Funds
Philadelphia, PA David P. O’Connor
Senior Vice President, General Counsel,
and Chief Legal Officer
Delaware Investments Family of Funds
Philadelphia, PA Richard Salus
Senior Vice President and
Chief Financial Officer
Delaware Investments Family of Funds
Philadelphia, PA | Contact information Investment manager
Delaware Management Company, a series
of Delaware Management Business Trust
Philadelphia, PA National distributor
Delaware Distributors, L.P.
Philadelphia, PA Shareholder servicing, dividend
disbursing, and transfer agent
Delaware Service Company, Inc.
2005 Market Street
Philadelphia, PA 19103-7094 For shareholders
800 523-1918 For securities dealers and financial
institutions representatives only
800 362-7500 Web site
www.delawareinvestments.com |
Delaware Investments is the marketing name of Delaware Management Holdings, Inc. and its subsidiaries.
Each Fund files its complete schedule of portfolio holdings with the Securities and Exchange Commission for the first and third quarters of each fiscal year on Form N-Q. Each Fund’s Forms N-Q, as well as a description of the policies and procedures that each Fund uses to determine how to vote proxies (if any) relating to portfolio securities are available without charge (i) upon request, by calling 800 523-1918; and (ii) on the Commission’s Web site at http://www.sec.gov. In addition, a description of the policies and procedures that each Fund uses to determine how to vote proxies (if any) relating to portfolio securities and each Fund’s Schedule of Investments are available without charge on the Fund’s Web site at http://www.delawareinvestments.com. Each Fund’s Forms N-Q may be reviewed and copied at the Commission’s Public Reference Room in Washington, D.C.; information on the operation of the Public Reference Room may be obtained by calling 800 SEC-0330.
Information (if any) regarding how each Fund voted proxies relating to portfolio securities during the most recently disclosed 12-month period ended June 30 is available without charge (i) through each Fund’s Web site at http://www.delawareinvestments.com; and (ii) on the Commission’s Web site at http://www.sec.gov.
73
Get shareholder reports and prospectuses online instead of in the mail.
> Visit www.delawareinvestments.com/edelivery
Simplify your life.Manage your investments online!
Get Account Access, the Delaware Investments® secure Web site that allows you to conduct your business online. Gain 24-hour access to your account and one of the highest levels of Web security available. You also get:
- Hassle-free investing — Make online purchases and redemptions at any time.
- Simplified tax processing — Automatically retrieve your Delaware Investments accounts’ 1099 information and import it directly into your 1040 tax return. Available only with Turbo Tax® OnlineSM and Desktop software — www.turbotax.com.
- Less mail clutter — Get instant access to your fund materials online with Delaware eDelivery.
Register for Account Access today! Please visit us at www.delawareinvestments.com, select Individual Investors, and click Account Access.
Please call our Shareholder Service Center at 800 523-1918 Monday through Friday from 8:00 a.m. to 7:00 p.m., Eastern Time, for assistance with any questions.
(2263)
| Printed in the USA |
| AR-WEST [8/31] CGI 10/07 | MF-07-09-008 PO12305 |
Item 2. Code of Ethics
The registrant has adopted a code of ethics that applies to the registrant’s principal executive officer, principal financial officer, principal accounting officer or controller, or persons performing similar functions, regardless of whether these individuals are employed by the registrant or a third party. A copy of the registrant’s Code of Business Ethics has been posted on Delaware Investments’ internet website at www.delawareinvestments.com. Any amendments to the Code of Business Ethics, and information on any waiver from its provisions granted by the registrant, will also be posted on this website within five business days of such amendment or waiver and will remain on the website for at least 12 months.
Item 3. Audit Committee Financial Expert
The registrant’s Board of Trustees/Directors has determined that each member of the registrant’s Audit Committee is an audit committee financial expert, as defined below. For purposes of this item, an “audit committee financial expert” is a person who has the following attributes:
a. An understanding of generally accepted accounting principles and financial statements;
b. The ability to assess the general application of such principles in connection with the accounting for estimates, accruals, and reserves;
c. Experience preparing, auditing, analyzing, or evaluating financial statements that present a breadth and level of complexity of accounting issues that are generally comparable to the breadth and complexity of issues that can reasonably be expected to be raised by the registrant’s financial statements, or experience actively supervising one or more persons engaged in such activities;
d. An understanding of internal controls and procedures for financial reporting; and
e. An understanding of audit committee functions.
An “audit committee financial expert” shall have acquired such attributes through:
a. Education and experience as a principal financial officer, principal accounting officer, controller, public accountant, or auditor or experience in one or more positions that involve the performance of similar functions;
b. Experience actively supervising a principal financial officer, principal accounting officer, controller, public accountant, auditor, or person performing similar functions;
c. Experience overseeing or assessing the performance of companies or public accountants with respect to the preparation, auditing, or evaluation of financial statements; or
d. Other relevant experience.
The registrant’s Board of Trustees/Directors has also determined that each member of the registrant’s Audit Committee is independent. In order to be “independent” for purposes of this item, the Audit Committee member may not: (i) other than in his or her capacity as a member of the Board of Trustees/Directors or any committee thereof, accept directly or indirectly any consulting, advisory or other compensatory fee from the issuer; or (ii) be an “interested person” of the registrant as defined in Section 2(a)(19) of the Investment Company Act of 1940.
The names of the audit committee financial experts on the registrant’s Audit Committee are set forth below:
Thomas L. Bennett 1
Thomas F. Madison
Janet L. Yeomans 1
J. Richard Zecher
Item 4. Principal Accountant Fees and Services
(a) Audit fees.
The aggregate fees billed for services provided to the registrant by its independent auditors for the audit of the registrant’s annual financial statements and for services normally provided by the independent auditors in connection with statutory and regulatory filings or engagements were $14,000 for the fiscal year ended August 31, 2007.
_______________________
1 The instructions to Form N-CSR require disclosure on the relevant experience of persons who qualify as audit committee financial experts based on “other relevant experience.” The Board of Trustees/Directors has determined that Mr. Bennett qualifies as an audit committee financial expert by virtue of his education, Chartered Financial Analyst designation, and his experience as a credit analyst, portfolio manager and the manager of other credit analysts and portfolio managers. The Board of Trustees/Directors has determined that Ms. Yeomans qualifies as an audit committee financial expert by virtue of her education and experience as the Treasurer of a large global corporation.
The aggregate fees billed for services provided to the registrant by its independent auditors for the audit of the registrant’s annual financial statements and for services normally provided by the independent auditors in connection with statutory and regulatory filings or engagements were $30,000 for the fiscal year ended August 31, 2006.
(b) Audit-related fees.
The aggregate fees billed by the registrant’s independent auditors for services relating to the performance of the audit of the registrant’s financial statements and not reported under paragraph (a) of this Item were $0 for the fiscal year ended August 31, 2007.
The aggregate fees billed by the registrant’s independent auditors for services relating to the performance of the audit of the financial statements of the registrant’s investment adviser and other service providers under common control with the adviser and that relate directly to the operations or financial reporting of the registrant were $13,400 for the registrant’s fiscal year ended August 31, 2007. The percentage of these fees relating to services approved by the registrant’s Audit Committee pursuant to the de minimis exception from the pre-approval requirement in Rule 2-01(c)(7)(i)(C) of Regulation S-X was 0%. These audit-related services were as follows: issuance of report concerning transfer agent's system of internal accounting control pursuant to Rule 17Ad-13 of the Securities Exchange Act.
The aggregate fees billed by the registrant’s independent auditors for services relating to the performance of the audit of the registrant’s financial statements and not reported under paragraph (a) of this Item were $0 for the fiscal year ended August 31, 2006.
The aggregate fees billed by the registrant’s independent auditors for services relating to the performance of the audit of the financial statements of the registrant’s investment adviser and other service providers under common control with the adviser and that relate directly to the operations or financial reporting of the registrant were $28,300 for the registrant’s fiscal year ended August 31, 2006. The percentage of these fees relating to services approved by the registrant’s Audit Committee pursuant to the de minimis exception from the pre-approval requirement in Rule 2-01(c)(7)(i)(C) of Regulation S-X was 0%. These audit-related services were as follows: issuance of report concerning transfer agent's system of internal accounting control pursuant to Rule 17Ad-13 of the Securities Exchange Act; and issuance of agreed upon procedures report to the registrant's Board in connection with the pass-through of internal legal cost relating to the operations of the registrant.
(c) Tax fees.
The aggregate fees billed by the registrant’s independent auditors for tax-related services provided to the registrant were $3,950 for the fiscal year ended August 31, 2007. The percentage of these fees relating to services approved by the registrant’s Audit Committee pursuant to the de minimis exception from the pre-approval requirement in Rule 2-01(c)(7)(i)(C) of Regulation S-X was 0%. These tax-related services were as follows: review of income tax returns and review of annual excise distribution calculations.
The aggregate fees billed by the registrant’s independent auditors for tax-related services provided to the registrant’s investment adviser and other service providers under common control with the adviser and that relate directly to the operations or financial reporting of the registrant were $0 for the registrant’s fiscal year ended August 31, 2007.
The aggregate fees billed by the registrant’s independent auditors for tax-related services provided to the registrant were $5,700 for the fiscal year ended August 31, 2006. The percentage of these fees relating to services approved by the registrant’s Audit Committee pursuant to the de minimis exception from the pre-approval requirement in Rule 2-01(c)(7)(i)(C) of Regulation S-X was 0%. These tax-related services were as follows: review of income tax returns and review of annual excise distribution calculations.
The aggregate fees billed by the registrant’s independent auditors for tax-related services provided to the registrant’s adviser and other service providers under common control with the adviser and that relate directly to the operations or financial reporting of the registrant were $0 for the registrant’s fiscal year ended August 31, 2006.
(d) All other fees.
The aggregate fees billed for all services provided by the independent auditors to the registrant other than those set forth in paragraphs (a), (b) and (c) of this Item were $0 for the fiscal year ended August 31, 2007.
The aggregate fees billed for all services other than those set forth in paragraphs (b) and (c) of this Item provided by the registrant’s independent auditors to the registrant’s adviser and other service providers under common control with the adviser and that relate directly to the operations or financial reporting of the registrant were $0 for the registrant’s fiscal year ended August 31, 2007.
The aggregate fees billed for all services provided by the independent auditors to the registrant other than those set forth in paragraphs (a), (b) and (c) of this Item were $0 for the fiscal year ended August 31, 2006.
The aggregate fees billed for all services other than those set forth in paragraphs (b) and (c) of this Item provided by the registrant’s independent auditors to the registrant’s adviser and other service providers under common control with the adviser and that relate directly to the operations or financial reporting of the registrant were $0 for the registrant’s fiscal year ended August 31, 2006.
(e) The registrant’s Audit Committee has established pre-approval policies and procedures as permitted by Rule 2-01(c)(7)(i)(B) of Regulation S-X (the “Pre-Approval Policy”) with respect to services provided by the registrant’s independent auditors. Pursuant to the Pre-Approval Policy, the Audit Committee has pre-approved the services set forth in the table below with respect to the registrant up to the specified fee limits. Certain fee limits are based on aggregate fees to the registrant and other registrants within the Delaware Investments Family of Funds.
| Service | Range of Fees |
| Audit Services | |
| Statutory audits or financial audits for new Funds | up to $25,000 per Fund |
| Services associated with SEC registration statements (e.g., Form N-1A, Form N-14, etc.), periodic reports and other documents filed with the SEC or other documents issued in connection with securities offerings (e.g., comfort letters for closed-end Fund offerings, consents), and assistance in responding to SEC comment letters | up to $10,000 per Fund |
| Consultations by Fund management as to the accounting or disclosure treatment of transactions or events and/or the actual or potential impact of final or proposed rules, standards or interpretations by the SEC, FASB, or other regulatory or standard-setting bodies (Note: Under SEC rules, some consultations may be considered “audit-related services” rather than “audit services”) | up to $25,000 in the aggregate |
| Audit-Related Services | |
| Consultations by Fund management as to the accounting or disclosure treatment of transactions or events and /or the actual or potential impact of final or proposed rules, standards or interpretations by the SEC, FASB, or other regulatory or standard-setting bodies (Note: Under SEC rules, some consultations may be considered “audit services” rather than “audit-related services”) | up to $25,000 in the aggregate |
| Tax Services | |
| U.S. federal, state and local and international tax planning and advice (e.g., consulting on statutory, regulatory or administrative developments, evaluation of Funds’ tax compliance function, etc.) | up to $25,000 in the aggregate |
| U.S. federal, state and local tax compliance (e.g., excise distribution reviews, etc.) | up to $5,000 per Fund |
| Review of federal, state, local and international income, franchise and other tax returns | up to $5,000 per Fund |
Under the Pre-Approval Policy, the Audit Committee has also pre-approved the services set forth in the table below with respect to the registrant’s investment adviser and other entities controlling, controlled by or under common control with the investment adviser that provide ongoing services to the registrant (the “Control Affiliates”) up to the specified fee limit. This fee limit is based on aggregate fees to the investment adviser and its Control Affiliates.
| Service | Range of Fees |
| Non-Audit Services | |
| Services associated with periodic reports and other documents filed with the SEC and assistance in responding to SEC comment letters | up to $10,000 in the aggregate |
The Pre-Approval Policy requires the registrant’s independent auditors to report to the Audit Committee at each of its regular meetings regarding all services initiated since the last such report was rendered, including those services authorized by the Pre-Approval Policy.
(f) Not applicable.
(g) The aggregate non-audit fees billed by the registrant’s independent auditors for services rendered to the registrant and to its investment adviser and other service providers under common control with the adviser were $252,638 and $259,520 for the registrant’s fiscal years ended August 31, 2007 and August 31, 2006, respectively.
(h) In connection with its selection of the independent auditors, the registrant’s Audit Committee has considered the independent auditors’ provision of non-audit services to the registrant’s investment adviser and other service providers under common control with the adviser that were not required to be pre-approved pursuant to Rule 2-01(c)(7)(ii) of Regulation S-X. The Audit Committee has determined that the independent auditors’ provision of these services is compatible with maintaining the auditors’ independence.
Item 5. Audit Committee of Listed Registrants
Not applicable.
Item 6. Schedule of Investments
Included as part of report to shareholders filed under Item 1 of this Form N-CSR.
Item 7. Disclosure of Proxy Voting Policies and Procedures for Closed-End Management Investment Companies
Not applicable.
Item 8. Portfolio Managers of Closed-End Management Investment Companies
Not applicable.
Item 9. Purchases of Equity Securities by Closed-End Management Investment Company and Affiliated Purchasers
Not applicable.
Item 10. Submission of Matters to a Vote of Security Holders
Not applicable.
Item 11. Controls and Procedures
The registrant’s principal executive officer and principal financial officer have evaluated the registrant’s disclosure controls and procedures within 90 days of the filing of this report and have concluded that they are effective in providing reasonable assurance that the information required to be disclosed by the registrant in its reports or statements filed under the Securities Exchange Act of 1934 is recorded, processed, summarized and reported within the time periods specified in the rules and forms of the Securities and Exchange Commission.
There were no significant changes in the registrant’s internal control over financial reporting that occurred during the second fiscal quarter of the period covered by the report to stockholders included herein (i.e., the registrant’s fourth fiscal quarter) that have materially affected, or are reasonably likely to materially affect, the registrant’s internal control over financial reporting.
Item 12. Exhibits
(a) (1) Code of Ethics
Not applicable.
| | (2) Certifications of Principal Executive Officer and Principal Financial Officer pursuant to Rule 30a-2 under the Investment Company Act of 1940 are attached hereto as Exhibit 99.CERT. |
| | |
| (3) Written solicitations to purchase securities pursuant to Rule 23c-1 under the Securities Exchange Act of 1934. |
Not applicable.
(b) Certifications pursuant to Section 906 of the Sarbanes-Oxley Act of 2002 are furnished herewith as Exhibit 99.906CERT.
SIGNATURES
Pursuant to the requirements of the Securities Exchange Act of 1934 and the Investment Company Act of 1940, the registrant has duly caused this report to be signed on its behalf, by the undersigned, thereunto duly authorized.
Name of Registrant: Voyageur Insured Funds
| By: | | Patrick P. Coyne |
| Title: | | Chief Executive Officer |
| Date: | | November 5, 2007 |
Pursuant to the requirements of the Securities Exchange Act of 1934 and the Investment Company Act of 1940, this report has been signed below by the following persons on behalf of the registrant and in the capacities and on the dates indicated.
| By: | | Patrick P. Coyne |
| Title: | | Chief Executive Officer |
| Date: | | November 5, 2007 |
| By: | | Richard Salus |
| Title: | | Chief Financial Officer |
| Date: | | November 5, 2007 |