UNITED STATES SECURITIES AND EXCHANGE COMMISSION
Washington, D.C. 20549
FORM N-CSR
CERTIFIED SHAREHOLDER REPORT OF REGISTERED MANAGEMENT
INVESTMENT COMPANIES
| Investment Company Act file number: | 811-04973 |
| Exact name of registrant as specified in charter: | Voyageur Insured Funds |
| Address of principal executive offices: | 2005 Market Street |
| Philadelphia, PA 19103 | |
| Name and address of agent for service: | David F. Connor, Esq. |
| 2005 Market Street | |
| Philadelphia, PA 19103 | |
| Registrant’s telephone number, including area code: | (800) 523-1918 |
| Date of fiscal year end: | August 31 |
| Date of reporting period: | August 31, 2008 |
Item 1. Reports to Stockholders
| Annual report | |
Delaware Tax-Free Arizona Fund | |
| August 31, 2008 | |
| Fixed income mutual funds |
Table of contents
| Portfolio management review | 1 |
| Performance summaries | 12 |
| Disclosure of Fund expenses | 28 |
| Sector allocations and credit quality breakdowns | 31 |
| Statements of net assets | 36 |
| Statements of operations | 70 |
| Statements of changes in net assets | 72 |
| Financial highlights | 82 |
| Notes to financial statements | 112 |
| Report of independent registered public accounting firm | 124 |
| Other Fund information | 126 |
| Board of trustees/directors and officers addendum | 132 |
| About the organization | 140 |
Funds are not FDIC insured and are not guaranteed. It is possible to lose the principal amount invested.
Mutual fund advisory services provided by Delaware Management Company, a series of Delaware Management
Business Trust, which is a registered investment advisor.
© 2008 Delaware Distributors, L.P.
All third-party trademarks cited are the property of their respective owners.
| Portfolio management review | |
| Delaware multi-state funds | Sept. 9, 2008 |
The managers of Delaware Tax-Free Arizona Fund, Delaware Tax-Free California Fund, Delaware Tax-Free Colorado Fund, Delaware Tax-Free Idaho Fund, and Delaware Tax-Free New York Fund provided the answers to the questions below as a review of the Funds’ activities for the fiscal year that ended Aug. 31, 2008. Bonds mentioned throughout the portfolio management review are rated by either Moody’s or Standard & Poor’s unless otherwise noted.
What was the market environment for tax-free investments during the fiscal year ended Aug. 31, 2008?
The annual period presented an extraordinarily difficult investment environment. The fiscal year began with a credit crisis triggered by a deepening slump in U.S. home prices coupled with a rising rate of home foreclosures. During the year, the crisis evolved through several stages. It affected all facets of the fixed income markets, including investment grade credit, high yield bonds, bank loans, mortgages, and municipal bonds. Within the municipal bond market, several events outlined below had major ramifications for portions of the market, specifically monoline insured bonds and auction rate securities.
The first phase of the crisis began just prior to Aug. 31, 2007, but its initial impact on the municipal market was related to liquidity — or the degree to which securities can be converted to cash — rather than credit. Investment banks were in the midst of their first round of asset write-downs and, as a result, their ability to deploy capital was constrained. Many dealers held back inventory and were less willing to inject liquidity into the municipal market.
What began as a liquidity issue early during the period, though, evolved into a full-blown credit crisis in November. Concerns grew stronger regarding credit ratings of the monoline insurers, the companies that underwrite insurance for much of the debt that municipalities issue. In recent years, these insurance companies have sought faster growth by insuring new and different types of investments, including the structured investment vehicles that many believe are at the root of the credit crisis. At that time, several AAA-rated insurance providers were warned by the ratings agencies that they may be required to increase their capital levels to maintain top-tier ratings. The fears surrounding insurer credit ratings increased outflows from the municipal bond market. We believe the credit warnings prompted already wary municipal bond investors to reevaluate credit ratings on what many had considered to be safe investments.
Early 2008 brought another round of bad news for municipal bond investors, triggered by downgrades of several bond insurers from their valued AAA-rated status. These downgrades set up an unwinding of tender option bonds and disrupted the auction process for auction rate securities (ARS), which led to a complete breakdown of the $1 billion-plus ARS market. Tender option bonds are complicated synthetic derivatives that allow owners to borrow at a short-term rate and reinvest the proceeds in higher-yielding, longer-term bonds. Auction rate securities are long-term securities for which the interest rate is reset at frequent auctions, often held every 35 days or less.
Failed auctions, or those without enough buyers willing to purchase the number of
The views expressed are current as of the date of this report and are subject to change.
Data for this portfolio management review were provided by Bloomberg unless otherwise noted.
1
Portfolio management review
Delaware multi-state funds
shares sold at the auction, made headlines during the period. The failures forced investors, who may have originally viewed the auction process as a source of short-term liquidity, into holding the long-term bond instead. The fears stoked by these issues created further havoc in an already beaten-down municipal bond market.
During the summer of 2008, the fixed income markets experienced a brief period in which investors seemed to focus once again on economic fundamentals — in this case the battle between heightened inflation expectations on one hand and deteriorating economic conditions on the other. The inflation fears were driven by spiking commodity prices, oil in particular. The crumbling housing market and weak employment data were the key statistics on the slow growth side. However, the brief focus on fundamentals was interrupted by another round of financial institution write-downs and further credit downgrades of the monoline insurers. The markets refocused on the credit crisis. More and more, insured municipal bonds began to trade based upon the underlying issuer’s credit rating, not the credit rating that the insurance would have warranted at one time.
On the bright side, retail investors have consistently been strong buyers of tax-exempt bonds. Flows into tax-exempt municipal bond funds were strong, particularly during calendar year 2008. Based on data collected weekly by AMG Data Services, municipal bond funds received positive flows in all but two weeks between January and the end of August, and often the flows were in excess of $500 million. (Source: Merrill Lynch.)
What was your strategy within such a difficult investment environment?
Throughout the year, we remained true to our overall investment strategy, which is to focus on income generated through a bottom-up, security-by-security selection process, utilizing our strengths in credit and trading. At the same time, we focused on balancing our core investment philosophy with a tactical positioning of our investment portfolios, given the tenuous credit environment.
We trimmed holdings with 20 or more years to maturity in favor of a greater investment in bonds with 2- to 10-year maturities throughout many of our funds. As gauged by the returns of the Lehman Brothers Municipal Bond Index, bonds with 2- to 10-year maturities outperformed the long-maturity end of the yield curve for the fiscal year. (At its most basic, a yield curve is a simple graph that depicts the interest rates of bonds. The graph shows bonds that are of equal quality but have different maturity dates.)
We also increased many funds’ exposures to refunded bonds, also known as prerefunded bonds, during the year. Prerefunded bonds were among the better-performing bonds within the municipal market. They face less credit risk than most bond issues because they are backed by the proceeds of the second bond issue, which typically consists of U.S. Treasury securities.
The municipal market underwent some shifts during the period as a result of the credit events we described. First, the monoline insurers covered fewer new issues. The number of insured bonds, which had hovered
2
at about 50% of all bonds for the last 10 years, declined to less than 10% of new issuance during the final months of the period, according to Citigroup Global Markets. This shift resulted in a more normalized municipal market, with more bonds trading based on their individual credit metrics, not the AAA rating of their former insurers.
A second shift involved the mix of buyers supporting the market. Traditional players, including retail — direct and via mutual funds — and property-and-casualty insurers, once again seemed to be the most active participants. Nontraditional municipal bond buyers, such as dealer arbitrage desks, began to play a diminished role as the liquidity squeeze constrained their capital. But even in a lesser role, these buyers affected the market. Periodically, when municipals were particularly cheap relative to Treasury bonds, the market received an active bid from these traders, which drove prices higher.
Broadly speaking, the troubles that plagued the monoline insurers during the year have affected credit spreads. Historically, bonds that would have been rated A and BBB on their own had usually come to market with higher ratings because they had been covered by high-quality insurance coverage. Now, as the vast majority of bonds are not insured, the supply of these mid- and low-investment grade bonds has expanded and spreads have widened. While the transition has been difficult, we believe the resulting market environment should favor our investment style. Given our emphasis on research and relative-value trading, we believe that our funds are well positioned for these new market dynamics.
Delaware Tax-Free Arizona Fund
How did the Fund perform versus its benchmark index?
Delaware Tax-Free Arizona Fund returned +2.78% at net asset value and -1.83% at maximum offer price (both figures represent Class A shares with all distributions reinvested) for the year ended Aug. 31, 2008. The Fund’s performance benchmark, the Lehman Brothers Municipal Bond Index, returned +4.48%.
For complete, annualized performance for Delaware Tax-Free Arizona Fund, please see the table on page 12.
What affected Fund performance?
Like that of much of the nation, Arizona’s housing market softened significantly. However, the state’s economic growth continued to outpace the nation’s, particularly in the areas of tourism, high tech, aerospace, and defense. Tourism-related jobs are now a significant component of the state’s service sector and wholesale/retail trade employment. The state has benefited in recent years from its aerospace and defense manufacturing. Total nonfarm payroll increased 0.1% year-over-year for the quarter ending March 31, 2008, according to the Nelson Rockefeller State Revenue Report #72. Despite personal income growth rates higher than the national rate, the state’s personal income remained below the national level, as reported by Moody’s. Arizona’s unemployment rate, at 4.8% as of June 2008, also remained below the national rate of 5.6% reported by the U.S. Labor Department.
Total revenue collections in the first seven months of fiscal 2008 were 5% below previous-year collections and 10.5% below forecast figures. Individual income tax declines corresponded to a 5% income tax cut granted
3
Portfolio management review
Delaware multi-state funds
for fiscal years 2007 and 2008. Budget gaps for 2009 now range from $1.9 to $2.2 billion according to the National Conference of State Legislatures State Budget Update.
Through the first seven months of 2008, national issuance declined 1.3% to total $259.8 billion. However, Arizona issuance increased to a total of $5.9 billion, according to Bond Buyer.
We employed tactical shifts in the Fund’s allocation throughout the year to adapt to the ongoing difficult conditions within the municipal bond markets. For example, as mentioned, we reduced by approximately 20% the Fund’s exposure to bonds with 20 or more years to maturity. To a large extent, we replaced these holdings with shorter-maturity bonds — typically high grade securities in the 5- to 15-year range. The Fund’s exposure to AAA-rated bonds declined; this was primarily due to the downgrades of the monoline insurers. In place of the diminished AAA exposure, Fund exposure to AA- and BBB-rated paper grew. We replaced some of the Fund’s BBB-rated bonds that had longer maturities with similarly rated bonds in the 7- to 9-year range. The Fund’s purchase of Scottsdale Water and Sewer bonds that were rated AAA and Aa1 provides a good example of our strategy during the year, as these bonds were highly rated and in the belly of the yield curve.
The top-performing bonds in Delaware Tax-Free Arizona Fund during the year generally came from the belly of the yield curve. For example, a AAA-rated, prerefunded bond that matures in 2012 issued by the Southern Arizona Capital Facility contributed to Fund performance. Though bonds in the 5- to 15-year range performed best, certain credits with longer maturities also added to Fund performance. Bonds that mature in 2032 issued to fund development in the city of Flagstaff, Ariz., for example, also added to Fund performance.
Broadly speaking, the Fund’s worst performers included bonds with 20 or more years to maturity as well as those that experienced ratings downgrades after having lost their insurance coverage. Due to the problems that the monoline insurers faced throughout much of the year, Fund exposure to AAA-rated bonds declined from 77% to 23%.
Among these downgraded bonds was a long-term (matures in 2029) industrial development revenue (IDR) bond issued by Maricopa County for the Arizona Public Service Company to raise funds for pollution control and prevention. This bond was backed by Ambac, a monoline insurance company, and has a published rating of AA. Yet investors in many cases began to ignore what they perceived as a high rating due to a bond carrying insurance, because they did not believe in the abilities of the underlying insurer. This bond’s underlying ratings are Baa2 and BBB- by Moody’s and S&P, respectively.
IDR bonds are municipal debt securities issued by a government agency on behalf of a private sector company and intended to build or acquire factories or other heavy equipment and tools.
Delaware Tax-Free California Fund
How did the Fund perform versus its benchmark index?
Delaware Tax-Free California Fund returned +2.21% at net asset value and -2.41% at maximum offer price (both figures represent Class A shares with all distributions reinvested) for the fiscal year ended
4
Aug. 31, 2008. The Fund’s performance benchmark, the Lehman Brothers Municipal Bond Index, returned +4.48%.
For complete, annualized performance for Delaware Tax-Free California Fund, please see the table on page 15.
What affected Fund performance?
California enjoys a large and diverse economy that in many ways mirrors that of the nation. The high rate of personal income, which generally comes from capital gains and options, makes the state tax revenue system vulnerable to small shifts in income levels of high earners. The state has been hard hit by the national housing slowdown. Median home sale prices in the first quarter of 2008 were down 20%, versus only 6% in the nation. Also in the first quarter of 2008, housing permits were down 47% on a year-over-year basis, according to Moody’s. Since the 2001 recession, state employment growth roughly mirrored or exceeded national levels. Numbers reported by the state show that employment grew by 1.1% in 2007. As of June 2008, the state’s unemployment rate had grown to 6.9%, higher than the national rate of 5.6% reported by the U.S. Labor Department. Sectors showing recent unemployment weakness were financial activities, construction, and retail trade.
In fiscal 2007, tax revenue receipts came in 3.4% below original budget projections but 0.8% above final estimates due to lower-than-expected personal income tax and sales tax — based on State Controller Statement of Cash Receipts reports. Already two months into the new fiscal year and lawmakers face the problem of closing an estimated $15 billion gap in the budget. Most of the budget gap is due to weak sales and income taxes.
Through the first seven months of 2008, national issuance declined 1.3% to total $259.8 billion. California issuance decreased 10% to total $40.8 billion, according to Bond Buyer.
We employed tactical shifts in the Fund’s asset allocation throughout the year to adapt to ongoing difficult conditions within the municipal bond markets. For example, as mentioned, we significantly reduced the Fund’s exposure to securities with 20 or more years to maturity. These holdings went from slightly more than 68% of the Fund’s holdings at the beginning of the Fund’s fiscal year to 41% at the end of the period. We replaced these holdings with high-grade, shorter-maturity bonds in the 5- to 15-year range. We also increased the Fund’s exposure to refunded bonds (also known as prerefunded bonds), as well as general obligation bonds during the year. Prerefunded bonds were among the better-performing bonds within the municipal market due to their low-risk profile. They face less credit risk than most bond issues because they are backed by the invested debt proceeds of a second bond issue, which typically consist of U.S. Treasury securities.
The Fund’s best-performing bonds were those that were refinanced during the year to take advantage of the lower interest-rate environment. Existing bondholders benefit from refinancing situations as their bonds transition from being longer maturities secured by system revenues, to bonds with shorter call dates secured by escrowed U.S. government securities. Examples of such bonds include a California general obligation bond prerefunded to its 7-year call date as well as revenue bonds issued to fund the Sacramento International Airport. These bonds’ high-grade credit quality and prized place in the belly of the yield curve also contributed to their price appreciation during the year.
5
Portfolio management review
Delaware multi-state funds
Bonds with longer maturity dates, as well as those of a lower credit quality, were among the Fund’s worst-performers. Two of the five worst performing credits were tax increment financing, or TIF, bonds. Municipalities use TIF bonds to encourage private investment and development in targeted areas by capturing the increased tax revenue generated by the private development and using the tax revenues to pay for public improvements and infrastructure necessary to enable such development. During the period, the state’s TIF bonds were negatively impacted by the severity of the decline of the California housing market. An unrated (20-plus-year) TIF bond issued by the city of Roseville, Calif., was one of the Fund’s weaker performers. We continued to watch this sector through the year, and did modestly reduce Fund exposure to TIFs. Based upon our credit surveillance, we continue to hold the Roseville position.
Delaware Tax-Free Colorado Fund
How did the Fund perform versus its benchmark index?
Delaware Tax-Free Colorado Fund returned +3.38% at net asset value and -1.31% at maximum offer price (both figures represent Class A shares with all distributions reinvested) for the year ended Aug. 31, 2008. The Fund’s performance benchmark, the Lehman Brothers Municipal Bond Index, returned +4.48%.
For complete, annualized performance for Delaware Tax-Free Colorado Fund, please see the table on page 18.
What affected Fund performance?
Colorado’s economy continued to show modest, resilient growth despite growing evidence that the national economy could lapse into recession. However, recent economic data suggest that Colorado could experience a mild slowdown, in our opinion. Colorado’s employment growth is expected to slow to 1.4% in 2008 after rising 2% last year. In 2007, the State’s unemployment rate was 3.8%. While it rose to 5.1% in June 2008, it was still below the national level of 5.6% reported by the U.S. Labor Department. For the fiscal year, General Fund revenues are projected to increase 3.4%, while the governor’s fiscal 2009 budget requests the maximum permissible 6% increase in General Fund appropriations, according to the Office of State Planning and Budgeting.
Through the first seven months of 2008, national issuance declined 1.3% to total $259.8 billion. Colorado issuance increased 2.3% to total $5.5 billion, as reported by Bond Buyer.
We employed tactical shifts in the Fund’s allocation throughout the year to adapt to the ongoing difficult conditions within the municipal bond markets. For example, as mentioned, we significantly reduced the Fund’s exposure to securities with 20 or more years to maturity. These holdings went from 55% of the Fund’s holdings at the beginning of the Fund’s fiscal year to 38% at the end of the period. We replaced these holdings with shorter-maturity bonds — typically those found in the 3- to 10-year range. In particular, we sold some of the Fund’s positions in longer-term BBB-rated bonds, and replaced them with similarly rated bonds with shorter maturities. In addition, we increased the Fund’s exposure to refunded bonds (also known as prerefunded bonds) during the year. Prerefunded bonds were among the better-performing bonds within the municipal market due to their low risk
6
profile. They face less credit risk than most bond issues because they are backed by the invested debt proceeds of a second bond issue, which typically consist of U.S. Treasury securities.
All five of the Fund’s top-performing bonds were refinanced during the year. For example, a Colorado School of Mines revenue bond was refinanced in September 2007. The bond’s price improved as it went from a long bond (due in 2037), secured by university revenues, to one being called in 2012 and secured by escrowed U.S. government securities. This bond was one of the Fund’s best performers.
Although we aggressively reduced Fund positions in longer-maturity bonds, the Fund’s remaining exposure to bonds with 20 or more years to maturity declined the most among its holdings. Poor performance among bonds that experienced credit downgrades as a direct result of their insurer being downgraded was also a theme throughout the year. Bonds issued to fund the Denver International Airport, for example, performed particularly poorly. This bond, which was insured by XL Capital Assurance, was downgraded during the year — from an AAA rating that reflected the insurer’s credit strength earlier during the fiscal period, to A1 and A+ by Moody’s and S&P, respectively — ratings that now reflect the credit strength of the underlying airport revenue bonds themselves.
Delaware Tax-Free Idaho Fund
How did the Fund perform versus its benchmark index?
Delaware Tax-Free Idaho Fund returned +3.93% at net asset value and -0.74% at maximum offer price (both figures represent Class A shares with all distributions reinvested) for the year ended Aug. 31, 2008. The Fund’s performance benchmark, the Lehman Brothers Municipal Bond Index, returned +4.48%.
For complete, annualized performance for Delaware Tax-Free Idaho Fund, please see the table on page 21.
What affected Fund performance?
Idaho’s economy has expanded and diversified in recent years, benefiting from population growth. The state has seen particular growth in the technology sector, including both manufacturing and tech-related services. According to Moody’s, an above average dependence on the natural resources sector persists despite the state’s progress in diversifying its economy. Employment and income growth has slowed, following a period of record growth from 2003 to 2007, though state economists anticipate that growth should continue to outpace the nation overall (source: S&P). As of June 2008, the state’s unemployment rate of 3.8% was well below the national unemployment rate of 5.6% reported by the U.S. Labor Department. The fiscal 2009 budget anticipates a 3.4% increase in General Fund revenues versus a 6.3% increase in expenditures, resulting in a lower projected ending fund balance.
Through the first seven months of 2008, national issuance declined to a total of $259.8 billion. Idaho issuance decreased 20% to total $557.5 million, according to Bond Buyer.
We employed tactical shifts in the Fund’s asset allocation throughout the year to adapt to the ongoing difficult conditions within the municipal bond markets. Though the
7
Portfolio management review
Delaware multi-state funds
Fund was not heavily exposed to bonds with maturities of 20 or more years, we further pared back its exposure to securities there by 6%. We replaced these holdings with shorter maturity bonds — typically high grade bonds in the 3- to 6-year range. We also increased the Fund’s exposure to refunded (also known as prerefunded) bonds as well as local general obligation bonds during the year. Prerefunded bonds were among the better-performing bonds within the municipal market due to their low risk profile. They face less credit risk than most bond issues because they are backed by the invested debt proceeds of a second bond issue, which typically consists of U.S. Treasury securities.
In general, high grade bonds that fell within the belly of the curve (particularly those with maturities of 5 to 8 years) performed well during the period. Bonds that were refinanced during the year also added to Fund performance. A bond issued to fund Canyon County School District, maturing in 2020, is one example. This bond was refinanced in April 2008 and is now being called on its first call date (in 2012) and secured by escrowed U.S. government securities.
Among the Fund’s weaker performers were long housing bonds issued by the Idaho Housing and Finance Association. The housing bond sector was one of the worst performing sectors within the municipal market as measured by the Lehman Brothers Municipal Bond Index. The housing bond sector was impacted by recent legislation aimed to support the housing market. Part of the bill allowed municipal housing agencies to increase their issuance and allowed new issues to be exempt from the alternate minimum tax. Spreads for existing housing bonds widened in the aftermath.
Low grade bonds with 20 or more years to maturity were also noteworthy for their poor performance. Though we reduced the Fund’s exposure to bonds that were further out along the yield curve, these holdings were victims of the volatile market environment.
Delaware Tax-Free New York Fund
How did the Fund perform versus its benchmark index?
Delaware Tax-Free New York Fund returned +4.04% at net asset value and -0.68% at maximum offer price (both figures represent Class A shares with all distributions reinvested) for the year ended Aug. 31, 2008. The Fund’s performance benchmark, the Lehman Brothers Municipal Bond Index, returned +4.48%.
For complete, annualized performance for Delaware Tax-Free New York Fund, please see the table on page 24.
What affected Fund performance?
New York’s economy has picked up in recent years, and the greater New York City area remains its primary growth driver. However, the national economic slowdown has had a significant effect on the state’s economy. New York’s economy relies primarily on the financial and insurance sectors, which account for more than 20% of total state wages (source: S&P). In the past 12 months ending March 2008, the state has seen moderate employment gains across various sectors with non-farm payroll increasing 0.9% compared to national growth of 0.7%, according to the Nelson A. Rockefeller State Revenue Report #72. The unemployment rate for the state of 5.3% as of June 2008 is slightly below the national level of 5.6%, reported by the U.S. Labor Department. In comparison to the enacted Budget Financial
8
Plan, NYC’s Division of Budget has significantly lowered its projections for tax receipts in each of the four years of the financial plan.
Through the first 7 months of 2008, national issuance declined 1.3% to total $259.8 billion. New York issuance increased 47.1% to total $24.7 billion, according to Bond Buyer.
We employed tactical shifts in the Fund’s asset allocation throughout the year to adapt to the ongoing difficult conditions within the municipal bond markets. For example, we reduced by approximately 20% the Fund’s exposure to securities with 20 or more years to maturity. We replaced a large portion of these holdings with generally high grade shorter maturity bonds in the 5- to 10-year range. Among credit, we reduced the Fund’s exposure to what we consider mid- and low-investment-grade bonds (rated A and BBB) and purchased positions in high grade bonds such as Aa2- and AAA-rated (by Moody’s and S&P, respectively) New York Transitional Finance Authority bonds, which are bonds secured by a dedicated portion of the sales tax in New York City.
Bonds that were refinanced during the year were among the Fund’s better-performing holdings. Existing bondholders benefit from refinancing situations because their bonds are now being called on the first call date and the security behind the call is escrowed a U.S. government security. High-grade bonds (rated AA or better) as well as bonds with 4- to 8-years to maturity also performed well. A revenue bond, issued by the New York State Dormitory Authority and due in 2011, was noteworthy for its positive performance.
Bonds with 20 or more years to maturity, as well as those of a lower credit quality broadly were among the Fund’s worst performing holdings. These bonds were most affected by the flight to quality that occurred throughout virtually the entire annual period. Their prices declined, reflecting the widening credit spreads throughout the period. A Baa3- and BBB-rated (by Moody’s and S&P, respectively) New York City Industrial Development Authority bond issued to fund cargo terminals at John F. Kennedy International Airport, due in 2028, is an example of one such bond. Its price fell during the year as investors required wider spreads for lower credit ratings.
9
Portfolio management review
Delaware multi-state funds
| Fund basics | |||
| Delaware Tax-Free Arizona Fund | As of Aug. 31, 2008 | ||
| Fund objective: | The Fund seeks as high a level of current income exempt from federal income tax and from the Arizona state personal income tax, as is consistent with preservation of capital. | ||
| Total Fund net assets: | $140 million | ||
| Number of holdings: | 88 | ||
| Fund start date: | April 1, 1991 | ||
| Nasdaq symbols | CUSIPs | ||||
| Class A | VAZIX | 928916204 | |||
| Class B | DVABX | 928928639 | |||
| Class C | DVACX | 928916501 |
| Delaware Tax-Free California Fund | As of Aug. 31, 2008 | ||
| Fund objective: | The Fund seeks as high a level of current income exempt from federal income tax and from the California state personal income tax, as is consistent with preservation of capital. | ||
| Total Fund net assets: | $89 million | ||
| Number of holdings: | 86 | ||
| Fund start date: | March 2, 1995 | ||
| Nasdaq symbols | CUSIPs | ||||
| Class A | DVTAX | 928928829 | |||
| Class B | DVTFX | 928928811 | |||
| Class C | DVFTX | 928928795 |
| Delaware Tax-Free Colorado Fund | As of Aug. 31, 2008 | ||
| Fund objective: | The Fund seeks as high a level of current income exempt from federal income tax and from the Colorado state personal income tax, as is consistent with preservation of capital. | ||
| Total Fund net assets: | $248 million | ||
| Number of holdings: | 106 | ||
| Fund start date: | April 23, 1987 | ||
| Nasdaq symbols | CUSIPs | ||||
| Class A | VCTFX | 928920107 | |||
| Class B | DVBTX | 928928787 | |||
| Class C | DVCTX | 92907R101 |
10
| Delaware Tax-Free Idaho Fund | As of Aug. 31, 2008 | ||
| Fund objective: | The Fund seeks as high a level of current income exempt from federal income tax and from the Idaho state personal income tax, as is consistent with preservation of capital. | ||
| Total Fund net assets: | $89 million | ||
| Number of holdings: | 82 | ||
| Fund start date: | Jan. 4, 1995 | ||
| Nasdaq symbols | CUSIPs | ||||
| Class A | VIDAX | 928928704 | |||
| Class B | DVTIX | 928928746 | |||
| Class C | DVICX | 928928803 |
| Delaware Tax-Free New York Fund | As of Aug. 31, 2008 | ||
| Fund objective: | The Fund seeks as high a level of current income exempt from federal income tax and from the New York state personal income tax, as is consistent with preservation of capital. | ||
| Total Fund net assets: | $19 million | ||
| Number of holdings: | 51 | ||
| Fund start date: | Nov. 6, 1987 | ||
| Nasdaq symbols | CUSIPs | ||||
| Class A | FTNYX | 928928274 | |||
| Class B | DVTNX | 928928266 | |||
| Class C | DVFNX | 928928258 |
11
| Performance summaries | |
| Delaware Tax-Free Arizona Fund | Aug. 31, 2008 |
The performance data quoted represent past performance; past performance does not guarantee future results. Investment return and principal value will fluctuate so your shares, when redeemed, may be worth more or less than their original cost. Please obtain the performance data for the most recent month end by calling 800 523-1918 or visiting our Web site at www.delawareinvestments.com/performance. Current performance may be lower or higher than the performance data quoted.
You should consider the investment objectives, risks, charges, and expenses of the investment company carefully before investing. The Delaware Tax-Free Arizona Fund prospectus contains this and other important information about the investment company. Please request a prospectus through your financial advisor or by calling 800 523-1918 or visiting our Web site at www.delawareinvestments.com. Read the prospectus carefully before you invest or send money.
A rise or fall in interest rates can have a significant impact on bond prices and the net asset value (NAV) of the Fund. Funds that invest in bonds can lose their value as interest rates rise, and an investor can lose principal.
| Fund performance | Average annual total returns through Aug. 31, 2008 | ||||||
| 1 year | 5 years | 10 years | Lifetime | ||||
| Class A (Est. April 1, 1991) | |||||||
| Excluding sales charge | +2.78% | +3.89% | +4.11% | +5.74% | |||
| Including sales charge | -1.83% | +2.93% | +3.64% | +5.46% | |||
| Class B (Est. March 10, 1995) | |||||||
| Excluding sales charge | +2.10% | +3.11% | +3.48% | +4.64% | |||
| Including sales charge | -1.85% | +2.85% | +3.48% | +4.64% | |||
| Class C (Est. May 26, 1994) | |||||||
| Excluding sales charge | +2.09% | +3.12% | +3.34% | +4.36% | |||
| Including sales charge | +1.11% | +3.12% | +3.34% | +4.36% | |||
Returns reflect the reinvestment of all distributions and any applicable sales charges as noted in the following paragraphs.
Performance for Class B and C shares, excluding sales charges, assumes either that contingent deferred sales charges did not apply or that the investment was not redeemed.
An expense limitation was in effect for all classes during the periods shown in the Fund performance chart above and in the Performance of a $10,000 investment chart on page 14. The current expenses for each class are listed on the chart on page 13. Performance would have been lower had the expense limitation not been in effect.
The Fund offers Class A, B, and C shares. Class A shares are sold with a maximum front-end sales charge of up to 4.50%, and have an annual distribution and service fee of up to 0.25% of average daily net assets.
Class B shares may only be purchased through dividend reinvestment and certain permitted exchanges as described in the prospectus. Please see the prospectus for additional information on Class B purchase and sales charges. Class B shares have a contingent
12
deferred sales charge that declines from 4.00% to zero depending on the period of time the shares are held. Class B shares will automatically convert to Class A shares on a quarterly basis approximately eight years after purchase. They are also subject to an annual distribution and service fee of up to 1.00% of average daily net assets. Please see the prospectus for additional information on Class B purchase and sales charges.
Ten-year and lifetime performance figures for Class B shares reflect conversion to Class A shares after eight years.
Class C shares are sold with a contingent deferred sales charge of 1.00% if redeemed during the first 12 months. They are also subject to an annual distribution and service fee of 1.00% of average daily net assets.
Please see the fee table in the prospectus and your financial professional for a more complete explanation of sales charges.
The performance table on page 12 and the graph on page 14 do not reflect the deduction of taxes the shareholder would pay on Fund distributions or redemptions of Fund shares.
Substantially all dividend income derived from tax-free funds is exempt from federal income tax. Some income may be subject to the federal alternative minimum tax that applies to certain investors. Capital gains, if any, are taxable.
Funds that invest primarily in a specific state may be more susceptible to the economic, regulatory, and other factors of that state than funds that invest more broadly.
The Fund’s expense ratios, as described in the most recent prospectus, are disclosed in the table below. Management has contracted to reimburse certain expenses and/or waive its management fees from Jan. 1, 2008, through Dec. 31, 2008. Please see the most recent prospectus for additional information on the fee waivers.
| Fund expense ratios | Class A | Class B | Class C | |||||||
| Total annual operating expenses | 0.90 | % | 1.65 | % | 1.65 | % | ||||
| (without fee waivers) | ||||||||||
| Net expense ratio | 0.75 | % | 1.50 | % | 1.50 | % | ||||
| (including fee waivers, if any)* | ||||||||||
| *The applicable fee waivers are discussed on pages 12 and 13. |
13
Performance summaries
Delaware Tax-Free Arizona Fund
Performance of a $10,000 investment
Average annual total returns from Aug. 31, 1998, through Aug. 31, 2008
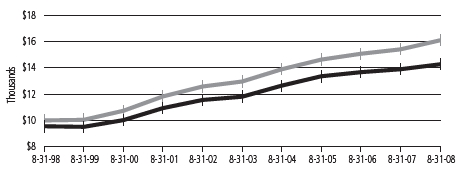
| For period beginning Aug. 31, 1998, through Aug. 31, 2008 | Starting value | Ending value | |||||
| Lehman Brothers Municipal Bond Index | $10,000 | $16,096 | |||||
| Delaware Tax-Free Arizona Fund — Class A Shares | $9,550 | $14,274 | |||||
The chart assumes $10,000 invested in the Fund on Aug. 31, 1998, and includes the effect of a 4.50% front-end sales charge and the reinvestment of all distributions. Please see pages 12 and 13 for additional details on these fees.
Performance of other Fund classes will vary due to different charges and expenses. The chart does not reflect the deduction of taxes the shareholders would pay on Fund distributions or redemptions of Fund shares.
The chart also assumes $10,000 invested in the Lehman Brothers Municipal Bond Index as of Aug. 31, 1998. The Lehman Brothers Municipal Bond Index measures the total return performance of the long-term, investment grade tax-exempt bond market. An index is unmanaged and does not reflect the costs of operating a mutual fund, such as the costs of buying, selling, and holding securities. You cannot invest directly in an index.
Past performance is not a guarantee of future results.
14
| Delaware Tax-Free California Fund | Aug. 31, 2008 |
The performance data quoted represent past performance; past performance does not guarantee future results. Investment return and principal value will fluctuate so your shares, when redeemed, may be worth more or less than their original cost. Please obtain the performance data for the most recent month end by calling 800 523-1918 or visiting our Web site at www.delawareinvestments.com/performance. Current performance may be lower or higher than the performance data quoted.
You should consider the investment objectives, risks, charges, and expenses of the investment company carefully before investing. The Delaware Tax-Free California Fund prospectus contains this and other important information about the investment company. Please request a prospectus through your financial advisor or by calling 800 523-1918 or visiting our Web site at www.delawareinvestments.com. Read the prospectus carefully before you invest or send money.
A rise or fall in interest rates can have a significant impact on bond prices and the net asset value (NAV) of the Fund. Funds that invest in bonds can lose their value as interest rates rise, and an investor can lose principal.
| Fund performance | Average annual total returns through Aug. 31, 2008 | |||||||
| 1 year | 5 years | 10 years | Lifetime | |||||
| Class A (Est. March 2, 1995) | ||||||||
| Excluding sales charge | +2.21% | +4.36% | +4.36% | +5.69% | ||||
| Including sales charge | -2.41% | +3.39% | +3.88% | +5.33% | ||||
| Class B (Est. Aug. 23, 1995) | ||||||||
| Excluding sales charge | +1.34% | +3.56% | +3.73% | +5.31% | ||||
| Including sales charge | -2.58% | +3.30% | +3.73% | +5.31% | ||||
| Class C (Est. April 9, 1996) | ||||||||
| Excluding sales charge | +1.35% | +3.57% | +3.57% | +4.79% | ||||
| Including sales charge | +0.37% | +3.57% | +3.57% | +4.79% | ||||
Returns reflect the reinvestment of all distributions and any applicable sales charges as noted in the following paragraphs.
Performance for Class B and C shares, excluding sales charges, assumes either that contingent deferred sales charges did not apply or that the investment was not redeemed.
15
Performance summaries
Delaware Tax-Free California Fund
An expense limitation was in effect for all classes during the periods shown in the Fund performance chart on page 15 and in the Performance of a $10,000 investment chart on page 17. The current expenses for each class are listed on the chart below. Performance would have been lower had the expense limitation not been in effect.
The Fund offers Class A, B, and C shares. Class A shares are sold with a maximum front-end sales charge of up to 4.50%, and have an annual distribution and service fee of up to 0.25% of average daily net assets.
Class B shares may only be purchased through dividend reinvestment and certain permitted exchanges as described in the prospectus. Please see the prospectus for additional information on Class B purchase and sales charges. Class B shares have a contingent deferred sales charge that declines from 4.00% to zero depending on the period of time the shares are held. Class B shares will automatically convert to Class A shares on a quarterly basis approximately eight years after purchase. They are also subject to an annual distribution and service fee of up to 1.00% of average daily net assets.
Ten-year and lifetime performance figures for Class B shares reflect conversion to Class A shares after eight years.
Class C shares are sold with a contingent deferred sales charge of 1.00% if redeemed during the first 12 months. They are also subject to an annual distribution and service fee of 1.00% of average daily net assets.
Please see the fee table in the prospectus and your financial professional for a more complete explanation of sales charges.
The performance table on page 15 and the graph on page 17 do not reflect the deduction of taxes the shareholder would pay on Fund distributions or redemptions of Fund shares.
Substantially all dividend income derived from tax-free funds is exempt from federal income tax. Some income may be subject to the federal alternative minimum tax that applies to certain investors. Capital gains, if any, are taxable.
Funds that invest primarily in a specific state may be more susceptible to the economic, regulatory, and other factors of that state than funds that invest more broadly.
The Fund’s expense ratios, as described in the most recent prospectus, are disclosed in the table below. Management has contracted to reimburse certain expenses and/or waive its management fees from Jan. 1, 2008, through Dec. 31, 2008. Please see the most recent prospectus for additional information on the fee waivers.
| Fund expense ratios | Class A | Class B | Class C | |||||||
| Total annual operating expenses | 0.97 | % | 1.72 | % | 1.72 | % | ||||
| (without fee waivers) | ||||||||||
| Net expense ratio | 0.88 | % | 1.63 | % | 1.63 | % | ||||
| (including fee waivers, if any)* | ||||||||||
| *The applicable fee waivers are discussed on pages 15 and 16. |
16
Performance of a $10,000 investment
Average annual total returns from Aug. 31, 1998, through Aug. 31, 2008
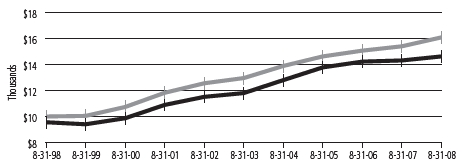
| For period beginning Aug. 31, 1998, through Aug. 31, 2008 | Starting value | Ending value | |||||
| Lehman Brothers Municipal Bond Index | $10,000 | $16,096 | |||||
| Delaware Tax-Free California Fund — Class A Shares | $9,550 | $14,615 | |||||
The chart assumes $10,000 invested in the Fund on Aug. 31, 1998, and includes the effect of a 4.50% front-end sales charge and the reinvestment of all distributions. Please see page 16 for additional details on these fees.
Performance of other Fund classes will vary due to different charges and expenses. The chart does not reflect the deduction of taxes the shareholders would pay on Fund distributions or redemptions of Fund shares.
The chart also assumes $10,000 invested in the Lehman Brothers Municipal Bond Index as of Aug. 31, 1998. The Lehman Brothers Municipal Bond Index measures the total return performance of the long-term, investment grade tax-exempt bond market. An index is unmanaged and does not reflect the costs of operating a mutual fund, such as the costs of buying, selling, and holding securities. You cannot invest directly in an index.
Past performance is not a guarantee of future results.
17
| Performance summaries | |
| Delaware Tax-Free Colorado Fund | Aug. 31, 2008 |
The performance data quoted represent past performance; past performance does not guarantee future results. Investment return and principal value will fluctuate so your shares, when redeemed, may be worth more or less than their original cost. Please obtain the performance data for the most recent month end by calling 800 523-1918 or visiting our Web site at www.delawareinvestments.com/performance. Current performance may be lower or higher than the performance data quoted.
You should consider the investment objectives, risks, charges, and expenses of the investment company carefully before investing. The Delaware Tax-Free Colorado Fund prospectus contains this and other important information about the investment company. Please request a prospectus through your financial advisor or by calling 800 523-1918 or visiting our Web site at www.delawareinvestments.com. Read the prospectus carefully before you invest or send money.
A rise or fall in interest rates can have a significant impact on bond prices and the net asset value (NAV) of the Fund. Funds that invest in bonds can lose their value as interest rates rise, and an investor can lose principal.
| Fund performance | Average annual total returns through Aug. 31, 2008 | |||||||
| 1 year | 5 years | 10 years | Lifetime | |||||
| Class A (Est. April 23, 1987) | ||||||||
| Excluding sales charge | +3.38% | +4.10% | +3.95% | +6.28% | ||||
| Including sales charge | -1.31% | +3.15% | +3.48% | +6.05% | ||||
| Class B (Est. March 22, 1995) | ||||||||
| Excluding sales charge | +2.60% | +3.32% | +3.32% | +4.70% | ||||
| Including sales charge | -1.36% | +3.06% | +3.32% | +4.70% | ||||
| Class C (Est. May 6, 1994) | ||||||||
| Excluding sales charge | +2.60% | +3.32% | +3.18% | +4.45% | ||||
| Including sales charge | +1.60% | +3.32% | +3.18% | +4.45% | ||||
Returns reflect the reinvestment of all distributions and any applicable sales charges as noted in the following paragraphs.
Performance for Class B and C shares, excluding sales charges, assumes either that contingent deferred sales charges did not apply or that the investment was not redeemed.
An expense limitation was in effect for all classes during the periods shown in the Fund performance chart above and in the Performance of a $10,000 investment chart on page 20. The current expenses for each class are listed on the chart on page 19. Performance would have been lower had the expense limitation not been in effect.
The Fund offers Class A, B, and C shares. Class A shares are sold with a maximum front-end sales charge of up to 4.50%, and have an annual distribution and service fee of up to 0.25% of average daily net assets.
Class B shares may only be purchased through dividend reinvestment and certain permitted exchanges as described in the prospectus. Class B shares have a contingent deferred sales charge that declines from 4.00% to zero depending on the period of time the shares
18
are held. Class B shares will automatically convert to Class A shares on a quarterly basis approximately eight years after purchase. They are also subject to an annual distribution and service fee of up to 1.00% of average daily net assets. Please see the prospectus for additional information on Class B purchase and sales charges.
Ten-year and lifetime performance figures for Class B shares reflect conversion to Class A shares after eight years.
Class C shares are sold with a contingent deferred sales charge of 1.00% if redeemed during the first 12 months. They are also subject to an annual distribution and service fee of 1.00% of average daily net assets.
Please see the fee table in the prospectus and your financial professional for a more complete explanation of sales charges.
The performance table on page 18 and the graph on page 20 do not reflect the deduction of taxes the shareholder would pay on Fund distributions or redemptions of Fund shares.
Substantially all dividend income derived from tax-free funds is exempt from federal income tax. Some income may be subject to the federal alternative minimum tax that applies to certain investors. Capital gains, if any, are taxable.
Funds that invest primarily in a specific state may be more susceptible to the economic, regulatory, and other factors of that state than funds that invest more broadly.
The Fund’s expense ratios, as described in the most recent prospectus, are disclosed in the table below. Management has contracted to reimburse certain expenses and/or waive its management fees from Jan. 1, 2008, through Dec. 31, 2008. Please see the most recent prospectus for additional information on the fee waivers.
| Fund expense ratios | Class A | Class B | Class C | |||||||
| Total annual operating expenses | 0.96 | % | 1.71 | % | 1.71 | % | ||||
| (without fee waivers) | ||||||||||
| Net expense ratio | 0.93 | % | 1.68 | % | 1.68 | % | ||||
| (including fee waivers, if any)* | ||||||||||
| *The applicable fee waivers are discussed on pages 18 and 19. |
19
Performance summaries
Delaware Tax-Free Colorado Fund
Performance of a $10,000 investment
Average annual total returns from Aug. 31, 1998, through Aug. 31, 2008
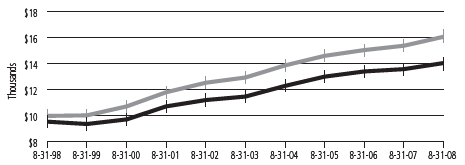
| For period beginning Aug. 31, 1998, through Aug. 31, 2008 | Starting value | Ending value | |||||
| Lehman Brothers Municipal Bond Index | $10,000 | $16,096 | |||||
| Delaware Tax-Free Colorado Fund — Class A Shares | $9,550 | $14,059 | |||||
The chart assumes $10,000 invested in the Fund on Aug. 31, 1998, and includes the effect of a 4.50% front-end sales charge and the reinvestment of all distributions. Please see pages 18 and 19 for additional details on these fees.
Performance of other Fund classes will vary due to different charges and expenses. The chart does not reflect the deduction of taxes the shareholder would pay on Fund distributions or redemptions of Fund shares.
The chart also assumes $10,000 invested in the Lehman Brothers Municipal Bond Index as of Aug. 31, 1998. The Lehman Brothers Municipal Bond Index measures the total return performance of the long-term, investment grade tax-exempt bond market. An index is unmanaged and does not reflect the costs of operating a mutual fund, such as the costs of buying, selling, and holding securities. You cannot invest directly in an index.
Past performance is not a guarantee of future results.
20
| Delaware Tax-Free Idaho Fund | Aug. 31, 2008 |
The performance data quoted represent past performance; past performance does not guarantee future results. Investment return and principal value will fluctuate so your shares, when redeemed, may be worth more or less than their original cost. Please obtain the performance data for the most recent month end by calling 800 523-1918 or visiting our Web site at www.delawareinvestments.com/performance. Current performance may be lower or higher than the performance data quoted.
You should consider the investment objectives, risks, charges, and expenses of the investment company carefully before investing. The Delaware Tax-Free Idaho Fund prospectus contains this and other important information about the investment company. Please request a prospectus through your financial advisor or by calling 800 523-1918 or visiting our Web site at www.delawareinvestments.com. Read the prospectus carefully before you invest or send money.
A rise or fall in interest rates can have a significant impact on bond prices and the net asset value (NAV) of the Fund. Funds that invest in bonds can lose their value as interest rates rise, and an investor can lose principal.
| Fund performance | Average annual total returns through Aug. 31, 2008 | |||||||
| 1 year | 5 years | 10 years | Lifetime | |||||
| Class A (Est. Jan. 4, 1995) | ||||||||
| Excluding sales charge | +3.93% | +4.27% | +4.17% | +5.66% | ||||
| Including sales charge | -0.74% | +3.32% | +3.69% | +5.31% | ||||
| Class B (Est. March 16, 1995) | ||||||||
| Excluding sales charge | +3.17% | +3.48% | +3.54% | +4.83% | ||||
| Including sales charge | -0.83% | +3.22% | +3.54% | +4.83% | ||||
| Class C (Est. Jan. 11, 1995) | ||||||||
| Excluding sales charge | +3.16% | +3.49% | +3.40% | +4.83% | ||||
| Including sales charge | +2.16% | +3.49% | +3.40% | +4.83% | ||||
Returns reflect the reinvestment of all distributions and any applicable sales charges as noted in the paragraphs on page 22.
Performance for Class B and C shares, excluding sales charges, assumes either that contingent deferred sales charges did not apply or that the investment was not redeemed.
21
Performance summaries
Delaware Tax-Free Idaho Fund
An expense limitation was in effect for all classes during the periods shown in the Fund performance chart on page 21 and in the Performance of a $10,000 investment chart on page 23. The current expenses for each class are listed on the chart below. Performance would have been lower had the expense limitation not been in effect.
The Fund offers Class A, B, and C shares. Class A shares are sold with a maximum front-end sales charge of up to 4.50%, and have an annual distribution and service fee of up to 0.25% of average daily net assets.
Class B shares may only be purchased through dividend reinvestment and certain permitted exchanges as described in the prospectus. Class B shares have a contingent deferred sales charge that declines from 4.00% to zero depending on the period of time the shares are held. Class B shares will automatically convert to Class A shares on a quarterly basis approximately eight years after purchase. They are also subject to an annual distribution and service fee of up to 1.00% of average daily net assets. Please see the prospectus for additional information on Class B purchase and sales charges.
Ten-year and lifetime performance figures for Class B shares reflect conversion to Class A shares after eight years.
Class C shares are sold with a contingent deferred sales charge of 1.00% if redeemed during the first 12 months. They are also subject to an annual distribution and service fee of 1.00% of average daily net assets.
Please see the fee table in the prospectus and your financial professional for a more complete explanation of sales charges.
The performance table on page 21 and the graph on page 23 do not reflect the deduction of taxes the shareholder would pay on Fund distributions or redemptions of Fund shares.
Substantially all dividend income derived from tax-free funds is exempt from federal income tax. Some income may be subject to the federal alternative minimum tax that applies to certain investors. Capital gains, if any, are taxable.
Funds that invest primarily in a specific state may be more susceptible to the economic, regulatory, and other factors of that state than funds that invest more broadly.
The Fund’s expense ratios, as described in the most recent prospectus, are disclosed in the table below. Management has contracted to reimburse certain expenses and/or waive its management fees from Jan. 1, 2008, through Dec. 31, 2008. Please see the most recent prospectus for additional information on the fee waivers.
| Fund expense ratios | Class A | Class B | Class C | |||||||
| Total annual operating expenses | 0.98 | % | 1.73 | % | 1.73 | % | ||||
| (without fee waivers) | ||||||||||
| Net expense ratio | 0.85 | % | 1.60 | % | 1.60 | % | ||||
| (including fee waivers, if any)* | ||||||||||
| *The applicable fee waivers are discussed on pages 21 and 22. |
22
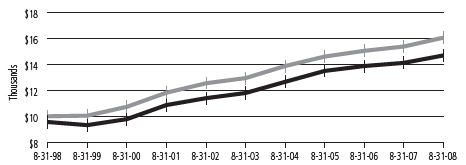
Performance of a $10,000 investment
Average annual total returns from Aug. 31, 1998, through Aug. 31, 2008
![]()
| For period beginning Aug. 31, 1998, through Aug. 31, 2008 | Starting value | Ending value | |||||
| Lehman Brothers Municipal Bond Index | $10,000 | $16,096 | |||||
| Delaware Tax-Free Idaho Fund — Class A Shares | $9,550 | $14,353 | |||||
The chart assumes $10,000 invested in the Fund on Aug. 31, 1998, and includes the effect of a 4.50% front-end sales charge and the reinvestment of all distributions. Please see page 22 for additional details on these fees.
Performance of other Fund classes will vary due to different charges and expenses.
The chart does not reflect the deduction of taxes the shareholders would pay on Fund distributions or redemptions of Fund shares.
The chart also assumes $10,000 invested in the Lehman Brothers Municipal Bond Index as of Aug. 31, 1998. The Lehman Brothers Municipal Bond Index measures the total return performance of the long-term, investment grade tax-exempt bond market. An index is unmanaged and does not reflect the costs of operating a mutual fund, such as the costs of buying, selling, and holding securities. You cannot invest directly in an index.
Past performance is not a guarantee of future results.
23
| Performance summaries | |
| Delaware Tax-Free New York Fund | Aug. 31, 2008 |
The performance data quoted represent past performance; past performance does not guarantee future results. Investment return and principal value will fluctuate so your shares, when redeemed, may be worth more or less than their original cost. Please obtain the performance data for the most recent month end by calling 800 523-1918 or visiting our Web site at www.delawareinvestments.com/performance. Current performance may be lower or higher than the performance data quoted.
You should consider the investment objectives, risks, charges, and expenses of the investment company carefully before investing. The Delaware Tax-Free New York Fund prospectus contains this and other important information about the investment company. Please request a prospectus through your financial advisor or by calling 800 523-1918 or visiting our Web site at www.delawareinvestments.com. Read the prospectus carefully before you invest or send money.
A rise or fall in interest rates can have a significant impact on bond prices and the net asset value (NAV) of the Fund. Funds that invest in bonds can lose their value as interest rates rise, and an investor can lose principal.
| Fund performance | Average annual total returns through Aug. 31, 2008 | |||||||
| 1 year | 5 years | 10 years | Lifetime | |||||
| Class A (Est. Nov. 6, 1987) | ||||||||
| Excluding sales charge | +4.04% | +4.50% | +4.42% | +5.97% | ||||
| Including sales charge | -0.68% | +3.54% | +3.95% | +5.73% | ||||
| Class B (Est. Nov. 14, 1994) | ||||||||
| Excluding sales charge | +3.17% | +3.71% | +3.80% | +4.65% | ||||
| Including sales charge | -0.82% | +3.45% | +3.80% | +4.65% | ||||
| Class C (Est. April 26, 1995) | ||||||||
| Excluding sales charge | +3.17% | +3.71% | +3.66% | +3.96% | ||||
| Including sales charge | +2.17% | +3.71% | +3.66% | +3.96% | ||||
Returns reflect the reinvestment of all distributions and any applicable sales charges as noted in the following paragraphs.
Performance for Class B and C shares, excluding sales charges, assumes either that contingent deferred sales charges did not apply or that the investment was not redeemed.
An expense limitation was in effect for all classes during the periods shown in the Fund performance chart above and in the Performance of a $10,000 investment chart on page 26. The current expenses for each class are listed on the chart on page 25. Performance would have been lower had the expense limitation not been in effect.
The Fund offers Class A, B, and C shares. Class A shares are sold with a maximum front-end sales charge of up to 4.50%, and have an annual distribution and service fee of up to 0.25% of average daily net assets.
Class B shares may only be purchased through dividend reinvestment and certain permitted exchanges as described in the prospectus. Class B shares have a contingent deferred sales charge that declines from 4.00% to zero depending on the period of time the shares
24
are held. Class B shares will automatically convert to Class A shares on a quarterly basis approximately eight years after purchase. They are also subject to an annual distribution and service fee of up to 1.00% of average daily net assets. Please see the prospectus for additional information on Class B purchase and sales charges.
Ten-year and lifetime performance figures for Class B shares reflect conversion to Class A shares after eight years.
Class C shares are sold with a contingent deferred sales charge of 1.00% if redeemed during the first 12 months. They are also subject to an annual distribution and service fee of 1.00% of average daily net assets.
Please see the fee table in the prospectus and your financial professional for a more complete explanation of sales charges.
The performance table on page 24 and the graph on page 26 do not reflect the deduction of taxes the shareholder would pay on Fund distributions or redemptions of Fund shares.
Substantially all dividend income derived from tax-free funds is exempt from federal income tax. Some income may be subject to the federal alternative minimum tax that applies to certain investors. Capital gains, if any, are taxable.
Funds that invest primarily in a specific state may be more susceptible to the economic, regulatory, and other factors of that state than funds that invest more broadly.
The Fund’s expense ratios, as described in the most recent prospectus, are disclosed in the table below. Management has contracted to reimburse certain expenses and/or waive its management fees from Jan. 1, 2008, through Dec. 31, 2008. Please see the most recent prospectus for additional information on the fee waivers.
| Fund expense ratios | Class A | Class B | Class C | |||||||
| Total annual operating expenses | 1.10 | % | 1.85 | % | 1.85 | % | ||||
| (without fee waivers) | ||||||||||
| Net expense ratios | 0.85 | % | 1.60 | % | 1.60 | % | ||||
| (including fee waivers, if any)* | ||||||||||
| *The applicable fee waivers are discussed on pages 24 and 25. |
25
Performance summaries
Delaware Tax-Free New York Fund
Performance of a $10,000 investment
Average annual total returns from Aug. 31, 1998, through Aug. 31, 2008
| For period beginning Aug. 31, 1998, through Aug. 31, 2008 | Starting value | Ending value | |||||
| Lehman Brothers Municipal Bond Index | $10,000 | $16,096 | |||||
| Delaware Tax-Free New York Fund — Class A Shares | $9,550 | $14,710 | |||||
The chart assumes $10,000 invested in the Fund on Aug. 31, 1998, and includes the effect of a 4.50% front-end sales charge and the reinvestment of all distributions. Please see pages 24 and 25 for additional details on these fees.
Performance of other Fund classes will vary due to different charges and expenses. The chart does not reflect the deduction of taxes the shareholder would pay on Fund distributions or redemptions of Fund shares.
The chart also assumes $10,000 invested in the Lehman Brothers Municipal Bond Index as of Aug. 31, 1998. The Lehman Brothers Municipal Bond Index measures the total return performance of the long-term, investment grade tax-exempt bond market. An index is unmanaged and does not reflect the costs of operating a mutual fund, such as the costs of buying, selling, and holding securities. You cannot invest directly in an index.
Past performance is not a guarantee of future results.
26
Disclosure of Fund expenses
For the period March 1, 2008 to August 31, 2008
As a shareholder of a Fund, you incur two types of costs: (1) transaction costs, including sales charges (loads) on purchase payments, reinvested dividends, or other distributions; redemption fees; and exchange fees; and (2) ongoing costs, including management fees; distribution and/or service (12b-1) fees; and other Fund expenses. These following examples are intended to help you understand your ongoing costs (in dollars) of investing in a Fund and to compare these costs with the ongoing costs of investing in other mutual funds.
The examples are based on an investment of $1,000 invested at the beginning of the period and held for the entire period March 1, 2008 to August 31, 2008.
Actual expenses
The first section of the tables shown, “Actual Fund Return,” provides information about actual account values and actual expenses. You may use the information in this section of the table, together with the amount you invested, to estimate the expenses that you paid over the period. Simply divide your account value by $1,000 (for example, an $8,600 account value divided by $1,000 = 8.6), then multiply the result by the number in the first section under the heading entitled “Expenses Paid During Period” to estimate the expenses you paid on your account during this period.
Hypothetical example for comparison purposes
The second section of the tables shown, “Hypothetical 5% Return,” provides information about hypothetical account values and hypothetical expenses based on the Funds’ actual expense ratios and an assumed rate of return of 5% per year before expenses, which is not the Funds’ actual return. The hypothetical account values and expenses may not be used to estimate the actual ending account balance or expenses you paid for the period. You may use this information to compare the ongoing costs of investing in each Fund and other funds. To do so, compare this 5% hypothetical example with the 5% hypothetical examples that appear in the shareholder reports of the other funds.
Please note that the expenses shown in the tables are meant to highlight your ongoing costs only and do not reflect any transactional costs, such as sales charges (loads), redemption fees, or exchange fees. Therefore, the second section of each table is useful in comparing ongoing costs only, and will not help you determine the relative total costs of owning different funds. In addition, if these transactional costs were included, your costs would have been higher. The Funds’ expenses shown in the tables reflect fee waivers in effect. The expenses shown in each table assume reinvestment of all dividends and distributions.
28
“Expenses Paid During Period” are equal to the Funds’ annualized expense ratios, multiplied by the average account value over the period, multiplied by 184/366 (to reflect the one-half year period).
Delaware Tax-Free Arizona Fund
Expense analysis of an investment of $1,000
| Beginning | Ending | Expenses | |||||||||
| Account Value | Account Value | Annualized | Paid During Period | ||||||||
| 3/1/08 | 8/31/08 | Expense Ratio | 3/1/08 to 8/31/08 | ||||||||
| Actual Fund return | |||||||||||
| Class A | $1,000.00 | $1,049.70 | 0.75 | % | $3.86 | ||||||
| Class B | 1,000.00 | 1,045.70 | 1.50 | % | 7.71 | ||||||
| Class C | 1,000.00 | 1,045.60 | 1.50 | % | 7.71 | ||||||
| Hypothetical 5% return (5% return before expenses) | |||||||||||
| Class A | $1,000.00 | $1,021.37 | 0.75 | % | $3.81 | ||||||
| Class B | 1,000.00 | 1,017.60 | 1.50 | % | 7.61 | ||||||
| Class C | 1,000.00 | 1,017.60 | 1.50 | % | 7.61 | ||||||
Delaware Tax-Free California Fund
Expense analysis of an investment of $1,000
| Beginning | Ending | Expenses | |||||||||
| Account Value | Account Value | Annualized | Paid During Period | ||||||||
| 3/1/08 | 8/31/08 | Expense Ratio | 3/1/08 to 8/31/08 | ||||||||
| Actual Fund return | |||||||||||
| Class A | $1,000.00 | $1,055.80 | 0.88 | % | $4.55 | ||||||
| Class B | 1,000.00 | 1,051.60 | 1.63 | % | 8.41 | ||||||
| Class C | 1,000.00 | 1,050.80 | 1.63 | % | 8.40 | ||||||
| Hypothetical 5% return (5% return before expenses) | |||||||||||
| Class A | $1,000.00 | $1,020.71 | 0.88 | % | $4.47 | ||||||
| Class B | 1,000.00 | 1,016.94 | 1.63 | % | 8.26 | ||||||
| Class C | 1,000.00 | 1,016.94 | 1.63 | % | 8.26 | ||||||
29
Disclosure of Fund expenses
Delaware Tax-Free Colorado Fund
Expense analysis of an investment of $1,000
| Beginning | Ending | Expenses | |||||||||
| Account Value | Account Value | Annualized | Paid During Period | ||||||||
| 3/1/08 | 8/31/08 | Expense Ratio | 3/1/08 to 8/31/08 | ||||||||
| Actual Fund return | |||||||||||
| Class A | $1,000.00 | $1,043.50 | 0.93 | % | $4.78 | ||||||
| Class B | 1,000.00 | 1,039.60 | 1.68 | % | 8.61 | ||||||
| Class C | 1,000.00 | 1,039.50 | 1.68 | % | 8.61 | ||||||
| Hypothetical 5% return (5% return before expenses) | |||||||||||
| Class A | $1,000.00 | $1,020.46 | 0.93 | % | $4.72 | ||||||
| Class B | 1,000.00 | 1,016.69 | 1.68 | % | 8.52 | ||||||
| Class C | 1,000.00 | 1,016.69 | 1.68 | % | 8.52 | ||||||
Delaware Tax-Free Idaho Fund
Expense analysis of an investment of $1,000
| Beginning | Ending | Expenses | |||||||||
| Account Value | Account Value | Annualized | Paid During Period | ||||||||
| 3/1/08 | 8/31/08 | Expense Ratio | 3/1/08 to 8/31/08 | ||||||||
| Actual Fund return | |||||||||||
| Class A | $1,000.00 | $1,049.50 | 0.85 | % | $4.38 | ||||||
| Class B | 1,000.00 | 1,045.60 | 1.60 | % | 8.23 | ||||||
| Class C | 1,000.00 | 1,044.60 | 1.60 | % | 8.22 | ||||||
| Hypothetical 5% return (5% return before expenses) | |||||||||||
| Class A | $1,000.00 | $1,020.86 | 0.85 | % | $4.32 | ||||||
| Class B | 1,000.00 | 1,017.09 | 1.60 | % | 8.11 | ||||||
| Class C | 1,000.00 | 1,017.09 | 1.60 | % | 8.11 | ||||||
Delaware Tax-Free New York Fund
Expense analysis of an investment of $1,000
| Beginning | Ending | Expenses | |||||||||
| Account Value | Account Value | Annualized | Paid During Period | ||||||||
| 3/1/08 | 8/31/08 | Expense Ratio | 3/1/08 to 8/31/08 | ||||||||
| Actual Fund return | |||||||||||
| Class A | $1,000.00 | $1,043.40 | 0.85 | % | $4.37 | ||||||
| Class B | 1,000.00 | 1,039.60 | 1.60 | % | 8.20 | ||||||
| Class C | 1,000.00 | 1,039.60 | 1.60 | % | 8.20 | ||||||
| Hypothetical 5% return (5% return before expenses) | |||||||||||
| Class A | $1,000.00 | $1,020.86 | 0.85 | % | $4.32 | ||||||
| Class B | 1,000.00 | 1,017.09 | 1.60 | % | 8.11 | ||||||
| Class C | 1,000.00 | 1,017.09 | 1.60 | % | 8.11 | ||||||
30
Sector allocations and credit quality breakdowns
Sector designations may be different than the sector designations presented in other Fund materials.
Delaware Tax-Free Arizona Fund
| Sector | Percentage of net assets | |
| Municipal Bonds | 98.59 | % |
| Corporate Revenue Bonds | 1.30 | % |
| Education Revenue Bonds | 5.15 | % |
| Electric Revenue Bonds | 5.96 | % |
| Escrowed to Maturity Bonds | 0.25 | % |
| Health Care Revenue Bonds | 6.84 | % |
| Housing Revenue Bonds | 1.81 | % |
| Lease Revenue Bonds | 11.83 | % |
| Local General Obligation Bonds | 5.93 | % |
| Pre-Refunded Bonds | 31.66 | % |
| Special Tax Revenue Bonds | 7.75 | % |
| State General Obligation Bonds | 5.68 | % |
| Transportation Revenue Bonds | 4.59 | % |
| Water & Sewer Revenue Bonds | 9.84 | % |
| Short-Term Investment | 0.38 | % |
| Total Value of Securities | 98.97 | % |
| Receivables and Other Assets Net of Liabilities | 1.03 | % |
| Total Net Assets | 100.00 | % |
| Credit quality breakdown (as a % of fixed income investments) | ||
| AAA | 23.47 | % |
| AA | 54.77 | % |
| A | 9.14 | % |
| BBB | 12.62 | % |
| Total | 100.00 | % |
31
Sector allocations and credit quality breakdowns
Sector designations may be different than the sector designations presented in other Fund materials.
Delaware Tax-Free California Fund
| Sector | Percentage of net assets | |
| Municipal Bonds | 98.96 | % |
| Education Revenue Bonds | 10.38 | % |
| Electric Revenue Bonds | 2.14 | % |
| Health Care Revenue Bonds | 6.67 | % |
| Housing Revenue Bonds | 8.71 | % |
| Lease Revenue Bonds | 7.76 | % |
| Local General Obligation Bonds | 9.47 | % |
| Pre-Refunded Bonds | 19.88 | % |
| Special Tax Revenue Bonds | 14.07 | % |
| State General Obligation Bonds | 9.28 | % |
| Transportation Revenue Bonds | 3.41 | % |
| Water & Sewer Revenue Bonds | 7.19 | % |
| Total Value of Securities | 98.96 | % |
| Receivables and Other Assets Net of Liabilities | 1.04 | % |
| Total Net Assets | 100.00 | % |
| Credit quality breakdown (as a % of fixed income investments) | ||
| AAA | 34.58 | % |
| AA | 22.84 | % |
| A | 19.35 | % |
| BBB | 13.85 | % |
| Not Rated | 9.38 | % |
| Total | 100.00 | % |
32
Delaware Tax-Free Colorado Fund
| Sector | Percentage of net assets | |
| Municipal Bonds | 97.75 | % |
| Education Revenue Bonds | 13.00 | % |
| Electric Revenue Bonds | 2.98 | % |
| Escrowed to Maturity Bonds | 2.31 | % |
| Health Care Revenue Bonds | 13.65 | % |
| Housing Revenue Bonds | 2.26 | % |
| Lease Revenue Bonds | 2.70 | % |
| Local General Obligation Bonds | 12.71 | % |
| Pre-Refunded Bonds | 33.47 | % |
| Special Tax Revenue Bonds | 6.15 | % |
| State General Obligation Bonds | 4.57 | % |
| Transportation Revenue Bonds | 2.30 | % |
| Water & Sewer Revenue Bonds | 1.65 | % |
| Short-Term Investments | 1.72 | % |
| Money Market Instrument | 0.39 | % |
| Variable Rate Demand Notes | 1.33 | % |
| Total Value of Securities | 99.47 | % |
| Receivables and Other Assets Net of Liabilities | 0.53 | % |
| Total Net Assets | 100.00 | % |
| Credit quality breakdown (as a % of fixed income investments) | ||
| AAA | 20.81 | % |
| AA | 34.05 | % |
| A | 14.55 | % |
| BBB | 20.61 | % |
| B | 0.76 | % |
| Not Rated | 9.22 | % |
| Total | 100.00 | % |
33
Sector allocations and credit quality breakdowns
Sector designations may be different than the sector designations presented in other Fund materials.
Delaware Tax-Free Idaho Fund
| Sector | Percentage of net assets | |
| Municipal Bonds | 95.44 | % |
| Corporate Revenue Bonds | 6.59 | % |
| Education Revenue Bonds | 10.43 | % |
| Escrowed to Maturity Bonds | 2.05 | % |
| Health Care Revenue Bonds | 3.94 | % |
| Housing Revenue Bonds | 6.16 | % |
| Lease Revenue Bonds | 5.76 | % |
| Local General Obligation Bonds | 25.07 | % |
| Pre-Refunded Bonds | 16.88 | % |
| Special Tax Revenue Bonds | 7.98 | % |
| State General Obligation Bonds | 3.13 | % |
| Transportation Revenue Bonds | 4.92 | % |
| Water & Sewer Revenue Bonds | 2.53 | % |
| Short-Term Investments | 1.57 | % |
| Money Market Instrument | 1.23 | % |
| Variable Rate Demand Note | 0.34 | % |
| Total Value of Securities | 97.01 | % |
| Receivables and Other Assets Net of Liabilities | 2.99 | % |
| Total Net Assets | 100.00 | % |
| Credit quality breakdown (as a % of fixed income investments) | ||
| AAA | 44.16 | % |
| AA | 16.60 | % |
| A | 18.53 | % |
| BBB | 16.40 | % |
| BB | 2.78 | % |
| Not Rated | 1.53 | % |
| Total | 100.00 | % |
34
Delaware Tax-Free New York Fund
| Sector | Percentage of net assets | |
| Municipal Bonds | 97.19 | % |
| Corporate Revenue Bonds | 6.22 | % |
| Education Revenue Bonds | 12.31 | % |
| Electric Revenue Bonds | 0.99 | % |
| Health Care Revenue Bonds | 9.25 | % |
| Housing Revenue Bonds | 1.13 | % |
| Lease Revenue Bonds | 5.83 | % |
| Local General Obligation Bonds | 3.48 | % |
| Pre-Refunded Bonds | 23.03 | % |
| Special Tax Revenue Bonds | 17.19 | % |
| State General Obligation Bonds | 0.50 | % |
| Transportation Revenue Bonds | 14.59 | % |
| Water & Sewer Revenue Bonds | 2.67 | % |
| Total Value of Securities | 97.19 | % |
| Receivables and Other Assets Net of Liabilities | 2.81 | % |
| Total Net Assets | 100.00 | % |
| Credit quality breakdown (as a % of fixed income investments) | ||
| AAA | 29.87 | % |
| AA | 34.15 | % |
| A | 15.11 | % |
| BBB | 14.08 | % |
| BB | 5.89 | % |
| Not Rated | 0.90 | % |
| Total | 100.00 | % |
35
| Statements of net assets | ||
| Delaware Tax-Free Arizona Fund | August 31, 2008 | |
| Principal amount | Value | |||||
| Municipal Bonds – 98.59% | ||||||
| Corporate Revenue Bonds – 1.30% | ||||||
| Maricopa County Pollution Control | ||||||
| (Palo Verde Project) Series A 5.05% 5/1/29 (AMBAC) | $ | 2,000,000 | $ | 1,822,320 | ||
| 1,822,320 | ||||||
| Education Revenue Bonds – 5.15% | ||||||
| Arizona State Board of Regents | ||||||
| (University of Arizona) 5.00% 6/1/21 | 1,255,000 | 1,332,132 | ||||
| Arizona State University Certificates of Participation | ||||||
| (Research Infrastructure Project) | ||||||
| 5.00% 9/1/30 (AMBAC) | 3,000,000 | 3,012,330 | ||||
| Pima County Industrial Development Authority | ||||||
| Educational Revenue (Tucson Country Day School | ||||||
| Project) 5.00% 6/1/37 | 1,000,000 | 810,770 | ||||
| South Campus Group Student Housing Revenue | ||||||
| (University of Arizona-South Campus Project) | ||||||
| 5.625% 9/1/35 (MBIA) | 1,000,000 | 989,720 | ||||
| Tucson Industrial Development Authority | ||||||
| (University of Arizona-Marshall Foundation) | ||||||
| Series B 5.00% 7/15/27 (AMBAC) | 1,000,000 | 1,004,140 | ||||
| University of Arizona Certificates of Participation | ||||||
| (University of Arizona Project) | ||||||
| Series A 5.125% 6/1/21 (AMBAC) | 85,000 | 86,944 | ||||
| 7,236,036 | ||||||
| Electric Revenue Bonds – 5.96% | ||||||
| Energy Management Services (University of Arizona- | ||||||
| Main Campus) 5.25% 7/1/17 (MBIA) | 1,500,000 | 1,602,360 | ||||
| Mesa Utilities System Revenue 5.00% 7/1/18 (FGIC) | 2,150,000 | 2,290,008 | ||||
| Puerto Rico Electric Power Authority Revenue | ||||||
| Series WW 5.00% 7/1/28 | 1,430,000 | 1,413,941 | ||||
| Salt River Project Agricultural Improvement & | ||||||
| Power District Electric System Revenue | ||||||
| Series A 5.00% 1/1/22 | 1,000,000 | 1,064,400 | ||||
| Series B 5.00% 1/1/31 (MBIA) | 2,000,000 | 2,005,280 | ||||
| 8,375,989 | ||||||
| Escrowed to Maturity Bonds – 0.25% | ||||||
| Phoenix Street & Highway User Revenue (Senior Lien) | ||||||
| 6.50% 7/1/09 (AMBAC) | 350,000 | 355,425 | ||||
| 355,425 | ||||||
36
| Principal amount | Value | |||||
| Municipal Bonds (continued) | ||||||
| Health Care Revenue Bonds – 6.84% | ||||||
| Arizona Health Facilities Authority Revenue | ||||||
| (Banner Health) Series D 5.375% 1/1/32 | $ | 1,500,000 | $ | 1,475,400 | ||
| Glendale Industrial Development Authority Hospital | ||||||
| Revenue (John C. Lincoln Health) 5.00% 12/1/42 | 2,500,000 | 2,109,000 | ||||
| Maricopa County Industrial Development Authority | ||||||
| Health Facilities Revenue (Catholic Health | ||||||
| Care West) Series A 5.50% 7/1/26 | 1,000,000 | 1,007,860 | ||||
| Scottsdale Industrial Development Authority | ||||||
| Hospital Revenue (Scottsdale Health Care) | ||||||
| Series A 5.25% 9/1/30 | 1,500,000 | 1,442,670 | ||||
| University Medical Center Hospital Revenue | ||||||
| 5.00% 7/1/24 | 800,000 | 753,568 | ||||
| 5.00% 7/1/35 | 1,000,000 | 884,310 | ||||
| Yavapai County Industrial Development Authority | ||||||
| Revenue (Yavapai Regional Medical Center) | ||||||
| Series A 5.25% 8/1/21 (RADIAN) | 2,000,000 | 1,927,240 | ||||
| 9,600,048 | ||||||
| Housing Revenue Bonds – 1.81% | ||||||
| Pima County Industrial Development Authority | ||||||
| Single Family Housing Revenue | ||||||
| Series A-1 6.125% 11/1/33 | ||||||
| (GNMA) (FNMA) (FHLMC) (AMT) | 15,000 | 15,208 | ||||
| Series B-1 6.10% 5/1/31 (GNMA) (AMT) | 45,000 | 45,612 | ||||
| Yuma Industrial Development Authority | ||||||
| Multifamily Housing Revenue | ||||||
| Series A 6.10% 9/20/19 (GNMA) (AMT) | 2,340,000 | 2,477,358 | ||||
| 2,538,178 | ||||||
| Lease Revenue Bonds – 11.83% | ||||||
| Arizona Game & Fish Department & | ||||||
| Community Beneficial Interest Certificates | ||||||
| (Administration Building Project) 5.00% 7/1/32 | 1,300,000 | 1,261,156 | ||||
| Marana Municipal Property Facilities Revenue | ||||||
| 5.00% 7/1/28 (AMBAC) | 575,000 | 582,107 | ||||
| Maricopa County Industrial Development Authority | ||||||
| Correctional Contract Revenue (Phoenix West Prison) | ||||||
| Series B 5.375% 7/1/22 (ACA) | 1,000,000 | 932,360 | ||||
| Phoenix Industrial Development Authority Lease | ||||||
| Revenue (Capitol Mall II, LLC Project) | ||||||
| 5.00% 9/15/28 (AMBAC) | 4,000,000 | 3,984,840 | ||||
37
Statements of net assets
Delaware Tax-Free Arizona Fund
| Principal amount | Value | |||||
| Municipal Bonds (continued) | ||||||
| Lease Revenue Bonds (continued) | ||||||
| Pinal County Certificates of Participation | ||||||
| 5.00% 12/1/29 | $ | 1,300,000 | $ | 1,266,681 | ||
| 5.125% 6/1/21 (AMBAC) | 4,675,000 | 4,791,828 | ||||
| Puerto Rico Public Buildings Authority Revenue | ||||||
| (Guaranteed Government Facilities) | ||||||
| Series D 5.25% 7/1/27 | 470,000 | 468,849 | ||||
| Series D 5.25% 7/1/36 | 270,000 | 267,251 | ||||
| Series I 5.25% 7/1/33 | 495,000 | 490,892 | ||||
| Salt River Project Arizona Agricultural Improvement & | ||||||
| Power District Certificates of Participation | ||||||
| 5.00% 12/1/18 (MBIA) | 1,500,000 | 1,561,275 | ||||
| University of Arizona Certificates of Participation | ||||||
| Series B 5.00% 6/1/31 (AMBAC) | 1,000,000 | 1,005,380 | ||||
| 16,612,619 | ||||||
| Local General Obligation Bonds – 5.93% | ||||||
| Chandler 5.00% 7/1/17 | 1,935,000 | 2,146,941 | ||||
| Cochise County Unified School District #68 | ||||||
| (Sierra Vista) 7.50% 7/1/10 (FGIC) | 1,000,000 | 1,089,850 | ||||
| Coconino & Yavapai Counties Joint Unified School | ||||||
| District #9 (Sedona Oak Creek Project of 2007) | ||||||
| Series A 4.50% 7/1/18 (FSA) | 1,520,000 | 1,621,399 | ||||
| DC Ranch Community Facilities | ||||||
| 5.00% 7/15/27 (AMBAC) | 1,000,000 | 993,900 | ||||
| Φ | Gila County Unifed School District #10 | |||||
| (Payson School Improvement-Project of 2006) | ||||||
| Series A 1.00% 7/1/27 (AMBAC) | 1,000,000 | 997,120 | ||||
| Maricopa County Unified School District #41 | ||||||
| (Gilbert School Improvement Projects of | ||||||
| 2005 & 2007) 3.25% 7/1/15 | 1,500,000 | 1,485,420 | ||||
| 8,334,630 | ||||||
| §Pre-Refunded Bonds – 31.66% | ||||||
| Arizona State Board of Regents Certificates of | ||||||
| Participation (University of Arizona-Main Campus) | ||||||
| Series 2000 A-1 5.125% 6/1/25-11 (AMBAC) | 1,250,000 | 1,341,463 | ||||
| Glendale Industrial Development Authority | ||||||
| Revenue (Midwestern University) | ||||||
| Series A 5.875% 5/15/31-11 | 1,000,000 | 1,093,260 | ||||
38
| Principal amount | Value | |||||
| Municipal Bonds (continued) | ||||||
| §Pre-Refunded Bonds (continued) | ||||||
| Mesa Industrial Development Authority | ||||||
| Revenue (Discovery Health Systems) | ||||||
| Series A 5.625% 1/1/29-10 (MBIA) | $ | 9,000,000 | $ | 9,473,759 | ||
| Mohave County Community College District | ||||||
| Revenue (State Board of Directors) | ||||||
| 6.00% 3/1/20-10 (MBIA) | 500,000 | 529,410 | ||||
| Phoenix Industrial Development Authority Lease | ||||||
| Revenue (Capitol Mall LLC Project) | ||||||
| 5.50% 9/15/27-10 (AMBAC) | 3,500,000 | 3,731,734 | ||||
| Phoenix Industrial Development Authority Multifamily | ||||||
| Housing Revenue (Ventana Palms Apartments Project) | ||||||
| Series A 6.20% 10/1/34-09 (MBIA) | 940,000 | 1,001,166 | ||||
| Phoenix Variable Purpose Series B 5.00% 7/1/27-12 | 2,435,000 | 2,488,546 | ||||
| Puerto Rico Commonwealth Highway & | ||||||
| Transportation Authority Revenue Series K | ||||||
| 5.00% 7/1/35-15 | 750,000 | 832,058 | ||||
| 5.00% 7/1/40-15 | 1,590,000 | 1,763,962 | ||||
| Puerto Rico Commonwealth Public | ||||||
| Improvement Revenue Series A | ||||||
| 5.00% 7/1/27-12 | 1,000,000 | 1,083,110 | ||||
| 5.125% 7/1/31-11 | 1,705,000 | 1,839,269 | ||||
| Puerto Rico Commonwealth Revenue | ||||||
| Series B 5.00% 7/1/35-16 | 2,000,000 | 2,239,660 | ||||
| Puerto Rico Electric Power Authority Revenue | ||||||
| Series NN 5.00% 7/1/32-13 (MBIA) | 1,750,000 | 1,926,785 | ||||
| Series RR 5.00% 7/1/35-15 (FGIC) | 1,545,000 | 1,722,072 | ||||
| Puerto Rico Public Buildings Authority | ||||||
| Revenue (Guaranteed Government Facilities) | ||||||
| Series D 5.25% 7/1/27-12 | 1,280,000 | 1,380,992 | ||||
| Series I 5.25% 7/1/33-14 | 5,000 | 5,485 | ||||
| Scottsdale Industrial Development Authority Hospital | ||||||
| Revenue (Scottsdale Health Care) | ||||||
| 5.70% 12/1/21-11 | 500,000 | 553,455 | ||||
| Scottsdale Municipal Property Corporation Excise Tax | ||||||
| Revenue 5.00% 7/1/21-16 | 1,505,000 | 1,674,343 | ||||
| Southern Arizona Capital Facilities Finance | ||||||
| Revenue (University of Arizona Project) | ||||||
| 5.10% 9/1/33-12 (MBIA) | 3,250,000 | 3,554,330 | ||||
39
Statements of net assets
Delaware Tax-Free Arizona Fund
| Principal amount | Value | |||||
| Municipal Bonds (continued) | ||||||
| §Pre-Refunded Bonds (continued) | ||||||
| Surprise Municipal Property Excise Tax | ||||||
| Revenue 5.70% 7/1/20-09 (FGIC) | $ | 3,000,000 | $ | 3,126,840 | ||
| University of Arizona Certificates of Participation | ||||||
| (University of Arizona Parking & Student Housing) | ||||||
| 5.75% 6/1/19-09 (AMBAC) | 1,000,000 | 1,029,390 | ||||
| (University of Arizona Project) | ||||||
| Series A 5.125% 6/1/21-12 (AMBAC) | 915,000 | 993,187 | ||||
| Series B 5.125% 6/1/22-12 (AMBAC) | 1,000,000 | 1,088,440 | ||||
| 44,472,716 | ||||||
| Special Tax Revenue Bonds – 7.75% | ||||||
| Arizona State Transportation Board Excise Tax Revenue | ||||||
| (Maricopa County Regional Area Road Foundation) | ||||||
| 5.00% 7/1/19 | 1,500,000 | 1,617,045 | ||||
| Arizona Tourism & Sports Authority Tax Revenue | ||||||
| (Multipurpose Stadium Facilities) | ||||||
| Series A 5.00% 7/1/28 (MBIA) | 2,500,000 | 2,522,275 | ||||
| Flagstaff Aspen Place Sawmill Improvement District | ||||||
| 5.00% 1/1/32 | 1,350,000 | 1,346,220 | ||||
| Marana Tangerine Farm Road Improvement District | ||||||
| Revenue 4.60% 1/1/26 | 1,000,000 | 877,770 | ||||
| Mesa Street & Highway Revenue 5.00% 7/1/20 (FSA) | 1,000,000 | 1,078,330 | ||||
| Peoria Municipal Development Authority Transition | ||||||
| Sales Tax, Excise Tax & State Shared Revenue | ||||||
| (Senior Lien and Subordinated Lien) 4.50% 1/1/16 | 1,000,000 | 1,066,190 | ||||
| Phoenix Civic Improvement Transition Excise Tax | ||||||
| Revenue (Light Rail Project) | ||||||
| 5.00% 7/1/20 (AMBAC) | 2,270,000 | 2,372,014 | ||||
| 10,879,844 | ||||||
| State General Obligation Bonds – 5.68% | ||||||
| Puerto Rico Commonwealth Public Improvement | ||||||
| Refunding Series A | ||||||
| 5.50% 7/1/17 | 1,765,000 | 1,847,196 | ||||
| 5.50% 7/1/19 | 1,300,000 | 1,359,878 | ||||
| Unrefunded Balance Series A | ||||||
| 5.125% 7/1/30 (FSA) | 480,000 | 484,190 | ||||
| 5.125% 7/1/31 | 3,370,000 | 3,309,677 | ||||
| Virgin Islands Public Finance Authority | ||||||
| (Gross Receipts Taxes) 5.00% 10/1/31 (ACA) | 1,000,000 | 978,510 | ||||
| 7,979,451 | ||||||
40
| Principal amount | Value | |||||
| Municipal Bonds (continued) | ||||||
| Transportation Revenue Bonds – 4.59% | ||||||
| Arizona State Transportation Board Grant Anticipation | ||||||
| Notes 5.00% 7/1/14 | $ | 1,500,000 | $ | 1,654,455 | ||
| Arizona State Transportation Board Highway | ||||||
| Revenue Series A 5.00% 7/1/23 | 1,000,000 | 1,040,990 | ||||
| Phoenix Civic Improvement Corporation Airport | ||||||
| Revenue Series B | ||||||
| 5.25% 7/1/27 (FGIC) (AMT) | 1,000,000 | 952,790 | ||||
| 5.25% 7/1/32 (FGIC) (AMT) | 3,000,000 | 2,795,400 | ||||
| 6,443,635 | ||||||
| Water & Sewer Revenue Bonds – 9.84% | ||||||
| Arizona Water Infrastructure Finance Authority | ||||||
| Revenue (Water Quality) Series A | ||||||
| 5.00% 10/1/14 | 1,500,000 | 1,663,575 | ||||
| Glendale Water & Sewer Revenue (Senior Lien) | ||||||
| 5.00% 7/1/28 (AMBAC) | 2,000,000 | 2,018,680 | ||||
| Phoenix Civic Improvement Corporation | ||||||
| Wastewater Systems Revenue | ||||||
| 5.00% 7/1/19 (MBIA) | 2,750,000 | 2,947,615 | ||||
| (Junior Lien) 5.00% 7/1/24 (FGIC) | 1,000,000 | 1,012,590 | ||||
| Phoenix Civic Improvement Corporation Water Systems | ||||||
| Revenue (Junior Lien) 5.00% 7/1/26 (FGIC) | 3,750,000 | 3,799,387 | ||||
| Scottsdale Water & Sewer Revenue | ||||||
| 4.00% 7/1/14 | 175,000 | 184,399 | ||||
| 4.00% 7/1/15 | 500,000 | 525,320 | ||||
| 4.00% 7/1/16 | 375,000 | 392,460 | ||||
| 5.25% 7/1/22 | 1,150,000 | 1,279,525 | ||||
| 13,823,551 | ||||||
| Total Municipal Bonds (cost $136,799,027) | 138,474,442 | |||||
| Number of shares | ||||||
| Short-Term Investment – 0.38% | ||||||
| Money Market Instrument – 0.38% | ||||||
| Federated Arizona Municipal Cash Trust | 528,711 | 528,711 | ||||
| Total Short-Term Investment (cost $528,711) | 528,711 | |||||
41
Statements of net assets
Delaware Tax-Free Arizona Fund
| Total Value of Securities – 98.97% (cost $137,327,738) | $ | 139,003,153 | ||
| Receivables and Other Assets | ||||
| Net of Liabilities – 1.03% | 1,450,065 | |||
| Net Assets Applicable to 12,848,954 | ||||
| Shares Outstanding – 100.00% | $ | 140,453,218 | ||
| Net Asset Value – Delaware Tax-Free Arizona Fund | ||||
| Class A ($122,027,536 / 11,165,680 Shares) | $10.93 | |||
| Net Asset Value – Delaware Tax-Free Arizona Fund | ||||
| Class B ($9,619,840 / 879,635 Shares) | $10.94 | |||
| Net Asset Value – Delaware Tax-Free Arizona Fund | ||||
| Class C ($8,805,842 / 803,639 Shares) | $10.96 | |||
| Components of Net Assets at August 31, 2008: | ||||
| Shares of beneficial interest (unlimited authorization – no par) | $ | 140,854,589 | ||
| Accumulated net realized loss on investments | (2,076,786 | ) | ||
| Net unrealized appreciation of investments | 1,675,415 | |||
| Total net assets | $ | 140,453,218 | ||
| f | Step coupon bond. Coupon increases periodically based on a predetermined schedule. Stated rate in effect at August 31, 2008. |
| § | Pre-Refunded Bonds. Municipals that are generally backed or secured by U.S. Treasury bonds. For Pre-Refunded Bonds, the stated maturity is followed by the year in which the bond is pre-refunded. See Note 8 in “Notes to financial statements.” |
42
| Summary of Abbreviations: ACA — Insured by American Capital Access AMBAC — Insured by the AMBAC Assurance Corporation AMT — Subject to Alternative Minimum Tax FGIC — Insured by the Financial Guaranty Insurance Company FHLMC — Insured by the Federal Home Loan Mortgage Corporation FNMA — Insured by Federal National Mortgage Association FSA — Insured by Financial Security Assurance GNMA — Insured by Government National Mortgage Association MBIA — Insured by the Municipal Bond Insurance Association RADIAN — Insured by Radian Asset Assurance |
| Net Asset Value and Offering Price Per Share – | ||
| Delaware Tax-Free Arizona Fund | ||
| Net asset value Class A (A) | $ | 10.93 |
| Sales charge (4.50% of offering price) (B) | 0.52 | |
| Offering price | $ | 11.45 |
| (A) | Net asset value per share, as illustrated, is the amount which would be paid upon redemption or repurchase of shares. | |
| (B) | See the current prospectus for purchases of $100,000 or more. |
See accompanying notes
43
| Statements of net assets | |
| Delaware Tax-Free California Fund | August 31, 2008 |
| Principal amount | Value | ||||
| Municipal Bonds – 98.96% | |||||
| Education Revenue Bonds – 10.38% | |||||
| California Educational Facilities Authority Revenue | |||||
| (University of the Pacific) Un-Refunded Balance | |||||
| 5.75% 11/1/30 (MBIA) | $ | 310,000 | $ | 323,327 | |
| (Woodbury University) 5.00% 1/1/36 | 1,000,000 | 848,040 | |||
| California Municipal Finance Authority Educational | |||||
| Revenue (American Heritage Foundation Project) | |||||
| Series A 5.25% 6/1/36 | 1,000,000 | 868,300 | |||
| California Statewide Communities | |||||
| Development Authority Revenue | |||||
| (California Baptist University Project) | |||||
| Series A 5.50% 11/1/38 | 1,000,000 | 878,490 | |||
| (Viewpoint School Project) 5.75% 10/1/33 (ACA) | 1,000,000 | 957,120 | |||
| (Windrush School Project) 5.50% 7/1/37 | 1,000,000 | 841,460 | |||
| California Statewide Communities Development | |||||
| Authority Student Housing Revenue | |||||
| (East Campus Apartments, LLC) | |||||
| Series A 5.625% 8/1/34 (ACA) | 1,000,000 | 963,020 | |||
| San Diego County Certificates of Participation | |||||
| (University of San Diego) 5.375% 10/1/41 | 1,000,000 | 1,003,640 | |||
| University of California Revenue (Multiple Purpose Projects) | |||||
| Series Q 5.00% 9/1/20 (FSA) | 1,290,000 | 1,356,371 | |||
| Series L 5.00% 5/15/16 | 225,000 | 249,581 | |||
| Series L 5.00% 5/15/19 | 850,000 | 920,907 | |||
| 9,210,256 | |||||
| Electric Revenue Bonds – 2.14% | |||||
| Chino Basin Regional Financing Authority Revenue | |||||
| Series A 5.00% 11/1/24 (AMBAC) | 845,000 | 859,247 | |||
| Southern California Public Power Authority | |||||
| Transmission Project Revenue Series A 5.00% 7/1/22 | 1,000,000 | 1,042,570 | |||
| 1,901,817 | |||||
| Health Care Revenue Bonds – 6.67% | |||||
| Association Bay Area Governments Finance | |||||
| Authority for California Nonprofit Corporations | |||||
| (San Diego Hospital Association) | |||||
| Series A 6.125% 8/15/20 | 1,250,000 | 1,286,163 | |||
| California Health Facilities Financing Authority Revenue | |||||
| (Catholic Health Care West) Series G 5.25% 7/1/23 | 1,000,000 | 1,000,170 | |||
| (The Episcopal Home) Series A | |||||
| 5.30% 2/1/32 (RADIAN) | 1,000,000 | 975,080 | |||
44
| Principal amount | Value | ||||
| Municipal Bonds (continued) | |||||
| Health Care Revenue Bonds (continued) | |||||
| California Infrastructure & Economic Development | |||||
| Bank Revenue (Kaiser Hospital Associates I, LLC) | |||||
| Series A 5.55% 8/1/31 | $ | 1,000,000 | $ | 1,007,130 | |
| California Statewide Communities Development | |||||
| Authority Revenue Series A | |||||
| (Presbyterian Homes Senior Living) 4.875% 11/15/36 | 1,000,000 | 828,980 | |||
| (Valleycare Health Systems) 5.125% 7/15/31 | 1,000,000 | 819,920 | |||
| 5,917,443 | |||||
| Housing Revenue Bonds – 8.71% | |||||
| California Housing Finance Agency | |||||
| Revenue (Home Mortgage) | |||||
| Series K 5.30% 8/1/23 (AMT) | 1,000,000 | 975,800 | |||
| Series M 5.95% 8/1/25 (AMT) | 1,000,000 | 1,009,420 | |||
| California Statewide Communities Development | |||||
| Authority Multifamily Housing Revenue | |||||
| (Citrus Gardens Apartments) Series D-1 5.375% 7/1/32 | 1,800,000 | 1,752,696 | |||
| (Silver Ridge Apartments) Series H 5.80% 8/1/33 | |||||
| (FNMA) (AMT) | 1,000,000 | 1,013,150 | |||
| Palm Springs Mobile Home Park Revenue | |||||
| (Sahara Mobile Home Park) Series A 5.75% 5/15/37 | 1,000,000 | 958,610 | |||
| Santa Clara County Multifamily Housing Authority | |||||
| Revenue (Rivertown Apartments Project) | |||||
| Series A 5.85% 8/1/31 (AMT) | 1,000,000 | 991,970 | |||
| Ventura County Area Multifamily Housing Authority | |||||
| Revenue (Glen Oaks Apartments) | |||||
| Series A 6.35% 7/20/34 (GNMA) | 970,000 | 1,027,928 | |||
| 7,729,574 | |||||
| Lease Revenue Bonds – 7.76% | |||||
| California Public Works Board Lease Revenue | |||||
| (Department of Corrections) | |||||
| Series A 5.00% 3/1/27 (AMBAC) | 1,000,000 | 1,004,460 | |||
| Series C 5.25% 6/1/28 | 1,500,000 | 1,515,645 | |||
| Elsinore Valley Municipal Water District | |||||
| Certificates of Participation Refunding | |||||
| Series A 5.00% 7/1/24 (BHAC) | 1,000,000 | 1,045,000 | |||
| Franklin-McKinley School District | |||||
| Certificates of Participation (Financing Project) | |||||
| Series B 5.00% 9/1/27 (AMBAC) | 1,060,000 | 1,060,922 | |||
45
Statements of net assets
Delaware Tax-Free California Fund
| Principal amount | Value | |||||
| Municipal Bonds (continued) | ||||||
| Lease Revenue Bonds (continued) | ||||||
| Puerto Rico Public Buildings Authority Revenue | ||||||
| (Government Facilities) 5.50% 7/1/35 (AMBAC) | $ | 700,000 | $ | 732,088 | ||
| San Diego County Certificates of Participation | ||||||
| 5.75% 7/1/31 (MBIA) | 1,000,000 | 1,050,120 | ||||
| ^ | San Mateo Unified High School District Certificates of | |||||
| Participation Capital Appreciation (Partnership | ||||||
| Phase I Projects) Series B 5.00% 12/15/43 (AMBAC) | 1,000,000 | 478,190 | ||||
| 6,886,425 | ||||||
| Local General Obligation Bonds – 9.47% | ||||||
| ^ | Anaheim School District Election 2002 | |||||
| 4.58% 8/1/25 (MBIA) | 1,250,000 | 507,525 | ||||
| Fairfield-Suisun Unified School District Election 2002 | ||||||
| 5.50% 8/1/28 (MBIA) | 500,000 | 520,500 | ||||
| Grossmont Union High School District Election of 2004 | ||||||
| 5.00% 8/1/23 (MBIA) | 1,000,000 | 1,035,440 | ||||
| Lawndale Elementary School District | ||||||
| Series B 5.00% 8/1/32 (FSA) | 1,000,000 | 1,007,390 | ||||
| Los Angeles Unified School District Refunding | ||||||
| Series B 4.75% 7/1/19 (FSA) | 1,000,000 | 1,053,090 | ||||
| Monterey Peninsula Community College District | ||||||
| Election 2002 Series C 4.50% 8/1/19 (FSA) | 1,000,000 | 1,044,740 | ||||
| San Diego Unified School District | ||||||
| Series E 5.00% 7/1/28 (FSA) | 2,000,000 | 2,164,780 | ||||
| Sierra Joint Community College Improvement | ||||||
| District #2 (Western Nevada) | ||||||
| Series A 5.25% 8/1/21 (BHAC) (FGIC) | 1,000,000 | 1,074,240 | ||||
| 8,407,705 | ||||||
| §Pre-Refunded Bonds – 19.88% | ||||||
| California Department of Water Resources | ||||||
| Series A 5.375% 5/1/21-12 | 2,000,000 | 2,225,080 | ||||
| Series X 5.00% 12/1/29-12 (FGIC) | 5,000 | 5,503 | ||||
| California State | ||||||
| 5.00% 2/1/33-14 | 1,000,000 | 1,108,140 | ||||
| 5.00% 2/1/33-14 (MBIA) | 1,000,000 | 1,103,380 | ||||
| Commerce Joint Powers Financing Authority | ||||||
| Revenue (Redevelopment Projects) | ||||||
| Series A 5.00% 8/1/28-13 (RADIAN) | 60,000 | 66,090 | ||||
46
| Principal amount | Value | ||||
| Municipal Bonds (continued) | |||||
| §Pre-Refunded Bonds (continued) | |||||
| Golden State Tobacco Securitization Settlement | |||||
| Revenue (Asset-Backed Senior Notes) Series B | |||||
| 5.50% 6/1/43-13 (RADIAN) | $ | 1,000,000 | $ | 1,101,820 | |
| 5.625% 6/1/33-13 | 1,000,000 | 1,107,300 | |||
| Oakland Industrial Revenue (1800 Harrison | |||||
| Foundation) Series B 6.00% 1/1/29-10 (AMBAC) | 800,000 | 843,848 | |||
| Poway Redevelopment Agency Tax Allocation | |||||
| 5.75% 6/15/33-10 (MBIA) | 1,130,000 | 1,243,418 | |||
| Puerto Rico Commonwealth Highway & Transportation | |||||
| Authority Revenue Series K 5.00% 7/1/45-15 | 1,500,000 | 1,664,115 | |||
| Puerto Rico Commonwealth Series B 5.00% 7/1/35-16 | 1,000,000 | 1,119,830 | |||
| Puerto Rico Public Buildings Authority Revenue | |||||
| (Guaranteed Government Facilities) | |||||
| Series I 5.50% 7/1/23-14 | 1,000,000 | 1,110,040 | |||
| Riverside County Redevelopment Agency Tax Allocation | |||||
| (Jurupa Valley Project) 5.25% 10/1/35-11 (AMBAC) | 500,000 | 554,080 | |||
| Sacramento County Airport System Revenue | |||||
| Series A 5.00% 7/1/32-12 (FSA) | 1,000,000 | 1,093,430 | |||
| San Diego County Certificates of Participation | |||||
| (The Burnham Institute) 6.25% 9/1/29-09 | 1,000,000 | 1,054,040 | |||
| Sequoia Union High School District Election 2001 | |||||
| 5.125% 7/1/31-11 (FSA) | 1,000,000 | 1,098,980 | |||
| Southern California Logistics Airport Authority Tax | |||||
| Allocation 6.50% 12/1/31-11 | 1,000,000 | 1,142,990 | |||
| 17,642,084 | |||||
| Special Tax Revenue Bonds – 14.07% | |||||
| Commerce Joint Powers Financing Authority | |||||
| Revenue (Redevelopment Projects) Un-Refunded | |||||
| Balance Series A 5.00% 8/1/28 (RADIAN) | 940,000 | 848,519 | |||
| Culver City Redevelopment Agency Refunding | |||||
| (Tax Allocation Redevelopment Project) | |||||
| Series A 5.00% 11/1/25 (AMBAC) | 1,000,000 | 1,002,560 | |||
| Fremont Community Facilities District #1 | |||||
| (Special Tax Pacific Commons) 5.375% 9/1/36 | 1,000,000 | 907,570 | |||
| Lake Elsinore Public Financing Authority Tax Allocation | |||||
| Series A 5.50% 9/1/30 | 1,000,000 | 988,680 | |||
47
Statements of net assets
Delaware Tax-Free California Fund
| Principal amount | Value | ||||
| Municipal Bonds (continued) | |||||
| Special Tax Revenue Bonds (continued) | |||||
| Lammersville School District Community Facilities | |||||
| District #2002 (Mountain House) 5.125% 9/1/35 | $ | 500,000 | $ | 429,680 | |
| Modesto Special Tax Community Facilities | |||||
| District #04-1 Village 2 5.15% 9/1/36 (MBIA) | 1,000,000 | 843,260 | |||
| Palm Drive Health Care District Parcel Tax | |||||
| Revenue 5.25% 4/1/30 | 2,000,000 | 1,656,520 | |||
| Poway Redevelopment Agency Tax Allocation | |||||
| Refunding 5.75% 6/15/33 (MBIA) | 270,000 | 286,432 | |||
| Poway Unified School District Community Facilities | |||||
| District #1 Special Tax Refunding | |||||
| 5.00% 10/1/17 (FSA) | 1,000,000 | 1,103,030 | |||
| Poway Unified School Special Tax District Community | |||||
| Facilities District #6 5.60% 9/1/33 | 1,000,000 | 989,380 | |||
| Puerto Rico Commonwealth Government Development | |||||
| Bank Senior Notes Series B 5.00% 12/1/15 | 1,000,000 | 1,022,200 | |||
| Roseville Westpark Special Tax Public Community | |||||
| Facilities District #1 5.25% 9/1/37 | 500,000 | 412,445 | |||
| San Bernardino County Special Tax Community | |||||
| Facilities District #2002-1 5.90% 9/1/33 | 2,000,000 | 1,996,100 | |||
| 12,486,376 | |||||
| State General Obligation Bonds – 9.28% | |||||
| California State | |||||
| Refunding 5.00% 8/1/18 | 1,500,000 | 1,602,000 | |||
| Refunding 5.00% 11/1/21 | 1,500,000 | 1,560,345 | |||
| Various Purpose 5.50% 11/1/33 | 2,000,000 | 2,040,360 | |||
| California State Veterans | |||||
| Series BJ 5.70% 12/1/32 (AMT) | 640,000 | 639,910 | |||
| Puerto Rico Commonwealth Public | |||||
| Improvement Refunding Series A | |||||
| 5.00% 7/1/16 (Assured Gty) | 540,000 | 577,125 | |||
| 5.25% 7/1/15 | 1,750,000 | 1,814,943 | |||
| 8,234,683 | |||||
48
| Principal amount | Value | |||||
| Municipal Bonds (continued) | ||||||
| Transportation Revenue Bonds – 3.41% | ||||||
| Bay Area Toll Authority Bridge Revenue | ||||||
| Series F 5.00% 4/1/22 | $ | 1,000,000 | $ | 1,052,730 | ||
| Port of Oakland Revenue | ||||||
| Series L 5.375% 11/1/27 (FGIC) (AMT) | 1,000,000 | 966,270 | ||||
| San Diego Redevelopment Agency (Centre City | ||||||
| Redevelopment Project) Series A 6.40% 9/1/25 | 1,000,000 | 1,011,590 | ||||
| 3,030,590 | ||||||
| Water & Sewer Revenue Bonds – 7.19% | ||||||
| California Department of Water Resources Power | ||||||
| Supply Revenue Series H 5.00% 5/1/17 | 1,000,000 | 1,093,850 | ||||
| California Department of Water Resources Systems | ||||||
| Revenue (Central Valley Project) | ||||||
| Series A 5.00% 12/1/22 | 1,000,000 | 1,070,040 | ||||
| Series A 5.00% 12/1/24 | 1,000,000 | 1,058,500 | ||||
| Un-Refunded Balance Series X 5.00% 12/1/29 (FGIC) | 995,000 | 1,004,025 | ||||
| Glendale Water Revenue 4.00% 2/1/18 (FSA) | 1,120,000 | 1,148,828 | ||||
| Metropolitan Water District Southern California | ||||||
| Waterworks Authority Revenue | ||||||
| Series B-1 5.00% 10/1/36 (FGIC) | 1,000,000 | 1,004,860 | ||||
| 6,380,103 | ||||||
| Total Municipal Bonds (cost $88,249,374) | 87,827,056 | |||||
| Total Value of Securities – 98.96% (cost $88,249,374) | 87,827,056 | |||||
| Receivables and Other Assets | ||||||
| Net of Liabilities – 1.04% | 926,938 | |||||
| Net Assets Applicable to 8,215,552 | ||||||
| Shares Outstanding – 100.00% | $ | 88,753,994 | ||||
| Net Asset Value – Delaware Tax-Free California Fund | ||||||
| Class A ($67,173,685 / 6,221,580 Shares) | $10.80 | |||||
| Net Asset Value – Delaware Tax-Free California Fund | ||||||
| Class B ($6,589,614 / 607,844 Shares) | $10.84 | |||||
| Net Asset Value – Delaware Tax-Free California Fund | ||||||
| Class C ($14,990,695 / 1,386,128 Shares) | $10.81 | |||||
49
Statements of net assets
Delaware Tax-Free California Fund
| Components of Net Assets at August 31, 2008: | ||||
| Shares of beneficial interest (unlimited authorization – no par) | $ | 90,504,007 | ||
| Undistributed net investment income | 1,300 | |||
| Accumulated net realized loss on investments | (1,328,995 | ) | ||
| Net unrealized depreciation of investments | (422,318 | ) | ||
| Total net assets | $ | 88,753,994 | ||
| ^ | Zero coupon security. The rate shown is the yield at the time of purchase. |
| § | Pre-Refunded Bonds. Municipals that are generally backed or secured by U.S. Treasury bonds. For Pre-Refunded Bonds, the stated maturity is followed by the year in which the bond is pre-refunded. See Note 8 in “Notes to financial statements.” |
Summary of Abbreviations:
ACA — Insured by American Capital Access
AMBAC — Insured by the AMBAC Assurance Corporation
AMT — Subject to Alternative Minimum Tax
Assured Gty — Insured by the Assured Guaranty Corporation
BHAC — Insured by the Berkshire Hathaway Assurance Company
FGIC — Insured by the Financial Guaranty Insurance Company
FNMA — Insured by Federal National Mortgage Association
FSA — Insured by Financial Security Assurance
GNMA — Insured by Government National Mortgage Association
MBIA — Insured by the Municipal Bond Insurance Association
RADIAN — Insured by Radian Asset Assurance
| Net Asset Value and Offering Price Per Share – | ||
| Delaware Tax-Free California Fund | ||
| Net asset value Class A (A) | $ | 10.80 |
| Sales charge (4.50% of offering price) (B) | 0.51 | |
| Offering price | $ | 11.31 |
| (A) | Net asset value per share, as illustrated, is the amount which would be paid upon redemption or repurchase of shares. | |
| (B) | See the current prospectus for purchases of $100,000 or more. |
See accompanying notes
50
Delaware Tax-Free Colorado Fund | August 31, 2008 |
| Principal amount | Value | |||||
| Municipal Bonds – 97.75% | ||||||
| Education Revenue Bonds – 13.00% | ||||||
| Boulder County Development Revenue | ||||||
| (University Corporation for Atmospheric Research) | ||||||
| 5.00% 9/1/33 (MBIA) | $ | 1,000,000 | $ | 997,170 | ||
| 5.00% 9/1/35 (AMBAC) | 1,000,000 | 991,210 | ||||
| Colorado Educational & Cultural Facilities Authority Revenue | ||||||
| (Charter School Project) 5.50% 5/1/36 (XLCA) | 2,280,000 | 2,290,830 | ||||
| (Johnson & Wales University Project) | ||||||
| Series A 5.00% 4/1/28 (XLCA) | 1,000,000 | 926,880 | ||||
| (Liberty Common Charter School Project) | ||||||
| 5.125% 12/1/33 (XLCA) | 2,740,000 | 2,647,552 | ||||
| (Montessori Districts Charter School Projects) | ||||||
| 6.125% 7/15/32 | 5,590,000 | 5,479,653 | ||||
| (Pinnacle Charter School Project) | ||||||
| 5.00% 6/1/33 (XLCA) | 2,170,000 | 2,060,567 | ||||
| @(Renaissance Charter School Project) 6.75% 6/1/29 | 2,000,000 | 1,861,900 | ||||
| (University of Northern Colorado Student Housing | ||||||
| Project) 5.125% 7/1/37 (MBIA) | 5,900,000 | 5,842,535 | ||||
| (Woodrow Wilson Charter School Project) | ||||||
| 5.25% 12/1/34 (XLCA) | 1,960,000 | 1,924,210 | ||||
| Colorado School Mines Auxiliary Facilities | ||||||
| Revenue 5.00% 12/1/37 (AMBAC) | 425,000 | 419,815 | ||||
| University of Colorado Enterprise System | ||||||
| Revenue Series A | ||||||
| 5.00% 6/1/30 (AMBAC) | 3,155,000 | 3,187,086 | ||||
| 5.375% 6/1/26 | 1,000,000 | 1,033,360 | ||||
| University of Puerto Rico Revenue | ||||||
| Series Q 5.00% 6/1/36 | 2,750,000 | 2,638,268 | ||||
| 32,301,036 | ||||||
| Electric Revenue Bonds – 2.98% | ||||||
| Colorado Springs Utilities Revenue | ||||||
| Series A 5.00% 11/15/29 | 5,000,000 | 5,033,500 | ||||
| Puerto Rico Electric Power Authority Revenue | ||||||
| Series WW 5.00% 7/1/28 | 2,400,000 | 2,373,048 | ||||
| 7,406,548 | ||||||
| Escrowed to Maturity Bonds – 2.31% | ||||||
| Colorado Health Facilities Authority Revenue | ||||||
| (Catholic Health Initiatives) Series A 5.50% 3/1/32 | 5,000,000 | 5,266,450 | ||||
| Galleria Metropolitan District 7.25% 12/1/09 | 445,000 | 459,547 | ||||
| 5,725,997 | ||||||
51
Statements of net assets
Delaware Tax-Free Colorado Fund
| Principal amount | Value | |||||
| Municipal Bonds (continued) | ||||||
| Health Care Revenue Bonds – 13.65% | ||||||
| Aurora Hospital Revenue (Children’s Hospital) | ||||||
| Series D 5.00% 12/1/23 (FSA) | $ | 2,775,000 | $ | 2,846,484 | ||
| Colorado Health Facilities Authority Revenue | ||||||
| ·(Adventist Health/Sunbelt) Series E 5.125% 11/15/24 | 1,450,000 | 1,422,668 | ||||
| (Catholic Health Initiatives) Series A 4.75% 9/1/40 | 1,000,000 | 879,900 | ||||
| (Christian Living Community Project) | ||||||
| Series A 5.75% 1/1/37 | 1,500,000 | 1,312,335 | ||||
| (Covenant Retirement Communities) | ||||||
| Series A 5.50% 12/1/33 (RADIAN) | 5,000,000 | 4,814,750 | ||||
| (Evangelical Lutheran) 5.00% 6/1/35 | 2,000,000 | 1,776,280 | ||||
| Series A 5.25% 6/1/34 | 2,750,000 | 2,541,880 | ||||
| (Parkview Medical Center) 5.00% 9/1/25 | 1,000,000 | 961,990 | ||||
| (Porter Place) Series A 6.00% 1/20/36 (GNMA) | 5,000,000 | 5,111,449 | ||||
| (Vail Valley Medical Center Project) 5.80% 1/15/27 | 3,475,000 | 3,503,495 | ||||
| (Valley View Hospital Association) 5.50% 5/15/28 | 1,000,000 | 974,790 | ||||
| Delta County Memorial Hospital District Enterprise | ||||||
| Revenue 5.35% 9/1/17 | 4,000,000 | 4,032,640 | ||||
| Denver Health & Hospital Authority Health Care | ||||||
| Revenue Series A 4.75% 12/1/36 | 1,500,000 | 1,237,380 | ||||
| Mesa County Residential Care Facilities Mortgage | ||||||
| Revenue (Hilltop Community Resources) | ||||||
| Series A 5.375% 12/1/28 (RADIAN) | 1,050,000 | 990,203 | ||||
| University of Colorado Hospital Authority Revenue | ||||||
| Series A 5.00% 11/15/37 | 1,690,000 | 1,494,146 | ||||
| 33,900,390 | ||||||
| Housing Revenue Bonds – 2.26% | ||||||
| Colorado Housing & Finance Authority | ||||||
| (Multifamily Housing Insured Mortgage) | ||||||
| Series C-3 6.15% 10/1/41 | 1,590,000 | 1,605,232 | ||||
| Denver City & County Multifamily Federal | ||||||
| Housing Authority Revenue (Insured Mortgage | ||||||
| Loan-Garden Court) 5.40% 7/1/39 (FHA) | 2,000,000 | 1,984,980 | ||||
| Puerto Rico Housing Finance Authority Subordinate- | ||||||
| Capital Fund Modernization 5.125% 12/1/27 | 2,040,000 | 2,016,479 | ||||
| 5,606,691 | ||||||
52
| Principal amount | Value | |||||
| Municipal Bonds (continued) | ||||||
| Lease Revenue Bonds – 2.70% | ||||||
| Colorado Educational & Cultural National | ||||||
| Conference of State Legislatures Office Building | ||||||
| Facilities Authority Revenue 5.25% 6/1/21 | $ | 2,000,000 | $ | 2,021,280 | ||
| @ | Conejos & Alamosa Counties School #11J | |||||
| Certificates of Participation 6.50% 4/1/11 | 675,000 | 675,911 | ||||
| El Paso County Certificates of Participation (Detention | ||||||
| Facilities Project) Series B 5.00% 12/1/27 (AMBAC) | 1,500,000 | 1,513,035 | ||||
| Puerto Rico Public Buildings Authority Revenue | ||||||
| (Guaranteed Government Facilities) | ||||||
| Series I 5.25% 7/1/33 | 1,475,000 | 1,462,758 | ||||
| Series M-2 5.50% 7/1/35 (AMBAC) | 1,000,000 | 1,045,840 | ||||
| 6,718,824 | ||||||
| Local General Obligation Bonds – 12.71% | ||||||
| Arapahoe County Water & Wastewater Public | ||||||
| Improvement District Revenue Series A | ||||||
| 5.125% 12/1/32 (MBIA) | 4,500,000 | 4,529,520 | ||||
| Denver City & County Justice System | ||||||
| 5.50% 8/1/16 | 5,000,000 | 5,732,300 | ||||
| (Facilities & Zoo) 5.00% 8/1/19 | 1,020,000 | 1,084,474 | ||||
| Denver West Metropolitan District | ||||||
| 5.00% 12/1/33 (RADIAN) | 1,400,000 | 1,209,208 | ||||
| County School District #1 | ||||||
| (Douglas & Elbert Counties) Series B | ||||||
| 5.00% 12/15/24 | 2,355,000 | 2,447,175 | ||||
| 5.125% 12/15/25 (FSA) | 2,000,000 | 2,056,680 | ||||
| El Paso County School District #2 (Harrison) | ||||||
| 5.00% 12/1/27 (MBIA) | 2,115,000 | 2,132,576 | ||||
| Garfield County School District #2 | ||||||
| 5.00% 12/1/25 (FSA) | 3,280,000 | 3,398,435 | ||||
| Grand County School District #2 (East Grand) | ||||||
| 5.25% 12/1/25 (FSA) | 2,485,000 | 2,626,570 | ||||
| La Plata County School District #9-R (Durango) | ||||||
| 5.125% 11/1/24 (MBIA) | 1,000,000 | 1,034,180 | ||||
| Larimer County Colorado School District # R-1 | ||||||
| 5.00% 12/15/16 | 500,000 | 552,540 | ||||
| North Range Metropolitan | ||||||
| District #1 4.50% 12/15/31 (ACA) | 1,500,000 | 1,100,070 | ||||
| District #2 5.50% 12/15/37 | 1,200,000 | 990,408 | ||||
53
Statements of net assets
Delaware Tax-Free Colorado Fund
| Principal amount | Value | ||||
| Municipal Bonds (continued) | |||||
| Local General Obligation Bonds (continued) | |||||
| Saddle Rock Metropolitan District | |||||
| 5.35% 12/1/31 (RADIAN) | $ | 1,130,000 | $ | 1,039,758 | |
| Sand Creek Metropolitan District Refunding & | |||||
| Improvement 5.00% 12/1/31 (XLCA) | 500,000 | 456,970 | |||
| Weld County School District #4 5.00% 12/1/19 (FSA) | 1,085,000 | 1,181,489 | |||
| 31,572,353 | |||||
| §Pre-Refunded Bonds – 33.47% | |||||
| Aurora Certificates of Participation | |||||
| 5.50% 12/1/30-10 (AMBAC) | 8,000,000 | 8,571,120 | |||
| Boulder County Hospital Revenue (Development | |||||
| Longmont United Hospital Project) | |||||
| 6.00% 12/1/30-10 (RADIAN) | 5,000,000 | 5,405,900 | |||
| Burlingame Multifamily Housing Revenue | |||||
| Series A 6.00% 11/1/29-09 (MBIA) | 1,250,000 | 1,321,038 | |||
| Colorado Educational & Cultural Facilities Authority | |||||
| Revenue (Core Knowledge Charter School Project) | |||||
| 7.00% 11/1/29-09 | 1,000,000 | 1,057,980 | |||
| (Littleton Academy Charter School Project) | |||||
| 6.125% 1/15/31-12 | 2,000,000 | 2,223,760 | |||
| (Stargate Charter School Project) 6.125% 5/1/33-13 | 2,000,000 | 2,264,420 | |||
| (University of Denver Project) | |||||
| 5.375% 3/1/23-11 (AMBAC) | 2,000,000 | 2,150,720 | |||
| Series A 5.00% 3/1/27-12 (MBIA) | 5,000,000 | 5,405,700 | |||
| Colorado School Mines Auxiliary Facilities | |||||
| 5.00% 12/1/37-12 (AMBAC) | 2,705,000 | 2,959,459 | |||
| Colorado Springs Revenue (Colorado College Project) | |||||
| 5.375% 6/1/32-09 | 2,570,000 | 2,667,454 | |||
| Denver Health & Hospital Authority Health Care | |||||
| Revenue Series A 5.375% 12/1/28-08 (ACA) | 2,770,000 | 2,824,320 | |||
| E-470 Public Highway Authority Revenue | |||||
| Series A 5.75% 9/1/35-10 (MBIA) | 3,100,000 | 3,363,252 | |||
| El Paso County Certificates of Participation (Judicial | |||||
| Building Project) Series A 5.00% 12/1/27-12 (AMBAC) | 2,000,000 | 2,160,500 | |||
| El Paso County School District #49 (Falcon) | |||||
| 5.50% 12/1/21-11 (FGIC) | 3,580,000 | 3,921,639 | |||
| Fremont County School District #1 (Canon City) | |||||
| 5.00% 12/1/24-13 (MBIA) | 1,735,000 | 1,912,057 | |||
| Garfield Pitkin & Eagle County School District #1 | |||||
| (Roaring Fork) Series A 5.00% 12/15/27-14 (FSA) | 1,500,000 | 1,665,210 | |||
54
| Principal amount | Value | ||||
| Municipal Bonds (continued) | |||||
| §Pre-Refunded Bonds (continued) | |||||
| Lincoln Park Metropolitan District 7.75% 12/1/26-11 | $ | 2,500,000 | $ | 2,898,250 | |
| North Range Metropolitan District #1 | |||||
| 7.25% 12/15/31-11 | 3,390,000 | 3,836,904 | |||
| Northwest Parkway Public Highway Authority Revenue | |||||
| Series A 5.25% 6/15/41-11 (FSA) | 11,100,000 | 12,036,063 | |||
| Pueblo County Certificates of Participation | |||||
| 6.50% 12/1/24-10 | 5,460,000 | 5,962,921 | |||
| Puerto Rico Commonwealth | |||||
| Series A 5.25% 7/1/30-16 | 1,235,000 | 1,404,207 | |||
| Series B 5.00% 7/1/35-16 | 310,000 | 347,147 | |||
| Puerto Rico Commonwealth Highway & Transportation | |||||
| Authority Revenue Series K 5.00% 7/1/40-15 | 2,500,000 | 2,773,525 | |||
| Puerto Rico Public Buildings Authority Revenue | |||||
| (Guaranteed Government Facilities) | |||||
| Series I 5.25% 7/1/33-14 | 25,000 | 27,423 | |||
| University of Colorado Hospital Authority Revenue | |||||
| Series A 5.60% 11/15/31-11 | 3,650,000 | 3,981,566 | |||
| 83,142,535 | |||||
| Special Tax Revenue Bonds – 6.15% | |||||
| Aspen Sales Tax Revenue (Parks & Open Spaces) | |||||
| Series B 5.25% 11/1/23 (FSA) | 2,040,000 | 2,160,972 | |||
| Baptist Road Rural Transportation Authority Sales & | |||||
| Use Tax Revenue 5.00% 12/1/26 | 2,000,000 | 1,641,960 | |||
| Loveland Special Improvements District #1 | |||||
| 7.50% 7/1/29 | 4,980,000 | 5,508,677 | |||
| Park Meadows Business Improvement District | |||||
| Shared Sales Tax Revenue | |||||
| 5.30% 12/1/27 | 950,000 | 898,938 | |||
| 5.35% 12/1/31 | 720,000 | 664,618 | |||
| Puerto Rico Commonwealth Government Development | |||||
| Bank (Senior Notes) Series B 5.00% 12/1/15 | 1,000,000 | 1,022,200 | |||
| Puerto Rico Commonwealth Infrastructure Financing | |||||
| Authority Revenue Series B 5.00% 7/1/46 | 1,200,000 | 1,148,916 | |||
| Regional Transportation District Sales Tax Revenue | |||||
| Series A 5.25% 11/1/18 | 2,000,000 | 2,239,979 | |||
| 15,286,260 | |||||
55
Statements of net assets
Delaware Tax-Free Colorado Fund
| Principal amount | Value | |||||
| Municipal Bonds (continued) | ||||||
| State General Obligation Bonds – 4.57% | ||||||
| Puerto Rico Commonwealth | ||||||
| Series A 5.25% 7/1/30 | $ | 765,000 | $ | 764,946 | ||
| Series B 5.00% 7/1/35 | 190,000 | 182,136 | ||||
| Puerto Rico Commonwealth Public Improvement Series A | ||||||
| 5.25% 7/1/15 | 1,650,000 | 1,711,232 | ||||
| 5.25% 7/1/21 | 4,000,000 | 4,005,639 | ||||
| 5.50% 7/1/18 | 1,650,000 | 1,714,037 | ||||
| Puerto Rico Government Development Bank | ||||||
| (Senior Notes) Series B 5.00% 12/1/14 | 1,000,000 | 1,028,360 | ||||
| Virgin Islands Public Finance Authority | ||||||
| (Gross Receipts Taxes) 5.00% 10/1/31 (ACA) | 2,000,000 | 1,957,020 | ||||
| 11,363,370 | ||||||
| Transportation Revenue Bonds – 2.30% | ||||||
| Denver City & County Airport Revenue | ||||||
| Series A 5.00% 11/15/25 (FGIC) | 2,000,000 | 1,961,400 | ||||
| Series B 5.00% 11/15/33 (XLCA) | 4,000,000 | 3,759,760 | ||||
| 5,721,160 | ||||||
| Water & Sewer Revenue Bonds – 1.65% | ||||||
| Pueblo Board Waterworks Revenue | ||||||
| 5.00% 11/1/21 (FSA) | 1,000,000 | 1,048,100 | ||||
| Ute Water Conservancy District Revenue | ||||||
| 5.75% 6/15/20 (MBIA) | 2,900,000 | 3,053,381 | ||||
| 4,101,481 | ||||||
| Total Municipal Bonds (cost $237,329,445) | 242,846,645 | |||||
| Number of shares | ||||||
| Short-Term Investments – 1.72% | ||||||
| Money Market Instrument – 0.39% | ||||||
| Dreyfus Cash Management Fund | 965,948 | 965,948 | ||||
| 965,948 | ||||||
56
| Principal amount | Value | |||||||
| Short-Term Investments (continued) | ||||||||
| ·Variable Rate Demand Notes – 1.33% | ||||||||
| Colorado Educational & Cultural Facilities Authority | ||||||||
| Revenue (National Jewish Federation Bond) | ||||||||
| 2.35% 9/1/37 | $ | 700,000 | $ | 700,000 | ||||
| 2.35% 9/1/38 | 1,200,000 | 1,200,000 | ||||||
| Colorado Health Facilities Authority Revenue | ||||||||
| (Sisters Charity Health Systems) Series B | ||||||||
| 1.90% 12/1/38 (ACA) | 700,000 | 700,000 | ||||||
| Colorado Housing & Finance Authority Single Family | ||||||||
| Mortgage Class I-B-2 1.90% 5/1/34 | 700,000 | 700,000 | ||||||
| 3,300,000 | ||||||||
| Total Short-Term Investments (cost $4,265,948) | 4,265,948 | |||||||
| Total Value of Securities – 99.47% (cost $241,595,393) | 247,112,593 | |||||||
| Receivables and Other Assets | ||||||||
| Net of Liabilities – 0.53% | 1,314,352 | |||||||
| Net Assets Applicable to 23,350,886 | ||||||||
| Shares Outstanding – 100.00% | $ | 248,426,945 | ||||||
| Net Asset Value – Delaware Tax-Free Colorado Fund | ||||||||
| Class A ($234,630,222 / 22,056,341 Shares) | $10.64 | |||||||
| Net Asset Value – Delaware Tax-Free Colorado Fund | ||||||||
| Class B ($3,960,439 / 372,049 Shares) | $10.64 | |||||||
| Net Asset Value – Delaware Tax-Free Colorado Fund | ||||||||
| Class C ($9,836,284 / 922,496 Shares) | $10.66 | |||||||
| Components of Net Assets at August 31, 2008: | ||||||||
| Shares of beneficial interest (unlimited authorization – no par) | $ | 251,403,905 | ||||||
| Accumulated net realized loss on investments | (8,494,160 | ) | ||||||
| Net unrealized appreciation of investments | 5,517,200 | |||||||
| Total net assets | $ | 248,426,945 | ||||||
57
Statements of net assets
Delaware Tax-Free Colorado Fund
| · | Variable rate security. The rate shown is the rate as of August 31, 2008. |
| @ | Illiquid security. At August 31, 2008, the aggregate amount of illiquid securities was $2,537,811, which represented 1.02% of the Fund’s net assets. See Note 8 in “Notes to financial statements.” |
| § | Pre-Refunded Bonds. Municipals that are generally backed or secured by U.S. Treasury bonds. For Pre-Refunded Bonds, the stated maturity is followed by the year in which the bond is pre-refunded. See Note 8 in “Notes to financial statements.” |
Summary of Abbreviations:
ACA — Insured by American Capital Access
AMBAC — Insured by the AMBAC Assurance Corporation
FGIC — Insured by the Financial Guaranty Insurance Company
FHA — Insured by the Federal Housing Administration
FSA — Insured by Financial Security Assurance
GNMA — Insured by Government National Mortgage Association
MBIA — Insured by the Municipal Bond Insurance Association
RADIAN — Insured by Radian Asset Assurance
XLCA — Insured by XL Capital Assurance
| Net Asset Value and Offering Price Per Share – | |||
| Delaware Tax-Free Colorado Fund | |||
| Net asset value Class A (A) | $ | 10.64 | |
| Sales charge (4.50% of offering price) (B) | 0.50 | ||
| Offering price | $ | 11.14 | |
| (A) | Net asset value per share, as illustrated, is the amount which would be paid upon redemption or repurchase of shares. | |
| (B) | See the current prospectus for purchases of $100,000 or more. |
See accompanying notes
58
| Delaware Tax-Free Idaho Fund | August 31, 2008 |
| Principal amount | Value | |||||
| Municipal Bonds – 95.44% | ||||||
| Corporate Revenue Bonds – 6.59% | ||||||
| Meridian Economic Industrial Development Revenue | ||||||
| (Hi-Micro Project) 5.85% 8/15/11 (AMT) | $ | 965,000 | $ | 966,756 | ||
| Nez Perce County Pollution Control Revenue | ||||||
| (Potlatch Project) 6.00% 10/1/24 | 2,535,000 | 2,409,492 | ||||
| Power County Pollution Control Revenue | ||||||
| (FMC Project) 5.625% 10/1/14 | 2,475,000 | 2,483,663 | ||||
| 5,859,911 | ||||||
| Education Revenue Bonds – 10.43% | ||||||
| Boise State University Revenue | ||||||
| 5.00% 4/1/17 (AMBAC) | 500,000 | 530,220 | ||||
| 5.375% 4/1/22 (FGIC) | 15,000 | 15,576 | ||||
| Series A 4.25% 4/1/32 (MBIA) | 1,500,000 | 1,337,490 | ||||
| Series A 5.00% 4/1/18 (FGIC) | 1,500,000 | 1,567,904 | ||||
| Idaho State University Revenue Refunding & | ||||||
| Improvement | ||||||
| 5.00% 4/1/20 (FSA) | 1,130,000 | 1,183,856 | ||||
| 5.00% 4/1/23 (FSA) | 2,115,000 | 2,170,497 | ||||
| University of Idaho | ||||||
| Series B 4.50% 4/1/41 (FSA) | 1,000,000 | 1,027,820 | ||||
| (General Refunding) Series A 5.00% 4/1/21 (AMBAC) | 1,150,000 | 1,191,044 | ||||
| University of Puerto Rico Revenue | ||||||
| Series Q 5.00% 6/1/36 (MBIA) | 250,000 | 239,843 | ||||
| 9,264,250 | ||||||
| Escrowed to Maturity Bonds – 2.05% | ||||||
| Puerto Rico Commonwealth Infrastructure Financing | ||||||
| Authority Revenue Series A 5.375% 10/1/24 | 1,750,000 | 1,821,680 | ||||
| 1,821,680 | ||||||
| Health Care Revenue Bonds – 3.94% | ||||||
| Idaho Health Facilities Authority Hospital Revenue | ||||||
| (Idaho Elks Rehabilitation Hospital Project) | ||||||
| �� 5.30% 7/15/18 | 625,000 | 626,444 | ||||
| 5.45% 7/15/23 | 2,000,000 | 1,986,780 | ||||
| Idaho Health Facilities Authority Revenue | ||||||
| (Portneuf Medical Center Project) | ||||||
| Series A 5.00% 9/1/35 (RADIAN) | 1,000,000 | 890,270 | ||||
| 3,503,494 | ||||||
59
Statements of net assets
Delaware Tax-Free Idaho Fund
| Principal amount | Value | |||||
| Municipal Bonds (continued) | ||||||
| Housing Revenue Bonds – 6.16% | ||||||
| Idaho Housing Agency Single Family Mortgage Revenue | ||||||
| Series A 6.05% 7/1/13 (AMBAC) (FHA) (VA) (AMT) | $ | 35,000 | $ | 35,968 | ||
| Series A 6.10% 7/1/16 (FHA) (VA) (AMT) | 40,000 | 41,146 | ||||
| Series A-1 6.85% 7/1/12 (AMT) | 5,000 | 5,098 | ||||
| Series B 6.45% 7/1/15 (AMT) | 15,000 | 15,219 | ||||
| Series C-2 6.35% 7/1/15 (AMT) | 15,000 | 15,012 | ||||
| Series E 6.35% 7/1/15 (FHA) (AMT) | 35,000 | 35,032 | ||||
| Series E-1 6.60% 7/1/11 | 5,000 | 5,092 | ||||
| Series G-2 6.15% 7/1/15 (FHA) (VA) (AMT) | 130,000 | 131,793 | ||||
| Idaho Housing & Finance Association | ||||||
| Single Family Mortgage Revenue | ||||||
| Series B Class I 5.00% 7/1/37 (AMT) | 980,000 | 842,702 | ||||
| Series C Class III 5.35% 1/1/25 (AMT) | 285,000 | 275,638 | ||||
| Series D Class III 5.45% 7/1/23 (AMT) | 985,000 | 976,027 | ||||
| Series E Class III 4.875% 1/1/26 (AMT) | 1,370,000 | 1,243,630 | ||||
| Series E Class III 5.00% 1/1/28 (AMT) | 945,000 | 930,551 | ||||
| Series I Class I 5.45% 1/1/39 (AMT) | 1,000,000 | 918,290 | ||||
| 5,471,198 | ||||||
| Lease Revenue Bonds – 5.76% | ||||||
| Blaine School District #61 Certificate of Participation | ||||||
| 5.00% 7/30/10 (AMBAC) | 750,000 | 781,928 | ||||
| Boise City Certificate of Participation | ||||||
| 5.375% 9/1/20 (FGIC) (AMT) | 2,100,000 | 2,078,412 | ||||
| Boise City Revenue Series A 5.375% 12/1/31 (MBIA) | 500,000 | 514,190 | ||||
| Idaho State Building Authority Revenue | ||||||
| Series A 5.00% 9/1/43 (XLCA) | 1,000,000 | 979,120 | ||||
| Series B 5.00% 9/1/21 (MBIA) | 750,000 | 763,065 | ||||
| 5,116,715 | ||||||
| Local General Obligation Bonds – 25.07% | ||||||
| Ada & Canyon Counties Joint School District #2 | ||||||
| Meridian (School Board Guaranteed Program) | ||||||
| 4.75% 2/15/20 | 1,000,000 | 1,049,230 | ||||
| 5.00% 7/30/20 | 600,000 | 627,972 | ||||
| 5.125% 7/30/19 | 1,005,000 | 1,058,466 | ||||
| 5.50% 7/30/16 | 1,305,000 | 1,497,148 | ||||
| Bannock County School District #025 | ||||||
| (Pocatello Idaho School Board Guaranteed Program) | ||||||
| 5.00% 8/15/15 | 1,040,000 | 1,143,397 | ||||
| 5.00% 8/15/16 | 1,100,000 | 1,199,990 | ||||
60
| Principal amount | Value | |||||
| Municipal Bonds (continued) | ||||||
| Local General Obligation Bonds (continued) | ||||||
| Boise City Independent School District | ||||||
| 5.00% 8/1/24 (FSA) | $ | 1,500,000 | $ | 1,582,770 | ||
| Canyon County School District #132 (Caldwell) | ||||||
| 5.00% 7/30/15 (FGIC) | 2,000,000 | 2,177,120 | ||||
| Series A 5.00% 9/15/22 (FSA) | 1,725,000 | 1,845,164 | ||||
| Series A 5.00% 9/15/23 (FSA) | 1,810,000 | 1,927,252 | ||||
| Lemhi County 5.20% 8/1/27 (FSA) | 2,145,000 | 2,180,434 | ||||
| Nampa Idaho 5.00% 8/1/21 (FGIC) | 2,475,000 | 2,588,255 | ||||
| Power & Cassia Counties Joint School District #381 | ||||||
| (American Falls) 5.00% 8/1/17 | 1,155,000 | 1,221,228 | ||||
| Twin Falls County Idaho School District #413 (Filer) | ||||||
| 5.25% 9/15/25 | 2,000,000 | 2,172,320 | ||||
| 22,270,746 | ||||||
| §Pre-Refunded Bonds – 16.88% | ||||||
| Ada & Canyon Counties Joint School District #2 | ||||||
| Meridian (School Board Guaranteed Program) | ||||||
| 5.00% 7/30/20-12 | 1,555,000 | 1,689,974 | ||||
| Boise State University Revenue Refunding & Improvement | ||||||
| 5.125% 4/1/31-12 (FGIC) | 1,000,000 | 1,086,860 | ||||
| 5.375% 4/1/22-12 (FGIC) | 985,000 | 1,071,532 | ||||
| North Idaho College Dormitory Housing Certificate | ||||||
| of Participation 6.45% 10/1/16-08 | 1,000,000 | 1,004,090 | ||||
| Puerto Rico Commonwealth Highway & Transportation | ||||||
| Authority Revenue | ||||||
| Series D 5.25% 7/1/38-12 | 1,000,000 | 1,083,050 | ||||
| Series G 5.00% 7/1/33-13 | 1,310,000 | 1,444,825 | ||||
| Series Y 5.00% 7/1/36-16 | 1,250,000 | 1,399,788 | ||||
| Puerto Rico Commonwealth Public Improvement | ||||||
| Revenue Series A 5.125% 7/1/31-11 | 1,010,000 | 1,089,538 | ||||
| Puerto Rico Electric Power Authority Revenue | ||||||
| Series II 5.25% 7/1/31-12 | 1,000,000 | 1,109,320 | ||||
| Series NN 5.125% 7/1/29-13 | 500,000 | 553,320 | ||||
| Puerto Rico Public Buildings Authority Revenue | ||||||
| (Guaranteed Government Facilities) | ||||||
| Series I 5.50% 7/1/23-14 | 1,000,000 | 1,110,040 | ||||
| University of Idaho (Student Fee Housing | ||||||
| Improvements Project) 5.25% 4/1/31-11 (FGIC) | 2,195,000 | 2,357,649 | ||||
| 14,999,986 | ||||||
61
Statements of net assets
Delaware Tax-Free Idaho Fund
| Principal amount | Value | ||||||
| Municipal Bonds (continued) | |||||||
| Special Tax Revenue Bonds – 7.98% | |||||||
| Boise Urban Renewal Agency Parking | |||||||
| Revenue (Tax Increment) | |||||||
| Series A 6.125% 9/1/15 | $ | 1,315,000 | $ | 1,325,297 | |||
| Series B 6.125% 9/1/15 | 1,075,000 | 1,083,417 | |||||
| Bonner County Local Improvement District #93-1 | |||||||
| 6.50% 4/30/10 | 60,000 | 60,232 | |||||
| Coeur D’Alene Local Improvement District #6 | |||||||
| Series 1995 6.00% 7/1/09 | 85,000 | 85,942 | |||||
| Series 1996 6.05% 7/1/10 | 90,000 | 90,916 | |||||
| Series 1997 6.10% 7/1/12 | 40,000 | 40,321 | |||||
| Series 1998 6.10% 7/1/14 | 45,000 | 45,311 | |||||
| Idaho Board Bank Authority Revenue Series B | |||||||
| 4.125% 9/15/36 (MBIA) | 755,000 | 660,361 | |||||
| 5.00% 9/15/30 (MBIA) | 725,000 | 741,363 | |||||
| Puerto Rico Commonwealth Highway & Transportation | |||||||
| Authority Revenue | |||||||
| Series W 5.50% 7/1/15 | 175,000 | 184,035 | |||||
| Puerto Rico Sales Tax Financing Revenue | |||||||
| Series A 5.25% 8/1/57 | 1,000,000 | 998,200 | |||||
| Virgin Islands Public Finance Authority Revenue | |||||||
| (Senior Lien-Matching Fund Loan Note) Series A | |||||||
| 5.25% 10/1/20 | 500,000 | 499,090 | |||||
| 5.25% 10/1/21 | 500,000 | 496,705 | |||||
| 5.25% 10/1/24 | 800,000 | 781,288 | |||||
| 7,092,478 | |||||||
| State General Obligation Bonds – 3.13% | |||||||
| Puerto Rico Commonwealth Public | |||||||
| Improvement Series A | |||||||
| 5.125% 7/1/31 | 1,815,000 | 1,782,512 | |||||
| 5.25% 7/1/22 | 1,000,000 | 1,000,770 | |||||
| 2,783,282 | |||||||
| Transportation Revenue Bonds – 4.92% | |||||||
| Idaho Housing & Finance Association Grant Revenue | |||||||
| (Anticipated Federal Highway Trust) | |||||||
| 5.00% 7/15/24 (MBIA) | 2,000,000 | 2,092,620 | |||||
| Series A 5.25% 7/15/25 (Assured Gty) | 1,500,000 | 1,612,380 | |||||
| Puerto Rico Commonwealth Highway & Transportation | |||||||
| Authority Revenue Series G 5.00% 7/1/33 | 690,000 | 663,387 | |||||
| 4,368,387 | |||||||
62
| Principal amount | Value | ||||||
| Municipal Bonds (continued) | |||||||
| Water & Sewer Revenue Bonds – 2.53% | |||||||
| Moscow Sewer Revenue 5.00% 11/1/22 (FSA) | $ | 2,175,000 | $ | 2,244,361 | |||
| 2,244,361 | |||||||
| Total Municipal Bonds (cost $83,835,867) | 84,796,488 | ||||||
| Number of shares | |||||||
| Short-Term Investments – 1.57% | |||||||
| Money Market Instrument – 1.23% | |||||||
| Dreyfus Cash Management Fund | 1,095,898 | 1,095,898 | |||||
| 1,095,898 | |||||||
| Principal amount | |||||||
| ŸVariable Rate Demand Note – 0.34% | |||||||
| Idaho Health Facilities Authority Revenue | |||||||
| (St. Luke’s Medical Center Project) | |||||||
| 2.53% 7/1/30 (FSA) | $300,000 | 300,000 | |||||
| 300,000 | |||||||
| Total Short-Term Investments (cost $1,395,898) | 1,395,898 | ||||||
| Total Value of Securities – 97.01% (cost $85,231,765) | 86,192,386 | ||||||
| Receivables and Other Assets | |||||||
| Net of Liabilities – 2.99% | 2,657,520 | ||||||
| Net Assets Applicable to 7,892,617 | |||||||
| Shares Outstanding – 100.00% | $ | 88,849,906 | |||||
| Net Asset Value – Delaware Tax-Free Idaho Fund | |||||||
| Class A ($72,237,169 / 6,415,622 Shares) | $11.26 | ||||||
| Net Asset Value – Delaware Tax-Free Idaho Fund | |||||||
| Class B ($5,123,186 / 455,841 Shares) | $11.24 | ||||||
| Net Asset Value – Delaware Tax-Free Idaho Fund | |||||||
| Class C ($11,489,551 / 1,021,154 Shares) | $11.25 | ||||||
63
Statements of net assets
Delaware Tax-Free Idaho Fund
| Components of Net Assets at August 31, 2008: | ||||
| Shares of beneficial interest (unlimited authorization – no par) | $ | 88,210,657 | ||
| Distributions in excess of net investment income | (11,301 | ) | ||
| Accumulated net realized loss on investments | (310,071 | ) | ||
| Net unrealized appreciation of investments | 960,621 | |||
| Total net assets | $ | 88,849,906 | ||
| § | Pre-Refunded Bonds. Municipals that are generally backed or secured by U.S. Treasury bonds. For Pre-Refunded Bonds, the stated maturity is followed by the year in which the bond is pre-refunded. See Note 8 in “Notes to financial statements.” |
| Ÿ | Variable rate security. The rate shown is the rate as of August 31, 2008. |
Summary of Abbreviations:
AMBAC — Insured by the AMBAC Assurance Corporation
AMT — Subject to the Alternative Minimum Tax
Assured Gty — Insured by the Assured Guaranty Corporation
FGIC — Insured by the Financial Guaranty Insurance Company
FHA — Insured by the Federal Housing Administration
FSA — Insured by Financial Security Assurance
MBIA — Insured by the Municipal Bond Insurance Association
RADIAN — Insured by Radian Asset Assurance
VA — Insured by the Veterans Administration
XLCA — Insured by XL Capital Assurance
| Net Asset Value and Offering Price Per Share – | |||
| Delaware Tax-Free Idaho Fund | |||
| Net asset value Class A (A) | $ | 11.26 | |
| Sales charge (4.50% of offering price) (B) | 0.53 | ||
| Offering price | $ | 11.79 |
| (A) | Net asset value per share, as illustrated, is the amount which would be paid upon redemption or repurchase of shares. |
| (B) | See the current prospectus for purchases of $100,000 or more. |
See accompanying notes
64
| Delaware Tax-Free New York Fund | August 31, 2008 |
| Principal amount | Value | ||||||
| Municipal Bonds – 97.19% | |||||||
| Corporate Revenue Bonds – 6.22% | |||||||
| New York City Industrial Development Agency Revenue | |||||||
| (Brooklyn Navy Yard Cogen Partners) | |||||||
| 5.75% 10/1/36 (AMT) | $ | 450,000 | $ | 432,135 | |||
| New York Energy Research & Development | |||||||
| Authority Pollution Control Revenue | |||||||
| (Central Hudson Gas) Series A 5.45% 8/1/27 (AMBAC) | 500,000 | 512,495 | |||||
| Suffolk County Industrial Development Agency Revenue | |||||||
| (Keyspan-Port Jefferson Energy Center) | |||||||
| 5.25% 6/1/27 (AMT) | 250,000 | 233,705 | |||||
| 1,178,335 | |||||||
| Education Revenue Bonds – 12.31% | |||||||
| Albany Industrial Development Agency Civic Facilities | |||||||
| Revenue (Brighter Choice Charter School) | |||||||
| Series A 5.00% 4/1/37 | 250,000 | 212,845 | |||||
| Amherst Industrial Development Agency Civic Facilities | |||||||
| Revenue (UBF Faculty Student Housing) | |||||||
| Series A 5.75% 8/1/30 (AMBAC) | 200,000 | 210,626 | |||||
| Dutchess County Industrial Development Agency | |||||||
| (Marist College) 5.00% 7/1/20 | 500,000 | 509,645 | |||||
| New York State Dormitory Authority Revenue | |||||||
| (Columbia University) Series A 5.00% 7/1/23 | 500,000 | 518,700 | |||||
| Non-State Supported Debt (University of Rochester) | |||||||
| DSeries A 4.375% 7/1/20 | 250,000 | 222,445 | |||||
| (Pratt Institute) 6.00% 7/1/20 (RADIAN) | 500,000 | 516,785 | |||||
| Series B 7.50% 5/15/11 | 125,000 | 139,783 | |||||
| 2,330,829 | |||||||
| Electric Revenue Bonds – 0.99% | |||||||
| Puerto Rico Electric Power Authority Revenue | |||||||
| Series WW 5.00% 7/1/28 | 190,000 | 187,866 | |||||
| 187,866 | |||||||
| Health Care Revenue Bonds – 9.25% | |||||||
| East Rochester Housing Authority Revenue | |||||||
| (Senior Living-Woodland Village Project) | |||||||
| 5.50% 8/1/33 | 200,000 | 170,138 | |||||
65
Statements of net assets
Delaware Tax-Free New York Fund
| Principal amount | Value | ||||||
| Municipal Bonds (continued) | |||||||
| Health Care Revenue Bonds (continued) | |||||||
| New York Dormitory Authority Revenue | |||||||
| (Chapel Oaks) 5.45% 7/1/26 (LOC, Allied Irish Bank) | $ | 450,000 | $ | 455,549 | |||
| (Millard Fillmore Hospital) | |||||||
| 5.375% 2/1/32 (AMBAC) (FHA) | 450,000 | 452,192 | |||||
| Non-State Supported Debt (Orange Regional | |||||||
| Medical Center) 6.125% 12/1/29 | 175,000 | 170,938 | |||||
| (Winthrop South Nassau Hospital) | |||||||
| Series B 5.50% 7/1/23 | 500,000 | 502,379 | |||||
| 1,751,196 | |||||||
| Housing Revenue Bonds – 1.13% | |||||||
| New York City Multifamily Housing Development | |||||||
| Housing Revenue Series G-1 4.875% 11/1/39 (AMT) | 250,000 | 213,323 | |||||
| 213,323 | |||||||
| Lease Revenue Bonds – 5.83% | |||||||
| Battery Park City Authority Revenue | |||||||
| Series A 5.00% 11/1/26 | 250,000 | 257,555 | |||||
| Nassau County Tobacco Settlement (Asset-Backed) | |||||||
| Series A-3 5.125% 6/1/46 | 125,000 | 108,384 | |||||
| Tobacco Settlement Financing Authority | |||||||
| Revenue (Asset-Backed) Series B-1C | |||||||
| 5.50% 6/1/20 | 200,000 | 211,530 | |||||
| 5.50% 6/1/21 | 500,000 | 527,500 | |||||
| 1,104,969 | |||||||
| Local General Obligation Bonds – 3.48% | |||||||
| New York City | |||||||
| Series D 5.00% 11/1/34 | 125,000 | 125,406 | |||||
| Subordinated Series C-1 5.00% 10/1/19 | 500,000 | 533,450 | |||||
| 658,856 | |||||||
| §Pre-Refunded Bonds – 23.03% | |||||||
| Albany Parking Authority Revenue | |||||||
| Series A 5.625% 7/15/25-11 | 280,000 | 308,801 | |||||
| Metropolitan Transportation Authority Revenue | |||||||
| (Dedicated Tax) Series A 6.125% 4/1/17-10 (FGIC) | 1,000,000 | 1,064,739 | |||||
| New York City Series J 5.25% 6/1/28-13 | 310,000 | 346,292 | |||||
| New York Dormitory Authority Revenue | |||||||
| (North Shore Long Island Jewish Group Project) | |||||||
| 5.50% 5/1/33-13 | 500,000 | 561,164 | |||||
| Series B 7.50% 5/15/11-09 | 130,000 | 138,286 | |||||
66
| Principal amount | Value | ||||||
| Municipal Bonds (continued) | |||||||
| §Pre-Refunded Bonds (continued) | |||||||
| Puerto Rico Commonwealth Highway & Transportation | |||||||
| Authority Revenue Series Y 5.50% 7/1/36-16 | $ | 475,000 | $ | 548,236 | |||
| Puerto Rico Commonwealth Series B 5.25% 7/1/32-16 | 155,000 | 176,237 | |||||
| Puerto Rico Electric Power Authority Revenue | |||||||
| Series II 5.25% 7/1/31-12 | 500,000 | 554,660 | |||||
| Series NN 5.125% 7/1/29-13 | 600,000 | 663,984 | |||||
| 4,362,399 | |||||||
| Special Tax Revenue Bonds – 17.19% | |||||||
| New York City Transitional Finance Authority | |||||||
| Revenue (Subordinated Future Tax Secured) | |||||||
| Series B 5.00% 11/1/18 | 500,000 | 546,925 | |||||
| New York Dormitory Authority State Personal Income | |||||||
| Tax Revenue Series C 5.00% 3/15/15 | 250,000 | 275,663 | |||||
| New York Dormitory Authority State Supported Debt | |||||||
| Revenue (Consolidated Services Contract) | |||||||
| 5.00% 7/1/17 (FSA) | 500,000 | 547,415 | |||||
| New York Sales Tax Asset Receivables | |||||||
| Series A 5.25% 10/15/27 (AMBAC) | 500,000 | 522,310 | |||||
| New York State Urban Development Revenue | |||||||
| (State Personal Income Tax) Series A-1 5.00% 12/15/22 | 250,000 | 265,045 | |||||
| Puerto Rico Commonwealth Infrastructure Financing | |||||||
| Authority Revenue Series B 5.00% 7/1/15 | 250,000 | 256,385 | |||||
| Puerto Rico Sales Tax Financing Revenue | |||||||
| Series A 5.25% 8/1/57 | 325,000 | 324,415 | |||||
| Schenectady Metroplex Development Authority | |||||||
| Revenue Series A 5.375% 12/15/21 | 500,000 | 517,470 | |||||
| 3,255,628 | |||||||
| State General Obligation Bonds – 0.50% | |||||||
| Puerto Rico Commonwealth Series B 5.25% 7/1/32 | 95,000 | 94,354 | |||||
| 94,354 | |||||||
| Transportation Revenue Bonds – 14.59% | |||||||
| Albany Parking Authority Revenue | |||||||
| Series A 5.625% 7/15/25 | 220,000 | 223,964 | |||||
| Metropolitan Transportation Authority Revenue | |||||||
| Series A 5.00% 11/15/27 | 200,000 | 213,118 | |||||
| Series F 5.00% 11/15/15 | 150,000 | 161,921 | |||||
| New York City Industrial Development Agency | |||||||
| Special Airport Facilities (JFK Airis Project) | |||||||
| Series A 5.50% 7/1/28 (AMT) | 500,000 | 420,875 | |||||
67
Statements of net assets
Delaware Tax-Free New York Fund
| Principal amount | Value | |||||||
| Municipal Bonds (continued) | ||||||||
| Transportation Revenue Bonds (continued) | ||||||||
| New York State Thruway Authority | ||||||||
| General Revenue Series H | ||||||||
| 5.00% 1/1/14 (MBIA) | $ | 500,000 | $ | 547,165 | ||||
| 5.00% 1/1/15 (MBIA) | 250,000 | 274,720 | ||||||
| Onondaga County Industrial Development Authority | ||||||||
| Revenue (Subordinated Air Cargo Project) | ||||||||
| 7.25% 1/1/32 (AMT) | 500,000 | 495,490 | ||||||
| Triborough Bridge & Tunnel Authority Revenue | ||||||||
| Series C 5.00% 11/15/24 | 200,000 | 210,952 | ||||||
| ŸSubordinated Series B-1 5.00% 11/15/25 | 200,000 | 214,296 | ||||||
| 2,762,501 | ||||||||
| Water & Sewer Revenue Bonds – 2.67% | ||||||||
| New York City Municipal Finance Authority Water & | ||||||||
| Sewer System Revenue Series A 5.125% 6/15/34 | 500,000 | 505,365 | ||||||
| 505,365 | ||||||||
| Total Municipal Bonds (cost $17,956,253) | 18,405,621 | |||||||
| Total Value of Securities – 97.19% (cost $17,956,253) | 18,405,621 | |||||||
| Receivables and Other Assets | ||||||||
| Net of Liabilities – 2.81% | 531,886 | |||||||
| Net Assets Applicable to 1,839,776 | ||||||||
| Shares Outstanding – 100.00% | $ | 18,937,507 | ||||||
| Net Asset Value – Delaware Tax-Free New York Fund | ||||||||
| Class A ($15,339,492 / 1,489,564 Shares) | $10.30 | |||||||
| Net Asset Value – Delaware Tax-Free New York Fund | ||||||||
| Class B ($1,549,313 / 150,794 Shares) | $10.27 | |||||||
| Net Asset Value – Delaware Tax-Free New York Fund | ||||||||
| Class C ($2,048,702 / 199,418 Shares) | $10.27 | |||||||
| Components of Net Assets at August 31, 2008: | ||||||||
| Shares of beneficial interest (unlimited authorization – no par) | $ | 18,713,550 | ||||||
| Distributions in excess of net investment income | (652 | ) | ||||||
| Accumulated net realized loss on investments | (224,759 | ) | ||||||
| Net unrealized appreciation of investments | 449,368 | |||||||
| Total net assets | $ | 18,937,507 | ||||||
68
| D | Step coupon bond. Indicates security that has a zero coupon that remains in effect until a predetermined date at which time the stated interest rate becomes effective. |
| § | Pre-Refunded Bonds. Municipals that are generally backed or secured by U.S. Treasury bonds. For Pre-Refunded Bonds, the stated maturity is followed by the year in which the bond is pre-refunded. See Note 8 in “Notes to Financial Statements.” |
| · | Variable rate security. The rate shown is the rate as of August 31, 2008. |
Summary of Abbreviations:
AMBAC — Insured by the AMBAC Assurance Corporation
AMT — Subject to Alternative Minimum Tax
FGIC — Insured by the Financial Guaranty Insurance Company
FHA — Insured by the Federal Housing Administration
FSA — Insured by Financial Security Assurance
LOC — Letter of Credit
MBIA — Insured by the Municipal Bond Insurance Association
RADIAN — Insured by Radian Asset Assurance
| Net Asset Value and Offering Price Per Share – | |||
| Delaware Tax-Free New York Fund | |||
| Net asset value Class A (A) | $ | 10.30 | |
| Sales charge (4.50% of offering price) (B) | 0.49 | ||
| Offering price | $ | 10.79 |
| (A) | Net asset value per share, as illustrated, is the amount which would be paid upon redemption or repurchase of shares. |
| (B) | See the current prospectus for purchases of $100,000 or more. |
See accompanying notes
69
Statements of operations
Year Ended August 31, 2008
| Delaware Tax-Free | Delaware Tax-Free | Delaware Tax-Free | |||||||||
| Arizona Fund | California Fund | Colorado Fund | |||||||||
| Investment Income: | |||||||||||
| Interest | $ | 6,760,104 | $ | 4,717,266 | $ | 13,059,308 | |||||
| Expenses: | |||||||||||
| Management fees | 709,076 | 520,140 | 1,412,198 | ||||||||
| Distribution expenses – Class A | 306,600 | 181,355 | 605,306 | ||||||||
| Distribution expenses – Class B | 110,044 | 81,831 | 45,464 | ||||||||
| Distribution expenses – Class C | 83,112 | 139,865 | 100,120 | ||||||||
| Dividend disbursing and transfer agent | |||||||||||
| fees and expenses | 59,449 | 41,955 | 128,194 | ||||||||
| Accounting and administration expenses | 56,719 | 37,824 | 102,693 | ||||||||
| Legal fees | 30,376 | 22,721 | 44,218 | ||||||||
| Registration fees | 22,797 | 14,857 | 7,587 | ||||||||
| Audit and tax | 17,492 | 14,503 | 24,069 | ||||||||
| Reports and statements to shareholders | 15,334 | 9,638 | 26,805 | ||||||||
| Trustees’ fees | 6,988 | 4,669 | 12,641 | ||||||||
| Custodian fees | 6,331 | 6,297 | 11,505 | ||||||||
| Pricing fees | 6,203 | 6,545 | 7,591 | ||||||||
| Insurance fees | 3,818 | 2,525 | 7,189 | ||||||||
| Consulting fees | 1,958 | 1,326 | 3,510 | ||||||||
| Trustees’ expenses | 765 | 520 | 1,420 | ||||||||
| Dues and services | 520 | 396 | 1,225 | ||||||||
| Taxes (other than taxes on income) | 327 | 271 | 558 | ||||||||
| 1,437,909 | 1,087,238 | 2,542,293 | |||||||||
| Less expenses waived | (225,515 | ) | (85,382 | ) | (37,804 | ) | |||||
| Less expense paid indirectly | (93 | ) | — | (464 | ) | ||||||
| Total operating expenses | 1,212,301 | 1,001,856 | 2,504,025 | ||||||||
| Net Investment Income | 5,547,803 | 3,715,410 | 10,555,283 | ||||||||
| Net Realized and Unrealized Loss | |||||||||||
| on Investments: | |||||||||||
| Net realized loss on investments | (122,728 | ) | (461,721 | ) | (620,603 | ) | |||||
| Net change in unrealized appreciation/ | |||||||||||
| depreciation of investments | (1,640,599 | ) | (1,438,134 | ) | (1,307,241 | ) | |||||
| Net Realized and Unrealized Loss | |||||||||||
| on Investments | (1,763,327 | ) | (1,899,855 | ) | (1,927,844 | ) | |||||
| Net Increase in Net Assets | |||||||||||
| Resulting from Operations | $ | 3,784,476 | $ | 1,815,555 | $ | 8,627,439 | |||||
See accompanying notes
70
| Delaware Tax-Free | Delaware Tax-Free | ||||||
| Idaho Fund | New York Fund | ||||||
| Investment Income: | |||||||
| Interest | $ | 4,128,563 | $ | 909,122 | |||
| Expenses: | |||||||
| Management fees | 481,706 | 103,764 | |||||
| Distribution expenses – Class A | 177,229 | 37,343 | |||||
| Distribution expenses – Class B | 54,933 | 18,315 | |||||
| Distribution expenses – Class C | 112,615 | 21,201 | |||||
| Dividend disbursing and transfer agent | |||||||
| fees and expenses | 40,294 | 14,106 | |||||
| Accounting and administration expenses | 35,029 | 7,546 | |||||
| Legal fees | 19,056 | 4,421 | |||||
| Audit and tax | 14,172 | 10,369 | |||||
| Reports and statements to shareholders | 9,790 | 1,687 | |||||
| Pricing fees | 6,721 | 4,385 | |||||
| Registration fees | 4,601 | 9,847 | |||||
| Trustees’ fees | 4,312 | 929 | |||||
| Custodian fees | 3,719 | 319 | |||||
| Insurance fees | 2,407 | 516 | |||||
| Consulting fees | 1,302 | 263 | |||||
| Trustees’ expenses | 475 | 103 | |||||
| Dues and services | 304 | 68 | |||||
| Taxes (other than taxes on income) | 125 | 36 | |||||
| 968,790 | 235,218 | ||||||
| Less expenses waived | (96,321 | ) | (44,442 | ) | |||
| Less expense paid indirectly | (63 | ) | (234 | ) | |||
| Total operating expenses | 872,406 | 190,542 | |||||
| Net Investment Income | 3,256,157 | 718,580 | |||||
| Net Realized and Unrealized Gain (Loss) | |||||||
| on Investments: | |||||||
| Net realized gain (loss) on investments | 75,661 | (59,331 | ) | ||||
| Net change in unrealized appreciation/ | |||||||
| depreciation of investments | (89,235 | ) | 64,192 | ||||
| Net Realized and Unrealized Gain | |||||||
| (Loss) on Investments | (13,574 | ) | 4,861 | ||||
| Net Increase in Net Assets | |||||||
| Resulting from Operations | $ | 3,242,583 | $ | 723,441 | |||
See accompanying notes
71
Statements of changes in net assets
Delaware Tax-Free Arizona Fund
| Year Ended | |||||||
| 8/31/08 | 8/31/07 | ||||||
| Increase (Decrease) in Net Assets from Operations: | |||||||
| Net investment income | $ | 5,547,803 | $ | 6,056,280 | |||
| Net realized gain (loss) on investments | (122,728 | ) | 490,852 | ||||
| Net change in unrealized | |||||||
| appreciation/depreciation of investments | (1,640,599 | ) | (4,262,046 | ) | |||
| Net increase in net assets resulting | |||||||
| from operations | 3,784,476 | 2,285,086 | |||||
| Dividends and Distributions to Shareholders from: | |||||||
| Net investment income: | |||||||
| Class A | (4,918,990 | ) | (5,301,244 | ) | |||
| Class B | (359,177 | ) | (493,503 | ) | |||
| Class C | (269,611 | ) | (261,558 | ) | |||
| (5,547,778 | ) | (6,056,305 | ) | ||||
| Capital Share Transactions: | |||||||
| Proceeds from shares sold: | |||||||
| Class A | 14,751,087 | 14,817,310 | |||||
| Class B | 343 | 42,624 | |||||
| Class C | 2,945,439 | 1,326,619 | |||||
| Net asset value of shares issued upon reinvestment | |||||||
| of dividends and distributions: | |||||||
| Class A | 2,407,736 | 2,683,432 | |||||
| Class B | 184,069 | 254,872 | |||||
| Class C | 174,113 | 151,832 | |||||
| 20,462,787 | 19,276,689 | ||||||
72
| Year Ended | |||||||
| 8/31/08 | 8/31/07 | ||||||
| Capital Share Transactions (continued): | |||||||
| Cost of shares repurchased: | |||||||
| Class A | $ | (19,237,873 | ) | $ | (20,096,086 | ) | |
| Class B | (2,845,303 | ) | (3,954,487 | ) | |||
| Class C | (1,815,293 | ) | (1,800,542 | ) | |||
| (23,898,469 | ) | (25,851,115 | ) | ||||
| Decrease in net assets derived from | |||||||
| capital share transactions | (3,435,682 | ) | (6,574,426 | ) | |||
| Net Decrease in Net Assets | (5,198,984 | ) | (10,345,645 | ) | |||
| Net Assets: | |||||||
| Beginning of year | 145,652,202 | 155,997,847 | |||||
| End of year1 | $ | 140,453,218 | $ | 145,652,202 | |||
| 1Including distributions in excess of | |||||||
| net investment income | $ | — | $ | (25 | ) | ||
See accompanying notes
73
Statements of changes in net assets
Delaware Tax-Free California Fund
| Year Ended | |||||||
| 8/31/08 | 8/31/07 | ||||||
| Increase (Decrease) in Net Assets from Operations: | |||||||
| Net investment income | $ | 3,715,410 | $ | 4,052,743 | |||
| Net realized loss on investments | (461,721 | ) | (115,067 | ) | |||
| Net change in unrealized | |||||||
| appreciation/depreciation of investments | (1,438,134 | ) | (3,513,338 | ) | |||
| Net increase in net assets resulting | |||||||
| from operations | 1,815,555 | 424,338 | |||||
| Dividends and Distributions to Shareholders from: | |||||||
| Net investment income: | |||||||
| Class A | (2,975,104 | ) | (3,215,450 | ) | |||
| Class B | (272,986 | ) | (394,961 | ) | |||
| Class C | (467,320 | ) | (442,332 | ) | |||
| (3,715,410 | ) | (4,052,743 | ) | ||||
| Capital Share Transactions: | |||||||
| Proceeds from shares sold: | |||||||
| Class A | 13,897,604 | 22,710,407 | |||||
| Class B | 141,422 | 156,402 | |||||
| Class C | 4,752,482 | 3,562,422 | |||||
| Net asset value of shares issued upon reinvestment | |||||||
| of dividends and distributions: | |||||||
| Class A | 1,795,621 | 1,801,612 | |||||
| Class B | 191,370 | 248,614 | |||||
| Class C | 353,985 | 301,848 | |||||
| 21,132,484 | 28,781,305 | ||||||
74
| Year Ended | |||||||
| 8/31/08 | 8/31/07 | ||||||
| Capital Share Transactions (continued): | |||||||
| Cost of shares repurchased: | |||||||
| Class A | $ | (23,597,793 | ) | $ | (21,163,745 | ) | |
| Class B | (2,976,125 | ) | (5,609,946 | ) | |||
| Class C | (3,278,508 | ) | (2,686,047 | ) | |||
| (29,852,426 | ) | (29,459,738 | ) | ||||
| Decrease in net assets derived from | |||||||
| capital share transactions | (8,719,942 | ) | (678,433 | ) | |||
| Net Decrease in Net Assets | (10,619,797 | ) | (4,306,838 | ) | |||
| Net Assets: | |||||||
| Beginning of year | 99,373,791 | 103,680,629 | |||||
| End of year1 | $ | 88,753,994 | $ | 99,373,791 | |||
| 1Including undistributed net investment income | $ | 1,300 | $ | 1,300 | |||
See accompanying notes
75
Statements of changes in net assets
Delaware Tax-Free Colorado Fund
| Year Ended | |||||||
| 8/31/08 | 8/31/07 | ||||||
| Increase (Decrease) in Net Assets from Operations: | |||||||
| Net investment income | $ | 10,555,283 | $ | 11,447,349 | |||
| Net realized gain (loss) on investments | (620,603 | ) | 1,009,130 | ||||
| Net change in unrealized | |||||||
| appreciation/depreciation of investments | (1,307,241 | ) | (8,914,311 | ) | |||
| Net increase in net assets resulting | |||||||
| from operations | 8,627,439 | 3,542,168 | |||||
| Dividends and Distributions to Shareholders from: | |||||||
| Net investment income: | |||||||
| Class A | (10,088,211 | ) | (10,862,047 | ) | |||
| Class B | (155,100 | ) | (226,901 | ) | |||
| Class C | (340,507 | ) | (350,030 | ) | |||
| (10,583,818 | ) | (11,438,978 | ) | ||||
| Capital Share Transactions: | |||||||
| Proceeds from shares sold: | |||||||
| Class A | 10,216,326 | 12,562,366 | |||||
| Class B | 19 | 21,748 | |||||
| Class C | 1,027,663 | 1,895,269 | |||||
| Net asset value of shares issued upon reinvestment | |||||||
| of dividends and distributions: | |||||||
| Class A | 6,399,592 | 6,872,419 | |||||
| Class B | 72,523 | 123,164 | |||||
| Class C | 231,599 | 249,264 | |||||
| 17,947,722 | 21,724,230 | ||||||
76
| Year Ended | |||||||
| 8/31/08 | 8/31/07 | ||||||
| Capital Share Transactions (continued): | |||||||
| Cost of shares repurchased: | |||||||
| Class A | $ | (26,823,353 | ) | $ | (24,077,528 | ) | |
| Class B | (1,411,740 | ) | (2,883,605 | ) | |||
| Class C | (1,502,110 | ) | (1,658,066 | ) | |||
| (29,737,203 | ) | (28,619,199 | ) | ||||
| Decrease in net assets derived from | |||||||
| capital share transactions | (11,789,481 | ) | (6,894,969 | ) | |||
| Net Decrease in Net Assets | (13,745,860 | ) | (14,791,779 | ) | |||
| Net Assets: | |||||||
| Beginning of year | 262,172,805 | 276,964,584 | |||||
| End of year1 | $ | 248,426,945 | $ | 262,172,805 | |||
| 1Including distributions in excess of | |||||||
| net investment income | $ | — | $ | (46 | ) | ||
See accompanying notes
77
Statements of changes in net assets
Delaware Tax-Free Idaho Fund
| Year Ended | |||||||
| 8/31/08 | 8/31/07 | ||||||
| Increase (Decrease) in Net Assets from Operations: | |||||||
| Net investment income | $ | 3,256,157 | $ | 3,152,236 | |||
| Net realized gain on investments | 75,661 | 16,031 | |||||
| Net change in unrealized | |||||||
| appreciation/depreciation of investments | (89,235 | ) | (1,398,888 | ) | |||
| Net increase in net assets resulting | |||||||
| from operations | 3,242,583 | 1,769,379 | |||||
| Dividends and Distributions to Shareholders from: | |||||||
| Net investment income: | |||||||
| Class A | (2,732,459 | ) | (2,530,731 | ) | |||
| Class B | (170,938 | ) | (228,879 | ) | |||
| Class C | (349,960 | ) | (389,967 | ) | |||
| (3,253,357 | ) | (3,149,577 | ) | ||||
| Capital Share Transactions: | |||||||
| Proceeds from shares sold: | |||||||
| Class A | 8,896,373 | 14,990,872 | |||||
| Class B | 12 | 572,489 | |||||
| Class C | 1,462,472 | 887,588 | |||||
| Net asset value of shares issued upon reinvestment | |||||||
| of dividends and distributions: | |||||||
| Class A | 1,765,961 | 1,630,892 | |||||
| Class B | 115,322 | 138,424 | |||||
| Class C | 215,873 | 241,640 | |||||
| 12,456,013 | 18,461,905 | ||||||
78
| Year Ended | |||||||
| 8/31/08 | 8/31/07 | ||||||
| Capital Share Transactions (continued): | |||||||
| Cost of shares repurchased: | |||||||
| Class A | $ | (8,346,549 | ) | $ | (8,413,693 | ) | |
| Class B | (1,000,259 | ) | (2,488,934 | ) | |||
| Class C | (1,717,154 | ) | (2,840,485 | ) | |||
| (11,063,962 | ) | (13,743,112 | ) | ||||
| Increase in net assets derived from | |||||||
| capital share transactions | 1,392,051 | 4,718,793 | |||||
| Net Increase in Net Assets | 1,381,277 | 3,338,595 | |||||
| Net Assets: | |||||||
| Beginning of year | 87,468,629 | 84,130,034 | |||||
| End of year1 | $ | 88,849,906 | $ | 87,468,629 | |||
| 1Including distributions in excess of | |||||||
| net investment income | $ | (11,301 | ) | $ | (11,253 | ) | |
See accompanying notes
79
Statements of changes in net assets
Delaware Tax-Free New York Fund
| Year Ended | |||||||
| 8/31/08 | 8/31/07 | ||||||
| Increase (Decrease) in Net Assets from Operations: | |||||||
| Net investment income | $ | 718,580 | $ | 743,181 | |||
| Net realized gain (loss) on investments | (59,331 | ) | 62,452 | ||||
| Net change in unrealized | |||||||
| appreciation/depreciation of investments | 64,192 | (521,401 | ) | ||||
| Net increase in net assets resulting | |||||||
| from operations | 723,441 | 284,232 | |||||
| Dividends and Distributions to Shareholders from: | |||||||
| Net investment income: | |||||||
| Class A | (591,360 | ) | (590,536 | ) | |||
| Class B | (58,984 | ) | (85,737 | ) | |||
| Class C | (68,233 | ) | (66,908 | ) | |||
| (718,577 | ) | (743,181 | ) | ||||
| Capital Share Transactions: | |||||||
| Proceeds from shares sold: | |||||||
| Class A | 1,725,009 | 2,521,809 | |||||
| Class B | 15,697 | 33,616 | |||||
| Class C | 773,501 | 494,335 | |||||
| Net asset value of shares issued upon reinvestment | |||||||
| of dividends and distributions: | |||||||
| Class A | 340,675 | 415,794 | |||||
| Class B | 34,201 | 35,753 | |||||
| Class C | 26,265 | 26,806 | |||||
| 2,915,348 | 3,528,113 | ||||||
80
| Year Ended | |||||||
| 8/31/08 | 8/31/07 | ||||||
| Capital Share Transactions (continued): | |||||||
| Cost of shares repurchased: | |||||||
| Class A | $ | (1,537,264 | ) | $ | (1,282,643 | ) | |
| Class B | (674,159 | ) | (712,045 | ) | |||
| Class C | (883,325 | ) | (407,314 | ) | |||
| (3,094,748 | ) | (2,402,002 | ) | ||||
| Increase (decrease) in net assets derived from | |||||||
| capital share transactions | (179,400 | ) | 1,126,111 | ||||
| Net Increase (Decrease) in Net Assets | (174,536 | ) | 667,162 | ||||
| Net Assets: | |||||||
| Beginning of year | 19,112,043 | 18,444,881 | |||||
| End of year1 | $ | 18,937,507 | $ | 19,112,043 | |||
| 1Including distributions in excess of | |||||||
| net investment income | $ | (652 | ) | $ | (655 | ) | |
See accompanying notes
81
Financial highlights
Delaware Tax-Free Arizona Fund Class A
Selected data for each share of the Fund outstanding throughout each period were as follows:
| Net asset value, beginning of period |
| Income (loss) from investment operations: |
| Net investment income |
| Net realized and unrealized gain (loss) on investments |
| Total from investment operations |
| Less dividends and distributions from: |
| Net investment income |
| Net realized gain on investments |
| Total dividends and distributions |
| Net asset value, end of period |
| Total return1 |
| Ratios and supplemental data: |
| Net assets, end of period (000 omitted) |
| Ratio of expenses to average net assets |
| Ratio of expenses to average net assets |
| prior to fees waived and expense paid indirectly |
| Ratio of net investment income to average net assets |
| Ratio of net investment income to average net assets |
| prior to fees waived and expense paid indirectly |
| Portfolio turnover |
1 Total investment return is based on the change in net asset value of a share during the period and assumes reinvestment of dividends and distributions at net asset value and does not reflect the impact of a sales charge. Total investment return reflects a waiver by the manager, as applicable. Performance would have been lower had the waiver not been in effect. |
See accompanying notes
82
| Year Ended | |||||||||||||||
| 8/31/08 | 8/31/07 | 8/31/06 | 8/31/05 | 8/31/04 | |||||||||||
| $11.070 | $11.350 | $11.560 | $11.410 | $11.160 | |||||||||||
| 0.444 | 0.465 | 0.467 | 0.468 | 0.469 | |||||||||||
| (0.140 | ) | (0.280 | ) | (0.210 | ) | 0.174 | 0.308 | ||||||||
| 0.304 | 0.185 | 0.257 | 0.642 | 0.777 | |||||||||||
| (0.444 | ) | (0.465 | ) | (0.467 | ) | (0.468 | ) | (0.469 | ) | ||||||
| — | — | — | (0.024 | ) | (0.058 | ) | |||||||||
| (0.444 | ) | (0.465 | ) | (0.467 | ) | (0.492 | ) | (0.527 | ) | ||||||
| $10.930 | $11.070 | $11.350 | $11.560 | $11.410 | |||||||||||
| 2.78% | 1.63% | 2.31% | 5.74% | 7.09% | |||||||||||
| $122,027 | $125,636 | $131,468 | $134,874 | $122,436 | |||||||||||
| 0.75% | 0.76% | 0.76% | 0.80% | 0.90% | |||||||||||
| 0.91% | 0.91% | 0.91% | 0.91% | 0.90% | |||||||||||
| 4.02% | 4.11% | 4.12% | 4.07% | 4.14% | |||||||||||
| 3.86% | 3.96% | 3.97% | 3.96% | 4.14% | |||||||||||
| 29% | 9% | 8% | 3% | 19% | |||||||||||
83
Financial highlights
Delaware Tax-Free Arizona Fund Class B
Selected data for each share of the Fund outstanding throughout each period were as follows:
| Net asset value, beginning of period |
| Income (loss) from investment operations: |
| Net investment income |
| Net realized and unrealized gain (loss) on investments |
| Total from investment operations |
| Less dividends and distributions from: |
| Net investment income |
| Net realized gain on investments |
| Total dividends and distributions |
| Net asset value, end of period |
| Total return1 |
| Ratios and supplemental data: |
| Net assets, end of period (000 omitted) |
| Ratio of expenses to average net assets |
| Ratio of expenses to average net assets |
| prior to fees waived and expense paid indirectly |
| Ratio of net investment income to average net assets |
| Ratio of net investment income to average net assets |
| prior to fees waived and expense paid indirectly |
| Portfolio turnover |
1 Total investment return is based on the change in net asset value of a share during the period and assumes reinvestment of dividends and distributions at net asset value and does not reflect the impact of a sales charge. Total investment return reflects a waiver by the manager, as applicable. Performance would have been lower had the waiver not been in effect.
See accompanying notes
84
| Year Ended | ||||||||||||||||
| 8/31/08 | 8/31/07 | 8/31/06 | 8/31/05 | 8/31/04 | ||||||||||||
| $11.070 | $11.360 | $11.570 | $11.420 | $11.170 | ||||||||||||
| 0.361 | 0.380 | 0.382 | 0.382 | 0.384 | ||||||||||||
| (0.130 | ) | (0.290 | ) | (0.210 | ) | 0.174 | 0.308 | |||||||||
| 0.231 | 0.090 | 0.172 | 0.556 | 0.692 | ||||||||||||
| (0.361 | ) | (0.380 | ) | (0.382 | ) | (0.382 | ) | (0.384 | ) | |||||||
| — | — | — | (0.024 | ) | (0.058 | ) | ||||||||||
| (0.361 | ) | (0.380 | ) | (0.382 | ) | (0.406 | ) | (0.442 | ) | |||||||
| $10.940 | $11.070 | $11.360 | $11.570 | $11.420 | ||||||||||||
| 2.10% | 0.78% | 1.54% | 4.95% | 6.28% | ||||||||||||
| $9,620 | $12,407 | $16,413 | $19,005 | $13,355 | ||||||||||||
| 1.50% | 1.51% | 1.51% | 1.55% | 1.65% | ||||||||||||
| 1.66% | 1.66% | 1.66% | 1.66% | 1.65% | ||||||||||||
| 3.27% | 3.36% | 3.37% | 3.32% | 3.39% | ||||||||||||
| 3.11% | 3.21% | 3.22% | 3.21% | 3.39% | ||||||||||||
| 29% | 9% | 8% | 3% | 19% | ||||||||||||
85
Financial highlights
Delaware Tax-Free Arizona Fund Class C
Selected data for each share of the Fund outstanding throughout each period were as follows:
| Net asset value, beginning of period |
| Income (loss) from investment operations: |
| Net investment income |
| Net realized and unrealized gain (loss) on investments |
| Total from investment operations |
| Less dividends and distributions from: |
| Net investment income |
| Net realized gain on investments |
| Total dividends and distributions |
| Net asset value, end of period |
| Total return1 |
| Ratios and supplemental data: |
| Net assets, end of period (000 omitted) |
| Ratio of expenses to average net assets |
| Ratio of expenses to average net assets |
| prior to fees waived and expense paid indirectly |
| Ratio of net investment income to average net assets |
| Ratio of net investment income to average net assets |
| prior to fees waived and expense paid indirectly |
| Portfolio turnover |
1 Total investment return is based on the change in net asset value of a share during the period and assumes reinvestment of dividends and distributions at net asset value and does not reflect the impact of a sales charge. Total investment return reflects a waiver by the manager, as applicable. Performance would have been lower had the waiver not been in effect.
See accompanying notes
86
| Year Ended | ||||||||||||||||
| 8/31/08 | 8/31/07 | 8/31/06 | 8/31/05 | 8/31/04 | ||||||||||||
| $11.090 | $11.380 | $11.580 | $11.430 | $11.180 | ||||||||||||
| 0.361 | 0.380 | 0.381 | 0.382 | 0.384 | ||||||||||||
| (0.130 | ) | (0.290 | ) | (0.200 | ) | 0.174 | 0.308 | |||||||||
| 0.231 | 0.090 | 0.181 | 0.556 | 0.692 | ||||||||||||
| (0.361 | ) | (0.380 | ) | (0.381 | ) | (0.382 | ) | (0.384 | ) | |||||||
| — | — | — | (0.024 | ) | (0.058 | ) | ||||||||||
| (0.361 | ) | (0.380 | ) | (0.381 | ) | (0.406 | ) | (0.442 | ) | |||||||
| $10.960 | $11.090 | $11.380 | $11.580 | $11.430 | ||||||||||||
| 2.09% | 0.77% | 1.63% | 4.94% | 6.27% | ||||||||||||
| $8,806 | $7,609 | $8,117 | $8,591 | $6,651 | ||||||||||||
| 1.50% | 1.51% | 1.51% | 1.55% | 1.65% | ||||||||||||
| 1.66% | 1.66% | 1.66% | 1.66% | 1.65% | ||||||||||||
| 3.27% | 3.36% | 3.37% | 3.32% | 3.39% | ||||||||||||
| 3.11% | 3.21% | 3.22% | 3.21% | 3.39% | ||||||||||||
| 29% | 9% | 8% | 3% | 19% | ||||||||||||
87
Financial highlights
Delaware Tax-Free California Fund Class A
Selected data for each share of the Fund outstanding throughout each period were as follows:
| Net asset value, beginning of period |
| Income (loss) from investment operations: |
| Net investment income |
| Net realized and unrealized gain (loss) on investments |
| Total from investment operations |
| Less dividends and distributions from: |
| Net investment income |
| Total dividends and distributions |
| Net asset value, end of period |
| Total return1 |
| Ratios and supplemental data: |
| Net assets, end of period (000 omitted) |
| Ratio of expenses to average net assets |
| Ratio of expenses to average net assets |
| prior to fees waived and expense paid indirectly |
| Ratio of net investment income to average net assets |
| Ratio of net investment income to average net assets |
| prior to fees waived and expense paid indirectly |
| Portfolio turnover |
1 Total investment return is based on the change in net asset value of a share during the period and assumes reinvestment of dividends and distributions at net asset value and does not reflect the impact of a sales charge. Total investment return reflects a waiver by the manager. Performance would have been lower had the waiver not been in effect.
See accompanying notes
88
| Year Ended | ||||||||||||||||
| 8/31/08 | 8/31/07 | 8/31/06 | 8/31/05 | 8/31/04 | ||||||||||||
| $11.010 | $11.400 | $11.490 | $11.110 | $10.750 | ||||||||||||
| 0.449 | 0.454 | 0.450 | 0.462 | 0.518 | ||||||||||||
| (0.210 | ) | (0.390 | ) | (0.090 | ) | 0.380 | 0.360 | |||||||||
| 0.239 | 0.064 | 0.360 | 0.842 | 0.878 | ||||||||||||
| (0.449 | ) | (0.454 | ) | (0.450 | ) | (0.462 | ) | (0.518 | ) | |||||||
| (0.449 | ) | (0.454 | ) | (0.450 | ) | (0.462 | ) | (0.518 | ) | |||||||
| $10.800 | $11.010 | $11.400 | $11.490 | $11.110 | ||||||||||||
| 2.21% | 0.51% | 3.24% | 7.72% | 8.34% | ||||||||||||
| $67,174 | $76,537 | $75,995 | $60,744 | $24,797 | ||||||||||||
| 0.88% | 0.89% | 0.88% | 0.84% | 0.50% | ||||||||||||
| 0.97% | 0.97% | 0.97% | 1.06% | 0.96% | ||||||||||||
| 4.11% | 3.98% | 3.97% | 4.03% | 4.72% | ||||||||||||
| 4.02% | 3.90% | 3.88% | 3.81% | 4.26% | ||||||||||||
| 34% | 21% | 14% | 11% | 48% | ||||||||||||
89
Financial highlights
Delaware Tax-Free California Fund Class B
Selected data for each share of the Fund outstanding throughout each period were as follows:
| Net asset value, beginning of period |
| Income (loss) from investment operations: |
| Net investment income |
| Net realized and unrealized gain (loss) on investments |
| Total from investment operations |
| Less dividends and distributions from: |
| Net investment income |
| Total dividends and distributions |
| Net asset value, end of period |
| Total return1 |
| Ratios and supplemental data: |
| Net assets, end of period (000 omitted) |
| Ratio of expenses to average net assets |
| Ratio of expenses to average net assets |
| prior to fees waived and expense paid indirectly |
| Ratio of net investment income to average net assets |
| Ratio of net investment income to average net assets |
| prior to fees waived and expense paid indirectly |
| Portfolio turnover |
1 Total investment return is based on the change in net asset value of a share during the period and assumes reinvestment of dividends and distributions at net asset value and does not reflect the impact of a sales charge. Total investment return reflects a waiver by the manager. Performance would have been lower had the waiver not been in effect.
See accompanying notes
90
| Year Ended | ||||||||||||||||
| 8/31/08 | 8/31/07 | 8/31/06 | 8/31/05 | 8/31/04 | ||||||||||||
| $11.060 | $11.440 | $11.530 | $11.160 | $10.790 | ||||||||||||
| 0.367 | 0.368 | 0.365 | 0.377 | 0.436 | ||||||||||||
| (0.220 | ) | (0.380 | ) | (0.090 | ) | 0.370 | 0.370 | |||||||||
| 0.147 | (0.012 | ) | 0.275 | 0.747 | 0.806 | |||||||||||
| (0.367 | ) | (0.368 | ) | (0.365 | ) | (0.377 | ) | (0.436 | ) | |||||||
| (0.367 | ) | (0.368 | ) | (0.365 | ) | (0.377 | ) | (0.436 | ) | |||||||
| $10.840 | $11.060 | $11.440 | $11.530 | $11.160 | ||||||||||||
| 1.34% | (0.15% | ) | 2.46% | 6.80% | 7.60% | |||||||||||
| $6,589 | $9,384 | $14,918 | $18,254 | $14,530 | ||||||||||||
| 1.63% | 1.64% | 1.63% | 1.59% | 1.25% | ||||||||||||
| 1.72% | 1.72% | 1.72% | 1.81% | 1.71% | ||||||||||||
| 3.36% | 3.23% | 3.22% | 3.28% | 3.97% | ||||||||||||
| 3.27% | 3.15% | 3.13% | 3.06% | 3.51% | ||||||||||||
| 34% | 21% | 14% | 11% | 48% | ||||||||||||
91
Financial highlights
Delaware Tax-Free California Fund Class C
Selected data for each share of the Fund outstanding throughout each period were as follows:
| Net asset value, beginning of period |
| Income (loss) from investment operations: |
| Net investment income |
| Net realized and unrealized gain (loss) on investments |
| Total from investment operations |
| Less dividends and distributions from: |
| Net investment income |
| Total dividends and distributions |
| Net asset value, end of period |
| Total return1 |
| Ratios and supplemental data: |
| Net assets, end of period (000 omitted) |
| Ratio of expenses to average net assets |
| Ratio of expenses to average net assets |
| prior to fees waived and expense paid indirectly |
| Ratio of net investment income to average net assets |
| Ratio of net investment income to average net assets |
| prior to fees waived and expense paid indirectly |
| Portfolio turnover |
1 Total investment return is based on the change in net asset value of a share during the period and assumes reinvestment of dividends and distributions at net asset value and does not reflect the impact of a sales charge. Total investment return reflects a waiver by the manager. Performance would have been lower had the waiver not been in effect.
See accompanying notes
92
| Year Ended | ||||||||||||||||
| 8/31/08 | 8/31/07 | 8/31/06 | 8/31/05 | 8/31/04 | ||||||||||||
| $11.030 | $11.420 | $11.500 | $11.130 | $10.760 | ||||||||||||
| 0.367 | 0.368 | 0.365 | 0.377 | 0.436 | ||||||||||||
| (0.220 | ) | (0.390 | ) | (0.080 | ) | 0.370 | 0.370 | |||||||||
| 0.147 | (0.022 | ) | 0.285 | 0.747 | 0.806 | |||||||||||
| (0.367 | ) | (0.368 | ) | (0.365 | ) | (0.377 | ) | (0.436 | ) | |||||||
| (0.367 | ) | (0.368 | ) | (0.365 | ) | (0.377 | ) | (0.436 | ) | |||||||
| $10.810 | $11.030 | $11.420 | $11.500 | $11.130 | ||||||||||||
| 1.35% | (0.24% | ) | 2.56% | 6.81% | 7.62% | |||||||||||
| $14,991 | $13,453 | $12,768 | $9,756 | $5,595 | ||||||||||||
| 1.63% | 1.64% | 1.63% | 1.59% | 1.25% | ||||||||||||
| 1.72% | 1.72% | 1.72% | 1.81% | 1.71% | ||||||||||||
| 3.36% | 3.23% | 3.22% | 3.28% | 3.97% | ||||||||||||
| 3.27% | 3.15% | 3.13% | 3.06% | 3.51% | ||||||||||||
| 34% | 21% | 14% | 11% | 48% | ||||||||||||
93
Financial highlights
Delaware Tax-Free Colorado Fund Class A
Selected data for each share of the Fund outstanding throughout each period were as follows:
| Net asset value, beginning of period |
| Income (loss) from investment operations: |
| Net investment income |
| Net realized and unrealized gain (loss) on investments |
| Total from investment operations |
| Less dividends and distributions from: |
| Net investment income |
| Total dividends and distributions |
| Net asset value, end of period |
| Total return1 |
| Ratios and supplemental data: |
| Net assets, end of period (000 omitted) |
| Ratio of expenses to average net assets |
| Ratio of expenses to average net assets |
| prior to fees waived and expense paid indirectly |
| Ratio of net investment income to average net assets |
| Ratio of net investment income to average net assets |
| prior to fees waived and expense paid indirectly |
| Portfolio turnover |
1 Total investment return is based on the change in net asset value of a share during the period and assumes reinvestment of dividends and distributions at net asset value and does not reflect the impact of a sales charge. Total investment return reflects a waiver by the manager, as applicable. Performance would have been lower had the waiver not been in effect.
See accompanying notes
94
| Year Ended | ||||||||||||||||
| 8/31/08 | 8/31/07 | 8/31/06 | 8/31/05 | 8/31/04 | ||||||||||||
| $10.730 | $11.040 | $11.200 | $11.070 | $10.830 | ||||||||||||
| 0.448 | 0.464 | 0.488 | 0.495 | 0.510 | ||||||||||||
| (0.089 | ) | (0.310 | ) | (0.160 | ) | 0.130 | 0.240 | |||||||||
| 0.359 | 0.154 | 0.328 | 0.625 | 0.750 | ||||||||||||
| (0.449 | ) | (0.464 | ) | (0.488 | ) | (0.495 | ) | (0.510 | ) | |||||||
| (0.449 | ) | (0.464 | ) | (0.488 | ) | (0.495 | ) | (0.510 | ) | |||||||
| $10.640 | $10.730 | $11.040 | $11.200 | $11.070 | ||||||||||||
| 3.38% | 1.38% | 3.03% | 5.78% | 7.04% | ||||||||||||
| $234,630 | $246,695 | $258,773 | $270,149 | $276,534 | ||||||||||||
| 0.93% | 0.94% | 0.93% | 0.94% | 0.95% | ||||||||||||
| 0.95% | 0.96% | 0.94% | 0.94% | 0.95% | ||||||||||||
| 4.16% | 4.22% | 4.43% | 4.46% | 4.63% | ||||||||||||
| 4.14% | 4.20% | 4.42% | 4.46% | 4.63% | ||||||||||||
| 15% | 12% | 8% | 8% | 13% | ||||||||||||
95
Financial highlights
Delaware Tax-Free Colorado Fund Class B
Selected data for each share of the Fund outstanding throughout each period were as follows:
| Net asset value, beginning of period |
| Income (loss) from investment operations: |
| Net investment income |
| Net realized and unrealized gain (loss) on investments |
| Total from investment operations |
| Less dividends and distributions from: |
| Net investment income |
| Total dividends and distributions |
| Net asset value, end of period |
| Total return1 |
| Ratios and supplemental data: |
| Net assets, end of period (000 omitted) |
| Ratio of expenses to average net assets |
| Ratio of expenses to average net assets |
| prior to fees waived and expense paid indirectly |
| Ratio of net investment income to average net assets |
| Ratio of net investment income to average net assets |
| prior to fees waived and expense paid indirectly |
| Portfolio turnover |
1 Total investment return is based on the change in net asset value of a share during the period and assumes reinvestment of dividends and distributions at net asset value and does not reflect the impact of a sales charge. Total investment return reflects a waiver by the manager, as applicable. Performance would have been lower had the waiver not been in effect.
See accompanying notes
96
| Year Ended | ||||||||||||||||
| 8/31/08 | 8/31/07 | 8/31/06 | 8/31/05 | 8/31/04 | ||||||||||||
| $10.730 | $11.050 | $11.200 | $11.080 | $10.830 | ||||||||||||
| 0.367 | 0.382 | 0.405 | 0.412 | 0.427 | ||||||||||||
| (0.089 | ) | (0.320 | ) | (0.150 | ) | 0.120 | 0.250 | |||||||||
| 0.278 | 0.062 | 0.255 | 0.532 | 0.677 | ||||||||||||
| (0.368 | ) | (0.382 | ) | (0.405 | ) | (0.412 | ) | (0.427 | ) | |||||||
| (0.368 | ) | (0.382 | ) | (0.405 | ) | (0.412 | ) | (0.427 | ) | |||||||
| $10.640 | $10.730 | $11.050 | $11.200 | $11.080 | ||||||||||||
| 2.60% | 0.53% | 2.35% | 4.89% | 6.34% | ||||||||||||
| $3,961 | $5,326 | $8,221 | $10,370 | $12,411 | ||||||||||||
| 1.68% | 1.69% | 1.68% | 1.69% | 1.70% | ||||||||||||
| 1.70% | 1.71% | 1.69% | 1.69% | 1.70% | ||||||||||||
| 3.41% | 3.47% | 3.68% | 3.71% | 3.88% | ||||||||||||
| 3.39% | 3.45% | 3.67% | 3.71% | 3.88% | ||||||||||||
| 15% | 12% | 8% | 8% | 13% | ||||||||||||
97
Financial highlights
Delaware Tax-Free Colorado Fund Class C
Selected data for each share of the Fund outstanding throughout each period were as follows:
| Net asset value, beginning of period |
| Income (loss) from investment operations: |
| Net investment income |
| Net realized and unrealized gain (loss) on investments |
| Total from investment operations |
| Less dividends and distributions from: |
| Net investment income |
| Total dividends and distributions |
| Net asset value, end of period |
| Total return1 |
| Ratios and supplemental data: |
| Net assets, end of period (000 omitted) |
| Ratio of expenses to average net assets |
| Ratio of expenses to average net assets |
| prior to fees waived and expense paid indirectly |
| Ratio of net investment income to average net assets |
| Ratio of net investment income to average net assets |
| prior to fees waived and expense paid indirectly |
| Portfolio turnover |
1 Total investment return is based on the change in net asset value of a share during the period and assumes reinvestment of dividends and distributions at net asset value and does not reflect the impact of a sales charge. Total investment return reflects a waiver by the manager, as applicable. Performance would have been lower had the waiver not been in effect.
See accompanying notes
98
| Year Ended | |||||||||||||||
| 8/31/08 | 8/31/07 | 8/31/06 | 8/31/05 | 8/31/04 | |||||||||||
| $10.750 | $11.070 | $11.220 | $11.090 | $10.850 | |||||||||||
| 0.367 | 0.382 | 0.405 | 0.413 | 0.427 | |||||||||||
| (0.089 | ) | (0.320 | ) | (0.150 | ) | 0.130 | 0.240 | ||||||||
| 0.278 | 0.062 | 0.255 | 0.543 | 0.667 | |||||||||||
| (0.368 | ) | (0.382 | ) | (0.405 | ) | (0.413 | ) | (0.427 | ) | ||||||
| (0.368 | ) | (0.382 | ) | (0.405 | ) | (0.413 | ) | (0.427 | ) | ||||||
| $10.660 | $10.750 | $11.070 | $11.220 | $11.090 | |||||||||||
| 2.60% | 0.53% | 2.34% | 4.99% | 6.23% | |||||||||||
| $9,836 | $10,152 | $9,971 | $9,170 | $9,579 | |||||||||||
| 1.68% | 1.69% | 1.68% | 1.69% | 1.70% | |||||||||||
| 1.70% | 1.71% | 1.69% | 1.69% | 1.70% | |||||||||||
| 3.41% | 3.47% | 3.68% | 3.71% | 3.88% | |||||||||||
| 3.39% | 3.45% | 3.67% | 3.71% | 3.88% | |||||||||||
| 15% | 12% | 8% | 8% | 13% | |||||||||||
99
Financial highlights
Delaware Tax-Free Idaho Fund Class A
Selected data for each share of the Fund outstanding throughout each period were as follows:
| Net asset value, beginning of period |
| Income (loss) from investment operations: |
| Net investment income |
| Net realized and unrealized gain (loss) on investments |
| Total from investment operations |
| Less dividends and distributions from: |
| Net investment income |
| Total dividends and distributions |
| Net asset value, end of period |
| Total return1 |
| Ratios and supplemental data: |
| Net assets, end of period (000 omitted) |
| Ratio of expenses to average net assets |
| Ratio of expenses to average net assets |
| prior to fees waived and expense paid indirectly |
| Ratio of net investment income to average net assets |
| Ratio of net investment income to average net assets |
| prior to fees waived and expense paid indirectly |
| Portfolio turnover |
1 Total investment return is based on the change in net asset value of a share during the period and assumes reinvestment of dividends and distributions at net asset value and does not reflect the impact of a sales charge. Total investment return reflects a waiver by the manager, as applicable. Performance would have been lower had the waiver not been in effect.
See accompanying notes
100
| Year Ended | |||||||||||||||
| 8/31/08 | 8/31/07 | 8/31/06 | 8/31/05 | 8/31/04 | |||||||||||
| $11.260 | $11.450 | $11.630 | $11.490 | $11.140 | |||||||||||
| 0.437 | 0.448 | 0.449 | 0.452 | 0.478 | |||||||||||
| — | (0.190 | ) | (0.180 | ) | 0.140 | 0.353 | |||||||||
| 0.437 | 0.258 | 0.269 | 0.592 | 0.831 | |||||||||||
| (0.437 | ) | (0.448 | ) | (0.449 | ) | (0.452 | ) | (0.481 | ) | ||||||
| (0.437 | ) | (0.448 | ) | (0.449 | ) | (0.452 | ) | (0.481 | ) | ||||||
| $11.260 | $11.260 | $11.450 | $11.630 | $11.490 | |||||||||||
| 3.93% | 2.27% | 2.40% | 5.25% | 7.58% | |||||||||||
| $72,237 | $69,931 | $62,808 | $60,554 | $55,572 | |||||||||||
| 0.85% | 0.86% | 0.85% | 0.87% | 0.97% | |||||||||||
| 0.96% | 0.98% | 0.98% | 0.98% | 0.97% | |||||||||||
| 3.87% | 3.92% | 3.95% | 3.92% | 4.21% | |||||||||||
| 3.76% | 3.80% | 3.82% | 3.81% | 4.21% | |||||||||||
| 11% | 8% | 15% | 27% | 13% | |||||||||||
101
Financial highlights
Delaware Tax-Free Idaho Fund Class B
Selected data for each share of the Fund outstanding throughout each period were as follows:
| Net asset value, beginning of period |
| Income (loss) from investment operations: |
| Net investment income |
| Net realized and unrealized gain (loss) on investments |
| Total from investment operations |
| Less dividends and distributions from: |
| Net investment income |
| Total dividends and distributions |
| Net asset value, end of period |
| Total return1 |
| Ratios and supplemental data: |
| Net assets, end of period (000 omitted) |
| Ratio of expenses to average net assets |
| Ratio of expenses to average net assets |
| prior to fees waived and expense paid indirectly |
| Ratio of net investment income to average net assets |
| Ratio of net investment income to average net assets |
| prior to fees waived and expense paid indirectly |
| Portfolio turnover |
1 Total investment return is based on the change in net asset value of a share during the period and assumes reinvestment of dividends and distributions at net asset value and does not reflect the impact of a sales charge. Total investment return reflects a waiver by the manager, as applicable. Performance would have been lower had the waiver not been in effect.
See accompanying notes
102
| Year Ended | |||||||||||||||
| 8/31/08 | 8/31/07 | 8/31/06 | 8/31/05 | 8/31/04 | |||||||||||
| $11.240 | $11.430 | $11.610 | $11.480 | $11.130 | |||||||||||
| 0.353 | 0.363 | 0.364 | 0.366 | 0.393 | |||||||||||
| — | (0.190 | ) | (0.180 | ) | 0.130 | 0.353 | |||||||||
| 0.353 | 0.173 | 0.184 | 0.496 | 0.746 | |||||||||||
| (0.353 | ) | (0.363 | ) | (0.364 | ) | (0.366 | ) | (0.396 | ) | ||||||
| (0.353 | ) | (0.363 | ) | (0.364 | ) | (0.366 | ) | (0.396 | ) | ||||||
| $11.240 | $11.240 | $11.430 | $11.610 | $11.480 | |||||||||||
| 3.17% | 1.51% | 1.64% | 4.39% | 6.79% | |||||||||||
| $5,123 | $6,003 | $7,892 | $10,911 | $13,044 | |||||||||||
| 1.60% | 1.61% | 1.60% | 1.62% | 1.72% | |||||||||||
| 1.71% | 1.73% | 1.73% | 1.73% | 1.72% | |||||||||||
| 3.12% | 3.17% | 3.20% | 3.17% | 3.46% | |||||||||||
| 3.01% | 3.05% | 3.07% | 3.06% | 3.46% | |||||||||||
| 11% | 8% | 15% | 27% | 13% | |||||||||||
103
Financial highlights
Delaware Tax-Free Idaho Fund Class C
Selected data for each share of the Fund outstanding throughout each period were as follows:
| Net asset value, beginning of period |
| Income (loss) from investment operations: |
| Net investment income |
| Net realized and unrealized gain (loss) on investments |
| Total from investment operations |
| Less dividends and distributions from: |
| Net investment income |
| Total dividends and distributions |
| Net asset value, end of period |
| Total return1 |
| Ratios and supplemental data: |
| Net assets, end of period (000 omitted) |
| Ratio of expenses to average net assets |
| Ratio of expenses to average net assets |
| prior to fees waived and expense paid indirectly |
| Ratio of net investment income to average net assets |
| Ratio of net investment income to average net assets |
| prior to fees waived and expense paid indirectly |
| Portfolio turnover |
1 Total investment return is based on the change in net asset value of a share during the period and assumes reinvestment of dividends and distributions at net asset value and does not reflect the impact of a sales charge. Total investment return reflects a waiver by the manager, as applicable. Performance would have been lower had the waiver not been in effect.
See accompanying notes
104
| Year Ended | |||||||||||||||
| 8/31/08 | 8/31/07 | 8/31/06 | 8/31/05 | 8/31/04 | |||||||||||
| $11.250 | $11.440 | $11.630 | $11.490 | $11.130 | |||||||||||
| 0.352 | 0.363 | 0.364 | 0.366 | 0.393 | |||||||||||
| — | (0.190 | ) | (0.190 | ) | 0.140 | 0.362 | |||||||||
| 0.352 | 0.173 | 0.174 | 0.506 | 0.755 | |||||||||||
| (0.352 | ) | (0.363 | ) | (0.364 | ) | (0.366 | ) | (0.395 | ) | ||||||
| (0.352 | ) | (0.363 | ) | (0.364 | ) | (0.366 | ) | (0.395 | ) | ||||||
| $11.250 | $11.250 | $11.440 | $11.630 | $11.490 | |||||||||||
| 3.16% | 1.51% | 1.56% | 4.47% | 6.87% | |||||||||||
| $11,490 | $11,535 | $13,430 | $15,678 | $15,041 | |||||||||||
| 1.60% | 1.61% | 1.60% | 1.62% | 1.72% | |||||||||||
| 1.71% | 1.73% | 1.73% | 1.73% | 1.72% | |||||||||||
| 3.12% | 3.17% | 3.20% | 3.17% | 3.46% | |||||||||||
| 3.01% | 3.05% | 3.07% | 3.06% | 3.46% | |||||||||||
| 11% | 8% | 15% | 27% | 13% | |||||||||||
105
Financial highlights
Delaware Tax-Free New York Fund Class A
Selected data for each share of the Fund outstanding throughout each period were as follows:
| Net asset value, beginning of period |
| Income (loss) from investment operations: |
| Net investment income |
| Net realized and unrealized gain (loss) on investments |
| Total from investment operations |
| Less dividends and distributions from: |
| Net investment income |
| Total dividends and distributions |
| Net asset value, end of period |
| Total return1 |
| Ratios and supplemental data: |
| Net assets, end of period (000 omitted) |
| Ratio of expenses to average net assets |
| Ratio of expenses to average net assets |
| prior to fees waived and expense paid indirectly |
| Ratio of net investment income to average net assets |
| Ratio of net investment income to average net assets |
| prior to fees waived and expense paid indirectly |
| Portfolio turnover |
1 Total investment return is based on the change in net asset value of a share during the period and assumes reinvestment of dividends and distributions at net asset value and does not reflect the impact of a sales charge. Total investment return reflects a waiver by the manager. Performance would have been lower had the waiver not been in effect.
See accompanying notes
106
| Year Ended | |||||||||||||||
| 8/31/08 | 8/31/07 | 8/31/06 | 8/31/05 | 8/31/04 | |||||||||||
| $10.300 | $10.550 | $10.700 | $10.470 | $10.220 | |||||||||||
| 0.411 | 0.435 | 0.449 | 0.453 | 0.479 | |||||||||||
| — | (0.250 | ) | (0.150 | ) | 0.230 | 0.250 | |||||||||
| 0.411 | 0.185 | 0.299 | 0.683 | 0.729 | |||||||||||
| (0.411 | ) | (0.435 | ) | (0.449 | ) | (0.453 | ) | (0.479 | ) | ||||||
| (0.411 | ) | (0.435 | ) | (0.449 | ) | (0.453 | ) | (0.479 | ) | ||||||
| $10.300 | $10.300 | $10.550 | $10.700 | $10.470 | |||||||||||
| 4.04% | 1.75% | 2.90% | 6.65% | 7.26% | |||||||||||
| $15,340 | $14,817 | $13,519 | $13,153 | $11,523 | |||||||||||
| 0.85% | 0.79% | 0.65% | 0.66% | 0.50% | |||||||||||
| 1.09% | 1.10% | 1.09% | 1.12% | 1.02% | |||||||||||
| 3.97% | 4.13% | 4.28% | 4.29% | 4.60% | |||||||||||
| 3.73% | 3.82% | 3.84% | 3.83% | 4.08% | |||||||||||
| 28% | 14% | 20% | 13% | 26% | |||||||||||
107
Financial highlights
Delaware Tax-Free New York Fund Class B
Selected data for each share of the Fund outstanding throughout each period were as follows:
| Net asset value, beginning of period |
| Income (loss) from investment operations: |
| Net investment income |
| Net realized and unrealized gain (loss) on investments |
| Total from investment operations |
| Less dividends and distributions from: |
| Net investment income |
| Total dividends and distributions |
| Net asset value, end of period |
| Total return1 |
| Ratios and supplemental data: |
| Net assets, end of period (000 omitted) |
| Ratio of expenses to average net assets |
| Ratio of expenses to average net assets |
| prior to fees waived and expense paid indirectly |
| Ratio of net investment income to average net assets |
| Ratio of net investment income to average net assets |
| prior to fees waived and expense paid indirectly |
| Portfolio turnover |
1 Total investment return is based on the change in net asset value of a share during the period and assumes reinvestment of dividends and distributions at net asset value and does not reflect the impact of a sales charge. Total investment return reflects a waiver by the manager. Performance would have been lower had the waiver not been in effect.
See accompanying notes
108
| Year Ended | |||||||||||||||
| 8/31/08 | 8/31/07 | 8/31/06 | 8/31/05 | 8/31/04 | |||||||||||
| $10.280 | $10.530 | $10.670 | $10.450 | $10.200 | |||||||||||
| 0.333 | 0.357 | 0.370 | 0.374 | 0.401 | |||||||||||
| (0.010 | ) | (0.250 | ) | (0.140 | ) | 0.220 | 0.250 | ||||||||
| 0.323 | 0.107 | 0.230 | 0.594 | 0.651 | |||||||||||
| (0.333 | ) | (0.357 | ) | (0.370 | ) | (0.374 | ) | (0.401 | ) | ||||||
| (0.333 | ) | (0.357 | ) | (0.370 | ) | (0.374 | ) | (0.401 | ) | ||||||
| $10.270 | $10.280 | $10.530 | $10.670 | $10.450 | |||||||||||
| 3.17% | 0.99% | 2.23% | 5.77% | 6.47% | |||||||||||
| $1,549 | $2,164 | $2,858 | $3,023 | $2,858 | |||||||||||
| 1.60% | 1.54% | 1.40% | 1.41% | 1.25% | |||||||||||
| 1.84% | 1.85% | 1.84% | 1.87% | 1.77% | |||||||||||
| 3.22% | 3.38% | 3.53% | 3.54% | 3.85% | |||||||||||
| 2.98% | 3.07% | 3.09% | 3.08% | 3.33% | |||||||||||
| 28% | 14% | 20% | 13% | 26% | |||||||||||
109
Financial highlights
Delaware Tax-Free New York Fund Class C
Selected data for each share of the Fund outstanding throughout each period were as follows:
| Net asset value, beginning of period |
| Income (loss) from investment operations: |
| Net investment income |
| Net realized and unrealized gain (loss) on investments |
| Total from investment operations |
| Less dividends and distributions from: |
| Net investment income |
| Total dividends and distributions |
| Net asset value, end of period |
| Total return1 |
| Ratios and supplemental data: |
| Net assets, end of period (000 omitted) |
| Ratio of expenses to average net assets |
| Ratio of expenses to average net assets |
| prior to fees waived and expense paid indirectly |
| Ratio of net investment income to average net assets |
| Ratio of net investment income to average net assets |
| prior to fees waived and expense paid indirectly |
| Portfolio turnover |
1 Total investment return is based on the change in net asset value of a share during the period and assumes reinvestment of dividends and distributions at net asset value and does not reflect the impact of a sales charge. Total investment return reflects a waiver by the manager. Performance would have been lower had the waiver not been in effect.
See accompanying notes
110
| Year Ended | |||||||||||||||
| 8/31/08 | 8/31/07 | 8/31/06 | 8/31/05 | 8/31/04 | |||||||||||
| $10.280 | $10.530 | $10.670 | $10.450 | $10.200 | |||||||||||
| 0.333 | 0.357 | 0.370 | 0.376 | 0.401 | |||||||||||
| (0.010 | ) | (0.250 | ) | (0.140 | ) | 0.220 | 0.250 | ||||||||
| 0.323 | 0.107 | 0.230 | 0.596 | 0.651 | |||||||||||
| (0.333 | ) | (0.357 | ) | (0.370 | ) | (0.376 | ) | (0.401 | ) | ||||||
| (0.333 | ) | (0.357 | ) | (0.370 | ) | (0.376 | ) | (0.401 | ) | ||||||
| $10.270 | $10.280 | $10.530 | $10.670 | $10.450 | |||||||||||
| 3.17% | 0.99% | 2.23% | 5.80% | 6.47% | |||||||||||
| $2,049 | $2,131 | $2,068 | $886 | $2,329 | |||||||||||
| 1.60% | 1.54% | 1.40% | 1.41% | 1.25% | |||||||||||
| 1.84% | 1.85% | 1.84% | 1.87% | 1.77% | |||||||||||
| 3.22% | 3.38% | 3.53% | 3.54% | 3.85% | |||||||||||
| 2.98% | 3.07% | 3.09% | 3.08% | 3.33% | |||||||||||
| 28% | 14% | 20% | 13% | 26% | |||||||||||
111
| Notes to financial statements | |
| Delaware multi-state funds | August 31, 2008 |
Voyageur Mutual Funds is organized as a Delaware statutory trust and offers five series: Delaware Minnesota High-Yield Municipal Bond Fund, Delaware National High-Yield Municipal Bond Fund, Delaware Tax-Free California Fund, Delaware Tax-Free Idaho Fund and Delaware Tax-Free New York Fund. Voyageur Mutual Funds II is organized as a Delaware statutory trust and offers one series: Delaware Tax-Free Colorado Fund. Voyageur Insured Funds is organized as a Delaware statutory trust and offers one series: Delaware Tax-Free Arizona Fund. Voyageur Mutual Funds, Voyageur Mutual Funds II, and Voyageur Insured Funds are individually referred to as a Trust and collectively as the Trusts. These financial statements and related notes pertain to Delaware Tax-Free Arizona Fund, Delaware Tax-Free California Fund, Delaware Tax-Free Colorado Fund, Delaware Tax-Free Idaho Fund and Delaware Tax-Free New York Fund (each, a Fund or, collectively, the Funds). The above Trusts are open-end investment companies. The Funds are considered non-diversified under the Investment Company Act of 1940, as amended, and offer Class A, Class B, and Class C shares. Class A shares are sold with a maximum front-end sales charge of up to 4.50%. Class A share purchases of $1,000,000 or more will incur a contingent deferred sales charge (CDSC) of 1% if redeemed during the first year and 0.50% during the second year, provided that Delaware Distributors, L.P. (DDLP) paid a financial advisor a commission on the purchase of those shares. Class B shares may only be purchased through dividend reinvestment and certain permitted exchanges. Prior to June 1, 2007, Class B shares were sold with a CDSC that declined from 4% to zero depending upon the period of time the shares were held. Class B shares will automatically convert to Class A shares on a quarterly basis approximately eight years after purchase. Class C shares are sold with a CDSC of 1%, if redeemed during the first 12 months.
The investment objective of the Funds is to seek as high a level of current income exempt from federal income tax and personal income tax in their respective states, as is consistent with preservation of capital.
1. Significant Accounting Policies
The following accounting policies are in accordance with U.S. generally accepted accounting principles and are consistently followed by the Funds.
Security Valuation — Long-term debt securities are valued by an independent pricing service or broker. To the extent current market prices are not available, the pricing service may take into account developments related to the specific security, as well as transactions in comparable securities. Short-term debt securities having less than 60 days to maturity are valued at amortized cost, which approximates market value. Open-end investment companies are valued at their published net asset value. Generally, other securities and assets for which market quotations are not readily available are valued at fair value as determined in good faith under the direction of each Fund’s Board of Trustees (Board). In determining whether market quotations are readily available or fair valuation will be used, various factors will be taken into consideration, such as market closures, aftermarket trading or significant events after local market trading (e.g., government actions or pronouncements, trading volume or volatility on markets, exchanges among dealers, or news events).
112
In September 2006, the Financial Accounting Standards Board (FASB) issued FASB Statement No. 157 “Fair Value Measurements” (FAS 157). FAS 157 establishes a framework for measuring fair value in U.S. generally accepted accounting principles, clarifies the definition of fair value within that framework, and expands disclosures about the use of fair value measurements. FAS 157 is intended to increase consistency and comparability among fair value estimates used in financial reporting. FAS 157 is effective for fiscal years beginning after November 15, 2007. Management does not expect the adoption of FAS 157 to have a material impact on the amounts reported in the financial statements.
Federal Income Taxes — Each Fund intends to continue to qualify for federal income tax purposes as a regulated investment company under Subchapter M of the Internal Revenue Code of 1986, as amended, and make the requisite distributions to shareholders. Accordingly, no provision for federal income taxes has been made in the financial statements.
Effective February 29, 2008, the Funds adopted FASB Interpretation No. 48 “Accounting for Uncertainty in Income Taxes” (FIN 48). FIN 48 provides guidance for how uncertain tax positions should be recognized, measured, presented, and disclosed in the financial statements. FIN 48 requires the evaluation of tax positions taken or expected to be taken in the course of preparing each Fund’s tax returns to determine whether the tax positions are “more-likely-than-not” of being sustained by the applicable tax authority. Tax positions not deemed to meet the more-likely-than-not threshold would be recorded as a tax benefit or expense in the current year. The adoption of FIN 48 did not result in the recording of any tax benefit or expense in the current period.
Class Accounting — Investment income and common expenses are allocated to the various classes of each Fund on the basis of “settled shares” of each class in relation to the net assets of each Fund. Realized and unrealized gain (loss) on investments are allocated to the various classes of each Fund on the basis of daily net assets of each class. Distribution expenses relating to a specific class are charged directly to that class.
Use of Estimates — The preparation of financial statements in conformity with U.S. generally accepted accounting principles requires management to make estimates and assumptions that affect the reported amounts of assets and liabilities at the date of the financial statements and the reported amounts of revenues and expenses during the reporting period. Actual results could differ from those estimates.
Other — Expenses directly attributable to the Funds are charged directly to the Funds. Other expenses common to various funds within the Delaware Investments® Family of Funds are generally allocated amongst such funds on the basis of average net assets. Management fees and some other expenses are paid monthly. Security transactions are recorded on the date the securities are purchased or sold (trade date) for financial reporting purposes. Costs used in calculating realized gains and losses on the sale of investment securities are those of the specific securities sold. Interest income is recorded on the accrual basis. Discounts and premiums are amortized to interest income over the lives of the respective securities. Each Fund declares dividends daily from net investment income and pays such dividends monthly and declares and pays distributions from net realized gain on investments, if any, annually.
113
Notes to financial statements
Delaware multi-state funds
1. Significant Accounting Policies (continued)
The Funds receive earnings credits from their custodian when positive cash balances are maintained, which are used to offset custody fees. The expense paid under this arrangement is included in custodian fees on the statements of operations with the corresponding expense offset shown as “expense paid indirectly.”
2. Investment Management, Administration Agreements and Other Transactions with Affiliates
In accordance with the terms of its respective investment management agreement, each Fund pays Delaware Management Company (DMC), a series of Delaware Management Business Trust and the investment manager, an annual fee, which is calculated based on each Fund’s average daily net assets as follows:
| Delaware | Delaware | Delaware | Delaware | Delaware | |||||
| Tax-Free | Tax-Free | Tax-Free | Tax-Free | Tax-Free | |||||
| Arizona Fund | California Fund | Colorado Fund | Idaho Fund | New York Fund | |||||
| On the first $500 million | 0.500% | 0.550% | 0.550% | 0.550% | 0.550% | ||||
| On the next $500 million | 0.475% | 0.500% | 0.500% | 0.500% | 0.500% | ||||
| On the next $1.5 billion | 0.450% | 0.450% | 0.450% | 0.450% | 0.450% | ||||
| In excess of $2.5 billion | 0.425% | 0.425% | 0.425% | 0.425% | 0.425% |
DMC has contractually agreed to waive that portion, if any, of its management fee and reimburse each Fund to the extent necessary to ensure that total annual operating expenses, (excluding any 12b-1 plan expenses, taxes, interest, inverse floater program expenses, brokerage fees, certain insurance costs, and non-routine expenses or costs, including, but not limited to, those relating to reorganizations, litigation, conducting shareholder meetings, and liquidations (collectively, “non-routine expenses”)), do not exceed specified percentages of average daily net assets as shown below. For purposes of these waivers and reimbursements, non-routine expenses may also include such additional costs and expenses, as may be agreed upon from time to time by each Fund’s Board and DMC. These expense waivers and reimbursements apply only to expenses paid directly by the Funds.
| Delaware | Delaware | Delaware | Delaware | Delaware | ||||||||||
| Tax-Free | Tax-Free | Tax-Free | Tax-Free | Tax-Free | ||||||||||
| Arizona Fund | California Fund | Colorado Fund | Idaho Fund | New York Fund | ||||||||||
| Operating expense | ||||||||||||||
| limitation as a percentage | ||||||||||||||
| of average daily net assets | ||||||||||||||
| (per annum) | 0.50% | 0.63% | 0.68% | 0.60% | 0.60% | |||||||||
| Expiration date | 12/31/08 | 12/31/08 | 12/31/08 | 12/31/08 | 12/31/08 | |||||||||
Effective October 1, 2007, Delaware Service Company, Inc. (DSC), an affiliate of DMC, provides fund accounting and financial administration oversight services to each Fund. For these services, each Fund pays DSC fees based on the aggregate daily net assets of the Delaware Investments®
114
Family of Funds at the following annual rate: 0.0050% of the first $30 billion; 0.0045% of the next $10 billion; 0.0040% of the next $10 billion; and 0.0025% of aggregate average daily net assets in excess of $50 billion. The fees payable to DSC under the service agreement described above are allocated among all Funds in the Delaware Investments® Family of Funds on a relative net asset value basis. Prior to October 1, 2007, DSC provided fund accounting and administrative services to each Fund and received a fee at an annual rate of 0.04% of average daily net assets. For the year ended August 31, 2008, each Fund was charged for these services as follows:
| Delaware | Delaware | Delaware | Delaware | Delaware | ||||||
| Tax-Free | Tax-Free | Tax-Free | Tax-Free | Tax-Free | ||||||
| Arizona Fund | California Fund | Colorado Fund | Idaho Fund | New York Fund | ||||||
| $11,292 | $7,605 | $20,446 | $6,910 | $1,496 |
DSC also provides dividend disbursing and transfer agency services. Each Fund pays DSC a monthly fee based on the number of shareholder accounts for dividend disbursing and transfer agent services.
Pursuant to a distribution agreement and distribution plan, each Fund pays DDLP, the distributor and an affiliate of DMC, an annual distribution and service fee not to exceed 0.25% of the average daily net assets of the Class A shares and 1.00% of the average daily net assets of the Class B and C shares.
At August 31, 2008, each Fund had liabilities payable to affiliates as follows:
| Delaware | Delaware | Delaware | Delaware | Delaware | |||||||||||
| Tax-Free | Tax-Free | Tax-Free | Tax-Free | Tax-Free | |||||||||||
| Arizona Fund | California Fund | Colorado Fund | Idaho Fund | New York Fund | |||||||||||
| Investment management | |||||||||||||||
| fee payable to DMC | $36,281 | $37,133 | $108,801 | $30,448 | $3,987 | ||||||||||
| Dividend disbursing, | |||||||||||||||
| transfer agent and fund | |||||||||||||||
| accounting oversight | |||||||||||||||
| fees and other expenses | |||||||||||||||
| payable to DSC | 5,209 | 3,803 | 11,087 | 3,538 | 1,244 | ||||||||||
| Distribution fees | |||||||||||||||
| payable to DDLP | 41,128 | 32,879 | 61,235 | 29,203 | 6,236 | ||||||||||
| Other expenses payable to | |||||||||||||||
| DMC and affiliates* | 5,192 | 4,306 | 10,437 | 5,216 | 5,471 | ||||||||||
* DMC, as part of its administrative services, pays operating expenses on behalf of each Fund and is reimbursed on a periodic basis. Such expenses include items such as printing of shareholder reports, fees for audit, legal and tax services, registration fees and trustees’ fees.
115
Notes to financial statements
Delaware multi-state funds
2. Investment Management, Administration Agreements and Other Transactions with Affiliates (continued)
As provided in the investment management agreement, each Fund bears the cost of certain legal and tax services, including internal legal and tax services provided to each Fund by DMC and/or its affiliates’ employees. For the year ended August 31, 2008, each Fund was charged for internal legal and tax services provided by DMC and/or its affiliates’ employees as follows:
| Delaware | Delaware | Delaware | Delaware | Delaware | |||||
| Tax-Free | Tax-Free | Tax-Free | Tax-Free | Tax-Free | |||||
| Arizona Fund | California Fund | Colorado Fund | Idaho Fund | New York Fund | |||||
| $9,987 | $6,655 | $18,073 | $6,173 | $1,331 |
For the year ended August 31, 2008, DDLP earned commissions on sales of Class A shares for each Fund as follows:
| Delaware | Delaware | Delaware | Delaware | Delaware | |||||
| Tax-Free | Tax-Free | Tax-Free | Tax-Free | Tax-Free | |||||
| Arizona Fund | California Fund | Colorado Fund | Idaho Fund | New York Fund | |||||
| $18,914 | $13,761 | $24,075 | $25,231 | $2,625 |
For the year ended August 31, 2008, DDLP received gross CDSC commissions on redemption of each Fund’s Class A, Class B and Class C shares, and these commissions were entirely used to offset up-front commissions previously paid by DDLP to broker-dealers on sales of those shares. The amounts received were as follows:
| Delaware | Delaware | Delaware | Delaware | Delaware | |||||||||||
| Tax-Free | Tax-Free | Tax-Free | Tax-Free | Tax-Free | |||||||||||
| Arizona Fund | California Fund | Colorado Fund | Idaho Fund | New York Fund | |||||||||||
| Class A | $5,558 | $17,593 | $ — | $ — | $ — | ||||||||||
| Class B | 11,430 | 4,413 | 1,222 | 1,369 | 310 | ||||||||||
| Class C | 1,861 | 1,894 | — | 599 | 506 | ||||||||||
Trustees’ fees include expenses accrued by each Fund for each Trustee’s retainer and meeting fees. Certain officers of DMC, DSC and DDLP are officers and/or Trustees of the Trusts. These officers and Trustees are paid no compensation by each Fund.
3. Investments
For the year ended August 31, 2008, the Funds made purchases and sales of investment securities other than short-term investments as follows:
| Delaware | Delaware | Delaware | Delaware | Delaware | |||||||||||
| Tax-Free | Tax-Free | Tax-Free | Tax-Free | Tax-Free | |||||||||||
| Arizona Fund | California Fund | Colorado Fund | Idaho Fund | New York Fund | |||||||||||
| Purchases | $39,763,247 | $31,348,807 | $38,251,935 | $10,895,625 | $5,502,286 | ||||||||||
| Sales | 42,305,326 | 37,934,339 | 50,980,741 | 9,549,040 | 5,049,312 | ||||||||||
116
At August 31, 2008, the cost of investments and unrealized appreciation (depreciation) for federal income tax purposes for each Fund were as follows:
| Delaware | Delaware | Delaware | Delaware | Delaware | ||||||||||||||||
| Tax-Free | Tax-Free | Tax-Free | Tax-Free | Tax-Free | ||||||||||||||||
| Arizona Fund | California Fund | Colorado Fund | Idaho Fund | New York Fund | ||||||||||||||||
| Cost of | ||||||||||||||||||||
| investments | $ | 137,327,738 | $ | 88,249,374 | $ | 241,593,686 | $ | 85,199,291 | $ | 17,956,253 | ||||||||||
| Aggregate | ||||||||||||||||||||
| unrealized | ||||||||||||||||||||
| appreciation | $ | 3,667,158 | $ | 2,259,472 | $ | 10,272,798 | $ | 2,212,589 | $ | 698,957 | ||||||||||
| Aggregate | ||||||||||||||||||||
| unrealized | ||||||||||||||||||||
| depreciation | (1,991,743 | ) | (2,681,790 | ) | (4,753,891 | ) | (1,219,494 | ) | (249,589 | ) | ||||||||||
| Net unrealized | ||||||||||||||||||||
| appreciation | ||||||||||||||||||||
| (depreciation) | $ | 1,675,415 | $ | (422,318 | ) | $ | 5,518,907 | $ | 993,095 | $ | 449,368 | |||||||||
4. Dividend and Distribution Information
Income and long-term capital gain distributions are determined in accordance with federal income tax regulations, which may differ from U.S. generally accepted accounting principles. Additionally, distributions from net short-term gains on sales of investment securities are treated as ordinary income for federal income tax purposes. The tax character of dividends and distributions paid during the years ended August 31, 2008 and 2007 was as follows:
| Delaware | Delaware | Delaware | Delaware | Delaware | ||||||||||||
| Tax-Free | Tax-Free | Tax-Free | Tax-Free | Tax-Free | ||||||||||||
| Arizona Fund | California Fund | Colorado Fund | Idaho Fund | New York Fund | ||||||||||||
| Year ended 8/31/08 | ||||||||||||||||
| Tax-exempt | ||||||||||||||||
| income | $ | 5,547,778 | $ | 3,715,410 | $ | 10,556,654 | $ | 3,253,357 | $718,577 | |||||||
| Ordinary income | — | — | 27,164 | — | — | |||||||||||
| Total | $ | 5,547,778 | $ | 3,715,410 | $ | 10,583,818 | $ | 3,253,357 | $718,577 | |||||||
| Year ended 8/31/07 | ||||||||||||||||
| Tax-exempt | ||||||||||||||||
| income | $ | 6,056,305 | $ | 4,052,743 | $ | 11,438,978 | $ | 3,149,577 | $743,181 | |||||||
117
Notes to financial statements
Delaware multi-state funds
5. Components of Net Assets on a Tax Basis
As of August 31, 2008, the components of net assets on a tax basis were as follows:
| Delaware | Delaware | Delaware | Delaware | Delaware | ||||||||||||||||
| Tax-Free | Tax-Free | Tax-Free | Tax-Free | Tax-Free | ||||||||||||||||
| Arizona Fund | California Fund | Colorado Fund | Idaho Fund | New York Fund | ||||||||||||||||
| Shares of beneficial | ||||||||||||||||||||
| interest | $ | 140,854,589 | $ | 90,504,007 | $ | 251,403,905 | $ | 88,210,657 | $ | 18,713,550 | ||||||||||
| Distributions | ||||||||||||||||||||
| payable | (134,206 | ) | (83,775 | ) | (245,832 | ) | (79,466 | ) | (17,774 | ) | ||||||||||
| Undistributed | ||||||||||||||||||||
| tax-exempt | ||||||||||||||||||||
| income | 134,206 | 85,075 | 245,832 | 68,165 | 17,122 | |||||||||||||||
| Post-October | ||||||||||||||||||||
| losses | (316,642 | ) | (439,060 | ) | (574,536 | ) | (17,447 | ) | (44,402 | ) | ||||||||||
| Capital loss | ||||||||||||||||||||
| carryforwards | (1,760,144 | ) | (889,935 | ) | (7,921,331 | ) | (325,098 | ) | (180,357 | ) | ||||||||||
| Unrealized appreciation | ||||||||||||||||||||
| (depreciation) of | ||||||||||||||||||||
| Investments | 1,675,415 | (422,318 | ) | 5,518,907 | 993,095 | 449,368 | ||||||||||||||
| Net assets | $ | 140,453,218 | $ | 88,753,994 | $ | 248,426,945 | $ | 88,849,906 | $ | 18,937,507 | ||||||||||
The differences between book basis and tax basis components of net assets are primarily attributable to tax deferral of losses on wash sales and tax treatment of market discount and premium on debt instruments.
Post-October losses represent losses realized on investment transactions from November 1, 2007 through August 31, 2008 that, in accordance with federal income tax regulations, each Fund has elected to defer and treat as having arisen in the following fiscal year.
118
For financial reporting purposes, capital accounts are adjusted to reflect the tax character of permanent book/tax differences. Reclassifications are primarily due to tax treatment of market discount and premium on certain debt instruments and capital loss carryforward expiration. Results of operations and net assets were not affected by these reclassifications. For the year ended August 31, 2008, the Funds recorded the following reclassifications:
| Delaware | Delaware | Delaware | |||||||||
| Tax-Free | Tax-Free | Tax-Free | |||||||||
| Arizona Fund | Colorado Fund | Idaho Fund | |||||||||
| Undistributed (distributions in excess of) | |||||||||||
| net investment income | $ | — | $ | 28,581 | $ | (2,848 | ) | ||||
| Accumulated net realized | |||||||||||
| gain (loss) | 301,055 | (28,581 | ) | 2,848 | |||||||
| Paid-in capital | (301,055 | ) | — | — | |||||||
For federal income tax purposes, capital loss carryforwards may be carried forward and applied against future capital gains. In 2008, the Funds utilized capital losses carryforwards as follows:
| Delaware | Delaware | |||
| Tax-Free | Tax-Free | |||
| Arizona Fund | Idaho Fund | |||
| Capital loss carryforward utilized | $193,914 | $73,639 |
In 2008, $301,055 of capital loss carryforwards expired for Delaware Tax-Free Arizona Fund.
Capital loss carryforwards remaining at August 31, 2008 will expire as follows:
| Delaware | Delaware | Delaware | Delaware | Delaware | |||||||||||||||
| Year of | Tax-Free | Tax-Free | Tax-Free | Tax-Free | Tax-Free | ||||||||||||||
| Expiration | Arizona Fund | California Fund | Colorado Fund | Idaho Fund | New York Fund | ||||||||||||||
| 2009 | $ | — | $662,241 | $1,044,895 | $ | 77,838 | $165,428 | ||||||||||||
| 2010 | — | — | — | 166,949 | — | ||||||||||||||
| 2011 | 78,759 | 6,039 | — | — | — | ||||||||||||||
| 2012 | 1,681,385 | — | 4,571,043 | — | — | ||||||||||||||
| 2013 | — | — | 57,695 | — | — | ||||||||||||||
| 2014 | — | — | 2,203,520 | 23,435 | — | ||||||||||||||
| 2015 | — | — | — | 56,876 | — | ||||||||||||||
| 2016 | — | 221,655 | 44,178 | — | 14,929 | ||||||||||||||
| Total | $ | 1,760,144 | $889,935 | $7,921,331 | $ | 325,098 | $180,357 | ||||||||||||
119
Notes to financial statements
Delaware multi-state funds
6. Capital Shares
Transactions in capital shares were as follows:
| Delaware Tax-Free | Delaware Tax-Free | Delaware Tax-Free | ||||||||||||||||
| Arizona Fund | California Fund | Colorado Fund | ||||||||||||||||
| Year Ended | Year Ended | Year Ended | ||||||||||||||||
| 8/31/08 | 8/31/07 | 8/31/08 | 8/31/07 | 8/31/08 | 8/31/07 | |||||||||||||
| Shares sold: | ||||||||||||||||||
| Class A | 1,334,775 | 1,310,222 | 1,269,777 | 1,994,358 | 948,236 | 1,137,342 | ||||||||||||
| Class B | 31 | 3,752 | 12,972 | 13,600 | 1 | 1,966 | ||||||||||||
| Class C | 266,518 | 117,465 | 433,780 | 311,172 | 95,653 | 171,332 | ||||||||||||
| Shares issued upon reinvestment of dividends and distributions: | ||||||||||||||||||
| Class A | 217,919 | 237,386 | 164,369 | 158,530 | 594,257 | 624,637 | ||||||||||||
| Class B | 16,633 | 22,522 | 17,433 | 21,767 | 6,724 | 11,169 | ||||||||||||
| Class C | 15,736 | 13,407 | 32,379 | 26,532 | 21,454 | 22,616 | ||||||||||||
| 1,851,612 | 1,704,754 | 1,930,710 | 2,525,959 | 1,666,325 | 1,969,062 | |||||||||||||
| Shares repurchased: | ||||||||||||||||||
| Class A | (1,740,104 | ) | (1,775,471 | ) | (2,161,501 | ) | (1,870,154 | ) | (2,487,354 | ) | (2,190,306 | ) | ||||||
| Class B | (257,420 | ) | (350,624 | ) | (271,127 | ) | (490,356 | ) | (130,940 | ) | (260,676 | ) | ||||||
| Class C | (164,512 | ) | (158,370 | ) | (299,668 | ) | (236,524 | ) | (139,008 | ) | (150,438 | ) | ||||||
| (2,162,036 | ) | (2,284,465 | ) | (2,732,296 | ) | (2,597,034 | ) | (2,757,302 | ) | (2,601,420 | ) | |||||||
| Net decrease | (310,424 | ) | (579,711 | ) | (801,586 | ) | (71,075 | ) | (1,090,977 | ) | (632,358 | ) | ||||||
| Delaware Tax-Free | Delaware Tax-Free | |||||||||||||||
| Idaho Fund | New York Fund | |||||||||||||||
| Year Ended | Year Ended | |||||||||||||||
| 8/31/08 | 8/31/07 | 8/31/08 | 8/31/07 | |||||||||||||
| Shares sold: | ||||||||||||||||
| Class A | 787,130 | 1,316,463 | 166,604 | 239,258 | ||||||||||||
| Class B | 1 | 49,968 | 1,496 | 3,253 | ||||||||||||
| Class C | 128,677 | 78,260 | 74,906 | 47,036 | ||||||||||||
| Shares issued upon reinvestment of dividends and distributions: | ||||||||||||||||
| Class A | 155,988 | 142,848 | 32,892 | 39,485 | ||||||||||||
| Class B | 10,201 | 12,137 | 3,309 | 3,399 | ||||||||||||
| Class C | 19,082 | 21,162 | 2,539 | 2,551 | ||||||||||||
| 1,101,079 | 1,620,838 | 281,746 | 334,982 | |||||||||||||
| Shares repurchased: | ||||||||||||||||
| Class A | (736,838 | ) | (736,545 | ) | (148,374 | ) | (121,595 | ) | ||||||||
| Class B | (88,298 | ) | (218,716 | ) | (64,544 | ) | (67,503 | ) | ||||||||
| Class C | (151,455 | ) | (248,413 | ) | (85,398 | ) | (38,590 | ) | ||||||||
| (976,591 | ) | (1,203,674 | ) | (298,316 | ) | (227,688 | ) | |||||||||
| Net increase (decrease) | 124,488 | 417,164 | (16,570 | ) | 107,294 | |||||||||||
120
For the years ended August 31, 2008 and 2007, the following shares and values were converted from Class B to Class A shares. The respective amounts are included in Class B redemptions and Class A subscriptions in the tables on the previous page and the statements of changes in net assets.
| Year Ended | Year Ended | |||||||||||||
| 8/31/08 | 8/31/07 | |||||||||||||
| Class B | Class A | Class B | Class A | |||||||||||
| Shares | Shares | Value | Shares | Shares | Value | |||||||||
| Delaware Tax-Free | ||||||||||||||
| Arizona Fund | 29,536 | 29,541 | $ | 328,168 | 90,057 | 90,103 | $ | 1,014,108 | ||||||
| Delaware Tax-Free | ||||||||||||||
| California Fund | 79,561 | 79,848 | 881,603 | 190,729 | 191,399 | 2,178,747 | ||||||||
| Delaware Tax-Free | ||||||||||||||
| Colorado Fund | 88,870 | 88,933 | 958,664 | 100,172 | 100,189 | 1,109,632 | ||||||||
| Delaware Tax-Free | ||||||||||||||
| Idaho Fund | 43,828 | 43,749 | 496,288 | 96,877 | 96,752 | 1,103,521 | ||||||||
| Delaware Tax-Free | ||||||||||||||
| New York Fund | 14,375 | 14,339 | 148,612 | 16,346 | 16,311 | 172,008 | ||||||||
7. Line of Credit
Each Fund, along with certain other funds in the Delaware Investments® Family of Funds (Participants), participates in a $225,000,000 revolving line of credit with the Bank of New York Mellon (BNY Mellon) to be used for temporary or emergency purposes as an additional source of liquidity to fund redemptions of investor shares. The Participants are charged an annual commitment fee, which is allocated across the Participants on the basis of each Participant’s allocation of the entire facility. The Participants may borrow up to a maximum of one third of their net assets under the agreement. The Funds had no amounts outstanding as of August 31, 2008, or at any time during the year then ended.
8. Credit and Market Risk
The Funds concentrate their investments in securities issued by municipalities. The value of these investments may be adversely affected by new legislation within the states, regional or local economic conditions, and differing levels of supply and demand for municipal bonds. Many municipalities insure repayment for their obligations. Although bond insurance reduces the risk of loss due to default by an issuer, such bonds remain subject to the risk that value may fluctuate for other reasons and there is no assurance that the insurance company will meet its obligations. A real or perceived decline in creditworthiness of a bond insurer can have an adverse impact on the value of insured bonds held in the Fund. At August 31, 2008, 61% of the Delaware Tax-Free Arizona Fund’s net assets, 42% of the Delaware Tax-Free California Fund’s net assets, 52% of the Delaware Tax-Free Colorado Fund’s net assets, 45% of the Delaware Tax-Free Idaho Fund’s net assets and 25% of the Delaware Tax-Free New York Fund’s net assets were insured by bond insurers. These securities have been identified in the statements of net assets.
121
Notes to financial statements
Delaware multi-state funds
8. Credit and Market Risk (continued)
The Funds may invest in advanced refunded bonds, escrow secured bonds or defeased bonds. Under current federal tax laws and regulations, state and local government borrowers are permitted to refinance outstanding bonds by issuing new bonds. The issuer refinances the outstanding debt to either reduce interest costs or to remove or alter restrictive covenants imposed by the bonds being refinanced. A refunding transaction where the municipal securities are being refunded within 90 days from the issuance of the refunding issue is known as a “current refunding”. Advance refunded bonds are bonds in which the refunded bond issue remains outstanding for more than 90 days following the issuance of the refunding issue. In an advance refunding, the issuer will use the proceeds of a new bond issue to purchase high grade interest bearing debt securities which are then deposited in an irrevocable escrow account held by an escrow agent to secure all future payments of principal and interest and bond premium of the advance refunded bond. Bonds are “escrowed to maturity” when the proceeds of the refunding issue are deposited in an escrow account for investment sufficient to pay all of the principal and interest on the original interest payment and maturity dates.
Bonds are considered “pre-refunded” when the refunding issue’s proceeds are escrowed only until a permitted call date or dates on the refunded issue with the refunded issue being redeemed at the time, including any required premium. Bonds become “defeased” when the rights and interests of the bondholders and of their lien on the pledged revenues or other security under the terms of the bond contract and are substituted with an alternative source of revenues (the escrow securities) sufficient to meet payments of principal and interest to maturity or to the first call dates. Escrowed secured bonds will often receive a rating of AAA from Moody’s Investors Service, Inc., Standard & Poor’s Ratings Group, and/or Fitch Ratings due to the strong credit quality of the escrow securities and the irrevocable nature of the escrow deposit agreement.
Each Fund may invest up to 15% of its net assets in illiquid securities, which may include securities with contractual restrictions on resale, securities exempt from registration under Rule 144A of the Securities Act of 1933, as amended, and other securities which may not be readily marketable. The relative illiquidity of these securities may impair each Fund from disposing of them in a timely manner and at a fair price when it is necessary or desirable to do so. While maintaining oversight, each Fund’s Board has delegated to DMC the day-to-day functions of determining whether individual securities are liquid for purposes of each Fund’s limitation on investments in illiquid assets. Securities eligible for resale pursuant to Rule 144A, which are determined to be liquid, are not subject to the Funds’ 15% limit on investments in illiquid securities. As of August 31, 2008, there were no Rule 144A securities. Illiquid securities have been identified on the statements of net assets.
9. Contractual Obligations
The Funds enter into contracts in the normal course of business that contain a variety of indemnifications. The Funds’ maximum exposure under these arrangements is unknown. However, the Funds have not had prior claims or losses pursuant to these contracts. Management has reviewed the Funds’ existing contracts and expects the risk of loss to be remote.
122
10. Tax Information (Unaudited)
The information set forth below is for each Fund’s fiscal year as required by federal income tax laws. Shareholders, however, must report distributions on a calendar year basis for income tax purposes, which may include distributions for portions of two fiscal years of a fund. Accordingly, the information needed by shareholders for income tax purposes will be sent to them in January of each year. Please consult your tax advisor for proper treatment of this information.
For the fiscal year ended August 31, 2008, each Fund designates distributions paid during the year as follows:
| (A) | |||||||
| Ordinary | (B) | ||||||
| Income | Tax-Exempt | Total | |||||
| Distributions | Distributions | Distributions | |||||
| (Tax Basis) | (Tax Basis) | (Tax Basis) | |||||
| Delaware Tax-Free Arizona Fund | — | 100.00 | % | 100.00 | % | ||
| Delaware Tax-Free California Fund | — | 100.00 | % | 100.00 | % | ||
| Delaware Tax-Free Colorado Fund | 0.26% | 99.74 | % | 100.00 | % | ||
| Delaware Tax-Free Idaho Fund | — | 100.00 | % | 100.00 | % | ||
| Delaware Tax-Free New York Fund | — | 100.00 | % | 100.00 | % | ||
(A) and (B) are based on a percentage of each Fund’s total distributions.
123
Report of independent
registered public accounting firm
To the Shareholders and Board of Trustees
Voyageur Insured Funds — Delaware Tax-Free Arizona Fund
Voyageur Mutual Funds — Delaware Tax-Free California Fund, Delaware Tax-Free Idaho
Fund, and Delaware Tax-Free New York Fund
Voyageur Mutual Funds II — Delaware Tax-Free Colorado Fund
We have audited the accompanying statements of net assets of Delaware Tax-Free Arizona Fund (the sole series of Voyageur Insured Funds), Delaware Tax-Free California Fund, Delaware Tax- Free Idaho Fund, and Delaware Tax-Free New York Fund (three of the series constituting Voyageur Mutual Funds) and Delaware Tax-Free Colorado Fund (the sole series of Voyageur Mutual Funds II) (the “Funds”) as of August 31, 2008, and the related statements of operations for the year then ended, the statements of changes in net assets for each of the two years in the period then ended, and the financial highlights for each of the five years in the period then ended. These financial statements and financial highlights are the responsibility of the Funds’ management. Our responsibility is to express an opinion on these financial statements and financial highlights based on our audits.
We conducted our audits in accordance with the standards of the Public Company Accounting Oversight Board (United States). Those standards require that we plan and perform the audit to obtain reasonable assurance about whether the financial statements and financial highlights are free of material misstatement. We were not engaged to perform an audit of the Funds’ internal control over financial reporting. Our audits included consideration of internal control over financial reporting as a basis for designing audit procedures that are appropriate in the circumstances, but not for the purpose of expressing an opinion on the effectiveness of the Funds’ internal control over financial reporting. Accordingly, we express no such opinion. An audit also includes examining, on a test basis, evidence supporting the amounts and disclosures in the financial statements and financial highlights, assessing the accounting principles used and significant estimates made by management, and evaluating the overall financial statement presentation. Our procedures included confirmation of securities owned as of August 31, 2008 by correspondence with the custodian and brokers or by other appropriate auditing procedures where replies from brokers were not received. We believe that our audits provide a reasonable basis for our opinion.
124
In our opinion, the financial statements and financial highlights referred to above present fairly, in all material respects, the financial position of the Delaware Tax Free Arizona Fund of Voyageur Insured Funds, the Delaware Tax-Free California Fund, the Delaware Tax-Free Idaho Fund, and the Delaware Tax-Free New York Fund of Voyageur Mutual Funds, and the Delaware Tax-Free Colorado Fund of Voyageur Mutual Funds II at August 31, 2008, the results of their operations for the year then ended, the changes in their net assets for each of the two years in the period then ended, and their financial highlights for each of the five years in the period then ended, in conformity with U.S. generally accepted accounting principles.

Philadelphia, Pennsylvania
October 20, 2008
125
Other Fund information
Delaware multi-state funds
Board Consideration of Delaware Tax-Free Arizona Fund, Delaware Tax-Free California Fund, Delaware Tax-Free Colorado Fund, Delaware Tax-Free Idaho Fund, and Delaware Tax-Free New York Fund Investment Advisory Agreement
At a meeting held on May 20-22, 2008 (the “Annual Meeting”), the Board of Trustees, including a majority of disinterested or independent Trustees, approved the renewal of the Investment Advisory Agreements for the Delaware Tax-Free Arizona Fund, Delaware Tax-Free California Fund, Delaware Tax-Free Colorado Fund, Delaware Tax-Free Idaho Fund and Delaware Tax-Free New York Fund (each a “Fund” and collectively, the “Funds”). In making its decision, the Board considered information furnished at regular quarterly Board meetings, including reports detailing Fund performance, investment strategies and expenses, as well as information prepared specifically in connection with the renewal of the investment advisory contracts. Information furnished specifically in connection with the renewal of the Investment Advisory Agreement with Delaware Management Company (“DMC”) included materials provided by DMC and its affiliates (“Delaware Investments”) concerning, among other things, the nature, extent and quality of services provided to the Funds, the costs of such services to the Funds, economies of scale and the financial condition and profitability of Delaware Investments. In addition, in connection with the Annual Meeting, the Board separately received and reviewed in February 2008 independent historical and comparative reports prepared by Lipper Inc. (“Lipper”), an independent statistical compilation organization. The Lipper reports compared each Fund’s investment performance and expenses with those of other comparable mutual funds. The independent Trustees reviewed the Lipper reports with Counsel to the Independent Trustees at the February 2008 Board Meeting and discussed such reports further with counsel earlier in the Annual Meeting. The Board requested and received certain information regarding Management’s policy with respect to advisory fee levels and its philosophy with respect to breakpoints; the structure of portfolio manager compensation; the investment manager’s profitability; and any constraints or limitations on the availability of securities in certain investment styles which might inhibit DMC’s ability to invest fully in accordance with Fund policies.
In considering information relating to the approval of each Fund’s advisory agreements, the independent Trustees received assistance and advice from and met separately with independent counsel. Although the Trustees gave attention to all information furnished, the following discussion identifies, under separate headings, the primary factors taken into account by the Board in its contract renewal considerations.
Nature, Extent and Quality of Service. The Board considered services provided by Delaware Investments® to the Funds and their shareholders. In reviewing the nature, extent and quality of services, the Board emphasized reports furnished to it throughout the year at regular Board Meetings covering matters such as the relative performance of the Funds, compliance of portfolio managers with the investment policies, strategies and restrictions for the Funds, the compliance of management personnel with the Code of Ethics adopted throughout the Delaware Investments Family of Funds complex and the adherence to fair value pricing procedures as established by the Board. The Board was pleased with the current staffing of the Funds’ investment advisor and the emphasis placed on research in the investment process.
126
Favorable consideration was given to DMC’s efforts to maintain expenditures and, in some instances, increase financial and human resources committed to fund matters. The Board also considered the transfer agent and shareholder services provided to Fund shareholders by Delaware Investments’ affiliate, Delaware Service Company, Inc. (“DSC”), noting DSC’s commitment to maintain a high level of service as well as Delaware Investments’ expenditures to improve the delivery of shareholder services. During 2007 Management commenced the outsourcing of certain investment accounting functions that are expected to improve further the quality and the cost of delivering investment accounting services to the Funds. The Board once again noted the benefits provided to Fund shareholders by being part of the Delaware Investments® Family of Funds, including each shareholder’s ability to exchange an investment in one Delaware Investments fund for the same class of shares in another Delaware Investments fund without a sales charge, to reinvest Fund dividends into additional shares of the Funds or into additional shares of other Delaware Investments funds and the privilege to combine holdings in other Delaware Investments funds to obtain a reduced sales charge. The Board was satisfied with the nature, extent and quality of the overall services provided by Delaware Investments.
Investment Performance. The Board considered the overall investment performance of DMC and the Funds. The Board placed significant emphasis on the investment performance of the Funds in view of its importance to shareholders. Although the Board gave appropriate consideration to performance reports and discussions with portfolio managers at Board meetings throughout the year, the Board gave particular weight to the Lipper reports furnished for the Annual Meeting. The Lipper reports prepared for each Fund showed the investment performance of its Class A shares in comparison to a group of similar funds as selected by Lipper (the “Performance Universe”). A fund with the best performance ranked first, and a fund with the poorest, ranked last. The highest/ best performing 25% of funds in the Performance Universe make up the first quartile; the next 25% — the second quartile; the next 25% — the third quartile; and the poorest/worst performing 25% of funds in the Performance Universe make up the fourth quartile. Comparative annualized performance for each Fund was shown for the past one-, three-, five- and ten-year periods ended December 31, 2007. The Board’s objective is that each Fund’s performance for the periods considered be at or above the median of its Performance Universe. The Trustees complimented Management on navigating the Delaware Investments Family of Funds fixed income funds through the turbulent financial markets since 2007 without incurring a major difficulty. The following paragraphs summarize the performance results for each Fund and the Board’s view of such performance.
Delaware Tax-Free Arizona Fund — The Performance Universe for the Fund consisted of the Fund and all retail and institutional Arizona municipal debt funds as selected by Lipper. The Lipper report comparison showed that the Fund’s total return for the one-year period was in the third quartile of its Performance Universe. The report further showed that the Fund’s total return for the three- and five-year periods was in the second quartile and the Fund’s total return for the ten-year period was in the first quartile. The Board noted that the Fund’s performance results were mixed but overall tended toward above median, which was acceptable.
127
Other Fund information
Delaware multi-state funds
Board Consideration of Delaware Tax-Free Arizona Fund, Delaware Tax-Free California Fund, Delaware Tax-Free Colorado Fund, Delaware Tax-Free Idaho Fund, and Delaware Tax-Free New York Fund Investment Advisory Agreement (continued)
Delaware Tax-Free California Fund — The Performance Universe for the Fund consisted of the Fund and all retail and institutional California municipal debt funds as selected by Lipper. The Lipper report comparison showed that the Fund’s total return for the one-year period was in the third quartile of its Performance Universe. The report further showed that the Fund’s total return for the three-year period was in the second quartile and the Fund’s total return for the five- and ten-year periods was in the first quartile. The Board noted that the Fund’s performance results were mixed but on an overall basis, above median, which was acceptable.
Delaware Tax-Free Colorado Fund — The Performance Universe for the Fund consisted of the Fund and all retail and institutional Colorado municipal debt funds as selected by Lipper. The Lipper report comparison showed that the Fund’s total return for the one- and ten-year periods was in the second quartile of its Performance Universe. The report further showed that the Fund’s total return for the three- and five-year periods was in the first quartile. The Board was satisfied with performance.
Delaware Tax-Free Idaho Fund — The Performance Universe for the Fund consisted of the Fund and all retail and institutional other state municipal debt funds as selected by Lipper. The Lipper report comparison showed that the Fund’s total return for the one-, three-, five- and ten-year periods was in the first quartile of its Performance Universe. The Board was very satisfied with performance.
Delaware Tax-Free New York Fund — The Performance Universe for the Fund consisted of the Fund and all retail and institutional New York municipal debt funds as selected by Lipper. The Lipper report comparison showed that the Fund’s total return for the one-year period was in the second quartile of its Performance Universe. The report further showed that the Fund’s total return for the three-, five- and ten-year periods was in the first quartile. The Board was satisfied with performance.
Comparative Expenses. The Board considered expense comparison data for the Delaware Investments® Family of Funds. Management provided the Board with information on pricing levels and fee structures for the Funds as of October 31, 2007 and the most recent fiscal year end for comparative funds as of August 31, 2007 or earlier. For any fund with a fiscal year end after August 31, 2007, such fund’s expense data were measured as of its fiscal year end for 2006. The Board focused on the comparative analysis of the effective management fees and total expense ratios of each Fund versus the effective management fees and expense ratios of a group of similar funds as selected by Lipper (the “Expense Group”). In reviewing comparative costs, each Fund’s contractual management fee and the actual management fee incurred by the Fund were compared with the contractual management fees (assuming all funds in the Expense Group were similar in size to the Fund) and actual management fees
128
(as reported by each fund) of other funds within the Expense Group, taking into account any applicable breakpoints and fee waivers. Each Fund’s total expenses were also compared with those of its Expense Group. The Lipper total expenses, for comparative consistency, were shown by Lipper for Class A shares and comparative total expenses including 12b-1 and non-12b-1 service fees. The Board also considered fees paid to Delaware Investments for non-management services. The Board noted its objective to limit each Fund’s total expense ratio to be competitive with that of the Expense Group. The following paragraphs summarize the expense results for each Fund and the Board’s view of such expenses.
Delaware Tax-Free Arizona Fund — The expense comparisons for the Fund showed that its actual management fee and total expenses were in the quartile with the second lowest expenses of its Expense Group. The Board was satisfied with the management fee and total expenses of the Fund in comparison to its Expense Group as shown in the Lipper report.
Delaware Tax-Free California Fund — The expense comparisons for the Fund showed that its actual management fee and total expenses were in the quartile with the second highest expenses of its Expense Group. The Board noted that the Fund’s total expenses were not in line with the Board’s objective. In evaluating the total expenses, the Board considered waivers in place through December 2008 and recent initiatives implemented by Management, such as the outsourcing of certain transfer agency and investment accounting services, creating an opportunity for a reduction in expenses. The Board was satisfied with Management’s efforts to improve the Fund’s total expense ratio and bring it in line with the Board’s objective.
Delaware Tax-Free Colorado Fund — The expense comparisons for the Fund showed that its actual management fee was in the quartile with the second highest expenses of its Expense Group and its total expenses were in the quartile with the highest expenses of its Expense Group. The Board noted that the Fund’s total expenses were not in line with the Board’s objective. In evaluating the total expenses, the Board considered waivers in place through December 2008 and recent initiatives implemented by Management, such as the outsourcing of certain transfer agency and investment accounting services, creating an opportunity for a reduction in expenses. Consequently, the Board was satisfied with Management’s efforts to improve the Fund’s total expense ratio and bring it in line with the Board’s objective.
Delaware Tax-Free Idaho Fund — The expense comparisons for the Fund showed that its actual management fee and total expenses were in the quartile with the second lowest expenses of its Expense Group. The Board was satisfied with the management fee and total expenses of the Fund in comparison to its Expense Group as shown in the Lipper report.
129
Other Fund information
Delaware multi-state funds
Board Consideration of Delaware Tax-Free Arizona Fund, Delaware Tax-Free California Fund, Delaware Tax-Free Colorado Fund, Delaware Tax-Free Idaho Fund, and Delaware Tax-Free New York Fund Investment Advisory Agreement (continued)
Delaware Tax-Free New York Fund — The expense comparisons for the Fund showed that its actual management fee was in the quartile with the lowest expenses of its Expense Group and its total expenses were in the quartile with the second lowest expenses of its Expense Group. The Board was satisfied with the management fee and total expenses of the Fund in comparison to its Expense Group as shown in the Lipper report.
Management Profitability. The Board considered the level of profits realized by Delaware Investments in connection with the operation of the Funds. In this respect, the Board reviewed the Investment Management Profitability Analysis that addressed the overall profitability of Delaware Investments’ business in providing management and other services to each of the individual funds and the Delaware Investments® Family of Funds as a whole. Specific attention was given to the methodology followed in allocating costs for the purpose of determining profitability. Management stated that the level of profits of Delaware Investments, to a certain extent, reflect operational cost savings and efficiencies initiated by Delaware Investments. The Board considered Delaware Investments’ efforts to improve services provided to fund shareholders and to meet additional regulatory and compliance requirements resulting from recent industry-wide SEC initiatives. The Board also considered the extent to which Delaware Investments might derive ancillary benefits from fund operations, including the potential for procuring additional business as a result of the prestige and visibility associated with its role as service provider to the Delaware Investments Family of Funds and the benefits from allocation of fund brokerage to improve trading efficiencies. The Board found that the management fees were reasonable in light of the services rendered and the level of profitability of Delaware Investments.
Economies of Scale. The Trustees considered whether economies of scale are realized by Delaware Investments as each Fund’s assets increase and the extent to which any economies of scale are reflected in the level of management fees charged. The Trustees reviewed the standardized advisory fee pricing and structure, approved by the Board and shareholders, which includes breakpoints. Breakpoints in the advisory fee occur when the advisory fee rate is reduced on assets in excess of specified levels. Breakpoints result in a lower advisory fee than would otherwise be the case on all assets when the asset levels specified are exceeded. The Board noted that the fee under each Fund’s management contract fell within the standard structure. Although each Fund has not reached a size at which it can take advantage of breakpoints, the Board recognized that the fee was structured so that when the Fund grows, economies of scale may be shared.
130
Fund management
Joseph R. Baxter
Senior Vice President, Head of Municipal Bond Department, Senior Portfolio Manager
Joseph R. Baxter is the head of the municipal bond department and is responsible for setting the department’s investment strategy. He is also a co-portfolio manager of the firm’s municipal bond funds and several client accounts. Before joining Delaware Investments in 1999, he held investment positions with First Union, most recently as a municipal portfolio manager with the Evergreen Funds. Baxter received a bachelor’s degree in finance and marketing from La Salle University.
Robert F. Collins, CFA
Senior Vice President, Senior Portfolio Manager
Robert F. Collins is a member of the firm’s municipal fixed income portfolio management team with primary responsibility for portfolio construction and strategic asset allocation. He is a co-portfolio manager of several of the firm’s municipal bond funds and client accounts. Prior to joining Delaware Investments in 2004, he spent five years as a co-manager of the municipal portfolio management group within PNC Advisors, where he oversaw the tax-exempt investments of high net worth and institutional accounts. Before that, he headed the municipal fixed income team at Wilmington Trust, where he managed funds and high net worth accounts. Collins earned a bachelor’s degree in economics from Ursinus College, and he is also a former president of The Financial Analysts of Wilmington, Delaware.
Stephen J. Czepiel
Senior Vice President, Senior Portfolio Manager
Stephen J. Czepiel is a member of the firm’s municipal fixed income portfolio management team with primary responsibility for portfolio construction and strategic asset allocation. He is a co-portfolio manager of the firm’s municipal bond funds and client accounts. He joined Delaware Investments in July 2004 as a senior bond trader. Previously, he was vice president at both Mesirow Financial and Loop Capital Markets. He began his career in the securities industry in 1982 as a municipal bond trader at Kidder Peabody and now has more than 20 years of experience in the municipal securities industry. Czepiel earned his bachelor’s degree in finance and economics from Duquesne University.
131
Board of trustees/directors and officers addendum
Delaware Investments® Family of Funds
A mutual fund is governed by a Board of Trustees/Directors (“Trustees”), which has oversight responsibility for the management of a fund’s business affairs. Trustees establish procedures and oversee and review the performance of the investment manager, the distributor, and others who perform services for the fund. The independent fund trustees, in particular, are advocates
| Name, Address, | Position(s) | Length of | ||
| and Birth Date | Held with Fund(s) | Time Served | ||
| Interested Trustees | ||||
| Patrick P. Coyne1 | Chairman, President, | Chairman and Trustee | ||
| 2005 Market Street | Chief Executive Officer, | since August 16, 2006 | ||
| Philadelphia, PA 19103 | and Trustee | |||
| April 1963 | President and | |||
| Chief Executive Officer | ||||
| since August 1, 2006 | ||||
| Independent Trustees | ||||
| Thomas L. Bennett | Trustee | Since March 2005 | ||
| 2005 Market Street | ||||
| Philadelphia, PA 19103 | ||||
| October 1947 | ||||
1 Patrick P. Coyne is considered to be an “Interested Trustee” because he is an executive officer of the Fund’s(s’) investment advisor.
132
for shareholder interests. Each trustee has served in that capacity since he or she was elected to or appointed to the Board of Trustees, and will continue to serve until his or her retirement or the election of a new trustee in his or her place. The following is a list of the Trustees and Officers with certain background and related information.
| Number of Portfolios in | ||||
| Principal Occupation(s) | Fund Complex Overseen | Other Directorships | ||
| During Past 5 Years | by Trustee or Officer | Held by Trustee or Officer | ||
| Patrick P. Coyne has served in | 84 | Director | ||
| various executive capacities | Kaydon Corp. | |||
| at different times at | ||||
| Delaware Investments.2 | Board of Governors Member | |||
| Investment Company | ||||
| Institute (ICI) | ||||
| (2007–Present) | ||||
| Member of Investment Committee | ||||
| Cradle of Liberty Council, BSA | ||||
| (November 2007–Present) | ||||
| Finance Committee Member | ||||
| St. John Vianney | ||||
| Roman Catholic Church | ||||
| (2007–Present) | ||||
| Private Investor | 84 | Director | ||
| (March 2004–Present) | Bryn Mawr Bank Corp. (BMTC) | |||
| (April 2007–Present) | ||||
| Investment Manager | ||||
| Morgan Stanley & Co. | Chairman of Investment | |||
| (January 1984–March 2004) | Committee | |||
| The Haverford School | ||||
| (2002–Present) | ||||
| Chairman of | ||||
| Investment Committee | ||||
| Pennsylvania Academy of | ||||
| Fine Arts (2007–Present) | ||||
| Trustee (2004–Present) | ||||
2 Delaware Investments is the marketing name for Delaware Management Holdings, Inc. and its subsidiaries, including the Fund’s(s’) investment advisor, principal underwriter, and its transfer agent.
133
Board of trustees/directors and officers addendum
Delaware Investments® Family of Funds
| Name, Address, | Position(s) | Length of | ||
| and Birth Date | Held with Fund(s) | Time Served | ||
| Independent Trustees (continued) | ||||
| Thomas L. Bennett | ||||
| (continued) | ||||
| John A. Fry | Trustee | Since January 2001 | ||
| 2005 Market Street | ||||
| Philadelphia, PA 19103 | ||||
| May 1960 | ||||
| Anthony D. Knerr | Trustee | Since April 1990 | ||
| 2005 Market Street | ||||
| Philadelphia, PA 19103 | ||||
| December 1938 | ||||
| Lucinda S. Landreth | Trustee | Since March 2005 | ||
| 2005 Market Street | ||||
| Philadelphia, PA 19103 | ||||
| June 1947 | ||||
| Ann R. Leven | Trustee | Since October 1989 | ||
| 2005 Market Street | ||||
| Philadelphia, PA 19103 | ||||
| November 1940 | ||||
| Thomas F. Madison | Trustee | Since May 19973 | ||
| 2005 Market Street | ||||
| Philadelphia, PA 19103 | ||||
| February 1936 | ||||
3 In 1997, several funds managed by Voyageur Fund Managers, Inc. (the “Voyageur Funds”) were incorporated into the Delaware Investments Family of Funds. Mr. Madison served as a director of the Voyageur Funds from 1993 until 1997.
134
| Number of Portfolios in | ||||
| Principal Occupation(s) | Fund Complex Overseen | Other Directorships | ||
| During Past 5 Years | by Trustee or Officer | Held by Trustee or Officer | ||
| Investment Committee | ||||
| Member | ||||
| Pennsylvania Horticultural | ||||
| Society | ||||
| (February 2006–Present) | ||||
| President | 84 | Director | ||
| Franklin & Marshall College | Community Health Systems | |||
| (June 2002–Present) | ||||
| Director | ||||
| Executive Vice President | Allied Barton | |||
| University of Pennsylvania | Security Holdings | |||
| (April 1995–June 2002) | ||||
| Founder and | 84 | None | ||
| Managing Director | ||||
| Anthony Knerr & Associates | ||||
| (Strategic Consulting) | ||||
| (1990–Present) | ||||
| Chief Investment Officer | 84 | None | ||
| Assurant, Inc. (Insurance) | ||||
| (2002–2004) | ||||
| Consultant | 84 | Director and Audit | ||
| ARL Associates | Committee Chair | |||
| (Financial Planning) | Systemax, Inc. | |||
| (1983–Present) | ||||
| President and | 84 | Director and Chair of | ||
| Chief Executive Officer | Compensation Committee, | |||
| MLM Partners, Inc. | Governance Committee | |||
| (Small Business Investing | Member | |||
| and Consulting) | CenterPoint Energy | |||
| (January 1993–Present) | ||||
135
Board of trustees/directors and officers addendum
Delaware Investments® Family of Funds
| Name, Address, | Position(s) | Length of | ||
| and Birth Date | Held with Fund(s) | Time Served | ||
| Independent Trustees (continued) | ||||
| Thomas F. Madison | ||||
| (continued) | ||||
| Janet L. Yeomans | Trustee | Since April 1999 | ||
| 2005 Market Street | ||||
| Philadelphia, PA 19103 | ||||
| July 1948 | ||||
| J. Richard Zecher | Trustee | Since March 2005 | ||
| 2005 Market Street | ||||
| Philadelphia, PA 19103 | ||||
| July 1940 | ||||
136
| Number of Portfolios in | ||||
| Principal Occupation(s) | Fund Complex Overseen | Other Directorships | ||
| During Past 5 Years | by Trustee or Officer | Held by Trustee or Officer | ||
| Lead Director and Chair of | ||||
| Audit and Governance | ||||
| Committees, Member of | ||||
| Compensation Committee | ||||
| Digital River, Inc. | ||||
| Director and Chair of | ||||
| Governance Committee, | ||||
| Audit Committee | ||||
| Member | ||||
| Rimage Corporation | ||||
| Director and Chair of | ||||
| the Compensation Committee | ||||
| Spanlink Communications | ||||
| Lead Director and Chair of | ||||
| Compensation and | ||||
| Governance Committees | ||||
| Valmont Industries, Inc. | ||||
| Vice President and Treasurer | 84 | None | ||
| (January 2006–Present) | ||||
| Vice President — Mergers & Acquisitions | ||||
| (January 2003–January 2006), and | ||||
| Vice President | ||||
| (July 1995–January 2003) | ||||
| 3M Corporation | ||||
| Founder | 84 | Director and Audit | ||
| Investor Analytics | Committee Member | |||
| (Risk Management) | Investor Analytics | |||
| (May 1999–Present) | ||||
| Director and Audit | ||||
| Founder | Committee Member | |||
| Sutton Asset Management | Oxigene, Inc. | |||
| (Hedge Fund) | ||||
| (September 1996–Present) | ||||
137
Board of trustees/directors and officers addendum
Delaware Investments® Family of Funds
| Name, Address, | Position(s) | Length of | ||
| and Birth Date | Held with Fund(s) | Time Served | ||
| Officers | ||||
| David F. Connor | Vice President, | Vice President since | ||
| 2005 Market Street | Deputy General | September 2000 | ||
| Philadelphia, PA 19103 | Counsel, and Secretary | and Secretary since | ||
| December 1963 | October 2005 | |||
| Daniel V. Geatens | Vice President | Treasurer | ||
| 2005 Market Street | and Treasurer | since October 25, 2007 | ||
| Philadelphia, PA 19103 | ||||
| October 1972 | ||||
| David P. O’Connor | Senior Vice President, | Senior Vice President, | ||
| 2005 Market Street | General Counsel, | General Counsel, and | ||
| Philadelphia, PA 19103 | and Chief Legal Officer | Chief Legal Officer | ||
| February 1966 | since October 2005 | |||
| Richard Salus | Senior Vice President | Chief Financial Officer | ||
| 2005 Market Street | and Chief Financial Officer | since November 2006 | ||
| Philadelphia, PA 19103 | ||||
| October 1963 | ||||
4 David F. Connor, Daniel V. Geatens, David P. O’Connor, and Richard Salus serve in similar capacities for the six portfolios of the Optimum Fund Trust, which have the same investment advisor, principal underwriter, and transfer agent as the registrant.
138
| Number of Portfolios in | ||||
| Principal Occupation(s) | Fund Complex Overseen | Other Directorships | ||
| During Past 5 Years | by Trustee or Officer | Held by Trustee or Officer | ||
| David F. Connor has served as | 84 | None4 | ||
| Vice President and Deputy | ||||
| General Counsel of | ||||
| Delaware Investments | ||||
| since 2000. | ||||
| Daniel V. Geatens has served | 84 | None4 | ||
| in various capacities at | ||||
| different times at | ||||
| Delaware Investments. | ||||
| David P. O’Connor has served in | 84 | None4 | ||
| various executive and legal | ||||
| capacities at different times | ||||
| at Delaware Investments. | ||||
| Richard Salus has served in | 84 | None4 | ||
| various executive capacities | ||||
| at different times at | ||||
| Delaware Investments. | ||||
The Statement of Additional Information for the Fund(s) includes additional information about the Trustees and Officers and is available, without charge, upon request by calling 800 523-1918.
139
About the organization
This annual report is for the information of Delaware Tax-Free Arizona Fund, Delaware Tax-Free California Fund, Delaware Tax-Free Colorado Fund, Delaware Tax-Free Idaho Fund, and Delaware Tax-Free New York Fund shareholders, but it may be used with prospective investors when preceded or accompanied by a current prospectus for Delaware Tax-Free Arizona Fund, Delaware Tax-Free California Fund, Delaware Tax-Free Colorado Fund, Delaware Tax-Free Idaho Fund, and Delaware Tax-Free New York Fund and the Delaware Investments® Fund profile for the most recently completed calendar quarter. These documents are available at www.delawareinvestments.com. The prospectus sets forth details about charges, expenses, investment objectives, and operating policies of the investment company. You should read the prospectus carefully before you invest. The figures in this report represent past results that are not a guarantee of future results. The return and principal value of an investment in the investment company will fluctuate so that shares, when redeemed, may be worth more or less than their original cost.
| Board of trustees | |
| Patrick P. Coyne | Ann R. Leven |
| Chairman, President, and | Consultant |
| Chief Executive Officer | ARL Associates |
| Delaware Investments Family of Funds | New York, NY |
| Philadelphia, PA | |
| Thomas F. Madison | |
| Thomas L. Bennett | President and Chief Executive Officer |
| Private Investor | MLM Partners, Inc. |
| Rosemont, PA | Minneapolis, MN |
| John A. Fry | Janet L. Yeomans |
| President | Vice President and Treasurer |
| Franklin & Marshall College | 3M Corporation |
| Lancaster, PA | St. Paul, MN |
| Anthony D. Knerr | J. Richard Zecher |
| Founder and Managing Director | Founder |
| Anthony Knerr & Associates | Investor Analytics |
| New York, NY | Scottsdale, AZ |
| Lucinda S. Landreth | |
| Former Chief Investment Officer | |
| Assurant, Inc. | |
| Philadelphia, PA | |
140
| Affiliated officers | Contact information |
| David F. Connor | Investment manager |
| Vice President, Deputy General Counsel, and | Delaware Management Company, a series of |
| Secretary | Delaware Management Business Trust |
| Delaware Investments® Family of Funds | Philadelphia, PA |
| Philadelphia, PA | |
| National distributor | |
| Daniel V. Geatens | Delaware Distributors, L.P. |
| Vice President and Treasurer | Philadelphia, PA |
| Delaware Investments Family of Funds | |
| Philadelphia, PA | Shareholder servicing, dividend disbursing, |
| and transfer agent | |
| David P. O’Connor | Delaware Service Company, Inc. |
| Senior Vice President, General Counsel, | 2005 Market Street |
| and Chief Legal Officer | Philadelphia, PA 19103-7094 |
| Delaware Investments Family of Funds | |
| Philadelphia, PA | For shareholders |
| 800 523-1918 | |
| Richard Salus | |
| Senior Vice President and | For securities dealers and financial |
| Chief Financial Officer | institutions representatives only |
| Delaware Investments Family of Funds | 800 362-7500 |
| Philadelphia, PA | |
| Web site | |
| www.delawareinvestments.com |
Delaware Investments is the marketing name of Delaware Management Holdings, Inc. and its subsidiaries.
Each Fund files its complete schedule of portfolio holdings with the Securities and Exchange Commission for the first and third quarters of each fiscal year on Form N-Q. Each Fund’s Forms N-Q, as well as a description of the policies and procedures that each Fund uses to determine how to vote proxies (if any) relating to portfolio securities are available without charge (i) upon request, by calling 800 523-1918; and (ii) on the Commission’s Web site at www.sec.gov. In addition, a description of the policies and procedures that each Fund uses to determine how to vote proxies (if any) relating to portfolio securities and each Fund’s Schedule of Investments are available without charge on each Fund’s Web site at www.delawareinvestments.com. Each Fund’s Forms N-Q may be reviewed and copied at the Commission’s Public Reference Room in Washington, D.C.; information on the operation of the Public Reference Room may be obtained by calling 800 SEC-0330.
Information (if any) regarding how each Fund voted proxies relating to portfolio securities during the most recently disclosed 12-month period ended June 30 is available without charge (i) through each Fund’s Web site at www.delawareinvestments.com; and (ii) on the Commission’s Web site at www.sec.gov.
141
Item 2. Code of Ethics
The registrant has adopted a code of ethics that applies to the registrant’s principal executive officer, principal financial officer, principal accounting officer or controller, or persons performing similar functions, regardless of whether these individuals are employed by the registrant or a third party. A copy of the registrant’s Code of Business Ethics has been posted on Delaware Investments’ internet website at www.delawareinvestments.com. Any amendments to the Code of Business Ethics, and information on any waiver from its provisions granted by the registrant, will also be posted on this website within five business days of such amendment or waiver and will remain on the website for at least 12 months.
Item 3. Audit Committee Financial Expert
The registrant’s Board of Trustees/Directors has determined that each member of the registrant’s Audit Committee is an audit committee financial expert, as defined below. For purposes of this item, an “audit committee financial expert” is a person who has the following attributes:
a. An understanding of generally accepted accounting principles and financial statements;
b. The ability to assess the general application of such principles in connection with the accounting for estimates, accruals, and reserves;
c. Experience preparing, auditing, analyzing, or evaluating financial statements that present a breadth and level of complexity of accounting issues that are generally comparable to the breadth and complexity of issues that can reasonably be expected to be raised by the registrant’s financial statements, or experience actively supervising one or more persons engaged in such activities;
d. An understanding of internal controls and procedures for financial reporting; and
e. An understanding of audit committee functions.
An “audit committee financial expert” shall have acquired such attributes through:
a. Education and experience as a principal financial officer, principal accounting officer, controller, public accountant, or auditor or experience in one or more positions that involve the performance of similar functions;
b. Experience actively supervising a principal financial officer, principal accounting officer, controller, public accountant, auditor, or person performing similar functions;
c. Experience overseeing or assessing the performance of companies or public accountants with respect to the preparation, auditing, or evaluation of financial statements; or
d. Other relevant experience.
The registrant’s Board of Trustees/Directors has also determined that each member of the registrant’s Audit Committee is independent. In order to be “independent” for purposes of this item, the Audit Committee member may not: (i) other than in his or her capacity as a member of the Board of Trustees/Directors or any committee thereof, accept directly or indirectly any consulting, advisory or other compensatory fee from the issuer; or (ii) be an “interested person” of the registrant as defined in Section 2(a)(19) of the Investment Company Act of 1940.
The names of the audit committee financial experts on the registrant’s Audit Committee are set forth below:
Thomas L. Bennett1
Thomas F. Madison
Janet L. Yeomans1
J. Richard Zecher
Item 4. Principal Accountant Fees and Services
(a) Audit fees.
The aggregate fees billed for services provided to the registrant by its independent auditors for the audit of the registrant’s annual financial statements and for services normally provided by the independent auditors in connection with statutory and regulatory filings or engagements were $14,300 for the fiscal year ended August 31, 2008.
_______________________
1 The instructions to Form N-CSR require disclosure on the relevant experience of persons who qualify as audit committee financial experts based on “other relevant experience.” The Board of Trustees/Directors has determined that Mr. Bennett qualifies as an audit committee financial expert by virtue of his education, Chartered Financial Analyst designation, and his experience as a credit analyst, portfolio manager and the manager of other credit analysts and portfolio managers. The Board of Trustees/Directors has determined that Ms. Yeomans qualifies as an audit committee financial expert by virtue of her education and experience as the Treasurer of a large global corporation.
The aggregate fees billed for services provided to the registrant by its independent auditors for the audit of the registrant’s annual financial statements and for services normally provided by the independent auditors in connection with statutory and regulatory filings or engagements were $14,000 for the fiscal year ended August 31, 2007.
(b) Audit-related fees.
The aggregate fees billed by the registrant’s independent auditors for services relating to the performance of the audit of the registrant’s financial statements and not reported under paragraph (a) of this Item were $0 for the fiscal year ended August 31, 2008.
The aggregate fees billed by the registrant’s independent auditors for services relating to the performance of the audit of the financial statements of the registrant’s investment adviser and other service providers under common control with the adviser and that relate directly to the operations or financial reporting of the registrant were $19,074 for the registrant’s fiscal year ended August 31, 2008. The percentage of these fees relating to services approved by the registrant’s Audit Committee pursuant to the de minimis exception from the pre-approval requirement in Rule 2-01(c)(7)(i)(C) of Regulation S-X was 0%. These audit-related services were as follows: issuance of report concerning transfer agent's system of internal accounting control pursuant to Rule 17Ad-13 of the Securities Exchange Act.
The aggregate fees billed by the registrant’s independent auditors for services relating to the performance of the audit of the registrant’s financial statements and not reported under paragraph (a) of this Item were $0 for the fiscal year ended August 31, 2007.
The aggregate fees billed by the registrant’s independent auditors for services relating to the performance of the audit of the financial statements of the registrant’s investment adviser and other service providers under common control with the adviser and that relate directly to the operations or financial reporting of the registrant were $13,400 for the registrant’s fiscal year ended August 31, 2007. The percentage of these fees relating to services approved by the registrant’s Audit Committee pursuant to the de minimis exception from the pre-approval requirement in Rule 2-01(c)(7)(i)(C) of Regulation S-X was 0%. These audit-related services were as follows: issuance of report concerning transfer agent's system of internal accounting control pursuant to Rule 17Ad-13 of the Securities Exchange Act.
(c) Tax fees.
The aggregate fees billed by the registrant’s independent auditors for tax-related services provided to the registrant were $3,750 for the fiscal year ended August 31, 2008. The percentage of these fees relating to services approved by the registrant’s Audit Committee pursuant to the de minimis exception from the pre-approval requirement in Rule 2-01(c)(7)(i)(C) of Regulation S-X was 0%. These tax-related services were as follows: review of income tax returns and review of annual excise distribution calculations.
The aggregate fees billed by the registrant’s independent auditors for tax-related services provided to the registrant’s investment adviser and other service providers under common control with the adviser and that relate directly to the operations or financial reporting of the registrant were $0 for the registrant’s fiscal year ended August 31, 2008.
The aggregate fees billed by the registrant’s independent auditors for tax-related services provided to the registrant were $3,950 for the fiscal year ended August 31, 2007. The percentage of these fees relating to services approved by the registrant’s Audit Committee pursuant to the de minimis exception from the pre-approval requirement in Rule 2-01(c)(7)(i)(C) of Regulation S-X was 0%. These tax-related services were as follows: review of income tax returns and review of annual excise distribution calculations.
The aggregate fees billed by the registrant’s independent auditors for tax-related services provided to the registrant’s investment adviser and other service providers under common control with the adviser and that relate directly to the operations or financial reporting of the registrant were $0 for the registrant’s fiscal year ended August 31, 2007.
(d) All other fees.
The aggregate fees billed for all services provided by the independent auditors to the registrant other than those set forth in paragraphs (a), (b) and (c) of this Item were $0 for the fiscal year ended August 31, 2008.
The aggregate fees billed for all services other than those set forth in paragraphs (b) and (c) of this Item provided by the registrant’s independent auditors to the registrant’s adviser and other service providers under common control with the adviser and that relate directly to the operations or financial reporting of the registrant were $0 for the registrant’s fiscal year ended August 31, 2008.
The aggregate fees billed for all services provided by the independent auditors to the registrant other than those set forth in paragraphs (a), (b) and (c) of this Item were $0 for the fiscal year ended August 31, 2007.
The aggregate fees billed for all services other than those set forth in paragraphs (b) and (c) of this Item provided by the registrant’s independent auditors to the registrant’s adviser and other service providers under common control with the adviser and that relate directly to the operations or financial reporting of the registrant were $0 for the registrant’s fiscal year ended August 31, 2007.
(e) The registrant’s Audit Committee has established pre-approval policies and procedures as permitted by Rule 2-01(c)(7)(i)(B) of Regulation S-X (the “Pre-Approval Policy”) with respect to services provided by the registrant’s independent auditors. Pursuant to the Pre-Approval Policy, the Audit Committee has pre-approved the services set forth in the table below with respect to the registrant up to the specified fee limits. Certain fee limits are based on aggregate fees to the registrant and other registrants within the Delaware Investments Family of Funds.
| Service | Range of Fees |
| Audit Services | |
| Statutory audits or financial audits for new Funds | up to $25,000 per Fund |
| Services associated with SEC registration statements (e.g., Form N-1A, Form N-14, etc.), periodic reports and other documents filed with the SEC or other documents issued in connection with securities offerings (e.g., comfort letters for closed-end Fund offerings, consents), and assistance in responding to SEC comment letters | up to $10,000 per Fund |
| Consultations by Fund management as to the accounting or disclosure treatment of transactions or events and/or the actual or potential impact of final or proposed rules, standards or interpretations by the SEC, FASB, or other regulatory or standard-setting bodies (Note: Under SEC rules, some consultations may be considered “audit-related services” rather than “audit services”) | up to $25,000 in the aggregate |
| Audit-Related Services | |
| Consultations by Fund management as to the accounting or disclosure treatment of transactions or events and /or the actual or potential impact of final or proposed rules, standards or interpretations by the SEC, FASB, or other regulatory or standard-setting bodies (Note: Under SEC rules, some consultations may be considered “audit services” rather than “audit-related services”) | up to $25,000 in the aggregate |
| Tax Services | |
| U.S. federal, state and local and international tax planning and advice (e.g., consulting on statutory, regulatory or administrative developments, evaluation of Funds’ tax compliance function, etc.) | up to $25,000 in the aggregate |
| U.S. federal, state and local tax compliance (e.g., excise distribution reviews, etc.) | up to $5,000 per Fund |
| Review of federal, state, local and international income, franchise and other tax returns | up to $5,000 per Fund |
Under the Pre-Approval Policy, the Audit Committee has also pre-approved the services set forth in the table below with respect to the registrant’s investment adviser and other entities controlling, controlled by or under common control with the investment adviser that provide ongoing services to the registrant (the “Control Affiliates”) up to the specified fee limit. This fee limit is based on aggregate fees to the investment adviser and its Control Affiliates.
| Service | Range of Fees |
| Non-Audit Services | |
| Services associated with periodic reports and other documents filed with the SEC and assistance in responding to SEC comment letters | up to $10,000 in the aggregate |
The Pre-Approval Policy requires the registrant’s independent auditors to report to the Audit Committee at each of its regular meetings regarding all services initiated since the last such report was rendered, including those services authorized by the Pre-Approval Policy.
(f) Not applicable.
(g) The aggregate non-audit fees billed by the registrant’s independent auditors for services rendered to the registrant and to its investment adviser and other service providers under common control with the adviser were $255,752 and $252,638 for the registrant’s fiscal years ended August 31, 2008 and August 31, 2007, respectively.
(h) In connection with its selection of the independent auditors, the registrant’s Audit Committee has considered the independent auditors’ provision of non-audit services to the registrant’s investment adviser and other service providers under common control with the adviser that were not required to be pre-approved pursuant to Rule 2-01(c)(7)(ii) of Regulation S-X. The Audit Committee has determined that the independent auditors’ provision of these services is compatible with maintaining the auditors’ independence.
Item 5. Audit Committee of Listed Registrants
Not applicable.
Item 6. Investments
(a) Included as part of report to shareholders filed under Item 1 of this Form N-CSR.
(b) Divestment of securities in accordance with Section 13(c) of the Investment Company Act of 1940.
Not applicable.
Item 7. Disclosure of Proxy Voting Policies and Procedures for Closed-End Management Investment Companies
Not applicable.
Item 8. Portfolio Managers of Closed-End Management Investment Companies
Not applicable.
Item 9. Purchases of Equity Securities by Closed-End Management Investment Company and Affiliated Purchasers
Not applicable.
Item 10. Submission of Matters to a Vote of Security Holders
Not applicable.
Item 11. Controls and Procedures
The registrant’s principal executive officer and principal financial officer have evaluated the registrant’s disclosure controls and procedures within 90 days of the filing of this report and have concluded that they are effective in providing reasonable assurance that the information required to be disclosed by the registrant in its reports or statements filed under the Securities Exchange Act of 1934 is recorded, processed, summarized and reported within the time periods specified in the rules and forms of the Securities and Exchange Commission.
There were no significant changes in the registrant’s internal control over financial reporting that occurred during the second fiscal quarter of the period covered by the report to stockholders included herein (i.e., the registrant’s fourth fiscal quarter) that have materially affected, or are reasonably likely to materially affect, the registrant’s internal control over financial reporting.
Item 12. Exhibits
(a) (1) Code of Ethics
Not applicable.
(2) Certifications of Principal Executive Officer and Principal Financial Officer pursuant to Rule 30a-2 under the Investment Company Act of 1940 are attached hereto as Exhibit 99.CERT.
(3) Written solicitations to purchase securities pursuant to Rule 23c-1 under the Securities Exchange Act of 1934.
Not applicable.
(b) Certifications pursuant to Section 906 of the Sarbanes-Oxley Act of 2002 are furnished herewith as Exhibit 99.906CERT.
SIGNATURES
Pursuant to the requirements of the Securities Exchange Act of 1934 and the Investment Company Act of 1940, the registrant has duly caused this report to be signed on its behalf, by the undersigned, thereunto duly authorized.
Name of Registrant: VOYAGEUR INSURED FUNDS
| PATRICK P. COYNE | ||
| By: | Patrick P. Coyne | |
| Title: | Chief Executive Officer | |
| Date: | November 5, 2008 | |
Pursuant to the requirements of the Securities Exchange Act of 1934 and the Investment Company Act of 1940, this report has been signed below by the following persons on behalf of the registrant and in the capacities and on the dates indicated.
| PATRICK P. COYNE | ||
| By: | Patrick P. Coyne | |
| Title: | Chief Executive Officer | |
| Date: | November 5, 2008 | |
| RICHARD SALUS | ||
| By: | Richard Salus | |
| Title: | Chief Financial Officer | |
| Date: | November 5, 2008 | |