UNITED STATES
SECURITIES AND EXCHANGE COMMISSION
Washington, D.C. 20549
FORMN-CSR
CERTIFIED SHAREHOLDER REPORT OF
REGISTERED MANAGEMENT INVESTMENT COMPANIES
Investment Company Act file number811-04975
MFS MULTIMARKET INCOME TRUST
(Exact name of registrant as specified in charter)
111 Huntington Avenue, Boston, Massachusetts 02199
(Address of principal executive offices) (Zip code)
Christopher R. Bohane
Massachusetts Financial Services Company
111 Huntington Avenue
Boston, Massachusetts 02199
(Name and address of agents for service)
Registrant’s telephone number, including area code: (617)954-5000
Date of fiscal year end: October 31
Date of reporting period: October 31, 2019
| ITEM 1. | REPORTS TO STOCKHOLDERS. |
Annual Report
October 31, 2019

MFS® Multimarket Income Trust

Beginning on January 1, 2021, as permitted by regulations adopted by the U.S. Securities and Exchange Commission, paper copies of the fund’s annual and semiannual shareholder reports will no longer be sent by mail, unless you specifically request paper copies of the reports. Instead, the complete reports will be made available on the fund’s Web site, and you will be notified by mail each time a report is posted and provided with a Web site link to access the report.
If you are already signed up to receive shareholder reports by email, you will not be affected by this change and you need not take any action. You may sign up to receive shareholder reports and other communications from the fund by email by contacting your financial intermediary (such as a broker-dealer or bank) or, if you hold your shares directly with the fund, by calling 1-800-637-2304 or by logging into your Investor Center account at www.computershare.com/investor.
Beginning on January 1, 2019, you may elect to receive all future reports in paper free of charge. Contact your financial intermediary to request that you continue to receive paper copies of your shareholder reports. If you invest directly with the fund, you can call 1-800-637-2304 to let the fund know that you wish to continue receiving paper copies of your shareholder reports. Your election to receive reports in paper will apply to all funds held in your account if you invest through your financial intermediary or all funds held with the MFS fund complex if you invest directly.
MMT-ANN
MANAGED DISTRIBUTION POLICY DISCLOSURE
The MFS Multimarket Income Trust’s (the fund) Board of Trustees adopted a managed distribution policy. The fund seeks to pay monthly distributions based on an annual rate of 8.00% of the fund’s average monthly net asset value. The primary purpose of the managed distribution policy is to provide shareholders with a constant, but not guaranteed, fixed minimum rate of distribution each month. You should not draw any conclusions about the fund’s investment performance from the amount of the current distribution or from the terms of the fund’s managed distribution policy. The Board may amend or terminate the managed distribution policy at any time without prior notice to fund shareholders. The amendment or termination of the managed distribution policy could have an adverse effect on the market price of the fund’s shares.
With each distribution, the fund will issue a notice to shareholders and an accompanying press release which will provide detailed information regarding the amount and composition of the distribution and other related information. The amounts and sources of distributions reported in the notice to shareholders are only estimates and are not being provided for tax reporting purposes. The actual amounts and sources of the amounts for tax reporting purposes will depend upon the fund’s investment experience during its fiscal year and may be subject to changes based on tax regulations. The fund will send you a Form 1099-DIV for the calendar year that will tell you how to report these distributions for federal income tax purposes. Please refer to “Tax Matters and Distributions” under Note 2 of the Notes to Financial Statements for information regarding the tax character of the fund’s distributions.
Under a managed distribution policy the fund may at times distribute more than its net investment income and net realized capital gains; therefore, a portion of your distribution may result in a return of capital. A return of capital may occur, for example, when some or all of the money that you invested in the fund is paid back to you. Any such returns of capital will decrease the fund’s total assets and, therefore, could have the effect of increasing the fund’s expense ratio. In addition, in order to make the level of distributions called for under its managed distribution policy, the fund may have to sell portfolio securities at a less than opportune time. A return of capital does not necessarily reflect the fund’s investment performance and should not be confused with ‘yield’ or ‘income’. The fund’s total return in relation to changes in net asset value is presented in the Financial Highlights.
MFS® Multimarket Income Trust
New York Stock Exchange Symbol:MMT
NOT FDIC INSURED• MAY LOSE VALUE• NO BANK GUARANTEE

LETTER FROM THE EXECUTIVE CHAIR
Dear Shareholders:
Slowing global growth, low inflation, and trade friction between the United States and China have been hallmarks of the past 12 months. After experiencing an uptick in
market volatility in late 2018, markets steadied during 2019, thanks in large measure to the adoption of a dovish policy stance on the part of global central banks, focused on supporting economic growth. The U.S. and China have repeatedly raised tariffs on each other, though preliminary steps toward an interim trade agreement have been undertaken, modestly easing tensions in recent months. While British Prime Minister Boris Johnson has negotiated a reworked withdrawal agreement with the European Union, Parliament has not yet approved the deal, leading the EU to grant the United Kingdom a Brexit delay until no later than January 31, 2020. Uncertainty over Brexit, along with the ripple effects from the trade conflict, have hampered business
confidence and investment in the U.K. and Europe, though investors hope that greater clarity regarding the Brexit outcome will emerge after a British parliamentary election in December.
Markets expect that the longest economic expansion in U.S. history will continue for the time being, albeit at a slower pace. In an effort to prolong the expansion, the U.S. Federal Reserve lowered interest rates three times between July and October. Similarly, the European Central Bank loosened policy in September. While the monetary policy environment remains quite accommodative, tentative signs of easing trade tensions and receding global recession fears have helped push global interest rates modestly higher from therecord-low levels posted late in the summer as investors grew less risk averse.
Here at MFS®, we aim to help our clients navigate the growing complexity of the markets and world economies. Our long-term investment philosophy and commitment to responsible allocation of capital allow us to wade through the noise to uncover what we believe are the best, most durable investment opportunities in the market. Through our powerful global investment platform, we combine collective expertise, thoughtful risk management and long-term discipline with the purpose of creating sustainable value for investors.
Respectfully,

Robert J. Manning
Executive Chair
MFS Investment Management
December 16, 2019
The opinions expressed in this letter are subject to change and may not be relied upon for investment advice. No forecasts can be guaranteed.
1
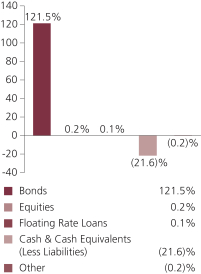
PORTFOLIO COMPOSITION
Portfolio structure at value (v)
| | | | |
| Fixed income sectors (i) | | | | |
| High Yield Corporates | | | 55.7% | |
| Investment Grade Corporates | | | 28.2% | |
| Emerging Markets Bonds | | | 26.9% | |
| Mortgage-Backed Securities | | | 4.2% | |
| Commercial Mortgage-Backed Securities | | | 2.2% | |
| Collateralized Debt Obligations | | | 1.8% | |
| Asset-Backed Securities | | | 0.3% | |
| Municipal Bonds | | | 0.2% | |
| Floating Rate Loans | | | 0.1% | |
| Non-U.S. Government Bonds | | | (4.1)% | |
| U.S. Treasury Securities | | | (8.7)% | |
| |
| Portfolio facts (i) | | | | |
| Average Duration (d) | | | 5.5 | |
| Average Effective Maturity (m) | | | 7.2 yrs. | |
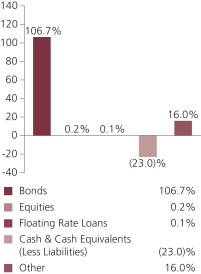
Portfolio structure reflecting equivalent exposure of derivative positions (i)
| | | | |
| Composition including fixed income credit quality (a)(i) | |
| AAA | | | 3.5% | |
| AA | | | 3.1% | |
| A | | | 8.2% | |
| BBB | | | 32.1% | |
| BB | | | 37.4% | |
| B | | | 23.6% | |
| CCC | | | 6.6% | |
| CC | | | 0.1% | |
| C (o) | | | 0.0% | |
| D (o) | | | 0.0% | |
| U.S. Government | | | 3.9% | |
| Federal Agencies | | | 4.2% | |
| Not Rated | | | (15.9)% | |
| Non-Fixed Income | | | 0.2% | |
| Cash & Cash Equivalents (Less Liabilities) | | | (23.0)% | |
| Other | | | 16.0% | |
2
Portfolio Composition – continued
| (a) | For all securities other than those specifically described below, ratings are assigned to underlying securities utilizing ratings from Moody’s, Fitch, and Standard & Poor’s rating agencies and applying the following hierarchy: If all three agencies provide a rating, the middle rating (after dropping the highest and lowest ratings) is assigned; if two of the three agencies rate a security, the lower of the two is assigned. Ratings are shown in the S&P and Fitch scale (e.g., AAA). Securities rated BBB or higher are considered investment grade. All ratings are subject to change. U.S. Government includes securities issued by the U.S. Department of the Treasury. Federal Agencies includes rated and unrated U.S. Agencyfixed-income securities, U.S. Agency mortgage-backed securities, and collateralized mortgage obligations of U.S. Agency mortgage-backed securities. Not Rated includes fixed income securities and fixed income derivatives, which have not been rated by any rating agency.Non-Fixed Income includes equity securities (including convertible bonds and equity derivatives) and/or commodity-linked derivatives. The fund may or may not have held all of these instruments on this date. The fund is not rated by these agencies. |
| (d) | Duration is a measure of how much a bond’s price is likely to fluctuate with general changes in interest rates, e.g., if rates rise 1.00%, a bond with a 5-year duration is likely to lose about 5.00% of its value due to the interest rate move. |
| (i) | For purposes of this presentation, the components include the value of securities, and reflect the impact of the equivalent exposure of derivative positions, if any. These amounts may be negative from time to time. Equivalent exposure is a calculated amount that translates the derivative position into a reasonable approximation of the amount of the underlying asset that the portfolio would have to hold at a given point in time to have the same price sensitivity that results from the portfolio’s ownership of the derivative contract. When dealing with derivatives, equivalent exposure is a more representative measure of the potential impact of a position on portfolio performance than value. The bond component will include any accrued interest amounts. |
| (m) | In determining each instrument’s effective maturity for purposes of calculating the fund’s dollar-weighted average effective maturity, MFS uses the instrument’s stated maturity or, if applicable, an earlier date on which MFS believes it is probable that a maturity-shortening device (such as a put, pre-refunding or prepayment) will cause the instrument to be repaid. Such an earlier date can be substantially shorter than the instrument’s stated maturity. |
| (v) | For purposes of this presentation, market value of fixed income and/or equity derivatives, if any, is included in Cash & Cash Equivalents. |
Where the fund holds convertible bonds, they are treated as part of the equity portion of the portfolio.
Cash & Cash Equivalents includes any cash, investments in money market funds, short-term securities, and other assets less liabilities. Please see the Statement of Assets and Liabilities for additional information related to the fund’s cash position and other assets and liabilities.
From time to time Cash & Cash Equivalents may be negative due to borrowings for leverage transactions and/or timing of cash receipts and disbursements.
Other includes equivalent exposure from currency derivatives and/or any offsets to derivative positions and may be negative.
Percentages are based on net assets as of October 31, 2019.
The portfolio is actively managed and current holdings may be different.
3
MANAGEMENT REVIEW
Summary of Results
MFS Multimarket Income Trust (fund) is aclosed-end fund. The fund’s investment objective is to seek high current income, but may also consider capital appreciation. The fund normally invests at least 80% of its net assets in fixed income securities. MFS considers debt instruments of all types to be fixed income securities. MFS normally invests the fund’s assets in corporate bonds of US and/or foreign issuers, US Government securities, foreign government securities, mortgage-backed and other asset-backed securities of US and foreign issuers, and/or debt instruments of issuers located in emerging market countries. MFS allocates the fund’s assets across these categories with a view toward broad diversification across and within these categories. MFS may also invest the fund’s assets in equity securities.
For the twelve months ended October 31, 2019, shares of the fund provided a total return of 14.78%, at net asset value, and a total return of 25.05%, at market value. This compares with a return of 8.38% for the fund’s benchmark, the Bloomberg Barclays U.S. High-Yield Corporate Bond 2% Issuer Capped Index. Over the same period, the fund’s other benchmark, the MFS Multimarket Income Trust Blended Index (Blended Index), generated a return of 10.22%. The Blended Index reflects the blended returns of various fixed income market indices, with percentage allocations to each index designed to resemble the fixed income allocations of the fund. The market indices and related percentage allocations used to compile the Blended Index are set forth in the Performance Summary.
The performance commentary below is based on the net asset value performance of the fund, which reflects the performance of the underlying pool of assets held by the fund. The total return at market value represents the return earned by owners of the shares of the fund, which are traded publicly on the exchange.
Market Environment
Fading fears of a near-term global recession, hopes for a partial trade deal between the United States and China and dramatically lower odds of ano-deal Brexit helped bolster market sentiment late in the period, after providing headwinds for many months prior. Changes in market sentiment, largely driven by uncertainty over the outcome of trade negotiations between the United States and China, contributed to periodic bouts of volatility during the reporting period. The global economy decelerated, led by weakness in China and Europe, although the pace of the slowdown moderated.
The deteriorating global growth backdrop, along with declining inflationary pressures, prompted the US Federal Reserve to adopt a more dovish posture beginning in early 2019, resulting in the first interest rate cut in over a decade at the end of July, followed by additional cuts in September and October. The Fed’s actions led to a sharp decline in long-term interest rates during the period’s second half, inverting portions of the US Treasury yield curve for a time. The Fed indicated in October that further rate cuts are unlikely unless the outlook for the economy materially worsens.
Globally, central banks have tilted more dovish as well, with the European Central Bank unveiling a package of easing measures, which included cutting overnight rates deeper into negative territory, restarting its bond-buying program and lengthening the term of
4
Management Review – continued
cheap loans to banks to three years from two. The central banks of India and Australia are among those that have cut rates several times in recent months, although China has been more cautious in increasing liquidity as it continues to attempt to deleverage its economy, cutting rates only marginally.
Emerging markets experienced considerable volatility through the end of 2018, as tighter global financial conditions exposed structural weakness in some countries. Those conditions improved in 2019, as the Fed became more dovish, but significant trade friction between the US and China weighed on sentiment for much of the year, although hopes for a partial trade deal improved sentiment late in the period. Idiosyncratic factors negatively impacted some emerging economies, such as Argentina and Turkey.
From a geopolitical perspective, Brexit uncertainty has receded. While British Prime Minister Boris Johnson has negotiated a reworked withdrawal agreement with the European Union, Parliament has not yet approved the deal, leading the EU to grant the United Kingdom a Brexit delay until no later than January 31, 2020. A UK general election, scheduled for December 12, may bring some clarity to the situation. Hopes for a limited trade agreement between the US and China, as well as fading global recession fears, were supportive factors for risk assets at period end.
Factors Affecting Performance
Relative to the Blended Index, the fund’s bond selection within theindustrialssector, particularly within “CCC”, “B” and “BB” rated (r) bonds, contributed to performance. In terms of allocation, the fund’s lesser exposure to “CCC” ratedsecurities benefited relative performance, along with allocations within emerging markets. The combination of a longer duration (d) stance and the fund’s positioning along the yield curve (y) further supported relative results.
The fund employs leverage and, to the extent that investments are purchased through the use of leverage, the fund’s net asset value may increase or decrease at a greater rate than a comparable unleveraged fund. During the reporting period, the use of leverage was a positive contributor to relative performance.
Conversely, a slight overweight allocation to “B” rated bonds dampened relative performance.
Respectfully,
Portfolio Manager(s)
Robert Spector, Ward Brown, David Cole, Pilar Gomez-Bravo, Andy Li, Henry Peabody, Jr., Robert Persons, Matt Ryan, and Michael Skatrud
| (d) | Duration is a measure of how much a bond’s price is likely to fluctuate with general changes in interest rates, e.g., if rates rise 1.00%, a bond with a5-year duration is likely to lose about 5.00% of its value. |
| (r) | Bonds rated “BBB”, “Baa”, or higher are considered investment grade; bonds rated “BB”, “Ba”, or below are considerednon-investment grade. The source for bond quality ratings is Moody’s Investors Service, Standard & Poor’s and Fitch, Inc. and are applied using the following hierarchy: If all three agencies provide a rating, the middle rating (after dropping the highest and lowest ratings) is assigned; if two of the three agencies rate a security, the lower |
5
Management Review – continued
| | of the two is assigned. Ratings are shown in the S&P and Fitch scale (e.g., AAA). For securities which are not rated by any of the three agencies, the security is considered Not Rated. |
| (y) | A yield curve graphically depicts the yields of different maturity bonds of the same credit quality and type; a normal yield curve is upward sloping, with short-term rates lower than long-term rates. |
Note to Shareholders: Effective February 1, 2019, Andy Li was added as a Portfolio Manager of the Fund. Effective September 1, 2019, Henry Peabody, Jr. was added as a Portfolio Manager of the Fund.
The views expressed in this report are those of the portfolio manager(s) only through the end of the period of the report as stated on the cover and do not necessarily reflect the views of MFS or any other person in the MFS organization. These views are subject to change at any time based on market or other conditions, and MFS disclaims any responsibility to update such views. These views may not be relied upon as investment advice or an indication of trading intent on behalf of any MFS portfolio. References to specific securities are not recommendations of such securities, and may not be representative of any MFS portfolio’s current or future investments.
6
PERFORMANCE SUMMARYTHROUGH 10/31/19
The following chart presents the fund’s historical performance in comparison to its benchmark(s). Investment return and principal value will fluctuate, and shares, when sold, may be worth more or less than their original cost; current performance may be lower or higher than quoted. The performance shown does not reflect the deduction of taxes, if any, that a shareholder would pay on fund distributions or the sale of fund shares. Performance data shown represents past performance and is no guarantee of future results.
Price Summary for MFS Multimarket Income Trust
| | | | | | | | | | | | |
| | | | | | | Date | | | Price | | |
| | | | | | |
Year Ended 10/31/19 | | | | Net Asset Value | | | 10/31/19 | | | $6.38 | | |
| | | | | | | 10/31/18 | | | $6.06 | | |
| | | | New York Stock Exchange Price | | | 10/31/19 | | | $6.01 | | |
| | | | | | | 10/31/19 | (high) (t) | | $6.01 | | |
| | | | | | | 12/20/18 | (low) (t) | | $5.03 | | |
| | | | | | | 10/31/18 | | | $5.24 | | |
Total Returns vs Benchmark(s)
| | | | | | | | | | |
| | | | | |
Year Ended 10/31/19 | | | | MFS Multimarket Income Trust at | | | | | | |
| | | | New York Stock Exchange Price (r) | | | 25.05% | | | |
| | | | Net Asset Value (r) | | | 14.78% | | | |
| | | | Bloomberg Barclays U.S. High-Yield Corporate Bond 2% Issuer Capped Index (f) | | | 8.38% | | | |
| | | | MFS Multimarket Income Trust Blended Index (f)(w) | | | 10.22% | | | |
| | | | Bloomberg Barclays Global Aggregate Credit Bond Index (f) | | | 11.32% | | | |
| | | | Bloomberg Barclays U.S. Government/Mortgage Bond Index (f) | | | 10.13% | | | |
| | | | | |
| | | | | JPMorgan Emerging Markets Bond Index Global (f) | | | 13.69% | | | |
| (f) | Source: FactSet Research Systems Inc. |
| (r) | Includes reinvestment of all distributions. |
| (t) | For the period November 1, 2018 through October 31, 2019. |
| (w) | As of October 31, 2019, the MFS Multimarket Income Trust Blended Index (a custom index) was comprised of 50% Bloomberg Barclays U.S. High-Yield Corporate Bond 2% Issuer Capped Index, 20% JPMorgan Emerging Markets Bond Index Global, 20% Bloomberg Barclays Global Aggregate Credit Bond Index, and 10% Bloomberg Barclays U.S. Government/Mortgage Bond Index. |
7
Performance Summary – continued
Benchmark Definition(s)
Bloomberg Barclays Global Aggregate Credit Bond Index – a subset of the Global Aggregate Index, and contains investment grade credit securities from the U.S. Aggregate,Pan-European Aggregate, Asian-Pacific Aggregate, Eurodollar, 144A, andEuro-Yen indices. Credit securities are publicly issued corporate and specified foreign debentures and secured notes that meet the specified maturity, liquidity and quality requirements.(b)
Bloomberg Barclays U.S. Government/Mortgage Bond Index – measures debt issued by the U.S. Government, and its agencies, as well as mortgage-backed pass-through securities of Ginnie Mae (GNMA), Fannie Mae (FNMA), and Freddie Mac (FHLMC).(b)
Bloomberg Barclays U.S. High-Yield Corporate Bond 2% Issuer Capped Index – a component of the Bloomberg Barclays U.S. High-Yield Corporate Bond Index, which measures performance ofnon-investment grade, fixed rate debt. The index limits the maximum exposure to any one issuer to 2%.(b)
JPMorgan Emerging Markets Bond Index Global – measures the performance of U.S. dollar-denominated debt instruments issued by emerging market sovereign and quasi-sovereign entities: Brady bonds, loans, Eurobonds.
It is not possible to invest directly in an index.
| (b) | BLOOMBERG® is a trademark and service mark of Bloomberg Finance L.P. and its affiliates (collectively “Bloomberg”). BARCLAYS® is a trademark and service mark of Barclays Bank Plc (collectively with its affiliates, “Barclays”), used under license. Bloomberg or Bloomberg’s licensors, including Barclays, own all proprietary rights in the Bloomberg Barclays Indices. Neither Bloomberg nor Barclays approves or endorses this material, or guarantees the accuracy or completeness of any information herein, or makes any warranty, express or implied, as to the results to be obtained therefrom, and, to the maximum extent allowed by law, neither shall have any liability or responsibility for injury or damages arising in connection therewith. |
Notes to Performance Summary
The fund’s shares may trade at a discount or premium to net asset value. When fund shares trade at a premium, buyers pay more than the net asset value underlying fund shares, and shares purchased at a premium would receive less than the amount paid for them in the event of the fund’s concurrent liquidation.
The fund’s target annual distribution rate is calculated based on an annual rate of 8.00% of the fund’s average monthly net asset value, not a fixed share price, and the fund’s dividend amount will fluctuate with changes in the fund’s average monthly net assets.
Net asset values and performance results based on net asset value per share do not include adjustments made for financial reporting purposes in accordance with U.S.
8
Performance Summary – continued
generally accepted accounting principles and may differ from amounts reported in the Statement of Assets and Liabilities or the Financial Highlights.
From time to time the fund may receive proceeds from litigation settlements, without which performance would be lower.
In accordance with Section 23(c) of the Investment Company Act of 1940, the fund hereby gives notice that it may from time to time repurchase shares of the fund in the open market at the option of the Board of Trustees and on such terms as the Trustees shall determine.
9
PORTFOLIO MANAGERS’ PROFILES
| | | | | | |
| Portfolio Manager | | Primary Role | | Since | | Title and Five Year History |
| Robert Spector | | Lead Portfolio
Manager | | 2017 | | Investment Officer of MFS; employed in the investment management area of MFS since 2011. |
| | | |
| Ward Brown | | Emerging Markets
Debt Instruments Portfolio Manager | | 2012 | | Investment Officer of MFS; employed in the investment management area of MFS since 2005. |
| | | |
| David Cole | | Below Investment
Grade Debt
InstrumentsPortfolio Manager | | 2006 | | Investment Officer of MFS; employed in the investment management area of MFS since 2004. |
| | | |
| Pilar Gomez-Bravo | | Debt Instruments
Portfolio Manager | | 2013 | | Investment Officer of MFS; employed in the investment management area of MFS since 2013. |
| | | |
| Andy Li | | Investment Grade
Debt Instruments
Portfolio Manager | | 2019 | | Investment Officer of MFS; employed in the investment management area of MFS since 2018; Portfolio Manager of Man GLG from 2014 to 2018; Portfolio Manager of ECM Asset Management prior to April 2014. |
| | | |
| Henry Peabody, Jr. | | Investment Grade
Debt Instruments
Portfolio Manager | | 2019 | | Investment Officer of MFS; employed in the investment management area of MFS since July 2019; Portfolio Manager and Analyst at Eaton Vance Management from 2014 to June 2019; Vice President/Research Analyst at Eaton Vance Management from July 2013 to October 2014. |
| | | |
| Robert Persons | | Investment Grade
Debt Instruments Portfolio Manager | | 2013 | | Investment Officer of MFS; employed in the investment management area of MFS since 2000. |
| | | |
| Matt Ryan | | Emerging Markets
Debt Instruments Portfolio Manager | | 2004 | | Investment Officer of MFS; employed in the investment management area of MFS since 1997. |
| | | |
| Michael Skatrud | | Below Investment
Grade Debt
Instruments
Portfolio Manager | | 2018 | | Investment Officer of MFS; employed in the investment management area of MFS since 2013. |
Note to Shareholders: Effective February 1, 2019, Andy Li was added as a Portfolio Manager of the Fund. Effective September 1, 2019, Henry Peabody, Jr. was added as a Portfolio Manager of the Fund.
10
DIVIDEND REINVESTMENT AND CASH PURCHASE PLAN
The fund offers a Dividend Reinvestment and Cash Purchase Plan (the “Plan”) that allows common shareholders to reinvest either all of the distributions paid by the fund or only the long-term capital gains. Generally, purchases are made at the market price unless that price exceeds the net asset value (the shares are trading at a premium). If the shares are trading at a premium, purchases will be made at a price of either the net asset value or 95% of the market price, whichever is greater. You can also buy shares on a quarterly basis in any amount $100 and over. The Plan Agent will purchase shares under the Cash Purchase Plan on the 15th of January, April, July, and October or shortly thereafter.
If shares are registered in your own name, new shareholders will automatically participate in the Plan, unless you have indicated that you do not wish to participate. If your shares are in the name of a brokerage firm, bank, or other nominee, you can ask the firm or nominee to participate in the Plan on your behalf. If the nominee does not offer the Plan, you may wish to request that your shares bere-registered in your own name so that you can participate. There is no service charge to reinvest distributions, nor are there brokerage charges for shares issued directly by the fund. However, when shares are bought on the New York Stock Exchange or otherwise on the open market, each participant pays a pro rata share of the transaction expenses, including commissions. The tax status of dividends and capital gain distributions does not change whether received in cash or reinvested in additional shares – the automatic reinvestment of distributions does not relieve you of any income tax that may be payable (or required to be withheld) on the distributions.
If your shares are held directly with the Plan Agent, you may withdraw from the Plan at any time by going to the Plan Agent’s website at www.computershare.com/investor, by calling1-800-637-2304 any business day from 9 a.m. to 5 p.m. Eastern time or by writing to the Plan Agent at P.O. Box 505005, Louisville, KY 40233-5005. Please have available the name of the fund and your account number. For certain types of registrations, such as corporate accounts, instructions must be submitted in writing. Please call for additional details. When you withdraw from the Plan, you can receive the value of the reinvested shares in one of three ways: your full shares will be held in your account, the Plan Agent will sell your shares and send the proceeds to you, or you may transfer your full shares to your investment professional who can hold or sell them. Additionally, the Plan Agent will sell your fractional shares and send the proceeds to you.
If you have any questions or for further information or a copy of the Plan, contact the Plan Agent Computershare Trust Company, N.A. (the Transfer Agent for the fund) at1-800-637-2304, at the Plan Agent’s website at www.computershare.com/investor, or by writing to the Plan Agent at P.O. Box 505005, Louisville, KY 40233-5005.
11
PORTFOLIO OF INVESTMENTS
10/31/19
The Portfolio of Investments is a complete list of all securities owned by your fund. It is categorized by broad-based asset classes.
| | | | | | | | |
| Bonds - 121.5% | | | | | | | | |
| | |
| Issuer | | Shares/Par | | | Value ($) | |
| Aerospace - 1.4% | | | | | | | | |
| Bombardier, Inc., 7.5%, 3/15/2025 (n) | | $ | 670,000 | | | $ | 640,118 | |
| F-Brasile S.p.A./F-Brasile U.S. LLC, 7.375%, 8/15/2026 (z) | | | 335,000 | | | | 350,075 | |
| Huntington Ingalls Industries, Inc., 3.483%, 12/01/2027 | | | 290,000 | | | | 303,079 | |
| L3Harris Technologies, Inc., 3.85%, 6/15/2023 (n) | | | 600,000 | | | | 633,626 | |
| Lockheed Martin Corp., 3.55%, 1/15/2026 | | | 406,000 | | | | 438,522 | |
| TransDigm, Inc., 6.5%, 7/15/2024 | | | 800,000 | | | | 826,000 | |
| TransDigm, Inc., 6.25%, 3/15/2026 (n) | | | 1,302,000 | | | | 1,394,767 | |
| TransDigm, Inc., 6.375%, 6/15/2026 | | | 340,000 | | | | 355,725 | |
| TransDigm, Inc., 5.5%, 11/15/2027 (z) | | | 735,000 | | | | 732,567 | |
| | | | | | | | |
| | | | | | | $ | 5,674,479 | |
| Apparel Manufacturers - 0.1% | | | | | | | | |
| Tapestry, Inc., 4.125%, 7/15/2027 | | $ | 511,000 | | | $ | 520,542 | |
| | |
| Asset-Backed & Securitized - 4.2% | | | | | | | | |
| Bayview Financial Revolving Mortgage Loan Trust, FLR, 3.64% (LIBOR - 1mo. + 1.6%), 12/28/2040 (z) | | $ | 1,024,552 | | | $ | 1,022,896 | |
| Benchmark Mortgage Trust,2019-B12, “A5”, 3.115%, 8/15/2052 | | | 1,335,878 | | | | 1,411,057 | |
| Commercial Mortgage Pass-Through Certificates, 2019-BNK19, 3.183%, 8/15/2061 (z) | | | 2,000,000 | | | | 2,118,900 | |
| Crest Ltd., CDO, 7%, (0.001% cash or 7% PIK) 1/28/2040 (a)(p) | | | 3,071,620 | | | | 136,687 | |
| GS Mortgage Securities Trust, 2019-GSA1, “A4”, 3.048%, 11/10/2052 | | | 2,000,000 | | | | 2,081,860 | |
| HarbourView CLO VII Ltd., 7RA, “B”, FLR, 3.703% (LIBOR - 3mo. + 1.7%), 7/18/2031 (z) | | | 2,500,000 | | | | 2,433,568 | |
| Lehman Brothers Commercial Conduit Mortgage Trust, 0.949%, 2/18/2030 (i) | | | 61,233 | | | | 1 | |
| Loomis, Sayles & Co., CLO,2015-2A, “A1R”, FLR, 2.9% (LIBOR - 3mo. + 0.9%), 4/15/2028 (n) | | | 2,500,000 | | | | 2,488,887 | |
| Morgan Stanley Capital I Trust,“2019-H7, “A4”, 3.261%, 7/15/2052 | | | 1,289,610 | | | | 1,370,363 | |
| Octagon Investment Partners XVII Ltd.,2013-1A, “BR2”, FLR, 3.339% (LIBOR - 3mo. + 1.4%), 1/25/2031 (n) | | | 2,139,000 | | | | 2,088,385 | |
| Wells Fargo Commercial Mortgage Trust,2019-C53, “A4”, 3.04%, 10/15/2052 | | | 2,000,000 | | | | 2,086,563 | |
| | | | | | | | |
| | | | | | | $ | 17,239,167 | |
| Automotive - 1.7% | | | | | | | | |
| Allison Transmission, Inc., 5%, 10/01/2024 (n) | | $ | 2,000,000 | | | $ | 2,047,500 | |
| Allison Transmission, Inc., 4.75%, 10/01/2027 (n) | | | 300,000 | | | | 307,500 | |
12
Portfolio of Investments – continued
| | | | | | | | |
| | |
| Issuer | | Shares/Par | | | Value ($) | |
| Bonds - continued | | | | | | | | |
| Automotive - continued | | | | | | | | |
| Allison Transmission, Inc., 5.875%, 6/01/2029 (n) | | $ | 105,000 | | | $ | 113,138 | |
| Continental AG, 0%, 9/12/2023 | | EUR | 500,000 | | | | 554,070 | |
| Ferrari N.V., 1.5%, 3/16/2023 | | | 425,000 | | | | 490,026 | |
| Ford Motor Credit Co. LLC, 1.514%, 2/17/2023 | | | 200,000 | | | | 222,554 | |
| IAA Spinco, Inc., 5.5%, 6/15/2027 (n) | | $ | 875,000 | | | | 937,475 | |
| Lear Corp., 4.25%, 5/15/2029 | | | 358,000 | | | | 369,152 | |
| Panther BR Aggregator 2 LP/Panther Finance Co., Inc., 8.5%, 5/15/2027 (n) | | | 1,085,000 | | | | 1,093,137 | |
| Volkswagen International Finance N.V., 1.875%, 3/30/2027 | | EUR | 300,000 | | | | 357,383 | |
| Volkswagen Leasing GmbH, 1.5%, 6/19/2026 | | | 300,000 | | | | 347,749 | |
| | | | | | | | |
| | | | | | | $ | 6,839,684 | |
| Banks & Diversified Financials (Covered Bonds) - 0.2% | | | | | |
| BPER Banca S.p.A., 5.125% to 5/31/2022, FLR (EUR Swap Rate - 5yr. + 4.91%) to 5/31/2027 | | EUR | 800,000 | | | $ | 943,544 | |
| | |
| Broadcasting - 3.2% | | | | | | | | |
| Diamond Sports Group, LLC/Diamond Sports Finance Co., 5.375%, 8/15/2026 (n) | | $ | 370,000 | | | $ | 386,650 | |
| Diamond Sports Group, LLC/Diamond Sports Finance Co., 6.625%, 8/15/2027 (z) | | | 565,000 | | | | 581,950 | |
| Discovery, Inc., 4.125%, 5/15/2029 | | | 219,000 | | | | 233,046 | |
| Fox Corp., 4.709%, 1/25/2029 (n) | | | 122,000 | | | | 138,805 | |
| iHeartCommunications, Inc., 6.375%, 5/01/2026 (n) | | | 130,000 | | | | 139,425 | |
| iHeartCommunications, Inc., 5.25%, 8/15/2027 (z) | | | 190,000 | | | | 196,023 | |
| Liberty Media Corp. - Liberty Formula One, 8.5%, 7/15/2029 | | | 605,000 | | | | 624,663 | |
| Match Group, Inc., 6.375%, 6/01/2024 | | | 1,060,000 | | | | 1,113,000 | |
| Match Group, Inc., 5%, 12/15/2027 (n) | | | 655,000 | | | | 683,656 | |
| MMS USA Financing, Inc., 1.75%, 6/13/2031 | | EUR | 1,200,000 | | | | 1,382,860 | |
| National CineMedia, LLC, 5.875%, 4/15/2028 (z) | | $ | 505,000 | | | | 530,806 | |
| Netflix, Inc., 5.875%, 2/15/2025 | | | 1,410,000 | | | | 1,551,000 | |
| Netflix, Inc., 5.875%, 11/15/2028 | | | 470,000 | | | | 517,588 | |
| Netflix, Inc., 3.875%, 11/15/2029 (n) | | EUR | 700,000 | | | | 798,783 | |
| Nexstar Escrow Corp., 5.625%, 7/15/2027 (n) | | $ | 705,000 | | | | 743,563 | |
| SES S.A., 0.875%, 11/04/2027 | | EUR | 150,000 | | | | 167,594 | |
| SES S.A., 5.625% to 1/29/2024, FLR (EUR Swap Rate - 5yr. + 5.4%) to 1/29/2029, FLR (EUR Swap Rate - 5yr. + 5.65%) to 1/29/2044, FLR (EUR Swap Rate - 5yr. + 6.4%) to 12/29/2049 | | | 550,000 | | | | 696,226 | |
| WMG Acquisition Corp., 5%, 8/01/2023 (n) | | $ | 250,000 | | | | 256,250 | |
| WMG Acquisition Corp., 4.875%, 11/01/2024 (n) | | | 1,135,000 | | | | 1,174,725 | |
| WMG Acquisition Corp., 5.5%, 4/15/2026 (n) | | | 195,000 | | | | 204,750 | |
| WPP Finance, 3.75%, 9/19/2024 | | | 352,000 | | | | 369,827 | |
| WPP Finance 2016 Co., 1.375%, 3/20/2025 | | EUR | 350,000 | | | | 407,460 | |
| | | | | | | | |
| | | | | | | $ | 12,898,650 | |
13
Portfolio of Investments – continued
| | | | | | | | |
| | |
| Issuer | | Shares/Par | | | Value ($) | |
| Bonds - continued | | | | | | | | |
| Brokerage & Asset Managers - 0.4% | | | | | | | | |
| E*TRADE Financial Corp., 2.95%, 8/24/2022 | | $ | 245,000 | | | $ | 249,594 | |
| Euroclear Investments S.A., 2.625%, 4/11/2048 | | EUR | 300,000 | | | | 366,878 | |
| Intercontinental Exchange, Inc., 3.75%, 12/01/2025 | | $ | 450,000 | | | | 488,974 | |
| Low Income Investment Fund, 3.386%, 7/01/2026 | | | 185,000 | | | | 190,383 | |
| Low Income Investment Fund, 3.711%, 7/01/2029 | | | 490,000 | | | | 509,880 | |
| | | | | | | | |
| | | | | | | $ | 1,805,709 | |
| Building - 3.5% | | | | | | | | |
| ABC Supply Co., Inc., 5.875%, 5/15/2026 (n) | | $ | 1,000,000 | | | $ | 1,050,300 | |
| ABC Supply Co., Inc., 4%, 1/15/2028 (z) | | | 1,140,000 | | | | 1,137,150 | |
| Beacon Escrow Corp., 4.875%, 11/01/2025 (n) | | | 791,000 | | | | 777,197 | |
| Beacon Roofing Supply, Inc., 4.5%, 11/15/2026 (n) | | | 345,000 | | | | 351,900 | |
Core & Main LP, 8.625%, (8.625% cash or
9.375% PIK) 9/15/2024 (p)(z) | | | 120,000 | | | | 119,400 | |
| Core & Main LP, 6.125%, 8/15/2025 (n) | | | 645,000 | | | | 655,481 | |
| CRH America Finance, Inc., 4.5%, 4/04/2048 (n) | | | 451,000 | | | | 490,998 | |
| HD Supply, Inc., 5.375%, 10/15/2026 (n) | | | 1,160,000 | | | | 1,226,700 | |
| Imerys S.A., 1.5%, 1/15/2027 | | EUR | 400,000 | | | | 461,404 | |
| James Hardie International Finance Ltd., 4.75%, 1/15/2025 (n) | | $ | 560,000 | | | | 580,911 | |
| James Hardie International Finance Ltd., 5%, 1/15/2028 (n) | | | 600,000 | | | | 628,500 | |
| Martin Marietta Materials, Inc., 3.45%, 6/01/2027 | | | 225,000 | | | | 232,944 | |
| Masco Corp., 4.45%, 4/01/2025 | | | 170,000 | | | | 184,988 | |
| Masco Corp., 4.375%, 4/01/2026 | | | 791,000 | | | | 858,488 | |
| NCI Building Systems, Inc., 8%, 4/15/2026 (n) | | | 455,000 | | | | 447,438 | |
| New Enterprise Stone & Lime Co., Inc., 10.125%, 4/01/2022 (n) | | | 490,000 | | | | 507,150 | |
| New Enterprise Stone & Lime Co., Inc., 6.25%, 3/15/2026 (n) | | | 861,000 | | | | 895,440 | |
| Patrick Industries, Inc., 7.5%, 10/15/2027 (z) | | | 380,000 | | | | 394,250 | |
| PriSo Acquisition Corp., 9%, 5/15/2023 (n) | | | 734,000 | | | | 673,445 | |
| Standard Industries, Inc., 5.375%, 11/15/2024 (n) | | | 985,000 | | | | 1,013,368 | |
| Standard Industries, Inc., 6%, 10/15/2025 (n) | | | 655,000 | | | | 687,750 | |
| Summit Materials LLC/Summit Materials Finance Co., 6.125%, 7/15/2023 | | | 995,000 | | | | 1,014,029 | |
| | | | | | | | |
| | | | | | | $ | 14,389,231 | |
| Business Services - 2.4% | | | | | | | | |
| Ascend Learning LLC, 6.875%, 8/01/2025 (n) | | $ | 695,000 | | | $ | 725,406 | |
| CDK Global, Inc., 4.875%, 6/01/2027 | | | 1,000,000 | | | | 1,053,750 | |
| Equinix, Inc., 5.75%, 1/01/2025 | | | 490,000 | | | | 506,552 | |
| Equinix, Inc., 5.875%, 1/15/2026 | | | 325,000 | | | | 345,215 | |
| Equinix, Inc., 2.875%, 2/01/2026 | | EUR | 450,000 | | | | 521,408 | |
| Euronet Worldwide, Inc., 1.375%, 5/22/2026 | | | 1,100,000 | | | | 1,223,233 | |
| Fidelity National Information Services, Inc., 3.875%, 6/05/2024 | | $ | 180,000 | | | | 192,470 | |
| Fidelity National Information Services, Inc., 2.602%, 5/21/2025 | | GBP | 100,000 | | | | 136,012 | |
| Fidelity National Information Services, Inc., 5%, 10/15/2025 | | $ | 58,000 | | | | 66,282 | |
| Fidelity National Information Services, Inc., 3%, 8/15/2026 | | | 1,004,000 | | | | 1,037,825 | |
14
Portfolio of Investments – continued
| | | | | | | | |
| | |
| Issuer | | Shares/Par | | | Value ($) | |
| Bonds - continued | | | | | | | | |
| Business Services - continued | | | | | | | | |
| Fidelity National Information Services, Inc., 3.36%, 5/21/2031 | | GBP | 150,000 | | | $ | 214,985 | |
| Financial & Risk U.S. Holdings, Inc., 8.25%, 11/15/2026 (n) | | $ | 325,000 | | | | 364,813 | |
| Fiserv, Inc., 4.4%, 7/01/2049 | | | 196,000 | | | | 219,508 | |
| Iron Mountain, Inc., REIT, 4.875%, 9/15/2027 | | | 205,000 | | | | 211,919 | |
| MSCI, Inc., 5.75%, 8/15/2025 (n) | | | 530,000 | | | | 555,837 | |
| MSCI, Inc., 4.75%, 8/01/2026 (n) | | | 1,725,000 | | | | 1,806,851 | |
| Verscend Escrow Corp., 9.75%, 8/15/2026 (n) | | | 640,000 | | | | 680,800 | |
| | | | | | | | |
| | | | | | | $ | 9,862,866 | |
| Cable TV - 5.9% | | | | | | | | |
| Altice Financing S.A., 7.5%, 5/15/2026 (n) | | $ | 280,000 | | | $ | 297,500 | |
| CCO Holdings LLC/CCO Holdings Capital Corp., 5.75%, 1/15/2024 | | | 232,000 | | | | 237,730 | |
| CCO Holdings LLC/CCO Holdings Capital Corp., 5.375%, 5/01/2025 (n) | | | 1,025,000 | | | | 1,063,437 | |
| CCO Holdings LLC/CCO Holdings Capital Corp., 5.75%, 2/15/2026 (n) | | | 2,025,000 | | | | 2,138,400 | |
| CCO Holdings LLC/CCO Holdings Capital Corp., 5.875%, 5/01/2027 (n) | | | 1,200,000 | | | | 1,272,000 | |
| CCO Holdings LLC/CCO Holdings Capital Corp., 4.75%, 3/01/2030 (z) | | | 490,000 | | | | 499,653 | |
| Charter Communications Operating LLC/Charter Communications Operating Capital Corp., 6.384%, 10/23/2035 | | | 347,000 | | | | 426,630 | |
| CSC Holdings LLC, 5.5%, 5/15/2026 (n) | | | 665,000 | | | | 700,744 | |
| CSC Holdings LLC, 5.5%, 4/15/2027 (n) | | | 2,775,000 | | | | 2,941,528 | |
| CSC Holdings LLC, 7.5%, 4/01/2028 (n) | | | 450,000 | | | | 507,375 | |
| DISH DBS Corp., 5.875%, 11/15/2024 | | | 755,000 | | | | 756,887 | |
| Eutelsat S.A., 2.25%, 7/13/2027 | | EUR | 800,000 | | | | 939,727 | |
| Intelsat Connect Finance, 9.5%, 2/15/2023 (n) | | $ | 440,000 | | | | 408,144 | |
| Intelsat Jackson Holdings S.A., 5.5%, 8/01/2023 | | | 1,190,000 | | | | 1,112,650 | |
| LCPR Senior Secured Financing D.A.C., 6.75%, 10/15/2027 (z) | | | 305,000 | | | | 313,006 | |
| Sirius XM Holdings, Inc., 4.625%, 7/15/2024 (n) | | | 1,205,000 | | | | 1,259,225 | |
| Sirius XM Holdings, Inc., 5.5%, 7/01/2029 (n) | | | 375,000 | | | | 405,356 | |
| Sirius XM Radio, Inc., 4.625%, 5/15/2023 (n) | | | 540,000 | | | | 549,720 | |
| Sirius XM Radio, Inc., 5.375%, 4/15/2025 (n) | | | 650,000 | | | | 676,000 | |
| Sirius XM Radio, Inc., 5.375%, 7/15/2026 (n) | | | 388,000 | | | | 409,340 | |
| Telenet Finance Luxembourg S.A., 5.5%, 3/01/2028 (n) | | | 1,200,000 | | | | 1,276,200 | |
| Telesat Holdings, Inc., 6.5%, 10/15/2027 (z) | | | 465,000 | | | | 485,483 | |
| Time Warner Cable, Inc., 4.5%, 9/15/2042 | | | 210,000 | | | | 210,175 | |
| Videotron Ltd., 5.375%, 6/15/2024 (n) | | | 215,000 | | | | 233,544 | |
| Videotron Ltd., 5.125%, 4/15/2027 (n) | | | 1,950,000 | | | | 2,071,875 | |
| Virgin Media Finance PLC, 5.75%, 1/15/2025 (n) | | | 400,000 | | | | 412,000 | |
| Virgin Media Secured Finance PLC, 5.5%, 5/15/2029 (z) | | | 465,000 | | | | 494,063 | |
| VTR Finance B.V., 6.875%, 1/15/2024 (n) | | | 770,000 | | | | 789,250 | |
15
Portfolio of Investments – continued
| | | | | | | | |
| | |
| Issuer | | Shares/Par | | | Value ($) | |
| Bonds - continued | | | | | | | | |
| Cable TV - continued | | | | | | | | |
| Ziggo Bond Finance B.V., 5.875%, 1/15/2025 (n) | | $ | 1,305,000 | | | $ | 1,344,150 | |
| | | | | | | | |
| | | | | | | $ | 24,231,792 | |
| Chemicals - 1.7% | | | | | | | | |
| Axalta Coating Systems Co., 4.875%, 8/15/2024 (n) | | $ | 1,620,000 | | | $ | 1,672,650 | |
| Consolidated Energy Finance S.A., 6.875%, 6/15/2025 (n) | | | 1,505,000 | | | | 1,459,850 | |
| Element Solutions, Inc., 5.875%, 12/01/2025 (z) | | | 280,000 | | | | 292,294 | |
| Sherwin-Williams Co., 3.8%, 8/15/2049 | | | 341,000 | | | | 346,607 | |
| Sociedad Quimica y Minera de Chile S.A., 4.25%, 5/07/2029 (n) | | | 1,194,000 | | | | 1,261,461 | |
| SPCM S.A., 4.875%, 9/15/2025 (n) | | | 1,005,000 | | | | 1,040,175 | |
| Starfruit Finance Co./Starfruit U.S. Holding Co. LLC, 8%, 10/01/2026 (z) | | | 550,000 | | | | 547,250 | |
| Symrise AG, 1.25%, 11/29/2025 | | EUR | 385,000 | | | | 446,184 | |
| | | | | | | | |
| | | | | | | $ | 7,066,471 | |
| Computer Software - 1.6% | | | | | | | | |
| Dassault Systemes S.A., 0.125%, 9/16/2026 | | EUR | 300,000 | | | $ | 334,091 | |
| Dassault Systemes S.A., 0.375%, 9/16/2029 | | | 300,000 | | | | 333,661 | |
| Dell International LLC/EMC Corp., 4.9%, 10/01/2026 (n) | | $ | 863,000 | | | | 936,347 | |
| Diamond 1 Finance Corp./Diamond 2 Finance Corp., 5.875%, 6/15/2021 (n) | | | 556,000 | | | | 564,551 | |
| Diamond 1 Finance Corp./Diamond 2 Finance Corp., 6.02%, 6/15/2026 (n) | | | 600,000 | | | | 684,827 | |
| Microsoft Corp., 4.1%, 2/06/2037 | | | 1,422,000 | | | | 1,683,740 | |
| Microsoft Corp., 3.95%, 8/08/2056 | | | 244,000 | | | | 288,823 | |
| VeriSign, Inc., 5.25%, 4/01/2025 | | | 870,000 | | | | 952,650 | |
| VeriSign, Inc., 4.75%, 7/15/2027 | | | 770,000 | | | | 813,312 | |
| | | | | | | | |
| | | | | | | $ | 6,592,002 | |
| Computer Software - Systems - 1.7% | | | | | | | | |
| Apple, Inc., 4.5%, 2/23/2036 | | $ | 1,100,000 | | | $ | 1,337,879 | |
| Apple, Inc., 4.25%, 2/09/2047 | | | 135,000 | | | | 161,737 | |
| CDW LLC/CDW Finance Corp., 4.25%, 4/01/2028 | | | 810,000 | | | | 838,431 | |
| Fair Isaac Corp., 5.25%, 5/15/2026 (n) | | | 1,200,000 | | | | 1,302,000 | |
| JDA Software Group, Inc., 7.375%, 10/15/2024 (n) | | | 720,000 | | | | 746,863 | |
| Sabre GLBL, Inc., 5.375%, 4/15/2023 (n) | | | 1,555,000 | | | | 1,595,819 | |
| SS&C Technologies Holdings, Inc., 5.5%, 9/30/2027 (n) | | | 1,015,000 | | | | 1,086,050 | |
| | | | | | | | |
| | | | | | | $ | 7,068,779 | |
| Conglomerates - 2.1% | | | | | | | | |
| Alstom S.A., 0.25%, 10/14/2026 | | EUR | 200,000 | | | $ | 221,588 | |
| Amsted Industries Co., 5.625%, 7/01/2027 (n) | | $ | 685,000 | | | | 724,388 | |
| BWX Technologies, Inc., 5.375%, 7/15/2026 (n) | | | 1,080,000 | | | | 1,143,774 | |
| CFX Escrow Corp., 6.375%, 2/15/2026 (n) | | | 210,000 | | | | 227,325 | |
16
Portfolio of Investments – continued
| | | | | | | | |
| | |
| Issuer | | Shares/Par | | | Value ($) | |
| Bonds - continued | | | | | | | | |
| Conglomerates - continued | | | | | | | | |
| EnerSys, 5%, 4/30/2023 (n) | | $ | 870,000 | | | $ | 897,187 | |
| Gates Global LLC, 6%, 7/15/2022 (n) | | | 457,000 | | | | 456,429 | |
| Granite Holdings U.S. Acquisition Co., 11%, 10/01/2027 (z) | | | 245,000 | | | | 227,238 | |
| Illinois Tool Works, Inc., 1%, 6/05/2031 | | EUR | 320,000 | | | | 372,123 | |
| MTS Systems Corp., 5.75%, 8/15/2027 (z) | | $ | 540,000 | | | | 565,650 | |
| Roper Technologies, Inc., 4.2%, 9/15/2028 | | | 343,000 | | | | 379,851 | |
| Roper Technologies, Inc. , 2.95%, 9/15/2029 | | | 270,000 | | | | 273,579 | |
| Stevens Holding Co., Inc., 6.125%, 10/01/2026 (n) | | | 680,000 | | | | 731,000 | |
| TriMas Corp., 4.875%, 10/15/2025 (n) | | | 1,290,000 | | | | 1,312,575 | |
| United Technologies Corp., 3.65%, 8/16/2023 | | | 493,000 | | | | 521,479 | |
| Wabtec Corp., 4.95%, 9/15/2028 | | | 364,000 | | | | 401,750 | |
| | | | | | | | |
| | | | | | | $ | 8,455,936 | |
| Construction - 0.7% | | | | | | | | |
| Mattamy Group Corp., 6.5%, 10/01/2025 (n) | | $ | 825,000 | | | $ | 872,437 | |
| Toll Brothers Finance Corp., 4.875%, 11/15/2025 | | | 570,000 | | | | 615,600 | |
| Toll Brothers Finance Corp., 4.35%, 2/15/2028 | | | 1,150,000 | | | | 1,195,641 | |
| | | | | | | | |
| | | | | | | $ | 2,683,678 | |
| Consumer Products - 0.7% | | | | | | | | |
| Coty, Inc., 6.5%, 4/15/2026 (n) | | $ | 570,000 | | | $ | 584,011 | |
| Energizer Holdings, Inc., 6.375%, 7/15/2026 (n) | | | 1,010,000 | | | | 1,076,963 | |
| Mattel, Inc., 6.75%, 12/31/2025 (n) | | | 130,000 | | | | 135,687 | |
| Reckitt Benckiser Treasury Services PLC, 3.625%, 9/21/2023 (n) | | | 500,000 | | | | 523,340 | |
| Reckitt Benckiser Treasury Services PLC, 3%, 6/26/2027 (n) | | | 396,000 | | | | 409,264 | |
| | | | | | | | |
| | | | | | | $ | 2,729,265 | |
| Consumer Services - 2.4% | | | | | | | | |
| Allied Universal Holdco LLC, 9.75%, 7/15/2027 (n) | | $ | 580,000 | | | $ | 606,100 | |
| Booking Holdings, Inc., 3.55%, 3/15/2028 | | | 238,000 | | | | 256,385 | |
| Cimpress N.V., 7%, 6/15/2026 (n) | | | 815,000 | | | | 859,825 | |
| Experian Finance PLC, 4.25%, 2/01/2029 (n) | | | 778,000 | | | | 875,273 | |
| Frontdoor, Inc., 6.75%, 8/15/2026 (n) | | | 675,000 | | | | 734,906 | |
| G4S International Finance PLC, 1.5%, 1/09/2023 | | EUR | 550,000 | | | | 627,466 | |
| GWB-CR Security Corp., 9.5%, 11/01/2027 | | $ | 104,000 | | | | 106,860 | |
| IHS Markit Ltd., 3.625%, 5/01/2024 | | | 180,000 | | | | 188,188 | |
| IHS Markit Ltd., 4%, 3/01/2026 (n) | | | 165,000 | | | | 173,946 | |
| IHS Markit Ltd., 4.25%, 5/01/2029 | | | 270,000 | | | | 290,847 | |
| ManpowerGroup, Inc., 1.75%, 6/22/2026 | | EUR | 450,000 | | | | 538,260 | |
| NVA Holdings, Inc., 6.875%, 4/01/2026 (n) | | $ | 400,000 | | | | 429,000 | |
| Realogy Group LLC, 9.375%, 4/01/2027 (n) | | | 705,000 | | | | 692,663 | |
| Service Corp. International, 5.125%, 6/01/2029 | | | 570,000 | | | | 607,050 | |
| ServiceMaster Co. LLC, 5.125%, 11/15/2024 (n) | | | 1,015,000 | | | | 1,050,525 | |
17
Portfolio of Investments – continued
| | | | | | | | |
| | |
| Issuer | | Shares/Par | | | Value ($) | |
| Bonds - continued | | | | | | | | |
| Consumer Services - continued | | | | | | | | |
| Toll Road Investors Partnership II LP, Capital Appreciation, 0%, 2/15/2027 (n) | | $ | 1,052,000 | | | $ | 757,393 | |
| Visa, Inc., 4.15%, 12/14/2035 | | | 465,000 | | | | 559,574 | |
| Visa, Inc., 3.65%, 9/15/2047 | | | 273,000 | | | | 307,545 | |
| | | | | | | | |
| | | | | | | $ | 9,661,806 | |
| Containers - 2.7% | | | | | | | | |
| ARD Finance S.A., 7.125%, 9/15/2023 | | $ | 970,000 | | | $ | 1,007,587 | |
ARD Securities Finance, 8.75%, (8.75% cash or
8.75% PIK) 1/31/2023 (n)(p) | | | 580,030 | | | | 589,979 | |
| Ball Corp., 5.25%, 7/01/2025 | | | 330,000 | | | | 367,125 | |
| BWAY Holding Co., Inc., 7.25%, 4/15/2025 (n) | | | 455,000 | | | | 435,094 | |
| Crown American LLC, 4.5%, 1/15/2023 | | | 1,147,000 | | | | 1,198,615 | |
| Crown Americas LLC/Crown Americas Capital Corp. V, 4.25%, 9/30/2026 | | | 945,000 | | | | 986,344 | |
| Crown Americas LLC/Crown Americas Capital Corp. VI, 4.75%, 2/01/2026 | | | 420,000 | | | | 440,706 | |
| DS Smith PLC, 0.875%, 9/12/2026 | | EUR | 350,000 | | | | 384,656 | |
| Flex Acquisition Co., Inc., 6.875%, 1/15/2025 (n) | | $ | 665,000 | | | | 623,438 | |
| Reynolds Group, 5.75%, 10/15/2020 | | | 581,465 | | | | 583,471 | |
| Reynolds Group, 5.125%, 7/15/2023 (n) | | | 725,000 | | | | 743,814 | |
| Reynolds Group, 7%, 7/15/2024 (n) | | | 195,000 | | | | 201,825 | |
| San Miguel Industrias PET S.A., 4.5%, 9/18/2022 | | | 839,000 | | | | 856,913 | |
| Sealed Air Corp., 4.875%, 12/01/2022 (n) | | | 1,110,000 | | | | 1,175,212 | |
| Silgan Holdings, Inc., 4.75%, 3/15/2025 | | | 890,000 | | | | 910,025 | |
| Trivium Packaging Finance B.V., 8.5%, 8/15/2027 (z) | | | 400,000 | | | | 426,500 | |
| | | | | | | | |
| | | | | | | $ | 10,931,304 | |
| Electrical Equipment - 0.3% | | | | | | | | |
| CommScope Technologies LLC, 6%, 6/15/2025 (n) | | $ | 545,000 | | | $ | 484,887 | |
| CommScope Technologies LLC, 5%, 3/15/2027 (n) | | | 850,000 | | | | 694,875 | |
| | | | | | | | |
| | | | | | | $ | 1,179,762 | |
| Electronics - 1.8% | | | | | | | | |
| Broadcom Corp./Broadcom Cayman Finance Ltd., 3.875%, 1/15/2027 | | $ | 767,000 | | | $ | 774,514 | |
| Broadcom, Inc., 4.25%, 4/15/2026 (n) | | | 734,000 | | | | 766,258 | |
| Entegris, Inc., 4.625%, 2/10/2026 (n) | | | 890,000 | | | | 916,280 | |
| Qorvo, Inc., 5.5%, 7/15/2026 | | | 1,230,000 | | | | 1,313,000 | |
| Sensata Technologies B.V., 5.625%, 11/01/2024 (n) | | | 1,535,000 | | | | 1,684,663 | |
| Sensata Technologies B.V., 5%, 10/01/2025 (n) | | | 890,000 | | | | 959,153 | |
| Sensata Technologies, Inc., 4.375%, 2/15/2030 (n) | | | 780,000 | | | | 785,363 | |
| Texas Instruments, Inc., 2.25%, 9/04/2029 | | | 312,000 | | | | 307,903 | |
| | | | | | | | |
| | | | | | | $ | 7,507,134 | |
18
Portfolio of Investments – continued
| | | | | | | | |
| | |
| Issuer | | Shares/Par | | | Value ($) | |
| Bonds - continued | | | | | | | | |
| Emerging Market Quasi-Sovereign - 8.5% | | | | | | | | |
| Abu Dhabi Crude Oil Pipeline, 3.65%, 11/02/2029 | | $ | 1,100,000 | | | $ | 1,181,246 | |
| Aeropuerto Internacional de Tocumen S.A. (Republic of Panama), 6%, 11/18/2048 (n) | | | 1,020,000 | | | | 1,269,900 | |
| Banco de Reservas de la Republica Dominicana, 7%, 2/01/2023 (n) | | | 946,000 | | | | 992,127 | |
| China Construction Bank, 4.25% to 2/27/2024, FLR (CMT - 5yr. + 1.88%) to 2/27/2029 | | | 964,000 | | | | 1,009,070 | |
| CNPC (HK) Overseas Capital Ltd. (People’s Republic of China), 4.5%, 4/28/2021 (n) | | | 1,242,000 | | | | 1,280,266 | |
| Corporacion Nacional del Cobre de Chile, 4.375%, 2/05/2049 (n) | | | 1,007,000 | | | | 1,115,111 | |
| Empresa Nacional del Petroleo (Republic of Chile), 3.75%, 8/05/2026 | | | 1,306,000 | | | | 1,332,503 | |
| Empresa Nacional del Petroleo (Republic of Chile), 3.75%, 8/05/2026 (n) | | | 423,000 | | | | 431,584 | |
| EQUATE Petrochemical B.V. (State of Kuwait), 4.25%, 11/03/2026 | | | 1,034,000 | | | | 1,100,168 | |
| Eskom Holdings SOC Ltd. (Republic of South Africa), 6.35%, 8/10/2028 (n) | | | 1,052,000 | | | | 1,112,761 | |
| Export-Import Bank of India, 3.375%, 8/05/2026 | | | 1,366,000 | | | | 1,399,787 | |
| Gaz Capital S.A. (Russian Federation), 4.95%, 2/06/2028 (n) | | | 492,000 | | | | 536,099 | |
| Greenko Dutch B.V., 5.25%, 7/24/2024 | | | 902,000 | | | | 908,549 | |
| KazMunayGas National Co., JSC (Republic of Kazakhstan), 5.375%, 4/24/2030 (n) | | | 1,002,000 | | | | 1,152,320 | |
| KazMunayGas National Co., JSC (Republic of Kazakhstan), 6.375%, 10/24/2048 (n) | | | 984,000 | | | | 1,237,675 | |
| MDGH - GMTN B.V. (United Arab Emirates), 2.5%, 11/07/2024 | | | 508,000 | | | | 506,730 | |
| MDGH - GMTN B.V. (United Arab Emirates), 2.875%, 11/07/2029 (z) | | | 1,091,000 | | | | 1,081,181 | |
| NTPC Ltd. (Republic of India), 4.25%, 2/26/2026 | | | 1,313,000 | | | | 1,389,167 | |
| Office Cherifien des Phosphates S.A. (Republic of Madagascar), 6.875%, 4/25/2044 (n) | | | 373,000 | | | | 464,385 | |
| Petrobras Global Finance B.V. (Federative Republic of Brazil), 5.75%, 2/01/2029 | | | 1,322,000 | | | | 1,471,188 | |
| Petrobras Global Finance B.V. (Federative Republic of Brazil), 6.9%, 3/19/2049 | | | 935,000 | | | | 1,086,751 | |
| Petroleos del Peru S.A., 4.75%, 6/19/2032 | | | 1,067,000 | | | | 1,153,107 | |
| Petroleos Mexicanos, 6.49%, 1/23/2027 (n) | | | 904,000 | | | | 965,020 | |
| Petroleos Mexicanos, 5.35%, 2/12/2028 | | | 1,000,000 | | | | 987,500 | |
| Power Finance Corp. Ltd. (Republic of India), 3.75%, 12/06/2027 | | | 550,000 | | | | 550,455 | |
| PT Indonesia Asahan Aluminium (Persero), 6.757%, 11/15/2048 (n) | | | 753,000 | | | | 965,953 | |
| PT Pertamina (Persero) (Republic of Indonesia), 3.65%, 7/30/2029 | | | 650,000 | | | | 667,127 | |
| PT Pertamina (Persero) (Republic of Indonesia), 6.5%, 11/07/2048 (n) | | | 1,200,000 | | | | 1,569,587 | |
| Sinopec Capital (2013) Ltd. (People’s Republic of China), 3.125%, 4/24/2023 (n) | | | 666,000 | | | | 680,424 | |
19
Portfolio of Investments – continued
| | | | | | | | |
| | |
| Issuer | | Shares/Par | | | Value ($) | |
| Bonds - continued | | | | | | | | |
| Emerging Market Quasi-Sovereign - continued | | | | | | | | |
| Southern Gas Corridor CJSC (Republic of Azerbaijan), 6.875%, 3/24/2026 | | $ | 1,367,000 | | | $ | 1,592,555 | |
| State Bank of India (London), 4.375%, 1/24/2024 | | | 500,000 | | | | 527,126 | |
| State Grid Overseas Investment (2014) Ltd. (People’s Republic of China), 4.125%, 5/07/2024 (n) | | | 1,563,000 | | | | 1,682,513 | |
| State Oil Company of the Azerbaijan Republic, 6.95%, 3/18/2030 | | | 1,152,000 | | | | 1,382,400 | |
| | | | | | | | |
| | | | | | | $ | 34,782,335 | |
| Emerging Market Sovereign - 9.4% | | | | | | | | |
| Arab Republic of Egypt, 6.588%, 2/21/2028 | | $ | 1,087,000 | | | $ | 1,106,023 | |
| Arab Republic of Egypt, 6.375%, 4/11/2031 (n) | | EUR | 1,011,000 | | | | 1,171,261 | |
| Arab Republic of Egypt, 7.903%, 2/21/2048 | | $ | 1,120,000 | | | | 1,120,750 | |
| Dominican Republic, 5.95%, 1/25/2027 | | | 997,000 | | | | 1,095,464 | |
| Dominican Republic, 6.85%, 1/27/2045 | | | 1,023,000 | | | | 1,152,164 | |
| Federal Republic of Nigeria, 8.747%, 1/21/2031 (n) | | | 1,415,000 | | | | 1,556,783 | |
| Gabonese Republic, 6.95%, 6/16/2025 | | | 883,000 | | | | 890,726 | |
| Government of Mongolia, 8.75%, 3/09/2024 | | | 941,000 | | | | 1,062,821 | |
| Government of Ukraine, 7.75%, 9/01/2023 | | | 1,061,000 | | | | 1,133,944 | |
| Government of Ukraine, 7.75%, 9/01/2024 | | | 589,000 | | | | 630,966 | |
| Government of Ukraine, 7.75%, 9/01/2025 | | | 900,000 | | | | 965,250 | |
| Government of Ukraine, GDP Linked Bond, 0%, 5/31/2040 | | | 824,000 | | | | 773,538 | |
| Kingdom of Saudi Arabia, 4.375%, 4/16/2029 (n) | | | 942,000 | | | | 1,051,547 | |
| Republic of Angola, 8.25%, 5/09/2028 | | | 491,000 | | | | 512,560 | |
| Republic of Argentina, 7.5%, 4/22/2026 | | | 884,000 | | | | 374,825 | |
| Republic of Argentina, 6.875%, 1/26/2027 | | | 1,469,000 | | | | 576,597 | |
| Republic of Colombia, 4.5%, 3/15/2029 | | | 1,216,000 | | | | 1,356,460 | |
| Republic of Colombia, 5%, 6/15/2045 | | | 1,050,000 | | | | 1,222,200 | |
| Republic of Colombia, 5.2%, 5/15/2049 | | | 1,003,000 | | | | 1,204,102 | |
| Republic of Cote d’Ivoire, 5.25%, 3/22/2030 | | EUR | 750,000 | | | | 827,064 | |
| Republic of El Salvador, 7.65%, 6/15/2035 | | $ | 1,029,000 | | | | 1,117,762 | |
| Republic of Ghana, 8.125%, 3/26/2032 (n) | | | 1,186,000 | | | | 1,198,572 | |
| Republic of Guatemala, 6.125%, 6/01/2050 (n) | | | 792,000 | | | | 929,618 | |
| Republic of Hungary, 7.625%, 3/29/2041 | | | 488,000 | | | | 801,731 | |
| Republic of Indonesia, 4.125%, 1/15/2025 (n) | | | 339,000 | | | | 360,815 | |
| Republic of Kenya, 8%, 5/22/2032 (n) | | | 1,046,000 | | | | 1,114,191 | |
| Republic of Paraguay, 5.6%, 3/13/2048 | | | 1,049,000 | | | | 1,208,983 | |
| Republic of Romania, 2%, 12/08/2026 (n) | | EUR | 1,011,000 | | | | 1,219,183 | |
| Republic of Romania, 2.124%, 7/16/2031 (n) | | | 1,200,000 | | | | 1,385,202 | |
| Republic of South Africa, 4.875%, 4/14/2026 | | $ | 432,000 | | | | 445,339 | |
| Republic of Sri Lanka, 6.125%, 6/03/2025 | | | 668,000 | | | | 658,275 | |
| Republic of Sri Lanka, 7.55%, 3/28/2030 (n) | | | 854,000 | | | | 863,711 | |
| Republic of Turkey, 7.625%, 4/26/2029 | | | 856,000 | | | | 918,060 | |
| Russian Federation, 4.75%, 5/27/2026 | | | 1,000,000 | | | | 1,099,596 | |
20
Portfolio of Investments – continued
| | | | | | | | |
| | |
| Issuer | | Shares/Par | | | Value ($) | |
| Bonds - continued | | | | | | | | |
| Emerging Market Sovereign - continued | | | | | | | | |
| Russian Federation, 4.25%, 6/23/2027 | | $ | 1,000,000 | | | $ | 1,071,512 | |
| Russian Federation, 4.375%, 3/21/2029 | | | 1,000,000 | | | | 1,081,496 | |
| State of Qatar, 4%, 3/14/2029 (n) | | | 533,000 | | | | 590,968 | |
| State of Qatar, 4.817%, 3/14/2049 (n) | | | 1,004,000 | | | | 1,234,739 | |
| United Mexican States, 4.5%, 4/22/2029 | | | 1,300,000 | | | | 1,430,013 | |
| | | | | | | | |
| | | | | | | $ | 38,514,811 | |
| Energy - Independent - 1.4% | | | | | | | | |
| Afren PLC, 11.5%, 2/01/2016 (a)(d)(z) | | $ | 326,905 | | | $ | 268 | |
| Afren PLC, 10.25%, 4/08/2019 (a)(d)(z) | | | 213,708 | | | | 175 | |
| Callon Petroleum Co., 6.375%, 7/01/2026 | | | 535,000 | | | | 498,887 | |
| CrownRock LP/CrownRock Finance, Inc., 5.625%, 10/15/2025 (n) | | | 830,000 | | | | 811,342 | |
| Highpoint Operating Corp., 7%, 10/15/2022 | | | 75,000 | | | | 67,125 | |
| Jagged Peak Energy LLC, 5.875%, 5/01/2026 | | | 415,000 | | | | 419,150 | |
| Laredo Petroleum, Inc., 6.25%, 3/15/2023 | | | 75,000 | | | | 68,438 | |
| Magnolia Oil & Gas Operating LLC/Magnolia Oil & Gas Finance Corp., 6%, 8/01/2026 (n) | | | 580,000 | | | | 580,000 | |
| Montage Resources Corp., 8.875%, 7/15/2023 | | | 75,000 | | | | 57,563 | |
| Parsley Energy LLC/Parsley Finance Corp., 5.625%, 10/15/2027 (n) | | | 630,000 | | | | 650,475 | |
| Range Resources Corp., 4.875%, 5/15/2025 | | | 95,000 | | | | 76,237 | |
| Sanchez Energy Corp., 6.125%, 1/15/2023 (a)(d) | | | 710,000 | | | | 31,950 | |
| SM Energy Co., 6.75%, 9/15/2026 | | | 495,000 | | | | 424,462 | |
| Southwestern Energy Co., 6.2%, 1/23/2025 | | | 95,000 | | | | 83,600 | |
| Tengizchevroil Finance Co. International Ltd., 4%, 8/15/2026 (n) | | | 422,000 | | | | 442,312 | |
| Tengizchevroil Finance Co. International Ltd., 4%, 8/15/2026 | | | 1,025,000 | | | | 1,074,335 | |
| WPX Energy, Inc., 5.75%, 6/01/2026 | | | 500,000 | | | | 502,500 | |
| | | | | | | | |
| | | | | | | $ | 5,788,819 | |
| Energy - Integrated - 0.3% | | | | | | | | |
| Eni S.p.A., 4%, 9/12/2023 (n) | | $ | 329,000 | | | $ | 347,992 | |
| Eni S.p.A., 4.25%, 5/09/2029 (n) | | | 379,000 | | | | 416,376 | |
| OMV AG, 1%, 7/03/2034 | | EUR | 210,000 | | | | 237,465 | |
| | | | | | | | |
| | | | | | | $ | 1,001,833 | |
| Entertainment - 1.1% | | | | | | | | |
| AMC Entertainment Holdings, Inc., 5.75%, 6/15/2025 | | $ | 475,000 | | | $ | 451,298 | |
| Live Nation Entertainment, Inc., 4.875%, 11/01/2024 (n) | | | 300,000 | | | | 310,500 | |
| Live Nation Entertainment, Inc., 5.625%, 3/15/2026 (n) | | | 1,365,000 | | | | 1,453,725 | |
| Live Nation Entertainment, Inc., 4.75%, 10/15/2027 (n) | | | 195,000 | | | | 203,307 | |
| Motion Bondco D.A.C., 6.625%, 11/15/2027 (z) | | | 450,000 | | | | 457,875 | |
| Six Flags Entertainment Corp., 4.875%, 7/31/2024 (n) | | | 1,615,000 | | | | 1,667,487 | |
| | | | | | | | |
| | | | | | | $ | 4,544,192 | |
21
Portfolio of Investments – continued
| | | | | | | | |
| | |
| Issuer | | Shares/Par | | | Value ($) | |
| Bonds - continued | | | | | | | | |
| Financial Institutions - 2.8% | | | | | | | | |
| AerCap Ireland Capital Ltd., 3.65%, 7/21/2027 | | $ | 703,000 | | | $ | 724,424 | |
| AnaCap Financial Europe S.A. SICAV-RAIF, 5%, 8/01/2024 | | EUR | 650,000 | | | | 645,563 | |
| Avation Capital S.A., 6.5%, 5/15/2021 (n) | | $ | 400,000 | | | | 417,000 | |
| Avolon Holdings Funding Ltd., 5.125%, 10/01/2023 | | | 975,000 | | | | 1,052,025 | |
| Avolon Holdings Funding Ltd., 5.25%, 5/15/2024 (n) | | | 640,000 | | | | 697,920 | |
| Avolon Holdings Funding Ltd., 3.95%, 7/01/2024 (n) | | | 454,000 | | | | 471,343 | |
| Avolon Holdings Funding Ltd., 4.375%, 5/01/2026 (n) | | | 363,000 | | | | 384,032 | |
| Garfunkelux Holdco 3 S.A., 7.5%, 8/01/2022 | | EUR | 550,000 | | | | 579,608 | |
| GE Capital International Funding Co., 3.373%, 11/15/2025 | | $ | 1,086,000 | | | | 1,117,433 | |
| Global Aircraft Leasing Co. Ltd., 6.5%, (6.5% cash or 7.25% PIK) 9/15/2024 (n)(p) | | | 1,330,000 | | | | 1,361,189 | |
| OneMain Financial Corp., 6.875%, 3/15/2025 | | | 485,000 | | | | 549,263 | |
| OneMain Financial Corp., 7.125%, 3/15/2026 | | | 315,000 | | | | 359,100 | |
| Park Aerospace Holdings Ltd., 5.5%, 2/15/2024 (n) | | | 1,955,000 | | | | 2,149,327 | |
| Wand Merger Corp., 8.125%, 7/15/2023 (n) | | | 685,000 | | | | 726,100 | |
| | | | | | | | |
| | | | | | | $ | 11,234,327 | |
| Food & Beverages - 3.4% | | | | | | | | |
| Anheuser-Busch InBev N.V., 1.5%, 4/18/2030 | | EUR | 325,000 | | | $ | 395,150 | |
| Anheuser-Busch InBev S.A., 1.65%, 3/28/2031 | | | 330,000 | | | | 405,839 | |
| Anheuser-Busch InBev Worldwide, Inc., 3.3%, 2/01/2023 | | $ | 1,554,000 | | | | 1,616,735 | |
| Anheuser-Busch InBev Worldwide, Inc., 4.375%, 4/15/2038 | | | 209,000 | | | | 233,460 | |
| Anheuser-Busch InBev Worldwide, Inc., 5.55%, 1/23/2049 | | | 331,000 | | | | 437,121 | |
| Constellation Brands, Inc., 4.25%, 5/01/2023 | | | 894,000 | | | | 957,233 | |
| Constellation Brands, Inc., 4.75%, 12/01/2025 | | | 313,000 | | | | 351,525 | |
| Cott Holdings, Inc., 5.5%, 4/01/2025 (n) | | | 1,030,000 | | | | 1,073,775 | |
| JBS USA LLC/JBS USA Finance, Inc., 6.75%, 2/15/2028 (n) | | | 1,030,000 | | | | 1,133,010 | |
| JBS USA Lux S.A./JBS USA Finance, Inc., 5.875%, 7/15/2024 (n) | | | 685,000 | | | | 706,406 | |
| Lamb Weston Holdings, Inc., 4.625%, 11/01/2024 (n) | | | 1,540,000 | | | | 1,618,925 | |
| Lamb Weston Holdings, Inc., 4.875%, 11/01/2026 (n) | | | 445,000 | | | | 467,806 | |
| NBM U.S. Holdings, Inc., 7%, 5/14/2026 (n) | | | 1,446,000 | | | | 1,533,483 | |
| Performance Food Group Co., 5.5%, 10/15/2027 (z) | | | 615,000 | | | | 650,363 | |
| Pilgrim’s Pride Corp., 5.75%, 3/15/2025 (n) | | | 350,000 | | | | 363,125 | |
| Pilgrim’s Pride Corp., 5.875%, 9/30/2027 (n) | | | 685,000 | | | | 733,991 | |
| U.S. Foods Holding Corp., 5.875%, 6/15/2024 (n) | | | 1,260,000 | | | | 1,297,800 | |
| | | | | | | | |
| | | | | | | $ | 13,975,747 | |
| Forest & Paper Products - 0.1% | | | | | | | | |
| Celulosa Arauco y Constitucion, 4.2%, 1/29/2030 (z) | | $ | 400,000 | | | $ | 399,200 | |
| | |
| Gaming & Lodging - 3.0% | | | | | | | | |
| CCM Merger, Inc., 6%, 3/15/2022 (n) | | $ | 760,000 | | | $ | 778,050 | |
| GLP Capital LP/GLP Financing II, Inc., 5.375%, 11/01/2023 | | | 530,000 | | | | 575,686 | |
| GLP Capital LP/GLP Financing II, Inc., 5.25%, 6/01/2025 | | | 760,000 | | | | 833,355 | |
22
Portfolio of Investments – continued
| | | | | | | | |
| | |
| Issuer | | Shares/Par | | | Value ($) | |
| Bonds - continued | | | | | | | | |
| Gaming & Lodging - continued | | | | | | | | |
| GLP Capital LP/GLP Financing II, Inc., 5.375%, 4/15/2026 | | $ | 350,000 | | | $ | 384,878 | |
| GLP Capital LP/GLP Financing II, Inc., 5.75%, 6/01/2028 | | | 640,000 | | | | 724,461 | |
| Hilton Domestic Operating Co., Inc., 5.125%, 5/01/2026 | | | 995,000 | | | | 1,044,750 | |
| Hilton Worldwide Finance LLC, 4.625%, 4/01/2025 | | | 1,355,000 | | | | 1,392,262 | |
| Las Vegas Sands Corp., 3.9%, 8/08/2029 | | | 263,000 | | | | 270,583 | |
| MGM Growth Properties LLC, 4.5%, 9/01/2026 | | | 1,560,000 | | | | 1,657,500 | |
| Sands China Ltd., 5.4%, 8/08/2028 | | | 1,047,000 | | | | 1,184,565 | |
| Scientific Games Corp., 8.25%, 3/15/2026 (n) | | | 435,000 | | | | 460,013 | |
| Wyndham Hotels Group LLC, 5.375%, 4/15/2026 (n) | | | 1,495,000 | | | | 1,577,225 | |
| Wynn Las Vegas LLC/Wynn Las Vegas Capital Corp., 5.5%, 3/01/2025 (n) | | | 915,000 | | | | 972,187 | |
| Wynn Las Vegas LLC/Wynn Las Vegas Capital Corp., 5.25%, 5/15/2027 (z) | | | 150,000 | | | | 156,375 | |
| Wynn Macau Ltd., 5.5%, 10/01/2027 (n) | | | 300,000 | | | | 308,719 | |
| | | | | | | | |
| | | | | | | $ | 12,320,609 | |
| Industrial - 0.5% | | | | | | | | |
| Bilfinger SE, 4.5%, 6/14/2024 | | EUR | 600,000 | | | $ | 716,879 | |
| Investor AB, 1.5%, 6/20/2039 | | | 180,000 | | | | 216,652 | |
| KAR Auction Services, Inc., 5.125%, 6/01/2025 (n) | | $ | 1,170,000 | | | | 1,221,187 | |
| | | | | | | | |
| | | | | | | $ | 2,154,718 | |
| Insurance - 0.3% | | | | | | | | |
| American International Group, Inc., 1.875%, 6/21/2027 | | EUR | 400,000 | | | $ | 482,202 | |
| Argentum Zurich Insurance, 3.5%, 10/01/2046 | | | 500,000 | | | | 642,301 | |
| Assicurazioni Generali S.p.A., 2.124%, 10/01/2030 | | | 150,000 | | | | 169,688 | |
| La Mondiale, 4.375% to 10/24/2029, FLR (EUR Swap Rate - 5yr. + 4.411%) to 10/24/2060 | | | 100,000 | | | | 114,949 | |
| | | | | | | | |
| | | | | | | $ | 1,409,140 | |
| Insurance - Health - 0.6% | | | | | | | | |
| Centene Corp., 6.125%, 2/15/2024 | | $ | 540,000 | | | $ | 561,433 | |
| Centene Corp., 5.375%, 6/01/2026 (n) | | | 700,000 | | | | 740,950 | |
| UnitedHealth Group, Inc., 4.625%, 7/15/2035 | | | 1,009,000 | | | | 1,222,206 | |
| | | | | | | | |
| | | | | | | $ | 2,524,589 | |
| Insurance - Property & Casualty - 1.5% | | | | | | | | |
| Alliant Holdings Intermediate LLC, 6.75%, 10/15/2027 (z) | | $ | 625,000 | | | $ | 650,069 | |
| AssuredPartners, Inc., 7%, 8/15/2025 (n) | | | 620,000 | | | | 617,675 | |
| Berkshire Hathaway, Inc., 2.75%, 3/15/2023 | | | 359,000 | | | | 369,786 | |
| Chubb INA Holdings, Inc., 2.3%, 11/03/2020 | | | 144,000 | | | | 144,446 | |
| Chubb INA Holdings, Inc., 2.875%, 11/03/2022 | | | 336,000 | | | | 345,601 | |
| Chubb INA Holdings, Inc., 0.875%, 6/15/2027 | | EUR | 100,000 | | | | 114,958 | |
| Chubb INA Holdings, Inc., 1.55%, 3/15/2028 | | | 100,000 | | | | 120,470 | |
| Chubb INA Holdings, Inc., 2.5%, 3/15/2038 | | | 227,000 | | | | 305,975 | |
23
Portfolio of Investments – continued
| | | | | | | | |
| | |
| Issuer | | Shares/Par | | | Value ($) | |
| Bonds - continued | | | | | | | | |
| Insurance - Property & Casualty - continued | | | | | | | | |
| Hartford Financial Services Group, Inc., 3.6%, 8/19/2049 | | $ | 526,000 | | | $ | 537,166 | |
| Hub International Ltd., 7%, 5/01/2026 (n) | | | 1,080,000 | | | | 1,111,050 | |
| Marsh & McLennan Cos., Inc., 3.5%, 6/03/2024 | | | 315,000 | | | | 331,476 | |
| Marsh & McLennan Cos., Inc., 4.35%, 1/30/2047 | | | 197,000 | | | | 228,110 | |
| Progressive Corp., 4.125%, 4/15/2047 | | | 602,000 | | | | 704,809 | |
| QBE Capital Funding III Ltd., 7.5% to 5/24/2021, FLR (GBP Swap Rate - 10yr. + 4.003%) to 5/24/2041 | | GBP | 300,000 | | | | 408,520 | |
| | | | | | | | |
| | | | | | | $ | 5,990,111 | |
| International Market Quasi-Sovereign - 0.6% | | | | | | | | |
| Electricite de France, 5.875% to 1/22/2029, FLR (GBP Swap Rate - 15yr. + 3.046%) to 1/22/2049, FLR (GBP Swap Rate - 15yr. + 3.796%) to 12/31/2165 | | GBP | 900,000 | | | $ | 1,259,081 | |
| Islandsbanki (Republic of Iceland), 1.125%, 1/19/2024 | | EUR | 820,000 | | | | 917,057 | |
| Vattenfall AB (Kingdom of Sweden), 0.5%, 6/24/2026 | | | 110,000 | | | | 124,541 | |
| | | | | | | | |
| | | | | | | $ | 2,300,679 | |
| International Market Sovereign - 0.1% | | | | | | | | |
| Government of Japan, 2.4%, 3/20/2037 | | JPY | 24,900,000 | | | $ | 319,010 | |
| | |
| Local Authorities - 0.2% | | | | | | | | |
| Province of Alberta, 4.5%, 12/01/2040 | | CAD | 410,000 | | | $ | 408,973 | |
| Province of British Columbia, 2.3%, 6/18/2026 | | | 595,000 | | | | 462,212 | |
| | | | | | | | |
| | | | | | | $ | 871,185 | |
| Machinery & Tools - 0.4% | | | | | | | | |
| Ashtead Capital, Inc., 5.625%, 10/01/2024 (n) | | $ | 865,000 | | | $ | 890,950 | |
| Atlas Copco Finance DAC, 0.125%, 9/03/2029 | | EUR | 100,000 | | | | 108,229 | |
| John Deere Cash Management S.A., 1.65%, 6/13/2039 | | | 350,000 | | | | 426,232 | |
| | | | | | | | |
| | | | | | | $ | 1,425,411 | |
| Major Banks - 5.0% | | | | | | | | |
| Bank of America Corp., 3.5%, 4/19/2026 | | $ | 1,437,000 | | | $ | 1,527,987 | |
| Bank of Ireland Group PLC, 0.75%, 7/08/2024 | | EUR | 200,000 | | | | 224,116 | |
| Bankinter S.A., 0.875%, 7/08/2026 | | | 400,000 | | | | 451,067 | |
| Barclays Bank PLC, 6%, 1/14/2021 | | | 500,000 | | | | 595,259 | |
| Barclays PLC, 2% to 1/24/2025, FLR (EUR Swap Rate - 1yr. + 0.78%) to 2/07/2028 | | | 950,000 | | | | 1,067,498 | |
| Barclays PLC, 7.875%, 12/29/2049 | | $ | 500,000 | | | | 533,164 | |
| Credit Agricole S.A., 1.25%, 10/02/2024 | | GBP | 400,000 | | | | 515,327 | |
| Credit Suisse Group AG, 1.25%, 7/17/2025 | | EUR | 500,000 | | | | 580,062 | |
| Credit Suisse Group AG, 1%, 6/24/2027 | | | 900,000 | | | | 1,030,892 | |
| Credit Suisse Group AG, 7.25%, 12/29/2049 (n) | | $ | 500,000 | | | | 543,750 | |
| Erste Group Bank AG, 0.875%, 5/22/2026 | | EUR | 300,000 | | | | 343,946 | |
24
Portfolio of Investments – continued
| | | | | | | | |
| | |
| Issuer | | Shares/Par | | | Value ($) | |
| Bonds - continued | | | | | | | | |
| Major Banks - continued | | | | | | | | |
| Erste Group Bank AG, 5.125% to 10/15/2025, FLR (EUR Swap Rate - 5yr. + 4.851%) to 10/15/2067 | | EUR | 800,000 | | | $ | 963,544 | |
| Goldman Sachs Group, Inc., 3%, 4/26/2022 | | $ | 1,250,000 | | | | 1,266,576 | |
| HSBC Holdings PLC, 4.375%, 11/23/2026 | | | 399,000 | | | | 431,145 | �� |
| JPMorgan Chase & Co., 2.95%, 10/01/2026 | | | 1,137,000 | | | | 1,173,540 | |
| JPMorgan Chase & Co., 4.26%, 2/22/2048 | | | 600,000 | | | | 700,225 | |
| Morgan Stanley, 3.125%, 7/27/2026 | | | 572,000 | | | | 594,015 | |
| Morgan Stanley, 3.95%, 4/23/2027 | | | 988,000 | | | | 1,052,498 | |
| Nationwide Building Society, 1.5%, 3/08/2026 | | EUR | 200,000 | | | | 233,713 | |
| Raiffeisen Bank International AG, 1.5% to 3/12/2025, FLR (EUR Swap Rate - 5yr. + 2.1%) to 3/12/2030 | | | 200,000 | | | | 222,208 | |
| Royal Bank of Canada, 2.55%, 7/16/2024 | | $ | 1,761,000 | | | | 1,788,123 | |
| Sumitomo Mitsui Financial Group, Inc., 0.465%, 5/30/2024 | | EUR | 250,000 | | | | 281,256 | |
| Sumitomo Mitsui Financial Group, Inc., 3.544%, 1/17/2028 | | $ | 1,027,000 | | | | 1,097,173 | |
| UBS Group AG, 6.875% to 8/07/2025, FLR (Swap Rate - 5yr. + 4.59%) to 12/29/2049 | | | 990,000 | | | | 1,072,665 | |
| UBS Group Funding (Jersey) Ltd., 7%, 7/28/2060 (n) | | | 1,043,000 | | | | 1,118,618 | |
| UniCredit S.p.A., 1.625% to 7/03/2024, FLR (EURIBOR - 3mo. + 1.9%) to 7/03/2025 | | EUR | 600,000 | | | | 688,423 | |
| UniCredito Italiano S.p.A., 6.572%, 1/14/2022 (n) | | $ | 412,000 | | | | 443,557 | |
| | | | | | | | |
| | | | | | | $ | 20,540,347 | |
| Medical & Health Technology & Services - 5.4% | | | | | | | | |
| Alcon, Inc., 3.8%, 9/23/2049 (n) | | $ | 200,000 | | | $ | 208,060 | |
| Avantor, Inc., 9%, 10/01/2025 (n) | | | 1,240,000 | | | | 1,385,328 | |
| BCPE Cycle Merger Sub II, Inc., 10.625%, 7/15/2027 (n) | | | 255,000 | | | | 238,425 | |
| Becton, Dickinson and Co., 1.401%, 5/24/2023 | | EUR | 700,000 | | | | 808,823 | |
| Becton, Dickinson and Co., 3.734%, 12/15/2024 | | $ | 66,000 | | | | 70,521 | |
| Becton, Dickinson and Co., 4.685%, 12/15/2044 | | | 212,000 | | | | 249,579 | |
| Cigna Corp., 4.125%, 11/15/2025 | | | 522,000 | | | | 565,362 | |
| DaVita, Inc., 5%, 5/01/2025 | | | 700,000 | | | | 707,140 | |
| Encompass Health Corp., 5.75%, 9/15/2025 | | | 370,000 | | | | 386,188 | |
| Encompass Health Corp., 4.5%, 2/01/2028 | | | 195,000 | | | | 199,388 | |
| HCA, Inc., 7.5%, 2/15/2022 | | | 835,000 | | | | 926,432 | |
| HCA, Inc., 5.375%, 2/01/2025 | | | 2,490,000 | | | | 2,735,887 | |
| HCA, Inc., 5.875%, 2/15/2026 | | | 1,210,000 | | | | 1,361,250 | |
| HCA, Inc., 5.25%, 6/15/2026 | | | 471,000 | | | | 527,062 | |
| HCA, Inc., 5.625%, 9/01/2028 | | | 160,000 | | | | 179,800 | |
| HCA, Inc., 5.125%, 6/15/2039 | | | 287,000 | | | | 315,206 | |
| HealthSouth Corp., 5.125%, 3/15/2023 | | | 1,120,000 | | | | 1,142,400 | |
| HealthSouth Corp., 5.75%, 11/01/2024 | | | 143,000 | | | | 144,609 | |
| Heartland Dental LLC, 8.5%, 5/01/2026 (n) | | | 605,000 | | | | 595,169 | |
| IQVIA Holdings, Inc., 5%, 5/15/2027 (n) | | | 1,365,000 | | | | 1,446,900 | |
| Laboratory Corp. of America Holdings, 4.7%, 2/01/2045 | | | 614,000 | | | | 685,159 | |
25
Portfolio of Investments – continued
| | | | | | | | |
| | |
| Issuer | | Shares/Par | | | Value ($) | |
| Bonds - continued | | | | | | | | |
| Medical & Health Technology & Services - continued | | | | | |
| Medtronic Global Holdings S.C.A., 1.75%, 7/02/2049 | | EUR | 1,000,000 | | | $ | 1,123,363 | |
| MPH Acquisition Holdings LLC, 7.125%, 6/01/2024 (n) | | $ | 575,000 | | | | 531,904 | |
| Northwell Healthcare, Inc., 4.26%, 11/01/2047 | | | 532,000 | | | | 588,691 | |
| Polaris, 8.5%, (8.5% cash or 8.5% PIK) 12/01/2022 (n)(p) | | | 325,000 | | | | 272,188 | |
| Quintiles IMS Holdings, Inc., 5%, 10/15/2026 (n) | | | 835,000 | | | | 880,925 | |
| Regional Care/LifePoint Health, Inc., 9.75%, 12/01/2026 (n) | | | 920,000 | | | | 1,009,700 | |
| Team Health Holdings, Inc., 6.375%, 2/01/2025 (n) | | | 200,000 | | | | 129,000 | |
| Tenet Healthcare Corp., 6.75%, 6/15/2023 | | | 610,000 | | | | 645,655 | |
| Tenet Healthcare Corp., 4.875%, 1/01/2026 (z) | | | 700,000 | | | | 724,500 | |
| Thermo Fisher Scientific, Inc., 2.95%, 9/19/2026 | | | 245,000 | | | | 254,665 | |
| Thermo Fisher Scientific, Inc., 0.875%, 10/01/2031 | | EUR | 200,000 | | | | 223,830 | |
| West Street Merger Sub, Inc., 6.375%, 9/01/2025 (n) | | $ | 735,000 | | | | 700,087 | |
| | | | | | | | |
| | | | | | | $ | 21,963,196 | |
| Medical Equipment - 1.0% | | | | | | | | |
| Abbott Ireland Financing Co., 1.5%, 9/27/2026 | | EUR | 450,000 | | | $ | 539,535 | |
| DH Europe Finance II S.à r.l., 0.45%, 3/18/2028 | | | 100,000 | | | | 110,504 | |
| DH Europe Finance II S.à r.l., 1.35%, 9/18/2039 | | | 250,000 | | | | 271,018 | |
| DH Europe Finance II S.à r.l., 1.8%, 9/18/2049 | | | 150,000 | | | | 163,278 | |
| Hill-Rom Holdings, Inc., 4.375%, 9/15/2027 (n) | | $ | 565,000 | | | | 581,950 | |
| Teleflex, Inc., 5.25%, 6/15/2024 | | | 1,005,000 | | | | 1,032,009 | |
| Teleflex, Inc., 4.875%, 6/01/2026 | | | 445,000 | | | | 466,555 | |
| Teleflex, Inc., 4.625%, 11/15/2027 | | | 1,015,000 | | | | 1,063,212 | |
| | | | | | | | |
| | | | | | | $ | 4,228,061 | |
| Metals & Mining - 1.9% | | | | | | | | |
| Baffinland Iron Mines Corp./Baffinland Iron Mines LP, 8.75%, 7/15/2026 (n) | | $ | 550,000 | | | $ | 550,000 | |
| Big River Steel LLC, 7.25%, 9/01/2025 (n) | | | 180,000 | | | | 184,950 | |
| Freeport-McMoRan Copper & Gold, Inc., 5.4%, 11/14/2034 | | | 560,000 | | | | 546,700 | |
| Freeport-McMoRan, Inc., 5%, 9/01/2027 | | | 670,000 | | | | 684,237 | |
| Freeport-McMoRan, Inc., 5.25%, 9/01/2029 | | | 670,000 | | | | 681,926 | |
| Grinding Media,Inc./Moly-Cop AltaSteel Ltd., 7.375%, 12/15/2023 (n) | | | 300,000 | | | | 289,500 | |
| Harsco Corp., 5.75%, 7/31/2027 (n) | | | 665,000 | | | | 690,782 | |
| Northwest Acquisitions ULC/Dominion Finco, Inc., 7.125%, 11/01/2022 (n) | | | 1,025,000 | | | | 512,500 | |
| Novelis Corp., 5.875%, 9/30/2026 (n) | | | 920,000 | | | | 966,092 | |
| Petra Diamonds U.S. Treasury PLC, 7.25%, 5/01/2022 (n) | | | 263,000 | | | | 184,100 | |
| Steel Dynamics, Inc., 4.125%, 9/15/2025 | | | 700,000 | | | | 715,820 | |
| Steel Dynamics, Inc., 5%, 12/15/2026 | | | 515,000 | | | | 548,578 | |
| SunCoke Energy Partners LP/SunCoke Energy Partners Finance Corp., 7.5%, 6/15/2025 (n) | | | 275,000 | | | | 233,750 | |
26
Portfolio of Investments – continued
| | | | | | | | |
| | |
| Issuer | | Shares/Par | | | Value ($) | |
| Bonds - continued | | | | | | | | |
| Metals & Mining - continued | | | | | | | | |
| TMS International Corp., 7.25%, 8/15/2025 (n) | | $ | 790,000 | | | $ | 653,725 | |
| Vale S.A., 3.75%, 1/10/2023 | | EUR | 400,000 | | | | 482,925 | |
| | | | | | | | |
| | | | | | | $ | 7,925,585 | |
| Midstream - 4.0% | | | | | | | | |
| AI Candelaria Spain SLU, 7.5%, 12/15/2028 (n) | | $ | 1,248,000 | | | $ | 1,407,120 | |
| Antero Midstream Partners LP, 5.75%, 3/01/2027 (z) | | | 95,000 | | | | 70,656 | |
| APT Pipelines Ltd., 5%, 3/23/2035 (n) | | | 542,000 | | | | 605,443 | |
| Cheniere Energy Partners LP, 5.25%, 10/01/2025 | | | 1,525,000 | | | | 1,578,375 | |
| Cheniere Energy, Inc., 5.875%, 3/31/2025 | | | 1,735,000 | | | | 1,923,837 | |
| Cheniere Energy, Inc., 4.5%, 10/01/2029 (n) | | | 550,000 | | | | 560,313 | |
| Cosan Ltd., 5.5%, 9/20/2029 (n) | | | 1,219,000 | | | | 1,267,760 | |
| GNL Quintero S.A., 4.634%, 7/31/2029 (n) | | | 1,030,000 | | | | 1,088,195 | |
| MPLX LP, 4.5%, 4/15/2038 | | | 371,000 | | | | 379,099 | |
| ONEOK, Inc., 4.95%, 7/13/2047 | | | 1,328,000 | | | | 1,437,960 | |
| Peru LNG, 5.375%, 3/22/2030 | | | 1,047,000 | | | | 1,072,128 | |
| Plains All American Pipeline, 3.55%, 12/15/2029 | | | 436,000 | | | | 416,857 | |
| Sabine Pass Liquefaction LLC, 5%, 3/15/2027 | | | 500,000 | | | | 549,201 | |
| Sabine Pass Liquefaction LLC, 4.2%, 3/15/2028 | | | 400,000 | | | | 421,989 | |
| Star Energy Geothermal Pte. Ltd., 6.75%, 4/24/2033 | | | 790,280 | | | | 837,944 | |
| Targa Resources Partners LP/Targa Resources Finance Corp., 5.25%, 5/01/2023 | | | 665,000 | | | | 667,494 | |
| Targa Resources Partners LP/Targa Resources Finance Corp., 5.125%, 2/01/2025 (n) | | | 625,000 | | | | 640,637 | |
| Targa Resources Partners LP/Targa Resources Finance Corp., 5.375%, 2/01/2027 | | | 1,195,000 | | | | 1,223,381 | |
| | | | | | | | |
| | | | | | | $ | 16,148,389 | |
| Mortgage-Backed - 4.2% | | | | | | | | |
| Fannie Mae, 2.5%, 10/01/2034 | | $ | 2,406,443 | | | $ | 2,436,666 | |
| Fannie Mae, 3%, 11/01/2034 | | | 2,000,000 | | | | 2,055,532 | |
| Freddie Mac, 2.673%, 3/25/2026 | | | 1,099,000 | | | | 1,140,614 | |
| Freddie Mac, 3.194%, 7/25/2027 | | | 850,000 | | | | 913,266 | |
| Freddie Mac, 3.926%, 7/25/2028 | | | 5,400,000 | | | | 6,105,655 | |
| Freddie Mac, 4.06%, 10/25/2028 | | | 2,010,000 | | | | 2,298,245 | |
| Ginnie Mae, 3%, 10/20/2049 | | | 2,000,000 | | | | 2,059,481 | |
| | | | | | | | |
| | | | | | | $ | 17,009,459 | |
| Municipals - 0.1% | | | | | | | | |
| Commonwealth of Puerto Rico, Public Improvement,“C-7”, 6%, 7/01/2027 | | $ | 50,000 | | | $ | 51,509 | |
| Oklahoma Development Finance Authority, Health System Rev. (OU Medicine Project), “C”, 5.45%, 8/15/2028 | | | 209,000 | | | | 242,722 | |
| | | | | | | | |
| | | | | | | $ | 294,231 | |
27
Portfolio of Investments – continued
| | | | | | | | |
| | |
| Issuer | | Shares/Par | | | Value ($) | |
| Bonds - continued | | | | | | | | |
| Natural Gas - Distribution - 0.5% | | | | | | | | |
| Boston Gas Co., 3.15%, 8/01/2027 (n) | | $ | 420,000 | | | $ | 438,375 | |
| Infraestructura Energética Nova S.A.B. de C.V., 4.875%, 1/14/2048 | | | 650,000 | | | | 619,125 | |
| NiSource, Inc., 2.95%, 9/01/2029 | | | 826,000 | | | | 833,916 | |
| | | | | | | | |
| | | | | | | $ | 1,891,416 | |
| Network & Telecom - 0.8% | | | | | | | | |
| AT&T, Inc., 4.75%, 5/15/2046 | | $ | 1,175,000 | | | $ | 1,304,532 | |
| C&W Senior Financing Designated Activity, 6.875%, 9/15/2027 (z) | | | 450,000 | | | | 473,625 | |
| Telecom Italia S.p.A., 3%, 9/30/2025 | | EUR | 450,000 | | | | 538,877 | |
| Verizon Communications, Inc., 0.875%, 3/19/2032 | | | 360,000 | | | | 402,177 | |
| Zayo Group LLC/Zayo Capital, Inc., 5.75%, 1/15/2027 (n) | | $ | 455,000 | | | | 462,453 | |
| | | | | | | | |
| | | | | | | $ | 3,181,664 | |
| Oil Services - 0.4% | | | | | | | | |
| Apergy Corp., 6.375%, 5/01/2026 | | $ | 750,000 | | | $ | 733,125 | |
| Diamond Offshore Drill Co., 5.7%, 10/15/2039 | | | 560,000 | | | | 299,600 | |
| Ensign Drilling, Inc., 9.25%, 4/15/2024 (n) | | | 155,000 | | | | 131,750 | |
| Nabors Industries, Inc., 5.75%, 2/01/2025 | | | 450,000 | | | | 335,385 | |
| | | | | | | | |
| | | | | | | $ | 1,499,860 | |
| Oils - 0.9% | | | | | | | | |
| Neste Oyj, 1.5%, 6/07/2024 | | EUR | 500,000 | | | $ | 584,002 | |
| Parkland Fuel Corp., 6%, 4/01/2026 (n) | | $ | 940,000 | | | | 993,768 | |
| PBF Holding Co. LLC/PBF Finance Corp., 7%, 11/15/2023 | | | 175,000 | | | | 180,250 | |
| PBF Holding Co. LLC/PBF Finance Corp., 7.25%, 6/15/2025 | | | 745,000 | | | | 778,525 | |
| Phillips 66, 4.875%, 11/15/2044 | | | 606,000 | | | | 726,617 | |
| Thaioil Treasury Center Co. Ltd., 5.375%, 11/20/2048 (n) | | | 359,000 | | | | 475,135 | |
| | | | | | | | |
| | | | | | | $ | 3,738,297 | |
| Other Banks & Diversified Financials - 2.8% | | | | | | | | |
| ABANCA Corp. Bancaria S.A., 6.125% to 1/18/2024, FLR (EUR Swap Rate - 5yr. + 5.93%) to 1/18/2029 | | EUR | 500,000 | | | $ | 610,855 | |
| AIB Group PLC, 1.5%, 3/29/2023 | | | 550,000 | | | | 635,938 | |
| AIB Group PLC, 1.25%, 5/28/2024 | | | 175,000 | | | | 200,652 | |
| Bangkok Bank (Hong Kong), 4.05%, 3/19/2024 (n) | | $ | 1,046,000 | | | | 1,111,792 | |
| BBVA Bancomer S.A. de C.V., 6.75%, 9/30/2022 | | | 850,000 | | | | 932,705 | |
| Belfius Bank S.A., 3.125%, 5/11/2026 | | EUR | 800,000 | | | | 1,017,781 | |
| BPCE S.A., 0.5%, 2/24/2027 | | | 200,000 | | | | 221,490 | |
| BPCE S.A., 5.25%, 4/16/2029 | | GBP | 400,000 | | | | 640,559 | |
| Caixa Geral de Depositos, 5.75%, 6/28/2028 | | EUR | 500,000 | | | | 629,447 | |
| Commerzbank AG, 0.625%, 8/28/2024 | | | 230,000 | | | | 260,800 | |
| Commerzbank AG, 4%, 3/23/2026 | | | 325,000 | | | | 412,997 | |
28
Portfolio of Investments – continued
| | | | | | | | |
| | |
| Issuer | | Shares/Par | | | Value ($) | |
| Bonds - continued | | | | | | | | |
| Other Banks & Diversified Financials - continued | | | | | | | | |
| CYBG PLC, 9.25% to 6/08/2024, FLR (GBP Government Yield - 5yr. + 8.307%) to 6/13/2049 | | GBP | 900,000 | | | $ | 1,241,593 | |
| Groupe BPCE S.A., 4.5%, 3/15/2025 (n) | | $ | 652,000 | | | | 699,549 | |
| Intesa Sanpaolo S.p.A., 5.25%, 1/28/2022 | | GBP | 250,000 | | | | 347,596 | |
| JSC Kazkommertsbank, 5.5%, 12/21/2022 | | $ | 910,653 | | | | 917,380 | |
| KBC Group N.V., 0.5% to 12/03/2024, FLR (EUR Swap Rate - 5yr. + 1.1%) to 12/03/2029 | | EUR | 200,000 | | | | 219,721 | |
| Macquarie Group Ltd., 1.25%, 3/05/2025 | | | 300,000 | | | | 346,562 | |
| UBS AG, 5.125%, 5/15/2024 | | $ | 981,000 | | | | 1,054,575 | |
| | | | | | | | |
| | | | | | | $ | 11,501,992 | |
| Pharmaceuticals - 0.9% | | | | | | | | |
| Eagle Holding Co. II LLC, 7.625%, 5/15/2022 (n) | | $ | 720,000 | | | $ | 726,300 | |
| Eagle Holding Co. II LLC, 7.75%, 5/15/2022 (n) | | | 170,000 | | | | 172,550 | |
| Endo Finance LLC/Endo Finco, Inc., 5.375%, 1/15/2023 (n) | | | 455,000 | | | | 286,650 | |
| Valeant Pharmaceuticals International, Inc., 5.5%, 3/01/2023 (n) | | | 366,000 | | | | 369,203 | |
| Valeant Pharmaceuticals International, Inc., 6.125%, 4/15/2025 (n) | | | 1,985,000 | | | | 2,060,678 | |
| | | | | | | | |
| | | | | | | $ | 3,615,381 | |
| Pollution Control - 0.4% | | | | | | | | |
| Covanta Holding Corp., 5.875%, 3/01/2024 | | $ | 1,175,000 | | | $ | 1,207,313 | |
| Covanta Holding Corp., 6%, 1/01/2027 | | | 140,000 | | | | 146,300 | |
| GFL Environmental, Inc., 8.5%, 5/01/2027 (z) | | | 195,000 | | | | 214,500 | |
| | | | | | | | |
| | | | | | | $ | 1,568,113 | |
| Printing & Publishing - 0.3% | | | | | | | | |
| Nielsen Co. Lux S.à r.l., 5%, 2/01/2025 (n) | | $ | 150,000 | | | $ | 149,250 | |
| Nielsen Finance LLC, 5%, 4/15/2022 (n) | | | 886,000 | | | | 890,448 | |
| | | | | | | | |
| | | | | | | $ | 1,039,698 | |
| Railroad & Shipping - 0.2% | | | | | | | | |
| Lima Metro Line 2 Finance Ltd., 5.875%, 7/05/2034 | | $ | 555,755 | | | $ | 650,373 | |
| Lima Metro Line 2 Finance Ltd., 4.35%, 4/05/2036 (n) | | | 314,000 | | | | 333,625 | |
| | | | | | | | |
| | | | | | | $ | 983,998 | |
| Real Estate - Apartment - 0.1% | | | | | | | | |
| Grand City Properties S.A., 2.5%, 10/24/2069 | | EUR | 500,000 | | | $ | 568,373 | |
| | |
| Real Estate - Healthcare - 0.4% | | | | | | | | |
| MPT Operating Partnership LP/MPT Financial Co., REIT, 5.25%, 8/01/2026 | | $ | 980,000 | | | $ | 1,030,225 | |
| MPT Operating Partnership LP/MPT Financial Co., REIT, 5%, 10/15/2027 | | | 435,000 | | | | 457,838 | |
| | | | | | | | |
| | | | | | | $ | 1,488,063 | |
29
Portfolio of Investments – continued
| | | | | | | | |
| | |
| Issuer | | Shares/Par | | | Value ($) | |
| Bonds - continued | | | | | | | | |
| Real Estate - Office - 0.1% | | | | | | | | |
| Merlin Properties SOCIMI S.A., REIT, 1.875%, 11/02/2026 | | EUR | 350,000 | | | $ | 419,085 | |
| | |
| Real Estate - Other - 1.1% | | | | | | | | |
| CyrusOne LP/CyrusOne Finance Corp., REIT, 5%, 3/15/2024 | | $ | 1,245,000 | | | $ | 1,282,350 | |
| CyrusOne LP/CyrusOne Finance Corp., REIT, 5.375%, 3/15/2027 | | | 785,000 | | | | 838,969 | |
| Ryman Hospitality Properties, Inc., REIT, 5%, 4/15/2023 | | | 685,000 | | | | 698,700 | |
| Ryman Hospitality Properties, Inc., REIT, 4.75%, 10/15/2027 (n) | | | 1,019,000 | | | | 1,053,493 | |
| SELP Finance S.à r.l., 1.5%, 12/20/2026 | | EUR | 460,000 | | | | 529,915 | |
| | | | | | | | |
| | | | | | | $ | 4,403,427 | |
| Restaurants - 0.8% | | | | | | | | |
| Golden Nugget, Inc., 6.75%, 10/15/2024 (n) | | $ | 565,000 | | | $ | 582,006 | |
| KFC Holding Co./Pizza Hut Holdings LLC/Taco Bell of America LLC, 5.25%, 6/01/2026 (n) | | | 1,975,000 | | | | 2,088,562 | |
| Yum! Brands, Inc., 4.75%, 1/15/2030 (z) | | | 510,000 | | | | 534,863 | |
| | | | | | | | |
| | | | | | | $ | 3,205,431 | |
| Retailers - 1.1% | | | | | | | | |
| AA Bond Co. Ltd., 2.875%, 1/31/2022 | | GBP | 225,000 | | | $ | 281,318 | |
| AA Bond Co. Ltd., 2.75%, 7/31/2023 | | | 625,000 | | | | 753,675 | |
| DriveTime Automotive Group, Inc., 8%, 6/01/2021 (n) | | $ | 490,000 | | | | 497,963 | |
| EG Global Finance PLC, 6.75%, 2/07/2025 (n) | | | 470,000 | | | | 470,000 | |
| EG Global Finance PLC, 8.5%, 10/30/2025 (z) | | | 335,000 | | | | 351,877 | |
| L Brands, Inc., 5.25%, 2/01/2028 | | | 1,040,000 | | | | 964,600 | |
| Marks & Spencer PLC, 3.25%, 7/10/2027 | | GBP | 350,000 | | | | 448,234 | |
| Party City Holdings, Inc., 6.625%, 8/01/2026 (n) | | $ | 280,000 | | | | 272,300 | |
| Sally Beauty Holdings, Inc., 5.625%, 12/01/2025 | | | 400,000 | | | | 413,000 | |
| | | | | | | | |
| | | | | | | $ | 4,452,967 | |
| Specialty Chemicals - 0.6% | | | | | | | | |
| Koppers, Inc., 6%, 2/15/2025 (n) | | $ | 480,000 | | | $ | 478,541 | |
| Univar USA, Inc., 6.75%, 7/15/2023 (n) | | | 1,760,000 | | | | 1,788,600 | |
| | | | | | | | |
| | | | | | | $ | 2,267,141 | |
| Specialty Stores - 0.5% | | | | | | | | |
| Penske Automotive Group Co., 5.375%, 12/01/2024 | | $ | 470,000 | | | $ | 482,925 | |
| Penske Automotive Group Co., 5.5%, 5/15/2026 | | | 520,000 | | | | 543,400 | |
| PetSmart, Inc., 5.875%, 6/01/2025 (n) | | | 209,000 | | | | 205,892 | |
| Richemont International S.A., 1.5%, 3/26/2030 | | EUR | 500,000 | | | | 616,521 | |
| | | | | | | | |
| | | | | | | $ | 1,848,738 | |
| State & Local Agencies - 0.2% | | | | | | | | |
| New Jersey Economic Development Authority State Pension Funding Rev., “A”, 7.425%, 2/15/2029 | | $ | 526,000 | | | $ | 669,950 | |
30
Portfolio of Investments – continued
| | | | | | | | |
| | |
| Issuer | | Shares/Par | | | Value ($) | |
| Bonds - continued | | | | | | | | |
| Supermarkets - 0.6% | | | | | | | | |
| Albertsons Cos. LLC/Safeway, Inc., 6.625%, 6/15/2024 | | $ | 335,000 | | | $ | 351,331 | |
| Albertsons Cos. LLC/Safeway, Inc., 5.75%, 3/15/2025 | | | 480,000 | | | | 496,656 | |
| Albertsons Cos. LLC/Safeway, Inc., 5.875%, 2/15/2028 (z) | | | 55,000 | | | | 58,713 | |
| Eurotorg LLC Via Bonitron DAC, 8.75%, 10/30/2022 | | | 1,003,000 | | | | 1,078,225 | |
| Loblaw Cos. Ltd., 4.86%, 9/12/2023 | | CAD | 421,000 | | | | 345,494 | |
| | | | | | | | |
| | | | | | | $ | 2,330,419 | |
| Supranational - 0.2% | | | | | | | | |
| Banque Ouest Africaine de Developpement, 4.7%, 10/22/2031 | | $ | 463,000 | | | $ | 465,926 | |
| International Bank for Reconstruction and Development, 2.8%, 1/13/2021 | | AUD | 270,000 | | | | 189,737 | |
| International Bank for Reconstruction and Development, 4.25%, 6/24/2025 | | | 405,000 | | | | 322,684 | |
| | | | | | | | |
| | | | | | | $ | 978,347 | |
| Telecommunications - Wireless - 4.7% | | | | | | | | |
| Altice France S.A., 8.125%, 2/01/2027 (n) | | $ | 650,000 | | | $ | 720,687 | |
| Altice France S.A., 5.5%, 1/15/2028 (z) | | | 200,000 | | | | 203,750 | |
| Altice Luxembourg S.A., 7.625%, 2/15/2025 (n) | | | 895,000 | | | | 922,969 | |
| American Tower Corp., REIT, 3.5%, 1/31/2023 | | | 743,000 | | | | 772,793 | |
| American Tower Corp., REIT, 4%, 6/01/2025 | | | 514,000 | | | | 552,720 | |
| American Tower Corp., REIT, 3.8%, 8/15/2029 | | | 602,000 | | | | 643,558 | |
| Crown Castle International Corp., 3.7%, 6/15/2026 | | | 741,000 | | | | 785,944 | |
| Digicel International Finance Ltd., 8.75%, 5/25/2024 (n) | | | 400,000 | | | | 379,000 | |
| Millicom International Cellular S.A., 6.625%, 10/15/2026 (n) | | | 1,018,000 | | | | 1,104,530 | |
| SBA Communications Corp., 4%, 10/01/2022 | | | 1,180,000 | | | | 1,203,777 | |
| SBA Communications Corp., 4.875%, 9/01/2024 | | | 1,240,000 | | | | 1,288,050 | |
| SFR Group S.A., 7.375%, 5/01/2026 (n) | | | 770,000 | | | | 824,551 | |
| Sprint Corp., 7.875%, 9/15/2023 | | | 1,905,000 | | | | 2,102,644 | |
| Sprint Corp., 7.125%, 6/15/2024 | | | 1,620,000 | | | | 1,757,700 | |
| Sprint Nextel Corp., 6%, 11/15/2022 | | | 490,000 | | | | 518,175 | |
| Tele2 AB Co., 2.125%, 5/15/2028 | | EUR | 700,000 | | | | 858,401 | |
| Telefónica Celular del Paraguay S.A., 5.875%, 4/15/2027 (n) | | $ | 900,000 | | | | 969,354 | |
| T-Mobile USA, Inc., 6.5%, 1/15/2024 | | | 405,000 | | | | 420,694 | |
| T-Mobile USA, Inc., 5.125%, 4/15/2025 | | | 730,000 | | | | 758,506 | |
| T-Mobile USA, Inc., 6.5%, 1/15/2026 | | | 800,000 | | | | 856,080 | |
| T-Mobile USA, Inc., 5.375%, 4/15/2027 | | | 1,125,000 | | | | 1,209,375 | |
| Vodafone Group PLC, 2.5%, 5/24/2039 | | EUR | 400,000 | | | | 495,321 | |
| | | | | | | | |
| | | | | | | $ | 19,348,579 | |
| Tobacco - 0.2% | | | | | | | | |
| Altria Group, Inc., 1.7%, 6/15/2025 | | EUR | 260,000 | | | $ | 298,000 | |
| Philip Morris International, Inc., 1.45%, 8/01/2039 | | | 650,000 | | | | 684,995 | |
| | | | | | | | |
| | | | | | | $ | 982,995 | |
31
Portfolio of Investments – continued
| | | | | | | | |
| | |
| Issuer | | Shares/Par | | | Value ($) | |
| Bonds - continued | | | | | | | | |
| Transportation - Services - 1.0% | | | | | | | | |
| Abertis Infraestructuras S.A., 2.375%, 9/27/2027 | | EUR | 300,000 | | | $ | 362,001 | |
| Heathrow Funding Ltd., 4.625%, 10/31/2046 | | GBP | 200,000 | | | | 367,019 | |
| Navios South American Logistics, Inc./Navios Logistics Finance (U.S.), Inc., 7.25%, 5/01/2022 | | $ | 843,000 | | | | 830,355 | |
| Rumo Luxembourg S.à r.l., 5.875%, 1/18/2025 | | | 1,212,000 | | | | 1,284,720 | |
| Transurban Finance Co., 1.75%, 3/29/2028 | | EUR | 400,000 | | | | 483,283 | |
| Vinci S.A., 3.75%, 4/10/2029 (z) | | $ | 821,000 | | | | 905,512 | |
| | | | | | | | |
| | | | | | | $ | 4,232,890 | |
| U.S. Treasury Obligations - 3.8% | | | | | | | | |
| U.S. Treasury Bonds, 3.5%, 2/15/2039 | | $ | 5,950,000 | | | $ | 7,384,973 | |
| U.S. Treasury Bonds, 3.75%, 11/15/2043 | | | 3,250,000 | | | | 4,225,254 | |
| U.S. Treasury Bonds, 2.25%, 8/15/2049 | | | 1,021,800 | | | | 1,038,005 | |
| U.S. Treasury Notes, 2%, 11/15/2026 (f) | | | 2,920,000 | | | | 2,996,992 | |
| | | | | | | | |
| | | | | | | $ | 15,645,224 | |
| Utilities - Electric Power - 4.3% | | | | | | | | |
| Adani Green Energy (UP) Ltd./Prayatna Developers Private | | | | | | | | |
| Ltd., 6.25%, 12/10/2024 (n) | | $ | 1,601,000 | | | $ | 1,697,124 | |
| Clearway Energy Operating LLC, 5.75%, 10/15/2025 | | | 1,840,000 | | | | 1,888,300 | |
| Consorcio Transmantaro S.A., 4.7%, 4/16/2034 (n) | | | 200,000 | | | | 218,752 | |
| Drax Finco PLC, 6.625%, 11/01/2025 (n) | | | 745,000 | | | | 788,769 | |
| Duke Energy Corp., 3.75%, 9/01/2046 | | | 220,000 | | | | 227,719 | |
| Emera U.S. Finance LP, 2.7%, 6/15/2021 | | | 142,000 | | | | 143,252 | |
| Emera U.S. Finance LP, 3.55%, 6/15/2026 | | | 162,000 | | | | 170,150 | |
| Enel Finance International N.V., 0.375%, 6/17/2027 | | EUR | 250,000 | | | | 278,863 | |
| Enel Finance International N.V., 3.5%, 4/06/2028 (n) | | $ | 730,000 | | | | 751,921 | |
| Enel S.p.A., 8.75% to 9/24/2023, FLR (Swap Rate - 5yr. + 5.88%) to 9/24/2043, FLR (Swap Rate - 5yr. + 6.63%) to 9/24/2073 (n) | | | 500,000 | | | | 587,500 | |
| Enel S.p.A., 6.625% to 9/15/2021, FLR (GBP Swap Rate - 5yr. + 4.089%) to 9/15/2026, FLR (GBP Swap Rate - 5yr. + 4.339%) to 9/15/2041, FLR (GBP Swap Rate - 5yr. + 5.089%) to 9/15/2076 | | GBP | 230,000 | | | | 324,372 | |
| Engie Energia Chile S.A., 4.5%, 1/29/2025 (n) | | $ | 1,023,000 | | | | 1,089,801 | |
| Evergy, Inc., 2.9%, 9/15/2029 | | | 918,000 | | | | 923,080 | |
| Exelon Corp., 3.497%, 6/01/2022 | | | 259,000 | | | | 266,524 | |
| FirstEnergy Corp., 3.9%, 7/15/2027 | | | 115,000 | | | | 123,763 | |
| innogy Finance B.V., 4.75%, 1/31/2034 | | GBP | 300,000 | | | | 498,515 | |
| Listrindo Capital B.V., 4.95%, 9/14/2026 | | $ | 910,000 | | | | 922,512 | |
| LLPL Capital Pte. Ltd., 6.875%, 2/04/2039 (n) | | | 907,167 | | | | 1,060,297 | |
| Mong Duong Finance Holdings B.V., 5.125%, 5/07/2029 | | | 594,000 | | | | 604,095 | |
| NextEra Energy Operating Co., 4.25%, 9/15/2024 (n) | | | 1,315,000 | | | | 1,367,600 | |
| NextEra Energy Operating Co., 4.5%, 9/15/2027 (n) | | | 780,000 | | | | 795,600 | |
| NextEra Energy, Inc., 4.25%, 7/15/2024 (n) | | | 478,000 | | | | 491,002 | |
| PPL Capital Funding, Inc., 5%, 3/15/2044 | | | 270,000 | | | | 318,046 | |
32
Portfolio of Investments – continued
| | | | | | | | |
| | |
| Issuer | | Shares/Par | | | Value ($) | |
| Bonds - continued | | | | | | | | |
| Utilities - Electric Power - continued | | | | | | | | |
| TerraForm Global Operating LLC, 6.125%, 3/01/2026 (n) | | $ | 230,000 | | | $ | 235,175 | |
| Transelec S.A., 4.25%, 1/14/2025 (n) | | | 535,000 | | | | 563,093 | |
| Virginia Electric & Power Co., 3.5%, 3/15/2027 | | | 839,000 | | | | 902,016 | |
| Virginia Electric & Power Co., 2.875%, 7/15/2029 | | | 348,000 | | | | 358,642 | |
| | | | | | | | |
| | | | | | | $ | 17,596,483 | |
| Utilities - Other - 0.1% | | | | | | | | |
| Suez S.A., 1.625% to 9/12/2026, FLR (EUR ICE Swap Rate - 5yr. + 2.151%) to 9/12/2031, FLR (EUR ICE Swap Rate - 5yr. + 3.151%) to 9/12/2059 | | EUR | 300,000 | | | $ | 332,935 | |
| Total Bonds (Identified Cost, $477,655,367) | | | | | | $ | 495,739,251 | |
| | |
| Common Stocks - 0.2% | | | | | | | | |
| Construction - 0.1% | | | | | | | | |
| ICA Tenedora, S.A. de C.V. (a) | | | 127,848 | | | $ | 225,775 | |
| | |
| Energy - Independent - 0.0% | | | | | | | | |
| Frontera Energy Corp. | | | 20,290 | | | $ | 161,711 | |
| | |
| Oil Services - 0.1% | | | | | | | | |
| LTRI Holdings LP (a)(u) | | | 520 | | | $ | 263,011 | |
| | |
| Special Products & Services - 0.0% | | | | | | | | |
| Motors Liquidation Co. (a) | | | 82 | | | $ | 808 | |
| Total Common Stocks (Identified Cost, $2,202,248) | | | | | | $ | 651,305 | |
| | |
| Floating Rate Loans (r) - 0.1% | | | | | | | | |
| Broadcasting - 0.0% | | | | | | | | |
| Warner Music Group, Term Loan F, 3.91%, 11/01/2023 | | $ | 137,000 | | | $ | 136,914 | |
| | |
| Conglomerates - 0.1% | | | | | | | | |
| Gates Global LLC, Term Loan B2, 4.535%, 4/01/2024 | | $ | 161,354 | | | $ | 157,752 | |
| | |
| Food & Beverages - 0.0% | | | | | | | | |
| U.S. Foods, Inc., Term Loan B, 3.785%, 6/27/2023 | | $ | 135,598 | | | $ | 135,980 | |
| Total Floating Rate Loans (Identified Cost, $422,931) | | | $ | 430,646 | |
| | |
| Convertible Bonds - 0.1% | | | | | | | | |
| Cable TV - 0.1% | | | | | | | | |
DISH Network Corp., 3.375%, 8/15/2026
(Identified Cost, $245,690) | | $ | 270,000 | | | $ | 252,467 | |
33
Portfolio of Investments – continued
| | | | | | | | | | | | | | | | |
| Warrants - 0.0% | | | | | | | | | | | | | | | | |
| | | | |
| Issuer | | Strike Price | | | First Exercise | | | Shares/Par | | | Value ($) | |
| Forest & Paper Products - 0.0% | | | | | | | | | | | | | | | | |
| Appvion Holdings Corp. - Tranche A (1 share for 1 warrant) (a) | | $ | 27.17 | | | | 8/24/18 | | | | 332 | | | $ | 83 | |
| Appvion Holdings Corp. - Tranche B (1 share for 1 warrant) (a) | | | 31.25 | | | | 8/24/18 | | | | 332 | | | | 41 | |
| Total Warrants (Identified Cost, $0) | | | | | | | | | | | $ | 124 | |
| | | |
| Investment Companies (h) - 3.7% | | | | | | | | | | | | | |
| Money Market Funds - 3.7% | | | | | | | | | | | | | | | | |
MFS Institutional Money Market Portfolio, 1.89% (v)
(Identified Cost, $15,257,288) | | | | 15,257,411 | | | $ | 15,258,936 | |
| | | | | | | | | | | | | | | | | | | | | | | | | | |
Underlying/
Expiration Date/
Exercise Price | | Put/Call | | Counterparty | | | | | | Notional
Amount | | | | | | Par Amount/
Number of
Contracts | | | | |
| Purchased Options - 0.0% | | | | | | | | | | | | | | | | | | | | | |
| Market Index Securities - 0.0% | | | | | | | | | | | | | | | | | | | | | |
| Markit iTraxx Europe Index - December 2019 @ EUR 50 (Premiums Paid, $9,958) | | Call | |
| Goldman Sachs
International |
| | | | | | | $14,945,020 | | | | EUR | | | | 13,400,000 | | | $ | 13,845 | |
| | | |
| Written Options (see table below) - 0.0% | | | | | | | | | | | | | |
| (Premiums Received, $3,668) | | | | | | | | | | | | | | | | | | | $ | (1,187 | ) |
| | | |
| Other Assets, Less Liabilities - (25.6)% | | | | | | | | | | | | (104,486,062 | ) |
| Net Assets - 100.0% | | | | | | | | | | | | | | | | | | | | | | $ | 407,859,325 | |
| (a) | Non-income producing security. |
| (f) | All or a portion of the security has been segregated as collateral for open futures contracts. |
| (h) | An affiliated issuer, which may be considered one in which the fund owns 5% or more of the outstanding voting securities, or a company which is under common control. At period end, the aggregate values of the fund’s investments in affiliated issuers and in unaffiliated issuers were $15,258,936 and $497,087,638, respectively. |
| (i) | Interest only security for which the fund receives interest on notional principal (Par amount). Par amount shown is the notional principal and does not reflect the cost of the security. |
| (n) | Securities exempt from registration under Rule 144A of the Securities Act of 1933. These securities may be sold in the ordinary course of business in transactions exempt from registration, normally to qualified institutional buyers. At period end, the aggregate value of these securities was $196,888,763, representing 48.3% of net assets. |
| (p) | Payment-in-kind (PIK) security for which interest income may be received in additional securities and/or cash. |
| (r) | The remaining maturities of floating rate loans may be less than the stated maturities shown as a result of contractual or optional prepayments by the borrower. Such prepayments cannot be predicted with certainty. These loans may be subject to restrictions on resale. The interest rate |
34
Portfolio of Investments – continued
| | shown represents the weighted average of the floating interest rates on settled contracts within the loan facility at period end, unless otherwise indicated. The floating interest rates on settled contracts are determined periodically by reference to a base lending rate and a spread. |
| (u) | The security was valued using significant unobservable inputs and is considered level 3 under the fair value hierarchy. For further information about the fund’s level 3 holdings, please see Note 2 in the Notes to Financial Statements. |
| (v) | Affiliated issuer that is available only to investment companies managed by MFS. The rate quoted for the MFS Institutional Money Market Portfolio is the annualizedseven-day yield of the fund at period end. |
| (z) | Restricted securities are not registered under the Securities Act of 1933 and are subject to legal restrictions on resale. These securities generally may be resold in transactions exempt from registration or to the public if the securities are subsequently registered. Disposal of these securities may involve time-consuming negotiations and prompt sale at an acceptable price may be difficult. The fund holds the following restricted securities: |
| | | | | | | | | | |
| Restricted Securities | | Acquisition
Date | | Cost | | | Value | |
| ABC Supply Co., Inc., 4%, 1/15/2028 | | 10/24/19 | | | $1,142,356 | | | | $1,137,150 | |
| Afren PLC, 11.5%, 2/01/2016 | | 1/27/11 | | | 315,788 | | | | 268 | |
| Afren PLC, 10.25%, 4/08/2019 | | 3/01/12 | | | 209,874 | | | | 175 | |
| Albertsons Cos. LLC/Safeway, Inc., 5.875%, 2/15/2028 | | 8/01/19 | | | 55,000 | | | | 58,713 | |
| Alliant Holdings Intermediate LLC, 6.75%, 10/15/2027 | | 10/02/19-10/03/19 | | | 628,791 | | | | 650,069 | |
| Altice France S.A., 5.5%, 1/15/2028 | | 9/13/19 | | | 200,000 | | | | 203,750 | |
| Antero Midstream Partners LP, 5.75%, 3/01/2027 | | 10/15/19 | | | 79,152 | | | | 70,656 | |
| Bayview Financial Revolving Mortgage Loan Trust, FLR, 3.64% (LIBOR - 1mo. + 1.6%), 12/28/2040 | | 3/01/06 | | | 1,024,552 | | | | 1,022,896 | |
| C&W Senior Financing Designated Activity, 6.875%, 9/15/2027 | | 8/22/19-9/24/19 | | | 474,253 | | | | 473,625 | |
| CCO Holdings LLC/CCO Holdings Capital Corp., 4.75%, 3/01/2030 | | 9/17/19 | | | 490,000 | | | | 499,653 | |
| Celulosa Arauco y Constitucion, 4.2%, 1/29/2030 | | 10/24/19-10/25/19 | | | 400,861 | | | | 399,200 | |
| Commercial Mortgage Pass-Through Certificates,2019-BNK19, 3.183%, 8/15/2061 | | 7/23/19 | | | 2,059,672 | | | | 2,118,900 | |
| Core & Main LP, 8.625%, (8.625% cash or 9.375% PIK) 9/15/2024 | | 9/12/19 | | | 119,525 | | | | 119,400 | |
| Diamond Sports Group, LLC/Diamond Sports Finance Co., 6.625%, 8/15/2027 | | 7/18/19-8/21/19 | | | 569,374 | | | | 581,950 | |
| EG Global Finance PLC, 8.5%, 10/30/2025 | | 10/11/19 | | | 335,000 | | | | 351,877 | |
| Element Solutions, Inc., 5.875%, 12/01/2025 | | 8/28/19-9/04/19 | | | 292,973 | | | | 292,294 | |
| F-Brasile S.p.A./F-Brasile U.S. LLC, 7.375%, 8/15/2026 | | 8/02/19 | | | 335,000 | | | | 350,075 | |
| GFL Environmental, Inc., 8.5%, 5/01/2027 | | 9/03/19 | | | 213,713 | | | | 214,500 | |
| Granite Holdings U.S. Acquisition Co., 11%, 10/01/2027 | | 9/25/19 | | | 235,696 | | | | 227,238 | |
| HarbourView CLO VII Ltd., 7RA, “B”, FLR, 3.703% (LIBOR - 3mo. + 1.7%), 7/18/2031 | | 5/17/18 | | | 2,500,000 | | | | 2,433,568 | |
| iHeartCommunications, Inc., 5.25%, 8/15/2027 | | 8/01/19-8/21/19 | | | 192,517 | | | | 196,023 | |
| LCPR Senior Secured Financing D.A.C., 6.75%, 10/15/2027 | | 10/22/19 | | | 305,000 | | | | 313,006 | |
35
Portfolio of Investments – continued
| | | | | | | | | | |
| Restricted Securities - continued | | Acquisition
Date | | Cost | | | Value | |
| MDGH - GMTN B.V. (United Arab Emirates), 2.875%, 11/07/2029 | | 10/29/19 | | | $1,079,195 | | | | $1,081,181 | |
| Motion Bondco D.A.C., 6.625%, 11/15/2027 | | 10/16/19-10/18/19 | | | 455,000 | | | | 457,875 | |
| MTS Systems Corp., 5.75%, 8/15/2027 | | 7/12/19 | | | 543,918 | | | | 565,650 | |
| National CineMedia, LLC, 5.875%, 4/15/2028 | | 10/02/19 | | | 507,640 | | | | 530,806 | |
| Patrick Industries, Inc., 7.5%, 10/15/2027 | | 9/12/19 | | | 380,000 | | | | 394,250 | |
| Performance Food Group Co., 5.5%, 10/15/2027 | | 9/16/19-9/17/19 | | | 625,893 | | | | 650,363 | |
| Starfruit Finance Co./Starfruit U.S. Holding Co. LLC, 8%, 10/01/2026 | | 9/04/19-9/05/19 | | | 542,925 | | | | 547,250 | |
| Telesat Holdings, Inc., 6.5%, 10/15/2027 | | 9/27/19 | | | 470,537 | | | | 485,483 | |
| Tenet Healthcare Corp., 4.875%, 1/01/2026 | | 8/12/19-/21/19 | | | 701,979 | | | | 724,500 | |
| TransDigm, Inc., 5.5%, 11/15/2027 | | 10/29/19 | | | 735,000 | | | | 732,567 | |
| Trivium Packaging Finance B.V., 8.5%, 8/15/2027 | | 7/19/19-7/22/19 | | | 408,306 | | | | 426,500 | |
| Vinci S.A., 3.75%, 4/10/2029 | | 4/03/19 | | | 819,059 | | | | 905,512 | |
| Virgin Media Secured Finance PLC, 5.5%, 5/15/2029 | | 10/21/19-10/30/19 | | | 493,808 | | | | 494,063 | |
| Wynn Las Vegas LLC/Wynn Las Vegas Capital Corp., 5.25%, 5/15/2027 | | 7/12/19 | | | 152,241 | | | | 156,375 | |
| Yum! Brands, Inc., 4.75%, 1/15/2030 | | 9/04/19 | | | 510,000 | | | | 534,863 | |
| Total Restricted Securities | | | | | | | | | $20,402,224 | |
| % of Net assets | | | | | | | | | 5.0% | |
The following abbreviations are used in this report and are defined:
| CDO | | Collateralized Debt Obligation |
| CLO | | Collateralized Loan Obligation |
| CMT | | Constant Maturity Treasury |
| EURIBOR | | Euro Interbank Offered Rate |
| FLR | | Floating Rate. Interest rate resets periodically based on the parenthetically disclosed reference rate plus a spread (if any). Theperiod-end rate reported may not be the current rate. All reference rates are USD unless otherwise noted. |
| ICE | | Intercontinental Exchange |
| LIBOR | | London Interbank Offered Rate |
| REIT | | Real Estate Investment Trust |
Abbreviations indicate amounts shown in currencies other than the U.S. dollar. All amounts are stated in U.S. dollars unless otherwise indicated. A list of abbreviations is shown below:
36
Portfolio of Investments – continued
Derivative Contracts at 10/31/19
Written Options
| | | | | | | | | | | | | | | | | | | | | | | | | | | | |
| Underlying | | Put/
Call | | | Counter-
party | | | | | Par
Amount/
Number
of
Contracts | | Notional
Amount | | | Exercise
Price | | | Expiration
Date | | | Value | |
| Liability Derivatives | | | | | | | | | | | | | | | | | | | | | | |
| | | | | | |
| Market Index Securities | | | | | | | | | | | | | | | | | | | | | | |
| Markit iTraxx Europe Index | | | Put | | | Goldman Sachs
International | | | EUR | | | (4,900,000) | | | $(5,464,970 | ) | | | EUR80 | | | | December - 2019 | | | | $(1,187 | ) |
| | | | | | | | | | | | | | | | | | | | | | | | | | | | |
Forward Foreign Currency Exchange Contracts
| | | | | | | | | | | | | | | | | | |
Currency Purchased | | | Currency Sold | | Counterparty | | Settlement
Date | | | Unrealized
Appreciation
(Depreciation) | |
| Asset Derivatives | | | | | | | | | | | | |
| CAD | | | 417,000 | | | USD | | 313,229 | | Deutsche Bank AG | | | 12/13/2019 | | | | $3,433 | |
| DKK | | | 11,054 | | | USD | | 1,631 | | Citibank N.A. | | | 12/13/2019 | | | | 24 | |
| HKD | | | 19,818,000 | | | USD | | 2,527,326 | | UBS AG | | | 12/13/2019 | | | | 1,299 | |
| KRW | | | 42,694,000 | | | USD | | 35,346 | | JPMorgan Chase Bank N.A. | | | 12/03/2019 | | | | 1,372 | |
| SGD | | | 54,000 | | | USD | | 39,124 | | UBS AG | | | 12/13/2019 | | | | 584 | |
| USD | | | 111,856 | | | EUR | | 100,000 | | UBS AG | | | 12/13/2019 | | | | 30 | |
| USD | | | 327,993 | | | JPY | | 35,000,000 | | BNP Paribas S.A. | | | 12/13/2019 | | | | 3,113 | |
| | | | | | | | | | | | | | | | | | |
| | | | | | | | | | | | | | | | | $9,855 | |
| | | | | | | | | | | | | | | | | | |
| Liability Derivatives | | | | | | | | | | | | |
| NOK | | | 1,421,290 | | | USD | | 155,136 | | Merrill Lynch International | | | 12/13/2019 | | | | $(545 | ) |
| USD | | | 662,546 | | | AUD | | 982,795 | | Merrill Lynch International | | | 12/13/2019 | | | | (15,656 | ) |
| USD | | | 522,560 | | | CAD | | 695,107 | | Citibank N.A. | | | 12/13/2019 | | | | (5,290 | ) |
| USD | | | 182,535 | | | CHF | | 180,919 | | Merrill Lynch International | | | 12/13/2019 | | | | (1,416 | ) |
| USD | | | 385,762 | | | EUR | | 348,827 | | Credit Suisse Group | | | 12/13/2019 | | | | (4,317 | ) |
| USD | | | 10,021,191 | | | EUR | | 9,002,755 | | Deutsche Bank AG | | | 11/18/2019 | | | | (28,675 | ) |
| USD | | | 226,757 | | | EUR | | 204,295 | | Deutsche Bank AG | | | 12/13/2019 | | | | (1,697 | ) |
| USD | | | 30,319,571 | | | EUR | | 27,548,720 | | Merrill Lynch International | | | 12/13/2019 | | | | (487,062 | ) |
| USD | | | 220,276 | | | EUR | | 198,142 | | Morgan Stanley Capital Services, Inc. | | | 12/13/2019 | | | | (1,298 | ) |
| USD | | | 1,178,840 | | | EUR | | 1,065,725 | | UBS AG | | | 12/13/2019 | | | | (12,919 | ) |
| USD | | | 6,963,167 | | | GBP | | 5,685,109 | | Deutsche Bank AG | | | 12/13/2019 | | | | (410,537 | ) |
| USD | | | 1,663,403 | | | MXN | | 32,899,000 | | Goldman Sachs International | | | 12/13/2019 | | | | (36,600 | ) |
| | | | | | | | | | | | | | | | | | |
| | | | | | | | | | | | | | | | | $(1,006,012 | ) |
| | | | | | | | | | | | | | | | | | |
37
Portfolio of Investments – continued
Futures Contracts
| | | | | | | | | | | | | | | | | | | | | | |
| Description | | Long/
Short | | | Currency | | | Contracts | | Notional
Amount | | | Expiration
Date | | | Value/
Unrealized
Appreciation
(Depreciation) | |
| Asset Derivatives | | | | | | | | | | | | | | | |
| | | | |
| Interest Rate Futures | | | | | | | | | | | | | | | |
| Euro-Bobl 5 yr | | | Short | | | | EUR | | | 102 | | | $15,314,448 | | | | December - 2019 | | | | $226,154 | |
| Euro-Bund 10 yr | | | Short | | | | EUR | | | 28 | | | 5,363,788 | | | | December - 2019 | | | | 139,216 | |
| U.S. Treasury Bond | | | Short | | | | USD | | | 5 | | | 806,875 | | | | December - 2019 | | | | 22,169 | |
| U.S. Treasury Note 10 yr | | | Short | | | | USD | | | 458 | | | 59,675,969 | | | | December - 2019 | | | | 717,095 | |
| | | | | | | | | | | | | | | | | | | | | | |
| | | | | | | | | | | | | | | | | | | | | $1,104,634 | |
| | | | | | | | | | | | | | | | | | | | | | |
| Liability Derivatives | | | | | | | | | | | | | | | |
| | | | |
| Interest Rate Futures | | | | | | | | | | | | | | | |
| U.S. Treasury Note 5 yr | | | Long | | | | USD | | | 76 | | | $9,059,438 | | | | December - 2019 | | | | $(57,862 | ) |
| | | | | | | | | | | | | | | | | | | | | | |
Uncleared Swap Agreements
| | | | | | | | | | | | | | | | | | | | | | | | |
Maturity
Date | | Notional
Amount | | | Counter-
party | | Cash
Flows to
Receive/
Frequency | | Cash
Flows to
Pay/
Frequency | | Unrealized
Appreciation
(Depreciation) | | | Net
Unamortized
Upfront
Payments
(Receipts) | | | Value | |
| Asset Derivatives | | | | | | | | | | | | | | | | |
| | | | | |
| Credit Default Swaps | | | | | | | | | | | | | | | | |
| 6/20/24 | | EUR | | | 600,000 | | | JPMorgan Chase Bank N.A. | | 5.00%/Quarterly | | (1) | | | $1,817 | | | | $112,462 | | | | $114,279 | |
| | | | | | | | | | | | | | | | | | | | | | | | |
| (1) | Fund, as protection seller, to pay notional amount upon a defined credit event by Glencore Finance Europe Ltd., 3.375%, 9/30/2020, a BBB+ rated bond. The fund entered into the contract to gain issuer exposure. |
The credit ratings presented here are an indicator of the current payment/performance risk of the related swap agreement, the reference obligation for which may be either a single security or, in the case of a credit default index, a basket of securities issued by corporate or sovereign issuers. Ratings are assigned to each reference security, including each individual security within a reference basket of securities, utilizing ratings from Moody’s, Fitch, and Standard & Poor’s rating agencies and applying the following hierarchy: If all three agencies provide a rating, the middle rating (after dropping the highest and lowest ratings) is assigned; if two of the three agencies rate a security, the lower of the two is assigned. Ratings are shown in the S&P and Fitch scale (e.g., AAA). The ratings for a credit default index are calculated by MFS as a weighted average of the external credit ratings of the individual securities that compose the index’s reference basket of securities.
At October 31, 2019, the fund had cash collateral of $710,000 and other liquid securities with an aggregate value of $838,544 to cover any collateral or margin obligations for certain derivative contracts. Restricted cash and/or deposits with brokers in the Statement of Assets and Liabilities are comprised of cash collateral.
See Notes to Financial Statements
38
Financial Statements
STATEMENT OF ASSETS AND LIABILITIES
At 10/31/19
This statement represents your fund’s balance sheet, which details the assets and liabilities comprising the total value of the fund.
| | | | |
| Assets | | | | |
Investments in unaffiliated issuers, at value (identified cost, $480,536,194) | | | $497,087,638 | |
Investments in affiliated issuers, at value (identified cost, $15,257,288) | | | 15,258,936 | |
Cash | | | 1,630 | |
Foreign currency, at value (identified cost, $11,932) | | | 11,990 | |
Restricted cash for | | | | |
Forward foreign currency exchange contracts | | | 710,000 | |
Receivables for | | | | |
Forward foreign currency exchange contracts | | | 9,855 | |
Investments sold | | | 468,855 | |
Interest | | | 5,814,312 | |
Uncleared swaps, at value (net of unamortized premiums paid, $112,462) | | | 114,279 | |
Other assets | | | 10,779 | |
Total assets | | | $519,488,274 | |
| |
| Liabilities | | | | |
Notes payable | | | $100,000,000 | |
Payables for | | | | |
Distributions | | | 202,129 | |
Forward foreign currency exchange contracts | | | 1,006,012 | |
Net daily variation margin on open futures contracts | | | 387,966 | |
Investments purchased | | | 9,458,924 | |
Written options | | | 1,187 | |
Payable to affiliates | | | | |
Investment adviser | | | 14,602 | |
Administrative services fee | | | 338 | |
Transfer agent and dividend disbursing costs | | | 5,294 | |
Payable for independent Trustees’ compensation | | | 10,327 | |
Accrued interest expense | | | 207,011 | |
Deferred country tax expense payable | | | 145,099 | |
Accrued expenses and other liabilities | | | 190,060 | |
Total liabilities | | | $111,628,949 | |
Net assets | | | $407,859,325 | |
| |
| Net assets consist of | | | | |
Paid-in capital | | | $415,421,216 | |
Total distributable earnings (loss) | | | (7,561,891 | ) |
Net assets | | | $407,859,325 | |
Shares of beneficial interest outstanding | | | 63,981,952 | |
Net asset value per share (net assets of $407,859,325 / 63,981,952 shares of beneficial interest outstanding) | | | $6.37 | |
See Notes to Financial Statements
39
Financial Statements
STATEMENT OF OPERATIONS
Year ended 10/31/19
This statement describes how much your fund earned in investment income and accrued in expenses. It also describes any gains and/or losses generated by fund operations.
| | | | |
| Net investment income (loss) | | | | |
Income | | | | |
Interest | | | $24,454,686 | |
Dividends from affiliated issuers | | | 171,756 | |
Dividends | | | 71,291 | |
Other | | | 16,206 | |
Foreign taxes withheld | | | (5,576 | ) |
Total investment income | | | $24,708,363 | |
Expenses | | | | |
Management fee | | | $2,758,838 | |
Transfer agent and dividend disbursing costs | | | 102,646 | |
Administrative services fee | | | 65,015 | |
Independent Trustees’ compensation | | | 65,651 | |
Stock exchange fee | | | 65,460 | |
Custodian fee | | | 45,448 | |
Shareholder communications | | | 159,655 | |
Audit and tax fees | | | 83,145 | |
Legal fees | | | 15,317 | |
Interest expense and fees | | | 2,888,098 | |
Miscellaneous | | | 62,703 | |
Total expenses | | | $6,311,976 | |
Net investment income (loss) | | | $18,396,387 | |
| |
| Realized and unrealized gain (loss) | | | | |
Realized gain (loss) (identified cost basis) | | | | |
Unaffiliated issuers (net of $48,882 country tax) | | | $476,558 | |
Affiliated issuers | | | 38 | |
Written options | | | 149,497 | |
Futures contracts | | | (6,878,794 | ) |
Swap agreements | | | 9,944 | |
Forward foreign currency exchange contracts | | | 3,977,097 | |
Foreign currency | | | (30,529 | ) |
Net realized gain (loss) | | | $(2,296,189 | ) |
Change in unrealized appreciation or depreciation | | | | |
Unaffiliated issuers (net of $96,217 increase in deferred country tax) | | | $36,538,800 | |
Affiliated issuers | | | 1,535 | |
Written options | | | 2,481 | |
Futures contracts | | | 386,075 | |
Swap agreements | | | 1,817 | |
Forward foreign currency exchange contracts | | | (2,257,424 | ) |
Translation of assets and liabilities in foreign currencies | | | 26,102 | |
Net unrealized gain (loss) | | | $34,699,386 | |
Net realized and unrealized gain (loss) | | | $32,403,197 | |
Change in net assets from operations | | | $50,799,584 | |
See Notes to Financial Statements
40
Financial Statements
STATEMENTS OF CHANGES IN NET ASSETS
These statements describe the increases and/or decreases in net assets resulting from operations, any distributions, and any shareholder transactions.
| | | | | | | | |
| | | Year ended | |
| | | 10/31/19 | | | 10/31/18 | |
| Change in net assets | | | | | | |
| | |
| From operations | | | | | | | | |
Net investment income (loss) | | | $18,396,387 | | | | $17,497,961 | |
Net realized gain (loss) | | | (2,296,189 | ) | | | 3,178,260 | |
Net unrealized gain (loss) | | | 34,699,386 | | | | (29,049,470 | ) |
Change in net assets from operations | | | $50,799,584 | | | | $(8,373,249 | ) |
Distributions to shareholders | | | $(18,671,582 | ) | | | $(20,316,659 | ) |
Tax return of capital distributions to shareholders | | | $(13,664,509 | ) | | | $(14,918,250 | ) |
Change in net assets from fund share transactions | | | $(18,139,266 | ) | | | $(20,317,818 | ) |
Total change in net assets | | | $324,227 | | | | $(63,925,976 | ) |
| | |
| Net assets | | | | | | | | |
At beginning of period | | | 407,535,098 | | | | 471,461,074 | |
At end of period | | | $407,859,325 | | | | $407,535,098 | |
See Notes to Financial Statements
41
Financial Statements
STATEMENT OF CASH FLOWS
Year ended 10/31/19
This statement provides a summary of cash flows from investment activity for the fund.
| | | | |
| Cash flows from operating activities: | | | | |
Change in net assets from operations | | | $50,799,584 | |
| |
| Adjustments to reconcile change in net assets from operations to net cash provided by operating activities: | | | | |
Purchase of investment securities | | | (336,162,809 | ) |
Proceeds from disposition of investment securities | | | 376,741,456 | |
Purchase of short-term investments, net | | | (7,904,705 | ) |
Realized gain/loss on investments | | | (525,440 | ) |
Unrealized appreciation/depreciation on investments | | | (36,636,552 | ) |
Unrealized appreciation/depreciation on foreign currency contracts | | | 2,257,424 | |
Unrealized appreciation/depreciation on swaps | | | (1,817 | ) |
Net amortization/accretion of income | | | 69,603 | |
Decrease in interest receivable | | | 197,095 | |
Increase in accrued expenses and other liabilities | | | 144,081 | |
Decrease in receivable for daily variation margin on open futures contracts | | | 171,585 | |
Increase in payable for net daily variation margin on open futures contracts | | | 387,966 | |
Decrease in other assets | | | 392 | |
Decrease in interest payable | | | (31,754 | ) |
Net cash provided by operating activities | | | $49,506,109 | |
| |
| Cash flows from financing activities: | | | | |
Distributions paid in cash | | | (32,327,120 | ) |
Repurchase of shares of beneficial interest | | | (18,293,899 | ) |
Net cash used by financing activities | | | $(50,621,019 | ) |
Net decrease in cash and restricted cash (a) | | | $(1,114,910 | ) |
| |
| Cash and restricted cash: | | | | |
Beginning of period (including foreign currency of $799,017) | | | $1,838,530 | |
End of period (including foreign currency of $11,990) | | | $723,620 | |
| (a) | See Note 2 for more information on presentational changes to the Statement of Cash Flows that were effective with the beginning of the current reporting period. |
Supplemental disclosure of cash flow information:
Cash paid during the year ended October 31, 2019 for interest was $2,919,852.
See Notes to Financial Statements
42
Financial Statements
FINANCIAL HIGHLIGHTS
The financial highlights table is intended to help you understand the fund’s financial performance for the past 5 years. Certain information reflects financial results for a single fund share. The total returns in the table represent the rate that an investor would have earned (or lost) on an investment in the fund share class (assuming reinvestment of all distributions) held for the entire period.
| | | | | | | | | | | | | | | | | | | | |
| | | Year ended | |
| | | | | |
| | | 10/31/19 | | | 10/31/18 | | | 10/31/17 | | | 10/31/16 | | | 10/31/15 | |
Net asset value, beginning of period | | | $6.06 | | | | $6.67 | | | | $6.73 | | | | $6.76 | | | | $7.39 | |
|
| Income (loss) from investment operations | |
Net investment income (loss) (d) | | | $0.28 | | | | $0.25 | | | | $0.30 | (c) | | | $0.34 | | | | $0.36 | |
Net realized and unrealized gain (loss) | | | 0.50 | | | | (0.38 | ) | | | 0.15 | | | | 0.15 | | | | (0.43 | ) |
Total from investment operations | | | $0.78 | | | | $(0.13 | ) | | | $0.45 | | | | $0.49 | | | | $(0.07 | ) |
|
| Less distributions declared to shareholders | |
From net investment income | | | $(0.29 | ) | | | $(0.29 | ) | | | $(0.31 | ) | | | $(0.37 | ) | | | $(0.46 | ) |
From net realized gain | | | — | | | | — | | | | — | | | | — | | | | (0.08 | ) |
From tax return of capital | | | (0.21 | ) | | | (0.22 | ) | | | (0.23 | ) | | | (0.16 | ) | | | (0.03 | ) |
Total distributions declared to shareholders | | | $(0.50 | ) | | | $(0.51 | ) | | | $(0.54 | ) | | | $(0.53 | ) | | | $(0.57 | ) |
Net increase from repurchase of capital shares | | | $0.03 | | | | $0.03 | | | | $0.03 | | | | $0.01 | | | | $0.01 | |
Net asset value, end of period (x) | | | $6.37 | | | | $6.06 | | | | $6.67 | | | | $6.73 | | | | $6.76 | |
Market value, end of period | | | $6.01 | | | | $5.24 | | | | $6.16 | | | | $5.97 | | | | $5.94 | |
Total return at market value (%) | | | 25.05 | | | | (7.01 | ) | | | 12.50 | | | | 9.93 | | | | 2.18 | |
Total return at net asset value (%) (j)(s)(x) | | | 14.60 | | | | (0.68 | ) | | | 8.06 | (c) | | | 8.89 | | | | 0.24 | |
|
Ratios (%) (to average net assets)
and Supplemental data: | |
Expenses before expense reductions (f) | | | 1.56 | | | | 1.33 | | | | 1.10 | (c) | | | 1.10 | | | | 0.98 | |
Expenses after expense reductions (f) | | | N/A | | | | N/A | | | | N/A | | | | N/A | | | | N/A | |
Net investment income (loss) | | | 4.54 | | | | 4.00 | | | | 4.45 | (c) | | | 5.13 | | | | 5.05 | |
Portfolio turnover | | | 65 | | | | 47 | | | | 50 | | | | 36 | | | | 47 | |
Net assets at end of period (000 omitted) | | | $407,859 | | | | $407,535 | | | | $471,461 | | | | $504,331 | | | | $515,095 | |
| | |
| Supplemental Ratios (%): | | | | | | | | | |
Ratios of expenses to average net assets after expense reductions and excluding interest expense and fees (f) | | | 0.84 | | | | 0.80 | | | | 0.78 | (c) | | | 0.87 | | | | 0.82 | |
| | | | | |
| Senior Securities: | | | | | | | | | | | | | | | | | | | | |
Total notes payable outstanding (000 omitted) | | | $100,000 | | | | $100,000 | | | | $100,000 | | | | $100,000 | | | | $100,000 | |
Asset coverage per $1,000 of indebtedness (k) | | | $5,079 | | | | $5,075 | | | | $5,715 | | | | $6,043 | | | | $6,151 | |
43
Financial Highlights – continued
| (c) | Amount reflects aone-time reimbursement of expenses by the custodian (or former custodian) without which net investment income and performance would be lower and expenses would be higher. |
| (d) | Per share data is based on average shares outstanding. |
| (f) | Ratios do not reflect reductions from fees paid indirectly, if applicable. |
| (j) | Total return at net asset value is calculated using the net asset value of the fund, not the publicly traded price and therefore may be different than the total return at market value. |
| (k) | Calculated by subtracting the fund’s total liabilities (not including notes payable) from the fund’s total assets and dividing this number by the notes payable outstanding and then multiplying by 1,000. |
| (s) | From time to time the fund may receive proceeds from litigation settlements, without which performance would be lower. |
| (x) | The net asset values and total returns at net asset value have been calculated on net assets which include adjustments made in accordance with U.S. generally accepted accounting principles required at period end for financial reporting purposes. |
See Notes to Financial Statements
44
NOTES TO FINANCIAL STATEMENTS
(1) Business and Organization
MFS Multimarket Income Trust (the fund) is organized as a Massachusetts business trust and is registered under the Investment Company Act of 1940, as amended, as a diversifiedclosed-end management investment company.
The fund is an investment company and accordingly follows the investment company accounting and reporting guidance of the Financial Accounting Standards Board (FASB) Accounting Standards Codification Topic 946 Financial Services – Investment Companies.
(2) Significant Accounting Policies
General– The preparation of financial statements in conformity with U.S. generally accepted accounting principles requires management to make estimates and assumptions that affect the reported amounts of assets and liabilities, and disclosure of contingent assets and liabilities at the date of the financial statements and the reported amounts of increases and decreases in net assets from operations during the reporting period. Actual results could differ from those estimates. In the preparation of these financial statements, management has evaluated subsequent events occurring after the date of the fund’s Statement of Assets and Liabilities through the date that the financial statements were issued. The fund invests in high-yield securities rated below investment grade. Investments in below investment grade quality securities can involve a substantially greater risk of default or can already be in default, and their values can decline significantly. Below investment grade quality securities tend to be more sensitive to adverse news about the issuer, or the market or economy in general, than higher quality debt instruments. The fund invests in foreign securities, including securities of emerging market issuers. Investments in foreign securities are vulnerable to the effects of changes in the relative values of the local currency and the U.S. dollar and to the effects of changes in each country’s market, economic, industrial, political, regulatory, geopolitical, and other conditions. Investments in emerging markets can involve additional and greater risks than the risks associated with investments in developed foreign markets. Emerging markets can have less developed markets, greater custody and operational risk, less developed legal, regulatory, and accounting systems, and greater political, social, and economic instability than developed markets.
In November 2016, the FASB issued Accounting Standards Update2016-18, Statement of Cash Flows (Topic 230) – Restricted Cash (“ASU2016-18”), which is effective for fiscal years beginning after December 15, 2017 and interim periods within those fiscal years. The fund adopted ASU2016-18 effective with the beginning of the current reporting period, which resulted in changes to the presentation of restricted cash in the fund’s Statement of Cash Flows and additional disclosures regarding the nature of the restrictions on cash and restricted cash.
In March 2017, the FASB issued Accounting Standards Update2017-08, Receivables –Nonrefundable Fees and Other Costs (Subtopic310-20) – Premium Amortization on Purchased Callable Debt Securities (“ASU2017-08”). For entities that purchased callable debt securities at a premium, ASU2017-08 requires that the premium be amortized to the earliest call date. ASU2017-08 will be effective for fiscal years beginning after December 15, 2018, and interim periods within those fiscal years.
45
Notes to Financial Statements – continued
Management has evaluated the potential impacts of ASU2017-08 and believes that adoption of ASU2017-08 will not have a material effect on the fund’s overall financial position or its overall results of operations.
Balance Sheet Offsetting – The fund’s accounting policy with respect to balance sheet offsetting is that, absent an event of default by the counterparty or a termination of the agreement, the International Swaps and Derivatives Association (ISDA) Master Agreement, or similar agreement, does not result in an offset of reported amounts of financial assets and financial liabilities in the Statement of Assets and Liabilities across transactions between the fund and the applicable counterparty. The fund’s right to setoff may be restricted or prohibited by the bankruptcy or insolvency laws of the particular jurisdiction to which a specific master netting agreement counterparty is subject. Balance sheet offsetting disclosures, to the extent applicable to the fund, have been included in the fund’s Significant Accounting Policies note under the captions for each of the fund’sin-scope financial instruments and transactions.
Investment Valuations – Equity securities, including restricted equity securities, are generally valued at the last sale or official closing price on their primary market or exchange as provided by a third-party pricing service. Equity securities, for which there were no sales reported that day, are generally valued at the last quoted daily bid quotation on their primary market or exchange as provided by a third-party pricing service. Debt instruments and floating rate loans, including restricted debt instruments, are generally valued at an evaluated or composite bid as provided by a third-party pricing service. Short-term instruments with a maturity at issuance of 60 days or less may be valued at amortized cost, which approximates market value. Exchange-traded options are generally valued at the last sale or official closing price on their primary exchange as provided by a third-party pricing service. Exchange-traded options for which there were no sales reported that day are generally valued at the last daily bid quotation on their primary exchange as provided by a third-party pricing service. Options not traded on an exchange are generally valued at a broker/dealer bid quotation. Foreign currency options are generally valued at valuations provided by a third-party pricing service. Futures contracts are generally valued at last posted settlement price on their primary exchange as provided by a third-party pricing service. Futures contracts for which there were no trades that day for a particular position are generally valued at the closing bid quotation on their primary exchange as provided by a third-party pricing service. Forward foreign currency exchange contracts are generally valued at the mean of bid and asked prices for the time period interpolated from rates provided by a third-party pricing service for proximate time periods. Swap agreements are generally valued at valuations provided by a third-party pricing service, which for cleared swaps includes an evaluation of any trading activity at the clearinghouses.Open-end investment companies are generally valued at net asset value per share. Securities and other assets generally valued on the basis of information from athird-party pricing service may also be valued at a broker/dealer bid quotation. In determining values, third-party pricing services can utilize both transaction data and market information such as yield, quality, coupon rate, maturity, type of issue, trading characteristics, and other market data. The values of foreign securities and other assets and liabilities expressed in foreign currencies are converted to U.S. dollars using the mean of bid and asked prices for rates provided by a third-party pricing service.
46
Notes to Financial Statements – continued
The Board of Trustees has delegated primary responsibility for determining or causing to be determined the value of the fund’s investments (including any fair valuation) to the adviser pursuant to valuation policies and procedures approved by the Board. If the adviser determines that reliable market quotations are not readily available, investments are valued at fair value as determined in good faith by the adviser in accordance with such procedures under the oversight of the Board of Trustees. Under the fund’s valuation policies and procedures, market quotations are not considered to be readily available for most types of debt instruments and floating rate loans and many types of derivatives. These investments are generally valued at fair value based on information from third-party pricing services. In addition, investments may be valued at fair value if the adviser determines that an investment’s value has been materially affected by events occurring after the close of the exchange or market on which the investment is principally traded (such as foreign exchange or market) and prior to the determination of the fund’s net asset value, or after the halt of trading of a specific security where trading does not resume prior to the close of the exchange or market on which the security is principally traded. The adviser generally relies on third-party pricing services or other information (such as the correlation with price movements of similar securities in the same or other markets; the type, cost and investment characteristics of the security; the business and financial condition of the issuer; and trading and other market data) to assist in determining whether to fair value and at what value to fair value an investment. The value of an investment for purposes of calculating the fund’s net asset value can differ depending on the source and method used to determine value. When fair valuation is used, the value of an investment used to determine the fund’s net asset value may differ from quoted or published prices for the same investment. There can be no assurance that the fund could obtain the fair value assigned to an investment if it were to sell the investment at the same time at which the fund determines its net asset value per share.
Various inputs are used in determining the value of the fund’s assets or liabilities. These inputs are categorized into three broad levels. In certain cases, the inputs used to measure fair value may fall into different levels of the fair value hierarchy. In such cases, an investment’s level within the fair value hierarchy is based on the lowest level of input that is significant to the fair value measurement. The fund’s assessment of the significance of a particular input to the fair value measurement in its entirety requires judgment, and considers factors specific to the investment. Level 1 includes unadjusted quoted prices in active markets for identical assets or liabilities. Level 2 includes other significant observable market-based inputs (including quoted prices for similar securities, interest rates, prepayment speed, and credit risk). Level 3 includes unobservable inputs, which may include the adviser’s own assumptions in determining the fair value of investments. Other financial instruments are derivative instruments, such as futures contracts, forward foreign currency exchange contracts, swap
47
Notes to Financial Statements – continued
agreements, and written options. The following is a summary of the levels used as of October 31, 2019 in valuing the fund’s assets or liabilities:
| | | | | | | | | | | | | | | | |
| | | | |
| Financial Instruments | | Level 1 | | | Level 2 | | | Level 3 | | | Total | |
| Equity Securities: | | | | | | | | | | | | | | | | |
United States | | | $808 | | | | $124 | | | | $263,011 | | | | $263,943 | |
Mexico | | | — | | | | 225,775 | | | | — | | | | 225,775 | |
Canada | | | 161,711 | | | | — | | | | — | | | | 161,711 | |
| U.S. Treasury Bonds & U.S. Government Agencies & Equivalents | | | — | | | | 15,645,224 | | | | — | | | | 15,645,224 | |
| Non-U.S. Sovereign Debt | | | — | | | | 76,895,182 | | | | — | | | | 76,895,182 | |
| Municipal Bonds | | | — | | | | 964,181 | | | | — | | | | 964,181 | |
| U.S. Corporate Bonds | | | — | | | | 246,154,642 | | | | — | | | | 246,154,642 | |
| Residential Mortgage-Backed Securities | | | — | | | | 17,009,459 | | | | — | | | | 17,009,459 | |
| Commercial Mortgage-Backed Securities | | | — | | | | 9,068,744 | | | | — | | | | 9,068,744 | |
| Asset-Backed Securities (including CDOs) | | | — | | | | 8,170,423 | | | | — | | | | 8,170,423 | |
| Foreign Bonds | | | — | | | | 122,097,708 | | | | — | | | | 122,097,708 | |
| Floating Rate Loans | | | — | | | | 430,646 | | | | — | | | | 430,646 | |
| Mutual Funds | | | 15,258,936 | | | | — | | | | — | | | | 15,258,936 | |
| Total | | | $15,421,455 | | | | $496,662,108 | | | | $263,011 | | | | $512,346,574 | |
| | |
| Other Financial Instruments | | | | | | | |
| Futures Contracts – Assets | | | $1,104,634 | | | | $— | | | | $— | | | | $1,104,634 | |
| Futures Contracts – Liabilities | | | (57,862 | ) | | | — | | | | — | | | | (57,862 | ) |
| Forward Foreign Currency Exchange Contracts – Assets | | | — | | | | 9,855 | | | | — | | | | 9,855 | |
| Forward Foreign Currency Exchange Contracts – Liabilities | | | — | | | | (1,006,012 | ) | | | — | | | | (1,006,012 | ) |
| Swap Agreements – Assets | | | — | | | | 114,279 | | | | — | | | | 114,279 | |
| Written Options – Liabilities | | | — | | | | (1,187 | ) | | | — | | | | (1,187 | ) |
For further information regarding security characteristics, see the Portfolio of Investments.
The following is a reconciliation of level 3 assets for which significant unobservable inputs were used to determine fair value. The table presents the activity of level 3 securities held at the beginning and the end of the period.
| | | | |
| |
| | | Equity Securities | |
| Balance as of 10/31/18 | | | $462,498 | |
Change in unrealized appreciation or depreciation | | | (199,487 | ) |
| Balance as of 10/31/19 | | | $263,011 | |
The net change in unrealized appreciation or depreciation from investments held as level 3 at October 31, 2019 is $(199,487). At October 31, 2019, the fund held one level 3 security.
Foreign Currency Translation – Purchases and sales of foreign investments, income, and expenses are converted into U.S. dollars based upon currency exchange rates prevailing on the respective dates of such transactions or on the reporting date for foreign denominated receivables and payables. Gains and losses attributable to foreign currency exchange rates on sales of securities are recorded for financial statement
48
Notes to Financial Statements – continued
purposes as net realized gains and losses on investments. Gains and losses attributable to foreign exchange rate movements on receivables, payables, income and expenses are recorded for financial statement purposes as foreign currency transaction gains and losses. That portion of both realized and unrealized gains and losses on investments that results from fluctuations in foreign currency exchange rates is not separately disclosed.
Derivatives– The fund uses derivatives primarily to increase or decrease exposure to a particular market or segment of the market, or security, to increase or decrease interest rate or currency exposure, or as alternatives to direct investments. Derivatives are used for hedging ornon-hedging purposes. While hedging can reduce or eliminate losses, it can also reduce or eliminate gains. When the fund uses derivatives as an investment to increase market exposure, or for hedging purposes, gains and losses from derivative instruments may be substantially greater than the derivative’s original cost.
The derivative instruments used by the fund during the period were written options, purchased options, futures contracts, forward foreign currency exchange contracts, and swap agreements. Depending on the type of derivative, the fund may exit a derivative position by entering into an offsetting transaction with a counterparty or exchange, negotiating an agreement with the derivative counterparty, or novating the position to a third party. The fund may be unable to promptly close out a futures position in instances where the daily fluctuation in the price for that type of future exceeds the daily limit set by the exchange. The fund’s period end derivatives, as presented in the Portfolio of Investments and the associated Derivative Contract tables, generally are indicative of the volume of its derivative activity during the period.
The following table presents, by major type of derivative contract, the fair value, on a gross basis, of the asset and liability components of derivatives held by the fund at October 31, 2019 as reported in the Statement of Assets and Liabilities:
| | | | | | | | | | |
| | | | | Fair Value (a) | |
| | | |
| Risk | | Derivative Contracts | | Asset Derivatives | | | Liability Derivatives | |
| Interest Rate | | Interest Rate Futures | | | $1,104,634 | | | | $(57,862 | ) |
Credit | | Purchased Credit Options | | | 13,845 | | | | — | |
| Foreign Exchange | | Forward Foreign Currency Exchange Contracts | | | 9,855 | | | | (1,006,012 | ) |
| Credit | | Credit Default Swaps | | | 114,279 | | | | — | |
| Credit | | Written Credit Options | | | — | | | | (1,187 | ) |
| Total | | | | | $1,242,613 | | | | $(1,065,061 | ) |
| (a) | The value of purchased options outstanding is included in investments in unaffiliated issuers, at value, within the fund’s Statement of Assets and Liabilities. Values presented in this table for futures contracts correspond to the values reported in the fund’s Portfolio of Investments. Only the current day net variation margin for futures contracts is separately reported within the fund’s Statement of Assets and Liabilities. |
49
Notes to Financial Statements – continued
The following table presents, by major type of derivative contract, the realized gain (loss) on derivatives held by the fund for the year ended October 31, 2019 as reported in the Statement of Operations:
| | | | | | | | | | | | | | | | | | | | |
| | | | | |
| Risk | | Futures
Contracts | | | Swap
Agreements | | | Forward
Foreign
Currency
Exchange
Contracts | | | Unaffiliated
Issuers
(Purchased
Options) | | | Written
Options | |
| Interest Rate | | | $(6,878,794 | ) | | | $— | | | | $— | | | | $— | | | | $— | |
| Foreign Exchange | | | — | | | | — | | | | 3,977,097 | | | | — | | | | — | |
| Credit | | | — | | | | 9,944 | | | | — | | | | (265,695 | ) | | | 149,497 | |
| Total | | | $(6,878,794 | ) | | | $9,944 | | | | $3,977,097 | | | | $(265,695 | ) | | | $149,497 | |
The following table presents, by major type of derivative contract, the change in unrealized appreciation or depreciation on derivatives held by the fund for the year ended October 31, 2019 as reported in the Statement of Operations:
| | | | | | | | | | | | | | | | | | | | |
| | | | | |
| Risk | | Futures
Contracts | | | Swap
Agreements | | | Forward
Foreign
Currency
Exchange
Contracts | | | Unaffiliated
Issuers
(Purchased
Options) | | | Written
Options | |
| Interest Rate | | | $386,075 | | | | $— | | | | $— | | | | $— | | | | $— | |
| Foreign Exchange | | | — | | | | — | | | | (2,257,424 | ) | | | — | | | | — | |
| Credit | | | — | | | | 1,817 | | | | — | | | | 3,887 | | | | 2,481 | |
| Total | | | $386,075 | | | | $1,817 | | | | $(2,257,424 | ) | | | $3,887 | | | | $2,481 | |
Derivative counterparty credit risk is managed through formal evaluation of the creditworthiness of all potential counterparties. On certain, but not all, uncleared derivatives, the fund attempts to reduce its exposure to counterparty credit risk whenever possible by entering into an ISDA Master Agreement on a bilateral basis. The ISDA Master Agreement gives each party to the agreement the right to terminate all transactions traded under such agreement if there is a specified deterioration in the credit quality of the other party. Upon an event of default or a termination of the ISDA Master Agreement, thenon-defaulting party has the right to close out all transactions traded under such agreement and to net amounts owed under each agreement to one net amount payable by one party to the other. This right to close out and net payments across all transactions traded under the ISDA Master Agreement could result in a reduction of the fund’s credit risk to such counterparty equal to any amounts payable by the fund under the applicable transactions, if any.
Collateral and margin requirements differ by type of derivative. For cleared derivatives (e.g., futures contracts, cleared swaps, and exchange-traded options), margin requirements are set by the clearing broker and the clearing house and collateral, in the form of cash or securities, is posted by the fund directly with the clearing broker. Collateral terms are counterparty agreement specific for uncleared derivatives (e.g., forward foreign currency exchange contracts, uncleared swap agreements, and uncleared options) and collateral, in the form of cash and securities, is held in segregated accounts with the fund’s custodian in connection with these agreements. For derivatives traded under an ISDA Master Agreement, which contains a collateral support annex, the collateral requirements are netted across all transactions traded
50
Notes to Financial Statements – continued
under such counterparty-specific agreement and an amount is posted from one party to the other to collateralize such obligations. Cash that has been segregated or delivered to cover the fund’s collateral or margin obligations under derivative contracts, if any, will be reported separately in the Statement of Assets and Liabilities as restricted cash for uncleared derivatives and/or deposits with brokers for cleared derivatives. Securities pledged as collateral or margin for the same purpose, if any, are noted in the Portfolio of Investments. The fund may be required to make payments of interest on uncovered collateral or margin obligations with the broker. Any such payments are included in “Interest expense and fees” in the Statement of Operations.
Written Options– In exchange for a premium, the fund wrote put options on securities for which it anticipated the price would increase. At the time the option was written, the fund believed the premium received exceeded the potential loss that could result from adverse price changes in the options’ underlying securities. In a written option, the fund as the option writer grants the buyer the right to purchase from, or sell to, the fund a specified number of shares or units of a particular security, currency or index at a specified price within a specified period of time.
The premium received is initially recorded as a liability in the Statement of Assets and Liabilities. The option is subsequentlymarked-to-market daily with the difference between the premium received and the market value of the written option being recorded as unrealized appreciation or depreciation. When a written option expires, the fund realizes a gain equal to the amount of the premium received. The difference between the premium received and the amount paid on effecting a closing transaction is considered a realized gain or loss. When a written put option is exercised, the premium reduces the cost basis of the security purchased by the fund.
At the initiation of the written option contract, for exchange traded options, the fund is required to deposit securities or cash as collateral with the custodian for the benefit of the broker or directly with the clearing broker, based on the type of option. For uncleared options, the fund may post collateral subject to the terms of an ISDA Master Agreement as generally described above if the market value of the options contract moves against it. The fund, as writer of an option, may have no control over whether the underlying securities may be sold (call) or purchased (put) and, as a result, bears the market risk of an unfavorable change in the price of the securities underlying the written option. Losses from writing options can exceed the premium received and can exceed the potential loss from an ordinary buy and sell transaction. Although the fund’s market risk may be significant, the maximum counterparty credit risk to the fund is equal to the market value of any collateral posted to the broker. For uncleared options, this risk is mitigated in cases where there is an ISDA Master Agreement between the fund and the counterparty providing for netting as described above.
Purchased Options– The fund purchased call and put options for a premium. Purchased call and put options entitle the holder to buy and sell a specified number of shares or units of a particular security, currency or index at a specified price at a specified date or within a specified period of time. Purchasing call options may hedge against an anticipated increase in the dollar cost of securities or currency to be acquired or increase the fund’s exposure to an underlying instrument. Purchasing put options may hedge against an anticipated decline in the value of portfolio securities or currency or decrease the fund’s exposure to an underlying instrument.
51
Notes to Financial Statements – continued
The premium paid is initially recorded as an investment in the Statement of Assets and Liabilities. That investment is subsequentlymarked-to-market daily with the difference between the premium paid and the market value of the purchased option being recorded as unrealized appreciation or depreciation. Premiums paid for purchased call and put options which have expired are treated as realized losses on investments in the Statement of Operations. Upon the exercise or closing of a purchased call option, the premium paid is added to the cost of the security or financial instrument purchased. Upon the exercise or closing of a purchased put option, the premium paid is offset against the proceeds on the sale of the underlying security or financial instrument in order to determine the realized gain or loss on investments.
Whether or not the option is exercised, the fund’s maximum risk of loss from purchasing an option is the amount of premium paid. All option contracts involve credit risk if the counterparty to the option contract fails to perform. For uncleared options, this risk is mitigated in cases where there is an ISDA Master Agreement between the fund and the counterparty providing for netting as described above and, where applicable, by the posting of collateral by the counterparty to the fund to cover the fund’s exposure to the counterparty under such ISDA Master Agreement.
Futures Contracts– The fund entered into futures contracts which may be used to hedge against or obtain broad market exposure, interest rate exposure, currency exposure, or to manage duration. A futures contract represents a commitment for the future purchase or sale of an asset at a specified price on a specified date.
Upon entering into a futures contract, the fund is required to deposit with the broker, either in cash or securities, an initial margin in an amount equal to a specified percentage of the notional amount of the contract. Subsequent payments (variation margin) are made or received by the fund each day, depending on the daily fluctuations in the value of the contract, and are recorded for financial statement purposes as unrealized gain or loss by the fund until the contract is closed or expires at which point the gain or loss on futures contracts is realized.
The fund bears the risk of interest rates, exchange rates or securities prices moving unexpectedly, in which case, the fund may not achieve the anticipated benefits of the futures contracts and may realize a loss. While futures contracts may present less counterparty risk to the fund since the contracts are exchange traded and the exchange’s clearinghouse guarantees payments to the broker, there is still counterparty credit risk due to the insolvency of the broker. The fund’s maximum risk of loss due to counterparty credit risk is equal to the margin posted by the fund to the broker plus any gains or minus any losses on the outstanding futures contracts.
Forward Foreign Currency Exchange Contracts– The fund entered into forward foreign currency exchange contracts for the purchase or sale of a specific foreign currency at a fixed price on a future date. These contracts may be used to hedge the fund’s currency risk or fornon-hedging purposes. For hedging purposes, the fund may enter into contracts to deliver or receive foreign currency that the fund will receive from or use in its normal investment activities. The fund may also use contracts to hedge against declines in the value of foreign currency denominated securities due to unfavorable exchange rate movements. Fornon-hedging purposes, the fund may enter
52
Notes to Financial Statements – continued
into contracts with the intent of changing the relative exposure of the fund’s portfolio of securities to different currencies to take advantage of anticipated exchange rate changes.
Forward foreign currency exchange contracts are adjusted by the daily exchange rate of the underlying currency and any unrealized gains or losses are recorded as a receivable or payable for forward foreign currency exchange contracts until the contract settlement date. On contract settlement date, any gain or loss on the contract is recorded as realized gains or losses on forward foreign currency exchange contracts.
Risks may arise upon entering into these contracts from unanticipated movements in the value of the contract and from the potential inability of counterparties to meet the terms of their contracts. Generally, the fund’s maximum risk due to counterparty credit risk is the unrealized gain on the contract due to the use of Continuous Linked Settlement, a multicurrency cash settlement system for the centralized settlement of foreign transactions. This risk is mitigated in cases where there is an ISDA Master Agreement between the fund and the counterparty providing for netting as described above and, where applicable, by the posting of collateral by the counterparty to the fund to cover the fund’s exposure to the counterparty under such ISDA Master Agreement.
Swap Agreements– During the period the fund entered into swap agreements. Swap agreements generally involve a periodic exchange of cash payments on a net basis, at specified intervals or upon the occurrence of specified events, between the fund and a counterparty. Certain swap agreements may be entered into as a bilateral contract (“uncleared swaps”) while others are required to be centrally cleared (“cleared swaps”). In a cleared swap transaction, the ultimate counterparty to the transaction is a clearinghouse (the “clearinghouse”). The contract is transferred and accepted by the clearinghouse immediately following execution of the swap contract with an executing broker. Thereafter, throughout the term of the cleared swap, the fund interfaces indirectly with the clearinghouse through a clearing broker and has counterparty risk to the clearing broker as well.
Both cleared and uncleared swap agreements are marked to market daily. The value of uncleared swap agreements is reported in the Statement of Assets and Liabilities as “Uncleared swaps, at value” which includes any related interest accruals to be paid or received by the fund. For cleared swaps, payments (variation margin) are made or received by the fund each day, depending on the daily fluctuations in the value of the cleared swap, such that only the current day net receivable or payable for variation margin is reported in the Statement of Assets and Liabilities.
For both cleared and uncleared swaps, the periodic exchange of net cash payments, at specified intervals or upon the occurrence of specified events as stipulated by the agreement, is recorded as realized gain or loss on swap agreements in the Statement of Operations. Premiums paid or received at the inception of the agreements are amortized using the effective interest method over the term of the agreement as realized gain or loss on swap agreements in the Statement of Operations. A liquidation payment received or made upon early termination is recorded as a realized gain or loss on swap agreements in the Statement of Operations. The change in unrealized appreciation or depreciation on swap agreements in the Statement of Operations
53
Notes to Financial Statements – continued
reflects the aggregate change over the reporting period in the value of swaps net of any unamortized premiums paid or received.
Risks related to swap agreements include the possible lack of a liquid market, unfavorable market and interest rate movements of the underlying instrument and the failure of the counterparty to perform under the terms of the agreements. The fund’s maximum risk of loss from counterparty credit risk is the discounted net value of the cash flows to be received from/paid to the counterparty over the contract’s remaining life, to the extent that the amount is positive. To address counterparty risk, uncleared swap agreements are limited to only highly-rated counterparties. Risk is further reduced by having an ISDA Master Agreement between the fund and the counterparty providing for netting as described above and, where applicable, by the posting of collateral by the counterparty to the fund to cover the fund’s exposure to the counterparty under such ISDA Master Agreement. The fund’s counterparty risk due to cleared swaps is mitigated by the fact that the clearinghouse is the true counterparty to the transaction and the regulatory requirement safeguards in the event of a clearing broker bankruptcy.
The fund entered into credit default swap agreements in order to manage its exposure to the market or certain sectors of the market, to reduce its credit risk exposure to defaults of corporate and sovereign issuers or to create exposure to corporate or sovereign issuers to which it is not otherwise exposed. In a credit default swap agreement, the protection buyer can make an upfront payment and will make a stream of payments to the protection seller based on a fixed percentage applied to the agreement notional amount in exchange for the right to receive a specified return upon the occurrence of a defined credit event on the reference obligation (which may be either a single security or a basket of securities issued by corporate or sovereign issuers) and, with respect to the cases where physical settlement applies, the delivery by the buyer to the seller of a defined deliverable obligation. Although agreement-specific, credit events generally consist of a combination of the following: bankruptcy, failure to pay, restructuring, obligation acceleration, obligation default, or repudiation/moratorium, each as defined in the 2003 ISDA Credit Derivatives Definitions as amended by the relevant agreement. Restructuring is generally not applicable when the reference obligation is issued by a North American corporation and obligation acceleration, obligation default, or repudiation/moratorium are generally only applicable when the reference obligation is issued by a sovereign entity or an entity in an emerging country. Upon determination of the final price for the deliverable obligation (or upon delivery of the deliverable obligation in the case of physical settlement), the difference between the value of the deliverable obligation and the swap agreement’s notional amount is recorded as realized gain or loss on swap agreements in the Statement of Operations.
Credit default swap agreements are considered to have credit-risk-related contingent features since they trigger payment by the protection seller to the protection buyer upon the occurrence of a defined credit event. The maximum amount of future, undiscounted payments that the fund, as protection seller, could be required to make is equal to the swap agreement’s notional amount. The protection seller’s payment obligation would be offset to the extent of the value of the agreement’s deliverable obligation. At October 31, 2019, the fund did not hold any credit default swap
54
Notes to Financial Statements – continued
agreements at an unrealized loss where it is the protection seller. The fund’s maximum risk of loss from counterparty risk, either as the protection seller or as the protection buyer, is the fair value of the agreement.
Loans and Other Direct Debt Instruments– The fund invests in loans and loan participations or other receivables. These investments may include standby financing commitments, including revolving credit facilities, which contractually obligate the fund to supply additional cash to the borrower on demand. The fund generally provides this financial support in order to preserve its existing investment or to obtain a more senior secured interest in the assets of the borrower. Loan participations involve a risk of insolvency of the lending bank or other financial intermediary.
Statement of Cash Flows– Information on financial transactions which have been settled through the receipt or disbursement of cash or restricted cash is presented in the Statement of Cash Flows. Cash as presented in the fund’s Statement of Assets and Liabilities includes cash on hand at the fund’s custodian bank and does not include any short-term investments. Restricted cash is presented in the fund’s Statement of Assets and Liabilities as restricted cash for uncleared derivatives and/or deposits with brokers for cleared derivatives and represents cash that has been segregated or delivered to cover the fund’s collateral or margin obligations under derivative contracts.
The following table provides a reconciliation of cash and restricted cash reported within the Statement of Assets and Liabilities with that shown in the Statement of Cash Flows:
| | | | |
| |
| | | 10/31/19 | |
| Cash | | | $13,620 | |
| Restricted cash | | | 710,000 | |
| Restricted cash included in deposits with brokers | | | — | |
| Total cash and restricted cash in the Statement of Cash Flows | | | $723,620 | |
The beginning of period cash and restricted cash balance in the Statement of Cash Flows is comprised of cash of $1,838,530, restricted cash of $0, and restricted cash included in deposits with brokers of $0.
Indemnifications– Under the fund’s organizational documents, its officers and Trustees may be indemnified against certain liabilities and expenses arising out of the performance of their duties to the fund. Additionally, in the normal course of business, the fund enters into agreements with service providers that may contain indemnification clauses. The fund’s maximum exposure under these agreements is unknown as this would involve future claims that may be made against the fund that have not yet occurred.
Investment Transactions and Income– Investment transactions are recorded on the trade date. Interest income is recorded on the accrual basis. All premium and discount is amortized or accreted for financial statement purposes in accordance with U.S. generally accepted accounting principles. The fund earns certain fees in connection with its floating rate loan purchasing activities. These fees are in addition to interest payments earned and may include amendment fees, commitment fees, facility fees, consent fees, and prepayment fees. Commitment fees are recorded on an accrual basis as income in the accompanying financial statements. Dividends received in cash are recorded on theex-dividend date. Certain dividends from foreign securities will be
55
Notes to Financial Statements – continued
recorded when the fund is informed of the dividend if such information is obtained subsequent to theex-dividend date. Dividend and interest payments received in additional securities are recorded on theex-dividend orex-interest date in an amount equal to the value of the security on such date. Debt obligations may be placed onnon-accrual status or set to accrue at a rate of interest less than the contractual coupon when the collection of all or a portion of interest has become doubtful. Interest income for those debt obligations may be further reduced by thewrite-off of the related interest receivables when deemed uncollectible.
The fund may receive proceeds from litigation settlements. Any proceeds received from litigation involving portfolio holdings are reflected in the Statement of Operations in realized gain/loss if the security has been disposed of by the fund or in unrealized gain/loss if the security is still held by the fund. Any other proceeds from litigation not related to portfolio holdings are reflected as other income in the Statement of Operations.
Tax Matters and Distributions– The fund intends to qualify as a regulated investment company, as defined under Subchapter M of the Internal Revenue Code, and to distribute all of its taxable income, including realized capital gains. As a result, no provision for federal income tax is required. The fund’s federal tax returns, when filed, will remain subject to examination by the Internal Revenue Service for a three year period. Management has analyzed the fund’s tax positions taken on federal and state tax returns for all open tax years and does not believe that there are any uncertain tax positions that require recognition of a tax liability. Foreign taxes, if any, have been accrued by the fund in the accompanying financial statements in accordance with the applicable foreign tax law. Foreign income taxes may be withheld by certain countries in which the fund invests. Additionally, capital gains realized by the fund on securities issued in or by certain foreign countries may be subject to capital gains tax imposed by those countries.
Distributions to shareholders are recorded on theex-dividend date. The fund seeks to pay monthly distributions based on an annual rate of 8.00% of the fund’s average monthly net asset value. As a result, distributions may exceed actual earnings which may result in a tax return of capital. Income and capital gain distributions are determined in accordance with income tax regulations, which may differ from U.S. generally accepted accounting principles. Certain capital accounts in the financial statements are periodically adjusted for permanent differences in order to reflect their tax character. These adjustments have no impact on net assets or net asset value per share. Temporary differences which arise from recognizing certain items of income, expense, gain or loss in different periods for financial statement and tax purposes will reverse at some time in the future.
Book/tax differences primarily relate to amortization and accretion of debt securities, straddle loss deferrals, and derivative transactions.
56
Notes to Financial Statements – continued
The tax character of distributions declared to shareholders for the last two fiscal years is as follows:
| | | | | | | | |
| | |
| | | Year ended
10/31/19 | | | Year ended
10/31/18 | |
| Ordinary income (including any short-term capital gains) | | | $18,671,582 | | | | $20,316,659 | |
| Tax return of capital (b) | | | 13,664,509 | | | | 14,918,250 | |
| | |
| Total distributions | | | $32,336,091 | | | | $35,234,909 | |
| (b) | Distributions in excess of tax basis earnings and profits are reported in the financial statements as a tax return of capital. |
The federal tax cost and the tax basis components of distributable earnings were as follows:
| | | | |
| |
| As of 10/31/19 | | | |
| |
| Cost of investments | | | $499,621,151 | |
| Gross appreciation | | | 22,148,095 | |
| |
| Gross depreciation | | | (9,258,965 | ) |
| Net unrealized appreciation (depreciation) | | | $12,889,130 | |
| |
| Capital loss carryforwards | | | (20,196,422 | ) |
| Other temporary differences | | | (254,599 | ) |
As of October 31, 2019, the fund had capital loss carryforwards available to offset future realized gains. These net capital losses may be carried forward indefinitely and their character is retained as short-term and/or long-term losses. Such losses are characterized as follows:
| | | | |
| Short-Term | | | $(1,981,466 | ) |
| Long-Term | | | (18,214,956 | ) |
| Total | | | $(20,196,422 | ) |
(3) Transactions with Affiliates
Investment Adviser– The fund has an investment advisory agreement with MFS to provide overall investment management and related administrative services and facilities to the fund. The management fee is computed daily and paid monthly at an annual rate of 0.34% of the fund’s average daily net assets and 5.40% of gross income. Gross income is calculated based on tax elections that generally include the accretion of discount and exclude the amortization of premium, which may differ from investment income reported in the Statement of Operations. The management fee, from net assets and gross income, incurred for the year ended October 31, 2019 was equivalent to an annual effective rate of 0.68% of the fund’s average daily net assets.
Transfer Agent– The fund engages Computershare Trust Company, N.A. (“Computershare”) as the sole transfer agent for the fund. MFS Service Center, Inc. (MFSC) monitors and supervises the activities of Computershare for an agreed upon fee approved by the Board of Trustees. For the year ended October 31, 2019, these fees paid to MFSC amounted to $32,455.
57
Notes to Financial Statements – continued
Administrator– MFS provides certain financial, legal, shareholder communications, compliance, and other administrative services to the fund. Under an administrative services agreement, the fund reimburses MFS the costs incurred to provide these services. The fund is charged an annual fixed amount of $17,500 plus a fee based on average daily net assets. The administrative services fee incurred for the year ended October 31, 2019 was equivalent to an annual effective rate of 0.0160% of the fund’s average daily net assets.
Trustees’ and Officers’ Compensation– The fund pays compensation to independent Trustees in the form of a retainer, attendance fees, and additional compensation to Board and Committee chairpersons. The fund does not pay compensation directly to Trustees or officers of the fund who are also officers of the investment adviser, all of whom receive remuneration from MFS for their services to the fund. Certain officers and Trustees of the fund are officers or directors of MFS and MFSC.
Prior to December 31, 2001, the fund had an unfunded defined benefit plan (“DB plan”) for independent Trustees. As of December 31, 2001, the Board took action to terminate the DB plan with respect to then-current and any future independent Trustees, such that the DB plan covers only certain of those former independent Trustees who retired on or before December 31, 2001. Effective January 1, 2002, accrued benefits under the DB plan for then-current independent Trustees who continued were credited to an unfunded retirement deferral plan (the “Retirement Deferral plan”), which was established for and exists solely with respect to these credited amounts, and is not available for other deferrals by these or other independent Trustees. Although the Retirement Deferral plan is unfunded, amounts deferred under the plan are periodically adjusted for investment experience as if they had been invested in shares of the fund. The DB plan resulted in a pension expense of $2,622 and the Retirement Deferral plan, which terminated on December 31, 2018, resulted in a net decrease in expense of $911. Both amounts are included in “Independent Trustees’ compensation” in the Statement of Operations for the year ended October 31, 2019. The liability for deferred retirement benefits payable to those former independent Trustees under the DB Plan amounted to $10,302 at October 31, 2019, and is included in “Payable for independent Trustees’ compensation” in the Statement of Assets and Liabilities.
Other– This fund and certain other funds managed by MFS (the funds) had entered into a service agreement (the ISO Agreement) which provided for payment of fees solely by the funds to Tarantino LLC in return for the provision of services of an Independent Senior Officer (ISO) for the funds. Frank L. Tarantino served as the ISO and was an officer of the funds and the sole member of Tarantino LLC. Effective June 30, 2019, Mr. Tarantino retired from his position as ISO for the funds, and the ISO Agreement was terminated. For the year ended October 31, 2019, the fee paid by the fund under this agreement was $601 and is included in “Miscellaneous” expense in the Statement of Operations. MFS had agreed to bear all expenses associated with office space, other administrative support, and supplies provided to the ISO.
The fund invests in the MFS Institutional Money Market Portfolio which is managed by MFS and seeks current income consistent with preservation of capital and liquidity. This money market fund does not pay a management fee to MFS.
58
Notes to Financial Statements – continued
(4) Portfolio Securities
For the year ended October 31, 2019, purchases and sales of investments, other than purchased option transactions and short-term obligations, were as follows:
| | | | | | | | |
| | |
| | | Purchases | | | Sales | |
| U.S. Government securities | | | $56,240,970 | | | | $96,502,141 | |
| Non-U.S. Government securities | | | $263,311,991 | | | | $258,292,319 | |
(5) Shares of Beneficial Interest
The fund’s Declaration of Trust permits the Trustees to issue an unlimited number of full and fractional shares of beneficial interest. The Trustees have authorized the repurchase by the fund of up to 10% annually of its own shares of beneficial interest. The fund repurchased 3,218,293 shares of beneficial interest during the year ended October 31, 2019 at an average price per share of $5.64 and a weighted average discount of 8.64% per share. The fund repurchased 3,490,222 shares of beneficial interest during the year ended October 31, 2018 at an average price per share of $5.82 and a weighted average discount of 9.08% per share. Transactions in fund shares were as follows:
| | | | | | | | | | | | | | | | |
| | | Year ended
10/31/19 | | | Year ended
10/31/18 | |
| | | | |
| | | Shares | | | Amount | | | Shares | | | Amount | |
| Capital shares reacquired | | | (3,218,293 | ) | | | $(18,139,266 | ) | | | (3,490,222 | ) | | | $(20,317,818 | ) |
(6) Loan Agreement
The fund has a credit agreement with a bank for a revolving secured line of credit that can be drawn upon up to $100,000,000. At October 31, 2019, the fund had outstanding borrowings under this agreement in the amount of $100,000,000, which are secured by a lien on the fund’s assets. The loan’s carrying value in the fund’s Statement of Assets and Liabilities approximates its fair value. The loan value as of the reporting date is considered level 2 under the fair value hierarchy. The credit agreement matures on August 19, 2020. Borrowings under the agreement can be made for liquidity or leverage purposes. Interest is charged at a rate per annum equal to LIBOR plus an agreed upon spread with the option to choose LIBOR periods of overnight, 1, 2, 3, or 6 months, or at the option of the borrower an alternate base rate plus an agreed upon spread. The fund incurred interest expense of $2,885,214 during the period, which is included in “Interest expense and fees” in the Statement of Operations. The fund may also be charged a commitment fee based on the average daily unused portion of the line of credit. The fund did not incur a commitment fee during the period. For the year ended October 31, 2019, the average loan balance was $100,000,000 at a weighted average annual interest rate of 2.89%. The fund is subject to certain covenants including, but not limited to, requirements with respect to asset coverage, portfolio diversification and liquidity.
59
Notes to Financial Statements – continued
(7) Investments in Affiliated Issuers
An affiliated issuer may be considered one in which the fund owns 5% or more of the outstanding voting securities, or a company which is under common control. For the purposes of this report, the following were affiliated issuers:
| | | | | | | | | | | | | | | | | | | | | | | | |
| | | | | | |
| Affiliated Issuers | | Beginning
Value | | | Purchases | | | Sales Proceeds | | | Realized
Gain
(Loss) | | | Change in
Unrealized
Appreciation or
Depreciation | | | Ending Value | |
| MFS Institutional Money Market Portfolio | | | $7,352,696 | | | | $147,818,418 | | | | $139,913,751 | | | | $38 | | | | $1,535 | | | | $15,258,936 | |
| | | | | | |
| Affiliated Issuers | | | | | | | | | | | | | | Dividend
Income | | | Capital Gain
Distributions | |
| MFS Institutional Money Market Portfolio | | | | | | | | | | | | $171,756 | | | | $— | |
60
REPORT OF INDEPENDENT REGISTERED PUBLIC ACCOUNTING FIRM
To the Shareholders and the Board of Trustees of MFS Multimarket Income Trust
Opinion on the Financial Statements
We have audited the accompanying statement of assets and liabilities of MFS Multimarket Income Trust (the “Fund”), including the portfolio of investments, as of October 31, 2019,and the related statements of operations and cash flows for the year then ended, the statements of changes in net assets for each of the two years in the period then ended, the financial highlights for each of the five years in the period then ended and the related notes (collectively referred to as the “financial statements”). In our opinion, the financial statements present fairly, in all material respects, the financial position of the Fund at October 31, 2019, the results of its operations and its cash flows for the year then ended, the changes in its net assets for each of the two years in the period then ended and its financial highlights for each of the five years in the period then ended, in conformity with U.S. generally accepted accounting principles.
Basis for Opinion
These financial statements are the responsibility of the Fund’s management. Our responsibility is to express an opinion on the Fund’s financial statements based on our audits. We are a public accounting firm registered with the Public Company Accounting Oversight Board (United States) (“PCAOB”) and are required to be independent with respect to the Fund in accordance with the U.S. federal securities laws and the applicable rules and regulations of the Securities and Exchange Commission and the PCAOB.
We conducted our audits in accordance with the standards of the PCAOB. Those standards require that we plan and perform the audit to obtain reasonable assurance about whether the financial statements are free of material misstatement, whether due to error or fraud. The Fund is not required to have, nor were we engaged to perform, an audit of the Fund’s internal control over financial reporting. As part of our audits, we are required to obtain an understanding of internal control over financial reporting but not for the purpose of expressing an opinion on the effectiveness of the Fund’s internal control over financial reporting. Accordingly, we express no such opinion.
Our audits included performing procedures to assess the risks of material misstatement of the financial statements, whether due to error or fraud, and performing procedures that respond to those risks. Such procedures included examining, on a test basis, evidence regarding the amounts and disclosures in the financial statements. Our procedures included confirmation of securities owned as of October 31, 2019,by correspondence with the custodian andothers or by other appropriate auditing procedures where replies from others were not received. Our audits also included
61
Report of Independent Registered Public Accounting Firm – continued
evaluating the accounting principles used and significant estimates made by management, as well as evaluating the overall presentation of the financial statements. We believe that our audits provide a reasonable basis for our opinion.

We have served as the auditor of one or more MFS investment companies since 1993.
Boston, Massachusetts
December 16, 2019
62
RESULTS OF SHAREHOLDER MEETING
(unaudited)
At the annual meeting of shareholders of MFS Multimarket Income Trust, which was held on October 3, 2019, the following action was taken:
Item 1: To elect the following individuals as Trustees:
| | | | | | | | |
| | | Number of Shares | |
Nominee | | For | | | Withheld Authority | |
| Maureen R. Goldfarb | | | 51,725,053.006 | | | | 1,136,292.443 | |
| Robert J. Manning | | | 51,838,644.309 | | | | 1,022,701.140 | |
| Maryanne L. Roepke | | | 45,879,876.223 | | | | 6,981,469.226 | |
| Laurie J. Thomsen | | | 51,702,386.006 | | | | 1,158,959.443 | |
63
TRUSTEES AND OFFICERS — IDENTIFICATION AND BACKGROUND
The Trustees and Officers of the Trust, as of December 1, 2019, are listed below, together with their principal occupations during the past five years. (Their titles may have varied during that period.) The address of each Trustee and Officer is 111 Huntington Avenue, Boston, Massachusetts 02199-7618.
| | | | | | | | | | | | |
Name, Age | | Position(s)
Held with Fund | | Trustee/
Officer Since (h) | | Term Expiring | | Number
of MFS
Funds
overseen
by the
Trustee | | Principal
Occupations During the Past Five Years | | Other Directorships
During the Past Five Years (j) |
| INTERESTED TRUSTEES |
Robert J. Manning (k) (age 56) | | Trustee | | February 2004 | | 2022 | | 133 | | Massachusetts Financial Services Company, Executive Chairman (since January 2017); Director; Chairman of the Board; Chief Executive Officer (until 2015);Co-Chief Executive Officer (2015-2016) | | N/A |
| | | | | | |
Robin A. Stelmach (k) (age 58) | | Trustee | | January 2014 | | 2021 | | 133 | | Massachusetts Financial Services Company, Vice Chair (since January 2017); Chief Operating Officer and Executive Vice President (until January 2017) | | N/A |
| INDEPENDENT TRUSTEES |
John P. Kavanaugh (age 65) | | Trustee and Chair of Trustees | | January 2009 | | 2020 | | 133 | | Private investor | | N/A |
| | | | | | |
Steven E. Buller (age 68) | | Trustee | | February 2014 | | 2020 | | 133 | | Financial Accounting Standards Advisory Council, Chairman (2014-2015); Public Company Accounting Oversight Board, Standing Advisory Group, Member (until 2014); BlackRock, Inc. (investment management), Managing Director (until 2014), BlackRock Finco UK (investment management), Director (until 2014) | | N/A |
64
Trustees and Officers – continued
| | | | | | | | | | | | |
Name, Age | | Position(s)
Held with Fund | | Trustee/
Officer Since (h) | | Term Expiring | | Number
of MFS
Funds
overseen
by the
Trustee | | Principal
Occupations During the Past Five Years | | Other Directorships
During the Past Five Years (j) |
John A. Caroselli (age 65) | | Trustee | | March 2017 | | 2021 | | 133 | | JC Global Advisors, LLC (management consulting), President (since 2015); First Capital Corporation (commercial finance), Executive Vice President (until 2015) | | N/A |
| | | | | | |
Maureen R. Goldfarb (age 64) | | Trustee | | January 2009 | | 2022 | | 133 | | Private investor | | N/A |
| | | | | | |
Michael Hegarty* (age 74) | | Trustee | | December 2004 | | 2020 | | 133 | | Private investor | | Rouse Properties Inc., Director (until 2016); Capmark Financial Group Inc., Director (until 2015) |
| | | | | | |
Peter D. Jones (age 64) | | Trustee | | January 2019 | | 2020 | | 133 | | Franklin Templeton Distributors, Inc. (investment management), President (until 2015); Franklin Templeton Institutional, LLC (investment management), Chairman (until 2015) | | N/A |
| | | | | | |
James W. Kilman, Jr. (age 58) | | Trustee | | January 2019 | | 2021 | | 133 | | Burford Capital Limited (finance and investment management), Chief Financial Officer (since 2019); KielStrand Capital LLC (family office and merchant bank), Chief Executive Officer (since 2016); Morgan Stanley & Co. (financial services), Vice Chairman of Investment Banking,Co-Head of Diversified Financials Coverage – Financial Institutions Investment Banking Group (until 2016) | | Alpha-En Corporation, Director (since 2016) |
65
Trustees and Officers – continued
| | | | | | | | | | | | |
Name, Age | | Position(s)
Held with Fund | | Trustee/
Officer Since (h) | | Term Expiring | | Number
of MFS
Funds
overseen
by the
Trustee | | Principal
Occupations During the Past Five Years | | Other Directorships
During the Past Five Years (j) |
Clarence Otis, Jr. (age 63) | | Trustee | | March 2017 | | 2021 | | 133 | | Darden Restaurants, Inc., Chief Executive Officer (until 2014) | | VF Corporation, Director; Verizon Communications, Inc., Director; The Travelers Companies, Director; Federal Reserve Bank of Atlanta, Director (until 2015) |
| | | | | | |
Maryanne L. Roepke (age 63) | | Trustee | | May 2014 | | 2022 | | 133 | | American Century Investments (investment management), Senior Vice President and Chief Compliance Officer (until 2014) | | N/A |
| | | | | | |
Laurie J. Thomsen (age 62) | | Trustee | | March 2005 | | 2022 | | 133 | | Private investor | | The Travelers Companies, Director; Dycom Industries, Inc., Director (since 2015) |
| | | | | | | | | | |
Name, Age | | Position(s)
Held with Fund | | Trustee/Officer Since (h) | | Term Expiring | | Number of
MFS Funds
for which
the Person is
an Officer | | Principal
Occupations During the Past Five Years |
| OFFICERS |
Christopher R. Bohane (k) (age 45) | | Assistant Secretary and Assistant Clerk | | July 2005 | | N/A | | 133 | | Massachusetts Financial Services Company, Vice President and Assistant General Counsel |
| | | | | |
Kino Clark (k) (age 51) | | Assistant Treasurer | | January 2012 | | N/A | | 133 | | Massachusetts Financial Services Company, Vice President |
| | | | | |
John W. Clark, Jr. (k) (age 52) | | Assistant Treasurer | | April 2017 | | N/A | | 133 | | Massachusetts Financial Services Company, Vice President (since March 2017); Deutsche Bank (financial services), Department Head – Treasurer’s Office (until February 2017) |
66
Trustees and Officers – continued
| | | | | | | | | | |
Name, Age | | Position(s)
Held with Fund | | Trustee/Officer Since (h) | | Term Expiring | | Number of
MFS Funds
for which
the Person is
an Officer | | Principal
Occupations During the Past Five Years |
Thomas H. Connors (k) (age 60) | | Assistant Secretary and Assistant Clerk | | September 2012 | | N/A | | 133 | | Massachusetts Financial Services Company, Vice President and Senior Counsel |
| | | | | |
David L. DiLorenzo (k) (age 51) | | President | | July 2005 | | N/A | | 133 | | Massachusetts Financial Services Company, Senior Vice President |
| | | | | |
Heidi W. Hardin (k) (age 52) | | Secretary and Clerk | | April 2017 | | N/A | | 133 | | Massachusetts Financial Services Company, Executive Vice President and General Counsel (since March 2017); Harris Associates (investment management), General Counsel (from September 2015 to January 2017); Janus Capital Management LLC (investment management), Senior Vice President and General Counsel (until September 2015) |
| | | | | |
Brian E. Langenfeld (k) (age 46) | | Assistant Secretary and Assistant Clerk | | June 2006 | | N/A | | 133 | | Massachusetts Financial Services Company, Vice President and Senior Counsel |
| | | | | |
Amanda S. Mooradian (k) (age 40) | | Assistant Secretary and Assistant Clerk | | September 2018 | | N/A | | 133 | | Massachusetts Financial Services Company, Assistant Vice President and Counsel |
| | | | | |
Susan A. Pereira (k) (age 49) | | Assistant Secretary and Assistant Clerk | | July 2005 | | N/A | | 133 | | Massachusetts Financial Services Company, Vice President and Assistant General Counsel |
| | | | | |
Kasey L. Phillips (k) (age 48) | | Assistant Treasurer | | September 2012 | | N/A | | 133 | | Massachusetts Financial Services Company, Vice President |
| | | | | |
Matthew A. Stowe (k) (age 45) | | Assistant Secretary and Assistant Clerk | | October 2014 | | N/A | | 133 | | Massachusetts Financial Services Company, Vice President and Assistant General Counsel |
67
Trustees and Officers – continued
| | | | | | | | | | |
Name, Age | | Position(s)
Held with Fund | | Trustee/Officer Since (h) | | Term Expiring | | Number of
MFS Funds
for which
the Person is
an Officer | | Principal
Occupations During the Past Five Years |
Martin J. Wolin (k) (age 52) | | Chief Compliance Officer | | July 2015 | | N/A | | 133 | | Massachusetts Financial Services Company, Senior Vice President and Chief Compliance Officer (since July 2015); Mercer (financial service provider), Chief Risk and Compliance Officer, North America and Latin America (until June 2015) |
| | | | | |
James O. Yost (k) (age 58) | | Treasurer | | September 1990 | | N/A | | 133 | | Massachusetts Financial Services Company, Senior Vice President |
| (h) | Date first appointed to serve as Trustee/officer of an MFS Fund. Each Trustee has served continuously since appointment unless indicated otherwise. For the period from December 15, 2004 until February 22, 2005, Mr. Manning served as Advisory Trustee. From January 2012 through December 2016, Messrs. DiLorenzo and Yost served as Treasurer and Deputy Treasurer of the Funds, respectively. |
| (j) | Directorships or trusteeships of companies required to report to the Securities and Exchange Commission (i.e., “public companies”). |
| (k) | “Interested person” of the Trust within the meaning of the Investment Company Act of 1940 (referred to as the 1940 Act), which is the principal federal law governing investment companies like the fund, as a result of a position with MFS. The address of MFS is 111 Huntington Avenue, Boston, Massachusetts 02199-7618. |
| * | As of December 31, 2019, Mr. Hegarty will retire as Trustee. |
The Trust holds annual shareholder meetings for the purpose of electing Trustees, and Trustees are elected for fixed terms. The Board of Trustees is currently divided into three classes, each having a term of three years which term expires on the date of the third annual meeting following the election to office of the Trustee’s class. Each year the term of one class expires. Each Trustee and officer will serve until next elected or his or her earlier death, resignation, retirement or removal. Under the terms of the Board’s retirement policy, an Independent Trustee shall retire at the end of the calendar year in which he or she reaches the earlier of 75 years of age or 15 years of service on the Board (or, in the case of any Independent Trustee who joined the Board prior to 2015, 20 years of service on the Board).
Messrs. Buller, Hegarty, Kilman and Otis and Ms. Roepke are members of the Trust’s Audit Committee. As of December 31, 2019, Mr. Hegarty will retire as Trustee and will no longer be a member of the Trust’s Audit Committee.
68
Trustees and Officers – continued
Each of the Interested Trustees and certain Officers hold comparable officer positions with certain affiliates of MFS.
| | |
| Investment Adviser | | Custodian |
| Massachusetts Financial Services Company | | State Street Bank and Trust Company |
111 Huntington Avenue Boston, MA 02199-7618 | | 1 Lincoln Street Boston, MA 02111-2900 |
| Portfolio Manager(s) | | Independent Registered Public Accounting Firm |
Robert Spector | | Ernst & Young LLP |
| Ward Brown | | 200 Clarendon Street |
| David Cole | | Boston, MA 02116 |
| Pilar Gomez-Bravo | | |
| Andy Li | | |
| Henry Peabody, Jr. | | |
| Robert Persons | | |
| Matt Ryan | | |
| Michael Skatrud | | |
| | |
69
BOARD REVIEW OF INVESTMENT ADVISORY AGREEMENT
The Investment Company Act of 1940 requires that both the full Board of Trustees and a majority of thenon-interested (“independent”) Trustees, voting separately, annually approve the continuation of the Fund’s investment advisory agreement with MFS. The Trustees consider matters bearing on the Fund and its advisory arrangements at their meetings throughout the year, including a review of performance data at each regular meeting. In addition, the independent Trustees met several times over the course of three months beginning in May and ending in July, 2019 (“contract review meetings”) for the specific purpose of considering whether to approve the continuation of the investment advisory agreement for the Fund and the other investment companies that the Board oversees (the “MFS Funds”). The independent Trustees were assisted in their evaluation of the Fund’s investment advisory agreement by independent legal counsel, from whom they received separate legal advice and with whom they met separately from MFS during various contract review meetings. The independent Trustees were also assisted in this process by the MFS Funds’ Independent Senior Officer, a senior officer appointed by and reporting to the independent Trustees.
In connection with their deliberations regarding the continuation of the investment advisory agreement, the Trustees, including the independent Trustees, considered such information and factors as they believed, in light of the legal advice furnished to them and their own business judgment, to be relevant. The investment advisory agreement for the Fund was considered separately, although the Trustees also took into account the common interests of all MFS Funds in their review. As described below, the Trustees considered the nature, quality, and extent of the various investment advisory, administrative, and shareholder services performed by MFS under the existing investment advisory agreement and other arrangements with the Fund.
In connection with their contract review meetings, the Trustees received and relied upon materials that included, among other items: (i) information provided by Broadridge Financial Solutions, Inc. (“Broadridge”), an independent third party, on the investment performance (based on net asset value) of the Fund for various time periods ended December 31, 2018 and the investment performance (based on net asset value) of a group of funds with substantially similar investment classifications/objectives (the “Broadridge performance universe”), (ii) information provided by Broadridge on the Fund’s advisory fees and other expenses and the advisory fees and other expenses of comparable funds identified by Broadridge as well as all other funds in the same investment classification/category (the “Broadridge expense group and universe”), (iii) information provided by MFS on the advisory fees of portfolios of other clients of MFS, including institutional separate accounts and other clients, (iv) information as to whether and to what extent applicable expense waivers, reimbursements or fee “breakpoints” are observed for the Fund, (v) information regarding MFS’ financial results and financial condition, including MFS’ and certain of its affiliates’ estimated profitability from services performed for the Fund and the MFS Funds as a whole, and compared to MFS’ institutional business, (vi) MFS’ views regarding the outlook for the mutual fund industry and the strategic business plans of MFS, (vii) descriptions of various functions performed by MFS for the Funds, such as compliance monitoring and portfolio trading practices, and (viii) information regarding the overall organization of
70
Board Review of Investment Advisory Agreement – continued
MFS, including information about MFS’ senior management and other personnel providing investment advisory, administrative and other services to the Fund and the other MFS Funds. The comparative performance, fee and expense information prepared and provided by Broadridge was not independently verified and the independent Trustees did not independently verify any information provided to them by MFS.
The Trustees’ conclusion as to the continuation of the investment advisory agreement was based on a comprehensive consideration of all information provided to the Trustees and not the result of any single factor. Some of the factors that figured particularly in the Trustees’ deliberations are described below, although individual Trustees may have evaluated the information presented differently from one another, giving different weights to various factors. It is also important to recognize that the fee arrangements for the Fund and other MFS Funds are the result of years of review and discussion between the independent Trustees and MFS, that certain aspects of such arrangements may receive greater scrutiny in some years than in others, and that the Trustees’ conclusions may be based, in part, on their consideration of these same arrangements during the course of the year and in prior years.
Based on information provided by Broadridge and MFS, the Trustees reviewed the Fund’s total return investment performance as well as the Broadridge performance universe over various time periods. The Trustees placed particular emphasis on the total return performance of the Fund’s common shares in comparison to the performance of funds in its Broadridge performance universe over the five-year period ended December 31, 2018, which the Trustees believed was a long enough period to reflect differing market conditions. The total return performance of the Fund’s common shares ranked 16th out of a total of 22 funds in the Broadridge performance universe for this five-year period (a ranking of first place out of the total number of funds in the performance universe indicating the best performer and a ranking of last place out of the total number of funds in the performance universe indicating the worst performer). The total return performance of the Fund’s common shares ranked 19th out of a total of 27 funds for theone-year period and 21st out of a total of 26 funds for thethree-year period ended December 31, 2018. Given the size of the Broadridge performance universe and information previously provided by MFS regarding differences between the Fund and other funds in its Broadridge performance universe, the Trustees also reviewed the Fund’s performance in comparison to a custom benchmark developed by MFS. The Fund outperformed its custom benchmark for each of theone-, three- and five-year periods ended December 31, 2018(one-year: –1.7% total return for the Fund versus –2.5% total return for the benchmark; three-year: 6.1% total return for the Fund versus 5.3% total return for the benchmark; five-year: 4.3% total return for the Fund versus 3.3% total return for the benchmark). Because of the passage of time, these performance results may differ from the performance results for more recent periods, including those shown elsewhere in this report.
In the course of their deliberations, the Trustees took into account information provided by MFS in connection with the contract review meetings, as well as during investment review meetings conducted with portfolio management personnel during the course of the year regarding the Fund’s performance. The Trustees observed that there were significant limitations to the usefulness of the comparative data provided by
71
Board Review of Investment Advisory Agreement – continued
Broadridge, noting that the applicable Broadridge performance universe for the Fund included funds that pursue substantially different investment programs as compared to that pursued by the Fund. After reviewing these and related factors, the Trustees concluded, within the context of their overall conclusions regarding the investment advisory agreement, that they were satisfied with MFS’ responses and efforts relating to investment performance.
In assessing the reasonableness of the Fund’s advisory fee, the Trustees considered, among other information, the Fund’s advisory fee and the total expense ratio of the Fund’s common shares as a percentage of average daily net assets and the advisory fee and total expense ratios of the Broadridge expense group based on information provided by Broadridge. The Trustees considered that, according to the data provided by Broadridge (which takes into account any fee reductions or expense limitations that were in effect during the Fund’s last fiscal year), the Fund’s effective advisory fee rate and total expense ratio were each lower than the Broadridge expense group median.
The Trustees also considered the advisory fees charged by MFS to any institutional separate accounts advised by MFS (“separate accounts”) and unaffiliated investment companies for which MFS serves as subadviser (“subadvised funds”) that have comparable investment strategies to the Fund, if any. In comparing these fees, the Trustees considered information provided by MFS as to the generally broader scope of services provided by MFS to the Fund, as well as the more extensive regulatory burdens imposed on MFS in managing the Fund, in comparison to separate accounts and subadvised funds.
The Trustees considered that, as aclosed-end fund, the Fund is unlikely to experience meaningful asset growth. As a result, the Trustees did not view the potential for realization of economies of scale as the Fund’s assets grow to be a material factor in their deliberations. The Trustees noted that they would consider economies of scale in the future in the event the Fund experiences significant asset growth, such as through an offering of preferred shares (which is not currently contemplated), or a material increase in the market value of the Fund’s portfolio securities.
The Trustees also considered information prepared by MFS relating to MFS’ costs and profits with respect to the Fund, the MFS Funds considered as a group, and other investment companies and accounts advised by MFS, as well as MFS’ methodologies used to determine and allocate its costs to the MFS Funds, the Fund and other accounts and products for purposes of estimating profitability.
After reviewing these and other factors described herein, the Trustees concluded, within the context of their overall conclusions regarding the investment advisory agreement, that the advisory fees charged to the Fund represent reasonable compensation in light of the services being provided by MFS to the Fund.
In addition, the Trustees considered MFS’ resources and related efforts to continue to retain, attract and motivate capable personnel to serve the Fund. The Trustees also considered current and developing conditions in the financial services industry, including the presence of large and well-capitalized companies which are spending, and appear to be prepared to continue to spend, substantial sums to engage personnel and to provide services to competing investment companies. In this regard, the
72
Board Review of Investment Advisory Agreement – continued
Trustees also considered the financial resources of MFS and its ultimate parent, Sun Life Financial Inc. The Trustees also considered the advantages and possible disadvantages to the Fund of having an adviser that also serves other investment companies as well as other accounts.
The Trustees also considered the nature, quality, cost, and extent of administrative services provided to the Fund by MFS under agreements other than the investment advisory agreement. The Trustees also considered the nature, extent and quality of certain other services MFS performs or arranges for on the Fund’s behalf, which may include securities lending programs, directed expense payment programs, class action recovery programs, and MFS’ interaction with third-party service providers, principally custodians andsub-custodians. The Trustees concluded that the variousnon-advisory services provided by MFS and its affiliates on behalf of the Fund were satisfactory.
The Trustees consideredso-called“fall-out benefits” to MFS such as reputational value derived from serving as investment manager to the MFS Funds. The Trustees also considered that, effective January 3, 2018, MFS had discontinued its historic practice of obtaining investment research from portfolio brokerage commissions paid by certain MFS Funds and would thereafter directly pay for or voluntarily reimburse a Fund, if applicable, for the costs of external research acquired through the use of the Fund’s portfolio brokerage commissions.
Based on their evaluation of factors that they deemed to be material, including those factors described above, the Board of Trustees, including the independent Trustees, concluded that the Fund’s investment advisory agreement with MFS should be continued for an additionalone-year period, commencing August 1, 2019.
73
PROXY VOTING POLICIES AND INFORMATION
MFS votes proxies on behalf of the fund pursuant to proxy voting policies and procedures that are available without charge, upon request, by calling 1-800-225-2606, by visitingmfs.com/proxyvoting, or by visiting the SEC’s Web site athttp://www.sec.gov.
Information regarding how the fund voted proxies relating to portfolio securities during the most recent twelve-month period ended June 30 is available by August 31 of each year without charge by visitingmfs.com/proxyvoting, or by visiting the SEC’s Web site athttp://www.sec.gov.
QUARTERLY PORTFOLIO DISCLOSURE
The fund files a complete schedule of portfolio holdings with the SEC for the first and third quarters of each fiscal year on Form N-Q or as an exhibit to its reports onForm N-PORT (for first and third fiscal quarters ending March 31, 2019 or after). The fund’s Form N-Q or Form N-PORT reports are available on the SEC’s website athttp://www.sec.gov.A shareholder can obtain the portfolio holdings report for the first and third quarters of the fund’s fiscal year atmfs.com/closedendfunds by choosing the fund’s name and then selecting the “Resources” tab and clicking on “Prospectus and Reports”.
FURTHER INFORMATION
From time to time, MFS may post important information about the fund or the MFS funds on the MFS web site (mfs.com). This information is available athttps://www.mfs.com/en-us/what-we-do/announcements.html or atmfs.com/closedendfunds by choosing the fund’s name.
Additional information about the fund (e.g. performance, dividends and the fund’s price history) is also available by clicking on the fund’s name under “Closed-End Funds” in the “Products” section of mfs.com.
INFORMATION ABOUT FUND CONTRACTS AND LEGAL CLAIMS
The fund has entered into contractual arrangements with an investment adviser, administrator, transfer agent, and custodian who each provide services to the fund. Unless expressly stated otherwise, shareholders are not parties to, or intended beneficiaries of these contractual arrangements, and these contractual arrangements are not intended to create any shareholder right to enforce them against the service providers or to seek any remedy under them against the service providers, either directly or on behalf of the fund.
Under the Trust’s By-Laws and Declaration of Trust, any claims asserted against or on behalf of the MFS Funds, including claims against Trustees and Officers, must be brought in state and federal courts located within the Commonwealth of Massachusetts.
FEDERAL TAX INFORMATION (unaudited)
The fund will notify shareholders of amounts for use in preparing 2019 income tax forms in January 2020.
74
rev. 3/16
| | | | |
| | | |
FACTS | | WHAT DOES MFS DO WITH YOUR PERSONAL INFORMATION? | |  |
| | |
| Why? | | Financial companies choose how they share your personal information. Federal law gives consumers the right to limit some but not all sharing. Federal law also requires us to tell you how we collect, share, and protect your personal information. Please read this notice carefully to understand what we do. |
| | |
| What? | | The types of personal information we collect and share depend on the product or service you have with us. This information can include: • Social Security number and account balances • Account transactions and transaction history • Checking account information and wire transfer instructions When you areno longer our customer, we continue to share your information as described in this notice. |
| | |
| How? | | All financial companies need to share customers’ personal information to run their everyday business. In the section below, we list the reasons financial companies can share their customers’ personal information; the reasons MFS chooses to share; and whether you can limit this sharing. |
| | | | |
Reasons we can share your
personal information | | Does MFS
share? | | Can you limit
this sharing? |
For our everyday business purposes – such as to process your transactions, maintain your account(s), respond to court orders and legal investigations, or report to credit bureaus | | Yes | | No |
For our marketing purposes – to offer our products and services to you | | No | | We don’t share |
For joint marketing with other financial companies | | No | | We don’t share |
For our affiliates’ everyday business purposes – information about your transactions and experiences | | No | | We don’t share |
For our affiliates’ everyday business purposes – information about your creditworthiness | | No | | We don’t share |
| For nonaffiliates to market to you | | No | | We don’t share |
| | |
| | |
| Questions? | | Call800-225-2606 or go tomfs.com. |
75
| | |
| Who we are |
| Who is providing this notice? | | MFS Funds, MFS Investment Management, MFS Institutional Advisors, Inc., and MFS Heritage Trust Company. |
| | |
| What we do |
| How does MFS protect my personal information? | | To protect your personal information from unauthorized access and use, we use security measures that comply with federal law. These measures include procedural, electronic, and physical safeguards for the protection of the personal information we collect about you. |
| How does MFS collect my personal information? | | We collect your personal information, for example, when you • open an account or provide account information • direct us to buy securities or direct us to sell your securities • make a wire transfer We also collect your personal information from others, such as credit bureaus, affiliates, or other companies. |
| Why can’t I limit all sharing? | | Federal law gives you the right to limit only • sharing for affiliates’ everyday business purposes – information about your creditworthiness • affiliates from using your information to market to you • sharing for nonaffiliates to market to you State laws and individual companies may give you additional rights to limit sharing. |
| | |
| Definitions |
| Affiliates | | Companies related by common ownership or control. They can be financial and nonfinancial companies. • MFS does not share personal information with affiliates, except for everyday business purposes as described on page one of this notice. |
| Nonaffiliates | | Companies not related by common ownership or control. They can be financial and nonfinancial companies. • MFS does not share with nonaffiliates so they can market to you. |
| Joint marketing | | A formal agreement between nonaffiliated financial companies that together market financial products or services to you. • MFS doesn’t jointly market. |
| | |
| Other important information |
| If you own an MFS product or receive an MFS service in the name of a third party such as a bank or broker-dealer, their privacy policy may apply to you instead of ours. |
76
CONTACT US
TRANSFER AGENT, REGISTRAR, AND
DIVIDEND DISBURSING AGENT
CALL
1-800-637-2304
9 a.m. to 5 p.m. Eastern time
WRITE
Computershare Trust Company, N.A.
P.O. Box 505005
Louisville, KY 40233-5005
New York Stock Exchange Symbol:MMT
The Registrant has adopted a Code of Ethics (the “Code”) pursuant to Section 406 of the Sarbanes-Oxley Act and as defined in FormN-CSR that applies to the Registrant’s principal executive officer and principal financial and accounting officer. During the period covered by this report, the Registrant has not amended any provision in the Code that relates to an element of the Code’s definition enumerated in paragraph (b) of Item 2 of this FormN-CSR. During the period covered by this report, the Registrant did not grant a waiver, including an implicit waiver, from any provision of the Code.
A copy of the Code is filed as an exhibit to this FormN-CSR.
| ITEM 3. | AUDIT COMMITTEE FINANCIAL EXPERT. |
Messrs. Steven E. Buller, Michael Hegarty, James Kilman, and Clarence Otis, Jr. and Ms. Maryanne L. Roepke, members of the Audit Committee, have been determined by the Board of Trustees in their reasonable business judgment to meet the definition of “audit committee financial expert” as such term is defined in FormN-CSR. In addition, Messrs. Buller, Hegarty, Kilman, and Otis and Ms. Roepke are “independent” members of the Audit Committee (as such term has been defined by the Securities and Exchange Commission in regulations implementing Section 407 of the Sarbanes-Oxley Act of 2002). The Securities and Exchange Commission has stated that the designation of a person as an audit committee financial expert pursuant to this Item 3 on the FormN-CSR does not impose on such a person any duties, obligations or liability that are greater than the duties, obligations or liability imposed on such person as a member of the Audit Committee and the Board of Trustees in the absence of such designation or identification.
As of December 31, 2019, Mr. Hegarty will retire as Trustee and will no longer be a member of the Audit Committee.
| ITEM 4. | PRINCIPAL ACCOUNTANT FEES AND SERVICES. |
Items 4(a) through 4(d) and 4(g):
The Board of Trustees has appointed Ernst & Young LLP (“E&Y”) to serve as independent accountants to the Registrant (hereinafter the “Registrant” or the “Fund”). The tables below set forth the audit fees billed to the Fund as well as fees fornon-audit services provided to the Fund and/or to the Fund’s investment adviser, Massachusetts Financial Services Company (“MFS”) and to various entities either controlling, controlled by, or under common control with MFS that provide ongoing services to the Fund (“MFS Related Entities”).
For the fiscal years ended October 31, 2019 and 2018, audit fees billed to the Fund by E&Y were as follows:
| | | | | | | | |
| | | Audit Fees | |
| | | 2019 | | | 2018 | |
Fees billed by E&Y: | | | | | | | | |
MFS Multimarket Income Trust | | | 59,226 | | | | 57,913 | |
For the fiscal years ended October 31, 2019 and 2018, fees billed by E&Y for audit-related, tax and other services provided to the Fund and for audit-related, tax and other services provided to MFS and MFS Related Entities were as follows:
| | | | | | | | | | | | | | | | | | | | | | | | |
| | | Audit-Related Fees1 | | | Tax Fees2 | | | All Other Fees3 | |
| | | 2019 | | | 2018 | | | 2019 | | | 2018 | | | 2019 | | | 2018 | |
Fees billed by E&Y: | | | | | | | | | | | | | | | | | | | | | | | | |
To MFS Multimarket Income Trust | | | 11,875 | | | | 11,608 | | | | 10,927 | | | | 10,676 | | | | 1,116 | | | | 1,142 | |
| | | |
| | | Audit-Related Fees1 | | | Tax Fees2 | | | All Other Fees3 | |
| | | 2019 | | | 2018 | | | 2019 | | | 2018 | | | 2019 | | | 2018 | |
Fees billed by E&Y: | | | | | | | | | | | | | | | | | | | | | | | | |
To MFS and MFS Related Entities of MFS Multimarket Income Trust* | | | 1,679,277 | | | | 1,728,076 | | | | 0 | | | | 0 | | | | 104,750 | | | | 34,150 | |
| | | | | | | | |
| | | Aggregate Fees for Non-audit
Services | |
| | | 2019 | | | 2018 | |
Fees Billed by E&Y: | | | | | | | | |
To MFS Multimarket Income Trust, MFS and MFS Related Entities# | | | 2,033,145 | | | | 1,983,352 | |
| * | This amount reflects the fees billed to MFS and MFS Related Entities fornon-audit services relating directly to the operations and financial reporting of the Fund (portions of which services also related to the operations and financial reporting of other funds within the MFS Funds complex). |
| # | This amount reflects the aggregate fees billed by E&Y fornon-audit services rendered to the Fund and fornon-audit services rendered to MFS and the MFS Related Entities. |
| 1 | The fees included under “Audit-Related Fees” are fees related to assurance and related services that are reasonably related to the performance of the audit or review of financial statements, but not reported under “Audit Fees,” including accounting consultations, agreed-upon procedure reports, attestation reports, comfort letters and internal control reviews. |
| 2 | The fees included under “Tax Fees” are fees associated with tax compliance, tax advice and tax planning, including services relating to the filing or amendment of federal, state or local income tax returns, regulated investment company qualification reviews and tax distribution and analysis. |
| 3 | The fees included under “All Other Fees” are fees for products and services provided by E&Y other than those reported under “Audit Fees,” “Audit-Related Fees” and “Tax Fees,” including fees for services related to review of internal controls and review of Rule38a-1 compliance program. |
Item 4(e)(1):
Set forth below are the policies and procedures established by the Audit Committee of the Board of Trustees relating to thepre-approval of audit andnon-audit related services:
To the extent required by applicable law,pre-approval by the Audit Committee of the Board is needed for all audit and permissiblenon-audit services rendered to the Fund and all permissiblenon-audit services rendered to MFS or MFS Related Entities if the services relate directly to the operations and financial reporting of the Registrant.Pre-approval is currently on anengagement-by-engagement basis. In the eventpre-approval of such services is necessary between regular meetings of the Audit Committee and it is not
practical to wait to seekpre-approval at the next regular meeting of the Audit Committee,pre-approval of such services may be referred to the Chair of the Audit Committee for approval; provided that the Chair may notpre-approve any individual engagement for such services exceeding $50,000 or multiple engagements for such services in the aggregate exceeding $100,000 between such regular meetings of the Audit Committee. Any engagementpre-approved by the Chair between regular meetings of the Audit Committee shall be presented for ratification by the entire Audit Committee at its next regularly scheduled meeting.
Item 4(e)(2):
None, or 0%, of the services relating to the Audit-Related Fees, Tax Fees and All Other Fees paid by the Fund and MFS and MFS Related Entities relating directly to the operations and financial reporting of the Registrant disclosed above were approved by the audit committee pursuant to paragraphs (c)(7)(i)(C) of Rule2-01 of RegulationS-X (which permits audit committee approval after the start of the engagement with respect to services other than audit, review or attest services, if certain conditions are satisfied).
Item 4(f):
Not applicable.
Item 4(h):
The Registrant’s Audit Committee has considered whether the provision by a Registrant’s independent registered public accounting firm ofnon-audit services to MFS and MFS Related Entities that were notpre-approved by the Committee (because such services were provided prior to the effectiveness of SEC rules requiringpre-approval or because such services did not relate directly to the operations and financial reporting of the Registrant) was compatible with maintaining the independence of the independent registered public accounting firm as the Registrant’s principal auditors.
| ITEM 5. | AUDIT COMMITTEE OF LISTED REGISTRANTS. |
The Registrant has an Audit Committee established in accordance with Section 3(a)(58)(A) of the Securities Exchange Act of 1934. The members of the Audit Committee are Messrs. Steven E. Buller, Michael Hegarty, James Kilman and Clarence Otis, Jr. and Ms. Maryanne L. Roepke.
As of December 31, 2019, Mr. Hegarty will retire as Trustee and will no longer be a member of the Audit Committee.
| ITEM 6. | SCHEDULE OF INVESTMENTS |
A schedule of investments of the Registrant is included as part of the report to shareholders of the Registrant under Item 1 of this FormN-CSR.
| ITEM 7. | DISCLOSURE OF PROXY VOTING POLICIES AND PROCEDURES FORCLOSED-END MANAGEMENT INVESTMENT COMPANIES. |
A copy of the proxy voting policies and procedures are attached hereto asEX-99.PROXYPOL.
| ITEM 8. | PORTFOLIO MANAGERS OFCLOSED-END MANAGEMENT INVESTMENT COMPANIES. |
Portfolio Manager(s)
Information regarding the portfolio manager(s) of the MFS Multimarket Income Trust (the “Fund”) is set forth below.Each portfolio manager is primarily responsible for theday-to-day management of the Fund.
Henry Peabody became a portfolio manager of the Fund on September 1, 2019.
| | | | | | |
Portfolio Manager | | Primary Role | | Since | | Title and Five Year History |
| Robert Spector | | Lead Portfolio Manager | | 2017 | | Investment Officer of MFS; employed in the investment area of MFS since 2011 |
| | | |
| Ward Brown | | Emerging Markets Debt Instruments Portfolio Manager | | 2012 | | Investment Officer of MFS; employed in the investment area of MFS since 2005 |
| | | |
| David Cole | | Below Investment Grade Debt Instruments Portfolio Manager | | 2006 | | Investment Officer of MFS; employed in the investment area of MFS since 2004 |
| | | |
| Pilar Gomez-Bravo | | Debt Instruments Portfolio Manager | | 2013 | | Investment Officer of MFS; employed in the investment area of MFS since 2013 |
| | | |
| Andy Li | | Investment Grade Debt Instruments Portfolio Manager | | February 2019 | | Investment Officer of MFS; employed in the investment area of MFS since 2018; Portfolio Manager at Man GLG from 2014 to 2018; Portfolio Manager at ECM Asset Management prior to April 2014 |
| | | |
| Henry Peabody | | Investment Grade Debt Instruments Portfolio Manager | | September 2019 | | Employed in the investment area of MFS since July 2019; Vice President/Portfolio Manager at Eaton Vance Management from November 2014 to June 2019; Vice President/Research Analyst at Eaton Vance Management from July 2013 to October 2014 |
| | | |
| Robert Persons | | Investment Grade Debt Instruments Portfolio Manager | | 2013 | | Investment Officer of MFS; employed in the investment area of MFS since 2000 |
| | | |
| Matt Ryan | | Emerging Markets Debt Instruments Portfolio Manager | | 2004 | | Investment Officer of MFS; employed in the investment area of MFS since 1997 |
| | | |
| Michael Skatrud | | Below Investment Grade Debt Instruments Portfolio Manager | | 2018 | | Investment Officer of MFS; Employed in the investment area of MFS since May 2013 |
Compensation
MFS’ philosophy is to align portfolio manager compensation with the goal to provide shareholders with long-term value through a collaborative investment process. Therefore, MFS uses long-term investment performance as well as contribution to the overall investment process and collaborative culture as key factors in determining portfolio manager compensation. In addition, MFS seeks to maintain total compensation programs that are competitive in the asset management industry in each geographic market where it has employees. MFS uses competitive compensation data to ensure that compensation practices are aligned with its goals of attracting, retaining, and motivating the highest-quality professionals.
MFS reviews portfolio manager compensation annually. In determining portfolio manager compensation, MFS uses quantitative means and qualitative means to help ensure a sustainable investment process. As of December 31, 2018, portfolio manager total cash compensation is a combination of base salary and performance bonus:
Base Salary – Base salary generally represents a smaller percentage of portfolio manager total cash compensation than performance bonus.
Performance Bonus – Generally, the performance bonus represents more than a majority of portfolio manager total cash compensation.
The performance bonus is based on a combination of quantitative and qualitative factors, generally with more weight given to the former and less weight given to the latter.
The quantitative portion is primarily based on thepre-taxperformance of accounts managed by the portfolio manager over a range of fixed-length time periods, intended to provide the ability to assess performance over time periods consistent with a full market cycle and a strategy’s investment horizon. The fixed-length time periods include the portfolio manager’s full tenure on each fund and, when available,ten-, five-, and three-year periods. For portfolio managers who have served for less than three years, shorter-term periods, including theone-year period, will also be considered, as will performance in previous roles, if any, held at the firm. Emphasis is generally placed on longer performance periods when multiple performance periods are available. Performance is evaluated across the full set of strategies and portfolios managed by a given portfolio manager, relative to appropriate peer group universes and/or representative indices (“benchmarks”). As of December 31, 2018, the following benchmarks were used to measure the following portfolio manager’s performance for the Fund:
| | | | |
Fund | | Portfolio Manager | | Benchmark(s) |
| MFS Multimarket Income Trust | | Robert Spector | | Bloomberg Barclays Global Aggregate Credit Bond Index JP Morgan Emerging Markets Bond Index Global Bloomberg Barclays U.S. High-Yield Corporate Bond 2% Issuer Capped Index Bloomberg Barclays U.S. Government/Mortgage Bond Index |
| | Ward Brown | | JPMorgan Emerging Markets Bond Index Global |
| | David Cole | | Bloomberg Barclays U.S. High-Yield Corporate Bond 2% Issuer Capped Index |
| | Pilar Gomez-Bravo | | Bloomberg Barclays Global Aggregate Credit Bond Index JPMorgan Emerging Markets Bond Index Global Bloomberg Barclays U.S. High-Yield Corporate Bond 2% Issuer Capped Index Bloomberg Barclays U.S. Government/Mortgage Bond Index |
| | Andy Li1 | | Bloomberg Barclays Global Aggregate Credit Bond Index |
| | Henry Peabody2 | | Bloomberg Barclays Global Aggregate Credit Bond Index |
| | Robert Persons | | Bloomberg Barclays Global Aggregate Credit Bond Index |
| | Matt Ryan | | JPMorgan Emerging Markets Bond Index Global |
| | Michael Skatrud | | Bloomberg Barclays U.S. High-Yield Corporate Bond 2% Issuer Capped Index |
| 1 | Information is as of February 1, 2019. |
| 2 | Information is as of September 1, 2019. |
Benchmarks may include versions and components of indices, custom indices, and linked indices that combine performance of different indices for different portions of the time period, where appropriate.
The qualitative portion is based on the results of an annual internal peer review process (where portfolio managers are evaluated by other portfolio managers, analysts, and traders) and management’s assessment of overall portfolio manager contribution to the MFS investment process and the client experience (distinct from fund and other account performance).
The performance bonus is generally a combination of cash and a deferred cash award. A deferred cash award is issued for a cash value and becomes payable over a three-year vesting period if the portfolio manager remains in the continuous employ of MFS or its affiliates. During the vesting period, the value of the unfunded deferred cash award will fluctuate as though the portfolio manager had invested the cash value of the award in an MFS Fund(s) selected by the portfolio manager.
MFS Equity Plan –Portfolio managers also typically benefit from the opportunity to participate in the MFS Equity Plan. Equity interests are awarded by management, on a discretionary basis, taking into account tenure at MFS, contribution to the investment process, and other factors.
Finally, portfolio managers also participate in benefit plans (including a defined contribution plan and health and other insurance plans) and programs available generally to other employees of MFS. The percentage such benefits represent of any portfolio manager’s compensation depends upon the length of the individual’s tenure at MFS and salary level, as well as other factors.
Ownership of Fund Shares
The following table shows the dollar range of equity securities of the Fund beneficially owned by the Fund’s portfolio manager(s) as of the Fund’s fiscal year ended October 31, 2019. The following dollar ranges apply:
N. None
A. $1 – $10,000
B. $10,001 – $50,000
C. $50,001 – $100,000
D. $100,001 – $500,000
E. $500,001 – $1,000,000
F. Over $1,000,000
| | |
Name of Portfolio Manager | | Dollar Range of Equity Securities in Fund |
| Robert Spector | | N |
| Ward Brown | | N |
| David Cole | | N |
| Pilar Gomez-Bravo | | N |
| Andy Li1 | | N |
| Henry Peabody2 | | N |
| Robert Persons | | N |
| Matt Ryan | | N |
| Michael Skatrud | | N |
| 1 | Mr. Li became a Portfolio Manager of the Fund on February 1, 2019. |
| 2 | Mr. Peabody became a Portfolio Manager of the Fund on September 1, 2019. |
Other Accounts
In addition to the Fund, each portfolio manager of the Fund is named as a portfolio manager of certain other accounts managed orsub-advised by MFS or an affiliate. The number and assets of these accounts were as follows as of the Fund’s fiscal year ended October 31, 2019:
| | | | | | | | | | | | | | | | | | | | | | | | |
| | | Registered Investment
Companies* | | | Other Pooled Investment
Vehicles | | | Other Accounts | |
Name | | Number of
Accounts | | | Total
Assets | | | Number of
Accounts | | | Total Assets | | | Number of
Accounts | | | Total Assets | |
Robert Spector | | | 6 | | | $ | 4.0 billion | | | | 10 | | | $ | 4.8 billion | | | | 44 | | | $ | 2.4 billion | |
Ward Brown | | | 7 | | | $ | 8.1 billion | | | | 6 | | | $ | 3.8 billion | | | | 6 | | | $ | 1.7 billion | |
David Cole | | | 13 | | | $ | 9.3 billion | | | | 6 | | | $ | 2.6 billion | | | | 3 | | | $ | 193.1 million | |
Pilar Gomez-Bravo | | | 5 | | | $ | 3.9 billion | | | | 6 | | | $ | 2.8 billion | | | | 4 | | | $ | 926.1 million | |
Andy Li (Became a Portfolio Manager of the Fund on February 1, 2019) | | | 5 | | | $ | 3.9 billion | | | | 6 | | | $ | 2.8 billion | | | | 4 | | | $ | 926.1 million | |
Henry Peabody (Became a Portfolio Manager of the Fund on September 1, 2019) | | | 2 | | | $ | 1.1 billion | | | | 2 | | | $ | 2.3 billion | | | | 0 | | | | N/A | |
Robert Persons | | | 18 | | | $ | 31.2 billion | | | | 10 | | | $ | 4.3 billion | | | | 9 | | | $ | 1.2 billion | |
Matt Ryan | | | 9 | | | $ | 12.4 billion | | | | 7 | | | $ | 4.3 billion | | | | 6 | | | $ | 1.7 billion | |
Michael Skatrud | | | 12 | | | $ | 9.3 billion | | | | 6 | | | $ | 1.1 billion | | | | 3 | | | $ | 193.1 million | |
Advisory fees are not based upon performance of any of the accounts identified in the table above.
Potential Conflicts of Interest
MFS seeks to identify potential conflicts of interest resulting from a portfolio manager’s management of both the Fund and other accounts, and has adopted policies and procedures designed to address such potential conflicts.
The management of multiple funds and accounts (including proprietary accounts) gives rise to conflicts of interest if the funds and accounts have different objectives and strategies, benchmarks, time horizons and fees as a portfolio manager must allocate his or her time and investment ideas across multiple funds and accounts. In certain instances, there are securities which are suitable for the Fund’s portfolio as well as for accounts of MFS or its subsidiaries with similar investment objectives. MFS’ trade allocation policies may give rise to conflicts of interest if the Fund’s orders do not get fully executed or are delayed in getting executed due to being aggregated with those of other accounts of MFS or its subsidiaries. A portfolio manager may execute transactions for another fund or account that may adversely affect the value of the Fund’s investments. Investments selected for funds or accounts other than the Fund may outperform investments selected for the Fund.
When two or more clients are simultaneously engaged in the purchase or sale of the same security, the securities are allocated among clients in a manner believed by MFS to be fair and equitable to each. Allocations may be based on many factors and may not always be pro rata based on assets managed. The allocation methodology could have a detrimental effect on the price or volume of the security as far as the Fund is concerned.
MFS and/or a portfolio manager may have a financial incentive to allocate favorable or limited opportunity investments or structure the timing of investments to favor accounts other than the Fund, for instance, those that pay a higher advisory fee and/or have a performance adjustment and/or include an investment by the portfolio manager.
| ITEM 9. | PURCHASES OF EQUITY SECURITIES BYCLOSED-END MANAGEMENT INVESTMENT COMPANY AND AFFILIATED PURCHASERS. |
MFS Multimarket Income Trust
| | | | | | | | | | | | | | | | |
Period | | (a)
Total number
of Shares
Purchased | | | (b)
Average
Price
Paid per
Share | | | (c)
Total Number
of Shares
Purchased as
Part of Publicly
Announced
Plans or
Programs | | | (d)
Maximum
Number (or
Approximate
Dollar Value) of
Shares that May
Yet Be Purchased
under the Plans
or Programs | |
11/01/18-11/30/18 | | | 320,378 | | | | 5.30 | | | | 320,378 | | | | 6,116,629 | |
12/01/18-12/31/18 | | | 86,510 | | | | 5.34 | | | | 86,510 | | | | 6,030,119 | |
1/01/19-1/31/19 | | | 648,826 | | | | 5.48 | | | | 648,826 | | | | 5,381,293 | |
2/01/19-2/28/19 | | | 271,052 | | | | 5.68 | | | | 271,052 | | | | 5,110,241 | |
3/01/19-3/31/19 | | | 122,596 | | | | 5.66 | | | | 122,596 | | | | 4,987,645 | |
4/01/19-4/30/19 | | | 886,213 | | | | 5.76 | | | | 886,213 | | | | 4,101,432 | |
5/01/19-5/31/19 | | | 416,531 | | | | 5.68 | | | | 416,531 | | | | 3,684,901 | |
6/01/19-6/30/19 | | | 131,498 | | | | 5.80 | | | | 131,498 | | | | 3,553,403 | |
7/01/19-7/31/19 | | | 70,000 | | | | 5.84 | | | | 70,000 | | | | 3,483,403 | |
8/01/19-8/31/19 | | | 178,689 | | | | 5.86 | | | | 178,689 | | | | 3,304,714 | |
9/01/19-9/30/19 | | | 86,000 | | | | 5.89 | | | | 86,000 | | | | 3,218,714 | |
10/1/19-10/31/19 | | | 0 | | | | N/A | | | | 0 | | | | 6,398,195 | |
| | | | | | | | | | | | | | | | |
Total | | | 3,218,293 | | | | 5.64 | | | | 3,218,293 | | | | | |
| | | | | | | | | | | | | | | | |
Note: The Board approved procedures to repurchase shares and reviews the results periodically. The notification to shareholders of the program is part of the semi-annual and annual reports sent to shareholders. These annual programs begin on October 1st of each year. The programs conform to the conditions of Rule10b-18 of the Securities Exchange Act of 1934 and limit the aggregate number of shares that may be purchased in each annual period (October 1 through the following September 30) to 10% of the Registrant’s outstanding shares as of the first day of the plan year (October 1). The aggregate number of shares available for purchase for the October 1, 2019 plan year is 6,398,195.
| ITEM 10. | SUBMISSION OF MATTERS TO A VOTE OF SECURITY HOLDERS. |
There were no material changes to the procedures by which shareholders may send recommendations to the Board for nominees to the Registrant’s Board since the Registrant last provided disclosure as to such procedures in response to the requirements of Item 407 (c)(2)(iv) of RegulationS-K or this Item.
| ITEM 11. | CONTROLS AND PROCEDURES. |
| (a) | Based upon their evaluation of the registrant’s disclosure controls and procedures (as defined in Rule30a-3(c) under the Investment Company Act of 1940 (the “Act”)) as conducted within 90 days of the filing date of this FormN-CSR, the registrant’s principal financial officer and principal executive officer have concluded that those disclosure controls and procedures provide reasonable assurance that the material information required to be disclosed by the registrant on this report is recorded, processed, summarized and reported within the time periods specified in the Securities and Exchange Commission’s rules and forms. |
| (b) | There were no changes in the registrant’s internal controls over financial reporting (as defined in Rule30a-3(d) under the Act) that occurred during the period covered by the report that has materially affected, or is reasonably likely to materially affect, the registrant’s internal control over financial reporting. |
| ITEM 12. | DISCLOSURE OF SECURITIES LENDING ACTIVITIES FORCLOSED-END MANAGEMENT INVESTMENT COMPANIES. |
During the fiscal year ending October 31, 2019, there were no fees or income related to securities lending activities of the Registrant.
| | |
| (a) | | (1) Any code of ethics, or amendment thereto, that is the subject of the disclosure required by Item 2, to the extent that the registrant intends to satisfy the Item 2 requirements through filing of an exhibit: Attached hereto as EX-99.COE. |
| |
| | (2) A separate certification for each principal executive officer and principal financial officer of the registrant as required by Rule 30a-2(a) under the Act (17 CFR 270.30a-2): Attached hereto as EX-99.302CERT. |
| |
| | (3) Any written solicitation to purchase securities under Rule 23c-1 under the Act (17 CFR 270.23c-1) sent or given during the period covered by the report by or on behalf of the registrant to 10 or more persons. Not applicable. |
| |
| | (4) Change in the registrant’s independent public accountant. Not applicable. |
| | |
| (c) | | If the report is filed under Section 13(a) or 15(d) of the Exchange Act, provide the certifications required by Rule 30a-2(b) under the Act (17 CFR 270.30a-2(b)), Rule 13a-14(b) or Rule 15d-14(b) under the Exchange Act (17 CFR 240.13a-14(b) or 240.15d-14(b)) and Section 1350 of Chapter 63 of Title 18 of the United States Code (18 U.S.C. 1350) as an exhibit. A certification furnished pursuant to this paragraph will not be deemed “filed” for the purposes of Section 18 of the Exchange Act (15 U.S.C. 78r), or otherwise subject to the liability of that section. Such certification will not be deemed to be incorporated by reference into any filing under the Securities Act of 1933 or the Exchange Act, except to the extent that the registrant specifically incorporates it by reference. Attached hereto as EX-99.906CERT. |
| |
| (c) | | Proxy Voting Policies and Procedures pursuant to Item 7 of Form N-CSR. Attached hereto as EX-99.PROXYPOL. |
| |
| (d) | | Notices to Trust’s common shareholders in accordance with Investment Company Act Section 19(a) and Rule 19a-1. Attached hereto as EX-99.19a-1. |
Notice
A copy of the Amended and Restated Declaration of Trust of the Registrant is on file with the Secretary of State of the Commonwealth of Massachusetts and notice is hereby given that this instrument is executed on behalf of the Registrant by an officer of the Registrant as an officer and not individually and the obligations of or arising out of this instrument are not binding upon any of the Trustees or shareholders individually, but are binding only upon the assets and property of the respective constituent series of the Registrant.
SIGNATURES
Pursuant to the requirements of the Securities Exchange Act of 1934 and the Investment Company Act of 1940, the registrant has duly caused this report to be signed on its behalf by the undersigned, thereunto duly authorized.
Registrant: MFS MULTIMARKET INCOME TRUST
| | |
| By (Signature and Title)* | | DAVID L. DILORENZO |
| | David L. DiLorenzo, President |
Date: December 16, 2019
Pursuant to the requirements of the Securities Exchange Act of 1934 and the Investment Company Act of 1940, this report has been signed below by the following persons on behalf of the registrant and in the capacities and on the dates indicated.
| | |
| By (Signature and Title)* | | DAVID L. DILORENZO |
| | David L. DiLorenzo, President (Principal Executive Officer) |
Date: December 16, 2019
| | |
| By (Signature and Title)* | | JAMES O. YOST |
| | James O. Yost, Treasurer (Principal Financial Officer and Accounting Officer) |
Date:December 16, 2019
| * | Print name and title of each signing officer under his or her signature. |