Transport Corporation Of America (TCAM) Inactive
Filed: 16 Nov 05, 12:00am
Searchable text section of graphics shown above
Confidential
A Presentation to the Board of Directors of
[LOGO]
Regarding Project TWINS
October 26, 2005
[LOGO]
Disclaimer
The historical financial information contained in this presentation has been obtained from Transport Corp. of America Inc. (“TCAM” or the “Company”), and public SEC filings; and has not been independently verified. The projections contained in this presentation regarding the future financial performance of TCAM are based upon forecasts provided by TCAM. Stephens Inc. has relied upon the accuracy of such historical financial information and projected financial results in preparing this presentation. Any inaccuracies in such historical financial information or projected financial results may change the conclusions expressed in this presentation. Stephens Inc. assumes no responsibility for any such inaccuracies in the historical financial information or projected financial results used in this presentation. This presentation has been prepared as of October 26, 2005 and reflects only information made available to us prior to such date. It does not include information regarding all of the assessments made by Stephens Inc. in arriving at its conclusions. This presentation has been prepared solely for the use of the Board of Directors of TCAM. It is confidential and may not be disclosed or provided to any third parties without the written permission of Stephens Inc.
[LOGO]
Table of Contents
|
|
|
|
Key Transaction Terms
Transaction | • Goldner Hawn Johnson & Morrison Inc. (“GHJM”) is to acquire 100% of the fully-diluted stock of TCAM for $10.00 per share in an all cash merger transaction. |
| • Management is offered an opportunity to participate in the transaction. |
|
|
Valuation | This transaction represents: |
| • An equity value of $68.0 million and an enterprise value of $113.7 million. |
| • A premium of 25.0% and 28.3% over the most recent and 30 day average closing share price. |
| • 40.8x 2005E EPS and 21.9x 2005E EBIT. |
|
|
Consideration / | • All cash financed by GHJM’s Marathon Fund and Wells Fargo and/or LaSalle. |
Financing | • GHJM has obtained financing commitments for the debt portion of the transaction. |
|
|
Approvals / | • TCAM shareholder approval. |
Conditions | • HSR and other customary closing conditions. |
|
|
Deal Protection | • Termination fee of $2 million plus expenses of up to $1 million (in total 4.4% of equity value). |
| • TCAM subject to standard non-solicitation provision with fiduciary out. |
|
|
Timing | • Expected closing January 2006. |
5
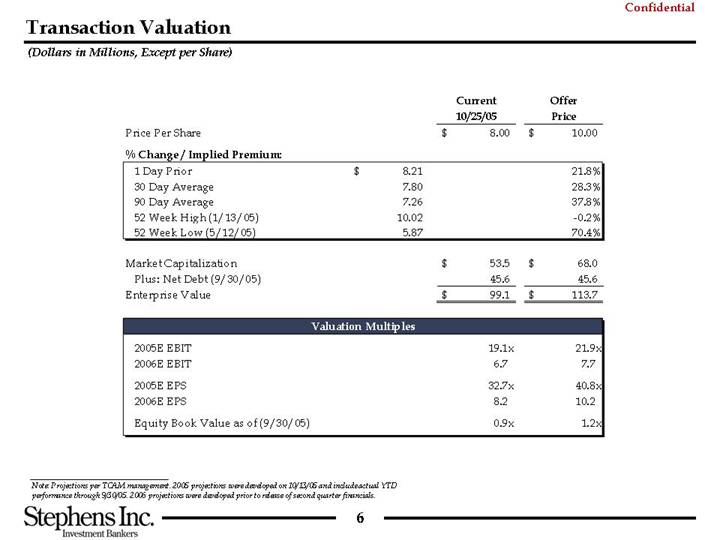
Transaction Valuation
(Dollars in Millions, Except per Share)
|
|
|
| Current |
| Offer |
| |||
Price Per Share |
|
|
| $ | 8.00 |
| $ | 10.00 |
| |
|
|
|
|
|
|
|
| |||
% Change / Implied Premium: |
|
|
|
|
|
|
| |||
1 Day Prior |
| $ | 8.21 |
|
|
| 21.8 | % | ||
30 Day Average |
| 7.80 |
|
|
| 28.3 | % | |||
90 Day Average |
| 7.26 |
|
|
| 37.8 | % | |||
52 Week High (1/13/05) |
| 10.02 |
|
|
| -0.2 | % | |||
52 Week Low (5/12/05) |
| 5.87 |
|
|
| 70.4 | % | |||
|
|
|
|
|
|
|
| |||
Market Capitalization |
|
|
| $ | 53.5 |
| $ | 68.0 |
| |
Plus: Net Debt (9/30/05) |
|
|
| 45.6 |
| 45.6 |
| |||
Enterprise Value |
|
|
| $ | 99.1 |
| $ | 113.7 |
| |
|
|
|
|
|
|
|
| |||
Valuation Multiples |
|
|
|
|
|
|
| |||
|
|
|
|
|
|
|
| |||
2005E EBIT |
|
|
| 19.1 | x | 21.9 | x | |||
2006E EBIT |
|
|
| 6.7 |
| 7.7 |
| |||
|
|
|
|
|
|
|
| |||
2005E EPS |
|
|
| 32.7 | x | 40.8 | x | |||
2006E EPS |
|
|
| 8.2 |
| 10.2 |
| |||
|
|
|
|
|
|
|
| |||
Equity Book Value as of (9/30/05) |
|
|
| 0.9 | x | 1.2 | x | |||
Note: Projections per TCAM management. 2005 projections were developed on 10/13/05 and include actual YTD performance through 9/30/05. 2006 projections were developed prior to release of second quarter financials.
6
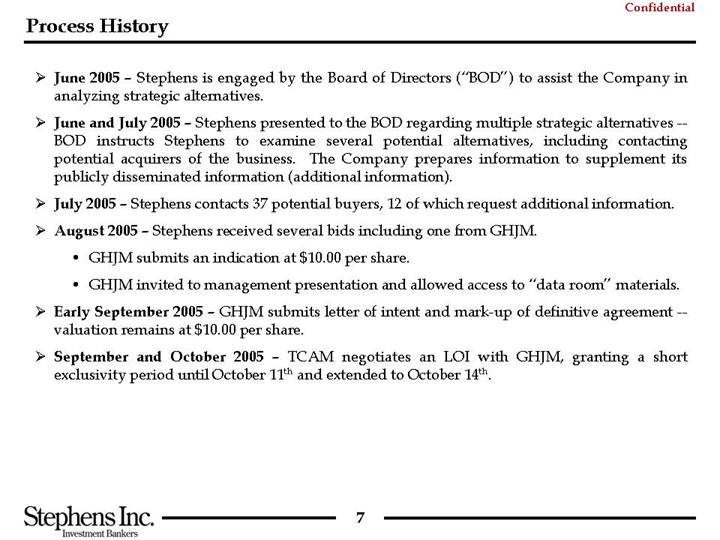
Process History
• June 2005 – Stephens is engaged by the Board of Directors (“BOD”) to assist the Company in analyzing strategic alternatives.
• June and July 2005 – Stephens presented to the BOD regarding multiple strategic alternatives — BOD instructs Stephens to examine several potential alternatives, including contacting potential acquirers of the business. The Company prepares information to supplement its publicly disseminated information (additional information).
• July 2005 – Stephens contacts 37 potential buyers, 12 of which request additional information.
• August 2005 – Stephens received several bids including one from GHJM.
• GHJM submits an indication at $10.00 per share.
• GHJM invited to management presentation and allowed access to “data room” materials.
• Early September 2005 – GHJM submits letter of intent and mark-up of definitive agreement — valuation remains at $10.00 per share.
• September and October 2005 – TCAM negotiates an LOI with GHJM, granting a short exclusivity period until October 11th and extended to October 14th.
7
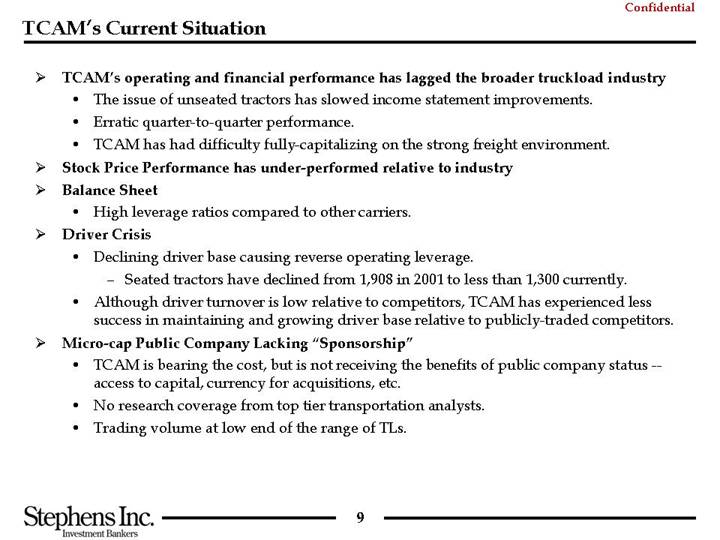
TCAM’s Current Situation
• TCAM’s operating and financial performance has lagged the broader truckload industry
• The issue of unseated tractors has slowed income statement improvements.
• Erratic quarter-to-quarter performance.
• TCAM has had difficulty fully-capitalizing on the strong freight environment.
• Stock Price Performance has under-performed relative to industry
• Balance Sheet
• High leverage ratios compared to other carriers.
• Driver Crisis
• Declining driver base causing reverse operating leverage.
• Seated tractors have declined from 1,908 in 2001 to less than 1,300 currently.
• Although driver turnover is low relative to competitors, TCAM has experienced less success in maintaining and growing driver base relative to publicly-traded competitors.
• Micro-cap Public Company Lacking “Sponsorship”
• TCAM is bearing the cost, but is not receiving the benefits of public company status — access to capital, currency for acquisitions, etc.
• No research coverage from top tier transportation analysts.
• Trading volume at low end of the range of TLs.
9
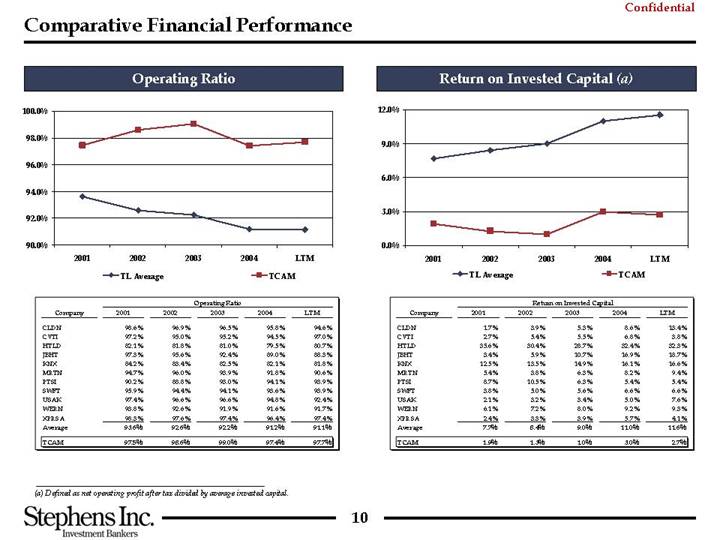
Comparative Financial Performance
Operating Ratio
[CHART]
|
| Operating Ratio |
| ||||||||
Company |
| 2001 |
| 2002 |
| 2003 |
| 2004 |
| LTM |
|
|
|
|
|
|
|
|
|
|
|
|
|
CLDN |
| 98.6 | % | 96.9 | % | 96.5 | % | 95.8 | % | 94.6 | % |
CVTI |
| 97.2 | % | 95.0 | % | 95.2 | % | 94.5 | % | 97.0 | % |
HTLD |
| 82.1 | % | 81.8 | % | 81.0 | % | 79.5 | % | 80.7 | % |
JBHT |
| 97.3 | % | 95.6 | % | 92.4 | % | 89.0 | % | 88.3 | % |
KNX |
| 84.2 | % | 83.4 | % | 82.5 | % | 82.1 | % | 81.8 | % |
MRTN |
| 94.7 | % | 96.0 | % | 93.9 | % | 91.8 | % | 90.6 | % |
PTSI |
| 90.2 | % | 88.8 | % | 93.0 | % | 94.1 | % | 93.9 | % |
SWFT |
| 95.9 | % | 94.4 | % | 94.1 | % | 93.6 | % | 93.9 | % |
USAK |
| 97.4 | % | 96.6 | % | 96.6 | % | 94.8 | % | 92.4 | % |
WERN |
| 93.8 | % | 92.6 | % | 91.9 | % | 91.6 | % | 91.7 | % |
XPRSA |
| 98.3 | % | 97.6 | % | 97.4 | % | 96.4 | % | 97.4 | % |
Average |
| 93.6 | % | 92.6 | % | 92.2 | % | 91.2 | % | 91.1 | % |
|
|
|
|
|
|
|
|
|
|
|
|
TCAM |
| 97.5 | % | 98.6 | % | 99.0 | % | 97.4 | % | 97.7 | % |
Return on Invested Capital (a)
[CHART]
|
| Return on Invested Capital |
| ||||||||
Company |
| 2001 |
| 2002 |
| 2003 |
| 2004 |
| LTM |
|
|
|
|
|
|
|
|
|
|
|
|
|
CLDN |
| 1.7 | % | 3.9 | % | 5.3 | % | 8.6 | % | 13.4 | % |
CVTI |
| 2.7 | % | 5.4 | % | 5.5 | % | 6.8 | % | 3.8 | % |
HTLD |
| 35.6 | % | 30.4 | % | 28.7 | % | 32.4 | % | 32.3 | % |
JBHT |
| 3.4 | % | 5.9 | % | 10.7 | % | 16.9 | % | 18.7 | % |
KNX |
| 12.5 | % | 13.5 | % | 14.9 | % | 16.1 | % | 16.6 | % |
MRTN |
| 5.4 | % | 3.8 | % | 6.3 | % | 8.2 | % | 9.4 | % |
PTSI |
| 8.7 | % | 10.5 | % | 6.3 | % | 5.4 | % | 5.4 | % |
SWFT |
| 3.8 | % | 5.0 | % | 5.6 | % | 6.6 | % | 6.6 | % |
USAK |
| 2.1 | % | 3.2 | % | 3.4 | % | 5.0 | % | 7.6 | % |
WERN |
| 6.1 | % | 7.2 | % | 8.0 | % | 9.2 | % | 9.3 | % |
XPRSA |
| 2.4 | % | 3.3 | % | 3.9 | % | 5.7 | % | 4.1 | % |
Average |
| 7.7 | % | 8.4 | % | 9.0 | % | 11.0 | % | 11.6 | % |
|
|
|
|
|
|
|
|
|
|
|
|
TCAM |
| 1.9 | % | 1.3 | % | 1.0 | % | 3.0 | % | 2.7 | % |
(a) Defined as net operating profit after tax divided by average invested capital.
10
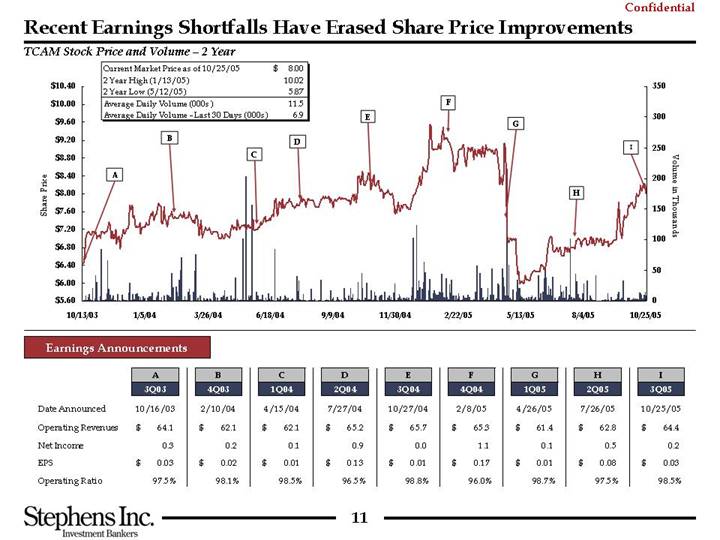
Recent Earnings Shortfalls Have Erased Share Price Improvements
TCAM Stock Price and Volume – 2 Year
Current Market Price as of 10/25/05 |
| $ | 8.00 |
|
2 Year High (1/13/05) |
| 10.02 |
| |
2 Year Low (5/12/05) |
| 5.87 |
| |
Average Daily Volume (000s) |
| 11.5 |
| |
Average Daily Volume - Last 30 Days (000s) |
| 6.9 |
| |
[CHART]
Earnings Announcements
|
| A |
| B |
| C |
| D |
| E |
| F |
| G |
| H |
| I |
| |||||||||
|
| 3Q03 |
| 4Q03 |
| 1Q04 |
| 2Q04 |
| 3Q04 |
| 4Q04 |
| 1Q05 |
| 2Q05 |
| 3Q05 |
| |||||||||
Date Announced |
| 10/16/03 |
| 2/10/04 |
| 4/15/04 |
| 7/27/04 |
| 10/27/04 |
| 2/8/05 |
| 4/26/05 |
| 7/26/05 |
| 10/25/05 |
| |||||||||
Operating Revenues |
| $ | 64.1 |
| $ | 62.1 |
| $ | 62.1 |
| $ | 65.2 |
| $ | 65.7 |
| $ | 65.3 |
| $ | 61.4 |
| $ | 62.8 |
| $ | 64.4 |
|
Net Income |
| 0.3 |
| 0.2 |
| 0.1 |
| 0.9 |
| 0.0 |
| 1.1 |
| 0.1 |
| 0.5 |
| 0.2 |
| |||||||||
EPS |
| $ | 0.03 |
| $ | 0.02 |
| $ | 0.01 |
| $ | 0.13 |
| $ | 0.01 |
| $ | 0.17 |
| $ | 0.01 |
| $ | 0.08 |
| $ | 0.03 |
|
Operating Ratio |
| 97.5 | % | 98.1 | % | 98.5 | % | 96.5 | % | 98.8 | % | 96.0 | % | 98.7 | % | 97.5 | % | 98.5 | % | |||||||||
11
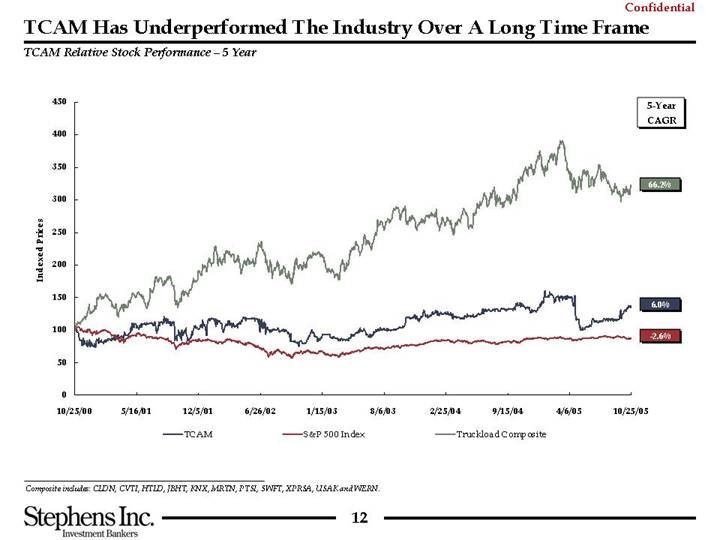
TCAM Has Underperformed The Industry Over A Long Time Frame
TCAM Relative Stock Performance – 5 Year
[CHART]
Composite includes: CLDN, CVTI, HTLD, JBHT, KNX, MRTN, PTSI, SWFT, XPRSA, USAK and WERN.
12
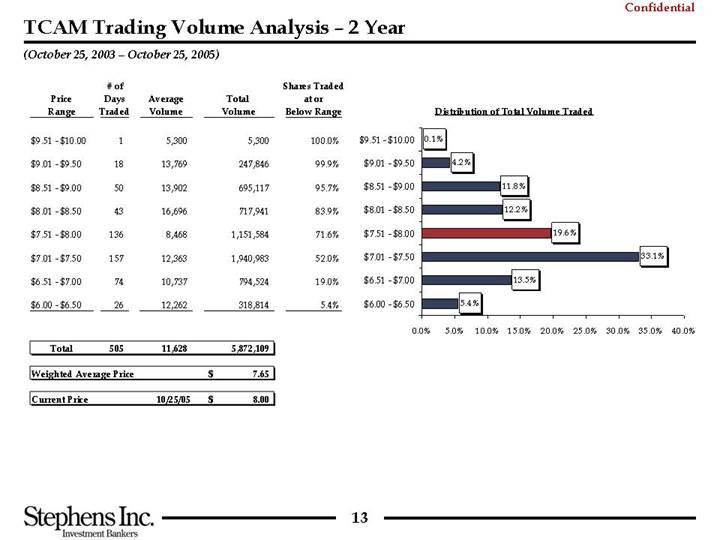
TCAM Trading Volume Analysis – 2 Year
(October 25, 2003 – October 25, 2005)
Price |
| # of |
| Average |
| Total |
| Shares Traded |
| |
|
|
|
|
|
|
|
|
|
| |
$9.51 - $10.00 |
| 1 |
| 5,300 |
| 5,300 |
| 100.0 | % | |
|
|
|
|
|
|
|
|
|
| |
$9.01 - $9.50 |
| 18 |
| 13,769 |
| 247,846 |
| 99.9 | % | |
|
|
|
|
|
|
|
|
|
| |
$8.51 - $9.00 |
| 50 |
| 13,902 |
| 695,117 |
| 95.7 | % | |
|
|
|
|
|
|
|
|
|
| |
$8.01 - $8.50 |
| 43 |
| 16,696 |
| 717,941 |
| 83.9 | % | |
|
|
|
|
|
|
|
|
|
| |
$7.51 - $8.00 |
| 136 |
| 8,468 |
| 1,151,584 |
| 71.6 | % | |
|
|
|
|
|
|
|
|
|
| |
$7.01 - $7.50 |
| 157 |
| 12,363 |
| 1,940,983 |
| 52.0 | % | |
|
|
|
|
|
|
|
|
|
| |
$6.51 - $7.00 |
| 74 |
| 10,737 |
| 794,524 |
| 19.0 | % | |
|
|
|
|
|
|
|
|
|
| |
$6.00 - $6.50 |
| 26 |
| 12,262 |
| 318,814 |
| 5.4 | % | |
|
|
|
|
|
|
|
|
|
| |
Total |
| 505 |
| 11,628 |
| 5,872,109 |
|
|
| |
|
|
|
|
|
|
|
|
|
| |
Weighted Average Price |
|
|
|
|
| $ | 7.65 |
|
|
|
|
|
|
|
|
|
|
|
|
| |
Current Price |
|
|
| 10/25/05 |
| $ | 8.00 |
|
|
|
Distribution of Total Volume Traded
[CHART]
13
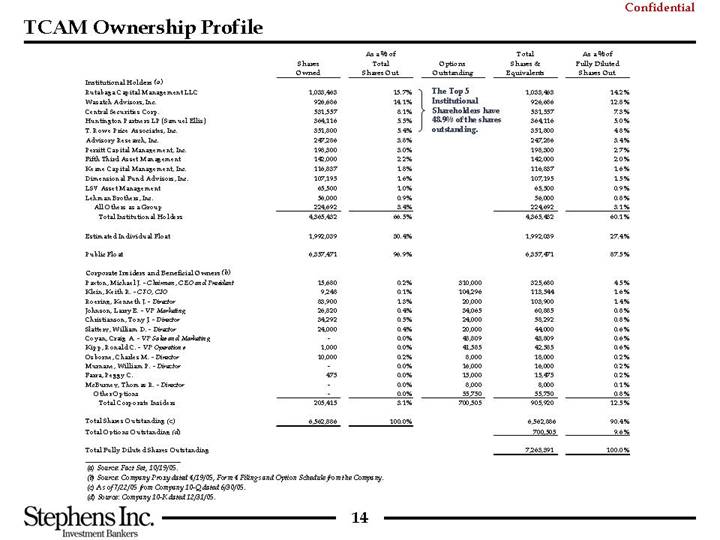
TCAM Ownership Profile
|
| Shares |
| As a % of |
| Options |
| Total |
| As a % of |
|
Institutional Holders (a) |
|
|
|
|
|
|
|
|
|
|
|
Rutabaga Capital Management LLC |
| 1,033,463 |
| 15.7 | % | The Top 5 |
| 1,033,463 |
| 14.2 | % |
Wasatch Advisors, Inc. |
| 926,686 |
| 14.1 | % | Institutional |
| 926,686 |
| 12.8 | % |
Central Securities Corp. |
| 531,557 |
| 8.1 | % | Shareholders have |
| 531,557 |
| 7.3 | % |
Huntington Partners LP (Samuel Ellis) |
| 364,116 |
| 5.5 | % | 48.9% of the shares |
| 364,116 |
| 5.0 | % |
T. Rowe Price Associates, Inc. |
| 351,800 |
| 5.4 | % | outstanding. |
| 351,800 |
| 4.8 | % |
Advisory Research, Inc. |
| 247,286 |
| 3.8 | % |
|
| 247,286 |
| 3.4 | % |
Perritt Capital Management, Inc. |
| 198,300 |
| 3.0 | % |
|
| 198,300 |
| 2.7 | % |
Fifth Third Asset Management |
| 142,000 |
| 2.2 | % |
|
| 142,000 |
| 2.0 | % |
Keane Capital Management, Inc. |
| 116,837 |
| 1.8 | % |
|
| 116,837 |
| 1.6 | % |
Dimensional Fund Advisors, Inc. |
| 107,195 |
| 1.6 | % |
|
| 107,195 |
| 1.5 | % |
LSV Asset Management |
| 65,500 |
| 1.0 | % |
|
| 65,500 |
| 0.9 | % |
Lehman Brothers, Inc. |
| 56,000 |
| 0.9 | % |
|
| 56,000 |
| 0.8 | % |
All Others as a Group |
| 224,692 |
| 3.4 | % |
|
| 224,692 |
| 3.1 | % |
Total Institutional Holders |
| 4,365,432 |
| 66.5 | % |
|
| 4,365,432 |
| 60.1 | % |
|
|
|
|
|
|
|
|
|
|
|
|
Estimated Individual Float |
| 1,992,039 |
| 30.4 | % |
|
| 1,992,039 |
| 27.4 | % |
|
|
|
|
|
|
|
|
|
|
|
|
Public Float |
| 6,357,471 |
| 96.9 | % |
|
| 6,357,471 |
| 87.5 | % |
|
|
|
|
|
|
|
|
|
|
|
|
Corporate Insiders and Beneficial Owners (b) |
|
|
|
|
|
|
|
|
|
|
|
Paxton, Michael J. - Chairman, CEO and President |
| 15,680 |
| 0.2 | % | 310,000 |
| 325,680 |
| 4.5 | % |
Klein, Keith R. - CFO, CIO |
| 9,248 |
| 0.1 | % | 104,296 |
| 113,544 |
| 1.6 | % |
Roering, Kenneth J. - Director |
| 83,900 |
| 1.3 | % | 20,000 |
| 103,900 |
| 1.4 | % |
Johnson, Larry E. - VP Marketing |
| 26,820 |
| 0.4 | % | 34,065 |
| 60,885 |
| 0.8 | % |
Christianson, Tony J. - Director |
| 34,292 |
| 0.5 | % | 24,000 |
| 58,292 |
| 0.8 | % |
Slattery, William D. - Director |
| 24,000 |
| 0.4 | % | 20,000 |
| 44,000 |
| 0.6 | % |
Coyan, Craig A. - VP Sales and Marketing |
| — |
| 0.0 | % | 43,809 |
| 43,809 |
| 0.6 | % |
Kipp, Ronald C. - VP Operations |
| 1,000 |
| 0.0 | % | 41,585 |
| 42,585 |
| 0.6 | % |
Osborne, Charles M. - Director |
| 10,000 |
| 0.2 | % | 8,000 |
| 18,000 |
| 0.2 | % |
Murnane, William P. - Director |
| — |
| 0.0 | % | 16,000 |
| 16,000 |
| 0.2 | % |
Farra, Peggy C. |
| 475 |
| 0.0 | % | 15,000 |
| 15,475 |
| 0.2 | % |
McBurney, Thomas R. - Director |
| — |
| 0.0 | % | 8,000 |
| 8,000 |
| 0.1 | % |
Other Options |
| — |
| 0.0 | % | 55,750 |
| 55,750 |
| 0.8 | % |
Total Corporate Insiders |
| 205,415 |
| 3.1 | % | 700,505 |
| 905,920 |
| 12.5 | % |
|
|
|
|
|
|
|
|
|
|
|
|
Total Shares Outstanding (c) |
| 6,562,886 |
| 100.0 | % |
|
| 6,562,886 |
| 90.4 | % |
Total Options Outstanding (d) |
|
|
|
|
|
|
| 700,505 |
| 9.6 | % |
|
|
|
|
|
|
|
|
|
|
|
|
Total Fully Diluted Shares Outstanding |
|
|
|
|
|
|
| 7,263,391 |
| 100.0 | % |
(a) Source: Fact Set, 10/19/05.
(b) Source: Company Proxy dated 4/19/05, Form 4 Filings and Option Schedule from the Company.
(c) As of 7/22/05 from Company 10-Q dated 6/30/05.
(d) Source: Company 10-K dated 12/31/05.
14
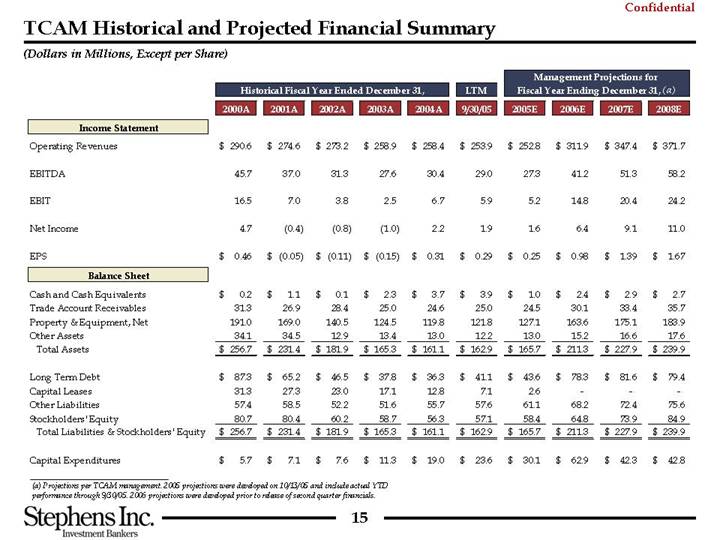
TCAM Historical and Projected Financial Summary
(Dollars in Millions, Except per Share)
|
| Historical Fiscal Year Ended December 31, |
| LTM |
| Management Projections for |
| ||||||||||||||||||||||||
|
| 2000A |
| 2001A |
| 2002A |
| 2003A |
| 2004A |
| 9/30/05 |
| 2005E |
| 2006E |
| 2007E |
| 2008E |
| ||||||||||
Income Statement |
|
|
|
|
|
|
|
|
|
|
|
|
|
|
|
|
|
|
|
|
| ||||||||||
Operating Revenues |
| $ | 290.6 |
| $ | 274.6 |
| $ | 273.2 |
| $ | 258.9 |
| $ | 258.4 |
| $ | 253.9 |
| $ | 252.8 |
| $ | 311.9 |
| $ | 347.4 |
| $ | 371.7 |
|
|
|
|
|
|
|
|
|
|
|
|
|
|
|
|
|
|
|
|
|
|
| ||||||||||
EBITDA |
| 45.7 |
| 37.0 |
| 31.3 |
| 27.6 |
| 30.4 |
| 29.0 |
| 27.3 |
| 41.2 |
| 51.3 |
| 58.2 |
| ||||||||||
|
|
|
|
|
|
|
|
|
|
|
|
|
|
|
|
|
|
|
|
|
| ||||||||||
EBIT |
| 16.5 |
| 7.0 |
| 3.8 |
| 2.5 |
| 6.7 |
| 5.9 |
| 5.2 |
| 14.8 |
| 20.4 |
| 24.2 |
| ||||||||||
|
|
|
|
|
|
|
|
|
|
|
|
|
|
|
|
|
|
|
|
|
| ||||||||||
Net Income |
| 4.7 |
| (0.4 | ) | (0.8 | ) | (1.0 | ) | 2.2 |
| 1.9 |
| 1.6 |
| 6.4 |
| 9.1 |
| 11.0 |
| ||||||||||
|
|
|
|
|
|
|
|
|
|
|
|
|
|
|
|
|
|
|
|
|
| ||||||||||
EPS |
| $ | 0.46 |
| $ | (0.05 | ) | $ | (0.11 | ) | $ | (0.15 | ) | $ | 0.31 |
| $ | 0.29 |
| $ | 0.25 |
| $ | 0.98 |
| $ | 1.39 |
| $ | 1.67 |
|
Balance Sheet |
|
|
|
|
|
|
|
|
|
|
|
|
|
|
|
|
|
|
|
|
| ||||||||||
Cash and Cash Equivalents |
| $ | 0.2 |
| $ | 1.1 |
| $ | 0.1 |
| $ | 2.3 |
| $ | 3.7 |
| $ | 3.9 |
| $ | 1.0 |
| $ | 2.4 |
| $ | 2.9 |
| $ | 2.7 |
|
Trade Account Receivables |
| 31.3 |
| 26.9 |
| 28.4 |
| 25.0 |
| 24.6 |
| 25.0 |
| 24.5 |
| 30.1 |
| 33.4 |
| 35.7 |
| ||||||||||
Property & Equipment, Net |
| 191.0 |
| 169.0 |
| 140.5 |
| 124.5 |
| 119.8 |
| 121.8 |
| 127.1 |
| 163.6 |
| 175.1 |
| 183.9 |
| ||||||||||
Other Assets |
| 34.1 |
| 34.5 |
| 12.9 |
| 13.4 |
| 13.0 |
| 12.2 |
| 13.0 |
| 15.2 |
| 16.6 |
| 17.6 |
| ||||||||||
Total Assets |
| $ | 256.7 |
| $ | 231.4 |
| $ | 181.9 |
| $ | 165.3 |
| $ | 161.1 |
| $ | 162.9 |
| $ | 165.7 |
| $ | 211.3 |
| $ | 227.9 |
| $ | 239.9 |
|
|
|
|
|
|
|
|
|
|
|
|
|
|
|
|
|
|
|
|
|
|
| ||||||||||
Long Term Debt |
| $ | 87.3 |
| $ | 65.2 |
| $ | 46.5 |
| $ | 37.8 |
| $ | 36.3 |
| $ | 41.1 |
| $ | 43.6 |
| $ | 78.3 |
| $ | 81.6 |
| $ | 79.4 |
|
Capital Leases |
| 31.3 |
| 27.3 |
| 23.0 |
| 17.1 |
| 12.8 |
| 7.1 |
| 2.6 |
| — |
| — |
| — |
| ||||||||||
Other Liabilities |
| 57.4 |
| 58.5 |
| 52.2 |
| 51.6 |
| 55.7 |
| 57.6 |
| 61.1 |
| 68.2 |
| 72.4 |
| 75.6 |
| ||||||||||
Stockholders’ Equity |
| 80.7 |
| 80.4 |
| 60.2 |
| 58.7 |
| 56.3 |
| 57.1 |
| 58.4 |
| 64.8 |
| 73.9 |
| 84.9 |
| ||||||||||
Total Liabilities & Stockholders’ Equity |
| $ | 256.7 |
| $ | 231.4 |
| $ | 181.9 |
| $ | 165.3 |
| $ | 161.1 |
| $ | 162.9 |
| $ | 165.7 |
| $ | 211.3 |
| $ | 227.9 |
| $ | 239.9 |
|
|
|
|
|
|
|
|
|
|
|
|
|
|
|
|
|
|
|
|
|
|
| ||||||||||
Capital Expenditures |
| $ | 5.7 |
| $ | 7.1 |
| $ | 7.6 |
| $ | 11.3 |
| $ | 19.0 |
| $ | 23.6 |
| $ | 30.1 |
| $ | 62.9 |
| $ | 42.3 |
| $ | 42.8 |
|
(a) Projections per TCAM management. 2005 projections were developed on 10/13/05 and include actual YTD performance through 9/30/05. 2006 projections were developed prior to release of second quarter financials.
15
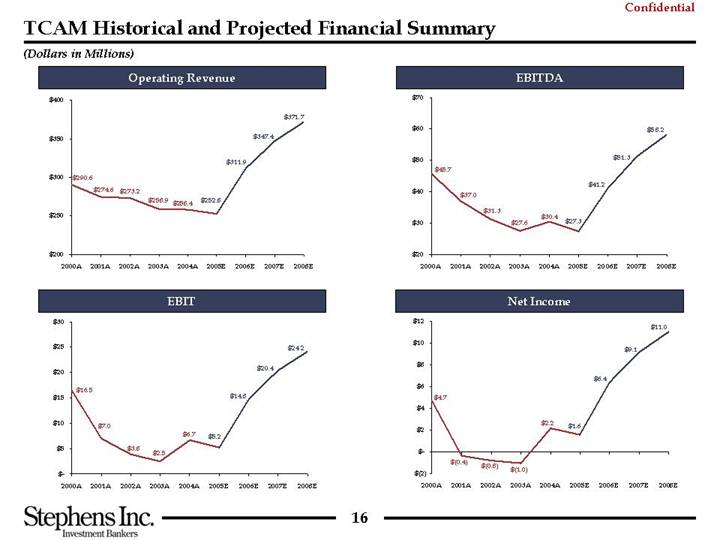
TCAM Historical and Projected Financial Summary
(Dollars in Millions)
Operating Revenue |
| EBITDA |
|
|
|
[CHART] |
| [CHART] |
|
|
|
EBIT |
| Net Income |
|
|
|
[CHART] |
| [CHART] |
16
Valuation Methodology
Stephens reviewed and considered the following methodologies in valuing TCAM:
• Comparable Company Analysis: Examined the trading multiples of selected publicly traded comparable companies offering services similar to TCAM. This analysis considered the trading multiples of the truckload industry, adjusting the multiples to reflect the relative size, profitability and growth of TCAM.
• Comparable Transaction Analysis: Reviewed historical multiples paid in acquisitions of businesses similar to TCAM over the past five years. This analysis utilized the relevant transaction multiples of EBIT and EPS and applied them to TCAM’s projected values for 2005 to estimate an implied per share value for TCAM in a change of control transaction.
• Discounted Cash Flow Analysis: Derived a valuation from the present value of the free cash flows projected for TCAM over the next five years and a terminal value based on an estimated perpetual growth rate. The discount rate for this analysis was based on the calculated weighted average cost of capital for TCAM based on available public information and adjusted for size.
• Leverage Buyout Analysis: Utilized TCAM projections for the next five years, estimated current debt capacity, utilized expected private equity returns, and assumed an exit EBIT multiple of 10.0x to derive a current valuation range.
• Premiums Analysis: Analyzed premiums paid for year-to-date transactions that ranged in size from $50 million to $500 million. Applied an applicable range of premiums from the analysis to TCAM’s current share to estimate an implied per share value in a change of control transaction.
18
Valuation Summary
(Dollars in Millions, Except per Share)
[CHART]
|
| Comparable Company |
| Acquisition Multiple |
| DCF |
| LBO |
| Premium |
| Market Price |
| |||||||||||
|
| LTM |
| FY 2005 |
| FY 2005 |
| FY 2005 |
| FY 2005 |
| Perpetual |
| IRR |
| Premium |
| 52 Week |
| |||||
Data: |
| $ | 5.9 |
| $ | 5.2 |
| $ | 0.25 |
| $ | 5.2 |
| $ | 0.25 |
| Discount Rate |
| 25.0% - 35.0% |
| 20.0% - 30.0% |
| High / Low |
|
Metric: |
| 9.0x - 11.0x |
| 8.0x - 10.0x |
| 12.0x - 16.0x |
| 9.0x - 11.0x |
| 13.0x - 17.0x |
| 12.0% |
|
|
|
|
|
|
| |||||
Note: 2005 Projections developed by management on 10/13/05 and include actual YTD performance through 9/30/05.
The DCF and LBO valuation analyses utilize projections developed by management prior to the second quarter release.
19
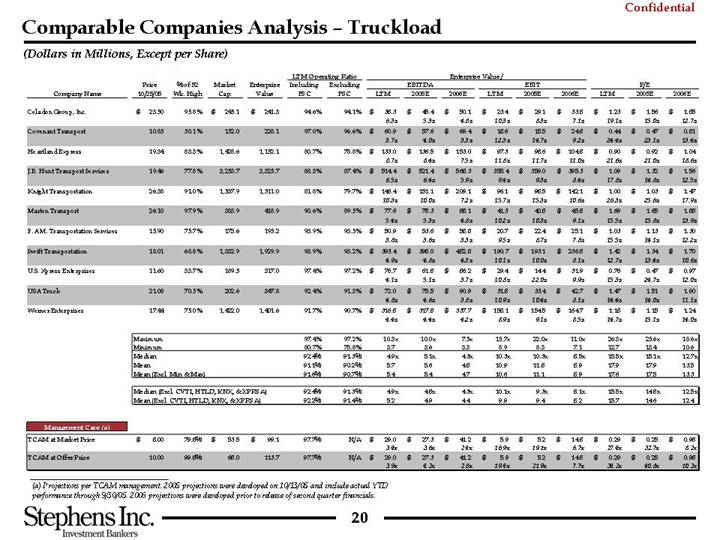
Comparable Companies Analysis – Truckload
(Dollars in Millions, Except per Share)
|
|
|
|
|
|
|
|
|
| LTM Operating Ratio |
| Enterprise Value / |
|
|
|
|
|
|
| ||||||||||||
|
| Price |
| % of 52 |
| Market |
| Enterprise |
| Including |
| Excluding |
| EBITDA |
| EBIT |
| P/E |
| ||||||||||||
Company Name |
| 10/25/05 |
| Wk. High |
| Cap. |
| Value |
| FSC |
| FSC |
| LTM |
| 2005E |
| 2006E |
| LTM |
| 2005E |
| 2006E |
| LTM |
| 2005E |
| 2006E |
|
|
|
|
|
|
|
|
|
|
|
|
|
|
|
|
|
|
|
|
|
|
|
|
|
|
|
|
|
|
|
|
|
Celadon Group, Inc. |
| $ | 23.50 |
| 95.8 | % | $ | 245.1 |
| $ | 241.3 |
| 94.6 | % | 94.1 | % | $ | 38.3 |
| $ | 45.4 |
| $ | 50.1 |
| $ | 23.4 |
| $ | 29.1 |
| $ | 33.8 |
| $ | 1.23 |
| $ | 1.56 |
| $ | 1.85 |
|
|
|
|
|
|
|
|
|
|
|
|
|
|
| 6.3x |
| 5.3x |
| 4.8x |
| 10.3x |
| 8.3x |
| 7.1x |
| 19.1x |
| 15.0x |
| 12.7x |
| ||||||||||||
Covenant Transport |
| 10.85 |
| 50.1 | % | 152.0 |
| 228.1 |
| 97.0 | % | 96.6 | % | $ | 60.9 |
| $ | 57.6 |
| $ | 69.4 |
| $ | 18.6 |
| $ | 15.5 |
| $ | 24.8 |
| $ | 0.44 |
| $ | 0.47 |
| $ | 0.81 |
| |||
|
|
|
|
|
|
|
|
|
|
|
|
|
| 3.7x |
| 4.0x |
| 3.3x |
| 12.3x |
| 14.7x |
| 9.2x |
| 24.4x |
| 23.1x |
| 13.4x |
| ||||||||||||
Heartland Express |
| 19.34 |
| 83.3 | % | 1,428.6 |
| 1,152.1 |
| 80.7 | % | 78.8 | % | $ | 133.0 |
| $ | 136.5 |
| $ | 153.0 |
| $ | 97.3 |
| $ | 98.6 |
| $ | 104.8 |
| $ | 0.90 |
| $ | 0.92 |
| $ | 1.04 |
| |||
|
|
|
|
|
|
|
|
|
|
|
|
|
| 8.7x |
| 8.4x |
| 7.5x |
| 11.8x |
| 11.7x |
| 11.0x |
| 21.6x |
| 21.0x |
| 18.6x |
| ||||||||||||
J.B. Hunt Transport Services |
| 19.46 |
| 77.8 | % | 3,253.7 |
| 3,325.7 |
| 88.3 | % | 87.4 | % | $ | 514.4 |
| $ | 521.4 |
| $ | 568.3 |
| $ | 355.4 |
| $ | 359.0 |
| $ | 395.3 |
| $ | 1.09 |
| $ | 1.32 |
| $ | 1.56 |
| |||
|
|
|
|
|
|
|
|
|
|
|
|
|
| 6.5x |
| 6.4x |
| 5.9x |
| 9.4x |
| 9.3x |
| 8.4x |
| 17.8x |
| 14.8x |
| 12.5x |
| ||||||||||||
Knight Transportation |
| 26.38 |
| 91.0 | % | 1,537.9 |
| 1,511.0 |
| 81.8 | % | 79.7 | % | $ | 146.4 |
| $ | 151.1 |
| $ | 209.1 |
| $ | 96.1 |
| $ | 98.5 |
| $ | 142.1 |
| $ | 1.00 |
| $ | 1.03 |
| $ | 1.47 |
| |||
|
|
|
|
|
|
|
|
|
|
|
|
|
| 10.3x |
| 10.0x |
| 7.2x |
| 15.7x |
| 15.3x |
| 10.6x |
| 26.3x |
| 25.6x |
| 17.9x |
| ||||||||||||
Marten Transport |
| 26.10 |
| 97.9 | % | 383.9 |
| 418.9 |
| 90.6 | % | 89.5 | % | $ | 77.6 |
| $ | 78.3 |
| $ | 88.1 |
| $ | 41.3 |
| $ | 40.8 |
| $ | 45.8 |
| $ | 1.69 |
| $ | 1.65 |
| $ | 1.88 |
| |||
|
|
|
|
|
|
|
|
|
|
|
|
|
| 5.4x |
| 5.3x |
| 4.8x |
| 10.2x |
| 10.3x |
| 9.1x |
| 15.5x |
| 15.8x |
| 13.9x |
| ||||||||||||
P.A.M. Transportation Services |
| 15.90 |
| 75.7 | % | 173.6 |
| 195.2 |
| 93.9 | % | 93.5 | % | $ | 50.9 |
| $ | 53.6 |
| $ | 58.8 |
| $ | 20.7 |
| $ | 22.4 |
| $ | 25.1 |
| $ | 1.03 |
| $ | 1.13 |
| $ | 1.30 |
| |||
|
|
|
|
|
|
|
|
|
|
|
|
|
| 3.8x |
| 3.6x |
| 3.3x |
| 9.5x |
| 8.7x |
| 7.8x |
| 15.5x |
| 14.1x |
| 12.2x |
| ||||||||||||
Swift Transportation |
| 18.01 |
| 68.8 | % | 1,332.9 |
| 1,929.9 |
| 93.9 | % | 93.2 | % | $ | 393.4 |
| $ | 398.0 |
| $ | 452.8 |
| $ | 190.7 |
| $ | 193.1 |
| $ | 236.8 |
| $ | 1.42 |
| $ | 1.34 |
| $ | 1.70 |
| |||
|
|
|
|
|
|
|
|
|
|
|
|
|
| 4.9x |
| 4.8x |
| 4.3x |
| 10.1x |
| 10.0x |
| 8.1x |
| 12.7x |
| 13.4x |
| 10.6x |
| ||||||||||||
U.S. Xpress Enterprises |
| 11.60 |
| 33.7 | % | 189.5 |
| 317.0 |
| 97.4 | % | 97.2 | % | $ | 76.7 |
| $ | 61.8 |
| $ | 86.2 |
| $ | 29.4 |
| $ | 14.4 |
| $ | 31.9 |
| $ | 0.76 |
| $ | 0.47 |
| $ | 0.97 |
| |||
|
|
|
|
|
|
|
|
|
|
|
|
|
| 4.1x |
| 5.1x |
| 3.7x |
| 10.8x |
| 22.0x |
| 9.9x |
| 15.3x |
| 24.7x |
| 12.0x |
| ||||||||||||
USA Truck |
| 21.08 |
| 70.5 | % | 202.6 |
| 347.8 |
| 92.4 | % | 91.3 | % | $ | 72.0 |
| $ | 75.5 |
| $ | 90.9 |
| $ | 31.8 |
| $ | 33.4 |
| $ | 42.7 |
| $ | 1.47 |
| $ | 1.51 |
| $ | 1.90 |
| |||
|
|
|
|
|
|
|
|
|
|
|
|
|
| 4.8x |
| 4.6x |
| 3.8x |
| 10.9x |
| 10.4x |
| 8.1x |
| 14.4x |
| 14.0x |
| 11.1x |
| ||||||||||||
Werner Enterprises |
| 17.44 |
| 75.0 | % | 1,422.0 |
| 1,401.6 |
| 91.7 | % | 90.7 | % | $ | 316.8 |
| $ | 317.8 |
| $ | 337.7 |
| $ | 158.1 |
| $ | 154.5 |
| $ | 164.7 |
| $ | 1.18 |
| $ | 1.15 |
| $ | 1.24 |
| |||
|
|
|
|
|
|
|
|
|
|
|
|
|
| 4.4x |
| 4.4x |
| 4.2x |
| 8.9x |
| 9.1x |
| 8.5x |
| 14.7x |
| 15.1x |
| 14.0x |
| ||||||||||||
|
|
|
|
|
|
|
|
|
|
|
|
|
|
|
|
|
|
|
|
|
|
|
|
|
|
|
|
|
|
|
| ||||||||||||
|
| Maximum |
| 97.4 | % | 97.2 | % | 10.3x |
| 10.0x |
| 7.5x |
| 15.7x |
| 22.0x |
| 11.0x |
| 26.3x |
| 25.6x |
| 18.6x |
| ||||||||||||||||||
|
| Minimum |
| 80.7 | % | 78.8 | % | 3.7 |
| 3.6 |
| 3.3 |
| 8.9 |
| 8.3 |
| 7.1 |
| 12.7 |
| 13.4 |
| 10.6 |
| ||||||||||||||||||
|
| Median |
| 92.4 | % | 91.3 | % | 4.9x |
| 5.1x |
| 4.3x |
| 10.3x |
| 10.3x |
| 8.5x |
| 15.5x |
| 15.1x |
| 12.7x |
| ||||||||||||||||||
|
| Mean |
| 91.1 | % | 90.2 | % | 5.7 |
| 5.6 |
| 4.8 |
| 10.9 |
| 11.8 |
| 8.9 |
| 17.9 |
| 17.9 |
| 13.5 |
| ||||||||||||||||||
|
| Mean (Excl. Min & Max) |
| 91.6 | % | 90.7 | % | 5.4 |
| 5.4 |
| 4.7 |
| 10.6 |
| 11.1 |
| 8.9 |
| 17.6 |
| 17.5 |
| 13.3 |
| ||||||||||||||||||
|
|
|
|
|
|
|
|
|
|
|
|
|
|
|
|
|
|
|
|
|
|
|
|
|
| ||||||||||||||||||
|
| Median (Excl. CVTI, HTLD, KNX, & XPRSA) |
| 92.4 | % | 91.3 | % | 4.9x |
| 4.8x |
| 4.3x |
| 10.1x |
| 9.3x |
| 8.1x |
| 15.5x |
| 14.8x |
| 12.5x |
| ||||||||||||||||||
|
| Mean (Excl. CVTI, HTLD, KNX, & XPRSA) |
| 92.2 | % | 91.4 | % | 5.2 |
| 4.9 |
| 4.4 |
| 9.9 |
| 9.4 |
| 8.2 |
| 15.7 |
| 14.6 |
| 12.4 |
| ||||||||||||||||||
|
|
|
|
|
|
|
|
|
|
|
|
|
|
|
|
|
|
|
|
|
|
|
|
|
| ||||||||||||||||||
Management Case: (a) |
|
|
|
|
|
|
|
|
|
|
|
|
|
|
|
|
|
|
|
|
|
|
| ||||||||||||||||||||
|
|
|
|
|
|
|
|
|
|
|
|
|
|
|
|
|
|
|
|
|
|
|
|
|
| ||||||||||||||||||
TCAM at Market Price |
| $ | 8.00 |
| 79.8 | % | $ | 53.5 |
| $ | 99.1 |
| 97.7 | % | N/A |
| $ | 29.0 |
| $ | 27.3 |
| $ | 41.2 |
| $ | 5.9 |
| $ | 5.2 |
| $ | 14.8 |
| $ | 0.29 |
| $ | 0.25 |
| $ | 0.98 |
|
|
|
|
|
|
|
|
|
|
|
|
|
|
| 3.4 | x | 3.6 | x | 2.4 | x | 16.9 | x | 19.1 | x | 6.7 | x | 27.4 | x | 32.7 | x | 8.2 | x | ||||||||||||
TCAM at Offer Price |
| 10.00 |
| 99.8 | % | 68.0 |
| 113.7 |
| 97.7 | % | N/A |
| $ | 29.0 |
| $ | 27.3 |
| $ | 41.2 |
| $ | 5.9 |
| $ | 5.2 |
| $ | 14.8 |
| $ | 0.29 |
| $ | 0.25 |
| $ | 0.98 |
| |||
|
|
|
|
|
|
|
|
|
|
|
|
|
| 3.9 | x | 4.2 | x | 2.8 | x | 19.4 | x | 21.9 | x | 7.7 | x | 34.2 | x | 40.8 | x | 10.2 | x | ||||||||||||
(a) Projections per TCAM management. 2005 projections were developed on 10/13/05 and include actual YTD performance through 9/30/05. 2006 projections were developed prior to release of second quarter financials.
20
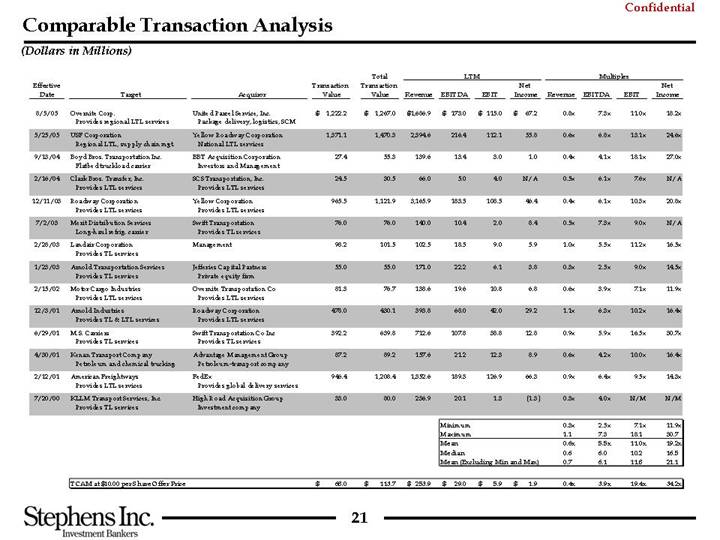
Comparable Transaction Analysis
(Dollars in Millions)
|
|
|
|
|
|
|
| Total |
| LTM |
| Multiples |
| ||||||||||||||||||
Effective |
|
|
|
|
| Transaction |
| Transaction |
|
|
|
|
|
|
| Net |
|
|
|
|
|
|
| Net |
| ||||||
Date |
| Target |
| Acquiror |
| Value |
| Value |
| Revenue |
| EBITDA |
| EBIT |
| Income |
| Revenue |
| EBITDA |
| EBIT |
| Income |
| ||||||
|
|
|
|
|
|
|
|
|
|
|
|
|
|
|
|
|
|
|
|
|
|
|
|
|
| ||||||
8/5/05 |
| Overnite Corp. |
| United Parcel Service, Inc. |
| $ | 1,222.2 |
| $ | 1,267.0 |
| $ | 1,686.9 |
| $ | 173.0 |
| $ | 115.0 |
| $ | 67.2 |
| 0.8x |
| 7.3x |
| 11.0x |
| 18.2x |
|
|
| Provides regional LTL services |
| Package delivery, logistics, SCM |
|
|
|
|
|
|
|
|
|
|
|
|
|
|
|
|
|
|
|
|
| ||||||
5/25/05 |
| USF Corporation |
| Yellow Roadway Corporation |
| 1,371.1 |
| 1,470.3 |
| 2,394.6 |
| 216.4 |
| 112.1 |
| 55.8 |
| 0.6x |
| 6.8x |
| 13.1x |
| 24.6x |
| ||||||
9/13/04 |
| Boyd Bros. Transportation Inc. |
| BBT Acquisition Corporation |
| 27.4 |
| 55.3 |
| 139.6 |
| 13.4 |
| 3.0 |
| 1.0 |
| 0.4x |
| 4.1x |
| 18.1x |
| 27.0x |
| ||||||
2/16/04 |
| Clark Bros. Transfer, Inc. |
| SCS Transportation, Inc. |
| 24.5 |
| 30.5 |
| 66.0 |
| 5.0 |
| 4.0 |
| N/A |
| 0.5x |
| 6.1x |
| 7.6x |
| N/A |
| ||||||
12/11/03 |
| Roadway Corporation |
| Yellow Corporation |
| 965.5 |
| 1,121.9 |
| 3,165.9 |
| 183.5 |
| 108.5 |
| 46.4 |
| 0.4x |
| 6.1x |
| 10.3x |
| 20.8x |
| ||||||
7/2/03 |
| Merit Distribution Services |
| Swift Transportation |
| 76.0 |
| 76.0 |
| 140.0 |
| 10.4 |
| 2.0 |
| 8.4 |
| 0.5x |
| 7.3x |
| 9.0x |
| N/A |
| ||||||
2/28/03 |
| Landair Corporation |
| Management |
| 98.2 |
| 101.5 |
| 102.5 |
| 18.5 |
| 9.0 |
| 5.9 |
| 1.0x |
| 5.5x |
| 11.2x |
| 16.5x |
| ||||||
1/23/03 |
| Arnold Transportation Services |
| Jefferies Capital Partners |
| 55.0 |
| 55.0 |
| 171.0 |
| 22.2 |
| 6.1 |
| 3.8 |
| 0.3x |
| 2.5x |
| 9.0x |
| 14.5x |
| ||||||
2/15/02 |
| Motor Cargo Industries |
| Overnite Transportation Co |
| 81.3 |
| 76.7 |
| 138.6 |
| 19.6 |
| 10.8 |
| 6.8 |
| 0.6x |
| 3.9x |
| 7.1x |
| 11.9x |
| ||||||
12/3/01 |
| Arnold Industries |
| Roadway Corporation |
| 478.0 |
| 430.1 |
| 393.8 |
| 68.0 |
| 42.0 |
| 29.2 |
| 1.1x |
| 6.3x |
| 10.2x |
| 16.4x |
| ||||||
|
| Provides TL & LTL services |
| Provides LTL services |
|
|
|
|
|
|
|
|
|
|
|
|
|
|
|
|
|
|
|
|
| ||||||
6/29/01 |
| M.S. Carriers |
| Swift Transportation Co Inc |
| 392.2 |
| 639.8 |
| 712.6 |
| 107.8 |
| 38.8 |
| 12.8 |
| 0.9x |
| 5.9x |
| 16.5x |
| 30.7x |
| ||||||
|
| Provides TL services |
| Provides TL services |
|
|
|
|
|
|
|
|
|
|
|
|
|
|
|
|
|
|
|
|
| ||||||
4/30/01 |
| Kenan Transport Company |
| Advantage Management Group |
| 87.2 |
| 89.2 |
| 157.6 |
| 21.2 |
| 12.3 |
| 8.9 |
| 0.6x |
| 4.2x |
| 10.0x |
| 16.4x |
| ||||||
|
| Petroleum and chemical trucking |
| Petroleum-transport company |
|
|
|
|
|
|
|
|
|
|
|
|
|
|
|
|
|
|
|
|
| ||||||
2/12/01 |
| American Freightways |
| FedEx |
| 946.4 |
| 1,208.4 |
| 1,352.6 |
| 189.3 |
| 126.9 |
| 66.3 |
| 0.9x |
| 6.4x |
| 9.5x |
| 14.3x |
| ||||||
|
| Provides LTL services |
| Provides global delivery services |
|
|
|
|
|
|
|
|
|
|
|
|
|
|
|
|
|
|
|
|
| ||||||
7/20/00 |
| KLLM Transport Services, Inc. |
| High Road Acquisition Group |
| 33.0 |
| 80.0 |
| 236.9 |
| 20.1 |
| 1.3 |
| (1.3 | ) | 0.3x |
| 4.0x |
| N/M |
| N/M |
| ||||||
|
| Provides TL services |
| Investment company |
|
|
|
|
|
|
|
|
|
|
|
|
|
|
|
|
|
|
|
|
| ||||||
|
|
|
|
|
|
|
|
|
|
|
| Minimum |
|
|
| 0.3x |
| 2.5x |
| 7.1x |
| 11.9x |
| ||||||||
|
|
|
|
|
|
|
|
|
|
|
| Maximum |
|
|
| 1.1 |
| 7.3 |
| 18.1 |
| 30.7 |
| ||||||||
|
|
|
|
|
|
|
|
|
|
|
| Mean |
|
|
| 0.6x |
| 5.5x |
| 11.0x |
| 19.2x |
| ||||||||
|
|
|
|
|
|
|
|
|
|
|
| Median |
|
|
| 0.6 |
| 6.0 |
| 10.2 |
| 16.5 |
| ||||||||
|
|
|
|
|
|
|
|
|
|
|
| Mean (Excluding Min and Max) |
| 0.7 |
| 6.1 |
| 11.8 |
| 21.1 |
| ||||||||||
TCAM at $10.00 per Share Offer Price |
| $ | 68.0 |
| $ | 113.7 |
| $ | 253.9 |
| $ | 29.0 |
| $ | 5.9 |
| $ | 1.9 |
| 0.4x |
| 3.9x |
| 19.4x |
| 34.2x |
| ||||
21
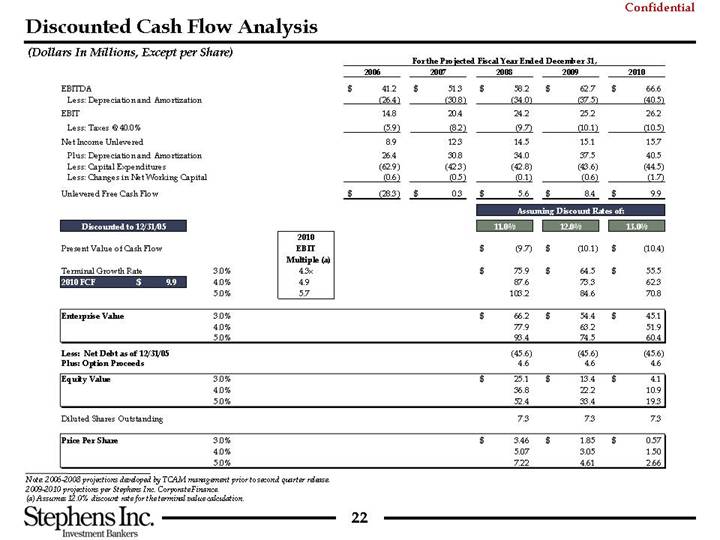
Discounted Cash Flow Analysis
(Dollars In Millions, Except per Share)
|
| For the Projected Fiscal Year Ended December 31, |
| |||||||||||||
|
| 2006 |
| 2007 |
| 2008 |
| 2009 |
| 2010 |
| |||||
|
|
|
|
|
|
|
|
|
|
|
|
|
|
|
|
|
EBITDA |
| $ | 41.2 |
| $ | 51.3 |
| $ | 58.2 |
| $ | 62.7 |
| $ | 66.6 |
|
Less: Depreciation and Amortization |
| (26.4 | ) | (30.8 | ) | (34.0 | ) | (37.5 | ) | (40.5 | ) | |||||
EBIT |
| 14.8 |
| 20.4 |
| 24.2 |
| 25.2 |
| 26.2 |
| |||||
Less: Taxes @ 40.0% |
| (5.9 | ) | (8.2 | ) | (9.7 | ) | (10.1 | ) | (10.5 | ) | |||||
Net Income Unlevered |
| 8.9 |
| 12.3 |
| 14.5 |
| 15.1 |
| 15.7 |
| |||||
Plus: Depreciation and Amortization |
| 26.4 |
| 30.8 |
| 34.0 |
| 37.5 |
| 40.5 |
| |||||
Less: Capital Expenditures |
| (62.9 | ) | (42.3 | ) | (42.8 | ) | (43.6 | ) | (44.5 | ) | |||||
Less: Changes in Net Working Capital |
| (0.6 | ) | (0.5 | ) | (0.1 | ) | (0.6 | ) | (1.7 | ) | |||||
|
|
|
|
|
|
|
|
|
|
|
| |||||
Unlevered Free Cash Flow |
| $ | (28.3 | ) | $ | 0.3 |
| $ | 5.6 |
| $ | 8.4 |
| $ | 9.9 |
|
|
|
|
|
|
| 2010 |
| Assuming Discount Rates of: |
| ||||||||
Discounted to 12/31/05 |
|
|
|
|
| Multiple (a) |
| 11.0% |
| 12.0% |
| 13.0% |
| ||||
|
|
|
|
|
|
|
|
|
|
|
|
|
| ||||
Present Value of Cash Flow |
|
|
|
|
|
|
| $ | (9.7 | ) | $ | (10.1 | ) | $ | (10.4 | ) | |
|
|
|
|
|
|
|
|
|
|
|
|
|
| ||||
Terminal Growth Rate |
|
|
| 3.0 | % | 4.3 | x | $ | 75.9 |
| $ | 64.5 |
| $ | 55.5 |
| |
2010 FCF |
| $ | 9.9 |
| 4.0 | % | 4.9 |
| 87.6 |
| 73.3 |
| 62.3 |
| |||
|
|
|
| 5.0 | % | 5.7 |
| 103.2 |
| 84.6 |
|
|
| ||||
|
|
|
|
|
|
|
|
|
|
|
|
|
| ||||
Enterprise Value |
|
|
| 3.0 | % |
|
| $ | 66.2 |
| $ | 54.4 |
| $ | 45.1 |
| |
|
|
|
| 4.0 | % |
|
| 77.9 |
| 63.2 |
| 51.9 |
| ||||
|
|
|
| 5.0 | % |
|
| 93.4 |
| 74.5 |
| 60.4 |
| ||||
|
|
|
|
|
|
|
|
|
|
|
|
|
| ||||
Less: Net Debt as of 12/31/05 |
|
|
|
|
|
|
| (45.6 | ) | (45.6 | ) | (45.6 | ) | ||||
Plus: Option Proceeds |
|
|
|
|
|
|
| 4.6 |
| 4.6 |
| 4.6 |
| ||||
|
|
|
|
|
|
|
|
|
|
|
|
|
| ||||
Equity Value |
|
|
| 3.0 | % |
|
| $ | 25.1 |
| $ | 13.4 |
| $ | 4.1 |
| |
|
|
|
| 4.0 | % |
|
| 36.8 |
| 22.2 |
| 10.9 |
| ||||
|
|
|
| 5.0 | % |
|
| 52.4 |
| 33.4 |
| 19.3 |
| ||||
Diluted Shares Outstanding |
|
|
|
|
|
|
| 7.3 |
| 7.3 |
| 7.3 |
| ||||
|
|
|
|
|
|
|
|
|
|
|
|
|
| ||||
Price Per Share |
|
|
| 3.0 | % |
|
| $ | 3.46 |
| $ | 1.85 |
| $ | 0.57 |
| |
|
|
|
| 4.0 | % |
|
| 5.07 |
| 3.05 |
| 1.50 |
| ||||
|
|
|
| 5.0 | % |
|
| 7.22 |
| 4.61 |
| 2.66 |
| ||||
Note: 2006-2008 projections developed by TCAM management prior to second quarter release.
2009-2010 projections per Stephens Inc. Corporate Finance.
(a) Assumes 12.0% discount rate for the terminal value calculation.
22
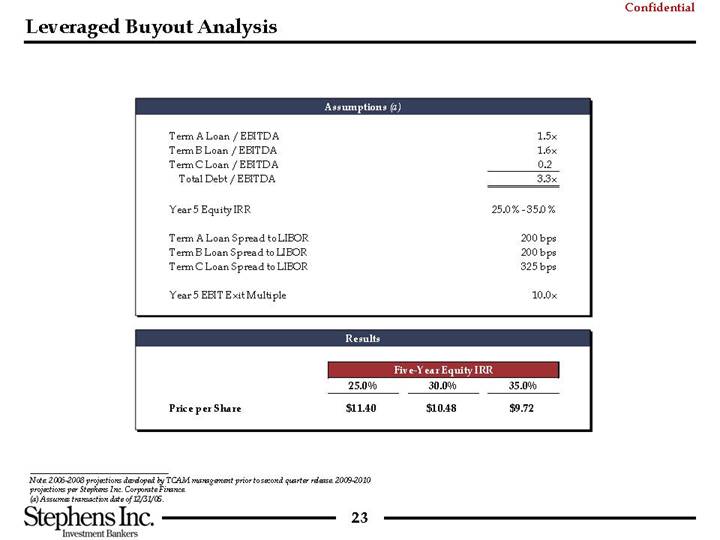
Leveraged Buyout Analysis
Assumptions (a)
Term A Loan / EBITDA |
| 1.5 | x |
Term B Loan / EBITDA |
| 1.6 | x |
Term C Loan / EBITDA |
| 0.2 |
|
Total Debt / EBITDA |
| 3.3 | x |
|
|
|
|
Year 5 Equity IRR |
| 25.0% - 35.0% |
|
|
|
|
|
Term A Loan Spread to LIBOR |
| 200 bps |
|
Term B Loan Spread to LIBOR |
| 200 bps |
|
Term C Loan Spread to LIBOR |
| 325 bps |
|
|
|
|
|
Year 5 EBIT Exit Multiple |
| 10.0 | x |
Results
|
| Five-Year Equity IRR |
| |||||||
|
| 25.0% |
| 30.0% |
| 35.0% |
| |||
Price per Share |
| $ | 11.40 |
| $ | 10.48 |
| $ | 9.72 |
|
Note: 2006-2008 projections developed by TCAM management prior to second quarter release.
2009-2010 projections per Stephens Inc. Corporate Finance.
(a) Assumes transaction date of 12/31/05.
23
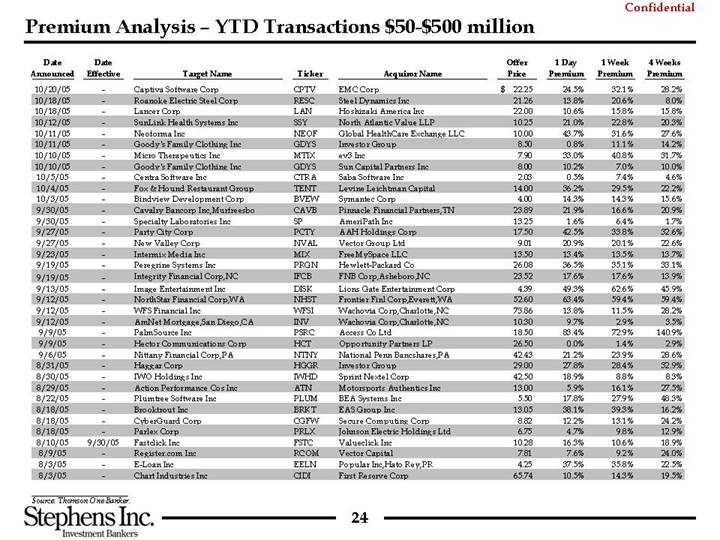
Premium Analysis – YTD Transactions $50-$500 million
Date |
| Date |
| Target Name |
| Ticker |
| Acquiror Name |
| Offer |
| 1 Day |
| 1 Week |
| 4 Weeks |
| |
|
|
|
|
|
|
|
|
|
|
|
|
|
|
|
|
|
| |
10/20/05 |
| — |
| Captiva Software Corp |
| CPTV |
| EMC Corp |
| $ | 22.25 |
| 24.5 | % | 32.1 | % | 28.2 | % |
10/18/05 |
| — |
| Roanoke Electric Steel Corp |
| RESC |
| Steel Dynamics Inc |
| 21.26 |
| 13.8 | % | 20.6 | % | 8.0 | % | |
10/18/05 |
| — |
| Lancer Corp |
| LAN |
| Hoshizaki America Inc |
| 22.00 |
| 10.6 | % | 15.8 | % | 15.8 | % | |
10/12/05 |
| — |
| SunLink Health Systems Inc |
| SSY |
| North Atlantic Value LLP |
| 10.25 |
| 21.0 | % | 22.8 | % | 20.3 | % | |
10/11/05 |
| — |
| Neoforma Inc |
| NEOF |
| Global HealthCare Exchange LLC |
| 10.00 |
| 43.7 | % | 31.6 | % | 27.6 | % | |
10/11/05 |
| — |
| Goody’s Family Clothing Inc |
| GDYS |
| Investor Group |
| 8.50 |
| 0.8 | % | 11.1 | % | 14.2 | % | |
10/10/05 |
| — |
| Micro Therapeutics Inc |
| MTIX |
| ev3 Inc |
| 7.90 |
| 33.0 | % | 40.8 | % | 31.7 | % | |
10/10/05 |
| — |
| Goody’s Family Clothing Inc |
| GDYS |
| Sun Capital Partners Inc |
| 8.00 |
| 10.2 | % | 7.0 | % | 10.0 | % | |
10/5/05 |
| — |
| Centra Software Inc |
| CTRA |
| Saba Software Inc |
| 2.03 |
| 0.5 | % | 7.4 | % | 4.6 | % | |
10/4/05 |
| — |
| Fox & Hound Restaurant Group |
| TENT |
| Levine Leichtman Capital |
| 14.00 |
| 36.2 | % | 29.5 | % | 22.2 | % | |
10/3/05 |
| — |
| Bindview Development Corp |
| BVEW |
| Symantec Corp |
| 4.00 |
| 14.3 | % | 14.3 | % | 15.6 | % | |
9/30/05 |
| — |
| Cavalry Bancorp Inc,Murfreesbo |
| CAVB |
| Pinnacle Financial Partners,TN |
| 23.89 |
| 21.9 | % | 16.6 | % | 20.9 | % | |
9/30/05 |
| — |
| Specialty Laboratories Inc |
| SP |
| AmeriPath Inc |
| 13.25 |
| 1.6 | % | 6.4 | % | 1.7 | % | |
9/27/05 |
| — |
| Party City Corp |
| PCTY |
| AAH Holdings Corp |
| 17.50 |
| 42.5 | % | 33.8 | % | 32.6 | % | |
9/27/05 |
| — |
| New Valley Corp |
| NVAL |
| Vector Group Ltd |
| 9.01 |
| 20.9 | % | 20.1 | % | 22.6 | % | |
9/23/05 |
| — |
| Intermix Media Inc |
| MIX |
| FreeMySpace LLC |
| 13.50 |
| 13.4 | % | 13.5 | % | 13.7 | % | |
9/19/05 |
| — |
| Peregrine Systems Inc |
| PRGN |
| Hewlett-Packard Co |
| 26.08 |
| 36.5 | % | 35.1 | % | 33.1 | % | |
9/19/05 |
| — |
| Integrity Financial Corp,NC |
| IFCB |
| FNB Corp,Asheboro,NC |
| 23.52 |
| 17.6 | % | 17.6 | % | 13.9 | % | |
9/13/05 |
| — |
| Image Entertainment Inc |
| DISK |
| Lions Gate Entertainment Corp |
| 4.39 |
| 49.3 | % | 62.6 | % | 45.9 | % | |
9/12/05 |
| — |
| NorthStar Financial Corp,WA |
| NHST |
| Frontier Finl Corp,Everett,WA |
| 52.60 |
| 63.4 | % | 59.4 | % | 59.4 | % | |
9/12/05 |
| — |
| WFS Financial Inc |
| WFSI |
| Wachovia Corp,Charlotte,NC |
| 73.86 |
| 13.8 | % | 11.5 | % | 28.2 | % | |
9/12/05 |
| — |
| AmNet Mortgage,San Diego,CA |
| INV |
| Wachovia Corp,Charlotte,NC |
| 10.30 |
| 9.7 | % | 2.9 | % | 3.5 | % | |
9/9/05 |
| — |
| PalmSource Inc |
| PSRC |
| Access Co Ltd |
| 18.50 |
| 83.4 | % | 72.9 | % | 140.9 | % | |
9/9/05 |
| — |
| Hector Communications Corp |
| HCT |
| Opportunity Partners LP |
| 26.50 |
| 0.0 | % | 1.4 | % | 2.9 | % | |
9/6/05 |
| — |
| Nittany Financial Corp,PA |
| NTNY |
| National Penn Bancshares,PA |
| 42.43 |
| 21.2 | % | 23.9 | % | 28.6 | % | |
8/31/05 |
| — |
| Haggar Corp |
| HGGR |
| Investor Group |
| 29.00 |
| 27.8 | % | 28.4 | % | 32.9 | % | |
8/30/05 |
| — |
| IWO Holdings Inc |
| IWHD |
| Sprint Nextel Corp |
| 42.50 |
| 18.9 | % | 8.8 | % | 8.3 | % | |
8/29/05 |
| — |
| Action Performance Cos Inc |
| ATN |
| Motorsports Authentics Inc |
| 13.00 |
| 5.9 | % | 16.1 | % | 27.5 | % | |
8/22/05 |
| — |
| Plumtree Software Inc |
| PLUM |
| BEA Systems Inc |
| 5.50 |
| 17.8 | % | 27.9 | % | 48.3 | % | |
8/18/05 |
| — |
| Brooktrout Inc |
| BRKT |
| EAS Group Inc |
| 13.05 |
| 38.1 | % | 39.3 | % | 16.2 | % | |
8/18/05 |
| — |
| CyberGuard Corp |
| CGFW |
| Secure Computing Corp |
| 8.82 |
| 12.2 | % | 13.1 | % | 24.2 | % | |
8/18/05 |
| — |
| Parlex Corp |
| PRLX |
| Johnson Electric Holdings Ltd |
| 6.75 |
| 4.7 | % | 9.8 | % | 12.9 | % | |
8/10/05 |
| 9/30/05 |
| Fastclick Inc |
| FSTC |
| Valueclick Inc |
| 10.28 |
| 16.3 | % | 10.6 | % | 18.9 | % | |
8/9/05 |
| — |
| Register.com Inc |
| RCOM |
| Vector Capital |
| 7.81 |
| 7.6 | % | 9.2 | % | 24.0 | % | |
8/3/05 |
| — |
| E-Loan Inc |
| EELN |
| Popular Inc,Hato Rey,PR |
| 4.25 |
| 37.5 | % | 35.8 | % | 22.5 | % | |
8/3/05 |
| — |
| Chart Industries Inc |
| CIDI |
| First Reserve Corp |
| 65.74 |
| 10.5 | % | 14.3 | % | 19.5 | % | |
Source: Thomson One Banker.
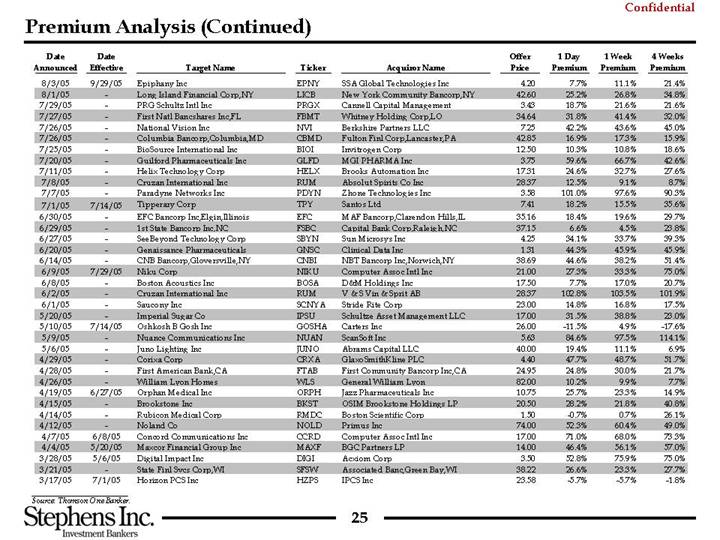
24
Date |
| Date |
| Target Name |
| Ticker |
| Acquiror Name |
| Offer |
| 1 Day |
| 1 Week |
| 4 Weeks |
|
|
|
|
|
|
|
|
|
|
|
|
|
|
|
|
|
|
|
8/3/05 |
| 9/29/05 |
| Epiphany Inc |
| EPNY |
| SSA Global Technologies Inc |
| 4.20 |
| 7.7 | % | 11.1 | % | 21.4 | % |
8/1/05 |
| — |
| Long Island Financial Corp,NY |
| LICB |
| New York Community Bancorp,NY |
| 42.60 |
| 25.2 | % | 26.8 | % | 34.8 | % |
7/29/05 |
| — |
| PRG Schultz Intl Inc |
| PRGX |
| Cannell Capital Management |
| 3.43 |
| 18.7 | % | 21.6 | % | 21.6 | % |
7/27/05 |
| — |
| First Natl Bancshares Inc,FL |
| FBMT |
| Whitney Holding Corp,LO |
| 34.64 |
| 31.8 | % | 41.4 | % | 32.0 | % |
7/26/05 |
| — |
| National Vision Inc |
| NVI |
| Berkshire Partners LLC |
| 7.25 |
| 42.2 | % | 43.6 | % | 45.0 | % |
7/26/05 |
| — |
| Columbia Bancorp,Columbia,MD |
| CBMD |
| Fulton Finl Corp,Lancaster,PA |
| 42.85 |
| 16.9 | % | 17.3 | % | 15.9 | % |
7/25/05 |
| — |
| BioSource International Inc |
| BIOI |
| Invitrogen Corp |
| 12.50 |
| 10.3 | % | 10.8 | % | 18.6 | % |
7/20/05 |
| — |
| Guilford Pharmaceuticals Inc |
| GLFD |
| MGI PHARMA Inc |
| 3.75 |
| 59.6 | % | 66.7 | % | 42.6 | % |
7/11/05 |
| — |
| Helix Technology Corp |
| HELX |
| Brooks Automation Inc |
| 17.31 |
| 24.6 | % | 32.7 | % | 27.6 | % |
7/8/05 |
| — |
| Cruzan International Inc |
| RUM |
| Absolut Spirits Co Inc |
| 28.37 |
| 12.5 | % | 9.1 | % | 8.7 | % |
7/7/05 |
| — |
| Paradyne Networks Inc |
| PDYN |
| Zhone Technologies Inc |
| 3.58 |
| 101.0 | % | 97.6 | % | 90.3 | % |
7/1/05 |
| 7/14/05 |
| Tipperary Corp |
| TPY |
| Santos Ltd |
| 7.41 |
| 18.2 | % | 15.5 | % | 35.6 | % |
6/30/05 |
| — |
| EFC Bancorp Inc,Elgin,Illinois |
| EFC |
| MAF Bancorp,Clarendon Hills,IL |
| 35.16 |
| 18.4 | % | 19.6 | % | 29.7 | % |
6/29/05 |
| — |
| 1st State Bancorp Inc,NC |
| FSBC |
| Capital Bank Corp,Raleigh,NC |
| 37.15 |
| 6.6 | % | 4.5 | % | 23.8 | % |
6/27/05 |
| — |
| SeeBeyond Technology Corp |
| SBYN |
| Sun Microsys Inc |
| 4.25 |
| 34.1 | % | 33.7 | % | 39.3 | % |
6/20/05 |
| — |
| Genaissance Pharmaceuticals |
| GNSC |
| Clinical Data Inc |
| 1.31 |
| 44.3 | % | 45.9 | % | 45.9 | % |
6/14/05 |
| — |
| CNB Bancorp,Gloversville,NY |
| CNBI |
| NBT Bancorp Inc,Norwich,NY |
| 38.69 |
| 44.6 | % | 38.2 | % | 51.4 | % |
6/9/05 |
| 7/29/05 |
| Niku Corp |
| NIKU |
| Computer Assoc Intl Inc |
| 21.00 |
| 27.3 | % | 33.3 | % | 75.0 | % |
6/8/05 |
| — |
| Boston Acoustics Inc |
| BOSA |
| D&M Holdings Inc |
| 17.50 |
| 7.7 | % | 17.0 | % | 20.7 | % |
6/2/05 |
| — |
| Cruzan International Inc |
| RUM |
| V & S Vin & Sprit AB |
| 28.37 |
| 102.8 | % | 103.5 | % | 101.9 | % |
6/1/05 |
| — |
| Saucony Inc |
| SCNYA |
| Stride Rite Corp |
| 23.00 |
| 14.8 | % | 16.8 | % | 17.5 | % |
5/20/05 |
| — |
| Imperial Sugar Co |
| IPSU |
| Schultze Asset Management LLC |
| 17.00 |
| 31.5 | % | 38.8 | % | 23.0 | % |
5/10/05 |
| 7/14/05 |
| Oshkosh B Gosh Inc |
| GOSHA |
| Carters Inc |
| 26.00 |
| -11.5 | % | 4.9 | % | -17.6 | % |
5/9/05 |
| — |
| Nuance Communications Inc |
| NUAN |
| ScanSoft Inc |
| 5.63 |
| 84.6 | % | 97.5 | % | 114.1 | % |
5/6/05 |
| — |
| Juno Lighting Inc |
| JUNO |
| Abrams Capital LLC |
| 40.00 |
| 19.4 | % | 11.1 | % | 6.9 | % |
4/29/05 |
| — |
| Corixa Corp |
| CRXA |
| GlaxoSmithKline PLC |
| 4.40 |
| 47.7 | % | 48.7 | % | 51.7 | % |
4/28/05 |
| — |
| First American Bank,CA |
| FTAB |
| First Community Bancorp Inc,CA |
| 24.95 |
| 24.8 | % | 30.0 | % | 21.7 | % |
4/26/05 |
| — |
| William Lyon Homes |
| WLS |
| General William Lyon |
| 82.00 |
| 10.2 | % | 9.9 | % | 7.7 | % |
4/19/05 |
| 6/27/05 |
| Orphan Medical Inc |
| ORPH |
| Jazz Pharmaceuticals Inc |
| 10.75 |
| 25.7 | % | 23.3 | % | 14.9 | % |
4/15/05 |
| — |
| Brookstone Inc |
| BKST |
| OSIM Brookstone Holdings LP |
| 20.50 |
| 28.2 | % | 21.8 | % | 40.8 | % |
4/14/05 |
| — |
| Rubicon Medical Corp |
| RMDC |
| Boston Scientific Corp |
| 1.50 |
| -.7 | % | 0.7 | % | 26.1 | % |
4/12/05 |
| — |
| Noland Co |
| NOLD |
| Primus Inc |
| 74.00 |
| 52.3 | % | 60.4 | % | 49.0 | % |
4/7/05 |
| 6/8/05 |
| Concord Communications Inc |
| CCRD |
| Computer Assoc Intl Inc |
| 17.00 |
| 71.0 | % | 68.0 | % | 73.3 | % |
4/4/05 |
| 5/20/05 |
| Maxcor Financial Group Inc |
| MAXF |
| BGC Partners LP |
| 14.00 |
| 46.4 | % | 56.1 | % | 57.0 | % |
3/28/05 |
| 5/6/05 |
| Digital Impact Inc |
| DIGI |
| Acxiom Corp |
| 3.50 |
| 52.8 | % | 75.9 | % | 75.0 | % |
3/21/05 |
| — |
| State Finl Svcs Corp,WI |
| SFSW |
| Associated Banc,Green Bay,WI |
| 38.22 |
| 26.6 | % | 23.3 | % | 27.7 | % |
3/17/05 |
| 7/1/05 |
| Horizon PCS Inc |
| HZPS |
| IPCS Inc |
| 23.58 |
| -5.7 | % | -5.7 | % | -1.8 | % |
Source: Thomson One Banker.
25
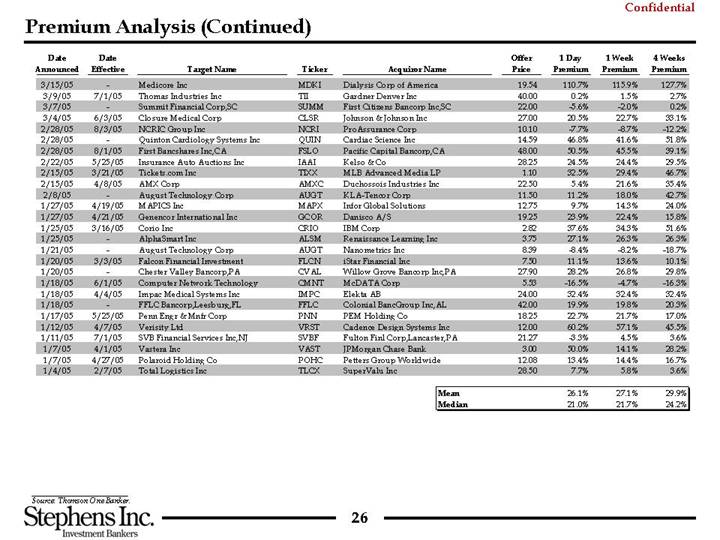
Date |
| Date |
| Target Name |
| Ticker |
| Acquiror Name |
| Offer |
| 1 Day |
| 1 Week |
| 4 Weeks |
|
|
|
|
|
|
|
|
|
|
|
|
|
|
|
|
|
|
|
3/15/05 |
| — |
| Medicore Inc |
| MDKI |
| Dialysis Corp of America |
| 19.54 |
| 110.7 | % | 115.9 | % | 127.7 | % |
3/9/05 |
| 7/1/05 |
| Thomas Industries Inc |
| TII |
| Gardner Denver Inc |
| 40.00 |
| 0.2 | % | 1.5 | % | 2.7 | % |
3/7/05 |
| — |
| Summit Financial Corp,SC |
| SUMM |
| First Citizens Bancorp Inc,SC |
| 22.00 |
| -5.6 | % | -2.0 | % | 0.2 | % |
3/4/05 |
| 6/3/05 |
| Closure Medical Corp |
| CLSR |
| Johnson & Johnson Inc |
| 27.00 |
| 20.5 | % | 22.7 | % | 33.1 | % |
2/28/05 |
| 8/3/05 |
| NCRIC Group Inc |
| NCRI |
| ProAssurance Corp |
| 10.10 |
| -7.7 | % | -8.7 | % | -12.2 | % |
2/28/05 |
| — |
| Quinton Cardiology Systems Inc |
| QUIN |
| Cardiac Science Inc |
| 14.59 |
| 46.8 | % | 41.6 | % | 51.8 | % |
2/28/05 |
| 8/1/05 |
| First Bancshares Inc,CA |
| FSLO |
| Pacific Capital Bancorp,CA |
| 48.00 |
| 50.5 | % | 45.5 | % | 39.1 | % |
2/22/05 |
| 5/25/05 |
| Insurance Auto Auctions Inc |
| IAAI |
| Kelso & Co |
| 28.25 |
| 24.5 | % | 24.4 | % | 29.5 | % |
2/15/05 |
| 3/21/05 |
| Tickets.com Inc |
| TIXX |
| MLB Advanced Media LP |
| 1.10 |
| 32.5 | % | 29.4 | % | 46.7 | % |
2/15/05 |
| 4/8/05 |
| AMX Corp |
| AMXC |
| Duchossois Industries Inc |
| 22.50 |
| 5.4 | % | 21.6 | % | 35.4 | % |
2/8/05 |
| — |
| August Technology Corp |
| AUGT |
| KLA-Tencor Corp |
| 11.50 |
| 11.2 | % | 18.0 | % | 42.7 | % |
1/27/05 |
| 4/19/05 |
| MAPICS Inc |
| MAPX |
| Infor Global Solutions |
| 12.75 |
| 9.7 | % | 14.3 | % | 24.0 | % |
1/27/05 |
| 4/21/05 |
| Genencor International Inc |
| GCOR |
| Danisco A/S |
| 19.25 |
| 23.9 | % | 22.4 | % | 15.8 | % |
1/25/05 |
| 3/16/05 |
| Corio Inc |
| CRIO |
| IBM Corp |
| 2.82 |
| 37.6 | % | 34.3 | % | 51.6 | % |
1/25/05 |
| — |
| AlphaSmart Inc |
| ALSM |
| Renaissance Learning Inc |
| 3.75 |
| 27.1 | % | 26.3 | % | 26.3 | % |
1/21/05 |
| — |
| August Technology Corp |
| AUGT |
| Nanometrics Inc |
| 8.39 |
| -8.4 | % | -8.2 | % | -18.7 | % |
1/20/05 |
| 3/3/05 |
| Falcon Financial Investment |
| FLCN |
| iStar Financial Inc |
| 7.50 |
| 11.1 | % | 13.6 | % | 10.1 | % |
1/20/05 |
| — |
| Chester Valley Bancorp,PA |
| CVAL |
| Willow Grove Bancorp Inc,PA |
| 27.90 |
| 28.2 | % | 26.8 | % | 29.8 | % |
1/18/05 |
| 6/1/05 |
| Computer Network Technology |
| CMNT |
| McDATA Corp |
| 5.53 |
| -16.5 | % | -4.7 | % | -16.3 | % |
1/18/05 |
| 4/4/05 |
| Impac Medical Systems Inc |
| IMPC |
| Elekta AB |
| 24.00 |
| 32.4 | % | 32.4 | % | 32.4 | % |
1/18/05 |
| — |
| FFLC Bancorp,Leesburg,FL |
| FFLC |
| Colonial BancGroup Inc,AL |
| 42.00 |
| 19.9 | % | 19.8 | % | 20.3 | % |
1/17/05 |
| 5/25/05 |
| Penn Engr & Mnfr Corp |
| PNN |
| PEM Holding Co |
| 18.25 |
| 22.7 | % | 21.7 | % | 17.0 | % |
1/12/05 |
| 4/7/05 |
| Verisity Ltd |
| VRST |
| Cadence Design Systems Inc |
| 12.00 |
| 60.2 | % | 57.1 | % | 45.5 | % |
1/11/05 |
| 7/1/05 |
| SVB Financial Services Inc,NJ |
| SVBF |
| Fulton Finl Corp,Lancaster,PA |
| 21.27 |
| -3.3 | % | 4.5 | % | 3.6 | % |
1/7/05 |
| 4/1/05 |
| Vastera Inc |
| VAST |
| JPMorgan Chase Bank |
| 3.00 |
| 50.0 | % | 14.1 | % | 28.2 | % |
1/7/05 |
| 4/27/05 |
| Polaroid Holding Co |
| POHC |
| Petters Group Worldwide |
| 12.08 |
| 13.4 | % | 14.4 | % | 16.7 | % |
1/4/05 |
| 2/7/05 |
| Total Logistics Inc |
| TLCX |
| SuperValu Inc |
| 28.50 |
| 7.7 | % | 5.8 | % | 3.6 | % |
|
|
|
|
|
|
|
|
|
|
|
|
|
|
|
|
|
|
|
|
|
|
|
|
|
|
|
| Mean |
| 26.1 | % | 27.1 | % | 29.9 | % |
|
|
|
|
|
|
|
|
|
| Median |
| 21.0 | % | 21.7 | % | 24.2 | % |
Source: Thomson One Banker.
26