UNITED STATES
SECURITIES AND EXCHANGE COMMISSION
Washington, D.C. 20549
FORM N-CSR/A
CERTIFIED SHAREHOLDER REPORT OF REGISTERED
MANAGEMENT INVESTMENT COMPANIES
Investment Company Act file number: 811-4984
(Exact name of registrant as specified in charter)
|
4151 Amon Carter Boulevard, MD 2450 Fort Worth, Texas 76155 |
(Address of principal executive offices)-(Zip code)
|
Gene L. Needles, Jr., PRESIDENT 4151 Amon Carter Boulevard, MD 2450 Fort Worth, Texas 76155 |
(Name and address of agent for service)
Registrant’s telephone number, including area code: (817) 391-6100
Date of fiscal year end: October 31, 2011
Date of reporting period: October 31, 2011
EXPLANATORY NOTE: The Registrant is filing this amendment to its Form N-CSR for the period ended October 31, 2011, originally filed with the Securities and Exchange Commission on January 6, 2012 (Accession Number 0001193-12-512005400). The sole purpose of this amendment is to correct the certifications that were filed with the original Form N-CSR filing. Except as set forth above, this Form N-CSR/A does not amend, update or change any other items or disclosure found in the original Form N-CSR filing.
ITEM 1. REPORTS TO STOCKHOLDERS.

About American Beacon Advisors
Since 1986, American Beacon Advisors has offered a variety of products and investment advisory services to numerous institutional and retail clients, including a variety of mutual funds, corporate cash management, and separate account management.
Our clients include defined benefit plans, defined contribution plans, foundations, endowments, corporations, financial planners, and other institutional investors. With American Beacon Advisors, you can put the experience of a multi-billion dollar asset management firm to work for your company.
Any opinions herein, including forecasts, reflect our judgment as of the end of the reporting period and are subject to change. Each advisor’s strategies and the Fund’s portfolio composition will change depending on economic and market conditions. This report is not a complete analysis of market conditions and therefore, should not be relied upon as investment advice. Although economic and market information has been compiled from reliable sources, American Beacon Advisors, Inc. makes no representation as to the completeness or accuracy of the statements contained herein.
| | |
| American Beacon Funds | | October 31, 2011 |
| | |

| | Fellow Shareholders, Some days it seems the best-kept secret of the past twelve months has been the U.S. equity market’s rise. This rise has occurred despite the ongoing waves of investor concern regarding the U.S. economy’s health and the realization that the European sovereign crisis has yet to find resolution. With headlines focused on geopolitical and economic risks, the strengthening underlying fundamentals at many publicly traded companies—and their relatively attractive market valuations—have drawn less attention. This near-term myopia can create opportunities for fund companies like ours, where our sub-advisors manage with a longer-term perspective. |
The market volatility also highlights the key benefit of our multi-manager approach—a strategy we feel can help smooth performance over time. The performance of the American Beacon Large Cap Value Fund reflects the results of manager diversification. It also reflects the American Beacon investment philosophy: that portfolios managed with a longer-term perspective tend to be better positioned for riding out episodes of economic and geopolitical turbulence.
For the twelve-month period ended October 31, 2011:
>> American Beacon Large Cap Value Fund (Institutional Class) returned 3.69%
At American Beacon, we remain focused on seeking opportunities and meeting market challenges to deliver the type of consistency in performance and service our shareholders value. We regard your trust in the American Beacon Funds as recognition that we are achieving these goals, and we appreciate your continued investment.
Recognition of our process has also come in the form of a 2010 Lipper Award. The American Beacon Large Cap Value Fund was cited by Lipper as the best fund in its category based on its 10-year performance.
For further details about the growing number of investment opportunities now available within the American Beacon Funds family, please visit our website at www.americanbeaconfunds.com.
Best Regards,

Gene L. Needles, Jr.
President
American Beacon Funds
American Beacon Large Cap Value Fund (AMR Class) received the 2010 Lipper Fund Award as the best fund in its category over the 10 years ended December 31, 2009. It was number one out of 185 funds in the Large-Cap Value Funds category based on risk-adjusted returns. The Lipper Fund Awards are part of the Thomson Reuters Awards for Excellence, a global family of awards that celebrate exceptional performance throughout the professional investment community. The Thomson Reuters Awards for Excellence recognize the world’s top funds, fund management firms, sell-side firms, research analysts, and investor relations teams. The Thomson Reuters Awards for Excellence also include the Extel Survey Awards, the StarMine Analyst Awards, and the StarMine Broker Rankings. For more information, please contact markets.awards@thomsonreuters.com or visit excellence.thomsonreuters.com. Past performance is no guarantee of future results.
1
Domestic Equity Market Overview
October 31, 2011 (Unaudited)
For most of the 12 months ended October 31, 2011, the U.S. equity markets followed an upward path, driven by the strength of corporate balance sheets and robust corporate earnings. This rise occurred despite the volatility that prevailed throughout the world markets, as investors reacted to ongoing political uncertainty about the European sovereign debt crisis and to the inaction of U.S. politicians in addressing the weak domestic economic situation. The overall rise of equities also occurred despite increased correlations among stocks and the actions of worried investors who shifted between risk-seeking and risk-averse strategies.
The relative strength of the equity market lasted until May 2011, when investors turned more risk averse. This shift coincided with the onset of increasingly negative news from Europe and some weaker-than-expected macroeconomic news in the U.S. Meanwhile, policymakers in the U.S. reached an impasse on how to meet the country’s fiscal challenges, which further fed investor worries. A sharp selloff ensued.
Oversold equities rebounded in early October 2011 and received an additional boost late in the month when European policymakers agreed to a framework for addressing the Greek crisis. Consequently, the S&P 500 Index generated its best-performing month in nearly 20 years, pushing its 12-month return into positive territory (+8.1%).
As unsettling as the volatility has been, the S&P 500 Index has outperformed almost all of the major developed and emerging equity markets. Little more than two years ago, the S&P 500 Index bottomed below 700. Since then, it has doubled. That rise has been uneven–investors in small cap stocks have benefited far more than those holding large cap issues. This is especially true for the mega-cap stocks in the Financial, Technology and Health Care sectors. Consider that over the 12-month period ending October 31, 2011, the largest 10% of companies (in terms of market capitalization) in the Russell 1000 Value Index fell 1.4%. The entire universe returned 6.2%.
Overall, the U.S. economy continued to heal. Corporate strength was good, while low interest rates, a depressed dollar and moderately rising employment were supportive of a modest, ongoing recovery. Nevertheless, risk is still part of the equation. Credible action from Washington continues to be elusive and the implementation of Europe’s agreement–and its likelihood of success–remains uncertain. Other geopolitical and economic concerns also remain. Yet, there are a number of positive factors that seem underappreciated by the market at this point:
| | • | | A lack of speculation in equities |
| | • | | Business inventories remain in balance |
| | • | | Corporate cash levels remain high |
| | • | | Corporate debt levels are low |
| | • | | Lackluster economic expectations are already priced into the market |
| | • | | Dividend payout ratios are low and have significant upside |
We believe the dividends and earnings available to owners of equities are generous given current prices. They sufficiently compensate investors for the risks at hand. We remain keenly focused on identifying undervalued franchises with strong balance sheets exhibiting the ability and willingness to return capital to shareholders.
2
Performance Overview
American Beacon Large Cap Value FundSM
October 31, 2011 (Unaudited)
The Institutional Class of the Large Cap Value Fund (“Fund”) returned 3.69% for the twelve months ended October 31, 2011. The Fund underperformed the Russell 1000® Value Index (the “Index”) return of 6.16% and the Lipper Large-Cap Value Funds Index return of 4.27%.
Comparison of Change in Value of a $10,000 Investment for the Period from 10/31/01 through 10/31/11

| | | | | | | | | | | | | | | | |
| | | Annualized Total Returns
Periods Ended 10/31/11 | | | Value of
$10,000 | |
| | | 1 Year | | | 5 Years | | | 10 Years | | | 10/31/01-
10/31/11 | |
Institutional Class(1,8) | | | 3.69 | % | | | -1.51 | % | | | 5.62 | % | | $ | 17,269 | |
Y Class (1, 2, 8) | | | 3.58 | % | | | -1.57 | % | | | 5.59 | % | | | 17,223 | |
Investor Class(1,8) | | | 3.30 | % | | | -1.82 | % | | | 5.31 | % | | | 16,771 | |
Advisor Class(1,3,8) | | | 3.11 | % | | | -2.02 | % | | | 5.17 | % | | | 16,547 | |
Retirement Class (1,4,8) | | | 2.86 | % | | | -2.16 | % | | | 5.09 | % | | | 16,423 | |
A Class with sales charge (1,5,8) | | | -2.79 | % | | | -3.02 | % | | | 4.67 | % | | | 15,784 | |
A Class without sales charge (1,5,8) | | | 3.12 | % | | | -1.86 | % | | | 5.29 | % | | | 16,742 | |
C Class with sales charge (1,6,8) | | | 1.36 | % | | | -2.04 | % | | | 5.19 | % | | | 16,591 | |
C Class without sales charge (1,6,8) | | | 2.36 | % | | | -2.04 | % | | | 5.19 | % | | | 16,591 | |
AMR Class(1,8) | | | 3.94 | % | | | -1.27 | % | | | 5.89 | % | | | 17,718 | |
Lipper Large-Cap Value Funds Index(7) | | | 4.27 | % | | | -1.59 | % | | | 3.34 | % | | | 13,885 | |
Russell 1000 Value Index (7) | | | 6.16 | % | | | -2.05 | % | | | 4.57 | % | | | 15,636 | |
| | 1. | Performance shown is historical and is not indicative of future returns. Investment returns and principal value will vary, and shares may be worth more or less at redemption than at original purchase. Performance shown is as of date indicated, and current performance may be lower or higher than the performance data quoted. To obtain performance as of the most recent month end, please visit www.americanbeaconfunds.com or call 1-800-967-9009. Fund performance in the table above does not reflect the deduction of taxes a shareholder would pay on distributions or the redemption of shares. |
| | 2. | Fund performance for the five-year and ten-year periods represents the total returns achieved by the |
| | Institutional Class from 10/31/01 up to 8/3/09, the inception date of the Y Class, and the returns of the Y Class since its inception. Expenses of the Y Class are higher than those of the Institutional Class. As a result, total returns shown may be higher than they would have been had the Y Class been in existence since 10/31/01. |
| | 3. | Fund performance for the ten-year period represents the total returns achieved by the Investor Class from 10/31/01 up to 5/31/05, the inception date of the Advisor Class, and the returns of the Advisor Class since its inception. Expenses of the Advisor Class are higher than those of the Investor Class. As a result, total returns shown may be higher than they would have been had the Advisor Class been in existence since 10/31/01. A portion of the fees charged to the Advisor Class of the Fund was waived in 2005. Performance prior to waiving fees was lower than the actual returns shown for 2005. |
| | 4. | Fund performance for the five-year and ten-year periods represents the total returns achieved by the Investor Class from 10/31/01 through 5/31/05 and the Advisor Class from 6/1/05 up to 5/1/09, the inception date of the Retirement Class, and the returns of the Retirement Class since its inception. Expenses of the Retirement Class are higher than those of the Advisor and Investor Classes. As a result, total returns shown may be higher than they would have been had the Retirement Class been in existence since 10/31/01. |
| | 5. | Fund performance for the five-year and ten-year periods represents the total returns achieved by the Investor Class from 10/31/01 through 5/17/10, the inception date of the A Class, and the returns of the A Class since its inception. Expenses of the A Class are higher than those of the Investor Class. As a result, total returns shown may be higher than they would have been had the A Class been in existence since 10/31/01. A Class shares have a maximum sales charge of 5.75%. |
| | 6. | Fund performance for the five-year and ten-year periods represents the total returns achieved by the Investor Class from 10/31/01 through 9/1/10, the inception date of the C Class, and the returns of the C Class since its inception. Expenses of the C Class are higher than those of the Investor Class. As a result, total returns shown may be higher than they would have been had the C Class been in existence since 10/31/01. C Class has a maximum contingent deferred sales charge of 1.00% for shares redeemed within one year of the date of purchase. |
| | 7. | The Russell 1000 Value Index is an unmanaged index of those stocks in the Russell 1000 Index with lower price-to-book ratios and lower forecasted growth values. Russell 1000 Value Index is a registered trademark of the Frank Russell Company. The Lipper Large-Cap Value Funds Index tracks the results of the 30 largest mutual funds in the Lipper Large-Cap Value Funds category. Lipper is an independent mutual fund research and ranking service. One cannot directly invest in an index. |
3
Performance Overview
American Beacon Large Cap Value FundSM
October 31, 2011 (Unaudited)
| | 8. | The total annual Fund operating expense ratio set forth in the most recent Fund prospectus for the Institutional, Y, Investor, Advisor, Retirement, A, and C Class shares was 0.60%, 0.71%, 0.97%, 1.11%, 1.38%, 1.07%, and 1.88%, respectively. The expense ratios above may vary from the expense ratios presented in other sections of this report that are based on expenses incurred during the period covered by this report. |
The Fund underperformed the Index primarily through stock selection, and to a lesser extent through sector allocation.
From a stock selection standpoint, the Fund’s holdings in the Financials sector detracted the most value relative to the Index. Companies in the Financials sector that had the greatest impact on the Fund’s underperformance were Banco Santander (down 14.9%), Citigroup (down 29.0%), and Wells Fargo (down 1.5%). The Fund’s holdings in the Industrials and Health Care sectors also hurt performance. PACCAR (down 16.9%) and Northrop Grumman (down 2.5%) were the largest detractors from performance in the Industrials sector. Cardinal Health (up 19.1%) and Hospira (down 5.3%) detracted the most relative value in the Health Care sector. Good stock selection in the Consumer Staples sector, where Diageo (up 16.4%) and Imperial Tobacco Group (up 17.7%) were the largest contributors, generated positive Fund returns.
An overweight in Information Technology, one of the poorer performing sectors in the Index, detracted value relative to the Index through sector allocation. This was somewhat offset by the Fund’s allocation to the Consumer Staples sector which on average, contributed to the Fund’s relative performance.
The sub-advisors continue to invest in a broadly diversified portfolio of companies that they believe have attractive valuations and above-average earnings growth potential. This approach should allow the Fund to benefit over the longer term.
Top Ten Holdings
| | | | |
| | | % of
Net Assets | |
JPMorgan Chase & Co. | | | 3.5 | % |
Wells Fargo & Co. | | | 2.8 | % |
ConocoPhillips | | | 2.6 | % |
Pfizer, Inc. | | | 2.4 | % |
Vodafone Group plc | | | 2.3 | % |
Hewlett-Packard Co. | | | 2.1 | % |
Microsoft Corp. | | | 2.0 | % |
Johnson & Johnson | | | 2.0 | % |
Bank of America Corp. | | | 1.9 | % |
AT&T, Inc. | | | 1.7 | % |
Sector Allocation
| | | | |
| | | % of Equities | |
Financials | | | 25.1 | % |
Energy | | | 12.1 | % |
Information Technology | | | 11.7 | % |
Health Care | | | 11.1 | % |
Consumer Discretionary | | | 9.7 | % |
Industrials | | | 9.5 | % |
Consumer Staples | | | 8.8 | % |
Telecommunication Services | | | 4.8 | % |
Utilities | | | 4.8 | % |
Materials | | | 2.4 | % |
4
Fund Expenses
American Beacon Large Cap Value FundSM
October 31, 2011 (Unaudited)
Fund Expense Example
As a shareholder of the Fund, you incur two types of costs: (1) transaction costs and (2) ongoing costs, including management fees, administrative service fees, distribution (12b-1) fees, and other Fund expenses. The examples below are intended to help you understand the ongoing cost (in dollars) of investing in the Fund and to compare these costs with the ongoing costs of investing in other mutual funds.
The examples are based on an investment of $1,000 invested at the beginning of the period in each Class and held for the entire period from May 1, 2011 through October 31, 2011.
Actual Expenses
The “Actual” lines of the table provide information about actual account values and actual expenses. You may use the information in this line, together with the amount you invested, to estimate the expenses that you paid over the period. Simply divide your account value by $1,000 (for example, an $8,600 account value divided by $1,000 = 8.6), then multiply the result by the number in the first line under the heading “Expenses Paid During Period” to estimate the expenses you paid on your account during this period. Shareholders of the Investor and Institutional Classes that invest in the Fund through an IRA may be subject to a custodial IRA fee of $15 that is typically deducted each December. If your account was subject to a custodial IRA fee during the period, your costs would have been $15 higher.
Hypothetical Example for Comparison Purposes
The “Hypothetical” lines of the table provide information about hypothetical account values and hypothetical expenses based on the Fund’s actual expense ratio and an assumed 5% per year rate of return before expenses (not the Fund’s actual return). You may compare the ongoing costs of investing in the Fund with other funds by contrasting this 5% hypothetical example and the 5% hypothetical examples that appear in the shareholder reports of the other funds. The hypothetical account values and expenses may not be used to estimate the actual ending account balance or expenses you paid for the period. Shareholders of the Investor and Institutional Classes that invest in the Fund through an IRA may be subject to a custodial IRA fee of $15 that is typically deducted each December. If your account was subject to a custodial IRA fee during the period, your costs would have been $15 higher.
You should also be aware that the expenses shown in the table highlight only your ongoing costs and do not reflect any transaction costs charged by the Fund. Similarly, the expense examples for other funds do not reflect any transaction costs charged by those funds,
such as sales charges (loads), redemption fees or exchange fees. Therefore, the “Hypothetical” lines of the table are useful in comparing ongoing costs only and will not help you determine the relative total costs of owning different funds. If you were subject to any transaction costs during the period, your costs would have been higher.
| | | | | | | | | | | | |
| | | Beginning
Account
Value
5/1/11 | | | Ending
Account
Value
10/31/11 | | | Expenses Paid
During Period*
5/1/11-10/31/11 | |
Institutional Class | | | | | | | | | | | | |
Actual | | $ | 1,000.00 | | | $ | 900.43 | | | $ | 2.83 | |
Hypothetical ** | | $ | 1,000.00 | | | $ | 1,022.23 | | | $ | 3.01 | |
| | | |
Y Class | | | | | | | | | | | | |
Actual | | $ | 1,000.00 | | | $ | 899.66 | | | $ | 3.30 | |
Hypothetical ** | | $ | 1,000.00 | | | $ | 1,021.73 | | | $ | 3.52 | |
| | | |
Investor Class | | | | | | | | | | | | |
Actual | | $ | 1,000.00 | | | $ | 898.60 | | | $ | 4.55 | |
Hypothetical ** | | $ | 1,000.00 | | | $ | 1,020.42 | | | $ | 4.84 | |
| | | |
Advisor Class | | | | | | | | | | | | |
Actual | | $ | 1,000.00 | | | $ | 897.78 | | | $ | 5.21 | |
Hypothetical ** | | $ | 1,000.00 | | | $ | 1,019.71 | | | $ | 5.55 | |
| | | |
Retirement Class | | | | | | | | | | | | |
Actual | | $ | 1,000.00 | | | $ | 896.42 | | | $ | 6.79 | |
Hypothetical ** | | $ | 1,000.00 | | | $ | 1,018.05 | | | $ | 7.22 | |
| | | |
A Class | | | | | | | | | | | | |
Actual | | $ | 1,000.00 | | | $ | 897.37 | | | $ | 5.83 | |
Hypothetical ** | | $ | 1,000.00 | | | $ | 1,019.06 | | | $ | 6.21 | |
| | | |
C Class | | | | | | | | | | | | |
Actual | | $ | 1,000.00 | | | $ | 894.81 | | | $ | 8.88 | |
Hypothetical ** | | $ | 1,000.00 | | | $ | 1,015.83 | | | $ | 9.45 | |
| | | |
AMR Class | | | | | | | | | | | | |
Actual | | $ | 1,000.00 | | | $ | 901.73 | | | $ | 1.58 | |
Hypothetical ** | | $ | 1,000.00 | | | $ | 1,023.54 | | | $ | 1.68 | |
| * | Expenses are equal to the Fund’s annualized expense ratios for the six-month period of 0.59%, 0.69%, 0.95%, 1.09%, 1.42%, 1.22%, 1.86%, and 0.33% for the Institutional, Y, Investor, Advisor, Retirement, A, C, and AMR Classes respectively, multiplied by the average account value over the period, multiplied by the number derived by dividing the number of days in the most recent fiscal half-year (184) by days in the year (365) to reflect the half-year period. |
| ** | 5% return before expenses. |
5
American Beacon Large Cap Value FundSM
Report of Independent Registered Public Accounting Firm
To the Shareholders and the Board of Trustees of
American Beacon Large Cap Value Fund:
We have audited the accompanying statement of assets and liabilities, including the schedule of investments, of the American Beacon Large Cap Value Fund (one of the funds constituting the American Beacon Funds) (collectively, the “Fund”), as of October 31, 2011, and the related statement of operations for the year then ended, the statement of changes in net assets for each of the two years in the period then ended, and financial highlights for the periods indicated therein. These financial statements and financial highlights are the responsibility of the Fund’s management. Our responsibility is to express an opinion on these financial statements and financial highlights based on our audits.
We conducted our audits in accordance with the standards of the Public Company Accounting Oversight Board (United States). Those standards require that we plan and perform the audit to obtain reasonable assurance about whether the financial statements and financial highlights are free of material misstatement. We were not engaged to perform an audit of the Fund’s internal control over financial reporting. Our audits included consideration of internal control over financial reporting as a basis for designing audit procedures that are appropriate in the circumstances, but not for the purpose of expressing an opinion on the effectiveness of the Fund’s internal control over financial reporting. Accordingly, we express no such opinion. An audit also includes examining, on a test basis, evidence supporting the amounts and disclosures in the financial statements and financial highlights, assessing the accounting principles used and significant estimates made by management, and evaluating the overall financial statement presentation. Our procedures included confirmation of securities owned as of October 31, 2011, by correspondence with the custodian and brokers or by other appropriate auditing procedures where replies from brokers were not received. We believe that our audits provide a reasonable basis for our opinion.
In our opinion, the financial statements and financial highlights referred to above present fairly, in all material respects, the financial position of the American Beacon Large Cap Value Fund at October 31, 2011, the results of its operations for the year then ended, the changes in its net assets for each of the two years in the period then ended, and the financial highlights for each of the periods indicated therein, in conformity with U.S. generally accepted accounting principles

Dallas, Texas
December 29, 2011
6
American Beacon Large Cap Value FundSM
Schedule of Investments
October 31, 2011
| | | | | | | | |
| | | Shares | | | Fair Value | |
| | | | | | (000’s) | |
COMMON STOCK - 94.93% | | | | | | | | |
CONSUMER DISCRETIONARY - 8.78% | |
Auto Components - 0.84% | | | | | | | | |
Johnson Controls, Inc. | | | 1,215,725 | | | $ | 40,034 | |
Magna International, Inc. | | | 703,000 | | | | 26,819 | |
| | | | | | | | |
| | | | | | | 66,853 | |
| | | | | | | | |
Automobiles - 0.67% | | | | | | | | |
General Motors Co.A | | | 2,058,943 | | | | 53,224 | |
| | | | | | | | |
Hotels, Restaurants & Leisure - 0.75% | | | | | | | | |
Carnival Corp. | | | 1,464,500 | | | | 51,565 | |
McDonald’s Corp. | | | 39,691 | | | | 3,685 | |
Wyndham Worldwide Corp. | | | 132,880 | | | | 4,474 | |
| | | | | | | | |
| | | | | | | 59,724 | |
| | | | | | | | |
Household Durables - 0.63% | | | | | | | | |
D.R. Horton, Inc. | | | 1,913,700 | | | | 21,298 | |
Lennar Corp., Class A | | | 1,101,000 | | | | 18,211 | |
Pulte Group, Inc. | | | 215,040 | | | | 1,114 | |
Stanley Black & Decker, Inc. | | | 156,484 | | | | 9,992 | |
| | | | | | | | |
| | | | | | | 50,615 | |
| | | | | | | | |
Leisure Equipment & Products - 0.10% | | | | | |
Hasbro, Inc. | | | 210,477 | | | | 8,011 | |
| | | | | | | | |
Media - 2.33% | | | | | | | | |
CBS Corp., Class BB | | | 1,024,400 | | | | 26,440 | |
Comcast Corp., Class A | | | 2,373,640 | | | | 54,594 | |
Comcast Corp., Class A, SpecialB | | | 1,101,300 | | | | 25,825 | |
Omnicom Group, Inc. | | | 207,557 | | | | 9,232 | |
The Interpublic Group of Cos., Inc. | | | 2,918,100 | | | | 27,664 | |
The Walt Disney Co. | | | 323,615 | | | | 11,288 | |
Time Warner Cable, Inc. | | | 363,900 | | | | 23,177 | |
Viacom, Inc., Class B | | | 177,730 | | | | 7,793 | |
| | | | | | | | |
| | | | | | | 186,013 | |
| | | | | | | | |
Multiline Retail - 1.05% | | | | | | | | |
JC Penney Co. Inc | | | 1,397,400 | | | | 44,828 | |
Kohl’s Corp. | | | 57,462 | | | | 3,046 | |
Target Corp. | | | 656,030 | | | | 35,918 | |
| | | | | | | | |
| | | | | | | 83,792 | |
| | | | | | | | |
Specialty Retail - 2.41% | | | | | | | | |
Advance Auto Parts, Inc. | | | 76,106 | | | | 4,952 | |
Best Buy Co. Inc | | | 1,071,400 | | | | 28,103 | |
RadioShack Corp. | | | 1,028,100 | | | | 12,245 | |
Staples, Inc. | | | 1,838,757 | | | | 27,508 | |
The Gap, Inc. | | | 5,173,600 | | | | 97,781 | |
The Home Depot, Inc. | | | 626,367 | | | | 22,424 | |
| | | | | | | | |
| | | | | | | 193,013 | |
| | | | | | | | |
Total Consumer Discretionary | | | | | | | 701,245 | |
| | | | | | | | |
CONSUMER STAPLES - 8.40% | | | | | |
Beverages - 2.08% | | | | | | | | |
Diageo plc, ADRC | | | 981,436 | | | | 81,341 | |
PepsiCo, Inc. | | | 1,339,620 | | | | 84,329 | |
| | | | | | | | |
| | | | | | | 165,670 | |
| | | | | | | | |
Food & Drug Retailing - 2.52% | | | | | | | | |
CVS Caremark Corp. | | | 1,494,693 | | | | 54,257 | |
Safeway, Inc. | | | 988,000 | | | | 19,138 | |
The Kroger Co. | | | 1,057,900 | | | | 24,522 | |
Wal-Mart Stores, Inc. | | | 1,831,960 | | | | 103,909 | |
| | | | | | | | |
| | | | | | | 201,826 | |
| | | | | | | | |
| | | | | | | | |
| | | Shares | | | Fair Value | |
| | | | | | (000’s) | |
Food Products - 0.51% | | | | | |
General Mills, Inc. | | | 326,865 | | | $ | 12,594 | |
Kellogg Co. | | | 96,109 | | | | 5,210 | |
Kraft Foods, Inc., Class A | | | 317,200 | | | | 11,159 | |
Nestle S.A., ADRC | | | 173,372 | | | | 10,014 | |
The JM Smucker Co. | | | 19,837 | | | | 1,528 | |
| | | | | | | | |
| | | | | | | 40,505 | |
| | | | | | | | |
Household Products - 0.19% | | | | | | | | |
Kimberly-Clark Corp. | | | 155,100 | | | | 10,812 | |
The Procter & Gamble Co. | | | 63,249 | | | | 4,047 | |
| | | | | | | | |
| | | | | | | 14,859 | |
| | | | | | | | |
Tobacco - 3.10% | | | | | | | | |
Altria Group, Inc. | | | 1,598,622 | | | | 44,042 | |
Imperial Tobacco Group plc, ADRC | | | 985,800 | | | | 71,964 | |
Philip Morris International, Inc. | | | 1,817,481 | | | | 126,988 | |
Reynolds American, Inc. | | | 128,445 | | | | 4,968 | |
| | | | | | | | |
| | | | | | | 247,962 | |
| | | | | | | | |
Total Consumer Staples | | | | | | | 670,822 | |
| | | | | | | | |
ENERGY - 11.54% | | | | | | | | |
Energy Equipment & Services - 0.24% | | | | | |
Cobalt International Energy, Inc.A | | | 1,400,100 | | | | 14,449 | |
Transocean Ltd. | | | 81,771 | | | | 4,673 | |
| | | | | | | | |
| | | | | | | 19,122 | |
| | | | | | | | |
Oil & Gas - 11.30% | | | | | | | | |
Apache Corp. | | | 103,591 | | | | 10,321 | |
BP plc, ADRC | | | 2,489,400 | | | | 109,982 | |
Chevron Corp. | | | 845,757 | | | | 88,847 | |
ConocoPhillips | | | 3,003,596 | | | | 209,199 | |
EOG Resources, Inc. | | | 44,076 | | | | 3,942 | |
Exxon Mobil Corp. | | | 677,056 | | | | 52,871 | |
Hess Corp. | | | 54,829 | | | | 3,430 | |
Marathon Oil Corp. | | | 1,575,100 | | | | 41,000 | |
Marathon Petroleum Corp. | | | 363,650 | | | | 13,055 | |
Occidental Petroleum Corp. | | | 974,948 | | | | 90,612 | |
Royal Dutch Shell plc, ADRC | | | 1,722,200 | | | | 122,968 | |
Spectra Energy Corp. | | | 3,266,400 | | | | 93,517 | |
Total S.A., ADRC | | | 1,190,500 | | | | 62,263 | |
| | | | | | | | |
| | | | | | | 902,007 | |
| | | | | | | | |
Total Energy | | | | | | | 921,129 | |
| | | | | | | | |
FINANCIALS - 23.93% | | | | | | | | |
Banks - 8.13% | | | | | | | | |
Bank of America Corp. | | | 22,222,642 | | | | 151,781 | |
Fifth Third Bancorp | | | 1,790,100 | | | | 21,499 | |
KeyCorp | | | 3,476,774 | | | | 24,546 | |
PNC Financial Services Group, Inc. | | | 2,240,053 | | | | 120,313 | |
SunTrust Banks, Inc. | | | 2,630,590 | | | | 51,902 | |
The Bank of New York Mellon Corp. | | | 1,795,237 | | | | 38,203 | |
Wells Fargo & Co. | | | 8,707,001 | | | | 225,597 | |
Zions Bancorporation | | | 869,100 | | | | 15,088 | |
| | | | | | | | |
| | | | | | | 648,929 | |
| | | | | | | | |
Diversified Financials - 9.30% | | | | | | | | |
American Express Co. | | | 1,744,200 | | | | 88,291 | |
BlackRock, Inc. | | | 48,814 | | | | 7,702 | |
Capital One Financial Corp. | | | 1,581,100 | | | | 72,193 | |
Citigroup, Inc. | | | 2,980,476 | | | | 94,153 | |
Franklin Resources, Inc. | | | 18,230 | | | | 1,944 | |
JPMorgan Chase & Co. | | | 8,024,824 | | | | 278,943 | |
Mastercard, Inc., Class A | | | 17,094 | | | | 5,936 | |
See accompanying notes
7
American Beacon Large Cap Value FundSM
Schedule of Investments
October 31, 2011
| | | | | | | | |
| | | Shares | | | Fair Value | |
| | | | | | (000’s) | |
Moody’s Corp. | | | 85,020 | | | $ | 3,017 | |
Morgan Stanley | | | 3,993,500 | | | | 70,445 | |
SLM Corp. | | | 2,583,300 | | | | 35,314 | |
State Street Corp. | | | 956,424 | | | | 38,630 | |
The Goldman Sachs Group, Inc. | | | 409,917 | | | | 44,906 | |
| | | | | | | | |
| | | | | | | 741,474 | |
| | | | | | | | |
Insurance - 5.47% | | | | | | | | |
ACE Ltd. | | | 506,426 | | | | 36,539 | |
American International Group, Inc. | | | 1,821,900 | | | | 44,983 | |
Aon Corp. | | | 173,746 | | | | 8,100 | |
Genworth Financial, Inc., Class A | | | 1,056,800 | | | | 6,742 | |
Hartford Financial Services Group, Inc. | | | 1,382,950 | | | | 26,622 | |
Lincoln National Corp. | | | 450,000 | | | | 8,573 | |
MetLife, Inc. | | | 2,900,300 | | | | 101,974 | |
Prudential Financial, Inc. | | | 417,588 | | | | 22,633 | |
The Allstate Corp. | | | 3,100,000 | | | | 81,653 | |
The Chubb Corp. | | | 93,610 | | | | 6,277 | |
The Travelers Cos., Inc. | | | 613,829 | | | | 35,817 | |
XL Group plc | | | 2,608,400 | | | | 56,707 | |
| | | | | | | | |
| | | | | | | 436,620 | |
| | | | | | | | |
Real Estate - 1.03% | | | | | | | | |
Annaly Capital Management, Inc.D | | | 3,195,400 | | | | 53,843 | |
Chimera Investment Corp.D | | | 9,369,200 | | | | 28,201 | |
| | | | | | | | |
| | | | | | | 82,044 | |
| | | | | | | | |
Total Financials | | | | | | | 1,909,067 | |
| | | | | | | | |
HEALTH CARE - 10.60% | | | | | | | | |
Biotechnology - 0.55% | | | | | | | | |
Amgen, Inc. | | | 771,000 | | | | 44,155 | |
| | | | | | | | |
Health Care Equipment & Supplies - 1.96% | | | | | |
Baxter International, Inc. | | | 1,328,400 | | | | 73,034 | |
Becton Dickinson and Co. | | | 98,045 | | | | 7,670 | |
Covidien plc | | | 135,300 | | | | 6,365 | |
Medtronic, Inc. | | | 1,662,379 | | | | 57,751 | |
St Jude Medical, Inc. | | | 168,766 | | | | 6,582 | |
Thermo Fisher Scientific, Inc. | | | 105,720 | | | | 5,315 | |
| | | | | | | | |
| | | | | | | 156,717 | |
| | | | | | | | |
Health Care Providers & Services - 0.89% | | | | | |
Quest Diagnostics, Inc. | | | 530,202 | | | | 29,585 | |
WellPoint, Inc. | | | 599,400 | | | | 41,299 | |
| | | | | | | | |
| | | | | | | 70,884 | |
| | | | | | | | |
Pharmaceuticals - 7.20% | | | | | | | | |
Abbott Laboratories | | | 287,429 | | | | 15,484 | |
Eli Lilly & Co. | | | 856,800 | | | | 31,839 | |
Johnson & Johnson | | | 2,496,701 | | | | 160,763 | |
Merck & Co. Inc | | | 3,233,755 | | | | 111,565 | |
Novartis AG, ADRC | | | 478,800 | | | | 27,038 | |
Pfizer, Inc. | | | 10,077,287 | �� | | | 194,088 | |
Roche Holding AG, ADRC | | | 105,111 | | | | 4,299 | |
Sanofi, ADRC | | | 828,700 | | | | 29,626 | |
| | | | | | | | |
| | | | | | | 574,702 | |
| | | | | | | | |
Total Health Care | | | | | | | 846,458 | |
| | | | | | | | |
INDUSTRIALS - 9.04% | | | | | | | | |
Aerospace & Defense - 3.26% | | | | | |
Huntington Ingalls Industries, Inc.A | | | 135,654 | | | | 4,002 | |
Lockheed Martin Corp. | | | 1,218,786 | | | | 92,505 | |
Northrop Grumman Corp. | | | 786,347 | | | | 45,412 | |
Raytheon Co. | | | 1,419,600 | | | | 62,732 | |
The Boeing Co. | | | 578,800 | | | | 38,079 | |
| | | | | | | | |
| | | Shares | | | Fair Value | |
| | | | | | (000’s) | |
United Technologies Corp. | | | 234,775 | | | $ | 18,308 | |
| | | | | | | | |
| | | | | | | 261,038 | |
| | | | | | | | |
Air Freight & Couriers - 0.47% | | | | | | | | |
FedEx Corp. | | | 457,600 | | | | 37,445 | |
| | | | | | | | |
Commercial Services & Supplies - 0.05% | | | | | |
The Dun & Bradstreet Corp. | | | 59,871 | | | | 4,003 | |
| | | | | | | | |
Construction & Engineering - 0.02% | | | | | |
Fluor Corp. | | | 29,852 | | | | 1,697 | |
| | | | | | | | |
Industrial Conglomerates - 2.95% | | | | | |
3M Co. | | | 743,304 | | | | 58,736 | |
General Electric Co. | | | 5,623,500 | | | | 93,969 | |
Honeywell International, Inc. | | | 1,435,938 | | | | 75,243 | |
Tyco International Ltd. | | | 157,300 | | | | 7,165 | |
| | | | | | | | |
| | | | | | | 235,113 | |
| | | | | | | | |
Machinery - 2.23% | | | | | | | | |
Cummins, Inc. | | | 322,800 | | | | 32,096 | |
Danaher Corp. | | | 191,767 | | | | 9,272 | |
Eaton Corp. | | | 98,824 | | | | 4,429 | |
Illinois Tool Works, Inc. | | | 730,700 | | | | 35,534 | |
ITT Corp. | | | 1,085,200 | | | | 49,486 | |
PACCAR, Inc. | | | 1,086,200 | | | | 46,967 | |
| | | | | | | | |
| | | | | | | 177,784 | |
| | | | | | | | |
Road & Rail - 0.06% | | | | | | | | |
Canadian National Railway Co. | | | 60,428 | | | | 4,739 | |
| | | | | | | | |
Total Industrials | | | | | | | 721,819 | |
| | | | | | | | |
INFORMATION TECHNOLOGY - 11.18% | | | | | |
Communications Equipment - 1.18% | | | | | | | | |
Cisco Systems, Inc. | | | 2,760,914 | | | | 51,159 | |
Corning, Inc. | | | 3,019,700 | | | | 43,152 | |
| | | | | | | | |
| | | | | | | 94,311 | |
| | | | | | | | |
Computers & Peripherals - 4.86% | | | | | |
Apple, Inc. | | | 151,770 | | | | 61,433 | |
Hewlett-Packard Co. | | | 6,180,169 | | | | 164,455 | |
International Business Machines Corp. | | | 624,616 | | | | 115,323 | |
Seagate Technology plc | | | 2,949,700 | | | | 47,638 | |
| | | | | | | | |
| | | | | | | 388,849 | |
| | | | | | | | |
Electronic Equipment & Instruments - 0.74% | | | | | |
Avnet, Inc. | | | 1,101,600 | | | | 33,390 | |
TE Connectivity Ltd. | | | 719,900 | | | | 25,592 | |
| | | | | | | | |
| | | | | | | 58,982 | |
| | | | | | | | |
IT Consulting & Services - 0.28% | | | | | |
Accenture plc, Class A | | | 270,778 | | | | 16,317 | |
Fiserv, Inc.A | | | 21,650 | | | | 1,275 | |
The Western Union Co. | | | 255,704 | | | | 4,467 | |
| | | | | | | | |
| | | | | | | 22,059 | |
| | | | | | | | |
Semiconductor Equipment & Products - 0.48% | | | | | |
ASML Holding N.V. | | | 80,580 | | | | 3,379 | |
Intel Corp. | | | 1,413,587 | | | | 34,689 | |
| | | | | | | | |
| | | | | | | 38,068 | |
| | | | | | | | |
Software - 3.64% | | | | | | | | |
CA, Inc. | | | 2,912,403 | | | | 63,083 | |
Microsoft Corp. | | | 6,047,400 | | | | 161,042 | |
Oracle Corp. | | | 2,023,504 | | | | 66,310 | |
| | | | | | | | |
| | | | | | | 290,435 | |
| | | | | | | | |
Total Information Technology | | | | | | | 892,704 | |
See accompanying notes
8
American Beacon Large Cap Value FundSM
Schedule of Investments
October 31, 2011
| | | | | | | | |
| | | Shares | | | Fair Value | |
| | | | | | (000’s) | |
MATERIALS - 2.32% | | | | | | | | |
Chemicals - 1.27% | | | | | | | | |
Air Products & Chemicals, Inc. | | | 359,758 | | | $ | 30,990 | |
EI du Pont de Nemours & Co. | | | 531,900 | | | | 25,568 | |
PPG Industries, Inc. | | | 263,629 | | | | 22,780 | |
The Dow Chemical Co. | | | 554,600 | | | | 15,462 | |
The Sherwin-Williams Co. | | | 73,116 | | | | 6,047 | |
| | | | | | | | |
| | | | | | | 100,847 | |
| | | | | | | | |
Metals & Mining - 1.05% | | | | | | | | |
ArcelorMittal | | | 1,136,950 | | | | 23,569 | |
Newmont Mining Corp. | | | 683,700 | | | | 45,692 | |
United States Steel Corp. | | | 580,200 | | | | 14,714 | |
| | | | | | | | |
| | | | | | | 83,975 | |
| | | | | | | | |
Total Materials | | | | | | | 184,822 | |
| | | | | | | | |
TELECOMMUNICATION SERVICES - 4.61% | | | | | |
Diversified Telecommunication Services - 2.29% | | | | | | | | |
AT&T, Inc. | | | 4,496,689 | | | | 131,797 | |
Verizon Communications, Inc. | | | 1,377,786 | | | | 50,951 | |
| | | | | | | | |
| | | | | | | 182,748 | |
| | | | | | | | |
Wireless Telecommunication Services - 2.32% | | | | | | | | |
Vodafone Group plc, ADRC | | | 6,660,384 | | | | 185,426 | |
| | | | | | | | |
Total Telecommunication Services | | | | | | | 368,174 | |
| | | | | | | | |
UTILITIES - 4.53% | | | | | | | | |
Electric Utilities - 4.31% | | | | | | | | |
CenterPoint Energy, Inc. | | | 2,920,400 | | | | 60,861 | |
Dominion Resources, Inc. | | | 1,115,600 | | | | 57,554 | |
Edison International | | | 826,200 | | | | 33,544 | |
Entergy Corp. | | | 403,800 | | | | 27,931 | |
Exelon Corp. | | | 1,476,300 | | | | 65,533 | |
PG&E Corp. | | | 193,654 | | | | 8,308 | |
PPL Corp. | | | 835,695 | | | | 24,544 | |
Public Service Enterprise Group, Inc. | | | 1,954,376 | | | | 65,862 | |
| | | | | | | | |
| | | | | | | 344,137 | |
| | | | | | | | |
Multi-Utilities - 0.22% | | | | | | | | |
Duke Energy Corp. | | | 503,990 | | | | 10,292 | |
Xcel Energy, Inc. | | | 267,400 | | | | 6,912 | |
| | | | | | | | |
| | | | | | | 17,204 | |
| | | | | | | | |
Total Utilities | | | | | | | 361,341 | |
| | | | | | | | |
Total Common Stock (Cost $7,725,891) | | | | | | | 7,577,581 | |
| | | | | | | | |
PREFERRED STOCK - 0.47% | | | | | | | | |
CONSUMER DISCRETIONARY - 0.46% | | | | | |
General Motors Co. | | | 878,825 | | | | 36,524 | |
| | | | | | | | |
UTILITIES - 0.01% | | | | | | | | |
PPL Corp. | | | 18,398 | | | | 1,046 | |
| | | | | | | | |
Total Preferred Stock (Cost $45,491) | | | | | | | 37,570 | |
| | | | | | | | |
SHORT-TERM INVESTMENTS- 3.55% | | | | | |
American Beacon U.S. Government Money Market Select FundE | | | 25,000,000 | | | | 25,000 | |
JPMorgan U.S. Government Money Market Fund | | | 258,181,783 | | | | 258,182 | |
| | | | | | | | |
Total Short-Term Investments (Cost $283,182) | | | | | | | 283,182 | |
| | | | | | | | |
| | | | |
| | | Fair Value | |
| | | (000’s) | |
TOTAL INVESTMENTS - 98.95% (Cost $8,054,564) | | | 7,898,333 | |
OTHER ASSETS, NET OF LIABILITIES - 1.05% | | | 84,041 | |
| | | | |
TOTAL NET ASSETS - 100.00% | | $ | 7,982,374 | |
| | | | |
Percentages are stated as a percent of net assets.
| A | Non-income producing security. |
| B | Non-voting participating shares. |
| C | ADR - American Depositary Receipt. |
| D | REIT - Real Estate Investment Trust. |
| E | This Fund is affiliated by having the same investment advisor. |
See accompanying notes
9
American Beacon Large Cap Value FundSM
Schedule of Investments
October 31, 2011
| | | | | | | | | | | | | | | | |
Futures Contracts | | | | | | | | | | | | | | | | |
(000’s) | | | | | | | | | | | | | | | | |
| | | Number of
Contracts | | | Expiration Date | | | Contract
Value | | | Unrealized
Appreciation/
(Depreciation) | |
S&P 500 Mini E Index Future | | | 4,428 | | | | December , 2011 | | | $ | 276,595 | | | $ | 13,366 | |
| | | | | | | | | | | | | | | | |
| | | | | | | | | | $ | 276,595 | | | $ | 13,366 | |
| | | | | | | | | | | | | | | | |
See accompanying notes
10
American Beacon Large Cap Value FundSM
Statement of Assets and Liabilities
October 31, 2011 (in thousands, except share and per share amounts)
| | | | |
Assets: | | | | |
Investments in unaffiliated securities, at fair valueA | | $ | 7,873,333 | |
Investments in affiliated securities, at fair valueB | | | 25,000 | |
Deposit with brokers for futures contracts | | | 17,660 | |
Receivable for investments sold | | | 36,570 | |
Dividends and interest receivable | | | 8,470 | |
Receivable for fund shares sold | | | 79,300 | |
Receivable for tax reclaims | | | 584 | |
Receivable for expense reimbursement (Note 2) | | | 4 | |
Prepaid expenses | | | 90 | |
| | | | |
Total assets | | | 8,041,011 | |
| | | | |
Liabilities: | | | | |
Payable for investments purchased | | | 21,692 | |
Payable for fund shares redeemed | | | 21,053 | |
Payable for variation margin on open futures contracts | | | 6,980 | |
Management and investment advisory fees payable (Note 2) | | | 5,455 | |
Administrative service and service fees payable (Note 2) | | | 2,516 | |
Professional fees payable | | | 47 | |
Other liabilities | | | 894 | |
| | | | |
Total liabilities | | | 58,637 | |
| | | | |
Net assets | | $ | 7,982,374 | |
| | | | |
Analysis of Net Assets: | | | | |
Paid-in-capital | | $ | 9,448,068 | |
Undistributed net investment income | | | 134,981 | |
Accumulated net realized loss | | | (1,457,810 | ) |
Unrealized depreciation of investments and futures contracts | | | (142,865 | ) |
| | | | |
Net assets | | $ | 7,982,374 | |
| | | | |
Shares outstanding (no par value): | | | | |
Institutional Class | | | 178,078,737 | |
| | | | |
Y Class | | | 7,133,081 | |
| | | | |
Investor Class | | | 209,102,452 | |
| | | | |
Advisor Class | | | 7,274,743 | |
| | | | |
Retirement Class | | | 57,433 | |
| | | | |
A Class | | | 218,885 | |
| | | | |
C Class | | | 74,030 | |
| | | | |
AMR Class | | | 30,244,207 | |
| | | | |
Net asset value, offering and redemption price per share: | | | | |
Institutional Class | | $ | 18.99 | |
| | | | |
Y Class | | $ | 18.92 | |
| | | | |
Investor Class | | $ | 17.99 | |
| | | | |
Advisor Class | | $ | 17.83 | |
| | | | |
Retirement Class | | $ | 17.74 | |
| | | | |
A Class (net asset value and redemption price) | | $ | 18.01 | |
| | | | |
A Class (offering price) | | $ | 19.11 | |
| | | | |
C Class | | $ | 17.95 | |
| | | | |
AMR Class | | $ | 18.81 | |
| | | | |
| | | |
A Cost of investments in unaffiliated securities | | $ | 8,029,564 | |
B Cost of investments in affiliated securities | | $ | 25,000 | |
See accompanying notes
11
American Beacon Large Cap Value FundSM
Statement of Operations
For the Year Ended October 31, 2011 (in thousands)
| | | | |
Investment Income: | | | | |
Dividend income from unaffiliated securities (net of foreign taxes)* | | $ | 219,124 | |
Dividend income from affiliated securities | | | 29 | |
Interest income | | | 20 | |
| | | | |
Total investment income | | | 219,173 | |
| | | | |
Expenses: | | | | |
Management and investment advisory fees (Note 2) | | | 20,128 | |
Administrative service fees (Note 2): | | | | |
Institutional Class | | | 10,866 | |
Y Class | | | 180 | |
Investor Class | | | 12,823 | |
Advisor Class | | | 414 | |
Retirement Class | | | 2 | |
A Class | | | 11 | |
C Class | | | 2 | |
AMR Class | | | 279 | |
Transfer agent fees: | | | | |
Institutional Class | | | 158 | |
Y Class | | | 9 | |
Investor Class | | | 187 | |
Advisor Class | | | 8 | |
A Class | | | 2 | |
C Class | | | 4 | |
AMR Class | | | 17 | |
Custody and fund accounting fees | | | 989 | |
Professional fees | | | 292 | |
Registration fees and expenses | | | 159 | |
Service fees (Note 2): | | | | |
Y Class | | | 60 | |
Investor Class | | | 15,656 | |
Advisor Class | | | 345 | |
Retirement Class | | | 1 | |
A Class | | | 4 | |
C Class | | | 1 | |
Distribution fees (Note 2): | | | | |
Advisor Class | | | 345 | |
Retirement Class | | | 3 | |
A Class | | | 7 | |
C Class | | | 6 | |
Prospectus and shareholder reports | | | 872 | |
Insurance fees | | | 195 | |
Trustee fees | | | 626 | |
Other expenses | | | 591 | |
| | | | |
Total expenses | | | 65,242 | |
| | | | |
Net fees waived and expenses reimbursed by Manager (Note 2) | | | (4 | ) |
| | | | |
Net expenses | | | 65,238 | |
| | | | |
Net investment income | | | 153,935 | |
| | | | |
| |
Realized and unrealized gain (loss) on investments: | | | | |
Net realized gain (loss) from: | | | | |
Investments | | | 551,073 | |
Commission recapture (Note 3) | | | 201 | |
Futures contracts | | | 48,025 | |
Change in net unrealized appreciation or depreciation of: | | | | |
Investments | | | (472,296 | ) |
Futures contracts | | | (6,915 | ) |
| | | | |
Net gain on investments | | | 120,088 | |
| | | | |
Net increase in net assets resulting from operations | | $ | 274,023 | |
| | | | |
* Foreign taxes | | $ | 1,100 | |
See accompanying notes
12
American Beacon Large Cap Value FundSM
Statement of Changes of Net Assets (in thousands)
| | | | | | | | |
| | | Year Ended
October 31,
2011 | | | Year Ended
October 31,
2010 | |
Increase (Decrease) in Net Assets: | | | | | | | | |
Operations: | | | | | | | | |
Net investment income | | $ | 153,935 | | | $ | 115,549 | |
Net realized gain (loss) on investments and futures contracts | | | 599,299 | | | | (62,309 | ) |
Change in net unrealized appreciation or depreciation of investments and futures contracts | | | (479,211 | ) | | | 992,998 | |
| | | | | | | | |
Net increase in net assets resulting from operations | | | 274,023 | | | | 1,046,238 | |
| | | | | | | | |
Distributions to Shareholders: | | | | | | | | |
Net investment income: | | | | | | | | |
Institutional Class | | | (47,237 | ) | | | (40,440 | ) |
Y Class | | | (27 | ) | | | (15 | ) |
Investor Class | | | (48,747 | ) | | | (61,616 | ) |
Advisor Class | | | (1,398 | ) | | | (1,747 | ) |
A Class | | | (13 | ) | | | — | |
C Class | | | (1 | ) | | | — | |
AMR Class | | | (8,633 | ) | | | (10,649 | ) |
| | | | | | | | |
Net distributions to shareholders | | | (106,056 | ) | | | (114,467 | ) |
| | | | | | | | |
Capital Share Transactions: | | | | | | | | |
Proceeds from sales of shares | | | 1,902,054 | | | | 2,598,273 | |
Reinvestment of dividends and distributions | | | 101,485 | | | | 109,446 | |
Cost of shares redeemed | | | (2,384,873 | ) | | | (2,099,289 | ) |
| | | | | | | | |
Net increase (decrease) in net assets from capital share transactions | | | (381,334 | ) | | | 608,430 | |
| | | | | | | | |
Net increase (decrease) in net assets | | | (213,367 | ) | | | 1,540,201 | |
| | | | | | | | |
Net Assets: | | | | | | | | |
Beginning of period | | | 8,195,741 | | | | 6,655,540 | |
| | | | | | | | |
End of Period * | | $ | 7,982,374 | | | $ | 8,195,741 | |
| | | | | | | | |
* Includes undistributed net investment income of | | $ | 134,981 | | | $ | 86,896 | |
| | | | | | | | |
See accompanying notes
13
American Beacon Large Cap Value FundSM
Notes to Financial Statements
October 31, 2011
1. Organization and Significant Accounting Policies
American Beacon Funds (the “Trust”), which is comprised of 20 Funds, is organized as a Massachusetts business trust and is registered under the Investment Company Act of 1940, as amended (the “Act”), as a diversified, open-end management investment company. These financial statements and notes to the financial statements relate to the American Beacon Large Cap Value Fund (the “Fund”), a series of the Trust.
American Beacon Advisors, Inc. (the “Manager”) is a wholly-owned subsidiary of Lighthouse Holdings, Inc. and was organized in 1986 to provide business management, advisory, administrative, and asset management consulting services to the Trust and other investors.
Class Disclosure
The Fund has multiple classes of shares designed to meet the needs of different groups of investors. The following table sets forth the differences amongst the classes:
| | |
Class: | | Offered to: |
| Institutional Class | | Investors making an initial investment of $250,000 |
| Y Class | | Investors making an initial investment of $100,000 |
| Investor Class | | General public and investors investing through an intermediary |
| Advisor Class | | Investors investing through an intermediary |
| Retirement Class | | Investors investing through an intermediary |
| A Class | | General public and investors investing through an intermediary with applicable sales charges |
| C Class | | General public and investors investing through an intermediary with applicable sales charges |
| AMR Class | | Investors in the tax-exempt retirement and benefit plans of the Manager, AMR Corporation, and its affiliates |
Each class offered by the Trust has equal rights as to assets and voting privileges. Income and non-class specific expenses are allocated daily to each class on the basis of the relative net assets. Realized and unrealized capital gains and losses of each class are allocated daily based on the relative net assets of each class of the respective Fund. Class specific expenses, where applicable, currently include administrative service fees, service fees, and distribution fees and vary amongst the classes as described more fully in Note 2.
New Accounting Prouncements
In April 2011, the Financial Accounting Standards Board (“FASB”) issued an Accounting Standards Update (“ASU”) related to the accounting for repurchase agreements and similar agreements that both entitles and obligates a transferor to repurchase or redeem financial assets before their maturity. The ASU modifies the criteria for determining effective control of transferred assets and as a result certain agreements may now be accounted for as secured borrowings. The ASU is effective prospectively for new transfers and existing transactions that are modified in the first interim or annual period beginning on or after December 15, 2011.
In May 2011, FASB issued an ASU to develop common requirements for measuring fair value and for disclosing information about fair value measurements in accordance with U.S. generally accepted accounting principles, (“U.S. GAAP”) and International Financial Reporting Standards (IFRSs). FASB concluded that the amendments in this ASU will improve the comparability of fair value measurements presented and disclosed in financial statements prepared in accordance with U.S. GAAP and IFRSs. The ASU is effective prospectively during interim or annual periods beginning on or after December 15, 2011.
At this time, management is evaluating the implications of these changes and their impact on the financial statements has not been determined.
14
American Beacon Large Cap Value FundSM
Notes to Financial Statements
October 31, 2011
2. Transactions with Affiliates
Management Agreement
The Trust and the Manager are parties to a Management Agreement that obligates the Manager to provide or oversee the provision of all investment advisory, fund management, and securities lending services. Investment assets of the Fund are managed by multiple investment advisors which have entered into separate investment advisory agreements with the Manager. As compensation for performing the duties required under the Management Agreement, the Manager receives from the Fund an annualized fee equal to 0.05% of the average daily net assets plus amounts paid by the Manager to unaffiliated investment advisors hired by the Manager to direct investment activities of the Fund. Management fees paid during the year ended October 31, 2011 were as follows (dollars in thousands):
| | | | | | |
Management Fee Rate | | Management Fee | | Amounts paid to Investment Advisors | | Net Amounts Retained by Manager |
0.175%-0.65% | | $20,128 | | $15,811 | | $4,317 |
Administrative Services Agreement
The Manager and the Trust entered into an Administrative Services Agreement which obligates the Manager to provide or oversee administrative services to the Fund. As compensation for performing the duties required under the Administrative Services Agreement, the Manager receives an annualized fee of 0.30% of the average daily net assets of the Institutional, Y, Investor, Advisor, and Retirement Classes of the Fund, 0.40% of the average daily net assets of the A and C Classes of the Fund, and 0.05% of the average daily net assets of the AMR Class of the Fund.
Distribution Plans
The Fund, except for the Advisor, Retirement, A, and C Classes of the Fund, has adopted a “defensive” Distribution Plan (the “Plan”) in accordance with Rule 12b-1 under the Act, pursuant to which no fees may be charged to the Fund for distribution purposes. However, the Plan authorizes the management and administrative service fees received by the Manager and the investment advisors hired by the Manager to be used for distribution purposes. Under this Plan, the Fund does not intend to compensate the Manager or any other party, either directly or indirectly, for the distribution of Fund shares.
Separate Distribution Plans (the “Distribution Plans”) have been adopted pursuant to Rule 12b-1 under the Act for the Advisor, Retirement, A, and C Classes of the Fund. Under the Distribution Plans, as compensation for distribution assistance, the Manager receives an annual fee of 0.25% of the average daily net assets of the Advisor, and A Classes, 0.50% of the average daily net assets of the Retirement Class, and 1.00% of the average daily net assets of the C Class. The fee will be payable without regard to whether the amount of the fee is more or less than the actual expenses incurred in a particular month by the Manager for distribution assistance.
Service Plans
The Manager and the Trust entered into Service Plans that obligate the Manager to oversee additional shareholder servicing of the Y, Investor, Advisor, Retirement, A, and C Classes. As compensation for performing the duties required under the Service Plans, the Manager receives 0.10% of the average daily net assets of the Y Class, 0.15% of the average daily net assets of the A and C Classes, 0.25% of the average daily net assets of the Advisor and Retirement Classes, and up to 0.375% of the average daily net assets of the Investor Class of the Fund.
15
American Beacon Large Cap Value FundSM
Notes to Financial Statements
October 31, 2011
Investment in Affiliated Funds
The Fund may invest in the American Beacon Money Market Select Fund and the American Beacon U.S. Government Money Market Select Fund (the “USG Select Fund”), (collectively the “Select Funds”). The Select Funds and the Fund have the same investment advisor and therefore, are considered to be affiliated. The Manager serves as investment advisor to the Select Funds and receives from the Select Funds an annualized fee of 0.09% of its average daily net assets of the Select Funds. During the year ended October 31, 2011, the Manager earned fees from the Select Funds totaling $41,493 on the Fund’s direct investment in the Select Funds.
Interfund Lending Program
Pursuant to an exemptive order issued by the Securities and Exchange Commission (“SEC”), the Fund, along with other registered investment companies having management contracts with the Manager, may participate in an interfund lending program as a borrower. This program provides an alternative credit facility allowing the Fund to borrow from other participating Funds. During the year ended October 31, 2011, the Fund did not utilize the credit facility.
Expense Reimbursement Plan
The Fund has adopted an Expense Reimbursement Plan whereby the Manager may seek repayment of fees waived or expenses reimbursed for a period of up to three years. However, reimbursement will occur only if the Class’ average net assets have grown or expenses have declined sufficiently to allow reimbursement without causing its expense ratio to exceed the previously agreed upon contractual expense limit. During the year ended October 31, 2011, the Manager voluntarily reimbursed $4,264 for the C Class which was receivable at October 31, 2011. A liability has not been booked as the Manager does not intend to seek repayment of this reimbursement.
3. Security Valuation and Fair Value Measurements
Investments are valued at the close of the New York Stock Exchange (the “Exchange”), normally 4 p.m. ET, each day that the Exchange is open for business. Equity securities for which market quotations are available are valued at the last sale price or official closing price (closing bid price or last evaluated quote if no sale has occurred) on the primary market or exchange on which they trade.
Investments in mutual funds are valued at the closing net asset value (“NAV”) per share of the mutual fund on the day of valuation. Investment grade short-term obligations with 60 days or less to maturity are valued using the amortized cost method, which approximates fair value.
Securities for which the market prices are not readily available or are not reflective of the fair value of the security, as determined by the Manager, will be priced at fair value following procedures approved by the Trust’s Board of Trustees (the “Board”).
Futures contracts are valued based upon their quoted daily settlement prices. Upon entering into a futures contract, a Fund is required to deposit with its futures broker, an amount of cash or U.S. Government and Agency Obligations in accordance with the initial margin requirements of the broker or exchange. Futures contracts are marked to market daily and an appropriate payable or receivable for the change in value (“variation margin”) is recorded by the Fund. Gains or losses are recognized, but not considered realized until the contracts expire or are closed. Futures contracts involve, to varying degrees, risk of loss in excess of the variation margin disclosed on the Statement of Assets and Liabilities.
16
American Beacon Large Cap Value FundSM
Notes to Financial Statements
October 31, 2011
Security Transactions and Investment Income
Security transactions are recorded on the trade date of the security purchase or sale. The Fund may purchase securities with delivery or payment to occur at a later date. At the time the Fund enters into a commitment to purchase a security, the transaction is recorded, and the value of the security is reflected in the NAV. The value of the security may vary with market fluctuations.
Dividend income, net of foreign taxes, is recorded on the ex-dividend date, except certain dividends from foreign securities which are recorded as soon as the information is available to the Fund. Interest income is earned from settlement date, recorded on the accrual basis, and adjusted, if necessary, for accretion of discounts and amortization of premiums. For financial and tax reporting purposes, realized gains and losses are determined on the basis of specific lot identification.
Dividends to Shareholders
Dividends from net investment income of the Fund normally will be declared and paid at least annually. Distributions, if any, of net realized capital gains are generally paid at least annually and recorded on the ex-dividend date.
Commission Recapture
The Fund has established brokerage commission recapture arrangements with certain brokers or dealers. If the Fund’s investment advisor chooses to execute a transaction through a participating broker, the broker rebates a portion of the commission back to the Fund. Any collateral benefit received through participation in the commission recapture program is directed exclusively to the Fund. This amount is reported with the net realized gain in the Fund’s Statement of Operations.
Allocation of Income, Expenses, Gains, and Losses
Income, expenses (other than those attributable to a specific class), gains, and losses are allocated daily to each class of shares based upon the relative proportion of net assets represented by such class. Operating expenses directly attributable to a specific class are charged against the operations of that class.
Use of Estimates
The preparation of financial statements in conformity with U.S. GAAP requires management to make estimates and assumptions that affect the amounts reported in the financial statements and accompanying notes. Actual results may differ from those estimated.
Other
Under the Trust’s organizational documents, its officers and trustees are indemnified against certain liability arising out of the performance of their duties to the Trust. In the normal course of business, the Trust enters into contracts that provide indemnification to the other party or parties against potential costs or liabilities. The Trust’s maximum exposure under these arrangements is dependent on claims that may be made in the future and, therefore, cannot be estimated. The Trust has had no prior claims or losses pursuant to any such agreement.
Valuation Inputs
Various inputs may be used to determine the fair value of the Fund’s investments. These inputs are summarized in three broad levels for financial statement purposes. The inputs or methodologies used to value securities are not necessarily an indication of the risk associated with investing in those securities.
17
American Beacon Large Cap Value FundSM
Notes to Financial Statements
October 31, 2011
| | |
| Level 1 - | | Quoted prices in active markets for identical securities. |
| |
| Level 2 - | | Prices determined using other significant observable inputs. These may include quoted prices for similar securities, interest rates, prepayment speeds, credit risk, and others. |
| |
| Level 3 - | | Prices determined using other significant unobservable inputs. Unobservable inputs reflect the Fund’s own assumptions about the factors market participants would use in pricing an investment, and would be based on the best information available. |
Level 1 and Level 2 trading assets and trading liabilities, at fair value
Common stocks and financial derivative instruments, such as futures contracts that are traded on a national securities exchange, are stated at the last reported sale or settlement price on the day of valuation. To the extent these securities are actively traded and valuation adjustments are not applied, they are categorized as Level 1 of the fair value hierarchy. Preferred securities and other equities traded on inactive markets or valued by reference to similar instruments are also categorized as Level 2 of the fair value hierarchy.
Investments in registered open-end investment management companies will be valued based upon the NAVs of such investments and are categorized as Level 1 of the fair value hierarchy. Short-term investments having a maturity of 60 days or less are generally valued at amortized cost which approximates fair value. These investments are categorized as Level 2 of the fair value hierarchy.
Level 3 trading assets and trading liabilities, at fair value
The valuation techniques and significant inputs used in determining the fair values of financial instruments classified as Level 3 of the fair value hierarchy are as follows:
Securities and other assets for which market quotes are not readily available are valued at fair value as determined in good faith by the Board or persons acting at their direction and are categorized as Level 3 of the fair value hierarchy.
Market quotes are considered not readily available in circumstances where there is an absence of current or reliable market-based data (e.g., trade information or broker quotes), including where events occur after the close of the relevant market, but prior to the Exchange close, that materially affect the values of a Fund’s securities or assets. In addition, market quotes are considered not readily available when, due to extraordinary circumstances, the exchanges or markets on which the securities trade, do not open for trading for the entire day and no other market prices are available. The Board has delegated to the Manager the responsibility for monitoring significant events that may materially affect the values of a Fund’s securities or assets and for determining whether the value of the applicable securities or assets should be re-evaluated in light of such significant events.
The Board has adopted methods for valuing securities and other assets in circumstances where market quotes are not readily available, and has delegated the responsibility for applying the valuation methods to the Manager. For instances in which daily market quotes are not readily available, investments may be valued, pursuant to guidelines established by the Board, with reference to other securities or indices. In the event that the security or asset cannot be valued pursuant to one of the valuation methods established by the Board, the fair value of the security or asset will be determined in good faith by the Valuation Committee of the Board, generally based upon recommendations provided by the Manager.
When a Fund uses fair valuation methods applied by the Manager that use significant unobservable inputs to determine its NAV, securities will be priced by another method that the Board or persons acting at their direction believe accurately reflects fair value and are categorized as Level 3 of the fair value hierarchy. These methods may require subjective determinations about the value of a security. While the Trust’s policy is
18
American Beacon Large Cap Value FundSM
Notes to Financial Statements
October 31, 2011
intended to result in a calculation of a Fund’s NAV that fairly reflects security values as of the time of pricing, the Trust cannot guarantee that values determined by the Board or persons acting at their direction would accurately reflect the price that a Fund could obtain for a security if it were to dispose of that security as of the time of pricing (for instance, in a forced or distressed sale). The prices used by a Fund may differ from the value that would be realized if the securities were sold.
For fair valuations using significant unobservable inputs, U.S. GAAP requires a reconciliation of the beginning to ending balances for reported fair values that presents changes attributable to total realized and unrealized gains or losses, purchases and sales, and transfers in and out of the Level 3 category during the period. The end of period timing recognition is used for the significant transfers between Levels of the Fund’s assets and liabilities. In accordance with the requirements of U.S. GAAP, a fair value hierarchy and Level 3 reconciliation, if any, have been included in the Notes to the Schedule of Investments for the Fund.
The Fund’s investments are summarized by level based on the inputs used to determine their values. As of October 31, 2011, the investments were classified as described below: (in thousands)
| | | | | | | | | | | | | | | | |
| | | Level 1 | | | Level 2 | | | Level 3 | | | Total | |
Common Stock | | $ | 7,577,581 | | | $ | — | | | $ | — | | | $ | 7,577,581 | |
Preferred Stock | | | 37,570 | | | | — | | | | — | | | | 37,570 | |
Short-Term Investments | | | 283,182 | | | | — | | | | — | | | | 283,182 | |
| | | | | | | | | | | | | | | | |
Total Investments in Securities | | $ | 7,898,333 | | | $ | — | | | $ | — | | | $ | 7,898,333 | |
| | | | | | | | | | | | | | | | |
Futures Contracts | | $ | 13,366 | | | | — | | | | — | | | $ | 13,366 | |
As of October 31, 2011, there were no significant transfers into or out of any level.
4. Securities and Other Investments
Real Estate Investment Trusts
The Fund may own shares of real estate investment trusts (“REITS”) which report information on the source of their distributions annually. The Fund re-characterizes distributions received from REIT investments based on information provided by the REITs into the following categories: ordinary income, long-term capital gains, and return of capital. If information is not available on a timely basis from the REITs, the re-characterization will be estimated based on available information which may include the previous year allocation. If new or additional information becomes available from the REITs at a later date, a re-characterization will be made the following year. These re-characterizations are not recorded for financial statement purposes, but as an adjustment to the calculation of taxable income.
5. Financial Derivative Instruments
Futures Contracts
Futures contracts are contracts to buy or sell a standard quantity of securities at a specified price on a future date. The Fund may enter into financial futures contracts as a method for keeping assets readily convertible to cash if needed to meet shareholder redemptions or for other needs while maintaining exposure to the stock or bond market, as applicable. The primary risks associated with the use of futures contracts are the possibility of illiquid markets or imperfect correlation between the values of the contracts and the underlying securities, or that the counterparty will fail to perform its obligations.
Upon entering into a futures contract, the Fund is required to set aside or deposit with a broker an amount, termed the initial margin, which typically represents 5% of the face value of the futures contract. The Fund usually reflects this amount on the Schedule of Investments as a U.S. Treasury Bill held as collateral for futures contracts or as Cash deposited with broker on the Statement of Assets and Liabilities. Payments to and
19
American Beacon Large Cap Value FundSM
Notes to Financial Statements
October 31, 2011
from the broker, known as variation margin, are required to be made on a daily basis as the price of the futures contract fluctuates. Changes in initial settlement values are accounted for as unrealized appreciation (depreciation) until the contracts are terminated, at which time realized gains and losses are recognized. Futures contracts are valued at the most recent settlement price established each day by the exchange on which they are traded.
Values of Derivative Instruments not accounted for as hedging instruments as of October 31, 2011 (in thousands):
| | | | | | | | |
Statement of Assets and Liabilities | | Derivatives | | | Fair Value | |
Unrealized appreciation of investments and futures contracts | | | Equity Contracts | * | | $ | 13,366 | |
Effect of derivative instruments not accounted for as hedging instruments during the year ended October 31, 2011 (in thousands):
| | | | | | | | |
Statement of Operations | | Derivatives | | | Total | |
Net realized gain (loss) from futures contracts | | | Equity Contracts | | | $ | 48,025 | |
Change in net unrealized appreciation or depreciation of futures contracts | | | Equity Contracts | | | $ | (6,915 | ) |
| * | Includes cumulative appreciation or depreciation of futures contracts as reported in the Schedule of Investments footnotes. Only current day’s variation margin is reported within the Statement of Assets and Liabilities. |
6. Federal Income and Excise Taxes
It is the policy of the Fund to qualify as a regulated investment company, by complying with all applicable provisions of Subchapter M of the Internal Revenue Code, as amended, and to make distribution of taxable income sufficient to relieve it from substantially all federal income and excise taxes. For federal income tax purposes, the Fund is treated as a single entity for the purpose of determining such qualification.
The Fund does not have any unrecognized tax benefits in the accompanying financial statements. Each of the tax years in the four year period ended October 31, 2011 remains subject to examination by the Internal Revenue Service. If applicable, the Fund recognizes interest accrued related to unrecognized tax benefits in interest expense and penalties in “Other expenses” on the Statement of Operations.
Dividends are categorized in accordance with income tax regulations which may treat certain transactions differently than U.S. GAAP. Accordingly, the character of distributions and composition of net assets for tax purposes may differ from those reflected in the accompanying financial statements.
The tax character of distributions paid during the fiscal years ended October 31, 2011 and October 31, 2010 were as follows (in thousands):
| | | | | | | | |
| | | Year Ended
October 31,
2011 | | | Year Ended
October 31,
2010 | |
Distributions paid from: | | | | | | | | |
Ordinary income* | | | | | | | | |
Institutional Class | | $ | 47,237 | | | $ | 40,440 | |
Y Class | | | 27 | | | | 15 | |
Investor Class | | | 48,747 | | | | 61,616 | |
Advisor Class | | | 1,398 | | | | 1,747 | |
A Class | | | 13 | | | | — | |
C Class | | | 1 | | | | — | |
AMR Class | | | 8,633 | | | | 10,649 | |
| | | | | | | | |
Total distributions paid | | $ | 106,056 | | | $ | 114,467 | |
| | | | | | | | |
| * | For tax purposes, short-term capital gains are considered ordinary income distributions. |
20
American Beacon Large Cap Value FundSM
Notes to Financial Statements
October 31, 2011
As of October 31, 2011, the components of distributable earnings (deficit) on a tax basis were as follows (in thousands):
| | | | |
Cost basis of investments for federal income tax purposes | | $ | 8,315,861 | |
| |
Unrealized appreciation | | | 648,132 | |
Unrealized depreciation | | | (1,065,660 | ) |
| | | | |
Net unrealized appreciation or depreciation | | | (417,528 | ) |
Undistributed ordinary income | | | 134,981 | |
Accumulated long-term gain or loss | | | (1,196,547 | ) |
Other temporary differences | | | 13,400 | |
| | | | |
Distributable earnings or deficit | | $ | (1,465,694 | ) |
| | | | |
Financial reporting records are adjusted for permanent book/tax differences to reflect tax character. Financial records are not adjusted for temporary differences. The temporary differences between financial reporting and tax-basis reporting of unrealized appreciation or depreciation are attributable primarily to the tax deferral of losses from wash sales and the realization for tax purposes of unrealized gains or losses on certain derivative instruments.
Due to inherent differences in the recognition of income, expenses and realized gains or losses under U.S. GAAP and federal income tax regulations, permanent differences between book and tax reporting have been identified and appropriately reclassified on the Statement of Assets and Liabilities.
Accordingly, the following amounts represent current year permanent differences derived from Section 732 basis adjustments that have been reclassified as of October 31, 2011 (in thousands):
| | | | |
Paid-in-capital | | $ | (200 | ) |
Undistributed net investment income (loss) | | | 206 | |
Accumulated net realized gain (loss) | | | (6 | ) |
Unrealized appreciation (depreciation) of investments and futures contracts | | | — | |
At October 31, 2011 the capital loss carry forward positions for federal income tax purposes were $456,315, $684,423, and $42,443 expiring in 2016, 2017, and 2018 respectively. The Fund utilized $588,377 of net capital loss carryovers for the year ended October 31, 2011. (in thousands)
7. Investment Transactions
The aggregate cost of purchases and proceeds from sales of investments other than short-term obligations for the year ended October 31, 2011 were (in thousands) $7,438,089 and $7,666,782, respectively.
A summary of the Fund’s direct ownership and transactions in the USG Select Fund for the year ended October 31, 2011 is set forth below (in thousands):
| | | | | | | | | | | | | | | | |
Affiliate | | October 31, 2010
Shares/Fair Value | | | Purchases | | | Sales | | | October 31, 2011
Shares/Fair Value | |
USG Select Fund | | $ | 60,000 | | | $ | 90,000 | | | $ | 125,000 | | | $ | 25,000 | |
21
American Beacon Large Cap Value FundSM
Notes to Financial Statements
October 31, 2011
8. Capital Share Transactions
The tables below summarize the activity in capital shares for each Class of the Fund (dollars and shares in thousands):
Year Ended October 31, 2011
| | | | | | | | | | | | | | | | | | | | | | | | | | | | | | | | |
| | | Institutional Class | | | Y Class | | | Investor Class | | | Advisor Class | |
| | | Shares | | | Amount | | | Shares | | | Amount | | | Shares | | | Amount | | | Shares | | | Amount | |
Shares sold | | | 39,716 | | | $ | 774,595 | | | | 7,497 | | | $ | 151,632 | | | | 45,467 | | | $ | 843,177 | | | | 1,548 | | | $ | 28,674 | |
Reinvestment of dividends | | | 2,273 | | | | 44,274 | | | | 1 | | | | 27 | | | | 2,547 | | | | 47,168 | | | | 75 | | | | 1,372 | |
Shares redeemed | | | (45,266 | ) | | | (866,688 | ) | | | (480 | ) | | | (9,076 | ) | | | (74,020 | ) | | | (1,366,606 | ) | | | (1,681 | ) | | | (30,880 | ) |
| | | | | | | | | | | | | | | | | | | | | | | | | | | | | | | | |
Net increase (decrease) in shares outstanding | | | (3,277 | ) | | $ | (47,819 | ) | | | 7,018 | | | $ | 142,583 | | | | (26,006 | ) | | $ | (476,261 | ) | | | (58 | ) | | $ | (834 | ) |
| | | | | | | | | | | | | | | | | | | | | | | | | | | | | | | | |
| | | | | | | | | | | | | | | | | | | | | | | | | | | | | | | | |
| | | Retirement Class | | | AMR Class | | | A Class | | | C Class | |
| | | Shares | | | Amount | | | Shares | | | Amount | | | Shares | | | Amount | | | Shares | | | Amount | |
Shares sold | | | 63 | | | $ | 1,138 | | | | 5,137 | | | $ | 97,647 | | | | 210 | | | $ | 3,855 | | | | 73 | | | $ | 1,336 | |
Reinvestment of dividends | | | — | | | | — | | | | 448 | | | | 8,633 | | | | 1 | | | | 11 | | | | — | | | | — | |
Shares redeemed | | | (6 | ) | | | (109 | ) | | | (5,724 | ) | | | (110,845 | ) | | | (38 | ) | | | (650 | ) | | | (1 | ) | | | (19 | ) |
| | | | | | | | | | | | | | | | | | | | | | | | | | | | | | | | |
Net increase (decrease) in shares outstanding | | | 57 | | | $ | 1,029 | | | | (139 | ) | | $ | (4,565 | ) | | | 173 | | | $ | 3,216 | | | | 72 | | | $ | 1,317 | |
| | | | | | | | | | | | | | | | | | | | | | | | | | | | | | | | |
Year Ended October 31, 2010
| | | | | | | | | | | | | | | | | | | | | | | | | | | | | | | | |
| | | Institutional Class | | | Y Class | | | Investor Class | | | Advisor Class | |
| | | Shares | | | Amount | | | Shares | | | Amount | | | Shares | | | Amount | | | Shares | | | Amount | |
Shares sold | | | 67,332 | | | $ | 1,191,741 | | | | 199 | | | $ | 3,527 | | | | 80,103 | | | $ | 1,343,174 | | | | 1,315 | | | $ | 21,942 | |
Reinvestment of dividends | | | 2,134 | | | | 36,957 | | | | 1 | | | | 15 | | | | 3,645 | | | | 60,109 | | | | 105 | | | | 1,716 | |
Shares redeemed | | | (24,252 | ) | | | (425,661 | ) | | | (85 | ) | | | (1,472 | ) | | | (93,570 | ) | | | (1,565,806 | ) | | | (1,557 | ) | | | (26,092 | ) |
| | | | | | | | | | | | | | | | | | | | | | | | | | | | | | | | |
Net increase (decrease) in shares outstanding | | | 45,214 | | | $ | 803,037 | | | | 115 | | | $ | 2,070 | | | | (9,822 | ) | | $ | (162,523 | ) | | | (137 | ) | | $ | (2,434 | ) |
| | | | | | | | | | | | | | | | | | | | | | | | | | | | | | | | |
| | | | | | | | | | | | | | | | | | | | | | | | | | | | | | | | |
| | | Retirement Class | | | AMR Class | | | A Class | | | C Class | |
| | | Shares | | | Amount | | | Shares | | | Amount | | | Shares | | | Amount | | | Shares | | | Amount | |
Shares sold | | | — | | | $ | 1 | | | | 2,145 | | | $ | 37,065 | | | | 46 | | | $ | 786 | | | | 2 | | | $ | 37 | |
Reinvestment of dividends | | | — | | | | — | | | | 623 | | | | 10,649 | | | | — | | | | — | | | | — | | | | — | |
Shares redeemed | | | — | | | | — | | | | (4,647 | ) | | | (80,258 | ) | | | — | | | | — | | | | — | | | | — | |
| | | | | | | | | | | | | | | | | | | | | | | | | | | | | | | | |
Net increase (decrease) in shares outstanding | | | — | | | $ | 1 | | | | (1,879 | ) | | $ | (32,544 | ) | | | 46 | | | $ | 786 | | | | 2 | | | $ | 37 | |
| | | | | | | | | | | | | | | | | | | | | | | | | | | | | | | | |
22
This page intentionally left blank.
23
American Beacon Large Cap Value FundSM
Financial Highlights
(For a share outstanding throughout the period)
| | | | | | | | | | | | | | | | | | | | | | | | | | | | | | | | |
| | | Institutional Class | | | Y Class | |
| | | Year Ended October 31, | | | Year Ended
October 31, | | | August 3 to
October 31,
2009 | |
| | | 2011G | | | 2010 | | | 2009 | | | 2008 | | | 2007 | | | 2011G | | | 2010 | | |
Net asset value, beginning of period | | $ | 18.56 | | | $ | 16.32 | | | $ | 15.01 | | | $ | 26.03 | | | $ | 23.77 | | | $ | 18.49 | | | $ | 16.32 | | | $ | 15.59 | |
| | | | | | | | | | | | | | | | | | | | | | | | | | | | | | | | |
Income from investment operations: | | | | | | | | | | | | | | | | | | | | | | | | | | | | | | | | |
Net investment incomeA | | | 0.39 | | | | 0.32 | | | | 0.35 | | | | 0.51 | | | | 0.40 | | | | 0.37 | | | | 0.29 | | | | 0.06 | |
Net gains (losses) on securities (both realized and unrealized) | | | 0.30 | | | | 2.22 | | | | 1.40 | | | | (10.41 | ) | | | 2.78 | | | | 0.30 | | | | 2.22 | | | | 0.67 | |
| | | | | | | | | | | | | | | | | | | | | | | | | | | | | | | | |
Total income (loss) from investment operations | | | 0.69 | | | | 2.54 | | | | 1.75 | | | | (9.90 | ) | | | 3.18 | | | | 0.67 | | | | 2.51 | | | | 0.73 | |
| | | | | | | | | | | | | | | | | | | | | | | | | | | | | | | | |
Less distributions: | | | | | | | | | | | | | | | | | | | | | | | | | | | | | | | | |
Dividends from net investment income | | | (0.26 | ) | | | (0.30 | ) | | | (0.44 | ) | | | (0.41 | ) | | | (0.31 | ) | | | (0.24 | ) | | | (0.34 | ) | | | — | |
Distributions from net realized gains on securities | | | — | | | | — | | | | — | | | | (0.71 | ) | | | (0.61 | ) | | | — | | | | — | | | | — | |
| | | | | | | | | | | | | | | | | | | | | | | | | | | | | | | | |
Total distributions | | | (0.26 | ) | | | (0.30 | ) | | | (0.44 | ) | | | (1.12 | ) | | | (0.92 | ) | | | (0.24 | ) | | | (0.34 | ) | | | — | |
| | | | | | | | | | | | | | | | | | | | | | | | | | | | | | | | |
Net asset value, end of period | | $ | 18.99 | | | $ | 18.56 | | | $ | 16.32 | | | $ | 15.01 | | | $ | 26.03 | | | $ | 18.92 | | | $ | 18.49 | | | $ | 16.32 | |
| | | | | | | | | | | | | | | | | | | | | | | | | | | | | | | | |
Total return B | | | 3.69 | % | | | 15.68 | % | | | 12.41 | % | | | (39.59 | )% | | | 13.76 | % | | | 3.58 | % | | | 15.50 | % | | | 4.68 | %D |
| | | | | | | | | | | | | | | | | | | | | | | | | | | | | | | | |
Ratios and supplemental data: | | | | | | | | | | | | | | | | | | | | | | | | | | | | | | | | |
Net assets, end of period (in thousands) | | $ | 3,380,918 | | | $ | 3,366,011 | | | $ | 2,221,162 | | | $ | 2,038,539 | | | $ | 2,493,451 | | | $ | 134,968 | | | $ | 2,123 | | | $ | 1 | |
Ratios to average net assets (annualized): | | | | | | | | | | | | | | | | | | | | | | | | | | | | | | | | |
Expenses, before waivers | | | 0.58 | % | | | 0.59 | % | | | 0.61 | % | | | 0.58 | % | | | 0.59 | % | | | 0.69 | % | | | 0.70 | % | | | 0.68 | %E |
Expenses, net of waivers | | | 0.58 | % | | | 0.59 | % | | | 0.61 | % | | | 0.58 | % | | | 0.59 | % | | | 0.69 | % | | | 0.70 | % | | | 0.68 | %E |
Net investment income (loss), before waivers | | | 1.96 | % | | | 1.73 | % | | | 2.36 | % | | | 2.19 | % | | | 1.82 | % | | | 1.88 | % | | | 1.51 | % | | | 1.58 | %E |
Net investment income, net of waivers | | | 1.96 | % | | | 1.73 | % | | | 2.36 | % | | | 2.19 | % | | | 1.82 | % | | | 1.88 | % | | | 1.51 | % | | | 1.58 | %E |
Portfolio turnover rate | | | 90 | % | | | 28 | % | | | 27 | % | | | 28 | % | | | 20 | % | | | 90 | % | | | 28 | % | | | 27 | %C |
| A | For purposes of this calculation, through October 31, 2007, the change in undistributed net investment income per share was derived by dividing the change in undistributed net investment income by average shares outstanding. |
| B | Based on net asset value, which does not reflect the sales charge, redemption fee, or contingent deferred sales charge, if applicable. |
| C | Portfolio turnover rate is for the period from November 1, 2008 through October 31, 2009. |
| F | Portfolio turnover rate is for the period from November 1, 2009 through October 31, 2010. |
| G | On December 1, 2010, MFS Institutional Advisors, Inc. assumed management of the Large Cap Value Fund’s assets previously managed by Metropolitan West Capital Management, LLC. |
24
American Beacon Large Cap Value Fund
Financial Highlights
(For a share outstanding throughout the period)
| | | | | | | | | | | | | | | | | | | | | | | | | | | | | | | | | | | | | | | | | | | | | | | | | | | | | | | | | | | | | | | | | | | | |
| Investor Class | | Advisor Class | | Retirement Class | | A Class |
| Year Ended October 31, | | Year Ended October 31, | | Year Ended
October 31, | | May 1 to
October 31,
2009 | | Year ended
October 31,
2011G |
| 2011G | | 2010 | | 2009 | | 2008 | | 2007 | | 2011G | | 2010 | | 2009 | | 2008 | | 2007 | | 2011G | | 2010 | | |
| | $ | 17.61 | | | | $ | 15.51 | | | | $ | 14.29 | | | | $ | 24.83 | | | | $ | 22.74 | | | | $ | 17.47 | | | | $ | 15.39 | | | | $ | 14.19 | | | | $ | 24.70 | | | | $ | 22.64 | | | | $ | 17.32 | | | | $ | 15.36 | | | | $ | 12.66 | | | | $ | 17.61 | |
| | | | | | | | | | | | | | | | | | | | | | | | | | | | | | | | | | | | | | | | | | | | | | | | | | | | | | | | | | | | | | | | | | | | | |
| | | | | | | | | | | | | | | | | | | | | | | | | | | | | | | | | | | | | | | | | | | | | | | | | | | | | | | | | | | | | | | | | | | | | |
| | | 0.30 | | | | | 0.23 | | | | | 0.28 | | | | | 0.41 | | | | | 0.35 | | | | | 0.27 | | | | | 0.21 | | | | | 0.26 | | | | | 0.32 | | | | | 0.28 | | | | | 0.20 | | | | | 0.18 | | | | | 0.08 | | | | | 0.24 | |
| | | 0.29 | | | | | 2.12 | | | | | 1.34 | | | | | (9.88 | ) | | | | 2.63 | | | | | 0.28 | | | | | 2.10 | | | | | 1.32 | | | | | (9.79 | ) | | | | 2.62 | | | | | 0.30 | | | | | 2.07 | | | | | 2.62 | | | | | 0.31 | |
| | | | | | | | | | | | | | | | | | | | | | | | | | | | | | | | | | | | | | | | | | | | | | | | | | | | | | | | | | | | | | | | | | | | | |
| | | 0.59 | | | | | 2.35 | | | | | 1.62 | | | | | (9.47 | ) | | | | 2.98 | | | | | 0.55 | | | | | 2.31 | | | | | 1.58 | | | | | (9.47 | ) | | | | 2.90 | | | | | 0.50 | | | | | 2.25 | | | | | 2.70 | | | | | 0.55 | |
| | | | | | | | | | | | | | | | | | | | | | | | | | | | | | | | | | | | | | | | | | | | | | | | | | | | | | | | | | | | | | | | | | | | | |
| | | | | | | | | | | | | | | | | | | | | | | | | | | | | | | | | | | | | | | | | | | | | | | | | | | | | | | | | | | | | | | | | | | | | |
| | | (0.21 | ) | | | | (0.25 | ) | | | | (0.40 | ) | | | | (0.36 | ) | | | | (0.28 | ) | | | | (0.19 | ) | | | | (0.23 | ) | | | | (0.38 | ) | | | | (0.33 | ) | | | | (0.23 | ) | | | | (0.08 | ) | | | | (0.29 | ) | | | | — | | | | | (0.15 | ) |
| | | — | | | | | — | | | | | — | | | | | (0.71 | ) | | | | (0.61 | ) | | | | — | | | | | — | | | | | — | | | | | (0.71 | ) | | | | (0.61 | ) | | | | — | | | | | — | | | | | — | | | | | — | |
| | | | | | | | | | | | | | | | | | | | | | | | | | | | | | | | | | | | | | | | | | | | | | | | | | | | | | | | | | | | | | | | | | | | | |
| | | (0.21 | ) | | | | (0.25 | ) | | | | (0.40 | ) | | | | (1.07 | ) | | | | (0.89 | ) | | | | (0.19 | ) | | | | (0.23 | ) | | | | (0.38 | ) | | | | (1.04 | ) | | | | (0.84 | ) | | | | (0.08 | ) | | | | (0.29 | ) | | | | — | | | | | (0.15 | ) |
| | | | | | | | | | | | | | | | | | | | | | | | | | | | | | | | | | | | | | | | | | | | | | | | | | | | | | | | | | | | | | | | | | | | | |
| | $ | 17.99 | | | | $ | 17.61 | | | | $ | 15.51 | | | | $ | 14.29 | | | | $ | 24.83 | | | | $ | 17.83 | | | | $ | 17.47 | | | | $ | 15.39 | | | | $ | 14.19 | | | | $ | 24.70 | | | | $ | 17.74 | | | | $ | 17.32 | | | | $ | 15.36 | | | | $ | 18.01 | |
| | | | | | | | | | | | | | | | | | | | | | | | | | | | | | | | | | | | | | | | | | | | | | | | | | | | | | | | | | | | | | | | | | | | | |
| | | 3.30 | % | | | | 15.27 | % | | | | 11.99 | % | | | | (39.72 | )% | | | | 13.46 | % | | | | 3.11 | % | | | | 15.14 | % | | | | 11.81 | % | | | | (39.87 | )% | | | | 13.16 | % | | | | 2.86 | % | | | | 14.78 | % | | | | 21.33 | %D | | | | 3.12 | % |
| | | | | | | | | | | | | | | | | | | | | | | | | | | | | | | | | | | | | | | | | | | | | | | | | | | | | | | | | | | | | | | | | | | | | |
| | | | | | | | | | | | | | | | | | | | | | | | | | | | | | | | | | | | | | | | | | | | | | | | | | | | | | | | | | | | | | | | | | | | | |
| | $ | 3,761,691 | | | | $ | 4,140,584 | | | | $ | 3,798,632 | | | | $ | 3,594,565 | | | | $ | 5,198,835 | | | | $ | 129,739 | | | | $ | 128,080 | | | | $ | 114,945 | | | | $ | 99,416 | | | | $ | 99,854 | | | | $ | 1,019 | | | | $ | 2 | | | | $ | 1 | | | | $ | 3,942 | |
| | | | | | | | | | | | | | | | | | | | | | | | | | | | | | | | | | | | | | | | | | | | | | | | | | | | | | | | | | | | | | | | | | | | | |
| | | 0.95 | % | | | | 0.96 | % | | | | 0.93 | % | | | | 0.83 | % | | | | 0.83 | % | | | | 1.08 | % | | | | 1.10 | % | | | | 1.12 | % | | | | 1.08 | % | | | | 1.08 | % | | | | 1.39 | % | | | | 1.37 | % | | | | 1.37 | %E | | | | 1.16 | % |
| | | 0.95 | % | | | | 0.96 | % | | | | 0.93 | % | | | | 0.83 | % | | | | 0.83 | % | | | | 1.08 | % | | | | 1.10 | % | | | | 1.10 | % | | | | 1.08 | % | | | | 1.08 | % | | | | 1.39 | % | | | | 1.37 | % | | | | 1.37 | %E | | | | 1.16 | % |
| | | 1.59 | % | | | | 1.36 | % | | | | 2.05 | % | | | | 1.94 | % | | | | 1.59 | % | | | | 1.46 | % | | | | 1.23 | % | | | | 1.84 | % | | | | 1.69 | % | | | | 1.32 | % | | | | 1.06 | % | | | | 0.95 | % | | | | 1.15 | %E | | | | 1.37 | % |
| | | 1.59 | % | | | | 1.36 | % | | | | 2.05 | % | | | | 1.94 | % | | | | 1.59 | % | | | | 1.46 | % | | | | 1.23 | % | | | | 1.86 | % | | | | 1.69 | % | | | | 1.32 | % | | | | 1.06 | % | | | | 0.95 | % | | | | 1.15 | %E | | | | 1.37 | % |
| | | 90 | % | | | | 28 | % | | | | 27 | % | | | | 28 | % | | | | 20 | % | | | | 90 | % | | | | 28 | % | | | | 27 | % | | | | 28 | % | | | | 20 | % | | | | 90 | % | | | | 28 | % | | | | 27 | %C | | | | 90 | % |
25
American Beacon Large Cap Value FundSM
Financial Highlights
(For a share outstanding throughout the period)
| | | | | | | | | | | | | | | | | | | | | | | | | | | | | | | | |
| | | A Class | | | AMR Class | | | C Class | |
| | | May 17 to
October 31,
2010 | | | Year Ended October 31, | | | Year ended
October 31,
2011G | | | September 1
to
October 31,
2010 | |
| | | | 2011G | | | 2010 | | | 2009 | | | 2008 | | | 2007 | | | |
Net asset value, beginning of period | | $ | 16.93 | | | $ | 18.37 | | | $ | 16.14 | | | $ | 14.88 | | | $ | 25.80 | | | $ | 23.55 | | | $ | 17.58 | | | $ | 16.17 | |
| | | | | | | | | | | | | | | | | | | | | | | | | | | | | | | | |
Income from investment operations: | | | | | | | | | | | | | | | | | | | | | | | | | | | | | | | | |
Net investment income (loss)A | | | 0.03 | | | | 0.41 | | | | 0.34 | | | | 0.37 | | | | 0.51 | | | | 0.45 | | | | 0.10 | | | | (0.01 | ) |
Net gains (losses) on securities (both realized and unrealized) | | | 0.65 | | | | 0.32 | | | | 2.22 | | | | 1.38 | | | | (10.26 | ) | | | 2.76 | | | | 0.32 | | | | 1.42 | |
| | | | | | | | | | | | | | | | | | | | | | | | | | | | | | | | |
Total income (loss) from investment operations | | | 0.68 | | | | 0.73 | | | | 2.56 | | | | 1.75 | | | | (9.75 | ) | | | 3.21 | | | | 0.42 | | | | 1.41 | |
| | | | | | | | | | | | | | | | | | | | | | | | | | | | | | | | |
Less distributions: | | | | | | | | | | | | | | | | | | | | | | | | | | | | | | | | |
Dividends from net investment income | | | — | | | | (0.29 | ) | | | (0.33 | ) | | | (0.49 | ) | | | (0.46 | ) | | | (0.35 | ) | | | (0.05 | ) | | | — | |
Distributions from net realized gains on securities | | | — | | | | — | | | | — | | | | — | | | | (0.71 | ) | | | (0.61 | ) | | | — | | | | — | |
| | | | | | | | | | | | | | | | | | | | | | | | | | | | | | | | |
Total distributions | | | — | | | | (0.29 | ) | | | (0.33 | ) | | | (0.49 | ) | | | (1.17 | ) | | | (0.96 | ) | | | (0.05 | ) | | | — | |
| | | | | | | | | | | | | | | | | | | | | | | | | | | | | | | | |
Net asset value, end of period | | $ | 17.61 | | | $ | 18.81 | | | $ | 18.37 | | | $ | 16.14 | | | $ | 14.88 | | | $ | 25.80 | | | $ | 17.95 | | | $ | 17.58 | |
| | | | | | | | | | | | | | | | | | | | | | | | | | | | | | | | |
Total return B | | | 4 02 | %D | | | 3.94 | % | | | 16.04 | % | | | 12.59 | % | | | (39.43 | )% | | | 14.03 | % | | | 2.36 | % | | | 8.72 | %D |
| | | | | | | | | | | | | | | | | | | | | | | | | | | | | | | | |
Ratios and supplemental data: | | | | | | | | | | | | | | | | | | | | | | | | | | | | | | | | |
Net assets, end of period (in thousands) | | $ | 814 | | | $ | 568,768 | | | $ | 558,089 | | | $ | 520,799 | | | $ | 497,127 | | | $ | 972,260 | | | $ | 1,329 | | | $ | 38 | |
Ratios to average net assets (annualized): | | | | | | | | | | | | | | | | | | | | | | | | | | | | | | | | |
Expenses, before waivers | | | 1.06 | %E | | | 0.33 | % | | | 0.34 | % | | | 0.36 | % | | | 0.32 | % | | | 0.32 | % | | | 2.54 | % | | | 2.14 | %E |
Expenses, net of waivers | | | 1.06 | %E | | | 0.33 | % | | | 0.34 | % | | | 0.36 | % | | | 0.32 | % | | | 0.32 | % | | | 1.84 | % | | | 1.87 | %E |
Net investment income (loss), before waivers | | | 1.09 | %E | | | 2.21 | % | | | 1.98 | % | | | 2.62 | % | | | 2.44 | % | | | 2.13 | % | | | (0.01 | )% | | | (0.76 | )%E |
Net investment income, net of waivers | | | 1.09 | %E | | | 2.21 | % | | | 1.98 | % | | | 2.62 | % | | | 2.44 | % | | | 2.13 | % | | | 0.68 | % | | | (0.50 | )%E |
Portfolio turnover rate | | | 28 | %F | | | 90 | % | | | 28 | % | | | 27 | % | | | 28 | % | | | 20 | % | | | 90 | % | | | 28 | %F |
| A | For purposes of this calculation, through October 31, 2007, the change in undistributed net investment income per share was derived by dividing the change in undistributed net investment income by average shares outstanding. |
| B | Based on net asset value, which does not reflect the sales charge, redemption fee, or contingent deferred sales charge, if applicable. |
| C | Portfolio turnover rate is for the period from November 1, 2008 through October 31, 2009. |
| F | Portfolio turnover rate is for the period from November 1, 2009 through October 31, 2010. |
| G | On December 1, 2010, MFS Institutional Advisors, Inc. assumed management of the Large Cap Value Fund’s assets previously managed by Metropolitan West Capital Management, LLC. |
26
American Beacon Funds
Privacy Policy & Federal Tax Information
October 31, 2011 (Unaudited)
Privacy Policy
The American Beacon Funds recognize and respect the privacy of our shareholders. We are providing this notice to you so you will understand how shareholder information may be collected and used.
We may collect nonpublic personal information about you from one or more of the following sources:
| | • | | information we receive from you on applications or other forms; |
| | • | | information about your transactions with us or our service providers; and |
| | • | | information we receive from third parties. |
We do not disclose any nonpublic personal information about our customers or former customers to anyone, except as permitted by law.
We restrict access to your nonpublic personal information to those employees or service providers who need to know that information to provide products or services to you. To ensure the confidentiality of your nonpublic personal information, we maintain safeguards that comply with federal standards.
Federal Tax Information
For corporate shareholders in the Fund, the percentage of ordinary dividend income distributed for the year ended October 31, 2010, which is designated as qualifying for the dividends-received deduction, was 77.92%.
For shareholders in the Fund, the percentage of dividend income distributed for the year ended October 31, 2010, which is designated as qualified dividend income under the Jobs Growth Tax Relief Act of 2003 was 100%.
Shareholders will receive notification in January 2012 of the percentage applicable to the preparation of their 2011 income tax returns.
27
Disclosure Regarding the Board of Trustees’ Approval of the Management
Agreement and Investment Advisory Agreements (Unaudited)
Disclosure Regarding Renewal and Approval of Management Agreement and Investment Advisory Agreements
At its May 26, 2011 meeting, the Board of Trustees (“Board”) considered the renewal of each existing Management Agreement between American Beacon Advisors, Inc. (the “Manager”) and the American Beacon Funds, the American Beacon Mileage Funds, the American Beacon Select Funds and the American Beacon Master Trust (collectively the “Funds”) and each Investment Advisory Agreement between the Manager and a subadvisor (“Investment Advisory Agreements” and collectively with the Management Agreement, the “Agreements”). In preparation for the Board’s consideration to renew these Agreements, the Board and its Investment Committee undertook steps to gather and consider information furnished by the Manager, the subadvisors and Lipper, Inc. (“Lipper”). The Board, with the assistance of independent legal counsel, requested and received certain relevant information from the Manager and each subadvisor.
In addition, the Board’s Investment Committee worked with Lipper to obtain relevant comparative information regarding the performance, fees and expenses of the Funds. The Investment Committee held a separate meeting on May 11, 2011 to consider the information provided by Lipper. Further, the Board took into consideration information furnished for the Board’s review and consideration throughout the year at regular Board and Investment Committee meetings, as well as information specifically prepared in connection with the renewal process.
In connection with the Board’s consideration of the Management Agreement and each Investment Advisory Agreement, the Trustees considered, among other materials, responses by the Manager and the subadvisors to inquiries requesting:
| | • | | a description of any significant changes (actual or anticipated) to principal activities, personnel, services provided to the Funds, or any other area, including how these changes might affect the Funds; |
| | • | | a copy of the firm’s most recent audited or unaudited financial statements, as well as Parts 1 and 2 of its Form ADV registration statement with the SEC; |
| | • | | a summary of any material pending or anticipated litigation or regulatory proceedings involving the firm or its personnel, including the results of any recent regulatory examination or independent audit; |
| | • | | a comparison of the performance of that portion of Fund assets managed by each firm with performance of other similar accounts managed by the firm, including a discussion of relative performance versus a peer group average and any remedial measures if the firm’s performance was materially below that of the peer group; |
| | • | | a profit/loss analysis of the firm and any actual or anticipated economies of scale in relation to the services it provides to each Fund; |
| | • | | an analysis of compensation, including a comparison with fees charged to other clients for which similar services are provided, any proposed changes to the fee schedule and the effect of any fee waivers; |
| | • | | a description of any payments by the subadvisers to the manager to support the Funds’ marketing efforts; |
| | • | | an evaluation of any other benefits to the firm or Funds as a result of their relationship, if any; |
| | • | | confirmation that the firm’s financial condition would not impair its ability to provide high-quality advisory services to the Funds; |
| | • | | a description of the scope of portfolio management services provided to the Funds, including whether such services differ from the services provided to other clients, including other registered investment companies, and any advantages or disadvantages that might accrue to the Funds due to the firm’s involvement in other activities; |
| | • | | a description of the personnel who are assigned primary responsibility for managing the Funds, including any changes during the past year, and a discussion of the adequacy of current and projected staffing levels to service the Funds; |
| | • | | a description of the basis upon which portfolio managers are compensated, including any “incentive” arrangements, and a description of the oversight mechanisms used to prevent a portfolio manager whose compensation is tied to performance of a Fund from taking undue risks; |
| | • | | a discussion regarding the firm’s participation in “soft dollar” arrangements, if any, or other brokerage allocation policies with respect to Fund transactions, including the firm’s methodology for obtaining best execution and the use of any affiliated broker-dealers; |
| | • | | a description of any actual or potential conflicts of interest anticipated in managing Fund assets; |
| | • | | a discussion of whether the firm has identified any investment or operational matters that likely present a high risk in managing Fund assets; |
| | • | | a description of trade allocation procedures among accounts managed by the firm; |
| | • | | a discussion of whether the firm receives, with respect to the Funds, other compensation, including any payment for order flow or ECN liquidity rebates |
| | • | | a certification by the firm regarding the reasonable design of its compliance program; |
| | • | | information regarding the firm’s code of ethics, insider trading policy and disaster recovery plan, including a description of any material changes thereto and a related certification of compliance by the firm; |
| | • | | a description of the firm’s affiliation with any broker-dealer; |
| | • | | a discussion of any anticipated change in the firm’s controlling persons; and |
| | • | | verification of the firm’s insurance coverage with regards to the services provided to the Funds. |
28
Disclosure Regarding the Board of Trustees’ Approval of the Management Agreement and Investment Advisory Agreements (Unaudited)
In addition to the foregoing, the Manager provided the following information specific to the renewal of the Management Agreement:
| | • | | a comparison of the performance of each Fund to comparable investment companies and appropriate indices, including comments on the relative performance of, as applicable, each subadvisor and each Fund versus the respective peer group average; |
| | • | | a discussion, if applicable, of any underperformance by a subadvisor relative to its peer group and what, if any, remedial measures the Manager has or intends to take; |
| | • | | a comparison of advisory fees and expense ratios for comparable mutual funds; |
| | • | | an analysis of any material complaints received from Fund shareholders; |
| | • | | a description of the extent to which the Manager monitors the investment activities and financial conditions of each subadvisor to the Funds; |
| | • | | a description of the Manager’s distribution activities with respect to promoting sales of Fund shares, including any revenue sharing practices; |
| | • | | a description of the Manager’s securities lending practices and the fees received from such practices; |
| | • | | a discussion of any rebate arrangements between the Manager and a service provider to the Funds pursuant to which the Manager receives direct or indirect benefits from the service provider; |
| | • | | a description of the portfolio turnover rate and average execution costs for each Fund and, as applicable, each subadvisor to a Fund; and |
| | • | | a description of how expenses that are not readily identifiable to a particular Fund are allocated. |
In connection with the Management Agreement and each Investment Advisory Agreement, the Board also obtained an analysis provided by Lipper that compared: (i) investment performance of each Fund versus comparable investment companies and appropriate indices; (ii) total Fund expenses of each Fund versus comparable mutual funds; and (iii) each Fund’s investment advisory fees versus comparable mutual funds. For each Fund with more than one class of shares, the class of shares used for comparative purposes was the class with the longest performance history, which in most cases was the Institutional Class. References below to each Fund’s Lipper peer group are to the group of comparable mutual funds included in the analysis provided by Lipper.
Provided below is an overview of the primary factors the Trustees considered at the Investment Committee meeting on May 11, 2011 at which the Trustees reviewed the investment performance of the Manager and each subadvisor and the primary factors considered by the Board at its May 26, 2011 meeting at which the Board considered the renewal of the Agreements. The Board did not identify any particular information that was most relevant to its consideration to renew the Management Agreement and each Investment Advisory Agreement, and each Trustee may have afforded different weight to the various factors. Legal counsel to the independent Trustees provided the Board with a memorandum regarding its responsibilities pertaining to the renewal of the Agreements. The memorandum explained the regulatory requirements surrounding the Trustees’ process for evaluating investment advisors and the terms of the contracts. Based on its evaluation, the Board unanimously concluded that the terms of each Agreement were reasonable and fair and that the renewal of each Agreement was in the best interests of the Funds and their shareholders.
Considerations With Respect to All Funds
In determining whether to renew the Management Agreement and each Investment Advisory Agreement, the Trustees considered the best interests of each Fund separately. While the Management Agreement and the Investment Advisory Agreements for all of the Funds were considered at the May 26, 2011 meeting, the Board considered each Fund’s investment management and subadvisory relationships separately. In each instance, the Board considered, among other things, the following factors: (1) the nature and quality of the services provided; (2) the investment performance of a Fund and, as applicable, each subadvisor for a Fund; (3) the costs incurred by the Manager and (to the extent provided) the subadvisors in rendering their services and their resulting profits or losses; (4) the extent to which economies of scale have been taken into account in setting each fee schedule; (5) whether fee levels reflect these economies of scale for the benefit of Fund investors; (6) comparisons of services and fees with contracts entered into by the Manager or a subadvisor or their affiliates with other clients (such as pension funds and other institutional funds); and (7) any other benefits derived or anticipated to be derived by the Manager or a subadvisor from their relationship with a Fund. The Trustees posed questions to various management personnel of the Manager regarding certain key aspects of the materials submitted in support of the renewal.
Nature, Extent and Quality of Services. With respect to the renewal of the Management Agreement, the Board considered, among other factors: each Fund’s generally favorable long-term performance and the background and experience of key investment personnel at the Manager; the low cost structure of the Funds; the Manager’s culture of compliance and support for compliance operations that reduce risks to the Funds; the manager’s commitment to increase assets in the Funds as demonstrated, for example, by the continued increase in sales personnel; the Manager’s continuing efforts to add new series and share classes to enhance the Funds’ product line; the Manager’s high quality of services; the Manager’s active role in monitoring and, as appropriate recommending additional or replacement subadvisors; the Manager’s commitment to increasing headcount and training employees in conjunction with product expansion; and efforts made by the Manager to retain key employees.
With respect to the renewal of each Investment Advisory Agreement, the Trustees considered the background and experience of each subadvisor’s investment personnel responsible for managing the Funds, the size of the subadvisor and their ability to continue to attract and retain qualified investment personnel. Based on the foregoing information, the Board concluded that the nature, extent and quality of the management and advisory services provided by the Manager and each subadvisor were appropriate for each Fund and, thus, determined to renew the Management Agreement and the Investment Advisory Agreement for each Fund.
29
Disclosure Regarding the Board of Trustees’ Approval of the Management Agreement and Investment Advisory Agreements (Unaudited)
Investment Performance. The Board evaluated the comparative information provided by Lipper and the Manager regarding each Fund’s investment performance relative to its benchmark index(es) and peer group. The Board considered the information provided by Lipper regarding its independent peer selection methodology to select all peer groups and universes. The Board also considered the performance reports and discussions with management at Board and Committee meetings throughout the year. The Manager also noted that it generally was satisfied with the performance of the subadvisors. A discussion regarding the Board’s considerations with respect to each Fund’s performance appears below under “Additional Considerations and Conclusions with Respect to the Large Cap Value Fund.”
Costs of the Services Provided to the Funds and the Profits Realized by the Manager from its Relationship with the Funds. In analyzing the cost of services and profitability of the Manager and a subadvisor by Fund, the Board considered the revenues earned and the expenses incurred by the Manager. The profits or losses were noted at both an individual Fund level and at an aggregate level for all Funds. The Board also considered that the Management Agreement for the Funds stipulates that, to the extent that a Fund invests all of its investable assets in another registered investment company (i.e., is a “Feeder Fund”), the Fund will not pay the Manager a management fee. Although the Board noted that, in certain cases, the fee rates paid by other clients is lower than the fee rates paid by the Funds, the difference reflects the greater level of responsibility and regulatory requirements associated with managing the Funds.
The Board also noted that the Manager proposed to continue the expense waivers and reimbursements for certain Funds and classes that were in place during the last fiscal year and to put in place new expense waivers and reimbursements for certain new classes of the Funds and new series of the Funds. The Board further considered that each subadvised Fund pays the Manager the amounts due to its subadvisors, and the Manager remits these amounts directly to the applicable subadvisors. The Board considered that the Manager receives service and administrative fees to compensate the Manager for providing administrative services to the Funds and to compensate third-party administrators and broker-dealers for services to Fund shareholders. In addition, the Board considered that the Manager receives management fees for overseeing the securities lending program on behalf of various Funds. The Board also noted that certain classes of the Funds maintain higher expense ratios in order to compensate third-party distributors.
In analyzing the cost of services and profitability for each subadvisor in connection with its investment advisory services to the Fund, the Board considered that, in many cases, the Manager has negotiated the lowest subadvisory fee a subadvisor charges for any comparable client accounts. The Board gave less weight to profitability considerations or did not view this data as imperative to its deliberations given the arm’s length nature of the relationship between the Manager and the subadvisors with respect to the negotiation of subadvisory fees.
Based on the foregoing information, the Board concluded that the profitability levels were reasonable in light of the services performed by the Manager and the subadvisors. A discussion regarding the Board’s considerations with respect to each Fund’s fee rates is set forth below under “Additional Considerations and Conclusions with Respect to the Large Cap Value Fund.”
Economies of Scale. In considering the reasonableness of the management and investment advisory fees, the Board considered whether economies of scale will be realized as the Funds grow and whether fee levels reflect these economies of scale for the benefit of Fund shareholders. In this regard, the Board considered that the Manager has negotiated breakpoints in many subadvisory fee rates. The Board also noted that, for purposes of determining the fee rates chargeable to the Funds, many subadvisors have agreed to take into account assets of AMR and its pension plans that are managed by the subadvisors. Thus, the Funds are able to receive lower effective fee rates. The Board also noted the Manager’s representation that assets in the Funds’ complex increased during 2010, primarily due to market appreciation.
In addition, the Board noted the Manager’s representation that, many of the Funds enjoy the primary benefit of economies of scale because low comparable fee levels are already reflected in the current level of management & administration fees charged by the Manager, the current fee structure already provides an adequate mechanism for the sharing of economies of scale with shareholders and due to the existing low cost structure of the Funds that further breakpoints are not appropriate at this time. Based on the foregoing information, the Board concluded that the Manager and subadvisor fee schedules for each Fund provides for a reasonable sharing of benefits from any economies of scale with the Fund.
Benefits Derived from the Relationship with the Funds. The Board considered the “fall-out” or ancillary benefits that accrue to the Manager and/or the subadvisors as a result of the advisory relationships with the Funds, including greater exposure in the marketplace with respect to the Manager’s or subadvisor’s investment process and expanding the level of assets under management by the Manager and the subadvisors. The Board also considered that the Manager will use the Large Cap Value Fund model in managing its collective investment trust.
In addition, the Manager noted that the Trusts also derive benefits from their association with the Manager. Specifically, the Board noted the Manager’s representation that it provides services to most Funds at a lower than industry average cost. The Board considered that certain of the subadvisors reimburse the Manager for certain of its costs relating to distribution activities for the Funds. The Board also considered that the Fund did not pay commissions to any affiliated broker-dealer of the Manager or the relevant subadvisor during the most recent fiscal year ended October 31, 2010.
Based on the foregoing information, the Board concluded that the potential benefits accruing to the Manager and the subadvisors by virtue of their relationships with the Funds appear to be fair and reasonable.
Additional Considerations and Conclusions with Respect to Each Fund
The performance comparisons below were made versus each Fund’s Lipper peer universe median. References to the Lipper expense universe below are to the group of comparable mutual funds included in the analysis provided to the Trustees by Lipper, Inc.
Additional Considerations and Conclusions with Respect to the Large Cap Value Fund
In considering the renewal of the Management Agreement, the Trustees considered the following additional factors: (1) the Large Cap Value Fund outperformed the peer universe median for the one-, three-, five-, and ten-year periods ended March 31, 2011 and (2) the expense ratio of the Institutional Class of Fund shares ranked better than the median of its Lipper universe.
30
Disclosure Regarding the Board of Trustees’ Approval of the Management Agreement and Investment Advisory Agreements (Unaudited)
In considering the renewal of the Investment Advisory Agreements with Barrow, Brandywine, and Hotchkis, the Trustees considered the following additional factors: (1) Barrow outperformed the peer universe median for the three-, five- and ten-year periods ended March 31, 2011, but underperformed for the one-year period; (2) Brandywine outperformed the peer universe median for the ten-year period ended March 31, 2011, but underperformed for the one-, three- and five-year periods; (3) Hotchkis outperformed the peer universe median for the one-, three- and ten-year periods ended March 31, 2011, but underperformed for the three- year period; (5) each of the Fund’s subadvisors has informed the Manager that it uses Fund commissions to obtain proprietary research, the application of which benefits the Fund and each of the subadvisor’s clients, but there is little or no impact to the Fund; and (6) the Manager’s recommendation to continue to retain each subadvisor.
Based on these considerations and those noted above with respect to all Funds, the Trustees (1) concluded that the fees paid to the Manager and the subadvisors under the Management and Investment Advisory Agreements are fair and reasonable, (2) determined that the Large Cap Value Fund and its shareholders would benefit from the Manager’s and subadvisors’ continued management of the Fund and (3) approved the renewal of the Management and Investment Advisory Agreements with respect to the Large Cap Value Fund.
31
Trustees and Officers of the American Beacon Funds
(Unaudited)
The Trustees and officers of the American Beacon Funds (the “Trust”) are listed below, together with their principal occupations during the past five years. Unless otherwise indicated, the address of each person listed below is 4151 Amon Carter Boulevard, MD 2450, Fort Worth, Texas 76155. Each Trustee oversees twenty funds in the fund complex that includes the Trust, the American Beacon Master Trust, the American Beacon Mileage Funds, and the American Beacon Select Funds. The Trust’s Statement of Additional Information contains additional information about the Trustees and is available without charge by calling 1-800-658-5811.
| | | | |
Name, Age and Address | | Position, Term of Office and Length of Time Served with the Trust | | Principal Occupation(s) During Past 5 Years and Current Directorships |
| | |
| INTERESTED TRUSTEES | | | | |
| | |
| | Term Lifetime of Trust until removal, resignation or retirement* | | |
| | |
| Alan D. Feld** (74) | | Trustee since 1996 | | Sole Shareholder of a professional corporation which is a Partner in the law firm of Akin, Gump, Strauss, Hauer & Feld, LLP (1960-Present); Director, Clear Channel Communications (1984-2008); Trustee, Center Point Properties (1994-2006); Member, Board of Trustees, Southern Methodist University; Member, Board of Visitors, M.D. Anderson Hospital; Board of Visitors, Zale/Lipshy Hospital; Trustee, American Beacon Mileage Funds (1996-Present); Trustee, American Beacon Select Funds (1999-Present); Trustee, American Beacon Master Trust Funds (1996-Present). |
| | |
| NON-INTERESTED TRUSTEES | | Term Lifetime of Trust until removal, resignation or retirement* | | |
| | |
| W. Humphrey Bogart (67) | | Trustee since 2004 | | Board Member, Baylor University Medical Center Foundation (1992-2004); Consultant, New River Canada Ltd. (mutual fund servicing company) (1998-2003); President and CEO, Allmerica Trust Company, NA (1996-1997); President and CEO, Fidelity Investments Southwest Company (1983-1995); Senior Vice President of Regional Centers, Fidelity Investments (1988-1995); Trustee, American Beacon Mileage Funds (2004-Present); Trustee, American Beacon Select Funds (2004-Present); Trustee, American Beacon Master Trust Funds (2004-Present). |
| | |
| Brenda A. Cline (50) | | Trustee since 2004 | | Executive Vice President, Chief Financial Officer, Treasurer and Secretary, Kimbell Art Foundation (1993-Present); Trustee, Texas Christian University (1998-Present); Trustee, W.I. Cook Foundation, Inc. (d/b/a Cook Children’s Health Foundation) (2001-2006); Director, Christian Church Foundation (1999-2007); Trustee, Trinity Valley School (2003-2004); Member; Trinity Valley School Endowment Committee (2004-Present); Trustee, American Beacon Mileage Funds (2004-present); Trustee, American Beacon Select Funds (2004-Present); Trustee, American Beacon Master Trust Funds (2004-Present). |
| | |
| Eugene J. Duffy (57) | | Trustee since 2008 | | Principal and Executive Vice President, Paradigm Asset Management (1994-Present); Director, Sunrise Bank of Atlanta (2008-Present); Chairman, Special Contributions Fund Board of Trustees, National Association for the Advancement of Colored People (2007-Present); Trustee, National Association for the Advancement of Colored People (2000-Present); Board of Visitors, Emory University (2006-Present); Trustee, Atlanta Botanical Garden (2006-Present); Board Member, Willie L. Brown Jr. Institute on Politics and Public Service (2001-Present); Chair, National Association of Securities Professionals (2000-2002); Deputy Chief Administrative Officer, City of Atlanta (1985-1990); Trustee, American Beacon Mileage Funds (2008-Present); Trustee, American Beacon Select Funds (2008-Present); Trustee, American Beacon Master Trust Funds (2008-Present). |
32
Trustees and Officers of the American Beacon Funds
(Unaudited)
| | | | |
Name, Age and Address | | Position, Term of Office and Length of Time Served with the Trust | | Principal Occupation(s) During Past 5 Years and Current Directorships |
| | |
| Thomas M. Dunning (69) | | Trustee since 2008 | | Non-Executive Chairman (2008-Present); Chairman (1998-2008) and Chief Executive Officer (1998-2007), Lockton Dunning Benefits (consulting firm in employee benefits); Director, Oncor Electric Delivery Company LLC (2007-present); Board Member, Baylor Health Care System Foundation (2007-present); Vice Chair, State Fair of Texas (1987-Present); Board Member, Southwestern Medical Foundation (1994-present); Board Member, John Tower Center for Political Studies/SMU (2008-Present); Board Member, University of Texas Development Board (2008-Present); Board Member, BancTec (2010 - Present) (software consulting); Trustee, American Beacon Mileage Funds (2008-Present); Trustee, American Beacon Select Funds (2008-Present); Trustee, American Beacon Master Trust Funds (2008-Present). |
| | |
| Richard A. Massman (68) | | Trustee since 2004 Chairman since 2008 | | Consultant and General Counsel Emeritus (2009-Present), Senior Vice President and General Counsel (1994-2009), Hunt Consolidated, Inc. (holding company engaged in oil and gas exploration and production, refining, real estate, farming, ranching and venture capital activities); Chairman (2007-2011) and Director (2005-2011), The Dallas Opera Foundation; Chairman (2006-2010) and Director (2005-2009), Temple Emanu-El Foundation; Trustee, Presbyterian Healthcare Foundation (2006-Present); Director, The Retina Foundation of the Southwest (2000-Present); Trustee, American Beacon Mileage Funds (2004-Present); Trustee, American Beacon Select Funds (2004-Present); Trustee, American Beacon Master Trust Funds (2004-Present). |
| | |
R. Gerald Turner (65) 225 Perkins Admin. Bldg. Southern Methodist Univ. Dallas, Texas 75275 | | Trustee since 2001 | | President, Southern Methodist University (1995-Present); Director, ChemFirst (1986-2002); Director, J.C. Penney Company, Inc. (1996-Present); Director, California Federal Preferred Capital Corp. (2001-2003); Director, Kronus Worldwide Inc. (chemical manufacturing) (2003-Present); Director, First Broadcasting Investment Partners, LLC (2003-2007); Member, Salvation Army of Dallas Board of Directors; Member, Methodist Hospital Advisory Board; Co-Chair, Knight Commission on Intercollegiate Athletics; Trustee, American Beacon Mileage Funds (2001-Present); Trustee, American Beacon Select Funds (2001-Present); Trustee, American Beacon Master Trust Funds (2001-Present). |
| | |
| Paul J. Zucconi,CPA (71) | | Trustee since 2008 | | Director, Affirmative Insurance Holdings, Inc. (producer of nonstandard automobile insurance) (2004-Present); Director, Titanium Metals Corporation (producer of titanium melted and mill products) (2002-Present); Director, Torchmark Corporation (life and health insurance products) (2002-Present); Director, Charter Bank (community services and products) (2010-Present); Director, Dallas Chapter of National Association of Corporate Directors (2004-Present); Partner, KPMG (1976-2001); Trustee, American Beacon Mileage Funds (2008-Present); Trustee, American Beacon Select Funds (2008-Present); Trustee, American Beacon Master Trust Funds (2008-Present). |
| | |
Name, Age and Address | | Position, Term of Office and Length of Time Served with the Trust | | Principal Occupation(s) During Past 5 Years and Current Directorships |
| | |
| OFFICERS | | Term One Year | | |
| | |
| Gene L. Needles, Jr. (56) | | President since 2009 Executive Vice President since 2009 | | President, CEO and Director (2009-Present), American Beacon Advisors, Inc.; President, CEO and Director (2009-Present), Lighthouse Holdings Inc.; President (2009-Present), American Beacon Mileage Funds; President (2009-Present), American Beacon Select Funds; President (2008-2009), Touchstone Investments; President (2003-2007), CEO (2004-2007), Managing Director of Sales (2002-2003), National Sales Manager (1999-2002), and Regional Sales Manager (1993-1999), AIM Distributors. |
33
Trustees and Officers of the American Beacon Funds
(Unaudited)
| | | | |
| William F. Quinn** (63) | | Executive Vice President from 2007 to 2008 and 2009 to Present President from 1987 to 2007 and 2008 to 2009 Trustee from 1987 to 2008 | | Executive Chairman (2009-Present), Chairman (2006-2009), CEO (2006-2007), President (1986-2006) and Director (2003-Present), American Beacon Advisors, Inc.; Chairman and Director (2008-Present), Lighthouse Holdings, Inc.; Chairman (1989-2003) and Director (1979-1989, 2003-Present), American Airlines Federal Credit Union; Director, Hicks Acquisition I, Inc. (2007-2009), Director, Hicks Acquisition II, Inc. (2010-Present); Director, Crescent Real Estate Equities, Inc.(1994-2007); Director, Pritchard, Hubble & Herr, LLC (investment advisor) (2001-2006); Director of Investment Committee, Southern Methodist University Endowment Fund (1996-Present); Member, Southern Methodist University Cox School of Business Advisory Board (1999-2002); Member, New York Stock Exchange Pension Manager Committee (1997-1998, 2000-2002, 2006-Present); Chairman (2007-Present) and Vice Chairman (2004-2007), Committee for the Investment of Employee Benefits; Director, United Way of Metropolitan Tarrant County (1988-2000, 2004-Present); the Independent Trustee, National Railroad Retirement Investment Trust (2011-Present); Trustee (1995-2008) and President (1995-2007, 2008-2009), American Beacon Mileage Funds; Trustee (1999-2008) and President (1999-2007, 2008-Present), American Beacon Select Funds; Trustee, American Beacon Master Trust (1995-2008); Director, American Beacon Global Funds SPC (2002-2011); Director, American Beacon Global Funds, plc (2007-2009). |
| | |
| Rosemary K. Behan (52) | | VP, Secretary and Chief Legal Officer since 2006 | | Vice President, Legal and Compliance, American Beacon Advisors, Inc. (2006-Present); Secretary (2008-Present), Lighthouse Holdings, Inc.; Assistant General Counsel, First Command Financial Planning, Inc. (2004-2006); Attorney, U.S. Securities and Exchange Commission, (1995-2004). |
| | |
| Brian E. Brett (51) | | VP since 2004 | | Vice President, Director of Sales, American Beacon Advisors, Inc. (2004-Present); Regional Vice President, Neuberger Berman, LLC (investment adviser) (1996-2004). |
| | |
| Wyatt Crumpler (45) | | VP since 2007 | | Vice President, Asset Management (2009-Present) and Vice President, Trust Investments (2007-2009), American Beacon Advisors, Inc.; Managing Director of Corporate Accounting (2004-2007) and Director of IT Strategy and Finance (2001-2004), American Airlines, Inc. |
| | |
| Erica Duncan (41) | | VP Since 2011 | | Vice President, Marketing and Client Services (2011-Present), American Beacon Advisors, Inc.; Supervisor, Brand Marketing (2010-2011), Invesco; Supervisor, Marketing Communications (2009-2010) and Senior Financial Writer (2004-2009), Invesco AIM. |
| | |
| Michael W. Fields (57) | | VP since 1989 | | Vice President, Fixed Income Investments, American Beacon Advisors, Inc. (1988-Present); Director American Beacon Global Funds SPC (2002-Present); Director, American Beacon Global Funds plc (2007-2009). |
| | |
| Melinda G. Heika (50) | | Treasurer since 2010 | | Vice President, Finance and Accounting (2010-Present), Controller (2005-2009), Assistant Controller (1998-2004), American Beacon Advisors, Inc.; Treasurer (2010-Present), Lighthouse Holdings, Inc. |
| | |
| Terri L. McKinney (47) | | VP since 2010 | | Vice-President, Enterprise Services (2009-Present), Managing Director (2003-2009), and Director of Marketing & Retail Sales (1996-2003), American Beacon Advisors, Inc.; President, Board of Trustees (2010-Present), Vice-President, Board of Trustees (2008-2010), and Trustee (2006-2008), Down Syndrome Guild of Dallas. |
| | |
| Jeffrey K. Ringdahl (36) | | VP since 2010 | | Chief Operating Officer, American Beacon Advisors, Inc. (2010-Present); Vice President, Product Management, Touchstone Advisors, Inc. (2007-2010); Senior Director, Business Integration, Fidelity Investments (2005-2007). |
| | |
| Samuel J. Silver (48) | | VP Since 2011 | | Vice President, Fixed Income Investments (2011-Present) and Senior Portfolio Manager, Fixed Income Investments (1999-2011), American Beacon Advisors, Inc. |
| | |
| Christina E. Sears (40) | | Chief Compliance Officer since 2004 and Asst. Secretary since 1999 | | Chief Compliance Officer (2004-Present) and Senior Compliance Analyst (1998-2004), American Beacon Advisors, Inc. |
34
Trustees and Officers of the American Beacon Funds
(Unaudited)
| | | | |
| John J. Okray (37) | | Asst. Secretary since 2010 | | Assistant General Counsel, American Beacon Advisors, Inc. (2010-Present); Asst. Secretary (2010-Present), Lighthouse Holdings, Inc.; Vice President, Oppenheimer Funds, Inc. (2004-2010). |
| | |
| Sonia L. Bates (55) | | Asst. Treasurer since 2011 | | Director, Tax and Financial Reporting (2011-Present), Manager, Tax and Financial Reporting (2005-2010), Senior Tax Analyst (1999-2004), American Beacon Advisors, Inc.; Asst. Treasurer (2011-Present), Lighthouse Holdings, Inc. |
| * | The Board has adopted a retirement plan that requires Trustees to retire no later than the last day of the calendar year in which they reach the age of 72, provided, however, that the Board may determine to grant one or more annual exemptions to this requirement. |
| ** | Mr. Feld is deemed to be an “interested person” of the Trusts, as defined by the 1940 Act. Mr. Feld’s law firm of Akin, Gump, Strauss, Hauer & Feld LLP has provided legal services within the past two fiscal years to the Manager and one or more of the Trust’s and Master Trust’s sub-advisors. |
35
This page intentionally left blank.
36
This page intentionally left blank.
37

Delivery of Documents
eDelivery is NOW AVAILABLE - Stop traditional mail delivery and receive your
shareholder reports and summary prospectus on-line. Sign up at
www.americanbeaconfunds.com
If you invest in the Fund through a financial institution, you may be able to receive the Fund’s regulatory mailings, such as the Summary Prospectus, Annual Report and Semi-Annual Report, by e-mail. If you are interested in this option, please go to www.icsdelivery.com and search for your financial institution’s name or contact your financial institution directly.
To obtain more information about the Fund:
| | |
 | |  |
By E-mail: american_beacon.funds@ambeacon.com | | On the Internet: Visit our website at www.americanbeaconfunds.com |
| | |
 | |  |
By Telephone: Institutional, Y, Investor, Advisor, Retirement Classes Call (800) 658-5811 AMR ClassSM Call (800) 345-2345 | | By Mail: American Beacon Funds P.O. Box 219643 Kansas City, MO 64121-9643 |
| | |
Availability of Quarterly Portfolio Schedules In addition to the Schedule of Investments provided in each semi-annual and annual report, the Fund files a complete schedule of its portfolio holdings with the Securities and Exchange Commission (“SEC”) on Form N-Q as of the first and third fiscal quarters. The Fund’s Forms N-Q are available on the SEC’s website at www.sec.gov. The Forms N-Q may also be reviewed and copied at the SEC’s Public Reference Room, 450 Fifth Street, NW, Washington, DC 20549. Information regarding the operation of the SEC’s Public Reference Room may be obtained by calling 1-800-SEC-0330. A complete schedule of the Fund’s portfolio holdings is also available on the Funds’ website (www.americanbeaconfunds.com) approximately twenty days after the end of each month. | | Availability of Proxy Voting Policy and Records A description of the policies and procedures the Fund uses to determine how to vote proxies relating to portfolio securities is available in the Fund’s Statement of Additional Information, is available free of charge on the Fund’s website (www.americanbeaconfunds.com) and by calling 1-800-967-9009 or by accessing the SEC’s website at www.sec.gov. The Fund’s proxy voting record for the most recent year ended June 30 is filed annually with the SEC on Form N-PX. The Fund’s Forms N-PX are available on the SEC’s website at www.sec.gov. The Fund’s proxy voting record may also be obtained by calling 1-800-967-9009. |
Fund Service Providers:
| | | | | | |
CUSTODIAN State Street Bank and Trust Boston, Massachusetts | | TRANSFER AGENT Boston Financial Data Services Kansas City, Missouri | | INDEPENDENT REGISTERED PUBLIC ACCOUNTING FIRM Ernst & Young LLP Dallas, Texas | | DISTRIBUTOR Foreside Fund Services, LLC Portland, Maine |
This report is prepared for shareholders of the American Beacon Funds and may be distributed to others only if preceded or accompanied by a current Prospectus or Summary Prospectus.
| | | | |
| American Beacon Funds and American Beacon Small Cap Value Fund are service marks of American Beacon Advisors, Inc. | | | AR 10/11 | |

About American Beacon Advisors
Since 1986, American Beacon Advisors has offered a variety of products and investment advisory services to numerous institutional and retail clients, including a variety of mutual funds, corporate cash management, and separate account management.
Our clients include defined benefit plans, defined contribution plans, foundations, endowments, corporations, financial planners, and other institutional investors. With American Beacon Advisors, you can put the experience of a multi-billion dollar asset management firm to work for your company.
Any opinions herein, including forecasts, reflect our judgment as of the end of the reporting period and are subject to change. Each advisor’s strategies and the Fund’s portfolio composition will change depending on economic and market conditions. This report is not a complete analysis of market conditions and therefore, should not be relied upon as investment advice. Although economic and market information has been compiled from reliable sources, American Beacon Advisors, Inc. makes no representation as to the completeness or accuracy of the statements contained herein.
Investing in the securities of small capitalization companies involves greater risk and the possibility of greater price volatility than investing in larger capitalization and more established companies.
| | |
| American Beacon Funds | | October 31, 2011 |
| | |
| | Fellow Shareholders, Some days it seems the best-kept secret of the past twelve months has been the U.S. equity market’s rise. This rise has occurred despite the ongoing waves of investor concern regarding the U.S. economy’s health and the realization that the European sovereign crisis has yet to find resolution. With headlines focused on geopolitical and economic risks, the strengthening underlying fundamentals at many publicly traded companies–and their relatively attractive market valuations–have drawn less attention. This near-term myopia can create opportunities for fund companies like ours, where our sub-advisors manage with a longer-term perspective. |
|
| The market volatility also highlights the key benefit of our multi-manager approach–a strategy we feel can help smooth performance over time. The performance of the American Beacon Small Cap Value Fund reflects the results of manager diversification. It also reflects the American Beacon investment philosophy: that portfolios managed with a longer-term perspective tend to be better positioned for riding out episodes of economic and geopolitical turbulence. |
For the twelve-month period ended October 31, 2011:
>> American Beacon Small Cap Value Fund (Institutional Class) returned 5.57%
At American Beacon, we remain focused on seeking opportunities and meeting market challenges to deliver the type of consistency in performance and service our shareholders value. We regard your trust in the American Beacon Funds as recognition that we are achieving these goals, and we appreciate your continued investment.
Recognition of our process has also come in the form of a 2011 Lipper Award. The American Beacon Small Cap Value Fund was cited by Lipper as the best fund in its category based on its 10-year performance.
For further details about the growing number of investment opportunities now available within the American Beacon Funds family, please visit our website at www.americanbeaconfunds.com.
| | | | |
| | Best Regards, | | |
|
|
| | |
| | Gene L. Needles, Jr. | | |
| | President | | |
| | American Beacon Funds | | |
American Beacon Small Cap Value Fund (AMR Class) received the 2011 Lipper Fund Award as the best fund in its category over the 10 years ended December 31, 2010. It was number one out of 69 funds in the Small-Cap Value Funds category based on risk-adjusted returns. The Lipper Fund Awards are part of the Thomson Reuters Awards for Excellence, a global family of awards that celebrate exceptional performance throughout the professional investment community. The Thomson Reuters Awards for Excellence recognize the world’s top funds, fund management firms, sell-side firms, research analysts, and investor relations teams. The Thomson Reuters Awards for Excellence also include the Extel Survey Awards, the StarMine Analyst Awards, and the StarMine Broker Rankings. For more information, please contact markets.awards@thomsonreuters.com or visit excellence.thomsonreuters.com. Past performance is no guarantee of future results.
1
Domestic Equity Market Overview
October 31, 2011 (Unaudited)
For most of the 12 months ended October 31, 2011, the U.S. equity markets followed an upward path, driven by the strength of corporate balance sheets and robust corporate earnings. This rise occurred despite the volatility that prevailed throughout the world markets, as investors reacted to ongoing political uncertainty about the European sovereign debt crisis and to the inaction of U.S. politicians in addressing the weak domestic economic situation. The overall rise of equities also occurred despite increased correlations among stocks and the actions of worried investors who shifted between risk-seeking and risk-averse strategies.
The relative strength of the equity market lasted until May 2011, when investors turned more risk averse. This shift coincided with the onset of increasingly negative news from Europe and some weaker-than-expected macroeconomic news in the U.S. Meanwhile, policymakers in the U.S. reached an impasse on how to meet the country’s fiscal challenges, which further fed investor worries. A sharp selloff ensued.
Oversold equities rebounded in early October 2011 and received an additional boost late in the month when European policymakers agreed to a framework for addressing the Greek crisis. Consequently, the S&P 500 Index generated its best-performing month in nearly 20 years, pushing its 12-month return into positive territory (+8.1%).
As unsettling as the volatility has been, the S&P 500 Index has outperformed almost all of the major developed and emerging equity markets. Little more than two years ago, the S&P 500 Index bottomed below 700. Since then, it has doubled. That rise has been uneven–investors in small cap stocks have benefited far more than those holding large cap issues. This is especially true for the mega-cap stocks in the Financial, Technology and Health Care sectors. Consider that over the 12-month period ending October 31, 2011, the largest 10% of companies (in terms of market capitalization) in the Russell 1000 Value Index fell 1.4%. The entire universe returned 6.2%.
Overall, the U.S. economy continued to heal. Corporate strength was good, while low interest rates, a depressed dollar and moderately rising employment were supportive of a modest, ongoing recovery. Nevertheless, risk is still part of the equation. Credible action from Washington continues to be elusive and the implementation of Europe’s agreement–and its likelihood of success–remains uncertain. Other geopolitical and economic concerns also remain. Yet, there are a number of positive factors that seem underappreciated by the market at this point:
| | • | | A lack of speculation in equities |
| | • | | Business inventories remain in balance |
| | • | | Corporate cash levels remain high |
| | • | | Corporate debt levels are low |
| | • | | Lackluster economic expectations are already priced into the market |
| | • | | Dividend payout ratios are low and have significant upside |
We believe the dividends and earnings available to owners of equities are generous given current prices. They sufficiently compensate investors for the risks at hand. We remain keenly focused on identifying undervalued franchises with strong balance sheets exhibiting the ability and willingness to return capital to shareholders.
2
Performance Overview
American Beacon Small Cap Value FundSM
October 31, 2011 (Unaudited)
The Institutional Class of the Small Cap Value Fund (“Fund”) returned 5.57% for the twelve months ended October 31, 2011, outperforming the Russell 2000® Value Index (the “Index”) return of 3.54% and the Lipper Small-Cap Value Funds Index return of 5.51% for the same period.
Comparison of Change in Value of a $10,000 Investment
For the Period from 10/31/01 through 10/31/11
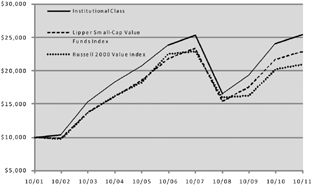
| | | | | | | | | | | | | | | | |
| | | Annualized Total Returns
Periods Ended 10/31/11 | |
| | | 1 Year | | | 5 Years | | | 10 Years | | | Value of
$10,000
10/31/01-
10/31/11 | |
Institutional Class(1,8) | | | 5.57 | % | | | 1.26 | % | | | 9.77 | % | | $ | 25,408 | |
Y Class(1,2,8) | | | 5.49 | % | | | 1.17 | % | | | 9.73 | % | | | 25,301 | |
Investor Class(1,8) | | | 5.20 | % | | | 0.94 | % | | | 9.47 | % | | | 24,713 | |
Advisor Class(1,3,8) | | | 5.07 | % | | | 0.75 | % | | | 9.25 | % | | | 24,227 | |
Retirement Class (1,4,8) | | | 4.79 | % | | | 0.63 | % | | | 9.19 | % | | | 24,084 | |
A Class with sales charge (1,5,8) | | | -1.11 | % | | | -0.31 | % | | | 8.79 | % | | | 23,216 | |
A Class without sales charge(1,5,8) | | | 4.92 | % | | | 0.88 | % | | | 9.43 | % | | | 24,633 | |
C Class with sales charge (1,6,8) | | | 3.06 | % | | | 0.68 | % | | | 9.32 | % | | | 24,388 | |
C Class without sales charge (1,6,8) | | | 4.06 | % | | | 0.68 | % | | | 9.32 | % | | | 24,388 | |
AMR Class(1,8) | | | 5.85 | % | | | 1.52 | % | | | 10.06 | % | | | 26,080 | |
Lipper Small-Cap Value Funds Index(7) | | | 5.51 | % | | | 1.01 | % | | | 8.62 | % | | | 22,871 | |
Russell 2000 Value Index(7) | | | 3.54 | % | | | -1.42 | % | | | 7.64 | % | | | 20,869 | |
| 1. | Performance shown is historical and is not indicative of future returns. Investment returns and principal value will vary, and shares may be worth more or less at redemption than at original purchase. Performance shown is as of date indicated, and current performance may be lower or higher than the performance data quoted. To obtain performance as of the most recent month end, please visit www.americanbeaconfunds.com or call 1-800-967-9009. Fund performance in the table above does not reflect the deduction of taxes a shareholder would pay on distributions or the redemption of shares. |
| 2. | Fund performance for the five-year and ten-year periods represents the total returns achieved by the Institutional |
| | Class from 10/31/01 up to 8/3/09, the inception date of the Y Class. Expenses of the Y Class are higher than those of the Institutional Class. As a result, total returns shown may be higher than they would have been had the Y Class been in existence since 10/31/01. |
| 3. | Fund performance for the ten-year period represents the total returns achieved by the Investor Class from 10/31/01 up to 5/1/03, and the returns of the Advisor Class since its inception. Expenses of the Advisor Class are higher than those of the Investor Class. As a result, total returns shown may be higher than they would have been had the Advisor Class been in existence since 10/31/01. A portion of the fees charged to the Advisor Class of the Fund was waived through 2004. Performance prior to waiving fees was lower than the actual returns shown for periods through 2004. |
| 4. | Fund performance for the five-year and ten-year periods represents the total returns achieved by the Investor Class from 10/31/01 up to 5/1/03 and the Advisor Class from 5/1/03 up to 5/1/09, the inception date of the Retirement Class, and the returns of the Retirement Class since its inception. Expenses of the Retirement Class are higher than those of the Advisor and Investor Classes. As a result, total returns shown may be higher than they would have been had the Retirement Class been in existence since 10/31/01. |
| 5. | Fund performance for the five-year and ten-year periods represents the total returns achieved by the Investor Class from 10/31/01 up to 5/17/10, the inception date of the A Class, and the returns of the A Class since its inception. Expenses of the A Class are higher than those of the Investor Class. As a result, total returns shown may be higher than they would have been had the A Class been in existence since 10/31/01. The maximum sales charge for A Class is 5.75%. |
| 6. | Fund performance for the five-year and ten-year periods represents the total returns achieved by the Investor Class from 10/31/01 up to 9/1/10, the inception date of the C Class, and the returns of the C Class since its inception. Expenses of the C Class are higher than those of the Investor Class. As a result, total returns shown may be higher than they would have been had the C Class been in existence since 10/31/01. The maximum contingent deferred sales charge for C Class is 1.00% for shares redeemed within one year of the date of purchase. |
| 7. | Russell 2000 Value Index is a registered trademark of Frank Russell Company. The Russell 2000 Value Index is an unmanaged index of those stocks in the Russell 2000 Index with lower price-to-book ratios and lower forecasted growth values. The Lipper Small-Cap Value Funds Index tracks the results of the 30 largest mutual funds in the Lipper Small-Cap Value Funds category. Lipper is an independent mutual fund research and ranking service. One cannot directly invest in an index. |
| 8. | The total annual Fund operating expense ratio set forth in the most recent Fund prospectus for the Institutional, Y, Investor, Advisor, Retirement, A, C, and AMR Class shares was 0.82%, 0.92%, 1.19%, 1.33%, 1.55%, 1.29%, 2.11%, and 0.34%, respectively. The expense ratios above may vary from the expense ratios presented in other sections of this report that are based on expenses incurred during the period covered by this report. |
3
Performance Overview
American Beacon Small Cap Value FundSM
October 31, 2011 (Unaudited)
The Fund outperformed the Index due to excess performance through both stock selection and sector allocation.
Superior stock selection in the Information Technology, Energy and Industrials sectors contributed value to performance relative to the Index. The Fund’s Information Technology companies that generated the most excess positive returns were Interdigital (up 33.0%), ON Semiconductor (up 61.3%) and Synaptics (up 14.8%). In the Energy sector, Oil States International (up 41.2%), Frontier Oil (up 116.8%) and Atwood Oceanics (up 32.3%) added the most relative value. For the period the Fund owned the securities, Weight Watchers (up 89.0%), Armstrong World Industries (up 54.9%) and Clean Harbors (up 65.6%) were the largest contributors in the Industrials sector. Poor stock selection in the Materials sector, where Greif (down 22.0%) and Westlake Chemical (down 20.2%) had the largest negative impact, detracted from the Fund’s performance.
A significant underweight in Financials and an overweight in the Health Care sector contributed approximately 40 basis points (0.40%) each to relative performance through sector allocation.
The sub-advisors continue to focus on uncovering investment opportunities through stock selection that should benefit the Fund’s performance over the longer term.
Top Ten Holdings
| | | | |
| | | % of
Net Assets | |
LifePoint Hospitals, Inc. | | | 1.0 | % |
Rent-A-Center, Inc. | | | 0.9 | % |
Valassis Communications, Inc. | | | 0.8 | % |
Portland General Electric Co. | | | 0.8 | % |
Great Plains Energy, Inc. | | | 0.7 | % |
Cloud Peak Energy, Inc. | | | 0.7 | % |
HealthSouth Corp. | | | 0.6 | % |
Iberiabank Corp. | | | 0.6 | % |
Webster Financial Corp. | | | 0.6 | % |
ProAssurance Corp. | | | 0.6 | % |
Sector Allocation
| | | | |
| | | % of Equities | |
Financials | | | 26.2 | % |
Industrials | | | 18.1 | % |
Consumer Discretionary | | | 15.2 | % |
Information Technology | | | 14.3 | % |
Health Care | | | 6.4 | % |
Materials | | | 6.2 | % |
Energy | | | 5.7 | % |
Utilities | | | 5.2 | % |
Consumer Staples | | | 2.3 | % |
Telecommunication Services | | | 0.4 | % |
4
Fund Expenses
American Beacon Small Cap Value FundSM
October 31, 2011 (Unaudited)
Fund Expense Example
As a shareholder of the Fund, you incur two types of costs: (1) transaction costs and (2) ongoing costs, including management fees, administrative service fees, distribution (12b-1) fees, and other Fund expenses. The examples below are intended to help you understand the ongoing cost (in dollars) of investing in the Fund and to compare these costs with the ongoing costs of investing in other mutual funds.
The examples are based on an investment of $1,000 invested at the beginning of the period in each Class and held for the entire period from May 1, 2011 through October 31, 2011.
Actual Expense
The “Actual” lines of the table provide information about actual account values and actual expenses. You may use the information in this line, together with the amount you invested, to estimate the expenses that you paid over the period. Simply divide your account value by $1,000 (for example, an $8,600 account value divided by $1,000 = 8.6), then multiply the result by the number in the first line under the heading “Expenses Paid During Period” to estimate the expenses you paid on your account during this period. Shareholders of the Investor and Institutional Classes that invest in the Fund through an IRA may be subject to a custodial IRA fee of $15 that is typically deducted each December. If your account was subject to a custodial IRA fee during the period, your costs would have been $15 higher.
Hypothetical Example for Comparison Purposes
The “Hypothetical” lines of the table provide information about hypothetical account values and hypothetical expenses based on the Fund’s actual expense ratio and an assumed 5% per year rate of return before expenses (not the Fund’s actual return). You may compare the ongoing costs of investing in the Fund with other funds by contrasting this 5% hypothetical example and the 5% hypothetical examples that appear in the shareholder reports of the other funds. The hypothetical account values and expenses may not be used to estimate the actual ending account balance or expenses you paid for the period. Shareholders of the Investor and Institutional Classes that invest in the Fund through an IRA may be subject to a custodial IRA fee of $15 that is typically deducted each December. If your account was subject
to a custodial IRA fee during the period, your costs would have been $15 higher.
You should also be aware that the expenses shown in the table highlight only your ongoing costs and do not reflect any transaction costs charged by the Fund. Similarly, the expense examples for other funds do not reflect any transaction costs charged by those funds, such as sales charges (loads), redemption fees or exchange fees. Therefore, the “Hypothetical” lines of the table are useful in comparing ongoing costs only and will not help you determine the relative total costs of owning different funds. If you were subject to any transaction costs during the period, your costs would have been higher.
| | | | | | | | | | | | |
| | | Beginning
Account
Value
5/1/11 | | | Ending
Account
Value
10/31/11 | | | Expenses Paid
During Period*
5/1/11-10/31/11 | |
Institutional Class | | | | | | | | | | | | |
Actual | | $ | 1,000.00 | | | $ | 855.77 | | | $ | 3.93 | |
Hypothetical ** | | $ | 1,000.00 | | | $ | 1,020.97 | | | $ | 4.28 | |
| | | |
Y Class | | | | | | | | | | | | |
Actual | | $ | 1,000.00 | | | $ | 855.58 | | | $ | 4.21 | |
Hypothetical ** | | $ | 1,000.00 | | | $ | 1,020.67 | | | $ | 4.58 | |
| | | |
Investor Class | | | | | | | | | | | | |
Actual | | $ | 1,000.00 | | | $ | 854.73 | | | $ | 5.61 | |
Hypothetical ** | | $ | 1,000.00 | | | $ | 1,019.16 | | | $ | 6.11 | |
| | | |
Advisor Class | | | | | | | | | | | | |
Actual | | $ | 1,000.00 | | | $ | 853.72 | | | $ | 6.31 | |
Hypothetical ** | | $ | 1,000.00 | | | $ | 1,018.40 | | | $ | 6.87 | |
| | | |
Retirement Class | | | | | | | | | | | | |
Actual | | $ | 1,000.00 | | | $ | 852.74 | | | $ | 7.71 | |
Hypothetical ** | | $ | 1,000.00 | | | $ | 1,016.89 | | | $ | 8.39 | |
| | | |
A Class | | | | | | | | | | | | |
Actual | | $ | 1,000.00 | | | $ | 852.78 | | | $ | 7.52 | |
Hypothetical ** | | $ | 1,000.00 | | | $ | 1,017.09 | | | $ | 8.19 | |
| | | |
C Class | | | | | | | | | | | | |
Actual | | $ | 1,000.00 | | | $ | 848.94 | | | $ | 12.54 | |
Hypothetical ** | | $ | 1,000.00 | | | $ | 1,011.64 | | | $ | 13.64 | |
| | | |
AMR Class | | | | | | | | | | | | |
Actual | | $ | 1,000.00 | | | $ | 857.47 | | | $ | 2.72 | |
Hypothetical ** | | $ | 1,000.00 | | | $ | 1,022.28 | | | $ | 2.96 | |
| * | Expenses are equal to the Fund’s annualized expense ratios for the six-month period of 0.84%, 0.90%, 1.20%, 1.35%, 1.65%, 1.61%, 2.69%, and 0.58% for the Institutional, Y, Investor, Advisor, Retirement, A, C, and AMR Classes respectively, multiplied by the average account value over the period, multiplied by the number derived by dividing the number of days in the most recent fiscal half-year (184) by days in the year (365) to reflect the half-year period. |
| ** | 5% return before expenses. |
5
American Beacon Small Cap Value FundSM
Report of Independent Registered Public Accounting Firm
To the Shareholders and the Board of Trustees of
American Beacon Small Cap Value Fund:
We have audited the accompanying statement of assets and liabilities, including the schedule of investments, of the American Beacon Small Cap Value Fund (one of the funds constituting the American Beacon Funds) (collectively, the “Fund”), as of October 31, 2011, and the related statement of operations for the year then ended, the statement of changes in net assets for each of the two years in the period then ended, and financial highlights for the periods indicated therein. These financial statements and financial highlights are the responsibility of the Fund’s management. Our responsibility is to express an opinion on these financial statements and financial highlights based on our audits.
We conducted our audits in accordance with the standards of the Public Company Accounting Oversight Board (United States). Those standards require that we plan and perform the audit to obtain reasonable assurance about whether the financial statements and financial highlights are free of material misstatement. We were not engaged to perform an audit of the Fund’s internal control over financial reporting. Our audits included consideration of internal control over financial reporting as a basis for designing audit procedures that are appropriate in the circumstances, but not for the purpose of expressing an opinion on the effectiveness of the Fund’s internal control over financial reporting. Accordingly, we express no such opinion. An audit also includes examining, on a test basis, evidence supporting the amounts and disclosures in the financial statements and financial highlights, assessing the accounting principles used and significant estimates made by management, and evaluating the overall financial statement presentation. Our procedures included confirmation of securities owned as of October 31, 2011, by correspondence with the custodian and brokers or by other appropriate auditing procedures where replies from brokers were not received. We believe that our audits provide a reasonable basis for our opinion.
In our opinion, the financial statements and financial highlights referred to above present fairly, in all material respects, the financial position of the American Beacon Small Cap Value Fund at October 31, 2011, the results of its operations for the year then ended, the changes in its net assets for each of the two years in the period then ended, and the financial highlights for each of the periods indicated therein, in conformity with U.S. generally accepted accounting principles.
Dallas, Texas
December 29, 2011
6
American Beacon Small Cap Value FundSM
Schedule of Investments
October 31, 2011
| | | | | | | | |
| | | Shares | | | Fair Value | |
| | | | | | (000’s) | |
COMMON STOCK - 92.25% | |
CONSUMER DISCRETIONARY - 14.05% | |
Auto Components - 1.24% | |
American Axle & Manufacturing Holdings, Inc. | | | 1,568,495 | | | $ | 15,199 | |
Cooper Tire & Rubber Co. | | | 114,539 | | | | 1,641 | |
Dorman Products, Inc.A | | | 46,180 | | | | 1,760 | |
Gentex Corp. | | | 374,500 | | | | 11,280 | |
Sauer-Danfoss, Inc. | | | 53,200 | | | | 2,060 | |
Superior Industries International, Inc.B | | | 69,420 | | | | 1,270 | |
The Goodyear Tire & Rubber Co. | | | 361,150 | | | | 5,186 | |
| | | | | | | | |
| | | | | | | 38,396 | |
| | | | | | | | |
Automobiles - 0.21% | | | | | | | | |
Thor Industries, Inc. | | | 244,080 | | | | 6,453 | |
|
Commercial Services & Supplies - 0.10% | |
Viad Corp. | | | 143,890 | | | | 3,012 | |
| | |
Distributors - 0.48% | | | | | | | | |
Brightpoint, Inc.A | | | 1,447,430 | | | | 14,691 | |
|
Hotels, Restaurants & Leisure - 1.46% | |
Bob Evans Farms, Inc. | | | 76,390 | | | | 2,513 | |
Brinker International, Inc. | | | 58,815 | | | | 1,347 | |
CEC Entertainment, Inc. | | | 28,850 | | | | 912 | |
International Speedway Corp., Class A | | | 138,859 | | | | 3,313 | |
Jack in the Box, Inc.A | | | 344,530 | | | | 7,090 | |
Lakes Entertainment, Inc.A | | | 150,800 | | | | 317 | |
Life Time Fitness, Inc.A | | | 38,330 | | | | 1,653 | |
Papa John’s International, Inc.A | | | 119,630 | | | | 4,039 | |
Shuffle Master, Inc.A | | | 885,900 | | | | 9,399 | |
Sonic Corp.A | | | 163,390 | | | | 1,211 | |
Speedway Motorsports, Inc. | | | 45,600 | | | | 593 | |
WMS Industries, Inc. | | | 586,050 | | | | 12,841 | |
| | | | | | | | |
| | | | | | | 45,228 | |
| | | | | | | | |
Household Durables - 1.28% | | | | | | | | |
Cavco Industries, Inc.A | | | 54,089 | | | | 2,436 | |
Ethan Allen Interiors, Inc. | | | 280,440 | | | | 5,552 | |
Furniture Brands International, Inc. | | | 833,900 | | | | 1,593 | |
Helen of Troy Ltd.A | | | 131,853 | | | | 3,815 | |
Lancaster Colony Corp.B | | | 64,730 | | | | 4,306 | |
Meritage Homes Corp. | | | 256,460 | | | | 4,552 | |
Mohawk Industries, Inc.A | | | 75,600 | | | | 3,980 | |
Ryland Group, Inc.B | | | 345,610 | | | | 4,666 | |
Whirlpool Corp. | | | 169,800 | | | | 8,627 | |
| | | | | | | | |
| | | | | | | 39,527 | |
| | | | | | | | |
Internet & Catalog Retail - 0.10% | | | | | |
Insight Enterprises, Inc.A | | | 120,350 | | | | 2,034 | |
Systemax, Inc. | | | 75,430 | | | | 1,141 | |
| | | | | | | | |
| | | | | | | 3,175 | |
| | | | | | | | |
Leisure Equipment & Products - 0.51% | |
Brunswick Corp. | | | 755,090 | | | | 13,335 | |
Callaway Golf Co. | | | 124,220 | | | | 722 | |
Jakks Pacific, Inc. | | | 86,265 | | | | 1,636 | |
| | | | | | | | |
| | | | | | | 15,693 | |
| | | | | | | | |
Media - 1.75% | | | | | | | | |
Belo Corp., Series A | | | 242,740 | | | | 1,539 | |
EW Scripps Co. | | | 121,710 | | | | 1,015 | |
John Wiley & Sons, Inc., Class A | | | 118,500 | | | | 5,636 | |
Meredith Corp.B | | | 372,430 | | | | 9,992 | |
| | | | | | | | |
| | | Shares | | | Fair Value | |
| | | | | | (000’s) | |
Scholastic Corp. | | | 125,970 | | | $ | 3,382 | |
Sinclair Broadcast Group, Inc., Class A | | | 134,100 | | | | 1,285 | |
The Washington Post Co., Class BB | | | 17,230 | | | | 5,861 | |
Valassis Communications, Inc.B | | | 1,307,300 | | | | 25,532 | |
| | | | | | | | |
| | | | | | | 54,242 | |
| | | | | | | | |
Multiline Retail - 1.11% | | | | | | | | |
99 Cents Only StoresA | | | 484,040 | | | | 10,552 | |
Big Lots, Inc. | | | 445,900 | | | | 16,806 | |
Fred’s, Inc., Class A | | | 80,940 | | | | 987 | |
Saks, Inc.B | | | 571,370 | | | | 6,039 | |
| | | | | | | | |
| | | | | | | 34,384 | |
| | | | | | | | |
Specialty Retail - 4.84% | | | | | | | | |
Aaron’s, Inc. | | | 246,400 | | | | 6,594 | |
Aeropostale, Inc.A | | | 763,800 | | | | 10,434 | |
American Greetings Corp., Class A | | | 104,760 | | | | 1,677 | |
America’s Car-Mart, Inc.A | | | 310,500 | | | | 10,364 | |
Asbury Automotive Group, Inc. | | | 84,620 | | | | 1,578 | |
Ascena Retail Group, Inc.A | | | 179,354 | | | | 5,183 | |
Big 5 Sporting Goods Corp. | | | 183,450 | | | | 1,418 | |
Cabela’s, Inc.A | | | 693,990 | | | | 17,294 | |
Chico’s FAS, Inc. | | | 516,020 | | | | 6,378 | |
Collective Brands, Inc.A | | | 49,875 | | | | 729 | |
DG FastChannel, Inc.A | | | 488,500 | | | | 9,106 | |
Express, Inc. | | | 344,190 | | | | 7,775 | |
GameStop Corp., Class AA B | | | 194,610 | | | | 4,976 | |
Group 1 Automotive, Inc. | | | 61,870 | | | | 2,819 | |
Hanesbrands, Inc.A | | | 186,530 | | | | 4,919 | |
Pier 1 Imports, Inc. | | | 306,150 | | | | 3,830 | |
Regis Corp. | | | 63,500 | | | | 1,039 | |
Rent-A-Center, Inc. | | | 807,218 | | | | 27,566 | |
Sonic Automotive, Inc.,
Class AB | | | 105,440 | | | | 1,547 | |
Stage Stores, Inc. | | | 113,300 | | | | 1,771 | |
The Buckle, Inc.B | | | 89,950 | | | | 4,008 | |
The Cato Corp., Class A | | | 42,310 | | | | 1,084 | |
The Childrens Place Retail Stores, Inc.A | | | 106,390 | | | | 4,995 | |
The Men’s Wearhouse, Inc. | | | 413,200 | | | | 12,760 | |
| | | | | | | | |
| | | | | | | 149,844 | |
| | | | | | | | |
Textiles & Apparel - 0.97% | | | | | | | | |
Maidenform Brands, Inc.A | | | 60,220 | | | | 1,480 | |
Quiksilver, Inc.A | | | 2,670,400 | | | | 8,946 | |
Skechers U.S.A. Inc,
Class AA | | | 684,420 | | | | 9,760 | |
The Jones Group, Inc. | | | 167,237 | | | | 1,868 | |
The Warnaco Group, Inc.A | | | 89,110 | | | | 4,375 | |
Unifirst Corp. | | | 38,630 | | | | 2,022 | |
Wolverine World Wide, Inc. | | | 36,925 | | | | 1,401 | |
| | | | | | | | |
| | | | | | | 29,852 | |
| | | | | | | | |
Total Consumer Discretionary | | | | 434,497 | |
| | | | | | | | |
| |
CONSUMER STAPLES - 2.15% | | | | | |
Food & Drug Retailing - 0.73% | | | | | |
Casey’s General Stores, Inc. | | | 112,746 | | | | 5,587 | |
Flowers Foods, Inc. | | | 291,020 | | | | 5,875 | |
Nash Finch Co. | | | 451 | | | | 12 | |
Spartan Stores, Inc. | | | 288,240 | | | | 4,935 | |
SUPERVALU, Inc.B | | | 233,400 | | | | 1,872 | |
The Andersons, Inc. | | | 47,440 | | | | 1,751 | |
Winn-Dixie Stores, Inc.A | | | 379,900 | | | | 2,409 | |
| | | | | | | | |
| | | | | | | 22,441 | |
| | | | | | | | |
Food Products - 1.26% | | | | | | | | |
Chiquita Brands International, Inc. | | | 78,480 | | | | 697 | |
Corn Products International, Inc. | | | 112,745 | | | | 5,468 | |
See accompanying notes
7
American Beacon Small Cap Value FundSM
Schedule of Investments
October 31, 2011
| | | | | | | | |
| | | Shares | | | Fair Value | |
| | | | | | (000’s) | |
Darling International, Inc.A | | | 128,700 | | | $ | 1,804 | |
Fresh Del Monte Produce, Inc. | | | 153,080 | | | | 3,897 | |
Overhill Farms, Inc.A | | | 316,300 | | | | 1,224 | |
Sanderson Farms, Inc.B | | | 208,814 | | | | 10,337 | |
Smithfield Foods, Inc.A | | | 424,080 | | | | 9,695 | |
Snyders-Lance, Inc. | | | 132,180 | | | | 2,805 | |
The Hain Celestial Group, Inc.A | | | 101,466 | | | | 3,405 | |
| | | | | | | | |
| | | | | | | 39,332 | |
| | | | | | | | |
Personal Products - 0.08% | |
Revlon, Inc., Class AA | | | 126,350 | | | | 1,861 | |
Steiner Leisure Ltd.A | | | 11,900 | | | | 573 | |
| | | | | | | | |
| | | | | | | 2,434 | |
| | | | | | | | |
Tobacco - 0.08% | | | | | | | | |
Universal Corp.B | | | 54,294 | | | | 2,325 | |
| | | | | | | | |
Total Consumer Staples | | | | 66,532 | |
| | | | | | | | |
| | |
ENERGY - 5.29% | | | | | | | | |
Energy Equipment & Services - 2.55% | |
Atwood Oceanics, Inc.A | | | 424,962 | | | | 18,164 | |
Bristow Group, Inc. | | | 201,240 | | | | 10,018 | |
Dawson Geophysical Co.A | | | 95,650 | | | | 2,764 | |
Global Industries Ltd.A | | | 665,190 | | | | 5,288 | |
Hercules Offshore, Inc.A | | | 281,370 | | | | 1,066 | |
Matrix Service Co.A | | | 378,627 | | | | 4,021 | |
Oil States International, Inc.A | | | 84,000 | | | | 5,847 | |
Parker Drilling Co. | | | 300,730 | | | | 1,663 | |
SEACOR Holdings, Inc. | �� | | 56,010 | | | | 4,769 | |
Superior Energy Services, Inc.A | | | 47,960 | | | | 1,349 | |
Tesco Corp.A | | | 263,454 | | | | 4,076 | |
Tidewater, Inc. | | | 273,640 | | | | 13,471 | |
Unit Corp.A | | | 132,395 | | | | 6,495 | |
| | | | | | | | |
| | | | | | | 78,991 | |
| | | | | | | | |
Oil & Gas - 2.74% | | | | | | | | |
Cloud Peak Energy, Inc. | | | 941,790 | | | | 21,615 | |
Comstock Resources, Inc.A | | | 123,840 | | | | 2,259 | |
Contango Oil & Gas Co.A | | | 110,900 | | | | 7,135 | |
Energy Partners Ltd.A | | | 760,170 | | | | 10,901 | |
EXCO Resources, Inc. | | | 606,800 | | | | 7,652 | |
Helix Energy Solutions Group, Inc.A | | | 370,340 | | | | 6,688 | |
Petroquest Energy, Inc.A B | | | 150,400 | | | | 1,096 | |
Stone Energy Corp.A | | | 531,100 | | | | 12,900 | |
Tesoro Corp. | | | 437,015 | | | | 11,336 | |
W&T Offshore, Inc. | | | 153,409 | | | | 3,021 | |
| | | | | | | | |
| | | | | | | 84,603 | |
| | | | | | | | |
Total Energy | | | | 163,594 | |
| | | | | | | | |
FINANCIALS - 24.19% | | | | | | | | |
Banks - 8.48% | | | | | | | | |
1st Source Corp. | | | 51,120 | | | | 1,229 | |
Associated Banc-Corp. | | | 1,011,060 | | | | 11,273 | |
Astoria Financial Corp. | | | 253,870 | | | | 2,107 | |
BancorpSouth, Inc. | | | 82,317 | | | | 804 | |
Bank of Hawaii Corp. | | | 86,816 | | | | 3,666 | |
Bank of the Ozarks, Inc. | | | 730,800 | | | | 18,175 | |
Boston Private Financial Holdings, Inc. | | | 62,400 | | | | 473 | |
Brookline Bancorp, Inc. | | | 600,650 | | | | 5,021 | |
Cardinal Financial Corp. | | | 177,030 | | | | 1,901 | |
Cathay General Bancorp | | | 202,360 | | | | 2,831 | |
Center Financial Corp.A | | | 406,900 | | | | 2,673 | |
Chemical Financial Corp. | | | 37,704 | | | | 759 | |
| | | | | | | | |
| | | Shares | | | Fair Value | |
| | | | | | (000’s) | |
City Holding Co.B | | | 36,310 | | | $ | 1,193 | |
City National Corp. | | | 151,378 | | | | 6,421 | |
Columbia Banking System, Inc. | | | 69,130 | | | | 1,318 | |
Community Bank System, Inc. | | | 26,630 | | | | 681 | |
CVB Financial Corp.B | | | 649,723 | | | | 6,309 | |
Dime Community Bancshares, Inc. | | | 81,055 | | | | 966 | |
East West Bancorp, Inc. | | | 38,175 | | | | 743 | |
First Financial Bancorp | | | 621,400 | | | | 10,191 | |
First Financial Holdings, Inc. | | | 182,800 | | | | 1,362 | |
First Horizon National Corp. | | | 708,793 | | | | 4,954 | |
First Interstate Bancsystem, Inc. | | | 296,000 | | | | 3,741 | |
First Midwest Bancorp, Inc. | | | 439,960 | | | | 3,964 | |
First Niagara Financial Group, Inc. | | | 221,100 | | | | 2,032 | |
FirstMerit Corp. | | | 105,825 | | | | 1,483 | |
FNB Corp. | | | 325,130 | | | | 3,281 | |
Fulton Financial Corp. | | | 678,300 | | | | 6,403 | |
Glacier Bancorp, Inc. | | | 12,434 | | | | 141 | |
Hancock Holding Co. | | | 540,278 | | | | 16,370 | |
Home Federal Bancorp, Inc. | | | 171,000 | | | | 1,719 | |
Iberiabank Corp. | | | 372,520 | | | | 19,268 | |
Independent Bank Corp. | | | 22,750 | | | | 590 | |
International Bancshares Corp. | | | 52,577 | | | | 953 | |
Lakeland Financial Corp. | | | 101,865 | | | | 2,434 | |
MB Financial, Inc. | | | 362,710 | | | | 6,010 | |
Nara Bancorp, Inc.A | | | 343,600 | | | | 2,914 | |
National Penn Bancshares, Inc. | | | 995,637 | | | | 7,766 | |
NBT Bancorp, Inc. | | | 31,725 | | | | 683 | |
Northwest Bancshares, Inc. | | | 219,690 | | | | 2,740 | |
Ocwen Financial Corp.A | | | 884,000 | | | | 12,818 | |
Old National Bancorp | | | 108,440 | | | | 1,255 | |
PacWest Bancorp | | | 238,900 | | | | 4,214 | |
Pinnacle Financial Partners, Inc.A | | | 87,920 | | | | 1,320 | |
Prosperity Bancshares, Inc. | | | 372,054 | | | | 14,320 | |
Provident Financial Services, Inc. | | | 477,470 | | | | 6,183 | |
Susquehanna Bancshares, Inc. | | | 228,020 | | | | 1,655 | |
SVB Financial Group | | | 126,320 | | | | 5,803 | |
Synovus Financial Corp.B | | | 6,424,200 | | | | 9,636 | |
TCF Financial Corp. | | | 190,571 | | | | 2,028 | |
Umpqua Holdings Corp. | | | 136,950 | | | | 1,568 | |
United Community Banks,
Inc.A B | | | 45,700 | | | | 338 | |
Washington Federal, Inc. | | | 334,405 | | | | 4,565 | |
Washington Trust Bancorp, Inc. | | | 61,250 | | | | 1,438 | |
Webster Financial Corp. | | | 970,286 | | | | 19,057 | |
WesBanco, Inc. | | | 75,638 | | | | 1,502 | |
Wintrust Financial Corp. | | | 249,695 | | | | 7,211 | |
| | | | | | | | |
| | | | | | | 262,453 | |
| | | | | | | | |
Diversified Financials - 4.22% | |
Advance America Cash Advance Centers, Inc. | | | 67,000 | | | | 565 | |
Apollo Investment Corp. | | | 166,106 | | | | 1,375 | |
Ares Capital Corp. | | | 879,000 | | | | 13,598 | |
CapitalSource, Inc. | | | 833,450 | | | | 5,301 | |
Capitol Federal Financial, Inc. | | | 342,950 | | | | 3,803 | |
Cash America International, Inc. | | | 280,928 | | | | 15,381 | |
CoreLogic, Inc. | | | 362,080 | | | | 4,407 | |
Credit Acceptance Corp.A | | | 94,160 | | | | 6,490 | |
Duff & Phelps Corp., Class A | | | 239,550 | | | | 3,040 | |
Encore Capital Group, Inc.A | | | 483,800 | | | | 13,106 | |
Ezcorp, Inc., Class A | | | 593,704 | | | | 16,494 | |
Federated Investors, Inc.,
Class BB | | | 289,900 | | | | 5,665 | |
Fifth Street Finance Corp.B | | | 1,170,100 | | | | 11,537 | |
Janus Capital Group, Inc.B | | | 967,700 | | | | 6,348 | |
See accompanying notes
8
American Beacon Small Cap Value FundSM
Schedule of Investments
October 31, 2011
| | | | | | | | |
| | | Shares | | | Fair Value | |
| | | | | | (000’s) | |
Kirkland’s, Inc.A | | | 104,250 | | | $ | 1,172 | |
Knight Capital Group, Inc., Class AA | | | 768,000 | | | | 9,592 | |
National Financial Partners Corp. | | | 71,940 | | | | 983 | |
Nelnet, Inc., Class A | | | 39,800 | | | | 855 | |
NewStar Financial, Inc.A | | | 130,230 | | | | 1,396 | |
Piper Jaffray CosA | | | 109,457 | | | | 2,272 | |
Raymond James Financial, Inc. | | | 101,200 | | | | 3,073 | |
Waddell & Reed Financial, Inc. | | | 52,405 | | | | 1,453 | |
World Acceptance Corp.A | | | 40,280 | | | | 2,725 | |
| | | | | | | | |
| | | | | | | 130,631 | |
| | | | | | | | |
Insurance - 7.90% | | | | | | | | |
Alleghany Corp. | | | 18,256 | | | | 5,793 | |
Allied World Assurance Co. Holdings AG | | | 114,280 | | | | 6,640 | |
Alterra Capital Holdings Ltd. | | | 272,940 | | | | 5,917 | |
American Equity Investment Life Holding Co. | | | 183,770 | | | | 1,992 | |
American Financial Group, Inc. | | | 208,035 | | | | 7,454 | |
Amtrust Financial Services, Inc. | | | 209,422 | | | | 5,315 | |
Argo Group International Holdings Ltd. | | | 54,000 | | | | 1,630 | |
Aspen Insurance Holdings Ltd. | | | 619,890 | | | | 16,421 | |
Assurant, Inc. | | | 38,500 | | | | 1,484 | |
CNO Financial Group, Inc.A | | | 2,012,130 | | | | 12,576 | |
Delphi Financial Group, Inc., Class A | | | 476,880 | | | | 12,628 | |
Employers Holdings, Inc. | | | 474,760 | | | | 7,701 | |
Endurance Specialty Holdings Ltd. | | | 502,790 | | | | 18,703 | |
Enstar Group Ltd.A | | | 35,243 | | | | 3,241 | |
FBL Financial Group, Inc., Class A | | | 77,170 | | | | 2,520 | |
Fidelity National Financial, Inc. | | | 457,200 | | | | 7,059 | |
First American Financial Corp. | | | 448,460 | | | | 5,382 | |
Global Indemnity plcA | | | 623,771 | | | | 12,594 | |
HCC Insurance Holdings, Inc. | | | 192,060 | | | | 5,111 | |
Horace Mann Educators Corp. | | | 456,200 | | | | 6,136 | |
Infinity Property & Casualty Corp. | | | 44,438 | | | | 2,576 | |
Kemper Corp. | | | 155,790 | | | | 4,189 | |
Maiden Holdings Ltd. | | | 168,960 | | | | 1,377 | |
Meadowbrook Insurance Group, Inc. | | | 124,810 | | | | 1,293 | |
Montpelier Re Holdings Ltd. | | | 156,278 | | | | 2,735 | |
National Western Life Insurance Co., Class A | | | 7,730 | | | | 1,111 | |
OneBeacon Insurance Group Ltd., Class A | | | 42,120 | | | | 641 | |
Platinum Underwriters Holdings Ltd. | | | 42,277 | | | | 1,464 | |
ProAssurance Corp. | | | 247,300 | | | | 18,930 | |
Protective Life Corp. | | | 376,980 | | | | 7,012 | |
RenaissanceRe Holdings Ltd. | | | 51,900 | | | | 3,535 | |
RLI Corp. | | | 43,670 | | | | 3,072 | |
Safety Insurance Group, Inc. | | | 38,630 | | | | 1,646 | |
Selective Insurance Group, Inc. | | | 125,390 | | | | 2,010 | |
StanCorp Financial Group, Inc. | | | 185,250 | | | | 6,287 | |
Symetra Financial Corp. | | | 1,439,970 | | | | 13,349 | |
The Hanover Insurance Group, Inc. | | | 99,115 | | | | 3,782 | |
The Navigators Group, Inc.A | | | 111,893 | | | | 5,105 | |
Tower Group, Inc. | | | 97,310 | | | | 2,309 | |
Validus Holdings Ltd. | | | 261,130 | | | | 7,145 | |
White Mountains Insurance Group Ltd. | | | 20,504 | | | | 8,612 | |
| | | | | | | | |
| | | | | | | 244,477 | |
| | | | | | | | |
Lodging/Resorts - 0.23% | |
DiamondRock Hospitality Co.C | | | 779,170 | | | | 7,051 | |
| | | | | | | | |
Real Estate - 3.36% | | | | | | | | |
Anworth Mortgage Asset Corp.C | | | 42,151 | | | | 272 | |
Avis Budget Group, Inc.A | | | 78,700 | | | | 1,110 | |
BioMed Realty Trust, Inc.C | | | 444,470 | | | | 8,049 | |
| | | | | | | | |
| | | Shares | | | Fair Value | |
| | | | | | (000’s) | |
Brandywine Realty TrustC | | | 155,600 | | | $ | 1,418 | |
CapLease, Inc.C | | | 915,800 | | | | 3,581 | |
CBL & Associates Properties, Inc.C | | | 422,855 | | | | 6,504 | |
Colony Financial, Inc.B | | | 414,100 | | | | 6,075 | |
CommonWealth REITC | | | 68,946 | | | | 1,334 | |
Corrections Corp. of AmericaA | | | 88,900 | | | | 1,976 | |
DCT Industrial Trust, Inc.C | | | 1,036,330 | | | | 5,140 | |
Duke Realty Corp.C | | | 125,663 | | | | 1,543 | |
Entertainment Properties TrustC | | | 142,220 | | | | 6,371 | |
Hospitality Properties TrustC | | | 60,148 | | | | 1,445 | |
LaSalle Hotel PropertiesC | | | 444,990 | | | | 10,640 | |
Lexington Realty TrustB C | | | 923,090 | | | | 7,255 | |
MI Developments, Inc., Class A | | | 501,300 | | | | 15,912 | |
National Health Investors, Inc.C | | | 132,240 | | | | 5,910 | |
Omega Healthcare Investors, Inc.C | | | 88,425 | | | | 1,570 | |
Pebblebrook Hotel TrustC | | | 275,364 | | | | 5,240 | |
Pennsylvania Real Estate Investment TrustC | | | 129,555 | | | | 1,329 | |
Starwood Property Trust, Inc.C | | | 488,700 | | | | 9,183 | |
Urstadt Biddle Properties, Inc., Class AC | | | 111,230 | | | | 1,984 | |
| | | | | | | | |
| | | | | | | 103,841 | |
| | | | | | | | |
Total Financials | | | | 748,453 | |
| | | | | | | | |
HEALTH CARE - 5.89% | | | | | | | | |
Biotechnology - 0.17% | | | | | | | | |
Charles River Laboratories International, Inc.A | | | 41,430 | | | | 1,337 | |
Viropharma, Inc.A | | | 201,100 | | | | 4,071 | |
| | | | | | | | |
| | | | | | | 5,408 | |
| | | | | | | | |
Health Care Equipment & Supplies - 1.08% | |
CONMED Corp.A | | | 60,220 | | | | 1,582 | |
Haemonetics Corp.A | | | 92,740 | | | | 5,653 | |
Hillenbrand, Inc. | | | 155,300 | | | | 3,278 | |
Invacare Corp. | | | 24,600 | | | | 552 | |
Kinetic Concepts, Inc.A | | | 69,600 | | | | 4,760 | |
Medidata Solutions, Inc.A | | | 579,618 | | | | 10,421 | |
STERIS Corp. | | | 230,950 | | | | 7,155 | |
| | | | | | | | |
| | | | | | | 33,401 | |
| | | | | | | | |
Health Care Providers & Services - 3.64% | |
Amedisys, Inc.A | | | 54,100 | | | | 710 | |
AMERIGROUP Corp.A | | | 210,800 | | | | 11,727 | |
Health Management Associates, Inc. | | | 203,200 | | | | 1,780 | |
Health Net, Inc.A | | | 246,320 | | | | 6,845 | |
HealthSouth Corp.A | | | 1,124,880 | | | | 19,865 | |
Healthspring, Inc.A | | | 113,708 | | | | 6,133 | |
Healthways, Inc.A | | | 34,280 | | | | 245 | |
LifePoint Hospitals, Inc.A | | | 765,995 | | | | 29,614 | |
Magellan Health Services, Inc.A | | | 94,310 | | | | 4,854 | |
MAXIMUS, Inc. | | | 47,620 | | | | 1,921 | |
Mednax, Inc.A | | | 91,270 | | | | 6,006 | |
Molina Healthcare, Inc.A | | | 34,500 | | | | 731 | |
Omnicell, Inc.A | | | 324,430 | | | | 4,850 | |
Owens & Minor, Inc. | | | 49,225 | | | | 1,473 | |
PAREXEL International Corp.A | | | 234,190 | | | | 5,159 | |
Select Medical Holdings Corp.A | | | 123,300 | | | | 1,073 | |
The Ensign Group, Inc. | | | 87,202 | | | | 1,985 | |
Triple-S Management Corp., Class BA | | | 50,540 | | | | 960 | |
Universal American Corp. | | | 363,760 | | | | 4,183 | |
WellCare Health Plans, Inc.A | | | 45,900 | | | | 2,250 | |
| | | | | | | | |
| | | | | | | 112,364 | |
| | | | | | | | |
See accompanying notes
9
American Beacon Small Cap Value FundSM
Schedule of Investments
October 31, 2011
| | | | | | | | |
| | | Shares | | | Fair Value | |
| | | | | | (000’s) | |
Pharmaceuticals - 1.00% | | | | | |
Endo Pharmaceuticals Holdings, Inc.A | | | 493,590 | | | $ | 15,948 | |
Hi-Tech Pharmacal Co. IncA | | | 14,000 | | | | 497 | |
Medicis Pharmaceutical Corp., Class A | | | 88,020 | | | | 3,370 | |
Par Pharmaceutical Cos., Inc. | | | 93,240 | | | | 2,853 | |
PharMerica Corp.A | | | 292,300 | | | | 4,560 | |
Salix Pharmaceuticals Ltd.A | | | 105,320 | | | | 3,608 | |
| | | | | | | | |
| | | | | | | 30,836 | |
| | | | | | | | |
Total Health Care | | | | 182,009 | |
| | | | | | | | |
INDUSTRIALS - 16.62% | |
Aerospace & Defense - 2.04% | |
Alliant Techsystems, Inc. | | | 272,105 | | | | 15,803 | |
Curtiss-Wright Corp. | | | 294,007 | | | | 9,638 | |
Huntington Ingalls Industries, Inc.A | | | 483,000 | | | | 14,249 | |
Spirit Aerosystems Holdings, Inc., Class AA | | | 552,840 | | | | 9,437 | |
Triumph Group, Inc. | | | 242,100 | | | | 14,066 | |
| | | | | | | | |
| | | | | | | 63,193 | |
| | | | | | | | |
Airlines - 0.12% | | | | | | | | |
Aircastle Ltd. | | | 314,501 | | | | 3,815 | |
| | | | | | | | |
Building Products - 0.96% | |
Apogee Enterprises, Inc. | | | 256,997 | | | | 2,806 | |
Crane Co. | | | 129,900 | | | | 5,730 | |
Drew Industries, Inc. | | | 80,560 | | | | 1,936 | |
Owens CorningA | | | 98,700 | | | | 2,801 | |
Simpson Manufacturing Co. Inc | | | 371,625 | | | | 11,394 | |
Trex Co. IncA B | | | 274,600 | | | | 5,075 | |
| | | | | | | | |
| | | | | | | 29,742 | |
| | | | | | | | |
Commercial Services & Supplies - 6.01% | |
Atlas Air Worldwide Holdings, Inc.A | | | 300,600 | | | | 11,579 | |
Bridgepoint Education, Inc.A B | | | 136,230 | | | | 2,952 | |
Career Education Corp.A | | | 200,130 | | | | 3,228 | |
Clean Harbors, Inc.A | | | 122,466 | | | | 7,136 | |
Convergys Corp.A | | | 314,090 | | | | 3,361 | |
Con-way, Inc. | | | 472,000 | | | | 13,910 | |
CSG Systems International, Inc.A | | | 96,240 | | | | 1,370 | |
Deluxe Corp. | | | 132,160 | | | | 3,122 | |
DeVry, Inc. | | | 101,240 | | | | 3,815 | |
Education Management Corp.A B | | | 137,000 | | | | 2,721 | |
Ennis, Inc. | | | 82,980 | | | | 1,214 | |
FTI Consulting, Inc.A B | | | 178,310 | | | | 7,027 | |
G&K Services, Inc., Class A | | | 48,140 | | | | 1,462 | |
Global Payments, Inc. | | | 44,800 | | | | 2,057 | |
Heidrick & Struggles International, Inc. | | | 289,800 | | | | 5,732 | |
Herman Miller, Inc. | | | 458,000 | | | | 9,458 | |
Hudson Highland Group, Inc.A | | | 630,300 | | | | 2,918 | |
Huron Consulting Group, Inc.A | | | 142,690 | | | | 5,138 | |
ITT Educational Services, Inc.B | | | 72,330 | | | | 4,482 | |
Kelly Services, Inc., Class A | | | 131,100 | | | | 2,143 | |
Kforce, Inc.A | | | 51,330 | | | | 655 | |
Korn/Ferry InternationalA | | | 830,780 | | | | 13,268 | |
Layne Christensen Co.A | | | 40,670 | | | | 1,024 | |
Manpower, Inc. | | | 120,700 | | | | 5,207 | |
McGrath Rentcorp | | | 127,548 | | | | 3,408 | |
Mobile Mini, Inc.A B | | | 623,100 | | | | 11,303 | |
Navigant Consulting, Inc.A | | | 41,800 | | | | 474 | |
PHH Corp.A | | | 778,060 | | | | 14,354 | |
RR Donnelley & Sons Co. | | | 282,440 | | | | 4,604 | |
Steelcase, Inc., A Shares | | | 574,092 | | | | 4,254 | |
| | | | | | | | |
| | | Shares | | | Fair Value | |
| | | | | | (000’s) | |
TAL International Group, Inc. | | | 85,980 | | | $ | 2,393 | |
Team, Inc. | | | 51,078 | | | | 1,277 | |
Tetra Tech, Inc.A | | | 293,040 | | | | 6,397 | |
The Brink’s Co. | | | 376,210 | | | | 10,455 | |
The Dun & Bradstreet Corp. | | | 39,300 | | | | 2,628 | |
The Geo Group, Inc.A | | | 166,110 | | | | 3,028 | |
United Stationers, Inc. | | | 186,870 | | | | 5,944 | |
| | | | | | | | |
| | | | | | | 185,498 | |
| | | | | | | | |
Construction & Engineering - 1.72% | |
AECOM Technology Corp.A | | | 304,510 | | | | 6,370 | |
Aegion Corp.A | | | 500,900 | | | | 7,408 | |
Comfort Systems USA, Inc. | | | 838,145 | | | | 9,220 | |
EMCOR Group, Inc. | | | 554,000 | | | | 13,889 | |
Granite Construction, Inc. | | | 273,410 | | | | 6,152 | |
Primoris Services Corp. | | | 109,564 | | | | 1,427 | |
Tutor Perini Corp. | | | 100,751 | | | | 1,464 | |
URS Corp. | | | 200,910 | | | | 7,172 | |
| | | | | | | | |
| | | | | | | 53,102 | |
| | | | | | | | |
Diversified Manufacturing - 0.05% | |
Barnes Group, Inc. | | | 66,980 | | | | 1,559 | |
| | | | | | | | |
Electrical Equipment - 1.01% | | | | | | | | |
EnerSysA | | | 403,845 | | | | 9,099 | |
General Cable Corp. | | | 69,669 | | | | 1,954 | |
II-VI, Inc. | | | 194,890 | | | | 3,705 | |
Regal-Beloit Corp. | | | 189,500 | | | | 10,067 | |
Thomas & Betts Corp. | | | 130,080 | | | | 6,464 | |
| | | | | | | | |
| | | | | | | 31,289 | |
| | | | | | | | |
Electronic Equipment & Instruments - 0.05% | |
PerkinElmer, Inc. | | | 68,150 | | | | 1,409 | |
| | | | | | | | |
Energy Equipment & Services - 0.07% | |
Hornbeck Offshore Services, Inc.A B | | | 66,710 | | | | 2,191 | |
| | | | | | | | |
Industrial Conglomerates - 0.51% | |
Carlisle Cos., Inc. | | | 184,946 | | | | 7,716 | |
Chemed Corp. | | | 95,350 | | | | 5,660 | |
Teleflex, Inc. | | | 30,195 | | | | 1,807 | |
Trimas Corp.A | | | 37,100 | | | | 723 | |
| | | | | | | | |
| | | | | | | 15,906 | |
| | | | | | | | |
Machinery - 2.89% | | | | | | | | |
Astec Industries, Inc.A | | | 158,760 | | | | 5,279 | |
Briggs & Stratton Corp. | | | 94,030 | | | | 1,373 | |
Ceradyne, Inc.A | | | 19,900 | | | | 666 | |
CIRCOR International, Inc. | | | 160,900 | | | | 5,603 | |
Columbus McKinnon Corp. | | | 180,000 | | | | 2,698 | |
Esterline Technologies Corp. | | | 73,163 | | | | 4,090 | |
FreightCar America, Inc. | | | 93,370 | | | | 1,769 | |
Harsco Corp. | | | 65,425 | | | | 1,508 | |
John Bean Technologies Corp. | | | 214,490 | | | | 3,462 | |
Kennametal, Inc. | | | 61,300 | | | | 2,384 | |
Meritor, Inc.A | | | 289,200 | | | | 2,753 | |
Miller Industries, Inc. | | | 231,100 | | | | 4,724 | |
Oshkosh Corp. | | | 637,600 | | | | 13,300 | |
Reliance Steel & Aluminum Co. | | | 56,090 | | | | 2,479 | |
RSC Holdings, Inc.A | | | 1,816,311 | | | | 17,726 | |
SPX Corp. | | | 28,000 | | | | 1,529 | |
Terex Corp. | | | 961,300 | | | | 15,995 | |
Watts Water Technologies, Inc. | | | 61,090 | | | | 1,924 | |
| | | | | | | | |
| | | | | | | 89,262 | |
| | | | | | | | |
See accompanying notes
10
American Beacon Small Cap Value FundSM
Schedule of Investments
October 31, 2011
| | | | | | | | |
| | | Shares | | | Fair Value | |
| | | | | | (000’s) | |
Marine - 0.37% | | | | | |
Diana Shipping, Inc. | | | 155,005 | | | $ | 1,276 | |
Gulfmark Offshore, Inc., Class AA | | | 67,452 | | | | 2,805 | |
Kirby Corp. | | | 121,300 | | | | 7,465 | |
| | | | | | | | |
| | | | | | | 11,546 | |
| | | | | | | | |
Metals & Mining - 0.05% | | | | | | | | |
Mueller Water Products, Inc. | | | 529,000 | | | | 1,455 | |
| | | | | | | | |
Road & Rail - 0.72% | | | | | | | | |
Amerco, Inc.A | | | 55,190 | | | | 4,178 | |
Forward Air Corp. | | | 370,309 | | | | 12,128 | |
RailAmerica, Inc.A | | | 134,870 | | | | 1,844 | |
Ryder System, Inc. | | | 34,315 | | | | 1,748 | |
Saia, Inc.A | | | 174,900 | | | | 2,335 | |
| | | | | | | | |
| | | | | | | 22,233 | |
| | | | | | | | |
Trading Companies & Distributors - 0.05% | |
WESCO International, Inc.A | | | 34,600 | | | | 1,677 | |
| | | | | | | | |
Total Industrials | | | | 513,877 | |
| | | | | | | | |
INFORMATION TECHNOLOGY - 13.20% | |
Communications Equipment - 1.50% | | | | | |
Anixter International, Inc. | | | 38,300 | | | | 2,248 | |
Arris Group, Inc.A | | | 1,067,282 | | | | 11,484 | |
Black Box Corp. | | | 295,100 | | | | 8,260 | |
Comtech Telecommunications Corp. | | | 68,740 | | | | 2,276 | |
InterDigital, Inc.B | | | 328,700 | | | | 14,282 | |
IxiaA | | | 424,710 | | | | 4,812 | |
Plantronics, Inc. | | | 44,325 | | | | 1,481 | |
Symmetricom, Inc.A | | | 315,000 | | | | 1,622 | |
| | | | | | | | |
| | | | | | | 46,465 | |
| | | | | | | | |
Computers & Peripherals - 1.18% | |
Electronics for Imaging, Inc.A | | | 269,170 | | | | 4,038 | |
Lexmark International, Inc. | | | 231,160 | | | | 7,328 | |
Mercury Computer Systems, Inc.A | | | 351,300 | | | | 5,129 | |
NCR Corp.A | | | 83,951 | | | | 1,598 | |
Synaptics, Inc.A B | | | 544,342 | | | | 18,393 | |
| | | | | | | | |
| | | | | | | 36,486 | |
| | | | | | | | |
Electronic Equipment & Instruments - 3.02% | |
Arrow Electronics, Inc. | | | 91,900 | | | | 3,313 | |
AVX Corp. | | | 438,320 | | | | 5,878 | |
Diebold, Inc. | | | 120,200 | | | | 3,880 | |
Ingram Micro, Inc., Class AA | | | 533,780 | | | | 9,544 | |
Itron, Inc.A | | | 239,100 | | | | 8,796 | |
Littelfuse, Inc. | | | 223,400 | | | | 10,938 | |
Methode Electronics, Inc. | | | 754,800 | | | | 7,012 | |
Multi-Fineline Electronix, Inc.A | | | 19,200 | | | | 440 | |
Newport Corp. | | | 96,530 | | | | 1,337 | |
Plexus Corp.A | | | 415,890 | | | | 10,688 | |
Scansource, Inc.A | | | 21,700 | | | | 754 | |
Tech Data Corp.A | | | 230,571 | | | | 11,340 | |
TTM Technologies, Inc.A | | | 209,620 | | | | 2,341 | |
Vishay Intertechnology, Inc.A | | | 1,600,440 | | | | 17,206 | |
| | | | | | | | |
| | | | | | | 93,467 | |
| | | | | | | | |
Internet Software & Services - 0.70% | |
Earthlink, Inc. | | | 86,200 | | | | 604 | |
Ebix, Inc.B | | | 707,300 | | | | 12,102 | |
j2 Global Communications, Inc. | | | 117,450 | | | | 3,615 | |
Netgear, Inc.A | | | 117,690 | | | | 4,173 | |
RealNetworks, Inc. | | | 33,380 | | | | 326 | |
United Online, Inc. | | | 95,300 | | | | 563 | |
| | | | | | | | |
| | | Shares | | | Fair Value | |
| | | | | | (000’s) | |
Websense, Inc.A | | | 8,116 | | | $ | 145 | |
| | | | | | | | |
| | | | | | | 21,528 | |
| | | | | | | | |
IT Consulting & Services - 1.32% | |
CACI International, Inc., Class AA | | | 270,060 | | | | 14,824 | |
CIBER, Inc.A | | | 399,800 | | | | 1,391 | |
Mantech International Corp. | | | 138,390 | | | | 4,862 | |
SYNNEX Corp.A | | | 604,460 | | | | 17,450 | |
Unisys Corp. | | | 87,530 | | | | 2,275 | |
| | | | | | | | |
| | | | | | | 40,802 | |
| | | | | | | | |
Semiconductor Equipment & Products - 3.26% | |
Advanced Energy Industries, Inc.A | | | 42,800 | | | | 400 | |
Amkor Technology, Inc.A B | | | 247,363 | | | | 1,197 | |
ATMI, Inc.A | | | 67,970 | | | | 1,387 | |
Brooks Automation, Inc. | | | 1,416,240 | | | | 14,799 | |
Cirrus Logic, Inc.A | | | 48,900 | | | | 814 | |
Cymer, Inc.A | | | 119,030 | | | | 5,172 | |
Diodes, Inc.A | | | 93,720 | | | | 2,097 | |
Entegris, Inc.A | | | 343,240 | | | | 3,075 | |
Entropic Communications, Inc.A B | | | 1,269,600 | | | | 7,389 | |
Fairchild Semiconductor International, Inc.A | | | 326,000 | | | | 4,880 | |
FEI Co.A | | | 130,260 | | | | 5,179 | |
GT Advanced Technologies, Inc.A B | | | 374,120 | | | | 3,068 | |
Kulicke & Soffa Industries, Inc. | | | 185,610 | | | | 1,791 | |
Lattice Semiconductor Corp.A | | | 303,730 | | | | 1,923 | |
Microsemi Corp. | | | 77,510 | | | | 1,431 | |
MKS Instruments, Inc. | | | 134,780 | | | | 3,591 | |
Novellus Systems, Inc.A | | | 230,310 | | | | 7,957 | |
ON Semiconductor Corp.A | | | 1,344,600 | | | | 10,178 | |
PMC - Sierra, Inc.A | | | 237,700 | | | | 1,507 | |
QLogic Corp.A | | | 416,073 | | | | 5,813 | |
Semtech Corp.A | | | 175,900 | | | | 4,295 | |
Teradyne, Inc.A | | | 477,920 | | | | 6,844 | |
Tessera Technologies, Inc.A | | | 305,000 | | | | 4,200 | |
TriQuint Semiconductor, Inc.A | | | 382,720 | | | | 2,036 | |
| | | | | | | | |
| | | | | | | 101,023 | |
| | | | | | | | |
Software - 2.22% | | | | | | | | |
Aspen Technology, Inc.A | | | 183,280 | | | | 3,178 | |
Cadence Design Systems, Inc.A | | | 349,200 | | | | 3,866 | |
Cognex Corp. | | | 463,480 | | | | 15,708 | |
DST Systems, Inc. | | | 152,420 | | | | 7,650 | |
FARO Technologies, Inc.A | | | 167,500 | | | | 6,998 | |
JDA Software Group, Inc.A | | | 123,355 | | | | 3,931 | |
Mentor Graphics Corp. | | | 1,184,700 | | | | 13,458 | |
Netscout Systems, Inc.A | | | 269,100 | | | | 4,411 | |
Parametric Technology Corp.A | | | 174,090 | | | | 3,626 | |
Take-Two Interactive Software, Inc. | | | 360,480 | | | | 5,688 | |
| | | | | | | | |
| | | | | | | 68,514 | |
| | | | | | | | |
Total Information Technology | | | | 408,285 | |
| | | | | | | | |
MATERIALS - 5.68% | | | | | | | | |
Chemicals - 2.51% | | | | | | | | |
A Schulman, Inc. | | | 45,120 | | | | 952 | |
Cabot Corp. | | | 204,450 | | | | 6,170 | |
Cytec Industries, Inc. | | | 137,120 | | | | 6,125 | |
HB Fuller Co. | | | 116,805 | | | | 2,510 | |
Huntsman Corp. | | | 68,642 | | | | 806 | |
Innophos Holdings, Inc. | | | 55,870 | | | | 2,458 | |
Innospec, Inc. | | | 26,100 | | | | 788 | |
LSB Industries, Inc.A | | | 36,700 | | | | 1,300 | |
NewMarket Corp.B | | | 36,790 | | | | 7,142 | |
See accompanying notes
11
American Beacon Small Cap Value FundSM
Schedule of Investments
October 31, 2011
| | | | | | | | |
| | | Shares | | | Fair Value | |
| | | | | | (000’s) | |
Olin Corp. | | | 539,850 | | | $ | 10,182 | |
OM Group, Inc. | | | 295,075 | | | | 8,531 | |
PolyOne Corp. | | | 1,035,700 | | | | 11,590 | |
Solutia, Inc.A | | | 303,830 | | | | 4,937 | |
Stepan Co. | | | 25,080 | | | | 1,938 | |
Westlake Chemical Corp.B | | | 170,120 | | | | 7,011 | |
WR Grace & Co.A | | | 122,970 | | | | 5,139 | |
| | | | | | | | |
| | | | | | | 77,579 | |
| | | | | | | | |
Containers & Packaging - 0.88% | | | | | |
Boise, Inc.B | | | 312,930 | | | | 1,893 | |
Greif, Inc., Class A | | | 195,100 | | | | 8,737 | |
Jarden Corp. | | | 289,520 | | | | 9,273 | |
KapStone Paper and Packaging Corp.A | | | 37,000 | | | | 607 | |
Packaging Corp of America | | | 260,790 | | | | 6,801 | |
| | | | | | | | |
| | | | | | | 27,311 | |
| | | | | | | | |
Metals & Mining - 1.81% | | | | | | | | |
AMCOL International Corp. | | | 116,538 | | | | 3,518 | |
AuRico Gold, Inc.A | | | 103,203 | | | | 1,004 | |
Carpenter Technology Corp. | | | 121,110 | | | | 6,869 | |
Century Aluminum Co. | | | 237,700 | | | | 2,653 | |
Coeur d’Alene Mines Corp. | | | 498,819 | | | | 12,755 | |
Gibraltar Industries, Inc. | | | 456,239 | | | | 5,092 | |
James River Coal Co.A B | | | 81,673 | | | | 845 | |
Kaiser Aluminum Corp. | | | 49,570 | | | | 2,303 | |
Metals USA Holdings Corp.A | | | 26,800 | | | | 292 | |
Minefinders Corp.A | | | 42,794 | | | | 606 | |
Noranda Aluminum Holding Corp. | | | 1,050,000 | | | | 9,723 | |
RTI International Metals, Inc. | | | 70,580 | | | | 1,863 | |
Thompson Creek Metals Co. Inc.A | | | 141,095 | | | | 1,006 | |
Worthington Industries, Inc. | | | 425,499 | | | | 7,353 | |
| | | | | | | | |
| | | | | | | 55,882 | |
| | | | | | | | |
Paper & Forest Products - 0.48% | | | | | |
Clearwater Paper Corp.A | | | 18,400 | | | | 610 | |
Domtar Corp. | | | 73,680 | | | | 6,035 | |
Louisiana-Pacific Corp. | | | 948,180 | | | | 6,305 | |
PH Glatfelter Co. | | | 118,700 | | | | 1,781 | |
| | | | | | | | |
| | | | | | | 14,731 | |
| | | | | | | | |
Total Materials | | | | 175,503 | |
| | | | | | | | |
|
TELECOMMUNICATION SERVICES - 0.41% | |
Diversified Telecommunication Services - 0.34% | |
AboveNet, Inc. | | | 49,630 | | | | 2,946 | |
Cincinnati Bell, Inc. | | | 512,480 | | | | 1,650 | |
EchoStar Corp., Class AA | | | 99,150 | | | | 2,614 | |
Loral Space & Communications, Inc.A | | | 54,610 | | | | 3,303 | |
| | | | | | | | |
| | | | | | | 10,513 | |
| | | | | | | | |
Wireless Telecommunication Services - 0.07% | |
US Cellular Corp.A | | | 56,600 | | | | 2,257 | |
| | | | | | | | |
Total Telecommunication Services | | | | 12,770 | |
| | | | | | | | |
|
UTILITIES - 4.77% | |
Electric Utilities - 3.26% | |
Allete, Inc. | | | 38,590 | | | | 1,525 | |
Black Hills Corp.B | | | 98,570 | | | | 3,323 | |
El Paso Electric Co. | | | 159,370 | | | | 5,105 | |
GenOn Energy, Inc.A | | | 617,300 | | | | 1,883 | |
Great Plains Energy, Inc.B | | | 1,062,810 | | | | 22,042 | |
Hawaiian Electric Industries, Inc. | | | 291,100 | | | | 7,374 | |
IDACORP, Inc. | | | 178,560 | | | | 7,210 | |
NorthWestern Corp. | | | 224,330 | | | | 7,728 | |
| | | | | | | | |
| | | Shares | | | Fair Value | |
| | | | | | (000’s) | |
NV Energy, Inc. | | | 562,233 | | | $ | 9,018 | |
Otter Tail Corp. | | | 74,260 | | | | 1,441 | |
PNM Resources, Inc. | | | 368,510 | | | | 6,626 | |
Portland General Electric Co. | | | 955,749 | | | | 23,453 | |
TECO Energy, Inc. | | | 19,335 | | | | 359 | |
Unisource Energy Corp. | | | 93,820 | | | | 3,498 | |
| | | | | | | | |
| | | | | | | 100,585 | |
| | | | | | | | |
Gas Utilities - 0.90% | | | | | | | | |
AGL Resources, Inc. | | | 123,930 | | | | 5,198 | |
Atmos Energy Corp. | | | 285,870 | | | | 9,811 | |
Energen Corp. | | | 29,763 | | | | 1,460 | |
UGI Corp. | | | 164,120 | | | | 4,705 | |
WGL Holdings, Inc. | | | 158,770 | | | | 6,797 | |
| | | | | | | | |
| | | | | | | 27,971 | |
| | | | | | | | |
Multi-Utilities - 0.61% | | | | | | | | |
Avista Corp. | | | 148,530 | | | | 3,780 | |
Vectren Corp. | | | 56,240 | | | | 1,596 | |
Westar Energy, Inc. | | | 498,290 | | | | 13,584 | |
| | | | | | | | |
| | | | | | | 18,960 | |
| | | | | | | | |
Total Utilities | | | | 147,516 | |
| | | | | | | | |
Total Common Stock (Cost $2,655,452) | | | | 2,853,036 | |
| | | | | | | | |
SHORT-TERM INVESTMENTS - 5.53% | |
American Beacon U.S. Government Money Market Select FundD | | | 20,000,000 | | | | 20,000 | |
JPMorgan U.S. Government Money Market Fund | | | 150,866,026 | | | | 150,866 | |
| | | | | | | | |
Total Short-Term Investments (Cost $170,866) | | | | | | | 170,866 | |
| | | | | | | | |
|
SECURITIES LENDING COLLATERAL - 6.14% | |
Wells Fargo Advantage Government Money Market Fund | | | 9,060,950 | | | | 9,061 | |
American Beacon U.S. Government Money Market Select FundD | | | 180,688,575 | | | | 180,689 | |
| | | | | | | | |
Total Securities Lending Collateral(Cost $189,750) | | | | | | | 189,750 | |
| | | | | | | | |
TOTAL INVESTMENTS - 103.92% (Cost $3,016,068) | | | | 3,213,652 | |
LIABILITIES, NET OF OTHER ASSETS - (3.92%) | | | | (121,233 | ) |
| | | | | | | | |
TOTAL NET ASSETS - 100.00% | | | $ | 3,092,419 | |
| | | | | | | | |
Percentages are stated as a percent of net assets.
| A | Non-income producing security. |
| B | All or a portion of this security is on loan at October 31, 2011. |
| C | REIT - Real Estate Investment Trust. |
| D | The Fund is affiliated by having the same investment advisor. |
See accompanying notes
12
American Beacon Small Cap Value FundSM
Schedule of Investments
October 31, 2011
| | | | | | | | | | | | | | |
Futures Contracts (000’s) | | | | | | | | | | | |
| | | Number of
Contracts | | | Expiration Date | | Contract
Value | | | Unrealized
Appreciation/
(Depreciation) | |
Russell 2000 Mini Index Future | | | 2,265 | | | December, 2011 | | $ | 167,451 | | | $ | 13,753 | |
| | | | | | | | | | | | | | |
| | | | | | | | $ | 167,451 | | | $ | 13,753 | |
| | | | | | | | | | | | | | |
See accompanying notes
13
American Beacon Small Cap Value FundSM
Statement of Assets and Liabilities
October 31, 2011 (in thousands, except share and per share amounts)
| | | | |
Assets: | | | | |
Investments in unaffiliated securities, at fair value A C | | $ | 3,012,963 | |
Investments in affiliated securities, at fair value B | | | 200,689 | |
Deposit with brokers for futures contracts | | | 15,036 | |
Receivable for investments sold | | | 19,015 | |
Dividends and interest receivable | | | 692 | |
Receivable for fund shares sold | | | 59,993 | |
Prepaid expenses | | | 43 | |
| | | | |
Total assets | | | 3,308,431 | |
| | | | |
Liabilities: | | | | |
Payable for investments purchased | | | 12,148 | |
Payable upon return of securities loaned | | | 189,750 | |
Payable for fund shares redeemed | | | 4,162 | |
Payable for variation margin on open futures contracts | | | 4,471 | |
Management and investment advisory fees payable (Note 2) | | | 4,284 | |
Administrative service and service fees payable (Note 2) | | | 796 | |
Professional fees payable | | | 34 | |
Other liabilities | | | 367 | |
| | | | |
Total liabilities | | | 216,012 | |
| | | | |
Net assets | | $ | 3,092,419 | |
| | | | |
Analysis of Net Assets: | | | | |
Paid-in-capital | | $ | 3,054,396 | |
Undistributed net investment income | | | 6,430 | |
Accumulated net realized loss | | | (179,745 | ) |
Unrealized appreciation of investments and futures contracts | | | 211,338 | |
| | | | |
Net assets | | $ | 3,092,419 | |
| | | | |
Shares outstanding (no par value): | | | | |
Institutional Class | | | 98,298,579 | |
| | | | |
Y Class | | | 1,566,848 | |
| | | | |
Investor Class | | | 46,252,037 | |
| | | | |
Advisor Class | | | 1,819,945 | |
| | | | |
Retirement Class | | | 100,922 | |
| | | | |
A Class | | | 100,174 | |
| | | | |
C Class | | | 61,293 | |
| | | | |
AMR Class | | | 18,106,686 | |
| | | | |
Net asset value, offering and redemption price per share: | | | | |
Institutional Class | | $ | 18.75 | |
| | | | |
Y Class | | $ | 18.66 | |
| | | | |
Investor Class | | $ | 18.23 | |
| | | | |
Advisor Class | | $ | 18.15 | |
| | | | |
Retirement Class | | $ | 18.01 | |
| | | | |
A Class (net asset value and redemption price) | | $ | 18.19 | |
| | | | |
A Class (offering price) | | $ | 19.30 | |
| | | | |
C Class | | $ | 18.04 | |
| | | | |
AMR Class | | $ | 18.71 | |
| | | | |
| | | | |
A Cost of investments in unaffiliated securities | | $ | 2,815,379 | |
B Cost of investments in affiliated securities | | $ | 200,689 | |
C Fair value of securities on loan | | $ | 185,342 | |
See accompanying notes
14
American Beacon Small Cap Value FundSM
Statement of Operations
For the year ended October 31, 2011 (in thousands)
| | | | |
Investment Income: | | | | |
Dividend income from unaffiliated securities (net of foreign taxes)* | | $ | 40,562 | |
Dividend income from affiliated securities | | | 8 | |
Interest income | | | 8 | |
Income derived from securities lending, net | | | 853 | |
| | | | |
Total investment income | | | 41,431 | |
| | | | |
Expenses: | | | | |
Management and investment advisory fees (Note 2) | | | 14,814 | |
Administrative service fees (Note 2): | | | | |
Institutional Class | | | 5,381 | |
Y Class | | | 28 | |
Investor Class | | | 3,038 | |
Advisor Class | | | 104 | |
Retirement Class | | | 3 | |
A Class | | | 3 | |
C Class | | | 1 | |
AMR Class | | | 186 | |
Transfer agent fees: | | | | |
Institutional Class | | | 64 | |
Y Class | | | 1 | |
Investor Class | | | 49 | |
Advisor Class | | | 3 | |
A Class | | | 2 | |
C Class | | | 2 | |
AMR Class | | | 13 | |
Custody and fund accounting fees | | | 362 | |
Professional fees | | | 129 | |
Registration fees and expenses | | | 109 | |
Service fees (Note 2): | | | | |
Y Class | | | 9 | |
Investor Class | | | 3,634 | |
Advisor Class | | | 87 | |
Retirement Class | | | 2 | |
A Class | | | 1 | |
C Class | | | 1 | |
Distribution fees (Note 2): | | | | |
Advisor Class | | | 87 | |
Retirement Class | | | 4 | |
A Class | | | 2 | |
C Class | | | 4 | |
Prospectus and shareholder reports | | | 542 | |
Insurance fees | | | 68 | |
Trustee fees | | | 233 | |
Other expenses | | | 169 | |
| | | | |
Total expenses | | | 29,135 | |
| | | | |
Net investment income | | | 12,296 | |
| | | | |
Realized and unrealized gain (loss) on investments: | | | | |
Net realized gain (loss) from: | | | | |
Investments | | | 254,752 | |
Commission recapture (Note 3) | | | 122 | |
Futures contracts | | | 19,122 | |
Change in net unrealized appreciation or depreciation of: | | | | |
Investments | | | (141,997 | ) |
Futures contracts | | | 6,228 | |
| | | | |
Net gain on investments | | | 138,227 | |
| | | | |
Net increase in net assets resulting from operations | | $ | 150,523 | |
| | | | |
* Foreign taxes | | $ | 31 | |
See accompanying notes
15
American Beacon Small Cap Value FundSM
Statement of Changes in Net Assets (in thousands)
| | | | | | | | |
| | | Year Ended
October 31,
2011 | | | Year Ended
October 31,
2010 | |
Increase (Decrease) in Net Assets: | | | | | | | | |
Operations: | | | | | | | | |
Net investment income | | $ | 12,296 | | | $ | 11,136 | |
Net realized gain on investments and futures contracts | | | 273,996 | | | | 179,781 | |
Change in net unrealized appreciation or depreciation of investments and futures contracts | | | (135,769 | ) | | | 296,564 | |
| | | | | | | | |
Net increase in net assets resulting from operations | | | 150,523 | | | | 487,481 | |
| | | | | | | | |
Distributions to Shareholders: | | | | | | | | |
Net investment income: | | | | | | | | |
Institutional Class | | | (7,510 | ) | | | (6,896 | ) |
Y Class | | | (4 | ) | | | – | |
Investor Class | | | (3,709 | ) | | | (2,275 | ) |
Advisor Class | | | (117 | ) | | | – | |
Retirement Class | | | (1 | ) | | | – | |
AMR Class | | | (2,000 | ) | | | (2,187 | ) |
| | | | | | | | |
Net distributions to shareholders | | | (13,341 | ) | | | (11,358 | ) |
| | | | | | | | |
Capital Share Transactions: | | | | | | | | |
Proceeds from sales of shares | | | 1,125,906 | | | | 942,144 | |
Reinvestment of dividends and distributions | | | 13,190 | | | | 11,249 | |
Cost of shares redeemed | | | (920,005 | ) | | | (752,815 | ) |
| | | | | | | | |
Net increase in net assets from capital share transactions | | | 219,091 | | | | 200,578 | |
| | | | | | | | |
Net increase in net assets | | | 356,273 | | | | 676,701 | |
| | | | | | | | |
Net Assets: | | | | | | | | |
Beginning of period | | | 2,736,146 | | | | 2,059,445 | |
| | | | | | | | |
End of Period * | | $ | 3,092,419 | | | $ | 2,736,146 | |
| | | | | | | | |
*Includes undistributed net investment income of | | $ | 6,430 | | | $ | 8,788 | |
| | | | | | | | |
See accompanying notes
16
American Beacon Small Cap Value FundSM
Notes to Financial Statements
October 31, 2011
1. Organization and Significant Accounting Policies
American Beacon Funds (the “Trust”), which is comprised of 20 Funds, is organized as a Massachusetts business trust and is registered under the Investment Company Act of 1940, as amended (the “Act”), as a diversified, open-end management investment company. These financial statements and notes to the financial statements relate to the American Beacon Small Cap Value Fund (the “Fund”), a series of the Trust.
American Beacon Advisors, Inc. (the “Manager”) is a wholly-owned subsidiary of Lighthouse Holdings, Inc. and was organized in 1986 to provide business management, advisory, administrative, and asset management consulting services to the Trust and other investors.
Class Disclosure
The Fund has multiple classes of shares designed to meet the needs of different groups of investors. The following table sets forth the differences amongst the classes:
| | |
Class: | | Offered to: |
| Institutional Class | | Investors making an initial investment of $250,000 |
| Y Class | | Investors making an initial investment of $100,000 |
| Investor Class | | General public and investors investing through an intermediary |
| Advisor Class | | Investors investing through an intermediary |
| Retirement Class | | Investors investing through an intermediary |
| A Class | | General public and investors investing through an intermediary with applicable sales charges |
| C Class | | General public and investors investing through an intermediary with applicable sales charges |
| AMR Class | | Investors in the tax-exempt retirement and benefit plans of the Manager, AMR Corporation, and its affiliates |
Each class offered by the Trust has equal rights as to assets and voting privileges. Income and non-class specific expenses are allocated daily to each class on the basis of the relative net assets. Realized and unrealized capital gains and losses of each class are allocated daily based on the relative net assets of each class of the respective Fund. Class specific expenses, where applicable, currently include administrative service fees, service fees, and distribution fees and vary amongst the classes as described more fully in Note 2.
New Accounting Pronouncements
In April 2011, the Financial Accounting Standards Board (“FASB”) issued an Accounting Standards Update (“ASU”) related to the accounting for repurchase agreements and similar agreements that both entitles and obligates a transferor to repurchase or redeem financial assets before their maturity. The ASU modifies the criteria for determining effective control of transferred assets and as a result certain agreements may now be accounted for as secured borrowings. The ASU is effective prospectively for new transfers and existing transactions that are modified in the first interim or annual period beginning on or after December 15, 2011.
In May 2011, FASB issued an ASU to develop common requirements for measuring fair value and for disclosing information about fair value measurements in accordance with U.S. generally accepted accounting principles, (“U.S. GAAP”) and International Financial Reporting Standards (IFRSs). FASB concluded that the amendments in this ASU will improve the comparability of fair value measurements presented and disclosed in financial statements prepared in accordance with U.S. GAAP and IFRSs. The ASU is effective prospectively during interim or annual periods beginning on or after December 15, 2011.
At this time, management is evaluating the implications of these changes and their impact on the financial statements has not been determined.
17
American Beacon Small Cap Value FundSM
Notes to Financial Statements
October 31, 2011
2. Transactions with Affiliates
Management Agreement
The Trust and the Manager are parties to a Management Agreement that obligates the Manager to provide or oversee the provision of all investment advisory, fund management, and securities lending services. Investment assets of the Fund are managed by multiple investment advisors which have entered into separate investment advisory agreements with the Manager. As compensation for performing the duties required under the Management Agreement, the Manager receives from the Fund an annualized fee equal to 0.05% of the average daily net assets plus amounts paid by the Manager to the unaffiliated investment advisors hired by the Manager to direct investment activities of the Fund. Management fees paid during the year ended October 31, 2011 were as follows (dollars in thousands):
| | | | | | |
Management Fee Rate | | Management Fee | | Amounts paid to Investment Advisors | | Net Amounts Retained by Manager |
| 0.30%-0.60% | | $14,814 | | $13,206 | | $1,608 |
As compensation for services provided by the Manager in connection with securities lending activities, the lending Fund pays to the Manager, with respect to cash collateral posted by borrowers, a fee up to 25% of the net monthly interest income (the gross interest income earned by the investment of cash collateral, less the amount paid to borrowers and related expenses) from such activities and, with respect to loan fees paid by borrowers, a fee up to 25% of such loan fees. This fee is netted against securities lending income in the Statement of Operations. During the year ended October 31, 2011, securities lending fees paid to the Manager were $153,996.
Administrative Services Agreement
The Manager and the Trust entered into an Administrative Services Agreement which obligates the Manager to provide or oversee administrative services to the Fund. As compensation for performing the duties required under the Administrative Services Agreement, the Manager receives an annualized fee of 0.30% of the average daily net assets of the Institutional, Y, Investor, Advisor, and Retirement Classes of the Fund, 0.40% of the average daily net assets of the A and C Classes of the Fund, and 0.05% of the average daily net assets of the AMR Class of the Fund.
Distribution Plans
The Fund, except for the Advisor, Retirement, A, and C Classes of the Fund, has adopted a “defensive” Distribution Plan (the “Plan”) in accordance with Rule 12b-1 under the Act, pursuant to which no fees may be charged to the Fund for distribution purposes. However, the Plan authorizes the management and administrative service fees received by the Manager and the investment advisors hired by the Manager to be used for distribution purposes. Under this Plan, the Fund does not intend to compensate the Manager or any other party, either directly or indirectly, for the distribution of Fund shares.
Separate Distribution Plans (the “Distribution Plans”) have been adopted pursuant to Rule 12b-1 under the Act for the Advisor, Retirement, A, and C Classes of the Fund. Under the Distribution Plans, as compensation for distribution assistance, the Manager receives an annual fee of 0.25% of the average daily net assets of the Advisor and A Classes, 0.50% of the average daily net assets of the Retirement Class, and 1.00% of the average daily net assets of the C Class. The fee will be payable without regard to whether the amount of the fee is more or less than the actual expenses incurred in a particular month by the Manager for distribution assistance.
Service Plans
The Manager and the Trust entered into Service Plans that obligate the Manager to oversee additional shareholder servicing of the Y, Investor, Advisor, Retirement, A, and C Classes. As compensation for performing the duties required under the Service Plans, the Manager receives 0.10% of the average daily net assets of the Y Class, 0.15% of the average daily net assets of the A and C Classes, 0.25% of the average daily net assets of the Advisor and Retirement Classes, and up to 0.375% of the average daily net assets of the Investor Class of the Fund.
18
American Beacon Small Cap Value FundSM
Notes to Financial Statements
October 31, 2011
Investment in Affiliated Funds
The Fund may invest in the American Beacon Money Market Select Fund and the American Beacon U.S. Government Money Market Select Fund (the “USG Select Fund”), (collectively the “Select Funds”). Cash collateral received by the Fund in connection with securities lending may be invested in the Select Funds. The Select Funds and the Fund have the same investment advisor and therefore, are considered to be affiliated. The Manager serves as investment advisor to the Select Funds and receives from the Select Funds an annualized fee of 0.09% of the average daily net assets of the Select Funds. During the year ended October 31, 2011, the Manager earned fees from the Select Funds totaling $11,123 on the Fund’s direct investment in the Select Funds and $140,306 from the Fund’s securities lending collateral invested in the Select Funds.
Interfund Lending Program
Pursuant to an exemptive order by the Securities and Exchange Commission (“SEC”), the Fund, along with other registered investment companies having management contracts with the Manager, may participate in an interfund lending program as a borrower. This program provides an alternative credit facility allowing the Fund to borrow from other participating Funds. During the year ended October 31, 2011, the Fund did not utilize the credit facility.
Expense Reimbursement Plan
The Fund has adopted an Expense Reimbursement Plan whereby the Manager may seek repayment of fees waived or expenses reimbursed for a period of up to three years. However, reimbursement will occur only if the Class’ average net assets have grown or expenses have declined sufficiently to allow reimbursement without causing its expense ratio to exceed the previously agreed upon contractual expense limit. During the year ended October 31, 2011, the Y Class waived $1. A liability has not been booked as the Manager does not intend to seek repayment of this reimbursement.
3. Security Valuation and Fair Value Measurements
Investments are valued at the close of the New York Stock Exchange (the “Exchange”), normally 4 p.m. ET, each day that the Exchange is open for business. Equity securities for which market quotations are available are valued at the last sale price or official closing price (closing bid price or last evaluated quote if no sale has occurred) on the primary market or exchange on which they trade.
Investments in mutual funds are valued at the closing net asset value (“NAV”) per share of the mutual fund on the day of valuation. Investment grade short-term obligations with 60 days or less to maturity are valued using the amortized cost method, which approximates fair value.
Securities for which market prices are not readily available or are not reflective of the fair value of the security, as determined by the Manager, will be priced at fair value following procedures approved by the Trust’s Board of Trustees (the “Board”).
Futures contracts are valued based upon their quoted daily settlement prices. Upon entering into a futures contract, a Fund is required to deposit with its futures broker, an amount of cash or U.S. Government and Agency Obligations in accordance with the initial margin requirements of the broker or exchange. Futures contracts are marked to market daily and an appropriate payable or receivable for the change in value (“variation margin”) is recorded by the Fund. Gains or losses are recognized, but not considered realized until the contracts expire or are closed. Futures contracts involve, to varying degrees, risk of loss in excess of the variation margin disclosed on the Statement of Assets and Liabilities.
19
American Beacon Small Cap Value FundSM
Notes to Financial Statements
October 31, 2011
Security Transactions and Investment Income
Security transactions are recorded on the trade date of the security purchase or sale. The Fund may purchase securities with delivery or payment to occur at a later date. At the time the Fund enters into a commitment to purchase a security, the transaction is recorded, and the value of the security is reflected in the NAV. The value of the security may vary with market fluctuations.
Dividend income, net of foreign taxes, is recorded on the ex-dividend date, except certain dividends from foreign securities which are recorded as soon as the information is available to the Fund. Interest income is earned from settlement date, recorded on the accrual basis, and adjusted, if necessary, for accretion of discounts and amortization of premiums. For financial and tax reporting purposes, realized gains and losses are determined on the basis of specific lot identification.
Dividends to Shareholders
Dividends from net investment income of the Fund normally will be declared and paid at least annually. Distributions, if any, of net realized capital gains are generally paid at least annually and recorded on the ex-dividend date.
Commission Recapture
The Fund has established brokerage commission recapture arrangements with certain brokers or dealers. If the Fund’s investment advisor chooses to execute a transaction through a participating broker, the broker rebates a portion of the commission back to the Fund. Any collateral benefit received through participation in the commission recapture program is directed exclusively to the Fund. This amount is reported with the net realized gain in the Fund’s Statement of Operations.
Allocation of Income, Expenses, Gains, and Losses
Income, expenses (other than those attributable to a specific class), gains, and losses are allocated daily to each class of shares based upon the relative proportion of net assets represented by such class. Operating expenses directly attributable to a specific class are charged against the operations of that class.
Use of Estimates
The preparation of financial statements in conformity with U.S. GAAP requires management to make estimates and assumptions that affect the amounts reported in the financial statements and accompanying notes. Actual results may differ from those estimated.
Other
Under the Trust’s organizational documents, its officers and trustees are indemnified against certain liability arising out of the performance of their duties to the Trust. In the normal course of business, the Trust enters into contracts that provide indemnification to the other party or parties against potential costs or liabilities. The Trust’s maximum exposure under these arrangements is dependent on claims that may be made in the future and, therefore, cannot be estimated. The Trust has had no prior claims or losses pursuant to any such agreement.
Valuation Inputs
Various inputs may be used to determine the fair value of the Fund’s investments. These inputs are summarized in three broad levels for financial statement purposes. The inputs or methodologies used to value securities are not necessarily an indication of the risk associated with investing in those securities.
20
American Beacon Small Cap Value FundSM
Notes to Financial Statements
October 31, 2011
| | | | |
| Level 1 | | - | | Quoted prices in active markets for identical securities. |
| | |
| Level 2 | | - | | Prices determined using other significant observable inputs. These may include quoted prices for similar securities, interest rates, prepayment speeds, credit risk, and others. |
| | |
| Level 3 | | - | | Prices determined using other significant unobservable inputs. Unobservable inputs reflect the Fund’s own assumptions about the factors market participants would use in pricing an investment, and would be based on the best information available. |
Level 1 and Level 2 trading assets and trading liabilities, at fair value
Common stocks and financial derivative instruments, such as futures contracts that are traded on a national securities exchange, are stated at the last reported sale or settlement price on the day of valuation. To the extent these securities are actively traded and valuation adjustments are not applied, they are categorized as Level 1 of the fair value hierarchy. Preferred securities and other equities traded on inactive markets or valued by reference to similar instruments are also categorized as Level 2 of the fair value hierarchy.
Investments in registered open-end investment management companies will be valued based upon the NAVs of such investments and are categorized as Level 1 of the fair value hierarchy. Short-term investments having a maturity of 60 days or less are generally valued at amortized cost which approximates fair value. These investments are categorized as Level 2 of the fair value hierarchy.
Level 3 trading assets and trading liabilities, at fair value
The valuation techniques and significant inputs used in determining the fair values of financial instruments classified as Level 3 of the fair value hierarchy are as follows:
Securities and other assets for which market quotes are not readily available are valued at fair value as determined in good faith by the Board or persons acting at their direction and are categorized as Level 3 of the fair value hierarchy.
Market quotes are considered not readily available in circumstances where there is an absence of current or reliable market-based data (e.g., trade information or broker quotes), including where events occur after the close of the relevant market, but prior to the Exchange close, that materially affect the values of a Fund’s securities or assets. In addition, market quotes are considered not readily available when, due to extraordinary circumstances, the exchanges or markets on which the securities trade, do not open for trading for the entire day and no other market prices are available. The Board has delegated to the Manager the responsibility for monitoring significant events that may materially affect the values of a Fund’s securities or assets and for determining whether the value of the applicable securities or assets should be re-evaluated in light of such significant events.
The Board has adopted methods for valuing securities and other assets in circumstances where market quotes are not readily available, and has delegated the responsibility for applying the valuation methods to the Manager. For instances in which daily market quotes are not readily available, investments may be valued, pursuant to guidelines established by the Board, with reference to other securities or indices. In the event that the security or asset cannot be valued pursuant to one of the valuation methods established by the Board, the fair value of the security or asset will be determined in good faith by the Valuation Committee of the Board, generally based upon recommendations provided by the Manager.
When a Fund uses fair valuation methods applied by the Manager that use significant unobservable inputs to determine its NAV, securities will be priced by another method that the Board or persons acting at their direction believe accurately reflects fair value and are categorized as Level 3 of the fair value hierarchy. These methods may require subjective determinations about the value of a security. While the Trust’s policy is intended to result in a calculation of a Fund’s NAV that fairly reflects security values as of the time of pricing, the Trust cannot guarantee that values determined by the Board or persons acting at their direction would accurately reflect the price that a Fund could obtain for a security if it were to dispose of that security as of the time of pricing (for instance, in a forced or distressed sale). The prices used by a Fund may differ from the value that would be realized if the securities were sold.
21
American Beacon Small Cap Value FundSM
Notes to Financial Statements
October 31, 2011
For fair valuations using significant unobservable inputs, U.S. GAAP requires a reconciliation of the beginning to ending balances for reported fair values that presents changes attributable to total realized and unrealized gains or losses, purchases and sales, and transfers in and out of the Level 3 category during the period. The end of period timing recognition is used for the significant transfers between Levels of the Fund’s assets and liabilities. In accordance with the requirements of U.S. GAAP, a fair value hierarchy and Level 3 reconciliation, if any, have been included in the Notes to the Schedule of Investments for the Fund.
The Fund’s investments are summarized by level based on the inputs used to determine their values. As of October 31, 2011, the Fund’s investments were classified as described below: (in thousands)
| | | | | | | | | | | | | | | | |
| | | Level 1 | | | Level 2 | | | Level 3 | | | Total | |
Common Stock | | $ | 2,853,036 | | | $ | — | | | $ | — | | | $ | 2,853,036 | |
Short-Term Investments | | | 170,866 | | | | — | | | | — | | | | 170,866 | |
Securities Lending Collateral invested in Money Market Funds | | | 189,750 | | | | — | | | | — | | | | 189,750 | |
| | | | | | | | | | | | | | | | |
Total Investments in Securities | | $ | 3,213,652 | | | $ | — | | | $ | — | | | $ | 3,213,652 | |
| | | | | | | | | | | | | | | | |
Futures Contracts | | $ | 13,753 | | | | — | | | | — | | | $ | 13,753 | |
As of October 31, 2011, there were no significant transfers into or out of any level.
4. Securities and Other Investments
Real Estate Investment Trusts
The Fund may own shares of real estate investment trusts (“REITS”) which report information on the source of their distributions annually. The Fund re-characterizes distributions received from REIT investments based on information provided by the REITs into the following categories: ordinary income, long-term capital gains, and return of capital. If information is not available on a timely basis from the REITs, the re-characterization will be estimated based on available information which may include the previous year allocation. If new or additional information becomes available from the REITs at a later date, a re-characterization will be made the following year. These re-characterizations are not recorded for financial statement purposes, but as an adjustment to the calculation of taxable income.
5. Financial Derivative Instruments
Futures Contracts
Futures contracts are contracts to buy or sell a standard quantity of securities at a specified price on a future date. The Fund may enter into financial futures contracts as a method for keeping assets readily convertible to cash if needed to meet shareholder redemptions or for other needs while maintaining exposure to the stock or bond market, as applicable. The primary risks associated with the use of futures contracts are the possibility of illiquid markets or imperfect correlation between the values of the contracts and the underlying securities, or that the counterparty will fail to perform its obligations.
Upon entering into a futures contract, the Fund is required to set aside or deposit with a broker an amount, termed the initial margin, which typically represents 5% of the face value of the futures contract. The Fund usually reflects this amount on the Schedule of Investments as a U.S. Treasury Bill held as collateral for futures contracts or as Cash deposited with broker on the Statement of Assets and Liabilities. Payments to and from the broker, known as variation margin, are required to be made on a daily basis as the price of the futures contract fluctuates. Changes in initial settlement values are accounted for as unrealized appreciation (depreciation) until the contracts are terminated, at which time realized gains and losses are recognized. Futures contracts are valued at the most recent settlement price established each day by the exchange on which they are traded.
22
American Beacon Small Cap Value FundSM
Notes to Financial Statements
October 31, 2011
Fair Values of Derivative Instruments not accounted for as hedging instruments as of October 31, 2011 (in thousands):
| | | | | | |
Statement of Assets and Liabilities | | Derivatives | | Fair Value | |
Unrealized appreciation of investments and futures contracts | | Equity Contracts* | | $ | 13,753 | |
Effect of derivative instruments not accounted for as hedging instruments during the year ended October 31, 2011 (in thousands):
| | | | | | |
Statement of Operations | | Derivatives | | Balance | |
Net realized gain (loss) from futures contracts | | Equity Contracts | | $ | 19,122 | |
Change in net unrealized appreciation or depreciation of futures contracts | | Equity Contracts | | | 6,228 | |
| * | Includes cumulative appreciation or depreciation of futures contracts as reported in the Schedule of Investments footnotes. Only current day’s variation margin is reported within the Statement of Assets and Liabilities. |
6. Federal Income and Excise Taxes
It is the policy of the Fund to qualify as a regulated investment company, by complying with all applicable provisions of Subchapter M of the Internal Revenue Code, as amended, and to make distribution of taxable income sufficient to relieve it from substantially all federal income and excise taxes. For federal income tax purposes, the Fund is treated as a single entity for the purpose of determining such qualification.
The Fund does not have any unrecognized tax benefits in the accompanying financial statements. Each of the tax years in the four year period ended October 31, 2011 remains subject to examination by the Internal Revenue Service. If applicable, the Fund recognizes interest accrued related to unrecognized tax benefits in interest expense and penalties in “Other expenses” on the Statement of Operations.
Dividends are categorized in accordance with income tax regulations which may treat certain transactions differently than U.S. GAAP. Accordingly, the character of distributions and composition of net assets for tax purposes may differ from those reflected in the accompanying financial statements.
The tax character of distributions paid during the fiscal years ended October 31, 2011 and October 31, 2010 were as follows (in thousands):
| | | | | | | | |
| | | Year Ended
October 31,
2011 | | | Year Ended
October 31,
2010 | |
Distributions paid from: | | | | | | | | |
Ordinary income* | | | | | | | | |
Institutional Class | | $ | 7,510 | | | $ | 6,896 | |
Y Class | | | 4 | | | | | |
Investor Class | | | 3,709 | | | | 2,275 | |
Advisor Class | | | 117 | | | | — | |
Retirement Class | | | 1 | | | | — | |
AMR Class | | | 2,000 | | | | 2,187 | |
| | | | | | | | |
Total distributions paid | | $ | 13,341 | | | $ | 11,358 | |
| | | | | | | | |
| * | For tax purposes, short-term capital gains are considered ordinary income distributions. |
23
American Beacon Small Cap Value FundSM
Notes to Financial Statements
October 31, 2011
As of October 31, 2011, the components of distributable earnings (deficit) on a tax basis were as follows (in thousands):
| | | | |
Cost basis of investments for federal income tax purposes | | $ | 3,060,890 | |
| |
Unrealized appreciation | | | 379,842 | |
Unrealized depreciation | | | (227,080 | ) |
| | | | |
Net unrealized appreciation or depreciation | | | 152,762 | |
| |
Undistributed ordinary income | | | 3,776 | |
Accumulated long-term gain (loss) | | | (132,269 | ) |
Other temporary differences | | | 13,754 | |
| | | | |
Distributable earnings (deficit) | | $ | 38,023 | |
| | | | |
Financial reporting records are adjusted for permanent book/tax differences to reflect tax character. Financial records are not adjusted for temporary differences. The temporary differences between financial reporting and tax-basis reporting of unrealized appreciation or depreciation are attributable primarily to the tax deferral of losses from wash sales, the realization for tax purposes of unrealized gains (losses) on certain derivative instruments, and reclassifications of income from real estate investment securities.
Due to inherent differences in the recognition of income, expenses and realized gains (losses) under U.S. GAAP and federal income tax regulations, permanent differences between book and tax reporting have been identified and appropriately reclassified on the Statement of Assets and Liabilities.
Accordingly, the following amounts represent current year permanent differences derived from reclassifications of income from real estate investment securities as of October 31, 2011 (in thousands):
| | | | |
Paid-in-capital | | $ | 518 | |
Undistributed net investment income (loss) | | | (1,313 | ) |
Accumulated net realized gain (loss) | | | 794 | |
Unrealized appreciation or depreciation of investments and futures contracts | | | 1 | |
At October 31, 2011 the capital loss carry forward position for federal income tax purposes was $118,516 expiring in 2017. The Fund utilized $274,780 of net capital loss carryovers for the year ended October 31, 2011. (in thousands)
7. Investment Transactions
The aggregate cost of purchases and proceeds from sales of investments, other than short-term obligations, for the year ended October 31, 2011 were (in thousands) $1,935,115 and $1,805,876, respectively.
A summary of the Fund’s direct transactions and security lending collateral transactions in the USG Select Fund for the year ended October 31, 2011 is set forth below (in thousands):
| | | | | | | | | | | | | | | | | | |
| | | Affiliate | | October 31, 2010
Shares/Fair Value | | | Purchases | | | Sales | | | October 31, 2011
Shares/Fair Value | |
Direct | | USG Select Fund | | $ | — | | | $ | 40,000 | | | $ | 20,000 | | | $ | 20,000 | |
Securities Lending | | USG Select Fund | | | 48,791 | | | | 769,948 | | | | 638,050 | | | | 180,689 | |
8. Securities Lending
The Fund may lend its securities to qualified financial institutions, such as certain broker-dealers, to earn additional income. The borrowers are required to secure their loans continuously with collateral in an amount at least equal to the fair value of the securities loaned, initially in an amount at least equal to 102% of the fair value of domestic securities loaned and 105% of the fair value of international securities loaned. Collateral is monitored and
24
American Beacon Small Cap Value FundSM
Notes to Financial Statements
October 31, 2011
marked to market daily. Daily mark to market amounts are required to be paid to the borrower or received from the borrower by the end of the following business day. This one day settlement for mark to market amounts may result in the collateral being temporarily less than the value of the securities on loan or temporarily more than the required minimum collateral.
To the extent that a loan is collateralized by cash, such cash collateral shall be invested by the securities lending agent (the “Agent”) in money market mutual funds, and other short-term investments, provided the investments meet certain quality and diversification requirements. Securities purchased with cash collateral proceeds are listed in the Fund’s Schedule of Investments and the collateral is shown on the Statement of Assets and Liabilities as a payable.
Securities lending income is generated from the demand premium (if any) paid by the borrower to borrow a specific security and from the return on investment of cash collateral, reduced by negotiated rebate fees paid to the borrower and transaction costs. To the extent that a loan is secured by non-cash collateral, securities lending income is generated as a demand premium reduced by transaction costs. Until May 1, 2011, the Fund, the Agent, and the Manager retained 75%, 15%, and 10%, respectively, of the income generated from securities lending. Beginning May 1, 2011, the Fund, the Agent, and the Manager retained 78%, 12% and 10%, respectively, of the income generated from securities lending.
While securities are on loan, the Fund continues to receive certain income associated with that security and any gain or loss in the market price that may occur during the term of the loan. In the case of domestic equities, the value of any dividend is received in the form of a substitute payment approximately equal to the dividend. In the case of foreign securities, a negotiated amount is received that is less than the actual dividend, but higher than the dividend amount minus the foreign tax that the Fund would be subject to on the dividend.
Securities lending transactions pose certain risks to the Fund, including that the borrower may not provide additional collateral when required or return the securities when due, that the value of the short-term investments will be less than the amount of cash collateral required to be returned to the borrower, that non-cash collateral may be subject to legal constraints in the event of a borrower bankruptcy, and that the cash collateral investments could become illiquid and unable to be used to return collateral to the borrower. The Fund could also experience delays and costs in gaining access to the collateral. The Fund bears the risk of any deficiency in the amount of the cash collateral available for return to the borrower and any action which impairs its ability to liquidate non-cash collateral to satisfy a borrower default.
As of October 31, 2011, the value of outstanding securities on loan and the value of collateral was as follows (in thousands):
| | | | |
Fair Value of Securities on Loan | | Non-Cash Collateral | | Cash Collateral Posted by Borrower |
| $ 185,342 | | $ — | | $ 189,750 |
Cash collateral is listed in the Fund’s Schedule of Investments and is shown on the Statement of Assets and Liabilities as a payable. Income earned on these investments is included in Income derived from securities lending in the Statement of Operations.
Non-cash collateral received by the Fund may not be sold or re-pledged except to satisfy a borrower default. Therefore, non-cash collateral is not included on the Fund’s Schedule of Investments or Statement of Assets and Liabilities.
25
American Beacon Small Cap Value FundSM
Notes to Financial Statements
October 31, 2011
9. Capital Share Transactions
The tables below summarize the activity in capital shares for each Class of the Fund (dollars and shares in thousands):
Year Ended October 31, 2011
| | | | | | | | | | | | | | | | | | | | | | | | | | | | | | | | |
| | | Institutional Class | | | Y Class | | | Investor Class | | | Advisor Class | |
| | | Shares | | | Amount | | | Shares | | | Amount | | | Shares | | | Amount | | | Shares | | | Amount | |
Shares sold | | | 32,139 | | | $ | 624,258 | | | | 1,690 | | | $ | 33,343 | | | | 14,401 | | | $ | 280,691 | | | | 762 | | | $ | 14,511 | |
Reinvestment of dividends | | | 372 | | | | 7,454 | | | | — | | | | 5 | | | | 185 | | | | 3,613 | | | | 6 | | | | 117 | |
Shares redeemed | | | (16,620 | ) | | | (326,085 | ) | | | (176 | ) | | | (3,142 | ) | | | (20,730 | ) | | | (395,525 | ) | | | (811 | ) | | | (15,684 | ) |
| | | | | | | | | | | | | | | | | | | | | | | | | | | | | | | | |
Net increase (decrease) in shares outstanding | | | 15,891 | | | $ | 305,627 | | | | 1,514 | | | $ | 30,206 | | | | (6,144 | ) | | $ | (111,221 | ) | | | (43 | ) | | $ | (1,056 | ) |
| | | | | | | | | | | | | | | | | | | | | | | | | | | | | | | | |
| | | | |
| | | Retirement Class | | | AMR Class | | | A Class | | | C Class | |
| | | Shares | | | Amount | | | Shares | | | Amount | | | Shares | | | Amount | | | Shares | | | Amount | |
Shares sold | | | 95 | | | $ | 1,761 | | | | 8,795 | | | $ | 167,845 | | | | 122 | | | $ | 2,379 | | | | 61 | | | $ | 1,118 | |
Reinvestment of dividends | | | — | | | | 1 | | | | 100 | | | | 2,000 | | | | — | | | | — | | | | — | | | | — | |
Shares redeemed | | | (15 | ) | | | ( 261 | ) | | | (8,847 | ) | | | (178,901 | ) | | | (23 | ) | | | (406 | ) | | | — | | | | (1 | ) |
| | | | | | | | | | | | | | | | | | | | | | | | | | | | | | | | |
Net increase (decrease) in shares outstanding | | | 80 | | | $ | 1,501 | | | | 48 | | | $ | (9,056 | ) | | | 99 | | | $ | 1,973 | | | | 61 | | | $ | 1,117 | |
| | | | | | | | | | | | | | | | | | | | | | | | | | | | | | | | |
Year Ended October 31, 2010 | | | | | | | | | | | | | | | | | | | | | | | | | | | | | | | | |
| | | Institutional Class | | | Y Class | | | Investor Class | | | Advisor Class | |
| | | Shares | | | Amount | | | Shares | | | Amount | | | Shares | | | Amount | | | Shares | | | Amount | |
Shares sold | | | 26,347 | | | $ | 442,447 | | | | 98 | | | $ | 1,732 | | | | 15,077 | | | $ | 249,419 | | | | 937 | | | $ | 15,835 | |
Reinvestment of dividends | | | 431 | | | | 6,838 | | | | — | | | | — | | | | 143 | | | | 2,224 | | | | — | | | | — | |
Shares redeemed | | | (16,704 | ) | | | (273,902 | ) | | | (46 | ) | | | (788 | ) | | | (14,033 | ) | | | (226,469 | ) | | | (1,102 | ) | | | (17,989 | ) |
| | | | | | | | | | | | | | | | | | | | | | | | | | | | | | | | |
Net increase (decrease) in shares outstanding | | | 10,074 | | | $ | 175,383 | | | | 52 | | | $ | 944 | | | | 1,187 | | | $ | 25,174 | | | | (165 | ) | | $ | (2,154 | ) |
| | | | | | | | | | | | | | | | | | | | | | | | | | | | | | | | |
| | | | |
| | | Retirement Class | | | AMR Class | | | A Class | | | C Class | |
| | | Shares | | | Amount | | | Shares | | | Amount | | | Shares | | | Amount | | | Shares | | | Amount | |
Shares sold | | | 22 | | | $ | 390 | | | | 13,750 | | | $ | 232,298 | | | | 1 | | | $ | 17 | | | | — | | | $ | 6 | |
Reinvestment of dividends | | | — | | | | — | | | | 138 | | | | 2,187 | | | | — | | | | — | | | | — | | | | — | |
Shares redeemed | | | (1 | ) | | | (25 | ) | | | (14,762 | ) | | | (233,642 | ) | | | — | | | | — | | | | — | | | | — | |
| | | | | | | | | | | | | | | | | | | | | | | | | | | | | | | | |
Net increase (decrease) in shares outstanding | | | 21 | | | $ | 365 | | | | (874 | ) | | $ | 843 | | | | 1 | | | $ | 17 | | | | — | | | $ | 6 | |
| | | | | | | | | | | | | | | | | | | | | | | | | | | | | | | | |
26
This page intentionally left blank.
27
American Beacon Small Cap Value FundSM
Financial Highlights
(For a share outstanding throughout the period)
| | | | | | | | | | | | | | | | | | | | | | | | | | | | | | | | | | | | | | | | | | | | |
| | | Institutional
Class | | | Y Class | | | Investor
Class | |
| | | Year Ended
October 31, | | | Year Ended
October 31, | | | August 3
to
October 31,
2009 | | | Year Ended
October 31, | |
| | | 2011 | | | 2010 | | | 2009 | | | 2008 | | | 2007 | | | 2011 | | | 2010 | | | | 2011 | | | 2010 | | | 2009 | |
Net asset value, beginning of period | | $ | 17.84 | | | $ | 14.39 | | | $ | 12.53 | | | $ | 22.10 | | | $ | 22.53 | | | $ | 17.76 | | | $ | 14.37 | | | $ | 14.03 | | | $ | 17.40 | | | $ | 14.05 | | | $ | 12.22 | |
| | | | | | | | | | | | | | | | | | | | | | | | | | | | | | | | | | | | | | | | | | | | |
Income from investment operations: | | | | | | | | | | | | | | | | | | | | | | | | | | | | | | | | | | | | | | | | | | | | |
| | | | | | | | | | | |
Net investment income (loss) | | | 0.08 | | | | 0.08 | | | | 0.10 | | | | 0.25 | | | | 0.22 | | | | 0.06 | | | | 0.14 | | | | 0.00 | | | | 0.02 | | | | 0.03 | | | | 0.08 | |
Net gains (losses) on securities (both realized and unrealized) | | | 0.92 | | | | 3.46 | | | | 1.96 | | | | (7.13 | ) | | | 1.10 | | | | 0.92 | | | | 3.36 | | | | 0.34 | | | | 0.88 | | | | 3.37 | | | | 1.91 | |
| | | | | | | | | | | | | | | | | | | | | | | | | | | | | | | | | | | | | | | | | | | | |
Total income (loss) from investment operations | | | 1.00 | | | | 3.54 | | | | 2.06 | | | | (6.88 | ) | | | 1.32 | | | | 0.98 | | | | 3.50 | | | | 0.34 | | | | 0.90 | | | | 3.40 | | | | 1.99 | |
| | | | | | | | | | | | | | | | | | | | | | | | | | | | | | | | | | | | | | | | | | | | |
Less distributions: | | | | | | | | | | | | | | | | | | | | | | | | | | | | | | | | | | | | | | | | | | | | |
Dividends from net investment income | | | (0.09 | ) | | | (0.09 | ) | | | (0.20 | ) | | | (0.22 | ) | | | (0.19 | ) | | | (0.08 | ) | | | (0.11 | ) | | | — | | | | (0.07 | ) | | | (0.05 | ) | | | (0.16 | ) |
Distributions from net realized gains on securities | | | — | | | | — | | | | — | | | | (2.47 | ) | | | (1.56 | ) | | | — | | | | — | | | | — | | | | — | | | | — | | | | — | |
| | | | | | | | | | | | | | | | | | | | | | | | | | | | | | | | | | | | | | | | | | | | |
Total distributions | | | (0.09 | ) | | | (0.09 | ) | | | (0.20 | ) | | | (2.69 | ) | | | (1.75 | ) | | | (0.08 | ) | | | (0.11 | ) | | | — | | | | (0.07 | ) | | | (0.05 | ) | | | (0.16 | ) |
| | | | | | | | | | | | | | | | | | | | | | | | | | | | | | | | | | | | | | | | | | | | |
Net asset value, end of period | | $ | 18.75 | | | $ | 17.84 | | | $ | 14.39 | | | $ | 12.53 | | | $ | 22.10 | | | $ | 18.66 | | | $ | 17.76 | | | $ | 14.37 | | | $ | 18.23 | | | $ | 17.40 | | | $ | 14.05 | |
| | | | | | | | | | | | | | | | | | | | | | | | | | | | | | | | | | | | | | | | | | | | |
Total return A,B | | | 5.57 | % | | | 24.71 | % | | | 16.97 | % | | | (34.84 | )% | | | 6.10 | % | | | 5.49 | % | | | 24.44 | % | | | 2.42 | %E | | | 5.14 | % | | | 24.21 | % | | | 16.59 | % |
| | | | | | | | | | | | | | | | | | | | | | | | | | | | | | | | | | | | | | | | | | | | |
Ratios and supplemental data: | | | | | | | | | | | | | | | | | | | | | | | | | | | | | | | | | | | | | | | | | | | | |
Net assets, end of period (in thousands) | | $ | 1,843,285 | | | $ | 1,470,084 | | | $ | 1,040,805 | | | $ | 826,232 | | | $ | 1,413,734 | | | $ | 29,234 | | | $ | 931 | | | $ | 1 | | | $ | 843,400 | | | $ | 911,737 | | | $ | 719,239 | |
Ratios to average net assets (annualized): | | | | | | | | | | | | | | | | | | | | | | | | | | | | | | | | | | | | | | | | | | | | |
Expenses before reimbursements | | | 0.82 | % | | | 0.81 | % | | | 0.84 | % | | | 0.81 | % | | | 0.80 | % | | | 0.94 | % | | | 0.91 | % | | | 1.11 | %C | | | 1.17 | % | | | 1.18 | % | | | 1.15 | % |
Expenses, net of reimbursements | | | 0.82 | % | | | 0.81 | % | | | 0.84 | % | | | 0.81 | % | | | 0.80 | % | | | 0.94 | % | | | 0.91 | % | | | 1.11 | %C | | | 1.17 | % | | | 1.18 | % | | | 1.15 | % |
Net investment income (loss), before reimbursements | | | 0.47 | % | | | 0.52 | % | | | 0.87 | % | | | 1.36 | % | | | 0.94 | % | | | 0.30 | % | | | 0.39 | % | | | 0.03 | %C | | | 0.12 | % | | | 0.17 | % | | | 0.59 | % |
Net investment income (loss), net of reimbursements | | | 0.47 | % | | | 0.52 | % | | | 0.87 | % | | | 1.36 | % | | | 0.94 | % | | | 0.30 | % | | | 0.39 | % | | | 0.03 | %C | | | 0.12 | % | | | 0.17 | % | | | 0.59 | % |
Portfolio turnover rate | | | 59 | % | | | 59 | % | | | 61 | % | | | 62 | % | | | 52 | % | | | 59 | % | | | 59 | % | | | 61 | %D | | | 59 | % | | | 59 | % | | | 61 | % |
| A | May include adjustments in accordance with accounting principles generally accepted in the United States of America and as such, the net assets for financial reporting purposes and the returns based upon those net asset values may differ from the net asset value and returns for shareholder transactions. |
| B | Based on net asset value, which does not reflect the sales charge, redemption fee, or contingent deferred sales charge, if applicable. |
| D | Portfolio turnover rate is for the period from November 1, 2008 through October 31, 2009. |
| F | Portfolio turnover rate is for the period from November 1, 2009 through October 31, 2010. |
28
American Beacon Small Cap Value FundSM
Financial Highlights
(For a share outstanding throughout the period)
| | | | | | | | | | | | | | | | | | | | | | | | | | | | | | | | | | | | | | | | | | | | | | | | | | | | | | | | | | |
Investor
Class | | | Advisor
Class | | | Retirement Class | | | AMR
Class | |
Year Ended
October 31, | | | Year Ended
October 31, | | | Year
Ended
October 31, | | | May 1 to
October 31, | | | Year Ended
October 31, | |
| 2008 | | | 2007 | | | 2011 | | | 2010 | | | 2009 | | | 2008 | | | 2007 | | | 2011 | | | 2010 | | | 2009 | | | 2011 | | | 2010 | | | 2009 | | | 2008 | | | 2007 | |
$ |
21.62 |
| | $ | 22.08 | | | $ | 17.33 | | | $ | 13.97 | | | $ | 12.13 | | | $ | 21.46 | | | $ | 21.94 | | | $ | 17.23 | | | $ | 13.95 | | | $ | 11.58 | | | $ | 17.76 | | | $ | 14.32 | | | $ | 12.48 | | | $ | 22.05 | | | $ | 22.48 | |
| | | | | | | | | | | | | | | | | | | | | | | | | | | | | | | | | | | | | | | | | | | | | | | | | | | | | | | | | | |
| | | | | | | | | | | | | | |
| | | | | | | | | | | | | | | | | | | | | | | | | | | | | | | | | | | | | | | | | | | | | | | | | | | | | | | | | | |
|
0.20 |
| | | 0.16 | | | | (0.01 | ) | | | 0.01 | | | | 0.06 | | | | 0.16 | | | | 0.10 | | | | 0.02 | | | | 0.04 | | | | (0.02 | ) | | | 0.13 | | | | 0.18 | | | | 0.11 | | | | 0.33 | | | | 0.30 | |
|
(6.97 |
) | | | 1.07 | | | | 0.89 | | | | 3.35 | | | | 1.90 | | | | (6.93 | ) | | | 1.07 | | | | 0.81 | | | | 3.28 | | | | 2.39 | | | | 0.92 | | | | 3.38 | | | | 1.97 | | | | (7.15 | ) | | | 1.08 | |
| | | | | | | | | | | | | | | | | | | | | | | | | | | | | | | | | | | | | | | | | | | | | | | | | | | | | | | | | | |
|
(6.77 |
) | | | 1.23 | | | | 0.88 | | | | 3.36 | | | | 1.96 | | | | (6.77 | ) | | | 1.17 | | | | 0.83 | | | | 3.32 | | | | 2.37 | | | | 1.05 | | | | 3.56 | | | | 2.08 | | | | (6.82 | ) | | | 1.38 | |
| | | | | | | | | | | | | | | | | | | | | | | | | | | | | | | | | | | | | | | | | | | | | | | | | | | | | | | | | | |
| | | | | | | | | | | | | | | | | | | | | | | | | | | | | | | | | | | | | | | | | | | | | | | | | | | | | | | | | | |
|
(0.16 |
) | | | (0.13 | ) | | | (0.06 | ) | | | — | | | | (0.12 | ) | | | (0.09 | ) | | | (0.09 | ) | | | (0.05 | ) | | | (0.04 | ) | | | — | | | | (0.10 | ) | | | (0.12 | ) | | | (0.24 | ) | | | (0.28 | ) | | | (0.25 | ) |
|
(2.47 |
) | | | (1.56 | ) | | | — | | | | — | | | | — | | | | (2.47 | ) | | | (1.56 | ) | | | — | | | | — | | | | — | | | | — | | | | — | | | | — | | | | (2.47 | ) | | | (1.56 | ) |
| | | | | | | | | | | | | | | | | | | | | | | | | | | | | | | | | | | | | | | | | | | | | | | | | | | | | | | | | | |
| | (2.63 | ) | | | (1.69 | ) | | | (0.06 | ) | | | — | | | | (0.12 | ) | | | (2.56 | ) | | | (1.65 | ) | | | (0.05 | ) | | | (0.04 | ) | | | — | | | | (0.10 | ) | | | (0.12 | ) | | | (0.24 | ) | | | (2.75 | ) | | | (1.81 | ) |
| | | | | | | | | | | | | | | | | | | | | | | | | | | | | | | | | | | | | | | | | | | | | | | | | | | | | | | | | | |
| $ | 12.22 | | | $ | 21.62 | | | $ | 18.15 | | | $ | 17.33 | | | $ | 13.97 | | | $ | 12.13 | | | $ | 21.46 | | | $ | 18.01 | | | $ | 17.23 | | | $ | 13.95 | | | $ | 18.71 | | | $ | 17.76 | | | $ | 14.32 | | | $ | 12.48 | | | $ | 22.05 | |
| | | | | | | | | | | | | | | | | | | | | | | | | | | | | | | | | | | | | | | | | | | | | | | | | | | | | | | | | | |
| | (35.04 | )% | | | 5.83 | % | | | 5.07 | % | | | 24.05 | % | | | 16.41 | % | | | (35.19 | )% | | | 5.55 | % | | | 4.79 | % | | | 23.82 | % | | | 20.47 | %E | | | 5.85 | % | | | 25.00 | % | | | 17.30 | % | | | (34.71 | )% | | | 6.39 | % |
| | | | | | | | | | | | | | | | | | | | | | | | | | | | | | | | | | | | | | | | | | | | | | | | | | | | | | | | | | |
| | | | | | | | | | | | | | |
| | | | | | | | | | | | | | | | | | | | | | | | | | | | | | | | | | | | | | | | | | | | | | | | | | | | | | | | | | |
$ |
699,670 |
| | $ | 1,316,188 | | | $ | 33,032 | | | $ | 32,295 | | | $ | 28,333 | | | $ | 33,479 | | | $ | 69,112 | | | $ | 1,817 | | | $ | 360 | | | $ | 1 | | | $ | 338,723 | | | $ | 320,715 | | | $ | 271,066 | | | $ | 209,927 | | | $ | 411,406 | |
| | | | | | | | | | | | | | |
| | | | | | | | | | | | | | | | | | | | | | | | | | | | | | | | | | | | | | | | | | | | | | | | | | | | | | | | | | |
|
1.06 |
% | | | 1.05 | % | | | 1.32 | % | | | 1.32 | % | | | 1.34 | % | | | 1.31 | % | | | 1.32 | % | | | 1.62 | % | | | 1.54 | % | | | 1.53 | %C | | | 0.56 | % | | | 0.57 | % | | | 0.59 | % | | | 0.56 | % | | | 0.54 | % |
|
1.06 |
% | | | 1.05 | % | | | 1.32 | % | | | 1.32 | % | | | 1.31 | % | | | 1.31 | % | | | 1.32 | % | | | 1.62 | % | | | 1.54 | % | | | 1.53 | %C | | | 0.56 | % | | | 0.57 | % | | | 0.59 | % | | | 0.56 | % | | | 0.54 | % |
|
1.12 |
% | | | 0.70 | % | | | (0.02 | )% | | | 0.03 | % | | | 0.44 | % | | | 0.86 | % | | | 0.43 | % | | | (0.35 | )% | | | (0.20 | )% | | | (0.28 | )%C | | | 0.72 | % | | | 0.76 | % | | | 1.11 | % | | | 1.62 | % | | | 1.21 | % |
|
1.12 |
% | | | 0.70 | % | | | (0.02 | )% | | | 0.03 | % | | | 0.48 | % | | | 0.86 | % | | | 0.43 | % | | | (0.35 | )% | | | (0.20 | )% | | | (0.28 | )%C | | | 0.72 | % | | | 0.76 | % | | | 1.11 | % | | | 1.62 | % | | | 1.21 | % |
| | 62 | % | | | 52 | % | | | 59 | % | | | 59 | % | | | 61 | % | | | 62 | % | | | 52 | % | | | 59 | % | | | 59 | % | | | 61 | %D | | | 59 | % | | | 59 | % | | | 61 | % | | | 62 | % | | | 52 | % |
29
American Beacon Small Cap Value FundSM
Financial Highlights
(For a share outstanding throughout the period)
| | | | | | | | | | | | | | | | |
| | | A Class | | | C Class | |
| | | Year
Ended
October 31,
2011 | | | May 17
to
October 31,
2010 | | | Year
Ended
October 31,
2011 | | | September 1
to
October 31,
2010 | |
Net asset value, beginning of period | | $ | 17.39 | | | $ | 17.33 | | | $ | 17.37 | | | $ | 15.62 | |
| | | | | | | | | | | | | | | | |
Income from investment operations: | | | | | | | | | | | | | | | | |
Net investment income (loss) | | | 0.03 | | | | 0.00 | | | | (0.04 | ) | | | (0.01 | ) |
| | | | |
Net gains (losses) on securities (both realized and unrealized) | | | 0.83 | | | | 0.06 | | | | 0.74 | | | | 1.76 | |
| | | | | | | | | | | | | | | | |
Total income (loss) from investment operations | | | 0.86 | | | | 0.06 | | | | 0.70 | | | | 1.75 | |
| | | | | | | | | | | | | | | | |
Less distributions: | | | | | | | | | | | | | | | | |
| | | | |
Dividends from net investment income | | | (0.06 | ) | | | — | | | | (0.03 | ) | | | — | |
| | | | |
Distributions from net realized gains on securities | | | — | | | | — | | | | — | | | | — | |
| | | | | | | | | | | | | | | | |
Total distributions | | | (0.06 | ) | | | — | | | | (0.03 | ) | | | — | |
| | | | | | | | | | | | | | | | |
Net asset value, end of period | | $ | 18.19 | | | $ | 17.39 | | | $ | 18.04 | | | $ | 17.37 | |
| | | | | | | | | | | | | | | | |
Total return A,B | | | 4.92 | % | | | 0.35 | %E | | | 4.00 | % | | | 11.20 | %E |
| | | | | | | | | | | | | | | | |
Ratios and supplemental data: | | | | | | | | | | | | | | | | |
Net assets, end of period (in thousands) | | $ | 1,822 | | | $ | 18 | | | $ | 1,106 | | | $ | 6 | |
Ratios to average net assets (annualized): | | | | | | | | | | | | | | | | |
Expenses before reimbursements | | | 1.57 | % | | | 1.28 | %C | | | 2.60 | % | | | 2.69 | %C |
Expenses, net of reimbursements | | | 1.57 | % | | | 1.28 | %C | | | 2.60 | % | | | 2.10 | %C |
Net investment income (loss), before reimbursements | | | (0.32 | )% | | | 0.01 | %C | | | (1.36 | )% | | | (1.86 | )%C |
Net investment income (loss), net of reimbursements | | | (0.32 | )% | | | 0.01 | %C | | | (1.36 | )% | | | (1.28 | )%C |
Portfolio turnover rate | | | 59 | % | | | 59 | %F | | | 59 | % | | | 59 | %F |
| A | May include adjustments in accordance with accounting principles generally accepted in the United States of America and as such, the net assets for financial reporting purposes and the returns based upon those net asset values may differ from the net asset value and returns for shareholder transactions. |
| B | Based on net asset value, which does not reflect the sales charge, redemption fee, or contingent deferred sales charge, if applicable. |
| D | Portfolio turnover rate is for the period from November 1, 2008 through October 31, 2009. |
| F | Portfolio turnover rate is for the period from November 1, 2009 through October 31, 2010. |
30
American Beacon Small Cap Value FundSM
Privacy Policy & Federal Tax Information
October 31, 2011 (Unaudited)
Privacy Policy
The American Beacon Funds recognize and respect the privacy of our shareholders. We are providing this notice to you so you will understand how shareholder information may be collected and used.
We may collect nonpublic personal information about you from one or more of the following sources:
| | • | | information we receive from you on applications or other forms; |
| | • | | information about your transactions with us or our service providers; and |
| | • | | information we receive from third parties. |
We do not disclose any nonpublic personal information about our customers or former customers to anyone, except as permitted by law.
We restrict access to your nonpublic personal information to those employees or service providers who need to know that information to provide products or services to you. To ensure the confidentiality of your nonpublic personal information, we maintain safeguards that comply with federal standards.
Federal Tax Information
For corporate shareholders in the Fund, the percentage of ordinary dividend income distributed for the year ended October 31, 2010, which is designated as qualifying for the dividends-received deduction, was 78.52%.
For shareholders in the Fund, the percentage of dividend income distributed for the year ended October 31, 2010, which is designated as qualified dividend income under the Jobs Growth Tax Relief Act of 2003, was 100%.
Shareholders will receive notification in January 2012 of the percentage applicable to the preparation of their 2011 income tax returns.
31
Disclosure Regarding the Board of Trustees’ Approval of the Management Agreement and Investment Advisory Agreements of the Fund (Unaudited)
Disclosure Regarding Renewal and Approval of Management Agreement and Investment Advisory Agreements
At its May 26, 2011 meeting, the Board of Trustees (“Board”) considered the renewal of each existing Management Agreement between American Beacon Advisors, Inc. (the “Manager”) and the American Beacon Funds, the American Beacon Mileage Funds, the American Beacon Select Funds and the American Beacon Master Trust (collectively the “Funds”) and each Investment Advisory Agreement between the Manager and a subadvisor (“Investment Advisory Agreements” and collectively with the Management Agreement, the “Agreements”). In preparation for the Board’s consideration to renew these Agreements, the Board and its Investment Committee undertook steps to gather and consider information furnished by the Manager, the subadvisors and Lipper, Inc. (“Lipper”). The Board, with the assistance of independent legal counsel, requested and received certain relevant information from the Manager and each subadvisor.
In addition, the Board’s Investment Committee worked with Lipper to obtain relevant comparative information regarding the performance, fees and expenses of the Funds. The Investment Committee held a separate meeting on May 11, 2011 to consider the information provided by Lipper. Further, the Board took into consideration information furnished for the Board’s review and consideration throughout the year at regular Board and Investment Committee meetings, as well as information specifically prepared in connection with the renewal process.
In connection with the Board’s consideration of the Management Agreement and each Investment Advisory Agreement, the Trustees considered, among other materials, responses by the Manager and the subadvisors to inquiries requesting:
| | • | | a description of any significant changes (actual or anticipated) to principal activities, personnel, services provided to the Funds, or any other area, including how these changes might affect the Funds; |
| | • | | a copy of the firm’s most recent audited or unaudited financial statements, as well as Parts 1 and 2 of its Form ADV registration statement with the SEC; |
| | • | | a summary of any material pending or anticipated litigation or regulatory proceedings involving the firm or its personnel, including the results of any recent regulatory examination or independent audit; |
| | • | | a comparison of the performance of that portion of Fund assets managed by each firm with performance of other similar accounts managed by the firm, including a discussion of relative performance versus a peer group average and any remedial measures if the firm’s performance was materially below that of the peer group; |
| | • | | a profit/loss analysis of the firm and any actual or anticipated economies of scale in relation to the services it provides to each Fund; |
| | • | | an analysis of compensation, including a comparison with fees charged to other clients for which similar services are provided, any proposed changes to the fee schedule and the effect of any fee waivers; |
| | • | | a description of any payments by the subadvisers to the manager to support the Funds’ marketing efforts; |
| | • | | an evaluation of any other benefits to the firm or Funds as a result of their relationship, if any; |
| | • | | confirmation that the firm’s financial condition would not impair its ability to provide high-quality advisory services to the Funds; |
| | • | | a description of the scope of portfolio management services provided to the Funds, including whether such services differ from the services provided to other clients, including other registered investment companies, and any advantages or disadvantages that might accrue to the Funds due to the firm’s involvement in other activities; |
| | • | | a description of the personnel who are assigned primary responsibility for managing the Funds, including any changes during the past year, and a discussion of the adequacy of current and projected staffing levels to service the Funds; |
| | • | | a description of the basis upon which portfolio managers are compensated, including any “incentive” arrangements, and a description of the oversight mechanisms used to prevent a portfolio manager whose compensation is tied to performance of a Fund from taking undue risks; |
| | • | | a discussion regarding the firm’s participation in “soft dollar” arrangements, if any, or other brokerage allocation policies with respect to Fund transactions, including the firm’s methodology for obtaining best execution and the use of any affiliated broker-dealers; |
| | • | | a description of any actual or potential conflicts of interest anticipated in managing Fund assets; |
| | • | | a discussion of whether the firm has identified any investment or operational matters that likely present a high risk in managing Fund assets; |
| | • | | a description of trade allocation procedures among accounts managed by the firm; |
| | • | | a discussion of whether the firm receives, with respect to the Funds, other compensation, including any payment for order flow or ECN liquidity rebates |
| | • | | a certification by the firm regarding the reasonable design of its compliance program; |
| | • | | information regarding the firm’s code of ethics, insider trading policy and disaster recovery plan, including a description of any material changes thereto and a related certification of compliance by the firm; |
| | • | | a description of the firm’s affiliation with any broker-dealer; |
| | • | | a discussion of any anticipated change in the firm’s controlling persons; and |
| | • | | verification of the firm’s insurance coverage with regards to the services provided to the Funds. |
32
Disclosure Regarding the Board of Trustees’ Approval of the Management Agreement and Investment Advisory Agreements of the Fund (Unaudited)
In addition to the foregoing, the Manager provided the following information specific to the renewal of the Management Agreement:
| | • | | a comparison of the performance of each Fund to comparable investment companies and appropriate indices, including comments on the relative performance of, as applicable, each subadvisor and each Fund versus the respective peer group average; |
| | • | | a discussion, if applicable, of any underperformance by a subadvisor relative to its peer group and what, if any, remedial measures the Manager has or intends to take; |
| | • | | a comparison of advisory fees and expense ratios for comparable mutual funds; |
| | • | | an analysis of any material complaints received from Fund shareholders; |
| | • | | a description of the extent to which the Manager monitors the investment activities and financial conditions of each subadvisor to the Funds; |
| | • | | a description of the Manager’s distribution activities with respect to promoting sales of Fund shares, including any revenue sharing practices; |
| | • | | a description of the Manager’s securities lending practices and the fees received from such practices; |
| | • | | a discussion of any rebate arrangements between the Manager and a service provider to the Funds pursuant to which the Manager receives direct or indirect benefits from the service provider; |
| | • | | a description of the portfolio turnover rate and average execution costs for each Fund and, as applicable, each subadvisor to a Fund; and |
| | • | | a description of how expenses that are not readily identifiable to a particular Fund are allocated. |
In connection with the Management Agreement and each Investment Advisory Agreement, the Board also obtained an analysis provided by Lipper that compared: (i) investment performance of each Fund versus comparable investment companies and appropriate indices; (ii) total Fund expenses of each Fund versus comparable mutual funds; and (iii) each Fund’s investment advisory fees versus comparable mutual funds. For each Fund with more than one class of shares, the class of shares used for comparative purposes was the class with the longest performance history, which in most cases was the Institutional Class. References below to each Fund’s Lipper peer group are to the group of comparable mutual funds included in the analysis provided by Lipper.
Provided below is an overview of the primary factors the Trustees considered at the Investment Committee meeting on May 11, 2011 at which the Trustees reviewed the investment performance of the Manager and each subadvisor and the primary factors considered by the Board at its May 26, 2011 meeting at which the Board considered the renewal of the Agreements. The Board did not identify any particular information that was most relevant to its consideration to renew the Management Agreement and each Investment Advisory Agreement, and each Trustee may have afforded different weight to the various factors. Legal counsel to the independent Trustees provided the Board with a memorandum regarding its responsibilities pertaining to the renewal of the Agreements. The memorandum explained the regulatory requirements surrounding the Trustees’ process for evaluating investment advisors and the terms of the contracts. Based on its evaluation, the Board unanimously concluded that the terms of each Agreement were reasonable and fair and that the renewal of each Agreement was in the best interests of the Funds and their shareholders.
Considerations With Respect to All Funds
In determining whether to renew the Management Agreement and each Investment Advisory Agreement, the Trustees considered the best interests of each Fund separately. While the Management Agreement and the Investment Advisory Agreements for all of the Funds were considered at the May 26, 2011 meeting, the Board considered each Fund’s investment management and subadvisory relationships separately. In each instance, the Board considered, among other things, the following factors: (1) the nature and quality of the services provided; (2) the investment performance of a Fund and, as applicable, each subadvisor for a Fund; (3) the costs incurred by the Manager and (to the extent provided) the subadvisors in rendering their services and their resulting profits or losses; (4) the extent to which economies of scale have been taken into account in setting each fee schedule; (5) whether fee levels reflect these economies of scale for the benefit of Fund investors; (6) comparisons of services and fees with contracts entered into by the Manager or a subadvisor or their affiliates with other clients (such as pension funds and other institutional funds); and (7) any other benefits derived or anticipated to be derived by the Manager or a subadvisor from their relationship with a Fund. The Trustees posed questions to various management personnel of the Manager regarding certain key aspects of the materials submitted in support of the renewal.
Nature, Extent and Quality of Services. With respect to the renewal of the Management Agreement, the Board considered, among other factors: each Fund’s generally favorable long-term performance and the background and experience of key investment personnel at the Manager; the low cost structure of the Funds; the Manager’s culture of compliance and support for compliance operations that reduce risks to the Funds; the manager’s commitment to increase assets in the Funds as demonstrated, for example, by the continued increase in sales personnel; the Manager’s continuing efforts to add new series and share classes to enhance the Funds’ product line; the Manager’s high quality of services; the Manager’s active role in monitoring and, as appropriate recommending additional or replacement subadvisors; the Manager’s commitment to increasing headcount and training employees in conjunction with product expansion; and efforts made by the Manager to retain key employees.
With respect to the renewal of each Investment Advisory Agreement, the Trustees considered the background and experience of each subadvisor’s investment personnel responsible for managing the Funds, the size of the subadvisor and their ability to continue to attract and retain qualified investment personnel. Based on the foregoing information, the Board concluded that the nature, extent and quality of the management and advisory services provided by the Manager and each subadvisor were appropriate for each Fund and, thus, determined to renew the Management Agreement and the Investment Advisory Agreement for each Fund.
33
Disclosure Regarding the Board of Trustees’ Approval of the Management Agreement and Investment Advisory Agreements of the Fund (Unaudited)
Investment Performance. The Board evaluated the comparative information provided by Lipper and the Manager regarding each Fund’s investment performance relative to its benchmark index(es) and peer group. The Board considered the information provided by Lipper regarding its independent peer selection methodology to select all peer groups and universes. The Board also considered the performance reports and discussions with management at Board and Committee meetings throughout the year. The Manager also noted that it generally was satisfied with the performance of the subadvisors. A discussion regarding the Board’s considerations with respect to each Fund’s performance appears below under “Additional Considerations and Conclusions with Respect to the Small Cap Value Fund.”
Costs of the Services Provided to the Funds and the Profits Realized by the Manager from its Relationship with the Funds. In analyzing the cost of services and profitability of the Manager and a subadvisor by Fund, the Board considered the revenues earned and the expenses incurred by the Manager. The profits or losses were noted at both an individual Fund level and at an aggregate level for all Funds. The Board also considered that the Management Agreement for the Funds stipulates that, to the extent that a Fund invests all of its investable assets in another registered investment company (i.e., is a “Feeder Fund”), the Fund will not pay the Manager a management fee. Although the Board noted that, in certain cases, the fee rates paid by other clients is lower than the fee rates paid by the Funds, the difference reflects the greater level of responsibility and regulatory requirements associated with managing the Funds.
The Board also noted that the Manager proposed to continue the expense waivers and reimbursements for certain Funds and classes that were in place during the last fiscal year and to put in place new expense waivers and reimbursements for certain new classes of the Funds and new series of the Funds. The Board further considered that each subadvised Fund pays the Manager the amounts due to its subadvisors, and the Manager remits these amounts directly to the applicable subadvisors. The Board considered that the Manager receives service and administrative fees to compensate the Manager for providing administrative services to the Funds and to compensate third-party administrators and broker-dealers for services to Fund shareholders. In addition, the Board considered that the Manager receives management fees for overseeing the securities lending program on behalf of various Funds. The Board also noted that certain classes of the Funds maintain higher expense ratios in order to compensate third-party distributors.
In analyzing the cost of services and profitability for each subadvisor in connection with its investment advisory services to the Fund, the Board considered that, in many cases, the Manager has negotiated the lowest subadvisory fee a subadvisor charges for any comparable client accounts. The Board gave less weight to profitability considerations or did not view this data as imperative to its deliberations given the arm’s length nature of the relationship between the Manager and the subadvisors with respect to the negotiation of subadvisory fees.
Based on the foregoing information, the Board concluded that the profitability levels were reasonable in light of the services performed by the Manager and the subadvisors. A discussion regarding the Board’s considerations with respect to each Fund’s fee rates is set forth below under “Additional Considerations and Conclusions with Respect to the Small Cap Value Fund.”
Economies of Scale. In considering the reasonableness of the management and investment advisory fees, the Board considered whether economies of scale will be realized as the Funds grow and whether fee levels reflect these economies of scale for the benefit of Fund shareholders. In this regard, the Board considered that the Manager has negotiated breakpoints in many subadvisory fee rates. The Board also noted that, for purposes of determining the fee rates chargeable to the Funds, many subadvisors have agreed to take into account assets of AMR and its pension plans that are managed by the subadvisors. Thus, the Funds are able to receive lower effective fee rates. The Board also noted the Manager’s representation that assets in the Funds’ complex increased during 2010, primarily due to market appreciation.
In addition, the Board noted the Manager’s representation that, many of the Funds enjoy the primary benefit of economies of scale because low comparable fee levels are already reflected in the current level of management & administration fees charged by the Manager, the current fee structure already provides an adequate mechanism for the sharing of economies of scale with shareholders and due to the existing low cost structure of the Funds that further breakpoints are not appropriate at this time. Based on the foregoing information, the Board concluded that the Manager and subadvisor fee schedules for each Fund provides for a reasonable sharing of benefits from any economies of scale with the Fund.
Benefits Derived from the Relationship with the Funds. The Board considered the “fall-out” or ancillary benefits that accrue to the Manager and/or the subadvisors as a result of the advisory relationships with the Funds, including greater exposure in the marketplace with respect to the Manager’s or subadvisor’s investment process and expanding the level of assets under management by the Manager and the subadvisors. The Board also considered that the Manager will use the Large Cap Value Fund model in managing its collective investment trust.
In addition, the Manager noted that the Trusts also derive benefits from their association with the Manager. Specifically, the Board noted the Manager’s representation that it provides services to most Funds at a lower than industry average cost. The Board considered that certain of the subadvisors reimburse the Manager for certain of its costs relating to distribution activities for the Funds. The Board also considered that the Fund did not pay commissions to any affiliated broker-dealer of the Manager or the relevant subadvisor during the most recent fiscal year ended October 31, 2010.
Based on the foregoing information, the Board concluded that the potential benefits accruing to the Manager and the subadvisors by virtue of their relationships with the Funds appear to be fair and reasonable.
34
Disclosure Regarding the Board of Trustees’ Approval of the Management Agreement and Investment Advisory Agreements of the Fund (Unaudited)
Additional Considerations and Conclusions with Respect to Each Fund
The performance comparisons below were made versus each Fund’s Lipper peer universe median. References to the Lipper expense universe below are to the group of comparable mutual funds included in the analysis provided to the Trustees by Lipper, Inc.
Additional Considerations and Conclusions with Respect to the Small Cap Value Fund
In considering the renewal of the Management Agreement, the Trustees considered the following additional factors: (1) the Small Cap Value Fund outperformed the peer universe median for the one-, three, five- and ten-year periods ended March 31, 2011 and (2) the expense ratio of the Institutional Class of Fund shares ranked better than the median of its Lipper universe.
In considering the renewal of the Investment Advisory Agreements with Barrow, Brandywine, Dreman Value Management, LLC (“Dreman”), Hotchkis, The Boston Company Asset Management, LLC (“TBC”), and Opus Capital Group, LLC (“Opus”), the Trustees considered the following additional factors: (1) Hotchkis outperformed the peer universe median for the one- three- and ten-year periods ended March 31, 2011, but underperformed for the five-year period; (2) Brandywine outperformed the peer universe median for the one- and ten-year periods ended March 31, 2011, but underperformed for the three- and five-year periods; (3) Barrow outperformed the peer universe median for the one-, three- and five-year periods ended March 31, 2011; (4) TBC outperformed the peer universe median for the three- and five-year periods ended March 31, 2011, but underperformed for the one-year period; (5) Opus outperformed the peer universe median for the one-, three-, and five-year periods ended March 31, 2011; (6) Dreman was allocated a portion of Fund assets on June 28, 2010 and underperformed it market benchmark index since inception; (7) Barrow, Brandywine, Hotchkis, and TBC informed the Manager that they use Fund commissions to obtain proprietary research, the application of which benefits the Fund and each of those subadvisors’ clients; and (8) the Manager’s recommendation to continue to retain each subadvisor.
Based on these considerations and those noted above with respect to all Funds, the Trustees (1) concluded that the fees paid to the Manager and the subadvisors under the Management and Investment Advisory Agreements are fair and reasonable, (2) determined that the Small Cap Value Fund and its shareholders would benefit from the Manager’s and subadvisors’ continued management of the Fund and (3) approved the renewal of the Management and Investment Advisory Agreements with respect to the Small Cap Value Fund.
35
Trustees and Officers of the American Beacon Funds
(Unaudited)
The Trustees and officers of the American Beacon Funds (the “Trust”) are listed below, together with their principal occupations during the past five years. Unless otherwise indicated, the address of each person listed below is 4151 Amon Carter Boulevard, MD 2450, Fort Worth, Texas 76155. Each Trustee oversees twenty funds in the fund complex that includes the Trust, the American Beacon Master Trust, the American Beacon Mileage Funds, and the American Beacon Select Funds. The Trust’s Statement of Additional Information contains additional information about the Trustees and is available without charge by calling 1-800-658-5811.
| | | | |
Name, Age and Address | | Position, Term of Office and Length of Time Served with the Trust | | Principal Occupation(s) During Past 5 Years and Current Directorships |
| | |
| INTERESTED TRUSTEES | | | | |
| | Term | | |
| | Lifetime of Trust until removal, resignation or retirement* | | |
| | |
| Alan D. Feld** (74) | | Trustee since 1996 | | Sole Shareholder of a professional corporation which is a Partner in the law firm of Akin, Gump, Strauss, Hauer & Feld, LLP (1960-Present); Director, Clear Channel Communications (1984-2008); Trustee, Center Point Properties (1994-2006); Member, Board of Trustees, Southern Methodist University; Member, Board of Visitors, M.D. Anderson Hospital; Board of Visitors, Zale/Lipshy Hospital; Trustee, American Beacon Mileage Funds (1996-Present); Trustee, American Beacon Select Funds (1999-Present); Trustee, American Beacon Master Trust Funds (1996-Present). |
| | |
| NON-INTERESTED TRUSTEES | | Term Lifetime of Trust until removal, resignation or retirement* | | |
| | |
| W. Humphrey Bogart (67) | | Trustee since 2004 | | Board Member, Baylor University Medical Center Foundation (1992-2004); Consultant, New River Canada Ltd. (mutual fund servicing company) (1998-2003); President and CEO, Allmerica Trust Company, NA (1996-1997); President and CEO, Fidelity Investments Southwest Company (1983-1995); Senior Vice President of Regional Centers, Fidelity Investments (1988-1995); Trustee, American Beacon Mileage Funds (2004-Present); Trustee, American Beacon Select Funds (2004-Present); Trustee, American Beacon Master Trust Funds (2004-Present). |
| | |
| Brenda A. Cline (50) | | Trustee since 2004 | | Executive Vice President, Chief Financial Officer, Treasurer and Secretary, Kimbell Art Foundation (1993-Present); Trustee, Texas Christian University (1998-Present); Trustee, W.I. Cook Foundation, Inc. (d/b/a Cook Children’s Health Foundation) (2001-2006); Director, Christian Church Foundation (1999-2007); Trustee, Trinity Valley School (2003-2004); Member; Trinity Valley School Endowment Committee (2004-Present); Trustee, American Beacon Mileage Funds (2004-present); Trustee, American Beacon Select Funds (2004-Present); Trustee, American Beacon Master Trust Funds (2004-Present). |
| | |
| Eugene J. Duffy (57) | | Trustee since 2008 | | Principal and Executive Vice President, Paradigm Asset Management (1994-Present); Director, Sunrise Bank of Atlanta (2008-Present); Chairman, Special Contributions Fund Board of Trustees, National Association for the Advancement of Colored People (2007-Present); Trustee, National Association for the Advancement of Colored People (2000-Present); Board of Visitors, Emory University (2006-Present); Trustee, Atlanta Botanical Garden (2006-Present); Board Member, Willie L. Brown Jr. Institute on Politics and Public Service (2001-Present); Chair, National Association of Securities Professionals (2000-2002); Deputy Chief Administrative Officer, City of Atlanta (1985-1990); Trustee, American Beacon Mileage Funds (2008-Present); Trustee, American Beacon Select Funds (2008-Present); Trustee, American Beacon Master Trust Funds (2008-Present). |
36
Trustees and Officers of the American Beacon Funds
(Unaudited)
| | | | |
Name, Age and Address | | Position, Term of Office and Length of Time Served with the Trust | | Principal Occupation(s) During Past 5 Years and Current Directorships |
| | |
| Thomas M. Dunning (69) | | Trustee since 2008 | | Non-Executive Chairman (2008-Present); Chairman (1998-2008) and Chief Executive Officer (1998-2007), Lockton Dunning Benefits (consulting firm in employee benefits); Director, Oncor Electric Delivery Company LLC (2007-present); Board Member, Baylor Health Care System Foundation (2007-present); Vice Chair, State Fair of Texas (1987-Present); Board Member, Southwestern Medical Foundation (1994-present); Board Member, John Tower Center for Political Studies/SMU (2008-Present); Board Member, University of Texas Development Board (2008-Present); Board Member, BancTec (2010 – Present) (software consulting); Trustee, American Beacon Mileage Funds (2008-Present); Trustee, American Beacon Select Funds (2008-Present); Trustee, American Beacon Master Trust Funds (2008-Present). |
| | |
| Richard A. Massman (68) | | Trustee since 2004 Chairman since 2008 | | Consultant and General Counsel Emeritus (2009-Present), Senior Vice President and General Counsel (1994-2009), Hunt Consolidated, Inc. (holding company engaged in oil and gas exploration and production, refining, real estate, farming, ranching and venture capital activities); Chairman (2007-2011) and Director (2005-2011), The Dallas Opera Foundation; Chairman (2006-2010) and Director (2005-2009), Temple Emanu-El Foundation; Trustee, Presbyterian Healthcare Foundation (2006-Present); Director, The Retina Foundation of the Southwest (2000-Present); Trustee, American Beacon Mileage Funds (2004-Present); Trustee, American Beacon Select Funds (2004-Present); Trustee, American Beacon Master Trust Funds (2004-Present). |
| | |
R. Gerald Turner (65) 225 Perkins Admin. Bldg. Southern Methodist Univ. Dallas, Texas 75275 | | Trustee since 2001 | | President, Southern Methodist University (1995-Present); Director, ChemFirst (1986-2002); Director, J.C. Penney Company, Inc. (1996-Present); Director, California Federal Preferred Capital Corp. (2001-2003); Director, Kronus Worldwide Inc. (chemical manufacturing) (2003-Present); Director, First Broadcasting Investment Partners, LLC (2003-2007); Member, Salvation Army of Dallas Board of Directors; Member, Methodist Hospital Advisory Board; Co-Chair, Knight Commission on Intercollegiate Athletics; Trustee, American Beacon Mileage Funds (2001-Present); Trustee, American Beacon Select Funds (2001-Present); Trustee, American Beacon Master Trust Funds (2001-Present). |
| | |
| Paul J. Zucconi,CPA (71) | | Trustee since 2008 | | Director, Affirmative Insurance Holdings, Inc. (producer of nonstandard automobile insurance) (2004-Present); Director, Titanium Metals Corporation (producer of titanium melted and mill products) (2002-Present); Director, Torchmark Corporation (life and health insurance products) (2002-Present); Director, Charter Bank (community services and products) (2010-Present); Director, Dallas Chapter of National Association of Corporate Directors (2004-Present); Partner, KPMG (1976-2001); Trustee, American Beacon Mileage Funds (2008-Present); Trustee, American Beacon Select Funds (2008-Present); Trustee, American Beacon Master Trust Funds (2008-Present). |
| | | | |
Name, Age and Address | | Position, Term of Office and Length of Time Served with the Trust | | Principal Occupation(s) During Past 5 Years and Current Directorships |
| | |
| OFFICERS | | Term | | |
| | One Year | | |
| | |
| Gene L. Needles, Jr. (56) | | President since 2009 Executive Vice President since 2009 | | President, CEO and Director (2009-Present), American Beacon Advisors, Inc.; President, CEO and Director (2009-Present), Lighthouse Holdings, Inc.; President (2009-Present), American Beacon Mileage Funds; President (2009-Present), American Beacon Select Funds; President (2008-2009), Touchstone Investments; President (2003-2007), CEO (2004-2007), Managing Director of Sales (2002-2003), National Sales Manager (1999-2002), and Regional Sales Manager (1993-1999), AIM Distributors. |
37
Trustees and Officers of the American Beacon Funds
(Unaudited)
| | | | |
| William F. Quinn** (63) | | Executive Vice President from 2007 to 2008 and 2009 to Present President from 1987 to 2007 and 2008 to 2009 Trustee from 1987 to 2008 | | Executive Chairman (2009-Present), Chairman (2006-2009), CEO (2006-2007), President (1986-2006) and Director (2003-Present), American Beacon Advisors, Inc.; Chairman and Director (2008-Present), Lighthouse Holdings, Inc.; Chairman (1989-2003) and Director (1979-1989, 2003-Present), American Airlines Federal Credit Union; Director, Hicks Acquisition I, Inc. (2007-2009), Director, Hicks Acquisition II, Inc. (2010-Present); Director, Crescent Real Estate Equities, Inc.(1994-2007); Director, Pritchard, Hubble & Herr, LLC (investment advisor) (2001-2006); Director of Investment Committee, Southern Methodist University Endowment Fund (1996-Present); Member, Southern Methodist University Cox School of Business Advisory Board (1999-2002); Member, New York Stock Exchange Pension Manager Committee (1997-1998, 2000-2002, 2006-Present); Chairman (2007-Present) and Vice Chairman (2004-2007), Committee for the Investment of Employee Benefits; Director, United Way of Metropolitan Tarrant County (1988-2000, 2004-Present); the Independent Trustee, National Railroad Retirement Investment Trust (2011-Present); Trustee (1995-2008) and President (1995-2007, 2008-2009), American Beacon Mileage Funds; Trustee (1999-2008) and President (1999-2007, 2008-Present), American Beacon Select Funds; Trustee, American Beacon Master Trust (1995-2008); Director, American Beacon Global Funds SPC (2002-2011); Director, American Beacon Global Funds, plc (2007-2009). |
| | |
| Rosemary K. Behan (52) | | VP, Secretary and Chief Legal Officer since 2006 | | Vice President, Legal and Compliance, American Beacon Advisors, Inc. (2006-Present); Secretary (2008-Present), Lighthouse Holdings, Inc.; Assistant General Counsel, First Command Financial Planning, Inc. (2004-2006); Attorney, U.S. Securities and Exchange Commission, (1995-2004). |
| | |
| Brian E. Brett (51) | | VP since 2004 | | Vice President, Director of Sales, American Beacon Advisors, Inc. (2004-Present); Regional Vice President, Neuberger Berman, LLC (investment adviser) (1996-2004). |
| | |
| Wyatt Crumpler (45) | | VP since 2007 | | Vice President, Asset Management (2009-Present) and Vice President, Trust Investments (2007-2009), American Beacon Advisors, Inc.; Managing Director of Corporate Accounting (2004-2007) and Director of IT Strategy and Finance (2001-2004), American Airlines, Inc. |
| | |
| Erica Duncan (41) | | VP Since 2011 | | Vice President, Marketing and Client Services (2011-Present), American Beacon Advisors, Inc.; Supervisor, Brand Marketing (2010-2011), Invesco; Supervisor, Marketing Communications (2009-2010) and Senior Financial Writer (2004-2009), Invesco AIM. |
| | |
| Michael W. Fields (57) | | VP since 1989 | | Vice President, Fixed Income Investments, American Beacon Advisors, Inc. (1988-Present); Director American Beacon Global Funds SPC (2002-Present); Director, American Beacon Global Funds plc (2007-2009). |
| | |
| Melinda G. Heika (50) | | Treasurer since 2010 | | Vice President, Finance and Accounting (2010-Present), Controller (2005-2009), Assistant Controller (1998-2004), American Beacon Advisors, Inc.; Treasurer (2010-Present), Lighthouse Holdings, Inc. |
| | |
| Terri L. McKinney (47) | | VP since 2010 | | Vice-President, Enterprise Services (2009-Present), Managing Director (2003-2009), and Director of Marketing & Retail Sales (1996-2003), American Beacon Advisors, Inc.; President, Board of Trustees (2010-Present), Vice-President, Board of Trustees (2008-2010), and Trustee (2006-2008), Down Syndrome Guild of Dallas. |
| | |
| Jeffrey K. Ringdahl (36) | | VP since 2010 | | Chief Operating Officer, American Beacon Advisors, Inc. (2010-Present); Vice President, Product Management, Touchstone Advisors, Inc. (2007-2010); Senior Director, Business Integration, Fidelity Investments (2005-2007). |
| | |
| Samuel J. Silver (48) | | VP Since 2011 | | Vice President, Fixed Income Investments (2011-Present) and Senior Portfolio Manager, Fixed Income Investments (1999-2011), American Beacon Advisors, Inc. |
| | |
| Christina E. Sears (40) | | Chief Compliance Officer since 2004 and Asst. Secretary since 1999 | | Chief Compliance Officer (2004-Present) and Senior Compliance Analyst (1998-2004), American Beacon Advisors, Inc. |
38
Trustees and Officers of the American Beacon Funds
(Unaudited)
| | | | |
| John J. Okray (37) | | Asst. Secretary since 2010 | | Assistant General Counsel, American Beacon Advisors, Inc. (2010-Present); Asst. Secretary (2010-Present), Lighthouse Holdings, Inc.; Vice President, Oppenheimer Funds, Inc. (2004-2010). |
| | |
| Sonia L. Bates (55) | | Asst. Treasurer since 2011 | | Director, Tax and Financial Reporting (2011-Present), Manager, Tax and Financial Reporting (2005-2010) Senior Tax Analyst (1999-2004), American Beacon Advisors, Inc.; Asst. Treasurer (2011-Present), Lighthouse Holdings, Inc. |
| * | The Board has adopted a retirement plan that requires Trustees to retire no later than the last day of the calendar year in which they reach the age of 72, provided, however, that the Board may determine to grant one or more annual exemptions to this requirement. |
| ** | Mr. Feld is deemed to be an “interested person” of the Trusts, as defined by the 1940 Act. Mr. Feld’s law firm of Akin, Gump, Strauss, Hauer & Feld LLP has provided legal services within the past two fiscal years to the Manager and one or more of the Trust’s and Master Trust’s sub-advisors. |
39
This page intentionally left blank.
40
This page intentionally left blank.
41
Delivery of Documents
eDelivery is NOW AVAILABLE – Stop traditional mail delivery and receive your
shareholder reports and summary prospectus on-line. Sign up at
www.americanbeaconfunds.com
If you invest in the Fund through a financial institution, you may be able to receive the Fund’s regulatory mailings, such as the Summary Prospectus, Annual Report and Semi-Annual Report, by e-mail. If you are interested in this option, please go to www.icsdelivery.com and search for your financial institution’s name or contact your financial institution directly.
To obtain more information about the Fund:
| | |
| | |
| | |
By E-mail: american_beacon.funds@ambeacon.com | | On the Internet: Visit our website at www.americanbeaconfunds.com |
| | |
| | |
| | |
By Telephone: Institutional, Y, Investor, Advisor and Retirement Classes Call (800) 658-5811 AMR ClassSM Call (800) 345-2345 | | By Mail: American Beacon Funds P.O. Box 219643 Kansas City, MO 64121-9643 |
| | |
Availability of Quarterly Portfolio Schedules In addition to the Schedule of Investments provided in each semi-annual and annual report, the Fund files a complete schedule of its portfolio holdings with the Securities and Exchange Commission (“SEC”) on Form N-Q as of the first and third fiscal quarters. The Fund’s Forms N-Q are available on the SEC’s website at www.sec.gov. The Forms N-Q may also be reviewed and copied at the SEC’s Public Reference Room, 450 Fifth Street, NW, Washington, DC 20549. Information regarding the operation of the SEC’s Public Reference Room may be obtained by calling 1-800-SEC-0330. A complete schedule of the Fund’s portfolio holdings is also available on the Funds’ website (www.americanbeaconfunds.com) approximately twenty days after the end of each month. | | Availability of Proxy Voting Policy and Records A description of the policies and procedures the Fund uses to determine how to vote proxies relating to portfolio securities is available in the Fund’s Statement of Additional Information, is available free of charge on the Fund’s website (www.americanbeaconfunds.com) and by calling 1-800-967-9009 or by accessing the SEC’s website at www.sec.gov. The Fund’s proxy voting record for the most recent year ended June 30 is filed annually with the SEC on Form N-PX. The Fund’s Forms N-PX are available on the SEC’s website at www.sec.gov. The Fund’s proxy voting record may also be obtained by calling 1-800-967-9009. |
Fund Service Providers:
| | | | | | |
| CUSTODIAN | | TRANSFER AGENT | | INDEPENDENT REGISTERED PUBLIC
ACCOUNTING FIRM | | DISTRIBUTOR |
| State Street Bank and Trust | | Boston Financial Data Services | | Ernst & Young LLP | | Foreside Fund Services, LLC |
| Boston, Massachusetts | | Kansas City, Missouri | | Dallas, Texas | | Portland, Maine |
This report is prepared for shareholders of the American Beacon Funds and may be distributed to others only if preceded or accompanied by a current Prospectus or Summary Prospectus.
| | | | |
| American Beacon Funds and American Beacon Small Cap Value Fund are service marks of American Beacon Advisors, Inc. | | | AR 10/11 | |

About American Beacon Advisors
Since 1986, American Beacon Advisors has offered a variety of products and investment advisory services to numerous institutional and retail clients, including a variety of mutual funds, corporate cash management, and separate account management.
Our clients include defined benefit plans, defined contribution plans, foundations, endowments, corporations, financial planners, and other institutional investors. With American Beacon Advisors, you can put the experience of a multi-billion dollar asset management firm to work for your company.
Any opinions herein, including forecasts, reflect our judgment as of the end of the reporting period and are subject to change. Each advisor’s strategies and the Fund’s portfolio composition will change depending on economic and market conditions. This report is not a complete analysis of market conditions and, therefore, should not be relied upon as investment advice. Although economic and market information has been compiled from reliable sources, American Beacon Advisors, Inc. makes no representation as to the completeness or accuracy of the statements contained herein.
Investing in foreign equities entails additional risk not associated with domestic equities, such as currency fluctuations, economic and political instability, and differences in accounting standards. The risks of investing in foreign equities are heightened when investing in emerging markets.
| | | | |
| American Beacon Funds | | | October 31, 2011 | |
| | |
| | Fellow Shareholders, Investor concerns regarding the health of the global economy and the ongoing European sovereign crisis have taken a toll on the international and emerging markets. With the headlines focused on geopolitical and economic risks, the strengthening underlying fundamentals at many publicly traded companies and continued economic growth—though at an admittedly slower pace—have drawn less attention. This near-term myopia can create opportunities for fund companies like ours, where our sub-advisors manage with a longer-term perspective. The market volatility also highlights the key benefit of our multi-manager approach—a strategy we feel can help smooth performance over time. |
The performance of our international and emerging markets equity funds over the past year fell short of our goals as our funds were affected along with their underlying asset classes. However, we believe our strategy will serve our investors over time as they navigate through episodes of economic and geopolitical turbulence.
For the twelve-month period ended October 31, 2011:
>>American Beacon Emerging Markets Fund (Institutional Class) returned -12.18%
>>American Beacon International Equity Fund (Institutional Class) returned -5.89%
At American Beacon, we remain focused on seeking opportunities and meeting market challenges to deliver the type of consistency and service our shareholders value. We regard your trust in the American Beacon Funds as recognition that we are achieving these goals, and we appreciate your continued investment.
For further details about the growing number of investment opportunities now available within the American Beacon Funds family, please visit our website at www.americanbeaconfunds.com.
|
| Best Regards, |
|
|
| Gene L. Needles, Jr. |
| President |
| American Beacon Funds |
1
Emerging Markets Overview
October 31, 2011 (Unaudited)
For the 12 months ended October 31, 2011, the MSCI Emerging Markets Index fell by 7.72%. Global stock markets were rocked by an ever-growing list of negative economic factors during the period. The euro-zone debt crisis, well into its second year, was the biggest drag on global markets, followed by growing fears of a double-dip recession in the U.S., and China’s efforts to cool an overheated real estate market.
Developed markets were locked in a deleveraging cycle that caused demand to shrink. Emerging market consumption was strong at upper-income levels, but inflation remained stubbornly high in many markets and middle-class consumers clearly felt the squeeze.
Markets began pricing in a global recession, with cyclical industries taking a big hit. During periods of heightened volatility, market correlation tends to rise. This was evident to a certain degree, although sector concentration minimized the impact. South Africa held up relatively well due to its precious metal exposure. Mexico actually benefitted from the country’s association with the U.S., which turned out to be the best of a troubled lot, and Indonesia actually delivered positive performance.
Emerging markets entered 2011 priced for continued earnings expansion. The MSCI Emerging Markets Index was trading at 12 times 2011 earnings, which were expected to rise approximately 19%. This was exceptionally optimistic considering the precarious situation in Europe, the U.S. employment situation, and an apparent property bubble in the world’s largest commodities buyer, China. In addition, inflation was high in several markets, as were local currency levels, adding another layer of pressure on both consumers and exporters.
Government and monetary policy officials faced a delicate balancing act between hiking interest rates to temper inflation, but risking further currency appreciation and slower demand, or using targeted measures to cools segments of the economy. India opted for the latter, China the former. Brazil acquiesced to higher rates, but not without a tax to discourage currency speculation. The result: Gross domestic product (GDP) growth in emerging markets has slowed from 8% in 2010 to an expected 6.4% for 2011. India’s GDP growth rate slowed from over 10% for 2010 to an estimated 7.1% for 2011, Brazil’s growth slowed from 7.5% to 3.7%, and China’s growth rate fell to 9.0% from 10.1%.
The widespread slowdown caused market multiples to contract to more reasonable levels and earnings estimates have fallen more than 10%. Although 2012 estimates may decline a bit further, valuation multiples are close to the 2008 trough.
There are near-term risks, however. The current global economic malaise will not be solved overnight, and risk aversion does not favor emerging markets. The situation in Europe is complicated and could continue to cause volatility and a flight to safety. U.S. political paralysis preceding the presidential election creates additional stress. In addition, Chinese officials have uncharacteristically sounded the growth alarm and indicated that financial reform would be critical to navigating the current economy.
2
Performance Overview
American Beacon Emerging Markets FundSM
October 31, 2011 (Unaudited)
The Institutional Class of the Emerging Markets Fund (“Fund”) returned -12.18% for the twelve months ended October 31, 2011. The Fund underperformed the MSCI Emerging Markets Index (the “Index”) return of -7.72% and the Lipper Emerging Markets Funds Index return of -9.49% for the period.
Comparison of Change in Value of a $10,000 Investment For The Period From 10/31/01 Through 10/31/11

| | | | | | | | | | | | | | | | |
| | | Annualized Total Returns | | | Value of
$10,000
10/31/01-
10/31/11 | |
| | | Periods Ended 10/31/11 | | |
| | | 1 Year | | | 5 Years | | | 10 Years | | |
Institutional Class(1,7) | | | -12.18 | % | | | 4.44 | % | | | 15.54 | % | | $ | 42,405 | |
Y Class (1,2,7) | | | -12.25 | % | | | 4.39 | % | | | 15.52 | % | | | 42,314 | |
Investor Class(1,3,7) | | | -12.65 | % | | | 4.03 | % | | | 15.20 | % | | | 41,149 | |
A Class with sales Charge(1,4,7) | | | -17.60 | % | | | 2.79 | % | | | 14.50 | % | | | 38,733 | |
A Class without sales Charge(1,4,7) | | | -12.58 | % | | | 4.02 | % | | | 15.19 | % | | | 41,124 | |
C Class with sales Charge(1,5,7) | | | -14.18 | % | | | 3.86 | % | | | 15.10 | | | | 40,810 | |
C Class without sales Charge(1,5,7) | | | -13.18 | % | | | 3.86 | % | | | 15.10 | % | | | 40,810 | |
AMR Class(1,7) | | | -12.30 | % | | | 4.58 | % | | | 15.78 | % | | | 43,274 | |
MSCI Emg Mkts Index (6) | | | -7.72 | % | | | 6.52 | % | | | 16.82 | % | | | 47,327 | |
Lipper Emg Mkts Funds Index(6) | | | -9.49 | % | | | 4.63 | % | | | 15.80 | % | | | 43,374 | |
| 1. | Performance shown is historical and is not indicative of future returns. Investment returns and principal value will vary, and shares may be worth more or less at redemption than at original purchase. Performance shown is as of the date indicated, and current performance may be lower or higher than the performance data quoted. To obtain performance as of the most recent month end, please visit www.americanbeaconfunds.com or call 1-800-967-9009. Fund performance in the table above does not reflect the deduction of taxes a shareholder would pay on distributions or the redemption of shares. |
| 2. | Fund performance for the five-year and ten-year periods represent the returns achieved by the Institutional Class from 10/31/01 up to 3/1/10, the inception date of the Y Class, and the returns of the Y Class since its inception. Expenses of the Y Class are higher than those of the Institutional Class. As a result, total returns shown may be higher than they would have been had the Y Class been in existence since 10/31/01. |
| 3. | Fund performance for the ten-year period represents the total returns achieved by the Institutional Class from 10/31/01 up to 10/1/02, the inception date of the Investor Class, and the returns of the Investor Class since its inception. Expenses of the Investor Class are higher than those of the Institutional Class. Therefore, total returns shown may be higher than they would have been had the Investor Class been in existence since 10/31/01. A portion of the fees charged to the Investor Class of the Fund was waived in 2004 and 2005 and recouped in 2006. Performance prior to fee waivers and fee recoupment is different than the actual returns shown. |
| 4. | Fund performance for the five-year and ten-year periods represents the returns achieved by the Institutional Class from 10/31/01 through 10/1/02, the Investor Class from 10/1/02 up to 5/17/10, the inception date of the A Class, and the returns of the A Class since its inception. Expenses of the A Class are higher than those of the Institutional and Investor Classes. As a result, total returns shown may be higher than they would have been had the A Class been in existence since 10/31/01. The maximum sales charge for A Class is 5.75%. |
| 5. | Fund performance for the five-year and ten-year periods represents the returns achieved by the Institutional Class from 10/31/01 through 10/1/02, the Investor Class from 10/1/02 up to 9/1/10, the inception date of the C Class, and the returns of the C Class since its inception. Expenses of the C Class are higher than those of the Institutional and Investor Classes. As a result, total returns shown may be higher than they would have been had the C Class been in existence since 10/31/01. The maximum contingent deferred sales charge for C Class is 1.00% for shares redeemed within one year of the date of purchase. |
| 6. | The MSCI Emerging Markets Index is a market capitalization weighted index composed of companies that are representative of the market structure of developing countries in Latin America, Asia, Eastern Europe, the Middle East and Africa. The Lipper Emerging Markets Funds Index tracks the results of the 30 largest mutual funds in the Lipper Emerging Markets Funds category. Lipper is an independent mutual fund research and ranking service. One cannot directly invest in an index. |
| 7. | The total annual Fund operating expense ratio set forth in the most recent Fund prospectus for the Institutional, Y, Investor, A, C, and AMR Class shares was 1.59%, 1.83%, 1.87%, 2.27%, 3.42%, and 1.35%, respectively. The expense ratios above may vary from the expense ratios presented in other sections of this report that are based on expenses incurred during the period covered by this report. |
The Fund underperformed the Index over the twelve-month period by 4.46% as a result of poor stock selection, as country allocation added value for the period.
Stock selections in China and Mexico led to the relative underperformance, more than offsetting positive selections in South Korea and Brazil. In China, investment in Chaoda Modern Agriculture Holdings Ltd. (down 81.0%) and Weiqiao Textile Co. (down 25.0%) contributed to the relative
3
Performance Overview
American Beacon Emerging Markets FundSM
October 31, 2011 (Unaudited)
underperformance. Detractors in Mexico included Cemex S.A.B. de C.V. (down 57.6%) and Desarrolladora Homex, S.A.B. de C.V. (down 55.5%). Positive contributors in South Korea, including Hyundai Motor Co. (up 23.2%), Lotte Chilsung Beverage Co. Ltd. (up 65.1%), and Lotte Confectionary Co. Ltd. (up 18.1% for the period it was held by the Fund), added value for the period. In Brazil, Vivo Participacoes S.A. (up 73.1%) and Redecard S.A. (up 41.5%) benefited relative performance.
Relative contribution from country allocation was positive for the twelve-month period, as a result of overweighting South Korea and the Czech Republic (up 6.2% and down 1.2%, respectively), and underweighting China (down 15.8%). Overweighting Turkey (down 34.7%) and underweighting Malaysia (up 3.5%) detracted from performance for the period.
The Fund’s basic philosophy remains focused on investing in attractively valued companies with above-average earnings growth expectations.
Top Ten Holdings
| | | | |
| | | % of
Net Assets | |
Petroleo Brasileiro S.A. | | | 3.0 | % |
Lukoil OAO | | | 2.2 | % |
Gazprom OAO | | | 1.9 | % |
Samsung Electronics Co. Ltd. | | | 1.8 | % |
KB Financial Group, Inc. | | | 1.6 | % |
First Pacific Co Ltd. | | | 1.6 | % |
POSCO | | | 1.5 | % |
Banco Santander Brasil S.A. | | | 1.5 | % |
China Mobile Ltd. | | | 1.5 | % |
Itau Unibanco Banco Holding S.A. | | | 1.5 | % |
Sector Allocation
| | | | |
| | | % of
Equities | |
Financials | | | 23.0 | % |
Telecommunication Services | | | 11.4 | % |
Consumer Staples | | | 10.9 | % |
Energy | | | 10.3 | % |
Information Technology | | | 9.6 | % |
Consumer Discretionary | | | 9.2 | % |
Materials | | | 9.1 | % |
Utilities | | | 7.9 | % |
Industrials | | | 7.0 | % |
Health Care | | | 1.6 | % |
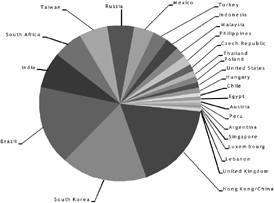
Country Allocation
| | | | |
| | | % of
Equities | |
Hong Kong/China | | | 18.1 | % |
South Korea | | | 17.2 | % |
Brazil | | | 16.4 | % |
India | | | 7.5 | % |
South Africa | | | 5.9 | % |
Taiwan | | | 5.7 | % |
Russia | | | 5.4 | % |
Mexico | | | 4.0 | % |
Turkey | | | 3.0 | % |
Indonesia | | | 2.6 | % |
Malaysia | | | 2.1 | % |
Philippines | | | 2.1 | % |
Czech Republic | | | 1.4 | % |
Thailand | | | 1.3 | % |
Poland | | | 1.2 | % |
United States | | | 1.2 | % |
Hungary | | | 1.0 | % |
Chile | | | 0.8 | % |
Egypt | | | 0.7 | % |
Austria | | | 0.6 | % |
Peru | | | 0.5 | % |
Argentina | | | 0.4 | % |
Singapore | | | 0.4 | % |
Luxembourg | | | 0.2 | % |
Lebanon | | | 0.2 | % |
United Kingdom | | | 0.1 | % |
4
Fund Expenses
American Beacon Emerging Markets FundSM
October 31, 2011 (Unaudited)
Fund Expense Example
As a shareholder of the Fund, you incur two types of costs: (1) transaction costs, such as redemption fees, and (2) ongoing costs, including management fees, administrative service fees, distribution (12b-1) fees, and other Fund expenses. The examples below are intended to help you understand the ongoing cost (in dollars) of investing in the Fund and to compare these costs with the ongoing costs of investing in other mutual funds.
The examples are based on an investment of $1,000 invested at the beginning of the period in each Class and held for the entire period from May 1, 2011 through October 31, 2011.
Actual Expenses
The “Actual” lines of the table provide information about actual account values and actual expenses. You may use the information in this line, together with the amount you invested, to estimate the expenses that you paid over the period. Simply divide your account value by $1,000 (for example, an $8,600 account value divided by $1,000 = 8.6), then multiply the result by the number in the first line under the heading “Expenses Paid During Period” to estimate the expenses you paid on your account during this period. Shareholders of the Investor and Institutional Classes that invest in the Fund through an IRA may be subject to a custodial IRA fee of $15 that is typically deducted each December. If your account was subject to a custodial IRA fee during the period, your costs would have been $15 higher.
Hypothetical Example for Comparison Purposes
The “Hypothetical” lines of the table provide information about hypothetical account values and hypothetical expenses based on the Fund’s actual expense ratio and an assumed 5% per year rate of return before expenses (not the Fund’s actual return). You may compare the ongoing costs of investing in the Fund with other funds by contrasting this 5% hypothetical example and the 5% hypothetical examples that appear in the shareholder reports of the other funds. The hypothetical account values and expenses may not be used to estimate the actual ending account balance or expenses you paid for the period. Shareholders of the Investor and Institutional Classes that invest in the Fund through an IRA may be subject to a custodial IRA fee of $15 that is typically deducted each December. If your account was subject to a custodial IRA fee during the period, your costs would have been $15 higher.
You should also be aware that the expenses shown in the table highlight only your ongoing costs and do not reflect any transaction costs charged by the Fund, such as redemption fees. Similarly, the expense examples for other funds do not reflect any transaction costs charged by those funds, such as sales charges (loads), redemption fees or exchange fees. Therefore, the “Hypothetical” lines of the table are useful in comparing ongoing costs only and will not help you determine the relative total costs of owning different funds. If you were subject to any transaction costs during the period, your costs would have been higher.
| | | | | | | | | | | | |
| | | Beginning
Account
Value
5/1/11 | | | Ending
Account
Value
10/31/11 | | | Expenses Paid
During Period*
5/1/11-10/31/11 | |
Institutional Class | | | | | | | | | | | | |
Actual | | $ | 1,000.00 | | | $ | 816.90 | | | $ | 5.08 | |
Hypothetical ** | | $ | 1,000.00 | | | $ | 1,019.61 | | | $ | 5.65 | |
| | | |
Y Class | | | | | | | | | | | | |
Actual | | $ | 1,000.00 | | | $ | 816.26 | | | $ | 5.54 | |
Hypothetical ** | | $ | 1,000.00 | | | $ | 1,019.11 | | | $ | 6.16 | |
| | | |
Investor Class | | | | | | | | | | | | |
Actual | | $ | 1,000.00 | | | $ | 814.67 | | | $ | 7.27 | |
Hypothetical ** | | $ | 1,000.00 | | | $ | 1,017.19 | | | $ | 8.08 | |
| | | |
A Class | | | | | | | | | | | | |
Actual | | $ | 1,000.00 | | | $ | 814.50 | | | $ | 6.59 | |
Hypothetical ** | | $ | 1,000.00 | | | $ | 1,017.95 | | | $ | 7.32 | |
| | | |
C Class | | | | | | | | | | | | |
Actual | | $ | 1,000.00 | | | $ | 812.34 | | | $ | 10.69 | |
Hypothetical ** | | $ | 1,000.00 | | | $ | 1,013.41 | | | $ | 11.88 | |
| | | |
AMR Class | | | | | | | | | | | | |
Actual | | $ | 1,000.00 | | | $ | 816.14 | | | $ | 6.04 | |
Hypothetical ** | | $ | 1,000.00 | | | $ | 1,018.55 | | | $ | 6.72 | |
| * | Expenses are equal to the Fund’s annualized expense ratios for the six-month period of 1.11%, 1.21%, 1.59%, 1.44%, 2.34%, and 1.32% for the Institutional, Y, Investor, A, C, and AMR Classes respectively, multiplied by the average account value over the period, multiplied by the number derived by dividing the number of days in the most recent fiscal half-year (184) by days in the year (365) to reflect the half-year period. |
| ** | 5% return before expenses. |
5
International Equity Market Overview
October 31, 2011 (Unaudited)
For the 12 months ended October 31, 2011, the MSCI EAFE Index declined by 4.08%. Equity markets were volatile during this period, generally finishing with negative returns.
Events throughout the year led to alternating intervals of investor confidence and investor fear. Positive developments included strong corporate earnings, low interest rates, and abundant liquidity provisions due to the quantitative easing efforts of various central banks. Among the negative developments were the deepening sovereign debt crisis in Europe; armed uprisings in the Middle East and Northern Africa; and the earthquake, tsunami, and nuclear crises in Japan.
In March, Japan’s fledgling recovery was derailed by a horrific three-pronged natural disaster – an earthquake, followed by a tsunami and a nuclear meltdown. While the human tragedy was considerable, the strength and resiliency of the Japanese people has been astounding. The aftermath sparked a severe retrenchment of gross domestic product (GDP) in the spring and early summer, impairing a variety of businesses. Parts of the global technology supply chain were particularly strongly affected. In more recent months, the Japanese economy has shown signs of recovery, which should continue to build despite the global GDP slowdown.
The most significant macro issue in 2011 has been the resumption of the European sovereign credit crisis, which reached a more dangerous level as fears over sovereign default in Portugal, Ireland, Greece and Spain spilled into the much larger and systemically important markets of Italy and France. The Greek government struggled to further extend austerity measures to qualify for their next tranche of bailout funds. However, austerity has triggered a severe recession, and debt-to-GDP levels continue to surge instead of fall. Investor sentiment then targeted European banks with any semblance of exposure to peripheral Europe, taking down shares dramatically with the thesis that sovereign defaults would drive a wave of equity capital raisings to repair balance sheets.
By the end of October, however, Germany and France, along with the other euro-zone nations, agreed to a more comprehensive rescue package. The package included the voluntary restructuring of Greek debt by bondholders (50% haircut), plus an
expansion of the European Financial Stability Facility (EFSF) up to $1.4 trillion and a plan to recapitalize Europe’s undercapitalized banks by up to $150 billion in aggregate. While the package appears more credible, its implementation will be the key to its ultimate success.
This backdrop has driven developed market economies to retain an extremely loose monetary policy, with the U.S. Federal Reserve indicating near-zero interest rates for the foreseeable future. The European Central Bank (ECB), with its incoming chief Mario Draghi from Italy, has recently cut rates 25 basis points (0.25%) to 1.25%, with an easing bias, and Japan continues their near-zero rate environment. However, the loose policy and quantitative easing in the U.S. has done little to extend the global recovery, as the U.S. continues to experience sluggish, below-trend growth. Europe, including its strong core in Germany, is at risk of a regional contraction due to widespread austerity. That said, valuations have become inexpensive during the year, and investor expectations have declined. As inflationary pressures in emerging markets abate and Europe figures out a way to navigate the near-term turbulence, there could be room for positive surprises from international equities over the next 12 months given just a hint of relative improvements in economic conditions.
6
Performance Overview
American Beacon International Equity FundSM
October 31, 2011 (Unaudited)
The Institutional Class of the International Equity Fund (“Fund”) returned -5.89% for the twelve months ended October 31, 2011. The Fund underperformed the MSCI EAFE Index (the “Index”) return of -4.08% but outperformed the Lipper International Funds Index return of -6.38% for the period.
Comparison of Change in Value of a $10,000 Investment
For The Period From 10/31/01 Through 10/31/11

| | | | | | | | | | | | | | | | |
| | | Annualized Total Returns | | | Value of | |
| | | Periods Ended 10/31/11 | | | $10,000 | |
| | | | | | | | | | | | 10/31/01- | |
| | | 1 Year | | | 5 Years | | | 10 Years | | | 10/31/11 | |
Institutional Class(1,8) | | | -5.89 | % | | | -2.27 | % | | | 6.55 | % | | $ | 18,861 | |
Y Class(1,2,8) | | | -6.00 | % | | | -2.32 | % | | | 6.53 | % | | | 18,821 | |
Investor Class(1,8) | | | -6.21 | % | | | -2.58 | % | | | 6.30 | % | | | 18,417 | |
Advisor Class(1,3,8) | | | -6.35 | % | | | -2.84 | % | | | 6.05 | % | | | 17,995 | |
Retirement Class(1,4,8) | | | -6.37 | % | | | -2.87 | % | | | 6.03 | % | | | 17,960 | |
A Class with sales charge(1,5,8) | | | -11.65 | % | | | -3.76 | % | | | 5.65 | % | | | 17,325 | |
A Class without sales charge(1,5,8) | | | -6.26 | % | | | -2.61 | % | | | 6.28 | % | | | 18,384 | |
C Class with sales charge(1,6,8) | | | -8.09 | % | | | -2.82 | % | | | 6.16 | % | | | 18,188 | |
C Class without sales charge(1,6,8) | | | -7.09 | % | | | -2.82 | % | | | 6.16 | % | | | 18,188 | |
AMR Class(1,8) | | | -5.62 | % | | | -2.02 | % | | | 6.82 | % | | | 19,339 | |
Lipper Int’l. Funds Index(7) | | | -6.38 | % | | | -1.39 | % | | | 6.44 | % | | | 18,674 | |
MSCI EAFE Index (7) | | | -4.08 | % | | | -2.41 | % | | | 5.73 | % | | | 17,465 | |
| 1. | Performance shown is historical and is not indicative of future returns. Investment returns and principal value will vary, and shares may be worth more or less at redemption than at original purchase. Performance shown is as of date indicated and current performance may be lower or higher than the performance data quoted. To obtain performance as of the most recent month end, please visit www.americanbeaconfunds.com or call 1-800-967-9009. Fund performance in the table above does not reflect the deduction of taxes a shareholder would pay on distributions or the redemption of shares. |
| 2. | Fund performance for the five-year and ten-year periods represents the total returns achieved by the Institutional Class from 10/31/01 up to 8/3/09, the inception date of the Y Class, and the returns of the Y Class since its inception. Expenses of the Y Class are higher than those of the |
| | Institutional Class. As a result, total returns shown may be higher than they would have been had the Y Class been in existence since 10/31/01. |
| 3. | Fund performance for the ten-year period represents the total returns achieved by the Investor Class from 10/31/01 up to 5/1/03, the inception date of the Advisor Class, and the returns of the Advisor Class since its inception. Expenses of the Advisor Class are higher than those of the Investor Class. As a result, total returns shown may be higher than they would have been had the Advisor Class been in existence since 10/31/01. A portion of the fees charged to the Advisor Class of the Fund was waived through 2007. Performance prior to waiving fees was lower than the actual returns shown for periods through 2007. |
| 4. | Fund performance for the five-year and ten-year periods represents the total returns achieved by the Investor Class from 10/31/01 through 4/30/03 and the Advisor Class from 5/1/03 up to 5/1/09, the inception date of the Retirement Class, and the returns of the Retirement Class since its inception. Expenses of the Retirement Class are higher than those of the Advisor and Investor Classes. As a result, total returns shown may be higher than they would have been had the Retirement Class been in existence since 10/31/01. |
| 5. | Fund performance for the five-year and ten-year periods represents the total returns achieved by the Investor Class from 10/31/01 up to 5/17/10, the inception date of the A Class, and the returns of the A Class since its inception. Expenses of the A Class are higher than those of the Investor Class. As a result, total returns shown may be higher than they would have been had the A Class been in existence since 10/31/01. The maximum sales charge for A Class is 5.75%. |
| 6. | Fund performance for the five-year and ten-year periods represents the total returns achieved by the Investor Class from 10/31/01 up to 9/1/10, the inception date of the C Class, and the returns of the C Class since its inception. Expenses of the C Class are higher than those of the Investor Class. As a result, total returns shown may be higher than they would have been had the C Class been in existence since 10/31/01. The maximum contingent deferred sales charge for C Class is 1.00% for shares redeemed within one year of the date of purchase. |
| 7. | The Lipper International Funds Index tracks the results of the 30 largest mutual funds in the Lipper International Funds category. Lipper is an independent mutual fund research and ranking service. The MSCI EAFE Index is a market capitalization weighted index of international stock performance composed of equities from developed markets excluding the U.S. and Canada. One cannot directly invest in an index. |
| 8. | The total annual Fund operating expense ratio set forth in the most recent Fund prospectus for the Institutional, Y, Investor, Advisor, Retirement, A, C, and AMR Class shares was 0.72%, 0.82%, 1.08%, 1.27%, 1.67%, 1.27%, 2.17%, and 0.47%, respectively. The expense ratios above may vary from the expense ratios presented in other sections of this report that are based on expenses incurred during the period covered by this report. |
7
Performance Overview
American Beacon International Equity FundSM
October 31, 2011 (Unaudited)
The Fund underperformed the Index by 1.81% over the twelve-month period due to country allocation, as stock selection added value.
Stock selections within Japan and France benefited the Fund’s relative performance. In Japan, the Fund added value through investments in Daito Trust Construction Co. Ltd. (up 56.2%), JGC Corp (up 52.5%), and KDDI Corp. (up 41.6%). In France, Sanofi (up 8.7%), EADS N.V. (up 28.8%), and Technip S.A. (up 16.5%) benefited relative performance for the period. Stock selections in Hong Kong and the Netherlands detracted from relative performance, including Esprit Holdings Ltd. (down 72.0%) in Hong Kong and Koninklijke Philips Electronics N.V. and PostNL N.V. (down 27.9% and 54.7%, respectively) in the Netherlands.
Country allocation contributed negatively to relative performance, specifically through underweighting Australia (up 3.5%) and overweighting France (down 11.5%). Investing in South Korea (up 6.2%) added value during the period.
Although economic and market conditions vary from period to period, the Fund’s primary strategy of investing in undervalued companies with above-average earnings growth expectations remains consistent.
Top Ten Holdings
| | | | |
| | | % of
Net Assets | |
Sanofi | | | 2.6 | % |
Novartis AG | | | 2.5 | % |
Siemens AG | | | 1.7 | % |
HSBC Holdings plc | | | 1.7 | % |
Royal Dutch Shell plc | | | 1.7 | % |
Vodafone Group plc | | | 1.7 | % |
Total S.A. | | | 1.6 | % |
DBS Group Holdings Ltd. | | | 1.6 | % |
Unilever plc | | | 1.5 | % |
GlaxoSmithKline plc | | | 1.5 | % |
Sector Allocation
| | | | |
| | | % of Equities | |
Financials | | | 20.5 | % |
Industrials | | | 14.4 | % |
Health Care | | | 11.9 | % |
Consumer Discretionary | | | 11.0 | % |
Energy | | | 9.5 | % |
Materials | | | 9.3 | % |
Consumer Staples | | | 7.4 | % |
Information Technology | | | 6.8 | % |
Telecommunication Services | | | 6.7 | % |
Utilities | | | 2.6 | % |
Regional Allocation*

| * | shown as a percentage of equities |
Region
| | | | |
Europe | | | 72.5 | % |
Asia | | | 25.2 | % |
North America | | | 1.6 | % |
Middle East | | | 0.7 | % |
8
Fund Expenses
American Beacon International Equity FundSM
October 31, 2011 (Unaudited)
Fund Expense Example
As a shareholder of the Fund, you incur two types of costs: (1) transaction costs, such as redemption fees, and (2) ongoing costs, including management fees, administrative service fees, distribution (12b-1) fees, and other Fund expenses. The examples below are intended to help you understand the ongoing cost (in dollars) of investing in the Fund and to compare these costs with the ongoing costs of investing in other mutual funds.
The examples are based on an investment of $1,000 invested at the beginning of the period in each Class and held for the entire period from May 1, 2011 through October 31, 2011.
Actual Expenses
The “Actual” lines of the table provide information about actual account values and actual expenses. You may use the information in this line, together with the amount you invested, to estimate the expenses that you paid over the period. Simply divide your account value by $1,000 (for example, an $8,600 account value divided by $1,000 = 8.6), then multiply the result by the number in the first line under the heading “Expenses Paid During Period” to estimate the expenses you paid on your account during this period. Shareholders of the Investor and Institutional Classes that invest in the Fund through an IRA may be subject to a custodial IRA fee of $15 that is typically deducted each December. If your account was subject to a custodial IRA fee during the period, your costs would have been $15 higher.
Hypothetical Example for Comparison Purposes
The “Hypothetical” lines of the table provide information about hypothetical account values and hypothetical expenses based on the Fund’s actual expense ratio and an assumed 5% per year rate of return before expenses (not the Fund’s actual return). You may compare the ongoing costs of investing in the Fund with other funds by contrasting this 5% hypothetical example and the 5% hypothetical examples that appear in the shareholder reports of the other funds. The hypothetical account values and expenses may not be used to estimate the actual ending account balance or expenses you paid for the period.
Shareholders of the Investor and Institutional Classes that invest in the Fund through an IRA may be subject to a custodial IRA fee of $15 that is typically deducted each December. If your account was subject to a custodial IRA fee during the period, your costs would have been $15 higher.
You should also be aware that the expenses shown in the table highlight only your ongoing costs and do not
reflect any transaction costs charged by the Fund, such as redemption fees. Similarly, the expense examples for other funds do not reflect any transaction costs charged by those funds, such as sales charges (loads), redemption fees or exchange fees. Therefore, the “Hypothetical” lines of the table are useful in comparing ongoing costs only and will not help you determine the relative total costs of owning different funds. If you were subject to any transaction costs during the period, your costs would have been higher.
| | | | | | | | | | | | |
| | | Beginning
Account
Value
5/1/11 | | | Ending
Account
Value
10/31/11 | | | Expenses Paid
During Period*
5/1/11-10/31/11 | |
Institutional Class | | | | | | | | | | | | |
Actual | | $ | 1,000.00 | | | $ | 828.53 | | | $ | 3.18 | |
Hypothetical ** | | $ | 1,000.00 | | | $ | 1,021.73 | | | $ | 3.52 | |
| | | |
Y Class | | | | | | | | | | | | |
Actual | | $ | 1,000.00 | | | $ | 828.27 | | | $ | 3.64 | |
Hypothetical ** | | $ | 1,000.00 | | | $ | 1,021.22 | | | $ | 4.02 | |
| | | |
Investor Class | | | | | | | | | | | | |
Actual | | $ | 1,000.00 | | | $ | 827.49 | | | $ | 4.88 | |
Hypothetical ** | | $ | 1,000.00 | | | $ | 1,019.86 | | | $ | 5.40 | |
| | | |
Advisor Class | | | | | | | | | | | | |
Actual | | $ | 1,000.00 | | | $ | 826.41 | | | $ | 5.75 | |
Hypothetical ** | | $ | 1,000.00 | | | $ | 1,018.90 | | | $ | 6.36 | |
| | | |
Retirement Class | | | | | | | | | | | | |
Actual | | $ | 1,000.00 | | | $ | 826.55 | | | $ | 6.08 | |
Hypothetical ** | | $ | 1,000.00 | | | $ | 1,018.55 | | | $ | 6.72 | |
| | | |
A Class | | | | | | | | | | | | |
Actual | | $ | 1,000.00 | | | $ | 827.31 | | | $ | 5.62 | |
Hypothetical ** | | $ | 1,000.00 | | | $ | 1,019.06 | | | $ | 6.21 | |
| | | |
C Class | | | | | | | | | | | | |
Actual | | $ | 1,000.00 | | | $ | 823.50 | | | $ | 8.96 | |
Hypothetical ** | | $ | 1,000.00 | | | $ | 1,015.38 | | | $ | 9.91 | |
| | | |
AMR Class | | | | | | | | | | | | |
Actual | | $ | 1,000.00 | | | $ | 829.82 | | | $ | 1.98 | |
Hypothetical ** | | $ | 1,000.00 | | | $ | 1,023.04 | | | $ | 2.19 | |
| * | Expenses are equal to the Fund’s annualized expense ratios for the six-month period of 0.69%, 0.79%, 1.06%, 1.25%, 1.32%, 1.22%, 1.95%, and 0.43% for the Institutional, Y, Investor, Advisor, Retirement, A, C, and AMR Classes respectively, multiplied by the average account value over the period, multiplied by the number derived by dividing the number of days in the most recent fiscal half-year (184) by days in the year (365) to reflect the half-year period. |
| ** | 5% return before expenses. |
9
American Beacon Funds
Report of Independent Registered Public Accounting Firm
To the Shareholders and the Board of Trustees of
American Beacon Emerging Markets Fund and American Beacon International Equity Fund:
We have audited the accompanying statements of assets and liabilities, including the schedules of investments, of the American Beacon Emerging Markets Fund and the American Beacon International Equity Fund (two of the funds constituting the American Beacon Funds) (collectively, the “Funds”), as of October 31, 2011, and the related statements of operations for the year then ended, the statements of changes in net assets for each of the two years in the period then ended, and financial highlights for the periods indicated therein. These financial statements and financial highlights are the responsibility of the Funds’ management. Our responsibility is to express an opinion on these financial statements and financial highlights based on our audits.
We conducted our audits in accordance with the standards of the Public Company Accounting Oversight Board (United States). Those standards require that we plan and perform the audit to obtain reasonable assurance about whether the financial statements and financial highlights are free of material misstatement. We were not engaged to perform an audit of the Funds’ internal control over financial reporting. Our audits included consideration of internal control over financial reporting as a basis for designing audit procedures that are appropriate in the circumstances, but not for the purpose of expressing an opinion on the effectiveness of each Fund’s internal control over financial reporting. Accordingly, we express no such opinion. An audit also includes examining, on a test basis, evidence supporting the amounts and disclosures in the financial statements and financial highlights, assessing the accounting principles used and significant estimates made by management, and evaluating the overall financial statement presentation. Our procedures included confirmation of securities owned as of October 31, 2011, by correspondence with the custodian and brokers or by other appropriate auditing procedures where replies from brokers were not received. We believe that our audits provide a reasonable basis for our opinion.
In our opinion, the financial statements and financial highlights referred to above present fairly, in all material respects, the financial position of the American Beacon Emerging Markets Fund and the American Beacon International Equity Fund at October 31, 2011, the results of their operations for the year then ended, the changes in their net assets for each of the two years in the period then ended, and the financial highlights for each of the periods indicated therein, in conformity with U.S. generally accepted accounting principles.
Dallas, Texas
December 29, 2011
10
American Beacon Emerging Markets FundSM
Schedule of Investments
October 31, 2011
| | | | | | | | |
| | | Shares | | | Fair Value | |
| | | | | | (000’s) | |
ARGENTINA - 0.38% | | | | | | | | |
COMMON STOCKS - (Cost $688) | | | | | |
Banco Macro S.A., ADRA | | | 4,192 | | | $ | 84 | |
Nortel Inversora S.A., ADRA | | | 18,400 | | | | 439 | |
| | | | | | | | |
Total Argentina | | | | | | | 523 | |
| | | | | | | | |
AUSTRIA - 0.60% | | | | | | | | |
COMMON STOCKS - (Cost $1,750) | | | | | |
Erste Group Bank AG | | | 38,472 | | | | 820 | |
| | | | | | | | |
BRAZIL - 15.39% | | | | | | | | |
COMMON STOCKS - 13.69% (Cost $20,659) | |
Banco do Brasil S.A. | | | 41,790 | | | | 630 | |
Banco Santander Brasil S.A., ADRA | | | 220,250 | | | | 2,005 | |
Brasil Insurance Participacoes e Administracao S.A. | | | 8,500 | | | | 82 | |
BRF - Brasil Foods S.A.B | | | 30,210 | | | | 629 | |
Centrais Eletricas Brasileiras S.A., ADRA | | | 100,100 | | | | 996 | |
Centrais Eletricas Brasileiras S.A.B | | | 51,766 | | | | 518 | |
Cia de Bebidas das Americas, ADRA | | | 20,480 | | | | 691 | |
Cielo S.A. | | | 9,600 | | | | 254 | |
Embraer S.A., ADRA | | | 44,640 | | | | 1,242 | |
Fibria Celulose S.A., ADRA | | | 25,500 | | | | 226 | |
Gerdau S.A., ADRA | | | 54,460 | | | | 491 | |
Grendene S.A. | | | 31,840 | | | | 146 | |
Itau Unibanco Holding S.A., ADRA | | | 65,289 | | | | 1,249 | |
Itau Unibanco Holding S.A. | | | 17,400 | | | | 284 | |
JBS S.A. | | | 175,100 | | | | 526 | |
Magnesita Refratarios S.A.B | | | 53,700 | | | | 195 | |
Marfrig Alimentos S.A. | | | 166,000 | | | | 721 | |
MRV Engenharia e Participacoes S.A. | | | 18,900 | | | | 133 | |
PDG Realty S.A. Empreendimentos e Participacoes | | | 55,100 | | | | 243 | |
Petroleo Brasileiro S.A., A Shares, ADRA B | | | 101,479 | | | | 2,566 | |
Petroleo Brasileiro S.A., ADRA B | | | 58,990 | | | | 1,593 | |
Porto Seguro S.A. | | | 20,960 | | | | 224 | |
Redecard S.A. | | | 19,900 | | | | 334 | |
Telefonica Brasil S.A., ADRA | | | 32,805 | | | | 952 | |
Ultrapar Participacoes S.A. | | | 11,600 | | | | 207 | |
Vale S.A., ADRA | | | 27,570 | | | | 701 | |
Viver Incorporadora e Construtora S.A.B | | | 679,880 | | | | 939 | |
| | | | | | | | |
Total Common Stocks | | | | | | | 18,777 | |
| | | | | | | | |
PREFERRED STOCKS - 1.70% (Cost $1,873) | |
Cia de Tecidos do Norte de Minas - Coteminas | | | 40,262 | | | | 84 | |
Cia Energetica de Minas Gerais | | | 200 | | | | 3 | |
Cia Energetica do Ceara | | | 31,800 | | | | 642 | |
Gerdau S.A. | | | 5,800 | | | | 52 | |
Itau Unibanco Holding S.A. | | | 28,055 | | | | 535 | |
Tele Norte Leste, ADRA | | | 40,110 | | | | 435 | |
Vale S.A., A Shares | | | 10,704 | | | | 254 | |
Vale S.A., ADRA | | | 14,086 | | | | 333 | |
| | | | | | | | |
Total Preferred Stocks | | | | | | | 2,338 | |
| | | | | | | | |
Total Brazil | | | | | | | 21,115 | |
| | | | | | | | |
| | | | | | | | |
| | | Shares | | | Fair Value | |
| | | | | | (000’s) | |
CHILE - 0.76% | | | | | | | | |
COMMON STOCKS - (Cost $1,095) | | | | | |
Banco Santander-Chile, ADRA | | | 2,800 | | | $ | 229 | |
Cencosud S.A. | | | 38,924 | | | | 244 | |
Empresa Nacional de Electricidad S.A., ADRA | | | 400 | | | | 19 | |
Empresa Nacional de Electricidad S.A. | | | 109,000 | | | | 176 | |
Enersis S.A., ADRA | | | 13,666 | | | | 268 | |
Enersis S.A. | | | 18,595 | | | | 7 | |
SACI Falabella | | | 10,276 | | | | 95 | |
| | | | | | | | |
Total Chile | | | | | | | 1,038 | |
| | | | | | | | |
CZECH REPUBLIC - 1.33% | | | | | | | | |
COMMON STOCKS - (Cost $1,785) | | | | | |
CEZ AS | | | 9,900 | | | | 419 | |
Komercni Banka AS | | | 1,524 | | | | 294 | |
Telefonica Czech Republic AS | | | 52,608 | | | | 1,106 | |
| | | | | | | | |
Total Czech Republic | | | | | | | 1,819 | |
| | | | | | | | |
EGYPT - 0.63% | | | | | | | | |
COMMON STOCKS - (Cost $1,001) | | | | | |
Commercial International Bank Egypt SAE | | | 120,292 | | | | 536 | |
Juhayna Food IndustriesB | | | 142,046 | | | | 116 | |
Telecom Egypt | | | 84,912 | | | | 212 | |
| | | | | | | | |
Total Egypt | | | | | | | 864 | |
| | | | | | | | |
HONG KONG/CHINA - 16.98% | | | | | |
COMMON STOCKS - (Cost $27,244) | | | | | |
Asia Cement China Holdings Corp. | | | 89,000 | | | | 42 | |
Bank of Communications Co Ltd. | | | 328,900 | | | | 226 | |
Beijing Capital International Airport Co Ltd. | | | 780,000 | | | | 347 | |
Belle International Holdings Ltd. | | | 169,000 | | | | 324 | |
BYD Electronic International Co Ltd. | | | 851,000 | | | | 310 | |
Chaoda Modern Agriculture Holdings Ltd. | | | 2,200,000 | | | | 312 | |
China Coal Energy Co Ltd. | | | 342,000 | | | | 419 | |
China Construction Bank Corp. | | | 1,527,325 | | | | 1,110 | |
China Dongxiang Group Co. | | | 1,711,000 | | | | 301 | |
China Life Insurance Co Ltd. | | | 238,000 | | | | 612 | |
China Mengniu Dairy Co Ltd. | | | 98,000 | | | | 311 | |
China Minsheng Banking Corp Ltd. | | | 235,000 | | | | 188 | |
China Mobile Ltd. | | | 210,000 | | | | 2,001 | |
China Pacific Insurance Group Co Ltd. | | | 117,400 | | | | 358 | |
China Petroleum & Chemical Corp. | | | 46,370 | | | | 44 | |
China Petroleum & Chemical Corp., ADRA | | | 870 | | | | 82 | |
China Power International Development Ltd. | | | 1,067,800 | | | | 228 | |
China Railway Construction Corp Ltd. | | | 402,500 | | | | 239 | |
China Railway Group Ltd. | | | 703,000 | | | | 234 | |
China Resources Power Holdings Co Ltd. | | | 1,120,000 | | | | 1,992 | |
China Telecom Corp Ltd. | | | 480,000 | | | | 298 | |
China Yuchai International Ltd. | | | 25,420 | | | | 387 | |
China ZhengTong Auto Services Holdings Ltd.B | | | 140,000 | | | | 148 | |
COSCO Pacific Ltd. | | | 140,000 | | | | 195 | |
Dickson Concepts International Ltd. | | | 687,945 | | | | 389 | |
First Pacific Co Ltd. | | | 2,147,074 | | | | 2,221 | |
GCL-Poly Energy Holdings Ltd. | | | 483,000 | | | | 152 | |
See accompanying notes
11
American Beacon Emerging Markets FundSM
Schedule of Investments
October 31, 2011
| | | | | | | | |
| | | Shares | | | Fair Value | |
| | | | | | (000’s) | |
Global Bio-Chem Technology Group Co Ltd. | | | 946,520 | | | $ | 213 | |
Guangzhou Automobile Group Co Ltd. | | | 359,370 | | | | 359 | |
Hengan International Group Co Ltd. | | | 32,500 | | | | 281 | |
Huaneng Power International, Inc. | | | 1,147,900 | | | | 513 | |
Huaneng Power International, Inc., ADRA | | | 370 | | | | 7 | |
Industrial & Commercial Bank of China | | | 1,237,555 | | | | 758 | |
Maanshan Iron & Steel | | | 376,000 | | | | 110 | |
Mindray Medical International Ltd., ADRA | | | 6,410 | | | | 175 | |
NWS Holdings Ltd. | | | 166,817 | | | | 253 | |
People’s Food Holdings Ltd. | | | 1,313,911 | | | | 685 | |
PetroChina Co. Ltd. | | | 872,000 | | | | 1,135 | |
Ping An Insurance Group Co. | | | 37,500 | | | | 272 | |
Renhe Commercial Holdings Co Ltd. | | | 1,834,000 | | | | 252 | |
Shanghai Industrial Holdings Ltd. | | | 115,000 | | | | 376 | |
Shanghai Pharmaceuticals Holding Co Ltd.B | | | 83,000 | | | | 159 | |
Sinotrans Ltd. | | | 6,639,058 | | | | 1,352 | |
Sohu.com, Inc.B | | | 5,700 | | | | 344 | |
Tencent Holdings Ltd. | | | 25,100 | | | | 572 | |
TPV Technology Ltd. | | | 264,970 | | | | 76 | |
Want Want China Holdings Ltd. | | | 296,000 | | | | 271 | |
Weiqiao Textile Co. | | | 1,741,100 | | | | 952 | |
Xinhua Winshare Publishing and Media Co Ltd. | | | 477,000 | | | | 210 | |
Yanzhou Coal Mining Co Ltd. | | | 112,000 | | | | 278 | |
Zhejiang Expressway Co. Ltd. | | | 362,000 | | | | 240 | |
| | | | | | | | |
Total Hong Kong/China | | | | | | | 23,313 | |
| | | | | | | | |
HUNGARY - 0.96% | | | | | | | | |
COMMON STOCKS - (Cost $1,391) | | | | | |
Magyar Telekom Telecommunications plc | | | 421,763 | | | | 973 | |
Richter Gedeon Nyrt | | | 2,141 | | | | 343 | |
| | | | | | | | |
Total Hungary | | | | | | | 1,316 | |
| | | | | | | | |
INDIA - 7.02% | | | | | | | | |
COMMON STOCKS - (Cost $10,051) | | | | | |
Asian Paints Ltd. | | | 3,162 | | | | 205 | |
Bank of India | | | 25,470 | | | | 173 | |
Dr Reddy’s Laboratories Ltd. | | | 9,012 | | | | 306 | |
Engineers India Ltd. | | | 2,041 | | | | 10 | |
GAIL India Ltd. | | | 16,460 | | | | 142 | |
Glenmark Pharmaceuticals Ltd. | | | 49,859 | | | | 321 | |
HDFC Bank Ltd. | | | 48,217 | | | | 482 | |
Hindustan Petroleum Corp Ltd. | | | 31,430 | | | | 215 | |
ICICI Bank Ltd. | | | 11,508 | | | | 217 | |
India Cements Ltd. | | | 223,410 | | | | 367 | |
IndusInd Bank Ltd. | | | 37,662 | | | | 221 | |
ITC Ltd. | | | 88,417 | | | | 385 | |
Jindal Steel & Power Ltd. | | | 16,299 | | | | 186 | |
Jubilant Life Sciences Ltd. | | | 63,090 | | | | 253 | |
Larsen & Toubro Ltd. | | | 7,117 | | | | 205 | |
Mahanagar Telephone Nigam | | | 186,640 | | | | 119 | |
Mahindra & Mahindra Ltd. | | | 16,031 | | | | 285 | |
NMDC Ltd. | | | 60,420 | | | | 290 | |
Oriental Bank of Commerce | | | 39,890 | | | | 236 | |
Reliance Energy Ltd. | | | 158,850 | | | | 1,505 | |
Reliance Industries Ltd. | | | 82,936 | | | | 1,476 | |
Rolta India Ltd. | | | 139,370 | | | | 237 | |
| | | | | | | | |
| | | Shares | | | Fair Value | |
| | | | | | (000’s) | |
State Bank of India | | | 7,590 | | | $ | 295 | |
State Bank of India, GDRD E | | | 5,090 | | | | 401 | |
Steel Authority of India Ltd. | | | 74,910 | | | | 171 | |
Sterlite Industries India Ltd., ADRA | | | 40 | | | | 0 | |
Sterlite Industries India Ltd. | | | 76,060 | | | | 195 | |
Tata Consultancy Services Ltd. | | | 18,999 | | | | 431 | |
Tata Steel Ltd. | | | 30,387 | | | | 298 | |
| | | | | | | | |
Total India | | | | | | | 9,627 | |
| | | | | | | | |
INDONESIA - 2.41% | | | | | | | | |
COMMON STOCKS - (Cost $2,682) | | | | | |
Aneka Tambang Tbk PT | | | 407,500 | | | | 81 | |
Astra Agro Lestari Tbk PT | | | 32,000 | | | | 77 | |
Astra International Tbk PT | | | 55,400 | | | | 424 | |
Bank Central Asia Tbk PT | | | 381,500 | | | | 345 | |
Bank Mandiri Tbk PT | | | 411,500 | | | | 325 | |
Indofood Sukses Makmur Tbk PT | | | 417,500 | | | | 244 | |
Indosat Tbk PT | | | 899,000 | | | | 540 | |
Kalbe Farma Tbk PT | | | 407,000 | | | | 158 | |
Lippo Karawaci Tbk PT | | | 4,578,500 | | | | 325 | |
Medco Energi Internasional Tbk PT | | | 1,118,000 | | | | 289 | |
Telekomunikasi Indonesia Tbk PT | | | 595,800 | | | | 495 | |
| | | | | | | | |
Total Indonesia | | | | | | | 3,303 | |
| | | | | | | | |
LEBANON - 0.20% | | | | | | | | |
COMMON STOCKS - (Cost $365) | | | | | |
Banque Audi sal- Audi Saradar Group, GDRE | | | 21,549 | | | | 139 | |
BLOM Bank SAL, GDRE | | | 17,692 | | | | 136 | |
| | | | | | | | |
Total Lebanon | | | | | | | 275 | |
| | | | | | | | |
LUXEMBOURG - 0.17% | | | | | | | | |
COMMON STOCKS - (Cost $268) | | | | | |
Samsonite International S.A.B | | | 141,300 | | | | 231 | |
| | | | | | | | |
MALAYSIA - 1.94% | | | | | | | | |
COMMON STOCKS - (Cost $2,994) | | | | | |
Axiata Group Bhd | | | 424,700 | | | | 673 | |
CIMB Group Holdings Bhd | | | 131,400 | | | | 322 | |
Genting Malaysia Bhd | | | 72,410 | | | | 90 | |
Malayan Banking Bhd | | | 43,472 | | | | 118 | |
Proton Holdings Bhd | | | 928,700 | | | | 805 | |
Sime Darby Bhd | | | 103,200 | | | | 296 | |
Tenaga Nasional Bhd | | | 187,250 | | | | 363 | |
| | | | | | | | |
Total Malaysia | | | | | | | 2,667 | |
| | | | | | | | |
MEXICO - 3.73% | | | | | | | | |
COMMON STOCKS - (Cost $5,812) | | | | | |
America Movil SAB de CV, ADRA | | | 68,182 | | | | 1,734 | |
Cemex SAB de CV, ADRA | | | 153,000 | | | | 669 | |
Consorcio ARA SAB de CV | | | 299,700 | | | | 82 | |
Desarrolladora Homex SAB de CV, ADRA B | | | 15,630 | | | | 234 | |
Fomento Economico Mexicano SAB de CV, ADRA | | | 9,880 | | | | 662 | |
Gruma SAB de CV | | | 431,540 | | | | 844 | |
Grupo Financiero Banorte SAB de CV | | | 89,200 | | | | 304 | |
Grupo Televisa S.A., ADRA | | | 21,000 | | | | 448 | |
Industrias CH SAB de CVB | | | 7,800 | | | | 25 | |
See accompanying notes
12
American Beacon Emerging Markets FundSM
Schedule of Investments
October 31, 2011
| | | | | | | | |
| | | Shares | | | Fair Value | |
| | | | | | (000’s) | |
Telefonos de Mexico SAB de CV, ADRA | | | 7,224 | | | $ | 113 | |
| | | | | | | | |
Total Mexico | | | | | | | 5,115 | |
| | | | | | | | |
PERU - 0.51% | | | | | | | | |
COMMON STOCKS - (Cost $672) | | | | | |
Cia de Minas Buenaventura S.A., ADRA | | | 8,130 | | | | 333 | |
Credicorp Ltd. | | | 3,310 | | | | 360 | |
| | | | | | | | |
Total Peru | | | | | | | 693 | |
| | | | | | | | |
PHILIPPINES - 1.97% | | | | | | | | |
COMMON STOCKS - (Cost $2,636) | | | | | |
Ayala Corp. | | | 37,872 | | | | 268 | |
Bank of the Philippine Islands | | | 11,123 | | | | 15 | |
First Philippine Holdings Corp. | | | 544,870 | | | | 663 | |
Metro Pacific Investments Corp. | | | 4,546,000 | | | | 341 | |
Metropolitan Bank & Trust | | | 269,649 | | | | 447 | |
Pepsi-Cola Products Philippines, Inc. | | | 5,274,000 | | | | 253 | |
Philippine Long Distance Telephone Co. | | | 6,580 | | | | 367 | |
SM Investments Corp. | | | 26,490 | | | | 342 | |
| | | | | | | | |
Total Philippines | | | | | | | 2,696 | |
| | | | | | | | |
POLAND - 1.11% | | | | | | | | |
COMMON STOCKS - (Cost $1,641) | | | | | |
Asseco Poland S.A. | | | 23,111 | | | | 359 | |
Bank Pekao S.A. | | | 2,960 | | | | 137 | |
Eurocash S.A. | | | 69,319 | | | | 549 | |
Telekomunikacja Polska S.A. | | | 88,979 | | | | 473 | |
| | | | | | | | |
Total Poland | | | | | | | 1,518 | |
| | | | | | | | |
RUSSIA - 5.06% | | | | | | | | |
COMMON STOCKS - (Cost $6,400) | | | | | |
Eurasia Drilling Co Ltd., GDRE | | | 2,986 | | | | 70 | |
Eurasia Drilling Co. Ltd, GDRE | | | 3,279 | | | | 77 | |
Gazprom OAO, ADRA | | | 229,980 | | | | 2,670 | |
Lukoil OAO, ADRA | | | 52,936 | | | | 3,055 | |
Rosneft Oil Co., GDRB E | | | 61,005 | | | | 434 | |
Tatneft, ADRA | | | 5,799 | | | | 171 | |
VimpelCom Ltd., ADRA | | | 42,230 | | | | 464 | |
| | | | | | | | |
Total Russia | | | | | | | 6,941 | |
| | | | | | | | |
SINGAPORE - 0.35% | | | | | | | | |
COMMON STOCKS - (Cost $526) | | | | | |
Haw Par Corp Ltd. | | | 108,325 | | | | 483 | |
| | | | | | | | |
SOUTH AFRICA - 5.60% | | | | | | | | |
COMMON STOCKS - (Cost $7,966) | | | | | |
Anglo Platinum Ltd. | | | 8,972 | | | | 646 | |
ArcelorMittal South Africa Ltd. | | | 10,584 | | | | 89 | |
AVI Ltd. | | | 78,242 | | | | 350 | |
Clicks Group Ltd. | | | 52,280 | | | | 274 | |
JD Group Ltd. | | | 151,460 | | | | 845 | |
MTN Group Ltd. | | | 43,145 | | | | 748 | |
Murray & Roberts Holdings Ltd. | | | 94,940 | | | | 288 | |
Naspers Ltd., N Shares | | | 15,939 | | | | 756 | |
Nedbank Group Ltd. | | | 7,970 | | | | 141 | |
Pick n Pay Stores Ltd. | | | 46,835 | | | | 234 | |
SABMiller plc | | | 21,875 | | | | 806 | |
Sappi Ltd. | | | 71,024 | | | | 208 | |
Sasol Ltd. | | | 3,890 | | | | 175 | |
| | | | | | | | |
| | | Shares | | | Fair Value | |
| | | | | | (000’s) | |
Standard Bank Group Ltd. | | | 153,184 | | | $ | 1,881 | |
Telkom SA Ltd. | | | 62,620 | | | | 241 | |
| | | | | | | | |
Total South Africa | | | | | | | 7,682 | |
| | | | | | | | |
SOUTH KOREA - 16.17% | | | | | | | | |
COMMON STOCKS - 15.30% (Cost $20,131) | |
Cheil Industries, Inc. | | | 2,425 | | | | 214 | |
Cheil Worldwide, Inc. | | | 7,110 | | | | 117 | |
Doosan Heavy Industries and Construction Co. Ltd. | | | 2,080 | | | | 111 | |
Grand Korea Leisure Co Ltd. | | | 7,600 | | | | 136 | |
Hyundai Development Co. | | | 16,220 | | | | 333 | |
Hyundai Engineering & Construction Co Ltd. | | | 4,119 | | | | 263 | |
Hyundai Heavy Industries Co Ltd. | | | 728 | | | | 196 | |
Hyundai Mobis | | | 1,343 | | | | 387 | |
Hyundai Motor Co. | | | 4,086 | | | | 829 | |
Hyundai Steel Co. | | | 2,420 | | | | 220 | |
Jinro Ltd. | | | 16,457 | | | | 376 | |
KB Financial Group, Inc. | | | 55,818 | | | | 2,186 | |
KB Financial Group, Inc., ADRA | | | 1,650 | | | | 64 | |
Korea Aerospace Industries Ltd.B | | | 7,570 | | | | 250 | |
Korea Electric Power Corp. | | | 76,915 | | | | 1,735 | |
Korea Exchange Bank | | | 84,120 | | | | 623 | |
Korea Life Insurance Co. Ltd. | | | 1,220 | | | | 7 | |
KT Corp., ADRA | | | 10,920 | | | | 182 | |
KT Corp. | | | 4,570 | | | | 153 | |
KT&G Corp. | | | 465 | | | | 29 | |
LG Chem Ltd. | | | 1,354 | | | | 436 | |
LG Electronics, Inc. | | | 7,160 | | | | 477 | |
LG Household & Health Care Ltd. | | | 305 | | | | 138 | |
Lotte Chilsung Beverage Co Ltd. | | | 1,119 | | | | 1,258 | |
Lotte Confectionery Co Ltd. | | | 41 | | | | 64 | |
Mando Corp. | | | 1,123 | | | | 193 | |
Mirae Asset Securities Co. Ltd. | | | 9,050 | | | | 288 | |
NCSoft Corp. | | | 911 | | | | 287 | |
NHN Corp. | | | 1,154 | | | | 241 | |
NongShim Co Ltd. | | | 1,758 | | | | 346 | |
POSCO, ADRA | | | 1,140 | | | | 98 | |
POSCO | | | 5,680 | | | | 1,969 | |
Samsung Electronics Co. Ltd. | | | 2,575 | | | | 2,234 | |
Samsung Fire & Marine Insurance Co Ltd. | | | 1,655 | | | | 350 | |
Samsung Heavy Industries Co. Ltd. | | | 2,610 | | | | 80 | |
Shinhan Financial Group Co Ltd. | | | 34,012 | | | | 1,334 | |
Shinsegae Co Ltd. | | | 1,066 | | | | 267 | |
SK Chemicals Co Ltd. | | | 924 | | | | 59 | |
SK Innovation Co. Ltd. | | | 865 | | | | 129 | |
SK Telecom Co Ltd., ADRA | | | 16,620 | | | | 246 | |
SK Telecom Co Ltd. | | | 8,620 | | | | 1,143 | |
SSCP Co Ltd. | | | 10,075 | | | | 34 | |
Tong Yang Life Insurance | | | 24,730 | | | | 297 | |
Woongjin Coway Co Ltd. | | | 7,346 | | | | 253 | |
Yuhan Corp. | | | 3,388 | | | | 370 | |
| | | | | | | | |
Total Common Stocks | | | | | | | 21,002 | |
| | | | | | | | |
PREFERRED STOCKS - 0.87% (Cost $954) | | | | | |
Hyundai Motor Co. | | | 15,412 | | | | 973 | |
Samsung Electronics Co. Ltd. | | | 385 | | | | 220 | |
| | | | | | | | |
Total Preferred Stocks | | | | | | | 1,193 | |
| | | | | | | | |
Total South Korea | | | | | | | 22,195 | |
| | | | | | | | |
See accompanying notes
13
American Beacon Emerging Markets FundSM
Schedule of Investments
October 31, 2011
| | | | | | | | |
| | | Shares | | | Fair Value | |
| | | | | | (000’s) | |
TAIWAN - 5.32% | | | | | | | | |
COMMON STOCKS - (Cost $7,697) | | | | | |
Asustek Computer, Inc. | | | 31,648 | | | $ | 220 | |
AU Optronics Corp., ADRA | | | 54,760 | | | | 234 | |
AU Optronics Corp. | | | 244,000 | | | | 105 | |
Catcher Technology Co. Ltd. | | | 22,000 | | | | 123 | |
China Steel Corp. | | | 2,744 | | | | 3 | |
Chinatrust Financial Holding Co Ltd. | | | 153,198 | | | | 100 | |
First Financial Holding Co Ltd. | | | 48,463 | | | | 32 | |
Formosa Plastics Corp. | | | 80,000 | | | | 232 | |
Foxconn Technology Co. Ltd. | | | 1,000 | | | | 3 | |
Fubon Financial Holding Co Ltd. | | | 148,527 | | | | 175 | |
Hon Hai Precision Industry Co Ltd. | | | 405,509 | | | | 1,116 | |
HTC Corp. | | | 14,458 | | | | 321 | |
KGI Securities Co Ltd. | | | 372,227 | | | | 155 | |
Largan Precision Co. Ltd. | | | 6,000 | | | | 133 | |
Lung Yen Life Service Corp. | | | 18,000 | | | | 55 | |
Nan Ya Printed Circuit Board Corp. | | | 131,099 | | | | 384 | |
Novatek Microelectronics Corp. | | | 192,000 | | | | 471 | |
Powertech Technology, Inc. | | | 110,400 | | | | 270 | |
Siliconware Precision Industries Co. | | | 242,000 | | | | 247 | |
Siliconware Precision Industries Co., ADRA | | | 9,260 | | | | 48 | |
SinoPac Financial Holdings Co Ltd. | | | 1,463,315 | | | | 470 | |
Taiwan Cement Corp. | | | 138,000 | | | | 170 | |
Taiwan Semiconductor Manufacturing Co Ltd. | | | 288,385 | | | | 702 | |
Tatung Co Ltd. | | | 397,298 | | | | 140 | |
TPK Holding Co Ltd.B | | | 2,200 | | | | 37 | |
Transcend Information, Inc. | | | 120,520 | | | | 281 | |
Uni-President Enterprises Corp. | | | 203,244 | | | | 281 | |
United Microelectronics Corp., ADRA | | | 19,450 | | | | 43 | |
United Microelectronics Corp. | | | 1,008,226 | | | | 445 | |
Young Fast Optoelectronics Co Ltd. | | | 88,541 | | | | 257 | |
Yuanta Financial Holding Co. Ltd. | | | 85,000 | | | | 48 | |
| | | | | | | | |
Total Taiwan | | | | | | | 7,301 | |
| | | | | | | | |
THAILAND - 1.23% | | | | | | | | |
COMMON STOCKS - (Cost $1,395) | | | | | |
Bangkok Bank PCL | | | 50,090 | | | | 252 | |
Banpu PCL | | | 450 | | | | 9 | |
Banpu PCL, NVDRC | | | 8,400 | | | | 170 | |
Kasikornbank PCL, NVDRC | | | 93,200 | | | | 371 | |
Kasikornbank PCL | | | 19,500 | | | | 78 | |
Land and Houses PCL, NVDRC | | | 1,908,900 | | | | 350 | |
PTT PCL, NVDRC | | | 20,400 | | | | 200 | |
Siam Cement PCL, NVDRC | | | 25,400 | | | | 256 | |
| | | | | | | | |
Total Thailand | | | | | | | 1,686 | |
| | | | | | | | |
TURKEY - 2.84% | | | | | | | | |
COMMON STOCKS - (Cost $4,423) | | | | | |
Anadolu Efes Biracilik Ve Malt Sanayii A.S. | | | 35,964 | | | | 437 | |
Asya Katilim Bankasi A.S. | | | 137,080 | | | | 145 | |
Coca-Cola icecek A.S. | | | 13,811 | | | | 187 | |
Dogus Otomotiv Servis ve Ticaret A.S. | | | 289,214 | | | | 623 | |
Turk Telekomunikasyon A.S. | | | 66,174 | | | | 280 | |
Turkcell Iletisim Hizmetleri A.S. | | | 31,130 | | | | 154 | |
Turkcell Iletisim Hizmetleri A.S., ADRA | | | 7,420 | | | | 91 | |
Turkiye Garanti Bankasi A.S. | | | 288,311 | | | | 1,012 | |
Turkiye Is Bankasi | | | 147,232 | | | | 342 | |
| | | | | | | | |
| | | Shares | | | Fair Value | |
| | | | | | (000’s) | |
Turkiye Vakiflar Bankasi Tao | | | 367,547 | | | $ | 625 | |
| | | | | | | | |
Total Turkey | | | | | | | 3,896 | |
| | | | | | | | |
UNITED KINGDOM - 0.08% | | | | | | | | |
COMMON STOCKS - (Cost $155) | | | | | |
JKX Oil & Gas plc | | | 44,300 | | | | 112 | |
UNITED STATES - 1.16% | | | | | | | | |
COMMON STOCKS - (Cost $2,127) | | | | | |
Central European Distribution Corp.B | | | 14,190 | | | | 77 | |
Flextronics International Ltd.B | | | 230,410 | | | | 1,512 | |
| | | | | | | | |
Total United States | | | | | | | 1,589 | |
| | | | | | | | |
SHORT-TERM INVESTMENTS - 4.41% (Cost $6,046) | | | | | |
JPMorgan U.S. Government Money Market Fund | | | 6,046,019 | | | | 6,046 | |
| | | | | | | | |
TOTAL INVESTMENTS - 98.31% (Cost $142,427) | | | | 134,864 | |
OTHER ASSETS, NET OF LIABILITIES - 1.69% | | | | | | | 2,320 | |
| | | | | | | | |
TOTAL NET ASSETS - 100.00% | | | $ | 137,184 | |
| | | | | | | | |
Percentages are stated as a percent of net assets.
| A | ADR - American Depositary Receipt. |
| B | Non-income producing security. |
| C | NVDR - Non Voting Depositary Receipt. |
| D | Security exempt from registration under the Securities Act of 1933. These securities may be resold to qualified institutional buyers pursuant to Rule 144A. At the period end, the value of these securities amounted to $401 or 0.29% of net assets. The Fund has no right to demand registration of these securities. |
| E | GDR - Global Depositary Receipt. |
See accompanying notes
14
American Beacon Emerging Markets FundSM
Schedule of Investments
October 31, 2011
Futures Contracts
(000’s)
| | | | | | | | | | | | | | | | |
| | | Number of
Contracts | | | Expiration Date | | | Contract
Value | | | Unrealized
Appreciation/
(Depreciation) | |
MSCI Emerging Market EMini Future | | | 136 | | | | December , 2011 | | | $ | 6,641 | | | $ | 551 | |
| | | | | | | | | | | | | | | | |
| | | | | | | | | | $ | 6,641 | | | $ | 551 | |
| | | | | | | | | | | | | | | | |
See accompanying notes
15
American Beacon International Equity FundSM
Schedule of Investments
October 31, 2011
| | | | | | | | |
| | | Shares | | | Fair Value | |
| | | | | | (000’s) | |
AUSTRALIA - 2.32% | | | | | | | | |
COMMON STOCKS - (Cost $28,429) | | | | | |
James Hardie Industries SE, CDI | | | 616,150 | | | $ | 3,982 | |
National Australia Bank Ltd. | | | 208,160 | | | | 5,556 | |
Primary Health Care Ltd. | | | 1,054,498 | | | | 3,668 | |
QBE Insurance Group Ltd. | | | 608,126 | | | | 9,334 | |
Telstra Corp Ltd. | | | 2,250,000 | | | | 7,318 | |
| | | | | | | | |
Total Australia | | | | | | | 29,858 | |
| | | | | | | | |
AUSTRIA - 0.18% | | | | | | | | |
COMMON STOCKS - (Cost $5,477) | | | | | |
Telekom Austria AG | | | 202,700 | | | | 2,305 | |
| | | | | | | | |
| | |
BELGIUM - 0.66% | | | | | | | | |
COMMON STOCKS - (Cost $3,878) | | | | | | | | |
Anheuser-Busch InBev N.V. | | | 154,200 | | | | 8,561 | |
| | | | | | | | |
CANADA - 0.81% | | | | | | | | |
COMMON STOCKS - (Cost $10,005) | | | | | |
Potash Corp of Saskatchewan, Inc. | | | 60,100 | | | | 2,845 | |
Rogers Communications, Inc., Class B | | | 83,000 | | | | 3,027 | |
Talisman Energy, Inc. | | | 319,100 | | | | 4,526 | |
| | | | | | | | |
Total Canada | | | | | | | 10,398 | |
| | | | | | | | |
FINLAND - 1.10% | | | | | | | | |
COMMON STOCKS - (Cost $18,087) | | | | | |
Nokia OYJ | | | 1,387,253 | | | | 9,348 | |
Sampo OYJ, A Shares | | | 176,120 | | | | 4,832 | |
| | | | | | | | |
Total Finland | | | | | | | 14,180 | |
| | | | | | | | |
FRANCE - 11.64% | | | | | | | | |
COMMON STOCKS - (Cost $151,505) | | | | | |
Air Liquide S.A. | | | 39,587 | | | | 5,113 | |
Alstom S.A. | | | 143,644 | | | | 5,340 | |
AXA S.A. | | | 727,656 | | | | 11,691 | |
BNP Paribas S.A. | | | 175,832 | | | | 7,796 | |
Carrefour S.A. | | | 352,830 | | | | 9,360 | |
Cie Generale des Etablissements Michelin | | | 90,220 | | | | 6,517 | |
Danone | | | 42,550 | | | | 2,941 | |
EDF S.A. | | | 145,570 | | | | 4,359 | |
France Telecom S.A. | | | 561,980 | | | | 10,111 | |
Gemalto N.V. | | | 103,177 | | | | 4,674 | |
Legrand S.A. | | | 184,985 | | | | 6,525 | |
Sanofi | | | 461,085 | | | | 33,006 | |
Societe Generale S.A. | | | 137,400 | | | | 3,940 | |
Technip S.A. | | | 69,550 | | | | 6,576 | |
Total S.A. | | | 395,727 | | | | 20,706 | |
Valeo S.A. | | | 110,396 | | | | 5,529 | |
Vinci S.A. | | | 52,228 | | | | 2,563 | |
Vivendi S.A. | | | 148,750 | | | | 3,332 | |
| | | | | | | | |
Total France | | | | | | | 150,079 | |
| | | | | | | | |
GERMANY - 8.88% | | | | | | | | |
COMMON STOCKS - (Cost $108,256) | | | | | |
Bayer AG | | | 68,921 | | | | 4,396 | |
Bayerische Motoren Werke AG | | | 76,620 | | | | 6,244 | |
| | | | | | | | |
| | | Shares | | | Fair Value | |
| | | | | | (000’s) | |
Celesio AG | | | 245,480 | | | $ | 3,879 | |
Deutsche Post AG | | | 986,027 | | | | 14,967 | |
E.ON AG | | | 523,957 | | | | 12,667 | |
GEA Group AG | | | 77,600 | | | | 2,134 | |
Linde AG | | | 54,673 | | | | 8,696 | |
Merck KGaA | | | 104,250 | | | | 9,718 | |
Muenchener Rueckversicherungs AG | | | 92,550 | | | | 12,407 | |
SAP AG | | | 282,113 | | | | 17,000 | |
Siemens AG | | | 213,899 | | | | 22,419 | |
| | | | | | | | |
Total Germany | | | | | | | 114,527 | |
| | | | | | | | |
GREECE - 0.27% | | | | | | | | |
COMMON STOCKS - (Cost $6,453) | | | | | |
OPAP S.A. | | | 299,602 | | | | 3,485 | |
| | | | | | | | |
HONG KONG/CHINA - 3.17% | | | | | |
COMMON STOCKS - (Cost $51,477) | | | | | |
AIA Group Ltd. | | | 1,302,600 | | | | 3,929 | |
Cheung Kong Holdings Ltd. | | | 472,500 | | | | 5,849 | |
Esprit Holdings Ltd. | | | 3,487,323 | | | | 5,040 | |
Hang Seng Bank Ltd. | | | 400,600 | | | | 5,159 | |
HSBC Holdings plc | | | 1,128,796 | | | | 10,023 | |
Hutchison Whampoa Ltd. | | | 187,000 | | | | 1,707 | |
Swire Pacific Ltd. | | | 237,100 | | | | 2,746 | |
Yue Yuen Industrial Holdings Ltd. | | | 2,281,667 | | | | 6,463 | |
| | | | | | | | |
Total Hong Kong/China | | | | | | | 40,916 | |
| | | | | | | | |
IRELAND - 0.58% | | | | | | | | |
COMMON STOCKS - (Cost $14,308) | | | | | |
CRH plc | | | 243,030 | | | | 4,356 | |
Smurfit Kappa Group plc | | | 465,636 | | | | 3,177 | |
| | | | | | | | |
Total Ireland | | | | | | | 7,533 | |
| | | | | | | | |
ISRAEL - 0.69% | | | | | | | | |
COMMON STOCKS - (Cost $10,413) | | | | | |
Teva Pharmaceutical Industries Ltd., ADRA | | | 217,350 | | | | 8,879 | |
| | | | | | | | |
ITALY - 2.14% | | | | | | | | |
COMMON STOCKS - (Cost $39,213) | | | | | |
Atlantia SpA | | | 219,537 | | | | 3,342 | |
ENI SpA | | | 233,856 | | | | 5,150 | |
Finmeccanica SpA | | | 566,485 | | | | 3,873 | |
Intesa Sanpaolo SpA | | | 1,379,241 | | | | 2,433 | |
Saras SpA | | | 4,787,605 | | | | 7,846 | |
Snam Rete Gas SpAB | | | 657,911 | | | | 3,190 | |
UniCredit SpA | | | 1,477,593 | | | | 1,723 | |
| | | | | | | | |
Total Italy | | | | | | | 27,557 | |
| | | | | | | | |
JAPAN - 14.04% | | | | | | | | |
COMMON STOCKS - (Cost $186,552) | | | | | |
Asics Corp. | | | 158,580 | | | | 2,104 | |
Canon, Inc. | | | 146,000 | | | | 6,667 | |
Daito Trust Construction Co Ltd. | | | 77,600 | | | | 6,892 | |
Don Quijote Co. Ltd. | | | 149,400 | | | | 5,491 | |
eAccess Ltd.B | | | 4,490 | | | | 1,207 | |
East Japan Railway Co. | | | 96,900 | | | | 5,884 | |
FANUC Corp. | | | 30,000 | | | | 4,844 | |
Haseko Corp. | | | 2,306,018 | | | | 1,461 | |
Honda Motor Co Ltd. | | | 309,500 | | | | 9,329 | |
See accompanying notes
16
American Beacon International Equity FundSM
Schedule of Investments
October 31, 2011
| | | | | | | | |
| | | Shares | | | Fair Value | |
| | | | | | (000’s) | |
ITOCHU Corp. | | | 221,700 | | | $ | 2,187 | |
JGC Corp. | | | 321,000 | | | | 9,012 | |
JS Group Corp. | | | 184,600 | | | | 3,863 | |
Kao Corp. | | | 110,300 | | | | 2,892 | |
KDDI Corp. | | | 465 | | | | 3,402 | |
Konica Minolta Holdings, Inc. | | | 347,500 | | | | 2,531 | |
Medipal Holdings Corp. | | | 580,800 | | | | 5,416 | |
Mitsubishi Corp. | | | 218,500 | | | | 4,497 | |
Mitsubishi UFJ Financial Group, Inc. | | | 2,099,400 | | | | 9,095 | |
Nintendo Co. Ltd. | | | 11,400 | | | | 1,724 | |
Ricoh Co Ltd. | | | 600,000 | | | | 4,922 | |
Sankyo Co Ltd. | | | 54,300 | | | | 2,838 | |
Shin-Etsu Chemical Co Ltd. | | | 191,900 | | | | 9,857 | |
SMC Corp. | | | 37,400 | | | | 5,827 | |
Sony Financial Holdings, Inc. | | | 544,100 | | | | 8,992 | |
Sumitomo Mitsui Financial Group, Inc. | | | 326,400 | | | | 9,100 | |
Taiyo Nippon Sanso Corp. | | | 786,000 | | | | 5,634 | |
Tokyo Electron Ltd. | | | 62,200 | | | | 3,321 | |
Tokyo Steel Manufacturing Co. Ltd. | | | 773,200 | | | | 6,503 | |
Toyoda Gosei Co Ltd. | | | 291,900 | | | | 5,188 | |
Toyota Motor Corp. | | | 511,800 | | | | 17,113 | |
Yahoo Japan Corp. | | | 16,481 | | | | 5,317 | |
Yamada Denki Co. Ltd. | | | 109,080 | | | | 7,862 | |
| | | | | | | | |
Total Japan | | | | | | | 180,972 | |
| | | | | | | | |
NETHERLANDS - 5.33% | | | | | | | | |
COMMON STOCKS - (Cost $82,342) | | | | | |
Aegon N.V. | | | 747,320 | | | | 3,551 | |
Akzo Nobel N.V. | | | 232,293 | | | | 12,215 | |
ING Groep N.V. | | | 1,329,060 | | | | 11,512 | |
Koninklijke Philips Electronics N.V. | | | 695,840 | | | | 14,412 | |
Randstad Holding N.V. | | | 83,910 | | | | 2,967 | |
Reed Elsevier N.V. | | | 934,678 | | | | 11,477 | |
SBM Offshore N.V. | | | 265,765 | | | | 5,842 | |
TNT Express N.V. | | | 308,309 | | | | 2,604 | |
TNT N.V. | | | 803,663 | | | | 4,071 | |
| | | | | | | | |
Total Netherlands | | | | | | | 68,651 | |
| | | | | | | | |
NEW ZEALAND - 0.22% | | | | | | | | |
COMMON STOCKS - (Cost $2,551) | | | | | |
Telecom Corp. of New Zealand Ltd. | | | 1,397,700 | | | | 2,866 | |
| | | | | | | | |
NORWAY - 1.58% | | | | | | | | |
COMMON STOCKS - (Cost $13,615) | | | | | |
Aker Solutions ASA | | | 192,300 | | | | 2,224 | |
Statoil ASA | | | 266,630 | | | | 6,782 | |
Telenor ASA | | | 640,840 | | | | 11,410 | |
| | | | | | | | |
Total Norway | | | | | | | 20,416 | |
| | | | | | | | |
PORTUGAL - 0.42% | | | | | | | | |
COMMON STOCKS - (Cost $5,853) | | | | | |
Portugal Telecom SGPS S.A. | | | 747,760 | | | | 5,352 | |
| | | | | | | | |
SINGAPORE - 2.63% | | | | | | | | |
COMMON STOCKS - (Cost $25,197) | | | | | |
DBS Group Holdings Ltd. | | | 2,115,060 | | | | 20,633 | |
SembCorp Industries Ltd. | | | 256,000 | | | | 843 | |
SembCorp Marine Ltd. | | | 1,124,000 | | | | 3,718 | |
Singapore Telecommunications Ltd. | | | 3,428,000 | | | | 8,683 | |
| | | | | | | | |
Total Singapore | | | | | | | 33,877 | |
| | | | | | | | |
| | | Shares | | | Fair Value | |
| | | | | | (000’s) | |
SOUTH KOREA - 2.42% | | | | | | | | |
COMMON STOCKS - (Cost $26,361) | | | | | |
Hyundai Heavy Industries Co Ltd. | | | 18,159 | | | $ | 4,883 | |
Hyundai Mobis | | | 9,600 | | | | 2,770 | |
KB Financial Group, Inc., ADRA | | | 143,018 | | | | 5,585 | |
KT&G Corp. | | | 148,595 | | | | 9,319 | |
LG Electronics, Inc. | | | 33,975 | | | | 2,266 | |
POSCO | | | 4,910 | | | | 1,703 | |
Samsung Electronics Co Ltd., GDRD E | | | 820 | | | | 353 | |
Samsung Electronics Co. Ltd., GDRE | | | 10,114 | | �� | | 4,334 | |
| | | | | | | | |
Total South Korea | | | | | | | 31,213 | |
| | | | | | | | |
SPAIN - 3.18% | | | | | | | | |
COMMON STOCKS - (Cost $39,771) | | | | | |
Amadeus IT Holding S.A., A Shares | | | 231,300 | | | | 4,341 | |
Banco Santander S.A., Rights, expiring 11/18/2011F G | | | 451,700 | | | | 78 | |
Banco Santander S.A.-EUR G | | | 450,966 | | | | 3,854 | |
Banco Santander S.A.-GBP | | | 400,828 | | | | 3,433 | |
Enagas S.A. | | | 300,284 | | | | 5,913 | |
Gamesa Corp Tecnologica S.A. | | | 541,541 | | | | 2,610 | |
Iberdrola S.A. | | | 226,058 | | | | 1,640 | |
Mediaset Espana Comunicacion S.A. | | | 235,800 | | | | 1,553 | |
Repsol YPF S.A. | | | 257,990 | | | | 7,773 | |
Tecnicas Reunidas S.A. | | | 105,422 | | | | 4,242 | |
Telefonica S.A. | | | 259,268 | | | | 5,531 | |
| | | | | | | | |
Total Spain | | | | | | | 40,968 | |
| | | | | | | | |
SWEDEN - 2.22% | | | | | | | | |
COMMON STOCKS - (Cost $29,064) | | | | | |
Assa Abloy AB, B Shares | | | 184,200 | | | | 4,471 | |
Skandinaviska Enskilda Banken AB, A Shares | | | 724,910 | | | | 4,520 | |
Svenska Cellulosa AB, B Shares | | | 316,950 | | | | 4,605 | |
Swedbank AB, A Shares | | | 328,000 | | | | 4,578 | |
Telefonaktiebolaget LM Ericsson, B Shares | | | 1,007,580 | | | | 10,489 | |
| | | | | | | | |
Total Sweden | | | | | | | 28,663 | |
| | | | | | | | |
SWITZERLAND - 7.19% | | | | | | | | |
COMMON STOCKS - (Cost $91,162) | | | | | |
Adecco S.A. | | | 69,120 | | | | 3,306 | |
Givaudan S.A. | | | 6,198 | | | | 5,634 | |
Julius Baer Group Ltd. | | | 121,450 | | | | 4,568 | |
Nestle S.A. | | | 67,550 | | | | 3,909 | |
Novartis AG | | | 564,345 | | | | 31,895 | |
Roche Holding AG | | | 113,570 | | | | 18,671 | |
Swiss Re AG | | | 100,960 | | | | 5,522 | |
UBS AG | | | 1,043,824 | | | | 13,168 | |
Zurich Financial Services AG | | | 26,423 | | | | 6,073 | |
| | | | | | | | |
Total Switzerland | | | | | | | 92,746 | |
| | | | | | | | |
UNITED KINGDOM - 21.48% | | | | | | | | |
COMMON STOCKS - (Cost $259,197) | | | | | |
Aviva plc | | | 1,667,651 | | | | 9,053 | |
BAE Systems plc | | | 1,267,054 | | | | 5,597 | |
Balfour Beatty plc | | | 994,454 | | | | 4,009 | |
Barclays plc | | | 1,465,316 | | | | 4,530 | |
BG Group plc | | | 213,342 | | | | 4,623 | |
BHP Billiton plc | | | 215,192 | | | | 6,774 | |
BP plc | | | 2,194,553 | | | | 16,175 | |
See accompanying notes
17
American Beacon International Equity FundSM
Schedule of Investments
October 31, 2011
| | | | | | | | |
| | | Shares | | | Fair Value | |
| | | | | | (000’s) | |
British American Tobacco plc | | | 414,441 | | | $ | 18,966 | |
British Sky Broadcasting Group plc | | | 201,000 | | | | 2,257 | |
Eurasian Natural Resources Corp plc | | | 326,135 | | | | 3,425 | |
GlaxoSmithKline plc | | | 851,290 | | | | 19,081 | |
Home Retail Group plc | | | 2,424,703 | | | | 3,890 | |
HSBC Holdings plc | | | 1,357,665 | | | | 11,848 | |
Informa plc | | | 908,043 | | | | 5,276 | |
International Power plc | | | 623,800 | | | | 3,382 | |
Kingfisher plc | | | 1,370,800 | | | | 5,669 | |
Lonmin plc | | | 296,110 | | | | 5,156 | |
Marks & Spencer Group plc | | | 646,520 | | | | 3,322 | |
Michael Page International plc | | | 505,512 | | | | 3,247 | |
Pearson plc | | | 132,713 | | | | 2,443 | |
Petrofac Ltd. | | | 181,922 | | | | 4,178 | |
Prudential plc | | | 605,480 | | | | 6,263 | |
Rexam plc | | | 1,822,523 | | | | 10,076 | |
Rio Tinto plc | | | 76,043 | | | | 4,112 | |
Rolls-Royce Holdings plc | | | 103,160,050 | | | | 16,722 | |
Royal Dutch Shell plc, A Shares | | | 307,738 | | | | 10,869 | |
Royal Dutch Shell plc, B Shares | | | 299,206 | | | | 10,755 | |
Standard Chartered plc | | | 429,744 | | | | 10,011 | |
Tesco plc | | | 1,508,138 | | | | 9,720 | |
Unilever plc | | | 598,459 | | | | 19,977 | |
Vodafone Group plc | | | 7,696,643 | | | | 21,345 | |
WM Morrison Supermarkets plc | | | 712,360 | | | | 3,447 | |
WPP plc | | | 367,900 | | | | 3,813 | |
Xstrata plc | | | 412,420 | | | | 6,871 | |
| | | | | | | | |
Total United Kingdom | | | | | | | 276,882 | |
| | | | | | | | |
UNITED STATES - 0.43% | | | | | |
COMMON STOCKS - (Cost $8,673) | | | | | |
Flextronics International Ltd.G | | | 848,510 | | | | 5,570 | |
| | | | | | | | |
SHORT-TERM INVESTMENTS- 4.90% | | | | | |
American Beacon U.S. Government Money Market Select FundC | | | 10,000,000 | | | | 10,000 | |
JPMorgan U.S. Government Money Market Fund | | | 53,146,703 | | | | 53,147 | |
| | | | | | | | |
Total Short-Term Investments (Cost $63,147) | | | | 63,147 | |
| | | | | | | | |
SECURITIES LENDING COLLATERAL - 0.28% (Cost $3,567) | | | | | |
American Beacon U.S. Government Money Market Select FundC | | | 3,077,700 | | | | 3,078 | |
Wells Fargo Advantage Government Money Market Fund | | | 489,320 | | | | 489 | |
| | | | | | | | |
Total Securities Lending Collateral | | | | | | | 3,567 | |
| | | | | | | | |
TOTAL INVESTMENTS - 98.76% (Cost $1,284,553) | | | | 1,273,168 | |
OTHER ASSETS, NET OF LIABILITIES - 1.24% | | | | 15,943 | |
| | | | | | | | |
TOTAL NET ASSETS - 100.00% | | | $ | 1,289,111 | |
| | | | | | | | |
Percentages are stated as a percent of net assets.
| A | ADR - American Depositary Receipt. |
| B | All or a portion of this security is on loan at October 31, 2011. |
| C | The Fund is affiliated by having the same investment advisor. |
| D | Security exempt from registration under the Securities Act of 1933. These securities may be resold to qualified institutional buyers pursuant to Rule 144A. At the period end, the value of these securities amounted to $353 or 0.03% of net assets. The Fund has no right to demand registration of these securities. |
| E | GDR - Global Depositary Receipt. |
| G | Non-income producing security. |
See accompanying notes
18
American Beacon International Equity FundSM
Schedule of Investments
October 31, 2011
Futures Contracts
(000’s)
| | | | | | | | | | | | |
| | | Number of
Contracts | | Expiration Date | | Contract
Value | | | Unrealized
Appreciation/
(Depreciation) | |
France CAC 40 Index | | 146 | | December, 2011 | | $ | 6,585 | | | $ | 504 | |
Germany DAX Index | | 27 | | December, 2011 | | | 5,811 | | | | 646 | |
UK FTSE 100 Index | | 178 | | December, 2011 | | | 15,913 | | | | 934 | |
Hang Seng Index | | 15 | | November, 2011 | | | 1,911 | | | | 95 | |
Italy MIB 30 Index | | 15 | | December, 2011 | | | 1,669 | | | | 147 | |
Tokyo FE TOPIX Index | | 151 | | December, 2011 | | | 14,698 | | | | 265 | |
Spain IBEX 35 Index | | 20 | | November, 2011 | | | 2,468 | | | | (9 | ) |
Sweden OMX Index | | 139 | | November, 2011 | | | 2,134 | | | | 89 | |
Canada S&PCDA 60 Index | | 60 | | December, 2011 | | | 8,417 | | | | 159 | |
Australia SPI Index | | 55 | | December, 2011 | | | 6,250 | | | | 289 | |
Netherlands 200 AEX Index | | 21 | | November, 2011 | | | 1,793 | | | | 31 | |
| | | | | | | | | | | | |
| | | | | | $ | 67,649 | | | $ | 3,150 | |
| | | | | | | | | | | | |
Forward Foreign Currency Exchange Contracts
(000’s)
| | | | | | | | | | | | | | |
Contracts To Deliver | | | | | Settlement
Date | | Contract
Value | | | Unrealized
Appreciation/
(Depreciation) | |
| | 1,225 | | | Canadian Dollar | | 12/16/2011 | | $ | 1,228 | | | $ | (40 | ) |
| | 598 | | | Swiss Franc | | 12/16/2011 | | | 682 | | | | (21 | ) |
| | 14,809 | | | Euro Currency | | 12/21/2011 | | | 20,484 | | | | (79 | ) |
| | 1,474 | | | Pound Sterling | | 12/16/2011 | | | 2,369 | | | | (73 | ) |
| | 1,987 | | | Swedish Krona | | 12/16/2011 | | | 304 | | | | (7 | ) |
| | 852 | | | Australian Dollar | | 12/16/2011 | | | 893 | | | | (49 | ) |
| | 172,489 | | | Japanese Yen | | 12/16/2011 | | | 2,208 | | | | 43 | |
| | | | | | | | | | | | | | |
| | Total contracts to deliver | | | | | | | $ | 28,168 | | | $ | (226 | ) |
| | | | | | | | | | | | | | |
| | (Receivable amount $27,942) | | | | | | | | | | | | | |
| | | | |
Contracts To Receive | | | | | Settlement
Date | | Contract
Value | | | Unrealized
Appreciation/
(Depreciation) | |
| | 8,756 | | | Canadian Dollar | | 12/16/2011 | | $ | 8,775 | | | $ | 132 | |
| | 5,388 | | | Swiss Franc | | 12/16/2011 | | | 6,142 | | | | 116 | |
| | 12,490 | | | Euro Currency | | 12/16/2011 | | | 17,276 | | | | 326 | |
| | 9,758 | | | Pound Sterling | | 12/16/2011 | | | 15,683 | | | | 397 | |
| | 13,148 | | | Swedish Krona | | 12/16/2011 | | | 2,013 | | | | 72 | |
| | 5,984 | | | Australian Dollar | | 12/16/2011 | | | 6,273 | | | | 291 | |
| | 1,164,423 | | | Japanese Yen | | 12/16/2011 | | | 14,907 | | | | (243 | ) |
| | | | | | | | | | | | | | |
| | Total contracts to receive | | | | | | | $ | 71,069 | | | $ | 1,091 | |
| | | | | | | | | | | | | | |
| | (Payable amount $69,978) | | | | | | | | | | | | | |
| | | | |
| | Net Currency Fluctuation | | | | | | | | | | | $ | 865 | |
| | | | | | | | | | | | | | |
See accompanying notes
19
American Beacon FundsSM
Statements of Assets and Liabilities
October 31, 2011 (in thousands, except share and per share amounts)
| | | | | | | | |
| | | Emerging Markets
Fund | | | International
Equity Fund | |
Assets: | | | | | | | | |
Investments in unaffiliated securities, at fair value A D | | $ | 134,864 | | | $ | 1,260,090 | |
Investments in affiliated securities, at fair value B | | | — | | | | 13,078 | |
Foreign currency, at fair value C | | | 585 | | | | 2,974 | |
Deposit with brokers for futures contracts | | | 762 | | | | 10,449 | |
Receivable for investments sold | | | 961 | | | | 5,236 | |
Dividends and interest receivable | | | 257 | | | | 2,711 | |
Receivable for fund shares sold | | | 1,096 | | | | 6,199 | |
Receivable for tax reclaims | | | 8 | | | | 1,558 | |
Receivable for expense reimbursement (Note 2) | | | 6 | | | | — | |
Unrealized appreciation of foreign currency contracts | | | — | | | | 1,377 | |
Prepaid expenses | | | 18 | | | | 45 | |
| | | | | | | | |
Total assets | | | 138,557 | | | | 1,303,717 | |
| | | | | | | | |
Liabilities: | | | | | | | | |
Payable for investments purchased | | | 587 | | | | 6,267 | |
Payable upon return of securities loaned | | | — | | | | 3,567 | |
Payable for fund shares redeemed | | | 71 | | | | 658 | |
Payable for variation margin on open futures contracts | | | 299 | | | | 1,681 | |
Management and investment advisory fees payable (Note 2) | | | 332 | | | | 1,259 | |
Administrative service and service fees payable (Note 2) | | | 11 | | | | 368 | |
Unrealized depreciation of foreign currency contracts | | | — | | | | 512 | |
Professional fees payable | | | 28 | | | | 41 | |
Trustee fees payable | | | 2 | | | | 24 | |
Prospectus and shareholder reports | | | 12 | | | | 123 | |
Other liabilities | | | 31 | | | | 106 | |
| | | | | | | | |
Total liabilities | | | 1,373 | | | | 14,606 | |
| | | | | | | | |
Net Assets | | $ | 137,184 | | | $ | 1,289,111 | |
| | | | | | | | |
Analysis of Net Assets: | | | | | | | | |
Paid-in-capital | | $ | 134,035 | | | $ | 1,414,325 | |
Undistributed net investment income | | | 1,256 | | | | 44,439 | |
Accumulated net realized gain (loss) | | | 8,912 | | | | (162,477 | ) |
Unrealized appreciation or depreciation of investments, futures contracts, and foreign currency translations | | | (7,019 | ) | | | (7,176 | ) |
| | | | | | | | |
Net assets | | $ | 137,184 | | | $ | 1,289,111 | |
| | | | | | | | |
Shares outstanding (no par value): | | | | | | | | |
Institutional Class | | | 672,880 | | | | 33,533,723 | |
| | | | | | | | |
Y Class | | | 415,344 | | | | 45,520 | |
| | | | | | | | |
Investor Class | | | 725,678 | | | | 25,584,611 | |
| | | | | | | | |
Advisor Class | | | N/A | | | | 65,389 | |
| | | | | | | | |
Retirement Class | | | N/A | | | | 86 | |
| | | | | | | | |
A Class | | | 34,725 | | | | 30,083 | |
| | | | | | | | |
C Class | | | 671 | | | | 4,999 | |
| | | | | | | | |
AMR Class | | | 8,938,641 | | | | 25,358,917 | |
| | | | | | | | |
Net asset value, offering and redemption price per share: | | | | | | | | |
Institutional Class | | $ | 12.67 | | | $ | 15.27 | |
| | | | | | | | |
Y Class | | $ | 12.75 | | | $ | 15.82 | |
| | | | | | | | |
Investor Class | | $ | 12.44 | | | $ | 15.11 | |
| | | | | | | | |
Advisor Class | | | N/A | | | $ | 15.52 | |
| | | | | | | | |
Retirement Class | | | N/A | | | $ | 15.44 | |
| | | | | | | | |
A Class (net asset value and redemption price) | | $ | 12.47 | | | $ | 15.33 | |
| | | | | | | | |
A Class (offering price) | | $ | 13.23 | | | $ | 16.27 | |
| | | | | | | | |
C Class | | $ | 12.38 | | | $ | 15.21 | |
| | | | | | | | |
AMR Class | | $ | 12.74 | | | $ | 15.31 | |
| | | | | | | | |
A Cost of investments in unaffiliated securities | | $ | 142,427 | | | $ | 1,271,475 | |
B Cost of investments in affiliated securities | | $ | — | | | $ | 13,078 | |
C Cost of foreign currency | | $ | 583 | | | $ | 2,917 | |
D Fair value of securities on loan | | $ | — | | | $ | 3,388 | |
See accompanying notes
20
American Beacon FundsSM
Statements of Operations
For the Year Ended October 31, 2011 (in thousands)
| | | | | | | | |
| | | Emerging
Markets
Fund | | | International
Equity Fund | |
Investment Income: | | | | | | | | |
Dividend income from unaffiliated securities (net of foreign taxes) A | | $ | 4,041 | | | $ | 49,272 | |
Interest income | | | 4 | | | | 17 | |
Income derived from securities lending, net | | | — | | | | 1,871 | |
| | | | | | | | |
Total investment income | | | 4,045 | | | | 51,160 | |
| | | | | | | | |
Expenses: | | | | | | | | |
Management and investment advisory fees (Note 2) | | | 1,207 | | | | 4,554 | |
Administrative service fees (Note 2): | | | | | | | | |
Institutional Class | | | 27 | | | | 1,617 | |
Y Class | | | 16 | | | | 2 | |
Investor Class | | | 35 | | | | 1,343 | |
Advisor Class | | | — | | | | 4 | |
A Class | | | 1 | | | | 1 | |
AMR Class | | | 65 | | | | 218 | |
Transfer agent fees: | | | | | | | | |
Institutional Class | | | 1 | | | | 34 | |
Y Class | | | 2 | | | | — | |
Investor Class | | | 4 | | | | 69 | |
Advisor Class | | | — | | | | 1 | |
A Class | | | 2 | | | | 2 | |
C Class | | | 2 | | | | 2 | |
AMR Class | | | 11 | | | | 15 | |
Custody and fund accounting fees | | | 520 | | | | 446 | |
Professional fees | | | 40 | | | | 76 | |
Registration fees and expenses | | | 54 | | | | 102 | |
Service fees (Note 2): | | | | | | | | |
Y Class | | | 5 | | | | 1 | |
Investor Class | | | 29 | | | | 1,601 | |
Advisor Class | | | — | | | | 3 | |
Distribution fees (Note 2): | | | | | | | | |
Advisor Class | | | — | | | | 3 | |
Prospectus and shareholder reports | | | 48 | | | | 161 | |
Trustee fees | | | 11 | | | | 104 | |
Other expenses | | | 63 | | | | 133 | |
| | | | | | | | |
Total expenses | | | 2,143 | | | | 10,492 | |
| | | | | | | | |
Net (fees waived and expenses reimbursed) (Note 2) | | | (68 | ) | | | (3 | ) |
| | | | | | | | |
Net expenses | | | 2,075 | | | | 10,489 | |
| | | | | | | | |
Net investment income | | | 1,970 | | | | 40,671 | |
| | | | | | | | |
Realized and unrealized gain (loss) on investments: | | | | | | | | |
Net realized gain (loss) from: B | | | | | | | | |
Investments | | | 18,567 | | | | 30,035 | |
Commission recapture (Note 3) | | | — | | | | 49 | |
Foreign currency transactions | | | 2,959 | | | | 43,643 | |
Futures contracts | | | (614 | ) | | | (1,700 | ) |
Change in net unrealized appreciation or depreciation of: | | | | | | | | |
Investments | | | (35,177 | ) | | | (167,943 | ) |
Foreign currency translations | | | (5,421 | ) | | | (18,362 | ) |
Futures contracts | | | 159 | | | | 2,309 | |
| | | | | | | | |
Net (loss) on investments | | | (19,527 | ) | | | (111,969 | ) |
| | | | | | | | |
Net (decrease) in net assets resulting from operations | | $ | (17,557 | ) | | $ | (71,298 | ) |
| | | | | | | | |
A Foreign taxes | | $ | 435 | | | $ | 4,547 | |
B Net of foreign withholding taxes on capital gains | | $ | 11 | | | $ | — | |
See accompanying notes
21
American Beacon FundsSM
Statements of Changes of Net Assets (in thousands)
| | | | | | | | | | | | | | | | |
| | | Emerging Markets Fund | | | International Equity Fund | |
| | | Year Ended
October 31,
2011 | | | Year Ended
October 31,
2010 | | | Year Ended
October 31,
2011 | | | Year Ended
October 31,
2010 | |
Increase (Decrease) in Net Assets: | | | | | | | | | | | | | | | | |
Operations: | | | | | | | | | | | | | | | | |
Net investment income | | $ | 1,970 | | | $ | 1,026 | | | $ | 40,671 | | | $ | 29,764 | |
Net realized gain on investments, futures contracts, and foreign currency transactions | | | 20,912 | | | | 19,496 | | | | 72,027 | | | | 35,831 | |
Change in net unrealized appreciation or depreciation of investments, futures contracts, and foreign currency translations | | | (40,439 | ) | | | 8,049 | | | | (183,996 | ) | | | 81,056 | |
| | | | | | | | | | | | | | | | |
Net increase (decrease) in net assets resulting from operations | | | (17,557 | ) | | | 28,571 | | | | (71,298 | ) | | | 146,651 | |
| | | | | | | | | | | | | | | | |
Distributions to Shareholders: | | | | | | | | | | | | | | | | |
Net investment income: | | | | | | | | | | | | | | | | |
Institutional Class | | | (85 | ) | | | (130 | ) | | | (14,155 | ) | | | (15,298 | ) |
Y Class | | | — | | | | — | | | | (7 | ) | | | — | |
Investor Class | | | (43 | ) | | | (131 | ) | | | (8,721 | ) | | | (12,702 | ) |
Advisor Class | | | — | | | | — | | | | (13 | ) | | | — | |
AMR Class | | | (942 | ) | | | (1,717 | ) | | | (15,008 | ) | | | (14,360 | ) |
| | | | | | | | | | | | | | | | |
Net distributions to shareholders | | | (1,070 | ) | | | (1,978 | ) | | | (37,904 | ) | | | (42,360 | ) |
| | | | | | | | | | | | | | | | |
Capital Share Transactions: | | | | | | | | | | | | | | | | |
Proceeds from sales of shares | | | 51,671 | | | | 19,983 | | | | 286,664 | | | | 253,975 | |
Reinvestment of dividends and distributions | | | 1,067 | | | | 1,969 | | | | 35,604 | | | | 39,420 | |
Cost of shares redeemed | | | (47,315 | ) | | | (27,910 | ) | | | (385,830 | ) | | | (304,686 | ) |
Redemption fees | | | 30 | | | | 36 | | | | 42 | | | | 177 | |
| | | | | | | | | | | | | | | | |
Net increase (decrease) in net assets from capital share transactions | | | 5,453 | | | | (5,922 | ) | | | (63,520 | ) | | | (11,114 | ) |
| | | | | | | | | | | | | | | | |
Net increase (decrease) in net assets | | | (13,174 | ) | | | 20,671 | | | | (172,722 | ) | | | 93,177 | |
| | | | | | | | | | | | | | | | |
Net Assets: | | | | | | | | | | | | | | | | |
Beginning of period | | | 150,358 | | | | 129,687 | | | | 1,461,833 | | | | 1,368,656 | |
| | | | | | | | | | | | | | | | |
End of Period * | | $ | 137,184 | | | $ | 150,358 | | | $ | 1,289,111 | | | $ | 1,461,833 | |
| | | | | | | | | | | | | | | | |
* Includes undistributed net investment income (loss) of | | $ | 1,256 | | | $ | 408 | | | $ | 44,439 | | | $ | 32,347 | |
| | | | | | | | | | | | | | | | |
See accompanying notes
22
American Beacon FundsSM
Notes to Financial Statements
October 31, 2011
1. Organization and Significant Accounting Policies
American Beacon Funds (the “Trust”), which is comprised of 20 Funds, is organized as a Massachusetts business trust and is registered under the Investment Company Act of 1940, as amended (the “Act”), as a diversified, open-end management investment company. These financial statements and notes to the financial statements relate to the American Beacon Emerging Markets Fund and the American Beacon International Equity Fund (each a “Fund” and collectively, the “Funds”), each a series of the Trust.
American Beacon Advisors, Inc. (the “Manager”) is a wholly-owned subsidiary of Lighthouse Holdings, Inc. and was organized in 1986 to provide business management, advisory, administrative, and asset management consulting services to the Trust and other investors.
Class Disclosure
Each Fund has multiple classes of shares designed to meet the needs of different groups of investors; however, not all Funds offer all classes. The following table sets forth the differences amongst the classes:
| | |
Class: | | Offered to: |
| Institutional Class | | Investors making an initial investment of $250,000 |
| Y Class | | Investors making an initial investment of $100,000 |
| Investor Class | | General public and investors investing through an intermediary |
| Advisor Class | | Investors investing through an intermediary |
| Retirement Class | | Investors investing through an intermediary |
| A Class | | General public and investors investing through an intermediary with applicable sales charges |
| C Class | | General public and investors investing through an intermediary with applicable sales charges |
| AMR Class | | Investors in the tax-exempt retirement and benefit plans of the Manager, AMR Corporation, and its affiliates |
Each class offered by the Trust has equal rights as to assets and voting privileges. Income and non-class specific expenses are allocated daily to each class on the basis of the relative net assets. Realized and unrealized capital gains and losses of each class are allocated daily based on the relative net assets of each class of the respective Fund. Class specific expenses, where applicable, currently include administrative service fees, service fees, and distribution fees and vary amongst the classes as described more fully in Note 2.
New Accounting Pronouncements
In April 2011, the Financial Accounting Standards Board (“FASB”) issued an Accounting Standards Update (“ASU”) related to the accounting for repurchase agreements and similar agreements that both entitles and obligates a transferor to repurchase or redeem financial assets before their maturity. The ASU modifies the criteria for determining effective control of transferred assets and as a result certain agreements may now be accounted for as secured borrowings. The ASU is effective prospectively for new transfers and existing transactions that are modified in the first interim or annual period beginning on or after December 15, 2011.
In May 2011, FASB issued an ASU to develop common requirements for measuring fair value and for disclosing information about fair value measurements in accordance with U.S. generally accepted accounting principles (“U.S. GAAP”) and International Financial Reporting Standards (IFRSs). FASB concluded that the amendments in this ASU will improve the comparability of fair value measurements presented and disclosed in financial statements prepared in accordance with U.S. GAAP and IFRSs. The ASU is effective prospectively during interim or annual periods beginning on or after December 15, 2011.
At this time, management is evaluating the implications of these changes and their impact on the financial statements has not been determined.
23
American Beacon FundsSM
Notes to Financial Statements
October 31, 2011
2. Transactions with Affiliates
Management Agreement
The Trust and the Manager are parties to a Management Agreement that obligates the Manager to provide or oversee the provision of all investment advisory, fund management, and securities lending services. Investment assets of the Funds are managed by multiple investment advisors which have entered into separate investment advisory agreements with the Manager. As compensation for performing the duties required under the Management Agreement, the Manager receives from the Funds an annualized fee equal to 0.05% of the average daily net assets plus amounts paid by the Manager to the unaffiliated investment advisors hired by the Manager to direct investment activities of the Funds. Management fees paid during the year ended October 31, 2011 were as follows (dollars in thousands):
| | | | | | | | | | | | | | |
| | | Management
Fee Rate | | Management
Fee | | | Amounts paid to
Investment Advisors | | | Net Amounts
Retained by Manager | |
Emerging Markets | | 0.60%-0.95% | | $ | 1,207 | | | $ | 1,129 | | | $ | 78 | |
International Equity | | 0.20%-0.55% | | $ | 4,554 | | | $ | 3,843 | | | $ | 711 | |
As compensation for services provided by the Manager in connection with securities lending activities, the lending Fund pays to the Manager, with respect to cash collateral posted by borrowers, a fee up to 25% of the net monthly interest income (the gross interest income earned by the investment of cash collateral, less the amount paid to borrowers and related expenses) from such activities and, with respect to loan fees paid by borrowers, a fee up to 25% of such loan fees. This fee is netted against securities lending income in the Statements of Operations. During the year ended October 31, 2011, securities lending fees paid to the Manager on behalf of the International Equity Fund was $248,302.
Administrative Services Agreement
The Manager and the Trust entered into an Administrative Services Agreement which obligates the Manager to provide or oversee administrative services to the Funds. As compensation for performing the duties required under the Administrative Services Agreement, the Manager receives an annualized fee of 0.30% of the average daily net assets of the Institutional, Y, Investor, Advisor and Retirement Classes, 0.40% of the average daily net assets of the A and C Classes, and 0.05% of the average daily net assets of the AMR Class of the Funds. Administrative Service fees for the Retirement and C Classes for the period ended October 31, 2011 were less than $500.
Distribution Plans
The Funds, except for the Advisor, Retirement, A, and C Classes of the Funds, have adopted a “defensive” Distribution Plan (the “Plan”) in accordance with Rule 12b-1 under the Act, pursuant to which no fees may be charged to the Funds for distribution purposes. However, the Plan authorizes the management and administrative service fees received by the Manager and the investment advisors hired by the Manager to be used for distribution purposes. Under this Plan, the Funds do not intend to compensate the Manager or any other party, either directly or indirectly, for the distribution of Funds shares.
Separate Distribution Plans (the “Distribution Plans”) have been adopted pursuant to Rule 12b-1 under the Act for the Advisor, Retirement, A, and C Classes of the Funds. Under the Distribution Plans, as compensation for distribution assistance, the Manager receives an annual fee of 0.25% of the average daily net assets of the Advisor and A Classes, 0.50% of the average daily net assets of the Retirement Class, and 1.00% of the average daily net assets of the C Class. The fee will be payable without regard to whether the amount of the fee is more or less than the actual expenses incurred in a particular month by the Manager for distribution assistance. Distribution fees for the Retirement, A, and C Classes for the period ended October 31, 2011 were less than $500.
24
American Beacon FundsSM
Notes to Financial Statements
October 31, 2011
Service Plans
The Manager and the Trust entered into Service Plans that obligate the Manager to oversee additional shareholder servicing of the Y, Investor, Advisor, Retirement, A, and C Classes. As compensation for performing the duties required under the Service Plans, the Manager receives 0.10% of the average daily net assets of the Y Class, 0.15% of the average daily net assets of the A and C Classes, 0.25% of the average daily net assets of the Advisor and Retirement Classes, and up to 0.375% of the average daily net assets of the Investor Class of the Funds. Service fees for the Retirement, A, and C Classes for the period ended October 31, 2011 were less than $500.
Brokerage Commissions
Affiliated entities of an investment advisor to the Emerging Markets Fund received net commissions on purchases and sales of the Fund’s portfolio securities totaling $2,819 for the year ended October 31, 2011.
Investment in Affiliated Funds
The Funds may invest in the American Beacon Money Market Select Fund and the U.S. Government Money Market Fund (the “USG Select Fund”), (collectively the “Select Funds”). Cash collateral received by the Funds in connection with securities lending may be invested in the Select Funds. The Select Funds and the Funds have the same investment advisor and therefore, are considered to be affiliated. The Manager serves as investment advisor to the Select Funds and receives from the Select Funds an annualized fee equal to 0.09% of the average daily net assets of the Select Funds. During the year ended October 31, 2011, fees earned by the Manager from the Select Funds were as follows:
| | | | | | | | | | | | |
| | | Direct
Investments in
Select Funds | | | Securities Lending
Collateral Invested
in Select Funds | | | Total | |
International Equity | | $ | 1,753 | | | $ | 29,313 | | | $ | 31,066 | |
Interfund Lending Program
Pursuant to an exemptive order by the Securities and Exchange Commission (“SEC”), the Funds, along with other registered investment companies having management contracts with the Manager, may participate in an interfund lending program as a borrower. This program provides an alternative credit facility allowing the Funds to borrow from other participating Funds. During the year ended October 31, 2011, the Emerging Markets Fund borrowed from the USG Select Fund on average $1,121,200 for two days at 0.81% with interest charges of $50.
Reimbursement of Expenses
The Manager contractually agreed to reimburse the Funds to the extent that total operating expenses exceeded a Fund’s expense cap. Of these amounts, approximately $6,000 was receivable to the Emerging Markets Fund from the Manager at October 31, 2011. For the year ended October 31, 2011, the Manager reimbursed expenses as follows:
| | | | | | | | | | | | | | | | | | |
| | | | | Expense Caps | | | | | | | |
Fund | | Class | | 11/1/10 to
2/28/11 | | | 3/1/11 to
10/31/11 | | | Reimbursed
Expenses | | | Expiration of
Reimbursements | |
Emerging Markets | | Institutional | | | 1.35 | % | | | 1.35 | % | | $ | 28,114 | | | | 2014 | |
Emerging Markets | | Y | | | 1.45 | % | | | 1.45 | % | | | 18,453 | | | | 2014 | |
Emerging Markets | | Investor | | | 1.79 | % | | | 1.79 | % | | | 16,804 | | | | 2014 | |
Emerging Markets | | A | | | 1.79 | % | | | 1.79 | % | | | 2,500 | | | | 2014 | |
Emerging Markets | | C | | | 2.54 | % | | | 2.54 | % | | | 1,710 | | | | 2014 | |
International Equity | | Retirement | | | N/A | | | | 1.47 | % | | | 31 | | | | 2014 | |
International Equity | | A | | | N/A | | | | 1.25 | % | | | 1,657 | | | | 2014 | |
International Equity | | C | | | N/A | | | | 1.99 | % | | | 1,675 | | | | 2014 | |
25
American Beacon FundsSM
Notes to Financial Statements
October 31, 2011
Expense Reimbursement Plan
The Funds have adopted an Expense Reimbursement Plan whereby the Manager may seek repayment of fees waived or expenses reimbursed for a period of up to three years. However, reimbursement will occur only if the Class’ average net assets have grown or expenses have declined sufficiently to allow reimbursement without causing its expense ratio to exceed the previously agreed upon contractual expense limit. The carryover of excess expenses potentially reimbursable to the Manager, but not recorded as a liability for the Emerging Markets Fund is approximately $29,000 expiring in 2013. For the year ended October 31, 2011, the Funds have not recorded a liability for potential reimbursements, due to the current assessment that a reimbursement is unlikely.
3. Security Valuation and Fair Value Measurements
Investments are valued at the close of the New York Stock Exchange (the “Exchange”), normally 4 p.m. ET, each day that the Exchange is open for business. Equity securities for which market quotations are available are valued at the last sale price or official closing price (closing bid price or last evaluated quote if no sale has occurred) on the primary market or exchange on which they trade.
Investments in mutual funds are valued at the closing net asset value (“NAV”) per share of the mutual fund on the day of valuation. Investment grade short-term obligations with 60 days or less to maturity are valued using the amortized cost method, which approximates fair value.
Securities for which the market prices are not readily available or are not reflective of the fair value of the security, as determined by the Manager, will be priced at fair value following procedures approved by the Trust’s Board of Trustees (the “Board”).
Futures contracts are valued based upon their quoted daily settlement prices. Upon entering into a futures contract, a Fund is required to deposit with its futures broker, an amount of cash or U.S. Government and Agency Obligations in accordance with the initial margin requirements of the broker or exchange. Futures contracts are marked to market daily and an appropriate payable or receivable for the change in value (“variation margin”) is recorded by the Fund. Gains or losses are recognized, but not considered realized until the contracts expire or are closed. Futures contracts involve, to varying degrees, risk of loss in excess of the variation margin disclosed on the Statements of Assets and Liabilities
For valuation purposes, the last quoted prices of non-U.S. equity securities may be adjusted under the circumstances described below. If the Fund determines that developments between the close of a foreign market and the close of the Exchange will, in its judgment, materially affect the value of some or all of its portfolio securities, the Fund will adjust the previous closing prices to reflect what it believes to be the fair value of the securities as of the close of the Exchange. In deciding whether it is necessary to adjust closing prices to reflect fair value, the Fund reviews a variety of factors, including developments in foreign markets, the performance of U.S. securities markets, and the performance of instruments trading in U.S. markets that represent foreign securities and baskets of foreign securities. A Fund may also fair value securities in other situations, such as when a particular foreign market is closed, but the Fund is open. The Fund uses outside pricing services to provide it with closing prices and information to evaluate and/or adjust those prices. The Fund cannot predict how often it will use closing prices and how often it will determine it necessary to adjust those prices to reflect fair value. As a means of evaluating its security valuation process, the Fund routinely compares closing prices, the next day’s opening prices in the same markets, and adjusted prices.
Security Transactions and Investment Income
Security transactions are recorded on the trade date of the security purchase or sale. The Funds may purchase securities with delivery or payment to occur at a later date. At the time the Funds enter into a commitment to purchase a security, the transaction is recorded, and the value of the security is reflected in the NAV. The value of the security may vary with market fluctuations.
26
American Beacon FundsSM
Notes to Financial Statements
October 31, 2011
Dividend income, net of foreign taxes, is recorded on the ex-dividend date, except certain dividends from foreign securities which are recorded as soon as the information is available to the Funds. Interest income is earned from settlement date, recorded on the accrual basis, and adjusted, if necessary, for accretion of discounts and amortization of premiums. For financial and tax reporting purposes, realized gains and losses are determined on the basis of specific lot identification.
Currency Translation
All assets and liabilities initially expressed in foreign currency values are converted into U.S. dollar values at the mean of the bid and ask prices of such currencies against U.S. dollars as last quoted by a recognized dealer. Income, expenses, and purchases and sales of investments are translated into U.S. dollars at the rate of exchange prevailing on the respective dates of such transactions. The effect of changes in foreign currency exchange rates on investments is separately identified from the fluctuations arising from changes in fair values of securities held and is reported with all other foreign currency gains and losses in the Funds’ Statements of Operations.
Dividends to Shareholders
Dividends from net investment income of the Funds normally will be declared and paid at least annually. Distributions, if any, of net realized capital gains are generally paid at least annually and recorded on the ex-dividend date.
Commission Recapture
The Funds have established brokerage commission recapture arrangements with certain brokers or dealers. If a Fund’s investment advisor chooses to execute a transaction through a participating broker, the broker rebates a portion of the commission back to the Fund. Any collateral benefit received through participation in the commission recapture program is directed exclusively to the Fund. This amount is reported with the net realized gain in the Fund’s Statement of Operations.
Allocation of Income, Expenses, Gains, and Losses
Income, expenses (other than those attributable to a specific class), gains, and losses are allocated daily to each class of shares based upon the relative proportion of net assets represented by such class. Operating expenses directly attributable to a specific class are charged against the operations of that class.
Use of Estimates
The preparation of financial statements in conformity with U.S. GAAP requires management to make estimates and assumptions that affect the amounts reported in the financial statements and accompanying notes. Actual results may differ from those estimated.
Redemption Fees
The Funds impose a 2% redemption fee on shares held for less than 90 days. The fee is deducted from the redemption proceeds and is intended to offset the trading costs, market impact, and other costs associated with short-term trading activity in the Funds. The “first-in, first-out” method is used to determine the holding period. The fee is allocated to all classes of the Funds pro-rata based on their respective net assets.
27
American Beacon FundsSM
Notes to Financial Statements
October 31, 2011
Other
Under the Trust’s organizational documents, its officers and trustees are indemnified against certain liability arising out of the performance of their duties to the Trust. In the normal course of business, the Trust enters into contracts that provide indemnification to the other party or parties against potential costs or liabilities. The Trust’s maximum exposure under these arrangements is dependent on claims that may be made in the future and, therefore, cannot be estimated. The Trust has had no prior claims or losses pursuant to any such agreement.
Valuation Inputs
Various inputs may be used to determine the fair value of the Funds’ investments. These inputs are summarized in three broad levels for financial statement purposes. The inputs or methodologies used to value securities are not necessarily an indication of the risk associated with investing in those securities.
Level 1 – Quoted prices in active markets for identical securities.
Level 2 – Prices determined using other significant observable inputs. These may include quoted prices for similar securities, interest rates, prepayment speeds, credit risk, and others.
Level 3 – Prices determined using other significant unobservable inputs. Unobservable inputs reflect the Fund’s own assumptions about the factors market participants would use in pricing an investment, and would be based on the best information available.
Level 1 and Level 2 trading assets and trading liabilities, at fair value
Common stocks and financial derivative instruments, such as futures contracts that are traded on a national securities exchange, are stated at the last reported sale or settlement price on the day of valuation. To the extent these securities are actively traded and valuation adjustments are not applied, they are categorized as Level 1 of the fair value hierarchy. Valuation adjustments may be applied to certain securities that are solely traded on a foreign exchange to account for the market movement between the close of the foreign market and the close of the Exchange. These securities are valued using pricing service providers that consider the correlation of the trading patterns of the foreign security to the intraday trading in the U.S. markets for investments. Securities using these valuation adjustments are categorized as Level 2 of the fair value hierarchy. Preferred securities and other equities traded on inactive markets or valued by reference to similar instruments are also categorized as Level 2 of the fair value hierarchy.
Investments in registered open-end investment management companies will be valued based upon the NAVs of such investments and are categorized as Level 1 of the fair value hierarchy. Short-term investments having a maturity of 60 days or less are generally valued at amortized cost which approximates fair value. These investments are categorized as Level 2 of the fair value hierarchy.
Over-the-counter financial derivative instruments, such as foreign currency contracts, derive their value from underlying asset prices, indices, reference rates, and other inputs or a combination of these factors. These contracts are normally valued on the basis of broker dealer quotations or pricing service providers. Depending on the product and the terms of the transaction, the fair value of the financial derivative contracts can be estimated by a pricing service provider using a series of techniques, including simulation pricing models. The pricing models use inputs that are observed from actively quoted markets such as issuer details, indices, spreads, interest rates, curves, dividends, and exchange rates. Financial derivatives that use similar valuation techniques and inputs as described above are categorized as Level 2 of the fair value hierarchy.
28
American Beacon FundsSM
Notes to Financial Statements
October 31, 2011
Level 3 trading assets and trading liabilities, at fair value
The valuation techniques and significant inputs used in determining the fair values of financial instruments classified as Level 3 of the fair value hierarchy are as follows:
Securities and other assets for which market quotes are not readily available are valued at fair value as determined in good faith by the Board or persons acting at their direction and are categorized as Level 3 of the fair value hierarchy.
Market quotes are considered not readily available in circumstances where there is an absence of current or reliable market-based data (e.g., trade information or broker quotes), including where events occur after the close of the relevant market, but prior to the Exchange close, that materially affect the values of a Fund’s securities or assets. In addition, market quotes are considered not readily available when, due to extraordinary circumstances, the exchanges or markets on which the securities trade do not open for trading for the entire day and no other market prices are available. The Board has delegated to the Manager the responsibility for monitoring significant events that may materially affect the values of a Fund’s securities or assets and for determining whether the value of the applicable securities or assets should be re-evaluated in light of such significant events.
The Board has adopted methods for valuing securities and other assets in circumstances where market quotes are not readily available, and has delegated the responsibility for applying the valuation methods to the Manager. For instances in which daily market quotes are not readily available, investments may be valued, pursuant to guidelines established by the Board, with reference to other securities or indices. In the event that the security or asset cannot be valued pursuant to one of the valuation methods established by the Board, the fair value of the security or asset will be determined in good faith by the Valuation Committee of the Board, generally based upon recommendations provided by the Manager.
When a Fund uses fair valuation methods applied by the Manager that use significant unobservable inputs to determine its NAV, securities will be priced by another method that the Board or persons acting at their direction believe accurately reflects fair value and are categorized as Level 3 of the fair value hierarchy. These methods may require subjective determinations about the value of a security. While the Trust’s policy is intended to result in a calculation of a Fund’s NAV that fairly reflects security values as of the time of pricing, the Trust cannot guarantee that values determined by the Board or persons acting at their direction would accurately reflect the price that a Fund could obtain for a security if it were to dispose of that security as of the time of pricing (for instance, in a forced or distressed sale). The prices used by a Fund may differ from the value that would be realized if the securities were sold.
For fair valuations using significant unobservable inputs, U.S. GAAP requires a reconciliation of the beginning to ending balances for reported fair values that presents changes attributable to total realized and unrealized gains or losses, purchases and sales, and transfers in and out of the Level 3 category during the period. The end of period timing recognition is used for the significant transfers between Levels of the Funds’ assets and liabilities. In accordance with the requirements of U.S. GAAP, a fair value hierarchy and Level 3 reconciliation, if any, have been included in the Notes to the Schedule of Investments for each respective Fund.
29
American Beacon FundsSM
Notes to Financial Statements
October 31, 2011
The Funds’ investments are summarized by level based on the inputs used to determine their values. As of October 31, 2011, the Funds’ investments were classified as described below: (in thousands)
| | | | | | | | | | | | | | | | |
Emerging Markets | | Level 1 | | | Level 2 | | | Level 3 | | | Total | |
Foreign Preferred Stocks | | $ | 2,338 | | | $ | 1,193 | | | $ | — | | | $ | 3,531 | |
Foreign Common Stocks | | | 41,377 | | | | 82,321 | | | | — | | | | 123,698 | |
U.S. Common Stocks | | | 1,589 | | | | — | | | | — | | | | 1,589 | |
Short-Term Investments | | | 6,046 | | | | — | | | | — | | | | 6,046 | |
| | | | | | | | | | | | | | | | |
Total Investments in Securities | | $ | 51,350 | | | $ | 83,514 | | | $ | — | | | $ | 134,864 | |
| | | | | | | | | | | | | | | | |
Futures Contracts | | | 551 | | | | — | | | | — | | | | 551 | |
| | | | |
International Equity | | Level 1 | | | Level 2 | | | Level 3 | | | Total | |
Foreign Common Stocks | | $ | 136,774 | | | $ | 1,064,032 | | | $ | — | | | $ | 1,200,806 | |
Foreign Rights | | | 78 | | | | — | | | | — | | | | 78 | |
U.S. Common Stocks | | | 5,570 | | | | — | | | | — | | | | 5,570 | |
Securities Lending Collateral invested in Money Market Funds | | | 3,567 | | | | — | | | | — | | | | 3,567 | |
Short-Term Investments | | | 63,147 | | | | — | | | | — | | | | 63,147 | |
| | | | | | | | | | | | | | | | |
Total Investments in Securities | | $ | 209,136 | | | $ | 1,064,032 | | | $ | — | | | $ | 1,273,168 | |
| | | | | | | | | | | | | | | | |
| | | | |
| Financial Derivative Instruments-Assets* | | Level 1 | | | Level 2 | | | Level 3 | | | Total | |
Equity Contracts | | $ | 3,150 | | | $ | — | | | $ | — | | | $ | 3,150 | |
Foreign Exchange Contracts | | | 1,377 | | | | — | | | | — | | | | 1,377 | |
| | | | | | | | | | | | | | | | |
| | $ | 4,527 | | | $ | — | | | $ | — | | | $ | 4,527 | |
| | | | | | | | | | | | | | | | |
| | | | |
| Financial Derivative Instruments-Liabilities* | | Level 1 | | | Level 2 | | | Level 3 | | | Total | |
Foreign Exchange Contracts | | $ | (512 | ) | | $ | — | | | $ | — | | | $ | (512 | ) |
| | | | | | | | | | | | | | | | |
| | $ | (512 | ) | | $ | — | | | $ | — | | | $ | (512 | ) |
| | | | | | | | | | | | | | | | |
| * | Financial derivative instruments may include open futures contracts and foreign currency contracts. |
During the periods ended October 31, 2010 through October 31, 2011, for the Emerging Markets Fund and International Equity Fund transferred common stock with a value of $62,746 and $908,003, respectively, from Level 1 to Level 2 as of the end of the period in accordance with fair value procedures established by the Board.
4. Securities and Other Investments
Restricted Securities
Certain Funds may invest in securities that are subject to legal or contractual restrictions on resale. These securities may be sold privately, but are required to be registered or exempted from such registration before being sold to the public. Private placement securities are generally considered to be restricted except for those securities traded between qualified institutional investors under the provisions of Rule 144A of the Securities Act of 1933. Disposal of restricted securities may involve time-consuming negotiations and expenses, and prompt sale at an acceptable price may be difficult to achieve. Restricted securities outstanding at the period ended October 31, 2011 are disclosed in the Notes to the Schedules of Investments.
5. Financial Derivative Instruments
Forward Foreign Currency Contracts
The Funds may enter into forward foreign currency contracts to hedge the exchange rate risk on investment transactions or to hedge the value of the Fund’s securities denominated in foreign currencies. Forward foreign currency contracts are valued at the forward exchange rate prevailing on the day of valuation. The Funds bear the market risk that arises from changes in foreign exchange rates, and accordingly, the unrealized gain (loss) on these contracts is reflected in the accompanying financial statements. The Funds also bear the credit risk if the counterparty fails to perform under the contract.
30
American Beacon FundsSM
Notes to Financial Statements
October 31, 2011
Futures Contracts
Futures contracts are contracts to buy or sell a standard quantity of securities at a specified price on a future date. The Funds may enter into financial futures contracts as a method for keeping assets readily convertible to cash if needed to meet shareholder redemptions or for other needs while maintaining exposure to the stock or bond market, as applicable. The primary risks associated with the use of futures contracts are the possibility of illiquid markets or imperfect correlation between the values of the contracts and the underlying securities, or that the counterparty will fail to perform its obligations.
Upon entering into a futures contract, the Funds are required to set aside or deposit with a broker an amount, termed the initial margin, which typically represents 5% of the face value of the futures contract. A Fund usually reflects this amount on the Schedule of Investments as a U.S. Treasury Bill held as collateral for futures contracts or as Cash deposited with broker on the Statements of Assets and Liabilities. Payments to and from the broker, known as variation margin, are required to be made on a daily basis as the price of the futures contract fluctuates. Changes in initial settlement values are accounted for as unrealized appreciation (depreciation) until the contracts are terminated, at which time realized gains and losses are recognized. Futures contracts are valued at the most recent settlement price established each day by the exchange on which they are traded.
Emerging Markets
Values of Derivative Instruments not accounted for as hedging instruments as of October 31, 2011 (in thousands):
| | | | | | | | |
Statements of Assets and Liabilities | | Derivatives | | | Fair Value | |
Unrealized appreciation or depreciation of investments, futures contracts, and foreign currency translations | | | Equity Contracts | (1) | | $ | 551 | |
Effect of financial derivative instruments not accounted for as hedging instruments during the year ended October 31, 2011 (in thousands):
| | | | | | | | |
Statements of Operations | | Derivatives | | | Balance | |
Net realized gain (loss) from futures contracts | | | Equity Contracts | | | $ | (614 | ) |
Change in net unrealized appreciation or depreciation of futures contracts | | | Equity Contracts | | | | 159 | |
| (1) | Includes cumulative appreciation or depreciation of futures contracts as reported in the Schedule of Investments footnotes. Only current day’s variation margin is reported within the Statements of Assets and Liabilities. |
International Equity
Values of financial instruments not accounted for as hedging instruments as of October 31, 2011 (in thousands):
Statements of Assets and Liabilities:
| | | | | | | | | | | | |
Assets | | Equity
contracts | | | Foreign exchange
contracts | | | Total | |
Unrealized appreciation or depreciation of investments, futures contracts, and foreign currency translations (2) | | $ | 3,150 | | | $ | — | | | $ | 3,150 | |
Unrealized appreciation of foreign currency contracts | | | — | | | | 1,377 | | | | 1,377 | |
| | | | | | | | | | | | |
| | $ | 3,150 | | | $ | 1,377 | | | $ | 4,527 | |
| | | | | | | | | | | | |
| | | |
Liabilities | | Equity
contracts | | | Foreign exchange
contracts | | | Total | |
Unrealized depreciation of foreign currency contracts | | $ | — | | | $ | (512 | ) | | $ | (512 | ) |
| | | | | | | | | | | | |
| | $ | — | | | $ | (512 | ) | | $ | (512 | ) |
| | | | | | | | | | | | |
Effect of financial derivative instruments on the Statements of Operations for the period ended October 31, 2011 (in thousands):
Statements of Operations:
| | | | | | | | | | | | |
| | | Equity
contracts | | | Foreign exchange
contracts | | | Total | |
Net realized gain (loss) from futures contracts | | $ | (1,700 | ) | | $ | — | | | $ | (1,700 | ) |
Net realized gain (loss) from foreign currency transactions | | | — | | | | 3,464 | | | | 3,464 | |
| | | | | | | | | | | | |
| | $ | (1,700 | ) | | $ | 3,464 | | | $ | 1,764 | |
| | | | | | | | | | | | |
31
American Beacon FundsSM
Notes to Financial Statements
October 31, 2011
| | | | | | | | | | | | |
| | | Equity
contracts | | | Foreign exchange
contracts | | | Total | |
Change in net unrealized appreciation or depreciation of futures contracts | | $ | 2,309 | | | $ | — | | | $ | 2,309 | |
Change in net unrealized appreciation or depreciation of foreign currency translations | | | — | | | | (1,806 | ) | | | (1,806 | ) |
| | | | | | | | | | | | |
| | $ | 2,309 | | | $ | (1,806 | ) | | $ | 503 | |
| | | | | | | | | | | | |
| (2) | Only current day’s variation margin is reported within the Statements of Assets and Liabilities. The variation margin is included in the open futures cumulative appreciation or depreciation as reported in the Notes to the Schedule of Investments. |
6. Federal Income and Excise Taxes
It is the policy of each Fund to qualify as a regulated investment company, by complying with all applicable provisions of Subchapter M of the Internal Revenue Code, as amended, and to make distribution of taxable income sufficient to relieve it from substantially all federal income and excise taxes. For federal income tax purposes, each Fund is treaded as a single entity for the purpose of determining such qualification.
The Funds do not have any unrecognized tax benefits in the accompanying financial statements. Each of the tax years in the four year period ended October 31, 2011 remains subject to examination by the Internal Revenue Service. If applicable, the Funds recognize interest accrued related to unrecognized tax benefits in interest expense and penalties in “Other expenses” on the Statements of Operations.
Dividends are categorized in accordance with income tax regulations which may treat certain transactions differently than U.S. GAAP. Accordingly, the character of distributions and composition of net assets for tax purposes may differ from those reflected in the accompanying financial statements.
The tax character of distributions paid during the fiscal years ended October 31, 2011 and October 31, 2010 were as follows (in thousands):
| | | | | | | | | | | | | | | | |
| | | Emerging Markets | | | International Equity | |
| | | Year Ended
October 31,
2011 | | | Year Ended
October 31,
2010 | | | Year Ended
October 31,
2011 | | | Year Ended
October 31,
2010 | |
Distributions paid from: Ordinary Income* | | | | | | | | | | | | | | | | |
Institutional Class | | $ | 85 | | | $ | 130 | | | $ | 14,155 | | | $ | 15,298 | |
Y Class | | | — | | | | — | | | | 7 | | | | — | |
Investor Class | | | 43 | | | | 131 | | | | 8,721 | | | | 12,702 | |
Advisor Class | | | — | | | | — | | | | 13 | | | | — | |
AMR Class | | | 942 | | | | 1,717 | | | | 15,008 | | | | 14,360 | |
| | | | | | | | | | | | | | | | |
Total distributions paid | | $ | 1,070 | | | $ | 1,978 | | | $ | 37,904 | | | $ | 42,360 | |
| | | | | | | | | | | | | | | | |
| * | For tax purposes, short-term capital gains are considered ordinary income distributions. |
As of October 31, 2011, the components of distributable earnings (deficit) on a tax basis were as follows (in thousands):
| | | | | | | | |
| | | Emerging
Markets | | | International
Equity | |
Cost basis of investments for federal income tax purposes | | $ | 147,921 | | | $ | 1,303,637 | |
Unrealized appreciation | | | 11,259 | | | | 151,928 | |
Unrealized depreciation | | | (24,316 | ) | | | (182,397 | ) |
| | | | | | | | |
Net unrealized appreciation or depreciation | | | (13,057 | ) | | | (30,469 | ) |
| | |
Undistributed ordinary income | | | 1,441 | | | | 45,383 | |
Accumulated long-term gain (loss) | | | 14,221 | | | | (146,295 | ) |
Other temporary differences | | | 544 | | | | 6,166 | |
| | | | | | | | |
Distributable earnings (deficit) | | $ | 3,149 | | | $ | (125,215 | ) |
| | | | | | | | |
32
American Beacon FundsSM
Notes to Financial Statements
October 31, 2011
Financial reporting records are adjusted for permanent book/tax differences to reflect tax character. Financial records are not adjusted for temporary differences. The temporary differences between financial reporting and tax-basis reporting of unrealized appreciation or depreciation are attributable primarily to the tax deferral of losses from wash sales, the realization for tax purposes of unrealized gain (losses) on certain derivative instruments, the realization for tax purposes of unrealized gain (losses) on investments in passive foreign investment companies, and Section 732 basis adjustments.
Due to inherent differences in the recognition of income, expenses and realized gains (losses) under U.S. GAAP and federal income tax regulations, permanent differences between book and tax reporting have been identified and appropriately reclassified on the Statements of Assets and Liabilities.
Accordingly, the following amounts represent current year permanent differences derived from foreign currency, gains (losses) from sales of investments in passive foreign investment companies, and Section 732 basis adjustments that have been reclassified as of October 31, 2011 (in thousands):
| | | | | | | | |
| | | Emerging
Markets | | | International
Equity | |
Paid-in-capital | | $ | (1 | ) | | $ | 276 | |
Undistributed net investment income (loss) | | | (52 | ) | | | 9,325 | |
Accumulated net realized gain (loss) | | | 52 | | | | (9,601 | ) |
Unrealized appreciation or depreciation of investments, futures contracts, and foreign currency translations | | | 1 | | | | — | |
At October 31, 2011, the capital loss carryforward position for federal income tax purposes was $143,145 for International Equity Fund expiring in 2017. The Emerging Markets Fund and the International Equity Fund utilized $3,612 and $52,932, respectively, of net capital loss carryovers for the year ended October 31, 2011 (in thousands).
7. Investment Transactions
The aggregate cost of purchases and proceeds from sales of investments, other than short-term obligations, for the year ended October 31, 2011 were (in thousands):
| | | | | | | | |
| | | Emerging
Markets | | | International
Equity | |
Purchases | | $ | 154,212 | | | $ | 458,880 | |
Sales and Maturities | | | 148,633 | | | | 536,540 | |
A summary of the Fund’s direct transactions in the USG Select Fund for the year ended October 31, 2011 is set forth below (in thousands):
| | | | | | | | | | | | | | | | | | | | |
| | | Affiliated Fund | | | October 31, 2010
Shares/Fair Value | | | Purchases | | | Sales | | | October 31, 2011
Shares/Fair Value | |
International Equity-Direct | | | USG Select Fund | | | $ | — | | | $ | 10,000 | | | $ | — | | | $ | 10,000 | |
International Equity-Securities Lending | | | USG Select Fund | | | $ | 4,370 | | | $ | 644,888 | | | $ | 646,180 | | | $ | 3,078 | |
8. Securities Lending
The International Equity Fund may lend its securities to qualified financial institutions, such as certain broker-dealers, to earn additional income. The borrowers are required to secure their loans continuously with collateral in an amount at least equal to the fair value of the securities loaned, initially in an amount at least equal to 102% of the fair value of domestic securities loaned and 105% of the fair value of international securities loaned. Collateral is monitored and marked to market daily. Daily mark to market amounts are required to be paid to the borrower or received from the borrower by the end of the following business day.
33
American Beacon FundsSM
Notes to Financial Statements
October 31, 2011
This one day settlement for mark to market amounts may result in the collateral being temporarily less than the value of the securities on loan or temporarily more than the required minimum collateral.
To the extent that a loan is collateralized by cash, such cash collateral shall be invested by the securities lending agent (the “Agent”) in money market mutual funds, and other short-term investments, provided the investments meet certain quality and diversification requirements. Securities purchased with cash collateral proceeds are listed in the Fund’s Schedule of Investments and the collateral is shown on the Statements of Assets and Liabilities as a payable.
Securities lending income is generated from the demand premium (if any) paid by the borrower to borrow a specific security and from the return on investment of cash collateral, reduced by negotiated rebate fees paid to the borrower and transaction costs. To the extent that a loan is secured by non-cash collateral, securities lending income is generated as a demand premium reduced by transaction costs. Until May 1, 2011, the Fund, the Agent, and the Manager retained 75%, 15%, and 10%, respectively, of the income generated from securities lending. Beginning May 1, 2011, the Fund, the Agent, and the Manager retained 78%, 12% and 10%, respectively, of the income generated from securities lending.
While securities are on loan, the Fund continues to receive certain income associated with that security and any gain or loss in the market price that may occur during the term of the loan. In the case of domestic equities, the value of any dividend is received in the form of a substitute payment approximately equal to the dividend. In the case of foreign securities, a negotiated amount is received that is less than the actual dividend, but higher than the dividend amount minus the foreign tax that the Fund would be subject to on the dividend.
Securities lending transactions pose certain risks to the Fund, including that the borrower may not provide additional collateral when required or return the securities when due, that the value of the short-term investments will be less than the amount of cash collateral required to be returned to the borrower, that non-cash collateral may be subject to legal constraints in the event of a borrower bankruptcy, and that the cash collateral investments could become illiquid and unable to be used to return collateral to the borrower. The Fund could also experience delays and costs in gaining access to the collateral. The Fund bears the risk of any deficiency in the amount of the cash collateral available for return to the borrower and any action which impairs its ability to liquidate non-cash collateral to satisfy a borrower default.
As of October 31, 2011, the value of outstanding securities on loan and the value of collateral was as follows (in thousands):
| | | | |
Fair Value of Securities on Loan | | Non-Cash Collateral | | Cash Collateral Posted by Borrower |
$ 3,388 | | $ — | | $ 3,567 |
Cash collateral is listed in the Fund’s Schedule of Investments and is shown on the Statements of Assets and Liabilities. Income earned on these investments is included in Income derived from securities lending in the Statements of Operations.
Non-cash collateral received by the Fund may not be sold or re-pledged except to satisfy a borrower default. Therefore, non-cash collateral is not included on the Fund’s Schedule of Investments or Statements of Assets and Liabilities.
34
American Beacon FundsSM
Notes to Financial Statements
October 31, 2011
9. Capital Share Transactions
The tables below summarize the activity in capital shares for each Class of the Fund (shares and dollars in thousands):
Year ended October 31, 2011
| | | | | | | | | | | | | | | | | | | | | | | | | | | | | | | | |
| | | Institutional Class | | | Y Class | | | Investor Class | | | AMR Class | |
Emerging Markets Fund | | Shares | | | Amount | | | Shares | | | Amount | | | Shares | | | Amount | | | Shares | | | Amount | |
Shares sold | | | 234 | | | $ | 3,361 | | | | 447 | | | $ | 6,562 | | | | 178 | | | $ | 2,540 | | | | 2,808 | | | $ | 38,701 | |
Reinvestment of dividends | | | 6 | | | | 84 | | | | — | | | | — | | | | 3 | | | | 41 | | | | 63 | | | | 942 | |
Shares redeemed | | | (187 | ) | | | (2,712 | )* | | | (33 | ) | | | (458 | )* | | | (329 | ) | | | (4,588 | )* | | | (2,747 | ) | | | (39,516 | )* |
| | | | | | | | | | | | | | | | | | | | | | | | | | | | | | | | |
Net increase (decrease) in shares outstanding | | | 53 | | | $ | 733 | | | | 414 | | | $ | 6,104 | | | | (148 | ) | | $ | (2,007 | ) | | | 124 | | | $ | 127 | |
| | | | | | | | | | | | | | | | | | | | | | | | | | | | | | | | |
| | | | | | | | | | | | | | | | |
| | | A Class | | | C Class | |
Emerging Markets Fund | | Shares | | | Amount | | | Shares | | | Amount | |
Shares sold | | | 36 | | | $ | 498 | | | | 1 | | | $ | 9 | |
Reinvestment of dividends | | | — | | | | — | | | | — | | | | — | |
Shares redeemed | | | (1 | ) | | | (11 | )* | | | — | | | | — | * |
| | | | | | | | | | | | | | | | |
Net increase in shares outstanding | | | 35 | | | $ | 487 | | | | 1 | | | $ | 9 | |
| | | | | | | | | | | | | | | | |
| | | | | | | | | | | | | | | | | | | | | | | | | | | | | | | | |
| | | Institutional Class | | | Y Class | | | Investor Class | | | Advisor Class | |
International Equity Fund | | Shares | | | Amount | | | Shares | | | Amount | | | Shares | | | Amount | | | Shares | | | Amount | |
Shares sold | | | 8,441 | | | $ | 139,313 | | | | 32 | | | $ | 548 | | | | 5,946 | | | $ | 98,128 | | | | 84 | | | $ | 1,395 | |
Reinvestment of dividends | | | 732 | | | | 11,984 | | | | — | | | | 7 | | | | 529 | | | | 8,593 | | | | 1 | | | | 13 | |
Shares redeemed | | | (7,305 | ) | | | (122,646 | )* | | | (1 | ) | | | (21 | )* | | | (9,134 | ) | | | (152,000 | )* | | | (64 | ) | | | (1,074 | )* |
| | | | | | | | | | | | | | | | | | | | | | | | | | | | | | | | |
Net increase (decrease) in shares outstanding | | | 1,868 | | | $ | 28,651 | | | | 31 | | | $ | 534 | | | | (2,659 | ) | | $ | (45,279 | ) | | | 21 | | | $ | 334 | |
| | | | | | | | | | | | | | | | | | | | | | | | | | | | | | | | |
| | | | |
| | | Retirement Class | | | AMR Class | | | A Class | | | C Class | |
International Equity Fund | | Shares | | | Amount | | | Shares | | | Amount | | | Shares | | | Amount | | | Shares | | | Amount | |
Shares sold | | | — | | | $ | — | | | | 3,041 | | | $ | 46,659 | | | | 32 | | | $ | 536 | | | | 5 | | | $ | 85 | |
Reinvestment of dividends | | | — | | | | — | | | | 917 | | | | 15,007 | | | | — | | | | — | | | | — | | | | — | |
Shares redeemed | | | — | | | | — | | | | (6,578 | ) | | | (110,019 | )* | | | (2 | ) | | | (28 | )* | | | — | | | | — | * |
| | | | | | | | | | | | | | | | | | | | | | | | | | | | | | | | |
Net increase (decrease) in shares outstanding | | | — | | | $ | — | | | | (2,620 | ) | | $ | (48,353 | ) | | | 30 | | | $ | 508 | | | | 5 | | | $ | 85 | |
| | | | | | | | | | | | | | | | | | | | | | | | | | | | | | | | |
Year Ended October 31, 2010
| | | | | | | | | | | | | | | | | | | | | | | | | | | | | | | | |
| | | Institutional Class | | | Y Class | | | Investor Class | | | AMR Class | |
Emerging Markets Fund | | Shares | | | Amount | | | Shares | | | Amount | | | Shares | | | Amount | | | Shares | | | Amount | |
Shares sold | | | 76 | | | $ | 969 | | | | 1 | | | $ | 11 | | | | 344 | | | $ | 4,388 | | | | 1,102 | | | $ | 14,612 | |
Reinvestment of dividends | | | 10 | | | | 125 | | | | — | | | | — | | | | 10 | | | | 127 | | | | 137 | | | | 1,717 | |
Shares redeemed | | | (260 | ) | | | (3,540 | )* | | | — | | | | — | * | | | (348 | ) | | | (4,368 | )* | | | (1,572 | ) | | | (19,966 | )* |
| | | | | | | | | | | | | | | | | | | | | | | | | | | | | | | | |
Net increase (decrease) in shares outstanding | | | (174 | ) | | $ | (2,446 | ) | | | 1 | | | $ | 11 | | | | 6 | | | $ | 147 | | | | (333 | ) | | $ | (3,637 | ) |
| | | | | | | | | | | | | | | | | | | | | | | | | | | | | | | | |
| | | | | | | | | | | | | | | | |
| | | A Class | | | C Class | |
Emerging Markets Fund | | Shares | | | Amount | | | Shares | | | Amount | |
Shares sold | | | — | | | $ | 2 | | | | — | | | $ | 1 | |
Reinvestment of dividends | | | — | | | | — | | | | — | | | | — | |
Shares redeemed | | | — | | | | — | * | | | — | | | | — | * |
| | | | | | | | | | | | | | | | |
Net increase in shares outstanding | | | — | | | $ | 2 | | | | — | | | $ | 1 | |
| | | | | | | | | | | | | | | | |
| | | | | | | | | | | | | | | | | | | | | | | | | | | | | | | | |
| | | Institutional Class | | | Y Class | | | Investor Class | | | Advisor Class | |
International Equity Fund | | Shares | | | Amount | | | Shares | | | Amount | | | Shares | | | Amount | | | Shares | | | Amount | |
Shares sold | | | 5,496 | | | $ | 83,841 | | | | 15 | | | $ | 227 | | | | 7,001 | | | $ | 105,328 | | | | 20 | | | $ | 300 | |
Reinvestment of dividends | | | 802 | | | | 12,580 | | | | — | | | | — | | | | 806 | | | | 12,480 | | | | — | | | | — | |
Shares redeemed | | | (6,209 | ) | | | (96,106 | )* | | | (1 | ) | | | (9 | )* | | | (8,688 | ) | | | (132,955 | )* | | | (89 | ) | | | (1,424 | )* |
| | | | | | | | | | | | | | | | | | | | | | | | | | | | | | | | |
Net increase (decrease) in shares outstanding | | | 89 | | | $ | 315 | | | | 14 | | | $ | 218 | | | | (881 | ) | | $ | (15,147 | ) | | | (69 | ) | | $ | (1,124 | ) |
| | | | | | | | | | | | | | | | | | | | | | | | | | | | | | | | |
35
American Beacon FundsSM
Notes to Financial Statements
October 31, 2011
| | | | | | | | | | | | | | | | | | | | | | | | | | | | | | | | |
| | | Retirement Class | | | AMR Class | | | A Class | | | C Class | |
International Equity Fund | | Shares | | | Amount | | | Shares | | | Amount | | | Shares | | | Amount | | | Shares | | | Amount | |
Shares sold | | | — | | | $ | — | | | | 4,214 | | | $ | 64,274 | | | | — | | | $ | 4 | | | | — | | | $ | 1 | |
Reinvestment of dividends | | | — | | | | — | | | | 912 | | | | 14,360 | | | | — | | | | — | | | | — | | | | — | |
Shares redeemed | | | — | | | | — | * | | | (4,789 | ) | | | (74,015 | )* | | | — | | | | — | * | | | — | | | | — | * |
| | | | | | | | | | | | | | | | | | | | | | | | | | | | | | | | |
Net increase in shares outstanding | | | — | | | $ | — | | | | 337 | | | $ | 4,619 | | | | — | | | $ | 4 | | | | — | | | $ | 1 | |
| | | | | | | | | | | | | | | | | | | | | | | | | | | | | | | | |
36
This page intentionally left blank.
37
American Beacon Emerging Markets FundSM
Financial Highlights
(For a share outstanding throughout the period)
| | | | | | | | | | | | | | | | | | | | | | | | | | | | | | | | | | | | |
| | | Institutional Class | | | Y Class | | | Investor Class | |
| | | Year Ended October 31, | | | Year
Ended
October 31, | | | March 1 to October 31, | | | Year Ended
October 31, | |
| | | 2011G | | | 2010 | | | 2009 | | | 2008 | | | 2007 | | | 2011G | | | 2010 | | | 2011G | | | 2010 | |
Net asset value, beginning of period | | $ | 14.55 | | | $ | 11.95 | | | $ | 9.00 | | | $ | 24.20 | | | $ | 17.42 | | | $ | 14.53 | | | $ | 12.29 | | | $ | 14.29 | | | $ | 11.77 | |
| | | | | | | | | | | | | | | | | | | | | | | | | | | | | | | | | | | | |
Income from investment operations: | | | | | | | | | | | | | | | | | | | | | | | | | | | | | | | | | | | | |
Net investment income (loss) | | | 0.16 | | | | 0.13 | | | | 0.05 | | | | 0.23 | | | | 0.26 | | | | 0.13 | | | | 0.04 | | | | 0.13 | | | | 0.04 | |
Net gains (losses) on securities (both realized and unrealized) | | | (1.91 | ) | | | 2.63 | | | | 4.42 | | | | (11.78 | ) | | | 9.11 | | | | (1.91 | ) | | | 2.20 | | | | (1.93 | ) | | | 2.63 | |
| | | | | | | | | | | | | | | | | | | | | | | | | | | | | | | | | | | | |
Total income (loss) from investment operations | | | (1.75 | ) | | | 2.76 | | | | 4.47 | | | | (11.55 | ) | | | 9.37 | | | | (1.78 | ) | | | 2.24 | | | | (1.80 | ) | | | 2.67 | |
| | | | | | | | | | | | | | | | | | | | | | | | | | | | | | | | | | | | |
Less distributions: | | | | | | | | | | | | | | | | | | | | | | | | | | | | | | | | | | | | |
Dividends from net investment income | | | (0.13 | ) | | | (0.16 | ) | | | (0.21 | ) | | | (0.10 | ) | | | (0.10 | ) | | | — | | | | — | | | | (0.05 | ) | | | (0.15 | ) |
Distributions from net realized gains on securities | | | — | | | | — | | | | (1.31 | ) | | | (3.55 | ) | | | (2.49 | ) | | | — | | | | — | | | | — | | | | — | |
| | | | | | | | | | | | | | | | | | | | | | | | | | | | | | | | | | | | |
Total distributions | | | (0.13 | ) | | | (0.16 | ) | | | (1.52 | ) | | | (3.65 | ) | | | (2.59 | ) | | | — | | | | — | | | | (0.05 | ) | | | (0.15 | ) |
| | | | | | | | | | | | | | | | | | | | | | | | | | | | | | | | | | | | |
Redemption fees added to beneficial interests | | | 0.00 | A | | | 0.00 | A | | | — | | | | — | | | | — | | | | 0.00 | A | | | 0.00 | A | | | 0.00 | A | | | 0.00 | A |
| | | | | | | | | | | | | | | | | | | | | | | | | | | | | | | | | | | | |
Net asset value, end of period | | $ | 12.67 | | | $ | 14.55 | | | $ | 11.95 | | | $ | 9.00 | | | $ | 24.20 | | | $ | 12.75 | | | $ | 14.53 | | | $ | 12.44 | | | $ | 14.29 | |
| | | | | | | | | | | | | | | | | | | | | | | | | | | | | | | | | | | | |
Total return B,C | | | (12.18 | )% | | | 23.36 | % | | | 60.56 | % | | | (55.59 | )% | | | 60.83 | % | | | (12.25 | )% | | | 18.23 | %D | | | (12.65 | )% | | | 22.85 | % |
| | | | | | | | | | | | | | | | | | | | | | | | | | | | | | | | | | | | |
Ratios and supplemental data: | | | | | | | | | | | | | | | | | | | | | | | | | | | | | | | | | | | | |
Net assets, end of period (in thousands) | | $ | 8,523 | | | $ | 9,023 | | | $ | 9,494 | | | $ | 5,478 | | | $ | 13,773 | | | $ | 5,296 | | | $ | 13 | | | $ | 9,030 | | | $ | 12,478 | |
Ratios to average net assets (annualized): | | | | | | | | | | | | | | | | | | | | | | | | | | | | | | | | | | | | |
Expenses, before reimbursements | | | 1.55 | % | | | 1.58 | % | | | 1.66 | % | | | 1.38 | % | | | 1.60 | % | | | 1.68 | % | | | 1.82 | %E | | | 1.84 | % | | | 1.86 | % |
Expenses, net of reimbursements | | | 1.24 | % | | | 1.39 | % | | | 1.66 | % | | | 1.38 | % | | | 1.60 | % | | | 1.33 | % | | | 1.42 | %E | | | 1.70 | % | | | 1.77 | % |
Net investment income (loss), before reimbursements | | | 0.99 | % | | | 0.58 | % | | | 0.95 | % | | | 1.35 | % | | | 0.93 | % | | | 0.99 | % | | | 0.40 | %E | | | 0.77 | % | | | 0.29 | % |
Net investment income (loss), net of reimbursements | | | 1.30 | % | | | 0.77 | % | | | 0.95 | % | | | 1.35 | % | | | 0.93 | % | | | 1.35 | % | | | 0.79 | %E | | | 0.91 | % | | | 0.37 | % |
Portfolio turnover rate | | | 101 | % | | | 64 | % | | | 70 | % | | | 82 | % | | | 81 | % | | | 101 | % | | | 64 | %F | | | 101 | % | | | 64 | % |
| A | Amounts represent less than $0.01 per share. |
| B | May include adjustments in accordance with accounting principles generally accepted in the United States of America and as such, the net asset value for reporting purposes and the returns based upon those net asset values may differ from the net asset value and returns for shareholder transactions. |
| C | Based on net asset value, which does not reflect the sales charge, redemption fee, or contingent deferred sales charge, if applicable. |
| F | Portfolio turnover rate is for the period from November 1, 2009 through October 31, 2010. |
| G | Brandes Investment Partners, LP was added as an investment manager to the Emerging Markets Fund on December 31, 2010. |
38
American Beacon Emerging Markets FundSM
Financial Highlights
(For a share outstanding throughout the period)
| | | | | | | | | | | | | | | | | | | | | | | | | | | | | | | | | | | | | | | | | | | | | | |
| Investor Class | | | A Class | | | AMR Class | | | C Class | |
| Year Ended October 31, | | | Year
Ended
October 31, | | | May 17 to
October 31, | | | Year Ended October 31, | | | Year
Ended
October 31, | | | September 1
to
October 31, | |
| 2009 | | | 2008 | | | 2007 | | | 2011G | | | 2010 | | | 2011G | | | 2010 | | | 2009 | | | 2008 | | | 2007 | | | 2011G | | | 2010 | |
| $ | 8.85 | | | $ | 23.91 | | | $ | 17.22 | | | $ | 14.27 | | | $ | 12.10 | | | $ | 14.62 | | | $ | 12.02 | | | $ | 9.06 | | | $ | 24.37 | | | $ | 17.52 | | | $ | 14.26 | | | $ | 12.89 | |
| | | | | | | | | | | | | | | | | | | | | | | | | | | | | | | | | | | | | | | | | | | | | | |
| | | | | | | | | | | |
| | | | | | | | | | | | | | | | | | | | | | | | | | | | | | | | | | | | | | | | | | | | | | |
| | 0.04 | | | | 0.17 | | | | 0.11 | | | | 0.06 | | | | 0.02 | | | | 0.18 | | | | 0.11 | | | | 0.09 | | | | 0.33 | | | | 0.19 | | | | 0.09 | | | | (0.02 | ) |
|
4.35 |
| | | (11.60 | ) | | | 9.11 | | | | (1.85 | ) | | | 2.15 | | | | (1.97 | ) | | | 2.68 | | | | 4.43 | | | | (11.91 | ) | | | 9.30 | | | | (1.97 | ) | | | 1.39 | |
| | | | | | | | | | | | | | | | | | | | | | | | | | | | | | | | | | | | | | | | | | | | | | |
|
4.39 |
| | | (11.43 | ) | | | 9.22 | | | | (1.79 | ) | | | 2.17 | | | | (1.79 | ) | | | 2.79 | | | | 4.52 | | | | (11.58 | ) | | | 9.49 | | | | (1.88 | ) | | | 1.37 | |
| | | | | | | | | | | | | | | | | | | | | | | | | | | | | | | | | | | | | | | | | | | | | | |
| | | | | | | | | | | |
| | | | | | | | | | | | | | | | | | | | | | | | | | | | | | | | | | | | | | | | | | | | | | |
|
(0.16 |
) | | | (0.08 | ) | | | (0.04 | ) | | | (0.01 | ) | | | — | | | | (0.09 | ) | | | (0.19 | ) | | | (0.25 | ) | | | (0.18 | ) | | | (0.15 | ) | | | — | | | | — | |
|
(1.31 |
) | | | (3.55 | ) | | | (2.49 | ) | | | — | | | | — | | | | — | | | | | | | | (1.31 | ) | | | (3.55 | ) | | | (2.49 | ) | | | — | | | | — | |
| | | | | | | | | | | | | | | | | | | | | | | | | | | | | | | | | | | | | | | | | | | | | | |
| | (1.47 | ) | | | (3.63 | ) | | | (2.53 | ) | | | (0.01 | ) | | | — | | | | (0.09 | ) | | | (0.19 | ) | | | (1.56 | ) | | | (3.73 | ) | | | (2.64 | ) | | | — | | | | — | |
| | | | | | | | | | | | | | | | | | | | | | | | | | | | | | | | | | | | | | | | | | | | | | |
|
— |
| | | — | | | | — | | | | 0.00 | A | | | 0.00 | A | | | 0.00 | A | | | 0.00 | A | | | — | | | | — | | | | — | | | | 0.00 | A | | | 0.00 | A |
| | | | | | | | | | | | | | | | | | | | | | | | | | | | | | | | | | | | | | | | | | | | | | |
| | $11.77 | | | $ | 8.85 | | | $ | 23.91 | | | $ | 12.47 | | | $ | 14.27 | | | $ | 12.74 | | | $ | 14.62 | | | $ | 12.02 | | | $ | 9.06 | | | $ | 24.37 | | | $ | 12.38 | | | $ | 14.26 | |
| | | | | | | | | | | | | | | | | | | | | | | | | | | | | | | | | | | | | | | | | | | | | | |
| | 60.24 | % | | | (55.75 | )% | | | 60.38 | % | | | (12.58 | )% | | | 17.93 | %D | | | (12.30 | )% | | | 23.47 | % | | | 61.01 | % | | | (55.48 | )% | | | 61.28 | % | | | (13.18 | )% | | | 10.63 | %D |
| | | | | | | | | | | | | | | | | | | | | | | | | | | | | | | | | | | | | | | | | | | | | | |
| | | | | | | | | | | |
| | | | | | | | | | | | | | | | | | | | | | | | | | | | | | | | | | | | | | | | | | | | | | |
$ |
10,208 |
| | $ | 5,183 | | | $ | 11,694 | | | $ | 433 | | | $ | 2 | | | $ | 113,894 | | | $ | 128,841 | | | $ | 109,985 | | | $ | 72,516 | | | $ | 271,726 | | | $ | 8 | | | $ | 1 | |
| | | | | | | | | | | |
| | | | | | | | | | | | | | | | | | | | | | | | | | | | | | | | | | | | | | | | | | | | | | |
| | | | | | | | | | | | | | | | | | | | | | | | | | | | | | | | | | | | | | | | | | | | | | |
|
1.96 |
% | | | 1.72 | % | | | 1.96 | % | | | 2.97 | % | | | 2.26 | %E | | | 1.31 | % | | | 1.34 | % | | | 1.42 | % | | | 1.17 | % | | | 1.37 | % | | | 26.96 | % | | | 4.49 | %E |
|
1.96 |
% | | | 1.72 | % | | | 1.96 | % | | | 1.46 | % | | | 1.78 | %E | | | 1.31 | % | | | 1.34 | % | | | 1.42 | % | | | 1.17 | % | | | 1.37 | % | | | 2.41 | % | | | 2.54 | %E |
|
0.65 |
% | | | 1.00 | % | | | 0.65 | % | | | (0.10 | )% | | | (0.10 | )%E | | | 1.29 | % | | | 0.79 | % | | | 1.27 | % | | | 1.46 | % | | | 1.25 | % | | | (23.86 | )% | | | (2.91 | )%E |
|
0.65 |
% | | | 1.00 | % | | | 0.65 | % | | | 1.41 | % | | | 0.39 | %E | | | 1.29 | % | | | 0.79 | % | | | 1.27 | % | | | 1.46 | % | | | 1.25 | % | | | 0.69 | % | | | (0.96 | )%E |
| | 70 | % | | | 82 | % | | | 81 | % | | | 101 | % | | | 64 | %F | | | 101 | % | | | 64 | % | | | 70 | % | | | 82 | % | | | 81 | % | | | 101 | % | | | 64 | %F |
39
American Beacon International Equity FundSM
Financial Highlights
(For a share outstanding throughout the period)
| | | | | | | | | | | | | | | | | | | | | | | | | | | | | | | | |
| | | Institutional Class | | | Y Class | |
| | | Year Ended October 31, | | | Year Ended
October 31, | | | August 3
to
October 31,
2009 | |
| | | 2011 | | | 2010 | | | 2009 | | | 2008 | | | 2007 | | | 2011 | | | 2010 | | |
Net asset value, beginning of period | | $ | 16.67 | | | $ | 15.51 | | | $ | 13.13 | | | $ | 27.32 | | | $ | 24.68 | | | $ | 17.17 | | | $ | 15.52 | | | $ | 14.89 | |
| | | | | | | | | | | | | | | | | | | | | | | | | | | | | | | | |
Income from investment operations: | | | | | | | | | | | | | | | | | | | | | | | | | | | | | | | | |
Net investment income | | | 0.46 | | | | 0.35 | | | | 0.54 | | | | 0.77 | | | | 0.65 | | | | 0.49 | | | | 0.04 | | | | 0.04 | |
Net gains (losses) on securities (both realized and unrealized) | | | (1.41 | ) | | | 1.30 | | | | 2.78 | | | | (11.60 | ) | | | 4.31 | | | | (1.50 | ) | | | 1.61 | | | | 0.59 | |
| | | | | | | | | | | | | | | | | | | | | | | | | | | | | | | | |
Total income (loss) from investment operations | | | (0.95 | ) | | | 1.65 | | | | 3.32 | | | | (10.83 | ) | | | 4.96 | | | | (1.01 | ) | | | 1.65 | | | | 0.63 | |
| | | | | | | | | | | | | | | | | | | | | | | | | | | | | | | | |
Less distributions: | | | | | | | | | | | | | | | | | | | | | | | | | | | | | | | | |
Dividends from net investment income | | | (0.45 | ) | | | (0.49 | ) | | | (0.61 | ) | | | (0.70 | ) | | | (0.50 | ) | | | (0.34 | ) | | | — | | | | — | |
Distributions from net realized gains on securities | | | — | | | | — | | | | (0.33 | ) | | | (2.66 | ) | | | (1.82 | ) | | | — | | | | — | | | | — | |
| | | | | | | | | | | | | | | | | | | | | | | | | | | | | | | | |
Total distributions | | | (0.45 | ) | | | (0.49 | ) | | | (0.94 | ) | | | (3.36 | ) | | | (2.32 | ) | | | (0.34 | ) | | | — | | | | — | |
| | | | | | | | | | | | | | | | | | | | | | | | | | | | | | | | |
Redemption fees added to beneficial interest | | | — | | | | — | | | | 0.00 | F | | | 0.00 | F | | | 0.00 | F | | | — | | | | — | | | | 0.00 | F |
| | | | | | | | | | | | | | | | | | | | | | | | | | | | | | | | |
Net asset value, end of period | | $ | 15.27 | | | $ | 16.67 | | | $ | 15.51 | | | $ | 13.13 | | | $ | 27.32 | | | $ | 15.82 | | | $ | 17.17 | | | $ | 15.52 | |
| | | | | | | | | | | | | | | | | | | | | | | | | | | | | | | | |
Total return A,B | | | (5.89 | )% | | | 10.81 | % | | | 27.44 | % | | | (44.81 | )% | | | 21.54 | % | | | (6.00 | )% | | | 10.63 | % | | | 4.23 | %C |
| | | | | | | | | | | | | | | | | | | | | | | | | | | | | | | | |
Ratios and supplemental data: | | | | | | | | | | | | | | | | | | | | | | | | | | | | | | | | |
Net assets, end of period (in thousands) | | $ | 512,093 | | | $ | 527,718 | | | $ | 489,837 | | | $ | 567,414 | | | $ | 1,686,668 | | | $ | 720 | | | $ | 245 | | | $ | 1 | |
Ratios to average net assets (annualized): | | | | | | | | | | | | | | | | | | | | | | | | | | | | | | | | |
Expenses, before reimbursements | | | 0.70 | % | | | 0.71 | % | | | 0.73 | % | | | 0.66 | % | | | 0.67 | % | | | 0.81 | % | | | 0.81 | % | | | 0.69 | %D |
Expenses, net of reimbursements | | | 0.70 | % | | | 0.71 | % | | | 0.73 | % | | | 0.66 | % | | | 0.67 | % | | | 0.81 | % | | | 0.81 | % | | | 0.69 | %D |
Net investment income (loss), before reimbursements | | | 2.90 | % | | | 2.21 | % | | | 2.76 | % | | | 2.91 | % | | | 2.46 | % | | | 3.00 | % | | | 1.44 | % | | | 1.00 | %D |
Net investment income, net of reimbursements | | | 2.90 | % | | | 2.21 | % | | | 2.76 | % | | | 2.91 | % | | | 2.46 | % | | | 3.00 | % | | | 1.44 | % | | | 1.00 | %D |
Portfolio turnover rate | | | 33 | % | | | 38 | % | | | 41 | % | | | 31 | % | | | 38 | % | | | 33 | % | | | 38 | % | | | 41 | %E |
| A | May include adjustments in accordance with accounting principles generally accepted in the United States of America and as such, the net asset value for reporting purposes and the returns based upon those net asset values may differ from the net asset value and returns for shareholder transactions. |
| B | Based on net asset value, which does not reflect the sales charge, redemption fee, or contingent deferred sales charge, if applicable. |
| E | Portfolio turnover rate is for the period from November 1, 2008 through October 31, 2009. |
| F | Amounts represent less than $0.01 per share. |
40
American Beacon International Equity FundSM
Financial Highlights
(For a share outstanding throughout the period)
| | | | | | | | | | | | | | | | | | | | |
| | | Investor Class | |
| | | Year Ended October 31, | |
| | | 2011 | | | 2010 | | | 2009 | | | 2008 | | | 2007 | |
Net asset value, beginning of period | | $ | 16.42 | | | $ | 15.30 | | | $ | 12.95 | | | $ | 26.99 | | | $ | 24.42 | |
| | | | | | | | | | | | | | | | | | | | |
Income from investment operations: | | | | | | | | | | | | | | | | | | | | |
Net investment income | | | 0.44 | | | | 0.29 | | | | 0.37 | | | | 0.66 | | | | 0.58 | |
Net gains (losses) on securities (both realized and unrealized) | | | (1.44 | ) | | | 1.27 | | | | 2.87 | | | | (11.41 | ) | | | 4.26 | |
| | | | | | | | | | | | | | | | | | | | |
Total income (loss) from investment operations | | | (1.00 | ) | | | 1.56 | | | | 3.24 | | | | (10.75 | ) | | | 4.84 | |
| | | | | | | | | | | | | | | | | | | | |
Less distributions: | | | | | | | | | | | | | | | | | | | | |
Dividends from net investment income | | | (0.31 | ) | | | (0.44 | ) | | | (0.56 | ) | | | (0.63 | ) | | | (0.45 | ) |
Distributions from net realized gains on securities | | | — | | | | — | | | | (0.33 | ) | | | (2.66 | ) | | | (1.82 | ) |
| | | | | | | | | | | | | | | | | | | | |
Total distributions | | | (0.31 | ) | | | (0.44 | ) | | | (0.89 | ) | | | (3.29 | ) | | | (2.27 | ) |
| | | | | | | | | | | | | | | | | | | | |
Redemption fees added to beneficial interest | | | — | | | | — | | | | 0.00 | C | | | 0.00 | C | | | 0.00 | C |
| | | | | | | | | | | | | | | | | | | | |
Net asset value, end of period | | $ | 15.11 | | | $ | 16.42 | | | $ | 15.30 | | | $ | 12.95 | | | $ | 26.99 | |
| | | | | | | | | | | | | | | | | | | | |
Total return A,B | | | (6.21 | )% | | | 10.36 | % | | | 27.08 | % | | | (44.96 | )% | | | 21.22 | % |
| | | | | | | | | | | | | | | | | | | | |
Ratios and supplemental data: | | | | | | | | | | | | | | | | | | | | |
Net assets, end of period (in thousands) | | $ | 386,560 | | | $ | 463,704 | | | $ | 445,596 | | | $ | 426,473 | | | $ | 909,385 | |
Ratios to average net assets (annualized): | | | | | | | | | | | | | | | | | | | | |
Expenses, before reimbursements | | | 1.07 | % | | | 1.07 | % | | | 1.05 | % | | | 0.92 | % | | | 0.93 | % |
Expenses, net of reimbursements | | | 1.07 | % | | | 1.07 | % | | | 1.05 | % | | | 0.92 | % | | | 0.93 | % |
Net investment income (loss), before reimbursements | | | 2.55 | % | | | 1.83 | % | | | 2.45 | % | | | 2.82 | % | | | 2.26 | % |
Net investment income, net of reimbursements | | | 2.55 | % | | | 1.83 | % | | | 2.45 | % | | | 2.82 | % | | | 2.26 | % |
Portfolio turnover rate | | | 33 | % | | | 38 | % | | | 41 | % | | | 31 | % | | | 38 | % |
| A | May include adjustments in accordance with accounting principles generally accepted in the United States of America and as such, the net asset value for reporting purposes and the returns based upon those net asset values may differ from the net asset value and returns for shareholder transactions. |
| B | Based on net asset value, which does not reflect the sales charge, redemption fee, or contingent deferred sales charge, if applicable. |
| C | Amounts represent less than $0.01 per share. |
41
American Beacon International Equity FundSM
Financial Highlights
(For a share outstanding throughout the period)
| | | | | | | | | | | | | | | | | | | | |
| | | | | | | | | | | | | | | | |
| | | | | | | | | | | | | | | | |
| | | Advisor Class | |
| | | Year Ended October 31, | |
| | | 2011 | | | 2010 | | | 2009 | | | 2008 | | | 2007 | |
Net asset value, beginning of period | | $ | 16.74 | | | $ | 15.20 | | | $ | 12.86 | | | $ | 26.83 | | | $ | 24.24 | |
| | | | | | | | | | | | | | | | | | | | |
Income from investment operations: | | | | | | | | | | | | | | | | | | | | |
Net investment income (loss) | | | 0.07 | | | | 0.89 | | | | 0.31 | | | | 0.62 | | | | 0.56 | |
Net gains (losses) on securities (both realized and unrealized) | | | (1.12 | ) | | | 0.65 | | | | 2.86 | | | | (11.35 | ) | | | 4.20 | |
| | | | | | | | | | | | | | | | | | | | |
Total income (loss) from investment operations | | | (1.05 | ) | | | 1.54 | | | | 3.17 | | | | (10.73 | ) | | | 4.76 | |
| | | | | | | | | | | | | | | | | | | | |
Less distributions: | | | | | | | | | | | | | | | | | | | | |
Dividends from net investment income | | | (0.17 | ) | | | — | | | | (0.50 | ) | | | (0.58 | ) | | | (0.35 | ) |
Distributions from net realized gains on securities | | | — | | | | — | | | | (0.33 | ) | | | (2.66 | ) | | | (1.82 | ) |
| | | | | | | | | | | | | | | | | | | | |
Total distributions | | | (0.17 | ) | | | — | | | | (0.83 | ) | | | (3.24 | ) | | | (2.17 | ) |
| | | | | | | | | | | | | | | | | | | | |
| | | | | |
Redemption fees added to beneficial interest | | | — | | | | — | | | | 0.00 | H | | | 0.00 | H | | | 0.00 | H |
| | | | | | | | | | | | | | | | | | | | |
Net asset value, end of period | | $ | 15.52 | | | $ | 16.74 | | | $ | 15.20 | | | $ | 12.86 | | | $ | 26.83 | |
| | | | | | | | | | | | | | | | | | | | |
Total return A,B | | | (6.35 | )% | | | 10.13 | % | | | 26.58 | % | | | (45.10 | )% | | | 21.00 | % |
| | | | | | | | | | | | | | | | | | | | |
Ratios and supplemental data: | | | | | | | | | | | | | | | | | | | | |
Net assets, end of period (in thousands) | | $ | 1,015 | | | $ | 746 | | | $ | 1,722 | | | $ | 1,546 | | | $ | 4,932 | |
Ratios to average net assets (annualized): | | | | | | | | | | | | | | | | | | | | |
Expenses, before reimbursements | | | 1.24 | % | | | 1.26 | % | | | 1.45 | % | | | 1.19 | % | | | 1.15 | % |
Expenses, net of reimbursements | | | 1.24 | % | | | 1.26 | % | | | 1.44 | % | | | 1.19 | % | | | 1.12 | % |
Net investment income (loss), before reimbursements | | | 2.52 | % | | | 1.64 | % | | | 2.25 | % | | | 2.36 | % | | | 2.01 | % |
Net investment income, net of reimbursements | | | 2.52 | % | | | 1.64 | % | | | 2.26 | % | | | 2.36 | % | | | 2.04 | % |
Portfolio turnover rate | | | 33 | % | | | 38 | % | | | 41 | % | | | 31 | % | | | 38 | % |
| A | May include adjustments in accordance with accounting principles generally accepted in the United States of America and as such, the net asset value for reporting purposes and the returns based upon those net asset values may differ from the net asset value and returns for shareholder transactions. |
| B | Based on net asset value, which does not reflect the sales charge, redemption fee, or contingent deferred sales charge, if applicable. |
| F | Portfolio turnover rate is for the period from November 1, 2008 through October 31, 2009. |
| G | Portfolio turnover rate is for the period from November 1, 2009 through October 31, 2010. |
| H | Amounts represents less than $0.01 per share. |
42
American Beacon International Equity FundSM
Financial Highlights
(For a share outstanding throughout the period)
| | | | | | | | | | | | | | | | | | | | | | | | | | | | | | | | | | | | | | | | | | | | | | |
| Retirement Class | | | AMR Class | | | A Class | | | C Class | |
Year Ended
October 31, | | | May 1 to
October 31,
2009 | | | Year Ended October 31, | | | Year
Ended
October 31,
2011 | | | May 17 to
October 31,
2010 | | | Year
Ended
October 31,
2011 | | | September
1 to
October 31,
2010 | |
| 2011 | | | 2010 | | | | 2011 | | | 2010 | | | 2009 | | | 2008 | | | 2007 | | | | | |
| $ | 16.71 | | | $ | 15.20 | | | $ | 11.78 | | | $ | 16.78 | | | $ | 15.61 | | | $ | 13.25 | | | $ | 27.54 | | | $ | 24.86 | | | $ | 16.40 | | | $ | 14.14 | | | $ | 16.39 | | | $ | 14.82 | |
| | | | | | | | | | | | | | | | | | | | | | | | | | | | | | | | | | | | | | | | | | | | | | |
| | | | | | | | | | | |
| | | | | | | | | | | | | | | | | | | | | | | | | | | | | | | | | | | | | | | | | | | | | | |
| | 0.39 | | | | 0.22 | | | | 0.12 | | | | 0.53 | | | | 0.39 | | | | 0.37 | | | | 0.72 | | | | 0.73 | | | | 0.12 | | | | 0.03 | | | | 0.07 | | | | (0.01 | ) |
| | (1.44 | ) | | | 1.29 | | | | 3.30 | | | | (1.44 | ) | | | 1.30 | | | | 2.99 | | | | (11.58 | ) | | | 4.33 | | | | (1.14 | ) | | | 2.23 | | | | (1.25 | ) | | | 1.58 | |
| | | | | | | | | | | | | | | | | | | | | | | | | | | | | | | | | | | | | | | | | | | | | | |
| | (1.05 | ) | | | 1.51 | | | | 3.42 | | | | (0.91 | ) | | | 1.69 | | | | 3.36 | | | | (10.86 | ) | | | 5.06 | | | | (1.02 | ) | | | 2.26 | | | | (1.18 | ) | | | 1.57 | |
| | | | | | | | | | | | | | | | | | | | | | | | | | | | | | | | | | | | | | | | | | | | | | |
| | | | | | | | | | | |
| | | | | | | | | | | | | | | | | | | | | | | | | | | | | | | | | | | | | | | | | | | | | | |
| | (0.22 | ) | | | — | | | | — | | | | (0.56 | ) | | | (0.52 | ) | | | (0.67 | ) | | | (0.77 | ) | | | (0.56 | ) | | | (0.05 | ) | | | — | | | | — | | | | — | |
| | — | | | | — | | | | — | | | | — | | | | — | | | | (0.33 | ) | | | (2.66 | ) | | | (1.82 | ) | | | — | | | | — | | | | — | | | | — | |
| | | | | | | | | | | | | | | | | | | | | | | | | | | | | | | | | | | | | | | | | | | | | | |
| | (0.22 | ) | | | — | | | | — | | | | (0.56 | ) | | | (0.52 | ) | | | (1.00 | ) | | | (3.43 | ) | | | (2.38 | ) | | | (0.05 | ) | | | — | | | | — | | | | — | |
| | | | | | | | | | | | | | | | | | | | | | | | | | | | | | | | | | | | | | | | | | | | | | |
| | | | | | | | | | | |
| | — | | | | — | | | | 0.00 | H | | | — | | | | — | | | | 0.00 | H | | | 0.00 | H | | | 0.00 | H | | | — | | | | — | | | | — | | | | — | |
| | | | | | | | | | | | | | | | | | | | | | | | | | | | | | | | | | | | | | | | | | | | | | |
| $ | 15.44 | | | $ | 16.71 | | | $ | 15.20 | | | $ | 15.31 | | | $ | 16.78 | | | $ | 15.61 | | | $ | 13.25 | | | $ | 27.54 | | | $ | 15.33 | | | $ | 16.40 | | | $ | 15.21 | | | $ | 16.39 | |
| | | | | | | | | | | | | | | | | | | | | | | | | | | | | | | | | | | | | | | | | | | | | | |
| | (6.37 | )% | | | 9.93 | % | | | 29.03 | %C | | | (5.62 | )% | | | 11.05 | % | | | 27.70 | % | | | (44.65 | )% | | | 21.86 | % | | | (6.26 | )% | | | 15.98 | %C | | | (7.20 | )% | | | 10.59 | %C |
| | | | | | | | | | | | | | | | | | | | | | | | | | | | | | | | | | | | | | | | | | | | | | |
| | | | | | | | | | | |
| | | | | | | | | | | | | | | | | | | | | | | | | | | | | | | | | | | | | | | | | | | | | | |
| $ | 1 | | | $ | 1 | | | $ | 1 | | | $ | 388,185 | | | $ | 469,414 | | | $ | 431,499 | | | $ | 328,083 | | | $ | 672,680 | | | $ | 461 | | | $ | 4 | | | $ | 76 | | | $ | 1 | |
| | | | | | | | | | | |
| | | | | | | | | | | | | | | | | | | | | | | | | | | | | | | | | | | | | | | | | | | | | | |
| | 3.43 | % | | | 1.66 | % | | | 1.48 | %D | | | 0.45 | % | | | 0.46 | % | | | 0.48 | % | | | 0.41 | % | | | 0.42 | % | | | 2.24 | % | | | 1.26 | %E | | | 7.39 | % | | | 2.60 | %E |
| | 1.30 | % | | | 1.47 | % | | | 1.48 | %D | | | 0.45 | % | | | 0.46 | % | | | 0.48 | % | | | 0.41 | % | | | 0.42 | % | | | 1.22 | % | | | 1.25 | %E | | | 1.95 | % | | | 1.99 | %E |
| | 0.17 | % | | | 1.25 | % | | | 1.72 | %D | | | 3.15 | % | | | 2.45 | % | | | 3.00 | % | | | 3.24 | % | | | 2.77 | % | | | 1.03 | % | | | 0.96 | %E | | | (4.32 | )% | | | (0.81 | )%E |
| | 2.30 | % | | | 1.44 | % | | | 1.72 | %D | | | 3.15 | % | | | 2.45 | % | | | 3.00 | % | | | 3.24 | % | | | 2.77 | % | | | 2.05 | % | | | 0.98 | %E | | | 1.11 | % | | | (0.20 | )%E |
| | 33 | % | | | 38 | % | | | 41 | %F | | | 33 | % | | | 38 | % | | | 41 | % | | | 31 | % | | | 38 | % | | | 33 | % | | | 38 | %G | | | 33 | % | | | 38 | %G |
43
American Beacon Funds
Privacy Policy & Federal Tax Information
October 31, 2011 (Unaudited)
Privacy Policy
The American Beacon Funds recognize and respect the privacy of our shareholders. We are providing this notice to you so you will understand how shareholder information may be collected and used.
We may collect nonpublic personal information about you from one or more of the following sources:
| | • | | information we receive from you on applications or other forms; |
| | • | | information about your transactions with us or our service providers; and |
| | • | | information we receive from third parties. |
We do not disclose any nonpublic personal information about our customers or former customers to anyone, except as permitted by law.
We restrict access to your nonpublic personal information to those employees or service providers who need to know that information to provide products or services to you. To ensure the confidentiality of your nonpublic personal information, we maintain safeguards that comply with federal standards.
Federal Tax Information
For shareholders in the Funds, the percentage of dividend income distributed for the year ended October 31, 2010, which is designated as qualified dividend income under the Jobs Growth Tax Relief Act of 2003, was as follows:
| | | | |
Emerging Markets Fund | | | 100.00 | % |
International Equity Fund | | | 59.53 | % |
Shareholders will receive notification in January 2012 of the percentage applicable to the preparation of their 2011 income tax returns.
The International Equity Fund designated a foreign tax credit of $4,546,995 and recognized foreign source income of $53,932,956 for the year ended October 31, 2011.
44
Disclosure Regarding the Board of Trustees’ Approval of the Investment
Management Agreement and Advisor Agreement (Unaudited)
Disclosure Regarding Renewal and Approval of Management Agreement and Investment Advisory Agreements
At its May 26, 2011 meeting, the Board of Trustees (“Board”) considered the renewal of each existing Management Agreement between American Beacon Advisors, Inc. (the “Manager”) and the American Beacon Funds, the American Beacon Mileage Funds, the American Beacon Select Funds and the American Beacon Master Trust (collectively the “Funds”) and each Investment Advisory Agreement between the Manager and a subadvisor (“Investment Advisory Agreements” and collectively with the Management Agreement, the “Agreements”). In preparation for the Board’s consideration to renew these Agreements, the Board and its Investment Committee undertook steps to gather and consider information furnished by the Manager, the subadvisors and Lipper, Inc. (“Lipper”). The Board, with the assistance of independent legal counsel, requested and received certain relevant information from the Manager and each subadvisor.
In addition, the Board’s Investment Committee worked with Lipper to obtain relevant comparative information regarding the performance, fees and expenses of the Funds. The Investment Committee held a separate meeting on May 11, 2011 to consider the information provided by Lipper. Further, the Board took into consideration information furnished for the Board’s review and consideration throughout the year at regular Board and Investment Committee meetings, as well as information specifically prepared in connection with the renewal process.
In connection with the Board’s consideration of the Management Agreement and each Investment Advisory Agreement, the Trustees considered, among other materials, responses by the Manager and the subadvisors to inquiries requesting:
| | • | | a description of any significant changes (actual or anticipated) to principal activities, personnel, services provided to the Funds, or any other area, including how these changes might affect the Funds; |
| | • | | a copy of the firm’s most recent audited or unaudited financial statements, as well as Parts 1 and 2 of its Form ADV registration statement with the SEC; |
| | • | | a summary of any material pending or anticipated litigation or regulatory proceedings involving the firm or its personnel, including the results of any recent regulatory examination or independent audit; |
| | • | | a comparison of the performance of that portion of Fund assets managed by each firm with performance of other similar accounts managed by the firm, including a discussion of relative performance versus a peer group average and any remedial measures if the firm’s performance was materially below that of the peer group; |
| | • | | a profit/loss analysis of the firm and any actual or anticipated economies of scale in relation to the services it provides to each Fund; |
| | • | | an analysis of compensation, including a comparison with fees charged to other clients for which similar services are provided, any proposed changes to the fee schedule and the effect of any fee waivers; |
| | • | | a description of any payments by the subadvisers to the manager to support the Funds’ marketing efforts; |
| | • | | an evaluation of any other benefits to the firm or Funds as a result of their relationship, if any; |
| | • | | confirmation that the firm’s financial condition would not impair its ability to provide high-quality advisory services to the Funds; |
| | • | | a description of the scope of portfolio management services provided to the Funds, including whether such services differ from the services provided to other clients, including other registered investment companies, and any advantages or disadvantages that might accrue to the Funds due to the firm’s involvement in other activities; |
| | • | | a description of the personnel who are assigned primary responsibility for managing the Funds, including any changes during the past year, and a discussion of the adequacy of current and projected staffing levels to service the Funds; |
| | • | | a description of the basis upon which portfolio managers are compensated, including any “incentive” arrangements, and a description of the oversight mechanisms used to prevent a portfolio manager whose compensation is tied to performance of a Fund from taking undue risks; |
| | • | | a discussion regarding the firm’s participation in “soft dollar” arrangements, if any, or other brokerage allocation policies with respect to Fund transactions, including the firm’s methodology for obtaining best execution and the use of any affiliated broker-dealers; |
| | • | | a description of any actual or potential conflicts of interest anticipated in managing Fund assets; |
| | • | | a discussion of whether the firm has identified any investment or operational matters that likely present a high risk in managing Fund assets; |
| | • | | a description of trade allocation procedures among accounts managed by the firm; |
| | • | | a discussion of whether the firm receives, with respect to the Funds, other compensation, including any payment for order flow or ECN liquidity rebates |
| | • | | a certification by the firm regarding the reasonable design of its compliance program; |
| | • | | information regarding the firm’s code of ethics, insider trading policy and disaster recovery plan, including a description of any material changes thereto and a related certification of compliance by the firm; |
| | • | | a description of the firm’s affiliation with any broker-dealer; |
| | • | | a discussion of any anticipated change in the firm’s controlling persons; and |
| | • | | verification of the firm’s insurance coverage with regards to the services provided to the Funds. |
45
Disclosure Regarding the Board of Trustees’ Approval of the Investment
Management Agreement and Advisor Agreement (Unaudited)
In addition to the foregoing, the Manager provided the following information specific to the renewal of the Management Agreement:
| | • | | a comparison of the performance of each Fund to comparable investment companies and appropriate indices, including comments on the relative performance of, as applicable, each subadvisor and each Fund versus the respective peer group average; |
| | • | | a discussion, if applicable, of any underperformance by a subadvisor relative to its peer group and what, if any, remedial measures the Manager has or intends to take; |
| | • | | a comparison of advisory fees and expense ratios for comparable mutual funds; |
| | • | | an analysis of any material complaints received from Fund shareholders; |
| | • | | a description of the extent to which the Manager monitors the investment activities and financial conditions of each subadvisor to the Funds; |
| | • | | a description of the Manager’s distribution activities with respect to promoting sales of Fund shares, including any revenue sharing practices; |
| | • | | a description of the Manager’s securities lending practices and the fees received from such practices; |
| | • | | a discussion of any rebate arrangements between the Manager and a service provider to the Funds pursuant to which the Manager receives direct or indirect benefits from the service provider; |
| | • | | a description of the portfolio turnover rate and average execution costs for each Fund and, as applicable, each subadvisor to a Fund; and |
| | • | | a description of how expenses that are not readily identifiable to a particular Fund are allocated. |
In connection with the Management Agreement and each Investment Advisory Agreement, the Board also obtained an analysis provided by Lipper that compared: (i) investment performance of each Fund versus comparable investment companies and appropriate indices; (ii) total Fund expenses of each Fund versus comparable mutual funds; and (iii) each Fund’s investment advisory fees versus comparable mutual funds. For each Fund with more than one class of shares, the class of shares used for comparative purposes was the class with the longest performance history, which in most cases was the Institutional Class. References below to each Fund’s Lipper peer group are to the group of comparable mutual funds included in the analysis provided by Lipper.
Provided below is an overview of the primary factors the Trustees considered at the Investment Committee meeting on May 11, 2011 at which the Trustees reviewed the investment performance of the Manager and each subadvisor and the primary factors considered by the Board at its May 26, 2011 meeting at which the Board considered the renewal of the Agreements. The Board did not identify any particular information that was most relevant to its consideration to renew the Management Agreement and each Investment Advisory Agreement, and each Trustee may have afforded different weight to the various factors. Legal counsel to the independent Trustees provided the Board with a memorandum regarding its responsibilities pertaining to the renewal of the Agreements. The memorandum explained the regulatory requirements surrounding the Trustees’ process for evaluating investment advisors and the terms of the contracts. Based on its evaluation, the Board unanimously concluded that the terms of each Agreement were reasonable and fair and that the renewal of each Agreement was in the best interests of the Funds and their shareholders.
Considerations With Respect to All Funds
In determining whether to renew the Management Agreement and each Investment Advisory Agreement, the Trustees considered the best interests of each Fund separately. While the Management Agreement and the Investment Advisory Agreements for all of the Funds were considered at the May 26, 2011 meeting, the Board considered each Fund’s investment management and subadvisory relationships separately. In each instance, the Board considered, among other things, the following factors: (1) the nature and quality of the services provided; (2) the investment performance of a Fund and, as applicable, each subadvisor for a Fund; (3) the costs incurred by the Manager and (to the extent provided) the subadvisors in rendering their services and their resulting profits or losses; (4) the extent to which economies of scale have been taken into account in setting each fee schedule; (5) whether fee levels reflect these economies of scale for the benefit of Fund investors; (6) comparisons of services and fees with contracts entered into by the Manager or a subadvisor or their affiliates with other clients (such as pension funds and other institutional funds); and (7) any other benefits derived or anticipated to be derived by the Manager or a subadvisor from their relationship with a Fund. The Trustees posed questions to various management personnel of the Manager regarding certain key aspects of the materials submitted in support of the renewal.
Nature, Extent and Quality of Services. With respect to the renewal of the Management Agreement, the Board considered, among other factors: each Fund’s generally favorable long-term performance and the background and experience of key investment personnel at the Manager; the low cost structure of the Funds; the Manager’s culture of compliance and support for compliance operations that reduce risks to the Funds; the manager’s commitment to increase assets in the Funds as demonstrated, for example, by the continued increase in sales personnel; the Manager’s continuing efforts to add new series and share classes to enhance the Funds’ product line; the Manager’s high quality of services; the Manager’s active role in monitoring and, as appropriate recommending additional or replacement subadvisors; the Manager’s commitment to increasing headcount and training employees in conjunction with product expansion; and efforts made by the Manager to retain key employees.
With respect to the renewal of each Investment Advisory Agreement, the Trustees considered the background and experience of each subadvisor’s investment personnel responsible for managing the Funds, the size of the subadvisor and their ability to continue to attract and retain qualified investment personnel. Based on the foregoing information, the Board concluded that the nature, extent and quality of the management and advisory services provided by the Manager and each subadvisor were appropriate for each Fund and, thus, determined to renew the Management Agreement and the Investment Advisory Agreement for each Fund.
46
Disclosure Regarding the Board of Trustees’ Approval of the Investment
Management Agreement and Advisor Agreement (Unaudited)
Investment Performance. The Board evaluated the comparative information provided by Lipper and the Manager regarding each Fund’s investment performance relative to its benchmark index(es) and peer group. The Board considered the information provided by Lipper regarding its independent peer selection methodology to select all peer groups and universes. The Board also considered the performance reports and discussions with management at Board and Committee meetings throughout the year. The Manager also noted that it generally was satisfied with the performance of the subadvisors. A discussion regarding the Board’s considerations with respect to each Fund’s performance appears below under “Additional Considerations and Conclusions with Respect to the Emerging Markets Fund” and “Additional Considerations and Conclusions with Respect to the International Equity Fund.”
Costs of the Services Provided to the Funds and the Profits Realized by the Manager from its Relationship with the Funds. In analyzing the cost of services and profitability of the Manager and a subadvisor by Fund, the Board considered the revenues earned and the expenses incurred by the Manager. The profits or losses were noted at both an individual Fund level and at an aggregate level for all Funds. The Board also considered that the Management Agreement for the Funds stipulates that, to the extent that a Fund invests all of its investable assets in another registered investment company (i.e., is a “Feeder Fund”), the Fund will not pay the Manager a management fee. Although the Board noted that, in certain cases, the fee rates paid by other clients is lower than the fee rates paid by the Funds, the difference reflects the greater level of responsibility and regulatory requirements associated with managing the Funds.
The Board also noted that the Manager proposed to continue the expense waivers and reimbursements for certain Funds and classes that were in place during the last fiscal year and to put in place new expense waivers and reimbursements for certain new classes of the Funds and new series of the Funds. The Board further considered that each subadvised Fund pays the Manager the amounts due to its subadvisors, and the Manager remits these amounts directly to the applicable subadvisors. The Board considered that the Manager receives service and administrative fees to compensate the Manager for providing administrative services to the Funds and to compensate third-party administrators and broker-dealers for services to Fund shareholders. In addition, the Board considered that the Manager receives management fees for overseeing the securities lending program on behalf of various Funds. The Board also noted that certain classes of the Funds maintain higher expense ratios in order to compensate third-party distributors.
In analyzing the cost of services and profitability for each subadvisor in connection with its investment advisory services to the Fund, the Board considered that, in many cases, the Manager has negotiated the lowest subadvisory fee a subadvisor charges for any comparable client accounts. The Board gave less weight to profitability considerations or did not view this data as imperative to its deliberations given the arm’s length nature of the relationship between the Manager and the subadvisors with respect to the negotiation of subadvisory fees.
Based on the foregoing information, the Board concluded that the profitability levels were reasonable in light of the services performed by the Manager and the subadvisors. A discussion regarding the Board’s considerations with respect to each Fund’s fee rates is set forth below under “Additional Considerations and Conclusions with Respect to the Emerging Markets Fund” and “Additional Considerations and Conclusions with Respect to the International Equity Fund.”
Economies of Scale. In considering the reasonableness of the management and investment advisory fees, the Board considered whether economies of scale will be realized as the Funds grow and whether fee levels reflect these economies of scale for the benefit of Fund shareholders. In this regard, the Board considered that the Manager has negotiated breakpoints in many subadvisory fee rates. The Board also noted that, for purposes of determining the fee rates chargeable to the Funds, many subadvisors have agreed to take into account assets of AMR and its pension plans that are managed by the subadvisors. Thus, the Funds are able to receive lower effective fee rates. The Board also noted the Manager’s representation that assets in the Funds’ complex increased during 2010, primarily due to market appreciation.
In addition, the Board noted the Manager’s representation that, many of the Funds enjoy the primary benefit of economies of scale because low comparable fee levels are already reflected in the current level of management & administration fees charged by the Manager, the current fee structure already provides an adequate mechanism for the sharing of economies of scale with shareholders and due to the existing low cost structure of the Funds that further breakpoints are not appropriate at this time. Based on the foregoing information, the Board concluded that the Manager and subadvisor fee schedules for each Fund provides for a reasonable sharing of benefits from any economies of scale with the Fund.
Benefits Derived from the Relationship with the Funds. The Board considered the “fall-out” or ancillary benefits that accrue to the Manager and/or the subadvisors as a result of the advisory relationships with the Funds, including greater exposure in the marketplace with respect to the Manager’s or subadvisor’s investment process and expanding the level of assets under management by the Manager and the subadvisors. The Board also considered that the Manager will use the Large Cap Value Fund model in managing its collective investment trust.
In addition, the Manager noted that the Trusts also derive benefits from their association with the Manager. Specifically, the Board noted the Manager’s representation that it provides services to most Funds at a lower than industry average cost. The Board considered that certain of the subadvisors reimburse the Manager for certain of its costs relating to distribution activities for the Funds. The Board also considered that, with the exception of the Emerging Markets and International Equity Funds, the Funds did not pay commissions to any affiliated broker-dealer of the Manager or the relevant subadvisor during the most recent fiscal year ended October 31, 2010.
47
Disclosure Regarding the Board of Trustees’ Approval of the Investment
Management Agreement and Advisor Agreement (Unaudited)
Based on the foregoing information, the Board concluded that the potential benefits accruing to the Manager and the subadvisors by virtue of their relationships with the Funds appear to be fair and reasonable.
Additional Considerations and Conclusions with Respect to Each Fund
The performance comparisons below were made versus each Fund’s Lipper peer universe median. References to the Lipper expense universe below are to the group of comparable mutual funds included in the analysis provided to the Trustees by Lipper, Inc.
Additional Considerations and Conclusions with Respect to the Emerging Markets Fund
In considering the renewal of the Management Agreement, the Trustees considered the following additional factors: (1) the Emerging Markets Fund outperformed the peer universe median for the one-, three-, five-, and ten-year periods ended March 31, 2011; and (2) the expense ratio of the Institutional Class of the Fund ranked better than the median of its Lipper expense universe.
In considering the renewal of the Investment Advisory Agreements with TBC, Morgan Stanley Investment Management Inc. (“MSIM”), the Trustees considered the following additional factors: (1) MSIM outperformed the peer universe median for the five- and ten-year periods ended March 31, 2011, but underperformed for the one- and three-year periods; (2) TBC outperformed the peer universe median for the three-, five- and ten-year periods ended March 31, 2011, but underperformed for the one-year period; (3) each of the Fund’s subadvisors has informed the Manager that it uses Fund commissions to obtain proprietary research, the application of which benefits the Fund and each subadvisor’s other clients; and (4) the Manager’s recommendation to continue to retain each subadvisor.
Based on these considerations and those noted above with respect to all Funds, the Trustees (1) concluded that the fees paid to the Manager and the subadvisors under the Management and Investment Advisory Agreements are fair and reasonable; (2) determined that the Emerging Markets Fund and its shareholders would benefit from the Manager’s and subadvisors’ continued management of the Fund; and (3) approved the renewal of the Management and Investment Advisory Agreements with respect to the Emerging Markets Fund.
Additional Considerations and Conclusions with Respect to the International Equity Fund
In considering the renewal of the Management Agreement, the Trustees considered the following additional factors: (1) the Fund outperformed the International Funds peer universe median for the three-, five-, and ten-year periods ended March 31, 2011, but underperformed for the one-year period; and (2) the expense ratio of the Institutional Class of Fund shares ranked better than the median of its Lipper expense universe.
In considering the renewal of the Investment Advisory Agreements with Causeway Capital Management LLC (“Causeway”), Lazard Asset Management LLC (“Lazard”), Templeton Investment Counsel, LLC (“Templeton”), and TBC, the Trustees considered the following additional factors: (1) Templeton outperformed the peer universe median for the one-, three-, five- and ten-year periods ended March 31, 2011; (2) Causeway outperformed the peer universe median for the one-, three-, five- and ten-year periods ended March 31, 2011; (3) Lazard outperformed the peer universe median for the three-year period ended March 31, 2011, but underperformed for the one-, five-, and ten-year periods; (4) TBC outperformed the peer universe median for the three-year period ended March 31, 2011, but underperformed for the one- and five-year periods; (5) each of the Fund’s subadvisors has informed the Manager that it uses Fund commissions to obtain proprietary research, the application of which benefits the Fund and each subadvisor’s other clients; and (6) the Manager’s recommendation to continue to retain each subadvisor.
Based on these considerations and those noted above with respect to all Funds, the Trustees (1) concluded that the fees paid to the Manager and the subadvisors under the Management and Investment Advisory Agreements are fair and reasonable; (2) determined that the International Equity Fund and its shareholders would benefit from the Manager’s and subadvisors’ continued management of the Fund; and (3) approved the renewal of the Management and Investment Advisory Agreements with respect to the International Equity.
48
Trustees and Officers of the American Beacon Funds
(Unaudited)
The Trustees and officers of the American Beacon Funds (the “Trust”) are listed below, together with their principal occupations during the past five years. Unless otherwise indicated, the address of each person listed below is 4151 Amon Carter Boulevard, MD 2450, Fort Worth, Texas 76155. Each Trustee oversees twenty funds in the fund complex that includes the Trust, the American Beacon Master Trust, the American Beacon Mileage Funds, and the American Beacon Select Funds. The Trust’s Statement of Additional Information contains additional information about the Trustees and is available without charge by calling 1-800-658-5811.
| | | | |
Name, Age and Address | | Position, Term of Office and Length of Time Served with the Trust | | Principal Occupation(s) During Past 5 Years and Current Directorships |
| | |
| INTERESTED TRUSTEES | | Term Lifetime of Trust until removal, resignation or retirement* | | |
| | |
Alan D. Feld** (74) | | Trustee since 1996 | | Sole Shareholder of a professional corporation which is a Partner in the law firm of Akin, Gump, Strauss, Hauer & Feld, LLP (1960-Present); Director, Clear Channel Communications (1984-2008); Trustee, Center Point Properties (1994-2006); Member, Board of Trustees, Southern Methodist University; Member, Board of Visitors, M.D. Anderson Hospital; Board of Visitors, Zale/Lipshy Hospital; Trustee, American Beacon Mileage Funds (1996-Present); Trustee, American Beacon Select Funds (1999-Present); Trustee, American Beacon Master Trust Funds (1996-Present). |
| | |
| NON-INTERESTED TRUSTEES | | Term Lifetime of Trust until removal, resignation or retirement* | | |
| | |
W. Humphrey Bogart (67) | | Trustee since 2004 | | Board Member, Baylor University Medical Center Foundation (1992-2004); Consultant, New River Canada Ltd. (mutual fund servicing company) (1998-2003); President and CEO, Allmerica Trust Company, NA (1996-1997); President and CEO, Fidelity Investments Southwest Company (1983-1995); Senior Vice President of Regional Centers, Fidelity Investments (1988-1995); Trustee, American Beacon Mileage Funds (2004-Present); Trustee, American Beacon Select Funds (2004-Present); Trustee, American Beacon Master Trust Funds (2004-Present). |
| | |
Brenda A. Cline (50) | | Trustee since 2004 | | Executive Vice President, Chief Financial Officer, Treasurer and Secretary, Kimbell Art Foundation (1993-Present); Trustee, Texas Christian University (1998-Present); Trustee, W.I. Cook Foundation, Inc. (d/b/a Cook Children’s Health Foundation) (2001-2006); Director, Christian Church Foundation (1999-2007); Trustee, Trinity Valley School (2003-2004); Member; Trinity Valley School Endowment Committee (2004-Present); Trustee, American Beacon Mileage Funds (2004-present); Trustee, American Beacon Select Funds (2004-Present); Trustee, American Beacon Master Trust Funds (2004-Present). |
| | |
Eugene J. Duffy (57) | | Trustee since 2008 | | Principal and Executive Vice President, Paradigm Asset Management (1994-Present); Director, Sunrise Bank of Atlanta (2008-Present); Chairman, Special Contributions Fund Board of Trustees, National Association for the Advancement of Colored People (2007-Present); Trustee, National Association for the Advancement of Colored People (2000-Present); Board of Visitors, Emory University (2006-Present); Trustee, Atlanta Botanical Garden (2006-Present); Board Member, Willie L. Brown Jr. Institute on Politics and Public Service (2001-Present); Chair, National Association of Securities Professionals (2000-2002); Deputy Chief Administrative Officer, City of Atlanta (1985-1990); Trustee, American Beacon Mileage Funds (2008-Present); Trustee, American Beacon Select Funds (2008-Present); Trustee, American Beacon Master Trust Funds (2008-Present). |
49
Trustees and Officers of the American Beacon Funds
(Unaudited)
| | | | | | |
Name, Age and Address | | Position, Term of Office and Length of Time Served with the Trust | | Principal Occupation(s) During Past 5 Years and Current Directorships |
| | |
Thomas M. Dunning (69) | | Trustee since 2008 | | Non-Executive Chairman (2008-Present); Chairman (1998-2008) and Chief Executive Officer (1998-2007), Lockton Dunning Benefits (consulting firm in employee benefits); Director, Oncor Electric Delivery Company LLC (2007-present); Board Member, Baylor Health Care System Foundation (2007-present); Vice Chair, State Fair of Texas (1987-Present); Board Member, Southwestern Medical Foundation (1994-present); Board Member, John Tower Center for Political Studies/SMU (2008-Present); Board Member, University of Texas Development Board (2008-Present); Board Member, BancTec (2010 – Present) (software consulting); Trustee, American Beacon Mileage Funds (2008-Present); Trustee, American Beacon Select Funds (2008-Present); Trustee, American Beacon Master Trust Funds (2008-Present). |
| | |
Richard A. Massman (68) | | Trustee since 2004 Chairman since 2008 | | Consultant and General Counsel Emeritus (2009-Present), Senior Vice President and General Counsel (1994-2009), Hunt Consolidated, Inc. (holding company engaged in oil and gas exploration and production, refining, real estate, farming, ranching and venture capital activities); Chairman (2007-2011) and Director (2005-2011), The Dallas Opera Foundation; Chairman (2006-2010) and Director (2005-2009), Temple Emanu-El Foundation; Trustee, Presbyterian Healthcare Foundation (2006-Present); Director, The Retina Foundation of the Southwest (2000-Present); Trustee, American Beacon Mileage Funds (2004-Present); Trustee, American Beacon Select Funds (2004-Present); Trustee, American Beacon Master Trust Funds (2004-Present). |
| | |
R. Gerald Turner (65) 225 Perkins Admin. Bldg. Southern Methodist Univ. Dallas, Texas 75275 | | Trustee since 2001 | | President, Southern Methodist University (1995-Present); Director, ChemFirst (1986-2002); Director, J.C. Penney Company, Inc. (1996-Present); Director, California Federal Preferred Capital Corp. (2001-2003); Director, Kronus Worldwide Inc. (chemical manufacturing) (2003-Present); Director, First Broadcasting Investment Partners, LLC (2003-2007); Member, Salvation Army of Dallas Board of Directors; Member, Methodist Hospital Advisory Board; Co-Chair, Knight Commission on Intercollegiate Athletics; Trustee, American Beacon Mileage Funds (2001-Present); Trustee, American Beacon Select Funds (2001-Present); Trustee, American Beacon Master Trust Funds (2001-Present). |
| | |
Paul J. Zucconi, CPA (71) | | Trustee since 2008 | | Director, Affirmative Insurance Holdings, Inc. (producer of nonstandard automobile insurance) (2004-Present); Director, Titanium Metals Corporation (producer of titanium melted and mill products) (2002-Present); Director, Torchmark Corporation (life and health insurance products) (2002-Present); Director, Charter Bank (community services and products) (2010-Present); Director, Dallas Chapter of National Association of Corporate Directors (2004-Present); Partner, KPMG (1976-2001); Trustee, American Beacon Mileage Funds (2008-Present); Trustee, American Beacon Select Funds (2008-Present); Trustee, American Beacon Master Trust Funds (2008-Present). |
| | | | | | |
Name, Age and Address | | Position, Term of Office and Length of Time Served with the Trust | | Principal Occupation(s) During Past 5 Years and Current Directorships |
| | |
OFFICERS Gene L. Needles, Jr. (56) | | Term One Year President since 2009 Executive Vice President since 2009 | | President, CEO and Director (2009-Present), American Beacon Advisors, Inc.; President, CEO and Director (2009-Present), Lighthouse Holdings, Inc.; President (2009-Present), American Beacon Mileage Funds; President (2009-Present), American Beacon Select Funds; President (2008-2009), Touchstone Investments; President (2003-2007), CEO (2004-2007), Managing Director of Sales (2002-2003), National Sales Manager (1999-2002), and Regional Sales Manager (1993-1999), AIM Distributors. |
50
Trustees and Officers of the American Beacon Funds
(Unaudited)
| | | | |
William F. Quinn** (63) | | Executive Vice President from 2007 to 2008 and 2009 to Present President from 1987 to 2007 and 2008 to 2009 Trustee from 1987 to 2008 | | Executive Chairman (2009-Present), Chairman (2006-2009), CEO (2006-2007), President (1986-2006) and Director (2003-Present), American Beacon Advisors, Inc.; Chairman and Director (2008-Present), Lighthouse Holdings, Inc.; Chairman (1989-2003) and Director (1979-1989, 2003-Present), American Airlines Federal Credit Union; Director, Hicks Acquisition I, Inc. (2007-2009), Director, Hicks Acquisition II, Inc. (2010-Present); Director, Crescent Real Estate Equities, Inc.(1994-2007); Director, Pritchard, Hubble & Herr, LLC (investment advisor) (2001-2006); Director of Investment Committee, Southern Methodist University Endowment Fund (1996-Present); Member, Southern Methodist University Cox School of Business Advisory Board (1999-2002); Member, New York Stock Exchange Pension Manager Committee (1997-1998, 2000-2002, 2006-Present); Chairman (2007-Present) and Vice Chairman (2004-2007), Committee for the Investment of Employee Benefits; Director, United Way of Metropolitan Tarrant County (1988-2000, 2004-Present); the Independent Trustee, National Railroad Retirement Investment Trust (2011-Present); Trustee (1995-2008) and President (1995-2007, 2008-2009), American Beacon Mileage Funds; Trustee (1999-2008) and President (1999-2007, 2008-Present), American Beacon Select Funds; Trustee, American Beacon Master Trust (1995-2008); Director, American Beacon Global Funds SPC (2002-2011); Director, American Beacon Global Funds, plc (2007-2009). |
| | |
Rosemary K. Behan (52) | | VP, Secretary and Chief Legal Officer since 2006 | | Vice President, Legal and Compliance, American Beacon Advisors, Inc. (2006-Present); Secretary (2008-Present), Lighthouse Holdings, Inc.; Assistant General Counsel, First Command Financial Planning, Inc. (2004-2006); Attorney, U.S. Securities and Exchange Commission, (1995-2004). |
| | |
Brian E. Brett (51) | | VP since 2004 | | Vice President, Director of Sales, American Beacon Advisors, Inc. (2004-Present); Regional Vice President, Neuberger Berman, LLC (investment adviser) (1996-2004). |
| | |
Wyatt Crumpler (45) | | VP since 2007 | | Vice President, Asset Management (2009-Present) and Vice President, Trust Investments (2007-2009), American Beacon Advisors, Inc.; Managing Director of Corporate Accounting (2004-2007) and Director of IT Strategy and Finance (2001-2004), American Airlines, Inc. |
| | |
Erica Duncan (41) | | VP Since 2011 | | Vice President, Marketing and Client Services (2011-Present), American Beacon Advisors, Inc.; Supervisor, Brand Marketing (2010-2011), Invesco; Supervisor, Marketing Communications (2009-2010) and Senior Financial Writer (2004-2009), Invesco AIM. |
| | |
Michael W. Fields (57) | | VP since 1989 | | Vice President, Fixed Income Investments, American Beacon Advisors, Inc. (1988-Present); Director American Beacon Global Funds SPC (2002-Present); Director, American Beacon Global Funds plc (2007-2009). |
| | |
Melinda G. Heika (50) | | Treasurer since 2010 | | Vice President, Finance and Accounting (2010-Present), Controller (2005-2009), Assistant Controller (1998-2004), American Beacon Advisors, Inc.; Treasurer (2010-Present), Lighthouse Holdings, Inc. |
| | |
Terri L. McKinney (47) | | VP since 2010 | | Vice-President, Enterprise Services (2009-Present), Managing Director (2003-2009), and Director of Marketing & Retail Sales (1996-2003), American Beacon Advisors, Inc.; President, Board of Trustees (2010-Present), Vice-President, Board of Trustees (2008-2010), and Trustee (2006-2008), Down Syndrome Guild of Dallas. |
| | |
Jeffrey K. Ringdahl (36) | | VP since 2010 | | Chief Operating Officer, American Beacon Advisors, Inc. (2010-Present); Vice President, Product Management, Touchstone Advisors, Inc. (2007-2010); Senior Director, Business Integration, Fidelity Investments (2005-2007). |
| | |
Samuel J. Silver (48) | | VP Since 2011 | | Vice President, Fixed Income Investments (2011-Present) and Senior Portfolio Manager, Fixed Income Investments (1999-2011), American Beacon Advisors, Inc. |
| | |
Christina E. Sears (40) | | Chief Compliance Officer since 2004 and Asst. Secretary since 1999 | | Chief Compliance Officer (2004-Present) and Senior Compliance Analyst (1998-2004), American Beacon Advisors, Inc. |
51
Trustees and Officers of the American Beacon Funds
(Unaudited)
| | | | |
| John J. Okray (37) | | Asst. Secretary since 2010 | | Assistant General Counsel, American Beacon Advisors, Inc. (2010-Present); Asst. Secretary (2010-Present), Lighthouse Holdings, Inc.; Vice President, Oppenheimer Funds, Inc. (2004-2010). |
| | |
| Sonia L. Bates (55) | | Asst. Treasurer since 2011 | | Director, Tax and Financial Reporting (2011-Present), Manager, Tax and Financial Reporting (2005-2010), Senior Tax Analyst (1999-2004), American Beacon Advisors, Inc.; Asst. Treasurer (2011-Present), Lighthouse Holdings, Inc. |
| * | The Board has adopted a retirement plan that requires Trustees to retire no later than the last day of the calendar year in which they reach the age of 72, provided, however, that the Board may determine to grant one or more annual exemptions to this requirement. |
| ** | Mr. Feld is deemed to be an “interested person” of the Trusts, as defined by the 1940 Act. Mr. Feld’s law firm of Akin, Gump, Strauss, Hauer & Feld LLP has provided legal services within the past two fiscal years to the Manager and one or more of the Trust’s and Master Trust’s sub-advisors. |
52
This page intentionally left blank.
53
Delivery of Documents
eDelivery is NOW AVAILABLE – Stop traditional mail delivery and receive your
shareholder reports and summary prospectus on-line. Sign up at
www.americanbeaconfunds.com
If you invest in the Fund through a financial institution, you may be able to receive the Fund’s regulatory mailings, such as the Summary Prospectus, Annual Report and Semi-Annual Report, by e-mail. If you are interested in this option, please go to www.icsdelivery.com and search for your financial institution’s name or contact your financial institution directly.
To obtain more information about the Fund:
| | | | | | |
| | | |
| | |
| | By E-mail: american_beacon.funds@ambeacon.com | | On the Internet: Visit our website at www.americanbeaconfunds.com | | |
| | | | | | |
| | | | | | |
| | | | | | |
| |
By Telephone: Institutional, Y, Investor, Advisor, Retirement, A, and C Classes Call (800) 658-5811 AMR ClassSM Call (800) 345-2345 | |
By Mail: American Beacon Funds P.O. Box 219643 Kansas City, MO 64121-9643 | | |
| | | | | | |
| | | | | | |
| | Availability of Quarterly Portfolio Schedules In addition to the Schedule of Investments provided in each semi-annual and annual report, the Fund files a complete schedule of its portfolio holdings with the Securities and Exchange Commission (“SEC”) on Form N-Q as of the first and third fiscal quarters. The Fund’s Forms N-Q are available on the SEC’s website at www.sec.gov. The Forms N-Q may also be reviewed and copied at the SEC’s Public Reference Room, 450 Fifth Street, NW, Washington, DC 20549. Information regarding the operation of the SEC’s Public Reference Room may be obtained by calling 1-800-SEC-0330. A complete schedule of the Fund’s portfolio holdings is also available on the Funds’ website (www.americanbeaconfunds.com) approximately twenty days after the end of each month. | | Availability of Proxy Voting Policy and Records A description of the policies and procedures the Fund uses to determine how to vote proxies relating to portfolio securities is available in the Fund’s Statement of Additional Information, is available free of charge on the Fund’s website (www.americanbeaconfunds.com) and by calling 1-800-967-9009 or by accessing the SEC’s website at www.sec.gov. The Fund’s proxy voting record for the most recent year ended June 30 is filed annually with the SEC on Form N-PX. The Fund’s Forms N-PX are available on the SEC’s website at www.sec.gov. The Fund’s proxy voting record may also be obtained by calling 1-800-967-9009. | | |
Fund Service Providers:
| | | | | | | | | | | | |
CUSTODIAN State Street Bank and Trust Boston, Massachusetts | | | | TRANSFER AGENT Boston Financial Data Services Kansas City, Missouri | | | | INDEPENDENT REGISTERED PUBLIC ACCOUNTING FIRM Ernst & Young LLP Dallas, Texas | | | | DISTRIBUTOR Foreside Fund Services, LLC Portland, Maine |
This report is prepared for shareholders of the American Beacon Funds and may be distributed to others only if preceded or accompanied by a current Prospectus or summary prospectus.
American Beacon Funds, American Beacon Emerging Markets Fund, and American Beacon International Equity Fund are service marks of American Beacon Advisors, Inc.
AR 10//11
About American Beacon Advisors
Since 1986, American Beacon Advisors has offered a variety of products and investment advisory services to numerous institutional and retail clients, including a variety of mutual funds, corporate cash management, and separate account management.
Our clients include defined benefit plans, defined contribution plans, foundations, endowments, corporations, financial planners, and other institutional investors. With American Beacon Advisors, you can put the experience of a multi-billion dollar asset management firm to work for your company.
Any opinions herein, including forecasts, reflect our judgment as of the end of the reporting period and are subject to change. Each advisor’s strategies and each Fund’s portfolio composition will change depending on economic and market conditions. This report is not a complete analysis of market conditions and, therefore, should not be relied upon as investment advice. Although economic and market information has been compiled from reliable sources, American Beacon Advisors, Inc. makes no representation as to the completeness or accuracy of the statements contained herein.
Investing in debt securities entails interest rate risk which is the risk that debt securities will decrease in value with increases in market interest rates. Investing in the securities of mid-capitalization companies involves greater risk and the possibility of greater price volatility than investing in larger capitalization and more established companies.
| | |
| American Beacon Funds | | October 31, 2011 |
| | |
| | Fellow Shareholders, Some days it seems the best-kept secret of the past twelve months has been the U.S. equity market’s rise. This rise has occurred despite the ongoing waves of investor concern regarding the U.S. economy’s health and the realization that the European sovereign crisis has yet to find resolution. With headlines focused on geopolitical and economic risks, the strengthening underlying fundamentals at many publicly traded companies–and their relatively attractive market valuations–have drawn less attention. This near-term myopia can create opportunities for fund companies like ours, where our sub-advisors manage with a longer-term perspective. |
The market volatility also highlights the key benefit of our multi-manager approach–a strategy we feel can help smooth performance over time. The performance of our domestic equity funds reflects the results of manager diversification. It also reflects the American Beacon investment philosophy: that portfolios managed with a longer-term perspective tend to be better positioned for riding out episodes of economic and geopolitical turbulence.
For the twelve-month period ended October 31, 2011:
>>American Beacon Balanced Fund (Institutional Class) returned 4.87%
>>American Beacon Large Cap Growth Fund (Institutional Class) generated 4.75%
>>American Beacon Mid-Cap Value Fund (Institutional Class) returned 6.08%
At American Beacon, we remain focused on seeking opportunities and meeting market challenges to deliver the type of consistency in performance and service our shareholders value. We regard your trust in the American Beacon Funds as recognition that we are achieving these goals, and we appreciate your continued investment.
For further details about the growing number of investment opportunities now available within the American Beacon Funds family, please visit our website at www.americanbeaconfunds.com.
| | | | |
| | Best Regards, | | |
|
|
| | |
| | Gene L. Needles, Jr. | | |
| | President | | |
| | American Beacon Funds | | |
1
Domestic Equity Market Overview
October 31, 2011 (Unaudited)
For most of the 12 months ended October 31, 2011, the U.S. equity markets followed an upward path, driven by the strength of corporate balance sheets and robust corporate earnings. This rise occurred despite the volatility that prevailed throughout the world markets, as investors reacted to ongoing political uncertainty about the European sovereign debt crisis and to the inaction of U.S. politicians in addressing the weak domestic economic situation. The overall rise of equities also occurred despite increased correlations among stocks and the actions of worried investors who shifted between risk-seeking and risk-averse strategies.
The relative strength of the equity market lasted until May 2011, when investors turned more risk averse. This shift coincided with the onset of increasingly negative news from Europe and some weaker-than-expected macroeconomic news in the U.S. Meanwhile, policymakers in the U.S. reached an impasse on how to meet the country’s fiscal challenges, which further fed investor worries. A sharp selloff ensued.
Oversold equities rebounded in early October 2011 and received an additional boost late in the month when European policymakers agreed to a framework for addressing the Greek crisis. Consequently, the S&P 500 Index generated its best-performing month in nearly 20 years, pushing its 12-month return into positive territory (+8.1%).
As unsettling as the volatility has been, the S&P 500 Index has outperformed almost all of the major developed and emerging equity markets. Little more than two years ago, the S&P 500 Index bottomed below 700. Since then, it has doubled. That rise has been uneven–investors in small cap stocks have benefited far more than those holding large cap issues. This is especially true for the mega-cap stocks in the Financial, Technology and Health Care sectors. Consider that over the 12-month period ending October 31, 2011, the largest 10% of companies (in terms of market capitalization) in the Russell 1000 Value Index fell 1.4%. The entire universe returned 6.2%.
Overall, the U.S. economy continued to heal. Corporate strength was good, while low interest rates, a depressed dollar and moderately rising employment were supportive of a modest, ongoing recovery. Nevertheless, risk is still part of the equation. Credible action from Washington continues to be elusive and the implementation of Europe’s agreement–and its likelihood of success–remains uncertain. Other geopolitical and economic concerns also remain. Yet, there are a number of positive factors that seem underappreciated by the market at this point:
| | • | | A lack of speculation in equities |
| | • | | Business inventories remain in balance |
| | • | | Corporate cash levels remain high |
| | • | | Corporate debt levels are low |
| | • | | Lackluster economic expectations are already priced into the market |
| | • | | Dividend payout ratios are low and have significant upside |
We believe the dividends and earnings available to owners of equities are generous given current prices. They sufficiently compensate investors for the risks at hand. We remain keenly focused on identifying undervalued franchises with strong balance sheets exhibiting the ability and willingness to return capital to shareholders.
2
Performance Overview
American Beacon Balanced FundSM
October 31, 2011 (Unaudited)
The Balanced Fund’s (“Fund”) Institutional Class returned 4.87% for the twelve months ended October 31, 2011. The Fund lagged the 60% Russell 1000® Value/40% Barclays Capital Aggregate Index (the “Balanced Composite Index”) benchmark return of 6.18% but outperformed the Lipper Mixed-Asset Target Allocation Growth Funds Index return of 4.50%.
Comparison of Change in Value of a $10,000 Investment
For The Period from 10/31/01 through 10/31/11
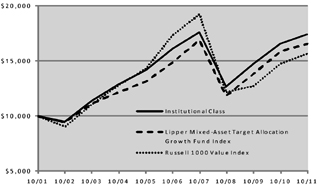
| | | | | | | | | | | | | | | | |
| | | Annualized Total Returns | | | Value of | |
| | Periods Ended 10/31/11 | | | $10,000 | |
| | | 1 Year | | | 5 Years | | | 10 Years | | | 10/31/01-
10/31/11 | |
Institutional Class(1,8) | | | 4.87 | % | | | 1.54 | % | | | 5.68 | % | | $ | 17,380 | |
Y Class(1,3,8) | | | 4.73 | % | | | 1.50 | % | | | 5.66 | % | | | 17,345 | |
Investor Class(1,8) | | | 4.52 | % | | | 1.24 | % | | | 5.38 | % | | | 16,891 | |
Advisor Class(1,2,8) | | | 4.33 | % | | | 1.04 | % | | | 5.22 | % | | | 16,630 | |
A Class with sales charge (1,4,8) | | | -1.64 | % | | | 0.03 | % | | | 4.75 | % | | | 15,908 | |
A Class without sales charge(1,4,8) | | | 4.37 | % | | | 1.22 | % | | | 5.37 | % | | | 16,872 | |
C Class with sales charge (1,5,8) | | | 2.65 | % | | | 1.02 | % | | | 5.27 | % | | | 16,706 | |
C Class without sales charge(1,5,8) | | | 3.65 | % | | | 1.02 | % | | | 5.27 | % | | | 16,706 | |
AMR Class(1,8) | | | 5.09 | % | | | 1.80 | % | | | 5.96 | % | | | 17,841 | |
Balanced Composite Index(6) | | | 6.18 | % | | | 1.75 | % | | | 5.31 | % | | | 16,781 | |
Russell 1000 Value Index (7) | | | 6.16 | % | | | -2.05 | % | | | 4.57 | % | | | 15,636 | |
Barclays Capital Aggregate Index(7) | | | 5.00 | % | | | 6.41 | % | | | 5.46 | % | | | 17,013 | |
Lipper Mixed-Asset Target Allocation Growth Funds Index (7) | | | 4.50 | % | | | 2.12 | % | | | 5.15 | % | | | 16,523 | |
| 1. | Performance shown is historical and is not indicative of future returns. Investment returns and principal value will vary, and shares may be worth more or less at redemption than at original purchase. Performance shown is as of date indicated, and current performance may be lower or higher than the performance data quoted. To obtain performance as of the most recent month end, please visit our website at www.americanbeaconfunds.com or call 1-800-967-9009. Fund performance in the table above does not reflect the deduction of taxes a shareholder would pay on distributions or the redemption of shares. |
| 2. | Fund performance for the ten-year period represents the total returns achieved by the Investor Class from 10/31/01 up to 5/31/05, the inception date of the Advisor Class, and the returns of the Advisor Class since its inception. Expenses of the Advisor Class are higher than those of the Investor Class. Therefore, total returns shown may be higher than they would have been had the Advisor Class been in existence since 10/31/01. A portion of the fees charged to the Advisor Class of the Fund was waived in 2005. Performance prior to waiving fees was lower than actual returns shown for 2005. |
| 3. | Fund performance for the five-year and ten-year periods represents the total returns achieved by the Institutional Class from 10/31/01 up to 3/1/10, the inception date of the Y Class, and the returns of the Y Class since its inception. Expenses of the Y Class are higher than those of the Institutional Class. Therefore, total returns shown may be higher than they would have been had the Y Class been in existence since 10/31/01. |
| 4. | Fund performance for the five-year and ten-year periods represents the total returns achieved by the Investor Class from 10/31/01 up to 5/17/10, the inception date of the A Class, and the returns of the A Class since its inception. Expenses of the A Class are higher than those of the Investor Class. Therefore, total returns shown may be higher than they would have been had the A Class been in existence since 10/31/01. A Class has a maximum sales charge of 5.75%. |
| 5. | Fund performance for the five-year and ten-year periods represents the total returns achieved by the Investor Class from 10/31/01 up to 9/1/10, the inception date of the C Class, and the returns of the C Class since its inception. Expenses of the C Class are higher than those of the Investor Class. Therefore, total returns shown may be higher than they would have been had the C Class been in existence since 10/31/01. The maximum contingent deferred sales charge for C Class is 1% for shares redeemed within one year of the date of purchase. |
| 6. | To reflect the Fund’s allocation of its assets between investment grade fixed-income securities and equity securities, the returns of the Russell 1000 Value Index and the Barclays Capital Aggregate Index have been combined in a 60%/40% proportion. |
| 7. | The Russell 1000 Value Index is an unmanaged index of those stocks in the Russell 1000 Index with lower price-to-book ratios and lower forecasted growth values. Russell 1000 Value Index and Russell 1000 Index are a registered trade marks of Frank Russell Company. The Barclays Capital Aggregate Index is a market value weighted index of government, corporate, mortgage-backed and asset-backed fixed-rate debt securities of all maturities. The Lipper Mixed-Asset Target Allocation Growth Funds Index tracks the results of the 30 largest mutual funds in the Lipper Mixed-Asset Target Allocation Growth Funds category. Lipper is an independent mutual fund research and ranking service. One cannot directly invest in an index. |
| 8. | The total annual Fund operating expense ratio set forth in the most recent Fund prospectus for the Institutional, Y, Investor, Advisor, A, C, and AMR Class shares was 0.59%, 0.69%, 0.94%, 1.10%, 1.09%, 1.87%, and 0.34%, respectively. The expense ratios above may vary from the expense ratios presented in other sections of this report that are based on expenses incurred during the period covered by this report. |
3
Performance Overview
American Beacon Balanced FundSM
October 31, 2011 (Unaudited)
During the twelve-month period, the Fund’s assets on average were invested 65% in equities (including equitized cash) and 35% in fixed-income securities, ending the period with the same allocation.
The equity portion of the Fund (excluding equitized cash) returned 4.3%, underperforming the Russell 1000® Value Index (the “Index”) return of 6.16%. The Fund’s equities underperformed the Index primarily due to security selection as sector allocation detracted minimal value from relative returns. The Fund’s holdings in the Financials, Information Technology and Industrials sectors detracted the most value relative to the Index. Hartford Financial Services (down 21.8%), ACE (up 21.7%) and Citigroup (down 28.7%) had the greatest negative impact on relative returns in the Financials sector. Hewlett Packard (down 33.9%) and Cisco Systems (down 18.0%) were the largest detractors from performance in the Information Technology sector. In the Industrials sector, PACCAR (down 16.1%) and Raytheon (down 1.3%) hurt performance the most.
A significant overweight in the Information Technology sector detracted value relative to the Index through sector allocation. On average, the Fund’s allocation to the Consumer Staples sector positively impacted the Fund’s returns.
The fixed-income portion of the Fund returned 6.0% for the period, outperforming the Barclays Capital Aggregate Index (the “Barclays Index”) return of 5.0%. An overweight in Corporates, one of the better performing sectors in the Barclays Index, contributed to the Fund’s performance through sector allocation as did an allocation to longer duration U.S. Treasuries that performed well as interest rates declined. The Fund’s holdings in Agency securities also added value.
The sub-advisors continue to focus on the disciplined selection of attractive securities that should allow the Fund to benefit long term.
Top Ten Equity Holdings
| | | | |
| | | % of
Net Assets | |
JPMorgan Chase & Co. | | | 2.1 | % |
ConocoPhillips | | | 1.7 | % |
Wells Fargo & Co. | | | 1.7 | % |
Bank of America Corp. | | | 1.1 | % |
Hewlett-Packard Co. | | | 1.3 | % |
Pfizer, Inc. | | | 1.4 | % |
Vodafone Group plc | | | 1.3 | % |
Microsoft Corp. | | | 1.3 | % |
Johnson & Johnson | | | 1.1 | % |
BP plc | | | 1.0 | % |
Sector Allocation
| | | | |
| | | % of Equities | |
Financials | | | 25.1 | % |
Energy | | | 12.7 | % |
Information Technology | | | 12.0 | % |
Health Care | | | 10.9 | % |
Consumer Discretionary | | | 9.6 | % |
Industrials | | | 8.7 | % |
Consumer Staples | | | 8.4 | % |
Telecommunication Services | | | 5.2 | % |
Utilities | | | 5.0 | % |
Materials | | | 2.4 | % |
Sector Allocation
| | | | |
| | | % of Fixed
Income | |
Corporate | | | 45.0 | % |
Mortgage-Backed | | | 24.5 | % |
Agency | | | 15.4 | % |
U.S. Treasury | | | 8.2 | % |
Commercial Mortgage Backed Securities | | | 3.0 | % |
Asset-Backed | | | 1.8 | % |
Municipal Obligations | | | 1.0 | % |
Industrials | | | 0.8 | % |
Other Government Obligations | | | 0.3 | % |
4
Performance Overview
American Beacon Large Cap Growth FundSM
October 31, 2011 (Unaudited)
The Institutional Class of the Large Cap Growth Fund (“Fund”) returned 4.75% for the twelve months ended October 31, 2011, trailing both the Russell 1000® Growth Index (the “Index”) return of 9.92% and the Lipper Large-Cap Growth Funds Index return of 6.34%.
Comparison of Change in Value of a $10,000 Investment
For the Period from 10/31/01 through 10/31/11
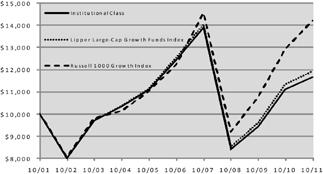
| | | | | | | | | | | | | | | | |
| | | Annualized Total Returns
Periods Ended 10/31/11 | | | Value of
$10,000
10/31/01-
10/31/11 | |
| | |
| | | 1 Year | | | 5 Years | | | 10 Years | | |
Institutional Class(1,6) | | | 4.75 | % | | | -1.28 | % | | | 1.52 | % | | $ | 11,633 | |
Y Class(1,2,6) | | | 4.58 | % | | | -1.35 | % | | | 1.49 | % | | | 11,594 | |
A Class with sales Charge(1,3,6) | | | -1.78 | % | | | -2.57 | % | | | 0.86 | % | | | 10,889 | |
A Class without sales charge (1,3,6) | | | 4.29 | % | | | -1.41 | % | | | 1.46 | % | | | 11,562 | |
C Class with sales Charge(1,4,6) | | | 2.78 | % | | | -1.54 | % | | | 1.39 | % | | | 11,486 | |
C Class without sales charge (1,4,6) | | | 3.78 | % | | | -1.54 | % | | | 1.39 | % | | | 11,486 | |
AMR Class(1,6) | | | 5.13 | % | | | -0.98 | % | | | 1.77 | % | | | 11,914 | |
Russell 1000 Growth Index(5) | | | 9.92 | % | | | 3.04 | % | | | 3.56 | % | | | 14,183 | |
Lipper Large-Cap Growth Funds Index(5) | | | 6.34 | % | | | 1.97 | % | | | 2.65 | % | | | 12,993 | |
| 1. | Performance shown is historical and is not indicative of future returns. Investment returns and principal value will vary, and shares may be worth more or less at redemption than at original purchase. Performance shown is as of date indicated, and current performance may be lower or higher than the performance data quoted. To obtain performance as of the most recent month end, please visit www.americanbeaconfunds.com or call 1-800-967-9009. Fund performance in the table above does not reflect the deduction of taxes a shareholder would pay on distributions or the redemption of shares. A portion of the fees charged to the Institutional Class of the Fund has been waived since 2004. Performance prior to waiving the fees was lower than actual returns shown for periods since 2004. |
| 2. | Fund performance for the five-year, and ten-year periods represents the total returns achieved by the Institutional Class from 10/31/01 up to 3/1/10, the inception date of the Y Class, and the returns of the Y Class since its inception. Expenses of the Y Class are higher than those of the Institutional Class. Therefore, total returns shown may be higher than they would have been had the Y Class been in existence since 3/1/10. |
| 3. | Fund performance for the five-year, and ten-year periods represents the total returns achieved by the Institutional Class from 10/31/01 up to 5/17/10, the inception date of the A Class, and the returns of the A Class since its inception. Expenses of the A Class are higher than those of the Institutional Class. Therefore, total returns shown may be higher than they would have been had the A Class been in existence since 10/31/01. A Class has a maximum sales charge of 5.75%. |
| 4. | Fund performance for the five-year, and ten-year periods represents the total returns achieved by the Institutional Class from 10/31/01 up to 9/1/10, the inception date of the C Class, and the returns of the C Class since its inception. Expenses of the C Class are higher than those of the Institutional Class. Therefore, total returns shown may be higher than they would have been had the C Class been in existence since 10/31/01. The maximum contingent deferred sales charge for C Class is 1% for shares redeemed within one year of the date of purchase. |
| 5. | The Russell 1000 Growth Index is an unmanaged index of those stocks in the Russell 1000 Index with higher price-to-book ratios and higher forecasted growth values. Russell 1000 Growth Index and Russell 1000 Index are registered trademarks of Frank Russell Company. The Lipper Large-Cap Growth Funds Index tracks the results of the 30 largest mutual funds in the Lipper Large-Cap Growth Funds category. Lipper is an independent mutual fund research and ranking service. One cannot directly invest in an index. |
| 6. | The total annual Fund operating expense ratio set forth in the most recent Fund prospectus for the Institutional, Y, A, C, and AMR Class shares was 0.95%, 1.07%, 1.50%, 2.54%, and 0.70%, respectively. The expense ratios above may vary from the expense ratios presented in other sections of this report that are based on expenses incurred during the period covered by this report. |
The Fund underperformed the Index primarily due to the impact of the cash equitization processA, which detracted from relative returns due to several exceedingly large cash inflows coinciding with days of extreme market downturns. Excluding the impact from the equitization of cash, the Fund slightly outperformed the Index through stock selection as sector allocation detracted value relative to the Index.
Excluding the impact from equitization of cash, most of the Fund’s excess performance was attributed to holdings in the Consumer Discretionary, Industrials and Health Care sectors. Nike (up 4.1%), Cheesecake Factory (up 3.8%) and Coach (up 37.1%) were the largest contributors in the Consumer Discretionary sector. Eaton (down 7.3%) and Norfolk Southern (up 10.1%) added the most relative value to performance in the Industrials sector. In the Health Care sector, UnitedHealth Group (up 37.3%) and Shire (up 40.4%) generated the most positive Fund returns. The
5
Performance Overview
American Beacon Large Cap Growth FundSM
October 31, 2011 (Unaudited)
aforementioned good performance was somewhat offset by poor stock selection in the Financials sector where CB Richard Ellis Group (down 63.4%) and Ameriprise Financial (down 4.6%) were the largest detractors.
Underweight positions in Energy and Consumer Staples, two of the better performing sectors in the Index, detracted value relative to the Index through sector allocation. An overweight in the Industrials sector also hurt performance.
Looking forward, the Fund’s sub-advisors will continue to maintain a disciplined, long-term approach to equity investing in larger stocks with above-average growth potential.
| A. | The Fund’s excess cash balances are invested in equity index futures contracts on a daily basis to gain market exposure. The Fund may invest cash allocated to securities purchases simultaneously in futures contracts until the cash is delivered to settle the securities transactions. Because the Fund may have market exposure in both the invested securities and futures contracts, the Fund may have more than 100% of its assets exposed to the markets. This can magnify gains and losses in the Fund. |
Top Ten Holdings
| | | | |
| | | % of
Net Assets | |
Apple, Inc. | | | 3.1 | % |
Union Pacific Corp. | | | 2.6 | % |
Google, Inc. | | | 2.4 | % |
Danaher Corp. | | | 2.4 | % |
UnitedHealth Group, Inc. | | | 2.2 | % |
EMC Corp. | | | 2.1 | % |
Oracle Corp. | | | 2.1 | % |
Monsanto Co. | | | 1.9 | % |
Intuit, Inc. | | | 1.5 | % |
Qualcomm, Inc. | | | 1.5 | % |
Sector Allocation
| | | | |
| | | % of Equities | |
Information Technology | �� | | 31.5 | % |
Consumer Discretionary | | | 19.0 | % |
Industrials | | | 16.3 | % |
Health Care | | | 12.8 | % |
Energy | | | 8.7 | % |
Materials | | | 4.6 | % |
Financials | | | 4.5 | % |
Consumer Staples | | | 1.7 | % |
Telecommunication Services | | | 0.9 | % |
6
Performance Overview
American Beacon Mid-Cap Value FundSM
October 31, 2011 (Unaudited)
The Institutional Class of the Mid-Cap Value Fund (“Fund”) returned 6.08% for the twelve months ended October 31, 2011. The Fund outperformed the Russell Midcap® Value Index (the “Index”) return of 5.83% and the Lipper Mid-Cap Value Funds Index return of 3.66%.
Comparison of Change in Value of a $10,000 Investment
For the Period from 6/30/04* through 10/31/11
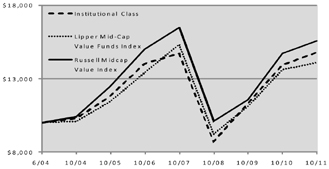
| | | | | | | | | | | | | | | | |
| | | Annualized Total Returns
Periods Ended 10/31/11 | | | Value of
$10,000
6/30/04-
10/31/11 | |
| | |
| | | 1 Year | | | 5 Years | | | Since
Incep.
(6/30/04) | | |
Institutional Class(1,3,9) | | | 6.08 | % | | | 1.09 | % | | | 5.47 | % | | $ | 14,781 | |
Y Class(1,4,9) | | | 5.98 | % | | | 1.07 | % | | | 5.46 | % | | | 14,768 | |
Investor Class (1,2,9) | | | 6.49 | % | | | 0.95 | % | | | 5.35 | % | | | 14,653 | |
Advisor Class (1,5,9) | | | 5.65 | % | | | 0.74 | % | | | 5.20 | % | | | 14,502 | |
A Class with sales charge (1,6,9) | | | -0.57 | % | | | -0.47 | % | | | 4.33 | % | | | 13,651 | |
A Class without sales charge (1,6,9) | | | 5.49 | % | | | 0.72 | % | | | 5.18 | % | | | 14,484 | |
C Class with sales charge (1,7,9) | | | 3.64 | % | | | 0.55 | % | | | 5.06 | % | | | 14,367 | |
C Class without sales charge (1,7,9) | | | 4.64 | % | | | 0.55 | % | | | 5.06 | % | | | 14,367 | |
AMR Class (1,9) | | | 6.20 | % | | | 1.23 | % | | | 5.60 | % | | | 14,913 | |
Russell Midcap Value Index(8) | | | 5.83 | % | | | 0.73 | % | | | 8.76 | % | | | 15,546 | |
Lipper Mid-Cap Value Funds Index(8) | | | 3.66 | % | | | 1.00 | % | | | 4.76 | % | | | 14,071 | |
| 1. | Performance shown is historical and is not indicative of future returns. Investment returns and principal value will vary, and shares may be worth more or less at redemption than at original purchase. Performance shown is as of date indicated and current performance may be lower or higher than the performance data quoted. To obtain performance as of the most recent month end, please visit www.americanbeaconfunds.com or call 1-800-967-9009. Fund performance in the table above does not reflect the deduction of taxes a shareholder would pay on distributions or the redemption of shares. A portion of the fees charged to the AMR Class of the Fund was waived through 2005. Performance prior to waiving fees was lower than the actual returns shown for periods through 2005. |
| 2. | Fund performance for the five-year and since inception periods represents the total returns achieved by the AMR Class from 6/30/04 up to 3/1/06, the inception date of the Investor Class, and the returns of the Investor Class since its inception. Expenses of the Investor Class are higher than those of the AMR Class. As a result, total returns shown may be higher than they would have been had the Investor Class been in existence since 6/30/04. A portion of the fees charged to the Investor Class of the Fund has been waived since 2006. Performance prior to waiving fees was lower than actual returns shown since 2006. |
| 3. | Fund performance for the since inception period represents the total returns achieved by the AMR Class from 6/30/04 up to 11/30/05, the inception date of the Institutional Class, and the returns of the Institutional Class since its inception. Expenses of the Institutional Class are higher than those of the AMR Class. As a result, total returns shown may be higher than they would have been had the Institutional Class been in existence since 6/30/04. A portion of the fees charged to the Institutional Class of the Fund has been waived since 2007. Performance prior to waiving fees was lower than actual returns shown since 2007. |
| 4. | Fund performance for the five-year and since inception periods represents the total returns achieved by the AMR Class from 6/30/04 up to 11/30/05, the inception date of the Institutional Class, and the total returns of the Institutional Class from 11/30/05 up to 3/1/10, the inception date of the Y Class and the returns of the Y Class since its inception. Expenses of the AMR and Institutional Classes are lower than those of the Y Class. As a result, total returns shown may be higher than they would have been had the Y Class been in existence since 6/30/04. |
| 5. | Fund performance for the five-year and since inception periods represents the total returns achieved by the AMR Class from 6/30/04 to 11/30/05, the Institutional Class from 11/30/05 to 3/1/06 and the Investor Class from 3/1/06 to 6/29/07. Because the AMR, Institutional, and Investor Classes had lower expenses, their performance was better than the Advisor Class would have realized during the same period. A portion of the fees charged to the Advisor Class of the Fund has been waived since 2007. Performance prior to waiving fees was lower than the actual returns shown since 2007. |
| 6. | Performance shown prior to the 5/17/10 inception of the A Class is that of the AMR Class from 6/30/04 to 11/30/05, the Institutional Class from 11/30/05 to 3/1/06 and the Investor Class from 3/1/06 to 5/17/10. Because the AMR, Institutional, and Investor Classes had lower expenses, their performance was better than the A Class would have realized during the same period. A Class shares has a maximum sales charge of 5.75%. |
| 7. | Performance shown prior to the 9/1/10 inception of the C Class is that of the AMR Class from 6/30/04 to 11/30/05, the Institutional Class from 11/30/05 to 3/1/06 and the Investor Class from 3/1/06 to 9/1/10. Because the AMR, Institutional, and Investor Classes had lower expenses, their performance was better than the C Class would have realized during the same period. The maximum contingent deferred sales charge for C Class is 1.00% for shares redeemed within one year of the date of purchase. |
| 8. | The Russell Midcap Value Index is an unmanaged index of those stocks in the Russell Midcap Index with lower price-to-book ratios and lower forecasted growth values. The Russell Midcap Index |
7
Performance Overview
American Beacon Mid-Cap Value FundSM
October 31, 2011 (Unaudited)
| | measures the performance of the 800 smallest companies in the Russell 1000 Index. Russell Midcap Value Index and Russell 1000 Index are registered trademarks of Frank Russell Company. The Lipper Mid-Cap Value Funds Index tracks the results of the 30 largest mutual funds in the Lipper Mid-Cap Value Funds category. Lipper is an independent mutual fund research and ranking service. One cannot directly invest in an index. |
| 9. | The total annual Fund operating expense ratio set forth in the most recent Fund prospectus for the Institutional, Y, Investor, Advisor, A, C, and AMR Class shares was 1.07%, 1.06%, 1.28%, 1.56%, 1.52%, 2.43%, and 0.78%, respectively. The expense ratios above may vary from the expense ratios presented in other sections of this report that are based on expenses incurred during the period covered by this report. |
The Fund outperformed the Index by generating excess returns through stock selection, as sector allocation detracted value relative to the Index.
Most of the Fund’s excess performance was due to holdings in the Health Care and Financials sectors. Zimmer Holdings (up 36.0%), Aetna (up 46.2%) and Immucor (up 51.6%) were the largest contributors to performance in the Health Care sector. In the Financials sector, Willis Group Holdings (up 14.4%), Capital One Financial (up 19.8%) and Chubb (up 14.2%) generated the most positive returns. The aforementioned good performance was somewhat offset by poor stock selection in the Consumer Staples sector where Avon Products (down 38.2%) and Sysco (down 13.4%) detracted relative value.
An overweight position in Information Technology, the second worst performing sector in the Index, detracted relative value from performance through sector allocation. Significant underweightings in Utilities, the best performing sector in the Index, and in the Energy sector also detracted from the Fund’s returns. An overweight in the Health Care sector generated positive Fund returns.
The sub-advisors’ philosophy of investing in undervalued companies that exhibit improving profitability and earnings growth potential should allow the Fund to benefit longer term.
Top Ten Holdings
| | | | |
| | | % of
Net Assets | |
Fifth Third Bancorp | | | 2.1 | % |
L-3 Communications Holdings, Inc. | | | 1.8 | % |
Molex, Inc. | | | 1.5 | % |
International Game Technology | | | 1.4 | % |
Molson Coors Brewing Co., Class B | | | 1.4 | % |
Avnet, Inc. | | | 1.4 | % |
Royal Caribbean Cruises Ltd. | | | 1.3 | % |
Willis Group Holdings plc | | | 1.3 | % |
Rent-A-Center, Inc. | | | 1.2 | % |
Masco Corp. | | | 1.2 | % |
Sector Allocation
| | | | |
| | | % of Equities | |
Financials | | | 27.6 | % |
Industrials | | | 17.3 | % |
Consumer Discretionary | | | 13.8 | % |
Information Technology | | | 9.5 | % |
Utilities | | | 8.7 | % |
Health Care | | | 6.6 | % |
Materials | | | 6.4 | % |
Consumer Staples | | | 5.2 | % |
Energy | | | 4.9 | % |
8
Fund Expenses
October 31, 2011 (Unaudited)
Fund Expense Example
As a shareholder of a Fund, you incur two types of costs: (1) transaction costs, including redemption fees if applicable, and (2) ongoing costs, including management fees, administrative service fees, distribution (12b-1) fees, and other Fund expenses. The examples below are intended to help you understand the ongoing cost (in dollars) of investing in a particular Fund and to compare these costs with the ongoing costs of investing in other mutual funds. The examples are based on an investment of $1,000 invested at the beginning of the period in each Class and held for the entire period from May 1, 2011 through October 31, 2011.
Actual Expenses
The following tables provide information about actual account values and actual expenses. You may use the information on this page, together with the amount you invested, to estimate the expenses that you paid over the period. Simply divide your account value by $1,000 (for example, an $8,600 account value divided by $1,000 = 8.6), then multiply the result by the “Expenses Paid During Period” for the applicable Fund to estimate the expenses you paid on your account during this period. Shareholders of the Investor and Institutional Classes that invest in a Fund through an IRA may be subject to a custodial IRA fee of $15 that is typically deducted each December. If your account was subject to a custodial IRA fee during the period, your costs would have been $15 higher.
| | | | | | | | | | | | |
Institutional Class | | Balanced
Fund | | | Large Cap
Growth
Fund | | | Mid-Cap
Value Fund | |
Beginning Account Value 5/1/11 | | $ | 1,000.00 | | | $ | 1,000.00 | | | $ | 1,000.00 | |
Ending Account Value 10/31/11 | | $ | 956.23 | | | $ | 886.79 | | | $ | 891.03 | |
Expenses Paid During Period 5/1/11-10/31/11 * | | $ | 2.91 | | | $ | 5.61 | | | $ | 4.62 | |
Annualized Expense Ratio | | | 0.59 | % | | | 1.18 | % | | | 0.97 | % |
| | | | | | | | | | | | |
Y Class | | Balanced
Fund | | | Large Cap
Growth
Fund | | | Mid-Cap
Value Fund | |
Beginning Account Value 5/1/11 | | $ | 1,000.00 | | | $ | 1,000.00 | | | $ | 1,000.00 | |
Ending Account Value 10/31/11 | | $ | 954.76 | | | $ | 885.18 | | | $ | 890.01 | |
Expenses Paid During Period 5/1/11-10/31/11 * | | $ | 4.53 | | | $ | 7.89 | | | $ | 1.05 | |
Annualized Expense Ratio | | | 0.92 | % | | | 1.66 | % | | | 0.22 | % |
| | | | | | | | |
Investor Class | | Balanced
Fund | | | Mid-Cap
Value Fund | |
Beginning Account Value 5/1/11 | | $ | 1,000.00 | | | $ | 1,000.00 | |
Ending Account Value 10/31/11 | | $ | 954.76 | | | $ | 890.01 | |
Expenses Paid During Period 5/1/11-10/31/11 * | | $ | 4.53 | | | $ | 1.05 | |
Annualized Expense Ratio | | | 0.92 | % | | | 0.22 | % |
| | |
Advisor Class | | Balanced
Fund | | | Mid-Cap
Value Fund | |
Beginning Account Value 5/1/11 | | $ | 1,000.00 | | | $ | 1,000.00 | |
Ending Account Value 10/31/11 | | $ | 954.18 | | | $ | 889.30 | |
Expenses Paid During Period 5/1/11-10/31/11 * | | $ | 5.37 | | | $ | 7.14 | |
Annualized Expense Ratio | | | 1.09 | % | | | 1.50 | % |
| | | | | | | | | | | | |
A Class | | Balanced
Fund | | | Large Cap
Growth
Fund | | | Mid-Cap
Value Fund | |
Beginning Account Value 5/1/11 | | $ | 1,000.00 | | | $ | 1,000.00 | | | $ | 1,000.00 | |
Ending Account Value 10/31/11 | | $ | 953.95 | | | $ | 886.30 | | | $ | 888.17 | |
Expenses Paid During Period 5/1/11-10/31/11 * | | $ | 5.47 | | | $ | 7.70 | | | $ | 7.09 | |
Annualized Expense Ratio | | | 1.11 | % | | | 1.62 | % | | | 1.49 | % |
9
Fund Expenses
October 31, 2011 (Unaudited)
| | | | | | | | | | | | |
C Class | | Balanced
Fund | | | Large Cap
Growth
Fund | | | Mid-Cap
Value Fund | |
Beginning Account Value 5/1/11 | | $ | 1,000.00 | | | $ | 1,000.00 | | | $ | 1,000.00 | |
Ending Account Value 10/31/11 | | $ | 950.98 | | | $ | 883.04 | | | $ | 885.19 | |
Expenses Paid During Period 5/1/11-10/31/11 * | | $ | 8.95 | | | $ | 10.77 | | | $ | 10.64 | |
Annualized Expense Ratio | | | 1.82 | % | | | 2.27 | % | | | 2.24 | % |
| | | | | | | | | | | | |
AMR Class | | Balanced
Fund | | | Large Cap
Growth
Fund | | | Mid-Cap
Value Fund | |
Beginning Account Value 5/1/11 | | $ | 1,000.00 | | | $ | 1,000.00 | | | $ | 1,000.00 | |
Ending Account Value 10/31/2011 | | $ | 957.51 | | | $ | 889.05 | | | $ | 891.03 | |
Expenses Paid During Period 5/1/11-10/31/11 * | | $ | 1.63 | | | $ | 3.81 | | | $ | 4.24 | |
Annualized Expense Ratio | | | 0.33 | % | | | 0.80 | % | | | 0.89 | % |
Hypothetical Example for Comparison Purposes
The following tables provide information about hypothetical account values and hypothetical expenses based on a Fund’s actual expense ratio and an assumed 5% per year rate of return before expenses (not the Fund’s actual return). You may compare the ongoing costs of investing in a particular Fund with other funds by contrasting this 5% hypothetical example and the 5% hypothetical examples that appear in the shareholder reports of the other funds. The hypothetical account values and expenses may not be used to estimate the actual ending account balance or expenses you paid for the period. Shareholders of the Investor and Institutional Classes that invest in a Fund through an IRA may be subject to a custodial IRA fee of $15 that is typically deducted each December. If your account was subject to a custodial IRA fee during the period, your costs would have been $15 higher.
You should also be aware that the expenses shown in the table highlight only your ongoing costs and do not reflect any transaction costs charged by a Fund, such as redemption fees as applicable. Similarly, the expense examples for other funds do not reflect any transaction costs charged by those funds, such as sales charges (loads), redemption fees or exchange fees. Therefore, the following tables are useful in comparing ongoing costs only and will not help you determine the relative total costs of owning different funds. If you were subject to any transaction costs during the period, your costs would have been higher.
| | | | | | | | | | | | |
Institutional Class | | Balanced
Fund | | | Large Cap
Growth
Fund | | | Mid-Cap
Value Fund | |
Beginning Account Value 5/1/11 | | $ | 1,000.00 | | | $ | 1,000.00 | | | $ | 1,000.00 | |
Ending Account Value 10/31/11 | | $ | 1,022.23 | | | $ | 1,019.26 | | | $ | 1,020.32 | |
Expenses Paid During Period 5/1/11-10/31/11 * | | $ | 3.01 | | | $ | 6.01 | | | $ | 4.94 | |
Annualized Expense Ratio | | | 0.59 | % | | | 1.18 | % | | | 0.97 | % |
| | | | | | | | | | | | |
Y Class | | Balanced
Fund | | | Large Cap
Growth
Fund | | | Mid-Cap
Value Fund | |
Beginning Account Value 5/1/11 | | $ | 1,000.00 | | | $ | 1,000.00 | | | $ | 1,000.00 | |
Ending Account Value 10/31/11 | | $ | 1,020.57 | | | $ | 1,016.84 | | | $ | 1,024.10 | |
Expenses Paid During Period 5/1/11-10/31/11 * | | $ | 4.69 | | | $ | 8.44 | | | $ | 1.12 | |
Annualized Expense Ratio | | | 0.92 | % | | | 1.66 | % | | | 0.22 | % |
| | | | | | | | |
Investor Class | | Balanced
Fund | | | Mid-Cap
Value Fund | |
Beginning Account Value 5/1/11 | | $ | 1,000.00 | | | $ | 1,000.00 | |
Ending Account Value 10/31/11 | | $ | 1,020.57 | | | $ | 1,024.10 | |
Expenses Paid During Period 5/1/11-10/31/11 * | | $ | 4.69 | | | $ | 1.12 | |
Annualized Expense Ratio | | | 0.92 | % | | | 0.22 | % |
| | | | | | | | |
Advisor Class | | Balanced
Fund | | | Mid-Cap
Value Fund | |
Beginning Account Value 5/1/11 | | $ | 1,000.00 | | | $ | 1,000.00 | |
Ending Account Value 10/31/11 | | $ | 1,019.71 | | | $ | 1,017.64 | |
Expenses Paid During Period 5/1/11-10/31/11 * | | $ | 5.55 | | | $ | 7.63 | |
Annualized Expense Ratio | | | 1.09 | % | | | 1.50 | % |
10
Fund Expenses
October 31, 2011 (Unaudited)
| | | | | | | | | | | | |
A Class | | Balanced
Fund | | | Large Cap
Growth
Fund | | | Mid-Cap
Value Fund | |
Beginning Account Value 5/1/11 | | $ | 1,000.00 | | | $ | 1,000.00 | | | $ | 1,000.00 | |
Ending Account Value 10/31/11 | | $ | 1,019.61 | | | $ | 1,017.04 | | | $ | 1,017.69 | |
Expenses Paid During Period 5/1/11-10/31/11 * | | $ | 5.65 | | | $ | 8.24 | | | $ | 7.58 | |
Annualized Expense Ratio | | | 1.11 | % | | | 1.62 | % | | | 1.49 | % |
| | | | | | | | | | | | |
C Class | | Balanced
Fund | | | Large Cap
Growth
Fund | | | Mid-Cap
Value Fund | |
Beginning Account Value 5/1/11 | | $ | 1,000.00 | | | $ | 1,000.00 | | | $ | 1,000.00 | |
Ending Account Value 10/31/11 | | $ | 1,016.03 | | | $ | 1,013.76 | | | $ | 1,013.91 | |
Expenses Paid During Period 5/1/11-10/31/11 * | | $ | 9.25 | | | $ | 11.52 | | | $ | 11.37 | |
Annualized Expense Ratio | | | 1.82 | % | | | 2.27 | % | | | 2.24 | % |
| | | | | | | | | | | | |
AMR Class | | Balanced
Fund | | | Large Cap
Growth
Fund | | | Mid-Cap
Value Fund | |
Beginning Account Value 5/1/11 | | $ | 1,000.00 | | | $ | 1,000.00 | | | $ | 1,000.00 | |
Ending Account Value 10/31/11 | | $ | 1,023.54 | | | $ | 1,021.17 | | | $ | 1,020.72 | |
Expenses Paid During Period 5/1/11-10/31/11 * | | $ | 1.68 | | | $ | 4.08 | | | $ | 4.53 | |
Annualized Expense Ratio | | | 0.33 | % | | | 0.80 | % | | | 0.89 | % |
| * | Expenses are equal to the Fund’s annualized expense ratios for the six-month period multiplied by the average account value over the period, multiplied by the number derived by dividing the number of days in the most recent fiscal half-year (184) by days in the year (365) to reflect the half-year period. |
11
American Beacon Funds
Report of Independent Registered Public Accounting Firm
To the Shareholders and the Board of Trustees of
American Beacon Balanced Fund, American Beacon Large Cap Growth Fund, and American Beacon Mid-Cap Value Fund:
We have audited the accompanying statements of assets and liabilities, including the schedules of investments, of the American Beacon Balanced Fund, the American Beacon Large Cap Growth Fund, and the American Beacon Mid-Cap Value Fund (three of the funds constituting the American Beacon Funds) (collectively, the “Funds”), as of October 31, 2011, and the related statements of operations for the year then ended, the statements of changes in net assets for each of the two years in the period then ended, and financial highlights for the periods indicated therein. These financial statements and financial highlights are the responsibility of the Funds’ management. Our responsibility is to express an opinion on these financial statements and financial highlights based on our audits.
We conducted our audits in accordance with the standards of the Public Company Accounting Oversight Board (United States). Those standards require that we plan and perform the audit to obtain reasonable assurance about whether the financial statements and financial highlights are free of material misstatement. We were not engaged to perform an audit of the Funds’ internal control over financial reporting. Our audits included consideration of internal control over financial reporting as a basis for designing audit procedures that are appropriate in the circumstances, but not for the purpose of expressing an opinion on the effectiveness of each Fund’s internal control over financial reporting. Accordingly, we express no such opinion. An audit also includes examining, on a test basis, evidence supporting the amounts and disclosures in the financial statements and financial highlights, assessing the accounting principles used and significant estimates made by management, and evaluating the overall financial statement presentation. Our procedures included confirmation of securities owned as of October 31, 2011, by correspondence with the custodian and brokers or by other appropriate auditing procedures where replies from brokers were not received. We believe that our audits provide a reasonable basis for our opinion.
In our opinion, the financial statements and financial highlights referred to above present fairly, in all material respects, the financial position of the American Beacon Balanced Fund, the American Beacon Large Cap Growth Fund, and the American Beacon Mid-Cap Value Fund at October 31, 2011, the results of their operations for the year then ended, the changes in their net assets for each of the two years in the period then ended, and the financial highlights for each of the periods indicated therein, in conformity with U.S. generally accepted accounting principles.
Dallas, Texas
December 29, 2011
12
American Beacon Balanced Fund
Schedule of Investments
October 31, 2011
| | | | | | | | |
| | | Shares | | | Fair Value | |
| | | | | | (000’s) | |
COMMON STOCK - 53.98% | | | | | | | | |
CONSUMER DISCRETIONARY - 4.89% | | | | | |
Auto Components - 0.45% | | | | | | | | |
Johnson Controls, Inc. | | | 64,400 | | | $ | 2,120 | |
Magna International, Inc. | | | 46,200 | | | | 1,763 | |
| | | | | | | | |
| | | | | | | 3,883 | |
| | | | | | | | |
Automobiles - 0.40% | | | | | | | | |
General Motors Co.A | | | 133,600 | | | | 3,454 | |
| | | | | | | | |
Hotels, Restaurants & Leisure - 0.49% | | | | | |
Carnival Corp. | | | 108,100 | | | | 3,806 | |
Wyndham Worldwide Corp. | | | 11,700 | | | | 394 | |
| | | | | | | | |
| | | | | | | 4,200 | |
| | | | | | | | |
Household Durables - 0.32% | | | | | | | | |
D.R. Horton, Inc. | | | 134,500 | | | | 1,497 | |
Lennar Corp., Class A | | | 77,400 | | | | 1,280 | |
| | | | | | | | |
| | | | | | | 2,777 | |
| | | | | | | | |
Media - 1.20% | | | | | | | | |
CBS Corp., Class BB | | | 69,700 | | | | 1,799 | |
Comcast Corp., Class A | | | 144,300 | | | | 3,319 | |
Comcast Corp. - Class A | | | 76,300 | | | | 1,789 | |
The Interpublic Group of Cos., Inc. | | | 189,200 | | | | 1,794 | |
Time Warner Cable, Inc. | | | 23,900 | | | | 1,522 | |
| | | | | | | | |
| | | | | | | 10,223 | |
| | | | | | | | |
Multiline Retail - 0.52% | | | | | | | | |
JC Penney Co. Inc. | | | 91,200 | | | | 2,926 | |
Target Corp. | | | 27,950 | | | | 1,530 | |
| | | | | | | | |
| | | | | | | 4,456 | |
| | | | | | | | |
Specialty Retail - 1.51% | | | | | | | | |
Best Buy Co. Inc. | | | 76,300 | | | | 2,001 | |
RadioShack Corp. | | | 73,400 | | | | 874 | |
Staples, Inc. | | | 118,600 | | | | 1,774 | |
The Gap, Inc. | | | 356,300 | | | | 6,735 | |
The Home Depot, Inc. | | | 40,650 | | | | 1,455 | |
| | | | | | | | |
| | | | | | | 12,839 | |
| | | | | | | | |
Total Consumer Discretionary | | | | | | | 41,832 | |
| | | | | | | | |
CONSUMER STAPLES - 4.56% | | | | | | | | |
Beverages - 1.14% | | | | | | | | |
Diageo plc, ADRC | | | 56,900 | | | | 4,716 | |
PepsiCo, Inc. | | | 79,600 | | | | 5,011 | |
| | | | | | | | |
| | | | | | | 9,727 | |
| | | | | | | | |
Food & Drug Retailing - 1.57% | | | | | | | | |
CVS Caremark Corp. | | | 90,200 | | | | 3,274 | |
Safeway, Inc. | | | 65,700 | | | | 1,273 | |
The Kroger Co. | | | 75,300 | | | | 1,745 | |
Wal-Mart Stores, Inc. | | | 126,000 | | | | 7,147 | |
| | | | | | | | |
| | | | | | | 13,439 | |
| | | | | | | | |
Food Products - 0.08% | | | | | | | | |
Kraft Foods, Inc., Class A | | | 20,500 | | | | 721 | |
| | | | | | | | |
Household Products - 0.08% | | | | | | | | |
Kimberly-Clark Corp. | | | 10,100 | | | | 704 | |
| | | | | | | | |
Tobacco - 1.69% | | | | | | | | |
Altria Group, Inc. | | | 94,400 | | | | 2,601 | |
Imperial Tobacco Group plc, ADRC | | | 67,400 | | | | 4,920 | |
Philip Morris International, Inc. | | | 97,800 | | | | 6,833 | |
| | | | | | | | |
| | | | | | | 14,354 | |
Total Consumer Staples | | | | | | | 38,945 | |
| | | | | | | | |
| | | | | | | | |
| | | Shares | | | Fair Value | |
| | | | | | (000’s) | |
ENERGY - 6.89% | | | | | | | | |
Energy Equipment & Services - 0.12% | | | | | |
Cobalt International Energy, Inc.A | | | 98,900 | | | $ | 1,021 | |
| | | | | | | | |
Oil & Gas - 6.77% | | | | | | | | |
BP plc, ADRC | | | 188,900 | | | | 8,345 | |
Chevron Corp. | | | 44,628 | | | | 4,688 | |
ConocoPhillips | | | 207,576 | | | | 14,457 | |
Exxon Mobil Corp. | | | 35,300 | | | | 2,757 | |
Marathon Oil Corp. | | | 108,400 | | | | 2,822 | |
Marathon Petroleum Corp. | | | 24,250 | | | | 871 | |
Occidental Petroleum Corp. | | | 58,000 | | | | 5,390 | |
Royal Dutch Shell plc, ADRC | | | 116,500 | | | | 8,317 | |
Spectra Energy Corp. | | | 216,400 | | | | 6,195 | |
Total S.A., ADRC | | | 77,200 | | | | 4,038 | |
| | | | | | | | |
| | | | | | | 57,880 | |
| | | | | | | | |
Total Energy | | | | | | | 58,901 | |
| | | | | | | | |
FINANCIALS - 13.64% | | | | | | | | |
Banks - 4.79% | | | | | | | | |
Bank of America Corp. | | | 1,428,080 | | | | 9,753 | |
Fifth Third Bancorp | | | 127,700 | | | | 1,534 | |
KeyCorp | | | 227,957 | | | | 1,609 | |
PNC Financial Services Group, Inc. | | | 140,358 | | | | 7,539 | |
SunTrust Banks, Inc. | | | 171,400 | | | | 3,382 | |
The Bank of New York Mellon Corp. | | | 83,400 | | | | 1,775 | |
Wells Fargo & Co. | | | 551,398 | | | | 14,286 | |
Zions Bancorporation | | | 62,200 | | | | 1,080 | |
| | | | | | | | |
| | | | | | | 40,958 | |
| | | | | | | | |
Diversified Financials - 5.25% | | | | | | | | |
American Express Co. | | | 111,900 | | | | 5,664 | |
Capital One Financial Corp. | | | 106,500 | | | | 4,863 | |
Citigroup, Inc. | | | 187,670 | | | | 5,928 | |
JPMorgan Chase & Co. | | | 516,334 | | | | 17,949 | |
Morgan Stanley | | | 274,500 | | | | 4,842 | |
SLM Corp. | | | 151,300 | | | | 2,068 | |
State Street Corp. | | | 45,500 | | | | 1,838 | |
The Goldman Sachs Group, Inc. | | | 16,300 | | | | 1,786 | |
| | | | | | | | |
| | | | | | | 44,938 | |
| | | | | | | | |
Insurance - 2.93% | | | | | | | | |
ACE Ltd. | | | 26,400 | | | | 1,905 | |
American International Group, Inc. | | | 118,100 | | | | 2,916 | |
Genworth Financial, Inc., Class A | | | 69,400 | | | | 443 | |
Hartford Financial Services Group, Inc. | | | 93,800 | | | | 1,806 | |
Lincoln National Corp. | | | 28,800 | | | | 549 | |
MetLife, Inc. | | | 169,388 | | | | 5,955 | |
Prudential Financial, Inc. | | | 13,400 | | | | 726 | |
The Allstate Corp. | | | 201,300 | | | | 5,302 | |
The Travelers Cos., Inc. | | | 32,900 | | | | 1,920 | |
XL Group plc | | | 162,200 | | | | 3,526 | |
| | | | | | | | |
| | | | | | | 25,048 | |
| | | | | | | | |
Real Estate - 0.67% | | | | | | | | |
Annaly Capital Management, Inc.D | | | 216,600 | | | | 3,649 | |
Chimera Investment Corp.D | | | 686,572 | | | | 2,067 | |
| | | | | | | | |
| | | | | | | 5,716 | |
| | | | | | | | |
Total Financials | | | | | | | 116,660 | |
| | | | | | | | |
HEALTH CARE - 5.93% | | | | | | | | |
Biotechnology - 0.38% | | | | | | | | |
Amgen, Inc. | | | 57,200 | | | | 3,276 | |
| | | | | | | | |
See accompanying notes
13
American Beacon Balanced Fund
Schedule of Investments
October 31, 2011
| | | | | | | | |
| | | Shares | | | Fair Value | |
| | | | | | (000’s) | |
Health Care Equipment & Supplies - 0.98% | | | | | |
Baxter International, Inc. | | | 86,600 | | | $ | 4,762 | |
Covidien plc | | | 8,700 | | | | 409 | |
Medtronic, Inc. | | | 92,200 | | | | 3,203 | |
| | | | | | | | |
| | | | | | | 8,374 | |
| | | | | | | | |
Health Care Providers & Services - 0.56% | | | | | |
Quest Diagnostics, Inc. | | | 28,800 | | | | 1,607 | |
WellPoint, Inc. | | | 46,600 | | | | 3,211 | |
| | | | | | | | |
| | | | | | | 4,818 | |
| | | | | | | | |
Pharmaceuticals - 4.01% | | | | | | | | |
Eli Lilly & Co. | | | 55,500 | | | | 2,062 | |
Johnson & Johnson | | | 146,900 | | | | 9,459 | |
Merck & Co. Inc. | | | 203,976 | | | | 7,037 | |
Novartis AG, ADRC | | | 30,700 | | | | 1,734 | |
Pfizer, Inc. | | | 625,054 | | | | 12,038 | |
Sanofi, ADRC | | | 53,700 | | | | 1,920 | |
| | | | | | | | |
| | | | | | | 34,250 | |
| | | | | | | | |
Total Health Care | | | | | | | 50,718 | |
| | | | | | | | |
INDUSTRIALS - 4.72% | | | | | | | | |
Aerospace & Defense - 1.60% | | | | | | | | |
Huntington Ingalls Industries, Inc.A | | | 6,550 | | | | 193 | |
Lockheed Martin Corp. | | | 55,500 | | | | 4,212 | |
Northrop Grumman Corp. | | | 41,100 | | | | 2,374 | |
Raytheon Co. | | | 91,600 | | | | 4,048 | |
The Boeing Co. | | | 42,900 | | | | 2,822 | |
| | | | | | | | |
| | | | | | | 13,649 | |
| | | | | | | | |
Air Freight & Couriers - 0.28% | | | | | | | | |
FedEx Corp. | | | 29,700 | | | | 2,430 | |
| | | | | | | | |
Industrial Conglomerates - 1.58% | | | | | |
3M Co. | | | 39,700 | | | | 3,137 | |
General Electric Co. | | | 377,300 | | | | 6,305 | |
Honeywell International, Inc. | | | 77,900 | | | | 4,082 | |
| | | | | | | | |
| | | | | | | 13,524 | |
| | | | | | | | |
Machinery - 1.26% | | | | | | | | |
Cummins, Inc. | | | 20,900 | | | | 2,078 | |
Illinois Tool Works, Inc. | | | 49,600 | | | | 2,412 | |
ITT Corp. | | | 70,600 | | | | 3,220 | |
PACCAR, Inc. | | | 70,400 | | | | 3,044 | |
| | | | | | | | |
| | | | | | | 10,754 | |
| | | | | | | | |
Total Industrials | | | | | | | 40,357 | |
| | | | | | | | |
INFORMATION TECHNOLOGY - 6.51% | | | | | |
Communications Equipment - 0.73% | | | | | |
Cisco Systems, Inc. | | | 182,000 | | | | 3,373 | |
Corning, Inc. | | | 198,400 | | | | 2,835 | |
| | | | | | | | |
| | | | | | | 6,208 | |
| | | | | | | | |
Computers & Peripherals - 2.93% | | | | | |
Apple, Inc. | | | 10,910 | | | | 4,416 | |
Hewlett-Packard Co. | | | 408,700 | | | | 10,875 | |
International Business Machines Corp. | | | 35,100 | | | | 6,481 | |
Seagate Technology plc | | | 208,000 | | | | 3,359 | |
| | | | | | | | |
| | | | | | | 25,131 | |
| | | | | | | | |
Electronic Equipment & Instruments - 0.51% | | | | | |
Avnet, Inc. | | | 87,400 | | | | 2,649 | |
TE Connectivity Ltd. | | | 47,225 | | | | 1,679 | |
| | | | | | | | |
| | | | | | | 4,328 | |
| | | | | | | | |
| | | | | | | | |
| | | Shares | | | Fair Value | |
| | | | | | (000’s) | |
Semiconductor Equipment & Products - 0.23% | | | | | |
Intel Corp. | | | 79,200 | | | $ | 1,944 | |
| | | | | | | | |
Software - 2.11% | | | | | | | | |
CA, Inc. | | | 188,774 | | | | 4,089 | |
Microsoft Corp. | | | 404,900 | | | | 10,782 | |
Oracle Corp. | | | 95,700 | | | | 3,136 | |
| | | | | | | | |
| | | | | | | 18,007 | |
| | | | | | | | |
Total Information Technology | | | | | | | 55,618 | |
| | | | | | | | |
MATERIALS - 1.28% | | | | | | | | |
Chemicals - 0.58% | | | | | | | | |
Air Products & Chemicals, Inc. | | | 15,100 | | | | 1,301 | |
EI du Pont de Nemours & Co. | | | 36,000 | | | | 1,730 | |
PPG Industries, Inc. | | | 9,400 | | | | 812 | |
The Dow Chemical Co. | | | 40,800 | | | | 1,138 | |
| | | | | | | | |
| | | | | | | 4,981 | |
| | | | | | | | |
Metals & Mining - 0.70% | | | | | | | | |
ArcelorMittal | | | 80,230 | | | | 1,663 | |
Newmont Mining Corp. | | | 48,500 | | | | 3,241 | |
United States Steel Corp. | | | 40,800 | | | | 1,035 | |
| | | | | | | | |
| | | | | | | 5,939 | |
| | | | | | | | |
Total Materials | | | | | | | 10,920 | |
| | | | | | | | |
TELECOMMUNICATION SERVICES - 2.84% | | | | | |
Diversified Telecommunication Services - 1.50% | | | | | |
AT&T, Inc. | | | 283,177 | | | | 8,299 | |
Verizon Communications, Inc. | | | 121,108 | | | | 4,479 | |
| | | | | | | | |
| | | | | | | 12,778 | |
| | | | | | | | |
Wireless Telecommunication Services - 1.34% | | | | | |
Vodafone Group plc, ADRC | | | 413,000 | | | | 11,498 | |
| | | | | | | | |
Total Telecommunication Services | | | | 24,276 | |
| | | | | | | | |
UTILITIES - 2.72% | | | | | | | | |
Electric Utilities - 2.57% | | | | | | | | |
CenterPoint Energy, Inc. | | | 198,000 | | | | 4,126 | |
Dominion Resources, Inc. | | | 89,900 | | | | 4,639 | |
Edison International | | | 53,600 | | | | 2,176 | |
Entergy Corp. | | | 19,500 | | | | 1,349 | |
Exelon Corp. | | | 95,700 | | | | 4,248 | |
PPL Corp. | | | 47,700 | | | | 1,401 | |
Public Service Enterprise Group, Inc. | | | 121,300 | | | | 4,088 | |
| | | | | | | | |
| | | | | | | 22,027 | |
| | | | | | | | |
Multi-Utilities - 0.15% | | | | | | | | |
Duke Energy Corp. | | | 36,480 | | | | 745 | |
Xcel Energy, Inc. | | | 19,400 | | | | 501 | |
| | | | | | | | |
| | | | | | | 1,246 | |
| | | | | | | | |
Total Utilities | | | | | | | 23,273 | |
| | | | | | | | |
Total Common Stock (Cost $460,376) | | | | | | | 461,500 | |
| | | | | | | | |
PREFERRED STOCK - 0.30% (Cost $3,130) | | | | | | | | |
CONSUMER DISCRETIONARY - 0.30% | | | | | |
General Motors Co. | | | 62,400 | | | | 2,593 | |
| | | | | | | | |
| | |
| | | Par Amount | | | Fair Value | |
| | | (000’s) | | | (000’s) | |
CORPORATE OBLIGATION - 14.77% | | | | | |
Finance - 6.89% | | | | | | | | |
AEGON Funding Co. LLC, | | | | | | | | |
5.75%, Due 12/15/2020E | | $ | 350 | | | | 379 | |
American Beacon Balanced Fund
Schedule of Investments
October 31, 2011
| | | | | | | | |
| | | Par Amount | | | Fair Value | |
| | | (000’s) | | | (000’s) | |
Aflac, Inc., | | | | | | | | |
8.50%, Due 5/15/2019 | | $ | 170 | | | $ | 213 | |
American Express Co., | | | | | | | | |
8.15%, Due 3/19/2038 | | | 200 | | | | 287 | |
American Express Credit Corp., | | | | | | | | |
5.125%, Due 8/25/2014 | | | 570 | | | | 619 | |
2.75%, Due 9/15/2015 | | | 150 | | | | 152 | |
American International Group, Inc., | | | | | | | | |
6.40%, Due 12/15/2020 | | | 625 | | | | 655 | |
ANZ National International Ltd., | | | | | | | | |
2.375%, Due 12/21/2012F | | | 350 | | | | 354 | |
Bank of America Corp., | | | | | | | | |
4.50%, Due 4/1/2015 | | | 270 | | | | 267 | |
6.50%, Due 8/1/2016 | | | 2,090 | | | | 2,174 | |
7.80%, Due 9/15/2016 | | | 700 | | | | 741 | |
7.625%, Due 6/1/2019 | | | 925 | | | | 1,005 | |
Bank One Corp., | | | | | | | | |
4.90%, Due 4/30/2015 | | | 250 | | | | 266 | |
Barclays Bank plc, | | | | | | | | |
3.90%, Due 4/7/2015 | | | 330 | | | | 336 | |
6.75%, Due 5/22/2019 | | | 350 | | | | 401 | |
BNP Paribas S.A., | | | | | | | | |
3.60%, Due 2/23/2016 | | | 320 | | | | 319 | |
Canadian Imperial Bank of Commerce, | | | | | | | | |
1.45%, Due 9/13/2013 | | | 410 | | | | 412 | |
Capital One Financial Corp., | | | | | | | | |
2.125%, Due 7/15/2014 | | | 335 | | | | 335 | |
Citigroup, Inc., | | | | | | | | |
1.302%, Due 4/1/2014G | | | 300 | | | | 289 | |
6.375%, Due 8/12/2014 | | | 920 | | | | 993 | |
0.548%, Due 11/5/2014G | | | 320 | | | | 299 | |
6.01%, Due 1/15/2015 | | | 420 | | | | 452 | |
6.125%, Due 11/21/2017 | | | 295 | | | | 325 | |
8.50%, Due 5/22/2019 | | | 1,300 | | | | 1,609 | |
CME Group, Inc., | | | | | | | | |
5.40%, Due 8/1/2013 | | | 260 | | | | 278 | |
CNA Financial Corp., | | | | | | | | |
7.35%, Due 11/15/2019 | | | 245 | | | | 270 | |
Cooperatieve Centrale Raiffeisen- Boerenleenbank BA, | | | | | | | | |
4.20%, Due 5/13/2014F | | | 200 | | | | 212 | |
2.125%, Due 10/13/2015 | | | 340 | | | | 343 | |
Credit Suisse, | | | | | | | | |
5.30%, Due 8/13/2019 | | | 325 | | | | 349 | |
Danske Bank A/S, | | | | | | | | |
1.451%, Due 4/14/2014F G | | | 620 | | | | 596 | |
Deutsche Bank AG, | | | | | | | | |
3.875%, Due 8/18/2014 | | | 325 | | | | 336 | |
Fifth Third Bancorp, | | | | | | | | |
3.625%, Due 1/25/2016 | | | 325 | | | | 333 | |
8.25%, Due 3/1/2038 | | | 1,900 | | | | 2,312 | |
General Electric Capital Corp., | | | | | | | | |
0.957%, Due 6/2/2014G | | | 1,595 | | | | 1,556 | |
0.591%, Due 1/8/2016G | | | 1,125 | | | | 1,047 | |
5.40%, Due 2/15/2017 | | | 300 | | | | 334 | |
5.625%, Due 5/1/2018 | | | 655 | | | | 724 | |
6.00%, Due 8/7/2019 | | | 350 | | | | 398 | |
5.50%, Due 1/8/2020 | | | 250 | | | | 279 | |
5.30%, Due 2/11/2021 | | | 170 | | | | 181 | |
5.875%, Due 1/14/2038 | | | 505 | | | | 542 | |
HCP, Inc., 5.375%, Due 2/1/2021 | | | 355 | | | | 365 | |
Health Care REIT, Inc., | | | | | | | | |
3.625%, Due 3/15/2016D | | | 185 | | | | 181 | |
| | | | | | | | |
| | | Par Amount | | | Fair Value | |
| | | (000’s) | | | (000’s) | |
5.25%, Due 1/15/2022D | | $ | 250 | | | $ | 239 | |
HSBC Finance Corp., | | | | | | | | |
0.653%, Due 1/15/2014G | | | 1,050 | | | | 979 | |
ING Bank N.V., 5.125%, Due 5/1/2015F | | | 450 | | | | 449 | |
JPMorgan Chase & Co., | | | | | | | | |
1.216%, Due 1/24/2014G | | | 1,375 | | | | 1,366 | |
3.70%, Due 1/20/2015 | | | 1,080 | | | | 1,125 | |
5.50%, Due 10/15/2040 | | | 325 | | | | 348 | |
JPMorgan Chase Bank NA, | | | | | | | | |
0.668%, Due 6/13/2016G | | | 415 | | | | 376 | |
KeyCorp, | | | | | | | | |
5.10%, Due 3/24/2021 | | | 140 | | | | 146 | |
Liberty Mutual Group, Inc., | | | | | | | | |
5.00%, Due 6/1/2021F | | | 280 | | | | 264 | |
Liberty Mutual Insurance Co., | | | | | | | | |
7.875%, Due 10/15/2026F | | | 1,500 | | | | 1,690 | |
Lincoln National Corp., | | | | | | | | |
4.75%, Due 2/15/2014 | | | 245 | | | | 258 | |
Lloyds TSB Bank plc, | | | | | | | | |
4.375%, Due 1/12/2015F | | | 325 | | | | 326 | |
6.375%, Due 1/21/2021 | | | 185 | | | | 198 | |
Merrill Lynch & Co. Inc, | | | | | | | | |
6.40%, Due 8/28/2017 | | | 795 | | | | 806 | |
6.50%, Due 7/15/2018 | | | 260 | | | | 258 | |
6.11%, Due 1/29/2037 | | | 365 | | | | 321 | |
MetLife Institutional Funding II, | | | | | | | | |
1.274%, Due 4/4/2014F G | | | 600 | | | | 598 | |
MetLife, Inc., | | | | | | | | |
5.00%, Due 11/24/2013 | | | 440 | | | | 470 | |
6.375%, Due 6/15/2034 | | | 350 | | | | 427 | |
Monumental Global Funding III, | | | | | | | | |
0.603%, Due 1/15/2014F G | | | 325 | | | | 316 | |
Morgan Stanley, | | | | | | | | |
0.691%, Due 1/9/2014G | | | 2,860 | | | | 2,636 | |
0.883%, Due 10/15/2015G | | | 920 | | | | 808 | |
7.30%, Due 5/13/2019 | | | 350 | | | | 376 | |
5.625%, Due 9/23/2019 | | | 350 | | | | 346 | |
5.50%, Due 7/28/2021 | | | 805 | | | | 786 | |
National Australia Bank Ltd., | | | | | | | | |
4.375%, Due 12/10/2020F | | | 325 | | | | 336 | |
Nordea Bank AB, | | | | | | | | |
2.50%, Due 11/13/2012F | | | 350 | | | | 354 | |
4.875%, Due 1/27/2020F | | | 300 | | | | 322 | |
PNC Funding Corp., | | | | | | | | |
4.25%, Due 9/21/2015 | | | 535 | | | | 577 | |
4.375%, Due 8/11/2020 | | | 330 | | | | 348 | |
Pricoa Global Funding I, | | | | | | | | |
5.40%, Due 10/18/2012F | | | 175 | | | | 182 | |
Prudential Financial, Inc., | | | | | | | | |
7.375%, Due 6/15/2019 | | | 300 | | | | 364 | |
Simon Property Group LP, | | | | | | | | |
5.75%, Due 12/1/2015 | | | 445 | | | | 499 | |
10.35%, Due 4/1/2019H | | | 325 | | | | 442 | |
Societe Generale S.A., | | | | | | | | |
2.20%, Due 9/14/2013F | | | 300 | | | | 288 | |
1.441%, Due 4/11/2014F G | | | 900 | | | | 819 | |
State Street Corp., | | | | | | | | |
4.30%, Due 5/30/2014 | | | 215 | | | | 232 | |
2.875%, Due 3/7/2016 | | | 505 | | | | 522 | |
SunTrust Banks, Inc., | | | | | | | | |
3.60%, Due 4/15/2016 | | | 175 | | | | 179 | |
The Bank of New York Mellon Corp., | | | | | | | | |
1.50%, Due 1/31/2014 | | | 335 | | | | 338 | |
See accompanying notes
15
American Beacon Balanced Fund
Schedule of Investments
October 31, 2011
| | | | | | | | |
| | | Par Amount | | | Fair Value | |
| | | (000’s) | | | (000’s) | |
4.30%, Due 5/15/2014 | | $ | 290 | | | $ | 314 | |
The Bear Stearns Cos. LLC, | | | | | | | | |
7.25%, Due 2/1/2018E | | | 1,640 | | | | 1,931 | |
The Goldman Sachs Group, Inc., | | | | | | | | |
5.35%, Due 1/15/2016 | | | 725 | | | | 768 | |
6.25%, Due 9/1/2017 | | | 650 | | | | 703 | |
5.95%, Due 1/18/2018 | | | 345 | | | | 363 | |
6.00%, Due 6/15/2020 | | | 175 | | | | 184 | |
6.75%, Due 10/1/2037 | | | 2,080 | | | | 1,998 | |
The Travelers Cos., Inc., | | | | | | | | |
3.90%, Due 11/1/2020 | | | 160 | | | | 167 | |
Travelers Property Casualty Corp., | | | | | | | | |
5.00%, Due 3/15/2013 | | | 565 | | | | 593 | |
UBS AG, | | | | | | | | |
5.875%, Due 12/20/2017 | | | 325 | | | | 356 | |
UnitedHealth Group, Inc., | | | | | | | | |
4.875%, Due 2/15/2013 | | | 480 | | | | 502 | |
3.875%, Due 10/15/2020 | | | 325 | | | | 342 | |
6.625%, Due 11/15/2037 | | | 1,590 | | | | 2,029 | |
US Bancorp, | | | | | | | | |
1.375%, Due 9/13/2013 | | | 415 | | | | 419 | |
2.20%, Due 11/15/2016 | | | 340 | | | | 343 | |
Wachovia Corp., | | | | | | | | |
0.773%, Due 10/15/2016G | | | 650 | | | | 567 | |
5.75%, Due 2/1/2018 | | | 950 | | | | 1,079 | |
Wells Fargo & Co., | | | | | | | | |
4.60%, Due 4/1/2021 | | | 335 | | | | 358 | |
Westpac Banking Corp., | | | | | | | | |
2.25%, Due 11/19/2012 | | | 330 | | | | 335 | |
Willis North America, Inc., | | | | | | | | |
6.20%, Due 3/28/2017 | | | 255 | | | | 279 | |
| | | | | | | | |
| | | | | | | 58,862 | |
| | | | | | | | |
Industrials - 6.46% | | | | | | | | |
Air Products & Chemicals, Inc., | | | | | | | | |
2.00%, Due 8/2/2016 | | | 135 | | | | 138 | |
Altria Group, Inc., | | | | | | | | |
9.70%, Due 11/10/2018 | | | 280 | | | | 376 | |
4.75%, Due 5/5/2021 | | | 310 | | | | 334 | |
America Movil SAB de CV, | | | | | | | | |
6.375%, Due 3/1/2035 | | | 350 | | | | 417 | |
American Honda Finance Corp., | | | | | | | | |
4.625%, Due 4/2/2013F | | | 425 | | | | 444 | |
3.875%, Due 9/21/2020F | | | 150 | | | | 155 | |
Analog Devices, Inc., | | | | | | | | |
3.00%, Due 4/15/2016 | | | 330 | | | | 346 | |
Anheuser-Busch InBev Worldwide, Inc., | | | | | | | | |
5.00%, Due 4/15/2020 | | | 330 | | | | 383 | |
8.00%, Due 11/15/2039 | | | 125 | | | | 191 | |
Apache Corp., | | | | | | | | |
5.10%, Due 9/1/2040 | | | 170 | | | | 197 | |
Applied Materials, Inc., | | | | | | | | |
2.65%, Due 6/15/2016 | | | 300 | | | | 309 | |
AT&T, Inc., | | | | | | | | |
5.10%, Due 9/15/2014 | | | 605 | | | | 672 | |
5.50%, Due 2/1/2018 | | | 775 | | | | 900 | |
6.80%, Due 5/15/2036 | | | 150 | | | | 189 | |
6.40%, Due 5/15/2038 | | | 175 | | | | 213 | |
5.35%, Due 9/1/2040 | | | 253 | | | | 276 | |
Baxter International, Inc., | | | | | | | | |
1.80%, Due 3/15/2013 | | | 205 | | | | 208 | |
Becton Dickinson and Co., | | | | | | | | |
3.25%, Due 11/12/2020 | | | 330 | | | | 338 | |
BP Capital Markets plc, | | | | | | | | |
| | | | | | | | |
| | | Par Amount | | | Fair Value | |
| | | (000’s) | | | (000’s) | |
3.20%, Due 3/11/2016 | | $ | 750 | | | $ | 788 | |
3.561%, Due 11/1/2021 | | | 230 | | | | 233 | |
Burlington Northern Santa Fe LLC, | | | | | | | | |
5.75%, Due 3/15/2018E | | | 425 | | | | 493 | |
7.95%, Due 8/15/2030E | | | 205 | | | | 290 | |
5.75%, Due 5/1/2040E | | | 170 | | | | 201 | |
Cameron International Corp., | | | | | | | | |
6.375%, Due 7/15/2018 | | | 135 | | | | 160 | |
Canadian National Railway Co., | | | | | | | | |
5.55%, Due 5/15/2018 | | | 350 | | | | 415 | |
Canadian Natural Resources Ltd., | | | | | | | | |
6.25%, Due 3/15/2038 | | | 365 | | | | 458 | |
Caterpillar Financial Services Corp., | | | | | | | | |
6.125%, Due 2/17/2014 | | | 460 | | | | 512 | |
2.75%, Due 6/24/2015 | | | 340 | | | | 353 | |
Cellco Partnership, | | | | | | | | |
8.50%, Due 11/15/2018 | | | 320 | | | | 433 | |
Cliffs Natural Resources, Inc., | | | | | | | | |
4.875%, Due 4/1/2021 | | | 225 | | | | 225 | |
Comcast Cable Communications Holdings, Inc., | | | | | | | | |
8.375%, Due 3/15/2013 | | | 128 | | | | 141 | |
Comcast Corp., | | | | | | | | |
6.30%, Due 11/15/2017 | | | 425 | | | | 502 | |
5.875%, Due 2/15/2018 | | | 270 | | | | 314 | |
6.45%, Due 3/15/2037 | | | 2,630 | | | | 3,144 | |
6.55%, Due 7/1/2039 | | | 350 | | | | 430 | |
ConocoPhillips, | | | | | | | | |
4.60%, Due 1/15/2015 | | | 250 | | | | 275 | |
5.20%, Due 5/15/2018 | | | 425 | | | | 492 | |
Cooper US, Inc., | | | | | | | | |
2.375%, Due 1/15/2016 | | | 330 | | | | 336 | |
3.875%, Due 12/15/2020 | | | 250 | | | | 264 | |
Covidien International Finance S.A., | | | | | | | | |
2.80%, Due 6/15/2015 | | | 290 | | | | 300 | |
CSX Corp., | | | | | | | | |
5.50%, Due 4/15/2041 | | | 325 | | | | 370 | |
CVS Caremark Corp., | | | | | | | | |
3.25%, Due 5/18/2015 | | | 170 | | | | 180 | |
Daimler Finance North America LLC, | | | | | | | | |
3.00%, Due 3/28/2016E F | | | 160 | | | | 161 | |
DIRECTV Holdings LLC, | | | | | | | | |
3.55%, Due 3/15/2015E | | | 380 | | | | 398 | |
6.35%, Due 3/15/2040E | | | 140 | | | | 167 | |
Eaton Corp., | | | | | | | | |
5.60%, Due 5/15/2018 | | | 300 | | | | 350 | |
Ensco plc, | | | | | | | | |
4.70%, Due 3/15/2021 | | | 250 | | | | 263 | |
EOG Resources, Inc., | | | | | | | | |
2.50%, Due 2/1/2016 | | | 325 | | | | 334 | |
Express Scripts, Inc., | | | | | | | | |
6.25%, Due 6/15/2014 | | | 370 | | | | 409 | |
France Telecom S.A., | | | | | | | | |
4.375%, Due 7/8/2014 | | | 215 | | | | 232 | |
2.125%, Due 9/16/2015 | | | 150 | | | | 151 | |
Genzyme Corp., | | | | | | | | |
5.00%, Due 6/15/2020 | | | 190 | | | | 215 | |
GlaxoSmithKline Capital, Inc., | | | | | | | | |
5.65%, Due 5/15/2018 | | | 250 | | | | 300 | |
Hewlett-Packard Co., | | | | | | | | |
2.20%, Due 12/1/2015 | | | 325 | | | | 326 | |
6.00%, Due 9/15/2041 | | | 1,885 | | | | 2,150 | |
Husky Energy, Inc., | | | | | | | | |
See accompanying notes
16
American Beacon Balanced Fund
Schedule of Investments
October 31, 2011
| | | | | | | | |
| | | Par Amount | | | Fair Value | |
| | | (000’s) | | | (000’s) | |
5.90%, Due 6/15/2014 | | $ | 190 | | | $ | 208 | |
Intel Corp., 3.30%, Due 10/1/2021 | | | 215 | | | | 222 | |
International Business Machines Corp., | | | | | | | | |
7.625%, Due 10/15/2018 | | | 615 | | | | 822 | |
John Deere Capital Corp., | | | | | | | | |
4.90%, Due 9/9/2013 | | | 470 | | | | 504 | |
Johnson Controls, Inc., | | | | | | | | |
1.75%, Due 3/1/2014 | | | 565 | | | | 570 | |
5.00%, Due 3/30/2020 | | | 320 | | | | 353 | |
Kellogg Co., | | | | | | | | |
4.25%, Due 3/6/2013 | | | 500 | | | | 522 | |
Koninklijke Philips Electronics N.V., | | | | | | | | |
5.75%, Due 3/11/2018 | | | 305 | | | | 355 | |
Lorillard Tobacco Co., | | | | | | | | |
8.125%, Due 6/23/2019 | | | 275 | | | | 331 | |
Marathon Oil Corp., | | | | | | | | |
6.00%, Due 10/1/2017 | | | 365 | | | | 424 | |
Marathon Petroleum Corp., | | | | | | | | |
3.50%, Due 3/1/2016F | | | 335 | | | | 344 | |
McKesson Corp., | | | | | | | | |
3.25%, Due 3/1/2016 | | | 160 | | | | 170 | |
Medtronic, Inc., | | | | | | | | |
3.00%, Due 3/15/2015 | | | 720 | | | | 764 | |
Norfolk Southern Corp., | | | | | | | | |
5.75%, Due 4/1/2018 | | | 425 | | | | 499 | |
Northrop Grumman Corp., | | | | | | | | |
5.05%, Due 8/1/2019 | | | 150 | | | | 169 | |
Novartis Capital Corp., | | | | | | | | |
2.90%, Due 4/24/2015 | | | 550 | | | | 584 | |
PepsiCo, Inc., | | | | | | | | |
2.50%, Due 5/10/2016 | | | 425 | | | | 442 | |
Petrobras International Finance Co., | | | | | | | | |
3.875%, Due 1/27/2016 | | | 340 | | | | 348 | |
6.875%, Due 1/20/2040 | | | 115 | | | | 133 | |
Petroleos Mexicanos, | | | | | | | | |
6.00%, Due 3/5/2020 | | | 325 | | | | 362 | |
Quest Diagnostics, Inc., | | | | | | | | |
4.75%, Due 1/30/2020 | | | 150 | | | | 161 | |
Rio Tinto Finance USA Ltd., | | | | | | | | |
2.50%, Due 5/20/2016 | | | 335 | | | | 344 | |
Rogers Communications, Inc., | | | | | | | | |
5.50%, Due 3/15/2014 | | | 325 | | | | 353 | |
Sanofi, | | | | | | | | |
1.625%, Due 3/28/2014 | | | 485 | | | | 494 | |
4.00%, Due 3/29/2021 | | | 355 | | | | 389 | |
Shell International Finance BV, | | | | | | | | |
3.10%, Due 6/28/2015 | | | 340 | | | | 362 | |
Teck Resources Ltd., | | | | | | | | |
6.00%, Due 8/15/2040 | | | 145 | | | | 159 | |
Telecom Italia Capital S.A., | | | | | | | | |
4.95%, Due 9/30/2014 | | | 175 | | | | 172 | |
Telefonica Emisiones SAU, | | | | | | | | |
3.992%, Due 2/16/2016 | | | 180 | | | | 177 | |
6.421%, Due 6/20/2016 | | | 350 | | | | 375 | |
Teva Pharmaceutical Finance II, | | | | | | | | |
3.00%, Due 6/15/2015 | | | 335 | | | | 351 | |
The Boeing Co., | | | | | | | | |
1.875%, Due 11/20/2012 | | | 350 | | | | 355 | |
The Coca-Cola Co., | | | | | | | | |
0.75%, Due 11/15/2013 | | | 735 | | | | 737 | |
1.80%, Due 9/1/2016F | | | 175 | | | | 175 | |
The Dow Chemical Co., | | | | | | | | |
7.60%, Due 5/15/2014 | | | 170 | | | | 193 | |
| | | | | | | | |
| | | Par Amount | | | Fair Value | |
| | | (000’s) | | | (000’s) | |
4.25%, Due 11/15/2020 | | $ | 305 | | | $ | 314 | |
The Home Depot, Inc., | | | | | | | | |
4.40%, Due 4/1/2021 | | | 300 | | | | 328 | |
Thomson Reuters Corp., | | | | | | | | |
4.70%, Due 10/15/2019 | | | 150 | | | | 161 | |
Time Warner Cable, Inc., | | | | | | | | |
5.40%, Due 7/2/2012 | | | 975 | | | | 1,004 | |
5.85%, Due 5/1/2017 | | | 650 | | | | 740 | |
6.75%, Due 7/1/2018 | | | 505 | | | | 602 | |
7.30%, Due 7/1/2038 | | | 1,920 | | | | 2,478 | |
Time Warner, Inc., | | | | | | | | |
6.875%, Due 5/1/2012 | | | 975 | | | | 1,002 | |
4.875%, Due 3/15/2020 | | | 160 | | | | 174 | |
4.75%, Due 3/29/2021 | | | 325 | | | | 353 | |
Transocean, Inc., | | | | | | | | |
6.80%, Due 3/15/2038 | | | 3,170 | | | | 3,512 | |
Tyco Electronics Group S.A., | | | | | | | | |
6.55%, Due 10/1/2017 | | | 255 | | | | 298 | |
Tyco International Finance S.A., | | | | | | | | |
3.75%, Due 1/15/2018 | | | 325 | | | | 342 | |
Union Pacific Corp., | | | | | | | | |
4.163%, Due 7/15/2022 | | | 306 | | | | 324 | |
United Parcel Service, Inc., | | | | | | | | |
3.125%, Due 1/15/2021 | | | 340 | | | | 354 | |
United Technologies Corp., | | | | | | | | |
6.125%, Due 7/15/2038 | | | 450 | | | | 552 | |
Valero Energy Corp., | | | | | | | | |
9.375%, Due 3/15/2019 | | | 135 | | | | 176 | |
6.625%, Due 6/15/2037 | | | 165 | | | | 180 | |
Verizon Communications, Inc., | | | | | | | | |
5.50%, Due 4/1/2017 | | | 350 | | | | 403 | |
4.60%, Due 4/1/2021 | | | 380 | | | | 417 | |
3.50%, Due 11/1/2021 | | | 140 | | | | 141 | |
6.90%, Due 4/15/2038 | | | 275 | | | | 362 | |
Viacom, Inc., | | | | | | | | |
6.875%, Due 4/30/2036 | | | 2,880 | | | | 3,677 | |
Vodafone Group plc, | | | | | | | | |
6.15%, Due 2/27/2037 | | | 365 | | | | 460 | |
Wal-Mart Stores, Inc., | | | | | | | | |
7.55%, Due 2/15/2030 | | | 350 | | | | 501 | |
Xerox Corp., | | | | | | | | |
5.65%, Due 5/15/2013 | | | 75 | | | | 79 | |
8.25%, Due 5/15/2014 | | | 160 | | | | 182 | |
4.25%, Due 2/15/2015 | | | 355 | | | | 374 | |
| | | | | | | | |
| | | | | | | 55,264 | |
| | | | | | | | |
Utilities - 1.41% | | | | | | | | |
Columbus Southern Power Co., | | | | | | | | |
5.50%, Due 3/1/2013 | | | 510 | | | | 537 | |
Commonwealth Edison Co., | | | | | | | | |
4.00%, Due 8/1/2020 | | | 175 | | | | 187 | |
Consolidated Edison Co. of New York, Inc., | | | | | | | | |
5.50%, Due 12/1/2039 | | | 350 | | | | 423 | |
Duke Energy Carolinas LLC, | | | | | | | | |
5.10%, Due 4/15/2018E | | | 350 | | | | 402 | |
Duke Energy Indiana, Inc., | | | | | | | | |
6.05%, Due 6/15/2016 | | | 520 | | | | 599 | |
EDF S.A., 4.60%, Due 1/27/2020F | | | 320 | | | | 341 | |
Energy Transfer Partners LP, | | | | | | | | |
8.50%, Due 4/15/2014H | | | 535 | | | | 607 | |
9.00%, Due 4/15/2019H | | | 260 | | | | 313 | |
Enterprise Products Operating LLC, | | | | | | | | |
5.65%, Due 4/1/2013E | | | 355 | | | | 375 | |
See accompanying notes
17
American Beacon Balanced Fund
Schedule of Investments
October 31, 2011
| | | | | | | | |
| | | Par Amount | | | Fair Value | |
| | | (000’s) | | | (000’s) | |
6.125%, Due 10/15/2039E | | $ | 310 | | | $ | 359 | |
Exelon Generation Co. LLC, | | | | | | | | |
5.20%, Due 10/1/2019E | | | 245 | | | | 263 | |
6.25%, Due 10/1/2039E | | | 275 | | | | 327 | |
FirstEnergy Solutions Corp., | | | | | | | | |
4.80%, Due 2/15/2015 | | | 175 | | | | 188 | |
Midamerican Energy Holdings Co., | | | | | | | | |
5.875%, Due 10/1/2012 | | | 510 | | | | 533 | |
6.125%, Due 4/1/2036 | | | 350 | | | | 435 | |
National Rural Utilities Cooperative Finance Corp., | | | | | | | | |
1.125%, Due 11/1/2013 | | | 335 | | | | 336 | |
ONEOK Partners LP, | | | | | | | | |
6.125%, Due 2/1/2041H | | | 355 | | | | 408 | |
Pacific Gas & Electric Co., | | | | | | | | |
6.25%, Due 12/1/2013 | | | 175 | | | | 193 | |
3.50%, Due 10/1/2020 | | | 300 | | | | 310 | |
Progress Energy, Inc., | | | | | | | | |
4.875%, Due 12/1/2019 | | | 350 | | | | 389 | |
Sempra Energy, | | | | | | | | |
6.50%, Due 6/1/2016 | | | 265 | | | | 310 | |
Southern Co., | | | | | | | | |
1.95%, Due 9/1/2016 | | | 310 | | | | 312 | |
Southern Power Co., | | | | | | | | |
6.25%, Due 7/15/2012 | | | 420 | | | | 435 | |
Spectra Energy Capital LLC, | | | | | | | | |
5.668%, Due 8/15/2014E | | | 275 | | | | 301 | |
5.65%, Due 3/1/2020E | | | 275 | | | | 303 | |
Spectra Energy Partners LP, | | | | | | | | |
4.60%, Due 6/15/2021H | | | 160 | | | | 164 | |
TransCanada PipeLines Ltd., | | | | | | | | |
7.625%, Due 1/15/2039 | | | 300 | | | | 429 | |
6.10%, Due 6/1/2040 | | | 170 | | | | 216 | |
Union Electric Co., | | | | | | | | |
6.70%, Due 2/1/2019 | | | 380 | | | | 469 | |
Virginia Electric and Power Co., | | | | | | | | |
5.40%, Due 4/30/2018 | | | 350 | | | | 412 | |
Westar Energy, Inc., | | | | | | | | |
6.00%, Due 7/1/2014 | | | 175 | | | | 193 | |
Xcel Energy, Inc., | | | | | | | | |
5.613%, Due 4/1/2017 | | | 869 | | | | 980 | |
| | | | | | | | |
| | | | | | | 12,049 | |
| | | | | | | | |
Total Corporate Obligations
(Cost $116,806) | | | | 126,175 | |
| | | | | | | | |
U.S. AGENCY OBLIGATION - 4.96% | |
U.S. Agency Obligations - 4.96% | | | | | | | | |
Federal Home Loan Mortgage Corp., | | | | | | | | |
4.50%, Due 1/15/2015 | | | 22,140 | | | | 24,728 | |
Federal National Mortgage Association, | | | | | | | | |
5.125%, Due 1/2/2014 | | | 645 | | | | 702 | |
6.25%, Due 5/15/2029 | | | 12,200 | | | | 16,628 | |
Private Export Funding Corp., | | | | | | | | |
2.125%, Due 7/15/2016 | | | 300 | | | | 309 | |
| | | | | | | | |
Total U.S. Agency Obligations
(Cost $35,803) | | | | 42,367 | |
| | | | | | | | |
OTHER GOVERNMENT OBLIGATIONS - 0.08% | |
Province of Ontario Canada, | | | | | | | | |
4.10%, Due 6/16/2014 | | | 350 | | | | 380 | |
3.15%, Due 12/15/2017 | | | 325 | | | | 342 | |
| | | | | | | | |
Total Other Government Obligations
(Cost $674) | | | | 722 | |
| | | | | | | | |
| | | | | | | | |
| | | Par Amount | | | Fair Value | |
| | | (000’s) | | | (000’s) | |
NON-AGENCY MORTGAGE-BACKED OBLIGATIONS - 1.11% | |
Banc of America Merrill Lynch Commercial Mortgage, Inc., | | | | | | | | |
5.317%, Due 9/10/2047, 2006-5 A2 | | $ | 299 | | | $ | 301 | |
5.634%, Due 4/10/2049, 2007-2 A2 | | | 340 | | | | 348 | |
Bear Stearns Commercial Mortgage Securities, | | | | | | | | |
5.201%, Due 12/11/2038, 2006-PWR14 A4 | | | 665 | | | | 716 | |
5.54%, Due 9/11/2041, 2006-PW13 A4 | | | 840 | | | | 924 | |
4.831%, Due 7/11/2042, 2004-PWR5 A4 | | | 428 | | | | 442 | |
Citigroup/Deutsche Bank Commercial Mortgage Trust, | | | | | | | | |
5.886%, Due 11/15/2044, 2007-CD5 A4 | | | 930 | | | | 1,012 | |
GS Mortgage Securities Corp II, | | | | | | | | |
4.607%, Due 7/10/2039, 2005-GG4 A3 | | | 350 | | | | 353 | |
3.679%, Due 8/10/2043, 2010-C1 A1F | | | 375 | | | | 390 | |
3.849%, Due 12/10/2043, 2010-C2 A1F | | | 539 | | | | 561 | |
3.645%, Due 3/10/2044, 2011-GC3 A2F | | | 500 | | | | 520 | |
JP Morgan Chase Commercial Mortgage Securities Corp., | | | | | | | | |
4.678%, Due 7/15/2042, 2005-LDP2 A3A | | | 298 | | | | 304 | |
3.853%, Due 6/15/2043, 2010-C1 A1F | | | 681 | | | | 708 | |
4.388%, Due 2/15/2046, 2011-C3A A3F | | | 550 | | | | 565 | |
4.625%, Due 3/15/2046, 2005-LDP1 A2 | | | 331 | | | | 335 | |
5.739%, Due 2/12/2049, 2007-CB19 A4 | | | 550 | | | | 595 | |
5.629%, Due 2/12/2051, 2007-CB20 A2 | | | 573 | | | | 584 | |
LB-UBS Commercial Mortgage Trust, | | | | | | | | |
5.424%, Due 2/15/2040, 2007-C1 A4 | | | 500 | | | | 532 | |
Wachovia Bank Commercial Mortgage Trust, | | | | | | | | |
5.737%, Due 6/15/2049, 2007-C32 A2 | | | 292 | | | | 298 | |
| | | | | | | | |
Total Non-Agency Mortgage-Backed Obligations
(Cost $8,735) | | | | 9,488 | |
| | | | | | | | |
ASSET-BACKED OBLIGATIONS - 0.59% | |
Ally Master Owner Trust, | | | | | | | | |
0.894%, Due 6/15/2015, 2011-5 AG | | | 600 | | | | 600 | |
BMW Floorplan Master Owner Trust, | | | | | | | | |
1.393%, Due 9/15/2014, 2009-1A AF G | | | 350 | | | | 352 | |
CNH Equipment Trust, | | | | | | | | |
1.17%, Due 5/15/2015, 2010-C A3 | | | 520 | | | | 521 | |
2.04%, Due 10/17/2016, 2011-A A4 | | | 380 | | | | 389 | |
Ford Credit Floorplan Master Owner Trust, | | | | | | | | |
1.793%, Due 9/15/2014, 2009-2 AG | | | 800 | | | | 808 | |
Harley-Davidson Motorcycle Trust, | | | | | | | | |
1.87%, Due 2/15/2014, 2009-4 A3 | | | 190 | | | | 191 | |
Honda Auto Receivables Owner Trust, | | | | | | | | |
3.30%, Due 9/15/2015, 2009-3 A4 | | | 470 | | | | 481 | |
Hyundai Auto Receivables Trust, | | | | | | | | |
See accompanying notes
18
American Beacon Balanced Fund
Schedule of Investments
October 31, 2011
| | | | | | | | |
| | | Par Amount | | | Fair Value | |
| | | (000’s) | | | (000’s) | |
3.15%, Due 3/15/2016, 2009-A A4 | | $ | 270 | | | $ | 279 | |
John Deere Owner Trust, | | | | | | | | |
2.59%, Due 10/15/2013, 2009-A A3 | | | 43 | | | | 43 | |
3.96%, Due 5/16/2016, 2009-A A4 | | | 265 | | | | 270 | |
Nissan Master Owner Trust Receivables, | | | | | | | | |
1.393%, Due 1/15/2015, 2010-AA AF G | | | 650 | | | | 655 | |
Volkswagen Auto Loan Enhanced Trust, | | | | | | | | |
6.24%, Due 7/20/2015, 2008-2 A4A | | | 400 | | | | 413 | |
| | | | | | | | |
Total Asset-Backed Obligations
(Cost $4,957) | | | | 5,002 | |
| | | | | | | | |
U.S. AGENCY MORTGAGE-BACKED OBLIGATIONS - 7.80% | |
Federal Home Loan Mortgage Corporation | | | | | | | | |
4.50%, Due 3/1/2019 | | | 339 | | | | 360 | |
5.00%, Due 10/1/2020 | | | 134 | | | | 145 | |
5.00%, Due 8/1/2033 | | | 767 | | | | 826 | |
5.50%, Due 2/1/2034 | | | 645 | | | | 701 | |
5.00%, Due 3/1/2034 | | | 575 | | | | 618 | |
6.00%, Due 6/1/2034 | | | 459 | | | | 507 | |
6.00%, Due 8/1/2034 | | | 355 | | | | 391 | |
5.00%, Due 8/1/2035 | | | 560 | | | | 601 | |
5.00%, Due 9/1/2035 | | | 404 | | | | 434 | |
6.00%, Due 8/1/2036 | | | 256 | | | | 282 | |
5.50%, Due 11/1/2036 | | | 508 | | | | 550 | |
5.50%, Due 4/1/2037 | | | 711 | | | | 770 | |
6.00%, Due 9/1/2037 | | | 209 | | | | 229 | |
5.50%, Due 12/1/2037 | | | 612 | | | | 666 | |
6.00%, Due 3/1/2038 | | | 1,044 | | | | 1,143 | |
5.50%, Due 5/1/2038 | | | 302 | | | | 327 | |
0.643%, Due 12/15/2040G | | | 1,738 | | | | 1,734 | |
4.00%, Due 1/1/2041 | | | 1,441 | | | | 1,497 | |
4.50%, Due 2/1/2041 | | | 1,418 | | | | 1,497 | |
| | | | | | | | |
| | | | | | | 13,278 | |
| | | | | | | | |
Federal National Mortgage Association | | | | | | | | |
5.50%, Due 2/1/2014 | | | 75 | | | | 81 | |
6.00%, Due 4/1/2016 | | | 104 | | | | 113 | |
5.00%, Due 12/1/2017 | | | 304 | | | | 328 | |
4.50%, Due 9/1/2018 | | | 207 | | | | 221 | |
4.00%, Due 8/1/2020 | | | 354 | | | | 376 | |
4.50%, Due 3/1/2025 | | | 473 | | | | 509 | |
3.50%, Due 1/1/2026 | | | 372 | | | | 387 | |
4.00%, Due 5/1/2026 | | | 1,885 | | | | 1,985 | |
5.00%, Due 3/1/2034 | | | 833 | | | | 899 | |
4.50%, Due 9/1/2034 | | | 404 | | | | 429 | |
5.50%, Due 12/1/2035 | | | 259 | | | | 282 | |
5.50%, Due 1/1/2036 | | | 442 | | | | 482 | |
5.00%, Due 2/1/2036 | | | 385 | | | | 415 | |
5.50%, Due 4/1/2036 | | | 493 | | | | 538 | |
6.00%, Due 9/1/2036 | | | 379 | | | | 417 | |
6.50%, Due 9/1/2036 | | | 838 | | | | 937 | |
5.50%, Due 12/1/2036 | | | 615 | | | | 669 | |
5.50%, Due 2/1/2037 | | | 630 | | | | 685 | |
5.50%, Due 8/1/2037 | | | 511 | | | | 557 | |
5.50%, Due 3/1/2038 | | | 1,038 | | | | 1,128 | |
5.50%, Due 6/1/2038 | | | 1,445 | | | | 1,571 | |
4.50%, Due 1/1/2040 | | | 1,696 | | | | 1,796 | |
5.00%, Due 7/1/2040 | | | 1,876 | | | | 2,031 | |
4.00%, Due 9/1/2040 | | | 1,318 | | | | 1,371 | |
4.00%, Due 1/1/2041 | | | 1,931 | | | | 2,010 | |
5.00%, Due 1/1/2041 | | | 2,035 | | | | 2,204 | |
4.00%, Due 2/1/2041 | | | 1,566 | | | | 1,640 | |
4.00%, Due 4/1/2041 | | | 1,980 | | | | 2,074 | |
| | | | | | | | |
| | | Par Amount | | | Fair Value | |
| | | (000’s) | | | (000’s) | |
4.50%, Due 4/1/2041 | | $ | 964 | | | $ | 1,021 | |
4.50%, Due 5/1/2041 | | | 1,901 | | | | 2,018 | |
4.50%, Due 8/1/2041 | | | 1,755 | | | | 1,858 | |
| | | | | | | | |
| | | | | | | 31,032 | |
| | | | | | | | |
Government National Mortgage Association | | | | | | | | |
7.00%, Due 12/15/2025 | | | 174 | | | | 202 | |
6.50%, Due 8/15/2027 | | | 193 | | | | 218 | |
6.50%, Due 11/15/2027 | | | 198 | | | | 224 | |
7.50%, Due 12/15/2028 | | | 162 | | | | 189 | |
5.50%, Due 7/15/2033 | | | 495 | | | | 553 | |
6.00%, Due 12/15/2033 | | | 514 | | | | 577 | |
5.50%, Due 2/20/2034 | | | 702 | | | | 784 | |
1.692%, Due 11/16/2035, 2009-148 A | | | 342 | | | | 345 | |
6.00%, Due 10/15/2038 | | | 944 | | | | 1,056 | |
2.989%, Due 3/16/2039, 2010-71 AC | | | 966 | | | | 1,001 | |
5.00%, Due 10/15/2039 | | | 2,899 | | | | 3,212 | |
6.00%, Due 11/15/2039 | | | 941 | | | | 1,052 | |
5.50%, Due 2/15/2040 | | | 1,093 | | | | 1,214 | |
4.50%, Due 10/20/2040 | | | 1,083 | | | | 1,180 | |
2.70%, Due 4/16/2043, 2011-109 AB | | | 1,994 | | | | 2,068 | |
2.542%, Due 9/16/2044, 2011-96 AC | | | 1,096 | | | | 1,132 | |
3.20%, Due 11/16/2044, 2011-92 B | | | 2,400 | | | | 2,493 | |
| | | | | | | | |
| | | | | | | 17,500 | |
| | | | | | | | |
National Credit Union Administration | | | | | | | | |
0.643%, Due 3/11/2020, 2011 R3 1AG | | | 2,597 | | | | 2,598 | |
0.691%, Due 10/7/2020, 2010 R1 1AG | | | 2,281 | | | | 2,284 | |
| | | | | | | | |
| | | | | | | 4,882 | |
| | | | | | | | |
Total U.S. Agency Mortgage-Backed Obligations
(Cost $64,226) | | | | 66,692 | |
| | | | | | | | |
U.S. TREASURY OBLIGATIONS - 2.63% | |
U.S. Treasury Bonds | | | | | | | | |
6.25%, Due 8/15/2023 | | | 800 | | | | 1,114 | |
6.875%, Due 8/15/2025 | | | 580 | | | | 866 | |
5.25%, Due 11/15/2028 | | | 250 | | | | 330 | |
4.75%, Due 2/15/2037 | | | 130 | | | | 167 | |
4.50%, Due 8/15/2039 | | | 930 | | | | 1,160 | |
4.25%, Due 11/15/2040 | | | 3,870 | | | | 4,649 | |
4.75%, Due 2/15/2041 | | | 565 | | | | 735 | |
4.375%, Due 5/15/2041 | | | 180 | | | | 221 | |
| | | | | | | | |
| | | | | | | 9,242 | |
| | | | | | | | |
U.S. Treasury Notes | | | | | | | | |
0.625%, Due 4/30/2013 | | | 1,000 | | | | 1,006 | |
2.625%, Due 7/31/2014 | | | 1,000 | | | | 1,061 | |
2.00%, Due 1/31/2016 | | | 2,530 | | | | 2,660 | |
2.00%, Due 4/30/2016 | | | 2,055 | | | | 2,160 | |
3.125%, Due 10/31/2016 | | | 900 | | | | 992 | |
3.625%, Due 2/15/2020 | | | 975 | | | | 1,108 | |
3.625%, Due 2/15/2021 | | | 3,170 | | | | 3,590 | |
3.125%, Due 5/15/2021 | | | 660 | | | | 717 | |
| | | | | | | | |
| | | | | | | 13,294 | |
| | | | | | | | |
Total U.S. Treasury Obligations
(Cost $20,205) | | | | 22,536 | |
| | | | | | | | |
MUNICIPAL OBLIGATIONS - 0.31% | |
Municipal Electric Authority of Georgia, | | | | | | | | |
6.64%, Due 4/1/2057 | | | 1,920 | | | | 1,945 | |
6.66%, Due 4/1/2057 | | | 710 | | | | 712 | |
| | | | | | | | |
Total Municipal Obligations
(Cost $2,617) | | | | 2,657 | |
| | | | | | | | |
See accompanying notes
19
American Beacon Balanced Fund
Schedule of Investments
October 31, 2011
| | | | | | | | |
| | | Shares | | | Fair Value | |
| | | | | | (000’s) | |
SHORT-TERM INVESTMENTS - 6.35% | |
American Beacon U.S. Government Money Market Select Fund I | | | 5,000,000 | | | $ | 5,000 | |
JPMorgan U.S. Government Money Market Fund | | | 45,093,994 | | | | 45,094 | |
| | |
| | | Par Amount | | | | |
| | | (000’s) | | | | |
United States Treasury Bill, 0.01%, Due 3/8/2012 | | $ | 2,170 | | | | 2,170 | |
United States Treasury Bill, 0%, Due 10/18/2012 | | | 2,010 | | | | 2,008 | |
| | | | | | | | |
Total Short-Term Investments
(Cost $54,270) | | | | 54,272 | |
| | | | | | | | |
TOTAL INVESTMENTS - 92.87%
(Cost $771,782) | | | | 794,004 | |
OTHER ASSETS, NET OF LIABILITIES - 7.13% | | | | | | | 60,989 | |
| | | | | | | | |
TOTAL NET ASSETS - 100.00% | | | | | | $ | 854,993 | |
| | | | | | | | |
| A | Non-income producing security. |
| B | Non-voting participating shares. |
| C | ADR - American Depositary Receipt. |
| D | REIT - Real Estate Investment Trust. |
| E | Limited Liability Company. |
| F | Security exempt from registration under the Securities Act of 1933. These securities may be resold to qualified institutional buyers pursuant to Rule 144A. At the period end, the value of these securities amounted to $12,477 or 1.46% of net assets. The Fund has no right to demand registration of these securities. |
| G | The coupon rate shown on floating or adjustable rate securities represents the rate at period end. The due date on these types of securities reflects the final maturity date. |
| I | The Fund is affiliated by having the same investment advisor. |
| | | | | | | | | | | | |
| Futures Contracts | | | | | | | | | | |
| (000’s) | | | | | | | | | | |
| | | Number of
Contracts | | Expiration Date | | Contract
Value | | | Unrealized
Appreciation/
(Depreciation) | |
S&P 500 Mini E Index Future | | 729 | | December, 2011 | | $ | 45,537 | | | $ | 2,695 | |
| | | | | | | | | | | | |
| | | | | | $ | 45,537 | | | $ | 2,695 | |
| | | | | | | | | | | | |
See accompanying notes
20
American Beacon Large Cap Growth Fund
Schedule of Investments
October 31, 2011
| | | | | | | | |
| | | Shares | | | Fair Value | |
| | | | | | (000’s) | |
COMMON STOCK - 95.23% | |
CONSUMER DISCRETIONARY - 18.09% | |
Auto Components - 1.53% | | | | | | | | |
BorgWarner, Inc. | | | 7,300 | | | $ | 558 | |
Lear Corp. | | | 16,087 | | | | 755 | |
| | | | | | | | |
| | | | | | | 1,313 | |
| | | | | | | | |
Hotels, Restaurants & Leisure - 3.47% | |
Ctrip.com International Ltd., ADR A | | | 10,200 | | | | 356 | |
International Game Technology | | | 51,290 | | | | 903 | |
Las Vegas Sands Corp.B | | | 16,900 | | | | 793 | |
Starbucks Corp. | | | 12,500 | | | | 529 | |
Yum! Brands, Inc. | | | 7,600 | | | | 407 | |
| | | | | | | | |
| | | | | | | 2,988 | |
| | | | | | | | |
Household Durables - 1.03% | |
Tempur-Pedic International, Inc.B | | | 13,052 | | | | 888 | |
| | | | | | | | |
| | |
Internet & Catalog Retail - 2.90% | | | | | | | | |
Amazon.com, Inc.B | | | 4,500 | | | | 961 | |
Expedia, Inc. | | | 25,562 | | | | 671 | |
priceline.com, Inc.B | | | 1,700 | | | | 863 | |
| | | | | | | | |
| | | | | | | 2,495 | |
| | | | | | | | |
Leisure Equipment & Products - 1.00% | |
Polaris Industries, Inc. | | | 13,548 | | | | 858 | |
| | | | | | | | |
Media - 0.97% | | | | | | | | |
CBS Corp., Class BC | | | 32,352 | | | | 835 | |
| | | | | | | | |
Multiline Retail - 0.86% | | | | | | | | |
Nordstrom, Inc. | | | 14,613 | | | | 741 | |
| | | | | | | | |
Specialty Retail - 4.62% | | | | | | | | |
Abercrombie & Fitch Co., Class A | | | 6,500 | | | | 484 | |
AutoZone, Inc.B | | | 2,445 | | | | 791 | |
Dollar Tree, Inc.B | | | 10,157 | | | | 812 | |
O’Reilly Automotive, Inc.B | | | 5,150 | | | | 392 | |
PetSmart, Inc. | | | 15,656 | | | | 735 | |
Ross Stores, Inc. | | | 8,689 | | | | 762 | |
| | | | | | | | |
| | | | | | | 3,976 | |
| | | | | | | | |
Textiles & Apparel - 1.71% | |
Coach, Inc. | | | 13,396 | | | | 872 | |
Ralph Lauren Corp. | | | 3,800 | | | | 603 | |
| | | | | | | | |
| | | | | | | 1,475 | |
| | | | | | | | |
Total Consumer Discretionary | | | | | | | 15,569 | |
| | | | | | | | |
CONSUMER STAPLES - 1.60% | |
Food & Drug Retailing - 0.55% | | | | | | | | |
Costco Wholesale Corp. | | | 5,700 | | | | 475 | |
| | | | | | | | |
Food Products - 0.59% | | | | | | | | |
General Mills, Inc. | | | 9,400 | | | | 362 | |
Green Mountain Coffee Roasters, Inc.B | | | 2,200 | | | | 143 | |
| | | | | | | | |
| | | | | | | 505 | |
| | | | | | | | |
Personal Products - 0.46% | | | | | | | | |
The Estee Lauder Cos., Inc., Class A | | | 4,000 | | | | 394 | |
| | | | | | | | |
Total Consumer Staples | | | | | | | 1,374 | |
| | | | | | | | |
ENERGY - 8.24% | | | | | | | | |
Energy Equipment & Services - 4.95% | |
FMC Technologies, Inc.B | | | 19,500 | | | | 874 | |
Helmerich & Payne, Inc. | | | 13,413 | | | | 713 | |
| | | | | | | | |
| | | Shares | | | Fair Value | |
| | | | | | (000’s) | |
National Oilwell Varco, Inc. | | | 11,418 | | | $ | 814 | |
Oceaneering International, Inc. | | | 18,086 | | | | 757 | |
Schlumberger Ltd. | | | 15,000 | | | | 1,103 | |
| | | | | | | | |
| | | | | | | 4,261 | |
| | | | | | | | |
Oil & Gas - 3.29% | | | | | | | | |
Concho Resources, Inc.B | | | 7,900 | | | | 748 | |
Occidental Petroleum Corp. | | | 8,700 | | | | 809 | |
Peabody Energy Corp. | | | 24,238 | | | | 1,051 | |
Range Resources Corp. | | | 3,300 | | | | 227 | |
| | | | | | | | |
| | | | | | | 2,835 | |
| | | | | | | | |
Total Energy | | | | | | | 7,096 | |
| | | | | | | | |
FINANCIALS - 4.27% | | | | | | | | |
American Express Co. | | | 15,349 | | | | 777 | |
Ameriprise Financial, Inc. | | | 16,394 | | | | 765 | |
CME Group, Inc. | | | 1,300 | | | | 358 | |
Franklin Resources, Inc. | | | 5,600 | | | | 597 | |
IntercontinentalExchange, Inc.B | | | 3,950 | | | | 513 | |
JPMorgan Chase & Co. | | | 10,000 | | | | 348 | |
TD Ameritrade Holding Corp. | | | 19,200 | | | | 322 | |
| | | | | | | | |
Total Financials | | | | | | | 3,680 | |
| | | | | | | | |
HEALTH CARE - 12.17% | | | | | | | | |
Biotechnology - 1.95% | | | | | | | | |
Biogen Idec, Inc.B | | | 3,000 | | | | 349 | |
Celgene Corp.B | | | 8,400 | | | | 545 | |
Gilead Sciences, Inc.B | | | 18,853 | | | | 785 | |
| | | | | | | | |
| | | | | | | 1,679 | |
| | | | | | | | |
Health Care Equipment & Supplies - 2.49% | |
Dentsply International, Inc. | | | 21,363 | | | | 790 | |
Edwards Lifesciences Corp.B | | | 7,300 | | | | 551 | |
Intuitive Surgical, Inc.B | | | 900 | | | | 390 | |
Varian Medical Systems, Inc. | | | 7,000 | | | | 411 | |
| | | | | | | | |
| | | | | | | 2,142 | |
| | | | | | | | |
Health Care Providers & Services - 5.82% | |
AmerisourceBergen Corp. | | | 19,085 | | | | 779 | |
Cerner Corp.B | | | 5,300 | | | | 336 | |
Covance, Inc.B | | | 14,944 | | | | 758 | |
Express Scripts, Inc.B | | | 10,000 | | | | 457 | |
McKesson Corp. | | | 9,477 | | | | 773 | |
UnitedHealth Group, Inc. | | | 39,838 | | | | 1,911 | |
| | | | | | | | |
| | | | | | | 5,014 | |
| | | | | | | | |
Pharmaceuticals - 1.91% | | | | | | | | |
Endo Pharmaceuticals Holdings, Inc.B | | | 23,436 | | | | 757 | |
Perrigo Co. | | | 3,750 | | | | 339 | |
Shire plc, ADRA | | | 5,800 | | | | 547 | |
| | | | | | | | |
| | | | | | | 1,643 | |
| | | | | | | | |
Total Health Care | | | | | | | 10,478 | |
| | | | | | | | |
INDUSTRIALS - 15.53% | | | | | | | | |
Aerospace & Defense - 0.85% | | | | | | | | |
United Technologies Corp. | | | 9,400 | | | | 733 | |
| | | | | | | | |
Air Freight & Couriers - 0.50% | | | | | | | | |
CH Robinson Worldwide, Inc. | | | 6,200 | | | | 430 | |
| | | | | | | | |
Construction & Engineering - 0.68% | |
Fluor Corp. | | | 10,300 | | | | 586 | |
| | | | | | | | |
Industrial Conglomerates - 1.73% | |
General Electric Co. | | | 46,842 | | | | 783 | |
See accompanying notes
21
American Beacon Large Cap Growth Fund
Schedule of Investments
October 31, 2011
| | | | | | | | |
| | | Shares | | | Fair Value | |
| | | | | | (000’s) | |
KBR, Inc. | | | 25,406 | | | $ | 709 | |
| | | | | | | | |
| | | | | | | 1,492 | |
| | | | | | | | |
Machinery - 9.22% | | | | | | | | |
Caterpillar, Inc. | | | 8,443 | | | | 798 | |
Cummins, Inc. | | | 8,257 | | | | 821 | |
Danaher Corp. | | | 42,095 | | | | 2,034 | |
Deere & Co. | | | 8,400 | | | | 638 | |
Donaldson Co, Inc. | | | 12,782 | | | | 819 | |
Dover Corp. | | | 13,341 | | | | 741 | |
Illinois Tool Works, Inc. | | | 8,400 | | | | 408 | |
Joy Global, Inc. | | | 9,288 | | | | 810 | |
Parker Hannifin Corp. | | | 10,613 | | | | 865 | |
| | | | | | | | |
| | | | | | | 7,934 | |
| | | | | | | | |
Road & Rail - 2.55% | | | | | | | | |
Union Pacific Corp. | | | 22,060 | | | | 2,197 | |
| | | | | | | | |
Total Industrials | | | | | | | 13,372 | |
| | | | | | | | |
INFORMATION TECHNOLOGY - 30.07% | | | | | |
Communications Equipment - 2.05% | | | | | |
Cisco Systems, Inc. | | | 47,628 | | | | 883 | |
F5 Networks, Inc.B | | | 8,515 | | | | 885 | |
| | | | | | | | |
| | | | | | | 1,768 | |
| | | | | | | | |
Computers & Peripherals - 10.11% | | | | | |
Apple, Inc. | | | 6,553 | | | | 2,653 | |
Dell, Inc.B | | | 50,062 | | | | 791 | |
EMC Corp. | | | 74,221 | | | | 1,819 | |
International Business Machines Corp. | | | 4,337 | | | | 801 | |
NetApp, Inc.B | | | 8,100 | | | | 332 | |
SanDisk Corp.B | | | 16,074 | | | | 814 | |
Teradata Corp.B | | | 13,296 | | | | 793 | |
Western Digital Corp.B | | | 25,899 | | | | 690 | |
| | | | | | | | |
| | | | | | | 8,693 | |
| | | | | | | | |
Internet Software & Services - 3.87% | | | | | |
Baidu Inc., ADRA B | | | 5,950 | | | | 834 | |
Google, Inc., Class AB | | | 3,503 | | | | 2,076 | |
VeriSign, Inc. | | | 13,200 | | | | 424 | |
| | | | | | | | |
| | | | | | | 3,334 | |
| | | | | | | | |
IT Consulting & Services - 2.76% | | | | | | | | |
Cognizant Technology Solutions Corp.B | | | 15,800 | | | | 1,149 | |
Visa, Inc., Class A | | | 13,150 | | | | 1,227 | |
| | | | | | | | |
| | | | | | | 2,376 | |
| | | | | | | | |
Semiconductor Equipment & Products - 5.24% | | | | | |
Altera Corp. | | | 27,192 | | | | 1,031 | |
Broadcom Corp., Class A | | | 20,688 | | | | 747 | |
Intel Corp. | | | 31,155 | | | | 765 | |
QUALCOMM, Inc. | | | 24,300 | | | | 1,253 | |
Skyworks Solutions, Inc. | | | 36,200 | | | | 717 | |
| | | | | | | | |
| | | | | | | 4,513 | |
| | | | | | | | |
Software - 6.04% | | | | | | | | |
Citrix Systems, Inc.B | | | 8,100 | | | | 590 | |
Intuit, Inc. | | | 24,154 | | | | 1,296 | |
Microsoft Corp. | | | 29,112 | | | | 775 | |
Oracle Corp. | | | 55,430 | | | | 1,817 | |
Salesforce.com, Inc.B | | | 5,400 | | | | 719 | |
| | | | | | | | |
| | | | | | | 5,197 | |
| | | | | | | | |
Total Information Technology | | | | | | | 25,881 | |
| | | | | | | | |
| | | | | | | | |
| | | Shares | | | Fair Value | |
| | | | | | (000’s) | |
MATERIALS - 4.38% | | | | | | | | |
Chemicals - 3.18% | | | | | | | | |
Ecolab, Inc. | | | 9,850 | | | $ | 530 | |
Monsanto Co. | | | 22,124 | | | | 1,610 | |
The Mosaic Co. | | | 10,335 | | | | 605 | |
| | | | | | | | |
| | | | | | | 2,745 | |
| | | | | | | | |
Metals & Mining - 1.20% | | | | | | | | |
Cliffs Natural Resources, Inc. | | | 5,400 | | | | 368 | |
Freeport-McMoRan Copper & Gold, Inc. | | | 16,409 | | | | 661 | |
| | | | | | | | |
| | | | | | | 1,029 | |
| | | | | | | | |
Total Materials | | | | | | | 3,774 | |
| | | | | | | | |
TELECOMMUNICATION SERVICES - 0.88% | | | | | |
American Tower Corp., Class A | | | 13,700 | | | | 755 | |
| | | | | | | | |
Total Common Stock (Cost $76,445) | | | | | | | 81,979 | |
| | | | | | | | |
SHORT-TERM INVESTMENTS - 3.79% (Cost $3,267) | | | | | |
JPMorgan U.S. Government Money Market Fund | | | 3,267,388 | | | | 3,267 | |
TOTAL INVESTMENTS - 99.02% (Cost $79,712) | | | | | | | 85,246 | |
| | | | | | | | |
OTHER ASSETS, NET OF LIABILITIES - 0.98% | | | | | | | 844 | |
| | | | | | | | |
TOTAL NET ASSETS - 100.00% | | | | | | $ | 86,090 | |
| | | | | | | | |
Percentages are stated as a percent of net assets.
| A | ADR - American Depositary Receipt. |
| B | Non-income producing security. |
| C | Non-voting participating shares. |
See accompanying notes
22
American Beacon Large Cap Growth Fund
Schedule of Investments
October 31, 2011
| | | | | | | | | | | | |
| Futures Contracts | | | | | | | | | | |
| (000’s) | | | | | | | | | | |
| | | Number of
Contracts | | Expiration Date | | Value | | | Unrealized
Appreciation/
(Depreciation) | |
S&P 500 Mini E Index Future | | 40 | | December, 2011 | | $ | 2,499 | | | $ | 39 | |
| | | | | | | | | | | | |
| | | | | | $ | 2,499 | | | $ | 39 | |
| | | | | | | | | | | | |
See accompanying notes
23
American Beacon Mid-Cap Value Fund
Schedule of Investments
October 31, 2011
| | | | | | | | |
| | | Shares | | | Fair Value | |
| | | | | | (000’s) | |
COMMON STOCK - 92.66% | | | | | | | | |
CONSUMER DISCRETIONARY - 12.82% | |
Automobiles - 0.40% | | | | | | | | |
Harley-Davidson, Inc. | | | 9,487 | | | $ | 369 | |
| | | | | | | | |
Hotels, Restaurants & Leisure - 3.26% | | | | | |
International Game Technology | | | 73,006 | | | | 1,284 | |
Royal Caribbean Cruises Ltd. | | | 41,969 | | | | 1,247 | |
WMS Industries, Inc. | | | 21,898 | | | | 480 | |
| | | | | | | | |
| | | | | | | 3,011 | |
| | | | | | | | |
Household Durables - 2.57% | | | | | | | | |
Mohawk Industries, Inc.A | | | 17,700 | | | | 932 | |
Newell Rubbermaid, Inc. | | | 38,677 | | | | 572 | |
Stanley Black & Decker, Inc. | | | 13,700 | | | | 875 | |
| | | | | | | | |
| | | | | | | 2,379 | |
| | | | | | | | |
Leisure Equipment & Products - 0.41% | | | | | |
Hasbro, Inc. | | | 10,055 | | | | 383 | |
| | | | | | | | |
Media - 1.61% | | | | | | | | |
Omnicom Group, Inc. | | | 24,275 | | | | 1,079 | |
The Interpublic Group of Cos., Inc. | | | 42,778 | | | | 406 | |
| | | | | | | | |
| | | | | | | 1,485 | |
| | | | | | | | |
Multiline Retail - 0.85% | | | | | | | | |
JC Penney Co. Inc | | | 24,400 | | | | 783 | |
| | | | | | | | |
Specialty Retail - 3.72% | | | | | | | | |
American Eagle Outfitters, Inc. | | | 30,565 | | | | 401 | |
Hanesbrands, Inc.A | | | 25,100 | | | | 662 | |
Rent-A-Center, Inc. | | | 33,725 | | | | 1,152 | |
Staples, Inc. | | | 63,275 | | | | 947 | |
Urban Outfitters, Inc.A | | | 10,311 | | | | 281 | |
| | | | | | | | |
| | | | | | | 3,443 | |
| | | | | | | | |
Total Consumer Discretionary | | | | | | | 11,853 | |
| | | | | | | | |
CONSUMER STAPLES - 4.84% | |
Beverages - 1.79% | | | | | | | | |
Constellation Brands, Inc.A | | | 18,142 | | | | 367 | |
Molson Coors Brewing Co., Class B | | | 30,309 | | | | 1,284 | |
| | | | | | | | |
| | | | | | | 1,651 | |
| | | | | | | | |
Food & Drug Retailing - 0.91% | | | | | | | | |
Sysco Corp. | | | 14,571 | | | | 404 | |
The Kroger Co. | | | 19,043 | | | | 441 | |
| | | | | | | | |
| | | | | | | 845 | |
| | | | | | | | |
Personal Products - 0.49% | | | | | | | | |
Avon Products, Inc. | | | 24,775 | | | | 453 | |
| | | | | | | | |
Tobacco - 1.65% | | | | | | | | |
Lorillard, Inc. | | | 7,100 | | | | 785 | |
Reynolds American, Inc. | | | 19,200 | | | | 743 | |
| | | | | | | | |
| | | | | | | 1,528 | |
| | | | | | | | |
Total Consumer Staples | | | | | | | 4,477 | |
| | | | | | | | |
ENERGY - 4.40% | | | | | | | | |
Energy Equipment & Services - 0.35% | |
Nabors Industries Ltd.A | | | 17,576 | | | | 322 | |
| | | | | | | | |
Oil & Gas - 4.05% | | | | | | | | |
EQT Corp. | | | 5,360 | | | | 340 | |
Murphy Oil Corp. | | | 17,778 | | | | 985 | |
Newfield Exploration Co.A | | | 8,422 | | | | 339 | |
Pioneer Natural Resources Co. | | | 5,160 | | | | 433 | |
| | | | | | | | |
| | | Shares | | | Fair Value | |
| | | | | | (000’s) | |
Range Resources Corp. | | | 5,024 | | | $ | 346 | |
Seadrill Ltd. | | | 25,000 | | | | 828 | |
Spectra Energy Corp. | | | 16,700 | | | | 478 | |
| | | | | | | | |
| | | | | | | 3,749 | |
| | | | | | | | |
Total Energy | | | | | | | 4,071 | |
| | | | | | | | |
FINANCIALS - 25.59% | | | | | | | | |
Banks - 6.67% | | | | | | | | |
Comerica, Inc. | | | 42,127 | | | | 1,076 | |
Fifth Third Bancorp | | | 162,265 | | | | 1,950 | |
KeyCorp | | | 84,750 | | | | 598 | |
New York Community Bancorp, Inc. | | | 41,300 | | | | 550 | |
PNC Financial Services Group, Inc. | | | 10,000 | | | | 537 | |
Regions Financial Corp. | | | 95,100 | | | | 374 | |
Synovus Financial Corp. | | | 90,818 | | | | 136 | |
TCF Financial Corp. | | | 37,055 | | | | 394 | |
Zions Bancorporation | | | 31,350 | | | | 544 | |
| | | | | | | | |
| | | | | | | 6,159 | |
| | | | | | | | |
Diversified Financials - 4.42% | | | | | | | | |
Ameriprise Financial, Inc. | | | 18,798 | | | | 878 | |
Capital One Financial Corp. | | | 18,800 | | | | 859 | |
Discover Financial Services | | | 36,300 | | | | 855 | |
Federated Investors, Inc., Class B | | | 19,705 | | | | 385 | |
SLM Corp. | | | 48,800 | | | | 667 | |
Towers Watson & Co., Class A | | | 6,750 | | | | 443 | |
| | | | | | | | |
| | | | | | | 4,087 | |
| | | | | | | | |
Insurance - 10.35% | | | | | | | | |
Axis Capital Holdings Ltd. | | | 18,875 | | | | 592 | |
Delphi Financial Group, Inc., Class A | | | 35,200 | | | | 932 | |
Endurance Specialty Holdings Ltd. | | | 11,355 | | | | 422 | |
PartnerRe Ltd. | | | 6,040 | | | | 376 | |
ProAssurance Corp. | | | 4,552 | | | | 348 | |
Protective Life Corp. | | | 42,725 | | | | 795 | |
Reinsurance Group of America, Inc. | | | 8,220 | | | | 429 | |
RenaissanceRe Holdings Ltd. | | | 12,175 | | | | 829 | |
The Allstate Corp. | | | 31,375 | | | | 826 | |
The Chubb Corp. | | | 6,100 | | | | 409 | |
Torchmark Corp. | | | 13,912 | | | | 569 | |
Unum Group | | | 20,277 | | | | 483 | |
Validus Holdings Ltd. | | | 24,732 | | | | 677 | |
Willis Group Holdings plc | | | 32,545 | | | | 1,183 | |
XL Group plc | | | 31,600 | | | | 687 | |
| | | | | | | | |
| | | | | | | 9,557 | |
| | | | | | | | |
Real Estate - 4.15% | | | | | | | | |
Annaly Capital Management, Inc. B | | | 21,700 | | | | 366 | |
Digital Realty Trust, Inc.B | | | 7,079 | | | | 441 | |
Essex Property Trust, Inc.B | | | 6,200 | | | | 885 | |
Hospitality Properties TrustB | | | 39,500 | | | | 950 | |
Host Hotels & Resorts LPB | | | 28,763 | | | | 410 | |
Liberty Property TrustB | | | 14,851 | | | | 475 | |
MI Developments, Inc., Class A | | | 9,875 | | | | 313 | |
| | | | | | | | |
| | | | | | | 3,840 | |
| | | | | | | | |
Total Financials | | | | | | | 23,643 | |
| | | | | | | | |
HEALTH CARE - 6.15% | | | | | | | | |
Health Care Equipment & Supplies - 1.31% | |
Hologic, Inc.A | | | 23,437 | | | | 378 | |
Patterson Cos., Inc. | | | 13,107 | | | | 412 | |
STERIS Corp. | | | 13,454 | | | | 417 | |
| | | | | | | | |
| | | | | | | 1,207 | |
| | | | | | | | |
See accompanying notes
24
American Beacon Mid-Cap Value Fund
Schedule of Investments
October 31, 2011
| | | | | | | | |
| | | Shares | | | Fair Value | |
| | | | | | (000’s) | |
Health Care Providers & Services - 4.84% | |
AmerisourceBergen Corp. | | | 8,246 | | | $ | 336 | |
Cardinal Health, Inc. | | | 16,200 | | | | 717 | |
Cigna Corp. | | | 14,900 | | | | 661 | |
Coventry Health Care, Inc.A | | | 26,900 | | | | 855 | |
HCA Holdings, Inc.A | | | 15,563 | | | | 365 | |
HealthSouth Corp.A | | | 20,556 | | | | 363 | |
Omnicare, Inc. | | | 24,800 | | | | 740 | |
Quest Diagnostics, Inc. | | | 7,952 | | | | 444 | |
| | | | | | | | |
| | | | | | | 4,481 | |
| | | | | | | | |
Total Health Care | | | | | | | 5,688 | |
| | | | | | | | |
INDUSTRIALS - 16.03% | | | | | | | | |
Aerospace & Defense - 4.80% | | | | | | | | |
Curtiss-Wright Corp. | | | 30,700 | | | | 1,006 | |
Goodrich Corp. | | | 6,300 | | | | 773 | |
L-3 Communications Holdings, Inc. | | | 24,725 | | | | 1,676 | |
Spirit Aerosystems Holdings, Inc., Class AA | | | 57,270 | | | | 978 | |
| | | | | | | | |
| | | | | | | 4,433 | |
| | | | | | | | |
Building Products - 1.87% | | | | | | | | |
Fortune Brands Home & Security, Inc.A | | | 41,050 | | | | 596 | |
Masco Corp. | | | 118,325 | | | | 1,136 | |
| | | | | | | | |
| | | | | | | 1,732 | |
| | | | | | | | |
Commercial Services & Supplies - 2.68% | | | | | | | | |
Avery Dennison Corp. | | | 14,002 | | | | 372 | |
Cintas Corp. | | | 13,513 | | | | 404 | |
Con-way, Inc. | | | 27,200 | | | | 801 | |
Republic Services, Inc. | | | 19,589 | | | | 558 | |
The Dun & Bradstreet Corp. | | | 5,100 | | | | 341 | |
| | | | | | | | |
| | | | | | | 2,476 | |
| | | | | | | | |
Construction & Engineering - 0.45% | |
Fluor Corp. | | | 7,239 | | | | 412 | |
| | | | | | | | |
Electrical Equipment - 2.64% | | | | | | | | |
Brady Corp., Class A | | | 35,150 | | | | 1,080 | |
Molex, Inc. | | | 54,937 | | | | 1,356 | |
| | | | | | | | |
| | | | | | | 2,436 | |
| | | | | | | | |
Industrial Conglomerates - 0.44% | |
Teleflex, Inc. | | | 6,821 | | | | 408 | |
| | | | | | | | |
Machinery - 2.35% | | | | | | | | |
Dover Corp. | | | 8,278 | | | | 460 | |
Eaton Corp. | | | 10,400 | | | | 466 | |
Flowserve Corp. | | | 4,431 | | | | 411 | |
ITT Corp. | | | 8,200 | | | | 374 | |
SPX Corp. | | | 8,500 | | | | 464 | |
| | | | | | | | |
| | | | | | | 2,175 | |
| | | | | | | | |
Marine - 0.80% | | | | | | | | |
Golar LNG Ltd. | | | 18,400 | | | | 744 | |
| | | | | | | | |
Total Industrials | | | | | | | 14,816 | |
| | | | | | | | |
INFORMATION TECHNOLOGY - 8.77% | |
Communications Equipment - 0.42% | | | | | | | | |
Brocade Communications Systems, Inc.A | | | 87,791 | | | | 385 | |
| | | | | | | | |
Electronic Equipment & Instruments - 2.87% | |
Avnet, Inc. | | | 41,725 | | | | 1,264 | |
Ingram Micro, Inc., Class AA | | | 43,400 | | | | 776 | |
| | | | | | | | |
| | | Shares | | | Fair Value | |
| | | | | | (000’s) | |
TE Connectivity Ltd. | | | 17,200 | | | $ | 611 | |
| | | | | | | | |
| | | | | | | 2,651 | |
| | | | | | | | |
IT Consulting & Services - 1.17% | |
Computer Sciences Corp. | | | 17,900 | | | | 563 | |
The Western Union Co. | | | 29,700 | | | | 519 | |
| | | | | | | | |
| | | | | | | 1,082 | |
| | | | | | | | |
Office Electronics - 0.66% | | | | | | | | |
Xerox Corp. | | | 74,700 | | | | 611 | |
| | | | | | | | |
Semiconductor Equipment & Products - 1.14% | | | | | | | | |
Analog Devices, Inc. | | | 10,341 | | | | 378 | |
Microchip Technology, Inc. | | | 18,600 | | | | 673 | |
| | | | | | | | |
| | | | | | | 1,051 | |
| | | | | | | | |
Software - 2.51% | | | | | | | | |
Adobe Systems, Inc. | | | 17,064 | | | | 502 | |
CA, Inc. | | | 38,350 | | | | 831 | |
Symantec Corp.A | | | 25,789 | | | | 439 | |
Synopsys, Inc.A | | | 20,607 | | | | 552 | |
| | | | | | | | |
| | | | | | | 2,324 | |
| | | | | | | | |
Total Information Technology | | | | | | | 8,104 | |
| | | | | | | | |
MATERIALS - 5.96% | | | | | | | | |
Chemicals - 1.96% | | | | | | | | |
Huntsman Corp. | | | 28,537 | | | | 335 | |
PPG Industries, Inc. | | | 10,700 | | | | 925 | |
The Sherwin-Williams Co. | | | 6,675 | | | | 552 | |
| | | | | | | | |
| | | | | | | 1,812 | |
| | | | | | | | |
Containers & Packaging - 2.58% | | | | | | | | |
Bemis Co, Inc. | | | 11,873 | | | | 334 | |
Jarden Corp. | | | 27,850 | | | | 892 | |
Owens-Illinois, Inc.A | | | 23,041 | | | | 463 | |
Packaging Corp of America | | | 14,650 | | | | 382 | |
Sonoco Products Co. | | | 10,000 | | | | 314 | |
| | | | | | | | |
| | | | | | | 2,385 | |
| | | | | | | | |
Metals & Mining - 1.42% | | | | | | | | |
Alcoa, Inc. | | | 20,141 | | | | 217 | |
Allegheny Technologies, Inc. | | | 14,214 | | | | 659 | |
Nucor Corp. | | | 11,494 | | | | 434 | |
| | | | | | | | |
| | | | | | | 1,310 | |
| | | | | | | | |
Total Materials | | | | | | | 5,507 | |
| | | | | | | | |
UTILITIES - 8.10% | | | | | | | | |
Electric Utilities - 5.05% | | | | | | | | |
CenterPoint Energy, Inc. | | | 38,000 | | | | 792 | |
Edison International | | | 23,274 | | | | 945 | |
Entergy Corp. | | | 15,275 | | | | 1,057 | |
Great Plains Energy, Inc. | | | 29,951 | | | | 621 | |
Pinnacle West Capital Corp. | | | 11,700 | | | | 533 | |
Portland General Electric Co. | | | 12,242 | | | | 300 | |
TECO Energy, Inc. | | | 22,943 | | | | 426 | |
| | | | | | | | |
| | | | | | | 4,674 | |
| | | | | | | | |
Gas Utilities - 1.34% | | | | | | | | |
AGL Resources, Inc. | | | 14,258 | | | | 598 | |
MDU Resources Group, Inc. | | | 13,250 | | | | 273 | |
Oneok, Inc. | | | 4,800 | | | | 365 | |
| | | | | | | | |
| | | | | | | 1,236 | |
| | | | | | | | |
Multi-Utilities - 1.71% | | | | | | | | |
SCANA Corp. | | | 12,232 | | | | 517 | |
See accompanying notes
25
American Beacon Mid-Cap Value Fund
Schedule of Investments
October 31, 2011
| | | | | | | | |
| | | Shares | | | Fair Value | |
| | | | | | (000’s) | |
Xcel Energy, Inc. | | | 41,028 | | | $ | 1,061 | |
| | | | | | | | |
| | | | | | | 1,578 | |
| | | | | | | | |
Total Utilities | | | | | | | 7,488 | |
| | | | | | | | |
Total Common Stock (Cost $78,239) | | | | | | | 85,647 | |
| | | | | | | | |
SHORT-TERM INVESTMENTS - 3.70% (Cost $3,416) | | | | | | | | |
JPMorgan U.S. Government Money Market Fund | | | 3,416,488 | | | | 3,416 | |
| | | | | | | | |
TOTAL INVESTMENTS - 96.36% (Cost $81,655) | | | | | | | 89,063 | |
OTHER ASSETS, NET OF LIABILITIES - 3.64% | | | | | | | 3,365 | |
| | | | | | | | |
TOTAL NET ASSETS - 100.00% | | | | | | $ | 92,428 | |
| | | | | | | | |
Percentages are stated as a percent of net assets.
| A | Non-income producing security. |
| B | REIT - Real Estate Investment Trust. |
| | | | | | | | | | | | | | | | |
| Futures Contracts | | | | | | | | | | | | |
| (000’s) | | | | | | | | | | | | |
| | | Number of
Contracts | | | Expiration Date | | | Value | | | Unrealized
Appreciation/
(Depreciation) | |
S&P 400 Midcap E Index Future | | | 35 | | | | December, 2011 | | | $ | 3,101 | | | $ | 246 | |
| | | | | | | | | | | | | | | | |
| | | | | | | | | | $ | 3,101 | | | $ | 246 | |
| | | | | | | | | | | | | | | | |
See accompanying notes
26
American Beacon Funds
Statements of Assets and Liabilities
October 31, 2011 (in thousands, except share and per share amounts)
| | | | | | | | | | | | |
| | | Balanced | | | Large Cap | | | Mid-Cap | |
| | | Fund | | | Growth Fund | | | Value Fund | |
Assets: | | | | | | | | | | | | |
Investments in unaffiliated securities, at fair value A | | $ | 789,004 | | | $ | 85,246 | | | $ | 89,063 | |
Investments in affiliated securities, at fair value B | | | 5,000 | | | | — | | | | — | |
Deposit with brokers for futures contracts | | | 2,784 | | | | 212 | | | | 216 | |
Receivable for investments sold | | | 2,996 | | | | 334 | | | | 14 | |
Dividends and interest receivable | | | 2,962 | | | | 29 | | | | 54 | |
Receivable for fund shares sold | | | 57,252 | | | | 2,732 | | | | 3,437 | |
Receivable for tax reclaims | | | 38 | | | | — | | | | — | |
Receivable for expense reimbursement (Note 2) | | | 6 | | | | — | | | | 4 | |
Prepaid expenses | | | 17 | | | | 28 | | | | 46 | |
| | | | | | | | | | | | |
Total assets | | | 860,059 | | | | 88,581 | | | | 92,834 | |
| | | | | | | | | | | | |
Liabilities: | | | | | | | | | | | | |
Payable for investments purchased | | | 3,232 | | | | 713 | | | | 49 | |
Payable for fund shares redeemed | | | 30 | | | | 1,483 | | | | 58 | |
Payable for variation margin on open futures contracts | | | 1,111 | | | | 79 | | | | 81 | |
Management and investment advisory fees payable (Note 2) | | | 497 | | | | 177 | | | | 170 | |
Administrative service and service fees payable (Note 2) | | | 73 | | | | 3 | | | | 12 | |
Professional fees payable | | | 40 | | | | 28 | | | | 28 | |
Trustee fees payable | | | 12 | | | | 1 | | | | — | |
Prospectus and shareholder reports | | | 47 | | | | 4 | | | | 7 | |
Other liabilities | | | 24 | | | | 3 | | | | 1 | |
| | | | | | | | | | | | |
Total liabilities | | | 5,066 | | | | 2,491 | | | | 406 | |
| | | | | | | | | | | | |
Net Assets | | $ | 854,993 | | | $ | 86,090 | | | $ | 92,428 | |
| | | | | | | | | | | | |
Analysis of Net Assets: | | | | | | | | | | | | |
Paid-in-capital | | $ | 876,545 | | | $ | 98,819 | | | $ | 96,176 | |
Undistributed net investment income (loss) | | | (763 | ) | | | 105 | | | | 901 | |
Accumulated net realized (loss) | | | (45,705 | ) | | | (18,407 | ) | | | (12,303 | ) |
Unrealized appreciation of investments and futures contracts | | | 24,916 | | | | 5,573 | | | | 7,654 | |
| | | | | | | | | | | | |
Net assets | | $ | 854,993 | | | $ | 86,090 | | | $ | 92,428 | |
| | | | | | | | | | | | |
Shares outstanding (no par value): | | | | | | | | | | | | |
Institutional Class | | | 2,401,223 | | | | 23,329 | | | | 3,437,338 | |
| | | | | | | | | | | | |
Y Class | | | 31,034 | | | | 1,073 | | | | 5,353 | |
| | | | | | | | | | | | |
Investor Class | | | 7,010,895 | | | | N/A | | | | 186,584 | |
| | | | | | | | | | | | |
Advisor Class | | | 286,099 | | | | N/A | | | | 3,868 | |
| | | | | | | | | | | | |
A Class | | | 48,708 | | | | 28,961 | | | | 10,478 | |
| | | | | | | | | | | | |
C Class | | | 75,995 | | | | 193 | | | | 2,353 | |
| | | | | | | | | | | | |
AMR Class | | | 59,886,038 | | | | 13,905,859 | | | | 5,853,626 | |
| | | | | | | | | | | | |
Net asset value, offering and redemption price per share: | | | | | | | | | | | | |
Institutional Class | | $ | 12.89 | | | $ | 6.12 | | | $ | 9.73 | |
| | | | | | | | | | | | |
Y Class | | $ | 12.93 | | | $ | 6.09 | | | $ | 9.72 | |
| | | | | | | | | | | | |
Investor Class | | $ | 11.93 | | | | N/A | | | $ | 9.71 | |
| | | | | | | | | | | | |
Advisor Class | | $ | 12.36 | | | | N/A | | | $ | 9.56 | |
| | | | | | | | | | | | |
A Class (net asset value and redemption price) | | $ | 12.06 | | | $ | 6.08 | | | $ | 9.61 | |
| | | | | | | | | | | | |
A Class (offering price) | | $ | 12.80 | | | $ | 6.45 | | | $ | 10.20 | |
| | | | | | | | | | | | |
C Class | | $ | 12.13 | | | $ | 6.05 | | | $ | 9.56 | |
| | | | | | | | | | | | |
AMR Class | | $ | 12.27 | | | $ | 6.17 | | | $ | 9.73 | |
| | | | | | | | | | | | |
| | | |
A Cost of investments in unaffiliated securities | | $ | 766,782 | | | $ | 79,712 | | | $ | 81,655 | |
B Cost of investments in affiliated securities | | $ | 5,000 | | | $ | — | | | $ | — | |
See accompanying notes
27
American Beacon Funds
Statements of Operations
For the year ended October 31, 2011 (in thousands)
| | | | | | | | | | | | |
| | | | | | Large Cap | | | | |
| | | Balanced | | | Growth | | | Mid-Cap | |
| | | Fund | | | Fund | | | Value Fund | |
Investment Income: | | | | | | | | | | | | |
Dividend income from unaffiliated securities (net of foreign taxes) A | | $ | 13,915 | | | $ | 917 | | | $ | 2,263 | |
Dividend income from affiliated securities | | | 1 | | | | — | | | | — | |
Interest income | | | 12,503 | | | | — | | | | — | |
| | | | | | | | | | | | |
Total investment income | | | 26,419 | | | | 917 | | | | 2,263 | |
| | | | | | | | | | | | |
Expenses: | | | | | | | | | | | | |
Management and investment advisory fees (Note 2) | | | 1,922 | | | | 514 | | | | 632 | |
Administrative service fees (Note 2): | | | | | | | | | | | | |
Institutional Class | | | 101 | | | | — | | | | 100 | |
Y Class | | | 1 | | | | — | | | | — | |
Investor Class | | | 252 | | | | — | | | | 30 | |
Advisor Class | | | 16 | | | | — | | | | — | |
A Class | | | 1 | | | | 1 | | | | — | |
C Class | | | 1 | | | | — | | | | — | |
AMR Class | | | 367 | | | | 48 | | | | 31 | |
Transfer agent fees: | | | | | | | | | | | | |
Institutional Class | | | 2 | | | | — | | | | 3 | |
Y Class | | | 3 | | | | 2 | | | | 2 | |
Investor Class | | | 13 | | | | — | | | | 2 | |
A Class | | | 2 | | | | 1 | | | | 2 | |
C Class | | | 2 | | | | 2 | | | | 2 | |
AMR Class | | | 41 | | | | 3 | | | | 3 | |
Custody and fund accounting fees | | | 98 | | | | 11 | | | | 12 | |
Professional fees | | | 54 | | | | 31 | | | | 36 | |
Registration fees and expenses | | | 74 | | | | 65 | | | | 70 | |
Service fees (Note 2): | | | | | | | | | | | | |
Investor Class | | | 277 | | | | — | | | | 25 | |
Advisor Class | | | 13 | | | | — | | | | — | |
A Class | | | 1 | | | | — | | | | — | |
Distribution fees (Note 2): | | | | | | | | | | | | |
Advisor Class | | | 13 | | | | — | | | | — | |
A Class | | | 1 | | | | 1 | | | | — | |
C Class | | | 3 | | | | — | | | | — | |
Prospectus and shareholder reports | | | 72 | | | | 27 | | | | 29 | |
Trustee fees | | | 63 | | | | 8 | | | | 8 | |
Other expenses | | | 69 | | | | 11 | | | | 26 | |
| | | | | | | | | | | | |
Total expenses | | | 3,462 | | | | 725 | | | | 1,013 | |
| | | | | | | | | | | | |
Net (fees waived and expenses reimbursed) (Note 2) | | | (6 | ) | | | (5 | ) | | | (57 | ) |
| | | | | | | | | | | | |
Net expenses | | | 3,456 | | | | 720 | | | | 956 | |
| | | | | | | | | | | | |
Net investment income | | | 22,963 | | | | 197 | | | | 1,307 | |
| | | | | | | | | | | | |
Realized and unrealized gain (loss) on investments: | | | | | | | | | | | | |
Net realized gain (loss) from: | | | | | | | | | | | | |
Investments | | | 47,922 | | | | 14,701 | | | | 7,905 | |
Commission recapture (Note 3) | | | 21 | | | | 1 | | | | 14 | |
Futures contracts | | | 1,564 | | | | (8,614 | ) | | | 427 | |
Change in net unrealized appreciation or depreciation of: | | | | | | | | | | | | |
Investments | | | (30,748 | ) | | | (10,857 | ) | | | (3,654 | ) |
Futures contracts | | | 1,282 | | | | (78 | ) | | | (171 | ) |
| | | | | | | | | | | | |
Net gain (loss) on investments | | | 20,041 | | | | (4,847 | ) | | | 4,521 | |
| | | | | | | | | | | | |
Net increase (decrease) in net assets resulting from operations | | $ | 43,004 | | | $ | (4,650 | ) | | $ | 5,828 | |
| | | | | | | | | | | | |
A Foreign taxes | | $ | 51 | | | $ | 1 | | | $ | — | |
See accompanying notes
28
American Beacon Funds
Statements of Changes in Net Assets (in thousands)
| | | | | | | | | | | | | | | | | | | | | | | | |
| | | Balanced Fund | | | Large Cap Growth Fund | | | Mid-Cap Value Fund | |
| | | Year Ended
October 31,
2011 | | | Year Ended
October 31,
2010 | | | Year Ended
October 31,
2011 | | | Year Ended
October 31,
2010 | | | Year Ended
October 31,
2011 | | | Year Ended
October 31,
2010 | |
Increase (Decrease) in Net Assets: | | | | | | | | | | | | | | | | | | | | | | | | |
Operations: | | | | | | | | | | | | | | | | | | | | | | | | |
Net investment income | | $ | 22,963 | | | $ | 24,341 | | | $ | 197 | | | $ | 143 | | | $ | 1,307 | | | $ | 966 | |
Net realized gain on investments and futures contracts | | | 49,507 | | | | 27,481 | | | | 6,088 | | | | 4,153 | | | | 8,346 | | | | 1,541 | |
Change in net unrealized appreciation or depreciation of investments and futures contracts | | | (29,466 | ) | | | 48,535 | | | | (10,935 | ) | | | 8,876 | | | | (3,825 | ) | | | 15,707 | |
| | | | | | | | | | | | | | | | | | | | | | | | |
Net increase (decrease) in net assets resulting from operations | | | 43,004 | | | | 100,357 | | | | (4,650 | ) | | | 13,172 | | | | 5,828 | | | | 18,214 | |
| | | | | | | | | | | | | | | | | | | | | | | | |
Distributions to Shareholders: | | | | | | | | | | | | | | | | | | | | | | | | |
Net investment income: | | | | | | | | | | | | | | | | | | | | | | | | |
Institutional Class | | | (876 | ) | | | (1,651 | ) | | | — | | | | — | | | | (30 | ) | | | (15 | ) |
Y Class | | | (10 | ) | | | — | | | | — | | | | — | | | | — | | | | — | |
Investor Class | | | (1,759 | ) | | | (4,637 | ) | | | — | | | | — | | | | (343 | ) | | | (161 | ) |
Advisor Class | | | (104 | ) | | | (314 | ) | | | — | | | | — | | | | (1 | ) | | | — | |
A Class | | | (7 | ) | | | — | | | | — | | | | — | | | | — | | | | — | |
C Class | | | (4 | ) | | | — | | | | — | | | | — | | | | — | | | | — | |
AMR Class | | | (21,013 | ) | | | (42,865 | ) | | | (167 | ) | | | (342 | ) | | | (753 | ) | | | (561 | ) |
| | | | | | | | | | | | | | | | | | | | | | | | |
Net distributions to shareholders | | | (23,773 | ) | | | (49,467 | ) | | | (167 | ) | | | (342 | ) | | | (1,127 | ) | | | (737 | ) |
| | | | | | | | | | | | | | | | | | | | | | | | |
Capital Share Transactions: | | | | | | | | | | | | | | | | | | | | | | | | |
Proceeds from sales of shares | | | 120,787 | | | | 75,404 | | | | 134,234 | | | | 46,888 | | | | 68,649 | | | | 42,825 | |
Reinvestment of dividends and distributions | | | 23,696 | | | | 49,350 | | | | 167 | | | | 342 | | | | 1,127 | | | | 736 | |
Cost of shares redeemed | | | (181,269 | ) | | | (115,828 | ) | | | (140,627 | ) | | | (34,211 | ) | | | (84,216 | ) | | | (38,192 | ) |
Redemption fees | | | — | | | | — | | | | — | | | | — | | | | 56 | | | | 88 | |
| | | | | | | | | | | | | | | | | | | | | | | | |
Net increase (decrease) in net assets from capital share transactions | | | (36,786 | ) | | | 8,926 | | | | (6,226 | ) | | | 13,019 | | | | (14,384 | ) | | | 5,457 | |
| | | | | | | | | | | | | | | | | | | | | | | | |
Net increase (decrease) in net assets | | | (17,555 | ) | | | 59,816 | | | | (11,043 | ) | | | 25,849 | | | | (9,683 | ) | | | 22,934 | |
| | | | | | | | | | | | | | | | | | | | | | | | |
Net Assets: | | | | | | | | | | | | | | | | | | | | | | | | |
Beginning of period | | | 872,548 | | | | 812,732 | | | | 97,133 | | | | 71,284 | | | | 102,111 | | | | 79,177 | |
| | | | | | | | | | | | | | | | | | | | | | | | |
End of Period * | | $ | 854,993 | | | $ | 872,548 | | | $ | 86,090 | | | $ | 97,133 | | | $ | 92,428 | | | $ | 102,111 | |
| | | | | | | | | | | | | | | | | | | | | | | | |
* Includes undistributed net investment income (loss) of | | $ | (763 | ) | | $ | (724 | ) | | $ | 105 | | | $ | 75 | | | $ | 901 | | | $ | 722 | |
| | | | | | | | | | | | | | | | | | | | | | | | |
See accompanying notes
29
American Beacon Funds
Notes to Financial Statements
October 31, 2011
1. Organization and Significant Accounting Policies
American Beacon Funds (the “Trust”), which is comprised of 20 Funds, is organized as a Massachusetts business trust and is registered under the Investment Company Act of 1940, as amended (the “Act”), as a diversified, open-end management investment company. These financial statements and notes to the financial statements relate to the American Beacon Balanced Fund, the American Beacon Large Cap Growth Fund, and the American Beacon Mid-Cap Value Fund (each a “Fund” and collectively, the “Funds”), each a series of the Trust.
American Beacon Advisors, Inc. (the “Manager”) is a wholly-owned subsidiary of Lighthouse Holdings, Inc. and was organized in 1986 to provide business management, advisory, administrative, and asset management consulting services to the Trust and other investors.
Class Disclosure
Each Fund has multiple classes of shares designed to meet the needs of different groups of investors; however, not all Funds offer all classes. The following table sets forth the differences amongst the classes:
| | |
Class: | | Offered to: |
Institutional Class | | Investors making an initial investment of $250,000 |
Y Class | | Investors making an initial investment of $100,000 |
Investor Class | | General public and investors investing through an intermediary |
Advisor Class | | Investors investing through an intermediary |
A Class | | General public and investors investing through an intermediary with applicable sales charges |
C Class | | General public and investors investing through an intermediary with applicable sales charges |
AMR Class | | Investors in the tax-exempt retirement and benefit plans of the Manager, AMR Corporation, and its affiliates |
Each class offered by the Trust has equal rights as to assets and voting privileges. Income and non-class specific expenses are allocated daily to each class on the basis of the relative net assets. Realized and unrealized capital gains and losses of each class are allocated daily based on the relative net assets of each class of the respective Fund. Class specific expenses, where applicable, currently include administrative service fees, service fees, and distribution fees and vary amongst the classes as described more fully in Note 2.
New Accounting Pronouncements
In April 2011, the Financial Accounting Standards Board (“FASB”) issued an Accounting Standards Update (“ASU”) related to the accounting for repurchase agreements and similar agreements that both entitles and obligates a transferor to repurchase or redeem financial assets before their maturity. The ASU modifies the criteria for determining effective control of transferred assets and as a result certain agreements may now be accounted for as secured borrowings. The ASU is effective prospectively for new transfers and existing transactions that are modified in the first interim or annual period beginning on or after December 15, 2011.
In May 2011, FASB issued an ASU to develop common requirements for measuring fair value and for disclosing information about fair value measurements in accordance with U.S. generally accepted accounting principles (“U.S. GAAP”) and International Financial Reporting Standards (IFRSs). FASB concluded that the amendments in this ASU will improve the comparability of fair value measurements presented and disclosed in financial statements prepared in accordance with U.S. GAAP and IFRSs. The ASU is effective prospectively during interim or annual periods beginning on or after December 15, 2011.
At this time, management is evaluating the implications of these changes and their impact on the financial statements has not been determined.
30
American Beacon Funds
Notes to Financial Statements
October 31, 2011
2. Transactions with Affiliates
Management Agreement
The Trust and the Manager are parties to a Management Agreement that obligates the Manager to provide or oversee the provision of all investment advisory, fund management, and securities lending services. Investment assets of the Funds are managed by multiple investment advisors which have entered into separate investment advisory agreements with the Manager. As compensation for performing the duties required under the Management Agreement, the Manager receives from the Funds an annualized fee equal to 0.05% of the average daily net assets plus amounts paid by the Manager to the unaffiliated investment advisors hired by the Manager to direct investment activities for the Funds. Management fees paid by the Funds during the year ended October 31, 2011 were as follows (dollars in thousands):
| | | | | | | | | | | | | | | | |
| | | Management
Fee Rate | | | Management
Fee | | | Amounts paid
to Investment
Advisors | | | Net Amounts
Retained by
Manager | |
Balanced | | | 0.175% - 0.65 | % | | $ | 1,922 | | | $ | 1,493 | | | $ | 429 | |
Large Cap Growth | | | 0.35% - 0.60 | % | | | 514 | | | | 466 | | | | 48 | |
Mid-Cap Value | | | 0.35% - 0.90 | % | | | 632 | | | | 580 | | | | 52 | |
Administrative Services Agreement
The Manager and the Trust entered into an Administrative Services Agreement which obligates the Manager to provide or oversee administrative services to the Funds. As compensation for performing the duties required under the Administrative Services Agreement, the Manager receives an annualized fee of 0.30% of the average daily net assets of the Institutional, Y, Investor, and Advisor Classes, 0.40% of the average daily net assets of the A and C Classes, and 0.05% of the average daily net assets of the AMR Class of each of the Funds.
Distribution Plans
The Funds, except for the Advisor, A, and C Classes of the Funds, have adopted a “defensive” Distribution Plan (the “Plan”) in accordance with Rule 12b-1 under the Act, pursuant to which no fees may be charged to the Funds for distribution purposes. However, the Plan authorizes the management and administrative service fees received by the Manager and the investment advisors hired by the Manager to be used for distribution purposes. Under this Plan, the Funds do not intend to compensate the Manager or any other party, either directly or indirectly, for the distribution of Fund shares.
Separate Distribution Plans (the “Distribution Plans”) have been adopted pursuant to Rule 12b-1 under the Act for the Advisor, A, and C Classes of the Funds. Under the Distribution Plans, as compensation for distribution assistance, the Manager receives an annual fee of 0.25% of the average daily net assets of the Advisor and A Classes, and 1.00% of the average daily net assets of the C Class. The fee will be payable without regard to whether the amount of the fee is more or less than the actual expenses incurred in a particular month by the Manager for distribution assistance.
Service Plans
The Manager and the Trust entered into Service Plans that obligate the Manager to oversee additional shareholder servicing of the Y, Investor, Advisor, A, and C Classes. As compensation for performing the duties required under the Service Plans, the Manager receives 0.10% of the average daily net assets of the Y Class, 0.15% of the average daily net assets of the A and C Classes, 0.25% of the average daily net assets of the Advisor Class and up to 0.375% of the average daily net assets of the Investor Class of the Funds. Service fees for the Y and C Classes for the period ended October 31, 2011 were less than $500.
31
American Beacon Funds
Notes to Financial Statements
October 31, 2011
Investment in Affiliated Funds
The Funds may invest in the American Beacon Money Market Select Fund or the U.S. Government Money Market Select Fund (the “USG Select Fund”) (collectively, the “Select Funds”). The Select Funds and the Funds have the same investment advisor and therefore, are considered to be affiliated. The Manager serves as investment advisor to the Select Funds and receives from the Select Funds an annualized fee up to 0.09% of the average daily net assets of the Select Fund. During the year ended October 31, 2011, the Manager earned $885 from the Balanced Fund’s investment in the Select Funds.
Interfund Lending Program
Pursuant to an exemptive order by the Securities and Exchange Commission (“SEC”), the Funds, along with other registered investment companies having management contracts with the Manager, may participate in an interfund lending program as a borrower. This program provides an alternative credit facility allowing the Funds to borrow from other participating Funds. During the year ended October 31, 2011, the Large Cap Growth Fund borrowed from the USG Select Fund on average $12,737,895 for two days at 0.79% with interest charges of $503, and the Balanced Fund borrowed from the USG Select Fund $13,407,649 for one day at 0.81% with interest charges of $298.
Reimbursement of Expenses
The Manager agreed to reimburse the following Funds to the extent that total annual fund operating expenses exceeded a Fund’s expense cap. Of these amounts, approximately $6,000 and $4,000 was receivable from the Manager at October 31, 2011 for the Balanced and Mid-Cap Value Funds, respectively. For the period ended October 31, 2011, the Manager waived or reimbursed expenses as follows:
| | | | | | | | | | | | | | | | |
| | | | | Expense Cap | | | | | | |
Fund | | Class | | 11/1/10
to
2/28/11 | | | 3/1/11
to
10/31/11 | | | Waived or
Reimbursed
Expenses | | | Expiration |
Balanced | | Y* | | | N/A | | | | N/A | | | $ | 2,590 | | | 2014 |
Balanced | | A* | | | N/A | | | | N/A | | | | 1,651 | | | 2014 |
Balanced | | C* | | | N/A | | | | N/A | | | | 1,619 | | | 2014 |
Large Cap Growth | | Y* | | | N/A | | | | N/A | | | | 1,651 | | | 2014 |
Large Cap Growth | | A* | | | N/A | | | | N/A | | | | 1,293 | | | 2014 |
Large Cap Growth | | C | | | N/A | | | | 2.20 | % | | | 1,688 | | | 2014 |
Mid-Cap Value | | Institutional | | | 0.98 | % | | | 0.98 | % | | | 42,532 | | | 2014 |
Mid-Cap Value | | Y | | | 1.08 | % | | | 1.08 | % | | | 1,719 | | | 2014 |
Mid-Cap Value | | Investor | | | 1.23 | % | | | 1.23 | % | | | 8,901 | | | 2014 |
Mid-Cap Value | | Advisor | | | 1.49 | % | | | 1.49 | % | | | 351 | | | 2014 |
Mid-Cap Value | | A | | | 1.49 | % | | | 1.49 | % | | | 1,816 | | | 2014 |
Mid-Cap Value | | C | | | 2.24 | % | | | 2.24 | % | | | 1,705 | | | 2014 |
Expense Reimbursement Plan
The Funds have adopted an Expense Reimbursement Plan whereby the Manager may seek repayment of fees waived or expenses reimbursed for a period of up to three years. However, reimbursement will occur only if the Class’ average net assets have grown or expenses have declined sufficiently to allow reimbursement without causing its expense ratio to exceed the previously agreed upon contractual expense limit. The carryovers for the Mid-Cap Value Fund are approximately $25,000 and $17,000, expiring 2012 and 2013, respectively. During the year ended October 31, 2011, the Funds have not recorded a liability for potential reimbursement, due to the current assessment that a reimbursement is unlikely.
32
American Beacon Funds
Notes to Financial Statements
October 31, 2011
3. Security Valuation and Fair Value Measurements
Investments are valued at the close of the New York Stock Exchange (the “Exchange”), normally 4 p.m. ET, each day that the Exchange is open for business. Equity securities for which market quotations are available are valued at the last sale price or official closing price (closing bid price or last evaluated quote if no sale has occurred) on the primary market or exchange on which they trade.
Debt securities (other than short-term securities) normally are valued on the basis of prices provided by an independent pricing service and may take into account appropriate factors such as institution-size trading in similar groups of securities, yield, quality, coupon rate, maturity, type of issue, trading characteristics, and other market data. Prices of debt securities may be determined using quotes obtained from brokers.
Investments in mutual funds are valued at the closing net asset value (“NAV”) per share of the mutual fund on the day of valuation. Investment grade short-term obligations with 60 days or less to maturity are valued using the amortized cost method, which approximates fair value.
Securities for which market prices are not readily available or are not reflective of the fair value of the security, as determined by the Manager, will be priced at fair value following procedures approved by the Trust’s Board of Trustees (the “Board”).
Futures contracts are valued based upon their quoted daily settlement prices. Upon entering into a futures contract, a Fund is required to deposit with its futures broker, an amount of cash or U.S. Government and Agency Obligations in accordance with the initial margin requirements of the broker or exchange. Futures contracts are marked to market daily and an appropriate payable or receivable for the change in value (“variation margin”) is recorded by the Fund. Gains or losses are recognized but not considered realized until the contracts expire or are closed. Futures contracts involve, to varying degrees, risk of loss in excess of the variation margin disclosed on the Statements of Assets and Liabilities.
Security Transactions and Investment Income
Security transactions are recorded on the trade date of the security purchase or sale. The Funds may purchase securities with delivery or payment to occur at a later date. At the time the Funds enter into a commitment to purchase a security, the transaction is recorded, and the value of the security is reflected in the NAV. The value of the security may vary with market fluctuations.
Dividend income, net of foreign taxes, is recorded on the ex-dividend date, except certain dividends from foreign securities which are recorded as soon as the information is available to the Funds. Interest income is earned from settlement date, recorded on the accrual basis, and adjusted, if necessary, for accretion of discounts and amortization of premiums. For financial and tax reporting purposes, realized gains and losses are determined on the basis of specific lot identification.
Dividends to Shareholders
Dividends from net investment income of the Balanced Fund normally will be declared and paid quarterly. Dividends from net investment income of the Large Cap Growth and Mid-Cap Value Funds normally will be declared and paid at least annually. Distributions, if any, of net realized capital gains are generally paid at least annually and recorded on the ex-dividend date.
Commission Recapture
The Funds have established brokerage commission recapture arrangements with certain brokers or dealers. If a Fund’s investment advisor chooses to execute a transaction through a participating broker, the
33
American Beacon Funds
Notes to Financial Statements
October 31, 2011
broker rebates a portion of the commission back to the Fund. Any collateral benefit received through participation in the commission recapture program is directed exclusively to the Fund. This amount is reported with the net realized gains in the Fund’s Statement of Operations.
Allocation of Income, Expenses, Gains, and Losses
Income, expenses (other than those attributable to a specific class), gains, and losses are allocated daily to each class of shares based upon the relative proportion of net assets represented by such class. Operating expenses directly attributable to a specific class are charged against the operations of that class.
Use of Estimates
The preparation of financial statements in conformity with U.S. GAAP requires management to make estimates and assumptions that affect the amounts reported in the financial statements and accompanying notes. Actual results may differ from those estimated.
Redemption Fees
The AMR Class of the Mid-Cap Value Fund imposes a 2% redemption fee on certain shares held for less than 180 days. The fee is deducted from the redemption proceeds and is intended to offset the trading costs, market impact, and other costs associated with short-term trading activity in the Funds. The “first-in, first-out” method is used to determine the holding period. The fee is allocated to all classes of each Fund pro-rata based on their respective net assets.
Other
Under the Trust’s organizational documents, its officers and trustees are indemnified against certain liability arising out of the performance of their duties to the Trust. In the normal course of business, the Trust enters into contracts that provide indemnification to the other party or parties against potential costs or liabilities. The Trust’s maximum exposure under these arrangements is dependent on claims that may be made in the future and, therefore, cannot be estimated. The Trust has had no prior claims or losses pursuant to any such agreement.
Valuation Inputs
Various inputs may be used to determine the fair value of the Funds’ investments. These inputs are summarized in three broad levels for financial statement purposes. The inputs or methodologies used to value securities are not necessarily an indication of the risk associated with investing in those securities.
| | |
| Level 1 - | | Quoted prices in active markets for identical securities. |
| |
| Level 2 - | | Prices determined using other significant observable inputs. These may include quoted prices for similar securities, interest rates, prepayment speeds, credit risk, and others. Level 2 securities are fixed-income securities that are valued using observable inputs as stated above. |
| |
| Level 3 - | | Prices determined using other significant unobservable inputs. Unobservable inputs reflect the Fund’s own assumptions about the factors market participants would use in pricing an investment, and would be based on the best information available. |
Level 1 and Level 2 trading assets and trading liabilities, at fair value
Fixed income securities including corporate, convertible and municipal bonds and notes, U.S. government agencies, U.S. treasury obligations, sovereign issues, bank loans, convertible preferred securities, and non-U.S. bonds are normally valued by pricing service providers that use broker dealer quotations,
34
American Beacon Funds
Notes to Financial Statements
October 31, 2011
reported trades or valuation estimates from their internal pricing models. The service providers’ internal models use inputs that are observable such as issuer details, interest rates, yield curves, prepayment speeds, credit risks/spreads, default rates, and quoted prices for similar assets. Securities that use similar valuation techniques and inputs as described above are categorized as Level 2 of the fair value hierarchy.
Fixed income securities purchased on a delayed-delivery basis are marked to market daily until settlement at the forward settlement date are categorized as Level 2 of the fair value hierarchy.
Mortgage-related and asset-backed securities are usually issued as separate tranches, or classes, of securities within each deal. These securities are also normally valued by pricing service providers that use broker dealer quotations or valuation estimates from their internal pricing models. The pricing models for these securities usually consider tranche-level attributes, current market data, estimated cash flows, and market-based yield spreads for each tranche, and incorporates deal collateral performance, as available. Mortgage-related and asset-backed securities that use similar valuation techniques and inputs as described above are categorized as Level 2 of the fair value hierarchy.
Common stocks and financial derivative instruments, such as futures contracts that are traded on a national securities exchange, are stated at the last reported sale or settlement price on the day of valuation. To the extent these securities are actively traded and valuation adjustments are not applied, they are categorized as Level 1 of the fair value hierarchy. Securities using these valuation adjustments are categorized as Level 2 of the fair value hierarchy. Preferred securities and other equities traded on inactive markets or valued by reference to similar instruments are also categorized as Level 2 of the fair value hierarchy.
Investments in registered open-end investment management companies will be valued based upon the NAVs of such investments and are categorized as Level 1 of the fair value hierarchy. Short-term investments having a maturity of 60 days or less are generally valued at amortized cost which approximates fair value. These investments are categorized as Level 2 of the fair value hierarchy.
Level 3 trading assets and trading liabilities, at fair value
The valuation techniques and significant inputs used in determining the fair values of financial instruments classified as Level 3 of the fair value hierarchy are as follows:
Securities and other assets for which market quotes are not readily available are valued at fair value as determined in good faith by the Board or persons acting at their direction and are categorized as Level 3 of the fair value hierarchy.
Market quotes are considered not readily available in circumstances where there is an absence of current or reliable market-based data (e.g., trade information or broker quotes), including where events occur after the close of the relevant market, but prior to the Exchange close, that materially affect the values of a Fund’s securities or assets. In addition, market quotes are considered not readily available when, due to extraordinary circumstances, the exchanges or markets on which the securities trade, do not open for trading for the entire day and no other market prices are available. The Board has delegated to the Manager the responsibility for monitoring significant events that may materially affect the fair values of a Fund’s securities or assets and for determining whether the value of the applicable securities or assets should be re-evaluated in light of such significant events.
The Board has adopted methods for valuing securities and other assets in circumstances where market quotes are not readily available, and has delegated the responsibility for applying the valuation methods to the Manager. For instances in which daily market quotes are not readily available, investments may be valued, pursuant to guidelines established by the Board, with reference to other securities or indices. In the event that the security or asset cannot be valued pursuant to one of the valuation methods established by the Board, the value of the security or asset will be determined in good faith by the Valuation Committee of the Board, generally based upon recommendations provided by the Manager.
35
American Beacon Funds
Notes to Financial Statements
October 31, 2011
When a Fund uses fair valuation methods applied by the Manager that use significant unobservable inputs to determine its NAV, securities will be priced by another method that the Board or persons acting at their direction believe accurately reflects fair value and are categorized as Level 3 of the fair value hierarchy. These methods may require subjective determinations about the value of a security. While the Trust’s policy is intended to result in a calculation of a Fund’s NAV that fairly reflects security values as of the time of pricing, the Trust cannot guarantee that values determined by the Board or persons acting at their direction would accurately reflect the price that a Fund could obtain for a security if it were to dispose of that security as of the time of pricing (for instance, in a forced or distressed sale). The prices used by a Fund may differ from the value that would be realized if the securities were sold.
For fair valuations using significant unobservable inputs, U.S. GAAP requires a reconciliation of the beginning to ending balances for reported fair values that presents changes attributable to total realized and unrealized gains or losses, purchases and sales, and transfers in and out of the Level 3 category during the period. The end of period timing recognition is used for the significant transfers between Levels of the Funds’ assets and liabilities. In accordance with the requirements of U.S. GAAP, a fair value hierarchy and Level 3 reconciliation, if any, have been included in the Notes to the Schedule of Investments for each respective Fund.
The Funds’ investments are summarized by level based on the inputs used to determine their values. As of October 31, 2011, the investments were classified as described below: (in thousands)
| | | | | | | | | | | | | | | | |
Balanced Fund | | Level 1 | | | Level 2 | | | Level 3 | | | Total | |
Common Stock | | $ | 461,500 | | | $ | — | | | $ | — | | | $ | 461,500 | |
Preferred Stock | | | 2,593 | | | | — | | | | — | | | | 2,593 | |
Corporate Obligations | | | — | | | | 126,175 | | | | — | | | | 126,175 | |
U.S. Agency Obligations | | | — | | | | 42,367 | | | | — | | | | 42,367 | |
Other Government Obligations | | | — | | | | 722 | | | | — | | | | 722 | |
Non-Agency Mortgage-Backed Obligations | | | — | | | | 9,488 | | | | — | | | | 9,488 | |
Asset-Backed Obligations | | | — | | | | 5,002 | | | | — | | | | 5,002 | |
U.S. Agency Mortgage-Backed Obligations | | | — | | | | 66,692 | | | | — | | | | 66,692 | |
U.S. Treasury Obligations | | | — | | | | 22,536 | | | | — | | | | 22,536 | |
Municipal Obligations | | | — | | | | 2,657 | | | | — | | | | 2,657 | |
Short-Term Investments | | | 50,094 | | | | 4,178 | | | | — | | | | 54,272 | |
| | | | | | | | | | | | | | | | |
Total Investments in Securities | | $ | 514,187 | | | $ | 279,817 | | | $ | — | | | $ | 794,004 | |
| | | | | | | | | | | | | | | | |
Futures Contracts | | | 2,695 | | | | — | | | | — | | | | 2,695 | |
| | | | |
Large Cap Growth Fund | | Level 1 | | | Level 2 | | | Level 3 | | | Total | |
Common Stock | | $ | 81,979 | | | $ | — | | | $ | — | | | $ | 81,979 | |
Short-Term Investments | | | 3,267 | | | | — | | | | — | | | | 3,267 | |
| | | | | | | | | | | | | | | | |
Total Investments in Securities | | $ | 85,246 | | | $ | — | | | $ | — | | | $ | 85,246 | |
| | | | | | | | | | | | | | | | |
Futures Contracts | | | 39 | | | | — | | | | — | | | | 39 | |
| | | | |
Mid-Cap Value Fund | | Level 1 | | | Level 2 | | | Level 3 | | | Total | |
Common Stock | | $ | 85,647 | | | $ | — | | | $ | — | | | $ | 85,647 | |
Short-Term Investments | | | 3,416 | | | | — | | | | — | | | | 3,416 | |
| | | | | | | | | | | | | | | | |
Total Investments in Securities | | $ | 89,063 | | | $ | — | | | $ | — | | | $ | 89,063 | |
| | | | | | | | | | | | | | | | |
Futures Contracts | | | 246 | | | | — | | | | — | | | | 246 | |
As of October 31, 2011, there were no significant transfers into or out of any level.
36
American Beacon Funds
Notes to Financial Statements
October 31, 2011
4. Securities and Other Investments
Real Estate Investment Trusts
The Funds may own shares of real estate investment trusts (“REITS”) which report information on the source of their distributions annually. The Funds re-characterize distributions received from REIT investments based on information provided by the REITs into the following categories: ordinary income, long-term capital gains, and return of capital. If information is not available on a timely basis from the REITs, the re-characterization will be estimated based on available information, which may include the previous year allocation. If new or additional information becomes available from the REITs at a later date, a re-characterization will be made the following year. These re-characterizations are not recorded for financial statement purposes, but as an adjustment to the calculation of taxable income.
Restricted Securities
Certain Funds may invest in securities that are subject to legal or contractual restrictions on resale. These securities may be sold privately, but are required to be registered or exempted from such registration before being sold to the public. Private placement securities are generally considered to be restricted except for those securities traded between qualified institutional investors under the provisions of Rule 144A of the Securities Act of 1933. Disposal of restricted securities may involve time-consuming negotiations and expenses, and prompt sale at an acceptable price may be difficult to achieve. Restricted securities outstanding at the period ended October 31, 2011 are disclosed in the Notes to the Schedules of Investments.
5. Financial Derivative Instruments
Futures Contracts
Futures contracts are contracts to buy or sell a standard quantity of securities at a specified price on a future date. The Funds may enter into financial futures contracts as a method for keeping assets readily convertible to cash if needed to meet shareholder redemptions or for other needs while maintaining exposure to the stock or bond market, as applicable. The primary risks associated with the use of futures contracts are the possibility of illiquid markets or imperfect correlation between the values of the contracts and the underlying securities, or that the counterparty will fail to perform its obligations.
Upon entering into a futures contract, the Funds are required to set aside or deposit with a broker an amount, termed the initial margin, which typically represents 5% of the face value of the futures contract. A Fund usually reflects this amount on the Schedule of Investments as a U.S. Treasury Bill held as collateral for futures contracts or as cash deposited with broker on the Statement of Assets and Liabilities. Payments to and from the broker, known as variation margin, are required to be made on a daily basis as the price of the futures contract fluctuates. Changes in initial settlement values are accounted for as unrealized appreciation (depreciation) until the contracts are terminated, at which time realized gains and losses are recognized. Futures contracts are valued at the most recent settlement price established each day by the exchange on which they are traded.
Balanced
Values of Derivative Instruments not accounted for as hedging instruments as of October 31, 2011 (in thousands):
| | | | | | |
Statements of Assets and Liabilities | | Derivatives | | Fair Value | |
Unrealized appreciation of investments and futures contracts | | Equity Contracts* | | $ | 2,695 | |
37
American Beacon Funds
Notes to Financial Statements
October 31, 2011
Effect of derivative instruments not accounted for as hedging instruments during the year ended October 31, 2011 (in thousands):
| | | | | | | | |
Statements of Operations | | Derivatives | | | Balance | |
Net realized gain (loss) from futures contracts | | | Equity Contracts | | | $ | 1,564 | |
Change in net unrealized appreciation or depreciation of futures contracts | | | Equity Contracts | | | | 1,282 | |
Large Cap Growth
Values of Derivative Instruments not accounted for as hedging instruments as of October 31, 2011 (in thousands):
| | | | | | | | |
Statements of Assets and Liabilities | | Derivatives | | | Fair Value | |
Unrealized appreciation of investments and futures contracts | | | Equity Contracts | * | | $ | 39 | |
Effect of derivative instruments not accounted for as hedging instruments during the year ended October 31, 2011 (in thousands):
| | | | | | | | |
Statements of Operations | | Derivatives | | | Balance | |
Net realized gain (loss) from futures contracts | | | Equity Contracts | | | $ | (8,614 | ) |
Change in net unrealized appreciation or depreciation of futures contracts | | | Equity Contracts | | | | (78 | ) |
Mid-Cap Value
Values of Derivative Instruments not accounted for as hedging instruments as of October 31, 2011 (in thousands):
| | | | | | | | |
Statements of Assets and Liabilities | | Derivatives | | | Fair Value | |
Unrealized appreciation of investments and futures contracts | | | Equity Contracts | * | | $ | 246 | |
Effect of derivative instruments not accounted for as hedging instruments during the year ended October 31, 2011 (in thousands):
| | | | | | | | |
Statements of Operations | | Derivatives | | | Balance | |
Net realized gain (loss) from futures contracts | | | Equity Contracts | | | $ | 427 | |
Change in net unrealized appreciation or depreciation of futures contracts | | | Equity Contracts | | | | (171 | ) |
| * | Includes cumulative appreciation or depreciation of futures contracts as reported in the Schedule of Investments footnotes. Only current day’s variation margin is reported within the Statements of Assets and Liabilities. |
6. Federal Income and Excise Taxes
It is the policy of each Fund to qualify as a regulated investment company, by complying with all applicable provisions of Subchapter M of the Internal Revenue Code, as amended, and to make distribution of taxable income sufficient to relieve it from substantially all federal income and excise taxes. For federal income tax purposes, each Fund is treated as a single entity for the purpose of determining such qualification.
The Funds do not have any unrecognized tax benefits in the accompanying financial statements. Each of the tax years in the four year period ended October 31, 2011 remains subject to examination by the Internal Revenue Service. If applicable, the Funds recognize interest accrued related to unrecognized tax benefits in interest expense and penalties in “Other expenses” on the Statements of Operations.
Dividends are categorized in accordance with income tax regulations which may treat certain transactions differently than U.S. GAAP. Accordingly, the character of distributions and composition of net assets for tax purposes may differ from those reflected in the accompanying financial statements.
The tax character of distributions paid during the fiscal years ended October 31, 2011 and October 31, 2010 were as follows (in thousands)
38
American Beacon Funds
Notes to Financial Statements
October 31, 2011
| | | | | | | | | | | | | | | | | | | | | | | | |
| | | Balanced | | | Large Cap Growth | | | Mid-Cap Value | |
| | | Year Ended
October 31,
2011 | | | Year Ended
October 31,
2010 | | | Year Ended
October 31,
2011 | | | Year Ended
October 31,
2010 | | | Year Ended
October 31,
2011 | | | Year Ended
October 31,
2010 | |
Distributions paid from: | | | | | | | | | | | | | | | | | | | | | | | | |
Ordinary income* | | | | | | | | | | | | | | | | | | | | | | | | |
Institutional Class | | $ | 876 | | | $ | 1,651 | | | $ | — | | | $ | — | | | $ | 30 | | | $ | 15 | |
Y Class | | | 10 | | | | — | | | | — | | | | — | | | | — | | | | — | |
Investor Class | | | 1,759 | | | | 4,637 | | | | — | | | | — | | | | 343 | | | | 161 | |
Advisor Class | | | 104 | | | | 314 | | | | — | | | | — | | | | 1 | | | | — | |
A Class | | | 7 | | | | — | | | | — | | | | — | | | | — | | | | — | |
C Class | | | 4 | | | | — | | | | — | | | | — | | | | — | | | | — | |
AMR Class | | | 21,013 | | | | 42,865 | | | | 167 | | | | 342 | | | | 753 | | | | 561 | |
| | | | | | | | | | | | | | | | | | | | | | | | |
Total distributions paid | | $ | 23,773 | | | $ | 49,467 | | | $ | 167 | | | $ | 342 | | | $ | 1,127 | | | $ | 737 | |
| | | | | | | | | | | | | | | | | | | | | | | | |
| * | For tax purposes, short-term capital gains are considered ordinary income distributions. |
As of October 31, 2011, the components of distributable earnings (deficit) on a tax basis were as follows (in thousands):
| | | | | | | | | | | | |
| | | Balanced | | | Large Cap
Growth | | | Mid-Cap
Value | |
Cost basis of investments for federal income tax purposes | | $ | 800,851 | | | $ | 83,714 | | | $ | 82,758 | |
Unrealized appreciation | | | 75,494 | | | | 5,122 | | | | 10,855 | |
Unrealized depreciation | | | (82,341 | ) | | | (3,590 | ) | | | (4,550 | ) |
| | | | | | | | | | | | |
Net unrealized appreciation or depreciation | | | (6,847 | ) | | | 1,532 | | | | 6,305 | |
| | | |
Undistributed ordinary income | | | 41 | | | | 105 | | | | 901 | |
Accumulated long-term gain (loss) | | | (17,445 | ) | | | (14,405 | ) | | | (11,201 | ) |
Other temporary differences | | | 2,699 | | | | 39 | | | | 247 | |
| | | | | | | | | | | | |
Distributable earnings (deficit) | | $ | (21,552 | ) | | $ | (12,729 | ) | | $ | (3,748 | ) |
| | | | | | | | | | | | |
Financial reporting records are adjusted for permanent book/tax differences to reflect tax character. Financial records are not adjusted for temporary differences. The temporary differences between financial reporting and tax-basis reporting of unrealized appreciation or depreciation are attributable primarily to the tax deferral of losses from wash sales, the realization for tax purposes of unrealized gains (losses) on certain derivative instruments, and book amortization of premiums.
Due to inherent differences in the recognition of income, expenses and realized gains (losses) under U.S. GAAP and federal income tax regulations, permanent differences between book and tax reporting have been identified and appropriately reclassified on the Statements of Assets and Liabilities.
Accordingly, the following amounts represent current year permanent differences derived from book amortization of premium, pay down reclasses, Section 732 basis adjustments, non-deductible expenses, and dividend reclasses that have been reclassified as of October 31, 2011 (in thousands):
| | | | | | | | | | | | |
| | | Balanced | | | Large Cap
Growth | | | Mid-Cap
Value | |
Paid-in-capital | | $ | 1 | | | $ | (1 | ) | | $ | — | |
Undistributed net investment income | | | 771 | | | | — | | | | (1 | ) |
Accumulated net realized gain (loss) | | | (772 | ) | | | — | | | | 1 | |
Unrealized appreciation or depreciation of investments and futures contracts | | | — | | | | 1 | | | | — | |
At October 31, 2011, capital loss carry forward positions for federal income tax purposes were as follows (in thousands):
| | | | | | | | | | | | | | | | |
Fund | | 2016 | | | 2017 | | | 2018 | | | Total | |
Balanced | | $ | — | | | $ | 14,750 | | | $ | — | | | $ | 14,750 | |
Large Cap Growth | | | 1,503 | | | | 12,863 | | | | — | | | | 14,366 | |
Mid-Cap Value | | | 2,205 | | | | 8,397 | | | | 353 | | | | 10,955 | |
39
American Beacon Funds
Notes to Financial Statements
October 31, 2011
The Balanced, Large Cap Growth, and Mid-Cap Value Funds utilized $48,498, $9,496, and $8,505, respectively, of net capital loss carryovers for the year ended October 31, 2011.
7. Investment Transactions
The aggregate cost of purchases and proceeds from sales and maturities of long-term investments during the year ended October 31, 2011 were as follows (in thousands):
| | | | | | | | | | | | |
| | | Balanced | | | Large Cap
Growth | | | Mid-Cap
Value | |
Purchases (excluding U.S. government securities) | | $ | 378,166 | | | $ | 152,596 | | | $ | 106,420 | |
Sales and maturities (excluding U.S. government securities) | | | 478,135 | | | | 163,314 | | | | 120,368 | |
Purchases of U.S. government securities | | | 92,344 | | | | — | | | | — | |
Sales and maturities of U.S. government securities | | | 116,041 | | | | — | | | | — | |
A summary of the Funds’ direct transactions in USG Select Fund for the year ended October 31, 2011 is set forth below (in thousands):
| | | | | | | | | | | | | | | | | | | | |
| | | Affiliate | | | October 31, 2010
Shares/Fair Value | | | Purchases | | | Sales | | | October 31, 2011
Shares/Fair Value | |
Balanced | | | USG Select Fund | | | $ | 2,900 | | | $ | 5,000 | | | $ | 2,900 | | | $ | 5,000 | |
8. Capital Share Transactions
The tables below summarize the activity in capital shares for each Class of the Funds (shares and dollars in thousands):
Year Ended October 31, 2011
| | | | | | | | | | | | | | | | | | | | | | | | | | | | | | | | |
| | | Institutional Class | | | Y Class | | | Investor Class | | | Advisor Class | |
Balanced Fund | | Shares | | | Amount | | | Shares | | | Amount | | | Shares | | | Amount | | | Shares | | | Amount | |
Shares sold | | | 631 | | | $ | 8,319 | | | | 27 | | | $ | 354 | | | | 2,294 | | | $ | 27,260 | | | | 136 | | | $ | 1,701 | |
Reinvestment of dividends | | | 67 | | | | 864 | | | | — | | | | 10 | | | | 141 | | | | 1,696 | | | | 8 | | | | 104 | |
Shares redeemed | | | (943 | ) | | | (12,382 | ) | | | — | | | | (1 | ) | | | (2,669 | ) | | | (32,048 | ) | | | (364 | ) | | | (4,500 | ) |
| | | | | | | | | | | | | | | | | | | | | | | | | | | | | | | | |
Net increase (decrease) in shares outstanding | | | (245 | ) | | $ | (3,199 | ) | | | 27 | | | $ | 363 | | | | (234 | ) | | $ | (3,092 | ) | | | (220 | ) | | $ | (2,695 | ) |
| | | | | | | | | | | | | | | | | | | | | | | | | | | | | | | | |
| | | | | | | | | | | | | | | | | | | | | | | | |
| | | AMR Class | | | A Class | | | C Class | |
Balanced Fund | | Shares | | | Amount | | | Shares | | | Amount | | | Shares | | | Amount | |
Shares sold | | | 6,625 | | | $ | 81,564 | | | | 57 | | | $ | 695 | | | | 76 | | | $ | 894 | |
Reinvestment of dividends | | | 1,702 | | | | 21,013 | | | | — | | | | 5 | | | | — | | | | 4 | |
Shares redeemed | | | (10,718 | ) | | | (132,193 | ) | | | (12 | ) | | | (145 | ) | | | — | | | | (1 | ) |
| | | | | | | | | | | | | | | | | | | | | | | | |
Net increase (decrease) in shares outstanding | | | (2,391 | ) | | $ | (29,616 | ) | | | 45 | | | $ | 555 | | | | 76 | | | $ | 897 | |
| | | | | | | | | | | | | | | | | | | | | | | | |
| | | | | | | | | | | | | | | | | | | | | | | | |
| | | Institutional Class | | | Y Class | | | AMR Class | |
Large Cap Growth Fund | | Shares | | | Amount | | | Shares | | | Amount | | | Shares | | | Amount | |
Shares sold | | | 26 | | | $ | 163 | | | | 1 | | | $ | 10 | | | | 20,858 | | | $ | 133,547 | |
Reinvestment of dividends | | | — | | | | — | | | | — | | | | — | | | | 26 | | | | 167 | |
Shares redeemed | | | (24 | ) | | | (146 | ) | | | (4 | ) | | | (28 | ) | | | (23,482 | ) | | | (140,139 | ) |
| | | | | | | | | | | | | | | | | | | | | | | | |
Net increase (decrease) in shares outstanding | | | 2 | | | $ | 17 | | | | (3 | ) | | $ | (18 | ) | | | (2,598 | ) | | $ | (6,425 | ) |
| | | | | | | | | | | | | | | | | | | | | | | | |
40
American Beacon Funds
Notes to Financial Statements
October 31, 2011
| | | | | | | | | | | | | | | | |
| | | A Class | | | C Class | |
Large Cap Growth Fund | | Shares | | | Amount | | | Shares | | | Amount | |
Shares sold | | | 80 | | | $ | 514 | | | | — | | | $ | — | |
Reinvestment of dividends | | | — | | | | — | | | | — | | | | — | |
Shares redeemed | | | (52 | ) | | | (314 | ) | | | — | | | | — | |
| | | | | | | | | | | | | | | | |
Net increase in shares outstanding | | | 28 | | | $ | 200 | | | | — | | | $ | — | |
| | | | | | | | | | | | | | | | |
| | | | | | | | | | | | | | | | | | | | | | | | | | | | | | | | |
| | | Institutional Class | | | Y Class | | | Investor Class | | | Advisor Class | |
Mid-Cap Value Fund | | Shares | | | Amount | | | Shares | | | Amount | | | Shares | | | Amount | | | Shares | | | Amount | |
Shares sold | | | 4,220 | | | $ | 42,145 | | | | 5 | | | $ | 48 | | | | 851 | | | $ | 8,664 | | | | 3 | | | $ | 35 | |
Reinvestment of dividends | | | 3 | | | | 30 | | | | — | | | | — | | | | 35 | | | | 343 | | | | — | | | | 1 | |
Shares redeemed | | | (1,085 | ) | | | (10,940 | )* | | | — | | | | — | * | | | (4,529 | ) | | | (43,908 | )* | | | (8 | ) | | | (75 | )* |
| | | | | | | | | | | | | | | | | | | | | | | | | | | | | | | | |
Net increase (decrease) in shares outstanding | | | 3,138 | | | $ | 31,235 | | | | 5 | | | $ | 48 | | | | (3,643 | ) | | $ | (34,901 | ) | | | (5 | ) | | $ | (39 | ) |
| | | | | | | | | | | | | | | | | | | | | | | | | | | | | | | | |
| | | | | | | | | | | | | | | | | | | | | | | | |
| | | AMR Class | | | A Class | | | C Class | |
Mid-Cap Value Fund | | Shares | | | Amount | | | Shares | | | Amount | | | Shares | | | Amount | |
Shares sold | | | 1,804 | | | $ | 17,611 | | | | 12 | | | $ | 122 | | | | 2 | | | $ | 24 | |
Reinvestment of dividends | | | 76 | | | | 753 | | | | — | | | | — | | | | — | | | | — | |
Shares redeemed | | | (2,930 | ) | | | (29,205 | )* | | | (3 | ) | | | (32 | )* | | | — | | | | — | * |
| | | | | | | | | | | | | | | | | | | | | | | | |
Net increase (decrease) in shares outstanding | | | (1,050 | ) | | $ | (10,841 | ) | | | 9 | | | $ | 90 | | | | 2 | | | $ | 24 | |
| | | | | | | | | | | | | | | | | | | | | | | | |
Year Ended October 31, 2010
| | | | | | | | | | | | | | | | | | | | | | | | | | | | | | | | |
| | | Institutional Class | | | Y Class | | | Investor Class | | | Advisor Class | |
Balanced Fund | | Shares | | | Amount | | | Shares | | | Amount | | | Shares | | | Amount | | | Shares | | | Amount | |
Shares sold | | | 938 | | | $ | 11,665 | | | | 4 | | | $ | 46 | | | | 2,259 | | | $ | 25,989 | | | | 97 | | | $ | 1,140 | |
Reinvestment of dividends | | | 133 | | | | 1,630 | | | | — | | | | 1 | | | | 402 | | | | 4,540 | | | | 27 | | | | 314 | |
Shares redeemed | | | (944 | ) | | | (11,665 | ) | | | — | | | | — | | | | (4,078 | ) | | | (46,277 | ) | | | (218 | ) | | | (2,568 | ) |
| | | | | | | | | | | | | | | | | | | | | | | | | | | | | | | | |
Net increase (decrease) in shares outstanding | | | 127 | | | $ | 1,630 | | | | 4 | | | $ | 47 | | | | (1,417 | ) | | $ | (15,748 | ) | | | (94 | ) | | $ | (1,114 | ) |
| | | | | | | | | | | | | | | | | | | | | | | | | | | | | | | | |
| | | | | | | | | | | | | | | | | | | | | | | | |
| | | AMR Class | | | A Class | | | C Class | |
Balanced Fund | | Shares | | | Amount | | | Shares | | | Amount | | | Shares | | | Amount | |
Shares sold | | | 3,103 | | | $ | 36,517 | | | | 4 | | | $ | 46 | | | | — | | | $ | 1 | |
Reinvestment of dividends | | | 3,684 | | | | 42,865 | | | | — | | | | — | | | | — | | | | — | |
Shares redeemed | | | (4,724 | ) | | | (55,318 | ) | | | — | | | | — | | | | — | | | | — | |
| | | | | | | | | | | | | | | | | | | | | | | | |
Net increase in shares outstanding | | | 2,063 | | | $ | 24,064 | | | | 4 | | | $ | 46 | | | | — | | | $ | 1 | |
| | | | | | | | | | | | | | | | | | | | | | | | |
| | | | | | | | | | | | | | | | | | | | | | | | |
| | | Institutional Class | | | Y Class | | | AMR Class | |
Large Cap Growth Fund | | Shares | | | Amount | | | Shares | | | Amount | | | Shares | | | Amount | |
Shares sold | | | 7 | | | $ | 38 | | | | 4 | | | $ | 20 | | | | 8,548 | | | $ | 46,823 | |
Reinvestment of dividends | | | — | | | | — | | | | — | | | | — | | | | 63 | | | | 342 | |
Shares redeemed | | | (12 | ) | | | (66 | ) | | | — | | | | — | | | | (6,328 | ) | | | (34,145 | ) |
| | | | | | | | | | | | | | | | | | | | | | | | |
Net increase (decrease) in shares outstanding | | | (5 | ) | | $ | (28 | ) | | | 4 | | | $ | 20 | | | | 2,283 | | | $ | 13,020 | |
| | | | | | | | | | | | | | | | | | | | | | | | |
| | | | | | | | | | | | | | | | |
| | | A Class | | | C Class | |
Large Cap Growth Fund | | Shares | | | Amount | | | Shares | | | Amount | |
Shares sold | | | 1 | | | $ | 6 | | | | — | | | $ | 1 | |
Reinvestment of dividends | | | — | | | | — | | | | — | | | | — | |
Shares redeemed | | | — | | | | — | | | | — | | | | — | |
| | | | | | | | | | | | | | | | |
Net increase in shares outstanding | | | 1 | | | $ | 6 | | | | — | | | $ | 1 | |
| | | | | | | | | | | | | | | | |
41
American Beacon Funds
Notes to Financial Statements
October 31, 2011
| | | | | | | | | | | | | | | | | | | | | | | | | | | | | | | | |
| | | Institutional Class | | | Y Class | | | Investor Class | | | Advisor Class | |
Mid-Cap Value Fund | | Shares | | | Amount | | | Shares | | | Amount | | | Shares | | | Amount | | | Shares | | | Amount | |
Shares sold | | | 59 | | | $ | 507 | | | | — | | | $ | 1 | | | | 1,672 | | | $ | 14,465 | | | | 8 | | | $ | 64 | |
Reinvestment of dividends | | | 2 | | | | 14 | | | | — | | | | — | | | | 20 | | | | 161 | | | | — | | | | — | |
Shares redeemed | | | (51 | ) | | | (439 | )* | | | — | | | | — | * | | | (963 | ) | | | (8,239 | )* | | | — | | | | — | * |
| | | | | | | | | | | | | | | | | | | | | | | | | | | | | | | | |
Net increase in shares outstanding | | | 10 | | | $ | 82 | | | | — | | | $ | 1 | | | | 729 | | | $ | 6,387 | | | | 8 | | | $ | 64 | |
| | | | | | | | | | | | | | | | | | | | | | | | | | | | | | | | |
| | | | | | | | | | | | | | | | | | | | | | | | |
| | | AMR Class | | | A Class | | | C Class | |
Mid-Cap Value Fund | | Shares | | | Amount | | | Shares | | | Amount | | | Shares | | | Amount | |
Shares sold | | | 3,214 | | | $ | 27,770 | | | | 2 | | | $ | 17 | | | | — | | | $ | 1 | |
Reinvestment of dividends | | | 68 | | | | 561 | | | | — | | | | — | | | | — | | | | — | |
Shares redeemed | | | (3,444 | ) | | | (29,426 | )* | | | — | | | | — | * | | | — | | | | — | * |
| | | | | | | | | | | | | | | | | | | | | | | | |
Net increase (decrease) in shares outstanding | | | (162 | ) | | $ | (1,095 | ) | | | 2 | | | $ | 17 | | | | — | | | $ | 1 | |
| | | | | | | | | | | | | | | | | | | | | | | | |
42
This page intentionally left blank.
43
American Beacon Balanced Fund
Financial Highlights
(For a share outstanding throughout the period)
| | | | | | | | | | | | | | | | | | | | | | | | | | | | | | | | | | | | |
| | | Institutional Class | | | Y Class | | | Investor Class | |
| | | Year Ended October 31, | | | Year
Ended
October 31, | | | March 1 to
October 31, | | | Year Ended
October 31, | |
| | 2011 | | | 2010 | | | 2009 | | | 2008 | | | 2007 | | | 2011 | | | 2010 | | | 2011 | | | 2010 | |
Net asset value, beginning of period | | $ | 12.62 | | | $ | 11.83 | | | $ | 10.63 | | | $ | 16.09 | | | $ | 15.83 | | | $ | 12.78 | | | $ | 12.20 | | | $ | 11.66 | | | $ | 10.96 | |
| | | | | | | | | | | | | | | | | | | | | | | | | | | | | | | | | | | | |
Income from investment operations: | | | | | | | | | | | | | | | | | | | | | | | | | | | | | | | | | | | | |
Net investment income | | | 0.32 | | | | 0.35 | | | | 0.43 | | | | 0.47 | | | | 0.50 | | | | 0.36 | | | | 0.16 | | | | 0.25 | | | | 0.25 | |
Net gains (losses) on securities (both realized and unrealized) | | | 0.29 | | | | 1.10 | | | | 1.25 | | | | (4.70 | ) | | | 0.90 | | | | 0.24 | | | | 0.57 | | | | 0.28 | | | | 1.04 | |
| | | | | | | | | | | | | | | | | | | | | | | | | | | | | | | | | | | | |
Total income (loss) from investment operations | | | 0.61 | | | | 1.45 | | | | 1.68 | | | | (4.23 | ) | | | 1.40 | | | | 0.60 | | | | 0.73 | | | | 0.53 | | | | 1.29 | |
| | | | | | | | | | | | | | | | | | | | | | | | | | | | | | | | | | | | |
Less distributions: | | | | | | | | | | | | | | | | | | | | | | | | | | | | | | | | | | | | |
Dividends from net investment income | | | (0.34 | ) | | | (0.66 | ) | | | (0.48 | ) | | | (0.44 | ) | | | (0.42 | ) | | | (0.45 | ) | | | (0.15 | ) | | | (0.26 | ) | | | (0.59 | ) |
Distributions from net realized gains on securities | | | — | | | | — | | | | — | | | | (0.79 | ) | | | (0.72 | ) | | | — | | | | — | | | | — | | | | — | |
| | | | | | | | | | | | | | | | | | | | | | | | | | | | | | | | | | | | |
Total distributions | | | (0.34 | ) | | | (0.66 | ) | | | (0.48 | ) | | | (1.23 | ) | | | (1.14 | ) | | | (0.45 | ) | | | (0.15 | ) | | | (0.26 | ) | | | (0.59 | ) |
| | | | | | | | | | | | | | | | | | | | | | | | | | | | | | | | | | | | |
Net asset value, end of period | | $ | 12.89 | | | $ | 12.62 | | | $ | 11.83 | | | $ | 10.63 | | | $ | 16.09 | | | $ | 12.93 | | | $ | 12.78 | | | $ | 11.93 | | | $ | 11.66 | |
| | | | | | | | | | | | | | | | | | | | | | | | | | | | | | | | | | | | |
Total return A | | | 4.87 | % | | | 12.47 | % | | | 16.64 | % | | | (28.23 | )% | | | 9.31 | % | | | 4.73 | % | | | 5.99 | %B | | | 4.52 | % | | | 12.06 | % |
| | | | | | | | | | | | | | | | | | | | | | | | | | | | | | | | | | | | |
Ratios and supplemental data: | | | | | | | | | | | | | | | | | | | | | | | | | | | | | | | | | | | | |
Net assets, end of period (in thousands) | | $ | 30,962 | | | $ | 33,405 | | | $ | 29,808 | | | $ | 36,557 | | | $ | 51,399 | | | $ | 401 | | | $ | 46 | | | $ | 83,657 | | | $ | 84,500 | |
| | | | | | | | | |
Ratios to average net assets (annualized): | | | | | | | | | | | | | | | | | | | | | | | | | | | | | | | | | | | | |
Expenses, before reimbursements | | | 0.58 | % | | | 0.58 | % | | | 0.60 | % | | | 0.56 | % | | | 0.57 | % | | | 1.48 | % | | | 0.68 | %C | | | 0.92 | % | | | 0.93 | % |
Expenses, net of reimbursements | | | 0.58 | % | | | 0.58 | % | | | 0.60 | % | | | 0.56 | % | | | 0.57 | % | | | 0.70 | % | | | 0.68 | %C | | | 0.92 | % | | | 0.93 | % |
| | | | | | | | | |
Net investment income, before reimbursements | | | 2.49 | % | | | 2.67 | % | | | 3.60 | % | | | 3.37 | % | | | 2.91 | % | | | 1.55 | % | | | 2.54 | %C | | | 2.16 | % | | | 2.34 | % |
| | | | | | | | | |
Net investment income, net of reimbursements | | | 2.49 | % | | | 2.67 | % | | | 3.60 | % | | | 3.37 | % | | | 2.91 | % | | | 2.34 | % | | | 2.54 | %C | | | 2.16 | % | | | 2.34 | % |
Portfolio turnover rate | | | 47 | % | | | 40 | % | | | 57 | % | | | 53 | % | | | 50 | % | | | 47 | % | | | 40 | %D | | | 47 | % | | | 40 | % |
| A | Based on net asset value, which does not reflect the sales charge, redemption fee, or contingent deferred sales charge, if applicable. |
| D | Portfolio turnover rate is for the period from November 1, 2009 through October 31, 2010. |
44
American Beacon Balanced Fund
Financial Highlights
(For a share outstanding throughout the period)
| | | | | | | | | | | | | | | | | | | | | | | | | | | | | | | | | | | | | | | | | | | | | | |
| Investor Class | | | Advisor Class | | | A Class | | | C Class | |
| Year Ended October 31, | | | Year Ended October 31, | | | Year
Ended
October 31, | | | May 17 to
October 31, | | | Year
Ended
October 31, | | | September 1 to
October 31, | |
| 2009 | | | 2008 | | | 2007 | | | 2011 | | | 2010 | | | 2009 | | | 2008 | | | 2007 | | | 2011 | | | 2010 | | | 2011 | | | 2010 | |
| $ | 9.91 | | | $ | 15.09 | | | $ | 14.91 | | | $ | 12.11 | | | $ | 11.35 | | | $ | 9.77 | | | $ | 14.95 | | | $ | 14.83 | | | $ | 11.94 | | | $ | 11.50 | | | $ | 11.92 | | | $ | 11.32 | |
| | | | | | | | | | | | | | | | | | | | | | | | | | | | | | | | | | | | | | | | | | | | | | |
| | | | | | | | | | | |
| | | | | | | | | | | | | | | | | | | | | | | | | | | | | | | | | | | | | | | | | | | | | | |
| | 0.30 | | | | 0.41 | | | | 0.41 | | | | 0.41 | | | | 0.32 | | | | 0.37 | | | | 0.34 | | | | 0.41 | | | | 0.38 | | | | 0.02 | | | | 0.20 | | | | 0.01 | |
|
1.23 |
| | | (4.39 | ) | | | 0.87 | | | | 0.11 | | | | 1.01 | | | | 1.21 | | | | (4.31 | ) | | | 0.83 | | | | 0.14 | | | | 0.43 | | | | 0.22 | | | | 0.59 | |
| | | | | | | | | | | | | | | | | | | | | | | | | | | | | | | | | | | | | | | | | | | | | | |
| | 1.53 | | | | (3.98 | ) | | | 1.28 | | | | 0.52 | | | | 1.33 | | | | 1.58 | | | | (3.97 | ) | | | 1.24 | | | | 0.52 | | | | 0.45 | | | | 0.42 | | | | 0.60 | |
| | | | | | | | | | | | | | | | | | | | | | | | | | | | | | | | | | | | | | | | | | | | | | |
| | | | | | | | | | | |
| | | | | | | | | | | | | | | | | | | | | | | | | | | | | | | | | | | | | | | | | | | | | | |
| | (0.48 | ) | | | (0.41 | ) | | | (0.38 | ) | | | (0.27 | ) | | | (0.57 | ) | | | — | | | | (0.42 | ) | | | (0.40 | ) | | | (0.40 | ) | | | (0.01 | ) | | | (0.21 | ) | | | 0.00 | |
| | — | | | | (0.79 | ) | | | (0.72 | ) | | | — | | | | — | | | | — | | | | (0.79 | ) | | | (0.72 | ) | | | — | | | | — | | | | — | | | | — | |
| | | | | | | | | | | | | | | | | | | | | | | | | | | | | | | | | | | | | | | | | | | | | | |
| | (0.48 | ) | | | (1.20 | ) | | | (1.10 | ) | | | (0.27 | ) | | | (0.57 | ) | | | — | | | | (1.21 | ) | | | (1.12 | ) | | | (0.40 | ) | | | (0.01 | ) | | | (0.21 | ) | | | 0.00 | |
| | | | | | | | | | | | | | | | | | | | | | | | | | | | | | | | | | | | | | | | | | | | | | |
| $ | 10.96 | | | $ | 9.91 | | | $ | 15.09 | | | $ | 12.36 | | | $ | 12.11 | | | $ | 11.35 | | | $ | 9.77 | | | $ | 14.95 | | | $ | 12.06 | | | $ | 11.94 | | | $ | 12.13 | | | $ | 11.92 | |
| | | | | | | | | | | | | | | | | | | | | | | | | | | | | | | | | | | | | | | | | | | | | | |
| | 16.29 | % | | | (28.39 | )% | | | 9.06 | % | | | 4.33 | % | | | 11.96 | % | | | 16.17 | % | | | (28.65 | )% | | | 8.83 | % | | | 4.37 | % | | | 3.90 | %B | | | 3.56 | % | | | 5.33 | %B |
| | | | | | | | | | | | | | | | | | | | | | | | | | | | | | | | | | | | | | | | | | | | | | |
| | | | | | | | | | | |
| | | | | | | | | | | | | | | | | | | | | | | | | | | | | | | | | | | | | | | | | | | | | | |
| $ | 94,915 | | | $ | 105,473 | | | $ | 202,750 | | | $ | 3,536 | | | $ | 6,127 | | | $ | 6,812 | | | $ | 7,674 | | | $ | 9,504 | | | $ | 588 | | | $ | 47 | | | $ | 922 | | | $ | 1 | |
| | | | | | | | | | | | | | | | | | | | | | | | | | | | | | | | | | | | | | | | | | | | | | |
| | | | | | | | | | | | | | | | | | | | | | | | | | | | | | | | | | | | | | | | | | | | | | |
| | 0.89 | % | | | 0.82 | % | | | 0.83 | % | | | 1.09 | % | | | 1.09 | % | | | 1.09 | % | | | 1.07 | % | | | 1.07 | % | | | 1.59 | % | | | 1.08 | %C | | | 2.34 | % | | | 2.14 | %C |
| | 0.89 | % | | | 0.82 | % | | | 0.83 | % | | | 1.09 | % | | | 1.09 | % | | | 1.09 | % | | | 1.07 | % | | | 1.07 | % | | | 1.10 | % | | | 1.08 | %C | | | 1.82 | % | | | 1.86 | %C |
| | | | | | | | | | | |
| | 3.26 | % | | | 3.12 | % | | | 2.65 | % | | | 2.01 | % | | | 2.18 | % | | | 3.06 | % | | | 2.86 | % | | | 2.34 | % | | | 1.47 | % | | | 1.51 | %C | | | 0.66 | % | | | 0.20 | %C |
| | | | | | | | | | | |
| | 3.26 | % | | | 3.12 | % | | | 2.65 | % | | | 2.01 | % | | | 2.18 | % | | | 3.06 | % | | | 2.86 | % | | | 2.34 | % | | | 1.95 | % | | | 1.51 | %C | | | 1.18 | % | | | 0.48 | %C |
| | 57 | % | | | 53 | % | | | 50 | % | | | 47 | % | | | 40 | % | | | 57 | % | | | 53 | % | | | 50 | % | | | 47 | % | | | 40 | %D | | | 47 | % | | | 40 | %D |
45
American Beacon Balanced Fund
Financial Highlights
(For a share outstanding throughout the period)
| | | | | | | | | | | | | | | | | | | | |
| | | AMR Class | |
| | | Year Ended October 31, | |
| | | 2011 | | | 2010 | | | 2009 | | | 2008 | | | 2007 | |
Net asset value, beginning of period | | $ | 12.02 | | | $ | 11.31 | | | $ | 10.19 | | | $ | 15.49 | | | $ | 15.27 | |
| | | | | | | | | | | | | | | | | | | | |
Income from investment operations: | | | | | | | | | | | | | | | | | | | | |
Net investment income | | | 0.34 | | | | 0.35 | | | | 0.39 | | | | 0.49 | | | | 0.50 | |
Net gains (losses) on securities (both realized and unrealized) | | | 0.27 | | | | 1.07 | | | | 1.24 | | | | (4.52 | ) | | | 0.89 | |
| | | | | | | | | | | | | | | | | | | | |
Total income (loss) from investment operations | | | 0.61 | | | | 1.42 | | | | 1.63 | | | | (4.03 | ) | | | 1.39 | |
| | | | | | | | | | | | | | | | | | | | |
Less distributions: | | | | | | | | | | | | | | | | | | | | |
Dividends from net investment income | | | (0.36 | ) | | | (0.71 | ) | | | (0.51 | ) | | | (0.48 | ) | | | (0.45 | ) |
Distributions from net realized gains on securities | | | — | | | | — | | | | — | | | | (0.79 | ) | | | (0.72 | ) |
| | | | | | | | | | | | | | | | | | | | |
Total distributions | | | (0.36 | ) | | | (0.71 | ) | | | (0.51 | ) | | | (1.27 | ) | | | (1.17 | ) |
| | | | | | | | | | | | | | | | | | | | |
Net asset value, end of period | | $ | 12.27 | | | $ | 12.02 | | | $ | 11.31 | | | $ | 10.19 | | | $ | 15.49 | |
| | | | | | | | | | | | | | | | | | | | |
Total return A | | | 5.09 | % | | | 12.84 | % | | | 16.95 | % | | | (28.08 | )% | | | 9.59 | % |
| | | | | | | | | | | | | | | | | | | | |
Ratios and supplemental data: | | | | | | | | | | | | | | | | | | | | |
Net assets, end of period (in thousands) | | $ | 734,927 | | | $ | 748,422 | | | $ | 681,197 | | | $ | 604,209 | | | $ | 898,584 | |
| | | | | |
Ratios to average net assets (annualized): | | | | | | | | | | | | | | | | | | | | |
Expenses, before reimbursements | | | 0.33 | % | | | 0.33 | % | | | 0.35 | % | | | 0.31 | % | | | 0.31 | % |
Expenses, net of reimbursements | | | 0.33 | % | | | 0.33 | % | | | 0.35 | % | | | 0.31 | % | | | 0.31 | % |
Net investment income, before reimbursements | | | 2.75 | % | | | 2.92 | % | | | 3.75 | % | | | 3.62 | % | | | 3.21 | % |
Net investment income, net of reimbursements | | | 2.75 | % | | | 2.92 | % | | | 3.75 | % | | | 3.62 | % | | | 3.21 | % |
Portfolio turnover rate | | | 47 | % | | | 40 | % | | | 57 | % | | | 53 | % | | | 50 | % |
| A | Based on net asset value, which does not reflect the sales charge, redemption fee, or contingent deferred sales charge, if applicable. |
46
This page intentionally left blank.
47
American Beacon Large Cap Growth Fund
Financial Highlights
(For a share outstanding throughout the period)
| | | | | | | | | | | | | | | | | | | | |
| | | Institutional Class | |
| | | Year Ended October 31, | |
| | | | | | | | | | | | | | | | |
| | | | | | | | | | | | | | | | |
| | | 2011 | | | 2010 | | | 2009A | | | 2008 | | | 2007 | |
Net asset value, beginning of period | | $ | 5.84 | | | $ | 4.97 | | | $ | 4.49 | | | $ | 7.67 | | | $ | 6.89 | |
| | | | | | | | | | | | | | | | | | | | |
Income from investment operations: | | | | | | | | | | | | | | | | | | | | |
Net investment income (loss) | | | (0.01 | ) | | | 0.00 | | | | 0.03 | | | | 0.05 | | | | 0.04 | |
Net gains (losses) on securities (both realized and unrealized) | | | 0.30 | | | | 0.88 | | | | 0.50 | | | | (2.97 | ) | | | 0.77 | |
| | | | | | | | | | | | | | | | | | | | |
Total income (loss) from investment operations | | | 0.29 | | | | 0.88 | | | | 0.53 | | | | (2.92 | ) | | | 0.81 | |
| | | | | | | | | | | | | | | | | | | | |
Less distributions: | | | | | | | | | | | | | | | | | | | | |
Dividends from net investment income | | | (0.01 | ) | | | (0.01 | ) | | | (0.05 | ) | | | (0.04 | ) | | | (0.03 | ) |
Distributions from net realized gains on securities | | | — | | | | — | | | | — | | | | (0.22 | ) | | | — | |
| | | | | | | | | | | | | | | | | | | | |
Total distributions | | | (0.01 | ) | | | (0.01 | ) | | | (0.05 | ) | | | (0.26 | ) | | | (0.03 | ) |
| | | | | | | | | | | | | | | | | | | | |
Net asset value, end of period | | $ | 6.12 | | | $ | 5.84 | | | $ | 4.97 | | | $ | 4.49 | | | $ | 7.67 | |
| | | | | | | | | | | | | | | | | | | | |
Total return B,F | | | 4.92 | % | | | 17.70 | % | | | 12.09 | % | | | (39.35 | )% | | | 11.84 | % |
| | | | | | | | | | | | | | | | | | | | |
Ratios and supplemental data: | | | | | | | | | | | | | | | | | | | | |
Net assets, end of period (in thousands) | | $ | 143 | | | $ | 125 | | | $ | 130 | | | $ | 83 | | | $ | 119 | |
Ratios to average net assets (annualized): | | | | | | | | | | | | | | | | | | | | |
Expenses, before reimbursements | | | 1.06 | % | | | 0.94 | % | | | 0.94 | % | | | 0.95 | % | | | 1.06 | % |
Expenses, net of reimbursements | | | 1.06 | % | | | 0.94 | % | | | 0.93 | % | | | 0.89 | % | | | 0.90 | % |
Net investment income (loss), before reimbursements | | | (0.15 | )% | | | (0.02 | )% | | | 0.36 | % | | | 0.68 | % | | | 0.42 | % |
Net investment income (loss), net of reimbursements | | | (0.15 | )% | | | (0.02 | )% | | | 0.38 | % | | | 0.74 | % | | | 0.58 | % |
Portfolio turnover rate | | | 179 | % | | | 92 | % | | | 147 | % | | | 112 | % | | | 128 | % |
| A | On March 17, 2009, Winslow Capital Management, Inc. assumed management of the Large Cap Growth Fund's assets previously managed by Goldman Sachs Asset Management, L.P. |
| B | Based on net asset value, which does not reflect the sales charge, redemption fee, or contingent deferred sales charge, if applicable. |
| E | Portfolio turnover rate is for the period from November 1, 2009 through October 31, 2010. |
| F | May include adjustments in accordance with accounting principles generally accepted in the United States of America and as such, the net asset value for financial reporting purposes and the returns based upon those net asset values may differ from the net asset value and returns for shareholder transactions. |
48
American Beacon Large Cap Growth Fund
Financial Highlights
(For a share outstanding throughout the period)
| | | | | | | | | | | | | | | | | | | | | | | | | | | | | | | | | | | | | | | | | | |
| Y Class | | | A Class | | | C Class | | | AMR Class | |
Year
Ended
October 31,
2011 | | | March 1
to
October 31,
2010 | | | Year
Ended
October 31,
2011 | | | May 17
to
October 31,
2010 | | | Year
Ended
October 31,
2011 | | | September
1 to
October 31,
2010 | | | Year Ended October 31, | |
| | | | | | | 2011 | | | 2010 | | | 2009A | | | 2008 | | | 2007 | |
| $ | 5.83 | | | $ | 5.41 | | | $ | 5.83 | | | $ | 5.40 | | | $ | 5.83 | | | $ | 5.17 | | | $ | 5.88 | | | $ | 5.00 | | | $ | 4.52 | | | $ | 7.72 | | | $ | 6.95 | |
| | | | | | | | | | | | | | | | | | | | | | | | | | | | | | | | | | | | | | | | | | |
| | | | | | | | | | |
| | | | | | | | | | | | | | | | | | | | | | | | | | | | | | | | | | | | | | | | | | |
| | (0.09 | ) | | | 0.00 | | | | (0.06 | ) | | | (0.01 | ) | | | (0.07 | ) | | | (0.02 | ) | | | 0.02 | | | | 0.01 | | | | 0.04 | | | | 0.07 | | | | 0.06 | |
| | 0.36 | | | | 0.42 | | | | 0.31 | | | | 0.44 | | | | 0.29 | | | | 0.68 | | | | 0.28 | | | | 0.89 | | | | 0.51 | | | | (2.99 | ) | | | 0.77 | |
| | | | | | | | | | | | | | | | | | | | | | | | | | | | | | | | | | | | | | | | | | |
| | 0.27 | | | | 0.42 | | | | 0.25 | | | | 0.43 | | | | 0.22 | | | | 0.66 | | | | 0.30 | | | | 0.90 | | | | 0.55 | | | | (2.92 | ) | | | 0.83 | |
| | | | | | | | | | | | | | | | | | | | | | | | | | | | | | | | | | | | | | | | | | |
| | | | | | | | | | |
| | | | | | | | | | | | | | | | | | | | | | | | | | | | | | | | | | | | | | | | | | |
| | (0.01 | ) | | | — | | | | — | | | | — | | | | — | | | | — | | | | (0.01 | ) | | | (0.02 | ) | | | (0.07 | ) | | | (0.06 | ) | | | (0.06 | ) |
| | — | | | | — | | | | — | | | | — | | | | — | | | | — | | | | — | | | | — | | | | — | | | | (0.22 | ) | | | — | |
| | | | | | | | | | | | | | | | | | | | | | | | | | | | | | | | | | | | | | | | | | |
| | (0.01 | ) | | | — | | | | — | | | | — | | | | — | | | | — | | | | (0.01 | ) | | | (0.02 | ) | | | (0.07 | ) | | | (0.28 | ) | | | (0.06 | ) |
| | | | | | | | | | | | | | | | | | | | | | | | | | | | | | | | | | | | | | | | | | |
| $ | 6.09 | | | $ | 5.83 | | | $ | 6.08 | | | $ | 5.83 | | | $ | 6.05 | | | $ | 5.83 | | | $ | 6.17 | | | $ | 5.88 | | | $ | 5.00 | | | $ | 4.52 | | | $ | 7.72 | |
| | | | | | | | | | | | | | | | | | | | | | | | | | | | | | | | | | | | | | | | | | |
| | 4.58 | % | | | 7.76 | %C | | | 4.29 | % | | | 7.96 | %C | | | 3.77 | % | | | 12.77 | %C | | | 5.13 | % | | | 18.11 | % | | | 12.46 | % | | | (39.17 | )% | | | 12.07 | % |
| | | | | | | | | | | | | | | | | | | | | | | | | | | | | | | | | | | | | | | | | | |
| | | | | | | | | | | | | | | | | | | | | | | | | | | | | | | | | | | | | | | | | | |
| $ | 6 | | | $ | 22 | | | $ | 176 | | | $ | 7 | | | $ | 1 | | | $ | 1 | | | $ | 85,764 | | | $ | 96,978 | | | $ | 71,154 | | | $ | 56,976 | | | $ | 101,698 | |
| | | | | | | | | | |
| | | | | | | | | | | | | | | | | | | | | | | | | | | | | | | | | | | | | | | | | | |
| | 9.75 | % | | | 1.06 | %D | | | 1.98 | % | | | 1.49 | %D | | | 141.71 | % | | | 3.14 | %D | | | 0.75 | % | | | 0.69 | % | | | 0.63 | % | | | 0.59 | % | | | 0.60 | % |
| | 1.28 | % | | | 1.06 | %D | | | 1.54 | % | | | 1.49 | %D | | | 2.17 | % | | | 2.20 | %D | | | 0.75 | % | | | 0.69 | % | | | 0.63 | % | | | 0.59 | % | | | 0.60 | % |
| | (8.81 | )% | | | (0.33 | )%D | | | (1.10 | )% | | | (0.90 | )%D | | | (140.73 | )% | | | (2.62 | )%D | | | 0.21 | % | | | 0.19 | % | | | 0.86 | % | | | 1.05 | % | | | 0.85 | % |
| | (0.34 | )% | | | (0.33 | )%D | | | (0.65 | )% | | | (0.90 | )%D | | | (1.20 | )% | | | (1.68 | )%D | | | 0.21 | % | | | 0.19 | % | | | 0.86 | % | | | 1.05 | % | | | 0.85 | % |
| | 179 | % | | | 92 | %E | | | 179 | % | | | 92 | %E | | | 179 | % | | | 92 | %E | | | 179 | % | | | 92 | % | | | 147 | % | | | 112 | % | | | 128 | % |
49
American Beacon Mid-Cap Value Fund
Financial Highlights
(For a share outstanding throughout the period)
| | | | | | | | | | | | | | | | | | | | | | | | | | | | | | | | | | | | |
| | | Institutional Class | | | Y Class | | | Investor Class | |
| | | Year Ended October 31, | | | Year Ended
October 31,
2011I | | |
March 1 to
October 31,
2010 | | | Year Ended
October 31, | |
| | | 2011I | | | 2010 | | | 2009 | | | 2008 | | | 2007 | | | | | 2011I | | | 2010 | |
Net asset value, beginning of period | | $ | 9.27 | | | $ | 7.57 | | | $ | 5.94 | | | $ | 11.01 | | | $ | 10.81 | | | $ | 9.27 | | | $ | 8.48 | | | $ | 9.20 | | | $ | 7.54 | |
| | | | | | | | | | | | | | | | | | | | | | | | | | | | | | | | | | | | |
Income from investment operations: | | | | | | | | | | | | | | | | | | | | | | | | | | | | | | | | | | | | |
Net investment income (loss) | | | 0.09 | | | | 0.08 | | | | 0.10 | | | | 0.16 | | | | 0.12 | | | | 0.08 | | | | 0.06 | | | | (0.03 | )A | | | 0.06 | |
Net gains (losses) on securities (both realized and unrealized) | | | 0.48 | | | | 1.67 | | | | 1.65 | | | | (4.31 | ) | | | 0.41 | | | | 0.48 | | | | 0.73 | | | | 0.63 | | | | 1.65 | |
| | | | | | | | | | | | | | | | | | | | | | | | | | | | | | | | | | | | |
Total income (loss) from investment operations | | | 0.57 | | | | 1.75 | | | | 1.75 | | | | (4.15 | ) | | | 0.53 | | | | 0.56 | | | | 0.79 | | | | 0.60 | | | | 1.71 | |
| | | | | | | | | | | | | | | | | | | | | | | | | | | | | | | | | | | | |
Less distributions: | | | | | | | | | | | | | | | | | | | | | | | | | | | | | | | | | | | | |
Dividends from net investment income | | | (0.11 | ) | | | (0.05 | ) | | | (0.12 | ) | | | (0.16 | ) | | | (0.07 | ) | | | (0.11 | ) | | | — | | | | (0.09 | ) | | | (0.05 | ) |
Distributions from net realized gains on securities | | | — | | | | — | | | | — | | | | (0.76 | ) | | | (0.26 | ) | | | — | | | | — | | | | — | | | | — | |
| | | | | | | | | | | | | | | | | | | | | | | | | | | | | | | | | | | | |
Total distributions | | | (0.11 | ) | | | (0.05 | ) | | | (0.12 | ) | | | (0.92 | ) | | | (0.33 | ) | | | (0.11 | ) | | | — | | | | (0.09 | ) | | | (0.05 | ) |
| | | | | | | | | | | | | | | | | | | | | | | | | | | | | | | | | | | | |
Redemption fees added to beneficial interestsB | | | 0 00 | | | | 0.00 | | | | 0.00 | | | | 0.00 | | | | 0.00 | | | | 0.00 | | | | 0.00 | | | | 0.00 | | | | 0.00 | |
| | | | | | | | | | | | | | | | | | | | | | | | | | | | | | | | | | | | |
Net asset value, end of period | | $ | 9.73 | | | $ | 9.27 | | | $ | 7.57 | | | $ | 5.94 | | | $ | 11.01 | | | $ | 9.72 | | | $ | 9.27 | | | $ | 9.71 | | | $ | 9.20 | |
| | | | | | | | | | | | | | | | | | | | | | | | | | | | | | | | | | | | |
Total return C,D | | | 6 08 | % | | | 23.19 | % | | | 30.24 | % | | | (40.86 | )% | | | 4.97 | % | | | 5.98 | % | | | 9.32 | %E | | | 6.49 | % | | | 22.77 | % |
| | | | | | | | | | | | | | | | | | | | | | | | | | | | | | | | | | | | |
Ratios and supplemental data: | | | | | | | | | | | | | | | | | | | | | | | | | | | | | | | | | | | | |
Net assets, end of period (in thousands) | | $ | 33,441 | | | $ | 2,778 | | | $ | 2,197 | | | $ | 2,256 | | | $ | 6,047 | | | $ | 52 | | | $ | 1 | | | $ | 1,812 | | | $ | 35,223 | |
Ratios to average net assets (annualized): | | | | | | | | | | | | | | | | | | | | | | | | | | | | | | | | | | | | |
Expenses, before reimbursements | | | 1.10 | % | | | 1.06 | % | | | 1.13 | % | | | 1.16 | % | | | 1.09 | % | | | 11.62 | % | | | 1.05 | %F | | | 1.32 | % | | | 1.27 | % |
Expenses, net of reimbursements | | | 0.97 | % | | | 0.98 | % | | | 0.98 | % | | | 0.98 | % | | | 0.92 | % | | | 1.06 | % | | | 1.01 | %F | | | 1.23 | % | | | 1.23 | % |
Net investment income (loss), before reimbursements | | | 0.91 | % | | | 0.90 | % | | | 1.14 | % | | | 1.33 | % | | | 1.05 | % | | | (9.44 | )% | | | 0.93 | %F | | | 1.33 | % | | | 0.70 | % |
Net investment income, net of reimbursements | | | 1.04 | % | | | 0.99 | % | | | 1.29 | % | | | 1.51 | % | | | 1.22 | % | | | 1.12 | % | | | 0.97 | %F | | | 1.42 | % | | | 0.75 | % |
Portfolio turnover rate | | | 107 | % | | | 40 | % | | | 42 | % | | | 28 | % | | | 35 | % | | | 107 | % | | | 40 | %G | | | 107 | % | | | 40 | % |
| A | Based on average shares outstanding. |
| B | Amounts represent less than $0.01 per share. |
| C | May include adjustments in accordance with accounting principles generally accepted in the United States of America and as such, the net asset value for financial reporting purposes and the returns based upon those net asset values may differ from the net asset value and returns for shareholder transactions. |
| D | Based on net asset value, which does not reflect the sales charge, redemption fee, or contingent deferred sales charge, if applicable. |
| G | Portfolio turnover rate is for the period from November 1, 2009 through October 31, 2010. |
| H | Portfolio turnover rate is for the period from November 1, 2006 through October 31, 2007. |
| I | Lee Munder Capital Group, LLC was added as an investment manager to the Mid-Cap Value Fund on July 1, 2011. |
50
American Beacon Funds Mid-Cap Value Fund
Financial Highlights
(For a share outstanding throughout the period)
| | | | | | | | | | | | | | | | | | | | | | | | | | | | | | | | | | | | | | | | | | | | | | | | | | | | | | | | | | |
| Investor Class | | | Advisor Class | | | AMR Class | | | A Class | |
| Year Ended October 31, | | | Year Ended October 31, | | | June 29
to
October 31,
2007 | | | Year Ended October 31, | | | Year
Ended
October 31,
2011I | | | May 17
to
October 31,
2010 | |
| 2009 | | | 2008 | | | 2007 | | | 2011I | | | 2010 | | | 2009 | | | 2008 | | | | 2011I | | | 2010 | | | 2009 | | | 2008 | | | 2007 | | | |
| $ | 5.92 | | | $ | 10.96 | �� | | $ | 10.80 | | | $ | 9.12 | | | $ | 7.49 | | | $ | 5.87 | | | $ | 10.94 | | | $ | 11.73 | | | $ | 9.27 | | | $ | 7.59 | | | $ | 5.97 | | | $ | 11.07 | | | $ | 10.87 | | | $ | 9.18 | | | $ | 9.00 | |
| | | | | | | | | | | | | | | | | | | | | | | | | | | | | | | | | | | | | | | | | | | | | | | | | | | | | | | | | | |
| | | | | | | | | | | | | | |
| | | | | | | | | | | | | | | | | | | | | | | | | | | | | | | | | | | | | | | | | | | | | | | | | | | | | | | | | | |
| | 0.07 | | | | 0.14 | | | | 0.10 | | | | 0.07 | | | | 0.07 | | | | 0.15 | | | | 0.10 | | | | 0.01 | | | | 0.15 | | | | 0.10 | | | | 0.07 | | | | 0.18 | | | | 0.18 | | | | 0.11 | | | | 0.01 | |
|
1.66 |
| | | (4.31 | ) | | | 0.40 | | | | 0.45 | | | | 1.61 | | | | 1.60 | | | | (4.27 | ) | | | (0.80 | ) | | | 0.43 | | | | 1.66 | | | | 1.70 | | | | (4.35 | ) | | | 0.36 | | | | 0.40 | | | | 0.17 | |
| | | | | | | | | | | | | | | | | | | | | | | | | | | | | | | | | | | | | | | | | | | | | | | | | | | | | | | | | | |
| | 1.73 | | | | (4.17 | ) | | | 0.50 | | | | 0.52 | | | | 1.68 | | | | 1.75 | | | | (4.17 | ) | | | (0.79 | ) | | | 0.58 | | | | 1.76 | | | | 1.77 | | | | (4.17 | ) | | | 0.54 | | | | 0.51 | | | | 0.18 | |
| | | | | | | | | | | | | | | | | | | | | | | | | | | | | | | | | | | | | | | | | | | | | | | | | | | | | | | | | | |
| | | | | | | | | | | | | | |
| | | | | | | | | | | | | | | | | | | | | | | | | | | | | | | | | | | | | | | | | | | | | | | | | | | | | | | | | | |
| | (0.11 | ) | | | (0.11 | ) | | | (0.08 | ) | | | (0.08 | ) | | | (0.05 | ) | | | (0.13 | ) | | | (0.14 | ) | | | — | | | | (0.12 | ) | | | (0.08 | ) | | | (0.15 | ) | | | (0.17 | ) | | | (0.08 | ) | | | (0.08 | ) | | | — | |
|
— |
| | | (0.76 | ) | | | (0.26 | ) | | | — | | | | — | | | | — | | | | (0.76 | ) | | | — | | | | — | | | | — | | | | — | | | | (0.76 | ) | | | (0.26 | ) | | | — | | | | — | |
| | | | | | | | | | | | | | | | | | | | | | | | | | | | | | | | | | | | | | | | | | | | | | | | | | | | | | | | | | |
| | (0.11 | ) | | | (0.87 | ) | | | (0.34 | ) | | | (0.08 | ) | | | (0.05 | ) | | | (0.13 | ) | | | (0.90 | ) | | | — | | | | (0.12 | ) | | | (0.08 | ) | | | (0.15 | ) | | | (0.93 | ) | | | (0.34 | ) | | | (0.08 | ) | | | — | |
| | | | | | | | | | | | | | | | | | | | | | | | | | | | | | | | | | | | | | | | | | | | | | | | | | | | | | | | | | |
| | 0.00 | | | | 0.00 | | | | 0.00 | | | | 0.00 | | | | 0.00 | | | | 0.00 | | | | 0.00 | | | | 0.00 | | | | 0.00 | | | | 0.00 | | | | 0.00 | | | | 0.00 | | | | 0.00 | | | | 0.00 | | | | 0.00 | |
| | | | | | | | | | | | | | | | | | | | | | | | | | | | | | | | | | | | | | | | | | | | | | | | | | | | | | | | | | |
| $ | 7.54 | | | $ | 5.92 | | | $ | 10.96 | | | $ | 9.56 | | | $ | 9.12 | | | $ | 7.49 | | | $ | 5.87 | | | $ | 10.94 | | | $ | 9.73 | | | $ | 9.27 | | | $ | 7.59 | | | $ | 5.97 | | | $ | 11.07 | | | $ | 9.61 | | | $ | 9.18 | |
| | | | | | | | | | | | | | | | | | | | | | | | | | | | | | | | | | | | | | | | | | | | | | | | | | | | | | | | | | |
| | 29.93% | | | | (41.04 | )% | | | 4.68 | % | | | 5.65 | % | | | 22.53 | % | | | 30.64 | % | | | (41.28 | )% | | | (6.73 | )%E | | | 6.20 | % | | | 23.28 | % | | | 30.56 | % | | | (40.82 | )% | | | 5.09 | % | | | 5.49 | % | | | 2.00 | %E |
| | | | | | | | | | | | | | | | | | | | | | | | | | | | | | | | | | | | | | | | | | | | | | | | | | | | | | | | | | |
| | | | | | | | | | | | | | | | | | | | | | | | | | | | | | | | | | | | | | | | | | | | | | | | | | | | | | | | | | |
| $ | 23,369 | | | $ | 16,550 | | | $ | 43,158 | | | $ | 37 | | | $ | 78 | | | $ | 7 | | | $ | 1 | | | $ | 1 | | | $ | 56,963 | | | $ | 64,012 | | | $ | 53,604 | | | $ | 34,253 | | | $ | 78,794 | | | $ | 101 | | | $ | 18 | |
| | | | | | | | | | | | | | | | | | | | | | | | | | | | | | | | | | | | | | | | | | | | | | | | | | | | | | | | | | |
| | 1.34 | % | | | 1.32 | % | | | 1.26 | % | | | 1.98 | % | | | 1.55 | % | | | 1.58 | % | | | 2.04 | % | | | 1.80 | %F | | | 0.83 | % | | | 0.77 | % | | | 0.82 | % | | | 0.82 | % | | | 0.75 | % | | | 3.44 | % | | | 1.51 | %F |
| | 1.23 | % | | | 1.23 | % | | | 1.23 | % | | | 1.49 | % | | | 1.44 | % | | | 1.50 | % | | | 1.50 | % | | | 1.50 | %F | | | 0.83 | % | | | 0.77 | % | | | 0.83 | % | | | 0.82 | % | | | 0.75 | % | | | 1.48 | % | | | 1.48 | %F |
|
0.87 |
% | | | 1.18 | % | | | 0.90 | % | | | 0.21 | % | | | 0.36 | % | | | 0.14 | % | | | 0.48 | % | | | 0.02 | %F | | | 1.34 | % | | | 1.19 | % | | | 1.38 | % | | | 1.68 | % | | | 1.40 | % | | | (1.36 | )% | | | 0.44 | %F |
| | 0.98 | % | | | 1.27 | % | | | 0.93 | % | | | 0.69 | % | | | 0.47 | % | | | 0.22 | % | | | 1.02 | % | | | 0.32 | %F | | | 1.34 | % | | | 1.19 | % | | | 1.38 | % | | | 1.68 | % | | | 1.41 | % | | | 0.60 | % | | | 0.47 | %F |
| | 42 | % | | | 28 | % | | | 35 | % | | | 107 | % | | | 40 | % | | | 42 | % | | | 28 | % | | | 35 | %H | | | 107 | % | | | 40 | % | | | 42 | % | | | 28 | % | | | 35 | % | | | 107 | % | | | 40 | %G |
51
American Beacon Mid-Cap Value Fund
Financial Highlights
(For a share outstanding throughout the period)
| | | | | | | | |
| | | C Class | |
| | | Year
Ended
October 31,
2011I | | | September 1
to
October 31,
2010 | |
Net asset value, beginning of period | | $ | 9.18 | | | $ | 8.30 | |
| | | | | | | | |
Income from investment operations: | | | | | | | | |
Net investment income (loss) | | | 0.05 | | | | (0.01 | ) |
Net gains on securities (both realized and unrealized) | | | 0.38 | | | | 0.89 | |
| | | | | | | | |
Total income from investment operations | | | 0.43 | | | | 0.88 | |
| | | | | | | | |
Less distributions: | | | | | | | | |
Dividends from net investment income | | | (0.05 | ) | | | — | |
Distributions from net realized gains on securities | | | — | | | | — | |
| | | | | | | | |
Total distributions | | | (0.05 | ) | | | — | |
| | | | | | | | |
Redemption fees added to beneficial interestsB | | | 0.00 | | | | 0.00 | |
| | | | | | | | |
Net asset value, end of period | | $ | 9.56 | | | $ | 9.18 | |
| | | | | | | | |
Total return C,D | | | 4.64 | % | | | 10.60 | %E |
| | | | | | | | |
Ratios and supplemental data: | | | | | | | | |
Net assets, end of period (in thousands) | | $ | 22 | | | $ | 1 | |
Ratios to average net assets (annualized): | | | | | | | | |
Expenses, before reimbursements | | | 19.14 | % | | | 3.20 | %F |
Expenses, net of reimbursements | | | 2.24 | % | | | 2.24 | %F |
Net investment (loss), before reimbursements | | | (16.96 | )% | | | (1.32 | )%F |
Net investment (loss), net of reimbursements | | | (0.06 | )% | | | (0.36 | )%F |
Portfolio turnover rate | | | 107 | % | | | 40 | %G |
| A | Based on average shares outstanding. |
| B | Amounts represent less than $0.01 per share. |
| C | May include adjustments in accordance with accounting principles generally accepted in the United States of America and as such, the net asset value for financial reporting purposes and the returns based upon those net asset values may differ from the net asset value and returns for shareholder transactions. |
| D | Based on net asset value, which does not reflect the sales charge, redemption fee, or contingent deferred sales charge, if applicable. |
| G | Portfolio turnover rate is for the period from November 1, 2009 through October 31, 2010. |
| H | Portfolio turnover rate is for the period from November 1, 2006 through October 31, 2007. |
| I | Lee Munder Capital Group, LLC was added as an investment manager to the Mid-Cap Value Fund on July 1, 2011. |
52
American Beacon Funds
Privacy Policy & Federal Tax Information
October 31, 2011 (Unaudited)
Privacy Policy
The American Beacon Funds recognize and respect the privacy of our shareholders. We are providing this notice to you so you will understand how shareholder information may be collected and used.
We may collect nonpublic personal information about you from one or more of the following sources:
| | • | | information we receive from you on applications or other forms; |
| | • | | information about your transactions with us or our service providers; and |
| | • | | information we receive from third parties. |
We do not disclose any nonpublic personal information about our customers or former customers to anyone, except as permitted by law.
We restrict access to your nonpublic personal information to those employees or service providers who need to know that information to provide products or services to you. To ensure the confidentiality of your nonpublic personal information, we maintain safeguards that comply with federal standards.
Federal Tax Information
For corporate shareholders in the Funds, the percentage of ordinary dividend income distributed for the year ended October 31, 2010, which is designated as qualifying for the dividends-received deduction, was as follows:
| | | | |
Balanced Fund | | | 37.27 | % |
Large Cap Growth Fund | | | 95.10 | % |
Mid-Cap Value Fund | | | 77.62 | % |
For shareholders in the Funds, the percentage of dividend income distributed for the year ended October 31, 2010, which is designated as qualified dividends income under the Jobs and Growth Tax Relief Act of 2003, was as follows:
| | | | |
Balanced Fund | | | 50.59 | % |
Large Cap Growth Fund | | | 100.00 | % |
Mid-Cap Value Fund | | | 100.00 | % |
Shareholders will receive notification in January 2012 of the percentage applicable to the preparation of their 2011 income tax returns.
53
Disclosure Regarding the Board of Trustees’ Approval of the Management Agreement and Investment Advisory Agreements of the Funds (Unaudited)
Disclosure Regarding Renewal and Approval of Management Agreement and Investment Advisory Agreements
At its May 26, 2011 meeting, the Board of Trustees (“Board”) considered the renewal of each existing Management Agreement between American Beacon Advisors, Inc. (the “Manager”) and the American Beacon Funds, the American Beacon Mileage Funds, the American Beacon Select Funds and the American Beacon Master Trust (collectively the “Funds”) and each Investment Advisory Agreement between the Manager and a subadvisor (“Investment Advisory Agreements” and collectively with the Management Agreement, the “Agreements”). In preparation for the Board’s consideration to renew these Agreements, the Board and its Investment Committee undertook steps to gather and consider information furnished by the Manager, the subadvisors and Lipper, Inc. (“Lipper”). The Board, with the assistance of independent legal counsel, requested and received certain relevant information from the Manager and each subadvisor.
In addition, the Board’s Investment Committee worked with Lipper to obtain relevant comparative information regarding the performance, fees and expenses of the Funds. The Investment Committee held a separate meeting on May 11, 2011 to consider the information provided by Lipper. Further, the Board took into consideration information furnished for the Board’s review and consideration throughout the year at regular Board and Investment Committee meetings, as well as information specifically prepared in connection with the renewal process.
In connection with the Board’s consideration of the Management Agreement and each Investment Advisory Agreement, the Trustees considered, among other materials, responses by the Manager and the subadvisors to inquiries requesting:
| | • | | a description of any significant changes (actual or anticipated) to principal activities, personnel, services provided to the Funds, or any other area, including how these changes might affect the Funds; |
| | • | | a copy of the firm’s most recent audited or unaudited financial statements, as well as Parts 1 and 2 of its Form ADV registration statement with the SEC; |
| | • | | a summary of any material pending or anticipated litigation or regulatory proceedings involving the firm or its personnel, including the results of any recent regulatory examination or independent audit; |
| | • | | a comparison of the performance of that portion of Fund assets managed by each firm with performance of other similar accounts managed by the firm, including a discussion of relative performance versus a peer group average and any remedial measures if the firm’s performance was materially below that of the peer group; |
| | • | | a profit/loss analysis of the firm and any actual or anticipated economies of scale in relation to the services it provides to each Fund; |
| | • | | an analysis of compensation, including a comparison with fees charged to other clients for which similar services are provided, any proposed changes to the fee schedule and the effect of any fee waivers; |
| | • | | a description of any payments by the subadvisers to the manager to support the Funds’ marketing efforts; |
| | • | | an evaluation of any other benefits to the firm or Funds as a result of their relationship, if any; |
| | • | | confirmation that the firm’s financial condition would not impair its ability to provide high-quality advisory services to the Funds; |
| | • | | a description of the scope of portfolio management services provided to the Funds, including whether such services differ from the services provided to other clients, including other registered investment companies, and any advantages or disadvantages that might accrue to the Funds due to the firm’s involvement in other activities; |
| | • | | a description of the personnel who are assigned primary responsibility for managing the Funds, including any changes during the past year, and a discussion of the adequacy of current and projected staffing levels to service the Funds; |
| | • | | a description of the basis upon which portfolio managers are compensated, including any “incentive” arrangements, and a description of the oversight mechanisms used to prevent a portfolio manager whose compensation is tied to performance of a Fund from taking undue risks; |
| | • | | a discussion regarding the firm’s participation in “soft dollar” arrangements, if any, or other brokerage allocation policies with respect to Fund transactions, including the firm’s methodology for obtaining best execution and the use of any affiliated broker-dealers; |
| | • | | a description of any actual or potential conflicts of interest anticipated in managing Fund assets; |
| | • | | a discussion of whether the firm has identified any investment or operational matters that likely present a high risk in managing Fund assets; |
| | • | | a description of trade allocation procedures among accounts managed by the firm; |
| | • | | a discussion of whether the firm receives, with respect to the Funds, other compensation, including any payment for order flow or ECN liquidity rebates |
| | • | | a certification by the firm regarding the reasonable design of its compliance program; |
| | • | | information regarding the firm’s code of ethics, insider trading policy and disaster recovery plan, including a description of any material changes thereto and a related certification of compliance by the firm; |
| | • | | a description of the firm’s affiliation with any broker-dealer; |
| | • | | a discussion of any anticipated change in the firm’s controlling persons; and |
| | • | | verification of the firm’s insurance coverage with regards to the services provided to the Funds. |
54
Disclosure Regarding the Board of Trustees’ Approval of the Management Agreement and Investment Advisory Agreements of the Funds (Unaudited)
In addition to the foregoing, the Manager provided the following information specific to the renewal of the Management Agreement:
| | • | | a comparison of the performance of each Fund to comparable investment companies and appropriate indices, including comments on the relative performance of, as applicable, each subadvisor and each Fund versus the respective peer group average; |
| | • | | a discussion, if applicable, of any underperformance by a subadvisor relative to its peer group and what, if any, remedial measures the Manager has or intends to take; |
| | • | | a comparison of advisory fees and expense ratios for comparable mutual funds; |
| | • | | an analysis of any material complaints received from Fund shareholders; |
| | • | | a description of the extent to which the Manager monitors the investment activities and financial conditions of each subadvisor to the Funds; |
| | • | | a description of the Manager’s distribution activities with respect to promoting sales of Fund shares, including any revenue sharing practices; |
| | • | | a description of the Manager’s securities lending practices and the fees received from such practices; |
| | • | | a discussion of any rebate arrangements between the Manager and a service provider to the Funds pursuant to which the Manager receives direct or indirect benefits from the service provider; |
| | • | | a description of the portfolio turnover rate and average execution costs for each Fund and, as applicable, each subadvisor to a Fund; and |
| | • | | a description of how expenses that are not readily identifiable to a particular Fund are allocated. |
In connection with the Management Agreement and each Investment Advisory Agreement, the Board also obtained an analysis provided by Lipper that compared: (i) investment performance of each Fund versus comparable investment companies and appropriate indices; (ii) total Fund expenses of each Fund versus comparable mutual funds; and (iii) each Fund’s investment advisory fees versus comparable mutual funds. For each Fund with more than one class of shares, the class of shares used for comparative purposes was the class with the longest performance history, which in most cases was the Institutional Class. References below to each Fund’s Lipper peer group are to the group of comparable mutual funds included in the analysis provided by Lipper.
Provided below is an overview of the primary factors the Trustees considered at the Investment Committee meeting on May 11, 2011 at which the Trustees reviewed the investment performance of the Manager and each subadvisor and the primary factors considered by the Board at its May 26, 2011 meeting at which the Board considered the renewal of the Agreements. The Board did not identify any particular information that was most relevant to its consideration to renew the Management Agreement and each Investment Advisory Agreement, and each Trustee may have afforded different weight to the various factors. Legal counsel to the independent Trustees provided the Board with a memorandum regarding its responsibilities pertaining to the renewal of the Agreements. The memorandum explained the regulatory requirements surrounding the Trustees’ process for evaluating investment advisors and the terms of the contracts. Based on its evaluation, the Board unanimously concluded that the terms of each Agreement were reasonable and fair and that the renewal of each Agreement was in the best interests of the Funds and their shareholders.
Considerations With Respect to All Funds
In determining whether to renew the Management Agreement and each Investment Advisory Agreement, the Trustees considered the best interests of each Fund separately. While the Management Agreement and the Investment Advisory Agreements for all of the Funds were considered at the May 26, 2011 meeting, the Board considered each Fund’s investment management and subadvisory relationships separately. In each instance, the Board considered, among other things, the following factors: (1) the nature and quality of the services provided; (2) the investment performance of a Fund and, as applicable, each subadvisor for a Fund; (3) the costs incurred by the Manager and (to the extent provided) the subadvisors in rendering their services and their resulting profits or losses; (4) the extent to which economies of scale have been taken into account in setting each fee schedule; (5) whether fee levels reflect these economies of scale for the benefit of Fund investors; (6) comparisons of services and fees with contracts entered into by the Manager or a subadvisor or their affiliates with other clients (such as pension funds and other institutional funds); and (7) any other benefits derived or anticipated to be derived by the Manager or a subadvisor from their relationship with a Fund. The Trustees posed questions to various management personnel of the Manager regarding certain key aspects of the materials submitted in support of the renewal.
Nature, Extent and Quality of Services. With respect to the renewal of the Management Agreement, the Board considered, among other factors: each Fund’s generally favorable long-term performance and the background and experience of key investment personnel at the Manager; the low cost structure of the Funds; the Manager’s culture of compliance and support for compliance operations that reduce risks to the Funds; the manager’s commitment to increase assets in the Funds as demonstrated, for example, by the continued increase in sales personnel; the Manager’s continuing efforts to add new series and share classes to enhance the Funds’ product line; the Manager’s high quality of services; the Manager’s active role in monitoring and, as appropriate recommending additional or replacement subadvisors; the Manager’s commitment to increasing headcount and training employees in conjunction with product expansion; and efforts made by the Manager to retain key employees.
With respect to the renewal of each Investment Advisory Agreement, the Trustees considered the background and experience of each subadvisor’s investment personnel responsible for managing the Funds, the size of the subadvisor and their ability to continue to attract and retain qualified investment personnel. Based on the foregoing information, the Board concluded that the nature, extent and quality of the management and advisory services provided by the Manager and each subadvisor were appropriate for each Fund and, thus, determined to renew the Management Agreement and the Investment Advisory Agreement for each Fund.
55
Disclosure Regarding the Board of Trustees’ Approval of the Management Agreement and Investment Advisory Agreements of the Funds (Unaudited)
Investment Performance. The Board evaluated the comparative information provided by Lipper and the Manager regarding each Fund’s investment performance relative to its benchmark index(es) and peer group. The Board considered the information provided by Lipper regarding its independent peer selection methodology to select all peer groups and universes. The Board also considered the performance reports and discussions with management at Board and Committee meetings throughout the year. The Manager also noted that it generally was satisfied with the performance of the subadvisors. A discussion regarding the Board’s considerations with respect to each Fund’s performance appears below under “Additional Considerations and Conclusions with Respect to the Balanced Fund, Additional Considerations and Conclusions with Respect to the Large Cap Growth Fund, and Additional Considerations and Conclusions with Respect to the Mid-Cap Value Fund.”
Costs of the Services Provided to the Funds and the Profits Realized by the Manager from its Relationship with the Funds. In analyzing the cost of services and profitability of the Manager and a subadvisor by Fund, the Board considered the revenues earned and the expenses incurred by the Manager. The profits or losses were noted at both an individual Fund level and at an aggregate level for all Funds. The Board also considered that the Management Agreement for the Funds stipulates that, to the extent that a Fund invests all of its investable assets in another registered investment company (i.e., is a “Feeder Fund”), the Fund will not pay the Manager a management fee. Although the Board noted that, in certain cases, the fee rates paid by other clients is lower than the fee rates paid by the Funds, the difference reflects the greater level of responsibility and regulatory requirements associated with managing the Funds.
The Board also noted that the Manager proposed to continue the expense waivers and reimbursements for certain Funds and classes that were in place during the last fiscal year and to put in place new expense waivers and reimbursements for certain new classes of the Funds and new series of the Funds. The Board further considered that each subadvised Fund pays the Manager the amounts due to its subadvisors, and the Manager remits these amounts directly to the applicable subadvisors. The Board considered that the Manager receives service and administrative fees to compensate the Manager for providing administrative services to the Funds and to compensate third-party administrators and broker-dealers for services to Fund shareholders. In addition, the Board considered that the Manager receives management fees for overseeing the securities lending program on behalf of various Funds. The Board also noted that certain classes of the Funds maintain higher expense ratios in order to compensate third-party distributors.
In analyzing the cost of services and profitability for each subadvisor in connection with its investment advisory services to the Fund, the Board considered that, in many cases, the Manager has negotiated the lowest subadvisory fee a subadvisor charges for any comparable client accounts. The Board gave less weight to profitability considerations or did not view this data as imperative to its deliberations given the arm’s length nature of the relationship between the Manager and the subadvisors with respect to the negotiation of subadvisory fees.
Based on the foregoing information, the Board concluded that the profitability levels were reasonable in light of the services performed by the Manager and the subadvisors. A discussion regarding the Board’s considerations with respect to each Fund’s fee rates is set forth below under “Additional Considerations and Conclusions with Respect to the Balanced Fund, Additional Considerations and Conclusions with Respect to the Large Cap Growth Fund, and Additional Considerations and Conclusions with Respect to the Mid-Cap Value Fund.”
Economies of Scale. In considering the reasonableness of the management and investment advisory fees, the Board considered whether economies of scale will be realized as the Funds grow and whether fee levels reflect these economies of scale for the benefit of Fund shareholders. In this regard, the Board considered that the Manager has negotiated breakpoints in many subadvisory fee rates. The Board also noted that, for purposes of determining the fee rates chargeable to the Funds, many subadvisors have agreed to take into account assets of AMR and its pension plans that are managed by the subadvisors. Thus, the Funds are able to receive lower effective fee rates. The Board also noted the Manager’s representation that assets in the Funds’ complex increased during 2010, primarily due to market appreciation.
In addition, the Board noted the Manager’s representation that, many of the Funds enjoy the primary benefit of economies of scale because low comparable fee levels are already reflected in the current level of management & administration fees charged by the Manager, the current fee structure already provides an adequate mechanism for the sharing of economies of scale with shareholders and due to the existing low cost structure of the Funds that further breakpoints are not appropriate at this time. Based on the foregoing information, the Board concluded that the Manager and subadvisor fee schedules for each Fund provides for a reasonable sharing of benefits from any economies of scale with the Fund.
Benefits Derived from the Relationship with the Funds. The Board considered the “fall-out” or ancillary benefits that accrue to the Manager and/or the subadvisors as a result of the advisory relationships with the Funds, including greater exposure in the marketplace with respect to the Manager’s or subadvisor’s investment process and expanding the level of assets under management by the Manager and the subadvisors. The Board also considered that the Manager will use the Large Cap Value Fund model in managing its collective investment trust.
In addition, the Manager noted that the Trusts also derive benefits from their association with the Manager. Specifically, the Board noted the Manager’s representation that it provides services to most Funds at a lower than industry average cost. The Board considered that certain of the subadvisors reimburse the Manager for certain of its costs relating to distribution activities for the Funds. The Board also considered that the Funds did not pay commissions to any affiliated broker-dealer of the Manager or the relevant subadvisor during the most recent fiscal year ended October 31, 2010.
56
Disclosure Regarding the Board of Trustees’ Approval of the Management Agreement and Investment Advisory Agreements of the Funds (Unaudited)
Based on the foregoing information, the Board concluded that the potential benefits accruing to the Manager and the subadvisors by virtue of their relationships with the Funds appear to be fair and reasonable.
Additional Considerations and Conclusions with Respect to Each Fund
The performance comparisons below were made versus each Fund’s Lipper peer universe median. References to the Lipper expense universe below are to the group of comparable mutual funds included in the analysis provided to the Trustees by Lipper, Inc.
Additional Considerations and Conclusions with Respect to the Balanced Fund
In considering the renewal of the Management Agreement, the Trustees considered the following additional factors: (1) the Balanced Fund outperformed the Mixed Asset Target Allocation Growth Funds (“MTAG”) peer universe median for the three-, five- and ten-year periods ended March 31, 2011, but underperformed for the one-year period; (2) the Manager outperformed its market index with respect to its portion of the Fund’s fixed income assets for the one-, three- and five-year periods ended March 31, 2011; and (3) the expense ratio of the Institutional Class of Fund ranked better than the median of its Lipper universe.
In considering the renewal of the Investment Advisory Agreements with Barrow, Brandywine Global Investment Management, LLC (“Brandywine”) and Hotchkis and Wiley Capital Management, LLC (“Hotchkis”), the Trustees considered the following additional factors: (1) Barrow outperformed the peer universe median for the three-, five- and ten-year periods ended March 31, 2011, but underperformed for the one-year period; (2) Brandywine outperformed the peer universe median for the five- and ten-year periods ended March 31, 2011, but underperformed for the one- and three-year periods; (3) Hotchkis outperformed its market benchmark index with respect to its allocated portion of the Fund’s equity assets for the three- and ten-year periods ended March 31, 2011, but underperformed for the one- and five- year periods; (4) Barrow, Hotchkis and Brandywine have informed the Manager that they use Fund commissions to obtain proprietary research, the application of which benefits the Fund; and (5) the Manager’s recommendation to continue to retain each subadvisor.
Based on these considerations and those noted above with respect to all Funds, the Trustees (1) concluded that the fees paid to the Manager and the subadvisors under the Management and Investment Advisory Agreements are fair and reasonable, (2) determined that the Balanced Fund and its shareholders would benefit from the Manager’s and subadvisors’ continued management of the Fund and (3) approved the renewal of the Management and Investment Advisory Agreements with respect to the Balanced Fund.
57
Disclosure Regarding the Board of Trustees’ Approval of the Management Agreement and Investment Advisory Agreements of the Funds (Unaudited)
Additional Considerations and Conclusions with Respect to the Large Cap Growth Fund
In considering the renewal of the Management Agreement, the Trustees considered the following additional factors: (1) the Large Cap Growth Fund outperformed the peer universe median for the one-year period, but underperformed for the three-, five-, and ten-year periods ended March 31, 2011 and (2) the expense ratio of the Institutional Class of Fund shares ranked better than the median of its Lipper expense universe.
In considering the renewal of the Investment Advisory Agreements with Renaissance Group LLC, dba Renaissance Investment Management (“Renaissance”) and Winslow Capital Management (“Winslow”), the Trustees considered the following additional factors: (1) Renaissance outperformed the peer universe median for the one-year but underperformed for the three-year period ended March 31, 2011; (2) Winslow outperformed the peer universe median for the one-year period ended March 31, 2011; (3) Renaissance has informed the Manager that it uses Fund commissions to obtain proprietary research, the application of which benefits the Fund and Renaissance’s other clients; and (4) the Manager’s recommendation to continue to retain each subadvisor.
Based on these considerations and those noted above with respect to all Funds, the Trustees (1) concluded that the fees paid to the Manager and the subadvisors under the Management and Investment Advisory Agreements are fair and reasonable, (2) determined that the Large Cap Growth Fund and its shareholders would benefit from the Manager’s and subadvisors’ continued management of the Fund and (3) approved the renewal of the Management and Investment Advisory Agreements with respect to the Large Cap Growth Fund.
Additional Considerations and Conclusions with Respect to the Mid-Cap Value Fund
In considering the renewal of the Management Agreement, the Trustees considered the following additional factors: (1) the Mid-Cap Value Fund outperformed its peer group universe median for the three- and five-year periods ended March 31, 2011, but underperformed for the one-year period; (2) the expense ratio of the Institutional Class of Fund shares was only one basis point higher than the median of its Lipper universe (after consideration of the Manager’s waiver).
In considering the renewal of the Investment Advisory Agreements with Barrow and Pzena Investment Management, LLC (“Pzena”), the Trustees considered the following additional factors: (1) Barrow outperformed the peer universe median for the three- and five-year periods, but underperformed for the one-year period ended March 31, 2011; (2) Pzena underperformed the peer universe median for the one-, three and five-year periods ended March 31, 2011; (3) Barrow has informed the Manager that it uses Fund commissions to obtain proprietary research, the application of which benefits the Fund and Barrow’s other clients; and (4) the Manager’s recommendation to continue to retain each subadvisor.
Based on these considerations and those noted above with respect to all Funds, the Trustees (1) concluded that the fees paid to the Manager and the subadvisors under the Management and Investment Advisory Agreements are fair and reasonable, (2) determined that the Mid-Cap Value Fund and its shareholders would benefit from the Manager’s and subadvisors’ continued management of the Fund and (3) approved the renewal of the Management and Investment Advisory Agreements with respect to the Mid-Cap Value Fund.
58
Trustees and Officers of the American Beacon Funds
(Unaudited)
The Trustees and officers of the American Beacon Funds (the “Trust”) are listed below, together with their principal occupations during the past five years. Unless otherwise indicated, the address of each person listed below is 4151 Amon Carter Boulevard, MD 2450, Fort Worth, Texas 76155. Each Trustee oversees twenty funds in the fund complex that includes the Trust, the American Beacon Master Trust, the American Beacon Mileage Funds, and the American Beacon Select Funds. The Trust’s Statement of Additional Information contains additional information about the Trustees and is available without charge by calling 1-800-658-5811.
| | | | |
Name, Age and Address | | Position, Term of Office and Length of Time Served with the Trust | | Principal Occupation(s) During Past 5 Years and Current Directorships |
| | |
| INTERESTED TRUSTEES | | | | |
| | |
| | Term | | |
| | Lifetime of Trust until removal, resignation or retirement* | | |
| | |
Alan D. Feld** (74) | | Trustee since 1996 | | Sole Shareholder of a professional corporation which is a Partner in the law firm of Akin, Gump, Strauss, Hauer & Feld, LLP (1960-Present); Director, Clear Channel Communications (1984-2008); Trustee, Center Point Properties (1994-2006); Member, Board of Trustees, Southern Methodist University; Member, Board of Visitors, M.D. Anderson Hospital; Board of Visitors, Zale/Lipshy Hospital; Trustee, American Beacon Mileage Funds (1996-Present); Trustee, American Beacon Select Funds (1999-Present); Trustee, American Beacon Master Trust Funds (1996-Present). |
| | |
| NON-INTERESTED TRUSTEES | | Term | | |
| | Lifetime of Trust until removal, resignation or retirement* | | |
| | |
W. Humphrey Bogart (67) | | Trustee since 2004 | | Board Member, Baylor University Medical Center Foundation (1992-2004); Consultant, New River Canada Ltd. (mutual fund servicing company) (1998-2003); President and CEO, Allmerica Trust Company, NA (1996-1997); President and CEO, Fidelity Investments Southwest Company (1983-1995); Senior Vice President of Regional Centers, Fidelity Investments (1988-1995); Trustee, American Beacon Mileage Funds (2004-Present); Trustee, American Beacon Select Funds (2004-Present); Trustee, American Beacon Master Trust Funds (2004-Present). |
| | |
Brenda A. Cline (50) | | Trustee since 2004 | | Executive Vice President, Chief Financial Officer, Treasurer and Secretary, Kimbell Art Foundation (1993-Present); Trustee, Texas Christian University (1998-Present); Trustee, W.I. Cook Foundation, Inc. (d/b/a Cook Children’s Health Foundation) (2001-2006); Director, Christian Church Foundation (1999-2007); Trustee, Trinity Valley School (2003-2004); Member; Trinity Valley School Endowment Committee (2004-Present); Trustee, American Beacon Mileage Funds (2004-present); Trustee, American Beacon Select Funds (2004-Present); Trustee, American Beacon Master Trust Funds (2004-Present). |
| | |
Eugene J. Duffy (57) | | Trustee since 2008 | | Principal and Executive Vice President, Paradigm Asset Management (1994-Present); Director, Sunrise Bank of Atlanta (2008-Present); Chairman, Special Contributions Fund Board of Trustees, National Association for the Advancement of Colored People (2007-Present); Trustee, National Association for the Advancement of Colored People (2000-Present); Board of Visitors, Emory University (2006-Present); Trustee, Atlanta Botanical Garden (2006-Present); Board Member, Willie L. Brown Jr. Institute on Politics and Public Service (2001-Present); Chair, National Association of Securities Professionals (2000-2002); Deputy Chief Administrative Officer, City of Atlanta (1985-1990); Trustee, American Beacon Mileage Funds (2008-Present); Trustee, American Beacon Select Funds (2008-Present); Trustee, American Beacon Master Trust Funds (2008-Present). |
59
Trustees and Officers of the American Beacon Funds
(Unaudited)
| | | | |
Name, Age and Address | | Position, Term of Office and
Length of Time Served with the
Trust | | Principal Occupation(s) During Past 5 Years and Current Directorships |
| | |
| Thomas M. Dunning (69) | | Trustee since 2008 | | Non-Executive Chairman (2008-Present); Chairman (1998-2008) and Chief Executive Officer (1998-2007), Lockton Dunning Benefits (consulting firm in employee benefits); Director, Oncor Electric Delivery Company LLC (2007-present); Board Member, Baylor Health Care System Foundation (2007-present); Vice Chair, State Fair of Texas (1987-Present); Board Member, Southwestern Medical Foundation (1994-present); Board Member, John Tower Center for Political Studies/SMU (2008-Present); Board Member, University of Texas Development Board (2008-Present); Board Member, BancTec (2010 – Present) (software consulting); Trustee, American Beacon Mileage Funds (2008-Present); Trustee, American Beacon Select Funds (2008-Present); Trustee, American Beacon Master Trust Funds (2008-Present). |
| | |
| Richard A. Massman (68) | | Trustee since 2004 Chairman since 2008 | | Consultant and General Counsel Emeritus (2009-Present), Senior Vice President and General Counsel (1994-2009), Hunt Consolidated, Inc. (holding company engaged in oil and gas exploration and production, refining, real estate, farming, ranching and venture capital activities); Chairman (2007-2011) and Director (2005-2011), The Dallas Opera Foundation; Chairman (2006-2010) and Director (2005-2009), Temple Emanu-El Foundation; Trustee, Presbyterian Healthcare Foundation (2006-Present); Director, The Retina Foundation of the Southwest (2000-Present); Trustee, American Beacon Mileage Funds (2004-Present); Trustee, American Beacon Select Funds (2004-Present); Trustee, American Beacon Master Trust Funds (2004-Present). |
| | |
R. Gerald Turner (65) 225 Perkins Admin. Bldg. Southern Methodist Univ. Dallas, Texas 75275 | | Trustee since 2001 | | President, Southern Methodist University (1995-Present); Director, ChemFirst (1986-2002); Director, J.C. Penney Company, Inc. (1996-Present); Director, California Federal Preferred Capital Corp. (2001-2003); Director, Kronus Worldwide Inc. (chemical manufacturing) (2003-Present); Director, First Broadcasting Investment Partners, LLC (2003-2007); Member, Salvation Army of Dallas Board of Directors; Member, Methodist Hospital Advisory Board; Co-Chair, Knight Commission on Intercollegiate Athletics; Trustee, American Beacon Mileage Funds (2001-Present); Trustee, American Beacon Select Funds (2001-Present); Trustee, American Beacon Master Trust Funds (2001-Present). |
| | |
| Paul J. Zucconi,CPA (71) | | Trustee since 2008 | | Director, Affirmative Insurance Holdings, Inc. (producer of nonstandard automobile insurance) (2004-Present); Director, Titanium Metals Corporation (producer of titanium melted and mill products) (2002-Present); Director, Torchmark Corporation (life and health insurance products) (2002-Present); Director, Charter Bank (community services and products) (2010-Present); Director, Dallas Chapter of National Association of Corporate Directors (2004-Present); Partner, KPMG (1976-2001); Trustee, American Beacon Mileage Funds (2008-Present); Trustee, American Beacon Select Funds (2008-Present); Trustee, American Beacon Master Trust Funds (2008-Present). |
| | |
Name, Age and Address | | Position, Term of Office and
Length of Time Served with the
Trust | | Principal Occupation(s) During Past 5 Years and Current Directorships |
| | |
| OFFICERS | | Term | | |
| | One Year | | |
| Gene L. Needles, Jr. (56) | | President since 2009 Executive Vice President since 2009 | | President, CEO and Director (2009-Present), American Beacon Advisors, Inc.; President, CEO and Director (2009-Present), Lighthouse Holdings, Inc.; President (2009-Present), American Beacon Mileage Funds; President (2009-Present), American Beacon Select Funds; President (2008-2009), Touchstone Investments; President (2003-2007), CEO (2004-2007), Managing Director of Sales (2002-2003), National Sales Manager (1999-2002), and Regional Sales Manager (1993-1999), AIM Distributors. |
60
Trustees and Officers of the American Beacon Funds
(Unaudited)
| | | | |
| William F. Quinn** (63) | | Executive Vice President from 2007 to 2008 and 2009 to Present President from 1987 to 2007 and 2008 to 2009 Trustee from 1987 to 2008 | | Executive Chairman (2009-Present), Chairman (2006-2009), CEO (2006-2007), President (1986-2006) and Director (2003-Present), American Beacon Advisors, Inc.; Chairman and Director (2008-Present), Lighthouse Holdings, Inc.; Chairman (1989-2003) and Director (1979-1989, 2003-Present), American Airlines Federal Credit Union; Director, Hicks Acquisition I, Inc. (2007-2009), Director, Hicks Acquisition II, Inc. (2010-Present); Director, Crescent Real Estate Equities, Inc.(1994-2007); Director, Pritchard, Hubble & Herr, LLC (investment advisor) (2001-2006); Director of Investment Committee, Southern Methodist University Endowment Fund (1996-Present); Member, Southern Methodist University Cox School of Business Advisory Board (1999-2002); Member, New York Stock Exchange Pension Manager Committee (1997-1998, 2000-2002, 2006-Present); Chairman (2007-Present) and Vice Chairman (2004-2007), Committee for the Investment of Employee Benefits; Director, United Way of Metropolitan Tarrant County (1988-2000, 2004-Present); the Independent Trustee, National Railroad Retirement Investment Trust (2011-Present); Trustee (1995-2008) and President (1995-2007, 2008-2009), American Beacon Mileage Funds; Trustee (1999-2008) and President (1999-2007, 2008-Present), American Beacon Select Funds; Trustee, American Beacon Master Trust (1995-2008); Director, American Beacon Global Funds SPC (2002-2011); Director, American Beacon Global Funds, plc (2007-2009). |
| | |
| Rosemary K. Behan (52) | | VP, Secretary and Chief Legal Officer since 2006 | | Vice President, Legal and Compliance, American Beacon Advisors, Inc. (2006-Present); Secretary (2008-Present), Lighthouse Holdings, Inc.; Assistant General Counsel, First Command Financial Planning, Inc. (2004-2006); Attorney, U.S. Securities and Exchange Commission, (1995-2004). |
| | |
| Brian E. Brett (51) | | VP since 2004 | | Vice President, Director of Sales, American Beacon Advisors, Inc. (2004-Present); Regional Vice President, Neuberger Berman, LLC (investment adviser) (1996-2004). |
| | |
| Wyatt Crumpler (45) | | VP since 2007 | | Vice President, Asset Management (2009-Present) and Vice President, Trust Investments (2007-2009), American Beacon Advisors, Inc.; Managing Director of Corporate Accounting (2004-2007) and Director of IT Strategy and Finance (2001-2004), American Airlines, Inc. |
| | |
| Erica Duncan (41) | | VP Since 2011 | | Vice President, Marketing and Client Services (2011-Present), American Beacon Advisors, Inc.; Supervisor, Brand Marketing (2010-2011), Invesco; Supervisor, Marketing Communications (2009-2010) and Senior Financial Writer (2004-2009), Invesco AIM. |
| | |
| Michael W. Fields (57) | | VP since 1989 | | Vice President, Fixed Income Investments, American Beacon Advisors, Inc. (1988-Present); Director American Beacon Global Funds SPC (2002-Present); Director, American Beacon Global Funds plc (2007-2009). |
| | |
| Melinda G. Heika (50) | | Treasurer since 2010 | | Vice President, Finance and Accounting (2010-Present), Controller (2005-2009), Assistant Controller (1998-2004), American Beacon Advisors, Inc.; Treasurer (2010- Present), Lighthouse Holdings, Inc. |
| | |
| Terri L. McKinney (47) | | VP since 2010 | | Vice-President, Enterprise Services (2009-Present), Managing Director (2003-2009), and Director of Marketing & Retail Sales (1996-2003), American Beacon Advisors, Inc.; President, Board of Trustees (2010-Present), Vice-President, Board of Trustees (2008-2010), and Trustee (2006-2008), Down Syndrome Guild of Dallas. |
| | |
| Jeffrey K. Ringdahl (36) | | VP since 2010 | | Chief Operating Officer, American Beacon Advisors, Inc. (2010-Present); Vice President, Product Management, Touchstone Advisors, Inc. (2007-2010); Senior Director, Business Integration, Fidelity Investments (2005-2007). |
| | |
| Samuel J. Silver (48) | | VP Since 2011 | | Vice President, Fixed Income Investments (2011-Present) and Senior Portfolio Manager, Fixed Income Investments (1999-2011), American Beacon Advisors, Inc. |
| | |
| Christina E. Sears (40) | | Chief Compliance Officer since 2004 and Asst. Secretary since1999 | | Chief Compliance Officer (2004-Present) and Senior Compliance Analyst (1998-2004), American Beacon Advisors, Inc. |
61
Trustees and Officers of the American Beacon Funds
(Unaudited)
| | | | |
John J. Okray (37) | | Asst. Secretary since 2010 | | Assistant General Counsel, American Beacon Advisors, Inc. (2010-Present); Vice President, Oppenheimer Funds, Inc. (2004-2010). |
| | |
| Sonia L. Bates (55) | | Asst. Treasurer since 2011 | | Director, Tax and Financial Reporting (2011-Present), Manager, Tax and Financial Reporting (2005-2010), Senior Tax Analyst (1999-2004), American Beacon Advisors, Inc.; Asst. Treasurer (2011-Present), Lighthouse Holdings, Inc. |
| * | The Board has adopted a retirement plan that requires Trustees to retire no later than the last day of the calendar year in which they reach the age of 72, provided, however, that the Board may determine to grant one or more annual exemptions to this requirement. |
| ** | Mr. Feld is deemed to be an “interested person” of the Trusts, as defined by the 1940 Act. Mr. Feld’s law firm of Akin, Gump, Strauss, Hauer & Feld LLP has provided legal services within the past two fiscal years to the Manager and one or more of the Trust’s and Master Trust’s sub-advisors. |
62
This page intentionally left blank.
63
This page intentionally left blank.
64
This page intentionally left blank.
65
Delivery of Documents
eDelivery is NOW AVAILABLE - Stop traditional mail delivery and receive your
shareholder reports and summary prospectus on-line. Sign up at
www.americanbeaconfunds.com
If you invest in the Fund through a financial institution, you may be able to receive the Fund’s regulatory mailings, such as the Summary Prospectus, Annual Report and Semi-Annual Report, by e-mail. If you are interested in this option, please go to www.icsdelivery.com and search for your financial institution’s name or contact your financial institution directly.
To obtain more information about the Fund:
| | |
| | |
| | |
By E-mail: american_beacon.funds@ambeacon.com | | On the Internet: Visit our website at www.americanbeaconfunds.com |
|
| | |
| | |
| | |
By Telephone: Institutional, Y, Investor, and Advisor Classes Call (800) 658-5811 AMR ClassSM Call (800) 345-2345 | | By Mail: American Beacon Funds P.O. Box 219643 Kansas City, MO 64121-9643 |
|
| | |
Availability of Quarterly Portfolio Schedules In addition to the Schedule of Investments provided in each semi-annual and annual report, the Fund files a complete schedule of its portfolio holdings with the Securities and Exchange Commission (“SEC”) on Form N-Q as of the first and third fiscal quarters. The Fund’s Forms N-Q are available on the SEC’s website at www.sec.gov. The Forms N-Q may also be reviewed and copied at the SEC’s Public Reference Room, 450 Fifth Street, NW, Washington, DC 20549. Information regarding the operation of the SEC’s Public Reference Room may be obtained by calling 1-800-SEC-0330. A complete schedule of the Fund’s portfolio holdings is also available on the Funds’ website (www.americanbeaconfunds.com) approximately twenty days after the end of each month. | | Availability of Proxy Voting Policy and Records A description of the policies and procedures the Fund uses to determine how to vote proxies relating to portfolio securities is available in the Fund’s Statement of Additional Information, is available free of charge on the Fund’s website (www.americanbeaconfunds.com) and by calling 1-800-967-9009 or by accessing the SEC’s website at www.sec.gov. The Fund’s proxy voting record for the most recent year ended June 30 is filed annually with the SEC on Form N-PX. The Fund’s Forms N-PX are available on the SEC’s website at www.sec.gov. The Fund’s proxy voting record may also be obtained by calling 1-800-967-9009. |
Fund Service Providers:
| | | | | | | | | | | | |
CUSTODIAN State Street Bank and
Trust Boston, Massachusetts | | | | TRANSFER AGENT Boston Financial Data
Services Kansas City, Missouri | | | | INDEPENDENT REGISTERED
PUBLIC ACCOUNTING FIRM Ernst & Young LLP Dallas, Texas | | | | DISTRIBUTOR Foreside Fund Services,
LLC Portland, Maine |
| | | | | | | | | | |
| | | | | | | | | |
This report is prepared for shareholders of the American Beacon Funds and may be distributed to others only if preceded or accompanied by a current Prospectus of Summary Prospectus.
| | |
| American Beacon Funds, American Beacon Balanced Fund, American Beacon Large Cap Growth Fund, and American Beacon Mid-Cap Value Fund are service marks of American Beacon Advisors, Inc. | | |
AR 10/11

About American Beacon Advisors
Since 1986, American Beacon Advisors has offered a variety of products and investment advisory services to numerous institutional and retail clients, including a variety of mutual funds, corporate cash management, and separate account management.
Our clients include defined benefit plans, defined contribution plans, foundations, endowments, corporations, financial planners, and other institutional investors. With American Beacon Advisors, you can put the experience of a multi-billion dollar asset management firm to work for your company.
Investing in debt securities entails interest rate risk which is the risk that debt securities will decrease in value with increases in market interest rates. Investing in high yield securities involves additional risks when compared to investing in investment grade securities. These include a greater risk of default or bankruptcy and an increased sensitivity to financial difficulties or changes in interest rates. The four highest Moody’s ratings for long-term obligations (or issuers thereof) are Aaa, Aa, A and Baa. Obligations rated Aaa are judged to be of the highest quality, with minimal credit risk. Obligations rated Aa are judged to be of high quality and are subject to very low credit risk. Obligations rated A are considered upper-medium grade and are subject to low credit risk. Obligations rated Baa are subject to moderate credit risk. They are considered medium-grade and as such may possess certain speculative characteristics. Following in order of decreasing credit ratings are Ba, B, Caa, Ca, and C.
Any opinions herein, including forecasts, reflect our judgment as of the end of the reporting period and are subject to change. Each advisor’s strategies and each Fund’s portfolio composition will change depending on economic and market conditions. This report is not a complete analysis of market conditions, and, therefore, should not be relied upon as investment advice. Although economic and market information has been compiled from reliable sources, American Beacon Advisors, Inc. makes no representation as to the completeness or accuracy of the statements contained herein.
| | |
| American Beacon Funds | | October 31, 2011 |
| | |
| | Fellow Shareholders, With the headlines focused on geopolitical and global economic risks and their effect on the creditworthiness of the U.S. government bond market, the strengthening underlying fundamentals at many credit-issuing companies—and their relatively attractive market valuations—have drawn less attention. This near-term myopia can create opportunities for fund companies like ours, where our sub-advisors manage with a longer-term perspective. |
|
| The market volatility also highlights the key benefit of our multi-manager approach—a strategy we feel can help smooth performance over time. The performance of our bond funds reflects the American Beacon investment philosophy: that portfolios managed with a longer-term perspective tend to be better positioned for riding out episodes of economic and geopolitical turbulence. |
For the twelve-month period ended October 31, 2011:
>>American Beacon High Yield Bond Fund (Institutional Class) returned 3.79%
>>American Beacon Retirement Income and Appreciation Fund (Investor Class) returned 2.71%
>>American Beacon Intermediate Bond Fund (Institutional Class) returned 4.11%
>>American Beacon Short-Term Bond Fund (Institutional Class) returned 0.17%
At American Beacon, we remain focused on seeking opportunities and meeting market challenges to deliver the type of consistency in performance and service our shareholders value. We regard your trust in the American Beacon Funds as recognition that we are achieving these goals, and we appreciate your continued investment.
For further details about the growing number of investment opportunities now available within the American Beacon Funds family, please visit our website at www.americanbeaconfunds.com.
Best Regards,
Gene L. Needles, Jr.
President
American Beacon Funds
1
Domestic Bond Market Overview
October 31, 2011 (Unaudited)
The Barclays Capital Aggregate Index rose 5.00% for the 12 months ended October 31, 2011. During the period, two themes dominated: the deepening sovereign debt crisis in Europe and the actions taken (or not taken) in response to the uneven U.S. economic recovery. Despite these dual concerns, the U.S. Treasury market still managed to consistently capture investor interest throughout the year.
Support for Treasuries came early. Responding to slowing economic activity and declining inflation, the U.S. Federal Reserve (Fed) announced a second round of quantitative easing (QE2) in November 2010. To implement this easing, the Fed bought $600 billion in U.S. Treasury securities by the end of the second quarter of 2011.
Periodic flights to quality by risk-averse global investors provided additional support for U.S. Treasuries. Throughout the year, investors grew more and more agitated by what they viewed as minimal efforts on the part of the European Union to resolve its sovereign debt crisis. Investors continued to find comfort in U.S. Treasuries and viewed them as the least risky alternative, greatly offsetting the negative impact of Standard & Poor’s downgrade of the U.S. credit rating—from AAA to AA+—in August 2011.
In September 2011, the Fed announced “Operation Twist” in an effort to invigorate the still weak economy and soft housing market. In doing so, the Fed plans to purchase $400 billion of Treasury bonds with maturities between six and 30 years and sell Treasury bonds with maturities of less than three years. In addition, the Fed also announced that it would likely keep the target Federal Funds Rate between 0% and 0.25% percent until at least mid-2013 based on its outlook for economic conditions.
Given intensifying concerns about the spread of the European crisis and what appeared to be the imminent collapse of Greece, credit spreads also widened in the final months of the period, which led Treasuries to significantly outperform the other sectors.
The Financial sector bore the brunt of the impact, as a range of financial institutions held substantial loans made to the European institutions and governments. The sector was further affected by the decline in liquidity throughout the global markets. Meanwhile, the Industrials and Utilities sectors also weakened. This pullback may have been due to concerns regarding an economic slowdown, but these concerns represent a longer-term issue for both sectors. Given the ongoing impact of the Fed’s “Operation Twist,” the still-strong balance sheets of many corporate issuers, and Europe’s ongoing debt woes, the U.S. bond market appears to remain on solid ground.
2
High Yield Bond Market Overview
October 31, 2011 (Unaudited)
The JPMorgan Global High Yield Bond Index gained 6.01% for the 12 months ended October 31, 2011. This performance reflects generally strong credit fundamentals at the majority of companies. The reporting period, however, was characterized by heightened volatility in the market.
The period began with a brief sell-off in November 2010, which was related to renewed concerns about Europe’s sovereign debt problems. This foreshadowed the market reactions that would arise later in the year. However, a favorable U.S. economic outlook and hope that Europe’s problems were contained led to a strong rebound that largely continued into June 2011. This rebound occurred despite weakness in March following the Japanese earthquake and the Libyan uprising. The generally positive trends were also supported by several large mergers and acquisitions involving high-yield companies being purchased by larger investment-grade companies. With expectations for the U.S. economy improving, the belief that high-yield default rates would remain low for a protracted period drove spreads down to 5% in February, while nominal yields reached a record low of 6.75% in May.
Volatility returned in force over the summer, when contentious negotiations over the U.S. debt ceiling soured investors’ risk appetite. Europe’s problems also came back to the forefront with a vengeance. Spreads soared in both August and September amid heightened concerns for a global recession, reaching nearly 9% in early October. After declines in August and September, the high-yield market sharply reversed course and regained some of the lost ground, resulting in a nearly 6% total return in October.
Many investors remain wary of both the U.S and European economic outlooks, and they continue to avoid the equity markets. With few investment options offering attractive yields, the double-digit yield offered by the high-yield market in early October proved a tempting investment choice. Low exposure to Europe and expectations for a below-normal default rate, combined with attractive valuations, led to large inflows into the high-yield asset class during the month.
For all the ups and downs, the high-yield market ended the year much as it began. The new issue market is open and active, particularly for higher-quality companies. Overall for the year, yields rose roughly 80 basis points (0.80%), while high yield spreads widened approximately 100 basis points (1.00%) to 720 basis points (7.20%). This resulted in a solid but below-coupon return of 6% for the market during the period.
3
Performance Overview
American Beacon High Yield Bond FundSM
October 31, 2011 (Unaudited)
The Institutional Class of the High Yield Bond Fund (“Fund”) returned 3.79% for the twelve months ended October 31, 2011. The Fund underperformed the JPMorgan Global High-Yield Index (the “Index”) return of 6.01% and the Lipper High Current Yield Funds Index return of 3.90% for the period.
Comparison of Change in Value of a $10,000 Investment
For the Period from 10/31/2001 through 10/31/11
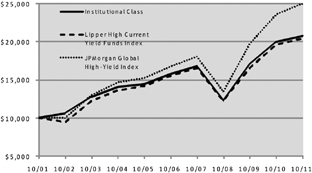
| | | | | | | | | | | | | | | | |
| | | Annualized Total Returns Periods Ended 10/31/11 | | | Value of
$10,000
10/31/01-
10/31/11 | |
| | | 1 Year | | | 5 Years | | | 10 Years | | |
Institutional Class(1,8) | | | 3.79 | % | | | 5.69 | % | | | 7.59 | % | | $ | 20,785 | |
Y Class(1,4,8) | | | 3.36 | % | | | 5.63 | % | | | 7.56 | % | | | 20,730 | |
Investor Class(1,2,8) | | | 3.41 | % | | | 5.40 | % | | | 7.31 | % | | | 20,241 | |
A Class with sales charge (1,5,8) | | | -1.57 | % | | | 4.40 | % | | | 6.80 | % | | | 19,305 | |
A Class without Sales charge (1,5,8) | | | 3.31 | % | | | 5.43 | % | | | 7.32 | % | | | 20,268 | |
C Class with sales charge (1,6,8) | | | 1.67 | % | | | 5.19 | % | | | 7.20 | % | | | 20,040 | |
C Class without sales charge (1,6,8) | | | 2.67 | % | | | 5.19 | % | | | 7.20 | % | | | 20,040 | |
AMR Class (1,3,8) | | | 3.96 | % | | | 5.92 | % | | | 7.71 | % | | | 21,014 | |
JPMorgan Global High-Yield Index (7) | | | 6.01 | % | | | 8.28 | % | | | 9.57 | % | | | 24,935 | |
Lipper High Current Yield Funds Index (7) | | | 3.90 | % | | | 5.70 | % | | | 7.39 | % | | | 20,401 | |
| 1. | Performance shown is historical and is not indicative of future returns. Investment returns and principal value will vary, and shares may be worth more or less at redemption than at original purchase. Performance shown is as of date indicated, and current performance may be lower or higher than the performance data quoted. To obtain performance as of the most recent month end, please visit www.americanbeaconfunds.com or call 1-800-967-9009. Fund performance in the table above does not reflect the deduction of taxes a shareholder would pay on distributions or the redemption of shares. A portion of the fees charged to the Institutional Class of the Fund was waived through 2004. Performance prior to waiving fees was lower than the actual returns shown for periods through 2004. |
| 2. | Fund performance for the ten-year period represents the total returns achieved by the Institutional Class from 10/31/01 up to 3/1/02, the inception date of the Investor Class, and the returns of the Investor Class since its inception. Expenses of the Investor Class are higher than those of the Institutional Class. As a result, total returns shown may be higher than they would have been had the Investor Class been in existence since 10/31/01. |
| 3. | Fund performance for the five-year and ten-year periods represents the total returns achieved by the Institutional Class from 10/31/01 up to 9/4/07, the inception date of the AMR Class, and the returns of the AMR Class since its inception. Expenses of the AMR Class are lower than those of the Institutional Class. As a result, total returns shown may be lower than they would have been had the AMR Class been in existence since 10/31/01. |
| 4. | Fund performance for the five-year and ten-year periods represent the returns achieved by the Institutional Class from 10/31/01 up to 3/1/10, the inception date of the Y Class, and the returns of the Y Class since its inception. Expenses of the Y Class are higher than those of the Institutional Class. As a result, total returns shown may be higher than they would have been had the Y Class been in existence since 10/31/01. |
| 5. | Fund performance for the five-year and ten-year periods represent the returns achieved by the Institutional Class from 10/31/01 through 3/1/02, and the returns of the Investor Class from 3/1/02 up to 5/17/10, the inception date of the A Class, and the returns of the A Class since its inception. Expenses of the A Class are higher than those of the Institutional and Investor Classes. As a result, total returns shown may be higher than they would have been had the A Class been in existence since 10/31/01. The maximum sales charge for A Class is 4.75%. |
| 6. | Fund performance for the five-year and ten-year periods represent the returns achieved by the Institutional Class from 10/31/01 through 3/1/02, and the returns of the Investor Class from 3/1/02 up to 9/1/10, the inception date of the C Class, and the returns of the C Class since its inception. Expenses of the C Class are higher than those of the Institutional and Investor Classes. As a result, total returns shown may be higher than they would have been had the C Class been in existence since 10/31/01. The maximum contingent deferred sales charge for C Class is 1.00% for shares redeemed within one year of the date of purchase. |
| 7. | The JPMorgan Global High-Yield Index (“JPMorgan Index”) is an unmanaged index of fixed income securities with a maximum credit rating of BB+ or Ba1. Issues must be publicly registered or issued under Rule 144A under the Securities Act of 1933, with a minimum issue size of $75 million (par amount). A maximum of two issues per issuer are included in the JPMorgan Index. Convertible bonds, preferred stock, and floating-rate bonds are excluded from the JPMorgan Index. The Lipper High Current Yield Funds Index tracks the results of the 30 largest mutual funds in the Lipper High Current Yield Funds category. Lipper is an independent mutual fund research and ranking service. One cannot directly invest in an index. |
| 8. | The total annual Fund operating expense ratio set forth in the most recent Fund prospectus for the Institutional, Y, Investor, A, C, and AMR Class shares was 0.82%, 0.85%, 1.07%, 1.33%, 2.08%, and 0.57%, respectively. The expense ratios above may vary from the expense ratios presented in other sections of this report that are based on expenses incurred during the period covered by this report. |
4
Performance Overview
American Beacon High Yield Bond FundSM
October 31, 2011 (Unaudited)
The underperformance of the Fund during the twelve-month period was primarily driven by weak issue selection across industries and credit quality.
From an industry standpoint, issue selections in the Wireless, Electric, and Paper industries contributed to the Fund’s relative underperformance, despite positive contribution from selections in the Property & Casualty Insurance and Retail industries.
From a industry allocation perspective, the Fund benefited from underweighting the Home Building industry (down 1.9%), however, maintaining an overweight position to the Property & Casualty Insurance industry detracted from the Fund’s relative returns as this industry (down 4.0%) was one of the worst performing in the Index.
From a credit quality perspective, issue selections in the B-rated category detracted from the Fund’s relative returns. The Fund’s BB-rated securities helped offset some of the underperformance as the Fund’s securities outperformed the BB-securities in the Index.
From a credit quality allocation perspective, allocations to the typical credit quality categories - BB, B, and CCC - were mostly neutral during the period. The Fund’s relative returns were not significantly impacted by its over/underweight to these categories. However, overweighting the CC-rated securities (up 35.6%) added value, which was more than offset by overweighting A-rated securities (down 1.5%) and underweighting non-rated securities (up 17.4%).
The sub-advisors’ “bottom-up,” research intensive investment process, which focuses on companies with strong cash flow and fundamental credit strength, remains in place.
Top Ten Holdings
| | | | |
| | | % of
Net Assets | |
CEDC Finance Corp International, Inc., 9.125%, Due 12/1/2016, 144A | | | 1.0 | % |
CIT Group, Inc., 7.000%, Due 5/2/2017, 144A | | | 0.9 | % |
DISH DBS Corp., 7.125%, Due 2/1/2016 | | | 0.9 | % |
Ford Motor Credit Co. LLC, 6.625%, Due 8/15/2017 | | | 0.8 | % |
Nuveen Investments, Inc., 10.50%, Due 11/15/2015 | | | 0.8 | % |
International Lease Finance Corp., 5.65%, Due 6/1/2014 | | | 0.8 | % |
RITE AID Corp., 9.75%, Due 6/12/2016 | | | 0.8 | % |
HUB International Holdings, Inc., 10.250%, Due 6/15/2015, 144A | | | 0.8 | % |
Synovus Financial Corp., 5.125%, Due 6/15/2017 | | | 0.8 | % |
Cricket Communications, Inc., 7.75%, Due 10/15/2020 | | | 0.7 | % |
Sector Allocation
| | | | |
| | | % of Equity
and Fixed
Income | |
Corporate Obligations - Industrials | | | 81.3 | % |
Corporate Obligations - Finance | | | 10.3 | % |
Corporate Obligations - Utilities | | | 5.7 | % |
Equity | | | 1.7 | % |
Convertible Obligations | | | 1.0 | % |
5
Performance Overview
American Beacon Retirement Income and Appreciation FundSM
October 31, 2011 (Unaudited)
The Y Class of the Retirement Income and Appreciation Fund (“Fund”) returned 2.96% for the twelve months ended October 31, 2011. Its benchmark, a blend of 75% Barclays Capital Aggregate Index (“Barclays Index”) and 25% BofA Merrill Lynch All U.S. Convertibles Index (“ML Index”), returned 4.18%. The Fund’s peer group, the Lipper Intermediate Investment Grade Index, returned 3.90% for the same period.
Comparison of Change in Value of a $10,000 Investment
For the Period from 7/1/03* through 10/31/11
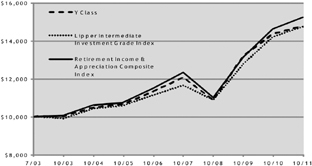
Annualized Total Returns
Periods Ended 10/31/11
| | | | | | | | | | | | | | | | |
| | | 1 Year | | | 5 Years | | | Since
Incep.
(7/1/03) | | | Value of
$10,000
7/1/03-
10/31/11 | |
Y Class(1,2,7) | | | 2.96 | % | | | 5.48 | % | | | 4.80 | % | | $ | 14,779 | |
Investor Class(1,7) | | | 2.71 | % | | | 5.41 | % | | | 4.76 | % | | | 14,734 | |
A Class with sales Charge(1,3,7) | | | -2.27 | % | | | 4.38 | % | | | 4.14 | % | | | 14,023 | |
A Class without sales Charge(1,3,7) | | | 2.61 | % | | | 5.40 | % | | | 4.75 | % | | | 14,724 | |
C Class with sales Charge(1,4,7) | | | 0.84 | % | | | 5.20 | % | | | 4.63 | % | | | 14,583 | |
C Class without sales Charge(1,4,7) | | | 1.84 | % | | | 5.20 | % | | | 4.63 | % | | | 14,583 | |
Retirement Income and Appreciation Composite Index(6) | | | 4.18 | % | | | 5.81 | % | | | 5.19 | % | | | 15,245 | |
Barclays Capital Aggregate Index (5) | | | 5.00 | % | | | 6.41 | % | | | 4.81 | % | | | 14,793 | |
BofA Merrill Lynch All U.S. Convertibles Index (5) | | | 1.02 | % | | | 3.03 | % | | | 5.64 | % | | | 15,799 | |
Lipper Intermediate Investment Grade Index (5) | | | 3.90 | % | | | 5.82 | % | | | 4.78 | % | | | 14,758 | |
| 1. | Performance shown is historical and is not indicative of future returns. Investment returns and principal value will vary, and shares may be worth more or less at redemption than at original purchase. Performance shown is as of date indicated and current performance may be lower or higher than the performance data quoted. To obtain performance as of the most recent month end, please visit www.americanbeaconfunds.com or call 1-800-967-9009. Fund performance in the table above does not reflect the deduction of taxes a shareholder would pay on distributions or the redemption of shares. |
| 2. | Fund performance for the five-year and since inception periods represent the returns achieved by the Investor Class from 7/1/03 up to 3/1/10, the inception date of the Y Class, and the returns of the Y Class since its inception. Expenses of the Y Class are lower than those of the Investor Class. As a result, total returns shown may be lower than they would have been had the Y Class been in existence since 7/1/03. |
| 3. | Fund performance for the five-year and since inception periods represent the returns achieved by the Investor Class from 7/1/03 up to 5/17/10, the inception date of the A Class, and the returns of the A Class since its inception. Expenses of the A Class are higher than those of the Investor Class. As a result, total returns shown may be higher than they would have been had the A Class been in existence since 7/1/03. The maximum sales charge for A Class is 4.75%. |
| 4. | Fund performance for the five-year and since inception periods represent the returns achieved by the Investor Class from 7/1/03 up to 9/1/10, the inception date of the C Class, and the returns of the C Class since its inception. Expenses of the C Class are higher than those of the Investor Class. As a result, total returns shown may be higher than they would have been had the C Class been in existence since 7/1/03. The maximum contingent deferred sales charge for C Class is 1.00% for shares redeemed within one year of the date of purchase. |
| 5. | The Barclays Capital Aggregate Index represents returns of the Barclays Capital Gov./Credit Intermediate Index (“Intermediate Index”) up to October 31, 2006 and the Barclays Capital Aggregate Index (“Aggregate Index”) thereafter. The Intermediate Index is an unmanaged index of investment grade corporate and government debt issues with maturities between one and ten years. The Aggregate Index is a market value weighted index of government, corporate, mortgage-backed and asset-backed fixed-rate debt securities of all maturities. The BofA Merrill Lynch All U.S. Convertibles Index is an unmanaged index of domestic securities of all quality grades that are convertible into U.S. dollar-denominated common stock, ADRs or cash equivalents. The Lipper Intermediate Investment Grade Index tracks the results of the 30 largest mutual funds in the Lipper Intermediate Investment Grade Funds category. Lipper is an independent mutual fund research and ranking service. One cannot directly invest in an index. |
| 6. | To reflect the Fund’s allocation of its assets between investment grade fixed-income securities and convertible securities, the returns of the Barclays Capital Aggregate Index and the BofA Merrill Lynch All U.S. Convertibles Index have been combined in a 75%/25% proportion. |
| 7. | The total annual Fund operating expense ratios set forth in the most recent Fund prospectus for the Y, Investor, A, and C Class shares was 0.81%, 1.09%, 1.21%, and 2.01%, respectively. The expense ratios above may vary from the expense ratios presented in other sections of this report that is based on expenses incurred during the period covered by this report. |
The Fund’s assets have been allocated approximately 75% to American Beacon Advisors, Inc. (the “Manager”) which invests primarily in income producing, short- and intermediate-term investment grade bonds and 25% to a sub-advisor which invests in convertible bonds, convertible preferreds, high yield bonds, and equities in order to enhance the potential return of the Fund.
6
Performance Overview
American Beacon Retirement Income and Appreciation FundSM
October 31, 2011 (Unaudited)
During the twelve-month period, the investment grade bond portion of the Fund returned 4.1% before expenses, compared to a 5.0% return for the Barclays Index. This portion of the Fund underperformed mostly due to a substantial overweight position in Corporates. The Fund’s Financial bond holdings, which underperformed Treasuries the most, were negatively impacted by the European crisis.
The remaining portion of the Fund, managed by the Fund’s sub-advisor, returned 2.6% before expenses. These results exceeded the 1.0% return of the ML Index. The sub-advisor’s underweight to Financials and security selection within this sector added value relative to the ML Index. The Materials sector also added value on an annual basis as commodity related companies posted solid gains. The sub-advisor’s slightly higher quality bias continued to positively impact performance.
The Manager and the Fund’s sub-advisor remain focused on the Fund’s investment objectives of generating income and capital appreciation.
Top Ten Holdings
| | | | |
| | | % of
Net Assets | |
Government National Mortgage Association, 2.70%, Due 4/16/2043 | | | 2.1 | % |
Government National Mortgage Association, 3.20%, Due 11/16/2044 | | | 2.0 | % |
Fannie Mae Pool, 5.00%, Due 1/1/2041 | | | 2.0 | % |
Government National Mortgage Association, 2.543%, Due 9/16/2044 | | | 1.8 | % |
National Credit Union Administration, 0.674%, Due 10/7/2020 | | | 1.7 | % |
National Credit Union Administration, 0.625%, Due 3/11/2020 | | | 1.5 | % |
Freddie Mac Gold Pool, 4.50%, Due 2/1/2041 | | | 1.3 | % |
Ford Credit Floorplan Master Owner Trust, 1.769%, Due 9/15/2014 | | | 1.2 | % |
Freddie Mac Gold Pool, 4.00%, Due 1/1/2041 | | | 1.2 | % |
Freddie Mac Gold Pool, 0.629%, Due 12/15/2040 | | | 1.2 | % |
Sector Allocation
| | | | |
| | | % of
Fixed Income | |
Corporate | | | 41.6 | % |
Mortgage-Backed | | | 30.4 | % |
Convertibles | | | 13.6 | % |
U.S. Treasury | | | 7.5 | % |
Asset-Backed | | | 3.4 | % |
Commercial Mortgage-Backed Securities | | | 2.9 | % |
Other Government Obligations | | | 0.4 | % |
Agency | | | 0.2 | % |
Sector Allocation
| | | | |
| | | % of Equities | |
Information Technology | | | 31.0 | % |
Energy | | | 26.4 | % |
Financials | | | 12.9 | % |
Industrials | | | 11.0 | % |
Materials | | | 8.9 | % |
Consumer Staples | | | 6.1 | % |
Health Care | | | 3.7 | % |
7
Performance Overview
American Beacon Intermediate Bond FundSM
October 31, 2011 (Unaudited)
The Institutional Class of the Intermediate Bond Fund (“Fund”) returned 4.11% for the twelve months ended October 31, 2011, underperforming the Barclays Capital Aggregate Index (the “Index”) return of 5.00%, but outperforming the Lipper Intermediate Investment Grade Index return of 3.90% for the same period.
Comparison of Change in Value of a $10,000 Investment
For the Period from 10/31/01 through 10/31/11

| | | | | | | | | | | | | | | | |
| | | Annualized Total Returns
Periods Ended 10/31/11 | | | Value of
$10,000
10/31/01-
10/31/11 | |
| | | 1 Year | | | 5 Years | | | 10 Years | | |
Institutional Class(1,7) | | | 4.11 | % | | | 6.55 | % | | | 5.34 | % | | $ | 16,821 | |
Y Class(1,3,7) | | | 4.19 | % | | | 6.53 | % | | | 5.33 | % | | | 16,810 | |
Investor Class (1,2,7) | | | 3.65 | % | | | 6.27 | % | | | 5.20 | % | | | 16,603 | |
A Class with sales Charge(1,4,7) | | | -1.44 | % | | | 5.17 | % | | | 4.66 | % | | | 15,768 | |
A Class without sales Charge(1,4,7) | | | 3.45 | % | | | 6.20 | % | | | 5.17 | % | | | 16,549 | |
C Class with sales Charge(1,5,7) | | | 1.70 | % | | | 6.04 | % | | | 5.09 | % | | | 16,427 | |
C Class without sales Charge(1,5,7) | | | 2.70 | % | | | 6.04 | % | | | 5.09 | % | | | 16,427 | |
Barclays Capital Agg. Index (6) | | | 5.00 | % | | | 6.41 | % | | | 5.46 | % | | | 17,013 | |
Lipper Intermediate Inv. Grade Index (6) | | | 3.90 | % | | | 5.82 | % | | | 5.10 | % | | | 16,442 | |
| 1. | Performance shown is historical and is not indicative of future returns. Investment returns and principal value will vary, and shares may be worth more or less at redemption than at original purchase. Performance shown is as of date indicated, and current performance may be lower or higher than the performance data quoted. To obtain performance as of the most recent month end, please visit www.americanbeaconfunds.com or call 1-800-967-9009. Fund performance in the table above does not reflect the deduction of taxes a shareholder would pay on distributions or the redemption of shares. |
| 2. | Fund performance represents the total returns achieved by the Institutional Class up to 3/2/09, the inception date of the Investor Class, and the returns of the Investor Class since its inception. Expenses of the Investor Class are higher than those of the Institutional Class. As a result, total returns shown may be higher than they would have been had the Investor Class been in existence since 10/31/01. |
| 3. | Fund performance for the five-year and ten-year periods represent the total returns achieved by the Institutional Class from 10/31/01 up to 3/1/10, the inception date of the |
| | Y Class, and the returns of the Y Class since its inception. Expenses of the Y Class are higher than those of the Institutional Class. As a result, total returns shown may be higher than they would have been had the Y Class been in existence since 10/31/01. |
| 4. | Fund performance for the five-year and ten-year periods represent the total returns achieved by the Institutional Class from 10/31/01 through 3/2/09, the Investor Class from 3/2/09 up to 5/17/10, the inception date of the A Class, and the returns of the A Class since its inception. Expenses of the A Class are higher than those of the Institutional and Investor Classes. As a result, total returns shown may be higher than they would have been had the A Class been in existence since 10/31/01. The maximum sales charge for A Class is 4.75%. |
| 5. | Fund performance for the five-year and ten-year periods represent the total returns achieved by the Institutional Class from 10/31/01 through 3/2/09, the Investor Class from 3/2/09 up to 9/1/10, the inception date of the C Class, and the returns of the C Class since its inception. Expenses of the C Class are higher than those of the Institutional and Investor Classes. As a result, total returns shown may be higher than they would have been had the C Class been in existence since 10/31/01. The maximum contingent deferred sales charge is 1.00% for shares redeemed within one year of the date of purchase. |
| 6. | The Barclays Capital Aggregate Index is a market value weighted index of government, corporate, mortgage-backed and asset-backed fixed-rate debt securities of all maturities. The Lipper Intermediate Investment Grade Index tracks the results of the 30 largest mutual funds in the Lipper Intermediate Investment Grade Funds category. Lipper is an independent research and ranking service. One cannot directly invest in an index. |
| 7. | The total annual Fund operating expense ratios set forth in the most recent Fund prospectus for the Institutional, Y, Investor, A, and C Class shares was 0.34%, 0.68%, 0.84%, 1.06%, and 1.83%, respectively. The expense ratios above may vary from the expense ratios presented in other sections of this report that is based on expenses incurred during the period covered by this report. |
The Fund underperformed the Index through both sector allocation and security selection. An underweight in U.S. Treasuries detracted value from the Fund’s performance relative to the Index. U.S. Treasuries were the best performing sector of the Index as interest rates declined during the latter half of the year. For this same reason, the Fund’s slightly shorter duration also detracted modest value. Poor selection in the Corporate sector, across the board, also hurt performance. The Fund’s overweight in Financials was the largest detractor among the Corporate bond holdings as these companies were negatively impacted by the European crisis.
The Fund’s investment managers remain focused on a conservative approach toward investing in the bond market, focusing on issuer-specific opportunities to add value.
8
Performance Overview
American Beacon Intermediate Bond FundSM
October 31, 2011 (Unaudited)
Top Ten Holdings
| | | | |
| | | % of
Net Assets | |
Freddie Mac Gold Pool, 5.00%, Due 4/1/2040 | | | 1.6 | % |
National Credit Union Administration, 0.625%, Due 3/11/2020 | | | 1.3 | % |
Fannie Mae Pool, 5.00%, Due 5/1/2040 | | | 1.3 | % |
Fannie Mae Pool, 4.50%, Due 1/1/2040 | | | 1.2 | % |
Government National Mortgage Association, 2.70%, Due 4/16/2043 | | | 1.1 | % |
Fannie Mae Pool, 4.50%, Due 3/1/2025 | | | 1.1 | % |
Government National Mortgage Association, 3.20%, Due 11/16/2044 | | | 1.0 | % |
National Credit Union Administration, 0.674%, Due 10/7/2020 | | | 1.0 | % |
Fannie Mae Pool, 5.50%, Due 6/1/2040 | | | 0.9 | % |
The Bear Stearns Cos., Inc., 7.25%, Due 2/1/2018 | | | 0.9 | % |
Sector Allocation
| | | | |
| | | % of
Fixed Income | |
Corporate | | | 45.3 | % |
Mortgage-Backed | | | 34.1 | % |
U.S. Treasury | | | 13.4 | % |
Commercial Mortgage-Backed Securities | | | 3.8 | % |
Asset-Backed | | | 2.9 | % |
Agency | | | 0.3 | % |
Other Government Obligations | | | 0.2 | % |
9
Performance Overview
American Beacon Short-Term Bond FundSM
October 31, 2011 (Unaudited)
The Institutional Class of the Short-Term Bond Fund (“Fund”) returned 0.17% for the twelve months ended October 31, 2011, which underperformed the BofA Merrill Lynch 1-3 Year Gov/Corp Index (the “Index”) return of 1.20% and the Lipper Short Investment Grade Bond Funds Index (“Lipper”) return of 1.09%.
Comparison of Change in Value of a $10,000 Investment
For the Period from 10/31/01 through 10/31/11

| | | | | | | | | | | | | | | | |
| | | Annualized Total Returns
Periods Ended 10/31/11 | | | Value of
$10,000
10/31/01-
10/31/11 | |
| | | 1 Year | | | 5 Years | | | 10 Years | | |
Institutional Class(1,6) | | | 0.17 | % | | | 3.64 | % | | | 3.35 | % | | $ | 13,906 | |
Y Class(1,2,6) | | | 0.04 | % | | | 3.61 | % | | | 3.34 | % | | | 13,884 | |
Investor Class(1,6) | | | -0.12 | % | | | 3.21 | % | | | 2.88 | % | | | 13,289 | |
A Class with sales Charge(1,3,6) | | | -2.84 | % | | | 2.66 | % | | | 2.60 | % | | | 12,927 | |
A Class without sales Charge(1,3,6) | | | -0.33 | % | | | 3.17 | % | | | 2.86 | % | | | 13,263 | |
C Class with sales Charge(1,4,6) | | | -2.00 | % | | | 3.02 | % | | | 2.79 | % | | | 13,166 | |
C Class without sales Charge(1,4,6) | | | -1.00 | % | | | 3.02 | % | | | 2.79 | % | | | 13,166 | |
Lipper Short Inv. Grade Bond Funds Index (5) | | | 1.09 | % | | | 3.33 | % | | | 3.00 | % | | | 13,445 | |
BofA Merrill Lynch 1-3Yr. Gov./Corp Index(5) | | | 1.20 | % | | | 4.06 | % | | | 3.55 | % | | | 14,169 | |
| 1. | Performance shown is historical and is not indicative of future returns. Investment returns and principal value will vary, and shares may be worth more or less at redemption than at original purchase. Performance shown is as of date indicated, and current performance may be lower or higher than the performance data quoted. To obtain performance as of the most recent month end, please visit www.americanbeaconfunds.com or call 1-800-967-9009. Fund performance in the table above does not reflect the deduction of taxes a shareholder would pay on distributions or the redemption of shares. A portion of the fees charged to the Investor Class of the Fund has been waived. Performance prior to waiving fees was lower than the actual returns shown. |
| 2. | Fund performance for the five-year and ten-year periods represent the total returns achieved by the Institutional Class from 10/31/01 through 3/1/10, the inception date of the Y Class, and the returns of the Y Class since its inception. Expenses of the Y Class are higher than those of the Institutional Class. As a result, total returns shown may be higher than they would have been had the Y Class been in existence since 10/31/01. |
| 3. | Fund performance for the five-year and ten-year periods represent the total returns achieved by the Investor Class from 10/31/01 up to 5/17/10, the inception date of the A Class, and the returns of the A Class since its inception. Expenses of the A Class are higher than those of the Investor Class. As a result, total returns shown may be higher than they would have been had the A Class been in existence since 10/31/01. The maximum sales charge for A Class is 2.50%. |
| 4. | Fund performance for the five-year and ten-year periods represent the total returns achieved by the Investor Class from 10/31/01 up to 9/1/10, the inception date of the C Class, and the returns of the C Class since its inception. Expenses of the C Class are higher than those of the Investor Class. As a result, total returns shown may be higher than they would have been had the C Class been in existence since 10/31/01. The maximum contingent deferred sales charge is 1.00% for shares redeemed within one year of the date of purchase. |
| 5. | The BofA Merrill Lynch 1-3 Yr. Gov./Corp. Index is a market value weighted performance benchmark for government and corporate fixed-rate debt securities with maturities between one and three years. The Lipper Short Investment Grade Bond Funds Index tracks the results of the 30 largest mutual funds in the Lipper Short Investment Grade Bond Funds category. Lipper is an independent mutual fund research and ranking service. One cannot directly invest in an index. |
| 6. | The total annual Fund operating expense ratio set forth in the most recent Fund prospectus for the Institutional, Y, Investor, A, and C Class shares was 0.35%, 0.65%, 0.86%, 1.02%, and 2.05%, respectively. The expense ratios above may vary from the expense ratios presented in other sections of this report that are based on expenses incurred during the period covered by this report. |
During the period, the Fund was overweight in the Corporate sector, primarily Financials, which underperformed as the European debt crisis deepened and U.S. Treasury yields declined. Investors sought the safety of U.S. Government obligations, which caused nearly all credit sectors to underperform. The Fund generally remains overweight in the various credit sectors to generate incremental yield-to-maturity compared to the Index, but this position may underperform during periods of heightened market volatility.
Also during the period, the Fund’s duration was shorter than that of the Index, which led to underperformance as interest rates declined. Given the near-record low levels of interest rates, we reduced the Fund’s duration to protect from an ultimate rise in interest rates. While a rise in rates does not appear to be imminent, the absolute low level of yields warrants a more defensive approach towards duration.
10
Performance Overview
American Beacon Short-Term Bond FundSM
October 31, 2011 (Unaudited)
In the mean time, we continue to look for opportunity in this low interest rate environment and strive to protect the Fund from an eventual rise in rates. We will also maintain our conservative approach toward credit risk and seek to outperform over the long-term on a risk-adjusted basis.
Top Ten Holdings
| | | | |
| | | % of
Net Assets | |
National Credit Union Administration, 0.625%, Due 3/11/2020 | | | 3.9 | % |
National Credit Union Administration, 0.691%, Due 1/8/2020 | | | 3.6 | % |
Government National Mortgage Association, 2.25%, Due 5/16/2033 | | | 2.2 | % |
Government National Mortgage Association, 2.45%, Due 7/16/2032 | | | 2.2 | % |
Ally Master Owner Trust, 1.031%, Due 9/15/2016 | | | 2.1 | % |
Government National Mortgage Association, 1.864%, Due 8/16/2031 | | | 1.9 | % |
Ford Credit Floorplan Master Owner Trust, 1.769%, Due 9/15/2014 | | | 1.7 | % |
Government National Mortgage Association, 2.45%, Due 7/16/2038 | | | 1.6 | % |
Government National Mortgage Association, 2.161%, Due 11/16/2036 | | | 1.6 | % |
National Australia Bank Ltd., 1.202%, Due 7/25/2014. | | | 1.6 | % |
Sector Allocation
| | | | |
| | | % of Fixed
Income | |
Corporate | | | 47.2 | % |
Mortgage-Backed | | | 33.5 | % |
Asset-Backed. | | | 15.8 | % |
U.S. Treasury Notes | | | 3.7 | % |
Commercial Mortgage-Backed Securities | | | 0.8 | % |
11
Fund Expenses
American Beacon Funds
October 31, 2011 (Unaudited)
Fund Expense Example
As a shareholder of a Fund, you incur two types of costs: (1) transaction costs, including redemption fees if applicable, and (2) ongoing costs, including management fees, administrative service fees, distribution (12b-1) fees, and other Fund expenses. The examples below are intended to help you understand the ongoing cost (in dollars) of investing in a particular Fund and to compare these costs with the ongoing costs of investing in other mutual funds. The examples are based on an investment of $1,000 invested at the beginning of the period in each Class and held for the entire period from May 1, 2011 through October 31, 2011.
Actual Expenses
The following tables provide information about actual account values and actual expenses. You may use the information on this page, together with the amount you invested, to estimate the expenses that you paid over the period. Simply divide your account value by $1,000 (for example, an $8,600 account value divided by $1,000 = 8.6), then multiply the result by the “Expenses Paid During Period” for the applicable Fund to estimate the expenses you paid on your account during this period. Shareholders of the Investor and Institutional Classes that invest in a Fund through an IRA may be subject to a custodial IRA fee of $15 that is typically deducted each December. If your account was subject to a custodial IRA fee during the period, your costs would have been $15 higher.
| | | | | | | | | | | | |
Institutional Class | | High Yield
Bond Fund | | | Intermediate
Bond Fund | | | Short-Term
Bond Fund | |
Beginning Account Value 5/1/11 | | $ | 1,000.00 | | | $ | 1,000.00 | | | $ | 1,000.00 | |
Ending Account Value 10/31/11 | | $ | 971.73 | | | $ | 1,041.85 | | | $ | 999.32 | |
Expenses Paid During Period 5/1/11-10/31/11 * | | $ | 4.62 | | | $ | 2.01 | | | $ | 2.12 | |
Annualized Expense Ratio | | | 0.93 | % | | | 0.39 | % | | | 0.42 | % |
| | | | | | | | | | | | | | | | |
Y Class | | High Yield
Bond Fund | | | Retirement
Income and
Appreciation
Fund | | | Intermediate
Bond Fund | | | Short-Term
Bond Fund | |
Beginning Account Value 5/1/11 | | $ | 1,000.00 | | | $ | 1,000.00 | | | $ | 1,000.00 | | | $ | 1,000.00 | |
Ending Account Value 10/31/11 | | $ | 969.56 | | | $ | 1,005.79 | | | $ | 1,039.77 | | | $ | 997.48 | |
Expenses Paid During Period 5/1/11-10/31/11 * | | $ | 5.81 | | | $ | 5.56 | | | $ | 4.06 | | | $ | 3.98 | |
Annualized Expense Ratio | | | 1.17 | % | | | 1.10 | % | | | 0.79 | % | | | 0.79 | % |
| | | | | | | | | | | | | | | | |
Investor Class | | High Yield
Bond Fund | | | Retirement
Income and
Appreciation
Fund | | | Intermediate
Bond Fund | | | Short-Term
Bond Fund | |
Beginning Account Value 5/1/11 | | $ | 1,000.00 | | | $ | 1,000.00 | | | $ | 1,000.00 | | | $ | 1,000.00 | |
Ending Account Value 10/31/11 | | $ | 969.56 | | | $ | 1,005.79 | | | $ | 1,039.77 | | | $ | 997.48 | |
Expenses Paid During Period 5/1/11-10/31/11 * | | $ | 5.81 | | | $ | 5.56 | | | $ | 4.06 | | | $ | 3.98 | |
Annualized Expense Ratio | | | 1.17 | % | | | 1.10 | % | | | 0.79 | % | | | 0.79 | % |
| | | | | | | | | | | | | | | | |
A Class | | High Yield
Bond Fund | | | Retirement
Income and
Appreciation
Fund | | | Intermediate
Bond Fund | | | Short-Term
Bond Fund | |
Beginning Account Value 5/1/11 | | $ | 1,000.00 | | | $ | 1,000.00 | | | $ | 1,000.00 | | | $ | 1,000.00 | |
Ending Account Value 10/31/11 | | $ | 969.83 | | | $ | 1,005.61 | | | $ | 1,038.74 | | | $ | 997.16 | |
Expenses Paid During Period 5/1/11-10/31/11 * | | $ | 5.46 | | | $ | 5.71 | | | $ | 5.09 | | | $ | 4.23 | |
Annualized Expense Ratio | | | 1.10 | % | | | 1.13 | % | | | 0.99 | % | | | 0.84 | % |
| | | | | | | | | | | | | | | | |
C Class | | High Yield
Bond Fund | | | Retirement
Income and
Appreciation
Fund | | | Intermediate
Bond Fund | | | Short-Term
Bond Fund | |
Beginning Account Value 5/1/11 | | $ | 1,000.00 | | | $ | 1,000.00 | | | $ | 1,000.00 | | | $ | 1,000.00 | |
Ending Account Value 10/31/11 | | $ | 966.16 | | | $ | 1,000.54 | | | $ | 1,034.83 | | | $ | 993.71 | |
Expenses Paid During Period 5/1/11-10/31/11 * | | $ | 9.22 | | | $ | 9.68 | | | $ | 8.92 | | | $ | 7.69 | |
Annualized Expense Ratio | | | 1.86 | % | | | 1.92 | % | | | 1.74 | % | | | 1.53 | % |
12
Fund Expenses
American Beacon Funds
October 31, 2011 (Unaudited)
| | | | |
AMR Class | | High Yield
Bond Fund | |
Beginning Account Value 5/1/11 | | $ | 1,000.00 | |
Ending Account Value 10/31/2011 | | $ | 972.12 | |
Expenses Paid During Period 5/1/11-10/31/11 * | | $ | 3.18 | |
Annualized Expense Ratio | | | 0.64 | % |
Hypothetical Example for Comparison Purposes
The following tables provide information about hypothetical account values and hypothetical expenses based on a Fund’s actual expense ratio and an assumed 5% per year rate of return before expenses (not the Fund’s actual return). You may compare the ongoing costs of investing in a particular Fund with other funds by contrasting this 5% hypothetical example and the 5% hypothetical examples that appear in the shareholder reports of the other funds. The hypothetical account values and expenses may not be used to estimate the actual ending account balance or expenses you paid for the period. Shareholders of the Investor and Institutional Classes that invest in a Fund through an IRA may be subject to a custodial IRA fee of $15 that is typically deducted each December. If your account was subject to a custodial IRA fee during the period, your costs would have been $15 higher.
You should also be aware that the expenses shown in the table highlight only your ongoing costs and do not reflect any transaction costs charged by a Fund, such as redemption fees as applicable. Similarly, the expense examples for other funds do not reflect any transaction costs charged by those funds, such as sales charges (loads), redemption fees or exchange fees. Therefore, the following tables are useful in comparing ongoing costs only and will not help you determine the relative total costs of owning different funds. If you were subject to any transaction costs during the period, your costs would have been higher.
| | | | | | | | | | | | |
Institutional Class | | High Yield
Bond Fund | | | Intermediate
Bond Fund | | | Short-Term
Bond Fund | |
Beginning Account Value 5/1/11 | | $ | 1,000.00 | | | $ | 1,000.00 | | | $ | 1,000.00 | |
Ending Account Value 10/31/11 | | $ | 1,020.52 | | | $ | 1,023.24 | | | $ | 1,023.09 | |
Expenses Paid During Period 5/1/11-10/31/11 * | | $ | 4.74 | | | $ | 1.99 | | | $ | 2.14 | |
Annualized Expense Ratio | | | 0.93 | % | | | 0.39 | % | | | 0.42 | % |
| | | | | | | | | | | | | | | | |
Y Class | | High Yield
Bond Fund | | | Retirement
Income and
Appreciation
Fund | | | Intermediate
Bond Fund | | | Short-Term
Bond Fund | |
Beginning Account Value 5/1/11 | | $ | 1,000.00 | | | $ | 1,000.00 | | | $ | 1,000.00 | | | $ | 1,000.00 | |
Ending Account Value 10/31/11 | | $ | 1,019.31 | | | $ | 1,019.66 | | | $ | 1,021.22 | | | $ | 1,021.22 | |
Expenses Paid During Period 5/1/11-10/31/11 * | | $ | 5.96 | | | $ | 5.60 | | | $ | 4.02 | | | $ | 4.02 | |
Annualized Expense Ratio | | | 1.17 | % | | | 1.10 | % | | | 0.79 | % | | | 0.79 | % |
| | | | | | | | | | | | | | | | |
Investor Class | | High Yield
Bond Fund | | | Retirement
Income and
Appreciation
Fund | | | Intermediate
Bond Fund | | | Short-Term
Bond Fund | |
Beginning Account Value 5/1/11 | | $ | 1,000.00 | | | $ | 1,000.00 | | | $ | 1,000.00 | | | $ | 1,000.00 | |
Ending Account Value 10/31/11 | | $ | 1,019.31 | | | $ | 1,019.66 | | | $ | 1,021.22 | | | $ | 1,021.22 | |
Expenses Paid During Period 5/1/11-10/31/11 * | | $ | 5.96 | | | $ | 5.60 | | | $ | 4.02 | | | $ | 4.02 | |
Annualized Expense Ratio | | | 1.17 | % | | | 1.10 | % | | | 0.79 | % | | | 0.79 | % |
| | | | | | | | | | | | | | | | |
A Class | | High Yield
Bond Fund | | | Retirement
Income and
Appreciation
Fund | | | Intermediate
Bond Fund | | | Short-Term
Bond Fund | |
Beginning Account Value 5/1/11 | | $ | 1,000.00 | | | $ | 1,000.00 | | | $ | 1,000.00 | | | $ | 1,000.00 | |
Ending Account Value 10/31/11 | | $ | 1,019.66 | | | $ | 1,019.51 | | | $ | 1,020.21 | | | $ | 1,020.97 | |
Expenses Paid During Period 5/1/11-10/31/11 * | | $ | 5.60 | | | $ | 5.75 | | | $ | 5.04 | | | $ | 4.28 | |
Annualized Expense Ratio | | | 1.10 | % | | | 1.13 | % | | | 0.99 | % | | | 0.84 | % |
13
Fund Expenses
American Beacon Funds
October 31, 2011 (Unaudited)
| | | | | | | | | | | | | | | | |
C Class | | High Yield
Bond Fund | | | Retirement
Income and
Appreciation
Fund | | | Intermediate
Bond Fund | | | Short-Term
Bond Fund | |
Beginning Account Value 5/1/11 | | $ | 1,000.00 | | | $ | 1,000.00 | | | $ | 1,000.00 | | | $ | 1,000.00 | |
Ending Account Value 10/31/11 | | $ | 1,015.83 | | | $ | 1,015.53 | | | $ | 1,016.43 | | | $ | 1,017.49 | |
Expenses Paid During Period 5/1/11-10/31/11 * | | $ | 9.45 | | | $ | 9.75 | | | $ | 8.84 | | | $ | 7.78 | |
Annualized Expense Ratio | | | 1.86 | % | | | 1.92 | % | | | 1.74 | % | | | 1.53 | % |
| | | | |
AMR Class | | High Yield
Bond Fund | |
Beginning Account Value 5/1/11 | | $ | 1,000.00 | |
Ending Account Value 10/31/11 | | $ | 1,021.98 | |
Expenses Paid During Period 5/1/11-10/31/11 * | | $ | 3.26 | |
Annualized Expense Ratio | | | 0.64 | % |
| * | Expenses are equal to the Fund’s annualized expense ratios for the six-month period multiplied by the average account value over the period, multiplied by the number derived by dividing the number of days in the most recent fiscal half-year (184) by days in the year (365) to reflect the half-year period. |
14
American Beacon Funds
Report of Independent Registered Public Accounting Firm
To the Shareholders and the Board of Trustees of
American Beacon High Yield Bond Fund, American Beacon Intermediate Bond Fund, American Beacon Retirement Income and Appreciation Fund, and American Beacon Short-Term Bond Fund:
We have audited the accompanying statements of assets and liabilities, including the schedules of investments, of the American Beacon High Yield Bond Fund, the American Beacon Retirement Income and Appreciation Fund, the American Beacon Intermediate Bond Fund, and the American Beacon Short-Term Bond Fund (four of the funds constituting the American Beacon Funds) (collectively, the “Funds”), as of October 31, 2011, and the related statements of operations for the year then ended, the statements of changes in net assets for each of the two years in the period then ended, and financial highlights for each of the periods indicated therein. These financial statements and financial highlights are the responsibility of the Funds’ management. Our responsibility is to express an opinion on these financial statements and financial highlights based on our audits.
We conducted our audits in accordance with the standards of the Public Company Accounting Oversight Board (United States). Those standards require that we plan and perform the audit to obtain reasonable assurance about whether the financial statements and financial highlights are free of material misstatement. We were not engaged to perform an audit of the Funds’ internal control over financial reporting. Our audits included consideration of internal control over financial reporting as a basis for designing audit procedures that are appropriate in the circumstances, but not for the purpose of expressing an opinion on the effectiveness of each Fund’s internal control over financial reporting. Accordingly, we express no such opinion. An audit also includes examining, on a test basis, evidence supporting the amounts and disclosures in the financial statements and financial highlights, assessing the accounting principles used and significant estimates made by management, and evaluating the overall financial statement presentation. Our procedures included confirmation of securities owned as of October 31, 2011, by correspondence with the custodian and brokers or by other appropriate auditing procedures where replies from brokers were not received. We believe that our audits provide a reasonable basis for our opinion.
In our opinion, the financial statements and financial highlights referred to above present fairly, in all material respects, the financial position of the American Beacon High Yield Bond Fund, the American Beacon Retirement Income and Appreciation Fund, the American Beacon Intermediate Bond Fund, and the American Beacon Short-Term Bond Fund at October 31, 2011, the results of their operations for the year then ended, the changes in their net assets for each of the two years in the period then ended, and the financial highlights for each of the periods indicated therein, in conformity with U.S. generally accepted accounting principles.
Dallas, Texas
December 29, 2011
15
American Beacon High Yield Bond Fund
Schedule of Investments
October 31, 2011
| | | | | | | | |
| | | Shares | | | Fair Value | |
| | | (000’s) | | | (000’s) | |
COMMON STOCKS - 0.41% | | | | | | | | |
COMMUNICATIONS - 0.01% | | | | | | | | |
Media - 0.01% | | | | | | | | |
Dex One Corp.A | | | 23,761 | | | $ | 15 | |
SuperMedia, Inc.A | | | 1,037 | | | | 2 | |
| | | | | | | | |
Total Communications | | | | | | | 17 | |
| | | | | | | | |
CONSUMER DISCRETIONARY - 0.13% | | | | | | | | |
Automobiles - 0.13% | | | | | | | | |
General Motors Co.A | | | 6,381 | | | | 165 | |
| | | | | | | | |
FINANCIALS - 0.04% | | | | | | | | |
Finance - 0.04% | | | | | | | | |
Marsico Holdings LLCA B | | | 13,199 | | | | 53 | |
| | | | | | | | |
INDUSTRIALS- 0.01% | | | | | | | | |
Marine - 0.01% | | | | | | | | |
Horizon Lines, Inc., Class AA | | | 32,303 | | | | 9 | |
| | | | | | | | |
RIGHTS/WARRANTS - 0.22% | | | | | | | | |
Charter Communications, Inc., | | | | | | | | |
Due 11/30/2014A C | | | 2,416 | | | | 27 | |
Due 11/30/2014A D | | | 2,759 | | | | 30 | |
General Motors Co., | | | | | | | | |
Due 7/10/2016A D | | | 5,801 | | | | 97 | |
Due 7/10/2019A D | | | 5,801 | | | | 68 | |
Horizon Lines, Inc.A | | | 122,999 | | | | 34 | |
| | | | | | | | |
Total Rights/Warrants | | | | | | | 256 | |
| | | | | | | | |
Total Common Stocks (Cost $2,402) | | | | | | | 500 | |
| | | | | | | | |
PREFERRED STOCKS - 0.87% | | | | | | | | |
FINANCIALS - 0.87% | | | | | | | | |
Diversified Financials - 0.02% | | | | | | | | |
Federal Home Loan Mortgage Corp.E | | | 10,000 | | | | 21 | |
Finance - 0.85% | | | | | | | | |
Ally Financial, Inc.F | | | 159 | | | | 119 | |
GMAC Capital Trust I E | | | 11,600 | | | | 243 | |
Zions Bancorporation | | | 26,300 | | | | 681 | |
| | | | | | | | |
| | | | | | | 1,043 | |
| | | | | | | | |
Total Preferred Stocks (Cost $1,212) | | | | | | | 1,064 | |
| | | | | | | | |
CONVERTIBLE PREFERRED STOCK - 0.22% (Cost $267) | | | | | | | | |
FINANCIALS - 0.22% | | | | | | | | |
Diversified Financials - 0.22% | | | | | | | | |
Wells Fargo & Co | | | 260 | | | | 275 | |
| | | | | | | | |
| | | | | | | | |
| | | Par Amount | | | | |
| | | (000’s) | | | | |
CONVERTIBLE OBLIGATIONS - 0.91% | | | | | | | | |
Convertible Obligations - 0.91% | | | | | | | | |
E*Trade Financial Corp., 0%, Due 8/31/2019 | | $ | 240 | | | | 252 | |
Horizon Lines, Inc., | | | | | | | | |
6.00%, Due 4/15/2017 | | | 870 | | | | 587 | |
Powerwave Technologies, Inc., 3.875%, Due 10/1/2027 | | | 485 | | | | 279 | |
| | | | | | | | |
Total Convertible Obligations (Cost $1,267) | | | | | | | 1,118 | |
| | | | | | | | |
CORPORATE OBLIGATIONS - 86.88% | | | | | | | | |
Finance - 9.24% | | | | | | | | |
ACE Cash Express, Inc., 11.00%, Due 2/1/2019F | | | 400 | | | | 373 | |
Alliant Holdings I, Inc., 11.00%, Due 5/1/2015F | | | 300 | | | | 309 | |
Ally Financial, Inc., | | | | | | | | |
6.875%, Due 8/28/2012 | | | 400 | | | | 405 | |
See accompanying notes
16
American Beacon High Yield Bond Fund
Schedule of Investments
October 31, 2011
| | | | | | | | |
| | | Par Amount | | | Fair Value | |
| | | (000’s) | | | (000’s) | |
8.00%, Due 12/31/2018 | | $ | 300 | | | $ | 294 | |
7.50%, Due 9/15/2020F | | | 400 | | | | 404 | |
Amsouth Bank, 4.85%, Due 4/1/2013 | | | 150 | | | | 144 | |
Bank of America Corp., 8.125%, Due 12/29/2049 | | | 500 | | | | 465 | |
Bank One Capital III, 8.75%, Due 9/1/2030 | | | 220 | | | | 268 | |
CIT Group, Inc., | | | | | | | | |
7.00%, Due 5/2/2017F | | | 1,100 | | | | 1,096 | |
6.625%, Due 4/1/2018F | | | 100 | | | | 105 | |
CNL Lifestyle Properties, Inc., 7.25%, Due 4/15/2019 | | | 250 | | | | 225 | |
E*Trade Financial Corp., 12.50%, Due 11/30/2017G | | | 640 | | | | 738 | |
Fontainebleau Las Vegas Holdings LLC, 10.25%, Due 6/15/2015B F J | | | 1,800 | | | | 2 | |
Harbinger Group, Inc., 10.625%, Due 11/15/2015F | | | 225 | | | | 226 | |
HUB International Holdings, Inc., | | | | | | | | |
9.00%, Due 12/15/2014F | | | 250 | | | | 249 | |
10.25%, Due 6/15/2015F | | | 1,075 | | | | 1,039 | |
International Lease Finance Corp., | | | | | | | | |
5.625%, Due 9/20/2013 | | | 160 | | | | 158 | |
5.65%, Due 6/1/2014 | | | 1,000 | | | | 960 | |
iPayment, Inc., 10.25%, Due 5/15/2018F | | | 200 | | | | 193 | |
Marsico Holdings LLC, 10.625%, Due 1/15/2020B F G | | | 200 | | | | 80 | |
MetLife, Inc., 10.75%, Due 8/1/2069 | | | 150 | | | | 198 | |
Nationwide Mutual Insurance Co., 9.375%, Due 8/15/2039F | | | 225 | | | | 276 | |
Nuveen Investments, Inc., | | | | | | | | |
5.50%, Due 9/15/2015 | | | 250 | | | | 213 | |
10.50%, Due 11/15/2015 | | | 975 | | | | 975 | |
Oppenheimer Holdings, Inc., 8.75%, Due 4/15/2018 | | | 300 | | | | 293 | |
Regions Bank, 7.50%, Due 5/15/2018 | | | 250 | | | | 244 | |
ROC Finance LLC, 12.125%, Due 9/1/2018B F | | | 175 | | | | 185 | |
Synovus Financial Corp., 5.125%, Due 6/15/2017 | | | 1,200 | | | | 1,026 | |
WMG Acquisition Corp., 11.50%, Due 10/1/2018F | | | 175 | | | | 175 | |
| | | | | | | | |
| | | | | | | 11,318 | |
| | | | | | | | |
Industrials - 72.59% | | | | | | | | |
Abengoa Finance SAU, 8.875%, Due 11/1/2017F | | | 400 | | | | 404 | |
Academy Ltd., 9.25%, Due 8/1/2019F | | | 300 | | | | 302 | |
Accuride Corp., 9.50%, Due 8/1/2018 | | | 670 | | | | 654 | |
Advanced Micro Devices, Inc., 7.75%, Due 8/1/2020 | | | 400 | | | | 406 | |
AE Escrow Corp., 9.75%, Due 3/15/2020F | | | 385 | | | | 400 | |
Affinia Group, Inc., 9.00%, Due 11/30/2014 | | | 250 | | | | 248 | |
Alcatel-Lucent USA, Inc., 6.45%, Due 3/15/2029 | | | 500 | | | | 440 | |
Alere, Inc., 8.625%, Due 10/1/2018 | | | 205 | | | | 205 | |
Allison Transmission, Inc., 7.125%, Due 5/15/2019F | | | 595 | | | | 576 | |
AMC Entertainment, Inc., 9.75%, Due 12/1/2020 | | | 160 | | | | 155 | |
American Petroleum Tankers Parent LLC, 10.25%, Due 5/1/2015B F | | | 275 | | | | 283 | |
Antero Resources Finance Corp., 7.25%, Due 8/1/2019F | | | 200 | | | | 206 | |
Appleton Papers, Inc., 10.50%, Due 6/15/2015F | | | 200 | | | | 200 | |
Arch Coal, Inc., | | | | | | | | |
7.00%, Due 6/15/2019F | | | 100 | | | | 104 | |
7.25%, Due 6/15/2021F | | | 200 | | | | 206 | |
ARD Finance S.A., 11.125%, Due 6/1/2018F | | | 300 | | | | 270 | |
Atkore International, Inc., 9.875%, Due 1/1/2018F | | | 365 | | | | 366 | |
Aviv Healthcare Properties LP, 7.75%, Due 2/15/2019F H | | | 200 | | | | 193 | |
Basic Energy Services, Inc., 7.125%, Due 4/15/2016 | | | 350 | | | | 355 | |
Belden, Inc., 7.00%, Due 3/15/2017 | | | 155 | | | | 156 | |
Berry Petroleum Co., 10.25%, Due 6/1/2014 | | | 397 | | | | 450 | |
Biomet, Inc., 11.625%, Due 10/15/2017 | | | 175 | | | | 191 | |
Boart Longyear Management Property Ltd., 7.00%, Due 4/1/2021F | | | 215 | | | | 212 | |
Bresnan Broadband Holdings LLC, 8.00%, Due 12/15/2018B F | | | 125 | | | | 129 | |
Brigham Exploration Co., 6.875%, Due 6/1/2019 | | | 75 | | | | 82 | |
Brightstar Corp., 9.50%, Due 12/1/2016F | | | 270 | | | | 273 | |
Burlington Coat Factory Warehouse Corp., 10.00%, Due 2/15/2019F | | | 465 | | | | 460 | |
Cablevision Systems Corp., 8.625%, Due 9/15/2017 | | | 400 | | | | 434 | |
Caesars Entertainment Operating Co. Inc., | | | | | | | | |
See accompanying notes
17
American Beacon High Yield Bond Fund
Schedule of Investments
October 31, 2011
| | | | | | | | |
| | | Par Amount | | | Fair Value | |
| | | (000’s) | | | (000’s) | |
10.75%, Due 2/1/2016 | | $ | 400 | | | $ | 332 | |
11.25%, Due 6/1/2017 | | | 700 | | | | 748 | |
Calumet Specialty Products Partners LP, 9.375%, Due 5/1/2019F H | | | 200 | | | | 192 | |
Casella Waste Systems, Inc., 11.00%, Due 7/15/2014 | | | 175 | | | | 189 | |
Catalyst Paper Corp., 11.00%, Due 12/15/2016F | | | 300 | | | | 174 | |
CCH II LLC, 13.50%, Due 11/30/2016B | | | 200 | | | | 231 | |
CCO Holdings LLC, | | | | | | | | |
7.25%, Due 10/30/2017B | | | 200 | | | | 209 | |
6.50%, Due 4/30/2021B | | | 200 | | | | 200 | |
CDRT Merger Sub, Inc., 8.125%, Due 6/1/2019F | | | 400 | | | | 400 | |
CDW LLC, 8.50%, Due 4/1/2019B F | | | 500 | | | | 485 | |
CEDC Finance Corp International, Inc., 9.125%, Due 12/1/2016F | | | 1,700 | | | | 1,223 | |
Cemex SAB de CV, 9.00%, Due 1/11/2018F | | | 765 | | | | 638 | |
Cengage Learning Acquisitions, Inc., 10.50%, Due 1/15/2015F | | | 250 | | | | 198 | |
Central Garden and Pet Co., 8.25%, Due 3/1/2018 | | | 154 | | | | 154 | |
Cenveo Corp., | | | | | | | | |
7.875%, Due 12/1/2013 | | | 515 | | | | 425 | |
8.875%, Due 2/1/2018 | | | 585 | | | | 507 | |
CEVA Group plc, | | | | | | | | |
11.625%, Due 10/1/2016F | | | 100 | | | | 101 | |
11.50%, Due 4/1/2018F | | | 200 | | | | 181 | |
CF Industries Holdings, Inc., 7.125%, Due 5/1/2020 | | | 285 | | | | 332 | |
Chaparral Energy, Inc., | | | | | | | | |
9.875%, Due 10/1/2020 | | | 500 | | | | 543 | |
8.25%, Due 9/1/2021 | | | 500 | | | | 509 | |
CHC Helicopter S.A., 9.25%, Due 10/15/2020F | | | 400 | | | | 360 | |
Chesapeake Energy Corp., | | | | | | | | |
6.625%, Due 8/15/2020 | | | 500 | | | | 542 | |
6.125%, Due 2/15/2021 | | | 100 | | | | 105 | |
Chesapeake Oilfield Operating LLC, 6.625%, Due 11/15/2019B F | | | 300 | | | | 308 | |
Chrysler Group LLC, 8.25%, Due 6/15/2021B F | | | 200 | | | | 183 | |
Cie Generale de Geophysique - Veritas, 6.50%, Due 6/1/2021F | | | 400 | | | | 398 | |
Cincinnati Bell, Inc., | | | | | | | | |
8.25%, Due 10/15/2017 | | | 100 | | | | 101 | |
8.75%, Due 3/15/2018 | | | 300 | | | | 288 | |
Clayton Williams Energy, Inc., 7.75%, Due 4/1/2019F | | | 400 | | | | 370 | |
Clear Channel Communications, Inc., 9.00%, Due 3/1/2021 | | | 600 | | | | 534 | |
Clear Channel Worldwide Holdings, Inc., 9.25%, Due 12/15/2017 | | | 350 | | | | 378 | |
Clearwire Communications LLC, | | | | | | | | |
12.00%, Due 12/1/2015B F | | | 115 | | | | 98 | |
12.00%, Due 12/1/2017B F | | | 375 | | | | 230 | |
ClubCorp Club Operations, Inc., 10.00%, Due 12/1/2018F | | | 300 | | | | 284 | |
Coffeyville Resources LLC, 10.875%, Due 4/1/2017B F | | | 350 | | | | 396 | |
Colt Defense LLC, 8.75%, Due 11/15/2017B | | | 130 | | | | 98 | |
CommScope, Inc., 8.25%, Due 1/15/2019F | | | 300 | | | | 296 | |
Community Health Systems, Inc., 8.875%, Due 7/15/2015 | | | 400 | | | | 410 | |
Concho Resources Inc., 6.50%, Due 1/15/2022 | | | 200 | | | | 210 | |
Consol Energy, Inc., | | | | | | | | |
8.00%, Due 4/1/2017 | | | 770 | | | | 842 | |
8.25%, Due 4/1/2020 | | | 412 | | | | 451 | |
CRC Health Corp., 10.75%, Due 2/1/2016 | | | 300 | | | | 286 | |
Cricket Communications, Inc., | | | | | | | | |
7.75%, Due 5/15/2016 | | | 185 | | | | 192 | |
7.75%, Due 10/15/2020 | | | 1,030 | | | | 880 | |
7.750%, Due 10/15/2020F | | | 285 | | | | 241 | |
| | |
Crown Media Holdings, Inc., 10.50%, Due 7/15/2019F | | | 200 | | | | 208 | |
CSC Holdings LLC, 6.75%, Due 11/15/2021B F | | | 200 | | | | 200 | |
Cumulus Media, Inc., 7.75%, Due 5/1/2019F | | | 300 | | | | 276 | |
Dave & Buster's, Inc., 11.00%, Due 6/1/2018 | | | 375 | | | | 394 | |
Dean Foods Co., 9.75%, Due 12/15/2018F | | | 600 | | | | 643 | |
Del Monte Foods Co., 7.625%, Due 2/15/2019F | | | 300 | | | | 285 | |
Digicel Group Ltd., 9.125%, Due 1/15/2015F | | | 225 | | | | 227 | |
DineEquity, Inc., 9.50%, Due 10/30/2018 | | | 100 | | | | 106 | |
See accompanying notes
18
American Beacon High Yield Bond Fund
Schedule of Investments
October 31, 2011
| | | | | | | | |
| | | Par Amount | | | Fair Value | |
| | | (000’s) | | | (000’s) | |
DISH DBS Corp., 7.125%, Due 2/1/2016 | | $ | 1,000 | | | $ | 1,062 | |
DJO Finance LLC, 7.75%, Due 4/15/2018B | | | 200 | | | | 169 | |
DynCorp International, Inc., 10.375%, Due 7/1/2017F | | | 730 | | | | 665 | |
eAccess Ltd., 8.25%, Due 4/1/2018F | | | 300 | | | | 291 | |
Eagle Rock Energy Partners LP, 8.375%, Due 6/1/2019F H | | | 200 | | | | 201 | |
Earthlink, Inc., 8.875%, Due 5/15/2019 | | | 320 | | | | 304 | |
Endo Pharmaceuticals Holdings, Inc., 7.00%, Due 7/15/2019F | | | 200 | | | | 216 | |
Energy Partners Ltd., 8.25%, Due 2/15/2018 | | | 165 | | | | 155 | |
Energy XXI Gulf Coast, Inc., 9.25%, Due 12/15/2017 | | | 805 | | | | 856 | |
EnergySolutions Inc., 10.75%, Due 8/15/2018B | | | 375 | | | | 379 | |
Equinix, Inc., 8.125%, Due 3/1/2018 | | | 175 | | | | 191 | |
Equinox Holdings, Inc., 9.50%, Due 2/1/2016F | | | 250 | | | | 253 | |
Euramax International, Inc., 9.50%, Due 4/1/2016F | | | 200 | | | | 170 | |
EVERTEC, Inc., 11.00%, Due 10/1/2018F | | | 500 | | | | 505 | |
ExamWorks Group, Inc., 9.00%, Due 7/15/2019F | | | 100 | | | | 96 | |
Exide Technologies, 8.625%, Due 2/1/2018 | | | 175 | | | | 175 | |
Exopack Holding Corp., 10.00%, Due 6/1/2018F | | | 300 | | | | 294 | |
Expro Finance Luxembourg SCA, 8.50%, Due 12/15/2016F | | | 400 | | | | 386 | |
FAGE Dairy Industry S.A., 9.875%, Due 2/1/2020F | | | 255 | | | | 217 | |
Felcor Lodging LP, 10.00%, Due 10/1/2014H | | | 165 | | | | 179 | |
First Data Corp., | | | | | | | | |
10.55%, Due 9/24/2015 | | | 342 | | | | 332 | |
8.25%, Due 1/15/2021F | | | 324 | | | | 308 | |
12.625%, Due 1/15/2021F | | | 150 | | | | 142 | |
FMG Resources August 2006 Property Ltd., | | | | | | | | |
6.875%, Due 2/1/2018F | | | 400 | | | | 384 | |
8.25%, Due 11/1/2019F | | | 100 | | | | 101 | |
Forbes Energy Services Ltd., 9.00%, Due 6/15/2019F | | | 240 | | | | 227 | |
Ford Motor Credit Co. LLC, | | | | | | | | |
6.625%, Due 8/15/2017B | | | 900 | | | | 985 | |
8.125%, Due 1/15/2020B | | | 400 | | | | 485 | |
Freescale Semiconductor, Inc., | | | | | | | | |
10.125%, Due 3/15/2018F | | | 175 | | | | 192 | |
9.25%, Due 4/15/2018F | | | 100 | | | | 108 | |
8.05%, Due 2/1/2020 | | | 100 | | | | 96 | |
10.75%, Due 8/1/2020 | | | 200 | | | | 210 | |
Frontier Communications Corp., | | | | | | | | |
8.25%, Due 4/15/2017 | | | 200 | | | | 214 | |
8.50%, Due 4/15/2020 | | | 300 | | | | 320 | |
8.75%, Due 4/15/2022 | | | 400 | | | | 424 | |
Gaylord Entertainment Co., 6.75%, Due 11/15/2014 | | | 190 | | | | 188 | |
GCI, Inc., 8.625%, Due 11/15/2019 | | | 405 | | | | 434 | |
General Motors Corp., 8.375%, Due 7/15/2049 | | | 1,570 | | | | 12 | |
Giant Funding Corp., 8.25%, Due 2/1/2018F | | | 300 | | | | 316 | |
Goodrich Petroleum Corp., 8.875%, Due 3/15/2019F | | | 550 | | | | 561 | |
Gray Television, Inc., 10.50%, Due 6/29/2015 | | | 250 | | | | 236 | |
GWR Operating Partnership LLP, 10.875%, Due 4/1/2017B | | | 400 | | | | 426 | |
HCA, Inc., | | | | | | | | |
9.00%, Due 12/15/2014 | | | 225 | | | | 232 | |
7.19%, Due 11/15/2015 | | | 200 | | | | 196 | |
7.50%, Due 2/15/2022 | | | 400 | | | | 408 | |
Helix Energy Solutions Group, Inc., 9.50%, Due 1/15/2016F | | | 505 | | | | 530 | |
Hercules Offshore, Inc., 10.50%, Due 10/15/2017F | | | 440 | | | | 440 | |
Hilcorp Energy I LP, 8.00%, Due 2/15/2020F H | | | 200 | | | | 215 | |
Horizon Lines LLC, | | | | | | | | |
11.00%, Due 10/15/2016B F | | | 660 | | | | 666 | |
13.00%, Due 10/15/2016B E F | | | 345 | | | | 342 | |
Hyva Global BV, 8.625%, Due 3/24/2016F | | | 200 | | | | 180 | |
Ineos Finance plc, 9.00%, Due 5/15/2015F | | | 100 | | | | 103 | |
Ineos Group Holdings Ltd., 8.50%, Due 2/15/2016F | | | 300 | | | | 254 | |
Intelsat Jackson Holdings S.A., | | | | | | | | |
11.25%, Due 6/15/2016 | | | 300 | | | | 317 | |
7.50%, Due 4/1/2021F | | | 400 | | | | 402 | |
See accompanying notes
19
American Beacon High Yield Bond Fund
Schedule of Investments
October 31, 2011
| | | | | | | | |
| | | Par Amount | | | Fair Value | |
| | | (000’s) | | | (000’s) | |
Intelsat Luxembourg S.A., | | | | | | | | |
11.50%, Due 2/4/2017 | | $ | 525 | | | $ | 525 | |
11.50%, Due 2/4/2017F | | | 350 | | | | 350 | |
International Automotive Components Group SL, 9.125%, Due 6/1/2018F | | | 200 | | | | 197 | |
inVentiv Health, Inc., 10.00%, Due 8/15/2018F | | | 900 | | | | 863 | |
Isle of Capri Casinos, Inc., | | | | | | | | |
7.00%, Due 3/1/2014 | | | 200 | | | | 192 | |
7.75%, Due 3/15/2019 | | | 150 | | | | 147 | |
ITC Deltacom, Inc., 10.50%, Due 4/1/2016 | | | 360 | | | | 364 | |
Jarden Corp., 7.50%, Due 5/1/2017 | | | 465 | | | | 498 | |
JBS USA LLC, 11.625%, Due 5/1/2014B | | | 375 | | | | 413 | |
Kabel BW Erste Beteiligungs GmbH, 7.50%, Due 3/15/2019F | | | 175 | | | | 182 | |
Key Energy Services, Inc., 6.75%, Due 3/1/2021 | | | 520 | | | | 532 | |
Kinove German Bondco GmbH, 9.625%, Due 6/15/2018F | | | 200 | | | | 193 | |
Level 3 Financing, Inc., 9.25%, Due 11/1/2014 | | | 425 | | | | 434 | |
Libbey Glass, Inc., 10.00%, Due 2/15/2015 | | | 175 | | | | 186 | |
Liberty Tire Recycling, 11.00%, Due 10/1/2016F | | | 525 | | | | 530 | |
Linn Energy LLC, | | | | | | | | |
6.50%, Due 5/15/2019B F | | | 355 | | | | 357 | |
8.625%, Due 4/15/2020B | | | 700 | | | | 771 | |
7.75%, Due 2/1/2021B F I | | | 230 | | | | 246 | |
Lions Gate Entertainment, Inc., 10.25%, Due 11/1/2016F | | | 155 | | | | 156 | |
M/I Homes, Inc., 8.625%, Due 11/15/2018 | | | 400 | | | | 360 | |
MacDermid, Inc., 9.50%, Due 4/15/2017F | | | 625 | | | | 593 | |
Mandalay Resort Group, 7.625%, Due 7/15/2013 | | | 500 | | | | 495 | |
Marina District Finance Co. Inc, 9.875%, Due 8/15/2018 | | | 450 | | | | 444 | |
MedAssets, Inc., 8.00%, Due 11/15/2018F | | | 300 | | | | 294 | |
Media General, Inc., 11.75%, Due 2/15/2017 | | | 200 | | | | 168 | |
MEMC Electronic Materials, Inc., 7.75%, Due 4/1/2019 | | | 225 | | | | 193 | |
MGM Resorts International, 6.625%, Due 7/15/2015 | | | 900 | | | | 854 | |
Michaels Stores, Inc., 7.75%, Due 11/1/2018 | | | 400 | | | | 406 | |
Midwest Gaming Borrower LLC, 11.625%, Due 4/15/2016B F | | | 225 | | | | 236 | |
Midwest Vanadium Property Ltd., 11.50%, Due 2/15/2018F | | | 200 | | | | 167 | |
Mirant Mid Atlantic Pass Through Trust C, 10.06%, Due 12/30/2028 | | | 244 | | | | 254 | |
Momentive Performance Materials, Inc., 9.00%, Due 1/15/2021 | | | 300 | | | | 254 | |
Mylan, Inc., 7.875%, Due 7/15/2020F | | | 400 | | | | 448 | |
Nalco Co., 6.625%, Due 1/15/2019F | | | 245 | | | | 273 | |
National CineMedia LLC, 7.875%, Due 7/15/2021B | | | 100 | | | | 101 | |
NBTY, Inc., 9.00%, Due 10/1/2018F | | | 200 | | | | 215 | |
NCL Corp Ltd., | | | | | | | | |
11.75%, Due 11/15/2016 | | | 350 | | | | 403 | |
9.50%, Due 11/15/2018F | | | 200 | | | | 208 | |
NCO Group, Inc., 11.875%, Due 11/15/2014 | | | 300 | | | | 281 | |
Neff Rental LLC, 9.625%, Due 5/15/2016B F | | | 120 | | | | 115 | |
NewPage Corp., 11.375%, Due 12/31/2014J | | | 500 | | | | 374 | |
Nexstar Broadcasting Inc., 8.875%, Due 4/15/2017 | | | 150 | | | | 152 | |
NII Capital Corp., 7.625%, Due 4/1/2021 | | | 310 | | | | 319 | |
Norske Skogindustrier ASA, 6.125%, Due 10/15/2015F | | | 750 | | | | 315 | |
Novelis, Inc., 8.75%, Due 12/15/2020 | | | 300 | | | | 327 | |
NPC International, Inc., 9.50%, Due 5/1/2014 | | | 350 | | | | 356 | |
NXP BV, 9.75%, Due 8/1/2018F | | | 300 | | | | 330 | |
Oasis Petroleum, Inc., 6.50%, Due 11/1/2021 | | | 100 | | | | 101 | |
Offshore Group Investments Ltd., 11.50%, Due 8/1/2015 | | | 170 | | | | 185 | |
OGX Petroleo e Gas Participacoes S.A., 8.50%, Due 6/1/2018F | | | 350 | | | | 347 | |
Omnova Solutions, Inc., 7.875%, Due 11/1/2018 | | | 100 | | | | 86 | |
OnCure Holdings, Inc., 11.75%, Due 5/15/2017 | | | 285 | | | | 248 | |
OPTI Canada, Inc., 8.25%, Due 12/15/2014J | | | 645 | | | | 419 | |
Peabody Energy Corp., 7.375%, Due 11/1/2016 | | | 500 | | | | 548 | |
Petco Animal Supplies, Inc., 9.25%, Due 12/1/2018F | | | 490 | | | | 521 | |
Petrohawk Energy Corp., 10.50%, Due 8/1/2014 | | | 200 | | | | 224 | |
Petroquest Energy, Inc., 10.00%, Due 9/1/2017 | | | 250 | | | | 259 | |
Pinnacle Entertainment, Inc., 7.50%, Due 6/15/2015 | | | 400 | | | | 393 | |
Pinnacle Foods Finance LLC, | | | | | | | | |
See accompanying notes
20
American Beacon High Yield Bond Fund
Schedule of Investments
October 31, 2011
| | | | | | | | |
| | | Par Amount | | | Fair Value | |
| | | (000’s) | | | (000’s) | |
9.25%, Due 4/1/2015B | | $ | 300 | | | $ | 311 | |
10.625%, Due 4/1/2017B | | | 225 | | | | 233 | |
Plains Exploration & Production Co., 10.00%, Due 3/1/2016 | | | 500 | | | | 555 | |
Prestige Brands, Inc., 8.25%, Due 4/1/2018 | | | 575 | | | | 586 | |
Prospect Medical Holdings, Inc., 12.75%, Due 7/15/2014 | | | 150 | | | | 159 | |
Quality Distribution LLC, 9.875%, Due 11/1/2018B | | | 250 | | | | 248 | |
Quicksilver Resources, Inc., | | | | | | | | |
8.25%, Due 8/1/2015 | | | 300 | | | | 314 | |
9.125%, Due 8/15/2019 | | | 400 | | | | 426 | |
Quiksilver, Inc., 6.875%, Due 4/15/2015 | | | 405 | | | | 382 | |
QVC, Inc., 7.50%, Due 10/1/2019F | | | 320 | | | | 348 | |
Qwest Corp., 8.375%, Due 5/1/2016 | | | 145 | | | | 166 | |
Radnet Management, Inc., 10.375%, Due 4/1/2018 | | | 350 | | | | 315 | |
RailAmerica, Inc., 9.25%, Due 7/1/2017 | | | 110 | | | | 120 | |
Reliance Intermediate Holdings LP, 9.50%, Due 12/15/2019F H | | | 450 | | | | 482 | |
Revlon Consumer Products Corp., 9.75%, Due 11/15/2015 | | | 300 | | | | 322 | |
Reynolds Group Issuer Inc., | | | | | | | | |
9.00%, Due 5/15/2018E F | | | 900 | | | | 870 | |
8.25%, Due 2/15/2021F | | | 100 | | | | 92 | |
Rite Aid Corp., 9.75%, Due 6/12/2016 | | | 875 | | | | 957 | |
Rosetta Resources, Inc., 9.50%, Due 4/15/2018 | | | 250 | | | | 273 | |
Rotech Healthcare, Inc., | | | | | | | | |
10.75%, Due 10/15/2015 | | | 100 | | | | 97 | |
10.50%, Due 3/15/2018 | | | 315 | | | | 250 | |
RSC Equipment Rental, Inc., 9.50%, Due 12/1/2014 | | | 100 | | | | 102 | |
Ryerson, Inc., 12.00%, Due 11/1/2015 | | | 175 | | | | 179 | |
Sabine Pass LNG LP, 7.50%, Due 11/30/2016H | | | 300 | | | | 297 | |
Salem Communications Corp., 9.625%, Due 12/15/2016 | | | 119 | | | | 121 | |
SandRidge Energy, Inc., | | | | | | | | |
9.875%, Due 5/15/2016F | | | 400 | | | | 424 | |
8.00%, Due 6/1/2018F | | | 700 | | | | 699 | |
Sealed Air Corp., | | | | | | | | |
8.125%, Due 9/15/2019F | | | 100 | | | | 109 | |
8.375%, Due 9/15/2021F | | | 350 | | | | 379 | |
Select Medical Corp., 7.625%, Due 2/1/2015 | | | 200 | | | | 186 | |
Shea Homes LP, 8.625%, Due 5/15/2019F H | | | 200 | | | | 181 | |
Shingle Springs Tribal Gaming Authority, 9.375%, Due 6/15/2015F | | | 200 | | | | 106 | |
Simmons Foods, Inc., 10.50%, Due 11/1/2017F | | | 300 | | | | 281 | |
Sinclair Television Group, Inc., 9.25%, Due 11/1/2017F | | | 250 | | | | 273 | |
Sirius XM Radio, Inc., 8.75%, Due 4/1/2015F | | | 175 | | | | 194 | |
Sitel LLC, 11.50%, Due 4/1/2018B | | | 400 | | | | 324 | |
Skilled Healthcare Group, Inc., 11.00%, Due 1/15/2014 | | | 140 | | | | 136 | |
Smurfit Kappa Treasury Funding Ltd., 7.50%, Due 11/20/2025 | | | 500 | | | | 470 | |
Solo Cup Co., 8.50%, Due 2/15/2014 | | | 200 | | | | 183 | |
Spectrum Brands Holdings, Inc., 9.50%, Due 6/15/2018 | | | 105 | | | | 117 | |
Sprint Capital Corp., 8.75%, Due 3/15/2032 | | | 465 | | | | 386 | |
Sprint Nextel Corp., 8.375%, Due 8/15/2017 | | | 800 | | | | 735 | |
Station Casinos, Inc., 6.875%, Due 3/1/2016J | | | 500 | | | | — | |
SunGard Data Systems, Inc., | | | | | | | | |
10.25%, Due 8/15/2015F | | | 100 | | | | 104 | |
7.625%, Due 11/15/2020F | | | 400 | | | | 410 | |
Swift Services Holdings, Inc., 10.00%, Due 11/15/2018 | | | 60 | | | | 62 | |
Syniverse Holdings, Inc., 9.125%, Due 1/15/2019 | | | 335 | | | | 348 | |
Telesat Canada, 12.50%, Due 11/1/2017B | | | 575 | | | | 641 | |
The Bon-Ton Department Stores, Inc., 10.25%, Due 3/15/2014 | | | 350 | | | | 311 | |
The Goodyear Tire & Rubber Co., 8.25%, Due 8/15/2020 | | | 500 | | | | 535 | |
The Hertz Corp., 6.75%, Due 4/15/2019 | | | 400 | | | | 408 | |
The Manitowoc Co. Inc, 8.50%, Due 11/1/2020 | | | 150 | | | | 156 | |
Ticketmaster Entertainment LLC, 10.75%, Due 8/1/2016B | | | 350 | | | | 366 | |
Titan International, Inc., 7.875%, Due 10/1/2017 | | | 440 | | | | 462 | |
Tower Automotive Holdings USA LLC, 10.625%, Due 9/1/2017B F | | | 250 | | | | 258 | |
TransUnion LLC, 11.375%, Due 6/15/2018B | | | 300 | | | | 334 | |
Travelport LLC, 9.875%, Due 9/1/2014B | | | 215 | | | | 151 | |
See accompanying notes
21
American Beacon High Yield Bond Fund
Schedule of Investments
October 31, 2011
| | | | | | | | |
| | | Par Amount | | | Fair Value | |
| | | (000’s) | | | (000’s) | |
Trimas Corp., 9.75%, Due 12/15/2017 | | $ | 170 | | | $ | 182 | |
tw telecom holdings, Inc., 8.00%, Due 3/1/2018 | | | 325 | | | | 345 | |
UCI International, Inc., 8.625%, Due 2/15/2019 | | | 200 | | | | 197 | |
United Rentals North America, Inc., 8.375%, Due 9/15/2020 | | | 400 | | | | 415 | |
United Surgical Partners International, Inc., 9.25%, Due 5/1/2017G | | | 300 | | | | 308 | |
Univision Communications, Inc., | | | | | | | | |
6.875%, Due 5/15/2019F | | | 315 | | | | 307 | |
7.875%, Due 11/1/2020F | | | 500 | | | | 505 | |
Vedanta Resources plc, 8.25%, Due 6/7/2021F | | | 240 | | | | 222 | |
VimpelCom Holdings BV, 7.504%, Due 3/1/2022F | | | 285 | | | | 267 | |
Virgolino de Oliveira Finance Ltd., 10.50%, Due 1/28/2018F | | | 200 | | | | 194 | |
Visant Corp., 10.00%, Due 10/1/2017 | | | 575 | | | | 558 | |
Viskase Cos., Inc., 9.875%, Due 1/15/2018F | | | 150 | | | | 153 | |
Vulcan Materials Co., 7.50%, Due 6/15/2021 | | | 100 | | | | 98 | |
W&T Offshore, Inc., 8.50%, Due 6/15/2019F | | | 395 | | | | 403 | |
WCA Waste Corp., 7.50%, Due 6/15/2019F | | | 250 | | | | 243 | |
West Corp., 7.875%, Due 1/15/2019 | | | 400 | | | | 406 | |
Wind Acquisition Finance S.A., | | | | | | | | |
11.75%, Due 7/15/2017F | | | 400 | | | | 396 | |
7.25%, Due 2/15/2018F | | | 325 | | | | 314 | |
Wind Acquisition Holdings Finance S.A., 12.25%, Due 7/15/2017F | | | 241 | | | | 220 | |
WMG Acquisition Corp., 9.50%, Due 6/15/2016 | | | 250 | | | | 265 | |
XM Satellite Radio, Inc., 13.00%, Due 8/1/2014F | | | 250 | | | | 284 | |
Yonkers Racing Corp., 11.375%, Due 7/15/2016F | | | 375 | | | | 385 | |
| | | | | | | | |
| | | | | | | 88,904 | |
| | | | | | | | |
Utilities - 5.05% | | | | | | | | |
Calpine Corp., | | | | | | | | |
7.875%, Due 7/31/2020F | | | 100 | | | | 107 | |
7.50%, Due 2/15/2021F | | | 600 | | | | 630 | |
Copano Energy LLC, 7.125%, Due 4/1/2021B | | | 200 | | | | 205 | |
Crosstex Energy LP, 8.875%, Due 2/15/2018H | | | 400 | | | | 424 | |
Elwood Energy LLC, 8.159%, Due 7/5/2026B | | | 611 | | | | 574 | |
Energy Future Holdings Corp., 5.55%, Due 11/15/2014 | | | 225 | | | | 144 | |
Energy Future Intermediate Holding Co. LLC, 10.00%, Due 12/1/2020B | | | 400 | | | | 420 | |
Energy Transfer Equity LP, 7.50%, Due 10/15/2020H | | | 300 | | | | 324 | |
Enterprise Products Operating LLC, 7.034%, Due 1/15/2068B | | | 510 | | | | 525 | |
Genesis Energy LP, 7.875%, Due 12/15/2018F H | | | 200 | | | | 194 | |
Inergy LP, 7.00%, Due 10/1/2018H | | | 225 | | | | 226 | |
Martin Midstream Partners LP, 8.875%, Due 4/1/2018H | | | 500 | | | | 519 | |
NRG Energy, Inc., | | | | | | | | |
7.625%, Due 1/15/2018F | | | 185 | | | | 187 | |
7.875%, Due 5/15/2021F | | | 335 | | | | 338 | |
Regency Energy Partners LP, | | | | | | | | |
9.375%, Due 6/1/2016H | | | 225 | | | | 250 | |
6.50%, Due 7/15/2021H | | | 225 | | | | 234 | |
Targa Resources Partners LP, 6.875%, Due 2/1/2021F H | | | 200 | | | | 198 | |
Texas Competitive Electric Holdings Co. LLC, | | | | | | | | |
10.25%, Due 11/1/2015B | | | 100 | | | | 39 | |
11.50%, Due 10/1/2020B F | | | 400 | | | | 344 | |
15.00%, Due 4/1/2021B | | | 400 | | | | 252 | |
The AES Corp., 9.75%, Due 4/15/2016 | | | 50 | | | | 57 | |
| | | | | | | | |
| | | | | | | 6,191 | |
| | | | | | | | |
Total Corporate Obligations (Cost $107,337) | | | | | | | 106,413 | |
| | |
| | | Shares | | | | |
SHORT-TERM INVESTMENTS - 5.49% (Cost $6,722) | | | | | | | | |
JPMorgan U.S. Government Money Market Fund | | | 6,721,880 | | | | 6,722 | |
| | | | | | | | |
TOTAL INVESTMENTS - 94.78% (Cost 119,207) | | | | | | | 116,092 | |
OTHER ASSETS, NET OF LIABILITIES - 5.22% | | | | | | | 6,390 | |
| | | | | | | | |
TOTAL NET ASSETS - 100.00% | | | | | | $ | 122,482 | |
| | | | | | | | |
Percentages are stated as a percent of net assets. | | | | | | | | |
See accompanying notes
22
American Beacon High Yield Bond Fund
Schedule of Investments
October 31, 2011
| A | Non-income producing security. |
| B | Limited Liability Company. |
| E | The coupon rate shown on floating or adjustable rate securities represents the rate at period end. The due date on these types of securities reflects the final maturity date. |
| F | Security exempt from registration under the Securities Act of 1933. These securities may be resold to qualified institutional buyers pursuant to Rule 144A. At the period end, the value of these securities amounted to $44,602 or 36.41% of net assets. The Fund has no right to demand registration of these securities. |
| I | Non-voting participating shares. |
See accompanying notes
23
American Beacon Retirement Income and Appreciation Fund
Schedule of Investments
October 31, 2011
| | | | | | | | |
| | | Shares | | | Fair Value | |
| | | | | | (000’s) | |
COMMON STOCKS - 5.09% | | | | | |
ENERGY - 0.83% | | | | | |
Energy Equipment & Services - 0.27% | | | | | |
Baker Hughes, Inc. | | | 7,000 | | | $ | 406 | |
| | | | | | | | |
Oil & Gas - 0.56% | | | | | | | | |
Occidental Petroleum Corp. | | | 5,300 | | | | 493 | |
Suncor Energy, Inc. | | | 11,000 | | | | 351 | |
| | | | | | | | |
| | | | | | | 844 | |
| | | | | | | | |
Total Energy | | | | 1,250 | |
| | | | | | | | |
FINANCIALS - 0.72% | | | | | | | | |
Diversified Financials - 0.50% | | | | | | | | |
Affiliated Managers Group, Inc.A | | | 3,700 | | | | 343 | |
T Rowe Price Group, Inc. | | | 7,700 | | | | 406 | |
| | | | | | | | |
| | | | | | | 749 | |
| | | | | | | | |
Insurance - 0.22% | | | | | | | | |
MetLife, Inc. | | | 4,800 | | | | 326 | |
| | | | | | | | |
Total Financials | | | | 1,075 | |
| | | | | | | | |
HEALTH CARE - 0.24% | | | | | | | | |
Covidien plc | | | 7,500 | | | | 353 | |
Illumina, Inc.A | | | 130 | | | | 4 | |
| | | | | | | | |
Total Health Care | | | | 357 | |
| | | | | | | | |
INDUSTRIALS - 0.71% | | | | | | | | |
Dover Corp. | | | 7,000 | | | | 389 | |
Eaton Corp. | | | 15,300 | | | | 685 | |
| | | | | | | | |
Total Industrials | | | | 1,074 | |
| | | | | | | | |
INFORMATION TECHNOLOGY - 2.01% | | | | | | | | |
Computers & Peripherals - 0.26% | | | | | | | | |
Dell, Inc.A | | | 25,000 | | | | 395 | |
| | | | | | | | |
IT Consulting & Services - 0.31% | | | | | | | | |
Accenture plc, Class A | | | 7,770 | | | | 468 | |
| | | | | | | | |
Semiconductor Equipment & Products - 0.52% | | | | | | | | |
QUALCOMM, Inc. | | | 15,100 | | | | 779 | |
| | | | | | | | |
Software - 0.92% | | | | | | | | |
Autodesk, Inc. | | | 14,500 | | | | 502 | |
Microsoft Corp. | | | 12,000 | | | | 320 | |
Oracle Corp. | | | 17,000 | | | | 557 | |
| | | | | | | | |
| | | | | | | 1,379 | |
| | | | | | | | |
Total Information Technology | | | | 3,021 | |
| | | | | | | | |
MATERIALS - 0.58% | | | | | | | | |
Barrick Gold Corp. | | | 10,700 | | | | 530 | |
Freeport-McMoRan Copper & Gold, Inc. | | | 8,500 | | | | 342 | |
| | | | | | | | |
Total Materials | | | | 872 | |
| | | | | | | | |
Total Common Stocks (Cost $7,652) | | | | 7,649 | |
| | | | | | | | |
CONVERTIBLE PREFERRED STOCK - 0.40% (Cost $486) | | | | | | | | |
CONSUMER STAPLES - 0.40% | | | | | | | | |
Bunge Ltd. | | | 6,058 | | | | 595 | |
| | | | | | | | |
PREFERRED STOCKS - 1.00% | | | | | | | | |
ENERGY - 0.88% | | | | | | | | |
Energy - 0.48% | | | | | | | | |
Apache Corp. | | | 12,850 | | | | 723 | |
| | | | | | | | |
| | | | | | | | |
| | | Shares | | | Fair Value | |
| | | | | | | (000’s | ) |
Oil & Gas - 0.40% | | | | | | | | |
Chesapeake Energy Corp. | | | 150 | | | $ | 174 | |
NextEra Energy, Inc. | | | 8,000 | | | | 424 | |
| | | | | | | | |
| | | | | | | 598 | |
| | | | | | | | |
Total Energy | | | | 1,321 | |
| | | | | | | | |
FINANCIALS - 0.12% | | | | | | | | |
AMG Capital Trust I | | | 4,150 | | | | 181 | |
| | | | | | | | |
Total Preferred Stocks (Cost $1,491) | | | | 1,502 | |
| | | | | | | | |
| | |
| | | Par Amount | | | | |
| | | (000’s | ) | | | | |
CONVERTIBLE OBLIGATIONS - 11.96% | |
Basic Materials - 1.10% | | | | | | | | |
Allegheny Technologies, Inc., | | | | | | | | |
4.25%, Due 6/1/2014 | | $ | 222 | | | | 301 | |
Goldcorp, Inc., | | | | | | | | |
2.00%, Due 8/1/2014 | | | 225 | | | | 291 | |
Newmont Mining Corp., | | | | | | | | |
3.00%, Due 2/15/2012 | | | 50 | | | | 73 | |
1.25%, Due 7/15/2014 | | | 425 | | | | 648 | |
1.625%, Due 7/15/2017 | | | 220 | | | | 343 | |
| | | | | | | | |
| | | | | | | 1,656 | |
| | | | | | | | |
Communications - 2.06% | | | | | | | | |
Anixter International, Inc., | | | | | | | | |
1.00%, Due 2/15/2013 | | | 610 | | | | 679 | |
Liberty Interactive LLC, | | | | | | | | |
3.125%, Due 3/30/2023B | | | 375 | | | | 418 | |
Nuance Communications, Inc., | | | | | | | | |
2.75%, Due 11/1/2031C | | | 260 | | | | 285 | |
Omnicom Group, Inc., | | | | | | | | |
0.000%, Due 7/1/2038 | | | 400 | | | | 423 | |
priceline.com, Inc., | | | | | | | | |
1.25%, Due 3/15/2015C | | | 300 | | | | 530 | |
Symantec Corp., | | | | | | | | |
1.00%, Due 6/15/2013 | | | 660 | | | | 766 | |
| | | | | | | | |
| | | | | | | 3,101 | |
| | | | | | | | |
Consumer Discretionary - 0.28% | | | | | | | | |
International Game Technology, | | | | | | | | |
3.25%, Due 5/1/2014 | | | 350 | | | | 419 | |
| | | | | | | | |
Energy - 0.50% | | | | | | | | |
Chesapeake Energy Corp., | | | | | | | | |
2.75%, Due 11/15/2035 | | | 700 | | | | 759 | |
| | | | | | | | |
Finance - 0.47% | | | | | | | | |
FTI Consulting, Inc., | | | | | | | | |
3.75%, Due 7/15/2012 | | | 300 | | | | 387 | |
Leucadia National Corp., | | | | | | | | |
3.75%, Due 4/15/2014 | | | 250 | | | | 323 | |
| | | | | | | | |
| | | | | | | 710 | |
| | | | | | | | |
Health Care - 0.49% | | | | | | | | |
Illumina, Inc., | | | | | | | | |
0.25%, Due 3/15/2016 C | | | 950 | | | | 734 | |
| | | | | | | | |
Industrials - 1.48% | | | | | | | | |
Danaher Corp., | | | | | | | | |
0.01%, Due 1/22/2021 | | | 370 | | | | 519 | |
Hologic, Inc., | | | | | | | | |
2.00%, Due 12/15/2037D | | | 660 | | | | 700 | |
ON Semiconductor Corp., | | | | | | | | |
2.625%, Due 12/15/2026 | | | 300 | | | | 327 | |
See accompanying notes
24
American Beacon Retirement Income and Appreciation Fund
Schedule of Investments
October 31, 2011
| | | | | | | | |
| | | Par Amount | | | Fair Value | |
| | | (000’s) | | | (000’s) | |
Stanley Black & Decker, Inc., | | | | | | | | |
0.01%, Due 5/17/2012D | | $ | 275 | | | $ | 300 | |
Tyson Foods, Inc., | | | | | | | | |
3.25%, Due 10/15/2013 | | | 300 | | | | 384 | |
| | | | | | | | |
| | | | | | | 2,230 | |
| | | | | | | | |
Pharmaceuticals - 1.62% | | | | | |
Endo Pharmaceuticals Holdings, Inc., | | | | | | | | |
1.75%, Due 4/15/2015 | | | 250 | | | | 311 | |
Gilead Sciences, Inc., | | | | | | | | |
1.00%, Due 5/1/2014 | | | 350 | | | | 387 | |
1.625%, Due 5/1/2016 | | | 885 | | | | 1,021 | |
Mylan, Inc., | | | | | | | | |
1.25%, Due 3/15/2012 | | | 705 | | | | 709 | |
| | | | | | | | |
| | | | | | | 2,428 | |
| | | | | | | | |
Technology - 3.96% | | | | | | | | |
Electronic Arts, Inc., | | | | | | | | |
0.75%, Due 7/15/2016C | | | 425 | | | | 432 | |
EMC Corp., | | | | | | | | |
1.75%, Due 12/1/2013 | | | 900 | | | | 1,431 | |
Intel Corp., | | | | | | | | |
3.25%, Due 8/1/2039 | | | 625 | | | | 789 | |
Lam Research Corp., | | | | | | | | |
1.25%, Due 5/15/2018C | | | 400 | | | | 394 | |
Microsoft Corp., | | | | | | | | |
6.25%, Due 6/15/2013C | | | 300 | | | | 305 | |
Navistar International Corp., | | | | | | | | |
3.00%, Due 10/15/2014 | | | 164 | | | | 184 | |
Rovi Corp., | | | | | | | | |
2.625%, Due 2/15/2040 | | | 267 | | | | 337 | |
SanDisk Corp., | | | | | | | | |
1.50%, Due 8/15/2017 | | | 1,025 | | | | 1,223 | |
Xilinx, Inc., | | | | | | | | |
2.625%, Due 6/15/2017 | | | 525 | | | | 675 | |
3.125%, Due 3/15/2037 | | | 150 | | | | 176 | |
| | | | | | | | |
| | | | | | | 5,946 | |
| | | | | | | | |
Total Convertible Obligations (Cost $16,223) | | | | | | | 17,983 | |
| | | | | | | | |
CORPORATE OBLIGATIONS - 36.59% | | | | | |
Finance - 17.51% | | | | | | | | |
AEGON Funding Co. LLC, | | | | | | | | |
5.75%, Due 12/15/2020B | | | 250 | | | | 271 | |
American Express Credit Corp., | | | | | | | | |
2.75%, Due 9/15/2015 | | | 125 | | | | 127 | |
American International Group, Inc., | | | | | | | | |
4.25%, Due 9/15/2014 | | | 800 | | | | 787 | |
6.40%, Due 12/15/2020 | | | 675 | | | | 707 | |
ANZ National International Ltd., | | | | | | | | |
2.375%, Due 12/21/2012C | | | 300 | | | | 304 | |
Bank of America Corp., | | | | | | | | |
7.80%, Due 9/15/2016 | | | 600 | | | | 635 | |
7.625%, Due 6/1/2019 | | | 1,000 | | | | 1,087 | |
Bank One Corp., | | | | | | | | |
4.90%, Due 4/30/2015 | | | 250 | | | | 266 | |
Barclays Bank plc, | | | | | | | | |
3.90%, Due 4/7/2015 | | | 290 | | | | 295 | |
6.75%, Due 5/22/2019 | | | 300 | | | | 344 | |
BNP Paribas S.A., | | | | | | | | |
3.60%, Due 2/23/2016 | | | 280 | | | | 279 | |
Citigroup, Inc., | | | | | | | | |
1.302%, Due 4/1/2014D | | | 300 | | | | 289 | |
0.548%, Due 11/5/2014D | | | 300 | | | | 281 | |
8.50%, Due 5/22/2019 | | | 1,250 | | | | 1,546 | |
| | | | | | | | |
| | | Par Amount | | | Fair Value | |
| | | (000’s) | | | (000’s) | |
CME Group, Inc., | | | | | | | | |
5.40%, Due 8/1/2013 | | $ | 230 | | | $ | 246 | |
Cooperatieve Centrale Raiffeisen-Boerenleenbank BA, | | | | | | | | |
4.20%, Due 5/13/2014C | | | 200 | | | | 212 | |
Credit Suisse, | | | | | | | | |
5.30%, Due 8/13/2019 | | | 350 | | | | 376 | |
Credit Suisse USA, Inc., | | | | | | | | |
7.125%, Due 7/15/2032 | | | 500 | | | | 603 | |
Danske Bank A/S, | | | | | | | | |
1.451%, Due 4/14/2014C D | | | 600 | | | | 577 | |
Deutsche Bank AG, | | | | | | | | |
3.875%, Due 8/18/2014 | | | 275 | | | | 284 | |
Fifth Third Bancorp, | | | | | | | | |
3.625%, Due 1/25/2016 | | | 275 | | | | 282 | |
General Electric Capital Corp., | | | | | | | | |
0.591%, Due 1/8/2016D | | | 1,033 | | | | 961 | |
5.625%, Due 5/1/2018 | | | 250 | | | | 276 | |
6.00%, Due 8/7/2019 | | | 300 | | | | 341 | |
5.50%, Due 1/8/2020 | | | 650 | | | | 725 | |
HSBC Finance Corp., | | | | | | | | |
0.653%, Due 1/15/2014D | | | 850 | | | | 793 | |
ING Bank N.V., | | | | | | | | |
5.125%, Due 5/1/2015C | | | 300 | | | | 299 | |
JPMorgan Chase & Co., | | | | | | | | |
3.70%, Due 1/20/2015 | | | 500 | | | | 521 | |
5.50%, Due 10/15/2040 | | | 350 | | | | 375 | |
JPMorgan Chase Bank NA, | | | | | | | | |
0.668%, Due 6/13/2016D | | | 375 | | | | 340 | |
Lincoln National Corp., | | | | | | | | |
4.75%, Due 2/15/2014 | | | 105 | | | | 111 | |
Lloyds TSB Bank plc, | | | | | | | | |
4.375%, Due 1/12/2015C | | | 300 | | | | 301 | |
Merrill Lynch & Co. Inc, | | | | | | | | |
6.11%, Due 1/29/2037 | | | 275 | | | | 242 | |
MetLife Institutional Funding II, | | | | | | | | |
1.274%, Due 4/4/2014C D | | | 800 | | | | 798 | |
MetLife, Inc., | | | | | | | | |
6.375%, Due 6/15/2034 | | | 400 | | | | 488 | |
Monumental Global Funding III, | | | | | | | | |
0.603%, Due 1/15/2014C D | | | 300 | | | | 291 | |
Morgan Stanley, | | | | | | | | |
0.883%, Due 10/15/2015D | | | 900 | | | | 791 | |
7.30%, Due 5/13/2019 | | | 280 | | | | 300 | |
5.625%, Due 9/23/2019 | | | 450 | | | | 444 | |
National Australia Bank Ltd., | | | | | | | | |
4.375%, Due 12/10/2020C | | | 250 | | | | 258 | |
Nordea Bank AB, | | | | | | | | |
2.50%, Due 11/13/2012C | | | 250 | | | | 253 | |
4.875%, Due 1/27/2020C | | | 250 | | | | 268 | |
PNC Funding Corp., | | | | | | | | |
4.375%, Due 8/11/2020 | | | 260 | | | | 274 | |
Pricoa Global Funding I, | | | | | | | | |
5.40%, Due 10/18/2012C | | | 150 | | | | 156 | |
Prudential Financial, Inc., | | | | | | | | |
7.375%, Due 6/15/2019 | | | 250 | | | | 304 | |
Simon Property Group LP, | | | | | | | | |
10.35%, Due 4/1/2019E | | | 300 | | | | 408 | |
Societe Generale S.A., | | | | | | | | |
2.20%, Due 9/14/2013C | | | 250 | | | | 240 | |
1.441%, Due 4/11/2014C D | | | 1,200 | | | | 1,091 | |
The Bear Stearns Cos. LLC, | | | | | | | | |
7.25%, Due 2/1/2018B | | | 925 | | | | 1,088 | |
See accompanying notes
25
American Beacon Retirement Income and Appreciation Fund
Schedule of Investments
October 31, 2011
| | | | | | | | |
| | | Par Amount | | | Fair Value | |
| | | (000’s) | | | (000’s) | |
The Goldman Sachs Group, Inc., | | | | | | | | |
5.35%, Due 1/15/2016 | | $ | 475 | | | $ | 503 | |
6.25%, Due 9/1/2017 | | | 550 | | | | 595 | |
6.00%, Due 6/15/2020 | | | 435 | | | | 458 | |
The Travelers Cos., Inc., | | | | | | | | |
3.90%, Due 11/1/2020 | | | 130 | | | | 136 | |
UBS AG, | | | | | | | | |
5.875%, Due 12/20/2017 | | | 275 | | | | 301 | |
UnitedHealth Group, Inc., | | | | | | | | |
3.875%, Due 10/15/2020 | | | 250 | | | | 263 | |
Wachovia Corp., | | | | | | | | |
0.773%, Due 10/15/2016D | | | 600 | | | | 523 | |
5.75%, Due 2/1/2018 | | | 900 | | | | 1,022 | |
| | | | | | | | |
| | | | | | | 26,336 | |
| | | | | | | | |
Industrials - 16.92% | | | | | | | | |
Altria Group, Inc., | | | | | | | | |
4.75%, Due 5/5/2021 | | | 300 | | | | 323 | |
America Movil SAB de CV, | | | | | | | | |
6.375%, Due 3/1/2035 | | | 275 | | | | 328 | |
American Axle & Manufacturing, Inc., | | | | | | | | |
7.875%, Due 3/1/2017 | | | 400 | | | | 405 | |
American Honda Finance Corp., | | | | | | | | |
4.625%, Due 4/2/2013C | | | 325 | | | | 339 | |
3.875%, Due 9/21/2020C | | | 125 | | | | 129 | |
Anheuser-Busch InBev Worldwide, Inc., | | | | | | | | |
5.00%, Due 4/15/2020 | | | 290 | | | | 337 | |
8.00%, Due 11/15/2039 | | | 100 | | | | 153 | |
Apache Corp., | | | | | | | | |
5.10%, Due 9/1/2040 | | | 130 | | | | 151 | |
AT&T, Inc., | | | | | | | | |
5.50%, Due 2/1/2018 | | | 750 | | | | 870 | |
6.80%, Due 5/15/2036 | | | 125 | | | | 158 | |
6.40%, Due 5/15/2038 | | | 125 | | | | 152 | |
BP Capital Markets plc, | | | | | | | | |
3.20%, Due 3/11/2016 | | | 280 | | | | 294 | |
Burlington Northern Santa Fe LLC, | | | | | | | | |
5.75%, Due 3/15/2018B | | | 325 | | | | 377 | |
5.75%, Due 5/1/2040B | | | 140 | | | | 166 | |
Calfrac Holdings LP, | | | | | | | | |
7.50%, Due 12/1/2020C E | | | 775 | | | | 744 | |
Canadian National Railway Co., | | | | | | | | |
5.55%, Due 5/15/2018 | | | 250 | | | | 296 | |
Canadian Natural Resources Ltd., | | | | | | | | |
6.25%, Due 3/15/2038 | | | 275 | | | | 345 | |
Caterpillar Financial Services Corp., | | | | | | | | |
1.90%, Due 12/17/2012 | | | 100 | | | | 101 | |
4.25%, Due 2/8/2013 | | | 250 | | | | 261 | |
2.75%, Due 6/24/2015 | | | 280 | | | | 291 | |
Comcast Cable Communications Holdings, Inc., | | | | | | | | |
8.375%, Due 3/15/2013 | | | 109 | | | | 120 | |
Comcast Corp., | | | | | | | | |
6.55%, Due 7/1/2039 | | | 400 | | | | 492 | |
Complete Production Services, Inc., | | | | | | | | |
8.00%, Due 12/15/2016 | | | 200 | | | | 208 | |
Comstock Resources, Inc., | | | | | | | | |
8.375%, Due 10/15/2017 | | | 300 | | | | 308 | |
Concho Resources, Inc., | | | | | | | | |
8.625%, Due 10/1/2017 | | | 275 | | | | 300 | |
ConocoPhillips, | | | | | | | | |
4.60%, Due 1/15/2015 | | | 200 | | | | 220 | |
5.20%, Due 5/15/2018 | | | 325 | | | | 376 | |
CSX Corp., | | | | | | | | |
| | | | | | | | |
| | | Par Amount | | | Fair Value | |
| | | (000’s) | | | (000’s) | |
5.50%, Due 4/15/2041 | | $ | 250 | | | $ | 285 | |
CVS Caremark Corp., | | | | | | | | |
3.25%, Due 5/18/2015 | | | 140 | | | | 148 | |
Daimler Finance North America LLC, | | | | | | | | |
3.00%, Due 3/28/2016B C | | | 150 | | | | 151 | |
Darling International, Inc., | | | | | | | | |
8.50%, Due 12/15/2018 | | | 202 | | | | 227 | |
Dean Foods Co., | | | | | | | | |
9.75%, Due 12/15/2018C | | | 400 | | | | 429 | |
DISH DBS Corp., | | | | | | | | |
7.875%, Due 9/1/2019 | | | 300 | | | | 329 | |
EOG Resources, Inc., | | | | | | | | |
2.50%, Due 2/1/2016 | | | 250 | | | | 257 | |
Equinix, Inc., | | | | | | | | |
7.00%, Due 7/15/2021 | | | 400 | | | | 426 | |
FMG Resources August 2006 Property Ltd., | | | | | | | | |
8.25%, Due 11/1/2019C | | | 694 | | | | 701 | |
France Telecom S.A., | | | | | | | | |
2.125%, Due 9/16/2015 | | | 125 | | | | 126 | |
GlaxoSmithKline Capital, Inc., | | | | | | | | |
5.65%, Due 5/15/2018 | | | 125 | | | | 150 | |
Hewlett-Packard Co., | | | | | | | | |
2.20%, Due 12/1/2015 | | | 250 | | | | 251 | |
HollyFrontier Corp., | | | | | | | | |
9.875%, Due 6/15/2017 | | | 140 | | | | 153 | |
iGate Corp., | | | | | | | | |
9.00%, Due 5/1/2016C | | | 300 | | | | 299 | |
International Business Machines Corp., | | | | | | | | |
7.625%, Due 10/15/2018 | | | 150 | | | | 200 | |
Jabil Circuit, Inc., | | | | | | | | |
8.25%, Due 3/15/2018 | | | 325 | | | | 377 | |
Jaguar Land Rover plc, | | | | | | | | |
7.75%, Due 5/15/2018C | | | 400 | | | | 396 | |
Jarden Corp., | | | | | | | | |
7.50%, Due 5/1/2017 | | | 30 | | | | 32 | |
7.50%, Due 1/15/2020 | | | 120 | | | | 128 | |
Johnson Controls, Inc., | | | | | | | | |
5.00%, Due 3/30/2020 | | | 300 | | | | 331 | |
Kellogg Co., | | | | | | | | |
4.25%, Due 3/6/2013 | | | 250 | | | | 261 | |
Liberty Interactive LLC, | | | | | | | | |
8.25%, Due 2/1/2030B | | | 450 | | | | 434 | |
3.25%, Due 3/15/2031B | | | 425 | | | | 341 | |
McKesson Corp., | | | | | | | | |
3.25%, Due 3/1/2016 | | | 140 | | | | 148 | |
Norfolk Southern Corp., | | | | | | | | |
5.75%, Due 4/1/2018 | | | 325 | | | | 381 | |
Northrop Grumman Corp., | | | | | | | | |
5.05%, Due 8/1/2019 | | | 150 | | | | 169 | |
Perry Ellis International, Inc., | | | | | | | | |
7.875%, Due 4/1/2019 | | | 210 | | | | 213 | |
Petrobras International Finance Co., | | | | | | | | |
3.875%, Due 1/27/2016 | | | 200 | | | | 205 | |
Petroleos Mexicanos, | | | | | | | | |
6.00%, Due 3/5/2020 | | | 300 | | | | 334 | |
Quest Diagnostics, Inc., | | | | | | | | |
4.75%, Due 1/30/2020 | | | 125 | | | | 134 | |
Qwest Capital Funding, Inc., | | | | | | | | |
7.75%, Due 2/15/2031 | | | 250 | | | | 245 | |
Royal Caribbean Cruises Ltd., | | | | | | | | |
7.50%, Due 10/15/2027 | | | 500 | | | | 484 | |
Seagate HDD Cayman, | | | | | | | | |
See accompanying notes
26
American Beacon Retirement Income and Appreciation Fund
Schedule of Investments
October 31, 2011
| | | | | | | | |
| | | Par Amount | | | Fair Value | |
| | | (000’s) | | | (000’s) | |
6.875%, Due 5/1/2020 | | $ | 350 | | | $ | 343 | |
SESI LLC, | | | | | | | | |
6.875%, Due 6/1/2014B | | | 435 | | | | 435 | |
Shell International Finance BV, | | | | | | | | |
3.10%, Due 6/28/2015 | | | 280 | | | | 298 | |
Spirit Aerosystems, Inc., | | | | | | | | |
7.50%, Due 10/1/2017 | | | 450 | | | | 484 | |
Swift Energy Co., | | | | | | | | |
7.125%, Due 6/1/2017 | | | 375 | | | | 381 | |
Telefonica Emisiones SAU, | | | | | | | | |
6.421%, Due 6/20/2016 | | | 300 | | | | 321 | |
The Boeing Co., | | | | | | | | |
1.875%, Due 11/20/2012 | | | 250 | | | | 254 | |
The Coca-Cola Co., | | | | | | | | |
1.80%, Due 9/1/2016C | | | 150 | | | | 150 | |
The Home Depot, Inc., | | | | | | | | |
4.40%, Due 4/1/2021 | | | 300 | | | | 328 | |
Thomson Reuters Corp., | | | | | | | | |
4.70%, Due 10/15/2019 | | | 125 | | | | 134 | |
Time Warner Cable, Inc., | | | | | | | | |
5.85%, Due 5/1/2017 | | | 650 | | | | 740 | |
Time Warner, Inc., | | | | | | | | |
4.875%, Due 3/15/2020 | | | 150 | | | | 163 | |
4.75%, Due 3/29/2021 | | | 325 | | | | 353 | |
Triumph Group, Inc., | | | | | | | | |
8.00%, Due 11/15/2017 | | | 300 | | | | 321 | |
Tyco International Finance S.A., | | | | | | | | |
3.75%, Due 1/15/2018 | | | 275 | | | | 289 | |
Union Pacific Corp., | | | | | | | | |
4.163%, Due 7/15/2022 | | | 262 | | | | 277 | |
United Technologies Corp., | | | | | | | | |
6.125%, Due 7/15/2038 | | | 450 | | | | 552 | |
Verizon Communications, Inc., | | | | | | | | |
5.50%, Due 4/1/2017 | | | 250 | | | | 288 | |
4.60%, Due 4/1/2021 | | | 340 | | | | 373 | |
6.90%, Due 4/15/2038 | | | 325 | | | | 428 | |
Vodafone Group plc, | | | | | | | | |
6.15%, Due 2/27/2037 | | | 275 | | | | 346 | |
W&T Offshore, Inc., | | | | | | | | |
8.50%, Due 6/15/2019C | | | 425 | | | | 434 | |
Wal-Mart Stores, Inc., | | | | | | | | |
7.55%, Due 2/15/2030 | | | 350 | | | | 501 | |
Xerox Corp., | | | | | | | | |
5.65%, Due 5/15/2013 | | | 75 | | | | 79 | |
8.25%, Due 5/15/2014 | | | 150 | | | | 171 | |
| | | | | | | | |
| | | | | | | 25,432 | |
| | | | | | | | |
Utilities - 2.16% | | | | | | | | |
Commonwealth Edison Co., | | | | | | | | |
4.00%, Due 8/1/2020 | | | 135 | | | | 145 | |
Consolidated Edison Co. of New York, Inc., | | | | | | | | |
5.50%, Due 12/1/2039 | | | 300 | | | | 362 | |
Duke Energy Carolinas LLC, | | | | | | | | |
5.10%, Due 4/15/2018B | | | 250 | | | | 287 | |
EDF S.A., | | | | | | | | |
4.60%, Due 1/27/2020C | | | 300 | | | | 320 | |
FirstEnergy Solutions Corp., | | | | | | | | |
4.80%, Due 2/15/2015 | | | 150 | | | | 161 | |
Midamerican Energy Holdings Co., | | | | | | | | |
6.125%, Due 4/1/2036 | | | 275 | | | | 342 | |
Pacific Gas & Electric Co., | | | | | | | | |
6.25%, Due 12/1/2013 | | | 175 | | | | 193 | |
| | | | | | | | |
| | | Par Amount | | | Fair Value | |
| | | (000’s) | | | (000’s) | |
3.50%, Due 10/1/2020 | | $ | 250 | | | $ | 258 | |
Progress Energy, Inc., | | | | | | | | |
4.875%, Due 12/1/2019 | | | 350 | | | | 389 | |
Southern Co., | | | | | | | | |
1.95%, Due 9/1/2016 | | | 310 | | | | 312 | |
TransCanada PipeLines Ltd., | | | | | | | | |
6.10%, Due 6/1/2040 | | | 140 | | | | 178 | |
Virginia Electric and Power Co., | | | | | | | | |
5.40%, Due 4/30/2018 | | | 250 | | | | 294 | |
| | | | | | | | |
| | | | | | | 3,241 | |
| | | | | | | | |
Total Corporate Obligations (Cost $52,355) | | | | | | | 55,009 | |
OTHER GOVERNMENT OBLIGATIONS - 0.39% | |
Province of Ontario Canada, | | | | | | | | |
4.10%, Due 6/16/2014 | | | 300 | | | | 325 | |
3.15%, Due 12/15/2017 | | | 250 | | | | 263 | |
| | | | | | | | |
Total Other Government Obligations (Cost $549) | | | | | | | 588 | |
U.S. AGENCY OBLIGATION - 0.21% (Cost $300) | |
U.S. Agency Obligations - 0.21% | | | | | | | | |
Private Export Funding Corp., | | | | | | | | |
2.125%, Due 7/15/2016 | | | 300 | | | | 309 | |
| | | | | | | | |
ASSET-BACKED SECURITIES - 2.93% | | | | | |
Ally Master Owner Trust, | | | | | | | | |
0.894%, Due 6/15/2015, 2011-5 AD | | | 650 | | | | 650 | |
BMW Floorplan Master Owner Trust, | | | | | | | | |
1.393%, Due 9/15/2014, 2009-1A AC D | | | 250 | | | | 251 | |
Citibank Credit Card Issuance Trust, | | | | | | | | |
1.793%, Due 5/15/2014, 2009-A2 A2D | | | 600 | | | | 605 | |
Ford Credit Floorplan Master Owner Trust, | | | | | | | | |
1.793%, Due 9/15/2014, 2009-2 AD | | | 1,800 | | | | 1,817 | |
Harley-Davidson Motorcycle Trust, | | | | | | | | |
1.87%, Due 2/15/2014, 2009-4 A3 | | | 163 | | | | 163 | |
Nissan Master Owner Trust Receivables, | | | | | | | | |
1.393%, Due 1/15/2015, 2010-AA AC D | | | 600 | | | | 605 | |
Volkswagen Auto Loan Enhanced Trust, | | | | | | | | |
6.24%, Due 7/20/2015, 2008-2 A4A | | | 300 | | | | 310 | |
| | | | | | | | |
Total Asset-Backed Securities (Cost $4,392) | | | | | | | 4,401 | |
| | | | | | | | |
NON-AGENCY MORTGAGE-BACKED OBLIGATIONS - 3.55% | | | | | | | | |
Banc of America Merrill Lynch Commercial Mortgage, Inc., | | | | | | | | |
5.317%, Due 9/10/2047, 2006-5 A2 | | | 230 | | | | 232 | |
5.634%, Due 4/10/2049, 2007-2 A2 | | | 316 | | | | 323 | |
GS Mortgage Securities Corp II, | | | | | | | | |
4.607%, Due 7/10/2039, 2005-GG4 A3 | | | 270 | | | | 273 | |
3.849%, Due 12/10/2043, 2010-C2 A1C | | | 637 | | | | 664 | |
3.645%, Due 3/10/2044, 2011-GC3 A2C | | | 750 | | | | 779 | |
JP Morgan Chase Commercial Mortgage Securities Corp., | | | | | | | | |
4.678%, Due 7/15/2042, 2005-LDP2 A3A | | | 230 | | | | 234 | |
3.853%, Due 6/15/2043, 2010-C1 A1C | | | 535 | | | | 556 | |
See accompanying notes
27
American Beacon Retirement Income and Appreciation Fund
Schedule of Investments
October 31, 2011
| | | | | | | | |
| | | Par Amount | | | Fair Value | |
| | | (000’s) | | | (000’s) | |
4.388%, Due 2/15/2046, 2011-C3A A3C | | $ | 650 | | | $ | 668 | |
5.739%, Due 2/12/2049, 2007-CB19 A4 | | | 400 | | | | 432 | |
5.629%, Due 2/12/2051, 2007-CB20 A2 | | | 450 | | | | 459 | |
LB-UBS Commercial Mortgage Trust, | | | | | | | | |
5.424%, Due 2/15/2040, 2007-C1 A4 | | | 450 | | | | 479 | |
Wachovia Bank Commercial Mortgage Trust, | | | | | | | | |
5.737%, Due 6/15/2049, 2007-C32 A2 | | | 230 | | | | 235 | |
| | | | | | | | |
Total Non-Agency Mortgage-Backed Obligations (Cost $5,198) | | | | | | | 5,334 | |
| | | | | | | | |
U.S. AGENCY MORTGAGE-BACKED OBLIGATIONS - 25.66% | | | | | | | | |
Federal Home Loan Mortgage Corporation | | | | | | | | |
5.00%, Due 2/1/2021 | | | 394 | | | | 425 | |
4.50%, Due 4/1/2021 | | | 406 | | | | 435 | |
5.00%, Due 9/1/2035 | | | 1,212 | | | | 1,303 | |
5.50%, Due 4/1/2037 | | | 356 | | | | 385 | |
5.00%, Due 3/1/2038 | | | 675 | | | | 725 | |
5.50%, Due 5/1/2038 | | | 432 | | | | 467 | |
0.643%, Due 12/15/2040D | | | 1,738 | | | | 1,735 | |
4.00%, Due 1/1/2041 | | | 1,729 | | | | 1,796 | |
4.50%, Due 2/1/2041 | | | 1,891 | | | | 1,996 | |
| | | | | | | | |
| | | | | | | 9,267 | |
| | | | | | | | |
Federal National Mortgage Association | | | | | | | | |
3.50%, Due 1/1/2026 | | | 465 | | | | 484 | |
6.50%, Due 7/1/2032 | | | 201 | | | | 227 | |
5.50%, Due 6/1/2033 | | | 411 | | | | 448 | |
4.50%, Due 9/1/2034 | | | 242 | | | | 257 | |
5.50%, Due 12/1/2035 | | | 481 | | | | 524 | |
5.00%, Due 2/1/2036 | | | 385 | | | | 415 | |
5.50%, Due 4/1/2036 | | | 658 | | | | 718 | |
5.50%, Due 2/1/2037 | | | 473 | | | | 514 | |
6.00%, Due 9/1/2037 | | | 293 | | | | 322 | |
6.00%, Due 1/1/2038 | | | 434 | | | | 477 | |
4.50%, Due 1/1/2040 | | | 1,388 | | | | 1,469 | |
4.00%, Due 9/1/2040 | | | 1,054 | | | | 1,097 | |
4.00%, Due 1/1/2041 | | | 2,897 | | | | 3,016 | |
| | | | | | | | |
| | | | | | | 9,968 | |
| | | | | | | | |
Government National Mortgage Association | | | | | | | | |
6.00%, Due 2/15/2033 | | | 481 | | | | 540 | |
5.50%, Due 4/15/2033 | | | 643 | | | | 718 | |
5.00%, Due 5/15/2033 | | | 457 | | | | 506 | |
1.692%, Due 11/16/2035, 2009-148 A | | | 306 | | | | 308 | |
2.989%, Due 3/16/2039, 2010-71 AC | | | 736 | | | | 763 | |
2.70%, Due 4/16/2043, 2011-109 AB | | | 2,991 | | | | 3,100 | |
2.542%, Due 9/16/2044, 2011-96 AC | | | 2,690 | | | | 2,778 | |
2.70%, Due 11/16/2044, 2011-92 AB | | | 1,245 | | | | 1,291 | |
3.20%, Due 11/16/2044, 2011-92 B | | | 2,900 | | | | 3,011 | |
2.351%, Due 6/16/2050, 2010-100 A | | | 1,442 | | | | 1,461 | |
| | | | | | | | |
| | | | | | | 14,476 | |
| | | | | | | | |
National Credit Union Administration | | | | | | | | |
0.643%, Due 3/11/2020, 2011 R3 1AD | | | 2,328 | | | | 2,329 | |
0.691%, Due 10/7/2020, 2010 R1 1AD | | | 2,526 | | | | 2,530 | |
| | | | | | | | |
| | | | | | | 4,859 | |
| | | | | | | | |
Total U.S. Agency Mortgage-Backed Obligations (Cost $37,187) | | | | | | | 38,570 | |
| | | | | | | | |
| | | | | | | | |
| | | Par Amount | | | Fair Value | |
| | | (000’s) | | | (000’s) | |
U.S. TREASURY OBLIGATIONS - 6.60% | | | | | |
U.S. Treasury Bonds | | | | | | | | |
6.25%, Due 8/15/2023 | | $ | 1,500 | | | $ | 2,089 | |
6.875%, Due 8/15/2025 | | | 250 | | | | 373 | |
5.25%, Due 11/15/2028 | | | 550 | | | | 727 | |
4.75%, Due 2/15/2037 | | | 420 | | | | 540 | |
4.50%, Due 8/15/2039 | | | 910 | | | | 1,135 | |
| | | | | | | | |
| | | | | | | 4,864 | |
| | | | | | | | |
U.S. Treasury Notes | | | | | | | | |
2.625%, Due 7/31/2014 | | | 2,000 | | | | 2,122 | |
3.125%, Due 10/31/2016 | | | 1,300 | | | | 1,433 | |
3.625%, Due 2/15/2020 | | | 1,325 | | | | 1,505 | |
| | | | | | | | |
| | | | | | | 5,060 | |
| | | | | | | | |
Total U.S. Treasury Obligations (Cost $8,962) | | | | 9,924 | |
| | | | | | | | |
| | | Shares | | | | |
SHORT-TERM INVESTMENTS - 4.81% (Cost $7,235) | | | | | | | | |
JPMorgan U.S. Government Money Market Fund | | | 7,234,725 | | | | 7,235 | |
| | | | | | | | |
TOTAL INVESTMENTS - 99.19% (Cost $142,030) | | | | 149,099 | |
OTHER ASSETS, NET OF LIABILITIES - 0.81% | | | | 1,212 | |
| | | | | | | | |
TOTAL NET ASSETS - 100.00% | | | $ | 150,311 | |
| | | | | | | | |
Percentages are stated as a percent of net assets.
| A | Non-income producing security. |
| B | Limited Liability Company. |
| C | Security exempt from registration under the Securities Act of 1933. These securities may be resold to qualified institutional buyers pursuant to Rule 144A. At the period end, the value of these securities amounted to $15,343 or 10.21% of net assets. The Fund has no right to demand registration of these securities. |
| D | The coupon rate shown on floating or adjustable rate securities represents the rate at period end. The due date on these types of securities reflects the final maturity date. |
See accompanying notes
28
American Beacon Intermediate Bond Fund
Schedule of Investments
October 31, 2011
| | | | | | | | |
| | | Par Amount | | | Fair Value | |
| | | (000’s) | | | (000’s) | |
CORPORATE OBLIGATIONS - 42.62% | | | | | | | | |
Finance - 19.81% | | | | | | | | |
AEGON Funding Co. LLC, 5.75%, Due 12/15/2020A | | $ | 400 | | | $ | 433 | |
Aflac, Inc., 8.50%, Due 5/15/2019 | | | 240 | | | | 301 | |
American Express Co., 8.15%, Due 3/19/2038 | | | 325 | | | | 466 | |
American Express Credit Corp., | | | | | | | | |
5.125%, Due 8/25/2014 | | | 835 | | | | 907 | |
2.75%, Due 9/15/2015 | | | 225 | | | | 228 | |
American International Group, Inc., | | | | | | | | |
4.25%, Due 9/15/2014 | | | 600 | | | | 590 | |
6.40%, Due 12/15/2020 | | | 800 | | | | 838 | |
ANZ National International Ltd., 2.375%, Due 12/21/2012B | | | 350 | | | | 354 | |
Bank of America Corp., | | | | | | | | |
4.50%, Due 4/1/2015 | | | 415 | | | | 410 | |
7.80%, Due 9/15/2016 | | | 700 | | | | 741 | |
7.625%, Due 6/1/2019 | | | 1,200 | | | | 1,304 | |
Bank One Corp., 4.90%, Due 4/30/2015 | | | 500 | | | | 532 | |
Barclays Bank plc, | | | | | | | | |
3.90%, Due 4/7/2015 | | | 380 | | | | 387 | |
6.75%, Due 5/22/2019 | | | 350 | | | | 401 | |
BNP Paribas S.A., 3.60%, Due 2/23/2016 | | | 400 | | | | 399 | |
Canadian Imperial Bank of Commerce, 1.45%, Due 9/13/2013 | | | 670 | | | | 674 | |
Capital One Financial Corp., 2.125%, Due 7/15/2014 | | | 465 | | | | 464 | |
Citigroup, Inc., | | | | | | | | |
1.302%, Due 4/1/2014C | | | 400 | | | | 385 | |
0.548%, Due 11/5/2014C | | | 380 | | | | 355 | |
6.01%, Due 1/15/2015 | | | 605 | | | | 650 | |
6.125%, Due 11/21/2017 | | | 355 | | | | 391 | |
8.50%, Due 5/22/2019 | | | 1,650 | | | | 2,043 | |
CME Group, Inc., 5.40%, Due 8/1/2013 | | | 260 | | | | 278 | |
CNA Financial Corp., 7.35%, Due 11/15/2019 | | | 210 | | | | 231 | |
Cooperatieve Centrale Raiffeisen-Boerenleenbank BA, | | | | | | | | |
4.20%, Due 5/13/2014B | | | 600 | | | | 635 | |
2.125%, Due 10/13/2015 | | | 510 | | | | 514 | |
Credit Suisse, 5.30%, Due 8/13/2019 | | | 425 | | | | 457 | |
Credit Suisse USA, Inc., 7.125%, Due 7/15/2032 | | | 500 | | | | 603 | |
Danske Bank A/S, 1.451%, Due 4/14/2014B C | | | 780 | | | | 750 | |
Deutsche Bank AG, 3.875%, Due 8/18/2014 | | | 400 | | | | 413 | |
Fifth Third Bancorp, 3.625%, Due 1/25/2016 | | | 400 | | | | 410 | |
General Electric Capital Corp., | | | | | | | | |
0.591%, Due 1/8/2016C | | | 1,300 | | | | 1,209 | |
5.40%, Due 2/15/2017 | | | 405 | | | | 451 | |
5.625%, Due 5/1/2018 | | | 795 | | | | 879 | |
6.00%, Due 8/7/2019 | | | 350 | | | | 398 | |
5.50%, Due 1/8/2020 | | | 800 | | | | 892 | |
5.30%, Due 2/11/2021 | | | 240 | | | | 255 | |
5.875%, Due 1/14/2038 | | | 745 | | | | 800 | |
HCP, Inc., 5.375%, Due 2/1/2021 | | | 500 | | | | 514 | |
Health Care REIT, Inc., | | | | | | | | |
3.625%, Due 3/15/2016E | | | 285 | | | | 278 | |
5.25%, Due 1/15/2022E | | | 345 | | | | 330 | |
HSBC Finance Corp., 0.653%, Due 1/15/2014C | | | 1,100 | | | | 1,026 | |
ING Bank N.V., 5.125%, Due 5/1/2015B | | | 250 | | | | 249 | |
JPMorgan Chase & Co., | | | | | | | | |
3.70%, Due 1/20/2015 | | | 1,655 | | | | 1,724 | |
5.50%, Due 10/15/2040 | | | 425 | | | | 455 | |
JPMorgan Chase Bank NA, 0.668%, Due 6/13/2016C | | | 480 | | | | 435 | |
KeyCorp, 5.10%, Due 3/24/2021 | | | 235 | | | | 244 | |
Liberty Mutual Group, Inc., 5.00%, Due 6/1/2021B | | | 390 | | | | 368 | |
Lincoln National Corp., 4.75%, Due 2/15/2014 | | | 50 | | | | 53 | |
Lloyds TSB Bank plc, | | | | | | | | |
4.375%, Due 1/12/2015B | | | 375 | | | | 376 | |
See accompanying notes
29
American Beacon Intermediate Bond Fund
Schedule of Investments
October 31, 2011
| | | | | | | | |
| | | Par Amount | | | Fair Value | |
| | | (000’s) | | | (000’s) | |
6.375%, Due 1/21/2021 | | $ | 260 | | | $ | 278 | |
Merrill Lynch & Co. Inc, | | | | | | | | |
6.40%, Due 8/28/2017 | | | 940 | | | | 953 | |
6.50%, Due 7/15/2018 | | | 520 | | | | 516 | |
6.11%, Due 1/29/2037 | | | 360 | | | | 316 | |
MetLife Institutional Funding II, 1.274%, Due 4/4/2014B C | | | 600 | | | | 598 | |
MetLife, Inc., | | | | | | | | |
5.00%, Due 11/24/2013 | | | 620 | | | | 662 | |
6.375%, Due 6/15/2034 | | | 500 | | | | 609 | |
Monumental Global Funding III, 0.603%, Due 1/15/2014B C | | | 375 | | | | 364 | |
Morgan Stanley, | | | | | | | | |
0.883%, Due 10/15/2015C | | | 1,180 | | | | 1,037 | |
7.30%, Due 5/13/2019 | | | 370 | | | | 397 | |
5.625%, Due 9/23/2019 | | | 600 | | | | 592 | |
National Australia Bank Ltd., 4.375%, Due 12/10/2020B | | | 425 | | | | 439 | |
Nordea Bank AB, | | | | | | | | |
2.50%, Due 11/13/2012B | | | 400 | | | | 404 | |
4.875%, Due 1/27/2020B | | | 450 | | | | 482 | |
PNC Funding Corp., | | | | | | | | |
4.25%, Due 9/21/2015 | | | 910 | | | | 982 | |
4.375%, Due 8/11/2020 | | | 410 | | | | 432 | |
Pricoa Global Funding I, 5.40%, Due 10/18/2012B | | | 175 | | | | 182 | |
Prudential Financial, Inc., 7.375%, Due 6/15/2019 | | | 450 | | | | 546 | |
Simon Property Group LP, | | | | | | | | |
5.75%, Due 12/1/2015D | | | 645 | | | | 723 | |
10.35%, Due 4/1/2019D | | | 375 | | | | 510 | |
Societe Generale S.A., | | | | | | | | |
2.20%, Due 9/14/2013B | | | 450 | | | | 432 | |
1.441%, Due 4/11/2014B C | | | 900 | | | | 819 | |
State Street Corp., | | | | | | | | |
4.30%, Due 5/30/2014 | | | 285 | | | | 308 | |
2.875%, Due 3/7/2016 | | | 705 | | | | 729 | |
SunTrust Banks, Inc., 3.60%, Due 4/15/2016 | | | 245 | | | | 251 | |
The Bank of New York Mellon Corp., | | | | | | | | |
1.50%, Due 1/31/2014 | | | 475 | | | | 480 | |
4.30%, Due 5/15/2014 | | | 395 | | | | 427 | |
The Bear Stearns Cos. LLC, 7.25%, Due 2/1/2018A | | | 2,145 | | | | 2,527 | |
The Goldman Sachs Group, Inc., | | | | | | | | |
5.35%, Due 1/15/2016 | | | 800 | | | | 847 | |
6.25%, Due 9/1/2017 | | | 800 | | | | 865 | |
5.95%, Due 1/18/2018 | | | 660 | | | | 694 | |
6.00%, Due 6/15/2020 | | | 490 | | | | 516 | |
The Travelers Cos., Inc., 3.90%, Due 11/1/2020 | | | 210 | | | | 219 | |
Travelers Property Casualty Corp., 5.00%, Due 3/15/2013 | | | 805 | | | | 845 | |
UBS AG, 5.875%, Due 12/20/2017 | | | 400 | | | | 438 | |
UnitedHealth Group, Inc., | | | | | | | | |
4.875%, Due 2/15/2013 | | | 650 | | | | 680 | |
3.875%, Due 10/15/2020 | | | 425 | | | | 448 | |
US Bancorp, | | | | | | | | |
1.375%, Due 9/13/2013 | | | 775 | | | | 783 | |
2.20%, Due 11/15/2016 | | | 485 | | | | 489 | |
Wachovia Corp., | | | | | | | | |
0.773%, Due 10/15/2016C | | | 750 | | | | 654 | |
5.75%, Due 2/1/2018 | | | 1,150 | | | | 1,306 | |
Wells Fargo & Co., 4.60%, Due 4/1/2021 | | | 470 | | | | 503 | |
Westpac Banking Corp., 2.25%, Due 11/19/2012 | | | 375 | | | | 381 | |
Willis North America, Inc., 6.20%, Due 3/28/2017 | | | 280 | | | | 307 | |
| | | | | | | | |
| | | | | | | 55,450 | |
| | | | | | | | |
Industrials - 17.58% | | | | | | | | |
Air Products & Chemicals, Inc., 2.00%, Due 8/2/2016 | | | 180 | | | | 184 | |
Altria Group, Inc., | | | | | | | | |
9.70%, Due 11/10/2018 | | | 375 | | | | 504 | |
4.75%, Due 5/5/2021 | | | 390 | | | | 420 | |
See accompanying notes
30
American Beacon Intermediate Bond Fund
Schedule of Investments
October 31, 2011
| | | | | | | | |
| | | Par Amount | | | Fair Value | |
| | | (000’s) | | | (000’s) | |
America Movil SAB de CV, 6.375%, Due 3/1/2035 | | $ | 375 | | | $ | 447 | |
American Honda Finance Corp., | | | | | | | | |
4.625%, Due 4/2/2013B | | | 250 | | | | 261 | |
3.875%, Due 9/21/2020B | | | 225 | | | | 233 | |
Analog Devices, Inc., 3.00%, Due 4/15/2016 | | | 460 | | | | 482 | |
Anheuser-Busch InBev Worldwide, Inc., | | | | | | | | |
5.00%, Due 4/15/2020 | | | 380 | | | | 441 | |
8.00%, Due 11/15/2039 | | | 175 | | | | 267 | |
Apache Corp., 5.10%, Due 9/1/2040 | | | 200 | | | | 232 | |
Applied Materials, Inc., 2.65%, Due 6/15/2016 | | | 415 | | | | 428 | |
AT&T, Inc., | | | | | | | | |
5.10%, Due 9/15/2014 | | | 880 | | | | 978 | |
5.50%, Due 2/1/2018 | | | 975 | | | | 1,132 | |
6.80%, Due 5/15/2036 | | | 225 | | | | 284 | |
6.40%, Due 5/15/2038 | | | 200 | | | | 244 | |
5.35%, Due 9/1/2040 | | | 283 | | | | 309 | |
Baxter International, Inc., 1.80%, Due 3/15/2013 | | | 270 | | | | 274 | |
Becton Dickinson and Co., 3.25%, Due 11/12/2020 | | | 475 | | | | 486 | |
BP Capital Markets plc, | | | | | | | | |
3.20%, Due 3/11/2016 | | | 990 | | | | 1,040 | |
3.561%, Due 11/1/2021 | | | 325 | | | | 330 | |
Burlington Northern Santa Fe LLC, | | | | | | | | |
5.75%, Due 3/15/2018A | | | 600 | | | | 697 | |
7.95%, Due 8/15/2030A | | | 195 | | | | 276 | |
5.75%, Due 5/1/2040A | | | 190 | | | | 225 | |
Cameron International Corp., 6.375%, Due 7/15/2018 | | | 225 | | | | 266 | |
Canadian National Railway Co., 5.55%, Due 5/15/2018 | | | 400 | | | | 474 | |
Canadian Natural Resources Ltd., 6.25%, Due 3/15/2038 | | | 360 | | | | 451 | |
Caterpillar Financial Services Corp., | | | | | | | | |
1.90%, Due 12/17/2012 | | | 100 | | | | 101 | |
4.25%, Due 2/8/2013 | | | 250 | | | | 261 | |
6.125%, Due 2/17/2014 | | | 600 | | | | 668 | |
2.75%, Due 6/24/2015 | | | 380 | | | | 395 | |
Cellco Partnership, 8.50%, Due 11/15/2018 | | | 460 | | | | 622 | |
Cliffs Natural Resources, Inc., 4.875%, Due 4/1/2021 | | | 280 | | | | 280 | |
Comcast Cable Communications Holdings, Inc., 8.375%, Due 3/15/2013 | | | 128 | | | | 141 | |
Comcast Corp., | | | | | | | | |
6.30%, Due 11/15/2017 | | | 465 | | | | 549 | |
5.875%, Due 2/15/2018 | | | 235 | | | | 273 | |
6.55%, Due 7/1/2039 | | | 500 | | | | 614 | |
ConocoPhillips, | | | | | | | | |
4.60%, Due 1/15/2015 | | | 550 | | | | 606 | |
5.20%, Due 5/15/2018 | | | 600 | | | | 694 | |
Cooper US, Inc., | | | | | | | | |
2.375%, Due 1/15/2016 | | | 480 | | | | 489 | |
3.875%, Due 12/15/2020 | | | 315 | | | | 333 | |
Covidien International Finance S.A., 2.80%, Due 6/15/2015 | | | 500 | | | | 517 | |
CSX Corp., 5.50%, Due 4/15/2041 | | | 425 | | | | 484 | |
CVS Caremark Corp., 3.25%, Due 5/18/2015 | | | 190 | | | | 201 | |
Daimler Finance North America LLC, 3.00%, Due 3/28/2016A B | | | 190 | | | | 191 | |
DIRECTV Holdings LLC, | | | | | | | | |
3.55%, Due 3/15/2015A | | | 525 | | | | 550 | |
6.35%, Due 3/15/2040A | | | 145 | | | | 173 | |
Eaton Corp., 5.60%, Due 5/15/2018 | | | 380 | | | | 444 | |
Ensco plc, 4.70%, Due 3/15/2021 | | | 350 | | | | 368 | |
EOG Resources, Inc., 2.50%, Due 2/1/2016 | | | 425 | | | | 437 | |
Express Scripts, Inc., 6.25%, Due 6/15/2014 | | | 610 | | | | 675 | |
France Telecom S.A., | | | | | | | | |
4.375%, Due 7/8/2014 | | | 385 | | | | 415 | |
2.125%, Due 9/16/2015 | | | 225 | | | | 226 | |
Genzyme Corp., 5.00%, Due 6/15/2020 | | | 235 | | | | 266 | |
GlaxoSmithKline Capital, Inc., 5.65%, Due 5/15/2018 | | | 125 | | | | 150 | |
Hewlett-Packard Co., 2.20%, Due 12/1/2015 | | | 425 | | | | 426 | |
See accompanying notes
31
American Beacon Intermediate Bond Fund
Schedule of Investments
October 31, 2011
| | | | | | | | |
| | | Par Amount | | | Fair Value | |
| | | (000’s) | | | (000’s) | |
Husky Energy, Inc., 5.90%, Due 6/15/2014 | | $ | 250 | | | $ | 274 | |
Intel Corp., 3.30%, Due 10/1/2021 | | | 315 | | | | 325 | |
International Business Machines Corp., 7.625%, Due 10/15/2018 | | | 745 | | | | 995 | |
John Deere Capital Corp., 4.90%, Due 9/9/2013 | | | 650 | | | | 697 | |
Johnson Controls, Inc., | | | | | | | | |
1.75%, Due 3/1/2014 | | | 745 | | | | 751 | |
5.00%, Due 3/30/2020 | | | 480 | | | | 529 | |
Kellogg Co., 4.25%, Due 3/6/2013 | | | 250 | | | | 261 | |
Koninklijke Philips Electronics N.V., 5.75%, Due 3/11/2018 | | | 470 | | | | 547 | |
Lorillard Tobacco Co., 8.125%, Due 6/23/2019 | | | 255 | | | | 307 | |
Marathon Oil Corp., 6.00%, Due 10/1/2017 | | | 475 | | | | 551 | |
Marathon Petroleum Corp., 3.50%, Due 3/1/2016B | | | 420 | | | | 431 | |
McKesson Corp., 3.25%, Due 3/1/2016 | | | 200 | | | | 212 | |
Medtronic, Inc., 3.00%, Due 3/15/2015 | | | 915 | | | | 970 | |
Norfolk Southern Corp., 5.75%, Due 4/1/2018 | | | 300 | | | | 352 | |
Northrop Grumman Corp., 5.05%, Due 8/1/2019 | | | 200 | | | | 226 | |
Novartis Capital Corp., 2.90%, Due 4/24/2015 | | | 780 | | | | 828 | |
PepsiCo, Inc., 2.50%, Due 5/10/2016 | | | 590 | | | | 613 | |
Petrobras International Finance Co., | | | | | | | | |
3.875%, Due 1/27/2016 | | | 505 | | | | 517 | |
6.875%, Due 1/20/2040 | | | 110 | | | | 127 | |
Petroleos Mexicanos, 6.00%, Due 3/5/2020 | | | 375 | | | | 417 | |
Quest Diagnostics, Inc., 4.75%, Due 1/30/2020 | | | 225 | | | | 242 | |
Rio Tinto Finance USA Ltd., 2.50%, Due 5/20/2016 | | | 475 | | | | 488 | |
Rogers Communications, Inc., 5.50%, Due 3/15/2014 | | | 430 | | | | 467 | |
Sanofi, | | | | | | | | |
1.625%, Due 3/28/2014 | | | 665 | | | | 677 | |
4.00%, Due 3/29/2021 | | | 495 | | | | 543 | |
Shell International Finance BV, 3.10%, Due 6/28/2015 | | | 380 | | | | 405 | |
Teck Resources Ltd., 6.00%, Due 8/15/2040 | | | 205 | | | | 225 | |
Telecom Italia Capital S.A., 4.95%, Due 9/30/2014 | | | 245 | | | | 241 | |
Telefonica Emisiones SAU, | | | | | | | | |
3.992%, Due 2/16/2016 | | | 255 | | | | 251 | |
6.421%, Due 6/20/2016 | | | 450 | | | | 482 | |
Teva Pharmaceutical Finance II, 3.00%, Due 6/15/2015 | | | 470 | | | | 493 | |
The Boeing Co., 1.875%, Due 11/20/2012 | | | 400 | | | | 406 | |
The Coca-Cola Co., | | | | | | | | |
0.75%, Due 11/15/2013 | | | 1,115 | | | | 1,118 | |
1.80%, Due 9/1/2016B | | | 175 | | | | 175 | |
The Dow Chemical Co., | | | | | | | | |
7.60%, Due 5/15/2014 | | | 220 | | | | 250 | |
4.25%, Due 11/15/2020 | | | 430 | | | | 442 | |
The Home Depot, Inc., 4.40%, Due 4/1/2021 | | | 400 | | | | 437 | |
Thomson Reuters Corp., 4.70%, Due 10/15/2019 | | | 225 | | | | 242 | |
Time Warner Cable, Inc., | | | | | | | | |
5.85%, Due 5/1/2017 | | | 800 | | | | 911 | |
6.75%, Due 7/1/2018 | | | 615 | | | | 733 | |
Time Warner, Inc., | | | | | | | | |
4.875%, Due 3/15/2020 | | | 290 | | | | 316 | |
4.75%, Due 3/29/2021 | | | 350 | | | | 380 | |
Tyco Electronics Group S.A., 6.55%, Due 10/1/2017 | | | 225 | | | | 263 | |
Tyco International Finance S.A., 3.75%, Due 1/15/2018 | | | 400 | | | | 421 | |
Union Pacific Corp., 4.163%, Due 7/15/2022 | | | 481 | | | | 509 | |
United Parcel Service, Inc., 3.125%, Due 1/15/2021 | | | 475 | | | | 494 | |
United Technologies Corp., 6.125%, Due 7/15/2038 | | | 600 | | | | 737 | |
Valero Energy Corp., | | | | | | | | |
9.375%, Due 3/15/2019 | | | 170 | | | | 222 | |
6.625%, Due 6/15/2037 | | | 205 | | | | 224 | |
Verizon Communications, Inc., | | | | | | | | |
5.50%, Due 4/1/2017 | | | 500 | | | | 575 | |
4.60%, Due 4/1/2021 | | | 280 | | | | 307 | |
3.50%, Due 11/1/2021 | | | 200 | | | | 202 | |
6.90%, Due 4/15/2038 | | | 500 | | | | 659 | |
See accompanying notes
32
American Beacon Intermediate Bond Fund
Schedule of Investments
October 31, 2011
| | | | | | | | |
| | | Par Amount | | | Fair Value | |
| | | (000’s) | | | (000’s) | |
Vodafone Group plc, 6.15%, Due 2/27/2037 | | $ | 360 | | | $ | 454 | |
Wal-Mart Stores, Inc., 7.55%, Due 2/15/2030 | | | 400 | | | | 573 | |
Xerox Corp., | | | | | | | | |
5.65%, Due 5/15/2013 | | | 50 | | | | 53 | |
8.25%, Due 5/15/2014 | | | 190 | | | | 216 | |
4.25%, Due 2/15/2015 | | | 500 | | | | 527 | |
| | | | | | | | |
| | | | | | | 49,204 | |
| | | | | | | | |
Utilities - 5.23% | | | | | | | | |
Columbus Southern Power Co., 5.50%, Due 3/1/2013 | | | 595 | | | | 626 | |
Commonwealth Edison Co., 4.00%, Due 8/1/2020 | | | 190 | | | | 203 | |
Consolidated Edison Co. of New York, Inc., 5.50%, Due 12/1/2039 | | | 350 | | | | 423 | |
Duke Energy Carolinas LLC, 5.10%, Due 4/15/2018A | | | 400 | | | | 460 | |
Duke Energy Indiana, Inc., 6.05%, Due 6/15/2016 | | | 450 | | | | 518 | |
EDF S.A., 4.60%, Due 1/27/2020B | | | 580 | | | | 618 | |
Energy Transfer Partners LP, | | | | | | | | |
8.50%, Due 4/15/2014D | | | 605 | | | | 687 | |
9.00%, Due 4/15/2019D | | | 300 | | | | 361 | |
Enterprise Products Operating LLC, | | | | | | | | |
5.65%, Due 4/1/2013A | | | 555 | | | | 587 | |
6.125%, Due 10/15/2039A | | | 350 | | | | 405 | |
Exelon Generation Co. LLC, | | | | | | | | |
5.20%, Due 10/1/2019A | | | 350 | | | | 376 | |
6.25%, Due 10/1/2039A | | | 365 | | | | 434 | |
FirstEnergy Solutions Corp., 4.80%, Due 2/15/2015 | | | 175 | | | | 188 | |
Midamerican Energy Holdings Co., | | | | | | | | |
5.875%, Due 10/1/2012 | | | 605 | | | | 632 | |
6.125%, Due 4/1/2036 | | | 375 | | | | 466 | |
National Rural Utilities Cooperative Finance Corp., 1.125%, Due 11/1/2013 | | | 485 | | | | 486 | |
ONEOK Partners LP, 6.125%, Due 2/1/2041D | | | 500 | | | | 575 | |
Pacific Gas & Electric Co., | | | | | | | | |
6.25%, Due 12/1/2013 | | | 150 | | | | 165 | |
3.50%, Due 10/1/2020 | | | 450 | | | | 465 | |
Progress Energy, Inc., 4.875%, Due 12/1/2019 | | | 450 | | | | 501 | |
Sempra Energy, 6.50%, Due 6/1/2016 | | | 325 | | | | 380 | |
Southern Co., 1.95%, Due 9/1/2016 | | | 380 | | | | 383 | |
Southern Power Co., 6.25%, Due 7/15/2012 | | | 550 | | | | 570 | |
Spectra Energy Capital LLC, | | | | | | | | |
5.668%, Due 8/15/2014A | | | 320 | | | | 350 | |
5.65%, Due 3/1/2020A | | | 265 | | | | 292 | |
Spectra Energy Partners LP, 4.60%, Due 6/15/2021D | | | 235 | | | | 241 | |
TransCanada PipeLines Ltd., | | | | | | | | |
7.625%, Due 1/15/2039 | | | 470 | | | | 672 | |
6.10%, Due 6/1/2040 | | | 290 | | | | 368 | |
Union Electric Co., 6.70%, Due 2/1/2019 | | | 510 | | | | 629 | |
Virginia Electric and Power Co., 5.40%, Due 4/30/2018 | | | 400 | | | | 471 | |
Westar Energy, Inc., 6.00%, Due 7/1/2014 | | | 200 | | | | 220 | |
Xcel Energy, Inc., 5.613%, Due 4/1/2017 | | | 781 | | | | 881 | |
| | | | | | | | |
| | | | | | | 14,633 | |
| | | | | | | | |
Total Corporate Obligations (Cost $112,750) | | | | | | | 119,287 | |
| | | | | | | | |
OTHER GOVERNMENT OBLIGATIONS - 0.29% | | | | | | | | |
Province of Ontario Canada, | | | | | | | | |
4.10%, Due 6/16/2014 | | | 350 | | | | 379 | |
3.15%, Due 12/15/2017 | | | 425 | | | | 448 | |
| | | | | | | | |
Total Other Government Obligations (Cost $774) | | | | | | | 827 | |
| | | | | | | | |
U.S. AGENCY OBLIGATIONS - 0.30% | | | | | | | | |
Federal National Mortgage Association, 5.125%, Due 1/2/2014 | | | 385 | | | | 419 | |
Private Export Funding Corp., 2.125%, Due 7/15/2016 | | | 400 | | | | 412 | |
| | | | | | | | |
Total U.S. Agency Obligations (Cost $784) | | | | | | | 831 | |
| | | | | | | | |
See accompanying notes
33
American Beacon Intermediate Bond Fund
Schedule of Investments
October 31, 2011
| | | | | | | | |
| | | Par Amount | | | Fair Value | |
| | | (000’s) | | | (000’s) | |
ASSET-BACKED SECURITIES - 2.70% | | | | | | | | |
Ally Master Owner Trust, 0.894%, Due 6/15/2015, 2011-5 AC | | $ | 750 | | | $ | 750 | |
BMW Floorplan Master Owner Trust, 1.393%, Due 9/15/2014, 2009-1A AB C | | | 400 | | | | 402 | |
Citibank Credit Card Issuance Trust, 1.793%, Due 5/15/2014, 2009-A2 A2C | | | 400 | | | | 403 | |
CNH Equipment Trust, | | | | | | | | |
1.17%, Due 5/15/2015, 2010-C A3 | | | 665 | | | | 666 | |
2.04%, Due 10/17/2016, 2011-A A4 | | | 470 | | | | 482 | |
Ford Credit Floorplan Master Owner Trust, 1.793%, Due 9/15/2014, 2009-2 AC | | | 2,400 | | | | 2,422 | |
Harley-Davidson Motorcycle Trust, 1.87%, Due 2/15/2014, 2009-4 A3 | | | 190 | | | | 191 | |
Honda Auto Receivables Owner Trust, 3.30%, Due 9/15/2015, 2009-3 A4 | | | 385 | | | | 394 | |
Hyundai Auto Receivables Trust, 3.15%, Due 3/15/2016, 2009-A A4 | | | 220 | | | | 228 | |
John Deere Owner Trust, | | | | | | | | |
2.59%, Due 10/15/2013, 2009-A A3 | | | 35 | | | | 35 | |
3.96%, Due 5/16/2016, 2009-A A4 | | | 510 | | | | 519 | |
Nissan Master Owner Trust Receivables, 1.393%, Due 1/15/2015, 2010-AA AB C | | | 750 | | | | 756 | |
Volkswagen Auto Loan Enhanced Trust, 6.24%, Due 7/20/2015, 2008-2 A4A | | | 300 | | | | 310 | |
| | | | | | | | |
Total Asset-Backed Securities (Cost $7,531) | | | | | | | 7,558 | |
| | | | | | | | |
NON-AGENCY MORTGAGE-BACKED OBLIGATIONS - 4.13% | | | | | | | | |
Banc of America Merrill Lynch Commercial Mortgage, Inc., | | | | | | | | |
5.317%, Due 9/10/2047, 2006-5 A2 | | | 324 | | | | 327 | |
5.634%, Due 4/10/2049, 2007-2 A2 | | | 413 | | | | 423 | |
Bear Stearns Commercial Mortgage Securities, | | | | | | | | |
5.201%, Due 12/11/2038, 2006-PWR14 A4 | | | 790 | | | | 851 | |
5.54%, Due 9/11/2041, 2006-PW13 A4 | | | 1,285 | | | | 1,414 | |
4.831%, Due 7/11/2042, 2004-PWR5 A4 | | | 700 | | | | 723 | |
Citigroup/Deutsche Bank Commercial Mortgage Trust, 5.886%, Due 11/15/2044, 2007-CD5 A4 | | | 840 | | | | 915 | |
GS Mortgage Securities Corp II, | | | | | | | | |
4.607%, Due 7/10/2039, 2005-GG4 A3 | | | 380 | | | | 384 | |
3.679%, Due 8/10/2043, 2010-C1 A1B | | | 562 | | | | 585 | |
3.849%, Due 12/10/2043, 2010-C2 A1B | | | 784 | | | | 816 | |
3.645%, Due 3/10/2044, 2011-GC3 A2B | | | 750 | | | | 780 | |
JP Morgan Chase Commercial Mortgage Securities Corp., | | | | | | | | |
4.678%, Due 7/15/2042, 2005-LDP2 A3A | | | 323 | | | | 330 | |
3.853%, Due 6/15/2043, 2010-C1 A1B | | | 729 | | | | 758 | |
4.388%, Due 2/15/2046, 2011-C3A A3B | | | 800 | | | | 821 | |
4.625%, Due 3/15/2046, 2005-LDP1 A2 | | | 251 | | | | 254 | |
5.739%, Due 2/12/2049, 2007-CB19 A4 | | | 550 | | | | 595 | |
5.629%, Due 2/12/2051, 2007-CB20 A2 | | | 614 | | | | 625 | |
LB-UBS Commercial Mortgage Trust, 5.424%, Due 2/15/2040, 2007-C1 A4 | | | 550 | | | | 585 | |
Wachovia Bank Commercial Mortgage Trust, 5.737%, Due 6/15/2049, 2007-C32 A2 | | | 363 | | | | 370 | |
| | | | | | | | |
Total Non-Agency Mortgage-Backed Obligations (Cost $10,788) | | | | | | | 11,556 | |
| | | | | | | | |
U.S. AGENCY MORTGAGE-BACKED OBLIGATIONS - 31.54% | | | | | | | | |
Federal Home Loan Mortgage Corporation - 6.44% | | | | | | | | |
4.50%, Due 3/1/2019 | | | 226 | | | | 240 | |
5.00%, Due 10/1/2020 | | | 537 | | | | 579 | |
5.00%, Due 8/1/2033 | | | 349 | | | | 375 | |
5.50%, Due 2/1/2034 | | | 430 | | | | 468 | |
6.00%, Due 8/1/2034 | | | 209 | | | | 230 | |
5.00%, Due 8/1/2035 | | | 240 | | | | 258 | |
5.00%, Due 9/1/2035 | | | 606 | | | | 652 | |
6.00%, Due 8/1/2036 | | | 159 | | | | 174 | |
5.50%, Due 4/1/2037 | | | 356 | | | | 385 | |
5.50%, Due 12/1/2037 | | | 1,519 | | | | 1,653 | |
5.00%, Due 3/1/2038 | | | 496 | | | | 533 | |
6.00%, Due 3/1/2038 | | | 859 | | | | 941 | |
5.50%, Due 5/1/2038 | | | 540 | | | | 584 | |
5.50%, Due 6/1/2038 | | | 387 | | | | 419 | |
5.50%, Due 10/1/2039 | | | 597 | | | | 645 | |
See accompanying notes
34
American Beacon Intermediate Bond Fund
Schedule of Investments
October 31, 2011
| | | | | | | | |
| | | Par Amount | | | Fair Value | |
| | | (000’s) | | | (000’s) | |
5.00%, Due 4/1/2040 | | $ | 4,097 | | | $ | 4,411 | |
0.643%, Due 12/15/2040 C | | | 2,318 | | | | 2,313 | |
4.00%, Due 1/1/2041 | | | 1,633 | | | | 1,696 | |
4.50%, Due 2/1/2041 | | | 1,418 | | | | 1,497 | |
| | | | | | | | |
| | | | | | | 18,053 | |
| | | | | | | | |
Federal National Mortgage Association - 16.01% | | | | | | | | |
6.50%, Due 2/1/2017 | | | 89 | | | | 98 | |
5.00%, Due 12/1/2017 | | | 304 | | | | 328 | |
4.50%, Due 9/1/2018 | | | 620 | | | | 664 | |
4.00%, Due 8/1/2020 | | | 152 | | | | 161 | |
4.50%, Due 3/1/2025 | | | 2,884 | | | | 3,104 | |
4.50%, Due 5/1/2025 | | | 147 | | | | 157 | |
4.50%, Due 6/1/2025 | | | 2,237 | | | | 2,383 | |
3.50%, Due 1/1/2026 | | | 559 | | | | 581 | |
4.00%, Due 5/1/2026 | | | 384 | | | | 404 | |
5.00%, Due 3/1/2034 | | | 460 | | | | 496 | |
5.50%, Due 6/1/2034 | | | 255 | | | | 279 | |
4.50%, Due 9/1/2034 | | | 161 | | | | 171 | |
5.50%, Due 2/1/2035 | | | 506 | | | | 552 | |
5.00%, Due 11/1/2035 | | | 631 | | | | 681 | |
5.50%, Due 12/1/2035 | | | 370 | | | | 403 | |
5.50%, Due 1/1/2036 | | | 440 | | | | 480 | |
5.00%, Due 2/1/2036 | | | 385 | | | | 415 | |
5.50%, Due 4/1/2036 | | | 822 | | | | 897 | |
6.00%, Due 9/1/2036 | | | 163 | | | | 179 | |
6.50%, Due 9/1/2036 | | | 626 | | | | 699 | |
6.50%, Due 12/1/2036 | | | 305 | | | | 340 | |
5.50%, Due 2/1/2037 | | | 473 | | | | 514 | |
5.50%, Due 8/1/2037 | | | 1,270 | | | | 1,386 | |
6.00%, Due 9/1/2037 | | | 439 | | | | 483 | |
6.00%, Due 1/1/2038 | | | 695 | | | | 763 | |
5.50%, Due 3/1/2038 | | | 1,270 | | | | 1,392 | |
5.00%, Due 4/1/2038 | | | 449 | | | | 484 | |
5.00%, Due 6/1/2038 | | | 521 | | | | 561 | |
5.50%, Due 6/1/2038 | | | 955 | | | | 1,038 | |
4.50%, Due 1/1/2040 | | | 3,084 | | | | 3,265 | |
5.00%, Due 5/1/2040 | | | 3,476 | | | | 3,763 | |
5.50%, Due 6/1/2040 | | | 2,336 | | | | 2,537 | |
4.50%, Due 8/1/2040 | | | 2,040 | | | | 2,160 | |
4.00%, Due 9/1/2040 | | | 2,020 | | | | 2,103 | |
4.00%, Due 1/1/2041 | | | 1,931 | | | | 2,010 | |
5.00%, Due 1/1/2041 | | | 2,017 | | | | 2,183 | |
4.00%, Due 2/1/2041 | | | 1,236 | | | | 1,295 | |
4.50%, Due 4/1/2041 | | | 964 | | | | 1,021 | |
4.50%, Due 5/1/2041 | | | 1,949 | | | | 2,070 | |
4.50%, Due 8/1/2041 | | | 2,179 | | | | 2,307 | |
| | | | | | | | |
| | | | | | | 44,807 | |
| | | | | | | | |
Government National Mortgage Association - 6.82% | | | | | | | | |
6.50%, Due 3/15/2028 | | | 215 | | | | 246 | |
6.00%, Due 4/15/2031 | | | 254 | | | | 286 | |
5.50%, Due 2/20/2034 | | | 301 | | | | 336 | |
2.012%, Due 6/15/2035 2011-144 AB | | | 2,000 | | | | 2,020 | |
1.692%, Due 11/16/2035 2009-148 A | | | 440 | | | | 443 | |
6.00%, Due 10/15/2038 | | | 1,174 | | | | 1,312 | |
2.989%, Due 3/16/2039 2010-71 AC | | | 1,058 | | | | 1,097 | |
6.00%, Due 11/15/2039 | | | 1,166 | | | | 1,304 | |
5.50%, Due 2/15/2040 | | | 996 | | | | 1,107 | |
4.50%, Due 10/20/2040 | | | 1,335 | | | | 1,455 | |
5.00%, Due 2/20/2041 | | | 1,190 | | | | 1,311 | |
2.70%, Due 4/16/2043 2011-109 AB | | | 2,991 | | | | 3,100 | |
2.542%, Due 9/16/2044 2011-96 AC | | | 2,192 | | | | 2,264 | |
3.20%, Due 11/16/2044 2011-92 B | | | 2,700 | | | | 2,804 | |
See accompanying notes
35
American Beacon Intermediate Bond Fund
Schedule of Investments
October 31, 2011
| | | | | | | | |
| | | Par Amount | | | Fair Value | |
| | | (000’s) | | | (000’s) | |
| | | | | | | 19,085 | |
| | | | | | | | |
National Credit Union Administration - 2.27% | | | | | | | | |
0.643%, Due 3/11/2020 2011 R3 1AC | | $ | 3,640 | | | $ | 3,641 | |
0.691%, Due 10/7/2020 2010 R1 1AC | | | 2,695 | | | | 2,699 | |
| | | | | | | | |
| | | | | | | 6,340 | |
| | | | | | | | |
Total U.S. Agency Mortgage-Backed Obligations (Cost $85,737) | | | | | | | 88,285 | |
| | | | | | | | |
U.S. TREASURY OBLIGATIONS - 12.61% | | | | | | | | |
U.S. Treasury Bonds - 4.91% | | | | | | | | |
6.25%, Due 8/15/2023 | | | 1,400 | | | | 1,949 | |
6.875%, Due 8/15/2025 | | | 770 | | | | 1,150 | |
5.25%, Due 11/15/2028 | | | 750 | | | | 991 | |
4.75%, Due 2/15/2037 | | | 800 | | | | 1,029 | |
4.50%, Due 8/15/2039 | | | 1,010 | | | | 1,260 | |
4.25%, Due 11/15/2040 | | | 5,110 | | | | 6,139 | |
4.75%, Due 2/15/2041 | | | 700 | | | | 910 | |
4.375%, Due 5/15/2041 | | | 255 | | | | 313 | |
| | | | | | | | |
| | | | | | | 13,741 | |
| | | | | | | | |
U.S. Treasury Notes - 7.70% | | | | | | | | |
2.625%, Due 7/31/2014 | | | 2,000 | | | | 2,122 | |
2.00%, Due 1/31/2016 | | | 3,805 | | | | 4,000 | |
2.00%, Due 4/30/2016 | | | 4,680 | | | | 4,918 | |
3.125%, Due 10/31/2016 | | | 1,400 | | | | 1,544 | |
3.625%, Due 2/15/2020 | | | 700 | | | | 795 | |
3.625%, Due 2/15/2021 | | | 5,995 | | | | 6,789 | |
3.125%, Due 5/15/2021 | | | 1,285 | | | | 1,397 | |
| | | | | | | | |
| | | | | | | 21,565 | |
| | | | | | | | |
Total U.S. Treasury Obligations (Cost $32,353) | | | | | | | 35,306 | |
| | | | | | | | |
| | | Shares | | | | |
SHORT-TERM INVESTMENTS - 3.12% (Cost $8,724) | | | | | | | | |
JPMorgan U.S. Government Money Market Fund | | | 8,724,027 | | | | 8,724 | |
| | | | | | | | |
TOTAL INVESTMENTS - 97.31% (Cost 259,337) | | | | | | | 272,374 | |
OTHER ASSETS, NET OF LIABILITIES - 2.69% | | | | 7,519 | |
| | | | | | | | |
TOTAL NET ASSETS - 100.00% | | | | | | $ | 279,893 | |
| | | | | | | | |
| | | | | | | | |
Percentages are stated as a percent of net assets.
| A | Limited Liability Company. |
| B | Security exempt from registration under the Securities Act of 1933. These securities may be resold to qualified institutional buyers pursuant to Rule 144A. At the period end, the value of these securities amounted to $13,279 or 4.74% of net assets. The Fund has no right to demand registration of these securities. |
| C | The coupon rate shown on floating or adjustable rate securities represents the rate at period end. The due date on these types of securities reflects the final maturity date. |
| E | REIT -Real Estate Investment Trust. |
See accompanying notes
36
American Beacon Short-Term Bond Fund
Schedule of Investments
October 31, 2011
| | | | | | | | |
| | | Par Amount | | | Fair Value | |
| | | (000’s) | | | (000’s) | |
CORPORATE OBLIGATIONS - 47.13% | | | | | | | | |
Finance - 26.94% | | | | | | | | |
ABN Amro Bank N.V., 2.198%, Due 1/30/2014A B | | $ | 2,000 | | | $ | 1,962 | |
American Express Co., 7.25%, Due 5/20/2014 | | | 1,000 | | | | 1,132 | |
American International Group, Inc., | | | | | | | | |
3.65%, Due 1/15/2014 | | | 2,000 | | | | 1,967 | |
4.25%, Due 9/15/2014 | | | 600 | | | | 590 | |
ANZ National International Ltd., 1.351%, Due 12/20/2013A B | | | 2,000 | | | | 1,989 | |
Bank of America Corp., | | | | | | | | |
1.848%, Due 1/30/2014A | | | 2,000 | | | | 1,895 | |
0.677%, Due 9/15/2014A | | | 1,290 | | | | 1,145 | |
Barclays Bank plc, 5.45%, Due 9/12/2012 | | | 1,000 | | | | 1,028 | |
Citigroup, Inc., | | | | | | | | |
1.302%, Due 4/1/2014A | | | 1,000 | | | | 963 | |
0.548%, Due 11/5/2014A | | | 2,573 | | | | 2,406 | |
CME Group, Inc., 5.40%, Due 8/1/2013 | | | 250 | | | | 268 | |
Credit Suisse, 5.00%, Due 5/15/2013 | | | 2,000 | | | | 2,081 | |
Danske Bank A/S, 1.451%, Due 4/14/2014A B | | | 3,000 | | | | 2,883 | |
Dexia Credit Local, 0.731%, Due 3/5/2013A B | | | 3,000 | | | | 2,818 | |
HSBC Finance Corp., 0.653%, Due 1/15/2014A | | | 1,000 | | | | 933 | |
ING Bank N.V., 1.737%, Due 6/9/2014A B | | | 3,000 | | | | 2,951 | |
Lloyds TSB Bank plc, 2.766%, Due 1/24/2014A | | | 2,000 | | | | 1,940 | |
MassMutual Global Funding II, 3.625%, Due 7/16/2012B | | | 500 | | | | 510 | |
MetLife Institutional Funding II, 1.274%, Due 4/4/2014A B | | | 3,000 | | | | 2,993 | |
Metropolitan Life Global Funding I, 2.875%, Due 9/17/2012B | | | 1,000 | | | | 1,015 | |
Monumental Global Funding III, 0.603%, Due 1/15/2014A B | | | 1,000 | | | | 971 | |
Morgan Stanley, 0.883%, Due 10/15/2015A | | | 3,000 | | | | 2,635 | |
National Australia Bank Ltd., 1.372%, Due 7/25/2014A B | | | 3,000 | | | | 3,033 | |
Nationwide Building Society, 5.50%, Due 7/18/2012B | | | 1,000 | | | | 1,029 | |
Pricoa Global Funding I, 5.40%, Due 10/18/2012B | | | 500 | | | | 520 | |
Prudential Financial, Inc., 4.50%, Due 7/15/2013 | | | 1,000 | | | | 1,050 | |
Societe Generale S.A., 1.441%, Due 4/11/2014A B | | | 2,000 | | | | 1,821 | |
Svenska Handelsbanken AB, 4.875%, Due 6/10/2014B | | | 1,500 | | | | 1,592 | |
The Goldman Sachs Group, Inc., | | | | | | | | |
4.75%, Due 7/15/2013 | | | 2,000 | | | | 2,060 | |
0.816%, Due 7/22/2015A | | | 1,000 | | | | 893 | |
Wachovia Bank NA, 0.637%, Due 11/3/2014A | | | 1,000 | | | | 931 | |
| | | | | | | | |
| | | | | | | 50,004 | |
| | | | | | | | |
Industrials - 16.99% | | | | | | | | |
American Honda Finance Corp., 4.625%, Due 4/2/2013B | | | 1,000 | | | | 1,044 | |
Anheuser-Busch InBev Worldwide, Inc., | | | | | | | | |
3.00%, Due 10/15/2012 | | | 1,000 | | | | 1,021 | |
2.50%, Due 3/26/2013 | | | 1,000 | | | | 1,024 | |
BP Capital Markets plc, 0.937%, Due 3/11/2014A | | | 3,000 | | | | 3,003 | |
Burlington Northern Santa Fe Corp., 4.875%, Due 1/15/2015 | | | 1,000 | | | | 1,108 | |
Caterpillar Financial Services Corp., 4.25%, Due 2/8/2013 | | | 500 | | | | 521 | |
Cellco Partnership, 5.25%, Due 2/1/2012 | | | 1,000 | | | | 1,011 | |
Comcast Cable Communications Holdings, Inc., 8.375%, Due 3/15/2013 | | | 1,365 | | | | 1,498 | |
Daimler Finance North America LLC, 0.973%, Due 3/28/2014A B C | | | 2,000 | | | | 1,970 | |
EOG Resources Canada, Inc., 4.75%, Due 3/15/2014B | | | 1,000 | | | | 1,075 | |
France Telecom S.A., 4.375%, Due 7/8/2014 | | | 1,000 | | | | 1,078 | |
General Mills, Inc., 5.25%, Due 8/15/2013 | | | 1,000 | | | | 1,074 | |
Hewlett-Packard Co., | | | | | | | | |
4.50%, Due 3/1/2013A | | | 1,000 | | | | 1,041 | |
0.719%, Due 5/30/2014A | | | 1,000 | | | | 984 | |
John Deere Capital Corp., 5.25%, Due 10/1/2012 | | | 1,000 | | | | 1,041 | |
Johnson Controls, Inc., 1.75%, Due 3/1/2014 | | | 500 | | | | 504 | |
Kraft Foods, Inc., 5.625%, Due 11/1/2011 | | | 64 | | | | 64 | |
Nissan Motor Acceptance Corp., 4.50%, Due 1/30/2015B | | | 1,000 | | | | 1,050 | |
Quest Diagnostics, Inc., 1.208%, Due 3/24/2014A | | | 1,000 | | | | 1,005 | |
Telefonica Emisiones SAU, 0.594%, Due 2/4/2013A | | | 1,000 | | | | 964 | |
Time Warner Cable, Inc., 5.40%, Due 7/2/2012 | | | 1,000 | | | | 1,029 | |
See accompanying notes
37
American Beacon Short-Term Bond Fund
Schedule of Investments
October 31, 2011
| | | | | | | | |
| | | Par Amount | | | Fair Value | |
| | | (000’s) | | | (000’s) | |
Tyco International Finance S.A., 4.125%, Due 10/15/2014 | | $ | 500 | | | $ | 536 | |
Union Pacific Corp., | | | | | | | | |
6.50%, Due 4/15/2012 | | | 500 | | | | 512 | |
5.45%, Due 1/31/2013 | | | 1,000 | | | | 1,056 | |
Verizon Communications, Inc., 0.973%, Due 3/28/2014A | | | 3,000 | | | | 3,011 | |
Volkswagen International Finance N.V., | | | | | | | | |
1.625%, Due 8/12/2013B | | | 1,000 | | | | 1,003 | |
0.984%, Due 4/1/2014A B | | | 2,000 | | | | 2,005 | |
Xerox Corp., 5.65%, Due 5/15/2013 | | | 300 | | | | 317 | |
| | | | | | | | |
| | | | | | | 31,549 | |
| | | | | | | | |
Utilities - 3.20% | | | | | | | | |
Dominion Resources, Inc., 5.70%, Due 9/17/2012 | | | 1,000 | | | | 1,039 | |
DTE Energy Co., 1.031%, Due 6/3/2013A | | | 1,000 | | | | 1,000 | |
EDF S.A., 5.50%, Due 1/26/2014B | | | 1,000 | | | | 1,085 | |
Midamerican Energy Holdings Co., 3.15%, Due 7/15/2012 | | | 1,000 | | | | 1,016 | |
NextEra Energy Capital Holdings, Inc., 0.672%, Due 11/9/2012A | | | 1,000 | | | | 1,000 | |
Pacific Gas & Electric Co., 6.25%, Due 12/1/2013 | | | 730 | | | | 804 | |
| | | | | | | | |
| | | | | | | 5,944 | |
| | | | | | | | |
Total Corporate Obligations (Cost $88,291) | | | | | | | 87,497 | |
| | | | | | | | |
ASSET-BACKED SECURITIES - 15.79% | | | | | | | | |
Ally Master Owner Trust, | | | | | | | | |
0.873%, Due 5/15/2016, 2011-3 A1A | | | 2,000 | | | | 1,994 | |
1.043%, Due 9/15/2016, 2011-4 A1A | | | 4,000 | | | | 3,954 | |
Bank of America Auto Trust, | | | | | | | | |
2.67%, Due 7/15/2013, 2009-1A A3B | | | 217 | | | | 218 | |
2.13%, Due 9/15/2013, 2009-2A A3B | | | 317 | | | | 318 | |
BMW Floorplan Master Owner Trust, 1.393%, Due 9/15/2014, 2009-1A AA B | | | 2,000 | | | | 2,011 | |
Capital One Multi-Asset Execution Trust, 4.70%, Due 6/15/2015, 2005-A7 A7 | | | 2,300 | | | | 2,373 | |
CarMax Auto Owner Trust, 0.72%, Due 11/15/2013, 2011-1 A2 | | | 995 | | | | 996 | |
Ford Credit Auto Owner Trust, 2.17%, Due 10/15/2013, 2009-D A3 | | | 462 | | | | 465 | |
Ford Credit Floorplan Master Owner Trust, | | | | | | | | |
1.793%, Due 9/15/2014, 2009-2 AA | | | 3,200 | | | | 3,228 | |
0.843%, Due 2/15/2016, 2011-1 A2A | | | 2,000 | | | | 1,998 | |
GE Dealer Floorplan Master Note Trust, 0.845%, Due 7/20/2016, 2011-1 AA | | | 2,500 | | | | 2,500 | |
GE Equipment Midticket LLC, 2.34%, Due 6/17/2013, 2009-1 A3C | | | 174 | | | | 175 | |
GE Equipment Small Ticket LLC, 1.45%, Due 1/21/2018, 2011-1 A3B C | | | 1,000 | | | | 1,007 | |
GE Equipment Transportation LLC, 1.00%, Due 11/20/2013, 2011-1 A3C | | | 2,000 | | | | 2,002 | |
Harley-Davidson Motorcycle Trust, 5.52%, Due 11/15/2013, 2007-3 A4 | | | 509 | | | | 515 | |
Honda Auto Receivables Owner Trust, 2.31%, Due 5/15/2013, 2009-3 A3 | | | 498 | | | | 501 | |
Nissan Auto Lease Trust, 1.12%, Due 12/15/2013, 2010-B A3 | | | 1,000 | | | | 1,004 | |
Nissan Master Owner Trust Receivables, 1.393%, Due 1/15/2015, 2010-AA AA B | | | 3,000 | | | | 3,024 | |
Volkswagen Auto Loan Enhanced Trust, 6.24%, Due 7/20/2015, 2008-2 A4A | | | 1,000 | | | | 1,033 | |
| | | | | | | | |
Total Asset-Backed Securities (Cost $29,313) | | | | | | | 29,316 | |
| | | | | | | | |
NON-AGENCY MORTGAGE-BACKED OBLIGATIONS - 1.60% | | | | | | | | |
Banc of America Merrill Lynch Commercial Mortgage, Inc., | | | | | | | | |
4.561%, Due 11/10/2041, 2004-5 A3 | | | 70 | | | | 70 | |
5.634%, Due 4/10/2049, 2007-2 A2 | | | 388 | | | | 398 | |
GS Mortgage Securities Corp II, 2.716%, Due 2/10/2021, 2011-ALF AB | | | 1,500 | | | | 1,498 | |
JP Morgan Chase Commercial Mortgage Securities Corp., 3.853%, Due 6/15/2043, 2010-C1 A1B | | | 972 | | | | 1,011 | |
| | | | | | | | |
Total Non-Agency Mortgage-Backed Obligations (Cost $2,942) | | | | | | | 2,977 | |
| | | | | | | | |
U.S. AGENCY MORTGAGE-BACKED OBLIGATIONS - 31.58% | | | | | | | | |
Government National Mortgage Association - 22.11% | | | | | | | | |
1.864%, Due 8/16/2031 2010-141 A | | | 3,488 | | | | 3,520 | |
2.239%, Due 12/16/2031 2009-115 IO | | | 2,882 | | | | 2,941 | |
2.45%, Due 7/16/2032 2011-109 A | | | 3,979 | | | | 4,079 | |
2.25%, Due 5/16/2033 2011-92 A | | | 3,972 | | | | 4,055 | |
2.25%, Due 8/16/2034 2011-78 A | | | 2,478 | | | | 2,527 | |
2.21%, Due 11/16/2034 2011-16 A | | | 2,950 | | | | 3,009 | |
1.692%, Due 11/16/2035 2009-148 A | | | 2,935 | | | | 2,956 | |
See accompanying notes
38
American Beacon Short-Term Bond Fund
Schedule of Investments
October 31, 2011
| | | | | | | | |
| | | Par Amount | | | Fair Value | |
| | | (000’s) | | | (000’s) | |
2.21%, Due 12/16/2035 2011-31 A | | $ | 2,958 | | | $ | 3,019 | |
2.782%, Due 6/16/2036 2010-13 AD | | | 1,919 | | | | 1,985 | |
3.069%, Due 6/16/2036 2010-52 A | | | 2,843 | | | | 2,983 | |
2.161%, Due 11/16/2036 2011-96 AB | | | 2,983 | | | | 3,044 | |
2.45%, Due 7/16/2038 2011-49 A | | | 2,969 | | | | 3,050 | |
2.989%, Due 3/16/2039 2010-71 AC | | | 1,839 | | | | 1,907 | |
3.210%, Due 10/16/2039 2010-22 AB | | | 1,896 | | | | 1,984 | |
| | | | | | | | |
| | | | | | | 41,059 | |
| | | | | | | | |
National Credit Union Administration - 9.47% | | | | | | | | |
0.691%, Due 1/8/2020 2011 R1 1AA | | | 6,582 | | | | 6,601 | |
0.641%, Due 2/6/2020 2011 R2 1AA | | | 1,747 | | | | 1,748 | |
0.643%, Due 3/11/2020 2011 R3 1AA | | | 7,218 | | | | 7,221 | |
0.621%, Due 4/6/2020 2011 R5 1AA | | | 1,358 | | | | 1,359 | |
1.84%, Due 10/7/2020 2010-R1 2A | | | 635 | | | | 643 | |
| | | | | | | | |
| | | | | | | 17,572 | |
| | | | | | | | |
Total U.S. Agency Mortgage-Backed Obligations (Cost $58,125) | | | | | | | 58,631 | |
| | | | | | | | |
U.S. TREASURY OBLIGATIONS - 3.71% | | | | | | | | |
U.S. Treasury Note, | | | | | | | | |
2.50%, Due 3/31/2015, | | | 4,500 | | | | 4,801 | |
1.75%, Due 7/31/2015, | | | 2,000 | | | | 2,083 | |
| | | | | | | | |
Total U.S. Treasury Obligations (Cost $6,511) | | | | | | | 6,884 | |
| | | | | | | | |
| | |
| | | Shares | | | | |
SHORT-TERM INVESTMENTS - 0.28% (Cost $519) | | | | | | | | |
JPMorgan U.S. Government Money Market Fund | | | 518,927 | | | | 519 | |
| | | | | | | | |
TOTAL INVESTMENTS - 100.09% (Cost 185,701) | | | | | | | 185,824 | |
LIABILITIES, NET OF OTHER ASSETS - (0.09%) | | | | | | | (187 | ) |
| | | | | | | | |
TOTAL NET ASSETS - 100.00% | | | | | | $ | 185,637 | |
| | | | | | | | |
Percentages are stated as a percent of net assets.
| A | The coupon rate shown on floating or adjustable rate securities represents the rate at period end. The due date on these types of securities reflects the final maturity date. |
| B | Security exempt from registration under the Securities Act of 1933. These securities may be resold to qualified institutional buyers pursuant to Rule 144A. At the period end, the value of these securities amounted to $44,406 or 23.92% of net assets. The Fund has no right to demand registration of these securities. |
| C | Limited Liability Company. |
See accompanying notes
39
American Beacon Funds
Statements of Assets and Liabilities
October 31, 2011 (in thousands except share and per share amounts)
| | | | | | | | | | | | | | | | |
| | | High Yield
Bond Fund | | | Retirement
Income and
Appreciation
Fund | | | Intermediate
Bond Fund | | | Short-Term
Bond Fund | |
Assets: | | | | | | | | | | | | | | | | |
Investments in unaffiliated securities, at fair value A | | $ | 116,092 | | | $ | 149,099 | | | $ | 272,374 | | | $ | 185,824 | |
Receivable for investments sold | | | 828 | | | | — | | | | 763 | | | | — | |
Dividends and interest receivable | | | 2,596 | | | | 1,016 | | | | 1,948 | | | | 620 | |
Receivable for fund shares sold | | | 4,904 | | | | 413 | | | | 8,291 | | | | 79 | |
Receivable for tax reclaims | | | 1 | | | | 4 | | | | 5 | | | | 3 | |
Receivable for expense reimbursement (Note 2) | | | — | | | | 5 | | | | 1 | | | | 10 | |
Prepaid expenses | | | 24 | | | | 38 | | | | 28 | | | | 20 | |
| | | | | | | | | | | | | | | | |
Total assets | | | 124,445 | | | | 150,575 | | | | 283,410 | | | | 186,556 | |
| | | | | | | | | | | | | | | | |
Liabilities: | | | | | | | | | | | | | | | | |
Payable for investments purchased | | | 1,313 | | | | — | | | | 3,245 | | | | — | |
Payable for fund shares redeemed | | | 378 | | | | 31 | | | | 164 | | | | 818 | |
Dividends payable | | | 48 | | | | 2 | | | | 1 | | | | 5 | |
Management and investment advisory fees payable (Note 2) | | | 151 | | | | 140 | | | | 46 | | | | 32 | |
Administrative service and service fees payable (Note 2) | | | 16 | | | | 56 | | | | 13 | | | | 23 | |
Professional fees payable | | | 29 | | | | 29 | | | | 32 | | | | 28 | |
Trustee fees payable | | | 2 | | | | 1 | | | | 4 | | | | 3 | |
Prospectus and shareholder reports | | | 19 | | | | 3 | | | | 6 | | | | 4 | |
Other liabilities | | | 7 | | | | 2 | | | | 6 | | | | 6 | |
| | | | | | | | | | | | | | | | |
Total liabilities | | | 1,963 | | | | 264 | | | | 3,517 | | | | 919 | |
| | | | | | | | | | | | | | | | |
Net Assets | | $ | 122,482 | | | $ | 150,311 | | | $ | 279,893 | | | $ | 185,637 | |
| | | | | | | | | | | | | | | | |
| | | | |
Analysis of Net Assets: | | | | | | | | | | | | | | | | |
Paid-in-capital | | | 127,970 | | | | 142,679 | | | | 264,088 | | | | 193,502 | |
Undistributed net investment income | | | 150 | | | | (149 | ) | | | 502 | | | | (308 | ) |
Accumulated net realized gain (loss) | | | (2,523 | ) | | | 712 | | | | 2,266 | | | | (7,680 | ) |
Unrealized appreciation or depreciation of investments | | | (3,115 | ) | | | 7,069 | | | | 13,037 | | | | 123 | |
| | | | | | | | | | | | | | | | |
Net assets | | $ | 122,482 | | | $ | 150,311 | | | $ | 279,893 | | | $ | 185,637 | |
| | | | | | | | | | | | | | | | |
Shares outstanding (no par value): | | | | | | | | | | | | | | | | |
Institutional Class | | | 4,735,428 | | | | N/A | | | | 25,054,126 | | | | 18,009,975 | |
| | | | | | | | | | | | | | | | |
Y Class | | | 1,223 | | | | 49,819 | | | | 5,428 | | | | 39,380 | |
| | | | | | | | | | | | | | | | |
Investor Class | | | 870,724 | | | | 13,604,594 | | | | 340,013 | | | | 2,815,982 | |
| | | | | | | | | | | | | | | | |
A Class | | | 13,507 | | | | 71,018 | | | | 53,253 | | | | 393,598 | |
| | | | | | | | | | | | | | | | |
C Class | | | 46,463 | | | | 146,234 | | | | 26,058 | | | | 42,538 | |
| | | | | | | | | | | | | | | | |
AMR Class | | | 8,444,590 | | | | N/A | | | | N/A | | | | N/A | |
| | | | | | | | | | | | | | | | |
Net asset value, offering and redemption price per share: | | | | | | | | | | | | | | | | |
Institutional Class | | $ | 8.68 | | | | N/A | | | $ | 10.99 | | | $ | 8.71 | |
| | | | | | | | | | | | | | | | |
Y Class | | $ | 8.69 | | | $ | 10.83 | | | $ | 11.03 | | | $ | 8.73 | |
| | | | | | | | | | | | | | | | |
Investor Class | | $ | 8.68 | | | $ | 10.84 | | | $ | 10.97 | | | $ | 8.72 | |
| | | | | | | | | | | | | | | | |
A Class (net asset value and redemption price) | | $ | 8.69 | | | $ | 10.85 | | | $ | 10.96 | | | $ | 8.71 | |
| | | | | | | | | | | | | | | | |
A Class (offering price) | | $ | 9.12 | | | $ | 11.39 | | | $ | 11.51 | | | $ | 8.93 | |
| | | | | | | | | | | | | | | | |
C Class | | $ | 8.67 | | | $ | 10.85 | | | $ | 10.97 | | | $ | 8.72 | |
| | | | | | | | | | | | | | | | |
AMR Class | | $ | 8.68 | | | | N/A | | | | N/A | | | | N/A | |
| | | | | | | | | | | | | | | | |
A Cost of investments in unaffiliated securities | | $ | 119,207 | | | $ | 142,030 | | | $ | 259,337 | | | $ | 185,701 | |
See accompanying notes
40
American Beacon Funds
Statements of Operations
For the year ended October 31, 2011 (in thousands)
| | | | | | | | | | | | | | | | |
| | | High Yield
Bond Fund | | | Retirement
Income and
Appreciation
Fund | | | Intermediate
Bond Fund | | | Short-Term
Bond Fund | |
Investment Income: | | | | | | | | | | | | | | | | |
Dividend income from unaffiliated securities (net of foreign taxes) A | | $ | 29 | | | $ | 266 | | | $ | 2 | | | $ | 1 | |
Interest income | | | 13,046 | | | | 4,399 | | | | 9,726 | | | | 3,740 | |
Miscellaneous Income | | | — | | | | 2 | | | | — | | | | — | |
| | | | | | | | | | | | | | | | |
Total investment income | | | 13,075 | | | | 4,667 | | | | 9,728 | | | | 3,741 | |
| | | | | | | | | | | | | | | | |
Expenses: | | | | | | | | | | | | | | | | |
Management and investment advisory fees (Note 2) | | | 623 | | | | 460 | | | | 561 | | | | 356 | |
Administrative service fees (Note 2): | | | | | | | | | | | | | | | | |
Institutional Class | | | 126 | | | | — | | | | 143 | | | | 77 | |
Y Class | | | — | | | | 1 | | | | — | | | | 1 | |
Investor Class | | | 76 | | | | 424 | | | | 11 | | | | 84 | |
A Class | | | — | | | | 2 | | | | 2 | | | | 6 | |
C Class | | | 1 | | | | 5 | | | | 1 | | | | 1 | |
AMR Class | | | 41 | | | | — | | | | — | | | | — | |
Transfer agent fees: | | | | | | | | | | | | | | | | |
Institutional Class | | | 11 | | | | — | | | | 12 | | | | 5 | |
Y Class | | | 2 | | | | 5 | | | | — | | | | 2 | |
Investor Class | | | 4 | | | | 7 | | | | 1 | | | | 9 | |
A Class | | | 2 | | | | 4 | | | | — | | | | 3 | |
C Class | | | 2 | | | | — | | | | — | | | | 2 | |
AMR Class | | | 4 | | | | — | | | | — | | | | — | |
Custody and fund accounting fees | | | 19 | | | | 18 | | | | 36 | | | | 22 | |
Professional fees | | | 35 | | | | 35 | | | | 41 | | | | 36 | |
Registration fees and expenses | | | 56 | | | | 66 | | | | 78 | | | | 76 | |
Service fees (Note 2): | | | | | | | | | | | | | | | | |
Investor Class | | | 63 | | | | 514 | | | | 9 | | | | 70 | |
A Class | | | — | | | | 1 | | | | 1 | | | | 2 | |
C Class | | | — | | | | 2 | | | | — | | | | 1 | |
Distribution fees (Note 2): | | | | | | | | | | | | | | | | |
A Class | | | — | | | | 1 | | | | 1 | | | | 3 | |
C Class | | | 2 | | | | 12 | | | | 2 | | | | 3 | |
Prospectus and shareholder reports | | | 46 | | | | 18 | | | | 69 | | | | 46 | |
Trustee fees | | | 12 | | | | 10 | | | | 24 | | | | 13 | |
Other expenses | | | 15 | | | | 11 | | | | 22 | | | | 15 | |
| | | | | | | | | | | | | | | | |
Total expenses | | | 1,140 | | | | 1,596 | | | | 1,014 | | | | 833 | |
| | | | | | | | | | | | | | | | |
Net (fees waived and expenses reimbursed) (Note 2) | | | (6 | ) | | | (10 | ) | | | (4 | ) | | | (47 | ) |
| | | | | | | | | | | | | | | | |
Net expenses | | | 1,134 | | | | 1,586 | | | | 1,010 | | | | 786 | |
| | | | | | | | | | | | | | | | |
Net investment income | | | 11,941 | | | | 3,081 | | | | 8,718 | | | | 2,955 | |
| | | | | | | | | | | | | | | | |
Realized and unrealized gain (loss) on investments: | | | | | | | | | | | | | | | | |
Net realized gain (loss) from: | | | | | | | | | | | | | | | | |
Investments | | | 8,136 | | | | 2,521 | | | | 2,756 | | | | 1,206 | |
Commission recapture (Note 3) | | | — | | | | 1 | | | | — | | | | — | |
Change in net unrealized appreciation or depreciation of: | | | | | | | | | | | | | | | | |
Investments | | | (12,888 | ) | | | (1,793 | ) | | | (635 | ) | | | (3,806 | ) |
| | | | | | | | | | | | | | | | |
Net gain (loss) on investments | | | (4,752 | ) | | | 729 | | | | 2,121 | | | | (2,600 | ) |
| | | | | | | | | | | | | | | | |
Net increase in net assets resulting from operations | | $ | 7,189 | | | $ | 3,810 | | | $ | 10,839 | | | $ | 355 | |
| | | | | | | | | | | | | | | | |
A Foreign taxes | | $ | — | | | $ | 3 | | | $ | — | | | $ | — | |
See accompanying notes
41
American Beacon Funds
Statements of Changes in Net Assets (in thousands)
| | | | | | | | | | | | | | | | |
| | | High Yield Bond Fund | | | Retirement Income and
Appreciation Fund | |
| | | Year Ended
October 31,
2011 | | | Year Ended
October 31,
2010 | | | Year Ended
October 31,
2011 | | | Year Ended
October 31,
2010 | |
Increase (Decrease) in Net Assets: | | | | | | | | | | | | | | | | |
Operations: | | | | | | | | | | | | | | | | |
Net investment income | | $ | 11,941 | | | $ | 19,682 | | | $ | 3,081 | | | $ | 3,236 | |
Net realized gain on investments | | | 8,136 | | | | 17,096 | | | | 2,522 | | | | 871 | |
Change in net unrealized appreciation or depreciation of investments | | | (12,888 | ) | | | (1,037 | ) | | | (1,793 | ) | | | 5,410 | |
| | | | | | | | | | | | | | | | |
Net increase in net assets resulting from operations | | | 7,189 | | | | 35,741 | | | | 3,810 | | | | 9,517 | |
| | | | | | | | | | | | | | | | |
Distributions to Shareholders: | | | | | | | | | | | | | | | | |
Net investment income: | | | | | | | | | | | | | | | | |
Institutional Class | | | (3,296 | ) | | | (3,870 | ) | | | — | | | | — | |
Y Class | | | — | | | | — | | | | (13 | ) | | | (2 | ) |
Investor Class | | | (1,941 | ) | | | (6,758 | ) | | | (3,349 | ) | | | (3,375 | ) |
A Class | | | (5 | ) | | | — | | | | (10 | ) | | | — | |
C Class | | | (11 | ) | | | — | | | | (17 | ) | | | (1 | ) |
AMR Class | | | (6,684 | ) | | | (9,049 | ) | | | — | | | | — | |
| | | | | | | | | | | | | | | | |
Net distributions to shareholders | | | (11,937 | ) | | | (19,677 | ) | | | (3,389 | ) | | | (3,378 | ) |
| | | | | | | | | | | | | | | | |
Capital Share Transactions: | | | | | | | | | | | | | | | | |
Proceeds from sales of shares | | | 37,430 | | | | 256,394 | | | | 49,115 | | | | 41,365 | |
Reinvestment of dividends and distributions | | | 11,132 | | | | 17,683 | | | | 3,264 | | | | 2,727 | |
Cost of shares redeemed | | | (107,035 | ) | | | (335,193 | ) | | | (30,079 | ) | | | (16,368 | ) |
Redemption fees | | | 32 | | | | 74 | | | | — | | | | — | |
| | | | | | | | | | | | | | | | |
Net increase (decrease) in net assets from capital share transactions | | | (58,441 | ) | | | (61,042 | ) | | | 22,300 | | | | 27,724 | |
| | | | | | | | | | | | | | | | |
Net increase (decrease) in net assets | | | (63,189 | ) | | | (44,978 | ) | | | 22,721 | | | | 33,863 | |
| | | | | | | | | | | | | | | | |
Net Assets: | | | | | | | | | | | | | | | | |
Beginning of period | | | 185,671 | | | | 230,649 | | | | 127,590 | | | | 93,727 | |
| | | | | | | | | | | | | | | | |
End of Period * | | $ | 122,482 | | | $ | 185,671 | | | $ | 150,311 | | | $ | 127,590 | |
| | | | | | | | | | | | | | | | |
* Includes undistributed net investment income (loss) of | | $ | 150 | | | $ | 503 | | | $ | (149 | ) | | $ | (62 | ) |
| | | | | | | | | | | | | | | | |
See accompanying notes
42
American Beacon Funds
Statements of Changes in Net Assets (in thousands)
| | | | | | | | | | | | | | | | |
| | | Intermediate Bond Fund | | | Short-Term Bond Fund | |
| | | Year Ended
October 31,
2011 | | | Year Ended
October 31,
2010 | | | Year Ended
October 31,
2011 | | | Year Ended
October 31,
2010 | |
Increase (Decrease) in Net Assets: | | | | | | | | | | | | | | | | |
Operations: | | | | | | | | | | | | | | | | |
Net investment income | | $ | 8,718 | | | $ | 8,674 | | | $ | 2,955 | | | $ | 3,569 | |
Net realized gain on investments | | | 2,756 | | | | 5,763 | | | | 1,206 | | | | 1,400 | |
Change in net unrealized appreciation or depreciation of investments | | | (635 | ) | | | 5,150 | | | | (3,806 | ) | | | 837 | |
| | | | | | | | | | | | | | | | |
Net increase in net assets resulting from operations | | | 10,839 | | | | 19,587 | | | | 355 | | | | 5,806 | |
| | | | | | | | | | | | | | | | |
Distributions to Shareholders: | | | | | | | | | | | | | | | | |
Net investment income: | | | | | | | | | | | | | | | | |
Institutional Class | | | (9,074 | ) | | | (8,812 | ) | | | (3,233 | ) | | | (3,855 | ) |
Y Class | | | (3 | ) | | | (2 | ) | | | (5 | ) | | | – | |
Investor Class | | | (101 | ) | | | (89 | ) | | | (489 | ) | | | (945 | ) |
A Class | | | (10 | ) | | | – | | | | (20 | ) | | | – | |
C Class | | | (5 | ) | | | (1 | ) | | | (3 | ) | | | – | |
Net realized gain on investments: | | | | | | | | | | | | | | | | |
Institutional Class | | | (4,838 | ) | | | – | | | | – | | | | – | |
Y Class | | | (6 | ) | | | – | | | | – | | | | – | |
Investor Class | | | (63 | ) | | | – | | | | – | | | | – | |
A Class | | | (2 | ) | | | – | | | | – | | | | – | |
C Class | | | (6 | ) | | | – | | | | – | | | | – | |
| | | | | | | | | | | | | | | | |
Net distributions to shareholders | | | (14,108 | ) | | | (8,904 | ) | | | (3,750 | ) | | | (4,800 | ) |
| | | | | | | | | | | | | | | | |
Capital Share Transactions: | | | | | | | | | | | | | | | | |
Proceeds from sales of shares | | | 64,388 | | | | 210,797 | | | | 97,611 | | | | 84,366 | |
Reinvestment of dividends and distributions | | | 14,072 | | | | 8,901 | | | | 3,703 | | | | 4,725 | |
Cost of shares redeemed | | | (90,614 | ) | | | (148,261 | ) | | | (66,867 | ) | | | (90,705 | ) |
| | | | | | | | | | | | | | | | |
Net increase (decrease) in net assets from capital share transactions | | | (12,154 | ) | | | 71,437 | | | | 34,447 | | | | (1,614 | ) |
| | | | | | | | | | | | | | | | |
Net increase (decrease) in net assets | | | (15,423 | ) | | | 82,120 | | | | 31,052 | | | | (608 | ) |
| | | | | | | | | | | | | | | | |
Net Assets: | | | | | | | | | | | | | | | | |
Beginning of period | | | 295,316 | | | | 213,196 | | | | 154,585 | | | | 155,193 | |
| | | | | | | | | | | | | | | | |
End of Period * | | $ | 279,893 | | | $ | 295,316 | | | $ | 185,637 | | | $ | 154,585 | |
| | | | | | | | | | | | | | | | |
* Includes undistributed net investment income (loss) of | | $ | 502 | | | $ | 501 | | | $ | (308 | ) | | $ | (539 | ) |
| | | | | | | | | | | | | | | | |
See accompanying notes
43
American Beacon Funds
Notes to Financial Statements
October 31, 2011
1. Organization and Significant Accounting Policies
American Beacon Funds (the “Trust”), which is comprised of 20 Funds, is organized as a Massachusetts business trust and is registered under the Investment Company Act of 1940, as amended (the “Act”), as a diversified, open-end management investment company. These financial statements and notes to the financial statements relate to the American Beacon High Yield Bond Fund, the American Beacon Retirement Income and Appreciation Fund, the American Beacon Intermediate Bond Fund, and the American Beacon Short-Term Bond Fund (each a “Fund” and collectively, the “Funds”), each a series of the Trust.
American Beacon Advisors, Inc. (the “Manager”) is a wholly-owned subsidiary of Lighthouse Holdings, Inc. and was organized in 1986 to provide business management, advisory, administrative, and asset management consulting services to the Trust and other investors.
Class Disclosure
Each Fund has multiple classes of shares designed to meet the needs of different groups of investors; however, not all Funds offer all classes. The following table sets forth the differences amongst the classes:
| | |
Class: | | Offered to: |
| Institutional Class | | Investors making an initial investment of $250,000 |
| Y Class | | Investors making an initial investment of $100,000 |
| Investor Class | | General public and investors investing through an intermediary |
| A Class | | General public and investors investing through an intermediary with applicable sales charges |
| C Class | | General public and investors investing through an intermediary with applicable sales charges |
| AMR Class | | Investors in the tax-exempt retirement and benefit plans of the Manager, AMR Corporation, and its affiliates |
Each class offered by the Trust has equal rights as to assets and voting privileges. Income and non-class specific expenses are allocated daily to each class on the basis of the relative net assets. Realized and unrealized capital gains and losses of each class are allocated daily based on the relative net assets of each class of the respective Fund. Class specific expenses, where applicable, currently include administrative service fees, service fees, and distribution fees and vary amongst the classes as described more fully in Note 2.
New Accounting Pronouncements
In April 2011, the Financial Accounting Standards Board (“FASB”) issued an Accounting Standards Update (“ASU”) related to the accounting for repurchase agreements and similar agreements that both entitles and obligates a transferor to repurchase or redeem financial assets before their maturity. The ASU modifies the criteria for determining effective control of transferred assets and as a result certain agreements may now be accounted for as secured borrowings. The ASU is effective prospectively for new transfers and existing transactions that are modified in the first interim or annual period beginning on or after December 15, 2011.
In May 2011, FASB issued an ASU to develop common requirements for measuring fair value and for disclosing information about fair value measurements in accordance with U.S. generally accepted accounting principles, (“U.S. GAAP”) and International Financial Reporting Standards (IFRSs). FASB concluded that the amendments in this ASU will improve the comparability of fair value measurements presented and disclosed in financial statements prepared in accordance with U.S. GAAP and IFRSs. The ASU is effective prospectively during interim or annual periods beginning on or after December 15, 2011.
At this time, management is evaluating the implications of these changes and their impact on the financial statements has not been determined.
44
American Beacon Funds
Notes to Financial Statements
October 31, 2011
2. Transactions with Affiliates
Management Agreement
The Trust and the Manager are parties to a Management Agreement that obligates the Manager to provide or oversee the provision of all investment advisory, fund management, and securities lending services. Investment assets of the High Yield Bond, Retirement Income and Appreciation, and Intermediate Bond Funds are managed by one or more investment advisors which have entered into separate investment advisory agreements with the Manager. As compensation for performing the duties required under the Management Agreement, the Manager receives from the High Yield Bond and Retirement Income and Appreciation Funds an annualized fee equal to 0.05% of the average daily net assets plus amounts paid by the Manager to the investment advisors hired by the Manager to direct investment activities of the Funds. The Manager receives an annualized fee of 0.20% of the average daily net assets of the Intermediate Bond Fund and pays a portion of its fee to an investment advisor hired by the Manager to direct investment activities of a portion of the Fund. The Manager is one of the investment advisors of the Retirement Income and Appreciation Fund and receives an annualized fee of 0.15% on the portion of assets managed by the Manager. The Manager serves as the sole investment advisor to the Short-Term Bond Fund. Management fees paid during the year ended October 31, 2011 were as follows (dollars in thousands):
| | | | | | | | | | | | | | | | |
| | | Management
Fee Rate | | | Management
Fee | | | Amounts paid
to Investment
Advisors | | | Net Amounts
Retained by
Manager | |
High Yield Bond | | | 0.30%-0.45% | | | | 623 | | | | 548 | | | | 75 | |
Retirement Income and Appreciation | | | 0.20%-0.80% | | | | 460 | | | | 388 | | | | 72 | |
Intermediate Bond | | | 0.20%-0.35% | | | | 561 | | | | 230 | | | | 331 | |
Short-Term Bond | | | 0.20% | | | | 356 | | | | — | | | | 356 | |
Administrative Services Agreement
The Manager and the Trust entered into an Administrative Services Agreement which obligates the Manager to provide or oversee administrative services to the Funds. As compensation for performing the duties required under the Administrative Services Agreement, the Manager receives an annualized fee of 0.30% of the average daily net assets of the Institutional, Y, and Investor Classes of each Fund, 0.40% of the average daily net assets of the A and C Classes of each Fund, and 0.05% of the average daily net assets of the AMR Class, except for the Institutional Class of the Intermediate and Short-Term Bond Funds from which the Manager receives a fee of 0.05% of average daily net assets.
Distribution Plans
The Funds, except for the A and C Classes of the Funds, have adopted a “defensive” Distribution Plan (the “Plan”) in accordance with Rule 12b-1 under the Act, pursuant to which no fees may be charged to the Funds for distribution purposes. However, the Plan authorizes the management and administrative service fees received by the Manager and the investment advisors hired by the Manager to be used for distribution purposes. Under this Plan, the Funds do not intend to compensate the Manager or any other party, either directly or indirectly, for the distribution of Fund shares.
Separate Distribution Plans (the “Distribution Plan”) have been adopted pursuant to Rule 12b-1 under the Act for the A and C Classes of the Funds. Under the Distribution Plan, as compensation for distribution assistance, the Manager receives an annual fee of 0.25% of the average daily net assets of each A Class and 1.00% of the average daily net assets of each C Class. The fee will be payable without regard to whether the amount of the fee is more or less than the actual expenses incurred in a particular month by the Manager for distribution assistance.
45
American Beacon Funds
Notes to Financial Statements
October 31, 2011
Service Plans
The Manager and the Trust entered into Service Plans that obligate the Manager to oversee additional shareholder servicing of the Y, Investor, A, and C Classes. As compensation for performing the duties required under the Service Plans, the Manager receives 0.10% of the average daily net assets of the Y Class, 0.15% of the average daily net assets of the A and C Classes, and up to 0.375% of the average daily net assets of the Investor Class of each Fund. Service fees for the Y Class for the period ended October 31, 2011 were less than $500.
Interfund Lending Program
Pursuant to an exemptive order by the Securities and Exchange Commission (“SEC”), the Funds, along with other registered investment companies having management contracts with the Manager, may participate in an interfund lending program as a borrower. This program provides an alternative credit facility allowing the Funds to borrow from other participating Funds. For the year ended October 31, 2011, the Funds did not utilize the credit facility.
Reimbursement of Expenses
The Manager voluntarily and contractually agreed to reimburse the following Funds to the extent that total operating expenses exceeded the Fund’s expense cap. Of these amounts, approximately $5,000, $1,000, and $10,000 was receivable from the Manager at October 31, 2011 for the Retirement Income and Appreciation, Intermediate Bond, and Short-Term Bond Funds, respectively. For the period ended October 31, 2011, the Manager reimbursed expenses as follows:
| | | | | | | | | | | | | | | | |
| | | | | Expense Caps | | | | | | |
Funds | | Class | | 11/1/10 to
2/28/11 | | | 3/1/11 to
10/31/11 | | | Reimbursed
Expenses | | | Expiration of
Reimbursements |
High Yield Bond | | Y* | | | N/A | | | | N/A | | | $ | 1,657 | | | 2014 |
High Yield Bond | | A | | | 1.12 | % | | | 1.12 | % | | | 1,864 | | | 2014 |
High Yield Bond | | C | | | 1.87 | % | | | 1.87 | % | | | 2,053 | | | 2014 |
Retirement Income and Appreciation | | Y* | | | N/A | | | | N/A | | | | 4,856 | | | 2014 |
Retirement Income and Appreciation | | Investor* | | | N/A | | | | N/A | | | | 150 | | | 2014 |
Retirement Income and Appreciation | | A | | | N/A | | | | 1.14 | % | | | 3,890 | | | 2014 |
Retirement Income and Appreciation | | C | | | N/A | | | | 1.96 | % | | | 530 | | | 2014 |
Intermediate Bond | | Y | | | 0.65 | % | | | 0.65 | % | | | 87 | | | 2014 |
Intermediate Bond | | Investor | | | 0.79 | % | | | 0.79 | % | | | 2,557 | | | 2014 |
Intermediate Bond | | A | | | 0.99 | % | | | 0.99 | % | | | 547 | | | 2014 |
Intermediate Bond | | C | | | 1.74 | % | | | 1.74 | % | | | 341 | | | 2014 |
Short-Term Bond | | Y | | | 0.65 | % | | | 0.64 | % | | | 2,269 | | | 2014 |
Short-Term Bond* | | Investor | | | 0.79 | % | | | 0.79 | % | | | 34,558 | | | 2014 |
Short-Term Bond | | A | | | 0.85 | % | | | 0.85 | % | | | 7,426 | | | 2014 |
Short Term Bond | | C | | | 1.60 | % | | | 1.60 | % | | | 2,857 | | | 2014 |
| * | Voluntary reimbursement. |
Expense Reimbursement Plan
The Funds have adopted an Expense Reimbursement Plan whereby the Manager may seek repayment of fees waived or expenses reimbursed for a period of up to three years. However, reimbursement will occur only if the Class’ average net assets have grown or expenses have declined sufficiently to allow reimbursement without causing its expense ratio to exceed the previously agreed upon contractual expense limit. The carryover of excess expenses potentially reimbursable to the Manager, but not recorded as a liability for the High Yield Bond Fund is $11 expiring in 2013; the Intermediate Bond Fund $10,509 and $2,320 expiring in 2012 and 2013, respectively; and for the Short-Term Bond Fund $73,068 and $64,863 expiring in 2012 and 2013, respectively. During the year ended October 31, 2011, the Funds have not recorded a liability for potential reimbursement due to the current assessment that a reimbursement is unlikely.
46
American Beacon Funds
Notes to Financial Statements
October 31, 2011
3. Security Valuation and Fair Value Measurements
Investments are valued at the close of the New York Stock Exchange (the “Exchange”), normally 4 p.m. ET, each day that the Exchange is open for business. Equity securities for which market quotations are available are valued at the last sale price or official closing price (closing bid price or last evaluated quote if no sale has occurred) on the primary market or exchange on which they trade.
Debt securities (other than short-term securities) normally are valued on the basis of prices provided by an independent pricing service and may take into account appropriate factors such as institution-size trading in similar groups of securities, yield, quality, coupon rate, maturity, type of issue, trading characteristics, and other market data. The prices of debt securities may be determined using quotes obtained from brokers.
Investments in mutual funds are valued at the closing net asset value (“NAV”) per share of the mutual fund on the day of valuation. Investment grade short-term obligations with 60 days or less to maturity are valued using the amortized cost method, which approximates fair value.
Securities for which market prices are not readily available or are not reflective of the fair value of the security, as determined by the Manager, will be priced at fair value following procedures approved by the Trust’s Board of Trustees (the “Board”).
Other investments, including restricted securities, and those financial instruments for which the above valuation procedures are inappropriate or are deemed not to reflect fair value are stated at fair value as determined in good faith by the Valuation Committee, established by the Fund’s Board.
Security Transactions and Investment Income
Security transactions are recorded on the trade date of the security purchase or sale. The Funds may purchase securities with delivery or payment to occur at a later date. At the time the Funds enter into a commitment to purchase a security, the transaction is recorded, and the value of the security is reflected in the NAV. The value of the security may vary with market fluctuations.
Dividend income, net of foreign taxes, is recorded on the ex-dividend date, except certain dividends from foreign securities which are recorded as soon as the information is available to the Funds. Interest income is earned from settlement date, recorded on the accrual basis, and adjusted, if necessary, for accretion of discounts and amortization of premiums. For financial and tax reporting purposes, realized gains and losses are determined on the basis of specific lot identification.
Dividends to Shareholders
Dividends from net investment income of the Funds generally will be declared daily and paid monthly. Distributions, if any, of net realized capital gains are generally paid at least annually and recorded on the ex-dividend date.
Commission Recapture
The Funds have established brokerage commission recapture arrangements with certain brokers or dealers. If a Fund’s investment advisor chooses to execute a transaction through a participating broker, the broker rebates a portion of the commission back to the Fund. Any collateral benefit received through participation in the commission recapture program is directed exclusively to the Fund. These amounts are reported with the net realized gains in the Fund’s Statement of Operations.
47
American Beacon Funds
Notes to Financial Statements
October 31, 2011
Allocation of Income, Expenses, Gains, and Losses
Income, expenses (other than those attributable to a specific class), gains, and losses are allocated daily to each class of shares based upon the relative proportion of net assets represented by such class. Operating expenses directly attributable to a specific class are charged against the operations of that class.
Use of Estimates
The preparation of financial statements in conformity with U.S. GAAP requires management to make estimates and assumptions that affect the amounts reported in the financial statements and accompanying notes. Actual results may differ from those estimated.
Redemption Fees
The High Yield Bond Fund imposes a 2% redemption fee on shares held for less than 90 days. The fee is deducted from the redemption proceeds and is intended to offset the trading costs, market impact, and other costs associated with short-term trading activity in the Fund. The “first-in, first-out” method is used to determine the holding period. The fee is allocated to all classes of the Fund pro-rata based on their respective net assets.
Other
Under the Trust’s organizational documents, its officers and trustees are indemnified against certain liability arising out of the performance of their duties to the Trust. In the normal course of business, the Trust enters into contracts that provide indemnification to the other party or parties against potential costs or liabilities. The Trust’s maximum exposure under these arrangements is dependent on claims that may be made in the future and, therefore, cannot be estimated. The Trust has had no prior claims or losses pursuant to any such agreement.
Valuation Inputs
Various inputs may be used to determine the fair value of the Funds’ investments. These inputs are summarized in three broad levels for financial statement purposes. The inputs or methodologies used to value securities are not necessarily an indication of the risk associated with investing in those securities.
Level 1 – Quoted prices in active markets for identical securities.
Level 2 – Prices determined using other significant observable inputs. These may include quoted prices for similar securities, interest rates, prepayment speeds, credit risk, and others. Level 2 securities are fixed-income securities that are valued using observable inputs as stated above.
Level 3 – Prices determined using other significant unobservable inputs. Unobservable inputs reflect the Fund’s own assumptions about the factors market participants would use in pricing an investment, and would be based on the best information available.
Level 1 and Level 2 trading assets and trading liabilities, at fair value
Fixed income securities including corporate, convertible and municipal bonds and notes, U.S. government agencies, U.S. treasury obligations, sovereign issues, bank loans, convertible preferred securities, and non-U.S. bonds are normally valued by pricing service providers that use broker dealer quotations, reported trades or valuation estimates from their internal pricing models. The service providers’ internal models use inputs that are observable such as issuer details, interest rates, yield curves, prepayment speeds, credit risks/spreads, default rates, and quoted prices for similar assets. Securities that use similar valuation techniques and inputs as described above are categorized as Level 2 of the fair value hierarchy.
48
American Beacon Funds
Notes to Financial Statements
October 31, 2011
Fixed income securities purchased on a delayed-delivery basis are marked to market daily until settlement at the forward settlement date are categorized as Level 2 of the fair value hierarchy.
Mortgage-related and asset-backed securities are usually issued as separate tranches, or classes, of securities within each deal. These securities are also normally valued by pricing service providers that use broker dealer quotations or valuation estimates from their internal pricing models. The pricing models for these securities usually consider tranche-level attributes, current market data, estimated cash flows, and market-based yield spreads for each tranche, and incorporates deal collateral performance, as available. Mortgage-related and asset-backed securities that use similar valuation techniques and inputs as described above are categorized as Level 2 of the fair value hierarchy.
Common stocks, exchange-traded funds and financial derivative instruments, such as futures contracts that are traded on a national securities exchange, are stated at the last reported sale or settlement price on the day of valuation. To the extent these securities are actively traded and valuation adjustments are not applied, they are categorized as Level 1 of the fair value hierarchy. Valuation adjustments may be applied to certain securities that are solely traded on a foreign exchange to account for the market movement between the close of the foreign market and the close of the Exchange. These securities are valued using pricing service providers that consider the correlation of the trading patterns of the foreign security to the intraday trading in the U.S. markets for investments. Securities using these valuation adjustments are categorized as Level 2 of the fair value hierarchy. Preferred securities and other equities traded on inactive markets or valued by reference to similar instruments are also categorized as Level 2 of the fair value hierarchy.
Investments in registered open-end investment management companies will be valued based upon the NAVs of such investments and are categorized as Level 1 of the fair value hierarchy. Short-term investments having a maturity of 60 days or less are generally valued at amortized cost which approximates fair value. These investments are categorized as Level 2 of the fair value hierarchy.
Level 3 trading assets and trading liabilities, at fair value
The valuation techniques and significant inputs used in determining the fair values of financial instruments classified as Level 3 of the fair value hierarchy are as follows:
Securities and other assets for which market quotes are not readily available are valued at fair value as determined in good faith by the Board or persons acting at their direction and are categorized as Level 3 of the fair value hierarchy.
Market quotes are considered not readily available in circumstances where there is an absence of current or reliable market-based data (e.g., trade information or broker quotes), including where events occur after the close of the relevant market, but prior to the Exchange close, that materially affect the values of a Fund’s securities or assets. In addition, market quotes are considered not readily available when, due to extraordinary circumstances, the exchanges or markets on which the securities trade, do not open for trading for the entire day and no other market prices are available. The Board has delegated to the Manager the responsibility for monitoring significant events that may materially affect the fair values of a Fund’s securities or assets and for determining whether the value of the applicable securities or assets should be re-evaluated in light of such significant events.
The Board has adopted methods for valuing securities and other assets in circumstances where market quotes are not readily available, and has delegated the responsibility for applying the valuation methods to the Manager. For instances in which daily market quotes are not readily available, investments may be valued, pursuant to guidelines established by the Board, with reference to other securities or indices. In the event that
49
American Beacon Funds
Notes to Financial Statements
October 31, 2011
the security or asset cannot be valued pursuant to one of the valuation methods established by the Board, the fair value of the security or asset will be determined in good faith by the Valuation Committee of the Board, generally based upon recommendations provided by the Manager.
When a Fund uses fair valuation methods applied by the Manager that use significant unobservable inputs to determine its NAV, securities will be priced by another method that the Board or persons acting at their direction believe accurately reflects fair value and are categorized as Level 3 of the fair value hierarchy. These methods may require subjective determinations about the value of a security. While the Trust’s policy is intended to result in a calculation of a Fund’s NAV that fairly reflects security values as of the time of pricing, the Trust cannot guarantee that values determined by the Board or persons acting at their direction would accurately reflect the price that a Fund could obtain for a security if it were to dispose of that security as of the time of pricing (for instance, in a forced or distressed sale). The prices used by a Fund may differ from the value that would be realized if the securities were sold.
For fair valuations using significant unobservable inputs, U.S. GAAP requires a reconciliation of the beginning to ending balances for reported fair values that presents changes attributable to total realized and unrealized gains or losses, purchases and sales, and transfers in and out of the Level 3 category during the period. The end of period timing recognition is used for the significant transfers between Levels of the Funds’ assets and liabilities. In accordance with the requirements of U.S. GAAP, a fair value hierarchy and Level 3 reconciliation, if any, have been included in the Notes to the Schedule of Investments for each respective Fund.
The Funds’ investments are summarized by level based on the inputs used to determine their values. As of October 31, 2011, the investments were classified as described below (in thousands):
| | | | | | | | | | | | | | | | |
High Yield Bond Fund | | Level 1 | | | Level 2 | | | Level 3 | | | Total | |
Common Stocks | | $ | 447 | | | $ | — | | | $ | 53 | | | $ | 500 | |
Preferred Stocks | | | 945 | | | | 119 | | | | — | | | | 1,064 | |
Convertible Preferred Stock | | | 275 | | | | — | | | | — | | | | 275 | |
Convertible Obligations | | | — | | | | 1,118 | | | | — | | | | 1,118 | |
Corporate Obligations | | | — | | | | 106,413 | | | | — | | | | 106,413 | |
Short-Term Investments | | | 6,722 | | | | — | | | | — | | | | 6,722 | |
| | | | | | | | | | | | | | | | |
Total Investments in Securities | | $ | 8,389 | | | $ | 107,650 | | | $ | 53 | | | $ | 116,092 | |
| | | | | | | | | | | | | | | | |
| | | | | | | | | | | | | | | | |
Retirement Income and Appreciation Fund | | Level 1 | | | Level 2 | | | Level 3 | | | Total | |
Common Stock | | $ | 7,649 | | | $ | — | | | $ | — | | | $ | 7,649 | |
Convertible Preferred | | | 595 | | | | — | | | | — | | | | 595 | |
Preferred Stocks | | | 1,328 | | | | 174 | | | | — | | | | 1,502 | |
Convertible Obligations | | | — | | | | 17,983 | | | | — | | | | 17,983 | |
Corporate Obligations | | | — | | | | 55,009 | | | | — | | | | 55,009 | |
Other Government Obligations | | | — | | | | 588 | | | | — | | | | 588 | |
U.S. Agency Obligations | | | — | | | | 309 | | | | — | | | | 309 | |
Asset-Backed Obligations | | | — | | | | 4,401 | | | | — | | | | 4,401 | |
Non-Agency Mortgage-Backed Obligations | | | — | | | | 5,334 | | | | — | | | | 5,334 | |
U.S. Agency Mortgage-Backed Obligations | | | — | | | | 38,570 | | | | — | | | | 38,570 | |
U.S. Treasury Obligations | | | — | | | | 9,924 | | | | — | | | | 9,924 | |
Short-Term Investments | | | 7,235 | | | | — | | | | — | | | | 7,235 | |
| | | | | | | | | | | | | | | | |
Total Investments in Securities | | $ | 16,807 | | | $ | 132,292 | | | $ | — | | | $ | 149,099 | |
| | | | | | | | | | | | | | | | |
50
American Beacon Funds
Notes to Financial Statements
October 31, 2011
| | | | | | | | | | | | | | | | |
Intermediate Bond Fund | | Level 1 | | | Level 2 | | | Level 3 | | | Total | |
Corporate Obligations | | $ | — | | | $ | 119,287 | | | $ | — | | | $ | 119,287 | |
Other Government Obligations | | | — | | | | 827 | | | | — | | | | 827 | |
U.S. Agency Obligations | | | — | | | | 831 | | | | — | | | | 831 | |
Asset-Backed Obligations | | | — | | | | 7,558 | | | | — | | | | 7,558 | |
Non-Agency Mortgage-Backed Obligations | | | — | | | | 11,556 | | | | — | | | | 11,556 | |
U.S. Agency Mortgage-Backed Obligations | | | — | | | | 88,285 | | | | — | | | | 88,285 | |
U.S. Treasury Obligations | | | — | | | | 35,306 | | | | — | | | | 35,306 | |
Short-Term Investments | | | 8,724 | | | | — | | | | — | | | | 8,724 | |
| | | | | | | | | | | | | | | | |
Total Investments in Securities | | $ | 8,724 | | | $ | 263,650 | | | $ | — | | | $ | 272,374 | |
| | | | | | | | | | | | | | | | |
| | | | | | | | | | | | | | | | |
Short-Term Bond Fund | | Level 1 | | | Level 2 | | | Level 3 | | | Total | |
Corporate Obligations | | $ | — | | | $ | 87,497 | | | $ | — | | | $ | 87,497 | |
Asset-Backed Obligations | | | — | | | | 29,316 | | | | — | | | | 29,316 | |
Non-Agency Mortgage-Backed Obligations | | | — | | | | 2,977 | | | | — | | | | 2,977 | |
U.S. Agency Mortgage-Backed Obligations | | | — | | | | 58,631 | | | | — | | | | 58,631 | |
U.S. Treasury Obligations | | | — | | | | 6,884 | | | | — | | | | 6,884 | |
Short-Term Investments | | | 519 | | | | — | | | | — | | | | 519 | |
| | | | | | | | | | | | | | | | |
Total Investments in Securities | | $ | 519 | | | $ | 185,305 | | | $ | — | | | $ | 185,824 | |
| | | | | | | | | | | | | | | | |
As of October 31, 2011, there were no significant transfers into or out of any level for the Retirement Income and Appreciation, Intermediate Bond, and Short-Term Bond Funds. For the High Yield Bond Fund, $52,796 was transferred from Common Stock Level 1 to Level 3.
The following is a reconciliation of Level 3 assets of the High Yield Bond Fund for which significant unobservable inputs were used to determine fair value. Transfers in or out of Level 3 represent the beginning value of any security or instrument where a change in the level has occurred from the beginning to the end of the period.
| | | | | | | | | | | | | | | | | | | | | | | | |
| | | Common
Stocks | | | Preferred
Stocks | | | Convertible
Preferred
Stocks | | | Convertible
Obligations | | | Corporate
Obligations | | | Totals | |
Balance as of October 31, 2010 | | $ | — | | | $ | — | | | $ | — | | | $ | — | | | $ | — | | | $ | — | |
Realized gain (loss) | | | — | | | | — | | | | — | | | | — | | | | — | | | | — | |
Change in unrealized appreciation or depreciation | | | 53 | | | | — | | | | — | | | | — | | | | — | | | | 53 | |
Purchases | | | — | | | | — | | | | — | | | | — | | | | — | | | | — | |
Sales | | | — | | | | — | | | | — | | | | — | | | | — | | | | — | |
Transfer into Level 3 | | | — | | | | — | | | | — | | | | — | | | | — | | | | — | |
Transfer out of Level 3 | | | — | | | | — | | | | — | | | | — | | | | — | | | | — | |
| | | | | | | | | | | | | | | | | | | | | | | | |
Balance as of October 31, 2011 | | | 53 | | | | — | | | | — | | | | — | | | | — | | | | 53 | |
| | | | | | | | | | | | | | | | | | | | | | | | |
Change in unrealized at period end* | | $ | 53 | | | $ | — | | | $ | — | | | $ | — | | | $ | — | | | $ | 53 | |
| | | | | | | | | | | | | | | | | | | | | | | | |
| * | Change in unrealized appreciation or depreciation attributable to Level 3 securities held at period end. This balance is included in the change in unrealized appreciation or depreciation on the Statement of Operations. |
4. Securities and Other Investments
Payment In-Kind Securities
Certain Funds may invest in payment in-kind securities. Payment in-kind securities give the issuer the option at each interest payment date of making interest payments in either cash or additional debt securities. Those additional debt securities usually have the same terms, including maturity dates and interest rates, and associated risks as the original bonds. The daily market quotations of the original bonds may include the accrued interest (referred to as a dirty price) and require a pro-rata adjustment from the unrealized appreciation or depreciation on investment to interest receivable in the Statements of Assets and Liabilities.
51
American Beacon Funds
Notes to Financial Statements
October 31, 2011
Restricted Securities
Certain Funds may invest in securities that are subject to legal or contractual restrictions on resale. These securities may be sold privately, but are required to be registered or exempted from such registration before being sold to the public. Private placement securities are generally considered to be restricted except for those securities traded between qualified institutional investors under the provisions of Rule 144A of the Securities Act of 1933. Disposal of restricted securities may involve time-consuming negotiations and expenses, and prompt sale at an acceptable price may be difficult to achieve. Restricted securities outstanding at the period ended October 31, 2011 are disclosed in the Notes to the Schedules of Investments.
High-Yield Securities
Non-investment-grade securities are rated below the four highest credit grades by at least one of the public rating agencies (or are unrated if not publicly rated). Participation in high-yielding securities transactions generally involves greater returns in the form of higher average yields. However, participation in such transactions involves greater risks, including sensitivity to economic changes, solvency, and relative liquidity in the secondary trading market. Lower ratings may reflect a greater possibility that the financial condition of the issuer, or adverse changes in general economic conditions, or both, may impair the ability of the issuer to make payments of interest and principal. The prices and yields of lower-rated securities generally fluctuate more than higher-quality securities, and such prices may decline significantly in periods of general economic difficulty or rising interest rates.
5. Federal Income and Excise Taxes
It is the policy of each Fund to qualify as a regulated investment company, by complying with all applicable provisions of Subchapter M of the Internal Revenue Code, as amended, and to make distribution of taxable income sufficient to relieve it from substantially all federal income and excise taxes. For federal income tax purposes, each Fund is treated as a single entity for the purpose of determining such qualification.
The Funds do not have any unrecognized tax benefits in the accompanying financial statements. Each of the tax years in the four year period ended October 31, 2011 remains subject to examination by the Internal Revenue Service. If applicable, the Funds recognize interest accrued related to unrecognized tax benefits in interest expense and penalties in “Other expenses” on the Statements of Operations.
Dividends are categorized in accordance with income tax regulations which may treat certain transactions differently than U.S. GAAP. Accordingly, the character of distributions and composition of net assets for tax purposes may differ from those reflected in the accompanying financial statements.
The tax character of distributions paid during the fiscal years ended October 31, 2011 and October 31, 2010 were as follows (in thousands)
| | | | | | | | | | | | | | | | |
| | | High Yield Bond | | | Retirement Income and
Appreciation | |
| | | Year Ended
October 31,
2011 | | | Year Ended
October 31,
2010 | | | Year Ended
October 31,
2011 | | | Year Ended
October 31,
2010 | |
Distributions paid from: | | | | | | | | | | | | | | | | |
Ordinary income* | | | | | | | | | | | | | | | | |
Institutional Class | | $ | 3,296 | | | $ | 3,870 | | | $ | — | | | $ | — | |
Y Class | | | — | | | | — | | | | 13 | | | | 2 | |
Investor Class | | | 1,941 | | | | 6,758 | | | | 3,349 | | | | 3,375 | |
A Class | | | 5 | | | | — | | | | 10 | | | | — | |
C Class | | | 11 | | | | — | | | | 17 | | | | 1 | |
AMR Class | | | 6,684 | | | | 9,049 | | | | — | | | | — | |
| | | | | | | | | | | | | | | | |
Total distributions paid | | $ | 11,937 | | | $ | 19,677 | | | $ | 3,389 | | | $ | 3,378 | |
| | | | | | | | | | | | | | | | |
| * | For tax purposes, short-term capital gains are considered ordinary income distributions. |
52
American Beacon Funds
Notes to Financial Statements
October 31, 2011
| | | | | | | | | | | | | | | | |
| | | Intermediate Bond | | | Short-Term Bond | |
| | | Year Ended
October 31,
2011 | | | Year Ended
October 31,
2010 | | | Year Ended
October 31,
2011 | | | Year Ended
October 31,
2010 | |
Distributions paid from: | | | | | | | | | | | | | | | | |
Ordinary income* | | | | | | | | | | | | | | | | |
Institutional Class | | $ | 12,384 | | | $ | 8,812 | | | $ | 3,233 | | | $ | 3,855 | |
Y Class | | | 8 | | | | 2 | | | | 5 | | | | — | |
Investor Class | | | 144 | | | | 89 | | | | 489 | | | | 945 | |
A Class | | | 11 | | | | — | | | | 20 | | | | — | |
C Class | | | 9 | | | | 1 | | | | 3 | | | | — | |
Capital Gains | | | | | | | | | | | | | | | | |
Institutional Class | | | 1,528 | | | | — | | | | — | | | | — | |
Y Class | | | 1 | | | | — | | | | — | | | | — | |
Investor Class | | | 20 | | | | — | | | | — | | | | — | |
A Class | | | 1 | | | | — | | | | — | | | | — | |
C Class | | | 2 | | | | — | | | | — | | | | — | |
| | | | | | | | | | | | | | | | |
Total distributions paid | | $ | 14,108 | | | $ | 8,904 | | | $ | 3,750 | | | $ | 4,800 | |
| | | | | | | | | | | | | | | | |
| * | For tax purposes, short-term capital gains are considered ordinary income distributions. |
As of October 31, 2011, the components of distributable earnings (deficit) on a tax basis were as follows (in thousands):
| | | | | | | | | | | | | | | | |
| | | High Yield
Bond | | | Retirement
Income and
Appreciation | | | Intermediate
Bond | | | Short-Term
Bond | |
Cost basis of investments for federal income tax purposes | | $ | 119,761 | | | $ | 142,284 | | | $ | 259,351 | | | $ | 186,540 | |
| | | | |
Unrealized appreciation | | | 4,272 | | | | 8,364 | | | | 13,644 | | | | 1,422 | |
Unrealized depreciation | | | (7,941 | ) | | | (1,549 | ) | | | (621 | ) | | | (2,138 | ) |
| | | | | | | | | | | | | | | | |
Net unrealized appreciation or depreciation | | | (3,669 | ) | | | 6,815 | | | | 13,023 | | | | (716 | ) |
| | | | |
Undistributed ordinary income | | | 199 | | | | 55 | | | | 504 | | | | 536 | |
Accumulated long-term gain (loss) | | | (1,970 | ) | | | 763 | | | | 2,280 | | | | (7,680 | ) |
Other temporary differences | | | (48 | ) | | | (1 | ) | | | (2 | ) | | | (5 | ) |
| | | | | | | | | | | | | | | | |
Distributable earnings (deficit) | | $ | (5,488 | ) | | $ | 7,632 | | | $ | 15,805 | | | $ | (7,865 | ) |
| | | | | | | | | | | | | | | | |
Financial reporting records are adjusted for permanent book/tax differences to reflect tax character. Financial records are not adjusted for temporary differences. The temporary differences between financial reporting and tax-basis reporting of unrealized appreciation or depreciation are attributable primarily to the tax deferral of losses from wash sales, book amortization for premiums, and income adjustments associated with contingent payment debt instruments.
Due to inherent differences in the recognition of income, expenses, and realized gains (losses) under U.S. GAAP and federal income tax regulations, permanent differences between book and tax reporting have been identified and appropriately reclassified on the Statements of Assets and Liabilities. Accordingly, the following amounts represent current year permanent differences derived from book amortization of premium, pay down reclasses, income adjustments associated with contingent payment debt instruments, and dividend reclasses that have been reclassified as of October 31, 2011 (in thousands):
| | | | | | | | | | | | | | | | |
| | | High Yield
Bond | | | Retirement
Income and
Appreciation | | | Intermediate
Bond | | | Short-Term
Bond | |
Paid-in-capital | | $ | 353 | | | $ | (165 | ) | | $ | (2 | ) | | $ | 2 | |
Undistributed net investment income | | | (357 | ) | | | 221 | | | | 476 | | | | 1,026 | |
Accumulated net realized gain (loss) | | | 4 | | | | (56 | ) | | | (474 | ) | | | (1,027 | ) |
Unrealized appreciation or depreciation of investments | | | — | | | | — | | | | — | | | | (1 | ) |
53
American Beacon Funds
Notes to Financial Statements
October 31, 2011
At October 31, 2011, capital loss carry forward positions for federal income tax purposes were as follows (in thousands):
| | | | | | | | | | | | | | | | | | | | |
| Fund | | 2014 | | | 2015 | | | 2016 | | | 2017 | | | Total | |
High Yield Bond | | | — | | | | — | | | | — | | | | 1,970 | | | | 1,970 | |
Short-Term Bond | | | 2,015 | | | | 467 | | | | 5,198 | | | | — | | | | 7,680 | |
The High Yield Bond, Retirement Income and Appreciation, and Short-Term Bond Funds utilized $7,732, $1,748, and $179, respectively, of net capital loss carryovers for the year ended October 31, 2011.
6. Investment Transactions
The aggregate cost of purchases and proceeds from sales and maturities of long-term investments during the year ended October 31, 2011 were as follows (in thousands):
| | | | | | | | | | | | | | | | |
| | | High Yield
Bond | | | Retirement
Income and
Appreciation | | | Intermediate
Bond | | | Short-Term
Bond | |
Purchases (excluding U.S. government securities) | | $ | 211,284 | | | $ | 93,156 | | | $ | 204,444 | | | $ | 147,611 | |
Sales and maturities (excluding U.S. government securities) | | | 275,488 | | | | 74,121 | | | | 225,454 | | | | 111,978 | |
Purchases of U.S. government securities | | | — | | | | 11,888 | | | | 89,083 | | | | 4,058 | |
Sales and maturities of U.S. government securities | | | — | | | | 27,966 | | | | 129,789 | | | | 15,568 | |
7. Capital Share Transactions
The tables below summarize the activity in capital shares for each Class of the Funds (shares and dollars in thousands):
Year Ended October 31, 2011
| | | | | | | | | | | | | | | | | | | | | | | | |
| | | Institutional Class | | | Y Class | | | Investor Class | |
High Yield Bond Fund | | Shares | | | Amount | | | Shares | | | Amount | | | Shares | | | Amount | |
Shares sold | | | 1,069 | | | $ | 9,564 | | | | 1 | | | $ | 10 | | | | 495 | | | $ | 4,488 | |
Reinvestment of dividends | | | 291 | | | | 2,618 | | | | — | | | | — | | | | 201 | | | | 1,821 | |
Shares redeemed | | | (1,203 | ) | | | (10,767 | )* | | | — | | | | — | * | | | (5,802 | ) | | | (53,202 | )* |
| | | | | | | | | | | | | | | | | | | | | | | | |
Net increase (decrease) in shares outstanding | | | 157 | | | $ | 1,415 | | | | 1 | | | $ | 10 | | | | (5,106 | ) | | $ | (46,893 | ) |
| | | | | | | | | | | | | | | | | | | | | | | | |
| | | |
| | | AMR Class | | | A Class | | | C Class | |
High Yield Bond Fund | | Shares | | | Amount | | | Shares | | | Amount | | | Shares | | | Amount | |
Shares sold | | | 2,566 | | | $ | 22,915 | | | | 9 | | | $ | 82 | | | | 43 | | | $ | 371 | |
Reinvestment of dividends | | | 742 | | | | 6,684 | | | | — | | | | 4 | | | | — | | | | 5 | |
Shares redeemed | | | (4,800 | ) | | | (43,025 | )* | | | — | | | | (1 | )* | | | (1 | ) | | | (8 | )* |
| | | | | | | | | | | | | | | | | | | | | | | | |
Net increase (decrease) in shares outstanding | | | (1,492 | ) | | $ | (13,426 | ) | | | 9 | | | $ | 85 | | | | 42 | | | $ | 368 | |
| | | | | | | | | | | | | | | | | | | | | | | | |
| | | | | | |
* Net of Redemption Fees | | | | | | | | | | | | | | | | | | | | | | | | |
| | | |
| | | Y Class | | | Investor Class | | | A Class | |
Retirement Income and Appreciation Fund | | Shares | | | Amount | | | Shares | | | Amount | | | Shares | | | Amount | |
Shares sold | | | 25 | | | $ | 261 | | | | 4,427 | | | $ | 47,560 | | | | 55 | | | $ | 591 | |
Reinvestment of dividends | | | 1 | | | | 13 | | | | 300 | | | | 3,228 | | | | 1 | | | | 9 | |
Shares redeemed | | | (10 | ) | | | (103 | ) | | | (2,778 | ) | | | (29,805 | ) | | | — | | | | (1 | ) |
| | | | | | | | | | | | | | | | | | | | | | | | |
Net increase in shares outstanding | | | 16 | | | $ | 171 | | | | 1,949 | | | $ | 20,983 | | | | 56 | | | $ | 599 | |
| | | | | | | | | | | | | | | | | | | | | | | | |
54
American Beacon Funds
Notes to Financial Statements
October 31, 2011
| | | | | | | | |
| | | C Class | |
Retirement Income and Appreciation Fund | | Shares | | | Amount | |
Shares sold | | | 65 | | | $ | 704 | |
Reinvestment of dividends | | | 2 | | | | 14 | |
Shares redeemed | | | (16 | ) | | | (170 | ) |
| | | | | | | | |
Net increase in shares outstanding | | | 51 | | | $ | 548 | |
| | | | | | | | |
| | | | | | | | | | | | | | | | | | | | | | | | |
| | | Institutional Class | | | Y Class | | | Investor Class | |
Intermediate Bond Fund | | Shares | | | Amount | | | Shares | | | Amount | | | Shares | | | Amount | |
Shares sold | | | 5,783 | | | $ | 62,684 | | | | 5 | | | $ | 53 | | | | 93 | | | $ | 1,002 | |
Reinvestment of dividends | | | 1,295 | | | | 13,905 | | | | 1 | | | | 10 | | | | 14 | | | | 153 | |
Shares redeemed | | | (8,216 | ) | | | (88,876 | ) | | | (35 | ) | | | (369 | ) | | | (112 | ) | | | (1,210 | ) |
| | | | | | | | | | | | | | | | | | | | | | | | |
Net (decrease) in shares outstanding | | | (1,138 | ) | | $ | (12,287 | ) | | | (29 | ) | | $ | (306 | ) | | | (5 | ) | | $ | (55 | ) |
| | | | | | | | | | | | | | | | | | | | | | | | |
| | | | | | | | | | | | | | | | |
| | | A Class | | | C Class | |
Intermediate Bond Fund | | Shares | | | Amount | | | Shares | | | Amount | |
Shares sold | | | 55 | | | $ | 587 | | | | 6 | | | $ | 61 | |
Reinvestment of dividends | | | — | | | | 1 | | | | — | | | | 3 | |
Shares redeemed | | | (6 | ) | | | (61 | ) | | | (9 | ) | | | (97 | ) |
| | | | | | | | | | | | | | | | |
Net increase (decrease) in shares outstanding | | | 49 | | | $ | 527 | | | | (3 | ) | | $ | (33 | ) |
| | | | | | | | | | | | | | | | |
| | | | | | | | | | | | | | | | | | | | | | | | |
| | | Institutional Class | | | Y Class | | | Investor Class | |
Short-Term Bond Fund | | Shares | | | Amount | | | Shares | | | Amount | | | Shares | | | Amount | |
Shares sold | | | 7,973 | | | $ | 70,089 | | | | 37 | | | $ | 323 | | | | 2,600 | | | $ | 22,888 | |
Reinvestment of dividends | | | 368 | | | | 3,231 | | | | 1 | | | | 5 | | | | 52 | | | | 456 | |
Shares redeemed | | | (5,105 | ) | | | (44,890 | ) | | | (4 | ) | | | (31 | ) | | | (2,442 | ) | | | (21,414 | ) |
| | | | | | | | | | | | | | | | | | | | | | | | |
Net increase in shares outstanding | | | 3,236 | | | $ | 28,430 | | | | 34 | | | $ | 297 | | | | 210 | | | $ | 1,930 | |
| | | | | | | | | | | | | | | | | | | | | | | | |
| | | | | | | | | | | | | | | | |
| | | A Class | | | C Class | |
Short-Term Bond Fund | | Shares | | | Amount | | | Shares | | | Amount | |
Shares sold | | | 422 | | | $ | 3,711 | | | | 68 | | | $ | 600 | |
Reinvestment of dividends | | | 1 | | | | 9 | | | | — | | | | 2 | |
Shares redeemed | | | (34 | ) | | | (304 | ) | | | (26 | ) | | | (228 | ) |
| | | | | | | | | | | | | | | | |
Net increase in shares outstanding | | | 389 | | | $ | 3,416 | | | | 42 | | | $ | 374 | |
| | | | | | | | | | | | | | | | |
Period Ended October 31, 2010
| | | | | | | | | | | | | | | | | | | | | | | | |
| | | Institutional Class | | | Y Class | | | Investor Class | |
High Yield Bond Fund | | Shares | | | Amount | | | Shares | | | Amount | | | Shares | | | Amount | |
Shares sold | | | 1,192 | | | $ | 10,318 | | | | — | | | $ | 1 | | | | 10,613 | | | $ | 91,795 | |
Reinvestment of dividends | | | 228 | | | | 1,978 | | | | — | | | | — | | | | 767 | | | | 6,656 | |
Shares redeemed | | | (2,453 | ) | | | (21,256 | )* | | | — | | | | — | * | | | (16,175 | ) | | | (139,538 | )* |
| | | | | | | | | | | | | | | | | | | | | | | | |
Net increase (decrease) in shares outstanding | | | (1,033 | ) | | $ | (8,960 | ) | | | — | | | $ | 1 | | | | (4,795 | ) | | $ | (41,087 | ) |
| | | | | | | | | | | | | | | | | | | | | | | | |
| | | | | | | | | | | | | | | | | | | | | | | | |
| | | AMR Class | | | A Class | | | C Class | |
High Yield Bond Fund | | Shares | | | Amount | | | Shares | | | Amount | | | Shares | | | Amount | |
Shares sold | | | 17,993 | | | $ | 154,205 | | | | 4 | | | $ | 39 | | | | 4 | | | $ | 36 | |
Reinvestment of dividends | | | 1,042 | | | | 9,049 | | | | — | | | | — | | | | — | | | | — | |
Shares redeemed | | | (20,103 | ) | | | (174,325 | )* | | | — | | | | — | * | | | — | | | | — | * |
| | | | | | | | | | | | | | | | | | | | | | | | |
Net increase (decrease) in shares outstanding | | | (1,068 | ) | | $ | (11,071 | ) | | | 4 | | | $ | 39 | | | | 4 | | | $ | 36 | |
| | | | | | | | | | | | | | | | | | | | | | | | |
| | | | | | |
* Net of Redemption Fees | | | | | | | | | | | | | | | | | | | | | | | | |
55
American Beacon Funds
Notes to Financial Statements
October 31, 2011
| | | | | | | | | | | | | | | | | | | | | | | | |
| | | Y Class | | | Investor Class | | | A Class | |
Retirement Income and Appreciation Fund | | Shares | | | Amount | | | Shares | | | Amount | | | Shares | | | Amount | |
Shares sold | | | 34 | | | $ | 357 | | | | 3,818 | | | $ | 39,811 | | | | 15 | | | $ | 164 | |
Reinvestment of dividends | | | — | | | | 2 | | | | 262 | | | | 2,724 | | | | — | | | | — | |
Shares redeemed | | | — | | | | — | | | | (1,567 | ) | | | (16,368 | ) | | | — | | | | — | |
| | | | | | | | | | | | | | | | | | | | | | | | |
Net increase in shares outstanding | | | 34 | | | $ | 359 | | | | 2,513 | | | $ | 26,167 | | | | 15 | | | $ | 164 | |
| | | | | | | | | | | | | | | | | | | | | | | | |
| | | | | | | | |
| | | C Class | |
Retirement Income and Appreciation Fund | | Shares | | | Amount | |
Shares sold | | | 96 | | | $ | 1,033 | |
Reinvestment of dividends | | | — | | | | 1 | |
Shares redeemed | | | — | | | | — | |
| | | | | | | | |
Net increase in shares outstanding | | | 96 | | | $ | 1,034 | |
| | | | | | | | |
| | | | | | | | | | | | | | | | | | | | | | | | |
| | | Institutional Class | | | Y Class | | | Investor Class | |
Intermediate Bond Fund | | Shares | | | Amount | | | Shares | | | Amount | | | Shares | | | Amount | |
Shares sold | | | 19,109 | | | $ | 208,277 | | | | 34 | | | $ | 381 | | | | 163 | | | $ | 1,767 | |
Reinvestment of dividends | | | 812 | | | | 8,811 | | | | — | | | | 2 | | | | 8 | | | | 88 | |
Shares redeemed | | | (13,473 | ) | | | (147,900 | ) | | | — | | | | (2 | ) | | | (33 | ) | | | (359 | ) |
| | | | | | | | | | | | | | | | | | | | | | | | |
Net increase in shares outstanding | | | 6,448 | | | $ | 69,188 | | | | 34 | | | $ | 381 | | | | 138 | | | $ | 1,496 | |
| | | | | | | | | | | | | | | | | | | | | | | | |
| | | | | | | | | | | | | | | | |
| | | A Class | | | C Class | |
Intermediate Bond Fund | | Shares | | | Amount | | | Shares | | | Amount | |
Shares sold | | | 4 | | | $ | 46 | | | | 29 | | | $ | 326 | |
Reinvestment of dividends | | | — | | | | — | | | | — | | | | — | |
Shares redeemed | | | — | | | | — | | | | — | | | | — | |
| | | | | | | | | | | | | | | | |
Net increase in shares outstanding | | | 4 | | | $ | 46 | | | | 29 | | | $ | 326 | |
| | | | | | | | | | | | | | | | |
| | | | | | | | | | | | | | | | | | | | | | | | |
| | | Institutional Class | | | Y Class | | | Investor Class | |
Short-Term Bond Fund | | Shares | | | Amount | | | Shares | | | Amount | | | Shares | | | Amount | |
Shares sold | | | 3,254 | | | $ | 28,766 | | | | 6 | | | $ | 51 | | | | 6,276 | | | $ | 55,504 | |
Reinvestment of dividends | | | 435 | | | | 3,852 | | | | — | | | | — | | | | 99 | | | | 873 | |
Shares redeemed | | | (3,048 | ) | | | (26,963 | ) | | | — | | | | — | | | | (7,209 | ) | | | (63,742 | ) |
| | | | | | | | | | | | | | | | | | | | | | | | |
Net increase (decrease) in shares outstanding | | | 641 | | | $ | 5,655 | | | | 6 | | | $ | 51 | | | | (834 | ) | | $ | (7,365 | ) |
| | | | | | | | | | | | | | | | | | | | | | | | |
| | | | | | | | | | | | | | | | |
| | | A Class | | | C Class | |
Short-Term Bond Fund | | Shares | | | Amount | | | Shares | | | Amount | |
Shares sold | | | 5 | | | $ | 44 | | | | — | | | $ | 1 | |
Reinvestment of dividends | | | — | | | | — | | | | — | | | | — | |
Shares redeemed | | | — | | | | — | | | | — | | | | — | |
| | | | | | | | | | | | | | | | |
Net increase in shares outstanding | | | 5 | | | $ | 44 | | | | — | | | $ | 1 | |
| | | | | | | | | | | | | | | | |
56
This page intentionally left blank.
57
American Beacon High Yield Bond Fund
Financial Highlights
(For a share outstanding throughout the period)
| | | | | | | | | | | | | | | | | | | | | | | | | | | | |
| | | Institutional Class | | | Y Class | |
| | | Year Ended October 31, | | | Year Ended October 31, | | | March 1 to October 31, | |
| | | 2011H | | | 2010 | | | 2009 | | | 2008A | | | 2007 | | | 2011H | | | 2010 | |
Net asset value, beginning of period | | $ | 9.05 | | | $ | 8.42 | | | $ | 6.77 | | | $ | 10.11 | | | $ | 10.20 | | | $ | 9.06 | | | $ | 8.63 | |
| | | | | | | | | | | | | | | | | | | | | | | | | | | | |
Income from investment operations: | | | | | | | | | | | | | | | | | | | | | | | | | | | | |
Net investment income | | | 0.71 | | | | 0.75 | | | | 0.79 | | | | 0.78 | | | | 0.77 | | | | 0.68 | | | | 0.50 | |
Net gains (losses) on securities (both realized and unrealized) | | | (0.37 | ) | | | 0.63 | | | | 1.66 | | | | (3.34 | ) | | | (0.09 | ) | | | (0.37 | ) | | | 0.43 | |
| | | | | | | | | | | | | | | | | | | | | | | | | | | | |
Total income (loss) from investment operations | | | 0.34 | | | | 1.38 | | | | 2.45 | | | | (2.56 | ) | | | 0.68 | | | | 0.31 | | | | 0.93 | |
| | | | | | | | | | | | | | | | | | | | | | | | | | | | |
Less distributions: | | | | | | | | | | | | | | | | | | | | | | | | | | | | |
Dividends from net investment income | | | (0.71 | ) | | | (0.75 | ) | | | (0.80 | ) | | | (0.78 | ) | | | (0.77 | ) | | | (0.68 | ) | | | (0.50 | ) |
Distributions from net realized gains on securities | | | — | | | | — | | | | — | | | | — | | | | — | | | | — | | | | — | |
| | | | | | | | | | | | | | | | | | | | | | | | | | | | |
Total distributions | | | (0.71 | ) | | | (0.75 | ) | | | (0.80 | ) | | | (0.78 | ) | | | (0.77 | ) | | | (0.68 | ) | | | (0.50 | ) |
| | | | | | | | | | | | | | | | | | | | | | | | | | | | |
Redemption fees added to beneficial interests | | | 0.00 | G | | | 0.00 | G | | | — | | | | — | | | | — | | | | 0.00 | G | | | 0.00 | G |
| | | | | | | | | | | | | | | | | | | | | | | | | | | | |
Net asset value, end of period | | $ | 8.68 | | | $ | 9.05 | | | $ | 8.42 | | | $ | 6.77 | | | $ | 10.11 | | | $ | 8.69 | | | $ | 9.06 | |
| | | | | | | | | | | | | | | | | | | | | | | | | | | | |
Total return B | | | 3.79 | % | | | 17.17 | % | | | 39.06 | % | | | (27.03 | )% | | | 6.85 | % | | | 3.36 | % | | | 11.17 | %C |
| | | | | | | | | | | | | | | | | | | | | | | | | | | | |
Ratios and supplemental data: | | | | | | | | | | | | | | | | | | | | | | | | | | | | |
Net assets, end of period (in thousands) | | $ | 41,093 | | | $ | 41,459 | | | $ | 47,254 | | | $ | 62,138 | | | $ | 114,911 | | | $ | 11 | | | $ | 1 | |
| | | | | | | |
Ratios to average net assets (annualized): | | | | | | | | | | | | | | | | | | | | | | | | | | | | |
Expenses, before reimbursements | | | 0.88 | % | | | 0.79 | % | | | 0.79 | % | | | 0.85 | % | | | 0.86 | % | | | 27.02 | % | | | 0.82 | %D |
Expenses, net of reimbursements | | | 0.88 | % | | | 0.79 | % | | | 0.79 | % | | | 0.85 | % | | | 0.85 | % | | | 1.61 | % | | | 0.82 | %D |
Net investment income (loss), before reimbursements | | | 7.90 | % | | | 8.69 | % | | | 11.46 | % | | | 8.38 | % | | | 7.54 | % | | | (18.29 | )% | | | 8.53 | %D |
Net investment income, net of reimbursements | | | 7.90 | % | | | 8.69 | % | | | 11.46 | % | | | 8.38 | % | | | 7.55 | % | | | 7.11 | % | | | 8.53 | %D |
Portfolio turnover rate | | | 149 | % | | | 176 | % | | | 212 | % | | | 157 | % | | | 92 | % | | | 149 | % | | | 176 | %E |
| A | On May 21, 2008, Post Advisory Group, LLC ceased managing a portion of the High Yield Bond Fund and on May 22, 2008 Logan Circle Partners, L.P. began managing a portion of the High Yield Bond Fund. |
| B | Based on net asset value, which does not reflect the sales charge, redemption fee, or contingent deferred sales charge, if applicable. |
| E | Portfolio turnover rate is for the period from November 1, 2009 through October 31, 2010. |
| F | Portfolio turnover rate is for the period from November 1, 2006 through October 31, 2007. |
| G | Amounts represent less than $0.01 per share. |
| H | PENN Capital Management Company, Inc. was added as an investment manager to the High Yield Bond Fund on September 15, 2011. |
58
American Beacon Funds High Yield Bond Fund
Financial Highlights
(For a share outstanding throughout the period)
| | | | | | | | | | | | | | | | | | | | | | | | | | | | | | | | | | | | | | | | | | | | | | | | | | | | | | |
| Investor Class | | | AMR Class | | | A Class | | | C Class | |
| Year Ended October 31, | | | Year Ended October 31, | | | September 4
to
October 31, | | | Year
Ended
October 31, | | | May 17 to
October 31, | | | Year
Ended
October 31, | | | September 1
to
October 31, | |
| 2011H | | | 2010 | | | 2009 | | | 2008A | | | 2007 | | | 2011H | | | 2010 | | | 2009 | | | 2008A | | | 2007 | | | 2011H | | | 2010 | | | 2011H | | | 2010 | |
| $ | 9.06 | | | $ | 8.42 | | | $ | 6.77 | | | $ | 10.11 | | | $ | 10.21 | | | $ | 9.06 | | | $ | 8.42 | | | $ | 6.77 | | | $ | 10.11 | | | $ | 9.94 | | | $ | 9.08 | | | $ | 8.67 | | | $ | 9.05 | | | $ | 8.68 | |
| | | | | | | | | | | | | | | | | | | | | | | | | | | | | | | | | | | | | | | | | | | | | | | | | | | | | | |
| | | | | | | | | | | | | |
| | | | | | | | | | | | | | | | | | | | | | | | | | | | | | | | | | | | | | | | | | | | | | | | | | | | | | |
| | 0.69 | | | | 0.73 | | | | 0.78 | | | | 0.75 | | | | 0.75 | | | | 0.74 | | | | 0.78 | | | | 0.81 | | | | 0.80 | | | | 0.12 | | | | 0.69 | | | | 0.32 | | | | 0.63 | | | | 0.09 | |
| | (0.38 | ) | | | 0.64 | | | | 1.65 | | | | (3.34 | ) | | | (0.10 | ) | | | (0.38 | ) | | | 0.63 | | | | 1.65 | | | | (3.34 | ) | | | 0.17 | | | | (0.39 | ) | | | 0.41 | | | | (0.39 | ) | | | 0.37 | |
| | | | | | | | | | | | | | | | | | | | | | | | | | | | | | | | | | | | | | | | | | | | | | | | | | | | | | |
| | 0.31 | | | | 1.37 | | | | 2.43 | | | | (2.59 | ) | | | 0.65 | | | | 0.36 | | | | 1.41 | | | | 2.46 | | | | (2.54 | ) | | | 0.29 | | | | 0.30 | | | | 0.73 | | | | 0.24 | | | | 0.46 | |
| | | | | | | | | | | | | | | | | | | | | | | | | | | | | | | | | | | | | | | | | | | | | | | | | | | | | | |
| | | | | | | | | | | | | |
| | | | | | | | | | | | | | | | | | | | | | | | | | | | | | | | | | | | | | | | | | | | | | | | | | | | | | |
| | (0.69 | ) | | | (0.73 | ) | | | (0.78 | ) | | | (0.75 | ) | | | (0.75 | ) | | | (0.74 | ) | | | (0.77 | ) | | | (0.81 | ) | | | (0.80 | ) | | | (0.12 | ) | | | (0.69 | ) | | | (0.32 | ) | | | (0.62 | ) | | | (0.09 | ) |
| | — | | | | — | | | | — | | | | — | | | | — | | | | — | | | | — | | | | — | | | | — | | | | — | | | | — | | | | — | | | | — | | | | — | |
| | | | | | | | | | | | | | | | | | | | | | | | | | | | | | | | | | | | | | | | | | | | | | | | | | | | | | |
| | (0.69 | ) | | | (0.73 | ) | | | (0.78 | ) | | | (0.75 | ) | | | (0.75 | ) | | | (0.74 | ) | | | (0.77 | ) | | | (0.81 | ) | | | (0.80 | ) | | | (0.12 | ) | | | (0.69 | ) | | | (0.32 | ) | | | (0.62 | ) | | | (0.09 | ) |
| | | | | | | | | | | | | | | | | | | | | | | | | | | | | | | | | | | | | | | | | | | | | | | | | | | | | | |
| | 0.00 | G | | | 0.00 | G | | | — | | | | — | | | | — | | | | 0.00 | G | | | 0.00 | G | | | — | | | | — | | | | — | | | | 0.00 | G | | | 0.00 | G | | | 0.00 | G | | | 0.00 | G |
| | | | | | | | | | | | | | | | | | | | | | | | | | | | | | | | | | | | | | | | | | | | | | | | | | | | | | |
| $ | 8.68 | | | $ | 9.06 | | | $ | 8.42 | | | $ | 6.77 | | | $ | 10.11 | | | $ | 8.68 | | | $ | 9.06 | | | $ | 8.42 | | | $ | 6.77 | | | $ | 10.11 | | | $ | 8.69 | | | $ | 9.08 | | | $ | 8.67 | | | $ | 9.05 | |
| | | | | | | | | | | | | | | | | | | | | | | | | | | | | | | | | | | | | | | | | | | | | | | | | | | | | | |
| | 3.41 | % | | | 17.00 | % | | | 38.70 | % | | | (27.24 | )% | | | 6.52 | % | | | 3.96 | % | | | 17.59 | % | | | 39.41 | % | | | (26.84 | )% | | | 2.94 | %C | | | 3.31 | % | | | 8.66 | %C | | | 2.67 | % | | | 5.31 | %C |
| | | | | | | | | | | | | | | | | | | | | | | | | | | | | | | | | | | | | | | | | | | | | | | | | | | | | | |
| | | | | | | | | | | | | |
| | | | | | | | | | | | | | | | | | | | | | | | | | | | | | | | | | | | | | | | | | | | | | | | | | | | | | |
| $ | 7,560 | | | $ | 54,142 | | | $ | 90,736 | | | $ | 13,949 | | | $ | 28,758 | | | $ | 73,298 | | | $ | 89,992 | | | $ | 92,659 | | | $ | 44,060 | | | $ | 82,322 | | | $ | 117 | | | $ | 40 | | | $ | 403 | | | $ | 37 | |
| | | | | | | | | | | | | |
| | | | | | | | | | | | | | | | | | | | | | | | | | | | | | | | | | | | | | | | | | | | | | | | | | | | | | |
| | 1.09 | % | | | 1.04 | % | | | 1.01 | % | | | 1.10 | % | | | 1.08 | % | | | 0.60 | % | | | 0.54 | % | | | 0.53 | % | | | 0.58 | % | | | 0.61 | %D | | | 3.93 | % | | | 1.30 | %D | | | 3.15 | % | | | 2.29 | %D |
| | 1.09 | % | | | 1.04 | % | | | 1.01 | % | | | 1.10 | % | | | 1.08 | % | | | 0.60 | % | | | 0.54 | % | | | 0.53 | % | | | 0.58 | % | | | 0.61 | %D | | | 1.11 | % | | | 1.12 | %D | | | 1.85 | % | | | 1.87 | %D |
| | 7.75 | % | | | 8.48 | % | | | 9.36 | % | | | 8.06 | % | | | 7.32 | % | | | 8.18 | % | | | 8.91 | % | | | 10.34 | % | | | 8.64 | % | | | 7.54 | %D | | | 4.74 | % | | | 6.93 | %D | | | 5.53 | % | | | 4.97 | %D |
| | 7.75 | % | | | 8.48 | % | | | 9.36 | % | | | 8.06 | % | | | 7.32 | % | | | 8.18 | % | | | 8.91 | % | | | 10.34 | % | | | 8.64 | % | | | 7.54 | %D | | | 7.56 | % | | | 7.11 | %D | | | 6.82 | % | | | 5.40 | %D |
| | 149 | % | | | 176 | % | | | 212 | % | | | 157 | % | | | 92 | % | | | 149 | % | | | 176 | % | | | 212 | % | | | 157 | % | | | 92 | %F | | | 149 | % | | | 176 | %E | | | 149 | % | | | 176 | %E |
59
American Beacon Retirement Income and Appreciation Fund
Financial Highlights
(For a share outstanding throughout the period)
| | | | | | | | | | | | | | | | | | | | | | | | | | | | |
| | | Y Class | | | Investor Class | |
| | | Year Ended October 31, | | | March 1 to October 31, | | | Year Ended October 31, | |
| | | 2011 | | | 2010 | | | 2011 | | | 2010 | | | 2009 | | | 2008 | | | 2007 | |
Net asset value, beginning of period | | $ | 10.80 | | | $ | 10.31 | | | $ | 10.81 | | | $ | 10.25 | | | $ | 8.80 | | | $ | 10.50 | | | $ | 10.25 | |
| | | | | | | | | | | | | | | | | | | | | | | | | | | | |
Income from investment operations: | | | | | | | | | | | | | | | | | | | | | | | | | | | | |
Net investment income | | | 0.26 | | | | 0.20 | | | | 0.27 | | | | 0.36 | | | | 0.32 | | | | 0.41 | | | | 0.36 | |
Net gains (losses) on securities (both realized and unrealized) | | | 0.05 | | | | 0.49 | | | | 0.02 | | | | 0.51 | | | | 1.53 | | | | (1.39 | ) | | | 0.32 | |
| | | | | | | | | | | | | | | | | | | | | | | | | | | | |
Total income (loss) from investment operations | | | 0.31 | | | | 0.69 | | | | 0.29 | | | | 0.87 | | | | 1.85 | | | | (0.98 | ) | | | 0.68 | |
| | | | | | | | | | | | | | | | | | | | | | | | | | | | |
Less distributions: | | | | | | | | | | | | | | | | | | | | | | | | | | | | |
Dividends from net investment income | | | (0.28 | ) | | | (0.20 | ) | | | (0.26 | ) | | | (0.31 | ) | | | (0.40 | ) | | | (0.49 | ) | | | (0.42 | ) |
Distributions from net realized gains on securities | | | — | | | | — | | | | — | | | | — | | | | — | | | | (0.23 | ) | | | (0.01 | ) |
Return of capital | | | — | | | | — | | | | — | | | | — | | | | — | E | | | — | | | | — | |
| | | | | | | | | | | | | | | | | | | | | | | | | | | | |
Total distributions | | | (0.28 | ) | | | (0.20 | ) | | | (0.26 | ) | | | (0.31 | ) | | | (0.40 | ) | | | (0.72 | ) | | | (0.43 | ) |
| | | | | | | | | | | | | | | | | | | | | | | | | | | | |
Net asset value, end of period | | $ | 10.83 | | | $ | 10.80 | | | $ | 10.84 | | | $ | 10.81 | | | $ | 10.25 | | | $ | 8.80 | | | $ | 10.50 | |
| | | | | | | | | | | | | | | | | | | | | | | | | | | | |
Total return A,F | | | 2.96 | % | | | 6.78 | %B | | | 2.71 | % | | | 8.60 | % | | | 21.50 | % | | | (10.02 | )% | | | 6.75 | % |
| | | | | | | | | | | | | | | | | | | | | | | | | | | | |
Ratios and supplemental data: | | | | | | | | | | | | | | | | | | | | | | | | | | | | |
Net assets, end of period (in thousands) | | $ | 539 | | | $ | 367 | | | $ | 147,415 | | | $ | 126,022 | | | $ | 93,727 | | | $ | 100,469 | | | $ | 99,789 | |
Ratios to average net assets (annualized): | | | | | | | | | | | | | | | | | | | | | | | | | | | | |
Expenses, before reimbursments | | | 1.80 | % | | | 0.80 | %C | | | 1.10 | % | | | 1.08 | % | | | 1.01 | % | | | 0.92 | % | | | 0.94 | % |
Expenses, net of reimbursements | | | 0.84 | % | | | 0.80 | %C | | | 1.10 | % | | | 1.08 | % | | | 1.01 | % | | | 0.92 | % | | | 0.94 | % |
Net investment income, before reimbursements | | | 1.45 | % | | | 2.74 | %C | | | 2.15 | % | | | 2.79 | % | | | 3.86 | % | | | 3.64 | % | | | 3.69 | % |
Net investment income, net of reimbursements | | | 2.41 | % | | | 2.74 | %C | | | 2.15 | % | | | 2.79 | % | | | 3.86 | % | | | 3.64 | % | | | 3.69 | % |
Portfolio turnover rate | | | 54 | % | | | 51 | %D | | | 54 | % | | | 51 | % | | | 53 | % | | | 76 | % | | | 103 | % |
| A | Based on net asset value, which does not reflect the sales charge, redemption fee, or contingent deferred sales charge, if applicable. |
| D | Portfolio turnover rate is for the period from November 1, 2009 through October 31, 2010. |
| E | The tax return of capital is calculated based on outstanding shares at the time of the distribution. Amounts are less than $0.01 per share. |
| F | May include adjustments in accordance with accounting principles generally accepted in the United States of America and as such, the net assets for financial reporting purposes and the returns based upon those net asset values may differ from the net asset value and returns for shareholder transactions. |
60
American Beacon Funds Retirement Income and Appreciation Fund
Financial Highlights
(For a share outstanding throughout the period)
| | | | | | | | | | | | |
A Class | | | C Class | |
Year
Ended
October 31, | | May 17 to
October 31, | | | Year
Ended
October 31, | | | September
1 to
October 31, | |
2011 | | 2010 | | | 2011 | | | 2010 | |
| $10.81 | | $ | 10.37 | | | $ | 10.82 | | | $ | 10.61 | |
| | | | | | | | | | | | |
| | | |
| | | | | | | | | | | | |
| 0.23 | | | 0.13 | | | | 0.15 | | | | 0.03 | |
0.05 | | | 0.44 | | | | 0.04 | | | | 0.20 | |
| | | | | | | | | | | | |
0.28 | | | 0.57 | | | | 0.19 | | | | 0.23 | |
| | | | | | | | | | | | |
| | | |
| | | | | | | | | | | | |
(0.24) | | | (0.13 | ) | | | (0.16 | ) | | | (0.02 | ) |
— | | | — | | | | — | | | | — | |
| — | | | — | | | | — | | | | — | |
| | | | | | | | | | | | |
| (0.24) | | | (0.13 | ) | | | (0.16 | ) | | | (0.02 | ) |
| | | | | | | | | | | | |
| $10.85 | | $ | 10.81 | | | $ | 10.85 | | | $ | 10.82 | |
| | | | | | | | | | | | |
| 2.61% | | | 5.52 | %B | | | 1.75 | % | | | 2.19 | %B |
| | | | | | | | | | | | |
| | | |
| | | | | | | | | | | | |
$770 | | $ | 166 | | | $ | 1,587 | | | $ | 1,035 | |
| | | | | | | | | | | | |
| | | | | | | | | | | | |
| | | | | | | | | | | | |
| 2.00% | | | 1.20 | %C | | | 1.99 | % | | | 2.33 | %C |
| 1.15% | | | 1.14 | %C | | | 1.94 | % | | | 1.96 | %C |
1.21% | | | 2.03 | %C | | | 1.25 | % | | | 1.40 | %C |
2.06% | | | 2.10 | %C | | | 1.30 | % | | | 1.77 | %C |
| 54% | | | 51 | %D | | | 54 | % | | | 51 | %D |
61
American Beacon Intermediate Bond Fund
Financial Highlights
(For a share outstanding throughout the period)
| | | | | | | | | | | | | | | | | | | | | | | | | | | | |
| | | Institutional Class | | | Y Class | |
| | | Year Ended October 31, | | | Year
Ended
October 31, | | | March 1 to
October 31, | |
| | | 2011 | | | 2010 | | | 2009 | | | 2008 | | | 2007 | | | 2011 | | | 2010 | |
Net asset value, beginning of period | | $ | 11.10 | | | $ | 10.69 | | | $ | 9.61 | | | $ | 10.10 | | | $ | 10.02 | | | $ | 11.10 | | | $ | 10.69 | |
| | | | | | | | | | | | | | | | | | | | | | | | | | | | |
Income from investment operations: | | | | | | | | | | | | | | | | | | | | | | | | | | | | |
Net investment income | | | 0.33 | | | | 0.39 | | | | 0.46 | | | | 0.50 | | | | 0.50 | | | | 0.27 | | | | 0.23 | |
Net gains (losses) on securities (both realized and unrealized) | | | 0.10 | | | | 0.40 | | | | 1.07 | | | | (0.51 | ) | | | 0.07 | | | | 0.17 | | | | 0.41 | |
| | | | | | | | | | | | | | | | | | | | | | | | | | | | |
Total income (loss) from investment operations | | | 0.43 | | | | 0.79 | | | | 1.53 | | | | (0.01 | ) | | | 0.57 | | | | 0.44 | | | | 0.64 | |
| | | | | | | | | | | | | | | | | | | | | | | | | | | | |
Less distributions: | | | | | | | | | | | | | | | | | | | | | | | | | | | | |
Dividends from net investment income | | | (0.35 | ) | | | (0.38 | ) | | | (0.45 | ) | | | (0.48 | ) | | | (0.49 | ) | | | (0.32 | ) | | | (0.23 | ) |
Distributions from net realized gains on securities | | | (0.19 | ) | | | — | | | | — | | | | — | | | | — | | | | (0.19 | ) | | | — | |
| | | | | | | | | | | | | | | | | | | | | | | | | | | | |
Total distributions | | | (0.54 | ) | | | (0.38 | ) | | | (0.45 | ) | | | (0.48 | ) | | | (0.49 | ) | | | (0.51 | ) | | | (0.23 | ) |
| | | | | | | | | | | | | | | | | | | | | | | | | | | | |
Net asset value, end of period | | $ | 10.99 | | | $ | 11.10 | | | $ | 10.69 | | | $ | 9.61 | | | $ | 10.10 | | | $ | 11.03 | | | $ | 11.10 | |
| | | | | | | | | | | | | | | | | | | | | | | | | | | | |
Total return A | | | 4.11 | % | | | 7.56 | % | | | 16.17 | % | | | (0.26 | )% | | | 5.83 | % | | | 4.19 | % | | | 6.03 | %B |
| | | | | | | | | | | | | | | | | | | | | | | | | | | | |
Ratios and supplemental data: | | | | | | | | | | | | | | | | | | | | | | | | | | | | |
Net assets, end of period (in thousands) | | $ | 275,234 | | | $ | 290,734 | | | $ | 210,983 | | | $ | 147,634 | | | $ | 109,674 | | | $ | 60 | | | $ | 382 | |
Ratios to average net assets (annualized): | | | | | | | | | | | | | | | | | | | | | | | | | | | | |
Expenses, before reimbursements | | | 0.35 | % | | | 0.33 | % | | | 0.32 | % | | | 0.30 | % | | | 0.34 | % | | | 0.73 | % | | | 0.67 | %C |
Expenses, net of reimbursements | | | 0.35 | % | | | 0.33 | % | | | 0.32 | % | | | 0.30 | % | | | 0.34 | % | | | 0.65 | % | | | 0.64 | %C |
| | | | | | | |
Net investment income, before reimbursments | | | 3.12 | % | | | 3.39 | % | | | 4.31 | % | | | 4.70 | % | | | 4.86 | % | | | 2.74 | % | | | 2.58 | %C |
| | | | | | | |
Net investment income, net of reimbursements | | | 3.12 | % | | | 3.39 | % | | | 4.32 | % | | | 4.70 | % | | | 4.86 | % | | | 2.82 | % | | | 2.60 | %C |
Portfolio turnover rate | | | 75 | % | | | 96 | % | | | 157 | % | | | 105 | % | | | 85 | % | | | 75 | % | | | 96 | %D |
| A | Based on net asset value, which does not reflect the sales charge, redemption fee, or contingent deferred sales charge, if applicable. |
| D | Portfolio turnover rate is for the period from November 1, 2009 through October 31, 2010. |
| E | Portfolio turnover rate is for the period from November 1, 2008 through October 31, 2009. |
62
American Beacon Intermediate Bond Fund
Financial Highlights
(For a share outstanding throughout the period)
| | | | | | | | | | | | | | | | | | | | | | | | | | |
| Investor Class | | | A Class | | | C Class | |
Year Ended
October 31, | | | March 2 to
October 31, | | | Year
Ended
October 31, | | | May 17 to
October 31, | | | Year
Ended
October 31, | | | September 1
to
October 31, | |
| 2011 | | | 2010 | | | 2009 | | | 2011 | | | 2010 | | | 2011 | | | 2010 | |
| $ | 11.08 | | | $ | 10.68 | | | $ | 10.14 | | | $ | 11.07 | | | $ | 10.74 | | | $ | 11.08 | | | $ | 11.05 | |
| | | | | | | | | | | | | | | | | | | | | | | | | | |
| | | | | | |
| | | | | | | | | | | | | | | | | | | | | | | | | | |
| | 0.29 | | | | 0.33 | | | | 0.27 | | | | 0.28 | | | | 0.13 | | | | 0.19 | | | | 0.03 | |
|
0.10 |
| | | 0.41 | | | | 0.54 | | | | 0.09 | | | | 0.33 | | | | 0.10 | | | | 0.03 | |
| | | | | | | | | | | | | | | | | | | | | | | | | | |
|
0.39 |
| | | 0.74 | | | | 0.81 | | | | 0.37 | | | | 0.46 | | | | 0.29 | | | | 0.06 | |
| | | | | | | | | | | | | | | | | | | | | | | | | | |
| | | | | | |
| | | | | | | | | | | | | | | | | | | | | | | | | | |
|
(0.31 |
) | | | (0.34 | ) | | | (0.27 | ) | | | (0.29 | ) | | | (0.13 | ) | | | (0.21 | ) | | | (0.03 | ) |
|
(0.19 |
) | | | — | | | | — | | | | (0.19 | ) | | | — | | | | (0.19 | ) | | | — | |
| | | | | | | | | | | | | | | | | | | | | | | | | | |
| | (0.50 | ) | | | (0.34 | ) | | | (0.27 | ) | | | (0.48 | ) | | | (0.13 | ) | | | (0.40 | ) | | | (0.03 | ) |
| | | | | | | | | | | | | | | | | | | | | | | | | | |
| $ | 10.97 | | | $ | 11.08 | | | $ | 10.68 | | | $ | 10.96 | | | $ | 11.07 | | | $ | 10.97 | | | $ | 11.08 | |
| | | | | | | | | | | | | | | | | | | | | | | | | | |
| | 3.65 | % | | | 7.01 | % | | | 8.05 | %B | | | 3.45 | % | | | 4.31 | %B | | | 2.70 | % | | | 0.56 | %B |
| | | | | | | | | | | | | | | | | | | | | | | | | | |
| | | | | | |
| | | | | | | | | | | | | | | | | | | | | | | | | | |
$ |
3,729 |
| | $ | 3,829 | | | $ | 2,213 | | | $ | 584 | | | $ | 46 | | | $ | 286 | | | $ | 325 | |
| | | | | | |
| | | | | | | | | | | | | | | | | | | | | | | | | | |
| | | | | | | | | | | | | | | | | | | | | | | | | | |
|
0.86 |
% | | | 0.83 | % | | | 1.22 | %C | | | 1.13 | % | | | 1.05 | %C | | | 1.86 | % | | | 2.09 | %C |
| | 0.79 | % | | | 0.76 | % | | | 0.81 | %C | | | 0.99 | % | | | 0.95 | %C | | | 1.72 | % | | | 1.74 | %C |
| | | | | | |
|
2.59 |
% | | | 2.88 | % | | | 3.33 | %C | | | 2.31 | % | | | 2.15 | %C | | | 1.61 | % | | | 0.88 | %C |
| | | | | | |
|
2.66 |
% | | | 2.95 | % | | | 3.74 | %C | | | 2.46 | % | | | 2.25 | %C | | | 1.75 | % | | | 1.23 | %C |
| | 75 | % | | | 96 | % | | | 157 | %E | | | 75 | % | | | 96 | %D | | | 75 | % | | | 96 | %D |
63
American Beacon Short-Term Bond Fund
Financial Highlights
(For a share outstanding throughout the period)
| | | | | | | | | | | | | | | | | | | | | | | | | | | | |
| | | Institutional Class | | | Y Class | |
| | | Year Ended October 31, | | | Year
Ended
October 31, | | | March 1 to
October 31, | |
| | | 2011 | | | 2010 | | | 2009 | | | 2008 | | | 2007 | | | 2011 | | | 2010 | |
Net asset value, beginning of period | | $ | 8.89 | | | $ | 8.83 | | | $ | 8.58 | | | $ | 8.79 | | | $ | 8.74 | | | $ | 8.90 | | | $ | 8.84 | |
| | | | | | | | | | | | | | | | | | | | | | | | | | | | |
Income from investment operations: | | | | | | | | | | | | | | | | | | | | | | | | | | | | |
Net investment income (loss) | | | 0.26 | | | | 0.23 | | | | 0.22 | A | | | 0.35 | A | | | 0.39 | A | | | 0.15 | | | | 0.15 | |
Net gains (losses) on securities (both realized and unrealized) | | | (0.25 | ) | | | 0.10 | | | | 0.33 | | | | (0.15 | ) | | | 0.09 | | | | (0.15 | ) | | | 0.08 | |
| | | | | | | | | | | | | | | | | | | | | | | | | | | | |
Total income (loss) from investment operations | | | 0.01 | | | | 0.33 | | | | 0.55 | | | | 0.20 | | | | 0.48 | | | | 0.00 | | | | 0.23 | |
| | | | | | | | | | | | | | | | | | | | | | | | | | | | |
Less distributions: | | | | | | | | | | | | | | | | | | | | | | | | | | | | |
Dividends from net investment income | | | (0.19 | ) | | | (0.27 | ) | | | (0.30 | ) | | | (0.41 | ) | | | (0.43 | ) | | | (0.17 | ) | | | (0.17 | ) |
Distributions from net realized gains on securities | | | — | | | | — | | | | — | | | | — | | | | — | | | | — | | | | — | |
| | | | | | | | | | | | | | | | | | | | | | | | | | | | |
Total distributions | | | (0.19 | ) | | | (0.27 | ) | | | (0.30 | ) | | | (0.41 | ) | | | (0.43 | ) | | | (0.17 | ) | | | (0.17 | ) |
| | | | | | | | | | | | | | | | | | | | | | | | | | | | |
Net asset value, end of period | | $ | 8.71 | | | $ | 8.89 | | | $ | 8.83 | | | $ | 8.58 | | | $ | 8.79 | | | $ | 8.73 | | | $ | 8.90 | |
| | | | | | | | | | | | | | | | | | | | | | | | | | | | |
Total return B | | | 0.17 | % | | | 3.78 | % | | | 6.56 | % | | | 2.21 | % | | | 5.61 | % | | | 0.04 | % | | | 2.55 | %C |
| | | | | | | | | | | | | | | | | | | | | | | | | | | | |
Ratios and supplemental data: | | | | | | | | | | | | | | | | | | | | | | | | | | | | |
Net assets, end of period (in thousands) | | $ | 156,937 | | | $ | 131,314 | | | $ | 124,791 | | | $ | 255,725 | | | $ | 89,427 | | | $ | 344 | | | $ | 51 | |
Ratios to average net assets (annualized): | | | | | | | | | | | | | | | | | | | | | | | | | | | | |
Expenses, before reimbursements | | | 0.37 | % | | | 0.35 | % | | | 0.33 | % | | | 0.31 | % | | | 0.37 | % | | | 1.43 | % | | | 0.65 | %D |
Expenses, net of reimbursements | | | 0.37 | % | | | 0.35 | % | | | 0.33 | % | | | 0.31 | % | | | 0.37 | % | | | 0.60 | % | | | 0.64 | %D |
Net investment income (loss), before reimbursments | | | 1.74 | % | | | 2.27 | % | | | 2.61 | % | | | 3.75 | % | | | 4.48 | % | | | 0.57 | % | | | 1.45 | %D |
Net investment income (loss), net of reimbursements | | | 1.74 | % | | | 2.27 | % | | | 2.62 | % | | | 3.75 | % | | | 4.48 | % | | | 1.40 | % | | | 1.47 | %D |
Portfolio turnover rate | | | 65 | % | | | 60 | % | | | 140 | % | | | 21 | % | | | 40 | % | | | 65 | % | | | 60 | %E |
| A | For purposes of this calculation, the change in undistributed net investment income per share was derived by dividing the change in undistributed net investment income by average shares outstanding for the period. |
| B | Based on net asset value, which does not reflect the sales charge, redemption fee, or contingent deferred sales charge, if applicable. |
| E | Portfolio turnover rate is for the period from November 1, 2009 through October 31, 2010. |
64
American Beacon Short-Term Bond Fund
Financial Highlights
(For a share outstanding throughout the period)
| | | | | | | | | | | | | | | | | | | | | | | | | | | | | | | | | | |
| Investor Class | | | A Class | | | C Class | |
| Year Ended October 31, | | | Year
Ended
October 31, | | | May 17 to
October 31, | | | Year
Ended October 31, | | | September 1
to
October 31, | |
| 2011 | | | 2010 | | | 2009 | | | 2008 | | | 2007 | | | 2011 | | | 2010 | | | 2011 | | | 2010 | |
| $ | 8.89 | | | $ | 8.84 | | | $ | 8.59 | | | $ | 8.81 | | | $ | 8.76 | | | $ | 8.89 | | | $ | 8.84 | | | $ | 8.90 | | | $ | 8.88 | |
| | | | | | | | | | | | | | | | | | | | | | | | | | | | | | | | | | |
| | | | | | | | | | | | | | | | | | | | | | | | | | | | | | | | | | |
| | 0.14 | | | | 0.08 | | | | 0.20 | A | | | 0.29 | A | | | 0.35 | A | | | 0.15 | | | | 0.09 | | | | 0.12 | | | | (0.04 | ) |
|
(0.15 |
) | | | 0.21 | | | | 0.34 | | | | (0.15 | ) | | | 0.09 | | | | (0.18 | ) | | | 0.07 | | | | (0.21 | ) | | | 0.08 | |
| | | | | | | | | | | | | | | | | | | | | | | | | | | | | | | | | | |
|
(0.01 |
) | | | 0.29 | | | | 0.54 | | | | 0.14 | | | | 0.44 | | | | (0.03 | ) | | | 0.16 | | | | (0.09 | ) | | | 0.04 | |
| | | | | | | | | | | | | | | | | | | | | | | | | | | | | | | | | | |
| | | | | | | | |
| | | | | | | | | | | | | | | | | | | | | | | | | | | | | | | | | | |
|
(0.16 |
) | | | (0.24 | ) | | | (0.29 | ) | | | (0.36 | ) | | | (0.39 | ) | | | (0.15 | ) | | | (0.11 | ) | | | (0.09 | ) | | | (0.02 | ) |
|
— |
| | | — | | | | — | | | | — | | | | — | | | | — | | | | — | | | | — | | | | — | |
| | | | | | | | | | | | | | | | | | | | | | | | | | | | | | | | | | |
| | (0.16 | ) | | | (0.24 | ) | | | (0.29 | ) | | | (0.36 | ) | | | (0.39 | ) | | | (0.15 | ) | | | (0.11 | ) | | | (0.09 | ) | | | (0.02 | ) |
| | | | | | | | | | | | | | | | | | | | | | | | | | | | | | | | | | |
| $ | 8.72 | | | $ | 8.89 | | | $ | 8.84 | | | $ | 8.59 | | | $ | 8.81 | | | $ | 8.71 | | | $ | 8.89 | | | $ | 8.72 | | | $ | 8.90 | |
| | | | | | | | | | | | | | | | | | | | | | | | | | | | | | | | | | |
| | (0.12 | )% | | | 3.33 | % | | | 6.34 | % | | | 1.54 | % | | | 5.08 | % | | | (0.33 | )% | | | 1.78 | %C | | | (1.00 | )% | | | 0.48 | %C |
| | | | | | | | | | | | | | | | | | | | | | | | | | | | | | | | | | |
| | | | | | | | |
| | | | | | | | | | | | | | | | | | | | | | | | | | | | | | | | | | |
$ |
24,557 |
| | $ | 23,175 | | | $ | 30,402 | | | $ | 7,733 | | | $ | 2,976 | | | $ | 3,428 | | | $ | 44 | | | $ | 371 | | | $ | 1 | |
| | | | | | | | |
| | | | | | | | | | | | | | | | | | | | | | | | | | | | | | | | | | |
| | | | | | | | | | | | | | | | | | | | | | | | | | | | | | | | | | |
| | 0.90 | % | | | 0.86 | % | | | 0.85 | % | | | 0.88 | % | | | 0.98 | % | | | 1.38 | % | | | 1.02 | %D | | | 2.47 | % | | | 2.28 | %D |
| | 0.78 | % | | | 0.67 | % | | | 0.54 | % | | | 0.85 | % | | | 0.87 | % | | �� | 0.84 | % | | | 0.81 | %D | | | 1.55 | % | | | 1.60 | %D |
|
1.18 |
% | | | 1.75 | % | | | 1.89 | % | | | 3.16 | % | | | 3.81 | % | | | 0.49 | % | | | 0.49 | %D | | | (0.43 | )% | | | (3.57 | )%D |
|
1.30 |
% | | | 1.94 | % | | | 2.20 | % | | | 3.19 | % | | | 3.91 | % | | | 1.03 | % | | | 0.69 | %D | | | 0.49 | % | | | (2.88 | )%D |
| | 65 | % | | | 60 | % | | | 140 | % | | | 21 | % | | | 40 | % | | | 65 | % | | | 60 | %E | | | 65 | % | | | 60 | %E |
65
American Beacon Funds
Privacy Policy & Federal Tax Information
October 31, 2011 (Unaudited)
Privacy Policy
The American Beacon Funds recognize and respect the privacy of our shareholders. We are providing this notice to you so you will understand how shareholder information may be collected and used.
We may collect nonpublic personal information about you from one or more of the following sources:
| | • | | information we receive from you on applications or other forms; |
| | • | | information about your transactions with us or our service providers; and |
| | • | | information we receive from third parties. |
We do not disclose any nonpublic personal information about our customers or former customers to anyone, except as permitted by law.
We restrict access to your nonpublic personal information to those employees or service providers who need to know that information to provide products or services to you. To ensure the confidentiality of your nonpublic personal information, we maintain safeguards that comply with federal standards.
Federal Tax Information
For corporate shareholders in the Funds, the percentage of ordinary dividend income distributed for the year ended October 31, 2010, which is designated as qualifying for the dividends-received deduction, was as follows:
| | | | |
High Yield Bond Fund | | | 0.15 | % |
Retirement Income and Appreciation Fund | | | 3.47 | % |
For shareholders in the Funds, the percentage of dividend income distributed for the year ended October 31, 2010, which is designated as qualified dividends income under the Jobs and Growth Tax Relief Act of 2003, was as follows:
| | | | |
Retirement Income and Appreciation Fund | | | 5.62 | % |
Shareholders will receive notification in January 2012 of the percentage applicable to the preparation of their 2011 income tax returns.
66
Disclosure Regarding the Board of Trustees’ Approval of the Management
Agreement and Investment Advisory Agreements of the Funds (Unaudited)
At its May 26, 2011 meeting, the Board of Trustees (“Board”) considered the renewal of each existing Management Agreement between American Beacon Advisors, Inc. (the “Manager”) and the American Beacon Funds, the American Beacon Mileage Funds, the American Beacon Select Funds and the American Beacon Master Trust (collectively the “Funds”) and each Investment Advisory Agreement between the Manager and a subadvisor (“Investment Advisory Agreements” and collectively with the Management Agreement, the “Agreements”). In preparation for the Board’s consideration to renew these Agreements, the Board and its Investment Committee undertook steps to gather and consider information furnished by the Manager, the subadvisors and Lipper, Inc. (“Lipper”). The Board, with the assistance of independent legal counsel, requested and received certain relevant information from the Manager and each subadvisor.
In addition, the Board’s Investment Committee worked with Lipper to obtain relevant comparative information regarding the performance, fees and expenses of the Funds. The Investment Committee held a separate meeting on May 11, 2011 to consider the information provided by Lipper. Further, the Board took into consideration information furnished for the Board’s review and consideration throughout the year at regular Board and Investment Committee meetings, as well as information specifically prepared in connection with the renewal process.
In connection with the Board’s consideration of the Management Agreement and each Investment Advisory Agreement, the Trustees considered, among other materials, responses by the Manager and the subadvisors to inquiries requesting:
| | • | | a description of any significant changes (actual or anticipated) to principal activities, personnel, services provided to the Funds, or any other area, including how these changes might affect the Funds; |
| | • | | a copy of the firm’s most recent audited or unaudited financial statements, as well as Parts 1 and 2 of its Form ADV registration statement with the SEC; |
| | • | | a summary of any material pending or anticipated litigation or regulatory proceedings involving the firm or its personnel, including the results of any recent regulatory examination or independent audit; |
| | • | | a comparison of the performance of that portion of Fund assets managed by each firm with performance of other similar accounts managed by the firm, including a discussion of relative performance versus a peer group average and any remedial measures if the firm’s performance was materially below that of the peer group; |
| | • | | a profit/loss analysis of the firm and any actual or anticipated economies of scale in relation to the services it provides to each Fund; |
| | • | | an analysis of compensation, including a comparison with fees charged to other clients for which similar services are provided, any proposed changes to the fee schedule and the effect of any fee waivers; |
| | • | | a description of any payments by the subadvisers to the manager to support the Funds’ marketing efforts; |
| | • | | an evaluation of any other benefits to the firm or Funds as a result of their relationship, if any; |
| | • | | confirmation that the firm’s financial condition would not impair its ability to provide high-quality advisory services to the Funds; |
| | • | | a description of the scope of portfolio management services provided to the Funds, including whether such services differ from the services provided to other clients, including other registered investment companies, and any advantages or disadvantages that might accrue to the Funds due to the firm’s involvement in other activities; |
| | • | | a description of the personnel who are assigned primary responsibility for managing the Funds, including any changes during the past year, and a discussion of the adequacy of current and projected staffing levels to service the Funds; |
| | • | | a description of the basis upon which portfolio managers are compensated, including any “incentive” arrangements, and a description of the oversight mechanisms used to prevent a portfolio manager whose compensation is tied to performance of a Fund from taking undue risks; |
| | • | | a discussion regarding the firm’s participation in “soft dollar” arrangements, if any, or other brokerage allocation policies with respect to Fund transactions, including the firm’s methodology for obtaining best execution and the use of any affiliated broker-dealers; |
| | • | | a description of any actual or potential conflicts of interest anticipated in managing Fund assets; |
| | • | | a discussion of whether the firm has identified any investment or operational matters that likely present a high risk in managing Fund assets; |
| | • | | a description of trade allocation procedures among accounts managed by the firm; |
| | • | | a discussion of whether the firm receives, with respect to the Funds, other compensation, including any payment for order flow or ECN liquidity rebates |
| | • | | a certification by the firm regarding the reasonable design of its compliance program; |
| | • | | information regarding the firm’s code of ethics, insider trading policy and disaster recovery plan, including a description of any material changes thereto and a related certification of compliance by the firm; |
| | • | | a description of the firm’s affiliation with any broker-dealer; |
| | • | | a discussion of any anticipated change in the firm’s controlling persons; and |
| | • | | verification of the firm’s insurance coverage with regards to the services provided to the Funds. |
In addition to the foregoing, the Manager provided the following information specific to the renewal of the Management Agreement:
| | • | | a comparison of the performance of each Fund to comparable investment companies and appropriate indices, including comments on the relative performance of, as applicable, each subadvisor and each Fund versus the respective peer group average; |
67
Disclosure Regarding the Board of Trustees’ Approval of the Management
Agreement and Investment Advisory Agreements of the Funds (Unaudited)
| | • | | a discussion, if applicable, of any underperformance by a subadvisor relative to its peer group and what, if any, remedial measures the Manager has or intends to take; |
| | • | | a comparison of advisory fees and expense ratios for comparable mutual funds; |
| | • | | an analysis of any material complaints received from Fund shareholders; |
| | • | | a description of the extent to which the Manager monitors the investment activities and financial conditions of each subadvisor to the Funds; |
| | • | | a description of the Manager’s distribution activities with respect to promoting sales of Fund shares, including any revenue sharing practices; |
| | • | | a description of the Manager’s securities lending practices and the fees received from such practices; |
| | • | | a discussion of any rebate arrangements between the Manager and a service provider to the Funds pursuant to which the Manager receives direct or indirect benefits from the service provider; |
| | • | | a description of the portfolio turnover rate and average execution costs for each Fund and, as applicable, each subadvisor to a Fund; and |
| | • | | a description of how expenses that are not readily identifiable to a particular Fund are allocated. |
In connection with the Management Agreement and each Investment Advisory Agreement, the Board also obtained an analysis provided by Lipper that compared: (i) investment performance of each Fund versus comparable investment companies and appropriate indices; (ii) total Fund expenses of each Fund versus comparable mutual funds; and (iii) each Fund’s investment advisory fees versus comparable mutual funds. For each Fund with more than one class of shares, the class of shares used for comparative purposes was the class with the longest performance history, which in most cases was the Institutional Class. References below to each Fund’s Lipper peer group are to the group of comparable mutual funds included in the analysis provided by Lipper.
Provided below is an overview of the primary factors the Trustees considered at the Investment Committee meeting on May 11, 2011 at which the Trustees reviewed the investment performance of the Manager and each subadvisor and the primary factors considered by the Board at its May 26, 2011 meeting at which the Board considered the renewal of the Agreements. The Board did not identify any particular information that was most relevant to its consideration to renew the Management Agreement and each Investment Advisory Agreement, and each Trustee may have afforded different weight to the various factors. Legal counsel to the independent Trustees provided the Board with a memorandum regarding its responsibilities pertaining to the renewal of the Agreements. The memorandum explained the regulatory requirements surrounding the Trustees’ process for evaluating investment advisors and the terms of the contracts. Based on its evaluation, the Board unanimously concluded that the terms of each Agreement were reasonable and fair and that the renewal of each Agreement was in the best interests of the Funds and their shareholders.
Considerations With Respect to All Funds
In determining whether to renew the Management Agreement and each Investment Advisory Agreement, the Trustees considered the best interests of each Fund separately. While the Management Agreement and the Investment Advisory Agreements for all of the Funds were considered at the May 26, 2011 meeting, the Board considered each Fund’s investment management and subadvisory relationships separately. In each instance, the Board considered, among other things, the following factors: (1) the nature and quality of the services provided; (2) the investment performance of a Fund and, as applicable, each subadvisor for a Fund; (3) the costs incurred by the Manager and (to the extent provided) the subadvisors in rendering their services and their resulting profits or losses; (4) the extent to which economies of scale have been taken into account in setting each fee schedule; (5) whether fee levels reflect these economies of scale for the benefit of Fund investors; (6) comparisons of services and fees with contracts entered into by the Manager or a subadvisor or their affiliates with other clients (such as pension funds and other institutional funds); and (7) any other benefits derived or anticipated to be derived by the Manager or a subadvisor from their relationship with a Fund. The Trustees posed questions to various management personnel of the Manager regarding certain key aspects of the materials submitted in support of the renewal.
Nature, Extent and Quality of Services. With respect to the renewal of the Management Agreement, the Board considered, among other factors: each Fund’s generally favorable long-term performance and the background and experience of key investment personnel at the Manager; the low cost structure of the Funds; the Manager’s culture of compliance and support for compliance operations that reduce risks to the Funds; the manager’s commitment to increase assets in the Funds as demonstrated, for example, by the continued increase in sales personnel; the Manager’s continuing efforts to add new series and share classes to enhance the Funds’ product line; the Manager’s high quality of services; the Manager’s active role in monitoring and, as appropriate recommending additional or replacement subadvisors; the Manager’s commitment to increasing headcount and training employees in conjunction with product expansion; and efforts made by the Manager to retain key employees.
With respect to the renewal of each Investment Advisory Agreement, the Trustees considered the background and experience of each subadvisor’s investment personnel responsible for managing the Funds, the size of the subadvisor and their ability to continue to attract and retain qualified investment personnel. Based on the foregoing information, the Board concluded that the nature, extent and quality of the management and advisory services provided by the Manager and each subadvisor were appropriate for each Fund and, thus, determined to renew the Management Agreement and the Investment Advisory Agreement for each Fund.
68
Disclosure Regarding the Board of Trustees’ Approval of the Management
Agreement and Investment Advisory Agreements of the Funds (Unaudited)
Investment Performance. The Board evaluated the comparative information provided by Lipper and the Manager regarding each Fund’s investment performance relative to its benchmark index(es) and peer group. The Board considered the information provided by Lipper regarding its independent peer selection methodology to select all peer groups and universes. The Board also considered the performance reports and discussions with management at Board and Committee meetings throughout the year. The Manager also noted that it generally was satisfied with the performance of the subadvisors. A discussion regarding the Board’s considerations with respect to each Fund’s performance appears below under “Additional Considerations and Conclusions with Respect to Each Fund.”
Costs of the Services Provided to the Funds and the Profits Realized by the Manager from its Relationship with the Funds. In analyzing the cost of services and profitability of the Manager and a subadvisor by Fund, the Board considered the revenues earned and the expenses incurred by the Manager. The profits or losses were noted at both an individual Fund level and at an aggregate level for all Funds. The Board also considered that the Management Agreement for the Funds stipulates that, to the extent that a Fund invests all of its investable assets in another registered investment company (i.e., is a “Feeder Fund”), the Fund will not pay the Manager a management fee. Although the Board noted that, in certain cases, the fee rates paid by other clients is lower than the fee rates paid by the Funds, the difference reflects the greater level of responsibility and regulatory requirements associated with managing the Funds.
The Board also noted that the Manager proposed to continue the expense waivers and reimbursements for certain Funds and classes that were in place during the last fiscal year and to put in place new expense waivers and reimbursements for certain new classes of the Funds and new series of the Funds. The Board further considered that each subadvised Fund pays the Manager the amounts due to its subadvisors, and the Manager remits these amounts directly to the applicable subadvisors. The Board considered that the Manager receives service and administrative fees to compensate the Manager for providing administrative services to the Funds and to compensate third-party administrators and broker-dealers for services to Fund shareholders. In addition, the Board considered that the Manager receives management fees for overseeing the securities lending program on behalf of various Funds. The Board also noted that certain classes of the Funds maintain higher expense ratios in order to compensate third-party distributors.
In analyzing the cost of services and profitability for each subadvisor in connection with its investment advisory services to the Fund, the Board considered that, in many cases, the Manager has negotiated the lowest subadvisory fee a subadvisor charges for any comparable client accounts. The Board gave less weight to profitability considerations or did not view this data as imperative to its deliberations given the arm’s length nature of the relationship between the Manager and the subadvisors with respect to the negotiation of subadvisory fees.
Based on the foregoing information, the Board concluded that the profitability levels were reasonable in light of the services performed by the Manager and the subadvisors. A discussion regarding the Board’s considerations with respect to each Fund’s fee rates is set forth below under “Additional Considerations and Conclusions with Respect to Each Fund.”
Economies of Scale. In considering the reasonableness of the management and investment advisory fees, the Board considered whether economies of scale will be realized as the Funds grow and whether fee levels reflect these economies of scale for the benefit of Fund shareholders. In this regard, the Board considered that the Manager has negotiated breakpoints in many subadvisory fee rates. The Board also noted that, for purposes of determining the fee rates chargeable to the Funds, many subadvisors have agreed to take into account assets of AMR and its pension plans that are managed by the subadvisors. Thus, the Funds are able to receive lower effective fee rates. The Board also noted the Manager’s representation that assets in the Funds’ complex increased during 2010, primarily due to market appreciation.
In addition, the Board noted the Manager’s representation that, many of the Funds enjoy the primary benefit of economies of scale because low comparable fee levels are already reflected in the current level of management & administration fees charged by the Manager, the current fee structure already provides an adequate mechanism for the sharing of economies of scale with shareholders and due to the existing low cost structure of the Funds that further breakpoints are not appropriate at this time. Based on the foregoing information, the Board concluded that the Manager and subadvisor fee schedules for each Fund provides for a reasonable sharing of benefits from any economies of scale with the Fund.
Benefits Derived from the Relationship with the Funds. The Board considered the “fall-out” or ancillary benefits that accrue to the Manager and/or the subadvisors as a result of the advisory relationships with the Funds, including greater exposure in the marketplace with respect to the Manager’s or subadvisor’s investment process and expanding the level of assets under management by the Manager and the subadvisors. The Board also considered that the Manager will use the Large Cap Value Fund model in managing its collective investment trust.
In addition, the Manager noted that the Trusts also derive benefits from their association with the Manager. Specifically, the Board noted the Manager’s representation that it provides services to most Funds at a lower than industry average cost. The Board considered that certain of the subadvisors reimburse the Manager for certain of its costs relating to distribution activities for the Funds. The Board also considered that the Funds did not pay commissions to any affiliated broker-dealer of the Manager or the relevant subadvisor during the most recent fiscal year ended October 31, 2010.
Based on the foregoing information, the Board concluded that the potential benefits accruing to the Manager and the subadvisors by virtue of their relationships with the Funds appear to be fair and reasonable.
Additional Considerations and Conclusions with Respect to Each Fund
The performance comparisons below were made versus each Fund’s Lipper peer universe median. References to the Lipper expense universe below are to the group of comparable mutual funds included in the analysis provided to the Trustees by Lipper, Inc.
69
Disclosure Regarding the Board of Trustees’ Approval of the Management
Agreement and Investment Advisory Agreements of the Funds (Unaudited)
Additional Considerations and Conclusions with Respect to the Retirement Income and Appreciation Fund
In considering the renewal of the Management Agreement, the Trustees considered the following additional factors: (1) the impact of the Retirement Income and Appreciation Fund’s unique investment strategy on peer performance and expense ratio comparisons; (2) the Fund outperformed or performed in-line with the peer universe median for the one-, three- and five-year periods ended March 31, 2011; (3) the Manager underperformed the peer universe median with respect to its allocated portion of the Fund’s assets for the one-year period but outperformed for the three-, and five-year periods; and (4) the expense ratio of the Fund ranked better than the median of its Lipper expense universe.
In considering the renewal of the Investment Advisory Agreement with Calamos Advisors LLC (“Calamos”), the Trustees considered the following additional factors: (1) Calamos underperformed the Merrill Lynch All U.S. Convertibles Index for the one-year period but outperformed for the three- and five-year periods ended March 31, 2011; and (2) the Manager’s recommendation to continue to retain Calamos.
Based on these considerations and those noted above with respect to all Funds, the Trustees (1) concluded that the fees paid to the Manager and Calamos under the Management and Investment Advisory Agreements are fair and reasonable, (2) determined that the Retirement Income and Appreciation Fund and its shareholders would benefit from the Manager’s and Calamos’ continued management of the Fund and (3) approved the renewal of the Management and Investment Advisory Agreements with respect to the Retirement Income and Appreciation Fund.
Additional Considerations and Conclusions with Respect to the High Yield Bond Fund
In considering the renewal of the Management Agreement, the Trustees considered the following additional factors: (1) the High Yield Bond Fund outperformed the peer universe median for the one- and ten-year periods ended March 31, 2011, but underperformed for the three- and five-year periods; and (2) the expense ratio of the Institutional Class ranked better than the median of its Lipper expense universe.
In considering the renewal of the Investment Advisory Agreement with Franklin Advisors, Inc. (“Franklin”) and Logan Circle, the Trustees considered the following additional factors: (1) Franklin outperformed the peer universe median for the one-year period ended March 31, 2011, but underperformed for the three-year period; (2) Logan Circle outperformed the peer universe median for the one-year period ended March 31, 2011; and (3) the Manager’s recommendation to continue to retain each subadvisor.
Based on these considerations and those noted above with respect to all Funds, the Trustees (1) concluded that the fees paid to the Manager and subadvisors under the Management and Investment Advisory Agreements are fair and reasonable; (2) determined that the High Yield Bond Fund and its shareholders would benefit from the Manager’s and subadvisors’ continued management of the Fund; and (3) approved the renewal of the Management and Investment Advisory Agreements with respect to the High Yield Bond Fund.
Additional Considerations and Conclusions with Respect to the Intermediate Bond Fund
In considering the renewal of the Management Agreement, the Trustees considered the following additional factors: (1) the Intermediate Bond Fund outperformed the peer universe median for the five- and ten-year periods ended March 31, 2011, but underperformed for the one- and three-year periods; (2) the Manager outperformed the universe peer median with respect to its allocated portion of the Fund’s assets for the five- and ten-year periods ended March 31, 2011, but underperformed for the one- and three-year periods; and (3) the expense ratio of the Institutional Class of Fund shares ranked better than the median of its Lipper universe.
In considering the renewal of the Investment Advisory Agreement with Barrow, Hanley, Mewhinney & Strauss, LLC (“Barrow”), the Trustees considered the following additional factors: (1) Barrow outperformed the peer universe median with respect to its allocated portion of the Fund’s assets for the three-, five- and ten-year periods ended March 31, 2011, but underperformed for the one-year period; and (2) the Manager’s recommendation to continue to retain Barrow.
Based on these considerations and those noted above with respect to all Funds, the Trustees (1) concluded that the fees paid to the Manager and Barrow under the Management and Investment Advisory Agreements are fair and reasonable, (2) determined that the Intermediate Bond Fund and its shareholders would benefit from the Manager’s and Barrow’s continued management of the Fund and (3) approved the renewal of the Management and Investment Advisory Agreements with respect to the Intermediate Bond Fund.
Additional Considerations and Conclusions with Respect to the Short-Term Bond Fund
In considering the renewal of the Management Agreement, the Trustees considered the following additional factors: (1) the Short-Term Bond Fund outperformed its benchmark index for the one and three-year periods ended March 31, 2011. Longer-term returns were adversely affected by unusually high cash flow volatility in 2008 and 2009; (2) the Short-Term Bond Fund outperformed the Lipper Index for the five- and ten-year periods ending March 31, 2011; and (3) the expense ratio of the Institutional Class of Fund shares was the lowest of its Lipper expense group average.
70
Disclosure Regarding the Board of Trustees’ Approval of the Management Agreement and Investment Advisory Agreements of the Funds (Unaudited)
Based on these considerations and those noted above with respect to all Funds, the Trustees (1) concluded that the fees paid to the Manager under the Management Agreement are fair and reasonable, (2) determined that the Short-Term Bond Fund and its shareholders would benefit from the Manager’s continued management of the Fund and (3) approved the renewal of the Management Agreement with respect to the Short-Term Bond Fund.
71
Trustees and Officers of the American Beacon Funds (Unaudited)
The Trustees and officers of the American Beacon Funds (the “Trust”) are listed below, together with their principal occupations during the past five years. Unless otherwise indicated, the address of each person listed below is 4151 Amon Carter Boulevard, MD 2450, Fort Worth, Texas 76155. Each Trustee oversees twenty funds in the fund complex that includes the Trust, the American Beacon Master Trust, the American Beacon Mileage Funds, and the American Beacon Select Funds. The Trust’s Statement of Additional Information contains additional information about the Trustees and is available without charge by calling 1-800-658-5811.
| | | | |
Name, Age and Address | | Position, Term of Office and Length of Time Served with the Trust | | Principal Occupation(s) During Past 5 Years and Current Directorships |
| | |
| INTERESTED TRUSTEES | | | | |
| | Term | | |
| | Lifetime of Trust until removal, resignation or retirement* | | |
| | |
| Alan D. Feld** (74) | | Trustee since 1996 | | Sole Shareholder of a professional corporation which is a Partner in the law firm of Akin, Gump, Strauss, Hauer & Feld, LLP (1960-Present); Director, Clear Channel Communications (1984-2008); Trustee, Center Point Properties (1994-2006); Member, Board of Trustees, Southern Methodist University; Member, Board of Visitors, M.D. Anderson Hospital; Board of Visitors, Zale/Lipshy Hospital; Trustee, American Beacon Mileage Funds (1996-Present); Trustee, American Beacon Select Funds (1999-Present); Trustee, American Beacon Master Trust Funds (1996-Present). |
| | |
| NON-INTERESTED TRUSTEES | | Term | | |
| | Lifetime of Trust until removal, resignation or retirement* | | |
| | |
| W. Humphrey Bogart (67) | | Trustee since 2004 | | Board Member, Baylor University Medical Center Foundation (1992-2004); Consultant, New River Canada Ltd. (mutual fund servicing company) (1998-2003); President and CEO, Allmerica Trust Company, NA (1996-1997); President and CEO, Fidelity Investments Southwest Company (1983-1995); Senior Vice President of Regional Centers, Fidelity Investments (1988-1995); Trustee, American Beacon Mileage Funds (2004-Present); Trustee, American Beacon Select Funds (2004-Present); Trustee, American Beacon Master Trust Funds (2004-Present). |
| | |
| Brenda A. Cline (50) | | Trustee since 2004 | | Executive Vice President, Chief Financial Officer, Treasurer and Secretary, Kimbell Art Foundation (1993-Present); Trustee, Texas Christian University (1998-Present); Trustee, W.I. Cook Foundation, Inc. (d/b/a Cook Children’s Health Foundation) (2001-2006); Director, Christian Church Foundation (1999-2007); Trustee, Trinity Valley School (2003-2004); Member; Trinity Valley School Endowment Committee (2004-Present); Trustee, American Beacon Mileage Funds (2004-present); Trustee, American Beacon Select Funds (2004-Present); Trustee, American Beacon Master Trust Funds (2004-Present). |
| | |
| Eugene J. Duffy (57) | | Trustee since 2008 | | Principal and Executive Vice President, Paradigm Asset Management (1994-Present); Director, Sunrise Bank of Atlanta (2008-Present); Chairman, Special Contributions Fund Board of Trustees, National Association for the Advancement of Colored People (2007-Present); Trustee, National Association for the Advancement of Colored People (2000-Present); Board of Visitors, Emory University (2006-Present); Trustee, Atlanta Botanical Garden (2006-Present); Board Member, Willie L. Brown Jr. Institute on Politics and Public Service (2001-Present); Chair, National Association of Securities Professionals (2000-2002); Deputy Chief Administrative Officer, City of Atlanta (1985-1990); Trustee, American Beacon Mileage Funds (2008-Present); Trustee, American Beacon Select Funds (2008-Present); Trustee, American Beacon Master Trust Funds (2008-Present). |
72
Trustees and Officers of the American Beacon Funds
(Unaudited)
| | | | |
Name, Age and Address | | Position, Term of Office and Length of Time Served with the Trust | | Principal Occupation(s) During Past 5 Years and Current Directorships |
| | |
| Thomas M. Dunning (69) | | Trustee since 2008 | | Non-Executive Chairman (2008-Present); Chairman (1998-2008) and Chief Executive Officer (1998-2007), Lockton Dunning Benefits (consulting firm in employee benefits); Director, Oncor Electric Delivery Company LLC (2007-present); Board Member, Baylor Health Care System Foundation (2007-present); Vice Chair, State Fair of Texas (1987-Present); Board Member, Southwestern Medical Foundation (1994-present); Board Member, John Tower Center for Political Studies/SMU (2008-Present); Board Member, University of Texas Development Board (2008-Present); Board Member, BancTec (2010 – Present) (software consulting); Trustee, American Beacon Mileage Funds (2008-Present); Trustee, American Beacon Select Funds (2008-Present); Trustee, American Beacon Master Trust Funds (2008-Present). |
| | |
| Richard A. Massman (68) | | Trustee since 2004 Chairman since 2008 | | Consultant and General Counsel Emeritus (2009-Present), Senior Vice President and General Counsel (1994-2009), Hunt Consolidated, Inc. (holding company engaged in oil and gas exploration and production, refining, real estate, farming, ranching and venture capital activities); Chairman (2007-2011) and Director (2005-2011), The Dallas Opera Foundation; Chairman (2006-2010) and Director (2005-2009), Temple Emanu-El Foundation; Trustee, Presbyterian Healthcare Foundation (2006-Present); Director, The Retina Foundation of the Southwest (2000-Present); Trustee, American Beacon Mileage Funds (2004-Present); Trustee, American Beacon Select Funds (2004-Present); Trustee, American Beacon Master Trust Funds (2004-Present). |
| | |
R. Gerald Turner (65) 225 Perkins Admin. Bldg. Southern Methodist Univ. Dallas, Texas 75275 | | Trustee since 2001 | | President, Southern Methodist University (1995-Present); Director, ChemFirst (1986-2002); Director, J.C. Penney Company, Inc. (1996-Present); Director, California Federal Preferred Capital Corp. (2001-2003); Director, Kronus Worldwide Inc. (chemical manufacturing) (2003-Present); Director, First Broadcasting Investment Partners, LLC (2003-2007); Member, Salvation Army of Dallas Board of Directors; Member, Methodist Hospital Advisory Board; Co-Chair, Knight Commission on Intercollegiate Athletics; Trustee, American Beacon Mileage Funds (2001-Present); Trustee, American Beacon Select Funds (2001-Present); Trustee, American Beacon Master Trust Funds (2001-Present). |
| | |
| Paul J. Zucconi, CPA (71) | | Trustee since 2008 | | Director, Affirmative Insurance Holdings, Inc. (producer of nonstandard automobile insurance) (2004-Present); Director, Titanium Metals Corporation (producer of titanium melted and mill products) (2002-Present); Director, Torchmark Corporation (life and health insurance products) (2002-Present); Director, Charter Bank (community services and products) (2010-Present); Director, Dallas Chapter of National Association of Corporate Directors (2004-Present); Partner, KPMG (1976-2001); Trustee, American Beacon Mileage Funds (2008-Present); Trustee, American Beacon Select Funds (2008-Present); Trustee, American Beacon Master Trust Funds (2008-Present). |
| | | | |
Name, Age and Address | | Position, Term of Office and Length of Time Served with the Trust | | Principal Occupation(s) During Past 5 Years and Current Directorships |
| | |
| OFFICERS | | Term | | |
| | One Year | | |
| | |
| Gene L. Needles, Jr. (56) | | President since 2009 Executive Vice President since 2009 | | President, CEO and Director (2009-Present), American Beacon Advisors, Inc.; President, CEO and Director (2009-Present), Lighthouse Holdings, Inc.; President (2009-Present), American Beacon Mileage Funds; President (2009-Present), American Beacon Select Funds; President (2008-2009), Touchstone Investments; President (2003-2007), CEO (2004-2007), Managing Director of Sales (2002-2003), National Sales Manager (1999-2002), and Regional Sales Manager (1993-1999), AIM Distributors. |
73
Trustees and Officers of the American Beacon Funds
(Unaudited)
| | | | |
| William F. Quinn** (63) | | Executive Vice President from 2007 to 2008 and 2009 to Present President from 1987 to 2007 and 2008 to 2009 Trustee from 1987 to 2008 | | Executive Chairman (2009-Present), Chairman (2006-2009), CEO (2006-2007), President (1986-2006) and Director (2003-Present), American Beacon Advisors, Inc.; Chairman and Director (2008-Present), Lighthouse Holdings, Inc.; Chairman (1989-2003) and Director (1979-1989, 2003-Present), American Airlines Federal Credit Union; Director, Hicks Acquisition I, Inc. (2007-2009), Director, Hicks Acquisition II, Inc. (2010-Present); Director, Crescent Real Estate Equities, Inc. (1994-2007); Director, Pritchard, Hubble & Herr, LLC (investment advisor) (2001-2006); Director of Investment Committee, Southern Methodist University Endowment Fund (1996-Present); Member, Southern Methodist University Cox School of Business Advisory Board (1999-2002); Member, New York Stock Exchange Pension Manager Committee (1997-1998, 2000-2002, 2006-Present); Chairman (2007-Present) and Vice Chairman (2004-2007), Committee for the Investment of Employee Benefits; Director, United Way of Metropolitan Tarrant County (1988-2000, 2004-Present); the Independent Trustee, National Railroad Retirement Investment Trust (2011-Present); Trustee (1995-2008) and President (1995-2007, 2008-2009), American Beacon Mileage Funds; Trustee (1999-2008) and President (1999-2007, 2008-Present), American Beacon Select Funds; Trustee, American Beacon Master Trust (1995-2008); Director, American Beacon Global Funds SPC (2002-2011); Director, American Beacon Global Funds, plc (2007-2009). |
| | |
| Rosemary K. Behan (52) | | VP, Secretary and Chief Legal Officer since 2006 | | Vice President, Legal and Compliance, American Beacon Advisors, Inc. (2006-Present); Secretary (2008-Present), Lighthouse Holding, Inc.; Assistant General Counsel, First Command Financial Planning, Inc. (2004-2006); Attorney, U.S. Securities and Exchange Commission, (1995-2004). |
| | |
| Brian E. Brett (51) | | VP since 2004 | | Vice President, Director of Sales, American Beacon Advisors, Inc. (2004-Present); Regional Vice President, Neuberger Berman, LLC (investment adviser) (1996-2004). |
| | |
| Wyatt Crumpler (45) | | VP since 2007 | | Vice President, Asset Management (2009-Present) and Vice President, Trust Investments (2007-2009), American Beacon Advisors, Inc.; Managing Director of Corporate Accounting (2004-2007) and Director of IT Strategy and Finance (2001-2004), American Airlines, Inc. |
| | |
| Erica Duncan (41) | | VP Since 2011 | | Vice President, Marketing and Client Services (2011-Present), American Beacon Advisors, Inc.; Supervisor, Brand Marketing (2010-2011), Invesco; Supervisor, Marketing Communications (2009-2010) and Senior Financial Writer (2004-2009), Invesco AIM. |
| | |
| Michael W. Fields (57) | | VP since 1989 | | Vice President, Fixed Income Investments, American Beacon Advisors, Inc. (1988-Present); Director American Beacon Global Funds SPC (2002-Present); Director, American Beacon Global Funds plc (2007-2009). |
| | |
| Melinda G. Heika (50) | | Treasurer since 2010 | | Vice President, Finance and Accounting (2010-Present), Controller (2005-2009), Assistant Controller (1998-2004), American Beacon Advisors, Inc.; Treasurer (2010-Present), Lighthouse Holdings, Inc. |
| | |
| Terri L. McKinney (47) | | VP since 2010 | | Vice-President, Enterprise Services (2009-Present), Managing Director (2003-2009), and Director of Marketing & Retail Sales (1996-2003), American Beacon Advisors, Inc.; President, Board of Trustees (2010-Present), Vice-President, Board of Trustees (2008-2010), and Trustee (2006-2008), Down Syndrome Guild of Dallas. |
| | |
| Jeffrey K. Ringdahl (36) | | VP since 2010 | | Chief Operating Officer, American Beacon Advisors, Inc. (2010-Present); Vice President, Product Management, Touchstone Advisors, Inc. (2007-2010); Senior Director, Business Integration, Fidelity Investments (2005-2007). |
| | |
| Samuel J. Silver (48) | | VP Since 2011 | | Vice President, Fixed Income Investments (2011-Present) and Senior Portfolio Manager, Fixed Income Investments (1999-2011), American Beacon Advisors, Inc. |
| | |
| Christina E. Sears (40) | | Chief Compliance Officer since 2004 and Asst. Secretary since 1999 | | Chief Compliance Officer (2004-Present) and Senior Compliance Analyst (1998-2004), American Beacon Advisors, Inc. |
74
Trustees and Officers of the American Beacon Funds
(Unaudited)
| | | | |
| John J. Okray (37) | | Asst. Secretary since 2010 | | Assistant General Counsel, American Beacon Advisors, Inc. (2010-Present); Vice President, Oppenheimer Funds, Inc. (2004-2010). |
| | |
| Sonia L. Bates (55) | | Asst. Treasurer since 2011 | | Director, Tax and Financial Reporting (2011-Present), Manager, Tax and Financial Reporting (2005-2010), Senior Tax Analyst (1999-2004), American Beacon Advisors, Inc.; Asst. Treasurer (2011-Present), Lighthouse Holdings, Inc. |
| * | The Board has adopted a retirement plan that requires Trustees to retire no later than the last day of the calendar year in which they reach the age of 72, provided, however, that the Board may determine to grant one or more annual exemptions to this requirement. |
| ** | Mr. Feld is deemed to be an “interested person” of the Trusts, as defined by the 1940 Act. Mr. Feld’s law firm of Akin, Gump, Strauss, Hauer & Feld LLP has provided legal services within the past two fiscal years to the Manager and one or more of the Trust’s and Master Trust’s sub-advisors. |
75
This page intentionally left blank.
76
Delivery of Documents
eDelivery is NOW AVAILABLE - Stop traditional mail delivery and receive your
shareholder reports and summary prospectus on-line. Sign up at
www.americanbeaconfunds.com
If you invest in the Fund through a financial institution, you may be able to receive the Fund’s regulatory mailings, such as the Summary Prospectus, Annual Report and Semi-Annual Report, by e-mail. If you are interested in this option, please go to www.icsdelivery.com and search for your financial institution’s name or contact your financial institution directly.
To obtain more information about the Fund:
| | |
| | |
By E-mail: american_beacon.funds@ambeacon.com | | On the Internet: Visit our website at www.americanbeaconfunds.com |
| | |
| | |
By Telephone: Institutional, Y, Investor, Advisor, Retirement Classes Call (800) 658-5811 AMR ClassSM Call (800) 345-2345 | | By Mail: American Beacon Funds P.O. Box 219643 Kansas City, MO 64121-9643 |
| | |
Availability of Quarterly Portfolio Schedules In addition to the Schedule of Investments provided in each semi-annual and annual report, the Fund files a complete schedule of its portfolio holdings with the Securities and Exchange Commission (“SEC”) on Form N-Q as of the first and third fiscal quarters. The Fund’s Forms N-Q are available on the SEC’s website at www.sec.gov. The Forms N-Q may also be reviewed and copied at the SEC’s Public Reference Room, 450 Fifth Street, NW, Washington, DC 20549. Information regarding the operation of the SEC’s Public Reference Room may be obtained by calling 1-800-SEC-0330. A complete schedule of the Fund’s portfolio holdings is also available on the Funds’ website (www.americanbeaconfunds.com) approximately twenty days after the end of each month. | | Availability of Proxy Voting Policy and Records A description of the policies and procedures the Fund uses to determine how to vote proxies relating to portfolio securities is available in the Fund’s Statement of Additional Information, is available free of charge on the Fund’s website (www.americanbeaconfunds.com) and by calling 1-800-967-9009 or by accessing the SEC’s website at www.sec.gov. The Fund’s proxy voting record for the most recent year ended June 30 is filed annually with the SEC on Form N-PX. The Fund’s Forms N-PX are available on the SEC’s website at www.sec.gov. The Fund’s proxy voting record may also be obtained by calling 1-800-967-9009. |
Fund Service Providers:
| | | | | | |
CUSTODIAN State Street Bank and Trust Boston, Massachusetts | | TRANSFER AGENT Boston Financial Data Services Kansas City, Missouri | | INDEPENDENT REGISTERED PUBLIC ACCOUNTING FIRM Ernst & Young LLP Dallas, Texas | | DISTRIBUTOR Foreside Fund Services, LLC Portland, Maine |
This report is prepared for shareholders of the American Beacon Funds and may be distributed to others only if preceded or accompanied by a current Prospectus or Summary Prospectus.
| | | | |
| American Beacon Funds and American Beacon Small Cap Value Fund are service marks of American Beacon Advisors, Inc. | | | AR 10/11 | |
ITEM 2. CODE OF ETHICS.
The Trust has adopted a code of ethics that applies to its principal executive and financial officers (the “Code”). The Trust amended its code February 16, 2010 to disclose a change in the Principal Financial Office. The Trust did not grant any waivers to the provisions of the Code during the period covered by the shareholder report presented in Item 1. The Code is filed herewith as Exhibit 99.CODE ETH.
ITEM 3. AUDIT COMMITTEE FINANCIAL EXPERT.
The Trust’s Board of Trustees has determined that Mr. Paul Zucconi, a member of the Trust’s Audit and Compliance Committee, is an “audit committee financial expert” as defined in Form N-CSR. Mr. Paul Zucconi is “independent” as defined in Form N-CSR.
ITEM 4. PRINCIPAL ACCOUNTANT FEES AND SERVICES.
| | | | | | | | |
| | Audit Fees | | | | | | Fiscal Year Ended | |
| $ | 37,869 | | | | | | 8/31/2010 | |
| $ | 318,158 | | | | | | 10/31/2010 | |
| $ | 95,455 | | | | | | 12/31/2010 | |
| $ | 144,159 | | | | | | 8/31/2011 | |
| $ | 328,501 | | | | | | 10/31/2011 | |
| $ | 72,527 | | | | | | 12/31/2011 | |
| | | | | | |
| Audit-Related Fees | | | | | Fiscal Year Ended | |
$ 0 | | | | | 8/31/2010 | |
$ 12,375* | | | | | 10/31/2010 | |
$ 3,875* | | | | | 12/31/2010 | |
$ 0 | | | | | 8/31/2011 | |
$ 0 | | | | | 10/31/2011 | |
$ 0 | | | | | 12/31/2011 | |
*Review of additional N-1A filings
| | | | | | | | |
| | Tax Fees | | | | | | Fiscal Year Ended | |
| $ | 3,426 | | | | | | 8/31/2010 | |
| $ | 40,277 | | | | | | 10/31/2010 | |
| $ | 4,129 | | | | | | 12/31/2010 | |
| $ | 3,426 | | | | | | 8/31/2011 | |
| $ | 50,971 | | | | | | 10/31/2011 | |
| $ | 3,398 | | | | | | 12/31/2011 | |
| | | | | | |
| All Other Fees | | | | | Fiscal Year Ended | |
$0 | | | | | 8/31/2010 | |
$0 | | | | | 10/31/2010 | |
$0 | | | | | 12/31/2010 | |
$0 | | | | | 8/31/2011 | |
$0 | | | | | 10/31/2011 | |
$0 | | | | | 12/31/2011 | |
(e)(1) Pursuant to its charter, the Trust’s Audit and Compliance Committee shall have the following duties and powers pertaining to pre-approval of audit and non-audit services provided by the Trust’s principal accountant:
- to approve, prior to appointment, the engagement of auditors to annually audit and provide their opinion on the Trusts’ financial statements, and, in connection therewith, reviewing and evaluating matters potentially affecting the independence and capabilities of the auditors;
- to approve, prior to appointment, the engagement of the auditors to provide non-audit services to the Trusts, an investment adviser to any series of the Trusts or any entity controlling, controlled by, or under common control with an investment adviser (“adviser affiliate”) that provides ongoing services to the Trusts, if the engagement relates directly to the operations and financial reporting of the Trusts;
- to consider whether the non-audit services provided by a Trust’s auditor to an investment adviser or any adviser affiliate that provides ongoing services to a series of the Trusts, which services were not pre-approved by the Committee, are compatible with maintaining the auditor’s independence;
- to review the arrangements for and scope of the annual audit and any special audits; and
- to review and approving the fees proposed to be charged to the Trusts by the auditors for each audit and non-audit service.
The Audit and Compliance Committee may delegate any portion of its authority, including the authority to grant pre-approvals of audit and permitted non-audit services, to a subcommittee of one or more members. Any decisions of the subcommittee to grant pre-approvals shall be presented to the full audit committee at its next regularly scheduled meeting.
(e)(2) None of the fees disclosed in paragraphs (b) through (d) above were approved by the audit committee pursuant to paragraph (c)(7)(i)(C) of Rule 2-01 of Regulation S-X.
Aggregate Non-Audit Fees for Services Rendered to the:
| | | | | | | | | | | | |
Registrant | | | Adviser | | |
| Adviser’s Affiliates Providing
Ongoing Services to Registrant |
| | | Fiscal Year Ended | |
$ 3,246 | | $ | 0 | | | | N/A | | | | 8/31/2010 | |
$ 52,652 | | $ | 0 | | | | N/A | | | | 10/31/2010 | |
$ 8,004 (Revised) | | $ | 0 | | | | N/A | | | | 12/31/2010 | |
$ 3,426 | | $ | 7,885 | | | | N/A | | | | 8/31/2011 | |
$ 50,971 | | $ | 0 | | | | N/A | | | | 10/31/2011 | |
$ 3,398 | | $ | 0 | | | | N/A | | | | 12/31/2011 | |
ITEM 5. AUDIT COMMITTEE OF LISTED REGISTRANTS.
Not applicable.
ITEM 6. SCHEDULE OF INVESTMENTS.
The schedules of investments for each series of the Trust are included in the shareholder report presented in Item 1.
ITEM 7. DISCLOSURE OF PROXY VOTING POLICIES AND PROCEDURES FOR CLOSED-END MANAGEMENT INVESTMENT COMPANIES.
Not applicable.
ITEM 8. PORTFOLIO MANAGERS OF CLOSED-END MANAGEMENT INVESTMENT COMPANIES.
Not applicable.
ITEM 9. PURCHASES OF EQUITY SECURITIES BY CLOSED-END MANAGEMENT INVESTMENT COMPANY AND AFFILIATED PURCHASERS.
Not applicable.
ITEM 10. SUBMISSION OF MATTERS TO A VOTE OF SECURITY HOLDERS.
The Trust has made no material changes to the procedures by which shareholders may recommend nominees to the Trust’s Board of Trustees since the Trust last disclosed such procedures in Schedule 14A.
ITEM 11. CONTROLS AND PROCEDURES.
(a) Based upon an evaluation within 90 days of the filing date of this report, the principal executive and financial officers concluded that the disclosure controls and procedures of the Trust are effective.
(b) There were no changes in the Trust’s internal control over financial reporting during the second fiscal quarter of the period covered by this report that has materially affected, or is reasonably likely to materially affect, the Trust’s internal control over financial reporting.
ITEM 12. EXHIBITS.
(a)(1) Filed herewith as EX-99.CODE ETH.
(a)(2) A separate certification for each principal executive officer and principal financial officer of the Trust as required by Rule 30a-2(a) under the Investment Company Act of 1940 is attached hereto as EX-99.CERT.
(a)(3) Not applicable.
(b) The certifications required by Rule 30a-2(b) under the Investment Company Act of 1940 are attached hereto as EX-99.906CERT.
SIGNATURES
Pursuant to the requirements of the Securities Exchange Act of 1934 and the Investment Company Act of 1940, the registrant has duly caused this report to be signed on its behalf by the undersigned, thereunto duly authorized.
(Registrant): American Beacon Funds
| | |
|
| |
| By | | /s/ Gene L. Needles, Jr. |
| | Gene L. Needles, Jr. President |
Date: September 6, 2012
Pursuant to the requirements of the Securities Exchange Act of 1934 and the Investment Company Act of 1940, this report has been signed below by the following persons on behalf of the registrant and in the capacities and on the dates indicated.
| | |
|
| |
| By | | /s/ Gene L. Needles, Jr. |
| | Gene L. Needles, Jr. President |
Date: September 6, 2012
| | |
|
| |
| By | | /s/ Melinda G. Heika |
| | Melinda G. Heika Treasurer |
Date: September 6, 2012