UNITED STATES
SECURITIES AND EXCHANGE COMMISSION
Washington, D.C. 20549
FORMN-CSR
CERTIFIED SHAREHOLDER REPORT OF REGISTERED
MANAGEMENT INVESTMENT COMPANIES
Investment Company Act file number:811-4984
AMERICAN BEACON FUNDS
(Exact name of registrant as specified in charter)
220 East Las Colinas Boulevard, Suite 1200
Irving, Texas 75039
(Address of principal executive offices)-( Zip code)
GENE L. NEEDLES, JR., PRESIDENT
220 East Las Colinas Boulevard, Suite 1200
Irving, Texas 75039
(Name and address of agent for service)
Registrant’s telephone number, including area code: (817)391-6100
Date of fiscal year end: December 31, 2019
Date of reporting period: December 31, 2019
FormN-CSR is to be used by management investment companies to file reports with the Commission not later than 10 days after the transmission to stockholders of any report that is required to be transmitted to stockholders under Rule30e-1 under the Investment Company Act of 1940 (17 CFR270.30e-1). The Commission may use the information provided on FormN-CSR in its regulatory, disclosure review, inspection, and policymaking roles.
A registrant is required to disclose the information specified by FormN-CSR, and the Commission will make this information public. A registrant is not required to respond to the collection of information contained in FormN-CSR unless the Form displays a currently valid Office of Management and Budget (“OMB”) control number. Please direct comments concerning the accuracy of the information collection burden estimate and any suggestions for reducing the burden to Secretary, Securities and Exchange Commission, 450 Fifth Street, NW, Washington, DC 20549-0609. The OMB has reviewed this collection of information under the clearance requirements of 44 U.S.C. § 3507.
| ITEM 1. | REPORTS TO STOCKHOLDERS. |
About American Beacon Advisors
Since 1986, American Beacon Advisors, Inc. has offered a variety of products and investment advisory services to numerous institutional and retail clients, including a variety of mutual funds, corporate cash management, and separate account management.
Our clients include defined benefit plans, defined contribution plans, foundations, endowments, corporations, financial planners, and other institutional investors. With American Beacon Advisors, you can put the experience of a multi-billion dollar asset management firm to work for your company.
BRIDGEWAY LARGE CAP GROWTH FUND
Growth stockstypically are more volatile than value stocks; however, value stocks have a lower expected growth rate in earnings and sales. Investing inforeign securitiesmay involve heightened risk due to currency fluctuations and economic and political risks. While the Fund is managed pursuant to a tax management strategy, the Fund’s investments could createcapital gains. The use offutures contractsfor cash management may subject the Fund to losing more money than invested. Please see the prospectus for a complete discussion of the Fund’s risks. There can be no assurances that the investment objectives of this Fund will be met.
BRIDGEWAY LARGE CAP VALUE FUND
Investing invalue stocksmay limit downside risk over time; however, the Fund may produce more modest gains than riskier stock funds as atrade-off for this potentially lower risk. Investing inforeign securitiesmay involve heightened risk due to currency fluctuations and economic and political risks. While the Fund is managed pursuant to a tax management strategy, the Fund’s investments could createcapital gains. The use offutures contractsfor cash management may subject the Fund to losing more money than invested. Please see the prospectus for a complete discussion of the Fund’s risks. There can be no assurances that the investment objectives of this Fund will be met.
Any opinions herein, including forecasts, reflect our judgment as of the end of the reporting period and are subject to change. Each advisor’s strategies and each Fund’s portfolio composition will change depending on economic and market conditions. This report is not a complete analysis of market conditions, and, therefore, should not be relied upon as investment advice. Although economic and market information has been compiled from reliable sources, American Beacon Advisors, Inc. makes no representation as to the completeness or accuracy of the statements contained herein.
American Beacon Funds | December 31, 2019 |
| 1 | ||||
| 2 | ||||
| 9 | ||||
| 11 | ||||
Schedules of Investments: | ||||
| 12 | ||||
| 17 | ||||
| 22 | ||||
| 25 | ||||
Financial Highlights: | ||||
| 44 | ||||
| 50 | ||||
| 56 | ||||
| 57 | ||||
| 65 | ||||
| Back Cover | ||||
 | Dear Shareholders,
In recent months, you’ve likely seen and heard news reports about disruptive headwinds in the global economy –including the U.S. trade war with China and its toll on the global economy, slowing global growth, the Federal Reserve’s series of rate cuts, Brexit, disruptions in the Middle East and protests in Hong Kong – and watched a flood of reaction in the world’s markets.
As Peter L. Bernstein said in his treatise on risk,Against the Gods: The Remarkable Story of Risk, published by John Wiley & Sons, Inc. in September 1998, “Volatility is a proxy for uncertainty and must be accommodated in measuring investment risk.”
During times of economic uncertainty and market volatility, fear of loss can be a powerful emotion – one that drives many investors to making short-term decisions subject to a variety of potential error-leading biases. Unfortunately, some short-term investment decisions may create more volatility rather than mitigate it. |
Instead of dwelling on the markets’ short-term reaction to waves of negative global news, we encourage investors to focus on the horizon instead. Long-term investing isn’t about identifying and anticipating the next big market move, it is about identifying the right investment products for riding out those moves. As a long-term investor, you should keep in mind the three Ds: direction, discipline and diversification.
| u | Direction: Achieving your long-term financial goals requires an individualized plan of action. You may want your plan to provide some measure of protection against periods of geopolitical turmoil, economic uncertainty, market volatility and job insecurity. Your plan should be reviewed annually and be adjusted in the event your long-range needs change. |
| u | Discipline:Long-term, systematic participation in an investment portfolio requires your resolution to stay the course. Spending time in the market – rather than trying to time the market – may place you in a better position to reach your long-term financial goals. |
| u | Diversification: By investing in different investment styles and asset classes, you may be able to help mitigate financial risks across your investment portfolio. By allocating your investment portfolio according to your risk-tolerance level, you may be better positioned to weather storms and achieve your long-term financial goals. |
Since 1986, American Beacon has endeavored to provide investors with a disciplined approach to realizing long-term financial goals. As a manager of managers, we strive to provide investment products that may enable investors to participate during market upswings while potentially insulating against market downswings.
Many of thesub-advisors to our mutual funds pursue upside capture and/or downside protection using proprietary strategies. The investment teams behind our mutual funds seek to produce consistent, long-term results rather than focus only on short-term movements in the markets. In managing our investment products, we emphasize identifying opportunities that offer the potential for long-term rewards.
Our management approach is more than a concept; it’s the cornerstone of our culture. And we strive to apply it at every turn as we seek to provide a well-diversified line of investment solutions to help our shareholders seek long-term rewards while mitigating volatility and risk.
Thank you for your continued interest in American Beacon. For additional information about our investment products or to access your account information, please visit our website atwww.americanbeaconfunds.com.
Best Regards,

Gene L. Needles, Jr.
President
American Beacon Funds
1
Domestic Equity Market Overview
December 31, 2019 (Unaudited)
The domestic equity market was strong for the12-month period under review despite uncertainty surrounding tariff, political and economic headlines. The 31.5% return of the S&P 500 Index (the “Index”) was its highest annual return since 2013; the Index recorded 35all-time highs during the year. Large-capitalization stocks outpaced small, and Growth stocks outperformed Value stocks across market caps. The Russell 2000 Growth Index outperformed the Russell 2000 Value Index by 6.1 percentage points, while the Russell 1000 Growth Index outperformed the Russell 1000 Value Index by 9.9 percentage points.
In the first quarter of 2019, the Index returned 13.7%, as aforementioned investor fears eased allowing equity markets to recoup nearly all declines from the fourth quarter of the 2018 market drawdown. This strong reversal was particularly driven by an increasingly optimistic outlook on U.S.-China trade talks, better-than-expected domestic GDP growth of 3.1%, healthy wage growth of 3.4%, and the Federal Reserve (the “Fed”) shifting to a more accommodative and “patient” stance.
Negative trade news flow between the U.S. and trading partners China and Mexico inundated investors during the second quarter of 2019 and drove market volatility. Optimism around U.S.-China trade relations quickly flipped negative with an announcement by the U.S. of a third round of tariffs. Additionally, the U.S. threatened a 5% tariff against Mexico. The tariff headlines, coupled with lower 2019 profit growth estimates for the Index, led to poor equity returns in May. However, Mexico’s ratification of the new United States-Mexico-Canada Agreement, which replaces the25-year-old North American Free Trade Agreement, as well as supportive macro data, such as a continued low unemployment rate of 3.6%, pushed the market higher for another consecutive quarter.
Trade-war rhetoric moved markets again in the third quarter of 2019. A fourth round of tariffs was announced and implemented, and the U.S. Department of the Treasury also designated China as a currency manipulator. Conversely, U.S. retail sales grew at a much better pace compared to the end of 2018 (4.4% year-over-year in August 2019 versus 1.5% in December 2018). Monetary conditions were again eased after the Fed cut its target rate twice during the third quarter of 2019, citing uncertainties in the global economic outlook.
A strong Index return of 9.1% in the fourth quarter of 2019 pushed the Index return for the12-month period to 31.5%. Despite a slower U.S. economic growth rate of 2.1%, unemployment again achieved another50-year low at 3.5%. In addition, domestic retail sales continued to grow at an increasing rate of 5.8% year-over-year in December, providing evidence the U.S. consumer remained healthy. October tariffs on China were canceled and, by the end of the year, Phase One of the U.S.-China trade deal was all but signed, causing business clarity and improved CEO confidence.
As the year ended, equity markets moved solidly higher in 2019, supported mainly by expandedprice-to-earnings multiples as a result of controlled inflation trends and a variety of economic metrics that served as a “no recession now” signal.
2
American Beacon Bridgeway Large Cap Growth FundSM
Performance Overview
December 31, 2019 (Unaudited)
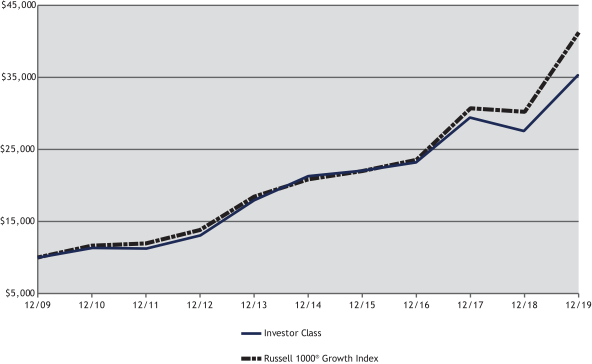
The Investor Class of the American Beacon Bridgeway Large Cap Growth Fund (the “Fund”) returned 29.70% for the twelve months ended December 31, 2019, compared to the Russell 1000® Growth Index (the “Index”) return of 36.39% for the same period.
Comparison of Change in Value of a $10,000 Investment for the period from 12/31/2009 through 12/31/2019
| Total Returns for the Period Ended December 31, 2019 |
| |||||||||||||||||||||||||||||||
Ticker | 1 Year | 3 Years | 5 Years | 10 Years | Value of $10,000 12/31/2009- 12/31/2019 | |||||||||||||||||||||||||||
Institutional Class (1,8) | BRLGX | 30.18 | % | 15.90 | % | 11.24 | % | 13.75 | % | $ | 36,262 | |||||||||||||||||||||
Y Class (1,2,8) | BLYYX | 30.11 | % | 15.81 | % | 11.17 | % | 13.71 | % | $ | 36,153 | |||||||||||||||||||||
Investor Class (1,3,8) | BLYPX | 29.70 | % | 15.47 | % | 10.91 | % | 13.58 | % | $ | 35,729 | |||||||||||||||||||||
A without Sales Charge (1,4,8) | BLYAX | 29.74 | % | 15.49 | % | 10.93 | % | 13.59 | % | $ | 35,769 | |||||||||||||||||||||
A with Sales Charge (1,4,8) | BLYAX | 22.29 | % | 13.23 | % | 9.63 | % | 12.92 | % | $ | 33,719 | |||||||||||||||||||||
C without Sales Charge (1,5,8) | BLYCX | 28.75 | % | 14.63 | % | 10.28 | % | 13.26 | % | $ | 34,720 | |||||||||||||||||||||
C with Sales Charge (1,5,8) | BLYCX | 27.75 | % | 14.63 | % | 10.28 | % | 13.26 | % | $ | 34,720 | |||||||||||||||||||||
R6 Class (1,6,8) | BLYRX | 30.30 | % | 15.93 | % | 11.26 | % | 13.76 | % | $ | 36,294 | |||||||||||||||||||||
Russell 1000® Growth Index (7) | 36.39 | % | 20.49 | % | 14.63 | % | 15.22 | % | $ | 41,234 | ||||||||||||||||||||||
| 1. | Performance shown is historical and is not indicative of future returns. Investment returns and principal value will vary, and shares may be worth more or less at redemption than at original purchase. Performance shown is calculated based on the publishedend-of-day net asset values as of date indicated, and current performance may be lower or higher than the performance data quoted. To obtain performance as of the most recent month end, please visitwww.americanbeaconfunds.com or call1-800-967-9009. Fund performance in the table above does not reflect the deduction of taxes a shareholder would pay on distributions or the redemption of shares. Generally accepted accounting principles require adjustments to be made to the net assets of the Fund at period end for financial reporting purposes only; and as such, the total return based on the unadjusted net asset value per share may differ from the total return reported in the financial highlights. A portion of fees charged to the Institutional Class of the Fund has been waived since Fund inception. Performance prior to waiving fees was lower than actual returns shown since inception. Please note that the recent performance of the securities market has helped produce short-term returns that are not typical and may not continue in the future. |
3
American Beacon Bridgeway Large Cap Growth FundSM
Performance Overview
December 31, 2019 (Unaudited)
| 2. | Fund performance for the five-year andten-year periods represent the returns achieved by the Institutional Class from 12/31/09 up to 2/5/16, the inception date of the Y Class, and the returns of the Y Class since its inception. Expenses of the Y Class are higher than those of the Institutional Class. As a result, total returns shown may be higher than they would have been had the Y Class been in existence since 12/31/09. A portion of the fees charged to the Y Class has been waived since Fund inception. Performance prior to waiving fees was lower than actual returns shown since inception. |
| 3. | Fund performance for the five-year andten-year periods represent the returns achieved by the Institutional Class from 12/31/09 up to 2/5/16, the inception date of the Investor Class, and the returns of the Investor Class since its inception. Expenses of the Investor Class are higher than those of the Institutional Class. Therefore, total returns shown may be higher than they would have been had the Investor Class been in existence since 12/31/09. A portion of the fees charged to the Investor Class of the Fund has been waived since Fund inception. Performance prior to waiving fees was higher than actual returns shown since inception. |
| 4. | Fund performance for the five-year andten-year periods represent the returns achieved by the Institutional Class from 12/31/09 through 2/5/16, the inception date of the A Class, and the returns of the A Class since its inception. Expenses of the A Class are higher than those of the Institutional Class. As a result, total returns shown may be higher than they would have been had the A Class been in existence since 12/31/09. A portion of the fees charged to the A Class of the Fund has been waived since Fund inception. Performance prior to waiving fees was lower than actual returns shown since inception. A Class shares have a maximum sales charge of 5.75%. |
| 5. | Fund performance for the five-year andten-year periods represent the returns achieved by the Institutional Class from 12/31/09 through 2/5/16, the inception date of the C Class, and the returns of the C Class since its inception. Expenses of the C Class are higher than those of the Institutional Class. As a result, total returns shown may be higher than they would have been had the C Class been in existence since 12/31/09. A portion of fees charged to the C Class of the Fund was waived from Fund inception through 2017, partially recovered in 2018, and waived in 2019. Performance prior to waiving fees was lower than actual returns shown through 2017 and for 2019. The maximum contingent deferred sales charge for the C Class is 1.00% for shares redeemed within one year of the date of purchase. |
| 6. | Fund performance for the three-year, five-year andten-year periods represent the returns achieved by the Institutional Class from 12/31/09 through 4/30/18, the inception date of the R6 Class and the returns of the R6 Class since its inception. Expenses of the R6 Class are lower than the Institutional Class. As a result, total returns shown may be lower than they would have been had the R6 Class been in existence since 12/31/09. A portion of fees charged to the R6 Class of the Fund has been waived since Fund inception. Performance prior to waiving fees was lower than actual returns shown since inception. |
| 7. | The Russell 1000® Growth Index measures the performance of thelarge-cap growth segment of the U.S. equity universe. It includes those Russell 1000 companies with higherprice-to-book ratios and higher forecasted growth values. The Russell 1000 Growth Index and Russell 1000 Index are registered trademarks of Frank Russell Company. Frank Russell Company (“Russell”) is the source and owner of the trademarks, service marks and copyrights related to the Russell Indexes. Russell® is a trademark of Frank Russell Company. Neither Russell nor its licensors accept any liability for any errors or omissions in the Russell Indexes and/or Russell ratings or underlying data, and no party may rely on any Russell Indexes and/or Russell ratings and/or underlying data contained in this communication. No further distribution of Russell Data is permitted without Russell’s express written consent. Russell does not promote, sponsor or endorse the content of this communication. One cannot directly invest in an index. |
| 8. | The Total Annual Fund Operating Expense ratios set forth in the most recent Fund prospectus for the Institutional, Y, Investor, A, C and R6 Class shares were 0.93%, 0.97%, 1.20%, 1.25%, 1.95% and 4.15%, respectively. The expense ratios above may vary from the expense ratios presented in other sections of this report that are based on expenses incurred during the period covered by this report. |
The Fund trailed the Index for the period due to stock selection and sector allocation.
Most of the Fund’s underperformance related to security selection was attributed to holdings in the Information Technology and Health Care sectors. Within Information Technology, underweighting Apple, Inc. and Microsoft Corp. (up 89.95% and 37.43%, respectively) hurt performance. In the Health Care sector, the Fund owned ABIOMED, Inc. (down 47.63%) and Centene Corp. (down 15.18%) detracting from relative performance. This performance was modestly offset by positions in the Consumer Discretionary sector. Within this sector, Lululemon Athletica, Inc. (up 91.23%) and Best Buy Co., Inc. (up 70.29%) contributed most to the Fund’s relative performance.
From a sector allocation perspective, the Fund’s overweight in Health Care detracted from relative performance, while an underweight to the Information Technology sector, the highest-returning sector in the Index, also hampered relative performance for the period. Offsetting some of this performance was an underweight allocation to the Energy sector, which was the worst performing sector for the period.
Thesub-advisor continues to invest in a broadly diversified portfolio of companies they believe have attractive valuations and above-average earnings growth potential. This approach should allow the Fund to benefit over the longer term.
4
American Beacon Bridgeway Large Cap Growth FundSM
Performance Overview
December 31, 2019 (Unaudited)
| Top Ten Holdings (% Net Assets) |
| |||||||
| Amazon.com, Inc. | 3.4 | |||||||
| Apple, Inc. | 3.2 | |||||||
| Micron Technology, Inc. | 2.8 | |||||||
| UnitedHealth Group, Inc. | 2.4 | |||||||
| Walt Disney Co. | 2.4 | |||||||
| O’Reilly Automotive, Inc. | 2.3 | |||||||
| VeriSign, Inc. | 2.2 | |||||||
| Advanced Micro Devices, Inc. | 2.1 | |||||||
| Starbucks Corp. | 2.0 | |||||||
| Merck & Co., Inc. | 1.9 | |||||||
| Total Fund Holdings | 80 | |||||||
| Sector Allocation (% Equities) |
| |||||||
| Information Technology | 34.7 | |||||||
| Consumer Discretionary | 17.9 | |||||||
| Health Care | 14.8 | |||||||
| Industrials | 8.7 | |||||||
| Communication Services | 7.6 | |||||||
| Financials | 6.2 | |||||||
| Real Estate | 4.6 | |||||||
| Consumer Staples | 3.6 | |||||||
| Materials | 1.9 | |||||||
5
American Beacon Bridgeway Large Cap Value FundSM
Performance Overview
December 31, 2019 (Unaudited)
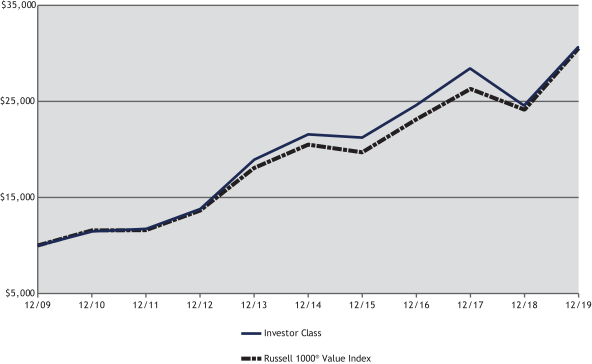
The Investor Class of the American Beacon Bridgeway Large Cap Value Fund (the “Fund”) returned 24.68% for the twelve months ended December 31, 2019. The Fund underperformed the Russell 1000® Value Index (the “Index”) return of 26.54% for the same period.
Comparison of Change in Value of a $10,000 Investment for the period from 12/31/2009 through 12/31/2019
| Total Returns for the Period Ended December 31, 2019 |
| |||||||||||||||||||||||||||||||
Ticker | 1 Year | 3 Years | 5 Years | 10 Years | Value of $10,000 12/31/2009- 12/31/2019 | |||||||||||||||||||||||||||
Institutional Class (1,8) | BRLVX | 25.11 | % | 7.93 | % | 7.61 | % | 12.12 | % | $ | 31,406 | |||||||||||||||||||||
Y Class (1,2,8) | BWLYX | 25.06 | % | 7.87 | % | 7.56 | % | 12.07 | % | $ | 31,248 | |||||||||||||||||||||
Investor Class (1,3,8) | BWLIX | 24.68 | % | 7.58 | % | 7.27 | % | 11.84 | % | $ | 30,614 | |||||||||||||||||||||
A without Sales Charge (1,4,8) | BWLAX | 24.70 | % | 7.55 | % | 7.24 | % | 11.77 | % | $ | 30,438 | |||||||||||||||||||||
A with Sales Charge (1,4,8) | BWLAX | 17.51 | % | 5.44 | % | 5.98 | % | 11.12 | % | $ | 28,697 | |||||||||||||||||||||
C without Sales Charge (1,5,8) | BWLCX | 23.79 | % | 6.77 | % | 6.45 | % | 11.14 | % | $ | 28,757 | |||||||||||||||||||||
C with Sales Charge (1,5,8) | BWLCX | 22.79 | % | 6.77 | % | 6.45 | % | 11.14 | % | $ | 28,757 | |||||||||||||||||||||
R6 Class (1,6,8) | BWLRX | 25.17 | % | 7.94 | % | 7.62 | % | 12.13 | % | $ | 31,414 | |||||||||||||||||||||
Russell 1000® Value Index (7) | 26.54 | % | 9.68 | % | 8.29 | % | 11.80 | % | $ | 30,505 | ||||||||||||||||||||||
| 1. | Performance shown is historical and is not indicative of future returns. Investment returns and principal value will vary, and shares may be worth more or less at redemption than at original purchase. Performance shown is calculated based on the publishedend-of-day net asset values as of date indicated, and current performance may be lower or higher than the performance data quoted. To obtain performance as of the most recent month end, please visitwww.americanbeaconfunds.com or call1-800-967-9009. Fund performance in the table above does not reflect the deduction of taxes a shareholder would pay on distributions or the redemption of shares. Generally accepted accounting principles require adjustments to be made to the net assets of the Fund at period end for financial reporting purposes only, and as such, the total returns based on the unadjusted net asset value per share may differ from the total return reported in the financial highlights. A portion of the fees charged to the Institutional Class was waived from 2008 through 2013, partially recovered in 2014, and fully recovered in 2015. Performance prior to waiving fees was lower than the actual returns shown for 2008 through 2013. Please note that the recent performance of the securities market has helped produce short-term returns that are not typical and may not continue in the future. |
6
American Beacon Bridgeway Large Cap Value FundSM
Performance Overview
December 31, 2019 (Unaudited)
| 2. | Fund performance for theten-year period represents the returns achieved by the Institutional Class from 12/31/09 up to 2/3/12, the inception date of the Y Class, and the returns of the Y Class since its inception. Expenses of the Y Class are higher than those of the Institutional Class. As a result, total returns shown may be higher than they would have been had the Y Class been in existence since 12/31/09. A portion of the fees charged to the Y Class was waived in 2012, partially recovered in 2013 and fully recovered in 2014. Performance prior to waiving fees was lower than the actual returns shown for 2012. |
| 3. | Fund performance for theten-year period represents the returns achieved by the Institutional Class from 12/31/09 up to 2/3/12, the inception date of the Investor Class, and the returns of the Investor Class since its inception. Expenses of the Investor Class are higher than those of the Institutional Class. Therefore, total returns shown may be higher than they would have been had the Investor Class been in existence since 12/31/09. A portion of the fees charged to the Investor Class was waived in 2012 and fully recovered in 2013. Performance prior to waiving fees was lower than the actual returns shown for 2012. |
| 4. | Fund performance for theten-year period represents the returns achieved by the Institutional Class from 12/31/09 through 2/3/12, the inception date of the A Class, and the returns of the A Class since its inception. Expenses of the A Class are higher than those of the Institutional Class. As a result, total returns shown may be higher than they would have been had the A Class been in existence since 12/31/09. A portion of the fees charged to the A Class was waived in 2012 and 2013 and fully recovered in 2014. Performance prior to waiving fees was lower than the actual returns shown for 2012 and 2013. A Class shares have a maximum sales charge of 5.75%. |
| 5. | Fund performance for theten-year period represents the returns achieved by the Institutional Class from 12/31/09 through 2/3/12, the inception date of the C Class, and the returns of the C Class since its inception. Expenses of the C Class are higher than those of the Institutional Class. As a result, total returns shown may be higher than they would have been had the C Class been in existence since 12/31/09. A portion of the fees charged to the C Class was waived in 2012 and 2013 and fully recovered in 2014. Performance prior to waiving fees was lower than the actual returns shown for 2012 and 2013. The maximum contingent deferred sales charge for the C Class is 1.00% for shares redeemed within one year of the date of purchase. |
| 6. | Fund performance for the three-year, five-year andten-year periods represent the returns achieved by the Institutional Class from 12/31/09 through 4/28/17, the inception date of the R6 Class, and the returns of the R6 Class since its inception. Expenses of the R6 Class are lower than the Institutional Class. As a result, total returns shown may be lower than they would have been had the R6 Class been in existence since 12/31/09. A portion of the fees charged to the R6 Class of the Fund was waived in 2017 and 2019. Performance prior to waiving fees was lower than actual returns shown for 2017 and 2019. |
| 7. | The Russell 1000® Value Index is an unmanaged index of those stocks in the Russell 1000 Index with lowerprice-to-book ratios and lower forecasted growth values. The Russell 1000 Index measures the performance of the 1,000 largest U.S. companies based on total market capitalization. Russell 1000 Value Index and Russell 1000 Index are registered trademarks of the Frank Russell Company. Frank Russell Company (“Russell”) is the source and owner of the trademarks, service marks and copyrights related to the Russell Indexes. RussellTM is a trademark of Frank Russell Company. Neither Russell nor its licensors accept any liability for any errors or omissions in the Russell Indexes and/or Russell ratings or underlying data, and no party may rely on any Russell Indexes and/or Russell ratings and/or underlying data contained in this communication. No further distribution of Russell Data is permitted without Russell’s express written consent. Russell does not promote, sponsor or endorse the content of this communication. One cannot directly invest in an index. |
| 8. | The Total Annual Fund Operating Expense ratios set forth in the most recent Fund prospectus for the Institutional, Y, Investor, A, C and R6 Class shares were 0.72%, 0.79%, 1.05%, 1.07%, 1.79% and 0.70%, respectively. The expense ratios above may vary from the expense ratios presented in other sections of this report that are based on expenses incurred during the period covered by this report. |
The Fund trailed the Index as stock selection detracted value relative to the Index while positive sector allocation added to relative performance.
From a stock selection perspective, the positions in the Consumer Discretionary and Industrials sectors detracted the most relative value. Within the Consumer Discretionary sector, the Fund’s positions in Macy’s, Inc. and Kohl’s Corp. (down 38.24% and 19.23%, respectively) hampered performance. Companies in the Industrials sector detracting from relative performance included American Airlines Group, Inc. (down 9.49%) and Johnson Controls International (down 4.46%). This was somewhat offset by stock selection in the Energy sector including Anadarko Petroleum Corp. (up 67.38%) and Marathon Oil Corp. (up 36.11%).
The Fund’s underweight allocation to the Energy sector, the worst performing sector for the Index, added to relative performance. The Fund’s overweight position to the Financials and Information Technology sectors, both high-performing sectors for the Index, also positively affected returns for the period. Somewhat offsetting this performance was a slight overweight to Materials and a modest underweight to the Real Estate sector.
Thesub-advisor continues to invest in a broadly diversified portfolio of companies they believe have attractive valuations and above-average earnings growth potential. This approach should allow the Fund to benefit over the longer term.
7
American Beacon Bridgeway Large Cap Value FundSM
Performance Overview
December 31, 2019 (Unaudited)
| Top Ten Holdings (% Net Assets) |
| |||||||
| Pfizer, Inc. | 1.7 | |||||||
| Bank of America Corp. | 1.6 | |||||||
| Walt Disney Co. | 1.6 | |||||||
| Citigroup, Inc. | 1.5 | |||||||
| Regions Financial Corp. | 1.5 | |||||||
| Biogen, Inc. | 1.4 | |||||||
| ConocoPhillips | 1.4 | |||||||
| Micron Technology, Inc. | 1.4 | |||||||
| Procter & Gamble Co. | 1.4 | |||||||
| Western Digital Corp. | 1.4 | |||||||
| Total Fund Holdings | 98 | |||||||
| Sector Allocation (% Equities) |
| |||||||
| Financials | 26.5 | |||||||
| Industrials | 11.8 | |||||||
| Health Care | 10.8 | |||||||
| Consumer Discretionary | 8.9 | |||||||
| Communication Services | 8.3 | |||||||
| Consumer Staples | 8.3 | |||||||
| Information Technology | 7.7 | |||||||
| Energy | 6.7 | |||||||
| Real Estate | 4.7 | |||||||
| Materials | 4.6 | |||||||
| Utilities | 1.7 | |||||||
8
American Beacon FundsSM
December 31, 2019 (Unaudited)
Fund Expense Example
As a shareholder of a Fund, you incur two types of costs: (1) transaction costs, including sales charges (loads) on purchase payments and redemption fees, if applicable, and (2) ongoing costs, including management fees, distribution(12b-1) fees,sub-transfer agent fees, and other Fund expenses. The Examples are intended to help you understand the ongoing cost (in dollars) of investing in the Funds and to compare these costs with the ongoing costs of investing in other mutual funds. The Examples are based on an investment of $1,000 invested at the beginning of the period in each Class and held for the entire period from July 1, 2019 through December 31, 2019.
Actual Expenses
The “Actual” lines of the tables provide information about actual account values and actual expenses. You may use the information on this page, together with the amount you invested, to estimate the expenses that you paid over the period. Simply divide your account value by $1,000 (for example, an $8,600 account value divided by $1,000 = $8.60), then multiply the result by the “Expenses Paid During Period” to estimate the expenses you paid on your account during this period. Shareholders of the Investor and Institutional Classes that invest in the Fund through an IRA or Roth IRA may be subject to a custodial IRA fee of $15 that is typically deducted each December. If your account was subject to a custodial IRA fee during the period, your costs would have been $15 higher.
Hypothetical Example for Comparison Purposes
The “Hypothetical” lines of the tables provide information about hypothetical account values and hypothetical expenses based on the Fund’s actual expense ratio and an assumed 5% per year rate of return before expenses (not the Fund’s actual return). You may compare the ongoing costs of investing in the Funds with other funds by contrasting this 5% hypothetical example and the 5% hypothetical examples that appear in the shareholder reports of the other funds. The hypothetical account values and expenses may not be used to estimate the actual ending account balance or expenses you paid for the period. Shareholders of the Investor and Institutional Classes that invest in the Funds through an IRA or Roth IRA may be subject to a custodial IRA fee of $15 that is typically deducted each December. If your account was subject to a custodial IRA fee during the period, your costs would have been $15 higher.
You should also be aware that the expenses shown in the table highlight only your ongoing costs and do not reflect any transaction costs charged by the Funds, such as sales charges (loads) or redemption fees, as applicable. Similarly, the expense examples for other funds do not reflect any transaction costs charged by those funds, such as sales charges (loads), redemption fees or exchange fees. Therefore, the “Hypothetical” lines of the tables are useful in comparing ongoing costs only and will not help you determine the relative total costs of owning different funds. If you were subject to any transaction costs during the period, your costs would have been higher.
9
American Beacon FundsSM
Expense Examples
December 31, 2019 (Unaudited)
| American Beacon Bridgeway Large Cap Growth Fund |
| ||||||||||||||
| Beginning Account Value 7/1/2019 | Ending Account Value 12/31/2019 | Expenses Paid During Period 7/1/2019-12/31/2019* | |||||||||||||
| Institutional Class | |||||||||||||||
| Actual | $1,000.00 | $1,074.00 | $4.23 | ||||||||||||
| Hypothetical** | $1,000.00 | $1,021.12 | $4.13 | ||||||||||||
| Y Class | |||||||||||||||
| Actual | $1,000.00 | $1,073.30 | $4.76 | ||||||||||||
| Hypothetical** | $1,000.00 | $1,020.62 | $4.63 | ||||||||||||
| Investor Class | |||||||||||||||
| Actual | $1,000.00 | $1,071.90 | $6.21 | ||||||||||||
| Hypothetical** | $1,000.00 | $1,019.21 | $6.06 | ||||||||||||
| A Class | |||||||||||||||
| Actual | $1,000.00 | $1,071.70 | $6.32 | ||||||||||||
| Hypothetical** | $1,000.00 | $1,019.11 | $6.16 | ||||||||||||
| C Class | |||||||||||||||
| Actual | $1,000.00 | $1,067.90 | $10.22 | ||||||||||||
| Hypothetical** | $1,000.00 | $1,015.33 | $9.96 | ||||||||||||
| R6 Class | |||||||||||||||
| Actual | $1,000.00 | $1,074.30 | $3.97 | ||||||||||||
| Hypothetical** | $1,000.00 | $1,021.37 | $3.87 | ||||||||||||
| * | Expenses are equal to the Fund’s annualized expense ratios for thesix-month period of 0.81%, 0.91%, 1.19%, 1.21%, 1.96%, and 0.76% for the Institutional, Y, Investor, A, C, and R6 Classes, respectively, multiplied by the average account value over the period, multiplied by the number derived by dividing the number of days in the most recent fiscal half-year (184) by days in the year (365) to reflect the half-year period. |
| ** | 5% return before expenses. |
| American Beacon Bridgeway Large Cap Value Fund |
| ||||||||||||||
| Beginning Account Value 7/1/2019 | Ending Account Value 12/31/2019 | Expenses Paid During Period 7/1/2019-12/31/2019* | |||||||||||||
| Institutional Class | |||||||||||||||
| Actual | $1,000.00 | $1,079.60 | $3.83 | ||||||||||||
| Hypothetical** | $1,000.00 | $1,021.53 | $3.72 | ||||||||||||
| Y Class | |||||||||||||||
| Actual | $1,000.00 | $1,079.60 | $4.19 | ||||||||||||
| Hypothetical** | $1,000.00 | $1,021.17 | $4.08 | ||||||||||||
| Investor Class | |||||||||||||||
| Actual | $1,000.00 | $1,077.80 | $5.60 | ||||||||||||
| Hypothetical** | $1,000.00 | $1,019.81 | $5.45 | ||||||||||||
| A Class | |||||||||||||||
| Actual | $1,000.00 | $1,077.70 | $5.76 | ||||||||||||
| Hypothetical** | $1,000.00 | $1,019.66 | $5.60 | ||||||||||||
| C Class | |||||||||||||||
| Actual | $1,000.00 | $1,073.80 | $9.51 | ||||||||||||
| Hypothetical** | $1,000.00 | $1,016.03 | $9.25 | ||||||||||||
| R6 Class | |||||||||||||||
| Actual | $1,000.00 | $1,079.70 | $3.62 | ||||||||||||
| Hypothetical** | $1,000.00 | $1,021.73 | $3.52 | ||||||||||||
| * | Expenses are equal to the Fund’s annualized expense ratios for thesix-month period of 0.73%, 0.80%, 1.07%, 1.10%, 1.82%, and 0.69% for the Institutional, Y, Investor, A, C, and R6 Classes, respectively, multiplied by the average account value over the period, multiplied by the number derived by dividing the number of days in the most recent fiscal half-year (184) by days in the year (365) to reflect the half-year period. |
| ** | 5% return before expenses. |
10
American Beacon FundsSM
Report of Independent Registered Public Accounting Firm
To the Shareholders and the Board of Trustees of American Beacon Bridgeway Large Cap Growth Fund and American Beacon Bridgeway Large Cap Value Fund
Opinion on the Financial Statements
We have audited the accompanying statements of assets and liabilities of American Beacon Bridgeway Large Cap Growth Fund and American Beacon Bridgeway Large Cap Value Fund (collectively referred to as the “Funds”), (two of the funds constituting American Beacon Funds (the “Trust”)), including the schedules of investments, as of December 31, 2019, and the related statements of operations, changes in net assets, and the financial highlights for each of the periods indicated in the table below and the related notes (collectively referred to as the “financial statements”). In our opinion, the financial statements present fairly, in all material respects, the financial position of each of the Funds at December 31, 2019, and the results of their operations, changes in net assets and financial highlights for each of the periods indicated in the table below, in conformity with U.S. generally accepted accounting principles. The financial highlights for the year ended June 30, 2015 of American Beacon Bridgeway Large Cap Growth Fund were audited by other auditors whose report dated August 27, 2015, expressed an opinion on those financial statements and financial highlights.
Individual fund constituting the | Statement of operations | Statements of changes | Financial highlights | |||
| American Beacon Bridgeway Large Cap Growth Fund | For the year ended December 31, 2019 | For each of the two years in the period ended December 31, 2019 | For each of the three years in the period ended December 31, 2019, the six months ended December 31, 2016, and the year ended June 30, 2016 | |||
| American Beacon Bridgeway Large Cap Value Fund | For the year ended December 31, 2019 | For each of the two years in the period ended December 31, 2019 | For each of the five years in the period ended December 31, 2019 | |||
Basis for Opinion
These financial statements are the responsibility of the Trust’s management. Our responsibility is to express an opinion on the Funds’ financial statements based on our audits. We are a public accounting firm registered with the Public Company Accounting Oversight Board (United States) (“PCAOB”) and are required to be independent with respect to the Trust in accordance with the U.S. federal securities laws and the applicable rules and regulations of the Securities and Exchange Commission and the PCAOB.
We conducted our audits in accordance with the standards of the PCAOB. Those standards require that we plan and perform the audit to obtain reasonable assurance about whether the financial statements are free of material misstatement, whether due to error or fraud. The Trust is not required to have, nor were we engaged to perform, an audit of the Trust’s internal control over financial reporting. As part of our audits, we are required to obtain an understanding of internal control over financial reporting, but not for the purpose of expressing an opinion on the effectiveness of the Trust’s internal control over financial reporting. Accordingly, we express no such opinion.
Our audits included performing procedures to assess the risks of material misstatement of the financial statements, whether due to error or fraud, and performing procedures that respond to those risks. Such procedures included examining, on a test basis, evidence regarding the amounts and disclosures in the financial statements. Our procedures included confirmation of securities owned as of December 31, 2019, by correspondence with the custodian and brokers or by other appropriate auditing procedures where replies from brokers were not received. Our audits also included evaluating the accounting principles used and significant estimates made by management, as well as evaluating the overall presentation of the financial statements. We believe that our audits provide a reasonable basis for our opinion.

We have served as the auditor of one or more American Beacon investment companies since 1987.
Dallas, Texas
February 28, 2020
11
American Beacon Bridgeway Large Cap Growth FundSM
Schedule of Investments
December 31, 2019
| Shares | Fair Value | ||||||||||||||
| COMMON STOCKS - 99.27% | |||||||||||||||
| Communication Services - 7.57% | |||||||||||||||
| Entertainment - 3.32% | |||||||||||||||
| Roku, Inc.A B | 13,900 | $ | 1,861,210 | ||||||||||||
| Walt Disney Co. | 32,100 | 4,642,623 | |||||||||||||
|
| ||||||||||||||
| 6,503,833 | |||||||||||||||
|
| ||||||||||||||
| Interactive Media & Services - 1.74% | |||||||||||||||
| Match Group, Inc.A B | 26,900 | 2,208,759 | |||||||||||||
| TripAdvisor, Inc. | 39,500 | 1,200,010 | |||||||||||||
|
| ||||||||||||||
| 3,408,769 | |||||||||||||||
|
| ||||||||||||||
| Media - 1.43% | |||||||||||||||
| Sirius XM Holdings, Inc.A | 392,200 | 2,804,230 | |||||||||||||
|
| ||||||||||||||
| Wireless Telecommunication Services - 1.08% | |||||||||||||||
| T-Mobile US, Inc.B | 27,100 | 2,125,182 | |||||||||||||
|
| ||||||||||||||
Total Communication Services | 14,842,014 | ||||||||||||||
|
| ||||||||||||||
| Consumer Discretionary - 17.76% | |||||||||||||||
| Hotels, Restaurants & Leisure - 2.79% | |||||||||||||||
| Starbucks Corp. | 44,100 | 3,877,272 | |||||||||||||
| Yum! Brands, Inc. | 15,800 | 1,591,534 | |||||||||||||
|
| ||||||||||||||
| 5,468,806 | |||||||||||||||
|
| ||||||||||||||
| Internet & Direct Marketing Retail - 4.45% | |||||||||||||||
| Amazon.com, Inc.B | 3,600 | 6,652,224 | |||||||||||||
| eBay, Inc. | 27,200 | 982,192 | |||||||||||||
| Wayfair, Inc., Class AA B | 12,000 | 1,084,440 | |||||||||||||
|
| ||||||||||||||
| 8,718,856 | |||||||||||||||
|
| ||||||||||||||
| Multiline Retail - 2.26% | |||||||||||||||
| Dollar General Corp. | 14,500 | 2,261,710 | |||||||||||||
| Target Corp. | 16,900 | 2,166,749 | |||||||||||||
|
| ||||||||||||||
| 4,428,459 | |||||||||||||||
|
| ||||||||||||||
| Specialty Retail - 6.75% | |||||||||||||||
| AutoZone, Inc.B | 1,700 | 2,025,227 | |||||||||||||
| Best Buy Co., Inc. | 35,600 | 3,125,680 | |||||||||||||
| Burlington Stores, Inc.B | 6,400 | 1,459,392 | |||||||||||||
| O’Reilly Automotive, Inc.B | 10,100 | 4,426,426 | |||||||||||||
| TJX Cos., Inc. | 36,000 | 2,198,160 | |||||||||||||
|
| ||||||||||||||
| 13,234,885 | |||||||||||||||
|
| ||||||||||||||
| Textiles, Apparel & Luxury Goods - 1.51% | |||||||||||||||
| Lululemon Athletica, Inc.B | 12,800 | 2,965,376 | |||||||||||||
|
| ||||||||||||||
Total Consumer Discretionary | 34,816,382 | ||||||||||||||
|
| ||||||||||||||
| Consumer Staples - 3.55% | |||||||||||||||
| Beverages - 1.33% | |||||||||||||||
| Monster Beverage Corp.B | 41,100 | 2,611,905 | |||||||||||||
|
| ||||||||||||||
| Food Products - 1.11% | |||||||||||||||
| Hershey Co. | 14,800 | 2,175,304 | |||||||||||||
|
| ||||||||||||||
| Household Products - 1.11% | |||||||||||||||
| Procter & Gamble Co. | 17,400 | 2,173,260 | |||||||||||||
|
| ||||||||||||||
Total Consumer Staples | 6,960,469 | ||||||||||||||
|
| ||||||||||||||
See accompanying notes
12
American Beacon Bridgeway Large Cap Growth FundSM
Schedule of Investments
December 31, 2019
| Shares | Fair Value | ||||||||||||||
| COMMON STOCKS - 99.27% (continued) | |||||||||||||||
| Financials - 6.19% | |||||||||||||||
| Capital Markets - 1.39% | |||||||||||||||
| Charles Schwab Corp. | 33,300 | $ | 1,583,748 | ||||||||||||
| Intercontinental Exchange, Inc. | 12,300 | 1,138,365 | |||||||||||||
|
| ||||||||||||||
| 2,722,113 | |||||||||||||||
|
| ||||||||||||||
| Consumer Finance - 2.19% | |||||||||||||||
| Capital One Financial Corp. | 9,500 | 977,645 | |||||||||||||
| Santander Consumer USA Holdings, Inc. | 64,000 | 1,495,680 | |||||||||||||
| Synchrony Financial | 50,600 | 1,822,106 | |||||||||||||
|
| ||||||||||||||
| 4,295,431 | |||||||||||||||
|
| ||||||||||||||
| Diversified Financial Services - 0.55% | |||||||||||||||
| Berkshire Hathaway, Inc., Class BB | 4,800 | 1,087,200 | |||||||||||||
|
| ||||||||||||||
| Insurance - 2.06% | |||||||||||||||
| Athene Holding Ltd., Class AB | 47,800 | 2,248,034 | |||||||||||||
| Progressive Corp. | 24,600 | 1,780,794 | |||||||||||||
|
| ||||||||||||||
| 4,028,828 | |||||||||||||||
|
| ||||||||||||||
Total Financials | 12,133,572 | ||||||||||||||
|
| ||||||||||||||
| Health Care - 14.72% | |||||||||||||||
| Biotechnology - 3.42% | |||||||||||||||
| Amgen, Inc. | 9,100 | 2,193,737 | |||||||||||||
| Biogen, Inc.B | 8,000 | 2,373,840 | |||||||||||||
| Exact Sciences Corp.A B | 23,200 | 2,145,536 | |||||||||||||
|
| ||||||||||||||
| 6,713,113 | |||||||||||||||
|
| ||||||||||||||
| Health Care Equipment & Supplies - 4.04% | |||||||||||||||
| ABIOMED, Inc.B | 7,000 | 1,194,130 | |||||||||||||
| Edwards Lifesciences Corp.B | 10,800 | 2,519,532 | |||||||||||||
| Insulet Corp.B | 13,100 | 2,242,720 | |||||||||||||
| ResMed, Inc. | 12,600 | 1,952,622 | |||||||||||||
|
| ||||||||||||||
| 7,909,004 | |||||||||||||||
|
| ||||||||||||||
| Health Care Providers & Services - 4.40% | |||||||||||||||
| Anthem, Inc. | 6,800 | 2,053,804 | |||||||||||||
| Cigna Corp.B | 9,400 | 1,922,206 | |||||||||||||
| UnitedHealth Group, Inc. | 15,800 | 4,644,884 | |||||||||||||
|
| ||||||||||||||
| 8,620,894 | |||||||||||||||
|
| ||||||||||||||
| Pharmaceuticals - 2.86% | |||||||||||||||
| Merck & Co., Inc. | 40,300 | 3,665,285 | |||||||||||||
| Zoetis, Inc. | 14,700 | 1,945,545 | |||||||||||||
|
| ||||||||||||||
| 5,610,830 | |||||||||||||||
|
| ||||||||||||||
Total Health Care | 28,853,841 | ||||||||||||||
|
| ||||||||||||||
| Industrials - 8.66% | |||||||||||||||
| Aerospace & Defense - 1.04% | |||||||||||||||
| HEICO Corp., Class A | 22,800 | 2,041,284 | |||||||||||||
|
| ||||||||||||||
| Airlines - 3.98% | |||||||||||||||
| Alaska Air Group, Inc. | 29,800 | 2,018,950 | |||||||||||||
| Delta Air Lines, Inc. | 50,000 | 2,924,000 | |||||||||||||
| United Airlines Holdings, Inc.B | 32,500 | 2,862,925 | |||||||||||||
|
| ||||||||||||||
| 7,805,875 | |||||||||||||||
|
| ||||||||||||||
See accompanying notes
13
American Beacon Bridgeway Large Cap Growth FundSM
Schedule of Investments
December 31, 2019
| Shares | Fair Value | ||||||||||||||
| COMMON STOCKS - 99.27% (continued) | |||||||||||||||
| Industrials - 8.66% (continued) | |||||||||||||||
| Commercial Services & Supplies - 2.68% | |||||||||||||||
| Rollins, Inc. | 49,600 | $ | 1,644,736 | ||||||||||||
| Waste Management, Inc. | 31,600 | 3,601,136 | |||||||||||||
|
| ||||||||||||||
| 5,245,872 | |||||||||||||||
|
| ||||||||||||||
| Trading Companies & Distributors - 0.96% | |||||||||||||||
| United Rentals, Inc.B | 11,300 | 1,884,501 | |||||||||||||
|
| ||||||||||||||
Total Industrials | 16,977,532 | ||||||||||||||
|
| ||||||||||||||
| Information Technology - 34.42% | |||||||||||||||
| Electronic Equipment, Instruments & Components - 1.03% | |||||||||||||||
| CDW Corp. | 14,100 | 2,014,044 | |||||||||||||
|
| ||||||||||||||
| IT Services - 8.40% | |||||||||||||||
| Alliance Data Systems Corp. | 6,900 | 774,180 | |||||||||||||
| Fidelity National Information Services, Inc. | 17,600 | 2,447,984 | |||||||||||||
| Fiserv, Inc.B | 16,300 | 1,884,769 | |||||||||||||
| Genpact Ltd. | 48,000 | 2,024,160 | |||||||||||||
| PayPal Holdings, Inc.B | 27,200 | 2,942,224 | |||||||||||||
| Square, Inc., Class AB | 33,500 | 2,095,760 | |||||||||||||
| VeriSign, Inc.B | 22,300 | 4,296,764 | |||||||||||||
|
| ||||||||||||||
| 16,465,841 | |||||||||||||||
|
| ||||||||||||||
| Semiconductors & Semiconductor Equipment - 4.92% | |||||||||||||||
| Advanced Micro Devices, Inc.B | 90,500 | 4,150,330 | |||||||||||||
| Micron Technology, Inc.B | 102,100 | 5,490,938 | |||||||||||||
|
| ||||||||||||||
| 9,641,268 | |||||||||||||||
|
| ||||||||||||||
| Software - 14.37% | |||||||||||||||
| ANSYS, Inc.B | 7,700 | 1,982,057 | |||||||||||||
| Cadence Design Systems, Inc.B | 48,400 | 3,357,024 | |||||||||||||
| Coupa Software, Inc.A B | 12,800 | 1,872,000 | |||||||||||||
| DocuSign, Inc.B | 28,300 | 2,097,313 | |||||||||||||
| Fair Isaac Corp.B | 6,200 | 2,323,016 | |||||||||||||
| Intuit, Inc. | 12,000 | 3,143,160 | |||||||||||||
| Paycom Software, Inc.B | 8,700 | 2,303,412 | |||||||||||||
| RingCentral, Inc., Class AB | 16,400 | 2,766,188 | |||||||||||||
| ServiceNow, Inc.B | 8,000 | 2,258,560 | |||||||||||||
| VMware, Inc., Class AA B | 9,500 | 1,442,005 | |||||||||||||
| Workday, Inc., Class AB | 15,700 | 2,581,865 | |||||||||||||
| Zendesk, Inc.B | 26,600 | 2,038,358 | |||||||||||||
|
| ||||||||||||||
| 28,164,958 | |||||||||||||||
|
| ||||||||||||||
| Technology Hardware, Storage & Peripherals - 5.70% | |||||||||||||||
| Apple, Inc. | 21,600 | 6,342,840 | |||||||||||||
| Dell Technologies, Inc., Class CB | 47,253 | 2,428,332 | |||||||||||||
| HP, Inc. | 117,500 | 2,414,625 | |||||||||||||
|
| ||||||||||||||
| 11,185,797 | |||||||||||||||
|
| ||||||||||||||
Total Information Technology | 67,471,908 | ||||||||||||||
|
| ||||||||||||||
| Materials - 1.88% | |||||||||||||||
| Chemicals - 1.88% | |||||||||||||||
| CF Industries Holdings, Inc. | 36,400 | 1,737,736 | |||||||||||||
| PPG Industries, Inc. | 14,500 | 1,935,605 | |||||||||||||
|
| ||||||||||||||
| 3,673,341 | |||||||||||||||
|
| ||||||||||||||
Total Materials | 3,673,341 | ||||||||||||||
|
| ||||||||||||||
See accompanying notes
14
American Beacon Bridgeway Large Cap Growth FundSM
Schedule of Investments
December 31, 2019
| Shares | Fair Value | ||||||||||||||||
| COMMON STOCKS - 99.27% (continued) | |||||||||||||||||
| Real Estate - 4.52% | |||||||||||||||||
| Equity Real Estate Investment Trusts (REITs) - 4.52% | |||||||||||||||||
| Alexandria Real Estate Equities, Inc. | 14,300 | $ | 2,310,594 | ||||||||||||||
| Crown Castle International Corp. | 14,100 | 2,004,315 | |||||||||||||||
| Equinix, Inc. | 3,400 | 1,984,580 | |||||||||||||||
| Equity LifeStyle Properties, Inc. | 36,400 | 2,562,196 | |||||||||||||||
|
| ||||||||||||||||
| 8,861,685 | |||||||||||||||||
|
| ||||||||||||||||
Total Real Estate | 8,861,685 | ||||||||||||||||
|
| ||||||||||||||||
Total Common Stocks (Cost $157,529,175) | 194,590,744 | ||||||||||||||||
|
| ||||||||||||||||
| SHORT-TERM INVESTMENTS - 1.38% | |||||||||||||||||
| Investment Companies - 1.29% | |||||||||||||||||
| American Beacon U.S. Government Money Market Select Fund, Select Class, 1.52%C D | 2,526,142 | 2,526,142 | |||||||||||||||
|
| ||||||||||||||||
| Principal Amount | |||||||||||||||||
| U.S. Treasury Obligations - 0.09% | |||||||||||||||||
| U.S. Treasury Bill, 1.870%, Due 2/13/2020E | $ | 170,000 | 169,705 | ||||||||||||||
|
| ||||||||||||||||
Total Short-Term Investments (Cost $2,695,771) | 2,695,847 | ||||||||||||||||
|
| ||||||||||||||||
| Shares | |||||||||||||||||
| SECURITIES LENDING COLLATERAL - 1.10% (Cost $2,165,786) | |||||||||||||||||
| Investment Companies - 1.10% | |||||||||||||||||
| American Beacon U.S. Government Money Market Select Fund, Select Class, 1.52%C D | 2,165,786 | 2,165,786 | |||||||||||||||
|
| ||||||||||||||||
TOTAL INVESTMENTS - 101.75% (Cost $162,390,732) | 199,452,377 | ||||||||||||||||
LIABILITIES, NET OF OTHER ASSETS - (1.75%) | (3,432,356 | ) | |||||||||||||||
|
| ||||||||||||||||
TOTAL NET ASSETS - 100.00% | $ | 196,020,021 | |||||||||||||||
|
| ||||||||||||||||
| Percentages are stated as a percent of net assets. | |||||||||||||||||
A All or a portion of this security is on loan, collateralized by either cash and/or U.S. Treasuries, at December 31, 2019 (Note 9).
BNon-income producing security.
C The Fund is affiliated by having the same investment advisor.
D7-day yield.
E This security or a piece thereof is held as segregated collateral.
| Long Futures Contracts Open on December 31, 2019: |
| |||||||||||||
| Equity Futures Contracts | ||||||||||||||
| Description | Number of Contracts | Expiration Date | Notional Amount | Contract Value | Unrealized Appreciation (Depreciation) | |||||||||
| S&P 500E-Mini Index Futures | 16 | March 2020 | $ 2,537,723 | $ | 2,584,880 | $ | 47,157 | |||||||
|
|
|
|
| ||||||||||
| $ 2,537,723 | $ | 2,584,880 | $ | 47,157 | ||||||||||
|
|
|
|
| ||||||||||
| Index Abbreviations: | ||
| S&P 500 | Standard & Poor’s U.S. EquityLarge-Cap Index. | |
See accompanying notes
15
American Beacon Bridgeway Large Cap Growth FundSM
Schedule of Investments
December 31, 2019
The Fund’s investments are summarized by level based on the inputs used to determine their values. As of December 31, 2019, the investments were classified as described below:
Bridgeway Large Cap Growth Fund | Level 1 | Level 2 | Level 3 | Total | ||||||||||||||||||||||||
Assets |
| |||||||||||||||||||||||||||
Common Stocks | $ | 194,590,744 | $ | - | $ | - | $ | 194,590,744 | ||||||||||||||||||||
Short-Term Investments | 2,526,142 | 169,705 | - | 2,695,847 | ||||||||||||||||||||||||
Securities Lending Collateral | 2,165,786 | - | - | 2,165,786 | ||||||||||||||||||||||||
|
|
|
|
|
|
|
| |||||||||||||||||||||
Total Investments in Securities - Assets | $ | 199,282,672 | $ | 169,705 | $ | - | $ | 199,452,377 | ||||||||||||||||||||
|
|
|
|
|
|
|
| |||||||||||||||||||||
Financial Derivative Instruments - Assets |
| |||||||||||||||||||||||||||
Futures Contracts | $ | 47,157 | $ | - | $ | - | $ | 47,157 | ||||||||||||||||||||
|
|
|
|
|
|
|
| |||||||||||||||||||||
Total Financial Derivative Instruments - Assets | $ | 47,157 | $ | - | $ | - | $ | 47,157 | ||||||||||||||||||||
|
|
|
|
|
|
|
| |||||||||||||||||||||
U.S. GAAP requires transfers between all levels to/from level 3 be disclosed. During the year ended December 31, 2019, there were no transfers into or out of Level 3.
See accompanying notes
16
American Beacon Bridgeway Large Cap Value FundSM
Schedule of Investments
December 31, 2019
| Shares | Fair Value | ||||||||||||||
| COMMON STOCKS - 99.14% | |||||||||||||||
| Communication Services - 8.24% | |||||||||||||||
| Diversified Telecommunication Services - 2.35% | |||||||||||||||
| AT&T, Inc. | 923,500 | $ | 36,090,380 | ||||||||||||
| CenturyLink, Inc. | 3,662,400 | 48,380,304 | |||||||||||||
|
| ||||||||||||||
| 84,470,684 | |||||||||||||||
|
| ||||||||||||||
| Entertainment - 1.61% | |||||||||||||||
| Walt Disney Co. | 400,000 | 57,852,000 | |||||||||||||
|
| ||||||||||||||
| Media - 4.28% | |||||||||||||||
| Charter Communications, Inc., Class AA | 65,800 | 31,918,264 | |||||||||||||
| Comcast Corp., Class A | 845,800 | 38,035,626 | |||||||||||||
| Discovery, Inc., Class AA B | 1,349,800 | 44,192,452 | |||||||||||||
| DISH Network Corp., Class AA | 1,121,300 | 39,772,511 | |||||||||||||
|
| ||||||||||||||
| 153,918,853 | |||||||||||||||
|
| ||||||||||||||
Total Communication Services | 296,241,537 | ||||||||||||||
|
| ||||||||||||||
| Consumer Discretionary - 8.85% | |||||||||||||||
| Auto Components - 1.16% | |||||||||||||||
| Lear Corp. | 304,700 | 41,804,840 | |||||||||||||
|
| ||||||||||||||
| Automobiles - 1.83% | |||||||||||||||
| Ford Motor Co. | 2,833,140 | 26,348,202 | |||||||||||||
| General Motors Co. | 1,077,280 | 39,428,448 | |||||||||||||
|
| ||||||||||||||
| 65,776,650 | |||||||||||||||
|
| ||||||||||||||
| Hotels, Restaurants & Leisure - 2.13% | |||||||||||||||
| McDonald’s Corp. | 207,900 | 41,083,119 | |||||||||||||
| Yum! Brands, Inc. | 349,831 | 35,238,477 | |||||||||||||
|
| ||||||||||||||
| 76,321,596 | |||||||||||||||
|
| ||||||||||||||
| Household Durables - 1.10% | |||||||||||||||
| PulteGroup, Inc. | 1,019,300 | 39,548,840 | |||||||||||||
|
| ||||||||||||||
| Internet & Direct Marketing Retail - 0.45% | |||||||||||||||
| eBay, Inc. | 448,400 | 16,191,724 | |||||||||||||
|
| ||||||||||||||
| Multiline Retail - 1.65% | |||||||||||||||
| Kohl’s Corp. | 695,200 | 35,420,440 | |||||||||||||
| Macy’s, Inc.B | 1,400,400 | 23,806,800 | |||||||||||||
|
| ||||||||||||||
| 59,227,240 | |||||||||||||||
|
| ||||||||||||||
| Specialty Retail - 0.53% | |||||||||||||||
| AutoZone, Inc.A | 16,000 | 19,060,960 | |||||||||||||
|
| ||||||||||||||
Total Consumer Discretionary | 317,931,850 | ||||||||||||||
|
| ||||||||||||||
| Consumer Staples - 8.23% | |||||||||||||||
| Beverages - 1.04% | |||||||||||||||
| Brown-Forman Corp., Class B | 554,300 | 37,470,680 | |||||||||||||
|
| ||||||||||||||
| Food & Staples Retailing - 1.92% | |||||||||||||||
| Kroger Co. | 1,148,000 | 33,280,520 | |||||||||||||
| Walgreens Boots Alliance, Inc. | 607,700 | 35,829,992 | |||||||||||||
|
| ||||||||||||||
| 69,110,512 | |||||||||||||||
|
| ||||||||||||||
| Food Products - 3.47% | |||||||||||||||
| Campbell Soup Co. | 750,700 | 37,099,594 | |||||||||||||
| Hershey Co. | 275,100 | 40,434,198 | |||||||||||||
| Hormel Foods Corp.B | 1,043,500 | 47,072,285 | |||||||||||||
|
| ||||||||||||||
| 124,606,077 | |||||||||||||||
|
| ||||||||||||||
See accompanying notes
17
American Beacon Bridgeway Large Cap Value FundSM
Schedule of Investments
December 31, 2019
| Shares | Fair Value | ||||||||||||||
| COMMON STOCKS - 99.14% (continued) | |||||||||||||||
| Consumer Staples - 8.23% (continued) | |||||||||||||||
| Household Products - 1.80% | |||||||||||||||
| Clorox Co. | 86,200 | $ | 13,235,148 | ||||||||||||
| Procter & Gamble Co. | 413,000 | 51,583,700 | |||||||||||||
|
| ||||||||||||||
| 64,818,848 | |||||||||||||||
|
| ||||||||||||||
Total Consumer Staples | 296,006,117 | ||||||||||||||
|
| ||||||||||||||
| Energy - 6.64% | |||||||||||||||
| Oil, Gas & Consumable Fuels - 6.64% | |||||||||||||||
| ConocoPhillips | 789,700 | 51,354,191 | |||||||||||||
| Devon Energy Corp. | 1,224,400 | 31,797,668 | |||||||||||||
| HollyFrontier Corp. | 729,700 | 37,003,087 | |||||||||||||
| Marathon Oil Corp. | 2,672,600 | 36,293,908 | |||||||||||||
| Marathon Petroleum Corp. | 529,500 | 31,902,375 | |||||||||||||
| Phillips 66 | 450,100 | 50,145,641 | |||||||||||||
|
| ||||||||||||||
| 238,496,870 | |||||||||||||||
|
| ||||||||||||||
Total Energy | 238,496,870 | ||||||||||||||
|
| ||||||||||||||
| Financials - 26.24% | |||||||||||||||
| Banks - 9.68% | |||||||||||||||
| Bank of America Corp. | 1,633,300 | 57,524,826 | |||||||||||||
| Citigroup, Inc. | 684,400 | 54,676,716 | |||||||||||||
| Fifth Third Bancorp | 1,285,300 | 39,510,122 | |||||||||||||
| Huntington Bancshares, Inc. | 2,398,800 | 36,173,904 | |||||||||||||
| KeyCorp | 1,117,500 | 22,618,200 | |||||||||||||
| Regions Financial Corp. | 3,150,900 | 54,069,444 | |||||||||||||
| US Bancorp | 673,900 | 39,955,531 | |||||||||||||
| Wells Fargo & Co. | 805,600 | 43,341,280 | |||||||||||||
|
| ||||||||||||||
| 347,870,023 | |||||||||||||||
|
| ||||||||||||||
| Capital Markets - 3.98% | |||||||||||||||
| Ameriprise Financial, Inc. | 228,700 | 38,096,846 | |||||||||||||
| Franklin Resources, Inc. | 1,340,800 | 34,833,984 | |||||||||||||
| Intercontinental Exchange, Inc. | 300,000 | 27,765,000 | |||||||||||||
| Morgan Stanley | 830,600 | 42,460,272 | |||||||||||||
|
| ||||||||||||||
| 143,156,102 | |||||||||||||||
|
| ||||||||||||||
| Consumer Finance - 4.33% | |||||||||||||||
| Ally Financial, Inc. | 1,144,100 | 34,963,696 | |||||||||||||
| Capital One Financial Corp. | 401,400 | 41,308,074 | |||||||||||||
| Discover Financial Services | 492,936 | 41,810,832 | |||||||||||||
| Synchrony Financial | 1,042,200 | 37,529,622 | |||||||||||||
|
| ||||||||||||||
| 155,612,224 | |||||||||||||||
|
| ||||||||||||||
| Diversified Financial Services - 1.21% | |||||||||||||||
| Voya Financial, Inc. | 714,200 | 43,551,916 | |||||||||||||
|
| ||||||||||||||
| Insurance - 7.04% | |||||||||||||||
| Aflac, Inc. | 580,200 | 30,692,580 | |||||||||||||
| Allstate Corp. | 352,800 | 39,672,360 | |||||||||||||
| American Financial Group, Inc. | 258,800 | 28,377,420 | |||||||||||||
| Cincinnati Financial Corp. | 199,300 | 20,956,395 | |||||||||||||
| MetLife, Inc. | 545,300 | 27,793,941 | |||||||||||||
| Principal Financial Group, Inc. | 593,800 | 32,659,000 | |||||||||||||
| Prudential Financial, Inc. | 410,200 | 38,452,148 | |||||||||||||
| Reinsurance Group of America, Inc. | 211,200 | 34,438,272 | |||||||||||||
|
| ||||||||||||||
| 253,042,116 | |||||||||||||||
|
| ||||||||||||||
Total Financials | 943,232,381 | ||||||||||||||
|
| ||||||||||||||
See accompanying notes
18
American Beacon Bridgeway Large Cap Value FundSM
Schedule of Investments
December 31, 2019
| Shares | Fair Value | ||||||||||||||
| COMMON STOCKS - 99.14% (continued) | |||||||||||||||
| Health Care - 10.73% | |||||||||||||||
| Biotechnology - 2.83% | |||||||||||||||
| Amgen, Inc. | 207,800 | $ | 50,094,346 | ||||||||||||
| Biogen, Inc.A | 174,200 | 51,690,366 | |||||||||||||
|
| ||||||||||||||
| 101,784,712 | |||||||||||||||
|
| ||||||||||||||
| Health Care Equipment & Supplies - 0.65% | |||||||||||||||
| Medtronic PLC | 206,200 | 23,393,390 | |||||||||||||
|
| ||||||||||||||
| Health Care Providers & Services - 2.01% | |||||||||||||||
| Anthem, Inc. | 131,200 | 39,626,336 | |||||||||||||
| HCA Healthcare, Inc. | 220,900 | 32,651,229 | |||||||||||||
|
| ||||||||||||||
| 72,277,565 | |||||||||||||||
|
| ||||||||||||||
| Pharmaceuticals - 5.24% | |||||||||||||||
| Jazz Pharmaceuticals PLCA | 260,100 | 38,827,728 | |||||||||||||
| Merck & Co., Inc. | 556,800 | 50,640,960 | |||||||||||||
| Mylan N.V.A | 1,967,000 | 39,536,700 | |||||||||||||
| Pfizer, Inc. | 1,515,000 | 59,357,700 | |||||||||||||
|
| ||||||||||||||
| 188,363,088 | |||||||||||||||
|
| ||||||||||||||
Total Health Care | 385,818,755 | ||||||||||||||
|
| ||||||||||||||
| Industrials - 11.74% | |||||||||||||||
| Aerospace & Defense - 0.97% | |||||||||||||||
| L3Harris Technologies, Inc. | 175,700 | 34,765,759 | |||||||||||||
|
| ||||||||||||||
| Airlines - 2.32% | |||||||||||||||
| American Airlines Group, Inc.B | 811,852 | 23,283,915 | |||||||||||||
| Delta Air Lines, Inc. | 446,900 | 26,134,712 | |||||||||||||
| United Airlines Holdings, Inc.A | 383,800 | 33,808,942 | |||||||||||||
|
| ||||||||||||||
| 83,227,569 | |||||||||||||||
|
| ||||||||||||||
| Building Products - 0.66% | |||||||||||||||
| Johnson Controls International PLC | 585,600 | 23,839,776 | |||||||||||||
|
| ||||||||||||||
| Commercial Services & Supplies - 2.50% | |||||||||||||||
| Republic Services, Inc. | 540,900 | 48,480,867 | |||||||||||||
| Waste Management, Inc. | 362,300 | 41,287,708 | |||||||||||||
|
| ||||||||||||||
| 89,768,575 | |||||||||||||||
|
| ||||||||||||||
| Electrical Equipment - 1.05% | |||||||||||||||
| AMETEK, Inc. | 378,500 | 37,751,590 | |||||||||||||
|
| ||||||||||||||
| Machinery - 1.06% | |||||||||||||||
| Fortive Corp. | 500,200 | 38,210,278 | |||||||||||||
|
| ||||||||||||||
| Professional Services - 1.12% | |||||||||||||||
| IHS Markit Ltd.A | 535,700 | 40,364,995 | |||||||||||||
|
| ||||||||||||||
| Road & Rail - 1.32% | |||||||||||||||
| Norfolk Southern Corp. | 244,800 | 47,523,024 | |||||||||||||
|
| ||||||||||||||
| Trading Companies & Distributors - 0.74% | |||||||||||||||
| Fastenal Co. | 717,000 | 26,493,150 | |||||||||||||
|
| ||||||||||||||
Total Industrials | 421,944,716 | ||||||||||||||
|
| ||||||||||||||
| Information Technology - 7.65% | |||||||||||||||
| Communications Equipment - 0.37% | |||||||||||||||
| Cisco Systems, Inc. | 277,900 | 13,328,084 | |||||||||||||
|
| ||||||||||||||
See accompanying notes
19
American Beacon Bridgeway Large Cap Value FundSM
Schedule of Investments
December 31, 2019
| Shares | Fair Value | ||||||||||||||
| COMMON STOCKS - 99.14% (continued) | |||||||||||||||
| Information Technology - 7.65% (continued) | |||||||||||||||
| Electronic Equipment, Instruments & Components - 0.98% | |||||||||||||||
| Corning, Inc. | 1,206,000 | $ | 35,106,660 | ||||||||||||
|
| ||||||||||||||
| IT Services - 1.81% | |||||||||||||||
| Amdocs Ltd. | 397,200 | 28,673,868 | |||||||||||||
| DXC Technology Co. | 349,300 | 13,130,187 | |||||||||||||
| Fidelity National Information Services, Inc. | 167,900 | 23,353,211 | |||||||||||||
|
| ||||||||||||||
| 65,157,266 | |||||||||||||||
|
| ||||||||||||||
| Semiconductors & Semiconductor Equipment - 1.81% | |||||||||||||||
| Micron Technology, Inc.A | 944,200 | 50,779,076 | |||||||||||||
| QUALCOMM, Inc. | 163,500 | 14,425,605 | |||||||||||||
|
| ||||||||||||||
| 65,204,681 | |||||||||||||||
|
| ||||||||||||||
| Software - 0.40% | |||||||||||||||
| Oracle Corp. | 269,500 | 14,278,110 | |||||||||||||
|
| ||||||||||||||
| Technology Hardware, Storage & Peripherals - 2.28% | |||||||||||||||
| Hewlett Packard Enterprise Co. | 1,924,900 | 30,528,914 | |||||||||||||
| Western Digital Corp. | 807,000 | 51,220,290 | |||||||||||||
|
| ||||||||||||||
| 81,749,204 | |||||||||||||||
|
| ||||||||||||||
Total Information Technology | 274,824,005 | ||||||||||||||
|
| ||||||||||||||
| Materials - 4.52% | |||||||||||||||
| Chemicals - 3.16% | |||||||||||||||
| Air Products & Chemicals, Inc. | 200,900 | 47,209,491 | |||||||||||||
| CF Industries Holdings, Inc. | 200,141 | 9,554,731 | |||||||||||||
| LyondellBasell Industries N.V., Class A | 449,400 | 42,459,312 | |||||||||||||
| PPG Industries, Inc. | 109,100 | 14,563,759 | |||||||||||||
|
| ||||||||||||||
| 113,787,293 | |||||||||||||||
|
| ||||||||||||||
| Metals & Mining - 1.36% | |||||||||||||||
| Freeport-McMoRan, Inc. | 3,721,200 | 48,822,144 | |||||||||||||
|
| ||||||||||||||
Total Materials | 162,609,437 | ||||||||||||||
|
| ||||||||||||||
| Real Estate - 4.63% | |||||||||||||||
| Equity Real Estate Investment Trusts (REITs) - 4.63% | |||||||||||||||
| Alexandria Real Estate Equities, Inc. | 281,800 | 45,533,244 | |||||||||||||
| Host Hotels & Resorts, Inc. | 1,937,700 | 35,944,335 | |||||||||||||
| Realty Income Corp. | 614,800 | 45,267,724 | |||||||||||||
| Sun Communities, Inc. | 263,900 | 39,611,390 | |||||||||||||
|
| ||||||||||||||
| 166,356,693 | |||||||||||||||
|
| ||||||||||||||
Total Real Estate | 166,356,693 | ||||||||||||||
|
| ||||||||||||||
| Utilities - 1.67% | |||||||||||||||
| Electric Utilities - 1.00% | |||||||||||||||
| Southern Co. | 565,700 | 36,035,090 | |||||||||||||
|
| ||||||||||||||
| Independent Power & Renewable Electricity Producers - 0.67% | |||||||||||||||
| AES Corp. | 1,211,400 | 24,106,860 | |||||||||||||
|
| ||||||||||||||
Total Utilities | 60,141,950 | ||||||||||||||
|
| ||||||||||||||
Total Common Stocks (Cost $3,096,316,506) | 3,563,604,311 | ||||||||||||||
|
| ||||||||||||||
See accompanying notes
20
American Beacon Bridgeway Large Cap Value FundSM
Schedule of Investments
December 31, 2019
| Shares | Fair Value | ||||||||||||||||
| SHORT-TERM INVESTMENTS - 1.14% | |||||||||||||||||
| Investment Companies - 1.08% | |||||||||||||||||
| American Beacon U.S. Government Money Market Select Fund, Select Class, 1.52%C D | 38,744,589 | $ | 38,744,589 | ||||||||||||||
|
| ||||||||||||||||
| Principal Amount | |||||||||||||||||
| U.S. Treasury Obligations - 0.06% | |||||||||||||||||
| U.S. Treasury Bill, 1.870%, Due 2/13/2020E | $ | 2,200,000 | 2,196,182 | ||||||||||||||
|
| ||||||||||||||||
Total Short-Term Investments (Cost $40,939,780) | 40,940,771 | ||||||||||||||||
|
| ||||||||||||||||
TOTAL INVESTMENTS - 100.28% (Cost $3,137,256,286) | 3,604,545,082 | ||||||||||||||||
LIABILITIES, NET OF OTHER ASSETS - (0.28%) | (9,976,311 | ) | |||||||||||||||
|
| ||||||||||||||||
TOTAL NET ASSETS - 100.00% | $ | 3,594,568,771 | |||||||||||||||
|
| ||||||||||||||||
| Percentages are stated as a percent of net assets. | |||||||||||||||||
ANon-income producing security.
B All or a portion of this security is on loan, collateralized by either cash and/or U.S. Treasuries, at December 31, 2019 (Note 9).
C The Fund is affiliated by having the same investment advisor.
D7-day yield.
E This security or a piece thereof is held as segregated collateral.
PLC - Public Limited Company.
| Long Futures Contracts Open on December 31, 2019: |
| |||||||||||||
| Equity Futures Contracts | ||||||||||||||
| Description | Number of Contracts | Expiration Date | Notional Amount | Contract Value | Unrealized Appreciation (Depreciation) | |||||||||
| S&P 500E-Mini Index Futures | 257 | March 2020 | $ 41,474,763 | $ | 41,519,635 | $ | 44,872 | |||||||
|
|
|
|
| ||||||||||
| $ 41,474,763 | $ | 41,519,635 | $ | 44,872 | ||||||||||
|
|
|
|
| ||||||||||
| Index Abbreviations: | ||
| S&P 500 | Standard & Poor’s U.S. EquityLarge-Cap Index. | |
The Fund’s investments are summarized by level based on the inputs used to determine their values. As of December 31, 2019, the investments were classified as described below:
Bridgeway Large Cap Value Fund | Level 1 | Level 2 | Level 3 | Total | ||||||||||||||||||||||||
Assets |
| |||||||||||||||||||||||||||
Common Stocks | $ | 3,563,604,311 | $ | - | $ | - | $ | 3,563,604,311 | ||||||||||||||||||||
Short-Term Investments | 38,744,589 | 2,196,182 | - | 40,940,771 | ||||||||||||||||||||||||
|
|
|
|
|
|
|
| |||||||||||||||||||||
Total Investments in Securities - Assets | $ | 3,602,348,900 | $ | 2,196,182 | $ | - | $ | 3,604,545,082 | ||||||||||||||||||||
|
|
|
|
|
|
|
| |||||||||||||||||||||
Financial Derivative Instruments - Assets |
| |||||||||||||||||||||||||||
Futures Contracts | $ | 44,872 | $ | - | $ | - | $ | 44,872 | ||||||||||||||||||||
|
|
|
|
|
|
|
| |||||||||||||||||||||
Total Financial Derivative Instruments - Assets | $ | 44,872 | $ | - | $ | - | $ | 44,872 | ||||||||||||||||||||
|
|
|
|
|
|
|
| |||||||||||||||||||||
U.S. GAAP requires transfers between all levels to/from level 3 be disclosed. During the year ended December 31, 2019, there were no transfers into or out of Level 3.
See accompanying notes
21
American Beacon FundsSM
Statements of Assets and Liabilities
December 31, 2019
| Bridgeway Large Cap Growth Fund | Bridgeway Large Cap Value Fund | |||||||||||
Assets: |
| |||||||||||
Investments in unaffiliated securities, at fair value† § | $ | 194,760,449 | $ | 3,565,800,493 | ||||||||
Investments in affiliated securities, at fair value‡ | 4,691,928 | 38,744,589 | ||||||||||
Dividends and interest receivable | 103,075 | 5,887,231 | ||||||||||
Deposits with broker for futures contracts | - | 56,334 | ||||||||||
Receivable for investments sold | 700,900 | 8,252,084 | ||||||||||
Receivable for fund shares sold | 148,399 | 3,664,378 | ||||||||||
Receivable for expense reimbursement (Note 2) | 118,627 | 6,542 | ||||||||||
Receivable for variation margin on open futures contracts (Note 5) | 47,219 | 45,403 | ||||||||||
Prepaid expenses | 63,520 | 130,836 | ||||||||||
|
|
|
| |||||||||
Total assets | 200,634,117 | 3,622,587,890 | ||||||||||
|
|
|
| |||||||||
Liabilities: |
| |||||||||||
Payable for investments purchased | 1,906,558 | - | ||||||||||
Payable for fund shares redeemed | 305,069 | 25,338,894 | ||||||||||
Cash due to broker for futures contracts | 41,033 | - | ||||||||||
Management andsub-advisory fees payable (Note 2) | 57,927 | 2,014,781 | ||||||||||
Service fees payable (Note 2) | 31,814 | 238,943 | ||||||||||
Transfer agent fees payable (Note 2) | 9,241 | 184,286 | ||||||||||
Payable upon return of securities loaned (Note 9) | 2,165,786 | - | ||||||||||
Custody and fund accounting fees payable | 6,764 | 65,616 | ||||||||||
Professional fees payable | 45,259 | 69,669 | ||||||||||
Payable for prospectus and shareholder reports | 6,379 | 94,196 | ||||||||||
Other liabilities | 38,266 | 12,734 | ||||||||||
|
|
|
| |||||||||
Total liabilities | 4,614,096 | 28,019,119 | ||||||||||
|
|
|
| |||||||||
Net assets | $ | 196,020,021 | $ | 3,594,568,771 | ||||||||
|
|
|
| |||||||||
Analysis of net assets: |
| |||||||||||
Paid-in-capital | $ | 149,697,621 | $ | 3,028,886,735 | ||||||||
Total distributable earnings (deficits)A | 46,322,400 | 565,682,036 | ||||||||||
|
|
|
| |||||||||
Net assets | $ | 196,020,021 | $ | 3,594,568,771 | ||||||||
|
|
|
| |||||||||
Shares outstanding at no par value (unlimited shares authorized): |
| |||||||||||
Institutional Class | 3,982,963 | 44,419,289 | ||||||||||
|
|
|
| |||||||||
Y Class | 68,535 | 53,799,030 | ||||||||||
|
|
|
| |||||||||
Investor Class | 2,445,136 | 21,730,914 | ||||||||||
|
|
|
| |||||||||
A Class | 68,763 | 2,178,050 | ||||||||||
|
|
|
| |||||||||
C Class | 38,097 | 2,263,235 | ||||||||||
|
|
|
| |||||||||
R6 Class | 3,597 | 8,391,825 | ||||||||||
|
|
|
| |||||||||
Net assets: |
| |||||||||||
Institutional Class | $ | 118,831,764 | $ | 1,205,569,140 | ||||||||
|
|
|
| |||||||||
Y Class | $ | 2,036,785 | $ | 1,455,648,440 | ||||||||
|
|
|
| |||||||||
Investor Class | $ | 71,928,098 | $ | 587,724,123 | ||||||||
|
|
|
| |||||||||
A Class | $ | 2,029,102 | $ | 58,637,332 | ||||||||
|
|
|
| |||||||||
C Class | $ | 1,086,848 | $ | 59,409,216 | ||||||||
|
|
|
| |||||||||
R6 Class | $ | 107,424 | $ | 227,580,520 | ||||||||
|
|
|
| |||||||||
Net asset value, offering and redemption price per share: |
| |||||||||||
Institutional Class | $ | 29.84 | $ | 27.14 | ||||||||
|
|
|
| |||||||||
Y Class | $ | 29.72 | $ | 27.06 | ||||||||
|
|
|
| |||||||||
Investor Class | $ | 29.42 | $ | 27.05 | ||||||||
|
|
|
| |||||||||
A Class | $ | 29.51 | $ | 26.92 | ||||||||
|
|
|
| |||||||||
A Class (offering price) | $ | 31.31 | $ | 28.56 | ||||||||
|
|
|
| |||||||||
C Class | $ | 28.53 | $ | 26.25 | ||||||||
|
|
|
| |||||||||
R6 Class | $ | 29.86 | $ | 27.12 | ||||||||
|
|
|
| |||||||||
† Cost of investments in unaffiliated securities | $ | 157,698,804 | $ | 3,098,511,697 | ||||||||
‡ Cost of investments in affiliated securities | $ | 4,691,928 | $ | 38,744,589 | ||||||||
§ Fair value of securities on loan | $ | 12,747,271 | $ | 102,365,471 | ||||||||
A The Fund’s investments in affiliated securities did not have unrealized appreciation (depreciation) at year end. |
| |||||||||||
See accompanying notes
22
American Beacon FundsSM
Statements of Operations
For the year ended December 31, 2019
| Bridgeway Large Cap Growth Fund | Bridgeway Large Cap Value Fund | |||||||||||
Investment income: |
| |||||||||||
Dividend income from unaffiliated securities | $ | 2,062,317 | $ | 98,302,203 | ||||||||
Dividend income from affiliated securities (Note 8) | 87,729 | 1,094,199 | ||||||||||
Interest income | 1,638 | 28,632 | ||||||||||
Income derived from securities lending (Note 9) | 20,484 | 234,382 | ||||||||||
|
|
|
| |||||||||
Total investment income | 2,172,168 | 99,659,416 | ||||||||||
|
|
|
| |||||||||
Expenses: |
| |||||||||||
Management andsub-advisory fees (Note 2) | 1,435,684 | 26,785,139 | ||||||||||
Transfer agent fees: | ||||||||||||
Institutional Class (Note 2) | 71,767 | 433,676 | ||||||||||
Y Class (Note 2) | 2,625 | 1,493,218 | ||||||||||
Investor Class | 7,415 | 31,852 | ||||||||||
A Class | - | 6,440 | ||||||||||
C Class | 10 | 8,432 | ||||||||||
R6 Class | - | 6,364 | ||||||||||
Custody and fund accounting fees | 45,718 | 391,314 | ||||||||||
Professional fees | 26,085 | 284,697 | ||||||||||
Registration fees and expenses | 99,761 | 189,080 | ||||||||||
Service fees (Note 2): | ||||||||||||
Investor Class | 244,935 | 3,036,695 | ||||||||||
A Class | 1,691 | 95,946 | ||||||||||
C Class | 841 | 68,638 | ||||||||||
Distribution fees (Note 2): | ||||||||||||
A Class | 4,799 | 177,230 | ||||||||||
C Class | 10,266 | 695,741 | ||||||||||
Prospectus and shareholder report expenses | 22,266 | 296,640 | ||||||||||
Trustee fees (Note 2) | 15,569 | 317,625 | ||||||||||
Other expenses | 31,677 | 365,780 | ||||||||||
|
|
|
| |||||||||
Total expenses | 2,021,109 | 34,684,507 | ||||||||||
|
|
|
| |||||||||
Net fees waived and expenses (reimbursed) (Note 2) | (112,290 | ) | (4,871 | ) | ||||||||
|
|
|
| |||||||||
Net expenses | 1,908,819 | 34,679,636 | ||||||||||
|
|
|
| |||||||||
Net investment income | 263,349 | 64,979,780 | ||||||||||
|
|
|
| |||||||||
Realized and unrealized gain (loss) from investments: |
| |||||||||||
Net realized gain (loss) from: | ||||||||||||
Investments in unaffiliated securitiesA | 27,135,499 | 204,631,006 | ||||||||||
Futures contracts | 1,255,967 | 10,006,004 | ||||||||||
Change in net unrealized appreciation (depreciation) of: | ||||||||||||
Investments in unaffiliated securitiesB | 27,940,614 | 626,516,359 | ||||||||||
Futures contracts | (2,484 | ) | (954,898 | ) | ||||||||
|
|
|
| |||||||||
Net gain from investments | 56,329,596 | 840,198,471 | ||||||||||
|
|
|
| |||||||||
Net increase in net assets resulting from operations | $ | 56,592,945 | $ | 905,178,251 | ||||||||
|
|
|
| |||||||||
A The Fund did not recognize net realized gains (losses) from the sale of investments in affiliated securities. |
| |||||||||||
B The Fund’s investments in affiliated securities did not have a change in unrealized appreciation (depreciation) at year end. |
| |||||||||||
See accompanying notes
23
American Beacon FundsSM
Statements of Changes in Net Assets
| Bridgeway Large Cap Growth Fund | Bridgeway Large Cap Value Fund | |||||||||||||||||||||||||||
| Year Ended December 31, 2019 | Year Ended December 31, 2018 | Year Ended December 31, 2019 | Year Ended December 31, 2018 | |||||||||||||||||||||||||
Increase (decrease) in net assets: | ||||||||||||||||||||||||||||
Operations: | ||||||||||||||||||||||||||||
Net investment income | $ | 263,349 | $ | 705,556 | $ | 64,979,780 | $ | 74,081,875 | ||||||||||||||||||||
Net realized gain from investments in unaffiliated securities and futures contracts | 28,391,466 | 15,861,210 | 214,637,010 | 169,733,284 | ||||||||||||||||||||||||
Change in net unrealized appreciation (depreciation) of investments in unaffiliated securities and futures contracts | 27,938,130 | (29,789,870 | ) | 625,561,461 | (926,602,905 | ) | ||||||||||||||||||||||
|
|
|
|
|
|
|
| |||||||||||||||||||||
Net increase (decrease) in net assets resulting from operations | 56,592,945 | (13,223,104 | ) | 905,178,251 | (682,787,746 | ) | ||||||||||||||||||||||
|
|
|
|
|
|
|
| |||||||||||||||||||||
Distributions to shareholders: |
| |||||||||||||||||||||||||||
Total retained earnings: | ||||||||||||||||||||||||||||
Institutional Class | (11,270,063 | ) | (15,182,919 | ) | (49,898,828 | ) | (126,509,744 | ) | ||||||||||||||||||||
Y Class | (199,045 | ) | (222,964 | ) | (58,703,209 | ) | (134,207,073 | ) | ||||||||||||||||||||
Investor Class | (6,878,930 | ) | (6,341,212 | ) | (22,164,868 | ) | (75,566,771 | ) | ||||||||||||||||||||
A Class | (197,898 | ) | (162,842 | ) | (2,157,671 | ) | (6,632,802 | ) | ||||||||||||||||||||
C Class | (110,609 | ) | (64,536 | ) | (1,806,442 | ) | (6,082,752 | ) | ||||||||||||||||||||
R6 Class | (11,081 | ) | (8,892 | ) | (9,322,560 | ) | (12,669,411 | ) | ||||||||||||||||||||
|
|
|
|
|
|
|
| |||||||||||||||||||||
Net distributions to shareholders | (18,667,626 | ) | (21,983,365 | ) | (144,053,578 | ) | (361,668,553 | ) | ||||||||||||||||||||
|
|
|
|
|
|
|
| |||||||||||||||||||||
Capital share transactions (Note 11): | ||||||||||||||||||||||||||||
Proceeds from sales of shares | 12,698,919 | 51,470,483 | 977,847,418 | 1,693,099,714 | ||||||||||||||||||||||||
Reinvestment of dividends and distributions | 18,255,572 | 21,667,625 | 141,054,545 | 346,742,403 | ||||||||||||||||||||||||
Cost of shares redeemed | (94,788,665 | ) | (72,750,374 | ) | (2,419,288,681 | ) | (1,634,032,413 | ) | ||||||||||||||||||||
|
|
|
|
|
|
|
| |||||||||||||||||||||
Net increase (decrease) in net assets from capital share transactions | (63,834,174 | ) | 387,734 | (1,300,386,718 | ) | 405,809,704 | ||||||||||||||||||||||
|
|
|
|
|
|
|
| |||||||||||||||||||||
Net (decrease) in net assets | (25,908,855 | ) | (34,818,735 | ) | (539,262,045 | ) | (638,646,595 | ) | ||||||||||||||||||||
|
|
|
|
|
|
|
| |||||||||||||||||||||
Net assets: | ||||||||||||||||||||||||||||
Beginning of period | 221,928,876 | 256,747,611 | 4,133,830,816 | 4,772,477,411 | ||||||||||||||||||||||||
|
|
|
|
|
|
|
| |||||||||||||||||||||
End of period | $ | 196,020,021 | $ | 221,928,876 | $ | 3,594,568,771 | $ | 4,133,830,816 | ||||||||||||||||||||
|
|
|
|
|
|
|
| |||||||||||||||||||||
See accompanying notes
24
American Beacon FundsSM
December 31, 2019
1. Organization and Significant Accounting Policies
American Beacon Funds (the “Trust”) is organized as a Massachusetts business trust. The Funds, each a series within the Trust, are registered under the Investment Company Act of 1940, as amended (the “Act”), as diversified,open-end management investment companies. As of December 31, 2019, the Trust consists ofthirty-two active series, two of which are presented in this filing: American Beacon Bridgeway Large Cap Growth Fund and American Beacon Bridgeway Large Cap Value Fund (collectively, the “Funds” and each individually a “Fund”). The remaining thirty active series are reported in separate filings.
American Beacon Advisors, Inc. (the “Manager”) is a Delaware corporation and a wholly-owned subsidiary of Resolute Investment Managers, Inc. (“RIM”) organized in 1986 to provide business management, advisory, administrative, and asset management consulting services to the Trust and other investors. The Manager is registered as an investment advisor under the Investment Advisers Act of 1940, as amended (the “Advisers Act”). RIM is, in turn, a wholly-owned subsidiary of Resolute Acquisition, Inc., which is a wholly-owned subsidiary of Resolute Topco, Inc., a wholly-owned subsidiary of Resolute Investment Holdings, LLC (“RIH”). RIH is owned primarily by Kelso Investment Associates VIII, L.P., KEP VI, LLC and Estancia Capital Partners L.P., investment funds affiliated with Kelso & Company, L.P. (“Kelso”) or Estancia Capital Management, LLC (“Estancia”), which are private equity firms.
Recently Adopted Accounting Pronouncements
In March 2017, the Financial Accounting Standards Board (“FASB”) issued Accounting Standards Update (“ASU”)2017-08,Premium Amortization of Purchased Callable Debt Securities. The amendments in the ASU shorten the premium amortization period on a purchased callable debt security from the security’s contractual life to the earliest call date. It is anticipated that this change will enhance disclosures by reducing losses recognized when a security is called on an earlier date. This ASU is effective for fiscal years beginning after December 15, 2018, and has been adopted accordingly with no material impact on the financial statements and other disclosures.
In August 2018, the FASB issued ASU2018-13,Fair Value Measurement (“Topic 820”). The amendments in the ASU impact disclosure requirements for fair value measurement. It is anticipated that this change will enhance the effectiveness of disclosures in the notes to the financial statements. This ASU is effective for fiscal years beginning after December 15, 2019. Early adoption is permitted and can include the entire standard or certain provisions that exclude or amend disclosures. For the year ended December 31, 2019, the Funds have chosen to adopt the standard. The adoption of this ASU guidance did not have a material impact on the financial statements and other disclosures.
Class Disclosure
Each Fund has multiple classes of shares designed to meet the needs of different groups of investors; however, not all of the Funds offer all classes. The following table sets forth the differences amongst the classes:
Class | Eligible Investors | Minimum Initial Investments | ||||
| Institutional | Large institutional investors - sold directly or through intermediary channels. | $ | 250,000 | |||
| Y Class | Large institutional retirement plan investors - sold directly or through intermediary channels. | $ | 100,000 | |||
| Investor | All investors using intermediary organizations, such as broker-dealers or retirement plan sponsors. | $ | 2,500 | |||
| A Class | All investors who invest through intermediary organizations, such as broker-dealers or third party administrator. Retail investors who invest directly through a financial intermediary such as a broker, bank, or registered investment advisor which may include afront-end sales charge and a contingent deferred sales charge (“CDSC”). | $ | 2,500 | |||
| C Class | Retail investors who invest directly through a financial intermediary, such as a broker or through employee directed benefit plans with applicable sales charges which may include CDSC. | $ | 1,000 | |||
| R6 Class | Large institutional retirement plan investors - sold through retirement plan sponsors. | None | ||||
25
American Beacon FundsSM
Notes to Financial Statements
December 31, 2019
Each class offered by the Trust has equal rights as to assets and voting privileges. Income andnon-class specific expenses are allocated daily to each class based on the relative net assets. Realized and unrealized capital gains and losses of each class are allocated daily based on the relative net assets of each class of the respective Fund. Class specific expenses, where applicable, currently include service, distribution, transfer agent fees, andsub-transfer agent fees that vary amongst the classes as described more fully in Note 2.
Significant Accounting Policies
The following is a summary of significant accounting policies, consistently followed by the Funds in preparation of the financial statements. The Funds are considered investment companies and accordingly, follow the investment company accounting and reporting guidance of the FASB Accounting Standards Codification Topic 946,Financial Services – Investment Companies,a part of Generally Accepted Accounting Principles (“U.S. GAAP”).
Security Transactions and Investment Income
Security transactions are recorded as of the trade date for financial reporting purposes. Securities purchased or sold on a when-issued or delayed-delivery basis may be settled beyond a standard settlement period for the security after the trade date.
Dividend income, net of foreign taxes, is recorded on theex-dividend date, except certain dividends from foreign securities which are recorded as soon as the information is available to the Funds. Interest income, net of foreign taxes, is earned from settlement date, recorded on the accrual basis, and adjusted, if necessary, for accretion of discounts and amortization of premiums. Realized gains (losses) from securities sold are determined based on specific lot identification.
Distributions to Shareholders
The Funds distribute most or all of its net earning and realized gains, if any, each taxable year in the form of dividends from net investment income and distributions of realized net capital gains and net gains from foreign currency transactions on an annual basis. The Funds do not have a fixed dividend rate and do not guarantee that it will pay any distributions in any particular period. Dividends to shareholders are determined in accordance with federal income tax regulations, which may differ in amount and character from net investment income and realized gains recognized for purposes of U.S. GAAP. To the extent necessary to fully distribute capital gains, the Funds may designate earnings and profits distributed to shareholders on the redemption of shares.
Commission Recapture
The Funds have established brokerage commission recapture arrangements with certain brokers or dealers. If the Funds’ investment advisor chooses to execute a transaction through a participating broker, the broker rebates a portion of the commission back to the Funds. Any collateral benefit received through participation in the commission recapture program is directed exclusively to the Funds. This amount is reported with the net realized gain (loss) in the Funds’ Statements of Operations, if applicable.
Allocation of Income, Trust Expenses, Gains, and Losses
Investment income, realized and unrealized gains and losses from investments of the Funds are allocated daily to each class of shares based upon the relative proportion of net assets of each class to the total net assets of the Funds. Expenses directly charged or attributable to the Funds will be paid from the assets of the Fund. Generally, expenses of the Trust will be allocated among and charged to the assets of the Funds on a basis that the Trust’s Board of Trustees (the “Board”) deems fair and equitable, which may be based on the relative net assets of the Funds or nature of the services performed and relative applicability to the Funds.
26
American Beacon FundsSM
Notes to Financial Statements
December 31, 2019
Use of Estimates
The preparation of financial statements in conformity with U.S. GAAP requires management to make estimates and assumptions that affect the amounts reported in the financial statements and accompanying notes. Actual results may differ from those estimated.
Other
Under the Trust’s organizational documents, its officers and trustees are indemnified against certain liabilities arising out of the performance of their duties to the Trust. In the normal course of business, the Trust enters into contracts that provide indemnification to the other party or parties against potential costs or liabilities. The Trust’s maximum exposure under these arrangements is dependent on claims that may be made in the future and, therefore, cannot be estimated. The Trust has had no prior claims or losses pursuant to any such agreement.
2. Transactions with Affiliates
Management and InvestmentSub-Advisory Agreements
The Funds and the Manager are parties to a Management Agreement that obligates the Manager to provide the Funds with investment advisory and administrative services. As compensation for performing the duties under the Management Agreement, the Manager will receive an annualized management fee based on a percentage of the Funds’ average daily net assets that is calculated and accrued daily according to the following schedule:
First $5 billion | 0.35 | % | ||
Next $5 billion | 0.325 | % | ||
Next $10 billion | 0.30 | % | ||
Over $20 billion | 0.275 | % |
The Trust, on behalf of the Funds, and the Manager have entered into an Investment Advisory Agreements with Bridgeway Capital Management, Inc. (the“Sub-Advisor”) pursuant to which each Fund has agreed to pay an annualizedsub-advisory fee that is calculated and accrued daily based on the Funds’ average daily net assets according to the following schedule:
First $250 million | 0.40 | % | ||
Next $250 million | 0.35 | % | ||
Over $500 million | 0.30 | % |
The Management andSub-Advisory Fees paid by the Funds for the year ended December 31, 2019 were as follows:
Bridgeway Large Cap Growth Fund
| Effective Fee Rate | Amount of Fees Paid | |||||||||||
Management Fees | 0.35 | % | $ | 700,160 | ||||||||
Sub-Advisor Fees | 0.40 | % | 735,524 | |||||||||
|
|
|
| |||||||||
Total | 0.75 | % | $ | 1,435,684 | ||||||||
|
|
|
| |||||||||
Bridgeway Large Cap Value Fund
| Effective Fee Rate | Amount of Fees Paid | |||||||||||
Management Fees | 0.35 | % | $ | 14,274,034 | ||||||||
Sub-Advisor Fees | 0.31 | % | 12,511,105 | |||||||||
|
|
|
| |||||||||
Total | 0.66 | % | $ | 26,785,139 | ||||||||
|
|
|
| |||||||||
27
American Beacon FundsSM
Notes to Financial Statements
December 31, 2019
As compensation for services provided by the Manager in connection with securities lending activities conducted by the Funds, the lending Fund pays to the Manager, with respect to cash collateral posted by borrowers, a fee up to 10% of the net monthly interest income (the gross interest income earned by the investment of cash collateral, less the amount paid to borrowers and related expenses) from such activities and, with respect to loan fees paid by borrowers, a fee up to 10% of such loan fees. These fees are included in “Income derived from securities lending” and “Management and investment advisory fees” on the Statements of Operations. During the year ended December 31, 2019, the Manager received securities lending fees of $2,815 and $27,446 for the securities lending activities of the Bridgeway Large Cap Growth Fund and Bridgeway Large Cap Value Fund, respectively.
Distribution Plans
The Funds, except for the A and C Classes of the Funds, have adopted a “defensive” Distribution Plan (the “Plan”) in accordance with Rule12b-1 under the Act, pursuant to which no separate fees may be charged to the Funds for distribution purposes. However, the Plan authorizes the management fee received by the Manager and the investment advisors hired by the Manager to be used for distribution purposes. Under this Plan, the Funds do not intend to compensate the Manager or any other party, either directly or indirectly, for the distribution of Fund shares.
Separate Distribution Plans (the “Distribution Plans”) have been adopted pursuant to Rule12b-1 under the Act for the A and C Classes of the Funds. Under the Distribution Plans, as compensation for distribution and shareholder servicing assistance, the Manager receives an annual fee of 0.25% of the average daily net assets of the A Class and 1.00% of the average daily net assets of the C Class. The fee will be payable without regard to whether the amount of the fee is more or less than the actual expenses incurred in a particular month by the Manager for distribution assistance.
Service Plans
The Manager and the Trust entered into Service Plans that obligate the Manager to oversee additional shareholder servicing of the Investor, A, and C Classes of the Funds. As compensation for performing the duties required under the Service Plans, the Manager receives an annualized fee up to 0.25% of the average daily net assets of the A and C Classes, and up to 0.375% of the average daily net assets of the Investor Class of the Funds.
Sub-Transfer Agent Fees
The Manager has entered into agreements, which include servicing agreements, with financial intermediaries that provide recordkeeping, processing, shareholder communications and other services to customers of the intermediaries that hold positions in the Institutional and Y Classes of the Funds and has agreed to compensate the intermediaries for providing these services. Intermediaries transact with the Funds primarily through the use of omnibus accounts on behalf of their customers who hold positions in the Funds. Certain services would have been provided by the Funds’ transfer agent and other service providers if the shareholders’ accounts were maintained directly by the Funds’ transfer agent. Accordingly, the Funds, pursuant to Board approval, have agreed to reimburse the Manager for certainnon-distribution shareholder services provided by financial intermediaries for the Institutional and Y Classes. The reimbursement amounts(sub-transfer agent fees) paid to the Manager are subject to a fee limit of up to 0.10% of an intermediary’s average net assets in the Institutional and Y Classes on an annual basis. During the year ended December 31, 2019, thesub-transfer agent fees, as reflected in “Transfer agent fees” on the Statements of Operations, were as follows:
Fund | Sub-Transfer Agent Fees | |||
Bridgeway Large Cap Growth | $ | 55,653 | ||
Bridgeway Large Cap Value | 1,770,855 | |||
28
American Beacon FundsSM
Notes to Financial Statements
December 31, 2019
As of December 31, 2019, the Funds owed the Manager the following reimbursement ofsub-transfer agent fees, as reflected in “Transfer agent fees payable” on the Statements of Assets and Liabilities:
Fund | Reimbursement Sub-Transfer Agent Fees | |||
Bridgeway Large Cap Growth | $ | 1,119 | ||
Bridgeway Large Cap Value | 156,993 | |||
Investments in Affiliated Funds
The Funds may invest in the American Beacon U.S. Government Money Market Select Fund (the “USG Select Fund”). Cash collateral received by the Funds in connection with securities lending may also be invested in the USG Select Fund. The Funds and the USG Select Fund have the same investment advisor and therefore, are considered to be affiliated. The Manager serves as investment advisor to the USG Select Fund and receives management fees and administrative fees totaling 0.10% of the average daily net assets of the USG Select Fund. During the year ended December 31, 2019, the Manager earned fees on the Funds’ direct investments and securities lending collateral investments in the USG Select Fund as shown below:
Fund | Direct Investments in USG Select Fund | Securities Lending Collateral Investments in USG Select Fund | Total | |||||||||
Bridgeway Large Cap Growth | $ | 4,264 | $ | 501 | $ | 4,765 | ||||||
Bridgeway Large Cap Value | 52,097 | 2,080 | 54,177 | |||||||||
Interfund Credit Facility
Pursuant to an exemptive order issued by the SEC, the Funds, along with other registered investment companies having management contracts with the Manager, may participate in a credit facility whereby each fund, under certain conditions, is permitted to lend money directly to and borrow directly from other participating funds for temporary purposes. The interfund credit facility is advantageous to the funds because it provides added liquidity and eliminates the need to maintain higher cash balances to meet redemptions. This situation could arise when shareholder redemptions exceed anticipated volumes and certain funds have insufficient cash on hand to satisfy such redemptions or when sales of securities do not settle as expected, resulting in a cash shortfall for a fund. When a fund liquidates portfolio securities to meet redemption requests, they often do not receive payment in settlement for up to two days (or longer for certain foreign transactions). Redemption requests normally are satisfied on the next business day. The credit facility provides a source of immediate, short-term liquidity pending settlement of the sale of portfolio securities. The credit facility is administered by a credit facility team consisting of professionals from the Manager’s asset management, compliance, and accounting areas who report the activities of the credit facility to the Board. During the year ended December 31, 2019, the Bridgeway Large Cap Growth Fund borrowed on average $22,641,543 for 4 days at an average interest rate of 3.02% with interest charges of $7,493 and the Bridgeway Large Cap Value Fund borrowed on average $18,222,064 for 5 days at an average interest rate of 2.80% with interest charges of $6,963. These amounts are recorded as “Other expenses” in the Statements of Operations.
29
American Beacon FundsSM
Notes to Financial Statements
December 31, 2019
Expense Reimbursement Plan
The Manager contractually agreed to reduce fees and/or reimburse expenses for the classes of the Funds to the extent that total operating expenses exceed the Funds’ expense cap. During the year ended December 31, 2019, the Manager waived and/or reimbursed expenses as follows:
| Expense Cap | Expiration of Reimbursed Expenses | |||||||||||||||||||||
Fund | Class | 1/1/2019 - 4/30/2019 | 5/1/2019 - 12/31/2019 | Reimbursed Expenses | (Recouped) Expenses | |||||||||||||||||
Bridgeway Large Cap Growth | Institutional | 0.81 | % | 0.81 | % | $ | 125,811 | $ | (16,725 | ) | 2022 | |||||||||||
Bridgeway Large Cap Growth | Y | 0.91 | % | 0.91 | % | 1,495 | (520 | ) | 2022 | |||||||||||||
Bridgeway Large Cap Growth | Investor | 1.19 | % | 1.19 | % | 32,866 | (29,642 | ) | 2022 | |||||||||||||
Bridgeway Large Cap Growth | A | 1.21 | % | 1.21 | % | 653 | (1,319 | ) | 2022 | |||||||||||||
Bridgeway Large Cap Growth | C | 1.96 | % | 1.96 | % | 89 | (502 | ) | 2022 | |||||||||||||
Bridgeway Large Cap Growth | R6 | 0.76 | % | 0.76 | % | 643 | (559 | ) | 2022 | |||||||||||||
Bridgeway Large Cap Value | R6 | 0.70 | % | N/A | 12,434 | (7,563 | ) | 2022 | ||||||||||||||
Of these amounts, $118,627 and $6,542 were disclosed as a receivable from the Manager on the Statements of Assets and Liabilities at December 31, 2019 for the Bridgeway Large Cap Growth Fund and Bridgeway Large Cap Value Fund, respectively.
The Funds have adopted an Expense Reimbursement Plan whereby the Manager may seek repayment of such fee or voluntary reductions and expense reimbursements. Under the policy, the Manager can be reimbursed by the Funds for any contractual or voluntary fee reductions or expense reimbursements if reimbursement to the Manager (a) occurs within three years from the date of the Manager’s waiver/reimbursement and (b) does not cause the Funds’ annual operating expenses to exceed the lesser of the contractual percentage limit in effect at the time of the waiver/reimbursement or time of recoupment. The reimbursed expenses listed above will expire in 2021 and 2022. The Funds did not record a liability for potential reimbursements due to the current assessment that reimbursements are unlikely. The carryover of excess expenses potentially reimbursable to the Manager, but not recorded as a liability are as follows:
Fund | Recouped Expenses | Excess Expense Carryover | Expired Expense Carryover | Expiration of Reimbursed Expenses | ||||||||||||
Bridgeway Large Cap Growth | $ | - | $ | - | $ | 38,672 | 2019 | |||||||||
Bridgeway Large Cap Growth | 43,799 | 375,714 | - | 2020 | ||||||||||||
Bridgeway Large Cap Growth | 101,998 | 241,324 | - | 2021 | ||||||||||||
Sales Commissions
The Funds’ Distributor, Resolute Investment Distributors, Inc. (“RID” or “Distributor”), may receive a portion of Class A sales charges from broker dealers which may be used to offset distribution related expenses. During the year ended December 31, 2019, RID collected $234 and $14,824 for Bridgeway Large Cap Growth Fund and Bridgeway Large Cap Value Fund, respectively, from the sale of Class A Shares.
A CDSC of 0.50% will be deducted with respect to Class A Shares on certain purchases of $1,000,000 or more that are redeemed in whole or part within 18 months of purchase, unless waived as discussed in the Funds’ Prospectus. Any applicable CDSC will be 0.50% of the lesser of the original purchase price or the value of the redemption of the Class A Shares redeemed. During the year ended December 31, 2019, CDSC fees of $1,367 were collected for Class A Shares of the Bridgeway Large Cap Value Fund. There were no CDSC fees collected for Class A Shares of the Bridgeway Large Cap Growth Fund for the same period herein.
A CDSC of 1.00% will be deducted with respect to Class C Shares redeemed within 12 months of purchase, unless waived as discussed in the Funds’ Prospectus. Any applicable CDSC will be 1.00% of the lesser of the original purchase price or the value of the redemption of the Class C Shares redeemed. During the year ended December 31, 2019, CDSC fees of $123 and $10,905 were collected for the Class C Shares of Bridgeway Large Cap Growth Fund and Bridgeway Large Cap Value Fund, respectively.
30
American Beacon FundsSM
Notes to Financial Statements
December 31, 2019
Trustee Fees and Expenses
Effective January 1, 2020, as compensation for their service to the American Beacon Funds Complex, including the Trust (collectively, the “Trusts”), each Trustee is compensated from the Trusts as follows: (1) an annual retainer of $120,000; (2) meeting attendance fee (for attendance in person or via teleconference) of (a) $12,000 for in person attendance, or $5,000 for telephonic attendance, by Board members for each regularly scheduled or special Board meeting, (b) $2,500 for attendance by Committee members at meetings of the Audit Committee and the Investment Committee, (c) $1,500 for attendance by Committee members at meetings of the Nominating and Governance Committee; and (d) $2,500 for attendance by Board members for each special telephonic Board meeting; and (3) reimbursement of reasonable expenses incurred in attending Board meetings, Committee meetings, and relevant educational seminars. The Trustees also may be compensated for attendance at special Board and/or Committee meetings from time to time. For her service as Board Chair, Ms. Cline receives an additional annual retainer of $50,000. Although she attends several committee meetings at each quarterly Board meeting, she receives only a single $2,500 fee each quarter for her attendance at those meetings. The chairpersons of the Audit Committee and the Investment Committee each receive an additional annual retainer of $25,000 and the Chair of the Nominating and Governance Committee receives an additional annual retainer of $15,000.
3. Security Valuation and Fair Value Measurements
The price of the Fund’s shares is based on its net asset value (“NAV”) per share. The Fund’s NAV is computed by adding total assets, subtracting all the Fund’s liabilities, and dividing the result by the total number of shares outstanding.
The NAV of each class of the Fund’s shares is determined based on a pro rata allocation of the Fund’s investment income, expenses and total capital gains and losses. The Fund’s NAV per share is determined each business day as of the regular close of trading on the New York Stock Exchange (“NYSE” or “Exchange”), which is typically 4:00 p.m. Eastern Time (“ET”). However, if trading on the NYSE closes at a time other than 4:00 p.m. ET, the Fund’s NAV per share typically would still be determined as of the regular close of trading on the NYSE. The Fund does not price its shares on days that the NYSE is closed. Foreign exchanges may permit trading in foreign securities on days when the Fund is not open for business, which may result in the value of the Fund’s portfolio investments being affected at a time when you are unable to buy or sell shares.
Equity securities, including shares ofclosed-end funds and exchange-traded funds (“ETFs”), are valued at the last sale price or official closing price taken from the primary exchange in which each security trades. Investments in other mutual funds are valued at the closing NAV per share on the day of valuation. Debt securities are valued at bid quotes from broker/dealers or evaluated bid prices from pricing services, who may consider a number of inputs and factors, such as prices of comparable securities, yield curves, spreads, credit ratings, coupon rates, maturity, default rates, and underlying collateral. Futures are valued based on their daily settlement prices. Exchange-traded andover-the-counter (“OTC”) options are valued at the last sale price. Options with no last sale for the day are priced at mid quote. Swaps are valued at evaluated mid prices from pricing services.
The valuation of securities traded on foreign markets and certain fixed-income securities will generally be based on prices determined as of the earlier closing time of the markets on which they primarily trade unless a significant event has occurred. When the Fund holds securities or other assets that are denominated in a foreign currency, the Fund will normally use the currency exchange rates as of 4:00 p.m. ET.
Securities may be valued at fair value, as determined in good faith and pursuant to procedures approved by the Board, under certain limited circumstances. For example, fair value pricing will be used when market quotations are not readily available or reliable, as determined by the Manager, such as when (i) trading for a security is restricted or stopped; (ii) a security’s trading market is closed (other than customary closings); or (iii) a security has beende-listed from a national exchange. A security with limited market liquidity may require fair value pricing if the Manager determines that the available price does not reflect the security’s true market value.
31
American Beacon FundsSM
Notes to Financial Statements
December 31, 2019
In addition, if a significant event that the Manager determines to affect the value of one or more securities held by the Fund occurs after the close of a related exchange but before the determination of the Fund’s NAV, fair value pricing may be used on the affected security or securities. Securities of small-capitalization companies are also more likely to require a fair value determination using these procedures because they are more thinly traded and less liquid than the securities of larger-capitalization companies. The Fund may fair value securities as a result of significant events occurring after the close of the foreign markets in which the Fund invests as described below. In addition, the Fund may invest in illiquid securities requiring these procedures.
The Fund may use fair value pricing for securities primarily traded innon-U.S. markets because most foreign markets close well before the Fund’s pricing time of 4:00 p.m. ET. The earlier close of these foreign markets gives rise to the possibility that significant events, including broad market moves, may have occurred in the interim and may materially affect the value of those securities. If the Manager determines that the last quoted prices ofnon-U.S. securities will, in its judgment, materially affect the value of some or all its portfolio securities, the Manager can adjust the previous closing prices to reflect what it believes to be the fair value of the securities as of the close of the Exchange. In deciding whether it is necessary to adjust closing prices to reflect fair value, the Manager reviews a variety of factors, including developments in foreign markets, the performance of U.S. securities markets, and the performance of instruments trading in U.S. markets that represent foreign securities and baskets of foreign securities. These securities are fair valued using a pricing service, using methods approved by the Board, that considers the correlation of the trading patterns of the foreign security to intraday trading in the U.S. markets, based on indices of domestic securities and other appropriate indicators such as prices of relevant American Depositary Receipts (“ADRs”) and futures contracts. The Valuation Committee, established by the Board, may also fair value securities in other situations, such as when a particular foreign market is closed but the Fund is open. The Fund uses outside pricing services to provide closing prices and information to evaluate and/or adjust those prices. As a means of evaluating its security valuation process, the Valuation Committee routinely compares closing prices, the next day’s opening prices in the same markets and adjusted prices.
Attempts to determine the fair value of securities introduce an element of subjectivity to the pricing of securities. As a result, the price of a security determined through fair valuation techniques may differ from the price quoted or published by other sources and may not accurately reflect the market value of the security when trading resumes. If a reliable market quotation becomes available for a security formerly valued through fair valuation techniques, the Manager compares the new market quotation to the fair value price to evaluate the effectiveness of the Fund’s fair valuation procedures. If any significant discrepancies are found, the Manager may adjust the Fund’s fair valuation procedures.
Valuation Inputs
Various inputs may be used to determine the fair value of the Funds’ investments. These inputs are summarized in three broad levels for financial statement purposes. The inputs or methodologies used to value securities are not necessarily an indication of the risk associated with investing in those securities.
| Level 1 | - | Quoted prices in active markets for identical securities. | ||
| Level 2 | - | Prices determined using other significant observable inputs. These may include quoted prices for similar securities, interest rates, prepayment speeds, credit risk, and others. | ||
| Level 3 | - | Prices determined using other significant unobservable inputs. Unobservable inputs reflect the Fund’s own assumptions about the factors market participants would use in pricing an investment. | ||
Level 1 and Level 2 trading assets and trading liabilities, at fair value
Common stocks, preferred securities, ETFs, and financial derivative instruments, such as futures contracts that are traded on a national securities exchange, are stated at the last reported sale or settlement price on the day of valuation. To the extent these securities are actively traded and valuation adjustments are not applied, they are
32
American Beacon FundsSM
Notes to Financial Statements
December 31, 2019
categorized as Level 1 of the fair value hierarchy. Preferred securities and other equities traded on inactive markets or valued by reference to similar instruments are generally categorized as Level 2 of the fair value hierarchy.
Investments in registeredopen-end investment management companies will be valued based upon the NAVs of such investments and are categorized as Level 1 of the fair value hierarchy.
4. Securities and Other Investments
Common Stock
Common stock generally takes the form of shares in a corporation which represent an ownership interest. It ranks below preferred stock and debt securities in claims for dividends and for assets of the company in a liquidation or bankruptcy. The value of a company’s common stock may fall as a result of factors directly relating to that company, such as decisions made by its management or decreased demand for the company’s products or services. A stock’s value may also decline because of factors affecting not just the company, but also companies in the same industry or sector. The price of a company’s stock may also be affected by changes in financial markets that are relatively unrelated to the company, such as changes in interest rates, currency exchange rates or industry regulation. Companies that elect to pay dividends on their common stock generally only do so after they invest in their own business and make required payments to bondholders and on other debt and preferred stock. Therefore, the value of a company’s common stock will usually be more volatile than its bonds, other debt and preferred stock. Common stock may be exchange-traded or OTC. OTC stock may be less liquid than exchange-traded stock.
Other Investment Company Securities and Other Exchange-Traded Products
The Funds at times may invest in shares of other investment companies, including money market funds and ETFs. The Funds may invest in investment company securities advised by the Manager or asub-advisor. To the extent that a Fund invests in shares of other registered investment companies, a Fund will indirectly bear fees and expenses, including for example, advisory and administrative fees, charged by those investment companies in addition to a Fund’s direct fees and expenses and will be subject to the risks associated with investments in those companies. For example, a Fund’s investments in money market funds are subject to interest rate risk, credit risk, and market risk. A Fund must rely on the investment company in which it invests to achieve its investment objective. If the investment company fails to achieve its investment objective, the value of a Fund’s investment may decline, adversely affecting a Fund’s performance. To the extent a Fund invests in other investment companies that invest in equity securities, fixed income securities and/or foreign securities, or that track an index, the Fund would be subject to the risks associated with the underlying investments held by the investment company or the index fluctuations to which the investment company is subject.
Real Estate Investment Trusts
The Funds may own shares of real estate investment trusts (“REITs”) which report information on the source of their distributions annually. The Fundsre-characterize distributions received from REIT investments based on information provided by the REITs into the following categories: ordinary income, long-term capital gains, and return of capital. If information is not available on a timely basis from the REITs, there-characterization will be estimated based on available information, which may include the previous year allocation. If new or additional information becomes available from the REITs at a later date, are-characterization will be made the following year.
5. Financial Derivative Instruments
The Funds may utilize derivative instruments to enhance return, hedge risk, gain efficient exposure to an asset class or to manage liquidity. When considering the Funds’ use of derivatives, it is important to note that the Funds do not use derivatives for the purpose of creating financial leverage.
33
American Beacon FundsSM
Notes to Financial Statements
December 31, 2019
Futures Contracts
Futures contracts are contracts to buy or sell a standard quantity of securities at a specified price on a future date. The Funds may enter into financial futures contracts as a method for keeping assets readily convertible to cash if needed to meet shareholder redemptions or for other needs while maintaining exposure to the stock or bond market, as applicable. The primary risks associated with the use of futures contracts are the possibility of illiquid markets or imperfect correlation between the values of the contracts and the underlying securities or that the counterparty will fail to perform its obligations.
Upon entering into a futures contract, the Funds are required to set aside or deposit with a broker an amount, termed the initial margin, which typically represents a portion of the face value of the futures contract. The Funds usually reflect this amount on the Schedules of Investments as a U.S. Treasury Bill held as collateral for futures contracts or as cash deposited with broker on the Statements of Assets and Liabilities. Payments to and from the broker, known as variation margin, are required to be made on a daily basis as the price of the futures contract fluctuates. Changes in initial settlement values are accounted for as unrealized appreciation (depreciation) until the contracts are terminated, at which time realized gains and losses are recognized. Futures contracts are valued at the most recent settlement price established each day by the exchange on which they are traded.
During the year ended December 31, 2019, the Funds entered into futures contracts primarily for exposing cash to markets.
The Funds’ average futures contracts outstanding fluctuate throughout the operating year as required to meet strategic requirements. The following table illustrates the average quarterly volume of futures contracts. For the purpose of this disclosure, volume is measured by contracts outstanding at each quarter end.
Average Futures Contracts Outstanding | ||||
Fund | Year Ended December 31, 2019 | |||
Bridgeway Large Cap Growth | 20 | |||
Bridgeway Large Cap Value | 198 | |||
The following is a summary of the fair valuations of the Funds’ derivative instruments categorized by risk exposure(1):
Bridgeway Large Cap Growth Fund
| Fair values of financial instruments on the Statements of Assets and Liabilities as of December 31, 2019: |
| ||||||||||||||||||||||||||||||||||||||||||||||||||||||
| Derivatives not accounted for as hedging instruments | |||||||||||||||||||||||||||||||||||||||||||||||||||||||
Assets: | Credit contracts | Foreign exchange contracts | Commodity contracts | Interest rate contracts | Equity contracts | Total | |||||||||||||||||||||||||||||||||||||||||||||||||
| Receivable for variation margin from open futures contracts(2) | $ | - | $ | - | $ | - | $ | - | $ | 47,157 | $ | 47,157 | |||||||||||||||||||||||||||||||||||||||||||
| The effect of financial derivative instruments on the Statements of Operations as of December 31, 2019: |
| ||||||||||||||||||||||||||||||||||||||||||||||||||||||
| Derivatives not accounted for as hedging instruments | |||||||||||||||||||||||||||||||||||||||||||||||||||||||
Realized gain (loss) from derivatives | Credit contracts | Foreign exchange contracts | Commodity contracts | Interest rate contracts | Equity contracts | Total | |||||||||||||||||||||||||||||||||||||||||||||||||
| Futures contracts | $ | - | $ | - | $ | - | $ | - | $ | 1,255,967 | $ | 1,255,967 | |||||||||||||||||||||||||||||||||||||||||||
Net change in unrealized appreciation | Credit contracts | Foreign exchange contracts | Commodity contracts | Interest rate contracts | Equity contracts | Total | |||||||||||||||||||||||||||||||||||||||||||||||||
| Futures contracts | $ | - | $ | - | $ | - | $ | - | $ | (2,484 | ) | $ | (2,484 | ) | |||||||||||||||||||||||||||||||||||||||||
34
American Beacon FundsSM
Notes to Financial Statements
December 31, 2019
Bridgeway Large Cap Value Fund
| Fair values of financial instruments on the Statements of Assets and Liabilities as of December 31, 2019: |
| |||||||||||||||||||||||||||||||||||||||||||
| Derivatives not accounted for as hedging instruments | ||||||||||||||||||||||||||||||||||||||||||||
Assets: | Credit contracts | Foreign exchange contracts | Commodity contracts | Interest rate contracts | Equity contracts | Total | ||||||||||||||||||||||||||||||||||||||
| Receivable for variation margin from open futures contracts(2) | $ | - | $ | - | $ | - | $ | - | $ | 44,872 | $ | 44,872 | ||||||||||||||||||||||||||||||||
| The effect of financial derivative instruments on the Statements of Operations as of December 31, 2019: |
| |||||||||||||||||||||||||||||||||||||||||||
| Derivatives not accounted for as hedging instruments | ||||||||||||||||||||||||||||||||||||||||||||
Realized gain (loss) from derivatives | Credit contracts | Foreign exchange contracts | Commodity contracts | Interest rate contracts | Equity contracts | Total | ||||||||||||||||||||||||||||||||||||||
| Futures contracts | $ | - | $ | - | $ | - | $ | - | $ | 10,006,004 | $ | 10,006,004 | ||||||||||||||||||||||||||||||||
Net change in unrealized appreciation | Credit contracts | Foreign exchange contracts | Commodity contracts | Interest rate contracts | Equity contracts | Total | ||||||||||||||||||||||||||||||||||||||
| Futures contracts | $ | - | $ | - | $ | - | $ | - | $ | (954,898 | ) | $ | (954,898 | ) | ||||||||||||||||||||||||||||||
(1)See Note 3 in the Notes to Financial Statements for additional information.
(2)Includes cumulative appreciation (depreciation) of futures contracts as reported in the Fund’s Schedule of Investments footnotes. Only current day’s variation margin is reported within the Statements of Assets and Liabilities.
Offsetting Assets and Liabilities
The Funds are parties to enforceable master netting agreements between brokers and counterparties which provide for the right to offset under certain circumstances. The Funds employ multiple money managers and counterparties and have elected not to offset qualifying financial and derivative instruments on the Statements of Assets and Liabilities, as such all financial and derivative instruments are presented on a gross basis. The impacts of netting arrangements that provide the right to offset are detailed below. The net amount represents the net receivable or payable that would be due from or to the counterparty in the event of default. Exposure from borrowings and other financing agreements such as repurchase agreements can only be netted across transactions governed by the same Master Agreement with the same legal entity. All amounts reported below represent the balance as of the report date, December 31, 2019.
Bridgeway Large Cap Growth Fund
| Offsetting of Financial and Derivative Assets as of December 31, 2019: |
| |||||||||||
| Assets | Liabilities | |||||||||||
| Futures Contracts(1) | $ | 47,157 | $ | - | ||||||||
|
|
|
| |||||||||
| Total derivative assets and liabilities in the Statement of Assets and Liabilities | $ | 47,157 | $ | - | ||||||||
|
|
|
| |||||||||
| Derivatives not subject to a Master Netting Agreement or similar agreement (“MNA”) | $ | (47,157 | ) | $ | - | |||||||
|
|
|
| |||||||||
| Remaining Contractual Maturity of the Agreements As of December 31, 2019 | ||||||||||||||||||||||||||||||||||||
| Overnight and Continuous | <30 days | Between 30 & 90 days | >90 days | Total | ||||||||||||||||||||||||||||||||
Securities Lending Transactions | ||||||||||||||||||||||||||||||||||||
Common Stocks | $ | 2,165,786 | $ | - | $ | - | $ | - | $ | 2,165,786 | ||||||||||||||||||||||||||
|
|
|
|
|
|
|
|
|
| |||||||||||||||||||||||||||
Total Borrowings | $ | 2,165,786 | $ | - | $ | - | $ | - | $ | 2,165,786 | ||||||||||||||||||||||||||
|
|
|
|
|
|
|
|
|
|
|
| |||||||||||||||||||||||||
Gross amount of recognized liabilities for securities lending transactions |
| $ | 2,165,786 | |||||||||||||||||||||||||||||||||
|
| |||||||||||||||||||||||||||||||||||
(1) Includes cumulative appreciation or (depreciation) of futures contracts as reported in the Schedule of Investments footnotes. Only current day’s variation margin is reported within the Statements of Assets and Liabilities.
35
American Beacon FundsSM
Notes to Financial Statements
December 31, 2019
Bridgeway Large Cap Value Fund
| Offsetting of Financial and Derivative Assets as of December 31, 2019: |
| |||||||||||
| Assets | Liabilities | |||||||||||
| Futures Contracts(1) | $ | 44,872 | $ | - | ||||||||
|
|
|
| |||||||||
| Total derivative assets and liabilities in the Statement of Assets and Liabilities | $ | 44,872 | $ | - | ||||||||
|
|
|
| |||||||||
| Derivatives not subject to a Master Netting Agreement or similar agreement (“MNA”) | $ | (44,872 | ) | $ | - | |||||||
|
|
|
| |||||||||
(1) Includes cumulative appreciation or (depreciation) of futures contracts as reported in the Schedule of Investments footnotes. Only current day’s variation margin is reported within the Statements of Assets and Liabilities.
6. Principal Risks
Investing in the Funds may involve certain risks including, but not limited to, those described below.
Equity Investments Risk
Equity securities are subject to market risk. The Funds’ investments in equity securities may include common stocks, preferred stocks, securities convertible into or exchangeable for common stocks, REITs, depositary receipts, and U.S. dollar-denominated foreign stocks traded on U.S. exchanges. Such investments may expose the Funds to additional risk. The value of a company’s common stock may fall as a result of factors affecting the company, companies in the same industry or sector, or the financial markets overall. Common stock generally is subordinate to preferred stock upon the liquidation or bankruptcy of the issuing company. Preferred stocks and convertible securities are sensitive to movements in interest rates. Preferred stocks may be less liquid than common stocks and, unlike common stocks, participation in the growth of an issuer may be limited. Distributions on preferred stocks generally are payable at the discretion of an issuer and after required payments to bond holders. Convertible securities are subject to the risk that the credit standing of the issuer may have an effect on the convertible securities’ investment value. Investments in REITs are subject to the risks associated with investing in the real estate industry such as adverse developments affecting the real estate industry and real property values. Depositary receipts and U.S. dollar-denominated foreign stocks traded on U.S. exchanges are subject to certain of the risks associated with investing directly in foreign securities, including, but not limited to, currency fluctuations and political and financial instability in the home country of a particular depositary receipt or foreign stock.
Futures Contracts Risk
Futures contracts are derivative instruments where one party pays a fixed price for an agreed amount of securities or other underlying assets at an agreed date. The use of such derivative instruments may expose the Funds to additional risks that they would not be subject to if they invested directly in the securities underlying those derivatives. Futures contracts may experience potentially dramatic price changes (losses) and imperfect correlation between the price of the contract and the underlying security or index, which will increase the volatility of the Funds and may involve a small investment of cash (the amount of initial and variation margin) relative to the magnitude of the risk assumed (the potential increase or decrease in the price of the futures contract).
Market Risk
Conditions in the U.S. and many foreign economies have resulted, and may continue to result, in certain instruments experiencing unusual liquidity issues, increased price volatility and, in some cases, credit downgrades and increased likelihood of default. These events have reduced the willingness and ability of some lenders to extend credit, and have made it more difficult for some borrowers to obtain financing on attractive terms, if at all. In some cases, traditional market participants have been less willing to make a market in some types of debt instruments, which has affected the liquidity of those instruments. During times of market turmoil, investors tend
36
American Beacon FundsSM
Notes to Financial Statements
December 31, 2019
to look to the safety of securities issued or backed by the U.S. Treasury, causing the prices of these securities to rise and the yields to decline. Reduced liquidity in fixed income and credit markets may negatively affect many issuers worldwide. In addition, global economies and financial markets are becoming increasingly interconnected, which increases the possibilities that conditions in one country or region might adversely impact issuers in a different country or region. A rise in protectionist trade policies, and the possibility of changes to some international trade agreements, could affect the economies of many nations, including the United States, in ways that cannot necessarily be foreseen at the present time.
In response to the financial crisis, the U.S. and other governments and the Federal Reserve and certain foreign central banks have taken steps to support financial markets. In some countries where economic conditions are recovering, they are nevertheless perceived as still fragile. Withdrawal of government support, failure of efforts in response to the crisis, or investor perception that such efforts are not succeeding, could adversely impact the value and liquidity of certain securities. The severity or duration of adverse economic conditions may also be affected by policy changes made by governments or quasi-governmental organizations, including changes in tax laws. The impact of new financial regulation legislation on the markets and the practical implications for market participants may not be fully known for some time. Regulatory changes are causing some financial services companies to exit long-standing lines of business, resulting in dislocations for other market participants. In addition, political and governmental events within the U.S. and abroad, such as the U.S. government’s inability at times to agree on a long-term budget and deficit reduction plan, the threat of a federal government shutdown and threats not to increase the federal government’s debt limit, may affect investor and consumer confidence and may adversely impact financial markets and the broader economy, perhaps suddenly and to a significant degree. The U.S. government has reduced the federal corporate income tax rates, and future legislative, regulatory and policy changes may result in more restrictions on international trade, less stringent prudential regulation of certain players in the financial markets, and significant new investments in infrastructure and national defense. Markets may react strongly to expectations about the changes in these policies, which could increase volatility, especially if the markets’ expectations for changes in government policies are not borne out.
Changes in market conditions will not have the same impact on all types of securities. Interest rates have been unusually low in recent years in the U.S. and abroad. Because there is little precedent for this situation, it is difficult to predict the impact of a significant rate increase on various markets. For example, because investors may buy securities or other investments with borrowed money, a significant increase in interest rates may cause a decline in the markets for those investments. Because of the sharp decline in the worldwide price of oil, there is a concern that oil producing nations may withdraw significant assets now held in U.S. Treasuries, which could force a substantial increase in interest rates. Regulators have expressed concern that rate increases may cause investors to sell fixed income securities faster than the market can absorb them, contributing to price volatility. In addition, there is a risk that the prices of goods and services in the U.S. and many foreign economies may decline over time, known as deflation (the opposite of inflation). Deflation may have an adverse effect on stock prices and creditworthiness and may make defaults on debt more likely. If a country’s economy slips into a deflationary pattern, it could last for a prolonged period and may be difficult to reverse.
A rise in protectionist trade policies, risks associated with the United Kingdom’s departure from the European Union on January 31, 2020 and trade agreement negotiations during the transition period, the risk of a trade dispute between the United States and China, and the possibility of changes to some international trade agreements, could affect the economies of many nations, including the United States, in ways that cannot necessarily be foreseen at the present time. The severity or duration of adverse economic conditions may also be affected by policy changes made by governments or quasi-governmental organizations. In addition, political and governmental events within the U.S. and abroad may affect investor and consumer confidence and may adversely impact financial markets and the broader economy, perhaps suddenly and to a significant degree.
37
American Beacon FundsSM
Notes to Financial Statements
December 31, 2019
Other Investment Companies Risk
The Funds may invest in shares of other registered investment companies, including money market funds that are advised by the Manager. To the extent that the Funds invest in shares of other registered investment companies, the Funds will indirectly bear the fees and expenses, including for example advisory and administrative fees, charged by those investment companies in addition to the Funds’ direct fees and expenses and will be subject to the risks associated with investments in those companies. For example, the Funds’ investments in money market funds are subject to interest rate risk, credit risk, and market risk. The Funds must rely on the investment company in which it invests to achieve its investment objective. If the investment company fails to achieve its investment objective, the value of the Funds’ investment will decline, adversely affecting the Funds’ performance. To the extent the Funds invest in other investment companies that invest in equity securities, fixed income securities and/or foreign securities, or track an index, the Funds are subject to the risks associated with the underlying investments held by the investment company or the index fluctuations to which the investment company is subject.
Securities Lending Risk
A Fund may lend its portfolio securities to brokers, dealers and financial institutions to seek income. There is a risk that a borrower may default on its obligations to return loaned securities; however, a Fund’s securities lending agent indemnifies the Fund against that risk. There is a risk that the assets of a Fund’s securities lending agent may be insufficient to satisfy any contractual indemnification requirements to the Fund. Borrowers of a Fund’s securities typically provide collateral in the form of cash that is reinvested in securities. A Fund will be responsible for the risks associated with the investment of cash collateral, including any collateral invested in an affiliated money market fund. A Fund may lose money on its investment of cash collateral or may fail to earn sufficient income on its investment to meet obligations to the borrower. In addition, delays may occur in the recovery of securities from borrowers, which could interfere with a Fund’s ability to vote proxies or to settle transactions and there is the risk of possible loss of rights in the collateral should the borrower fail financially. In any case in which the loaned securities are not returned to the Fund before anex-dividend date, the payment in lieu of the dividend that the Fund receives from the securities’ borrower would not be treated as a dividend for federal income tax purposes and thus would not qualify for treatment as “qualified dividend income”.
7. Federal Income and Excise Taxes
It is the policy of each Fund to qualify as a regulated investment company (“RIC”), by complying with all applicable provisions of Subchapter M of the Internal Revenue Code, as amended, and to make distributions of taxable income sufficient to relieve it from substantially all federal income and excise taxes. For federal income tax purposes, each Fund is treated as a single entity for the purpose of determining such qualification.
The Funds do not have any unrecorded tax liabilities in the accompanying financial statements. Each of the tax years in the four year period ended December 31, 2019 remain subject to examination by the Internal Revenue Service. If applicable, the Funds recognize interest accrued related to unrecognized tax benefits in interest expense and penalties in “Other expenses” on the Statements of Operations.
The Funds may be subject to taxes imposed by countries in which it invests. Such taxes are generally based on returns of income earned or gains realized or repatriated. Taxes are accrued and applied to net investment income, net realized capital gains and net unrealized appreciation (depreciation), as applicable, as the income is earned or capital gains are recorded.
Dividends are categorized in accordance with income tax regulations which may treat certain transactions differently than U.S. GAAP. Accordingly, the character of distributions and composition of net assets for tax purposes may differ from those reflected in the accompanying financial statements.
38
American Beacon FundsSM
Notes to Financial Statements
December 31, 2019
The tax character of distributions paid were as follows:
| Bridgeway Large Cap Growth Fund | Bridgeway Large Cap Value Fund | |||||||||||||||||||||||||||
| Year Ended December 31, 2019 | Year Ended December 31, 2018 | Year Ended December 31, 2019 | Year Ended December 31, 2018 | |||||||||||||||||||||||||
Distributions paid from: |
| |||||||||||||||||||||||||||
Ordinary income* |
| |||||||||||||||||||||||||||
Institutional Class | $ | 265,226 | $ | 4,987,298 | $ | 23,305,258 | $ | 27,614,673 | ||||||||||||||||||||
Y Class | 4,684 | 73,240 | 26,904,554 | 28,353,880 | ||||||||||||||||||||||||
Investor Class | 161,886 | 1,982,511 | 8,833,240 | 13,076,256 | ||||||||||||||||||||||||
A Class | 4,657 | 50,056 | 871,149 | 1,185,249 | ||||||||||||||||||||||||
C Class | 2,603 | 19,838 | 443,571 | 491,400 | ||||||||||||||||||||||||
R6 Class | 261 | 2,921 | 4,396,187 | 2,795,518 | ||||||||||||||||||||||||
Long-term capital gains |
| |||||||||||||||||||||||||||
Institutional Class | 11,004,837 | 10,195,621 | 26,593,570 | 98,895,071 | ||||||||||||||||||||||||
Y Class | 194,361 | 149,724 | 31,798,655 | 105,853,194 | ||||||||||||||||||||||||
Investor Class | 6,717,044 | 4,358,701 | 13,331,628 | 62,490,515 | ||||||||||||||||||||||||
A Class | 193,241 | 112,786 | 1,286,522 | 5,447,552 | ||||||||||||||||||||||||
C Class | 108,006 | 44,698 | 1,362,871 | 5,591,352 | ||||||||||||||||||||||||
R6 Class | 10,820 | 5,971 | 4,926,373 | 9,873,893 | ||||||||||||||||||||||||
|
|
|
|
|
|
|
| |||||||||||||||||||||
Total distributions paid | $ | 18,667,626 | $ | 21,983,365 | $ | 144,053,578 | $ | 361,668,553 | ||||||||||||||||||||
|
|
|
|
|
|
|
| |||||||||||||||||||||
*For tax purposes, short-term gains are considered ordinary income distributions.
As of December 31, 2019 the components of distributable earnings (deficits) on a tax basis were as follows:
Fund | Tax Cost | Unrealized Appreciation | Unrealized (Depreciation) | Net Unrealized Appreciation (Depreciation) | ||||||||||||||||||||||||
| Bridgeway Large Cap Growth | $ | 162,390,769 | $ | 39,997,476 | $ | (2,935,868 | ) | $ | 37,061,608 | |||||||||||||||||||
| Bridgeway Large Cap Value | 3,137,256,287 | 598,891,949 | (131,603,154 | ) | 467,288,795 | |||||||||||||||||||||||
Fund | Net Unrealized Appreciation (Depreciation) | Undistributed Ordinary Income | Undistributed Long-Term Capital Gains | Accumulated Capital and Other (Losses) | Other Temporary Differences | Distributable Earnings | ||||||||||||||||||||||||||||||||||||||
| Bridgeway Large Cap Growth | $ | 37,061,608 | $ | 1,909,893 | $ | 7,350,899 | $ | – | $ | – | $ | 46,322,400 | ||||||||||||||||||||||||||||||||
| Bridgeway Large Cap Value | 467,288,795 | 14,332,931 | 84,060,310 | – | – | 565,682,036 | ||||||||||||||||||||||||||||||||||||||
Financial reporting records are adjusted for permanent book/tax differences to reflect tax character. Financial records are not adjusted for temporary differences. The temporary differences between financial reporting andtax-basis reporting of unrealized appreciation (depreciation) are attributable primarily to the tax deferral of losses from wash sales and the realization for tax purposes of unrealized gains (losses) on certain derivative instruments.
Due to inherent differences in the recognition of income, expenses, and realized gains (losses) under U.S. GAAP and federal income tax regulations, permanent differences between book and tax reporting have been identified and appropriately reclassified on the Statements of Assets and Liabilities.
The Funds had no permanent differences as of December 31, 2019:
Under the Regulated Investment Company Modernization Act of 2010 (“RIC MOD”), net capital losses recognized by the Funds in taxable years beginning after December 22, 2010 are carried forward indefinitely and retain their character as short-term and/or long-term losses.
As of December 31, 2019, the Funds did not have any capital loss carryforwards.
39
American Beacon FundsSM
Notes to Financial Statements
December 31, 2019
8. Investment Transactions
The aggregate cost of purchases and proceeds from sales and maturities of investments, other than short-term obligations, for the year ended December 31, 2019 were as follows:
Fund | Purchases (non-U.S. Government Securities) | Sales(non-U.S. Government Securities) | ||||||||||
Bridgeway Large Cap Growth | $ | 150,508,071 | $ | 226,748,190 | ||||||||
Bridgeway Large Cap Value | 1,743,671,291 | 3,025,699,281 | ||||||||||
A summary of the Funds’ transactions in the USG Select Fund for the year ended December 31, 2019 are as follows:
Fund | Type of Transaction | December 31, 2018 Shares/Fair Value | Purchases | Sales | December 31, 2019 Shares/Fair Value | Dividend Income | ||||||||||||||||||||||||||||||||||||
| Bridgeway Large Cap Growth | Direct | $ | 4,647,290 | $ | 114,710,201 | $ | 116,831,349 | $ | 2,526,142 | $ | 87,729 | |||||||||||||||||||||||||||||||
| Bridgeway Large Cap Growth | Securities Lending | - | 13,681,853 | 11,516,067 | 2,165,786 | N/A | ||||||||||||||||||||||||||||||||||||
| Bridgeway Large Cap Value | Direct | 41,766,144 | 2,418,767,484 | 2,421,789,039 | 38,744,589 | 1,094,199 | ||||||||||||||||||||||||||||||||||||
| Bridgeway Large Cap Value | Securities Lending | - | 116,158,284 | 116,158,284 | - | N/A | ||||||||||||||||||||||||||||||||||||
9. Securities Lending
The Funds may lend their securities to qualified financial institutions, such as certain broker-dealers, to earn additional income. The borrowers are required to secure their loans continuously with collateral in an amount at least equal to the fair value of the securities loaned, initially in an amount at least equal to 102% of the fair value of domestic securities loaned and 105% of the fair value of international securities loaned. Collateral is monitored andmarked-to-market daily. Dailymark-to-market amounts are required to be paid to the borrower or received from the borrower by the end of the following business day. This one day settlement formark-to-market amounts may result in the collateral being temporarily less than the value of the securities on loan or temporarily more than the required minimum collateral.
To the extent that a loan is collateralized by cash, such cash collateral shall be invested by the securities lending agent (the “Agent”) in money market mutual funds and other short-term investments, provided the investments meet certain quality and diversification requirements. Securities purchased with cash collateral proceeds are listed in the Funds’ Schedule of Investments and the collateral is shown on the Statements of Assets and Liabilities as a payable.
Securities lending income is generated from the demand premium (if any) paid by the borrower to borrow a specific security and from the return on investment of cash collateral, reduced by negotiated rebate fees paid to the borrower and transaction costs. To the extent that a loan is secured bynon-cash collateral, securities lending income is generated as a demand premium reduced by transaction costs. The Funds, the Agent, and the Manager retained 80%, 10%, and 10%, respectively, of the income generated from securities lending.
While securities are on loan, the Funds continue to receive certain income associated with that security and any gain or loss in the market price that may occur during the term of the loan. In the case of domestic equities, the value of any dividend is received in the form of a substitute payment approximately equal to the dividend. In the case of foreign securities, a negotiated amount is received that is less than the actual dividend, but higher than the dividend amount minus the foreign tax that the Funds would be subject to on the dividend.
Securities lending transactions pose certain risks to the Funds, including that the borrower may not provide additional collateral when required or return the securities when due, that the value of the short-term investments
40
American Beacon FundsSM
Notes to Financial Statements
December 31, 2019
will be less than the amount of cash collateral required to be returned to the borrower, thatnon-cash collateral may be subject to legal constraints in the event of a borrower bankruptcy, and that the cash collateral investments could become illiquid and unable to be used to return collateral to the borrower. The Funds could also experience delays and costs in gaining access to the collateral. The Funds bear the risk of any deficiency in the amount of the cash collateral available for return to the borrower and any action which impairs its ability to liquidatenon-cash collateral to satisfy a borrower default.
As of December 31, 2019, the value of outstanding securities on loan and the value of collateral were as follows:
Fund | Market Value of Securities on Loan | Cash Collateral Received | Non-Cash Collateral Received | Total Collateral Received | ||||||||||||||||||||||||
| Bridgeway Large Cap Growth | $ | 12,747,271 | $ | 2,165,786 | $ | 10,807,746 | $ | 12,973,532 | ||||||||||||||||||||
| Bridgeway Large Cap Value | 102,365,471 | - | 104,450,586 | 104,450,586 | ||||||||||||||||||||||||
Cash collateral is listed on the Funds’ Schedules of Investments and is shown on the Statements of Assets and Liabilities. Income earned on these investments is included in “Income derived from securities lending” on the Statements of Operations.
Non-cash collateral received by the Funds may not be sold orre-pledged except to satisfy a borrower default. Therefore,non-cash collateral is not included on the Funds’ Schedules of Investments or Statements of Assets and Liabilities.
10. Borrowing Arrangements
Effective November 14, 2019 (the “Effective Date”), the Funds, along with certain other funds managed by the Manager (“Participating Funds”), entered into a committed revolving line of credit (the “Committed Line”) agreement with State Street Bank and Trust Company (the “Bank”) to be used to facilitate portfolio liquidity. The maximum borrowing amount under the Committed Line is $250 million with interest at a rate equal to the higher of(a) one-month London Inter-Bank Offered Rate (“LIBOR”) plus 1.25% per annum or (b) the Federal Funds rate plus 1.25% per annum on amounts borrowed. Each of the Participating Funds paid a closing fee of $100,000 on the Effective Date and a quarterly commitment fee at a rate of 0.25% per annum on the unused portion of the Committed Line amount. The Committed Line expires November 12, 2020, unless extended by the Bank or terminated by the Participating Funds in accordance with the agreement.
On the Effective Date, the Funds, along with certain other Participating Funds managed by the Manager, also entered into an uncommitted discretionary demand revolving line of credit (the “Uncommitted Line”) agreement with the Bank to be used to facilitate portfolio liquidity. The maximum borrowing amount under the Uncommitted Line is $50 million with interest at a rate equal to the higher of(a) one-month LIBOR plus 1.25% per annum or (b) the Federal Funds rate plus 1.25% per annum on each outstanding loan. Each of the Participating Funds paid a closing fee of $35,000 on the Effective Date. The Uncommitted Line expires November 12, 2020 unless extended by the Bank or terminated by the Participating Funds in accordance with the agreement.
The Participating Funds paid administration, legal and arrangement fees, which are recognized as a component of “Other expenses” on the Statements of Operations, along with commitment fees, that have been allocated among the Participating Funds based on average daily net assets.
During the year ended December 31, 2019, the Funds did not utilize this facility.
41
American Beacon FundsSM
Notes to Financial Statements
December 31, 2019
11. Capital Share Transactions
The tables below summarize the activity in capital shares for each Class of the Funds:
| Institutional Class | ||||||||||||||||||||||||||||
| Year Ended December 31, 2019 | Year Ended December 31, 2018 | |||||||||||||||||||||||||||
Bridgeway Large Cap Growth Fund | Shares | Amount | Shares | Amount | ||||||||||||||||||||||||
| Shares sold | 324,106 | $ | 9,469,356 | 1,040,789 | $ | 33,050,110 | ||||||||||||||||||||||
| Reinvestment of dividends | 364,137 | 10,869,492 | 601,438 | 14,867,540 | ||||||||||||||||||||||||
| Shares redeemed | (2,686,027 | ) | (78,392,764 | ) | (1,621,619 | ) | (51,081,982 | ) | ||||||||||||||||||||
|
|
|
|
|
|
|
| |||||||||||||||||||||
| Net increase (decrease) in shares outstanding | (1,997,784 | ) | $ | (58,053,916 | ) | 20,608 | $ | (3,164,332 | ) | |||||||||||||||||||
|
|
|
|
|
|
|
| |||||||||||||||||||||
| Y Class | ||||||||||||||||||||||||||||
| Year Ended December 31, 2019 | Year Ended December 31, 2018 | |||||||||||||||||||||||||||
Bridgeway Large Cap Growth Fund | Shares | Amount | Shares | Amount | ||||||||||||||||||||||||
| Shares sold | 41,071 | $ | 1,221,925 | 148,641 | $ | 4,689,413 | ||||||||||||||||||||||
| Reinvestment of dividends | 6,695 | 199,045 | 9,042 | 222,964 | ||||||||||||||||||||||||
| Shares redeemed | (70,745 | ) | (2,101,935 | ) | (133,776 | ) | (4,247,166 | ) | ||||||||||||||||||||
|
|
|
|
|
|
|
| |||||||||||||||||||||
| Net increase (decrease) in shares outstanding | (22,979 | ) | $ | (680,965 | ) | 23,907 | $ | 665,211 | ||||||||||||||||||||
|
|
|
|
|
|
|
| |||||||||||||||||||||
| Investor Class | ||||||||||||||||||||||||||||
| Year Ended December 31, 2019 | Year Ended December 31, 2018 | |||||||||||||||||||||||||||
Bridgeway Large Cap Growth Fund | Shares | Amount | Shares | Amount | ||||||||||||||||||||||||
| Shares sold | 54,950 | $ | 1,653,213 | 325,619 | $ | 10,564,180 | ||||||||||||||||||||||
| Reinvestment of dividends | 233,725 | 6,878,528 | 258,809 | 6,340,851 | ||||||||||||||||||||||||
| Shares redeemed | (473,407 | ) | (13,822,576 | ) | (358,159 | ) | (11,243,187 | ) | ||||||||||||||||||||
|
|
|
|
|
|
|
| |||||||||||||||||||||
| Net increase (decrease) in shares outstanding | (184,732 | ) | $ | (5,290,835 | ) | 226,269 | $ | 5,661,844 | ||||||||||||||||||||
|
|
|
|
|
|
|
| |||||||||||||||||||||
| A Class | ||||||||||||||||||||||||||||
| Year Ended December 31, 2019 | Year Ended December 31, 2018 | |||||||||||||||||||||||||||
Bridgeway Large Cap Growth Fund | Shares | Amount | Shares | Amount | ||||||||||||||||||||||||
| Shares sold | 3,012 | $ | 90,592 | 79,808 | $ | 2,553,888 | ||||||||||||||||||||||
| Reinvestment of dividends | 6,704 | 197,898 | 6,628 | 162,842 | ||||||||||||||||||||||||
| Shares redeemed | (8,630 | ) | (250,326 | ) | (174,526 | ) | (5,758,888 | ) | ||||||||||||||||||||
|
|
|
|
|
|
|
| |||||||||||||||||||||
| Net increase (decrease) in shares outstanding | 1,086 | $ | 38,164 | (88,090 | ) | $ | (3,042,158 | ) | ||||||||||||||||||||
|
|
|
|
|
|
|
| |||||||||||||||||||||
| C Class | ||||||||||||||||||||||||||||
| Year Ended December 31, 2019 | Year Ended December 31, 2018 | |||||||||||||||||||||||||||
Bridgeway Large Cap Growth Fund | Shares | Amount | Shares | Amount | ||||||||||||||||||||||||
| Shares sold | 9,300 | $ | 263,833 | 17,572 | $ | 512,892 | ||||||||||||||||||||||
| Reinvestment of dividends | 3,874 | 110,609 | 2,686 | 64,536 | ||||||||||||||||||||||||
| Shares redeemed | (7,597 | ) | (221,064 | ) | (14,005 | ) | (419,151 | ) | ||||||||||||||||||||
|
|
|
|
|
|
|
| |||||||||||||||||||||
| Net increase in shares outstanding | 5,577 | $ | 153,378 | 6,253 | $ | 158,277 | ||||||||||||||||||||||
|
|
|
|
|
|
|
| |||||||||||||||||||||
| R6 Class | ||||||||||||||||||||||||||||
| Year Ended December 31, 2019 | April 30, 2018A to December 31, 2018 | |||||||||||||||||||||||||||
Bridgeway Large Cap Growth Fund | Shares | Amount | Shares | Amount | ||||||||||||||||||||||||
| Shares sold | - | $ | - | 3,237 | B | $ | 100,000 | B | ||||||||||||||||||||
| Reinvestment of dividends | - | - | 360 | 8,892 | ||||||||||||||||||||||||
|
|
|
|
|
|
|
| |||||||||||||||||||||
| Net increase in shares outstanding | - | $ | - | 3,597 | $ | 108,892 | ||||||||||||||||||||||
|
|
|
|
|
|
|
| |||||||||||||||||||||
42
American Beacon FundsSM
Notes to Financial Statements
December 31, 2019
| Institutional Class | ||||||||||||||||||||||||||||
| Year Ended December 31, 2019 | Year Ended December 31, 2018 | |||||||||||||||||||||||||||
Bridgeway Large Cap Value Fund | Shares | Amount | Shares | Amount | ||||||||||||||||||||||||
| Shares sold | 12,047,419 | $ | 306,145,671 | 20,154,772 | $ | 566,575,933 | ||||||||||||||||||||||
| Reinvestment of dividends | 1,773,435 | 48,148,759 | 5,392,771 | 119,827,368 | ||||||||||||||||||||||||
| Shares redeemed | (33,216,721 | ) | (854,845,294 | ) | (15,913,378 | ) | (436,185,153 | ) | ||||||||||||||||||||
|
|
|
|
|
|
|
| |||||||||||||||||||||
| Net increase (decrease) in shares outstanding | (19,395,867 | ) | $ | (500,550,864 | ) | 9,634,165 | $ | 250,218,148 | ||||||||||||||||||||
|
|
|
|
|
|
|
| |||||||||||||||||||||
| Y Class | ||||||||||||||||||||||||||||
| Year Ended December 31, 2019 | Year Ended December 31, 2018 | |||||||||||||||||||||||||||
Bridgeway Large Cap Value Fund | Shares | Amount | Shares | Amount | ||||||||||||||||||||||||
| Shares sold | 16,724,658 | $ | 426,777,300 | 26,074,553 | $ | 741,021,782 | ||||||||||||||||||||||
| Reinvestment of dividends | 2,131,290 | 57,694,034 | 5,731,412 | 126,950,769 | ||||||||||||||||||||||||
| Shares redeemed | (31,709,599 | ) | (810,319,281 | ) | (19,465,093 | ) | (524,126,128 | ) | ||||||||||||||||||||
|
|
|
|
|
|
|
| |||||||||||||||||||||
| Net increase (decrease) in shares outstanding | (12,853,651 | ) | $ | (325,847,947 | ) | 12,340,872 | $ | 343,846,423 | ||||||||||||||||||||
|
|
|
|
|
|
|
| |||||||||||||||||||||
| Investor Class | ||||||||||||||||||||||||||||
| Year Ended December 31, 2019 | Year Ended December 31, 2018 | |||||||||||||||||||||||||||
Bridgeway Large Cap Value Fund | Shares | Amount | Shares | Amount | ||||||||||||||||||||||||
| Shares sold | 5,783,122 | $ | 145,523,103 | 7,915,359 | $ | 225,754,431 | ||||||||||||||||||||||
| Reinvestment of dividends | 817,055 | 22,109,503 | 3,409,029 | 75,407,714 | ||||||||||||||||||||||||
| Shares redeemed | (24,264,151 | ) | (623,217,163 | ) | (20,764,261 | ) | (577,282,060 | ) | ||||||||||||||||||||
|
|
|
|
|
|
|
| |||||||||||||||||||||
| Net (decrease) in shares outstanding | (17,663,974 | ) | $ | (455,584,557 | ) | (9,439,873 | ) | $ | (276,119,915 | ) | ||||||||||||||||||
|
|
|
|
|
|
|
| |||||||||||||||||||||
| A Class | ||||||||||||||||||||||||||||
| Year Ended December 31, 2019 | Year Ended December 31, 2018 | |||||||||||||||||||||||||||
Bridgeway Large Cap Value Fund | Shares | Amount | Shares | Amount | ||||||||||||||||||||||||
| Shares sold | 524,036 | $ | 13,042,263 | 1,278,825 | $ | 36,372,119 | ||||||||||||||||||||||
| Reinvestment of dividends | 77,978 | 2,100,719 | 294,620 | 6,490,474 | ||||||||||||||||||||||||
| Shares redeemed | (1,976,037 | ) | (50,282,114 | ) | (1,419,507 | ) | (39,139,055 | ) | ||||||||||||||||||||
|
|
|
|
|
|
|
| |||||||||||||||||||||
| Net increase (decrease) in shares outstanding | (1,374,023 | ) | $ | (35,139,132 | ) | 153,938 | $ | 3,723,538 | ||||||||||||||||||||
|
|
|
|
|
|
|
| |||||||||||||||||||||
| C Class | ||||||||||||||||||||||||||||
| Year Ended December 31, 2019 | Year Ended December 31, 2018 | |||||||||||||||||||||||||||
Bridgeway Large Cap Value Fund | Shares | Amount | Shares | Amount | ||||||||||||||||||||||||
| Shares sold | 110,708 | $ | 2,694,165 | 549,320 | $ | 14,941,345 | ||||||||||||||||||||||
| Reinvestment of dividends | 63,912 | 1,678,970 | 251,124 | 5,396,667 | ||||||||||||||||||||||||
| Shares redeemed | (1,352,619 | ) | (33,637,583 | ) | (1,071,380 | ) | (27,748,192 | ) | ||||||||||||||||||||
|
|
|
|
|
|
|
| |||||||||||||||||||||
| Net (decrease) in shares outstanding | (1,177,999 | ) | $ | (29,264,448 | ) | (270,936 | ) | $ | (7,410,180 | ) | ||||||||||||||||||
|
|
|
|
|
|
|
| |||||||||||||||||||||
| R6 Class | ||||||||||||||||||||||||||||
| Year Ended December 31, 2019 | Year Ended December 31, 2018 | |||||||||||||||||||||||||||
Bridgeway Large Cap Value Fund | Shares | Amount | Shares | Amount | ||||||||||||||||||||||||
| Shares sold | 3,342,503 | $ | 83,664,916 | 3,785,688 | $ | 108,434,104 | ||||||||||||||||||||||
| Reinvestment of dividends | 343,626 | 9,322,560 | 570,694 | 12,669,411 | ||||||||||||||||||||||||
| Shares redeemed | (1,805,883 | ) | (46,987,246 | ) | (1,050,587 | ) | (29,551,825 | ) | ||||||||||||||||||||
|
|
|
|
|
|
|
| |||||||||||||||||||||
| Net increase in shares outstanding | 1,880,246 | $ | 46,000,230 | 3,305,795 | $ | 91,551,690 | ||||||||||||||||||||||
|
|
|
|
|
|
|
| |||||||||||||||||||||
A Commencement of operations.
B Seed capital was received on April 30, 2018 in the amount of $100,000 for the R6 Class. As a result, shares were issued in the amount of 3,237 for R6 Class.
12. Subsequent Events
Management has evaluated subsequent events for possible recognition or disclosure in the financial statements through the date the financial statements are issued. Management has determined that there are no material events that would require disclosure in the Funds’ financial statements through this date.
43
American Beacon Bridgeway Large Cap Growth FundSM
Financial Highlights
(For a share outstanding throughout the period)
| Institutional ClassA | ||||||||||||||||||||||||||||||||||||||||||||
| Year Ended December 31, | Year EndedB December 31, | Six Months Ended December 31, | Year Ended June 30, | |||||||||||||||||||||||||||||||||||||||||
| 2019 | 2018 | 2017 | 2016 | 2016 | 2015 | |||||||||||||||||||||||||||||||||||||||
|
| |||||||||||||||||||||||||||||||||||||||||||
Net asset value, beginning of period | $ | 25.27 | $ | 29.88 | $ | 24.47 | $ | 22.77 | $ | 23.71 | $ | 20.51 | ||||||||||||||||||||||||||||||||
|
|
|
|
|
|
|
|
|
|
|
| |||||||||||||||||||||||||||||||||
Income (loss) from investment operations: | ||||||||||||||||||||||||||||||||||||||||||||
Net investment income | 0.10 | 0.13 | 0.10 | 0.04 | 0.07 | 0.17 | C | |||||||||||||||||||||||||||||||||||||
Net gains (losses) on investments (both realized and unrealized) | 7.55 | (1.99 | ) | 6.56 | 1.82 | (0.90 | ) | 3.14 | ||||||||||||||||||||||||||||||||||||
|
|
|
|
|
|
|
|
|
|
|
| |||||||||||||||||||||||||||||||||
Total income (loss) from investment operations | 7.65 | (1.86 | ) | 6.66 | 1.86 | (0.83 | ) | 3.31 | ||||||||||||||||||||||||||||||||||||
|
|
|
|
|
|
|
|
|
|
|
| |||||||||||||||||||||||||||||||||
Less distributions: | ||||||||||||||||||||||||||||||||||||||||||||
Dividends from net investment income | - | (0.11 | ) | (0.08 | ) | (0.16 | ) | (0.11 | ) | (0.11 | ) | |||||||||||||||||||||||||||||||||
Distributions from net realized gains | (3.08 | ) | (2.64 | ) | (1.17 | ) | - | - | - | |||||||||||||||||||||||||||||||||||
|
|
|
|
|
|
|
|
|
|
|
| |||||||||||||||||||||||||||||||||
Total distributions | (3.08 | ) | (2.75 | ) | (1.25 | ) | (0.16 | ) | (0.11 | ) | (0.11 | ) | ||||||||||||||||||||||||||||||||
|
|
|
|
|
|
|
|
|
|
|
| |||||||||||||||||||||||||||||||||
Net asset value, end of period | $ | 29.84 | $ | 25.27 | $ | 29.88 | $ | 24.47 | $ | 22.77 | $ | 23.71 | ||||||||||||||||||||||||||||||||
|
|
|
|
|
|
|
|
|
|
|
| |||||||||||||||||||||||||||||||||
Total returnD | 30.27 | % | (6.03 | )% | 27.21 | % | 8.15 | %E | (3.52 | )% | 16.19 | % | ||||||||||||||||||||||||||||||||
|
|
|
|
|
|
|
|
|
|
|
| |||||||||||||||||||||||||||||||||
Ratios and supplemental data: |
| |||||||||||||||||||||||||||||||||||||||||||
Net assets, end of period | $ | 118,831,764 | $ | 151,163,119 | $ | 178,062,388 | $ | 133,638,400 | $ | 136,460,611 | $ | 156,493,513 | ||||||||||||||||||||||||||||||||
Ratios to average net assets: | ||||||||||||||||||||||||||||||||||||||||||||
Expenses, before reimbursements | 0.90 | % | 0.93 | % | 1.06 | % | 1.02 | %F | 0.89 | % | 0.81 | % | ||||||||||||||||||||||||||||||||
Expenses, net of reimbursements | 0.81 | % | 0.81 | % | 0.81 | % | 0.81 | %F | 0.83 | % | 0.81 | % | ||||||||||||||||||||||||||||||||
Net investment income, before expense reimbursements | 0.19 | % | 0.26 | % | 0.15 | % | 0.12 | %F | 0.30 | % | 0.75 | % | ||||||||||||||||||||||||||||||||
Net investment income, net of reimbursements | 0.28 | % | 0.38 | % | 0.40 | % | 0.33 | %F | 0.35 | % | 0.75 | % | ||||||||||||||||||||||||||||||||
Portfolio turnover rate | 77 | % | 60 | % | 78 | % | 40 | %E | 100 | % | 48 | % | ||||||||||||||||||||||||||||||||
| A | Prior to the reorganization on February 5, 2016, the Institutional Class was known as Class N. |
| B | On December 15, 2017, pursuant to a plan of Reorganization on termination, the American Beacon Bridgeway Large Cap Growth II Fund (“Target Fund”) transferred all of its property and assets to the American Beacon Bridgeway Large Cap Growth Fund (“Acquiring Fund”) in exchange solely for voting shares of the Acquiring Fund and the assumption of the Target Fund’s liabilities. |
| C | Per share amounts have been calculated using the average shares method. |
| D | Based on net asset value, which does not reflect the sales charge, redemption fee, or contingent deferred sales charge, if applicable. May include adjustments in accordance with U.S. GAAP and as such, the net asset value for reporting purposes and the returns based upon those net asset values may differ from the net asset value and returns for shareholder transactions. |
| E | Not annualized. |
| F | Annualized. |
See accompanying notes
44
American Beacon Bridgeway Large Cap Growth FundSM
Financial Highlights
(For a share outstanding throughout the period)
| Y Class | ||||||||||||||||||||||||||||||||||||
| Year Ended December 31, | Year EndedA December 31, | Six Months Ended December 31, | February 5, 2016B to June 30, | |||||||||||||||||||||||||||||||||
| 2019 | 2018 | 2017 | 2016 | 2016 | ||||||||||||||||||||||||||||||||
|
| |||||||||||||||||||||||||||||||||||
Net asset value, beginning of period | $ | 25.21 | $ | 29.82 | $ | 24.45 | $ | 22.77 | $ | 20.46 | ||||||||||||||||||||||||||
|
|
|
|
|
|
|
|
|
| |||||||||||||||||||||||||||
Income (loss) from investment operations: | ||||||||||||||||||||||||||||||||||||
Net investment income | 0.05 | 0.12 | 0.05 | 0.03 | 0.03 | |||||||||||||||||||||||||||||||
Net gains (losses) on investments (both realized and unrealized) | 7.54 | (1.98 | ) | 6.57 | 1.81 | 2.28 | ||||||||||||||||||||||||||||||
|
|
|
|
|
|
|
|
|
| |||||||||||||||||||||||||||
Total income (loss) from investment operations | 7.59 | (1.86 | ) | 6.62 | 1.84 | 2.31 | ||||||||||||||||||||||||||||||
|
|
|
|
|
|
|
|
|
| |||||||||||||||||||||||||||
Less distributions: | ||||||||||||||||||||||||||||||||||||
Dividends from net investment income | - | (0.11 | ) | (0.08 | ) | (0.16 | ) | - | ||||||||||||||||||||||||||||
Distributions from net realized gains | (3.08 | ) | (2.64 | ) | (1.17 | ) | - | - | ||||||||||||||||||||||||||||
|
|
|
|
|
|
|
|
|
| |||||||||||||||||||||||||||
Total distributions | (3.08 | ) | (2.75 | ) | (1.25 | ) | (0.16 | ) | - | |||||||||||||||||||||||||||
|
|
|
|
|
|
|
|
|
| |||||||||||||||||||||||||||
Net asset value, end of period | $ | 29.72 | $ | 25.21 | $ | 29.82 | $ | 24.45 | $ | 22.77 | ||||||||||||||||||||||||||
|
|
|
|
|
|
|
|
|
| |||||||||||||||||||||||||||
Total returnC | 30.11 | % | (6.04 | )% | 27.06 | % | 8.06 | %D | 11.29 | %D | ||||||||||||||||||||||||||
|
|
|
|
|
|
|
|
|
| |||||||||||||||||||||||||||
Ratios and supplemental data: | ||||||||||||||||||||||||||||||||||||
Net assets, end of period | $ | 2,036,785 | $ | 2,306,982 | $ | 2,016,161 | $ | 669,530 | $ | 401,220 | ||||||||||||||||||||||||||
Ratios to average net assets: | ||||||||||||||||||||||||||||||||||||
Expenses, before reimbursements | 0.95 | % | 0.97 | % | 1.13 | % | 1.09 | %E | 4.00 | %E | ||||||||||||||||||||||||||
Expenses, net of reimbursements | 0.91 | % | 0.91 | % | 0.91 | % | 0.91 | %E | 0.91 | %E | ||||||||||||||||||||||||||
Net investment income (loss), before expense reimbursements | 0.12 | % | 0.27 | % | 0.08 | % | 0.11 | %E | (2.69 | )%E | ||||||||||||||||||||||||||
Net investment income, net of reimbursements | 0.16 | % | 0.33 | % | 0.30 | % | 0.28 | %E | 0.40 | %E | ||||||||||||||||||||||||||
Portfolio turnover rate | 77 | % | 60 | % | 78 | % | 40 | %D | 100 | %F | ||||||||||||||||||||||||||
| A | On December 15, 2017, pursuant to a plan of Reorganization on termination, the American Beacon Bridgeway Large Cap Growth II Fund (“Target Fund”) transferred all of its property and assets to the American Beacon Bridgeway Large Cap Growth Fund (“Acquiring Fund”) in exchange solely for voting shares of the Acquiring Fund and the assumption of the Target Fund’s liabilities. |
| B | Commencement of operations. |
| C | Based on net asset value, which does not reflect the sales charge, redemption fee, or contingent deferred sales charge, if applicable. May include adjustments in accordance with U.S. GAAP and as such, the net asset value for reporting purposes and the returns based upon those net asset values may differ from the net asset value and returns for shareholder transactions. |
| D | Not annualized. |
| E | Annualized. |
| F | Portfolio turnover rate is for the period from February 5, 2016 through December 31, 2016 and is not annualized. |
See accompanying notes
45
American Beacon Bridgeway Large Cap Growth FundSM
Financial Highlights
(For a share outstanding throughout the period)
| Investor Class | ||||||||||||||||||||||||||||||||||||
| Year Ended December 31, | Year EndedA December 31, | Six Months Ended December 31, | February 5, 2016B to June 30, | |||||||||||||||||||||||||||||||||
| 2019 | 2018 | 2017 | 2016 | 2016 | ||||||||||||||||||||||||||||||||
|
| |||||||||||||||||||||||||||||||||||
Net asset value, beginning of period | $ | 25.05 | $ | 29.65 | $ | 24.38 | $ | 22.74 | $ | 20.46 | ||||||||||||||||||||||||||
|
|
|
|
|
|
|
|
|
| |||||||||||||||||||||||||||
Income (loss) from investment operations: | ||||||||||||||||||||||||||||||||||||
Net investment income (loss) | (0.04 | ) | 0.01 | (0.01 | ) | (0.01 | ) | 0.01 | ||||||||||||||||||||||||||||
Net gains (losses) on investments (both realized and unrealized) | 7.49 | (1.94 | ) | 6.53 | 1.81 | 2.27 | ||||||||||||||||||||||||||||||
|
|
|
|
|
|
|
|
|
| |||||||||||||||||||||||||||
Total income (loss) from investment operations | 7.45 | (1.93 | ) | 6.52 | 1.80 | 2.28 | ||||||||||||||||||||||||||||||
|
|
|
|
|
|
|
|
|
| |||||||||||||||||||||||||||
Less distributions: | ||||||||||||||||||||||||||||||||||||
Dividends from net investment income | - | (0.03 | ) | (0.08 | ) | (0.16 | ) | - | ||||||||||||||||||||||||||||
Distributions from net realized gains | (3.08 | ) | (2.64 | ) | (1.17 | ) | - | - | ||||||||||||||||||||||||||||
|
|
|
|
|
|
|
|
|
| |||||||||||||||||||||||||||
Total distributions | (3.08 | ) | (2.67 | ) | (1.25 | ) | (0.16 | ) | - | |||||||||||||||||||||||||||
|
|
|
|
|
|
|
|
|
| |||||||||||||||||||||||||||
Net asset value, end of period | $ | 29.42 | $ | 25.05 | $ | 29.65 | $ | 24.38 | $ | 22.74 | ||||||||||||||||||||||||||
|
|
|
|
|
|
|
|
|
| |||||||||||||||||||||||||||
Total returnC | 29.74 | % | (6.33 | )% | 26.72 | % | 7.90 | %D | 11.14 | %D | ||||||||||||||||||||||||||
|
|
|
|
|
|
|
|
|
| |||||||||||||||||||||||||||
Ratios and supplemental data: | ||||||||||||||||||||||||||||||||||||
Net assets, end of period | $ | 71,928,098 | $ | 65,869,325 | $ | 71,273,896 | $ | 399,798 | $ | 133,696 | ||||||||||||||||||||||||||
Ratios to average net assets: | ||||||||||||||||||||||||||||||||||||
Expenses, before reimbursements | 1.20 | % | 1.20 | % | 1.40 | % | 1.55 | %E | 8.43 | %E | ||||||||||||||||||||||||||
Expenses, net of reimbursements | 1.19 | % | 1.19 | % | 1.19 | % | 1.19 | %E | 1.18 | %E | ||||||||||||||||||||||||||
Net investment (loss), before expense reimbursements | (0.11 | )% | (0.01 | )% | (0.66 | )% | (0.35 | )%E | (7.08 | )%E | ||||||||||||||||||||||||||
Net investment income (loss), net of reimbursements | (0.10 | )% | 0.00 | %F | (0.45 | )% | 0.02 | %E | 0.17 | %E | ||||||||||||||||||||||||||
Portfolio turnover rate | 77 | % | 60 | % | 78 | % | 40 | %D | 100 | %G | ||||||||||||||||||||||||||
| A | On December 15, 2017, pursuant to a plan of Reorganization on termination, the American Beacon Bridgeway Large Cap Growth II Fund (“Target Fund”) transferred all of its property and assets to the American Beacon Bridgeway Large Cap Growth Fund (“Acquiring Fund”) in exchange solely for voting shares of the Acquiring Fund and the assumption of the Target Fund’s liabilities. |
| B | Commencement of operations. |
| C | Based on net asset value, which does not reflect the sales charge, redemption fee, or contingent deferred sales charge, if applicable. May include adjustments in accordance with U.S. GAAP and as such, the net asset value for reporting purposes and the returns based upon those net asset values may differ from the net asset value and returns for shareholder transactions. |
| D | Not annualized. |
| E | Annualized. |
| F | Amount represents less than 0.005% of average net assets. |
| G | Portfolio turnover rate is for the period from February 5, 2016 through December 31, 2016 and is not annualized. |
See accompanying notes
46
American Beacon Bridgeway Large Cap Growth FundSM
Financial Highlights
(For a share outstanding throughout the period)
| A Class | ||||||||||||||||||||||||||||||||||||
| Year Ended December 31, | Year EndedA December 31, | Six Months Ended December 31, | February 5, 2016B to June 30, | |||||||||||||||||||||||||||||||||
| 2019 | 2018 | 2017 | 2016 | 2016 | ||||||||||||||||||||||||||||||||
|
| |||||||||||||||||||||||||||||||||||
Net asset value, beginning of period | $ | 25.12 | $ | 29.70 | $ | 24.39 | $ | 22.74 | $ | 20.46 | ||||||||||||||||||||||||||
|
|
|
|
|
|
|
|
|
| |||||||||||||||||||||||||||
Income (loss) from investment operations: | ||||||||||||||||||||||||||||||||||||
Net investment income (loss) | (0.03 | ) | (0.11 | ) | 0.00 | C | 0.00 | C | 0.00 | C | ||||||||||||||||||||||||||
Net gains (losses) on investments (both realized and unrealized) | 7.50 | (1.83 | ) | 6.54 | 1.81 | 2.28 | ||||||||||||||||||||||||||||||
|
|
|
|
|
|
|
|
|
| |||||||||||||||||||||||||||
Total income (loss) from investment operations | 7.47 | (1.94 | ) | 6.54 | 1.81 | 2.28 | ||||||||||||||||||||||||||||||
|
|
|
|
|
|
|
|
|
| |||||||||||||||||||||||||||
Less distributions: | ||||||||||||||||||||||||||||||||||||
Dividends from net investment income | - | - | (0.06 | ) | (0.16 | ) | - | |||||||||||||||||||||||||||||
Distributions from net realized gains | (3.08 | ) | (2.64 | ) | (1.17 | ) | - | - | ||||||||||||||||||||||||||||
|
|
|
|
|
|
|
|
|
| |||||||||||||||||||||||||||
Total distributions | (3.08 | ) | (2.64 | ) | (1.23 | ) | (0.16 | ) | - | |||||||||||||||||||||||||||
|
|
|
|
|
|
|
|
|
| |||||||||||||||||||||||||||
Net asset value, end of period | $ | 29.51 | $ | 25.12 | $ | 29.70 | $ | 24.39 | $ | 22.74 | ||||||||||||||||||||||||||
|
|
|
|
|
|
|
|
|
| |||||||||||||||||||||||||||
Total returnD | 29.74 | % | (6.35 | )% | 26.79 | % | 7.94 | %E | 11.14 | %E | ||||||||||||||||||||||||||
|
|
|
|
|
|
|
|
|
| |||||||||||||||||||||||||||
Ratios and supplemental data: | ||||||||||||||||||||||||||||||||||||
Net assets, end of period | $ | 2,029,102 | $ | 1,700,188 | $ | 4,625,607 | $ | 135,710 | $ | 159,744 | ||||||||||||||||||||||||||
Ratios to average net assets: | ||||||||||||||||||||||||||||||||||||
Expenses, before reimbursements | 1.18 | % | 1.25 | % | 1.44 | % | 1.43 | %F | 5.25 | %F | ||||||||||||||||||||||||||
Expenses, net of reimbursements | 1.21 | % | 1.21 | % | 1.21 | % | 1.21 | %F | 1.21 | %F | ||||||||||||||||||||||||||
Net investment (loss), before expense reimbursements | (0.09 | )% | (0.09 | )% | (0.23 | )% | (0.26 | )%F | (4.01 | )%F | ||||||||||||||||||||||||||
Net investment income (loss), net of reimbursements | (0.12 | )% | (0.05 | )% | 0.00 | %G | (0.05 | )%F | 0.02 | %F | ||||||||||||||||||||||||||
Portfolio turnover rate | 77 | % | 60 | % | 78 | % | 40 | %E | 100 | %H | ||||||||||||||||||||||||||
| A | On December 15, 2017, pursuant to a plan of Reorganization on termination, the American Beacon Bridgeway Large Cap Growth II Fund (“Target Fund”) transferred all of its property and assets to the American Beacon Bridgeway Large Cap Growth Fund (“Acquiring Fund”) in exchange solely for voting shares of the Acquiring Fund and the assumption of the Target Fund’s liabilities. |
| B | Commencement of operations. |
| C | Amount represents less than $0.01 per share. |
| D | Based on net asset value, which does not reflect the sales charge, redemption fee, or contingent deferred sales charge, if applicable. May include adjustments in accordance with U.S. GAAP and as such, the net asset value for reporting purposes and the returns based upon those net asset values may differ from the net asset value and returns for shareholder transactions. |
| E | Not annualized. |
| F | Annualized. |
| G | Amount rounds to less than 0.005%. |
| H | Portfolio turnover rate is for the period from February 5, 2016 through December 31, 2016 and is not annualized. |
See accompanying notes
47
American Beacon Bridgeway Large Cap Growth FundSM
Financial Highlights
(For a share outstanding throughout the period)
| C Class | ||||||||||||||||||||||||||||||||||||
| Year Ended December 31, | Year EndedA December 31, | Six Months Ended December 31, | February 5, 2016B to June 30, | |||||||||||||||||||||||||||||||||
| 2019 | 2018 | 2017 | 2016 | 2016 | ||||||||||||||||||||||||||||||||
|
| |||||||||||||||||||||||||||||||||||
Net asset value, beginning of period | $ | 24.55 | $ | 29.30 | $ | 24.22 | $ | 22.67 | $ | 20.46 | ||||||||||||||||||||||||||
|
|
|
|
|
|
|
|
|
| |||||||||||||||||||||||||||
Income (loss) from investment operations: | ||||||||||||||||||||||||||||||||||||
Net investment (loss) | (0.20 | ) | (0.17 | ) | (0.10 | ) | (0.13 | ) | (0.04 | ) | ||||||||||||||||||||||||||
Net gains (losses) on investments (both realized and unrealized) | 7.26 | (1.94 | ) | 6.35 | 1.84 | 2.25 | ||||||||||||||||||||||||||||||
|
|
|
|
|
|
|
|
|
| |||||||||||||||||||||||||||
Total income (loss) from investment operations | 7.06 | (2.11 | ) | 6.25 | 1.71 | 2.21 | ||||||||||||||||||||||||||||||
|
|
|
|
|
|
|
|
|
| |||||||||||||||||||||||||||
Less distributions: | ||||||||||||||||||||||||||||||||||||
Dividends from net investment income | - | - | - | (0.16 | ) | - | ||||||||||||||||||||||||||||||
Distributions from net realized gains | (3.08 | ) | (2.64 | ) | (1.17 | ) | - | - | ||||||||||||||||||||||||||||
|
|
|
|
|
|
|
|
|
| |||||||||||||||||||||||||||
Total distributions | (3.08 | ) | (2.64 | ) | (1.17 | ) | (0.16 | ) | - | |||||||||||||||||||||||||||
|
|
|
|
|
|
|
|
|
| |||||||||||||||||||||||||||
Net asset value, end of period | $ | 28.53 | $ | 24.55 | $ | 29.30 | $ | 24.22 | $ | 22.67 | ||||||||||||||||||||||||||
|
|
|
|
|
|
|
|
|
| |||||||||||||||||||||||||||
Total returnC | 28.75 | % | (7.02 | )% | 25.78 | % | 7.52 | %D | 10.80 | %D | ||||||||||||||||||||||||||
|
|
|
|
|
|
|
|
|
| |||||||||||||||||||||||||||
Ratios and supplemental data: | ||||||||||||||||||||||||||||||||||||
Net assets, end of period | $ | 1,086,848 | $ | 798,319 | $ | 769,559 | $ | 175,907 | $ | 244,146 | ||||||||||||||||||||||||||
Ratios to average net assets: | ||||||||||||||||||||||||||||||||||||
Expenses, before reimbursements | 1.92 | % | 1.95 | % | 2.09 | % | 2.18 | %E | 7.33 | %E | ||||||||||||||||||||||||||
Expenses, net of reimbursements | 1.96 | % | 1.96 | % | 1.96 | % | 1.96 | %E | 1.96 | %E | ||||||||||||||||||||||||||
Net investment (loss), before expense reimbursements | (0.83 | )% | (0.76 | )% | (0.90 | )% | (1.04 | )%E | (5.98 | )%E | ||||||||||||||||||||||||||
Net investment (loss), net of reimbursements | (0.87 | )% | (0.77 | )% | (0.77 | )% | (0.81 | )%E | (0.62 | )%E | ||||||||||||||||||||||||||
Portfolio turnover rate | 77 | % | 60 | % | 78 | % | 40 | %D | 100 | %F | ||||||||||||||||||||||||||
| A | On December 15, 2017, pursuant to a plan of Reorganization on termination, the American Beacon Bridgeway Large Cap Growth II Fund (“Target Fund”) transferred all of its property and assets to the American Beacon Bridgeway Large Cap Growth Fund (“Acquiring Fund”) in exchange solely for voting shares of the Acquiring Fund and the assumption of the Target Fund’s liabilities. |
| B | Commencement of operations. |
| C | Based on net asset value, which does not reflect the sales charge, redemption fee, or contingent deferred sales charge, if applicable. May include adjustments in accordance with U.S. GAAP and as such, the net asset value for reporting purposes and the returns based upon those net asset values may differ from the net asset value and returns for shareholder transactions. |
| D | Not annualized. |
| E | Annualized. |
| F | Portfolio turnover rate is for the period from February 5, 2016 through December 31, 2016 and is not annualized. |
See accompanying notes
48
American Beacon Bridgeway Large Cap Growth FundSM
Financial Highlights
(For a share outstanding throughout the period)
| R6 Class | ||||||||||||
| Year Ended December 31, 2019 | April 30, 2018A to December 31, 2018 | |||||||||||
|
| |||||||||||
Net asset value, beginning of period | $ | 25.28 | $ | 30.89 | ||||||||
|
|
|
| |||||||||
Income from investment operations: | ||||||||||||
Net investment income | 0.10 | 0.12 | ||||||||||
Net gains (losses) on investments (both realized and unrealized) | 7.56 | (2.98 | ) | |||||||||
|
|
|
| |||||||||
Total income (loss) from investment operations | 7.66 | (2.86 | ) | |||||||||
|
|
|
| |||||||||
Less distributions: | ||||||||||||
Dividends from net investment income | - | (0.11 | ) | |||||||||
Distributions from net realized gains | (3.08 | ) | (2.64 | ) | ||||||||
|
|
|
| |||||||||
Total distributions | (3.08 | ) | (2.75 | ) | ||||||||
|
|
|
| |||||||||
Net asset value, end of period | $ | 29.86 | $ | 25.28 | ||||||||
|
|
|
| |||||||||
Total returnB | 30.30 | % | (9.07 | )%C | ||||||||
|
|
|
| |||||||||
Ratios and supplemental data: | ||||||||||||
Net assets, end of period | $ | 107,424 | $ | 90,943 | ||||||||
Ratios to average net assets: | ||||||||||||
Expenses, before reimbursements | 0.84 | % | 4.15 | %D | ||||||||
Expenses, net of reimbursements | 0.76 | % | 0.76 | %D | ||||||||
Net investment income (loss), before expense reimbursements | 0.25 | % | (2.85 | )%D | ||||||||
Net investment income, net of reimbursements | 0.33 | % | 0.54 | %D | ||||||||
Portfolio turnover rate | 77 | % | 60 | %E | ||||||||
| A | Commencement of operations. |
| B | Based on net asset value, which does not reflect the sales charge, redemption fee, or contingent deferred sales charge, if applicable. May include adjustments in accordance with U.S. GAAP and as such, the net asset value for reporting purposes and the returns based upon those net asset values may differ from the net asset value and returns for shareholder transactions. |
| C | Not annualized. |
| D | Annualized. |
| E | Portfolio turnover rate is for the period from April 30, 2018 through December 31, 2018 and is not annualized. |
See accompanying notes
49
American Beacon Bridgeway Large Cap Value FundSM
Financial Highlights
(For a share outstanding throughout the period)
| Institutional Class | ||||||||||||||||||||||||||||||||||||
| Year Ended December 31, | ||||||||||||||||||||||||||||||||||||
| 2019 | 2018 | 2017 | 2016 | 2015 | ||||||||||||||||||||||||||||||||
|
| |||||||||||||||||||||||||||||||||||
Net asset value, beginning of period | $ | 22.61 | $ | 28.57 | $ | 26.08 | $ | 22.75 | $ | 23.89 | ||||||||||||||||||||||||||
|
|
|
|
|
|
|
|
|
| |||||||||||||||||||||||||||
Income (loss) from investment operations: | ||||||||||||||||||||||||||||||||||||
Net investment income | 0.55 | 0.45 | 0.37 | 0.38 | 0.28 | |||||||||||||||||||||||||||||||
Net gains (losses) on investments (both realized and unrealized) | 5.13 | (4.28 | ) | 3.78 | 3.32 | (0.58 | ) | |||||||||||||||||||||||||||||
|
|
|
|
|
|
|
|
|
| |||||||||||||||||||||||||||
Total income (loss) from investment operations | 5.68 | (3.83 | ) | 4.15 | 3.70 | (0.30 | ) | |||||||||||||||||||||||||||||
|
|
|
|
|
|
|
|
|
| |||||||||||||||||||||||||||
Less distributions: | ||||||||||||||||||||||||||||||||||||
Dividends from net investment income | (0.54 | ) | (0.47 | ) | (0.39 | ) | (0.35 | ) | (0.29 | ) | ||||||||||||||||||||||||||
Distributions from net realized gains | (0.61 | ) | (1.66 | ) | (1.27 | ) | (0.02 | ) | (0.55 | ) | ||||||||||||||||||||||||||
Tax return of capital | - | - | - | - | (0.00 | )A | ||||||||||||||||||||||||||||||
|
|
|
|
|
|
|
|
|
| |||||||||||||||||||||||||||
Total distributions | (1.15 | ) | (2.13 | ) | (1.66 | ) | (0.37 | ) | (0.84 | ) | ||||||||||||||||||||||||||
|
|
|
|
|
|
|
|
|
| |||||||||||||||||||||||||||
Net asset value, end of period | $ | 27.14 | $ | 22.61 | $ | 28.57 | $ | 26.08 | $ | 22.75 | ||||||||||||||||||||||||||
|
|
|
|
|
|
|
|
|
| |||||||||||||||||||||||||||
Total returnB | 25.11 | % | (13.28 | )% | 15.88 | % | 16.24 | % | (1.23 | )% | ||||||||||||||||||||||||||
|
|
|
|
|
|
|
|
|
| |||||||||||||||||||||||||||
Ratios and supplemental data: |
| |||||||||||||||||||||||||||||||||||
Net assets, end of period | $ | 1,205,569,140 | $ | 1,442,789,043 | $ | 1,547,760,278 | $ | 1,185,013,905 | $ | 682,849,171 | ||||||||||||||||||||||||||
Ratios to average net assets: | ||||||||||||||||||||||||||||||||||||
Expenses, before reimbursements | 0.73 | % | 0.72 | % | 0.72 | % | 0.73 | % | 0.75 | % | ||||||||||||||||||||||||||
Expenses, net of reimbursements | 0.73 | % | 0.72 | % | 0.72 | % | 0.73 | % | 0.79 | % | ||||||||||||||||||||||||||
Net investment income, before expense reimbursements | 1.71 | % | 1.63 | % | 1.41 | % | 1.69 | % | 1.61 | % | ||||||||||||||||||||||||||
Net investment income, net of reimbursements | 1.71 | % | 1.63 | % | 1.41 | % | 1.69 | % | 1.57 | % | ||||||||||||||||||||||||||
Portfolio turnover rate | 44 | % | 49 | % | 48 | % | 56 | % | 43 | % | ||||||||||||||||||||||||||
| A | Tax return of capital is calculated based on outstanding shares at the time of distribution. Amounts are less than $0.01 per share. |
| B | Based on net asset value, which does not reflect the sales charge, redemption fee, or contingent deferred sales charge, if applicable. May include adjustments in accordance with U.S. GAAP and as such, the net asset value for reporting purposes and the returns based upon those net asset values may differ from the net asset value and returns for shareholder transactions. |
See accompanying notes
50
American Beacon Bridgeway Large Cap Value FundSM
Financial Highlights
(For a share outstanding throughout the period)
| Y Class | ||||||||||||||||||||||||||||||||||||
| Year Ended December 31, | ||||||||||||||||||||||||||||||||||||
| 2019 | 2018 | 2017 | 2016 | 2015 | ||||||||||||||||||||||||||||||||
|
| |||||||||||||||||||||||||||||||||||
Net asset value, beginning of period | $ | 22.54 | $ | 28.49 | $ | 26.01 | $ | 22.69 | $ | 23.84 | ||||||||||||||||||||||||||
|
|
|
|
|
|
|
|
|
| |||||||||||||||||||||||||||
Income (loss) from investment operations: | ||||||||||||||||||||||||||||||||||||
Net investment income | 0.46 | 0.44 | 0.33 | 0.32 | 0.27 | |||||||||||||||||||||||||||||||
Net gains (losses) on investments (both realized and unrealized) | 5.19 | (4.28 | ) | 3.79 | 3.35 | (0.57 | ) | |||||||||||||||||||||||||||||
|
|
|
|
|
|
|
|
|
| |||||||||||||||||||||||||||
Total income (loss) from investment operations | 5.65 | (3.84 | ) | 4.12 | 3.67 | (0.30 | ) | |||||||||||||||||||||||||||||
|
|
|
|
|
|
|
|
|
| |||||||||||||||||||||||||||
Less distributions: | ||||||||||||||||||||||||||||||||||||
Dividends from net investment income | (0.52 | ) | (0.45 | ) | (0.37 | ) | (0.33 | ) | (0.30 | ) | ||||||||||||||||||||||||||
Distributions from net realized gains | (0.61 | ) | (1.66 | ) | (1.27 | ) | (0.02 | ) | (0.55 | ) | ||||||||||||||||||||||||||
Tax return of capital | - | - | - | - | (0.00 | )A | ||||||||||||||||||||||||||||||
|
|
|
|
|
|
|
|
|
| |||||||||||||||||||||||||||
Total distributions | (1.13 | ) | (2.11 | ) | (1.64 | ) | (0.35 | ) | (0.85 | ) | ||||||||||||||||||||||||||
|
|
|
|
|
|
|
|
|
| |||||||||||||||||||||||||||
Net asset value, end of period | $ | 27.06 | $ | 22.54 | $ | 28.49 | $ | 26.01 | $ | 22.69 | ||||||||||||||||||||||||||
|
|
|
|
|
|
|
|
|
| |||||||||||||||||||||||||||
Total returnB | 25.06 | % | (13.35 | )% | 15.82 | % | 16.17 | % | (1.26 | )% | ||||||||||||||||||||||||||
|
|
|
|
|
|
|
|
|
| |||||||||||||||||||||||||||
Ratios and supplemental data: |
| |||||||||||||||||||||||||||||||||||
Net assets, end of period | $ | 1,455,648,440 | $ | 1,502,519,807 | $ | 1,547,228,114 | $ | 879,852,983 | $ | 414,585,125 | ||||||||||||||||||||||||||
Ratios to average net assets: | ||||||||||||||||||||||||||||||||||||
Expenses, before reimbursements | 0.80 | % | 0.79 | % | 0.79 | % | 0.80 | % | 0.81 | % | ||||||||||||||||||||||||||
Expenses, net of reimbursements | 0.80 | % | 0.79 | % | 0.79 | % | 0.80 | % | 0.81 | % | ||||||||||||||||||||||||||
Net investment income, before expense reimbursements | 1.65 | % | 1.57 | % | 1.35 | % | 1.63 | % | 1.55 | % | ||||||||||||||||||||||||||
Net investment income, net of reimbursements | 1.65 | % | 1.57 | % | 1.35 | % | 1.63 | % | 1.55 | % | ||||||||||||||||||||||||||
Portfolio turnover rate | 44 | % | 49 | % | 48 | % | 56 | % | 43 | % | ||||||||||||||||||||||||||
| A | Tax return of capital is calculated based on outstanding shares at the time of distribution. Amounts are less than $0.01 per share. |
| B | Based on net asset value, which does not reflect the sales charge, redemption fee, or contingent deferred sales charge, if applicable. May include adjustments in accordance with U.S. GAAP and as such, the net asset value for reporting purposes and the returns based upon those net asset values may differ from the net asset value and returns for shareholder transactions. |
See accompanying notes
51
American Beacon Bridgeway Large Cap Value FundSM
Financial Highlights
(For a share outstanding throughout the period)
| Investor Class | ||||||||||||||||||||||||||||||||||||
| Year Ended December 31, | ||||||||||||||||||||||||||||||||||||
| 2019 | 2018 | 2017 | 2016 | 2015 | ||||||||||||||||||||||||||||||||
|
| |||||||||||||||||||||||||||||||||||
Net asset value, beginning of period | $ | 22.50 | $ | 28.41 | $ | 25.93 | $ | 22.64 | $ | 23.77 | ||||||||||||||||||||||||||
|
|
|
|
|
|
|
|
|
| |||||||||||||||||||||||||||
Income (loss) from investment operations: | ||||||||||||||||||||||||||||||||||||
Net investment income | 0.62 | 0.43 | 0.32 | 0.27 | 0.25 | |||||||||||||||||||||||||||||||
Net gains (losses) on investments (both realized and unrealized) | 4.95 | (4.33 | ) | 3.71 | 3.31 | (0.61 | ) | |||||||||||||||||||||||||||||
|
|
|
|
|
|
|
|
|
| |||||||||||||||||||||||||||
Total income (loss) from investment operations | 5.57 | (3.90 | ) | 4.03 | 3.58 | (0.36 | ) | |||||||||||||||||||||||||||||
|
|
|
|
|
|
|
|
|
| |||||||||||||||||||||||||||
Less distributions: | ||||||||||||||||||||||||||||||||||||
Dividends from net investment income | (0.41 | ) | (0.35 | ) | (0.28 | ) | (0.27 | ) | (0.22 | ) | ||||||||||||||||||||||||||
Distributions from net realized gains | (0.61 | ) | (1.66 | ) | (1.27 | ) | (0.02 | ) | (0.55 | ) | ||||||||||||||||||||||||||
Tax return of capital | - | - | - | - | (0.00 | )A | ||||||||||||||||||||||||||||||
|
|
|
|
|
|
|
|
|
| |||||||||||||||||||||||||||
Total distributions | (1.02 | ) | (2.01 | ) | (1.55 | ) | (0.29 | ) | (0.77 | ) | ||||||||||||||||||||||||||
|
|
|
|
|
|
|
|
|
| |||||||||||||||||||||||||||
Net asset value, end of period | $ | 27.05 | $ | 22.50 | $ | 28.41 | $ | 25.93 | $ | 22.64 | ||||||||||||||||||||||||||
|
|
|
|
|
|
|
|
|
| |||||||||||||||||||||||||||
Total returnB | 24.74 | % | (13.60 | )% | 15.52 | % | 15.81 | % | (1.51 | )% | ||||||||||||||||||||||||||
|
|
|
|
|
|
|
|
|
| |||||||||||||||||||||||||||
Ratios and supplemental data: |
| |||||||||||||||||||||||||||||||||||
Net assets, end of period | $ | 587,724,123 | $ | 886,572,501 | $ | 1,387,184,369 | $ | 1,583,853,257 | $ | 977,719,149 | ||||||||||||||||||||||||||
Ratios to average net assets: | ||||||||||||||||||||||||||||||||||||
Expenses, before reimbursements | 1.08 | % | 1.05 | % | 1.06 | % | 1.08 | % | 1.09 | % | ||||||||||||||||||||||||||
Expenses, net of reimbursements | 1.08 | % | 1.05 | % | 1.06 | % | 1.08 | % | 1.09 | % | ||||||||||||||||||||||||||
Net investment income, before expense reimbursements | 1.37 | % | 1.26 | % | 1.04 | % | 1.35 | % | 1.28 | % | ||||||||||||||||||||||||||
Net investment income, net of reimbursements | 1.37 | % | 1.26 | % | 1.04 | % | 1.35 | % | 1.28 | % | ||||||||||||||||||||||||||
Portfolio turnover rate | 44 | % | 49 | % | 48 | % | 56 | % | 43 | % | ||||||||||||||||||||||||||
| A | Tax return of capital is calculated based on outstanding shares at the time of distribution. Amounts are less than $0.01 per share. |
| B | Based on net asset value, which does not reflect the sales charge, redemption fee, or contingent deferred sales charge, if applicable. May include adjustments in accordance with U.S. GAAP and as such, the net asset value for reporting purposes and the returns based upon those net asset values may differ from the net asset value and returns for shareholder transactions. |
See accompanying notes
52
American Beacon Bridgeway Large Cap Value FundSM
Financial Highlights
(For a share outstanding throughout the period)
| A Class | ||||||||||||||||||||||||||||||||||||
| Year Ended December 31, | ||||||||||||||||||||||||||||||||||||
| 2019 | 2018 | 2017 | 2016 | 2015 | ||||||||||||||||||||||||||||||||
|
| |||||||||||||||||||||||||||||||||||
Net asset value, beginning of period | $ | 22.41 | $ | 28.32 | $ | 25.82 | $ | 22.53 | $ | 23.66 | ||||||||||||||||||||||||||
|
|
|
|
|
|
|
|
|
| |||||||||||||||||||||||||||
Income (loss) from investment operations: | ||||||||||||||||||||||||||||||||||||
Net investment income | 0.58 | 0.36 | 0.42 | 0.32 | 0.27 | |||||||||||||||||||||||||||||||
Net gains (losses) on investments (both realized and unrealized) | 4.95 | (4.25 | ) | 3.58 | 3.24 | (0.64 | ) | |||||||||||||||||||||||||||||
|
|
|
|
|
|
|
|
|
| |||||||||||||||||||||||||||
Total income (loss) from investment operations | 5.53 | (3.89 | ) | 4.00 | 3.56 | (0.37 | ) | |||||||||||||||||||||||||||||
|
|
|
|
|
|
|
|
|
| |||||||||||||||||||||||||||
Less distributions: | ||||||||||||||||||||||||||||||||||||
Dividends from net investment income | (0.41 | ) | (0.36 | ) | (0.23 | ) | (0.25 | ) | (0.21 | ) | ||||||||||||||||||||||||||
Distributions from net realized gains | (0.61 | ) | (1.66 | ) | (1.27 | ) | (0.02 | ) | (0.55 | ) | ||||||||||||||||||||||||||
Tax return of capital | - | - | - | - | (0.00 | )A | ||||||||||||||||||||||||||||||
|
|
|
|
|
|
|
|
|
| |||||||||||||||||||||||||||
Total distributions | (1.02 | ) | (2.02 | ) | (1.50 | ) | (0.27 | ) | (0.76 | ) | ||||||||||||||||||||||||||
|
|
|
|
|
|
|
|
|
| |||||||||||||||||||||||||||
Net asset value, end of period | $ | 26.92 | $ | 22.41 | $ | 28.32 | $ | 25.82 | $ | 22.53 | ||||||||||||||||||||||||||
|
|
|
|
|
|
|
|
|
| |||||||||||||||||||||||||||
Total returnB | 24.70 | % | (13.60 | )% | 15.46 | % | 15.79 | % | (1.56 | )% | ||||||||||||||||||||||||||
|
|
|
|
|
|
|
|
|
| |||||||||||||||||||||||||||
Ratios and supplemental data: |
| |||||||||||||||||||||||||||||||||||
Net assets, end of period | $ | 58,637,332 | $ | 79,610,028 | $ | 96,229,248 | $ | 152,520,884 | $ | 147,394,607 | ||||||||||||||||||||||||||
Ratios to average net assets: | ||||||||||||||||||||||||||||||||||||
Expenses, before reimbursements | 1.10 | % | 1.07 | % | 1.08 | % | 1.12 | % | 1.12 | % | ||||||||||||||||||||||||||
Expenses, net of reimbursements | 1.10 | % | 1.07 | % | 1.08 | % | 1.12 | % | 1.12 | % | ||||||||||||||||||||||||||
Net investment income, before expense reimbursements | 1.35 | % | 1.28 | % | 1.01 | % | 1.31 | % | 1.25 | % | ||||||||||||||||||||||||||
Net investment income, net of reimbursements | 1.35 | % | 1.28 | % | 1.01 | % | 1.31 | % | 1.25 | % | ||||||||||||||||||||||||||
Portfolio turnover rate | 44 | % | 49 | % | 48 | % | 56 | % | 43 | % | ||||||||||||||||||||||||||
| A | Tax return of capital is calculated based on outstanding shares at the time of distribution. Amounts are less than $0.01 per share. |
| B | Based on net asset value, which does not reflect the sales charge, redemption fee, or contingent deferred sales charge, if applicable. May include adjustments in accordance with U.S. GAAP and as such, the net asset value for reporting purposes and the returns based upon those net asset values may differ from the net asset value and returns for shareholder transactions. |
See accompanying notes
53
American Beacon Bridgeway Large Cap Value FundSM
Financial Highlights
(For a share outstanding throughout the period)
| C Class | ||||||||||||||||||||||||||||||||||||
| Year Ended December 31, | ||||||||||||||||||||||||||||||||||||
| 2019 | 2018 | 2017 | 2016 | 2015 | ||||||||||||||||||||||||||||||||
|
| |||||||||||||||||||||||||||||||||||
Net asset value, beginning of period | $ | 21.86 | $ | 27.63 | $ | 25.27 | $ | 22.08 | $ | 23.27 | ||||||||||||||||||||||||||
|
|
|
|
|
|
|
|
|
| |||||||||||||||||||||||||||
Income (loss) from investment operations: | ||||||||||||||||||||||||||||||||||||
Net investment income | 0.21 | 0.16 | 0.08 | 0.13 | 0.13 | |||||||||||||||||||||||||||||||
Net gains (losses) on investments (both realized and unrealized) | 4.99 | (4.12 | ) | 3.62 | 3.16 | (0.66 | ) | |||||||||||||||||||||||||||||
|
|
|
|
|
|
|
|
|
| |||||||||||||||||||||||||||
Total income (loss) from investment operations | 5.20 | (3.96 | ) | 3.70 | 3.29 | (0.53 | ) | |||||||||||||||||||||||||||||
|
|
|
|
|
|
|
|
|
| |||||||||||||||||||||||||||
Less distributions: | ||||||||||||||||||||||||||||||||||||
Dividends from net investment income | (0.20 | ) | (0.15 | ) | (0.07 | ) | (0.08 | ) | (0.11 | ) | ||||||||||||||||||||||||||
Distributions from net realized gains | (0.61 | ) | (1.66 | ) | (1.27 | ) | (0.02 | ) | (0.55 | ) | ||||||||||||||||||||||||||
Tax return of capital | - | - | - | - | (0.00 | )A | ||||||||||||||||||||||||||||||
|
|
|
|
|
|
|
|
|
| |||||||||||||||||||||||||||
Total distributions | (0.81 | ) | (1.81 | ) | (1.34 | ) | (0.10 | ) | (0.66 | ) | ||||||||||||||||||||||||||
|
|
|
|
|
|
|
|
|
| |||||||||||||||||||||||||||
Net asset value, end of period | $ | 26.25 | $ | 21.86 | $ | 27.63 | $ | 25.27 | $ | 22.08 | ||||||||||||||||||||||||||
|
|
|
|
|
|
|
|
|
| |||||||||||||||||||||||||||
Total returnB | 23.79 | % | (14.23 | )% | 14.62 | % | 14.91 | % | (2.27 | )% | ||||||||||||||||||||||||||
|
|
|
|
|
|
|
|
|
| |||||||||||||||||||||||||||
Ratios and supplemental data: |
| |||||||||||||||||||||||||||||||||||
Net assets, end of period | $ | 59,409,216 | $ | 75,231,917 | $ | 102,553,616 | $ | 100,447,531 | $ | 84,411,378 | ||||||||||||||||||||||||||
Ratios to average net assets: | ||||||||||||||||||||||||||||||||||||
Expenses, before reimbursements | 1.81 | % | 1.79 | % | 1.83 | % | 1.86 | % | 1.87 | % | ||||||||||||||||||||||||||
Expenses, net of reimbursements | 1.81 | % | 1.79 | % | 1.83 | % | 1.86 | % | 1.87 | % | ||||||||||||||||||||||||||
Net investment income, before expense reimbursements | 0.63 | % | 0.54 | % | 0.28 | % | 0.57 | % | 0.48 | % | ||||||||||||||||||||||||||
Net investment income, net of reimbursements | 0.63 | % | 0.54 | % | 0.28 | % | 0.57 | % | 0.48 | % | ||||||||||||||||||||||||||
Portfolio turnover rate | 44 | % | 49 | % | 48 | % | 56 | % | 43 | % | ||||||||||||||||||||||||||
| A | Tax return of capital is calculated based on outstanding shares at the time of distribution. Amounts are less than $0.01 per share. |
| B | Based on net asset value, which does not reflect the sales charge, redemption fee, or contingent deferred sales charge, if applicable. May include adjustments in accordance with U.S. GAAP and as such, the net asset value for reporting purposes and the returns based upon those net asset values may differ from the net asset value and returns for shareholder transactions. |
See accompanying notes
54
American Beacon Bridgeway Large Cap Value FundSM
Financial Highlights
(For a share outstanding throughout the period)
| R6 Class | ||||||||||||||||||||
| Year Ended December 31, | April 28, 2017A to December 31, | |||||||||||||||||||
| 2019 | 2018 | 2017 | ||||||||||||||||||
|
| |||||||||||||||||||
Net asset value, beginning of period | $ | 22.59 | $ | 28.55 | $ | 26.73 | ||||||||||||||
|
|
|
|
|
| |||||||||||||||
Income from investment operations: | ||||||||||||||||||||
Net investment income | 0.49 | 0.54 | 0.11 | |||||||||||||||||
Net gains (losses) on investments (both realized and unrealized) | 5.20 | (4.37 | ) | 3.37 | ||||||||||||||||
|
|
|
|
|
| |||||||||||||||
Total income (loss) from investment operations | 5.69 | (3.83 | ) | 3.48 | ||||||||||||||||
|
|
|
|
|
| |||||||||||||||
Less distributions: | ||||||||||||||||||||
Dividends from net investment income | (0.55 | ) | (0.47 | ) | (0.39 | ) | ||||||||||||||
Distributions from net realized gains | (0.61 | ) | (1.66 | ) | (1.27 | ) | ||||||||||||||
|
|
|
|
|
| |||||||||||||||
Total distributions | (1.16 | ) | (2.13 | ) | (1.66 | ) | ||||||||||||||
|
|
|
|
|
| |||||||||||||||
Net asset value, end of period | $ | 27.12 | $ | 22.59 | $ | 28.55 | ||||||||||||||
|
|
|
|
|
| |||||||||||||||
Total returnB | 25.17 | % | (13.27 | )% | 13.01 | %C | ||||||||||||||
|
|
|
|
|
| |||||||||||||||
Ratios and supplemental data: |
| |||||||||||||||||||
Net assets, end of period | $ | 227,580,520 | $ | 147,107,520 | $ | 91,521,786 | ||||||||||||||
Ratios to average net assets: | ||||||||||||||||||||
Expenses, before reimbursements | 0.70 | % | 0.70 | % | 0.75 | %D | ||||||||||||||
Expenses, net of reimbursements | 0.70 | % | 0.70 | % | 0.71 | %D | ||||||||||||||
Net investment income, before expense reimbursements | 1.76 | % | 1.69 | % | 1.44 | %D | ||||||||||||||
Net investment income, net of reimbursements | 1.76 | % | 1.69 | % | 1.48 | %D | ||||||||||||||
Portfolio turnover rate | 44 | % | 49 | % | 48 | %E | ||||||||||||||
| A | Commencement of operations. |
| B | Based on net asset value, which does not reflect the sales charge, redemption fee, or contingent deferred sales charge, if applicable. May include adjustments in accordance with U.S. GAAP and as such, the net asset value for reporting purposes and the returns based upon those net asset values may differ from the net asset value and returns for shareholder transactions. |
| C | Not annualized. |
| D | Annualized. |
| E | Portfolio turnover rate is for the period from April 28, 2017 through December 31, 2017 and is not annualized. |
See accompanying notes
55
American Beacon FundsSM
December 31, 2019 (Unaudited)
Certain tax information regarding the Funds is required to be provided to shareholders based upon the Funds’ income and distributions for the taxable year ended December 31, 2019. The information and distributions reported herein may differ from information and distributions taxable to the shareholders for the calendar year ended December 31, 2019.
The Funds designated the following items with regard to distributions paid during the fiscal year ended December 31, 2019. All designations are based on financial information available as of this annual report and, accordingly, are subject to change. For each item, it is the intention of the Funds to designate the maximum amount permitted under the Internal Revenue Code of 1986, as amended, and the regulations there under.
Corporate Dividends-Received Deduction:
Bridgeway Large Cap Growth | 100 | % | ||
Bridgeway Large Cap Value | 100 | % |
Qualified Dividend Income:
Bridgeway Large Cap Growth | 100 | % | ||
Bridgeway Large Cap Value | 100 | % |
Long-Term Capital Gain Distributions:
Bridgeway Large Cap Growth | $ | 18,228,309 | ||
Bridgeway Large Cap Value | 79,299,619 |
Short-Term Capital Gain Distributions:
Bridgeway Large Cap Growth | $ | 439,317 | ||
Bridgeway Large Cap Value | 76,832 |
Shareholders will receive notification in January 2020 of the applicable tax information necessary to prepare their 2019 income tax returns.
56
Trustees and Officers of the American Beacon FundsSM(Unaudited)
The Trustees and officers of the American Beacon Funds (the “Trust”) are listed below, together with their principal occupations during the past five years. The address of each person listed below is 220 Las Colinas Boulevard East, Suite 1200, Irving, Texas 75039. Each Trustee overseesthirty-six funds in the fund complex that includes the Trust, the American Beacon Select Funds, the American Beacon Institutional Funds Trust, the American Beacon Sound Point Enhanced Income Fund, American Beacon Apollo Total Return Fund and the American Beacon Sound Point Alternative Lending Fund. The Trust’s Statement of Additional Information contains additional information about the Trustees and is available without charge by calling1-800-658-5811.
Name, Age | Position, Term of Office and Length of Time Served with the Trust | Principal Occupation(s) During Past 5 Years and Current Directorships | ||
| INTERESTED TRUSTEES | Term | |||
| Lifetime of Trust until removal, resignation or retirement* | ||||
| Alan D. Feld** (83) | Trustee since 1996 | Partner in the law firm of Akin, Gump, Strauss, Hauer & Feld, LLP (law firm) (1960-Present); Trustee, American Beacon Select Funds (1999-Present); Trustee, American Beacon Institutional Funds Trust (2017-Present); Trustee, American Beacon Sound Point Enhanced Income Fund (2018-Present); Trustee, American Beacon Apollo Total Return Fund (2018-Present); Trustee, American Beacon Sound Point Alternative Lending Fund (2019-Present). | ||
| NON-INTERESTED TRUSTEES | Term | |||
| Lifetime of Trust until removal, resignation or retirement* | ||||
| Gilbert G. Alvarado (50) | Trustee since 2015 | Director, Kura MD, Inc. (local telehealth organization) (2015-present); Vice President & CFO, Sierra Health Foundation (health conversion private foundation) (2006-Present); Vice President & CFO, Sierra Health Foundation: Center for Health Program Management (California public benefit corporation) (2012-Present); Director, Innovative North State (2012-2015); Director, Sacramento Regional Technology Alliance (2011-2016); Director, Women’s Empowerment (2009-2014); Director, Valley Healthcare Staffing (2017-present); Trustee, American Beacon Select Funds (2015-Present); Trustee, American Beacon Institutional Funds Trust (2017-Present); Trustee, American Beacon Sound Point Enhanced Income Fund (2018-Present); Trustee, American Beacon Apollo Total Return Fund (2018-Present); Trustee, American Beacon Sound Point Alternative Lending Fund (2019-Present). | ||
| Joseph B. Armes (57) | Trustee since 2015 | Chairman & CEO, CSW Industrials f/k/a Capital Southwest Corporation (investment company) (2015-Present); Chairman of the Board of Capital Southwest Corporation, predecessor to CSW Industrials, Inc. (2014-2017) (investment company); CEO, Capital Southwest Corporation (2013-2015); President & CEO, JBA Investment Partners (family investment vehicle) (2010-Present); Director and Chair of Audit Committee, RSP Permian (oil and gas producer) (2013-Present); Trustee, American Beacon Select Funds (2015-Present); Trustee, American Beacon Institutional Funds Trust (2017-Present); Trustee, American Beacon Sound Point Enhanced Income Fund (2018-Present); Trustee, American Beacon Apollo Total Return Fund (2018-Present); Trustee, American Beacon Sound Point Alternative Lending Fund (2019-Present). | ||
| Gerard J. Arpey (61) | Trustee since 2012 | Director, The Home Depot, Inc. (2015-Present); Partner, Emerald Creek Group (private equity firm) (2011-Present); Director, S.C. Johnson & Son, Inc. (privately held company) (2008-present); Trustee, American Beacon Select Funds (2012-Present); Trustee, American Beacon Institutional Funds Trust (2017-Present); Trustee, American Beacon Sound Point Enhanced Income Fund (2018-Present); Trustee, American Beacon Apollo Total Return Fund (2018-Present); Trustee, American Beacon Sound Point Alternative Lending Fund (2019-Present). | ||
57
Trustees and Officers of the American Beacon FundsSM(Unaudited)
Name, Age | Position, Term of Office and Length of Time Served with the Trust | Principal Occupation(s) During Past 5 Years and Current Directorships | ||
| NON-INTERESTED TRUSTEES (CONT.) | Term | |||
| Lifetime of Trust until removal, resignation or retirement* | ||||
| Brenda A. Cline (59) | Trustee since 2004 Chair since 2019 Vice Chair 2018 | Chief Financial Officer, Treasurer and Secretary, Kimbell Art Foundation (1993-Present); Director, Tyler Technologies, Inc. (public sector software solutions company) (2014-Present); Director, Range Resources Corporation (oil and natural gas company) (2015-Present); Trustee, CushingClosed-End and Open-End Funds and ETFs (2017-Present); Trustee, American Beacon Select Funds (2004-Present); ; Trustee, American Beacon Institutional Funds Trust (2017-Present); Trustee, American Beacon Sound Point Enhanced Income Fund (2018-Present); Trustee, American Beacon Apollo Total Return Fund (2018-Present); Trustee, American Beacon Sound Point Alternative Lending Fund (2019-Present). | ||
| Eugene J. Duffy (65) | Trustee since 2008 | Managing Director, Global Investment Management Distribution, Mesirow Financial (2016-Present); Managing Director, Institutional Services, Intercontinental Real Estate Corporation (2014-Present); Principal and Executive Vice President, Paradigm Asset Management (1994-2014); Trustee, American Beacon Select Funds (2008-Present); Trustee, American Beacon Institutional Funds Trust (2017-Present); Trustee, American Beacon Sound Point Enhanced Income Fund (2018-Present); Trustee, American Beacon Apollo Total Return Fund (2018-Present); Trustee, American Beacon Sound Point Alternative Lending Fund (2019-Present). | ||
| Claudia A. Holz (62) | Trustee since 2018 | Partner, KPMG LLP (1990-2017); Trustee, American Beacon Select Funds (2018-Present); Trustee, American Beacon Institutional Funds Trust (2018-Present); Trustee, American Beacon Sound Point Enhanced Income Fund (2018-Present); Trustee, American Beacon Apollo Total Return Fund (2018-Present); Trustee, American Beacon Sound Point Alternative Lending Fund (2019-Present). | ||
| Douglas A. Lindgren (58) | Trustee since 2018 | CEO North America, Carne Global Financial Services (2016-2017); Managing Director, IPS Investment Management and Global Head, Content Management, UBS Wealth Management (2010-2016); Trustee, American Beacon Select Funds (2018-Present); Trustee, American Beacon Institutional Funds Trust (2018-Present); Trustee, American Beacon Sound Point Enhanced Income Fund (2018-Present); Trustee, American Beacon Apollo Total Return Fund (2018-Present); Trustee, American Beacon Sound Point Alternative Lending Fund (2019-Present). | ||
| Richard A. Massman (76) | Trustee since 2004 Chair 2008-2018 Chair Emeritus since 2019 | Consultant and General Counsel Emeritus, Hunt Consolidated, Inc. (holding company engaged in oil and gas exploration and production, refining, real estate, farming, ranching and venture capital activities) (2009-Present); Trustee, American Beacon Select Funds (2004-Present); Trustee, American Beacon Institutional Funds Trust (2017-Present); Trustee, American Beacon Sound Point Enhanced Income Fund (2018-Present); Trustee, American Beacon Apollo Total Return Fund (2018-Present); Trustee, American Beacon Sound Point Alternative Lending Fund (2019-Present). | ||
| Barbara J. McKenna, CFA (56) | Trustee since 2012 | President/Managing Principal, Longfellow Investment Management Company (2005-Present); Trustee, American Beacon Select Funds (2012-Present); Trustee, American Beacon Institutional Funds Trust (2017-Present); Trustee, American Beacon Sound Point Enhanced Income Fund (2018-Present); Trustee, American Beacon Apollo Total Return Fund (2018-Present); Trustee, American Beacon Sound Point Alternative Lending Fund (2019-Present). | ||
58
Trustees and Officers of the American Beacon FundsSM(Unaudited)
Name, Age | Position, Term of Office and Length of Time Served with the Trust | Principal Occupation(s) During Past 5 Years and Current Directorships | ||
| NON-INTERESTED TRUSTEES (CONT.) | Term | |||
| Lifetime of Trust until removal, resignation or retirement* | ||||
| R. Gerald Turner (74) | Trustee since 2001 | President, Southern Methodist University (1995-Present); Director, J.C. Penney Company, Inc. (1996-Present); Director, Kronus Worldwide Inc. (chemical manufacturing) (2003-Present); Trustee, American Beacon Select Funds (2001-Present); Trustee, American Beacon Institutional Funds Trust (2017-Present); Trustee, American Beacon Sound Point Enhanced Income Fund (2018-Present); Trustee, American Beacon Apollo Total Return Fund (2018-Present); Trustee, American Beacon Sound Point Alternative Lending Fund (2019-Present). | ||
| OFFICERS | Term | |||
| One Year | ||||
| Gene L. Needles, Jr. (65) | President since 2009 | President (2009-2018), CEO and Director (2009-Present), and Chairman (2018-Present), American Beacon Advisors, Inc., President (2015-2018), Director and CEO (2015-Present), and Chairman (2018-Present), Resolute Investment Holdings, LLC; President (2015-2018), Director and CEO (2015-Present), and Chairman (2018-Present),Resolute Topco, Inc.; President (2015-2018); Director, and CEO (2015-Present), and Chairman (2018-Present), Resolute Acquisition, Inc.; President (2015-2018), Director and CEO (2015-Present), Chairman (2018-Present), Resolute Investment Managers, Inc.; Director, Chairman, President and CEO, Resolute Investment Distributors (2017-Present); Director, Chairman, President and CEO; Resolute Investment Services, Inc. (2017-Present); President and CEO, Lighthouse Holdings Parent, Inc. (2009-2015); President, CEO and Director, Lighthouse Holdings, Inc. (2009-2015); Manager, President and CEO, American Private Equity Management, LLC (2012-Present); Director, Chairman, President and CEO, Alpha Quant Advisors, LLC (2016-Present); Director, ARK Investment Management LLC (2016-Present); Director, Shapiro Capital Management LLC (2017-Present); Director, Chairman and CEO, Continuous Capital, LLC (2018-Present); President, American Beacon Cayman Managed Futures Strategy Fund, Ltd. (2014-Present); Director and President, American Beacon Cayman Transformational Innovation Company, LTD., (2017-2018); President, American Beacon Delaware Transformational Innovation Corporation (2017-2018); President American Beacon Cayman TargetRisk Company, Ltd. (2018-Present);Member, Investment Advisory Committee, Employees Retirement System of Texas (2017-Present); Trustee, American Beacon NextShares Trust (2015-Present); President, American Beacon Select Funds (2009-Present); President, American Beacon Institutional Funds Trust (2017-Present); President, American Beacon Sound Point Enhanced Income Fund (2018-Present); President, American Beacon Apollo Total Return Fund (2018-Present); Director, RSW Investments Holdings LLC, (2019-Present); Manager, SSI Investment Management, LLC (2019-Present); President, American Beacon Sound Point Alternative Lending Fund (2019-Present); Director, Green Harvest Asset Management (2019-Present); Director, National Investment Services of America, LLC (2019-Present). | ||
59
Trustees and Officers of the American Beacon FundsSM(Unaudited)
Name, Age | Position, Term of Office and Length of Time Served with the Trust | Principal Occupation(s) During Past 5 Years and Current Directorships | ||
| OFFICERS (CONT.) | Term | |||
| One Year | ||||
| Rosemary K. Behan (60) | VP, Secretary and Chief Legal Officer since 2006 | Vice President, Secretary and General Counsel, American Beacon Advisors, Inc. (2006-Present); Secretary, Resolute Investment Holdings, LLC (2015-Present); Secretary, Resolute Topco, Inc. (2015-Present); Secretary, Resolute Acquisition, Inc. (2015-Present); Vice President, Secretary and General Counsel, Resolute Investment Managers, Inc. (2015-Present); Secretary, Resolute Investment Distributors, Inc. (2017-Present); Vice President, Secretary and General Counsel, Resolute Investment Services, Inc. (2017-Present); Vice President and Secretary, Lighthouse Holdings Parent, Inc. (2008-2015); Vice President and Secretary, Lighthouse Holdings, Inc. (2008-2015); Secretary, American Private Equity Management, LLC (2008-Present); Secretary and General Counsel, Alpha Quant Advisors, LLC (2016-Present); Vice President and Secretary, Continuous Capital, LLC (2018-Present); Secretary, American Beacon Delaware Transformational Innovation Corporation (2017-2018); Secretary, American Beacon Cayman Transformational Innovation Company, Ltd. (2017-2018); Secretary, American Beacon Cayman Managed Futures Strategy Fund, Ltd. (2014-Present); Secretary, American Beacon Cayman TargetRisk Company, Ltd (2018-Present); Chief Legal Officer, Vice President and Secretary, American Beacon Select Funds (2006-Present); Chief Legal Officer, Vice President and Secretary, American Beacon Institutional Funds Trust (2017-Present); Chief Legal Officer, Vice President and Secretary, American Beacon Sound Point Enhanced Income Fund (2018-Present); Chief Legal Officer, Vice President and Secretary American Beacon Apollo Total Return Fund (2018-Present); Chief Legal Officer, Vice President and Secretary, American Beacon Sound Point Alternative Lending Fund (2019-Present); Secretary, Green Harvest Asset Management (2019-Present). | ||
| Brian E. Brett (59) | VP since 2004 | Senior Vice President, Head of Distribution (2012-Present), Vice President, Director of Sales (2004-2012), American Beacon Advisors, Inc.; Senior Vice President, Resolute Investment Managers, Inc. (2017-Present); Senior Vice President, Resolute Investment Distributors, Inc. (2018-Present), Senior Vice President, Resolute Investment Services, Inc. (2018-Present); Senior Vice President, Lighthouse Holdings Parent, Inc. (2008-2015); Senior Vice President, Lighthouse Holdings, Inc. (2008-2015); Vice President, American Beacon Select Funds (2004-Present); Vice President, American Beacon Institutional Funds Trust (2017-Present); Vice President American Beacon Sound Point Enhanced Income Fund (2018-Present); Vice President American Beacon Apollo Total Return Fund (2018-Present); Vice President, American Beacon Sound Point Alternative Lending Fund (2019-Present). | ||
| Paul B. Cavazos (50) | VP since 2016 | Chief Investment Officer and Senior Vice President, American Beacon Advisors, Inc. (2016-Present); Chief Investment Officer, DTE Energy (2007-2016); Vice President, American Private Equity Management, L.L.C. (2017-Present); Vice President, American Beacon Select Funds (2016-Present); Vice President, American Beacon Institutional Funds Trust (2017-Present); Vice President American Beacon Sound Point Enhanced Income Fund (2018-Present);Vice President American Beacon Apollo Total Return Fund (2018-Present); Vice President, American Beacon Sound Point Alternative Lending Fund (2019-Present). | ||
60
Trustees and Officers of the American Beacon FundsSM(Unaudited)
Name, Age | Position, Term of Office and Length of Time Served with the Trust | Principal Occupation(s) During Past 5 Years and Current Directorships | ||
| OFFICERS (CONT.) | Term | |||
| One Year | ||||
| Erica Duncan (49) | VP Since 2011 | Vice President, American Beacon Advisors, Inc. (2011-Present); Vice President, Resolute Investment Managers (2018-Present); Vice President, Resolute Investment Services, Inc. (2018-Present); Vice President, American Beacon Select Funds (2011-Present); Vice President, American Beacon Institutional Funds Trust (2017-Present); Vice President American Beacon Sound Point Enhanced Income Fund (2018-Present); Vice President American Beacon Apollo Total Return Fund (2018-Present); Vice President, American Beacon Sound Point Alternative Lending Fund (2019-Present). | ||
| Melinda G. Heika (58) | Treasurer since 2010 | Treasurer and CFO (2010-Present), American Beacon Advisors, Inc.; Treasurer, Resolute Topco, Inc. (2015-Present); Treasurer, Resolute Investment Holdings, LLC. (2015-Present); Treasurer, Resolute Acquisition, Inc. (2015-Present); Treasurer and CFO, Resolute Investment Managers, Inc. (2017-Present); Treasurer, Resolute Investment Distributors, Inc. (2017-2017); Treasurer and CFO, Resolute Investment Services, Inc. (2015-Present); Treasurer, Lighthouse Holdings Parent Inc., (2010-2015); Treasurer, Lighthouse Holdings, Inc. (2010-2015); Treasurer, American Private Equity Management, LLC (2012-Present); Treasurer and CFO, Alpha Quant Advisors, LLC (2016-Present); Treasurer and CFO, Continuous Capital, LLC (2018-Present); Treasurer, American Beacon Cayman Transformational Innovation, Ltd. (2017-2018); Treasurer, American Beacon Delaware Transformational Innovation Corporation (2017-2018); Director and Treasurer, American Beacon Cayman Managed Futures Strategy Fund, Ltd. (2014-Present); Treasurer, American Beacon Cayman TargetRisk Company, Ltd. (2018-Present); Treasurer, American Beacon Select Funds (2010-Present); Treasurer, American Beacon Institutional Funds Trust (2017-Present); Treasurer, American Beacon Sound Point Enhanced Income Fund (2018-Present); Treasurer, American Beacon Apollo Total Return Fund (2018-Present); Treasurer, American Beacon Sound Point Alternative Lending Fund (2019-Present); Treasurer, Green Harvest Asset Management (2019-Present). | ||
| Terri L. McKinney (56) | VP since 2010 | Vice President (2009-Present), Managing Director (2003-2009), American Beacon Advisors, Inc.; Vice President, Resolute Investment Managers, Inc. (2017-Present); Vice President, Resolute Investment Services, Inc (2018-Present); Vice President, Alpha Quant Advisors, LLC (2016-Present); Vice President, Continuous Capital, LLC (2018-Present); Vice President, American Beacon Select Funds (2010-Present); Vice President, American Beacon Institutional Funds Trust (2017-Present); Vice President, American Beacon Sound Point Enhanced Income Fund (2018-Present); Vice President, American Beacon Apollo Total Return Fund (2018-Present); Vice President, American Beacon Sound Point Alternative Lending Fund (2019-Present). | ||
61
Trustees and Officers of the American Beacon FundsSM(Unaudited)
Name, Age | Position, Term of Office and Length of Time Served with the Trust | Principal Occupation(s) During Past 5 Years and Current Directorships | ||
| OFFICERS (CONT.) | Term | |||
| One Year | ||||
| Jeffrey K. Ringdahl (44) | VP since 2010 | Director (2015-Present), President (2018-Present), Chief Operating Officer (2010-Present), Senior Vice President (2013-2018), Vice President (2010-2013), American Beacon Advisors, Inc.; Director (2015-Present), President (2018-Present), Senior Vice Present (2015-2018), Resolute Investment Holdings, LLC; Director (2015-Present), President (2018-Present), Senior Vice President (2015-2018), Resolute Topco, Inc.; Director (2015-Present), President (2018-Present), Senior Vice President (2015-2018), Resolute Acquisition, Inc.; Director (2015-Present), President & COO (2018-Present), Senior Vice President (2015-2018), Resolute Investment Managers, Inc.; Director and Executive Vice President (2017-Present), Resolute Investment Distributors, Inc.; Director (2017-Present), President & COO (2018-Present), Executive Vice President (2017-2018), Resolute Investment Services, Inc.; Senior Vice President (2017-Present), Vice President (2012-2017), Manager (2015-Present), American Private Equity Management, LLC; Senior Vice President, Lighthouse Holdings Parent, Inc. (2013-2015); Senior Vice President, Lighthouse Holdings, Inc. (2013-2015); Trustee, American Beacon NextShares Trust (2015-Present); Director, Executive Vice President & COO, Alpha Quant Advisors, LLC (2016-Present); Director, Shapiro Capital Management, LLC (2017-Present); Director, Executive Vice President & COO, Continuous Capital, LLC (2018-Present); Director and Vice President, American Beacon Cayman Transformational Innovation Company, Ltd., (2017-Present); Vice President, American Beacon Delaware Transformational Innovation Corporation (2017-2018); Director and Vice President, American Beacon Cayman Managed Futures Strategy Fund, Ltd. (2014-Present); Vice President, American Beacon Cayman TargetRisk Company, Ltd (2018-Present); Vice President, American Beacon Select Funds (2010-2018); Vice President, American Beacon Institutional Funds Trust (2017-Present); Vice President, American Beacon Sound Point Enhanced Income Fund (2018-Present); Vice President, American Beacon Apollo Total Return Fund (2018-Present); Director, RSW Investments Holdings LLC, (2019-Present); Manager, SSI Investment Management, LLC (2019-Present), Vice President, American Beacon Sound Point Alternative Lending Fund (2019-Present); Director, National Investment Services of America, LLC (2019-Present). | ||
| Samuel J. Silver (56) | VP Since 2011 | Vice President (2011-Present), Chief Fixed Income Officer (2016-Present), American Beacon Advisors, Inc. (2011-Present); Vice President, American Beacon Select Funds (2011-Present); Vice President, American Beacon Institutional Funds Trust (2017-Present); Vice President, American Beacon Sound Point Enhanced Income Fund (2018-Present); Vice President, American Beacon Apollo Total Return Fund (2018-Present); Vice President, American Beacon Sound Point Alternative Lending Fund (2019-Present). | ||
62
Trustees and Officers of the American Beacon FundsSM(Unaudited)
Name, Age | Position, Term of Office and Length of Time Served with the Trust | Principal Occupation(s) During Past 5 Years and Current Directorships | ||
| OFFICERS (CONT.) | Term | |||
| One Year | ||||
| Christina E. Sears (48) | Chief Compliance Officer since 2004 and Asst. Secretary since 1999 | Vice President, American Beacon Advisors, Inc. (2019-Present); Chief Compliance Officer, American Beacon Advisors, Inc. (2004-Present); Vice President, Resolute Investment Managers, Inc. (2017-Present); Vice President, Resolute Investment Distributors (2017-Present); Vice President, Resolute Investment Services, Inc. (2019-Present); Chief Compliance Officer, American Private Equity Management, LLC (2012-Present); Chief Compliance Officer (2016-2019) and Vice President, Alpha Quant Advisors, LLC (2016-Present); Vice President, Continuous Capital, LLC (2018-Present); Chief Compliance Officer (2004-Present) and Assistant Secretary (1999-Present), American Beacon Select Funds; Chief Compliance Officer and Assistant Secretary, American Beacon Institutional Funds Trust (2017-Present); Chief Compliance Officer and Assistant Secretary, American Beacon Sound Point Enhanced Income Fund (2018-Present); Chief Compliance Officer and Assistant Secretary, American Beacon Apollo Total Return Fund (2018-Present); Chief Compliance Officer and Assistant Secretary, American Beacon Sound Point Alternative Lending Fund (2019-Present). | ||
| Sonia L. Bates (63) | Asst. Treasurer since 2011 | Assistant Treasurer, American Beacon Advisors, Inc. (2011-2018); Assistant Treasurer, Lighthouse Holdings Parent Inc. (2011-2015); Assistant Treasurer, Lighthouse Holdings, Inc. (2011-2015); Assistant Treasurer, American Private Equity Management, LLC (2012-Present); Assistant Treasurer, American Beacon Cayman Transformational Innovation Company, Ltd. (2017-Present); Assistant Treasurer, American Beacon Cayman TargetRisk Company, Ltd. (2018-Present); Assistant Treasurer, American Beacon Select Funds (2011-Present); Assistant Treasurer, American Beacon Institutional Funds Trust (2017-Present); Assistant Treasurer, American Beacon Sound Point Enhanced Income Fund (2018-Present); Assistant Treasurer, American Beacon Apollo Total Return Fund (2018-Present); Assistant Treasurer, American Beacon Sound Point Alternative Lending Fund (2019-Present). | ||
| Shelley D. Abrahams (45) | Assistant Secretary since 2008 | Assistant Secretary, American Beacon Select Funds (2008-Present); Assistant Secretary, American Beacon Institutional Funds Trust (2017-Present); Assistant Secretary, American Beacon Sound Point Enhanced Income Fund (2018-Present); Assistant Secretary, American Beacon Apollo Total Return Fund (2018-Present); Assistant Secretary, American Beacon Sound Point Alternative Lending Fund (2019-Present); Assistant Secretary, Green Harvest Asset Management (2019-Present). | ||
| Rebecca L. Harris (53) | Assistant Secretary since 2010 | Vice President, American Beacon Advisors, Inc. (2011-Present); Vice President, Resolute Investment Managers, Inc. (2017-Present); Vice President, Resolute Investment Services (2015-Present); Vice President, Alpha Quant Advisors, LLC (2016-Present); Vice President, Continuous Capital, LLC (2018-Present); Assistant Secretary, American Beacon Select Funds (2010-Present); Assistant Secretary, American Beacon Institutional Funds Trust (2017-Present); Assistant Secretary, American Beacon Sound Point Enhanced Income Fund (2018-Present); Assistant Secretary, American Beacon Apollo Total Return Fund (2018-Present); Assistant Secretary, American Beacon Sound Point Alternative Lending Fund (2019-Present). | ||
63
Trustees and Officers of the American Beacon FundsSM(Unaudited)
Name, Age | Position, Term of Office and Length of Time Served with the Trust | Principal Occupation(s) During Past 5 Years and Current Directorships | ||
| OFFICERS (CONT.) | Term | |||
| One Year | ||||
| Teresa A. Oxford (61) | Assistant Secretary since 2015 | Assistant Secretary, American Beacon Advisors, Inc. (2015-Present); Assistant Secretary, Resolute Investment Distributors (2018-Present); Assistant Secretary, Resolute Investment Services (2018-Present); Assistant Secretary, Alpha Quant Advisors, LLC (2016-Present); Assistant Secretary, American Beacon Select Funds (2015-Present); Assistant Secretary, American Beacon Institutional Funds Trust (2017-Present); Assistant Secretary, American Beacon Sound Point Enhanced Income Fund (2018-Present); Assistant Secretary, American Beacon Apollo Total Return Fund (2018-Present); Assistant Secretary, American Beacon Sound Point Alternative Lending Fund (2019-Present); Assistant Secretary, Green Harvest Asset Management (2019-Present). | ||
* As of 11/12/2014, the Board adopted a retirement plan that requires Trustees, other than Messrs. Feld and Massman to retire no later than the last day of the calendar year in which they reach the age of 75. As of 11/7/17, the Board approved a waiver of the mandatory retirement policy with respect to Mr. Massman, who turned 75 in November 2018, to permit him to continue to serve on the Board as Chair Emeritus through 12/31/19. As of 1/1/2020 both Messrs. Feld and Massman retired from the Board.
** Mr. Feld is deemed to be an “interested person” of the Trusts, as defined by the 1940 Act. Mr. Feld’s law firm of Akin, Gump, Strauss, Hauer & Feld LLP has provided legal services within the past two fiscal years to one or more of the Trust’ssub-advisors.
64
American Beacon FundsSM
December 31, 2019 (Unaudited)
The American Beacon Funds recognize and respect the privacy of our shareholders. We are providing this notice to you, so you will understand how shareholder information may be collected and used.
We may collect nonpublic personal information about you from one or more of the following sources:
| • | information we receive from you on applications or other forms; |
| • | information about your transactions with us or our service providers; and |
| • | information we receive from third parties. |
We do not disclose any nonpublic personal information about our customers or former customers to anyone, except as permitted by law.
We restrict access to your nonpublic personal information to those employees or service providers who need to know that information to provide products or services to you. To ensure the confidentiality of your nonpublic personal information, we maintain safeguards that comply with federal standards.
65
This page intentionally left blank.
66

eDelivery isNOW AVAILABLE - Stop traditional mail delivery and receive your
shareholder reports and summary prospectuson-line. Sign up at
www.americanbeaconfunds.com
If you invest in the Fund through a financial institution, you may be able to receive the Fund’s regulatory mailings, such as the Prospectus, Annual Report and Semi-Annual Report, bye-mail. If you are interested in this option, please go towww.icsdelivery.comand search for your financial institution’s name or contact your financial institution directly.
To obtain more information about the Fund:
 |  | |
| ByE-mail: | On the Internet: | |
| american_beacon.funds@ambeacon.com | Visit our website atwww.americanbeaconfunds.com | |
By Telephone: Call (800)658-5811 |
By Mail: American Beacon Funds P.O. Box 219643 Kansas City, MO 64121-9643 | |
| Availability of Quarterly Portfolio Schedules | Availability of Proxy Voting Policy and Records | |
| In addition to the Schedule of Investments provided in each semi-annual and annual report, the Fund files a complete schedule of its portfolio holdings with the Securities and Exchange Commission (“SEC”) on FormN-PORT as of the end of each fiscal quarters. The Fund’s FormsN-PORT are available on the SEC’s website atwww.sec.gov. The FormsN-PORT may also be reviewed and copied at the SEC’s Public Reference Section, 100 F Street, NE, Washington, D.C. 20549-2736. Information regarding the operation of the SEC’s Public Reference Room may be obtained by calling(800)-SEC-0330. A complete schedule of the Fund’s portfolio holdings is also available atwww.americanbeaconfunds.com approximately sixty days after the end of each calendar quarter. | A description of the policies and procedures the Fund uses to determine how to vote proxies relating to portfolio securities is available in the Fund’s Statement of Additional Information, is available free of charge on the Fund’s websitewww.americanbeaconfunds.com and by calling1-800-967-9009 or by accessing the SEC’s website atwww.sec.gov. The Fund’s proxy voting record for the most recent year ended June 30 is filed annually with the SEC on FormN-PX. The Fund’s FormsN-PX are available on the SEC’s website atwww.sec.gov. The Fund’s proxy voting record may also be obtained by calling1-800-967-9009. | |


Fund Service Providers:
CUSTODIAN State Street Bank and Trust Company Boston, Massachusetts | TRANSFER AGENT DST Asset Manager Solutions, Inc. Quincy, Massachusetts | INDEPENDENT REGISTERED PUBLIC ACCOUNTING FIRM Ernst & Young LLP Dallas, Texas | DISTRIBUTOR Resolute Investment Distributors, Inc. Irving, Texas |
This report is prepared for shareholders of the American Beacon Funds and may be distributed to others only if preceded or accompanied by a current Prospectus or Summary Prospectus.
American Beacon Funds, American Beacon Bridgeway Large Cap Growth Fund, and American Beacon Bridgeway Large Cap Value Fund are service marks of American Beacon Advisors, Inc.
AR 12/19

About American Beacon Advisors
Since 1986, American Beacon Advisors, Inc. has offered a variety of products and investment advisory services to numerous institutional and retail clients, including a variety of mutual funds, corporate cash management, and separate account management.
Our clients include defined benefit plans, defined contribution plans, foundations, endowments, corporations, financial planners, and other institutional investors. With American Beacon Advisors, you can put the experience of a multi-billion dollar asset management firm to work for your company.
STEPHENSMID-CAP GROWTH FUND
Growth stockstypically are more volatile than value stocks; however, value stocks have a lower expected growth rate in earnings and sales. Investing inmedium-capitalization stocksmay involve greater volatility and lower liquidity than larger company stocks. Investing inforeign securitiesmay involve heightened risk due to currency fluctuations and economic and political risks. The use offutures contractsfor cash management may subject the Fund to losing more money than invested. The Fund participates in asecurities lendingprogram. Please see the prospectus for a complete discussion of the Fund’s risks. There can be no assurances that the investment objectives of this Fund will be met.
STEPHENS SMALL CAP GROWTH FUND
Growth stockstypically are more volatile than value stocks; however, value stocks have a lower expected growth rate in earnings and sales. Investing insmall-capitalization stocksmay involve greater volatility and lower liquidity than larger company stocks. Investing inforeign securitiesmay involve heightened risk due to currency fluctuations and economic and political risks. The use offutures contractsfor cash management may subject the Fund to losing more money than invested. The Fund participates in asecurities lendingprogram. Please see the prospectus for a complete discussion of the Fund’s risks. There can be no assurances that the investment objectives of this Fund will be met.
Any opinions herein, including forecasts, reflect our judgment as of the end of the reporting period and are subject to change. Each advisor’s strategies and each Fund’s portfolio composition will change depending on economic and market conditions. This report is not a complete analysis of market conditions, and, therefore, should not be relied upon as investment advice. Although economic and market information has been compiled from reliable sources, American Beacon Advisors, Inc. makes no representation as to the completeness or accuracy of the statements contained herein.
American Beacon Funds | December 31, 2019 |
| 1 | ||||
| 2 | ||||
| 9 | ||||
| 11 | ||||
| 12 | ||||
| 16 | ||||
| 20 | ||||
| 24 | ||||
| 41 | ||||
| 47 | ||||
| 53 | ||||
Disclosure Regarding Approval of the Management and Investment Advisory Agreements | 54 | |||
| 55 | ||||
| 63 | ||||
| Back Cover | ||||
 | Dear Shareholders,
In recent months, you’ve likely seen and heard news reports about disruptive headwinds in the global economy –including the U.S. trade war with China and its toll on the global economy, slowing global growth, the Federal Reserve’s series of rate cuts, Brexit, disruptions in the Middle East and protests in Hong Kong – and watched a flood of reaction in the world’s markets.
As Peter L. Bernstein said in his treatise on risk,Against the Gods: The Remarkable Story of Risk, published by John Wiley & Sons, Inc. in September 1998, “Volatility is a proxy for uncertainty and must be accommodated in measuring investment risk.”
During times of economic uncertainty and market volatility, fear of loss can be a powerful emotion – one that drives many investors to making short-term decisions subject to a variety of potential error-leading biases. Unfortunately, |
some short-term investment decisions may create more volatility rather than mitigate it.
Instead of dwelling on the markets’ short-term reaction to waves of negative global news, we encourage investors to focus on the horizon instead. Long-term investing isn’t about identifying and anticipating the next big market move, it is about identifying the right investment products for riding out those moves. As a long-term investor, you should keep in mind the three Ds: direction, discipline and diversification.
| u | Direction: Achieving your long-term financial goals requires an individualized plan of action. You may want your plan to provide some measure of protection against periods of geopolitical turmoil, economic uncertainty, market volatility and job insecurity. Your plan should be reviewed annually and be adjusted in the event your long-range needs change. |
| u | Discipline:Long-term, systematic participation in an investment portfolio requires your resolution to stay the course. Spending time in the market – rather than trying to time the market – may place you in a better position to reach your long-term financial goals. |
| u | Diversification: By investing in different investment styles and asset classes, you may be able to help mitigate financial risks across your investment portfolio. By allocating your investment portfolio according to your risk-tolerance level, you may be better positioned to weather storms and achieve your long-term financial goals. |
Since 1986, American Beacon has endeavored to provide investors with a disciplined approach to realizing long-term financial goals. As a manager of managers, we strive to provide investment products that may enable investors to participate during market upswings while potentially insulating against market downswings.
Many of thesub-advisors to our mutual funds pursue upside capture and/or downside protection using proprietary strategies. The investment teams behind our mutual funds seek to produce consistent, long-term results rather than focus only on short-term movements in the markets. In managing our investment products, we emphasize identifying opportunities that offer the potential for long-term rewards.
Our management approach is more than a concept; it’s the cornerstone of our culture. And we strive to apply it at every turn as we seek to provide a well-diversified line of investment solutions to help our shareholders seek long-term rewards while mitigating volatility and risk.
Thank you for your continued interest in American Beacon. For additional information about our investment products or to access your account information, please visit our website atwww.americanbeaconfunds.com.
Best Regards,

Gene L. Needles, Jr.
President
American Beacon Funds
1
Domestic Equity Market Overview
December 31, 2019 (Unaudited)
The domestic equity market was strong for the12-month period under review despite uncertainty surrounding tariff, political and economic headlines. The 31.5% return of the S&P 500 Index (the “Index”) was its highest annual return since 2013; the Index recorded 35all-time highs during the year. Large-capitalization stocks outpaced small, and Growth stocks outperformed Value stocks across market caps. The Russell 2000 Growth Index outperformed the Russell 2000 Value Index by 6.1 percentage points, while the Russell 1000 Growth Index outperformed the Russell 1000 Value Index by 9.9 percentage points.
In the first quarter of 2019, the Index returned 13.7%, as aforementioned investor fears eased allowing equity markets to recoup nearly all declines from the fourth quarter of the 2018 market drawdown. This strong reversal was particularly driven by an increasingly optimistic outlook on U.S.-China trade talks, better-than-expected domestic GDP growth of 3.1%, healthy wage growth of 3.4%, and the Federal Reserve (the “Fed”) shifting to a more accommodative and “patient” stance.
Negative trade news flow between the U.S. and trading partners China and Mexico inundated investors during the second quarter of 2019 and drove market volatility. Optimism around U.S.-China trade relations quickly flipped negative with an announcement by the U.S. of a third round of tariffs. Additionally, the U.S. threatened a 5% tariff against Mexico. The tariff headlines, coupled with lower 2019 profit growth estimates for the Index, led to poor equity returns in May. However, Mexico’s ratification of the new United States-Mexico-Canada Agreement, which replaces the25-year-old North American Free Trade Agreement, as well as supportive macro data, such as a continued low unemployment rate of 3.6%, pushed the market higher for another consecutive quarter.
Trade-war rhetoric moved markets again in the third quarter of 2019. A fourth round of tariffs was announced and implemented, and the U.S. Department of the Treasury also designated China as a currency manipulator. Conversely, U.S. retail sales grew at a much better pace compared to the end of 2018 (4.4% year-over-year in August 2019 versus 1.5% in December 2018). Monetary conditions were again eased after the Fed cut its target rate twice during the third quarter of 2019, citing uncertainties in the global economic outlook.
A strong Index return of 9.1% in the fourth quarter of 2019 pushed the Index return for the12-month period to 31.5%. Despite a slower U.S. economic growth rate of 2.1%, unemployment again achieved another50-year low at 3.5%. In addition, domestic retail sales continued to grow at an increasing rate of 5.8% year-over-year in December, providing evidence the U.S. consumer remained healthy. October tariffs on China were canceled and, by the end of the year, Phase One of the U.S.-China trade deal was all but signed, causing business clarity and improved CEO confidence.
As the year ended, equity markets moved solidly higher in 2019, supported mainly by expandedprice-to-earnings multiples as a result of controlled inflation trends and a variety of economic metrics that served as a “no recession now” signal.
2
American Beacon Stephens Mid-Cap Growth FundSM
Performance Overview
December 31, 2019 (Unaudited)
The Investor Class of the American Beacon StephensMid-Cap Growth Fund (the “Fund”) returned 31.28% for the twelve months ended December 31, 2019. The Fund underperformed the Russell Midcap® Growth Index (the “Index”) return of 35.47% for the same period.
Comparison of Change in Value of a $10,000 Investment for the period from 12/31/2009 through 12/31/2019
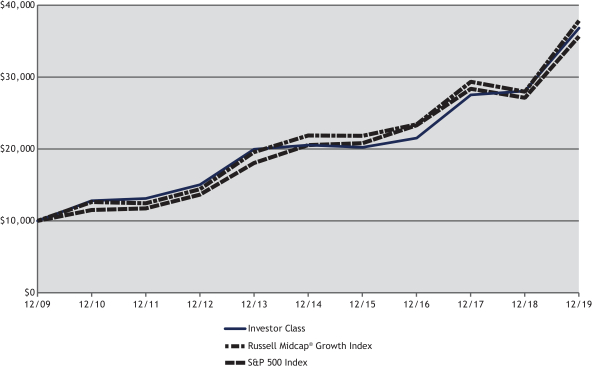
| Total Returns for the Period Ended December 31, 2019 |
| |||||||||||||||||||||||||||||||
Ticker | 1 Year | 3 Years | 5 Years | 10 Years | Value of $10,000 12/31/2009- 12/31/2019 | |||||||||||||||||||||||||||
Institutional Class (1,2,8) . | SFMIX | 31.79 | % | 20.03 | % | 12.77 | % | 14.31 | % | $ | 38,083 | |||||||||||||||||||||
Y Class (1,3,8) . . . . . | SMFYX | 31.62 | % | 19.89 | % | 12.63 | % | 14.16 | % | $ | 37,608 | |||||||||||||||||||||
Investor Class (1,8) | STMGX | 31.28 | % | 19.63 | % | 12.38 | % | 13.92 | % | $ | 36,823 | |||||||||||||||||||||
A without Sales Charge (1,4,8) | SMFAX | 31.22 | % | 19.56 | % | 12.31 | % | 13.87 | % | $ | 36,656 | |||||||||||||||||||||
A with Sales Charge (1,4,8) | SMFAX | 23.67 | % | 17.22 | % | 10.99 | % | 13.20 | % | $ | 34,563 | |||||||||||||||||||||
C without Sales Charge (1,5,8) | SMFCX | 30.31 | % | 18.68 | % | 11.48 | % | 13.22 | % | $ | 34,607 | |||||||||||||||||||||
C with Sales Charge (1,5,8) | SMFCX | 29.31 | % | 18.68 | % | 11.48 | % | 13.22 | % | $ | 34,607 | |||||||||||||||||||||
R6 (1,6,8) | SFMRX | 31.84 | % | 20.04 | % | 12.77 | % | 14.31 | % | $ | 38,097 | |||||||||||||||||||||
Russell Midcap® Growth Index (7) | 35.47 | % | 17.36 | % | 11.60 | % | 14.24 | % | $ | 37,856 | ||||||||||||||||||||||
S&P 500 Index (7) | 31.49 | % | 15.27 | % | 11.70 | % | 13.56 | % | $ | 35,666 | ||||||||||||||||||||||
| 1. | Performance shown is historical and is not indicative of future returns. Investment returns and principal value will vary, and shares may be worth more or less at redemption than at original purchase. Performance shown is calculated based on the publishedend-of-day net asset values as of date indicated, and current performance may be lower or higher than the performance data quoted. To obtain performance as of the most recent month end, please visitwww.americanbeaconfunds.com or call1-800-9687-9009. Fund performance in the table above does not reflect the deduction of taxes a shareholder would pay on distributions or the redemption of shares. Generally accepted accounting principles require adjustments to be made to the net assets of the Fund at period end for financial reporting purposes only; and as such, the total return based on the unadjusted net asset value per share may differ from the total return reported in the financial highlights. Please note that the recent performance of the securities market has helped produce short-term returns that are not typical and may not continue in the future. A portion of the fees charged to the Investor Class was waived from 2007 through 2013, partially recovered in 2014, fully recovered in 2015, and waived in 2018 and 2019. Performance prior to waiving fees was lower than the actual returns shown for 2007 through 2013 and for 2018 and 2019. |
3
American Beacon Stephens Mid-Cap Growth FundSM
Performance Overview
December 31, 2019 (Unaudited)
| 2. | A portion of the fees charged to the Institutional Class has been waived since Class inception (August 31, 2006). Performance prior to waiving fees was lower than the actual returns shown since inception. |
| 3. | Fund performance for theten-year period represents the returns achieved by the Investor Class from 12/31/09 up to 2/24/12, the inception date of the Y Class, and the returns of the Y Class since its inception. Expenses of the Y Class are lower than those of the Investor Class. Therefore, total returns shown may be lower than they would have been had the Y Class been in existence since 12/31/09. A portion of the fees charged to the Y Class was waived in 2012 and 2013, partially recovered in 2014, fully recovered in 2015, and waived from 2017 through 2019. Performance prior to waiving fees was lower than the actual returns shown in 2012, 2013, and 2017 through 2019. |
| 4. | Fund performance for theten-year period represents the returns achieved by the Investor Class from 12/31/09 up to 2/24/12, the inception date of the A Class, and the returns of the A Class since its inception. Expenses of the A Class are higher than those of the Investor Class. Therefore, total returns shown may be higher than they would have been had the A Class been in existence since 12/31/09. A portion of the fees charged to the A Class was waived in 2012 and 2013, fully recovered in 2015, and waived in 2016 and 2018. Performance prior to waiving fees was lower than the actual returns shown in 2012, 2013, 2016 and 2018. A Class shares have a maximum sales charge of 5.75%. |
| 5. | Fund performance for theone-year, three-year, five-year andten-year periods represents the returns achieved by the Investor Class from 12/31/09 up to 2/24/12, the inception date of the C Class, and the returns of the C Class since its inception. Expenses of the C Class are higher than those of the Investor Class. Therefore, total returns shown may be higher than they would have been had the C Class been in existence since 12/31/09. A portion of the fees charged to the C Class was waived from 2012 through 2014, fully recovered in 2015, and waived in 2016 through 2018. Performance prior to waiving fees was lower than actual returns shown for 2012 through 2014 and for 2016 through 2018. The maximum contingent deferred sales charge for the C Class is 1.00% for shares redeemed within one year of the date of purchase. |
| 6. | Fund performance for theten-year period represents the returns achieved by the Institutional Class from 12/31/09 up to 12/31/18, the inception date of the R6 Class, and the returns of the R6 Class since its inception. Expenses of the R6 Class are lower than those of the Institutional Class. Therefore, total returns shown may be lower than they would have been had the R6 Class been in existence since 12/31/09. A portion of the fees charged to the R6 Class has been waived since Fund inception. Performance prior to waiving fees was lower than actual returns shown since inception. |
| 7. | The Russell Midcap® Growth Index is an unmanaged index of those stocks in the Russell Midcap Index with higherprice-to-book ratios and higher forecasted growth values. Russell Midcap Index measures the performance of the 800 smallest companies in the Russell 1000 Index. Russell Midcap Index, Russell Midcap Growth Index and Russell 1000 Index are registered trademarks of Frank Russell Company. Frank Russell Company (“Russell”) is the source and owner of the trademarks, service marks and copyrights related to the Russell Indexes. Russell® is a trademark of Frank Russell Company. Neither Russell nor its licensors accept any liability for any errors or omissions in the Russell Indexes and/ or Russell ratings or underlying data, and no party may rely on any Russell Indexes and/or Russell ratings and/or underlying data contained in this communication. No further distribution of Russell Data is permitted without Russell’s express written consent. Russell does not promote, sponsor or endorse the content of this communication. The S&P 500 Index is an unmanaged index of common stocks publicly traded in the United States. The S&P 500 Index is a product of S&P Dow Jones Indices LLC, a division of S&P Global or its affiliates (“SPDJI”) and has been licensed for use by American Beacon Advisors. Standard & Poor’s® and S&P® are registered trademarks of Standard & Poor’s Financial Services LLC, a division of S&P Global (“S&P”). Dow Jones® is a registered trademark of Dow Jones Trademark Holdings LLC (“Dow Jones”). The American Beacon StephensMid-Cap Growth Fund is not sponsored, endorsed, sold or promoted by SPDJI, Dow Jones, S&P or their respective affiliates, and none of such parties make any representation regarding the advisability of investing in such product(s) nor do they have any liability for any errors, omissions or interruptions of the S&P 500 Index. One cannot directly invest in an index. |
| 8. | The Total Annual Fund Operating Expense ratios set forth in the most recent Fund prospectus for the Institutional, Y, Investor, A, C and R6 Class shares were 1.03%, 1.07%, 1.27%, 1.32%, 2.06% and 0.98%, respectively. The expense ratios above may vary from the expense ratios presented in other sections of this report that are based on expenses incurred during the period covered by this report. |
The Fund underperformed the Index due to both sector allocation and stock selection for the period.
As it relates to sector allocation, the Fund’s cash position served as a drag on performance relative to the benchmark. The Fund also held an overweight to Health Care, which further detracted from relative returns. Offsetting some of this performance were underweights to the Materials and Consumer Discretionary sectors.
From a stock selection standpoint, holdings in the Health Care and Consumer Discretionary sectors detracted the most from relative returns. In Health Care, Abiomed, Inc. was down 50.8% and Covetrus, Inc. was down 65.6% for the period. Within Consumer Discretionary, the Fund held Grubhub, Inc. (down 54.8%), Canada Goose Holdings, Inc. (down 23.2%) and Ollie’s Bargain Outlet Holdings, Inc. (down 6.5%).
In contrast, stock selection in the Communication Services sector contributed to relative returns. The Fund avoided Index-position Twitter, Inc., which had a volatile year before ending up 11.5%. Also boosting relative
4
American Beacon StephensMid-Cap Growth FundSM
Performance Overview
December 31, 2019 (Unaudited)
returns were absences from CBS Corp. Class B,Non-Voting (down 6.6%) and TripAdvisor, Inc. (down 36.7%) in the Index. Selections in Industrials also positively impacted performance during the period, with holdings CoStar Group, Inc. up 76.7% and Copart, Inc. up 90.4%.
Looking forward, the Fund’ssub-advisor will continue to maintain a disciplined, long-term approach to equity investing in medium capitalization stocks with above-average growth potential.
| Top Ten Holdings (% Net Assets) |
| |||||||
| Burlington Stores, Inc. | 2.0 | |||||||
| Live Nation Entertainment, Inc. | 2.0 | |||||||
| CoStar Group, Inc. | 1.9 | |||||||
| MarketAxess Holdings, Inc. | 1.9 | |||||||
| Copart, Inc. | 1.8 | |||||||
| Global Payments, Inc. | 1.8 | |||||||
| Verisk Analytics, Inc. | 1.8 | |||||||
| Aspen Technology, Inc. | 1.7 | |||||||
| DexCom, Inc. | 1.7 | |||||||
| IDEXX Laboratories, Inc. | 1.7 | |||||||
| Total Fund Holdings | 91 | |||||||
| Sector Allocation (% Equities) |
| |||||||
| Information Technology | 34.0 | |||||||
| Health Care | 20.6 | |||||||
| Industrials | 14.5 | |||||||
| Consumer Discretionary | 14.5 | |||||||
| Communication Services | 6.6 | |||||||
| Financials | 5.4 | |||||||
| Consumer Staples | 2.4 | |||||||
| Energy | 2.0 | |||||||
5
American Beacon Stephens Small Cap Growth FundSM
Performance Overview
December 31, 2019 (Unaudited)
The Investor Class of the American Beacon Stephens Small Cap Growth Fund (the “Fund”) returned 22.49% for the twelve months ended December 31, 2019, underperforming the Russell 2000® Growth Index (the “Index”) return of 28.48% for the same period.
Comparison of Change in Value of a $10,000 Investment for the period from 12/31/2009 through 12/31/2019

| Total Returns for the Period Ended December 31, 2019 |
| |||||||||||||||||||||||||||||||
Ticker | 1 Year | 3 Years | 5 Years | 10 Years | Value of $10,000 12/31/2009- 12/31/2019 | |||||||||||||||||||||||||||
Institutional Class (1,2,8) | STSIX | 22.92 | % | 14.88 | % | 9.71 | % | 12.68 | % | $ | 33,011 | |||||||||||||||||||||
Y Class (1,3,8) | SPWYX | 22.82 | % | 14.81 | % | 9.60 | % | 12.55 | % | $ | 32,624 | |||||||||||||||||||||
Investor Class (1,8) | STSGX | 22.49 | % | 14.56 | % | 9.39 | % | 12.37 | % | $ | 32,099 | |||||||||||||||||||||
A without Sales Charge (1,4,8) | SPWAX | 22.48 | % | 14.53 | % | 9.34 | % | 12.28 | % | $ | 31,840 | |||||||||||||||||||||
A with Sales Charge (1,4,8) | SPWAX | 15.45 | % | 12.31 | % | 8.06 | % | 11.61 | % | $ | 30,005 | |||||||||||||||||||||
C without Sales Charge (1,5,8) | SPWCX | 21.56 | % | 13.67 | % | 8.49 | % | 11.61 | % | $ | 30,001 | |||||||||||||||||||||
C with Sales Charge (1,5,8) | SPWCX | 20.56 | % | 13.67 | % | 8.49 | % | 11.61 | % | $ | 30,001 | |||||||||||||||||||||
R6 Class (1,6,8) | STSRX | 22.92 | % | 14.88 | % | 9.71 | % | 12.68 | % | $ | 33,011 | |||||||||||||||||||||
Russell 2000® Growth Index (7) | 28.48% | 12.49 | % | 9.34 | % | 13.01 | % | $ | 33,965 | |||||||||||||||||||||||
S&P 500 Index (7) | 31.49 | % | 15.27 | % | 11.70 | % | 13.56 | % | $ | 35,666 | ||||||||||||||||||||||
| 1. | Performance shown is historical and is not indicative of future returns. Investment returns and principal value will vary, and shares may be worth more or less at redemption than at original purchase. Performance shown is calculated based on the publishedend-of-day net asset values as of date indicated, and current performance may be lower or higher than the performance data quoted. To obtain performance as of the most recent month end, please visitwww.americanbeaconfunds.comor call1-800-967-9009. Fund performance in the table above does not reflect the deduction of taxes a shareholder would pay on distributions or the redemption of shares. Generally accepted accounting principles require adjustments to be made to the net assets of the Fund at period end for financial reporting purposes only; and as such, the total return based on the unadjusted net asset value per share may differ from the total return reported in the financial highlights. Please note that the recent performance of the securities market has helped produce short-term returns that are not typical and may not continue in the future. A portion of the fees charged to the Investor Class was waived from 2005 through 2013, fully recovered in 2014, waived in 2015, and fully recovered in 2017. Performance prior to waiving fees was lower than actual returns shown for 2005 through 2013 and for 2015. |
6
American Beacon Stephens Small Cap Growth FundSM
Performance Overview
December 31, 2019 (Unaudited)
| 2. | A portion of the fees charged to the Institutional Class was waived from 2006 through 2013 and fully recovered in 2014. Performance prior to waiving fees was lower than actual returns shown for 2006 through 2013. |
| 3. | Fund performance for theten-year period represents the returns achieved by the Investor Class from 12/31/09 up to 2/24/12, the inception date of the Y Class, and the returns of the Y Class since its inception. Expenses of the Y Class are lower than those of the Investor Class. Therefore, total returns shown may be lower than they would have been had the Y Class been in existence since 12/31/09. A portion of the fees charged to the Y Class was waived in 2012 and 2013 and fully recovered in 2014. Performance prior to waiving fees was lower than actual returns shown for 2012 and 2013. |
| 4. | Fund performance for theten-year period represents the returns achieved by the Investor Class from 12/31/09 up to 2/24/12, the inception date of the A Class, and the returns of the A Class since its inception. Expenses of the A Class are higher than those of the Investor Class. As a result, total returns shown may be higher than they would have been had the A Class been in existence since 12/31/09. A portion of the fees charged to the A Class was waived in 2012, partially recovered in 2013 and 2014, and fully recovered in 2015. Performance prior to waiving fees was lower than actual returns shown for 2012. A Class shares have a maximum sales charge of 5.75%. |
| 5. | Fund performance for theten-year period represents the returns achieved by the Investor Class from 12/31/09 up to 2/24/12, the inception date of the C Class, and the returns of the C Class since its inception. Expenses of the C Class are higher than those of the Investor Class. As a result, total returns shown may be higher than they would have been had the C Class been in existence since 12/31/09. A portion of the fees charged to the C Class was waived in 2012, partially recovered in 2013 and 2014, and fully recovered in 2015. Performance prior to waiving fees was lower than actual returns shown for 2012. The maximum contingent deferred sales charge for the C Class is 1.00% for shares redeemed within one year of the date of purchase. |
| 6. | Fund performance represents the returns achieved by the Institutional Class from 12/31/09 up to 4/30/19, the inception date of the R6 Class, and the returns of the R6 Class since its inception. Expenses of the R6 Class are lower than those of the Institutional Class. Therefore, total returns shown may be lower than they would have been had the R6 Class been in existence since 12/31/09. A portion of the fees charged to the R6 Class has been waived since Fund inception. Performance prior to waiving fees was lower than actual returns shown since inception. |
| 7. | The Russell 2000® Growth Index is an unmanaged index of those stocks in the Russell 2000 Index with higherprice-to-book ratios and higher forecasted growth values. Russell 2000 Index is an unmanaged index of approximately 2000 smaller-capitalization stocks from various industrial sectors. Russell 2000 Index and Russell 2000 Growth Index are registered trademarks of Frank Russell Company. Frank Russell Company (“Russell”) is the source and owner of the trademarks, service marks and copyrights related to the Russell Indexes. Russell® is a trademark of Frank Russell Company. Neither Russell nor its licensors accept any liability for any errors or omissions in the Russell Indexes and/or Russell ratings or underlying data, and no party may rely on any Russell Indexes and/or Russell ratings and/or underlying data contained in this communication. No further distribution of Russell Data is permitted without Russell’s express written consent. Russell does not promote, sponsor or endorse the content of this communication. The S&P 500 Index is an unmanaged index of common stocks publicly traded in the United States. The S&P 500 Index is a product of S&P Dow Jones Indices LLC, a division of S&P Global or its affiliates (“SPDJI”) and has been licensed for use by American Beacon Advisors. Standard & Poor’s® and S&P® are registered trademarks of Standard & Poor’s Financial Services LLC, a division of S&P Global (“S&P”). Dow Jones® is a registered trademark of Dow Jones Trademark Holdings LLC (“Dow Jones”). The American Beacon Stephens Small Cap Growth Fund is not sponsored, endorsed, sold or promoted by SPDJI, Dow Jones, S&P or their respective affiliates, and none of such parties make any representation regarding the advisability of investing in such product(s) nor do they have any liability for any errors, omissions or interruptions of the S&P 500 Index. One cannot directly invest in an index. |
| 8. | The Total Annual Fund Operating Expense ratios set forth in the most recent Fund prospectus for the Institutional, Y, Investor, A, C and R6 Class shares were 1.04%, 1.10%, 1.33%, 1.33%, 2.10% and 1.05%, respectively. The expense ratios above may vary from the expense ratios presented in other sections of this report that are based on expenses incurred during the period covered by this report. |
The Fund underperformed the Index due to both security selection and sector allocation.
Security selection detracted the most value for the period, led by positions in Health Care and Communication Services. In the Health Care sector, the Fund did not hold Index-positions Array Biopharma, Inc. (up 225.1%) and Arrowhead Pharmaceuticals, Inc. (up 410.7%). The Fund’s position in Ligand Pharmaceuticals, Inc. (down 23.0%) further dragged on relative performance. Within Communication Services, ANGI Homeservices, Inc., A Class was down 44.8% and Boingo Wireless, Inc. was down 46.9% during the year.
The aforementioned performance was partially offset by selections in the Fund’s Information Technology sector. In this sector, the following companies contributed the most to relative performance: PROS Holdings, Inc. was up 90.7%, Globant S.A. was up 88.4%, and Manhattan Associates, Inc. was up 88.3%.
As it relates to sector allocation, the Fund’s cash position was a detractor from relative performance. An overweight to Financials, one of the lowest performers for the Index, further impacted returns for the period. Slightly offsetting some of this performance was a sizeable overweight to Information Technology, the second-best performer for the Index, as well as an underweight to Materials.
7
American Beacon Stephens Small Cap Growth FundSM
Performance Overview
December 31, 2019 (Unaudited)
Looking forward, the Fund’ssub-advisor will continue to maintain a disciplined, long-term approach to equity investing in smaller capitalization stocks with above-average growth potential.
| Top Ten Holdings (% Net Assets) |
| |||||||
| ICON PLC | 2.3 | |||||||
| Euronet Worldwide, Inc. | 1.8 | |||||||
| Trex Co., Inc. | 1.8 | |||||||
| Aspen Technology, Inc. | 1.7 | |||||||
| Encore Capital Group, Inc. | 1.7 | |||||||
| Five9, Inc. | 1.7 | |||||||
| PRA Group, Inc. | 1.7 | |||||||
| PROS Holdings, Inc. | 1.7 | |||||||
| Repligen Corp. | 1.7 | |||||||
| Omnicell, Inc. | 1.6 | |||||||
| Total Fund Holdings | 90 | |||||||
| Sector Allocation (% Equities) |
| |||||||
| Information Technology | 34.1 | |||||||
| Health Care | 21.3 | |||||||
| Industrials | 16.6 | |||||||
| Consumer Discretionary | 13.5 | |||||||
| Financials | 8.7 | |||||||
| Consumer Staples | 2.1 | |||||||
| Communication Services | 2.0 | |||||||
| Materials | 1.0 | |||||||
| Energy | 0.7 | |||||||
8
American Beacon FundsSM
December 31, 2019 (Unaudited)
Fund Expense Example
As a shareholder of a Fund, you incur two types of costs: (1) transaction costs, including sales charges (loads) on purchase payments and redemption fees, if applicable, and (2) ongoing costs, including management fees, distribution(12b-1) fees,sub-transfer agent fees, and other Fund expenses. The Examples are intended to help you understand the ongoing cost (in dollars) of investing in the Funds and to compare these costs with the ongoing costs of investing in other mutual funds. The Examples are based on an investment of $1,000 invested at the beginning of the period in each Class and held for the entire period from July 1, 2019 through December 31, 2019.
Actual Expenses
The “Actual” lines of the tables provide information about actual account values and actual expenses. You may use the information on this page, together with the amount you invested, to estimate the expenses that you paid over the period. Simply divide your account value by $1,000 (for example, an $8,600 account value divided by $1,000 = $8.60), then multiply the result by the “Expenses Paid During Period” to estimate the expenses you paid on your account during this period. Shareholders of the Investor and Institutional Classes that invest in the Funds through an IRA or Roth IRA may be subject to a custodial IRA fee of $15 that is typically deducted each December. If your account was subject to a custodial IRA fee during the period, your costs would have been $15 higher.
Hypothetical Example for Comparison Purposes
The “Hypothetical” lines of the tables provide information about hypothetical account values and hypothetical expenses based on the Funds’ actual expense ratio and an assumed 5% per year rate of return before expenses (not the Funds’ actual return). You may compare the ongoing costs of investing in the Funds with other funds by contrasting this 5% hypothetical example and the 5% hypothetical examples that appear in the shareholder reports of the other funds. The hypothetical account values and expenses may not be used to estimate the actual ending account balance or expenses you paid for the period. Shareholders of the Investor and Institutional Classes that invest in the Funds through an IRA or Roth IRA may be subject to a custodial IRA fee of $15 that is typically deducted each December. If your account was subject to a custodial IRA fee during the period, your costs would have been $15 higher.
You should also be aware that the expenses shown in the table highlight only your ongoing costs and do not reflect any transaction costs charged by the Funds, such as sales charges (loads) or redemption fees, as applicable. Similarly, the expense examples for other funds do not reflect any transaction costs charged by those funds, such as sales charges (loads), redemption fees or exchange fees. Therefore, the “Hypothetical” lines of the tables are useful in comparing ongoing costs only and will not help you determine the relative total costs of owning different funds. If you were subject to any transaction costs during the period, your costs would have been higher.
9
American Beacon FundsSM
Expense Examples
December 31, 2019 (Unaudited)
| American Beacon StephensMid-Cap Growth Fund |
| ||||||||||||||
| Beginning Account Value 7/1/2019 | Ending Account Value 12/31/2019 | Expenses Paid During Period 7/1/2019-12/31/2019* | |||||||||||||
| Institutional Class | |||||||||||||||
| Actual | $1,000.00 | $1,042.80 | $4.58 | ||||||||||||
| Hypothetical** | $1,000.00 | $1,020.72 | $4.53 | ||||||||||||
| Y Class | |||||||||||||||
| Actual | $1,000.00 | $1,042.00 | $5.10 | ||||||||||||
| Hypothetical** | $1,000.00 | $1,020.22 | $5.04 | ||||||||||||
| Investor Class | |||||||||||||||
| Actual | $1,000.00 | $1,040.90 | $6.38 | ||||||||||||
| Hypothetical** | $1,000.00 | $1,018.96 | $6.31 | ||||||||||||
| A Class | |||||||||||||||
| Actual | $1,000.00 | $1,040.20 | $6.58 | ||||||||||||
| Hypothetical** | $1,000.00 | $1,018.75 | $6.51 | ||||||||||||
| C Class | |||||||||||||||
| Actual | $1,000.00 | $1,036.90 | $10.17 | ||||||||||||
| Hypothetical** | $1,000.00 | $1,015.22 | $10.06 | ||||||||||||
| R6 Class | |||||||||||||||
| Actual | $1,000.00 | $1,042.80 | $4.33 | ||||||||||||
| Hypothetical** | $1,000.00 | $1,020.97 | $4.28 | ||||||||||||
| * | Expenses are equal to the Fund’s annualized expense ratios for thesix-month period of 0.89%, 0.99%, 1.24%, 1.28%, 1.98%, and 0.84% for the Institutional, Y, Investor, A, C, and R6 Classes, respectively, multiplied by the average account value over the period, multiplied by the number derived by dividing the number of days in the most recent fiscal half-year (184) by days in the year (365) to reflect the half-year period. |
| ** | 5% return before expenses. |
| American Beacon Stephens Small Cap Growth Fund |
| ||||||||||||||
| Beginning Account Value 7/1/2019 | Ending Account Value 12/31/2019 | Expenses Paid During Period 7/1/2019-12/31/2019* | |||||||||||||
| Institutional Class | |||||||||||||||
| Actual | $1,000.00 | $998.20 | $5.24 | ||||||||||||
| Hypothetical** | $1,000.00 | $1,019.96 | $5.30 | ||||||||||||
| Y Class | |||||||||||||||
| Actual | $1,000.00 | $997.60 | $5.59 | ||||||||||||
| Hypothetical** | $1,000.00 | $1,019.61 | $5.65 | ||||||||||||
| Investor Class | |||||||||||||||
| Actual | $1,000.00 | $996.00 | $6.74 | ||||||||||||
| Hypothetical** | $1,000.00 | $1,018.45 | $6.82 | ||||||||||||
| A Class | |||||||||||||||
| Actual | $1,000.00 | $996.60 | $6.69 | ||||||||||||
| Hypothetical** | $1,000.00 | $1,018.50 | $6.77 | ||||||||||||
| C Class | |||||||||||||||
| Actual | $1,000.00 | $992.00 | $10.54 | ||||||||||||
| Hypothetical** | $1,000.00 | $1,014.62 | $10.66 | ||||||||||||
| R6 Class | |||||||||||||||
| Actual | $1,000.00 | $997.60 | $4.78 | ||||||||||||
| Hypothetical** | $1,000.00 | $1,020.42 | $4.84 | ||||||||||||
| * | Expenses are equal to the Fund’s annualized expense ratios for thesix-month period of 1.04%, 1.11%, 1.34%, 1.33%, 2.10%, and 0.95% for the Institutional, Y, Investor, A, C, and R6 Classes, respectively, multiplied by the average account value over the period, multiplied by the number derived by dividing the number of days in the most recent fiscal half-year (184) by days in the year (365) to reflect the half-year period. |
| ** | 5% return before expenses. |
10
American Beacon FundsSM
Report of Independent Registered Public Accounting Firm
To the Shareholders and the Board of Trustees of American Beacon StephensMid-Cap Growth Fund and American Beacon Stephens Small Cap Growth Fund
Opinion on the Financial Statements
We have audited the accompanying statements of assets and liabilities of American Beacon StephensMid-Cap Growth Fund and American Beacon Stephens Small Cap Growth Fund (collectively referred to as the “Funds”), (two of the funds constituting American Beacon Funds (the “Trust”)), including the schedules of investments, as of December 31, 2019, and the related statements of operations for the year then ended, the statements of changes in net assets for each of the two years in the period then ended, the financial highlights for each of the five years in the period then ended and the related notes (collectively referred to as the “financial statements”). In our opinion, the financial statements present fairly, in all material respects, the financial position of each of the Funds at December 31, 2019, the results of their operations for the year then ended, the changes in their net assets for each of the two years in the period then ended and their financial highlights for each of the five years in the period then ended, in conformity with U.S. generally accepted accounting principles.
Basis for Opinion
These financial statements are the responsibility of the Trust’s management. Our responsibility is to express an opinion on the Funds’ financial statements based on our audits. We are a public accounting firm registered with the Public Company Accounting Oversight Board (United States) (“PCAOB”) and are required to be independent with respect to the Trust in accordance with the U.S. federal securities laws and the applicable rules and regulations of the Securities and Exchange Commission and the PCAOB.
We conducted our audits in accordance with the standards of the PCAOB. Those standards require that we plan and perform the audit to obtain reasonable assurance about whether the financial statements are free of material misstatement, whether due to error or fraud. The Trust is not required to have, nor were we engaged to perform, an audit of the Trust’s internal control over financial reporting. As part of our audits, we are required to obtain an understanding of internal control over financial reporting, but not for the purpose of expressing an opinion on the effectiveness of the Trust’s internal control over financial reporting. Accordingly, we express no such opinion.
Our audits included performing procedures to assess the risks of material misstatement of the financial statements, whether due to error or fraud, and performing procedures that respond to those risks. Such procedures included examining, on a test basis, evidence regarding the amounts and disclosures in the financial statements. Our procedures included confirmation of securities owned as of December 31, 2019, by correspondence with the custodian and brokers or by other appropriate auditing procedures where replies from brokers were not received. Our audits also included evaluating the accounting principles used and significant estimates made by management, as well as evaluating the overall presentation of the financial statements. We believe that our audits provide a reasonable basis for our opinion.

We have served as the auditor of one or more American Beacon investment companies since 1987.
Dallas, Texas
February 28, 2020
11
American Beacon StephensMid-Cap Growth FundSM
Schedule of Investments
December 31, 2019
| Shares | Fair Value | ||||||||||||||
| COMMON STOCKS - 97.53% | |||||||||||||||
| Communication Services - 6.44% | |||||||||||||||
| Entertainment - 5.01% | |||||||||||||||
| Electronic Arts, Inc.A | 30,171 | $ | 3,243,684 | ||||||||||||
| Live Nation Entertainment, Inc.A | 95,984 | 6,859,977 | |||||||||||||
| Spotify Technology S.A.A | 27,329 | 4,087,052 | |||||||||||||
| Take-Two Interactive Software, Inc.A | 27,384 | 3,352,623 | |||||||||||||
|
| ||||||||||||||
| 17,543,336 | |||||||||||||||
|
| ||||||||||||||
| Interactive Media & Services - 1.43% | |||||||||||||||
| IAC/InterActiveCorpA | 20,090 | 5,004,620 | |||||||||||||
|
| ||||||||||||||
Total Communication Services | 22,547,956 | ||||||||||||||
|
| ||||||||||||||
| Consumer Discretionary - 14.12% | |||||||||||||||
| Diversified Consumer Services - 1.88% | |||||||||||||||
| Bright Horizons Family Solutions, Inc.A | 31,228 | 4,693,256 | |||||||||||||
| Grand Canyon Education, Inc.A | 19,867 | 1,903,060 | |||||||||||||
|
| ||||||||||||||
| 6,596,316 | |||||||||||||||
|
| ||||||||||||||
| Hotels, Restaurants & Leisure - 2.36% | |||||||||||||||
| Domino’s Pizza, Inc. | 17,818 | 5,234,572 | |||||||||||||
| MGM Resorts International | 90,834 | 3,022,047 | |||||||||||||
|
| ||||||||||||||
| 8,256,619 | |||||||||||||||
|
| ||||||||||||||
| Internet & Direct Marketing Retail - 1.41% | |||||||||||||||
| MercadoLibre, Inc.A | 8,610 | 4,924,403 | |||||||||||||
|
| ||||||||||||||
| Multiline Retail - 1.03% | |||||||||||||||
| Ollie’s Bargain Outlet Holdings, Inc.A B | 55,331 | 3,613,668 | |||||||||||||
|
| ||||||||||||||
| Specialty Retail - 5.60% | |||||||||||||||
| Aaron’s, Inc. | 73,489 | 4,196,957 | |||||||||||||
| Burlington Stores, Inc.A | 30,663 | 6,992,084 | |||||||||||||
| Five Below, Inc.A | 32,869 | 4,202,630 | |||||||||||||
| Ross Stores, Inc. | 36,154 | 4,209,049 | |||||||||||||
|
| ||||||||||||||
| 19,600,720 | |||||||||||||||
|
| ||||||||||||||
| Textiles, Apparel & Luxury Goods - 1.84% | |||||||||||||||
| Canada Goose Holdings, Inc.A B | 39,544 | 1,433,074 | |||||||||||||
| Lululemon Athletica, Inc.A | 21,704 | 5,028,166 | |||||||||||||
|
| ||||||||||||||
| 6,461,240 | |||||||||||||||
|
| ||||||||||||||
Total Consumer Discretionary | 49,452,966 | ||||||||||||||
|
| ||||||||||||||
| Consumer Staples - 2.30% | |||||||||||||||
| Beverages - 2.30% | |||||||||||||||
| Brown-Forman Corp., Class B | 53,263 | 3,600,579 | |||||||||||||
| Monster Beverage Corp.A | 70,486 | 4,479,385 | |||||||||||||
|
| ||||||||||||||
| 8,079,964 | |||||||||||||||
|
| ||||||||||||||
Total Consumer Staples | 8,079,964 | ||||||||||||||
|
| ||||||||||||||
| Energy - 1.94% | |||||||||||||||
| Energy Equipment & Services - 0.34% | |||||||||||||||
| Core Laboratories N.V. | 31,909 | 1,202,012 | |||||||||||||
|
| ||||||||||||||
| Oil, Gas & Consumable Fuels - 1.60% | |||||||||||||||
| Cabot Oil & Gas Corp. | 120,995 | 2,106,523 | |||||||||||||
| Parsley Energy, Inc., Class A | 73,231 | 1,384,798 | |||||||||||||
See accompanying notes
12
American Beacon StephensMid-Cap Growth FundSM
Schedule of Investments
December 31, 2019
| Shares | Fair Value | ||||||||||||||
| COMMON STOCKS - 97.53% (continued) | |||||||||||||||
| Energy - 1.94% (continued) | |||||||||||||||
| Oil, Gas & Consumable Fuels - 1.60% (continued) | |||||||||||||||
| Pioneer Natural Resources Co. | 13,872 | $ | 2,099,805 | ||||||||||||
|
| ||||||||||||||
| 5,591,126 | |||||||||||||||
|
| ||||||||||||||
Total Energy | 6,793,138 | ||||||||||||||
|
| ||||||||||||||
| Financials - 5.30% | |||||||||||||||
| Banks - 1.21% | |||||||||||||||
| SVB Financial GroupA | 16,901 | 4,242,827 | |||||||||||||
|
| ||||||||||||||
| Capital Markets - 3.06% | |||||||||||||||
| MarketAxess Holdings, Inc. | 17,146 | 6,500,220 | |||||||||||||
| Tradeweb Markets, Inc., Class A | 90,946 | 4,215,347 | |||||||||||||
|
| ||||||||||||||
| 10,715,567 | |||||||||||||||
|
| ||||||||||||||
| Consumer Finance - 1.03% | |||||||||||||||
| FirstCash, Inc. | 44,646 | 3,599,807 | |||||||||||||
|
| ||||||||||||||
Total Financials | 18,558,201 | ||||||||||||||
|
| ||||||||||||||
| Health Care - 20.08% | |||||||||||||||
| Biotechnology - 0.95% | |||||||||||||||
| Alexion Pharmaceuticals, Inc.A | 17,968 | 1,943,239 | |||||||||||||
| Exelixis, Inc.A | 77,986 | 1,374,114 | |||||||||||||
|
| ||||||||||||||
| 3,317,353 | |||||||||||||||
|
| ||||||||||||||
| Health Care Equipment & Supplies - 10.18% | |||||||||||||||
| ABIOMED, Inc.A | 9,765 | 1,665,811 | |||||||||||||
| Align Technology, Inc.A | 9,047 | 2,524,475 | |||||||||||||
| DexCom, Inc.A | 27,823 | 6,086,003 | |||||||||||||
| Hologic, Inc.A | 69,622 | 3,634,965 | |||||||||||||
| IDEXX Laboratories, Inc.A | 23,105 | 6,033,409 | |||||||||||||
| Insulet Corp.A | 14,042 | 2,403,990 | |||||||||||||
| Intuitive Surgical, Inc.A | 7,635 | 4,513,430 | |||||||||||||
| ResMed, Inc. | 38,099 | 5,904,202 | |||||||||||||
| Varian Medical Systems, Inc.A | 20,383 | 2,894,590 | |||||||||||||
|
| ||||||||||||||
| 35,660,875 | |||||||||||||||
|
| ||||||||||||||
| Health Care Providers & Services - 1.37% | |||||||||||||||
| Acadia Healthcare Co., Inc.A B | 64,373 | 2,138,471 | |||||||||||||
| Henry Schein, Inc.A | 39,961 | 2,666,198 | |||||||||||||
|
| ||||||||||||||
| 4,804,669 | |||||||||||||||
|
| ||||||||||||||
| Health Care Technology - 2.07% | |||||||||||||||
| Cerner Corp. | 56,510 | 4,147,269 | |||||||||||||
| Veeva Systems, Inc., Class AA | 22,155 | 3,116,322 | |||||||||||||
|
| ||||||||||||||
| 7,263,591 | |||||||||||||||
|
| ||||||||||||||
| Life Sciences Tools & Services - 4.96% | |||||||||||||||
| ICON PLCA | 30,701 | 5,287,633 | |||||||||||||
| Illumina, Inc.A | 17,064 | 5,660,811 | |||||||||||||
| PRA Health Sciences, Inc.A | 31,880 | 3,543,462 | |||||||||||||
| QIAGEN N.V.A | 85,766 | 2,898,891 | |||||||||||||
|
| ||||||||||||||
| 17,390,797 | |||||||||||||||
|
| ||||||||||||||
| Pharmaceuticals - 0.55% | |||||||||||||||
| Pacira BioSciences, Inc.A | 42,218 | 1,912,476 | |||||||||||||
|
| ||||||||||||||
Total Health Care | 70,349,761 | ||||||||||||||
|
| ||||||||||||||
See accompanying notes
13
American Beacon StephensMid-Cap Growth FundSM
Schedule of Investments
December 31, 2019
| Shares | Fair Value | ||||||||||||||
| COMMON STOCKS - 97.53% (continued) | |||||||||||||||
| Industrials - 14.18% | |||||||||||||||
| Aerospace & Defense - 2.37% | |||||||||||||||
| HEICO Corp., Class A | 43,320 | $ | 3,878,440 | ||||||||||||
| L3Harris Technologies, Inc. | 22,282 | 4,408,939 | |||||||||||||
|
| ||||||||||||||
| 8,287,379 | |||||||||||||||
|
| ||||||||||||||
| Air Freight & Logistics - 0.45% | |||||||||||||||
| CH Robinson Worldwide, Inc.B | 20,085 | 1,570,647 | |||||||||||||
|
| ||||||||||||||
| Commercial Services & Supplies - 1.75% | |||||||||||||||
| Copart, Inc.A | 67,395 | 6,128,901 | |||||||||||||
|
| ||||||||||||||
| Electrical Equipment - 1.57% | |||||||||||||||
| Rockwell Automation, Inc. | 16,764 | 3,397,560 | |||||||||||||
| Sensata Technologies Holding PLCA | 39,031 | 2,102,600 | |||||||||||||
|
| ||||||||||||||
| 5,500,160 | |||||||||||||||
|
| ||||||||||||||
| Industrial Conglomerates - 0.96% | |||||||||||||||
| Roper Technologies, Inc. | 9,453 | 3,348,536 | |||||||||||||
|
| ||||||||||||||
| Machinery - 0.57% | |||||||||||||||
| Middleby Corp.A | 18,406 | 2,015,825 | |||||||||||||
|
| ||||||||||||||
| Professional Services - 4.80% | |||||||||||||||
| CoStar Group, Inc.A | 11,110 | 6,647,113 | |||||||||||||
| IHS Markit Ltd.A | 51,987 | 3,917,221 | |||||||||||||
| Verisk Analytics, Inc. | 41,903 | 6,257,794 | |||||||||||||
|
| ||||||||||||||
| 16,822,128 | |||||||||||||||
|
| ||||||||||||||
| Road & Rail - 0.89% | |||||||||||||||
| JB Hunt Transport Services, Inc. | 26,648 | 3,111,953 | |||||||||||||
|
| ||||||||||||||
| Trading Companies & Distributors - 0.82% | |||||||||||||||
| Fastenal Co. | 78,097 | 2,885,684 | |||||||||||||
|
| ||||||||||||||
Total Industrials | 49,671,213 | ||||||||||||||
|
| ||||||||||||||
| Information Technology - 33.17% | |||||||||||||||
| Electronic Equipment, Instruments & Components - 5.02% | |||||||||||||||
| Cognex Corp. | 72,970 | 4,089,239 | |||||||||||||
| FLIR Systems, Inc. | 95,668 | 4,981,433 | |||||||||||||
| IPG Photonics Corp.A B | 18,655 | 2,703,482 | |||||||||||||
| Keysight Technologies, Inc.A | 35,174 | 3,609,908 | |||||||||||||
| National Instruments Corp. | 51,561 | 2,183,093 | |||||||||||||
|
| ||||||||||||||
| 17,567,155 | |||||||||||||||
|
| ||||||||||||||
| IT Services - 8.30% | |||||||||||||||
| Euronet Worldwide, Inc.A | 34,279 | 5,400,999 | |||||||||||||
| Fiserv, Inc.A | 38,696 | 4,474,418 | |||||||||||||
| Global Payments, Inc. | 34,930 | 6,376,821 | |||||||||||||
| Shopify, Inc., Class AA | 12,712 | 5,054,037 | |||||||||||||
| Square, Inc., Class AA B | 50,246 | 3,143,390 | |||||||||||||
| WEX, Inc.A | 22,063 | 4,621,316 | |||||||||||||
|
| ||||||||||||||
| 29,070,981 | |||||||||||||||
|
| ||||||||||||||
| Semiconductors & Semiconductor Equipment - 3.94% | |||||||||||||||
| Microchip Technology, Inc.B | 56,263 | 5,891,861 | |||||||||||||
| NXP Semiconductors N.V. | 15,865 | 2,018,980 | |||||||||||||
| ON Semiconductor Corp.A | 81,419 | 1,984,995 | |||||||||||||
See accompanying notes
14
American Beacon StephensMid-Cap Growth FundSM
Schedule of Investments
December 31, 2019
| Shares | Fair Value | ||||||||||||||
| COMMON STOCKS - 97.53% (continued) | |||||||||||||||
| Information Technology - 33.17% (continued) | |||||||||||||||
| Semiconductors & Semiconductor Equipment - 3.94% (continued) | |||||||||||||||
| Xilinx, Inc. | 39,894 | $ | 3,900,437 | ||||||||||||
|
| ||||||||||||||
| 13,796,273 | |||||||||||||||
|
| ||||||||||||||
| Software - 15.91% | |||||||||||||||
| ANSYS, Inc.A | 13,013 | 3,349,676 | |||||||||||||
| Aspen Technology, Inc.A | 50,073 | 6,055,328 | |||||||||||||
| Autodesk, Inc.A | 29,417 | 5,396,843 | |||||||||||||
| Cadence Design Systems, Inc.A | 85,111 | 5,903,299 | |||||||||||||
| Coupa Software, Inc.A B | 6,279 | 918,304 | |||||||||||||
| DocuSign, Inc.A | 48,023 | 3,558,984 | |||||||||||||
| Dropbox, Inc., Class AA | 83,657 | 1,498,297 | |||||||||||||
| Envestnet, Inc.A | 48,636 | 3,386,524 | |||||||||||||
| Fortinet, Inc.A | 31,687 | 3,382,904 | |||||||||||||
| Guidewire Software, Inc.A B | 11,636 | 1,277,284 | |||||||||||||
| Palo Alto Networks, Inc.A | 15,999 | 3,699,769 | |||||||||||||
| Proofpoint, Inc.A | 26,142 | 3,000,579 | |||||||||||||
| PTC, Inc.A | 34,074 | 2,551,802 | |||||||||||||
| RingCentral, Inc., Class AA | 21,192 | 3,574,454 | |||||||||||||
| Splunk, Inc.A | 30,448 | 4,560,197 | |||||||||||||
| Tyler Technologies, Inc.A | 12,094 | 3,628,442 | |||||||||||||
|
| ||||||||||||||
| 55,742,686 | |||||||||||||||
|
| ||||||||||||||
Total Information Technology | 116,177,095 | ||||||||||||||
|
| ||||||||||||||
Total Common Stocks (Cost $273,794,874) | 341,630,294 | ||||||||||||||
|
| ||||||||||||||
| SHORT-TERM INVESTMENTS - 2.35% (Cost $8,224,439) | |||||||||||||||
| Investment Companies - 2.35% | |||||||||||||||
| American Beacon U.S. Government Money Market Select Fund, Select Class, 1.52%C D | 8,224,439 | 8,224,439 | |||||||||||||
|
| ||||||||||||||
| SECURITIES LENDING COLLATERAL - 0.39% (Cost $1,361,768) | |||||||||||||||
| Investment Companies - 0.39% | |||||||||||||||
| American Beacon U.S. Government Money Market Select Fund, Select Class, 1.52%C D | 1,361,768 | 1,361,768 | |||||||||||||
|
| ||||||||||||||
TOTAL INVESTMENTS - 100.27% (Cost $283,381,081) | 351,216,501 | ||||||||||||||
LIABILITIES, NET OF OTHER ASSETS - (0.27%) | (961,209 | ) | |||||||||||||
|
| ||||||||||||||
TOTAL NET ASSETS - 100.00% | $ | 350,255,292 | |||||||||||||
|
| ||||||||||||||
| Percentages are stated as a percent of net assets. | |||||||||||||||
ANon-income producing security.
B All or a portion of this security is on loan, collateralized by either cash and/or U.S.Treasuries, at December 31, 2019 (Note 8).
C The Fund is affiliated by having the same investment advisor.
D7-day yield.
PLC - Public Limited Company.
The Fund’s investments are summarized by level based on the inputs used to determine their values. As of December 31, 2019, the investments were classified as described below:
StephensMid-Cap Growth Fund | Level 1 | Level 2 | Level 3 | Total | ||||||||||||||||||||||||
Assets | ||||||||||||||||||||||||||||
Common Stocks | $ | 341,630,294 | $ | - | $ | - | $ | 341,630,294 | ||||||||||||||||||||
Short-Term Investments | 8,224,439 | - | - | 8,224,439 | ||||||||||||||||||||||||
Securities Lending Collateral | 1,361,768 | - | - | 1,361,768 | ||||||||||||||||||||||||
|
|
|
|
|
|
|
| |||||||||||||||||||||
Total Investments in Securities - Assets | $ | 351,216,501 | $ | - | $ | - | $ | 351,216,501 | ||||||||||||||||||||
|
|
|
|
|
|
|
| |||||||||||||||||||||
U.S. GAAP requires transfers between all levels to/from level 3 be disclosed. During the year ended December 31, 2019, there were no transfers into or out of Level 3.
See accompanying notes
15
American Beacon Stephens Small Cap Growth FundSM
Schedule of Investments
December 31, 2019
| Shares | Fair Value | ||||||||||||||
| COMMON STOCKS - 100.00% | |||||||||||||||
| Communication Services - 2.02% | |||||||||||||||
| Entertainment - 0.56% | |||||||||||||||
| Take-Two Interactive Software, Inc.A | 17,525 | $ | 2,145,586 | ||||||||||||
|
| ||||||||||||||
| Interactive Media & Services - 0.79% | |||||||||||||||
| ANGI Homeservices, Inc., Class AA B | 354,316 | 3,001,056 | |||||||||||||
|
| ||||||||||||||
| Wireless Telecommunication Services - 0.67% | |||||||||||||||
| Boingo Wireless, Inc.A | 234,123 | 2,563,647 | |||||||||||||
|
| ||||||||||||||
Total Communication Services | 7,710,289 | ||||||||||||||
|
| ||||||||||||||
| Consumer Discretionary - 13.52% | |||||||||||||||
| Diversified Consumer Services - 4.48% | |||||||||||||||
| Bright Horizons Family Solutions, Inc.A | 38,182 | 5,738,373 | |||||||||||||
| Chegg, Inc.A | 154,466 | 5,855,806 | |||||||||||||
| Grand Canyon Education, Inc.A | 36,013 | 3,449,685 | |||||||||||||
| OneSpaWorld Holdings Ltd.A | 122,869 | 2,069,114 | |||||||||||||
|
| ||||||||||||||
| 17,112,978 | |||||||||||||||
|
| ||||||||||||||
| Hotels, Restaurants & Leisure - 1.03% | |||||||||||||||
| Wingstop, Inc. | 45,625 | 3,934,244 | |||||||||||||
|
| ||||||||||||||
| Multiline Retail - 1.53% | |||||||||||||||
| Ollie’s Bargain Outlet Holdings, Inc.A B | 89,457 | 5,842,436 | |||||||||||||
|
| ||||||||||||||
| Specialty Retail - 5.88% | |||||||||||||||
| Aaron’s, Inc. | 106,574 | 6,086,441 | |||||||||||||
| Boot Barn Holdings, Inc.A | 67,190 | 2,991,971 | |||||||||||||
| Five Below, Inc.A | 35,703 | 4,564,986 | |||||||||||||
| Floor & Decor Holdings, Inc., Class AA | 95,524 | 4,853,574 | |||||||||||||
| Monro, Inc. | 12,343 | 965,223 | |||||||||||||
| Sportsman’s Warehouse Holdings, Inc.A | 369,043 | 2,963,415 | |||||||||||||
|
| ||||||||||||||
| 22,425,610 | |||||||||||||||
|
| ||||||||||||||
| Textiles, Apparel & Luxury Goods - 0.60% | |||||||||||||||
| Canada Goose Holdings, Inc.A B | 62,841 | 2,277,358 | |||||||||||||
|
| ||||||||||||||
Total Consumer Discretionary | 51,592,626 | ||||||||||||||
|
| ||||||||||||||
| Consumer Staples - 2.05% | |||||||||||||||
| Food Products - 2.05% | |||||||||||||||
| Calavo Growers, Inc.B | 60,801 | 5,507,963 | |||||||||||||
| Limoneira Co. | 120,466 | 2,316,561 | |||||||||||||
|
| ||||||||||||||
| 7,824,524 | |||||||||||||||
|
| ||||||||||||||
Total Consumer Staples | 7,824,524 | ||||||||||||||
|
| ||||||||||||||
| Energy - 0.70% | |||||||||||||||
| Energy Equipment & Services - 0.27% | |||||||||||||||
| Core Laboratories N.V.B | 26,795 | 1,009,367 | |||||||||||||
|
| ||||||||||||||
| Oil, Gas & Consumable Fuels - 0.43% | |||||||||||||||
| Parsley Energy, Inc., Class A | 87,526 | 1,655,117 | |||||||||||||
|
| ||||||||||||||
Total Energy | 2,664,484 | ||||||||||||||
|
| ||||||||||||||
| Financials - 8.75% | |||||||||||||||
| Banks - 0.99% | |||||||||||||||
| Ameris Bancorp | 88,781 | 3,776,744 | |||||||||||||
|
| ||||||||||||||
See accompanying notes
16
American Beacon Stephens Small Cap Growth FundSM
Schedule of Investments
December 31, 2019
| Shares | Fair Value | ||||||||||||||
| COMMON STOCKS - 100.00% (continued) | |||||||||||||||
| Financials - 8.75% (continued) | |||||||||||||||
| Capital Markets - 1.24% | |||||||||||||||
| MarketAxess Holdings, Inc. | 12,457 | $ | 4,722,573 | ||||||||||||
|
| ||||||||||||||
| Consumer Finance - 5.64% | |||||||||||||||
| Encore Capital Group, Inc.A B | 187,038 | 6,613,664 | |||||||||||||
| EZCORP, Inc., Class AA B | 439,911 | 3,000,193 | |||||||||||||
| FirstCash, Inc. | 67,670 | 5,456,232 | |||||||||||||
| PRA Group, Inc.A | 178,162 | 6,467,281 | |||||||||||||
|
| ||||||||||||||
| 21,537,370 | |||||||||||||||
|
| ||||||||||||||
| Insurance - 0.88% | |||||||||||||||
| Palomar Holdings, Inc.A | 66,170 | 3,340,923 | |||||||||||||
|
| ||||||||||||||
Total Financials | 33,377,610 | ||||||||||||||
|
| ||||||||||||||
| Health Care - 21.27% | |||||||||||||||
| Biotechnology - 1.28% | |||||||||||||||
| Ligand Pharmaceuticals, Inc.A B | 46,729 | 4,873,368 | |||||||||||||
|
| ||||||||||||||
| Health Care Equipment & Supplies - 5.41% | |||||||||||||||
| Insulet Corp.A | 28,757 | 4,923,198 | |||||||||||||
| Neogen Corp.A | 48,303 | 3,152,254 | |||||||||||||
| NuVasive, Inc.A | 60,724 | 4,696,394 | |||||||||||||
| Penumbra, Inc.A B | 29,491 | 4,844,487 | |||||||||||||
| Tandem Diabetes Care, Inc.A B | 50,417 | 3,005,357 | |||||||||||||
|
| ||||||||||||||
| 20,621,690 | |||||||||||||||
|
| ||||||||||||||
| Health Care Providers & Services - 3.15% | |||||||||||||||
| Acadia Healthcare Co., Inc.A | 107,679 | 3,577,096 | |||||||||||||
| BioTelemetry, Inc.A | 72,763 | 3,368,927 | |||||||||||||
| HealthEquity, Inc.A | 68,685 | 5,087,498 | |||||||||||||
|
| ||||||||||||||
| 12,033,521 | |||||||||||||||
|
| ||||||||||||||
| Health Care Technology - 3.43% | |||||||||||||||
| HealthStream, Inc.A | 90,062 | 2,449,686 | |||||||||||||
| HMS Holdings Corp.A | 150,222 | 4,446,571 | |||||||||||||
| Omnicell, Inc.A | 75,626 | 6,180,157 | |||||||||||||
|
| ||||||||||||||
| 13,076,414 | |||||||||||||||
|
| ||||||||||||||
| Life Sciences Tools & Services - 6.34% | |||||||||||||||
| Bio-Techne Corp. | 19,392 | 4,256,738 | |||||||||||||
| ICON PLCA | 51,544 | 8,877,423 | |||||||||||||
| PRA Health Sciences, Inc.A | 40,395 | 4,489,904 | |||||||||||||
| Repligen Corp.A | 71,145 | 6,580,913 | |||||||||||||
|
| ||||||||||||||
| 24,204,978 | |||||||||||||||
|
| ||||||||||||||
| Pharmaceuticals - 1.66% | |||||||||||||||
| Pacira BioSciences, Inc.A | 105,604 | 4,783,861 | |||||||||||||
| Supernus Pharmaceuticals, Inc.A | 65,687 | 1,558,096 | |||||||||||||
|
| ||||||||||||||
| 6,341,957 | |||||||||||||||
|
| ||||||||||||||
Total Health Care | 81,151,928 | ||||||||||||||
|
| ||||||||||||||
| Industrials - 16.57% | |||||||||||||||
| Aerospace & Defense - 6.96% | |||||||||||||||
| AeroVironment, Inc.A | 75,376 | 4,653,714 | |||||||||||||
| Axon Enterprise, Inc.A | 79,659 | 5,837,411 | |||||||||||||
See accompanying notes
17
American Beacon Stephens Small Cap Growth FundSM
Schedule of Investments
December 31, 2019
| Shares | Fair Value | ||||||||||||||
| COMMON STOCKS - 100.00% (continued) | |||||||||||||||
| Industrials - 16.57% (continued) | |||||||||||||||
| Aerospace & Defense - 6.96% (continued) | |||||||||||||||
| HEICO Corp., Class A | 66,883 | $ | 5,988,035 | ||||||||||||
| Kratos Defense & Security Solutions, Inc.A | 280,880 | 5,058,649 | |||||||||||||
| Mercury Systems, Inc.A | 72,897 | 5,037,912 | |||||||||||||
|
| ||||||||||||||
| 26,575,721 | |||||||||||||||
|
| ||||||||||||||
| Air Freight & Logistics - 1.30% | |||||||||||||||
| Echo Global Logistics, Inc.A | 97,181 | 2,011,647 | |||||||||||||
| Hub Group, Inc., Class AA | 57,660 | 2,957,381 | |||||||||||||
|
| ||||||||||||||
| 4,969,028 | |||||||||||||||
|
| ||||||||||||||
| Building Products - 1.77% | |||||||||||||||
| Trex Co., Inc.A | 74,979 | 6,739,112 | |||||||||||||
|
| ||||||||||||||
| Machinery - 4.56% | |||||||||||||||
| Kornit Digital Ltd.A B | 167,200 | 5,723,256 | |||||||||||||
| Lindsay Corp.B | 20,099 | 1,929,303 | |||||||||||||
| Proto Labs, Inc.A | 46,345 | 4,706,335 | |||||||||||||
| RBC Bearings, Inc.A | 31,962 | 5,060,863 | |||||||||||||
|
| ||||||||||||||
| 17,419,757 | |||||||||||||||
|
| ||||||||||||||
| Professional Services - 0.55% | |||||||||||||||
| CoStar Group, Inc.A | 3,486 | 2,085,674 | |||||||||||||
|
| ||||||||||||||
| Trading Companies & Distributors - 1.43% | |||||||||||||||
| SiteOne Landscape Supply, Inc.A B | 60,071 | 5,445,436 | |||||||||||||
|
| ||||||||||||||
Total Industrials | 63,234,728 | ||||||||||||||
|
| ||||||||||||||
| Information Technology - 34.08% | |||||||||||||||
| Electronic Equipment, Instruments & Components - 3.93% | |||||||||||||||
| Cognex Corp. | 62,029 | 3,476,105 | |||||||||||||
| FLIR Systems, Inc. | 109,985 | 5,726,919 | |||||||||||||
| National Instruments Corp. | 56,683 | 2,399,958 | |||||||||||||
| nLight, Inc.A B | 166,697 | 3,380,615 | |||||||||||||
|
| ||||||||||||||
| 14,983,597 | |||||||||||||||
|
| ||||||||||||||
| IT Services - 3.53% | |||||||||||||||
| Euronet Worldwide, Inc.A | 43,759 | 6,894,668 | |||||||||||||
| MAXIMUS, Inc. | 28,536 | 2,122,793 | |||||||||||||
| WEX, Inc.A | 21,160 | 4,432,174 | |||||||||||||
|
| ||||||||||||||
| 13,449,635 | |||||||||||||||
|
| ||||||||||||||
| Semiconductors & Semiconductor Equipment - 4.54% | |||||||||||||||
| Inphi Corp.A | 55,033 | 4,073,543 | |||||||||||||
| Power Integrations, Inc. | 34,458 | 3,408,241 | |||||||||||||
| Semtech Corp.A | 102,744 | 5,435,157 | |||||||||||||
| Silicon Laboratories, Inc.A | 38,014 | 4,408,864 | |||||||||||||
|
| ||||||||||||||
| 17,325,805 | |||||||||||||||
|
| ||||||||||||||
| Software - 22.08% | |||||||||||||||
| 8x8, Inc.A | 140,576 | 2,572,541 | |||||||||||||
| Aspen Technology, Inc.A | 53,558 | 6,476,769 | |||||||||||||
| Cornerstone OnDemand, Inc.A | 64,776 | 3,792,635 | |||||||||||||
| CyberArk Software Ltd.A | 29,599 | 3,450,652 | |||||||||||||
| Envestnet, Inc.A | 87,071 | 6,062,754 | |||||||||||||
| FireEye, Inc.A | 218,539 | 3,612,450 | |||||||||||||
See accompanying notes
18
American Beacon Stephens Small Cap Growth FundSM
Schedule of Investments
December 31, 2019
| Shares | Fair Value | ||||||||||||||
| COMMON STOCKS - 100.00% (continued) | |||||||||||||||
| Information Technology - 34.08% (continued) | |||||||||||||||
| Software - 22.08% (continued) | |||||||||||||||
| Five9, Inc.A | 100,522 | $ | 6,592,233 | ||||||||||||
| Globant S.A.A | 54,206 | 5,748,546 | |||||||||||||
| Guidewire Software, Inc.A | 26,768 | 2,938,323 | |||||||||||||
| Manhattan Associates, Inc.A | 73,067 | 5,827,093 | |||||||||||||
| Mimecast Ltd.A | 60,887 | 2,641,278 | |||||||||||||
| Proofpoint, Inc.A | 50,178 | 5,759,431 | |||||||||||||
| PROS Holdings, Inc.A | 110,958 | 6,648,603 | |||||||||||||
| Q2 Holdings, Inc.A B | 68,403 | 5,546,115 | |||||||||||||
| Qualys, Inc.A | 43,524 | 3,628,596 | |||||||||||||
| Rapid7, Inc.A | 49,784 | 2,788,900 | |||||||||||||
| SPS Commerce, Inc.A | 69,265 | 3,838,666 | |||||||||||||
| Tyler Technologies, Inc.A | 15,754 | 4,726,515 | |||||||||||||
| Varonis Systems, Inc.A B | 20,668 | 1,606,110 | |||||||||||||
|
| ||||||||||||||
| 84,258,210 | |||||||||||||||
|
| ||||||||||||||
Total Information Technology | 130,017,247 | ||||||||||||||
|
| ||||||||||||||
| Materials - 1.04% | |||||||||||||||
| Chemicals - 1.04% | |||||||||||||||
| Balchem Corp. | 38,845 | 3,947,817 | |||||||||||||
|
| ||||||||||||||
Total Common Stocks (Cost $221,691,626) | 381,521,253 | ||||||||||||||
|
| ||||||||||||||
| SHORT-TERM INVESTMENTS - 0.19% (Cost $735,867) | |||||||||||||||
| Investment Companies - 0.19% | |||||||||||||||
| American Beacon U.S. Government Money Market Select Fund, Select Class, 1.52%C D | 735,867 | 735,867 | |||||||||||||
|
| ||||||||||||||
| SECURITIES LENDING COLLATERAL - 1.62% (Cost $6,159,911) | |||||||||||||||
| Investment Companies - 1.62% | |||||||||||||||
| American Beacon U.S. Government Money Market Select Fund, Select Class, 1.52%C D | 6,159,911 | 6,159,911 | |||||||||||||
|
| ||||||||||||||
TOTAL INVESTMENTS - 101.81% (Cost $228,587,404) | 388,417,031 | ||||||||||||||
LIABILITIES, NET OF OTHER ASSETS - (1.81%) | (6,901,126 | ) | |||||||||||||
|
| ||||||||||||||
TOTAL NET ASSETS - 100.00% | $ | 381,515,905 | |||||||||||||
|
| ||||||||||||||
| Percentages are stated as a percent of net assets. | |||||||||||||||
ANon-income producing security.
B All or a portion of this security is on loan, collateralized by either cash and/or U.S.Treasuries, at December 31, 2019 (Note 8).
C The Fund is affiliated by having the same investment advisor.
D7-day yield.
PLC - Public Limited Company.
The Fund’s investments are summarized by level based on the inputs used to determine their values. As of December 31, 2019, the investments were classified as described below:
Stephens Small Cap Growth Fund | Level 1 | Level 2 | Level 3 | Total | ||||||||||||||||||||||||
Assets |
| |||||||||||||||||||||||||||
Common Stocks | $ | 381,521,253 | $ | - | $ | - | $ | 381,521,253 | ||||||||||||||||||||
Short-Term Investments | 735,867 | - | - | 735,867 | ||||||||||||||||||||||||
Securities Lending Collateral | 6,159,911 | - | - | 6,159,911 | ||||||||||||||||||||||||
|
|
|
|
|
|
|
| |||||||||||||||||||||
Total Investments in Securities - Assets | $ | 388,417,031 | $ | - | $ | - | $ | 388,417,031 | ||||||||||||||||||||
|
|
|
|
|
|
|
| |||||||||||||||||||||
U.S. GAAP requires transfers between all levels to/from level 3 be disclosed. During the year ended December 31, 2019, there were no transfers into or out of Level 3.
See accompanying notes
19
American Beacon FundsSM
Statements of Assets and Liabilities
December 31, 2019
| StephensMid-Cap Growth Fund | Stephens Small Cap Growth Fund | |||||||||||
Assets: |
| |||||||||||
Investments in unaffiliated securities, at fair value†§ | $ | 341,630,294 | $ | 381,521,253 | ||||||||
Investments in affiliated securities, at fair value‡ | 9,586,207 | 6,895,778 | ||||||||||
Dividends and interest receivable | 46,520 | 52,038 | ||||||||||
Receivable for investments sold | - | 11,677,594 | ||||||||||
Receivable for fund shares sold | 823,732 | 306,720 | ||||||||||
Prepaid expenses | 52,936 | 37,158 | ||||||||||
|
|
|
| |||||||||
Total assets | 352,139,689 | 400,490,541 | ||||||||||
|
|
|
| |||||||||
Liabilities: |
| |||||||||||
Payable for investments purchased | - | 125,070 | ||||||||||
Payable for fund shares redeemed | 223,819 | 12,239,981 | ||||||||||
Payable for expense reimbursement (Note 2) | 7,985 | 79,241 | ||||||||||
Management andsub-advisory fees payable (Note 2) | 235,033 | 312,005 | ||||||||||
Service fees payable (Note 2) | 10,864 | 18,895 | ||||||||||
Transfer agent fees payable (Note 2) | 1,411 | 13,799 | ||||||||||
Payable upon return of securities loaned (Note 8)§ | 1,361,768 | 6,159,911 | ||||||||||
Custody and fund accounting fees payable | 8,720 | 12,121 | ||||||||||
Professional fees payable | 31,943 | 1,774 | ||||||||||
Payable for prospectus and shareholder reports | 841 | 11,776 | ||||||||||
Other liabilities | 2,013 | 63 | ||||||||||
|
|
|
| |||||||||
Total liabilities | 1,884,397 | 18,974,636 | ||||||||||
|
|
|
| |||||||||
Net assets | $ | 350,255,292 | $ | 381,515,905 | ||||||||
|
|
|
| |||||||||
Analysis of net assets: |
| |||||||||||
Paid-in-capital | $ | 283,333,814 | $ | 217,577,625 | ||||||||
Total distributable earnings (deficits)A | 66,921,478 | 163,938,280 | ||||||||||
|
|
|
| |||||||||
Net assets | $ | 350,255,292 | $ | 381,515,905 | ||||||||
|
|
|
| |||||||||
See accompanying notes
20
American Beacon FundsSM
Statements of Assets and Liabilities
December 31, 2019
| StephensMid-Cap Growth Fund | Stephens Small Cap Growth Fund | |||||||||||
Shares outstanding at no par value (unlimited shares authorized): |
| |||||||||||
Institutional Class | 10,239,311 | 15,874,103 | ||||||||||
|
|
|
| |||||||||
Y Class | 1,133,214 | 3,902,767 | ||||||||||
|
|
|
| |||||||||
Investor Class | 656,258 | 4,657,138 | ||||||||||
|
|
|
| |||||||||
A Class | 288,306 | 363,216 | ||||||||||
|
|
|
| |||||||||
C Class | 153,476 | 66,541 | ||||||||||
|
|
|
| |||||||||
R6 ClassB C | 628,263 | 527,979 | ||||||||||
|
|
|
| |||||||||
Net assets: |
| |||||||||||
Institutional Class | $ | 278,175,115 | $ | 244,394,530 | ||||||||
|
|
|
| |||||||||
Y Class | $ | 30,544,300 | $ | 59,481,096 | ||||||||
|
|
|
| |||||||||
Investor Class | $ | 14,802,058 | $ | 63,799,443 | ||||||||
|
|
|
| |||||||||
A Class | $ | 6,467,469 | $ | 4,899,301 | ||||||||
|
|
|
| |||||||||
C Class | $ | 3,193,238 | $ | 808,661 | ||||||||
|
|
|
| |||||||||
R6 ClassB C | $ | 17,073,112 | $ | 8,132,874 | ||||||||
|
|
|
| |||||||||
Net asset value, offering and redemption price per share: |
| |||||||||||
Institutional Class | $ | 27.17 | $ | 15.40 | ||||||||
|
|
|
| |||||||||
Y Class | $ | 26.95 | $ | 15.24 | ||||||||
|
|
|
| |||||||||
Investor Class | $ | 22.56 | $ | 13.70 | ||||||||
|
|
|
| |||||||||
A Class | $ | 22.43 | $ | 13.49 | ||||||||
|
|
|
| |||||||||
A Class (offering price) | $ | 23.80 | $ | 14.31 | ||||||||
|
|
|
| |||||||||
C Class | $ | 20.81 | $ | 12.15 | ||||||||
|
|
|
| |||||||||
R6 ClassB C | $ | 27.18 | $ | 15.40 | ||||||||
|
|
|
| |||||||||
† Cost of investments in unaffiliated securities | $ | 273,794,874 | $ | 221,691,626 | ||||||||
‡ Cost of investments in affiliated securities | $ | 9,586,207 | $ | 6,895,778 | ||||||||
§ Fair value of securities on loan | $ | 17,720,483 | $ | 47,096,107 | ||||||||
| AThe Fund’s investments in affiliated securities did not have unrealized appreciation (depreciation) at year end. |
| |||||||||||
| BClass launched on December 31, 2018 and commenced operations on January 2, 2019 in the StephensMid-Cap Growth Fund (Note 1). |
| |||||||||||
| CClass launched on April 30, 2019 and commenced operations on May 1, 2019 in the Stephens Small Cap Growth Fund (Note 1). |
| |||||||||||
See accompanying notes
21
American Beacon FundsSM
Statements of Operations
For the year ended December 31, 2019
| Stephens Mid-Cap Growth Fund | Stephens Small Cap Growth Fund | |||||||||||
Investment income: |
| |||||||||||
Dividend income from unaffiliated securities (net of foreign taxes)† | $ | 881,180 | $ | 799,748 | ||||||||
Dividend income from affiliated securities (Note 7) | 184,565 | 185,311 | ||||||||||
Interest income | 213 | 84 | ||||||||||
Income derived from securities lending (Note 8) | 11,635 | 40,250 | ||||||||||
|
|
|
| |||||||||
Total investment income | 1,077,593 | 1,025,393 | ||||||||||
|
|
|
| |||||||||
Expenses: |
| |||||||||||
Management andsub-advisory fees (Note 2) | 1,961,745 | 3,949,233 | ||||||||||
Transfer agent fees: | ||||||||||||
Institutional Class (Note 2) | 80,954 | 117,562 | ||||||||||
Y Class (Note 2) | 21,803 | 62,666 | ||||||||||
Investor Class | 2,236 | 3,616 | ||||||||||
A Class | 431 | 360 | ||||||||||
C Class | 250 | 96 | ||||||||||
R6 ClassA B | 1,820 | 2,189 | ||||||||||
Custody and fund accounting fees | 49,776 | 62,182 | ||||||||||
Professional fees | 60,070 | 52,551 | ||||||||||
Registration fees and expenses | 106,404 | 93,710 | ||||||||||
Service fees (Note 2): | ||||||||||||
Investor Class | 51,234 | 191,642 | ||||||||||
A Class | 7,511 | 4,090 | ||||||||||
C Class | 1,981 | 1,135 | ||||||||||
Distribution fees (Note 2): | ||||||||||||
A Class | 22,136 | 13,646 | ||||||||||
C Class | 30,490 | 10,084 | ||||||||||
Prospectus and shareholder report expenses | 21,929 | 34,163 | ||||||||||
Trustee fees (Note 2) | 17,596 | 31,690 | ||||||||||
Other expenses | 20,710 | 46,413 | ||||||||||
|
|
|
| |||||||||
Total expenses | 2,459,076 | 4,677,028 | ||||||||||
|
|
|
| |||||||||
Net fees waived and expenses (reimbursed) (Note 2) | (135,167 | ) | (18,786 | ) | ||||||||
|
|
|
| |||||||||
Net expenses | 2,323,909 | 4,658,242 | ||||||||||
|
|
|
| |||||||||
Net investment (loss) | (1,246,316 | ) | (3,632,849 | ) | ||||||||
|
|
|
| |||||||||
Realized and unrealized gain from investments: |
| |||||||||||
Net realized gain from: | ||||||||||||
Investments in unaffiliated securitiesC | 1,513,288 | 36,639,071 | ||||||||||
Change in net unrealized appreciation of: | ||||||||||||
Investments in unaffiliated securitiesD | 50,142,892 | 48,881,662 | ||||||||||
|
|
|
| |||||||||
Net gain from investments | 51,656,180 | 85,520,733 | ||||||||||
|
|
|
| |||||||||
Net increase in net assets resulting from operations | $ | 50,409,864 | $ | 81,887,884 | ||||||||
|
|
|
| |||||||||
† Foreign taxes | $ | 8,945 | $ | 7,881 | ||||||||
AClass launched on December 31, 2018 and commenced operations on January 2, 2019 in the StephensMid-Cap Growth Fund (Note 1). |
| |||||||||||
BClass launched on April 30, 2019 and commenced operations on May 1, 2019 in the Stephens Small Cap Growth Fund (Note 1). |
| |||||||||||
CThe Fund did not recognize net realized gains (losses) from the sale of investments in affiliated securities. |
| |||||||||||
DThe Fund’s investments in affiliated securities did not have a change in unrealized appreciation (depreciation) at year end. |
| |||||||||||
See accompanying notes
22
American Beacon FundsSM
Statements of Changes in Net Assets
| StephensMid-Cap Growth Fund | Stephens Small Cap Growth Fund | |||||||||||||||||||||||||||
| Year Ended December 31, 2019 | Year Ended December 31, 2018 | Year Ended December 31, 2019 | Year Ended December 31, 2018 | |||||||||||||||||||||||||
Increase (decrease) in net assets: |
| |||||||||||||||||||||||||||
Operations: |
| |||||||||||||||||||||||||||
Net investment (loss) | $ | (1,246,316 | ) | $ | (803,062 | ) | $ | (3,632,849 | ) | $ | (4,305,985 | ) | ||||||||||||||||
Net realized gain from investments in unaffiliated securities | 1,513,288 | 15,570,916 | 36,639,071 | 111,127,480 | ||||||||||||||||||||||||
Change in net unrealized appreciation (depreciation) of investments in unaffiliated securities | 50,142,892 | (16,821,873 | ) | 48,881,662 | (66,227,807 | ) | ||||||||||||||||||||||
|
|
|
|
|
|
|
| |||||||||||||||||||||
Net increase (decrease) in net assets resulting from operations | 50,409,864 | (2,054,019 | ) | 81,887,884 | 40,593,688 | |||||||||||||||||||||||
|
|
|
|
|
|
|
| |||||||||||||||||||||
Distributions to shareholders: |
| |||||||||||||||||||||||||||
Total retained earnings: | ||||||||||||||||||||||||||||
Institutional Class | (8,147,853 | ) | (5,425,780 | ) | (24,776,590 | ) | (76,595,283 | ) | ||||||||||||||||||||
Y Class | (894,750 | ) | (757,041 | ) | (5,801,234 | ) | (18,278,992 | ) | ||||||||||||||||||||
Investor Class | (514,984 | ) | (1,251,731 | ) | (6,756,362 | ) | (16,618,636 | ) | ||||||||||||||||||||
A Class | (226,381 | ) | (1,124,545 | ) | (558,550 | ) | (1,689,188 | ) | ||||||||||||||||||||
C Class | (120,145 | ) | (144,407 | ) | (99,376 | ) | (366,743 | ) | ||||||||||||||||||||
R6 ClassA B | (493,965 | ) | - | (779,978 | ) | - | ||||||||||||||||||||||
|
|
|
|
|
|
|
| |||||||||||||||||||||
Net distributions to shareholders | (10,398,078 | ) | (8,703,504 | ) | (38,772,090 | ) | (113,548,842 | ) | ||||||||||||||||||||
|
|
|
|
|
|
|
| |||||||||||||||||||||
Capital share transactions (Note 10): | ||||||||||||||||||||||||||||
Proceeds from sales of shares | 268,908,107 | 78,079,866 | 140,286,646 | 138,657,979 | ||||||||||||||||||||||||
Reinvestment of dividends and distributions | 7,671,334 | 8,387,775 | 35,453,806 | 100,058,452 | ||||||||||||||||||||||||
Cost of shares redeemed | (80,331,201 | ) | (58,755,155 | ) | (189,913,453 | ) | (387,151,403 | ) | ||||||||||||||||||||
|
|
|
|
|
|
|
| |||||||||||||||||||||
Net increase (decrease) in net assets from capital share transactions | 196,248,240 | 27,712,486 | (14,173,001 | ) | (148,434,972 | ) | ||||||||||||||||||||||
|
|
|
|
|
|
|
| |||||||||||||||||||||
Net increase (decrease) in net assets | 236,260,026 | 16,954,963 | 28,942,793 | (221,390,126 | ) | |||||||||||||||||||||||
|
|
|
|
|
|
|
| |||||||||||||||||||||
Net assets: | ||||||||||||||||||||||||||||
Beginning of period | 113,995,266 | 97,040,303 | 352,573,112 | 573,963,238 | ||||||||||||||||||||||||
|
|
|
|
|
|
|
| |||||||||||||||||||||
End of period | $ | 350,255,292 | $ | 113,995,266 | $ | 381,515,905 | $ | 352,573,112 | ||||||||||||||||||||
|
|
|
|
|
|
|
| |||||||||||||||||||||
AClass launched on December 31, 2018 and commenced operations on January 2, 2019 in the StephensMid-Cap Growth Fund (Note 1).
BClass launched on April 30, 2019 and commenced operations on May 1, 2019 in the Stephens Small Cap Growth Fund (Note 1).
See accompanying notes
23
American Beacon FundsSM
December 31, 2019
1. Organization and Significant Accounting Policies
American Beacon Funds (the “Trust”) is organized as a Massachusetts business trust. The Funds, each a series within the Trust, are registered under the Investment Company Act of 1940, as amended (the “Act”), as diversified,open-end management investment companies. As of December 31, 2019, the Trust consists ofthirty-two active series, two of which are presented in this filing: American Beacon StephensMid-Cap Growth Fund and American Beacon Stephens Small Cap Growth Fund (collectively, the “Funds” and each individually a “Fund”). The remaining thirty active series are reported in separate filings.
American Beacon Advisors, Inc. (the “Manager”) is a Delaware corporation and a wholly-owned subsidiary of Resolute Investment Managers, Inc. (“RIM”) organized in 1986 to provide business management, advisory, administrative, and asset management consulting services to the Trust and other investors. The Manager is registered as an investment advisor under the Investment Advisers Act of 1940, as amended (the “Advisers Act”). RIM is, in turn, a wholly-owned subsidiary of Resolute Acquisition, Inc., which is a wholly-owned subsidiary of Resolute Topco, Inc., a wholly-owned subsidiary of Resolute Investment Holdings, LLC (“RIH”). RIH is owned primarily by Kelso Investment Associates VIII, L.P., KEP VI, LLC and Estancia Capital Partners L.P., investment funds affiliated with Kelso & Company, L.P. (“Kelso”) or Estancia Capital Management, LLC (“Estancia”), which are private equity firms.
Recently Adopted Accounting Pronouncements
In March 2017, the Financial Accounting Standards Board (“FASB”) issued Accounting Standards Update (“ASU”)2017-08,Premium Amortization of Purchased Callable Debt Securities. The amendments in the ASU shorten the premium amortization period on a purchased callable debt security from the security’s contractual life to the earliest call date. It is anticipated that this change will enhance disclosures by reducing losses recognized when a security is called on an earlier date. This ASU is effective for fiscal years beginning after December 15, 2018, and has been updated accordingly with no material impact on the financial statements and other disclosures.
In August 2018, the FASB issued ASU2018-13,Fair Value Measurement (“Topic 820”). The amendments in the ASU impact disclosure requirements for fair value measurement. It is anticipated that this change will enhance the effectiveness of disclosures in the notes to the financial statements. This ASU is effective for fiscal years beginning after December 15, 2019. Early adoption is permitted and can include the entire standard or certain provisions that exclude or amend disclosures. For the year ended December 31, 2019, the Funds have chosen to adopt the standard. The adoption of this ASU guidance did not have a material impact on the financial statements and other disclosures.
Class Disclosure
On December 31, 2018 and April 30, 2019, the Stephens Mid-Cap Growth Fund and the Stephens Small Cap Growth Fund, respectively, created the R6 Class, a new class made available for sale to provide third party intermediaries an investment option for the large 401(K) plans that does not charge12b-1 orsub-transfer agency fees pursuant to the Fund’s registration statement filed with the United States Securities and Exchange Commission (“SEC”).
Each Fund has multiple classes of shares designed to meet the needs of different groups of investors. The following table sets forth the differences amongst the classes:
Class | Eligible Investors | Minimum Initial Investments | ||||
| Institutional | Large institutional investors - sold directly or through intermediary channels. | $ | 250,000 | |||
| Y Class | Large institutional retirement plan investors - sold directly or through intermediary channels. | $ | 100,000 | |||
24
American Beacon FundsSM
Notes to Financial Statements
December 31, 2019
Class | Eligible Investors | Minimum Initial Investments | ||||
| Investor | All investors using intermediary organizations, such as broker-dealers or retirement plan sponsors. | $ | 2,500 | |||
| A Class | All investors who invest through intermediary organizations, such as broker-dealers or third party administrator. Retail investors who invest directly through a financial intermediary such as a broker, bank, or registered investment advisor which may include afront-end sales charge and a contingent deferred sales charge (“CDSC”). | $ | 2,500 | |||
| C Class | Retail investors who invest directly through a financial intermediary, such as a broker or through employee directed benefit plans with applicable sales charges which may include CDSC. | $ | 1,000 | |||
| R6 Class | Large institutional retirement plan investors - sold through retirement plan sponsors. | None | ||||
Each class offered by the Trust has equal rights as to assets and voting privileges. Income andnon-class specific expenses are allocated daily to each class based on the relative net assets. Realized and unrealized capital gains and losses of each class are allocated daily based on the relative net assets of each class of the respective Fund. Class specific expenses, where applicable, currently include service, distribution, transfer agent fees, andsub-transfer agent fees that vary amongst the classes as described more fully in Note 2.
Significant Accounting Policies
The following is a summary of significant accounting policies, consistently followed by the Funds in preparation of the financial statements. The Funds are considered investment companies and accordingly, follow the investment company accounting and reporting guidance of the FASB Accounting Standards Codification Topic 946,Financial Services – Investment Companies,a part of Generally Accepted Accounting Principles (“U.S. GAAP”).
Security Transactions and Investment Income
Security transactions are recorded as of the trade date for financial reporting purposes. Securities purchased or sold on a when-issued or delayed-delivery basis may be settled beyond a standard settlement period for the security after the trade date.
Dividend income, net of foreign taxes, is recorded on theex-dividend date, except certain dividends from foreign securities which are recorded as soon as the information is available to the Funds. Interest income, net of foreign taxes, is earned from settlement date, recorded on the accrual basis, and adjusted, if necessary, for accretion of discounts and amortization of premiums. Realized gains (losses) from securities sold are determined based on specific lot identification.
Distributions to Shareholders
The Funds distribute most or all of its net earnings and realized gains, if any, each taxable year in the form of dividends from net investment income and distributions of realized net capital gains and net gains from foreign currency transactions on an annual basis. The Funds do not have a fixed dividend rate and do not guarantee that it will pay any distributions in any particular period. Dividends to shareholders are determined in accordance with federal income tax regulations, which may differ in amount and character from net investment income and realized gains recognized for purposes of U.S. GAAP. To the extent necessary to fully distribute capital gains, the Funds may designate earnings and profits distributed to shareholders on the redemption of shares.
Allocation of Income, Trust Expenses, Gains, and Losses
Investment income, realized and unrealized gains and losses from investments of the Funds are allocated daily to each class of shares based upon the relative proportion of net assets of each class to the total net assets of
25
American Beacon FundsSM
Notes to Financial Statements
December 31, 2019
the Funds. Expenses directly charged or attributable to the Fund will be paid from the assets of the Fund. Generally, expenses of the Trust will be allocated among and charged to the assets of the Funds on a basis that the Trust’s Board of Trustees (the “Board”) deems fair and equitable, which may be based on the relative net assets of the Funds or nature of the services performed and relative applicability to the Funds.
Use of Estimates
The preparation of financial statements in conformity with U.S. GAAP requires management to make estimates and assumptions that affect the amounts reported in the financial statements and accompanying notes. Actual results may differ from those estimated.
Other
Under the Trust’s organizational documents, its officers and trustees are indemnified against certain liabilities arising out of the performance of their duties to the Trust. In the normal course of business, the Trust enters into contracts that provide indemnification to the other party or parties against potential costs or liabilities. The Trust’s maximum exposure under these arrangements is dependent on claims that may be made in the future and, therefore, cannot be estimated. The Trust has had no prior claims or losses pursuant to any such agreement.
2. Transactions with Affiliates
Management and InvestmentSub-Advisory Agreements
The Funds and the Manager are parties to a Management Agreement that obligates the Manager to provide the Funds with investment advisory and administrative services. As compensation for performing the duties under the Management Agreement, the Manager will receive an annualized management fee based on a percentage of the Funds’ average daily net assets that is calculated and accrued daily according to the following schedule:
First $5 billion | 0.35 | % | ||
Next $5 billion | 0.325 | % | ||
Next $10 billion | 0.30 | % | ||
Over $20 billion | 0.275 | % |
The Trust, on behalf of the Funds, and the Manager have entered into an Investment Advisory Agreement with Stephens Investment Management Group LLC (the“Sub-Advisor”) pursuant to which each Fund has agreed to pay an annualizedsub-advisory fee that is calculated and accrued daily based on the Funds’ average daily net assets according to the following schedule:
StephensMid-Cap Growth Fund
All assets | 0.45 | % |
Stephens Small Cap Growth*
First $200 million | 0.60 | % | ||
Over $200 million | 0.55 | % |
* Effective August 23, 2019, the rates changed from 0.65% for the first $200 million of assets and 0.60% for assets over $200 million.
The Management andSub-Advisory Fees paid by the Funds for the year ended December 31, 2019 were as follows:
StephensMid-Cap Growth Fund
| Effective Fee Rate | Amount of Fees Paid | |||||||||||
Management Fees | 0.35 | % | $ | 858,574 | ||||||||
Sub-Advisor Fees | 0.45 | % | 1,103,171 | |||||||||
|
|
|
| |||||||||
Total | 0.80 | % | $ | 1,961,745 | ||||||||
|
|
|
| |||||||||
26
American Beacon FundsSM
Notes to Financial Statements
December 31, 2019
Stephens Small Cap Growth Fund
| Effective Fee Rate | Amount of Fees Paid | |||||||||||
Management Fees | 0.35 | % | $ | 1,442,344 | ||||||||
Sub-Advisor Fees | 0.61 | % | 2,506,889 | |||||||||
|
|
|
| |||||||||
Total | 0.96 | % | $ | 3,949,233 | ||||||||
|
|
|
| |||||||||
As compensation for services provided by the Manager in connection with securities lending activities conducted by the Funds, the lending Fund pays to the Manager, with respect to cash collateral posted by borrowers, a fee up to 10% of the net monthly interest income (the gross interest income earned by the investment of cash collateral, less the amount paid to borrowers and related expenses) from such activities and, with respect to loan fees paid by borrowers, a fee up to 10% of such loan fees. These fees are included in “Income derived from securities lending” and “Management and investment advisory fees” on the Statements of Operations. During the year ended December 31, 2019, the Manager received securities lending fees of $1,616 and $5,223 for the securities lending activities of the StephensMid-Cap Growth Fund and Stephens Small Cap Growth Fund, respectively.
Distribution Plans
The Funds, except for the A and C Classes of the Funds, have adopted a “defensive” Distribution Plan (the “Plan”) in accordance with Rule12b-1 under the Act, pursuant to which no separate fees may be charged to the Funds for distribution purposes. However, the Plan authorizes the management fee received by the Manager and the investment advisors hired by the Manager to be used for distribution purposes. Under this Plan, the Funds do not intend to compensate the Manager or any other party, either directly or indirectly, for the distribution of Fund shares.
Separate Distribution Plans (the “Distribution Plans”) have been adopted pursuant to Rule12b-1 under the Act for the A and C Classes of the Funds. Under the Distribution Plans, as compensation for distribution and shareholder servicing assistance, the Manager receives an annual fee of 0.25% of the average daily net assets of the A Class and 1.00% of the average daily net assets of the C Class. The fee will be payable without regard to whether the amount of the fee is more or less than the actual expenses incurred in a particular month by the Manager for distribution assistance.
Service Plans
The Manager and the Trust entered into Service Plans that obligate the Manager to oversee additional shareholder servicing of the Investor, A, and C Classes of the Funds. As compensation for performing the duties required under the Service Plans, the Manager receives an annualized fee up to 0.25% of the average daily net assets of the A and C Classes, and up to 0.375% of the average daily net assets of the Investor Class of the Funds.
Sub-Transfer Agent Fees
The Manager has entered into agreements, which include servicing agreements, with financial intermediaries that provide recordkeeping, processing, shareholder communications and other services to customers of the intermediaries that hold positions in the Institutional and Y Classes of the Funds and has agreed to compensate the intermediaries for providing these services. Intermediaries transact with the Funds primarily through the use of omnibus accounts on behalf of their customers who hold positions in the Funds. Certain services would have been provided by the Funds’ transfer agent and other service providers if the shareholders’ accounts were maintained directly by the Funds’ transfer agent. Accordingly, the Funds, pursuant to Board approval, have agreed to reimburse the Manager for certainnon-distribution shareholder services provided by financial intermediaries for the Institutional and Y Classes. The reimbursement amounts(sub-transfer agent fees) paid to the Manager are subject to a fee limit of up to 0.10% of an intermediary’s average net assets in the Institutional and Y
27
American Beacon FundsSM
Notes to Financial Statements
December 31, 2019
Classes on an annual basis. During the year ended December 31, 2019, thesub-transfer agent fees, as reflected in “Transfer agent fees” on the Statements of Operations, were as follows:
Fund | Sub-Transfer Agent Fees | |||
StephensMid-Cap Growth | $ | 95,774 | ||
Stephens Small Cap Growth | 168,673 | |||
As of December 31, 2019, the Manager owed the StephensMid-Cap Growth Fund the following reimbursement ofsub-transfer agent fees, as reflected in “Transfer agent fees payable” on the Statements of Assets and Liabilities:
Fund | Reimbursement Sub-Transfer Agent Fees | |||
StephensMid-Cap Growth | $ | 11,019 | * | |
Stephens Small Cap Growth | 11,018 | |||
* This balance is presented as a contra liability as of December 31, 2019.
Investments in Affiliated Funds
The Funds may invest in the American Beacon U.S. Government Money Market Select Fund (the “USG Select Fund”). Cash collateral received by the Funds in connection with securities lending may also be invested in the USG Select Fund. The Funds and the USG Select Fund have the same investment advisor and therefore, are considered to be affiliated. The Manager serves as investment advisor to the USG Select Fund and receives management fees and administrative fees totaling 0.10% of the average daily net assets of the USG Select Fund. During the year ended December 31, 2019, the Manager earned fees on the Funds’ direct investments and securities lending collateral investments in the USG Select Fund as shown below:
Fund | Direct Investments in USG Select Fund | Securities Lending Collateral Investments in USG Select Fund | Total | |||||||||
StephensMid-Cap Growth | $ | 8,977 | $ | 1,788 | $ | 10,765 | ||||||
Stephens Small Cap Growth | 8,572 | 6,711 | 15,283 | |||||||||
Interfund Credit Facility
Pursuant to an exemptive order issued by the SEC, the Funds, along with other registered investment companies having management contracts with the Manager, may participate in a credit facility whereby each fund, under certain conditions, is permitted to lend money directly to and borrow directly from other participating funds for temporary purposes. The interfund credit facility is advantageous to the funds because it provides added liquidity and eliminates the need to maintain higher cash balances to meet redemptions. This situation could arise when shareholder redemptions exceed anticipated volumes and certain funds have insufficient cash on hand to satisfy such redemptions or when sales of securities do not settle as expected, resulting in a cash shortfall for a fund. When a fund liquidates portfolio securities to meet redemption requests, they often do not receive payment in settlement for up to two days (or longer for certain foreign transactions). Redemption requests normally are satisfied on the next business day. The credit facility provides a source of immediate, short-term liquidity pending settlement of the sale of portfolio securities. The credit facility is administered by a credit facility team consisting of professionals from the Manager’s asset management, compliance, and accounting areas who report the activities of the credit facility to the Board. During the year ended December 31, 2019, the Stephens Small Cap Growth Fund borrowed on average $2,963,985 for 10 days at an average interest rate of 2.79% with interest charges of $2,414. These amounts are recorded as “Other expenses” in the Statements of Operations. For the year ended December 31, 2019, the StephensMid-Cap Growth Fund did not utilize the credit facility.
28
American Beacon FundsSM
Notes to Financial Statements
December 31, 2019
Expense Reimbursement Plan
The Manager contractually agreed to reduce fees and/or reimburse expenses for the classes of the Funds to the extent that total operating expenses exceed the Funds’ expense cap. During the year ended December 31, 2019, the Manager waived and/or reimbursed expenses as follows:
| Expense Cap | ||||||||||||||||||||||
Fund | Class | 1/1/2019 - 8/22/2019 | 8/23/2019 - 12/31/2019 | Reimbursed Expenses | (Recouped) Expenses | Expiration of Reimbursed Expenses | ||||||||||||||||
StephensMid-Cap Growth | Institutional | 0.89 | % | 0.89 | % | $ | 130,594 | $ | (8,257 | ) | 2022 | |||||||||||
StephensMid-Cap Growth | Y | 0.99 | % | 0.99 | % | 6,707 | (2,006 | ) | 2022 | |||||||||||||
StephensMid-Cap Growth | Investor | 1.25 | % | 1.25 | % | 7,692 | (3,597 | ) | 2022 | |||||||||||||
StephensMid-Cap Growth | A | 1.29 | % | 1.29 | % | 1,366 | (2,765 | ) | 2022 | |||||||||||||
StephensMid-Cap Growth | C | 2.04 | % | 2.04 | % | 824 | (1,368 | ) | 2022 | |||||||||||||
StephensMid-Cap Growth | R6 | 0.84 | % | 0.84 | % | 6,296 | (319 | ) | 2022 | |||||||||||||
Stephens Small Cap Growth | Institutional | N/A | 0.99 | % | 71,395 | (57,055 | ) | 2022 | ||||||||||||||
Stephens Small Cap Growth | Y | N/A | 1.06 | % | 13,759 | (12,701 | ) | 2022 | ||||||||||||||
Stephens Small Cap Growth | Investor | N/A | 1.31 | % | 10,143 | (10,143 | ) | 2022 | ||||||||||||||
Stephens Small Cap Growth | A | N/A | 1.28 | % | 1,393 | (1,128 | ) | 2022 | ||||||||||||||
Stephens Small Cap Growth | C | N/A | 2.06 | % | 381 | (160 | ) | 2022 | ||||||||||||||
Stephens Small Cap Growth | R6 | 1.05 | %* | 0.95 | % | 2,902 | - | 2022 | ||||||||||||||
* The effective date is 4/30/2019.
Of these amounts, $7,985 and $79,241 were disclosed as a payable to the Manager on the Statements of Assets and Liabilities at December 31, 2019 for the StephensMid-Cap Growth Fund and the Stephens Small Cap Growth Fund, respectively.
The Funds have adopted an Expense Reimbursement Plan whereby the Manager may seek repayment of such fee or voluntary reductions and expense reimbursements. Under the policy, the Manager can be reimbursed by the Funds for any contractual or voluntary fee reductions or expense reimbursements if reimbursement to the Manager (a) occurs within three years from the date of the Manager’s waiver/reimbursement and (b) does not cause the Funds’ annual operating expenses to exceed the lesser of the contractual percentage limit in effect at the time of the waiver/reimbursement or time of recoupment. The reimbursed expenses listed above will expire in 2022. The Funds did not record a liability for potential reimbursements due to the current assessment that reimbursements are unlikely. The carryover of excess expenses potentially reimbursable to the Manager, but not recorded as a liability are as follows:
Fund | Recouped Expenses | Excess Expense Carryover | Expired Expense Carryover | Expiration of Reimbursed Expenses | ||||||||||||
StephensMid-Cap Growth | $ | - | $ | - | $ | 45,832 | 2019 | |||||||||
StephensMid-Cap Growth | 3,272 | 47,779 | - | 2020 | ||||||||||||
StephensMid-Cap Growth | 6,495 | 97,708 | - | 2021 | ||||||||||||
Sales Commissions
The Funds’ Distributor, Resolute Investment Distributors, Inc. (“RID” or “Distributor”), may receive a portion of Class A sales charges from broker dealers which may be used to offset distribution related expenses. During the year ended December 31, 2019, CDSC fees of $3,647 and $666 were collected for the Class A Shares of StephensMid-Cap Growth Fund and Stephens Small Cap Growth Fund, respectively.
A CDSC of 0.50% will be deducted with respect to Class A Shares on certain purchases of $1,000,000 or more that are redeemed in whole or part within 18 months of purchase, unless waived as discussed in the Funds’ Prospectus. Any applicable CDSC will be 0.50% of the lesser of the original purchase price or the value of the redemption of the Class A Shares redeemed. During the year ended December 31, 2019, there were no CDSC fees collected for Class A Shares of the Funds.
29
American Beacon FundsSM
Notes to Financial Statements
December 31, 2019
A CDSC of 1.00% will be deducted with respect to Class C Shares redeemed within 12 months of purchase, unless waived as discussed in the Funds’ Prospectus. Any applicable CDSC will be 1.00% of the lesser of the original purchase price or the value of the redemption of the Class C Shares redeemed. During the year ended December 31, 2019, CDSC fees of $220 and $329 were collected for the Class C Shares of StephensMid-Cap Growth Fund and Stephens Small Cap Growth Fund, respectively.
Trustee Fees and Expenses
Effective January 1, 2020, as compensation for their service to the American Beacon Funds Complex, including the Trust (collectively, the “Trusts”), each Trustee is compensated from the Trusts as follows: (1) an annual retainer of $120,000; (2) meeting attendance fee (for attendance in person or via teleconference) of (a) $12,000 for in person attendance, or $5,000 for telephonic attendance, by Board members for each regularly scheduled or special Board meeting, (b) $2,500 for attendance by Committee members at meetings of the Audit Committee and the Investment Committee, (c) $1,500 for attendance by Committee members at meetings of the Nominating and Governance Committee; and (d) $2,500 for attendance by Board members for each special telephonic Board meeting; and (3) reimbursement of reasonable expenses incurred in attending Board meetings, Committee meetings, and relevant educational seminars. The Trustees also may be compensated for attendance at special Board and/or Committee meetings from time to time. For her service as Board Chair, Ms. Cline receives an additional annual retainer of $50,000. Although she attends several committee meetings at each quarterly Board meeting, she receives only a single $2,500 fee each quarter for her attendance at those meetings. The chairpersons of the Audit Committee and the Investment Committee each receive an additional annual retainer of $25,000 and the Chair of the Nominating and Governance Committee receives an additional annual retainer of $15,000.
3. Security Valuation and Fair Value Measurements
The price of the Fund’s shares is based on its net asset value (“NAV”) per share. The Fund’s NAV is computed by adding total assets, subtracting all the Fund’s liabilities, and dividing the result by the total number of shares outstanding of the Fund or class.
Investments are valued at the close of the New York Stock Exchange (the “Exchange”), normally at 4:00 p.m. Eastern Time, each day that the Exchange is open for business. Equity securities, including exchange-traded funds (“ETFs”) for which market quotations are available are valued at the last sale price or official closing price (closing bid price or last evaluated quote if no sale has occurred) on the primary market or exchange on which they trade.
Investments inopen-end mutual funds are valued at the closing NAV per share of the mutual fund on the day of valuation.
Securities for which the market prices are not readily available or are not reflective of the fair value of the security, as determined by the Manager, will be priced at fair value following procedures approved by the Board.
Other investments, including restricted securities and those financial instruments for which the above valuation procedures are inappropriate or are deemed not to reflect fair value, are stated at fair value, as determined in good faith by the Manager’s Valuation Committee, pursuant to procedures established by the Board.
Valuation Inputs
Various inputs may be used to determine the fair value of the Funds’ investments. These inputs are summarized in three broad levels for financial statement purposes. The inputs or methodologies used to value securities are not necessarily an indication of the risk associated with investing in those securities.
| Level 1 | - | Quoted prices in active markets for identical securities. | ||
| Level 2 | - | Prices determined using other significant observable inputs. These may include quoted prices for similar securities, interest rates, prepayment speeds, credit risk, and others. | ||
| Level 3 | - | Prices determined using other significant unobservable inputs. Unobservable inputs reflect the Fund’s own assumptions about the factors market participants would use in pricing an investment. | ||
30
American Beacon FundsSM
Notes to Financial Statements
December 31, 2019
Level 1 and Level 2 trading assets and trading liabilities, at fair value
Common stocks, preferred securities, ETFs, and financial derivative instruments, such as futures contracts that are traded on a national securities exchange, are stated at the last reported sale or settlement price on the day of valuation. To the extent these securities are actively traded and valuation adjustments are not applied, they are categorized as Level 1 of the fair value hierarchy. Preferred securities and other equities traded on inactive markets or valued by reference to similar instruments are generally categorized as Level 2 of the fair value hierarchy.
Investments in registeredopen-end investment management companies will be valued based upon the NAVs of such investments and are categorized as Level 1 of the fair value hierarchy.
4. Securities and Other Investments
Common Stock
Common stock generally takes the form of shares in a corporation which represent an ownership interest. It ranks below preferred stock and debt securities in claims for dividends and for assets of the company in a liquidation or bankruptcy. The value of a company’s common stock may fall as a result of factors directly relating to that company, such as decisions made by its management or decreased demand for the company’s products or services. A stock’s value may also decline because of factors affecting not just the company, but also companies in the same industry or sector. The price of a company’s stock may also be affected by changes in financial markets that are relatively unrelated to the company, such as changes in interest rates, currency exchange rates or industry regulation. Companies that elect to pay dividends on their common stock generally only do so after they invest in their own business and make required payments to bondholders and on other debt and preferred stock. Therefore, the value of a company’s common stock will usually be more volatile than its bonds, other debt and preferred stock. Common stock may be exchange-traded orover-the-counter (“OTC”). OTC stock may be less liquid than exchange-traded stock.
Other Investment Company Securities and Other Exchange-Traded Products
The Funds at times may invest in shares of other investment companies, including money market funds and ETFs. The Funds may invest in securities of an investment company advised by the Manager or asub-advisor. Investments in the securities of other investment companies may involve duplication of advisory fees and certain other expenses. By investing in another investment company, the Funds become a shareholder of that investment company. As a result, the Funds’ shareholders indirectly will bear the Funds’ proportionate share of the fees and expenses paid by shareholders of the other investment company, in addition to the fees and expenses the Funds’ shareholders directly bear in connection with the Funds’ own operations. These other fees and expenses are reflected as Acquired Fund Fees and Expenses and are included in the Fees and Expenses Table for the Funds in their Prospectus, if applicable. Investments in other investment companies may involve the payment of substantial premiums above the value of such issuer’s portfolio securities.
5. Principal Risks
Investing in the Funds may involve certain risks including, but not limited to, those described below.
Equity Investments Risk
Equity securities are subject to market risk. The Funds’ investments in equity securities may include common stocks, preferred stocks, securities convertible into or exchangeable for common stocks, REITs, depositary receipts, and U.S. dollar-denominated foreign stocks traded on U.S. exchanges. Such investments may expose the
31
American Beacon FundsSM
Notes to Financial Statements
December 31, 2019
Funds to additional risk. The value of a company’s common stock may fall as a result of factors affecting the company, companies in the same industry or sector, or the financial markets overall. Common stock generally is subordinate to preferred stock upon the liquidation or bankruptcy of the issuing company. Preferred stocks and convertible securities are sensitive to movements in interest rates. Preferred stocks may be less liquid than common stocks and, unlike common stocks, participation in the growth of an issuer may be limited. Distributions on preferred stocks generally are payable at the discretion of an issuer and after required payments to bond holders. Convertible securities are subject to the risk that the credit standing of the issuer may have an effect on the convertible securities’ investment value. Investments in REITs are subject to the risks associated with investing in the real estate industry such as adverse developments affecting the real estate industry and real property values. Depositary receipts and U.S. dollar-denominated foreign stocks traded on U.S. exchanges are subject to certain of the risks associated with investing directly in foreign securities, including, but not limited to, currency fluctuations and political and financial instability in the home country of a particular depositary receipt or foreign stock.
Foreign Investing Risk
Non-U.S. investments carry potential risks not associated with U.S. investments. Such risks include, but are not limited to: (1) currency exchange rate fluctuations, (2) political and financial instability, (3) less liquidity, (4) lack of uniform accounting, auditing and financial reporting standards, (5) increased price volatility, (6) different government regulation and supervision of foreign stock exchanges, brokers and listed companies, and (7) delays in transaction settlement in some foreign markets.
Investment Risk
An investment in the Funds is not a deposit with a bank and is not insured or guaranteed by the Federal Deposit Insurance Corporation or any other government agency. When you sell your shares of the Funds, they could be worth less than what you paid for them. Therefore, you may lose money by investing in the Funds.
Market Risk
Conditions in the U.S. and many foreign economies have resulted, and may continue to result, in certain instruments experiencing unusual liquidity issues, increased price volatility and, in some cases, credit downgrades and increased likelihood of default. These events have reduced the willingness and ability of some lenders to extend credit, and have made it more difficult for some borrowers to obtain financing on attractive terms, if at all. In some cases, traditional market participants have been less willing to make a market in some types of debt instruments, which has affected the liquidity of those instruments. During times of market turmoil, investors tend to look to the safety of securities issued or backed by the U.S. Treasury, causing the prices of these securities to rise and the yields to decline. Reduced liquidity in fixed income and credit markets may negatively affect many issuers worldwide. In addition, global economies and financial markets are becoming increasingly interconnected, which increases the possibilities that conditions in one country or region might adversely impact issuers in a different country or region. A rise in protectionist trade policies, and the possibility of changes to some international trade agreements, could affect the economies of many nations, including the United States, in ways that cannot necessarily be foreseen at the present time.
In response to the financial crisis, the U.S. and other governments and the Federal Reserve and certain foreign central banks have taken steps to support financial markets. In some countries where economic conditions are recovering, they are nevertheless perceived as still fragile. Withdrawal of government support, failure of efforts in response to the crisis, or investor perception that such efforts are not succeeding, could adversely impact the value and liquidity of certain securities. The severity or duration of adverse economic conditions may also be affected by policy changes made by governments or quasi-governmental organizations, including changes in tax laws. The impact of new financial regulation legislation on the markets and the practical implications for market participants may not be fully known for some time. Regulatory changes are causing some financial services
32
American Beacon FundsSM
Notes to Financial Statements
December 31, 2019
companies to exit long-standing lines of business, resulting in dislocations for other market participants. In addition, political and governmental events within the U.S. and abroad, such as the U.S. government’s inability at times to agree on a long-term budget and deficit reduction plan, the threat of a federal government shutdown and threats not to increase the federal government’s debt limit, may affect investor and consumer confidence and may adversely impact financial markets and the broader economy, perhaps suddenly and to a significant degree. The U.S. government has reduced the federal corporate income tax rates, and future legislative, regulatory and policy changes may result in more restrictions on international trade, less stringent prudential regulation of certain players in the financial markets, and significant new investments in infrastructure and national defense. Markets may react strongly to expectations about the changes in these policies, which could increase volatility, especially if the markets’ expectations for changes in government policies are not borne out.
Changes in market conditions will not have the same impact on all types of securities. Interest rates have been unusually low in recent years in the U.S. and abroad. Because there is little precedent for this situation, it is difficult to predict the impact of a significant rate increase on various markets. For example, because investors may buy securities or other investments with borrowed money, a significant increase in interest rates may cause a decline in the markets for those investments. Because of the sharp decline in the worldwide price of oil, there is a concern that oil producing nations may withdraw significant assets now held in U.S. Treasuries, which could force a substantial increase in interest rates. Regulators have expressed concern that rate increases may cause investors to sell fixed income securities faster than the market can absorb them, contributing to price volatility. In addition, there is a risk that the prices of goods and services in the U.S. and many foreign economies may decline over time, known as deflation (the opposite of inflation). Deflation may have an adverse effect on stock prices and creditworthiness and may make defaults on debt more likely. If a country’s economy slips into a deflationary pattern, it could last for a prolonged period and may be difficult to reverse.
A rise in protectionist trade policies, risks associated with the United Kingdom’s departure from the European Union on January 31, 2020 and trade agreement negotiations during the transition period, the risk of a trade dispute between the United States and China, and the possibility of changes to some international trade agreements, could affect the economies of many nations, including the United States, in ways that cannot necessarily be foreseen at the present time. The severity or duration of adverse economic conditions may also be affected by policy changes made by governments or quasi-governmental organizations. In addition, political and governmental events within the U.S. and abroad may affect investor and consumer confidence and may adversely impact financial markets and the broader economy, perhaps suddenly and to a significant degree.
Other Investment Companies Risk
The Funds may invest in shares of other registered investment companies, including money market funds and exchange-traded funds (“ETFs”). To the extent that the Funds invest in shares of other registered investment companies, the Funds will indirectly bear the fees and expenses, including for example, advisory and administrative fees, charged by those investment companies in addition to the Funds’ direct fees and expenses and will be subject to the risks associated with investments in those companies. For example, the Funds’ investments in money market funds are subject to interest rate risk, credit risk, and market risk. The Funds must rely on the investment company in which it invests to achieve its investment objective. If the investment company fails to achieve its investment objective, the value of the Funds’ investment may decline, adversely affecting the Funds’ performance. ETFs are subject to the following risks that do not apply to conventional funds: (1) the market price of an ETF’s shares may trade at a discount or premium to its NAV; (2) an active trading market for an ETF’s shares may not develop or be maintained; or (3) trading of an ETF’s shares may be halted if the listing exchange’s officials deem such action appropriate, the shares are delisted from the exchange, or the activation of market-wide “circuit breakers” (which are tied to large decreases in stock prices) halts stock trading generally. An ETF that tracks an index may not precisely replicate the returns of its benchmark index. To the extent the Funds invest in other investment companies that invest in equity securities, fixed-income securities and/or foreign securities, or that track an index, the Funds are subject to the risks associated with the underlying investments held by the investment company or the index fluctuations to which the investment company is subject. ETFs have expenses associated with their operation, typically including advisory fees.
33
American Beacon FundsSM
Notes to Financial Statements
December 31, 2019
Sector Risk
Sector risk is the risk associated with a Fund holding a significant amount of investments in similar businesses, which would be similarly affected by particular economic or market events, which may, in certain circumstances, cause the value of the equity and debt securities of companies in a particular sector of the market to change. To the extent a Fund has substantial holdings within a particular sector, the risks to a Fund associated with that sector increase.
To the extent a Fund invests significantly in the financial services sector, the value of the Fund’s shares may be particularly vulnerable to factors affecting that sector, such as the availability and cost of capital funds, changes in interest rates, the rate of corporate and consumer debt defaults, extensive government regulation and price competition. The value of a Fund’s shares could experience significantly greater volatility than investment companies investing more broadly.
Securities Lending Risk
A Fund may lend its portfolio securities to brokers, dealers and financial institutions to seek income. There is a risk that a borrower may default on its obligations to return loaned securities; however, a Fund’s securities lending agent indemnifies the Fund against that risk. There is a risk that the assets of a Fund’s securities lending agent may be insufficient to satisfy any contractual indemnification requirements to the Fund. Borrowers of a Fund’s securities typically provide collateral in the form of cash that is reinvested in securities. A Fund will be responsible for the risks associated with the investment of cash collateral, including any collateral invested in an affiliated money market fund. A Fund may lose money on its investment of cash collateral or may fail to earn sufficient income on its investment to meet obligations to the borrower. In addition, delays may occur in the recovery of securities from borrowers, which could interfere with a Fund’s ability to vote proxies or to settle transactions and there is the risk of possible loss of rights in the collateral should the borrower fail financially. In any case in which the loaned securities are not returned to the Fund before anex-dividend date, the payment in lieu of the dividend that the Fund receives from the securities’ borrower would not be treated as a dividend for federal income tax purposes and thus would not qualify for treatment as “qualified dividend income”.
Offsetting Assets and Liabilities
The Funds are parties to enforceable master netting agreements between brokers and counterparties which provide for the right to offset under certain circumstances. The Funds employ multiple money managers and counterparties and have elected not to offset qualifying financial and derivative instruments on the Statements of Assets and Liabilities, as such all financial and derivative instruments are presented on a gross basis. The impacts of netting arrangements that provide the right to offset are detailed below. The net amount represents the net receivable or payable that would be due from or to the counterparty in the event of default. Exposure from borrowings and other financing agreements such as repurchase agreements can only be netted across transactions governed by the same Master Agreement with the same legal entity. All amounts reported below represent the balance as of the report date, December 31, 2019.
StephensMid-Cap Growth Fund
| Remaining Contractual Maturity of the Agreements As of December 31, 2019 | ||||||||||||||||||||||||||||||||||||
| Overnight and Continuous | <30 days | Between 30 & 90 days | >90 days | Total | ||||||||||||||||||||||||||||||||
Securities Lending Transactions |
| |||||||||||||||||||||||||||||||||||
Common Stocks | $ | 1,361,768 | $ | - | $ | - | $ | - | $ | 1,361,768 | ||||||||||||||||||||||||||
|
|
|
|
|
|
|
|
|
| |||||||||||||||||||||||||||
Total Borrowings | $ | 1,361,768 | $ | - | $ | - | $ | - | $ | 1,361,768 | ||||||||||||||||||||||||||
|
|
|
|
|
|
|
|
|
| |||||||||||||||||||||||||||
Gross amount of recognized liabilities for securities lending transactions |
| $ | 1,361,768 | |||||||||||||||||||||||||||||||||
|
| |||||||||||||||||||||||||||||||||||
34
American Beacon FundsSM
Notes to Financial Statements
December 31, 2019
Stephens Small Cap Growth Fund
| Remaining Contractual Maturity of the Agreements As of December 31, 2019 | ||||||||||||||||||||||||||||||||||||
| Overnight and Continuous | <30 days | Between 30 & 90 days | >90 days | Total | ||||||||||||||||||||||||||||||||
Securities Lending Transactions |
| |||||||||||||||||||||||||||||||||||
Common Stocks | $ | 6,159,911 | $ | - | $ | - | $ | - | $ | 6,159,911 | ||||||||||||||||||||||||||
|
|
|
|
|
|
|
|
|
| |||||||||||||||||||||||||||
Total Borrowings | $ | 6,159,911 | $ | - | $ | - | $ | - | $ | 6,159,911 | ||||||||||||||||||||||||||
|
|
|
|
|
|
|
|
|
| |||||||||||||||||||||||||||
Gross amount of recognized liabilities for securities lending transactions |
| $ | 6,159,911 | |||||||||||||||||||||||||||||||||
|
| |||||||||||||||||||||||||||||||||||
6. Federal Income and Excise Taxes
It is the policy of each Fund to qualify as a regulated investment company (“RIC”), by complying with all applicable provisions of Subchapter M of the Internal Revenue Code, as amended, and to make distributions of taxable income sufficient to relieve it from substantially all federal income and excise taxes. For federal income tax purposes, each Fund is treated as a single entity for the purpose of determining such qualification.
The Funds do not have any unrecorded tax liabilities in the accompanying financial statements. Each of the tax years in the four year period ended December 31, 2019 remain subject to examination by the Internal Revenue Service. If applicable, the Funds recognize interest accrued related to unrecognized tax benefits in interest expense and penalties in “Other expenses” on the Statements of Operations.
The Funds may be subject to taxes imposed by countries in which it invests. Such taxes are generally based on returns of income earned or gains realized or repatriated. Taxes are accrued and applied to net investment income, net realized capital gains and net unrealized appreciation (depreciation), as applicable, as the income is earned or capital gains are recorded.
The tax character of distributions paid were as follows:
| StephensMid-Cap Growth Fund | Stephens Small Cap Growth Fund | |||||||||||||||||||||||||||
| Year Ended December 31, 2019 | Year Ended December 31, 2018 | Year Ended December 31, 2019 | Year Ended December 31, 2018 | |||||||||||||||||||||||||
Distributions paid from: | ||||||||||||||||||||||||||||
Long-term capital gains | ||||||||||||||||||||||||||||
Institutional Class | $ | 8,147,853 | $ | 5,425,780 | $ | 24,776,590 | $ | 76,595,283 | ||||||||||||||||||||
Y Class | 894,750 | 757,041 | 5,801,234 | 18,278,992 | ||||||||||||||||||||||||
Investor Class | 514,984 | 1,251,731 | 6,756,362 | 16,618,636 | ||||||||||||||||||||||||
A Class | 226,381 | 1,124,545 | 558,550 | 1,689,188 | ||||||||||||||||||||||||
C Class | 120,145 | 144,407 | 99,376 | 366,743 | ||||||||||||||||||||||||
R6 Class | 493,965 | - | 779,978 | - | ||||||||||||||||||||||||
|
|
|
|
|
|
|
| |||||||||||||||||||||
Total distributions paid | $ | 10,398,078 | $ | 8,703,504 | $ | 38,772,090 | $ | 113,548,842 | ||||||||||||||||||||
|
|
|
|
|
|
|
| |||||||||||||||||||||
* For tax purposes, short-term gains are considered ordinary income distributions.
As of December 31, 2019, the components of distributable earnings (deficits) on a tax basis were as follows:
Fund | Tax Cost | Unrealized Appreciation | Unrealized (Depreciation) | Net Unrealized Appreciation (Depreciation) | ||||||||||||||||||||||||
| StephensMid-Cap Growth | $ | 284,137,117 | $ | 74,009,640 | $ | (6,930,256 | ) | $ | 67,079,384 | |||||||||||||||||||
| Stephens Small Cap Growth | 231,914,756 | 165,936,707 | (9,434,432 | ) | 156,502,275 | |||||||||||||||||||||||
35
American Beacon FundsSM
Notes to Financial Statements
December 31, 2019
Fund | Net Unrealized Appreciation (Depreciation) | Undistributed Ordinary Income | Undistributed Long-Term Capital Gains | Accumulated Capital and Other (Losses) | Other Temporary Differences | Distributable Earnings | ||||||||||||||||||||||||||||||||||||||
| StephensMid-Cap Growth | $ | 67,079,384 | $ | – | $ | – | $ | (157,906 | ) | $ | – | $ | 66,921,478 | |||||||||||||||||||||||||||||||
| Stephens Small Cap Growth | 156,502,275 | – | 7,436,005 | – | – | 163,938,280 | ||||||||||||||||||||||||||||||||||||||
Financial reporting records are adjusted for permanent book/tax differences to reflect tax character. Financial records are not adjusted for temporary differences. The temporary differences between financial reporting andtax-basis reporting of unrealized appreciation (depreciation) are attributable primarily to the tax deferral of losses from wash sales and the tax deferral of post-October net capital losses.
Due to inherent differences in the recognition of income, expenses, and realized gains (losses) under U.S. GAAP and federal income tax regulations, permanent differences between book and tax reporting have been identified and appropriately reclassified on the Statements of Assets and Liabilities.
Accordingly, the following amounts represent current year permanent differences derived fromnon-utilization of net operating losses as of December 31, 2019:
Fund | Paid-In-Capital | Distributable Earnings/ (Deficits) | ||||||||||
| StephensMid-Cap Growth | $ | (1,246,316 | ) | $ | 1,246,316 | |||||||
| Stephens Small Cap Growth | (3,632,849 | ) | 3,632,849 | |||||||||
Under the Regulated Investment Company Modernization Act of 2010 (“RIC MOD”), net capital losses recognized by the Funds in taxable years beginning after December 22, 2010 are carried forward indefinitely and retain their character as short-term and/or long-term losses.
As of December 31, 2019, the Funds did not have any capital loss carryforwards.
The Funds are permitted for tax purposes to defer into the next fiscal year qualified late year losses. Qualified late year capital losses are net losses incurred after October 31 through the Fund’s fiscal year end, December 31, 2019. Qualified late year ordinary losses are specified losses generally incurred after October 31 through the end of the Fund’s fiscal year end, December 31, 2019. For the period ending December 31, 2019, Stephens Mid-Cap Growth deferred $417,817 short-term capital losses and $259,711 long-term capital gains for a net capital loss deferral of $157,906 to January 1, 2020.
7. Investment Transactions
The aggregate cost of purchases and proceeds from sales and maturities of investments, other than short-term obligations, for the year ended December 31, 2019 were as follows:
Fund | Purchases(non-U.S. Government Securities) | Sales(non-U.S. Government Securities) | ||||||||||
| StephensMid-Cap Growth | $ | 212,842,556 | $ | 34,896,597 | ||||||||
| Stephens Small Cap Growth | 77,793,028 | 139,527,947 | ||||||||||
A summary of the Funds’ transactions in the USG Select Fund for the year ended December 31, 2019 are as follows:
Fund | Type of Transaction | December 31, 2018 Shares/Fair Value | Purchases | Sales | December 31, 2019 Shares/Fair Value | Dividend Income | ||||||||||||||||||||||||||||||||||||
| StephensMid-Cap Growth | Direct | $ | 1,239,434 | $ | 186,460,348 | $ | 179,475,343 | $ | 8,224,439 | $ | 184,565 | |||||||||||||||||||||||||||||||
| StephensMid-Cap Growth | Securities Lending | 1,055,421 | 30,232,954 | 29,926,607 | 1,361,768 | N/A | ||||||||||||||||||||||||||||||||||||
| Stephens Small Cap Growth | Direct | - | 106,111,290 | 105,375,423 | 735,867 | 185,311 | ||||||||||||||||||||||||||||||||||||
| Stephens Small Cap Growth | Securities Lending | 11,354,466 | 71,979,207 | 77,173,762 | 6,159,911 | N/A | ||||||||||||||||||||||||||||||||||||
36
American Beacon FundsSM
Notes to Financial Statements
December 31, 2019
8. Securities Lending
The Funds may lend their securities to qualified financial institutions, such as certain broker-dealers, to earn additional income. The borrowers are required to secure their loans continuously with collateral in an amount at least equal to the fair value of the securities loaned, initially in an amount at least equal to 102% of the fair value of domestic securities loaned and 105% of the fair value of international securities loaned. Collateral is monitored andmarked-to-market daily. Dailymark-to-market amounts are required to be paid to the borrower or received from the borrower by the end of the following business day. This one day settlement formark-to-market amounts may result in the collateral being temporarily less than the value of the securities on loan or temporarily more than the required minimum collateral.
To the extent that a loan is collateralized by cash, such cash collateral shall be invested by the securities lending agent (the “Agent”) in money market mutual funds and other short-term investments, provided the investments meet certain quality and diversification requirements. Securities purchased with cash collateral proceeds are listed in the Funds’ Schedule of Investments and the collateral is shown on the Statements of Assets and Liabilities as a payable.
Securities lending income is generated from the demand premium (if any) paid by the borrower to borrow a specific security and from the return on investment of cash collateral, reduced by negotiated rebate fees paid to the borrower and transaction costs. To the extent that a loan is secured bynon-cash collateral, securities lending income is generated as a demand premium reduced by transaction costs. The Funds, the Agent, and the Manager retained 80%, 10%, and 10%, respectively, of the income generated from securities lending.
While securities are on loan, the Funds continue to receive certain income associated with that security and any gain or loss in the market price that may occur during the term of the loan. In the case of domestic equities, the value of any dividend is received in the form of a substitute payment approximately equal to the dividend. In the case of foreign securities, a negotiated amount is received that is less than the actual dividend, but higher than the dividend amount minus the foreign tax that the Funds would be subject to on the dividend.
Securities lending transactions pose certain risks to the Funds, including that the borrower may not provide additional collateral when required or return the securities when due, that the value of the short-term investments will be less than the amount of cash collateral required to be returned to the borrower, thatnon-cash collateral may be subject to legal constraints in the event of a borrower bankruptcy, and that the cash collateral investments could become illiquid and unable to be used to return collateral to the borrower. The Funds could also experience delays and costs in gaining access to the collateral. The Funds bear the risk of any deficiency in the amount of the cash collateral available for return to the borrower and any action which impairs its ability to liquidatenon-cash collateral to satisfy a borrower default.
As of December 31, 2019, the value of outstanding securities on loan and the value of collateral were as follows:
Fund | Market Value of Securities on Loan | Cash Collateral Received | Non-Cash Collateral Received | Total Collateral Received | ||||||||||||||||||||||||||||
| StephensMid-Cap Growth | $ | 17,720,483 | $ | 1,361,768 | $ | 16,685,431 | $ | 18,047,199 | ||||||||||||||||||||||||
| Stephens Small Cap Growth | 47,096,107 | 6,159,911 | 42,138,697 | 48,298,608 | ||||||||||||||||||||||||||||
Cash collateral is listed on the Funds’ Schedules of Investments and is shown on the Statements of Assets and Liabilities. Income earned on these investments is included in “Income derived from securities lending” on the Statements of Operations.
Non-cash collateral received by the Funds may not be sold orre-pledged except to satisfy a borrower default. Therefore,non-cash collateral is not included on the Funds’ Schedules of Investments or Statements of Assets and Liabilities.
37
American Beacon FundsSM
Notes to Financial Statements
December 31, 2019
9. Borrowing Arrangements
Effective November 14, 2019 (the “Effective Date”), the Funds, along with certain other funds managed by the Manager (“Participating Funds”), entered into a committed revolving line of credit (the “Committed Line”) agreement with State Street Bank and Trust Company (the “Bank”) to be used to facilitate portfolio liquidity. The maximum borrowing amount under the Committed Line is $250 million with interest at a rate equal to the higher of(a) one-month London Inter-Bank Offered Rate (“LIBOR”) plus 1.25% per annum or (b) the Federal Funds rate plus 1.25% per annum on amounts borrowed. Each of the Participating Funds paid a closing fee of $100,000 on the Effective Date and a quarterly commitment fee at a rate of 0.25% per annum on the unused portion of the Committed Line amount. The Committed Line expires November 12, 2020, unless extended by the Bank or terminated by the Participating Funds in accordance with the agreement.
On the Effective Date, the Funds, along with certain other Participating Funds managed by the Manager, also entered into an uncommitted discretionary demand revolving line of credit (the “Uncommitted Line”) agreement with the Bank to be used to facilitate portfolio liquidity. The maximum borrowing amount under the Uncommitted Line is $50 million with interest at a rate equal to the higher of(a) one-month LIBOR plus 1.25% per annum or (b) the Federal Funds rate plus 1.25% per annum on each outstanding loan. Each of the Participating Funds paid a closing fee of $35,000 on the Effective Date. The Uncommitted Line expires November 12, 2020 unless extended by the Bank or terminated by the Participating Funds in accordance with the agreement.
The Participating Funds paid administration, legal and arrangement fees, which are recognized as a component of “Other expenses” on the Statements of Operations, along with commitment fees, that have been allocated among the Participating Funds based on average daily net assets.
During the year ended December 31, 2019, the Funds did not utilize this facility.
10. Capital Share Transactions
The tables below summarize the activity in capital shares for each Class of the Funds:
| Institutional Class | ||||||||||||||||||||||||||||
| Year Ended December 31, | ||||||||||||||||||||||||||||
| 2019 | 2018 | |||||||||||||||||||||||||||
StephensMid-Cap Growth Fund | Shares | Amount | Shares | Amount | ||||||||||||||||||||||||
| Shares sold | 8,675,357 | $ | 225,809,554 | 2,358,949 | $ | 58,811,049 | ||||||||||||||||||||||
| Reinvestment of dividends | 202,603 | 5,527,012 | 250,100 | 5,174,568 | ||||||||||||||||||||||||
| Shares redeemed | (2,152,234 | ) | (56,451,107 | ) | (1,809,263 | ) | (42,838,051 | ) | ||||||||||||||||||||
|
|
|
|
|
|
|
| |||||||||||||||||||||
| Net increase in shares outstanding | 6,725,726 | $ | 174,885,459 | 799,786 | $ | 21,147,566 | ||||||||||||||||||||||
|
|
|
|
|
|
|
| |||||||||||||||||||||
| Y Class | ||||||||||||||||||||||||||||
| Year Ended December 31, | ||||||||||||||||||||||||||||
| 2019 | 2018 | |||||||||||||||||||||||||||
StephensMid-Cap Growth Fund | Shares | Amount | Shares | Amount | ||||||||||||||||||||||||
| Shares sold | 790,607 | $ | 20,551,345 | 299,355 | $ | 7,427,070 | ||||||||||||||||||||||
| Reinvestment of dividends | 32,440 | 877,828 | 36,061 | 741,056 | ||||||||||||||||||||||||
| Shares redeemed | (175,915 | ) | (4,550,758 | ) | (101,782 | ) | (2,476,639 | ) | ||||||||||||||||||||
|
|
|
|
|
|
|
| |||||||||||||||||||||
| Net increase in shares outstanding | 647,132 | $ | 16,878,415 | 233,634 | $ | 5,691,487 | ||||||||||||||||||||||
|
|
|
|
|
|
|
| |||||||||||||||||||||
| Investor Class | ||||||||||||||||||||||||||||
| Year Ended December 31, | ||||||||||||||||||||||||||||
| 2019 | 2018 | |||||||||||||||||||||||||||
StephensMid-Cap Growth Fund | Shares | Amount | Shares | Amount | ||||||||||||||||||||||||
| Shares sold | 172,721 | $ | 3,681,388 | 438,488 | $ | 9,927,938 | ||||||||||||||||||||||
| Reinvestment of dividends | 19,375 | 438,838 | 69,860 | 1,211,364 | ||||||||||||||||||||||||
| Shares redeemed | (341,010 | ) | (7,338,963 | ) | (473,243 | ) | (10,248,837 | ) | ||||||||||||||||||||
|
|
|
|
|
|
|
| |||||||||||||||||||||
| Net increase (decrease) in shares outstanding | (148,914 | ) | $ | (3,218,737 | ) | 35,105 | $ | 890,465 | ||||||||||||||||||||
|
|
|
|
|
|
|
| |||||||||||||||||||||
38
American Beacon FundsSM
Notes to Financial Statements
December 31, 2019
| A Class | ||||||||||||||||||||||||||||
| Year Ended December 31, | ||||||||||||||||||||||||||||
| 2019 | 2018 | |||||||||||||||||||||||||||
StephensMid-Cap Growth Fund | Shares | Amount | Shares | Amount | ||||||||||||||||||||||||
| Shares sold | 31,021 | $ | 658,147 | 33,452 | $ | 726,471 | ||||||||||||||||||||||
| Reinvestment of dividends | 9,533 | 214,761 | 64,851 | 1,119,326 | ||||||||||||||||||||||||
| Shares redeemed | (446,487 | ) | (9,791,483 | ) | (130,372 | ) | (2,604,564 | ) | ||||||||||||||||||||
|
|
|
|
|
|
|
| |||||||||||||||||||||
| Net (decrease) in shares outstanding | (405,933 | ) | $ | (8,918,575 | ) | (32,069 | ) | $ | (758,767 | ) | ||||||||||||||||||
|
|
|
|
|
|
|
| |||||||||||||||||||||
| C Class | ||||||||||||||||||||||||||||
| Year Ended December 31, | ||||||||||||||||||||||||||||
| 2019 | 2018 | |||||||||||||||||||||||||||
StephensMid-Cap Growth Fund | Shares | Amount | Shares | Amount | ||||||||||||||||||||||||
| Shares sold | 37,065 | $ | 739,652 | 63,297 | $ | 1,087,338 | ||||||||||||||||||||||
| Reinvestment of dividends | 5,693 | 118,930 | 8,748 | 141,461 | ||||||||||||||||||||||||
| Shares redeemed | (34,804 | ) | (707,333 | ) | (29,360 | ) | (587,064 | ) | ||||||||||||||||||||
|
|
|
|
|
|
|
| |||||||||||||||||||||
| Net increase in shares outstanding | 7,954 | $ | 151,249 | 42,685 | $ | 641,735 | ||||||||||||||||||||||
|
|
|
|
|
|
|
| |||||||||||||||||||||
| R6 Class | ||||||||||||||||||||||||||||
| Year Ended December 31, 2019 | Period Ended December 31, 2018A | |||||||||||||||||||||||||||
StephensMid-Cap Growth Fund | Shares | Amount | Shares | Amount | ||||||||||||||||||||||||
| Shares sold | 661,501 | $ | 17,468,021 | 4,710 | $ | 100,000 | ||||||||||||||||||||||
| Reinvestment of dividends | 18,107 | 493,965 | - | - | ||||||||||||||||||||||||
| Shares redeemed | (56,055 | ) | (1,491,557 | ) | - | - | ||||||||||||||||||||||
|
|
|
|
|
|
|
| |||||||||||||||||||||
| Net increase in shares outstanding | 623,553 | $ | 16,470,429 | 4,710 | $ | 100,000 | ||||||||||||||||||||||
|
|
|
|
|
|
|
| |||||||||||||||||||||
| Institutional Class | ||||||||||||||||||||||||||||
| Year Ended December 31, | ||||||||||||||||||||||||||||
| 2019 | 2018 | |||||||||||||||||||||||||||
Stephens Small Cap Growth Fund | Shares | Amount | Shares | Amount | ||||||||||||||||||||||||
| Shares sold | 5,384,052 | $ | 86,839,870 | 3,867,303 | $ | 82,471,413 | ||||||||||||||||||||||
| Reinvestment of dividends | 1,388,810 | 21,540,446 | 4,704,001 | 63,362,893 | ||||||||||||||||||||||||
| Shares redeemed | (8,744,493 | ) | (143,573,984 | ) | (13,532,203 | ) | (291,145,177 | ) | ||||||||||||||||||||
|
|
|
|
|
|
|
| |||||||||||||||||||||
| Net (decrease) in shares outstanding | (1,971,631 | ) | $ | (35,193,668 | ) | (4,960,899 | ) | $ | (145,310,871 | ) | ||||||||||||||||||
|
|
|
|
|
|
|
| |||||||||||||||||||||
| Y Class | ||||||||||||||||||||||||||||
| Year Ended December 31, | ||||||||||||||||||||||||||||
| 2019 | 2018 | |||||||||||||||||||||||||||
Stephens Small Cap Growth Fund | Shares | Amount | Shares | Amount | ||||||||||||||||||||||||
| Shares sold | 1,273,740 | $ | 20,210,164 | 882,266 | $ | 18,176,645 | ||||||||||||||||||||||
| Reinvestment of dividends | 376,731 | 5,782,821 | 1,361,228 | 18,172,394 | ||||||||||||||||||||||||
| Shares redeemed | (1,174,453 | ) | (19,042,416 | ) | (3,157,113 | ) | (57,685,578 | ) | ||||||||||||||||||||
|
|
|
|
|
|
|
| |||||||||||||||||||||
| Net increase (decrease) in shares outstanding | 476,018 | $ | 6,950,569 | (913,619 | ) | $ | (21,336,539 | ) | ||||||||||||||||||||
|
|
|
|
|
|
|
| |||||||||||||||||||||
| Investor Class | ||||||||||||||||||||||||||||
| Year Ended December 31, | ||||||||||||||||||||||||||||
| 2019 | 2018 | |||||||||||||||||||||||||||
Stephens Small Cap Growth Fund | Shares | Amount | Shares | Amount | ||||||||||||||||||||||||
| Shares sold | 1,698,303 | $ | 24,963,869 | 1,652,665 | $ | 34,553,602 | ||||||||||||||||||||||
| Reinvestment of dividends | 486,439 | 6,712,856 | 1,355,706 | 16,485,380 | ||||||||||||||||||||||||
| Shares redeemed | (1,719,250 | ) | (25,032,031 | ) | (1,734,700 | ) | (34,493,228 | ) | ||||||||||||||||||||
|
|
|
|
|
|
|
| |||||||||||||||||||||
| Net increase in shares outstanding | 465,492 | $ | 6,644,694 | 1,273,671 | $ | 16,545,754 | ||||||||||||||||||||||
|
|
|
|
|
|
|
| |||||||||||||||||||||
| A Class | ||||||||||||||||||||||||||||
| Year Ended December 31, | ||||||||||||||||||||||||||||
| 2019 | 2018 | |||||||||||||||||||||||||||
Stephens Small Cap Growth Fund | Shares | Amount | Shares | Amount | ||||||||||||||||||||||||
| Shares sold | 6,838 | $ | 100,116 | 140,666 | $ | 2,978,897 | ||||||||||||||||||||||
| Reinvestment of dividends | 41,028 | 557,564 | 140,687 | 1,686,836 | ||||||||||||||||||||||||
| Shares redeemed | (114,496 | ) | (1,637,069 | ) | (167,136 | ) | (3,468,914 | ) | ||||||||||||||||||||
|
|
|
|
|
|
|
| |||||||||||||||||||||
| Net increase (decrease) in shares outstanding | (66,630 | ) | $ | (979,389 | ) | 114,217 | $ | 1,196,819 | ||||||||||||||||||||
|
|
|
|
|
|
|
| |||||||||||||||||||||
39
American Beacon FundsSM
Notes to Financial Statements
December 31, 2019
| C Class | ||||||||||||||||||||||||||||
| Year Ended December 31, | ||||||||||||||||||||||||||||
| 2019 | 2018 | |||||||||||||||||||||||||||
Stephens Small Cap Growth Fund | Shares | Amount | Shares | Amount | ||||||||||||||||||||||||
| Shares sold | 4,620 | $ | 61,033 | 26,426 | $ | 477,422 | ||||||||||||||||||||||
| Reinvestment of dividends | 7,326 | 89,667 | 31,847 | 350,949 | ||||||||||||||||||||||||
| Shares redeemed | (40,521 | ) | (536,232 | ) | (21,527 | ) | (358,506 | ) | ||||||||||||||||||||
|
|
|
|
|
|
|
| |||||||||||||||||||||
| Net increase (decrease) in shares outstanding | (28,575 | ) | $ | (385,532 | ) | 36,746 | $ | 469,865 | ||||||||||||||||||||
|
|
|
|
|
|
|
| |||||||||||||||||||||
| R6 Class | ||||||||||||||||||||||||||||
| Period Ended December 31, 2019B | ||||||||||||||||||||||||||||
Stephens Small Cap Growth Fund | Shares | Amount | ||||||||||||||||||||||||||
| Shares sold | 484,218 | $ | 8,111,594 | |||||||||||||||||||||||||
| Reinvestment of dividends | 49,675 | 770,452 | ||||||||||||||||||||||||||
| Shares redeemed | (5,914 | ) | (91,721 | ) | ||||||||||||||||||||||||
|
|
|
| |||||||||||||||||||||||||
| Net increase in shares outstanding | 527,979 | $ | 8,790,325 | |||||||||||||||||||||||||
|
|
|
| |||||||||||||||||||||||||
A Class launched on December 31, 2018 and commenced operations on January 2, 2019 (Note 1).
B Class launched on April 30,2019 and commenced operations on May 1, 2019 (Note 1).
11. Subsequent Events
Management has evaluated subsequent events for possible recognition or disclosure in the financial statements through the date the financial statements are issued. Management has determined that there are no material events that would require disclosure in the Funds’ financial statements through this date.
40
American Beacon StephensMid-Cap Growth FundSM
Financial Highlights
(For a share outstanding throughout the period)
Institutional Class | ||||||||||||||||||||||||||||||||||||
Year Ended December 31, | ||||||||||||||||||||||||||||||||||||
| 2019 | 2018 | 2017 | 2016 | 2015 | ||||||||||||||||||||||||||||||||
|
| |||||||||||||||||||||||||||||||||||
Net asset value, beginning of period | $ | 21.23 | $ | 22.45 | $ | 18.29 | $ | 18.11 | $ | 19.24 | ||||||||||||||||||||||||||
|
|
|
|
|
|
|
|
|
| |||||||||||||||||||||||||||
Income (loss) from investment operations: | ||||||||||||||||||||||||||||||||||||
Net investment (loss) | (0.12 | )A | (0.12 | )A | (0.07 | ) | (0.26 | ) | (0.13 | ) | ||||||||||||||||||||||||||
Net gains (losses) on investments (both realized and unrealized) | 6.87 | 0.57 | 5.26 | 1.49 | (0.11 | ) | ||||||||||||||||||||||||||||||
|
|
|
|
|
|
|
|
|
| |||||||||||||||||||||||||||
Total income (loss) from investment operations | 6.75 | 0.45 | 5.19 | 1.23 | (0.24 | ) | ||||||||||||||||||||||||||||||
|
|
|
|
|
|
|
|
|
| |||||||||||||||||||||||||||
Less distributions: | ||||||||||||||||||||||||||||||||||||
Dividends from net investment income | - | - | - | - | - | |||||||||||||||||||||||||||||||
Distributions from net realized gains | (0.81 | ) | (1.67 | ) | (1.03 | ) | (1.05 | ) | (0.89 | ) | ||||||||||||||||||||||||||
|
|
|
|
|
|
|
|
|
| |||||||||||||||||||||||||||
Total distributions | (0.81 | ) | (1.67 | ) | (1.03 | ) | (1.05 | ) | (0.89 | ) | ||||||||||||||||||||||||||
|
|
|
|
|
|
|
|
|
| |||||||||||||||||||||||||||
Net asset value, end of period | $ | 27.17 | $ | 21.23 | $ | 22.45 | $ | 18.29 | $ | 18.11 | ||||||||||||||||||||||||||
|
|
|
|
|
|
|
|
|
| |||||||||||||||||||||||||||
Total returnB | 31.79 | % | 2.20 | % | 28.38 | % | 6.76 | % | (1.23 | )% | ||||||||||||||||||||||||||
|
|
|
|
|
|
|
|
|
| |||||||||||||||||||||||||||
Ratios and supplemental data: | ||||||||||||||||||||||||||||||||||||
Net assets, end of period | $ | 278,175,115 | $ | 74,603,963 | $ | 60,933,913 | $ | 50,451,447 | $ | 76,666,136 | ||||||||||||||||||||||||||
Ratios to average net assets: | ||||||||||||||||||||||||||||||||||||
Expenses, before reimbursements or recoupments | 0.96 | % | 1.04 | % | 1.07 | % | 1.09 | % | 1.01 | % | ||||||||||||||||||||||||||
Expenses, net of reimbursements or recoupmentsC | 0.89 | % | 0.94 | %D | 0.99 | % | 1.00 | % | 0.99 | % | ||||||||||||||||||||||||||
Net investment (loss), before expense reimbursements | (0.52 | )% | (0.60 | )% | (0.36 | )% | (0.60 | )% | (0.54 | )% | ||||||||||||||||||||||||||
Net investment (loss), net of reimbursements | (0.45 | )% | (0.50 | )% | (0.28 | )% | (0.51 | )% | (0.53 | )% | ||||||||||||||||||||||||||
Portfolio turnover rate | 15 | % | 38 | % | 24 | % | 22 | % | 19 | % | ||||||||||||||||||||||||||
| A | Per share amounts have been calculated using the average shares method. |
| B | Based on net asset value, which does not reflect the sales charge, redemption fee, or contingent deferred sales charge, if applicable. May include adjustments in accordance with U.S. GAAP and as such, the net asset value for reporting purposes and the returns based upon those net asset values may differ from the net asset value and returns for shareholder transactions. |
| C | Expense ratios may exceed stated expense caps in Note 2 due to security lending expenses, which are not reimbursable under the agreement with the Manager. |
| D | Expense ratios may exceed stated expense caps in Note 2 due to the change in the contractual expense caps on July 1, 2018. |
See accompanying notes
41
American Beacon StephensMid-Cap Growth FundSM
Financial Highlights
(For a share outstanding throughout the period)
Y Class | ||||||||||||||||||||||||||||||||||||
Year Ended December 31, | ||||||||||||||||||||||||||||||||||||
| 2019 | 2018 | 2017 | 2016 | 2015 | ||||||||||||||||||||||||||||||||
|
| |||||||||||||||||||||||||||||||||||
Net asset value, beginning of period | $ | 21.09 | $ | 22.34 | $ | 18.22 | $ | 18.06 | $ | 19.22 | ||||||||||||||||||||||||||
|
|
|
|
|
|
|
|
|
| |||||||||||||||||||||||||||
Income (loss) from investment operations: | ||||||||||||||||||||||||||||||||||||
Net investment income (loss) | (0.14 | )A | (0.15 | )A | 0.12 | (0.10 | ) | (0.15 | ) | |||||||||||||||||||||||||||
Net gains (losses) on investments (both realized and unrealized) | 6.81 | 0.57 | 5.03 | 1.31 | (0.12 | ) | ||||||||||||||||||||||||||||||
|
|
|
|
|
|
|
|
|
| |||||||||||||||||||||||||||
Total income (loss) from investment operations | 6.67 | 0.42 | 5.15 | 1.21 | (0.27 | ) | ||||||||||||||||||||||||||||||
|
|
|
|
|
|
|
|
|
| |||||||||||||||||||||||||||
Less distributions: | ||||||||||||||||||||||||||||||||||||
Dividends from net investment income | - | - | - | - | - | |||||||||||||||||||||||||||||||
Distributions from net realized gains | (0.81 | ) | (1.67 | ) | (1.03 | ) | (1.05 | ) | (0.89 | ) | ||||||||||||||||||||||||||
|
|
|
|
|
|
|
|
|
| |||||||||||||||||||||||||||
Total distributions | (0.81 | ) | (1.67 | ) | (1.03 | ) | (1.05 | ) | (0.89 | ) | ||||||||||||||||||||||||||
|
|
|
|
|
|
|
|
|
| |||||||||||||||||||||||||||
Net asset value, end of period | $ | 26.95 | $ | 21.09 | $ | 22.34 | $ | 18.22 | $ | 18.06 | ||||||||||||||||||||||||||
|
|
|
|
|
|
|
|
|
| |||||||||||||||||||||||||||
Total returnB | 31.62 | % | 2.08 | % | 28.27 | % | 6.67 | % | (1.39 | )% | ||||||||||||||||||||||||||
|
|
|
|
|
|
|
|
|
| |||||||||||||||||||||||||||
Ratios and supplemental data: | ||||||||||||||||||||||||||||||||||||
Net assets, end of period | $ | 30,544,300 | $ | 10,252,661 | $ | 5,639,207 | $ | 2,510,649 | $ | 2,479,918 | ||||||||||||||||||||||||||
Ratios to average net assets: | ||||||||||||||||||||||||||||||||||||
Expenses, before reimbursements | 1.01 | % | 1.08 | % | 1.11 | % | 1.12 | % | 1.06 | % | ||||||||||||||||||||||||||
Expenses, net of reimbursementsC | 0.99 | % | 1.03 | %D | 1.09 | % | 1.12 | % | 1.09 | % | ||||||||||||||||||||||||||
Net investment (loss), before expense reimbursements | (0.57 | )% | (0.64 | )% | (0.42 | )% | (0.63 | )% | (0.60 | )% | ||||||||||||||||||||||||||
Net investment (loss), net of reimbursements | (0.55 | )% | (0.59 | )% | (0.40 | )% | (0.63 | )% | (0.63 | )% | ||||||||||||||||||||||||||
Portfolio turnover rate | 15 | % | 38 | % | 24 | % | 22 | % | 19 | % | ||||||||||||||||||||||||||
| A | Per share amounts have been calculated using the average shares method. |
| B | Based on net asset value, which does not reflect the sales charge, redemption fee, or contingent deferred sales charge, if applicable. May include adjustments in accordance with U.S. GAAP and as such, the net asset value for reporting purposes and the returns based upon those net asset values may differ from the net asset value and returns for shareholder transactions. |
| C | Expense ratios may exceed stated expense caps in Note 2 due to security lending expenses, which are not reimbursable under the agreement with the Manager. |
| D | Expense ratios may exceed stated expense caps in Note 2 due to the change in the contractual expense caps on July 1, 2018. |
See accompanying notes
42
American Beacon StephensMid-Cap Growth FundSM
Financial Highlights
(For a share outstanding throughout the period)
| Investor Class | ||||||||||||||||||||||||||||||||||||
| Year Ended December 31, | ||||||||||||||||||||||||||||||||||||
| 2019 | 2018 | 2017 | 2016 | 2015 | ||||||||||||||||||||||||||||||||
|
| |||||||||||||||||||||||||||||||||||
Net asset value, beginning of period | $ | 17.80 | $ | 19.15 | $ | 15.77 | $ | 15.80 | $ | 16.97 | ||||||||||||||||||||||||||
|
|
|
|
|
|
|
|
|
| |||||||||||||||||||||||||||
Income (loss) from investment operations: | ||||||||||||||||||||||||||||||||||||
Net investment (loss) | (0.55 | ) | (0.12 | ) | (0.21 | ) | (0.27 | ) | (0.32 | ) | ||||||||||||||||||||||||||
Net gains on investments (both realized and unrealized) | 6.12 | 0.44 | 4.62 | 1.29 | 0.04 | |||||||||||||||||||||||||||||||
|
|
|
|
|
|
|
|
|
| |||||||||||||||||||||||||||
Total income (loss) from investment operations | 5.57 | 0.32 | 4.41 | 1.02 | (0.28 | ) | ||||||||||||||||||||||||||||||
|
|
|
|
|
|
|
|
|
| |||||||||||||||||||||||||||
Less distributions: | ||||||||||||||||||||||||||||||||||||
Dividends from net investment income | - | - | - | - | - | |||||||||||||||||||||||||||||||
Distributions from net realized gains | (0.81 | ) | (1.67 | ) | (1.03 | ) | (1.05 | ) | (0.89 | ) | ||||||||||||||||||||||||||
|
|
|
|
|
|
|
|
|
| |||||||||||||||||||||||||||
Total distributions | (0.81 | ) | (1.67 | ) | (1.03 | ) | (1.05 | ) | (0.89 | ) | ||||||||||||||||||||||||||
|
|
|
|
|
|
|
|
|
| |||||||||||||||||||||||||||
Net asset value, end of period | $ | 22.56 | $ | 17.80 | $ | 19.15 | $ | 15.77 | $ | 15.80 | ||||||||||||||||||||||||||
|
|
|
|
|
|
|
|
|
| |||||||||||||||||||||||||||
Total returnA | 31.28 | % | 1.91 | % | 27.97 | % | 6.42 | % | (1.63 | )% | ||||||||||||||||||||||||||
|
|
|
|
|
|
|
|
|
| |||||||||||||||||||||||||||
Ratios and supplemental data: | ||||||||||||||||||||||||||||||||||||
Net assets, end of period | $ | 14,802,058 | $ | 14,330,547 | $ | 14,749,984 | $ | 13,078,292 | $ | 14,814,940 | ||||||||||||||||||||||||||
Ratios to average net assets: | ||||||||||||||||||||||||||||||||||||
Expenses, before reimbursements | 1.28 | % | 1.28 | % | 1.29 | % | 1.38 | % | 1.32 | % | ||||||||||||||||||||||||||
Expenses, net of reimbursementsB | 1.25 | % | 1.25 | %C | 1.29 | % | 1.38 | % | 1.35 | % | ||||||||||||||||||||||||||
Net investment (loss), before expense reimbursements | (0.84 | )% | (0.86 | )% | (0.58 | )% | (0.89 | )% | (0.85 | )% | ||||||||||||||||||||||||||
Net investment (loss), net of reimbursements | (0.81 | )% | (0.83 | )% | (0.58 | )% | (0.89 | )% | (0.89 | )% | ||||||||||||||||||||||||||
Portfolio turnover rate | 15 | % | 38 | % | 24 | % | 22 | % | 19 | % | ||||||||||||||||||||||||||
| A | Based on net asset value, which does not reflect the sales charge, redemption fee, or contingent deferred sales charge, if applicable. May include adjustments in accordance with U.S. GAAP and as such, the net asset value for reporting purposes and the returns based upon those net asset values may differ from the net asset value and returns for shareholder transactions. |
| B | Expense ratios may exceed stated expense caps in Note 2 due to security lending expenses, which are not reimbursable under the agreement with the Manager. |
| C | Expense ratios may exceed stated expense caps in Note 2 due to the change in the contractual expense caps on July 1, 2018. |
See accompanying notes
43
American Beacon StephensMid-Cap Growth FundSM
Financial Highlights
(For a share outstanding throughout the period)
A Class | ||||||||||||||||||||||||||||||||||||
Year Ended December 31, | ||||||||||||||||||||||||||||||||||||
| 2019 | 2018 | 2017 | 2016 | 2015 | ||||||||||||||||||||||||||||||||
|
| |||||||||||||||||||||||||||||||||||
Net asset value, beginning of period | $ | 17.71 | $ | 19.08 | $ | 15.72 | $ | 15.77 | $ | 16.94 | ||||||||||||||||||||||||||
|
|
|
|
|
|
|
|
|
| |||||||||||||||||||||||||||
Income (loss) from investment operations: | ||||||||||||||||||||||||||||||||||||
Net investment (loss) | (1.94 | ) | (0.24 | ) | (0.28 | ) | (0.14 | ) | (0.20 | ) | ||||||||||||||||||||||||||
Net gains (losses) on investments (both realized and unrealized) | 7.47 | 0.54 | 4.67 | 1.14 | (0.08 | ) | ||||||||||||||||||||||||||||||
|
|
|
|
|
|
|
|
|
| |||||||||||||||||||||||||||
Total income (loss) from investment operations | 5.53 | 0.30 | 4.39 | 1.00 | (0.28 | ) | ||||||||||||||||||||||||||||||
|
|
|
|
|
|
|
|
|
| |||||||||||||||||||||||||||
Less distributions: | ||||||||||||||||||||||||||||||||||||
Dividends from net investment income | - | - | - | - | - | |||||||||||||||||||||||||||||||
Distributions from net realized gains | (0.81 | ) | (1.67 | ) | (1.03 | ) | (1.05 | ) | (0.89 | ) | ||||||||||||||||||||||||||
|
|
|
|
|
|
|
|
|
| |||||||||||||||||||||||||||
Total distributions | (0.81 | ) | (1.67 | ) | (1.03 | ) | (1.05 | ) | (0.89 | ) | ||||||||||||||||||||||||||
|
|
|
|
|
|
|
|
|
| |||||||||||||||||||||||||||
Net asset value, end of period | $ | 22.43 | $ | 17.71 | $ | 19.08 | $ | 15.72 | $ | 15.77 | ||||||||||||||||||||||||||
|
|
|
|
|
|
|
|
|
| |||||||||||||||||||||||||||
Total returnA | 31.22 | % | 1.81 | % | 27.93 | % | 6.30 | % | (1.63 | )% | ||||||||||||||||||||||||||
|
|
|
|
|
|
|
|
|
| |||||||||||||||||||||||||||
Ratios and supplemental data: | ||||||||||||||||||||||||||||||||||||
Net assets, end of period | $ | 6,467,469 | $ | 12,293,695 | $ | 13,854,727 | $ | 13,886,296 | $ | 13,907,563 | ||||||||||||||||||||||||||
Ratios to average net assets: | ||||||||||||||||||||||||||||||||||||
Expenses, before reimbursements | 1.27 | % | 1.33 | % | 1.39 | % | 1.42 | % | 1.36 | % | ||||||||||||||||||||||||||
Expenses, net of reimbursementsB | 1.29 | % | 1.31 | %C | 1.39 | % | 1.41 | % | 1.39 | % | ||||||||||||||||||||||||||
Net investment (loss), before expense reimbursements | (0.84 | )% | (0.91 | )% | (0.67 | )% | (0.92 | )% | (0.90 | )% | ||||||||||||||||||||||||||
Net investment (loss), net of reimbursements | (0.86 | )% | (0.89 | )% | (0.67 | )% | (0.92 | )% | (0.93 | )% | ||||||||||||||||||||||||||
Portfolio turnover rate | 15 | % | 38 | % | 24 | % | 22 | % | 19 | % | ||||||||||||||||||||||||||
| A | Based on net asset value, which does not reflect the sales charge, redemption fee, or contingent deferred sales charge, if applicable. May include adjustments in accordance with U.S. GAAP and as such, the net asset value for reporting purposes and the returns based upon those net asset values may differ from the net asset value and returns for shareholder transactions. |
| B | Expense ratios may exceed stated expense caps in Note 2 due to security lending expenses, which are not reimbursable under the agreement with the Manager. |
| C | Expense ratios may exceed stated expense caps in Note 2 due to the change in the contractual expense caps on July 1, 2018. |
See accompanying notes
44
American Beacon StephensMid-Cap Growth FundSM
Financial Highlights
(For a share outstanding throughout the period)
C Class | ||||||||||||||||||||||||||||||||||||
Year Ended December 31, | ||||||||||||||||||||||||||||||||||||
| 2019 | 2018 | 2017 | 2016 | 2015 | ||||||||||||||||||||||||||||||||
|
| |||||||||||||||||||||||||||||||||||
Net asset value, beginning of period | $ | 16.59 | $ | 18.11 | $ | 15.08 | $ | 15.28 | $ | 16.57 | ||||||||||||||||||||||||||
|
|
|
|
|
|
|
|
|
| |||||||||||||||||||||||||||
Income (loss) from investment operations: | ||||||||||||||||||||||||||||||||||||
Net investment (loss) | (0.25 | ) | (0.33 | )A | (0.11 | ) | (0.60 | ) | (0.17 | ) | ||||||||||||||||||||||||||
Net gains (losses) on investments (both realized and unrealized) | 5.28 | 0.48 | 4.17 | 1.45 | (0.23 | ) | ||||||||||||||||||||||||||||||
|
|
|
|
|
|
|
|
|
| |||||||||||||||||||||||||||
Total income (loss) from investment operations | 5.03 | 0.15 | 4.06 | 0.85 | (0.40 | ) | ||||||||||||||||||||||||||||||
|
|
|
|
|
|
|
|
|
| |||||||||||||||||||||||||||
Less distributions: | ||||||||||||||||||||||||||||||||||||
Dividends from net investment income | - | - | - | - | - | |||||||||||||||||||||||||||||||
Distributions from net realized gains | (0.81 | ) | (1.67 | ) | (1.03 | ) | (1.05 | ) | (0.89 | ) | ||||||||||||||||||||||||||
|
|
|
|
|
|
|
|
|
| |||||||||||||||||||||||||||
Total distributions | (0.81 | ) | (1.67 | ) | (1.03 | ) | (1.05 | ) | (0.89 | ) | ||||||||||||||||||||||||||
|
|
|
|
|
|
|
|
|
| |||||||||||||||||||||||||||
Net asset value, end of period | $ | 20.81 | $ | 16.59 | $ | 18.11 | $ | 15.08 | $ | 15.28 | ||||||||||||||||||||||||||
|
|
|
|
|
|
|
|
|
| |||||||||||||||||||||||||||
Total returnB | 30.31 | % | 1.07 | % | 26.93 | % | 5.52 | % | (2.39 | )% | ||||||||||||||||||||||||||
|
|
|
|
|
|
|
|
|
| |||||||||||||||||||||||||||
Ratios and supplemental data: | ||||||||||||||||||||||||||||||||||||
Net assets, end of period | $ | 3,193,238 | $ | 2,414,400 | $ | 1,862,472 | $ | 1,389,526 | $ | 2,123,334 | ||||||||||||||||||||||||||
Ratios to average net assets: | ||||||||||||||||||||||||||||||||||||
Expenses, before reimbursements | 2.00 | % | 2.07 | % | 2.11 | % | 2.19 | % | 2.11 | % | ||||||||||||||||||||||||||
Expenses, net of reimbursementsC | 2.01 | % | 2.06 | %D | 2.11 | % | 2.18 | % | 2.14 | % | ||||||||||||||||||||||||||
Net investment (loss), before expense reimbursements | (1.56 | )% | (1.64 | )% | (1.40 | )% | (1.70 | )% | (1.65 | )% | ||||||||||||||||||||||||||
Net investment (loss), net of reimbursements | (1.57 | )% | (1.63 | )% | (1.39 | )% | (1.69 | )% | (1.68 | )% | ||||||||||||||||||||||||||
Portfolio turnover rate | 15 | % | 38 | % | 24 | % | 22 | % | 19 | % | ||||||||||||||||||||||||||
| A | Per share amounts have been calculated using the average shares method. |
| B | Based on net asset value, which does not reflect the sales charge, redemption fee, or contingent deferred sales charge, if applicable. May include adjustments in accordance with U.S. GAAP and as such, the net asset value for reporting purposes and the returns based upon those net asset values may differ from the net asset value and returns for shareholder transactions. |
| C | Expense ratios may exceed stated expense caps in Note 2 due to security lending expenses, which are not reimbursable under the agreement with the Manager. |
| D | Expense ratios may exceed stated expense caps in Note 2 due to the change in the contractual expense caps on July 1, 2018. |
See accompanying notes
45
American Beacon StephensMid-Cap Growth FundSM
Financial Highlights
(For a share outstanding throughout the period)
| R6 Class | ||||||||||||
| Year Ended December 31, 2019 | Period EndedA December 31, 2018 | |||||||||||
Net asset value, beginning of period | $ | 21.23 | $ | 21.23 | ||||||||
|
|
|
| |||||||||
Income from investment operations: | ||||||||||||
Net investment income (loss) | (0.05 | ) | - | |||||||||
Net gains on investments (both realized and unrealized) | 6.81 | - | ||||||||||
|
|
|
| |||||||||
Total income from investment operations | 6.76 | - | ||||||||||
|
|
|
| |||||||||
Less distributions: | ||||||||||||
Dividends from net investment income | - | - | ||||||||||
Distributions from net realized gains | (0.81 | ) | - | |||||||||
|
|
|
| |||||||||
Total distributions | (0.81 | ) | - | |||||||||
|
|
|
| |||||||||
Net asset value, end of period | $ | 27.18 | $ | 21.23 | ||||||||
|
|
|
| |||||||||
Total returnB | 31.84 | % | 0.00 | % | ||||||||
|
|
|
| |||||||||
Ratios and supplemental data: | ||||||||||||
Net assets, end of period | $ | 17,073,112 | $ | 100,000 | ||||||||
Ratios to average net assets: | ||||||||||||
Expenses, before reimbursements | 0.92 | % | 0.00 | % | ||||||||
Expenses, net of reimbursementsC | 0.84 | % | 0.00 | % | ||||||||
Net investment income (loss), before expense reimbursements | (0.50 | )% | 0.00 | % | ||||||||
Net investment income (loss), net of reimbursements | (0.42 | )% | 0.00 | % | ||||||||
Portfolio turnover rate | 15 | % | 38 | %D | ||||||||
| A | Class launched on December 31, 2018 and commenced operations on January 2, 2019 (Note 1). |
| B | Based on net asset value, which does not reflect the sales charge, redemption fee, or contingent deferred sales charge, if applicable. May include adjustments in accordance with U.S. GAAP and as such, the net asset value for reporting purposes and the returns based upon those net asset values may differ from the net asset value and returns for shareholder transactions. |
| C | Expense ratios may exceed stated expense caps in Note 2 due to security lending expenses, which are not reimbursable under the agreement with the Manager. |
| D | Not annualized. |
See accompanying notes
46
American Beacon Stephens Small Cap Growth FundSM
Financial Highlights
(For a share outstanding throughout the period)
Institutional Class | ||||||||||||||||||||||||||||||||||||
Year Ended December 31, | ||||||||||||||||||||||||||||||||||||
| 2019 | 2018 | 2017 | 2016 | 2015 | ||||||||||||||||||||||||||||||||
|
| |||||||||||||||||||||||||||||||||||
Net asset value, beginning of period | $ | 13.83 | $ | 19.01 | $ | 16.45 | $ | 15.08 | $ | 16.57 | ||||||||||||||||||||||||||
|
|
|
|
|
|
|
|
|
| |||||||||||||||||||||||||||
Income (loss) from investment operations: | ||||||||||||||||||||||||||||||||||||
Net investment income (loss) | (0.26 | ) | (0.33 | )A | (0.23 | ) | 0.00 | B | (0.13 | ) | ||||||||||||||||||||||||||
Net gains (losses) on investments (both realized and unrealized) | 3.44 | 0.80 | 3.44 | 1.51 | (0.65 | ) | ||||||||||||||||||||||||||||||
|
|
|
|
|
|
|
|
|
| |||||||||||||||||||||||||||
Total income (loss) from investment operations | 3.18 | 0.47 | 3.21 | 1.51 | (0.78 | ) | ||||||||||||||||||||||||||||||
|
|
|
|
|
|
|
|
|
| |||||||||||||||||||||||||||
Less distributions: | ||||||||||||||||||||||||||||||||||||
Dividends from net investment income | - | - | - | - | - | |||||||||||||||||||||||||||||||
Distributions from net realized gains | (1.61 | ) | (5.65 | ) | (0.65 | ) | (0.14 | ) | (0.71 | ) | ||||||||||||||||||||||||||
Tax return of capital | - | - | (0.00 | )C | - | - | ||||||||||||||||||||||||||||||
|
|
|
|
|
|
|
|
|
| |||||||||||||||||||||||||||
Total distributions | (1.61 | ) | (5.65 | ) | (0.65 | ) | (0.14 | ) | (0.71 | ) | ||||||||||||||||||||||||||
|
|
|
|
|
|
|
|
|
| |||||||||||||||||||||||||||
Net asset value, end of period | $ | 15.40 | $ | 13.83 | $ | 19.01 | $ | 16.45 | $ | 15.08 | ||||||||||||||||||||||||||
|
|
|
|
|
|
|
|
|
| |||||||||||||||||||||||||||
Total returnD | 22.92 | % | 3.26 | % | 19.52 | % | 9.98 | % | (4.69 | )% | ||||||||||||||||||||||||||
|
|
|
|
|
|
|
|
|
| |||||||||||||||||||||||||||
Ratios and supplemental data: | ||||||||||||||||||||||||||||||||||||
Net assets, end of period | $ | 244,394,530 | $ | 246,845,478 | $ | 433,520,624 | $ | 450,286,537 | $ | 300,919,215 | ||||||||||||||||||||||||||
Ratios to average net assets: | ||||||||||||||||||||||||||||||||||||
Expenses, before reimbursements or recoupments | 1.08 | % | 1.09 | % | 1.08 | % | 1.09 | % | 1.08 | % | ||||||||||||||||||||||||||
Expenses, net of reimbursements or recoupmentsE | 1.08 | %F | 1.09 | % | 1.08 | % | 1.09 | % | 1.08 | % | ||||||||||||||||||||||||||
Net investment (loss), before expense reimbursements | (0.83 | )% | (0.76 | )% | (0.79 | )% | (0.78 | )% | (0.67 | )% | ||||||||||||||||||||||||||
Net investment (loss), net of reimbursements | (0.83 | )% | (0.76 | )% | (0.79 | )% | (0.78 | )% | (0.67 | )% | ||||||||||||||||||||||||||
Portfolio turnover rate | 20 | % | 16 | % | 22 | % | 40 | % | 25 | % | ||||||||||||||||||||||||||
| A | Includesnon-recurring dividends. Without these dividends, net investment loss per share would have been $ |
| B | Amount represents less than $0.01 per share. |
| C | Tax return of capital is calculated based on outstanding shares at the time of distribution. Amounts are less than $0.01 per share. |
| D | Based on net asset value, which does not reflect the sales charge, redemption fee, or contingent deferred sales charge, if applicable. May include adjustments in accordance with U.S. GAAP and as such, the net asset value for reporting purposes and the returns based upon those net asset values may differ from the net asset value and returns for shareholder transactions. |
| E | Expense ratios may exceed stated expense caps in Note 2 due to security lending expenses, which are not reimbursable under the agreement with the Manager. |
| F | Expense ratios may exceed stated expense caps in Note 2 due to the change in the contractual expense caps on August 23, 2019. |
See accompanying notes
47
American Beacon Stephens Small Cap Growth FundSM
Financial Highlights
(For a share outstanding throughout the period)
Y Class | ||||||||||||||||||||||||||||||||||||
Year Ended December 31, | ||||||||||||||||||||||||||||||||||||
| 2019 | 2018 | 2017 | 2016 | 2015 | ||||||||||||||||||||||||||||||||
|
| |||||||||||||||||||||||||||||||||||
Net asset value, beginning of period | $ | 13.72 | $ | 18.91 | $ | 16.38 | $ | 15.02 | $ | 16.54 | ||||||||||||||||||||||||||
|
|
|
|
|
|
|
|
|
| |||||||||||||||||||||||||||
Income (loss) from investment operations: | ||||||||||||||||||||||||||||||||||||
Net investment (loss) | (0.14 | )A | (0.49 | )B | (0.28 | ) | (0.52 | ) | (0.14 | ) | ||||||||||||||||||||||||||
Net gains (losses) on investments (both realized and unrealized) | 3.27 | 0.95 | 3.46 | 2.02 | (0.67 | ) | ||||||||||||||||||||||||||||||
|
|
|
|
|
|
|
|
|
| |||||||||||||||||||||||||||
Total income (loss) from investment operations | 3.13 | 0.46 | 3.18 | 1.50 | (0.81 | ) | ||||||||||||||||||||||||||||||
|
|
|
|
|
|
|
|
|
| |||||||||||||||||||||||||||
Less distributions: | ||||||||||||||||||||||||||||||||||||
Dividends from net investment income | - | - | - | - | - | |||||||||||||||||||||||||||||||
Distributions from net realized gains | (1.61 | ) | (5.65 | ) | (0.65 | ) | (0.14 | ) | (0.71 | ) | ||||||||||||||||||||||||||
Tax return of capital | - | - | (0.00 | )C | - | - | ||||||||||||||||||||||||||||||
|
|
|
|
|
|
|
|
|
| |||||||||||||||||||||||||||
Total distributions | (1.61 | ) | (5.65 | ) | (0.65 | ) | (0.14 | ) | (0.71 | ) | ||||||||||||||||||||||||||
|
|
|
|
|
|
|
|
|
| |||||||||||||||||||||||||||
Net asset value, end of period | $ | 15.24 | $ | 13.72 | $ | 18.91 | $ | 16.38 | $ | 15.02 | ||||||||||||||||||||||||||
|
|
|
|
|
|
|
|
|
| |||||||||||||||||||||||||||
Total returnD | 22.74 | % | 3.25 | % | 19.42 | % | 9.96 | % | (4.88 | )% | ||||||||||||||||||||||||||
|
|
|
|
|
|
|
|
|
| |||||||||||||||||||||||||||
Ratios and supplemental data: | ||||||||||||||||||||||||||||||||||||
Net assets, end of period | $ | 59,481,096 | $ | 46,998,050 | $ | 82,072,563 | $ | 81,069,652 | $ | 142,980,166 | ||||||||||||||||||||||||||
Ratios to average net assets: | ||||||||||||||||||||||||||||||||||||
Expenses, before reimbursements | 1.14 | % | 1.15 | % | 1.14 | % | 1.15 | % | 1.14 | % | ||||||||||||||||||||||||||
Expenses, net of reimbursementsE | 1.14 | %F | 1.15 | % | 1.14 | % | 1.15 | % | 1.14 | % | ||||||||||||||||||||||||||
Net investment (loss), before expense reimbursements | (0.89 | )% | (0.83 | )% | (0.85 | )% | (0.81 | )% | (0.74 | )% | ||||||||||||||||||||||||||
Net investment (loss), net of reimbursements | (0.89 | )% | (0.83 | )% | (0.85 | )% | (0.81 | )% | (0.74 | )% | ||||||||||||||||||||||||||
Portfolio turnover rate | 20 | % | 16 | % | 22 | % | 40 | % | 25 | % | ||||||||||||||||||||||||||
| A | Per share amounts have been calculated using the average shares method. |
| B | Includesnon-recurring dividends. Without these dividends, net investment loss per share would have been $(0.52). |
| C | Tax return of capital is calculated based on outstanding shares at the time of distribution. Amounts are less than $0.01 per share. |
| D | Based on net asset value, which does not reflect the sales charge, redemption fee, or contingent deferred sales charge, if applicable. May include adjustments in accordance with U.S. GAAP and as such, the net asset value for reporting purposes and the returns based upon those net asset values may differ from the net asset value and returns for shareholder transactions. |
| E | Expense ratios may exceed stated expense caps in Note 2 due to security lending expenses, which are not reimbursable under the agreement with the Manager. |
| F | Expense ratios may exceed stated expense caps in Note 2 due to the change in the contractual expense caps on August 23, 2019. |
See accompanying notes
48
American Beacon Stephens Small Cap Growth FundSM
Financial Highlights
(For a share outstanding throughout the period)
Investor Class | ||||||||||||||||||||||||||||||||||||
Year Ended December 31, | ||||||||||||||||||||||||||||||||||||
| 2019 | 2018 | 2017 | 2016 | 2015 | ||||||||||||||||||||||||||||||||
|
| |||||||||||||||||||||||||||||||||||
Net asset value, beginning of period | $ | 12.49 | $ | 17.77 | $ | 15.45 | $ | 14.20 | $ | 15.71 | ||||||||||||||||||||||||||
|
|
|
|
|
|
|
|
|
| |||||||||||||||||||||||||||
Income (loss) from investment operations: | ||||||||||||||||||||||||||||||||||||
Net investment (loss) | (0.17 | )A | (0.21 | )AB | (0.37 | ) | (0.41 | ) | (0.82 | ) | ||||||||||||||||||||||||||
Net gains on investments (both realized and unrealized) | 2.99 | 0.58 | 3.34 | 1.80 | 0.02 | |||||||||||||||||||||||||||||||
|
|
|
|
|
|
|
|
|
| |||||||||||||||||||||||||||
Total income (loss) from investment operations | 2.82 | 0.37 | 2.97 | 1.39 | (0.80 | ) | ||||||||||||||||||||||||||||||
|
|
|
|
|
|
|
|
|
| |||||||||||||||||||||||||||
Less distributions: | ||||||||||||||||||||||||||||||||||||
Dividends from net investment income | - | - | - | - | - | |||||||||||||||||||||||||||||||
Distributions from net realized gains | (1.61 | ) | (5.65 | ) | (0.65 | ) | (0.14 | ) | (0.71 | ) | ||||||||||||||||||||||||||
Tax return of capital | - | - | (0.00 | )C | - | - | ||||||||||||||||||||||||||||||
|
|
|
|
|
|
|
|
|
| |||||||||||||||||||||||||||
Total distributions | (1.61 | ) | (5.65 | ) | (0.65 | ) | (0.14 | ) | (0.71 | ) | ||||||||||||||||||||||||||
|
|
|
|
|
|
|
|
|
| |||||||||||||||||||||||||||
Net asset value, end of period | $ | 13.70 | $ | 12.49 | $ | 17.77 | $ | 15.45 | $ | 14.20 | ||||||||||||||||||||||||||
|
|
|
|
|
|
|
|
|
| |||||||||||||||||||||||||||
Total returnD | 22.49 | % | 2.93 | % | 19.23 | % | 9.76 | % | (5.08 | )% | ||||||||||||||||||||||||||
|
|
|
|
|
|
|
|
|
| |||||||||||||||||||||||||||
Ratios and supplemental data: | ||||||||||||||||||||||||||||||||||||
Net assets, end of period | $ | 63,799,443 | $ | 52,359,859 | $ | 51,839,469 | $ | 50,544,287 | $ | 55,921,959 | ||||||||||||||||||||||||||
Ratios to average net assets: | ||||||||||||||||||||||||||||||||||||
Expenses, before reimbursements | 1.38 | % | 1.38 | % | 1.29 | % | 1.35 | % | 1.40 | % | ||||||||||||||||||||||||||
Expenses, net of reimbursementsE | 1.38 | %F | 1.38 | % | 1.31 | % | 1.35 | % | 1.39 | % | ||||||||||||||||||||||||||
Net investment (loss), before expense reimbursements | (1.13 | )% | (1.05 | )% | (1.01 | )% | (1.02 | )% | (1.01 | )% | ||||||||||||||||||||||||||
Net investment (loss), net of reimbursements | (1.13 | )% | (1.05 | )% | (1.03 | )% | (1.02 | )% | (1.00 | )% | ||||||||||||||||||||||||||
Portfolio turnover rate | 20 | % | 16 | % | 22 | % | 40 | % | 25 | % | ||||||||||||||||||||||||||
| A | Per share amounts have been calculated using the average shares method. |
| B | Includesnon-recurring dividends. Without these dividends, net investment loss per share would have been $(0.24). |
| C | Tax return of capital is calculated based on outstanding shares at the time of distribution. Amounts are less than $0.01 per share. |
| D | Based on net asset value, which does not reflect the sales charge, redemption fee, or contingent deferred sales charge, if applicable. May include adjustments in accordance with U.S. GAAP and as such, the net asset value for reporting purposes and the returns based upon those net asset values may differ from the net asset value and returns for shareholder transactions. |
| E | Expense ratios may exceed stated expense caps in Note 2 due to security lending expenses, which are not reimbursable under the agreement with the Manager. |
| F | Expense ratios may exceed stated expense caps in Note 2 due to the change in the contractual expense caps on August 23, 2019. |
See accompanying notes
49
American Beacon Stephens Small Cap Growth FundSM
Financial Highlights
(For a share outstanding throughout the period)
A Class | ||||||||||||||||||||||||||||||||||||
Year Ended December 31, | ||||||||||||||||||||||||||||||||||||
| 2019 | 2018 | 2017 | 2016 | 2015 | ||||||||||||||||||||||||||||||||
|
| |||||||||||||||||||||||||||||||||||
Net asset value, beginning of period | $ | 12.32 | $ | 17.59 | $ | 15.32 | $ | 14.10 | $ | 15.61 | ||||||||||||||||||||||||||
|
|
|
|
|
|
|
|
|
| |||||||||||||||||||||||||||
Income (loss) from investment operations: | ||||||||||||||||||||||||||||||||||||
Net investment (loss) | (0.39 | ) | (0.22 | )AB | (0.62 | ) | (0.31 | ) | (0.19 | ) | ||||||||||||||||||||||||||
Net gains (losses) on investments (both realized and unrealized) | 3.17 | 0.60 | 3.54 | 1.67 | (0.61 | ) | ||||||||||||||||||||||||||||||
|
|
|
|
|
|
|
|
|
| |||||||||||||||||||||||||||
Total income (loss) from investment operations | 2.78 | 0.38 | 2.92 | 1.36 | (0.80 | ) | ||||||||||||||||||||||||||||||
|
|
|
|
|
|
|
|
|
| |||||||||||||||||||||||||||
Less distributions: | ||||||||||||||||||||||||||||||||||||
Dividends from net investment income | - | - | - | (0.00 | )C | - | ||||||||||||||||||||||||||||||
Distributions from net realized gains | (1.61 | ) | (5.65 | ) | (0.65 | ) | (0.14 | ) | (0.71 | ) | ||||||||||||||||||||||||||
Tax return of capital | - | - | (0.00 | )C | - | - | ||||||||||||||||||||||||||||||
|
|
|
|
|
|
|
|
|
| |||||||||||||||||||||||||||
Total distributions | (1.61 | ) | (5.65 | ) | (0.65 | ) | (0.14 | ) | (0.71 | ) | ||||||||||||||||||||||||||
|
|
|
|
|
|
|
|
|
| |||||||||||||||||||||||||||
Net asset value, end of period | $ | 13.49 | $ | 12.32 | $ | 17.59 | $ | 15.32 | $ | 14.10 | ||||||||||||||||||||||||||
|
|
|
|
|
|
|
|
|
| |||||||||||||||||||||||||||
Total returnD | 22.48 | % | 3.03 | % | 19.06 | % | 9.61 | % | (5.11 | )% | ||||||||||||||||||||||||||
|
|
|
|
|
|
|
|
|
| |||||||||||||||||||||||||||
Ratios and supplemental data: | ||||||||||||||||||||||||||||||||||||
Net assets, end of period | $ | 4,899,301 | $ | 5,293,719 | $ | 5,553,261 | $ | 7,029,682 | $ | 8,197,136 | ||||||||||||||||||||||||||
Ratios to average net assets: | ||||||||||||||||||||||||||||||||||||
Expenses, before reimbursements | 1.37 | % | 1.38 | % | 1.40 | % | 1.46 | % | 1.44 | % | ||||||||||||||||||||||||||
Expenses, net of reimbursementsE | 1.37 | %F | 1.38 | % | 1.40 | % | 1.46 | % | 1.48 | % | ||||||||||||||||||||||||||
Net investment (loss), before expense reimbursements | (1.12 | )% | (1.09 | )% | (1.11 | )% | (1.14 | )% | (1.03 | )% | ||||||||||||||||||||||||||
Net investment (loss), net of reimbursements | (1.12 | )% | (1.09 | )% | (1.11 | )% | (1.14 | )% | (1.08 | )% | ||||||||||||||||||||||||||
Portfolio turnover rate | 20 | % | 16 | % | 22 | % | 40 | % | 25 | % | ||||||||||||||||||||||||||
| A | Includesnon-recurring dividends. Without these dividends, net investment loss per share would have been $(0.25). |
| B | Per share amounts have been calculated using the average shares method. |
| C | Tax return of capital is calculated based on outstanding shares at the time of distribution. Amounts are less than $0.01 per share. |
| D | Based on net asset value, which does not reflect the sales charge, redemption fee, or contingent deferred sales charge, if applicable. May include adjustments in accordance with U.S. GAAP and as such, the net asset value for reporting purposes and the returns based upon those net asset values may differ from the net asset value and returns for shareholder transactions. |
| E | Expense ratios may exceed stated expense caps in Note 2 due to security lending expenses, which are not reimbursable under the agreement with the Manager. |
| F | Expense ratios may exceed stated expense caps in Note 2 due to the change in the contractual expense caps on August 23, 2019. |
See accompanying notes
50
American Beacon Stephens Small Cap Growth FundSM
Financial Highlights
(For a share outstanding throughout the period)
C Class | ||||||||||||||||||||||||||||||||||||
Year Ended December 31, | ||||||||||||||||||||||||||||||||||||
| 2019 | 2018 | 2017 | 2016 | 2015 | ||||||||||||||||||||||||||||||||
|
| |||||||||||||||||||||||||||||||||||
Net asset value, beginning of period | $ | 11.31 | $ | 16.74 | $ | 14.71 | $ | 13.65 | $ | 15.26 | ||||||||||||||||||||||||||
|
|
|
|
|
|
|
|
|
| |||||||||||||||||||||||||||
Income (loss) from investment operations: | ||||||||||||||||||||||||||||||||||||
Net investment (loss) | (1.19 | ) | (0.35 | )AB | (1.25 | ) | (1.08 | ) | (0.31 | ) | ||||||||||||||||||||||||||
Net gains (losses) on investments (both realized and unrealized) | 3.64 | 0.57 | 3.93 | 2.28 | (0.59 | ) | ||||||||||||||||||||||||||||||
|
|
|
|
|
|
|
|
|
| |||||||||||||||||||||||||||
Total income (loss) from investment operations | 2.45 | 0.22 | 2.68 | 1.20 | (0.90 | ) | ||||||||||||||||||||||||||||||
|
|
|
|
|
|
|
|
|
| |||||||||||||||||||||||||||
Less distributions: | ||||||||||||||||||||||||||||||||||||
Dividends from net investment income | - | - | - | - | - | |||||||||||||||||||||||||||||||
Distributions from net realized gains | (1.61 | ) | (5.65 | ) | (0.65 | ) | (0.14 | ) | (0.71 | ) | ||||||||||||||||||||||||||
Tax return of capital | - | - | - | (0.00 | )C | - | ||||||||||||||||||||||||||||||
|
|
|
|
|
|
|
|
|
| |||||||||||||||||||||||||||
Total distributions | (1.61 | ) | (5.65 | ) | (0.65 | ) | (0.14 | ) | (0.71 | ) | ||||||||||||||||||||||||||
|
|
|
|
|
|
|
|
|
| |||||||||||||||||||||||||||
Net asset value, end of period | $ | 12.15 | $ | 11.31 | $ | 16.74 | $ | 14.71 | $ | 13.65 | ||||||||||||||||||||||||||
|
|
|
|
|
|
|
|
|
| |||||||||||||||||||||||||||
Total returnD | 21.56 | % | 2.19 | % | 18.22 | % | 8.76 | % | (5.89 | )% | ||||||||||||||||||||||||||
|
|
|
|
|
|
|
|
|
| |||||||||||||||||||||||||||
Ratios and supplemental data: | ||||||||||||||||||||||||||||||||||||
Net assets, end of period | $ | 808,661 | $ | 1,076,006 | $ | 977,321 | $ | 1,280,971 | $ | 2,348,424 | ||||||||||||||||||||||||||
Ratios to average net assets: | ||||||||||||||||||||||||||||||||||||
Expenses, before reimbursements | 2.17 | % | 2.15 | % | 2.14 | % | 2.23 | % | 2.19 | % | ||||||||||||||||||||||||||
Expenses, net of reimbursementsE | 2.14 | %F | 2.15 | % | 2.14 | % | 2.23 | % | 2.26 | % | ||||||||||||||||||||||||||
Net investment (loss), before expense reimbursements | (1.92 | )% | (1.84 | )% | (1.86 | )% | (1.91 | )% | (1.79 | )% | ||||||||||||||||||||||||||
Net investment (loss), net of reimbursements | (1.89 | )% | (1.84 | )% | (1.86 | )% | (1.91 | )% | (1.85 | )% | ||||||||||||||||||||||||||
Portfolio turnover rate | 20 | % | 16 | % | 22 | % | 40 | % | 25 | % | ||||||||||||||||||||||||||
| A | Includesnon-recurring dividends. Without these dividends, net investment loss per share would have been $(0.38). |
| B | Per share amounts have been calculated using the average shares method. |
| C | Tax return of capital is calculated based on outstanding shares at the time of distribution. Amounts are less than $0.01 per share. |
| D | Based on net asset value, which does not reflect the sales charge, redemption fee, or contingent deferred sales charge, if applicable. May include adjustments in accordance with U.S. GAAP and as such, the net asset value for reporting purposes and the returns based upon those net asset values may differ from the net asset value and returns for shareholder transactions. |
| E | Expense ratios may exceed stated expense caps in Note 2 due to security lending expenses, which are not reimbursable under the agreement with the Manager. |
| F | Expense ratios may exceed stated expense caps in Note 2 due to the change in the contractual expense caps on August 23, 2019. |
See accompanying notes
51
American Beacon Stephens Small Cap Growth FundSM
Financial Highlights
(For a share outstanding throughout the period)
| R6 Class | ||||
| Period EndedA December 31, 2019 | ||||
Net asset value, beginning of period | $ | 16.91 | ||
|
| |||
Income from investment operations: | ||||
Net investment income (loss) | (0.01 | ) | ||
Net gains on investments (both realized and unrealized) | 0.11 | |||
|
| |||
Total income from investment operations | 0.10 | |||
|
| |||
Less distributions: | ||||
Dividends from net investment income | - | |||
Distributions from net realized gains | (1.61 | ) | ||
|
| |||
Total distributions | (1.61 | ) | ||
|
| |||
Net asset value, end of period | $ | 15.40 | ||
|
| |||
Total returnB | 0.53 | %C | ||
|
| |||
Ratios and supplemental data: | ||||
Net assets, end of period | $ | 8,132,874 | ||
Ratios to average net assets: | ||||
Expenses, before reimbursements | 1.41 | %D | ||
Expenses, net of reimbursementsE | 0.96 | %DF | ||
Net investment income (loss), before expense reimbursements | (1.18 | )%D | ||
Net investment income (loss), net of reimbursements | (0.73 | )%D | ||
Portfolio turnover rate | 20 | %C | ||
| A | Class launched on April 30, 2019 and commenced operations on May 1, 2019 (Note 1). |
| B | Based on net asset value, which does not reflect the sales charge, redemption fee, or contingent deferred sales charge, if applicable. May include adjustments in accordance with U.S. GAAP and as such, the net asset value for reporting purposes and the returns based upon those net asset values may differ from the net asset value and returns for shareholder transactions. |
| C | Not annualized. |
| D | Annualized. |
| E | Expense ratios may exceed stated expense caps in Note 2 due to security lending expenses, which are not reimbursable under the agreement with the Manager. |
| F | Expense ratios may exceed stated expense caps in Note 2 due to the change in the contractual expense caps on August 23, 2019. |
See accompanying notes
52
American Beacon FundsSM
December 31, 2019 (Unaudited)
Certain tax information regarding the Funds is required to be provided to shareholders based upon the Funds’ income and distributions for the taxable year ended December 31, 2019. The information and distributions reported herein may differ from information and distributions taxable to the shareholders for the calendar year ended December 31, 2019.
The Funds designated the following items with regard to distributions paid during the fiscal year ended December 31, 2019. All designations are based on financial information available as of this annual report and, accordingly, are subject to change. For each item, it is the intention of the Funds to designate the maximum amount permitted under the Internal Revenue Code of 1986, as amended, and the regulations there under.
Corporate Dividends-Received Deduction:
StephensMid-Cap Growth | 0.00 | % | ||
Stephens Small Cap Growth | 0.00 | % |
Qualified Dividend Income:
StephensMid-Cap Growth | 0.00 | % | ||
Stephens Small Cap Growth | 0.00 | % |
Long-Term Capital Gain Distributions:
StephensMid-Cap Growth | $ | 10,398,078 | ||
Stephens Small Cap Growth | 38,772,090 |
Short-Term Capital Gain Distributions:
StephensMid-Cap Growth | $ | - | ||
Stephens Small Cap Growth | - |
Shareholders will receive notification in January 2020 of the applicable tax information necessary to prepare their 2019 income tax returns.
53
Disclosure Regarding Approval of the Management and Investment Advisory Agreements(Unaudited)
Approval Related to American Beacon Stephens Small Cap Growth Fund
At its August19-20, 2019 meetings, the Board of Trustees (“Board”) considered the approval of an amendment (the “Amendment”) to the existing investment advisory agreement among American Beacon Advisors, Inc. (the “Manager”), Stephens Investment Management Group, LLC (“Stephens”) and the Trust, on behalf of the American Beacon Stephens Small Cap Growth Fund (the “Fund”), a series of the Trust (the “Agreement”), to reduce the fee rate payable to Stephens.
The Board determined that it did not need to consider certain factors that it typically considers during its annual reviews of investment advisory agreements because the Board had reviewed, among other matters, the nature, extent and quality of services being provided to the Fund by Stephens at the Board’s May 9, 2019 andJune 4-5, 2019 meetings in connection with the review of the Agreement. Additionally, the Board considered that, other than reducing thesub-advisory fee rate included in the Agreement, the Amendment would not result in any other changes to the information reviewed by the Board at the May 9, 2019 and June4-5, 2019 meetings, including the nature, extent and quality of services provided to the Fund and the personnel providingday-to-day services for the Fund.
Based on the various considerations described above, the Board, including a majority of Trustees who are not “interested persons” of the Fund, the Manager or Stephens, as that term is defined in the Investment Company Act of 1940, as amended, concluded that the proposed investment advisory fee rate is fair and reasonable and the approval of the Amendment is in the best interests of the Fund and approved the Amendment.
54
Trustees and Officers of the American Beacon FundsSM(Unaudited)
The Trustees and officers of the American Beacon Funds (the “Trust”) are listed below, together with their principal occupations during the past five years. The address of each person listed below is 220 Las Colinas Boulevard East, Suite 1200, Irving, Texas 75039. Each Trustee overseesthirty-six funds in the fund complex that includes the Trust, the American Beacon Select Funds, the American Beacon Institutional Funds Trust, the American Beacon Sound Point Enhanced Income Fund, American Beacon Apollo Total Return Fund and the American Beacon Sound Point Alternative Lending Fund. The Trust’s Statement of Additional Information contains additional information about the Trustees and is available without charge by calling1-800-658-5811.
Name, Age | Position, Term of Office and Length of Time Served with the Trust | Principal Occupation(s) During Past 5 Years and Current Directorships | ||
| INTERESTED TRUSTEES | Term | |||
| Lifetime of Trust until removal, resignation or retirement* | ||||
| Alan D. Feld** (83) | Trustee since 1996 | Partner in the law firm of Akin, Gump, Strauss, Hauer & Feld, LLP (law firm) (1960-Present); Trustee, American Beacon Select Funds (1999-Present); Trustee, American Beacon Institutional Funds Trust (2017-Present); Trustee, American Beacon Sound Point Enhanced Income Fund (2018-Present); Trustee, American Beacon Apollo Total Return Fund (2018-Present); Trustee, American Beacon Sound Point Alternative Lending Fund (2019-Present). | ||
| NON-INTERESTED TRUSTEES | Term | |||
| Lifetime of Trust until removal, resignation or retirement* | ||||
| Gilbert G. Alvarado (50) | Trustee since 2015 | Director, Kura MD, Inc. (local telehealth organization) (2015-present); Vice President & CFO, Sierra Health Foundation (health conversion private foundation) (2006-Present); Vice President & CFO, Sierra Health Foundation: Center for Health Program Management (California public benefit corporation) (2012-Present); Director, Innovative North State (2012-2015); Director, Sacramento Regional Technology Alliance (2011-2016); Director, Women’s Empowerment (2009-2014); Director, Valley Healthcare Staffing (2017-present); Trustee, American Beacon Select Funds (2015-Present); Trustee, American Beacon Institutional Funds Trust (2017-Present); Trustee, American Beacon Sound Point Enhanced Income Fund (2018-Present); Trustee, American Beacon Apollo Total Return Fund (2018-Present); Trustee, American Beacon Sound Point Alternative Lending Fund (2019-Present). | ||
| Joseph B. Armes (57) | Trustee since 2015 | Chairman & CEO, CSW Industrials f/k/a Capital Southwest Corporation (investment company) (2015-Present); Chairman of the Board of Capital Southwest Corporation, predecessor to CSW Industrials, Inc. (2014-2017) (investment company); CEO, Capital Southwest Corporation (2013-2015); President & CEO, JBA Investment Partners (family investment vehicle) (2010-Present); Director and Chair of Audit Committee, RSP Permian (oil and gas producer) (2013-Present); Trustee, American Beacon Select Funds (2015-Present); Trustee, American Beacon Institutional Funds Trust (2017-Present); Trustee, American Beacon Sound Point Enhanced Income Fund (2018-Present); Trustee, American Beacon Apollo Total Return Fund (2018-Present); Trustee, American Beacon Sound Point Alternative Lending Fund (2019-Present). | ||
| Gerard J. Arpey (61) | Trustee since 2012 | Director, The Home Depot, Inc. (2015-Present); Partner, Emerald Creek Group (private equity firm) (2011-Present); Director, S.C. Johnson & Son, Inc. (privately held company) (2008-present); Trustee, American Beacon Select Funds (2012-Present); Trustee, American Beacon Institutional Funds Trust (2017-Present); Trustee, American Beacon Sound Point Enhanced Income Fund (2018-Present); Trustee, American Beacon Apollo Total Return Fund (2018-Present); Trustee, American Beacon Sound Point Alternative Lending Fund (2019-Present). | ||
55
Trustees and Officers of the American Beacon FundsSM(Unaudited)
Name, Age | Position, Term of Office and Length of Time Served with the Trust | Principal Occupation(s) During Past 5 Years and Current Directorships | ||
| NON-INTERESTED TRUSTEES (CONT.) | Term | |||
| Lifetime of Trust until removal, resignation or retirement* | ||||
| Brenda A. Cline (59) | Trustee since 2004 Chair since 2019 Vice Chair 2018 | Chief Financial Officer, Treasurer and Secretary, Kimbell Art Foundation (1993-Present); Director, Tyler Technologies, Inc. (public sector software solutions company) (2014-Present); Director, Range Resources Corporation (oil and natural gas company) (2015-Present); Trustee, CushingClosed-End andOpen-End Funds and ETFs (2017-Present); Trustee, American Beacon Select Funds (2004-Present); ; Trustee, American Beacon Institutional Funds Trust (2017-Present); Trustee, American Beacon Sound Point Enhanced Income Fund (2018-Present); Trustee, American Beacon Apollo Total Return Fund (2018-Present); Trustee, American Beacon Sound Point Alternative Lending Fund(2019-Present). | ||
| Eugene J. Duffy (65) | Trustee since 2008 | Managing Director, Global Investment Management Distribution, Mesirow Financial (2016-Present); Managing Director, Institutional Services, Intercontinental Real Estate Corporation (2014-Present); Principal and Executive Vice President, Paradigm Asset Management (1994-2014); Trustee, American Beacon Select Funds (2008-Present); Trustee, American Beacon Institutional Funds Trust (2017-Present); Trustee, American Beacon Sound Point Enhanced Income Fund (2018-Present); Trustee, American Beacon Apollo Total Return Fund (2018-Present); Trustee, American Beacon Sound Point Alternative Lending Fund (2019-Present). | ||
| Claudia A. Holz (62) | Trustee since 2018 | Partner, KPMG LLP (1990-2017); Trustee, American Beacon Select Funds (2018-Present); Trustee, American Beacon Institutional Funds Trust (2018-Present); Trustee, American Beacon Sound Point Enhanced Income Fund (2018-Present); Trustee, American Beacon Apollo Total Return Fund (2018-Present); Trustee, American Beacon Sound Point Alternative Lending Fund (2019-Present). | ||
| Douglas A. Lindgren (58) | Trustee since 2018 | CEO North America, Carne Global Financial Services (2016-2017); Managing Director, IPS Investment Management and Global Head, Content Management, UBS Wealth Management (2010-2016); Trustee, American Beacon Select Funds (2018-Present); Trustee, American Beacon Institutional Funds Trust (2018-Present); Trustee, American Beacon Sound Point Enhanced Income Fund (2018-Present); Trustee, American Beacon Apollo Total Return Fund (2018-Present); Trustee, American Beacon Sound Point Alternative Lending Fund (2019-Present). | ||
| Richard A. Massman (76) | Trustee since 2004 Chair 2008-2018 Chair Emeritus since 2019 | Consultant and General Counsel Emeritus, Hunt Consolidated, Inc. (holding company engaged in oil and gas exploration and production, refining, real estate, farming, ranching and venture capital activities) (2009-Present); Trustee, American Beacon Select Funds (2004-Present); Trustee, American Beacon Institutional Funds Trust (2017-Present); Trustee, American Beacon Sound Point Enhanced Income Fund (2018-Present); Trustee, American Beacon Apollo Total Return Fund (2018-Present); Trustee, American Beacon Sound Point Alternative Lending Fund (2019-Present). | ||
| Barbara J. McKenna, CFA (56) | Trustee since 2012 | President/Managing Principal, Longfellow Investment Management Company (2005-Present); Trustee, American Beacon Select Funds (2012-Present); Trustee, American Beacon Institutional Funds Trust (2017-Present); Trustee, American Beacon Sound Point Enhanced Income Fund (2018-Present); Trustee, American Beacon Apollo Total Return Fund (2018-Present); Trustee, American Beacon Sound Point Alternative Lending Fund (2019-Present). | ||
56
Trustees and Officers of the American Beacon FundsSM(Unaudited)
Name, Age | Position, Term of Office and Length of Time Served with the Trust | Principal Occupation(s) During Past 5 Years and Current Directorships | ||
| NON-INTERESTED TRUSTEES (CONT.) | Term | |||
| Lifetime of Trust until removal, resignation or retirement* | ||||
| R. Gerald Turner (74) | Trustee since 2001 | President, Southern Methodist University (1995-Present); Director, J.C. Penney Company, Inc. (1996-Present); Director, Kronus Worldwide Inc. (chemical manufacturing) (2003-Present); Trustee, American Beacon Select Funds (2001-Present); Trustee, American Beacon Institutional Funds Trust (2017-Present); Trustee, American Beacon Sound Point Enhanced Income Fund (2018-Present); Trustee, American Beacon Apollo Total Return Fund (2018-Present); Trustee, American Beacon Sound Point Alternative Lending Fund (2019-Present). | ||
| OFFICERS | Term | |||
| One Year | ||||
| Gene L. Needles, Jr. (65) | President since 2009 | President (2009-2018), CEO and Director (2009-Present), and Chairman (2018-Present), American Beacon Advisors, Inc., President (2015-2018), Director and CEO (2015-Present), and Chairman (2018-Present), Resolute Investment Holdings, LLC; President (2015-2018), Director and CEO (2015-Present), and Chairman (2018-Present),Resolute Topco, Inc.; President (2015-2018); Director, and CEO (2015-Present), and Chairman (2018-Present), Resolute Acquisition, Inc.; President (2015-2018), Director and CEO (2015-Present), Chairman (2018-Present), Resolute Investment Managers, Inc.; Director, Chairman, President and CEO, Resolute Investment Distributors (2017-Present); Director, Chairman, President and CEO; Resolute Investment Services, Inc. (2017-Present); President and CEO, Lighthouse Holdings Parent, Inc. (2009-2015); President, CEO and Director, Lighthouse Holdings, Inc. (2009-2015); Manager, President and CEO, American Private Equity Management, LLC (2012-Present); Director, Chairman, President and CEO, Alpha Quant Advisors, LLC (2016-Present); Director, ARK Investment Management LLC (2016-Present); Director, Shapiro Capital Management LLC (2017-Present); Director, Chairman and CEO, Continuous Capital, LLC (2018-Present); President, American Beacon Cayman Managed Futures Strategy Fund, Ltd. (2014-Present); Director and President, American Beacon Cayman Transformational Innovation Company, LTD., (2017-2018); President, American Beacon Delaware Transformational Innovation Corporation (2017-2018); President American Beacon Cayman TargetRisk Company, Ltd. (2018-Present);Member, Investment Advisory Committee, Employees Retirement System of Texas (2017-Present); Trustee, American Beacon NextShares Trust (2015-Present); President, American Beacon Select Funds (2009-Present); President, American Beacon Institutional Funds Trust (2017-Present); President, American Beacon Sound Point Enhanced Income Fund (2018-Present); President, American Beacon Apollo Total Return Fund (2018-Present); Director, RSW Investments Holdings LLC, (2019-Present); Manager, SSI Investment Management, LLC (2019-Present); President, American Beacon Sound Point Alternative Lending Fund (2019-Present); Director, Green Harvest Asset Management (2019-Present); Director, National Investment Services of America, LLC (2019-Present). | ||
57
Trustees and Officers of the American Beacon FundsSM(Unaudited)
Name, Age | Position, Term of Office and Length of Time Served with the Trust | Principal Occupation(s) During Past 5 Years and Current Directorships | ||
| OFFICERS (CONT.) | Term | |||
| One Year | ||||
| Rosemary K. Behan (60) | VP, Secretary and Chief Legal Officer since 2006 | Vice President, Secretary and General Counsel, American Beacon Advisors, Inc. (2006-Present); Secretary, Resolute Investment Holdings, LLC (2015-Present); Secretary, Resolute Topco, Inc. (2015-Present); Secretary, Resolute Acquisition, Inc. (2015-Present); Vice President, Secretary and General Counsel, Resolute Investment Managers, Inc. (2015-Present); Secretary, Resolute Investment Distributors, Inc. (2017-Present); Vice President, Secretary and General Counsel, Resolute Investment Services, Inc. (2017-Present); Vice President and Secretary, Lighthouse Holdings Parent, Inc. (2008-2015); Vice President and Secretary, Lighthouse Holdings, Inc. (2008-2015); Secretary, American Private Equity Management, LLC (2008-Present); Secretary and General Counsel, Alpha Quant Advisors, LLC (2016-Present); Vice President and Secretary, Continuous Capital, LLC (2018-Present); Secretary, American Beacon Delaware Transformational Innovation Corporation (2017-2018); Secretary, American Beacon Cayman Transformational Innovation Company, Ltd. (2017-2018); Secretary, American Beacon Cayman Managed Futures Strategy Fund, Ltd. (2014-Present); Secretary, American Beacon Cayman TargetRisk Company, Ltd (2018-Present); Chief Legal Officer, Vice President and Secretary, American Beacon Select Funds (2006-Present); Chief Legal Officer, Vice President and Secretary, American Beacon Institutional Funds Trust (2017-Present); Chief Legal Officer, Vice President and Secretary, American Beacon Sound Point Enhanced Income Fund (2018-Present); Chief Legal Officer, Vice President and Secretary American Beacon Apollo Total Return Fund (2018-Present); Chief Legal Officer, Vice President and Secretary, American Beacon Sound Point Alternative Lending Fund (2019-Present); Secretary, Green Harvest Asset Management (2019-Present). | ||
| Brian E. Brett (59) | VP since 2004 | Senior Vice President, Head of Distribution (2012-Present), Vice President, Director of Sales (2004-2012), American Beacon Advisors, Inc.; Senior Vice President, Resolute Investment Managers, Inc. (2017-Present); Senior Vice President, Resolute Investment Distributors, Inc. (2018-Present), Senior Vice President, Resolute Investment Services, Inc. (2018-Present); Senior Vice President, Lighthouse Holdings Parent, Inc. (2008-2015); Senior Vice President, Lighthouse Holdings, Inc. (2008-2015); Vice President, American Beacon Select Funds (2004-Present); Vice President, American Beacon Institutional Funds Trust (2017-Present); Vice President American Beacon Sound Point Enhanced Income Fund (2018-Present); Vice President American Beacon Apollo Total Return Fund (2018-Present); Vice President, American Beacon Sound Point Alternative Lending Fund (2019-Present). | ||
| Paul B. Cavazos (50) | VP since 2016 | Chief Investment Officer and Senior Vice President, American Beacon Advisors, Inc. (2016-Present); Chief Investment Officer, DTE Energy (2007-2016); Vice President, American Private Equity Management, L.L.C. (2017-Present); Vice President, American Beacon Select Funds (2016-Present); Vice President, American Beacon Institutional Funds Trust (2017-Present); Vice President American Beacon Sound Point Enhanced Income Fund (2018-Present);Vice President American Beacon Apollo Total Return Fund (2018-Present); Vice President, American Beacon Sound Point Alternative Lending Fund (2019-Present). | ||
58
Trustees and Officers of the American Beacon FundsSM(Unaudited)
Name, Age | Position, Term of Office and Length of Time Served with the Trust | Principal Occupation(s) During Past 5 Years and Current Directorships | ||
| OFFICERS (CONT.) | Term | |||
| One Year | ||||
| Erica Duncan (49) | VP Since 2011 | Vice President, American Beacon Advisors, Inc. (2011-Present); Vice President, Resolute Investment Managers (2018-Present); Vice President, Resolute Investment Services, Inc. (2018-Present); Vice President, American Beacon Select Funds (2011-Present); Vice President, American Beacon Institutional Funds Trust (2017-Present); Vice President American Beacon Sound Point Enhanced Income Fund (2018-Present); Vice President American Beacon Apollo Total Return Fund (2018-Present); Vice President, American Beacon Sound Point Alternative Lending Fund (2019-Present). | ||
| Melinda G. Heika (58) | Treasurer since 2010 | Treasurer and CFO (2010-Present), American Beacon Advisors, Inc.; Treasurer, Resolute Topco, Inc. (2015-Present); Treasurer, Resolute Investment Holdings, LLC. (2015-Present); Treasurer, Resolute Acquisition, Inc. (2015-Present); Treasurer and CFO, Resolute Investment Managers, Inc. (2017-Present); Treasurer, Resolute Investment Distributors, Inc. (2017-2017); Treasurer and CFO, Resolute Investment Services, Inc. (2015-Present); Treasurer, Lighthouse Holdings Parent Inc., (2010-2015); Treasurer, Lighthouse Holdings, Inc. (2010-2015); Treasurer, American Private Equity Management, LLC (2012-Present); Treasurer and CFO, Alpha Quant Advisors, LLC (2016-Present); Treasurer and CFO, Continuous Capital, LLC (2018-Present); Treasurer, American Beacon Cayman Transformational Innovation, Ltd. (2017-2018); Treasurer, American Beacon Delaware Transformational Innovation Corporation (2017-2018); Director and Treasurer, American Beacon Cayman Managed Futures Strategy Fund, Ltd. (2014-Present); Treasurer, American Beacon Cayman TargetRisk Company, Ltd. (2018-Present); Treasurer, American Beacon Select Funds (2010-Present); Treasurer, American Beacon Institutional Funds Trust (2017-Present); Treasurer, American Beacon Sound Point Enhanced Income Fund (2018-Present); Treasurer, American Beacon Apollo Total Return Fund (2018-Present); Treasurer, American Beacon Sound Point Alternative Lending Fund (2019-Present); Treasurer, Green Harvest Asset Management (2019-Present). | ||
| Terri L. McKinney (56) | VP since 2010 | Vice President (2009-Present), Managing Director (2003-2009), American Beacon Advisors, Inc.; Vice President, Resolute Investment Managers, Inc. (2017-Present); Vice President, Resolute Investment Services, Inc (2018-Present); Vice President, Alpha Quant Advisors, LLC (2016-Present); Vice President, Continuous Capital, LLC (2018-Present); Vice President, American Beacon Select Funds (2010-Present); Vice President, American Beacon Institutional Funds Trust (2017-Present); Vice President, American Beacon Sound Point Enhanced Income Fund (2018-Present); Vice President, American Beacon Apollo Total Return Fund (2018-Present); Vice President, American Beacon Sound Point Alternative Lending Fund (2019-Present). | ||
59
Trustees and Officers of the American Beacon FundsSM(Unaudited)
Name, Age | Position, Term of Office and Length of Time Served with the Trust | Principal Occupation(s) During Past 5 Years and Current Directorships | ||
| OFFICERS (CONT.) | Term | |||
| One Year | ||||
| Jeffrey K. Ringdahl (44) | VP since 2010 | Director (2015-Present), President (2018-Present), Chief Operating Officer (2010-Present), Senior Vice President (2013-2018), Vice President (2010-2013), American Beacon Advisors, Inc.; Director (2015-Present), President (2018-Present), Senior Vice Present (2015-2018), Resolute Investment Holdings, LLC; Director (2015-Present), President (2018-Present), Senior Vice President (2015-2018), Resolute Topco, Inc.; Director (2015-Present), President (2018-Present), Senior Vice President (2015-2018), Resolute Acquisition, Inc.; Director (2015-Present), President & COO (2018-Present), Senior Vice President (2015-2018), Resolute Investment Managers, Inc.; Director and Executive Vice President (2017-Present), Resolute Investment Distributors, Inc.; Director (2017-Present), President & COO (2018-Present), Executive Vice President (2017-2018), Resolute Investment Services, Inc.; Senior Vice President (2017-Present), Vice President (2012-2017), Manager (2015-Present), American Private Equity Management, LLC; Senior Vice President, Lighthouse Holdings Parent, Inc. (2013-2015); Senior Vice President, Lighthouse Holdings, Inc. (2013-2015); Trustee, American Beacon NextShares Trust (2015-Present); Director, Executive Vice President & COO, Alpha Quant Advisors, LLC (2016-Present); Director, Shapiro Capital Management, LLC (2017-Present); Director, Executive Vice President & COO, Continuous Capital, LLC (2018-Present); Director and Vice President, American Beacon Cayman Transformational Innovation Company, Ltd., (2017-Present); Vice President, American Beacon Delaware Transformational Innovation Corporation (2017-2018); Director and Vice President, American Beacon Cayman Managed Futures Strategy Fund, Ltd. (2014-Present); Vice President, American Beacon Cayman TargetRisk Company, Ltd (2018-Present); Vice President, American Beacon Select Funds (2010-2018); Vice President, American Beacon Institutional Funds Trust (2017-Present); Vice President, American Beacon Sound Point Enhanced Income Fund (2018-Present); Vice President, American Beacon Apollo Total Return Fund (2018-Present); Director, RSW Investments Holdings LLC, (2019-Present); Manager, SSI Investment Management, LLC (2019-Present), Vice President, American Beacon Sound Point Alternative Lending Fund (2019-Present); Director, National Investment Services of America, LLC (2019-Present). | ||
| Samuel J. Silver (56) | VP Since 2011 | Vice President (2011-Present), Chief Fixed Income Officer (2016-Present), American Beacon Advisors, Inc. (2011-Present); Vice President, American Beacon Select Funds (2011-Present); Vice President, American Beacon Institutional Funds Trust (2017-Present); Vice President, American Beacon Sound Point Enhanced Income Fund (2018-Present); Vice President, American Beacon Apollo Total Return Fund (2018-Present); Vice President, American Beacon Sound Point Alternative Lending Fund (2019-Present). | ||
60
Trustees and Officers of the American Beacon FundsSM(Unaudited)
Name, Age | Position, Term of Office and Length of Time Served with the Trust | Principal Occupation(s) During Past 5 Years and Current Directorships | ||
| OFFICERS (CONT.) | Term | |||
| One Year | ||||
| Christina E. Sears (48) | Chief Compliance Officer since 2004 and Asst. Secretary since 1999 | Vice President, American Beacon Advisors, Inc. (2019-Present); Chief Compliance Officer, American Beacon Advisors, Inc. (2004-Present); Vice President, Resolute Investment Managers, Inc. (2017-Present); Vice President, Resolute Investment Distributors (2017-Present); Vice President, Resolute Investment Services, Inc. (2019-Present); Chief Compliance Officer, American Private Equity Management, LLC (2012-Present); Chief Compliance Officer (2016-2019) and Vice President, Alpha Quant Advisors, LLC (2016-Present); Vice President, Continuous Capital, LLC (2018-Present); Chief Compliance Officer (2004-Present) and Assistant Secretary (1999-Present), American Beacon Select Funds; Chief Compliance Officer and Assistant Secretary, American Beacon Institutional Funds Trust (2017-Present); Chief Compliance Officer and Assistant Secretary, American Beacon Sound Point Enhanced Income Fund (2018-Present); Chief Compliance Officer and Assistant Secretary, American Beacon Apollo Total Return Fund (2018-Present); Chief Compliance Officer and Assistant Secretary, American Beacon Sound Point Alternative Lending Fund (2019-Present). | ||
| Sonia L. Bates (63) | Asst. Treasurer since 2011 | Assistant Treasurer, American Beacon Advisors, Inc. (2011-2018); Assistant Treasurer, Lighthouse Holdings Parent Inc. (2011-2015); Assistant Treasurer, Lighthouse Holdings, Inc. (2011-2015); Assistant Treasurer, American Private Equity Management, LLC (2012-Present); Assistant Treasurer, American Beacon Cayman Transformational Innovation Company, Ltd. (2017-Present); Assistant Treasurer, American Beacon Cayman TargetRisk Company, Ltd. (2018-Present); Assistant Treasurer, American Beacon Select Funds (2011-Present); Assistant Treasurer, American Beacon Institutional Funds Trust (2017-Present); Assistant Treasurer, American Beacon Sound Point Enhanced Income Fund (2018-Present); Assistant Treasurer, American Beacon Apollo Total Return Fund (2018-Present); Assistant Treasurer, American Beacon Sound Point Alternative Lending Fund (2019-Present). | ||
| Shelley D. Abrahams (45) | Assistant Secretary since 2008 | Assistant Secretary, American Beacon Select Funds (2008-Present); Assistant Secretary, American Beacon Institutional Funds Trust (2017-Present); Assistant Secretary, American Beacon Sound Point Enhanced Income Fund (2018-Present); Assistant Secretary, American Beacon Apollo Total Return Fund (2018-Present); Assistant Secretary, American Beacon Sound Point Alternative Lending Fund (2019-Present); Assistant Secretary, Green Harvest Asset Management (2019-Present). | ||
| Rebecca L. Harris (53) | Assistant Secretary since 2010 | Vice President, American Beacon Advisors, Inc. (2011-Present); Vice President, Resolute Investment Managers, Inc. (2017-Present); Vice President, Resolute Investment Services (2015-Present); Vice President, Alpha Quant Advisors, LLC (2016-Present); Vice President, Continuous Capital, LLC (2018-Present); Assistant Secretary, American Beacon Select Funds (2010-Present); Assistant Secretary, American Beacon Institutional Funds Trust (2017-Present); Assistant Secretary, American Beacon Sound Point Enhanced Income Fund (2018-Present); Assistant Secretary, American Beacon Apollo Total Return Fund (2018-Present); Assistant Secretary, American Beacon Sound Point Alternative Lending Fund (2019-Present). | ||
61
Trustees and Officers of the American Beacon FundsSM(Unaudited)
Name, Age | Position, Term of Office and Length of Time Served with the Trust | Principal Occupation(s) During Past 5 Years and Current Directorships | ||
| OFFICERS (CONT.) | Term | |||
| One Year | ||||
| Teresa A. Oxford (61) | Assistant Secretary since 2015 | Assistant Secretary, American Beacon Advisors, Inc. (2015-Present); Assistant Secretary, Resolute Investment Distributors (2018-Present); Assistant Secretary, Resolute Investment Services (2018-Present); Assistant Secretary, Alpha Quant Advisors, LLC (2016-Present); Assistant Secretary, American Beacon Select Funds (2015-Present); Assistant Secretary, American Beacon Institutional Funds Trust (2017-Present); Assistant Secretary, American Beacon Sound Point Enhanced Income Fund (2018-Present); Assistant Secretary, American Beacon Apollo Total Return Fund (2018-Present); Assistant Secretary, American Beacon Sound Point Alternative Lending Fund (2019-Present); Assistant Secretary, Green Harvest Asset Management (2019-Present). | ||
* As of 11/12/2014, the Board adopted a retirement plan that requires Trustees, other than Messrs. Feld and Massman to retire no later than the last day of the calendar year in which they reach the age of 75. As of 11/7/17, the Board approved a waiver of the mandatory retirement policy with respect to Mr. Massman, who turned 75 in November 2018, to permit him to continue to serve on the Board as Chair Emeritus through 12/31/19. As of 1/1/2020 both Messrs. Feld and Massman retired from the Board.
** Mr. Feld is deemed to be an “interested person” of the Trusts, as defined by the 1940 Act. Mr. Feld’s law firm of Akin, Gump, Strauss, Hauer & Feld LLP has provided legal services within the past two fiscal years to one or more of the Trust’ssub-advisors.
62
American Beacon FundsSM
December 31, 2019 (Unaudited)
The American Beacon Funds recognize and respect the privacy of our shareholders. We are providing this notice to you, so you will understand how shareholder information may be collected and used.
We may collect nonpublic personal information about you from one or more of the following sources:
| • | information we receive from you on applications or other forms; |
| • | information about your transactions with us or our service providers; and |
| • | information we receive from third parties. |
We do not disclose any nonpublic personal information about our customers or former customers to anyone, except as permitted by law.
We restrict access to your nonpublic personal information to those employees or service providers who need to know that information to provide products or services to you. To ensure the confidentiality of your nonpublic personal information, we maintain safeguards that comply with federal standards.
63
This page intentionally left blank.
64

eDelivery isNOW AVAILABLE - Stop traditional mail delivery and receive your shareholder reports and summary prospectuson-line. Sign up at
www.americanbeaconfunds.com
If you invest in the Fund through a financial institution, you may be able to receive the Fund’s regulatory mailings, such as the Prospectus, Annual Report and Semi-Annual Report, bye-mail. If you are interested in this option, please go towww.icsdelivery.com and search for your financial institution’s name or contact your financial institution directly.
To obtain more information about the Fund:
 |  | |
| ByE-mail: | On the Internet: | |
| american_beacon.funds@ambeacon.com | Visit our website atwww.americanbeaconfunds.com | |
By Telephone: Call (800)658-5811 |
By Mail: American Beacon Funds P.O. Box 219643 Kansas City, MO 64121-9643 | |
| Availability of Quarterly Portfolio Schedules | Availability of Proxy Voting Policy and Records | |
| In addition to the Schedule of Investments provided in each semi-annual and annual report, the Fund files a complete schedule of its portfolio holdings with the Securities and Exchange Commission (“SEC”) on FormN-PORT as of the end of each fiscal quarters. The Fund’s FormsN-PORT are available on the SEC’s website atwww.sec.gov. The FormsN-PORT may also be reviewed and copied at the SEC’s Public Reference Section, 100 F Street, NE, Washington, D.C. 20549-2736. Information regarding the operation of the SEC’s Public Reference Room may be obtained by calling(800)-SEC-0330. A complete schedule of the Fund’s portfolio holdings is also available atwww.americanbeaconfunds.com approximately twenty days after the end of each month. | A description of the policies and procedures the Fund uses to determine how to vote proxies relating to portfolio securities is available in the Fund’s Statement of Additional Information, is available free of charge on the Fund’s websitewww.americanbeaconfunds.com and by calling1-800-967-9009 or by accessing the SEC’s website atwww.sec.gov. The Fund’s proxy voting record for the most recent year ended June 30 is filed annually with the SEC on FormN-PX. The Fund’s FormsN-PX are available on the SEC’s website atwww.sec.gov. The Fund’s proxy voting record may also be obtained by calling1-800-967-9009. | |


Fund Service Providers:
CUSTODIAN State Street Bank and Trust Company Boston, Massachusetts | TRANSFER AGENT DST Asset Manager Solutions, Inc. Quincy, Massachusetts | INDEPENDENT REGISTERED PUBLIC ACCOUNTING FIRM Ernst & Young LLP Dallas, Texas | DISTRIBUTOR Resolute Investment Distributors Irving, Texas |
This report is prepared for shareholders of the American Beacon Funds and may be distributed to others only if preceded or accompanied by a current Prospectus or Summary Prospectus.
American Beacon Funds, American Beacon StephensMid-Cap Growth Fund and American Beacon Stephens Small Cap Growth Fund are service marks of American Beacon Advisors, Inc.
AR 12/19

About American Beacon Advisors
Since 1986, American Beacon Advisors, Inc. has offered a variety of products and investment advisory services to numerous institutional and retail clients, including a variety of mutual funds, corporate cash management, and separate account management.
Our clients include defined benefit plans, defined contribution plans, foundations, endowments, corporations, financial planners, and other institutional investors. With American Beacon Advisors, you can put the experience of a multi-billion dollar asset management firm to work for your company.
BAHL & GAYNOR SMALL CAP GROWTH FUND
Investing insmall-capitalization stocksmay involve greater volatility and lower liquidity than larger company stocks. Investing inforeign securitiesmay involve heightened risk due to currency fluctuations and economic and political risks.Growth stockstypically are more volatile than value stocks; however, value stocks have a lower expected growth rate in earnings and sales. The use offutures contractsfor cash management may subject the Fund to losing more money than invested. The Fund participates in asecurities lendingprogram. Please see the prospectus for a complete discussion of the Fund’s risks. There can be no assurances that the investment objectives of this Fund will be met.
Any opinions herein, including forecasts, reflect our judgment as of the end of the reporting period and are subject to change. Each advisor’s strategies and each Fund’s portfolio composition will change depending on economic and market conditions. This report is not a complete analysis of market conditions, and, therefore, should not be relied upon as investment advice. Although economic and market information has been compiled from reliable sources, American Beacon Advisors, Inc. makes no representation as to the completeness or accuracy of the statements contained herein.
American Beacon Funds | December 31, 2019 |
| 1 | ||||
| 2 | ||||
| 6 | ||||
| 8 | ||||
Schedule of Investments: | ||||
| 9 | ||||
| 14 | ||||
| 17 | ||||
Financial Highlights: | ||||
| 35 | ||||
| 40 | ||||
| 41 | ||||
| 49 | ||||
| Back��Cover | ||||
 | Dear Shareholders,
In recent months, you’ve likely seen and heard news reports about disruptive headwinds in the global economy –including the U.S. trade war with China and its toll on the global economy, slowing global growth, the Federal Reserve’s series of rate cuts, Brexit, disruptions in the Middle East and protests in Hong Kong – and watched a flood of reaction in the world’s markets.
As Peter L. Bernstein said in his treatise on risk,Against the Gods: The Remarkable Story of Risk, published by John Wiley & Sons, Inc. in September 1998, “Volatility is a proxy for uncertainty and must be accommodated in measuring investment risk.”
During times of economic uncertainty and market volatility, fear of loss can be a powerful emotion – one that drives many investors to making short-term decisions subject to a variety of potential error-leading biases. Unfortunately, some short-term investment decisions may create more volatility rather than mitigate it. |
Instead of dwelling on the markets’ short-term reaction to waves of negative global news, we encourage investors to focus on the horizon instead. Long-term investing isn’t about identifying and anticipating the next big market move, it is about identifying the right investment products for riding out those moves. As a long-term investor, you should keep in mind the three Ds: direction, discipline and diversification.
| u | Direction: Achieving your long-term financial goals requires an individualized plan of action. You may want your plan to provide some measure of protection against periods of geopolitical turmoil, economic uncertainty, market volatility and job insecurity. Your plan should be reviewed annually and be adjusted in the event your long-range needs change. |
| u | Discipline:Long-term, systematic participation in an investment portfolio requires your resolution to stay the course. Spending time in the market – rather than trying to time the market – may place you in a better position to reach your long-term financial goals. |
| u | Diversification: By investing in different investment styles and asset classes, you may be able to help mitigate financial risks across your investment portfolio. By allocating your investment portfolio according to your risk-tolerance level, you may be better positioned to weather storms and achieve your long-term financial goals. |
Since 1986, American Beacon has endeavored to provide investors with a disciplined approach to realizing long-term financial goals. As a manager of managers, we strive to provide investment products that may enable investors to participate during market upswings while potentially insulating against market downswings.
Many of thesub-advisors to our mutual funds pursue upside capture and/or downside protection using proprietary strategies. The investment teams behind our mutual funds seek to produce consistent, long-term results rather than focus only on short-term movements in the markets. In managing our investment products, we emphasize identifying opportunities that offer the potential for long-term rewards.
Our management approach is more than a concept; it’s the cornerstone of our culture. And we strive to apply it at every turn as we seek to provide a well-diversified line of investment solutions to help our shareholders seek long-term rewards while mitigating volatility and risk.
Thank you for your continued interest in American Beacon. For additional information about our investment products or to access your account information, please visit our website atwww.americanbeaconfunds.com.
Best Regards,

Gene L. Needles, Jr.
President
American Beacon Funds
1
Domestic Equity Market Overview
December 31, 2019 (Unaudited)
The domestic equity market was strong for the12-month period under review despite uncertainty surrounding tariff, political and economic headlines. The 31.5% return of the S&P 500 Index (the “Index”) was its highest annual return since 2013; the Index recorded 35all-time highs during the year. Large-capitalization stocks outpaced small, and Growth stocks outperformed Value stocks across market caps. The Russell 2000 Growth Index outperformed the Russell 2000 Value Index by 6.1 percentage points, while the Russell 1000 Growth Index outperformed the Russell 1000 Value Index by 9.9 percentage points.
In the first quarter of 2019, the Index returned 13.7%, as aforementioned investor fears eased allowing equity markets to recoup nearly all declines from the fourth quarter of the 2018 market drawdown. This strong reversal was particularly driven by an increasingly optimistic outlook on U.S.-China trade talks, better-than-expected domestic GDP growth of 3.1%, healthy wage growth of 3.4%, and the Federal Reserve (the “Fed”) shifting to a more accommodative and “patient” stance.
Negative trade news flow between the U.S. and trading partners China and Mexico inundated investors during the second quarter of 2019 and drove market volatility. Optimism around U.S.-China trade relations quickly flipped negative with an announcement by the U.S. of a third round of tariffs. Additionally, the U.S. threatened a 5% tariff against Mexico. The tariff headlines, coupled with lower 2019 profit growth estimates for the Index, led to poor equity returns in May. However, Mexico’s ratification of the new United States-Mexico-Canada Agreement, which replaces the25-year-old North American Free Trade Agreement, as well as supportive macro data, such as a continued low unemployment rate of 3.6%, pushed the market higher for another consecutive quarter.
Trade-war rhetoric moved markets again in the third quarter of 2019. A fourth round of tariffs was announced and implemented, and the U.S. Department of the Treasury also designated China as a currency manipulator. Conversely, U.S. retail sales grew at a much better pace compared to the end of 2018 (4.4% year-over-year in August 2019 versus 1.5% in December 2018). Monetary conditions were again eased after the Fed cut its target rate twice during the third quarter of 2019, citing uncertainties in the global economic outlook.
A strong Index return of 9.1% in the fourth quarter of 2019 pushed the Index return for the12-month period to 31.5%. Despite a slower U.S. economic growth rate of 2.1%, unemployment again achieved another50-year low at 3.5%. In addition, domestic retail sales continued to grow at an increasing rate of 5.8% year-over-year in December, providing evidence the U.S. consumer remained healthy. October tariffs on China were canceled and, by the end of the year, Phase One of the U.S.-China trade deal was all but signed, causing business clarity and improved CEO confidence.
As the year ended, equity markets moved solidly higher in 2019, supported mainly by expandedprice-to-earnings multiples as a result of controlled inflation trends and a variety of economic metrics that served as a “no recession now” signal.
2
American Beacon Bahl & Gaynor Small Cap Growth FundSM
Performance Overview
December 31, 2019 (Unaudited)
The Investor Class of the American Beacon Bahl & Gaynor Small Cap Growth Fund (the “Fund”) returned 24.99% for the twelve months ended December 31, 2019. The Fund underperformed the Russell 2000® Growth Index (the “Index”) return of 28.48% for the same period.
Comparison of Change in Value of a $10,000 Investment for the period from 7/15/2014 through 12/31/2019
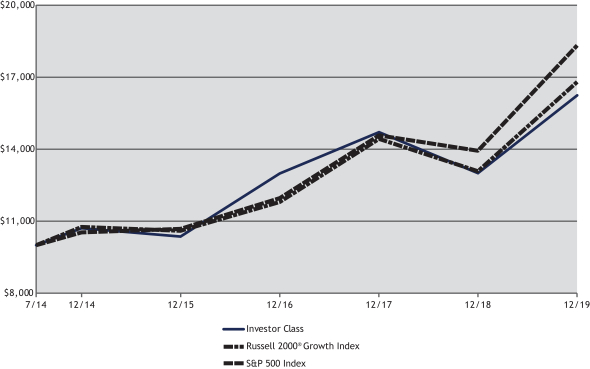
| Total Returns for the Period Ended December 31, 2019 |
| |||||||||||||||||||||||||||||||
Ticker | 1 Year | 3 Years | 5 Years | Since Inception (7/15/2014) | Value of $10,000 7/15/2014- 12/31/2019 | |||||||||||||||||||||||||||
Institutional Class (1,4) | GBSIX | 25.49 | % | 8.16 | % | 9.10 | % | 9.70 | % | $ | 16,582 | |||||||||||||||||||||
Y Class (1,4) | GBSYX | 25.34 | % | 8.04 | % | 8.99 | % | 9.60 | % | $ | 16,499 | |||||||||||||||||||||
Investor Class (1,4) | GBSPX | 24.99 | % | 7.74 | % | 8.68 | % | 9.28 | % | $ | 16,236 | |||||||||||||||||||||
A without Sales Charge (1,2,4) | GBSAX | 24.97 | % | 7.70 | % | 8.66 | % | 9.26 | % | $ | 16,220 | |||||||||||||||||||||
A with Sales Charge (1,2,4) | GBSAX | 17.75 | % | 5.60 | % | 7.38 | % | 8.08 | % | $ | 15,287 | |||||||||||||||||||||
C without Sales Charge (1,2,4) | GBSCX | 23.99 | % | 6.93 | % | 7.85 | % | 8.44 | % | $ | 15,568 | |||||||||||||||||||||
C with Sales Charge (1,2,4) | GBSCX | 22.99 | % | 6.93 | % | 7.85 | % | 8.44 | % | $ | 15,568 | |||||||||||||||||||||
Russell 2000® Growth Index (3) | 28.48 | % | 12.49 | % | 9.34 | % | 9.96 | % | $ | 16,799 | ||||||||||||||||||||||
S&P 500 Index (3) | 31.49 | % | 15.27 | % | 11.70 | % | 11.71 | % | $ | 18,314 | ||||||||||||||||||||||
| 1. | Performance shown is historical and is not indicative of future returns. Investment returns and principal value will vary, and shares may be worth more or less at redemption than at original purchase. Performance shown is calculated based on the publishedend-of-day net asset values as of date indicated, and current performance may be lower or higher than the performance data quoted. To obtain performance as of the most recent month end, please visitwww.americanbeaconfunds.com or call1-800-967-9009. Fund performance in the table above does not reflect the deduction of taxes a shareholder would pay on distributions or the redemption of shares. Generally accepted accounting principles require adjustments to be made to the net assets of the Fund at period end for financial reporting purposes only; and as such, the total return based on the unadjusted net asset value per share may differ from the total return reported in the financial highlights. A portion of the fees charged to each Class of the Fund has been waived since Fund inception. Performance prior to waiving fees was lower than actual returns shown since inception. Please note that the recent performance of the securities market has helped produce short-term returns that are not typical and may not continue in the future. |
| 2. | A Class shares have a maximum sales charge of 5.75%. The maximum contingent deferred sales charge for the C Class is 1.00% for shares redeemed within one year of the date of purchase. |
3
American Beacon Bahl & Gaynor Small Cap Growth FundSM
Performance Overview
December 31, 2019 (Unaudited)
| 3. | The Russell 2000® Growth Index is an unmanaged index of those stocks in the Russell 2000® Index with higherprice-to-book ratios and higher forecasted growth values. The Russell 2000 Growth Index and the Russell 2000 Index are registered trademarks of Frank Russell Company. Frank Russell Company (“Russell”) is the source and owner of the trademarks, service marks and copyrights related to the Russell Indexes. Russell® is a trademark of Frank Russell Company. Neither Russell nor its licensors accept any liability for any errors or omissions in the Russell Indexes and/or Russell ratings or underlying data, and no party may rely on any Russell Indexes and/or Russell ratings and/or underlying data contained in this communication. No further distribution of Russell Data is permitted without Russell’s express written consent. Russell does not promote, sponsor or endorse the content of this communication. The S&P 500 Index is an unmanaged index of common stocks publicly traded in the United States. The S&P 500 Index is a product of S&P Dow Jones Indices LLC, a division of S&P Global or its affiliates (“SPDJI”) and has been licensed for use by American Beacon Advisors. Standard & Poor’s® and S&P® are registered trademarks of Standard & Poor’s Financial Services LLC, a division of S&P Global (“S&P”). Dow Jones® is a registered trademark of Dow Jones Trademark Holdings LLC (“Dow Jones”). The American Beacon Bahl & Gaynor Small Cap Growth Fund is not sponsored, endorsed, sold or promoted by SPDJI, Dow Jones, S&P or their respective affiliates, and none of such parties make any representation regarding the advisability of investing in such product(s) nor do they have any liability for any errors, omissions or interruptions of the S&P 500 Index. One cannot directly invest in an index. |
| 4. | The Total Annual Fund Operating Expense ratios set forth in the most recent Fund prospectus for the Institutional, Y, Investor, A and C Class shares were 1.26%, 1.34%, 1.53%, 1.61% and 2.35%, respectively. The expense ratios above may vary from the expense ratios presented in other sections of this report that are based on expenses incurred during the period covered by this report. |
The Fund underperformed the Index due to both sector allocation and stock selection.
As it relates to sector allocation, the Fund was overweight Financials, one of the lower performing sectors in the Index. The Fund held a sizeable underweight to Health Care, one of the best performing sectors for the Index, which also detracted value for the period. Offsetting some of this performance were underweights to Energy, the worst performing sector in the Index, and Consumer Discretionary.
From a stock selection standpoint, the Fund’s holdings in the Health Care and Industrials sectors detracted the most from relative performance. In the Health Care sector, the Fund’s positions in Cantel Medical Corp. (down 9.0%) and Phibro Animal Health Corp., Class A (down 33.8%) negatively impacted returns. The Fund did not hold Index-positions Array Biopharma, Inc. (up 225.1%) and Arrowhead Pharmaceuticals, Inc. (up 410.7%), further detracting from relative performance. Within the Industrials sector, Healthcare Services Group was down 43.0%, Matthews International Corp., Class A was down 13.0%, and Raven Industries, Inc. was down 3.8%. The Fund was also absent Index-position Generac Holdings, Inc., which was up 102.4% for the period.
Offsetting some of the aforementioned performance were positions in the Information Technology and Communication Services sectors. In Information Technology, the Fund held Pegasystems, Inc. (up 66.9%), CSG Systems International Inc. (up 65.0%) and SYNNEX Corp. (up 62.1%), which boosted relative returns. Within the Communication Services sector, the Fund held Nexstar Media Group, Class A (up 51.2%) and avoided Index-position Liberty TripAdvisor Holdings, Class A (down 53.7%).
The Fund’s basic philosophy remains focused on investing in companies using a fundamental investment approach that seeks long-term capital appreciation.
4
American Beacon Bahl & Gaynor Small Cap Growth FundSM
Performance Overview
December 31, 2019 (Unaudited)
| Top Ten Holdings (% Net Assets) | ||||||||
| Chemed Corp. | 3.0 | |||||||
| Kinsale Capital Group, Inc. | 2.7 | |||||||
| CSG Systems International, Inc. | 2.6 | |||||||
| J&J Snack Foods Corp. | 2.6 | |||||||
| Inter Parfums, Inc. | 2.6 | |||||||
| BWX Technologies, Inc. | 2.5 | |||||||
| CONMED Corp. | 2.4 | |||||||
| John Bean Technologies Corp. | 2.4 | |||||||
| Pegasystems, Inc. | 2.4 | |||||||
| Federal Signal Corp. | 2.3 | |||||||
| Total Fund Holdings | 69 | |||||||
| Sector Allocation (% Equities) | ||||||||
| Industrials | 20.4 | |||||||
| Information Technology | 19.1 | |||||||
| Health Care | 17.0 | |||||||
| Financials | 12.3 | |||||||
| Consumer Staples | 9.4 | |||||||
| Consumer Discretionary | 8.6 | |||||||
| Materials | 3.9 | |||||||
| Utilities | 3.2 | |||||||
| Real Estate | 2.5 | |||||||
| Communication Services | 2.4 | |||||||
| Energy | 1.2 | |||||||
5
American Beacon Bahl & Gaynor Small Cap Growth FundSM
December 31, 2019 (Unaudited)
Fund Expense Example
As a shareholder of a Fund, you incur two types of costs: (1) transaction costs, including sales charges (loads) on purchase payments and redemption fees, if applicable, and (2) ongoing costs, including management fees, distribution(12b-1) fees,sub-transfer agent fees, and other Fund expenses. The Examples are intended to help you understand the ongoing cost (in dollars) of investing in the Fund and to compare these costs with the ongoing costs of investing in other mutual funds. The Examples are based on an investment of $1,000 invested at the beginning of the period in each Class and held for the entire period from July 1, 2019 through December 31, 2019.
Actual Expenses
The “Actual” lines of the tables provide information about actual account values and actual expenses. You may use the information on this page, together with the amount you invested, to estimate the expenses that you paid over the period. Simply divide your account value by $1,000 (for example, an $8,600 account value divided by $1,000 = $8.60), then multiply the result by the “Expenses Paid During Period” to estimate the expenses you paid on your account during this period. Shareholders of the Investor and Institutional Classes that invest in the Fund through an IRA or Roth IRA may be subject to a custodial IRA fee of $15 that is typically deducted each December. If your account was subject to a custodial IRA fee during the period, your costs would have been $15 higher.
Hypothetical Example for Comparison Purposes
The “Hypothetical” lines of the tables provide information about hypothetical account values and hypothetical expenses based on the Fund’s actual expense ratio and an assumed 5% per year rate of return before expenses (not the Fund’s actual return). You may compare the ongoing costs of investing in the Fund with other funds by contrasting this 5% hypothetical example and the 5% hypothetical examples that appear in the shareholder reports of the other funds. The hypothetical account values and expenses may not be used to estimate the actual ending account balance or expenses you paid for the period. Shareholders of the Investor and Institutional Classes that invest in the Funds through an IRA or Roth IRA may be subject to a custodial IRA fee of $15 that is typically deducted each December. If your account was subject to a custodial IRA fee during the period, your costs would have been $15 higher.
You should also be aware that the expenses shown in the table highlight only your ongoing costs and do not reflect any transaction costs charged by the Fund, such as sales charges (loads) or redemption fees, as applicable. Similarly, the expense examples for other funds do not reflect any transaction costs charged by those funds, such as sales charges (loads), redemption fees or exchange fees. Therefore, the “Hypothetical” lines of the tables are useful in comparing ongoing costs only and will not help you determine the relative total costs of owning different funds. If you were subject to any transaction costs during the period, your costs would have been higher.
6
American Beacon Bahl & Gaynor Small Cap Growth FundSM
Expense Examples
December 31, 2019 (Unaudited)
| American Beacon Bahl & Gaynor Small Cap Growth Fund |
| ||||||||||||||
| Beginning Account Value 7/1/2019 | Ending Account Value 12/31/2019 | Expenses Paid During Period 7/1/2019-12/31/2019* | |||||||||||||
| Institutional Class | |||||||||||||||
| Actual | $1,000.00 | $1,077.70 | $5.13 | ||||||||||||
| Hypothetical** | $1,000.00 | $1,020.27 | $4.99 | ||||||||||||
| Y Class | |||||||||||||||
| Actual | $1,000.00 | $1,077.40 | $5.66 | ||||||||||||
| Hypothetical** | $1,000.00 | $1,019.76 | $5.50 | ||||||||||||
| Investor Class | |||||||||||||||
| Actual | $1,000.00 | $1,075.50 | $7.11 | ||||||||||||
| Hypothetical** | $1,000.00 | $1,018.35 | $6.92 | ||||||||||||
| A Class | |||||||||||||||
| Actual | $1,000.00 | $1,075.50 | $7.22 | ||||||||||||
| Hypothetical** | $1,000.00 | $1,018.25 | $7.02 | ||||||||||||
| C Class | |||||||||||||||
| Actual | $1,000.00 | $1,070.90 | $11.12 | ||||||||||||
| Hypothetical** | $1,000.00 | $1,014.47 | $10.82 | ||||||||||||
| * | Expenses are equal to the Fund’s annualized expense ratios for thesix-month period of 0.98%, 1.08%, 1.36%, 1.38%, and 2.13% for the Institutional, Y, Investor, A, and C Classes, respectively, multiplied by the average account value over the period, multiplied by the number derived by dividing the number of days in the most recent fiscal half-year (184) by days in the year (365) to reflect the half-year period. |
| ** | 5% return before expenses. |
7
American Beacon Bahl & Gaynor Small Cap Growth FundSM
Report of Independent Registered Public Accounting Firm
To the Shareholders and the Board of Trustees of American Beacon Bahl & Gaynor Small Cap Growth Fund
Opinion on the Financial Statements
We have audited the accompanying statement of assets and liabilities of American Beacon Bahl & Gaynor Small Cap Growth Fund (the “Fund”) (one of the funds constituting American Beacon Funds (the “Trust”)), including the schedule of investments, as of December 31, 2019, and the related statement of operations for the year then ended, the statements of changes in net assets for each of the two years in the period then ended, the financial highlights for each of the five years in the period then ended and the related notes (collectively referred to as the “financial statements”). In our opinion, the financial statements present fairly, in all material respects, the financial position of the Fund at December 31, 2019, the results of its operations for the year then ended, the changes in its net assets for each of the two years in the period then ended and its financial highlights for each of the five years in the period then ended, in conformity with U.S. generally accepted accounting principles.
Basis for Opinion
These financial statements are the responsibility of the Trust’s management. Our responsibility is to express an opinion on the Fund’s financial statements based on our audits. We are a public accounting firm registered with the Public Company Accounting Oversight Board (United States) (“PCAOB”) and are required to be independent with respect to the Trust in accordance with the U.S. federal securities laws and the applicable rules and regulations of the Securities and Exchange Commission and the PCAOB.
We conducted our audits in accordance with the standards of the PCAOB. Those standards require that we plan and perform the audit to obtain reasonable assurance about whether the financial statements are free of material misstatement, whether due to error or fraud. The Trust is not required to have, nor were we engaged to perform, an audit of the Trust’s internal control over financial reporting. As part of our audits, we are required to obtain an understanding of internal control over financial reporting, but not for the purpose of expressing an opinion on the effectiveness of the Trust’s internal control over financial reporting. Accordingly, we express no such opinion.
Our audits included performing procedures to assess the risks of material misstatement of the financial statements, whether due to error or fraud, and performing procedures that respond to those risks. Such procedures included examining, on a test basis, evidence regarding the amounts and disclosures in the financial statements. Our procedures included confirmation of securities owned as of December 31, 2019, by correspondence with the custodian. Our audits also included evaluating the accounting principles used and significant estimates made by management, as well as evaluating the overall presentation of the financial statements. We believe that our audits provide a reasonable basis for our opinion.

We have served as the auditor of one or more American Beacon investment companies since 1987.
Dallas, Texas
February 28, 2020
8
American Beacon Bahl & Gaynor Small Cap Growth FundSM
December 31, 2019
| Shares | Fair Value | ||||||||||||||
| COMMON STOCKS - 98.97% | |||||||||||||||
| Communication Services - 2.35% | |||||||||||||||
| Entertainment - 0.36% | |||||||||||||||
| Cinemark Holdings, Inc.A | 4,750 | $ | 160,787 | ||||||||||||
|
| ||||||||||||||
| Media - 1.99% | |||||||||||||||
| Nexstar Media Group, Inc., Class A | 7,639 | 895,673 | |||||||||||||
|
| ||||||||||||||
Total Communication Services | 1,056,460 | ||||||||||||||
|
| ||||||||||||||
| Consumer Discretionary - 8.52% | |||||||||||||||
| Auto Components - 1.46% | |||||||||||||||
| LCI Industries | 6,130 | 656,707 | |||||||||||||
|
| ||||||||||||||
| Automobiles - 0.68% | |||||||||||||||
| Winnebago Industries, Inc. | 5,760 | 305,165 | |||||||||||||
|
| ||||||||||||||
| Hotels, Restaurants & Leisure - 2.77% | |||||||||||||||
| Marriott Vacations Worldwide Corp. | 3,554 | 457,613 | |||||||||||||
| Ruth’s Hospitality Group, Inc. | 8,293 | 180,497 | |||||||||||||
| Texas Roadhouse, Inc.A | 10,824 | 609,608 | |||||||||||||
|
| ||||||||||||||
| 1,247,718 | |||||||||||||||
|
| ||||||||||||||
| Household Durables - 0.31% | |||||||||||||||
| Hooker Furniture Corp. | 5,417 | 139,163 | |||||||||||||
|
| ||||||||||||||
| Leisure Products - 2.11% | |||||||||||||||
| Brunswick Corp. | 8,390 | 503,232 | |||||||||||||
| Johnson Outdoors, Inc., Class A | 5,843 | 448,158 | |||||||||||||
|
| ||||||||||||||
| 951,390 | |||||||||||||||
|
| ||||||||||||||
| Specialty Retail - 0.75% | |||||||||||||||
| Winmark Corp. | 1,700 | 337,110 | |||||||||||||
|
| ||||||||||||||
| Textiles, Apparel & Luxury Goods - 0.44% | |||||||||||||||
| Superior Group of Cos., Inc. | 14,579 | 197,399 | |||||||||||||
|
| ||||||||||||||
Total Consumer Discretionary | 3,834,652 | ||||||||||||||
|
| ||||||||||||||
| Consumer Staples - 9.33% | |||||||||||||||
| Food Products - 6.78% | |||||||||||||||
| Calavo Growers, Inc.A | 10,883 | 985,891 | |||||||||||||
| J&J Snack Foods Corp. | 6,434 | 1,185,593 | |||||||||||||
| Lancaster Colony Corp. | 5,482 | 877,669 | |||||||||||||
|
| ||||||||||||||
| 3,049,153 | |||||||||||||||
|
| ||||||||||||||
| Personal Products - 2.55% | |||||||||||||||
| Inter Parfums, Inc. | 15,785 | 1,147,727 | |||||||||||||
|
| ||||||||||||||
Total Consumer Staples | 4,196,880 | ||||||||||||||
|
| ||||||||||||||
| Energy - 1.15% | |||||||||||||||
| Oil, Gas & Consumable Fuels - 1.15% | |||||||||||||||
| World Fuel Services Corp. | 11,935 | 518,218 | |||||||||||||
|
| ||||||||||||||
| Financials - 12.17% | |||||||||||||||
| Banks - 6.20% | |||||||||||||||
| First Financial Bancorp | 37,798 | 961,581 | |||||||||||||
| First Interstate BancSystem, Inc., Class A | 19,700 | 825,824 | |||||||||||||
See accompanying notes
9
American Beacon Bahl & Gaynor Small Cap Growth FundSM
Schedule of Investments
December 31, 2019
| Shares | Fair Value | ||||||||||||||
| COMMON STOCKS - 98.97% (continued) | |||||||||||||||
| Financials - 12.17% (continued) | |||||||||||||||
| Banks - 6.20% (continued) | |||||||||||||||
| Glacier Bancorp, Inc. | 6,802 | $ | 312,824 | ||||||||||||
| S&T Bancorp, Inc. | 10,380 | 418,210 | |||||||||||||
| TCF Financial Corp. | 5,760 | 269,568 | |||||||||||||
|
| ||||||||||||||
| 2,788,007 | |||||||||||||||
|
| ||||||||||||||
| Capital Markets - 1.41% | |||||||||||||||
| Evercore, Inc., Class A | 8,506 | 635,909 | |||||||||||||
|
| ||||||||||||||
| Insurance - 4.56% | |||||||||||||||
| Horace Mann Educators Corp. | 18,733 | 817,883 | |||||||||||||
| Kinsale Capital Group, Inc. | 12,149 | 1,235,067 | |||||||||||||
|
| ||||||||||||||
| 2,052,950 | |||||||||||||||
|
| ||||||||||||||
Total Financials | 5,476,866 | ||||||||||||||
|
| ||||||||||||||
| Health Care - 16.82% | |||||||||||||||
| Health Care Equipment & Supplies - 8.99% | |||||||||||||||
| Atrion Corp. | 821 | 616,981 | |||||||||||||
| Cantel Medical Corp.A | 7,486 | 530,757 | |||||||||||||
| CONMED Corp. | 9,567 | 1,069,878 | |||||||||||||
| LeMaitre Vascular, Inc. | 26,826 | 964,395 | |||||||||||||
| Mesa Laboratories, Inc. | 3,465 | 864,171 | |||||||||||||
|
| ||||||||||||||
| 4,046,182 | |||||||||||||||
|
| ||||||||||||||
| Health Care Providers & Services - 5.13% | |||||||||||||||
| Chemed Corp. | 3,069 | 1,348,089 | |||||||||||||
| US Physical Therapy, Inc. | 8,390 | 959,397 | |||||||||||||
|
| ||||||||||||||
| 2,307,486 | |||||||||||||||
|
| ||||||||||||||
| Health Care Technology - 1.54% | |||||||||||||||
| Simulations Plus, Inc. | 23,820 | 692,447 | |||||||||||||
|
| ||||||||||||||
| Life Sciences Tools & Services - 1.16% | |||||||||||||||
| Luminex Corp. | 22,601 | 523,439 | |||||||||||||
|
| ||||||||||||||
Total Health Care | 7,569,554 | ||||||||||||||
|
| ||||||||||||||
| Industrials - 20.22% | |||||||||||||||
| Aerospace & Defense - 2.98% | |||||||||||||||
| BWX Technologies, Inc. | 17,926 | 1,112,846 | |||||||||||||
| Curtiss-Wright Corp. | 1,630 | 229,651 | |||||||||||||
|
| ||||||||||||||
| 1,342,497 | |||||||||||||||
|
| ||||||||||||||
| Building Products - 3.71% | |||||||||||||||
| AAON, Inc. | 8,422 | 416,131 | |||||||||||||
| Simpson Manufacturing Co., Inc. | 7,566 | 607,020 | |||||||||||||
| Universal Forest Products, Inc. | 13,533 | 645,524 | |||||||||||||
|
| ||||||||||||||
| 1,668,675 | |||||||||||||||
|
| ||||||||||||||
| Commercial Services & Supplies - 5.77% | |||||||||||||||
| MSA Safety, Inc. | 7,669 | 969,055 | |||||||||||||
| Ritchie Bros Auctioneers, Inc. | 16,629 | 714,216 | |||||||||||||
| Tetra Tech, Inc. | 10,589 | 912,348 | |||||||||||||
|
| ||||||||||||||
| 2,595,619 | |||||||||||||||
|
| ||||||||||||||
See accompanying notes
10
American Beacon Bahl & Gaynor Small Cap Growth FundSM
Schedule of Investments
December 31, 2019
| Shares | Fair Value | ||||||||||||||
| COMMON STOCKS - 98.97% (continued) | |||||||||||||||
| Industrials - 20.22% (continued) | |||||||||||||||
| Machinery - 4.74% | |||||||||||||||
| Federal Signal Corp. | 32,360 | $ | 1,043,610 | ||||||||||||
| John Bean Technologies Corp. | 9,655 | 1,087,732 | |||||||||||||
|
| ||||||||||||||
| 2,131,342 | |||||||||||||||
|
| ||||||||||||||
| Professional Services - 1.68% | |||||||||||||||
| Barrett Business Services, Inc. | 8,357 | 755,974 | |||||||||||||
|
| ||||||||||||||
| Road & Rail - 0.94% | |||||||||||||||
| Landstar System, Inc. | 3,728 | 424,508 | |||||||||||||
|
| ||||||||||||||
| Trading Companies & Distributors - 0.40% | |||||||||||||||
| MSC Industrial Direct Co., Inc., Class A | 2,302 | 180,638 | |||||||||||||
|
| ||||||||||||||
Total Industrials | 9,099,253 | ||||||||||||||
|
| ||||||||||||||
| Information Technology - 18.90% | |||||||||||||||
| Electronic Equipment, Instruments & Components - 1.56% | |||||||||||||||
| SYNNEX Corp. | 5,447 | 701,573 | |||||||||||||
|
| ||||||||||||||
| IT Services - 5.80% | |||||||||||||||
| CSG Systems International, Inc. | 22,920 | 1,186,797 | |||||||||||||
| Hackett Group, Inc. | 31,883 | 514,592 | |||||||||||||
| ManTech International Corp., Class A | 11,366 | 907,916 | |||||||||||||
|
| ||||||||||||||
| 2,609,305 | |||||||||||||||
|
| ||||||||||||||
| Semiconductors & Semiconductor Equipment - 4.92% | |||||||||||||||
| Brooks Automation, Inc. | 13,239 | 555,508 | |||||||||||||
| Cabot Microelectronics Corp. | 2,006 | 289,506 | |||||||||||||
| Monolithic Power Systems, Inc. | 2,796 | 497,744 | |||||||||||||
| Power Integrations, Inc. | 5,806 | 574,272 | |||||||||||||
| Silicon Motion Technology Corp., ADR | 5,859 | 297,110 | |||||||||||||
|
| ||||||||||||||
| 2,214,140 | |||||||||||||||
|
| ||||||||||||||
| Software - 6.62% | |||||||||||||||
| Blackbaud, Inc. | 7,249 | 577,020 | |||||||||||||
| LogMeIn, Inc. | 3,312 | 283,971 | |||||||||||||
| Pegasystems, Inc. | 13,684 | 1,089,931 | |||||||||||||
| Progress Software Corp. | 16,235 | 674,564 | |||||||||||||
| QAD, Inc., Class A | 6,976 | 355,288 | |||||||||||||
|
| ||||||||||||||
| 2,980,774 | |||||||||||||||
|
| ||||||||||||||
Total Information Technology | 8,505,792 | ||||||||||||||
|
| ||||||||||||||
| Materials - 3.80% | |||||||||||||||
| Chemicals - 3.80% | |||||||||||||||
| Balchem Corp. | 7,639 | 776,351 | |||||||||||||
| PolyOne Corp. | 9,442 | 347,371 | |||||||||||||
| Stepan Co. | 5,715 | 585,445 | |||||||||||||
|
| ||||||||||||||
| 1,709,167 | |||||||||||||||
|
| ||||||||||||||
Total Materials | 1,709,167 | ||||||||||||||
|
| ||||||||||||||
| Real Estate - 2.51% | |||||||||||||||
| Equity Real Estate Investment Trusts (REITs) - 1.91% | |||||||||||||||
| CoreSite Realty Corp. | 5,685 | 637,402 | |||||||||||||
| First Industrial Realty Trust, Inc. | 5,351 | 222,120 | |||||||||||||
|
| ||||||||||||||
| 859,522 | |||||||||||||||
|
| ||||||||||||||
See accompanying notes
11
American Beacon Bahl & Gaynor Small Cap Growth FundSM
Schedule of Investments
December 31, 2019
| Shares | Fair Value | ||||||||||||||
| COMMON STOCKS - 98.97% (continued) | |||||||||||||||
| Real Estate - 2.51% (continued) | |||||||||||||||
| Real Estate Management & Development - 0.60% | |||||||||||||||
| RE/MAX Holdings, Inc., Class A | 6,978 | $ | 268,583 | ||||||||||||
|
| ||||||||||||||
Total Real Estate | 1,128,105 | ||||||||||||||
|
| ||||||||||||||
| Utilities - 3.20% | |||||||||||||||
| Gas Utilities - 3.20% | |||||||||||||||
| Chesapeake Utilities Corp. | 6,014 | 576,322 | |||||||||||||
| ONE Gas, Inc. | 9,230 | 863,651 | |||||||||||||
|
| ||||||||||||||
| 1,439,973 | |||||||||||||||
|
| ||||||||||||||
Total Utilities | 1,439,973 | ||||||||||||||
|
| ||||||||||||||
Total Common Stocks (Cost $35,408,510) | 44,534,920 | ||||||||||||||
|
| ||||||||||||||
| SHORT-TERM INVESTMENTS - 1.02% | |||||||||||||||
| Investment Companies - 0.91% | |||||||||||||||
| American Beacon U.S. Government Money Market Select Fund, Select Class, 1.52%B C | 409,470 | 409,470 | |||||||||||||
|
| ||||||||||||||
| Principal Amount | |||||||||||||||
| U.S. Treasury Obligations - 0.11% | |||||||||||||||
| U.S. Treasury Bill, 1.870%, Due 2/13/2020D | $ | 50,000 | 49,913 | ||||||||||||
|
| ||||||||||||||
Total Short-Term Investments (Cost $459,360) | 459,383 | ||||||||||||||
|
| ||||||||||||||
TOTAL INVESTMENTS - 99.99% (Cost $35,867,870) | 44,994,303 | ||||||||||||||
OTHER ASSETS, NET OF LIABILITIES - 0.01% | 2,338 | ||||||||||||||
|
| ||||||||||||||
TOTAL NET ASSETS - 100.00% | $ | 44,996,641 | |||||||||||||
|
| ||||||||||||||
| Percentages are stated as a percent of net assets. | |||||||||||||||
A All or a portion of this security is on loan, collateralized by either cash and/or U.S Treasuries, at December 31, 2019 (Note 9).
B The Fund is affiliated by having the same investment advisor.
C7-day yield.
D This security or a piece thereof is held as segregated collateral.
ADR - American Depositary Receipt.
| Long Futures Contracts Open on December 31, 2019: |
| |||||||||||||||
Equity Futures Contracts | ||||||||||||||||
| Description | Number of Contracts | Expiration Date | Notional Amount | Contract Value | Unrealized Appreciation (Depreciation) | |||||||||||
| Russell 2000E-Mini Index Futures | 6 | March 2020 | $ 497,526 | $ | 501,180 | $ | 3,654 | |||||||||
|
|
|
|
|
| |||||||||||
| $ 497,526 | $ | 501,180 | $ | 3,654 | ||||||||||||
|
|
|
|
|
| |||||||||||
See accompanying notes
12
American Beacon Bahl & Gaynor Small Cap Growth FundSM
Schedule of Investments
December 31, 2019
The Fund’s investments are summarized by level based on the inputs used to determine their values. As of December 31, 2019, the investments were classified as described below:
Bahl & Gaynor Small Cap Growth Fund | Level 1 | Level 2 | Level 3 | Total | ||||||||||||||||||||||||
Assets | ||||||||||||||||||||||||||||
Common Stocks | $ | 44,534,920 | $ | - | $ | - | $ | 44,534,920 | ||||||||||||||||||||
Short-Term Investments | 409,470 | 49,913 | - | 459,383 | ||||||||||||||||||||||||
|
|
|
|
|
|
|
| |||||||||||||||||||||
Total Investments in Securities - Assets | $ | 44,944,390 | $ | 49,913 | $ | - | $ | 44,994,303 | ||||||||||||||||||||
|
|
|
|
|
|
|
| |||||||||||||||||||||
Financial Derivative Instruments - Assets | ||||||||||||||||||||||||||||
Futures Contracts | $ | 3,654 | $ | - | $ | - | $ | 3,654 | ||||||||||||||||||||
|
|
|
|
|
|
|
| |||||||||||||||||||||
Total Financial Derivative Instruments - Assets | $ | 3,654 | $ | - | $ | - | $ | 3,654 | ||||||||||||||||||||
|
|
|
|
|
|
|
| |||||||||||||||||||||
U.S. GAAP requires transfers between all levels to/from level 3 be disclosed. During the year ended December 31, 2019, there were no transfers into or out of Level 3.
See accompanying notes
13
American Beacon Bahl & Gaynor Small Cap Growth FundSM
Statement of Assets and Liabilities
December 31, 2019
Assets: |
| |||
Investments in unaffiliated securities, at fair value†§ | $ | 44,584,833 | ||
Investments in affiliated securities, at fair value‡ | 409,470 | |||
Dividends and interest receivable | 43,402 | |||
Receivable for fund shares sold | 49,722 | |||
Receivable for expense reimbursement (Note 2) | 14,515 | |||
Receivable for variation margin on open futures contracts (Note 5) | 3,696 | |||
Prepaid expenses | 20,100 | |||
|
| |||
Total assets | 45,125,738 | |||
|
| |||
Liabilities: |
| |||
Payable for fund shares redeemed | 41,868 | |||
Cash due to broker for futures contracts | 3,005 | |||
Management andsub-advisory fees payable (Note 2) | 33,207 | |||
Service fees payable (Note 2) | 2,499 | |||
Transfer agent fees payable (Note 2) | 3,168 | |||
Custody and fund accounting fees payable | 4,471 | |||
Professional fees payable | 36,414 | |||
Payable for prospectus and shareholder reports | 4,140 | |||
Other liabilities | 325 | |||
|
| |||
Total liabilities | 129,097 | |||
|
| |||
Net assets | $ | 44,996,641 | ||
|
| |||
Analysis of net assets: |
| |||
Paid-in-capital | $ | 38,195,149 | ||
Total distributable earnings (deficits)A | 6,801,492 | |||
|
| |||
Net assets | �� | $ | 44,996,641 | |
|
| |||
Shares outstanding at no par value (unlimited shares authorized): |
| |||
Institutional Class | 1,228,394 | |||
|
| |||
Y Class | 1,526,460 | |||
|
| |||
Investor Class | 226,351 | |||
|
| |||
A Class | 111,016 | |||
|
| |||
C Class | 23,588 | |||
|
| |||
Net assets: |
| |||
Institutional Class | $ | 17,837,496 | ||
|
| |||
Y Class | $ | 22,038,090 | ||
|
| |||
Investor Class | $ | 3,217,039 | ||
|
| |||
A Class | $ | 1,579,622 | ||
|
| |||
C Class | $ | 324,394 | ||
|
| |||
Net asset value, offering and redemption price per share: |
| |||
Institutional Class | $ | 14.52 | ||
|
| |||
Y Class | $ | 14.44 | ||
|
| |||
Investor Class | $ | 14.21 | ||
|
| |||
A Class | $ | 14.23 | ||
|
| |||
A Class (offering price) | $ | 15.10 | ||
|
| |||
C Class | $ | 13.75 | ||
|
| |||
† Cost of investments in unaffiliated securities | $ | 35,458,400 | ||
‡ Cost of investments in affiliated securities | $ | 409,470 | ||
§ Fair value of securities of loan | $ | 1,872,650 | ||
A The Fund’s investments in affiliated securities did not have unrealized appreciation (depreciation) at year end. |
| |||
See accompanying notes
14
American Beacon Bahl & Gaynor Small Cap Growth FundSM
Statement of Operations
For the year ended December 31, 2019
Investment income: |
| |||
Dividend income from unaffiliated securities (net of foreign taxes)† | $ | 650,769 | ||
Dividend income from affiliated securities (Note 8) | 9,622 | |||
Interest income | 400 | |||
Income derived from securities lending (Note 9) | 606 | |||
|
| |||
Total investment income | 661,397 | |||
|
| |||
Expenses: |
| |||
Management andsub-advisory fees (Note 2) | 382,178 | |||
Transfer agent fees: | ||||
Institutional Class (Note 2) | 8,000 | |||
Y Class (Note 2) | 22,907 | |||
Investor Class | 1,394 | |||
A Class | 157 | |||
C Class | 62 | |||
Custody and fund accounting fees | 33,937 | |||
Professional fees | 38,586 | |||
Registration fees and expenses | 72,169 | |||
Service fees (Note 2): | ||||
Investor Class | 11,811 | |||
A Class | 2,486 | |||
C Class | 557 | |||
Distribution fees (Note 2): | ||||
A Class | 5,388 | |||
C Class | 3,110 | |||
Prospectus and shareholder report expenses | 15,561 | |||
Trustee fees (Note 2) | 3,371 | |||
Other expenses | 14,401 | |||
|
| |||
Total expenses | 616,075 | |||
|
| |||
Net fees waived and expenses (reimbursed) (Note 2) | (141,101 | ) | ||
|
| |||
Net expenses | 474,974 | |||
|
| |||
Net investment income | 186,423 | |||
|
| |||
Realized and unrealized gain (loss) from investments: |
| |||
Net realized gain (loss) from: | ||||
Investments in unaffiliated securitiesA | (1,193,878 | ) | ||
Futures contracts | 90,903 | |||
Change in net unrealized appreciation (depreciation) of: | ||||
Investments in unaffiliated securitiesB | 10,459,678 | |||
Futures contracts | (1,406 | ) | ||
|
| |||
Net gain from investments | 9,355,297 | |||
|
| |||
Net increase in net assets resulting from operations | $ | 9,541,720 | ||
|
| |||
† Foreign taxes | $ | 2,181 | ||
A The Fund did not recognize net realized gains (losses) from the sale of investments in affiliated securities. |
| |||
B The Fund’s investments in affiliated securities did not have a change in unrealized appreciation (depreciation) at year end. |
| |||
See accompanying notes
15
American Beacon Bahl & Gaynor Small Cap Growth FundSM
Statement of Changes in Net Assets
| Year Ended December 31, 2019 | Year Ended December 31, 2018 | |||||||||||
Increase (decrease) in net assets: |
| |||||||||||
Operations: |
| |||||||||||
Net investment income | $ | 186,423 | $ | 152,139 | ||||||||
Net realized gain (loss) from investments in unaffiliated securities and futures contracts | (1,102,975 | ) | 960,355 | |||||||||
Change in net unrealized appreciation (depreciation) of investments in unaffiliated securities and futures contracts | 10,458,272 | (6,775,452 | ) | |||||||||
|
|
|
| |||||||||
Net increase (decrease) in net assets resulting from operations | 9,541,720 | (5,662,958 | ) | |||||||||
|
|
|
| |||||||||
Distributions to shareholders: |
| |||||||||||
Total retained earnings: | ||||||||||||
Institutional Class | (75,322 | ) | (804,590 | ) | ||||||||
Y Class | (94,465 | ) | (1,089,668 | ) | ||||||||
Investor Class | (11,534 | ) | (170,642 | ) | ||||||||
A Class | (4,681 | ) | (233,558 | ) | ||||||||
C Class | - | (18,746 | ) | |||||||||
Tax return of capital: | ||||||||||||
Institutional Class | - | (4,403 | ) | |||||||||
Y Class | - | (5,963 | ) | |||||||||
Investor Class | - | (934 | ) | |||||||||
A Class | - | (1,312 | ) | |||||||||
C Class | - | (111 | ) | |||||||||
|
|
|
| |||||||||
Net distributions to shareholders | (186,002 | ) | (2,329,927 | ) | ||||||||
|
|
|
| |||||||||
Capital share transactions (Note 11): |
| |||||||||||
Proceeds from sales of shares | 8,734,505 | 25,901,810 | ||||||||||
Reinvestment of dividends and distributions | 180,671 | 2,250,379 | ||||||||||
Cost of shares redeemed | (12,021,467 | ) | (21,844,616 | ) | ||||||||
|
|
|
| |||||||||
Net increase (decrease) in net assets from capital share transactions | (3,106,291 | ) | 6,307,573 | |||||||||
|
|
|
| |||||||||
Net increase (decrease) in net assets | 6,249,427 | (1,685,312 | ) | |||||||||
|
|
|
| |||||||||
Net assets: |
| |||||||||||
Beginning of period | 38,747,214 | 40,432,526 | ||||||||||
|
|
|
| |||||||||
End of period | $ | 44,996,641 | $ | 38,747,214 | ||||||||
|
|
|
| |||||||||
See accompanying notes
16
American Beacon Bahl & Gaynor Small Cap Growth FundSM
December 31, 2019
1. Organization and Significant Accounting Policies
American Beacon Funds (the “Trust”) is organized as a Massachusetts business trust. The Fund, a series within the Trust, is registered under the Investment Company Act of 1940, as amended (the “Act”), as a diversified,open-end management investment company. As of December 31, 2019, the Trust consists ofthirty-two active series, one of which is presented in this filing: American Beacon Bahl & Gaynor Small Cap Growth Fund (the “Fund”). The remainingthirty-one active series are reported in separate filings.
American Beacon Advisors, Inc. (the “Manager”) is a Delaware corporation and a wholly-owned subsidiary of Resolute Investment Managers, Inc. (“RIM”) organized in 1986 to provide business management, advisory, administrative, and asset management consulting services to the Trust and other investors. The Manager is registered as an investment advisor under the Investment Advisers Act of 1940, as amended (the “Advisers Act”). RIM is, in turn, a wholly-owned subsidiary of Resolute Acquisition, Inc., which is a wholly-owned subsidiary of Resolute Topco, Inc., a wholly-owned subsidiary of Resolute Investment Holdings, LLC (“RIH”). RIH is owned primarily by Kelso Investment Associates VIII, L.P., KEP VI, LLC and Estancia Capital Partners L.P., investment funds affiliated with Kelso & Company, L.P. (“Kelso”) or Estancia Capital Management, LLC (“Estancia”), which are private equity firms.
Recently Adopted Accounting Pronouncements
In March 2017, the Financial Accounting Standards Board (“FASB”) issued Accounting Standards Update (“ASU”)2017-08,Premium Amortization of Purchased Callable Debt Securities. The amendments in the ASU shorten the premium amortization period on a purchased callable debt security from the security’s contractual life to the earliest call date. It is anticipated that this change will enhance disclosures by reducing losses recognized when a security is called on an earlier date. This ASU is effective for fiscal years beginning after December 15, 2018, and has been adopted accordingly with no material impact on the financial statements and other disclosures.
In August 2018, the FASB issued ASU2018-13,Fair Value Measurement (“Topic 820”). The amendments in the ASU impact disclosure requirements for fair value measurement. It is anticipated that this change will enhance the effectiveness of disclosures in the notes to the financial statements. This ASU is effective for fiscal years beginning after December 15, 2019. Early adoption is permitted and can include the entire standard or certain provisions that exclude or amend disclosures. For the year ended December 31, 2019, the Fund has chosen to adopt the standard. The adoption of this ASU guidance did not have a material impact on the financial statements and other disclosures.
Class Disclosure
The Fund has multiple classes of shares designed to meet the needs of different groups of investors. The following table sets forth the differences amongst the classes:
Class | Eligible Investors | Minimum Initial Investments | ||||
| Institutional | Large institutional investors - sold directly or through intermediary channels. | $ | 250,000 | |||
| Y Class | Large institutional retirement plan investors - sold directly or through intermediary channels. | $ | 100,000 | |||
| Investor | All investors using intermediary organizations, such as broker-dealers or retirement plan sponsors. | $ | 2,500 | |||
| A Class | All investors who invest through intermediary organizations, such as broker-dealers or third party administrator. Retail investors who invest directly through a financial intermediary such as a broker, bank, or registered investment advisor which may include afront-end sales charge and a contingent deferred sales charge (“CDSC”). | $ | 2,500 | |||
| C Class | Retail investors who invest directly through a financial intermediary such as a broker or through employee directed benefit plans with applicable sales charges which may include CDSC. | $ | 1,000 | |||
17
American Beacon Bahl & Gaynor Small Cap Growth FundSM
Notes to Financial Statements
December 31, 2019
Each class offered by the Trust has equal rights as to assets and voting privileges. Income andnon-class specific expenses are allocated daily to each class based on the relative net assets. Realized and unrealized capital gains and losses of each class are allocated daily based on the relative net assets of each class of the respective Fund. Class specific expenses, where applicable, currently include service, distribution, transfer agent fees, andsub-transfer agent fees that vary amongst the classes as described more fully in Note 2.
Significant Accounting Policies
The following is a summary of significant accounting policies, consistently followed by the Fund in preparation of the financial statements. The Fund is considered an investment company and accordingly, follows the investment company accounting and reporting guidance of the FASB Accounting Standards Codification Topic 946,Financial Services – Investment Companies,a part of Generally Accepted Accounting Principles (“U.S. GAAP”).
Security Transactions and Investment Income
Security transactions are recorded as of the trade date for financial reporting purposes. Securities purchased or sold on a when-issued or delayed-delivery basis may be settled beyond a standard settlement period for the security after the trade date.
Dividend income, net of foreign taxes, is recorded on theex-dividend date, except certain dividends from foreign securities which are recorded as soon as the information is available to the Fund. Interest income, net of foreign taxes, is earned from settlement date, recorded on the accrual basis, and adjusted, if necessary, for accretion of discounts and amortization of premiums. Realized gains (losses) from securities sold are determined on the basis of specific lot identification.
Distributions to Shareholders
Distributions, if any, of net investment income are generally paid at least annually and recorded on theex-dividend date. Distributions, if any, of net realized capital gains are generally paid at least annually and recorded on theex-dividend date. Dividends to shareholders are determined in accordance with federal income tax regulations, which may differ in amount and character from net investment income and realized gains recognized for purposes of U.S. GAAP. To the extent necessary to fully distribute capital gains, the Fund may designate earnings and profits distributed to shareholders on the redemption of shares.
Commission Recapture
The Fund has established brokerage commission recapture arrangements with certain brokers or dealers. If the Fund’s investment advisor chooses to execute a transaction through a participating broker, the broker rebates a portion of the commission back to the Fund. Any collateral benefit received through participation in the commission recapture program is directed exclusively to the Fund. This amount is reported with the net realized gain in the Fund’s Statement of Operations, if applicable.
Allocation of Income, Trust Expenses, Gains, and Losses
Investment income, realized and unrealized gains and losses from investments of the Fund is allocated daily to each class of shares based upon the relative proportion of net assets of each class to the total net assets of the Fund. Expenses directly charged or attributable to the Fund will be paid from the assets of the Fund. Generally, expenses of the Trust will be allocated among and charged to the assets of the Fund on a basis that the Trust’s Board of Trustees (the “Board”) deems fair and equitable, which may be based on the relative net assets of the Fund or nature of the services performed and relative applicability to the Fund.
18
American Beacon Bahl & Gaynor Small Cap Growth FundSM
Notes to Financial Statements
December 31, 2019
Use of Estimates
The preparation of financial statements in conformity with U.S. GAAP requires management to make estimates and assumptions that affect the amounts reported in the financial statements and accompanying notes. Actual results may differ from those estimated.
Other
Under the Trust’s organizational documents, its officers and trustees are indemnified against certain liabilities arising out of the performance of their duties to the Trust. In the normal course of business, the Trust enters into contracts that provide indemnification to the other party or parties against potential costs or liabilities. The Trust’s maximum exposure under these arrangements is dependent on claims that may be made in the future and, therefore, cannot be estimated. The Trust has had no prior claims or losses pursuant to any such agreement.
2. Transactions with Affiliates
Management and InvestmentSub-Advisory Agreements
The Fund and the Manager are parties to a Management Agreement that obligates the Manager to provide the Fund with investment advisory and administrative services. As compensation for performing the duties under the Management Agreement, the Manager will receive an annualized management fee based on a percentage of the Fund’s average daily net assets that is calculated and accrued daily according to the following schedule:
First $5 billion | 0.35 | % | ||
Next $5 billion | 0.325 | % | ||
Next $10 billion | 0.30 | % | ||
Over $20 billion | 0.275 | % |
The Trust, on behalf of the Fund, and the Manager have entered into an Investment Advisory Agreement with the Bahl & Gaynor, Inc. (the“Sub-Advisor”) pursuant to which the Fund has agreed to pay an annualizedsub-advisory fee that is calculated and accrued daily based on the Fund’s average daily net assets according to the following schedule:
First $500 million | 0.525 | % | ||
Over $500 million | 0.50 | % |
The Management andSub-Advisory Fees paid by the Fund for the year ended December 31, 2019 were as follows:
| Effective Fee Rate | Amount of Fees Paid | |||||||||||
Management Fees | 0.350 | % | $ | 153,461 | ||||||||
Sub-Advisor Fees | 0.525 | % | 228,717 | |||||||||
|
|
|
| |||||||||
Total | 0.875 | % | $ | 382,178 | ||||||||
|
|
|
| |||||||||
As compensation for services provided by the Manager in connection with securities lending activities conducted by the Fund, the lending Fund pays to the Manager, with respect to cash collateral posted by borrowers, a fee up to 10% of the net monthly interest income (the gross interest income earned by the investment of cash collateral, less the amount paid to borrowers and related expenses) from such activities and, with respect to loan fees paid by borrowers, a fee up to 10% of such loan fees. These fees are included in “Income derived from securities lending” and “Management and investment advisory fees” on the Statement of Operations. During the year ended December 31, 2019, the Manager received securities lending fees of $78 for the securities lending activities of the Fund.
19
American Beacon Bahl & Gaynor Small Cap Growth FundSM
Notes to Financial Statements
December 31, 2019
Distribution Plans
The Fund, except for the A and C Classes of the Fund, has adopted a “defensive” Distribution Plan (the “Plan”) in accordance with Rule12b-1 under the Act, pursuant to which no separate fees may be charged to the Fund for distribution purposes. However, the Plan authorizes the management fee received by the Manager and the investment advisors hired by the Manager to be used for distribution purposes. Under this Plan, the Fund does not intend to compensate the Manager or any other party, either directly or indirectly, for the distribution of Fund shares.
Separate Distribution Plans (the “Distribution Plans”) have been adopted pursuant to Rule12b-1 under the Act for the A and C Classes of the Fund. Under the Distribution Plans, as compensation for distribution and shareholder servicing assistance, the Manager receives an annual fee of 0.25% of the average daily net assets of the A Class and 1.00% of the average daily net assets of the C Class. The fee will be payable without regard to whether the amount of the fee is more or less than the actual expenses incurred in a particular month by the Manager for distribution assistance.
Service Plans
The Manager and the Trust entered into a Service Plan that obligates the Manager to oversee additional shareholder servicing of the Investor, A, and C Classes of the Fund. As compensation for performing the duties required under the Service Plan, the Manager receives an annualized fee up to 0.25% of the average daily net assets of the A and C Classes, and up to 0.375% of the average daily net assets of the Investor Class of the Fund.
Sub-Transfer Agent Fees
The Manager has entered into agreements, which include servicing agreements, with financial intermediaries that provide recordkeeping, processing, shareholder communications and other services to customers of the intermediaries that hold positions in the Institutional and Y Classes of the Fund and has agreed to compensate the intermediaries for providing these services. Intermediaries transact with the Fund primarily through the use of omnibus accounts on behalf of their customers who hold positions in the Fund. Certain services would have been provided by the Fund’s transfer agent and other service providers if the shareholders’ accounts were maintained directly by the Fund’s transfer agent. Accordingly, the Fund, pursuant to Board approval, has agreed to reimburse the Manager for certainnon-distribution shareholder services provided by financial intermediaries for the Institutional and Y Classes. The reimbursement amounts(sub-transfer agent fees) paid to the Manager are subject to a fee limit of up to 0.10% of an intermediary’s average net assets in the Institutional and Y Classes on an annual basis. During the year ended December 31, 2019, thesub-transfer agent fees, as reflected in “Transfer agent fees” on the Statement of Operations, were as follows:
Fund | Sub-Transfer Agent Fees | |||
Bahl & Gaynor Small Cap Growth | $ | 29,387 | ||
As of December 31, 2019, the Fund owed the Manager the following reimbursement ofsub-transfer agent fees, as reflected in “Transfer agent fees payable” on the Statement of Assets and Liabilities:
Fund | Reimbursement Sub-Transfer Agent Fees | |||
Bahl & Gaynor Small Cap Growth | $ | 2,744 | ||
Investments in Affiliated Funds
The Fund may invest in the American Beacon U.S. Government Money Market Select Fund (the “USG Select Fund”). Cash collateral received by the Fund in connection with securities lending may also be invested in the USG Select Fund. The Fund and the USG Select Fund have the same investment advisor and therefore, are considered to
20
American Beacon Bahl & Gaynor Small Cap Growth FundSM
Notes to Financial Statements
December 31, 2019
be affiliated. The Manager serves as investment advisor to the USG Select Fund and receives management fees and administrative fees totaling 0.10% of the average daily net assets of the USG Select Fund. During the year ended December 31, 2019, the Manager earned fees on the Fund’s direct investments and securities lending collateral investments in the USG Select Fund as shown below:
Fund | Direct Investments in USG Select Fund | Securities Lending Collateral Investments in USG Select Fund | Total | |||||||||
Bahl & Gaynor Small Cap Growth | $ | 451 | $ | 63 | $ | 514 | ||||||
Interfund Credit Facility
Pursuant to an exemptive order issued by the SEC, the Fund, along with other registered investment companies having management contracts with the Manager, may participate in a credit facility whereby each fund, under certain conditions, is permitted to lend money directly to and borrow directly from other participating funds for temporary purposes. The interfund credit facility is advantageous to the funds because it provides added liquidity and eliminates the need to maintain higher cash balances to meet redemptions. This situation could arise when shareholder redemptions exceed anticipated volumes and certain funds have insufficient cash on hand to satisfy such redemptions or when sales of securities do not settle as expected, resulting in a cash shortfall for a fund. When a fund liquidates portfolio securities to meet redemption requests, they often do not receive payment in settlement for up to two days (or longer for certain foreign transactions). Redemption requests normally are satisfied on the next business day. The credit facility provides a source of immediate, short-term liquidity pending settlement of the sale of portfolio securities. The credit facility is administered by a credit facility team consisting of professionals from the Manager’s asset management, compliance, and accounting areas who report the activities of the credit facility to the Board. During the year ended December 31, 2019, the Fund borrowed on average $388,405 for 6 days at an average interest rate of 3.07% with interest charges of $195. These amounts are recorded as “Other expenses” in the Statement of Operations.
Expense Reimbursement Plan
The Manager contractually agreed to reduce fees and/or reimburse expenses for the classes of the Fund to the extent that total operating expenses exceed the Fund’s expense cap. During the year ended December 31, 2019, the Manager waived and/or reimbursed expenses as follows:
| Expense Cap | Expiration of Reimbursed Expenses | |||||||||||||||||
Fund | Class | 1/1/2019 - 12/31/2019 | Reimbursed Expenses | (Recouped) Expenses | ||||||||||||||
Bahl & Gaynor Small Cap Growth | Institutional | 0.98 | % | $ | 57,935 | $ | - | 2022 | ||||||||||
Bahl & Gaynor Small Cap Growth | Y | 1.08 | % | 65,702 | - | 2022 | ||||||||||||
Bahl & Gaynor Small Cap Growth | Investor | 1.36 | % | 10,716 | - | 2022 | ||||||||||||
Bahl & Gaynor Small Cap Growth | A | 1.38 | % | 5,676 | - | 2022 | ||||||||||||
Bahl & Gaynor Small Cap Growth | C | 2.13 | % | 1,072 | - | 2022 | ||||||||||||
Of these amounts, $14,515 was disclosed as a receivable from the Manager on the Statement of Assets and Liabilities at December 31, 2019.
The Fund has adopted an Expense Reimbursement Plan whereby the Manager may seek repayment of such fee or voluntary reductions and expense reimbursements. Under the policy, the Manager can be reimbursed by the Fund for any contractual or voluntary fee reductions or expense reimbursements if reimbursement to the Manager (a) occurs within three years from the date of the Manager’s waiver/reimbursement and (b) does not cause the Fund’s annual operating expenses to exceed the lesser of the contractual percentage limit in effect at the time of the waiver/reimbursement or time of recoupment. The reimbursed expenses listed above will expire in 2022. The
21
American Beacon Bahl & Gaynor Small Cap Growth FundSM
Notes to Financial Statements
December 31, 2019
Fund did not record a liability for potential reimbursement due to the current assessment that a reimbursement is uncertain. The carryover of excess expenses potentially reimbursable to the Manager, but not recorded as a liability are as follows:
Fund | Recouped Expenses | Excess Expense Carryover | Expired Expense Carryover | Expiration of Reimbursed Expenses | ||||||||||||
Bahl & Gaynor Small Cap Growth | $ | - | $ | - | $ | 99,310 | 2019 | |||||||||
Bahl & Gaynor Small Cap Growth | 51 | 98,429 | - | 2020 | ||||||||||||
Bahl & Gaynor Small Cap Growth | 195 | 117,878 | - | 2021 | ||||||||||||
Sales Commissions
The Fund’s Distributor, Resolute Investment Distributors, Inc. (“RID” or “Distributor”), may receive a portion of Class A sales charges from broker dealers which may be used to offset distribution related expenses. During the year ended December 31, 2019, fees of $132 were collected for Class A Shares of the Fund.
A CDSC of 0.50% will be deducted with respect to Class A Shares on certain purchases of $1,000,000 or more that are redeemed in whole or part within 18 months of purchase, unless waived as discussed in the Fund’s Prospectus. Any applicable CDSC will be 0.50% of the lesser of the original purchase price or the value of the redemption of the Class A Shares redeemed. During the year ended December 31, 2019, CDSC fees of $83 were collected for Class A Shares of the Fund.
A CDSC of 1.00% will be deducted with respect to Class C Shares redeemed within 12 months of purchase, unless waived as discussed in the Fund’s Prospectus. Any applicable CDSC will be 1.00% of the lesser of the original purchase price or the value of the redemption of the Class C Shares redeemed. During the year ended December 31, 2019, CDSC fees of $87 were collected for Class C Shares of the Fund.
Trustee Fees and Expenses
Effective January 1, 2020, as compensation for their service to the American Beacon Funds Complex, including the Trust (collectively, the “Trusts”), each Trustee is compensated from the Trusts as follows: (1) an annual retainer of $120,000; (2) meeting attendance fee (for attendance in person or via teleconference) of (a) $12,000 for in person attendance, or $5,000 for telephonic attendance, by Board members for each regularly scheduled or special Board meeting, (b) $2,500 for attendance by Committee members at meetings of the Audit Committee and the Investment Committee, (c) $1,500 for attendance by Committee members at meetings of the Nominating and Governance Committee; and (d) $2,500 for attendance by Board members for each special telephonic Board meeting; and (3) reimbursement of reasonable expenses incurred in attending Board meetings, Committee meetings, and relevant educational seminars. The Trustees also may be compensated for attendance at special Board and/or Committee meetings from time to time. For her service as Board Chair, Ms. Cline receives an additional annual retainer of $50,000. Although she attends several committee meetings at each quarterly Board meeting, she receives only a single $2,500 fee each quarter for her attendance at those meetings. The chairpersons of the Audit Committee and the Investment Committee each receive an additional annual retainer of $25,000 and the Chair of the Nominating and Governance Committee receives an additional annual retainer of $15,000.
3. Security Valuation and Fair Value Measurements
The price of the Fund’s shares is based on its net asset value (“NAV”) per share. The Fund’s NAV is computed by adding total assets, subtracting all the Fund’s liabilities, and dividing the result by the total number of shares outstanding.
The NAV of each class of the Fund’s shares is determined based on a pro rata allocation of the Fund’s investment income, expenses and total capital gains and losses. The Fund’s NAV per share is determined each business day as of the regular close of trading on the New York Stock Exchange (“NYSE” or “Exchange”), which is typically 4:00 p.m. Eastern Time (“ET”). However, if trading on the NYSE closes at a time other than 4:00 p.m. ET, the Fund’s NAV per share typically would still be determined as of the regular close of trading on the NYSE. The Fund does not price its shares on days that the NYSE is closed. Foreign exchanges may permit trading in foreign
22
American Beacon Bahl & Gaynor Small Cap Growth FundSM
Notes to Financial Statements
December 31, 2019
securities on days when the Fund is not open for business, which may result in the value of the Fund’s portfolio investments being affected at a time when you are unable to buy or sell shares.
Equity securities, including shares ofclosed-end funds and exchange-traded funds (“ETFs”), are valued at the last sale price or official closing price taken from the primary exchange in which each security trades. Investments in other mutual funds are valued at the closing NAV per share on the day of valuation. Debt securities are valued at bid quotes from broker/dealers or evaluated bid prices from pricing services, who may consider a number of inputs and factors, such as prices of comparable securities, yield curves, spreads, credit ratings, coupon rates, maturity, default rates, and underlying collateral. Futures are valued based on their daily settlement prices. Exchange-traded andover-the-counter (“OTC”) options are valued at the last sale price. Options with no last sale for the day are priced at mid quote. Swaps are valued at evaluated mid prices from pricing services.
The valuation of securities traded on foreign markets and certain fixed-income securities will generally be based on prices determined as of the earlier closing time of the markets on which they primarily trade unless a significant event has occurred. When the Fund holds securities or other assets that are denominated in a foreign currency, the Fund will normally use the currency exchange rates as of 4:00 p.m. ET.
Securities may be valued at fair value, as determined in good faith and pursuant to procedures approved by the Board, under certain limited circumstances. For example, fair value pricing will be used when market quotations are not readily available or reliable, as determined by the Manager, such as when (i) trading for a security is restricted or stopped; (ii) a security’s trading market is closed (other than customary closings); or (iii) a security has beende-listed from a national exchange. A security with limited market liquidity may require fair value pricing if the Manager determines that the available price does not reflect the security’s true market value. In addition, if a significant event that the Manager determines to affect the value of one or more securities held by the Fund occurs after the close of a related exchange but before the determination of the Fund’s NAV, fair value pricing may be used on the affected security or securities. Securities of small-capitalization companies are also more likely to require a fair value determination using these procedures because they are more thinly traded and less liquid than the securities of larger-capitalization companies. The Fund may fair value securities as a result of significant events occurring after the close of the foreign markets in which the Fund invests as described below. In addition, the Fund may invest in illiquid securities requiring these procedures.
The Fund may use fair value pricing for securities primarily traded innon-U.S. markets because most foreign markets close well before the Fund’s pricing time of 4:00 p.m. ET. The earlier close of these foreign markets gives rise to the possibility that significant events, including broad market moves, may have occurred in the interim and may materially affect the value of those securities. If the Manager determines that the last quoted prices ofnon-U.S. securities will, in its judgment, materially affect the value of some or all its portfolio securities, the Manager can adjust the previous closing prices to reflect what it believes to be the fair value of the securities as of the close of the Exchange. In deciding whether it is necessary to adjust closing prices to reflect fair value, the Manager reviews a variety of factors, including developments in foreign markets, the performance of U.S. securities markets, and the performance of instruments trading in U.S. markets that represent foreign securities and baskets of foreign securities. These securities are fair valued using a pricing service, using methods approved by the Board, that considers the correlation of the trading patterns of the foreign security to intraday trading in the U.S. markets, based on indices of domestic securities and other appropriate indicators such as prices of relevant American Depositary Receipts (“ADRs”) and futures contracts. The Valuation Committee, established by the Board, may also fair value securities in other situations, such as when a particular foreign market is closed but the Fund is open. The Fund uses outside pricing services to provide closing prices and information to evaluate and/or adjust those prices. As a means of evaluating its security valuation process, the Valuation Committee routinely compares closing prices, the next day’s opening prices in the same markets and adjusted prices.
Attempts to determine the fair value of securities introduce an element of subjectivity to the pricing of securities. As a result, the price of a security determined through fair valuation techniques may differ from the price quoted or published by other sources and may not accurately reflect the market value of the security when trading resumes. If a reliable market quotation becomes available for a security formerly valued through fair
23
American Beacon Bahl & Gaynor Small Cap Growth FundSM
Notes to Financial Statements
December 31, 2019
valuation techniques, the Manager compares the new market quotation to the fair value price to evaluate the effectiveness of the Fund’s fair valuation procedures. If any significant discrepancies are found, the Manager may adjust the Fund’s fair valuation procedures.
Investments inopen-end mutual funds are valued at the closing NAV per share of the mutual fund on the day of valuation.
Securities for which the market prices are not readily available or are not reflective of the fair value of the security, as determined by the Manager, will be priced at fair value following procedures approved by the Board.
Futures contracts are valued based upon their quoted daily settlement prices. Upon entering into a futures contract, the Fund is required to deposit with their futures broker, an amount of cash or U.S. Government and Agency Obligations in accordance with the initial margin requirements of the broker or exchange. Futures contracts aremarked-to-market daily and an appropriate payable or receivable for the change in value (“variation margin”) is recorded by the Fund. Gains or losses are recognized, but not considered realized until the contracts expire or are closed. Futures contracts involve, to varying degrees, risk of loss in excess of the variation margin disclosed on the Statement of Assets and Liabilities.
Other investments for which the above valuation procedures are inappropriate or are deemed not to reflect fair value, are stated at fair value as determined in good faith by the Manager’s Valuation Committee, pursuant to procedures established by the Board.
Valuation Inputs
Various inputs may be used to determine the fair value of the Fund’s investments. These inputs are summarized in three broad levels for financial statement purposes. The inputs or methodologies used to value securities are not necessarily an indication of the risk associated with investing in those securities.
| Level 1 | - | Quoted prices in active markets for identical securities. | ||
| Level 2 | - | Prices determined using other significant observable inputs. These may include quoted prices for similar securities, interest rates, prepayment speeds, credit risk, and others. | ||
| Level 3 | - | Prices determined using other significant unobservable inputs. Unobservable inputs reflect the Fund’s own assumptions about the factors market participants would use in pricing an investment. | ||
Level 1 and Level 2 trading assets and trading liabilities, at fair value
Common stocks, preferred securities, ETFs, and financial derivative instruments, such as futures contracts that are traded on a national securities exchange, are stated at the last reported sale or settlement price on the day of valuation. To the extent these securities are actively traded and valuation adjustments are not applied, they are categorized as Level 1 of the fair value hierarchy. Preferred securities and other equities traded on inactive markets or valued by reference to similar instruments are generally categorized as Level 2 of the fair value hierarchy.
Investments in registeredopen-end investment management companies will be valued based upon the NAVs of such investments and are categorized as Level 1 of the fair value hierarchy.
4. Securities and Other Investments
Common Stock
Common stock generally takes the form of shares in a corporation which represent an ownership interest. It ranks below preferred stock and debt securities in claims for dividends and for assets of the company in a
24
American Beacon Bahl & Gaynor Small Cap Growth FundSM
Notes to Financial Statements
December 31, 2019
liquidation or bankruptcy. The value of a company’s common stock may fall as a result of factors directly relating to that company, such as decisions made by its management or decreased demand for the company’s products or services. A stock’s value may also decline because of factors affecting not just the company, but also companies in the same industry or sector. The price of a company’s stock may also be affected by changes in financial markets that are relatively unrelated to the company, such as changes in interest rates, currency exchange rates or industry regulation. Companies that elect to pay dividends on their common stock generally only do so after they invest in their own business and make required payments to bondholders and on other debt and preferred stock. Therefore, the value of a company’s common stock will usually be more volatile than its bonds, other debt and preferred stock. Common stock may be exchange-traded or OTC. OTC stock may be less liquid than exchange-traded stock.
Foreign Securities
The Fund may invest in U.S. dollar-denominated equity and debt securities of foreign issuers and foreign branches of U.S. banks, including negotiable certificates of deposit (“CDs”), bankers’ acceptances, and commercial paper. Foreign issuers are issuers organized and doing business principally outside the United States and include corporations, banks, non-U.S. governments, and quasi-governmental organizations. While investments in foreign securities are intended to reduce risk by providing further diversification, such investments involve sovereign and other risks, in addition to the credit and market risks normally associated with domestic securities. These additional risks include the possibility of adverse political and economic developments (including political or social instability, nationalization, expropriation, or confiscatory taxation); the potentially adverse effects of unavailability of public information regarding issuers, different governmental supervision and regulation of financial markets, reduced liquidity of certain financial markets, and the lack of uniform accounting, auditing, and financial reporting standards or the application of standards that are different or less stringent than those applied in the United States; different laws and customs governing securities tracking; and possibly limited access to the courts to enforce a Fund’s rights as an investor.
Other Investment Company Securities and Other Exchange-Traded Products
The Fund may invest in shares of other investment companies, includingopen-end funds,closed-end funds, business development companies, ETFs, unit investment trusts, and other investment companies of the Trust. The Fund may invest in securities of an investment company advised by the Manager or asub-advisor. Investments in the securities of other investment companies may involve duplication of advisory fees and certain other expenses. By investing in another investment company, the Fund becomes a shareholder of that investment company. As a result, the Fund’s shareholders indirectly will bear the Fund’s proportionate share of the fees and expenses paid by shareholders of the other investment company, in addition to the fees and expenses the Fund’s shareholders directly bear in connection with the Fund’s own operations. These other fees and expenses are reflected as Acquired Fund Fees and Expenses and are included in the Fees and Expenses Table for the Fund in its Prospectus, if applicable. Investments in other investment companies may involve the payment of substantial premiums above the value of such issuer’s portfolio securities.
Real Estate Investment Trusts
The Fund may own shares of real estate investment trusts (“REITs”) which report information on the source of their distributions annually. The Fundre-characterizes distributions received from REIT investments based on information provided by the REITs into the following categories: ordinary income, long-term capital gains, and return of capital. If information is not available on a timely basis from the REITs, there-characterization will be estimated based on available information, which may include the previous year allocation. If new or additional information becomes available from the REITs at a later date, are-characterization will be made the following year.
5. Financial Derivative Instruments
The Fund may utilize derivative instruments to gain market exposure on cash balances to hedge foreign currency exposure or reduce market exposure in anticipation of liquidity needs. When considering the Fund’s use of derivatives, it is important to note that the Fund does not use derivatives for the purpose of creating financial leverage.
25
American Beacon Bahl & Gaynor Small Cap Growth FundSM
Notes to Financial Statements
December 31, 2019
Futures Contracts
Futures contracts are contracts to buy or sell a standard quantity of securities at a specified price on a future date. The Fund may enter into financial futures contracts as a method for keeping assets readily convertible to cash if needed to meet shareholder redemptions or for other needs while maintaining exposure to the stock or bond market, as applicable. The primary risks associated with the use of futures contracts are the possibility of illiquid markets or imperfect correlation between the values of the contracts and the underlying securities or that the counterparty will fail to perform its obligations.
Upon entering into a futures contract, the Fund is required to set aside or deposit with a broker an amount, termed the initial margin, which typically represents a portion of the face value of the futures contract. The Fund usually reflects this amount on the Schedule of Investments as a U.S. Treasury Bill held as collateral for futures contracts or as cash deposited with broker on the Statement of Assets and Liabilities. Payments to and from the broker, known as variation margin, are required to be made on a daily basis as the price of the futures contract fluctuates. Changes in initial settlement values are accounted for as unrealized appreciation (depreciation) until the contracts are terminated, at which time realized gains and losses are recognized. Futures contracts are valued at the most recent settlement price established each day by the exchange on which they are traded.
During the year ended December 31, 2019, the Fund entered into futures contracts primarily for exposing cash to markets.
The Fund’s average futures contracts outstanding fluctuate throughout the operating year as required to meet strategic requirements. The following table illustrates the average quarterly volume of futures contracts. For the purpose of this disclosure, volume is measured by contracts outstanding at each quarter end.
Average Futures Contracts Outstanding | ||||
Fund | Year Ended December 31, 2019 | |||
Bahl & Gaynor Small Cap Growth | 6 | |||
The following is a summary of the fair valuations of the Fund’s derivative instruments categorized by risk exposure(1):
| Fair values of financial instruments on the Statement of Assets and Liabilities as of December 31, 2019: |
| ||||||||||||||||||||||||||||||||||||||||||||||||||||||
| Derivatives not accounted for as hedging instruments | |||||||||||||||||||||||||||||||||||||||||||||||||||||||
Assets: | Credit contracts | Foreign exchange contracts | Commodity contracts | Interest rate contracts | Equity contracts | Total | |||||||||||||||||||||||||||||||||||||||||||||||||
| Receivable for variation margin from open futures contracts(2) | $ | - | $ | - | $ | - | $ | - | $ | 3,654 | $ | 3,654 | |||||||||||||||||||||||||||||||||||||||||||
| The effect of financial derivative instruments on the Statement of Operations as of December 31, 2019: |
| ||||||||||||||||||||||||||||||||||||||||||||||||||||||
| Derivatives not accounted for as hedging instruments | |||||||||||||||||||||||||||||||||||||||||||||||||||||||
Realized gain (loss) from derivatives | Credit contracts | Foreign exchange contracts | Commodity contracts | Interest rate contracts | Equity contracts | Total | |||||||||||||||||||||||||||||||||||||||||||||||||
| Futures contracts | $ | - | $ | - | $ | - | $ | - | $ | 90,903 | $ | 90,903 | |||||||||||||||||||||||||||||||||||||||||||
Net change in unrealized appreciation | Credit contracts | Foreign exchange contracts | Commodity contracts | Interest rate contracts | Equity contracts | Total | |||||||||||||||||||||||||||||||||||||||||||||||||
| Futures contracts | $ | - | $ | - | $ | - | $ | - | $ | (1,406 | ) | $ | (1,406 | ) | |||||||||||||||||||||||||||||||||||||||||
(1)See Note 3 in the Notes to Financial Statements for additional information.
(2)Includes cumulative appreciation (depreciation) of futures contracts as reported in the Fund’s Schedule of Investments footnotes. Only current day’s variation margin is reported within the Statement of Assets and Liabilities.
26
American Beacon Bahl & Gaynor Small Cap Growth FundSM
Notes to Financial Statements
December 31, 2019
Offsetting Assets and Liabilities
The Fund is a party to enforceable master netting agreements between brokers and counterparties which provide for the right to offset under certain circumstances. The Fund employs multiple money managers and counterparties and has elected not to offset qualifying financial and derivative instruments on the Statement of Assets and Liabilities, as such all financial and derivative instruments are presented on a gross basis. The impacts of netting arrangements that provide the right to offset are detailed below. The net amount represents the net receivable or payable that would be due from or to the counterparty in the event of default. Exposure from borrowings and other financing agreements such as repurchase agreements can only be netted across transactions governed by the same Master Agreement with the same legal entity. All amounts reported below represent the balance as of the report date, December 31, 2019.
| Offsetting of Financial and Derivative Assets as of December 31, 2019: |
| |||||||||||
| Assets | Liabilities | |||||||||||
| Futures Contracts(1) | $ | 3,654 | $ | - | ||||||||
|
|
|
| |||||||||
| Total derivative assets and liabilities in the Statement of Assets and Liabilities | $ | 3,654 | $ | - | ||||||||
|
|
|
| |||||||||
| Derivatives not subject to a Master Netting Agreement or similar agreement (“MNA”) | $ | (3,654 | ) | $ | - | |||||||
|
|
|
| |||||||||
(1)Includes cumulative appreciation (depreciation) of futures contracts as reported in the Fund’s Schedule of Investments footnotes. Only current day’s variation margin is reported within the Statement of Assets and Liabilities.
6. Principal Risks
Investing in the Fund may involve certain risks including, but not limited to, those described below.
Dividend Risk
An issuer of stock held by the Fund may choose not to declare a dividend or the dividend rate might not remain at current levels. Dividend paying stocks might not experience the same level of earnings growth or capital appreciation asnon-dividend paying stocks.
Equity Investments Risk
Equity securities are subject to market risk. The Fund’s investments in equity securities may include common stocks, preferred stocks, securities convertible into or exchangeable for common stocks, REITs, depositary receipts, and U.S. dollar-denominated foreign stocks traded on U.S. exchanges. Such investments may expose the Fund to additional risk. The value of a company’s common stock may fall as a result of factors affecting the company, companies in the same industry or sector, or the financial markets overall. Common stock generally is subordinate to preferred stock upon the liquidation or bankruptcy of the issuing company. Preferred stocks and convertible securities are sensitive to movements in interest rates. Preferred stocks may be less liquid than common stocks and, unlike common stocks, participation in the growth of an issuer may be limited. Distributions on preferred stocks generally are payable at the discretion of an issuer and after required payments to bond holders. Convertible securities are subject to the risk that the credit standing of the issuer may have an effect on the convertible securities’ investment value. Investments in REITs are subject to the risks associated with investing in the real estate industry such as adverse developments affecting the real estate industry and real property values. Depositary receipts and U.S. dollar-denominated foreign stocks traded on U.S. exchanges are subject to certain of the risks associated with investing directly in foreign securities, including, but not limited to, currency exchange rate fluctuations, political and financial instability in the home country of a particular depositary receipt, less liquidity and more volatility, less government regulation and supervision and delays in transaction settlement.
27
American Beacon Bahl & Gaynor Small Cap Growth FundSM
Notes to Financial Statements
December 31, 2019
Foreign Investing Risk
Non-U.S. investments carry potential risks not associated with U.S. investments. Such risks include, but are not limited to: (1) currency exchange rate fluctuations, (2) political and financial instability, (3) less liquidity, (4) lack of uniform accounting, auditing and financial reporting standards, (5) increased volatility, (6) different government regulation and supervision of foreign stock exchanges, brokers and listed companies, and (7) delays in transaction settlement in some foreign markets.
Futures Contracts Risk
Futures contracts are derivative instruments where one party pays a fixed price for an agreed amount of securities or other underlying assets at an agreed date. The use of such derivative instruments may expose the Fund to additional risks that it would not be subject to if it invested directly in the securities underlying those derivatives. Futures contracts may experience potentially dramatic price changes (losses) and imperfect correlation between the price of the contract and the underlying security or index, which will increase the volatility of the Fund and may involve a small investment of cash (the amount of initial and variation margin) relative to the magnitude of the risk assumed (the potential increase or decrease in the price of the futures contract).
Investment Risk
An investment in the Fund is not a deposit with a bank and is not insured or guaranteed by the Federal Deposit Insurance Corporation or any other government agency. When you sell your shares of the Fund, they could be worth less than what you paid for them. Therefore, you may lose money by investing in the Fund.
Market Risk
Conditions in the U.S. and many foreign economies have resulted, and may continue to result, in certain instruments experiencing unusual liquidity issues, increased price volatility and, in some cases, credit downgrades and increased likelihood of default. These events have reduced the willingness and ability of some lenders to extend credit, and have made it more difficult for some borrowers to obtain financing on attractive terms, if at all. In some cases, traditional market participants have been less willing to make a market in some types of debt instruments, which has affected the liquidity of those instruments. During times of market turmoil, investors tend to look to the safety of securities issued or backed by the U.S. Treasury, causing the prices of these securities to rise and the yields to decline. Reduced liquidity in fixed income and credit markets may negatively affect many issuers worldwide. In addition, global economies and financial markets are becoming increasingly interconnected, which increases the possibilities that conditions in one country or region might adversely impact issuers in a different country or region. A rise in protectionist trade policies, risks associated with the United Kingdom’s vote to leave the European Union, the risk of a “trade war” between the United States and China, and the possibility of changes to some international trade agreements, could affect the economies of many nations, including the United States, in ways that cannot necessarily be foreseen at the present time.
In response to the financial crisis, the U.S. and other governments and the Federal Reserve and certain foreign central banks have taken steps to support financial markets. In some countries where economic conditions are recovering, they are nevertheless perceived as still fragile. Withdrawal of government support, failure of efforts in response to the crisis, or investor perception that such efforts are not succeeding, could adversely impact the value and liquidity of certain securities. The severity or duration of adverse economic conditions may also be affected by policy changes made by governments or quasi-governmental organizations, including changes in tax laws. The impact of new financial regulation legislation on the markets and the practical implications for market participants may not be fully known for some time. Regulatory changes are causing some financial services companies to exit long-standing lines of business, resulting in dislocations for other market participants. In addition, political and governmental events within the U.S. and abroad, such as the U.S. government’s inability at times to agree on a long-term budget and deficit reduction plan, the threat of a federal government shutdown and threats not to increase the federal government’s debt limit, may affect investor and consumer confidence and may
28
American Beacon Bahl & Gaynor Small Cap Growth FundSM
Notes to Financial Statements
December 31, 2019
adversely impact financial markets and the broader economy, perhaps suddenly and to a significant degree. The U.S. government has reduced the federal corporate income tax rates, and future legislative, regulatory and policy changes may result in more restrictions on international trade, less stringent prudential regulation of certain players in the financial markets, and significant new investments in infrastructure and national defense. Markets may react strongly to expectations about the changes in these policies, which could increase volatility, especially if the markets’ expectations for changes in government policies are not borne out.
Changes in market conditions will not have the same impact on all types of securities. Interest rates have been unusually low in recent years in the U.S. and abroad. Because there is little precedent for this situation, it is difficult to predict the impact of a significant rate increase on various markets. For example, because investors may buy securities or other investments with borrowed money, a significant increase in interest rates may cause a decline in the markets for those investments. Because of the sharp decline in the worldwide price of oil, there is a concern that oil producing nations may withdraw significant assets now held in U.S. Treasuries, which could force a substantial increase in interest rates. Regulators have expressed concern that rate increases may cause investors to sell fixed income securities faster than the market can absorb them, contributing to price volatility. In addition, there is a risk that the prices of goods and services in the U.S. and many foreign economies may decline over time, known as deflation (the opposite of inflation). Deflation may have an adverse effect on stock prices and creditworthiness and may make defaults on debt more likely. If a country’s economy slips into a deflationary pattern, it could last for a prolonged period and may be difficult to reverse.
A rise in protectionist trade policies, risks associated with the United Kingdom’s departure from the European Union on January 31, 2020 and trade agreement negotiations during the transition period, the risk of a trade dispute between the United States and China, and the possibility of changes to some international trade agreements, could affect the economies of many nations, including the United States, in ways that cannot necessarily be foreseen at the present time. The severity or duration of adverse economic conditions may also be affected by policy changes made by governments or quasi-governmental organizations. In addition, political and governmental events within the U.S. and abroad may affect investor and consumer confidence and may adversely impact financial markets and the broader economy, perhaps suddenly and to a significant degree.
Other Investment Companies Risk
The Fund may invest in shares of other registered investment companies, including money market funds that are advised by the Manager. To the extent that the Fund invests in shares of other registered investment companies, the Fund will indirectly bear the fees and expenses, including for example advisory and administrative fees, charged by those investment companies in addition to the Fund’s direct fees and expenses and will be subject to the risks associated with investments in those companies. For example, the Fund’s investments in money market funds are subject to interest rate risk, credit risk, and market risk. The Fund must rely on the investment company in which it invests to achieve its investment objective. If the investment company fails to achieve its investment objective, the value of the Fund’s investment will decline, adversely affecting the Fund’s performance. To the extent the Fund invests in other investment companies that invest in equity securities, fixed income securities and/or foreign securities, or track an index, the Fund is subject to the risks associated with the underlying investments held by the investment company or the index fluctuations to which the investment company is subject.
Securities Lending Risk
A Fund may lend its portfolio securities to brokers, dealers and financial institutions to seek income. There is a risk that a borrower may default on its obligations to return loaned securities; however, a Fund’s securities lending agent indemnifies the Fund against that risk. There is a risk that the assets of a Fund’s securities lending agent may be insufficient to satisfy any contractual indemnification requirements to the Fund. Borrowers of a Fund’s securities typically provide collateral in the form of cash that is reinvested in securities. A Fund will be responsible for the risks associated with the investment of cash collateral, including any collateral invested in an affiliated money market fund. A Fund may lose money on its investment of cash collateral or may fail to earn sufficient income on its investment to meet obligations to the borrower. In addition, delays may occur in the
29
American Beacon Bahl & Gaynor Small Cap Growth FundSM
Notes to Financial Statements
December 31, 2019
recovery of securities from borrowers, which could interfere with a Fund’s ability to vote proxies or to settle transactions and there is the risk of possible loss of rights in the collateral should the borrower fail financially. In any case in which the loaned securities are not returned to the Fund before anex-dividend date, the payment in lieu of the dividend that the Fund receives from the securities’ borrower would not be treated as a dividend for federal income tax purposes and thus would not qualify for treatment as “qualified dividend income”.
7. Federal Income and Excise Taxes
It is the policy of the Fund to qualify as a regulated investment company (“RIC”), by complying with all applicable provisions of Subchapter M of the Internal Revenue Code, as amended, and to make distributions of taxable income sufficient to relieve it from substantially all federal income and excise taxes. For federal income tax purposes, the Fund is treated as a single entity for the purpose of determining such qualification.
The Fund does not have any unrecorded tax liabilities in the accompanying financial statements. Each of the tax years in the four year period ended December 31, 2019 remain subject to examination by the Internal Revenue Service. If applicable, the Fund recognizes interest accrued related to unrecognized tax benefits in interest expense and penalties in “Other expenses” on the Statement of Operations.
The Fund may be subject to taxes imposed by countries in which it invests. Such taxes are generally based on returns of income earned or gains realized or repatriated. Taxes are accrued and applied to net investment income, net realized capital gains and net unrealized appreciation (depreciation), as applicable, as the income is earned or capital gains are recorded.
Dividends are categorized in accordance with income tax regulations which may treat certain transactions differently than U.S. GAAP. Accordingly, the character of distributions and composition of net assets for tax purposes may differ from those reflected in the accompanying financial statements.
The tax character of distributions paid were as follows:
| Year Ended December 31, 2019 | Year Ended December 31, 2018 | |||||||||||
Distributions paid from: |
| |||||||||||
Ordinary income* |
| |||||||||||
Institutional Class | $ | 75,322 | $ | 149,845 | ||||||||
Y Class | 94,465 | 202,939 | ||||||||||
Investor Class | 11,534 | 31,779 | ||||||||||
A Class | 4,681 | 38,561 | ||||||||||
C Class | - | 2,264 | ||||||||||
Long-term capital gains |
| |||||||||||
Institutional Class | - | 654,745 | ||||||||||
Y Class | - | 886,729 | ||||||||||
Investor Class | - | 138,863 | ||||||||||
A Class | - | 194,997 | ||||||||||
C Class | - | 16,482 | ||||||||||
Tax return of capital |
| |||||||||||
Institutional Class | - | 4,403 | ||||||||||
Y Class | - | 5,963 | ||||||||||
Investor Class | - | 934 | ||||||||||
A Class | - | 1,312 | ||||||||||
C Class | - | 111 | ||||||||||
|
|
|
| |||||||||
Total distributions paid | $ | 186,002 | $ | 2,329,927 | ||||||||
|
|
|
| |||||||||
*For tax purposes, short-term gains are considered ordinary income distributions.
30
American Beacon Bahl & Gaynor Small Cap Growth FundSM
Notes to Financial Statements
December 31, 2019
As of December 31, 2019, the components of distributable earnings (deficits) on a tax basis were as follows:
Fund | Tax Cost | Unrealized Appreciation | Unrealized (Depreciation) | Net Unrealized Appreciation (Depreciation) | ||||||||||||||||||||||||
| Bahl & Gaynor Small Cap Growth | $ | 36,195,651 | $ | 9,096,610 | $ | (297,957 | ) | $ | 8,798,653 | |||||||||||||||||||
Fund | Net Unrealized Appreciation (Depreciation) | Undistributed Ordinary Income | Undistributed Long-Term Capital Gains | Accumulated Capital and Other (Losses) | Other Temporary Differences | Distributable Earnings | ||||||||||||||||||||||||||||||||||||||
| Bahl & Gaynor Small Cap Growth | $ | 8,798,653 | $ | 11 | $ | – | $ | (1,997,172 | ) | $ | - | $ | 6,801,492 | |||||||||||||||||||||||||||||||
Financial reporting records are adjusted for permanent book/tax differences to reflect tax character. Financial records are not adjusted for temporary differences. The temporary differences between financial reporting andtax-basis reporting of unrealized appreciation (depreciation) are attributable primarily to the tax deferral of losses from wash sales and the realization for tax purposes of unrealized gains (losses) on certain derivative instruments.
Due to inherent differences in the recognition of income, expenses, and realized gains (losses) under U.S. GAAP and federal income tax regulations, permanent differences between book and tax reporting have been identified and appropriately reclassified on the Statement of Assets and Liabilities.
The Fund had no permanent differences as of December 31, 2019:
Under the Regulated Investment Company Modernization Act of 2010 (“RIC MOD”), net capital losses recognized by the Fund in taxable years beginning after December 22, 2010 are carried forward indefinitely and retain their character as short-term and/or long-term losses.
As of December 31, 2019, the Funds had the following capital loss carryforwards:
Fund | Short-Term Capital Loss Carryforwards | Long-Term Capital Loss Carryforwards | ||||||||||
| Bahl & Gaynor Small Cap Growth | $ | 773,972 | $ | 1,223,201 | ||||||||
8. Investment Transactions
The aggregate cost of purchases and proceeds from sales and maturities of investments, other than short-term obligations, for the year ended December 31, 2019 were as follows:
Fund | Purchases (non-U.S. Government Securities) | Sales (non-U.S. Government Securities) | ||||||||||
| Bahl & Gaynor Small Cap Growth | $ | 15,091,262 | $ | 17,475,692 | ||||||||
A summary of the Fund’s transactions in the USG Select Fund for the year ended December 31, 2019 were as follows:
Fund | Type of Transaction | December 31, 2018 Shares/Fair Value | Purchases | Sales | December 31, 2019 Shares/Fair Value | Dividend Income | ||||||||||||||||||||||||||||||||||||
| Bahl & Gaynor Small Cap Growth | Direct | $ | 361,200 | $ | 11,638,248 | $ | 11,589,978 | $ | 409,470 | $ | 9,622 | |||||||||||||||||||||||||||||||
| Bahl & Gaynor Small Cap Growth | Securities Lending | 177,337 | 6,533,230 | 6,710,567 | - | N/A | ||||||||||||||||||||||||||||||||||||
31
American Beacon Bahl & Gaynor Small Cap Growth FundSM
Notes to Financial Statements
December 31, 2019
9. Securities Lending
The Fund may lend its securities to qualified financial institutions, such as certain broker-dealers, to earn additional income. The borrowers are required to secure their loans continuously with collateral in an amount at least equal to the fair value of the securities loaned, initially in an amount at least equal to 102% of the fair value of domestic securities loaned and 105% of the fair value of international securities loaned. Collateral is monitored andmarked-to-market daily. Dailymark-to-market amounts are required to be paid to the borrower or received from the borrower by the end of the following business day. This one day settlement formark-to-market amounts may result in the collateral being temporarily less than the value of the securities on loan or temporarily more than the required minimum collateral.
To the extent that a loan is collateralized by cash, such cash collateral shall be invested by the securities lending agent (the “Agent”) in money market mutual funds and other short-term investments, provided the investments meet certain quality and diversification requirements. Securities purchased with cash collateral proceeds are listed in the Fund’s Schedule of Investments and the collateral is shown on the Statement of Assets and Liabilities as a payable.
Securities lending income is generated from the demand premium (if any) paid by the borrower to borrow a specific security and from the return on investment of cash collateral, reduced by negotiated rebate fees paid to the borrower and transaction costs. To the extent that a loan is secured bynon-cash collateral, securities lending income is generated as a demand premium reduced by transaction costs. The Fund, the Agent, and the Manager retained 80%, 10%, and 10%, respectively, of the income generated from securities lending.
While securities are on loan, the Fund continues to receive certain income associated with that security and any gain or loss in the market price that may occur during the term of the loan. In the case of domestic equities, the value of any dividend is received in the form of a substitute payment approximately equal to the dividend. In the case of foreign securities, a negotiated amount is received that is less than the actual dividend, but higher than the dividend amount minus the foreign tax that the Fund would be subject to on the dividend.
Securities lending transactions pose certain risks to the Fund, including that the borrower may not provide additional collateral when required or return the securities when due, that the value of the short-term investments will be less than the amount of cash collateral required to be returned to the borrower, thatnon-cash collateral may be subject to legal constraints in the event of a borrower bankruptcy, and that the cash collateral investments could become illiquid and unable to be used to return collateral to the borrower. The Fund could also experience delays and costs in gaining access to the collateral. The Fund bears the risk of any deficiency in the amount of the cash collateral available for return to the borrower and any action which impairs its ability to liquidatenon-cash collateral to satisfy a borrower default.
As of December 31, 2019, the value of outstanding securities on loan and the value of collateral were as follows:
Fund | Market Value of Securities on Loan | Cash Collateral Received | Non-Cash Collateral Received | Total Collateral Received | ||||||||||||||||||||||||
| Bahl & Gaynor Small Cap Growth | $ | 1,872,650 | $ | - | $ | 1,916,132 | $ | 1,916,132 | ||||||||||||||||||||
Cash collateral is listed on the Fund’s Schedule of Investments and is shown on the Statement of Assets and Liabilities. Income earned on these investments is included in “Income derived from securities lending” on the Statement of Operations.
Non-cash collateral received by the Fund may not be sold orre-pledged except to satisfy a borrower default. Therefore,non-cash collateral is not included on the Fund’s Schedule of Investments or Statement of Assets and Liabilities.
32
American Beacon Bahl & Gaynor Small Cap Growth FundSM
Notes to Financial Statements
December 31, 2019
10. Borrowing Arrangements
Effective November 14, 2019 (the “Effective Date”), the Fund, along with certain other funds managed by the Manager (“Participating Funds”), entered into a committed revolving line of credit (the “Committed Line”) agreement with State Street Bank and Trust Company (the “Bank”) to be used to facilitate portfolio liquidity. The maximum borrowing amount under the Committed Line is $250 million with interest at a rate equal to the higher of(a) one-month London Inter-Bank Offered Rate (“LIBOR”) plus 1.25% per annum or (b) the Federal Funds rate plus 1.25% per annum on amounts borrowed. Each of the Participating Funds paid a closing fee of $100,000 on the Effective Date and a quarterly commitment fee at a rate of 0.25% per annum on the unused portion of the Committed Line amount. The Committed Line expires November 12, 2020, unless extended by the Bank or terminated by the Participating Funds in accordance with the agreement.
On the Effective Date, the Fund, along with certain other Participating Funds managed by the Manager, also entered into an uncommitted discretionary demand revolving line of credit (the “Uncommitted Line”) agreement with the Bank to be used to facilitate portfolio liquidity. The maximum borrowing amount under the Uncommitted Line is $50 million with interest at a rate equal to the higher of(a) one-month LIBOR plus 1.25% per annum or (b) the Federal Funds rate plus 1.25% per annum on each outstanding loan. Each of the Participating Funds paid a closing fee of $35,000 on the Effective Date. The Uncommitted Line expires November 12, 2020 unless extended by the Bank or terminated by the Participating Funds in accordance with the agreement.
The Participating Funds paid administration, legal and arrangement fees, which are recognized as a component of “Other expenses” on the Statement of Operations, along with commitment fees, that have been allocated among the Participating Funds based on average daily net assets.
During the year ended December 31, 2019, the Fund did not utilize this facility.
11. Capital Share Transactions
The tables below summarize the activity in capital shares for each Class of the Fund:
| Institutional Class | ||||||||||||||||||||||||||||
| Year Ended December 31, 2019 | Year Ended December 31, 2018 | |||||||||||||||||||||||||||
Bahl & Gaynor Small Cap Growth Fund | Shares | Amount | Shares | Amount | ||||||||||||||||||||||||
| Shares sold | 125,798 | $ | 1,591,846 | 329,292 | $ | 4,592,069 | ||||||||||||||||||||||
| Reinvestment of dividends | 5,163 | 75,322 | 71,089 | 808,993 | ||||||||||||||||||||||||
| Shares redeemed | (96,357 | ) | (1,289,871 | ) | (390,684 | ) | (5,654,166 | ) | ||||||||||||||||||||
|
|
|
|
|
|
|
| |||||||||||||||||||||
| Net increase (decrease) in shares outstanding | 34,604 | $ | 377,297 | 9,697 | $ | (253,104 | ) | |||||||||||||||||||||
|
|
|
|
|
|
|
| |||||||||||||||||||||
| Y Class | ||||||||||||||||||||||||||||
| Year Ended December 31, 2019 | Year Ended December 31, 2018 | |||||||||||||||||||||||||||
Bahl & Gaynor Small Cap Growth Fund | Shares | Amount | Shares | Amount | ||||||||||||||||||||||||
| Shares sold | 487,613 | $ | 6,141,181 | 984,130 | $ | 14,247,967 | ||||||||||||||||||||||
| Reinvestment of dividends | 6,138 | 89,056 | 90,866 | 1,028,605 | ||||||||||||||||||||||||
| Shares redeemed | (513,061 | ) | (6,622,200 | ) | (617,367 | ) | (8,242,731 | ) | ||||||||||||||||||||
|
|
|
|
|
|
|
| |||||||||||||||||||||
| Net increase (decrease) in shares outstanding | (19,310 | ) | $ | (391,963 | ) | 457,629 | $ | 7,033,841 | ||||||||||||||||||||
|
|
|
|
|
|
|
| |||||||||||||||||||||
| Investor Class | ||||||||||||||||||||||||||||
| Year Ended December 31, 2019 | Year Ended December 31, 2018 | |||||||||||||||||||||||||||
Bahl & Gaynor Small Cap Growth Fund | Shares | Amount | Shares | Amount | ||||||||||||||||||||||||
| Shares sold | 61,538 | $ | 810,365 | 334,760 | $ | 4,781,116 | ||||||||||||||||||||||
| Reinvestment of dividends | 815 | 11,612 | 15,351 | 171,479 | ||||||||||||||||||||||||
| Shares redeemed | (75,797 | ) | (993,240 | ) | (426,169 | ) | (6,075,485 | ) | ||||||||||||||||||||
|
|
|
|
|
|
|
| |||||||||||||||||||||
| Net (decrease) in shares outstanding | (13,444 | ) | $ | (171,263 | ) | (76,058 | ) | $ | (1,122,890 | ) | ||||||||||||||||||
|
|
|
|
|
|
|
| |||||||||||||||||||||
33
American Beacon Bahl & Gaynor Small Cap Growth FundSM
Notes to Financial Statements
December 31, 2019
| A Class | ||||||||||||||||||||||||||||
| Year Ended December 31, 2019 | Year Ended December 31, 2018 | |||||||||||||||||||||||||||
Bahl & Gaynor Small Cap Growth Fund | Shares | Amount | Shares | Amount | ||||||||||||||||||||||||
| Shares sold | 10,242 | $ | 130,620 | 148,996 | $ | 2,119,325 | ||||||||||||||||||||||
| Reinvestment of dividends | 327 | 4,681 | 19,956 | 223,104 | ||||||||||||||||||||||||
| Shares redeemed | (246,102 | ) | (3,014,915 | ) | (110,139 | ) | (1,534,614 | ) | ||||||||||||||||||||
|
|
|
|
|
|
|
| |||||||||||||||||||||
| Net increase (decrease) in shares outstanding | (235,533 | ) | $ | (2,879,614 | ) | 58,813 | $ | 807,815 | ||||||||||||||||||||
|
|
|
|
|
|
|
| |||||||||||||||||||||
| C Class | ||||||||||||||||||||||||||||
| Year Ended December 31, 2019 | Year Ended December 31, 2018 | |||||||||||||||||||||||||||
Bahl & Gaynor Small Cap Growth Fund | Shares | Amount | Shares | Amount | ||||||||||||||||||||||||
| Shares sold | 4,670 | $ | 60,493 | 11,307 | $ | 161,333 | ||||||||||||||||||||||
| Reinvestment of dividends | - | - | 1,676 | 18,198 | ||||||||||||||||||||||||
| Shares redeemed | (7,929 | ) | (101,241 | ) | (24,881 | ) | (337,620 | ) | ||||||||||||||||||||
|
|
|
|
|
|
|
| |||||||||||||||||||||
| Net (decrease) in shares outstanding | (3,259 | ) | $ | (40,748 | ) | (11,898 | ) | $ | (158,089 | ) | ||||||||||||||||||
|
|
|
|
|
|
|
| |||||||||||||||||||||
12. Subsequent Events
Management has evaluated subsequent events for possible recognition or disclosure in the financial statements through the date the financial statements are issued. Management has determined that there are no material events that would require disclosure in the Fund’s financial statements through this date.
34
American Beacon Bahl & Gaynor Small Cap Growth FundSM
(For a share outstanding throughout the period)
| Institutional Class | ||||||||||||||||||||||||||||||||||||
| Year Ended December 31, | ||||||||||||||||||||||||||||||||||||
| 2019 | 2018 | 2017 | 2016 | 2015 | ||||||||||||||||||||||||||||||||
|
| |||||||||||||||||||||||||||||||||||
Net asset value, beginning of period | $ | 11.62 | $ | 13.93 | $ | 12.77 | $ | 10.17 | $ | 10.71 | ||||||||||||||||||||||||||
|
|
|
|
|
|
|
|
|
| |||||||||||||||||||||||||||
Income (loss) from investment operations: | ||||||||||||||||||||||||||||||||||||
Net investment income | 0.07 | 0.07 | 0.04 | 0.03 | 0.08 | |||||||||||||||||||||||||||||||
Net gains (losses) on investments (both realized and unrealized) | 2.89 | (1.66 | ) | 1.71 | 2.60 | (0.39 | ) | |||||||||||||||||||||||||||||
|
|
|
|
|
|
|
|
|
| |||||||||||||||||||||||||||
Total income (loss) from investment operations | 2.96 | (1.59 | ) | 1.75 | 2.63 | (0.31 | ) | |||||||||||||||||||||||||||||
|
|
|
|
|
|
|
|
|
| |||||||||||||||||||||||||||
Less distributions: | ||||||||||||||||||||||||||||||||||||
Dividends from net investment income | (0.06 | ) | (0.05 | ) | (0.05 | ) | (0.03 | ) | (0.06 | ) | ||||||||||||||||||||||||||
Distributions from net realized gains | - | (0.67 | ) | (0.54 | ) | - | (0.16 | ) | ||||||||||||||||||||||||||||
Tax return of capitalB | - | (0.00 | )A | - | - | (0.01 | ) | |||||||||||||||||||||||||||||
|
|
|
|
|
|
|
|
|
| |||||||||||||||||||||||||||
Total distributions | (0.06 | ) | (0.72 | ) | (0.59 | ) | (0.03 | ) | (0.23 | ) | ||||||||||||||||||||||||||
|
|
|
|
|
|
|
|
|
| |||||||||||||||||||||||||||
Net asset value, end of period | $ | 14.52 | $ | 11.62 | $ | 13.93 | $ | 12.77 | $ | 10.17 | ||||||||||||||||||||||||||
|
|
|
|
|
|
|
|
|
| |||||||||||||||||||||||||||
Total returnC | 25.49 | % | (11.27 | )% | 13.65 | % | 25.88 | % | (2.96 | )% | ||||||||||||||||||||||||||
|
|
|
|
|
|
|
|
|
| |||||||||||||||||||||||||||
Ratios and supplemental data: | ||||||||||||||||||||||||||||||||||||
Net assets, end of period | $ | 17,837,496 | $ | 13,875,243 | $ | 16,498,344 | $ | 7,563,970 | $ | 3,231,461 | ||||||||||||||||||||||||||
Ratios to average net assets: | ||||||||||||||||||||||||||||||||||||
Expenses, before reimbursements | 1.33 | % | 1.26 | % | 1.32 | % | 1.85 | % | 3.04 | % | ||||||||||||||||||||||||||
Expenses, net of reimbursements | 0.98 | % | 0.98 | % | 0.98 | % | 0.98 | % | 0.98 | % | ||||||||||||||||||||||||||
Net investment income (loss), before expense reimbursements | 0.18 | % | 0.17 | % | 0.18 | % | (0.30 | )% | (1.33 | )% | ||||||||||||||||||||||||||
Net investment income, net of reimbursements | 0.53 | % | 0.45 | % | 0.52 | % | 0.57 | % | 0.72 | % | ||||||||||||||||||||||||||
Portfolio turnover rate | 35 | % | 42 | % | 38 | % | 23 | % | 54 | % | ||||||||||||||||||||||||||
| A | Amount represents less than $0.01 per share. |
| B | Tax return of capital is calculated based on outstanding shares at the time of distribution. |
| C | Based on net asset value, which does not reflect the sales charge, redemption fee, or contingent deferred sales charge, if applicable. May include adjustments in accordance with U.S. GAAP and as such, the net asset value for reporting purposes and the returns based upon those net asset values may differ from the net asset value and returns for shareholder transactions. |
See accompanying notes
35
American Beacon Bahl & Gaynor Small Cap Growth FundSM
Financial Highlights
(For a share outstanding throughout the period)
| Y Class | ||||||||||||||||||||||||||||||||||||
| Year Ended December 31, | ||||||||||||||||||||||||||||||||||||
| 2019 | 2018 | 2017 | 2016 | 2015 | ||||||||||||||||||||||||||||||||
|
| |||||||||||||||||||||||||||||||||||
Net asset value, beginning of period | $ | 11.57 | $ | 13.89 | $ | 12.75 | $ | 10.16 | $ | 10.71 | ||||||||||||||||||||||||||
|
|
|
|
|
|
|
|
|
| |||||||||||||||||||||||||||
Income (loss) from investment operations: | ||||||||||||||||||||||||||||||||||||
Net investment income | 0.06 | 0.05 | 0.05 | 0.04 | 0.06 | |||||||||||||||||||||||||||||||
Net gains (losses) on investments (both realized and unrealized) | 2.87 | (1.65 | ) | 1.68 | 2.58 | (0.38 | ) | |||||||||||||||||||||||||||||
|
|
|
|
|
|
|
|
|
| |||||||||||||||||||||||||||
Total income (loss) from investment operations | 2.93 | (1.60 | ) | 1.73 | 2.62 | (0.32 | ) | |||||||||||||||||||||||||||||
|
|
|
|
|
|
|
|
|
| |||||||||||||||||||||||||||
Less distributions: | ||||||||||||||||||||||||||||||||||||
Dividends from net investment income | (0.06 | ) | (0.05 | ) | (0.05 | ) | (0.03 | ) | (0.06 | ) | ||||||||||||||||||||||||||
Distributions from net realized gains | - | (0.67 | ) | (0.54 | ) | - | (0.16 | ) | ||||||||||||||||||||||||||||
Tax return of capitalB | - | (0.00 | )A | - | - | (0.01 | ) | |||||||||||||||||||||||||||||
|
|
|
|
|
|
|
|
|
| |||||||||||||||||||||||||||
Total distributions | (0.06 | ) | (0.72 | ) | (0.59 | ) | (0.03 | ) | (0.23 | ) | ||||||||||||||||||||||||||
|
|
|
|
|
|
|
|
|
| |||||||||||||||||||||||||||
Net asset value, end of period | $ | 14.44 | $ | 11.57 | $ | 13.89 | $ | 12.75 | $ | 10.16 | ||||||||||||||||||||||||||
|
|
|
|
|
|
|
|
|
| |||||||||||||||||||||||||||
Total returnC | 25.34 | % | (11.37 | )% | 13.52 | % | 25.80 | % | (3.05 | )% | ||||||||||||||||||||||||||
|
|
|
|
|
|
|
|
|
| |||||||||||||||||||||||||||
Ratios and supplemental data: | ||||||||||||||||||||||||||||||||||||
Net assets, end of period | $ | 22,038,090 | $ | 17,879,581 | $ | 15,114,316 | $ | 6,856,954 | $ | 2,711,465 | ||||||||||||||||||||||||||
Ratios to average net assets: | ||||||||||||||||||||||||||||||||||||
Expenses, before reimbursements | 1.38 | % | 1.34 | % | 1.38 | % | 1.98 | % | 2.76 | % | ||||||||||||||||||||||||||
Expenses, net of reimbursements | 1.08 | % | 1.08 | % | 1.08 | % | 1.08 | % | 1.08 | % | ||||||||||||||||||||||||||
Net investment income (loss), before expense reimbursements | 0.13 | % | 0.13 | % | 0.12 | % | (0.43 | )% | (0.98 | )% | ||||||||||||||||||||||||||
Net investment income, net of reimbursements | 0.43 | % | 0.39 | % | 0.42 | % | 0.47 | % | 0.70 | % | ||||||||||||||||||||||||||
Portfolio turnover rate | 35 | % | 42 | % | 38 | % | 23 | % | 54 | % | ||||||||||||||||||||||||||
| A | Amount represents less than $0.01 per share. |
| B | Tax return of capital is calculated based on outstanding shares at the time of distribution. |
| C | Based on net asset value, which does not reflect the sales charge, redemption fee, or contingent deferred sales charge, if applicable. May include adjustments in accordance with U.S. GAAP and as such, the net asset value for reporting purposes and the returns based upon those net asset values may differ from the net asset value and returns for shareholder transactions. |
See accompanying notes
36
American Beacon Bahl & Gaynor Small Cap Growth FundSM
Financial Highlights
(For a share outstanding throughout the period)
| Investor Class | ||||||||||||||||||||||||||||||||||||
| Year Ended December 31, | ||||||||||||||||||||||||||||||||||||
| 2019 | 2018 | 2017 | 2016 | 2015 | ||||||||||||||||||||||||||||||||
|
| |||||||||||||||||||||||||||||||||||
Net asset value, beginning of period | $ | 11.41 | $ | 13.75 | $ | 12.65 | $ | 10.12 | $ | 10.69 | ||||||||||||||||||||||||||
|
|
|
|
|
|
|
|
|
| |||||||||||||||||||||||||||
Income (loss) from investment operations: | ||||||||||||||||||||||||||||||||||||
Net investment income (loss) | 0.01 | (0.00 | )A | 0.02 | 0.03 | 0.05 | ||||||||||||||||||||||||||||||
Net gains (losses) on investments (both realized and unrealized) | 2.84 | (1.62 | ) | 1.66 | 2.53 | (0.39 | ) | |||||||||||||||||||||||||||||
|
|
|
|
|
|
|
|
|
| |||||||||||||||||||||||||||
Total income (loss) from investment operations | 2.85 | (1.62 | ) | 1.68 | 2.56 | (0.34 | ) | |||||||||||||||||||||||||||||
|
|
|
|
|
|
|
|
|
| |||||||||||||||||||||||||||
Less distributions: | ||||||||||||||||||||||||||||||||||||
Dividends from net investment income | (0.05 | ) | (0.05 | ) | (0.04 | ) | (0.03 | ) | (0.06 | ) | ||||||||||||||||||||||||||
Distributions from net realized gains | - | (0.67 | ) | (0.54 | ) | - | (0.16 | ) | ||||||||||||||||||||||||||||
Tax return of capitalB | - | (0.00 | )A | - | - | (0.01 | ) | |||||||||||||||||||||||||||||
|
|
|
|
|
|
|
|
|
| |||||||||||||||||||||||||||
Total distributions | (0.05 | ) | (0.72 | ) | (0.58 | ) | (0.03 | ) | (0.23 | ) | ||||||||||||||||||||||||||
|
|
|
|
|
|
|
|
|
| |||||||||||||||||||||||||||
Net asset value, end of period | $ | 14.21 | $ | 11.41 | $ | 13.75 | $ | 12.65 | $ | 10.12 | ||||||||||||||||||||||||||
|
|
|
|
|
|
|
|
|
| |||||||||||||||||||||||||||
Total returnC | 24.99 | % | (11.64 | )% | 13.23 | % | 25.31 | % | (3.25 | )% | ||||||||||||||||||||||||||
|
|
|
|
|
|
|
|
|
| |||||||||||||||||||||||||||
Ratios and supplemental data: | ||||||||||||||||||||||||||||||||||||
Net assets, end of period | $ | 3,217,039 | $ | 2,736,498 | $ | 4,344,476 | $ | 3,595,277 | $ | 498,128 | ||||||||||||||||||||||||||
Ratios to average net assets: | ||||||||||||||||||||||||||||||||||||
Expenses, before reimbursements | 1.71 | % | 1.53 | % | 1.57 | % | 2.09 | % | 3.19 | % | ||||||||||||||||||||||||||
Expenses, net of reimbursements | 1.36 | % | 1.36 | % | 1.36 | % | 1.36 | % | 1.36 | % | ||||||||||||||||||||||||||
Net investment (loss), before expense reimbursements | (0.20 | )% | (0.14 | )% | (0.09 | )% | (0.51 | )% | (1.47 | )% | ||||||||||||||||||||||||||
Net investment income, net of reimbursements | 0.15 | % | 0.03 | % | 0.12 | % | 0.23 | % | 0.35 | % | ||||||||||||||||||||||||||
Portfolio turnover rate | 35 | % | 42 | % | 38 | % | 23 | % | 54 | % | ||||||||||||||||||||||||||
| A | Amount represents less than $0.01 per share. |
| B | Tax return of capital is calculated based on outstanding shares at the time of distribution. |
| C | Based on net asset value, which does not reflect the sales charge, redemption fee, or contingent deferred sales charge, if applicable. May include adjustments in accordance with U.S. GAAP and as such, the net asset value for reporting purposes and the returns based upon those net asset values may differ from the net asset value and returns for shareholder transactions. |
See accompanying notes
37
American Beacon Bahl & Gaynor Small Cap Growth FundSM
Financial Highlights
(For a share outstanding throughout the period)
| A Class | ||||||||||||||||||||||||||||||||||||
| Year Ended December 31, | ||||||||||||||||||||||||||||||||||||
| 2019 | 2018 | 2017 | 2016 | 2015 | ||||||||||||||||||||||||||||||||
|
| |||||||||||||||||||||||||||||||||||
Net asset value, beginning of period | $ | 11.42 | $ | 13.75 | $ | 12.64 | $ | 10.11 | $ | 10.69 | ||||||||||||||||||||||||||
|
|
|
|
|
|
|
|
|
| |||||||||||||||||||||||||||
Income (loss) from investment operations: | ||||||||||||||||||||||||||||||||||||
Net investment income | 0.01 | A | 0.02 | 0.03 | 0.04 | 0.03 | ||||||||||||||||||||||||||||||
Net gains (losses) on investments (both realized and unrealized) | 2.84 | (1.64 | ) | 1.65 | 2.52 | (0.38 | ) | |||||||||||||||||||||||||||||
|
|
|
|
|
|
|
|
|
| |||||||||||||||||||||||||||
Total income (loss) from investment operations | 2.85 | (1.62 | ) | 1.68 | 2.56 | (0.35 | ) | |||||||||||||||||||||||||||||
|
|
|
|
|
|
|
|
|
| |||||||||||||||||||||||||||
Less distributions: | ||||||||||||||||||||||||||||||||||||
Dividends from net investment income | (0.04 | ) | (0.04 | ) | (0.03 | ) | (0.03 | ) | (0.06 | ) | ||||||||||||||||||||||||||
Distributions from net realized gains | - | (0.67 | ) | (0.54 | ) | - | (0.16 | ) | ||||||||||||||||||||||||||||
Tax return of capitalB | - | (0.00 | )B | - | - | (0.01 | ) | |||||||||||||||||||||||||||||
|
|
|
|
|
|
|
|
|
| |||||||||||||||||||||||||||
Total distributions | (0.04 | ) | (0.71 | ) | (0.57 | ) | (0.03 | ) | (0.23 | ) | ||||||||||||||||||||||||||
|
|
|
|
|
|
|
|
|
| |||||||||||||||||||||||||||
Net asset value, end of period | $ | 14.23 | $ | 11.42 | $ | 13.75 | $ | 12.64 | $ | 10.11 | ||||||||||||||||||||||||||
|
|
|
|
|
|
|
|
|
| |||||||||||||||||||||||||||
Total returnD | 24.97 | % | (11.70 | )% | 13.30 | % | 25.34 | % | (3.34 | )% | ||||||||||||||||||||||||||
|
|
|
|
|
|
|
|
|
| |||||||||||||||||||||||||||
Ratios and supplemental data: | ||||||||||||||||||||||||||||||||||||
Net assets, end of period | $ | 1,579,622 | $ | 3,958,224 | $ | 3,955,277 | $ | 2,321,426 | $ | 454,614 | ||||||||||||||||||||||||||
Ratios to average net assets: | ||||||||||||||||||||||||||||||||||||
Expenses, before reimbursements | 1.64 | % | 1.61 | % | 1.69 | % | 2.18 | % | 2.88 | % | ||||||||||||||||||||||||||
Expenses, net of reimbursements | 1.38 | % | 1.38 | % | 1.38 | % | 1.38 | % | 1.38 | % | ||||||||||||||||||||||||||
Net investment (loss), before expense reimbursements | (0.18 | )% | (0.16 | )% | (0.20 | )% | (0.61 | )% | (1.08 | )% | ||||||||||||||||||||||||||
Net investment income, net of reimbursements | 0.08 | % | 0.07 | % | 0.11 | % | 0.18 | % | 0.41 | % | ||||||||||||||||||||||||||
Portfolio turnover rate | 35 | % | 42 | % | 38 | % | 23 | % | 54 | % | ||||||||||||||||||||||||||
| A | Per share amounts have been calculated using the average shares method. |
| B | Amount represents less than $0.01 per share. |
| C | Tax return of capital is calculated based on outstanding shares at the time of distribution. |
| D | Based on net asset value, which does not reflect the sales charge, redemption fee, or contingent deferred sales charge, if applicable. May include adjustments in accordance with U.S. GAAP and as such, the net asset value for reporting purposes and the returns based upon those net asset values may differ from the net asset value and returns for shareholder transactions. |
See accompanying notes
38
American Beacon Bahl & Gaynor Small Cap Growth FundSM
Financial Highlights
(For a share outstanding throughout the period)
| C Class | ||||||||||||||||||||||||||||||||||||
| Year Ended December 31, | ||||||||||||||||||||||||||||||||||||
| 2019 | 2018 | 2017 | 2016 | 2015 | ||||||||||||||||||||||||||||||||
|
| |||||||||||||||||||||||||||||||||||
Net asset value, beginning of period | $ | 11.09 | $ | 13.42 | $ | 12.42 | $ | 10.00 | $ | 10.65 | ||||||||||||||||||||||||||
|
|
|
|
|
|
|
|
|
| |||||||||||||||||||||||||||
Income (loss) from investment operations: | ||||||||||||||||||||||||||||||||||||
Net investment (loss) | (0.14 | ) | (0.21 | ) | (0.06 | ) | (0.05 | ) | (0.01 | ) | ||||||||||||||||||||||||||
Net gains (losses) on investments (both realized and unrealized) | 2.80 | (1.45 | ) | 1.60 | 2.49 | (0.41 | ) | |||||||||||||||||||||||||||||
|
|
|
|
|
|
|
|
|
| |||||||||||||||||||||||||||
Total income (loss) from investment operations | 2.66 | (1.66 | ) | 1.54 | 2.44 | (0.42 | ) | |||||||||||||||||||||||||||||
|
|
|
|
|
|
|
|
|
| |||||||||||||||||||||||||||
Less distributions: | ||||||||||||||||||||||||||||||||||||
Dividends from net investment income | - | - | - | (0.02 | ) | (0.06 | ) | |||||||||||||||||||||||||||||
Distributions from net realized gains | - | (0.67 | ) | (0.54 | ) | - | (0.16 | ) | ||||||||||||||||||||||||||||
Tax return of capitalB | - | (0.00 | )A | - | - | (0.01 | ) | |||||||||||||||||||||||||||||
|
|
|
|
|
|
|
|
|
| |||||||||||||||||||||||||||
Total distributions | - | (0.67 | ) | (0.54 | ) | (0.02 | ) | (0.23 | ) | |||||||||||||||||||||||||||
|
|
|
|
|
|
|
|
|
| |||||||||||||||||||||||||||
Net asset value, end of period | $ | 13.75 | $ | 11.09 | $ | 13.42 | $ | 12.42 | $ | 10.00 | ||||||||||||||||||||||||||
|
|
|
|
|
|
|
|
|
| |||||||||||||||||||||||||||
Total returnC | 23.99 | % | (12.26 | )% | 12.38 | % | 24.35 | % | (4.01 | )% | ||||||||||||||||||||||||||
|
|
|
|
|
|
|
|
|
| |||||||||||||||||||||||||||
Ratios and supplemental data: | ||||||||||||||||||||||||||||||||||||
Net assets, end of period | $ | 324,394 | $ | 297,668 | $ | 520,113 | $ | 412,390 | $ | 308,822 | ||||||||||||||||||||||||||
Ratios to average net assets: | ||||||||||||||||||||||||||||||||||||
Expenses, before reimbursements | 2.47 | % | 2.35 | % | 2.44 | % | 3.09 | % | 3.84 | % | ||||||||||||||||||||||||||
Expenses, net of reimbursements | 2.13 | % | 2.13 | % | 2.13 | % | 2.13 | % | 2.13 | % | ||||||||||||||||||||||||||
Net investment (loss), before expense reimbursements | (0.97 | )% | (0.92 | )% | (0.96 | )% | (1.56 | )% | (2.09 | )% | ||||||||||||||||||||||||||
Net investment (loss), net of reimbursements | (0.63 | )% | (0.70 | )% | (0.65 | )% | (0.60 | )% | (0.38 | )% | ||||||||||||||||||||||||||
Portfolio turnover rate | 35 | % | 42 | % | 38 | % | 23 | % | 54 | % | ||||||||||||||||||||||||||
| A | Amount represents less than $0.01 per share. |
| B | Tax return of capital is calculated based on outstanding shares at the time of distribution. |
| C | Based on net asset value, which does not reflect the sales charge, redemption fee, or contingent deferred sales charge, if applicable. May include adjustments in accordance with U.S. GAAP and as such, the net asset value for reporting purposes and the returns based upon those net asset values may differ from the net asset value and returns for shareholder transactions. |
See accompanying notes
39
American Beacon Bahl & Gaynor Small Cap Growth FundSM
December 31, 2019 (Unaudited)
Certain tax information regarding the Fund is required to be provided to shareholders based upon the Fund’s income and distributions for the taxable year ended December 31, 2019. The information and distributions reported herein may differ from information and distributions taxable to the shareholders for the calendar year ended December 31, 2019.
The Fund designated the following items with regard to distributions paid during the fiscal year ended December 31, 2019. All designations are based on financial information available as of this annual report and, accordingly, are subject to change. For each item, it is the intention of the Fund to designate the maximum amount permitted under the Internal Revenue Code of 1986, as amended, and the regulations there under.
Corporate Dividends-Received Deduction:
Bahl & Gaynor Small Cap Growth | 100 | % |
Qualified Dividend Income:
Bahl & Gaynor Small Cap Growth | 100 | % |
Long-Term Capital Gain Distributions:
Bahl & Gaynor Small Cap Growth | $ | - |
Short-Term Capital Gain Distributions:
Bahl & Gaynor Small Cap Growth | $ | - |
Shareholders will receive notification in January 2020 of the applicable tax information necessary to prepare their 2019 income tax returns.
40
Trustees and Officers of the American Beacon FundsSM(Unaudited)
The Trustees and officers of the American Beacon Funds (the “Trust”) are listed below, together with their principal occupations during the past five years. The address of each person listed below is 220 Las Colinas Boulevard East, Suite 1200, Irving, Texas 75039. Each Trustee overseesthirty-six funds in the fund complex that includes the Trust, the American Beacon Select Funds, the American Beacon Institutional Funds Trust, the American Beacon Sound Point Enhanced Income Fund, American Beacon Apollo Total Return Fund and the American Beacon Sound Point Alternative Lending Fund. The Trust’s Statement of Additional Information contains additional information about the Trustees and is available without charge by calling1-800-658-5811.
Name, Age | Position, Term of Office and Length of Time Served with the Trust | Principal Occupation(s) During Past 5 Years and Current Directorships | ||
| INTERESTED TRUSTEES | Term | |||
| Lifetime of Trust until removal, resignation or retirement* | ||||
| Alan D. Feld** (83) | Trustee since 1996 | Partner in the law firm of Akin, Gump, Strauss, Hauer & Feld, LLP (law firm) (1960-Present); Trustee, American Beacon Select Funds (1999-Present); Trustee, American Beacon Institutional Funds Trust (2017-Present); Trustee, American Beacon Sound Point Enhanced Income Fund (2018-Present); Trustee, American Beacon Apollo Total Return Fund (2018-Present); Trustee, American Beacon Sound Point Alternative Lending Fund (2019-Present). | ||
| NON-INTERESTED TRUSTEES | Term | |||
| Lifetime of Trust until removal, resignation or retirement* | ||||
| Gilbert G. Alvarado (50) | Trustee since 2015 | Director, Kura MD, Inc. (local telehealth organization) (2015-present); Vice President & CFO, Sierra Health Foundation (health conversion private foundation) (2006-Present); Vice President & CFO, Sierra Health Foundation: Center for Health Program Management (California public benefit corporation) (2012-Present); Director, Innovative North State (2012-2015); Director, Sacramento Regional Technology Alliance (2011-2016); Director, Women’s Empowerment (2009-2014); Director, Valley Healthcare Staffing (2017-present); Trustee, American Beacon Select Funds (2015-Present); Trustee, American Beacon Institutional Funds Trust (2017-Present); Trustee, American Beacon Sound Point Enhanced Income Fund (2018-Present); Trustee, American Beacon Apollo Total Return Fund (2018-Present); Trustee, American Beacon Sound Point Alternative Lending Fund (2019-Present). | ||
| Joseph B. Armes (57) | Trustee since 2015 | Chairman & CEO, CSW Industrials f/k/a Capital Southwest Corporation (investment company) (2015-Present); Chairman of the Board of Capital Southwest Corporation, predecessor to CSW Industrials, Inc. (2014-2017) (investment company); CEO, Capital Southwest Corporation (2013-2015); President & CEO, JBA Investment Partners (family investment vehicle) (2010-Present); Director and Chair of Audit Committee, RSP Permian (oil and gas producer) (2013-Present); Trustee, American Beacon Select Funds (2015-Present); Trustee, American Beacon Institutional Funds Trust (2017-Present); Trustee, American Beacon Sound Point Enhanced Income Fund (2018-Present); Trustee, American Beacon Apollo Total Return Fund (2018-Present); Trustee, American Beacon Sound Point Alternative Lending Fund (2019-Present). | ||
| Gerard J. Arpey (61) | Trustee since 2012 | Director, The Home Depot, Inc. (2015-Present); Partner, Emerald Creek Group (private equity firm) (2011-Present); Director, S.C. Johnson & Son, Inc. (privately held company) (2008-present); Trustee, American Beacon Select Funds (2012-Present); Trustee, American Beacon Institutional Funds Trust (2017-Present); Trustee, American Beacon Sound Point Enhanced Income Fund (2018-Present); Trustee, American Beacon Apollo Total Return Fund (2018-Present); Trustee, American Beacon Sound Point Alternative Lending Fund (2019-Present). | ||
41
Trustees and Officers of the American Beacon FundsSM(Unaudited)
Name, Age | Position, Term of Office and Length of Time Served with the Trust | Principal Occupation(s) During Past 5 Years and Current Directorships | ||
| NON-INTERESTED TRUSTEES (CONT.) | Term | |||
| Lifetime of Trust until removal, resignation or retirement* | ||||
| Brenda A. Cline (59) | Trustee since 2004 Chair since 2019 Vice Chair 2018 | Chief Financial Officer, Treasurer and Secretary, Kimbell Art Foundation (1993-Present); Director, Tyler Technologies, Inc. (public sector software solutions company) (2014-Present); Director, Range Resources Corporation (oil and natural gas company) (2015-Present); Trustee, CushingClosed-End andOpen-End Funds and ETFs (2017-Present); Trustee, American Beacon Select Funds (2004-Present); ; Trustee, American Beacon Institutional Funds Trust (2017-Present); Trustee, American Beacon Sound Point Enhanced Income Fund (2018-Present); Trustee, American Beacon Apollo Total Return Fund (2018-Present); Trustee, American Beacon Sound Point Alternative Lending Fund (2019-Present). | ||
| Eugene J. Duffy (65) | Trustee since 2008 | Managing Director, Global Investment Management Distribution, Mesirow Financial (2016-Present); Managing Director, Institutional Services, Intercontinental Real Estate Corporation (2014-Present); Principal and Executive Vice President, Paradigm Asset Management (1994-2014); Trustee, American Beacon Select Funds (2008-Present); Trustee, American Beacon Institutional Funds Trust (2017-Present); Trustee, American Beacon Sound Point Enhanced Income Fund (2018-Present); Trustee, American Beacon Apollo Total Return Fund (2018-Present); Trustee, American Beacon Sound Point Alternative Lending Fund (2019-Present). | ||
| Claudia A. Holz (62) | Trustee since 2018 | Partner, KPMG LLP (1990-2017); Trustee, American Beacon Select Funds (2018-Present); Trustee, American Beacon Institutional Funds Trust (2018-Present); Trustee, American Beacon Sound Point Enhanced Income Fund (2018-Present); Trustee, American Beacon Apollo Total Return Fund (2018-Present); Trustee, American Beacon Sound Point Alternative Lending Fund (2019-Present). | ||
| Douglas A. Lindgren (58) | Trustee since 2018 | CEO North America, Carne Global Financial Services (2016-2017); Managing Director, IPS Investment Management and Global Head, Content Management, UBS Wealth Management (2010-2016); Trustee, American Beacon Select Funds (2018-Present); Trustee, American Beacon Institutional Funds Trust (2018-Present); Trustee, American Beacon Sound Point Enhanced Income Fund (2018-Present); Trustee, American Beacon Apollo Total Return Fund (2018-Present); Trustee, American Beacon Sound Point Alternative Lending Fund (2019-Present). | ||
| Richard A. Massman (76) | Trustee since 2004 Chair 2008-2018 Chair Emeritus since 2019 | Consultant and General Counsel Emeritus, Hunt Consolidated, Inc. (holding company engaged in oil and gas exploration and production, refining, real estate, farming, ranching and venture capital activities) (2009-Present); Trustee, American Beacon Select Funds (2004-Present); Trustee, American Beacon Institutional Funds Trust (2017-Present); Trustee, American Beacon Sound Point Enhanced Income Fund (2018-Present); Trustee, American Beacon Apollo Total Return Fund (2018-Present); Trustee, American Beacon Sound Point Alternative Lending Fund (2019-Present). | ||
| Barbara J. McKenna, CFA (56) | Trustee since 2012 | President/Managing Principal, Longfellow Investment Management Company (2005-Present); Trustee, American Beacon Select Funds (2012-Present); Trustee, American Beacon Institutional Funds Trust (2017-Present); Trustee, American Beacon Sound Point Enhanced Income Fund (2018-Present); Trustee, American Beacon Apollo Total Return Fund (2018-Present); Trustee, American Beacon Sound Point Alternative Lending Fund (2019-Present). | ||
42
Trustees and Officers of the American Beacon FundsSM(Unaudited)
Name, Age | Position, Term of Office and Length of Time Served with the Trust | Principal Occupation(s) During Past 5 Years and Current Directorships | ||
| NON-INTERESTED TRUSTEES (CONT.) | Term | |||
| Lifetime of Trust until removal, resignation or retirement* | ||||
| R. Gerald Turner (74) | Trustee since 2001 | President, Southern Methodist University (1995-Present); Director, J.C. Penney Company, Inc. (1996-Present); Director, Kronus Worldwide Inc. (chemical manufacturing) (2003-Present); Trustee, American Beacon Select Funds (2001-Present); Trustee, American Beacon Institutional Funds Trust (2017-Present); Trustee, American Beacon Sound Point Enhanced Income Fund (2018-Present); Trustee, American Beacon Apollo Total Return Fund (2018-Present); Trustee, American Beacon Sound Point Alternative Lending Fund (2019-Present). | ||
| OFFICERS | Term | |||
| One Year | ||||
| Gene L. Needles, Jr. (65) | President since 2009 | President (2009-2018), CEO and Director (2009-Present), and Chairman (2018-Present), American Beacon Advisors, Inc., President (2015-2018), Director and CEO (2015-Present), and Chairman (2018-Present), Resolute Investment Holdings, LLC; President (2015-2018), Director and CEO (2015-Present), and Chairman (2018-Present),Resolute Topco, Inc.; President (2015-2018); Director, and CEO (2015-Present), and Chairman (2018-Present), Resolute Acquisition, Inc.; President (2015-2018), Director and CEO (2015-Present), Chairman (2018-Present), Resolute Investment Managers, Inc.; Director, Chairman, President and CEO, Resolute Investment Distributors (2017-Present); Director, Chairman, President and CEO; Resolute Investment Services, Inc. (2017-Present); President and CEO, Lighthouse Holdings Parent, Inc. (2009-2015); President, CEO and Director, Lighthouse Holdings, Inc. (2009-2015); Manager, President and CEO, American Private Equity Management, LLC (2012-Present); Director, Chairman, President and CEO, Alpha Quant Advisors, LLC (2016-Present); Director, ARK Investment Management LLC (2016-Present); Director, Shapiro Capital Management LLC (2017-Present); Director, Chairman and CEO, Continuous Capital, LLC (2018-Present); President, American Beacon Cayman Managed Futures Strategy Fund, Ltd. (2014-Present); Director and President, American Beacon Cayman Transformational Innovation Company, LTD., (2017-2018); President, American Beacon Delaware Transformational Innovation Corporation (2017-2018); President American Beacon Cayman TargetRisk Company, Ltd. (2018-Present);Member, Investment Advisory Committee, Employees Retirement System of Texas (2017-Present); Trustee, American Beacon NextShares Trust (2015-Present); President, American Beacon Select Funds (2009-Present); President, American Beacon Institutional Funds Trust (2017-Present); President, American Beacon Sound Point Enhanced Income Fund (2018-Present); President, American Beacon Apollo Total Return Fund (2018-Present); Director, RSW Investments Holdings LLC, (2019-Present); Manager, SSI Investment Management, LLC (2019-Present); President, American Beacon Sound Point Alternative Lending Fund (2019-Present); Director, Green Harvest Asset Management (2019-Present); Director, National Investment Services of America, LLC (2019-Present). | ||
43
Trustees and Officers of the American Beacon FundsSM(Unaudited)
Name, Age | Position, Term of Office and Length of Time Served with the Trust | Principal Occupation(s) During Past 5 Years and Current Directorships | ||
| OFFICERS (CONT.) | Term | |||
| One Year | ||||
| Rosemary K. Behan (60) | VP, Secretary and Chief Legal Officer since 2006 | Vice President, Secretary and General Counsel, American Beacon Advisors, Inc. (2006-Present); Secretary, Resolute Investment Holdings, LLC (2015-Present); Secretary, Resolute Topco, Inc. (2015-Present); Secretary, Resolute Acquisition, Inc. (2015-Present); Vice President, Secretary and General Counsel, Resolute Investment Managers, Inc. (2015-Present); Secretary, Resolute Investment Distributors, Inc. (2017-Present); Vice President, Secretary and General Counsel, Resolute Investment Services, Inc. (2017-Present); Vice President and Secretary, Lighthouse Holdings Parent, Inc. (2008-2015); Vice President and Secretary, Lighthouse Holdings, Inc. (2008-2015); Secretary, American Private Equity Management, LLC (2008-Present); Secretary and General Counsel, Alpha Quant Advisors, LLC (2016-Present); Vice President and Secretary, Continuous Capital, LLC (2018-Present); Secretary, American Beacon Delaware Transformational Innovation Corporation (2017-2018); Secretary, American Beacon Cayman Transformational Innovation Company, Ltd. (2017-2018); Secretary, American Beacon Cayman Managed Futures Strategy Fund, Ltd. (2014-Present); Secretary, American Beacon Cayman TargetRisk Company, Ltd (2018-Present); Chief Legal Officer, Vice President and Secretary, American Beacon Select Funds (2006-Present); Chief Legal Officer, Vice President and Secretary, American Beacon Institutional Funds Trust (2017-Present); Chief Legal Officer, Vice President and Secretary, American Beacon Sound Point Enhanced Income Fund (2018-Present); Chief Legal Officer, Vice President and Secretary American Beacon Apollo Total Return Fund (2018-Present); Chief Legal Officer, Vice President and Secretary, American Beacon Sound Point Alternative Lending Fund (2019-Present); Secretary, Green Harvest Asset Management (2019-Present). | ||
| Brian E. Brett (59) | VP since 2004 | Senior Vice President, Head of Distribution (2012-Present), Vice President, Director of Sales (2004-2012), American Beacon Advisors, Inc.; Senior Vice President, Resolute Investment Managers, Inc. (2017-Present); Senior Vice President, Resolute Investment Distributors, Inc. (2018-Present), Senior Vice President, Resolute Investment Services, Inc. (2018-Present); Senior Vice President, Lighthouse Holdings Parent, Inc. (2008-2015); Senior Vice President, Lighthouse Holdings, Inc. (2008-2015); Vice President, American Beacon Select Funds (2004-Present); Vice President, American Beacon Institutional Funds Trust (2017-Present); Vice President American Beacon Sound Point Enhanced Income Fund (2018-Present); Vice President American Beacon Apollo Total Return Fund (2018-Present); Vice President, American Beacon Sound Point Alternative Lending Fund (2019-Present). | ||
| Paul B. Cavazos (50) | VP since 2016 | Chief Investment Officer and Senior Vice President, American Beacon Advisors, Inc. (2016-Present); Chief Investment Officer, DTE Energy (2007-2016); Vice President, American Private Equity Management, L.L.C. (2017-Present); Vice President, American Beacon Select Funds (2016-Present); Vice President, American Beacon Institutional Funds Trust (2017-Present); Vice President American Beacon Sound Point Enhanced Income Fund (2018-Present);Vice President American Beacon Apollo Total Return Fund (2018-Present); Vice President, American Beacon Sound Point Alternative Lending Fund (2019-Present). | ||
44
Trustees and Officers of the American Beacon FundsSM(Unaudited)
Name, Age | Position, Term of Office and Length of Time Served with the Trust | Principal Occupation(s) During Past 5 Years and Current Directorships | ||
| OFFICERS (CONT.) | Term | |||
| One Year | ||||
| Erica Duncan (49) | VP Since 2011 | Vice President, American Beacon Advisors, Inc. (2011-Present); Vice President, Resolute Investment Managers (2018-Present); Vice President, Resolute Investment Services, Inc. (2018-Present); Vice President, American Beacon Select Funds (2011-Present); Vice President, American Beacon Institutional Funds Trust (2017-Present); Vice President American Beacon Sound Point Enhanced Income Fund (2018-Present); Vice President American Beacon Apollo Total Return Fund (2018-Present); Vice President, American Beacon Sound Point Alternative Lending Fund (2019-Present). | ||
| Melinda G. Heika (58) | Treasurer since 2010 | Treasurer and CFO (2010-Present), American Beacon Advisors, Inc.; Treasurer, Resolute Topco, Inc. (2015-Present); Treasurer, Resolute Investment Holdings, LLC. (2015-Present); Treasurer, Resolute Acquisition, Inc. (2015-Present); Treasurer and CFO, Resolute Investment Managers, Inc. (2017-Present); Treasurer, Resolute Investment Distributors, Inc. (2017-2017); Treasurer and CFO, Resolute Investment Services, Inc. (2015-Present); Treasurer, Lighthouse Holdings Parent Inc., (2010-2015); Treasurer, Lighthouse Holdings, Inc. (2010-2015); Treasurer, American Private Equity Management, LLC (2012-Present); Treasurer and CFO, Alpha Quant Advisors, LLC (2016-Present); Treasurer and CFO, Continuous Capital, LLC (2018-Present); Treasurer, American Beacon Cayman Transformational Innovation, Ltd. (2017-2018); Treasurer, American Beacon Delaware Transformational Innovation Corporation (2017-2018); Director and Treasurer, American Beacon Cayman Managed Futures Strategy Fund, Ltd. (2014-Present); Treasurer, American Beacon Cayman TargetRisk Company, Ltd. (2018-Present); Treasurer, American Beacon Select Funds (2010-Present); Treasurer, American Beacon Institutional Funds Trust (2017-Present); Treasurer, American Beacon Sound Point Enhanced Income Fund (2018-Present); Treasurer, American Beacon Apollo Total Return Fund (2018-Present); Treasurer, American Beacon Sound Point Alternative Lending Fund (2019-Present); Treasurer, Green Harvest Asset Management (2019-Present). | ||
| Terri L. McKinney (56) | VP since 2010 | Vice President (2009-Present), Managing Director (2003-2009), American Beacon Advisors, Inc.; Vice President, Resolute Investment Managers, Inc. (2017-Present); Vice President, Resolute Investment Services, Inc (2018-Present); Vice President, Alpha Quant Advisors, LLC (2016-Present); Vice President, Continuous Capital, LLC (2018-Present); Vice President, American Beacon Select Funds (2010-Present); Vice President, American Beacon Institutional Funds Trust (2017-Present); Vice President, American Beacon Sound Point Enhanced Income Fund (2018-Present); Vice President, American Beacon Apollo Total Return Fund (2018-Present); Vice President, American Beacon Sound Point Alternative Lending Fund (2019-Present). | ||
45
Trustees and Officers of the American Beacon FundsSM(Unaudited)
Name, Age | Position, Term of Office and Length of Time Served with the Trust | Principal Occupation(s) During Past 5 Years and Current Directorships | ||
| OFFICERS (CONT.) | Term | |||
| One Year | ||||
| Jeffrey K. Ringdahl (44) | VP since 2010 | Director (2015-Present), President (2018-Present), Chief Operating Officer (2010-Present), Senior Vice President (2013-2018), Vice President (2010-2013), American Beacon Advisors, Inc.; Director (2015-Present), President (2018-Present), Senior Vice Present (2015-2018), Resolute Investment Holdings, LLC; Director (2015-Present), President (2018-Present), Senior Vice President (2015-2018), Resolute Topco, Inc.; Director (2015-Present), President (2018-Present), Senior Vice President (2015-2018), Resolute Acquisition, Inc.; Director (2015-Present), President & COO (2018-Present), Senior Vice President (2015-2018), Resolute Investment Managers, Inc.; Director and Executive Vice President (2017-Present), Resolute Investment Distributors, Inc.; Director (2017-Present), President & COO (2018-Present), Executive Vice President (2017-2018), Resolute Investment Services, Inc.; Senior Vice President (2017-Present), Vice President (2012-2017), Manager (2015-Present), American Private Equity Management, LLC; Senior Vice President, Lighthouse Holdings Parent, Inc. (2013-2015); Senior Vice President, Lighthouse Holdings, Inc. (2013-2015); Trustee, American Beacon NextShares Trust (2015-Present); Director, Executive Vice President & COO, Alpha Quant Advisors, LLC (2016-Present); Director, Shapiro Capital Management, LLC (2017-Present); Director, Executive Vice President & COO, Continuous Capital, LLC (2018-Present); Director and Vice President, American Beacon Cayman Transformational Innovation Company, Ltd., (2017-Present); Vice President, American Beacon Delaware Transformational Innovation Corporation (2017-2018); Director and Vice President, American Beacon Cayman Managed Futures Strategy Fund, Ltd. (2014-Present); Vice President, American Beacon Cayman TargetRisk Company, Ltd (2018-Present); Vice President, American Beacon Select Funds (2010-2018); Vice President, American Beacon Institutional Funds Trust (2017-Present); Vice President, American Beacon Sound Point Enhanced Income Fund (2018-Present); Vice President, American Beacon Apollo Total Return Fund (2018-Present); Director, RSW Investments Holdings LLC, (2019-Present); Manager, SSI Investment Management, LLC (2019-Present), Vice President, American Beacon Sound Point Alternative Lending Fund (2019-Present); Director, National Investment Services of America, LLC (2019-Present). | ||
| Samuel J. Silver (56) | VP Since 2011 | Vice President (2011-Present), Chief Fixed Income Officer (2016-Present), American Beacon Advisors, Inc. (2011-Present); Vice President, American Beacon Select Funds (2011-Present); Vice President, American Beacon Institutional Funds Trust (2017-Present); Vice President, American Beacon Sound Point Enhanced Income Fund (2018-Present); Vice President, American Beacon Apollo Total Return Fund (2018-Present); Vice President, American Beacon Sound Point Alternative Lending Fund (2019-Present). | ||
46
Trustees and Officers of the American Beacon FundsSM(Unaudited)
Name, Age | Position, Term of Office and Length of Time Served with the Trust | Principal Occupation(s) During Past 5 Years and Current Directorships | ||
| OFFICERS (CONT.) | Term | |||
| One Year | ||||
| Christina E. Sears (48) | Chief Compliance Officer since 2004 and Asst. Secretary since 1999 | Vice President, American Beacon Advisors, Inc. (2019-Present); Chief Compliance Officer, American Beacon Advisors, Inc. (2004-Present); Vice President, Resolute Investment Managers, Inc. (2017-Present); Vice President, Resolute Investment Distributors (2017-Present); Vice President, Resolute Investment Services, Inc. (2019-Present); Chief Compliance Officer, American Private Equity Management, LLC (2012-Present); Chief Compliance Officer (2016-2019) and Vice President, Alpha Quant Advisors, LLC (2016-Present); Vice President, Continuous Capital, LLC (2018-Present); Chief Compliance Officer (2004-Present) and Assistant Secretary (1999-Present), American Beacon Select Funds; Chief Compliance Officer and Assistant Secretary, American Beacon Institutional Funds Trust (2017-Present); Chief Compliance Officer and Assistant Secretary, American Beacon Sound Point Enhanced Income Fund (2018-Present); Chief Compliance Officer and Assistant Secretary, American Beacon Apollo Total Return Fund (2018-Present); Chief Compliance Officer and Assistant Secretary, American Beacon Sound Point Alternative Lending Fund (2019-Present). | ||
| Sonia L. Bates (63) | Asst. Treasurer since 2011 | Assistant Treasurer, American Beacon Advisors, Inc. (2011-2018); Assistant Treasurer, Lighthouse Holdings Parent Inc. (2011-2015); Assistant Treasurer, Lighthouse Holdings, Inc. (2011-2015); Assistant Treasurer, American Private Equity Management, LLC (2012-Present); Assistant Treasurer, American Beacon Cayman Transformational Innovation Company, Ltd. (2017-Present); Assistant Treasurer, American Beacon Cayman TargetRisk Company, Ltd. (2018-Present); Assistant Treasurer, American Beacon Select Funds (2011-Present); Assistant Treasurer, American Beacon Institutional Funds Trust (2017-Present); Assistant Treasurer, American Beacon Sound Point Enhanced Income Fund (2018-Present); Assistant Treasurer, American Beacon Apollo Total Return Fund (2018-Present); Assistant Treasurer, American Beacon Sound Point Alternative Lending Fund (2019-Present). | ||
| Shelley D. Abrahams (45) | Assistant Secretary since 2008 | Assistant Secretary, American Beacon Select Funds (2008-Present); Assistant Secretary, American Beacon Institutional Funds Trust (2017-Present); Assistant Secretary, American Beacon Sound Point Enhanced Income Fund (2018-Present); Assistant Secretary, American Beacon Apollo Total Return Fund (2018-Present); Assistant Secretary, American Beacon Sound Point Alternative Lending Fund (2019-Present); Assistant Secretary, Green Harvest Asset Management (2019-Present). | ||
| Rebecca L. Harris (53) | Assistant Secretary since 2010 | Vice President, American Beacon Advisors, Inc. (2011-Present); Vice President, Resolute Investment Managers, Inc. (2017-Present); Vice President, Resolute Investment Services (2015-Present); Vice President, Alpha Quant Advisors, LLC (2016-Present); Vice President, Continuous Capital, LLC (2018-Present); Assistant Secretary, American Beacon Select Funds (2010-Present); Assistant Secretary, American Beacon Institutional Funds Trust (2017-Present); Assistant Secretary, American Beacon Sound Point Enhanced Income Fund (2018-Present); Assistant Secretary, American Beacon Apollo Total Return Fund (2018-Present); Assistant Secretary, American Beacon Sound Point Alternative Lending Fund (2019-Present). | ||
47
Trustees and Officers of the American Beacon FundsSM(Unaudited)
Name, Age | Position, Term of Office and Length of Time Served with the Trust | Principal Occupation(s) During Past 5 Years and Current Directorships | ||
| OFFICERS (CONT.) | Term | |||
| One Year | ||||
| Teresa A. Oxford (61) | Assistant Secretary since 2015 | Assistant Secretary, American Beacon Advisors, Inc. (2015-Present); Assistant Secretary, Resolute Investment Distributors (2018-Present); Assistant Secretary, Resolute Investment Services (2018-Present); Assistant Secretary, Alpha Quant Advisors, LLC (2016-Present); Assistant Secretary, American Beacon Select Funds (2015-Present); Assistant Secretary, American Beacon Institutional Funds Trust (2017-Present); Assistant Secretary, American Beacon Sound Point Enhanced Income Fund (2018-Present); Assistant Secretary, American Beacon Apollo Total Return Fund (2018-Present); Assistant Secretary, American Beacon Sound Point Alternative Lending Fund (2019-Present); Assistant Secretary, Green Harvest Asset Management (2019-Present). | ||
* As of 11/12/2014, the Board adopted a retirement plan that requires Trustees, other than Messrs. Feld and Massman to retire no later than the last day of the calendar year in which they reach the age of 75. As of 11/7/17, the Board approved a waiver of the mandatory retirement policy with respect to Mr. Massman, who turned 75 in November 2018, to permit him to continue to serve on the Board as Chair Emeritus through 12/31/19. As of 1/1/2020 both Messrs. Feld and Massman retired from the Board.
** Mr. Feld is deemed to be an “interested person” of the Trusts, as defined by the 1940 Act. Mr. Feld’s law firm of Akin, Gump, Strauss, Hauer & Feld LLP has provided legal services within the past two fiscal years to one or more of the Trust’ssub-advisors.
48
American Beacon FundsSM
December 31, 2019 (Unaudited)
The American Beacon Funds recognize and respect the privacy of our shareholders. We are providing this notice to you, so you will understand how shareholder information may be collected and used.
We may collect nonpublic personal information about you from one or more of the following sources:
| • | information we receive from you on applications or other forms; |
| • | information about your transactions with us or our service providers; and |
| • | information we receive from third parties. |
We do not disclose any nonpublic personal information about our customers or former customers to anyone, except as permitted by law.
We restrict access to your nonpublic personal information to those employees or service providers who need to know that information to provide products or services to you. To ensure the confidentiality of your nonpublic personal information, we maintain safeguards that comply with federal standards.
49
This page intentionally left blank.
50

eDelivery isNOW AVAILABLE - Stop traditional mail delivery and receive your
shareholder reports and summary prospectuson-line. Sign up at
www.americanbeaconfunds.com
If you invest in the Fund through a financial institution, you may be able to receive the Fund’s regulatory mailings, such as the Prospectus, Annual Report and Semi-Annual Report, bye-mail. If you are interested in this option, please go towww.icsdelivery.com and search for your financial institution’s name or contact your financial institution directly.
To obtain more information about the Fund:
 |  | |
| ByE-mail: | On the Internet: | |
| american_beacon.funds@ambeacon.com | Visit our website atwww.americanbeaconfunds.com | |
By Telephone: Call (800)658-5811 |
By Mail: American Beacon Funds P.O. Box 219643 Kansas City, MO 64121-9643 | |
| Availability of Quarterly Portfolio Schedules | Availability of Proxy Voting Policy and Records | |
| In addition to the Schedule of Investments provided in each semi-annual and annual report, the Fund files a complete schedule of its portfolio holdings with the Securities and Exchange Commission (“SEC”) on FormN-PORT as of the end of each fiscal quarters. The Fund’s FormsN-PORT are available on the SEC’s website atwww.sec.gov. The FormsN-PORT may also be reviewed and copied at the SEC’s Public Reference Section, 100 F Street, NE, Washington, D.C. 20549-2736. Information regarding the operation of the SEC’s Public Reference Room may be obtained by calling(800)-SEC-0330. A complete schedule of the Fund’s portfolio holdings is also available atwww.americanbeaconfunds.com approximately twenty days after the end of each month. | A description of the policies and procedures the Fund uses to determine how to vote proxies relating to portfolio securities is available in the Fund’s Statement of Additional Information, is available free of charge on the Fund’s websitewww.americanbeaconfunds.com and by calling1-800-967-9009 or by accessing the SEC’s website atwww.sec.gov. The Fund’s proxy voting record for the most recent year ended June 30 is filed annually with the SEC on FormN-PX. The Fund’s FormsN-PX are available on the SEC’s website atwww.sec.gov. The Fund’s proxy voting record may also be obtained by calling1-800-967-9009. | |


Fund Service Providers:
CUSTODIAN State Street Bank and Trust Company Boston, Massachusetts | TRANSFER AGENT DST Asset Manager Solutions, Inc. Quincy, Massachusetts | INDEPENDENT REGISTERED PUBLIC ACCOUNTING FIRM Ernst & Young LLP Dallas, Texas | DISTRIBUTOR Resolute Investment Distributors, Inc. Irving, Texas |
This report is prepared for shareholders of the American Beacon Funds and may be distributed to others only if preceded or accompanied by a current Prospectus or Summary Prospectus.
American Beacon Funds and American Beacon Bahl & Gaynor Small Cap Growth Fund are service marks of American Beacon Advisors, Inc.
AR 12/19
About American Beacon Advisors
Since 1986, American Beacon Advisors, Inc. has offered a variety of products and investment advisory services to numerous institutional and retail clients, including a variety of mutual funds, corporate cash management, and separate account management.
Our clients include defined benefit plans, defined contribution plans, foundations, endowments, corporations, financial planners, and other institutional investors. With American Beacon Advisors, you can put the experience of a multi-billion dollar asset management firm to work for your company.
AHL MANAGED FUTURES STRATEGY FUND
Investing inderivative instrumentsinvolves liquidity, credit, interest rate and market risks. The use ofquantitative modelsmay lead to high levels of trading and concentration among certain investments, resulting in higher trading costs and return volatility. Investing inforeign and emerging market securitiesmay involve heightened risk due to currency fluctuations and economic and political risks.Regulatory changesmay impair the Fund’s ability to qualify for federal income tax treatment as a regulated investment company, which could result in the Fund and shareholders incurring significant income tax expense. The Fund may havehigh portfolio turnover risk, which could increase the Fund’s transaction costs and possibly have a negative impact on performance. Because the Fund may invest infewer issuersthan a more diversified portfolio, the fluctuating value of a single holding may have a greater effect on the value of the Fund.
AHL TARGETRISK FUND
Investing inderivative instrumentsinvolves liquidity, credit, interest rate and market risks. The use ofquantitative modelsmay lead to high levels of trading and concentration among certain investments, resulting in higher trading costs and return volatility. The Fund’s investments inhigh-yield or junk-rated securitiesare subject to greater levels of credit, interest rate, market and liquidity risks than investment-grade securities. In a period of sustained deflation,inflation index-linked securitiesmay not pay any income and may suffer a loss. Investing inforeign and emerging market securitiesmay involve heightened risk due to currency fluctuations and economic and political risks.Regulatory changesmay impair the Fund’s ability to qualify for federal income tax treatment as a regulated investment company, which could result in the Fund and shareholders incurring significant income tax expense. The Fund may havehigh portfolio turnover risk, which could increase the Fund’s transaction costs and possibly have a negative impact on performance. Because the Fund may invest infewer issuersthan a more diversified portfolio, the fluctuating value of a single holding may have a greater effect on the value of the Fund.
Please see the prospectus for a complete discussion of the Funds’ risks. There can be no assurances that the investment objectives of these Funds will be met.
Any opinions herein, including forecasts, reflect our judgment as of the end of the reporting period and are subject to change. Each advisor’s strategies and the Fund’s portfolio composition will change depending on economic and market conditions. This report is not a complete analysis of market conditions and therefore, should not be relied upon as investment advice. Although economic and market information has been compiled from reliable sources, American Beacon Advisors, Inc. makes no representation as to the completeness or accuracy of the statements contained herein.
American Beacon Funds | December 31, 2019 |
| 1 | ||||
| 2 | ||||
| 8 | ||||
| 10 | ||||
| 11 | ||||
| 36 | ||||
| 41 | ||||
| 45 | ||||
| 77 | ||||
| 82 | ||||
| 87 | ||||
| 88 | ||||
| 89 | ||||
| 97 | ||||
| Back Cover | ||||
 | Dear Shareholders,
In recent months, you’ve likely seen and heard news reports about disruptive headwinds in the global economy –including the U.S. trade war with China and its toll on the global economy, slowing global growth, the Federal Reserve’s series of rate cuts, Brexit, disruptions in the Middle East and protests in Hong Kong – and watched a flood of reaction in the world’s markets.
As Peter L. Bernstein said in his treatise on risk,Against the Gods: The Remarkable Story of Risk, published by John Wiley & Sons, Inc. in September 1998, “Volatility is a proxy for uncertainty and must be accommodated in measuring investment risk.”
During times of economic uncertainty and market volatility, fear of loss can be a powerful emotion – one that drives many investors to making short-term decisions subject to a variety of potential error-leading biases. Unfortunately, some short-term investment decisions may create more volatility rather than mitigate it. |
Instead of dwelling on the markets’ short-term reaction to waves of negative global news, we encourage investors to focus on the horizon instead. Long-term investing isn’t about identifying and anticipating the next big market move, it is about identifying the right investment products for riding out those moves. As a long-term investor, you should keep in mind the three Ds: direction, discipline and diversification.
| u | Direction: Achieving your long-term financial goals requires an individualized plan of action. You may want your plan to provide some measure of protection against periods of geopolitical turmoil, economic uncertainty, market volatility and job insecurity. Your plan should be reviewed annually and be adjusted in the event your long-range needs change. |
| u | Discipline:Long-term, systematic participation in an investment portfolio requires your resolution to stay the course. Spending time in the market – rather than trying to time the market – may place you in a better position to reach your long-term financial goals. |
| u | Diversification: By investing in different investment styles and asset classes, you may be able to help mitigate financial risks across your investment portfolio. By allocating your investment portfolio according to your risk-tolerance level, you may be better positioned to weather storms and achieve your long-term financial goals. |
Since 1986, American Beacon has endeavored to provide investors with a disciplined approach to realizing long-term financial goals. As a manager of managers, we strive to provide investment products that may enable investors to participate during market upswings while potentially insulating against market downswings.
Many of thesub-advisors to our mutual funds pursue upside capture and/or downside protection using proprietary strategies. The investment teams behind our mutual funds seek to produce consistent, long-term results rather than focus only on short-term movements in the markets. In managing our investment products, we emphasize identifying opportunities that offer the potential for long-term rewards.
Our management approach is more than a concept; it’s the cornerstone of our culture. And we strive to apply it at every turn as we seek to provide a well-diversified line of investment solutions to help our shareholders seek long-term rewards while mitigating volatility and risk.
Thank you for your continued interest in American Beacon. For additional information about our investment products or to access your account information, please visit our website atwww.americanbeaconfunds.com.
Best Regards,

Gene L. Needles, Jr.
President
American Beacon Funds
1
Alternative Investments
December 31, 2019 (Unaudited)
Markets capped off a strong year following the long-awaited phase one partial trade agreement between the U.S. and China. The markets also benefited from moderate economic growth across the world.
In the U.S., the labor market and the healthy and resilient consumer contributed to a moderately growing economy. The Federal Reserve shifted to a dovish stance early in 2019 and carried it throughout the year while cutting rates on three different occasions, the last time in October. Recession fears were quelled as the yield curve steepened and the stock market pushed to newall-time highs.
Globally, central banks were accommodative as well. This overall market backdrop led to a solid performance for the year across major asset classes, including global equities and global bonds.
For the year, alternative investments broadly produced positive absolute returns, although they failed to keep pace with public markets. For context, the HFRX Global Hedge Fund Index returned a solid 8.62% in 2019.Sub-category performance highlights included: the HFRX Equity Hedge Index, up 10.71%; the HFRX Macro/CTA Index, up 4.84%; and the HFRX Relative Value Arbitrage Index, up 6.55%.
2
American Beacon AHL Managed Futures Strategy FundSM
Performance Overview
December 31, 2019 (Unaudited)
The Investor Class of the American Beacon AHL Managed Futures Strategy Fund (the “Fund”) returned 0.08% for the twelve months ended December 31, 2019.
Comparison of Change in Value of a $10,000 Investment for the period from 8/19/2014 through 12/31/2019
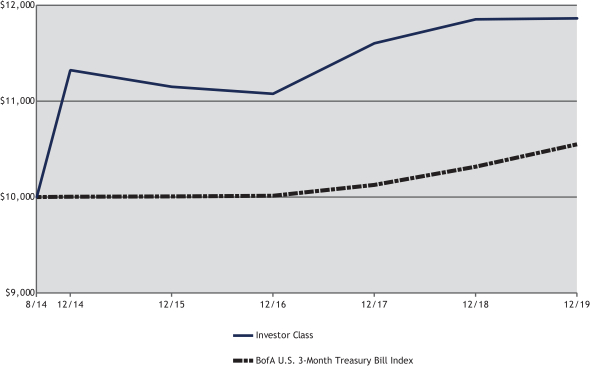
| Total Returns for the Period ended December 31, 2019 |
| |||||||||||||||||||||||||||||||
Ticker | 1 Year | 3 Years | 5 Years | Since Inception | Value of $10,000 8/19/2014- 12/31/2019 | |||||||||||||||||||||||||||
Institutional Class (1,4) | AHLIX | 0.43 | % | 2.70 | % | 1.32 | % | 3.63 | % | $ | 12,111 | |||||||||||||||||||||
Y Class (1,4) | AHLYX | 0.34 | % | 2.63 | % | 1.24 | % | 3.54 | % | $ | 12,052 | |||||||||||||||||||||
Investor Class (1,4) | AHLPX | 0.08 | % | 2.32 | % | 0.93 | % | 3.23 | % | $ | 11,862 | |||||||||||||||||||||
A without Sales Charge (1,2,4) | AHLAX | (0.04 | )% | 2.26 | % | 0.90 | % | 3.20 | % | $ | 11,841 | |||||||||||||||||||||
A with Sales Charge (1,2,4) | AHLAX | (5.79 | )% | 0.27 | % | (0.30 | )% | 2.07 | % | $ | 11,160 | |||||||||||||||||||||
C without Sales Charge (1,2,4) | AHLCX | (0.78 | )% | 1.54 | % | 0.16 | % | 2.44 | % | $ | 11,384 | |||||||||||||||||||||
C with Sales Charge (1,2,4) | AHLCX | (1.78 | )% | 1.54 | % | 0.16 | % | 2.44 | % | $ | 11,384 | |||||||||||||||||||||
BofA U.S. 3-Month Treasury Bill Index (3) | 2.28 | % | 1.67 | % | 1.07 | % | 1.00 | % | $ | 10,550 | ||||||||||||||||||||||
| 1. | Performance shown is historical and is not indicative of future returns. Investment returns and principal value will vary, and shares may be worth more or less at redemption than at original purchase. Performance shown is calculated based on the publishedend-of-day net asset values as of date indicated, and current performance may be lower or higher than the performance data quoted. To obtain performance as of the most recent month end, please visitwww.americanbeaconfunds.com or call1-800-967-9009. Fund performance in the table above does not reflect the deduction of taxes a shareholder would pay on distributions or the redemption of shares. Generally accepted accounting principles require adjustments to be made to the net assets of the Fund at period end for financial reporting purposes only; and as such, the total return based on the unadjusted net asset value per share may differ from the total return reported in the financial highlights. A portion of the fees charged to each Class of the Fund has been waived since Fund inception. Performance prior to waiving fees was lower than actual returns shown. |
| 2. | A Class shares have a maximum sales charge of 5.75%. The maximum contingent deferred sales charge for the C Class is 1.00% for shares redeemed within one year of the date of purchase. |
3
American Beacon AHL Managed Futures Strategy FundSM
Performance Overview
December 31, 2019 (Unaudited)
| 3. | The BofA U.S. 3-Month Treasury Bill Index is designed to measure the total return on cash, including price and interest income, based on short-term government Treasury bills of about90-day maturity. One cannot directly invest in an index. |
| 4. | The Total Annual Fund Operating Expense ratios set forth in the most recent Fund prospectus for the Institutional, Y, Investor, A and C Class shares were 1.71%, 1.72%, 1.97%, 2.05% and 2.78%, respectively. The expense ratios above may vary from the expense ratios presented in other sections of this report that are based on expenses incurred during the period covered by this report. |
For the period, Fixed Income was the best and sole positively performing sector, returning 8.07%. Long positions for most of year in the German Bund (+1.30%) and Australian10-year Bond (+0.82%) were the best markets in the sector.
Commodities contributed most negatively with an annual loss of 4.13%. Mixed positioning in Gasoline RBOB(-0.81%) and WTI Crude Oil(-0.74%) detracted the most.
Currencies generated losses of 2.54%, paced by mixed positioning in the Japanese yen / U.S. dollar(-1.31%) and Canadian dollar / U.S. dollar pairs(-0.95%).
Lastly, Stocks added a loss of 1.68%. The leading detractor was the South African All Share Index(-1.04%), which flipped positioning from short to long nine times during the year. Detracting second most was the Russell 2000, which returned-0.64% with similar unstable positioning.
Looking forward, the Fund’ssub-advisor will continue to implement its trading strategy designed to capitalize on price trends (up or down) in a broad range of global equities, fixed income, currency, and commodity futures markets; seeking to achieve the Fund’s goal of capital growth.
4
American Beacon AHL Managed Futures Strategy FundSM
Performance Overview
December 31, 2019 (Unaudited)
| Commodities | % of VaR | * | ||||||
| Crude Oil | Long | 7.0 | ||||||
| Natural Gas | Short | 5.9 | ||||||
| Gold | Long | 3.5 | ||||||
| Silver | Long | 2.4 | ||||||
| Copper | Long | 2.2 | ||||||
| Currencies | % of VaR | * | ||||||
| JPY / USD | Short | 6.3 | ||||||
| MXN / USD | Long | 4.1 | ||||||
| AUD / USD | Long | 2.2 | ||||||
| CAD / USD | Long | 2.0 | ||||||
| CLP / USD | Short | 1.3 | ||||||
| Equities | % of VaR | * | ||||||
| Korean Kospi Index | Long | 3.3 | ||||||
| S&P 500 Index | Long | 3.3 | ||||||
| Hang Seng Index | Long | 2.4 | ||||||
| Russell 2000 Index | Long | 2.4 | ||||||
| Australian SPI 200 Index | Long | 2.2 | ||||||
| Fixed Income | % of VaR | * | ||||||
| US Treasuries | Short | 2.4 | ||||||
| Japanese Bonds | Short | 1.5 | ||||||
| German10-Year Bond | Long | 0.7 | ||||||
| Eurodollar | Short | 0.7 | ||||||
| Euribor | Long | 0.4 |
| * | Value at Risk (“VaR”) is a measure of the potential loss in value of a portfolio over a defined period for a given confidence interval. Aone-day VaR at the 95% confidence level represents that there is a 5% probability that themark-to-market loss on the portfolio over a one day horizon will exceed this value (assuming normal markets and no trading in the portfolio). |
5
American Beacon AHL TargetRisk FundSM
Performance Overview
December 31, 2019 (Unaudited)
The Investor Class of the American Beacon AHL TargetRisk Fund (the “Fund”) returned 26.85% for the twelve months ended December 31, 2019.
Comparison of Change in Value of a $10,000 Investment for the period from 12/31/2018 through 12/31/2019
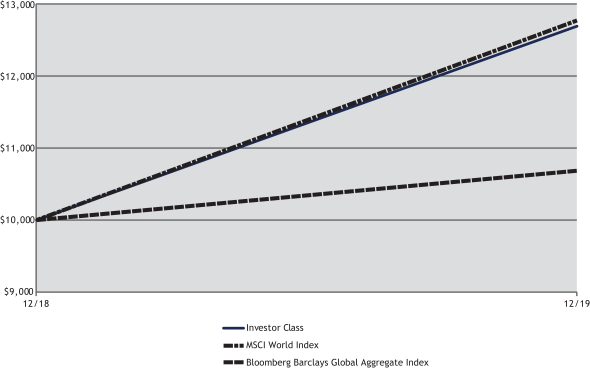
| Total Returns for the Period Ended December 31, 2019 | ||||||||||||||||||||||
Ticker | 1 Year | Since Inception | Value of $10,000 12/31/2018- 12/31/2019 | |||||||||||||||||||
Institutional Class (1,3) | AHTIX | 27.17 | % | 27.17 | % | $ | 12,717 | |||||||||||||||
Y Class (1,3) | AHTYX | 27.06 | % | 27.06 | % | $ | 12,706 | |||||||||||||||
Investor Class (1,3) | AHTPX | 26.85 | % | 26.85 | % | $ | 12,685 | |||||||||||||||
A without Sales Charge (1,2,3) | AHTAX | 26.98 | % | 18.36 | % | $ | 12,699 | |||||||||||||||
A with Sales Charge (1,2,3) | AHTAX | 19.68 | % | 8.37 | % | $ | 11,968 | |||||||||||||||
C without Sales Charge (1,2,3) | AHACX | 26.35 | % | 17.49 | % | $ | 12,535 | |||||||||||||||
C with Sales Charge (1,2,3) | AHACX | 25.35 | % | 15.92 | % | $ | 12,535 | |||||||||||||||
MSCI World Index (4) | 27.67 | % | 27.67 | % | $ | 12,767 | ||||||||||||||||
Bloomberg Barclays Global Aggregate Index (4) | 6.84 | % | 6.84 | % | $ | 10,684 | ||||||||||||||||
| 1. | Performance shown is historical and is not indicative of future returns. Investment returns and principal value will vary, and shares may be worth more or less at redemption than at original purchase. Performance shown is calculated based on the publishedend-of-day net asset values as of date indicated, and current performance may be lower or higher than the performance data quoted. To obtain performance as of the most recent month end, please visitwww.americanbeaconfunds.com or call1-800-967-9009. Fund performance in the table above does not reflect the deduction of taxes a shareholder would pay on distributions or the redemption of shares. Generally accepted accounting principles require adjustments to be made to the net assets of the Fund at period end for financial reporting purposes only, and as such, the total return based on the unadjusted net asset value per share may differ from the total return reported in the financial highlights. Please note that the recent performance of the securities market has helped produce short-term returns that are not typical and may not continue in the future. A portion of the fees charged to each Class of the Fund has been waived since Fund inception. Performance prior to waiving fees was lower than actual returns shown since inception. |
| 2. | A Class shares have a maximum sales charge of 5.75%. The maximum contingent deferred sales charge for the C Class is 1.00% for shares redeemed within one year of the date of purchase. Fund performance represents the returns achieved by the Investor Class from 12/31/18 up to the 4/30/19 inception date of the A and C Classes and returns of the A and C Classes since 4/30/19. |
6
American Beacon AHL TargetRisk FundSM
Performance Overview
December 31, 2019 (Unaudited)
| 3. | The Total Annual Fund Operating Expense ratios set forth in the most recent Fund prospectus for the Institutional, Y, Investor, A and C Class shares were 2.04%, 2.14%, 2.42%, 2.44% and 3.19%, respectively. The expense ratios above may vary from the expense ratios presented in other sections of this report that are based on expenses incurred during the period covered by this report. |
| 4. | The AHL TargetRisk Fund’s annual total return is compared to the TargetRisk Composite Index, which combines the returns of the MSCI World Index Hedged to U.S. Dollars (USD) and the Bloomberg Barclays Global Aggregate Total Return Index Value Hedged USD in a 60%/40% proportion. The MSCI World Index Hedged to USD represents a close estimation of the performance that can be achieved by hedging the currency exposures of its parent index, the MSCI World Index, to the USD, the “home” currency for the hedged index. The index is 100% hedged to the USD by selling each foreign currency forward at theone-month forward weight. The parent index is composed of large andmid-cap stocks across 23 Developed Markets (DM) countries and its local performance is calculated in 13 different currencies, including the Euro. The MSCI© information contained herein: (1) is provided “as is,” (2) is proprietary to MSCI and/or its content providers, (3) may not be used to create any financial instruments or products or any indexes and (4) may not be copied or distributed without MSCI’s express written consent. MSCI disclaims all warranties with respect to the information. Neither MSCI nor its content providers are responsible for any damages or losses arising from any use of this information. The Bloomberg Barclays Global Aggregate Total Return Index Value Hedged USD is a flagship measure of global investment grade debt from 24 local currency markets. This multi-currency benchmark includes treasury, government-related, corporate and securitized fixed-rate bonds from both developed and emerging markets issuers. One cannot directly invest in an index. |
On a gross basis, all sectors contributed positive results to the portfolio. Leading the way was Stocks, returning 12.09%. The best performing markets were the S&P 500 Index (+2.55%) and the FTSE 100 Index (+2.09%).
Fixed Income was the second-best contributor, returning 9.60%. U.S. TIPS (+2.32%) generated the largest gains, and the U.K. 10-year Gilts (+1.23%) registered the second largest.
Credit returned 4.73% during the prior twelve months. The U.S. 5-year High Yield CDX Index (+2.13%) performed best, followed by the U.S. 5-year CDX Index (+1.40%).
Lastly, Commodities contributed 0.56% to performance during the period.
Looking forward, the Fund’s sub-advisor will continue to implement its trading strategy designed to maintain its targeted risk profile, by investing in a broad range of global equities, fixed income, credit, and commodity markets; seeking to achieve the Fund’s goal of capital growth.
| Top Ten Holdings | % of VaR | * | ||||||
| U.S. Treasuries | 17.9 | |||||||
| UK10-Year Gilts | 11.5 | |||||||
| FTSE 100 Index | 10.5 | |||||||
| BBG Commodityex-Agriculturals Index | 9.0 | |||||||
| S&P 500 Index | 6.7 | |||||||
| German10-Year Bund | 4.5 | |||||||
| NASDAQ 100 Index | 3.8 | |||||||
| French10-Year Bond | 2.9 | |||||||
| Nikkei Index | 2.9 | |||||||
| US High Yield CDX Index | 2.9 |
| * | Value at Risk (“VaR”) is a measure of the potential loss in value of a portfolio over a defined period for a given confidence interval. Aone-day VaR at the 95% confidence level represents that there is a 5% probability that themark-to-market loss on the portfolio over a one day horizon will exceed this value (assuming normal markets and no trading in the portfolio). |
7
American Beacon FundsSM
December 31, 2019 (Unaudited)
Fund Expense Example
As a shareholder of a Fund, you incur two types of costs: (1) transaction costs, including sales charges (loads) on purchase payments and redemption fees, if applicable, and (2) ongoing costs, including management fees, distribution(12b-1) fees,sub-transfer agent fees, and other Fund expenses. The Examples are intended to help you understand the ongoing cost (in dollars) of investing in the Funds and to compare these costs with the ongoing costs of investing in other mutual funds. The Examples are based on an investment of $1,000 invested at the beginning of the period in each Class and held for the entire period from July 1, 2019 through December 31, 2019.
Actual Expenses
The “Actual” lines of the tables provide information about actual account values and actual expenses. You may use the information on this page, together with the amount you invested, to estimate the expenses that you paid over the period. Simply divide your account value by $1,000 (for example, an $8,600 account value divided by $1,000 = $8.60), then multiply the result by the “Expenses Paid During Period” to estimate the expenses you paid on your account during this period. Shareholders of the Investor and Institutional Classes that invest in the Fund through an IRA or Roth IRA may be subject to a custodial IRA fee of $15 that is typically deducted each December. If your account was subject to a custodial IRA fee during the period, your costs would have been $15 higher.
Hypothetical Example for Comparison Purposes
The “Hypothetical” lines of the tables provide information about hypothetical account values and hypothetical expenses based on the Fund’s actual expense ratio and an assumed 5% per year rate of return before expenses (not the Fund’s actual return). You may compare the ongoing costs of investing in the Funds with other funds by contrasting this 5% hypothetical example and the 5% hypothetical examples that appear in the shareholder reports of the other funds. The hypothetical account values and expenses may not be used to estimate the actual ending account balance or expenses you paid for the period. Shareholders of the Investor and Institutional Classes that invest in the Funds through an IRA or Roth IRA may be subject to a custodial IRA fee of $15 that is typically deducted each December. If your account was subject to a custodial IRA fee during the period, your costs would have been $15 higher.
You should also be aware that the expenses shown in the table highlight only your ongoing costs and do not reflect any transaction costs charged by the Funds, such as sales charges (loads) or redemption fees, as applicable. Similarly, the expense examples for other funds do not reflect any transaction costs charged by those funds, such as sales charges (loads), redemption fees or exchange fees. Therefore, the “Hypothetical” lines of the tables are useful in comparing ongoing costs only and will not help you determine the relative total costs of owning different funds. If you were subject to any transaction costs during the period, your costs would have been higher.
8
American Beacon FundsSM
Expense Examples
December 31, 2019 (Unaudited)
| American Beacon AHL Managed Futures Strategy Fund |
| ||||||||||||||
| Beginning Account Value 7/1/2019 | Ending Account Value 12/31/2019 | Expenses Paid During Period 7/1/2019-12/31/2019* | |||||||||||||
| Institutional Class | |||||||||||||||
| Actual | $1,000.00 | $992.20 | $7.73 | ||||||||||||
| Hypothetical** | $1,000.00 | $1,017.44 | $7.83 | ||||||||||||
| Y Class | |||||||||||||||
| Actual | $1,000.00 | $991.20 | $8.23 | ||||||||||||
| Hypothetical** | $1,000.00 | $1,016.94 | $8.34 | ||||||||||||
| Investor Class | |||||||||||||||
| Actual | $1,000.00 | $989.50 | $9.63 | ||||||||||||
| Hypothetical** | $1,000.00 | $1,015.53 | $9.75 | ||||||||||||
| A Class | |||||||||||||||
| Actual | $1,000.00 | $990.20 | $9.73 | ||||||||||||
| Hypothetical** | $1,000.00 | $1,015.43 | $9.86 | ||||||||||||
| C Class | |||||||||||||||
| Actual | $1,000.00 | $985.40 | $13.46 | ||||||||||||
| Hypothetical** | $1,000.00 | $1,011.65 | $13.64 | ||||||||||||
| * | Expenses are equal to the Fund’s annualized expense ratios for thesix-month period of 1.54%, 1.64%, 1.92%, 1.94%, and 2.69% for the Institutional, Y, Investor, A, and C Classes, respectively, multiplied by the average account value over the period, multiplied by the number derived by dividing the number of days in the most recent fiscal half-year (184) by days in the year (365) to reflect the half-year period. |
| ** | 5% return before expenses. |
| American Beacon AHL TargetRisk Fund |
| ||||||||||||||
| Beginning Account Value 7/1/2019 | Ending Account Value 12/31/2019 | Expenses Paid During Period 7/1/2019-12/31/2019* | |||||||||||||
| Institutional Class | |||||||||||||||
| Actual | $1,000.00 | $1,058.00 | $5.39 | ||||||||||||
| Hypothetical** | $1,000.00 | $1,019.96 | $5.30 | ||||||||||||
| Y Class | |||||||||||||||
| Actual | $1,000.00 | $1,058.80 | $5.92 | ||||||||||||
| Hypothetical** | $1,000.00 | $1,019.46 | $5.80 | ||||||||||||
| Investor Class | |||||||||||||||
| Actual | $1,000.00 | $1,058.00 | $7.37 | ||||||||||||
| Hypothetical** | $1,000.00 | $1,018.05 | $7.22 | ||||||||||||
| A Class | |||||||||||||||
| Actual | $1,000.00 | $1,057.20 | $7.47 | ||||||||||||
| Hypothetical** | $1,000.00 | $1,017.95 | $7.32 | ||||||||||||
| C Class | |||||||||||||||
| Actual | $1,000.00 | $1,053.70 | $11.34 | ||||||||||||
| Hypothetical** | $1,000.00 | $1,014.17 | $11.12 | ||||||||||||
| * | Expenses are equal to the Fund’s annualized expense ratios for thesix-month period of 1.04%, 1.14%, 1.42%, 1.44%, and 2.19% for the Institutional, Y, Investor, A, and C Classes, respectively, multiplied by the average account value over the period, multiplied by the number derived by dividing the number of days in the most recent fiscal half-year (184) by days in the year (365) to reflect the half-year period. |
| ** | 5% return before expenses. |
9
American Beacon FundsSM
Report of Independent Registered Public Accounting Firm
To the Shareholders and the Board of Trustees of American Beacon AHL Managed Futures Strategy Fund and American Beacon AHL TargetRisk Fund
Opinion on the Financial Statements
We have audited the accompanying consolidated statements of assets and liabilities of American Beacon AHL Managed Futures Strategy Fund and American Beacon AHL TargetRisk Fund (collectively referred to as the “Funds”), (two of the funds constituting American Beacon Funds (the “Trust”)), including the consolidated schedules of investments, as of December 31, 2019, and the related consolidated statements of operations, changes in net assets, and financial highlights for each of the periods indicated in the table below and the related notes (collectively referred to as the “financial statements”). In our opinion, the financial statements present fairly, in all material respects, the consolidated financial position of each of the Funds at December 31, 2019, and the consolidated results of their operations, changes in net assets and financial highlights for each of the periods indicated in the table below, in conformity with U.S. generally accepted accounting principles.
Individual fund constituting the | Consolidated | Consolidated Statements of | Consolidated Financial highlights | |||
| American Beacon AHL Managed Futures Strategy Fund | For the year ended December 31, 2019 | For each of the two years in the period ended December 31, 2019 | For each of the five years in the period ended December 31, 2019 | |||
| American Beacon AHL TargetRisk | For the year ended December 31, 2019 | For the year ended December 31, 2019 and for the day of December 31, 2018 (commencement of operations) | For the year ended December 31, 2019 and for the day of December 31, 2018 (commencement of operations) | |||
Basis for Opinion
These financial statements are the responsibility of the Trust’s management. Our responsibility is to express an opinion on the Funds’ financial statements based on our audits. We are a public accounting firm registered with the Public Company Accounting Oversight Board (United States) (“PCAOB”) and are required to be independent with respect to the Trust in accordance with the U.S. federal securities laws and the applicable rules and regulations of the Securities and Exchange Commission and the PCAOB.
We conducted our audits in accordance with the standards of the PCAOB. Those standards require that we plan and perform the audit to obtain reasonable assurance about whether the financial statements are free of material misstatement, whether due to error or fraud. The Trust is not required to have, nor were we engaged to perform, an audit of the Trust’s internal control over financial reporting. As part of our audits, we are required to obtain an understanding of internal control over financial reporting, but not for the purpose of expressing an opinion on the effectiveness of the Trust’s internal control over financial reporting. Accordingly, we express no such opinion.
Our audits included performing procedures to assess the risks of material misstatement of the financial statements, whether due to error or fraud, and performing procedures that respond to those risks. Such procedures included examining, on a test basis, evidence regarding the amounts and disclosures in the financial statements. Our procedures included confirmation of securities owned as of December 31, 2019, by correspondence with the custodian and brokers or by other appropriate auditing procedures where replies from brokers were not received. Our audits also included evaluating the accounting principles used and significant estimates made by management, as well as evaluating the overall presentation of the financial statements. We believe that our audits provide a reasonable basis for our opinion.

We have served as the auditor of one or more American Beacon investment companies since 1987.
Dallas, Texas
February 28, 2020
10
American Beacon AHL Managed Futures Strategy FundSM
Consolidated Schedule of Investments
December 31, 2019
| Shares | Fair Value | ||||||||||||||
| SHORT-TERM INVESTMENTS - 88.55% | |||||||||||||||
| Investment Companies - 2.15% | |||||||||||||||
| American Beacon U.S. Government Money Market Select Fund, Select Class, 1.52%A B C | 21,740,982 | $ | 21,740,982 | ||||||||||||
|
| ||||||||||||||
| Principal Amount | |||||||||||||||
| U.S. Treasury Obligations - 86.40% | |||||||||||||||
U.S. Treasury Bills, | |||||||||||||||
2.064%, Due 1/23/2020A | $ | 50,500,000 | 50,456,696 | ||||||||||||
0.619%, Due 2/20/2020A | 27,000,000 | 26,944,324 | |||||||||||||
1.252%, Due 2/20/2020 | 55,000,000 | 54,886,585 | |||||||||||||
1.886%, Due 3/5/2020 | 45,000,000 | 44,881,678 | |||||||||||||
1.882%, Due 3/19/2020A | 78,000,000 | 77,752,808 | |||||||||||||
0.643%, Due 3/26/2020A | 29,000,000 | 28,897,976 | |||||||||||||
1.081%, Due 3/26/2020 | 50,000,000 | 49,824,096 | |||||||||||||
1.641%, Due 4/2/2020 | 55,000,000 | 54,787,983 | |||||||||||||
1.616%, Due 4/9/2020A | 86,000,000 | 85,642,922 | |||||||||||||
1.557%, Due 4/23/2020 | 50,000,000 | 49,761,572 | |||||||||||||
1.558%, Due 5/7/2020 | 3,900,000 | 3,879,201 | |||||||||||||
0.340%, Due 5/14/2020A | 26,000,000 | 25,853,251 | |||||||||||||
1.233%, Due 5/14/2020 | 95,000,000 | 94,463,802 | |||||||||||||
1.548%, Due 6/4/2020A | 93,000,000 | 92,388,729 | |||||||||||||
1.541%, Due 6/18/2020 | 65,000,000 | 64,532,816 | |||||||||||||
1.118%, Due 7/16/2020A | 69,000,000 | 68,422,882 | |||||||||||||
|
| ||||||||||||||
| 873,377,321 | |||||||||||||||
|
| ||||||||||||||
Total Short-Term Investments (Cost $894,927,156) | 895,118,303 | ||||||||||||||
|
| ||||||||||||||
TOTAL INVESTMENTS - 88.55% (Cost $894,927,156) | 895,118,303 | ||||||||||||||
OTHER ASSETS, NET OF LIABILITIES - 11.45% | 115,797,097 | ||||||||||||||
|
| ||||||||||||||
TOTAL NET ASSETS - 100.00% | $ | 1,010,915,400 | |||||||||||||
|
| ||||||||||||||
| Percentages are stated as a percent of net assets. | |||||||||||||||
A All or a portion represents positions held by the American Beacon Cayman Managed Futures Strategy Fund, Ltd.
B The Fund is affiliated by having the same investment advisor.
C7-day yield.
D Fair valued pursuant to procedures approved by the Board of Trustees.
| Long Futures Contracts Open on December 31, 2019: |
| |||||||||||||||
| Commodity Futures Contracts | ||||||||||||||||
| Description | Number of Contracts | Expiration Date | Notional Amount | Contract Value | Unrealized Appreciation (Depreciation) | |||||||||||
| Brent Crude FuturesA | 681 | January 2020 | $ | 43,914,095 | $ | 44,946,000 | $ | 1,031,905 | ||||||||
| Coffee FuturesA | 284 | March 2020 | 12,034,749 | 13,813,050 | 1,778,301 | |||||||||||
| Gasoline RBOB FuturesA | 345 | January 2020 | 24,507,878 | 24,495,345 | (12,533 | ) | ||||||||||
| Gold 100oz FuturesA | 671 | February 2020 | 99,938,744 | 102,200,010 | 2,261,266 | |||||||||||
| LME Copper FuturesA | 41 | January 2020 | 6,042,614 | 6,312,463 | 269,849 | |||||||||||
| LME Copper FuturesA | 58 | February 2020 | 8,735,019 | 8,944,325 | 209,306 | |||||||||||
| LME Copper FuturesA | 191 | March 2020 | 29,414,601 | 29,485,625 | 71,024 | |||||||||||
| LME Copper FuturesA | 352 | March 2020 | 24,473,066 | 24,613,600 | 140,534 | |||||||||||
| LME Lead FuturesA | 93 | January 2020 | 5,118,240 | 4,457,025 | (661,215 | ) | ||||||||||
| LME Lead FuturesA | 7 | February 2020 | 340,180 | 337,006 | (3,174 | ) | ||||||||||
| LME Nickel FuturesA | 74 | January 2020 | 7,774,994 | 6,201,792 | (1,573,202 | ) | ||||||||||
| LME Primary Aluminum FuturesA | 284 | January 2020 | 12,647,904 | 12,703,675 | 55,771 | |||||||||||
| LME Primary Aluminum FuturesA | 229 | February 2020 | 10,401,312 | 10,310,725 | (90,587 | ) | ||||||||||
| LME Primary Aluminum FuturesA | 285 | March 2020 | 13,010,686 | 12,896,250 | (114,436 | ) | ||||||||||
| LME Zinc FuturesA | 134 | January 2020 | 8,425,466 | 7,641,350 | (784,116 | ) | ||||||||||
| LME Zinc FuturesA | 133 | February 2020 | 7,713,599 | 7,573,519 | (140,080 | ) | ||||||||||
| Low Sulphur Gasoil FuturesA | 336 | January 2020 | 20,551,313 | 20,630,400 | 79,087 | |||||||||||
| Low Sulphur Gasoil FuturesA | 22 | February 2020 | 1,373,277 | 1,350,250 | (23,027 | ) | ||||||||||
See accompanying notes
11
American Beacon AHL Managed Futures Strategy FundSM
Consolidated Schedule of Investments
December 31, 2019
| Commodity Futures Contracts | ||||||||||||||||||
| Description | Number of Contracts | Expiration Date | Notional Amount | Contract Value | Unrealized Appreciation (Depreciation) | |||||||||||||
| NY Harbor ULSD FuturesA | 251 | January 2020 | $ | 21,291,279 | $ | 21,324,358 | $ | 33,079 | ||||||||||
| Silver FuturesA | 404 | March 2020 | 35,450,955 | 36,200,420 | 749,465 | |||||||||||||
| Sugar #11 World FuturesA | 938 | February 2020 | 13,798,543 | 14,098,515 | 299,972 | |||||||||||||
| WTI Crude FuturesA | 676 | January 2020 | 40,822,384 | 41,276,560 | 454,176 | |||||||||||||
|
|
|
|
|
| |||||||||||||
| $ | 447,780,898 | $ | 451,812,263 | $ | 4,031,365 | |||||||||||||
|
|
|
|
|
| |||||||||||||
| Currency Futures Contracts | ||||||||||||||||||
| Description | Number of Contracts | Expiration Date | Notional Amount | Contract Value | Unrealized Appreciation (Depreciation) | |||||||||||||
| Austrailian Dollar Currency Futures | 1,496 | March 2020 | $ | 104,263,069 | $ | 105,288,480 | $ | 1,025,411 | ||||||||||
| Canadian Dollar Currency Futures | 2,217 | March 2020 | 169,426,665 | 170,897,445 | 1,470,780 | |||||||||||||
| Euro Currency Futures | 86 | March 2020 | 12,119,409 | 12,128,150 | 8,741 | |||||||||||||
| Mexican Peso Futures | 6,095 | March 2020 | 156,681,122 | 159,658,525 | 2,977,403 | |||||||||||||
| New Zealand Dollar Currency Futures | 313 | March 2020 | 21,063,383 | 21,127,500 | 64,117 | |||||||||||||
| Swiss Franc Currency Futures | 38 | March 2020 | 4,935,906 | 4,940,000 | 4,094 | |||||||||||||
|
|
|
|
|
| |||||||||||||
| $ | 468,489,554 | $ | 474,040,100 | $ | 5,550,546 | |||||||||||||
|
|
|
|
|
| |||||||||||||
| Equity Futures Contracts | ||||||||||||||||||
| Description | Number of Contracts | Expiration Date | Notional Amount | Contract Value | Unrealized Appreciation (Depreciation) | |||||||||||||
| Amsterdam Index Futures | 176 | January 2020 | $ | 23,982,949 | $ | 23,873,113 | $ | (109,836 | ) | |||||||||
| CAC40 Index Futures | 398 | January 2020 | 26,617,559 | 26,652,264 | 34,705 | |||||||||||||
| DAX Index Futures | 128 | March 2020 | 47,755,278 | 47,547,515 | (207,763 | ) | ||||||||||||
| Euro Stoxx 50 Index Futures | 1,344 | March 2020 | 56,338,730 | 56,217,089 | (121,641 | ) | ||||||||||||
| FTSE 100 Index Futures | 501 | March 2020 | 49,549,047 | 49,765,201 | 216,154 | |||||||||||||
| FTSE/JSE Top 40 Index Futures | 926 | March 2020 | 34,318,731 | 33,956,419 | (362,312 | ) | ||||||||||||
| FTSE/MIB Index Futures | 271 | March 2020 | 35,738,432 | 35,580,940 | (157,492 | ) | ||||||||||||
| Hang Seng China Enterprises Index Futures | 536 | January 2020 | 38,137,657 | 38,557,910 | 420,253 | |||||||||||||
| Hang Seng Index Futures | 221 | January 2020 | 39,698,015 | 40,088,741 | 390,726 | |||||||||||||
| KOSPI 200 Index Futures | 1,094 | March 2020 | 66,613,779 | 69,814,692 | 3,200,913 | |||||||||||||
| Mini MSCI EAFE Index Futures | 439 | March 2020 | 44,823,143 | 44,701,175 | (121,968 | ) | ||||||||||||
| Mini MSCI Emerging Markets Index Futures | 695 | March 2020 | 38,195,738 | 38,926,950 | 731,212 | |||||||||||||
| MSCI Taiwan Stock Index Futures | 962 | January 2020 | 44,441,932 | 44,213,520 | (228,412 | ) | ||||||||||||
| NASDAQ 100E-Mini Futures | 314 | March 2020 | 53,559,091 | 54,964,130 | 1,405,039 | |||||||||||||
| Nikkei 225 (SGX) Futures | 441 | March 2020 | 47,568,219 | 47,436,266 | (131,953 | ) | ||||||||||||
| OMXS30 Index Futures | 1,198 | January 2020 | 22,878,548 | 22,616,745 | (261,803 | ) | ||||||||||||
| Russell 2000E-Mini Index Futures | 633 | March 2020 | 52,093,537 | 52,874,490 | 780,953 | |||||||||||||
| S&P 500E-Mini Index Futures | 635 | March 2020 | 100,855,010 | 102,587,425 | 1,732,415 | |||||||||||||
| S&P/TSX 60 Index Futures | 332 | March 2020 | 51,758,758 | 51,768,018 | 9,260 | |||||||||||||
| SPI 200 Futures | 557 | March 2020 | 66,383,650 | 64,523,645 | (1,860,005 | ) | ||||||||||||
| TOPIX Index Futures | 325 | March 2020 | 51,432,595 | 51,477,153 | 44,558 | |||||||||||||
|
|
|
|
|
| |||||||||||||
| $ | 992,740,398 | $ | 998,143,401 | $ | 5,403,003 | |||||||||||||
|
|
|
|
|
| |||||||||||||
| Interest Rate Futures Contracts | ||||||||||||||||||
| Description | Number of Contracts | Expiration Date | Notional Amount | Contract Value | Unrealized Appreciation (Depreciation) | |||||||||||||
| 3-Month Euro Euribor Futures | 58 | March 2021 | $ | 16,333,081 | $ | 16,321,576 | $ | (11,505 | ) | |||||||||
| 3-Month Euro Euribor Futures | 548 | December 2021 | 154,233,843 | 154,095,495 | (138,348 | ) | ||||||||||||
| 3-Month Euro Euribor Futures | 330 | September 2022 | 92,827,521 | 92,692,938 | (134,583 | ) | ||||||||||||
| 90-Day Sterling Futures | 1,255 | March 2021 | 206,410,776 | 206,337,146 | (73,630 | ) | ||||||||||||
| 90-Day Sterling Futures | 654 | December 2021 | 107,510,514 | 107,452,232 | (58,282 | ) | ||||||||||||
| Australian3-Year Bond Futures | 23 | March 2020 | 1,868,416 | 1,856,349 | (12,067 | ) | ||||||||||||
| Euro-Bobl Futures | 75 | March 2020 | 11,302,807 | 11,241,957 | (60,850 | ) | ||||||||||||
| Euro-Bund Futures | 203 | March 2020 | 39,351,517 | 38,821,441 | (530,076 | ) | ||||||||||||
| Long GILT Futures | 76 | March 2020 | 13,413,909 | 13,225,970 | (187,939 | ) | ||||||||||||
|
|
|
|
|
| |||||||||||||
| $ | 643,252,384 | $ | 642,045,104 | $ | (1,207,280 | ) | ||||||||||||
|
|
|
|
|
| |||||||||||||
See accompanying notes
12
American Beacon AHL Managed Futures Strategy FundSM
Consolidated Schedule of Investments
December 31, 2019
| Short Futures Contracts Open on December 31, 2019: |
| |||||||||||||||
| Commodity Futures Contracts | ||||||||||||||||
| Description | Number of Contracts | Expiration Date | Notional Amount | Contract Value | Unrealized Appreciation (Depreciation) | |||||||||||
| Cocoa FuturesA | 11 | March 2020 | $ | (266,955 | ) | $ | (279,400 | ) | $ | (12,445 | ) | |||||
| Corn FuturesA | 905 | March 2020 | (17,134,032 | ) | (17,545,688 | ) | (411,656 | ) | ||||||||
| Henry Hub Natural Gas FuturesA D | 392 | March 2020 | (2,212,216 | ) | (2,106,020 | ) | 106,196 | |||||||||
| Henry Hub Natural Gas FuturesA D | 392 | April 2020 | (2,212,216 | ) | (2,141,300 | ) | 70,916 | |||||||||
| Henry Hub Natural Gas FuturesA D | 392 | May 2020 | (2,212,216 | ) | (2,200,100 | ) | 12,116 | |||||||||
| Henry Hub Natural Gas FuturesA D | 392 | June 2020 | (2,212,216 | ) | (2,256,940 | ) | (44,724 | ) | ||||||||
| Henry Hub Natural Gas FuturesA D | 392 | July 2020 | (2,212,216 | ) | (2,270,660 | ) | (58,444 | ) | ||||||||
| Henry Hub Natural Gas FuturesA D | 392 | August 2020 | (2,212,216 | ) | (2,260,860 | ) | (48,644 | ) | ||||||||
| Henry Hub Natural Gas FuturesA D | 392 | September 2020 | (2,212,216 | ) | (2,293,200 | ) | (80,984 | ) | ||||||||
| Henry Hub Natural Gas FuturesA D | 376 | October 2020 | (2,489,958 | ) | (2,272,920 | ) | 217,038 | |||||||||
| Henry Hub Natural Gas FuturesA D | 376 | November 2020 | (2,489,958 | ) | (2,434,600 | ) | 55,358 | |||||||||
| Henry Hub Natural Gas FuturesA D | 376 | December 2020 | (2,489,958 | ) | (2,545,520 | ) | (55,562 | ) | ||||||||
| Henry Hub Natural Gas FuturesA D | 376 | January 2021 | (2,489,958 | ) | (2,502,280 | ) | (12,322 | ) | ||||||||
| Henry Hub Natural Gas FuturesA D | 376 | February 2021 | (2,489,958 | ) | (2,391,360 | ) | 98,598 | |||||||||
| KC Hard Red Winter Wheat FuturesA | 51 | March 2020 | (1,093,892 | ) | (1,239,300 | ) | (145,408 | ) | ||||||||
| LME Copper FuturesA | 41 | January 2020 | (5,900,650 | ) | (6,312,462 | ) | (411,812 | ) | ||||||||
| LME Copper FuturesA | 58 | February 2020 | (8,469,379 | ) | (8,944,325 | ) | (474,946 | ) | ||||||||
| LME Lead FuturesA | 93 | January 2020 | (4,765,195 | ) | (4,457,025 | ) | 308,170 | |||||||||
| LME Lead FuturesA | 142 | February 2020 | (6,971,948 | ) | (6,836,412 | ) | 135,536 | |||||||||
| LME Lead FuturesA | 16 | March 2020 | (767,528 | ) | (771,400 | ) | (3,872 | ) | ||||||||
| LME Nickel FuturesA | 74 | January 2020 | (6,629,292 | ) | (6,201,792 | ) | 427,500 | |||||||||
| LME Nickel FuturesA | 42 | February 2020 | (3,482,641 | ) | (3,528,000 | ) | (45,359 | ) | ||||||||
| LME Nickel FuturesA | 10 | March 2020 | (817,232 | ) | (841,500 | ) | (24,268 | ) | ||||||||
| LME Primary Aluminum FuturesA | 284 | January 2020 | (12,380,300 | ) | (12,703,675 | ) | (323,375 | ) | ||||||||
| LME Primary Aluminum FuturesA | 229 | February 2020 | (9,963,364 | ) | (10,310,725 | ) | (347,361 | ) | ||||||||
| LME Primary Aluminum FuturesA | 594 | March 2020 | (26,012,087 | ) | (26,878,500 | ) | (866,413 | ) | ||||||||
| LME Zinc FuturesA | 134 | January 2020 | (7,839,201 | ) | (7,641,350 | ) | 197,851 | |||||||||
| LME Zinc FuturesA | 310 | February 2020 | (17,865,759 | ) | (17,652,563 | ) | 213,196 | |||||||||
| LME Zinc FuturesA | 116 | March 2020 | (6,506,510 | ) | (6,596,775 | ) | (90,265 | ) | ||||||||
| Natural Gas FuturesA | 2,265 | January 2020 | (52,276,841 | ) | (49,580,850 | ) | 2,695,991 | |||||||||
| Soybean FuturesA | 394 | March 2020 | (17,715,149 | ) | (18,823,350 | ) | (1,108,201 | ) | ||||||||
|
|
|
|
|
| |||||||||||
| $ | (234,793,257 | ) | $ | (234,820,852 | ) | $ | (27,595 | ) | ||||||||
|
|
|
|
|
| |||||||||||
| Currency Futures Contracts | ||||||||||||||||
| Description | Number of Contracts | Expiration Date | Notional Amount | Contract Value | Unrealized Appreciation (Depreciation) | |||||||||||
| British Pound Currency Futures | 137 | March 2020 | $ | (11,250,115 | ) | $ | (11,381,275 | ) | $ | (131,160 | ) | |||||
| Japanese Yen Currency Futures | 3,173 | March 2020 | (366,691,594 | ) | (366,699,644 | ) | (8,050 | ) | ||||||||
| U.S. Dollar Index Futures | 163 | March 2020 | (15,687,010 | ) | (15,657,454 | ) | 29,556 | |||||||||
|
|
|
|
|
| |||||||||||
| $ | (393,628,719 | ) | $ | (393,738,373 | ) | $ | (109,654 | ) | ||||||||
|
|
|
|
|
| |||||||||||
| Interest Rate Futures Contracts | ||||||||||||||||
| Description | Number of Contracts | Expiration Date | Notional Amount | Contract Value | Unrealized Appreciation (Depreciation) | |||||||||||
| 90-Day Eurodollar Futures | 816 | March 2021 | $ | (200,962,441 | ) | $ | (200,817,600 | ) | $ | 144,841 | ||||||
| 90-Day Eurodollar Futures | 30 | December 2021 | (7,375,407 | ) | (7,379,625 | ) | (4,218 | ) | ||||||||
| 90-Day Eurodollar Futures | 71 | September 2022 | (17,448,437 | ) | (17,453,575 | ) | (5,138 | ) | ||||||||
| Australian10-Year Bond Futures | 22 | March 2020 | (2,218,984 | ) | (2,207,059 | ) | 11,925 | |||||||||
| Euro-Buxl Futures | 6 | March 2020 | (1,335,516 | ) | (1,335,137 | ) | 379 | |||||||||
| Euro-Schatz Futures | 631 | March 2020 | (79,239,919 | ) | (79,205,539 | ) | 34,380 | |||||||||
| Japanese10-Year Government Bond Futures | 156 | March 2020 | (218,563,221 | ) | (218,490,452 | ) | 72,769 | |||||||||
| U.S. Long Bond Futures | 47 | March 2020 | (7,447,986 | ) | (7,327,594 | ) | 120,392 | |||||||||
| U.S. Treasury10-Year Note Futures | 358 | March 2020 | (46,200,715 | ) | (45,975,031 | ) | 225,684 | |||||||||
| U.S. Treasury2-Year Note Futures | 641 | March 2020 | (138,221,005 | ) | (138,135,500 | ) | 85,505 | |||||||||
See accompanying notes
13
American Beacon AHL Managed Futures Strategy FundSM
Consolidated Schedule of Investments
December 31, 2019
| Interest Rate Futures Contracts | ||||||||||||||||
| Description | Number of Contracts | Expiration Date | Notional Amount | Contract Value | Unrealized Appreciation (Depreciation) | |||||||||||
| U.S. Treasury5-Year Note Futures | 483 | March 2020 | $ | (57,402,187 | ) | $ | (57,288,328 | ) | $ | 113,859 | ||||||
| U.S. Ultra Bond Futures | 32 | March 2020 | (5,903,726 | ) | (5,813,000 | ) | 90,726 | |||||||||
|
|
|
|
|
| |||||||||||
| $ | (782,319,544 | ) | $ | (781,428,440 | ) | $ | 891,104 | |||||||||
|
|
|
|
|
| |||||||||||
| Forward Foreign Currency Contracts Open on December 31, 2019: | ||||||||||||||||||||||||||
| Currency Purchased* | Currency Sold* | Settlement Date | Counterparty | Unrealized Appreciation | Unrealized (Depreciation) | Net Unrealized Appreciation (Depreciation) | ||||||||||||||||||||
| INR | 34,984 | USD | 34,968 | 1/15/2020 | DUB | $ | 16 | $ | – | $ | 16 | |||||||||||||||
| INR | 34,984 | USD | 35,289 | 1/15/2020 | DUB | – | (305 | ) | (305 | ) | ||||||||||||||||
| INR | 69,969 | USD | 69,930 | 1/15/2020 | DUB | 39 | – | 39 | ||||||||||||||||||
| INR | 69,969 | USD | 69,936 | 1/15/2020 | DUB | 33 | – | 33 | ||||||||||||||||||
| TWD | 83,448 | USD | 83,125 | 1/15/2020 | DUB | 323 | – | 323 | ||||||||||||||||||
| TWD | 83,448 | USD | 83,125 | 1/15/2020 | DUB | 323 | – | 323 | ||||||||||||||||||
| TWD | 83,448 | USD | 83,122 | 1/15/2020 | DUB | 326 | – | 326 | ||||||||||||||||||
| KRW | 86,496 | USD | 85,965 | 1/15/2020 | DUB | 531 | – | 531 | ||||||||||||||||||
| INR | 139,937 | USD | 141,044 | 1/15/2020 | DUB | – | (1,107 | ) | (1,107 | ) | ||||||||||||||||
| INR | 151,599 | USD | 151,781 | 1/15/2020 | DUB | – | (182 | ) | (182 | ) | ||||||||||||||||
| TWD | 166,897 | USD | 166,196 | 1/15/2020 | DUB | 701 | – | 701 | ||||||||||||||||||
| TWD | 166,897 | USD | 166,124 | 1/15/2020 | DUB | 773 | – | 773 | ||||||||||||||||||
| KRW | 172,993 | USD | 172,045 | 1/15/2020 | DUB | 948 | – | 948 | ||||||||||||||||||
| KRW | 172,993 | USD | 172,166 | 1/15/2020 | DUB | 827 | – | 827 | ||||||||||||||||||
| KRW | 172,993 | USD | 172,107 | 1/15/2020 | DUB | 886 | – | 886 | ||||||||||||||||||
| KRW | 172,993 | USD | 172,129 | 1/15/2020 | DUB | 864 | – | 864 | ||||||||||||||||||
| INR | 174,921 | USD | 176,334 | 1/15/2020 | DUB | – | (1,413 | ) | (1,413 | ) | ||||||||||||||||
| INR | 180,807 | USD | 181,741 | 1/15/2020 | DUB | – | (934 | ) | (934 | ) | ||||||||||||||||
| INR | 244,890 | USD | 246,247 | 1/15/2020 | DUB | – | (1,357 | ) | (1,357 | ) | ||||||||||||||||
| TWD | 250,345 | USD | 249,360 | 1/15/2020 | DUB | 985 | – | 985 | ||||||||||||||||||
| TWD | 250,345 | USD | 249,244 | 1/15/2020 | DUB | 1,101 | – | 1,101 | ||||||||||||||||||
| TWD | 250,345 | USD | 249,120 | 1/15/2020 | DUB | 1,225 | – | 1,225 | ||||||||||||||||||
| KRW | 259,489 | USD | 258,193 | 1/15/2020 | DUB | 1,296 | – | 1,296 | ||||||||||||||||||
| TWD | 333,793 | USD | 332,513 | 1/15/2020 | DUB | 1,280 | – | 1,280 | ||||||||||||||||||
| TWD | 333,793 | USD | 332,613 | 1/15/2020 | DUB | 1,180 | – | 1,180 | ||||||||||||||||||
| TWD | 333,793 | USD | 332,701 | 1/15/2020 | DUB | 1,092 | – | 1,092 | ||||||||||||||||||
| TWD | 333,793 | USD | 332,786 | 1/15/2020 | DUB | 1,007 | – | 1,007 | ||||||||||||||||||
| KRW | 345,986 | USD | 344,285 | 1/15/2020 | DUB | 1,701 | - | 1,701 | ||||||||||||||||||
| KRW | 345,986 | USD | 344,202 | 1/15/2020 | DUB | 1,784 | - | 1,784 | ||||||||||||||||||
| INR | 349,843 | USD | 353,392 | 1/15/2020 | DUB | - | (3,549 | ) | (3,549 | ) | ||||||||||||||||
| TWD | 417,241 | USD | 415,613 | 1/15/2020 | DUB | 1,628 | - | 1,628 | ||||||||||||||||||
| KRW | 432,482 | USD | 431,488 | 1/15/2020 | DUB | 994 | - | 994 | ||||||||||||||||||
| INR | 454,796 | USD | 458,431 | 1/15/2020 | DUB | - | (3,635 | ) | (3,635 | ) | ||||||||||||||||
| KRW | 518,979 | USD | 516,467 | 1/15/2020 | DUB | 2,512 | - | 2,512 | ||||||||||||||||||
| KRW | 518,979 | USD | 517,715 | 1/15/2020 | DUB | 1,264 | - | 1,264 | ||||||||||||||||||
| KRW | 518,979 | USD | 517,827 | 1/15/2020 | DUB | 1,152 | - | 1,152 | ||||||||||||||||||
| KRW | 518,979 | USD | 517,697 | 1/15/2020 | DUB | 1,282 | - | 1,282 | ||||||||||||||||||
| KRW | 518,979 | USD | 514,549 | 1/15/2020 | DUB | 4,430 | - | 4,430 | ||||||||||||||||||
| KRW | 518,979 | USD | 516,859 | 1/15/2020 | DUB | 2,120 | - | 2,120 | ||||||||||||||||||
| INR | 559,749 | USD | 564,366 | 1/15/2020 | DUB | - | (4,617 | ) | (4,617 | ) | ||||||||||||||||
| TWD | 584,138 | USD | 579,317 | 1/15/2020 | DUB | 4,821 | - | 4,821 | ||||||||||||||||||
| TWD | 584,138 | USD | 582,570 | 1/15/2020 | DUB | 1,568 | - | 1,568 | ||||||||||||||||||
| KRW | 605,475 | USD | 603,173 | 1/15/2020 | DUB | 2,302 | - | 2,302 | ||||||||||||||||||
| KRW | 605,475 | USD | 603,339 | 1/15/2020 | DUB | 2,136 | - | 2,136 | ||||||||||||||||||
| KRW | 605,475 | USD | 603,043 | 1/15/2020 | DUB | 2,432 | - | 2,432 | ||||||||||||||||||
| KRW | 605,475 | USD | 601,220 | 1/15/2020 | DUB | 4,255 | - | 4,255 | ||||||||||||||||||
| KRW | 605,475 | USD | 601,065 | 1/15/2020 | DUB | 4,410 | - | 4,410 | ||||||||||||||||||
| KRW | 605,475 | USD | 602,000 | 1/15/2020 | DUB | 3,475 | - | 3,475 | ||||||||||||||||||
| KRW | 605,475 | USD | 601,478 | 1/15/2020 | DUB | 3,997 | - | 3,997 | ||||||||||||||||||
| INR | 664,701 | USD | 670,782 | 1/15/2020 | DUB | - | (6,081 | ) | (6,081 | ) | ||||||||||||||||
See accompanying notes
14
American Beacon AHL Managed Futures Strategy FundSM
Consolidated Schedule of Investments
December 31, 2019
| Currency Purchased* | Currency Sold* | Settlement Date | Counterparty | Unrealized Appreciation | Unrealized (Depreciation) | Net Unrealized Appreciation (Depreciation) | ||||||||||||||||||||
| TWD | 667,586 | USD | 666,555 | 1/15/2020 | DUB | $ | 1,031 | $ | - | $ | 1,031 | |||||||||||||||
| KRW | 691,971 | USD | 689,292 | 1/15/2020 | DUB | 2,679 | - | 2,679 | ||||||||||||||||||
| KRW | 691,971 | USD | 690,291 | 1/15/2020 | DUB | 1,680 | - | 1,680 | ||||||||||||||||||
| KRW | 691,971 | USD | 688,695 | 1/15/2020 | DUB | 3,276 | - | 3,276 | ||||||||||||||||||
| INR | 699,686 | USD | 698,296 | 1/15/2020 | DUB | 1,390 | - | 1,390 | ||||||||||||||||||
| TWD | 751,034 | USD | 749,026 | 1/15/2020 | DUB | 2,008 | - | 2,008 | ||||||||||||||||||
| TWD | 751,034 | USD | 749,825 | 1/15/2020 | DUB | 1,209 | - | 1,209 | ||||||||||||||||||
| KRW | 778,468 | USD | 772,831 | 1/15/2020 | DUB | 5,637 | - | 5,637 | ||||||||||||||||||
| KRW | 778,468 | USD | 773,988 | 1/15/2020 | DUB | 4,480 | - | 4,480 | ||||||||||||||||||
| KRW | 778,468 | USD | 773,974 | 1/15/2020 | DUB | 4,494 | - | 4,494 | ||||||||||||||||||
| KRW | 778,468 | USD | 773,728 | 1/15/2020 | DUB | 4,740 | - | 4,740 | ||||||||||||||||||
| KRW | 778,468 | USD | 775,127 | 1/15/2020 | DUB | 3,341 | - | 3,341 | ||||||||||||||||||
| TWD | 834,483 | USD | 832,559 | 1/15/2020 | DUB | 1,924 | - | 1,924 | ||||||||||||||||||
| TWD | 834,483 | USD | 832,937 | 1/15/2020 | DUB | 1,546 | - | 1,546 | ||||||||||||||||||
| INR | 839,623 | USD | 839,866 | 1/15/2020 | DUB | - | (243 | ) | (243 | ) | ||||||||||||||||
| KRW | 864,964 | USD | 865,209 | 1/15/2020 | DUB | - | (245 | ) | (245 | ) | ||||||||||||||||
| KRW | 864,964 | USD | 865,269 | 1/15/2020 | DUB | - | (305 | ) | (305 | ) | ||||||||||||||||
| KRW | 864,964 | USD | 859,328 | 1/15/2020 | DUB | 5,636 | - | 5,636 | ||||||||||||||||||
| KRW | 864,964 | USD | 859,498 | 1/15/2020 | DUB | 5,466 | - | 5,466 | ||||||||||||||||||
| KRW | 864,964 | USD | 861,823 | 1/15/2020 | DUB | 3,141 | - | 3,141 | ||||||||||||||||||
| TWD | 917,931 | USD | 914,916 | 1/15/2020 | DUB | 3,015 | - | 3,015 | ||||||||||||||||||
| KRW | 951,461 | USD | 950,079 | 1/15/2020 | DUB | 1,382 | - | 1,382 | ||||||||||||||||||
| KRW | 951,461 | USD | 945,667 | 1/15/2020 | DUB | 5,794 | - | 5,794 | ||||||||||||||||||
| KRW | 951,461 | USD | 946,823 | 1/15/2020 | DUB | 4,638 | - | 4,638 | ||||||||||||||||||
| KRW | 951,461 | USD | 948,849 | 1/15/2020 | DUB | 2,612 | - | 2,612 | ||||||||||||||||||
| KRW | 1,037,957 | USD | 1,038,475 | 1/15/2020 | DUB | - | (518 | ) | (518 | ) | ||||||||||||||||
| KRW | 1,037,957 | USD | 1,035,384 | 1/15/2020 | DUB | 2,573 | - | 2,573 | ||||||||||||||||||
| KRW | 1,037,957 | USD | 1,034,679 | 1/15/2020 | DUB | 3,278 | - | 3,278 | ||||||||||||||||||
| KRW | 1,037,957 | USD | 1,022,896 | 1/15/2020 | DUB | 15,061 | - | 15,061 | ||||||||||||||||||
| KRW | 1,037,957 | USD | 1,026,984 | 1/15/2020 | DUB | 10,973 | - | 10,973 | ||||||||||||||||||
| TWD | 1,084,828 | USD | 1,080,877 | 1/15/2020 | DUB | 3,951 | - | 3,951 | ||||||||||||||||||
| KRW | 1,124,454 | USD | 1,117,031 | 1/15/2020 | DUB | 7,423 | - | 7,423 | ||||||||||||||||||
| KRW | 1,124,454 | USD | 1,107,269 | 1/15/2020 | DUB | 17,185 | - | 17,185 | ||||||||||||||||||
| KRW | 1,124,454 | USD | 1,117,079 | 1/15/2020 | DUB | 7,375 | - | 7,375 | ||||||||||||||||||
| KRW | 1,156,890 | USD | 1,144,229 | 1/15/2020 | DUB | 12,661 | - | 12,661 | ||||||||||||||||||
| KRW | 1,156,890 | USD | 1,144,013 | 1/15/2020 | DUB | 12,877 | - | 12,877 | ||||||||||||||||||
| INR | 1,189,466 | USD | 1,188,313 | 1/15/2020 | DUB | 1,153 | - | 1,153 | ||||||||||||||||||
| KRW | 1,210,950 | USD | 1,203,473 | 1/15/2020 | DUB | 7,477 | - | 7,477 | ||||||||||||||||||
| KRW | 1,210,950 | USD | 1,203,121 | 1/15/2020 | DUB | 7,829 | - | 7,829 | ||||||||||||||||||
| KRW | 1,210,950 | USD | 1,202,625 | 1/15/2020 | DUB | 8,325 | - | 8,325 | ||||||||||||||||||
| INR | 1,224,450 | USD | 1,229,839 | 1/15/2020 | DUB | - | (5,389 | ) | (5,389 | ) | ||||||||||||||||
| INR | 1,224,450 | USD | 1,234,507 | 1/15/2020 | DUB | - | (10,057 | ) | (10,057 | ) | ||||||||||||||||
| INR | 1,259,434 | USD | 1,261,233 | 1/15/2020 | DUB | - | (1,799 | ) | (1,799 | ) | ||||||||||||||||
| KRW | 1,297,446 | USD | 1,280,978 | 1/15/2020 | DUB | 16,468 | - | 16,468 | ||||||||||||||||||
| TWD | 1,335,172 | USD | 1,328,506 | 1/15/2020 | DUB | 6,666 | - | 6,666 | ||||||||||||||||||
| KRW | 1,362,319 | USD | 1,348,366 | 1/15/2020 | DUB | 13,953 | - | 13,953 | ||||||||||||||||||
| KRW | 1,362,319 | USD | 1,348,667 | 1/15/2020 | DUB | 13,652 | - | 13,652 | ||||||||||||||||||
| KRW | 1,383,943 | USD | 1,366,564 | 1/15/2020 | DUB | 17,379 | - | 17,379 | ||||||||||||||||||
| TWD | 1,418,621 | USD | 1,410,555 | 1/15/2020 | DUB | 8,066 | - | 8,066 | ||||||||||||||||||
| INR | 1,434,356 | USD | 1,433,286 | 1/15/2020 | DUB | 1,070 | - | 1,070 | ||||||||||||||||||
| KRW | 1,470,439 | USD | 1,452,333 | 1/15/2020 | DUB | 18,106 | - | 18,106 | ||||||||||||||||||
| TWD | 1,502,069 | USD | 1,497,156 | 1/15/2020 | DUB | 4,913 | - | 4,913 | ||||||||||||||||||
| KRW | 1,556,936 | USD | 1,541,466 | 1/15/2020 | DUB | 15,470 | - | 15,470 | ||||||||||||||||||
| KRW | 1,643,432 | USD | 1,622,240 | 1/15/2020 | DUB | 21,192 | - | 21,192 | ||||||||||||||||||
| KRW | 1,643,432 | USD | 1,629,083 | 1/15/2020 | DUB | 14,349 | - | 14,349 | ||||||||||||||||||
| INR | 1,644,262 | USD | 1,651,998 | 1/15/2020 | DUB | - | (7,736 | ) | (7,736 | ) | ||||||||||||||||
| TWD | 1,752,414 | USD | 1,746,565 | 1/15/2020 | DUB | 5,849 | - | 5,849 | ||||||||||||||||||
| INR | 1,784,199 | USD | 1,793,479 | 1/15/2020 | DUB | - | (9,280 | ) | (9,280 | ) | ||||||||||||||||
| INR | 1,935,797 | USD | 1,944,304 | 1/15/2020 | DUB | - | (8,507 | ) | (8,507 | ) | ||||||||||||||||
See accompanying notes
15
American Beacon AHL Managed Futures Strategy FundSM
Consolidated Schedule of Investments
December 31, 2019
| Currency Purchased* | Currency Sold* | Settlement Date | Counterparty | Unrealized Appreciation | Unrealized (Depreciation) | Net Unrealized Appreciation (Depreciation) | ||||||||||||||||||||
| KRW | 1,946,170 | USD | 1,926,783 | 1/15/2020 | DUB | $ | 19,387 | $ | - | $ | 19,387 | |||||||||||||||
| KRW | 2,011,042 | USD | 1,989,322 | 1/15/2020 | DUB | 21,720 | - | 21,720 | ||||||||||||||||||
| KRW | 2,032,666 | USD | 2,009,560 | 1/15/2020 | DUB | 23,106 | - | 23,106 | ||||||||||||||||||
| INR | 2,040,750 | USD | 2,051,304 | 1/15/2020 | DUB | - | (10,554 | ) | (10,554 | ) | ||||||||||||||||
| KRW | 2,119,163 | USD | 2,095,072 | 1/15/2020 | DUB | 24,091 | - | 24,091 | ||||||||||||||||||
| INR | 2,466,392 | USD | 2,475,508 | 1/15/2020 | DUB | - | (9,116 | ) | (9,116 | ) | ||||||||||||||||
| INR | 2,466,392 | USD | 2,475,212 | 1/15/2020 | DUB | - | (8,820 | ) | (8,820 | ) | ||||||||||||||||
| TWD | 2,670,345 | USD | 2,657,715 | 1/15/2020 | DUB | 12,630 | - | 12,630 | ||||||||||||||||||
| INR | 2,996,987 | USD | 3,002,603 | 1/15/2020 | DUB | - | (5,616 | ) | (5,616 | ) | ||||||||||||||||
| INR | 3,061,070 | USD | 3,075,609 | 1/15/2020 | DUB | - | (14,539 | ) | (14,539 | ) | ||||||||||||||||
| INR | 3,288,523 | USD | 3,306,599 | 1/15/2020 | DUB | - | (18,076 | ) | (18,076 | ) | ||||||||||||||||
| INR | 3,323,507 | USD | 3,328,241 | 1/15/2020 | DUB | - | (4,734 | ) | (4,734 | ) | ||||||||||||||||
| INR | 3,416,799 | USD | 3,431,042 | 1/15/2020 | DUB | - | (14,243 | ) | (14,243 | ) | ||||||||||||||||
| INR | 3,603,382 | USD | 3,624,424 | 1/15/2020 | DUB | - | (21,042 | ) | (21,042 | ) | ||||||||||||||||
| INR | 3,953,225 | USD | 3,970,709 | 1/15/2020 | DUB | - | (17,484 | ) | (17,484 | ) | ||||||||||||||||
| KRW | 10,898,550 | USD | 10,697,911 | 1/15/2020 | DUB | 200,639 | - | 200,639 | ||||||||||||||||||
| PHP | 11,251,735 | USD | 11,190,294 | 1/15/2020 | DUB | 61,441 | - | 61,441 | ||||||||||||||||||
| PHP | 13,028,325 | USD | 12,970,169 | 1/15/2020 | DUB | 58,156 | - | 58,156 | ||||||||||||||||||
| USD | 1,770,449 | KRW | 1,816,425 | 1/15/2020 | DUB | - | (45,976 | ) | (45,976 | ) | ||||||||||||||||
| USD | 1,688,740 | KRW | 1,729,929 | 1/15/2020 | DUB | - | (41,189 | ) | (41,189 | ) | ||||||||||||||||
| USD | 1,435,423 | KRW | 1,470,439 | 1/15/2020 | DUB | - | (35,016 | ) | (35,016 | ) | ||||||||||||||||
| USD | 1,181,883 | KRW | 1,210,950 | 1/15/2020 | DUB | - | (29,067 | ) | (29,067 | ) | ||||||||||||||||
| USD | 1,182,213 | KRW | 1,210,950 | 1/15/2020 | DUB | - | (28,737 | ) | (28,737 | ) | ||||||||||||||||
| USD | 1,181,574 | KRW | 1,210,950 | 1/15/2020 | DUB | - | (29,376 | ) | (29,376 | ) | ||||||||||||||||
| USD | 1,175,503 | KRW | 1,210,950 | 1/15/2020 | DUB | - | (35,447 | ) | (35,447 | ) | ||||||||||||||||
| USD | 1,016,097 | KRW | 1,037,957 | 1/15/2020 | DUB | - | (21,860 | ) | (21,860 | ) | ||||||||||||||||
| USD | 1,007,058 | KRW | 1,037,957 | 1/15/2020 | DUB | - | (30,899 | ) | (30,899 | ) | ||||||||||||||||
| USD | 1,006,612 | KRW | 1,037,957 | 1/15/2020 | DUB | - | (31,345 | ) | (31,345 | ) | ||||||||||||||||
| USD | 980,118 | INR | 979,560 | 1/15/2020 | DUB | 558 | - | 558 | ||||||||||||||||||
| USD | 980,447 | INR | 979,560 | 1/15/2020 | DUB | 887 | - | 887 | ||||||||||||||||||
| USD | 921,891 | KRW | 951,461 | 1/15/2020 | DUB | - | (29,570 | ) | (29,570 | ) | ||||||||||||||||
| USD | 847,932 | KRW | 864,964 | 1/15/2020 | DUB | - | (17,032 | ) | (17,032 | ) | ||||||||||||||||
| USD | 838,068 | KRW | 864,964 | 1/15/2020 | DUB | - | (26,896 | ) | (26,896 | ) | ||||||||||||||||
| USD | 838,441 | KRW | 864,964 | 1/15/2020 | DUB | - | (26,523 | ) | (26,523 | ) | ||||||||||||||||
| USD | 838,117 | KRW | 864,964 | 1/15/2020 | DUB | - | (26,847 | ) | (26,847 | ) | ||||||||||||||||
| USD | 804,922 | INR | 804,639 | 1/15/2020 | DUB | 283 | - | 283 | ||||||||||||||||||
| USD | 764,682 | KRW | 778,468 | 1/15/2020 | DUB | - | (13,786 | ) | (13,786 | ) | ||||||||||||||||
| USD | 754,129 | KRW | 778,468 | 1/15/2020 | DUB | - | (24,339 | ) | (24,339 | ) | ||||||||||||||||
| USD | 756,315 | KRW | 778,468 | 1/15/2020 | DUB | - | (22,153 | ) | (22,153 | ) | ||||||||||||||||
| USD | 756,398 | KRW | 778,468 | 1/15/2020 | DUB | - | (22,070 | ) | (22,070 | ) | ||||||||||||||||
| USD | 754,458 | KRW | 778,468 | 1/15/2020 | DUB | - | (24,010 | ) | (24,010 | ) | ||||||||||||||||
| USD | 754,901 | KRW | 778,468 | 1/15/2020 | DUB | - | (23,567 | ) | (23,567 | ) | ||||||||||||||||
| USD | 699,467 | INR | 699,686 | 1/15/2020 | DUB | - | (219 | ) | (219 | ) | ||||||||||||||||
| USD | 679,469 | KRW | 691,971 | 1/15/2020 | DUB | - | (12,502 | ) | (12,502 | ) | ||||||||||||||||
| USD | 673,128 | KRW | 691,971 | 1/15/2020 | DUB | - | (18,843 | ) | (18,843 | ) | ||||||||||||||||
| USD | 671,727 | KRW | 691,971 | 1/15/2020 | DUB | - | (20,244 | ) | (20,244 | ) | ||||||||||||||||
| USD | 673,208 | KRW | 691,971 | 1/15/2020 | DUB | - | (18,763 | ) | (18,763 | ) | ||||||||||||||||
| USD | 671,941 | KRW | 691,971 | 1/15/2020 | DUB | - | (20,030 | ) | (20,030 | ) | ||||||||||||||||
| USD | 672,896 | KRW | 691,971 | 1/15/2020 | DUB | - | (19,075 | ) | (19,075 | ) | ||||||||||||||||
| USD | 672,970 | KRW | 691,971 | 1/15/2020 | DUB | - | (19,001 | ) | (19,001 | ) | ||||||||||||||||
| USD | 673,367 | KRW | 691,971 | 1/15/2020 | DUB | - | (18,604 | ) | (18,604 | ) | ||||||||||||||||
| USD | 673,005 | KRW | 691,971 | 1/15/2020 | DUB | - | (18,966 | ) | (18,966 | ) | ||||||||||||||||
| USD | 672,404 | KRW | 691,971 | 1/15/2020 | DUB | - | (19,567 | ) | (19,567 | ) | ||||||||||||||||
| USD | 670,801 | KRW | 691,971 | 1/15/2020 | DUB | - | (21,170 | ) | (21,170 | ) | ||||||||||||||||
| USD | 671,766 | KRW | 691,971 | 1/15/2020 | DUB | - | (20,205 | ) | (20,205 | ) | ||||||||||||||||
| USD | 671,186 | KRW | 691,971 | 1/15/2020 | DUB | - | (20,785 | ) | (20,785 | ) | ||||||||||||||||
| USD | 672,664 | KRW | 691,971 | 1/15/2020 | DUB | - | (19,307 | ) | (19,307 | ) | ||||||||||||||||
| USD | 670,561 | KRW | 691,971 | 1/15/2020 | DUB | - | (21,410 | ) | (21,410 | ) | ||||||||||||||||
| USD | 672,449 | KRW | 691,971 | 1/15/2020 | DUB | - | (19,522 | ) | (19,522 | ) | ||||||||||||||||
See accompanying notes
16
American Beacon AHL Managed Futures Strategy FundSM
Consolidated Schedule of Investments
December 31, 2019
| Currency Purchased* | Currency Sold* | Settlement Date | Counterparty | Unrealized Appreciation | Unrealized (Depreciation) | Net Unrealized Appreciation (Depreciation) | ||||||||||||||||||||
| USD | 665,937 | INR | 664,701 | 1/15/2020 | DUB | $ | 1,236 | $ | - | $ | 1,236 | |||||||||||||||
| USD | 594,041 | KRW | 605,475 | 1/15/2020 | DUB | - | (11,434 | ) | (11,434 | ) | ||||||||||||||||
| USD | 589,027 | KRW | 605,475 | 1/15/2020 | DUB | - | (16,448 | ) | (16,448 | ) | ||||||||||||||||
| USD | 588,735 | KRW | 605,475 | 1/15/2020 | DUB | - | (16,740 | ) | (16,740 | ) | ||||||||||||||||
| USD | 588,423 | KRW | 605,475 | 1/15/2020 | DUB | - | (17,052 | ) | (17,052 | ) | ||||||||||||||||
| USD | 590,035 | KRW | 605,475 | 1/15/2020 | DUB | - | (15,440 | ) | (15,440 | ) | ||||||||||||||||
| USD | 589,260 | KRW | 605,475 | 1/15/2020 | DUB | - | (16,215 | ) | (16,215 | ) | ||||||||||||||||
| USD | 588,117 | KRW | 605,475 | 1/15/2020 | DUB | - | (17,358 | ) | (17,358 | ) | ||||||||||||||||
| USD | 588,052 | KRW | 605,475 | 1/15/2020 | DUB | - | (17,423 | ) | (17,423 | ) | ||||||||||||||||
| USD | 589,236 | KRW | 605,475 | 1/15/2020 | DUB | - | (16,239 | ) | (16,239 | ) | ||||||||||||||||
| USD | 588,884 | KRW | 605,475 | 1/15/2020 | DUB | - | (16,591 | ) | (16,591 | ) | ||||||||||||||||
| USD | 587,155 | KRW | 605,475 | 1/15/2020 | DUB | - | (18,320 | ) | (18,320 | ) | ||||||||||||||||
| USD | 504,363 | KRW | 518,979 | 1/15/2020 | DUB | - | (14,616 | ) | (14,616 | ) | ||||||||||||||||
| USD | 454,896 | INR | 454,796 | 1/15/2020 | DUB | 100 | - | 100 | ||||||||||||||||||
| USD | 455,221 | INR | 454,796 | 1/15/2020 | DUB | 425 | - | 425 | ||||||||||||||||||
| USD | 455,214 | INR | 454,796 | 1/15/2020 | DUB | 418 | - | 418 | ||||||||||||||||||
| USD | 417,250 | TWD | 417,241 | 1/15/2020 | DUB | 9 | - | 9 | ||||||||||||||||||
| USD | 246,462 | TWD | 250,345 | 1/15/2020 | DUB | - | (3,883 | ) | (3,883 | ) | ||||||||||||||||
| USD | 174,871 | INR | 174,921 | 1/15/2020 | DUB | - | (50 | ) | (50 | ) | ||||||||||||||||
| USD | 175,124 | INR | 174,921 | 1/15/2020 | DUB | 203 | - | 203 | ||||||||||||||||||
| USD | 164,469 | TWD | 166,897 | 1/15/2020 | DUB | - | (2,428 | ) | (2,428 | ) | ||||||||||||||||
| USD | 164,534 | TWD | 166,897 | 1/15/2020 | DUB | - | (2,363 | ) | (2,363 | ) | ||||||||||||||||
| USD | 164,463 | TWD | 166,897 | 1/15/2020 | DUB | - | (2,434 | ) | (2,434 | ) | ||||||||||||||||
| USD | 164,534 | TWD | 166,897 | 1/15/2020 | DUB | - | (2,363 | ) | (2,363 | ) | ||||||||||||||||
| USD | 139,893 | INR | 139,937 | 1/15/2020 | DUB | - | (44 | ) | (44 | ) | ||||||||||||||||
| USD | 139,917 | INR | 139,937 | 1/15/2020 | DUB | - | (20 | ) | (20 | ) | ||||||||||||||||
| USD | 140,090 | INR | 139,937 | 1/15/2020 | DUB | 153 | - | 153 | ||||||||||||||||||
| USD | 84,258 | KRW | 86,496 | 1/15/2020 | DUB | - | (2,238 | ) | (2,238 | ) | ||||||||||||||||
| USD | 82,243 | TWD | 83,448 | 1/15/2020 | DUB | - | (1,205 | ) | (1,205 | ) | ||||||||||||||||
| USD | 82,272 | TWD | 83,448 | 1/15/2020 | DUB | - | (1,176 | ) | (1,176 | ) | ||||||||||||||||
| USD | 8,637,454 | KRW | 8,872,033 | 1/16/2020 | DUB | - | (234,579 | ) | (234,579 | ) | ||||||||||||||||
| INR | 9,613,616 | USD | 9,694,841 | 1/22/2020 | DUB | - | (81,225 | ) | (81,225 | ) | ||||||||||||||||
| TWD | 501,205 | USD | 502,310 | 2/6/2020 | DUB | - | (1,105 | ) | (1,105 | ) | ||||||||||||||||
| TWD | 584,739 | USD | 586,579 | 2/6/2020 | DUB | - | (1,840 | ) | (1,840 | ) | ||||||||||||||||
| TWD | 584,739 | USD | 586,402 | 2/6/2020 | DUB | - | (1,663 | ) | (1,663 | ) | ||||||||||||||||
| BRL | 24,859 | USD | 24,117 | 1/3/2020 | HUS | 742 | - | 742 | ||||||||||||||||||
| BRL | 24,859 | USD | 24,095 | 1/3/2020 | HUS | 764 | - | 764 | ||||||||||||||||||
| BRL | 24,859 | USD | 24,091 | 1/3/2020 | HUS | 768 | - | 768 | ||||||||||||||||||
| BRL | 24,859 | USD | 24,131 | 1/3/2020 | HUS | 728 | - | 728 | ||||||||||||||||||
| BRL | 24,859 | USD | 24,096 | 1/3/2020 | HUS | 763 | - | 763 | ||||||||||||||||||
| BRL | 24,859 | USD | 24,101 | 1/3/2020 | HUS | 758 | - | 758 | ||||||||||||||||||
| BRL | 24,859 | USD | 24,147 | 1/3/2020 | HUS | 712 | - | 712 | ||||||||||||||||||
| BRL | 24,859 | USD | 24,082 | 1/3/2020 | HUS | 777 | - | 777 | ||||||||||||||||||
| BRL | 24,859 | USD | 24,123 | 1/3/2020 | HUS | 736 | - | 736 | ||||||||||||||||||
| BRL | 24,859 | USD | 24,126 | 1/3/2020 | HUS | 733 | - | 733 | ||||||||||||||||||
| BRL | 24,859 | USD | 24,122 | 1/3/2020 | HUS | 737 | - | 737 | ||||||||||||||||||
| BRL | 24,859 | USD | 24,123 | 1/3/2020 | HUS | 736 | - | 736 | ||||||||||||||||||
| BRL | 24,859 | USD | 24,125 | 1/3/2020 | HUS | 734 | - | 734 | ||||||||||||||||||
| BRL | 24,859 | USD | 24,112 | 1/3/2020 | HUS | 747 | - | 747 | ||||||||||||||||||
| BRL | 24,859 | USD | 23,705 | 1/3/2020 | HUS | 1,154 | - | 1,154 | ||||||||||||||||||
| BRL | 24,859 | USD | 23,694 | 1/3/2020 | HUS | 1,165 | - | 1,165 | ||||||||||||||||||
| BRL | 24,859 | USD | 23,710 | 1/3/2020 | HUS | 1,149 | - | 1,149 | ||||||||||||||||||
| BRL | 24,859 | USD | 23,714 | 1/3/2020 | HUS | 1,145 | - | 1,145 | ||||||||||||||||||
| BRL | 24,859 | USD | 24,046 | 1/3/2020 | HUS | 813 | - | 813 | ||||||||||||||||||
| BRL | 24,859 | USD | 24,049 | 1/3/2020 | HUS | 810 | - | 810 | ||||||||||||||||||
| BRL | 24,859 | USD | 24,102 | 1/3/2020 | HUS | 757 | - | 757 | ||||||||||||||||||
| BRL | 24,859 | USD | 24,105 | 1/3/2020 | HUS | 754 | - | 754 | ||||||||||||||||||
| BRL | 24,859 | USD | 24,105 | 1/3/2020 | HUS | 754 | - | 754 | ||||||||||||||||||
| BRL | 24,859 | USD | 24,106 | 1/3/2020 | HUS | 753 | - | 753 | ||||||||||||||||||
See accompanying notes
17
American Beacon AHL Managed Futures Strategy FundSM
Consolidated Schedule of Investments
December 31, 2019
| Currency Purchased* | Currency Sold* | Settlement Date | Counterparty | Unrealized Appreciation | Unrealized (Depreciation) | Net Unrealized Appreciation (Depreciation) | ||||||||||||||||||||
| BRL | 24,859 | USD | 24,116 | 1/3/2020 | HUS | $ | 743 | $ | - | $ | 743 | |||||||||||||||
| BRL | 24,859 | USD | 24,116 | 1/3/2020 | HUS | 743 | - | 743 | ||||||||||||||||||
| BRL | 24,859 | USD | 24,116 | 1/3/2020 | HUS | 743 | - | 743 | ||||||||||||||||||
| BRL | 24,859 | USD | 24,114 | 1/3/2020 | HUS | 745 | - | 745 | ||||||||||||||||||
| BRL | 24,859 | USD | 24,118 | 1/3/2020 | HUS | 741 | - | 741 | ||||||||||||||||||
| BRL | 24,859 | USD | 24,114 | 1/3/2020 | HUS | 745 | - | 745 | ||||||||||||||||||
| BRL | 24,859 | USD | 24,119 | 1/3/2020 | HUS | 740 | - | 740 | ||||||||||||||||||
| BRL | 24,859 | USD | 24,125 | 1/3/2020 | HUS | 734 | - | 734 | ||||||||||||||||||
| BRL | 24,859 | USD | 24,119 | 1/3/2020 | HUS | 740 | - | 740 | ||||||||||||||||||
| BRL | 24,859 | USD | 24,119 | 1/3/2020 | HUS | 740 | - | 740 | ||||||||||||||||||
| BRL | 24,859 | USD | 24,123 | 1/3/2020 | HUS | 736 | - | 736 | ||||||||||||||||||
| BRL | 24,859 | USD | 24,124 | 1/3/2020 | HUS | 735 | - | 735 | ||||||||||||||||||
| BRL | 24,859 | USD | 24,267 | 1/3/2020 | HUS | 592 | - | 592 | ||||||||||||||||||
| BRL | 24,859 | USD | 24,260 | 1/3/2020 | HUS | 599 | - | 599 | ||||||||||||||||||
| BRL | 24,859 | USD | 24,266 | 1/3/2020 | HUS | 593 | - | 593 | ||||||||||||||||||
| BRL | 24,859 | USD | 24,271 | 1/3/2020 | HUS | 588 | - | 588 | ||||||||||||||||||
| BRL | 24,859 | USD | 24,260 | 1/3/2020 | HUS | 599 | - | 599 | ||||||||||||||||||
| BRL | 24,859 | USD | 24,293 | 1/3/2020 | HUS | 566 | - | 566 | ||||||||||||||||||
| BRL | 24,859 | USD | 24,293 | 1/3/2020 | HUS | 566 | - | 566 | ||||||||||||||||||
| BRL | 24,859 | USD | 24,294 | 1/3/2020 | HUS | 565 | - | 565 | ||||||||||||||||||
| BRL | 24,859 | USD | 24,245 | 1/3/2020 | HUS | 614 | - | 614 | ||||||||||||||||||
| BRL | 24,859 | USD | 24,250 | 1/3/2020 | HUS | 609 | - | 609 | ||||||||||||||||||
| BRL | 24,859 | USD | 24,278 | 1/3/2020 | HUS | 581 | - | 581 | ||||||||||||||||||
| BRL | 24,859 | USD | 24,378 | 1/3/2020 | HUS | 481 | - | 481 | ||||||||||||||||||
| BRL | 24,859 | USD | 23,835 | 1/3/2020 | HUS | 1,024 | - | 1,024 | ||||||||||||||||||
| BRL | 24,859 | USD | 23,839 | 1/3/2020 | HUS | 1,020 | - | 1,020 | ||||||||||||||||||
| BRL | 24,859 | USD | 23,835 | 1/3/2020 | HUS | 1,024 | - | 1,024 | ||||||||||||||||||
| BRL | 24,859 | USD | 23,833 | 1/3/2020 | HUS | 1,026 | - | 1,026 | ||||||||||||||||||
| BRL | 24,859 | USD | 23,831 | 1/3/2020 | HUS | 1,028 | - | 1,028 | ||||||||||||||||||
| BRL | 24,859 | USD | 23,854 | 1/3/2020 | HUS | 1,005 | - | 1,005 | ||||||||||||||||||
| BRL | 24,859 | USD | 23,860 | 1/3/2020 | HUS | 999 | - | 999 | ||||||||||||||||||
| BRL | 24,859 | USD | 23,857 | 1/3/2020 | HUS | 1,002 | - | 1,002 | ||||||||||||||||||
| BRL | 24,859 | USD | 23,844 | 1/3/2020 | HUS | 1,015 | - | 1,015 | ||||||||||||||||||
| BRL | 24,859 | USD | 23,846 | 1/3/2020 | HUS | 1,013 | - | 1,013 | ||||||||||||||||||
| BRL | 24,859 | USD | 23,817 | 1/3/2020 | HUS | 1,042 | - | 1,042 | ||||||||||||||||||
| BRL | 24,859 | USD | 23,811 | 1/3/2020 | HUS | 1,048 | - | 1,048 | ||||||||||||||||||
| BRL | 24,859 | USD | 23,813 | 1/3/2020 | HUS | 1,046 | - | 1,046 | ||||||||||||||||||
| BRL | 24,859 | USD | 23,849 | 1/3/2020 | HUS | 1,010 | - | 1,010 | ||||||||||||||||||
| BRL | 24,859 | USD | 23,862 | 1/3/2020 | HUS | 997 | - | 997 | ||||||||||||||||||
| BRL | 24,859 | USD | 23,854 | 1/3/2020 | HUS | 1,005 | - | 1,005 | ||||||||||||||||||
| BRL | 24,859 | USD | 23,865 | 1/3/2020 | HUS | 994 | - | 994 | ||||||||||||||||||
| BRL | 24,859 | USD | 23,855 | 1/3/2020 | HUS | 1,004 | - | 1,004 | ||||||||||||||||||
| BRL | 24,859 | USD | 23,849 | 1/3/2020 | HUS | 1,010 | - | 1,010 | ||||||||||||||||||
| BRL | 24,859 | USD | 23,846 | 1/3/2020 | HUS | 1,013 | - | 1,013 | ||||||||||||||||||
| BRL | 24,859 | USD | 23,846 | 1/3/2020 | HUS | 1,013 | - | 1,013 | ||||||||||||||||||
| BRL | 24,859 | USD | 23,813 | 1/3/2020 | HUS | 1,046 | - | 1,046 | ||||||||||||||||||
| BRL | 24,859 | USD | 23,814 | 1/3/2020 | HUS | 1,045 | - | 1,045 | ||||||||||||||||||
| BRL | 24,859 | USD | 23,849 | 1/3/2020 | HUS | 1,010 | - | 1,010 | ||||||||||||||||||
| BRL | 24,859 | USD | 23,691 | 1/3/2020 | HUS | 1,168 | - | 1,168 | ||||||||||||||||||
| BRL | 24,859 | USD | 23,690 | 1/3/2020 | HUS | 1,169 | - | 1,169 | ||||||||||||||||||
| BRL | 24,859 | USD | 24,423 | 1/3/2020 | HUS | 436 | - | 436 | ||||||||||||||||||
| BRL | 24,859 | USD | 24,428 | 1/3/2020 | HUS | 431 | - | 431 | ||||||||||||||||||
| BRL | 24,859 | USD | 24,425 | 1/3/2020 | HUS | 434 | - | 434 | ||||||||||||||||||
| BRL | 24,859 | USD | 24,431 | 1/3/2020 | HUS | 428 | - | 428 | ||||||||||||||||||
| BRL | 24,859 | USD | 24,432 | 1/3/2020 | HUS | 427 | - | 427 | ||||||||||||||||||
| BRL | 24,859 | USD | 24,337 | 1/3/2020 | HUS | 522 | - | 522 | ||||||||||||||||||
| BRL | 24,859 | USD | 24,410 | 1/3/2020 | HUS | 449 | - | 449 | ||||||||||||||||||
| BRL | 24,859 | USD | 24,411 | 1/3/2020 | HUS | 448 | - | 448 | ||||||||||||||||||
| BRL | 24,859 | USD | 24,419 | 1/3/2020 | HUS | 440 | - | 440 | ||||||||||||||||||
See accompanying notes
18
American Beacon AHL Managed Futures Strategy FundSM
Consolidated Schedule of Investments
December 31, 2019
| Currency Purchased* | Currency Sold* | Settlement Date | Counterparty | Unrealized Appreciation | Unrealized (Depreciation) | Net Unrealized Appreciation (Depreciation) | ||||||||||||||||||||
| BRL | 24,859 | USD | 24,422 | 1/3/2020 | HUS | $ | 437 | $ | - | $ | 437 | |||||||||||||||
| BRL | 24,859 | USD | 24,423 | 1/3/2020 | HUS | 436 | - | 436 | ||||||||||||||||||
| BRL | 24,859 | USD | 24,414 | 1/3/2020 | HUS | 445 | - | 445 | ||||||||||||||||||
| BRL | 24,859 | USD | 24,422 | 1/3/2020 | HUS | 437 | - | 437 | ||||||||||||||||||
| BRL | 24,859 | USD | 24,335 | 1/3/2020 | HUS | 524 | - | 524 | ||||||||||||||||||
| BRL | 24,859 | USD | 24,341 | 1/3/2020 | HUS | 518 | - | 518 | ||||||||||||||||||
| BRL | 24,859 | USD | 24,426 | 1/3/2020 | HUS | 433 | - | 433 | ||||||||||||||||||
| BRL | 24,859 | USD | 24,432 | 1/3/2020 | HUS | 427 | - | 427 | ||||||||||||||||||
| BRL | 24,859 | USD | 24,339 | 1/3/2020 | HUS | 520 | - | 520 | ||||||||||||||||||
| BRL | 24,859 | USD | 24,335 | 1/3/2020 | HUS | 524 | - | 524 | ||||||||||||||||||
| BRL | 24,859 | USD | 24,335 | 1/3/2020 | HUS | 524 | - | 524 | ||||||||||||||||||
| BRL | 24,859 | USD | 24,329 | 1/3/2020 | HUS | 530 | - | 530 | ||||||||||||||||||
| BRL | 24,859 | USD | 24,423 | 1/3/2020 | HUS | 436 | - | 436 | ||||||||||||||||||
| BRL | 24,859 | USD | 24,413 | 1/3/2020 | HUS | 446 | - | 446 | ||||||||||||||||||
| BRL | 24,859 | USD | 24,332 | 1/3/2020 | HUS | 527 | - | 527 | ||||||||||||||||||
| BRL | 24,859 | USD | 24,323 | 1/3/2020 | HUS | 536 | - | 536 | ||||||||||||||||||
| BRL | 49,718 | USD | 48,119 | 1/3/2020 | HUS | 1,599 | - | 1,599 | ||||||||||||||||||
| BRL | 49,718 | USD | 48,072 | 1/3/2020 | HUS | 1,646 | - | 1,646 | ||||||||||||||||||
| BRL | 49,718 | USD | 48,163 | 1/3/2020 | HUS | 1,555 | - | 1,555 | ||||||||||||||||||
| BRL | 49,718 | USD | 48,227 | 1/3/2020 | HUS | 1,491 | - | 1,491 | ||||||||||||||||||
| BRL | 49,718 | USD | 48,283 | 1/3/2020 | HUS | 1,435 | - | 1,435 | ||||||||||||||||||
| BRL | 49,718 | USD | 48,269 | 1/3/2020 | HUS | 1,449 | - | 1,449 | ||||||||||||||||||
| BRL | 49,718 | USD | 48,265 | 1/3/2020 | HUS | 1,453 | - | 1,453 | ||||||||||||||||||
| BRL | 49,718 | USD | 48,280 | 1/3/2020 | HUS | 1,438 | - | 1,438 | ||||||||||||||||||
| BRL | 49,718 | USD | 48,284 | 1/3/2020 | HUS | 1,434 | - | 1,434 | ||||||||||||||||||
| BRL | 49,718 | USD | 48,287 | 1/3/2020 | HUS | 1,431 | - | 1,431 | ||||||||||||||||||
| BRL | 49,718 | USD | 48,274 | 1/3/2020 | HUS | 1,444 | - | 1,444 | ||||||||||||||||||
| BRL | 49,718 | USD | 48,291 | 1/3/2020 | HUS | 1,427 | - | 1,427 | ||||||||||||||||||
| BRL | 49,718 | USD | 48,303 | 1/3/2020 | HUS | 1,415 | - | 1,415 | ||||||||||||||||||
| BRL | 49,718 | USD | 48,228 | 1/3/2020 | HUS | 1,490 | - | 1,490 | ||||||||||||||||||
| BRL | 49,718 | USD | 48,251 | 1/3/2020 | HUS | 1,467 | - | 1,467 | ||||||||||||||||||
| BRL | 49,718 | USD | 48,251 | 1/3/2020 | HUS | 1,467 | - | 1,467 | ||||||||||||||||||
| BRL | 49,718 | USD | 48,257 | 1/3/2020 | HUS | 1,461 | - | 1,461 | ||||||||||||||||||
| BRL | 49,718 | USD | 48,191 | 1/3/2020 | HUS | 1,527 | - | 1,527 | ||||||||||||||||||
| BRL | 49,718 | USD | 48,251 | 1/3/2020 | HUS | 1,467 | - | 1,467 | ||||||||||||||||||
| BRL | 49,718 | USD | 48,226 | 1/3/2020 | HUS | 1,492 | - | 1,492 | ||||||||||||||||||
| BRL | 49,718 | USD | 48,227 | 1/3/2020 | HUS | 1,491 | - | 1,491 | ||||||||||||||||||
| BRL | 49,718 | USD | 48,197 | 1/3/2020 | HUS | 1,521 | - | 1,521 | ||||||||||||||||||
| BRL | 49,718 | USD | 48,209 | 1/3/2020 | HUS | 1,509 | - | 1,509 | ||||||||||||||||||
| BRL | 49,718 | USD | 48,209 | 1/3/2020 | HUS | 1,509 | - | 1,509 | ||||||||||||||||||
| BRL | 49,718 | USD | 48,321 | 1/3/2020 | HUS | 1,397 | - | 1,397 | ||||||||||||||||||
| BRL | 49,718 | USD | 48,159 | 1/3/2020 | HUS | 1,559 | - | 1,559 | ||||||||||||||||||
| BRL | 49,718 | USD | 48,177 | 1/3/2020 | HUS | 1,541 | - | 1,541 | ||||||||||||||||||
| BRL | 49,718 | USD | 48,179 | 1/3/2020 | HUS | 1,539 | - | 1,539 | ||||||||||||||||||
| BRL | 49,718 | USD | 48,185 | 1/3/2020 | HUS | 1,533 | - | 1,533 | ||||||||||||||||||
| BRL | 49,718 | USD | 48,238 | 1/3/2020 | HUS | 1,480 | - | 1,480 | ||||||||||||||||||
| BRL | 49,718 | USD | 48,249 | 1/3/2020 | HUS | 1,469 | - | 1,469 | ||||||||||||||||||
| BRL | 49,718 | USD | 48,234 | 1/3/2020 | HUS | 1,484 | - | 1,484 | ||||||||||||||||||
| BRL | 49,718 | USD | 48,240 | 1/3/2020 | HUS | 1,478 | - | 1,478 | ||||||||||||||||||
| BRL | 49,718 | USD | 48,239 | 1/3/2020 | HUS | 1,479 | - | 1,479 | ||||||||||||||||||
| BRL | 49,718 | USD | 48,251 | 1/3/2020 | HUS | 1,467 | - | 1,467 | ||||||||||||||||||
| BRL | 49,718 | USD | 48,227 | 1/3/2020 | HUS | 1,491 | - | 1,491 | ||||||||||||||||||
| BRL | 49,718 | USD | 47,392 | 1/3/2020 | HUS | 2,326 | - | 2,326 | ||||||||||||||||||
| BRL | 49,718 | USD | 47,416 | 1/3/2020 | HUS | 2,302 | - | 2,302 | ||||||||||||||||||
| BRL | 49,718 | USD | 47,400 | 1/3/2020 | HUS | 2,318 | - | 2,318 | ||||||||||||||||||
| BRL | 49,718 | USD | 47,416 | 1/3/2020 | HUS | 2,302 | - | 2,302 | ||||||||||||||||||
| BRL | 49,718 | USD | 47,423 | 1/3/2020 | HUS | 2,295 | - | 2,295 | ||||||||||||||||||
| BRL | 49,718 | USD | 47,418 | 1/3/2020 | HUS | 2,300 | - | 2,300 | ||||||||||||||||||
| BRL | 49,718 | USD | 47,774 | 1/3/2020 | HUS | 1,944 | - | 1,944 | ||||||||||||||||||
See accompanying notes
19
American Beacon AHL Managed Futures Strategy FundSM
Consolidated Schedule of Investments
December 31, 2019
| Currency Purchased* | Currency Sold* | Settlement Date | Counterparty | Unrealized Appreciation | Unrealized (Depreciation) | Net Unrealized Appreciation (Depreciation) | ||||||||||||||||||||
| BRL | 49,718 | USD | 47,819 | 1/3/2020 | HUS | $ | 1,899 | $ | - | $ | 1,899 | |||||||||||||||
| BRL | 49,718 | USD | 47,846 | 1/3/2020 | HUS | 1,872 | - | 1,872 | ||||||||||||||||||
| BRL | 49,718 | USD | 47,848 | 1/3/2020 | HUS | 1,870 | - | 1,870 | ||||||||||||||||||
| BRL | 49,718 | USD | 47,859 | 1/3/2020 | HUS | 1,859 | - | 1,859 | ||||||||||||||||||
| BRL | 49,718 | USD | 48,087 | 1/3/2020 | HUS | 1,631 | - | 1,631 | ||||||||||||||||||
| BRL | 49,718 | USD | 48,094 | 1/3/2020 | HUS | 1,624 | - | 1,624 | ||||||||||||||||||
| BRL | 49,718 | USD | 48,110 | 1/3/2020 | HUS | 1,608 | - | 1,608 | ||||||||||||||||||
| BRL | 49,718 | USD | 48,076 | 1/3/2020 | HUS | 1,642 | - | 1,642 | ||||||||||||||||||
| BRL | 49,718 | USD | 48,087 | 1/3/2020 | HUS | 1,631 | - | 1,631 | ||||||||||||||||||
| BRL | 49,718 | USD | 48,087 | 1/3/2020 | HUS | 1,631 | - | 1,631 | ||||||||||||||||||
| BRL | 49,718 | USD | 48,087 | 1/3/2020 | HUS | 1,631 | - | 1,631 | ||||||||||||||||||
| BRL | 49,718 | USD | 48,095 | 1/3/2020 | HUS | 1,623 | - | 1,623 | ||||||||||||||||||
| BRL | 49,718 | USD | 48,105 | 1/3/2020 | HUS | 1,613 | - | 1,613 | ||||||||||||||||||
| BRL | 49,718 | USD | 48,199 | 1/3/2020 | HUS | 1,519 | - | 1,519 | ||||||||||||||||||
| BRL | 49,718 | USD | 48,207 | 1/3/2020 | HUS | 1,511 | - | 1,511 | ||||||||||||||||||
| BRL | 49,718 | USD | 48,209 | 1/3/2020 | HUS | 1,509 | - | 1,509 | ||||||||||||||||||
| BRL | 49,718 | USD | 48,211 | 1/3/2020 | HUS | 1,507 | - | 1,507 | ||||||||||||||||||
| BRL | 49,718 | USD | 48,210 | 1/3/2020 | HUS | 1,508 | - | 1,508 | ||||||||||||||||||
| BRL | 49,718 | USD | 48,222 | 1/3/2020 | HUS | 1,496 | - | 1,496 | ||||||||||||||||||
| BRL | 49,718 | USD | 48,220 | 1/3/2020 | HUS | 1,498 | - | 1,498 | ||||||||||||||||||
| BRL | 49,718 | USD | 48,215 | 1/3/2020 | HUS | 1,503 | - | 1,503 | ||||||||||||||||||
| BRL | 49,718 | USD | 48,216 | 1/3/2020 | HUS | 1,502 | - | 1,502 | ||||||||||||||||||
| BRL | 49,718 | USD | 48,220 | 1/3/2020 | HUS | 1,498 | - | 1,498 | ||||||||||||||||||
| BRL | 49,718 | USD | 48,222 | 1/3/2020 | HUS | 1,496 | - | 1,496 | ||||||||||||||||||
| BRL | 49,718 | USD | 48,229 | 1/3/2020 | HUS | 1,489 | - | 1,489 | ||||||||||||||||||
| BRL | 49,718 | USD | 48,229 | 1/3/2020 | HUS | 1,489 | - | 1,489 | ||||||||||||||||||
| BRL | 49,718 | USD | 48,230 | 1/3/2020 | HUS | 1,488 | - | 1,488 | ||||||||||||||||||
| BRL | 49,718 | USD | 48,233 | 1/3/2020 | HUS | 1,485 | - | 1,485 | ||||||||||||||||||
| BRL | 49,718 | USD | 48,238 | 1/3/2020 | HUS | 1,480 | - | 1,480 | ||||||||||||||||||
| BRL | 49,718 | USD | 48,238 | 1/3/2020 | HUS | 1,480 | - | 1,480 | ||||||||||||||||||
| BRL | 49,718 | USD | 48,239 | 1/3/2020 | HUS | 1,479 | - | 1,479 | ||||||||||||||||||
| BRL | 49,718 | USD | 48,255 | 1/3/2020 | HUS | 1,463 | - | 1,463 | ||||||||||||||||||
| BRL | 49,718 | USD | 48,237 | 1/3/2020 | HUS | 1,481 | - | 1,481 | ||||||||||||||||||
| BRL | 49,718 | USD | 48,544 | 1/3/2020 | HUS | 1,174 | - | 1,174 | ||||||||||||||||||
| BRL | 49,718 | USD | 48,473 | 1/3/2020 | HUS | 1,245 | - | 1,245 | ||||||||||||||||||
| BRL | 49,718 | USD | 48,631 | 1/3/2020 | HUS | 1,087 | - | 1,087 | ||||||||||||||||||
| BRL | 49,718 | USD | 48,515 | 1/3/2020 | HUS | 1,203 | - | 1,203 | ||||||||||||||||||
| BRL | 49,718 | USD | 48,667 | 1/3/2020 | HUS | 1,051 | - | 1,051 | ||||||||||||||||||
| BRL | 49,718 | USD | 48,762 | 1/3/2020 | HUS | 956 | - | 956 | ||||||||||||||||||
| BRL | 49,718 | USD | 48,757 | 1/3/2020 | HUS | 961 | - | 961 | ||||||||||||||||||
| BRL | 49,718 | USD | 48,766 | 1/3/2020 | HUS | 952 | - | 952 | ||||||||||||||||||
| BRL | 49,718 | USD | 47,652 | 1/3/2020 | HUS | 2,066 | - | 2,066 | ||||||||||||||||||
| BRL | 49,718 | USD | 47,641 | 1/3/2020 | HUS | 2,077 | - | 2,077 | ||||||||||||||||||
| BRL | 49,718 | USD | 47,686 | 1/3/2020 | HUS | 2,032 | - | 2,032 | ||||||||||||||||||
| BRL | 49,718 | USD | 47,684 | 1/3/2020 | HUS | 2,034 | - | 2,034 | ||||||||||||||||||
| BRL | 49,718 | USD | 47,635 | 1/3/2020 | HUS | 2,083 | - | 2,083 | ||||||||||||||||||
| BRL | 49,718 | USD | 47,703 | 1/3/2020 | HUS | 2,015 | - | 2,015 | ||||||||||||||||||
| BRL | 49,718 | USD | 47,713 | 1/3/2020 | HUS | 2,005 | - | 2,005 | ||||||||||||||||||
| BRL | 49,718 | USD | 47,698 | 1/3/2020 | HUS | 2,020 | - | 2,020 | ||||||||||||||||||
| BRL | 49,718 | USD | 47,684 | 1/3/2020 | HUS | 2,034 | - | 2,034 | ||||||||||||||||||
| BRL | 49,718 | USD | 47,694 | 1/3/2020 | HUS | 2,024 | - | 2,024 | ||||||||||||||||||
| BRL | 49,718 | USD | 47,376 | 1/3/2020 | HUS | 2,342 | - | 2,342 | ||||||||||||||||||
| BRL | 49,718 | USD | 47,427 | 1/3/2020 | HUS | 2,291 | - | 2,291 | ||||||||||||||||||
| BRL | 49,718 | USD | 47,423 | 1/3/2020 | HUS | 2,295 | - | 2,295 | ||||||||||||||||||
| BRL | 49,718 | USD | 47,377 | 1/3/2020 | HUS | 2,341 | - | 2,341 | ||||||||||||||||||
| BRL | 49,718 | USD | 47,399 | 1/3/2020 | HUS | 2,319 | - | 2,319 | ||||||||||||||||||
| BRL | 49,718 | USD | 48,850 | 1/3/2020 | HUS | 868 | - | 868 | ||||||||||||||||||
| BRL | 49,718 | USD | 48,859 | 1/3/2020 | HUS | 859 | - | 859 | ||||||||||||||||||
| BRL | 49,718 | USD | 48,669 | 1/3/2020 | HUS | 1,049 | - | 1,049 | ||||||||||||||||||
See accompanying notes
20
American Beacon AHL Managed Futures Strategy FundSM
Consolidated Schedule of Investments
December 31, 2019
| Currency Purchased* | Currency Sold* | Settlement Date | Counterparty | Unrealized Appreciation | Unrealized (Depreciation) | Net Unrealized Appreciation (Depreciation) | ||||||||||||||||||||
| BRL | 49,718 | USD | 48,681 | 1/3/2020 | HUS | $ | 1,037 | $ | - | $ | 1,037 | |||||||||||||||
| BRL | 49,718 | USD | 48,821 | 1/3/2020 | HUS | 897 | - | 897 | ||||||||||||||||||
| BRL | 49,718 | USD | 48,828 | 1/3/2020 | HUS | 890 | - | 890 | ||||||||||||||||||
| BRL | 49,718 | USD | 48,850 | 1/3/2020 | HUS | 868 | - | 868 | ||||||||||||||||||
| BRL | 49,718 | USD | 48,851 | 1/3/2020 | HUS | 867 | - | 867 | ||||||||||||||||||
| BRL | 49,718 | USD | 48,822 | 1/3/2020 | HUS | 896 | - | 896 | ||||||||||||||||||
| BRL | 49,718 | USD | 48,832 | 1/3/2020 | HUS | 886 | - | 886 | ||||||||||||||||||
| BRL | 49,718 | USD | 48,833 | 1/3/2020 | HUS | 885 | - | 885 | ||||||||||||||||||
| BRL | 49,718 | USD | 48,864 | 1/3/2020 | HUS | 854 | - | 854 | ||||||||||||||||||
| BRL | 49,718 | USD | 48,669 | 1/3/2020 | HUS | 1,049 | - | 1,049 | ||||||||||||||||||
| BRL | 49,718 | USD | 48,682 | 1/3/2020 | HUS | 1,036 | - | 1,036 | ||||||||||||||||||
| BRL | 49,718 | USD | 48,670 | 1/3/2020 | HUS | 1,048 | - | 1,048 | ||||||||||||||||||
| BRL | 74,577 | USD | 72,169 | 1/3/2020 | HUS | 2,408 | - | 2,408 | ||||||||||||||||||
| BRL | 74,577 | USD | 72,124 | 1/3/2020 | HUS | 2,453 | - | 2,453 | ||||||||||||||||||
| BRL | 74,577 | USD | 72,131 | 1/3/2020 | HUS | 2,446 | - | 2,446 | ||||||||||||||||||
| BRL | 74,577 | USD | 72,176 | 1/3/2020 | HUS | 2,401 | - | 2,401 | ||||||||||||||||||
| BRL | 74,577 | USD | 72,213 | 1/3/2020 | HUS | 2,364 | - | 2,364 | ||||||||||||||||||
| BRL | 74,577 | USD | 72,403 | 1/3/2020 | HUS | 2,174 | - | 2,174 | ||||||||||||||||||
| BRL | 74,577 | USD | 72,354 | 1/3/2020 | HUS | 2,223 | - | 2,223 | ||||||||||||||||||
| BRL | 74,577 | USD | 72,388 | 1/3/2020 | HUS | 2,189 | - | 2,189 | ||||||||||||||||||
| BRL | 74,577 | USD | 72,394 | 1/3/2020 | HUS | 2,183 | - | 2,183 | ||||||||||||||||||
| BRL | 74,577 | USD | 72,368 | 1/3/2020 | HUS | 2,209 | - | 2,209 | ||||||||||||||||||
| BRL | 74,577 | USD | 72,397 | 1/3/2020 | HUS | 2,180 | - | 2,180 | ||||||||||||||||||
| BRL | 74,577 | USD | 72,394 | 1/3/2020 | HUS | 2,183 | - | 2,183 | ||||||||||||||||||
| BRL | 74,577 | USD | 72,288 | 1/3/2020 | HUS | 2,289 | - | 2,289 | ||||||||||||||||||
| BRL | 74,577 | USD | 72,281 | 1/3/2020 | HUS | 2,296 | - | 2,296 | ||||||||||||||||||
| BRL | 74,577 | USD | 72,436 | 1/3/2020 | HUS | 2,141 | - | 2,141 | ||||||||||||||||||
| BRL | 74,577 | USD | 72,459 | 1/3/2020 | HUS | 2,118 | - | 2,118 | ||||||||||||||||||
| BRL | 74,577 | USD | 72,479 | 1/3/2020 | HUS | 2,098 | - | 2,098 | ||||||||||||||||||
| BRL | 74,577 | USD | 72,258 | 1/3/2020 | HUS | 2,319 | - | 2,319 | ||||||||||||||||||
| BRL | 74,577 | USD | 72,366 | 1/3/2020 | HUS | 2,211 | - | 2,211 | ||||||||||||||||||
| BRL | 74,577 | USD | 72,352 | 1/3/2020 | HUS | 2,225 | - | 2,225 | ||||||||||||||||||
| BRL | 74,577 | USD | 71,107 | 1/3/2020 | HUS | 3,470 | - | 3,470 | ||||||||||||||||||
| BRL | 74,577 | USD | 71,126 | 1/3/2020 | HUS | 3,451 | - | 3,451 | ||||||||||||||||||
| BRL | 74,577 | USD | 71,109 | 1/3/2020 | HUS | 3,468 | - | 3,468 | ||||||||||||||||||
| BRL | 74,577 | USD | 71,117 | 1/3/2020 | HUS | 3,460 | - | 3,460 | ||||||||||||||||||
| BRL | 74,577 | USD | 71,118 | 1/3/2020 | HUS | 3,459 | - | 3,459 | ||||||||||||||||||
| BRL | 74,577 | USD | 71,630 | 1/3/2020 | HUS | 2,947 | �� | - | 2,947 | |||||||||||||||||
| BRL | 74,577 | USD | 71,735 | 1/3/2020 | HUS | 2,842 | - | 2,842 | ||||||||||||||||||
| BRL | 74,577 | USD | 71,745 | 1/3/2020 | HUS | 2,832 | - | 2,832 | ||||||||||||||||||
| BRL | 74,577 | USD | 71,743 | 1/3/2020 | HUS | 2,834 | - | 2,834 | ||||||||||||||||||
| BRL | 74,577 | USD | 71,791 | 1/3/2020 | HUS | 2,786 | - | 2,786 | ||||||||||||||||||
| BRL | 74,577 | USD | 71,776 | 1/3/2020 | HUS | 2,801 | - | 2,801 | ||||||||||||||||||
| BRL | 74,577 | USD | 71,790 | 1/3/2020 | HUS | 2,787 | - | 2,787 | ||||||||||||||||||
| BRL | 74,577 | USD | 71,747 | 1/3/2020 | HUS | 2,830 | - | 2,830 | ||||||||||||||||||
| BRL | 74,577 | USD | 71,722 | 1/3/2020 | HUS | 2,855 | - | 2,855 | ||||||||||||||||||
| BRL | 74,577 | USD | 71,743 | 1/3/2020 | HUS | 2,834 | - | 2,834 | ||||||||||||||||||
| BRL | 74,577 | USD | 71,756 | 1/3/2020 | HUS | 2,821 | - | 2,821 | ||||||||||||||||||
| BRL | 74,577 | USD | 71,780 | 1/3/2020 | HUS | 2,797 | - | 2,797 | ||||||||||||||||||
| BRL | 74,577 | USD | 71,785 | 1/3/2020 | HUS | 2,792 | - | 2,792 | ||||||||||||||||||
| BRL | 74,577 | USD | 71,789 | 1/3/2020 | HUS | 2,788 | - | 2,788 | ||||||||||||||||||
| BRL | 74,577 | USD | 71,797 | 1/3/2020 | HUS | 2,780 | - | 2,780 | ||||||||||||||||||
| BRL | 74,577 | USD | 71,798 | 1/3/2020 | HUS | 2,779 | - | 2,779 | ||||||||||||||||||
| BRL | 74,577 | USD | 72,160 | 1/3/2020 | HUS | 2,417 | - | 2,417 | ||||||||||||||||||
| BRL | 74,577 | USD | 72,164 | 1/3/2020 | HUS | 2,413 | - | 2,413 | ||||||||||||||||||
| BRL | 74,577 | USD | 72,154 | 1/3/2020 | HUS | 2,423 | - | 2,423 | ||||||||||||||||||
| BRL | 74,577 | USD | 72,072 | 1/3/2020 | HUS | 2,505 | - | 2,505 | ||||||||||||||||||
| BRL | 74,577 | USD | 72,123 | 1/3/2020 | HUS | 2,454 | - | 2,454 | ||||||||||||||||||
| BRL | 74,577 | USD | 72,107 | 1/3/2020 | HUS | 2,470 | - | 2,470 | ||||||||||||||||||
See accompanying notes
21
American Beacon AHL Managed Futures Strategy FundSM
Consolidated Schedule of Investments
December 31, 2019
| Currency Purchased* | Currency Sold* | Settlement Date | Counterparty | Unrealized Appreciation | Unrealized (Depreciation) | Net Unrealized Appreciation (Depreciation) | ||||||||||||||||||||
| BRL | 74,577 | USD | 72,107 | 1/3/2020 | HUS | $ | 2,470 | $ | - | $ | 2,470 | |||||||||||||||
| BRL | 74,577 | USD | 72,123 | 1/3/2020 | HUS | 2,454 | - | 2,454 | ||||||||||||||||||
| BRL | 74,577 | USD | 72,183 | 1/3/2020 | HUS | 2,394 | - | 2,394 | ||||||||||||||||||
| BRL | 74,577 | USD | 72,192 | 1/3/2020 | HUS | 2,385 | - | 2,385 | ||||||||||||||||||
| BRL | 74,577 | USD | 72,139 | 1/3/2020 | HUS | 2,438 | - | 2,438 | ||||||||||||||||||
| BRL | 74,577 | USD | 72,770 | 1/3/2020 | HUS | 1,807 | - | 1,807 | ||||||||||||||||||
| BRL | 74,577 | USD | 72,980 | 1/3/2020 | HUS | 1,597 | - | 1,597 | ||||||||||||||||||
| BRL | 74,577 | USD | 73,133 | 1/3/2020 | HUS | 1,444 | - | 1,444 | ||||||||||||||||||
| BRL | 74,577 | USD | 73,130 | 1/3/2020 | HUS | 1,447 | - | 1,447 | ||||||||||||||||||
| BRL | 74,577 | USD | 73,151 | 1/3/2020 | HUS | 1,426 | - | 1,426 | ||||||||||||||||||
| BRL | 74,577 | USD | 73,153 | 1/3/2020 | HUS | 1,424 | - | 1,424 | ||||||||||||||||||
| BRL | 74,577 | USD | 71,471 | 1/3/2020 | HUS | 3,106 | - | 3,106 | ||||||||||||||||||
| BRL | 74,577 | USD | 71,459 | 1/3/2020 | HUS | 3,118 | - | 3,118 | ||||||||||||||||||
| BRL | 74,577 | USD | 71,459 | 1/3/2020 | HUS | 3,118 | - | 3,118 | ||||||||||||||||||
| BRL | 74,577 | USD | 71,471 | 1/3/2020 | HUS | 3,106 | - | 3,106 | ||||||||||||||||||
| BRL | 74,577 | USD | 71,487 | 1/3/2020 | HUS | 3,090 | - | 3,090 | ||||||||||||||||||
| BRL | 74,577 | USD | 71,131 | 1/3/2020 | HUS | 3,446 | - | 3,446 | ||||||||||||||||||
| BRL | 74,577 | USD | 71,144 | 1/3/2020 | HUS | 3,433 | - | 3,433 | ||||||||||||||||||
| BRL | 74,577 | USD | 71,048 | 1/3/2020 | HUS | 3,529 | - | 3,529 | ||||||||||||||||||
| BRL | 74,577 | USD | 71,085 | 1/3/2020 | HUS | 3,492 | - | 3,492 | ||||||||||||||||||
| BRL | 74,577 | USD | 73,198 | 1/3/2020 | HUS | 1,379 | - | 1,379 | ||||||||||||||||||
| BRL | 74,577 | USD | 73,276 | 1/3/2020 | HUS | 1,301 | - | 1,301 | ||||||||||||||||||
| BRL | 74,577 | USD | 73,285 | 1/3/2020 | HUS | 1,292 | - | 1,292 | ||||||||||||||||||
| BRL | 99,436 | USD | 96,221 | 1/3/2020 | HUS | 3,215 | - | 3,215 | ||||||||||||||||||
| BRL | 99,436 | USD | 96,276 | 1/3/2020 | HUS | 3,160 | - | 3,160 | ||||||||||||||||||
| BRL | 99,436 | USD | 96,518 | 1/3/2020 | HUS | 2,918 | - | 2,918 | ||||||||||||||||||
| BRL | 99,436 | USD | 96,528 | 1/3/2020 | HUS | 2,908 | - | 2,908 | ||||||||||||||||||
| BRL | 99,436 | USD | 96,573 | 1/3/2020 | HUS | 2,863 | - | 2,863 | ||||||||||||||||||
| BRL | 99,436 | USD | 96,619 | 1/3/2020 | HUS | 2,817 | - | 2,817 | ||||||||||||||||||
| BRL | 99,436 | USD | 96,642 | 1/3/2020 | HUS | 2,794 | - | 2,794 | ||||||||||||||||||
| BRL | 99,436 | USD | 95,661 | 1/3/2020 | HUS | 3,775 | - | 3,775 | ||||||||||||||||||
| BRL | 99,436 | USD | 95,802 | 1/3/2020 | HUS | 3,634 | - | 3,634 | ||||||||||||||||||
| BRL | 99,436 | USD | 95,696 | 1/3/2020 | HUS | 3,740 | - | 3,740 | ||||||||||||||||||
| BRL | 99,436 | USD | 95,702 | 1/3/2020 | HUS | 3,734 | - | 3,734 | ||||||||||||||||||
| BRL | 99,436 | USD | 95,718 | 1/3/2020 | HUS | 3,718 | - | 3,718 | ||||||||||||||||||
| BRL | 99,436 | USD | 95,718 | 1/3/2020 | HUS | 3,718 | - | 3,718 | ||||||||||||||||||
| BRL | 99,436 | USD | 96,132 | 1/3/2020 | HUS | 3,304 | - | 3,304 | ||||||||||||||||||
| BRL | 99,436 | USD | 96,226 | 1/3/2020 | HUS | 3,210 | - | 3,210 | ||||||||||||||||||
| BRL | 99,436 | USD | 96,319 | 1/3/2020 | HUS | 3,117 | - | 3,117 | ||||||||||||||||||
| BRL | 99,436 | USD | 96,210 | 1/3/2020 | HUS | 3,226 | - | 3,226 | ||||||||||||||||||
| BRL | 99,436 | USD | 96,220 | 1/3/2020 | HUS | 3,216 | - | 3,216 | ||||||||||||||||||
| BRL | 99,436 | USD | 97,274 | 1/3/2020 | HUS | 2,162 | - | 2,162 | ||||||||||||||||||
| BRL | 99,436 | USD | 97,324 | 1/3/2020 | HUS | 2,112 | - | 2,112 | ||||||||||||||||||
| BRL | 99,436 | USD | 97,523 | 1/3/2020 | HUS | 1,913 | - | 1,913 | ||||||||||||||||||
| BRL | 99,436 | USD | 97,537 | 1/3/2020 | HUS | 1,899 | - | 1,899 | ||||||||||||||||||
| BRL | 99,436 | USD | 97,539 | 1/3/2020 | HUS | 1,897 | - | 1,897 | ||||||||||||||||||
| BRL | 99,436 | USD | 95,278 | 1/3/2020 | HUS | 4,158 | - | 4,158 | ||||||||||||||||||
| BRL | 99,436 | USD | 95,234 | 1/3/2020 | HUS | 4,202 | - | 4,202 | ||||||||||||||||||
| BRL | 124,295 | USD | 120,260 | 1/3/2020 | HUS | 4,035 | - | 4,035 | ||||||||||||||||||
| BRL | 124,295 | USD | 120,237 | 1/3/2020 | HUS | 4,058 | - | 4,058 | ||||||||||||||||||
| BRL | 124,295 | USD | 120,262 | 1/3/2020 | HUS | 4,033 | - | 4,033 | ||||||||||||||||||
| BRL | 124,295 | USD | 120,341 | 1/3/2020 | HUS | 3,954 | - | 3,954 | ||||||||||||||||||
| BRL | 124,295 | USD | 120,298 | 1/3/2020 | HUS | 3,997 | - | 3,997 | ||||||||||||||||||
| BRL | 124,295 | USD | 119,352 | 1/3/2020 | HUS | 4,943 | - | 4,943 | ||||||||||||||||||
| BRL | 124,295 | USD | 119,463 | 1/3/2020 | HUS | 4,832 | - | 4,832 | ||||||||||||||||||
| BRL | 124,295 | USD | 119,583 | 1/3/2020 | HUS | 4,712 | - | 4,712 | ||||||||||||||||||
| BRL | 124,295 | USD | 119,649 | 1/3/2020 | HUS | 4,646 | - | 4,646 | ||||||||||||||||||
| BRL | 124,295 | USD | 119,664 | 1/3/2020 | HUS | 4,631 | - | 4,631 | ||||||||||||||||||
| BRL | 124,295 | USD | 119,592 | 1/3/2020 | HUS | 4,703 | - | 4,703 | ||||||||||||||||||
See accompanying notes
22
American Beacon AHL Managed Futures Strategy FundSM
Consolidated Schedule of Investments
December 31, 2019
| Currency Purchased* | Currency Sold* | Settlement Date | Counterparty | Unrealized Appreciation | Unrealized (Depreciation) | Net Unrealized Appreciation (Depreciation) | ||||||||||||||||||||
| BRL | 124,295 | USD | 119,626 | 1/3/2020 | HUS | $ | 4,669 | $ | - | $ | 4,669 | |||||||||||||||
| BRL | 124,295 | USD | 120,222 | 1/3/2020 | HUS | 4,073 | - | 4,073 | ||||||||||||||||||
| BRL | 124,295 | USD | 120,164 | 1/3/2020 | HUS | 4,131 | - | 4,131 | ||||||||||||||||||
| BRL | 124,295 | USD | 120,245 | 1/3/2020 | HUS | 4,050 | - | 4,050 | ||||||||||||||||||
| BRL | 124,295 | USD | 120,349 | 1/3/2020 | HUS | 3,946 | - | 3,946 | ||||||||||||||||||
| BRL | 124,295 | USD | 120,282 | 1/3/2020 | HUS | 4,013 | - | 4,013 | ||||||||||||||||||
| BRL | 124,295 | USD | 121,590 | 1/3/2020 | HUS | 2,705 | - | 2,705 | ||||||||||||||||||
| BRL | 124,295 | USD | 121,602 | 1/3/2020 | HUS | 2,693 | - | 2,693 | ||||||||||||||||||
| BRL | 124,295 | USD | 121,655 | 1/3/2020 | HUS | 2,640 | - | 2,640 | ||||||||||||||||||
| BRL | 124,295 | USD | 121,672 | 1/3/2020 | HUS | 2,623 | - | 2,623 | ||||||||||||||||||
| BRL | 124,295 | USD | 121,895 | 1/3/2020 | HUS | 2,400 | - | 2,400 | ||||||||||||||||||
| BRL | 124,295 | USD | 121,923 | 1/3/2020 | HUS | 2,372 | - | 2,372 | ||||||||||||||||||
| BRL | 124,295 | USD | 121,940 | 1/3/2020 | HUS | 2,355 | - | 2,355 | ||||||||||||||||||
| BRL | 124,295 | USD | 121,925 | 1/3/2020 | HUS | 2,370 | - | 2,370 | ||||||||||||||||||
| BRL | 124,295 | USD | 119,070 | 1/3/2020 | HUS | 5,225 | - | 5,225 | ||||||||||||||||||
| BRL | 124,295 | USD | 119,108 | 1/3/2020 | HUS | 5,187 | - | 5,187 | ||||||||||||||||||
| BRL | 124,295 | USD | 119,056 | 1/3/2020 | HUS | 5,239 | - | 5,239 | ||||||||||||||||||
| BRL | 149,154 | USD | 143,490 | 1/3/2020 | HUS | 5,664 | - | 5,664 | ||||||||||||||||||
| BRL | 149,154 | USD | 143,336 | 1/3/2020 | HUS | 5,818 | - | 5,818 | ||||||||||||||||||
| BRL | 149,154 | USD | 143,688 | 1/3/2020 | HUS | 5,466 | - | 5,466 | ||||||||||||||||||
| BRL | 149,154 | USD | 143,707 | 1/3/2020 | HUS | 5,447 | - | 5,447 | ||||||||||||||||||
| BRL | 149,154 | USD | 143,742 | 1/3/2020 | HUS | 5,412 | - | 5,412 | ||||||||||||||||||
| BRL | 149,154 | USD | 143,596 | 1/3/2020 | HUS | 5,558 | - | 5,558 | ||||||||||||||||||
| BRL | 149,154 | USD | 143,579 | 1/3/2020 | HUS | 5,575 | - | 5,575 | ||||||||||||||||||
| BRL | 149,154 | USD | 144,400 | 1/3/2020 | HUS | 4,754 | - | 4,754 | ||||||||||||||||||
| BRL | 149,154 | USD | 144,483 | 1/3/2020 | HUS | 4,671 | - | 4,671 | ||||||||||||||||||
| BRL | 149,154 | USD | 144,410 | 1/3/2020 | HUS | 4,744 | - | 4,744 | ||||||||||||||||||
| BRL | 149,154 | USD | 145,883 | 1/3/2020 | HUS | 3,271 | - | 3,271 | ||||||||||||||||||
| BRL | 149,154 | USD | 145,947 | 1/3/2020 | HUS | 3,207 | - | 3,207 | ||||||||||||||||||
| BRL | 149,154 | USD | 145,993 | 1/3/2020 | HUS | 3,161 | - | 3,161 | ||||||||||||||||||
| BRL | 149,154 | USD | 146,025 | 1/3/2020 | HUS | 3,129 | - | 3,129 | ||||||||||||||||||
| BRL | 149,154 | USD | 146,324 | 1/3/2020 | HUS | 2,830 | - | 2,830 | ||||||||||||||||||
| BRL | 149,154 | USD | 142,684 | 1/3/2020 | HUS | 6,470 | - | 6,470 | ||||||||||||||||||
| BRL | 174,012 | USD | 167,187 | 1/3/2020 | HUS | 6,825 | - | 6,825 | ||||||||||||||||||
| BRL | 174,012 | USD | 167,208 | 1/3/2020 | HUS | 6,804 | - | 6,804 | ||||||||||||||||||
| BRL | 174,012 | USD | 167,246 | 1/3/2020 | HUS | 6,766 | - | 6,766 | ||||||||||||||||||
| BRL | 174,012 | USD | 167,476 | 1/3/2020 | HUS | 6,536 | - | 6,536 | ||||||||||||||||||
| BRL | 174,012 | USD | 167,428 | 1/3/2020 | HUS | 6,584 | - | 6,584 | ||||||||||||||||||
| BRL | 174,012 | USD | 170,648 | 1/3/2020 | HUS | 3,364 | - | 3,364 | ||||||||||||||||||
| BRL | 174,012 | USD | 170,656 | 1/3/2020 | HUS | 3,356 | - | 3,356 | ||||||||||||||||||
| BRL | 174,012 | USD | 170,685 | 1/3/2020 | HUS | 3,327 | - | 3,327 | ||||||||||||||||||
| BRL | 179,670 | USD | 176,158 | 1/3/2020 | HUS | 3,512 | - | 3,512 | ||||||||||||||||||
| BRL | 179,670 | USD | 176,145 | 1/3/2020 | HUS | 3,525 | - | 3,525 | ||||||||||||||||||
| BRL | 198,871 | USD | 191,337 | 1/3/2020 | HUS | 7,534 | - | 7,534 | ||||||||||||||||||
| BRL | 200,114 | USD | 196,269 | 1/3/2020 | HUS | 3,845 | - | 3,845 | ||||||||||||||||||
| BRL | 203,562 | USD | 200,309 | 1/3/2020 | HUS | 3,253 | - | 3,253 | ||||||||||||||||||
| BRL | 204,320 | USD | 199,611 | 1/3/2020 | HUS | 4,709 | - | 4,709 | ||||||||||||||||||
| BRL | 216,951 | USD | 213,439 | 1/3/2020 | HUS | 3,512 | - | 3,512 | ||||||||||||||||||
| BRL | 223,730 | USD | 215,581 | 1/3/2020 | HUS | 8,149 | - | 8,149 | ||||||||||||||||||
| BRL | 223,730 | USD | 215,591 | 1/3/2020 | HUS | 8,139 | - | 8,139 | ||||||||||||||||||
| BRL | 223,730 | USD | 215,300 | 1/3/2020 | HUS | 8,430 | - | 8,430 | ||||||||||||||||||
| BRL | 223,730 | USD | 215,388 | 1/3/2020 | HUS | 8,342 | - | 8,342 | ||||||||||||||||||
| BRL | 223,730 | USD | 215,561 | 1/3/2020 | HUS | 8,169 | - | 8,169 | ||||||||||||||||||
| BRL | 223,730 | USD | 214,003 | 1/3/2020 | HUS | 9,727 | - | 9,727 | ||||||||||||||||||
| BRL | 235,030 | USD | 231,021 | 1/3/2020 | HUS | 4,009 | - | 4,009 | ||||||||||||||||||
| BRL | 261,722 | USD | 257,693 | 1/3/2020 | HUS | 4,029 | - | 4,029 | ||||||||||||||||||
| BRL | 263,422 | USD | 257,273 | 1/3/2020 | HUS | 6,149 | - | 6,149 | ||||||||||||||||||
| BRL | 267,233 | USD | 260,922 | 1/3/2020 | HUS | 6,311 | - | 6,311 | ||||||||||||||||||
| BRL | 273,448 | USD | 263,133 | 1/3/2020 | HUS | 10,315 | - | 10,315 | ||||||||||||||||||
See accompanying notes
23
American Beacon AHL Managed Futures Strategy FundSM
Consolidated Schedule of Investments
December 31, 2019
| Currency Purchased* | Currency Sold* | Settlement Date | Counterparty | Unrealized Appreciation | Unrealized (Depreciation) | Net Unrealized Appreciation (Depreciation) | ||||||||||||||||||||
| BRL | 291,964 | USD | 286,383 | 1/3/2020 | HUS | $ | 5,581 | $ | - | $ | 5,581 | |||||||||||||||
| BRL | 307,347 | USD | 302,756 | 1/3/2020 | HUS | 4,591 | - | 4,591 | ||||||||||||||||||
| BRL | 323,166 | USD | 309,123 | 1/3/2020 | HUS | 14,043 | - | 14,043 | ||||||||||||||||||
| BRL | 334,423 | USD | 329,234 | 1/3/2020 | HUS | 5,189 | - | 5,189 | ||||||||||||||||||
| BRL | 335,264 | USD | 327,410 | 1/3/2020 | HUS | 7,854 | - | 7,854 | ||||||||||||||||||
| BRL | 337,371 | USD | 330,631 | 1/3/2020 | HUS | 6,740 | - | 6,740 | ||||||||||||||||||
| BRL | 348,025 | USD | 332,950 | 1/3/2020 | HUS | 15,075 | - | 15,075 | ||||||||||||||||||
| BRL | 348,963 | USD | 343,486 | 1/3/2020 | HUS | 5,477 | - | 5,477 | ||||||||||||||||||
| BRL | 366,248 | USD | 357,234 | 1/3/2020 | HUS | 9,014 | - | 9,014 | ||||||||||||||||||
| BRL | 371,108 | USD | 363,570 | 1/3/2020 | HUS | 7,538 | - | 7,538 | ||||||||||||||||||
| BRL | 392,584 | USD | 385,926 | 1/3/2020 | HUS | 6,658 | - | 6,658 | ||||||||||||||||||
| BRL | 428,816 | USD | 420,311 | 1/3/2020 | HUS | 8,505 | - | 8,505 | ||||||||||||||||||
| BRL | 433,901 | USD | 426,522 | 1/3/2020 | HUS | 7,379 | - | 7,379 | ||||||||||||||||||
| BRL | 459,720 | USD | 449,125 | 1/3/2020 | HUS | 10,595 | - | 10,595 | ||||||||||||||||||
| BRL | 472,320 | USD | 457,226 | 1/3/2020 | HUS | 15,094 | - | 15,094 | ||||||||||||||||||
| BRL | 479,777 | USD | 467,822 | 1/3/2020 | HUS | 11,955 | - | 11,955 | ||||||||||||||||||
| BRL | 522,037 | USD | 506,133 | 1/3/2020 | HUS | 15,904 | - | 15,904 | ||||||||||||||||||
| BRL | 569,404 | USD | 552,950 | 1/3/2020 | HUS | 16,454 | - | 16,454 | ||||||||||||||||||
| BRL | 587,420 | USD | 573,714 | 1/3/2020 | HUS | 13,706 | - | 13,706 | ||||||||||||||||||
| BRL | 598,686 | USD | 584,632 | 1/3/2020 | HUS | 14,054 | - | 14,054 | ||||||||||||||||||
| BRL | 598,686 | USD | 584,390 | 1/3/2020 | HUS | 14,296 | - | 14,296 | ||||||||||||||||||
| BRL | 612,960 | USD | 598,833 | 1/3/2020 | HUS | 14,127 | - | 14,127 | ||||||||||||||||||
| BRL | 621,473 | USD | 607,076 | 1/3/2020 | HUS | 14,397 | - | 14,397 | ||||||||||||||||||
| BRL | 682,930 | USD | 666,267 | 1/3/2020 | HUS | 16,663 | - | 16,663 | ||||||||||||||||||
| BRL | 719,666 | USD | 701,767 | 1/3/2020 | HUS | 17,899 | - | 17,899 | ||||||||||||||||||
| BRL | 742,315 | USD | 724,696 | 1/3/2020 | HUS | 17,619 | - | 17,619 | ||||||||||||||||||
| BRL | 771,048 | USD | 752,209 | 1/3/2020 | HUS | 18,839 | - | 18,839 | ||||||||||||||||||
| BRL | 961,212 | USD | 938,051 | 1/3/2020 | HUS | 23,161 | - | 23,161 | ||||||||||||||||||
| BRL | 1,100,847 | USD | 1,069,011 | 1/3/2020 | HUS | 31,836 | - | 31,836 | ||||||||||||||||||
| BRL | 1,138,808 | USD | 1,105,711 | 1/3/2020 | HUS | 33,097 | - | 33,097 | ||||||||||||||||||
| BRL | 1,822,988 | USD | 1,754,764 | 1/3/2020 | HUS | 68,224 | - | 68,224 | ||||||||||||||||||
| BRL | 1,831,274 | USD | 1,763,035 | 1/3/2020 | HUS | 68,239 | - | 68,239 | ||||||||||||||||||
| BRL | 59,089,666 | USD | 58,309,395 | 1/3/2020 | HUS | 780,271 | - | 780,271 | ||||||||||||||||||
| USD | 2,142,347 | BRL | 2,237,303 | 1/3/2020 | HUS | - | (94,956 | ) | (94,956 | ) | ||||||||||||||||
| USD | 1,965,111 | BRL | 2,043,956 | 1/3/2020 | HUS | - | (78,845 | ) | (78,845 | ) | ||||||||||||||||
| USD | 1,807,120 | BRL | 1,867,182 | 1/3/2020 | HUS | - | (60,062 | ) | (60,062 | ) | ||||||||||||||||
| USD | 1,807,033 | BRL | 1,867,182 | 1/3/2020 | HUS | - | (60,149 | ) | (60,149 | ) | ||||||||||||||||
| USD | 1,806,555 | BRL | 1,867,182 | 1/3/2020 | HUS | - | (60,627 | ) | (60,627 | ) | ||||||||||||||||
| USD | 1,823,198 | BRL | 1,864,419 | 1/3/2020 | HUS | - | (41,221 | ) | (41,221 | ) | ||||||||||||||||
| USD | 1,399,758 | BRL | 1,458,390 | 1/3/2020 | HUS | - | (58,632 | ) | (58,632 | ) | ||||||||||||||||
| USD | 1,375,774 | BRL | 1,441,818 | 1/3/2020 | HUS | - | (66,044 | ) | (66,044 | ) | ||||||||||||||||
| USD | 1,182,482 | BRL | 1,231,543 | 1/3/2020 | HUS | - | (49,061 | ) | (49,061 | ) | ||||||||||||||||
| USD | 1,150,719 | BRL | 1,200,633 | 1/3/2020 | HUS | - | (49,914 | ) | (49,914 | ) | ||||||||||||||||
| USD | 1,142,357 | BRL | 1,190,491 | 1/3/2020 | HUS | - | (48,134 | ) | (48,134 | ) | ||||||||||||||||
| USD | 1,048,749 | BRL | 1,091,583 | 1/3/2020 | HUS | - | (42,834 | ) | (42,834 | ) | ||||||||||||||||
| USD | 1,033,834 | BRL | 1,078,218 | 1/3/2020 | HUS | - | (44,384 | ) | (44,384 | ) | ||||||||||||||||
| USD | 1,024,837 | BRL | 1,056,504 | 1/3/2020 | HUS | - | (31,667 | ) | (31,667 | ) | ||||||||||||||||
| USD | 1,011,672 | BRL | 1,054,300 | 1/3/2020 | HUS | - | (42,628 | ) | (42,628 | ) | ||||||||||||||||
| USD | 1,012,634 | BRL | 1,044,075 | 1/3/2020 | HUS | - | (31,441 | ) | (31,441 | ) | ||||||||||||||||
| USD | 961,725 | BRL | 1,000,814 | 1/3/2020 | HUS | - | (39,089 | ) | (39,089 | ) | ||||||||||||||||
| USD | 958,198 | BRL | 996,429 | 1/3/2020 | HUS | - | (38,231 | ) | (38,231 | ) | ||||||||||||||||
| USD | 939,753 | BRL | 978,276 | 1/3/2020 | HUS | - | (38,523 | ) | (38,523 | ) | ||||||||||||||||
| USD | 940,291 | BRL | 978,275 | 1/3/2020 | HUS | - | (37,984 | ) | (37,984 | ) | ||||||||||||||||
| USD | 934,319 | BRL | 973,200 | 1/3/2020 | HUS | - | (38,881 | ) | (38,881 | ) | ||||||||||||||||
| USD | 933,985 | BRL | 973,200 | 1/3/2020 | HUS | - | (39,215 | ) | (39,215 | ) | ||||||||||||||||
| USD | 901,698 | BRL | 944,639 | 1/3/2020 | HUS | - | (42,941 | ) | (42,941 | ) | ||||||||||||||||
| USD | 903,134 | BRL | 940,650 | 1/3/2020 | HUS | - | (37,516 | ) | (37,516 | ) | ||||||||||||||||
| USD | 903,525 | BRL | 940,316 | 1/3/2020 | HUS | - | (36,791 | ) | (36,791 | ) | ||||||||||||||||
| USD | 866,044 | BRL | 901,136 | 1/3/2020 | HUS | - | (35,092 | ) | (35,092 | ) | ||||||||||||||||
See accompanying notes
24
American Beacon AHL Managed Futures Strategy FundSM
Consolidated Schedule of Investments
December 31, 2019
| Currency Purchased* | Currency Sold* | Settlement Date | Counterparty | Unrealized Appreciation | Unrealized (Depreciation) | Net Unrealized Appreciation (Depreciation) | ||||||||||||||||||||
| USD | 847,633 | BRL | 881,663 | 1/3/2020 | HUS | $ | - | $ | (34,030 | ) | $ | (34,030 | ) | |||||||||||||
| USD | 833,495 | BRL | 867,372 | 1/3/2020 | HUS | - | (33,877 | ) | (33,877 | ) | ||||||||||||||||
| USD | 805,605 | BRL | 838,989 | 1/3/2020 | HUS | - | (33,384 | ) | (33,384 | ) | ||||||||||||||||
| USD | 800,268 | BRL | 832,774 | 1/3/2020 | HUS | - | (32,506 | ) | (32,506 | ) | ||||||||||||||||
| USD | 777,728 | BRL | 811,001 | 1/3/2020 | HUS | - | (33,273 | ) | (33,273 | ) | ||||||||||||||||
| USD | 777,728 | BRL | 811,001 | 1/3/2020 | HUS | - | (33,273 | ) | (33,273 | ) | ||||||||||||||||
| USD | 755,052 | BRL | 787,711 | 1/3/2020 | HUS | - | (32,659 | ) | (32,659 | ) | ||||||||||||||||
| USD | 754,872 | BRL | 787,711 | 1/3/2020 | HUS | - | (32,839 | ) | (32,839 | ) | ||||||||||||||||
| USD | 747,923 | BRL | 778,192 | 1/3/2020 | HUS | - | (30,269 | ) | (30,269 | ) | ||||||||||||||||
| USD | 751,384 | BRL | 774,770 | 1/3/2020 | HUS | - | (23,386 | ) | (23,386 | ) | ||||||||||||||||
| USD | 726,404 | BRL | 755,712 | 1/3/2020 | HUS | - | (29,308 | ) | (29,308 | ) | ||||||||||||||||
| USD | 723,408 | BRL | 754,753 | 1/3/2020 | HUS | - | (31,345 | ) | (31,345 | ) | ||||||||||||||||
| USD | 715,786 | BRL | 745,768 | 1/3/2020 | HUS | - | (29,982 | ) | (29,982 | ) | ||||||||||||||||
| USD | 699,477 | BRL | 727,124 | 1/3/2020 | HUS | - | (27,647 | ) | (27,647 | ) | ||||||||||||||||
| USD | 694,826 | BRL | 722,980 | 1/3/2020 | HUS | - | (28,154 | ) | (28,154 | ) | ||||||||||||||||
| USD | 687,960 | BRL | 715,768 | 1/3/2020 | HUS | - | (27,808 | ) | (27,808 | ) | ||||||||||||||||
| USD | 682,928 | BRL | 704,336 | 1/3/2020 | HUS | - | (21,408 | ) | (21,408 | ) | ||||||||||||||||
| USD | 673,526 | BRL | 701,022 | 1/3/2020 | HUS | - | (27,496 | ) | (27,496 | ) | ||||||||||||||||
| USD | 679,903 | BRL | 700,050 | 1/3/2020 | HUS | - | (20,147 | ) | (20,147 | ) | ||||||||||||||||
| USD | 670,126 | BRL | 697,875 | 1/3/2020 | HUS | - | (27,749 | ) | (27,749 | ) | ||||||||||||||||
| USD | 670,025 | BRL | 697,874 | 1/3/2020 | HUS | - | (27,849 | ) | (27,849 | ) | ||||||||||||||||
| USD | 668,127 | BRL | 696,050 | 1/3/2020 | HUS | - | (27,923 | ) | (27,923 | ) | ||||||||||||||||
| USD | 647,918 | BRL | 666,714 | 1/3/2020 | HUS | - | (18,796 | ) | (18,796 | ) | ||||||||||||||||
| USD | 623,181 | BRL | 648,494 | 1/3/2020 | HUS | - | (25,313 | ) | (25,313 | ) | ||||||||||||||||
| USD | 615,372 | BRL | 642,189 | 1/3/2020 | HUS | - | (26,817 | ) | (26,817 | ) | ||||||||||||||||
| USD | 614,361 | BRL | 638,736 | 1/3/2020 | HUS | - | (24,375 | ) | (24,375 | ) | ||||||||||||||||
| USD | 579,271 | BRL | 602,829 | 1/3/2020 | HUS | - | (23,558 | ) | (23,558 | ) | ||||||||||||||||
| USD | 578,379 | BRL | 602,016 | 1/3/2020 | HUS | - | (23,637 | ) | (23,637 | ) | ||||||||||||||||
| USD | 550,345 | BRL | 566,707 | 1/3/2020 | HUS | - | (16,362 | ) | (16,362 | ) | ||||||||||||||||
| USD | 541,816 | BRL | 564,390 | 1/3/2020 | HUS | - | (22,574 | ) | (22,574 | ) | ||||||||||||||||
| USD | 533,905 | BRL | 556,840 | 1/3/2020 | HUS | - | (22,935 | ) | (22,935 | ) | ||||||||||||||||
| USD | 532,876 | BRL | 555,183 | 1/3/2020 | HUS | - | (22,307 | ) | (22,307 | ) | ||||||||||||||||
| USD | 520,917 | BRL | 546,896 | 1/3/2020 | HUS | - | (25,979 | ) | (25,979 | ) | ||||||||||||||||
| USD | 513,165 | BRL | 530,106 | 1/3/2020 | HUS | - | (16,941 | ) | (16,941 | ) | ||||||||||||||||
| USD | 475,453 | BRL | 495,061 | 1/3/2020 | HUS | - | (19,608 | ) | (19,608 | ) | ||||||||||||||||
| USD | 466,915 | BRL | 485,440 | 1/3/2020 | HUS | - | (18,525 | ) | (18,525 | ) | ||||||||||||||||
| USD | 458,380 | BRL | 478,253 | 1/3/2020 | HUS | - | (19,873 | ) | (19,873 | ) | ||||||||||||||||
| USD | 462,715 | BRL | 472,320 | 1/3/2020 | HUS | - | (9,605 | ) | (9,605 | ) | ||||||||||||||||
| USD | 438,373 | BRL | 447,461 | 1/3/2020 | HUS | - | (9,088 | ) | (9,088 | ) | ||||||||||||||||
| USD | 438,308 | BRL | 447,461 | 1/3/2020 | HUS | - | (9,153 | ) | (9,153 | ) | ||||||||||||||||
| USD | 438,212 | BRL | 447,461 | 1/3/2020 | HUS | - | (9,249 | ) | (9,249 | ) | ||||||||||||||||
| USD | 427,934 | BRL | 446,050 | 1/3/2020 | HUS | - | (18,116 | ) | (18,116 | ) | ||||||||||||||||
| USD | 416,935 | BRL | 435,031 | 1/3/2020 | HUS | - | (18,096 | ) | (18,096 | ) | ||||||||||||||||
| USD | 416,877 | BRL | 433,686 | 1/3/2020 | HUS | - | (16,809 | ) | (16,809 | ) | ||||||||||||||||
| USD | 413,415 | BRL | 431,287 | 1/3/2020 | HUS | - | (17,872 | ) | (17,872 | ) | ||||||||||||||||
| USD | 413,767 | BRL | 422,602 | 1/3/2020 | HUS | - | (8,835 | ) | (8,835 | ) | ||||||||||||||||
| USD | 406,060 | BRL | 422,602 | 1/3/2020 | HUS | - | (16,542 | ) | (16,542 | ) | ||||||||||||||||
| USD | 403,501 | BRL | 420,944 | 1/3/2020 | HUS | - | (17,443 | ) | (17,443 | ) | ||||||||||||||||
| USD | 403,616 | BRL | 419,840 | 1/3/2020 | HUS | - | (16,224 | ) | (16,224 | ) | ||||||||||||||||
| USD | 397,683 | BRL | 413,886 | 1/3/2020 | HUS | - | (16,203 | ) | (16,203 | ) | ||||||||||||||||
| USD | 393,003 | BRL | 408,791 | 1/3/2020 | HUS | - | (15,788 | ) | (15,788 | ) | ||||||||||||||||
| USD | 387,028 | BRL | 402,922 | 1/3/2020 | HUS | - | (15,894 | ) | (15,894 | ) | ||||||||||||||||
| USD | 387,287 | BRL | 402,922 | 1/3/2020 | HUS | - | (15,635 | ) | (15,635 | ) | ||||||||||||||||
| USD | 383,612 | BRL | 400,211 | 1/3/2020 | HUS | - | (16,599 | ) | (16,599 | ) | ||||||||||||||||
| USD | 388,507 | BRL | 400,029 | 1/3/2020 | HUS | - | (11,522 | ) | (11,522 | ) | ||||||||||||||||
| USD | 379,064 | BRL | 395,347 | 1/3/2020 | HUS | - | (16,283 | ) | (16,283 | ) | ||||||||||||||||
| USD | 378,413 | BRL | 389,457 | 1/3/2020 | HUS | - | (11,044 | ) | (11,044 | ) | ||||||||||||||||
| USD | 378,221 | BRL | 389,457 | 1/3/2020 | HUS | - | (11,236 | ) | (11,236 | ) | ||||||||||||||||
| USD | 368,529 | BRL | 383,242 | 1/3/2020 | HUS | - | (14,713 | ) | (14,713 | ) | ||||||||||||||||
See accompanying notes
25
American Beacon AHL Managed Futures Strategy FundSM
Consolidated Schedule of Investments
December 31, 2019
| Currency Purchased* | Currency Sold* | Settlement Date | Counterparty | Unrealized Appreciation | Unrealized (Depreciation) | Net Unrealized Appreciation (Depreciation) | ||||||||||||||||||||
| USD | 362,033 | BRL | 374,192 | 1/3/2020 | HUS | $ | - | $ | (12,159 | ) | $ | (12,159 | ) | |||||||||||||
| USD | 357,659 | BRL | 372,884 | 1/3/2020 | HUS | - | (15,225 | ) | (15,225 | ) | ||||||||||||||||
| USD | 350,939 | BRL | 372,884 | 1/3/2020 | HUS | - | (21,945 | ) | (21,945 | ) | ||||||||||||||||
| USD | 354,643 | BRL | 369,463 | 1/3/2020 | HUS | - | (14,820 | ) | (14,820 | ) | ||||||||||||||||
| USD | 340,832 | BRL | 348,025 | 1/3/2020 | HUS | - | (7,193 | ) | (7,193 | ) | ||||||||||||||||
| USD | 341,230 | BRL | 348,025 | 1/3/2020 | HUS | - | (6,795 | ) | (6,795 | ) | ||||||||||||||||
| USD | 335,530 | BRL | 348,025 | 1/3/2020 | HUS | - | (12,495 | ) | (12,495 | ) | ||||||||||||||||
| USD | 325,136 | BRL | 338,634 | 1/3/2020 | HUS | - | (13,498 | ) | (13,498 | ) | ||||||||||||||||
| USD | 319,399 | BRL | 332,143 | 1/3/2020 | HUS | - | (12,744 | ) | (12,744 | ) | ||||||||||||||||
| USD | 311,254 | BRL | 324,400 | 1/3/2020 | HUS | - | (13,146 | ) | (13,146 | ) | ||||||||||||||||
| USD | 311,187 | BRL | 324,400 | 1/3/2020 | HUS | - | (13,213 | ) | (13,213 | ) | ||||||||||||||||
| USD | 311,683 | BRL | 324,247 | 1/3/2020 | HUS | - | (12,564 | ) | (12,564 | ) | ||||||||||||||||
| USD | 310,099 | BRL | 323,466 | 1/3/2020 | HUS | - | (13,367 | ) | (13,367 | ) | ||||||||||||||||
| USD | 307,751 | BRL | 323,166 | 1/3/2020 | HUS | - | (15,415 | ) | (15,415 | ) | ||||||||||||||||
| USD | 307,867 | BRL | 323,166 | 1/3/2020 | HUS | - | (15,299 | ) | (15,299 | ) | ||||||||||||||||
| USD | 317,259 | BRL | 323,166 | 1/3/2020 | HUS | - | (5,907 | ) | (5,907 | ) | ||||||||||||||||
| USD | 316,834 | BRL | 323,166 | 1/3/2020 | HUS | - | (6,332 | ) | (6,332 | ) | ||||||||||||||||
| USD | 313,306 | BRL | 323,166 | 1/3/2020 | HUS | - | (9,860 | ) | (9,860 | ) | ||||||||||||||||
| USD | 313,517 | BRL | 323,166 | 1/3/2020 | HUS | - | (9,649 | ) | (9,649 | ) | ||||||||||||||||
| USD | 289,688 | BRL | 301,376 | 1/3/2020 | HUS | - | (11,688 | ) | (11,688 | ) | ||||||||||||||||
| USD | 291,289 | BRL | 300,022 | 1/3/2020 | HUS | - | (8,733 | ) | (8,733 | ) | ||||||||||||||||
| USD | 292,726 | BRL | 298,307 | 1/3/2020 | HUS | - | (5,581 | ) | (5,581 | ) | ||||||||||||||||
| USD | 292,733 | BRL | 298,307 | 1/3/2020 | HUS | - | (5,574 | ) | (5,574 | ) | ||||||||||||||||
| USD | 289,292 | BRL | 298,307 | 1/3/2020 | HUS | - | (9,015 | ) | (9,015 | ) | ||||||||||||||||
| USD | 289,244 | BRL | 298,307 | 1/3/2020 | HUS | - | (9,063 | ) | (9,063 | ) | ||||||||||||||||
| USD | 283,990 | BRL | 298,307 | 1/3/2020 | HUS | - | (14,317 | ) | (14,317 | ) | ||||||||||||||||
| USD | 280,456 | BRL | 291,822 | 1/3/2020 | HUS | - | (11,366 | ) | (11,366 | ) | ||||||||||||||||
| USD | 275,768 | BRL | 287,360 | 1/3/2020 | HUS | - | (11,592 | ) | (11,592 | ) | ||||||||||||||||
| USD | 271,662 | BRL | 280,644 | 1/3/2020 | HUS | - | (8,982 | ) | (8,982 | ) | ||||||||||||||||
| USD | 268,418 | BRL | 280,148 | 1/3/2020 | HUS | - | (11,730 | ) | (11,730 | ) | ||||||||||||||||
| USD | 260,465 | BRL | 273,448 | 1/3/2020 | HUS | - | (12,983 | ) | (12,983 | ) | ||||||||||||||||
| USD | 261,422 | BRL | 273,448 | 1/3/2020 | HUS | - | (12,026 | ) | (12,026 | ) | ||||||||||||||||
| USD | 260,778 | BRL | 273,448 | 1/3/2020 | HUS | - | (12,670 | ) | (12,670 | ) | ||||||||||||||||
| USD | 261,729 | BRL | 273,448 | 1/3/2020 | HUS | - | (11,719 | ) | (11,719 | ) | ||||||||||||||||
| USD | 261,494 | BRL | 273,448 | 1/3/2020 | HUS | - | (11,954 | ) | (11,954 | ) | ||||||||||||||||
| USD | 267,809 | BRL | 273,448 | 1/3/2020 | HUS | - | (5,639 | ) | (5,639 | ) | ||||||||||||||||
| USD | 267,803 | BRL | 273,448 | 1/3/2020 | HUS | - | (5,645 | ) | (5,645 | ) | ||||||||||||||||
| USD | 268,090 | BRL | 273,448 | 1/3/2020 | HUS | - | (5,358 | ) | (5,358 | ) | ||||||||||||||||
| USD | 265,105 | BRL | 273,448 | 1/3/2020 | HUS | - | (8,343 | ) | (8,343 | ) | ||||||||||||||||
| USD | 260,368 | BRL | 273,448 | 1/3/2020 | HUS | - | (13,080 | ) | (13,080 | ) | ||||||||||||||||
| USD | 260,367 | BRL | 273,448 | 1/3/2020 | HUS | - | (13,081 | ) | (13,081 | ) | ||||||||||||||||
| USD | 260,814 | BRL | 273,448 | 1/3/2020 | HUS | - | (12,634 | ) | (12,634 | ) | ||||||||||||||||
| USD | 256,540 | BRL | 266,884 | 1/3/2020 | HUS | - | (10,344 | ) | (10,344 | ) | ||||||||||||||||
| USD | 258,996 | BRL | 266,686 | 1/3/2020 | HUS | - | (7,690 | ) | (7,690 | ) | ||||||||||||||||
| USD | 253,107 | BRL | 263,382 | 1/3/2020 | HUS | - | (10,275 | ) | (10,275 | ) | ||||||||||||||||
| USD | 237,778 | BRL | 248,589 | 1/3/2020 | HUS | - | (10,811 | ) | (10,811 | ) | ||||||||||||||||
| USD | 237,635 | BRL | 248,589 | 1/3/2020 | HUS | - | (10,954 | ) | (10,954 | ) | ||||||||||||||||
| USD | 236,938 | BRL | 248,589 | 1/3/2020 | HUS | - | (11,651 | ) | (11,651 | ) | ||||||||||||||||
| USD | 241,051 | BRL | 248,589 | 1/3/2020 | HUS | - | (7,538 | ) | (7,538 | ) | ||||||||||||||||
| USD | 215,785 | BRL | 225,060 | 1/3/2020 | HUS | - | (9,275 | ) | (9,275 | ) | ||||||||||||||||
| USD | 214,000 | BRL | 223,730 | 1/3/2020 | HUS | - | (9,730 | ) | (9,730 | ) | ||||||||||||||||
| USD | 213,602 | BRL | 223,730 | 1/3/2020 | HUS | - | (10,128 | ) | (10,128 | ) | ||||||||||||||||
| USD | 219,608 | BRL | 223,730 | 1/3/2020 | HUS | - | (4,122 | ) | (4,122 | ) | ||||||||||||||||
| USD | 211,595 | BRL | 223,730 | 1/3/2020 | HUS | - | (12,135 | ) | (12,135 | ) | ||||||||||||||||
| USD | 200,363 | BRL | 208,447 | 1/3/2020 | HUS | - | (8,084 | ) | (8,084 | ) | ||||||||||||||||
| USD | 190,102 | BRL | 198,871 | 1/3/2020 | HUS | - | (8,769 | ) | (8,769 | ) | ||||||||||||||||
| USD | 189,596 | BRL | 198,871 | 1/3/2020 | HUS | - | (9,275 | ) | (9,275 | ) | ||||||||||||||||
| USD | 190,358 | BRL | 198,871 | 1/3/2020 | HUS | - | (8,513 | ) | (8,513 | ) | ||||||||||||||||
| USD | 189,471 | BRL | 198,871 | 1/3/2020 | HUS | - | (9,400 | ) | (9,400 | ) | ||||||||||||||||
See accompanying notes
26
American Beacon AHL Managed Futures Strategy FundSM
Consolidated Schedule of Investments
December 31, 2019
| Currency Purchased* | Currency Sold* | Settlement Date | Counterparty | Unrealized Appreciation | Unrealized (Depreciation) | Net Unrealized Appreciation (Depreciation) | ||||||||||||||||||||
| USD | 195,141 | BRL | 198,871 | 1/3/2020 | HUS | $ | - | $ | (3,730 | ) | $ | (3,730 | ) | |||||||||||||
| USD | 195,017 | BRL | 198,871 | 1/3/2020 | HUS | - | (3,854 | ) | (3,854 | ) | ||||||||||||||||
| USD | 192,864 | BRL | 198,871 | 1/3/2020 | HUS | - | (6,007 | ) | (6,007 | ) | ||||||||||||||||
| USD | 192,896 | BRL | 198,871 | 1/3/2020 | HUS | - | (5,975 | ) | (5,975 | ) | ||||||||||||||||
| USD | 188,014 | BRL | 198,871 | 1/3/2020 | HUS | - | (10,857 | ) | (10,857 | ) | ||||||||||||||||
| USD | 166,902 | BRL | 174,013 | 1/3/2020 | HUS | - | (7,111 | ) | (7,111 | ) | ||||||||||||||||
| USD | 166,406 | BRL | 174,013 | 1/3/2020 | HUS | - | (7,607 | ) | (7,607 | ) | ||||||||||||||||
| USD | 166,592 | BRL | 174,013 | 1/3/2020 | HUS | - | (7,421 | ) | (7,421 | ) | ||||||||||||||||
| USD | 170,770 | BRL | 174,013 | 1/3/2020 | HUS | - | (3,243 | ) | (3,243 | ) | ||||||||||||||||
| USD | 168,744 | BRL | 174,013 | 1/3/2020 | HUS | - | (5,269 | ) | (5,269 | ) | ||||||||||||||||
| USD | 166,842 | BRL | 174,013 | 1/3/2020 | HUS | - | (7,171 | ) | (7,171 | ) | ||||||||||||||||
| USD | 166,854 | BRL | 174,013 | 1/3/2020 | HUS | - | (7,159 | ) | (7,159 | ) | ||||||||||||||||
| USD | 167,061 | BRL | 174,013 | 1/3/2020 | HUS | - | (6,952 | ) | (6,952 | ) | ||||||||||||||||
| USD | 166,973 | BRL | 174,013 | 1/3/2020 | HUS | - | (7,040 | ) | (7,040 | ) | ||||||||||||||||
| USD | 167,005 | BRL | 174,013 | 1/3/2020 | HUS | - | (7,008 | ) | (7,008 | ) | ||||||||||||||||
| USD | 166,544 | BRL | 174,013 | 1/3/2020 | HUS | - | (7,469 | ) | (7,469 | ) | ||||||||||||||||
| USD | 166,543 | BRL | 174,012 | 1/3/2020 | HUS | - | (7,469 | ) | (7,469 | ) | ||||||||||||||||
| USD | 166,690 | BRL | 174,012 | 1/3/2020 | HUS | - | (7,322 | ) | (7,322 | ) | ||||||||||||||||
| USD | 166,337 | BRL | 174,012 | 1/3/2020 | HUS | - | (7,675 | ) | (7,675 | ) | ||||||||||||||||
| USD | 166,330 | BRL | 174,012 | 1/3/2020 | HUS | - | (7,682 | ) | (7,682 | ) | ||||||||||||||||
| USD | 166,239 | BRL | 174,012 | 1/3/2020 | HUS | - | (7,773 | ) | (7,773 | ) | ||||||||||||||||
| USD | 163,957 | BRL | 174,012 | 1/3/2020 | HUS | - | (10,055 | ) | (10,055 | ) | ||||||||||||||||
| USD | 163,940 | BRL | 174,012 | 1/3/2020 | HUS | - | (10,072 | ) | (10,072 | ) | ||||||||||||||||
| USD | 163,714 | BRL | 174,012 | 1/3/2020 | HUS | - | (10,298 | ) | (10,298 | ) | ||||||||||||||||
| USD | 163,707 | BRL | 174,012 | 1/3/2020 | HUS | - | (10,305 | ) | (10,305 | ) | ||||||||||||||||
| USD | 163,890 | BRL | 174,012 | 1/3/2020 | HUS | - | (10,122 | ) | (10,122 | ) | ||||||||||||||||
| USD | 164,535 | BRL | 174,012 | 1/3/2020 | HUS | - | (9,477 | ) | (9,477 | ) | ||||||||||||||||
| USD | 142,440 | BRL | 149,154 | 1/3/2020 | HUS | - | (6,714 | ) | (6,714 | ) | ||||||||||||||||
| USD | 142,380 | BRL | 149,154 | 1/3/2020 | HUS | - | (6,774 | ) | (6,774 | ) | ||||||||||||||||
| USD | 142,278 | BRL | 149,154 | 1/3/2020 | HUS | - | (6,876 | ) | (6,876 | ) | ||||||||||||||||
| USD | 141,979 | BRL | 149,154 | 1/3/2020 | HUS | - | (7,175 | ) | (7,175 | ) | ||||||||||||||||
| USD | 142,231 | BRL | 149,154 | 1/3/2020 | HUS | - | (6,923 | ) | (6,923 | ) | ||||||||||||||||
| USD | 142,833 | BRL | 149,154 | 1/3/2020 | HUS | - | (6,321 | ) | (6,321 | ) | ||||||||||||||||
| USD | 146,160 | BRL | 149,154 | 1/3/2020 | HUS | - | (2,994 | ) | (2,994 | ) | ||||||||||||||||
| USD | 144,662 | BRL | 149,154 | 1/3/2020 | HUS | - | (4,492 | ) | (4,492 | ) | ||||||||||||||||
| USD | 144,614 | BRL | 149,154 | 1/3/2020 | HUS | - | (4,540 | ) | (4,540 | ) | ||||||||||||||||
| USD | 144,652 | BRL | 149,154 | 1/3/2020 | HUS | - | (4,502 | ) | (4,502 | ) | ||||||||||||||||
| USD | 143,007 | BRL | 149,154 | 1/3/2020 | HUS | - | (6,147 | ) | (6,147 | ) | ||||||||||||||||
| USD | 143,202 | BRL | 149,154 | 1/3/2020 | HUS | - | (5,952 | ) | (5,952 | ) | ||||||||||||||||
| USD | 143,192 | BRL | 149,154 | 1/3/2020 | HUS | - | (5,962 | ) | (5,962 | ) | ||||||||||||||||
| USD | 143,188 | BRL | 149,154 | 1/3/2020 | HUS | - | (5,966 | ) | (5,966 | ) | ||||||||||||||||
| USD | 142,800 | BRL | 149,154 | 1/3/2020 | HUS | - | (6,354 | ) | (6,354 | ) | ||||||||||||||||
| USD | 142,759 | BRL | 149,154 | 1/3/2020 | HUS | - | (6,395 | ) | (6,395 | ) | ||||||||||||||||
| USD | 142,956 | BRL | 149,154 | 1/3/2020 | HUS | - | (6,198 | ) | (6,198 | ) | ||||||||||||||||
| USD | 142,956 | BRL | 149,154 | 1/3/2020 | HUS | - | (6,198 | ) | (6,198 | ) | ||||||||||||||||
| USD | 142,936 | BRL | 149,154 | 1/3/2020 | HUS | - | (6,218 | ) | (6,218 | ) | ||||||||||||||||
| USD | 142,843 | BRL | 149,154 | 1/3/2020 | HUS | - | (6,311 | ) | (6,311 | ) | ||||||||||||||||
| USD | 142,722 | BRL | 149,154 | 1/3/2020 | HUS | - | (6,432 | ) | (6,432 | ) | ||||||||||||||||
| USD | 142,600 | BRL | 149,154 | 1/3/2020 | HUS | - | (6,554 | ) | (6,554 | ) | ||||||||||||||||
| USD | 142,596 | BRL | 149,154 | 1/3/2020 | HUS | - | (6,558 | ) | (6,558 | ) | ||||||||||||||||
| USD | 142,029 | BRL | 149,154 | 1/3/2020 | HUS | - | (7,125 | ) | (7,125 | ) | ||||||||||||||||
| USD | 142,539 | BRL | 149,154 | 1/3/2020 | HUS | - | (6,615 | ) | (6,615 | ) | ||||||||||||||||
| USD | 142,160 | BRL | 149,154 | 1/3/2020 | HUS | - | (6,994 | ) | (6,994 | ) | ||||||||||||||||
| USD | 142,070 | BRL | 149,154 | 1/3/2020 | HUS | - | (7,084 | ) | (7,084 | ) | ||||||||||||||||
| USD | 140,559 | BRL | 149,154 | 1/3/2020 | HUS | - | (8,595 | ) | (8,595 | ) | ||||||||||||||||
| USD | 140,447 | BRL | 149,154 | 1/3/2020 | HUS | - | (8,707 | ) | (8,707 | ) | ||||||||||||||||
| USD | 140,344 | BRL | 149,154 | 1/3/2020 | HUS | - | (8,810 | ) | (8,810 | ) | ||||||||||||||||
| USD | 118,425 | BRL | 124,295 | 1/3/2020 | HUS | - | (5,870 | ) | (5,870 | ) | ||||||||||||||||
| USD | 118,451 | BRL | 124,295 | 1/3/2020 | HUS | - | (5,844 | ) | (5,844 | ) | ||||||||||||||||
See accompanying notes
27
American Beacon AHL Managed Futures Strategy FundSM
Consolidated Schedule of Investments
December 31, 2019
| Currency Purchased* | Currency Sold* | Settlement Date | Counterparty | Unrealized Appreciation | Unrealized (Depreciation) | Net Unrealized Appreciation (Depreciation) | ||||||||||||||||||||
| USD | 118,377 | BRL | 124,295 | 1/3/2020 | HUS | $ | - | $ | (5,918 | ) | $ | (5,918 | ) | |||||||||||||
| USD | 118,565 | BRL | 124,295 | 1/3/2020 | HUS | - | (5,730 | ) | (5,730 | ) | ||||||||||||||||
| USD | 118,585 | BRL | 124,295 | 1/3/2020 | HUS | - | (5,710 | ) | (5,710 | ) | ||||||||||||||||
| USD | 118,540 | BRL | 124,295 | 1/3/2020 | HUS | - | (5,755 | ) | (5,755 | ) | ||||||||||||||||
| USD | 118,302 | BRL | 124,295 | 1/3/2020 | HUS | - | (5,993 | ) | (5,993 | ) | ||||||||||||||||
| USD | 118,290 | BRL | 124,295 | 1/3/2020 | HUS | - | (6,005 | ) | (6,005 | ) | ||||||||||||||||
| USD | 118,288 | BRL | 124,295 | 1/3/2020 | HUS | - | (6,007 | ) | (6,007 | ) | ||||||||||||||||
| USD | 118,285 | BRL | 124,295 | 1/3/2020 | HUS | - | (6,010 | ) | (6,010 | ) | ||||||||||||||||
| USD | 118,706 | BRL | 124,295 | 1/3/2020 | HUS | - | (5,589 | ) | (5,589 | ) | ||||||||||||||||
| USD | 118,748 | BRL | 124,295 | 1/3/2020 | HUS | - | (5,547 | ) | (5,547 | ) | ||||||||||||||||
| USD | 118,833 | BRL | 124,295 | 1/3/2020 | HUS | - | (5,462 | ) | (5,462 | ) | ||||||||||||||||
| USD | 118,967 | BRL | 124,295 | 1/3/2020 | HUS | - | (5,328 | ) | (5,328 | ) | ||||||||||||||||
| USD | 118,949 | BRL | 124,295 | 1/3/2020 | HUS | - | (5,346 | ) | (5,346 | ) | ||||||||||||||||
| USD | 119,003 | BRL | 124,295 | 1/3/2020 | HUS | - | (5,292 | ) | (5,292 | ) | ||||||||||||||||
| USD | 119,184 | BRL | 124,295 | 1/3/2020 | HUS | - | (5,111 | ) | (5,111 | ) | ||||||||||||||||
| USD | 119,161 | BRL | 124,295 | 1/3/2020 | HUS | - | (5,134 | ) | (5,134 | ) | ||||||||||||||||
| USD | 119,335 | BRL | 124,295 | 1/3/2020 | HUS | - | (4,960 | ) | (4,960 | ) | ||||||||||||||||
| USD | 119,312 | BRL | 124,295 | 1/3/2020 | HUS | - | (4,983 | ) | (4,983 | ) | ||||||||||||||||
| USD | 118,977 | BRL | 124,295 | 1/3/2020 | HUS | - | (5,318 | ) | (5,318 | ) | ||||||||||||||||
| USD | 119,048 | BRL | 124,295 | 1/3/2020 | HUS | - | (5,247 | ) | (5,247 | ) | ||||||||||||||||
| USD | 119,048 | BRL | 124,295 | 1/3/2020 | HUS | - | (5,247 | ) | (5,247 | ) | ||||||||||||||||
| USD | 119,045 | BRL | 124,295 | 1/3/2020 | HUS | - | (5,250 | ) | (5,250 | ) | ||||||||||||||||
| USD | 119,034 | BRL | 124,295 | 1/3/2020 | HUS | - | (5,261 | ) | (5,261 | ) | ||||||||||||||||
| USD | 118,947 | BRL | 124,295 | 1/3/2020 | HUS | - | (5,348 | ) | (5,348 | ) | ||||||||||||||||
| USD | 118,848 | BRL | 124,295 | 1/3/2020 | HUS | - | (5,447 | ) | (5,447 | ) | ||||||||||||||||
| USD | 118,831 | BRL | 124,295 | 1/3/2020 | HUS | - | (5,464 | ) | (5,464 | ) | ||||||||||||||||
| USD | 118,831 | BRL | 124,295 | 1/3/2020 | HUS | - | (5,464 | ) | (5,464 | ) | ||||||||||||||||
| USD | 118,292 | BRL | 124,295 | 1/3/2020 | HUS | - | (6,003 | ) | (6,003 | ) | ||||||||||||||||
| USD | 118,313 | BRL | 124,295 | 1/3/2020 | HUS | - | (5,982 | ) | (5,982 | ) | ||||||||||||||||
| USD | 118,755 | BRL | 124,295 | 1/3/2020 | HUS | - | (5,540 | ) | (5,540 | ) | ||||||||||||||||
| USD | 118,717 | BRL | 124,295 | 1/3/2020 | HUS | - | (5,578 | ) | (5,578 | ) | ||||||||||||||||
| USD | 117,072 | BRL | 124,295 | 1/3/2020 | HUS | - | (7,223 | ) | (7,223 | ) | ||||||||||||||||
| USD | 117,067 | BRL | 124,295 | 1/3/2020 | HUS | - | (7,228 | ) | (7,228 | ) | ||||||||||||||||
| USD | 117,028 | BRL | 124,295 | 1/3/2020 | HUS | - | (7,267 | ) | (7,267 | ) | ||||||||||||||||
| USD | 116,946 | BRL | 124,295 | 1/3/2020 | HUS | - | (7,349 | ) | (7,349 | ) | ||||||||||||||||
| USD | 117,067 | BRL | 124,295 | 1/3/2020 | HUS | - | (7,228 | ) | (7,228 | ) | ||||||||||||||||
| USD | 117,121 | BRL | 124,295 | 1/3/2020 | HUS | - | (7,174 | ) | (7,174 | ) | ||||||||||||||||
| USD | 116,967 | BRL | 124,295 | 1/3/2020 | HUS | - | (7,328 | ) | (7,328 | ) | ||||||||||||||||
| USD | 117,509 | BRL | 124,295 | 1/3/2020 | HUS | - | (6,786 | ) | (6,786 | ) | ||||||||||||||||
| USD | 94,713 | BRL | 99,436 | 1/3/2020 | HUS | - | (4,723 | ) | (4,723 | ) | ||||||||||||||||
| USD | 94,702 | BRL | 99,436 | 1/3/2020 | HUS | - | (4,734 | ) | (4,734 | ) | ||||||||||||||||
| USD | 94,915 | BRL | 99,436 | 1/3/2020 | HUS | - | (4,521 | ) | (4,521 | ) | ||||||||||||||||
| USD | 94,863 | BRL | 99,436 | 1/3/2020 | HUS | - | (4,573 | ) | (4,573 | ) | ||||||||||||||||
| USD | 94,879 | BRL | 99,436 | 1/3/2020 | HUS | - | (4,557 | ) | (4,557 | ) | ||||||||||||||||
| USD | 95,372 | BRL | 99,436 | 1/3/2020 | HUS | - | (4,064 | ) | (4,064 | ) | ||||||||||||||||
| USD | 95,359 | BRL | 99,436 | 1/3/2020 | HUS | - | (4,077 | ) | (4,077 | ) | ||||||||||||||||
| USD | 95,329 | BRL | 99,436 | 1/3/2020 | HUS | - | (4,107 | ) | (4,107 | ) | ||||||||||||||||
| USD | 95,461 | BRL | 99,436 | 1/3/2020 | HUS | - | (3,975 | ) | (3,975 | ) | ||||||||||||||||
| USD | 95,232 | BRL | 99,436 | 1/3/2020 | HUS | - | (4,204 | ) | (4,204 | ) | ||||||||||||||||
| USD | 95,177 | BRL | 99,436 | 1/3/2020 | HUS | - | (4,259 | ) | (4,259 | ) | ||||||||||||||||
| USD | 95,316 | BRL | 99,436 | 1/3/2020 | HUS | - | (4,120 | ) | (4,120 | ) | ||||||||||||||||
| USD | 95,325 | BRL | 99,436 | 1/3/2020 | HUS | - | (4,111 | ) | (4,111 | ) | ||||||||||||||||
| USD | 95,459 | BRL | 99,436 | 1/3/2020 | HUS | - | (3,977 | ) | (3,977 | ) | ||||||||||||||||
| USD | 95,288 | BRL | 99,436 | 1/3/2020 | HUS | - | (4,148 | ) | (4,148 | ) | ||||||||||||||||
| USD | 95,268 | BRL | 99,436 | 1/3/2020 | HUS | - | (4,168 | ) | (4,168 | ) | ||||||||||||||||
| USD | 95,238 | BRL | 99,436 | 1/3/2020 | HUS | - | (4,198 | ) | (4,198 | ) | ||||||||||||||||
| USD | 95,229 | BRL | 99,436 | 1/3/2020 | HUS | - | (4,207 | ) | (4,207 | ) | ||||||||||||||||
| USD | 95,234 | BRL | 99,436 | 1/3/2020 | HUS | - | (4,202 | ) | (4,202 | ) | ||||||||||||||||
| USD | 95,223 | BRL | 99,436 | 1/3/2020 | HUS | - | (4,213 | ) | (4,213 | ) | ||||||||||||||||
See accompanying notes
28
American Beacon AHL Managed Futures Strategy FundSM
Consolidated Schedule of Investments
December 31, 2019
| Currency Purchased* | Currency Sold* | Settlement Date | Counterparty | Unrealized Appreciation | Unrealized (Depreciation) | Net Unrealized Appreciation (Depreciation) | ||||||||||||||||||||
| USD | 95,168 | BRL | 99,436 | 1/3/2020 | HUS | $ | - | $ | (4,268 | ) | $ | (4,268 | ) | |||||||||||||
| USD | 95,166 | BRL | 99,436 | 1/3/2020 | HUS | - | (4,270 | ) | (4,270 | ) | ||||||||||||||||
| USD | 94,708 | BRL | 99,436 | 1/3/2020 | HUS | - | (4,728 | ) | (4,728 | ) | ||||||||||||||||
| USD | 94,702 | BRL | 99,436 | 1/3/2020 | HUS | - | (4,734 | ) | (4,734 | ) | ||||||||||||||||
| USD | 95,029 | BRL | 99,436 | 1/3/2020 | HUS | - | (4,407 | ) | (4,407 | ) | ||||||||||||||||
| USD | 94,963 | BRL | 99,436 | 1/3/2020 | HUS | - | (4,473 | ) | (4,473 | ) | ||||||||||||||||
| USD | 94,783 | BRL | 99,436 | 1/3/2020 | HUS | - | (4,653 | ) | (4,653 | ) | ||||||||||||||||
| USD | 94,758 | BRL | 99,436 | 1/3/2020 | HUS | - | (4,678 | ) | (4,678 | ) | ||||||||||||||||
| USD | 93,691 | BRL | 99,436 | 1/3/2020 | HUS | - | (5,745 | ) | (5,745 | ) | ||||||||||||||||
| USD | 93,680 | BRL | 99,436 | 1/3/2020 | HUS | - | (5,756 | ) | (5,756 | ) | ||||||||||||||||
| USD | 93,710 | BRL | 99,436 | 1/3/2020 | HUS | - | (5,726 | ) | (5,726 | ) | ||||||||||||||||
| USD | 93,539 | BRL | 99,436 | 1/3/2020 | HUS | - | (5,897 | ) | (5,897 | ) | ||||||||||||||||
| USD | 93,563 | BRL | 99,436 | 1/3/2020 | HUS | - | (5,873 | ) | (5,873 | ) | ||||||||||||||||
| USD | 93,548 | BRL | 99,436 | 1/3/2020 | HUS | - | (5,888 | ) | (5,888 | ) | ||||||||||||||||
| USD | 93,552 | BRL | 99,436 | 1/3/2020 | HUS | - | (5,884 | ) | (5,884 | ) | ||||||||||||||||
| USD | 93,548 | BRL | 99,436 | 1/3/2020 | HUS | - | (5,888 | ) | (5,888 | ) | ||||||||||||||||
| USD | 93,545 | BRL | 99,436 | 1/3/2020 | HUS | - | (5,891 | ) | (5,891 | ) | ||||||||||||||||
| USD | 93,508 | BRL | 99,436 | 1/3/2020 | HUS | - | (5,928 | ) | (5,928 | ) | ||||||||||||||||
| USD | 93,688 | BRL | 99,436 | 1/3/2020 | HUS | - | (5,748 | ) | (5,748 | ) | ||||||||||||||||
| USD | 94,021 | BRL | 99,436 | 1/3/2020 | HUS | - | (5,415 | ) | (5,415 | ) | ||||||||||||||||
| USD | 71,519 | BRL | 74,577 | 1/3/2020 | HUS | - | (3,058 | ) | (3,058 | ) | ||||||||||||||||
| USD | 70,992 | BRL | 74,577 | 1/3/2020 | HUS | - | (3,585 | ) | (3,585 | ) | ||||||||||||||||
| USD | 71,132 | BRL | 74,577 | 1/3/2020 | HUS | - | (3,445 | ) | (3,445 | ) | ||||||||||||||||
| USD | 70,968 | BRL | 74,577 | 1/3/2020 | HUS | - | (3,609 | ) | (3,609 | ) | ||||||||||||||||
| USD | 70,973 | BRL | 74,577 | 1/3/2020 | HUS | - | (3,604 | ) | (3,604 | ) | ||||||||||||||||
| USD | 70,952 | BRL | 74,577 | 1/3/2020 | HUS | - | (3,625 | ) | (3,625 | ) | ||||||||||||||||
| USD | 71,105 | BRL | 74,577 | 1/3/2020 | HUS | - | (3,472 | ) | (3,472 | ) | ||||||||||||||||
| USD | 71,097 | BRL | 74,577 | 1/3/2020 | HUS | - | (3,480 | ) | (3,480 | ) | ||||||||||||||||
| USD | 71,616 | BRL | 74,577 | 1/3/2020 | HUS | - | (2,961 | ) | (2,961 | ) | ||||||||||||||||
| USD | 71,575 | BRL | 74,577 | 1/3/2020 | HUS | - | (3,002 | ) | (3,002 | ) | ||||||||||||||||
| USD | 71,580 | BRL | 74,577 | 1/3/2020 | HUS | - | (2,997 | ) | (2,997 | ) | ||||||||||||||||
| USD | 71,376 | BRL | 74,577 | 1/3/2020 | HUS | - | (3,201 | ) | (3,201 | ) | ||||||||||||||||
| USD | 71,368 | BRL | 74,577 | 1/3/2020 | HUS | - | (3,209 | ) | (3,209 | ) | ||||||||||||||||
| USD | 71,454 | BRL | 74,577 | 1/3/2020 | HUS | - | (3,123 | ) | (3,123 | ) | ||||||||||||||||
| USD | 71,307 | BRL | 74,577 | 1/3/2020 | HUS | - | (3,270 | ) | (3,270 | ) | ||||||||||||||||
| USD | 71,011 | BRL | 74,577 | 1/3/2020 | HUS | - | (3,566 | ) | (3,566 | ) | ||||||||||||||||
| USD | 70,960 | BRL | 74,577 | 1/3/2020 | HUS | - | (3,617 | ) | (3,617 | ) | ||||||||||||||||
| USD | 71,236 | BRL | 74,577 | 1/3/2020 | HUS | - | (3,341 | ) | (3,341 | ) | ||||||||||||||||
| USD | 71,239 | BRL | 74,577 | 1/3/2020 | HUS | - | (3,338 | ) | (3,338 | ) | ||||||||||||||||
| USD | 71,533 | BRL | 74,577 | 1/3/2020 | HUS | - | (3,044 | ) | (3,044 | ) | ||||||||||||||||
| USD | 70,260 | BRL | 74,577 | 1/3/2020 | HUS | - | (4,317 | ) | (4,317 | ) | ||||||||||||||||
| USD | 70,217 | BRL | 74,577 | 1/3/2020 | HUS | - | (4,360 | ) | (4,360 | ) | ||||||||||||||||
| USD | 70,218 | BRL | 74,577 | 1/3/2020 | HUS | - | (4,359 | ) | (4,359 | ) | ||||||||||||||||
| USD | 70,180 | BRL | 74,577 | 1/3/2020 | HUS | - | (4,397 | ) | (4,397 | ) | ||||||||||||||||
| USD | 70,299 | BRL | 74,577 | 1/3/2020 | HUS | - | (4,278 | ) | (4,278 | ) | ||||||||||||||||
| USD | 70,299 | BRL | 74,577 | 1/3/2020 | HUS | - | (4,278 | ) | (4,278 | ) | ||||||||||||||||
| USD | 70,241 | BRL | 74,577 | 1/3/2020 | HUS | - | (4,336 | ) | (4,336 | ) | ||||||||||||||||
| USD | 70,174 | BRL | 74,577 | 1/3/2020 | HUS | - | (4,403 | ) | (4,403 | ) | ||||||||||||||||
| USD | 47,358 | BRL | 49,718 | 1/3/2020 | HUS | - | (2,360 | ) | (2,360 | ) | ||||||||||||||||
| USD | 47,346 | BRL | 49,718 | 1/3/2020 | HUS | - | (2,372 | ) | (2,372 | ) | ||||||||||||||||
| USD | 47,422 | BRL | 49,718 | 1/3/2020 | HUS | - | (2,296 | ) | (2,296 | ) | ||||||||||||||||
| USD | 47,315 | BRL | 49,718 | 1/3/2020 | HUS | - | (2,403 | ) | (2,403 | ) | ||||||||||||||||
| USD | 47,307 | BRL | 49,718 | 1/3/2020 | HUS | - | (2,411 | ) | (2,411 | ) | ||||||||||||||||
| USD | 47,449 | BRL | 49,718 | 1/3/2020 | HUS | - | (2,269 | ) | (2,269 | ) | ||||||||||||||||
| USD | 47,724 | BRL | 49,718 | 1/3/2020 | HUS | - | (1,994 | ) | (1,994 | ) | ||||||||||||||||
| USD | 47,593 | BRL | 49,718 | 1/3/2020 | HUS | - | (2,125 | ) | (2,125 | ) | ||||||||||||||||
| USD | 47,564 | BRL | 49,718 | 1/3/2020 | HUS | - | (2,154 | ) | (2,154 | ) | ||||||||||||||||
| USD | 47,334 | BRL | 49,718 | 1/3/2020 | HUS | - | (2,384 | ) | (2,384 | ) | ||||||||||||||||
| USD | 47,502 | BRL | 49,718 | 1/3/2020 | HUS | - | (2,216 | ) | (2,216 | ) | ||||||||||||||||
See accompanying notes
29
American Beacon AHL Managed Futures Strategy FundSM
Consolidated Schedule of Investments
December 31, 2019
| Currency Purchased* | Currency Sold* | Settlement Date | Counterparty | Unrealized Appreciation | Unrealized (Depreciation) | Net Unrealized Appreciation (Depreciation) | ||||||||||||||||||||
| USD | 46,846 | BRL | 49,718 | 1/3/2020 | HUS | $ | - | $ | (2,872 | ) | $ | (2,872 | ) | |||||||||||||
| USD | 46,832 | BRL | 49,718 | 1/3/2020 | HUS | - | (2,886 | ) | (2,886 | ) | ||||||||||||||||
| USD | 46,855 | BRL | 49,718 | 1/3/2020 | HUS | - | (2,863 | ) | (2,863 | ) | ||||||||||||||||
| USD | 46,781 | BRL | 49,718 | 1/3/2020 | HUS | - | (2,937 | ) | (2,937 | ) | ||||||||||||||||
| USD | 46,781 | BRL | 49,718 | 1/3/2020 | HUS | - | (2,937 | ) | (2,937 | ) | ||||||||||||||||
| USD | 46,780 | BRL | 49,718 | 1/3/2020 | HUS | - | (2,938 | ) | (2,938 | ) | ||||||||||||||||
| USD | 46,858 | BRL | 49,718 | 1/3/2020 | HUS | - | (2,860 | ) | (2,860 | ) | ||||||||||||||||
| USD | 23,687 | BRL | 24,859 | 1/3/2020 | HUS | - | (1,172 | ) | (1,172 | ) | ||||||||||||||||
| USD | 23,841 | BRL | 24,859 | 1/3/2020 | HUS | - | (1,018 | ) | (1,018 | ) | ||||||||||||||||
| USD | 23,384 | BRL | 24,859 | 1/3/2020 | HUS | - | (1,475 | ) | (1,475 | ) | ||||||||||||||||
| CNY | 71,751 | USD | 71,353 | 1/15/2020 | HUS | 398 | - | 398 | ||||||||||||||||||
| CNY | 71,751 | USD | 71,413 | 1/15/2020 | HUS | 338 | - | 338 | ||||||||||||||||||
| CNY | 143,501 | USD | 142,857 | 1/15/2020 | HUS | 644 | - | 644 | ||||||||||||||||||
| CNY | 215,252 | USD | 214,103 | 1/15/2020 | HUS | 1,149 | - | 1,149 | ||||||||||||||||||
| CNY | 215,252 | USD | 214,252 | 1/15/2020 | HUS | 1,000 | - | 1,000 | ||||||||||||||||||
| CNY | 287,002 | USD | 285,571 | 1/15/2020 | HUS | 1,431 | - | 1,431 | ||||||||||||||||||
| CNY | 287,002 | USD | 285,755 | 1/15/2020 | HUS | 1,247 | - | 1,247 | ||||||||||||||||||
| CNY | 287,002 | USD | 285,726 | 1/15/2020 | HUS | 1,276 | - | 1,276 | ||||||||||||||||||
| CNY | 358,753 | USD | 358,321 | 1/15/2020 | HUS | 432 | - | 432 | ||||||||||||||||||
| CNY | 358,753 | USD | 357,041 | 1/15/2020 | HUS | 1,712 | - | 1,712 | ||||||||||||||||||
| CNY | 430,503 | USD | 429,584 | 1/15/2020 | HUS | 919 | - | 919 | ||||||||||||||||||
| CNY | 430,503 | USD | 428,528 | 1/15/2020 | HUS | 1,975 | - | 1,975 | ||||||||||||||||||
| CNY | 502,254 | USD | 500,200 | 1/15/2020 | HUS | 2,054 | - | 2,054 | ||||||||||||||||||
| CNY | 502,254 | USD | 501,649 | 1/15/2020 | HUS | 605 | - | 605 | ||||||||||||||||||
| CNY | 574,004 | USD | 570,548 | 1/15/2020 | HUS | 3,456 | - | 3,456 | ||||||||||||||||||
| CNY | 645,755 | USD | 641,620 | 1/15/2020 | HUS | 4,135 | - | 4,135 | ||||||||||||||||||
| CNY | 717,505 | USD | 712,951 | 1/15/2020 | HUS | 4,554 | - | 4,554 | ||||||||||||||||||
| CNY | 717,505 | USD | 713,572 | 1/15/2020 | HUS | 3,933 | - | 3,933 | ||||||||||||||||||
| CNY | 717,505 | USD | 713,816 | 1/15/2020 | HUS | 3,689 | - | 3,689 | ||||||||||||||||||
| CNY | 789,256 | USD | 784,560 | 1/15/2020 | HUS | 4,696 | - | 4,696 | ||||||||||||||||||
| CNY | 789,256 | USD | 784,851 | 1/15/2020 | HUS | 4,405 | - | 4,405 | ||||||||||||||||||
| CNY | 1,291,509 | USD | 1,286,339 | 1/15/2020 | HUS | 5,170 | - | 5,170 | ||||||||||||||||||
| CNY | 1,435,011 | USD | 1,428,960 | 1/15/2020 | HUS | 6,051 | - | 6,051 | ||||||||||||||||||
| USD | 354,697 | CNY | 358,753 | 1/15/2020 | HUS | - | (4,056 | ) | (4,056 | ) | ||||||||||||||||
| USD | 212,990 | CNY | 215,252 | 1/15/2020 | HUS | - | (2,262 | ) | (2,262 | ) | ||||||||||||||||
| USD | 212,993 | CNY | 215,252 | 1/15/2020 | HUS | - | (2,259 | ) | (2,259 | ) | ||||||||||||||||
| USD | 141,993 | CNY | 143,501 | 1/15/2020 | HUS | - | (1,508 | ) | (1,508 | ) | ||||||||||||||||
| USD | 71,014 | CNY | 71,751 | 1/15/2020 | HUS | - | (737 | ) | (737 | ) | ||||||||||||||||
| USD | 71,004 | CNY | 71,751 | 1/15/2020 | HUS | - | (747 | ) | (747 | ) | ||||||||||||||||
| USD | 71,597 | CNY | 71,751 | 1/15/2020 | HUS | - | (154 | ) | (154 | ) | ||||||||||||||||
| EUR | 10,451,471 | USD | 10,343,745 | 1/16/2020 | HUS | 107,726 | - | 107,726 | ||||||||||||||||||
| USD | 20,440,318 | EUR | 20,654,014 | 1/16/2020 | HUS | - | (213,696 | ) | (213,696 | ) | ||||||||||||||||
| COP | 195,322 | USD | 191,861 | 1/17/2020 | HUS | 3,461 | - | 3,461 | ||||||||||||||||||
| COP | 195,322 | USD | 191,919 | 1/17/2020 | HUS | 3,403 | - | 3,403 | ||||||||||||||||||
| COP | 195,322 | USD | 191,852 | 1/17/2020 | HUS | 3,470 | - | 3,470 | ||||||||||||||||||
| COP | 278,703 | USD | 275,440 | 1/17/2020 | HUS | 3,263 | - | 3,263 | ||||||||||||||||||
| COP | 278,703 | USD | 275,178 | 1/17/2020 | HUS | 3,525 | - | 3,525 | ||||||||||||||||||
| COP | 292,983 | USD | 287,765 | 1/17/2020 | HUS | 5,218 | - | 5,218 | ||||||||||||||||||
| COP | 390,645 | USD | 383,844 | 1/17/2020 | HUS | 6,801 | - | 6,801 | ||||||||||||||||||
| COP | 418,054 | USD | 412,956 | 1/17/2020 | HUS | 5,098 | - | 5,098 | ||||||||||||||||||
| COP | 418,054 | USD | 413,556 | 1/17/2020 | HUS | 4,498 | - | 4,498 | ||||||||||||||||||
| COP | 488,306 | USD | 479,506 | 1/17/2020 | HUS | 8,800 | - | 8,800 | ||||||||||||||||||
| COP | 488,306 | USD | 479,811 | 1/17/2020 | HUS | 8,495 | - | 8,495 | ||||||||||||||||||
| COP | 488,306 | USD | 479,606 | 1/17/2020 | HUS | 8,700 | - | 8,700 | ||||||||||||||||||
| COP | 488,306 | USD | 479,719 | 1/17/2020 | HUS | 8,587 | - | 8,587 | ||||||||||||||||||
| COP | 557,406 | USD | 551,137 | 1/17/2020 | HUS | 6,269 | - | 6,269 | ||||||||||||||||||
| COP | 696,757 | USD | 688,923 | 1/17/2020 | HUS | 7,834 | - | 7,834 | ||||||||||||||||||
| COP | 696,757 | USD | 689,134 | 1/17/2020 | HUS | 7,623 | - | 7,623 | ||||||||||||||||||
| COP | 1,216,158 | USD | 1,210,874 | 1/17/2020 | HUS | 5,284 | - | 5,284 | ||||||||||||||||||
See accompanying notes
30
American Beacon AHL Managed Futures Strategy FundSM
Consolidated Schedule of Investments
December 31, 2019
| Currency Purchased* | Currency Sold* | Settlement Date | Counterparty | Unrealized Appreciation | Unrealized (Depreciation) | Net Unrealized Appreciation (Depreciation) | ||||||||||||||||||||
| COP | 1,520,197 | USD | 1,514,182 | 1/17/2020 | HUS | $ | 6,015 | $ | - | $ | 6,015 | |||||||||||||||
| USD | 2,730,764 | COP | 2,918,779 | 1/17/2020 | HUS | - | (188,015 | ) | (188,015 | ) | ||||||||||||||||
| USD | 2,040,727 | COP | 2,128,276 | 1/17/2020 | HUS | - | (87,549 | ) | (87,549 | ) | ||||||||||||||||
| BRL | 24,836 | USD | 24,653 | 2/4/2020 | HUS | 183 | - | 183 | ||||||||||||||||||
| BRL | 24,836 | USD | 24,638 | 2/4/2020 | HUS | 198 | - | 198 | ||||||||||||||||||
| BRL | 24,836 | USD | 24,641 | 2/4/2020 | HUS | 195 | - | 195 | ||||||||||||||||||
| BRL | 24,836 | USD | 24,644 | 2/4/2020 | HUS | 192 | - | 192 | ||||||||||||||||||
| BRL | 24,836 | USD | 24,641 | 2/4/2020 | HUS | 195 | - | 195 | ||||||||||||||||||
| BRL | 24,836 | USD | 24,644 | 2/4/2020 | HUS | 192 | - | 192 | ||||||||||||||||||
| BRL | 24,836 | USD | 24,644 | 2/4/2020 | HUS | 192 | - | 192 | ||||||||||||||||||
| BRL | 24,836 | USD | 24,645 | 2/4/2020 | HUS | 191 | - | 191 | ||||||||||||||||||
| BRL | 24,836 | USD | 24,572 | 2/4/2020 | HUS | 264 | - | 264 | ||||||||||||||||||
| BRL | 24,836 | USD | 24,647 | 2/4/2020 | HUS | 189 | - | 189 | ||||||||||||||||||
| BRL | 24,836 | USD | 24,647 | 2/4/2020 | HUS | 189 | - | 189 | ||||||||||||||||||
| BRL | 24,836 | USD | 24,661 | 2/4/2020 | HUS | 175 | - | 175 | ||||||||||||||||||
| BRL | 24,836 | USD | 24,655 | 2/4/2020 | HUS | 181 | - | 181 | ||||||||||||||||||
| BRL | 24,836 | USD | 24,665 | 2/4/2020 | HUS | 171 | - | 171 | ||||||||||||||||||
| BRL | 24,836 | USD | 24,667 | 2/4/2020 | HUS | 169 | - | 169 | ||||||||||||||||||
| BRL | 24,836 | USD | 24,669 | 2/4/2020 | HUS | 167 | - | 167 | ||||||||||||||||||
| BRL | 24,836 | USD | 24,668 | 2/4/2020 | HUS | 168 | - | 168 | ||||||||||||||||||
| BRL | 24,836 | USD | 24,669 | 2/4/2020 | HUS | 167 | - | 167 | ||||||||||||||||||
| BRL | 24,836 | USD | 24,669 | 2/4/2020 | HUS | 167 | - | 167 | ||||||||||||||||||
| BRL | 24,836 | USD | 24,675 | 2/4/2020 | HUS | 161 | - | 161 | ||||||||||||||||||
| BRL | 24,836 | USD | 24,668 | 2/4/2020 | HUS | 168 | - | 168 | ||||||||||||||||||
| BRL | 24,836 | USD | 24,574 | 2/4/2020 | HUS | 262 | - | 262 | ||||||||||||||||||
| BRL | 24,836 | USD | 24,454 | 2/4/2020 | HUS | 382 | - | 382 | ||||||||||||||||||
| BRL | 24,836 | USD | 24,441 | 2/4/2020 | HUS | 395 | - | 395 | ||||||||||||||||||
| BRL | 24,836 | USD | 24,447 | 2/4/2020 | HUS | 389 | - | 389 | ||||||||||||||||||
| BRL | 24,836 | USD | 24,445 | 2/4/2020 | HUS | 391 | - | 391 | ||||||||||||||||||
| BRL | 24,836 | USD | 24,514 | 2/4/2020 | HUS | 322 | - | 322 | ||||||||||||||||||
| BRL | 24,836 | USD | 24,518 | 2/4/2020 | HUS | 318 | - | 318 | ||||||||||||||||||
| BRL | 24,836 | USD | 24,486 | 2/4/2020 | HUS | 350 | - | 350 | ||||||||||||||||||
| BRL | 24,836 | USD | 24,503 | 2/4/2020 | HUS | 333 | - | 333 | ||||||||||||||||||
| BRL | 24,836 | USD | 24,540 | 2/4/2020 | HUS | 296 | - | 296 | ||||||||||||||||||
| BRL | 24,836 | USD | 24,519 | 2/4/2020 | HUS | 317 | - | 317 | ||||||||||||||||||
| BRL | 24,836 | USD | 24,522 | 2/4/2020 | HUS | 314 | - | 314 | ||||||||||||||||||
| BRL | 24,836 | USD | 24,525 | 2/4/2020 | HUS | 311 | - | 311 | ||||||||||||||||||
| BRL | 24,836 | USD | 24,529 | 2/4/2020 | HUS | 307 | - | 307 | ||||||||||||||||||
| BRL | 24,836 | USD | 24,526 | 2/4/2020 | HUS | 310 | - | 310 | ||||||||||||||||||
| BRL | 24,836 | USD | 24,522 | 2/4/2020 | HUS | 314 | - | 314 | ||||||||||||||||||
| BRL | 24,836 | �� | USD | 24,524 | 2/4/2020 | HUS | 312 | - | 312 | |||||||||||||||||
| BRL | 31,045 | USD | 30,751 | 2/4/2020 | HUS | 294 | - | 294 | ||||||||||||||||||
| BRL | 49,672 | USD | 49,435 | 2/4/2020 | HUS | 237 | - | 237 | ||||||||||||||||||
| BRL | 49,672 | USD | 49,288 | 2/4/2020 | HUS | 384 | - | 384 | ||||||||||||||||||
| BRL | 49,672 | USD | 49,293 | 2/4/2020 | HUS | 379 | - | 379 | ||||||||||||||||||
| BRL | 49,672 | USD | 49,293 | 2/4/2020 | HUS | 379 | - | 379 | ||||||||||||||||||
| BRL | 49,672 | USD | 49,301 | 2/4/2020 | HUS | 371 | - | 371 | ||||||||||||||||||
| BRL | 49,672 | USD | 49,300 | 2/4/2020 | HUS | 372 | - | 372 | ||||||||||||||||||
| BRL | 49,672 | USD | 49,299 | 2/4/2020 | HUS | 373 | - | 373 | ||||||||||||||||||
| BRL | 49,672 | USD | 49,300 | 2/4/2020 | HUS | 372 | - | 372 | ||||||||||||||||||
| BRL | 49,672 | USD | 49,333 | 2/4/2020 | HUS | 339 | - | 339 | ||||||||||||||||||
| BRL | 49,672 | USD | 49,331 | 2/4/2020 | HUS | 341 | - | 341 | ||||||||||||||||||
| BRL | 49,672 | USD | 48,998 | 2/4/2020 | HUS | 674 | - | 674 | ||||||||||||||||||
| BRL | 49,672 | USD | 49,007 | 2/4/2020 | HUS | 665 | - | 665 | ||||||||||||||||||
| BRL | 49,672 | USD | 49,019 | 2/4/2020 | HUS | 653 | - | 653 | ||||||||||||||||||
| BRL | 49,672 | USD | 48,970 | 2/4/2020 | HUS | 702 | - | 702 | ||||||||||||||||||
| BRL | 49,672 | USD | 48,965 | 2/4/2020 | HUS | 707 | - | 707 | ||||||||||||||||||
| BRL | 49,672 | USD | 48,971 | 2/4/2020 | HUS | 701 | - | 701 | ||||||||||||||||||
| BRL | 49,672 | USD | 48,973 | 2/4/2020 | HUS | 699 | - | 699 | ||||||||||||||||||
See accompanying notes
31
American Beacon AHL Managed Futures Strategy FundSM
Consolidated Schedule of Investments
December 31, 2019
| Currency Purchased* | Currency Sold* | Settlement Date | Counterparty | Unrealized Appreciation | Unrealized (Depreciation) | Net Unrealized Appreciation (Depreciation) | ||||||||||||||||||||
| BRL | 49,672 | USD | 48,976 | 2/4/2020 | HUS | $ | 696 | $ | - | $ | 696 | |||||||||||||||
| BRL | 49,672 | USD | 48,977 | 2/4/2020 | HUS | 695 | - | 695 | ||||||||||||||||||
| BRL | 49,672 | USD | 48,995 | 2/4/2020 | HUS | 677 | - | 677 | ||||||||||||||||||
| BRL | 49,672 | USD | 48,994 | 2/4/2020 | HUS | 678 | - | 678 | ||||||||||||||||||
| BRL | 49,672 | USD | 49,000 | 2/4/2020 | HUS | 672 | - | 672 | ||||||||||||||||||
| BRL | 49,672 | USD | 49,006 | 2/4/2020 | HUS | 666 | - | 666 | ||||||||||||||||||
| BRL | 49,672 | USD | 49,007 | 2/4/2020 | HUS | 665 | - | 665 | ||||||||||||||||||
| BRL | 49,672 | USD | 49,088 | 2/4/2020 | HUS | 584 | - | 584 | ||||||||||||||||||
| BRL | 49,672 | USD | 49,070 | 2/4/2020 | HUS | 602 | - | 602 | ||||||||||||||||||
| BRL | 49,672 | USD | 49,073 | 2/4/2020 | HUS | 599 | - | 599 | ||||||||||||||||||
| BRL | 49,672 | USD | 49,073 | 2/4/2020 | HUS | 599 | - | 599 | ||||||||||||||||||
| BRL | 49,672 | USD | 49,073 | 2/4/2020 | HUS | 599 | - | 599 | ||||||||||||||||||
| BRL | 49,672 | USD | 49,074 | 2/4/2020 | HUS | 598 | - | 598 | ||||||||||||||||||
| BRL | 49,672 | USD | 49,076 | 2/4/2020 | HUS | 596 | - | 596 | ||||||||||||||||||
| BRL | 49,672 | USD | 49,162 | 2/4/2020 | HUS | 510 | - | 510 | ||||||||||||||||||
| BRL | 49,672 | USD | 49,162 | 2/4/2020 | HUS | 510 | - | 510 | ||||||||||||||||||
| BRL | 53,812 | USD | 53,003 | 2/4/2020 | HUS | 809 | - | 809 | ||||||||||||||||||
| BRL | 68,299 | USD | 67,557 | 2/4/2020 | HUS | 742 | - | 742 | ||||||||||||||||||
| BRL | 74,508 | USD | 74,232 | 2/4/2020 | HUS | 276 | - | 276 | ||||||||||||||||||
| BRL | 74,508 | USD | 74,194 | 2/4/2020 | HUS | 314 | - | 314 | ||||||||||||||||||
| BRL | 74,508 | USD | 73,525 | 2/4/2020 | HUS | 983 | - | 983 | ||||||||||||||||||
| BRL | 74,508 | USD | 73,466 | 2/4/2020 | HUS | 1,042 | - | 1,042 | ||||||||||||||||||
| BRL | 74,508 | USD | 73,466 | 2/4/2020 | HUS | 1,042 | - | 1,042 | ||||||||||||||||||
| BRL | 74,508 | USD | 73,483 | 2/4/2020 | HUS | 1,025 | - | 1,025 | ||||||||||||||||||
| BRL | 74,508 | USD | 73,484 | 2/4/2020 | HUS | 1,024 | �� | - | 1,024 | |||||||||||||||||
| BRL | 74,508 | USD | 73,502 | 2/4/2020 | HUS | 1,006 | - | 1,006 | ||||||||||||||||||
| BRL | 74,508 | USD | 73,499 | 2/4/2020 | HUS | 1,009 | - | 1,009 | ||||||||||||||||||
| BRL | 74,508 | USD | 73,639 | 2/4/2020 | HUS | 869 | - | 869 | ||||||||||||||||||
| BRL | 74,508 | USD | 73,646 | 2/4/2020 | HUS | 862 | - | 862 | ||||||||||||||||||
| BRL | 74,508 | USD | 73,555 | 2/4/2020 | HUS | 953 | - | 953 | ||||||||||||||||||
| BRL | 74,508 | USD | 73,564 | 2/4/2020 | HUS | 944 | - | 944 | ||||||||||||||||||
| BRL | 74,508 | USD | 73,582 | 2/4/2020 | HUS | 926 | - | 926 | ||||||||||||||||||
| BRL | 74,508 | USD | 73,609 | 2/4/2020 | HUS | 899 | - | 899 | ||||||||||||||||||
| BRL | 74,508 | USD | 73,610 | 2/4/2020 | HUS | 898 | - | 898 | ||||||||||||||||||
| BRL | 74,508 | USD | 73,611 | 2/4/2020 | HUS | 897 | - | 897 | ||||||||||||||||||
| BRL | 74,508 | USD | 73,621 | 2/4/2020 | HUS | 887 | - | 887 | ||||||||||||||||||
| BRL | 74,508 | USD | 73,637 | 2/4/2020 | HUS | 871 | - | 871 | ||||||||||||||||||
| BRL | 74,508 | USD | 73,637 | 2/4/2020 | HUS | 871 | - | 871 | ||||||||||||||||||
| BRL | 74,508 | USD | 73,621 | 2/4/2020 | HUS | 887 | - | 887 | ||||||||||||||||||
| BRL | 74,508 | USD | 73,626 | 2/4/2020 | HUS | 882 | - | 882 | ||||||||||||||||||
| BRL | 74,508 | USD | 73,717 | 2/4/2020 | HUS | 791 | - | 791 | ||||||||||||||||||
| BRL | 74,508 | USD | 73,742 | 2/4/2020 | HUS | 766 | - | 766 | ||||||||||||||||||
| BRL | 99,345 | USD | 98,979 | 2/4/2020 | HUS | 366 | - | 366 | ||||||||||||||||||
| BRL | 99,345 | USD | 98,339 | 2/4/2020 | HUS | 1,006 | - | 1,006 | ||||||||||||||||||
| BRL | 99,345 | USD | 98,273 | 2/4/2020 | HUS | 1,072 | - | 1,072 | ||||||||||||||||||
| BRL | 99,345 | USD | 98,314 | 2/4/2020 | HUS | 1,031 | - | 1,031 | ||||||||||||||||||
| BRL | 99,345 | USD | 98,013 | 2/4/2020 | HUS | 1,332 | - | 1,332 | ||||||||||||||||||
| BRL | 99,345 | USD | 98,174 | 2/4/2020 | HUS | 1,171 | - | 1,171 | ||||||||||||||||||
| BRL | 99,345 | USD | 98,109 | 2/4/2020 | HUS | 1,236 | - | 1,236 | ||||||||||||||||||
| BRL | 99,345 | USD | 98,133 | 2/4/2020 | HUS | 1,212 | - | 1,212 | ||||||||||||||||||
| BRL | 99,345 | USD | 98,160 | 2/4/2020 | HUS | 1,185 | - | 1,185 | ||||||||||||||||||
| BRL | 99,345 | USD | 98,177 | 2/4/2020 | HUS | 1,168 | - | 1,168 | ||||||||||||||||||
| BRL | 124,181 | USD | 123,721 | 2/4/2020 | HUS | 460 | - | 460 | ||||||||||||||||||
| BRL | 124,181 | USD | 123,737 | 2/4/2020 | HUS | 444 | - | 444 | ||||||||||||||||||
| BRL | 124,181 | USD | 123,767 | 2/4/2020 | HUS | 414 | - | 414 | ||||||||||||||||||
| BRL | 124,181 | USD | 123,778 | 2/4/2020 | HUS | 403 | - | 403 | ||||||||||||||||||
| BRL | 124,181 | USD | 123,656 | 2/4/2020 | HUS | 525 | - | 525 | ||||||||||||||||||
| BRL | 124,181 | USD | 122,684 | 2/4/2020 | HUS | 1,497 | - | 1,497 | ||||||||||||||||||
| BRL | 124,181 | USD | 122,703 | 2/4/2020 | HUS | 1,478 | - | 1,478 | ||||||||||||||||||
See accompanying notes
32
American Beacon AHL Managed Futures Strategy FundSM
Consolidated Schedule of Investments
December 31, 2019
| Currency Purchased* | Currency Sold* | Settlement Date | Counterparty | Unrealized Appreciation | Unrealized (Depreciation) | Net Unrealized Appreciation (Depreciation) | ||||||||||||||||||||
| BRL | 124,181 | USD | 122,739 | 2/4/2020 | HUS | $ | 1,442 | $ | - | $ | 1,442 | |||||||||||||||
| BRL | 124,181 | USD | 122,739 | 2/4/2020 | HUS | 1,442 | - | 1,442 | ||||||||||||||||||
| BRL | 149,017 | USD | 148,347 | 2/4/2020 | HUS | 670 | - | 670 | ||||||||||||||||||
| BRL | 149,017 | USD | 148,497 | 2/4/2020 | HUS | 520 | - | 520 | ||||||||||||||||||
| BRL | 149,017 | USD | 148,457 | 2/4/2020 | HUS | 560 | - | 560 | ||||||||||||||||||
| BRL | 149,017 | USD | 147,486 | 2/4/2020 | HUS | 1,531 | - | 1,531 | ||||||||||||||||||
| BRL | 173,853 | USD | 173,212 | 2/4/2020 | HUS | 641 | - | 641 | ||||||||||||||||||
| BRL | 173,853 | USD | 173,224 | 2/4/2020 | HUS | 629 | - | 629 | ||||||||||||||||||
| BRL | 173,853 | USD | 173,225 | 2/4/2020 | HUS | 628 | - | 628 | ||||||||||||||||||
| BRL | 173,853 | USD | 173,066 | 2/4/2020 | HUS | 787 | - | 787 | ||||||||||||||||||
| BRL | 198,689 | USD | 197,956 | 2/4/2020 | HUS | 733 | - | 733 | ||||||||||||||||||
| BRL | 223,525 | USD | 221,633 | 2/4/2020 | HUS | 1,892 | - | 1,892 | ||||||||||||||||||
| BRL | 223,525 | USD | 222,778 | 2/4/2020 | HUS | 747 | - | 747 | ||||||||||||||||||
| BRL | 223,525 | USD | 221,315 | 2/4/2020 | HUS | 2,210 | - | 2,210 | ||||||||||||||||||
| BRL | 244,975 | USD | 242,071 | 2/4/2020 | HUS | 2,904 | - | 2,904 | ||||||||||||||||||
| BRL | 248,361 | USD | 247,441 | 2/4/2020 | HUS | 920 | - | 920 | ||||||||||||||||||
| BRL | 248,361 | USD | 247,506 | 2/4/2020 | HUS | 855 | - | 855 | ||||||||||||||||||
| BRL | 295,195 | USD | 292,039 | 2/4/2020 | HUS | 3,156 | - | 3,156 | ||||||||||||||||||
| BRL | 298,034 | USD | 296,912 | 2/4/2020 | HUS | 1,122 | - | 1,122 | ||||||||||||||||||
| BRL | 298,034 | USD | 295,850 | 2/4/2020 | HUS | 2,184 | - | 2,184 | ||||||||||||||||||
| BRL | 298,034 | USD | 294,314 | 2/4/2020 | HUS | 3,720 | - | 3,720 | ||||||||||||||||||
| BRL | 347,706 | USD | 344,243 | 2/4/2020 | HUS | 3,463 | - | 3,463 | ||||||||||||||||||
| BRL | 388,228 | USD | 382,921 | 2/4/2020 | HUS | 5,307 | - | 5,307 | ||||||||||||||||||
| BRL | 391,169 | USD | 387,397 | 2/4/2020 | HUS | 3,772 | - | 3,772 | ||||||||||||||||||
| BRL | 431,365 | USD | 425,380 | 2/4/2020 | HUS | 5,985 | - | 5,985 | ||||||||||||||||||
| BRL | 499,561 | USD | 494,343 | 2/4/2020 | HUS | 5,218 | - | 5,218 | ||||||||||||||||||
| BRL | 524,945 | USD | 518,861 | 2/4/2020 | HUS | 6,084 | - | 6,084 | ||||||||||||||||||
| BRL | 542,256 | USD | 533,780 | 2/4/2020 | HUS | 8,476 | - | 8,476 | ||||||||||||||||||
| BRL | 701,621 | USD | 693,975 | 2/4/2020 | HUS | 7,646 | - | 7,646 | ||||||||||||||||||
| BRL | 745,084 | USD | 738,716 | 2/4/2020 | HUS | 6,368 | - | 6,368 | ||||||||||||||||||
| BRL | 932,008 | USD | 931,937 | 2/4/2020 | HUS | 71 | - | 71 | ||||||||||||||||||
| BRL | 968,609 | USD | 961,846 | 2/4/2020 | HUS | 6,763 | - | 6,763 | ||||||||||||||||||
| BRL | 1,215,663 | USD | 1,214,966 | 2/4/2020 | HUS | 697 | - | 697 | ||||||||||||||||||
| BRL | 2,996,893 | USD | 2,999,904 | 2/4/2020 | HUS | - | (3,011 | ) | (3,011 | ) | ||||||||||||||||
| BRL | 2,996,894 | USD | 2,999,346 | 2/4/2020 | HUS | - | (2,452 | ) | (2,452 | ) | ||||||||||||||||
| BRL | 2,996,894 | USD | 3,000,162 | 2/4/2020 | HUS | - | (3,268 | ) | (3,268 | ) | ||||||||||||||||
| BRL | 3,241,769 | USD | 3,239,509 | 2/4/2020 | HUS | 2,260 | - | 2,260 | ||||||||||||||||||
| USD | 58,235,824 | BRL | 59,035,493 | 2/4/2020 | HUS | - | (799,669 | ) | (799,669 | ) | ||||||||||||||||
| CLP | 266,090 | USD | 259,855 | 2/6/2020 | HUS | 6,235 | - | 6,235 | ||||||||||||||||||
| CLP | 266,090 | USD | 260,024 | 2/6/2020 | HUS | 6,066 | - | 6,066 | ||||||||||||||||||
| CLP | 532,180 | USD | 520,048 | 2/6/2020 | HUS | 12,132 | - | 12,132 | ||||||||||||||||||
| CLP | 532,180 | USD | 520,183 | 2/6/2020 | HUS | 11,997 | - | 11,997 | ||||||||||||||||||
| CLP | 540,006 | USD | 533,768 | 2/6/2020 | HUS | 6,238 | - | 6,238 | ||||||||||||||||||
| CLP | 598,703 | USD | 584,598 | 2/6/2020 | HUS | 14,105 | - | 14,105 | ||||||||||||||||||
| CLP | 720,008 | USD | 711,462 | 2/6/2020 | HUS | 8,546 | - | 8,546 | ||||||||||||||||||
| CLP | 798,270 | USD | 779,970 | 2/6/2020 | HUS | 18,300 | - | 18,300 | ||||||||||||||||||
| CLP | 900,010 | USD | 888,876 | 2/6/2020 | HUS | 11,134 | - | 11,134 | ||||||||||||||||||
| CLP | 900,010 | USD | 889,642 | 2/6/2020 | HUS | 10,368 | - | 10,368 | ||||||||||||||||||
| CLP | 1,130,883 | USD | 1,141,246 | 2/6/2020 | HUS | - | (10,363 | ) | (10,363 | ) | ||||||||||||||||
| CLP | 1,130,883 | USD | 1,135,438 | 2/6/2020 | HUS | - | (4,555 | ) | (4,555 | ) | ||||||||||||||||
| CLP | 1,862,630 | USD | 1,871,107 | 2/6/2020 | HUS | - | (8,477 | ) | (8,477 | ) | ||||||||||||||||
| CLP | 1,995,675 | USD | 2,013,504 | 2/6/2020 | HUS | - | (17,829 | ) | (17,829 | ) | ||||||||||||||||
| USD | 16,876,120 | CLP | 17,794,770 | 2/6/2020 | HUS | - | (918,650 | ) | (918,650 | ) | ||||||||||||||||
| USD | 14,295,841 | CLP | 15,000,825 | 2/6/2020 | HUS | - | (704,984 | ) | (704,984 | ) | ||||||||||||||||
| USD | 2,887,817 | CLP | 3,060,035 | 2/6/2020 | HUS | - | (172,218 | ) | (172,218 | ) | ||||||||||||||||
| USD | 2,113,109 | CLP | 2,204,073 | 2/6/2020 | HUS | - | (90,964 | ) | (90,964 | ) | ||||||||||||||||
| USD | 947,683 | CLP | 989,007 | 2/6/2020 | HUS | - | (41,324 | ) | (41,324 | ) | ||||||||||||||||
| USD | 487,569 | CLP | 506,838 | 2/6/2020 | HUS | - | (19,269 | ) | (19,269 | ) | ||||||||||||||||
| USD | 487,357 | CLP | 506,838 | 2/6/2020 | HUS | - | (19,481 | ) | (19,481 | ) | ||||||||||||||||
See accompanying notes
33
American Beacon AHL Managed Futures Strategy FundSM
Consolidated Schedule of Investments
December 31, 2019
| Currency Purchased* | Currency Sold* | Settlement Date | Counterparty | Unrealized Appreciation | Unrealized (Depreciation) | Net Unrealized Appreciation (Depreciation) | ||||||||||||||||||||
| USD | 487,772 | CLP | 506,838 | 2/6/2020 | HUS | $ | - | $ | (19,066 | ) | $ | (19,066 | ) | |||||||||||||
| USD | 487,688 | CLP | 506,838 | 2/6/2020 | HUS | - | (19,150 | ) | (19,150 | ) | ||||||||||||||||
| USD | 389,806 | CLP | 405,471 | 2/6/2020 | HUS | - | (15,665 | ) | (15,665 | ) | ||||||||||||||||
| USD | 389,891 | CLP | 405,471 | 2/6/2020 | HUS | - | (15,580 | ) | (15,580 | ) | ||||||||||||||||
| USD | 390,872 | CLP | 405,471 | 2/6/2020 | HUS | - | (14,599 | ) | (14,599 | ) | ||||||||||||||||
| USD | 292,553 | CLP | 304,103 | 2/6/2020 | HUS | - | (11,550 | ) | (11,550 | ) | ||||||||||||||||
| USD | 235,097 | CLP | 243,916 | 2/6/2020 | HUS | - | (8,819 | ) | (8,819 | ) | ||||||||||||||||
| CNY | 358,391 | USD | 358,397 | 2/18/2020 | HUS | - | (6 | ) | (6 | ) | ||||||||||||||||
| CNY | 430,069 | USD | 429,738 | 2/18/2020 | HUS | 331 | - | 331 | ||||||||||||||||||
| PEN | 75,322 | USD | 75,283 | 2/25/2020 | RBS | 39 | - | 39 | ||||||||||||||||||
| PEN | 75,322 | USD | 75,283 | 2/25/2020 | RBS | 39 | - | 39 | ||||||||||||||||||
| PEN | 75,322 | USD | 74,667 | 2/25/2020 | RBS | 655 | - | 655 | ||||||||||||||||||
| PEN | 150,644 | USD | 150,566 | 2/25/2020 | RBS | 78 | - | 78 | ||||||||||||||||||
| PEN | 150,644 | USD | 149,324 | 2/25/2020 | RBS | 1,320 | - | 1,320 | ||||||||||||||||||
| PEN | 150,644 | USD | 149,517 | 2/25/2020 | RBS | 1,127 | - | 1,127 | ||||||||||||||||||
| PEN | 150,644 | USD | 149,421 | 2/25/2020 | RBS | 1,223 | - | 1,223 | ||||||||||||||||||
| PEN | 150,644 | USD | 149,378 | 2/25/2020 | RBS | 1,266 | - | 1,266 | ||||||||||||||||||
| PEN | 225,966 | USD | 224,163 | 2/25/2020 | RBS | 1,803 | - | 1,803 | ||||||||||||||||||
| PEN | 301,288 | USD | 298,884 | 2/25/2020 | RBS | 2,404 | - | 2,404 | ||||||||||||||||||
| PEN | 301,288 | USD | 298,629 | 2/25/2020 | RBS | 2,659 | - | 2,659 | ||||||||||||||||||
| PEN | 301,288 | USD | 298,627 | 2/25/2020 | RBS | 2,661 | - | 2,661 | ||||||||||||||||||
| PEN | 376,610 | USD | 376,362 | 2/25/2020 | RBS | 248 | - | 248 | ||||||||||||||||||
| PEN | 376,610 | USD | 373,292 | 2/25/2020 | RBS | 3,318 | - | 3,318 | ||||||||||||||||||
| PEN | 376,610 | USD | 373,465 | 2/25/2020 | RBS | 3,145 | - | 3,145 | ||||||||||||||||||
| PEN | 451,933 | USD | 451,634 | 2/25/2020 | RBS | 299 | - | 299 | ||||||||||||||||||
| PEN | 451,933 | USD | 451,497 | 2/25/2020 | RBS | 436 | - | 436 | ||||||||||||||||||
| PEN | 451,933 | USD | 447,956 | 2/25/2020 | RBS | 3,977 | - | 3,977 | ||||||||||||||||||
| PEN | 451,933 | USD | 447,889 | 2/25/2020 | RBS | 4,044 | - | 4,044 | ||||||||||||||||||
| PEN | 527,255 | USD | 522,590 | 2/25/2020 | RBS | 4,665 | - | 4,665 | ||||||||||||||||||
| PEN | 602,577 | USD | 602,094 | 2/25/2020 | RBS | 483 | - | 483 | ||||||||||||||||||
| PEN | 632,133 | USD | 627,217 | 2/25/2020 | RBS | 4,916 | - | 4,916 | ||||||||||||||||||
| PEN | 648,342 | USD | 643,109 | 2/25/2020 | RBS | 5,233 | - | 5,233 | ||||||||||||||||||
| PEN | 677,899 | USD | 677,359 | 2/25/2020 | RBS | 540 | - | 540 | ||||||||||||||||||
| USD | 1,692,122 | PEN | 1,732,408 | 2/25/2020 | RBS | - | (40,286 | ) | (40,286 | ) | ||||||||||||||||
| USD | 956,417 | PEN | 979,187 | 2/25/2020 | RBS | - | (22,770 | ) | (22,770 | ) | ||||||||||||||||
|
|
|
|
|
| |||||||||||||||||||||
| $ | 3,579,155 | (9,232,837 | ) | (5,653,682 | ) | |||||||||||||||||||||
|
|
|
|
|
| |||||||||||||||||||||
| * | All values denominated in USD |
| Glossary: | ||
| Counterparty Abbreviations: | ||
| DUB | Deutsche Bank AG | |
| HUS | HSBC Bank (USA) | |
| RBS | Royal Bank of Scotland PLC | |
| Currency Abbreviations: | ||
| BRL | Brazilian Real | |
| CLP | Chilean Peso | |
| CNY | Chinese Yuan | |
| COP | Colombian Peso | |
| EUR | Euro | |
| INR | Indian Rupee | |
| KRW | South Korean Won | |
| PEN | Peruvian Nuevo Sol | |
| PHP | Philippine Peso | |
| TWD | Taiwan Dollar | |
| USD | United States Dollar | |
See accompanying notes
34
American Beacon AHL Managed Futures Strategy FundSM
Consolidated Schedule of Investments
December 31, 2019
| Index Abbreviations: | ||
| CAC40 | Euronet Paris - French Stock Market Index. | |
| DAX | Deutsche Boerse AG German Stock Index. | |
| Euro S toxx 50 | Eurozone Blue-chip Index. | |
| FTSE 100 | Financial Times Stock Exchange 100 Index. | |
| FTSE/JSE Top 40 | Largest 40 companies ranked by full market value in the FTSE/JSEAll-Share Index. | |
| FTSE/MIB | Borsa Italiana - Italian Stock Market Index. | |
| Hang Seng | Hong Kong Stock Market Index. | |
| KOSPI | South Korean Stock Market Index. | |
| MSCI | Morgan Stanley Capital International. | |
| MSCI EAFE | Morgan Stanley Capital International - Europe, Australasia, and Far East. | |
| NASDAQ | National Association of Securities Dealers Automated Quotations. | |
| NIKKEI 225 | Nikkei Stock Average. | |
| OMXS30 | Stockholm Stock Exchange’s leading share index. | |
| Russell 2000 | U.S.Small-Cap Stock Market Index. | |
| S&P 500 | Standard & Poor’s U.S. EquityLarge-Cap Index. | |
| S&P/TSX | Canadian Equity Market Index. | |
| SPI 200 | Australian Equity Market Index Future. | |
| TOPIX | Tokyo Stock Exchange Tokyo Price Index. | |
| Exchange Abbreviations: | ||
| JSE | Johannesburg Stock Exchange. | |
| LME | London Metal Exchange. | |
| SGX | Singapore Stock Exchange. | |
| Other Abbreviations: | ||
| Bobl | Medium term debt that is issued by the Federal Republic of Germany. | |
| Bund | German Federal Government Bond. | |
| Buxl | Long term debt that is issued by the Federal Republic of Germany. | |
| EURIBOR | Euro Interbank Offered Rate. | |
| GILT | Bank of England Bonds. | |
| RBOB | Reformulated Gasoline Blendstock for Oxygen Blending. | |
| Sugar #11 | World Benchmark for raw sugar. | |
| ULSD | Ultra-low-sulfur diesel. | |
| WTI | West Texas Intermediate. | |
The Fund’s investments are summarized by level based on the inputs used to determine their values. As of December 31, 2019, the investments were classified as described below:
AHL Managed Futures Strategy Fund | Level 1 | Level 2 | Level 3 | Total | ||||||||||||||||||||||||
Assets | ||||||||||||||||||||||||||||
Short-Term Investments | $ | 21,740,982 | $ | 873,377,321 | $ | - | $ | 895,118,303 | ||||||||||||||||||||
|
|
|
|
|
|
|
| |||||||||||||||||||||
Total Investments in Securities - Assets | $ | 21,740,982 | $ | 873,377,321 | $ | - | $ | 895,118,303 | ||||||||||||||||||||
|
|
|
|
|
|
|
| |||||||||||||||||||||
Financial Derivative Instruments - Assets | ||||||||||||||||||||||||||||
Futures Contracts | $ | 26,858,729 | $ | 560,222 | $ | - | $ | 27,418,951 | ||||||||||||||||||||
Forward Foreign Currency Contracts | - | 3,579,155 | - | 3,579,155 | ||||||||||||||||||||||||
|
|
|
|
|
|
|
| |||||||||||||||||||||
Total Financial Derivative Instruments - Assets | $ | 26,858,729 | $ | 4,139,377 | $ | - | $ | 30,998,106 | ||||||||||||||||||||
|
|
|
|
|
|
|
| |||||||||||||||||||||
Financial Derivative Instruments - Liabilities | ||||||||||||||||||||||||||||
Futures Contracts | $ | (12,586,782 | ) | $ | (300,680 | ) | $ | - | $ | (12,887,462 | ) | |||||||||||||||||
Forward Foreign Currency Contracts | - | (9,232,837 | ) | - | (9,232,837 | ) | ||||||||||||||||||||||
|
|
|
|
|
|
|
| |||||||||||||||||||||
Total Financial Derivative Instruments - Liabilities | $ | (12,586,782 | ) | $ | (9,533,517 | ) | $ | - | $ | (22,120,299 | ) | |||||||||||||||||
|
|
|
|
|
|
|
| |||||||||||||||||||||
U.S. GAAP requires transfers between all levels to/from level 3 be disclosed. During the year ended December 31, 2019, there were no transfers into or out of Level 3.
See accompanying notes
35
American Beacon AHL TargetRisk FundSM
Consolidated Schedule of Investments
December 31, 2019
| Principal Amount* | Fair Value | ||||||||||||||
| FOREIGN SOVEREIGN OBLIGATIONS - 40.41% | |||||||||||||||
| Deutsche Bundesrepublik Inflation-Linked Bond, 0.500%, Due 4/15/2030, Series I/LA B F | EUR | 13,786,630 | $ | 18,333,584 | |||||||||||
| French Republic Government Bond OAT, | |||||||||||||||
0.100%, Due 3/1/2029, Series OATEA B | EUR | 7,070,980 | 8,748,052 | ||||||||||||
0.700%, Due 7/25/2030, Series OATEA B C | EUR | 6,840,925 | 9,091,061 | ||||||||||||
| United Kingdom Gilt Inflation-Linked, | |||||||||||||||
0.125%, Due 8/10/2028, Series 3MOA B | GBP | 4,160,240 | 6,831,508 | ||||||||||||
0.125%, Due 3/22/2029, Series 3MOA B | GBP | 9,785,840 | 16,276,477 | ||||||||||||
|
| ||||||||||||||
Total Foreign Sovereign Obligations (Cost $58,828,251) | 59,280,682 | ||||||||||||||
|
| ||||||||||||||
| U.S. TREASURY OBLIGATIONS - 27.18% | |||||||||||||||
| United States Treasury Inflation-Protected Security, | |||||||||||||||
0.500%, Due 4/15/2024A | $ | 12,243,480 | 12,441,417 | ||||||||||||
0.125%, Due 10/15/2024A | 3,008,910 | 3,026,229 | |||||||||||||
0.750%, Due 7/15/2028A | 6,150,840 | 6,470,805 | |||||||||||||
0.875%, Due 1/15/2029A | 10,191,100 | 10,821,899 | |||||||||||||
0.250%, Due 7/15/2029A | 7,041,930 | 7,110,264 | |||||||||||||
|
| ||||||||||||||
Total U.S. Treasury Obligations (Cost $39,749,800) | 39,870,614 | ||||||||||||||
|
| ||||||||||||||
| Shares | |||||||||||||||
| SHORT-TERM INVESTMENTS - 20.44% | |||||||||||||||
| Investment Companies - 3.53% | |||||||||||||||
| American Beacon U.S. Government Money Market Select Fund, Select Class, 1.52%D E F | 5,176,875 | 5,176,875 | |||||||||||||
|
| ||||||||||||||
| Principal Amount* | |||||||||||||||
| U.S. Treasury Obligations - 16.91% | |||||||||||||||
| U.S. Treasury Bills, | |||||||||||||||
0.253%, Due 6/4/2020F | $ | 8,000,000 | 7,947,418 | ||||||||||||
0.528%, Due 7/16/2020 | 17,000,000 | 16,857,811 | |||||||||||||
|
| ||||||||||||||
| 24,805,229 | |||||||||||||||
|
| ||||||||||||||
Total Short-Term Investments (Cost $29,985,386) | 29,982,104 | ||||||||||||||
|
| ||||||||||||||
TOTAL INVESTMENTS - 88.03% (Cost $128,563,437) | 129,133,400 | ||||||||||||||
OTHER ASSETS, NET OF LIABILITIES - 11.97% | 17,566,181 | ||||||||||||||
|
| ||||||||||||||
TOTAL NET ASSETS - 100.00% | $ | 146,699,581 | |||||||||||||
|
| ||||||||||||||
Percentages are stated as a percent of net assets. * In U.S. Dollars unless otherwise noted. | |||||||||||||||
A Inflation-Indexed Note.
B RegS - Security purchased under the Securities Act of 1933, which exempts from registration securities offered and sold outside of the United States. Such a security cannot be sold in the United States without either an effective registration statement filed pursuant to the Securities Act of 1933, or pursuant to an exemption from registration.
C Security exempt from registration under the Securities Act of 1933. These securities may be resold to qualified institutional buyers pursuant to Rule 144A. At the period end, the value of these securities amounted to $9,091,061 or 6.20% of net assets. The Fund has no right to demand registration of these securities.
D The Fund is affiliated by having the same investment advisor.
E7-day yield.
F All or a portion represents positions held by the American Beacon Cayman TargetRisk Co, Ltd.
GILT - Bank of England Bonds.
OAT - Obligations Assimilables du Trésor.
See accompanying notes
36
American Beacon AHL TargetRisk FundSM
Consolidated Schedule of Investments
December 31, 2019
| Long Futures Contracts Open on December 31, 2019: |
| |||||||||||||||
| Equity Futures Contracts | ||||||||||||||||
| Description | Number of Contracts | Expiration Date | Notional Amount | Contract Value | Unrealized Appreciation (Depreciation) | |||||||||||
| Amsterdam Index Futures | 28 | January 2020 | $ | 3,822,117 | $ | 3,797,995 | $ | (24,122 | ) | |||||||
| BIST 30 Index Futures | 395 | February 2020 | 932,737 | 938,200 | 5,463 | |||||||||||
| CAC40 Index Futures | 71 | January 2020 | 4,752,640 | 4,754,550 | 1,910 | |||||||||||
| DAX Index Futures | 11 | March 2020 | 4,110,734 | 4,086,114 | (24,620 | ) | ||||||||||
| Euro Stoxx 50 Index Futures | 131 | March 2020 | 5,464,199 | 5,479,493 | 15,294 | |||||||||||
| FTSE 100 Index Futures | 261 | March 2020 | 25,606,734 | 25,925,584 | 318,850 | |||||||||||
| FTSE China A50 Index Futures | 27 | January 2020 | 382,998 | 389,070 | 6,072 | |||||||||||
| FTSE/JSE Top 40 Index Futures | 29 | March 2020 | 1,076,686 | 1,063,430 | (13,256 | ) | ||||||||||
| FTSE/MIB Index Futures | 20 | March 2020 | 2,642,293 | 2,625,900 | (16,393 | ) | ||||||||||
| Hang Seng China Enterprises Index Futures | 25 | January 2020 | 1,782,235 | 1,798,410 | 16,175 | |||||||||||
| Hang Seng Index Futures | 10 | January 2020 | 1,799,916 | 1,813,970 | 14,054 | |||||||||||
| KOSPI 200 Index Futures | 55 | March 2020 | 3,325,687 | 3,509,879 | 184,192 | |||||||||||
| MSCI SING IX ETS Futures | 45 | January 2020 | 1,246,014 | 1,242,983 | (3,031 | ) | ||||||||||
| MSCI Taiwan Stock Index Futures | 26 | January 2020 | 1,201,568 | 1,194,960 | (6,608 | ) | ||||||||||
| NASDAQ 100E-Mini Futures | 55 | March 2020 | 9,425,071 | 9,627,475 | 202,404 | |||||||||||
| Nikkei 225 (SGX) Futures | 68 | March 2020 | 7,336,529 | 7,314,436 | (22,093 | ) | ||||||||||
| OMXS30 Index Futures | 56 | January 2020 | 1,070,658 | 1,057,210 | (13,448 | ) | ||||||||||
| S&P 500E-Mini Index Futures | 126 | March 2020 | 20,025,633 | 20,355,930 | 330,297 | |||||||||||
| S&P/TSX 60 Index Futures | 47 | March 2020 | 7,331,376 | 7,328,605 | (2,771 | ) | ||||||||||
| SGX NIFTY 50 Index Futures | 10 | January 2020 | 246,615 | 244,900 | (1,715 | ) | ||||||||||
| SPI 200 Futures | 11 | March 2020 | 1,309,092 | 1,274,255 | (34,837 | ) | ||||||||||
| TOPIX Index Futures | 25 | March 2020 | 3,955,365 | 3,959,781 | 4,416 | |||||||||||
|
|
|
|
|
| |||||||||||
| $ | 108,846,897 | $ | 109,783,130 | $ | 936,233 | |||||||||||
|
|
|
|
|
| |||||||||||
| Interest Rate Futures Contracts | ||||||||||||||||
| Description | Number of Contracts | Expiration Date | Notional Amount | Contract Value | Unrealized Appreciation (Depreciation) | |||||||||||
| Canadian10-Year Bond Futures | 30 | March 2020 | $ | 3,229,346 | $ | 3,176,158 | $ | (53,188 | ) | |||||||
| Euro OAT Futures | 40 | March 2020 | 7,365,323 | 7,303,164 | (62,159 | ) | ||||||||||
| Euro-Bobl Futures | 82 | March 2020 | 12,327,182 | 12,291,207 | (35,975 | ) | ||||||||||
| Euro-BTP Futures | 29 | March 2020 | 4,624,341 | 4,634,124 | 9,783 | |||||||||||
| Euro-Bund Futures | 73 | March 2020 | 14,120,709 | 13,960,420 | (160,289 | ) | ||||||||||
| Euro-Buxl Futures | 7 | March 2020 | 1,599,101 | 1,557,660 | (41,441 | ) | ||||||||||
| Japanese10-Year Government Bond Futures | 15 | March 2020 | 21,026,484 | 21,008,697 | (17,787 | ) | ||||||||||
| Korea10-Year Government Bond Futures | 17 | March 2020 | 1,921,810 | 1,915,137 | (6,673 | ) | ||||||||||
| Korea3-Year Government Bond Futures | 24 | March 2020 | 2,292,125 | 2,294,055 | 1,930 | |||||||||||
| Long GILT Futures | 192 | March 2020 | 33,745,497 | 33,412,584 | (332,913 | ) | ||||||||||
| U.S. Long Bond Futures | 83 | March 2020 | 13,203,803 | 12,940,219 | (263,584 | ) | ||||||||||
| U.S. Treasury10-Year Note Futures | 147 | March 2020 | 19,050,841 | 18,878,015 | (172,826 | ) | ||||||||||
| U.S. Treasury2-Year Note Futures | 33 | March 2020 | 7,115,720 | 7,111,500 | (4,220 | ) | ||||||||||
| U.S. Treasury5-Year Note Futures | 120 | March 2020 | 14,281,621 | 14,233,125 | (48,496 | ) | ||||||||||
| U.S. Ultra Bond Futures | 45 | March 2020 | 8,455,387 | 8,174,531 | (280,856 | ) | ||||||||||
|
|
|
|
|
| |||||||||||
| $ | 164,359,290 | $ | 162,890,596 | $ | (1,468,694 | ) | ||||||||||
|
|
|
|
|
| |||||||||||
| Centrally Cleared Swap Agreements Outstanding on December 31, 2019: |
| |||||||||||||||||||||||||||
| Credit Default Swaps on Credit Indices - Sell Protection(1) | ||||||||||||||||||||||||||||
| Index/Tranches | Fixed Rate (%) | Payment Frequency | Expiration Date | Implied Credit Spread at 12/31/2019(2) (%) | Curr | Notional Amount(3) (000s) | Premiums Paid (Received) | Fair Value | Unrealized Appreciation (Depreciation) | |||||||||||||||||||
| Markit CDXNA.HY-315-Year Index Version 1 | 5.00 | Quarterly | 12/20/2024 | 2.8054 | USD | 5,000 | $ | 482,796 | $ | 490,434 | $ | 7,638 | ||||||||||||||||
| iTraxx Europe Senior Financials | 5.00 | Quarterly | 12/20/2024 | 2.0728 | EUR | 10,000 | 1,388,615 | 1,546,800 | 158,185 | |||||||||||||||||||
See accompanying notes
37
American Beacon AHL TargetRisk FundSM
Consolidated Schedule of Investments
December 31, 2019
| Credit Default Swaps on Credit Indices - Sell Protection(1) | ||||||||||||||||||||||||||||
| Index/Tranches | Fixed Rate (%) | Payment Frequency | Expiration Date | Implied Credit Spread at 12/31/2019(2) (%) | Curr | Notional Amount(3) (000s) | Premiums Paid (Received) | Fair Value | Unrealized Appreciation (Depreciation) | |||||||||||||||||||
| iTraxx Europe Senior Financials | 1.00 | Quarterly | 12/20/2024 | 0.4422 | EUR | 45,000 | $ | 1,272,463 | $ | 1,418,582 | $ | 146,119 | ||||||||||||||||
| Markit CDXNA.HY-315-Year Index Version 1 | 1.00 | Quarterly | 12/20/2024 | 0.4530 | USD | 55,000 | 1,357,738 | 1,444,613 | 86,875 | |||||||||||||||||||
| Markit CDXNA.HY-315-Year Index Version 1 | 5.00 | Quarterly | 12/20/2024 | 2.8054 | USD | 20,000 | (225,419 | ) | 1,960,579 | 2,185,998 | ||||||||||||||||||
|
|
|
|
|
| |||||||||||||||||||||||
| $ | 4,276,193 | $ | 6,861,008 | $ | 2,584,815 | |||||||||||||||||||||||
|
|
|
|
|
| |||||||||||||||||||||||
| (1) | If the Fund is a seller of protection and a credit event occurs, as defined under the terms of that particular swap agreement, the Fund will either (i) pay to the buyer of protection an amount equal to the notional amount of the swap and take delivery of the referenced obligation or underlying securities comprising the referenced index or (ii) pay a net settlement amount in the form of cash or securities equal to the notional amount of the swap less the recovery value of the referenced obligation or underlying securities comprising the referenced index. |
| (2) | Implied credit spreads, represented in absolute terms, utilized in determining the fair value of credit default swaps agreements on corporate issues and sovereign issues of an emerging country as of period end serve as an indicator of the current status of the payment/performance risk and represent the likelihood or risk of default for the credit derivative. The implied credit spread of a particular referenced entity reflects the cost of buying/selling protection and may include upfront payments required to be made to enter into the agreement. Wider credit spreads represent a deterioration of the referenced entity’s credit soundness and a greater likelihood or risk of default or other credit event occurring as defined under the terms of the agreement. |
| (3) | The maximum potential amount the Fund could be required to pay as a seller of credit protection or receive as a buyer of credit protection if a credit event occurs as defined under the terms of that particular swap agreement. |
| OTC Swap Agreements Outstanding on December 31, 2019: |
| |||||||||||||||||||||||||||||
| Total Return Swap Agreements | ||||||||||||||||||||||||||||||
| Pay/Receive Floating Rate | Description | Reference Entity | Counter- party | Floating Rate | Payment Frequency | Expiration Date | Reference Quantity | Notional Amount | Premiums Paid (Received) | Unrealized Appreciation (Depreciation) | ||||||||||||||||||||
| Pay | 1-Month USD-LIBOR | BBUXALC INDEX | JPM | 0.000% | Monthly | 1/6/2020 | 207,000 | 22,464,307 | $ | 484 | $ | 616,433 | ||||||||||||||||||
|
|
|
| |||||||||||||||||||||||||||
| $ | 484 | $ | 616,433 | |||||||||||||||||||||||||||
|
|
|
| |||||||||||||||||||||||||||
| Forward Foreign Currency Contracts Open on December 31, 2019: |
| |||||||||||||||||||||||||
| Currency Purchased* | Currency Sold* | Settlement Date | Counterparty | Unrealized Appreciation | Unrealized (Depreciation) | Net Unrealized Appreciation (Depreciation) | ||||||||||||||||||||
| EUR | 786,498 | USD | 777,144 | 1/16/2020 | SSB | $ | 9,354 | $ | - | $ | 9,354 | |||||||||||||||
| EUR | 1,258,229 | USD | 1,243,471 | 1/16/2020 | SSB | 14,758 | - | 14,758 | ||||||||||||||||||
| EUR | 1,426,128 | USD | 1,422,577 | 1/16/2020 | SSB | 3,551 | - | 3,551 | ||||||||||||||||||
| USD | 22,772,769 | GBP | 22,937,584 | 1/16/2020 | SSB | - | (164,815 | ) | (164,815 | ) | ||||||||||||||||
| USD | 20,969,449 | EUR | 21,217,758 | 1/16/2020 | SSB | - | (248,309 | ) | (248,309 | ) | ||||||||||||||||
| USD | 18,395,540 | EUR | 18,613,370 | 1/16/2020 | SSB | - | (217,830 | ) | (217,830 | ) | ||||||||||||||||
| USD | 1,421,710 | EUR | 1,432,006 | 1/16/2020 | SSB | - | (10,296 | ) | (10,296 | ) | ||||||||||||||||
| USD | 1,242,270 | GBP | 1,257,030 | 1/16/2020 | SSB | - | (14,760 | ) | (14,760 | )�� | ||||||||||||||||
| USD | 776,147 | EUR | 781,768 | 1/16/2020 | SSB | - | (5,621 | ) | (5,621 | ) | ||||||||||||||||
| USD | 332,628 | EUR | 334,798 | 1/16/2020 | SSB | - | (2,170 | ) | (2,170 | ) | ||||||||||||||||
| USD | 235,267 | EUR | 238,059 | 1/16/2020 | SSB | - | (2,792 | ) | (2,792 | ) | ||||||||||||||||
| USD | 126,284 | GBP | 126,677 | 1/16/2020 | SSB | - | (393 | ) | (393 | ) | ||||||||||||||||
| USD | 114,448 | EUR | 115,294 | 1/16/2020 | SSB | - | (846 | ) | (846 | ) | ||||||||||||||||
| USD | 67,301 | JPY | 67,777 | 1/16/2020 | SSB | - | (476 | ) | (476 | ) | ||||||||||||||||
| USD | 28,549 | GBP | 28,779 | 1/16/2020 | SSB | - | (230 | ) | (230 | ) | ||||||||||||||||
| USD | 20,707 | CAD | 21,136 | 1/16/2020 | SSB | - | (429 | ) | (429 | ) | ||||||||||||||||
| USD | 20,140 | EUR | 20,271 | 1/16/2020 | SSB | - | (131 | ) | (131 | ) | ||||||||||||||||
| USD | 16,305 | JPY | 16,272 | 1/16/2020 | SSB | 33 | - | 33 | ||||||||||||||||||
| USD | 13,995 | CAD | 14,211 | 1/16/2020 | SSB | - | (216 | ) | (216 | ) | ||||||||||||||||
| USD | 9,551 | SGD | 9,635 | 1/16/2020 | SSB | - | (84 | ) | (84 | ) | ||||||||||||||||
| USD | 8,948 | CAD | 9,065 | 1/16/2020 | SSB | - | (117 | ) | (117 | ) | ||||||||||||||||
| USD | 7,413 | HKD | 7,432 | 1/16/2020 | SSB | - | (19 | ) | (19 | ) | ||||||||||||||||
See accompanying notes
38
American Beacon AHL TargetRisk FundSM
Consolidated Schedule of Investments
December 31, 2019
| Currency Purchased* | Currency Sold* | Settlement Date | Counterparty | Unrealized Appreciation | Unrealized (Depreciation) | Net Unrealized Appreciation (Depreciation) | ||||||||||||||||||||
| USD | 4,142 | EUR | 4,187 | 1/16/2020 | SSB | $ | - | $ | (45 | ) | $ | (45 | ) | |||||||||||||
| USD | 3,556 | TRY | 3,470 | 1/16/2020 | SSB | 86 | - | 86 | ||||||||||||||||||
| USD | 3,260 | TRY | 3,193 | 1/16/2020 | SSB | 67 | - | 67 | ||||||||||||||||||
| USD | 2,731 | TRY | 2,682 | 1/16/2020 | SSB | 49 | - | 49 | ||||||||||||||||||
| USD | 2,567 | SEK | 2,574 | 1/16/2020 | SSB | - | (7 | ) | (7 | ) | ||||||||||||||||
| USD | 1,472 | SEK | 1,487 | 1/16/2020 | SSB | - | (15 | ) | (15 | ) | ||||||||||||||||
|
|
|
|
|
| |||||||||||||||||||||
| $ | 27,898 | $ | (669,601 | ) | $ | (641,703 | ) | |||||||||||||||||||
|
|
|
|
|
| |||||||||||||||||||||
| * | All values denominated in USD |
| Glossary: | ||
| Counterparty Abbreviations: | ||
| JPM | JPMorgan Chase Bank, N.A. | |
| SSB | State Street Bank & Trust Co. | |
| Currency Abbreviations: | ||
| CAD | Canadian Dollar | |
| EUR | Euro | |
| GBP | Pound Sterling | |
| HKD | Hong Kong Dollar | |
| JPY | Japanese Yen | |
| SEK | Swedish Krona | |
| SGD | Singapore Dollar | |
| TRY | Turkish Lira | |
| USD | United States Dollar | |
| Index Abbreviations: | ||
| BBUXALC | Bloomberg Commodity ex-Agriculture and Livestock Capped Index. | |
| BIST 30 | Bora Istanbul 30 Index. | |
| CAC40 | Euronet Paris - French Stock Market Index. | |
| DAX | Deutsche Boerse AG German Stock Index. | |
| Euro Stoxx 50 | Eurozone Blue-chip Index. | |
| FTSE 100 | Financial Times Stock Exchange 100 Index. | |
| FTSE China A50 | Financial Times Stock Exchange China A50 Index. | |
| FTSE/JSE Top 40 | Largest 40 companies ranked by full market value in the FTSE/JSEAll-Share Index. | |
| FTSE/MIB | Borsa Italiana - Italian Stock Market Index. | |
| Hang Seng | Hong Kong Stock Market Index. | |
| KOSPI | South Korean Stock Market Index. | |
| MSCI | Morgan Stanley Capital International. | |
| MSCI SING IX ETS | Morgan Stanley Capital International Singapore Exchange-Traded Funds. | |
| NASDAQ | National Association of Securities Dealers Automated Quotations. | |
| NIKKEI 225 | Nikkei Stock Average. | |
| OMXS30 | Stockholm Stock Exchange’s leading share index. | |
| S&P 500 | Standard & Poor’s U.S. EquityLarge-Cap Index. | |
| S&P/TSX | Canadian Equity Market Index. | |
| SGX NIFTY | Singapore Stock Exchange NIFTY. | |
| SPI 200 | Australian Equity Market Index Future. | |
| TOPIX | Tokyo Stock Exchange Tokyo Price Index. | |
| Exchange Abbreviations: | ||
| JSE | Johannesburg Stock Exchange. | |
| SGX | Singapore Stock Exchange. | |
| OTC | Over-the-Counter. | |
See accompanying notes
39
American Beacon AHL TargetRisk FundSM
Consolidated Schedule of Investments
December 31, 2019
| Other Abbreviations: | ||
| Bobl | Medium term debt that is issued by the Federal Republic of Germany. | |
| BTP | Buoni del Tesoro Poliennali. | |
| Bund | German Federal Government Bond. | |
| Buxl | Long term debt that is issued by the Federal Republic of Germany. | |
| CDX | Credit Default Swap Index. | |
| GILT | Bank of England Bonds. | |
| iTraxx | Credit Default Swap Index. | |
| LIBOR | London Interbank Offered Rate. | |
| OAT | Obligations Assimilables du Trésor. | |
The Fund’s investments are summarized by level based on the inputs used to determine their values. As of December 31, 2019, the investments were classified as described below:
AHL TargetRisk Fund | Level 1 | Level 2 | Level 3 | Total | ||||||||||||||||||||||||
Assets |
| |||||||||||||||||||||||||||
Foreign Sovereign Obligations | $ | - | $ | 59,280,682 | $ | - | $ | 59,280,682 | ||||||||||||||||||||
U.S. Treasury Obligations | - | 39,870,614 | - | 39,870,614 | ||||||||||||||||||||||||
Short-Term Investments | 5,176,875 | 24,805,229 | - | 29,982,104 | ||||||||||||||||||||||||
|
|
|
|
|
|
|
| |||||||||||||||||||||
Total Investments in Securities - Assets | $ | 5,176,875 | $ | 123,956,525 | $ | - | $ | 129,133,400 | ||||||||||||||||||||
|
|
|
|
|
|
|
| |||||||||||||||||||||
Financial Derivative Instruments - Assets |
| |||||||||||||||||||||||||||
Futures Contracts | $ | 1,110,840 | $ | - | $ | - | $ | 1,110,840 | ||||||||||||||||||||
Swap Contract Agreements | - | 3,201,248 | - | 3,201,248 | ||||||||||||||||||||||||
Forward Foreign Currency Contracts | - | 27,898 | - | 27,898 | ||||||||||||||||||||||||
|
|
|
|
|
|
|
| |||||||||||||||||||||
Total Financial Derivative Instruments - Assets | $ | 1,110,840 | $ | 3,229,146 | $ | - | $ | 4,339,986 | ||||||||||||||||||||
|
|
|
|
|
|
|
| |||||||||||||||||||||
Financial Derivative Instruments - Liabilities |
| |||||||||||||||||||||||||||
Futures Contracts | $ | (1,643,301 | ) | $ | - | $ | - | $ | (1,643,301 | ) | ||||||||||||||||||
Forward Foreign Currency Contracts | - | (669,601 | ) | - | (669,601 | ) | ||||||||||||||||||||||
|
|
|
|
|
|
|
| |||||||||||||||||||||
Total Financial Derivative Instruments - Liabilities | $ | (1,643,301 | ) | $ | (669,601 | ) | $ | - | $ | (2,312,902 | ) | |||||||||||||||||
|
|
|
|
|
|
|
| |||||||||||||||||||||
U.S. GAAP requires transfers between all levels to/from level 3 be disclosed. During the year ended December 31, 2019, there were no transfers into or out of Level 3.
See accompanying notes
40
American Beacon FundsSM
Statements of Assets and Liabilities
December 31, 2019
| AHL Managed Futures Strategy FundA | AHL TargetRisk FundA | |||||||||||
Assets: |
| |||||||||||
Investments in unaffiliated securities, at fair value† | $ | 873,377,321 | $ | 123,956,525 | ||||||||
Investments in affiliated securities, at fair value‡ | 21,740,982 | 5,176,875 | ||||||||||
Foreign currency, at fair value^ | - | 454,182 | ||||||||||
Foreign currency deposits with brokers for futures contracts and swap agreements, at fair value¤ | 40,790,395 | 3,662,561 | ||||||||||
Cash | 5 | - | ||||||||||
Cash collateral held at custodian for the benefit of the broker | 11,958,121 | 2,080,000 | ||||||||||
Dividends and interest receivable | 26,442 | 182,475 | ||||||||||
Deposits with broker for futures contracts and swap agreements | 50,603,820 | 1,429,634 | ||||||||||
Receivable for fund shares sold | 8,249,446 | 4,170,395 | ||||||||||
Receivable for expense reimbursement (Note 2) | 74,940 | 19,661 | ||||||||||
Unrealized appreciation from forward foreign currency contracts | 3,579,155 | 27,898 | ||||||||||
Cash collateral held at broker | - | 1,360,000 | ||||||||||
Receivable for variation margin on open futures contracts (Note 5) | 14,346,944 | - | ||||||||||
Receivable for variation margin on open centrally cleared swap agreements (Note 5) | - | 6,861,008 | ||||||||||
Unrealized appreciation from swap agreements | - | 616,917 | ||||||||||
Prepaid expenses | 59,140 | 73,758 | ||||||||||
|
|
|
| |||||||||
Total assets | 1,024,806,711 | 150,071,889 | ||||||||||
|
|
|
| |||||||||
Liabilities: |
| |||||||||||
Payable for investments purchased | - | 1,461,740 | ||||||||||
Payable for fund shares redeemed | 3,046,135 | 39,669 | ||||||||||
Payable for variation margin on open futures contracts (Note 5) | - | 544,934 | ||||||||||
Cash due to custodian | - | 445,938 | ||||||||||
Management andsub-advisory fees payable (Note 2) | 1,197,254 | 104,220 | ||||||||||
Service fees payable (Note 2) | 16,340 | 10,734 | ||||||||||
Transfer agent fees payable (Note 2) | 26,987 | 12,798 | ||||||||||
Custody and fund accounting fees payable | 217,312 | 10,052 | ||||||||||
Professional fees payable | 71,118 | 72,036 | ||||||||||
Payable for prospectus and shareholder reports | 70,085 | 34 | ||||||||||
Unrealized depreciation from forward foreign currency contracts | 9,232,837 | 669,601 | ||||||||||
Other liabilities | 13,243 | 552 | ||||||||||
|
|
|
| |||||||||
Total liabilities | 13,891,311 | 3,372,308 | ||||||||||
|
|
|
| |||||||||
Net assets | $ | 1,010,915,400 | $ | 146,699,581 | ||||||||
|
|
|
| |||||||||
Analysis of net assets: |
| |||||||||||
Paid-in-capital | $ | 1,002,332,299 | $ | 143,821,655 | ||||||||
Total distributable earnings (deficits)B | 8,583,101 | 2,877,926 | ||||||||||
|
|
|
| |||||||||
Net assets | $ | 1,010,915,400 | $ | 146,699,581 | ||||||||
|
|
|
| |||||||||
See accompanying notes
41
American Beacon FundsSM
Statements of Assets and Liabilities
December 31, 2019
| AHL Managed Futures Strategy FundA | AHL TargetRisk FundA | |||||||||||
Shares outstanding at no par value (unlimited shares authorized): |
| |||||||||||
Institutional Class | 34,027,479 | 1,043,445 | ||||||||||
|
|
|
| |||||||||
Y Class | 62,346,545 | 9,733,771 | ||||||||||
|
|
|
| |||||||||
Investor Class | 1,858,264 | 697,771 | ||||||||||
|
|
|
| |||||||||
A ClassC | 419,726 | 121,209 | ||||||||||
|
|
|
| |||||||||
C ClassC | 646,642 | 471,785 | ||||||||||
|
|
|
| |||||||||
Net assets: |
| |||||||||||
Institutional Class | $ | 347,611,671 | $ | 12,692,260 | ||||||||
|
|
|
| |||||||||
Y Class | $ | 634,005,786 | $ | 118,366,001 | ||||||||
|
|
|
| |||||||||
Investor Class | $ | 18,716,672 | $ | 8,469,551 | ||||||||
|
|
|
| |||||||||
A ClassC | $ | 4,229,124 | $ | 1,469,217 | ||||||||
|
|
|
| |||||||||
C ClassC | $ | 6,352,147 | $ | 5,702,552 | ||||||||
|
|
|
| |||||||||
Net asset value, offering and redemption price per share: |
| |||||||||||
Institutional Class | $ | 10.22 | $ | 12.16 | ||||||||
|
|
|
| |||||||||
Y Class | $ | 10.17 | $ | 12.16 | ||||||||
|
|
|
| |||||||||
Investor Class | $ | 10.07 | $ | 12.14 | ||||||||
|
|
|
| |||||||||
A ClassC | $ | 10.08 | $ | 12.12 | ||||||||
|
|
|
| |||||||||
A Class (offering price) | $ | 10.69 | $ | 12.86 | ||||||||
|
|
|
| |||||||||
C ClassC | $ | 9.82 | $ | 12.09 | ||||||||
|
|
|
| |||||||||
† Cost of investments in unaffiliated securities | $ | 873,186,174 | $ | 123,386,562 | ||||||||
‡ Cost of investments in affiliated securities | $ | 21,740,982 | $ | 5,176,875 | ||||||||
¤ Cost of foreign currency deposits with broker for futures contracts and swap agreements | $ | 40,248,290 | $ | 3,639,806 | ||||||||
^ Cost of foreign currency | $ | - | $ | 455,957 | ||||||||
| A Consolidated financial statement. See Note 1 in the Notes to Financial Statements for additional information. |
| |||||||||||
| B The Fund’s investments in affiliated securities did not have unrealized appreciation (depreciation) at year end. |
| |||||||||||
| C Class commenced operations April 30, 2019 in the AHL TargetRisk Fund (Note 1). |
| |||||||||||
See accompanying notes
42
American Beacon FundsSM
Statements of Operations
For the year ended December 31, 2019
| AHL Managed Futures Strategy FundA | AHL TargetRisk FundA | |||||||||||
Investment income: |
| |||||||||||
Dividend income from unaffiliated securities | $ | 1,324 | $ | - | ||||||||
Dividend income from affiliated securities (Note 8) | 493,014 | 68,798 | ||||||||||
Interest income (net of foreign taxes)† | 21,294,119 | 361,754 | ||||||||||
|
|
|
| |||||||||
Total investment income | 21,788,457 | 430,552 | ||||||||||
|
|
|
| |||||||||
Expenses: |
| |||||||||||
Management andsub-advisory fees (Note 2) | 13,898,811 | 555,389 | ||||||||||
Transfer agent fees: | ||||||||||||
Institutional Class (Note 2) | 158,922 | 2,299 | ||||||||||
Y Class (Note 2) | 441,931 | 20,902 | ||||||||||
Investor Class | 1,760 | 2,957 | ||||||||||
A Class | 97 | 2,192 | ||||||||||
C Class | 394 | 2,225 | ||||||||||
Custody and fund accounting fees | 1,497,880 | 70,863 | ||||||||||
Professional fees | 154,322 | 216,945 | ||||||||||
Registration fees and expenses | 168,144 | 96,173 | ||||||||||
Service fees (Note 2): | ||||||||||||
Investor Class | 65,737 | 13,859 | ||||||||||
A Class | 3,136 | 52 | ||||||||||
C Class | 4,314 | 991 | ||||||||||
Distribution fees (Note 2): | ||||||||||||
A Class | 10,283 | 1,084 | ||||||||||
C Class | 59,717 | 15,902 | ||||||||||
Prospectus and shareholder report expenses | 188,976 | 6,884 | ||||||||||
Trustee fees (Note 2) | 78,425 | 4,058 | ||||||||||
Dividends and interest on securities sold short | 4,119 | - | ||||||||||
Other expenses | 69,259 | 12,320 | ||||||||||
|
|
|
| |||||||||
Total expenses | 16,806,227 | 1,025,095 | ||||||||||
|
|
|
| |||||||||
Net fees waived and expenses (reimbursed) (Note 2) | (176,006 | ) | (312,636 | ) | ||||||||
|
|
|
| |||||||||
Net expenses | 16,630,221 | 712,459 | ||||||||||
|
|
|
| |||||||||
Net investment income (loss) | 5,158,236 | (281,907 | ) | |||||||||
|
|
|
| |||||||||
Realized and unrealized gain (loss) from investments: |
| |||||||||||
Net realized gain (loss) from: | ||||||||||||
Investments in unaffiliated securitiesB | (14,227 | ) | 577,575 | |||||||||
Foreign currency transactions | 1,234,034 | (145,216 | ) | |||||||||
Forward foreign currency contracts | 1,796,870 | (292,026 | ) | |||||||||
Futures contracts | 20,387,728 | 7,035,986 | ||||||||||
Swap agreements | - | (171,091 | ) | |||||||||
Change in net unrealized appreciation (depreciation) of: | ||||||||||||
Investments in unaffiliated securitiesC | 190,808 | 569,963 | ||||||||||
Foreign currency transactions | 488,602 | 22,615 | ||||||||||
Forward foreign currency contracts | (5,882,017 | ) | (641,703 | ) | ||||||||
Futures contracts | (17,495,822 | ) | (532,461 | ) | ||||||||
Swap agreements | - | 3,106,750 | ||||||||||
|
|
|
| |||||||||
Net gain from investments | 705,976 | 9,530,392 | ||||||||||
|
|
|
| |||||||||
Net increase in net assets resulting from operations | $ | 5,864,212 | $ | 9,248,485 | ||||||||
|
|
|
| |||||||||
† Foreign taxes | $ | 117,261 | $ | 12,374 | ||||||||
A Consolidated financial statement. See Note 1 in the Notes to Financial Statements for additional information. |
| |||||||||||
B The Fund did not recognize net realized gains (losses) from the sale of investments in affiliated securities. |
| |||||||||||
C The Fund’s investments in affiliated securities did not have a change in unrealized appreciation (depreciation) at year end. |
| |||||||||||
See accompanying notes
43
American Beacon FundsSM
Statements of Changes in Net Assets
| AHL Managed Futures Strategy FundA | AHL TargetRisk FundA | |||||||||||||||||||||||||||
| Year Ended December 31, 2019 | Year Ended December 31, 2018 | Year Ended December 31, 2019 | Year EndedB December 31, 2018 | |||||||||||||||||||||||||
Increase (decrease) in net assets: |
| |||||||||||||||||||||||||||
Operations: |
| |||||||||||||||||||||||||||
Net investment income (loss) | $ | 5,158,236 | $ | 1,065,554 | $ | (281,907 | ) | $ | - | |||||||||||||||||||
Net realized gain (loss) from investments in unaffiliated securities, foreign currency transactions, forward foreign currency contracts, futures contracts, and swap agreements | 23,404,405 | (356,327 | ) | 7,005,228 | - | |||||||||||||||||||||||
Change in net unrealized appreciation (depreciation) of investments in unaffiliated securities, foreign currency transactions, forward foreign currency contracts, futures contracts, and swap agreements | (22,698,429 | ) | 24,815,639 | 2,525,164 | - | |||||||||||||||||||||||
|
|
|
|
|
|
|
| |||||||||||||||||||||
Net increase in net assets resulting from operations | 5,864,212 | 25,524,866 | 9,248,485 | - | ||||||||||||||||||||||||
|
|
|
|
|
|
|
| |||||||||||||||||||||
Distributions to shareholders: |
| |||||||||||||||||||||||||||
Total retained earnings: | ||||||||||||||||||||||||||||
Institutional Class | (15,911,068 | ) | (7,171,786 | ) | (547,525 | ) | - | |||||||||||||||||||||
Y Class | (26,890,090 | ) | (8,502,485 | ) | (4,646,898 | ) | - | |||||||||||||||||||||
Investor Class | (742,167 | ) | (252,884 | ) | (552,502 | ) | - | |||||||||||||||||||||
A ClassC | (165,970 | ) | (59,819 | ) | (59,924 | ) | - | |||||||||||||||||||||
C ClassC | (225,505 | ) | (32,986 | ) | (232,392 | ) | - | |||||||||||||||||||||
|
|
|
|
|
|
|
| |||||||||||||||||||||
Net distributions to shareholders | (43,934,800 | ) | (16,019,960 | ) | (6,039,241 | ) | - | |||||||||||||||||||||
|
|
|
|
|
|
|
| |||||||||||||||||||||
Capital share transactions (Note 11): |
| |||||||||||||||||||||||||||
Proceeds from sales of shares | 387,529,072 | 562,411,814 | 154,498,103 | 20,000,000 | ||||||||||||||||||||||||
Reinvestment of dividends and distributions | 41,023,690 | 14,959,325 | 6,001,429 | - | ||||||||||||||||||||||||
Cost of shares redeemed | (302,826,349 | ) | (186,100,916 | ) | (42,009,205 | ) | - | |||||||||||||||||||||
|
|
|
|
|
|
|
| |||||||||||||||||||||
Net increase in net assets from capital share transactions | 125,726,413 | 391,270,223 | 118,490,327 | 20,000,000 | ||||||||||||||||||||||||
|
|
|
|
|
|
|
| |||||||||||||||||||||
Net increase in net assets | 87,655,825 | 400,775,129 | 121,699,571 | 20,000,000 | ||||||||||||||||||||||||
|
|
|
|
|
|
|
| |||||||||||||||||||||
Net assets: |
| |||||||||||||||||||||||||||
Beginning of period | 923,259,575 | 522,484,446 | 25,000,010 | 5,000,010 | D | |||||||||||||||||||||||
|
|
|
|
|
|
|
| |||||||||||||||||||||
End of period | $ | 1,010,915,400 | $ | 923,259,575 | $ | 146,699,581 | $ | 25,000,010 | ||||||||||||||||||||
|
|
|
|
|
|
|
| |||||||||||||||||||||
A Consolidated financial statement. See Note 1 in the Notes to Financial Statements for additional information. |
| |||||||||||||||||||||||||||
B Commenced operations December 31, 2018 (Note 1). |
| |||||||||||||||||||||||||||
C Class commenced operations April 30, 2019 in the AHL TargetRisk Fund (Note 1). |
| |||||||||||||||||||||||||||
D Seed capital. |
| |||||||||||||||||||||||||||
See accompanying notes
44
American Beacon FundsSM
December 31, 2019
1. Organization and Significant Accounting Policies
American Beacon Funds (the “Trust”) is organized as a Massachusetts business trust. The Funds, each a series within the Trust, are registered under the Investment Company Act of 1940, as amended (the “Act”), asnon-diversified,open-end management investment companies. As of December 31, 2019, the Trust consists ofthirty-two active series, two of which are presented in this filing: American Beacon AHL Managed Futures Strategy Fund and American Beacon AHL TargetRisk Fund (collectively, the “Funds” and each individually a “Fund”). The remaining thirty active series are reported in separate filings.
American Beacon Advisors, Inc. (the “Manager”), a Delaware corporation and a wholly-owned subsidiary of Resolute Investment Managers, Inc. (“RIM”), was organized in 1986 to provide business management, advisory, administrative, and asset management consulting services to the Trust and other investors. The Manager is registered as an investment advisor under the Investment Advisers Act of 1940, as amended (the “Advisers Act”). RIM is, in turn, a wholly-owned subsidiary of Resolute Acquisition, Inc., which is a wholly-owned subsidiary of Resolute Topco, Inc., a wholly-owned subsidiary of Resolute Investment Holdings, LLC (“RIH”). RIH is owned primarily by Kelso Investment Associates VIII, L.P., KEP VI, LLC and Estancia Capital Partners L.P., investment funds affiliated with Kelso & Company, L.P. (“Kelso”) or Estancia Capital Management, LLC (“Estancia”), which are private equity firms.
Recently Adopted Accounting Pronouncements
In March 2017, the Financial Accounting Standards Board (“FASB”) issued Accounting Standards Update (“ASU”)2017-08,Premium Amortization of Purchased Callable Debt Securities. The amendments in the ASU shorten the premium amortization period on a purchased callable debt security from the security’s contractual life to the earliest call date. It is anticipated that this change will enhance disclosures by reducing losses recognized when a security is called on an earlier date. This ASU is effective for fiscal years beginning after December 15, 2018, and has been adopted accordingly with no material impact on the financial statements and other disclosures.
In August 2018, the FASB issued ASU2018-13,Fair Value Measurement (“Topic 820”). The amendments in the ASU impact disclosure requirements for fair value measurement. It is anticipated that this change will enhance the effectiveness of disclosures in the notes to the financial statements. This ASU is effective for fiscal years beginning after December 15, 2019. Early adoption is permitted and can include the entire standard or certain provisions that exclude or amend disclosures. For the year ended December 31, 2019, the Funds have chosen to adopt the standard. The adoption of this ASU guidance did not have a material impact on the financial statements and other disclosures.
Class Disclosure
On April 30, 2019, the AHL TargetRisk Fund created the A and C Classes, new classes made available for sale through intermediary organizations pursuant to the Fund’s registration statement filed with the United States Securities and Exchange Commission (the “SEC”).
45
American Beacon FundsSM
Notes to Financial Statements
December 31, 2019
Each Fund has multiple classes of shares designed to meet the needs of different groups of investors. The following table sets forth the differences amongst the classes:
Class | Eligible Investors | Minimum Initial Investments | ||||
| Institutional | Large institutional investors - sold directly or through intermediary channels. | $ | 250,000 | |||
| Y Class | Large institutional retirement plan investors - sold directly or through intermediary channels. | $ | 100,000 | |||
| Investor | All investors using intermediary organizations, such as broker-dealers or retirement plan sponsors. | $ | 2,500 | |||
| A Class | All investors who invest through intermediary organizations, such as broker-dealers or third party administrator. Retail investors who invest directly through a financial intermediary such as a broker, bank, or registered investment advisor which may include afront-end sales charge and a contingent deferred sales charge (“CDSC”). | $ | 2,500 | |||
| C Class | Retail investors who invest directly through a financial intermediary such as a broker or through employee directed benefit plans with applicable sales charges which may include CDSC. | $ | 1,000 | |||
Each class offered by the Trust has equal rights as to assets and voting privileges. Income andnon-class specific expenses are allocated daily to each class based on the relative net assets. Realized and unrealized capital gains and losses of each class are allocated daily based on the relative net assets of each class of the respective Fund. Class specific expenses, where applicable, currently include service, distribution, transfer agent fees, andsub-transfer agent fees that vary amongst the classes as described more fully in Note 2.
Consolidation of Subsidiaries
The Schedules of Investments of the AHL Managed Futures Strategy Fund and the AHL TargetRisk Fund are consolidated to include the accounts of the American Beacon Cayman Managed Futures Strategy Fund, Ltd. and American Beacon Cayman TargetRisk Fund, Ltd., respectively, each of which are wholly-owned and controlled subsidiaries (the “Subsidiaries”) of the Funds. All intercompany accounts and transactions have been eliminated in consolidation for the Funds.
For Federal tax purposes, taxable income for each Fund and its Subsidiary are calculated separately. The Subsidiaries are classified as controlled foreign corporations under the Internal Revenue Code of 1986 (the “Code”) and each Subsidiary’s taxable income is included in the calculation of the applicable Fund’s taxable income. Net losses of the Subsidiaries are not deductible by the Funds either in the current period or future periods. The Subsidiaries have a fiscal year end of December 31st for financial statement consolidation purposes and a nonconforming tax year end of November 30th.
Each Fund may invest up to 25% of its total assets in its Subsidiary, which acts as an investment vehicle in order to effect certain investments consistent with the Fund’s investment objectives and policies. The Funds expect to achieve a significant portion of their exposure to commodities and commodities-related investments through investment in the Subsidiaries. Unlike the Funds, the Subsidiaries may invest without limitation in commodities and commodities-related investments.
Fund | Inception Date of Subsidiary | Subsidiary Net Assets at December 31, 2019 | % of Total Net Assets of the Fund at December 31, 2019 | |||||||||
American Beacon Cayman Managed Futures Strategy Fund, Ltd. | August 19, 2014 | $ | 240,680,087 | 23.8 | % | |||||||
American Beacon Cayman TargetRisk Fund, Ltd. | December 31, 2018 | 29,312,010 | 20.0 | % | ||||||||
46
American Beacon FundsSM
Notes to Financial Statements
December 31, 2019
CFTC Regulation
On August 13, 2013, the Commodity Futures Trading Commission (“CFTC”) adopted rules to harmonize conflicting SEC and CFTC disclosure, reporting and recordkeeping requirements for registered investment companies that do not meet an exemption from the definition of commodity pool. The harmonization rules provide that the CFTC will accept the SEC’s disclosure, reporting, and recordkeeping regime as substituted compliance for substantially all of the otherwise applicable CFTC regulations as long as such investment companies meet the applicable SEC requirements.
The Funds are commodity pools, as defined in the regulation of the CFTC and operated by the Manager, a commodity pool operator regulated by the CFTC.
Significant Accounting Policies
The following is a summary of significant accounting policies, consistently followed by the Funds in preparation of the financial statements. The Funds are considered investment companies and accordingly, follow the investment company accounting and reporting guidance of the FASB Accounting Standards Codification Topic 946,Financial Services – Investment Companies,a part of Generally Accepted Accounting Principles (“U.S. GAAP”).
Security Transactions and Investment Income
Security transactions are recorded as of the trade date for financial reporting purposes. Securities purchased or sold on a when-issued or delayed-delivery basis may be settled beyond a standard settlement period for the security after the trade date.
Dividend income, net of foreign taxes, is recorded on theex-dividend date, except certain dividends from foreign securities which are recorded as soon as the information is available to the Funds. Interest income, net of foreign taxes, is earned from settlement date, recorded on the accrual basis, and adjusted, if necessary, for accretion of discounts and amortization of premiums. Realized gains (losses) from securities sold are determined based on specific lot identification.
Distributions to Shareholders
The Funds distribute most or all of its net earnings and realized gains, if any, each taxable year in the form of dividends from net investment income and distributions of realized net capital gains and net gains from foreign currency transactions on an annual basis. The Funds do not have a fixed dividend rate and do not guarantee that it will pay any distributions in any particular period. Dividends to shareholders are determined in accordance with federal income tax regulations, which may differ in amount and character from net investment income and realized gains recognized for purposes of U.S. GAAP. To the extent necessary to fully distribute capital gains, the Funds may designate earnings and profits distributed to shareholders on the redemption of shares.
Allocation of Income, Trust Expenses, Gains, and Losses
Investment income, realized and unrealized gains and losses from investments of the Funds are allocated daily to each class of shares based upon the relative proportion of net assets of each class to the total net assets of the Funds. Expenses directly charged or attributable to the Fund will be paid from the assets of the Fund. Generally, expenses of the Trust will be allocated among and charged to the assets of the Funds on a basis that the Trust’s Board of Trustees (the “Board”) deems fair and equitable, which may be based on the relative net assets of the Funds or nature of the services performed and relative applicability to the Funds.
47
American Beacon FundsSM
Notes to Financial Statements
December 31, 2019
Use of Estimates
The preparation of financial statements in conformity with U.S. GAAP requires management to make estimates and assumptions that affect the amounts reported in the financial statements and accompanying notes. Actual results may differ from those estimated.
Other
Under the Trust’s organizational documents, its officers and trustees are indemnified against certain liabilities arising out of the performance of their duties to the Trust. In the normal course of business, the Trust enters into contracts that provide indemnification to the other party or parties against potential costs or liabilities. The Trust’s maximum exposure under these arrangements is dependent on claims that may be made in the future and, therefore, cannot be estimated. The Trust has had no prior claims or losses pursuant to any such agreement.
2. Transactions with Affiliates
Management and InvestmentSub-Advisory Agreements
The AHL Managed Futures Strategy Fund and the Manager are parties to a Management Agreement that obligates the Manager to provide the Fund with investment advisory and administrative services. As compensation for performing the duties under the Management Agreement, the Manager will receive an annualized management fee based on a percentage of the Fund’s average daily net assets that is calculated and accrued daily, equal to 0.35%.
The AHL TargetRisk Fund and the Manager are parties to a Management Agreement that obligates the Manager to provide the Fund with investment advisory and administrative services. As compensation for preforming the duties under the Management Agreement, the Manager will receive an annualized management fee based on a percentage of the Fund’s average daily net assets that is calculated and accrued daily according to the following schedule:
First $5 billion | 0.35 | % | ||
Next $5 billion | 0.325 | % | ||
Next $10 billion | 0.30 | % | ||
Over $20 billion | 0.275 | % |
The Trust, on behalf of the Funds, and the Manager have entered into an Investment Advisory Agreement with AHL Partners LLP (the“Sub-Advisor”), pursuant to which each Fund has agreed to pay an annualizedsub-advisory fee that is calculated and accrued daily based on the Funds’ average daily net assets according to the following schedules:
AHL Managed Futures Strategy Fund
All Assets | 1.00 | % |
AHL TargetRisk Fund
First $500 million | 0.55 | % | ||
Next $500 million | 0.50 | % | ||
Next $500 million | 0.45 | % | ||
Over $1.5 billion | 0.40 | % |
48
American Beacon FundsSM
Notes to Financial Statements
December 31, 2019
The Management andSub-Advisory Fees paid by the Funds for the year ended December 31, 2019 were as follows:
AHL Managed Futures Strategy Fund
| Effective Fee Rate | Amount of Fees Paid | |||||||||||
Management Fees | 0.35 | % | $ | 3,601,142 | ||||||||
Sub-Advisor Fees | 1.00 | % | 10,297,669 | |||||||||
|
|
|
| |||||||||
Total | 1.35 | % | $ | 13,898,811 | ||||||||
|
|
|
| |||||||||
AHL TargetRisk Fund
| Effective Fee Rate | Amount of Fees Paid | |||||||||||
Management Fees | 0.35 | % | $ | 215,444 | ||||||||
Sub-Advisor Fees | 0.55 | % | 339,945 | |||||||||
|
|
|
| |||||||||
Total | 0.90 | % | $ | 555,389 | ||||||||
|
|
|
| |||||||||
Distribution Plans
The Funds, except for the A and C Classes of the Funds, have adopted a “defensive” Distribution Plan (the “Plan”) in accordance with Rule12b-1 under the Act, pursuant to which no separate fees may be charged to the Funds for distribution purposes. However, the Plan authorizes the management fee received by the Manager and the investment advisors hired by the Manager to be used for distribution purposes. Under this Plan, the Funds do not intend to compensate the Manager or any other party, either directly or indirectly, for the distribution of Fund shares.
Separate Distribution Plans (the “Distribution Plans”) have been adopted pursuant to Rule12b-1 under the Act for the A and C Classes of the Funds. Under the Distribution Plans, as compensation for distribution and shareholder servicing assistance, the Manager receives an annual fee of 0.25% of the average daily net assets of the A Class and 1.00% of the average daily net assets of the C Class. The fee will be payable without regard to whether the amount of the fee is more or less than the actual expenses incurred in a particular month by the Manager for distribution assistance.
Service Plans
The Manager and the Trust entered into Service Plans that obligate the Manager to oversee additional shareholder servicing of the Investor, A, and C Classes of the Funds. As compensation for performing the duties required under the Service Plans, the Manager receives an annualized fee up to 0.25% of the average daily net assets of the A and C Classes, and up to 0.375% of the average daily net assets of the Investor Class of the Funds.
Sub-Transfer Agent Fees
The Manager has entered into agreements, which include servicing agreements, with financial intermediaries that provide recordkeeping, processing, shareholder communications and other services to customers of the intermediaries that hold positions in the Institutional and Y Classes of the Funds and has agreed to compensate the intermediaries for providing these services. Intermediaries transact with the Funds primarily through the use of omnibus accounts on behalf of their customers who hold positions in the Funds. Certain services would have been provided by the Funds’ transfer agent and other service providers if the shareholders’ accounts were maintained directly by the Funds’ transfer agent. Accordingly, the Funds, pursuant to Board approval, have agreed to reimburse the Manager for certainnon-distribution shareholder services provided by financial intermediaries for the Institutional and Y Classes. The reimbursement amounts(sub-transfer agent fees) paid to the
49
American Beacon FundsSM
Notes to Financial Statements
December 31, 2019
Manager are subject to a fee limit of up to 0.10% of an intermediary’s average net assets in the Institutional and Y Classes on an annual basis. During the year ended December 31, 2019, thesub-transfer agent fees, as reflected in “Transfer agent fees” on the Statements of Operations, were as follows:
Fund | Sub-Transfer Agent Fees | |||
AHL Managed Futures Strategy | $ | 553,611 | ||
AHL TargetRisk | 18,874 | |||
As of December 31, 2019, the Funds owed the Manager the following reimbursement ofsub-transfer agent fees, as reflected in “Transfer agent fees payable” on the Statements of Assets and Liabilities:
Fund | Reimbursement Sub-Transfer Agent Fees | |||
AHL Managed Futures Strategy | $ | 21,314 | ||
AHL TargetRisk | 11,265 | |||
Investments in Affiliated Funds
The Funds may invest in the American Beacon U.S. Government Money Market Select Fund (the “USG Select Fund”). The Funds and the USG Select Fund have the same investment advisor and therefore, are considered to be affiliated. The Manager serves as investment advisor to the USG Select Fund and receives management fees and administrative fees totaling 0.10% of the average daily net assets of the USG Select Fund. During the year ended December 31, 2019, the Manager earned fees on the Funds’ direct investments in the USG Select Fund as shown below:
Fund | Direct Investments in USG Select Fund | |||
AHL Managed Futures Strategy | $ | 25,863 | ||
AHL TargetRisk | 3,764 | |||
Interfund Credit Facility
Pursuant to an exemptive order issued by the U.S. Securities and Exchange Commission (“SEC”), the Funds, along with other registered investment companies having management contracts with the Manager, may participate in a credit facility whereby each fund, under certain conditions, is permitted to lend money directly to and borrow directly from other participating funds for temporary purposes. The interfund credit facility is advantageous to the funds because it provides added liquidity and eliminates the need to maintain higher cash balances to meet redemptions. This situation could arise when shareholder redemptions exceed anticipated volumes and certain funds have insufficient cash on hand to satisfy such redemptions or when sales of securities do not settle as expected, resulting in a cash shortfall for a fund. When a fund liquidates portfolio securities to meet redemption requests, they often do not receive payment in settlement for up to two days (or longer for certain foreign transactions). Redemption requests normally are satisfied on the next business day. The credit facility provides a source of immediate, short-term liquidity pending settlement of the sale of portfolio securities. The credit facility is administered by a credit facility team consisting of professionals from the Manager’s asset management, compliance, and accounting areas who report the activities of the credit facility to the Board. During the year ended December 31, 2019, the Funds did not utilize the credit facility.
50
American Beacon FundsSM
Notes to Financial Statements
December 31, 2019
Expense Reimbursement Plan
The Manager contractually agreed to reduce fees and/or reimburse expenses for the classes of the Funds to the extent that total operating expenses exceed the Funds’ expense cap. During the year ended December 31, 2019, the Manager waived and/or reimbursed expenses as follows:
| Expense Cap | Expiration of Reimbursed Expenses | |||||||||||||||||
Fund | Class | 1/1/2019 - 12/31/2019 | Reimbursed Expenses | (Recouped) Expenses | ||||||||||||||
AHL Managed Futures Strategy | Institutional | 1.54 | % | $ | 262,378 | $ | (31,850 | ) | 2022 | |||||||||
AHL Managed Futures Strategy | Y | 1.64 | % | 243,590 | (296,357 | ) | 2022 | |||||||||||
AHL Managed Futures Strategy | Investor | 1.92 | % | 23,297 | (19,806 | ) | 2022 | |||||||||||
AHL Managed Futures Strategy | A | 1.94 | % | 997 | (3,103 | ) | 2022 | |||||||||||
AHL Managed Futures Strategy | C | 2.69 | % | 1,575 | (4,715 | ) | 2022 | |||||||||||
AHL TargetRisk | Institutional | 1.04 | % | 170,616 | (61,705 | ) | 2022 | |||||||||||
AHL TargetRisk | Y | 1.14 | % | 179,347 | (11,525 | ) | 2022 | |||||||||||
AHL TargetRisk | Investor | 1.42 | % | 24,394 | (1,476 | ) | 2022 | |||||||||||
AHL TargetRisk | A* | 1.44 | % | 4,061 | (212 | ) | 2022 | |||||||||||
AHL TargetRisk | C* | 2.19 | % | 9,912 | (776 | ) | 2022 | |||||||||||
*Commenced operations on April 30, 2019.
Of these amounts, $74,940 and $19,661 were disclosed as a receivable from the Manager on the Statements of Assets and Liabilities at December 31, 2019 for the AHL Managed Futures Strategy Fund and the AHL TargetRisk Fund, respectively.
The Funds have adopted an Expense Reimbursement Plan whereby the Manager may seek repayment of such fee or voluntary reductions and expense reimbursements. Under the policy, the Manager can be reimbursed by the Funds for any contractual or voluntary fee reductions or expense reimbursements if reimbursement to the Manager (a) occurs within three years from the date of the Manager’s waiver/reimbursement and (b) does not cause the Funds’ annual operating expenses to exceed the lesser of the contractual percentage limit in effect at the time of the waiver/reimbursement or time of recoupment. The reimbursed expenses listed above will expire in 2022. The Funds did not record a liability for potential reimbursements due to the current assessment that a reimbursements are uncertain. The carryover of excess expenses potentially reimbursable to the Manager, but not recorded as a liability are as follows:
Fund | Recouped Expenses | Excess Expense Carryover | Expired Expense Carryover | Expiration of Reimbursed Expenses | ||||||||||||
AHL Managed Futures Strategy | $ | - | $ | - | $ | 1,178,840 | 2019 | |||||||||
AHL Managed Futures Strategy | 117,187 | 2,099,369 | - | 2020 | ||||||||||||
AHL Managed Futures Strategy | 268,433 | 913,005 | - | 2021 | ||||||||||||
AHL TargetRisk | 55,187 | 61,866 | - | 2021 | ||||||||||||
Sales Commissions
The Funds’ Distributor, Resolute Investment Distributors, Inc. (“RID” or “Distributor”), may receive a portion of Class A sales charges from broker dealers which may be used to offset distribution related expenses. During the year ended December 31, 2019, RID collected $1,664 and $4,235 for AHL Managed Futures Strategy Fund and AHL TargetRisk Fund from the sale of Class A Shares, respectively.
A CDSC of 0.50% will be deducted with respect to Class A Shares on certain purchases of $1,000,000 or more that are redeemed in whole or part within 18 months of purchase, unless waived as discussed in the Funds’ Prospectus. Any applicable CDSC will be 0.50% of the lesser of the original purchase price or the value of the redemption of the Class A Shares redeemed. During the year ended December 31, 2019, there were no CDSC fees collected for Class A Shares of the Funds.
51
American Beacon FundsSM
Notes to Financial Statements
December 31, 2019
A CDSC of 1.00% will be deducted with respect to Class C Shares redeemed within 12 months of purchase, unless waived as discussed in the Funds’ Prospectus. Any applicable CDSC will be 1.00% of the lesser of the original purchase price or the value of the redemption of the Class C Shares redeemed. During the year ended December 31, 2019, CDSC fees of $694 were collected for the Class C Shares of AHL Managed Futures Strategy Fund. There were no CDSC fees collected for the Class C Shares of the AHL TargetRisk Fund for the same period herein.
Trustee Fees and Expenses
Effective January 1, 2020, as compensation for their service to the American Beacon Funds Complex, including the Trust (collectively, the “Trusts”), each Trustee is compensated from the Trusts as follows: (1) an annual retainer of $120,000; (2) meeting attendance fee (for attendance in person or via teleconference) of (a) $12,000 for in person attendance, or $5,000 for telephonic attendance, by Board members for each regularly scheduled or special Board meeting, (b) $2,500 for attendance by Committee members at meetings of the Audit Committee and the Investment Committee, (c) $1,500 for attendance by Committee members at meetings of the Nominating and Governance Committee; and (d) $2,500 for attendance by Board members for each special telephonic Board meeting; and (3) reimbursement of reasonable expenses incurred in attending Board meetings, Committee meetings, and relevant educational seminars. The Trustees also may be compensated for attendance at special Board and/or Committee meetings from time to time. For her service as Board Chair, Ms. Cline receives an additional annual retainer of $50,000. Although she attends several committee meetings at each quarterly Board meeting, she receives only a single $2,500 fee each quarter for her attendance at those meetings. The chairpersons of the Audit Committee and the Investment Committee each receive an additional annual retainer of $25,000 and the Chair of the Nominating and Governance Committee receives an additional annual retainer of $15,000.
3. Security Valuation and Fair Value Measurements
The price of the Fund’s shares is based on its net asset value (“NAV”) per share. The Fund’s NAV is computed by adding total assets, subtracting all the Fund’s liabilities, and dividing the result by the total number of shares outstanding.
The NAV of each class of the Fund’s shares is determined based on a pro rata allocation of the Fund’s investment income, expenses and total capital gains and losses. The Fund’s NAV per share is determined each business day as of the regular close of trading on the New York Stock Exchange (“NYSE” or “Exchange”), which is typically 4:00 p.m. Eastern Time (“ET”). However, if trading on the NYSE closes at a time other than 4:00 p.m. ET, the Fund’s NAV per share typically would still be determined as of the regular close of trading on the NYSE. The Fund does not price its shares on days that the NYSE is closed. Foreign exchanges may permit trading in foreign securities on days when the Fund is not open for business, which may result in the value of the Fund’s portfolio investments being affected at a time when you are unable to buy or sell shares.
Equity securities, including shares ofclosed-end funds and exchange-traded funds (“ETFs”), are valued at the last sale price or official closing price taken from the primary exchange in which each security trades. Investments in other mutual funds are valued at the closing NAV per share on the day of valuation. Debt securities are valued at bid quotes from broker/dealers or evaluated bid prices from pricing services, who may consider a number of inputs and factors, such as prices of comparable securities, yield curves, spreads, credit ratings, coupon rates, maturity, default rates, and underlying collateral. Futures are valued based on their daily settlement prices. Exchange-traded andover-the-counter (“OTC”) options are valued at the last sale price. Options with no last sale for the day are priced at mid quote. Swaps are valued at evaluated mid prices from pricing services.
The valuation of securities traded on foreign markets and certain fixed-income securities will generally be based on prices determined as of the earlier closing time of the markets on which they primarily trade unless a significant event has occurred. When the Fund holds securities or other assets that are denominated in a foreign currency, the Fund will normally use the currency exchange rates as of 4:00 p.m. ET.
52
American Beacon FundsSM
Notes to Financial Statements
December 31, 2019
Securities may be valued at fair value, as determined in good faith and pursuant to procedures approved by the Board, under certain limited circumstances. For example, fair value pricing will be used when market quotations are not readily available or reliable, as determined by the Manager, such as when (i) trading for a security is restricted or stopped; (ii) a security’s trading market is closed (other than customary closings); or (iii) a security has beende-listed from a national exchange. A security with limited market liquidity may require fair value pricing if the Manager determines that the available price does not reflect the security’s true market value. In addition, if a significant event that the Manager determines to affect the value of one or more securities held by the Fund occurs after the close of a related exchange but before the determination of the Fund’s NAV, fair value pricing may be used on the affected security or securities. Securities of small-capitalization companies are also more likely to require a fair value determination using these procedures because they are more thinly traded and less liquid than the securities of larger-capitalization companies. The Fund may fair value securities as a result of significant events occurring after the close of the foreign markets in which the Fund invests as described below. In addition, the Fund may invest in illiquid securities requiring these procedures.
The Fund may use fair value pricing for securities primarily traded innon-U.S. markets because most foreign markets close well before the Fund’s pricing time of 4:00 p.m. ET. The earlier close of these foreign markets gives rise to the possibility that significant events, including broad market moves, may have occurred in the interim and may materially affect the value of those securities. If the Manager determines that the last quoted prices ofnon-U.S. securities will, in its judgment, materially affect the value of some or all its portfolio securities, the Manager can adjust the previous closing prices to reflect what it believes to be the fair value of the securities as of the close of the Exchange. In deciding whether it is necessary to adjust closing prices to reflect fair value, the Manager reviews a variety of factors, including developments in foreign markets, the performance of U.S. securities markets, and the performance of instruments trading in U.S. markets that represent foreign securities and baskets of foreign securities. These securities are fair valued using a pricing service, using methods approved by the Board, that considers the correlation of the trading patterns of the foreign security to intraday trading in the U.S. markets, based on indices of domestic securities and other appropriate indicators such as prices of relevant American Depositary Receipts (“ADRs”) and futures contracts. The Valuation Committee, established by the Board, may also fair value securities in other situations, such as when a particular foreign market is closed but the Fund is open. The Fund uses outside pricing services to provide closing prices and information to evaluate and/or adjust those prices. As a means of evaluating its security valuation process, the Valuation Committee routinely compares closing prices, the next day’s opening prices in the same markets and adjusted prices.
Attempts to determine the fair value of securities introduce an element of subjectivity to the pricing of securities. As a result, the price of a security determined through fair valuation techniques may differ from the price quoted or published by other sources and may not accurately reflect the market value of the security when trading resumes. If a reliable market quotation becomes available for a security formerly valued through fair valuation techniques, the Manager compares the new market quotation to the fair value price to evaluate the effectiveness of the Fund’s fair valuation procedures. If any significant discrepancies are found, the Manager may adjust the Fund’s fair valuation procedures.
Valuation Inputs
Various inputs may be used to determine the fair value of the Funds’ investments. These inputs are summarized in three broad levels for financial statement purposes. The inputs or methodologies used to value securities are not necessarily an indication of the risk associated with investing in those securities.
| Level 1 | - | Quoted prices in active markets for identical securities. | ||
| Level 2 | - | Prices determined using other significant observable inputs. These may include quoted prices for similar securities, interest rates, prepayment speeds, credit risk, and others. | ||
| Level 3 | - | Prices determined using other significant unobservable inputs. Unobservable inputs reflect the Fund’s own assumptions about the factors market participants would use in pricing an investment. | ||
53
American Beacon FundsSM
Notes to Financial Statements
December 31, 2019
Level 1 and Level 2 trading assets and trading liabilities, at fair value
Common stocks, ETFs, preferred securities, and financial derivative instruments, such as futures contracts or options that are traded on a national securities exchange, are stated at the last reported sale or settlement price on the day of valuation. To the extent these securities are actively traded and valuation adjustments are not applied, they are categorized as Level 1 of the fair value hierarchy. Valuation adjustments may be applied to certain securities that are solely traded on a foreign exchange to account for the market movement between the close of the foreign market and the close of the Exchange. These securities are valued using pricing service providers that consider the correlation of the trading patterns of the foreign security to the intraday trading in the U.S. markets for investments. Securities using these valuation adjustments are categorized as Level 2 of the fair value hierarchy. Preferred securities and other equities traded on inactive markets or valued by reference to similar instruments are generally categorized as Level 2 of the fair value hierarchy.
Fixed-income securities including corporate, convertible and municipal bonds and notes, U.S. government agencies, U.S. Treasury obligations, sovereign issues, bank loans, convertible preferred securities, andnon-U.S. bonds are normally valued by pricing service providers that use broker dealer quotations, reported trades or valuation estimates from their internal pricing models. The service providers’ internal models use inputs that are observable such as issuer details, interest rates, yield curves, prepayment speeds, credit risks/spreads, default rates, and quoted prices for similar assets. Securities that use similar valuation techniques and inputs as described above are categorized as Level 2 of the fair value hierarchy. Fixed-income securities purchased on a delayed-delivery basis aremarked-to-market daily until settlement at the forward settlement date and are categorized as Level 2 of the fair value hierarchy.
Mortgage-related and asset-backed securities (“ABS”) are usually issued as separate tranches, or classes, of securities within each deal. These securities are also normally valued by pricing service providers that use broker-dealer quotations or valuation estimates from their internal pricing models. The pricing models for these securities usually consider tranche-level attributes, current market data, estimated cash flows, and market-based yield spreads for each tranche, and incorporates deal collateral performance, as available. Mortgage-related and ABS that use similar valuation techniques and inputs as described above are categorized as Level 2 of the fair value hierarchy.
Investments in registeredopen-end investment management companies will be valued based upon the NAVs of such investments and are categorized as Level 1 of the fair value hierarchy.
OTC financial derivative instruments, such as forward foreign currency contracts derive their value from underlying asset prices, indices, reference rates, and other inputs or a combination of these factors. These contracts are normally valued on the basis of broker dealer quotations or pricing service providers. Depending on the product and the terms of the transaction, the fair value of the financial derivative contracts can be estimated by a pricing service provider using a series of techniques, including simulation pricing models. The pricing models use inputs that are observed from actively quoted markets such as issuer details, indices, spreads, interest rates, curves, dividends, and exchange rates. Financial derivatives that use similar valuation techniques and inputs as described above are categorized as Level 2 of the fair value hierarchy.
4. Securities and Other Investments
Commodity Instruments
Exposure to physical commodities may subject the AHL Managed Futures Strategy Fund to greater volatility than investments in traditional securities. The value of such investments may be affected by overall market movements, commodity index volatility, changes in interest rates, or factors affecting a particular industry or commodity, such as supply and demand, drought, floods, weather, embargoes, tariffs and international economic, political and regulatory developments. Their value may also respond to investor perception of instability in the
54
American Beacon FundsSM
Notes to Financial Statements
December 31, 2019
national or international economy, whether or not justified by the facts. However, these investments may help to moderate fluctuations in the value of the Fund’s other holdings, because these investments may not correlate with investments in traditional securities. Economic and other events (whether real or perceived) can reduce the demand for commodities, which may reduce market prices and cause the value of the Fund’s shares to fall. No active trading market may exist for certain commodities investments, which may impair the ability of the Fund to sell or realize the full value of such investments in the event of the need to liquidate such investments. Certain commodities are subject to limited pricing flexibility because of supply and demand factors. Others are subject to broad price fluctuations as a result of the volatility of the prices for certain raw materials and the instability of supplies of other materials. These additional variables may create additional investment risks and result in greater volatility than investments in traditional securities. Because physical commodities do not generate investment income, the return on such investments will be derived solely from the appreciation or depreciation on such investments. Certain types of commodities instruments (such as commodity-linked swaps and commodity-linked structured notes) are subject to the risk that the counterparty to the instrument will not perform or will be unable to perform in accordance with the terms of the instrument.
Fixed-Income Investments
The Funds may hold debt, including government and corporate debt, and other fixed-income securities. Typically, the values of fixed-income securities change inversely with prevailing interest rates. Therefore, a fundamental risk of fixed-income securities is interest rate risk, which is the risk that their value will generally decline as prevailing interest rates rise, which may cause the Funds’ NAV to likewise decrease, and vice versa. How specific fixed-income securities may react to changes in interest rates will depend on the specific characteristics of each security. For example, while securities with longer maturities tend to produce higher yields, they also tend to be more sensitive to changes in prevailing interest rates and are, therefore, more volatile than shorter-term securities and are subject to greater market fluctuations as a result of changes in interest rates. Fixed-income securities are also subject to credit risk, which is the risk that the credit strength of an issuer of a fixed-income security will weaken and/or that the issuer will be unable to make timely principal and interest payments and that the security may go into default. In addition, there is prepayment risk, which is the risk that during periods of falling interest rates, certain fixed-income securities with higher interest rates, such as mortgage-backed securities (“MBS”) and ABS, may be prepaid by their issuers thereby reducing the amount of interest payments. This may result in a Fund having to reinvest its proceeds in lower yielding securities. Securities underlying MBS and ABS, which may include subprime mortgages, also may be subject to a higher degree of credit risk, valuation risk, and liquidity risk.
Foreign Securities
The Funds may invest in U.S. dollar-denominated andnon-U.S. dollar denominated equity and debt securities of foreign issuers and foreign branches of U.S. banks, including negotiable certificates of deposit (“CDs”), bankers’ acceptances, and commercial paper. Foreign issuers are issuers organized and doing business principally outside the United States and include corporations, banks,non-U.S. governments, and quasi-governmental organizations. While investments in foreign securities may be intended to reduce risk by providing further diversification, such investments involve sovereign and other risks, in addition to the credit and market risks normally associated with domestic securities. These additional risks include the possibility of adverse political and economic developments (including political or social instability, nationalization, expropriation, or confiscatory taxation); the potentially adverse effects of unavailability of public information regarding issuers, different governmental supervision and regulation of financial markets, reduced liquidity of certain financial markets, and the lack of uniform accounting, auditing, and financial reporting standards or the application of standards that are different or less stringent than those applied in the United States; different laws and customs governing securities tracking; and possibly limited access to the courts to enforce the Funds’ rights as an investor.
55
American Beacon FundsSM
Notes to Financial Statements
December 31, 2019
Illiquid and Restricted Securities
Generally, an illiquid asset is an asset that a Fund reasonably expects cannot be sold or disposed of in current market conditions in seven calendar days or less without the sale or disposition significantly changing the market value of the investment.
Historically, illiquid securities have included securities that have not been registered under the Securities Act of 1933, as amended (the “Securities Act”), securities that are otherwise not readily marketable, and repurchase agreements having a remaining maturity of longer than seven calendar days. Securities that have not been registered under the Securities Act are referred to as private placements or restricted securities and are purchased directly from the issuer or in the secondary market. These securities may be sold only in a privately negotiated transaction or pursuant to an exemption from registration.
Limitations on resale may have an adverse effect on the marketability of portfolio securities, and a Fund might be unable to dispose of restricted or other illiquid securities promptly or at reasonable prices and might thereby experience difficulty satisfying redemptions within seven calendar days. In addition, a Fund may get only limited information about an issuer, so it may be less able to predict a loss. A Fund also might have to register such restricted securities in order to dispose of them resulting in additional expense and delay. Adverse market conditions could impede such a public offering of securities.
In recognition of the increased size and liquidity of the institutional market for unregistered securities and the importance of institutional investors in the formation of capital, the SEC adopted Rule 144A under the Securities Act. Rule 144A is designed to facilitate efficient trading among institutional investors by permitting the sale of certain unregistered securities to qualified institutional buyers. To the extent privately placed securities held by a Fund qualify under Rule 144A and an institutional market develops for those securities, that Fund likely will be able to dispose of the securities without registering them under the Securities Act.
Other Investment Company Securities and Other Exchange-Traded Products
The Funds at times may invest in shares of other investment companies, including money market funds and ETFs. The Funds may invest in securities of an investment company advised by the Manager or asub-advisor. Investments in the securities of other investment companies may involve duplication of advisory fees and certain other expenses. By investing in another investment company, the Funds become a shareholder of that investment company. As a result, the Funds’ shareholders indirectly will bear the Funds’ proportionate share of the fees and expenses paid by shareholders of the other investment company, in addition to the fees and expenses the Funds’ shareholders directly bear in connection with the Funds’ own operations. These other fees and expenses are reflected as Acquired Fund Fees and Expenses and are included in the Fees and Expenses Table for the Funds in their Prospectus, if applicable. Investments in other investment companies may involve the payment of substantial premiums above the value of such issuer’s portfolio securities.
The Funds can invest free cash balances in registeredopen-end investment companies regulated as money market funds under the Act, to provide liquidity or for defensive purposes. The Funds could invest in money market funds rather than purchasing individual short-term investments. If the Funds invests in money market funds, shareholders will bear their proportionate share of the expenses, including for example, advisory and administrative fees, of the money market funds in which the Funds invest, including advisory fees charged by the Manager to any applicable money market funds advised by the Manager.
U.S. Treasury Obligations
U.S. Treasury obligations include bills (initial maturities of one year or less), notes (initial maturities between two and ten years), and bonds (initial maturities over ten years) issued by the U.S. Treasury, Separately Traded Registered Interest and Principal component parts of such obligations (known as “STRIPS”) and inflation-indexed securities. The prices of these securities (like all debt securities) change between issuance and maturity in response to fluctuating market interest rates. U.S. Treasury obligations are subject to credit risk and interest rate risk.
56
American Beacon FundsSM
Notes to Financial Statements
December 31, 2019
5. Financial Derivative Instruments
The Funds may utilize derivative instruments to gain market exposure on cash balances or reduce market exposure in anticipation of liquidity needs. When considering the Funds’ use of derivatives, it is important to note that the Funds do not use derivatives for the purpose of creating financial leverage.
Forward Foreign Currency Contracts
The Funds may enter into forward foreign currency contracts to hedge the exchange rate risk on investment transactions or to hedge the value of the Funds’ securities denominated in foreign currencies. Forward foreign currency contracts are valued at the forward exchange rate prevailing on the day of valuation. The Funds may also use currency contracts to increase exposure to a foreign currency or to shift exposure to foreign currency fluctuations from one country to another. The Funds bear the market risk that arises from changes in foreign exchange rates, and accordingly, the unrealized gain (loss) on these contracts is reflected in the accompanying financial statements. The Funds also bear the credit risk if the counterparty fails to perform under the contract.
During the year ended December 31, 2019, the Funds entered into forward foreign currency contracts primarily for investing and/or hedging foreign currency fluctuations.
The Funds’ forward foreign currency contract notional dollar values outstanding fluctuate throughout the operating year as required to meet strategic requirements. The following table illustrates the average quarterly volume of forward foreign currency contracts. For the purpose of this disclosure, volume is measured by the amounts bought and sold in USD at each quarter end.
Average Forward Foreign Currency Notional Amounts Outstanding | ||||||||||||
Fund | Purchased Contracts | Sold Contracts | ||||||||||
AHL Managed Futures Strategy | $ | 317,657,682 | $ | 401,169,332 | ||||||||
AHL TargetRisk | 1,500,748 | 34,798,120 | ||||||||||
Futures Contracts
Futures contracts are contracts to buy or sell a standard quantity of securities at a specified price on a future date. The Funds may enter into financial futures contracts as a method for keeping assets readily convertible to cash if needed to meet shareholder redemptions or for other needs while maintaining exposure to the stock or bond market, as applicable. The primary risks associated with the use of futures contracts are the possibility of illiquid markets or imperfect correlation between the values of the contracts and the underlying securities or that the counterparty will fail to perform its obligations.
Upon entering into a futures contract, the Funds are required to set aside or deposit with a broker an amount, termed the initial margin, which typically represents a portion of the face value of the futures contract. The Funds usually reflects this amount on the Schedules of Investments as a U.S. Treasury Bill held as collateral for futures contracts or as cash deposited with broker on the Statements of Assets and Liabilities. Payments to and from the broker, known as variation margin, are required to be made on a daily basis as the price of the futures contract fluctuates. Changes in initial settlement values are accounted for as unrealized appreciation (depreciation) until the contracts are terminated, at which time realized gains and losses are recognized. Futures contracts are valued at the most recent settlement price established each day by the exchange on which they are traded.
During the year ended December 31, 2019, the Funds entered into futures contracts primarily for investing and hedging purposes.
The Funds’ average futures contracts outstanding fluctuate throughout the operating year as required to meet strategic requirements. The following table illustrates the average quarterly volume of futures contracts. For the purpose of this disclosure, volume is measured by contracts outstanding at each quarter end.
Average Futures Contracts Outstanding | ||||
Fund | Year Ended December 31, 2019 | |||
AHL Managed Futures Strategy | $ | 55,534 | ||
AHL TargetRisk | 1,220 | |||
57
American Beacon FundsSM
Notes to Financial Statements
December 31, 2019
Swap Agreements
A swap is a transaction in which a Fund and a counterparty agree to pay or receive payments at specified dates based upon or calculated by reference to changes in specified prices or rates (e.g., interest rates in the case of interest rate swaps) or the performance of specified securities or indices based on a specified amount (the “notional” amount). Nearly any type of derivative, including forward contracts, can be structured as a swap.
Swap agreements can be structured to provide exposure to a variety of different types of investments or market factors. For example, in an interest rate swap, fixed-rate payments may be exchanged for floating rate payments; in a currency swap, U.S. dollar-denominated payments may be exchanged for payments denominated in a foreign currency; and in a total return swap, payments tied to the investment return on a particular asset, group of assets or index may be exchanged for payments that are effectively equivalent to interest payments or for payments tied to the return on another asset, group of assets, or index. Swaps may have a leverage component, and adverse changes in the value or level of the underlying asset, reference rate or index can result in gains or losses that are substantially greater than the amount invested in the swap itself.
Some swaps currently are, and more in the future will be, centrally cleared. Swaps that are centrally-cleared are exposed to the creditworthiness of the clearing organizations (and, consequently, that of their members—generally, banks and broker-dealers) involved in the transaction. For example, an investor could lose margin payments it has deposited with the clearing organization as well as the net amount of gains not yet paid by the clearing organization if it breaches its agreement with the investor or becomes insolvent or goes into bankruptcy. In the event of bankruptcy of the clearing organization, the investor may be able to recover only a portion of the net amount of gains on its transactions and of the margin owed to it, potentially resulting in losses to the investor.
Swaps that are not centrally cleared, involve the risk that a loss may be sustained as a result of the insolvency or bankruptcy of the counterparty or the failure of the counterparty to make required payments or otherwise comply with the terms of the agreement. To mitigate this risk, the Fund will only enter into swap agreements with counterparties considered by asub-advisor to present minimum risk of default and the Fund normally obtains collateral to secure its exposure. Changing conditions in a particular market area, whether or not directly related to the referenced assets that underlie the swap agreement, may have an adverse impact on the creditworthiness of a counterparty.
The centrally cleared and OTC swap agreements into which a Fund enters normally provide for the obligations of the Fund and its counterparty in the event of a default or other early termination to be determined on a net basis. Similarly, periodic payments on a swap transaction that are due by each party on the same day normally are netted. To the extent that a swap agreement is subject to netting, the Fund’s cover and asset segregation responsibilities will normally be with respect to the net amount owed by the Fund. However, the Fund may be required to segregate liquid assets equal to the full notional amount of certain swaps, such as written credit default swaps on physically settled forwards or written options. The amount that the Fund must segregate may be reduced by the value of any collateral that it has pledged to secure its own obligations under the swap.
Credit Default Swap Agreements
Credit default swap agreements involve one party making a stream of payments (referred to as the buyer of protection) to another party (the seller of protection) in exchange for the right to receive a specified return in the event of a default or other credit event for the referenced entity, obligation or index. As a seller of protection on credit default swap agreements, a Fund will generally receive from the buyer of protection a fixed rate of periodic premiums throughout the term of the swap provided that there is no credit event. As the seller, the Fund would effectively add leverage to its portfolio because, in addition to its total net assets, the Fund would be subject to investment exposure up to the notional amount of the swap.
58
American Beacon FundsSM
Notes to Financial Statements
December 31, 2019
If the Fund is a seller of protection and a credit event occurs, as defined under the terms of that particular swap agreement, the Fund will either (i) pay to the buyer of protection an amount equal to the notional amount of the swap and take delivery of the referenced obligation, other deliverable obligations or underlying securities comprising the referenced index or (ii) pay a net settlement amount in the form of cash or securities equal to the notional amount of the swap less the recovery value of the referenced obligation or underlying securities comprising the referenced index. If the Fund is a buyer of protection and a credit event occurs, as defined under the terms of that particular swap agreement, the Fund will either (i) receive from the seller of protection an amount equal to the notional amount of the swap and deliver the referenced obligation, other deliverable obligations or underlying securities comprising the referenced index or (ii) receive a net settlement amount in the form of cash or securities equal to the notional amount of the swap less the recovery value of the referenced obligation or underlying securities comprising the referenced index. Recovery values are estimated by market makers considering either industry standard recovery rates or entity specific factors and considerations until a credit event occurs. If a credit event has occurred, the recovery value is determined by a facilitated auction whereby a minimum number of allowable broker bids, together with a specified valuation method, are used to calculate the settlement value.
Credit default swap agreements on corporate issues, sovereign issues of an emerging country or U.S. municipal issues involve one party making a stream of payments to another party in exchange for the right to receive a specified return in the event of a default or other credit event. If a credit event occurs and cash settlement is not elected, a variety of other deliverable obligations may be delivered in lieu of the specific referenced obligation. The ability to deliver other obligations may result in acheapest-to-deliver option (the buyer of protection’s right to choose the deliverable obligation with the lowest value following a credit event). The Fund may use credit default swaps on corporate issues, sovereign issues of an emerging country or U.S. municipal issues to provide a measure of protection against defaults of the issuers (i.e., to reduce risk where the Fund owns or has exposure to the referenced obligation) or to take an active long or short position with respect to the likelihood of a particular issuer’s default.
Credit default swap agreements on asset-backed securities involve one party making a stream of payments to another party in exchange for the right to receive a specified return in the event of a default or other credit event. Unlike credit default swaps on corporate issues, sovereign issues of an emerging country or U.S. municipal issues, deliverable obligations in most instances would be limited to the specific referenced obligation as performance for asset-backed securities can vary across deals. Prepayments, principal paydowns, and other writedown or loss events on the underlying mortgage loans will reduce the outstanding principal balance of the referenced obligation. These reductions may be temporary or permanent as defined under the terms of the swap agreement and the notional amount for the swap agreement will be adjusted by corresponding amounts. The Fund may use credit default swaps on asset-backed securities to provide a measure of protection against defaults of the referenced obligation that the Fund owns or to take an active long or short position with respect to the likelihood of a particular referenced obligation’s default that the Fund does not own.
Credit default swap agreements on credit indices involve one party making a stream of payments to another party in exchange for the right to receive a specified return in the event of a write-down, principal shortfall, interest shortfall or default of all or part of the referenced entities comprising the credit index. A credit index is a basket of credit instruments or exposures designed to be representative of some part of the credit market as a whole. These indices are made up of reference credits that are judged by a poll of dealers to be the most liquid entities in the credit default swap market based on the sector of the index. Components of the indices may include, but are not limited to, investment grade securities, high yield securities, asset-backed securities, emerging markets, and/or various credit ratings within each sector. Credit indices are traded using credit default swaps with standardized terms including a fixed spread and standard maturity dates. An index credit default swap references all the names in the index, and if there is a default, the credit event is settled based on that name’s weight in the index. The composition of the indices changes periodically, usually every six months, and for most indices, each name has an equal weight in the index. The Fund may use credit default swaps on credit indices to hedge a portfolio of credit default swaps or bonds, which is less expensive than it would be to buy many credit
59
American Beacon FundsSM
Notes to Financial Statements
December 31, 2019
default swaps to achieve a similar effect. Credit default swaps on indices are benchmarks for protecting investors owning bonds against default, and traders use them to speculate on changes in credit quality.
Implied credit spreads, represented in absolute terms, utilized in determining the market value of credit default swap agreements on corporate issues, sovereign issues of an emerging country or U.S. municipal issues as of period end are disclosed in the Notes to the Schedule of Investments and serve as an indicator of the current status of the payment/performance risk and represent a market participant view of the likelihood or risk of default for the underlying referenced security to credit derivative. The implied credit spread of a particular referenced entity reflects the cost of buying/selling protection and may include upfront payments required to be made to enter into the agreement. For credit default swap agreements on asset-backed securities and credit indices, the quoted market prices and resulting values serve as the indicator of the current status of the payment/performance risk. Wider credit spreads represent a deterioration of the referenced entity’s credit soundness and a greater likelihood or risk of default or other credit event occurring as defined under the terms of the agreement.
The maximum potential amount of future payments (undiscounted) that the Fund as a seller of protection could be required to make under a credit default swap agreement would be an amount equal to the notional amount of the agreement. Notional amounts of each individual credit default swap agreement outstanding as of December 31, 2019, for which the Fund is the seller of protection is disclosed in the Notes to the Schedule of Investments. These potential amounts would be partially offset by any recovery values of the respective referenced obligations, upfront payments received upon entering into the agreement, or net amounts received from the settlement of buy protection credit default swap agreements entered into by the Fund for the same referenced entity or entities.
During the year ended December 31, 2019, the AHL TargetRisk Fund entered into credit default swaps primarily for return enhancement and hedging.
The Fund’s credit default swap contract notional amounts outstanding fluctuate throughout the operating year as required to meet the strategic requirements. The following table illustrates the average quarterly volume of credit default swap contracts. For the purpose of this disclosure, the volume is measure by the notional amounts outstanding at each quarter end.
Average Credit Default Swap Notional Amounts Outstanding | ||||
Fund | Year Ended December 31, 2019 | |||
AHL TargetRisk | $ | 98,750,000 | ||
Total Return Swap Agreements
The AHL TargetRisk Fund may enter into total return swaps in order to take a “long” or “short” position with respect to an underlying referenced asset. The Fund is subject to market price volatility of the underlying referenced asset. A total return swap involves commitments to pay interest in exchange for a market linked return based on a notional amount. To the extent that the total return of the security, group of securities or index underlying the transaction exceeds or falls short of the offsetting interest obligation, the Fund will receive a payment from or make a payment to the counterparty.
The Fund’s total return swap contracts outstanding fluctuate throughout the operating year as required to meet strategic requirements. The following table illustrates the average quarterly volume of total return swap contracts. For the purpose of this disclosure, volume is measured by contracts outstanding at each quarter end:
Average Total Return Swap Notional Amounts Outstanding | ||||
Fund | Year Ended December 31, 2019 | |||
AHL TargetRisk | $ | 10,671,993 | ||
60
American Beacon FundsSM
Notes to Financial Statements
December 31, 2019
The following is a summary of the fair valuations of the Funds’ derivative instruments categorized by risk exposure(1):
AHL Managed Futures Strategy Fund
| Fair values of financial instruments on the Statements of Assets and Liabilities as of December 31, 2019: |
| ||||||||||||||||||||||||||||||||||||||||||||||||||||||
| Derivatives not accounted for as hedging instruments | |||||||||||||||||||||||||||||||||||||||||||||||||||||||
Assets: | Credit contracts | Foreign exchange contracts | Commodity contracts | Interest rate contracts | Equity contracts | Total | |||||||||||||||||||||||||||||||||||||||||||||||||
| Unrealized appreciation of forward foreign currency contracts | $ | - | $ | 3,579,155 | $ | - | $ | - | $ | - | $ | 3,579,155 | |||||||||||||||||||||||||||||||||||||||||||
| Receivable for variation margin from open futures contracts(2) | - | 5,580,102 | 11,972,201 | 900,460 | 8,966,188 | 27,418,951 | |||||||||||||||||||||||||||||||||||||||||||||||||
| Derivatives not accounted for as hedging instruments | |||||||||||||||||||||||||||||||||||||||||||||||||||||||
Liabilities: | Credit contracts | Foreign exchange contracts | Commodity contracts | Interest rate contracts | Equity contracts | Total | |||||||||||||||||||||||||||||||||||||||||||||||||
| Unrealized depreciation of forward foreign currency contracts | $ | - | $ | (9,232,837 | ) | $ | - | $ | - | $ | - | $ | (9,232,837 | ) | |||||||||||||||||||||||||||||||||||||||||
| Payable for variation margin from open futures contracts(2) | - | (139,210 | ) | (7,968,431 | ) | (1,216,636 | ) | (3,563,185 | ) | (12,887,462 | ) | ||||||||||||||||||||||||||||||||||||||||||||
| The effect of financial derivative instruments on the Statements of Operations as of December 31, 2019: |
| ||||||||||||||||||||||||||||||||||||||||||||||||||||||
| Derivatives not accounted for as hedging instruments | |||||||||||||||||||||||||||||||||||||||||||||||||||||||
Realized gain (loss) from derivatives | Credit contracts | Foreign exchange contracts | Commodity contracts | Interest rate contracts | Equity contracts | Total | |||||||||||||||||||||||||||||||||||||||||||||||||
| Forward foreign currency contracts | $ | - | $ | 1,796,870 | $ | - | $ | - | $ | - | $ | 1,796,870 | |||||||||||||||||||||||||||||||||||||||||||
| Futures contracts | - | (21,320,864 | ) | (39,047,997 | ) | 96,919,745 | (16,163,156 | ) | 20,387,728 | ||||||||||||||||||||||||||||||||||||||||||||||
Net change in unrealized appreciation | Credit contracts | Foreign exchange contracts | Commodity contracts | Interest rate contracts | Equity contracts | Total | |||||||||||||||||||||||||||||||||||||||||||||||||
| Forward foreign currency contracts | $ | - | $ | (5,882,017 | ) | $ | - | $ | - | $ | - | $ | (5,882,017 | ) | |||||||||||||||||||||||||||||||||||||||||
| Futures contracts | - | 562,744 | (3,339,778 | ) | (14,766,297 | ) | 47,509 | (17,495,822 | ) | ||||||||||||||||||||||||||||||||||||||||||||||
AHL TargetRisk Fund
| Fair values of financial instruments on the Statements of Assets and Liabilities as of December 31, 2019: |
| ||||||||||||||||||||||||||||||||||||||||||||||||||||||
| Derivatives not accounted for as hedging instruments | |||||||||||||||||||||||||||||||||||||||||||||||||||||||
Assets: | Credit contracts | Foreign exchange contracts | Commodity contracts | Interest rate contracts | Equity contracts | Total | |||||||||||||||||||||||||||||||||||||||||||||||||
| Unrealized appreciation of forward foreign currency contracts | $ | - | $ | 27,898 | $ | - | $ | - | $ | - | $ | 27,898 | |||||||||||||||||||||||||||||||||||||||||||
| Receivable for variation margin from open futures contracts(2) | - | - | - | 11,713 | 1,099,127 | 1,110,840 | |||||||||||||||||||||||||||||||||||||||||||||||||
| Unrealized appreciation from swap agreements | 2,584,815 | - | - | - | 616,433 | 3,201,248 | |||||||||||||||||||||||||||||||||||||||||||||||||
Liabilities: | Credit contracts | Foreign exchange contracts | Commodity contracts | Interest rate contracts | Equity contracts | Total | |||||||||||||||||||||||||||||||||||||||||||||||||
| Unrealized depreciation of forward foreign currency contracts | $ | - | $ | (669,601 | ) | $ | - | $ | - | $ | - | $ | (669,601 | ) | |||||||||||||||||||||||||||||||||||||||||
| Payable for variation margin from open futures contracts(2) | - | - | - | (1,480,407 | ) | (162,894 | ) | (1,643,301 | ) | ||||||||||||||||||||||||||||||||||||||||||||||
61
American Beacon FundsSM
Notes to Financial Statements
December 31, 2019
| The effect of financial derivative instruments on the Statements of Operations as of December 31, 2019: |
| ||||||||||||||||||||||||||||||||||||||||||||||||||||||
| Derivatives not accounted for as hedging instruments | |||||||||||||||||||||||||||||||||||||||||||||||||||||||
Realized gain (loss) from derivatives | Credit contracts | Foreign exchange contracts | Commodity contracts | Interest rate contracts | Equity contracts | Total | |||||||||||||||||||||||||||||||||||||||||||||||||
| Forward foreign currency contracts | $ | - | $ | (292,026 | ) | $ | - | $ | - | $ | - | $ | (292,026 | ) | |||||||||||||||||||||||||||||||||||||||||
| Futures contracts | - | - | - | 967,352 | 6,068,634 | 7,035,986 | |||||||||||||||||||||||||||||||||||||||||||||||||
| Swap agreements | (166,543 | ) | - | - | - | (4,548 | ) | (171,091 | ) | ||||||||||||||||||||||||||||||||||||||||||||||
Net change in unrealized appreciation | Credit contracts | Foreign exchange contracts | Commodity contracts | Interest rate contracts | Equity contracts | Total | |||||||||||||||||||||||||||||||||||||||||||||||||
| Forward foreign currency contracts | $ | - | $ | (641,703 | ) | $ | - | $ | - | $ | - | $ | (641,703 | ) | |||||||||||||||||||||||||||||||||||||||||
| Futures contracts | - | - | - | (1,468,694 | ) | 936,233 | (532,461 | ) | |||||||||||||||||||||||||||||||||||||||||||||||
| Swap agreements | 2,490,317 | - | - | - | 616,433 | 3,106,750 | |||||||||||||||||||||||||||||||||||||||||||||||||
(1)See Note 3 in the Notes to Financial Statements for additional information.
(2)Includes cumulative appreciation (depreciation) of futures contracts as reported in the Fund’s Schedule of Investments footnotes. Only current day’s variation margin is reported within the Statements of Assets and Liabilities.
Master Agreements
International Swaps and Derivatives Association, Inc. Master Agreements (“ISDA Master Agreements”) with counterparties govern transactions in over-the-counter (“OTC”) derivative and foreign exchange contracts entered into by the Fund and those counterparties. The ISDA Master Agreements contain provisions for general obligations, representations, agreements, collateral and events of default or termination. Events of termination include conditions that may entitle counterparties to elect to terminate early and cause settlement of all outstanding transactions under the applicable ISDA Master Agreement. Any election to terminate early could be material to the financial statements. Since different types of forward and OTC financial derivative transactions have different mechanics and are sometimes traded out of different legal entities of a particular counterparty organization, each type of transaction may be covered by a different Master Agreement, resulting in the need for multiple agreements with a single counterparty. As the Master Agreements are specific to unique operations of different asset types, they allow a Fund to net its total exposure to a counterparty in the event of a default with respect to all the transactions governed under a single agreement with a counterparty.
Master Securities Forward Transaction Agreements (“Master Forward Agreements”) govern the considerations and factors surrounding the settlement of certain forward settling transactions, such as delayed delivery or sale-buyback financing transactions by and between a Fund and select counterparties. The Master Forward Agreements maintain provisions for, among other things, initiation and confirmation, payment and transfer, events of default, termination, and maintenance of collateral.
Offsetting Assets and Liabilities
The Funds are parties to enforceable master netting agreements between brokers and counterparties which provide for the right to offset under certain circumstances. The Funds employ multiple money managers and counterparties and have elected not to offset qualifying financial and derivative instruments on the Statements of Assets and Liabilities, as such all financial and derivative instruments are presented on a gross basis. The impacts of netting arrangements that provide the right to offset are detailed below. The net amount represents the net receivable or payable that would be due from or to the counterparty in the event of default. Exposure from borrowings and other financing agreements such as repurchase agreements can only be netted across transactions governed by the same Master Agreement with the same legal entity. All amounts reported below represent the balance as of the report date, December 31, 2019.
62
American Beacon FundsSM
Notes to Financial Statements
December 31, 2019
AHL Managed Futures Strategy Fund
| Offsetting of Financial and Derivative Assets as of December 31, 2019: |
| |||||||||||
| Assets | Liabilities | |||||||||||
| Futures Contracts(1) | $ | 27,418,951 | $ | 12,887,462 | ||||||||
| Forward Foreign Currency Contracts(2) | 3,579,155 | 9,232,837 | ||||||||||
|
|
|
| |||||||||
| Total derivative assets and liabilities in the Statement of Assets and Liabilities | $ | 30,998,106 | $ | 22,120,299 | ||||||||
|
|
|
| |||||||||
| Derivatives not subject to a Master Netting Agreement or similar agreement (“MNA”) | $ | (27,418,951 | ) | $ | (12,887,462 | ) | ||||||
|
|
|
| |||||||||
| Total derivative assets and liabilities subject to an MNA | $ | 3,579,155 | $ | 9,232,837 | ||||||||
|
|
|
| |||||||||
| Financial Assets, Derivatives, and Collateral Received/(Pledged) by Counterparty as of December 31, 2019: | ||||||
| Gross Amounts of Assets Presented in the Statement of Assets and Liabilities | Derivatives Available for Offset | Gross Amounts Not Offset in the Statement of Assets and Liabilities | |||||||||||||||||||||||||||||||||||||||||||
Counterparty | Non-Cash Collateral Pledged | Cash Collateral Pledged | Net Amount | ||||||||||||||||||||||||||||||||||||||||||
| Deutsche Bank AG | $ | 835,854 | $ | (835,854 | ) | $ | - | $ | - | $ | - | ||||||||||||||||||||||||||||||||||
| HSBC Bank (USA) | 2,696,723 | (2,696,723 | ) | - | - | - | |||||||||||||||||||||||||||||||||||||||
| Royal Bank of Scotland PLC | 46,578 | (46,578 | ) | - | - | - | |||||||||||||||||||||||||||||||||||||||
|
|
|
|
|
|
|
|
|
| ||||||||||||||||||||||||||||||||||||
| Total | $ | 3,579,155 | $ | (3,579,155 | ) | $ | - | $ | - | $ | - | ||||||||||||||||||||||||||||||||||
|
|
|
|
|
|
|
|
|
| ||||||||||||||||||||||||||||||||||||
| Gross Amounts of Liabilities Presented in the Statement of Assets and Liabilities | Derivatives Available for Offset | Gross Amounts Not Offset in the Statement of Assets and Liabilities | |||||||||||||||||||||||||||||||||||||||||||
Counterparty | Non-Cash Collateral Received | Cash Collateral Received | Net Amount | ||||||||||||||||||||||||||||||||||||||||||
| Deutsche Bank AG | $ | 1,617,893 | $ | (835,854 | ) | $ | - | $ | - | $ | 782,039 | ||||||||||||||||||||||||||||||||||
| HSBC Bank (USA) | 7,551,888 | (2,696,723 | ) | - | - | 4,855,165 | |||||||||||||||||||||||||||||||||||||||
| Royal Bank of Scotland PLC | 63,056 | (46,578 | ) | - | - | 16,478 | |||||||||||||||||||||||||||||||||||||||
|
|
|
|
|
|
|
|
|
| ||||||||||||||||||||||||||||||||||||
| Total | $ | 9,232,837 | $ | (3,579,155 | ) | $ | - | $ | - | $ | 5,653,682 | ||||||||||||||||||||||||||||||||||
|
|
|
|
|
|
|
|
|
| ||||||||||||||||||||||||||||||||||||
AHL TargetRisk Fund
| Offsetting of Financial and Derivative Assets as of December 31, 2019: |
| |||||||||||
| Assets | Liabilities | ||||||||||
| Futures Contracts(1) | $ | 1,110,840 | $ | 1,643,301 | ||||||||
| Swap Agreement - Centrally cleared(1) | 2,584,815 | - | ||||||||||
| Swap Agreement - OTC(2) | 616,433 | - | ||||||||||
| Forward Foreign Currency Contracts(2) | 27,898 | 669,601 | ||||||||||
|
|
|
| |||||||||
| Total derivative assets and liabilities in the Statement of Assets and Liabilities | $ | 4,339,986 | $ | 2,312,902 | ||||||||
|
|
|
| |||||||||
| Derivatives not subject to a Master Netting Agreement or similar agreement (“MNA”) | $ | (3,695,655 | ) | $ | (1,643,301 | ) | ||||||
|
|
|
| |||||||||
| Total derivative assets and liabilities subject to an MNA | $ | 644,331 | $ | 669,601 | ||||||||
|
|
|
| |||||||||
| Financial Assets, Derivatives, and Collateral Received/(Pledged) by Counterparty as of December 31, 2019: | ||||||
| Gross Amounts of Assets Presented in the Statement of Assets and Liabilities | Derivatives Available for Offset | Gross Amounts Not Offset in the Statement of Assets and Liabilities | |||||||||||||||||||||||||||||||||||||||||||
Counterparty | Non-Cash Collateral Pledged | Cash Collateral Pledged | Net Amount | ||||||||||||||||||||||||||||||||||||||||||
| JPMorgan Chase Bank, N.A. | $ | 616,433 | $ | - | $ | - | $ | - | $ | 616,433 | |||||||||||||||||||||||||||||||||||
| State Street Bank & Trust Co. | 27,898 | (27,898 | ) | - | - | - | |||||||||||||||||||||||||||||||||||||||
|
|
|
|
|
|
|
|
|
| ||||||||||||||||||||||||||||||||||||
| Total | $ | 644,331 | $ | (27,898 | ) | $ | - | $ | - | $ | 616,433 | ||||||||||||||||||||||||||||||||||
|
|
|
|
|
|
|
|
|
| ||||||||||||||||||||||||||||||||||||
| Gross Amounts of Liabilities Presented in the Statement of Assets and Liabilities | Derivatives Available for Offset | Gross Amounts Not Offset in the Statement of Assets and Liabilities | |||||||||||||||||||||||||||||||||||||||||||
Counterparty | Non-Cash Collateral Received | Cash Collateral Received | Net Amount | ||||||||||||||||||||||||||||||||||||||||||
| State Street Bank & Trust Co. | $ | 669,601 | $ | (27,898 | ) | $ | - | $ | - | $ | 641,703 | ||||||||||||||||||||||||||||||||||
|
|
|
|
|
|
|
|
|
| ||||||||||||||||||||||||||||||||||||
| Total | $ | 669,601 | $ | (27,898 | ) | $ | - | $ | - | $ | 641,703 | ||||||||||||||||||||||||||||||||||
|
|
|
|
|
|
|
|
|
| ||||||||||||||||||||||||||||||||||||
63
American Beacon FundsSM
Notes to Financial Statements
December 31, 2019
(1)Includes cumulative appreciation or (depreciation) of futures contracts as reported in the Schedule of Investments footnotes. Only current day’s variation margin is reported within the Statements of Assets and Liabilities.
(2)The securities presented here within are not subject to master netting agreements. As such, this is disclosed for informational purposes only.
6. Principal Risks
Investing in the Funds may involve certain risks including, but not limited to, those described below.
Commodities Risk
The Funds’ investments in commodity-linked derivative instruments may subject the Funds to greater volatility than investments in traditional securities. The value of commodity-linked derivative instruments may be affected by changes in overall market movements, commodity index volatility, changes in interest rates, or factors affecting a particular industry or commodity, such as changes in supply and demand, drought, floods, weather, livestock disease, embargoes, tariffs, war, acts of terrorism and international economic, political and regulatory developments. The Funds and the Subsidiaries each may concentrate its assets in a particular sector of the commodities market (such as oil, metal or agricultural products). As a result, the Funds and the Subsidiaries may be more susceptible to risks associated with those sectors. The Funds’ investments in commodity-related instruments may lead to losses in excess of the Funds’ investment in such products. Such losses can significantly and adversely affect the NAV of the Funds and, consequently, a shareholder’s interest in the Funds.
Counterparty Risk
There are two separate categories of counterparty risk that arise out of a Fund’s investments in derivatives. The first relates to the risk that its swap counterparty defaults, and the second category relates to the risk that a futures commission merchant (“FCM”) would default on an obligation set forth in an agreement between a Fund and the FCM. As for the first category of risk, entering into derivatives in the OTC market involves counterparty risk, which is the risk that the dealer providing the derivative or other product will fail to timely perform its payment and other obligations or experience financial difficulties, which may include filing for bankruptcy. Therefore, to the extent that a Fund engages in trading in OTC markets, the Fund could be exposed to greater risk of loss through default than if it confined its trading to transactions that are centrally cleared. The second category of risk exists at and from the time that a Fund enters into derivatives transactions that are centrally cleared. In such cases, a clearing organization becomes the Fund’s counterparty and the principal counterparty risk is that the clearing organization itself will default. In addition, the FCM may hold margin posted in connection with those contracts and that margin may bere-hypothecated (orre-pledged) by the FCM and lost or its return delayed due to a default by the FCM or other customer of the FCM. The FCM may itself file for bankruptcy, which would either delay the return of, or jeopardize altogether the assets posted by the FCM as margin in response to margin calls relating to cleared positions. If a counterparty fails to meet its contractual obligations, goes bankrupt, or otherwise experiences a business interruptions, a Fund could miss investment opportunities or otherwise hold investments it would prefer to sell, resulting in losses for the Fund.
Credit Risk
The Funds are subject to the risk that the issuer or guarantor of a debt security, or the counterparty to a derivatives contract or a loan will fail to make timely payment of interest or principal or otherwise honor its obligations or default completely. A decline in the credit rating of an individual security held by the Funds may have an adverse impact on its price and make it difficult for the Funds to sell it. Ratings represent a rating agency’s opinion regarding the quality of the security and are not a guarantee of quality. Rating agencies might not always change their credit rating on an issuer or security in a timely manner to reflect events that could affect the issuer’s ability to make timely payments on its obligations. Credit risk is typically greater for securities with ratings that are below investment grade. Since the Funds can invest significantly in high-yield investments considered speculative in nature, this risk may be substantial.
64
American Beacon FundsSM
Notes to Financial Statements
December 31, 2019
Currency Risk
The Funds may have exposure to foreign currencies by making direct investments innon-U.S. currencies or in securities denominated innon-U.S. currencies, or by purchasing or selling forward currency exchange contracts innon-U.S. currencies. Foreign currencies may decline in value relative to the U.S. dollar, or, in the case of hedging positions, the U.S. dollar may decline in value relative to the currency being hedged, and thereby affect a Fund’s investments in foreign(non-U.S.) currencies or in securities that trade in, and receive revenues in, or in derivatives that provide exposure to, foreign(non-U.S.) currencies. Currency exchange rates may fluctuate significantly over short periods of time for a number of reasons, including changes in interest rates, intervention (or the failure to intervene) by U.S. or foreign governments, central banks or supranational entities such as the International Monetary Fund, or by the imposition of currency controls or other political developments in the United States or abroad. As a result, the Funds’ investments in foreign currency denominated securities may reduce the returns of the Funds. Currency futures, forwards, options or swaps may not always work as intended, and in specific cases, the Funds may be worse off than if it had not used such instrument(s). There may not always be suitable hedging instruments available. Even where suitable hedging instruments are available, the Funds may choose to not hedge its currency risks.
Derivatives Risk
Derivatives may involve significant risk. The use of derivative instruments may expose the Funds to additional risks that they would not be subject to if they invested directly in the securities or other instruments underlying those derivatives, including the high degree of leverage often embedded in such instruments, and potential material and prolonged deviations between the theoretical value and realizable value of a derivative. Some derivatives have the potential for unlimited loss, regardless of the size of the Funds’ initial investment. Derivatives may be illiquid and may be more volatile than other types of investments. The Funds may buy or sell derivatives not traded on an exchange and which may be subject to heightened liquidity and valuation risk. Derivative investments can increase portfolio turnover and transaction costs. Derivatives also are subject to counterparty risk and credit risk. As a result, the Funds may obtain no recovery of their investment or may only obtain a limited recovery, and any recovery may be delayed. Not all derivative transactions require a counterparty to post collateral, which may expose the Funds to greater losses in the event of a default by a counterparty.
Foreign Investing and Emerging Markets Risk
Non-U.S. investments carry potential risks not associated with U.S. investments. Such risks include, but are not limited to: (1) currency exchange rate fluctuations, (2) political and financial instability, (3) less liquidity, (4) lack of uniform accounting, auditing and financial reporting standards, (5) increased price volatility, (6) different government regulation and supervision of foreign stock exchanges, brokers and listed companies, and (7) delays in transaction settlement in some foreign markets. To the extent the Funds invest a significant portion of its assets in securities of a single country or region, it is more likely to be affected by events or conditions of that country or region. In addition, the economies and political environments of emerging market countries tend to be more unstable than those of developed countries, resulting in more volatile rates of return than the developed markets and substantially greater risk to investors. There may be very limited oversight of certain foreign banks or securities depositories that hold foreign securities and currency and the laws of certain countries may limit the ability to recover such assets if a foreign bank or depository or their agents goes bankrupt. When investing in emerging markets, the risks of investing in foreign securities are heightened. Emerging markets have unique risks that are greater than, or in addition to, investing in developed markets because emerging markets are generally smaller, less developed, less liquid and more volatile than the securities markets of the U.S. and other developed markets. There are also risks of: greater political uncertainties; an economy’s dependence on revenues from particular commodities or on international aid or development assistance; currency transfer restrictions; a limited number of potential buyers for such securities, resulting in increased volatility and limited liquidity for emerging market securities; trading suspensions; and delays and disruptions in securities settlement procedures. In addition, there may be less information available to make investment decisions and more volatile rates of return.
65
American Beacon FundsSM
Notes to Financial Statements
December 31, 2019
Futures Contracts Risk
Futures contracts are derivative instruments where one party pays a fixed price for an agreed amount of securities or other underlying assets at an agreed date. The use of such derivative instruments may expose the Funds to additional risks that they would not be subject to if they invested directly in the securities underlying those derivatives. Futures contracts may experience potentially dramatic price changes (losses) and imperfect correlation between the price of the contract and the underlying security or index, which will increase the volatility of the Funds and may involve a small investment of cash (the amount of initial and variation margin) relative to the magnitude of the risk assumed (the potential increase or decrease in the price of the futures contract).
Hedging Risk
If the Funds use a hedging instrument at the wrong time or judges the market conditions incorrectly, or the hedged instrument does not correlate to the risk sought to be hedged, the hedge might be unsuccessful, reduce the Funds’ return, or create a loss.
High Portfolio Turnover Risk
Portfolio turnover is a measure of the Funds’ trading activity over aone-year period. A portfolio turnover rate of 100% would indicate that the Funds sold and replaced the entire value of its securities holdings during the period. High portfolio turnover could increase the Funds’ transaction costs because of increased broker commissions resulting from such transactions. These costs are not reflected in the Funds’ annual operating expenses or in the expense example, but they can have a negative impact on performance. Frequent trading by the Funds could also result in increased realized net capital gains, distributions of which are taxable to the Funds’ shareholders (including net short-term capital gain distributions, which are taxable to them as ordinary income).
High-Yield Securities Risk
Investing in high-yield, below investment-grade securities (commonly referred to as “junk bonds”) generally involves significantly greater risks of loss of your money than an investment in investment grade securities. High-yield debt securities may fluctuate more widely in price and yield and may fall in price when the economy is weak or expected to become weak. High-yield securities are considered to be speculative with respect to an issuer’s ability to pay interest and principal and carry a greater risk that the issuers of lower-rated securities will default on the timely payment of principal and interest. Below investment grade securities may experience greater price volatility and less liquidity than investment grade securities.
Interest Rate Risk
Investments in investment-grade andnon-investment grade fixed-income securities are subject to interest rate risk. The value of the Funds’ fixed-income investments typically will fall when interest rates rise. The Funds may be particularly sensitive to changes in interest rates if it invests in debt securities with intermediate and long terms to maturity. Debt securities with longer durations tend to be more sensitive to changes in interest rates, usually making them more volatile than debt securities with shorter durations. For example, if a bond has a duration of eight years, a 1% increase in interest rates could be expected to result in a 8% decrease in the value of the bond. Yields of debt securities will fluctuate over time. Following the financial crisis that started in 2008, the Federal Reserve attempted to stabilize the economy and support the economic recovery by keeping the federal funds rate (the interest rate at which depository institutions lend reserve balances to each other overnight) at or near zero percent. The Federal Reserve has raised the federal funds rate several times since December 2015 and may continue to increase or decrease rates in the future. Interest rates may rise significantly and/or rapidly, potentially resulting in substantial losses to the Funds. During periods of very low or negative interest rates, the Funds may be unable to maintain positive returns. Certain European countries and Japan have recently
66
American Beacon FundsSM
Notes to Financial Statements
December 31, 2019
experienced negative interest rates on deposits and debt securities have traded at negative yields. Negative interest rates may become more prevalent amongnon-U.S. issuers, and potentially within the United States. Changing interest rates, including rates that fall below zero, may have unpredictable effects on markets, may result in heightened market volatility and may detract from Funds’ performance to the extent the Funds are exposed to such interest rates.
Leverage Risk
Financial leverage magnifies the exposure to the movement in prices of an asset or class of assets underlying a derivative instrument and results in increased volatility, which means that a Fund will have the potential for greater losses than if a Fund does not use the derivative instruments that have a leveraging effect. Leverage tends to magnify, sometimes significantly, the effect of any increase or decrease in a Fund’s exposure to an asset or class of assets and may cause a Fund’s NAV to be volatile.
A Fund may experience leveraging risk in connection with investments in derivatives because its investments in derivatives may be purchased with a fraction of the assets that would be needed to purchase the securities directly, so that the remainder of the assets may be invested in other investments. Such investments may have the effect of leveraging a Fund because a Fund may experience gains or losses not only on its investments in derivatives, but also on the investments purchased with the remainder of the assets. If the value of a Fund’s investments in derivatives is increasing, this could be offset by declining values of a Fund’s other investments. Conversely, it is possible that the rise in the value of a Fund’snon-derivative investments could be offset by a decline in the value of a Fund’s investments in derivatives. In either scenario, a Fund may experience losses. In a market where the value of a Fund’s investments in derivatives is declining and the value of its other investments is declining, a Fund may experience substantial losses. The use of leverage may cause a Fund to liquidate portfolio positions when it may not be advantageous to do so to satisfy its obligations or to meet any required asset segregation requirements. In addition, the costs that a Fund pays to engage in these practices are additional costs borne by a Fund and could reduce or eliminate any net investment profits.
Liquidity Risk
When there is little or no active trading market for a specific type of security, it can become more difficult to purchase or sell the securities at or near their perceived value. During such periods, certain investments held by the Funds may be difficult to sell or other investments may be difficult to purchase at favorable times or prices. As a result, the Funds may have to lower the price on certain securities that it is trying to sell, sell other securities instead or forgo an investment opportunity, any of which could have a negative effect on Fund management or performance. Redemptions by a few large investors in a Fund at such times may have a significant adverse effect on a Fund’s NAV per share and remaining Fund shareholders. In addition, the market-making capacity of dealers in certain types of securities has been reduced in recent years, in part as a result of structural and regulatory changes, such as fewer proprietary trading desks and increased regulatory capital requirements for broker-dealers. Further, many broker-dealers have reduced their inventory of certain debt securities. This could negatively affect a Fund’s ability to buy or sell debt securities and increase the related volatility and trading costs. A Fund may lose money if it is forced to sell certain investments at unfavorable prices to meet redemption requests or other cash needs.
Market Direction Risk
Since the Funds will typically hold both long and short positions, an investment in the Funds will involve market risks associated with different types of investment decisions than those made for a typical “long only” fund. The Funds’ results could suffer both when there is a general market advance and the Funds hold significant “short” positions, and when there is a general market decline and the Funds hold significant “long” positions. In recent years, the markets have shown considerable volatility from day to day and even inintra-day trading.
67
American Beacon FundsSM
Notes to Financial Statements
December 31, 2019
Market Risk
Conditions in the U.S. and many foreign economies have resulted, and may continue to result, in certain instruments experiencing unusual liquidity issues, increased price volatility and, in some cases, credit downgrades and increased likelihood of default. These events have reduced the willingness and ability of some lenders to extend credit, and have made it more difficult for some borrowers to obtain financing on attractive terms, if at all. In some cases, traditional market participants have been less willing to make a market in some types of debt instruments, which has affected the liquidity of those instruments. During times of market turmoil, investors tend to look to the safety of securities issued or backed by the U.S. Treasury, causing the prices of these securities to rise and the yields to decline. Reduced liquidity in fixed income and credit markets may negatively affect many issuers worldwide. In addition, global economies and financial markets are becoming increasingly interconnected, which increases the possibilities that conditions in one country or region might adversely impact issuers in a different country or region. A rise in protectionist trade policies, and the possibility of changes to some international trade agreements, could affect the economies of many nations, including the United States, in ways that cannot necessarily be foreseen at the present time.
In response to the financial crisis, the U.S. and other governments and the Federal Reserve and certain foreign central banks have taken steps to support financial markets. In some countries where economic conditions are recovering, they are nevertheless perceived as still fragile. Withdrawal of government support, failure of efforts in response to the crisis, or investor perception that such efforts are not succeeding, could adversely impact the value and liquidity of certain securities. The severity or duration of adverse economic conditions may also be affected by policy changes made by governments or quasi-governmental organizations, including changes in tax laws. The impact of new financial regulation legislation on the markets and the practical implications for market participants may not be fully known for some time. Regulatory changes are causing some financial services companies to exit long-standing lines of business, resulting in dislocations for other market participants. In addition, political and governmental events within the U.S. and abroad, such as the U.S. government’s inability at times to agree on a long-term budget and deficit reduction plan, the threat of a federal government shutdown and threats not to increase the federal government’s debt limit, may affect investor and consumer confidence and may adversely impact financial markets and the broader economy, perhaps suddenly and to a significant degree. The U.S. government has reduced the federal corporate income tax rates, and future legislative, regulatory and policy changes may result in more restrictions on international trade, less stringent prudential regulation of certain players in the financial markets, and significant new investments in infrastructure and national defense. Markets may react strongly to expectations about the changes in these policies, which could increase volatility, especially if the markets’ expectations for changes in government policies are not borne out.
Changes in market conditions will not have the same impact on all types of securities. Interest rates have been unusually low in recent years in the U.S. and abroad. Because there is little precedent for this situation, it is difficult to predict the impact of a significant rate increase on various markets. For example, because investors may buy securities or other investments with borrowed money, a significant increase in interest rates may cause a decline in the markets for those investments. Because of the sharp decline in the worldwide price of oil, there is a concern that oil producing nations may withdraw significant assets now held in U.S. Treasuries, which could force a substantial increase in interest rates. Regulators have expressed concern that rate increases may cause investors to sell fixed income securities faster than the market can absorb them, contributing to price volatility. In addition, there is a risk that the prices of goods and services in the U.S. and many foreign economies may decline over time, known as deflation (the opposite of inflation). Deflation may have an adverse effect on stock prices and creditworthiness and may make defaults on debt more likely. If a country’s economy slips into a deflationary pattern, it could last for a prolonged period and may be difficult to reverse.
A rise in protectionist trade policies, risks associated with the United Kingdom’s departure from the European Union on January 31, 2020 and trade agreement negotiations during the transition period, the risk of a trade dispute between the United States and China, and the possibility of changes to some international trade agreements, could affect the economies of many nations, including the United States, in ways that cannot
68
American Beacon FundsSM
Notes to Financial Statements
December 31, 2019
necessarily be foreseen at the present time. The severity or duration of adverse economic conditions may also be affected by policy changes made by governments or quasi-governmental organizations. In addition, political and governmental events within the U.S. and abroad may affect investor and consumer confidence and may adversely impact financial markets and the broader economy, perhaps suddenly and to a significant degree.
Non-Diversification Risk
When a Fund isnon-diversified, it may invest a high percentage of its assets in a limited number of issuers. When a Fund invests in a relatively small number of issuers it may be more susceptible to risks associated with a single economic, political or regulatory occurrence than a more diversified portfolio might be. Some of those issuers also may present substantial credit or other risks. When a Fund isnon-diversified, its NAV and total return may also fluctuate more or be subject to declines in weaker markets than a diversified mutual fund.
Obsolescence Risk
The Funds are unlikely to be successful in its quantitative trading strategies unless the assumptions underlying the models are realistic and either remain realistic and relevant in the future or are adjusted to account for changes in the overall market environment. If such assumptions are inaccurate or become inaccurate and are not promptly adjusted, it is likely that profitable trading signals will not be generated. If and to the extent that the models do not reflect certain factors, and thesub-advisor does not successfully address such omission through its testing and evaluation and modify the models accordingly, major losses may result – all of which will be borne by the Funds. Thesub-advisor will continue to test, evaluate and add new Models, which may lead to the Models being modified from time to time. Any modification of the Models or strategies will not be subject to any requirement that shareholders receive notice of the change or that they consent to it. There can be no assurance as to the effects (positive or negative) of any modification to the Models or strategies on a Fund’s performance.
Other Investment Companies Risk
The Funds may invest in shares of other registered investment companies, including exchange-traded funds (“ETFs”) and money market funds. To the extent that the Funds invest in shares of other registered investment companies, the Funds will indirectly bear the fees and expenses, including for example, advisory and administrative fees, charged by those investment companies in addition to the Funds’ direct fees and expenses and will be subject to the risks associated with investments in those companies. For example, the Funds’ investments in money market funds are subject to interest rate risk, credit risk, and market risk. The Funds must rely on the investment company in which it invests to achieve its investment objective. If the investment company fails to achieve its investment objective, the value of the Funds’ investment may decline, adversely affecting the Funds’ performance. ETFs are subject to the following risks that do not apply to conventional funds: (1) the market price of an ETF’s shares may trade at a discount or premium to its NAV; (2) an active trading market for an ETF’s shares may not develop or be maintained; or (3) trading of an ETF’s shares may be halted if the listing exchange’s officials deem such action appropriate, the shares are delisted from the exchange, or the activation of market-wide “circuit breakers” (which are tied to large decreases in stock prices) halts stock trading generally. An ETF that tracks an index may not precisely replicate the returns of its benchmark index. To the extent the Funds invest in other investment companies that invest in equity securities, fixed-income securities and/or foreign securities, or that track an index, the Funds are subject to the risks associated with the underlying investments held by the investment company or the index fluctuations to which the investment company is subject. ETFs have expenses associated with their operation, typically including advisory fees.
Short Position Risk
The Fund’s losses are potentially unlimited in a short position transaction because there is potentially no limit on the amount that the security that the Fund is required to purchase may have appreciated. Because the Fund may invest the proceeds of a short sale, another effect of short selling on the Fund is similar to the effect of
69
American Beacon FundsSM
Notes to Financial Statements
December 31, 2019
leverage, in that it may amplify changes in the Fund’s NAV since it may increase the exposure of the Fund to certain markets.
Sovereign and Quasi Sovereign Debt Risk
An investment in sovereign and quasi-sovereign debt obligations involves special risks not present in corporate debt obligations. Sovereign and quasi-sovereign debt securities are issued or guaranteed by a sovereign government or entity affiliated with or backed by a sovereign government. The issuer of the sovereign or quasisovereign debt that controls the repayment of the debt may be unable or unwilling to repay principal or interest when due, and a Fund may have limited recourse in the event of a default. In addition, these investments are subject to risk of payment delays or defaults due to: (1) country cash flow problems, (2) insufficient foreign currency reserves, (3) political considerations, (4) large debt positions relative to the country’s economy, (5) policies toward foreign lenders or investors, (6) the failure to implement economic reforms required by the International Monetary Fund or other multilateral agencies, or (7) an inability or unwillingness to repay debts. It may be particularly difficult to enforce the rights of debt holders in emerging markets. A governmental entity that defaults on an obligation may request additional time in which to pay or receive further loans or may seek to restructure its obligations to reduce interest rates or outstanding principal. There is no legal process for collecting sovereign and quasi-sovereign debt that a government does not pay nor are there bankruptcy proceedings through which all or part of the sovereign debt that a governmental entity has not repaid may be collected. Sovereign and quasi-sovereign debt risk is increased for emerging markets issuers, which are among the largest debtors to commercial banks and foreign governments. At times, certain emerging market countries have declared moratoria on the payment of principal and interest on external debt. Certain emerging market countries have experienced difficulty in servicing their sovereign debt on a timely basis, which has led to defaults and the restructuring of certain indebtedness.
Subsidiary Risk
There can be no assurance that the investment objective of a Subsidiary will be achieved. The Subsidiaries are not registered under the Act, and are not subject to all the investor protections of the Act. However, each Fund wholly owns and controls its respective Subsidiary, and each Fund and its respective Subsidiary are both managed by the Manager and thesub-advisor pursuant to separate agreements, making it unlikely that a Subsidiary will take action contrary to the interests of its respective Fund and its shareholders. The Board has oversight responsibility for the investment activities of the Funds, including its investment in the Subsidiaries, and each Fund’s role as sole shareholder of its respective Subsidiary. Changes in the laws of the United States and/or the Cayman Islands, under which the Funds and Subsidiaries, respectively, are organized, could result in the inability of the Funds and/or Subsidiaries to operate as described in the Prospectus and could negatively affect the Funds and their respective shareholders. For example, the Cayman Islands government has undertaken not to impose any income, corporate or capital gains tax, estate duty, inheritance tax, gift tax or withholding tax on the Subsidiaries. If Cayman Islands law changes such that the Subsidiaries must pay Cayman Islands taxes, Fund shareholders would likely suffer decreased investment returns. Rulemaking by the CFTC or other regulatory initiatives may affect the Funds’ ability to use its respective Subsidiary to pursue its investment strategies.
Swap Agreement Risk
Swaps can involve greater risks than a direct investment in an underlying asset, because swaps typically include a certain amount of embedded leverage and as such are subject to leveraging risk. If swaps are used as a hedging strategy, the Funds are subject to the risk that the hedging strategy may not eliminate the risk that is intended to offset, due to, among other reasons, the occurrence of unexpected price movements or thenon-occurrence of expected price movements. Swaps also may be difficult to value. Interest rate swaps, total return swaps, currency swaps, credit default swaps and commodities swaps are subject to counterparty risk, credit risk and liquidity risk. In addition, interest rate swaps are subject to interest rate risk, total return swaps are subject to market risk, and interest rate risk if the underlying securities are bonds or other debt obligations, currency swaps are subject to currency risk, and commodities swaps are subject to commodities risk.
70
American Beacon FundsSM
Notes to Financial Statements
December 31, 2019
Tax Risk
To qualify as a regulated investment company under Subchapter M (“RIC”), the Funds must derive at least 90 percent of its gross income for each taxable year from “qualifying income” under Subchaper M. Although qualifying income does not include income derived directly from commodities, including certain commodity-linked derivative instruments – and a Fund, therefore will restrict its gross income from direct investments therein to a maximum of 10% of its gross income for each taxable year – a Fund’s investment in a Subsidiary is expected to provide a Fund with exposure to the commodities markets within the limitations of the requirements of Subchapter M.
The IRS issued a large number of private letter rulings (“PLRs”) (which the Funds may not cite as precedent) from 2006 through 2011 that income a RIC derives from a wholly owned foreign subsidiary (a “controlled foreign corporation” or “CFC”) (such as a Subsidiary) that earns income derived from commodity-linked derivative instruments is qualifying income. Treasury regulations published on March 19, 2019, provide that income inclusions of a RIC from a CFC are qualifying income for the RIC whether or not the CFC makes distributions to the RIC out of its associated earnings and profits for the applicable taxable year. The federal income tax treatment of a Fund’s commodity-linked investments and income from a Subsidiary may be materially adversely affected further by future legislation, other Treasury regulations, and/or guidance issued by the IRS that could affect whether income from such investments is qualifying income under Subchapter M or otherwise materially affect the character, timing or recognition, and/or amount of a Fund’s taxable income and/or net capital gains and, therefore, the distributions a Fund makes. If a Fund were unable to qualify as a RIC for one or more taxable years, it would incur potentially significant federal income tax expense. In certain such instances, its income available for distribution to shareholders would be reduced and all such distributions from current or accumulated earnings and profits would be taxable to them as dividend income. In that event, a Fund may not utilize all the potential additional investment strategies.
Valuation Risk
This is the risk that a Fund has valued a security at a price different from the price at which it can be sold. This risk may be especially pronounced for investments, such as derivatives, which may be illiquid or which may become illiquid and for securities that trade in relatively thin markets and/or markets that experience extreme volatility. If market conditions make it difficult to value certain investments, a Fund may value these investments using more subjective methods, such as fair-value methodologies. Investors who purchase or redeem Fund shares on days when a Fund is holding fair-valued securities may receive fewer or more shares, or lower or higher redemption proceeds, than they would have received if a Fund had not fair-valued the securities or had used a different valuation methodology. The value of foreign securities, certain fixed income securities and currencies, as applicable, may be materially affected by events after the close of the markets on which they are traded, but before a Fund determines its NAV. A Fund’s ability to value its investments in an accurate and timely manner may be impacted by technological issues and/or errors by third party service providers, such as pricing services or accounting agents.
Volatility Risk
The Funds may have investments that appreciate or decrease significantly in value over short periods of time. This may cause the Funds’ NAV to experience significant increases or declines in value over short periods of time. Market interest rate changes may also cause the Fund’s NAV per share to experience volatility. This is because the value of an obligation asset in the Fund is partially a function of whether it is paying what the market perceives to be a market rate of interest for the particular obligation given its individual credit and other characteristics. If market interest rates change, an obligation’s value could be affected to the extent the interest rate paid on that obligation does not reset at the same time.
71
American Beacon FundsSM
Notes to Financial Statements
December 31, 2019
7. Federal Income and Excise Taxes
It is the policy of each Fund to qualify as a regulated investment company (“RIC”), by complying with all applicable provisions of Subchapter M of the Internal Revenue Code, as amended, and to make distributions of taxable income sufficient to relieve it from substantially all federal income and excise taxes. For federal income tax purposes, each Fund is treated as a single entity for the purpose of determining such qualification.
The Funds do not have any unrecorded tax liabilities in the accompanying financial statements. Each of the tax years in the four year period ended December 31, 2019 remain subject to examination by the Internal Revenue Service for AHL Managed Futures Strategy Fund. The two year period ended December 31, 2019 remains subject to examination by the Internal Revenue Service for AHL TargetRisk Fund. If applicable, the Funds recognize interest accrued related to unrecognized tax benefits in interest expense and penalties in “Other expenses” on the Statements of Operations.
The Funds may be subject to taxes imposed by countries in which it invests. Such taxes are generally based on returns of income earned or gains realized or repatriated. Taxes are accrued and applied to net investment income, net realized capital gains and net unrealized appreciation (depreciation), as applicable, as the income is earned or capital gains are recorded.
Dividends are categorized in accordance with income tax regulations which may treat certain transactions differently than U.S. GAAP. Accordingly, the character of distributions and composition of net assets for tax purposes may differ from those reflected in the accompanying financial statements. The Funds also utilize earnings and profits distributed to shareholders on redemptions of shares as part of the dividends paid deduction.
The tax character of distributions paid were as follows:
| AHL Managed Futures Strategy Fund | AHL TargetRisk Fund | |||||||||||||||||||||||||||
| Year Ended December 31, 2019 | Year Ended December 31, 2018 | Year Ended December 31, 2019 | Year Ended December 31, 2018A | |||||||||||||||||||||||||
Distributions paid from: |
| |||||||||||||||||||||||||||
Ordinary income* |
| |||||||||||||||||||||||||||
Institutional Class | $ | 9,234,413 | $ | 7,171,786 | $ | 326,601 | $ | - | ||||||||||||||||||||
Y Class | 15,348,555 | 8,502,485 | 2,771,893 | - | ||||||||||||||||||||||||
Investor Class | 403,194 | 252,884 | 329,122 | - | ||||||||||||||||||||||||
A Class | 89,638 | 59,819 | 35,728 | - | ||||||||||||||||||||||||
C Class | 102,163 | 32,986 | 134,524 | - | ||||||||||||||||||||||||
Long-term capital gains |
| |||||||||||||||||||||||||||
Institutional Class | 6,676,655 | - | 220,924 | - | ||||||||||||||||||||||||
Y Class | 11,541,535 | - | 1,875,005 | - | ||||||||||||||||||||||||
Investor Class | 338,973 | - | 223,380 | - | ||||||||||||||||||||||||
A Class | 76,332 | - | 24,196 | - | ||||||||||||||||||||||||
C Class | 123,342 | - | 97,868 | - | ||||||||||||||||||||||||
|
|
|
|
|
|
|
| |||||||||||||||||||||
Total distributions paid | $ | 43,934,800 | $ | 16,019,960 | $ | 6,039,241 | $ | - | ||||||||||||||||||||
|
|
|
|
|
|
|
| |||||||||||||||||||||
* For tax purposes, short-term gains are considered ordinary income distributions.
A Commencement of operations.
As of December 31, 2019, the components of distributable earnings (deficits) on a tax basis were as follows:
Fund | Tax Cost | Unrealized Appreciation | Unrealized (Depreciation) | Net Unrealized Appreciation (Depreciation) | ||||||||||||||||||||||||
| AHL Managed Futures Strategy | $ | 968,733,184 | $ | 14,810,235 | $ | (57,530,620 | ) | $ | (42,720,385 | ) | ||||||||||||||||||
| AHL TargetRisk | 126,691,351 | 2,768,936 | (1,857,766 | ) | 911,170 | |||||||||||||||||||||||
72
American Beacon FundsSM
Notes to Financial Statements
December 31, 2019
Fund | Net Unrealized Appreciation (Depreciation) | Undistributed Ordinary Income | Undistributed Long-Term Capital Gains | Accumulated Capital and Other (Losses) | Other Temporary Differences | Distributable Earnings | ||||||||||||||||||||||||||||
| AHL Managed Futures Strategy | $ | (42,720,385 | ) | $ | 5,887,932 | $ | 17,481,745 | $ | (5,797,318 | ) | $ | 33,731,127 | $ | 8,583,101 | ||||||||||||||||||||
| AHL TargetRisk | 911,170 | 1,733,490 | 100,187 | – | 133,079 | 2,877,926 | ||||||||||||||||||||||||||||
Financial reporting records are adjusted for permanent book/tax differences to reflect tax character. Financial records are not adjusted for temporary differences. The temporary differences between financial reporting andtax-basis reporting of unrealized appreciation (depreciation) are attributable primarily to the tax deferral of losses from wash sales, the tax deferral of losses related to straddles, the tax deferral of post-October ordinary losses and the realization for tax purposes of unrealized gains (losses) on certain derivative instruments.
Due to inherent differences in the recognition of income, expenses, and realized gains (losses) under U.S. GAAP and federal income tax regulations, permanent differences between book and tax reporting have been identified and appropriately reclassified on the Statements of Assets and Liabilities. Accordingly, the following amounts represent current year permanent differences derived from non-deductible excise tax and the reclassification of income from investment subsidiary as of December 31, 2019:
Fund | Paid-In-Capital | Distributable Earnings/(Deficits) | ||||||||||
| AHL Managed Futures Strategy | $ | (33,569,721 | ) | $ | 33,569,721 | |||||||
| AHL TargetRisk | 331,318 | (331,318 | ) | |||||||||
Under the Regulated Investment Company Modernization Act of 2010 (“RIC MOD”), net capital losses recognized by the Funds in taxable years beginning after December 22, 2010 are carried forward indefinitely and retain their character as short-term and/or long-term losses.
As of December 31, 2019, the Funds did not have any capital loss carryforwards.
The Funds are permitted for tax purposes to defer into the next fiscal year qualified late year losses. Qualified late year capital losses are net losses incurred after October 31 through the Fund’s fiscal year end, December 31, 2019. Qualified late year ordinary losses are specified losses generally incurred after October 31 through the end of the Fund’s fiscal year end, December 31, 2019. For the period ending December 31, 2019, AHL Managed Futures Strategy Fund deferred $5,797,318 in ordinary losses to January 1, 2020.
8. Investment Transactions
The aggregate cost of purchases and proceeds from sales and maturities of investments, other than short-term obligations, for the year ended December 31, 2019 were as follows:
Fund | Purchases (non-U.S. Government Securities) | Purchases of U.S. Government Securities | Sales(non-U.S. Government Securities) | Sales of U.S. Government Securities | ||||||||||||||||||||||||
| AHL Managed Futures Strategy | $ | - | $ | - | $ | - | $ | - | ||||||||||||||||||||
| AHL TargetRisk | 83,296,603 | 45,589,668 | 25,776,814 | 6,339,861 | ||||||||||||||||||||||||
A summary of the Funds’ transactions in the USG Select Fund for the year ended December 31, 2019 are as follows:
Fund | Type of Transaction | December 31, 2018 Shares/Fair Value | Purchases | Sales | December 31, 2019 Shares/Fair Value | Dividend Income | ||||||||||||||||||||||||||||||||||||
| AHL Managed Futures Strategy | Direct | $ | 20,760,352 | $ | 973,445,133 | $ | 972,464,503 | $ | 21,740,982 | $ | 493,014 | |||||||||||||||||||||||||||||||
| AHL TargetRisk | Direct | - | 171,552,670 | 166,375,795 | 5,176,875 | 68,798 | ||||||||||||||||||||||||||||||||||||
73
American Beacon FundsSM
Notes to Financial Statements
December 31, 2019
9. Borrowing Arrangements
Effective November 14, 2019 (the “Effective Date”), the Funds, along with certain other funds managed by the Manager (“Participating Funds”), entered into a committed revolving line of credit (the “Committed Line”) agreement with State Street Bank and Trust Company (the “Bank”) to be used to facilitate portfolio liquidity. The maximum borrowing amount under the Committed Line is $250 million with interest at a rate equal to the higher of(a) one-month London Inter-Bank Offered Rate (“LIBOR”) plus 1.25% per annum or (b) the Federal Funds rate plus 1.25% per annum on amounts borrowed. Each of the Participating Funds will pay a closing fee of $100,000 on the Effective Date and a quarterly commitment fee at a rate of 0.25% per annum on the unused portion of the Committed Line amount. The Committed Line expires November 12, 2020, unless extended by the Bank or terminated by the Participating Funds in accordance with the agreement.
On the Effective Date, the Funds, along with certain other Participating Funds managed by the Manager, also entered into an uncommitted discretionary demand revolving line of credit (the “Uncommitted Line”) agreement with the Bank to be used to facilitate portfolio liquidity. The maximum borrowing amount under the Uncommitted Line is $50 million with interest at a rate equal to the higher of(a) one-month LIBOR plus 1.25% per annum or (b) the Federal Funds rate plus 1.25% per annum on each outstanding loan. Each of the Participating Funds paid a closing fee of $35,000 on the Effective Date. The Uncommitted Line expires November 12, 2020 unless extended by the Bank or terminated by the Participating Funds in accordance with the agreement.
The Participating Funds paid administration, legal and arrangement fees, which are recognized as a component of “Other expenses” on the Statements of Operations, along with commitment fees, that have been allocated among the Participating Funds based on average daily net assets.
During the year ended December 31, 2019, the Funds did not utilize this facility.
10. Capital Share Transactions
The tables below summarize the activity in capital shares for each Class of the Funds:
| Institutional Class | ||||||||||||||||||||||||||||
| Year Ended December 31, | ||||||||||||||||||||||||||||
| 2019 | 2018 | |||||||||||||||||||||||||||
AHL Managed Futures Strategy Fund | Shares | Amount | Shares | Amount | ||||||||||||||||||||||||
| Shares sold | 5,523,825 | $ | 58,583,179 | 5,973,429 | $ | 62,786,869 | ||||||||||||||||||||||
| Reinvestment of dividends | 1,438,862 | 14,719,562 | 615,079 | 6,482,930 | ||||||||||||||||||||||||
| Shares redeemed | (10,209,295 | ) | (107,993,004 | ) | (6,356,582 | ) | (66,708,717 | ) | ||||||||||||||||||||
|
|
|
|
|
|
|
| |||||||||||||||||||||
| Net increase (decrease) in shares outstanding | (3,246,608 | ) | $ | (34,690,263 | ) | 231,926 | $ | 2,561,082 | ||||||||||||||||||||
|
|
|
|
|
|
|
| |||||||||||||||||||||
| Y Class | ||||||||||||||||||||||||||||
| Year Ended December 31, | ||||||||||||||||||||||||||||
| 2019 | 2018 | |||||||||||||||||||||||||||
AHL Managed Futures Strategy Fund | Shares | Amount | Shares | Amount | ||||||||||||||||||||||||
| Shares sold | 29,821,234 | $ | 313,727,954 | 46,402,937 | $ | 482,140,377 | ||||||||||||||||||||||
| Reinvestment of dividends | 2,476,697 | 25,237,540 | 776,199 | 8,142,322 | ||||||||||||||||||||||||
| Shares redeemed | (17,263,378 | ) | (182,376,411 | ) | (9,511,262 | ) | (99,100,466 | ) | ||||||||||||||||||||
|
|
|
|
|
|
|
| |||||||||||||||||||||
| Net increase in shares outstanding | 15,034,553 | $ | 156,589,083 | 37,667,874 | $ | 391,182,233 | ||||||||||||||||||||||
|
|
|
|
|
|
|
| |||||||||||||||||||||
| Investor Class | ||||||||||||||||||||||||||||
| Year Ended December 31, | ||||||||||||||||||||||||||||
| 2019 | 2018 | |||||||||||||||||||||||||||
AHL Managed Futures Strategy Fund | Shares | Amount | Shares | Amount | ||||||||||||||||||||||||
| Shares sold | 571,566 | $ | 6,048,728 | 1,056,484 | $ | 10,980,221 | ||||||||||||||||||||||
| Reinvestment of dividends | 72,388 | 730,397 | 24,122 | 250,869 | ||||||||||||||||||||||||
| Shares redeemed | (435,062 | ) | (4,608,458 | ) | (1,370,470 | ) | (14,058,394 | ) | ||||||||||||||||||||
|
|
|
|
|
|
|
| |||||||||||||||||||||
| Net increase (decrease) in shares outstanding | 208,892 | $ | 2,170,667 | (289,864 | ) | $ | (2,827,304 | ) | ||||||||||||||||||||
|
|
|
|
|
|
|
| |||||||||||||||||||||
74
American Beacon FundsSM
Notes to Financial Statements
December 31, 2019
| A Class | ||||||||||||||||||||||||||||
| Year Ended December 31, | ||||||||||||||||||||||||||||
| 2019 | 2018 | |||||||||||||||||||||||||||
AHL Managed Futures Strategy Fund | Shares | Amount | Shares | Amount | ||||||||||||||||||||||||
| Shares sold | 595,806 | $ | 6,284,846 | 450,225 | $ | 4,711,443 | ||||||||||||||||||||||
| Reinvestment of dividends | 15,181 | 153,174 | 5,476 | 56,952 | ||||||||||||||||||||||||
| Shares redeemed | (601,608 | ) | (6,325,478 | ) | (369,052 | ) | (3,812,812 | ) | ||||||||||||||||||||
|
|
|
|
|
|
|
| |||||||||||||||||||||
| Net increase in shares outstanding | 9,379 | $ | 112,542 | 86,649 | $ | 955,583 | ||||||||||||||||||||||
|
|
|
|
|
|
|
| |||||||||||||||||||||
| C Class | ||||||||||||||||||||||||||||
| Year Ended December 31, | ||||||||||||||||||||||||||||
| 2019 | 2018 | |||||||||||||||||||||||||||
AHL Managed Futures Strategy Fund | Shares | Amount | Shares | Amount | ||||||||||||||||||||||||
| Shares sold | 281,963 | $ | 2,884,365 | 175,816 | $ | 1,792,904 | ||||||||||||||||||||||
| Reinvestment of dividends | 18,599 | 183,017 | 2,581 | 26,252 | ||||||||||||||||||||||||
| Shares redeemed | (150,522 | ) | (1,522,998 | ) | (241,190 | ) | (2,420,527 | ) | ||||||||||||||||||||
|
|
|
|
|
|
|
| |||||||||||||||||||||
| Net increase (decrease) in shares outstanding | 150,040 | $ | 1,544,384 | (62,793 | ) | $ | (601,371 | ) | ||||||||||||||||||||
|
|
|
|
|
|
|
| |||||||||||||||||||||
| Institutional Class | ||||||||||||||||||||||||||||
| Year Ended December 31, 2019 | December 31, 2018Ato December 31, 2018 | |||||||||||||||||||||||||||
AHL TargetRisk Fund | Shares | Amount | Shares | Amount | ||||||||||||||||||||||||
| Shares sold | 1,011,041 | $ | 12,665,501 | 2,480,000 | B | $ | 24,800,000 | B | ||||||||||||||||||||
| Reinvestment of dividends | 44,728 | 547,021 | - | - | ||||||||||||||||||||||||
| Shares redeemed | (2,492,324 | ) | (30,547,335 | ) | - | - | ||||||||||||||||||||||
|
|
|
|
|
|
|
| |||||||||||||||||||||
| Net increase (decrease) in shares outstanding | (1,436,555 | ) | $ | (17,334,813 | ) | 2,480,000 | $ | 24,800,000 | ||||||||||||||||||||
|
|
|
|
|
|
|
| |||||||||||||||||||||
| Y Class | ||||||||||||||||||||||||||||
| Year Ended December 31, 2019 | December 31, 2018Ato December 31, 2018 | |||||||||||||||||||||||||||
AHL TargetRisk Fund | Shares | Amount | Shares | Amount | ||||||||||||||||||||||||
| Shares sold | 9,844,871 | $ | 121,540,614 | 10,000 | B | $ | 100,000 | B | ||||||||||||||||||||
| Reinvestment of dividends | 377,186 | 4,612,984 | - | - | ||||||||||||||||||||||||
| Shares redeemed | (498,286 | ) | (6,193,664 | ) | - | - | ||||||||||||||||||||||
|
|
|
|
|
|
|
| |||||||||||||||||||||
| Net increase in shares outstanding | 9,723,771 | $ | 119,959,934 | 10,000 | $ | 100,000 | ||||||||||||||||||||||
|
|
|
|
|
|
|
| |||||||||||||||||||||
| Investor Class | ||||||||||||||||||||||||||||
| Year Ended December 31, 2019 | December 31, 2018Ato December 31, 2018 | |||||||||||||||||||||||||||
AHL TargetRisk Fund | Shares | Amount | Shares | Amount | ||||||||||||||||||||||||
| Shares sold | 1,047,196 | $ | 12,947,060 | 10,001 | B | $ | 100,010 | B | ||||||||||||||||||||
| Reinvestment of dividends | 45,009 | 549,107 | - | - | ||||||||||||||||||||||||
| Shares redeemed | (404,435 | ) | (4,935,327 | ) | - | - | ||||||||||||||||||||||
|
|
|
|
|
|
|
| |||||||||||||||||||||
| Net increase in shares outstanding | 687,770 | $ | 8,560,840 | 10,001 | $ | 100,010 | ||||||||||||||||||||||
|
|
|
|
|
|
|
| |||||||||||||||||||||
| A Class | ||||||||||||||||||||||||||||
| April 30, 2019A December 31, 2019 | ||||||||||||||||||||||||||||
AHL TargetRisk Fund | Shares | Amount | ||||||||||||||||||||||||||
| Shares sold | 129,968 | $ | 1,601,555 | |||||||||||||||||||||||||
| Reinvestment of dividends | 4,916 | 59,925 | ||||||||||||||||||||||||||
| Shares redeemed | (13,675 | ) | (169,113 | ) | ||||||||||||||||||||||||
|
|
|
| |||||||||||||||||||||||||
| Net increase in shares outstanding | 121,209 | $ | 1,492,367 | |||||||||||||||||||||||||
|
|
|
| |||||||||||||||||||||||||
| C Class | ||||||||||||||||||||||||||||
| April 30, 2019A December 31, 2019 | ||||||||||||||||||||||||||||
AHL TargetRisk Fund | Shares | Amount | ||||||||||||||||||||||||||
| Shares sold | 466,000 | $ | 5,743,373 | |||||||||||||||||||||||||
| Reinvestment of dividends | 19,111 | 232,392 | ||||||||||||||||||||||||||
| Shares redeemed | (13,326 | ) | (163,766 | ) | ||||||||||||||||||||||||
|
|
|
| |||||||||||||||||||||||||
| Net increase in shares outstanding | 471,785 | $ | 5,811,999 | |||||||||||||||||||||||||
|
|
|
| |||||||||||||||||||||||||
| A | Commencement of operations. |
| B | Seed capital was received on December 31, 2018 in the amount of $24,800,000 for the Institutional Class, $100,000 for the Y Class, and $100,010 for the Investor Class. Shares were issued in the amount of 2,480,000 for the Institutional Class, 10,000 for the Y Class, and 10,001 for the Investor Class. |
75
American Beacon FundsSM
Notes to Financial Statements
December 31, 2019
11. Subsequent Events
Management has evaluated subsequent events for possible recognition or disclosure in the financial statements through the date the financial statements are issued. Management has determined that there are no material events that would require disclosure in the Funds’ financial statements through this date.
76
American Beacon AHL Managed Futures Strategy FundSM
(For a share outstanding throughout the period)
| Institutional Class | ||||||||||||||||||||||||||||||||||||
| Year Ended December 31, | ||||||||||||||||||||||||||||||||||||
| 2019 | 2018 | 2017 | 2016 | 2015 | ||||||||||||||||||||||||||||||||
|
| |||||||||||||||||||||||||||||||||||
Net asset value, beginning of period | $ | 10.63 | $ | 10.57 | $ | 10.44 | $ | 10.46 | $ | 10.95 | ||||||||||||||||||||||||||
|
|
|
|
|
|
|
|
|
| |||||||||||||||||||||||||||
Income (loss) from investment operations: | ||||||||||||||||||||||||||||||||||||
Net investment income (loss) | 0.04 | (0.02 | ) | (0.08 | ) | 0.20 | (0.06 | ) | ||||||||||||||||||||||||||||
Net gains (losses) on investments (both realized and unrealized) | 0.01 | 0.28 | 0.63 | (0.22 | ) | (0.07 | ) | |||||||||||||||||||||||||||||
|
|
|
|
|
|
|
|
|
| |||||||||||||||||||||||||||
Total income (loss) from investment operations | 0.05 | 0.26 | 0.55 | (0.02 | ) | (0.13 | ) | |||||||||||||||||||||||||||||
|
|
|
|
|
|
|
|
|
| |||||||||||||||||||||||||||
Less distributions: | ||||||||||||||||||||||||||||||||||||
Dividends from net investment income | (0.27 | ) | (0.14 | ) | - | - | (0.21 | ) | ||||||||||||||||||||||||||||
Distributions from net realized gains | (0.19 | ) | (0.06 | ) | (0.42 | ) | - | (0.15 | ) | |||||||||||||||||||||||||||
Tax return of capital | - | - | - | - | (0.00 | )A | ||||||||||||||||||||||||||||||
|
|
|
|
|
|
|
|
|
| |||||||||||||||||||||||||||
Total distributions | (0.46 | ) | (0.20 | ) | (0.42 | ) | - | (0.36 | ) | |||||||||||||||||||||||||||
|
|
|
|
|
|
|
|
|
| |||||||||||||||||||||||||||
Net asset value, end of period | $ | 10.22 | $ | 10.63 | $ | 10.57 | $ | 10.44 | $ | 10.46 | ||||||||||||||||||||||||||
|
|
|
|
|
|
|
|
|
| |||||||||||||||||||||||||||
Total returnB | 0.43 | % | 2.42 | % | 5.31 | % | (0.19 | )% | (1.15 | )% | ||||||||||||||||||||||||||
|
|
|
|
|
|
|
|
|
| |||||||||||||||||||||||||||
Ratios and supplemental data: |
| |||||||||||||||||||||||||||||||||||
Net assets, end of period | $ | 347,611,671 | $ | 396,044,490 | $ | 391,617,624 | $ | 353,601,987 | $ | 20,932,502 | ||||||||||||||||||||||||||
Ratios to average net assets: | ||||||||||||||||||||||||||||||||||||
Expenses, before reimbursements | 1.60 | % | 1.71 | % | 1.98 | % | 1.90 | % | 2.25 | % | ||||||||||||||||||||||||||
Expenses, net of reimbursements | 1.54 | % | 1.54 | % | 1.54 | % | 1.54 | % | 1.54 | % | ||||||||||||||||||||||||||
Net investment income (loss), before expense reimbursements | 0.52 | % | (0.40 | )% | (1.20 | )% | (1.69 | )% | (2.29 | )% | ||||||||||||||||||||||||||
Net investment income (loss), net of reimbursements | 0.58 | % | (0.23 | )% | (0.77 | )% | (1.33 | )% | (1.57 | )% | ||||||||||||||||||||||||||
Portfolio turnover rateC | – | % | – | % | – | % | – | % | - | % | ||||||||||||||||||||||||||
| A | Tax return of capital is calculated based on outstanding shares at the time of distribution. Amounts are less than $0.01 per share. |
| B | Based on net asset value, which does not reflect the sales charge, redemption fee, or contingent deferred sales charge, if applicable. May include adjustments in accordance with U.S. GAAP and as such, the net asset value for reporting purposes and the returns based upon those net asset values may differ from the net asset value and returns for shareholder transactions. |
| C | Portfolio turnover is based on the lesser of long-term purchases or sales divided by the average long-term fair value during the period. The Fund did not invest in any long-term securities during the reporting period. |
See accompanying notes
77
American Beacon AHL Managed Futures Strategy FundSM
Financial Highlights
(For a share outstanding throughout the period)
| Y Class | ||||||||||||||||||||||||||||||||||||
| Year Ended December 31, | ||||||||||||||||||||||||||||||||||||
| 2019 | 2018 | 2017 | 2016 | 2015 | ||||||||||||||||||||||||||||||||
|
| |||||||||||||||||||||||||||||||||||
Net asset value, beginning of period | $ | 10.58 | $ | 10.53 | $ | 10.41 | $ | 10.45 | $ | 10.94 | ||||||||||||||||||||||||||
|
|
|
|
|
|
|
|
|
| |||||||||||||||||||||||||||
Income (loss) from investment operations: | ||||||||||||||||||||||||||||||||||||
Net investment income (loss) | 0.08 | 0.10 | (0.07 | ) | (0.08 | ) | (0.05 | ) | ||||||||||||||||||||||||||||
Net gains (losses) on investments (both realized and unrealized) | (0.05 | ) | 0.14 | 0.61 | 0.04 | (0.08 | ) | |||||||||||||||||||||||||||||
|
|
|
|
|
|
|
|
|
| |||||||||||||||||||||||||||
Total income (loss) from investment operations | 0.03 | 0.24 | 0.54 | (0.04 | ) | (0.13 | ) | |||||||||||||||||||||||||||||
|
|
|
|
|
|
|
|
|
| |||||||||||||||||||||||||||
Less distributions: | ||||||||||||||||||||||||||||||||||||
Dividends from net investment income | (0.25 | ) | (0.13 | ) | - | - | (0.21 | ) | ||||||||||||||||||||||||||||
Distributions from net realized gains | (0.19 | ) | (0.06 | ) | (0.42 | ) | - | (0.15 | ) | |||||||||||||||||||||||||||
Tax return of capital | - | - | - | - | (0.00 | )A | ||||||||||||||||||||||||||||||
|
|
|
|
|
|
|
|
|
| |||||||||||||||||||||||||||
Total distributions | (0.44 | ) | (0.19 | ) | (0.42 | ) | - | (0.36 | ) | |||||||||||||||||||||||||||
|
|
|
|
|
|
|
|
|
| |||||||||||||||||||||||||||
Redemption fees added to beneficial interests | - | - | - | - | - | |||||||||||||||||||||||||||||||
|
|
|
|
|
|
|
|
|
| |||||||||||||||||||||||||||
Net asset value, end of period | $ | 10.17 | $ | 10.58 | $ | 10.53 | $ | 10.41 | $ | 10.45 | ||||||||||||||||||||||||||
|
|
|
|
|
|
|
|
|
| |||||||||||||||||||||||||||
Total returnB | 0.34 | % | 2.28 | % | 5.23 | % | (0.38 | )% | (1.15 | )% | ||||||||||||||||||||||||||
|
|
|
|
|
|
|
|
|
| |||||||||||||||||||||||||||
Ratios and supplemental data: |
| |||||||||||||||||||||||||||||||||||
Net assets, end of period | $ | 634,005,786 | $ | 500,530,112 | $ | 101,513,775 | $ | 52,391,912 | $ | 33,817,374 | ||||||||||||||||||||||||||
Ratios to average net assets: | ||||||||||||||||||||||||||||||||||||
Expenses, before reimbursements and recoupments | 1.63 | % | 1.72 | % | 2.04 | % | 1.97 | % | 2.28 | % | ||||||||||||||||||||||||||
Expenses, net of reimbursements and recoupments | 1.64 | % | 1.64 | % | 1.64 | % | 1.64 | % | 1.64 | % | ||||||||||||||||||||||||||
Net investment income (loss), before expense reimbursements and recoupments | 0.48 | % | 0.71 | % | (1.25 | )% | (1.76 | )% | (1.70 | )% | ||||||||||||||||||||||||||
Net investment income (loss), net of reimbursements and recoupments | 0.47 | % | 0.79 | % | (0.84 | )% | (1.44 | )% | (1.06 | )% | ||||||||||||||||||||||||||
Portfolio turnover rateC | – | % | – | % | – | % | – | % | – | % | ||||||||||||||||||||||||||
| A | Tax return of capital is calculated based on outstanding shares at the time of distribution. Amounts are less than $0.01 per share. |
| B | Based on net asset value, which does not reflect the sales charge, redemption fee, or contingent deferred sales charge, if applicable. May include adjustments in accordance with U.S. GAAP and as such, the net asset value for reporting purposes and the returns based upon those net asset values may differ from the net asset value and returns for shareholder transactions. |
| C | Portfolio turnover is based on the lesser of long-term purchases or sales divided by the average long-term fair value during the period. The Fund did not invest in any long-term securities during the reporting period. |
See accompanying notes
78
American Beacon AHL Managed Futures Strategy FundSM
Financial Highlights
(For a share outstanding throughout the period)
| Investor Class | ||||||||||||||||||||||||||||||||||||
| Year Ended December 31, | ||||||||||||||||||||||||||||||||||||
| 2019 | 2018 | 2017 | 2016 | 2015 | ||||||||||||||||||||||||||||||||
|
| |||||||||||||||||||||||||||||||||||
Net asset value, beginning of period | $ | 10.48 | $ | 10.44 | $ | 10.35 | $ | 10.41 | $ | 10.93 | ||||||||||||||||||||||||||
|
|
|
|
|
|
|
|
|
| |||||||||||||||||||||||||||
Income (loss) from investment operations: | ||||||||||||||||||||||||||||||||||||
Net investment income (loss) | 0.06 | (0.12 | ) | (0.11 | ) | (0.25 | ) | (0.09 | ) | |||||||||||||||||||||||||||
Net gains (losses) on investments (both realized and unrealized) | (0.05 | ) | 0.31 | 0.62 | 0.19 | (0.08 | ) | |||||||||||||||||||||||||||||
|
|
|
|
|
|
|
|
|
| |||||||||||||||||||||||||||
Total income (loss) from investment operations | 0.01 | 0.19 | 0.51 | (0.06 | ) | (0.17 | ) | |||||||||||||||||||||||||||||
|
|
|
|
|
|
|
|
|
| |||||||||||||||||||||||||||
Less distributions: | ||||||||||||||||||||||||||||||||||||
Dividends from net investment income | (0.23 | ) | (0.09 | ) | - | - | (0.20 | ) | ||||||||||||||||||||||||||||
Distributions from net realized gains | (0.19 | ) | (0.06 | ) | (0.42 | ) | - | (0.15 | ) | |||||||||||||||||||||||||||
Tax return of capital | - | - | - | - | (0.00 | )A | ||||||||||||||||||||||||||||||
|
|
|
|
|
|
|
|
|
| |||||||||||||||||||||||||||
Total distributions | (0.42 | ) | (0.15 | ) | (0.42 | ) | - | (0.35 | ) | |||||||||||||||||||||||||||
|
|
|
|
|
|
|
|
|
| |||||||||||||||||||||||||||
Net asset value, end of period | $ | 10.07 | $ | 10.48 | $ | 10.44 | $ | 10.35 | $ | 10.41 | ||||||||||||||||||||||||||
|
|
|
|
|
|
|
|
|
| |||||||||||||||||||||||||||
Total returnB | 0.08 | % | 1.85 | % | 4.98 | % | (0.58 | )% | (1.54 | )% | ||||||||||||||||||||||||||
|
|
|
|
|
|
|
|
|
| |||||||||||||||||||||||||||
Ratios and supplemental data: |
| |||||||||||||||||||||||||||||||||||
Net assets, end of period | $ | 18,716,672 | $ | 17,292,936 | $ | 20,241,387 | $ | 31,223,150 | $ | 37,185,001 | ||||||||||||||||||||||||||
Ratios to average net assets: | ||||||||||||||||||||||||||||||||||||
Expenses, before reimbursements | 1.94 | % | 1.97 | % | 2.20 | % | 2.13 | % | 2.40 | % | ||||||||||||||||||||||||||
Expenses, net of reimbursements | 1.92 | % | 1.92 | % | 1.92 | % | 1.92 | % | 1.92 | % | ||||||||||||||||||||||||||
Net investment income (loss), before expense reimbursements | 0.17 | % | (0.95 | )% | (1.48 | )% | (1.93 | )% | (2.07 | )% | ||||||||||||||||||||||||||
Net investment income (loss), net of reimbursements | 0.19 | % | (0.90 | )% | (1.20 | )% | (1.72 | )% | (1.59 | )% | ||||||||||||||||||||||||||
Portfolio turnover rateC | – | % | – | % | – | % | – | % | – | % | ||||||||||||||||||||||||||
| A | Tax return of capital is calculated based on outstanding shares at the time of distribution. Amounts are less than $0.01 per share. |
| B | Based on net asset value, which does not reflect the sales charge, redemption fee, or contingent deferred sales charge, if applicable. May include adjustments in accordance with U.S. GAAP and as such, the net asset value for reporting purposes and the returns based upon those net asset values may differ from the net asset value and returns for shareholder transactions. |
| C | Portfolio turnover is based on the lesser of long-term purchases or sales divided by the average long-term fair value during the period. The Fund did not invest in any long-term securities during the reporting period. |
See accompanying notes
79
American Beacon AHL Managed Futures Strategy FundSM
Financial Highlights
(For a share outstanding throughout the period)
| A Class | ||||||||||||||||||||||||||||||||||||
| Year Ended December 31, | ||||||||||||||||||||||||||||||||||||
| 2019 | 2018 | 2017 | 2016 | 2015 | ||||||||||||||||||||||||||||||||
|
| |||||||||||||||||||||||||||||||||||
Net asset value, beginning of period | $ | 10.49 | $ | 10.53 | $ | 10.36 | $ | 10.44 | $ | 10.93 | ||||||||||||||||||||||||||
|
|
|
|
|
|
|
|
|
| |||||||||||||||||||||||||||
Income (loss) from investment operations: | ||||||||||||||||||||||||||||||||||||
Net investment income (loss) | 0.04 | (0.06 | )A | (0.41 | ) | 0.23 | (0.52 | ) | ||||||||||||||||||||||||||||
Net gains (losses) on investments (both realized and unrealized) | (0.03 | ) | 0.18 | 1.00 | (0.31 | ) | 0.36 | |||||||||||||||||||||||||||||
|
|
|
|
|
|
|
|
|
| |||||||||||||||||||||||||||
Total income (loss) from investment operations | 0.01 | 0.12 | 0.59 | (0.08 | ) | (0.16 | ) | |||||||||||||||||||||||||||||
|
|
|
|
|
|
|
|
|
| |||||||||||||||||||||||||||
Less distributions: | ||||||||||||||||||||||||||||||||||||
Dividends from net investment income | (0.23 | ) | (0.10 | ) | - | - | (0.18 | ) | ||||||||||||||||||||||||||||
Distributions from net realized gains | (0.19 | ) | (0.06 | ) | (0.42 | ) | - | (0.15 | ) | |||||||||||||||||||||||||||
Tax return of capital | - | - | - | - | (0.00 | )B | ||||||||||||||||||||||||||||||
|
|
|
|
|
|
|
|
|
| |||||||||||||||||||||||||||
Total distributions | (0.42 | ) | (0.16 | ) | (0.42 | ) | - | (0.33 | ) | |||||||||||||||||||||||||||
|
|
|
|
|
|
|
|
|
| |||||||||||||||||||||||||||
Net asset value, end of period | $ | 10.08 | $ | 10.49 | $ | 10.53 | $ | 10.36 | $ | 10.44 | ||||||||||||||||||||||||||
|
|
|
|
|
|
|
|
|
| |||||||||||||||||||||||||||
Total returnC | 0.06 | % | 1.14 | % | 5.77 | % | (0.77 | )% | (1.45 | )% | ||||||||||||||||||||||||||
|
|
|
|
|
|
|
|
|
| |||||||||||||||||||||||||||
Ratios and supplemental data: | ||||||||||||||||||||||||||||||||||||
Net assets, end of period | $ | 4,229,124 | $ | 4,303,787 | $ | 3,408,861 | $ | 23,330,824 | $ | 9,890,720 | ||||||||||||||||||||||||||
Ratios to average net assets: | ||||||||||||||||||||||||||||||||||||
Expenses, before reimbursements and recoupments | 1.89 | % | 2.05 | % | 2.35 | % | 2.29 | % | 2.55 | % | ||||||||||||||||||||||||||
Expenses, net of reimbursements | 1.94 | % | 1.94 | % | 1.94 | % | 1.94 | % | 1.94 | % | ||||||||||||||||||||||||||
Net investment income (loss), before expense reimbursements | 0.22 | % | (0.72 | )% | (1.62 | )% | (2.08 | )% | (3.59 | )% | ||||||||||||||||||||||||||
Net investment income (loss), net of reimbursements and recoupments | 0.17 | % | (0.61 | )% | (1.21 | )% | (1.74 | )% | (2.98 | )% | ||||||||||||||||||||||||||
Portfolio turnover rateD | – | % | – | % | – | % | – | % | – | % | ||||||||||||||||||||||||||
| A | Per share amounts have been calculated using the average shares method. |
| B | Tax return of capital is calculated based on outstanding shares at the time of distribution. Amounts are less than $0.01 per share. |
| C | Based on net asset value, which does not reflect the sales charge, redemption fee, or contingent deferred sales charge, if applicable. May include adjustments in accordance with U.S. GAAP and as such, the net asset value for reporting purposes and the returns based upon those net asset values may differ from the net asset value and returns for shareholder transactions. |
| D | Portfolio turnover is based on the lesser of long-term purchases or sales divided by the average long-term fair value during the period. The Fund did not invest in any long-term securities during the reporting period. |
See accompanying notes
80
American Beacon AHL Managed Futures Strategy FundSM
Financial Highlights
(For a share outstanding throughout the period)
| C Class | ||||||||||||||||||||||||||||||||||||
| Year Ended December 31, | ||||||||||||||||||||||||||||||||||||
| 2019 | 2018 | 2017 | 2016 | 2015 | ||||||||||||||||||||||||||||||||
|
| |||||||||||||||||||||||||||||||||||
Net asset value, beginning of period | $ | 10.25 | $ | 10.19 | $ | 10.20 | $ | 10.34 | $ | 10.90 | ||||||||||||||||||||||||||
|
|
|
|
|
|
|
|
|
| |||||||||||||||||||||||||||
Income (loss) from investment operations: | ||||||||||||||||||||||||||||||||||||
Net investment (loss) | (0.06 | )D | (0.17 | ) | (0.17 | ) | (0.08 | ) | (0.09 | ) | ||||||||||||||||||||||||||
Net gains (losses) on investments (both realized and unrealized) | (0.02 | ) | 0.30 | 0.58 | (0.06 | ) | (0.16 | ) | ||||||||||||||||||||||||||||
|
|
|
|
|
|
|
|
|
| |||||||||||||||||||||||||||
Total income (loss) from investment operations | (0.08 | ) | 0.13 | 0.41 | (0.14 | ) | (0.25 | ) | ||||||||||||||||||||||||||||
|
|
|
|
|
|
|
|
|
| |||||||||||||||||||||||||||
Less distributions: | ||||||||||||||||||||||||||||||||||||
Dividends from net investment income | (0.16 | ) | (0.01 | ) | - | - | (0.16 | ) | ||||||||||||||||||||||||||||
Distributions from net realized gains | (0.19 | ) | (0.06 | ) | (0.42 | ) | - | (0.15 | ) | |||||||||||||||||||||||||||
Tax return of capital | - | - | - | - | (0.00 | )A | ||||||||||||||||||||||||||||||
|
|
|
|
|
|
|
|
|
| |||||||||||||||||||||||||||
Total distributions | (0.35 | ) | (0.07 | ) | (0.42 | ) | - | (0.31 | ) | |||||||||||||||||||||||||||
|
|
|
|
|
|
|
|
|
| |||||||||||||||||||||||||||
Net asset value, end of period | $ | 9.82 | $ | 10.25 | $ | 10.19 | $ | 10.20 | $ | 10.34 | ||||||||||||||||||||||||||
|
|
|
|
|
|
|
|
|
| |||||||||||||||||||||||||||
Total returnB | (0.78 | )% | 1.30 | % | 4.06 | % | (1.35 | )% | (2.30 | )% | ||||||||||||||||||||||||||
|
|
|
|
|
|
|
|
|
| |||||||||||||||||||||||||||
Ratios and supplemental data: | ||||||||||||||||||||||||||||||||||||
Net assets, end of period | $ | 6,352,147 | $ | 5,088,250 | $ | 5,702,799 | $ | 4,300,637 | $ | 2,151,492 | ||||||||||||||||||||||||||
Ratios to average net assets: | ||||||||||||||||||||||||||||||||||||
Expenses, before reimbursements and recoupments | 2.64 | % | 2.78 | % | 3.10 | % | 3.04 | % | 3.32 | % | ||||||||||||||||||||||||||
Expenses, net of reimbursements | 2.69 | % | 2.69 | % | 2.69 | % | 2.69 | % | 2.69 | % | ||||||||||||||||||||||||||
Net investment (loss), before expense reimbursements | (0.53 | )% | (1.61 | )% | (2.31 | )% | (2.84 | )% | (2.88 | )% | ||||||||||||||||||||||||||
Net investment (loss), net of reimbursements and recoupments | (0.58 | )% | (1.52 | )% | (1.90 | )% | (2.49 | )% | (2.25 | )% | ||||||||||||||||||||||||||
Portfolio turnover rateC | – | % | – | % | – | % | – | % | – | % | ||||||||||||||||||||||||||
| A | Tax return of capital is calculated based on outstanding shares at the time of distribution. Amounts are less than $0.01 per share. |
| B | Based on net asset value, which does not reflect the sales charge, redemption fee, or contingent deferred sales charge, if applicable. May include adjustments in accordance with U.S. GAAP and as such, the net asset value for reporting purposes and the returns based upon those net asset values may differ from the net asset value and returns for shareholder transactions. |
| C | Portfolio turnover is based on the lesser of long-term purchases or sales divided by the average long-term fair value during the period. The Fund did not invest in any long-term securities during the reporting period. |
| D | Per share amounts have been calculated using the average shares method. |
See accompanying notes
81
American Beacon AHL TargetRisk FundSM
Financial Highlights
(For a share outstanding throughout the period)
| Institutional Class | ||||||||||||
| Year Ended December 31, 2019 | Period EndedA December 31, 2018 | |||||||||||
|
| |||||||||||
Net asset value, beginning of period | $ | 10.00 | $ | 10.00 | ||||||||
|
|
|
| |||||||||
Income (loss) from investment operations: | ||||||||||||
Net investment income | 0.02 | - | ||||||||||
Net gains on investments (both realized and unrealized) | 2.69 | - | ||||||||||
|
|
|
| |||||||||
Total income (loss) from investment operations | 2.71 | - | ||||||||||
|
|
|
| |||||||||
Less distributions: | ||||||||||||
Dividends from net investment income | (0.02 | ) | - | |||||||||
Distributions from net realized gains | (0.53 | ) | - | |||||||||
|
|
|
| |||||||||
Total distributions | (0.55 | ) | - | |||||||||
|
|
|
| |||||||||
Net asset value, end of period | $ | 12.16 | $ | 10.00 | ||||||||
|
|
|
| |||||||||
Total returnB | 27.06 | % | – | % | ||||||||
|
|
|
| |||||||||
Ratios and supplemental data: |
| |||||||||||
Net assets, end of period | $ | 12,692,260 | $ | 24,800,000 | ||||||||
Ratios to average net assets: | ||||||||||||
Expenses, before reimbursements | 1.59 | % | 89.10 | %C | ||||||||
Expenses, net of reimbursements | 1.04 | % | 0.00 | %D | ||||||||
Net investment income (loss), before expense reimbursements | (0.44 | )% | (89.10 | )%C | ||||||||
Net investment income, net of reimbursements | 0.11 | % | 0.00 | % | ||||||||
Portfolio turnover rate | 77 | % | – | % | ||||||||
| A | Commenced operations on December 31, 2018. |
| B | Based on net asset value, which does not reflect the sales charge, redemption fee, or contingent deferred sales charge, if applicable. May include adjustments in accordance with U.S. GAAP and as such, the net asset value for reporting purposes and the returns based upon those net asset values may differ from the net asset value and returns for shareholder transactions. |
| C | Annualized. |
| D | The Manager agreed to voluntarily waive expenses as of 12/31/18, despite expense caps being in place, due to the one day of operations on the Fund. |
See accompanying notes
82
American Beacon AHL TargetRisk FundSM
Financial Highlights
(For a share outstanding throughout the period)
| Y Class | ||||||||||||
| Year Ended December 31, 2019 | Period EndedA December 31, 2018 | |||||||||||
|
| |||||||||||
Net asset value, beginning of period | $ | 10.00 | $ | 10.00 | ||||||||
|
|
|
| |||||||||
Income (loss) from investment operations: | ||||||||||||
Net investment income (loss) | (0.02 | ) | - | |||||||||
Net gains on investments (both realized and unrealized) | 2.73 | - | ||||||||||
|
|
|
| |||||||||
Total income (loss) from investment operations | 2.71 | - | ||||||||||
|
|
|
| |||||||||
Less distributions: | ||||||||||||
Dividends from net investment income | (0.02 | ) | - | |||||||||
Distributions from net realized gains | (0.53 | ) | - | |||||||||
|
|
|
| |||||||||
Total distributions | (0.55 | ) | - | |||||||||
|
|
|
| |||||||||
Redemption fees added to beneficial interests | - | - | ||||||||||
|
|
|
| |||||||||
Net asset value, end of period | $ | 12.16 | $ | 10.00 | ||||||||
|
|
|
| |||||||||
Total returnB | 27.06 | % | – | % | ||||||||
|
|
|
| |||||||||
Ratios and supplemental data: |
| |||||||||||
Net assets, end of period | $ | 118,366,001 | $ | 100,000 | ||||||||
Ratios to average net assets: | ||||||||||||
Expenses, before reimbursements | 1.62 | % | 241.64 | %C | ||||||||
Expenses, net of reimbursements | 1.14 | % | 0.00 | %D | ||||||||
Net investment income (loss), before expense reimbursements | (1.13 | )% | (241.64 | )%C | ||||||||
Net investment income (loss), net of reimbursements | (0.65 | )% | 0.00 | % | ||||||||
Portfolio turnover rate | 77 | % | – | % | ||||||||
| A | Commenced operations on December 31, 2018. |
| B | Based on net asset value, which does not reflect the sales charge, redemption fee, or contingent deferred sales charge, if applicable. May include adjustments in accordance with U.S. GAAP and as such, the net asset value for reporting purposes and the returns based upon those net asset values may differ from the net asset value and returns for shareholder transactions. |
| C | Annualized. |
| D | The Manager agreed to voluntarily waive expenses as of 12/31/18, despite expense caps being in place, due to the one day of operations on the Fund. |
See accompanying notes
83
American Beacon AHL TargetRisk FundSM
Financial Highlights
(For a share outstanding throughout the period)
| Investor Class | ||||||||||||
| Year Ended December 31, 2019 | Period EndedA December 31, 2018 | |||||||||||
|
| |||||||||||
Net asset value, beginning of period | $ | 10.00 | $ | 10.00 | ||||||||
|
|
|
| |||||||||
Income (loss) from investment operations: | ||||||||||||
Net investment income (loss) | (0.07 | ) | - | |||||||||
Net gains on investments (both realized and unrealized) | 2.76 | - | ||||||||||
|
|
|
| |||||||||
Total income (loss) from investment operations | 2.69 | - | ||||||||||
|
|
|
| |||||||||
Less distributions: | ||||||||||||
Dividends from net investment income | (0.02 | ) | - | |||||||||
Distributions from net realized gains | (0.53 | ) | - | |||||||||
|
|
|
| |||||||||
Total distributions | (0.55 | ) | - | |||||||||
|
|
|
| |||||||||
Net asset value, end of period | $ | 12.14 | $ | 10.00 | ||||||||
|
|
|
| |||||||||
Total returnB | 26.85 | % | – | % | ||||||||
|
|
|
| |||||||||
Ratios and supplemental data: |
| |||||||||||
Net assets, end of period | $ | 8,469,551 | $ | 100,010 | ||||||||
Ratios to average net assets: | ||||||||||||
Expenses, before reimbursements | 1.93 | % | 241.89 | %C | ||||||||
Expenses, net of reimbursements | 1.42 | % | 0.00 | %D | ||||||||
Net investment income (loss), before expense reimbursements | (1.49 | )% | (241.89 | )%C | ||||||||
Net investment income (loss), net of reimbursements | (0.98 | )% | 0.00 | % | ||||||||
Portfolio turnover rate | 77 | % | – | % | ||||||||
| A | Commenced operations on December 31, 2018. |
| B | Based on net asset value, which does not reflect the sales charge, redemption fee, or contingent deferred sales charge, if applicable. May include adjustments in accordance with U.S. GAAP and as such, the net asset value for reporting purposes and the returns based upon those net asset values may differ from the net asset value and returns for shareholder transactions. |
| C | Annualized. |
| D | The Manager agreed to voluntarily waive expenses as of 12/31/18, despite expense caps being in place, due to the one day of operations on the Fund. |
See accompanying notes
84
American Beacon AHL TargetRisk FundSM
Financial Highlights
(For a share outstanding throughout the period)
| A Class | ||||
| Period EndedA December 31, 2019 | ||||
|
| |||
Net asset value, beginning of period | $ | 11.32 | ||
|
| |||
Income (loss) from investment operations: | ||||
Net investment income (loss) | (0.03 | ) | ||
Net gains on investments (both realized and unrealized) | 1.38 | |||
|
| |||
Total income (loss) from investment operations | 1.35 | |||
|
| |||
Less distributions: | ||||
Dividends from net investment income | (0.02 | ) | ||
Distributions from net realized gains | (0.53 | ) | ||
|
| |||
Total distributions | (0.55 | ) | ||
|
| |||
Net asset value, end of period | $ | 12.12 | ||
|
| |||
Total returnB | 11.89 | %C | ||
|
| |||
Ratios and supplemental data: |
| |||
Net assets, end of period | $ | 1,469,217 | ||
Ratios to average net assets: | ||||
Expenses, before reimbursements | 2.33 | %D | ||
Expenses, net of reimbursements | 1.44 | %D | ||
Net investment income (loss), before expense reimbursements | (1.73 | )%D | ||
Net investment income (loss), net of reimbursements | (0.84 | )%D | ||
Portfolio turnover rate | 77 | %C | ||
| A | Commenced operations on April 30, 2019. |
| B | Based on net asset value, which does not reflect the sales charge, redemption fee, or contingent deferred sales charge, if applicable. May include adjustments in accordance with U.S. GAAP and as such, the net asset value for reporting purposes and the returns based upon those net asset values may differ from the net asset value and returns for shareholder transactions. |
| C | Not annualized. |
| D | Annualized. |
See accompanying notes
85
American Beacon AHL TargetRisk FundSM
Financial Highlights
(For a share outstanding throughout the period)
| C Class | ||||
| Period EndedA December 31, 2019 | ||||
|
| |||
Net asset value, beginning of period | $ | 11.32 | ||
|
| |||
Income (loss) from investment operations: | ||||
Net investment income (loss) | (0.06 | ) | ||
Net gains on investments (both realized and unrealized) | 1.36 | |||
|
| |||
Total income (loss) from investment operations | 1.30 | |||
|
| |||
Less distributions: | ||||
Dividends from net investment income | - | |||
Distributions from net realized gains | (0.53 | ) | ||
|
| |||
Total distributions | (0.53 | ) | ||
|
| |||
Net asset value, end of period | $ | 12.09 | ||
|
| |||
Total returnB | 11.42 | %C | ||
|
| |||
Ratios and supplemental data: |
| |||
Net assets, end of period | $ | 5,702,552 | ||
Ratios to average net assets: | ||||
Expenses, before reimbursements | 2.76 | %D | ||
Expenses, net of reimbursements | 2.19 | %D | ||
Net investment income (loss), before expense reimbursements | (2.28 | )%D | ||
Net investment income (loss), net of reimbursements | (1.71 | )%D | ||
Portfolio turnover rate | 77 | %C | ||
| A | Commenced operations on April 30, 2019. |
| B | Based on net asset value, which does not reflect the sales charge, redemption fee, or contingent deferred sales charge, if applicable. May include adjustments in accordance with U.S. GAAP and as such, the net asset value for reporting purposes and the returns based upon those net asset values may differ from the net asset value and returns for shareholder transactions. |
| C | Not annualized. |
| D | Annualized. |
See accompanying notes
86
American Beacon FundsSM
Affirmation of the Commodity Pool Operator
December 31, 2019 (Unaudited)
To the best of my knowledge and belief, the information contained in the attached financial statements for the American Beacon AHL Managed Futures Strategy Fund and American Beacon AHL TargetRisk Fund for the period from January 1, 2019 to December 31, 2019, is accurate and complete.

Melinda G. Heika, Treasurer
American Beacon Advisors, Inc.
Commodity Pool Operator for the American Beacon AHL
Managed Futures Strategy Fund and American Beacon AHL
TargetRisk Fund
87
American Beacon FundsSM
December 31, 2019 (Unaudited)
Certain tax information regarding the Funds is required to be provided to shareholders based upon the Funds’ income and distributions for the taxable year ended December 31, 2019. The information and distributions reported herein may differ from information and distributions taxable to the shareholders for the calendar year ended December 31, 2019.
The Funds designated the following items with regard to distributions paid during the fiscal year ended December 31, 2019. All designations are based on financial information available as of this annual report and, accordingly, are subject to change. For each item, it is the intention of the Funds to designate the maximum amount permitted under the Internal Revenue Code of 1986, as amended, and the regulations there under.
Corporate Dividends-Received Deduction:
AHL Managed Futures Strategy | 0.00 | % | ||
AHL TargetRisk | 0.00 | % |
Qualified Dividend Income:
AHL Managed Futures Strategy | 0.00 | % | ||
AHL TargetRisk | 0.00 | % |
Long-Term Capital Gain Distributions:
AHL Managed Futures Strategy | $ | 18,756,837 | ||
AHL TargetRisk | 2,441,373 |
Short-Term Capital Gain Distributions:
AHL Managed Futures Strategy | $ | 2,705,665 | ||
AHL TargetRisk | 3,355,787 |
Shareholders will receive notification in January 2020 of the applicable tax information necessary to prepare their 2019 income tax returns.
88
Trustees and Officers of the American Beacon FundsSM(Unaudited)
The Trustees and officers of the American Beacon Funds (the “Trust”) are listed below, together with their principal occupations during the past five years. The address of each person listed below is 220 Las Colinas Boulevard East, Suite 1200, Irving, Texas 75039. Each Trustee overseesthirty-six funds in the fund complex that includes the Trust, the American Beacon Select Funds, the American Beacon Institutional Funds Trust, the American Beacon Sound Point Enhanced Income Fund, American Beacon Apollo Total Return Fund and the American Beacon Sound Point Alternative Lending Fund. The Trust’s Statement of Additional Information contains additional information about the Trustees and is available without charge by calling1-800-658-5811.
Name, Age | Position, Term of Office and Length of Time Served with the Trust | Principal Occupation(s) During Past 5 Years and Current Directorships | ||
| INTERESTED TRUSTEES | Term | |||
| Lifetime of Trust until removal, resignation or retirement* | ||||
| Alan D. Feld** (83) | Trustee since 1996 | Partner in the law firm of Akin, Gump, Strauss, Hauer & Feld, LLP (law firm) (1960-Present); Trustee, American Beacon Select Funds (1999-Present); Trustee, American Beacon Institutional Funds Trust (2017-Present); Trustee, American Beacon Sound Point Enhanced Income Fund (2018-Present); Trustee, American Beacon Apollo Total Return Fund (2018-Present); Trustee, American Beacon Sound Point Alternative Lending Fund (2019-Present). | ||
| NON-INTERESTED TRUSTEES | Term | |||
| Lifetime of Trust until removal, resignation or retirement* | ||||
| Gilbert G. Alvarado (50) | Trustee since 2015 | Director, Kura MD, Inc. (local telehealth organization) (2015-present); Vice President & CFO, Sierra Health Foundation (health conversion private foundation) (2006-Present); Vice President & CFO, Sierra Health Foundation: Center for Health Program Management (California public benefit corporation) (2012-Present); Director, Innovative North State (2012-2015); Director, Sacramento Regional Technology Alliance (2011-2016); Director, Women’s Empowerment (2009-2014); Director, Valley Healthcare Staffing (2017-present); Trustee, American Beacon Select Funds (2015-Present); Trustee, American Beacon Institutional Funds Trust (2017-Present); Trustee, American Beacon Sound Point Enhanced Income Fund (2018-Present); Trustee, American Beacon Apollo Total Return Fund (2018-Present); Trustee, American Beacon Sound Point Alternative Lending Fund (2019-Present). | ||
| Joseph B. Armes (57) | Trustee since 2015 | Chairman & CEO, CSW Industrials f/k/a Capital Southwest Corporation (investment company) (2015-Present); Chairman of the Board of Capital Southwest Corporation, predecessor to CSW Industrials, Inc. (2014-2017) (investment company); CEO, Capital Southwest Corporation (2013-2015); President & CEO, JBA Investment Partners (family investment vehicle) (2010-Present); Director and Chair of Audit Committee, RSP Permian (oil and gas producer) (2013-Present); Trustee, American Beacon Select Funds (2015-Present); Trustee, American Beacon Institutional Funds Trust (2017-Present); Trustee, American Beacon Sound Point Enhanced Income Fund (2018-Present); Trustee, American Beacon Apollo Total Return Fund (2018-Present); Trustee, American Beacon Sound Point Alternative Lending Fund (2019-Present). | ||
| Gerard J. Arpey (61) | Trustee since 2012 | Director, The Home Depot, Inc. (2015-Present); Partner, Emerald Creek Group (private equity firm) (2011-Present); Director, S.C. Johnson & Son, Inc. (privately held company) (2008-present); Trustee, American Beacon Select Funds (2012-Present); Trustee, American Beacon Institutional Funds Trust (2017-Present); Trustee, American Beacon Sound Point Enhanced Income Fund (2018-Present); Trustee, American Beacon Apollo Total Return Fund (2018-Present); Trustee, American Beacon Sound Point Alternative Lending Fund (2019-Present). | ||
89
Trustees and Officers of the American Beacon FundsSM(Unaudited)
Name, Age | Position, Term of Office and Length of Time Served with the Trust | Principal Occupation(s) During Past 5 Years and Current Directorships | ||
| NON-INTERESTED TRUSTEES (CONT.) | Term | |||
| Lifetime of Trust until removal, resignation or retirement* | ||||
| Brenda A. Cline (59) | Trustee since 2004 Chair since 2019 Vice Chair 2018 | Chief Financial Officer, Treasurer and Secretary, Kimbell Art Foundation (1993-Present); Director, Tyler Technologies, Inc. (public sector software solutions company) (2014-Present); Director, Range Resources Corporation (oil and natural gas company) (2015-Present); Trustee, CushingClosed-End andOpen-End Funds and ETFs (2017-Present); Trustee, American Beacon Select Funds (2004-Present); ; Trustee, American Beacon Institutional Funds Trust (2017-Present); Trustee, American Beacon Sound Point Enhanced Income Fund (2018-Present); Trustee, American Beacon Apollo Total Return Fund (2018-Present); Trustee, American Beacon Sound Point Alternative Lending Fund (2019-Present). | ||
| Eugene J. Duffy (65) | Trustee since 2008 | Managing Director, Global Investment Management Distribution, Mesirow Financial (2016-Present); Managing Director, Institutional Services, Intercontinental Real Estate Corporation (2014-Present); Principal and Executive Vice President, Paradigm Asset Management (1994-2014); Trustee, American Beacon Select Funds (2008-Present); Trustee, American Beacon Institutional Funds Trust (2017-Present); Trustee, American Beacon Sound Point Enhanced Income Fund (2018-Present); Trustee, American Beacon Apollo Total Return Fund (2018-Present); Trustee, American Beacon Sound Point Alternative Lending Fund (2019-Present). | ||
| Claudia A. Holz (62) | Trustee since 2018 | Partner, KPMG LLP (1990-2017); Trustee, American Beacon Select Funds (2018-Present); Trustee, American Beacon Institutional Funds Trust (2018-Present); Trustee, American Beacon Sound Point Enhanced Income Fund (2018-Present); Trustee, American Beacon Apollo Total Return Fund (2018-Present); Trustee, American Beacon Sound Point Alternative Lending Fund (2019-Present). | ||
| Douglas A. Lindgren (58) | Trustee since 2018 | CEO North America, Carne Global Financial Services (2016-2017); Managing Director, IPS Investment Management and Global Head, Content Management, UBS Wealth Management (2010-2016); Trustee, American Beacon Select Funds (2018-Present); Trustee, American Beacon Institutional Funds Trust (2018-Present); Trustee, American Beacon Sound Point Enhanced Income Fund (2018-Present); Trustee, American Beacon Apollo Total Return Fund (2018-Present); Trustee, American Beacon Sound Point Alternative Lending Fund (2019-Present). | ||
| Richard A. Massman (76) | Trustee since 2004 Chair 2008-2018 Chair Emeritus since 2019 | Consultant and General Counsel Emeritus, Hunt Consolidated, Inc. (holding company engaged in oil and gas exploration and production, refining, real estate, farming, ranching and venture capital activities) (2009-Present); Trustee, American Beacon Select Funds (2004-Present); Trustee, American Beacon Institutional Funds Trust (2017-Present); Trustee, American Beacon Sound Point Enhanced Income Fund (2018-Present); Trustee, American Beacon Apollo Total Return Fund (2018-Present); Trustee, American Beacon Sound Point Alternative Lending Fund (2019-Present). | ||
| Barbara J. McKenna, CFA (56) | Trustee since 2012 | President/Managing Principal, Longfellow Investment Management Company (2005-Present); Trustee, American Beacon Select Funds (2012-Present); Trustee, American Beacon Institutional Funds Trust (2017-Present); Trustee, American Beacon Sound Point Enhanced Income Fund (2018-Present); Trustee, American Beacon Apollo Total Return Fund (2018-Present); Trustee, American Beacon Sound Point Alternative Lending Fund (2019-Present). | ||
90
Trustees and Officers of the American Beacon FundsSM(Unaudited)
Name, Age | Position, Term of Office and Length of Time Served with the Trust | Principal Occupation(s) During Past 5 Years and Current Directorships | ||
| NON-INTERESTED TRUSTEES (CONT.) | Term | |||
| Lifetime of Trust until removal, resignation or retirement* | ||||
| R. Gerald Turner (74) | Trustee since 2001 | President, Southern Methodist University (1995-Present); Director, J.C. Penney Company, Inc. (1996-Present); Director, Kronus Worldwide Inc. (chemical manufacturing) (2003-Present); Trustee, American Beacon Select Funds (2001-Present); Trustee, American Beacon Institutional Funds Trust (2017-Present); Trustee, American Beacon Sound Point Enhanced Income Fund (2018-Present); Trustee, American Beacon Apollo Total Return Fund (2018-Present); Trustee, American Beacon Sound Point Alternative Lending Fund (2019-Present). | ||
| OFFICERS | Term | |||
| One Year | ||||
| Gene L. Needles, Jr. (65) | President since 2009 | President (2009-2018), CEO and Director (2009-Present), and Chairman (2018-Present), American Beacon Advisors, Inc., President (2015-2018), Director and CEO (2015-Present), and Chairman (2018-Present), Resolute Investment Holdings, LLC; President (2015-2018), Director and CEO (2015-Present), and Chairman (2018-Present),Resolute Topco, Inc.; President (2015-2018); Director, and CEO (2015-Present), and Chairman (2018-Present), Resolute Acquisition, Inc.; President (2015-2018), Director and CEO (2015-Present), Chairman (2018-Present), Resolute Investment Managers, Inc.; Director, Chairman, President and CEO, Resolute Investment Distributors (2017-Present); Director, Chairman, President and CEO; Resolute Investment Services, Inc. (2017-Present); President and CEO, Lighthouse Holdings Parent, Inc. (2009-2015); President, CEO and Director, Lighthouse Holdings, Inc. (2009-2015); Manager, President and CEO, American Private Equity Management, LLC (2012-Present); Director, Chairman, President and CEO, Alpha Quant Advisors, LLC (2016-Present); Director, ARK Investment Management LLC (2016-Present); Director, Shapiro Capital Management LLC (2017-Present); Director, Chairman and CEO, Continuous Capital, LLC (2018-Present); President, American Beacon Cayman Managed Futures Strategy Fund, Ltd. (2014-Present); Director and President, American Beacon Cayman Transformational Innovation Company, LTD., (2017-2018); President, American Beacon Delaware Transformational Innovation Corporation (2017-2018); President American Beacon Cayman TargetRisk Company, Ltd. (2018-Present);Member, Investment Advisory Committee, Employees Retirement System of Texas (2017-Present); Trustee, American Beacon NextShares Trust (2015-Present); President, American Beacon Select Funds (2009-Present); President, American Beacon Institutional Funds Trust (2017-Present); President, American Beacon Sound Point Enhanced Income Fund (2018-Present); President, American Beacon Apollo Total Return Fund (2018-Present); Director, RSW Investments Holdings LLC, (2019-Present); Manager, SSI Investment Management, LLC (2019-Present); President, American Beacon Sound Point Alternative Lending Fund (2019-Present); Director, Green Harvest Asset Management (2019-Present); Director, National Investment Services of America, LLC (2019-Present). | ||
91
Trustees and Officers of the American Beacon FundsSM(Unaudited)
Name, Age | Position, Term of Office and Length of Time Served with the Trust | Principal Occupation(s) During Past 5 Years and Current Directorships | ||
| OFFICERS (CONT.) | Term | |||
| One Year | ||||
| Rosemary K. Behan (60) | VP, Secretary and Chief Legal Officer since 2006 | Vice President, Secretary and General Counsel, American Beacon Advisors, Inc. (2006-Present); Secretary, Resolute Investment Holdings, LLC (2015-Present); Secretary, Resolute Topco, Inc. (2015-Present); Secretary, Resolute Acquisition, Inc. (2015-Present); Vice President, Secretary and General Counsel, Resolute Investment Managers, Inc. (2015-Present); Secretary, Resolute Investment Distributors, Inc. (2017-Present); Vice President, Secretary and General Counsel, Resolute Investment Services, Inc. (2017-Present); Vice President and Secretary, Lighthouse Holdings Parent, Inc. (2008-2015); Vice President and Secretary, Lighthouse Holdings, Inc. (2008-2015); Secretary, American Private Equity Management, LLC (2008-Present); Secretary and General Counsel, Alpha Quant Advisors, LLC (2016-Present); Vice President and Secretary, Continuous Capital, LLC (2018-Present); Secretary, American Beacon Delaware Transformational Innovation Corporation (2017-2018); Secretary, American Beacon Cayman Transformational Innovation Company, Ltd. (2017-2018); Secretary, American Beacon Cayman Managed Futures Strategy Fund, Ltd. (2014-Present); Secretary, American Beacon Cayman TargetRisk Company, Ltd (2018-Present); Chief Legal Officer, Vice President and Secretary, American Beacon Select Funds (2006-Present); Chief Legal Officer, Vice President and Secretary, American Beacon Institutional Funds Trust (2017-Present); Chief Legal Officer, Vice President and Secretary, American Beacon Sound Point Enhanced Income Fund (2018-Present); Chief Legal Officer, Vice President and Secretary American Beacon Apollo Total Return Fund (2018-Present); Chief Legal Officer, Vice President and Secretary, American Beacon Sound Point Alternative Lending Fund (2019-Present); Secretary, Green Harvest Asset Management (2019-Present). | ||
| Brian E. Brett (59) | VP since 2004 | Senior Vice President, Head of Distribution (2012-Present), Vice President, Director of Sales (2004-2012), American Beacon Advisors, Inc.; Senior Vice President, Resolute Investment Managers, Inc. (2017-Present); Senior Vice President, Resolute Investment Distributors, Inc. (2018-Present), Senior Vice President, Resolute Investment Services, Inc. (2018-Present); Senior Vice President, Lighthouse Holdings Parent, Inc. (2008-2015); Senior Vice President, Lighthouse Holdings, Inc. (2008-2015); Vice President, American Beacon Select Funds (2004-Present); Vice President, American Beacon Institutional Funds Trust (2017-Present); Vice President American Beacon Sound Point Enhanced Income Fund (2018-Present); Vice President American Beacon Apollo Total Return Fund (2018-Present); Vice President, American Beacon Sound Point Alternative Lending Fund (2019-Present). | ||
| Paul B. Cavazos (50) | VP since 2016 | Chief Investment Officer and Senior Vice President, American Beacon Advisors, Inc. (2016-Present); Chief Investment Officer, DTE Energy (2007-2016); Vice President, American Private Equity Management, L.L.C. (2017-Present); Vice President, American Beacon Select Funds (2016-Present); Vice President, American Beacon Institutional Funds Trust (2017-Present); Vice President American Beacon Sound Point Enhanced Income Fund (2018-Present);Vice President American Beacon Apollo Total Return Fund (2018-Present); Vice President, American Beacon Sound Point Alternative Lending Fund (2019-Present). | ||
92
Trustees and Officers of the American Beacon FundsSM(Unaudited)
Name, Age | Position, Term of Office and Length of Time Served with the Trust | Principal Occupation(s) During Past 5 Years and Current Directorships | ||
| OFFICERS (CONT.) | Term | |||
| One Year | ||||
| Erica Duncan (49) | VP Since 2011 | Vice President, American Beacon Advisors, Inc. (2011-Present); Vice President, Resolute Investment Managers (2018-Present); Vice President, Resolute Investment Services, Inc. (2018-Present); Vice President, American Beacon Select Funds (2011-Present); Vice President, American Beacon Institutional Funds Trust (2017-Present); Vice President American Beacon Sound Point Enhanced Income Fund (2018-Present); Vice President American Beacon Apollo Total Return Fund (2018-Present); Vice President, American Beacon Sound Point Alternative Lending Fund (2019-Present). | ||
| Melinda G. Heika (58) | Treasurer since 2010 | Treasurer and CFO (2010-Present), American Beacon Advisors, Inc.; Treasurer, Resolute Topco, Inc. (2015-Present); Treasurer, Resolute Investment Holdings, LLC. (2015-Present); Treasurer, Resolute Acquisition, Inc. (2015-Present); Treasurer and CFO, Resolute Investment Managers, Inc. (2017-Present); Treasurer, Resolute Investment Distributors, Inc. (2017-2017); Treasurer and CFO, Resolute Investment Services, Inc. (2015-Present); Treasurer, Lighthouse Holdings Parent Inc., (2010-2015); Treasurer, Lighthouse Holdings, Inc. (2010-2015); Treasurer, American Private Equity Management, LLC (2012-Present); Treasurer and CFO, Alpha Quant Advisors, LLC (2016-Present); Treasurer and CFO, Continuous Capital, LLC (2018-Present); Treasurer, American Beacon Cayman Transformational Innovation, Ltd. (2017-2018); Treasurer, American Beacon Delaware Transformational Innovation Corporation (2017-2018); Director and Treasurer, American Beacon Cayman Managed Futures Strategy Fund, Ltd. (2014-Present); Treasurer, American Beacon Cayman TargetRisk Company, Ltd. (2018-Present); Treasurer, American Beacon Select Funds (2010-Present); Treasurer, American Beacon Institutional Funds Trust (2017-Present); Treasurer, American Beacon Sound Point Enhanced Income Fund (2018-Present); Treasurer, American Beacon Apollo Total Return Fund (2018-Present); Treasurer, American Beacon Sound Point Alternative Lending Fund (2019-Present); Treasurer, Green Harvest Asset Management (2019-Present). | ||
| Terri L. McKinney (56) | VP since 2010 | Vice President (2009-Present), Managing Director (2003-2009), American Beacon Advisors, Inc.; Vice President, Resolute Investment Managers, Inc. (2017-Present); Vice President, Resolute Investment Services, Inc (2018-Present); Vice President, Alpha Quant Advisors, LLC (2016-Present); Vice President, Continuous Capital, LLC (2018-Present); Vice President, American Beacon Select Funds (2010-Present); Vice President, American Beacon Institutional Funds Trust (2017-Present); Vice President, American Beacon Sound Point Enhanced Income Fund (2018-Present); Vice President, American Beacon Apollo Total Return Fund (2018-Present); Vice President, American Beacon Sound Point Alternative Lending Fund (2019-Present). | ||
93
Trustees and Officers of the American Beacon FundsSM(Unaudited)
Name, Age | Position, Term of Office and Length of Time Served with the Trust | Principal Occupation(s) During Past 5 Years and Current Directorships | ||
| OFFICERS (CONT.) | Term | |||
| One Year | ||||
| Jeffrey K. Ringdahl (44) | VP since 2010 | Director (2015-Present), President (2018-Present), Chief Operating Officer (2010-Present), Senior Vice President (2013-2018), Vice President (2010-2013), American Beacon Advisors, Inc.; Director (2015-Present), President (2018-Present), Senior Vice Present (2015-2018), Resolute Investment Holdings, LLC; Director (2015-Present), President (2018-Present), Senior Vice President (2015-2018), Resolute Topco, Inc.; Director (2015-Present), President (2018-Present), Senior Vice President (2015-2018), Resolute Acquisition, Inc.; Director (2015-Present), President & COO (2018-Present), Senior Vice President (2015-2018), Resolute Investment Managers, Inc.; Director and Executive Vice President (2017-Present), Resolute Investment Distributors, Inc.; Director (2017-Present), President & COO (2018-Present), Executive Vice President (2017-2018), Resolute Investment Services, Inc.; Senior Vice President (2017-Present), Vice President (2012-2017), Manager (2015-Present), American Private Equity Management, LLC; Senior Vice President, Lighthouse Holdings Parent, Inc. (2013-2015); Senior Vice President, Lighthouse Holdings, Inc. (2013-2015); Trustee, American Beacon NextShares Trust (2015-Present); Director, Executive Vice President & COO, Alpha Quant Advisors, LLC (2016-Present); Director, Shapiro Capital Management, LLC (2017-Present); Director, Executive Vice President & COO, Continuous Capital, LLC (2018-Present); Director and Vice President, American Beacon Cayman Transformational Innovation Company, Ltd., (2017-Present); Vice President, American Beacon Delaware Transformational Innovation Corporation (2017-2018); Director and Vice President, American Beacon Cayman Managed Futures Strategy Fund, Ltd. (2014-Present); Vice President, American Beacon Cayman TargetRisk Company, Ltd (2018-Present); Vice President, American Beacon Select Funds (2010-2018); Vice President, American Beacon Institutional Funds Trust (2017-Present); Vice President, American Beacon Sound Point Enhanced Income Fund (2018-Present); Vice President, American Beacon Apollo Total Return Fund (2018-Present); Director, RSW Investments Holdings LLC, (2019-Present); Manager, SSI Investment Management, LLC (2019-Present), Vice President, American Beacon Sound Point Alternative Lending Fund (2019-Present); Director, National Investment Services of America, LLC (2019-Present). | ||
| Samuel J. Silver (56) | VP Since 2011 | Vice President (2011-Present), Chief Fixed Income Officer (2016-Present), American Beacon Advisors, Inc. (2011-Present); Vice President, American Beacon Select Funds (2011-Present); Vice President, American Beacon Institutional Funds Trust (2017-Present); Vice President, American Beacon Sound Point Enhanced Income Fund (2018-Present); Vice President, American Beacon Apollo Total Return Fund (2018-Present); Vice President, American Beacon Sound Point Alternative Lending Fund (2019-Present). | ||
94
Trustees and Officers of the American Beacon FundsSM(Unaudited)
Name, Age | Position, Term of Office and Length of Time Served with the Trust | Principal Occupation(s) During Past 5 Years and Current Directorships | ||
| OFFICERS (CONT.) | Term | |||
| One Year | ||||
| Christina E. Sears (48) | Chief Compliance Officer since 2004 and Asst. Secretary since 1999 | Vice President, American Beacon Advisors, Inc. (2019-Present); Chief Compliance Officer, American Beacon Advisors, Inc. (2004-Present); Vice President, Resolute Investment Managers, Inc. (2017-Present); Vice President, Resolute Investment Distributors (2017-Present); Vice President, Resolute Investment Services, Inc. (2019-Present); Chief Compliance Officer, American Private Equity Management, LLC (2012-Present); Chief Compliance Officer (2016-2019) and Vice President, Alpha Quant Advisors, LLC (2016-Present); Vice President, Continuous Capital, LLC (2018-Present); Chief Compliance Officer (2004-Present) and Assistant Secretary (1999-Present), American Beacon Select Funds; Chief Compliance Officer and Assistant Secretary, American Beacon Institutional Funds Trust (2017-Present); Chief Compliance Officer and Assistant Secretary, American Beacon Sound Point Enhanced Income Fund (2018-Present); Chief Compliance Officer and Assistant Secretary, American Beacon Apollo Total Return Fund (2018-Present); Chief Compliance Officer and Assistant Secretary, American Beacon Sound Point Alternative Lending Fund (2019-Present). | ||
| Sonia L. Bates (63) | Asst. Treasurer since 2011 | Assistant Treasurer, American Beacon Advisors, Inc. (2011-2018); Assistant Treasurer, Lighthouse Holdings Parent Inc. (2011-2015); Assistant Treasurer, Lighthouse Holdings, Inc. (2011-2015); Assistant Treasurer, American Private Equity Management, LLC (2012-Present); Assistant Treasurer, American Beacon Cayman Transformational Innovation Company, Ltd. (2017-Present); Assistant Treasurer, American Beacon Cayman TargetRisk Company, Ltd. (2018-Present); Assistant Treasurer, American Beacon Select Funds (2011-Present); Assistant Treasurer, American Beacon Institutional Funds Trust (2017-Present); Assistant Treasurer, American Beacon Sound Point Enhanced Income Fund (2018-Present); Assistant Treasurer, American Beacon Apollo Total Return Fund (2018-Present); Assistant Treasurer, American Beacon Sound Point Alternative Lending Fund (2019-Present). | ||
| Shelley D. Abrahams (45) | Assistant Secretary since 2008 | Assistant Secretary, American Beacon Select Funds (2008-Present); Assistant Secretary, American Beacon Institutional Funds Trust (2017-Present); Assistant Secretary, American Beacon Sound Point Enhanced Income Fund (2018-Present); Assistant Secretary, American Beacon Apollo Total Return Fund (2018-Present); Assistant Secretary, American Beacon Sound Point Alternative Lending Fund (2019-Present); Assistant Secretary, Green Harvest Asset Management (2019-Present). | ||
| Rebecca L. Harris (53) | Assistant Secretary since 2010 | Vice President, American Beacon Advisors, Inc. (2011-Present); Vice President, Resolute Investment Managers, Inc. (2017-Present); Vice President, Resolute Investment Services (2015-Present); Vice President, Alpha Quant Advisors, LLC (2016-Present); Vice President, Continuous Capital, LLC (2018-Present); Assistant Secretary, American Beacon Select Funds (2010-Present); Assistant Secretary, American Beacon Institutional Funds Trust (2017-Present); Assistant Secretary, American Beacon Sound Point Enhanced Income Fund (2018-Present); Assistant Secretary, American Beacon Apollo Total Return Fund (2018-Present); Assistant Secretary, American Beacon Sound Point Alternative Lending Fund(2019-Present). | ||
95
Trustees and Officers of the American Beacon FundsSM(Unaudited)
Name, Age | Position, Term of Office and Length of Time Served with the Trust | Principal Occupation(s) During Past 5 Years and Current Directorships | ||
| OFFICERS (CONT.) | Term | |||
| One Year | ||||
| Teresa A. Oxford (61) | Assistant Secretary since 2015 | Assistant Secretary, American Beacon Advisors, Inc. (2015-Present); Assistant Secretary, Resolute Investment Distributors (2018-Present); Assistant Secretary, Resolute Investment Services (2018-Present); Assistant Secretary, Alpha Quant Advisors, LLC (2016-Present); Assistant Secretary, American Beacon Select Funds (2015-Present); Assistant Secretary, American Beacon Institutional Funds Trust (2017-Present); Assistant Secretary, American Beacon Sound Point Enhanced Income Fund (2018-Present); Assistant Secretary, American Beacon Apollo Total Return Fund (2018-Present); Assistant Secretary, American Beacon Sound Point Alternative Lending Fund (2019-Present); Assistant Secretary, Green Harvest Asset Management (2019-Present). | ||
* As of 11/12/2014, the Board adopted a retirement plan that requires Trustees, other than Messrs. Feld and Massman to retire no later than the last day of the calendar year in which they reach the age of 75. As of 11/7/17, the Board approved a waiver of the mandatory retirement policy with respect to Mr. Massman, who turned 75 in November 2018, to permit him to continue to serve on the Board as Chair Emeritus through 12/31/19. As of 1/1/2020 both Messrs. Feld and Massman retired from the Board.
** Mr. Feld is deemed to be an “interested person” of the Trusts, as defined by the 1940 Act. Mr. Feld’s law firm of Akin, Gump, Strauss, Hauer & Feld LLP has provided legal services within the past two fiscal years to one or more of the Trust’ssub-advisors.
96
American Beacon FundsSM
December 31, 2019 (Unaudited)
The American Beacon Funds recognize and respect the privacy of our shareholders. We are providing this notice to you, so you will understand how shareholder information may be collected and used.
We may collect nonpublic personal information about you from one or more of the following sources:
| • | information we receive from you on applications or other forms; |
| • | information about your transactions with us or our service providers; and |
| • | information we receive from third parties. |
We do not disclose any nonpublic personal information about our customers or former customers to anyone, except as permitted by law.
We restrict access to your nonpublic personal information to those employees or service providers who need to know that information to provide products or services to you. To ensure the confidentiality of your nonpublic personal information, we maintain safeguards that comply with federal standards.
97
This page intentionally left blank.
98
This page intentionally left blank.
99
This page intentionally left blank.
100

eDelivery isNOW AVAILABLE - Stop traditional mail delivery and receive your
shareholder reports and summary prospectus on-line. Sign up at
www.americanbeaconfunds.com
If you invest in the Fund through a financial institution, you may be able to receive the Fund’s regulatory mailings, such as the Prospectus, Annual Report and Semi-Annual Report, by e-mail. If you are interested in this option, please go towww.icsdelivery.com and search for your financial institution’s name or contact your financial institution directly.
To obtain more information about the Fund:
 |  | |
| By E-mail: | On the Internet: | |
| american_beacon.funds@ambeacon.com | Visit our website atwww.americanbeaconfunds.com | |
By Telephone: Call (800) 658-5811 |
By Mail: American Beacon Funds P.O. Box 219643 Kansas City, MO 64121-9643 | |
| Availability of Quarterly Portfolio Schedules | Availability of Proxy Voting Policy and Records | |
| In addition to the Schedule of Investments provided in each semi-annual and annual report, the Fund files a complete schedule of its portfolio holdings with the Securities and Exchange Commission (“SEC”) on Form N-PORT as of the end of each fiscal quarter. The Fund’s Forms N-PORT are available on the SEC’s website atwww.sec.gov. The Forms N-PORT may also be reviewed and copied at the SEC’s Public Reference Section, 100 F Street, NE, Washington, D.C. 20549-2736. Information regarding the operation of the SEC’s Public Reference Room may be obtained by calling(800)-SEC-0330. A complete schedule of the Funds’ portfolio holdings is also available atwww.americanbeaconfunds.com approximately sixty days after the end of each calendar quarter. | A description of the policies and procedures the Fund uses to determine how to vote proxies relating to portfolio securities is available in the Fund’s Statement of Additional Information, is available free of charge on the Fund’s websitewww.americanbeaconfunds.com and by calling1-800-967-9009 or by accessing the SEC’s website atwww.sec.gov. The Fund’s proxy voting record for the most recent year ended June 30 is filed annually with the SEC on Form N-PX. The Fund’s Forms N-PX are available on the SEC’s website atwww.sec.gov. The Fund’s proxy voting record may also be obtained by calling 1-800-967-9009. | |


Fund Service Providers:
CUSTODIAN State Street Bank and Trust Company Boston, Massachusetts | TRANSFER AGENT DST Asset Managers Solutions, Inc. Quincy, Massachusetts | INDEPENDENT REGISTERED PUBLIC ACCOUNTING FIRM Ernst & Young LLP Dallas, Texas | DISTRIBUTOR Resolute Investment Distributors, Inc. Irving, Texas |
This report is prepared for shareholders of the American Beacon Funds and may be distributed to others only if preceded or accompanied by a current Prospectus or Summary Prospectus.
American Beacon Funds, American Beacon AHL Managed Futures Strategy Fund and American Beacon AHL TargetRisk Fund are service marks of American Beacon Advisors, Inc.
AR 12/19
ITEM 2. CODE OF ETHICS.
The Trust adopted a code of ethics that applies to its principal executive and financial officers (the “Code”). The Trust amended its code August 19, 2019 to disclose the addition of the American Beacon Sound Point Enhanced Income Fund, American Beacon Apollo Total Return Fund and American Beacon Sound Point Alternative Lending Fund and to disclose a change to limit the value of gifts received by the principal officer or financial officer to $100. The Trust did not grant any waivers to the provisions of the Code during the period covered by the shareholder reports presented in Item 1. The Code is filed herewith as Exhibit 99.CODE ETH.
ITEM 3. AUDIT COMMITTEE FINANCIAL EXPERT.
The Trust’s Board of Trustees has determined that Gilbert G. Alvarado and Claudia Holz, members of the Trust’s Audit and Compliance Committee, are “audit committee financial experts” as defined in FormN-CSR. Mr. Gilbert Alvarado and Ms. Claudia Holz are “independent” as defined in FormN-CSR.
ITEM 4. PRINCIPAL ACCOUNTANT FEES AND SERVICES.
(a) | ||||
Audit Fees | Fiscal Year Ended | |||
$254,636 | 12/31/2018 | |||
$249,955 | 12/31/2019 | |||
(b)1 | ||||
Audit-Related Fees | Fiscal Year Ended | |||
$0 | 12/31/2018 | |||
$0 | 12/31/2019 | |||
(c)2 | ||||
Tax Fees | Fiscal Year Ended | |||
$126,107 | 12/31/2018 | |||
$100,572 | 12/31/2019 | |||
(d) | ||||
All Other Fees | Fiscal Year Ended | |||
$0 | 12/31/2018 | |||
$0 | 12/31/2019 | |||
| 1 | “Audit-Related Fees” are the aggregate fees billed for assurance and related services reasonably related to the performance of the audit or review of financial statements that are not reported under “Audit Fees”. These fees include accounting consultations and consents, if applicable. |
| 2 | “Tax Fees” are the aggregate fees billed for professional services for tax advice, tax compliance, and tax planning. These fees include federal and state tax reviews, excise tax reviews, and PFIC analysis reviews. |
(e)(1) Pursuant to its charter, the Trust’s Audit and Compliance Committee shall have the following duties and powers pertaining topre-approval of audit andnon-audit services provided by the Trust’s principal accountant:
| • | to approve, prior to appointment, the engagement of auditors to annually audit and provide their opinion on the Trusts’ financial statements, and, in connection therewith, reviewing and evaluating matters potentially affecting the independence and capabilities of the auditors; |
| • | to approve, prior to appointment, the engagement of the auditors to providenon-audit services to the Trusts, an investment adviser to any series of the Trusts or any entity controlling, controlled by, or |
under common control with an investment adviser (“adviser affiliate”) that provides ongoing services to the Trusts, if the engagement relates directly to the operations and financial reporting of the Trusts;
| • | to consider whether thenon-audit services provided by a Trust’s auditor to an investment adviser or any adviser affiliate that provides ongoing services to a series of the Trusts, which services were notpre-approved by the Committee, are compatible with maintaining the auditor’s independence; |
| • | to review the arrangements for and scope of the annual audit and any special audits; and |
| • | to review and approving the fees proposed to be charged to the Trusts by the auditors for each audit andnon-audit service. |
The Audit and Compliance Committee may delegate any portion of its authority, including the authority to grantpre-approvals of audit and permittednon-audit services, to a subcommittee of one or more members. Any decisions of the subcommittee to grantpre-approvals shall be presented to the full audit committee at its next regularly scheduled meeting.
(e)(2) None of the fees disclosed in paragraphs (b) through (d) above were approved by the audit committee pursuant to paragraph (c)(7)(i)(C) of Rule2-01 of RegulationS-X.
(f) Not applicable.
(g) AggregateNon-Audit Fees for Services Rendered to the:
Registrant | Adviser | Adviser’s Affiliates Providing Ongoing Services to Registrant | Fiscal Year Ended | |||||||||
$126,107 | $ | 409,769 | N/A | 12/31/2018 | ||||||||
$100,572 | $ | 547,885 | N/A | 12/31/2019 | ||||||||
(h) Not applicable.
ITEM 5. AUDIT COMMITTEE OF LISTED REGISTRANTS.
Not applicable.
ITEM 6. SCHEDULE OF INVESTMENTS.
The schedules of investments for each series of the Trust are included in the shareholder reports presented in Item 1.
ITEM 7. DISCLOSURE OF PROXY VOTING POLICIES AND PROCEDURES FORCLOSED-END MANAGEMENT
INVESTMENT COMPANIES.
Not applicable.
ITEM 8. PORTFOLIO MANAGERS OFCLOSED-END MANAGEMENT INVESTMENT COMPANIES.
Not applicable.
ITEM 9. PURCHASES OF EQUITY SECURITIES BYCLOSED-END MANAGEMENT INVESTMENT COMPANY
AND AFFILIATED PURCHASERS.
Not applicable.
ITEM 10. SUBMISSION OF MATTERS TO A VOTE OF SECURITY HOLDERS.
The Trust has made no material changes to the procedures by which shareholders may recommend nominees to the Trust’s Board of Trustees since the Trust last disclosed such procedures in Schedule 14A.
ITEM 11. CONTROLS AND PROCEDURES.
(a) Based upon an evaluation within 90 days of the filing date of this report, the principal executive and financial officers concluded that the disclosure controls and procedures of the Trust are effective.
(b) There were no changes in the Trust’s internal control over financial reporting during the second fiscal quarter of the period covered by this report that has materially affected, or is reasonably likely to materially affect, the Trust’s internal control over financial reporting.
ITEM 12. EXHIBITS.
(a)(1) Filed herewith asEX-99.CODE ETH.
(a)(2) A separate certification for each principal executive officer and principal financial officer of the Trust as required by Rule30a-2(a) under the Investment Company Act of 1940 is attached hereto asEX-99.CERT.
(a)(3) Not applicable.
(b) The certifications required by Rule30a-2(b) under the Investment Company Act of 1940 are attached hereto asEX-99.906CERT.
SIGNATURES
Pursuant to the requirements of the Securities Exchange Act of 1934 and the Investment Company Act of 1940, the registrant has duly caused this report to be signed on its behalf by the undersigned, thereunto duly authorized.
(Registrant): American Beacon Funds
| By | /s/ Gene L. Needles, Jr. | |
| Gene L. Needles, Jr. | ||
| President | ||
| American Beacon Funds |
Date: March 9, 2020
Pursuant to the requirements of the Securities Exchange Act of 1934 and the Investment Company Act of 1940, this report has been signed below by the following persons on behalf of the registrant and in the capacities and on the dates indicated.
| By | /s/ Gene L. Needles, Jr. | |
| Gene L. Needles, Jr. | ||
| President | ||
| American Beacon Funds |
Date: March 9, 2020
| By | /s/ Melinda G. Heika | |
| Melinda G. Heika | ||
| Treasurer | ||
| American Beacon Funds |
Date: March 9, 2020