UNITED STATES
SECURITIES AND EXCHANGE COMMISSION
Washington, D.C. 20549
FORM N-CSR
CERTIFIED SHAREHOLDER REPORT OF REGISTERED
MANAGEMENT INVESTMENT COMPANIES
Investment Company Act file number: 811-4984
AMERICAN BEACON FUNDS
(Exact name of registrant as specified in charter)
220 East Las Colinas Boulevard, Suite 1200
Irving, Texas 75039
(Address of principal executive offices)-(Zip code)
JEFFREY K. RINGDAHL, PRESIDENT
220 East Las Colinas Boulevard, Suite 1200
Irving, Texas 75039
(Name and address of agent for service)
Registrant’s telephone number, including area code: (817) 391-6100
Date of fiscal year end: October 31, 2023
Date of reporting period: October 31, 2023
Form N-CSR is to be used by management investment companies to file reports with the Commission not later than 10 days after the transmission to stockholders of any report that is required to be transmitted to stockholders under Rule 30e-1 under the Investment Company Act of 1940 (17 CFR 270.30e-1). The Commission may use the information provided on Form N-CSR in its regulatory, disclosure review, inspection, and policymaking roles.
A registrant is required to disclose the information specified by Form N-CSR, and the Commission will make this information public. A registrant is not required to respond to the collection of information contained in Form N-CSR unless the Form displays a currently valid Office of Management and Budget (“OMB”) control number. Please direct comments concerning the accuracy of the information collection burden estimate and any suggestions for reducing the burden to Secretary, Securities and Exchange Commission, 450 Fifth Street, NW, Washington, DC 20549-0609. The OMB has reviewed this collection of information under the clearance requirements of 44 U.S.C. § 3507.
| ITEM 1. | REPORTS TO STOCKHOLDERS. |
About American Beacon Advisors
Since 1986, American Beacon Advisors, Inc. has offered a variety of products and investment advisory services to numerous institutional and retail clients, including a variety of mutual funds, corporate cash management, and separate account management.
Our clients include defined benefit plans, defined contribution plans, foundations, endowments, corporations, financial planners, and other institutional investors. With American Beacon Advisors, you can put the experience of a multi-billion dollar asset management firm to work for your company.
BALANCED FUND
The use of fixed-income securities entails interest rate and credit risks. Interest rate risk is the risk that debt securities will decrease in value with increases in market interest rates. Credit risk is the risk that the issuer of a bond will fail to make timely payment of interest or principal; the decline in an issuer’s credit rating can cause the price of its bonds to go down. Investing in foreign securities may involve heightened risk due to currency fluctuations and economic and political risks. Investing in value stocks may limit downside risk over time; however, the Fund may produce more modest gains than riskier stock funds as a trade-off for this potentially lower risk. To the extent the Fund invests more heavily in particular sectors, its performance will be sensitive to factors affecting those sectors. Financial sector companies are heavily regulated and particularly sensitive to interest rate fluctuations. The use of futures contracts for cash management may subject the Fund to losing more money than invested. The Fund participates in a securities lending program. Please see the prospectus for a complete discussion of the Fund’s risks. There can be no assurances that the investment objectives of this Fund will be met.
Any opinions herein, including forecasts, reflect our judgment as of the end of the reporting period and are subject to change. Each advisor’s strategies and each Fund’s portfolio composition will change depending on economic and market conditions. This report is not a complete analysis of market conditions, and, therefore, should not be relied upon as investment advice. Although economic and market information has been compiled from reliable sources, American Beacon Advisors, Inc. makes no representation as to the completeness or accuracy of the statements contained herein.
American Beacon Funds | October 31, 2023 |
Contents
| | | | |
Additional Fund Information | | | Back Cover | |
President’s Message
| | |
 | | Dear Shareholders, In the words of Theodor Seuss Geisel, the beloved children’s author and cartoonist known as Dr. Seuss, “Only you can control your future.” While we as individuals cannot control everything that’s happening in the world around us or within the global economy and markets, we can take steps to diversify our risk exposure as we seek to preserve and grow our personal savings. By making prudent adjustments to our investment portfolios with the help of trusted financial professionals, we may be better positioned to withstand the negative financial forces we’re likely to encounter in our lifetime – especially during periods like today’s geopolitical turmoil and economic uncertainty. |
At American Beacon, we endeavor to provide a broad range of disciplined investment strategies to help you potentially collect the fruits of your labor over the fullness of time. We work diligently to cultivate relationships with the investment managers who serve as sub-advisors to our investment products. Since our firm’s inception as a pension fiduciary in 1986 and the launch of our first sub-advised, multi-manager mutual funds in 1987, we have continued expanding our innovative product offerings. And we are committed to applying a solutions-based, risk-managed approach in our pursuit of institutional wisdom while striving to generate earned alpha and enduring value.
Thank you for entrusting your financial future with American Beacon. For more information about our investment products or to access your account information, please visit our website at www.americanbeaconfunds.com.
Best Regards,

Jeffrey K. Ringdahl
President
American Beacon Funds
1
Domestic Bond and Domestic Equity Market Overviews
October 31, 2023 (Unaudited)
Domestic Bond Market Overview
During the 12 months ended October 31, 2023, the economy faced increasing headwinds in the form of sharply higher interest rates and the dissipation of savings that were built up during the COVID-19 pandemic. Additionally, the benign tailwind of healthy supply chains removed one of the primary causes of inflation seen during the period. With the broad increase in interest rates and positive excess return in all investment-grade spread sectors, the bond market posted a small positive total return of 0.36% for the Bloomberg® US Aggregate Bond Index (the “Index”) over the past 12 months. The period’s return qualifies as the eighth worst annual return in the 47-year history of the Index. The Credit sector excess return was a positive 4.07% over the period; within the sector, low-quality credit performed the best, resulting in an excess return of 5.00%. The Mortgage-Backed Securities sector had a small, positive excess return of 0.08%. The Agency and Asset-Backed Securities sectors also followed suit, delivering positive excess returns of 0.73% and 1.17%, respectively. In total, the Index had a positive excess return of 1.21% for the period.
October 2023 marked the third consecutive month in which the Federal Reserve (“Fed”) maintained a pause in its tightening efforts, following a 17-month period of rate hikes. A Fed pause after a tightening cycle has historically been associated with significantly lower bond yields in the future. Despite the Fed’s observation of “resilient” strength in the labor market, there have been increasing signs of weakness. This trend raises concerns about the Fed’s reliance on employment data that tends to lag behind market dynamics, potentially leading to a policy mistake similar to the one witnessed in 2021. (In 2021, the Fed delayed the conclusion of its easing policy, failing to address mounting inflationary pressures that ultimately proved to be more persistent than transitory.) The Fed’s belief in the resilience of the U.S. economy may be misplaced, as both economic growth and inflation are expected to trend lower in the future. Furthermore, the majority of leading economic indicators (including the Conference Board’s Leading Economic Indicator Index®, money supply, supply chains and tightened lending standards) also point toward a significant slowdown in economic growth and inflation. Given this backdrop, interest rates could potentially decline over the coming months.
2
Domestic Bond and Domestic Equity Market Overviews
October 31, 2023 (Unaudited)
Domestic Equity Market Overview
For the 12-month period ended October 31, 2023, domestic equity markets were mostly higher and had a range of risks and rewards under the surface. During the period, the Federal Reserve (“Fed”) continued to tighten monetary policy through six rate hikes totaling 2.25%. The last 0.25% hike in late July culminated in a target policy rate of 5.25% to 5.50% as inflation levels remained uncomfortably above the Fed’s target of 2%. The underlying U.S. economy remained on steady footing – despite many economists forecasting recession – as the unemployment rate remained below 4%, and third quarter U.S. real gross domestic product grew at an annualized rate of 4.9%.
In the U.S., the technology-heavy Nasdaq Composite® was up an impressive 18.0%. The S&P 500® Index was up 10.1% with mixed underlying sector performance. The top-performing S&P sectors, by a significant margin, were Communication Services (up 35.8%) and Information Technology (up 30.8%). Conversely, the worst-performing sectors were Utilities (down 7.7%) and Real Estate (down 6.5%).
From a style standpoint, Growth easily outpaced Value as shown by the 17.3% return for the Russell 3000® Growth Index compared to the Russell 3000® Value Index return of -0.5%.
In terms of market capitalization, small-cap stocks significantly underperformed their larger-capitalization peers, evidenced by the Russell 2000® Index return of -8.6% compared to the Russell 1000® Index return of 9.5%.
3
American Beacon Balanced FundSM
Performance Overview
October 31, 2023 (Unaudited)
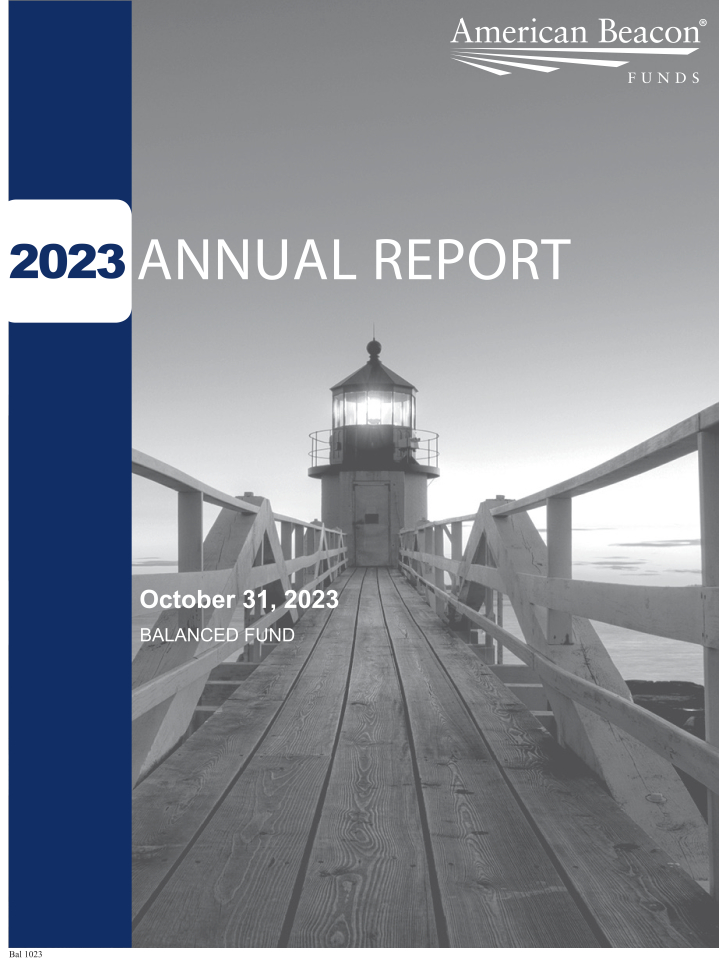
The Investor Class of the American Beacon Balanced Fund (the “Fund”) returned 2.46% for the twelve months ended October 31, 2023, outperforming the Balanced Composite Index (40% Bloomberg US Aggregate Bond Index / 60% Russell 1000® Value Index) return of 0.36% for the same period.
Comparison of Changes in Value of a $10,000 Investment for the period 10/31/2013 through 10/31/2023
| | | | | | | | | | | | | | | | | | | | | | | | | | | | | | |
| Total Returns for the Period ended October 31, 2023 | | | | | |
| | | | | | | | | | | | | | | | | | | | | | | | | | | | | | |
| | | | | | |
| | | Ticker | | 1 Year | | 3 Years | | 5 Years | | 10 Years | | Value of $10,000 10/31/2013- 10/31/2023 |
R5 Class (1,6) | | AADBX | | | | 2.80 | % | | | | 7.69 | % | | | | 5.83 | % | | | | 5.93 | % | | | $ | 17,790 | |
| | | | | | |
Y Class (1,6) | | ACBYX | | | | 2.68 | % | | | | 7.59 | % | | | | 5.74 | % | | | | 5.87 | % | | | $ | 17,684 | |
| | | | | | |
Investor Class (1,6) | | AABPX | | | | 2.46 | % | | | | 7.37 | % | | | | 5.51 | % | | | | 5.60 | % | | | $ | 17,249 | |
| | | | | | |
Advisor Class (1,6) | | ABLSX | | | | 2.35 | % | | | | 7.20 | % | | | | 5.32 | % | | | | 5.42 | % | | | $ | 16,956 | |
| | | | | | |
A Class without sales charge (1,2,6) | | ABFAX | | | | 2.44 | % | | | | 7.34 | % | | | | 5.48 | % | | | | 5.56 | % | | | $ | 17,187 | |
| | | | | | |
A Class with sales Charge (1,2,6) | | ABFAX | | | | (3.42 | )% | | | | 5.23 | % | | | | 4.23 | % | | | | 4.94 | % | | | $ | 16,202 | |
| | | | | | |
C Class without sales charge (1,3,6) | | ABCCX | | | | 1.68 | % | | | | 6.54 | % | | | | 4.70 | % | | | | 4.94 | % | | | $ | 16,195 | |
| | | | | | |
C Class with sales charge (1,3,6) | | ABCCX | | | | 0.68 | % | | | | 6.54 | % | | | | 4.70 | % | | | | 4.94 | % | | | $ | 16,195 | |
| | | | | | |
| | | | | | | | | | | | | | | | | | | | | | | | | | | | |
| | | | | | |
Balanced Composite Index (40% Bloomberg US Aggregate Bond Index/60% Russell 1000® Value Index) (4) | | | | | | 0.36 | % | | | | 3.91 | % | | | | 4.31 | % | | | | 5.15 | % | | | $ | 16,520 | |
| | | | | | |
Russell 1000® Value Index (5) | | | | | | 0.13 | % | | | | 10.21 | % | | | | 6.60 | % | | | | 7.60 | % | | | $ | 20,799 | |
| | | | | | |
Bloomberg US Aggregate Bond Index (5) | | | | | | 0.36 | % | | | | (5.57 | )% | | | | (0.06 | )% | | | | 0.88 | % | | | $ | 10,921 | |
| 1. | Performance shown is historical and is not indicative of future returns. Investment returns and principal value will vary, and shares may be worth more or less at redemption than at original purchase. Performance shown is calculated based on the published end of day net asset values as of date indicated, and current performance may be lower or higher than the performance data quoted. To obtain performance as of the most recent month end, please visit www.americanbeaconfunds.com or call 1-800-967-9009. Fund performance in the table above does not reflect the deduction of taxes a shareholder would pay on distributions or the redemption of shares. Generally accepted accounting principles require adjustments to be made to the net assets of the Fund at period end for financial reporting purposes only; and as such, the total return based on the unadjusted net asset value per share may differ from the total return reported in the financial highlights. |
4
American Beacon Balanced FundSM
Performance Overview
October 31, 2023 (Unaudited)
| 2. | A portion of the fees charged to the A Class of the Fund was waived in 2018. Performance prior to waiving fees was lower than the actual returns shown for the ten-year period. A Class has a maximum sales charge of 5.75%. |
| 3. | A portion of the fees charged to the C Class of the Fund was waived in 2018. Performance prior to waiving fees was lower than the actual returns shown for the ten-year period. The maximum contingent deferred sales charge for C Class is 1% for shares redeemed within one year of the date of purchase. |
| 4. | To reflect the Fund’s allocation of its assets between investment-grade fixed-income securities and equity securities, the returns of the Bloomberg US Aggregate Bond Index and Russell 1000 Value Index have been combined in a 40% / 60% proportion, respectively. |
| 5. | The Russell 1000® Value Index is an unmanaged index of those stocks in the Russell 1000 Index with lower price-to-book ratios and lower forecasted growth values. Russell 1000 Value Index is a registered trademark of Frank Russell Company. American Beacon Funds is not promoted, sponsored or endorsed by, nor in any way affiliated with the London Stock Exchange Group plc and its group undertakings (collectively, the “LSE Group”). FTSE Russell is a trading name of certain of the LSE Group companies. LSE Group is not responsible for and has not reviewed the American Beacon Balanced Fund nor any associated literature or publications and LSE Group makes no representation or warranty, express or implied, as to their accuracy, or completeness, or otherwise. All rights in the Russell 1000 Value Index (the “Index”) vest in the relevant LSE Group company which owns the Index. Russell 1000® is a trademark of the relevant LSE Group company and is used by any other LSE Group company under license. The Index is calculated by or on behalf of FTSE International Limited or its affiliate, agent or partner. The LSE Group does not accept any liability whatsoever to any person arising out of (a) the use of, reliance on or any error in the Index or (b) investment in or operation of the Fund. The LSE Group makes no claim, prediction, warranty or representation either as to the results to be obtained from the Fund or the suitability of the Index for the purpose to which it is being put by the Manager. The Bloomberg US Aggregate Bond Index is a broad-based benchmark that measures the investment grade, U.S. dollar-denominated, fixed-rate taxable bond market. BLOOMBERG® is a trademark and service mark of Bloomberg Finance L.P. and its affiliates (collectively, “Bloomberg”). Bloomberg or Bloomberg’s licensors, own all proprietary rights in the Bloomberg Indices. Bloomberg does not approve or endorse this material, or guarantee the accuracy or completeness of any information herein, or make any warranty, express or implied, as to the results to be obtained therefrom and, to the maximum extent allowed by law, shall not have any liability or responsibility for injury or damages arising in connection therewith. |
| 6. | The Total Annual Fund Operating Expense ratios set forth in the most recent Fund prospectus for the R5, Y, Investor, Advisor, A, and C Class shares were 0.72%, 0.80%, 1.03%, 1.19%, 1.04%, and 1.78%, respectively. The expense ratios above may vary from the expense ratios presented in other sections of this report that are based on expenses incurred during the period covered by this report. |
As of October 31, 2023, the Fund’s asset allocation was 60% in equities (including equitized cash) and 40% in fixed-income securities.
The equity portion of the Fund (excluding equitized cash) returned 5.08% for the period, outperforming the Russell 1000 Value Index (the “Index”) return of 0.13%. The Fund outperformed the Index as both stock selection and sector allocation contributed to outperformance relative to the Index.
Stock selection in the Industrials and Information Technology sectors contributed most of the relative outperformance during the twelve-month period. In the Industrials sector, Vertiv Holdings Co. (up 174.8%) and FedEx Corp. (up 53.2%) added value. In the Information Technology sector, the Fund’s positions in Broadcom, Inc. (up 82.2%) and Microsoft Corp. (up 49.7%) also contributed. Conversely, positions in M&T Bank Corp. (down 29.9%) and Citizens Financial Group, Inc. (down 35.5%) detracted from performance within the Financials sector.
The Fund’s underweight allocation to the Health Care sector (down 10.5%) and the Utilities sector (down 8.0%) helped performance with respect to sector allocation. On the other hand, an overweight allocation to the Consumer Discretionary sector (down 5.5%) detracted from the Fund’s relative outperformance.
The fixed-income portion of the Fund returned 1.18% for the twelve-month period, outperforming the Bloomberg US Aggregate Bond Index (the “Bloomberg Index”) return of 0.36%. The Fund’s fixed-income performance relative to the Bloomberg Index was helped by security selection and sector allocation. Selections in higher-quality securities, such as A and AAA, (up 2.6% and 4.0%, respectively), contributed to relative value, as did the Fund’s selections in Service and Manufacturing within Corporates (up 3.7% and 4.0%, respectively). However, security selections within U.S. Treasuries (down 1.4%), detracted from value. Furthermore, an overweight to A rated securities (up 2.0%) and Finance within Corporates (up 3.5%) contributed to performance. From a duration perspective, the portfolio’s return was helped by selections within the ten to thirty year maturity (down 0.2%).
The sub-advisors continue to focus on the disciplined selection of attractive securities that should allow the Fund to benefit long-term.
5
American Beacon Balanced FundSM
Performance Overview
October 31, 2023 (Unaudited)
| | | | | | | | |
| Top Ten Holdings (% Net Assets) | |
| Vertiv Holdings Co. | | | | | | | 2.0 | |
| Elevance Health, Inc. | | | | | | | 1.8 | |
| Wells Fargo & Co. | | | | | | | 1.7 | |
| American International Group, Inc. | | | | | | | 1.6 | |
| Comcast Corp., Class A | | | | | | | 1.4 | |
| Fidelity National Information Services, Inc. | | | | | | | 1.3 | |
| U.S. Bancorp | | | | | | | 1.2 | |
| U.S. Treasury Notes, 3.500%, Due 2/15/2033 | | | | | | | 1.2 | |
| Alphabet, Inc., Class A | | | | | | | 1.1 | |
| Halliburton Co. | | | | | | | 1.1 | |
| | |
| Total Fund Holdings | | | 400 | | | | | |
| | | | | | | | |
| Sector Allocation (% Equities) | |
| Financials | | | | | | | 21.6 | |
| Health Care | | | | | | | 13.6 | |
| Energy | | | | | | | 13.5 | |
| Information Technology | | | | | | | 12.5 | |
| Industrials | | | | | | | 11.5 | |
| Consumer Discretionary | | | | | | | 9.1 | |
| Communication Services | | | | | | | 6.5 | |
| Materials | | | | | | | 4.5 | |
| Consumer Staples | | | | | | | 2.8 | |
| Utilities | | | | | | | 2.5 | |
| Real Estate | | | | | | | 1.9 | |
| | | | | | | | |
| Sector Allocation (% Fixed Income) | |
| U.S. Treasury Obligations | | | | | | | 26.8 | |
| U.S. Agency Mortgage-Backed Obligations | | | | | | | 24.2 | |
| Financial | | | | | | | 13.7 | |
| Communications | | | | | | | 5.0 | |
| Asset-Backed Obligations | | | | | | | 4.8 | |
| Utilities | | | | | | | 4.7 | |
| Consumer, Non-Cyclical | | | | | | | 4.6 | |
| Technology | | | | | | | 4.6 | |
| Industrial | | | | | | | 3.9 | |
| Consumer, Cyclical | | | | | | | 3.0 | |
| U.S. Government Agency Obligations | | | | | | | 2.0 | |
| Energy | | | | | | | 2.0 | |
| Commercial Mortgage-Backed Obligations | | | | | | | 0.6 | |
| Basic Materials | | | | | | | 0.1 | |
6
American Beacon Balanced FundSM
Expense Examples
October 31, 2023 (Unaudited)
Fund Expense Example
As a shareholder of a Fund, you incur two types of costs: (1) transaction costs, including sales charges (loads) on purchase payments and redemption fees, if applicable, and (2) ongoing costs, including management fees, distribution (12b-1) fees, sub-transfer agent fees, and other Fund expenses. The Examples are intended to help you understand the ongoing cost (in dollars) of investing in the Fund and to compare these costs with the ongoing costs of investing in other mutual funds. The Examples are based on an investment of $1,000 invested at the beginning of the period in each Class and held for the entire period from May 1, 2023 through October 31, 2023.
Actual Expenses
The “Actual” lines of the tables provide information about actual account values and actual expenses. You may use the information on this page, together with the amount you invested, to estimate the expenses that you paid over the period. Simply divide your account value by $1,000 (for example, an $8,600 account value divided by $1,000 = $8.60), then multiply the result by the “Expenses Paid During Period” to estimate the expenses you paid on your account during this period. Shareholders of the Investor and R5 Classes that invest in the Fund through an IRA or Roth IRA may be subject to a custodial IRA fee of $15 that is typically deducted each December. If your account was subject to a custodial IRA fee during the period, your costs would have been $15 higher.
Hypothetical Example for Comparison Purposes
The “Hypothetical” lines of the tables provide information about hypothetical account values and hypothetical expenses based on the Fund’s actual expense ratio and an assumed 5% per year rate of return before expenses (not the Fund’s actual return). You may compare the ongoing costs of investing in the Fund with other funds by contrasting this 5% hypothetical example and the 5% hypothetical examples that appear in the shareholder reports of the other funds. The hypothetical account values and expenses may not be used to estimate the actual ending account balance or expenses you paid for the period. Shareholders of the Investor and R5 Classes that invest in the Fund through an IRA or Roth IRA may be subject to a custodial IRA fee of $15 that is typically deducted each December. If your account was subject to a custodial IRA fee during the period, your costs would have been $15 higher.
You should also be aware that the expenses shown in the table highlight only your ongoing costs and do not reflect any transaction costs charged by the Fund, such as sales charges (loads) or redemption fees, as applicable. Similarly, the expense examples for other funds do not reflect any transaction costs charged by those funds, such as sales charges (loads), redemption fees or exchange fees. Therefore, the “Hypothetical” lines of the tables are useful in comparing ongoing costs only and will not help you determine the relative total costs of owning different funds. If you were subject to any transaction costs during the period, your costs would have been higher.
7
American Beacon Balanced FundSM
Expense Examples
October 31, 2023 (Unaudited)
| | | | | | | | | | | | | | | |
| American Beacon Balanced Fund | |
| | | |
| | | Beginning Account Value
5/1/2023 | | Ending Account Value
10/31/2023 | | Expenses Paid During
Period
5/1/2023-10/31/2023* |
| R5 Class | | | | | | | | | | | | | | | |
| Actual | | | | $1,000.00 | | | | | $978.10 | | | | | $4.09 | |
| Hypothetical** | | | | $1,000.00 | | | | | $1,021.07 | | | | | $4.18 | |
| Y Class | | | | | | | | | | | | | | | |
| Actual | | | | $1,000.00 | | | | | $977.10 | | | | | $4.49 | |
| Hypothetical** | | | | $1,000.00 | | | | | $1,020.67 | | | | | $4.58 | |
| Investor Class | | | | | | | | | | | | | | | |
| Actual | | | | $1,000.00 | | | | | $976.40 | | | | | $5.33 | |
| Hypothetical** | | | | $1,000.00 | | | | | $1,019.81 | | | | | $5.45 | |
| Advisor Class | | | | | | | | | | | | | | | |
| Actual | | | | $1,000.00 | | | | | $976.10 | | | | | $6.28 | |
| Hypothetical** | | | | $1,000.00 | | | | | $1,018.85 | | | | | $6.41 | |
| A Class | | | | | | | | | | | | | | | |
| Actual | | | | $1,000.00 | | | | | $976.10 | | | | | $5.58 | |
| Hypothetical** | | | | $1,000.00 | | | | | $1,019.56 | | | | | $5.70 | |
| C Class | | | | | | | | | | | | | | | |
| Actual | | | | $1,000.00 | | | | | $972.70 | | | | | $9.30 | |
| Hypothetical** | | | | $1,000.00 | | | | | $1,015.78 | | | | | $9.50 | |
| * | Expenses are equal to the Fund’s annualized expense ratios for the six-month period of 0.82%, 0.90%, 1.07%, 1.26%, 1.12%, and 1.87% for the R5, Y, Investor, Advisor, A, and C Classes, respectively, multiplied by the average account value over the period, multiplied by the number derived by dividing the number of days in the most recent fiscal half-year (184) by days in the year (365) to reflect the half-year period. |
| ** | 5% return before expenses. |
8
American Beacon Balanced FundSM
Report of Independent Registered Public Accounting Firm
To the Board of Trustees of American Beacon Funds and Shareholders of American Beacon Balanced Fund
Opinion on the Financial Statements
We have audited the accompanying statement of assets and liabilities, including the schedule of investments, of American Beacon Balanced Fund (one of the funds constituting American Beacon Funds, referred hereafter as the “Fund”) as of October 31, 2023, the related statement of operations for the year ended October 31, 2023, the statement of changes in net assets for each of the two years in the period ended October 31, 2023, including the related notes, and the financial highlights for each of the two years in the period ended October 31, 2023 (collectively referred to as the “financial statements”). In our opinion, the financial statements present fairly, in all material respects, the financial position of the Fund as of October 31, 2023, the results of its operations for the year then ended, the changes in its net assets for each of the two years in the period ended October 31, 2023 and the financial highlights for each of the two years in the period ended October 31, 2023 in conformity with accounting principles generally accepted in the United States of America.
The financial statements of the Fund as of and for the year ended October 31, 2021 and the financial highlights for each of the periods ended on or prior to October 31, 2021 (not presented herein, other than the financial highlights) were audited by other auditors whose report dated December 30, 2021 expressed an unqualified opinion on those financial statements and financial highlights.
Basis for Opinion
These financial statements are the responsibility of the Fund’s management. Our responsibility is to express an opinion on the Fund’s financial statements based on our audits. We are a public accounting firm registered with the Public Company Accounting Oversight Board (United States) (PCAOB) and are required to be independent with respect to the Fund in accordance with the U.S. federal securities laws and the applicable rules and regulations of the Securities and Exchange Commission and the PCAOB.
We conducted our audits of these financial statements in accordance with the standards of the PCAOB. Those standards require that we plan and perform the audit to obtain reasonable assurance about whether the financial statements are free of material misstatement, whether due to error or fraud.
Our audits included performing procedures to assess the risks of material misstatement of the financial statements, whether due to error or fraud, and performing procedures that respond to those risks. Such procedures included examining, on a test basis, evidence regarding the amounts and disclosures in the financial statements. Our audits also included evaluating the accounting principles used and significant estimates made by management, as well as evaluating the overall presentation of the financial statements. Our procedures included confirmation of securities owned as of October 31, 2023 by correspondence with the custodians and brokers; when replies were not received from brokers, we performed other auditing procedures. We believe that our audits provide a reasonable basis for our opinion.
/s/PricewaterhouseCoopers LLP
Boston, Massachusetts
December 27, 2023
We have served as the auditor of one or more investment companies in the American Beacon family of funds since 2016.
9
American Beacon Balanced FundSM
Schedule of Investments
October 31, 2023
| | | | | | | | | | | | | | | |
| | | |
| | | Shares | | | | Fair Value |
| | | | | | | |
| | | |
| COMMON STOCKS - 54.44% | | | | | | |
| | | |
| Communication Services - 3.53% | | | | | | |
| | | |
| Entertainment - 0.73% | | | | | | |
| Electronic Arts, Inc. | | | | 3,866 | | | | | | | | | $ | 478,572 | |
| Warner Bros Discovery, Inc.A | | | | 30,199 | | | | | | | | | | 300,178 | |
| | | | | | | | | | | | | | | |
| | | | | | | | | | | | | | 778,750 | |
| | | | | | | | | | | | | | | |
| | | | | | | | | | | | | | | |
| | | |
| Interactive Media & Services - 1.11% | | | | | | |
| Alphabet, Inc., Class AA | | | | 9,526 | | | | | | | | | | 1,181,986 | |
| | | | | | | | | | | | | | | |
| | | | | | | | | | | | | | | |
| | | |
| Media - 1.69% | | | | | | |
| Comcast Corp., Class A | | | | 36,893 | | | | | | | | | | 1,523,312 | |
| Omnicom Group, Inc. | | | | 2,186 | | | | | | | | | | 163,754 | |
| Paramount Global, Class B | | | | 10,900 | | | | | | | | | | 118,592 | |
| | | | | | | | | | | | | | | |
| | | | | | | | | | | | | | 1,805,658 | |
| | | | | | | | | | | | | | | |
| | | | | | | | | | | | | | | |
Total Communication Services | | | | | | | | | | | | | | 3,766,394 | |
| | | | | | | | | | | | | | | |
| | | | | | | | | | | | | | | |
| | | |
| Consumer Discretionary - 4.77% | | | | | | |
| | | |
| Automobile Components - 1.27% | | | | | | |
| Adient PLCA | | | | 3,332 | | | | | | | | | | 112,255 | |
| Aptiv PLCA | | | | 12,755 | | | | | | | | | | 1,112,236 | |
| BorgWarner, Inc. | | | | 3,400 | | | | | | | | | | 125,460 | |
| | | | | | | | | | | | | | | |
| | | | | | | | | | | | | | 1,349,951 | |
| | | | | | | | | | | | | | | |
| | | | | | | | | | | | | | | |
| | | |
| Automobiles - 0.66% | | | | | | |
| General Motors Co. | | | | 25,142 | | | | | | | | | | 709,004 | |
| | | | | | | | | | | | | | | |
| | | | | | | | | | | | | | | |
| | | |
| Hotels, Restaurants & Leisure - 2.32% | | | | | | |
| Aramark | | | | 29,585 | | | | | | | | | | 796,724 | |
| Booking Holdings, Inc.A | | | | 55 | | | | | | | | | | 153,426 | |
| Las Vegas Sands Corp. | | | | 22,103 | | | | | | | | | | 1,049,009 | |
| Wynn Resorts Ltd. | | | | 5,449 | | | | | | | | | | 478,313 | |
| | | | | | | | | | | | | | | |
| | | | | | | | | | | | | | 2,477,472 | |
| | | | | | | | | | | | | | | |
| | | | | | | | | | | | | | | |
| | | |
| Specialty Retail - 0.52% | | | | | | |
| Lithia Motors, Inc. | | | | 2,291 | | | | | | | | | | 554,903 | |
| | | | | | | | | | | | | | | |
| | | | | | | | | | | | | | | |
Total Consumer Discretionary | | | | | | | | | | | | | | 5,091,330 | |
| | | | | | | | | | | | | | | |
| | | | | | | | | | | | | | | |
| | | |
| Consumer Staples - 1.19% | | | | | | |
| | | |
| Beverages - 0.29% | | | | | | |
| Keurig Dr Pepper, Inc. | | | | 10,226 | | | | | | | | | | 310,155 | |
| | | | | | | | | | | | | | | |
| | | | | | | | | | | | | | | |
| | | |
| Tobacco - 0.90% | | | | | | |
| Philip Morris International, Inc. | | | | 10,750 | | | | | | | | | | 958,470 | |
| | | | | | | | | | | | | | | |
| | | | | | | | | | | | | | | |
Total Consumer Staples | | | | | | | | | | | | | | 1,268,625 | |
| | | | | | | | | | | | | | | |
| | | | | | | | | | | | | | | |
| | | |
| Energy - 6.43% | | | | | | |
| | | |
| Energy Equipment & Services - 1.98% | | | | | | |
| Baker Hughes Co. | | | | 4,600 | | | | | | | | | | 158,332 | |
| Halliburton Co. | | | | 29,787 | | | | | | | | | | 1,171,821 | |
| NOV, Inc. | | | | 31,600 | | | | | | | | | | 630,736 | |
| Schlumberger NV | | | | 2,800 | | | | | | | | | | 155,848 | |
| | | | | | | | | | | | | | | |
| | | | | | | | | | | | | | 2,116,737 | |
| | | | | | | | | | | | | | | |
| | | | | | | | | | | | | | | |
| | | |
| Oil, Gas & Consumable Fuels - 4.45% | | | | | | |
| APA Corp. | | | | 25,914 | | | | | | | | | | 1,029,304 | |
| Hess Corp. | | | | 5,728 | | | | | | | | | | 827,123 | |
See accompanying notes
10
American Beacon Balanced FundSM
Schedule of Investments
October 31, 2023
| | | | | | | | | | | | | | | |
| | | |
| | | Shares | | | | Fair Value |
| | | | | | | |
| | | |
| COMMON STOCKS - 54.44% (continued) | | | | | | |
| | | |
| Energy - 6.43% (continued) | | | | | | |
| | | |
| Oil, Gas & Consumable Fuels - 4.45% (continued) | | | | | | |
| Marathon Oil Corp. | | | | 22,831 | | | | | | | | | $ | 623,515 | |
| Murphy Oil Corp. | | | | 3,500 | | | | | | | | | | 157,045 | |
| Ovintiv, Inc. | | | | 8,700 | | | | | | | | | | 417,600 | |
| Phillips 66 | | | | 6,177 | | | | | | | | | | 704,610 | |
| Pioneer Natural Resources Co. | | | | 4,116 | | | | | | | | | | 983,724 | |
| | | | | | | | | | | | | | | |
| | | | | | | | | | | | | | 4,742,921 | |
| | | | | | | | | | | | | | | |
| | | | | | | | | | | | | | | |
Total Energy | | | | | | | | | | | | | | 6,859,658 | |
| | | | | | | | | | | | | | | |
| | | | | | | | | | | | | | | |
| | | |
| Financials - 12.58% | | | | | | |
| | | |
| Banks - 5.52% | | | | | | |
| Bank of America Corp. | | | | 9,100 | | | | | | | | | | 239,694 | |
| Citigroup, Inc. | | | | 28,357 | | | | | | | | | | 1,119,818 | |
| Citizens Financial Group, Inc. | | | | 29,068 | | | | | | | | | | 681,063 | |
| First Citizens BancShares, Inc., Class A | | | | 175 | | | | | | | | | | 241,630 | |
| M&T Bank Corp. | | | | 4,496 | | | | | | | | | | 506,924 | |
| U.S. Bancorp | | | | 40,114 | | | | | | | | | | 1,278,834 | |
| Wells Fargo & Co. | | | | 45,916 | | | | | | | | | | 1,826,080 | |
| | | | | | | | | | | | | | | |
| | | | | | | | | | | | | | 5,894,043 | |
| | | | | | | | | | | | | | | |
| | | | | | | | | | | | | | | |
| | | |
| Capital Markets - 1.61% | | | | | | |
| Bank of New York Mellon Corp. | | | | 15,315 | | | | | | | | | | 650,887 | |
| Goldman Sachs Group, Inc. | | | | 1,967 | | | | | | | | | | 597,201 | |
| State Street Corp. | | | | 7,306 | | | | | | | | | | 472,187 | |
| | | | | | | | | | | | | | | |
| | | | | | | | | | | | | | 1,720,275 | |
| | | | | | | | | | | | | | | |
| | | | | | | | | | | | | | | |
| | | |
| Consumer Finance - 0.68% | | | | | | |
| American Express Co. | | | | 2,767 | | | | | | | | | | 404,065 | |
| Capital One Financial Corp. | | | | 1,600 | | | | | | | | | | 162,064 | |
| Discover Financial Services | | | | 1,900 | | | | | | | | | | 155,952 | |
| | | | | | | | | | | | | | | |
| | | | | | | | | | | | | | 722,081 | |
| | | | | | | | | | | | | | | |
| | | | | | | | | | | | | | | |
| | | |
| Financial Services - 1.64% | | | | | | |
| Corebridge Financial, Inc. | | | | 7,800 | | | | | | | | | | 156,000 | |
| Equitable Holdings, Inc. | | | | 5,900 | | | | | | | | | | 156,763 | |
| Fidelity National Information Services, Inc. | | | | 29,319 | | | | | | | | | | 1,439,856 | |
| | | | | | | | | | | | | | | |
| | | | | | | | | | | | | | 1,752,619 | |
| | | | | | | | | | | | | | | |
| | | | | | | | | | | | | | | |
| | | |
| Insurance - 3.13% | | | | | | |
| Allstate Corp. | | | | 5,229 | | | | | | | | | | 669,992 | |
| American International Group, Inc. | | | | 27,610 | | | | | | | | | | 1,692,769 | |
| Hartford Financial Services Group, Inc. | | | | 7,000 | | | | | | | | | | 514,150 | |
| Willis Towers Watson PLC | | | | 1,969 | | | | | | | | | | 464,467 | |
| | | | | | | | | | | | | | | |
| | | | | | | | | | | | | | 3,341,378 | |
| | | | | | | | | | | | | | | |
| | | | | | | | | | | | | | | |
Total Financials | | | | | | | | | | | | | | 13,430,396 | |
| | | | | | | | | | | | | | | |
| | | | | | | | | | | | | | | |
| | | |
| Health Care - 7.89% | | | | | | |
| | | |
| Health Care Equipment & Supplies - 1.66% | | | | | | |
| GE HealthCare Technologies, Inc. | | | | 8,687 | | | | | | | | | | 578,294 | |
| Medtronic PLC | | | | 14,426 | | | | | | | | | | 1,017,898 | |
| Zimmer Biomet Holdings, Inc. | | | | 1,732 | | | | | | | | | | 180,838 | |
| | | | | | | | | | | | | | | |
| | | | | | | | | | | | | | 1,777,030 | |
| | | | | | | | | | | | | | | |
| | | | | | | | | | | | | | | |
| | | |
| Health Care Providers & Services - 4.61% | | | | | | |
| Centene Corp.A | | | | 6,400 | | | | | | | | | | 441,472 | |
| Cigna Group | | | | 1,110 | | | | | | | | | | 343,212 | |
See accompanying notes
11
American Beacon Balanced FundSM
Schedule of Investments
October 31, 2023
| | | | | | | | | | | | | | | |
| | | |
| | | Shares | | | | Fair Value |
| | | | | | | |
| | | |
| COMMON STOCKS - 54.44% (continued) | | | | | | |
| | | |
| Health Care - 7.89% (continued) | | | | | | |
| | | |
| Health Care Providers & Services - 4.61% (continued) | | | | | | |
| CVS Health Corp. | | | | 13,999 | | | | | | | | | $ | 966,071 | |
| Elevance Health, Inc. | | | | 4,219 | | | | | | | | | | 1,898,930 | |
| HCA Healthcare, Inc. | | | | 1,370 | | | | | | | | | | 309,812 | |
| UnitedHealth Group, Inc. | | | | 1,786 | | | | | | | | | | 956,510 | |
| | | | | | | | | | | | | | | |
| | | | | | | | | | | | | | 4,916,007 | |
| | | | | | | | | | | | | | | |
| | | | | | | | | | | | | | | |
| | | |
| Life Sciences Tools & Services - 0.59% | | | | | | |
| Avantor, Inc.A | | | | 36,087 | | | | | | | | | | 628,996 | |
| | | | | | | | | | | | | | | |
| | | | | | | | | | | | | | | |
| | | |
| Pharmaceuticals - 1.03% | | | | | | |
| GSK PLC, ADR | | | | 4,654 | | | | | | | | | | 166,148 | |
| Merck & Co., Inc. | | | | 7,442 | | | | | | | | | | 764,293 | |
| Sanofi SA, ADR | | | | 3,803 | | | | | | | | | | 172,086 | |
| | | | | | | | | | | | | | | |
| | | | | | | | | | | | | | 1,102,527 | |
| | | | | | | | | | | | | | | |
| | | | | | | | | | | | | | | |
Total Health Care | | | | | | | | | | | | | | 8,424,560 | |
| | | | | | | | | | | | | | | |
| | | | | | | | | | | | | | | |
| | | |
| Industrials - 6.44% | | | | | | |
| | | |
| Aerospace & Defense - 0.96% | | | | | | |
| Boeing Co.A | | | | 2,000 | | | | | | | | | | 373,640 | |
| General Dynamics Corp. | | | | 800 | | | | | | | | | | 193,048 | |
| RTX Corp. | | | | 5,600 | | | | | | | | | | 455,784 | |
| | | | | | | | | | | | | | | |
| | | | | | | | | | | | | | 1,022,472 | |
| | | | | | | | | | | | | | | |
| | | | | | | | | | | | | | | |
| | | |
| Air Freight & Logistics - 0.56% | | | | | | |
| FedEx Corp. | | | | 2,500 | | | | | | | | | | 600,250 | |
| | | | | | | | | | | | | | | |
| | | | | | | | | | | | | | | |
| | | |
| Construction & Engineering - 0.40% | | | | | | |
| AECOM | | | | 3,860 | | | | | | | | | | 295,483 | |
| Fluor Corp.A | | | | 4,000 | | | | | | | | | | 133,160 | |
| | | | | | | | | | | | | | | |
| | | | | | | | | | | | | | 428,643 | |
| | | | | | | | | | | | | | | |
| | | | | | | | | | | | | | | |
| | | |
| Electrical Equipment - 2.02% | | | | | | |
| Vertiv Holdings Co. | | | | 55,003 | | | | | | | | | | 2,159,968 | |
| | | | | | | | | | | | | | | |
| | | | | | | | | | | | | | | |
| | | |
| Ground Transportation - 0.69% | | | | | | |
| JB Hunt Transport Services, Inc. | | | | 4,292 | | | | | | | | | | 737,666 | |
| | | | | | | | | | | | | | | |
| | | | | | | | | | | | | | | |
| | | |
| Industrial Conglomerates - 0.65% | | | | | | |
| General Electric Co. | | | | 6,362 | | | | | | | | | | 691,104 | |
| | | | | | | | | | | | | | | |
| | | | | | | | | | | | | | | |
| | | |
| Machinery - 1.15% | | | | | | |
| Cummins, Inc. | | | | 1,812 | | | | | | | | | | 391,936 | |
| PACCAR, Inc. | | | | 2,808 | | | | | | | | | | 231,744 | |
| Stanley Black & Decker, Inc. | | | | 5,585 | | | | | | | | | | 475,004 | |
| Timken Co. | | | | 1,900 | | | | | | | | | | 131,328 | |
| | | | | | | | | | | | | | | |
| | | | | | | | | | | | | | 1,230,012 | |
| | | | | | | | | | | | | | | |
| | | | | | | | | | | | | | | |
| | | |
| Passenger Airlines - 0.01% | | | | | | |
| Southwest Airlines Co. | | | | 208 | | | | | | | | | | 4,624 | |
| | | | | | | | | | | | | | | |
| | | | | | | | | | | | | | | |
Total Industrials | | | | | | | | | | | | | | 6,874,739 | |
| | | | | | | | | | | | | | | |
| | | | | | | | | | | | | | | |
| | | |
| Information Technology - 6.39% | | | | | | |
| | | |
| Communications Equipment - 0.87% | | | | | | |
| F5, Inc.A | | | | 6,100 | | | | | | | | | | 924,699 | |
| | | | | | | | | | | | | | | |
| | | | | | | | | | | | | | | |
See accompanying notes
12
American Beacon Balanced FundSM
Schedule of Investments
October 31, 2023
| | | | | | | | | | | | | | | |
| | | |
| | | Shares | | | | Fair Value |
| | | | | | | |
| | | |
| COMMON STOCKS - 54.44% (continued) | | | | | | |
| | | |
| Information Technology - 6.39% (continued) | | | | | | |
| | | |
| Electronic Equipment, Instruments & Components - 0.52% | | | | | | |
| Corning, Inc. | | | | 9,535 | | | | | | | | | $ | 255,157 | |
| TE Connectivity Ltd. | | | | 2,558 | | | | | | | | | | 301,460 | |
| | | | | | | | | | | | | | | |
| | | | | | | | | | | | | | 556,617 | |
| | | | | | | | | | | | | | | |
| | | | | | | | | | | | | | | |
| | | |
| IT Services - 0.45% | | | | | | |
| Cognizant Technology Solutions Corp., Class A | | | | 7,403 | | | | | | | | | | 477,271 | |
| | | | | | | | | | | | | | | |
| | | | | | | | | | | | | | | |
| | | |
| Semiconductors & Semiconductor Equipment - 2.36% | | | | | | |
| Broadcom, Inc. | | | | 1,299 | | | | | | | | | | 1,092,940 | |
| Micron Technology, Inc. | | | | 5,000 | | | | | | | | | | 334,350 | |
| QUALCOMM, Inc. | | | | 6,526 | | | | | | | | | | 711,269 | |
| Skyworks Solutions, Inc. | | | | 4,345 | | | | | | | | | | 376,885 | |
| | | | | | | | | | | | | | | |
| | | | | | | | | | | | | | 2,515,444 | |
| | | | | | | | | | | | | | | |
| | | | | | | | | | | | | | | |
| | | |
| Software - 2.19% | | | | | | |
| Microsoft Corp. | | | | 2,400 | | | | | | | | | | 811,464 | |
| Oracle Corp. | | | | 10,642 | | | | | | | | | | 1,100,383 | |
| Workday, Inc., Class AA | | | | 2,030 | | | | | | | | | | 429,771 | |
| | | | | | | | | | | | | | | |
| | | | | | | | | | | | | | 2,341,618 | |
| | | | | | | | | | | | | | | |
| | | | | | | | | | | | | | | |
Total Information Technology | | | | | | | | | | | | | | 6,815,649 | |
| | | | | | | | | | | | | | | |
| | | | | | | | | | | | | | | |
| | | |
| Materials - 2.64% | | | | | | |
| | | |
| Chemicals - 2.24% | | | | | | |
| Air Products & Chemicals, Inc. | | | | 3,095 | | | | | | | | | | 874,152 | |
| Axalta Coating Systems Ltd.A | | | | 24,274 | | | | | | | | | | 636,707 | |
| DuPont de Nemours, Inc. | | | | 7,051 | | | | | | | | | | 513,877 | |
| Olin Corp. | | | | 8,700 | | | | | | | | | | 371,664 | |
| | | | | | | | | | | | | | | |
| | | | | | | | | | | | | | 2,396,400 | |
| | | | | | | | | | | | | | | |
| | | | | | | | | | | | | | | |
| | | |
| Construction Materials - 0.30% | | | | | | |
| CRH PLC | | | | 5,978 | | | | | | | | | | 320,241 | |
| | | | | | | | | | | | | | | |
| | | | | | | | | | | | | | | |
| | | |
| Containers & Packaging - 0.10% | | | | | | |
| International Paper Co. | | | | 3,025 | | | | | | | | | | 102,033 | |
| | | | | | | | | | | | | | | |
| | | | | | | | | | | | | | | |
Total Materials | | | | | | | | | | | | | | 2,818,674 | |
| | | | | | | | | | | | | | | |
| | | | | | | | | | | | | | | |
| | | |
| Real Estate - 1.12% | | | | | | |
| | | |
| Specialized REITs - 1.12% | | | | | | |
| Public Storage | | | | 1,309 | | | | | | | | | | 312,471 | |
| VICI Properties, Inc. | | | | 31,433 | | | | | | | | | | 876,981 | |
| | | | | | | | | | | | | | | |
| | | | | | | | | | | | | | 1,189,452 | |
| | | | | | | | | | | | | | | |
| | | | | | | | | | | | | | | |
Total Real Estate | | | | | | | | | | | | | | 1,189,452 | |
| | | | | | | | | | | | | | | |
| | | | | | | | | | | | | | | |
| | | |
| Utilities - 1.46% | | | | | | |
| | | |
| Electric Utilities - 1.46% | | | | | | |
| Entergy Corp. | | | | 3,293 | | | | | | | | | | 314,778 | |
| Pinnacle West Capital Corp. | | | | 8,307 | | | | | | | | | | 616,213 | |
| PPL Corp. | | | | 25,547 | | | | | | | | | | 627,690 | |
| | | | | | | | | | | | | | | |
| | | | | | | | | | | | | | 1,558,681 | |
| | | | | | | | | | | | | | | |
| | | | | | | | | | | | | | | |
Total Utilities | | | | | | | | | | | | | | 1,558,681 | |
| | | | | | | | | | | | | | | |
| | | | | | | | | | | | | | | |
Total Common Stocks (Cost $46,289,522) | | | | | | | | | | | | | | 58,098,158 | |
| | | | | | | | | | | | | | | |
| | | | | | | | | | | | | | | |
See accompanying notes
13
American Beacon Balanced FundSM
Schedule of Investments
October 31, 2023
| | | | | | | | | | | | | | | |
| | | |
| | | Shares | | | | Fair Value |
| | | | | | | |
| | | |
| FOREIGN COMMON STOCKS - 3.73% | | | | | | |
| | | |
| Communication Services - 0.22% | | | | | | |
| | | |
| Wireless Telecommunication Services - 0.22% | | | | | | |
| Vodafone Group PLC, ADR | | | | 25,932 | | | | | | | | | $ | 239,612 | |
| | | | | | | | | | | | | | | |
| | | | | | | | | | | | | | | |
| | | |
| Consumer Discretionary - 0.51% | | | | | | |
| | | |
| Automobile Components - 0.51% | | | | | | |
| Magna International, Inc. | | | | 11,204 | | | | | | | | | | 538,800 | |
| | | | | | | | | | | | | | | |
| | | | | | | | | | | | | | | |
| | | |
| Consumer Staples - 0.46% | | | | | | |
| | | |
| Personal Products - 0.46% | | | | | | |
| Unilever PLC, ADR | | | | 10,400 | | | | | | | | | | 492,440 | |
| | | | | | | | | | | | | | | |
| | | | | | | | | | | | | | | |
| | | |
| Energy - 1.45% | | | | | | |
| | | |
| Oil, Gas & Consumable Fuels - 1.45% | | | | | | |
| Cenovus Energy, Inc. | | | | 12,200 | | | | | | | | | | 232,776 | |
| Enbridge, Inc. | | | | 22,439 | | | | | | | | | | 718,946 | |
| Shell PLC, ADR | | | | 9,135 | | | | | | | | | | 595,054 | |
| | | | | | | | | | | | | | | |
| | | | | | | | | | | | | | 1,546,776 | |
| | | | | | | | | | | | | | | |
| | | | | | | | | | | | | | | |
Total Energy | | | | | | | | | | | | | | 1,546,776 | |
| | | | | | | | | | | | | | | |
| | | | | | | | | | | | | | | |
| | | |
| Industrials - 0.24% | | | | | | |
| | | |
| Machinery - 0.24% | | | | | | |
| CNH Industrial NV | | | | 22,880 | | | | | | | | | | 251,222 | |
| | | | | | | | | | | | | | | |
| | | | | | | | | | | | | | | |
| | | |
| Information Technology - 0.85% | | | | | | |
| | | |
| Communications Equipment - 0.85% | | | | | | |
| Telefonaktiebolaget LM Ericsson, ADRF | | | | 203,720 | | | | | | | | | | 908,591 | |
| | | | | | | | | | | | | | | |
| | | | | | | | | | | | | | | |
Total Foreign Common Stocks (Cost $3,897,785) | | | | | | | | | | | | | | 3,977,441 | |
| | | | | | | | | | | | | | | |
| | | |
| | | Principal Amount | | | | |
| | | | | | | |
| | | |
| CORPORATE OBLIGATIONS - 12.45% | | | | | | |
| | | |
| Basic Materials - 0.05% | | | | | | |
| | | |
| Chemicals - 0.05% | | | | | | |
| EIDP, Inc., 1.700%, Due 7/15/2025 | | | $ | 55,000 | | | | | | | | | | 51,222 | |
| | | | | | | | | | | | | | | |
| | | | | | | | | | | | | | | |
| | | |
| Communications - 1.17% | | | | | | |
| | | |
| Internet - 0.43% | | | | | | |
| Amazon.com, Inc., | | | | | | | | | | | | | | | |
1.200%, Due 6/3/2027 | | | | 250,000 | | | | | | | | | | 216,776 | |
4.650%, Due 12/1/2029 | | | | 250,000 | | | | | | | | | | 241,190 | |
| | | | | | | | | | | | | | | |
| | | | | | | | | | | | | | 457,966 | |
| | | | | | | | | | | | | | | |
| | | | | | | | | | | | | | | |
| | | |
| Media - 0.35% | | | | | | |
| Charter Communications Operating LLC/Charter Communications Operating Capital, | | | | | | | | | | | | | | | |
3.500%, Due 3/1/2042 | | | | 60,000 | | | | | | | | | | 35,602 | |
4.800%, Due 3/1/2050 | | | | 105,000 | | | | | | | | | | 69,615 | |
3.700%, Due 4/1/2051 | | | | 95,000 | | | | | | | | | | 52,401 | |
| Comcast Corp., 6.550%, Due 7/1/2039 | | | | 217,000 | | | | | | | | | | 217,474 | |
| | | | | | | | | | | | | | | |
| | | | | | | | | | | | | | 375,092 | |
| | | | | | | | | | | | | | | |
| | | | | | | | | | | | | | | |
| | | |
| Telecommunications - 0.39% | | | | | | |
| AT&T, Inc., | | | | | | | | | | | | | | | |
2.250%, Due 2/1/2032 | | | | 50,000 | | | | | | | | | | 37,020 | |
2.550%, Due 12/1/2033 | | | | 95,000 | | | | | | | | | | 68,361 | |
3.800%, Due 12/1/2057 | | | | 70,000 | | | | | | | | | | 42,451 | |
3.650%, Due 9/15/2059 | | | | 175,000 | | | | | | | | | | 101,989 | |
See accompanying notes
14
American Beacon Balanced FundSM
Schedule of Investments
October 31, 2023
| | | | | | | | | | | | | | | |
| | | |
| | | Principal Amount | | | | Fair Value |
| | | | | | | |
| | | |
| CORPORATE OBLIGATIONS - 12.45% (continued) | | | | | | |
| | | |
| Communications - 1.17% (continued) | | | | | | |
| | | |
| Telecommunications - 0.39% (continued) | | | | | | |
| Verizon Communications, Inc., 4.329%, Due 9/21/2028 | | | $ | 180,000 | | | | | | | | | $ | 167,680 | |
| | | | | | | | | | | | | | | |
| | | | | | | | | | | | | | 417,501 | |
| | | | | | | | | | | | | | | |
| | | | | | | | | | | | | | | |
Total Communications | | | | | | | | | | | | | | 1,250,559 | |
| | | | | | | | | | | | | | | |
| | | | | | | | | | | | | | | |
| | | |
| Consumer, Cyclical - 0.85% | | | | | | |
| | | |
| Airlines - 0.06% | | | | | | |
| American Airlines Pass-Through Trust, 3.150%, Due 8/15/2033, 2019 1 Series AA | | | | 68,862 | | | | | | | | | | 57,440 | |
| | | | | | | | | | | | | | | |
| | | | | | | | | | | | | | | |
| | | |
| Entertainment - 0.08% | | | | | | |
| Warnermedia Holdings, Inc., 5.141%, Due 3/15/2052 | | | | 125,000 | | | | | | | | | | 88,828 | |
| | | | | | | | | | | | | | | |
| | | | | | | | | | | | | | | |
| | | |
| Retail - 0.71% | | | | | | |
| Home Depot, Inc., 2.950%, Due 6/15/2029 | | | | 500,000 | | | | | | | | | | 439,010 | |
| Walmart, Inc., | | | | | | | | | | | | | | | |
2.375%, Due 9/24/2029 | | | | 150,000 | | | | | | | | | | 128,444 | |
7.550%, Due 2/15/2030 | | | | 169,000 | | | | | | | | | | 190,195 | |
| | | | | | | | | | | | | | | |
| | | | | | | | | | | | | | 757,649 | |
| | | | | | | | | | | | | | | |
| | | | | | | | | | | | | | | |
Total Consumer, Cyclical | | | | | | | | | | | | | | 903,917 | |
| | | | | | | | | | | | | | | |
| | | | | | | | | | | | | | | |
| | | |
| Consumer, Non-Cyclical - 1.18% | | | | | | |
| | | |
| Agriculture - 0.22% | | | | | | |
| Philip Morris International, Inc., 5.375%, Due 2/15/2033 | | | | 250,000 | | | | | | | | | | 231,453 | |
| | | | | | | | | | | | | | | |
| | | | | | | | | | | | | | | |
| | | |
| Beverages - 0.27% | | | | | | |
| PepsiCo, Inc., 4.450%, Due 5/15/2028 | | | | 300,000 | | | | | | | | | | 292,577 | |
| | | | | | | | | | | | | | | |
| | | | | | | | | | | | | | | |
| | | |
| Commercial Services - 0.10% | | | | | | |
| Moody’s Corp., 2.550%, Due 8/18/2060 | | | | 50,000 | | | | | | | | | | 23,067 | |
| Quanta Services, Inc., | | | | | | | | | | | | | | | |
2.900%, Due 10/1/2030 | | | | 60,000 | | | | | | | | | | 47,334 | |
3.050%, Due 10/1/2041 | | | | 70,000 | | | | | | | | | | 42,129 | |
| | | | | | | | | | | | | | | |
| | | | | | | | | | | | | | 112,530 | |
| | | | | | | | | | | | | | | |
| | | | | | | | | | | | | | | |
| | | |
| Pharmaceuticals - 0.59% | | | | | | |
| Bristol-Myers Squibb Co., 3.400%, Due 7/26/2029 | | | | 560,000 | | | | | | | | | | 502,650 | |
| Viatris, Inc., 3.850%, Due 6/22/2040 | | | | 200,000 | | | | | | | | | | 125,037 | |
| | | | | | | | | | | | | | | |
| | | | | | | | | | | | | | 627,687 | |
| | | | | | | | | | | | | | | |
| | | | | | | | | | | | | | | |
Total Consumer, Non-Cyclical | | | | | | | | | | | | | | 1,264,247 | |
| | | | | | | | | | | | | | | |
| | | | | | | | | | | | | | | |
| | | |
| Energy - 0.27% | | | | | | |
| | | |
| Oil & Gas - 0.07% | | | | | | |
| Diamondback Energy, Inc., | | | | | | | | | | | | | | | |
6.250%, Due 3/15/2033 | | | | 50,000 | | | | | | | | | | 49,454 | |
4.250%, Due 3/15/2052 | | | | 40,000 | | | | | | | | | | 27,631 | |
| | | | | | | | | | | | | | | |
| | | | | | | | | | | | | | 77,085 | |
| | | | | | | | | | | | | | | |
| | | | | | | | | | | | | | | |
| | | |
| Pipelines - 0.20% | | | | | | |
| Energy Transfer LP, 7.500%, Due 7/1/2038 | | | | 90,000 | | | | | | | | | | 92,228 | |
| Kinder Morgan Energy Partners LP, 5.400%, Due 9/1/2044 | | | | 30,000 | | | | | | | | | | 24,272 | |
| ONEOK Partners LP, 6.850%, Due 10/15/2037 | | | | 45,000 | | | | | | | | | | 44,094 | |
| Targa Resources Corp., 4.200%, Due 2/1/2033 | | | | 60,000 | | | | | | | | | | 49,843 | |
| | | | | | | | | | | | | | | |
| | | | | | | | | | | | | | 210,437 | |
| | | | | | | | | | | | | | | |
| | | | | | | | | | | | | | | |
Total Energy | | | | | | | | | | | | | | 287,522 | |
| | | | | | | | | | | | | | | |
| | | | | | | | | | | | | | | |
See accompanying notes
15
American Beacon Balanced FundSM
Schedule of Investments
October 31, 2023
| | | | | | | | | | | | | | | |
| | | |
| | | Principal Amount | | | | Fair Value |
| | | | | | | |
| | | |
| CORPORATE OBLIGATIONS - 12.45% (continued) | | | | | | |
| | | |
| Financial - 4.25% | | | | | | |
| | | |
| Banks - 2.99% | | | | | | |
| Bank of America Corp., | | | | | | | | | | | | | | | |
4.125%, Due 1/22/2024 | | | $ | 193,000 | | | | | | | | | $ | 192,218 | |
1.734%, Due 7/22/2027, (Secured Overnight Financing Rate + 0.960%)B | | | | 350,000 | | | | | | | | | | 308,857 | |
2.592%, Due 4/29/2031, (Secured Overnight Financing Rate + 2.150%)B | | | | 50,000 | | | | | | | | | | 39,480 | |
1.898%, Due 7/23/2031, (Secured Overnight Financing Rate + 1.530%)B | | | | 45,000 | | | | | | | | | | 33,541 | |
2.299%, Due 7/21/2032, (Secured Overnight Financing Rate + 1.220%)B | | | | 180,000 | | | | | | | | | | 133,066 | |
2.572%, Due 10/20/2032, (Secured Overnight Financing Rate + 1.210%)B | | | | 100,000 | | | | | | | | | | 75,041 | |
2.482%, Due 9/21/2036, (5 yr. CMT + 1.200%)B | | | | 60,000 | | | | | | | | | | 42,848 | |
6.110%, Due 1/29/2037 | | | | 176,000 | | | | | | | | | | 167,743 | |
| Citigroup, Inc., | | | | | | | | | | | | | | | |
1.281%, Due 11/3/2025, (Secured Overnight Financing Rate + 0.528%)B | | | | 40,000 | | | | | | | | | | 37,855 | |
3.400%, Due 5/1/2026 | | | | 350,000 | | | | | | | | | | 329,271 | |
4.412%, Due 3/31/2031, (Secured Overnight Financing Rate + 3.914%)B | | | | 110,000 | | | | | | | | | | 97,483 | |
5.875%, Due 1/30/2042 | | | | 145,000 | | | | | | | | | | 134,960 | |
| Fifth Third Bank NA, 2.250%, Due 2/1/2027 | | | | 250,000 | | | | | | | | | | 217,952 | |
| Goldman Sachs Group, Inc., | | | | | | | | | | | | | | | |
1.431%, Due 3/9/2027, (Secured Overnight Financing Rate + 0.798%)B | | | | 110,000 | | | | | | | | | | 97,702 | |
1.542%, Due 9/10/2027, (Secured Overnight Financing Rate + 0.818%)B | | | | 65,000 | | | | | | | | | | 56,547 | |
4.411%, Due 4/23/2039, (3 mo. USD Term SOFR + 1.692%)B | | | | 55,000 | | | | | | | | | | 43,729 | |
| JPMorgan Chase & Co., | | | | | | | | | | | | | | | |
1.561%, Due 12/10/2025, (Secured Overnight Financing Rate + 0.605%)B | | | | 35,000 | | | | | | | | | | 33,120 | |
5.500%, Due 10/15/2040 | | | | 313,000 | | | | | | | | | | 286,394 | |
| Morgan Stanley, | | | | | | | | | | | | | | | |
0.864%, Due 10/21/2025, Series I, (Secured Overnight Financing Rate + 0.745%)B | | | | 90,000 | | | | | | | | | | 84,978 | |
3.591%, Due 7/22/2028C | | | | 100,000 | | | | | | | | | | 90,736 | |
2.239%, Due 7/21/2032, (Secured Overnight Financing Rate + 1.178%)B | | | | 45,000 | | | | | | | | | | 33,260 | |
| Northern Trust Corp., 6.125%, Due 11/2/2032 | | | | 60,000 | | | | | | | | | | 57,963 | |
| PNC Financial Services Group, Inc., | | | | | | | | | | | | | | | |
3.400%, Due 9/15/2026, Series T, (5 yr. CMT + 2.595%)B D | | | | 140,000 | | | | | | | | | | 100,725 | |
2.550%, Due 1/22/2030 | | | | 500,000 | | | | | | | | | | 397,158 | |
| State Street Corp., 2.354%, Due 11/1/2025, (Secured Overnight Financing Rate + 0.940%)B | | | | 100,000 | | | | | | | | | | 95,957 | |
| | | | | | | | | | | | | | | |
| | | | | | | | | | | | | | 3,188,584 | |
| | | | | | | | | | | | | | | |
| | | | | | | | | | | | | | | |
| | | |
| Insurance - 0.89% | | | | | | |
| Berkshire Hathaway Finance Corp., 2.300%, Due 3/15/2027 | | | | 300,000 | | | | | | | | | | 273,670 | |
| Fidelity National Financial, Inc., 3.200%, Due 9/17/2051 | | | | 55,000 | | | | | | | | | | 28,847 | |
| Markel Group, Inc., 3.450%, Due 5/7/2052 | | | | 125,000 | | | | | | | | | | 75,987 | |
| MetLife, Inc., | | | | | | | | | | | | | | | |
6.375%, Due 6/15/2034 | | | | 169,000 | | | | | | | | | | 170,594 | |
4.721%, Due 12/15/2044 | | | | 193,000 | | | | | | | | | | 152,370 | |
| Prudential Financial, Inc., 4.600%, Due 5/15/2044 | | | | 313,000 | | | | | | | | | | 246,185 | |
| | | | | | | | | | | | | | | |
| | | | | | | | | | | | | | 947,653 | |
| | | | | | | | | | | | | | | |
| | | | | | | | | | | | | | | |
| | | |
| REITS - 0.37% | | | | | | |
| Alexandria Real Estate Equities, Inc., 1.875%, Due 2/1/2033 | | | | 50,000 | | | | | | | | | | 34,149 | |
| American Tower Corp., 2.300%, Due 9/15/2031 | | | | 80,000 | | | | | | | | | | 59,147 | |
| Simon Property Group LP, 3.375%, Due 10/1/2024 | | | | 313,000 | | | | | | | | | | 305,504 | |
| | | | | | | | | | | | | | | |
| | | | | | | | | | | | | | 398,800 | |
| | | | | | | | | | | | | | | |
| | | | | | | | | | | | | | | |
Total Financial | | | | | | | | | | | | | | 4,535,037 | |
| | | | | | | | | | | | | | | |
| | | | | | | | | | | | | | | |
| | | |
| Industrial - 1.23% | | | | | | |
| | | |
| Aerospace/Defense - 0.20% | | | | | | |
| RTX Corp., 6.125%, Due 7/15/2038 | | | | 217,000 | | | | | | | | | | 208,200 | |
| | | | | | | | | | | | | | | |
| | | | | | | | | | | | | | | |
| | | |
| Machinery - Construction & Mining - 0.33% | | | | | | |
| Caterpillar Financial Services Corp., 4.900%, Due 1/17/2025 | | | | 350,000 | | | | | | | | | | 347,886 | |
| | | | | | | | | | | | | | | |
| | | | | | | | | | | | | | | |
See accompanying notes
16
American Beacon Balanced FundSM
Schedule of Investments
October 31, 2023
| | | | | | | | | | | | | | | |
| | | |
| | | Principal Amount | | | | Fair Value |
| | | | | | | |
| | | |
| CORPORATE OBLIGATIONS - 12.45% (continued) | | | | | | |
| | | |
| Industrial - 1.23% (continued) | | | | | | |
| | | |
| Machinery - Diversified - 0.39% | | | | | | |
| John Deere Capital Corp., 2.450%, Due 1/9/2030 | | | $ | 500,000 | | | | | | | | | $ | 417,575 | |
| | | | | | | | | | | | | | | |
| | | | | | | | | | | | | | | |
| | | |
| Transportation - 0.31% | | | | | | |
| Burlington Northern Santa Fe LLC, 5.750%, Due 5/1/2040 | | | | 202,000 | | | | | | | | | | 193,362 | |
| CSX Corp., 5.500%, Due 4/15/2041 | | | | 157,000 | | | | | | | | | | 142,407 | |
| | | | | | | | | | | | | | | |
| | | | | | | | | | | | | | 335,769 | |
| | | | | | | | | | | | | | | |
| | | | | | | | | | | | | | | |
Total Industrial | | | | | | | | | | | | | | 1,309,430 | |
| | | | | | | | | | | | | | | |
| | | | | | | | | | | | | | | |
| | | |
| Technology - 1.81% | | | | | | |
| | | |
| Computers - 1.21% | | | | | | |
| Apple, Inc., | | | | | | | | | | | | | | | |
1.400%, Due 8/5/2028 | | | | 200,000 | | | | | | | | | | 168,444 | |
2.200%, Due 9/11/2029 | | | | 300,000 | | | | | | | | | | 254,261 | |
| Dell International LLC/EMC Corp., 3.450%, Due 12/15/2051 | | | | 70,000 | | | | | | | | | | 41,968 | |
| Hewlett Packard Enterprise Co., 6.350%, Due 10/15/2045 | | | | 500,000 | | | | | | | | | | 460,394 | |
| International Business Machines Corp., 4.250%, Due 5/15/2049 | | | | 500,000 | | | | | | | | | | 367,853 | |
| | | | | | | | | | | | | | | |
| | | | | | | | | | | | | | 1,292,920 | |
| | | | | | | | | | | | | | | |
| | | | | | | | | | | | | | | |
| | | |
| Semiconductors - 0.46% | | | | | | |
| Entegris Escrow Corp., 4.750%, Due 4/15/2029E | | | | 70,000 | | | | | | | | | | 62,654 | |
| NVIDIA Corp., 1.550%, Due 6/15/2028 | | | | 500,000 | | | | | | | | | | 422,934 | |
| | | | | | | | | | | | | | | |
| | | | | | | | | | | | | | 485,588 | |
| | | | | | | | | | | | | | | |
| | | | | | | | | | | | | | | |
| | | |
| Software - 0.14% | | | | | | |
| VMware, Inc., 2.200%, Due 8/15/2031 | | | | 205,000 | | | | | | | | | | 151,919 | |
| | | | | | | | | | | | | | | |
| | | | | | | | | | | | | | | |
Total Technology | | | | | | | | | | | | | | 1,930,427 | |
| | | | | | | | | | | | | | | |
| | | | | | | | | | | | | | | |
| | | |
| Utilities - 1.64% | | | | | | |
| | | |
| Electric - 1.55% | | | | | | |
| American Electric Power Co., Inc., 2.031%, Due 3/15/2024 | | | | 65,000 | | | | | | | | | | 63,905 | |
| Appalachian Power Co., 4.500%, Due 3/1/2049, Series Y | | | | 25,000 | | | | | | | | | | 18,216 | |
| Arizona Public Service Co., 2.650%, Due 9/15/2050 | | | | 30,000 | | | | | | | | | | 15,455 | |
| Berkshire Hathaway Energy Co., 6.125%, Due 4/1/2036 | | | | 235,000 | | | | | | | | | | 229,090 | |
| Consolidated Edison Co. of New York, Inc., 5.500%, Due 12/1/2039, Series 09 C | | | | 169,000 | | | | | | | | | | 150,056 | |
| Consumers Energy Co., 2.500%, Due 5/1/2060 | | | | 32,000 | | | | | | | | | | 15,626 | |
| DTE Energy Co., 1.050%, Due 6/1/2025, Series F | | | | 75,000 | | | | | | | | | | 69,293 | |
| Duke Energy Carolinas LLC, | | | | | | | | | | | | | | | |
6.000%, Due 1/15/2038 | | | | 40,000 | | | | | | | | | | 38,962 | |
6.050%, Due 4/15/2038 | | | | 115,000 | | | | | | | | | | 111,141 | |
| Duke Energy Progress LLC, 4.150%, Due 12/1/2044 | | | | 75,000 | | | | | | | | | | 55,095 | |
| Duke Energy Progress NC Storm Funding LLC, 2.387%, Due 7/1/2039, Series A 2 | | | | 265,000 | | | | | | | | | | 195,924 | |
| Entergy Arkansas LLC, 3.350%, Due 6/15/2052 | | | | 55,000 | | | | | | | | | | 33,260 | |
| Entergy Corp., 2.800%, Due 6/15/2030 | | | | 30,000 | | | | | | | | | | 24,394 | |
| Entergy Louisiana LLC, 4.000%, Due 3/15/2033 | | | | 47,000 | | | | | | | | | | 39,596 | |
| Florida Power & Light Co., 3.950%, Due 3/1/2048 | | | | 50,000 | | | | | | | | | | 35,922 | |
| Kentucky Utilities Co., 3.300%, Due 6/1/2050 | | | | 55,000 | | | | | | | | | | 33,686 | |
| National Rural Utilities Cooperative Finance Corp., | | | | | | | | | | | | | | | |
1.000%, Due 10/18/2024, Series D | | | | 50,000 | | | | | | | | | | 47,762 | |
5.450%, Due 10/30/2025 | | | | 70,000 | | | | | | | | | | 69,886 | |
| PacifiCorp, 5.500%, Due 5/15/2054 | | | | 270,000 | | | | | | | | | | 221,511 | |
| Sempra, 3.300%, Due 4/1/2025 | | | | 85,000 | | | | | | | | | | 81,734 | |
| Vistra Operations Co. LLC, 5.125%, Due 5/13/2025E | | | | 110,000 | | | | | | | | | | 107,407 | |
| | | | | | | | | | | | | | | |
| | | | | | | | | | | | | | 1,657,921 | |
| | | | | | | | | | | | | | | |
| | | | | | | | | | | | | | | |
See accompanying notes
17
American Beacon Balanced FundSM
Schedule of Investments
October 31, 2023
| | | | | | | | | | | | | | | |
| | | |
| | | Principal Amount | | | | Fair Value |
| | | | | | | |
| | | |
| CORPORATE OBLIGATIONS - 12.45% (continued) | | | | | | |
| | | |
| Utilities - 1.64% (continued) | | | | | | |
| | | |
| Gas - 0.09% | | | | | | |
| National Fuel Gas Co., 3.950%, Due 9/15/2027 | | | $ | 50,000 | | | | | | | | | $ | 45,391 | |
| Sempra Global, 3.250%, Due 1/15/2032E | | | | 65,000 | | | | | | | | | | 48,985 | |
| | | | | | | | | | | | | | | |
| | | | | | | | | | | | | | 94,376 | |
| | | | | | | | | | | | | | | |
| | | | | | | | | | | | | | | |
Total Utilities | | | | | | | | | | | | | | 1,752,297 | |
| | | | | | | | | | | | | | | |
| | | | | | | | | | | | | | | |
Total Corporate Obligations (Cost $15,122,572) | | | | | | | | | | | | | | 13,284,658 | |
| | | | | | | | | | | | | | | |
| | | | | | | | | | | | | | | |
| | | |
| FOREIGN CORPORATE OBLIGATIONS - 3.87% | | | | | | |
| | | |
| Communications - 0.78% | | | | | | |
| | | |
| Internet - 0.28% | | | | | | |
| Alibaba Group Holding Ltd., 3.600%, Due 11/28/2024 | | | | 313,000 | | | | | | | | | | 305,297 | |
| | | | | | | | | | | | | | | |
| | | | | | | | | | | | | | | |
| | | |
| Media - 0.18% | | | | | | |
| Thomson Reuters Corp., 3.850%, Due 9/29/2024 | | | | 193,000 | | | | | | | | | | 188,625 | |
| | | | | | | | | | | | | | | |
| | | | | | | | | | | | | | | |
| | | |
| Telecommunications - 0.32% | | | | | | |
| America Movil SAB de CV, 6.375%, Due 3/1/2035 | | | | 169,000 | | | | | | | | | | 170,756 | |
| Deutsche Telekom International Finance BV, 4.875%, Due 3/6/2042E | | | | 150,000 | | | | | | | | | | 122,502 | |
| TELUS Corp., 3.400%, Due 5/13/2032 | | | | 60,000 | | | | | | | | | | 47,614 | |
| | | | | | | | | | | | | | | |
| | | | | | | | | | | | | | 340,872 | |
| | | | | | | | | | | | | | | |
| | | | | | | | | | | | | | | |
Total Communications | | | | | | | | | | | | | | 834,794 | |
| | | | | | | | | | | | | | | |
| | | | | | | | | | | | | | | |
| | | |
| Consumer, Cyclical - 0.32% | | | | | | |
| | | |
| Auto Manufacturers - 0.32% | | | | | | |
| Mercedes-Benz Finance North America LLC, 5.250%, Due 11/29/2027E | | | | 350,000 | | | | | | | | | | 343,999 | |
| | | | | | | | | | | | | | | |
| | | | | | | | | | | | | | | |
| | | |
| Consumer, Non-Cyclical - 0.62% | | | | | | |
| | | |
| Agriculture - 0.19% | | | | | | |
| BAT Capital Corp., | | | | | | | | | | | | | | | |
2.259%, Due 3/25/2028 | | | | 65,000 | | | | | | | | | | 54,572 | |
7.081%, Due 8/2/2053 | | | | 135,000 | | | | | | | | | | 121,016 | |
| Reynolds American, Inc., 5.700%, Due 8/15/2035 | | | | 35,000 | | | | | | | | | | 30,065 | |
| | | | | | | | | | | | | | | |
| | | | | | | | | | | | | | 205,653 | |
| | | | | | | | | | | | | | | |
| | | | | | | | | | | | | | | |
| | | |
| Beverages - 0.43% | | | | | | |
| Anheuser-Busch InBev Worldwide, Inc., 5.450%, Due 1/23/2039 | | | | 500,000 | | | | | | | | | | 463,192 | |
| | | | | | | | | | | | | | | |
| | | | | | | | | | | | | | | |
Total Consumer, Non-Cyclical | | | | | | | | | | | | | | 668,845 | |
| | | | | | | | | | | | | | | |
| | | | | | | | | | | | | | | |
| | | |
| Energy - 0.51% | | | | | | |
| | | |
| Oil & Gas - 0.34% | | | | | | |
| Saudi Arabian Oil Co., 4.375%, Due 4/16/2049E | | | | 500,000 | | | | | | | | | | 365,573 | |
| | | | | | | | | | | | | | | |
| | | | | | | | | | | | | | | |
| | | |
| Pipelines - 0.17% | | | | | | |
| Enbridge, Inc., 5.700%, Due 3/8/2033 | | | | 110,000 | | | | | | | | | | 103,042 | |
| TransCanada PipeLines Ltd., 6.100%, Due 6/1/2040 | | | | 82,000 | | | | | | | | | | 75,650 | |
| | | | | | | | | | | | | | | |
| | | | | | | | | | | | | | 178,692 | |
| | | | | | | | | | | | | | | |
| | | | | | | | | | | | | | | |
Total Energy | | | | | | | | | | | | | | 544,265 | |
| | | | | | | | | | | | | | | |
| | | | | | | | | | | | | | | |
| | | |
| Financial - 1.13% | | | | | | |
| | | |
| Banks - 1.01% | | | | | | |
| Barclays PLC, 2.894%, Due 11/24/2032, (1 yr. CMT + 1.300%)B | | | | 280,000 | | | | | | | | | | 204,864 | |
| Deutsche Bank AG, 7.146%, Due 7/13/2027, (Secured Overnight Financing Rate + 2.520%)B | | | | 230,000 | | | | | | | | | | 229,824 | |
See accompanying notes
18
American Beacon Balanced FundSM
Schedule of Investments
October 31, 2023
| | | | | | | | | | | | | | | |
| | | |
| | | Principal Amount | | | | Fair Value |
| | | | | | | |
| | | |
| FOREIGN CORPORATE OBLIGATIONS - 3.87% (continued) | | | | | | |
| | | |
| Financial - 1.13% (continued) | | | | | | |
| | | |
| Banks - 1.01% (continued) | | | | | | |
| Mitsubishi UFJ Financial Group, Inc., | | | | | | | | | | | | | | | |
2.193%, Due 2/25/2025 | | | $ | 75,000 | | | | | | | | | $ | 71,267 | |
2.852%, Due 1/19/2033, (1 yr. CMT + 1.100%)B | | | | 200,000 | | | | | | | | | | 153,993 | |
| Royal Bank of Canada, 1.200%, Due 4/27/2026 | | | | 250,000 | | | | | | | | | | 222,942 | |
| UBS Group AG, 3.091%, Due 5/14/2032, (Secured Overnight Financing Rate + 1.730%)B E | | | | 250,000 | | | | | | | | | | 192,749 | |
| | | | | | | | | | | | | | | |
| | | | | | | | | | | | | | 1,075,639 | |
| | | | | | | | | | | | | | | |
| | | | | | | | | | | | | | | |
| | | |
| Financial Services - 0.12% | | | | | | |
| AerCap Ireland Capital DAC/AerCap Global Aviation Trust, 3.300%, Due 1/30/2032 | | | | 165,000 | | | | | | | | | | 128,035 | |
| | | | | | | | | | | | | | | |
| | | | | | | | | | | | | | | |
Total Financial | | | | | | | | | | | | | | 1,203,674 | |
| | | | | | | | | | | | | | | |
| | | | | | | | | | | | | | | |
| | | |
| Industrial - 0.29% | | | | | | |
| | | |
| Aerospace/Defense - 0.29% | | | | | | |
| BAE Systems Holdings, Inc., 3.800%, Due 10/7/2024E | | | | 313,000 | | | | | | | | | | 306,549 | |
| | | | | | | | | | | | | | | |
| | | | | | | | | | | | | | | |
| | | |
| Utilities - 0.22% | | | | | | |
| | | |
| Electric - 0.22% | | | | | | |
| National Grid PLC, 5.809%, Due 6/12/2033 | | | | 245,000 | | | | | | | | | | 231,461 | |
| | | | | | | | | | | | | | | |
| | | | | | | | | | | | | | | |
Total Foreign Corporate Obligations (Cost $4,474,676) | | | | | | | | | | | | | | 4,133,587 | |
| | | | | | | | | | | | | | | |
| | | | | | | | | | | | | | | |
| | | |
| ASSET-BACKED OBLIGATIONS - 1.89% | | | | | | |
| Ally Auto Receivables Trust, 3.310%, Due 11/15/2026, 2022 1 A3 | | | | 110,000 | | | | | | | | | | 107,599 | |
| AmeriCredit Automobile Receivables Trust, | | | | | | | | | | | | | | | |
0.370%, Due 8/18/2025, 2021 1 A3 | | | | 1,038 | | | | | | | | | | 1,036 | |
0.340%, Due 12/18/2026, 2021 2 A3 | | | | 24,769 | | | | | | | | | | 24,412 | |
4.380%, Due 4/18/2028, 2022 2 A3 | | | | 90,000 | | | | | | | | | | 88,283 | |
| Americredit Automobile Receivables Trust, 5.840%, Due 10/19/2026, 2023 1 A2A | | | | 107,911 | | | | | | | | | | 107,654 | |
| BMW Vehicle Owner Trust, 3.210%, Due 8/25/2026, 2022 A A3 | | | | 55,000 | | | | | | | | | | 53,695 | |
| CNH Equipment Trust, | | | | | | | | | | | | | | | |
1.160%, Due 6/16/2025, 2020 A A3 | | | | 5,332 | | | | | | | | | | 5,316 | |
0.400%, Due 12/15/2025, 2021 A A3 | | | | 44,124 | | | | | | | | | | 42,820 | |
| Ford Credit Auto Lease Trust, 3.230%, Due 5/15/2025, 2022 A A3 | | | | 123,539 | | | | | | | | | | 122,669 | |
| Ford Credit Auto Owner Trust, 1.530%, Due 5/15/2034, 2021 2 AE | | | | 110,000 | | | | | | | | | | 96,817 | |
| GM Financial Automobile Leasing Trust, | | | | | | | | | | | | | | | |
1.900%, Due 3/20/2025, 2022 1 A3 | | | | 76,307 | | | | | | | | | | 75,460 | |
4.010%, Due 9/22/2025, 2022 3 A3 | | | | 90,000 | | | | | | | | | | 88,984 | |
| GM Financial Revolving Receivables Trust, 1.170%, Due 6/12/2034, 2021 1 AE | | | | 90,000 | | | | | | | | | | 79,076 | |
| Honda Auto Receivables Owner Trust, | | | | | | | | | | | | | | | |
1.880%, Due 5/15/2026, 2022 1 A3 | | | | 120,000 | | | | | | | | | | 115,805 | |
4.930%, Due 11/15/2027, 2023 2 A3 | | | | 100,000 | | | | | | | | | | 98,387 | |
| John Deere Owner Trust, | | | | | | | | | | | | | | | |
2.320%, Due 9/16/2026, 2022 A A3 | | | | 93,462 | | | | | | | | | | 90,694 | |
3.740%, Due 2/16/2027, 2022 B A3 | | | | 100,000 | | | | | | | | | | 97,134 | |
| Mercedes-Benz Auto Lease Trust, 0.400%, Due 11/15/2024, 2021 B A3 | | | | 45,077 | | | | | | | | | | 44,797 | |
| New Economy Assets Phase 1 Sponsor LLC, 1.910%, Due 10/20/2061, 2021 1 A1E | | | | 125,000 | | | | | | | | | | 106,884 | |
| Public Service New Hampshire Funding LLC, 3.094%, Due 2/1/2026, 2018 1 A1 | | | | 5,913 | | | | | | | | | | 5,870 | |
| Taco Bell Funding LLC, 2.294%, Due 8/25/2051, 2021 1A A2IIE | | | | 98,250 | | | | | | | | | | 79,479 | |
| Toyota Auto Loan Extended Note Trust, 1.350%, Due 5/25/2033, 2020 1A AE | | | | 135,000 | | | | | | | | | | 125,556 | |
| Toyota Auto Receivables Owner Trust, 1.230%, Due 6/15/2026, 2022 A A3 | | | | 88,934 | | | | | | | | | | 85,982 | |
| Verizon Master Trust, 0.500%, Due 5/20/2027, 2021 1 A | | | | 200,000 | | | | | | | | | | 193,992 | |
| Volkswagen Auto Loan Enhanced Trust, 1.020%, Due 6/22/2026, 2021 1 A3 | | | | 84,794 | | | | | | | | | | 81,848 | |
| | | | | | | | | | | | | | | |
| | | | | | | | | | | | | | | |
Total Asset-Backed Obligations (Cost $2,122,110) | | | | | | | | | | | | | | 2,020,249 | |
| | | | | | | | | | | | | | | |
| | | | | | | | | | | | | | | |
See accompanying notes
19
American Beacon Balanced FundSM
Schedule of Investments
October 31, 2023
| | | | | | | | | | | | | | | |
| | | |
| | | Principal Amount | | | | Fair Value |
| | | | | | | |
| | | |
| COMMERCIAL MORTGAGE-BACKED OBLIGATIONS - 0.23% | | | | | | |
| BX Commercial Mortgage Trust, 6.149%, Due 9/15/2036, 2021 VOLT A, (1 mo. USD Term SOFR + 0.814%)B E | | | $ | 140,000 | | | | | | | | | $ | 135,614 | |
| Cold Storage Trust, 6.351%, Due 11/15/2037, 2020 ICE5 A, (1 mo. USD Term SOFR + 1.014%)B E | | | | 113,044 | | | | | | | | | | 111,785 | |
| | | | | | | | | | | | | | | |
| | | | | | | | | | | | | | | |
Total Commercial Mortgage-Backed Obligations (Cost $253,044) | | | | | | | | | | | | | | 247,399 | |
| | | | | | | | | | | | | | | |
| | | | | | | | | | | | | | | |
| | | |
| U.S. AGENCY MORTGAGE-BACKED OBLIGATIONS - 9.53% | | | | | | |
| Federal Home Loan Mortgage Corp., | | | | | | | | | | | | | | | |
3.500%, Due 9/1/2028 | | | | 11,242 | | | | | | | | | | 10,861 | |
3.000%, Due 11/1/2032 | | | | 44,603 | | | | | | | | | | 41,386 | |
5.000%, Due 8/1/2033 | | | | 15,842 | | | | | | | | | | 15,445 | |
5.500%, Due 2/1/2034 | | | | 15,805 | | | | | | | | | | 15,579 | |
2.500%, Due 6/1/2035 | | | | 64,622 | | | | | | | | | | 57,133 | |
2.000%, Due 3/1/2036 | | | | 187,801 | | | | | | | | | | 159,928 | |
4.000%, Due 1/1/2041 | | | | 44,986 | | | | | | | | | | 40,340 | |
4.500%, Due 2/1/2041 | | | | 32,280 | | | | | | | | | | 29,886 | |
2.500%, Due 9/1/2041 | | | | 275,740 | | | | | | | | | | 223,033 | |
3.500%, Due 5/1/2042 | | | | 139,821 | | | | | | | | | | 119,068 | |
3.500%, Due 6/1/2042 | | | | 145,654 | | | | | | | | | | 128,302 | |
3.000%, Due 4/1/2047 | | | | 123,077 | | | | | | | | | | 101,979 | |
3.000%, Due 8/1/2048 | | | | 115,528 | | | | | | | | | | 95,328 | |
2.500%, Due 7/1/2050 | | | | 79,434 | | | | | | | | | | 61,433 | |
2.500%, Due 12/1/2050 | | | | 70,873 | | | | | | | | | | 54,854 | |
2.500%, Due 11/1/2051 | | | | 139,947 | | | | | | | | | | 108,747 | |
2.000%, Due 2/1/2052 | | | | 253,828 | | | | | | | | | | 187,968 | |
2.500%, Due 5/1/2052 | | | | 115,518 | | | | | | | | | | 89,646 | |
6.000%, Due 3/1/2053 | | | | 74,895 | | | | | | | | | | 73,323 | |
5.500%, Due 9/1/2053 | | | | 226,855 | | | | | | | | | | 215,961 | |
| | | | | | | | | | | | | | | |
| | | | | | | | | | | | | | 1,830,200 | |
| | | | | | | | | | | | | | | |
| Federal National Mortgage Association, | | | | | | | | | | | | | | | |
3.500%, Due 1/1/2028C | | | | 9,391 | | | | | | | | | | 9,048 | |
5.000%, Due 3/1/2034C | | | | 17,221 | | | | | | | | | | 16,762 | |
4.500%, Due 4/1/2034 | | | | 28,379 | | | | | | | | | | 26,099 | |
3.000%, Due 10/1/2034 | | | | 4,200 | | | | | | | | | | 3,780 | |
2.000%, Due 11/1/2035C | | | | 133,139 | | | | | | | | | | 114,045 | |
2.000%, Due 12/1/2035C | | | | 59,414 | | | | | | | | | | 50,896 | |
3.500%, Due 6/1/2037 | | | | 86,355 | | | | | | | | | | 77,780 | |
5.500%, Due 6/1/2038 | | | | 3,593 | | | | | | | | | | 3,519 | |
4.500%, Due 1/1/2040 | | | | 32,478 | | | | | | | | | | 29,963 | |
5.000%, Due 5/1/2040 | | | | 54,397 | | | | | | | | | | 51,960 | |
5.000%, Due 6/1/2040 | | | | 41,653 | | | | | | | | | | 39,950 | |
4.000%, Due 9/1/2040 | | | | 30,086 | | | | | | | | | | 26,919 | |
4.000%, Due 1/1/2041 | | | | 61,687 | | | | | | | | | | 55,232 | |
2.500%, Due 11/1/2041 | | | | 116,234 | | | | | | | | | | 93,341 | |
3.000%, Due 6/1/2043 | | | | 282,895 | | | | | | | | | | 238,116 | |
3.000%, Due 8/1/2043 | | | | 254,091 | | | | | | | | | | 213,555 | |
4.000%, Due 11/1/2044C | | | | 39,496 | | | | | | | | | | 35,068 | |
4.000%, Due 7/1/2045 | | | | 59,898 | | | | | | | | | | 53,098 | |
3.500%, Due 8/1/2045 | | | | 28,846 | | | | | | | | | | 24,916 | |
3.500%, Due 11/1/2045 | | | | 272,440 | | | | | | | | | | 234,988 | |
3.500%, Due 1/1/2046 | | | | 108,716 | | | | | | | | | | 93,903 | |
3.500%, Due 5/1/2046 | | | | 29,134 | | | | | | | | | | 25,025 | |
4.000%, Due 7/1/2046 | | | | 58,518 | | | | | | | | | | 51,930 | |
3.000%, Due 10/1/2046 | | | | 22,224 | | | | | | | | | | 18,380 | |
3.000%, Due 11/1/2046 | | | | 134,455 | | | | | | | | | | 111,302 | |
3.500%, Due 3/1/2047 | | | | 31,267 | | | | | | | | | | 26,832 | |
4.500%, Due 7/1/2047 | | | | 16,173 | | | | | | | | | | 14,772 | |
4.500%, Due 8/1/2047 | | | | 25,898 | | | | | | | | | | 23,703 | |
3.500%, Due 9/1/2047 | | | | 40,003 | | | | | | | | | | 34,237 | |
4.000%, Due 3/1/2048 | | | | 44,859 | | | | | | | | | | 39,497 | |
See accompanying notes
20
American Beacon Balanced FundSM
Schedule of Investments
October 31, 2023
| | | | | | | | | | | | | | | |
| | | |
| | | Principal Amount | | | | Fair Value |
| | | | | | | |
| | | |
| U.S. AGENCY MORTGAGE-BACKED OBLIGATIONS - 9.53% (continued) | | | | | | |
| Federal National Mortgage Association, (continued) | | | | | | | | | | | | | | | |
4.500%, Due 4/1/2048 | | | $ | 11,890 | | | | | | | | | $ | 10,848 | |
4.500%, Due 7/1/2048 | | | | 41,383 | | | | | | | | | | 37,732 | |
4.500%, Due 7/1/2048C | | | | 30,316 | | | | | | | | | | 27,811 | |
4.500%, Due 10/1/2049 | | | | 90,920 | | | | | | | | | | 82,570 | |
4.000%, Due 11/1/2049 | | | | 167,605 | | | | | | | | | | 147,321 | |
2.500%, Due 8/1/2050C | | | | 163,468 | | | | | | | | | | 127,638 | |
2.500%, Due 8/1/2050 | | | | 180,367 | | | | | | | | | | 139,634 | |
3.000%, Due 8/1/2050 | | | | 97,943 | | | | | | | | | | 79,092 | |
2.500%, Due 9/1/2050 | | | | 115,016 | | | | | | | | | | 89,072 | |
2.500%, Due 10/1/2050C | | | | 52,594 | | | | | | | | | | 40,731 | |
3.000%, Due 10/1/2050C | | | | 108,218 | | | | | | | | | | 87,503 | |
2.000%, Due 3/1/2051C | | | | 305,774 | | | | | | | | | | 227,555 | |
2.000%, Due 4/1/2051C | | | | 376,524 | | | | | | | | | | 280,409 | |
3.000%, Due 5/1/2051C | | | | 119,032 | | | | | | | | | | 96,468 | |
3.000%, Due 6/1/2051 | | | | 126,054 | | | | | | | | | | 101,353 | |
3.500%, Due 6/1/2051C | | | | 143,134 | | | | | | | | | | 119,883 | |
2.000%, Due 7/1/2051C | | | | 262,812 | | | | | | | | | | 194,848 | |
3.500%, Due 7/1/2051C | | | | 126,340 | | | | | | | | | | 107,381 | |
3.000%, Due 11/1/2051C | | | | 91,538 | | | | | | | | | | 73,504 | |
2.000%, Due 1/1/2052C | | | | 273,350 | | | | | | | | | | 202,545 | |
2.500%, Due 2/1/2052 | | | | 555,037 | | | | | | | | | | 428,317 | |
3.500%, Due 5/1/2052 | | | | 156,591 | | | | | | | | | | 130,792 | |
4.000%, Due 6/1/2052 | | | | 191,966 | | | | | | | | | | 166,667 | |
5.000%, Due 6/1/2052 | | | | 299,082 | | | | | | | | | | 278,795 | |
3.000%, Due 7/1/2052C | | | | 124,802 | | | | | | | | | | 101,055 | |
4.000%, Due 9/1/2052C | | | | 198,491 | | | | | | | | | | 171,881 | |
4.500%, Due 10/1/2052C | | | | 178,976 | | | | | | | | | | 160,770 | |
5.000%, Due 12/1/2052 | | | | 136,536 | | | | | | | | | | 126,034 | |
5.000%, Due 4/1/2053C | | | | 97,492 | | | | | | | | | | 90,298 | |
4.500%, Due 6/1/2053C | | | | 228,598 | | | | | | | | | | 205,794 | |
6.000%, Due 9/1/2053C | | | | 223,126 | | | | | | | | | | 217,428 | |
| | | | | | | | | | | | | | | |
| | | | | | | | | | | | | | 6,190,345 | |
| | | | | | | | | | | | | | | |
| Government National Mortgage Association, | | | | | | | | | | | | | | | |
6.500%, Due 8/15/2027 | | | | 7,009 | | | | | | | | | | 7,020 | |
6.500%, Due 11/15/2027 | | | | 7,583 | | | | | | | | | | 7,628 | |
7.500%, Due 12/15/2028 | | | | 8,796 | | | | | | | | | | 8,941 | |
5.500%, Due 7/15/2033 | | | | 16,237 | | | | | | | | | | 15,962 | |
6.000%, Due 12/15/2033 | | | | 22,697 | | | | | | | | | | 22,939 | |
5.500%, Due 2/20/2034 | | | | 23,175 | | | | | | | | | | 22,997 | |
5.000%, Due 10/15/2039 | | | | 42,566 | | | | | | | | | | 41,277 | |
3.500%, Due 9/15/2041 | | | | 82,515 | | | | | | | | | | 73,065 | |
3.500%, Due 8/20/2047 | | | | 15,457 | | | | | | | | | | 13,362 | |
3.500%, Due 10/20/2047 | | | | 14,203 | | | | | | | | | | 12,276 | |
4.000%, Due 1/20/2048 | | | | 70,940 | | | | | | | | | | 63,737 | |
5.000%, Due 1/20/2050 | | | | 34,359 | | | | | | | | | | 32,486 | |
4.500%, Due 2/20/2050 | | | | 30,960 | | | | | | | | | | 28,427 | |
5.000%, Due 2/20/2050 | | | | 17,592 | | | | | | | | | | 16,659 | |
2.500%, Due 4/20/2050 | | | | 149,312 | | | | | | | | | | 119,640 | |
2.500%, Due 6/20/2051 | | | | 148,880 | | | | | | | | | | 118,821 | |
3.000%, Due 6/20/2051 | | | | 64,619 | | | | | | | | | | 53,569 | |
2.500%, Due 7/20/2051 | | | | 233,881 | | | | | | | | | | 186,737 | |
3.000%, Due 8/20/2051 | | | | 146,796 | | | | | | | | | | 122,901 | |
2.500%, Due 11/20/2051 | | | | 118,902 | | | | | | | | | | 94,853 | |
3.000%, Due 12/20/2051 | | | | 288,276 | | | | | | | | | | 238,685 | |
3.500%, Due 1/20/2052 | | | | 105,308 | | | | | | | | | | 89,839 | |
4.000%, Due 3/20/2052 | | | | 110,997 | | | | | | | | | | 97,683 | |
2.500%, Due 4/20/2052 | | | | 67,269 | | | | | | | | | | 53,649 | |
4.500%, Due 9/20/2052 | | | | 142,383 | | | | | | | | | | 128,858 | |
See accompanying notes
21
American Beacon Balanced FundSM
Schedule of Investments
October 31, 2023
| | | | | | | | | | | | | | | |
| | | |
| | | Principal Amount | | | | Fair Value |
| | | | | | | |
| | | |
| U.S. AGENCY MORTGAGE-BACKED OBLIGATIONS - 9.53% (continued) | | | | | | |
| Government National Mortgage Association, (continued) | | | | | | | | | | | | | | | |
5.000%, Due 4/20/2053 | | | $ | 275,586 | | | | | | | | | $ | 256,783 | |
5.500%, Due 7/20/2053 | | | | 228,443 | | | | | | | | | | 218,787 | |
| | | | | | | | | | | | | | | |
| | | | | | | | | | | | | | 2,147,581 | |
| | | | | | | | | | | | | | | |
| | | | | | | | | | | | | | | |
Total U.S. Agency Mortgage-Backed Obligations (Cost $11,906,562) | | | | | | | | | | | | | | 10,168,126 | |
| | | | | | | | | | | | | | | |
| | | | | | | | | | | | | | | |
| | | |
| U.S. GOVERNMENT AGENCY OBLIGATIONS - 0.80% | | | | | | |
| Federal Farm Credit Banks Funding Corp., | | | | | | | | | | | | | | | |
4.375%, Due 10/24/2029 | | | | 250,000 | | | | | | | | | | 241,034 | |
3.750%, Due 1/25/2030 | | | | 300,000 | | | | | | | | | | 276,689 | |
| Federal Home Loan Banks, 4.500%, Due 12/14/2029 | | | | 350,000 | | | | | | | | | | 339,201 | |
| | | | | | | | | | | | | | | |
| | | | | | | | | | | | | | | |
Total U.S. Government Agency Obligations (Cost $905,922) | | | | | | | | | | | | | | 856,924 | |
| | | | | | | | | | | | | | | |
| | | | | | | | | | | | | | | |
| | | |
| U.S. TREASURY OBLIGATIONS - 10.55% | | | | | | |
| U.S. Treasury Bonds, | | | | | | | | | | | | | | | |
6.875%, Due 8/15/2025 | | | | 279,000 | | | | | | | | | | 287,272 | |
5.250%, Due 11/15/2028 | | | | 217,000 | | | | | | | | | | 220,704 | |
4.750%, Due 2/15/2037 | | | | 304,000 | | | | | | | | | | 299,274 | |
4.500%, Due 8/15/2039 | | | | 241,000 | | | | | | | | | | 224,535 | |
2.750%, Due 8/15/2042 | | | | 250,000 | | | | | | | | | | 175,938 | |
3.875%, Due 2/15/2043 | | | | 585,000 | | | | | | | | | | 489,023 | |
2.875%, Due 5/15/2049 | | | | 500,000 | | | | | | | | | | 338,223 | |
1.375%, Due 8/15/2050 | | | | 920,000 | | | | | | | | | | 422,877 | |
2.875%, Due 5/15/2052 | | | | 170,000 | | | | | | | | | | 114,345 | |
3.625%, Due 2/15/2053 | | | | 330,000 | | | | | | | | | | 259,153 | |
| | | | | | | | | | | | | | | |
| | | | | | | | | | | | | | 2,831,344 | |
| | | | | | | | | | | | | | | |
| U.S. Treasury Notes, | | | | | | | | | | | | | | | |
1.250%, Due 8/31/2024 | | | | 220,000 | | | | | | | | | | 212,463 | |
4.250%, Due 9/30/2024 | | | | 250,000 | | | | | | | | | | 247,275 | |
1.125%, Due 1/15/2025 | | | | 250,000 | | | | | | | | | | 237,812 | |
1.125%, Due 2/28/2025 | | | | 575,000 | | | | | | | | | | 544,318 | |
2.875%, Due 7/31/2025 | | | | 500,000 | | | | | | | | | | 481,035 | |
4.250%, Due 10/15/2025 | | | | 250,000 | | | | | | | | | | 246,055 | |
2.000%, Due 11/15/2026 | | | | 500,000 | | | | | | | | | | 459,453 | |
2.500%, Due 3/31/2027 | | | | 250,000 | | | | | | | | | | 231,611 | |
4.125%, Due 10/31/2027 | | | | 250,000 | | | | | | | | | | 243,301 | |
2.875%, Due 5/15/2028 | | | | 200,000 | | | | | | | | | | 184,039 | |
3.625%, Due 5/31/2028 | | | | 225,000 | | | | | | | | | | 214,049 | |
2.875%, Due 8/15/2028 | | | | 300,000 | | | | | | | | | | 274,711 | |
2.625%, Due 2/15/2029 | | | | 450,000 | | | | | | | | | | 403,242 | |
2.875%, Due 4/30/2029 | | | | 300,000 | | | | | | | | | | 271,055 | |
2.375%, Due 5/15/2029 | | | | 450,000 | | | | | | | | | | 395,719 | |
1.625%, Due 8/15/2029 | | | | 350,000 | | | | | | | | | | 293,713 | |
1.750%, Due 11/15/2029 | | | | 850,000 | | | | | | | | | | 714,299 | |
3.500%, Due 1/31/2030 | | | | 350,000 | | | | | | | | | | 323,654 | |
1.500%, Due 2/15/2030 | | | | 905,000 | | | | | | | | | | 740,792 | |
4.000%, Due 2/28/2030 | | | | 250,000 | | | | | | | | | | 237,715 | |
4.125%, Due 11/15/2032 | | | | 250,000 | | | | | | | | | | 236,045 | |
3.500%, Due 2/15/2033 | | | | 1,375,000 | | | | | | | | | | 1,233,848 | |
| | | | | | | | | | | | | | | |
| | | | | | | | | | | | | | 8,426,204 | |
| | | | | | | | | | | | | | | |
| | | | | | | | | | | | | | | |
Total U.S. Treasury Obligations (Cost $12,450,651) | | | | | | | | | | | | | | 11,257,548 | |
| | | | | | | | | | | | | | | |
| | | | | | | | | | | | | | | |
See accompanying notes
22
American Beacon Balanced FundSM
Schedule of Investments
October 31, 2023
| | | | | | | | | | | | | | | |
| | | |
| | | Shares | | | | Fair Value |
| | | | | | | |
| | | |
| SHORT-TERM INVESTMENTS - 2.07% (Cost $2,210,473) | | | | | | |
| | | |
| Investment Companies - 2.07% | | | | | | |
| American Beacon U.S. Government Money Market Select Fund, 5.19%G H | | | | 2,210,473 | | | | | | | | | $ | 2,210,473 | |
| | | | | | | | | | | | | | | |
| | | | | | | | | | | | | | | |
| | | |
| SECURITIES LENDING COLLATERAL - 0.82% (Cost $870,903) | | | | | | |
| | | |
| Investment Companies - 0.82% | | | | | | |
| American Beacon U.S. Government Money Market Select Fund, 5.19%G H | | | | 870,903 | | | | | | | | | | 870,903 | |
| | | | | | | | | | | | | | | |
| | | | | | | | | | | | | | | |
TOTAL INVESTMENTS - 100.38% (Cost $100,504,220) | | | | | | | | | | | | | | 107,125,466 | |
LIABILITIES, NET OF OTHER ASSETS - (0.38%) | | | | | | | | | | | | | | (400,867 | ) |
| | | | | | | | | | | | | | | |
TOTAL NET ASSETS - 100.00% | | | | | | | | | | | | | $ | 106,724,599 | |
| | | | | | | | | | | | | | | |
| | | | | | | |
| Percentages are stated as a percent of net assets. | | | | | | | | | | | | | | | |
A Non-income producing security.
B Variable, floating, or adjustable rate securities with an interest rate that changes periodically. Rates are periodically reset with rates that are based on a predetermined benchmark such as a widely followed interest rate such as T-bills, SOFR, LIBOR or PRIME plus a fixed spread. The interest rate disclosed reflects the rate in effect on October 31, 2023.
C Coupon rate may change based on changes of the underlying collateral or prepayments of principal. The coupon rate shown represents the rate at period end.
D Perpetual maturity. The date shown, if any, is the next call date.
E Security exempt from registration under the Securities Act of 1933. These securities may be resold to qualified institutional buyers pursuant to Rule 144A. At the period end, the value of these securities amounted to $2,285,629 or 2.14% of net assets. The Fund has no right to demand registration of these securities.
F All or a portion of this security is on loan, collateralized by either cash and/or U.S. Treasuries, at October 31, 2023 (Note 9).
G The Fund is affiliated by having the same investment advisor.
H 7-day yield.
ADR - American Depositary Receipt.
CMT - Constant Maturity Treasury.
DAC - Designated Activity Company.
LIBOR - London Interbank Offered Rate.
LLC - Limited Liability Company.
LP - Limited Partnership.
PLC - Public Limited Company.
PRIME - A rate, charged by banks, based on the U.S. Federal Funds rate.
SOFR - Secured Overnight Financing Rate.
| | | | | | | | | | | | | | | | |
| Long Futures Contracts Open on October 31, 2023: | |
|
| Equity Futures Contracts | |
| Description | | Number of
Contracts | | Expiration Date | | Notional Amount | | | Contract Value | | | Unrealized
Appreciation
(Depreciation) | |
| CME e-Mini Standard & Poor’s 500 Index Futures | | 10 | | December 2023 | | $ | 2,178,911 | | | $ | 2,106,125 | | | $ | (72,786 | ) |
| | | | | | | | | | | | | | | | |
| | | | | | $ | 2,178,911 | | | $ | 2,106,125 | | | $ | (72,786 | ) |
| | | | | | | | | | | | | | | | |
| | |
|
| Index Abbreviations: |
| CME | | Chicago Mercantile Exchange. |
The Fund’s investments are summarized by level based on the inputs used to determine their values. As of October 31, 2023, the investments were classified as described below:
| | | | | | | | | | | | | | | | | | | | | | | | | | | | |
Balanced Fund | | Level 1 | | | | | | Level 2 | | | | | | Level 3 | | | | | | Total | |
Assets | |
Common Stocks | | $ | 58,098,158 | | | | | | | $ | - | | | | | | | $ | - | | | | | | | $ | 58,098,158 | |
Foreign Common Stocks | | | 3,977,441 | | | | | | | | - | | | | | | | | - | | | | | | | | 3,977,441 | |
Corporate Obligations | | | - | | | | | | | | 13,284,658 | | | | | | | | - | | | | | | | | 13,284,658 | |
Foreign Corporate Obligations | | | - | | | | | | | | 4,133,587 | | | | | | | | - | | | | | | | | 4,133,587 | |
Asset-Backed Obligations | | | - | | | | | | | | 2,020,249 | | | | | | | | - | | | | | | | | 2,020,249 | |
See accompanying notes
23
American Beacon Balanced FundSM
Schedule of Investments
October 31, 2023
| | | | | | | | | | | | | | | | | | | | | | | | | | | | |
Balanced Fund | | Level 1 | | | | | | Level 2 | | | | | | Level 3 | | | | | | Total | |
Commercial Mortgage-Backed Obligations | | $ | - | | | | | | | $ | 247,399 | | | | | | | $ | - | | | | | | | $ | 247,399 | |
U.S. Agency Mortgage-Backed Obligations | | | - | | | | | | | | 10,168,126 | | | | | | | | - | | | | | | | | 10,168,126 | |
U.S. Government Agency Obligations | | | - | | | | | | | | 856,924 | | | | | | | | - | | | | | | | | 856,924 | |
U.S. Treasury Obligations | | | - | | | | | | | | 11,257,548 | | | | | | | | - | | | | | | | | 11,257,548 | |
Short-Term Investments | | | 2,210,473 | | | | | | | | - | | | | | | | | - | | | | | | | | 2,210,473 | |
Securities Lending Collateral | | | 870,903 | | | | | | | | - | | | | | | | | - | | | | | | | | 870,903 | |
| | | | | | | | | | | | | | | | | | | | | | | | | | | | |
Total Investments in Securities - Assets | | $ | 65,156,975 | | | | | | | $ | 41,968,491 | | | | | | | $ | - | | | | | | | $ | 107,125,466 | |
| | | | | | | | | | | | | | | | | | | | | | | | | | | | |
|
Financial Derivative Instruments - Liabilities | |
Futures Contracts | | $ | (72,786 | ) | | | | | | $ | - | | | | | | | $ | - | | | | | | | $ | (72,786 | ) |
| | | | | | | | | | | | | | | | | | | | | | | | | | | | |
Total Financial Derivative Instruments - Liabilities | | $ | (72,786 | ) | | | | | | $ | - | | | | | | | $ | - | | | | | | | $ | (72,786 | ) |
| | | | | | | | | | | | | | | | | | | | | | | | | | | | |
U.S. GAAP requires transfers between all levels to/from level 3 be disclosed. During the year ended October 31, 2023, there were no transfers into or out of Level 3.
See accompanying notes
24
American Beacon Balanced FundSM
Statement of Assets and Liabilities
October 31, 2023
| | | | |
Assets: | | | | |
Investments in unaffiliated securities, at fair value† § | | $ | 104,044,090 | |
Investments in affiliated securities, at fair value‡ | | | 3,081,376 | |
Cash collateral held at broker for futures contracts | | | 156,000 | |
Dividends and interest receivable | | | 443,760 | |
Deposits with broker for futures contracts | | | 86,013 | |
Receivable for investments sold | | | 345,898 | |
Receivable for fund shares sold | | | 127,626 | |
Receivable for tax reclaims | | | 1,969 | |
Prepaid expenses | | | 37,615 | |
| | | | |
Total assets | | | 108,324,347 | |
| | | | |
Liabilities: | | | | |
Payable for investments purchased | | | 255,372 | |
Payable for fund shares redeemed | | | 206,406 | |
Management and sub-advisory fees payable (Note 2) | | | 81,183 | |
Service fees payable (Note 2) | | | 11,916 | |
Transfer agent fees payable (Note 2) | | | 6,385 | |
Payable upon return of securities loaned (Note 9)§ | | | 870,903 | |
Custody and fund accounting fees payable | | | 11,784 | |
Professional fees payable | | | 68,339 | |
Trustee fees payable (Note 2) | | | 781 | |
Payable for prospectus and shareholder reports | | | 10,380 | |
Payable for variation margin from open futures contracts (Note 5) | | | 72,797 | |
Other liabilities | | | 3,502 | |
| | | | |
Total liabilities | | | 1,599,748 | |
| | | | |
Commitments and contingent liabilities (Note 2) | | | | |
| | | | |
Net assets | | $ | 106,724,599 | |
| | | | |
Analysis of net assets: | | | | |
Paid-in-capital | | $ | 99,931,147 | |
Total distributable earnings (deficits)A | | | 6,793,452 | |
| | | | |
Net assets | | $ | 106,724,599 | |
| | | | |
Shares outstanding at no par value (unlimited shares authorized): | | | | |
R5 Class | | | 830,663 | |
| | | | |
Y Class | | | 1,845,658 | |
| | | | |
Investor Class | | | 4,328,281 | |
| | | | |
Advisor Class | | | 81,399 | |
| | | | |
A Class | | | 1,219,754 | |
| | | | |
C Class | | | 1,082,891 | |
| | | | |
Net assets: | | | | |
R5 Class | | $ | 10,827,923 | |
| | | | |
Y Class | | $ | 24,304,867 | |
| | | | |
Investor Class | | $ | 46,044,377 | |
| | | | |
Advisor Class | | $ | 960,288 | |
| | | | |
A Class | | $ | 12,917,238 | |
| | | | |
C Class | | $ | 11,669,906 | |
| | | | |
Net asset value, offering and redemption price per share: | | | | |
R5 Class | | $ | 13.04 | |
| | | | |
Y Class | | $ | 13.17 | |
| | | | |
Investor Class | | $ | 10.64 | |
| | | | |
Advisor Class | | $ | 11.80 | |
| | | | |
A Class | | $ | 10.59 | |
| | | | |
A Class (offering price) | | $ | 11.24 | |
| | | | |
C Class | | $ | 10.78 | |
| | | | |
| |
† Cost of investments in unaffiliated securities | | $ | 97,422,844 | |
‡ Cost of investments in affiliated securities | | $ | 3,081,376 | |
§ Fair value of securities on loan | | $ | 863,162 | |
|
A The Fund’s investments in affiliated securities did not have unrealized appreciation (depreciation) at year end. | |
See accompanying notes
25
American Beacon Balanced FundSM
Statement of Operations
For the year ended October 31, 2023
| | | | |
Investment income: | | | | |
Dividend income from unaffiliated securities (net of foreign taxes)† | | $ | 1,783,944 | |
Dividend income from affiliated securities (Note 2) | | | 186,823 | |
Interest income | | | 1,851,438 | |
Income derived from securities lending (Note 9) | | | 4,053 | |
| | | | |
Total investment income | | | 3,826,258 | |
| | | | |
Expenses: | | | | |
Management and sub-advisory fees (Note 2) | | | 672,966 | |
Transfer agent fees: | | | | |
R5 Class (Note 2) | | | 3,987 | |
Y Class (Note 2) | | | 38,611 | |
Investor Class | | | 10,807 | |
Advisor Class | | | 120 | |
A Class | | | 980 | |
C Class | | | 939 | |
Custody and fund accounting fees | | | 59,866 | |
Professional fees | | | 73,809 | |
Registration fees and expenses | | | 85,569 | |
Service fees (Note 2): | | | | |
Investor Class | | | 149,923 | |
Advisor Class | | | 2,257 | |
A Class | | | 11,896 | |
C Class | | | 12,414 | |
Distribution fees (Note 2): | | | | |
Advisor Class | | | 2,441 | |
A Class | | | 34,424 | |
C Class | | | 146,122 | |
Prospectus and shareholder report expenses | | | 33,069 | |
Trustee fees (Note 2) | | | 13,145 | |
Loan expense (Note 10) | | | 7,484 | |
Other expenses | | | 41,818 | |
| | | | |
Total expenses | | | 1,402,647 | |
| | | | |
Net investment income | | | 2,423,611 | |
| | | | |
| |
Realized and unrealized gain (loss) from investments: | | | | |
Net realized gain (loss) from: | | | | |
Investments in unaffiliated securitiesA | | | 336,785 | |
Commission recapture (Note 1) | | | 851 | |
Foreign currency transactions | | | (63 | ) |
Futures contracts | | | 993,078 | |
Change in net unrealized appreciation (depreciation) of: | | | | |
Investments in unaffiliated securitiesB | | | 606,297 | |
Futures contracts | | | (224,628 | ) |
| | | | |
Net gain from investments | | | 1,712,320 | |
| | | | |
Net increase in net assets resulting from operations | | $ | 4,135,931 | |
| | | | |
| |
† Foreign taxes | | $ | 12,587 | |
| |
A The Fund did not recognize net realized gains (losses) from the sale of investments in affiliated securities. | | | | |
B The Fund’s investments in affiliated securities did not have a change in unrealized appreciation (depreciation) at year end. | |
See accompanying notes
26
American Beacon Balanced FundSM
Statement of Changes in Net Assets
| | | | | | | | | | | | |
| | | Year Ended
October 31, 2023 | | | | | | Year Ended
October 31, 2022 | |
Increase (decrease) in net assets: | | | | | | | | | | | | |
Operations: | | | | | | | | | | | | |
Net investment income | | $ | 2,423,611 | | | | | | | $ | 1,931,110 | |
Net realized gain from investments in unaffiliated securities, commission recapture, foreign currency transactions, and futures contracts | | | 1,330,651 | | | | | | | | 12,934,545 | |
Change in net unrealized appreciation (depreciation) of investments in unaffiliated securities, and futures contracts | | | 381,669 | | | | | | | | (30,985,160 | ) |
| | | | | | | | | | | | |
Net increase (decrease) in net assets resulting from operations | | | 4,135,931 | | | | | | | | (16,119,505 | ) |
| | | | | | | | | | | | |
Distributions to shareholders: | |
Total retained earnings: | | | | | | | | | | | | |
R5 Class | | | (1,266,660 | ) | | | | | | | (1,823,210 | ) |
Y Class | | | (4,232,877 | ) | | | | | | | (3,321,953 | ) |
Investor Class | | | (6,394,827 | ) | | | | | | | (7,892,846 | ) |
Advisor Class | | | (117,843 | ) | | | | | | | (149,432 | ) |
A Class | | | (1,592,314 | ) | | | | | | | (1,361,049 | ) |
C Class | | | (1,686,923 | ) | | | | | | | (1,993,250 | ) |
| | | | | | | | | | | | |
Net distributions to shareholders | | | (15,291,444 | ) | | | | | | | (16,541,740 | ) |
| | | | | | | | | | | | |
| | | |
Capital share transactions (Note 11): | | | | | | | | | | | | |
Proceeds from sales of shares | | | 35,647,313 | | | | | | | | 29,778,307 | |
Reinvestment of dividends and distributions | | | 13,509,118 | | | | | | | | 15,879,719 | |
Cost of shares redeemed | | | (59,755,583 | ) | | | | | | | (73,095,956 | ) |
| | | | | | | | | | | | |
Net (decrease) in net assets from capital share transactions | | | (10,599,152 | ) | | | | | | | (27,437,930 | ) |
| | | | | | | | | | | | |
Net (decrease) in net assets | | | (21,754,665 | ) | | | | | | | (60,099,175 | ) |
| | | | | | | | | | | | |
Net assets: | | | | | | | | | | | | |
Beginning of year | | | 128,479,264 | | | | | | | | 188,578,439 | |
| | | | | | | | | | | | |
End of year | | $ | 106,724,599 | | | | | | | $ | 128,479,264 | |
| | | | | | | | | | | | |
See accompanying notes
27
American Beacon Balanced FundSM
Notes to Financial Statements
October 31, 2023
1. Organization and Significant Accounting Policies
American Beacon Funds (the “Trust”) is organized as a Massachusetts business trust. The Fund, a series within the Trust, is registered under the Investment Company Act of 1940, as amended (the “Act”), as a diversified, open-end management investment company. As of October 31, 2023, the Trust consists of twenty-four active series, one of which is presented in this filing: American Beacon Balanced Fund (the “Fund”). The remaining twenty-three active series are reported in separate filings.
American Beacon Advisors, Inc. (the “Manager”) is a Delaware corporation and a wholly-owned subsidiary of Resolute Investment Managers, Inc. (“RIM”) organized in 1986 to provide business management, advisory, administrative, and asset management consulting services to the Trust and other investors. The Manager is registered as an investment advisor under the Investment Advisers Act of 1940, as amended (the “Advisers Act”). RIM is, in turn, a wholly-owned subsidiary of Resolute Acquisition, Inc., which is a wholly-owned subsidiary of Resolute Topco, Inc., a wholly-owned subsidiary of Resolute Investment Holdings, LLC (“RIH”). RIH is owned primarily by Kelso Investment Associates VIII, L.P., KEP VI, LLC and Estancia Capital Partners L.P., investment funds affiliated with Kelso & Company, L.P. (“Kelso”) or Estancia Capital Management, LLC (“Estancia”), which are private equity firms.
On July 11, 2023, (i) RIH, RIM and certain of their affiliates, and (ii) the current owners of approximately 93% of RIH (the “Current Ownership Group”) entered into a transaction agreement with certain creditors of RIM (the “Lender Group”) pursuant to which (i) all equity interests in RIH would be cancelled, (ii) new equity interests would be issued to members of the Lender Group, and (iii) the existing credit agreements between RIM and the Lender Group would be terminated and a new credit agreement would be executed (“Transaction”). The Lender Group consists of various institutional investment funds (“New Ownership Group”) that are managed by financial institutions and other investment advisory firms.
Upon the closing of the Transaction, the Manager will be wholly-owned indirectly by the New Ownership Group, rather than the Current Ownership Group. The Transaction is expected to close in the fourth calendar quarter of 2023, subject to the satisfaction of certain closing conditions. The Transaction will result in a change of control of the Manager and the termination of the Fund’s management and investment advisory agreements (the “Current Management Agreement” and “Current Investment Advisory Agreement”, respectively). The Board has approved a new management agreement with the Manager (the “New Management Agreement”) and new investment advisory agreements among the Manager, the sub-advisor and the Trust, on behalf of the Fund (the “New Investment Advisory Agreement”) (collectively, the “Agreements”), that would become effective upon the closing of the Transaction. A special meeting of the shareholders of the Fund as of July 31, 2023, was held on October 27, 2023 to consider the Agreements. The shareholders of the Fund did not achieve a quorum in favor of the Agreements, therefore the meeting was adjourned to November 17, 2023. At the second meeting on November 17, 2023, a quorum was present for the Fund and the Agreements were approved by the shareholders. In advance of the meeting, proxy materials were sent to those shareholders regarding the New Management Agreement and any other matters proposed for shareholder approval. There are no anticipated changes in the services provided by the Manager or sub-advisors or in the fee rates charged by the Manager to a Fund. Please see the Results of Shareholder Meeting for more information.
Recently Adopted Accounting Pronouncements
In March 2020, the Financial Accounting Standards Board (“FASB”) issued Accounting Standards Update (“ASU”) No. 2020-04, Reference Rate Reform (Topic 848); Facilitation of the Effects of Reference Rate Reform on Financial Reporting, which provides optional guidance for a limited period of time to ease the potential burden in accounting for (or recognizing the effects of) reference rate reform. The guidance is applicable to contracts referencing London Inter-bank Offered Rate (“LIBOR”) or another reference rate that is expected to be discontinued due to reference rate reform. The ASU is effective as of March 12, 2020 and generally can be applied through December 31, 2022. In December 2022, the FASB issued ASU No. 2022-06 Reference Rate Reform (Topic 848): Deferral of the Sunset Date of Topic 848 which updates and clarifies ASU No. 2020-04. The amendments in this ASU defer the sunset date of Topic 848 from December 31, 2022, to December 31, 2024. Management expects these ASUs will not have a material impact on the Fund’s financial statements.
28
American Beacon Balanced FundSM
Notes to Financial Statements
October 31, 2023
In June 2022, the FASB issued ASU No. 2022-03, Fair Value Measurement (Topic 820); Fair Value Measurement of Equity Securities Subject to Contractual Sale Restrictions, which provides clarifying guidance that a contractual restriction on the sale of an equity security is not considered part of the unit of account of the equity security and, therefore, is not considered in measuring fair value. The ASU is effective for fiscal years beginning after December 15, 2023, and interim periods within those fiscal years. Management expects the ASU will not have a material impact on the Fund’s financial statements.
Class Disclosure
The Fund has multiple classes of shares designed to meet the needs of different groups of investors. The following table sets forth the differences amongst the classes:
| | | | | | |
Class | | Eligible Investors | | Minimum Initial
Investments | |
| R5 Class | | Large institutional investors - sold directly or through intermediary channels. | | $ | 250,000 | |
| | |
| Y Class | | Large institutional retirement plan investors - sold directly or through intermediary channels. | | $ | 100,000 | |
| | |
| Investor Class | | All investors using intermediary organizations, such as broker-dealers or retirement plan sponsors. | | $ | 2,500 | |
| | |
| Advisor Class | | All investors who invest through intermediary organizations, such as broker-dealers or third party administrators. | | $ | 2,500 | |
| | |
| A Class | | All investors who invest through intermediary organizations, such as broker-dealers or third party administrator. Retail investors who invest directly through a financial intermediary such as a broker, bank, or registered investment advisor which may include a front-end sales charge and a contingent deferred sales charge (“CDSC”). | | $ | 2,500 | |
| | |
| C Class | | Retail investors who invest directly through a financial intermediary such as a broker or through employee directed benefit plans with applicable sales charges which may include CDSC. | | $ | 1,000 | |
Each class offered by the Trust has equal rights as to assets and voting privileges. Income and non-class specific expenses are allocated daily to each class based on the relative net assets. Realized and unrealized capital gains and losses of each class are allocated daily based on the relative net assets of each class of the respective Fund. Class specific expenses, where applicable, currently include service, distribution, transfer agent fees, and sub-transfer agent fees that vary amongst the classes as described more fully in Note 2.
Significant Accounting Policies
The following is a summary of significant accounting policies, consistently followed by the Fund in preparation of the financial statements. The Fund is considered an investment company and accordingly, follows the investment company accounting and reporting guidance of the FASB Accounting Standards Codification Topic 946, Financial Services – Investment Companies, a part of Generally Accepted Accounting Principles (“U.S. GAAP”).
Security Transactions and Investment Income
Security transactions are recorded as of the trade date for financial reporting purposes. Securities purchased or sold on a when-issued or delayed-delivery basis may be settled beyond a standard settlement period for the security after the trade date.
Dividend income, net of foreign taxes, is recorded on the ex-dividend date, except certain dividends from foreign securities which are recorded as soon as the information is available to the Fund. Tax reclaim accruals are automatically generated on accounting and custody systems at the time of the income event based on the tax databases maintained by the Fund’s custodian. Reconciliations are performed between custody and accounting systems to help ensure reclaim accruals are in line. Interest income, net of foreign taxes, is earned from
29
American Beacon Balanced FundSM
Notes to Financial Statements
October 31, 2023
settlement date, recorded on the accrual basis, and adjusted, if necessary, for accretion of discounts and amortization of premiums. For convertible securities, premiums attributable to the conversion feature are not amortized. Realized gains (losses) from securities sold are determined on the basis of specific lot identification. Estimated tax liabilities on certain foreign securities are recorded on an accrual basis and are reflected as components of interest income or net change in unrealized appreciation (depreciation) on investments on the Statement of Operations, as appropriate. Tax liabilities realized as a result of such security sales are reflected as a component of net realized gain (loss) on investments on the Statement of Operations. Paydown gains (losses) on mortgage-related and other asset-backed securities, if any, are recorded as components of interest income on the Statement of Operations. Income or short-term capital gain distributions received from registered investment companies, if any, are recorded as dividend income. Long-term gain distributions received from registered investment companies, if any, are recorded as realized gains.
Debt obligations may be placed on a non-accrual status and related interest income may be reduced by ceasing current accruals and writing off interest receivable when the collection of all or a portion of interest has become doubtful based on consistently applied procedures. A debt obligation is removed for non-accrual when the issuer resumes interest payments or when collectability of interest is probable. Realized gains (losses) from securities sold are determined on the basis of specific lot identification.
Distributions to Shareholders
The Fund distributes most or all of its net earnings and realized gains, if any, each taxable year in the form of dividends from net investment income on a quarterly basis and distributions of realized net capital gains and net gains or losses from foreign currency transactions on an annual basis. The Fund does not have a fixed dividend rate and does not guarantee that it will pay any distributions in any particular period. Dividends to shareholders are determined in accordance with federal income tax regulations, which may differ in amount and character from net investment income and realized gains recognized for purposes of U.S. GAAP. To the extent necessary to fully distribute capital gains, the Fund may designate earnings and profits distributed to shareholders on the redemption of shares.
Commission Recapture
The Fund has established brokerage commission recapture arrangements with certain brokers or dealers. If the Fund’s investment advisor chooses to execute a transaction through a participating broker, the broker rebates a portion of the commission back to the Fund. Any collateral benefit received through participation in the commission recapture program is directed exclusively to the Fund. This amount is reported with the net realized gain (loss) in the Fund’s Statement of Operations, if applicable.
Allocation of Income, Trust Expenses, Gains, and Losses
Investment income and realized and unrealized gains and losses from investments of the Fund are allocated daily to each class of shares based upon the relative proportion of net assets of each class to the total net assets of the Fund. Expenses directly charged or attributable to the Fund will be paid from the assets of the Fund. Generally, expenses of the Trust will be allocated among and charged to the assets of the Fund on a basis that the Trust’s Board of Trustees (the “Board”) deems fair and equitable, which may be based on the relative net assets of the Fund or nature of the services performed and relative applicability to the Fund.
Use of Estimates
The preparation of financial statements in conformity with U.S. GAAP requires management to make estimates and assumptions that affect the amounts reported in the financial statements and accompanying notes. Actual results may differ from those estimated.
30
American Beacon Balanced FundSM
Notes to Financial Statements
October 31, 2023
Other
Under the Trust’s organizational documents, its officers and trustees are indemnified against certain liabilities arising out of the performance of their duties to the Trust. In the normal course of business, the Trust enters into contracts that provide indemnification to the other party or parties against potential costs or liabilities. The Trust’s maximum exposure under these arrangements is dependent on claims that may be made in the future and, therefore, cannot be estimated. The Trust has had no prior claims or losses pursuant to any such agreement.
2. Transactions with Affiliates
Management and Investment Sub-Advisory Agreements
The Fund and the Manager are parties to a Management Agreement that obligates the Manager to provide the Fund with investment advisory and administrative services. As compensation for performing the duties under the Management Agreement, the Manager will receive an annualized management fee based on a percentage of the Fund’s average daily net assets that is calculated and accrued daily according to the following schedule:
| | | | |
First $15 billion | | | 0.35 | % |
Next $15 billion | | | 0.325 | % |
Over $30 billion | | | 0.30 | % |
The Manager also receives a fee of 0.15% of the average daily net assets of the Fund as compensation for the management of a portion of the Fund’s assets.
The Trust, on behalf of the Fund, and the Manager have entered into Investment Advisory Agreements with Barrow, Hanley, Mewhinney & Strauss, LLC and Hotchkis and Wiley Capital Management, LLC (the “Sub-Advisors”) pursuant to which the Fund has agreed to pay an annualized sub-advisory fee that is calculated and accrued daily based on the Fund’s average daily net assets.
The Management and Sub-Advisory Fees paid by the Fund for the year ended October 31, 2023 were as follows:
| | | | | | | | | | | | |
| | | Effective Fee Rate | | | | | | Amount of Fees Paid | |
Management Fees | | | 0.35 | % | | | | | | $ | 466,356 | |
Sub-Advisory Fees | | | 0.17 | % | | | | | | | 206,610 | |
| | | | | | | | | | | | |
Total | | | 0.52 | % | | | | | | $ | 672,966 | |
| | | | | | | | | | | | |
As compensation for services provided by the Manager in connection with securities lending activities conducted by a Fund, the lending Fund pays to the Manager, with respect to cash collateral posted by borrowers, a fee of 10% of the net monthly investment income (the income earned in the form of interest, dividends and realized capital gains from the investment of cash collateral, plus any negative rebate fees paid by borrowers, less the rebate amount paid to borrowers as well as related expenses) and, with respect to collateral other than cash, a fee up to 10% of loan fees and demand premiums paid by borrowers. These fees are included in “Income derived from securities lending” and “Management and sub-advisory fees” on the Statement of Operations. During the year ended October 31, 2023, the Manager received securities lending fees of $426 for the securities lending activities of the Fund.
Distribution Plans
Separate Distribution Plans (the “Distribution Plans”) have been adopted pursuant to Rule 12b-1 under the Act for the Advisor, A and C Classes of the Fund. Under the Distribution Plans, as compensation for distribution and
31
American Beacon Balanced FundSM
Notes to Financial Statements
October 31, 2023
shareholder servicing assistance, the Manager receives an annual fee of 0.25% of the average daily net assets of the Advisor and A Classes and 1.00% of the average daily net assets of the C Class. The fee will be payable without regard to whether the amount of the fee is more or less than the actual expenses incurred in a particular month by the Manager for distribution assistance.
Service Plans
The Manager and the Trust entered into a Service Plan that obligates the Manager to oversee additional shareholder servicing of the Investor, Advisor, A, and C Classes of the Fund. As compensation for performing the duties required under the Service Plan, the Manager receives an annualized fee up to 0.25% of the average daily net assets of the A and C Classes, up to 0.25% of the average daily net assets of the Advisor Class, and up to 0.375% of the average daily net assets of the Investor Class of the Fund.
Sub-Transfer Agent Fees
The Manager has entered into agreements, which include servicing agreements, with financial intermediaries that provide recordkeeping, processing, shareholder communications and other services to customers of the intermediaries that hold positions in the R5 and Y Classes of the Fund and has agreed to compensate the intermediaries for providing these services. Intermediaries transact with the Fund primarily through the use of omnibus accounts on behalf of its customers who hold positions in the Fund. Certain services would have been provided by the Fund’s transfer agent and other service providers if the shareholders’ accounts were maintained directly by the Fund’s transfer agent. Accordingly, the Fund, pursuant to Board approval, has agreed to reimburse the Manager for certain non-distribution shareholder services provided by financial intermediaries for the R5 and Y Classes. The reimbursement amounts (sub-transfer agent fees) paid to the Manager are subject to a fee limit of up to 0.10% of an intermediary’s average net assets in the R5 and Y Classes on an annual basis. During the year ended October 31, 2023, the sub-transfer agent fees, as reflected in “Transfer agent fees” on the Statement of Operations, were as follows:
| | | | |
Fund | | Sub-Transfer Agent Fees | |
Balanced | | $ | 39,743 | |
As of October 31, 2023, the Fund owed the Manager the following reimbursement of sub-transfer agent fees, as reflected in “Transfer agent fees payable” on the Statement of Assets and Liabilities:
| | | | |
Fund | | Reimbursement
Sub-Transfer Agent Fees | |
Balanced | | $ | 4,032 | |
Investments in Affiliated Funds
The Fund may invest in the American Beacon U.S. Government Money Market Select Fund (the “USG Select Fund”). Cash collateral received by the Fund in connection with securities lending may also be invested in the USG Select Fund. The Fund listed below held the following shares with an October 31, 2023 fair value and dividend income earned from the investment in the USG Select Fund.
| | | | | | | | | | | | | | | | | | | | | | | | | | | | | | | | | | | | | | | | | | | | | | | | | | |
Affiliated Security | | Type of
Transaction | | | | | Fund | | | | | | October 31,
2023
Shares/Principal | | | | | | Change in
Unrealized
Gain (Loss) | | | | | | Realized
Gain
(Loss) | | | | | | Dividend
Income | | | | | | October 31,
2023
Fair Value | |
| U.S. Government Money Market Select | | Direct | | | | | | | Balanced | | | | | | | $ | 2,210,473 | | | | | | | $ | - | | | | | | | $ | - | | | | | | | $ | 186,823 | | | | | | | $ | 2,210,473 | |
| U.S. Government Money Market Select | | Securities Lending | | | | | | | Balanced | | | | | | | | 870,903 | | | | | | | | - | | | | | | | | - | | | | | | | | N/A | | | | | | | | 870,903 | |
32
American Beacon Balanced FundSM
Notes to Financial Statements
October 31, 2023
The Fund and the USG Select Fund have the same investment advisor and therefore, are considered to be affiliated. The Manager serves as investment advisor to the USG Select Fund and receives management fees and administrative fees totaling 0.10% of the average daily net assets of the USG Select Fund. During the year ended October 31, 2023, the Manager earned fees on the Fund’s direct investments and securities lending collateral investments in the USG Select Fund as shown below:
| | | | | | | | | | | | |
Fund | | Direct Investments in
USG Select Fund | | | Securities Lending
Collateral
Investments in USG
Select Fund | | | Total | |
Balanced | | $ | 4,182 | | | $ | 515 | | | $ | 4,697 | |
Interfund Credit Facility
Pursuant to an exemptive order issued by the U.S. Securities and Exchange Commission (“SEC”), the Fund, along with other registered investment companies having management contracts with the Manager, may participate in a credit facility whereby each fund, under certain conditions, is permitted to lend money directly to and borrow directly from other participating funds for temporary purposes. The interfund credit facility is advantageous to the funds because it provides added liquidity and eliminates the need to maintain higher cash balances to meet redemptions. This situation could arise when shareholder redemptions exceed anticipated volumes and certain funds have insufficient cash on hand to satisfy such redemptions or when sales of securities do not settle as expected, resulting in a cash shortfall for the fund. When the fund liquidates portfolio securities to meet redemption requests, they often do not receive payment in settlement for up to two days (or longer for certain foreign transactions). Redemption requests normally are satisfied on the next business day. The credit facility provides a source of immediate, short-term liquidity pending settlement of the sale of portfolio securities. The credit facility is administered by a credit facility team consisting of professionals from the Manager’s asset management, compliance, and accounting areas who report the activities of the credit facility to the Board. During the year ended October 31, 2023, the Fund borrowed on average $9,781,966 for 2 days at an average interest rate of 5.89% with interest charges of $3,157. These amounts are recorded as “Other expenses” in the Statement of Operations. These amounts are recorded as “Other expenses” in the Statement of Operations.
Expense Reimbursement Plan
The Fund has adopted an Expense Reimbursement Plan whereby the Manager may seek repayment of contractual or voluntary fee reductions and expense reimbursements. Under the policy, the Manager can be reimbursed by the Fund for any contractual or voluntary fee reductions or expense reimbursements if reimbursement to the Manager (a) occurs within three years from the date of the Manager’s waiver/reimbursement and (b) does not cause the Fund’s annual operating expenses to exceed the lesser of the contractual percentage limit in effect at the time of the waiver/reimbursement or time of recoupment. During the year ended October 31, 2023 there were no waived fees, expenses reimbursed, or recouped expenses, and no commitment or contingent liability is expected.
Sales Commissions
The Fund’s Distributor, Resolute Investment Distributors, Inc. (“RID” or “Distributor”), may receive a portion of A Class sales charges from broker dealers which may be used to offset distribution related expenses. During the year ended October 31, 2023, RID collected $2,044 from the sale of A Class Shares of the Fund.
A CDSC of 0.50% will be deducted with respect to A Class Shares on certain purchases of $1,000,000 or more that are redeemed in whole or part within 18 months of purchase, unless waived as discussed in the Fund’s Prospectus. Any applicable CDSC will be 0.50% of the lesser of the original purchase price or the value of the redemption of the A Class Shares redeemed. During the year ended October 31, 2023, there were no CDSC fees collected for the A Class Shares of the Fund.
33
American Beacon Balanced FundSM
Notes to Financial Statements
October 31, 2023
A CDSC of 1.00% will be deducted with respect to C Class Shares redeemed within 12 months of purchase, unless waived as discussed in the Fund’s Prospectus. Any applicable CDSC will be 1.00% of the lesser of the original purchase price or the value of the redemption of the C Class Shares redeemed. During the year ended October 31, 2023, CDSC fees of $947 were collected for C Class Shares of the Fund.
Trustee Fees and Expenses
As compensation for their service to the American Beacon Funds Complex, including the Trust (collectively, the “Trusts”), each Trustee is compensated from the Trusts as follows: (1) an annual retainer of $130,000; (2) meeting attendance fee (for attendance in-person or via teleconference) of (a) $12,000 for in person attendance, or $5,000 for telephonic attendance, by Board members for each regularly scheduled or special Board meeting, (b) $2,500 for attendance by Committee members at meetings of the Audit and Compliance Committee and the Investment Committee, (c) $1,000 for attendance by Committee members at meetings of the Nominating and Governance Committee; and (d) $2,500 for attendance by Board members for each special telephonic Board meeting; and (3) reimbursement of reasonable expenses incurred in attending Board meetings, Committee meetings, and relevant educational seminars. For this purpose, the Board considers attendance at regular meetings held by video conference to constitute in-person attendance at a Board meeting. The Trustees also may be compensated for attendance at special Board and/or Committee meetings from time to time. For her service as Board Chair, Ms. Cline receives an additional annual retainer of $50,000. Although she attends several committee meetings at each quarterly Board meeting, she receives only a single $2,500 fee each quarter for her attendance at those meetings. The chairpersons of the Audit and Compliance Committee and the Investment Committee each receive an additional annual retainer of $25,000 and the Chair of the Nominating and Governance Committee receives an additional annual retainer of $10,000.
3. Security Valuation and Fair Value Measurements
The price of the Fund’s shares is based on its net asset value (“NAV”) per share. The Fund’s NAV is computed by adding total assets, subtracting all the Fund’s liabilities, and dividing the result by the total number of shares outstanding.
The NAV of each class of the Fund’s shares is determined based on a pro rata allocation of the Fund’s investment income, expenses and total capital gains and losses. The Fund’s NAV per share is determined each business day as of the regular close of trading on the New York Stock Exchange (“NYSE” or “Exchange”), which is typically 4:00 p.m. Eastern Time (“ET”). However, if trading on the NYSE closes at a time other than 4:00 p.m. ET, the Fund’s NAV per share typically would still be determined as of the regular close of trading on the NYSE. The Fund does not price its shares on days that the NYSE is closed. Foreign exchanges may permit trading in foreign securities on days when the Fund is not open for business, which may result in the value of the Fund’s portfolio investments being affected at a time when you are unable to buy or sell shares.
Equity securities, including shares of closed-end funds and exchange-traded funds (“ETFs”), are valued at the last sale price or official closing price taken from the primary exchange in which each security trades. Investments in other mutual funds are valued at the closing NAV per share on the day of valuation. Debt securities are valued at bid quotes from broker/dealers or evaluated bid prices from pricing services, who may consider a number of inputs and factors, such as prices of comparable securities, yield curves, spreads, credit ratings, coupon rates, maturity, default rates, and underlying collateral. Futures are valued based on their daily settlement prices. Exchange-traded and over-the-counter (“OTC”) options are valued at the last sale price. Options with no last sale for the day are priced at mid quote. Swaps are valued at evaluated mid prices from pricing services.
The valuation of securities traded on foreign markets and certain fixed-income securities will generally be based on prices determined as of the earlier closing time of the markets on which they primarily trade unless a significant event has occurred. When the Fund holds securities or other assets that are denominated in a foreign currency, the Fund will normally use the currency exchange rates as of 4:00 p.m. ET.
34
American Beacon Balanced FundSM
Notes to Financial Statements
October 31, 2023
Rule 2a-5 under the Investment Company Act (the “Valuation Rule”) establishes requirements for determining fair value in good faith for purposes of the Investment Company Act, including related oversight and reporting requirements. The Valuation Rule also defines when market quotations are “readily available,” which is the threshold for determining whether a Fund must fair value a security. Among other things, the Valuation Rule permits the Board to designate the Manager as Valuation Designee to perform the Fund’s fair value determinations subject to board oversight and certain reporting and other requirements intended to ensure that the Board receives the information it needs to oversee the Manager’s fair value determinations.
Securities may be valued at fair value, as determined in good faith and pursuant to the Manager’s procedures, under certain limited circumstances. For example, fair value pricing will be used for fixed-income securities and when market quotations are not readily available or reliable, as determined by the Manager, such as when (i) trading for a security is restricted or stopped; (ii) a security’s trading market is closed (other than customary closings); or (iii) a security has been de-listed from a national exchange. A security with limited market liquidity may require fair value pricing if the Manager determines that the available price does not reflect the security’s true market value. In addition, if a significant event that the Manager determines to affect the value of one or more securities held by the Fund occurs after the close of a related exchange but before the determination of the Fund’s NAV, fair value pricing may be used on the affected security or securities. Securities of small-capitalization companies are also more likely to require a fair value determination using these procedures because they are more thinly traded and less liquid than the securities of larger-capitalization companies. The Fund may fair value securities as a result of significant events occurring after the close of the foreign markets in which the Fund invests as described below. In addition, the Fund may invest in illiquid securities requiring these procedures.
The Fund may use fair value pricing for securities primarily traded in non-U.S. markets because most foreign markets close well before the Fund’s pricing time of 4:00 p.m. ET. The earlier close of these foreign markets gives rise to the possibility that significant events, including broad market moves, may have occurred in the interim and may materially affect the value of those securities. If the Manager determines that the last quoted prices of non-U.S. securities will, in its judgment, materially affect the value of some or all the Fund’s portfolio securities, the Manager can adjust the previous closing prices to reflect what it believes to be the fair value of the securities as of the close of the Exchange. In deciding whether it is necessary to adjust closing prices to reflect fair value, the Manager reviews a variety of factors, including developments in foreign markets, the performance of U.S. securities markets, and the performance of instruments trading in U.S. markets that represent foreign securities and baskets of foreign securities. These securities are fair valued using a pricing service, using methods approved by the Manager, that considers the correlation of the trading patterns of the foreign security to intraday trading in the U.S. markets, based on indices of domestic securities and other appropriate indicators such as prices of relevant American Depositary Receipts (“ADRs”) and futures contracts. The Manager’s Valuation Committee may also fair value securities in other situations, such as when a particular foreign market is closed but the Fund is open. The Fund uses outside pricing services to provide closing prices and information to evaluate and/or adjust those prices. As a means of evaluating its security valuation process, the Valuation Committee routinely compares closing prices, the next day’s opening prices in the same markets and adjusted prices.
Attempts to determine the fair value of securities introduce an element of subjectivity to the pricing of securities. As a result, the price of a security determined through fair valuation techniques may differ from the price quoted or published by other sources and may not accurately reflect the market value of the security when trading resumes. If a reliable market quotation becomes available for a security formerly valued through fair valuation techniques, the Manager compares the new market quotation to the fair value price to evaluate the effectiveness of the Fund’s fair valuation procedures. If any significant discrepancies are found, the Manager may adjust Manager’s fair valuation procedures for the Fund.
35
American Beacon Balanced FundSM
Notes to Financial Statements
October 31, 2023
Valuation Inputs
Various inputs may be used to determine the fair value of the Fund’s investments. These inputs are summarized in three broad levels for financial statement purposes. The inputs or methodologies used to value securities are not necessarily an indication of the risk associated with investing in those securities.
| | | | |
| Level 1 | | - | | Quoted prices in active markets for identical securities. |
| | |
| Level 2 | | - | | Prices determined using other significant observable inputs. These may include quoted prices for similar securities, interest rates, prepayment speeds, credit risk, and others. |
| | |
| Level 3 | | - | | Prices determined using other significant unobservable inputs. Unobservable inputs reflect the Fund’s own assumptions about the factors market participants would use in pricing an investment. |
Level 1 and Level 2 trading assets and trading liabilities, at fair value
Common stocks, preferred securities and financial derivative instruments, such as futures contracts that are traded on a national securities exchange, are stated at the last reported sale or settlement price on the day of valuation. To the extent these securities are actively traded and valuation adjustments are not applied, they are categorized as Level 1 of the fair value hierarchy. Preferred securities and other equities traded on inactive markets or valued by reference to similar instruments are generally categorized as Level 2 of the fair value hierarchy.
With respect to the Fund’s investments that do not have readily available market quotations, the Board has designated the Adviser as its valuation designee to perform fair valuations pursuant to Rule 2a-5 under the Act (the “Valuation Designee”). If market prices are not readily available or are deemed unreliable, the Valuation Designee will use the fair value of the security or other instrument as determined in good faith under policies and procedures established by the Manager and under the oversight of the Board (“Valuation Procedures”). Market prices are considered not readily available where there is an absence of current or reliable market-based data (e.g., trade information or broker quotes), including where events occur after the close of the relevant market, but prior to the NYSE Close, that materially affect the values of the Fund’s portfolio holdings or assets. In addition, market prices are considered not readily available when, due to extraordinary circumstances, the exchanges or markets on which the securities or other instruments trade do not open for trading for the entire day and no other market prices are available. Fair value pricing is subjective in nature and the use of fair value pricing by the Valuation Designee may cause the NAV of the Fund’s shares to differ significantly from the NAV that would have been calculated using market prices at the close of the exchange on which a portfolio holding is primarily traded. There can be no assurance that the Fund could obtain the fair value assigned to an investment if the Fund were to sell the investment at approximately the time at which the Fund determines its NAV.
Fixed-income securities including corporate, convertible and municipal bonds and notes, U.S. government agencies, U.S. Treasury obligations, sovereign issues, bank loans, convertible preferred securities, and non-U.S. bonds are normally valued by pricing service providers that use broker dealer quotations, reported trades or valuation estimates from their internal pricing models. The service providers’ internal models use inputs that are observable such as issuer details, interest rates, yield curves, prepayment speeds, credit risks/spreads, default rates, and quoted prices for similar assets. Securities that use similar valuation techniques and inputs as described above are categorized as Level 2 of the fair value hierarchy. Fixed-income securities purchased on a delayed-delivery basis are marked-to-market daily until settlement at the forward settlement date and are categorized as Level 2 of the fair value hierarchy.
Mortgage-related and asset-backed securities (“ABS”) are usually issued as separate tranches, or classes, of securities within each deal. These securities are also normally valued by pricing service providers that use broker-dealer quotations or valuation estimates from their internal pricing models. The pricing models for these securities usually consider tranche-level attributes, current market data, estimated cash flows, and market-based yield spreads for each tranche, and incorporates deal collateral performance, as available. Mortgage-related and ABS that use similar valuation techniques and inputs as described above are categorized as Level 2 of the fair value hierarchy.
36
American Beacon Balanced FundSM
Notes to Financial Statements
October 31, 2023
Investments in registered open-end investment management companies will be valued based upon the NAVs of such investments and are categorized as Level 1 of the fair value hierarchy.
4. Securities and Other Investments
Agency Mortgage-Backed Securities
Certain mortgage-backed securities (“MBS”) may be issued or guaranteed by the U.S. government or a government sponsored entity, such as the Federal National Mortgage Association (“Fannie Mae”) or the Federal Home Loan Mortgage Corporation (“Freddie Mac”). Although these instruments may be guaranteed by the U.S. government or a government sponsored entity, many such MBS are not backed by the full faith and credit of the United States and are still exposed to the risk of non-payment.
American Depositary Receipts and Non-Voting Depositary Receipts
ADRs are depositary receipts for foreign issuers in registered form traded in U.S. securities markets. Non-Voting Depositary Receipts (“NVDRs”) represent financial interests in an issuer but the holder is not entitled to any voting rights. Depositary receipts may not be denominated in the same currency as the securities into which they may be converted. Investing in depositary receipts entails substantially the same risks as direct investment in foreign securities. There is generally less publicly available information about foreign companies and there may be less governmental regulation and supervision of foreign stock exchanges, brokers, and listed companies. In addition, such companies may use different accounting and financial standards (and certain currencies may become unavailable for transfer from a foreign currency), resulting in the Fund’s possible inability to convert immediately into U.S. currency proceeds realized upon the sale of portfolio securities of the affected foreign companies. In addition, the Fund may invest in unsponsored depositary receipts, the issuers of which are not obligated to disclose material information about the underlying securities to investors in the United States. Ownership of unsponsored depositary receipts may not entitle the Fund to the same benefits and rights as ownership of a sponsored depositary receipt or the underlying security.
Asset-Backed Securities (“ABS”)
ABS are securities issued by trusts and special purpose entities that are backed by pools of assets, such as automobile and credit-card receivables, home equity loans, and student loans, which pass through the payments on the underlying obligations to the security holders (less servicing fees paid to the originator or fees for any credit enhancement). Typically, loans or accounts receivable paper are transferred from the originator to a specially created trust, which repackages the trust’s interests as securities with a minimum denomination and a specific term. The securities are then privately placed or publicly offered. Examples include certificates for automobile receivables and so-called plastic bonds, backed by credit card receivables. The Fund is permitted to invest in ABS, subject to the Fund’s rating and quality requirements.
The value of an ABS is affected by, among other things, changes in the market’s perception of the asset backing the security, the creditworthiness of the servicing agent for the loan pool, the originator of the loans and the financial institution providing any credit enhancement. Payments of principal and interest passed through to holders of ABS are frequently supported by some form of credit enhancement, such as a letter of credit, surety bond, limited guarantee by another entity or by having a priority to certain of the borrower’s other assets. The degree of credit enhancement varies, and generally applies to only a portion of the ABS’s par value. Value is also affected if any credit enhancement has been exhausted.
Common Stock
Common stock generally takes the form of shares in a corporation which represent an ownership interest. It ranks below preferred stock and debt securities in claims for dividends and for assets of the company in a liquidation or bankruptcy. The value of a company’s common stock may fall as a result of factors directly relating
37
American Beacon Balanced FundSM
Notes to Financial Statements
October 31, 2023
to that company, such as decisions made by its management or decreased demand for the company’s products or services. A stock’s value may also decline because of factors affecting not just the company, but also companies in the same industry or sector. The price of a company’s stock may also be affected by changes in financial markets that are relatively unrelated to the company, such as changes in interest rates, currency exchange rates or industry regulation. Companies that elect to pay dividends on their common stock generally only do so after they invest in their own business and make required payments to bondholders and on other debt and preferred stock. Therefore, the value of a company’s common stock will usually be more volatile than its bonds, other debt and preferred stock. Common stock may be exchange-traded or OTC. OTC stock may be less liquid than exchange-traded stock.
Fixed-Income Investments
The Fund may hold debt, including government and corporate debt, and other fixed-income securities. Typically, the values of fixed-income securities change inversely with prevailing interest rates. Therefore, a fundamental risk of fixed-income securities is interest rate risk, which is the risk that their value will generally decline as prevailing interest rates rise, which may cause the Fund’s NAV to likewise decrease, and vice versa. How specific fixed-income securities may react to changes in interest rates will depend on the specific characteristics of each security. For example, while securities with longer maturities tend to produce higher yields, they also tend to be more sensitive to changes in prevailing interest rates and are, therefore, more volatile than shorter-term securities and are subject to greater market fluctuations as a result of changes in interest rates. Fixed-income securities are also subject to credit risk, which is the risk that the credit strength of an issuer of a fixed-income security will weaken and/or that the issuer will be unable to make timely principal and interest payments and that the security may go into default. In addition, there is prepayment risk, which is the risk that during periods of falling interest rates, certain fixed-income securities with higher interest rates, such as MBS and ABS, may be prepaid by their issuers thereby reducing the amount of interest payments. This may result in the Fund having to reinvest its proceeds in lower yielding securities. Securities underlying MBS and ABS, which may include subprime mortgages, also may be subject to a higher degree of credit risk, valuation risk, and liquidity risk.
Illiquid and Restricted Securities
Generally, an illiquid asset is an asset that the Fund reasonably expects cannot be sold or disposed of in current market conditions in seven calendar days or less without the sale or disposition significantly changing the market value of the investment, as determined pursuant to Rule 22e-4 under the Act or as otherwise permitted or required by SEC rules and interpretations. Historically, illiquid securities have included securities that have not been registered under the Securities Act, securities that are otherwise not readily marketable, and repurchase agreements having a remaining maturity of longer than seven calendar days. Securities that have not been registered under the Securities Act are referred to as private placements or restricted securities and are purchased directly from the issuer or in the secondary market. These securities may be sold only in a privately negotiated transaction or pursuant to an exemption from registration. A large institutional market exists for certain securities that are not registered under the Securities Act, including repurchase agreements, commercial paper, foreign securities, municipal securities and corporate bonds and notes. Institutional investors depend on an efficient institutional market in which the unregistered security can be readily resold or on an issuer’s ability to honor a demand for repayment. However, the fact that there are contractual or legal restrictions on resale of such investments to the general public or to certain institutions may not be indicative of their liquidity.
Limitations on resale may have an adverse effect on the marketability of portfolio securities, and the Fund might be unable to dispose of restricted or other illiquid securities promptly or at reasonable prices and might thereby experience difficulty satisfying redemptions within seven calendar days. In addition, the Fund may get only limited information about an issuer, so it may be less able to predict a loss. The Fund also might have to register such restricted securities in order to dispose of them resulting in additional expense and delay. Adverse market conditions could impede such a public offering of securities.
In recognition of the increased size and liquidity of the institutional market for unregistered securities and the importance of institutional investors in the formation of capital, the SEC adopted Rule 144A under the
38
American Beacon Balanced FundSM
Notes to Financial Statements
October 31, 2023
Securities Act. Rule 144A is designed to facilitate efficient trading among institutional investors by permitting the sale of certain unregistered securities to qualified institutional buyers. To the extent privately placed securities held by the Fund qualify under Rule 144A and an institutional market develops for those securities, the Fund likely will be able to dispose of the securities without registering them under the Securities Act. To the extent that institutional buyers become, for a time, uninterested in purchasing these securities, investing in Rule 144A securities could increase the level of the Fund’s illiquidity. The Manager or the Sub-Advisor, as applicable, may determine that certain securities qualified for trading under Rule 144A are liquid. Regulation S under the Securities Act permits the sale abroad of securities that are not registered for sale in the United States and includes a provision for U.S. investors, such as the Fund, to purchase such unregistered securities if certain conditions are met.
Securities sold in private placement offerings made in reliance on the “private placement” exemption from registration afforded by Section 4(a)(2) of the Securities Act and resold to qualified institutional buyers under Rule 144A under the Securities Act (“Section 4(a)(2) securities”) are restricted as to disposition under the federal securities laws, and generally are sold to institutional investors, such as the Fund, that agree they are purchasing the securities for investment and not with an intention to distribute to the public. Any resale by the purchaser must be pursuant to an exempt transaction and may be accomplished in accordance with Rule 144A. Section 4(a)(2) securities normally are resold to other institutional investors through or with the assistance of the issuer or dealers that make a market in the Section 4(a)(2) securities, thus providing liquidity. The Manager and the sub-advisor will carefully monitor the Fund’s investments in Section 4(a)(2) securities offered and sold under Rule 144A, focusing on such important factors, among others, as valuation, liquidity, and availability of information. Investments in Section 4(a)(2) securities could have the effect of reducing the Fund’s liquidity to the extent that qualified institutional buyers no longer wish to purchase these restricted securities.
Restricted securities outstanding during the year ended October 31, 2023 are disclosed in the Notes to the Schedule of Investments.
Mortgage-Backed Securities
MBS often have stated maturities of up to thirty years when they are issued, depending upon the length of the mortgages underlying the securities. In practice however, unscheduled or early payments of principal and interest on the underlying mortgages may make the securities’ effective maturity shorter than this, and the prevailing interest rates may be higher or lower than the current yield of the Fund’s portfolio at the time resulting in reinvestment risk.
Rising or high interest rates may result in slower than expected principal payments which may tend to extend the duration of MBS, making them more volatile and more sensitive to changes in interest rates. This is known as extension risk.
MBS may have less potential for capital appreciation than comparable fixed-income securities due to the likelihood of increased prepayments of mortgages resulting from foreclosures or declining interest rates. These foreclosed or refinanced mortgages are paid off at face value (par) or less, causing a loss, particularly for any investor who may have purchased the security at a premium or a price above par. In such an environment, this risk limits the potential price appreciation of these securities.
Mortgage-Related and Other Asset-Backed Securities
The Fund may invest in mortgage or other ABS. These securities may include mortgage instruments issued by U.S. government agencies (“agency mortgages”) or those issued by private entities (“non-agency mortgages”). Specific types of instruments may include mortgage pass-through securities, collateralized mortgage obligations (“CMOs”), commercial mortgage-backed securities, mortgage dollar rolls, CMO residuals, stripped mortgage-backed securities and other securities that directly or indirectly represent a participation in, or are secured by a payable from, mortgage loans on real property. The value of the Fund’s MBS may be affected by, among other things,
39
American Beacon Balanced FundSM
Notes to Financial Statements
October 31, 2023
changes or perceived changes in interest rates, factors concerning the interests in and structure of the issuer or the originator of the mortgage, or the quality of the underlying assets. The mortgages underlying the securities may default or decline in quality or value. Through its investments in MBS, the Fund has exposure to subprime loans, Alt-A loans and non-conforming loans as well as to the mortgage and credit markets generally. Underlying collateral related to subprime, Alt-A and non-conforming mortgage loans has become increasingly susceptible to defaults and declines in quality or value, especially in a declining residential real estate market. In addition, regulatory or tax changes may adversely affect the mortgage securities markets as a whole.
Other Investment Company Securities and Other Exchange-Traded Products
The Fund may invest in shares of other investment companies, including open-end funds, closed-end funds, business development companies (“BDCs”), ETFs, unit investment trusts, and other investment companies of the Trust. The Fund may invest in securities of an investment company advised by the Manager or the Sub-Advisor. Investments in the securities of other investment companies may involve duplication of advisory fees and certain other expenses. By investing in another investment company, the Fund becomes a shareholder of that investment company. As a result, the Fund’s shareholders indirectly will bear the Fund’s proportionate share of the fees and expenses paid by shareholders of the other investment company, in addition to the fees and expenses the Fund’s shareholders directly bear in connection with the Fund’s own operations. These other fees and expenses are reflected as Acquired Fund Fees and Expenses and are included in the Fees and Expenses Table for the Fund in its Prospectus, if applicable. Investments in other investment companies may involve the payment of substantial premiums above the value of such issuer’s portfolio securities.
Privately Issued Mortgage-Backed Securities
Pools created by non-governmental issuers generally offer a higher rate of interest than government and government-related pools because there are no direct or indirect government guarantees of payments in such pools. However, timely payment of interest and principal of these pools is often partially supported by various enhancements such as over-collateralization and senior/subordination structures and by various forms of insurance or guarantees, including individual loan, title, pool and hazard insurance. The insurance and guarantees are issued by government entities, private insurers or the mortgage poolers. Although the market for such securities is becoming increasingly liquid, securities issued by certain private organizations may not be readily marketable.
Publicly Traded Partnerships/Master Limited Partnerships (“MLPs”)
The Fund may invest in publicly traded partnerships such as MLPs. MLPs issue units that are registered with the SEC and are freely tradable on a securities exchange or in the OTC market. An MLP may have one or more general partners, who conduct the business, and one or more limited partners, who contribute capital. The general partner or partners are jointly and severally responsible for the liabilities of the MLP. (An MLP also may be an entity similar to a limited partnership, such as an LLC, which has one or more managers or managing members and non-managing members (who are like limited partners)). The Fund invests in an MLP as a limited partner and normally would not be liable for the debts of an MLP beyond the amount the Fund has invested therein, but it would not be shielded to the same extent that a shareholder of a corporation would be. In certain instances, creditors of an MLP would have the right to seek a return of capital that had been distributed to a limited partner. The right of an MLP’s creditors would continue even after the Fund had sold its investment in the partnership. MLPs typically invest in real estate and oil and gas equipment leasing assets, but they also finance entertainment, research and development, and other projects.
Real Estate Investment Trusts (“REITs”)
REITs are pooled investment vehicles that own, and often operate, income producing real estate or invest in mortgages secured by loans on such real estate or both. REITs are susceptible to the risks associated with direct ownership of real estate, such as declines in property values, increase in property taxes, operating expenses, rising
40
American Beacon Balanced FundSM
Notes to Financial Statements
October 31, 2023
interest rates or overbuilding, zoning changes, and losses from casualty or condemnation. REITs typically are subject to management fees and other expenses that are separate from those of the Fund.
U.S. Government Agency Securities
U.S. Government agency securities are issued or guaranteed by the U.S. Government or its agencies or instrumentalities. Some obligations issued by U.S. Government agencies and instrumentalities are supported by the full faith and credit of the U.S. Treasury; others by the right of the issuer to borrow from the U.S. Treasury; others by discretionary authority of the U.S. Government to purchase certain obligations of the agency or instrumentality; and others only by the credit of the agency or instrumentality. U.S. Government securities bear fixed, floating or variable rates of interest. While the U.S. Government currently provides financial support to certain U.S. Government-sponsored agencies or instrumentalities, no assurance can be given that it will always do so, since it is not so obligated by law. U.S. Government securities include U.S. Treasury bills, notes and bonds, Federal Home Loan Bank (“FHLB”) obligations, Federal Farm Credit Bank (“FFCB”) obligations, U.S. Government agency obligations and repurchase agreements secured thereby. U.S. Government agency securities are subject to credit risk and interest rate risk.
U.S. Treasury Obligations
U.S. Treasury obligations include bills (initial maturities of one year or less), notes (initial maturities between two and ten years), and bonds (initial maturities over ten years) issued by the U.S. Treasury, Separately Traded Registered Interest and Principal component parts of such obligations (known as “STRIPS”) and inflation-indexed securities. The prices of these securities (like all debt securities) change between issuance and maturity in response to fluctuating market interest rates. U.S. Treasury obligations are subject to credit risk and interest rate risk.
Variable or Floating Rate Obligations
The interest rates payable on certain fixed-income securities in which the Fund may invest are not fixed and may fluctuate based upon changes in market rates. A variable rate obligation has an interest rate which is adjusted at predesignated periods in response to changes in the market rate of interest on which the interest rate is based. Variable and floating rate obligations are less effective than fixed rate instruments at locking in a particular yield. Nevertheless, such obligations may fluctuate in value in response to interest rate changes if there is a delay between changes in market interest rates and the interest reset date for the obligation, or for other reasons.
5. Financial Derivative Instruments
The Fund may utilize derivative instruments to gain market exposure on cash balances or reduce market exposure in anticipation of liquidity needs. When considering the Fund’s use of derivatives, it is important to note that the Fund does not use derivatives for the purpose of creating financial leverage.
Futures Contracts
A futures contract is a contract to purchase or sell a particular security, or the cash value of an asset, such as securities, indices, or currencies, at a specified future date at a price agreed upon when the contract is made. Under many such contracts, no delivery of the actual underlying asset is required. Rather, upon the expiration of the contract, settlement is made by exchanging cash in an amount equal to the difference between the contract price and the closing price of the asset (e.g., a security or an index) at expiration, net of the initial and variation margin that was previously paid. An equity index futures contract is based on the value of an underlying index. The Fund may, from time to time, use futures positions to equitize cash and expose its portfolio to changes in securities prices or index prices. This can magnify gains and losses in the Fund. The Fund also may have to sell assets at inopportune times to satisfy its settlement or collateral obligations. The risks associated with the use of futures
41
American Beacon Balanced FundSM
Notes to Financial Statements
October 31, 2023
contracts also include that there may be an imperfect correlation between the changes in market value of the prices of futures contracts and the assets underlying such contracts and that there may not be a liquid secondary market for a futures contract.
During the year ended October 31, 2023, the Fund entered into futures contracts primarily for exposing cash to markets.
The Fund’s average futures contracts outstanding fluctuate throughout the operating year as required to meet strategic requirements. The following table illustrates the average quarterly volume of futures contracts. For the purpose of this disclosure, volume is measured by contracts outstanding at each quarter end.
| | | | |
Average Futures Contracts Outstanding | |
Fund | | Year Ended October 31, 2023 | |
Balanced | | | 17 | |
The following is a summary of the fair valuations of the Fund’s derivative instruments categorized by risk exposure(1):
| | | | | | | | | | | | | | | | | | | | | | | | | | | | | | | | | | | | | | | | | | | | | | | | | | | | | | | |
| Fair values of financial instruments on the Statement of Assets and Liabilities as of October 31, 2023: | |
| | | |
| | | Derivatives not accounted for as hedging instruments | | | | |
| | | | | | | | | | | |
Liabilities: | | Credit contracts | | | | Foreign exchange
contracts | | | | Commodity
contracts | | | | Interest rate
contracts | | | | Equity contracts | | | | Total |
| Payable for variation margin from open futures contracts(2) | | | $ | - | | | | | | | | | $ | - | | | | | | | | | $ | - | | | | | | | | | $ | - | | | | | | | | | $ | (72,786 | ) | | | | | | | | $ | (72,786 | ) |
| | | | | | | | | | | | | | | | | | | | | | | | | | | | | | | | | | | | | | | | | | | | | | | | | | | | | | | |
| The effect of financial derivative instruments on the Statement of Operations as of October 31, 2023: | |
| | | |
| | | Derivatives not accounted for as hedging instruments | | | | |
| | | | | | | | | | | |
Realized gain (loss) from derivatives
recognized as a result of operations | | Credit contracts | | | | Foreign exchange
contracts | | | | Commodity
contracts | | | | Interest rate
contracts | | | | Equity contracts | | | | Total |
| Futures contracts | | | $ | - | | | | | | | | | $ | - | | | | | | | | | $ | - | | | | | | | | | $ | - | | | | | | | | | $ | 993,078 | | | | | | | | | $ | 993,078 | |
| | | | | | | | | | | |
Net change in unrealized appreciation
(depreciation) of derivatives recognized
as a result from operations: | | Credit contracts | | | | Foreign exchange
contracts | | | | Commodity
contracts | | | | Interest rate
contracts | | | | Equity contracts | | | | Total |
| Futures contracts | | | $ | - | | | | | | | | | $ | - | | | | | | | | | $ | - | | | | | | | | | $ | - | | | | | | | | | $ | (224,628 | ) | | | | | | | | $ | (224,628 | ) |
(1) See Note 3 in the Notes to Financial Statements for additional information.
(2) Includes cumulative appreciation (depreciation) of futures contracts as reported in the Fund’s Schedule of Investments footnotes. Only current day’s variation margin is reported within the Statement of Assets and Liabilities.
Offsetting Assets and Liabilities
The Fund is a party to enforceable master netting agreements between brokers and counterparties which provide for the right to offset under certain circumstances. The Fund employs multiple money managers and counterparties and has elected not to offset qualifying financial and derivative instruments on the Statement of Assets and Liabilities, as such all financial and derivative instruments are presented on a gross basis. The impacts of netting arrangements that provide the right to offset are detailed below, if applicable. The net amount represents the net receivable or payable that would be due from or to the counterparty in the event of default. Exposure from borrowings and other financing agreements such as repurchase agreements can only be netted across transactions governed by the same Master Agreement with the same legal entity. All amounts reported below represent the balance as of the report date, October 31, 2023.
42
American Beacon Balanced FundSM
Notes to Financial Statements
October 31, 2023
| | | | | | | | | | | | |
| Offsetting of Financial and Derivative Assets as of October 31, 2023: | | | | | | | | | | | | |
| | Assets | | | | | | Liabilities | |
| Futures Contracts(1) | | $ | - | | | | | | | $ | (72,786 | ) |
| | | | | | | | | | | | |
| Total derivative assets and liabilities in the Statement of Assets and Liabilities | | $ | - | | | | | | | $ | (72,786 | ) |
| | | | | | | | | | | | |
| Derivatives not subject to a Master Netting Agreement or similar agreement (“MNA”) | | $ | - | | | | | | | $ | 72,786 | |
| | | | | | | | | | | | |
| | | | | | | | | | | | | | | | | | | | | | | | | | | | | | | | | | | | |
| | | Remaining Contractual Maturity of the Agreements
As of October 31, 2023 | |
| | | Overnight and
Continuous | | | | | | <30 days | | | | | | Between
30 & 90 days | | | | | | >90 days | | | | | | Total | |
Securities Lending Transactions | | | | | | | | | | | | | | | | | | | | | | | | | | | | | | | | | | | | |
Common Stocks | | $ | 870,903 | | | | | | | $ | - | | | | | | | | - | | | | | | | $ | - | | | | | | | $ | 870,903 | |
| | | | | | | | | | | | | | | | | | | | | | | | | | | | | | | | | | | | |
Total Borrowings | | $ | 870,903 | | | | | | | $ | - | | | | | | | $ | - | | | | | | | $ | - | | | | | | | $ | 870,903 | |
| | | | | | | | | | | | | | | | | | | | | | | | | | | | | | | | | | | | |
Gross amount of recognized liabilities for securities lending transactions | | | $ | 870,903 | |
| | | | | | | | | | | | | | | | | | | | | | | | | | | | | | | | | | | | |
(1) Includes cumulative appreciation or (depreciation) of futures contracts as reported in the Schedule of Investments footnotes. Only current day’s variation margin is reported within the Statement of Assets and Liabilities.
6. Principal Risks
Investing in the Fund may involve certain risks including, but not limited to, those described below.
Asset-Backed and Mortgage Related Securities Risk
Investments in asset-backed and mortgage related securities are subject to market risks for fixed-income securities which include, but are not limited to, interest rate risk, prepayment risk and extension risk. Small movements in interest rates (both increases and decreases) may quickly and significantly reduce the value of certain MBS and ABS securities. If interest rates fall, the rate of prepayments tends to increase as borrowers are motivated to pay off debt and refinance at new lower rates. When mortgages and other obligations are prepaid and when securities are called, the Fund may have to reinvest in securities with a lower yield or fail to recover additional amounts (i.e., premiums) paid for securities with higher interest rates, resulting in an unexpected capital loss and/or a decrease in the amount of dividends and yield. Because prepayments increase when interest rates fall, the prices of MBS and ABS do not increase as much as other fixed-income securities when interest rates fall. When interest rates rise, borrowers are less likely to prepay their mortgage and other loans. A decreased rate of prepayments lengthens the expected maturity of MBS and ABS. Therefore, the prices of MBS and ABS may decrease more than prices of other fixed-income securities when interest rates rise. Rising interest rates tend to extend the duration of these securities, making them more sensitive to changes in interest rates. Rising interest rates also may increase the risk of default by borrowers. As a result, in a period of rising interest rates, the Fund that holds these types of securities, may experience additional volatility and losses. A decline in the credit quality of and defaults by the issuers of asset-backed and mortgage related securities or instability in the markets for such securities may affect the value and liquidity of such securities, which could result in losses to the Fund. In addition, certain asset-backed and mortgage related securities may include securities backed by pools of loans made to “subprime” borrowers or borrowers with blemished credit histories; the risk of defaults is generally higher in the case of mortgage pools that include such subprime mortgages.
Credit Risk
The Fund is subject to the risk that the issuer or guarantor of a debt security, or the counterparty to a derivatives contract or a loan will fail to make timely payment of interest or principal or otherwise honor its obligations or default completely. A decline in the credit rating of an individual security held by the Fund may have an adverse impact on its price and make it difficult for the Fund to sell it. Ratings represent a rating agency’s opinion regarding the quality of the security and are not a guarantee of quality. Rating agencies might not always
43
American Beacon Balanced FundSM
Notes to Financial Statements
October 31, 2023
change their credit rating on an issuer or security in a timely manner to reflect events that could affect the issuer’s ability to make timely payments on its obligations. Credit risk is typically greater for securities with ratings that are below investment grade.
Environmental, Social, and/or Governance Investing Risk
The use of environmental, social, and/or governance (“ESG”) considerations by a sub-advisor may cause the Fund to make different investments than funds that have a similar investment style but do not incorporate such considerations in their strategy. As with the use of any investment considerations involved in investment decisions, there is no guarantee that the use of any ESG investment considerations will result in the selection of issuers that will outperform other issuers or help reduce risk in the Fund. The Fund may underperform funds that do not incorporate these considerations.
Equity Investments Risk
Equity securities are subject to investment risk and market risk. The Fund’s investments in equity securities may include common stocks, preferred stocks, securities convertible into or exchangeable for common stocks, REITs, depositary receipts, and U.S. dollar-denominated foreign stocks traded on U.S. exchanges. Such investments may expose the Fund to additional risk. The value of a company’s common stock may fall as a result of factors affecting the company, companies in the same industry or sector, or the financial markets overall. Common stock generally is subordinate to preferred stock upon the liquidation or bankruptcy of the issuing company. Preferred stocks and convertible securities are sensitive to movements in interest rates. Preferred stocks may be less liquid than common stocks and, unlike common stocks, participation in the growth of an issuer may be limited. Distributions on preferred stocks generally are payable at the discretion of an issuer and after required payments to bond holders. Convertible securities are subject to the risk that the credit standing of the issuer may have an effect on the convertible securities’ investment value. Investments in REITs are subject to the risks associated with investing in the real estate industry such as adverse developments affecting the real estate industry and real property values. Depositary receipts and U.S. dollar-denominated foreign stocks traded on U.S. exchanges are subject to certain of the risks associated with investing directly in foreign securities, including, but not limited to, currency fluctuations and political and financial instability in the home country of a particular depositary receipt or foreign stock.
Foreign Investing Risk
Non-U.S. investments carry potential risks not associated with U.S. investments. Such risks include, but are not limited to: (1) currency exchange rate fluctuations, (2) political and financial instability, (3) less liquidity, (4) lack of uniform accounting, auditing and financial reporting standards, (5) increased price volatility, (6) less government regulation and supervision of foreign stock exchanges, brokers and listed companies, and (7) delays in transaction settlement in some foreign markets. To the extent the Fund invests a significant portion of its assets in securities of a single country or region, it is more likely to be affected by events or conditions of that country or region.
Futures Contracts Risk
Futures contracts are derivative instruments where one party pays a fixed price for an agreed amount of securities or other underlying assets at an agreed date. The use of such derivative instruments may expose the Fund to additional risks that it would not be subject to if it invested directly in the securities underlying those derivatives. There may at times be an imperfect correlation between the movement in the prices of futures contracts and the value of their underlying instruments or indexes. There can be no assurance that any strategy used will succeed. There also can be no assurance that, at all times, a liquid market will exist for offsetting a futures contract that the Fund has previously bought or sold and this may result in the inability to close a futures contract when desired. Futures contracts may experience potentially dramatic price changes, which will increase
44
American Beacon Balanced FundSM
Notes to Financial Statements
October 31, 2023
the volatility of the Fund and may involve a small investment of cash (the amount of initial and variation margin) relative to the magnitude of the risk assumed (the potential increase or decrease in the price of the futures contract).
Illiquid and Restricted Securities Risk
Securities not registered in the U.S. under the Securities Act, including Rule 144A securities, are restricted as to their resale. Such securities may not be listed on an exchange and may have no active trading market. They may be more difficult to purchase or sell at an advantageous time or price because such securities may not be readily marketable in broad public markets. The Fund may not be able to sell a restricted security when the sub-advisor considers it desirable to do so and/or may have to sell the security at a lower price than the Fund believes is its fair market value. In addition, transaction costs may be higher for restricted securities and the Fund may receive only limited information regarding the issuer of a restricted security. The Fund may have to bear the expense of registering restricted securities for resale and the risk of substantial delays in effecting the registration.
Interest Rate Risk
Generally, the value of investments with interest rate risk, such as fixed-income securities or derivatives, will move in the opposite direction to movements in interest rates. Factors including central bank monetary policy, rising inflation rates, and changes in general economic conditions may cause interest rates to rise, which could cause the value of the Fund’s investments to decline. Interest rates may rise, perhaps significantly and/or rapidly, potentially resulting in substantial losses to the Fund. Interest rate changes may have a more pronounced effect on the market value of fixed-rate instruments than on floating-rate instruments. The value of floating rate and variable securities may decline if their interest rates do not rise as quickly, or as much, as general interest rates. The prices of fixed-income securities or derivatives are also affected by their durations. Fixed-income securities or derivatives with longer durations generally have greater sensitivity to changes in interest rates. Rising interest rates may cause the value of the Fund’s investments with longer durations and terms to maturity to decline, which may adversely affect the value of the Fund. For example, if a bond has a duration of eight years, a 1% increase in interest rates could be expected to result in an 8% decrease in the value of the bond. An increase in interest rates can impact markets broadly as well. To the extent the Fund holds an investment with a negative interest rate to maturity, the Fund may generate a negative return on that investment.
Liquidity Risk
The Fund is susceptible to the risk that certain investments held by the Fund may have limited marketability, be subject to restrictions on sale, be difficult or impossible to purchase or sell at favorable times or prices, or become less liquid in response to market developments or adverse credit events that may affect issuers or guarantors of a security. An inability to sell a portfolio position can adversely affect the Fund’s value or prevent the Fund from being able to take advantage of other investment opportunities. Market prices for such instruments may be volatile. The Fund could lose money if it is unable to dispose of an investment at a time that is most beneficial to the Fund. The Fund may be required to dispose of investments at unfavorable times or prices to satisfy obligations, which may result in losses or may be costly to the Fund. For example, liquidity risk may be magnified in rising interest rate environments due to higher than normal redemption rates. Unexpected redemptions may force the Fund to sell certain investments at unfavorable prices to meet redemption requests or other cash needs. Judgment plays a greater role in pricing illiquid investments than in investments with more active markets.
Market Risk
The Fund is subject to the risk that the securities markets will move down, sometimes rapidly and unpredictably, based on overall economic conditions and other factors, which may negatively affect the Fund’s performance. Equity securities generally have greater price volatility than fixed-income securities, although under
45
American Beacon Balanced FundSM
Notes to Financial Statements
October 31, 2023
certain market conditions fixed-income securities may have comparable or greater price volatility. During a general downturn in the securities markets, multiple assets may decline in value simultaneously. In some cases, traditional market participants have been less willing to make a market in some types of debt instruments, which has affected the liquidity of those instruments. During times of market turmoil, investors tend to look to the safety of securities issued or backed by the U.S. Treasury, causing the prices of these securities to rise and the yields to decline. Reduced liquidity in fixed-income and credit markets may negatively affect many issuers worldwide. Prices in many financial markets have increased significantly over the last decade, but there have also been periods of adverse market and financial developments and cyclical change during that timeframe, which have resulted in unusually high levels of volatility in domestic and foreign financial markets that has caused losses for investors and may occur again in the future, particularly if markets enter a period of uncertainty or economic weakness. The value of a security may decline due to adverse issuer-specific conditions, general market conditions unrelated to a particular issuer, or factors that affect a particular industry or industries. Changes in the financial condition of a single issuer or market segment also can impact the market as a whole.
Geopolitical and other events, including war, terrorism, economic uncertainty, trade disputes, pandemics, public health crises, natural disasters and related events have led, and in the future may continue to lead, to instability in world economies and markets generally and reduced liquidity in equity, credit and fixed-income markets, which may disrupt economies and markets and adversely affect the value of your investment. Changes in value may be temporary or may last for extended periods.
Policy changes by the U.S. government and/or Federal Reserve and political events within the U.S. and abroad, including the U.S. presidential election, the U.S. government’s inability at times to agree on a long-term budget and deficit reduction plan, the threat of a federal government shutdown and threats not to increase the federal government’s debt limit, may affect investor and consumer confidence and may adversely impact financial markets and the broader economy, perhaps suddenly and to a significant degree.
Markets and market participants are increasingly reliant upon both publicly available and proprietary information data systems. Data imprecision, software or other technology malfunctions, programming inaccuracies, unauthorized use or access, and similar circumstances may impair the performance of these systems and may have an adverse impact upon a single issuer, a group of issuers, or the market at large. The financial markets generally move in cycles, with periods of rising prices followed by periods of declining prices. The value of your investment may reflect these fluctuations.
Mortgage-Backed and Mortgage Related Securities Risk
Investments in mortgage-backed and mortgage-related securities are influenced by the factors affecting the mortgages underlying the securities or the housing market. Investments in mortgage-backed and mortgage-related securities also are subject to market risks for fixed-income securities, which include, but are not limited to, credit risk, interest rate risk, prepayment risk, extension risk, callable securities risk, and valuation risk. A decline in the credit quality of the issuers of mortgage-backed and mortgage-related securities or instability in the markets for such securities may affect the value and liquidity of such securities, which could result in losses to the Fund. These securities are also subject to the risk of default on the underlying mortgages, particularly during periods of market downturn, and an unexpectedly high rate of defaults on the underlying assets will adversely affect the security’s value.
Multiple Sub-Advisor Risk
The Manager may allocate the Fund’s assets among multiple sub-advisors, each of which is responsible for investing its allocated portion of the Fund’s assets. To a significant extent, the Fund’s performance will depend on the success of the Manager in allocating the Fund’s assets to sub-advisors and its selection and oversight of the sub-advisors. Because each sub-advisor manages its allocated portion of the Fund independently from another sub-advisor, the same security may be held in different portions of the Fund, or may be acquired for one portion of
46
American Beacon Balanced FundSM
Notes to Financial Statements
October 31, 2023
the Fund at a time when a sub-advisor to another portion deems it appropriate to dispose of the security from that other portion, resulting in higher expenses without accomplishing any net result in the Fund’s holdings. Similarly, under some market conditions, one sub-advisor may believe that temporary, defensive investments in short-term instruments or cash are appropriate when another sub-advisor believes continued exposure to the equity or debt markets is appropriate for its allocated portion of the Fund. Because each sub-advisor directs the trading for its own portion of the Fund, and does not aggregate its transactions with those of the other sub-advisors, the Fund may incur higher brokerage costs than would be the case if a single sub-adviser were managing the entire Fund. In addition, while the Manager seeks to allocate the Fund’s assets among the Fund’s sub-advisors in a manner that it believes is consistent with achieving the Fund’s investment objective(s), the Manager may be subject to potential conflicts of interest in allocating the Fund’s assets among sub-advisors, due to factors that could impact the Manager’s revenues and profits.
Other Investment Companies Risk
The Fund may invest in shares of other registered investment companies, including money market funds that are advised by the Manager. To the extent that the Fund invests in shares of other registered investment companies, the Fund will indirectly bear the fees and expenses, including for example advisory and administrative fees, charged by those investment companies in addition to the Fund’s direct fees and expenses and will be subject to the risks associated with investments in those companies. For example, the Fund’s investments in money market funds are subject to interest rate risk, credit risk, and market risk. The Fund must rely on the investment company in which it invests to achieve its investment objective. If the investment company fails to achieve its investment objective, the value of the Fund’s investment will decline, adversely affecting the Fund’s performance. To the extent the Fund invests in other investment companies that invest in equity securities, fixed-income securities and/or foreign securities, or that track an index, the Fund is subject to the risks associated with the underlying investments held by the investment company or the index fluctuations to which the investment company is subject.
Prepayment and Extension Risk
When interest rates fall, borrowers will generally repay the loans that underlie certain debt securities, especially mortgage-related and other types of ABS, more quickly than expected, causing the issuer of the security to repay the principal prior to the security’s expected maturity date. The Fund may need to reinvest the proceeds at a lower interest rate, reducing its income. Securities subject to prepayment risk generally offer less potential for gains when prevailing interest rates fall. If the Fund buys those securities at a premium, accelerated prepayments on those securities could cause the Fund to lose a portion of its principal investment. The impact of prepayments on the price of a security may be difficult to predict and may increase the security’s price volatility. Extension risk is the risk that a decrease in prepayments may, as a result of higher interest rates or other factors, result in the extension of a security’s effective maturity, increase the risk of default and delayed payment, heighten interest rate risk and increase the potential for a decline in its price. In addition, as a consequence of a decrease in prepayments, the amount of principal available to a Fund for investment would be reduced.
Recent Market Events Risk
Both U.S. and international markets have experienced significant volatility in recent months and years. As a result of such volatility, investment returns may fluctuate significantly. Moreover, the risks discussed herein associated with an investment in the Fund may be increased.
Although interest rates were unusually low in recent years in the U.S. and abroad, in 2022, the Federal Reserve and certain foreign central banks began to raise interest rates as part of their efforts to address rising inflation. It is difficult to accurately predict the pace at which interest rates may continue to increase, the timing, frequency or magnitude of any such increases, or when such increases might stop. Additionally, various economic and political factors could cause the Federal Reserve or another foreign central bank to change their approach in
47
American Beacon Balanced FundSM
Notes to Financial Statements
October 31, 2023
the future and such actions may result in an economic slowdown in the U.S. and abroad. Unexpected increases in interest rates could lead to market volatility or reduce liquidity in certain sectors of the market. Deteriorating economic fundamentals may, in turn, increase the risk of default or insolvency of particular issuers, negatively impact market value, cause credit spreads to widen, and reduce bank balance sheets. Any of these could cause an increase in market volatility, reduce liquidity across various markets or decrease confidence in the markets. Additionally, high public debt in the U.S. and other countries creates ongoing systemic and market risks and policymaking uncertainty.
In March 2023, the shutdown of certain financial institutions in the U.S. and questions regarding the viability of other financial institutions raised economic concerns over disruption in the U.S. and global banking systems. There can be no certainty that the actions taken by the U.S. or foreign governments will be effective in mitigating the effects of financial institution failures on the economy and restoring public confidence in the U.S. and global banking systems. Some countries, including the U.S., have in recent years adopted more protectionist trade policies. Slowing global economic growth; risks associated with a trade agreement between the United Kingdom and the European Union; the risks associated with ongoing trade negotiations with China; and the possibility of changes to some international trade agreements; political or economic dysfunction within some nations, including major producers of oil; and dramatic changes in commodity and currency prices could have adverse effects that cannot be foreseen at the present time.
Tensions, war, or open conflict between nations, such as between Russia and Ukraine, in the Middle East or in eastern Asia could affect the economies of many nations, including the United States. The duration of ongoing hostilities in the Middle East and between Russia and Ukraine, and any sanctions and related events cannot be predicted. Those events present material uncertainty and risk with respect to markets globally and the performance of the Fund and its investments or operations could be negatively impacted.
Regulators in the U.S. have proposed and recently adopted a number of changes to regulations involving the markets and issuers, some of which apply to the Fund. The full effect of various newly-adopted regulations is not currently known. Additionally, it is not clear whether the proposed regulations will be adopted. However, due to the broad scope of the new and proposed regulations, certain changes could limit the Fund’s ability to pursue its investment strategies or make certain investments, or may make it more costly for the Fund to operate, which may impact performance.
Economists and others have expressed increasing concern about the potential effects of global climate change on property and security values. Certain issuers, industries and regions may be adversely affected by the impacts of climate change, including on the demand for and the development of goods and services and related production costs, and the impacts of legislation, regulation and international accords related to climate change, as well as any indirect consequences of regulation or business trends driven by climate change.
Redemption Risk
The Fund may experience periods of heavy redemptions that could cause the Fund to sell assets at inopportune times or at a loss or depressed value. Redemption risk is greater to the extent that one or more investors or intermediaries control a large percentage of investments in the Fund, have short investment horizons, or have unpredictable cash flow needs. A general rise in interest rates has the potential to cause investors to move out of fixed-income securities on a large scale, which may increase redemptions from mutual funds that hold large amounts of fixed-income securities. This, coupled with a reduction in the ability or willingness of dealers and other institutional investors to buy or hold fixed-income securities, may result in decreased liquidity and increased volatility in the fixed-income markets, and heightened redemption risk. Heavy redemptions, whether by a few large investors or many smaller investors, could hurt the Fund’s performance. This risk is heightened if the Fund invests in emerging market securities, which are generally less liquid than the securities of U.S. and other developed markets. The sale of assets to meet redemption requests may create net capital gains or losses, which could cause the Fund to have to distribute substantial capital gains.
48
American Beacon Balanced FundSM
Notes to Financial Statements
October 31, 2023
Sector Risk
Sector risk is the risk associated with the Fund holding a significant amount of investments in similar businesses, which would be similarly affected by particular economic or market events, which may, in certain circumstances, cause the value of the equity and debt securities of companies in a particular sector of the market to change. To the extent the Fund has substantial holdings within a particular sector, the risks to the Fund associated with that sector increase.
In addition, when the Fund focuses its investments in certain sectors of the economy, its performance may be driven largely by sector performance and could fluctuate more widely than if the Fund were invested more evenly across sectors. Individual sectors may be more volatile, and may perform differently, than the broader market. The businesses that constitute a sector may all react the same way to economic, political or regulatory events. The Fund’s performance could also be affected if the sectors do not perform as expected. The lack of exposure to one or more sectors may adversely affect performance. As the Fund’s portfolio changes over time, the Fund’s exposure to a particular sector may become higher or lower.
Securities Lending Risk
The Fund may lend its portfolio securities to brokers, dealers and financial institutions in order to obtain additional income. Borrowers of the Fund’s securities provide collateral either in the form of cash, which the Fund reinvests in securities or in the form of non-cash collateral consisting of securities issued or guaranteed by the U.S. government or one of its agencies or instrumentalities. The Fund will be responsible for the risks associated with the investment of cash collateral, including any collateral invested in an affiliated money market fund. The Fund may lose money on its investment of cash collateral or may fail to earn sufficient income on its investment to cover its payment to the borrower of a pre-negotiated fee or “rebate” for the use of that cash collateral in connection with the loan. The Fund could also lose money due to a decline in the value of non-cash collateral. In addition, delays may occur in the recovery of securities from borrowers, which could interfere with the Fund’s ability to vote proxies or to settle transactions or could result in increased costs. Moreover, if the borrower becomes subject to insolvency or similar proceedings, the Fund could incur delays in its ability to enforce its rights in its collateral. There also is a risk that a borrower may default on its obligation to return loaned securities at a time when the value of the Fund’s collateral is inadequate. Although the Fund’s securities lending agent may indemnify the Fund against that risk, it is also possible that the securities lending agent will be unable to satisfy its indemnification obligations. In any case in which the loaned securities are not returned to the Fund before an ex-dividend date, whether or not due to a default by the borrower, the payment in lieu of the dividend that the Fund receives from the securities’ borrower would not be treated as a dividend for federal income tax purposes and thus would not qualify for treatment as “qualified dividend income.”
U.S. Government Securities and Government-Sponsored Enterprises Risk
A security backed by the U.S. Treasury or the full faith and credit of the United States is guaranteed only as to the timely payment of interest and principal when held to maturity. The market prices for such securities are not guaranteed and will fluctuate. Additionally, circumstances could arise that would prevent the payment of interest or principal. This could result in losses to the Fund. Investments in government-sponsored enterprises are debt obligations issued by agencies and instrumentalities of the U.S. Government. These obligations vary in the level of support they receive from the U.S. Government. They may be: (i) supported by the full faith and credit of the U.S. Treasury, such as those of the Government National Mortgage Association (‘‘Ginnie Mae’’); (ii) supported by the right of the issuer to borrow from the U.S. Treasury, such as those of the Federal Home Loan Bank and the Federal Farm Credit Banks; (iii) supported by the discretionary authority of the U.S. Government to purchase the agency obligations, such as those of Fannie Mae and Freddie Mac or (iv) supported only by the credit of the issuer, such as those of the Federal Farm Credit Bureau. The U.S. Government may choose not to provide financial support to U.S. Government-sponsored agencies or instrumentalities if it is not legally obligated to do so, in which case, if the issuer defaulted, to the extent the Fund held securities of such issuers, it might not be able to recover its
49
American Beacon Balanced FundSM
Notes to Financial Statements
October 31, 2023
investment from the U.S. Government. U.S. government securities and securities of government-sponsored entities are also subject to credit risk, interest rate risk and market risk. The rising U.S. national debt may lead to adverse impacts on the value of U.S. government securities due to potentially higher costs for the U.S. government to obtain new financing.
7. Federal Income and Excise Taxes
It is the policy of the Fund to qualify as a regulated investment company (“RIC”), by complying with all applicable provisions of Subchapter M of the Internal Revenue Code, as amended, and to make distributions of taxable income sufficient to relieve it from substantially all federal income and excise taxes. For federal income tax purposes, the Fund is treated as a single entity for the purpose of determining such qualification.
The Fund does not have any unrecorded tax liabilities in the accompanying financial statements. Each of the tax years in the four year period ended October 31, 2023 remain subject to examination by the Internal Revenue Service. If applicable, the Fund recognizes interest accrued related to unrecognized tax benefits in interest expense and penalties in “Other expenses” on the Statement of Operations.
The Fund may be subject to taxes imposed by countries in which it invests. Such taxes are generally based on returns of income earned or gains realized or repatriated. Taxes are accrued and applied to net investment income, net realized capital gains and net unrealized appreciation (depreciation), as applicable, as the income is earned or capital gains are recorded.
Dividends are categorized in accordance with income tax regulations which may treat certain transactions differently than U.S. GAAP. Accordingly, the character of distributions and composition of net assets for tax purposes may differ from those reflected in the accompanying financial statements.
The tax character of distributions paid were as follows:
| | | | | | | | | | | | |
| | | Year Ended
October 31, 2023 | | | | | | Year Ended
October 31, 2022 | |
Distributions paid from: | | | | | | | | | | | | |
Ordinary income* | | | | | | | | | | | | |
R5 Class | | $ | 221,835 | | | | | | | $ | 588,223 | |
Y Class | | | 632,021 | | | | | | | | 1,126,437 | |
Investor Class | | | 1,060,072 | | | | | | | | 2,454,402 | |
Advisor Class | | | 15,766 | | | | | | | | 44,219 | |
A Class | | | 270,624 | | | | | | | | 451,949 | |
C Class | | | 163,337 | | | | | | | | 521,662 | |
Long-term capital gains | | | | | | | | | | | | |
R5 Class | | | 1,044,825 | | | | | | | | 1,234,987 | |
Y Class | | | 3,600,856 | | | | | | | | 2,195,516 | |
Investor Class | | | 5,334,755 | | | | | | | | 5,438,444 | |
Advisor Class | | | 102,077 | | | | | | | | 105,213 | |
A Class | | | 1,321,690 | | | | | | | | 909,100 | |
C Class | | | 1,523,586 | | | | | | | | 1,471,588 | |
| | | | | | | | | | | | |
Total distributions paid | | $ | 15,291,444 | | | | | | | $ | 16,541,740 | |
| | | | | | | | | | | | |
* For tax purposes, short-term capital gains are considered ordinary income distributions.
As of October 31, 2023, the components of distributable earnings (deficits) on a tax basis were as follows:
| | | | | | | | | | | | | | | | | | | | | | | | | | | | |
Fund | | Tax Cost | | | | | | Unrealized
Appreciation | | | | | | Unrealized
(Depreciation) | | | | | | Net Unrealized
Appreciation
(Depreciation) | |
Balanced | | $ | 103,124,733 | | | | | | | $ | 12,849,668 | | | | | | | $ | (8,848,935 | ) | | | | | | $ | 4,000,733 | |
50
American Beacon Balanced FundSM
Notes to Financial Statements
October 31, 2023
| | | | | | | | | | | | | | | | | | | | | | | | | | | | | | | | | | | | | | | | | | | | |
Fund | | Net Unrealized
Appreciation
(Depreciation) | | | | �� | | Undistributed
Ordinary
Income | | | | | | Undistributed
Long-Term
Capital Gains | | | | | | Accumulated
Capital and
Other (Losses) | | | | | | Other Temporary
Differences | | | | | | Distributable
Earnings | |
Balanced | | $ | 4,000,733 | | | | | | | $ | 2,583,185 | | | | | | | $ | 209,535 | | | | | | | $ | - | | | | | | | $ | (1 | ) | | | | | | $ | 6,793,452 | |
Financial reporting records are adjusted for permanent book/tax differences to reflect tax character. Financial records are not adjusted for temporary differences. The temporary differences between financial reporting and tax-basis reporting of unrealized appreciation (depreciation) are attributable primarily to the tax deferral of losses from wash sales, book amortization of premiums, and the realization for tax purposes of unrealized gains (losses) on certain derivative instruments.
Due to inherent differences in the recognition of income, expenses, and realized gains (losses) under U.S. GAAP and federal income tax regulations, permanent differences between book and tax reporting have been identified and appropriately reclassified on the Statement of Assets and Liabilities. The Fund had no permanent differences as of October 31, 2023.
For federal income tax purposes, the Fund measures its capital loss carryforwards annually at October 31, its fiscal year end. Capital loss carryforwards retain their character as short-term and/or long-term and may be carried forward and applied against future realized capital gains with no expiration date.
As of October 31, 2023, the Fund did not have any capital loss carryforwards.
8. Investment Transactions
The aggregate cost of purchases and proceeds from sales and maturities of investments, other than short-term obligations, for the year ended October 31, 2023 were as follows:
| | | | | | | | | | | | | | | | | | | | | | | | | | | | |
Fund | | Purchases
(non-U.S.
Government
Securities) | | | | | | Purchases of
U.S.
Government
Securities | | | | | | Sales
(non-U.S.
Government
Securities) | | | | | | Sales of U.S.
Government
Securities | |
| Balanced | | $ | 40,062,992 | | | | | | | $ | 21,032,700 | | | | | | | $ | 60,789,731 | | | | | | | $ | 20,457,097 | |
A summary of the Fund’s transactions in the USG Select Fund for the year ended October 31, 2023 were as follows:
| | | | | | | | | | | | | | | | | | | | | | | | | | | | | | | | | | |
Fund | | Type of
Transaction | | | | | October 31,
2022
Shares/Fair
Value | | | | | | Purchases | | | | | | Sales | | | | | | October 31,
2023
Shares/Fair
Value | |
| Balanced | | Direct | | | | | | $ | 3,684,483 | | | | | | | $ | 98,477,673 | | | | | | | $ | 99,951,683 | | | | | | | $ | 2,210,473 | |
| Balanced | | Securities Lending | | | | | | | 570,161 | | | | | | | | 7,999,396 | | | | | | | | 7,698,654 | | | | | | | | 870,903 | |
9. Securities Lending
The Fund may lend its securities to qualified financial institutions, such as certain broker-dealers, to earn additional income. The borrowers are required to secure their loans continuously with collateral in an amount at least equal to the fair value of the securities loaned, initially in an amount at least equal to 102% of the fair value of domestic securities loaned and 105% of the fair value of international securities loaned. Collateral is monitored and marked-to-market daily. Daily mark-to-market amounts are required to be paid to the borrower or received from the borrower by the end of the following business day. This one day settlement for mark-to-market amounts may result in the collateral being temporarily less than the value of the securities on loan or temporarily more than the required minimum collateral.
51
American Beacon Balanced FundSM
Notes to Financial Statements
October 31, 2023
To the extent that a loan is collateralized by cash, such cash collateral shall be invested by the securities lending agent (the “Agent”) in money market mutual funds and other short-term investments, provided the investments meet certain quality and diversification requirements. Securities purchased with cash collateral proceeds are listed in the Fund’s Schedule of Investments and the collateral is shown on the Statement of Assets and Liabilities as a payable.
Securities lending income is generated from the demand premium (if any) paid by the borrower to borrow a specific security and from the return on investment of cash collateral, reduced by negotiated rebate fees paid to the borrower and transaction costs. To the extent that a loan is secured by non-cash collateral, securities lending income is generated as a demand premium reduced by transaction costs. The Fund, the Agent, and the Manager retained 80%, 10%, and 10%, respectively, of the income generated from securities lending.
While securities are on loan, the Fund continues to receive certain income associated with that security and any gain or loss in the market price that may occur during the term of the loan. In the case of domestic equities, the value of any dividend is received in the form of a substitute payment approximately equal to the dividend. In the case of foreign securities, a negotiated amount is received that is less than the actual dividend, but higher than the dividend amount minus the foreign tax that the Fund would be subject to on the dividend.
Securities lending transactions pose certain risks to the Fund, including that the borrower may not provide additional collateral when required or return the securities when due, that the value of the short-term investments will be less than the amount of cash collateral required to be returned to the borrower, that non-cash collateral may be subject to legal constraints in the event of a borrower bankruptcy, and that the cash collateral investments could become illiquid and unable to be used to return collateral to the borrower. The Fund could also experience delays and costs in gaining access to the collateral. The Fund bears the risk of any deficiency in the amount of the cash collateral available for return to the borrower and any action which impairs its ability to liquidate non-cash collateral to satisfy a borrower default.
As of October 31, 2023, the value of outstanding securities on loan and the value of collateral were as follows:
| | | | | | | | | | | | | | | | | | | | | | | | | | | | |
Fund | | Fair Value of
Securities
on Loan | | | | | | Cash
Collateral
Received | | | | | | Non-Cash
Collateral
Received | | | | | | Total
Collateral
Received | |
Balanced | | $ | 863,162 | | | | | | | $ | 870,903 | | | | | | | $ | - | | | | | | | $ | 870,903 | |
Cash collateral is listed on the Fund’s Schedule of Investments and is shown on the Statement of Assets and Liabilities. Income earned on these investments is included in “Income derived from securities lending” on the Statement of Operations.
Non-cash collateral received by the Fund may not be sold or re-pledged except to satisfy a borrower default. Therefore, non-cash collateral is not included on the Fund’s Schedule of Investments or Statement of Assets and Liabilities.
10. Borrowing Arrangements
Effective November 10, 2023 (the “Effective Date”), the Fund, along with certain other funds managed by the Manager (“Participating Funds”), renewed a committed revolving line of credit (the “Committed Line”) agreement with State Street Bank and Trust Company (the “Bank”) to be used to facilitate portfolio liquidity. The maximum borrowing amount under the Committed Line is $100 million with interest at a rate equal to the higher of (a) Overnight Bank Funding Rate (“OBFR”) daily fluctuating rate per annum equal to 1.25% plus the sum of 0.10% or (b) the Federal Funds daily fluctuating rate per annum on amounts borrowed. Each of the Participating Funds paid a proportional amount of a quarterly commitment fee at a rate of 0.25% per annum on the unused portion of the Committed Line amount. The Committed Line expires November 8, 2024, unless extended by the Bank or terminated by the Participating Funds in accordance with the agreement. Prior to the Effective Date, the maximum borrowing amount under the Committed Line was $100 million with an expiration date November 9, 2023.
52
American Beacon Balanced FundSM
Notes to Financial Statements
October 31, 2023
On the Effective Date, the Fund, along with certain other Participating Funds managed by the Manager, also renewed an uncommitted discretionary demand revolving line of credit (the “Uncommitted Line”) agreement with the Bank to be used to facilitate portfolio liquidity. The maximum borrowing amount under the Uncommitted Line is $100 million with interest at a rate equal to the higher of (a) OBFR daily fluctuating rate per annum equal to 1.25% plus the sum of 0.10% or (b) the Federal Funds daily fluctuating rate per annum on amounts borrowed on each outstanding loan. Each of the Participating Funds paid a proportional amount of a closing fee of $35,000 on the Effective Date. The Uncommitted Line expires November 8, 2024, unless extended by the Bank or terminated by the Participating Funds in accordance with the agreement. Prior to the Effective Date, the maximum borrowing amount under the Uncommitted Line was $100 million with an expiration date November 9, 2023.
The Participating Funds paid administration, legal and arrangement fees, which are recognized as a component of “Loan expense” on the Statement of Operations, along with commitment fees, that have been allocated among the Participating Funds based on average daily net assets.
During the year ended October 31, 2023, the Fund did not utilize these facilities.
11. Capital Share Transactions
The tables below summarize the activity in capital shares for each Class of the Fund:
| | | | | | | | | | | | | | | | | | | | | | | | | | | | |
| | | R5 Class | |
| | | Year Ended
October 31, 2023 | | | | | | Year Ended
October 31, 2022 | |
Balanced Fund | | Shares | | | | | | Amount | | | | | | Shares | | | | | | Amount | |
| Shares sold | | | 114,738 | | | | | | | $ | 1,572,317 | | | | | | | | 92,239 | | | | | | | $ | 1,424,132 | |
| Reinvestment of dividends | | | 95,464 | | | | | | | | 1,256,702 | | | | | | | | 117,460 | | | | | | | | 1,813,106 | |
| Shares redeemed | | | (301,917 | ) | | | | | | | (4,114,926 | ) | | | | | | | (627,599 | ) | | | | | | | (9,312,650 | ) |
| | | | | | | | | | | | | | | | | | | | | | | | | | | | |
| Net (decrease) in shares outstanding | | | (91,715 | ) | | | | | | $ | (1,285,907 | ) | | | | | | | (417,900 | ) | | | | | | $ | (6,075,412 | ) |
| | | | | | | | | | | | | | | | | | | | | | | | | | | | |
| | | | |
| | | Y Class | |
| | | Year Ended
October 31, 2023 | | | | | | Year Ended
October 31, 2022 | |
Balanced Fund | | Shares | | | | | | Amount | | | | | | Shares | | | | | | Amount | |
| Shares sold | | | 1,683,854 | | | | | | | $ | 23,540,169 | | | | | | | | 618,054 | | | | | | | $ | 9,515,385 | |
| Reinvestment of dividends | | | 206,059 | | | | | | | | 2,741,669 | | | | | | | | 190,414 | | | | | | | | 2,954,277 | |
| Shares redeemed | | | (2,176,175 | ) | | | | | | | (29,436,634 | ) | | | | | | | (1,069,937 | ) | | | | | | | (15,679,736 | ) |
| | | | | | | | | | | | | | | | | | | | | | | | | | | | |
| Net (decrease) in shares outstanding | | | (286,262 | ) | | | | | | $ | (3,154,796 | ) | | | | | | | (261,469 | ) | | | | | | $ | (3,210,074 | ) |
| | | | | | | | | | | | | | | | | | | | | | | | | | | | |
| | | | |
| | | Investor Class | |
| | | Year Ended
October 31, 2023 | | | | | | Year Ended
October 31, 2022 | |
Balanced Fund | | Shares | | | | | | Amount | | | | | | Shares | | | | | | Amount | |
| Shares sold | | | 609,884 | | | | | | | $ | 6,849,318 | | | | | | | | 1,048,496 | | | | | | | $ | 13,635,873 | |
| Reinvestment of dividends | | | 578,977 | | | | | | | | 6,243,097 | | | | | | | | 599,785 | | | | | | | | 7,742,136 | |
| Shares redeemed | | | (1,500,258 | ) | | | | | | | (16,655,877 | ) | | | | | | | (2,947,671 | ) | | | | | | | (37,586,828 | ) |
| | | | | | | | | | | | | | | | | | | | | | | | | | | | |
| Net (decrease) in shares outstanding | | | (311,397 | ) | | | | | | $ | (3,563,462 | ) | | | | | | | (1,299,390 | ) | | | | | | $ | (16,208,819 | ) |
| | | | | | | | | | | | | | | | | | | | | | | | | | | | |
| | | | |
| | | Advisor Class | |
| | | Year Ended
October 31, 2023 | | | | | | Year Ended
October 31, 2022 | |
Balanced Fund | | Shares | | | | | | Amount | | | | | | Shares | | | | | | Amount | |
| Shares sold | | | 10,764 | | | | | | | $ | 132,209 | | | | | | | | 4,854 | | | | | | | $ | 69,586 | |
| Reinvestment of dividends | | | 9,879 | | | | | | | | 117,843 | | | | | | | | 10,568 | | | | | | | | 149,432 | |
| Shares redeemed | | | (26,647 | ) | | | | | | | (318,598 | ) | | | | | | | (64,006 | ) | | | | | | | (922,977 | ) |
| | | | | | | | | | | | | | | | | | | | | | | | | | | | |
| Net (decrease) in shares outstanding | | | (6,004 | ) | | | | | | $ | (68,546 | ) | | | | | | | (48,584 | ) | | | | | | $ | (703,959 | ) |
| | | | | | | | | | | | | | | | | | | | | | | | | | | | |
| | | | |
53
American Beacon Balanced FundSM
Notes to Financial Statements
October 31, 2023
| | | | | | | | | | | | | | | | | | | | | | | | | | | | |
| | | A Class | |
| | | Year Ended
October 31, 2023 | | | | | | Year Ended
October 31, 2022 | |
Balanced Fund | | Shares | | | | | | Amount | | | | | | Shares | | | | | | Amount | |
| Shares sold | | | 253,745 | | | | | | | $ | 2,817,904 | | | | | | | | 321,581 | | | | | | | $ | 4,046,911 | |
| Reinvestment of dividends | | | 137,291 | | | | | | | | 1,473,679 | | | | | | | | 97,000 | | | | | | | | 1,242,228 | |
| Shares redeemed | | | (324,640 | ) | | | | | | | (3,594,051 | ) | | | | | | | (238,299 | ) | | | | | | | (3,032,402 | ) |
| | | | | | | | | | | | | | | | | | | | | | | | | | | | |
| Net increase in shares outstanding | | | 66,396 | | | | | | | $ | 697,532 | | | | | | | | 180,282 | | | | | | | $ | 2,256,737 | |
| | | | | | | | | | | | | | | | | | | | | | | | | | | | |
| | | | |
| | | C Class | |
| | | Year Ended
October 31, 2023 | | | | | | Year Ended
October 31, 2022 | |
Balanced Fund | | Shares | | | | | | Amount | | | | | | Shares | | | | | | Amount | |
| Shares sold | | | 64,838 | | | | | | | $ | 735,396 | | | | | | | | 83,940 | | | | | | | $ | 1,086,420 | |
| Reinvestment of dividends | | | 153,620 | | | | | | | | 1,676,128 | | | | | | | | 151,077 | | | | | | | | 1,978,540 | |
| Shares redeemed | | | (498,554 | ) | | | | | | | (5,635,497 | ) | | | | | | | (510,072 | ) | | | | | | | (6,561,363 | ) |
| | | | | | | | | | | | | | | | | | | | | | | | | | | | |
| Net (decrease) in shares outstanding | | | (280,096 | ) | | | | | | $ | (3,223,973 | ) | | | | | | | (275,055 | ) | | | | | | $ | (3,496,403 | ) |
| | | | | | | | | | | | | | | | | | | | | | | | | | | | |
12. Subsequent Events
Management has evaluated subsequent events for possible recognition or disclosure in the financial statements through the date the financial statements are issued. Management has determined that there are no material events that would require disclosure in the Fund’s financial statements through this date.
54
American Beacon Balanced FundSM
Financial Highlights
(For a share outstanding throughout the period)
| | | | | | | | | | | | | | | | | | | | | | | | | | | | | | | | | | | | |
| | | R5 ClassA | |
| | | Year Ended October 31, | |
| | | 2023 | | | | | | 2022 | | | | | | 2021 | | | | | | 2020B | | | | | | 2019 | |
| | | | |
Net asset value, beginning of period | | $ | 14.07 | | | | | | | $ | 16.93 | | | | | | | $ | 14.35 | | | | | | | $ | 16.36 | | | | | | | $ | 16.20 | |
| | | | | | | | | | | | | | | | | | | | | | | | | | | | | | | | | | | | |
Income (loss) from investment operations: | | | | | | | | | | | | | | | | | | | | | | | | | | | | | | | | | | | | |
Net investment income | | | 0.24 | | | | | | | | 0.11 | | | | | | | | 0.19 | | | | | | | | 0.20 | | | | | | | | 0.31 | |
Net gains (losses) on investments (both realized and unrealized) | | | 0.15 | | | | | | | | (1.56 | ) | | | | | | | 4.34 | | | | | | | | (0.80 | ) | | | | | | | 1.23 | |
| | | | | | | | | | | | | | | | | | | | | | | | | | | | | | | | | | | | |
Total income (loss) from investment operations | | | 0.39 | | | | | | | | (1.45 | ) | | | | | | | 4.53 | | | | | | | | (0.60 | ) | | | | | | | 1.54 | |
| | | | | | | | | | | | | | | | | | | | | | | | | | | | | | | | | | | | |
Less distributions: | | | | | | | | | | | | | | | | | | | | | | | | | | | | | | | | | | | | |
Dividends from net investment income | | | (0.26 | ) | | | | | | | (0.23 | ) | | | | | | | (0.30 | ) | | | | | | | (0.24 | ) | | | | | | | (0.26 | ) |
Distributions from net realized gains | | | (1.16 | ) | | | | | | | (1.18 | ) | | | | | | | (1.65 | ) | | | | | | | (1.17 | ) | | | | | | | (1.12 | ) |
| | | | | | | | | | | | | | | | | | | | | | | | | | | | | | | | | | | | |
Total distributions | | | (1.42 | ) | | | | | | | (1.41 | ) | | | | | | | (1.95 | ) | | | | | | | (1.41 | ) | | | | | | | (1.38 | ) |
| | | | | | | | | | | | | | | | | | | | | | | | | | | | | | | | | | | | |
Net asset value, end of period | | $ | 13.04 | | | | | | | $ | 14.07 | | | | | | | $ | 16.93 | | | | | | | $ | 14.35 | | | | | | | $ | 16.36 | |
| | | | | | | | | | | | | | | | | | | | | | | | | | | | | | | | | | | | |
Total returnC | | | 2.80 | % | | | | | | | (9.20 | )% | | | | | | | 33.80 | % | | | | | | | (4.14 | )% | | | | | | | 10.89 | % |
| | | | | | | | | | | | | | | | | | | | | | | | | | | | | | | | | | | | |
| | | | | | | | | |
Ratios and supplemental data: | | | | | | | | | | | | | | | | | | | | | | | | | | | | | | | | | | | | |
Net assets, end of period | | $ | 10,827,923 | | | | | | | $ | 12,977,305 | | | | | | | $ | 22,687,613 | | | | | | | $ | 22,476,942 | | | | | | | $ | 46,593,155 | |
Ratios to average net assets: | | | | | | | | | | | | | | | | | | | | | | | | | | | | | | | | | | | | |
Expenses, before reimbursements and/or recoupments | | | 0.78 | % | | | | | | | 0.72 | % | | | | | | | 0.70 | % | | | | | | | 0.88 | % | | | | | | | 0.66 | % |
Expenses, net of reimbursements and/or recoupments | | | 0.78 | % | | | | | | | 0.72 | % | | | | | | | 0.70 | % | | | | | | | 0.88 | % | | | | | | | 0.66 | % |
Net investment income, before expense reimbursements and/or recoupments | | | 2.10 | % | | | | | | | 1.51 | % | | | | | | | 1.37 | % | | | | | | | 1.82 | % | | | | | | | 2.24 | % |
Net investment income, net of reimbursements and/or recoupments | | | 2.10 | % | | | | | | | 1.51 | % | | | | | | | 1.37 | % | | | | | | | 1.82 | % | | | | | | | 2.24 | % |
Portfolio turnover rate | | | 48 | % | | | | | | | 30 | % | | | | | | | 37 | % | | | | | | | 82 | % | | | | | | | 68 | % |
| A | Prior to February 28, 2020, the R5 Class was known as Institutional Class. |
| B | On January 23, 2020, Brandywine Global Investment Management, LLC was terminated and ceased managing assets of the Fund. |
| C | Based on net asset value, which does not reflect the sales charge, redemption fee, or contingent deferred sales charge, if applicable. May include adjustments in accordance with U.S. GAAP and as such, the net asset value for reporting purposes and the returns based upon those net asset values may differ from the net asset value and returns for shareholder transactions. |
See accompanying notes
55
American Beacon Balanced FundSM
Financial Highlights
(For a share outstanding throughout the period)
| | | | | | | | | | | | | | | | | | | | | | | | | | | | | | | | | | | | |
| | | Y Class | |
| | | Year Ended October 31, | |
| | | 2023 | | | | | | 2022 | | | | | | 2021 | | | | | | 2020A | | | | | | 2019 | |
| | | | |
Net asset value, beginning of period | | $ | 14.20 | | | | | | | $ | 17.07 | | | | | | | $ | 14.46 | | | | | | | $ | 16.47 | | | | | | | $ | 16.31 | |
| | | | | | | | | | | | | | | | | | | | | | | | | | | | | | | | | | | | |
Income (loss) from investment operations: | | | | | | | | | | | | | | | | | | | | | | | | | | | | | | | | | | | | |
Net investment income | | | 0.29 | | | | | | | | 0.21 | | | | | | | | 0.20 | | | | | | | | 0.25 | | | | | | | | 0.33 | |
Net gains (losses) on investments (both realized and unrealized) | | | 0.08 | | | | | | | | (1.68 | ) | | | | | | | 4.35 | | | | | | | | (0.86 | ) | | | | | | | 1.20 | |
| | | | | | | | | | | | | | | | | | | | | | | | | | | | | | | | | | | | |
Total income (loss) from investment operations | | | 0.37 | | | | | | | | (1.47 | ) | | | | | | | 4.55 | | | | | | | | (0.61 | ) | | | | | | | 1.53 | |
| | | | | | | | | | | | | | | | | | | | | | | | | | | | | | | | | | | | |
Less distributions: | | | | | | | | | | | | | | | | | | | | | | | | | | | | | | | | | | | | |
Dividends from net investment income | | | (0.24 | ) | | | | | | | (0.22 | ) | | | | | | | (0.29 | ) | | | | | | | (0.23 | ) | | | | | | | (0.25 | ) |
Distributions from net realized gains | | | (1.16 | ) | | | | | | | (1.18 | ) | | | | | | | (1.65 | ) | | | | | | | (1.17 | ) | | | | | | | (1.12 | ) |
| | | | | | | | | | | | | | | | | | | | | | | | | | | | | | | | | | | | |
Total distributions | | | (1.40 | ) | | | | | | | (1.40 | ) | | | | | | | (1.94 | ) | | | | | | | (1.40 | ) | | | | | | | (1.37 | ) |
| | | | | | | | | | | | | | | | | | | | | | | | | | | | | | | | | | | | |
Net asset value, end of period | | $ | 13.17 | | | | | | | $ | 14.20 | | | | | | | $ | 17.07 | | | | | | | $ | 14.46 | | | | | | | $ | 16.47 | |
| | | | | | | | | | | | | | | | | | | | | | | | | | | | | | | | | | | | |
Total returnB | | | 2.68 | % | | | | | | | (9.25 | )% | | | | | | | 33.66 | % | | | | | | | (4.17 | )% | | | | | | | 10.75 | % |
| | | | | | | | | | | | | | | | | | | | | | | | | | | | | | | | | | | | |
| | | | | | | | | |
Ratios and supplemental data: | | | | | | | | | | | | | | | | | | | | | | | | | | | | | | | | | | | | |
Net assets, end of period | | $ | 24,304,867 | | | | | | | $ | 30,273,662 | | | | | | | $ | 40,858,765 | | | | | | | $ | 43,550,846 | | | | | | | $ | 62,956,422 | |
Ratios to average net assets: | | | | | | | | | | | | | | | | | | | | | | | | | | | | | | | | | | | | |
Expenses, before reimbursements and/or recoupments | | | 0.84 | % | | | | | | | 0.80 | % | | | | | | | 0.77 | % | | | | | | | 0.96 | % | | | | | | | 0.74 | % |
Expenses, net of reimbursements and/or recoupments | | | 0.84 | % | | | | | | | 0.80 | % | | | | | | | 0.77 | % | | | | | | | 0.96 | % | | | | | | | 0.74 | % |
Net investment income, before expense reimbursements and/or recoupments | | | 2.01 | % | | | | | | | 1.46 | % | | | | | | | 1.31 | % | | | | | | | 1.71 | % | | | | | | | 2.15 | % |
Net investment income, net of reimbursements and/or recoupments | | | 2.01 | % | | | | | | | 1.46 | %�� | | | | | | | 1.31 | % | | | | | | | 1.71 | % | | | | | | | 2.15 | % |
Portfolio turnover rate | | | 48 | % | | | | | | | 30 | % | | | | | | | 37 | % | | | | | | | 82 | % | | | | | | | 68 | % |
| A | On January 23, 2020, Brandywine Global Investment Management, LLC was terminated and ceased managing assets of the Fund. |
| B | Based on net asset value, which does not reflect the sales charge, redemption fee, or contingent deferred sales charge, if applicable. May include adjustments in accordance with U.S. GAAP and as such, the net asset value for reporting purposes and the returns based upon those net asset values may differ from the net asset value and returns for shareholder transactions. |
See accompanying notes
56
American Beacon Balanced FundSM
Financial Highlights
(For a share outstanding throughout the period)
| | | | | | | | | | | | | | | | | | | | | | | | | | | | | | | | | | | | |
| | | Investor Class | |
| | | Year Ended October 31, | |
| | | 2023 | | | | | | 2022 | | | | | | 2021 | | | | | | 2020A | | | | | | 2019 | |
| | | | |
Net asset value, beginning of period | | $ | 11.74 | | | | | | | $ | 14.35 | | | | | | | $ | 12.43 | | | | | | | $ | 14.36 | | | | | | | $ | 14.41 | |
| | | | | | | | | | | | | | | | | | | | | | | | | | | | | | | | | | | | |
Income (loss) from investment operations: | | | | | | | | | | | | | | | | | | | | | | | | | | | | | | | | | | | | |
Net investment income | | | 0.11 | | | | | | | | 0.15 | B | | | | | | | 0.22 | | | | | | | | 0.03 | | | | | | | | 0.18 | |
Net gains (losses) on investments (both realized and unrealized) | | | 0.17 | | | | | | | | (1.39 | ) | | | | | | | 3.61 | | | | | | | | (0.58 | ) | | | | | | | 1.11 | |
| | | | | | | | | | | | | | | | | | | | | | | | | | | | | | | | | | | | |
Total income (loss) from investment operations | | | 0.28 | | | | | | | | (1.24 | ) | | | | | | | 3.83 | | | | | | | | (0.55 | ) | | | | | | | 1.29 | |
| | | | | | | | | | | | | | | | | | | | | | | | | | | | | | | | | | | | |
Less distributions: | | | | | | | | | | | | | | | | | | | | | | | | | | | | | | | | | | | | |
Dividends from net investment income | | | (0.22 | ) | | | | | | | (0.19 | ) | | | | | | | (0.26 | ) | | | | | | | (0.21 | ) | | | | | | | (0.22 | ) |
Distributions from net realized gains | | | (1.16 | ) | | | | | | | (1.18 | ) | | | | | | | (1.65 | ) | | | | | | | (1.17 | ) | | | | | | | (1.12 | ) |
| | | | | | | | | | | | | | | | | | | | | | | | | | | | | | | | | | | | |
Total distributions | | | (1.38 | ) | | | | | | | (1.37 | ) | | | | | | | (1.91 | ) | | | | | | | (1.38 | ) | | | | | | | (1.34 | ) |
| | | | | | | | | | | | | | | | | | | | | | | | | | | | | | | | | | | | |
Net asset value, end of period | | $ | 10.64 | | | | | | | $ | 11.74 | | | | | | | $ | 14.35 | | | | | | | $ | 12.43 | | | | | | | $ | 14.36 | |
| | | | | | | | | | | | | | | | | | | | | | | | | | | | | | | | | | | | |
Total returnC | | | 2.46 | % | | | | | | | (9.40 | )% | | | | | | | 33.32 | % | | | | | | | (4.41 | )% | | | | | | | 10.50 | % |
| | | | | | | | | | | | | | | | | | | | | | | | | | | | | | | | | | | | |
| | | | | | | | | |
Ratios and supplemental data: | | | | | | | | | | | | | | | | | | | | | | | | | | | | | | | | | | | | |
Net assets, end of period | | $ | 46,044,377 | | | | | | | $ | 54,447,528 | | | | | | | $ | 85,251,213 | | | | | | | $ | 68,284,615 | | | | | | | $ | 96,065,263 | |
Ratios to average net assets: | | | | | | | | | | | | | | | | | | | | | | | | | | | | | | | | | | | | |
Expenses, before reimbursements and/or recoupments | | | 1.04 | % | | | | | | | 1.03 | % | | | | | | | 0.99 | % | | | | | | | 1.20 | % | | | | | | | 0.97 | % |
Expenses, net of reimbursements and/or recoupments | | | 1.04 | % | | | | | | | 1.03 | % | | | | | | | 0.99 | % | | | | | | | 1.20 | % | | | | | | | 0.97 | % |
Net investment income, before expense reimbursements and/or recoupments | | | 1.84 | % | | | | | | | 1.22 | % | | | | | | | 1.07 | % | | | | | | | 1.47 | % | | | | | | | 1.92 | % |
Net investment income, net of reimbursements and/or recoupments | | | 1.84 | % | | | | | | | 1.22 | % | | | | | | | 1.07 | % | | | | | | | 1.47 | % | | | | | | | 1.92 | % |
Portfolio turnover rate | | | 48 | % | | | | | | | 30 | % | | | | | | | 37 | % | | | | | | | 82 | % | | | | | | | 68 | % |
| A | On January 23, 2020, Brandywine Global Investment Management, LLC was terminated and ceased managing assets of the Fund. |
| B | Per share amounts have been calculated using the average shares method. |
| C | Based on net asset value, which does not reflect the sales charge, redemption fee, or contingent deferred sales charge, if applicable. May include adjustments in accordance with U.S. GAAP and as such, the net asset value for reporting purposes and the returns based upon those net asset values may differ from the net asset value and returns for shareholder transactions. |
See accompanying notes
57
American Beacon Balanced FundSM
Financial Highlights
(For a share outstanding throughout the period)
| | | | | | | | | | | | | | | | | | | | | | | | | | | | | | | | | | | | |
| | | Advisor Class | |
| | | Year Ended October 31, | |
| | | 2023 | | | | | | 2022 | | | | | | 2021 | | | | | | 2020A | | | | | | 2019 | |
| | | | |
Net asset value, beginning of period | | $ | 12.86 | | | | | | | $ | 15.59 | | | | | | | $ | 13.35 | | | | | | | $ | 15.34 | | | | | | | $ | 15.29 | |
| | | | | | | | | | | | | | | | | | | | | | | | | | | | | | | | | | | | |
Income (loss) from investment operations: | | | | | | | | | | | | | | | | | | | | | | | | | | | | | | | | | | | | |
Net investment income | | | 0.15 | | | | | | | | 0.15 | B | | | | | | | 0.15 | | | | | | | | 0.18 | B | | | | | | | 0.26 | |
Net gains (losses) on investments (both realized and unrealized) | | | 0.15 | | | | | | | | (1.54 | ) | | | | | | | 3.97 | | | | | | | | (0.81 | ) | | | | | | | 1.11 | |
| | | | | | | | | | | | | | | | | | | | | | | | | | | | | | | | | | | | |
Total income (loss) from investment operations | | | 0.30 | | | | | | | | (1.39 | ) | | | | | | | 4.12 | | | | | | | | (0.63 | ) | | | | | | | 1.37 | |
| | | | | | | | | | | | | | | | | | | | | | | | | | | | | | | | | | | | |
Less distributions: | | | | | | | | | | | | | | | | | | | | | | | | | | | | | | | | | | | | |
Dividends from net investment income | | | (0.20 | ) | | | | | | | (0.16 | ) | | | | | | | (0.23 | ) | | | | | | | (0.19 | ) | | | | | | | (0.20 | ) |
Distributions from net realized gains | | | (1.16 | ) | | | | | | | (1.18 | ) | | | | | | | (1.65 | ) | | | | | | | (1.17 | ) | | | | | | | (1.12 | ) |
| | | | | | | | | | | | | | | | | | | | | | | | | | | | | | | | | | | | |
Total distributions | | | (1.36 | ) | | | | | | | (1.34 | ) | | | | | | | (1.88 | ) | | | | | | | (1.36 | ) | | | | | | | (1.32 | ) |
| | | | | | | | | | | | | | | | | | | | | | | | | | | | | | | | | | | | |
Net asset value, end of period | | $ | 11.80 | | | | | | | $ | 12.86 | | | | | | | $ | 15.59 | | | | | | | $ | 13.35 | | | | | | | $ | 15.34 | |
| | | | | | | | | | | | | | | | | | | | | | | | | | | | | | | | | | | | |
Total returnC | | | 2.35 | % | | | | | | | (9.62 | )% | | | | | | | 33.17 | % | | | | | | | (4.65 | )% | | | | | | | 10.41 | % |
| | | | | | | | | | | | | | | | | | | | | | | | | | | | | | | | | | | | |
| | | | | | | | | |
Ratios and supplemental data: | | | | | | | | | | | | | | | | | | | | | | | | | | | | | | | | | | | | |
Net assets, end of period | | $ | 960,288 | | | | | | | $ | 1,124,266 | | | | | | | $ | 2,120,450 | | | | | | | $ | 1,760,622 | | | | | | | $ | 6,039,168 | |
Ratios to average net assets: | | | | | | | | | | | | | | | | | | | | | | | | | | | | | | | | | | | | |
Expenses, before reimbursements and/or recoupments | | | 1.24 | % | | | | | | | 1.19 | % | | | | | | | 1.16 | % | | | | | | | 1.36 | % | | | | | | | 1.14 | % |
Expenses, net of reimbursements and/or recoupments | | | 1.24 | % | | | | | | | 1.19 | % | | | | | | | 1.16 | % | | | | | | | 1.36 | % | | | | | | | 1.14 | % |
Net investment income, before expense reimbursements and/or recoupments | | | 1.66 | % | | | | | | | 1.05 | % | | | | | | | 0.91 | % | | | | | | | 1.29 | % | | | | | | | 1.76 | % |
Net investment income, net of reimbursements and/or recoupments | | | 1.66 | % | | | | | | | 1.05 | % | | | | | | | 0.91 | % | | | | | | | 1.29 | % | | | | | | | 1.76 | % |
Portfolio turnover rate | | | 48 | % | | | | | | | 30 | % | | | | | | | 37 | % | | | | | | | 82 | % | | | | | | | 68 | % |
| A | On January 23, 2020, Brandywine Global Investment Management, LLC was terminated and ceased managing assets of the Fund. |
| B | Per share amounts have been calculated using the average shares method. |
| C | Based on net asset value, which does not reflect the sales charge, redemption fee, or contingent deferred sales charge, if applicable. May include adjustments in accordance with U.S. GAAP and as such, the net asset value for reporting purposes and the returns based upon those net asset values may differ from the net asset value and returns for shareholder transactions. |
See accompanying notes
58
American Beacon Balanced FundSM
Financial Highlights
(For a share outstanding throughout the period)
| | | | | | | | | | | | | | | | | | | | | | | | | | | | | | | | | | | | |
| | | A Class | |
| | | Year Ended October 31, | |
| | | 2023 | | | | | | 2022 | | | | | | 2021 | | | | | | 2020A | | | | | | 2019 | |
| | | | |
Net asset value, beginning of period | | $ | 11.69 | | | | | | | $ | 14.31 | | | | | | | $ | 12.39 | | | | | | | $ | 14.33 | | | | | | | $ | 14.38 | |
| | | | | | | | | | | | | | | | | | | | | | | | | | | | | | | | | | | | |
Income (loss) from investment operations: | | | | | | | | | | | | | | | | | | | | | | | | | | | | | | | | | | | | |
Net investment income | | | 0.23 | | | | | | | | 0.25 | | | | | | | | 0.11 | | | | | | | | 0.15 | | | | | | | | 0.22 | |
Net gains (losses) on investments (both realized and unrealized) | | | 0.05 | | | | | | | | (1.50 | ) | | | | | | | 3.71 | | | | | | | | (0.71 | ) | | | | | | | 1.07 | |
| | | | | | | | | | | | | | | | | | | | | | | | | | | | | | | | | | | | |
Total income (loss) from investment operations | | | 0.28 | | | | | | | | (1.25 | ) | | | | | | | 3.82 | | | | | | | | (0.56 | ) | | | | | | | 1.29 | |
| | | | | | | | | | | | | | | | | | | | | | | | | | | | | | | | | | | | |
Less distributions: | | | | | | | | | | | | | | | | | | | | | | | | | | | | | | | | | | | | |
Dividends from net investment income | | | (0.22 | ) | | | | | | | (0.19 | ) | | | | | | | (0.25 | ) | | | | | | | (0.21 | ) | | | | | | | (0.22 | ) |
Distributions from net realized gains | | | (1.16 | ) | | | | | | | (1.18 | ) | | | | | | | (1.65 | ) | | | | | | | (1.17 | ) | | | | | | | (1.12 | ) |
| | | | | | | | | | | | | | | | | | | | | | | | | | | | | | | | | | | | |
Total distributions | | | (1.38 | ) | | | | | | | (1.37 | ) | | | | | | | (1.90 | ) | | | | | | | (1.38 | ) | | | | | | | (1.34 | ) |
| | | | | | | | | | | | | | | | | | | | | | | | | | | | | | | | | | | | |
Net asset value, end of period | | $ | 10.59 | | | | | | | $ | 11.69 | | | | | | | $ | 14.31 | | | | | | | $ | 12.39 | | | | | | | $ | 14.33 | |
| | | | | | | | | | | | | | | | | | | | | | | | | | | | | | | | | | | | |
Total returnB | | | 2.44 | % | | | | | | | (9.49 | )% | | | | | | | 33.39 | % | | | | | | | (4.49 | )% | | | | | | | 10.54 | % |
| | | | | | | | | | | | | | | | | | | | | | | | | | | | | | | | | | | | |
| | | | | | | | | |
Ratios and supplemental data: | | | | | | | | | | | | | | | | | | | | | | | | | | | | | | | | | | | | |
Net assets, end of period | | $ | 12,917,238 | | | | | | | $ | 13,482,666 | | | | | | | $ | 13,922,687 | | | | | | | $ | 12,863,938 | | | | | | | $ | 16,228,685 | |
Ratios to average net assets: | | | | | | | | | | | | | | | | | | | | | | | | | | | | | | | | | | | | |
Expenses, before reimbursements and/or recoupments | | | 1.09 | % | | | | | | | 1.04 | % | | | | | | | 1.02 | % | | | | | | | 1.21 | % | | | | | | | 1.01 | % |
Expenses, net of reimbursements and/or recoupments | | | 1.09 | % | | | | | | | 1.04 | % | | | | | | | 1.02 | % | | | | | | | 1.21 | % | | | | | | | 1.01 | %C |
Net investment income, before expense reimbursements and/or recoupments | | | 1.80 | % | | | | | | | 1.22 | % | | | | | | | 1.04 | % | | | | | | | 1.46 | % | | | | | | | 1.88 | % |
Net investment income, net of reimbursements and/or recoupments | | | 1.80 | % | | | | | | | 1.22 | % | | | | | | | 1.04 | % | | | | | | | 1.46 | % | | | | | | | 1.88 | % |
Portfolio turnover rate | | | 48 | % | | | | | | | 30 | % | | | | | | | 37 | % | | | | | | | 82 | % | | | | | | | 68 | % |
| A | On January 23, 2020, Brandywine Global Investment Management, LLC was terminated and ceased managing assets of the Fund. |
| B | Based on net asset value, which does not reflect the sales charge, redemption fee, or contingent deferred sales charge, if applicable. May include adjustments in accordance with U.S. GAAP and as such, the net asset value for reporting purposes and the returns based upon those net asset values may differ from the net asset value and returns for shareholder transactions. |
| C | This ratio does not include a voluntary reimbursement of service fees as included in the prior year. |
See accompanying notes
59
American Beacon Balanced FundSM
Financial Highlights
(For a share outstanding throughout the period)
| | | | | | | | | | | | | | | | | | | | | | | | | | | | | | | | | | | | |
| | | C Class | |
| | | Year Ended October 31, | |
| | | 2023 | | | | | | 2022 | | | | | | 2021 | | | | | | 2020A | | | | | | 2019 | |
| | | | |
Net asset value, beginning of period | | $ | 11.87 | | | | | | | $ | 14.49 | | | | | | | $ | 12.53 | | | | | | | $ | 14.48 | | | | | | | $ | 14.55 | |
| | | | | | | | | | | | | | | | | | | | | | | | | | | | | | | | | | | | |
Income (loss) from investment operations: | | | | | | | | | | | | | | | | | | | | | | | | | | | | | | | | | | | | |
Net investment income | | | 0.12 | B | | | | | | | 0.06 | B | | | | | | | 0.04 | B | | | | | | | 0.05 | | | | | | | | 0.10 | |
Net gains (losses) on investments (both realized and unrealized) | | | 0.08 | | | | | | | | (1.41 | ) | | | | | | | 3.72 | | | | | | | | (0.70 | ) | | | | | | | 1.09 | |
| | | | | | | | | | | | | | | | | | | | | | | | | | | | | | | | | | | | |
Total income (loss) from investment operations | | | 0.20 | | | | | | | | (1.35 | ) | | | | | | | 3.76 | | | | | | | | (0.65 | ) | | | | | | | 1.19 | |
| | | | | | | | | | | | | | | | | | | | | | | | | | | | | | | | | | | | |
Less distributions: | | | | | | | | | | | | | | | | | | | | | | | | | | | | | | | | | | | | |
Dividends from net investment income | | | (0.13 | ) | | | | | | | (0.09 | ) | | | | | | | (0.15 | ) | | | | | | | (0.13 | ) | | | | | | | (0.14 | ) |
Distributions from net realized gains | | | (1.16 | ) | | | | | | | (1.18 | ) | | | | | | | (1.65 | ) | | | | | | | (1.17 | ) | | | | | | | (1.12 | ) |
| | | | | | | | | | | | | | | | | | | | | | | | | | | | | | | | | | | | |
Total distributions | | | (1.29 | ) | | | | | | | (1.27 | ) | | | | | | | (1.80 | ) | | | | | | | (1.30 | ) | | | | | | | (1.26 | ) |
| | | | | | | | | | | | | | | | | | | | | | | | | | | | | | | | | | | | |
Net asset value, end of period | | $ | 10.78 | | | | | | | $ | 11.87 | | | | | | | $ | 14.49 | | | | | | | $ | 12.53 | | | | | | | $ | 14.48 | |
| | | | | | | | | | | | | | | | | | | | | | | | | | | | | | | | | | | | |
Total returnC | | | 1.68 | % | | | | | | | (10.11 | )% | | | | | | | 32.32 | % | | | | | | | (5.09 | )% | | | | | | | 9.63 | % |
| | | | | | | | | | | | | | | | | | | | | | | | | | | | | | | | | | | | |
| | | | | | | | | |
Ratios and supplemental data: | | | | | | | | | | | | | | | | | | | | | | | | | | | | | | | | | | | | |
Net assets, end of period | | $ | 11,669,906 | | | | | | | $ | 16,173,837 | | | | | | | $ | 23,737,711 | | | | | | | $ | 23,951,798 | | | | | | | $ | 30,848,500 | |
Ratios to average net assets: | | | | | | | | | | | | | | | | | | | | | | | | | | | | | | | | | | | | |
Expenses, before reimbursements and/or recoupments | | | 1.83 | % | | | | | | | 1.78 | % | | | | | | | 1.75 | % | | | | | | | 1.95 | % | | | | | | | 1.76 | % |
Expenses, net of reimbursements and/or recoupments | | | 1.83 | % | | | | | | | 1.78 | % | | | | | | | 1.75 | % | | | | | | | 1.95 | % | | | | | | | 1.76 | %D |
Net investment income, before expense reimbursements and/or recoupments | | | 1.04 | % | | | | | | | 0.47 | % | | | | | | | 0.32 | % | | | | | | | 0.72 | % | | | | | | | 1.13 | % |
Net investment income, net of reimbursements and/or recoupments | | | 1.04 | % | | | | | | | 0.47 | % | | | | | | | 0.32 | % | | | | | | | 0.72 | % | | | | | | | 1.13 | % |
Portfolio turnover rate | | | 48 | % | | | | | | | 30 | % | | | | | | | 37 | % | | | | | | | 82 | % | | | | | | | 68 | % |
| A | On January 23, 2020, Brandywine Global Investment Management, LLC was terminated and ceased managing assets of the Fund. |
| B | Per share amounts have been calculated using the average shares method. |
| C | Based on net asset value, which does not reflect the sales charge, redemption fee, or contingent deferred sales charge, if applicable. May include adjustments in accordance with U.S. GAAP and as such, the net asset value for reporting purposes and the returns based upon those net asset values may differ from the net asset value and returns for shareholder transactions. |
| D | This ratio does not include a voluntary reimbursement of service fees as included in the prior year. |
See accompanying notes
60
American Beacon Balanced FundSM
Federal Tax Information
October 31, 2023 (Unaudited)
Certain tax information regarding the Funds is required to be provided to shareholders based upon the Funds’ income and distributions for the taxable year ended October 31, 2023. The information and distributions reported herein may differ from information and distributions taxable to the shareholders for the calendar year ended December 31, 2023.
The Funds designated the following items with regard to distributions paid during the fiscal year ended October 31, 2023. All designations are based on financial information available as of this annual report and, accordingly, are subject to change. For each item, it is the intention of the Funds to designate the maximum amount permitted under the Internal Revenue Code of 1986, as amended, and the regulations there under.
Corporate Dividends-Received Deduction:
Qualified Dividend Income:
Long-Term Capital Gain Distributions:
Short-Term Capital Gain Distributions:
Shareholders will receive notification in January 2024 of the applicable tax information necessary to prepare their 2023 income tax returns.
61
Disclosure Regarding the Renewal and Approval of Current Management and Investment Advisory Agreements (Unaudited)
At meetings held on May 16, 2023 and June 6-7, 2023 (collectively, the “Meetings”), the Board of Trustees (“Board” or “Trustees”) considered and then, at its June 7, 2023 meeting, approved the renewal of:
(1) the Management Agreement between American Beacon Advisors, Inc. (“Manager”) and the American Beacon Funds (“Trust”) on behalf of the American Beacon Balanced Fund (“Fund”); and
(2) the Investment Advisory Agreements among the Manager and the Trust, on behalf of the Fund, and each of Barrow, Hanley, Mewhinney & Strauss, LLC (“Barrow”) and Hotchkis and Wiley Capital Management, LLC (“Hotchkis”) (each, a “sub-advisor” and collectively, the “sub-advisors”).
The Management Agreement and the Investment Advisory Agreements are referred to herein individually as an “Agreement” and collectively as the “Agreements.”
In preparation for its consideration of the renewal of the Agreements, the Board undertook steps to gather and consider information furnished by the Manager, the sub-advisors, Broadridge, Inc. (“Broadridge”) and Morningstar, Inc. (“Morningstar”). The Board, with the assistance of independent legal counsel, requested and received certain relevant information from the Manager and each sub-advisor.
In advance of the Meetings, the Board’s Investment Committee and/or the Manager coordinated the production of information from Broadridge and Morningstar regarding the performance, fees and expenses of the Fund as well as information from the Manager and the sub-advisors. At the Meetings, the Board considered the information provided in connection with the renewal process, as well as information furnished to the Board throughout the year at regular meetings of the Board and its committees. In connection with the Board’s consideration of the Agreements, the Trustees received and evaluated such information as they deemed necessary. This information is described below in the section summarizing the factors the Board considered in connection with its renewal and approval of the Agreements, as well as the section describing additional Board considerations with respect to the Fund.
The Board noted that the Manager provides management and administrative services to the Fund pursuant to the Management Agreement. The Board considered that many mutual funds have separate contracts governing each type of service and observed that, with respect to such mutual funds, the actual management fee rates provided by Broadridge for peer group funds reflect the combined advisory and administrative fees, reduced by any fee waivers and/or reimbursements.
The Manager or a sub-advisor may not have been able to, or opted not to, provide information in response to certain information requests, in which case the Board conducted its evaluation of the firm based on information that was provided. In such cases, the Board determined that the omission of any such information was not material to its considerations.
Provided below is an overview of certain factors the Board considered in connection with its decision to approve the renewal of the Agreements. The Board did not identify any particular information that was most relevant to its consideration of whether to approve the renewal of each Agreement, and each Trustee may have afforded different weight to the various factors. Legal counsel to the independent Trustees provided the Board with a memorandum regarding its responsibilities pertaining to the renewal of investment advisory contracts, such as the Agreements, and related regulatory guidelines. Based on its evaluation, the Board unanimously concluded that the terms of each Agreement were reasonable and fair and that the approval of the renewal of each Agreement was in the best interests of the Fund and its shareholders.
Considerations With Respect to the Renewal of the Management Agreement and the Investment Advisory Agreements
In determining whether to approve the renewal of the Agreements, the Board considered the Fund’s investment management and sub-advisory relationships separately. In each instance, the Board considered, among
62
Disclosure Regarding the Renewal and Approval of Current Management and Investment Advisory Agreements (Unaudited)
other things, the following factors: (1) the nature, extent and quality of the services provided; (2) the investment performance of the Fund and the sub-advisors for the Fund; (3) the profits, if any, earned by the Manager in rendering services to the Fund; (4) comparisons of services and fee rates with contracts entered into by the Manager or a sub-advisor or their affiliates with other clients (such as pension funds and other institutional clients); (5) the extent to which economies of scale, if any, have been taken into account in setting each fee rate schedule; (6) whether fee rate levels reflect economies of scale, if any, for the benefit of Fund investors; and (7) any other benefits derived or anticipated to be derived by the Manager or the sub-advisors from their relationships with the Fund.
Nature, Extent and Quality of Services. With respect to the renewal of the Management Agreement, the Board considered, among other factors: the Fund’s long-term performance; the length of service of key investment personnel at the Manager; the cost structure of the Fund; the financial condition of the Manager, including its parent company; the Manager’s culture of compliance and support that reduce risks to the Fund; the Manager’s quality of services; the Manager’s active role in monitoring and, as appropriate, recommending additional or replacement sub-advisors; and the Manager’s representations regarding its efforts to retain key employees and maintain staffing levels.
With respect to the renewal of each Investment Advisory Agreement, the Board considered, among other factors: the representations made by each sub-advisor regarding the sub-advisor’s level of staffing; asset size; the financial stability of each sub-advisor; and its compliance program. Based on the foregoing and other information, the Board concluded that the nature, extent and quality of the management and advisory services provided by the Manager and each sub-advisor were appropriate for the Fund.
Investment Performance. The Board evaluated the comparative information provided by Broadridge and the Manager regarding the performance of the Fund relative to its Broadridge Performance Universe, Morningstar Category, and/or benchmark index, as well as the Fund’s Morningstar rating. The Board considered the information provided by Broadridge regarding its independent methodology for selecting the Fund’s Broadridge Performance Universe. In addition, the Board considered the performance reports and discussions with management at meetings of the Board and its committees throughout the year. The Board also evaluated the comparative information provided by each sub-advisor regarding the performance of its portion of the Fund relative to the performance of other comparable investment accounts and a composite of comparable investment accounts managed by the sub-advisor, the Fund’s custom blended benchmark index and a component index thereof, as applicable. In addition, the Board considered the Manager’s recommendation to continue to retain each sub-advisor. A discussion regarding the Board’s considerations with respect to the Fund’s performance appears below under “Additional Considerations and Conclusions with Respect to the Fund.”
Costs of the Services Provided to the Fund and the Profits Realized by the Manager from its Relationship with the Fund. In analyzing the costs of services and profitability of the Manager, the Board considered the revenues earned and the expenses incurred by the Manager, before and after the payment of distribution-related expenses by the Manager. The profits or losses were noted at both an aggregate level for all funds within the group of mutual funds sponsored by the Manager (the “Fund Complex”) and at an individual fund level, with the Manager earning a profit before and after the payment of distribution-related expenses by the Manager for the Fund. The Board also considered comparative information provided by the Manager regarding the Manager’s overall profitability with respect to the Fund Complex relative to the overall profitability of other firms in the mutual fund industry, as disclosed in publicly available sources. Although the Board noted that, in certain cases, the fee rates paid by other clients of the Manager are lower than the fee rates paid by the Fund, the Manager represented that the difference is attributable to, among other factors, the fact that the Manager does not perform administrative services for non-investment company clients and reflects the greater level of responsibility and regulatory requirements associated with managing the Fund.
The Board further considered that, with respect to the Fund, the Management Agreement provides for the Manager to receive a management fee comprised of an annualized fee that is retained by the Manager. In addition,
63
Disclosure Regarding the Renewal and Approval of Current Management and Investment Advisory Agreements (Unaudited)
the Board considered that the Manager receives fees for managing the portion of the Fund with respect to which the Manager has not delegated day-to-day management to a sub-advisor and for administering and overseeing the securities lending program on behalf of the Fund. The Board also noted that certain share classes of the Fund maintain higher expense ratios in order to compensate third-party financial intermediaries.
In analyzing the fee rates charged by each sub-advisor in connection with its investment advisory services to the Fund, the Board considered the representations made by each sub-advisor that the Fund’s sub-advisory fee rate schedule generally was favorable compared to other comparable client accounts. The Board did not request profitability data from the sub-advisors because the Board did not view this data as imperative to its deliberations given the arms-length nature of the relationship between the Manager and the sub-advisors with respect to the negotiation of sub-advisory fee rates. In addition, the Board noted that the sub-advisors may not account for their profits on an account-by-account basis and that different firms likely employ different methodologies in connection with these calculations.
Based on the foregoing and other information, the Board concluded that the profitability levels of the Manager were reasonable in light of the services performed by the Manager. A discussion regarding the Board’s considerations with respect to the Fund’s fee rates is set forth below under “Additional Considerations and Conclusions with Respect to the Fund.”
Economies of Scale. In considering the reasonableness of the management and investment advisory fees rates, the Board considered whether economies of scale will be realized as the Fund grows and whether fee rate levels reflect these economies of scale for the benefit of Fund shareholders. In this regard, the Board considered that, with respect to each sub-advisor, the Manager has negotiated breakpoints in the sub-advisory fee rate schedule. The Board also noted that, for purposes of determining the fee rates chargeable to the Fund, certain sub-advisors have agreed to take into account other clients of the Manager whose assets are allocated to the sub-advisors by the Manager for purposes of calculating the Fund’s sub-advisory fee rate breakpoints.
In addition, the Board noted the Manager’s representation that the Management Agreement contains fee schedule breakpoints at higher asset levels with respect to the Fund, except for the portion of the Fund with respect to which the Manager has not delegated day-to-day management to a sub-advisor. In this regard, the Board considered that the Fund’s current assets did not exceed the threshold necessary to reach the first management fee breakpoint. Based on the foregoing and other information, the Board concluded that the Manager and sub-advisor fee rate schedules for the Fund provide for a reasonable sharing of benefits from any economies of scale with the Fund.
Benefits Derived from the Relationship with the Fund. The Board considered the Manager’s and sub-advisor’s responses to inquiries regarding “fall-out” or ancillary benefits that accrue to the Manager and/or the sub-advisors as a result of their advisory relationships with the Fund. For example, the Board considered that the Manager may invest the Fund’s cash balances and cash collateral provided by the borrowers of the Fund’s securities in the American Beacon U.S. Government Money Market Select Fund, which the Manager manages directly, and for which the Manager receives a fee. In addition, the Board noted that each sub-advisor benefits from soft dollar arrangements for proprietary and third-party research. Based on the foregoing and other information, the Board concluded that the potential benefits accruing to the Manager and the sub-advisors by virtue of their relationships with the Fund appear to be fair and reasonable.
Additional Considerations and Conclusions with Respect to the Fund
The performance comparisons below were made for the Fund’s R5 Class shares relative to the Fund’s Broadridge Performance Universe and Morningstar Category. With respect to the Broadridge Performance Universe, the 1st Quintile represents the top 20 percent of the universe based on performance, and the 5th Quintile represents the bottom 20 percent of the universe based on performance. References to the Fund’s Broadridge Performance Universe are to the respective universe of mutual funds with comparable investment classifications and objectives
64
Disclosure Regarding the Renewal and Approval of Current Management and Investment Advisory Agreements (Unaudited)
as determined by Broadridge. The performance of each sub-advisor was calculated by the Manager based on information provided by the Fund’s custodian.
In reviewing the performance, the Board viewed longer-term performance over a full market cycle, typically five years or longer, as the most important consideration because relative performance over shorter periods may be significantly impacted by market or economic events and not necessarily reflective of sub-advisor skill.
The expense comparisons below were made for the Fund’s R5 Class shares relative to the Fund’s Broadridge Expense Universe and Broadridge Expense Group, and Y Class shares relative to the Fund’s Morningstar Fee Level universe. The 1st Quintile represents the lowest 20 percent of the universe or group based on lowest total expense, and the 5th Quintile represents the highest 20 percent of the universe or group based on highest total expense. References to the Fund’s Expense Group and Expense Universe are to the respective group or universe of comparable mutual funds as determined by Broadridge. Broadridge Expense Groups consist of the Fund and a representative sample of funds with similar operating structures and asset sizes, as selected by Broadridge. A Broadridge Expense Universe includes all funds with comparable investment classifications/objectives and similar operating structures to that of the share class under review for the Fund, including funds in the Broadridge Expense Group. The Broadridge expense comparisons are based on the most recent audited financial information publicly available for the Fund as of December 31, 2022. References to the Fund’s Morningstar Fee Level ranking are to the institutional share class of comparable mutual funds as determined by Morningstar.
The Board considered the Fund’s Morningstar fee level category with the 1st Quintile representing the lowest 20 percent of the category constituents and the 5th Quintile representing the highest 20 percent of the category in terms of total expense.
In considering the renewal of the Management Agreement for the Fund, the Board considered the following additional factors:
Broadridge Total Expenses Excluding 12b-1 Fees and Morningstar Fee Level Ranking
| | | | |
Compared to Broadridge Expense Group | | | 1 | st Quintile |
Compared to Broadridge Expense Universe | | | 4 | th Quintile |
Morningstar Fee Level Ranking | | | 3 | rd Quintile |
Broadridge and Morningstar Performance Analysis (five-year period ended December 31, 2022)
| | | | |
Compared to Broadridge Performance Universe | | | 2 | nd Quintile |
Compared to Morningstar Category | | | 2 | nd Quintile |
The Board noted that the Manager receives an additional fee under the Management Agreement for directly making investment decisions with respect to a portion of the Fund’s assets. In considering the renewal of the Management Agreement and the Investment Advisory Agreements with Barrow, Hotchkis, and the Manager, the Board considered that the diversification of investment strategies facilitated by the Fund’s multi-manager structure permits the Fund to mitigate the risks associated with a single sub-advisor. The Board also considered the following additional factors:
Sub-advisor Performance (compared to Broadridge Performance Universe for period indicated ended December 31, 2022)
| | | | | | | | |
Barrow | | | 5 Years | | | | 1 | st Quintile |
Hotchkis* | | | 5 Years | | | | 1 | st Quintile |
AmBeacon** | | | 5 Years | | | | 2 | nd Quintile |
* Hotchkis manages an equity sleeve of the Fund only. Accordingly, the return of Hotchkis’ portion of the Fund is compared to the Broadridge large cap value Performance Universe.
** AmBeacon directly makes investment decisions with respect to a fixed income portion of the Fund only. Accordingly, the return of AmBeacon’s portion of the Fund is compared to the Broadridge core bond Performance Universe.
65
Disclosure Regarding the Renewal and Approval of Current Management and Investment Advisory Agreements (Unaudited)
The Board also considered the Manager’s recommendation to continue to retain each sub-advisor.
Based on these and other considerations, the Board: (1) concluded that the fees paid to the Manager and the sub-advisors under the Agreements are fair and reasonable; and (2) determined that the Fund and its shareholders would benefit from the Manager’s and sub-advisors’ continued management of the Fund.
66
Disclosure Regarding the Approval of New Management and Investment Advisory Agreements (Unaudited)
On July 11, 2023, (i) Resolute Investment Holdings, LLC (“RIH”), its indirect wholly-owned subsidiary, Resolute Investment Managers, Inc. (“RIM”), the parent company of American Beacon Advisors, Inc. (“Manager”), the investment manager of American Beacon Funds (“Trust”), and certain of their affiliates, and (ii) the current owners of approximately 93% of RIH (“Current Ownership Group”), entered into a transaction agreement (“Transaction Agreement”) with certain creditors of RIM (“Lender Group”) to strengthen the capital structure of RIH, the indirect 100% owner of RIM and the Manager (together with RIH, “Resolute”). Pursuant to the Transaction Agreement, (i) all equity interests in RIH would be cancelled, (ii) new equity interests would be issued to members of the Lender Group (“New Ownership Group”), and (iii) the existing credit agreements between RIM and the Lender Group would be terminated and a new credit agreement would be executed (“Transaction”).
Upon the closing of the Transaction (“Closing”), the Manager will be wholly owned indirectly by the New Ownership Group, rather than by the Current Ownership Group. This change in control will be deemed to be an “assignment” under the Investment Company Act of 1940 Act, as amended (“1940 Act”), of the Trust’s (i) existing management agreement (“Current Management Agreement”) with the Manager with respect to the American Beacon Balanced Fund (“Fund”) and other series of the Trust (“Other Funds”), and (ii) existing investment advisory agreements (“Current Investment Advisory Agreements”) among the Manager, the Trust and each of Barrow, Hanley, Mewhinney & Strauss, LLC (“Barrow”) and Hotchkis and Wiley Capital Management, LLC (“Hotchkis”) on behalf of the Fund. Barrow and Hotchkis are collectively referred to herein as the “Sub-Advisors.” As required by the 1940 Act, the Current Management Agreement and Current Investment Advisory Agreements (“Current Agreements”) provide for their automatic termination in the event of an assignment, and, therefore, will terminate upon the Closing.
The Board of Trustees (“Trustees” or “Board”) of the Trust met by videoconference on July 7, 2023, and in-person on July 12, 2023 (“July Meetings”), to discuss the Transaction and consider the effect that the Transaction would have on the Fund and the Other Funds. In addition, the Board received various information from the Manager regarding the intended purposes and framework of the Transaction at its meetings in-person on February 28–March 1, 2023 (“March Meeting”) and June 6–7, 2023, and by videoconference on May 16, 2023 (“May-June Meetings”). Following the March Meeting, the Board designated an ad hoc special committee (“Committee”) to meet with representatives of the Manager and receive updates on the negotiations and, as appropriate, to provide input with respect to the process. Throughout this process, the Board and the Committee were advised by independent legal counsel and received guidance concerning, among other matters, the Trustees’ responsibilities in connection with their consideration with respect to the Fund of a new Management Agreement (“New Management Agreement”), and new Investment Advisory Agreements (each, a “New Investment Advisory Agreement” and, collectively with the New Management Agreement, the “New Agreements”). The Trustees were advised that the New Agreements would replace the Current Agreements, upon the assignment and termination of the Current Agreements upon the Closing.
In advance of the July Meetings, the Board requested and received detailed information from the Manager regarding the Transaction. In connection with the Transaction, the Board reviewed materials furnished by the Manager, which had been reviewed, as applicable, by representatives of the New Ownership Group and met with senior representatives of the Manager. The Board also reviewed the material terms of the Transaction and considered its possible effects on the Fund and its shareholders. During these meetings, representatives of the Manager indicated their belief that the Transaction would not adversely affect the continued operation of the Fund, the capabilities of the key personnel of the Manager who currently manage the Fund to continue to provide services to the Fund at the current levels, or the capabilities of the Sub-Advisors to provide the same level of services to the Fund.
In evaluating the New Management Agreement, the Trustees considered that they generally have been satisfied with the nature and quality of the services provided to the Fund by the Manager, including investment advisory and administrative services, and that the Fund would be best served by an arrangement that appeared likely to maintain the continuity and stability of these services. Accordingly, the Board considered information communicated by the Manager regarding the anticipated benefits of the substantially strengthened capital
67
Disclosure Regarding the Approval of New Management and Investment Advisory Agreements (Unaudited)
structure of Resolute that would result from the Transaction, and the related positive anticipated impact on the Manager’s resources available for future staffing, compensation, and staff retention. The Manager’s representatives also indicated that they believe that the Transaction best facilitates continuity of management and view such continuity as beneficial to the long-term success of the Fund, but noted that there could be no assurance of any particular benefits that may result.
In connection with the Board’s determination to approve the New Agreements, the Trustees considered, among other information, the following factors as they relate to the Transaction:
| | • | | The manner in which the Fund’s assets are managed will not change as a result of the Transaction, and the same people who currently manage the Fund’s assets are expected to continue to do so after the Transaction; |
| | • | | The fee rates payable by the Fund under the New Agreements are the same as the fee rates payable under the Current Agreements; |
| | • | | The New Agreements are identical in all material respects to the Current Agreements; |
| | • | | The Manager and the Sub-Advisors would provide the same services to the Fund pursuant to the New Agreements as they had been providing under the Current Agreements; |
| | • | | The Manager’s personnel who will provide management services to the Fund are not expected to change and the commitment of the New Ownership Group to retain key personnel currently employed by the Manager who currently provide services to the Fund; |
| | • | | The Sub-Advisors’ personnel who will provide advisory services to the Fund are not expected to change; |
| | • | | Resolute’s substantially strengthened capital structure following the Closing, which would enable Resolute to continue to provide the Manager with the financial resources necessary to continue to operate and grow the Fund; |
| | • | | The anticipated governance structure to be employed in the management of RIM and that following the Transaction the Manager is expected to maintain continuity of management, a similar degree of operational autonomy and its current culture of compliance; |
| | • | | The various measures in place and/or prepared to be employed to address any potential impact of the Transaction on the Manager’s business, including its day-to-day operations; |
| | • | | The anticipated absence of any adverse impact of the Transaction on the Fund’s Sub-Advisors and other key service providers; |
| | • | | The alignment of the strategic business objectives of the New Ownership Group with regard to its investment in the Manager and the Manager’s activities with respect to the Trust, which objectives are consistent with the Manager’s current objectives; |
| | • | | Fund shareholders will not bear any costs in connection with the Transaction, inasmuch as the Manager and, indirectly, the New Ownership Group will bear the costs, fees and expenses incurred by the Fund in connection with the Transaction, the proxy statement, the fees and expenses of accountants and attorneys relating to the Transaction, and the fees and expenses of the Board and the Committee for meetings held in connection with the Transaction; |
| | • | | The Fund may realize benefits as a result of the Transaction, including that the Transaction is expected to maintain continuity of management of the Fund and may reduce the potential vulnerability to changes in control of the Manager that could be adverse to the Fund’s interests and affect the retention of key employees providing services to the Fund; |
| | • | | The Manager’s representation that there had been no material changes or developments relating to the Manager or the Sub-Advisors since the May-June Meetings, other than the changes or developments subsequently reported to the Board; and |
68
Disclosure Regarding the Approval of New Management and Investment Advisory Agreements (Unaudited)
| | • | | The Trustees had requested and evaluated information relevant to the renewal of the Current Agreements at their May-June Meetings. |
In light of the proximity of the Board’s consideration of the renewal or approval of the Current Agreements at the May-June Meetings, the Trustees determined that it was not necessary to repeat certain aspects of the review conducted in connection with the approvals made the prior month. Based on the process undertaken and the considerations weighed by the Board with respect to the renewal of the Current Agreements, and the Board’s due diligence review in connection with the Transaction during the July Meetings, the Board approved the New Agreements at the July 12, 2023 meeting, and recommended that, as applicable, the shareholders of the Fund also approve the New Agreements. The factors considered by the Board in connection with the approval of the Current Agreements are described in the section of this report titled “Disclosure Regarding Approval of the Current Management and Investment Advisory Agreements.”
69
American Beacon Balanced FundSM
Results of Shareholder Meeting(Unaudited)
A special meeting of shareholders of each of the portfolios of the American Beacon Funds (the “Trust”) was held on October 27, 2023, and adjourned to November 17, 2023. A quorum was achieved and the shareholders of the American Beacon Balanced Fund (the “Fund”), a portfolio of the Trust, approved a new management agreement between American Beacon Advisors, Inc. (“American Beacon”) and the Trust, with respect to the Fund, at the meeting held on November 17. 2023, that will become effective upon the change in control of American Beacon.
The following is the result of the shareholder votes for this proposal:
| | | | | | | | | | | | | | | | | | | | | | | | | | | | |
Fund | | For | | | | | | Against | | | | | | Abstain | | | | | | Non-Voting | |
American Beacon Balanced Fund | | | 4,433,023.45 | | | | | | | | 171,747.06 | | | | | | | | 771,217.33 | | | | | | | | 4,787,833.08 | |
70
Trustees and Officers of the American Beacon FundsSM (Unaudited)
The Trustees and officers of the American Beacon Funds (the “Trust”) are listed below, together with their principal occupations during the past five years. The address of each person listed below is 220 East Las Colinas Boulevard, Suite 1200, Irving, Texas 75039. Each Trustee oversees twenty-seven funds in the fund complex that includes the Trust, the American Beacon Select Funds, and the American Beacon Institutional Funds Trust. The Trust’s Statement of Additional Information contains additional information about the Trustees and is available without charge by calling 1-800-658-5811.
| | | | |
Name, Age | | Position, Term of Office and Length of Time Served with the Trust | | Principal Occupation(s) During Past 5 Years and Current Directorships |
| INTERESTED TRUSTEES | | Term | | |
| | Lifetime of Trust until removal, resignation or retirement* | | |
| | |
| Eugene J. Duffy (1954)** | | Trustee since 2008 | | Managing Director, Global Investment Management Distribution, Mesirow Financial Administrative Corporation (2016-Present); Managing Director, Institutional Services, Intercontinental Real Estate Corporation (2014-2016); Trustee, American Beacon Select Funds (2008-Present); Trustee, American Beacon Institutional Funds Trust (2017-Present); Trustee, American Beacon Sound Point Enhanced Income Fund (2018–2021); Trustee, American Beacon Apollo Total Return Fund (2018–2021). |
| | |
| NON-INTERESTED TRUSTEES | | Term | | |
| | Lifetime of Trust until removal, resignation or retirement* | | |
| | |
| Gilbert G. Alvarado (1969) | | Trustee since 2015 | | Chief Financial Officer (2022-Present), The Conrad Prebys Foundation; President, SJVIIF, LLC, Impact Investment Fund (2018-2022); Director, Kura MD, Inc. (local telehealth organization) (2015-2017); Senior Vice President & CFO, Sierra Health Foundation (health conversion private foundation) (2006-2022); Senior Vice President & CFO, Sierra Health Foundation: Center for Health Program Management (California public benefit corporation) (2012-2022); Director, Sacramento Regional Technology Alliance (2011-2016); Director, Valley Healthcare Staffing (2017–2018); Trustee, American Beacon Select Funds (2015-Present); Trustee, American Beacon Institutional Funds Trust (2017-Present); Trustee, American Beacon Sound Point Enhanced Income Fund (2018–2021); Trustee, American Beacon Apollo Total Return Fund (2018–2021). |
| | |
| Joseph B. Armes (1962) | | Trustee since 2015 | | Director, Switchback Energy Acquisition (2019-2021); Chairman & CEO, CSW Industrials f/k/a Capital Southwest Corporation (investment company) (2015-Present); Chairman of the Board of Capital Southwest Corporation, predecessor to CSW Industrials, Inc. (2014-2017) (investment company); President & CEO, JBA Investment Partners (family investment vehicle) (2010-Present); Director and Chair of Audit Committee, RSP Permian (oil and gas producer) (2013-2018); Trustee, American Beacon Select Funds (2015-Present); Trustee, American Beacon Institutional Funds Trust (2017-Present); Trustee, American Beacon Sound Point Enhanced Income Fund (2018–2021); Trustee, American Beacon Apollo Total Return Fund (2018–2021). |
| | |
| Gerard J. Arpey (1958) | | Trustee since 2012 | | Partner, Emerald Creek Group (private equity firm) (2011-Present); Director, S.C. Johnson & Son, Inc. (privately held company) (2008-present); Director, The Home Depot, Inc. (2015-Present); Trustee, American Beacon Select Funds (2012-Present); Trustee, American Beacon Institutional Funds Trust (2017-Present); Trustee, American Beacon Sound Point Enhanced Income Fund (2018–2021); Trustee, American Beacon Apollo Total Return Fund (2018–2021). |
71
Trustees and Officers of the American Beacon FundsSM (Unaudited)
| | | | |
Name, Age | | Position, Term of Office and Length of Time Served with the Trust | | Principal Occupation(s) During Past 5 Years and Current Directorships |
| NON-INTERESTED TRUSTEES (CONT.) | | Term | | |
| | Lifetime of Trust until removal, resignation or retirement* | | |
| | |
| Brenda A. Cline (1960) | | Trustee since 2004 Chair since 2019 Vice Chair 2018 | | Chief Financial Officer, Treasurer and Secretary, Kimbell Art Foundation (1993-Present); Director, Tyler Technologies, Inc. (public sector software solutions company) (2014-Present); Director, Range Resources Corporation (oil and natural gas company) (2015-Present); Trustee, Cushing Closed-End and Open-End Funds (2017-2021);Chair, (2019-Present), Vice Chair (2018), Trustee (2004-Present), American Beacon Select Funds; Chair (2019-Present), Vice Chair (2018), Trustee (2017-Present), American Beacon Institutional Funds Trust; Chair (2019-2021), Vice Chair (2018), Trustee (2018-2021), American Beacon Sound Point Enhanced Income Fund (2018–2021); Chair (2019-2021), Vice Chair (2018), Trustee (2018-2021), American Beacon Apollo Total Return Fund (2018–2021). |
| | |
| Claudia A. Holz (1957) | | Trustee since 2018 | | Independent Director, Blue Owl Capital, Inc. (2021-Present); Partner, KPMG LLP (1990 – 2017); Trustee, American Beacon Select Funds (2018-Present); Trustee, American Beacon Institutional Funds Trust (2018-Present); Trustee, American Beacon Sound Point Enhanced Income Fund (2018–2021); Trustee, American Beacon Apollo Total Return Fund (2018–2021). |
| | |
| Douglas A. Lindgren (1961) | | Trustee since 2018 | | Director, JLL Income Property Trust (2022-Present); CEO North America, Carne Global Financial Services (2016-2017); Consultant, Carne Financial Services (2017-2019); Managing Director, IPS Investment Management and Global Head, Content Management, UBS Wealth Management (2010-2016); Trustee, American Beacon Select Funds (2018-Present); Trustee, American Beacon Institutional Funds Trust (2018-Present); Trustee, American Beacon Sound Point Enhanced Income Fund (2018–2021); Trustee, American Beacon Apollo Total Return Fund (2018–2021). |
| | |
| Barbara J. McKenna, CFA (1963) | | Trustee since 2012 | | President/Managing Principal, Longfellow Investment Management Company (2005-Present, President since 2009); Member, External Diversity Council of the Federal Reserve Bank of Boston (2021-Present); Member, Federal Reserve Bank of Boston CEO Roundtable (2021-Present); Board Advisor, United States Tennis Association (2021-Present); Trustee, American Beacon Select Funds (2012-Present); Trustee, American Beacon Institutional Funds Trust (2017-Present); Trustee, American Beacon Sound Point Enhanced Income Fund (2018–2021); Trustee, American Beacon Apollo Total Return Fund (2018–2021). |
72
Trustees and Officers of the American Beacon FundsSM (Unaudited)
| | | | |
Name, Age | | Position, Term of Office and Length of Time Served with the Trust | | Principal Occupation(s) During Past 5 Years and Current Directorships |
| OFFICERS | | Term | | |
| | One Year | | |
| | |
| Jeffrey K. Ringdahl (1975) | | President since 2022 Vice President (2010-2022) | | Director (2015-Present), President (2018-Present), Chief Executive Officer (2022-Present), Chief Operating Officer (2010-2022), Senior Vice President (2013-2018), American Beacon Advisors, Inc.; Director (2015-Present), President (2018-Present), Senior Vice President (2015-2018), Resolute Investment Holdings, LLC; Director (2015-Present), President (2018-Present), Senior Vice President (2015-2018), Resolute Topco, Inc.; Director (2015-Present), President (2018-Present), Senior Vice President (2015-2018), Resolute Acquisition, Inc.; Director (2015-Present), President (2018-Present), Chief Executive Officer (2022-Present); Chief Operating Officer (2018-2022), Senior Vice President (2015-2018), Resolute Investment Managers, Inc.; Director (2017-Present), President & Chief Executive Officer (2022-Present), Executive Vice President (2017-2022), Resolute Investment Distributors, Inc.; Director (2017-Present), President (2018-Present), Chief Executive Officer (2022-Present), Chief Operating Officer (2018-2022), Executive Vice President (2017-2018), Resolute Investment Services, Inc.; President (2022-Present), Senior Vice President (2017-2022), Vice President (2012-2017), Manager (2015-Present), American Private Equity Management, L.L.C.; Trustee, American Beacon NextShares Trust (2015-2020); Director, Executive Vice President & Chief Operating Officer, Alpha Quant Advisors, LLC (2016-2020); Director, Shapiro Capital Management, LLC (2017-Present); Director and Executive Vice President, Continuous Capital, LLC (2018-2022); Director, RSW Investments Holdings LLC (2019-Present); Manager, SSI Investment Management, LLC (2019-Present); Director, National Investment Services of America, LLC (2019-Present); Director and Vice President American Beacon Cayman Transformational Innovation Company, Ltd. (2017-2018); Vice President, American Beacon Delaware Transformational Innovation Corporation (2017-2018); Director (2014-Present), President (2022-Present), Vice President (2014-2022), American Beacon Cayman Managed Futures Strategy Fund, Ltd.; Director (2018-Present), President (2022-Present), (Vice President (2018-2022), American Beacon Cayman TargetRisk Company, Ltd.; President (2022-Present); Vice President (2010-2022), Director and President, American Beacon Cayman Multi-Alternatives Company, Ltd.; (2023-Present); Director and President, American Beacon Cayman Trend Company, Ltd. (2023-Present); American Beacon Select Funds; President (2022-Present), Vice President (2017-2022), American Beacon Institutional Funds Trust; Vice President, American Beacon Sound Point Enhanced Income Fund (2018-2021); Vice President, American Beacon Apollo Total Return Fund (2018-2021). |
73
Trustees and Officers of the American Beacon FundsSM (Unaudited)
| | | | |
Name, Age | | Position, Term of Office and Length of Time Served with the Trust | | Principal Occupation(s) During Past 5 Years and Current Directorships |
| OFFICERS (CONT.) | | Term | | |
| | One Year | | |
| | |
| Rosemary K. Behan (1959) | | VP, Secretary and Chief Legal Officer since 2006 | | Senior Vice President (2021-Present), Vice President (2006-2021), Secretary and General Counsel (2006-Present), American Beacon Advisors, Inc.; Secretary, Resolute Investment Holdings, LLC (2015-Present); Secretary, Resolute Topco, Inc. (2015-Present); Secretary, Resolute Acquisition, Inc. (2015–Present); Senior Vice President (2021-Present), Vice President (2015-2021), Secretary and General Counsel (2015-Present), Resolute Investment Managers, Inc.; Secretary, Resolute Investment Distributors, Inc. (2017-Present); Senior Vice President (2021-Present), Vice President (2017-2021), Secretary and General Counsel (2017-Present), Resolute Investment Services, Inc.; Secretary, American Private Equity Management, L.L.C. (2008-Present); Secretary and General Counsel, Alpha Quant Advisors, LLC (2016-2020); Vice President and Secretary, Continuous Capital, LLC (2018-2022); Secretary, Green Harvest Asset Management (2019-2021); Secretary, American Beacon Delaware Transformational Innovation Corporation (2017-2018); Secretary, American Beacon Cayman Transformational Innovation Company, Ltd. (2017-2018); Secretary, American Beacon Cayman Managed Futures Strategy Fund, Ltd. (2014-Present); Secretary, American Beacon Cayman TargetRisk Company, Ltd. (2018-Present); Secretary, American Beacon Cayman Multi-Alternatives Company, Ltd. (2023-Present); Secretary, American Beacon Cayman Trend Company, Ltd. (2023-Present); Chief Legal Officer, Vice President and Secretary, American Beacon Select Funds (2006-Present); Chief Legal Officer, Vice President and Secretary, American Beacon Institutional Funds Trust (2017-Present); Chief Legal Officer, Vice President and Secretary, American Beacon Sound Point Enhanced Income Fund (2018-2021); Chief Legal Officer, Vice President and Secretary, American Beacon Apollo Total Return Fund (2018-2021). |
| | |
| Gregory J. Stumm (1981) | | VP since 2022 | | Senior Vice President, American Beacon Advisors, Inc. (2022-Present); Senior Vice President, Resolute Investment Managers, Inc. (2022-Present); Director and Senior Vice President, Resolute Investment Distributors, Inc. (2022-Present); Senior Vice President, Resolute Investment Services, Inc. (2022-Present); Vice President, American Beacon Select Funds (2022-Present); Vice President, American Beacon Institutional Funds Trust (2022-Present). |
| | |
| Paul B. Cavazos (1969) | | VP since 2016 | | Chief Investment Officer and Senior Vice President, American Beacon Advisors, Inc. (2016-Present); American Private Equity Management, L.L.C. (2017–Present); Vice President, American Beacon Select Funds (2016-Present); Vice President, American Beacon Institutional Funds Trust (2017-Present); Vice President, American Beacon Sound Point Enhanced Income Fund (2018-2021); Vice President, American Beacon Apollo Total Return Fund (2018-2021). |
| | |
| Erica Duncan (1970) | | VP since 2011 | | Vice President, American Beacon Advisors, Inc. (2011-Present); Vice President, Resolute Investment Managers (2018-Present); Vice President, Resolute Investment Services, Inc. (2018-Present); Vice President, American Beacon Select Funds (2011-Present); Vice President, American Beacon Institutional Funds Trust (2017-Present); Vice President, American Beacon Sound Point Enhanced Income Fund (2018-2021); Vice President, American Beacon Apollo Total Return Fund (2018-2021). |
74
Trustees and Officers of the American Beacon FundsSM (Unaudited)
| | | | |
Name, Age | | Position, Term of Office and Length of Time Served with the Trust | | Principal Occupation(s) During Past 5 Years and Current Directorships |
| OFFICERS (CONT.) | | Term | | |
| | One Year | | |
| | |
| Melinda G. Heika (1961) | | VP since 2021 | | Senior Vice President (2021-Present), Treasurer and CFO (2010-Present), American Beacon Advisors, Inc.; Treasurer, Resolute Topco, Inc. (2015-Present); Treasurer, Resolute Investment Holdings, LLC. (2015-Present); Treasurer, Resolute Acquisition, Inc. (2015-Present); Senior Vice President (2021-Present), Treasurer and CFO (2017-Present), Resolute Investment Managers, Inc.; Treasurer, Resolute Investment Distributors, Inc. (2017); Senior Vice President (2021-Present); Treasurer and CFO (2017-Present), Resolute Investment Services, Inc.; Treasurer, American Private Equity Management, L.L.C. (2012-Present); Treasurer and CFO, Alpha Quant Advisors, LLC (2016-2020); Treasurer and CFO, Continuous Capital, LLC (2018-2022); Treasurer, American Beacon Cayman Transformational Innovation, Ltd. (2017-2018); Treasurer, American Beacon Delaware Transformational Innovation Corporation (2017-2018); Director (2014-Present), Vice President (2022-Present) and Treasurer (2014-2022), American Beacon Cayman Managed Futures Strategy Fund, Ltd.; Director and Vice President (2022-Present), and Treasurer(2018-2022), American Beacon Cayman TargetRisk Company, Ltd. (2018-Present); Director and Vice President, American Beacon Cayman Multi-Alternatives Company, Ltd. (2023-Present); Director and Vice President, American Beacon Cayman Trend Company, Ltd. (2023-Present) Principal Accounting Officer and Treasurer (2010-2021); American Beacon Funds; Vice President (2021-Present), Principal Accounting Officer (2017-2021) and Treasurer (2010-2021), American Beacon Select Funds; Vice President (2021–Present), Principal Accounting Officer and Treasurer (2017-2021), American Beacon Institutional Funds Trust; Vice President (2021), Principal Accounting Officer and Treasurer (2018-2021), American Beacon Sound Point Enhanced Income Fund; Vice President (2021), Principal Accounting Officer and Treasurer, American Beacon Apollo Total Return Fund (2018-2021). |
| | |
| Terri L. McKinney (1963) | | VP since 2010 | | Senior Vice President (2021-Present), Vice President (2009-2021), American Beacon Advisors, Inc.; Senior Vice President (2021–Present); Vice President (2017-2021), Resolute Investment Managers, Inc.; Senior Vice President (2021-Present), Vice President (2018-2021), Resolute Investment Services, Inc; Vice President, Alpha Quant Advisors, LLC (2016-2020); Vice President, Continuous Capital, LLC (2018-2022); Vice President, American Beacon Select Funds (2010-Present); Vice President, American Beacon Institutional Funds Trust (2017-Present); Vice President, American Beacon Sound Point Enhanced Income Fund (2018-2021); Vice President, American Beacon Apollo Total Return Fund (2018-2021). |
| | |
| Samuel J. Silver (1963) | | VP since 2011 | | Vice President (2011-Present), Chief Fixed Income Officer (2016-Present), American Beacon Advisors, Inc.; Vice President, American Beacon Select Funds (2011-Present); Vice President, American Beacon Institutional Funds Trust (2017-Present); Vice President, American Beacon Sound Point Enhanced Income Fund (2018-2021); Vice President, American Beacon Apollo Total Return Fund (2018-2021). |
75
Trustees and Officers of the American Beacon FundsSM (Unaudited)
| | | | |
Name, Age | | Position, Term of Office and Length of Time Served with the Trust | | Principal Occupation(s) During Past 5 Years and Current Directorships |
| OFFICERS (CONT.) | | Term | | |
| | One Year | | |
| | |
| Christina E. Sears (1971) | | Chief Compliance Officer since 2004 | | Chief Compliance Officer (2004-Present), Vice President (2019-Present); American Beacon Advisors, Inc.; Vice President, Resolute Investment Managers, Inc. (2017-Present); Vice President, Resolute Investment Distributors (2017-Present); Vice President, Resolute Investment Services, Inc. (2019-Present); Chief Compliance Officer, American Private Equity Management, L.L.C. (2012-Present); Chief Compliance Officer, Green Harvest Asset Management, LLC (2019-2021); Chief Compliance Officer, RSW Investments Holdings, LLC (2019-Present); Chief Compliance Officer (2016-2019) and Vice President (2016-2020), Alpha Quant Advisors, LLC ; Chief Compliance Officer (2018-2019), Vice President (2018-2022), Continuous Capital, LLC; Assistant Secretary, American Beacon Funds (1999-Present); Chief Compliance Officer (2004-Present) and Assistant Secretary (1999-Present), American Beacon Select Funds; Chief Compliance Officer and Assistant Secretary, American Beacon Institutional Funds Trust (2017-Present); Chief Compliance Officer and Assistant Secretary, American Beacon Sound Point Enhanced Income Fund (2018-2021); Chief Compliance Officer and Assistant Secretary, American Beacon Apollo Total Return Fund (2018-2021). |
| | |
| Sonia L. Bates (1956) | | Principal Accounting Officer and Treasurer since 2021 | | Assistant Treasurer, American Beacon Advisors, Inc. (2011-2018); Vice President, Fund and Tax Reporting (2023-Present), Director, Fund and Tax Reporting (2011-2023), Resolute Investment Services, Inc.; Assistant Treasurer, American Private Equity Management, L.L.C. (2012-Present); Assistant Treasurer, American Beacon Cayman Transformational Innovation Company, Ltd. (2017-2018); Treasurer, American Beacon Cayman Managed Futures Strategy Fund, Ltd. (2022-Present); Treasurer (2022-Present), Assistant Treasurer (2018-2022), American Beacon Cayman TargetRisk Company, Ltd.; Treasurer, American Beacon Cayman Multi-Alternatives Company, Ltd. (2023-Present); Treasurer, American Beacon Cayman Trend Company, Ltd. (2023-Present); Assistant Treasurer, American Beacon Funds (2011-2021); Principal Accounting Officer and Treasurer (2021-Present), Assistant Treasurer (2011-2021), American Beacon Select Funds; Principal Accounting Officer and Treasurer (2021-Present), Assistant Treasurer (2017-2021), American Beacon Institutional Funds Trust; Principal Accounting Officer and Treasurer (2021), Assistant Treasurer (2018-2021), American Beacon Sound Point Enhanced Income Fund; Principal Accounting Officer and Treasurer (2021), Assistant Treasurer (2018-2021), American Beacon Apollo Total Return Fund. |
| | |
| Shelley L. Dyson (1969) | | Assistant Treasurer since 2021 | | Fund Tax Manager (2020-Present), Manager, Tax (2014-2020), Resolute Investment Services, Inc.; Assistant Treasurer American Beacon Cayman Managed Futures Strategy Fund, Ltd. (2022-Present); Assistant Treasurer, American Beacon Cayman TargetRisk Company, Ltd. (2022-Present); Assistant Treasurer, American Beacon Cayman Multi-Alternatives Company, Ltd. (2023-Present); Assistant Treasurer, American Beacon Cayman Trend Company, Ltd. (2023-Present); Assistant Treasurer, American Beacon Select Funds (2021-Present); Assistant Treasurer, American Beacon Institutional Funds Trust (2021-Present); Assistant Treasurer, American Beacon Sound Point Enhanced Income Fund (2021); Assistant Treasurer, American Beacon Apollo Total Return Fund (2021). |
76
Trustees and Officers of the American Beacon FundsSM (Unaudited)
| | | | |
Name, Age | | Position, Term of Office and Length of Time Served with the Trust | | Principal Occupation(s) During Past 5 Years and Current Directorships |
| OFFICERS (CONT.) | | Term | | |
| | One Year | | |
| | |
| Shelley D. Abrahams (1974) | | Assistant Secretary since 2008 | | Corporate Governance Manager (2023-Present), Senior Corporate Governance & Regulatory Specialist (2020-2023), Corporate Governance & Regulatory Specialist (2017-2020), Resolute Investment Services, Inc.; Assistant Secretary, American Beacon Cayman Managed Futures Strategy Fund, Ltd. (2022-Present); Assistant Secretary, American Beacon Cayman TargetRisk Company, Ltd. (2022-Present); Assistant Secretary, American Beacon Cayman Multi-Alternatives Company, Ltd. (2023-Present); Assistant Secretary, American Beacon Cayman Trend Company, Ltd. (2023-Present); Assistant Secretary, American Beacon Select Funds (2008-Present); Assistant Secretary, American Beacon Institutional Funds Trust (2017-Present); Assistant Secretary, American Beacon Sound Point Enhanced Income Fund (2018-2021); Assistant Secretary, American Beacon Apollo Total Return Fund (2018-2021). |
| | |
| Rebecca L. Harris (1966) | | Vice President since 2022 | | Senior Vice President (2021-Present), Vice President (2011-2021), American Beacon Advisors, Inc.; Senior Vice President (2021-Present), Vice President (2017-2021), Resolute Investment Managers, Inc.; Senior Vice President (2021-Present), Vice President (2015-Present), Resolute Investment Services; Vice President, Alpha Quant Advisors, LLC (2016-2020); Vice President (2018-Present), Director (2022) Continuous Capital, LLC; Director, National Investment Services of American, LLC (2022-Present); Director, RSW Investments Holdings LLC (2022-Present); Director Shapiro Capital Management LLC (2022-Present); Director, SSI Investment Management LLC (2022-Present); Assistant Secretary, American Beacon Funds (2010-2022); Vice President (2022-Present), Assistant Secretary (2010-2022), American Beacon Select Funds; Vice President (2022-Present), Assistant Secretary (2017-2022), American Beacon Institutional Funds Trust; Assistant Secretary, American Beacon Sound Point Enhanced Income Fund (2018-2021); Assistant Secretary, American Beacon Apollo Total Return Fund (2018-2021). |
| | |
| Teresa A. Oxford (1958) | | Assistant Secretary since 2015 | | Assistant Secretary and Associate General Counsel, American Beacon Advisors, Inc. (2015-Present); Assistant Secretary, Resolute Investment Distributors (2018-2021); Assistant Secretary and Associate General Counsel, Resolute Investment Managers, Inc. (2017-Present); Assistant Secretary and Associate General Counsel, Resolute Investment Services (2018-Present); Assistant Secretary, Alpha Quant Advisors, LLC (2016-2020); Assistant Secretary, Continuous Capital, LLC (2020-2022); Assistant Secretary, American Beacon Select Funds (2015-Present); Assistant Secretary, American Beacon Institutional Funds Trust (2017-Present); Assistant Secretary, American Beacon Sound Point Enhanced Income Fund (2018-2021); Assistant Secretary, American Beacon Apollo Total Return Fund (2018-2021). |
| | |
| Michael D. Jiang (1984) | | Assistant Secretary since 2021 | | Assistant Secretary (2022-Present), Associate General Counsel (2021-Present), American Beacon Advisors, Inc.; Assistant Secretary (2021-Present), Resolute Investment Distributors, Inc.; Assistant Secretary (2022-Present), Associate General Counsel (2021-Present), Resolute Investment Managers, Inc.; Assistant Secretary (2022–Present) and Associate General Counsel, (2021-Present), Resolute Investment Services, Inc.; Vice President (2018-2021), Second Vice President (2015-2018), The Northern Trust Company; Assistant Secretary, American Beacon Select Funds (2021-Present); Assistant Secretary, American Beacon Institutional Funds Trust (2021-Present); Assistant Secretary, American Beacon Sound Point Enhanced Income Fund (2021); Assistant Secretary, American Beacon Apollo Total Return Fund (2021). |
* As of 11/12/2014, the Board adopted a retirement plan that requires Trustees to retire no later than the last day of the calendar year in which they reach the age of 75.
** Mr. Duffy is being deemed to be an “interested person” of the Trust, as defined by the Investment Company Act of 1940, as amended, by virtue of his position with Mesirow Financial, Inc., a broker-dealer.
77
American Beacon Balanced FundSM
Privacy Policy
October 31, 2023 (Unaudited)
The American Beacon Funds recognize and respect the privacy of our shareholders. We are providing this notice to you so you will understand how shareholder information may be collected and used.
We may collect nonpublic personal information about you from one or more of the following sources:
| | • | | information we receive from you on applications or other forms; |
| | • | | information about your transactions with us or our service providers; and |
| | • | | information we receive from third parties. |
We do not disclose any nonpublic personal information about our customers or former customers to anyone, except as permitted by law.
We restrict access to your nonpublic personal information to those employees or service providers who need to know that information to provide products or services to you. To ensure the confidentiality of your nonpublic personal information, we maintain safeguards that comply with federal standards.
78
This page intentionally left blank.
79
This page intentionally left blank.
80

Delivery of Documents
Shareholder reports are available online at www.americanbeaconfunds.com/reports. Please be advised that reports are no longer sent by mail. Instead, the reports are made available online, and you will be notified by mail each time a report is posted online. You will be provided with a website link to access the report. You may elect to receive all future reports in paper free of charge. You can request to continue receiving paper copies by calling 1-866-345-5954, or you may directly inform your financial intermediary. Detailed instructions are also included in your report notifications.
If you invest in the Fund through a financial institution, you may be able to receive the Fund’s regulatory mailings, such as the Prospectus, Annual Report and Semi-Annual Report, by e-mail. If you are interested in this option, please go to www.icsdelivery.com and search for your financial institution’s name or contact your financial institution directly.
To obtain more information about the Fund:
| | |
 | |  |
| | |
| By E-mail: | | On the Internet: |
| american_beacon.funds@ambeacon.com | | Visit our website at www.americanbeaconfunds.com |
| | | |
| | | |
| | |

By Telephone: Call (800) 658-5811 | | 
By Mail: American Beacon Funds P.O. Box 219643 Kansas City, MO 64121-9643 |
|
|
|
| | | |
| | | |
| Availability of Quarterly Portfolio Schedules | | Availability of Proxy Voting Policy and Records |
| | |
| In addition to the Schedule of Investments provided in each semi-annual and annual report, the Fund files a complete schedule of its portfolio holdings with the Securities and Exchange Commission (“SEC”) on Form N-PORT as of the end of each fiscal quarter. The Fund’s Forms N-PORT are available on the SEC’s website at www.sec.gov. The Forms N-PORT may also be reviewed and copied at the SEC’s Public Reference Section, 100 F Street, NE, Washington, D.C. 20549-2736. Information regarding the operation of the SEC’s Public Reference Room may be obtained by calling (800)-SEC-0330. A complete schedule of the Fund’s portfolio holdings is also available at www.americanbeaconfunds.com approximately twenty days after the end of each month. | | A description of the policies and procedures the Fund uses to determine how to vote proxies relating to portfolio securities is available in the Fund’s Statement of Additional Information, is available free of charge on the Fund’s website www.americanbeaconfunds.com and by calling 1-800-967-9009 or by accessing the SEC’s website at www.sec.gov. The Fund’s proxy voting record for the most recent year ended June 30 is filed annually with the SEC on Form N-PX. The Fund’s Forms N-PX are available on the SEC’s website at www.sec.gov. The Fund’s proxy voting record may also be obtained by calling 1-800-967-9009. |
Fund Service Providers:
| | | | | | | | | | | | |
CUSTODIAN State Street Bank and Trust Company Boston, Massachusetts | | | | TRANSFER AGENT SS&C GIDS, Inc. Quincy, Massachusetts | | | | INDEPENDENT REGISTERED PUBLIC ACCOUNTING FIRM PricewaterhouseCoopers LLP Boston, Massachusetts | | | | DISTRIBUTOR Resolute Investment Distributors, Inc. Irving, Texas |
This report is prepared for shareholders of the American Beacon Funds and may be distributed to others only if preceded or accompanied by a current Prospectus or Summary Prospectus.
American Beacon Funds and American Beacon Balanced Fund are service marks of American Beacon Advisors, Inc.
AR 10/23

About American Beacon Advisors
Since 1986, American Beacon Advisors, Inc. has offered a variety of products and investment advisory services to numerous institutional and retail clients, including a variety of mutual funds, corporate cash management, and separate account management.
Our clients include defined benefit plans, defined contribution plans, foundations, endowments, corporations, financial planners, and other institutional investors. With American Beacon Advisors, you can put the experience of a multi-billion dollar asset management firm to work for your company.
GARCIA HAMILTON QUALITY BOND FUND
The use of fixed-income securities entails interest rate and credit risks. Interest rate risk is the risk that debt securities will decrease in value with increases in market interest rates. Credit risk is the risk that the issuer of a bond will fail to make timely payment of interest or principal; and the decline in an issuer’s credit rating can cause the price of its bonds to go down. To the extent the Fund invests more heavily in particular sectors, its performance will be sensitive to factors affecting those sectors. Financial sector companies are heavily regulated and particularly sensitive to interest rate fluctuations. The Fund’s incorporation of environmental, social and/or governance (ESG) considerations in its investment strategy may cause it to underperform funds that do not incorporate these considerations. Please see the prospectus for a complete discussion of the Fund’s risks. There can be no assurances that the investment objectives of this Fund will be met.
This report may contain information obtained from third parties, including ratings from credit rating agencies such as Standard & Poor’s. Reproduction and distribution of third-party content in any form is prohibited except with the prior written permission of the related third party. Third-party content providers do not guarantee the accuracy, completeness, timeliness or availability of any information, including ratings, and are not responsible for any errors or omissions (negligent or otherwise), regardless of the cause, or for the results obtained from the use of such content. THIRD-PARTY CONTENT PROVIDERS GIVE NO EXPRESS OR IMPLIED WARRANTIES, INCLUDING, BUT NOT LIMITED TO, ANY WARRANTIES OF MERCHANTABILITY OR FITNESS FOR A PARTICULAR PURPOSE OR USE. THIRD-PARTY CONTENT PROVIDERS SHALL NOT BE LIABLE FOR ANY DIRECT, INDIRECT, INCIDENTAL, EXEMPLARY, COMPENSATORY, PUNITIVE, SPECIAL OR CONSEQUENTIAL DAMAGES, COSTS, EXPENSES, LEGAL FEES OR LOSSES (INCLUDING LOST INCOME OR PROFITS AND OPPORTUNITY COSTS OR LOSSES CAUSED BY NEGLIGENCE) IN CONNECTION WITH ANY USE OF THEIR CONTENT, INCLUDING RATINGS.
Credit ratings are statements of opinions and are not statements of fact or recommendations to purchase, hold or sell securities. They do not address the suitability of securities or the suitability of securities for investment purposes and should not be relied on as investment advice.
Any opinions herein, including forecasts, reflect our judgment as of the end of the reporting period and are subject to change. Each advisor’s strategies and the Fund’s portfolio composition will change depending on economic and market conditions. This report is not a complete analysis of market conditions and therefore, should not be relied upon as investment advice. Although economic and market information has been compiled from reliable sources, American Beacon Advisors, Inc. makes no representation as to the completeness or accuracy of the statements contained herein.
American Beacon Funds | October 31, 2023 |
Contents
President’s Message
| | |
 | | Dear Shareholders, In the words of Theodor Seuss Geisel, the beloved children’s author and cartoonist known as Dr. Seuss, “Only you can control your future.” While we as individuals cannot control everything that’s happening in the world around us or within the global economy and markets, we can take steps to diversify our risk exposure as we seek to preserve and grow our personal savings. By making prudent adjustments to our investment portfolios with the help of trusted financial professionals, we may be better positioned to withstand the negative financial forces we’re likely to encounter in our lifetime – especially during periods like today’s geopolitical turmoil and economic uncertainty. |
At American Beacon, we endeavor to provide a broad range of disciplined investment strategies to help you potentially collect the fruits of your labor over the fullness of time. We work diligently to cultivate relationships with the investment managers who serve as sub-advisors to our investment products. Since our firm’s inception as a pension fiduciary in 1986 and the launch of our first sub-advised, multi-manager mutual funds in 1987, we have continued expanding our innovative product offerings. And we are committed to applying a solutions-based, risk-managed approach in our pursuit of institutional wisdom while striving to generate earned alpha and enduring value.
Thank you for entrusting your financial future with American Beacon. For more information about our investment products or to access your account information, please visit our website at www.americanbeaconfunds.com.
Best Regards,

Jeffrey K. Ringdahl
President
American Beacon Funds
1
Domestic Bond Market Overview
October 31, 2023 (Unaudited)
During the 12 months ended October 31, 2023, the economy faced increasing headwinds in the form of sharply higher interest rates and the dissipation of savings that were built up during the COVID-19 pandemic. Additionally, the benign tailwind of healthy supply chains removed one of the primary causes of inflation seen during the period. With the broad increase in interest rates and positive excess return in all investment-grade spread sectors, the bond market posted a small positive total return of 0.36% for the Bloomberg® US Aggregate Bond Index (the “Index”) over the past 12 months. The period’s return qualifies as the eighth worst annual return in the 47-year history of the Index. The Credit sector excess return was a positive 4.07% over the period; within the sector, low-quality credit performed the best, resulting in an excess return of 5.00%. The Mortgage-Backed Securities sector had a small, positive excess return of 0.08%. The Agency and Asset-Backed Securities sectors also followed suit, delivering positive excess returns of 0.73% and 1.17%, respectively. In total, the Index had a positive excess return of 1.21% for the period.
October 2023 marked the third consecutive month in which the Federal Reserve (“Fed”) maintained a pause in its tightening efforts, following a 17-month period of rate hikes. A Fed pause after a tightening cycle has historically been associated with significantly lower bond yields in the future. Despite the Fed’s observation of “resilient” strength in the labor market, there have been increasing signs of weakness. This trend raises concerns about the Fed’s reliance on employment data that tends to lag behind market dynamics, potentially leading to a policy mistake similar to the one witnessed in 2021. (In 2021, the Fed delayed the conclusion of its easing policy, failing to address mounting inflationary pressures that ultimately proved to be more persistent than transitory.) The Fed’s belief in the resilience of the U.S. economy may be misplaced, as both economic growth and inflation are expected to trend lower in the future. Furthermore, the majority of leading economic indicators (including the Conference Board’s Leading Economic Indicator Index®, money supply, supply chains and tightened lending standards) also point toward a significant slowdown in economic growth and inflation. Given this backdrop, interest rates could potentially decline over the coming months.
2
American Beacon Garcia Hamilton Quality Bond FundSM
Performance Overview
October 31, 2023 (Unaudited)
The Investor Class of the American Beacon Garcia Hamilton Quality Bond Fund (the “Fund”) returned -1.59% for the twelve months ended October 31, 2023. The Bloomberg US Aggregate Bond Index (the “Index”) returned 0.36% for the same period. The Fund’s longer duration impacted returns as interest rates rose to cyclical highs through period end.
Comparison of Changes in Value of a $10,000 Investment for the period 4/4/2016 through 10/31/2023
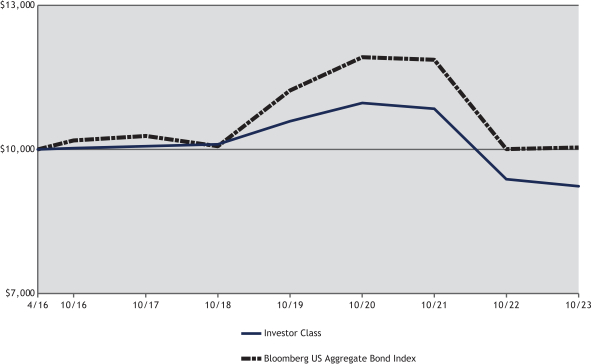
| | | | | | | | | | | | | | | | | | | | | | | | | | | | | | |
| Total Returns for the Period ended Oct 31, 2023 | |
| | | | | | |
| | | Ticker | | 1 Year | | 3 Years | | 5 Years | | Since Inception 04/04/2016 | | Value of $10,000 04/04/2016- 10/31/2023 |
R5 Class (1,4) | | GHQIX | | | | (1.08 | )% | | | | (5.16 | )% | | | | (1.39 | )% | | | | (0.66 | )% | | | $ | 9,513 | |
Y Class (1,4) | | GHQYX | | | | (1.27 | )% | | | | (5.29 | )% | | | | (1.50 | )% | | | | (0.77 | )% | | | $ | 9,433 | |
Investor Class (1,4) | | GHQPX | | | | (1.59 | )% | | | | (5.57 | )% | | | | (1.79 | )% | | | | (1.05 | )% | | | $ | 9,231 | |
R6 Class (1,3,4) | | GHQRX | | | | (1.17 | )% | | | | (5.17 | )% | | | | (1.40 | )% | | | | (0.66 | )% | | | $ | 9,508 | |
| | | | | | | | | | | | | | | | | | | | | | | | | | | | | |
Bloomberg US Aggregate Bond Index (2) | | | | | | 0.36 | % | | | | (5.57 | )% | | | | (0.06 | )% | | | | 0.05 | % | | | $ | 10,037 | |
| 1. | Performance shown is historical and is not indicative of future returns. Investment returns and principal value will vary, and shares may be worth more or less at redemption than at original purchase. Performance shown is calculated based on the published end of day net asset values as of the date indicated and current performance may be lower or higher than the performance data quoted. To obtain performance as of the most recent month end, please visit www.americanbeaconfunds.com or call 1-800-967-9009. Fund performance in the table above does not reflect the deduction of taxes a shareholder would pay on distributions or the redemption of shares. Generally accepted accounting principles require adjustments to be made to the net assets of the Fund at period end for financial reporting purposes only; and as such, the total return based on the unadjusted net asset value per share may differ from the total return reported in the financial highlights. A portion of the fees charged to each Class of the Fund has been waived since Fund inception. Performance prior to waiving fees was lower than the actual returns shown since inception. |
| 2. | The Bloomberg US Aggregate Bond Index is a broad-based benchmark that measures the investment grade, U.S. dollar-denominated, fixed-rate taxable bond market. BLOOMBERG® is a trademark and service mark of Bloomberg Finance L.P. and its affiliates (collectively, “Bloomberg”). Bloomberg or Bloomberg’s licensors, own all proprietary rights in the Bloomberg Indices. Bloomberg does not approve or endorse this material, or guarantee the accuracy or completeness of any information herein, or make any warranty, express or implied, as to the results to be obtained therefrom and, to the maximum extent allowed by law, shall not have any liability or responsibility for injury or damages arising in connection therewith. One cannot directly invest in an index. |
3
American Beacon Garcia Hamilton Quality Bond FundSM
Performance Overview
October 31, 2023 (Unaudited)
| 3. | Fund performance for the five-year and since inception periods represent the returns achieved by the R5 Class from 4/4/16 through 2/28/19, the inception date of the R6 Class, and the returns of the R6 Class since its inception. Expenses of the R6 Class are lower than the R5 Class. As a result, total returns shown may be lower than they would have been had the R6 Class been in existence since 4/4/16. |
| 4. | The Total Annual Fund Operating Expense ratios set forth in the most recent Fund prospectus for the R5, Y, Investor, and R6 Class shares were 0.66%, 0.73%, 1.13%, and 0.63%, respectively. The expense ratios above may vary from the expense ratios presented in other sections of this report that are based on expenses incurred during the period covered by this report. |
While the U.S. Federal Reserve Bank (the “Fed”) paused its rate-hiking campaign in July 2023, interest rates at the longer end of the yield curve continued to rise as the economy and inflation were more resilient than expected. The Fund held a duration of approximately 6.7 years during the period, as compared to 6.2 years for the Index. Within the Index, the 1-3 year maturity segment returned 3.3%, 5-7 year maturities returned 1.0% and 10+ year maturities returned -2.9% for the period. The Fund was positioned for a slowing economy and lower inflation, which would put downward pressure on interest rates.
Among the primary Index sectors, Corporates produced the highest returns, at 2.8%, Treasuries returned -0.6%, and Agency Mortgages returned -0.8%. Additionally, within Corporates, lower-rated issuers outperformed higher quality with “Baa”-rated issuers returning 3.6%, “A”-rated returning 2.2% and “AA”-rated returning 1.3%. The Fund intentionally avoids “Baa”-rated issuers to minimize exposure to lower quality and potentially more volatile issuers.
The Fund was also underweight the Corporate sector overall as narrow credit spreads and the expectation of a slowing economy led the subadvisor to reduce credit exposure. The Fund held approximately half the allocation to Corporates as compared the Index during the period.
Within Agency Mortgage-Backed securities, the Fund held a notable overweight position, offsetting the underweight in Corporates, to take advantage of their attractive carry and high credit quality. Although mortgages underperformed during the period, as investors preferred low quality, they are expected to outperform in upcoming quarters as the economy begins to moderate.
The primary components of the Fund’s strategy are to actively manage duration, sector allocation and yield-curve exposures based on top-down views of interest rates and other macroeconomic variables. The Fund invests in high-quality, low-volatility securities that provide the benefit of fixed income investing when investors need it most. No derivatives, leverage, foreign currency, or high-yield bonds are used in the strategy.
4
American Beacon Garcia Hamilton Quality Bond FundSM
Performance Overview
October 31, 2023 (Unaudited)
| | | | | | | | |
| Top Ten Holdings (% Net Assets) | | | | | | | | |
| U.S. Treasury Notes, 1.875%, Due 2/15/2032 | | | | | | | 10.5 | |
| U.S. Treasury Bonds, 2.500%, Due 2/15/2045 | | | | | | | 5.8 | |
| U.S. Treasury Notes, 3.500%, Due 2/15/2033 | | | | | | | 5.6 | |
| U.S. Treasury Bonds, 3.750%, Due 8/15/2041 | | | | | | | 5.0 | |
| Federal Home Loan Mortgage Corp., 2.000%, Due 8/1/2042 | | | | | | | 3.9 | |
| Federal Home Loan Mortgage Corp., 2.500%, Due 4/1/2052 | | | | | | | 3.9 | |
| Federal Home Loan Mortgage Corp., 2.500%, Due 3/1/2052 | | | | | | | 3.8 | |
| Federal Home Loan Mortgage Corp., 4.000%, Due 10/1/2052 | | | | | | | 3.8 | |
| Federal Home Loan Mortgage Corp., 3.000%, Due 5/1/2052 | | | | | | | 3.7 | |
| Federal National Mortgage Association, 3.000%, Due 5/1/2052 | | | | | | | 3.7 | |
| | |
| Total Fund Holdings | | | 34 | | | | | |
| | | | | | | | |
| Sector Allocation (% Investments) | | | | | | | | |
| U.S. Agency Mortgage-Backed Obligations | | | | | | | 55.8 | |
| U.S. Treasury Obligations | | | | | | | 31.9 | |
| Financial | | | | | | | 7.4 | |
| Communications | | | | | | | 3.4 | |
| Technology | | | | | | | 1.5 | |
5
American Beacon Garcia Hamilton Quality Bond FundSM
Expense Examples
October 31, 2023 (Unaudited)
Fund Expense Example
As a shareholder of a Fund, you incur two types of costs: (1) transaction costs, including sales charges (loads) on purchase payments and redemption fees, if applicable, and (2) ongoing costs, including management fees, distribution (12b-1) fees, sub-transfer agent fees, and other Fund expenses. The Examples are intended to help you understand the ongoing cost (in dollars) of investing in the Fund and to compare these costs with the ongoing costs of investing in other mutual funds. The Examples are based on an investment of $1,000 invested at the beginning of the period in each Class and held for the entire period from May 1, 2023 through October 31, 2023.
Actual Expenses
The “Actual” lines of the tables provide information about actual account values and actual expenses. You may use the information on this page, together with the amount you invested, to estimate the expenses that you paid over the period. Simply divide your account value by $1,000 (for example, an $8,600 account value divided by $1,000 = $8.60), then multiply the result by the “Expenses Paid During Period” to estimate the expenses you paid on your account during this period. Shareholders of the Investor and R5 Classes that invest in the Fund through an IRA or Roth IRA may be subject to a custodial IRA fee of $15 that is typically deducted each December. If your account was subject to a custodial IRA fee during the period, your costs would have been $15 higher.
Hypothetical Example for Comparison Purposes
The “Hypothetical” lines of the tables provide information about hypothetical account values and hypothetical expenses based on the Fund’s actual expense ratio and an assumed 5% per year rate of return before expenses (not the Fund’s actual return). You may compare the ongoing costs of investing in the Fund with other funds by contrasting this 5% hypothetical example and the 5% hypothetical examples that appear in the shareholder reports of the other funds. The hypothetical account values and expenses may not be used to estimate the actual ending account balance or expenses you paid for the period. Shareholders of the Investor and R5 Classes that invest in the Fund through an IRA or Roth IRA may be subject to a custodial IRA fee of $15 that is typically deducted each December. If your account was subject to a custodial IRA fee during the period, your costs would have been $15 higher.
You should also be aware that the expenses shown in the table highlight only your ongoing costs and do not reflect any transaction costs charged by the Fund, such as sales charges (loads) or redemption fees, as applicable. Similarly, the expense examples for other funds do not reflect any transaction costs charged by those funds, such as sales charges (loads), redemption fees or exchange fees. Therefore, the “Hypothetical” lines of the tables are useful in comparing ongoing costs only and will not help you determine the relative total costs of owning different funds. If you were subject to any transaction costs during the period, your costs would have been higher.
6
American Beacon Garcia Hamilton Quality Bond FundSM
Expense Examples
October 31, 2023 (Unaudited)
| | | | | | | | | | | | | | | |
| American Beacon Garcia Hamilton Quality Bond Fund | |
| | | |
| | | Beginning Account Value
5/1/2023 | | Ending Account Value
10/31/2023 | | Expenses Paid During
Period
5/1/2023-10/31/2023* |
| R5 Class | | | | | | | | | | | | | | | |
| Actual | | | | $1,000.00 | | | | | $914.50 | | | | | $2.17 | |
| Hypothetical** | | | | $1,000.00 | | | | | $1,022.94 | | | | | $2.29 | |
| Y Class | | | | | | | | | | | | | | | |
| Actual | | | | $1,000.00 | | | | | $912.90 | | | | | $2.46 | |
| Hypothetical** | | | | $1,000.00 | | | | | $1,022.64 | | | | | $2.60 | |
| Investor Class | | | | | | | | | | | | | | | |
| Actual | | | | $1,000.00 | | | | | $910.40 | | | | | $4.00 | |
| Hypothetical** | | | | $1,000.00 | | | | | $1,021.02 | | | | | $4.23 | |
| R6 Class | | | | | | | | | | | | | | | |
| Actual | | | | $1,000.00 | | | | | $912.40 | | | | | $1.98 | |
| Hypothetical** | | | | $1,000.00 | | | | | $1,023.14 | | | | | $2.09 | |
| * | Expenses are equal to the Fund’s annualized expense ratios for the six-month period of 0.45%, 0.51%, 0.83%, and 0.41% for the R5, Y, Investor, and R6 Classes, respectively, multiplied by the average account value over the period, multiplied by the number derived by dividing the number of days in the most recent fiscal half-year (184) by days in the year (365) to reflect the half-year period. |
| ** | 5% return before expenses. |
7
American Beacon Garcia Hamilton Quality Bond FundSM
Report of Independent Registered Public Accounting Firm
To the Board of Trustees of American Beacon Funds and Shareholders of American Beacon Garcia Hamilton Quality Bond Fund
Opinion on the Financial Statements
We have audited the accompanying statement of assets and liabilities, including the schedule of investments, of American Beacon Garcia Hamilton Quality Bond Fund (one of the funds constituting American Beacon Funds, referred hereafter as the “Fund”) as of October 31, 2023, the related statement of operations for the year ended October 31, 2023, the statement of changes in net assets for each of the two years in the period ended October 31, 2023, including the related notes, and the financial highlights for each of the two years in the period ended October 31, 2023 (collectively referred to as the “financial statements”). In our opinion, the financial statements present fairly, in all material respects, the financial position of the Fund as of October 31, 2023, the results of its operations for the year then ended, the changes in its net assets for each of the two years in the period ended October 31, 2023 and the financial highlights for each of the two years in the period ended October 31, 2023 in conformity with accounting principles generally accepted in the United States of America.
The financial statements of the Fund as of and for the year ended October 31, 2021 and the financial highlights for each of the periods ended on or prior to October 31, 2021 (not presented herein, other than the financial highlights) were audited by other auditors whose report dated December 30, 2021 expressed an unqualified opinion on those financial statements and financial highlights.
Basis for Opinion
These financial statements are the responsibility of the Fund’s management. Our responsibility is to express an opinion on the Fund’s financial statements based on our audits. We are a public accounting firm registered with the Public Company Accounting Oversight Board (United States) (PCAOB) and are required to be independent with respect to the Fund in accordance with the U.S. federal securities laws and the applicable rules and regulations of the Securities and Exchange Commission and the PCAOB.
We conducted our audits of these financial statements in accordance with the standards of the PCAOB. Those standards require that we plan and perform the audit to obtain reasonable assurance about whether the financial statements are free of material misstatement, whether due to error or fraud.
Our audits included performing procedures to assess the risks of material misstatement of the financial statements, whether due to error or fraud, and performing procedures that respond to those risks. Such procedures included examining, on a test basis, evidence regarding the amounts and disclosures in the financial statements. Our audits also included evaluating the accounting principles used and significant estimates made by management, as well as evaluating the overall presentation of the financial statements. Our procedures included confirmation of securities owned as of October 31, 2023 by correspondence with the custodians and brokers; when replies were not received from brokers, we performed other auditing procedures. We believe that our audits provide a reasonable basis for our opinion.
/s/PricewaterhouseCoopers LLP
Boston, Massachusetts
December 27, 2023
We have served as the auditor of one or more investment companies in the American Beacon family of funds since 2016.
8
American Beacon Garcia Hamilton Quality Bond FundSM
Schedule of Investments
October 31, 2023
| | | | | | | | | | | | | | | |
| | | |
| | | Principal Amount | | | | Fair Value |
| | | | | | | |
| | | |
| CORPORATE OBLIGATIONS - 12.29% | | | | | | |
| | | |
| Communications - 3.45% | | | | | | |
| | | |
| Media - 3.45% | | | | | | |
| Walt Disney Co., 3.800%, Due 3/22/2030 | | | $ | 10,230,000 | | | | | | | | | $ | 9,136,405 | |
| | | | | | | | | | | | | | | |
| | | | | | | | | | | | | | | |
| | | |
| Financial - 7.34% | | | | | | |
| | | |
| Banks - 7.34% | | | | | | |
| Bank of America Corp., 3.974%, Due 2/7/2030, (3 mo. USD Term SOFR + 1.472%)A | | | | 5,546,000 | | | | | | | | | | 4,907,268 | |
| Citigroup, Inc., 3.980%, Due 3/20/2030, (3 mo. USD Term SOFR + 1.600%)A | | | | 5,680,000 | | | | | | | | | | 5,028,775 | |
| JPMorgan Chase & Co., 2.739%, Due 10/15/2030, (3 mo. USD Term SOFR + 1.510%)A | | | | 4,885,000 | | | | | | | | | | 4,015,197 | |
| Morgan Stanley, 3.622%, Due 4/1/2031, (Secured Overnight Financing Rate + 3.120%)A | | | | 2,265,000 | | | | | | | | | | 1,920,898 | |
| Wells Fargo & Co., 4.478%, Due 4/4/2031, (3 mo. USD Term SOFR + 4.032%)A | | | | 4,030,000 | | | | | | | | | | 3,581,164 | |
| | | | | | | | | | | | | | | |
| | | | | | | | | | | | | | 19,453,302 | |
| | | | | | | | | | | | | | | |
| | | | | | | | | | | | | | | |
Total Financial | | | | | | | | | | | | | | 19,453,302 | |
| | | | | | | | | | | | | | | |
| | | | | | | | | | | | | | | |
| | | |
| Technology - 1.50% | | | | | | |
| | | |
| Computers - 1.50% | | | | | | |
| International Business Machines Corp., 3.500%, Due 5/15/2029 | | | | 4,464,000 | | | | | | | | | | 3,981,206 | |
| | | | | | | | | | | | | | | |
| | | | | | | | | | | | | | | |
Total Corporate Obligations (Cost $37,921,072) | | | | | | | | | | | | | | 32,570,913 | |
| | | | | | | | | | | | | | | |
| | | | | | | | | | | | | | | |
| | | |
| U.S. AGENCY MORTGAGE-BACKED OBLIGATIONS - 55.52% | | | | | | |
| Federal Home Loan Mortgage Corp., | | | | | | | | | | | | | | | |
4.000%, Due 2/1/2039 | | | | 4,108,607 | | | | | | | | | | 3,787,206 | |
3.000%, Due 1/1/2040 | | | | 3,788,439 | | | | | | | | | | 3,232,880 | |
2.000%, Due 8/1/2042 | | | | 13,178,541 | | | | | | | | | | 10,306,732 | |
2.500%, Due 9/1/2042 | | | | 11,896,918 | | | | | | | | | | 9,553,947 | |
2.500%, Due 3/1/2052 | | | | 12,968,878 | | | | | | | | | | 9,972,548 | |
2.500%, Due 4/1/2052 | | | | 13,322,902 | | | | | | | | | | 10,246,178 | |
3.000%, Due 5/1/2052 | | | | 12,141,208 | | | | | | | | | | 9,743,091 | |
4.000%, Due 10/1/2052 | | | | 11,783,654 | | | | | | | | | | 10,198,166 | |
4.000%, Due 11/1/2052 | | | | 11,202,289 | | | | | | | | | | 9,686,466 | |
| Federal National Mortgage Association, | | | | | | | | | | | | | | | |
4.000%, Due 5/1/2039 | | | | 7,066,402 | | | | | | | | | | 6,392,448 | |
4.000%, Due 9/1/2039 | | | | 3,278,594 | | | | | | | | | | 2,971,721 | |
3.500%, Due 10/1/2039 | | | | 5,272,265 | | | | | | | | | | 4,575,853 | |
3.000%, Due 7/1/2040B | | | | 6,737,628 | | | | | | | | | | 5,716,425 | |
3.000%, Due 8/1/2040B | | | | 4,402,071 | | | | | | | | | | 3,757,325 | |
4.000%, Due 8/1/2040B | | | | 3,947,765 | | | | | | | | | | 3,559,648 | |
4.000%, Due 6/1/2049B | | | | 7,037,931 | | | | | | | | | | 6,191,122 | |
2.500%, Due 11/1/2050 | | | | 6,491,923 | | | | | | | | | | 5,018,691 | |
2.500%, Due 5/1/2051 | | | | 8,209,844 | | | | | | | | | | 6,346,160 | |
3.000%, Due 5/1/2052 | | | | 20,538,629 | | | | | | | | | | 16,482,122 | |
3.500%, Due 10/1/2052 | | | | 11,257,003 | | | | | | | | | | 9,399,185 | |
| | | | | | | | | | | | | | | |
| | | | | | | | | | | | | | | |
Total U.S. Agency Mortgage-Backed Obligations (Cost $164,040,206) | | | | | | | | | | | | | | 147,137,914 | |
| | | | | | | | | | | | | | | |
| | | | | | | | | | | | | | | |
| | | |
| U.S. TREASURY OBLIGATIONS - 31.75% | | | | | | |
| U.S. Treasury Bonds, | | | | | | | | | | | | | | | |
3.750%, Due 8/15/2041 | | | | 15,960,000 | | | | | | | | | | 13,274,231 | |
2.500%, Due 2/15/2045 | | | | 23,500,000 | | | | | | | | | | 15,263,067 | |
2.500%, Due 5/15/2046 | | | | 14,025,000 | | | | | | | | | | 8,952,990 | |
| U.S. Treasury Notes, | | | | | | | | | | | | | | | |
2.375%, Due 5/15/2029 | | | | 4,550,000 | | | | | | | | | | 4,001,156 | |
1.875%, Due 2/15/2032 | | | | 34,910,000 | | | | | | | | | | 27,805,270 | |
3.500%, Due 2/15/2033 | | | | 16,530,000 | | | | | | | | | | 14,833,092 | |
| | | | | | | | | | | | | | | |
| | | | | | | | | | | | | | | |
Total U.S. Treasury Obligations (Cost $96,083,512) | | | | | | | | | | | | | | 84,129,806 | |
| | | | | | | | | | | | | | | |
TOTAL INVESTMENTS - 99.56% (Cost $298,044,790) | | | | | | | | | | | | | | 263,838,633 | |
OTHER ASSETS, NET OF LIABILITIES - 0.44% | | | | | | | | | | | | | | 1,172,574 | |
| | | | | | | | | | | | | | | |
TOTAL NET ASSETS - 100.00% | | | | | | | | | | | | | $ | 265,011,207 | |
| | | | | | | | | | | | | | | |
| | | | | | | |
See accompanying notes
9
American Beacon Garcia Hamilton Quality Bond FundSM
Schedule of Investments
October 31, 2023
| | | | | | | | | | | | | | | |
| Percentages are stated as a percent of net assets. | | | | | | | | | | | | | | | |
A Variable, floating, or adjustable rate securities with an interest rate that changes periodically. Rates are periodically reset with rates that are based on a predetermined benchmark such as a widely followed interest rate such as T-bills, SOFR, LIBOR or PRIME plus a fixed spread. The interest rate disclosed reflects the rate in effect on October 31, 2023.
B Coupon rate may change based on changes of the underlying collateral or prepayments of principal. The coupon rate shown represents the rate at period end.
|
| LIBOR - London Interbank Offered Rate. |
| PRIME - A rate, charged by banks, based on the U.S. Federal Funds rate. |
| SOFR - Secured Overnight Financing Rate. |
| USD - United States Dollar. |
The Fund’s investments are summarized by level based on the inputs used to determine their values. As of October 31, 2023, the investments were classified as described below:
| | | | | | | | | | | | | | | | | | | | | | | | | | | | |
Garcia Hamilton Quality Bond Fund | | Level 1 | | | | | | Level 2 | | | | | | Level 3 | | | | | | Total | |
Assets | |
Corporate Obligations | | $ | - | | | | | | | $ | 32,570,913 | | | | | | | $ | - | | | | | | | $ | 32,570,913 | |
U.S. Agency Mortgage-Backed Obligations | | | - | | | | | | | | 147,137,914 | | | | | | | | - | | | | | | | | 147,137,914 | |
U.S. Treasury Obligations | | | - | | | | | | | | 84,129,806 | | | | | | | | - | | | | | | | | 84,129,806 | |
| | | | | | | | | | | | | | | | | | | | | | | | | | | | |
Total Investments in Securities - Assets | | $ | - | | | | | | | $ | 263,838,633 | | | | | | | $ | - | | | | | | | $ | 263,838,633 | |
| | | | | | | | | | | | | | | | | | | | | | | | | | | | |
U.S. GAAP requires transfers between all levels to/from level 3 be disclosed. During the year ended October 31, 2023, there were no transfers into or out of Level 3.
See accompanying notes
10
American Beacon Garcia Hamilton Quality Bond FundSM
Statement of Assets and Liabilities
October 31, 2023
| | | | |
Assets: | | | | |
Investments in unaffiliated securities, at fair value† | | $ | 263,838,633 | |
Cash | | | 681,713 | |
Interest receivable | | | 1,404,895 | |
Receivable for fund shares sold | | | 212,516 | |
Receivable for expense reimbursement (Note 2) | | | 53,536 | |
Prepaid expenses | | | 28,149 | |
| | | | |
Total assets | | | 266,219,442 | |
| | | | |
Liabilities: | | | | |
Payable for fund shares redeemed | | | 967,964 | |
Dividends payable | | | 24,600 | |
Management and sub-advisory fees payable (Note 2) | | | 125,196 | |
Service fees payable (Note 2) | | | 238 | |
Transfer agent fees payable (Note 2) | | | 6,779 | |
Custody and fund accounting fees payable | | | 13,746 | |
Professional fees payable | | | 60,797 | |
Trustee fees payable (Note 2) | | | 1,929 | |
Payable for prospectus and shareholder reports | | | 6,610 | |
Other liabilities | | | 376 | |
| | | | |
Total liabilities | | | 1,208,235 | |
| | | | |
Commitments and contingent liabilities (Note 2) | | | | |
Net assets | | $ | 265,011,207 | |
| | | | |
Analysis of net assets: | | | | |
Paid-in-capital | | $ | 344,852,035 | |
Total distributable earnings (deficits)A | | | (79,840,828 | ) |
| | | | |
Net assets | | $ | 265,011,207 | |
| | | | |
Shares outstanding at no par value (unlimited shares authorized): | | | | |
R5 Class | | | 1,886,796 | |
| | | | |
Y Class | | | 6,090,191 | |
| | | | |
Investor Class | | | 92,668 | |
| | | | |
R6 Class | | | 25,080,556 | |
| | | | |
Net assets: | | | | |
R5 Class | | $ | 15,104,966 | |
| | | | |
Y Class | | $ | 48,666,569 | |
| | | | |
Investor Class | | $ | 740,628 | |
| | | | |
R6 Class | | $ | 200,499,044 | |
| | | | |
Net asset value, offering and redemption price per share: | | | | |
R5 Class | | $ | 8.01 | |
| | | | |
Y Class | | $ | 7.99 | |
| | | | |
Investor Class | | $ | 7.99 | |
| | | | |
R6 Class | | $ | 7.99 | |
| | | | |
| |
† Cost of investments in unaffiliated securities | | $ | 298,044,790 | |
| |
A The Fund’s investments in affiliated securities did not have unrealized appreciation (depreciation) at year end. | | | | |
See accompanying notes
11
American Beacon Garcia Hamilton Quality Bond FundSM
Statement of Operations
For the year ended October 31, 2023
| | | | |
Investment income: | | | | |
Interest income | | $ | 12,253,681 | |
| | | | |
Total investment income | | | 12,253,681 | |
| | | | |
Expenses: | | | | |
Management and sub-advisory fees (Note 2) | | | 1,705,011 | |
Transfer agent fees: | | | | |
R5 Class (Note 2) | | | 22,452 | |
Y Class (Note 2) | | | 50,443 | |
Investor Class | | | 1,315 | |
R6 Class | | | 7,945 | |
Custody and fund accounting fees | | | 59,970 | |
Professional fees | | | 86,887 | |
Registration fees and expenses | | | 64,216 | |
Service fees (Note 2): | | | | |
Investor Class | | | 3,311 | |
Prospectus and shareholder report expenses | | | 22,589 | |
Trustee fees (Note 2) | | | 30,413 | |
Loan expense (Note 8) | | | 1,954 | |
Other expenses | | | 43,458 | |
| | | | |
Total expenses | | | 2,099,964 | |
| | | | |
Net fees waived and expenses (reimbursed) (Note 2) | | | (753,949 | ) |
| | | | |
Net expenses | | | 1,346,015 | |
| | | | |
Net investment income | | | 10,907,666 | |
| | | | |
| |
Realized and unrealized gain (loss) from investments: | | | | |
Net realized (loss) from: | | | | |
Investments in unaffiliated securitiesA | | | (13,497,511 | ) |
Change in net unrealized appreciation of: | | | | |
Investments in unaffiliated securitiesB | | | 2,948,027 | |
| | | | |
Net (loss) from investments | | | (10,549,484 | ) |
| | | | |
Net increase in net assets resulting from operations | | $ | 358,182 | |
| | | | |
| |
A The Fund did not recognize net realized gains (losses) from the sale of investments in affiliated securities. | | | | |
B The Fund’s investments in affiliated securities did not have a change in unrealized appreciation (depreciation) at year end. | |
See accompanying notes
12
American Beacon Garcia Hamilton Quality Bond FundSM
Statement of Changes in Net Assets
| | | | | | | | | | | | |
| | | Year Ended
October 31, 2023 | | | | | | Year Ended
October 31, 2022 | |
Increase (decrease) in net assets: | | | | | | | | | | | | |
Operations: | | | | | | | | | | | | |
Net investment income | | $ | 10,907,666 | | | | | | | $ | 5,348,425 | |
Net realized (loss) from investments in unaffiliated securities | | | (13,497,511 | ) | | | | | | | (23,878,317 | ) |
Change in net unrealized appreciation (depreciation) of investments in unaffiliated securities | | | 2,948,027 | | | | | | | | (37,232,425 | ) |
| | | | | | | | | | | | |
Net increase (decrease) in net assets resulting from operations | | | 358,182 | | | | | | | | (55,762,317 | ) |
| | | | | | | | | | | | |
| | | |
Distributions to shareholders: | | | | | | | | | | | | |
Total retained earnings: | | | | | | | | | | | | |
R5 Class | | | (1,870,733 | ) | | | | | | | (3,883,600 | ) |
Y Class | | | (1,567,482 | ) | | | | | | | (505,181 | ) |
Investor Class | | | (25,683 | ) | | | | | | | (18,049 | ) |
R6 Class | | | (6,783,410 | ) | | | | | | | (4,868,664 | ) |
| | | | | | | | | | | | |
Net distributions to shareholders | | | (10,247,308 | ) | | | | | | | (9,275,494 | ) |
| | | | | | | | | | | | |
| | | |
Capital share transactions (Note 9): | | | | | | | | | | | | |
Proceeds from sales of shares | | | 82,037,288 | | | | | | | | 138,162,109 | |
Reinvestment of dividends and distributions | | | 9,615,714 | | | | | | | | 7,805,071 | |
Cost of shares redeemed | | | (173,589,366 | ) | | | | | | | (105,503,986 | ) |
| | | | | | | | | | | | |
Net increase (decrease) in net assets from capital share transactions | | | (81,936,364 | ) | | | | | | | 40,463,194 | |
| | | | | | | | | | | | |
Net (decrease) in net assets | | | (91,825,490 | ) | | | | | | | (24,574,617 | ) |
| | | | | | | | | | | | |
Net assets: | | | | | | | | | | | | |
Beginning of year | | | 356,836,697 | | | | | | | | 381,411,314 | |
| | | | | | | | | | | | |
End of year | | $ | 265,011,207 | | | | | | | $ | 356,836,697 | |
| | | | | | | | | | | | |
See accompanying notes
13
American Beacon Garcia Hamilton Quality Bond FundSM
Notes to Financial Statements
October 31, 2023
1. Organization and Significant Accounting Policies
American Beacon Funds (the “Trust”) is organized as a Massachusetts business trust. The Fund, a series within the Trust, is registered under the Investment Company Act of 1940, as amended (the “Act”), as a diversified, open-end management investment company. As of October 31, 2023, the Trust consists of twenty-four active series, one of which is presented in this filing: American Beacon Garcia Hamilton Quality Bond Fund (the “Fund”). The remaining twenty-three active series are reported in separate filings.
American Beacon Advisors, Inc. (the “Manager”) is a Delaware corporation and a wholly-owned subsidiary of Resolute Investment Managers, Inc. (“RIM”) organized in 1986 to provide business management, advisory, administrative, and asset management consulting services to the Trust and other investors. The Manager is registered as an investment advisor under the Investment Advisers Act of 1940, as amended (the “Advisers Act”). RIM is, in turn, a wholly-owned subsidiary of Resolute Acquisition, Inc., which is a wholly-owned subsidiary of Resolute Topco, Inc., a wholly-owned subsidiary of Resolute Investment Holdings, LLC (“RIH”). RIH is owned primarily by Kelso Investment Associates VIII, L.P., KEP VI, LLC and Estancia Capital Partners L.P., investment funds affiliated with Kelso & Company, L.P. (“Kelso”) or Estancia Capital Management, LLC (“Estancia”), which are private equity firms.
On July 11, 2023, (i) RIH, RIM and certain of their affiliates, and (ii) the current owners of approximately 93% of RIH (the “Current Ownership Group”) entered into a transaction agreement with certain creditors of RIM (the “Lender Group”) pursuant to which (i) all equity interests in RIH would be cancelled, (ii) new equity interests would be issued to members of the Lender Group, and (iii) the existing credit agreements between RIM and the Lender Group would be terminated and a new credit agreement would be executed (“Transaction”). The Lender Group consists of various institutional investment funds (“New Ownership Group”) that are managed by financial institutions and other investment advisory firms.
Upon the closing of the Transaction, the Manager will be wholly-owned indirectly by the New Ownership Group, rather than the Current Ownership Group. The Transaction is expected to close in the fourth calendar quarter of 2023, subject to the satisfaction of certain closing conditions. The Transaction will result in a change of control of the Manager and the termination of the Fund’s management and investment advisory agreements (the “Current Management Agreement” and “Current Investment Advisory Agreements”, respectively). The Board has approved a new management agreement with the Manager (the “New Management Agreement”) and a new investment advisory agreement among the Manager, the sub-advisor and the Trust, on behalf of the Fund (“New Investment Advisory Agreements”) (collectively, the “Agreements”), that would become effective upon the closing of the Transaction. A special meeting of the shareholders of the Fund as of July 31, 2023 was held on October 27, 2023 to consider the Agreements. The shareholders of the Fund approved the Agreements between the Trust and the Fund. In advance of the meeting, proxy materials were sent to those shareholders regarding the New Management Agreement. There are no anticipated changes in the services provided by the Manager or sub-advisor or in the fee rates charged by the Manager to a Fund. Please see the Results of Shareholder Meeting for more information.
Recently Adopted Accounting Pronouncements
In March 2020, the Financial Accounting Standards Board (“FASB”) issued Accounting Standards Update (“ASU”) No. 2020-04, Reference Rate Reform (Topic 848); Facilitation of the Effects of Reference Rate Reform on Financial Reporting, which provides optional guidance for a limited period of time to ease the potential burden in accounting for (or recognizing the effects of) reference rate reform. The guidance is applicable to contracts referencing London Inter-bank Offered Rate (“LIBOR”) or another reference rate that is expected to be discontinued due to reference rate reform. The ASU is effective as of March 12, 2020 and generally can be applied through December 31, 2022. In December 2022, the FASB issued ASU No. 2022-06 Reference Rate Reform (Topic 848): Deferral of the Sunset Date of Topic 848 which updates and clarifies ASU No. 2020-04. The amendments in this ASU defer the sunset date of Topic 848 from December 31, 2022, to December 31, 2024. Management expects these ASUs will not have a material impact on the Fund’s financial statements.
14
American Beacon Garcia Hamilton Quality Bond FundSM
Notes to Financial Statements
October 31, 2023
In June 2022, the FASB issued ASU No. 2022-03, Fair Value Measurement (Topic 820); Fair Value Measurement of Equity Securities Subject to Contractual Sale Restrictions, which provides clarifying guidance that a contractual restriction on the sale of an equity security is not considered part of the unit of account of the equity security and, therefore, is not considered in measuring fair value. The ASU is effective for fiscal years beginning after December 15, 2023, and interim periods within those fiscal years. Management expects the ASU will not have a material impact on the Fund’s financial statements.
Class Disclosure
The Fund has multiple classes of shares designed to meet the needs of different groups of investors. The following table sets forth the differences amongst the classes:
| | | | | | |
Class | | Eligible Investors | | Minimum Initial
Investments | |
| R5 Class | | Large institutional investors - sold directly or through intermediary channels. | | $ | 250,000 | |
| | |
| Y Class | | Large institutional retirement plan investors - sold directly or through intermediary channels. | | $ | 100,000 | |
| | |
| Investor Class | | All investors using intermediary organizations, such as broker-dealers or retirement plan sponsors. | | $ | 2,500 | |
| | |
| R6 Class | | Large institutional retirement plan investors - sold through retirement plan sponsors. | | | None | |
Each class offered by the Trust has equal rights as to assets and voting privileges. Income and non-class specific expenses are allocated daily to each class based on the relative net assets. Realized and unrealized capital gains and losses of each class are allocated daily based on the relative net assets of each class of the respective Fund. Class specific expenses, where applicable, currently include service, distribution, transfer agent fees, and sub-transfer agent fees that vary amongst the classes as described more fully in Note 2.
Significant Accounting Policies
The following is a summary of significant accounting policies, consistently followed by the Fund in preparation of the financial statements. The Fund is considered an investment company and accordingly, follows the investment company accounting and reporting guidance of the FASB Accounting Standards Codification Topic 946, Financial Services – Investment Companies, a part of Generally Accepted Accounting Principles (“U.S. GAAP”).
Security Transactions and Investment Income
Security transactions are recorded as of the trade date for financial reporting purposes. Securities purchased or sold on a when-issued or delayed-delivery basis may be settled beyond a standard settlement period for the security after the trade date.
Dividend income, net of foreign taxes, is recorded on the ex-dividend date, except certain dividends from foreign securities which are recorded as soon as the information is available to the Fund. Interest income, net of foreign taxes, is earned from settlement date, recorded on the accrual basis, and adjusted, if necessary, for accretion of discounts and amortization of premiums. Realized gains (losses) from securities sold are determined based on specific lot identification.
Distributions to Shareholders
The Fund distributes most or all of its net earnings and realized gains, if any, each taxable year in the form of dividends from net investment income on a monthly basis and distributions of realized net capital gains and net gains or losses from foreign currency transactions on an annual basis. The Fund does not have a fixed dividend rate and does not guarantee that it will pay any distributions in any particular period. Dividends to shareholders are
15
American Beacon Garcia Hamilton Quality Bond FundSM
Notes to Financial Statements
October 31, 2023
determined in accordance with federal income tax regulations, which may differ in amount and character from net investment income and realized gains recognized for purposes of U.S. GAAP. To the extent necessary to fully distribute capital gains, the Fund may designate earnings and profits distributed to shareholders on the redemption of shares.
Allocation of Income, Trust Expenses, Gains, and Losses
Investment income and realized and unrealized gains and losses from investments of the Fund are allocated daily to each class of shares based upon the relative proportion of net assets of each class to the total net assets of the Fund. Expenses directly charged or attributable to the Fund will be paid from the assets of the Fund. Generally, expenses of the Trust will be allocated among and charged to the assets of the Fund on a basis that the Trust’s Board of Trustees (the “Board”) deems fair and equitable, which may be based on the relative net assets of the Fund or nature of the services performed and relative applicability to the Fund.
Use of Estimates
The preparation of financial statements in conformity with U.S. GAAP requires management to make estimates and assumptions that affect the amounts reported in the financial statements and accompanying notes. Actual results may differ from those estimated.
Other
Under the Trust’s organizational documents, its officers and trustees are indemnified against certain liabilities arising out of the performance of their duties to the Trust. In the normal course of business, the Trust enters into contracts that provide indemnification to the other party or parties against potential costs or liabilities. The Trust’s maximum exposure under these arrangements is dependent on claims that may be made in the future and, therefore, cannot be estimated. The Trust has had no prior claims or losses pursuant to any such agreement.
2. Transactions with Affiliates
Management and Investment Sub-Advisory Agreements
The Fund and the Manager are parties to a Management Agreement that obligates the Manager to provide the Fund with investment advisory and administrative services. As compensation for performing the duties under the Management Agreement, the Manager will receive an annualized management fee based on a percentage of the Fund’s average daily net assets that is calculated and accrued daily according to the following schedule:
| | | | |
First $5 billion | | | 0.35 | % |
Next $5 billion | | | 0.325 | % |
Next $10 billion | | | 0.30 | % |
Over $20 billion | | | 0.275 | % |
The Trust, on behalf of the Fund, and the Manager have entered into an Investment Advisory Agreement with Garcia Hamilton & Associates, L.P. (the “Sub-Advisor”) pursuant to which the Fund has agreed to pay an annualized sub-advisory fee that is calculated and accrued daily based on the Fund’s average daily net assets according to the following schedule:
| | | | |
First $1 billion | | | 0.20 | % |
Over $1 billion | | | 0.15 | % |
16
American Beacon Garcia Hamilton Quality Bond FundSM
Notes to Financial Statements
October 31, 2023
The Management and Sub-Advisory Fees paid by the Fund for the year ended October 31, 2023 were as follows:
| | | | | | | | | | | | |
| | | Effective Fee Rate | | | | | | Amount of Fees Paid | |
Management Fees | | | 0.35 | % | | | | | | $ | 1,085,007 | |
Sub-Advisory Fees | | | 0.20 | % | | | | | | | 620,004 | |
| | | | | | | | | | | | |
Total | | | 0.55 | % | | | | | | $ | 1,705,011 | |
| | | | | | | | | | | | |
Distribution Plans
The Fund has adopted a Distribution Plan (the “Plan”) in accordance with Rule 12b-1 under the Act, pursuant to which no separate fees may be charged to the Fund for distribution purposes. However, the Plan authorizes the management fees received by the Manager and/or the investment advisors hired by the Manager to be used for distribution purposes. Under this Plan, the Fund does not intend to compensate the Manager or any other party, either directly or indirectly, for the distribution of Fund shares.
Service Plans
The Manager and the Trust entered into a Service Plan that obligates the Manager to oversee additional shareholder servicing of the Investor Class of the Fund. As compensation for performing the duties required under the Service Plan, the Manager receives an annualized fee up to 0.375% of the average daily net assets of the Investor Class of the Fund.
Sub-Transfer Agent Fees
The Manager has entered into agreements, which include servicing agreements, with financial intermediaries that provide recordkeeping, processing, shareholder communications and other services to customers of the intermediaries that hold positions in the R5 and Y Classes of the Fund and has agreed to compensate the intermediaries for providing these services. Intermediaries transact with the Fund primarily through the use of omnibus accounts on behalf of its customers who hold positions in the Fund. Certain services would have been provided by the Fund’s transfer agent and other service providers if the shareholders’ accounts were maintained directly by the Fund’s transfer agent. Accordingly, the Fund, pursuant to Board approval, has agreed to reimburse the Manager for certain non-distribution shareholder services provided by financial intermediaries for the R5 and Y Classes. The reimbursement amounts (sub-transfer agent fees) paid to the Manager are subject to a fee limit of up to 0.10% of an intermediary’s average net assets in the R5 and Y Classes on an annual basis. During the year ended October 31, 2023, the sub-transfer agent fees, as reflected in “Transfer agent fees” on the Statement of Operations, were as follows:
| | | | |
Fund | | Sub-Transfer Agent Fees | |
Garcia Hamilton Quality Bond | | $ | 68,186 | |
As of October 31, 2023, the Fund owed the Manager the following reimbursement of sub-transfer agent fees, as reflected in “Transfer agent fees payable” on the Statement of Assets and Liabilities:
| | | | |
Fund | | Reimbursement Sub-Transfer
Agent Fees | |
Garcia Hamilton Quality Bond | | $ | 4,735 | |
Interfund Credit Facility
Pursuant to an exemptive order issued by the U.S. Securities and Exchange Commission (“SEC”), the Fund, along with other registered investment companies having management contracts with the Manager, may participate in a credit facility whereby each fund, under certain conditions, is permitted to lend money directly to
17
American Beacon Garcia Hamilton Quality Bond FundSM
Notes to Financial Statements
October 31, 2023
and borrow directly from other participating funds for temporary purposes. The interfund credit facility is advantageous to the funds because it provides added liquidity and eliminates the need to maintain higher cash balances to meet redemptions. This situation could arise when shareholder redemptions exceed anticipated volumes and certain funds have insufficient cash on hand to satisfy such redemptions or when sales of securities do not settle as expected, resulting in a cash shortfall for the fund. When the fund liquidates portfolio securities to meet redemption requests, they often do not receive payment in settlement for up to two days (or longer for certain foreign transactions). Redemption requests normally are satisfied on the next business day. The credit facility provides a source of immediate, short-term liquidity pending settlement of the sale of portfolio securities. The credit facility is administered by a credit facility team consisting of professionals from the Manager’s asset management, compliance, and accounting areas who report the activities of the credit facility to the Board. During the year ended October 31, 2023, the Fund did not utilize the credit facility.
Expense Reimbursement Plan
The Manager contractually agreed to reduce fees and/or reimburse expenses for the classes of the Fund, through February 29, 2024, to the extent that total operating expenses (excluding taxes, interest, brokerage commissions, acquired fund fees and expenses, securities lending fees, expenses associated with securities sold short, litigation, and other extraordinary expenses) exceed the Fund’s expense cap. During the year ended October 31, 2023, the Manager waived and/or reimbursed expenses as follows:
| | | | | | | | | | | | | | | | | | | | | | |
| | | | | Expense Cap | | | | | | | | | Expiration of
Reimbursed
Expenses | |
Fund | | Class | | 11/1/2022 -
2/28/2023 | | | 3/1/2023 -
10/31/2023 | | | Reimbursed
Expenses | | | (Recouped)
Expenses | |
Garcia Hamilton Quality Bond | | R5 | | | 0.45 | % | | | 0.45 | % | | $ | 138,639 | | | $ | - | | | | 2025-2026 | |
Garcia Hamilton Quality Bond | | Y | | | 0.51 | % | | | 0.51 | % | | | 117,636 | | | | - | | | | 2025-2026 | |
Garcia Hamilton Quality Bond | | Investor | | | 0.83 | % | | | 0.83 | % | | | 3,036 | | | | - | | | | 2025-2026 | |
Garcia Hamilton Quality Bond | | R6 | | | 0.41 | % | | | 0.41 | % | | | 494,638 | | | | - | | | | 2025-2026 | |
Of the above amounts, $53,536 was disclosed as a Receivable for expense reimbursement on the Statement of Assets and Liabilities at October 31, 2023.
The Fund has adopted an Expense Reimbursement Plan whereby the Manager may seek repayment of contractual or voluntary fee reductions and expense reimbursements. Under the policy, the Manager can be reimbursed by the Fund for any contractual or voluntary fee reductions or expense reimbursements if reimbursement to the Manager (a) occurs within three years from the date of the Manager’s waiver/reimbursement and (b) does not cause the Fund’s annual operating expenses to exceed the lesser of the contractual percentage limit in effect at the time of the waiver/reimbursement or time of recoupment. The reimbursed expenses listed above will expire in 2025 and 2026. The Fund did not record a liability for potential contingent reimbursement due to the current assessment that a reimbursement is uncertain. The carryover of excess expenses potentially reimbursable to the Manager, but not recorded as a liability are as follows:
| | | | | | | | | | | | | | | | |
Fund | | Recouped
Expenses | | | Excess Expense
Carryover | | | Expired Expense
Carryover | | | Expiration of
Reimbursed
Expenses | |
Garcia Hamilton Quality Bond | | $ | - | | | $ | - | | | $ | 855,336 | | | | 2022-2023 | |
Garcia Hamilton Quality Bond | | | - | | | | 814,374 | | | | - | | | | 2023-2024 | |
Garcia Hamilton Quality Bond | | | - | | | | 876,814 | | | | - | | | | 2024-2025 | |
Trustee Fees and Expenses
As compensation for their service to the American Beacon Funds Complex, including the Trust (collectively, the “Trusts”), each Trustee is compensated from the Trusts as follows: (1) an annual retainer of $130,000; (2) meeting attendance fee (for attendance in-person or via teleconference) of (a) $12,000 for in person
18
American Beacon Garcia Hamilton Quality Bond FundSM
Notes to Financial Statements
October 31, 2023
attendance, or $5,000 for telephonic attendance, by Board members for each regularly scheduled or special Board meeting, (b) $2,500 for attendance by Committee members at meetings of the Audit and Compliance Committee and the Investment Committee, (c) $1,000 for attendance by Committee members at meetings of the Nominating and Governance Committee; and (d) $2,500 for attendance by Board members for each special telephonic Board meeting; and (3) reimbursement of reasonable expenses incurred in attending Board meetings, Committee meetings, and relevant educational seminars. For this purpose, the Board considers attendance at regular meetings held by video conference to constitute in-person attendance at a Board meeting. The Trustees also may be compensated for attendance at special Board and/or Committee meetings from time to time. For her service as Board Chair, Ms. Cline receives an additional annual retainer of $50,000. Although she attends several committee meetings at each quarterly Board meeting, she receives only a single $2,500 fee each quarter for her attendance at those meetings. The chairpersons of the Audit and Compliance Committee and the Investment Committee each receive an additional annual retainer of $25,000 and the Chair of the Nominating and Governance Committee receives an additional annual retainer of $10,000.
3. Security Valuation and Fair Value Measurements
The price of the Fund’s shares is based on the Fund’s Net Asset Value (“NAV”). The NAV of the Fund, or each of its share classes, as applicable, is determined by dividing the total value of portfolio investments and other assets, less any liabilities attributable to the Fund or class, by the total number of shares outstanding of the Fund or class.
Investments are valued at the close of the New York Stock Exchange (the “Exchange”), normally at 4:00 p.m. Eastern Time, each day that the Exchange is open for business.
Debt securities are valued at bid quotes from broker/dealers or evaluated bid prices from pricing services, who may consider a number of inputs and factors, such as prices of comparable securities, yield curves, spreads, credit ratings, coupon rates, maturity, default rates, and underlying collateral.
Investments in open-end mutual funds are valued at the closing NAV per share of the mutual fund on the day of valuation.
Rule 2a-5 under the Investment Company Act (the “Valuation Rule”) establishes requirements for determining fair value in good faith for purposes of the Investment Company Act, including related oversight and reporting requirements. The Valuation Rule also defines when market quotations are “readily available,” which is the threshold for determining whether a Fund must fair value a security. Among other things, the Valuation Rule permits the Board to designate the Manager as Valuation Designee to perform the Fund’s fair value determinations subject to board oversight and certain reporting and other requirements intended to ensure that the Board receives the information it needs to oversee the Manager’s fair value determinations. Effective September 8, 2022, the Board has designated the Manager as valuation designee to perform fair value functions in accordance with the requirements of the Valuation Rule.
Securities may be valued at fair value, as determined in good faith and pursuant to the Manager’s procedures, under certain limited circumstances. For example, fair value pricing will be used for fixed-income securities and when market quotations are not readily available or reliable, as determined by the Manager, such as when (i) trading for a security is restricted or stopped; (ii) a security’s trading market is closed (other than customary closings); or (iii) a security has been de-listed from a national exchange. A security with limited market liquidity may require fair value pricing if the Manager determines that the available price does not reflect the security’s true market value.
Attempts to determine the fair value of securities introduce an element of subjectivity to the pricing of securities. As a result, the price of a security determined through fair valuation techniques may differ from the price quoted or published by other sources and may not accurately reflect the market value of the security when
19
American Beacon Garcia Hamilton Quality Bond FundSM
Notes to Financial Statements
October 31, 2023
trading resumes. If a reliable market quotation becomes available for a security formerly valued through fair valuation techniques, the Manager compares the new market quotation to the fair value price to evaluate the effectiveness of the Fund’s fair valuation procedures. If any significant discrepancies are found, the Manager may adjust Manager’s fair valuation procedures for the Fund.
Valuation Inputs
Various inputs may be used to determine the fair value of the Fund’s investments. These inputs are summarized in three broad levels for financial statement purposes. The inputs or methodologies used to value securities are not necessarily an indication of the risk associated with investing in those securities.
| | | | |
| Level 1 | | - | | Quoted prices in active markets for identical securities. |
| | |
| Level 2 | | - | | Prices determined using other significant observable inputs. These may include quoted prices for similar securities, interest rates, prepayment speeds, credit risk, and others. |
| | |
| Level 3 | | - | | Prices determined using other significant unobservable inputs. Unobservable inputs reflect the Fund’s own assumptions about the factors market participants would use in pricing an investment. |
Level 1 and Level 2 trading assets and trading liabilities, at fair value
With respect to the Fund’s investments that do not have readily available market quotations, the Board has designated the Adviser as its valuation designee to perform fair valuations pursuant to Rule 2a-5 under the Act (the “Valuation Designee”). If market prices are not readily available or are deemed unreliable, the Valuation Designee will use the fair value of the security or other instrument as determined in good faith under policies and procedures established by the Manager and under the oversight of the Board (“Valuation Procedures”). Market prices are considered not readily available where there is an absence of current or reliable market-based data (e.g., trade information or broker quotes), including where events occur after the close of the relevant market, but prior to the NYSE Close, that materially affect the values of the Fund’s portfolio holdings or assets. In addition, market prices are considered not readily available when, due to extraordinary circumstances, the exchanges or markets on which the securities or other instruments trade do not open for trading for the entire day and no other market prices are available. Fair value pricing is subjective in nature and the use of fair value pricing by the Valuation Designee may cause the NAV of the Fund’s shares to differ significantly from the NAV that would have been calculated using market prices at the close of the exchange on which a portfolio holding is primarily traded. There can be no assurance that the Fund could obtain the fair value assigned to an investment if the Fund were to sell the investment at approximately the time at which the Fund determines its NAV.
Fixed-income securities including corporate, convertible and municipal bonds and notes, U.S. government agencies, U.S. Treasury obligations, sovereign issues, bank loans, convertible preferred securities, and non-U.S. bonds are normally valued by pricing service providers that use broker dealer quotations, reported trades or valuation estimates from their internal pricing models. The service providers’ internal models use inputs that are observable such as issuer details, interest rates, yield curves, prepayment speeds, credit risks/spreads, default rates, and quoted prices for similar assets. Securities that use similar valuation techniques and inputs as described above are categorized as Level 2 of the fair value hierarchy. Fixed-income securities purchased on a delayed-delivery basis are marked-to-market daily until settlement at the forward settlement date and are categorized as Level 2 of the fair value hierarchy.
Mortgage-related and asset-backed securities (“ABS”) are usually issued as separate tranches, or classes, of securities within each deal. These securities are also normally valued by pricing service providers that use broker-dealer quotations or valuation estimates from their internal pricing models. The pricing models for these securities usually consider tranche-level attributes, current market data, estimated cash flows, and market-based yield spreads for each tranche, and incorporates deal collateral performance, as available. Mortgage-related and ABS that use similar valuation techniques and inputs as described above are categorized as Level 2 of the fair value hierarchy.
20
American Beacon Garcia Hamilton Quality Bond FundSM
Notes to Financial Statements
October 31, 2023
Investments in registered open-end investment management companies will be valued based upon the NAVs of such investments and are categorized as Level 1 of the fair value hierarchy.
4. Securities and Other Investments
Agency Mortgage-Backed Securities
Certain mortgage-backed securities (“MBS”) may be issued or guaranteed by the U.S. government or a government sponsored entity, such as the Federal National Mortgage Association (“Fannie Mae”) or the Federal Home Loan Mortgage Corporation (“Freddie Mac”). Although these instruments may be guaranteed by the U.S. government or a government sponsored entity, many such MBS are not backed by the full faith and credit of the United States and are still exposed to the risk of non-payment.
Fixed-Income Investments
The Fund may hold debt, including government and corporate debt, and other fixed-income securities. Typically, the values of fixed-income securities change inversely with prevailing interest rates. Therefore, a fundamental risk of fixed-income securities is interest rate risk, which is the risk that their value will generally decline as prevailing interest rates rise, which may cause the Fund’s NAV to likewise decrease, and vice versa. How specific fixed-income securities may react to changes in interest rates will depend on the specific characteristics of each security. For example, while securities with longer maturities tend to produce higher yields, they also tend to be more sensitive to changes in prevailing interest rates and are, therefore, more volatile than shorter-term securities and are subject to greater market fluctuations as a result of changes in interest rates. Fixed-income securities are also subject to credit risk, which is the risk that the credit strength of an issuer of a fixed-income security will weaken and/or that the issuer will be unable to make timely principal and interest payments and that the security may go into default. In addition, there is prepayment risk, which is the risk that during periods of falling interest rates, certain fixed-income securities with higher interest rates, such as MBS and ABS, may be prepaid by their issuers thereby reducing the amount of interest payments. This may result in the Fund having to reinvest its proceeds in lower yielding securities. Securities underlying MBS and ABS, which may include subprime mortgages, also may be subject to a higher degree of credit risk, valuation risk, and liquidity risk.
Mortgage-Backed Securities
MBS often have stated maturities of up to thirty years when they are issued, depending upon the length of the mortgages underlying the securities. In practice however, unscheduled or early payments of principal and interest on the underlying mortgages may make the securities’ effective maturity shorter than this, and the prevailing interest rates may be higher or lower than the current yield of the Fund’s portfolio at the time resulting in reinvestment risk.
Rising or high interest rates may result in slower than expected principal payments which may tend to extend the duration of MBS, making them more volatile and more sensitive to changes in interest rates. This is known as extension risk.
MBS may have less potential for capital appreciation than comparable fixed-income securities due to the likelihood of increased prepayments of mortgages resulting from foreclosures or declining interest rates. These foreclosed or refinanced mortgages are paid off at face value (par) or less, causing a loss, particularly for any investor who may have purchased the security at a premium or a price above par. In such an environment, this risk limits the potential price appreciation of these securities.
21
American Beacon Garcia Hamilton Quality Bond FundSM
Notes to Financial Statements
October 31, 2023
Mortgage-Related and Other Asset-Backed Securities
The Fund may invest in mortgage or other ABS. These securities may include mortgage instruments issued by U.S. government agencies (“agency mortgages”) or those issued by private entities (“non-agency mortgages”). Specific types of instruments may include mortgage pass-through securities, collateralized mortgage obligations (“CMOs”), commercial mortgage-backed securities, mortgage dollar rolls, CMO residuals, stripped mortgage-backed securities and other securities that directly or indirectly represent a participation in, or are secured by a payable from, mortgage loans on real property. The value of the Fund’s MBS may be affected by, among other things, changes or perceived changes in interest rates, factors concerning the interests in and structure of the issuer or the originator of the mortgage, or the quality of the underlying assets. The mortgages underlying the securities may default or decline in quality or value. Through its investments in MBS, the Fund has exposure to subprime loans, Alt-A loans and non-conforming loans as well as to the mortgage and credit markets generally. Underlying collateral related to subprime, Alt-A and non-conforming mortgage loans has become increasingly susceptible to defaults and declines in quality or value, especially in a declining residential real estate market. In addition, regulatory or tax changes may adversely affect the mortgage securities markets as a whole.
Other Investment Company Securities and Other Exchange-Traded Products
The Fund may invest in shares of other investment companies, including open-end funds, closed-end funds, business development companies (“BDCs”), ETFs, unit investment trusts, and other investment companies of the Trust. The Fund may invest in securities of an investment company advised by the Manager or the Sub-Advisor. Investments in the securities of other investment companies may involve duplication of advisory fees and certain other expenses. By investing in another investment company, the Fund becomes a shareholder of that investment company. As a result, the Fund shareholders indirectly will bear the Fund’s proportionate share of the fees and expenses paid by shareholders of the other investment company, in addition to the fees and expenses the Fund shareholders directly bear in connection with the Fund’s own operations. These other fees and expenses are reflected as Acquired Fund Fees and Expenses and are included in the Fees and Expenses Table for the Fund in its Prospectus, if applicable. Investments in other investment companies may involve the payment of substantial premiums above the value of such issuer’s portfolio securities.
U.S. Government Agency Securities
U.S. Government agency securities are issued or guaranteed by the U.S. Government or its agencies or instrumentalities. Some obligations issued by U.S. Government agencies and instrumentalities are supported by the full faith and credit of the U.S. Treasury; others by the right of the issuer to borrow from the U.S. Treasury; others by discretionary authority of the U.S. Government to purchase certain obligations of the agency or instrumentality; and others only by the credit of the agency or instrumentality. U.S. Government securities bear fixed, floating or variable rates of interest. While the U.S. Government currently provides financial support to certain U.S. Government-sponsored agencies or instrumentalities, no assurance can be given that it will always do so, since it is not so obligated by law. U.S. Government securities include U.S. Treasury bills, notes and bonds, Federal Home Loan Bank (“FHLB”) obligations, Federal Farm Credit Bank (“FFCB”) obligations, U.S. Government agency obligations and repurchase agreements secured thereby. U.S. Government agency securities are subject to credit risk and interest rate risk.
U.S. Treasury Obligations
U.S. Treasury obligations include bills (initial maturities of one year or less), notes (initial maturities between two and ten years), and bonds (initial maturities over ten years) issued by the U.S. Treasury, Separately Traded Registered Interest and Principal component parts of such obligations (known as “STRIPS”) and inflation-indexed securities. The prices of these securities (like all debt securities) change between issuance and maturity in response to fluctuating market interest rates. U.S. Treasury obligations are subject to credit risk and interest rate risk.
22
American Beacon Garcia Hamilton Quality Bond FundSM
Notes to Financial Statements
October 31, 2023
5. Principal Risks
Investing in the Fund may involve certain risks including, but not limited to, those described below.
Credit Risk
The Fund is subject to the risk that the issuer or guarantor of a debt security, or the counterparty to a derivatives contract or a loan will fail to make timely payment of interest or principal or otherwise honor its obligations or default completely. A decline in the credit rating of an individual security held by the Fund may have an adverse impact on its price and make it difficult for the Fund to sell it. Ratings represent a rating agency’s opinion regarding the quality of the security and are not a guarantee of quality. Rating agencies might not always change their credit rating on an issuer or security in a timely manner to reflect events that could affect the issuer’s ability to make timely payments on its obligations. Credit risk is typically greater for securities with ratings that are below investment grade. Since the Fund can invest significantly in high-yield investments considered speculative in nature, this risk may be substantial.
Floating Rate Securities Risk
The coupons on certain fixed income securities in which the Fund may invest are not fixed and may fluctuate based upon changes in market rates. The coupon on a floating rate security is generally based on an interest rate such as a money-market index, London Interbank Offered Rate (“LIBOR”), Secured Overnight Financing Rate (“SOFR”) or a Treasury bill rate. Such securities are subject to interest rate risk and may fluctuate in value in response to interest rate changes if there is a delay between changes in market interest rates and the interest reset date for the obligation, or for other reasons. As short-term interest rates decline, the coupons on floating rate securities typically decrease. Alternatively, during periods of rising interest rates, changes in the coupons of floating rate securities may lag behind changes in market rates or may have limits on the maximum increases in the coupon rates. The value of floating rate securities may decline if their coupons do not rise as much, or as quickly, as interest rates in general. Conversely, floating rate securities will not generally increase in value if interest rates decline. Floating rate obligations are less effective than fixed rate obligations at locking in a particular yield and are subject to credit risk.
Interest Rate Risk
Generally, the value of investments with interest rate risk, such as fixed-income securities or derivatives, will move in the opposite direction to movements in interest rates. Factors including central bank monetary policy, rising inflation rates, and changes in general economic conditions may cause interest rates to rise, which could cause the value of the Fund’s investments to decline. Interest rates may rise, perhaps significantly and/or rapidly, potentially resulting in substantial losses to the Fund. Interest rate changes may have a more pronounced effect on the market value of fixed-rate instruments than on floating-rate instruments. The value of floating rate and variable securities may decline if their interest rates do not rise as quickly, or as much, as general interest rates. The prices of fixed-income securities or derivatives are also affected by their durations. Fixed-income securities or derivatives with longer durations generally have greater sensitivity to changes in interest rates. Rising interest rates may cause the value of the Fund’s investments with longer durations and terms to maturity to decline, which may adversely affect the value of the Fund. For example, if a bond has a duration of eight years, a 1% increase in interest rates could be expected to result in an 8% decrease in the value of the bond. An increase in interest rates can impact markets broadly as well. To the extent the Fund holds an investment with a negative interest rate to maturity, the Fund may generate a negative return on that investment.
Investment Risk
An investment in the Fund is not a deposit with a bank and is not insured or guaranteed by the Federal Deposit Insurance Corporation or any other government agency. When you sell your shares of the Fund, they could be worth less than what you paid for them. Therefore, you may lose money by investing in the Fund.
23
American Beacon Garcia Hamilton Quality Bond FundSM
Notes to Financial Statements
October 31, 2023
Liquidity Risk
When there is little or no active trading market for a specific type of security it can become more difficult to purchase or sell the securities at or near their perceived value. During such periods, certain investments held by the Fund may be difficult to sell or other investments may be difficult to purchase at favorable times or prices. As a result, the Fund may have to lower the price on certain securities that it is trying to sell, sell other securities instead or forgo an investment opportunity, any of which could have a negative effect on Fund management or performance. Redemptions by a few large investors in the Fund at such times may have a significant adverse effect on the Fund’s NAV per share and remaining Fund shareholders. In addition, the market-making capacity of dealers in certain types of securities has been reduced in recent years, in part as a result of structural and regulatory changes, such as fewer proprietary trading desks and increased regulatory capital requirements for broker-dealers. Further, many broker-dealers have reduced their inventory of certain debt securities. This could negatively affect the Fund’s ability to buy or sell debt securities and increase the related volatility and trading costs. The Fund may lose money if it is forced to sell certain investments at unfavorable prices to meet redemption requests or other cash needs.
Market Risk
The Fund is subject to the risk that the securities markets will move down, sometimes rapidly and unpredictably, based on overall economic conditions and other factors, which may negatively affect the Fund’s performance. Equity securities generally have greater price volatility than fixed-income securities, although under certain market conditions fixed-income securities may have comparable or greater price volatility. During a general downturn in the securities markets, multiple assets may decline in value simultaneously. In some cases, traditional market participants have been less willing to make a market in some types of debt instruments, which has affected the liquidity of those instruments. During times of market turmoil, investors tend to look to the safety of securities issued or backed by the U.S. Treasury, causing the prices of these securities to rise and the yields to decline. Reduced liquidity in fixed-income and credit markets may negatively affect many issuers worldwide. Prices in many financial markets have increased significantly over the last decade, but there have also been periods of adverse market and financial developments and cyclical change during that timeframe, which have resulted in unusually high levels of volatility in domestic and foreign financial markets that has caused losses for investors and may occur again in the future, particularly if markets enter a period of uncertainty or economic weakness. The value of a security may decline due to adverse issuer-specific conditions, general market conditions unrelated to a particular issuer, or factors that affect a particular industry or industries. Changes in the financial condition of a single issuer or market segment also can impact the market as a whole.
Geopolitical and other events, including war, terrorism, economic uncertainty, trade disputes, pandemics, public health crises, natural disasters and related events have led, and in the future may continue to lead, to instability in world economies and markets generally and reduced liquidity in equity, credit and fixed-income markets, which may disrupt economies and markets and adversely affect the value of your investment. Changes in value may be temporary or may last for extended periods.
Policy changes by the U.S. government and/or Federal Reserve and political events within the U.S. and abroad, including the U.S. presidential election, the U.S. government’s inability at times to agree on a long-term budget and deficit reduction plan, the threat of a federal government shutdown and threats not to increase the federal government’s debt limit, may affect investor and consumer confidence and may adversely impact financial markets and the broader economy, perhaps suddenly and to a significant degree.
Markets and market participants are increasingly reliant upon both publicly available and proprietary information data systems. Data imprecision, software or other technology malfunctions, programming inaccuracies, unauthorized use or access, and similar circumstances may impair the performance of these systems and may have an adverse impact upon a single issuer, a group of issuers, or the market at large. The financial markets generally move in cycles, with periods of rising prices followed by periods of declining prices. The value of your investment may reflect these fluctuations.
24
American Beacon Garcia Hamilton Quality Bond FundSM
Notes to Financial Statements
October 31, 2023
Mortgage-Backed and Mortgage Related Securities Risk
Investments in mortgage-backed and mortgage-related securities are influenced by the factors affecting the mortgages underlying the securities or the housing market. Investments in mortgage-backed and mortgage-related securities also are subject to market risks for fixed-income securities, which include, but are not limited to, credit risk, interest rate risk, prepayment risk, extension risk, callable securities risk, and valuation risk. A decline in the credit quality of the issuers of mortgage-backed and mortgage-related securities or instability in the markets for such securities may affect the value and liquidity of such securities, which could result in losses to the Fund. These securities are also subject to the risk of default on the underlying mortgages, particularly during periods of market downturn, and an unexpectedly high rate of defaults on the underlying assets will adversely affect the security’s value.
Other Investment Companies Risk
The Fund may invest in shares of other registered investment companies, including money market funds that are advised by the Manager. To the extent that the Fund invests in shares of other registered investment companies, the Fund will indirectly bear the fees and expenses, including for example advisory and administrative fees, charged by those investment companies in addition to the Fund’s direct fees and expenses and will be subject to the risks associated with investments in those companies. For example, the Fund’s investments in money market funds are subject to interest rate risk, credit risk, and market risk. The Fund must rely on the investment company in which it invests to achieve its investment objective. If the investment company fails to achieve its investment objective, the value of the Fund’s investment will decline, adversely affecting the Fund’s performance. To the extent the Fund invests in other investment companies that invest in equity securities, fixed-income securities and/or foreign securities, or that track an index, the Fund is subject to the risks associated with the underlying investments held by the investment company or the index fluctuations to which the investment company is subject.
Prepayment and Extension Risk
When interest rates fall, borrowers will generally repay the loans that underlie certain debt securities, especially mortgage-related and other types of ABS, more quickly than expected, causing the issuer of the security to repay the principal prior to the security’s expected maturity date. The Fund may need to reinvest the proceeds at a lower interest rate, reducing its income. Securities subject to prepayment risk generally offer less potential for gains when prevailing interest rates fall. If the Fund buys those securities at a premium, accelerated prepayments on those securities could cause the Fund to lose a portion of its principal investment. The impact of prepayments on the price of a security may be difficult to predict and may increase the security’s price volatility. Variable and floating rate securities may be less sensitive to prepayment risk. Extension risk is the risk that a decrease in prepayments may, as a result of higher interest rates or other factors, result in the extension of a security’s effective maturity, heighten interest rate risk and increase the potential for a decline in its price.
Recent Market Events Risk
Both U.S. and international markets have experienced significant volatility in recent months and years. As a result of such volatility, investment returns may fluctuate significantly. Moreover, the risks discussed herein associated with an investment in the Fund may be increased.
Although interest rates were unusually low in recent years in the U.S. and abroad, in 2022, the Federal Reserve and certain foreign central banks began to raise interest rates as part of their efforts to address rising inflation. It is difficult to accurately predict the pace at which interest rates may continue to increase, the timing, frequency or magnitude of any such increases, or when such increases might stop. Additionally, various economic and political factors could cause the Federal Reserve or another foreign central bank to change their approach in the future and such actions may result in an economic slowdown in the U.S. and abroad. Unexpected increases in interest rates could lead to market volatility or reduce liquidity in certain sectors of the market. Deteriorating
25
American Beacon Garcia Hamilton Quality Bond FundSM
Notes to Financial Statements
October 31, 2023
economic fundamentals may, in turn, increase the risk of default or insolvency of particular issuers, negatively impact market value, cause credit spreads to widen, and reduce bank balance sheets. Any of these could cause an increase in market volatility, reduce liquidity across various markets or decrease confidence in the markets. Additionally, high public debt in the U.S. and other countries creates ongoing systemic and market risks and policymaking uncertainty.
In March 2023, the shutdown of certain financial institutions in the U.S. and questions regarding the viability of other financial institutions raised economic concerns over disruption in the U.S. and global banking systems. There can be no certainty that the actions taken by the U.S. or foreign governments will be effective in mitigating the effects of financial institution failures on the economy and restoring public confidence in the U.S. and global banking systems. Some countries, including the U.S., have in recent years adopted more protectionist trade policies. Slowing global economic growth; risks associated with a trade agreement between the United Kingdom and the European Union; the risks associated with ongoing trade negotiations with China; and the possibility of changes to some international trade agreements; political or economic dysfunction within some nations, including major producers of oil; and dramatic changes in commodity and currency prices could have adverse effects that cannot be foreseen at the present time.
Tensions, war, or open conflict between nations, such as between Russia and Ukraine, in the Middle East or in eastern Asia could affect the economies of many nations, including the United States. The duration of ongoing hostilities in the Middle East and between Russia and Ukraine, and any sanctions and related events cannot be predicted. Those events present material uncertainty and risk with respect to markets globally and the performance of the Fund and its investments or operations could be negatively impacted.
Regulators in the U.S. have proposed and recently adopted a number of changes to regulations involving the markets and issuers, some of which apply to the Fund. The full effect of various newly-adopted regulations is not currently known. Additionally, it is not clear whether the proposed regulations will be adopted. However, due to the broad scope of the new and proposed regulations, certain changes could limit the Fund’s ability to pursue its investment strategies or make certain investments, or may make it more costly for the Fund to operate, which may impact performance.
Economists and others have expressed increasing concern about the potential effects of global climate change on property and security values. Certain issuers, industries and regions may be adversely affected by the impacts of climate change, including on the demand for and the development of goods and services and related production costs, and the impacts of legislation, regulation and international accords related to climate change, as well as any indirect consequences of regulation or business trends driven by climate change.
Redemption Risk
The Fund may experience periods of high levels of redemptions that could cause the Fund to sell assets at inopportune times or at a loss or depressed value. The sale of assets to meet redemption requests may create net capital gains, which could cause the Fund to have to distribute substantial capital gains. Redemption risk is heightened during periods of declining or illiquid markets. During periods of heavy redemptions, the Fund may borrow funds through the interfund credit facility or from a bank line of credit, which may increase costs. A rise in interest rates or other market developments may cause investors to move out of fixed-income securities on a large scale. Heavy redemptions could hurt the Fund’s performance.
Sector Risk
Sector risk is the risk associated with the Fund holding a significant amount of investments in similar businesses, which would be similarly affected by particular economic or market events, which may, in certain circumstances, cause the value of the equity and debt securities of companies in a particular sector of the market to change. To the extent a Fund has substantial holdings within a particular sector, the risks to the Fund associated
26
American Beacon Garcia Hamilton Quality Bond FundSM
Notes to Financial Statements
October 31, 2023
with that sector increase. In addition, when a Fund focuses its investments in certain sectors of the economy, its performance may be driven largely by sector performance and could fluctuate more widely than if the Fund were invested more evenly across sectors. Individual sectors may be more volatile, and may perform differently, than the broader market. The businesses that constitute a sector may all react the same way to economic, political or regulatory events. The Fund’s performance could also be affected if the sectors do not perform as expected. The lack of exposure to one or more sectors may adversely affect performance. As the Fund’s portfolio changes over time, the Fund’s exposure to a particular sector may become higher or lower.
Environmental, Social, and/or Governance Investing Risk
The use of environmental, social, and/or governance (“ESG”) considerations by the sub-advisor may cause the Fund to make different investments than funds that have a similar investment style but do not incorporate such considerations in their strategy. As with the use of any investment considerations involved in investment decisions, there is no guarantee that the use of any ESG investment considerations will result in the selection of issuers that will outperform other issuers or help reduce risk in the Fund. The Fund may choose not to, or may not be able to, take advantage of certain investment opportunities due to these considerations, which may adversely affect performance. The Fund may underperform funds that do not incorporate these considerations.
U.S. Government Securities and Government-Sponsored Enterprises Risk
A security backed by the U.S. Treasury or the full faith and credit of the United States is guaranteed only as to the timely payment of interest and principal when held to maturity. The market prices for such securities are not guaranteed and will fluctuate. Additionally, circumstances could arise that would prevent the payment of interest or principal. This could result in losses to the Fund. Investments in government-sponsored enterprises are debt obligations issued by agencies and instrumentalities of the U.S. Government. These obligations vary in the level of support they receive from the U.S. Government. They may be: (i) supported by the full faith and credit of the U.S. Treasury, such as those of the Government National Mortgage Association (‘‘Ginnie Mae’’); (ii) supported by the right of the issuer to borrow from the U.S. Treasury, such as those of the Federal Home Loan Bank and the Federal Farm Credit Banks; (iii) supported by the discretionary authority of the U.S. Government to purchase the agency obligations, such as those of Fannie Mae and Freddie Mac or (iv) supported only by the credit of the issuer, such as those of the Federal Farm Credit Bureau. The U.S. Government may choose not to provide financial support to U.S. Government-sponsored agencies or instrumentalities if it is not legally obligated to do so, in which case, if the issuer defaulted, to the extent the Fund held securities of such issuers, it might not be able to recover its investment from the U.S. Government. U.S. government securities and securities of government-sponsored entities are also subject to credit risk, interest rate risk and market risk. The rising U.S. national debt may lead to adverse impacts on the value of U.S. government securities due to potentially higher costs for the U.S. government to obtain new financing.
Variable and Floating Rate Securities Risk
The coupons on certain fixed-income securities in which the Fund may invest are not fixed and may fluctuate based upon changes in market rates. The coupon on a floating rate security is generally based on an interest rate such as a money-market index, SOFR, LIBOR or a Treasury bill rate. Such securities are subject to interest rate risk and may fluctuate in value in response to interest rate changes if there is a delay between changes in market interest rates and the interest reset date for the obligation, or for other reasons. As short-term interest rates decline, the coupons on variable and floating rate securities typically decrease. Alternatively, during periods of rising interest rates, changes in the coupons of variable and floating rate securities may lag behind changes in market rates or may have limits on the maximum increases in the coupon rates. The value of variable and floating rate securities may decline if their coupons do not rise as much, or as quickly, as interest rates in general. Conversely, variable and floating rate securities will not generally increase in value if interest rates decline. Variable and floating rate securities are less effective at locking in a particular yield and are subject to credit risk. Certain types of floating rate instruments may also be subject to greater liquidity risk than other debt securities.
27
American Beacon Garcia Hamilton Quality Bond FundSM
Notes to Financial Statements
October 31, 2023
6. Federal Income and Excise Taxes
It is the policy of the Fund to qualify as a regulated investment company (“RIC”), by complying with all applicable provisions of Subchapter M of the Internal Revenue Code, as amended, and to make distributions of taxable income sufficient to relieve it from substantially all federal income and excise taxes. For federal income tax purposes, the Fund is treated as a single entity for the purpose of determining such qualification.
The Fund does not have any unrecorded tax liabilities in the accompanying financial statements. Each of the tax years in the four year period ended October 31, 2023 remain subject to examination by the Internal Revenue Service. If applicable, the Fund recognizes interest accrued related to unrecognized tax benefits in interest expense and penalties in “Other expenses” on the Statement of Operations.
The Fund may be subject to taxes imposed by countries in which it invests. Such taxes are generally based on returns of income earned or gains realized or repatriated. Taxes are accrued and applied to net investment income, net realized capital gains and net unrealized appreciation (depreciation), as applicable, as the income is earned or capital gains are recorded.
Dividends are categorized in accordance with income tax regulations which may treat certain transactions differently than U.S. GAAP. Accordingly, the character of distributions and composition of net assets for tax purposes may differ from those reflected in the accompanying financial statements.
The tax character of distributions paid were as follows:
| | | | | | | | | | | | |
| | | Year Ended
October 31, 2023 | | | | | | Year Ended
October 31, 2022 | |
Distributions paid from: | | | | | | | | | | | | |
Ordinary income* | | | | | | | | | | | | |
R5 Class | | $ | 1,870,733 | | | | | | | $ | 3,883,600 | |
Y Class | | | 1,567,482 | | | | | | | | 505,181 | |
Investor Class | | | 25,683 | | | | | | | | 18,049 | |
R6 Class | | | 6,783,410 | | | | | | | | 4,868,664 | |
| | | | | | | | | | | | |
Total distributions paid | | $ | 10,247,308 | | | | | | | $ | 9,275,494 | |
| | | | | | | | | | | | |
*For tax purposes, short-term capital gains are considered ordinary income distributions.
As of October 31, 2023, components of distributable earnings (deficits) on a tax basis were as follows:
| | | | | | | | | | | | | | | | | | | | | | | | | | | | |
Fund | | Tax Cost | | | | | | Unrealized
Appreciation | | | | | | Unrealized
(Depreciation) | | | | | | Net Unrealized
Appreciation
(Depreciation) | |
Garcia Hamilton Quality Bond | | $ | 300,283,365 | | | | | | | $ | - | | | | | | | $ | (36,444,732 | ) | | | | | | $ | (36,444,732 | ) |
| | | | | | | | | | | | | | | | | | | | | | | | | | | | | | | | | | | | | | | | | | | | |
Fund | | Net Unrealized
Appreciation
(Depreciation) | | | | | | Undistributed
Ordinary
Income | | | | | | Undistributed
Long-Term
Capital Gains | | | | | | Accumulated
Capital and
Other (Losses) | | | | | | Other Temporary
Differences | | | | | | Distributable
Earnings | |
Garcia Hamilton Quality Bond | | $ | (36,444,732 | ) | | | | | | $ | 1,034,026 | | | | | | | $ | - | | | | | | | $ | (44,405,522 | ) | | | | | | $ | (24,600 | ) | | | | | | $ | (79,840,828 | ) |
Financial reporting records are adjusted for permanent book/tax differences to reflect tax character. Financial records are not adjusted for temporary differences. The temporary differences between financial reporting and tax-basis reporting of unrealized appreciation (depreciation) are attributable primarily to the tax deferral of losses from wash sales, unused capital loss carryforwards, book amortization of premiums, and dividends payable.
28
American Beacon Garcia Hamilton Quality Bond FundSM
Notes to Financial Statements
October 31, 2023
Due to inherent differences in the recognition of income, expenses, and realized gains (losses) under U.S. GAAP and federal income tax regulations, permanent differences between book and tax reporting have been identified and appropriately reclassified on the Statement of Assets and Liabilities. The Fund had no permanent differences as of October 31, 2023.
For federal income tax purposes, the Fund measures its capital loss carryforwards annually at October 31, its fiscal year end. Capital loss carryforwards retain their character as short-term and/or long-term and may be carried forward and applied against future realized capital gains with no expiration date.
As of October 31, 2023, the Fund had $27,179,271 short-term and $17,226,251 long-term capital loss carryforwards.
7. Investment Transactions
The aggregate cost of purchases and proceeds from sales and maturities of investments, other than short-term obligations, for the year ended October 31, 2023 were as follows:
| | | | | | | | | | | | | | | | | | | | | | | | | | | | |
Fund | | Purchases
(non-U.S.
Government
Securities) | | | | | | Purchases of U.S.
Government
Securities | | | | | | Sales
(non-U.S.
Government
Securities) | | | | | | Sales of U.S.
Government
Securities | |
| Garcia Hamilton Quality Bond | | $ | - | | | | | | | $ | 223,125,203 | | | | | | | $ | 51,970,340 | | | | | | | $ | 238,487,579 | |
8. Borrowing Arrangements
Effective November 10, 2023 (the “Effective Date”), the Fund, along with certain other funds managed by the Manager (“Participating Funds”), renewed a committed revolving line of credit (the “Committed Line”) agreement with State Street Bank and Trust Company (the “Bank”) to be used to facilitate portfolio liquidity. The maximum borrowing amount under the Committed Line is $100 million with interest at a rate equal to the higher of (a) Overnight Bank Funding Rate (“OBFR”) daily fluctuating rate per annum equal to 1.25% plus the sum of 0.10% or (b) the Federal Funds daily fluctuating rate per annum on amounts borrowed. Each of the Participating Funds paid a proportional amount of a quarterly commitment fee at a rate of 0.25% per annum on the unused portion of the Committed Line amount. The Committed Line expires November 8, 2024, unless extended by the Bank or terminated by the Participating Funds in accordance with the agreement.
On the Effective Date, the Fund, along with certain other Participating Funds managed by the Manager, also renewed an uncommitted discretionary demand revolving line of credit (the “Uncommitted Line”) agreement with the Bank to be used to facilitate portfolio liquidity. The maximum borrowing amount under the Uncommitted Line is $100 million with interest at a rate equal to the higher of (a) OBFR daily fluctuating rate per annum equal to 1.25% plus the sum of 0.10% or (b) the Federal Funds daily fluctuating rate per annum on amounts borrowed on each outstanding loan. Each of the Participating Funds paid a proportional amount of a closing fee of $35,000 on the Effective Date. The Uncommitted Line expires November 8, 2024, unless extended by the Bank or terminated by the Participating Funds in accordance with the agreement.
The Participating Funds paid administration, legal and arrangement fees, which are recognized as a component of “Loan expense” on the Statement of Operations, along with commitment fees, that have been allocated among the Participating Funds based on average daily net assets.
During the year ended October 31, 2023, the Fund did not utilize these facilities.
29
American Beacon Garcia Hamilton Quality Bond FundSM
Notes to Financial Statements
October 31, 2023
9. Capital Share Transactions
The tables below summarize the activity in capital shares for each Class of the Fund:
| | | | | | | | | | | | | | | | | | | | | | | | | | | | |
| | | R5 Class | |
| | | Year Ended
October 31, 2023 | | | | | | Year Ended
October 31, 2022 | |
Garcia Hamilton Quality Bond Fund | | Shares | | | | | | Amount | | | | | | Shares | | | | | | Amount | |
| Shares sold | | | 2,557,082 | | | | | | | $ | 22,072,236 | | | | | | | | 3,829,693 | | | | | | | $ | 36,028,161 | |
| Reinvestment of dividends | | | 142,894 | | | | | | | | 1,246,251 | | | | | | | | 261,864 | | | | | | | | 2,413,176 | |
| Shares redeemed | | | (16,884,928 | ) | | | | | | | (146,350,750 | ) | | | | | | | (7,582,035 | ) | | | | | | | (69,577,829 | ) |
| | | | | | | | | | | | | | | | | | | | | | | | | | | | |
| Net (decrease) in shares outstanding | | | (14,184,952 | ) | | | | | | $ | (123,032,263 | ) | | | | | | | (3,490,478 | ) | | | | | | $ | (31,136,492 | ) |
| | | | | | | | | | | | | | | | | | | | | | | | | | | | |
| | | | |
| | | Y Class | |
| | | Year Ended
October 31, 2023 | | | | | | Year Ended
October 31, 2022 | |
Garcia Hamilton Quality Bond Fund | | Shares | | | | | | Amount | | | | | | Shares | | | | | | Amount | |
| Shares sold | | | 4,151,066 | | | | | | | $ | 36,683,765 | | | | | | | | 3,216,895 | | | | | | | $ | 29,448,381 | |
| Reinvestment of dividends | | | 182,068 | | | | | | | | 1,567,034 | | | | | | | | 55,633 | | | | | | | | 505,182 | |
| Shares redeemed | | | (1,769,579 | ) | | | | | | | (14,889,312 | ) | | | | | | | (1,910,958 | ) | | | | | | | (17,632,482 | ) |
| | | | | | | | | | | | | | | | | | | | | | | | | | | | |
| Net increase in shares outstanding | | | 2,563,555 | | | | | | | $ | 23,361,487 | | | | | | | | 1,361,570 | | | | | | | $ | 12,321,081 | |
| | | | | | | | | | | | | | | | | | | | | | | | | | | | |
| | | | |
| | | Investor Class | |
| | | Year Ended
October 31, 2023 | | | | | | Year Ended
October 31, 2022 | |
Garcia Hamilton Quality Bond Fund | | Shares | | | | | | Amount | | | | | | Shares | | | | | | Amount | |
| Shares sold | | | 18,623 | | | | | | | $ | 161,268 | | | | | | | | 18,615 | | | | | | | $ | 166,288 | |
| Reinvestment of dividends | | | 2,973 | | | | | | | | 25,683 | | | | | | | | 1,972 | | | | | | | | 18,049 | |
| Shares redeemed | | | (31,030 | ) | | | | | | | (267,389 | ) | | | | | | | (19,219 | ) | | | | | | | (170,982 | ) |
| | | | | | | | | | | | | | | | | | | | | | | | | | | | |
| Net increase (decrease) in shares outstanding | | | (9,434 | ) | | | | | | $ | (80,438 | ) | | | | | | | 1,368 | | | | | | | $ | 13,355 | |
| | | | | | | | | | | | | | | | | | | | | | | | | | | | |
| | | | |
| | | R6 Class | |
| | | Year Ended
October 31, 2023 | | | | | | Year Ended
October 31, 2022 | |
Garcia Hamilton Quality Bond Fund | | Shares | | | | | | Amount | | | | | | Shares | | | | | | Amount | |
| Shares sold | | | 2,709,351 | | | | | | | $ | 23,120,019 | | | | | | | | 7,495,674 | | | | | | | $ | 72,519,279 | |
| Reinvestment of dividends | | | 785,921 | | | | | | | | 6,776,746 | | | | | | | | 531,033 | | | | | | | | 4,868,664 | |
| Shares redeemed | | | (1,381,439 | ) | | | | | | | (12,081,915 | ) | | | | | | | (1,946,793 | ) | | | | | | | (18,122,693 | ) |
| | | | | | | | | | | | | | | | | | | | | | | | | | | | |
| Net increase in shares outstanding | | | 2,113,833 | | | | | | | $ | 17,814,850 | | | | | | | | 6,079,914 | | | | | | | $ | 59,265,250 | |
| | | | | | | | | | | | | | | | | | | | | | | | | | | | |
10. Subsequent Events
Management has evaluated subsequent events for possible recognition or disclosure in the financial statements through the date the financial statements are issued. Management has determined that there are no material events that would require disclosure in the Fund’s financial statements through this date.
30
American Beacon Garcia Hamilton Quality Bond FundSM
Financial Highlights
(For a share outstanding throughout the period)
| | | | | | | | | | | | | | | | | | | | | | | | | | | | | | | | | | | | |
| | | R5 ClassA | |
| | | Year Ended October 31, | |
| | | 2023 | | | | | | 2022 | | | | | | 2021 | | | | | | 2020 | | | | | | 2019 | |
| | | | |
Net asset value, beginning of period | | $ | 8.37 | | | | | | | $ | 9.85 | | | | | | | $ | 10.27 | | | | | | | $ | 10.05 | | | | | | | $ | 9.79 | |
| | | | | | | | | | | | | | | | | | | | | | | | | | | | | | | | | | | | |
Income (loss) from investment operations: | | | | | | | | | | | | | | | | | | | | | | | | | | | | | | | | | | | | |
Net investment income (loss) | | | 0.30 | B | | | | | | | 0.06 | | | | | | | | (0.01 | )B | | | | | | | 0.11 | | | | | | | | 0.24 | |
Net gains (losses) on investments (both realized and unrealized) | | | (0.37 | ) | | | | | | | (1.33 | ) | | | | | | | (0.08 | ) | | | | | | | 0.28 | | | | | | | | 0.26 | |
| | | | | | | | | | | | | | | | | | | | | | | | | | | | | | | | | | | | |
Total income (loss) from investment operations | | | (0.07 | ) | | | | | | | (1.27 | ) | | | | | | | (0.09 | ) | | | | | | | 0.39 | | | | | | | | 0.50 | |
| | | | | | | | | | | | | | | | | | | | | | | | | | | | | | | | | | | | |
Less distributions: | | | | | | | | | | | | | | | | | | | | | | | | | | | | | | | | | | | | |
Dividends from net investment income | | | (0.29 | ) | | | | | | | (0.21 | ) | | | | | | | (0.14 | ) | | | | | | | (0.17 | ) | | | | | | | (0.24 | ) |
Distributions from net realized gains | | | – | | | | | | | | – | | | | | | | | (0.19 | ) | | | | | | | – | | | | | | | | – | |
| | | | | | | | | | | | | | | | | | | | | | | | | | | | | | | | | | | | |
Total distributions | | | (0.29 | ) | | | | | | | (0.21 | ) | | | | | | | (0.33 | ) | | | | | | | (0.17 | ) | | | | | | | (0.24 | ) |
| | | | | | | | | | | | | | | | | | | | | | | | | | | | | | | | | | | | |
Net asset value, end of period | | $ | 8.01 | | | | | | | $ | 8.37 | | | | | | | $ | 9.85 | | | | | | | $ | 10.27 | | | | | | | $ | 10.05 | |
| | | | | | | | | | | | | | | | | | | | | | | | | | | | | | | | | | | | |
Total returnC | | | (1.08 | )% | | | | | | | (13.04 | )% | | | | | | | (0.84 | )% | | | | | | | 3.93 | % | | | | | | | 5.20 | % |
| | | | | | | | | | | | | | | | | | | | | | | | | | | | | | | | | | | | |
| | | | | | | | | |
Ratios and supplemental data: | | | | | | | | | | | | | | | | | | | | | | | | | | | | | | | | | | | | |
Net assets, end of period | | $ | 15,104,966 | | | | | | | $ | 134,519,084 | | | | | | | $ | 192,774,622 | | | | | | | $ | 172,774,140 | | | | | | | $ | 316,582,604 | |
Ratios to average net assets: | | | | | | | | | | | | | | | | | | | | | | | | | | | | | | | | | | | | |
Expenses, before reimbursements and/or recoupments | | | 0.69 | % | | | | | | | 0.66 | % | | | | | | | 0.67 | % | | | | | | | 0.68 | % | | | | | | | 0.66 | % |
Expenses, net of reimbursements and/or recoupments | | | 0.45 | % | | | | | | | 0.45 | % | | | | | | | 0.45 | % | | | | | | | 0.45 | % | | | | | | | 0.45 | % |
Net investment income (loss), before expense reimbursements and/or recoupments | | | 3.20 | % | | | | | | | 1.06 | % | | | | | | | (0.32 | )% | | | | | | | 1.15 | % | | | | | | | 2.18 | % |
Net investment income (loss), net of reimbursements and/or recoupments | | | 3.44 | % | | | | | | | 1.27 | % | | | | | | | (0.10 | )% | | | | | | | 1.38 | % | | | | | | | 2.39 | % |
Portfolio turnover rate | | | 72 | % | | | | | | | 158 | % | | | | | | | 71 | % | | | | | | | 122 | % | | | | | | | 58 | % |
| A | Prior to February 28, 2020, the R5 Class was known as Institutional Class. |
| B | Per share amounts have been calculated using the average shares method. |
| C | Based on net asset value, which does not reflect the sales charge, redemption fee, or contingent deferred sales charge, if applicable. May include adjustments in accordance with U.S. GAAP and as such, the net asset value for reporting purposes and the returns based upon those net asset values may differ from the net asset value and returns for shareholder transactions. |
See accompanying notes
31
American Beacon Garcia Hamilton Quality Bond FundSM
Financial Highlights
(For a share outstanding throughout the period)
| | | | | | | | | | | | | | | | | | | | | | | | | | | | | | | | | | | | |
| | | Y Class | |
| | | Year Ended October 31, | |
| | | 2023 | | | | | | 2022 | | | | | | 2021 | | | | | | 2020 | | | | | | 2019 | |
| | | | |
Net asset value, beginning of period | | $ | 8.36 | | | | | | | $ | 9.86 | | | | | | | $ | 10.27 | | | | | | | $ | 10.05 | | | | | | | $ | 9.79 | |
| | | | | | | | | | | | | | | | | | | | | | | | | | | | | | | | | | | | |
Income (loss) from investment operations: | | | | | | | | | | | | | | | | | | | | | | | | | | | | | | | | | | | | |
Net investment income | | | 0.37 | | | | | | | | 0.22 | | | | | | | | (0.00 | )A | | | | | | | 0.13 | | | | | | | | 0.24 | |
Net gains (losses) on investments (both realized and unrealized) | | | (0.46 | ) | | | | | | | (1.51 | ) | | | | | | | (0.08 | ) | | | | | | | 0.25 | | | | | | | | 0.25 | |
| | | | | | | | | | | | | | | | | | | | | | | | | | | | | | | | | | | | |
Total income (loss) from investment operations | | | (0.09 | ) | | | | | | | (1.29 | ) | | | | | | | (0.08 | ) | | | | | | | 0.38 | | | | | | | | 0.49 | |
| | | | | | | | | | | | | | | | | | | | | | | | | | | | | | | | | | | | |
Less distributions: | | | | | | | | | | | | | | | | | | | | | | | | | | | | | | | | | | | | |
Dividends from net investment income | | | (0.28 | ) | | | | | | | (0.21 | ) | | | | | | | (0.14 | ) | | | | | | | (0.16 | ) | | | | | | | (0.23 | ) |
Distributions from net realized gains | | | – | | | | | | | | – | | | | | | | | (0.19 | ) | | | | | | | – | | | | | | | | – | |
| | | | | | | | | | | | | | | | | | | | | | | | | | | | | | | | | | | | |
Total distributions | | | (0.28 | ) | | | | | | | (0.21 | ) | | | | | | | (0.33 | ) | | | | | | | (0.16 | ) | | | | | | | (0.23 | ) |
| | | | | | | | | | | | | | | | | | | | | | | | | | | | | | | | | | | | |
Net asset value, end of period | | $ | 7.99 | | | | | | | $ | 8.36 | | | | | | | $ | 9.86 | | | | | | | $ | 10.27 | | | | | | | $ | 10.05 | |
| | | | | | | | | | | | | | | | | | | | | | | | | | | | | | | | | | | | |
Total returnB | | | (1.27 | )% | | | | | | | (13.24 | )% | | | | | | | (0.81 | )% | | | | | | | 3.83 | % | | | | | | | 5.09 | % |
| | | | | | | | | | | | | | | | | | | | | | | | | | | | | | | | | | | | |
| | | | | | | | | |
Ratios and supplemental data: | | | | | | | | | | | | | | | | | | | | | | | | | | | | | | | | | | | | |
Net assets, end of period | | $ | 48,666,569 | | | | | | | $ | 29,473,503 | | | | | | | $ | 21,340,613 | | | | | | | $ | 18,928,869 | | | | | | | $ | 17,927,537 | |
Ratios to average net assets: | | | | | | | | | | | | | | | | | | | | | | | | | | | | | | | | | | | | |
Expenses, before reimbursements and/or recoupments | | | 0.75 | % | | | | | | | 0.73 | % | | | | | | | 0.74 | % | | | | | | | 0.74 | % | | | | | | | 0.73 | % |
Expenses, net of reimbursements and/or recoupments | | | 0.51 | % | | | | | | | 0.51 | % | | | | | | | 0.52 | %C | | | | | | | 0.55 | % | | | | | | | 0.55 | % |
Net investment income (loss), before expense reimbursements and/or recoupments | | | 3.23 | % | | | | | | | 1.10 | % | | | | | | | (0.38 | )% | | | | | | | 1.03 | % | | | | | | | 2.14 | % |
Net investment income (loss), net of reimbursements and/or recoupments | | | 3.47 | % | | | | | | | 1.32 | % | | | | | | | (0.16 | )% | | | | | | | 1.22 | % | | | | | | | 2.32 | % |
Portfolio turnover rate | | | 72 | % | | | | | | | 158 | % | | | | | | | 71 | % | | | | | | | 122 | % | | | | | | | 58 | % |
| A | Amount represents less than $0.01 per share. |
| B | Based on net asset value, which does not reflect the sales charge, redemption fee, or contingent deferred sales charge, if applicable. May include adjustments in accordance with U.S. GAAP and as such, the net asset value for reporting purposes and the returns based upon those net asset values may differ from the net asset value and returns for shareholder transactions. |
| C | Expense ratios may exceed stated expense caps in Note 2 due to the change in the contractual expense caps on February 28, 2021. |
See accompanying notes
32
American Beacon Garcia Hamilton Quality Bond FundSM
Financial Highlights
(For a share outstanding throughout the period)
| | | | | | | | | | | | | | | | | | | | | | | | | | | | | | | | | | | | |
| | | Investor Class | |
| | | Year Ended October 31, | |
| | | 2023 | | | | | | 2022 | | | | | | 2021 | | | | | | 2020 | | | | | | 2019 | |
| | | | |
Net asset value, beginning of period | | $ | 8.36 | | | | | | | $ | 9.85 | | | | | | | $ | 10.26 | | | | | | | $ | 10.05 | | | | | | | $ | 9.79 | |
| | | | | | | | | | | | | | | | | | | | | | | | | | | | | | | | | | | | |
Income (loss) from investment operations: | | | | | | | | | | | | | | | | | | | | | | | | | | | | | | | | | | | | |
Net investment income (loss) | | | 0.21 | | | | | | | | 0.09 | | | | | | | | (0.04 | )A | | | | | | | 0.13 | A | | | | | | | 0.21 | |
Net gains (losses) on investments (both realized and unrealized) | | | (0.33 | ) | | | | | | | (1.40 | ) | | | | | | | (0.07 | ) | | | | | | | 0.22 | | | | | | | | 0.26 | |
| | | | | | | | | | | | | | | | | | | | | | | | | | | | | | | | | | | | |
Total income (loss) from investment operations | | | (0.12 | ) | | | | | | | (1.31 | ) | | | | | | | (0.11 | ) | | | | | | | 0.35 | | | | | | | | 0.47 | |
| | | | | | | | | | | | | | | | | | | | | | | | | | | | | | | | | | | | |
Less distributions: | | | | | | | | | | | | | | | | | | | | | | | | | | | | | | | | | | | | |
Dividends from net investment income | | | (0.25 | ) | | | | | | | (0.18 | ) | | | | | | | (0.11 | ) | | | | | | | (0.14 | ) | | | | | | | (0.21 | ) |
Distributions from net realized gains | | | – | | | | | | | | – | | | | | | | | (0.19 | ) | | | | | | | – | | | | | | | | – | |
| | | | | | | | | | | | | | | | | | | | | | | | | | | | | | | | | | | | |
Total distributions | | | (0.25 | ) | | | | | | | (0.18 | ) | | | | | | | (0.30 | ) | | | | | | | (0.14 | ) | | | | | | | (0.21 | ) |
| | | | | | | | | | | | | | | | | | | | | | | | | | | | | | | | | | | | |
Net asset value, end of period | | $ | 7.99 | | | | | | | $ | 8.36 | | | | | | | $ | 9.85 | | | | | | | $ | 10.26 | | | | | | | $ | 10.05 | |
| | | | | | | | | | | | | | | | | | | | | | | | | | | | | | | | | | | | |
Total returnB | | | (1.59 | )% | | | | | | | (13.47 | )% | | | | | | | (1.11 | )% | | | | | | | 3.54 | % | | | | | | | 4.80 | % |
| | | | | | | | | | | | | | | | | | | | | | | | | | | | | | | | | | | | |
| | | | | | | | | |
Ratios and supplemental data: | | | | | | | | | | | | | | | | | | | | | | | | | | | | | | | | | | | | |
Net assets, end of period | | $ | 740,628 | | | | | | | $ | 853,503 | | | | | | | $ | 991,788 | | | | | | | $ | 365,190 | | | | | | | $ | 14,904,591 | |
Ratios to average net assets: | | | | | | | | | | | | | | | | | | | | | | | | | | | | | | | | | | | | |
Expenses, before reimbursements and/or recoupments | | | 1.17 | % | | | | | | | 1.13 | % | | | | | | | 1.29 | % | | | | | | | 1.20 | % | | | | | | | 1.04 | % |
Expenses, net of reimbursements and/or recoupments | | | 0.83 | % | | | | | | | 0.83 | % | | | | | | | 0.83 | % | | | | | | | 0.83 | % | | | | | | | 0.83 | % |
Net investment income (loss), before expense reimbursements and/or recoupments | | | 2.78 | % | | | | | | | 0.63 | % | | | | | | | (0.91 | )% | | | | | | | 0.90 | % | | | | | | | 1.81 | % |
Net investment income (loss), net of reimbursements and/or recoupments | | | 3.12 | % | | | | | | | 0.93 | % | | | | | | | (0.45 | )% | | | | | | | 1.27 | % | | | | | | | 2.02 | % |
Portfolio turnover rate | | | 72 | % | | | | | | | 158 | % | | | | | | | 71 | % | | | | | | | 122 | % | | | | | | | 58 | % |
| A | Based on average shares outstanding for the period. |
| B | Based on net asset value, which does not reflect the sales charge, redemption fee, or contingent deferred sales charge, if applicable. May include adjustments in accordance with U.S. GAAP and as such, the net asset value for reporting purposes and the returns based upon those net asset values may differ from the net asset value and returns for shareholder transactions. |
See accompanying notes
33
American Beacon Garcia Hamilton Quality Bond FundSM
Financial Highlights
(For a share outstanding throughout the period)
| | | | | | | | | | | | | | | | | | | | | | | | | | | | | | | | | | | | |
| | | R6 Class | |
| | | Year Ended October 31, | | | | | | February 28,
2019A to
October 31, | |
| | | | |
| | | 2023 | | | | | | 2022 | | | | | | 2021 | | | | | | 2020 | | | | | | 2019 | |
| | | | |
Net asset value, beginning of period | | $ | 8.36 | | | | | | | $ | 9.85 | | | | | | | $ | 10.26 | | | | | | | $ | 10.04 | | | | | | | $ | 9.87 | |
| | | | | | | | | | | | | | | | | | | | | | | | | | | | | | | | | | | | |
Income from investment operations: | | | | | | | | | | | | | | | | | | | | | | | | | | | | | | | | | | | | |
Net investment income (loss) | | | 0.32 | | | | | | | | 0.17 | | | | | | | | (0.01 | )B | | | | | | | 0.14 | | | | | | | | 0.17 | |
Net gains (losses) on investments (both realized and unrealized) | | | (0.40 | ) | | | | | | | (1.44 | ) | | | | | | | (0.06 | ) | | | | | | | 0.25 | | | | | | | | 0.17 | |
| | | | | | | | | | | | | | | | | | | | | | | | | | | | | | | | | | | | |
Total income (loss) from investment operations | | | (0.08 | ) | | | | | | | (1.27 | ) | | | | | | | (0.07 | ) | | | | | | | 0.39 | | | | | | | | 0.34 | |
| | | | | | | | | | | | | | | | | | | | | | | | | | | | | | | | | | | | |
Less distributions: | | | | | | | | | | | | | | | | | | | | | | | | | | | | | | | | | | | | |
Dividends from net investment income | | | (0.29 | ) | | | | | | | (0.22 | ) | | | | | | | (0.15 | ) | | | | | | | (0.17 | ) | | | | | | | (0.17 | ) |
Distributions from net realized gains | | | – | | | | | | | | – | | | | | | | | (0.19 | ) | | | | | | | – | | | | | | | | – | |
| | | | | | | | | | | | | | | | | | | | | | | | | | | | | | | | | | | | |
Total distributions | | | (0.29 | ) | | | | | | | (0.22 | ) | | | | | | | (0.34 | ) | | | | | | | (0.17 | ) | | | | | | | (0.17 | ) |
| | | | | | | | | | | | | | | | | | | | | | | | | | | | | | | | | | | | |
Net asset value, end of period | | $ | 7.99 | | | | | | | $ | 8.36 | | | | | | | $ | 9.85 | | | | | | | $ | 10.26 | | | | | | | $ | 10.04 | |
| | | | | | | | | | | | | | | | | | | | | | | | | | | | | | | | | | | | |
Total returnC | | | (1.17 | )% | | | | | | | (13.11 | )% | | | | | | | (0.70 | )% | | | | | | | 3.97 | % | | | | | | | 3.44 | %D |
| | | | | | | | | | | | | | | | | | | | | | | | | | | | | | | | | | | | |
| | | | | | | | | |
Ratios and supplemental data: | | | | | | | | | | | | | | | | | | | | | | | | | | | | | | | | | | | | |
Net assets, end of period | | $ | 200,499,044 | | | | | | | $ | 191,990,607 | | | | | | | $ | 166,304,291 | | | | | | | $ | 141,893,384 | | | | | | | $ | 130,208,195 | |
Ratios to average net assets: | | | | | | | | | | | | | | | | | | | | | | | | | | | | | | | | | | | | |
Expenses, before reimbursements and/or recoupments | | | 0.65 | % | | | | | | | 0.63 | % | | | | | | | 0.64 | % | | | | | | | 0.64 | % | | | | | | | 0.66 | %E |
Expenses, net of reimbursements and/or recoupments | | | 0.41 | % | | | | | | | 0.41 | % | | | | | | | 0.41 | % | | | | | | | 0.41 | % | | | | | | | 0.41 | %E |
Net investment income (loss), before expense reimbursements and/or recoupments | | | 3.31 | % | | | | | | | 1.14 | % | | | | | | | (0.28 | )% | | | | | | | 1.13 | % | | | | | | | 1.90 | %E |
Net investment income (loss), net of reimbursements and/or recoupments | | | 3.55 | % | | | | | | | 1.36 | % | | | | | | | (0.05 | )% | | | | | | | 1.36 | % | | | | | | | 2.15 | %E |
Portfolio turnover rate | | | 72 | % | | | | | | | 158 | % | | | | | | | 71 | % | | | | | | | 122 | % | | | | | | | 58 | %F |
| A | Commencement of operations. |
| B | Based on average shares outstanding for the period. |
| C | Based on net asset value, which does not reflect the sales charge, redemption fee, or contingent deferred sales charge, if applicable. May include adjustments in accordance with U.S. GAAP and as such, the net asset value for reporting purposes and the returns based upon those net asset values may differ from the net asset value and returns for shareholder transactions. |
| F | Portfolio turnover rate is for the period from February 28, 2019 through October 31, 2019 and is not annualized. |
See accompanying notes
34
American Beacon FundsSM
Federal Tax Information
October 31, 2023 (Unaudited)
Certain tax information regarding the Funds are required to be provided to shareholders based upon the Funds’ income and distributions for the taxable year ended October 31, 2023. The information and distributions reported herein may differ from information and distributions taxable to the shareholders for the calendar year ended December 31, 2023.
The Fund designated the following items with regard to distributions paid during the fiscal year ended October 31, 2023. All designations are based on financial information available as of this annual report and, accordingly, are subject to change. For each item, it is the intention of the Funds to designate the maximum amount permitted under the Internal Revenue Code of 1986, as amended, and the regulations there under.
Corporate Dividends-Received Deduction:
| | | | |
Garcia Hamilton Quality Bond | | | 0.00 | % |
Qualified Dividend Income:
| | | | |
Garcia Hamilton Quality Bond | | | 0.00 | % |
Long-Term Capital Gain Distributions:
| | | | |
Garcia Hamilton Quality Bond | | $ | 0 | |
Short-Term Capital Gain Distributions:
| | | | |
Garcia Hamilton Quality Bond | | $ | 0 | |
Shareholders will receive notification in January 2024 of the applicable tax information necessary to prepare their 2023 income tax returns.
35
Disclosure Regarding the Renewal and Approval of Current Management and Investment Advisory Agreements (Unaudited)
At meetings held on May 16, 2023 and June 6-7, 2023 (collectively, the “Meetings”), the Board of Trustees (“Board” or “Trustees”) considered and then, at its June 7, 2023 meeting, approved the renewal of:
(1) the Management Agreement between American Beacon Advisors, Inc. (“Manager”) and the American Beacon Funds (“Trust”) on behalf of the American Beacon Garcia Hamilton Quality Bond Fund (“Fund”); and
(2) the Investment Advisory Agreement among the Manager and the Trust, on behalf of the Fund, and Garcia Hamilton & Associates, LP (“sub-advisor”).
The Management Agreement and the Investment Advisory Agreement are referred to herein individually as an “Agreement” and collectively as the “Agreements.”
In preparation for its consideration of the renewal of the Agreements, the Board undertook steps to gather and consider information furnished by the Manager, the sub-advisor, Broadridge, Inc. (“Broadridge”) and Morningstar, Inc. (“Morningstar”). The Board, with the assistance of independent legal counsel, requested and received certain relevant information from the Manager and the sub-advisor.
In advance of the Meetings, the Board’s Investment Committee and/or the Manager coordinated the production of information from Broadridge and Morningstar regarding the performance, fees and expenses of the Fund as well as information from the Manager and the sub-advisor. At the Meetings, the Board considered the information provided in connection with the renewal process, as well as information furnished to the Board throughout the year at regular meetings of the Board and its committees. In connection with the Board’s consideration of the Agreements, the Trustees received and evaluated such information as they deemed necessary. This information is described below in the section summarizing the factors the Board considered in connection with its renewal and approval of the Agreements, as well as the section describing additional Board considerations with respect to the Fund.
The Board noted that the Manager provides management and administrative services to the Fund pursuant to the Management Agreement. The Board considered that many mutual funds have separate contracts governing each type of service and observed that, with respect to such mutual funds, the actual management fee rates provided by Broadridge for peer group funds reflect the combined advisory and administrative fees, reduced by any fee waivers and/or reimbursements.
The Manager or the sub-advisor may not have been able to, or opted not to, provide information in response to certain information requests, in which case the Board conducted its evaluation of the firm based on information that was provided. In such cases, the Board determined that the omission of any such information was not material to its considerations.
Provided below is an overview of certain factors the Board considered in connection with its decision to approve the renewal of the Agreements. The Board did not identify any particular information that was most relevant to its consideration of whether to approve the renewal of each Agreement, and each Trustee may have afforded different weight to the various factors. Legal counsel to the independent Trustees provided the Board with a memorandum regarding its responsibilities pertaining to the renewal of investment advisory contracts, such as the Agreements, and related regulatory guidelines. Based on its evaluation, the Board unanimously concluded that the terms of each Agreement were reasonable and fair and that the approval of the renewal of each Agreement was in the best interests of the Fund and its shareholders.
Considerations With Respect to the Renewal of the Management Agreement and the Investment Advisory Agreement
In determining whether to approve the renewal of the Agreements, the Board considered the Fund’s investment management and sub-advisory relationships separately. In each instance, the Board considered, among
36
Disclosure Regarding the Renewal and Approval of Current Management and Investment Advisory Agreements (Unaudited)
other things, the following factors: (1) the nature, extent and quality of the services provided; (2) the investment performance of the Fund and the sub-advisor for the Fund; (3) the profits, if any, earned by the Manager in rendering services to the Fund; (4) comparisons of services and fee rates with contracts entered into by the Manager or the sub-advisor or their affiliates with other clients (such as pension funds and other institutional clients); (5) the extent to which economies of scale, if any, have been taken into account in setting each fee rate schedule; (6) whether fee rate levels reflect economies of scale, if any, for the benefit of Fund investors; and (7) any other benefits derived or anticipated to be derived by the Manager or the sub-advisor from its relationship with the Fund.
Nature, Extent and Quality of Services. With respect to the renewal of the Management Agreement, the Board considered, among other factors: the Fund’s long-term performance; the length of service of key investment personnel at the Manager; the cost structure of the Fund; the financial condition of the Manager, including its parent company; the Manager’s culture of compliance and support that reduce risks to the Fund; the Manager’s quality of services; the Manager’s active role in monitoring and, as appropriate, recommending additional or replacement sub-advisors; and the Manager’s representations regarding its efforts to retain key employees and maintain staffing levels.
With respect to the renewal of the Investment Advisory Agreement, the Board considered, among other factors: the representations made by the sub-advisor regarding the sub-advisor’s level of staffing; asset size; the financial stability of the sub-advisor; and its compliance program. Based on the foregoing and other information, the Board concluded that the nature, extent and quality of the management and advisory services provided by the Manager and the sub-advisor were appropriate for the Fund.
Investment Performance. The Board evaluated the comparative information provided by Broadridge and the Manager regarding the performance of the Fund relative to its Broadridge Performance Universe, Morningstar Category, and/or benchmark index, as well as the Fund’s Morningstar rating. The Board considered the information provided by Broadridge regarding its independent methodology for selecting the Fund’s Broadridge Performance Universe. In addition, the Board considered the performance reports and discussions with management at meetings of the Board and its committees throughout the year. The Board also evaluated the comparative information provided by the sub-advisor regarding the performance of the Fund relative to the performance of a composite of comparable investment accounts managed by the sub-advisor and the Fund’s benchmark index. In addition, the Board considered the Manager’s recommendation to continue to retain the sub-advisor. A discussion regarding the Board’s considerations with respect to the Fund’s performance appears below under “Additional Considerations and Conclusions with Respect to the Fund.”
Costs of the Services Provided to the Fund and the Profits Realized by the Manager from its Relationship with the Fund. In analyzing the costs of services and profitability of the Manager, the Board considered the revenues earned and the expenses incurred by the Manager, before and after the payment of distribution-related expenses by the Manager. The profits or losses were noted at both an aggregate level for all funds within the group of mutual funds sponsored by the Manager (the “Fund Complex”) and at an individual fund level, with the Manager earning a profit before the payment of distribution-related expenses by the Manager and sustaining a loss after the payment of distribution-related expenses by the Manager with respect to the Fund. The Board also considered comparative information provided by the Manager regarding the Manager’s overall profitability with respect to the Fund Complex relative to the overall profitability of other firms in the mutual fund industry, as disclosed in publicly available sources. Although the Board noted that, in certain cases, the fee rates paid by other clients of the Manager are lower than the fee rates paid by the Fund, the Manager represented that the difference is attributable to, among other factors, the fact that the Manager does not perform administrative services for non-investment company clients and reflects the greater level of responsibility and regulatory requirements associated with managing the Fund. The Board also noted that, for the Fund and its share classes, the Manager is waiving fees and/or reimbursing expenses.
37
Disclosure Regarding the Renewal and Approval of Current Management and Investment Advisory Agreements (Unaudited)
The Board further considered that, with respect to the Fund, the Management Agreement provides for the Manager to receive a management fee comprised of an annualized fee that is retained by the Manager. The Board also noted that certain share classes of the Fund maintain higher expense ratios in order to compensate third-party financial intermediaries.
In analyzing the fee rates charged by the sub-advisor in connection with its investment advisory services to the Fund, the Board considered the sub-advisor’s representation that the sub-advisory fees charged to the Fund are higher than certain other accounts advised by the sub-advisor due to the higher level of servicing that the Fund requires. The Board did not request profitability data from the sub-advisor because the Board did not view this data as imperative to its deliberations given the arms-length nature of the relationship between the Manager and the sub-advisor with respect to the negotiation of sub-advisory fee rates. In addition, the Board noted that the sub-advisor may not account for its profits on an account-by-account basis and that different firms likely employ different methodologies in connection with these calculations.
Based on the foregoing and other information, the Board concluded that the profitability levels of the Manager were reasonable in light of the services performed by the Manager. A discussion regarding the Board’s considerations with respect to the Fund’s fee rates is set forth below under “Additional Considerations and Conclusions with Respect to the Fund.”
Economies of Scale. In considering the reasonableness of the management and investment advisory fees rates, the Board considered whether economies of scale will be realized as the Fund grows and whether fee rate levels reflect these economies of scale for the benefit of Fund shareholders. In this regard, the Board considered that the Manager has negotiated breakpoints in the sub-advisory fee rate schedule for the Fund and that the Fund’s asset level did not exceed the threshold necessary to reach the first sub-advisory fee rate breakpoint.
In addition, the Board noted the Manager’s representation that the Management Agreement contains fee schedule breakpoints at higher asset levels with respect to the Fund. In this regard, the Board considered that the Fund’s current assets did not exceed the threshold necessary to reach the first management fee breakpoint. Based on the foregoing and other information, the Board concluded that the Manager and sub-advisor fee rate schedules for the Fund provide for a reasonable sharing of benefits from any economies of scale with the Fund.
Benefits Derived from the Relationship with the Fund. The Board considered the Manager’s and sub-advisor’s responses to inquiries regarding “fall-out” or ancillary benefits that accrue to the Manager and/or the sub-advisor as a result of their advisory relationships with the Fund. For example, the Board considered that the Manager may invest the Fund’s cash balances in the American Beacon U.S. Government Money Market Select Fund, which the Manager manages directly, and for which the Manager receives a fee. Based on the foregoing and other information, the Board concluded that the potential benefits accruing to the Manager and the sub-advisor by virtue of their relationships with the Fund appear to be fair and reasonable.
Additional Considerations and Conclusions with Respect to the Fund
The performance comparisons below were made for the Fund’s R5 Class shares relative to the Fund’s Broadridge Performance Universe and Morningstar Category. With respect to the Broadridge Performance Universe, the 1st Quintile represents the top 20 percent of the universe based on performance, and the 5th Quintile represents the bottom 20 percent of the universe based on performance. References to the Fund’s Broadridge Performance Universe are to the respective universe of mutual funds with comparable investment classifications and objectives as determined by Broadridge.
In reviewing the performance, the Board viewed longer-term performance over a full market cycle, typically five years or longer, as the most important consideration because relative performance over shorter periods may be significantly impacted by market or economic events and not necessarily reflective of sub-advisor skill.
38
Disclosure Regarding the Renewal and Approval of Current Management and Investment Advisory Agreements (Unaudited)
The expense comparisons below were made for the Fund’s R5 Class shares relative to the Fund’s Broadridge Expense Universe and Broadridge Expense Group, and Y Class shares relative to the Fund’s Morningstar Fee Level universe. The 1st Quintile represents the lowest 20 percent of the universe or group based on lowest total expense, and the 5th Quintile represents the highest 20 percent of the universe or group based on highest total expense. References to the Fund’s Expense Group and Expense Universe are to the respective group or universe of comparable mutual funds as determined by Broadridge. Broadridge Expense Groups consist of the Fund and a representative sample of funds with similar operating structures and asset sizes, as selected by Broadridge. A Broadridge Expense Universe includes all funds with comparable investment classifications/objectives and similar operating structures to that of the share class under review for the Fund, including funds in the Broadridge Expense Group. The Broadridge expense comparisons are based on the most recent audited financial information publicly available for the Fund as of December 31, 2022. References to the Fund’s Morningstar Fee Level ranking are to the institutional share class of comparable mutual funds as determined by Morningstar.
The Board considered the Fund’s Morningstar fee level category with the 1st Quintile representing the lowest 20 percent of the category constituents and the 5th Quintile representing the highest 20 percent of the category in terms of total expense.
In considering the renewal of the Agreements with the sub-advisor for the Fund, the Board considered the following additional factors:
Broadridge Total Expenses Excluding 12b-1 Fees and Morningstar Fee Level Ranking
| | | | |
Compared to Broadridge Expense Group | | | 3 | rd Quintile |
Compared to Broadridge Expense Universe | | | 4 | th Quintile |
Morningstar Fee Level Ranking | | | 4 | th Quintile |
Broadridge and Morningstar Performance Analysis (five-year period ended December 31, 2022)
| | | | |
Compared to Broadridge Performance Universe | | | 5 | th Quintile |
Compared to Morningstar Category | | | 4 | th Quintile |
The Board also considered: (1) representations by the Manager and sub-advisor that the periods of underperformance were due primarily to the sub-advisor’s duration-management strategy; (2) the recent improvement in relative performance in the rising interest rate environment, resulting in a 1st Quintile ranking in the Broadridge Performance Universe for the one-year period ended December 31, 2022; and (3) the Manager’s recommendation to continue to retain the sub-advisor.
Based on these and other considerations, the Board: (1) concluded that the fees paid to the Manager and sub-advisor under the Agreements are fair and reasonable; and (2) determined that the Fund and its shareholders would benefit from the Manager’s and sub-advisor’s continued management of the Fund.
39
Disclosure Regarding the Approval of New Management and Investment Advisory Agreements (Unaudited)
On July 11, 2023, (i) Resolute Investment Holdings, LLC (“RIH”), its indirect wholly-owned subsidiary, Resolute Investment Managers, Inc. (“RIM”), the parent company of American Beacon Advisors, Inc. (“Manager”), the investment manager of American Beacon Funds (“Trust”), and certain of their affiliates, and (ii) the current owners of approximately 93% of RIH (“Current Ownership Group”), entered into a transaction agreement (“Transaction Agreement”) with certain creditors of RIM (“Lender Group”) to strengthen the capital structure of RIH, the indirect 100% owner of RIM and the Manager (together with RIH, “Resolute”). Pursuant to the Transaction Agreement, (i) all equity interests in RIH would be cancelled, (ii) new equity interests would be issued to members of the Lender Group (“New Ownership Group”), and (iii) the existing credit agreements between RIM and the Lender Group would be terminated and a new credit agreement would be executed (“Transaction”).
Upon the closing of the Transaction (“Closing”), the Manager will be wholly owned indirectly by the New Ownership Group, rather than by the Current Ownership Group. This change in control will be deemed to be an “assignment” under the Investment Company Act of 1940 Act, as amended (“1940 Act”), of the Trust’s (i) existing management agreement (“Current Management Agreement”) with the Manager with respect to the American Beacon Garcia Hamilton Quality Bond Fund (“Fund”) and other series of the Trust (“Other Funds”), and (ii) existing investment advisory agreement (“Current Investment Advisory Agreement”) among the Manager, the Trust and Garcia Hamilton & Associates, LP (“Sub-Advisor”) on behalf of the Fund. As required by the 1940 Act, the Current Management Agreement and Current Investment Advisory Agreement (“Current Agreements”) provide for their automatic termination in the event of an assignment, and, therefore, will terminate upon the Closing.
The Board of Trustees (“Trustees” or “Board”) of the Trust met by videoconference on July 7, 2023, and in-person on July 12, 2023 (“July Meetings”), to discuss the Transaction and consider the effect that the Transaction would have on the Fund and the Other Funds. In addition, the Board received various information from the Manager regarding the intended purposes and framework of the Transaction at its meetings in-person on February 28–March 1, 2023 (“March Meeting”) and June 6–7, 2023, and by videoconference on May 16, 2023 (“May-June Meetings”). Following the March Meeting, the Board designated an ad hoc special committee (“Committee”) to meet with representatives of the Manager and receive updates on the negotiations and, as appropriate, to provide input with respect to the process. Throughout this process, the Board and the Committee were advised by independent legal counsel and received guidance concerning, among other matters, the Trustees’ responsibilities in connection with their consideration with respect to the Fund of a new Management Agreement (“New Management Agreement”), and new Investment Advisory Agreement (“New Investment Advisory Agreement” and, collectively with the New Management Agreement, the “New Agreements”). The Trustees were advised that the New Agreements would replace the Current Agreements, upon the assignment and termination of the Current Agreements upon the Closing.
In advance of the July Meetings, the Board requested and received detailed information from the Manager regarding the Transaction. In connection with the Transaction, the Board reviewed materials furnished by the Manager, which had been reviewed, as applicable, by representatives of the New Ownership Group and met with senior representatives of the Manager. The Board also reviewed the material terms of the Transaction and considered its possible effects on the Fund and its shareholders. During these meetings, representatives of the Manager indicated their belief that the Transaction would not adversely affect the continued operation of the Fund, the capabilities of the key personnel of the Manager who currently manage the Fund to continue to provide services to the Fund at the current levels, or the capabilities of the Sub-Advisor to provide the same level of services to the Fund.
In evaluating the New Management Agreement, the Trustees considered that they generally have been satisfied with the nature and quality of the services provided to the Fund by the Manager, including investment advisory and administrative services, and that the Fund would be best served by an arrangement that appeared likely to maintain the continuity and stability of these services. Accordingly, the Board considered information communicated by the Manager regarding the anticipated benefits of the substantially strengthened capital structure of Resolute that would result from the Transaction, and the related positive anticipated impact on the Manager’s resources available for future staffing, compensation, and staff retention. The Manager’s
40
Disclosure Regarding the Approval of New Management and Investment Advisory Agreements (Unaudited)
representatives also indicated that they believe that the Transaction best facilitates continuity of management and view such continuity as beneficial to the long-term success of the Fund, but noted that there could be no assurance of any particular benefits that may result.
In connection with the Board’s determination to approve the New Agreements, the Trustees considered, among other information, the following factors as they relate to the Transaction:
| | • | | The manner in which the Fund’s assets are managed will not change as a result of the Transaction, and the same people who currently manage the Fund’s assets are expected to continue to do so after the Transaction; |
| | • | | The fee rates payable by the Fund under the New Agreements are the same as the fee rates payable under the Current Agreements; |
| | • | | The Manager’s commitment to maintaining the contractual fee waiver/expense reimbursement agreement that is currently in effect with respect to the Fund for a period of two years following the Closing to ensure that shareholders do not face an increase in expenses; |
| | • | | The New Agreements are identical in all material respects to the Current Agreements; |
| | • | | The Manager and the Sub-Advisor would provide the same services to the Fund pursuant to the New Agreements as they had been providing under the Current Agreements; |
| | • | | The Manager’s personnel who will provide management services to the Fund are not expected to change and the commitment of the New Ownership Group to retain key personnel currently employed by the Manager who currently provide services to the Fund; |
| | • | | The Sub-Advisor personnel who will provide advisory services to the Fund are not expected to change; |
| | • | | Resolute’s substantially strengthened capital structure following the Closing, which would enable Resolute to continue to provide the Manager with the financial resources necessary to continue to operate and grow the Fund; |
| | • | | The anticipated governance structure to be employed in the management of RIM and that following the Transaction the Manager is expected to maintain continuity of management, a similar degree of operational autonomy and its current culture of compliance; |
| | • | | The various measures in place and/or prepared to be employed to address any potential impact of the Transaction on the Manager’s business, including its day-to-day operations; |
| | • | | The anticipated absence of any adverse impact of the Transaction on the Fund’s Sub-Advisor and other key service providers; |
| | • | | The alignment of the strategic business objectives of the New Ownership Group with regard to its investment in the Manager and the Manager’s activities with respect to the Trust, which objectives are consistent with the Manager’s current objectives; |
| | • | | Fund shareholders will not bear any costs in connection with the Transaction, inasmuch as the Manager and, indirectly, the New Ownership Group will bear the costs, fees and expenses incurred by the Fund in connection with the Transaction, the proxy statement, the fees and expenses of accountants and attorneys relating to the Transaction, and the fees and expenses of the Board and the Committee for meetings held in connection with the Transaction; |
| | • | | The Fund may realize benefits as a result of the Transaction, including that the Transaction is expected to maintain continuity of management of the Fund and may reduce the potential vulnerability to changes in control of the Manager that could be adverse to the Fund’s interests and affect the retention of key employees providing services to the Fund; |
| | • | | The Manager’s representation that there had been no material changes or developments relating to the Manager or the Sub-Advisor since the May-June Meetings, other than the changes or developments subsequently reported to the Board; and |
41
Disclosure Regarding the Approval of New Management and Investment Advisory Agreements (Unaudited)
| | • | | The Trustees had requested and evaluated information relevant to the renewal of the Current Agreements at their May-June Meetings. |
In light of the proximity of the Board’s consideration of the renewal or approval of the Current Agreements at the May-June Meetings, the Trustees determined that it was not necessary to repeat certain aspects of the review conducted in connection with the approvals made the prior month. Based on the process undertaken and the considerations weighed by the Board with respect to the renewal of the Current Agreements, and the Board’s due diligence review in connection with the Transaction during the July Meetings, the Board approved the New Agreements at the July 12, 2023 meeting, and recommended that, as applicable, the shareholders of the Fund also approve the New Agreements. The factors considered by the Board in connection with the approval of the Current Agreements are described in the section of this report titled “Disclosure Regarding Approval of the Current Management and Investment Advisory Agreements.”
42
American Beacon Garcia Hamilton Quality Bond FundSM
Results of Shareholder Meeting (Unaudited)
A special meeting of shareholders of each of the portfolios of the American Beacon Funds (the “Trust”) was held on October 27, 2023. The shareholders of the American Beacon Garcia Hamilton Quality Bond Fund (the “Fund”), a portfolio of the Trust, approved a new management agreement between American Beacon Advisors, Inc. (“American Beacon”) and the Trust, with respect to the Fund, that will be effective upon the change in control of American Beacon. Approval of this proposal required a majority of the outstanding voting securities of the Fund.
The following is the result of the shareholder votes for this proposal:
| | | | | | | | | | | | | | | | | | | | | | | | | | |
Fund | | For | | | | | Against | | | | | | Abstain | | | | | | Non-Voting | |
| Garcia Hamilton Quality Bond Fund | | 27,044,174.37 | | | | | | | 13,690.00 | | | | | | | | 40,200.00 | | | | | | | | 8,137,404.28 | |
43
Trustees and Officers of the American Beacon FundsSM (Unaudited)
The Trustees and officers of the American Beacon Funds (the “Trust”) are listed below, together with their principal occupations during the past five years. The address of each person listed below is 220 East Las Colinas Boulevard, Suite 1200, Irving, Texas 75039. Each Trustee oversees twenty-seven funds in the fund complex that includes the Trust, the American Beacon Select Funds, and the American Beacon Institutional Funds Trust. The Trust’s Statement of Additional Information contains additional information about the Trustees and is available without charge by calling 1-800-658-5811.
| | | | |
Name, Age | | Position, Term of Office and Length of Time Served with the Trust | | Principal Occupation(s) During Past 5 Years and Current Directorships |
| INTERESTED TRUSTEES | | Term | | |
| | Lifetime of Trust until removal, resignation or retirement* | | |
| | |
| Eugene J. Duffy (1954)** | | Trustee since 2008 | | Managing Director, Global Investment Management Distribution, Mesirow Financial Administrative Corporation (2016-Present); Managing Director, Institutional Services, Intercontinental Real Estate Corporation (2014-2016); Trustee, American Beacon Select Funds (2008-Present); Trustee, American Beacon Institutional Funds Trust (2017-Present); Trustee, American Beacon Sound Point Enhanced Income Fund (2018–2021); Trustee, American Beacon Apollo Total Return Fund (2018–2021). |
| | |
| NON-INTERESTED TRUSTEES | | Term | | |
| | Lifetime of Trust until removal, resignation or retirement* | | |
| | |
| Gilbert G. Alvarado (1969) | | Trustee since 2015 | | Chief Financial Officer (2022-Present), The Conrad Prebys Foundation; President, SJVIIF, LLC, Impact Investment Fund (2018-2022); Director, Kura MD, Inc. (local telehealth organization) (2015-2017); Senior Vice President & CFO, Sierra Health Foundation (health conversion private foundation) (2006-2022); Senior Vice President & CFO, Sierra Health Foundation: Center for Health Program Management (California public benefit corporation) (2012-2022); Director, Sacramento Regional Technology Alliance (2011-2016); Director, Valley Healthcare Staffing (2017–2018); Trustee, American Beacon Select Funds (2015-Present); Trustee, American Beacon Institutional Funds Trust (2017-Present); Trustee, American Beacon Sound Point Enhanced Income Fund (2018–2021); Trustee, American Beacon Apollo Total Return Fund (2018–2021). |
| | |
| Joseph B. Armes (1962) | | Trustee since 2015 | | Director, Switchback Energy Acquisition (2019-2021); Chairman & CEO, CSW Industrials f/k/a Capital Southwest Corporation (investment company) (2015-Present); Chairman of the Board of Capital Southwest Corporation, predecessor to CSW Industrials, Inc. (2014-2017) (investment company); President & CEO, JBA Investment Partners (family investment vehicle) (2010-Present); Director and Chair of Audit Committee, RSP Permian (oil and gas producer) (2013-2018); Trustee, American Beacon Select Funds (2015-Present); Trustee, American Beacon Institutional Funds Trust (2017-Present); Trustee, American Beacon Sound Point Enhanced Income Fund (2018–2021); Trustee, American Beacon Apollo Total Return Fund (2018–2021). |
| | |
| Gerard J. Arpey (1958) | | Trustee since 2012 | | Partner, Emerald Creek Group (private equity firm) (2011-Present); Director, S.C. Johnson & Son, Inc. (privately held company) (2008-present); Director, The Home Depot, Inc. (2015-Present); Trustee, American Beacon Select Funds (2012-Present); Trustee, American Beacon Institutional Funds Trust (2017-Present); Trustee, American Beacon Sound Point Enhanced Income Fund (2018–2021); Trustee, American Beacon Apollo Total Return Fund (2018–2021). |
44
Trustees and Officers of the American Beacon FundsSM (Unaudited)
| | | | |
Name, Age | | Position, Term of Office and Length of Time Served with the Trust | | Principal Occupation(s) During Past 5 Years and Current Directorships |
| NON-INTERESTED TRUSTEES (CONT.) | | Term | | |
| | Lifetime of Trust until removal, resignation or retirement* | | |
| | |
| Brenda A. Cline (1960) | | Trustee since 2004 Chair since 2019 Vice Chair 2018 | | Chief Financial Officer, Treasurer and Secretary, Kimbell Art Foundation (1993-Present); Director, Tyler Technologies, Inc. (public sector software solutions company) (2014-Present); Director, Range Resources Corporation (oil and natural gas company) (2015-Present); Trustee, Cushing Closed-End and Open-End Funds (2017-2021);Chair, (2019-Present), Vice Chair (2018), Trustee (2004-Present), American Beacon Select Funds; Chair (2019-Present), Vice Chair (2018), Trustee (2017-Present), American Beacon Institutional Funds Trust; Chair (2019-2021), Vice Chair (2018), Trustee (2018-2021), American Beacon Sound Point Enhanced Income Fund (2018–2021); Chair (2019-2021), Vice Chair (2018), Trustee (2018-2021), American Beacon Apollo Total Return Fund (2018–2021). |
| | |
| Claudia A. Holz (1957) | | Trustee since 2018 | | Independent Director, Blue Owl Capital, Inc. (2021-Present); Partner, KPMG LLP (1990 – 2017); Trustee, American Beacon Select Funds (2018-Present); Trustee, American Beacon Institutional Funds Trust (2018-Present); Trustee, American Beacon Sound Point Enhanced Income Fund (2018–2021); Trustee, American Beacon Apollo Total Return Fund (2018–2021). |
| | |
| Douglas A. Lindgren (1961) | | Trustee since 2018 | | Director, JLL Income Property Trust (2022-Present); CEO North America, Carne Global Financial Services (2016-2017); Consultant, Carne Financial Services (2017-2019); Managing Director, IPS Investment Management and Global Head, Content Management, UBS Wealth Management (2010-2016); Trustee, American Beacon Select Funds (2018-Present); Trustee, American Beacon Institutional Funds Trust (2018-Present); Trustee, American Beacon Sound Point Enhanced Income Fund (2018–2021); Trustee, American Beacon Apollo Total Return Fund (2018–2021). |
| | |
| Barbara J. McKenna, CFA (1963) | | Trustee since 2012 | | President/Managing Principal, Longfellow Investment Management Company (2005-Present, President since 2009); Member, External Diversity Council of the Federal Reserve Bank of Boston (2021-Present); Member, Federal Reserve Bank of Boston CEO Roundtable (2021-Present); Board Advisor, United States Tennis Association (2021-Present); Trustee, American Beacon Select Funds (2012-Present); Trustee, American Beacon Institutional Funds Trust (2017-Present); Trustee, American Beacon Sound Point Enhanced Income Fund (2018–2021); Trustee, American Beacon Apollo Total Return Fund (2018–2021). |
45
Trustees and Officers of the American Beacon FundsSM (Unaudited)
| | | | |
Name, Age | | Position, Term of Office and Length of Time Served with the Trust | | Principal Occupation(s) During Past 5 Years and Current Directorships |
| OFFICERS | | Term | | |
| | One Year | | |
| | |
| Jeffrey K. Ringdahl (1975) | | President since 2022 Vice President (2010-2022) | | Director (2015-Present), President (2018-Present), Chief Executive Officer (2022-Present), Chief Operating Officer (2010-2022), Senior Vice President (2013-2018), American Beacon Advisors, Inc.; Director (2015-Present), President (2018-Present), Senior Vice President (2015-2018), Resolute Investment Holdings, LLC; Director (2015-Present), President (2018-Present), Senior Vice President (2015-2018), Resolute Topco, Inc.; Director (2015-Present), President (2018-Present), Senior Vice President (2015-2018), Resolute Acquisition, Inc.; Director (2015-Present), President (2018-Present), Chief Executive Officer (2022-Present); Chief Operating Officer (2018-2022), Senior Vice President (2015-2018), Resolute Investment Managers, Inc.; Director (2017-Present), President & Chief Executive Officer (2022-Present), Executive Vice President (2017-2022), Resolute Investment Distributors, Inc.; Director (2017-Present), President (2018-Present), Chief Executive Officer (2022-Present), Chief Operating Officer (2018-2022), Executive Vice President (2017-2018), Resolute Investment Services, Inc.; President (2022-Present), Senior Vice President (2017-2022), Vice President (2012-2017), Manager (2015-Present), American Private Equity Management, L.L.C.; Trustee, American Beacon NextShares Trust (2015-2020); Director, Executive Vice President & Chief Operating Officer, Alpha Quant Advisors, LLC (2016-2020); Director, Shapiro Capital Management, LLC (2017-Present); Director and Executive Vice President, Continuous Capital, LLC (2018-2022); Director, RSW Investments Holdings LLC (2019-Present); Manager, SSI Investment Management, LLC (2019-Present); Director, National Investment Services of America, LLC (2019-Present); Director and Vice President American Beacon Cayman Transformational Innovation Company, Ltd. (2017-2018); Vice President, American Beacon Delaware Transformational Innovation Corporation (2017-2018); Director (2014-Present), President (2022-Present), Vice President (2014-2022), American Beacon Cayman Managed Futures Strategy Fund, Ltd.; Director (2018-Present), President (2022-Present), (Vice President (2018-2022), American Beacon Cayman TargetRisk Company, Ltd.; President (2022-Present); Vice President (2010-2022), Director and President, American Beacon Cayman Multi-Alternatives Company, Ltd.; (2023-Present); Director and President, American Beacon Cayman Trend Company, Ltd. (2023-Present); American Beacon Select Funds; President (2022-Present), Vice President (2017-2022), American Beacon Institutional Funds Trust; Vice President, American Beacon Sound Point Enhanced Income Fund (2018-2021); Vice President, American Beacon Apollo Total Return Fund (2018-2021). |
46
Trustees and Officers of the American Beacon FundsSM (Unaudited)
| | | | |
Name, Age | | Position, Term of Office and Length of Time Served with the Trust | | Principal Occupation(s) During Past 5 Years and Current Directorships |
| OFFICERS (CONT.) | | Term | | |
| | One Year | | |
| | |
| Rosemary K. Behan (1959) | | VP, Secretary and Chief Legal Officer since 2006 | | Senior Vice President (2021-Present), Vice President (2006-2021), Secretary and General Counsel (2006-Present), American Beacon Advisors, Inc.; Secretary, Resolute Investment Holdings, LLC (2015-Present); Secretary, Resolute Topco, Inc. (2015-Present); Secretary, Resolute Acquisition, Inc. (2015–Present); Senior Vice President (2021-Present), Vice President (2015-2021), Secretary and General Counsel (2015-Present), Resolute Investment Managers, Inc.; Secretary, Resolute Investment Distributors, Inc. (2017-Present); Senior Vice President (2021-Present), Vice President (2017-2021), Secretary and General Counsel (2017-Present), Resolute Investment Services, Inc.; Secretary, American Private Equity Management, L.L.C. (2008-Present); Secretary and General Counsel, Alpha Quant Advisors, LLC (2016-2020); Vice President and Secretary, Continuous Capital, LLC (2018-2022); Secretary, Green Harvest Asset Management (2019-2021); Secretary, American Beacon Delaware Transformational Innovation Corporation (2017-2018); Secretary, American Beacon Cayman Transformational Innovation Company, Ltd. (2017-2018); Secretary, American Beacon Cayman Managed Futures Strategy Fund, Ltd. (2014-Present); Secretary, American Beacon Cayman TargetRisk Company, Ltd. (2018-Present); Secretary, American Beacon Cayman Multi-Alternatives Company, Ltd. (2023-Present); Secretary, American Beacon Cayman Trend Company, Ltd. (2023-Present); Chief Legal Officer, Vice President and Secretary, American Beacon Select Funds (2006-Present); Chief Legal Officer, Vice President and Secretary, American Beacon Institutional Funds Trust (2017-Present); Chief Legal Officer, Vice President and Secretary, American Beacon Sound Point Enhanced Income Fund (2018-2021); Chief Legal Officer, Vice President and Secretary, American Beacon Apollo Total Return Fund (2018-2021). |
| | |
| Gregory J. Stumm (1981) | | VP since 2022 | | Senior Vice President, American Beacon Advisors, Inc. (2022-Present); Senior Vice President, Resolute Investment Managers, Inc. (2022-Present); Director and Senior Vice President, Resolute Investment Distributors, Inc. (2022-Present); Senior Vice President, Resolute Investment Services, Inc. (2022-Present); Vice President, American Beacon Select Funds (2022-Present); Vice President, American Beacon Institutional Funds Trust (2022-Present). |
| | |
| Paul B. Cavazos (1969) | | VP since 2016 | | Chief Investment Officer and Senior Vice President, American Beacon Advisors, Inc. (2016-Present); American Private Equity Management, L.L.C. (2017–Present); Vice President, American Beacon Select Funds (2016-Present); Vice President, American Beacon Institutional Funds Trust (2017-Present); Vice President, American Beacon Sound Point Enhanced Income Fund (2018-2021); Vice President, American Beacon Apollo Total Return Fund (2018-2021). |
| | |
| Erica Duncan (1970) | | VP since 2011 | | Vice President, American Beacon Advisors, Inc. (2011-Present); Vice President, Resolute Investment Managers (2018-Present); Vice President, Resolute Investment Services, Inc. (2018-Present); Vice President, American Beacon Select Funds (2011-Present); Vice President, American Beacon Institutional Funds Trust (2017-Present); Vice President, American Beacon Sound Point Enhanced Income Fund (2018-2021); Vice President, American Beacon Apollo Total Return Fund (2018-2021). |
47
Trustees and Officers of the American Beacon FundsSM (Unaudited)
| | | | |
Name, Age | | Position, Term of Office and Length of Time Served with the Trust | | Principal Occupation(s) During Past 5 Years and Current Directorships |
| OFFICERS (CONT.) | | Term | | |
| | One Year | | |
| | |
| Melinda G. Heika (1961) | | VP since 2021 | | Senior Vice President (2021-Present), Treasurer and CFO (2010-Present), American Beacon Advisors, Inc.; Treasurer, Resolute Topco, Inc. (2015-Present); Treasurer, Resolute Investment Holdings, LLC. (2015-Present); Treasurer, Resolute Acquisition, Inc. (2015-Present); Senior Vice President (2021-Present), Treasurer and CFO (2017-Present), Resolute Investment Managers, Inc.; Treasurer, Resolute Investment Distributors, Inc. (2017); Senior Vice President (2021-Present); Treasurer and CFO (2017-Present), Resolute Investment Services, Inc.; Treasurer, American Private Equity Management, L.L.C. (2012-Present); Treasurer and CFO, Alpha Quant Advisors, LLC (2016-2020); Treasurer and CFO, Continuous Capital, LLC (2018-2022); Treasurer, American Beacon Cayman Transformational Innovation, Ltd. (2017-2018); Treasurer, American Beacon Delaware Transformational Innovation Corporation (2017-2018); Director (2014-Present), Vice President (2022-Present) and Treasurer (2014-2022), American Beacon Cayman Managed Futures Strategy Fund, Ltd.; Director and Vice President (2022-Present), and Treasurer(2018-2022), American Beacon Cayman TargetRisk Company, Ltd. (2018-Present); Director and Vice President, American Beacon Cayman Multi-Alternatives Company, Ltd. (2023-Present); Director and Vice President, American Beacon Cayman Trend Company, Ltd. (2023-Present) Principal Accounting Officer and Treasurer (2010-2021); American Beacon Funds; Vice President (2021-Present), Principal Accounting Officer (2017-2021) and Treasurer (2010-2021), American Beacon Select Funds; Vice President (2021–Present), Principal Accounting Officer and Treasurer (2017-2021), American Beacon Institutional Funds Trust; Vice President (2021), Principal Accounting Officer and Treasurer (2018-2021), American Beacon Sound Point Enhanced Income Fund; Vice President (2021), Principal Accounting Officer and Treasurer, American Beacon Apollo Total Return Fund (2018-2021). |
| | |
| Terri L. McKinney (1963) | | VP since 2010 | | Senior Vice President (2021-Present), Vice President (2009-2021), American Beacon Advisors, Inc.; Senior Vice President (2021–Present); Vice President (2017-2021), Resolute Investment Managers, Inc.; Senior Vice President (2021-Present), Vice President (2018-2021), Resolute Investment Services, Inc; Vice President, Alpha Quant Advisors, LLC (2016-2020); Vice President, Continuous Capital, LLC (2018-2022); Vice President, American Beacon Select Funds (2010-Present); Vice President, American Beacon Institutional Funds Trust (2017-Present); Vice President, American Beacon Sound Point Enhanced Income Fund (2018-2021); Vice President, American Beacon Apollo Total Return Fund (2018-2021). |
| | |
| Samuel J. Silver (1963) | | VP since 2011 | | Vice President (2011-Present), Chief Fixed Income Officer (2016-Present), American Beacon Advisors, Inc.; Vice President, American Beacon Select Funds (2011-Present); Vice President, American Beacon Institutional Funds Trust (2017-Present); Vice President, American Beacon Sound Point Enhanced Income Fund (2018-2021); Vice President, American Beacon Apollo Total Return Fund (2018-2021). |
48
Trustees and Officers of the American Beacon FundsSM (Unaudited)
| | | | |
Name, Age | | Position, Term of Office and Length of Time Served with the Trust | | Principal Occupation(s) During Past 5 Years and Current Directorships |
| OFFICERS (CONT.) | | Term | | |
| | One Year | | |
| | |
| Christina E. Sears (1971) | | Chief Compliance Officer since 2004 | | Chief Compliance Officer (2004-Present), Vice President (2019-Present); American Beacon Advisors, Inc.; Vice President, Resolute Investment Managers, Inc. (2017-Present); Vice President, Resolute Investment Distributors (2017-Present); Vice President, Resolute Investment Services, Inc. (2019-Present); Chief Compliance Officer, American Private Equity Management, L.L.C. (2012-Present); Chief Compliance Officer, Green Harvest Asset Management, LLC (2019-2021); Chief Compliance Officer, RSW Investments Holdings, LLC (2019-Present); Chief Compliance Officer (2016-2019) and Vice President (2016-2020), Alpha Quant Advisors, LLC ; Chief Compliance Officer (2018-2019), Vice President (2018-2022), Continuous Capital, LLC; Assistant Secretary, American Beacon Funds (1999-Present); Chief Compliance Officer (2004-Present) and Assistant Secretary (1999-Present), American Beacon Select Funds; Chief Compliance Officer and Assistant Secretary, American Beacon Institutional Funds Trust (2017-Present); Chief Compliance Officer and Assistant Secretary, American Beacon Sound Point Enhanced Income Fund (2018-2021); Chief Compliance Officer and Assistant Secretary, American Beacon Apollo Total Return Fund (2018-2021). |
| | |
| Sonia L. Bates (1956) | | Principal Accounting Officer and Treasurer since 2021 | | Assistant Treasurer, American Beacon Advisors, Inc. (2011-2018); Vice President, Fund and Tax Reporting (2023-Present), Director, Fund and Tax Reporting (2011-2023), Resolute Investment Services, Inc.; Assistant Treasurer, American Private Equity Management, L.L.C. (2012-Present); Assistant Treasurer, American Beacon Cayman Transformational Innovation Company, Ltd. (2017-2018); Treasurer, American Beacon Cayman Managed Futures Strategy Fund, Ltd. (2022-Present); Treasurer (2022-Present), Assistant Treasurer (2018-2022), American Beacon Cayman TargetRisk Company, Ltd.; Treasurer, American Beacon Cayman Multi-Alternatives Company, Ltd. (2023-Present); Treasurer, American Beacon Cayman Trend Company, Ltd. (2023-Present); Assistant Treasurer, American Beacon Funds (2011-2021); Principal Accounting Officer and Treasurer (2021-Present), Assistant Treasurer (2011-2021), American Beacon Select Funds; Principal Accounting Officer and Treasurer (2021-Present), Assistant Treasurer (2017-2021), American Beacon Institutional Funds Trust; Principal Accounting Officer and Treasurer (2021), Assistant Treasurer (2018-2021), American Beacon Sound Point Enhanced Income Fund; Principal Accounting Officer and Treasurer (2021), Assistant Treasurer (2018-2021), American Beacon Apollo Total Return Fund. |
| | |
| Shelley L. Dyson (1969) | | Assistant Treasurer since 2021 | | Fund Tax Manager (2020-Present), Manager, Tax (2014-2020), Resolute Investment Services, Inc.; Assistant Treasurer American Beacon Cayman Managed Futures Strategy Fund, Ltd. (2022-Present); Assistant Treasurer, American Beacon Cayman TargetRisk Company, Ltd. (2022-Present); Assistant Treasurer, American Beacon Cayman Multi-Alternatives Company, Ltd. (2023-Present); Assistant Treasurer, American Beacon Cayman Trend Company, Ltd. (2023-Present); Assistant Treasurer, American Beacon Select Funds (2021-Present); Assistant Treasurer, American Beacon Institutional Funds Trust (2021-Present); Assistant Treasurer, American Beacon Sound Point Enhanced Income Fund (2021); Assistant Treasurer, American Beacon Apollo Total Return Fund (2021). |
49
Trustees and Officers of the American Beacon FundsSM (Unaudited)
| | | | |
Name, Age | | Position, Term of Office and Length of Time Served with the Trust | | Principal Occupation(s) During Past 5 Years and Current Directorships |
| OFFICERS (CONT.) | | Term | | |
| | One Year | | |
| | |
| Shelley D. Abrahams (1974) | | Assistant Secretary since 2008 | | Corporate Governance Manager (2023-Present), Senior Corporate Governance & Regulatory Specialist (2020-2023), Corporate Governance & Regulatory Specialist (2017-2020), Resolute Investment Services, Inc.; Assistant Secretary, American Beacon Cayman Managed Futures Strategy Fund, Ltd. (2022-Present); Assistant Secretary, American Beacon Cayman TargetRisk Company, Ltd. (2022-Present); Assistant Secretary, American Beacon Cayman Multi-Alternatives Company, Ltd. (2023-Present); Assistant Secretary, American Beacon Cayman Trend Company, Ltd. (2023-Present); Assistant Secretary, American Beacon Select Funds (2008-Present); Assistant Secretary, American Beacon Institutional Funds Trust (2017-Present); Assistant Secretary, American Beacon Sound Point Enhanced Income Fund (2018-2021); Assistant Secretary, American Beacon Apollo Total Return Fund (2018-2021). |
| | |
| Rebecca L. Harris (1966) | | Vice President since 2022 | | Senior Vice President (2021-Present), Vice President (2011-2021), American Beacon Advisors, Inc.; Senior Vice President (2021-Present), Vice President (2017-2021), Resolute Investment Managers, Inc.; Senior Vice President (2021-Present), Vice President (2015-Present), Resolute Investment Services; Vice President, Alpha Quant Advisors, LLC (2016-2020); Vice President (2018-Present), Director (2022) Continuous Capital, LLC; Director, National Investment Services of American, LLC (2022-Present); Director, RSW Investments Holdings LLC (2022-Present); Director Shapiro Capital Management LLC (2022-Present); Director, SSI Investment Management LLC (2022-Present); Assistant Secretary, American Beacon Funds (2010-2022); Vice President (2022-Present), Assistant Secretary (2010-2022), American Beacon Select Funds; Vice President (2022-Present), Assistant Secretary (2017-2022), American Beacon Institutional Funds Trust; Assistant Secretary, American Beacon Sound Point Enhanced Income Fund (2018-2021); Assistant Secretary, American Beacon Apollo Total Return Fund (2018-2021). |
| | |
| Teresa A. Oxford (1958) | | Assistant Secretary since 2015 | | Assistant Secretary and Associate General Counsel, American Beacon Advisors, Inc. (2015-Present); Assistant Secretary, Resolute Investment Distributors (2018-2021); Assistant Secretary and Associate General Counsel, Resolute Investment Managers, Inc. (2017-Present); Assistant Secretary and Associate General Counsel, Resolute Investment Services (2018-Present); Assistant Secretary, Alpha Quant Advisors, LLC (2016-2020); Assistant Secretary, Continuous Capital, LLC (2020-2022); Assistant Secretary, American Beacon Select Funds (2015-Present); Assistant Secretary, American Beacon Institutional Funds Trust (2017-Present); Assistant Secretary, American Beacon Sound Point Enhanced Income Fund (2018-2021); Assistant Secretary, American Beacon Apollo Total Return Fund (2018-2021). |
| | |
| Michael D. Jiang (1984) | | Assistant Secretary since 2021 | | Assistant Secretary (2022-Present), Associate General Counsel (2021-Present), American Beacon Advisors, Inc.; Assistant Secretary (2021-Present), Resolute Investment Distributors, Inc.; Assistant Secretary (2022-Present), Associate General Counsel (2021-Present), Resolute Investment Managers, Inc.; Assistant Secretary (2022–Present) and Associate General Counsel, (2021-Present), Resolute Investment Services, Inc.; Vice President (2018-2021), Second Vice President (2015-2018), The Northern Trust Company; Assistant Secretary, American Beacon Select Funds (2021-Present); Assistant Secretary, American Beacon Institutional Funds Trust (2021-Present); Assistant Secretary, American Beacon Sound Point Enhanced Income Fund (2021); Assistant Secretary, American Beacon Apollo Total Return Fund (2021). |
* As of 11/12/2014, the Board adopted a retirement plan that requires Trustees to retire no later than the last day of the calendar year in which they reach the age of 75.
** Mr. Duffy is being deemed to be an “interested person” of the Trust, as defined by the Investment Company Act of 1940, as amended, by virtue of his position with Mesirow Financial, Inc., a broker-dealer.
50
American Beacon FundsSM
Privacy Policy
October 31, 2023 (Unaudited)
The American Beacon Funds recognize and respect the privacy of our shareholders. We are providing this notice to you so you will understand how shareholder information may be collected and used.
We may collect nonpublic personal information about you from one or more of the following sources:
| | • | | information we receive from you on applications or other forms; |
| | • | | information about your transactions with us or our service providers; and |
| | • | | information we receive from third parties. |
We do not disclose any nonpublic personal information about our customers or former customers to anyone, except as permitted by law.
We restrict access to your nonpublic personal information to those employees or service providers who need to know that information to provide products or services to you. To ensure the confidentiality of your nonpublic personal information, we maintain safeguards that comply with federal standards.
51
This page intentionally left blank.
52

Delivery of Documents
Shareholder reports are available online at www.americanbeaconfunds.com/reports. Please be advised that reports are no longer sent by mail. Instead, the reports are made available online, and you will be notified by mail each time a report is posted online. You will be provided with a website link to access the report. You may elect to receive all future reports in paper free of charge. You can request to continue receiving paper copies by calling 1-866-345-5954, or you may directly inform your financial intermediary. Detailed instructions are also included in your report notifications.
If you invest in the Fund through a financial institution, you may be able to receive the Fund’s regulatory mailings, such as the Prospectus, Annual Report and Semi-Annual Report, by e-mail. If you are interested in this option, please go to www.icsdelivery.com and search for your financial institution’s name or contact your financial institution directly.
To obtain more information about the Fund:
| | |
 | |  |
| | |
| By E-mail: | | On the Internet: |
| american_beacon.funds@ambeacon.com | | Visit our website at www.americanbeaconfunds.com |
| | | |
| | | |
| | |

By Telephone: Call (800) 658-5811 | | 
By Mail: American Beacon Funds P.O. Box 219643 Kansas City, MO 64121-9643 |
|
|
|
| | | |
| | | |
| Availability of Quarterly Portfolio Schedules | | Availability of Proxy Voting Policy and Records |
| | |
| In addition to the Schedule of Investments provided in each semi-annual and annual report, the Fund files a complete schedule of its portfolio holdings with the Securities and Exchange Commission (“SEC”) on Form N-PORT as of the end of each fiscal quarter. The Fund’s Forms N-PORT are available on the SEC’s website at www.sec.gov. The Forms N-PORT may also be reviewed and copied at the SEC’s Public Reference Section, 100 F Street, NE, Washington, D.C. 20549-2736. Information regarding the operation of the SEC’s Public Reference Room may be obtained by calling (800)-SEC-0330. A complete schedule of the Fund’s portfolio holdings is also available at www.americanbeaconfunds.com approximately twenty days after the end of each month. | | A description of the policies and procedures the Fund uses to determine how to vote proxies relating to portfolio securities is available in the Fund’s Statement of Additional Information, is available free of charge on the Fund’s website www.americanbeaconfunds.com and by calling 1-800-967-9009 or by accessing the SEC’s website at www.sec.gov. The Fund’s proxy voting record for the most recent year ended June 30 is filed annually with the SEC on Form N-PX. The Fund’s Forms N-PX are available on the SEC’s website at www.sec.gov. The Fund’s proxy voting record may also be obtained by calling 1-800-967-9009. |
Fund Service Providers:
| | | | | | | | | | | | |
CUSTODIAN State Street Bank and Trust Company Boston, Massachusetts | | | | TRANSFER AGENT SS&C GIDS, Inc. Quincy, Massachusetts | | | | INDEPENDENT REGISTERED PUBLIC ACCOUNTING FIRM PricewaterhouseCoopers LLP Boston, Massachusetts | | | | DISTRIBUTOR Resolute Investment Distributors, Inc. Irving, Texas |
This report is prepared for shareholders of the American Beacon Funds and may be distributed to others only if preceded or accompanied by a current Prospectus or Summary Prospectus.
American Beacon Funds and American Beacon Garcia Hamilton Quality Bond Fund are service marks of American Beacon Advisors, Inc.
AR 10/23

About American Beacon Advisors
Since 1986, American Beacon Advisors, Inc. has offered a variety of products and investment advisory services to numerous institutional and retail clients, including a variety of mutual funds, corporate cash management, and separate account management.
Our clients include defined benefit plans, defined contribution plans, foundations, endowments, corporations, financial planners, and other institutional investors. With American Beacon Advisors, you can put the experience of a multi-billion dollar asset management firm to work for your company.
EAM INTERNATIONAL SMALL CAP FUND
Investing in small-capitalization stocks may involve greater volatility and lower liquidity than larger company stocks. Growth stocks typically are more volatile than value stocks; however, value stocks have a lower expected growth rate in earnings and sales. Investing in foreign and emerging market securities may involve heightened risk due to currency fluctuations and economic and political risks. To the extent the Fund invests more heavily in a particular country or geographic region, its performance will be sensitive to factors affecting that country or region. The Fund may have high portfolio turnover risk, which could increase the Fund’s transaction costs and possibly have a negative impact on performance. Geopolitical and other events have led to market disruptions causing adverse changes in the value of investments broadly. Changes in value may be temporary or may last for extended periods. The use of futures contracts for cash management may subject the Fund to losing more money than invested. The Fund participates in a securities lending program. Please see the prospectus for a complete discussion of the Fund’s risks. There can be no assurances that the investment objectives of this Fund will be met.
INTERNATIONAL EQUITY FUND
Investing in foreign securities may involve heightened risk due to currency fluctuations and economic and political risks. Investing in value stocks may limit downside risk over time; however, the Fund may produce more modest gains than riskier stock funds as a trade-off for this potentially lower risk. To the extent the Fund invests more heavily in particular sectors, its performance will be sensitive to factors affecting those sectors. Financial sector companies are heavily regulated and particularly sensitive to interest rate fluctuations. The Fund’s incorporation of environmental, social and/or governance (ESG) considerations in its investment strategy may cause it to underperform funds that do not incorporate these considerations. The use of futures contracts for cash management may subject the Fund to losing more money than invested. The Fund participates in a securities lending program. Please see the prospectus for a complete discussion of the Fund’s risks. There can be no assurances that the investment objectives of this Fund will be met.
Any opinions herein, including forecasts, reflect our judgment as of the end of the reporting period and are subject to change. Each advisor’s strategies and each Fund’s portfolio composition will change depending on economic and market conditions. This report is not a complete analysis of market conditions, and, therefore, should not be relied upon as investment advice. Although economic and market information has been compiled from reliable sources, American Beacon Advisors, Inc. makes no representation as to the completeness or accuracy of the statements contained herein.
American Beacon Funds | October 31, 2023 |
Contents
| | | | |
Additional Fund Information | | | Back Cover | |
President’s Message
| | |
 | | Dear Shareholders, In the words of Theodor Seuss Geisel, the beloved children’s author and cartoonist known as Dr. Seuss, “Only you can control your future.” While we as individuals cannot control everything that’s happening in the world around us or within the global economy and markets, we can take steps to diversify our risk exposure as we seek to preserve and grow our personal savings. By making prudent adjustments to our investment portfolios with the help of trusted financial professionals, we may be better positioned to withstand the negative financial forces we’re likely to encounter in our lifetime – especially during periods like today’s geopolitical turmoil and economic uncertainty. |
At American Beacon, we endeavor to provide a broad range of disciplined investment strategies to help you potentially collect the fruits of your labor over the fullness of time. We work diligently to cultivate relationships with the investment managers who serve as sub-advisors to our investment products. Since our firm’s inception as a pension fiduciary in 1986 and the launch of our first sub-advised, multi-manager mutual funds in 1987, we have continued expanding our innovative product offerings. And we are committed to applying a solutions-based, risk-managed approach in our pursuit of institutional wisdom while striving to generate earned alpha and enduring value.
Thank you for entrusting your financial future with American Beacon. For more information about our investment products or to access your account information, please visit our website at www.americanbeaconfunds.com.
Best Regards,

Jeffrey K. Ringdahl
President
American Beacon Funds
1
International Equity Market Overview
October 31, 2023 (Unaudited)
During the 12 months ended October 31, 2023, international stock prices increased as evidenced by the MSCI ACWI ex-U.S. Index (up 12.1%), the MSCI EAFE Index (up 14.4%) and the MSCI Emerging Markets Index (up 10.8%).
The broad economic and investment landscape smoothed out the knots of the previous years as the current fiscal year progressed. Markets began an upward climb in the last quarter of 2022, buoyed by the reduced pace of inflation and interest rates. The Federal Reserve and other central banks continued to reduce their frequency of interest rate hikes as bodies like the International Monetary Fund forecast global inflation as slowing from 8.7% to 6.9% in calendar year 2022 and then dropping to 5.8% in 2023 and 2024, respectively.
The slower pace helped push equity prices higher. Amid such tailwinds, most stock and fixed-income indexes ended the period with gains. Non-U.S. stock returns were broadly positive and international Value stocks continued to outperform their Growth stock peers.
2
American Beacon EAM International Small Cap FundSM
Performance Overview
October 31, 2023 (Unaudited)
For the annual period ending October 31, 2023, the American Beacon EAM International Small Cap Fund Investor Class (the “Fund”) returned 15.06% outperforming the MSCI ACWI ex USA Small Cap Index (the “Index”) return of 8.82%. Effective January 21, 2023, EAM Global Investors LLC began serving as sub-advisor to the Fund and implemented a policy to invest at least 80% of its net assets (plus the amount of borrowings for investment purposes) in equity securities of small-market capitalization companies that are economically tied to countries outside of the United States, including developed and emerging market countries.
Comparison of Changes in Value of a $10,000 Investment for the period 10/31/2013 through 10/31/2023
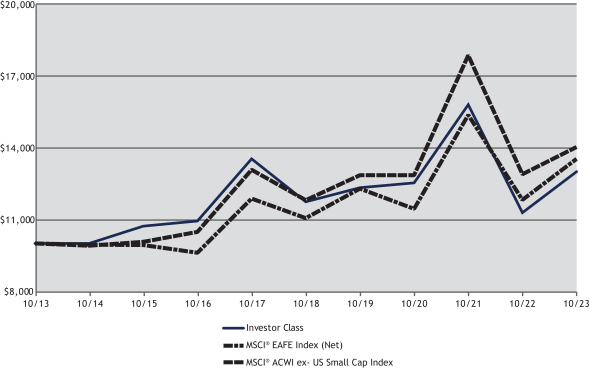
| | | | | | | | | | | | | | | | | | | | | | | | | | | | | | |
| Total Returns for the Period ended October 31, 2023 | | | | | | | | | | | | | | | | | | | | | |
| | | | | | |
| | | Ticker | | 1 Year | | 3 Years | | 5 Years | | 10 Years | | Value of $10,000 10/31/2013- 10/31/2023 |
R5 Class (1,3,4,5) | | TOVIX | | | | 15.75 | % | | | | 1.60 | % | | | | 2.40 | % | | | | 2.81 | % | | | $ | 13,200 | |
Y Class (1,2,4,5) | | TOVYX | | | | 15.28 | % | | | | 1.43 | % | | | | 2.26 | % | | | | 2.74 | % | | | $ | 13,110 | |
Investor Class (1,4,5) | | TIVFX | | | | 15.06 | % | | | | 1.21 | % | | | | 2.05 | % | | | | 2.64 | % | | | $ | 12,975 | |
| | | | | | | | | | | | | | | | | | | | | | | | | | | | | |
MSCI® EAFE Index (Net) (4) | | | | | | 14.40 | % | | | | 5.73 | % | | | | 4.10 | % | | | | 3.05 | % | | | $ | 13,511 | |
MSCI® ACWI ex- US Small Cap Index (4) | | | | | | 8.82 | % | | | | 2.96 | % | | | | 3.51 | % | | | | 3.43 | % | | | $ | 14,013 | |
| 1. | Performance shown is historical and is not indicative of future returns. Investment returns and principal value will vary, and shares may be worth more or less at redemption than at original purchase. Performance shown is calculated based on the published end of day net asset values as of date indicated and current performance may be lower or higher than the performance data quoted. To obtain performance as of the most recent month end, please visit www.americanbeaconfunds.com or call 1-800-967-9009. Fund performance in the table above does not reflect the deduction of taxes a shareholder would pay on distributions or the redemption of shares. Generally accepted accounting principles require adjustments to be made to the net assets of the Fund at period end for financial reporting purposes only; and as such, the total return based on the unadjusted net asset value per share may differ from the total return reported in the financial highlights. A portion of fees charged to the Investor Class of the Fund was waived from Fund inception through 2019. Performance prior to waiving fees was lower than the actual returns shown for that period. Please note that the recent performance of the securities market has helped produce short-term returns that are not typical and may not continue in the future. |
3
American Beacon EAM International Small Cap FundSM
Performance Overview
October 31, 2023 (Unaudited)
| 2. | Fund performance for the five-year and ten-year periods represents the total returns achieved by the Investor Class from 10/31/2013 up to 1/18/19, the inception date of the Y Class. Expenses of the Y Class are lower than those of the Investor Class. As a result, total returns shown may be lower than they would have been had the Y Class been in existence since 10/31/2013. |
| 3. | Fund performance for the five-year and ten-year periods represents the total returns achieved by the Investor Class from 10/31/2013 up to 1/18/19, the inception date of the R5 Class. Expenses of the R5 Class are lower than those of the Investor Class. As a result, total returns shown may be lower than they would have been had the R5 Class been in existence since 10/31/2013. A portion of fees charged to the R5 Class of the Fund was waived from Class inception through 2023. Performance prior to waiving fees was lower than actual returns shown for periods when waivers were in effect. |
| 4. | Prior to January 21, 2023, the Fund was named the American Beacon Tocqueville International Value Fund. Effective January 21, 2023, EAM Global Investors LLC began serving as sub-advisor to the Fund, and implemented a policy to invest at least 80% of its net assets (plus the amount of borrowings for investment purposes) in equity securities of small-market capitalization companies that are economically tied to countries outside of the United States, including developed and emerging market countries. The Fund’s benchmark index was changed from the MSCI EAFE Index to the MSCI ACWI ex USA Small Cap Index. Performance through January 20, 2023, reflects the Fund’s performance under the management and strategy of its prior sub-advisor. The MSCI EAFE Index (Net) is a market capitalization weighted index of international stock performance composed of equities from developed markets excluding the U.S. and Canada. The MSCI ACWI (All Country World Index) ex USA Small Cap Index is a market-capitalization weighted index designed to measure the investable equity market performance for global investors of small-cap stocks in developed and emerging markets, excluding the U.S. One cannot directly invest in an index. The MSCI information contained herein: (1) is provided “as is,” (2) is proprietary to MSCI and/or its content providers, (3) may not be used to create any financial instruments or products or any indexes and (4) may not be copied or distributed without MSCI’s express written consent. MSCI disclaims all warranties with respect to the information. Neither MSCI nor its content providers are responsible for any damages or losses arising from any use of this information. |
| 5. | The Total Annual Fund Operating Expense ratios set forth in the most recent Fund prospectus for the R5, Y and Investor Class shares were 0.92%, 0.98% and 1.20%, respectively. The expense ratios above may vary from the expense ratios presented in other sections of this report that are based on expenses incurred during the period covered by this report. |
The Fund outperformed the Index over the period mainly due to positive security selection, while allocation decisions also added value. From a sector standpoint, positive security selection was derived primarily from the Information Technology, Industrials, and Communication Services sectors. On the other hand, security selection in the Financials sector slightly detracted from relative performance. From an allocation perspective, underweighting the Real Estate sector added the most value and conversely underweighting the Financials sector detracted somewhat from performance.
The Fund’s strategy remains consistent, systematically investing in companies that exhibit momentum combined with fundamental rationale in a risk-aware approach with efficient implementation.
| | | | | | | | |
| Top Ten Holdings (% Net Assets) | | | | | | | | |
| BW LPG Ltd. | | | | | | | 1.1 | |
| King Yuan Electronics Co. Ltd. | | | | | | | 1.1 | |
| New Oriental Education & Technology Group, Inc. | | | | | | | 1.1 | |
| Sapporo Holdings Ltd. | | | | | | | 1.0 | |
| Acter Group Corp. Ltd. | | | | | | | 1.0 | |
| Mytilineos SA | | | | | | | 1.0 | |
| Makalot Industrial Co. Ltd. | | | | | | | 1.0 | |
| JUMBO SA | | | | | | | 0.9 | |
| Technip Energies NV | | | | | | | 0.9 | |
| Celestica, Inc. | | | | | | | 0.9 | |
| | |
| Total Fund Holdings | | | 113 | | | | | |
| | | | | | | | |
| Sector Allocation (% Equities) | | | | | | | | |
| Information Technology | | | | | | | 21.6 | |
| Industrials | | | | | | | 17.8 | |
| Consumer Discretionary | | | | | | | 15.4 | |
| Energy | | | | | | | 13.6 | |
| Consumer Staples | | | | | | | 9.3 | |
| Materials | | | | | | | 7.3 | |
| Health Care | | | | | | | 6.3 | |
| Financials | | | | | | | 5.9 | |
| Communication Services | | | | | | | 1.9 | |
| Real Estate | | | | | | | 0.9 | |
| | | | | | | | |
4
American Beacon EAM International Small Cap FundSM
Performance Overview
October 31, 2023 (Unaudited)
| | | | | | | | |
| Country Allocation (% Equities) | | | | | | | | |
| Japan | | | | | | | 27.2 | |
| Taiwan | | | | | | | 13.5 | |
| Australia | | | | | | | 8.9 | |
| Canada | | | | | | | 8.3 | |
| China/Hong Kong | | | | | | | 5.9 | |
| United Kingdom | | | | | | | 4.2 | |
| Italy | | | | | | | 3.6 | |
| Norway | | | | | | | 3.5 | |
| Republic of Korea | | | | | | | 3.3 | |
| Singapore | | | | | | | 3.1 | |
| Mexico | | | | | | | 3.0 | |
| Greece | | | | | | | 2.2 | |
| United States | | | | | | | 1.6 | |
| Brazil | | | | | | | 1.4 | |
| France | | | | | | | 1.0 | |
| Germany | | | | | | | 1.0 | |
| South Africa | | | | | | | 1.0 | |
| Sweden | | | | | | | 1.0 | |
| Israel | | | | | | | 1.0 | |
| Switzerland | | | | | | | 1.0 | |
| Netherlands | | | | | | | 0.9 | |
| Thailand | | | | | | | 0.9 | |
| Denmark | | | | | | | 0.9 | |
| Jordan | | | | | | | 0.8 | |
| Belgium | | | | | | | 0.8 | |
5
American Beacon International Equity FundSM
Performance Overview
October 31, 2023 (Unaudited)
The Investor Class of the American Beacon International Equity Fund (the “Fund”) returned 19.64% for the twelve months ended October 31, 2023. The Fund outperformed the MSCI® EAFE Index (the “Index”) return of 14.40%.
Comparison of Changes in Value of a $10,000 Investment for the period 10/31/2013 through 10/31/2023
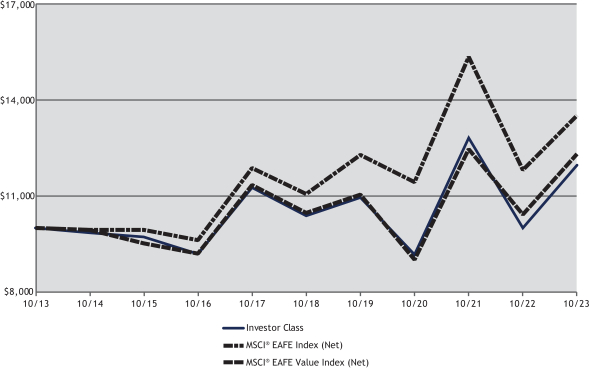
| | | | | | | | | | | | | | | | | | | | | | | | | | | | | | |
| Total Returns for the Period ended October 31, 2023 | |
| | | | | | |
| | | Ticker | | 1 Year | | 3 Years | | 5 Years | | 10 Years | | Value of $10,000 10/31/2013- 10/31/2023 |
R5 Class (1,5) | | AAIEX | | | | 20.09 | % | | | | 9.65 | % | | | | 3.24 | % | | | | 2.16 | % | | | $ | 12,378 | |
Y Class (1,5) | | ABEYX | | | | 20.01 | % | | | | 9.56 | % | | | | 3.15 | % | | | | 2.08 | % | | | $ | 12,282 | |
Investor Class (1,5) . . | | AAIPX | | | | 19.64 | % | | | | 9.28 | % | | | | 2.88 | % | | | | 1.80 | % | | | $ | 11,958 | |
Advisor Class (1,5) . . | | AAISX | | | | 19.45 | % | | | | 9.14 | % | | | | 2.74 | % | | | | 1.68 | % | | | $ | 11,815 | |
A Class without sales charge (1,2,5) | | AIEAX | | | | 19.55 | % | | | | 9.21 | % | | | | 2.81 | % | | | | 1.74 | % | | | $ | 11,887 | |
A Class with sales Charge (1,2,5) . | | AIEAX | | | | 12.70 | % | | | | 7.07 | % | | | | 1.60 | % | | | | 1.14 | % | | | $ | 11,201 | |
C Class without sales charge (1,2,5) | | AILCX | | | | 18.66 | % | | | | 8.39 | % | | | | 2.05 | % | | | | 1.14 | % | | | $ | 11,199 | |
C Class with sales charge (1,2,5) . | | AILCX | | | | 17.66 | % | | | | 8.39 | % | | | | 2.05 | % | | | | 1.14 | % | | | $ | 11,199 | |
R6 Class (1,3,5) . . . . | | AAERX | | | | 20.15 | % | | | | 9.71 | % | | | | 3.30 | % | | | | 2.20 | % | | | $ | 12,435 | |
| | | | | | | | | | | | | | | | | | | | | | | | | | | | | |
MSCI® EAFE Index (Net) (4) | | | | | | 14.40 | % | | | | 5.73 | % | | | | 4.10 | % | | | | 3.05 | % | | | $ | 13,511 | |
MSCI® EAFE Value Index (Net) (4) | | | | | | 18.11 | % | | | | 10.97 | % | | | | 3.30 | % | | | | 2.10 | % | | | $ | 12,307 | |
| 1. | Performance shown is historical and is not indicative of future returns. Investment returns and principal value will vary, and shares may be worth more or less at redemption than at original purchase. Performance shown is calculated based on the published end of day net asset values as of date indicated and current performance may be lower or higher than the performance data quoted. To obtain performance as of the most recent month end, please visit www.americanbeaconfunds.com or call 1-800-967-9009. Fund performance in the table above does not reflect the deduction of taxes a shareholder would pay on distributions or the redemption of shares. Generally accepted accounting principles require adjustments to be made to the net assets of the Fund at period end for financial reporting purposes only; and as such, the total return based on the unadjusted net asset value per share may differ from the total return reported in the financial highlights. A portion of the fees charged to the R5 Class of the Fund was waived from 2013 through 2015. Performance prior to waiving fees was lower than actual returns shown for 2013 through 2015. Please note that the recent performance of the securities market has helped produce short-term returns that are not typical and may not continue in the future. |
6
American Beacon International Equity FundSM
Performance Overview
October 31, 2023 (Unaudited)
| 2. | The maximum sales charge for A Class is 5.75%. The maximum contingent deferred sales charge for C Class is 1.00% for shares redeemed within one year of the date of purchase. |
| 3. | Fund performance for the ten-year period represents the returns achieved by the R5 Class from 10/31/2013 through 2/28/17, the inception date of the R6 Class, and the returns of the R6 Class since its inception. Expenses of the R6 Class are lower than those of the R5 Class. As a result, total returns shown may be lower than they would have been had the R6 Class been in existence since 10/31/2013. A portion of the fees charged to the R6 Class of the Fund has been waived since Class inception. Performance prior to waiving fees was lower than the actual returns shown since inception. |
| 4. | The MSCI EAFE Index (Net) is a market capitalization weighted index of international stock performance composed of equities from developed markets excluding the U.S. and Canada. The MSCI EAFE Value Index (Net) is an unmanaged index of those stocks in the MSCI EAFE Index with lower price-to- book ratios and lower forecasted growth values. One cannot directly invest in an index. The MSCI information contained herein: (1) is provided “as is,” (2) is proprietary to MSCI and/or its content providers, (3) may not be used to create any financial instruments or products or any indexes and (4) may not be copied or distributed without MSCI’s express written consent. MSCI disclaims all warranties with respect to the information. Neither MSCI nor its content providers are responsible for any damages or losses arising from any use of this information. |
| 5. | The Total Annual Fund Operating Expense ratios set forth in the most recent Fund prospectus for the R5, Y, Investor, Advisor, A, C, and R6 Class shares were 0.72%, 0.81%, 1.07%, 1.20%, 1.14%, 1.89%, and 0.71%, respectively. The expense ratios above may vary from the expense ratios presented in other sections of this report that are based on expenses incurred during the period covered by this report. |
The Fund outperformed the Index during the period primarily due to security selection while country allocation also boosted performance.
Security selections within the United Kingdom and Italy were the primary contributors to the Fund’s relative outperformance, while security selections in the Netherlands detracted from value. Contributing securities included Rolls Royce Holdings PLC (up 201.7%) in the United Kingdom and UniCredit SpA (up 105.5%) within Italy. The Fund’s investments in the Netherlands, including Akzo Nobel NV (up 12.1%) hurt relative performance during the prior twelve months.
From a country allocation perspective, a null allocation to Australia (up 3.8%) and an underweight allocation to Switzerland (up 8.0%) contributed to the Fund’s outperformance relative to the Index. However, an underweight allocation to Denmark (up 41.7%) detracted from relative value during the period.
Although economic and market conditions vary from period to period, the Fund’s primary strategy of investing in undervalued companies with above-average earnings growth expectations remains consistent.
| | | | | | | | |
| Top Ten Holdings (% Net Assets) | | | | | | | | |
| Roche Holding AG | | | | | | | 3.2 | |
| Samsung Electronics Co. Ltd. | | | | | | | 2.3 | |
| GSK PLC | | | | | | | 2.2 | |
| Sanofi SA | | | | | | | 2.1 | |
| BP PLC | | | | | | | 1.8 | |
| Rolls-Royce Holdings PLC | | | | | | | 1.7 | |
| Barclays PLC | | | | | | | 1.6 | |
| RELX PLC | | | | | | | 1.5 | |
| British American Tobacco PLC | | | | | | | 1.5 | |
| SUMCO Corp. | | | | | | | 1.5 | |
| | |
| Total Fund Holdings | | | 144 | | | | | |
| | | | | | | | |
7
American Beacon International Equity FundSM
Performance Overview
October 31, 2023 (Unaudited)
| | | | | | | | |
| Sector Allocation (% Equities) | | | | | | | | |
| Industrials | | | | | | | 16.8 | |
| Financials | | | | | | | 15.3 | |
| Health Care | | | | | | | 14.7 | |
| Consumer Discretionary | | | | | | | 13.9 | |
| Consumer Staples | | | | | | | 10.0 | |
| Information Technology | | | | | | | 9.9 | |
| Materials | | | | | | | 8.3 | |
| Energy | | | | | | | 3.8 | |
| Communication Services | | | | | | | 3.5 | |
| Utilities | | | | | | | 3.1 | |
| Real Estate | | | | | | | 0.7 | |
| | | | | | | | |
| Country Allocation (% Equities) | | | | | | | | |
| United Kingdom | | | | | | | 23.4 | |
| France | | | | | | | 13.5 | |
| United States | | | | | | | 11.1 | |
| Germany | | | | | | | 10.3 | |
| Japan | | | | | | | 9.6 | |
| Netherlands | | | | | | | 5.4 | |
| Republic of Korea | | | | | | | 4.7 | |
| Switzerland | | | | | | | 2.9 | |
| Canada | | | | | | | 2.6 | |
| Ireland | | | | | | | 2.4 | |
| Italy | | | | | | | 2.4 | |
| China/Hong Kong | | | | | | | 1.7 | |
| Spain | | | | | | | 1.7 | |
| Sweden | | | | | | | 1.4 | |
| Belgium | | | | | | | 1.4 | |
| Finland | | | | | | | 1.3 | |
| Austria | | | | | | | 0.9 | |
| Singapore | | | | | | | 0.9 | |
| South Africa | | | | | | | 0.6 | |
| Denmark | | | | | | | 0.6 | |
| Brazil | | | | | | | 0.4 | |
| Australia | | | | | | | 0.4 | |
| Portugal | | | | | | | 0.3 | |
| Jordan | | | | | | | 0.1 | |
8
American Beacon FundsSM
Expense Examples
October 31, 2023 (Unaudited)
Fund Expense Example
As a shareholder of a Fund, you incur two types of costs: (1) transaction costs, including sales charges (loads) on purchase payments and redemption fees, if applicable, and (2) ongoing costs, including management fees, distribution (12b-1) fees, sub-transfer agent fees, and other Fund expenses. The Examples are intended to help you understand the ongoing cost (in dollars) of investing in the Fund and to compare these costs with the ongoing costs of investing in other mutual funds. The Examples are based on an investment of $1,000 invested at the beginning of the period in each Class and held for the entire period from May 1, 2023 through October 31, 2023.
Actual Expenses
The “Actual” lines of the tables provide information about actual account values and actual expenses. You may use the information on this page, together with the amount you invested, to estimate the expenses that you paid over the period. Simply divide your account value by $1,000 (for example, an $8,600 account value divided by $1,000 = $8.60), then multiply the result by the “Expenses Paid During Period” to estimate the expenses you paid on your account during this period. Shareholders of the Investor and R5 Classes that invest in the Fund through an IRA or Roth IRA may be subject to a custodial IRA fee of $15 that is typically deducted each December. If your account was subject to a custodial IRA fee during the period, your costs would have been $15 higher.
Hypothetical Example for Comparison Purposes
The “Hypothetical” lines of the tables provide information about hypothetical account values and hypothetical expenses based on the Fund’s actual expense ratio and an assumed 5% per year rate of return before expenses (not the Fund’s actual return). You may compare the ongoing costs of investing in the Fund with other funds by contrasting this 5% hypothetical example and the 5% hypothetical examples that appear in the shareholder reports of the other funds. The hypothetical account values and expenses may not be used to estimate the actual ending account balance or expenses you paid for the period. Shareholders of the Investor and R5 Classes that invest in the Funds through an IRA or Roth IRA may be subject to a custodial IRA fee of $15 that is typically deducted each December. If your account was subject to a custodial IRA fee during the period, your costs would have been $15 higher.
You should also be aware that the expenses shown in the table highlight only your ongoing costs and do not reflect any transaction costs charged by the Fund, such as sales charges (loads) or redemption fees, as applicable. Similarly, the expense examples for other funds do not reflect any transaction costs charged by those funds, such as sales charges (loads), redemption fees or exchange fees. Therefore, the “Hypothetical” lines of the tables are useful in comparing ongoing costs only and will not help you determine the relative total costs of owning different funds. If you were subject to any transaction costs during the period, your costs would have been higher.
9
American Beacon FundsSM
Expense Examples
October 31, 2023 (Unaudited)
| | | | | | | | | | | | | | | |
| American Beacon EAM International Small Cap Fund | |
| | | |
| | | Beginning Account Value
5/1/2023 | | Ending Account Value
10/31/2023 | | Expenses Paid During
Period
5/1/2023-10/31/2023* |
| R5 Class | | | | | | | | | | | | | | | |
| Actual | | | | $1,000.00 | | | | | $970.80 | | | | | $4.47 | |
| Hypothetical** | | | | $1,000.00 | | | | | $1,020.67 | | | | | $4.58 | |
| Y Class | | | | | | | | | | | | | | | |
| Actual | | | | $1,000.00 | | | | | $967.60 | | | | | $7.79 | |
| Hypothetical** | | | | $1,000.00 | | | | | $1,017.29 | | | | | $7.98 | |
| Investor Class | | | | | | | | | | | | | | | |
| Actual | | | | $1,000.00 | | | | | $966.60 | | | | | $8.58 | |
| Hypothetical** | | | | $1,000.00 | | | | | $1,016.48 | | | | | $8.79 | |
| * | Expenses are equal to the Fund’s annualized expense ratios for the six-month period of 0.90%, 1.57%, and 1.73% for the R5, Y, and Investor Classes, respectively, multiplied by the average account value over the period, multiplied by the number derived by dividing the number of days in the most recent fiscal half-year (184) by days in the year (365) to reflect the half-year period. |
| ** | 5% return before expenses. |
| | | | | | | | | | | | | | | |
| American Beacon International Equity Fund | | | | | | | | | | | | | | | |
| | | |
| | | Beginning Account Value
5/1/2023 | | Ending Account Value
10/31/2023 | | Expenses Paid During
Period
5/1/2023-10/31/2023* |
| R5 Class | | | | | | | | | | | | | | | |
| Actual | | | | $1,000.00 | | | | | $925.80 | | | | | $3.93 | |
| Hypothetical** | | | | $1,000.00 | | | | | $1,021.12 | | | | | $4.13 | |
| Y Class | | | | | | | | | | | | | | | |
| Actual | | | | $1,000.00 | | | | | $925.30 | | | | | $4.22 | |
| Hypothetical** | | | | $1,000.00 | | | | | $1,020.82 | | | | | $4.43 | |
| Investor Class | | | | | | | | | | | | | | | |
| Actual | | | | $1,000.00 | | | | | $924.00 | | | | | $5.43 | |
| Hypothetical** | | | | $1,000.00 | | | | | $1,019.56 | | | | | $5.70 | |
| Advisor Class | | | | | | | | | | | | | | | |
| Actual | | | | $1,000.00 | | | | | $923.30 | | | | | $6.21 | |
| Hypothetical** | | | | $1,000.00 | | | | | $1,018.75 | | | | | $6.51 | |
| A Class | | | | | | | | | | | | | | | |
| Actual | | | | $1,000.00 | | | | | $923.90 | | | | | $5.82 | |
| Hypothetical** | | | | $1,000.00 | | | | | $1,019.16 | | | | | $6.11 | |
| C Class | | | | | | | | | | | | | | | |
| Actual | | | | $1,000.00 | | | | | $920.20 | | | | | $9.53 | |
| Hypothetical** | | | | $1,000.00 | | | | | $1,015.28 | | | | | $10.01 | |
| R6 Class | | | | | | | | | | | | | | | |
| Actual | | | | $1,000.00 | | | | | $926.00 | | | | | $3.35 | |
| Hypothetical** | | | | $1,000.00 | | | | | $1,021.73 | | | | | $3.52 | |
| * | Expenses are equal to the Fund’s annualized expense ratios for the six-month period of 0.81%, 0.87%, 1.12%, 1.28%, 1.20%, 1.97%, and 0.69% for the R5, Y, Investor, Advisor, A, C, and R6 Classes, respectively, multiplied by the average account value over the period, multiplied by the number derived by dividing the number of days in the most recent fiscal half-year (184) by days in the year (365) to reflect the half-year period. |
| ** | 5% return before expenses. |
10
American Beacon FundsSM
Report of Independent Registered Public Accounting Firm
To the Board of Trustees of American Beacon Funds and Shareholders of American Beacon EAM International Small Cap Fund and American Beacon International Equity Fund
Opinions on the Financial Statements
We have audited the accompanying statements of assets and liabilities, including the schedules of investments, of American Beacon EAM International Small Cap Fund and American Beacon International Equity Fund (two of the funds constituting American Beacon Funds, hereafter collectively referred to as the “Funds”) as of October 31, 2023, the related statements of operations for the year ended October 31, 2023, the statements of changes in net assets for each of the two years in the period ended October 31, 2023, including the related notes, and the financial highlights for each of the two years in the period ended October 31, 2023 (collectively referred to as the “financial statements”). In our opinion, the financial statements present fairly, in all material respects, the financial position of each of the Funds as of October 31, 2023, the results of each of their operations for the year then ended, the changes in each of their net assets for each of the two years in the period ended October 31, 2023 and each of the financial highlights for the two years in the period ended October 31, 2023 in conformity with accounting principles generally accepted in the United States of America.
The financial statements of the Funds as of and for the year ended October 31, 2021 and the financial highlights for each of the periods ended on or prior to October 31, 2021 (not presented herein, other than the financial highlights) were audited by other auditors whose report dated December 30, 2021 expressed an unqualified opinion on those financial statements and financial highlights.
Basis for Opinions
These financial statements are the responsibility of the Funds’ management. Our responsibility is to express an opinion on the Funds’ financial statements based on our audits. We are a public accounting firm registered with the Public Company Accounting Oversight Board (United States) (PCAOB) and are required to be independent with respect to the Funds in accordance with the U.S. federal securities laws and the applicable rules and regulations of the Securities and Exchange Commission and the PCAOB.
We conducted our audits of these financial statements in accordance with the standards of the PCAOB. Those standards require that we plan and perform the audit to obtain reasonable assurance about whether the financial statements are free of material misstatement, whether due to error or fraud.
Our audits included performing procedures to assess the risks of material misstatement of the financial statements, whether due to error or fraud, and performing procedures that respond to those risks. Such procedures included examining, on a test basis, evidence regarding the amounts and disclosures in the financial statements. Our audits also included evaluating the accounting principles used and significant estimates made by management, as well as evaluating the overall presentation of the financial statements. Our procedures included confirmation of securities owned as of October 31, 2023 by correspondence with the custodians and brokers; when replies were not received from brokers, we performed other auditing procedures. We believe that our audits provide a reasonable basis for our opinions.
/s/ PricewaterhouseCoopers LLP
Boston, Massachusetts
December 27, 2023
We have served as the auditor of one or more investment companies in the American Beacon family of funds since 2016.
11
American Beacon EAM International Small Cap FundSM
Schedule of Investments
October 31, 2023
| | | | | | | | | | | | | | | |
| | | |
| | | Shares | | | | Fair Value |
| | | | | | | |
| | | |
| Australia - 7.82% | | | | | | |
| | | |
| Foreign Common Stocks - 7.82% | | | | | | |
| Altium Ltd.A | | | | 35,517 | | | | | | | | | $ | 905,326 | |
| AUB Group Ltd.A | | | | 62,701 | | | | | | | | | | 1,083,956 | |
| Boral Ltd.A B | | | | 359,668 | | | | | | | | | | 1,036,768 | |
| carsales.com Ltd.A | | | | 63,018 | | | | | | | | | | 1,113,112 | |
| HUB24 Ltd.A | | | | 51,319 | | | | | | | | | | 993,395 | |
| Karoon Energy Ltd.A B | | | | 603,584 | | | | | | | | | | 988,809 | |
| Megaport Ltd.A B C | | | | 160,974 | | | | | | | | | | 991,179 | |
| Pro Medicus Ltd.A C | | | | 23,859 | | | | | | | | | | 1,137,700 | |
| Seven Group Holdings Ltd.A | | | | 53,395 | | | | | | | | | | 945,729 | |
| Stanmore Resources Ltd.A B | | | | 393,391 | | | | | | | | | | 950,443 | |
| | | | | | | | | | | | | | | |
Total Foreign Common Stocks | | | | | | | | | | | | | | 10,146,417 | |
| | | | | | | | | | | | | | | |
| | | | | | | | | | | | | | | |
Total Australia (Cost $10,765,431) | | | | | | | | | | | | | | 10,146,417 | |
| | | | | | | | | | | | | | | |
| | | | | | | | | | | | | | | |
| | | |
| Belgium - 0.66% (Cost $918,717) | | | | | | |
| | | |
| Foreign Common Stocks - 0.66% | | | | | | |
| Lotus Bakeries NVA | | | | 116 | | | | | | | | | | 860,593 | |
| | | | | | | | | | | | | | | |
| | | | | | | | | | | | | | | |
| | | |
| Brazil - 1.25% | | | | | | |
| | | |
| Foreign Common Stocks - 1.25% | | | | | | |
| Cyrela Brazil Realty SA Empreendimentos e Participacoes | | | | 187,039 | | | | | | | | | | 667,394 | |
| PRIO SAB | | | | 100,894 | | | | | | | | | | 954,558 | |
| | | | | | | | | | | | | | | |
Total Foreign Common Stocks | | | | | | | | | | | | | | 1,621,952 | |
| | | | | | | | | | | | | | | |
| | | | | | | | | | | | | | | |
Total Brazil (Cost $1,893,707) | | | | | | | | | | | | | | 1,621,952 | |
| | | | | | | | | | | | | | | |
| | | | | | | | | | | | | | | |
| | | |
| Canada - 7.22% | | | | | | |
| | | |
| Foreign Common Stocks - 7.22% | | | | | | |
| Athabasca Oil Corp.B | | | | 334,121 | | | | | | | | | | 992,665 | |
| Celestica, Inc.B | | | | 50,610 | | | | | | | | | | 1,181,356 | |
| Denison Mines Corp.B C | | | | 698,979 | | | | | | | | | | 1,132,346 | |
| Finning International, Inc. | | | | 33,891 | | | | | | | | | | 908,159 | |
| NexGen Energy Ltd.B | | | | 185,751 | | | | | | | | | | 1,121,137 | |
| SNC-Lavalin Group, Inc. | | | | 35,287 | | | | | | | | | | 980,173 | |
| Stantec, Inc.C | | | | 17,909 | | | | | | | | | | 1,095,784 | |
| Stella-Jones, Inc.C | | | | 22,429 | | | | | | | | | | 1,174,864 | |
| Trican Well Service Ltd. | | | | 232,244 | | | | | | | | | | 785,451 | |
| | | | | | | | | | | | | | | |
Total Foreign Common Stocks | | | | | | | | | | | | | | 9,371,935 | |
| | | | | | | | | | | | | | | |
| | | | | | | | | | | | | | | |
Total Canada (Cost $9,128,159) | | | | | | | | | | | | | | 9,371,935 | |
| | | | | | | | | | | | | | | |
| | | | | | | | | | | | | | | |
| | | |
| China/Hong Kong - 5.15% | | | | | | |
| | | |
| Foreign Common Stocks - 5.15% | | | | | | |
| Hisense Home Appliances Group Co. Ltd., Class HA | | | | 422,228 | | | | | | | | | | 1,169,351 | |
| MINISO Group Holding Ltd., ADR | | | | 45,694 | | | | | | | | | | 1,156,515 | |
| New Oriental Education & Technology Group, Inc.A B | | | | 215,490 | | | | | | | | | | 1,414,983 | |
| Sany Heavy Equipment International Holdings Co. Ltd.A | | | | 624,299 | | | | | | | | | | 820,103 | |
| United Laboratories International Holdings Ltd.A | | | | 1,020,699 | | | | | | | | | | 1,041,767 | |
| Yangzijiang Shipbuilding Holdings Ltd.A | | | | 1,020,543 | | | | | | | | | | 1,080,986 | |
| | | | | | | | | | | | | | | |
Total Foreign Common Stocks | | | | | | | | | | | | | | 6,683,705 | |
| | | | | | | | | | | | | | | |
| | | | | | | | | | | | | | | |
Total China/Hong Kong (Cost $6,299,693) | | | | | | | | | | | | | | 6,683,705 | |
| | | | | | | | | | | | | | | |
| | | | | | | | | | | | | | | |
| | | |
| Denmark - 0.76% (Cost $1,038,843) | | | | | | |
| | | |
| Foreign Common Stocks - 0.76% | | | | | | |
| Zealand Pharma ASA B | | | | 23,859 | | | | | | | | | | 991,026 | |
| | | | | | | | | | | | | | | |
| | | | | | | | | | | | | | | |
See accompanying notes
12
American Beacon EAM International Small Cap FundSM
Schedule of Investments
October 31, 2023
| | | | | | | | | | | | | | | |
| | | |
| | | Shares | | | | Fair Value |
| | | | | | | |
| | | |
| France - 0.91% (Cost $1,051,297) | | | | | | |
| | | |
| Foreign Common Stocks - 0.91% | | | | | | |
| Technip Energies NVA | | | | 54,044 | | | | | | | | | $ | 1,181,992 | |
| | | | | | | | | | | | | | | |
| | | | | | | | | | | | | | | |
| | | |
| Germany - 0.90% (Cost $1,124,608) | | | | | | |
| | | |
| Foreign Common Stocks - 0.90% | | | | | | |
| HOCHTIEF AGA | | | | 11,359 | | | | | | | | | | 1,173,233 | |
| | | | | | | | | | | | | | | |
| | | | | | | | | | | | | | | |
| | | |
| Greece - 1.95% | | | | | | |
| | | |
| Foreign Common Stocks - 1.95% | | | | | | |
| JUMBO SAA | | | | 46,612 | | | | | | | | | | 1,226,303 | |
| Mytilineos SAA | | | | 35,151 | | | | | | | | | | 1,301,588 | |
| | | | | | | | | | | | | | | |
Total Foreign Common Stocks | | | | | | | | | | | | | | 2,527,891 | |
| | | | | | | | | | | | | | | |
| | | | | | | | | | | | | | | |
Total Greece (Cost $2,228,586) | | | | | | | | | | | | | | 2,527,891 | |
| | | | | | | | | | | | | | | |
| | | | | | | | | | | | | | | |
| | | |
| Israel - 0.84% (Cost $717,615) | | | | | | |
| | | |
| Foreign Common Stocks - 0.84% | | | | | | |
| Camtek Ltd.B | | | | 20,764 | | | | | | | | | | 1,092,187 | |
| | | | | | | | | | | | | | | |
| | | | | | | | | | | | | | | |
| | | |
| Italy - 3.13% | | | | | | |
| | | |
| Foreign Common Stocks - 2.40% | | | | | | |
| Banca Popolare di Sondrio SpAA | | | | 190,554 | | | | | | | | | | 1,038,974 | |
| Buzzi SpAA | | | | 39,269 | | | | | | | | | | 1,039,307 | |
| Leonardo SpAA | | | | 69,232 | | | | | | | | | | 1,044,470 | |
| | | | | | | | | | | | | | | |
| | | | | | | | | | | | | | | |
Total Foreign Common Stocks | | | | | | | | | | | | | | 3,122,751 | |
| | | | | | | | | | | | | | | |
| | | | | | | | | | | | | | | |
| | | |
| Foreign Preferred Stocks - 0.73% | | | | | | |
| Danieli & C Officine Meccaniche SpAA D | | | | 46,720 | | | | | | | | | | 942,586 | |
| | | | | | | | | | | | | | | |
| | | | | | | | | | | | | | | |
Total Italy (Cost $4,148,221) | | | | | | | | | | | | | | 4,065,337 | |
| | | | | | | | | | | | | | | |
| | | | | | | | | | | | | | | |
| | | |
| Japan - 23.73% | | | | | | |
| | | |
| Foreign Common Stocks - 23.73% | | | | | | |
| Asics Corp.A | | | | 32,424 | | | | | | | | | | 1,026,621 | |
| Fuyo General Lease Co. Ltd.A | | | | 12,804 | | | | | | | | | | 1,042,022 | |
| Isetan Mitsukoshi Holdings Ltd.A | | | | 100,396 | | | | | | | | | | 1,131,091 | |
| Iwatani Corp.A | | | | 16,386 | | | | | | | | | | 783,009 | |
| Iyogin Holdings, Inc.A | | | | 127,813 | | | | | | | | | | 917,962 | |
| Kanematsu Corp.A | | | | 68,998 | | | | | | | | | | 931,738 | |
| Kusuri No. Aoki Holdings Co. Ltd.A | | | | 15,411 | | | | | | | | | | 1,002,149 | |
| Lawson, Inc.A | | | | 21,541 | | | | | | | | | | 1,038,254 | |
| Macnica Holdings, Inc.A | | | | 28,529 | | | | | | | | | | 1,154,985 | |
| Makino Milling Machine Co. Ltd.A | | | | 20,782 | | | | | | | | | | 869,253 | |
| MatsukiyoCocokara & Co.A | | | | 65,688 | | | | | | | | | | 1,152,187 | |
| Micronics Japan Co. Ltd.A | | | | 61,673 | | | | | | | | | | 936,556 | |
| Nakanishi, Inc.A | | | | 44,962 | | | | | | | | | | 985,765 | |
| Nisshin Seifun Group, Inc. | | | | 68,050 | | | | | | | | | | 1,001,154 | |
| Nitto Kogyo Corp.A | | | | 33,274 | | | | | | | | | | 759,637 | |
| Nomura Micro Science Co. Ltd.A | | | | 21,219 | | | | | | | | | | 1,092,287 | |
| Okamura Corp.A | | | | 76,815 | | | | | | | | | | 1,092,617 | |
| Osaka Soda Co. Ltd.A C | | | | 18,870 | | | | | | | | | | 1,107,985 | |
| Rakuten Bank Ltd.A B C | | | | 63,692 | | | | | | | | | | 1,093,459 | |
| Sangetsu Corp.A | | | | 51,304 | | | | | | | | | | 962,901 | |
| Sanrio Co. Ltd.A | | | | 20,433 | | | | | | | | | | 865,147 | |
| Sanwa Holdings Corp.A | | | | 73,582 | | | | | | | | | | 992,376 | |
| Sapporo Holdings Ltd.A | | | | 38,618 | | | | | | | | | | 1,358,712 | |
| SCREEN Holdings Co. Ltd.A | | | | 22,406 | | | | | | | | | | 1,041,348 | |
| SKY Perfect JSAT Holdings, Inc.A | | | | 211,445 | | | | | | | | | | 986,179 | |
See accompanying notes
13
American Beacon EAM International Small Cap FundSM
Schedule of Investments
October 31, 2023
| | | | | | | | | | | | | | | |
| | | |
| | | Shares | | | | Fair Value |
| | | | | | | |
| | | |
| Japan - 23.73% (continued) | | | | | | |
| | | |
| Foreign Common Stocks - 23.73% (continued) | | | | | | |
| Sumitomo Forestry Co. Ltd.A | | | | 37,906 | | | | | | | | | $ | 897,236 | |
| Tokyo Electron Device Ltd.A | | | | 37,321 | | | | | | | | | | 953,320 | |
| Tokyo Seimitsu Co. Ltd.A | | | | 15,164 | | | | | | | | | | 712,859 | |
| Toyoda Gosei Co. Ltd.A | | | | 44,592 | | | | | | | | | | 885,392 | |
| Toyota Boshoku Corp.A | | | | 52,520 | | | | | | | | | | 910,232 | |
| Zensho Holdings Co. Ltd.A | | | | 21,207 | | | | | | | | | | 1,118,453 | |
| | | | | | | | | | | | | | | |
Total Foreign Common Stocks | | | | | | | | | | | | | | 30,802,886 | |
| | | | | | | | | | | | | | | |
| | | | | | | | | | | | | | | |
Total Japan (Cost $30,755,114) | | | | | | | | | | | | | | 30,802,886 | |
| | | | | | | | | | | | | | | |
| | | | | | | | | | | | | | | |
| | | |
| Jordan - 0.71% (Cost $1,119,829) | | | | | | |
| | | |
| Foreign Common Stocks - 0.71% | | | | | | |
| Hikma Pharmaceuticals PLCA | | | | 39,847 | | | | | | | | | | 923,201 | |
| | | | | | | | | | | | | | | |
| | | | | | | | | | | | | | | |
| | | |
| Mexico - 2.60% | | | | | | |
| | | |
| Foreign Common Stocks - 2.60% | | | | | | |
| Alsea SAB de CVB | | | | 285,927 | | | | | | | | | | 949,019 | |
| Gruma SAB de CV, Class B | | | | 54,880 | | | | | | | | | | 955,872 | |
| Qualitas Controladora SAB de CV | | | | 56,317 | | | | | | | | | | 465,524 | |
| Vista Energy SAB de CV, ADRB | | | | 37,049 | | | | | | | | | | 1,008,474 | |
| | | | | | | | | | | | | | | |
Total Foreign Common Stocks | | | | | | | | | | | | | | 3,378,889 | |
| | | | | | | | | | | | | | | |
| | | | | | | | | | | | | | | |
Total Mexico (Cost $3,522,807) | | | | | | | | | | | | | | 3,378,889 | |
| | | | | | | | | | | | | | | |
| | | | | | | | | | | | | | | |
| | | |
| Netherlands - 0.83% (Cost $1,137,417) | | | | | | |
| | | |
| Foreign Common Stocks - 0.83% | | | | | | |
| Redcare Pharmacy NVA B E | | | | 9,636 | | | | | | | | | | 1,074,379 | |
| | | | | | | | | | | | | | | |
| | | | | | | | | | | | | | | |
| | | |
| Norway - 3.08% | | | | | | |
| | | |
| Foreign Common Stocks - 3.08% | | | | | | |
| Aker Solutions ASAA | | | | 205,105 | | | | | | | | | | 817,846 | |
| Frontline PLCA | | | | 52,038 | | | | | | | | | | 1,162,722 | |
| Seadrill Ltd.A B | | | | 23,274 | | | | | | | | | | 921,839 | |
| Stolt-Nielsen Ltd.A | | | | 33,331 | | | | | | | | | | 1,097,034 | |
| | | | | | | | | | | | | | | |
Total Foreign Common Stocks | | | | | | | | | | | | | | 3,999,441 | |
| | | | | | | | | | | | | | | |
| | | | | | | | | | | | | | | |
Total Norway (Cost $4,038,072) | | | | | | | | | | | | | | 3,999,441 | |
| | | | | | | | | | | | | | | |
| | | | | | | | | | | | | | | |
| | | |
| Republic of Korea - 2.89% | | | | | | |
| | | |
| Foreign Common Stocks - 2.89% | | | | | | |
| Hana Micron, Inc.A | | | | 51,863 | | | | | | | | | | 950,832 | |
| Hanall Biopharma Co. Ltd.A B | | | | 42,321 | | | | | | | | | | 917,312 | |
| Hanmi Semiconductor Co. Ltd.A | | | | 21,820 | | | | | | | | | | 865,364 | |
| Sam-A Aluminum Co. Ltd.A | | | | 10,855 | | | | | | | | | | 1,013,260 | |
| | | | | | | | | | | | | | | |
Total Foreign Common Stocks | | | | | | | | | | | | | | 3,746,768 | |
| | | | | | | | | | | | | | | |
| | | | | | | | | | | | | | | |
Total Republic of Korea (Cost $3,082,242) | | | | | | | | | | | | | | 3,746,768 | |
| | | | | | | | | | | | | | | |
| | | | | | | | | | | | | | | |
| | | |
| Singapore - 2.69% | | | | | | |
| | | |
| Foreign Common Stocks - 2.69% | | | | | | |
| BW LPG Ltd.A E | | | | 104,494 | | | | | | | | | | 1,480,279 | |
| Hafnia Ltd.A | | | | 174,269 | | | | | | | | | | 1,144,386 | |
| Keppel Corp. Ltd.A | | | | 185,067 | | | | | | | | | | 840,890 | |
| Keppel REITA | | | | 37,013 | | | | | | | | | | 21,496 | |
| | | | | | | | | | | | | | | |
Total Foreign Common Stocks | | | | | | | | | | | | | | 3,487,051 | |
| | | | | | | | | | | | | | | |
| | | | | | | | | | | | | | | |
Total Singapore (Cost $3,208,711) | | | | | | | | | | | | | | 3,487,051 | |
| | | | | | | | | | | | | | | |
See accompanying notes
14
American Beacon EAM International Small Cap FundSM
Schedule of Investments
October 31, 2023
| | | | | | | | | | | | | | | |
| | | |
| | | Shares | | | | Fair Value |
| | | | | | | |
| | | |
| South Africa - 0.87% (Cost $1,214,996) | | | | | | |
| | | |
| Foreign Common Stocks - 0.87% | | | | | | |
| Bid Corp. Ltd. A | | | | 53,499 | | | | | | | | | $ | 1,133,918 | |
| | | | | | | | | | | | | | | |
| | | | | | | | | | | | | | | |
| | | |
| Sweden - 0.86% (Cost $1,025,259) | | | | | | |
| | | |
| Foreign Common Stocks - 0.86% | | | | | | |
| Alleima ABA | | | | 183,542 | | | | | | | | | | 1,118,965 | |
| | | | | | | | | | | | | | | |
| | | | | | | | | | | | | | | |
| | | |
| Switzerland - 0.83% (Cost $1,010,301) | | | | | | |
| | | |
| Foreign Common Stocks - 0.83% | | | | | | |
| Ypsomed Holding AGA | | | | 3,918 | | | | | | | | | | 1,083,565 | |
| | | | | | | | | | | | | | | |
| | | | | | | | | | | | | | | |
| | | |
| Taiwan - 11.75% | | | | | | |
| | | |
| Foreign Common Stocks - 11.75% | | | | | | |
| Accton Technology Corp.A | | | | 71,315 | | | | | | | | | | 1,111,364 | |
| Acter Group Corp. Ltd.A | | | | 235,733 | | | | | | | | | | 1,309,727 | |
| ADATA Technology Co. Ltd.A | | | | 324,935 | | | | | | | | | | 977,137 | |
| Asia Vital Components Co. Ltd.A | | | | 77,311 | | | | | | | | | | 678,379 | |
| Chicony Electronics Co. Ltd.A | | | | 253,457 | | | | | | | | | | 974,216 | |
| Compeq Manufacturing Co. Ltd.A | | | | 587,044 | | | | | | | | | | 966,356 | |
| Elite Material Co. Ltd.A | | | | 70,088 | | | | | | | | | | 778,296 | |
| Getac Holdings Corp.A | | | | 509,409 | | | | | | | | | | 1,141,283 | |
| Gold Circuit Electronics Ltd.A | | | | 164,176 | | | | | | | | | | 905,766 | |
| King Slide Works Co. Ltd.A | | | | 32,014 | | | | | | | | | | 720,021 | |
| King Yuan Electronics Co. Ltd.A | | | | 609,830 | | | | | | | | | | 1,438,774 | |
| Makalot Industrial Co. Ltd.A | | | | 114,406 | | | | | | | | | | 1,281,758 | |
| Weltrend SemiconductorA | | | | 500,099 | | | | | | | | | | 1,006,050 | |
| Wistron NeWeb Corp.A | | | | 204,268 | | | | | | | | | | 811,736 | |
| WPG Holdings Ltd.A | | | | 520,470 | | | | | | | | | | 1,152,820 | |
| | | | | | | | | | | | | | | |
Total Foreign Common Stocks | | | | | | | | | | | | | | 15,253,683 | |
| | | | | | | | | | | | | | | |
| | | | | | | | | | | | | | | |
Total Taiwan (Cost $13,826,278) | | | | | | | | | | | | | | 15,253,683 | |
| | | | | | | | | | | | | | | |
| | | | | | | | | | | | | | | |
| | | |
| Thailand - 0.79% (Cost $1,088,945) | | | | | | |
| | | |
| Foreign Common Stocks - 0.79% | | | | | | |
| WHA Corp. PCL | | | | 7,357,476 | | | | | | | | | | 1,023,507 | |
| | | | | | | | | | | | | | | |
| | | | | | | | | | | | | | | |
| | | |
| United Kingdom - 3.64% | | | | | | |
| | | |
| Foreign Common Stocks - 3.64% | | | | | | |
| Domino’s Pizza Group PLCA | | | | 201,918 | | | | | | | | | | 843,905 | |
| Marks & Spencer Group PLCA B | | | | 364,486 | | | | | | | | | | 961,342 | |
| Melrose Industries PLCA | | | | 165,084 | | | | | | | | | | 938,150 | |
| Sage Group PLCA | | | | 87,794 | | | | | | | | | | 1,037,771 | |
| Subsea 7 SAA | | | | 72,328 | | | | | | | | | | 948,580 | |
| | | | | | | | | | | | | | | |
Total Foreign Common Stocks | | | | | | | | | | | | | | 4,729,748 | |
| | | | | | | | | | | | | | | |
| | | | | | | | | | | | | | | |
Total United Kingdom (Cost $5,145,173) | | | | | | | | | | | | | | 4,729,748 | |
| | | | | | | | | | | | | | | |
| | | | | | | | | | | | | | | |
| | | |
| United States - 1.44% | | | | | | |
| | | |
| Common Stocks - 1.44% | | | | | | |
| RHI Magnesita NVA | | | | 28,101 | | | | | | | | | | 879,623 | |
| Samsonite International SAA E | | | | 317,366 | | | | | | | | | | 987,412 | |
| | | | | | | | | | | | | | | |
Total Common Stocks | | | | | | | | | | | | | | 1,867,035 | |
| | | | | | | | | | | | | | | |
| | | | | | | | | | | | | | | |
Total United States (Cost $2,188,146) | | | | | | | | | | | | | | 1,867,035 | |
| | | | | | | | | | | | | | | |
See accompanying notes
15
American Beacon EAM International Small Cap FundSM
Schedule of Investments
October 31, 2023
| | | | | | | | | | | | | | | |
| | | |
| | | Shares | | | | Fair Value |
| | | | | | | |
| | | |
| SHORT-TERM INVESTMENTS - 10.58% (Cost $13,732,959) | | | | | | |
| | | |
| Investment Companies - 10.58% | | | | | | |
| American Beacon U.S. Government Money Market Select Fund, 5.19%F G | | | | 13,732,959 | | | | | | | | | $ | 13,732,959 | |
| | | | | | | | | | | | | | | |
| | | | | | | | | | | | | | | |
| | | |
| SECURITIES LENDING COLLATERAL - 0.20% (Cost $258,291) | | | | | | |
| | | |
| Investment Companies - 0.20% | | | | | | |
| American Beacon U.S. Government Money Market Select Fund, 5.19%F G | | | | 258,291 | | | | | | | | | | 258,291 | |
| | | | | | | | | | | | | | | |
| | | | | | | | | | | | | | | |
TOTAL INVESTMENTS - 98.08% (Cost $125,669,417) | | | | | | | | | | | | | | 127,330,554 | |
OTHER ASSETS, NET OF LIABILITIES - 1.92% | | | | | | | | | | | | | | 2,492,637 | |
| | | | | | | | | | | | | | | |
TOTAL NET ASSETS - 100.00% | | | | | | | | | | | | | $ | 129,823,191 | |
| | | | | | | | | | | | | | | |
| | | | | | | |
| Percentages are stated as a percent of net assets. | | | | | | | | | | | | | | | |
A Security has been fair valued pursuant to the Manager’s procedures related to pricing that is not available after the close of exchange or the available price does not reflect the security’s true market value. At period end, the value of these securities amounted to $94,693,165 or 72.94% of net assets.
B Non-income producing security.
C All or a portion of this security is on loan, collateralized by either cash and/or U.S. Treasuries, at October 31, 2023 (Note 9).
D A type of Preferred Stock that has no maturity date.
E Security exempt from registration under the Securities Act of 1933. These securities may be resold to qualified institutional buyers pursuant to Rule 144A. At the period end, the value of these securities amounted to $3,542,070 or 2.73% of net assets. The Fund has no right to demand registration of these securities.
F The Fund is affiliated by having the same investment advisor.
G 7-day yield.
ADR - American Depositary Receipt.
PCL - Public Company Limited (Thailand).
PLC - Public Limited Company.
See accompanying notes
16
American Beacon EAM International Small Cap FundSM
Schedule of Investments
October 31, 2023
The Fund’s investments are summarized by level based on the inputs used to determine their values. As of October 31, 2023, the investments were classified as described below:
| | | | | | | | | | | | | | | | | | | | | | | | | | | | |
EAM International Small Cap Fund | | Level 1 | | | | | | Level 2 | | | | | | Level 3 | | | | | | Total | |
Assets | | | | | | | | | | | | | | | | | | | | | | | | | | | | |
Foreign Common Stocks | | | | | | | | | | | | | | | | | | | | | | | | | | | | |
Australia | | $ | - | | | | | | | $ | 10,146,417 | | | | | | | $ | - | | | | | | | $ | 10,146,417 | |
Belgium | | | - | | | | | | | | 860,593 | | | | | | | | - | | | | | | | | 860,593 | |
Brazil | | | 1,621,952 | | | | | | | | - | | | | | | | | - | | | | | | | | 1,621,952 | |
Canada | | | 9,371,935 | | | | | | | | - | | | | | | | | - | | | | | | | | 9,371,935 | |
China/Hong Kong | | | 1,156,515 | | | | | | | | 5,527,190 | | | | | | | | - | | | | | | | | 6,683,705 | |
Denmark | | | - | | | | | | | | 991,026 | | | | | | | | - | | | | | | | | 991,026 | |
France | | | - | | | | | | | | 1,181,992 | | | | | | | | - | | | | | | | | 1,181,992 | |
Germany | | | - | | | | | | | | 1,173,233 | | | | | | | | - | | | | | | | | 1,173,233 | |
Greece | | | - | | | | | | | | 2,527,891 | | | | | | | | - | | | | | | | | 2,527,891 | |
Israel | | | 1,092,187 | | | | | | | | - | | | | | | | | - | | | | | | | | 1,092,187 | |
Italy | | | - | | | | | | | | 3,122,751 | | | | | | | | - | | | | | | | | 3,122,751 | |
Japan | | | 1,001,154 | | | | | | | | 29,801,732 | | | | | | | | - | | | | | | | | 30,802,886 | |
Jordan | | | - | | | | | | | | 923,201 | | | | | | | | - | | | | | | | | 923,201 | |
Mexico | | | 3,378,889 | | | | | | | | - | | | | | | | | - | | | | | | | | 3,378,889 | |
Netherlands | | | - | | | | | | | | 1,074,379 | | | | | | | | - | | | | | | | | 1,074,379 | |
Norway | | | - | | | | | | | | 3,999,441 | | | | | | | | - | | | | | | | | 3,999,441 | |
Republic of Korea | | | - | | | | | | | | 3,746,768 | | | | | | | | - | | | | | | | | 3,746,768 | |
Singapore | | | - | | | | | | | | 3,487,051 | | | | | | | | - | | | | | | | | 3,487,051 | |
South Africa | | | - | | | | | | | | 1,133,918 | | | | | | | | - | | | | | | | | 1,133,918 | |
Sweden | | | - | | | | | | | | 1,118,965 | | | | | | | | - | | | | | | | | 1,118,965 | |
Switzerland | | | - | | | | | | | | 1,083,565 | | | | | | | | - | | | | | | | | 1,083,565 | |
Taiwan | | | - | | | | | | | | 15,253,683 | | | | | | | | - | | | | | | | | 15,253,683 | |
Thailand | | | 1,023,507 | | | | | | | | - | | | | | | | | - | | | | | | | | 1,023,507 | |
United Kingdom | | | - | | | | | | | | 4,729,748 | | | | | | | | - | | | | | | | | 4,729,748 | |
Foreign Preferred Stocks | | | | | | | | | | | | | | | | | | | | | | | | | | | | |
Italy | | | - | | | | | | | | 942,586 | | | | | | | | - | | | | | | | | 942,586 | |
Common Stocks | | | | | | | | | | | | | | | | | | | | | | | | | | | | |
United States | | | - | | | | | | | | 1,867,035 | | | | | | | | - | | | | | | | | 1,867,035 | |
Short-Term Investments | | | 13,732,959 | | | | | | | | - | | | | | | | | - | | | | | | | | 13,732,959 | |
Securities Lending Collateral | | | 258,291 | | | | | | | | - | | | | | | | | - | | | | | | | | 258,291 | |
| | | | | | | | | | | | | | | | | | | | | | | | | | | | |
Total Investments in Securities - Assets | | $ | 32,637,389 | | | | | | | $ | 94,693,165 | | | | | | | $ | - | | | | | | | $ | 127,330,554 | |
| | | | | | | | | | | | | | | | | | | | | | | | | | | | |
U.S. GAAP requires transfers between all levels to/from level 3 be disclosed. During the year ended October 31, 2023, there were no transfers into or out of Level 3.
See accompanying notes
17
American Beacon International Equity FundSM
Schedule of Investments
October 31, 2023
| | | | | | | | | | | | | | | |
| | | |
| | | Shares | | | | Fair Value |
| | | | | | | |
| | | |
| Australia - 0.33% (Cost $2,742,371) | | | | | | |
| | | |
| Foreign Common Stocks - 0.33% | | | | | | |
| Rio Tinto PLCA | | | | 45,421 | | | | | | | | | $ | 2,895,020 | |
| | | | | | | | | | | | | | | |
| | | | | | | | | | | | | | | |
| | | |
| Austria - 0.85% (Cost $7,243,874) | | | | | | |
| | | |
| Foreign Common Stocks - 0.85% | | | | | | |
| Mondi PLCA | | | | 460,552 | | | | | | | | | | 7,439,876 | |
| | | | | | | | | | | | | | | |
| | | | | | | | | | | | | | | |
| | | |
| Belgium - 1.30% | | | | | | |
| | | |
| Foreign Common Stocks - 1.30% | | | | | | |
| Anheuser-Busch InBev SAA | | | | 97,695 | | | | | | | | | | 5,557,663 | |
| KBC Group NVA | | | | 46,763 | | | | | | | | | | 2,574,123 | |
| UCB SAA | | | | 44,934 | | | | | | | | | | 3,292,843 | |
| | | | | | | | | | | | | | | |
Total Foreign Common Stocks | | | | | | | | | | | | | | 11,424,629 | |
| | | | | | | | | | | | | | | |
| | | | | | | | | | | | | | | |
Total Belgium (Cost $12,343,492) | | | | | | | | | | | | | | 11,424,629 | |
| | | | | | | | | | | | | | | |
| | | | | | | | | | | | | | | |
| | | |
| Brazil - 0.38% (Cost $3,169,176) | | | | | | |
| | | |
| Foreign Common Stocks - 0.38% | | | | | | |
| ERO Copper Corp.B C | | | | 245,216 | | | | | | | | | | 3,327,900 | |
| | | | | | | | | | | | | | | |
| | | | | | | | | | | | | | | |
| | | |
| Canada - 2.46% | | | | | | |
| | | |
| Foreign Common Stocks - 2.46% | | | | | | |
| Alimentation Couche-Tard, Inc. | | | | 72,244 | | | | | | | | | | 3,932,720 | |
| Canadian Pacific Kansas City Ltd.B | | | | 47,596 | | | | | | | | | | 3,379,342 | |
| Gildan Activewear, Inc.B | | | | 105,775 | | | | | | | | | | 3,004,491 | |
| Linamar Corp. | | | | 117,229 | | | | | | | | | | 5,068,722 | |
| Suncor Energy, Inc. | | | | 192,219 | | | | | | | | | | 6,225,026 | |
| | | | | | | | | | | | | | | |
Total Foreign Common Stocks | | | | | | | | | | | | | | 21,610,301 | |
| | | | | | | | | | | | | | | |
| | | | | | | | | | | | | | | |
Total Canada (Cost $20,432,394) | | | | | | | | | | | | | | 21,610,301 | |
| | | | | | | | | | | | | | | |
| | | | | | | | | | | | | | | |
| | | |
| China/Hong Kong - 1.64% | | | | | | |
| | | |
| Foreign Common Stocks - 1.64% | | | | | | |
| AIA Group Ltd.A | | | | 587,200 | | | | | | | | | | 5,114,037 | |
| ESR Group Ltd.A D | | | | 1,644,200 | | | | | | | | | | 2,108,708 | |
| Prudential PLCA | | | | 689,550 | | | | | | | | | | 7,233,555 | |
| | | | | | | | | | | | | | | |
Total Foreign Common Stocks | | | | | | | | | | | | | | 14,456,300 | |
| | | | | | | | | | | | | | | |
| | | | | | | | | | | | | | | |
Total China/Hong Kong (Cost $17,927,142) | | | | | | | | | | | | | | 14,456,300 | |
| | | | | | | | | | | | | | | |
| | | | | | | | | | | | | | | |
| | | |
| Denmark - 0.53% | | | | | | |
| | | |
| Foreign Common Stocks - 0.53% | | | | | | |
| AP Moller - Maersk AS, Class BA | | | | 1,117 | | | | | | | | | | 1,858,848 | |
| Carlsberg AS, Class BA | | | | 23,240 | | | | | | | | | | 2,773,009 | |
| | | | | | | | | | | | | | | |
Total Foreign Common Stocks | | | | | | | | | | | | | | 4,631,857 | |
| | | | | | | | | | | | | | | |
| | | | | | | | | | | | | | | |
Total Denmark (Cost $5,285,471) | | | | | | | | | | | | | | 4,631,857 | |
| | | | | | | | | | | | | | | |
| | | | | | | | | | | | | | | |
| | | |
| Finland - 1.25% | | | | | | |
| | | |
| Foreign Common Stocks - 1.25% | | | | | | |
| Fortum OYJA | | | | 257,089 | | | | | | | | | | 3,061,299 | |
| Nokia OYJA | | | | 1,348,482 | | | | | | | | | | 4,499,746 | |
| Nordea Bank AbpA | | | | 327,796 | | | | | | | | | | 3,446,297 | |
| | | | | | | | | | | | | | | |
Total Foreign Common Stocks | | | | | | | | | | | | | | 11,007,342 | |
| | | | | | | | | | | | | | | |
| | | | | | | | | | | | | | | |
Total Finland (Cost $12,099,623) | | | | | | | | | | | | | | 11,007,342 | |
| | | | | | | | | | | | | | | |
See accompanying notes
18
American Beacon International Equity FundSM
Schedule of Investments
October 31, 2023
| | | | | | | | | | | | | | | |
| | | |
| | | Shares | | | | Fair Value |
| | | | | | | |
| | | |
| France - 12.67% | | | | | | |
| | | |
| Foreign Common Stocks - 12.67% | | | | | | |
| Air Liquide SAA | | | | 60,465 | | | | | | | | | $ | 10,362,991 | |
| Airbus SEA | | | | 35,294 | | | | | | | | | | 4,720,855 | |
| Alstom SAA | | | | 341,499 | | | | | | | | | | 4,617,656 | |
| Arkema SAA | | | | 32,365 | | | | | | | | | | 3,037,363 | |
| AXA SAA | | | | 154,976 | | | | | | | | | | 4,599,390 | |
| BNP Paribas SAA | | | | 135,043 | | | | | | | | | | 7,760,735 | |
| Bureau Veritas SAA | | | | 168,606 | | | | | | | | | | 3,841,332 | |
| Capgemini SEA | | | | 24,026 | | | | | | | | | | 4,258,607 | |
| Carrefour SAA | | | | 180,478 | | | | | | | | | | 3,169,087 | |
| Cie de Saint-Gobain SAA | | | | 80,732 | | | | | | | | | | 4,409,775 | |
| Danone SAA | | | | 111,210 | | | | | | | | | | 6,624,391 | |
| Eiffage SAA | | | | 101,001 | | | | | | | | | | 9,192,320 | |
| Engie SAA | | | | 572,752 | | | | | | | | | | 9,121,502 | |
| Kering SAA | | | | 10,569 | | | | | | | | | | 4,274,542 | |
| Orange SAA | | | | 417,143 | | | | | | | | | | 4,907,655 | |
| Pernod Ricard SAA | | | | 26,539 | | | | | | | | | | 4,718,615 | |
| Rexel SAA | | | | 446,946 | | | | | | | | | | 9,121,274 | |
| Thales SAA | | | | 30,725 | | | | | | | | | | 4,528,014 | |
| Valeo SEA | | | | 152,240 | | | | | | | | | | 2,009,629 | |
| Verallia SAA D | | | | 94,677 | | | | | | | | | | 3,098,809 | |
| Vinci SAA | | | | 27,972 | | | | | | | | | | 3,093,152 | |
| | | | | | | | | | | | | | | |
Total Foreign Common Stocks | | | | | | | | | | | | | | 111,467,694 | |
| | | | | | | | | | | | | | | |
| | | | | | | | | | | | | | | |
Total France (Cost $112,364,938) | | | | | | | | | | | | | | 111,467,694 | |
| | | | | | | | | | | | | | | |
| | | | | | | | | | | | | | | |
| | | |
| Germany - 9.68% | | | | | | |
| | | |
| Foreign Common Stocks - 9.34% | | | | | | |
| Allianz SEA | | | | 21,091 | | | | | | | | | | 4,929,642 | |
| Bayer AGA | | | | 55,223 | | | | | | | | | | 2,373,194 | |
| Bayerische Motoren Werke AGA | | | | 85,707 | | | | | | | | | | 7,946,859 | |
| Continental AGA | | | | 180,363 | | | | | | | | | | 11,711,705 | |
| Covestro AGA C D | | | | 50,876 | | | | | | | | | | 2,567,810 | |
| Deutsche Telekom AGA | | | | 308,121 | | | | | | | | | | 6,676,807 | |
| Infineon Technologies AGA | | | | 102,100 | | | | | | | | | | 2,966,652 | |
| LANXESS AGA | | | | 94,041 | | | | | | | | | | 2,149,787 | |
| Mercedes-Benz Group AGA | | | | 112,331 | | | | | | | | | | 6,588,671 | |
| Merck KGaAA | | | | 35,981 | | | | | | | | | | 5,415,176 | |
| MTU Aero Engines AGA | | | | 11,319 | | | | | | | | | | 2,120,344 | |
| Rheinmetall AGA | | | | 15,371 | | | | | | | | | | 4,398,387 | |
| RWE AGA | | | | 84,072 | | | | | | | | | | 3,212,527 | |
| SAP SEA | | | | 87,754 | | | | | | | | | | 11,759,021 | |
| Siemens Healthineers AGA D | | | | 96,132 | | | | | | | | | | 4,704,492 | |
| Vonovia SEA | | | | 113,126 | | | | | | | | | | 2,596,993 | |
| | | | | | | | | | | | | | | |
| | | | | | | | | | | | | | | |
Total Foreign Common Stocks | | | | | | | | | | | | | | 82,118,067 | |
| | | | | | | | | | | | | | | |
| | | | | | | | | | | | | | | |
| | | |
| Foreign Preferred Stocks - 0.34% | | | | | | |
| Henkel AG & Co. KGaAA E | | | | 41,541 | | | | | | | | | | 2,991,911 | |
| | | | | | | | | | | | | | | |
| | | | | | | | | | | | | | | |
Total Germany (Cost $90,309,062) | | | | | | | | | | | | | | 85,109,978 | |
| | | | | | | | | | | | | | | |
| | | | | | | | | | | | | | | |
| | | |
| Ireland - 2.29% | | | | | | |
| | | |
| Foreign Common Stocks - 2.29% | | | | | | |
| Ryanair Holdings PLC, ADRC | | | | 107,896 | | | | | | | | | | 9,462,479 | |
| Smurfit Kappa Group PLCA | | | | 327,274 | | | | | | | | | | 10,695,425 | |
| | | | | | | | | | | | | | | |
Total Foreign Common Stocks | | | | | | | | | | | | | | 20,157,904 | |
| | | | | | | | | | | | | | | |
| | | | | | | | | | | | | | | |
Total Ireland (Cost $21,636,953) | | | | | | | | | | | | | | 20,157,904 | |
| | | | | | | | | | | | | | | |
See accompanying notes
19
American Beacon International Equity FundSM
Schedule of Investments
October 31, 2023
| | | | | | | | | | | | | | | |
| | | |
| | | Shares | | | | Fair Value |
| | | | | | | |
| | | |
| Italy - 2.24% | | | | | | |
| | | |
| Foreign Common Stocks - 2.24% | | | | | | |
| Enel SpAA | | | | 1,161,397 | | | | | | | | | $ | 7,384,667 | |
| UniCredit SpAA | | | | 493,467 | | | | | | | | | | 12,345,306 | |
| | | | | | | | | | | | | | | |
Total Foreign Common Stocks | | | | | | | | | | | | | | 19,729,973 | |
| | | | | | | | | | | | | | | |
| | | | | | | | | | | | | | | |
Total Italy (Cost $14,370,770) | | | | | | | | | | | | | | 19,729,973 | |
| | | | | | | | | | | | | | | |
| | | | | | | | | | | | | | | |
| | | |
| Japan - 8.99% | | | | | | |
| | | |
| Foreign Common Stocks - 8.99% | | | | | | |
| Asics Corp.A | | | | 103,800 | | | | | | | | | | 3,286,555 | |
| Bandai Namco Holdings, Inc.A | | | | 143,000 | | | | | | | | | | 2,969,329 | |
| BayCurrent Consulting, Inc.A | | | | 122,600 | | | | | | | | | | 3,085,451 | |
| Digital Garage, Inc.A | | | | 70,300 | | | | | | | | | | 1,408,228 | |
| Disco Corp.A | | | | 16,300 | | | | | | | | | | 2,869,116 | |
| FANUC Corp.A | | | | 224,300 | | | | | | | | | | 5,753,674 | |
| Hitachi Ltd.A | | | | 72,500 | | | | | | | | | | 4,607,104 | |
| Kokusai Electric Corp.B C | | | | 149,000 | | | | | | | | | | 2,428,039 | |
| MatsukiyoCocokara & Co.A | | | | 339,700 | | | | | | | | | | 5,958,441 | |
| Murata Manufacturing Co. Ltd.A | | | | 369,900 | | | | | | | | | | 6,140,706 | |
| Renesas Electronics Corp.A C | | | | 222,500 | | | | | | | | | | 2,924,765 | |
| Shimano, Inc.A | | | | 13,700 | | | | | | | | | | 1,983,991 | |
| SMC Corp.A | | | | 100 | | | | | | | | | | 46,087 | |
| SUMCO Corp.A | | | | 1,016,500 | | | | | | | | | | 13,142,969 | |
| Sumitomo Mitsui Financial Group, Inc.A | | | | 181,000 | | | | | | | | | | 8,690,209 | |
| Suzuki Motor Corp.A | | | | 114,200 | | | | | | | | | | 4,431,808 | |
| Takeda Pharmaceutical Co. Ltd.A | | | | 160,000 | | | | | | | | | | 4,339,283 | |
| Tokyo Electron Ltd.A | | | | 23,800 | | | | | | | | | | 3,196,892 | |
| ZOZO, Inc.A B | | | | 95,800 | | | | | | | | | | 1,818,811 | |
| | | | | | | | | | | | | | | |
Total Foreign Common Stocks | | | | | | | | | | | | | | 79,081,458 | |
| | | | | | | | | | | | | | | |
| | | | | | | | | | | | | | | |
Total Japan (Cost $77,311,528) | | | | | | | | | | | | | | 79,081,458 | |
| | | | | | | | | | | | | | | |
| | | | | | | | | | | | | | | |
| | | |
| Jordan - 0.10% (Cost $696,852) | | | | | | |
| | | |
| Foreign Common Stocks - 0.10% | | | | | | |
| Hikma Pharmaceuticals PLCA | | | | 36,802 | | | | | | | | | | 852,652 | |
| | | | | | | | | | | | | | | |
| | | | | | | | | | | | | | | |
| | | |
| Netherlands - 5.08% | | | | | | |
| | | |
| Foreign Common Stocks - 5.08% | | | | | | |
| Akzo Nobel NVA | | | | 147,320 | | | | | | | | | | 9,894,237 | |
| ING Groep NVA | | | | 624,474 | | | | | | | | | | 8,007,515 | |
| Koninklijke Philips NVA | | | | 265,737 | | | | | | | | | | 5,042,238 | |
| NN Group NVA | | | | 304,614 | | | | | | | | | | 9,782,952 | |
| Shell PLCA | | | | 211,974 | | | | | | | | | | 6,924,640 | |
| Universal Music Group NVA | | | | 205,799 | | | | | | | | | | 5,018,116 | |
| | | | | | | | | | | | | | | |
Total Foreign Common Stocks | | | | | | | | | | | | | | 44,669,698 | |
| | | | | | | | | | | | | | | |
| | | | | | | | | | | | | | | |
Total Netherlands (Cost $48,733,693) | | | | | | | | | | | | | | 44,669,698 | |
| | | | | | | | | | | | | | | |
| | | | | | | | | | | | | | | |
| | | |
| Portugal - 0.25% (Cost $1,538,018) | | | | | | |
| | | |
| Foreign Common Stocks - 0.25% | | | | | | |
| Galp Energia SGPS SAA | | | | 145,377 | | | | | | | | | | 2,188,583 | |
| | | | | | | | | | | | | | | |
| | | | | | | | | | | | | | | |
| | | |
| Republic of Korea - 4.40% | | | | | | |
| | | |
| Foreign Common Stocks - 4.40% | | | | | | |
| Hana Financial Group, Inc.A | | | | 207,511 | | | | | | | | | | 6,053,949 | |
| Hyundai Mobis Co. Ltd.A | | | | 44,998 | | | | | | | | | | 7,018,740 | |
| LG Uplus Corp.A | | | | 188,951 | | | | | | | | | | 1,419,382 | |
| Samsung Electronics Co. Ltd.A | | | | 403,201 | | | | | | | | | | 20,105,891 | |
See accompanying notes
20
American Beacon International Equity FundSM
Schedule of Investments
October 31, 2023
| | | | | | | | | | | | | | | |
| | | |
| | | Shares | | | | Fair Value |
| | | | | | | |
| | | |
| Republic of Korea - 4.40% (continued) | | | | | | |
| | | |
| Foreign Common Stocks - 4.40% (continued) | | | | | | |
| SK Hynix, Inc.A | | | | 46,584 | | | | | | | | | $ | 4,069,617 | |
| | | | | | | | | | | | | | | |
Total Foreign Common Stocks | | | | | | | | | | | | | | 38,667,579 | |
| | | | | | | | | | | | | | | |
| | | | | | | | | | | | | | | |
Total Republic of Korea (Cost $34,291,094) | | | | | | | | | | | | | | 38,667,579 | |
| | | | | | | | | | | | | | | |
| | | | | | | | | | | | | | | |
| | | |
| Singapore - 0.83% | | | | | | |
| | | |
| Foreign Common Stocks - 0.83% | | | | | | |
| DBS Group Holdings Ltd.A | | | | 203,510 | | | | | | | | | | 4,893,189 | |
| United Overseas Bank Ltd.A | | | | 124,500 | | | | | | | | | | 2,457,842 | |
| | | | | | | | | | | | | | | |
Total Foreign Common Stocks | | | | | | | | | | | | | | 7,351,031 | |
| | | | | | | | | | | | | | | |
| | | | | | | | | | | | | | | |
Total Singapore (Cost $5,660,002) | | | | | | | | | | | | | | 7,351,031 | |
| | | | | | | | | | | | | | | |
| | | | | | | | | | | | | | | |
| | | |
| South Africa - 0.60% (Cost $8,126,787) | | | | | | |
| | | |
| Foreign Common Stocks - 0.60% | | | | | | |
| Anglo American PLC, 0.000%, Due 0/0/0A | | | | 206,831 | | | | | | | | | | 5,279,637 | |
| | | | | | | | | | | | | | | |
| | | | | | | | | | | | | | | |
| | | |
| Spain - 1.61% | | | | | | |
| | | |
| Foreign Common Stocks - 1.61% | | | | | | |
| Aena SME SAA D | | | | 30,971 | | | | | | | | | | 4,488,337 | |
| Amadeus IT Group SAA | | | | 51,725 | | | | | | | | | | 2,955,157 | |
| Iberdrola SAA | | | | 258,685 | | | | | | | | | | 2,882,822 | |
| Industria de Diseno Textil SAA | | | | 111,857 | | | | | | | | | | 3,863,746 | |
| | | | | | | | | | | | | | | |
Total Foreign Common Stocks | | | | | | | | | | | | | | 14,190,062 | |
| | | | | | | | | | | | | | | |
| | | | | | | | | | | | | | | |
Total Spain (Cost $13,453,340) | | | | | | | | | | | | | | 14,190,062 | |
| | | | | | | | | | | | | | | |
| | | | | | | | | | | | | | | |
| | | |
| Sweden - 1.31% | | | | | | |
| | | |
| Foreign Common Stocks - 1.31% | | | | | | |
| Assa Abloy AB, Class BA B | | | | 40,339 | | | | | | | | | | 859,666 | |
| Sandvik ABA | | | | 261,578 | | | | | | | | | | 4,450,245 | |
| Telefonaktiebolaget LM Ericsson, Class BA | | | | 445,264 | | | | | | | | | | 2,000,910 | |
| Volvo Car AB, Class BA B C | | | | 1,216,202 | | | | | | | | | | 4,195,156 | |
| | | | | | | | | | | | | | | |
Total Foreign Common Stocks | | | | | | | | | | | | | | 11,505,977 | |
| | | | | | | | | | | | | | | |
| | | | | | | | | | | | | | | |
Total Sweden (Cost $13,731,092) | | | | | | | | | | | | | | 11,505,977 | |
| | | | | | | | | | | | | | | |
| | | | | | | | | | | | | | | |
| | | |
| Switzerland - 2.77% | | | | | | |
| | | |
| Foreign Common Stocks - 2.77% | | | | | | |
| ABB Ltd.A | | | | 132,301 | | | | | | | | | | 4,448,327 | |
| Adecco Group AGA | | | | 244,693 | | | | | | | | | | 9,255,915 | |
| Cie Financiere Richemont SA, Class AA | | | | 16,915 | | | | | | | | | | 1,997,193 | |
| Novartis AGA | | | | 46,395 | | | | | | | | | | 4,331,376 | |
| UBS Group AGA | | | | 61,458 | | | | | | | | | | 1,435,672 | |
| Zurich Insurance Group AGA | | | | 6,064 | | | | | | | | | | 2,873,170 | |
| | | | | | | | | | | | | | | |
Total Foreign Common Stocks | | | | | | | | | | | | | | 24,341,653 | |
| | | | | | | | | | | | | | | |
| | | | | | | | | | | | | | | |
Total Switzerland (Cost $19,801,236) | | | | | | | | | | | | | | 24,341,653 | |
| | | | | | | | | | | | | | | |
| | | | | | | | | | | | | | | |
| | | |
| United Kingdom - 21.95% | | | | | | |
| | | |
| Foreign Common Stocks - 21.95% | | | | | | |
| 3i Group PLCA | | | | 238,920 | | | | | | | | | | 5,643,294 | |
| AstraZeneca PLCA | | | | 74,992 | | | | | | | | | | 9,373,676 | |
| AstraZeneca PLC, ADR | | | | 138,151 | | | | | | | | | | 8,735,288 | |
| Barclays PLCA | | | | 9,007,193 | | | | | | | | | | 14,401,386 | |
| Barratt Developments PLCA | | | | 1,481,166 | | | | | | | | | | 7,481,269 | |
| Berkeley Group Holdings PLCA | | | | 37,452 | | | | | | | | | | 1,845,764 | |
| BP PLCA | | | | 2,576,927 | | | | | | | | | | 15,730,420 | |
| British American Tobacco PLCA | | | | 450,593 | | | | | | | | | | 13,447,300 | |
See accompanying notes
21
American Beacon International Equity FundSM
Schedule of Investments
October 31, 2023
| | | | | | | | | | | | | | | |
| | | |
| | | Shares | | | | Fair Value |
| | | | | | | |
| | | |
| United Kingdom - 21.95% (continued) | | | | | | |
| | | |
| Foreign Common Stocks - 21.95% (continued) | | | | | | |
| Coca-Cola Europacific Partners PLCA | | | | 88,005 | | | | | | | | | $ | 5,134,569 | |
| Compass Group PLCA | | | | 305,136 | | | | | | | | | | 7,699,382 | |
| Diageo PLCA | | | | 142,283 | | | | | | | | | | 5,391,849 | |
| DS Smith PLCA | | | | 1,254,221 | | | | | | | | | | 4,349,559 | |
| Kingfisher PLCA | | | | 3,517,428 | | | | | | | | | | 9,011,974 | |
| Legal & General Group PLCA | | | | 871,965 | | | | | | | | | | 2,247,575 | |
| NatWest Group PLCA | | | | 808,993 | | | | | | | | | | 1,759,123 | |
| Nomad Foods Ltd.C | | | | 210,670 | | | | | | | | | | 2,911,459 | |
| Reckitt Benckiser Group PLCA | | | | 147,365 | | | | | | | | | | 9,879,291 | |
| RELX PLCA | | | | 384,976 | | | | | | | | | | 13,466,049 | |
| RELX PLCA | | | | 82,807 | | | | | | | | | | 2,887,387 | |
| Rolls-Royce Holdings PLCA C | | | | 5,676,365 | | | | | | | | | | 14,889,977 | |
| Segro PLCA | | | | 141,694 | | | | | | | | | | 1,234,922 | |
| Standard Chartered PLCA | | | | 165,526 | | | | | | | | | | 1,279,404 | |
| Taylor Wimpey PLCA | | | | 6,417,124 | | | | | | | | | | 8,691,810 | |
| Unilever PLCA | | | | 206,498 | | | | | | | | | | 9,783,963 | |
| WH Smith PLCA | | | | 206,149 | | | | | | | | | | 2,912,456 | |
| Whitbread PLCA | | | | 50,084 | | | | | | | | | | 2,030,551 | |
| WPP PLCA | | | | 1,258,249 | | | | | | | | | | 10,838,222 | |
| | | | | | | | | | | | | | | |
Total Foreign Common Stocks | | | | | | | | | | | | | | 193,057,919 | |
| | | | | | | | | | | | | | | |
| | | | | | | | | | | | | | | |
Total United Kingdom (Cost $196,838,644) | | | | | | | | | | | | | | 193,057,919 | |
| | | | | | | | | | | | | | | |
| | | | | | | | | | | | | | | |
| | | |
| United States - 10.40% | | | | | | |
| | | |
| Common Stocks - 10.40% | | | | | | |
| Aon PLC, Class A | | | | 29,318 | | | | | | | | | | 9,070,989 | |
| Constellium SEC | | | | 221,381 | | | | | | | | | | 3,497,820 | |
| GSK PLCA | | | | 1,108,376 | | | | | | | | | | 19,718,367 | |
| ICON PLCC | | | | 23,912 | | | | | | | | | | 5,833,572 | |
| Roche Holding AGA | | | | 110,062 | | | | | | | | | | 28,434,228 | |
| Sanofi SAA | | | | 206,801 | | | | | | | | | | 18,874,027 | |
| Signify NVA D | | | | 233,388 | | | | | | | | | | 6,051,949 | |
| | | | | | | | | | | | | | | |
Total Common Stocks | | | | | | | | | | | | | | 91,480,952 | |
| | | | | | | | | | | | | | | |
| | | | | | | | | | | | | | | |
Total United States (Cost $99,524,433) | | | | | | | | | | | | | | 91,480,952 | |
| | | | | | | | | | | | | | | |
| | | | | | | | | | | | | | | |
| | | |
| SHORT-TERM INVESTMENTS - 4.40% (Cost $38,723,902) | | | | | | |
| | | |
| Investment Companies - 4.40% | | | | | | |
| American Beacon U.S. Government Money Market Select Fund, 5.19%F G | | | | 38,723,902 | | | | | | | | | | 38,723,902 | |
| | | | | | | | | | | | | | | |
| | | | | | | | | | | | | | | |
| | | |
| SECURITIES LENDING COLLATERAL - 0.02% (Cost $171,336) | | | | | | |
| | | |
| Investment Companies - 0.02% | | | | | | |
| American Beacon U.S. Government Money Market Select Fund, 5.19%F G | | | | 171,336 | | | | | | | | | | 171,336 | |
| | | | | | | | | | | | | | | |
| | | | | | | | | | | | | | | |
TOTAL INVESTMENTS - 98.33% (Cost $878,527,223) | | | | | | | | | | | | | | 864,821,213 | |
OTHER ASSETS, NET OF LIABILITIES - 1.67% | | | | | | | | | | | | | | 14,702,386 | |
| | | | | | | | | | | | | | | |
TOTAL NET ASSETS - 100.00% | | | | | | | | | | | | | $ | 879,523,599 | |
| | | | | | | | | | | | | | | |
| | | | | | | |
| Percentages are stated as a percent of net assets. | | | | | | | | | | | | | | | |
A Security has been fair valued pursuant to the Manager’s procedures related to pricing that is not available after the close of exchange or the available price does not reflect the security’s true market value. At period end, the value of these securities amounted to $759,048,128 or 86.30% of net assets.
B All or a portion of this security is on loan, collateralized by either cash and/or U.S. Treasuries, at October 31, 2023 (Note 9).
C Non-income producing security.
D Security exempt from registration under the Securities Act of 1933. These securities may be resold to qualified institutional buyers pursuant to Rule 144A. At the period end, the value of these securities amounted to $23,020,106 or 2.62% of net assets. The Fund has no right to demand registration of these securities.
E A type of Preferred Stock that has no maturity date.
See accompanying notes
22
American Beacon International Equity FundSM
Schedule of Investments
October 31, 2023
F 7-day yield.
G The Fund is affiliated by having the same investment advisor.
ADR - American Depositary Receipt.
PLC - Public Limited Company.
| | | | | | | | | | | | | | | | |
| Long Futures Contracts Open on October 31, 2023: | |
|
| Equity Futures Contracts | |
| Description | | Number of
Contracts | | Expiration Date | | Notional Amount | | | Contract Value | | | Unrealized
Appreciation
(Depreciation) | |
| ICE U.S. mini MSCI EAFE Index Futures | | 412 | | December 2023 | | $ | 41,200,349 | | | $ | 40,666,460 | | | $ | (533,889 | ) |
| | | | | | | | | | | | | | | | |
| | | | | | $ | 41,200,349 | | | $ | 40,666,460 | | | $ | (533,889 | ) |
| | | | | | | | | | | | | | | | |
| | |
| Index Abbreviations: |
| ICE | | Intercontinental Exchange. |
| MSCI EAFE | | Morgan Stanley Capital International - Europe, Australasia, and Far East. |
The Fund’s investments are summarized by level based on the inputs used to determine their values. As of October 31, 2023, the investments were classified as described below:
| | | | | | | | | | | | | | | | | | | | | | | | | | | | |
International Equity Fund | | Level 1 | | | | | | Level 2 | | | | | | Level 3 | | | | | | Total | |
Assets | | | | | | | | | | | | | | | | | | | | | | | | | | | | |
Foreign Common Stocks | | | | | | | | | | | | | | | | | | | | | | | | | | | | |
Australia | | $ | - | | | | | | | $ | 2,895,020 | | | | | | | $ | - | | | | | | | $ | 2,895,020 | �� |
Austria | | | - | | | | | | | | 7,439,876 | | | | | | | | - | | | | | | | | 7,439,876 | |
Belgium | | | - | | | | | | | | 11,424,629 | | | | | | | | - | | | | | | | | 11,424,629 | |
Brazil | | | 3,327,900 | | | | | | | | - | | | | | | | | - | | | | | | | | 3,327,900 | |
Canada | | | 21,610,301 | | | | | | | | - | | | | | | | | - | | | | | | | | 21,610,301 | |
China/Hong Kong | | | - | | | | | | | | 14,456,300 | | | | | | | | - | | | | | | | | 14,456,300 | |
Denmark | | | - | | | | | | | | 4,631,857 | | | | | | | | - | | | | | | | | 4,631,857 | |
Finland | | | - | | | | | | | | 11,007,342 | | | | | | | | - | | | | | | | | 11,007,342 | |
France | | | - | | | | | | | | 111,467,694 | | | | | | | | - | | | | | | | | 111,467,694 | |
Germany | | | - | | | | | | | | 82,118,067 | | | | | | | | - | | | | | | | | 82,118,067 | |
Ireland | | | 9,462,479 | | | | | | | | 10,695,425 | | | | | | | | - | | | | | | | | 20,157,904 | |
Italy | | | - | | | | | | | | 19,729,973 | | | | | | | | - | | | | | | | | 19,729,973 | |
Japan | | | 2,428,039 | | | | | | | | 76,653,419 | | | | | | | | - | | | | | | | | 79,081,458 | |
Jordan | | | - | | | | | | | | 852,652 | | | | | | | | - | | | | | | | | 852,652 | |
Netherlands | | | - | | | | | | | | 44,669,698 | | | | | | | | - | | | | | | | | 44,669,698 | |
Portugal | | | - | | | | | | | | 2,188,583 | | | | | | | | - | | | | | | | | 2,188,583 | |
Republic of Korea | | | - | | | | | | | | 38,667,579 | | | | | | | | - | | | | | | | | 38,667,579 | |
Singapore | | | - | | | | | | | | 7,351,031 | | | | | | | | - | | | | | | | | 7,351,031 | |
South Africa | | | - | | | | | | | | 5,279,637 | | | | | | | | - | | | | | | | | 5,279,637 | |
Spain | | | - | | | | | | | | 14,190,062 | | | | | | | | - | | | | | | | | 14,190,062 | |
Sweden | | | - | | | | | | | | 11,505,977 | | | | | | | | - | | | | | | | | 11,505,977 | |
Switzerland | | | - | | | | | | | | 24,341,653 | | | | | | | | - | | | | | | | | 24,341,653 | |
United Kingdom | | | 11,646,747 | | | | | | | | 181,411,172 | | | | | | | | - | | | | | | | | 193,057,919 | |
Foreign Preferred Stocks | | | | | | | | | | | | | | | | | | | | | | | | | | | | |
Germany | | | - | | | | | | | | 2,991,911 | | | | | | | | - | | | | | | | | 2,991,911 | |
Common Stocks | | | | | | | | | | | | | | | | | | | | | | | | | | | | |
United States | | | 18,402,381 | | | | | | | | 73,078,571 | | | | | | | | - | | | | | | | | 91,480,952 | |
Short-Term Investments | | | 38,723,902 | | | | | | | | - | | | | | | | | - | | | | | | | | 38,723,902 | |
Securities Lending Collateral | | | 171,336 | | | | | | | | - | | | | | | | | - | | | | | | | | 171,336 | |
| | | | | | | | | | | | | | | | | | | | | | | | | | | | |
Total Investments in Securities - Assets | | $ | 105,773,085 | | | | | | | $ | 759,048,128 | | | | | | | $ | - | | | | | | | $ | 864,821,213 | |
| | | | | | | | | | | | | | | | | | | | | | | | | | | | |
Financial Derivative Instruments - Liabilities | | | | | | | | | | | | | | | | | | | | | | | | | | | | |
Futures Contracts | | $ | (533,889 | ) | | | | | | $ | - | | | | | | | $ | - | | | | | | | $ | (533,889 | ) |
| | | | | | | | | | | | | | | | | | | | | | | | | | | | |
Total Financial Derivative Instruments - Liabilities | | $ | (533,889 | ) | | | | | | $ | - | | | | | | | $ | - | | | | | | | $ | (533,889 | ) |
| | | | | | | | | | | | | | | | | | | | | | | | | | | | |
U.S. GAAP requires transfers between all levels to/from level 3 be disclosed. During the year ended October 31, 2023, there were no transfers into or out of Level 3.
See accompanying notes
23
American Beacon FundsSM
Statements of Assets and Liabilities
October 31, 2023
| | | | | | | | | | | | |
| | | EAM International
Small Cap Fund | | | | | | International
Equity Fund | |
Assets: | | | | | | | | | | | | |
Investments in unaffiliated securities, at fair value†§ | | $ | 113,339,304 | | | | | | | $ | 825,925,975 | |
Investments in affiliated securities, at fair value‡ | | | 13,991,250 | | | | | | | | 38,895,238 | |
Foreign currency, at fair value¤ | | | 30,671 | | | | | | | | 1,250,115 | |
Cash | | | – | | | | | | | | 229,488 | |
Cash collateral held at broker for futures contracts | | | – | | | | | | | | 1,286,000 | |
Dividends and interest receivable | | | 321,903 | | | | | | | | 2,504,691 | |
Deposits with broker for futures contracts | | | – | | | | | | | | 662,514 | |
Receivable for investments sold | | | 3,734,663 | | | | | | | | 13,019,042 | |
Receivable for fund shares sold | | | 301,511 | | | | | | | | 4,596,597 | |
Receivable for tax reclaims | | | 1,362,774 | | | | | | | | 4,962,269 | |
Receivable for expense reimbursement (Note 2) | | | 10,453 | | | | | | | | 41,266 | |
Prepaid expenses | | | 17,229 | | | | | | | | 50,867 | |
| | | | | | | | | | | | |
Total assets | | | 133,109,758 | | | | | | | | 893,424,062 | |
| | | | | | | | | | | | |
Liabilities: | |
Payable for investments purchased | | | 2,688,933 | | | | | | | | 6,188,734 | |
Payable for fund shares redeemed | | | 111,596 | | | | | | | | 5,396,263 | |
Management and sub-advisory fees payable (Note 2) | | | 61,351 | | | | | | | | 1,127,419 | |
Service fees payable (Note 2) | | | – | | | | | | | | 31,046 | |
Transfer agent fees payable (Note 2) | | | 7,311 | | | | | | | | 50,540 | |
Payable upon return of securities loaned (Note 9)§ | | | 258,291 | | | | | | | | 171,336 | |
Custody and fund accounting fees payable | | | 48,844 | | | | | | | | 82,312 | |
Professional fees payable | | | 75,495 | | | | | | | | 196,994 | |
Trustee fees payable (Note 2) | | | 897 | | | | | | | | 6,574 | |
Payable for prospectus and shareholder reports | | | 7,264 | | | | | | | | 83,977 | |
Payable for variation margin from open futures contracts (Note 5) | | | – | | | | | | | | 532,978 | |
Other liabilities | | | 26,585 | | | | | | | | 32,290 | |
| | | | | | | | | | | | |
Total liabilities | | | 3,286,567 | | | | | | | | 13,900,463 | |
| | | | | | | | | | | | |
Commitments and contingent liabilities (Note 2) | | | | | | | | | | | | |
| | | | | | | | | | | | |
Net assets | | $ | 129,823,191 | | | | | | | $ | 879,523,599 | |
| | | | | | | | | | | | |
Analysis of net assets: | |
Paid-in-capital | | $ | 128,483,704 | | | | | | | $ | 870,314,724 | |
Total distributable earnings (deficits)A | | | 1,339,487 | | | | | | | | 9,208,875 | |
| | | | | | | | | | | | |
Net assets | | $ | 129,823,191 | | | | | | | $ | 879,523,599 | |
| | | | | | | | | | | | |
Shares outstanding at no par value (unlimited shares authorized): | |
R5 Class | | | 412,624 | | | | | | | | 24,732,522 | |
| | | | | | | | | | | | |
Y Class | | | 4,101,309 | | | | | | | | 4,981,985 | |
| | | | | | | | | | | | |
Investor Class | | | 3,978,477 | | | | | | | | 3,860,354 | |
| | | | | | | | | | | | |
Advisor Class | | | N/A | | | | | | | | 717,076 | |
| | | | | | | | | | | | |
A Class | | | N/A | | | | | | | | 543,964 | |
| | | | | | | | | | | | |
C Class | | | N/A | | | | | | | | 165,086 | |
| | | | | | | | | | | | |
R6 Class | | | N/A | | | | | | | | 17,334,528 | |
| | | | | | | | | | | | |
Net assets: | |
R5 Class | | $ | 6,316,496 | | | | | | | $ | 413,488,011 | |
| | | | | | | | | | | | |
Y Class | | $ | 62,512,548 | | | | | | | $ | 87,634,823 | |
| | | | | | | | | | | | |
Investor Class | | $ | 60,994,147 | | | | | | | $ | 63,864,486 | |
| | | | | | | | | | | | |
Advisor Class | | | N/A | | | | | | | $ | 12,257,174 | |
| | | | | | | | | | | | |
A Class | | | N/A | | | | | | | $ | 8,977,482 | |
| | | | | | | | | | | | |
C Class | | | N/A | | | | | | | $ | 2,608,270 | |
| | | | | | | | | | | | |
R6 Class | | | N/A | | | | | | | $ | 290,693,353 | |
| | | | | | | | | | | | |
See accompanying notes
24
American Beacon FundsSM
Statements of Assets and Liabilities
October 31, 2023
| | | | | | | | | | | | |
| | | EAM International
Small Cap Fund | | | | | | International
Equity Fund | |
Net asset value, offering and redemption price per share: | |
R5 Class | | $ | 15.31 | | | | | | | $ | 16.72 | |
| | | | | | | | | | | | |
Y Class | | $ | 15.24 | | | | | | | $ | 17.59 | |
| | | | | | | | | | | | |
Investor Class | | $ | 15.33 | | | | | | | $ | 16.54 | |
| | | | | | | | | | | | |
Advisor Class | | | N/A | | | | | | | $ | 17.09 | |
| | | | | | | | | | | | |
A Class | | | N/A | | | | | | | $ | 16.50 | |
| | | | | | | | | | | | |
A Class (offering price) | | | N/A | | | | | | | $ | 17.51 | |
| | | | | | | | | | | | |
C Class | | | N/A | | | | | | | $ | 15.80 | |
| | | | | | | | | | | | |
R6 Class | | | N/A | | | | | | | $ | 16.77 | |
| | | | | | | | | | | | |
| | | |
† Cost of investments in unaffiliated securities | | $ | 111,678,167 | | | | | | | $ | 839,631,985 | |
‡ Cost of investments in affiliated securities | | $ | 13,991,250 | | | | | | | $ | 38,895,238 | |
§ Fair value of securities on loan | | $ | 5,205,811 | | | | | | | $ | 12,610,607 | |
^ Cost of foreign currency | | $ | 30,834 | | | | | | | $ | 1,249,722 | |
| |
A The Fund’s investments in affiliated securities did not have unrealized appreciation (depreciation) at year end. | | | | | |
See accompanying notes
25
American Beacon FundsSM
Statements of Operations
For the year ended October 31, 2023
| | | | | | | | | | | | |
| | | EAM International
Small Cap Fund | | | | | | International
Equity Fund | |
Investment income: | |
Dividend income from unaffiliated securities (net of foreign taxes)† | | $ | 3,536,796 | A | | | | | | $ | 32,142,057 | |
Dividend income from affiliated securities (Note 2) | | | 424,322 | | | | | | | | 1,910,547 | |
Interest income† | | | - | | | | | | | | 1,487,711 | |
Income derived from securities lending (Note 9) | | | 96,661 | | | | | | | | 271,029 | |
Other income | | | 584 | | | | | | | | 1,281 | |
| | | | | | | | | | | | |
Total investment income | | | 4,058,363 | | | | | | | | 35,812,625 | |
| | | | | | | | | | | | |
Expenses: | |
Management and sub-advisory fees (Note 2) | | | 1,228,057 | | | | | | | | 7,039,106 | |
Transfer agent fees: | | | | | | | | | | | | |
R5 Class (Note 2) | | | 3,895 | | | | | | | | 187,641 | |
Y Class (Note 2) | | | 88,112 | | | | | | | | 104,206 | |
Investor Class | | | 6,622 | | | | | | | | 11,969 | |
Advisor Class | | | - | | | | | | | | 1,712 | |
A Class | | | - | | | | | | | | 3,905 | |
C Class | | | - | | | | | | | | 3,036 | |
R6 Class | | | - | | | | | | | | 34,400 | |
Custody and fund accounting fees | | | 170,770 | | | | | | | | 357,674 | |
Professional fees | | | 222,799 | | | | | | | | 299,608 | |
Registration fees and expenses | | | 53,782 | | | | | | | | 120,096 | |
Service fees (Note 2): | | | | | | | | | | | | |
Investor Class | | | 206,196 | | | | | | | | 359,278 | |
Advisor Class | | | - | | | | | | | | 36,056 | |
A Class | | | - | | | | | | | | 11,183 | |
C Class | | | - | | | | | | | | 3,548 | |
Distribution fees (Note 2): | | | | | | | | | | | | |
Advisor Class | | | - | | | | | | | | 36,163 | |
A Class | | | - | | | | | | | | 19,975 | |
C Class | | | - | | | | | | | | 31,298 | |
ICI membership dues and license expenses | | | 131,102 | | | | | | | | - | |
Prospectus and shareholder report expenses | | | 40,359 | | | | | | | | 139,934 | |
Trustee fees (Note 2) | | | 15,628 | | | | | | | | 111,376 | |
Loan expense (Note 10) | | | 9,383 | | | | | | | | 7,210 | |
Other expenses | | | 12,163 | | | | | | | | 289,224 | |
| | | | | | | | | | | | |
Total expenses | | | 2,188,868 | | | | | | | | 9,208,598 | |
| | | | | | | | | | | | |
Net fees waived and expenses (reimbursed) (Note 2) | | | (23,655 | ) | | | | | | | (241,021 | ) |
| | | | | | | | | | | | |
Net expenses | | | 2,165,213 | | | | | | | | 8,967,577 | |
| | | | | | | | | | | | |
Net investment income | | | 1,893,150 | | | | | | | | 26,845,048 | |
| | | | | | | | | | | | |
| | | |
Realized and unrealized gain (loss) from investments: | | | | | | | | | | | | |
Net realized gain (loss) from: | | | | | | | | | | | | |
Investments in unaffiliated securitiesB | | | 14,250,289 | | | | | | | | 60,029,606 | |
Commission recapture (Note 1) | | | 1 | | | | | | | | 6 | |
Foreign currency transactions | | | (339,797 | ) | | | | | | | (6,864 | ) |
Futures contracts | | | - | | | | | | | | 2,243,418 | |
Change in net unrealized appreciation (depreciation) of: | | | | | | | | | | | | |
Investments in unaffiliated securitiesC | | | 13,786,334 | | | | | | | | 183,611,777 | |
Foreign currency transactions | | | 104,406 | | | | | | | | 391,768 | |
Futures contracts | | | - | | | | | | | | (1,693,962 | ) |
| | | | | | | | | | | | |
Net gain from investments | | | 27,801,233 | | | | | | | | 244,575,749 | |
| | | | | | | | | | | | |
Net increase in net assets resulting from operations | | $ | 29,694,383 | | | | | | | $ | 271,420,797 | |
| | | | | | | | | | | | |
| | | |
† Foreign taxes | | $ | 334,238 | | | | | | | $ | 3,459,829 | |
|
A Includes significant dividends of $430,110. | |
B The Fund did not recognize net realized gains (losses) from the sale of investments in affiliated securities. | |
C The Fund’s investments in affiliated securities did not have a change in unrealized appreciation (depreciation) at year end. | |
See accompanying notes
26
American Beacon FundsSM
Statements of Changes in Net Assets
| | | | | | | | | | | | | | | | | | | | | | | | | | | | |
| | | EAM International Small Cap Fund | | | | | | International Equity Fund | |
| | | Year Ended
October 31, 2023 | | | | | | Year Ended
October 31, 2022 | | | | | | Year Ended
October 31, 2023 | | | | | | Year Ended
October 31, 2022 | |
Increase (decrease) in net assets: | | | | | | | | | | | | | | | | | | | | | | | | | | | | |
Operations: | | | | | | | | | | | | | | | | | | | | | | | | | | | | |
Net investment income | | $ | 1,893,150 | | | | | | | $ | 3,061,392 | | | | | | | $ | 26,845,048 | | | | | | | $ | 37,264,194 | |
Net realized gain (loss) from investments in unaffiliated securities, commission recapture, foreign currency transactions, and futures contracts | | | 13,910,493 | | | | | | | | 6,637,273 | | | | | | | | 62,266,166 | | | | | | | | (28,181,801 | ) |
Change in net unrealized appreciation (depreciation) of investments in unaffiliated securities, foreign currency transactions, and futures contracts | | | 13,890,740 | | | | | | | | (100,151,391 | ) | | | | | | | 182,309,583 | | | | | | | | (419,168,714 | ) |
| | | | | | | | | | | | | | | | | | | | | | | | | | | | |
Net increase (decrease) in net assets resulting from operations | | | 29,694,383 | | | | | | | | (90,452,726 | ) | | | | | | | 271,420,797 | | | | | | | | (410,086,321 | ) |
| | | | | | | | | | | | | | | | | | | | | | | | | | | | |
Distributions to shareholders: | |
Total retained earnings: | | | | | | | | | | | | | | | | | | | | | | | | | | | | |
R5 Class | | | (284,205 | ) | | | | | | | (826,787 | ) | | | | | | | (19,840,233 | ) | | | | | | | (128,782,324 | ) |
Y Class | | | (1,719,644 | ) | | | | | | | (7,166,939 | ) | | | | | | | (2,512,663 | ) | | | | | | | (21,034,641 | ) |
Investor Class | | | (1,056,156 | ) | | | | | | | (5,498,436 | ) | | | | | | | (2,090,798 | ) | | | | | | | (11,784,591 | ) |
Advisor Class | | | – | | | | | | | | – | | | | | | | | (304,447 | ) | | | | | | | (1,694,524 | ) |
A Class | | | – | | | | | | | | – | | | | | | | | (188,613 | ) | | | | | | | (912,492 | ) |
C Class | | | – | | | | | | | | – | | | | | | | | (48,919 | ) | | | | | | | (383,590 | ) |
R6 Class | | | – | | | | | | | | – | | | | | | | | (8,756,091 | ) | | | | | | | (39,116,826 | ) |
| | | | | | | | | | | | | | | | | | | | | | | | | | | | |
Net distributions to shareholders | | | (3,060,005 | ) | | | | | | | (13,492,162 | ) | | | | | | | (33,741,764 | ) | | | | | | | (203,708,988 | ) |
| | | | | | | | | | | | | | | | | | | | | | | | | | | | |
| | | | | | | |
Capital share transactions (Note 11): | | | | | | | | | | | | | | | | | | | | | | | | | | | | |
Proceeds from sales of shares | | | 31,413,470 | | | | | | | | 68,033,556 | | | | | | | | 291,643,278 | | | | | | | | 455,433,342 | |
Reinvestment of dividends and distributions | | | 2,681,566 | | | | | | | | 12,016,355 | | | | | | | | 32,494,086 | | | | | | | | 198,403,571 | |
Cost of shares redeemed | | | (113,325,777 | ) | | | | | | | (155,710,053 | ) | | | | | | | (1,070,787,931 | ) | | | | | | | (772,371,121 | ) |
| | | | | | | | | | | | | | | | | | | | | | | | | | | | |
Net (decrease) in net assets from capital share transactions | | | (79,230,741 | ) | | | | | | | (75,660,142 | ) | | | | | | | (746,650,567 | ) | | | | | | | (118,534,208 | ) |
| | | | | | | | | | | | | | | | | | | | | | | | | | | | |
Net (decrease) in net assets | | | (52,596,363 | ) | | | | | | | (179,605,030 | ) | | | | | | | (508,971,534 | ) | | | | | | | (732,329,517 | ) |
| | | | | | | | | | | | | | | | | | | | | | | | | | | | |
Net assets: | | | | | | | | | | | | | | | | | | | | | | | | | | | | |
Beginning of year | | | 182,419,554 | | | | | | | | 362,024,584 | | | | | | | | 1,388,495,133 | | | | | | | | 2,120,824,650 | |
| | | | | | | | | | | | | | | | | | | | | | | | | | | | |
End of year | | $ | 129,823,191 | | | | | | | $ | 182,419,554 | | | | | | | $ | 879,523,599 | | | | | | | $ | 1,388,495,133 | |
| | | | | | | | | | | | | | | | | | | | | | | | | | | | |
See accompanying notes
27
American Beacon FundsSM
Notes to Financial Statements
October 31, 2023
1. Organization and Significant Accounting Policies
American Beacon Funds (the “Trust”) is organized as a Massachusetts business trust. The Funds, each a series within the Trust, are registered under the Investment Company Act of 1940, as amended (the “Act”), as diversified, open-end management investment companies. As of October 31, 2023, the Trust consists of twenty-four active series, two of which are presented in this filing: American Beacon EAM International Small Cap Fund and American Beacon International Equity Fund (collectively, the “Funds” and each individually a “Fund”). The remaining twenty-two active series are reported in separate filings. Prior to January 21, 2023, American Beacon EAM International Small Cap Fund was known as American Beacon Tocqueville International Value Fund.
American Beacon Advisors, Inc. (the “Manager”) is a Delaware corporation and a wholly-owned subsidiary of Resolute Investment Managers, Inc. (“RIM”) organized in 1986 to provide business management, advisory, administrative, and asset management consulting services to the Trust and other investors. The Manager is registered as an investment advisor under the Investment Advisers Act of 1940, as amended (the “Advisers Act”). RIM is, in turn, a wholly-owned subsidiary of Resolute Acquisition, Inc., which is a wholly-owned subsidiary of Resolute Topco, Inc., a wholly-owned subsidiary of Resolute Investment Holdings, LLC (“RIH”). RIH is owned primarily by Kelso Investment Associates VIII, L.P., KEP VI, LLC and Estancia Capital Partners L.P., investment funds affiliated with Kelso & Company, L.P. (“Kelso”) or Estancia Capital Management, LLC (“Estancia”), which are private equity firms.
On July 11, 2023, (i) RIH, RIM and certain of their affiliates, and (ii) the current owners of approximately 93% of RIH (the “Current Ownership Group”) entered into a transaction agreement with certain creditors of RIM (the “Lender Group”) pursuant to which (i) all equity interests in RIH would be cancelled, (ii) new equity interests would be issued to members of the Lender Group, and (iii) the existing credit agreements between RIM and the Lender Group would be terminated and a new credit agreement would be executed (“Transaction”). The Lender Group consists of various institutional investment funds (“New Ownership Group”) that are managed by financial institutions and other investment advisory firms.
Upon the closing of the Transaction, the Manager will be wholly-owned indirectly by the New Ownership Group, rather than the Current Ownership Group. The Transaction is expected to close in the fourth calendar quarter of 2023, subject to the satisfaction of certain closing conditions. The Transaction will result in a change of control of the Manager and the termination of the Funds’ management and investment advisory agreements (the “Current Management Agreement” and “Current Investment Advisory Agreement”, respectively). The Board has approved a new management agreement with the Manager (the “New Management Agreement”) and new investment advisory agreements among the Manager, the sub-advisors and American Beacon Funds, on behalf of the Funds (the “New Investment Advisory Agreements”) (collectively, the “Agreements”), that would become effective upon the closing of the Transaction. A special meeting of the shareholders of the Funds as of July 31, 2023, was held on October 27, 2023 to consider the Agreements. The shareholders of the Funds did not achieve a quorum in favor of the Agreements, therefore the meeting was adjourned to November 17, 2023. At the second meeting on November 17, 2023, a quorum was present for the American Beacon EAM International Small Cap Fund and the Agreements were approved by the shareholders. The shareholders of the American Beacon International Equity Fund did not achieve a quorum in favor of the Agreements, therefore the meeting was adjourned to December 8, 2023. At the third meeting on December 8, 2023, a quorum was present for the American Beacon International Equity Fund and the Agreements were approved by the shareholders. In advance of the meeting, proxy materials were sent to those shareholders regarding the New Management Agreement and any other matters proposed for shareholder approval. There are no anticipated changes in the services provided by the Manager or sub-advisors or in the fee rates charged by the Manager to a Fund. Please see the Results of Shareholder Meeting for more information.
Recently Adopted Accounting Pronouncements
In March 2020, the Financial Accounting Standards Board (“FASB”) issued Accounting Standards Update (“ASU”) No. 2020-04, Reference Rate Reform (Topic 848); Facilitation of the Effects of Reference Rate Reform on Financial Reporting, which provides optional guidance for a limited period of time to ease the potential burden in accounting for (or recognizing the effects of) reference rate reform. The guidance is applicable to contracts
28
American Beacon FundsSM
Notes to Financial Statements
October 31, 2023
referencing London Inter-bank Offered Rate (“LIBOR”) or another reference rate that is expected to be discontinued due to reference rate reform. The ASU is effective as of March 12, 2020 and generally can be applied through December 31, 2022. In December 2022, the FASB issued ASU No. 2022-06 Reference Rate Reform (Topic 848): Deferral of the Sunset Date of Topic 848 which updates and clarifies ASU No. 2020-04. The amendments in this ASU defer the sunset date of Topic 848 from December 31, 2022, to December 31, 2024. Management expects these ASUs will not have a material impact on the Funds’ financial statements.
In June 2022, the FASB issued ASU No. 2022-03, Fair Value Measurement (Topic 820); Fair Value Measurement of Equity Securities Subject to Contractual Sale Restrictions, which provides clarifying guidance that a contractual restriction on the sale of an equity security is not considered part of the unit of account of the equity security and, therefore, is not considered in measuring fair value. The ASU is effective for fiscal years beginning after December 15, 2023, and interim periods within those fiscal years. Management expects the ASU will not have a material impact on the Funds’ financial statements.
Class Disclosure
Each Fund has multiple classes of shares designed to meet the needs of different groups of investors; however, not all of the Funds offer all classes. The following table sets forth the differences amongst the classes:
| | | | | | |
Class | | Eligible Investors | | Minimum Initial
Investments | |
| R5 Class | | Large institutional investors - sold directly or through intermediary channels. | | $ | 250,000 | |
| | |
| Y Class | | Large institutional retirement plan investors - sold directly or through intermediary channels. | | $ | 100,000 | |
| | |
| Investor Class | | All investors using intermediary organizations, such as broker-dealers or retirement plan sponsors. | | $ | 2,500 | |
| | |
| Advisor Class | | All investors who invest through intermediary organizations, such as broker-dealers or third party administrators. | | $ | 2,500 | |
| | |
| A Class | | All investors who invest through intermediary organizations, such as broker-dealers or third party administrator. Retail investors who invest directly through a financial intermediary such as a broker, bank, or registered investment advisor which may include a front-end sales charge and a contingent deferred sales charge (“CDSC”). | | $ | 2,500 | |
| | |
| C Class | | Retail investors who invest directly through a financial intermediary such as a broker or through employee directed benefit plans with applicable sales charges which may include CDSC. | | $ | 1,000 | |
| | |
| R6 Class | | Large institutional retirement plan investors - sold through retirement plan sponsors. | | | None | |
Each class offered by the Trust has equal rights as to assets and voting privileges. Income and non-class specific expenses are allocated daily to each class based on the relative net assets. Realized and unrealized capital gains and losses of each class are allocated daily based on the relative net assets of each class of the respective Fund. Class specific expenses, where applicable, currently include service, distribution, transfer agent fees, and sub-transfer agent fees that vary amongst the classes as described more fully in Note 2.
Significant Accounting Policies
The following is a summary of significant accounting policies, consistently followed by the Funds in preparation of the financial statements. The Funds are considered investment companies and accordingly, follow the investment company accounting and reporting guidance of the FASB Accounting Standards Codification Topic 946, Financial Services – Investment Companies, a part of Generally Accepted Accounting Principles (“U.S. GAAP”).
Security Transactions and Investment Income
Security transactions are recorded as of the trade date for financial reporting purposes. Securities purchased or sold on a when-issued or delayed-delivery basis may be settled beyond a standard settlement period for the security after the trade date.
29
American Beacon FundsSM
Notes to Financial Statements
October 31, 2023
Dividend income, net of foreign taxes, is recorded on the ex-dividend date, except certain dividends from foreign securities which are recorded as soon as the information is available to the Funds. Tax reclaim accruals are automatically generated on accounting and custody systems at the time of the income event based on the tax databases maintained by the Funds’ custodian. Reconciliations are performed between custody and accounting systems to help ensure reclaim accruals are in line. Estimated tax liabilities on certain foreign securities are recorded on an accrual basis and are reflected as components of interest income or net change in unrealized appreciation (depreciation) on investments on the Statements of Operations, as appropriate. Tax liabilities realized as a result of such security sales are reflected as a component of net realized gain (loss) on investments on the Statements of Operations. Interest income, net of foreign taxes, is earned from settlement date, recorded on the accrual basis, and adjusted, if necessary, for accretion of discounts and amortization of premiums. Realized gains (losses) from securities sold are determined based on specific lot identification.
Central Securities Depositories Regulation (“CSDR”)
Effective February 1, 2022, the CSDR introduced new measures for the authorization and supervision of European Union Central Security Depositories and sets out to create a common set of prudential, organizational, and conduct of business standards at a European level. CSDR is designed to support securities settlement and operational aspects of securities settlement, including the provision of shorter settlement periods; mandatory buy-ins; and cash penalties, to prevent and address settlement fails. CSDR measures are aimed to prevent settlement fails by ensuring that all transaction details are provided to facilitate settlement, as well as further incentivizing timely settlement by imposing cash penalty fines and buy-ins. The Funds may be subject to pay cash penalties and may also receive cash penalties with certain counterparties in instances where there are settlement fails. At this time, management believes the adoption of CSDR will not have a material impact to the financial statements.
Currency Translation
All assets and liabilities initially expressed in foreign currency values are converted into U.S. dollar values at the mean of the bid and ask prices of such currencies against U.S. dollars as last quoted by a recognized dealer. Income, expenses, and purchases and sales of investments are translated into U.S. dollars at the rate of the exchange prevailing on the respective dates of such transactions. The effect of changes in foreign currency exchange rates on investments is separately identified from the fluctuations arising from changes in market values of securities held and is reported with all other foreign currency gains and losses on the Funds’ Statements of Operations.
Distributions to Shareholders
The Funds distribute most or all of their net earnings and realized gains, if any, each taxable year in the form of dividends from net investment income and distributions of realized net capital gains and net gains or losses from foreign currency transactions on an annual basis. The Funds do not have a fixed dividend rate and do not guarantee that they will pay any distributions in any particular period. Dividends to shareholders are determined in accordance with federal income tax regulations, which may differ in amount and character from net investment income and realized gains recognized for purposes of U.S. GAAP. To the extent necessary to fully distribute capital gains, the Funds may designate earnings and profits distributed to shareholders on the redemption of shares.
Commission Recapture
The Funds have established brokerage commission recapture arrangements with certain brokers or dealers. If the Funds’ investment advisor chooses to execute a transaction through a participating broker, the broker rebates a portion of the commission back to the Funds. Any collateral benefit received through participation in the commission recapture program is directed exclusively to the Funds. This amount is reported with the net realized gain (loss) in the Funds’ Statements of Operations, if applicable.
30
American Beacon FundsSM
Notes to Financial Statements
October 31, 2023
Allocation of Income, Trust Expenses, Gains, and Losses
Investment income and realized and unrealized gains and losses from investments of the Funds are allocated daily to each class of shares based upon the relative proportion of net assets of each class to the total net assets of the Funds. Expenses directly charged or attributable to a Fund will be paid from the assets of a Fund. Generally, expenses of the Trust will be allocated among and charged to the assets of the Funds on a basis that the Trust’s Board of Trustees (the “Board”) deems fair and equitable, which may be based on the relative net assets of the Funds or nature of the services performed and relative applicability to the Funds.
Use of Estimates
The preparation of financial statements in conformity with U.S. GAAP requires management to make estimates and assumptions that affect the amounts reported in the financial statements and accompanying notes. Actual results may differ from those estimated.
Other
Under the Trust’s organizational documents, its officers and trustees are indemnified against certain liabilities arising out of the performance of their duties to the Trust. In the normal course of business, the Trust enters into contracts that provide indemnification to the other party or parties against potential costs or liabilities. The Trust’s maximum exposure under these arrangements is dependent on claims that may be made in the future and, therefore, cannot be estimated. The Trust has had no prior claims or losses pursuant to any such agreement.
2. Transactions with Affiliates
Management and Investment Sub-Advisory Agreements
The Funds and the Manager are parties to a Management Agreement that obligates the Manager to provide the Funds with investment advisory and administrative services. As compensation for performing the duties under the Management Agreement, the Manager will receive an annualized management fee based on a percentage of each Fund’s average daily net assets that is calculated and accrued daily according to the following schedules:
EAM International Small Cap Fund
| | | | |
First $5 billion | | | 0.35 | % |
Next $5 billion | | | 0.325 | % |
Next $10 billion | | | 0.30 | % |
Over $20 billion | | | 0.275 | % |
International Equity Fund
| | | | |
First $15 billion | | | 0.35 | % |
Next $15 billion | | | 0.325 | % |
Over $30 billion | | | 0.30 | % |
The Trust, on behalf of the American Beacon International Equity Fund, and the Manager have entered into Investment Advisory Agreements with Causeway Capital Management LLC; Lazard Asset Management LLC; and American Century Investment Management, Inc. pursuant to which the Fund has agreed to pay an annualized sub-advisory fee that is calculated and accrued daily based on the Fund’s average daily net assets.
The Board of the Trust, at the recommendation of the Manager, approved: (i) the termination of the investment advisory agreement among the Manager, Tocqueville Asset Management LP, and the Trust, on behalf of the American Beacon EAM International Small Cap Fund (formerly known as the American Beacon Tocqueville International Value Fund), effective January 20, 2023, and (ii) a new investment advisory agreement among the Manager, EAM Global Investors, LLC, and the Trust, on behalf of the Fund, effective January 21, 2023.
31
American Beacon FundsSM
Notes to Financial Statements
October 31, 2023
The Trust, on behalf of the American Beacon EAM International Small Cap Fund, and the Manager have entered into an Investment Advisory Agreement with EAM Global Investors, LLC, pursuant to which the Fund has agreed to pay an annualized sub-advisory fee that is calculated and accrued daily according to the following schedule:
| | | | |
First $1 billion | | | 0.40 | % |
Next $1 billion | | | 0.35 | % |
Over $2 billion | | | 0.325 | % |
The Management and Sub-Advisory Fees paid by the Funds for the year ended October 31, 2023 were as follows:
EAM International Small Cap Fund
| | | | | | | | | | | | |
| | | Effective Fee Rate | | | | | | Amount of Fees Paid | |
Management Fees | | | 0.35 | % | | | | | | $ | 578,819 | |
Sub-Advisory Fees | | | 0.40 | % | | | | | | | 649,238 | |
| | | | | | | | | | | | |
Total | | | 0.75 | % | | | | | | $ | 1,228,057 | |
| | | | | | | | | | | | |
International Equity Fund
| | | | | | | | | | | | |
| | | Effective Fee Rate | | | | | | Amount of Fees Paid | |
Management Fees | | | 0.35 | % | | | | | | $ | 3,905,678 | |
Sub-Advisory Fees | | | 0.26 | % | | | | | | | 3,133,428 | |
| | | | | | | | | | | | |
Total | | | 0.61 | % | | | | | | $ | 7,039,106 | |
| | | | | | | | | | | | |
As compensation for services provided by the Manager in connection with securities lending activities conducted by a Fund, the lending Fund pays to the Manager, with respect to cash collateral posted by borrowers, a fee of 10% of the net monthly investment income (the income earned in the form of interest, dividends and realized capital gains from the investment of cash collateral, plus any negative rebate fees paid by borrowers, less the rebate amount paid to borrowers as well as related expenses) and, with respect to collateral other than cash, a fee up to 10% of loan fees and demand premiums paid by borrowers. These fees are included in “Income derived from securities lending” and “Management and sub-advisory fees” on the Statements of Operations. During the year ended October 31, 2023, the Manager received securities lending fees of $10,846 and $26,768 for the securities lending activities of EAM International Small Cap Fund and International Equity Fund, respectively.
Distribution Plans
Separate Distribution Plans (the “Distribution Plans”) have been adopted pursuant to Rule 12b-1 under the Act for the Advisor, A and C Classes of the Funds. Under the Distribution Plans, as compensation for distribution and shareholder servicing assistance, the Manager receives an annual fee of 0.25% of the average daily net assets of the Advisor and A Classes and 1.00% of the average daily net assets of the C Class. The fee will be payable without regard to whether the amount of the fee is more or less than the actual expenses incurred in a particular month by the Manager for distribution assistance.
Service Plans
The Manager and the Trust entered into a Service Plan that obligates the Manager to oversee additional shareholder servicing of the Investor, Advisor, A, and C Classes of the Funds. As compensation for performing the duties required under the Service Plan, the Manager receives an annualized fee up to 0.25% of the average daily net assets of the A and C Classes, up to 0.25% of the average daily net assets of the Advisor Class, and up to 0.375% of the average daily net assets of the Investor Class of the Funds.
32
American Beacon FundsSM
Notes to Financial Statements
October 31, 2023
Sub-Transfer Agent Fees
The Manager has entered into agreements, which include servicing agreements, with financial intermediaries that provide recordkeeping, processing, shareholder communications and other services to customers of the intermediaries that hold positions in the R5 and Y Classes of the Funds and has agreed to compensate the intermediaries for providing these services. Intermediaries transact with the Funds primarily through the use of omnibus accounts on behalf of their customers who hold positions in the Funds. Certain services would have been provided by the Funds’ transfer agent and other service providers if the shareholders’ accounts were maintained directly by the Funds’ transfer agent. Accordingly, the Funds, pursuant to Board approval, have agreed to reimburse the Manager for certain non-distribution shareholder services provided by financial intermediaries for the R5 and Y Classes. The reimbursement amounts (sub-transfer agent fees) paid to the Manager are subject to a fee limit of up to 0.10% of an intermediary’s average net assets in the R5 and Y Classes on an annual basis. During the year ended October 31, 2023, the sub-transfer agent fees, as reflected in “Transfer agent fees” on the Statements of Operations, were as follows:
| | | | |
Fund | | Sub-Transfer Agent Fees | |
EAM International Small Cap | | $ | 86,726 | |
International Equity | | | 257,152 | |
As of October 31, 2023, the Funds owed the Manager the following reimbursement of sub-transfer agent fees, as reflected in “Transfer agent fees payable” on the Statements of Assets and Liabilities:
| | | | |
Fund | | Reimbursement
Sub-Transfer Agent Fees | |
EAM International Small Cap | | $ | 5,709 | |
International Equity | | | 35,763 | |
Investments in Affiliated Funds
The Funds may invest in the American Beacon U.S. Government Money Market Select Fund (the “USG Select Fund”). Cash collateral received by the Funds in connection with securities lending may also be invested in the USG Select Fund. The Funds listed below held the following shares with an October 31, 2023 fair value and dividend income earned from the investment in the USG Select Fund.
| | | | | | | | | | | | | | | | | | | | | | | | | | | | | | | | | | | | | | | | | | | | | | | | |
Affiliated Security | | Type of
Transaction | | | | | Fund | | | | | October 31,
2023
Shares/Principal | | | | | | Change in
Unrealized
Gain (Loss) | | | | | | Realized
Gain
(Loss) | | | | | | Dividend
Income | | | | | | October 31,
2023
Fair Value | |
| U.S. Government Money Market Select | | Direct | | | | | | EAM
International
Small Cap | | | | | | $ | 13,732,959 | | | | | | | $ | - | | | | | | | $ | - | | | | | | | $ | 424,322 | | | | | | | $ | 13,732,959 | |
| U.S. Government Money Market Select | | Securities Lending | | | | | | EAM
International
Small Cap | | | | | | | 258,291 | | | | | | | | - | | | | | | | | - | | | | | | | | N/A | | | | | | | | 258,291 | |
| U.S. Government Money Market Select | | Direct | | | | | | International
Equity | | | | | | | 38,723,902 | | | | | | | | - | | | | | | | | - | | | | | | | | 1,910,547 | | | | | | | | 38,723,902 | |
| U.S. Government Money Market Select | | Securities Lending | | | | | | International
Equity | | | | | | | 171,336 | | | | | | | | - | | | | | | | | - | | | | | | | | N/A | | | | | | | | 171,336 | |
33
American Beacon FundsSM
Notes to Financial Statements
October 31, 2023
The Funds and the USG Select Fund have the same investment advisor and therefore, are considered to be affiliated. The Manager serves as investment advisor to the USG Select Fund and receives management fees and administrative fees totaling 0.10% of the average daily net assets of the USG Select Fund. During the year ended October 31, 2023, the Manager earned fees on the Funds’ direct investments and securities lending collateral investments in the USG Select Fund as shown below:
| | | | | | | | | | | | |
Fund | | Direct Investments in
USG Select Fund | | | Securities Lending
Collateral
Investments in USG
Select Fund | | | Total | |
EAM International Small Cap | | $ | 9,096 | | | $ | 1,527 | | | $ | 10,623 | |
International Equity | | | 40,998 | | | | 8,998 | | | | 49,996 | |
Interfund Credit Facility
Pursuant to an exemptive order issued by the U.S. Securities and Exchange Commission (“SEC”), the Funds, along with other registered investment companies having management contracts with the Manager, may participate in a credit facility whereby each fund, under certain conditions, is permitted to lend money directly to and borrow directly from other participating funds for temporary purposes. The interfund credit facility is advantageous to the funds because it provides added liquidity and eliminates the need to maintain higher cash balances to meet redemptions. This situation could arise when shareholder redemptions exceed anticipated volumes and certain funds have insufficient cash on hand to satisfy such redemptions or when sales of securities do not settle as expected, resulting in a cash shortfall for a fund. When a fund liquidates portfolio securities to meet redemption requests, they often do not receive payment in settlement for up to two days (or longer for certain foreign transactions). Redemption requests normally are satisfied on the next business day. The credit facility provides a source of immediate, short-term liquidity pending settlement of the sale of portfolio securities. The credit facility is administered by a credit facility team consisting of professionals from the Manager’s asset management, compliance, and accounting areas who report the activities of the credit facility to the Board. During the year ended October 31, 2023, the EAM International Small Cap Fund borrowed on average $2,902,786 for 14 days at an average interest rate of 5.36% with interest charges of $6,000 and the International Equity Fund did not utilize the credit facility. These amounts are recorded as “Other expenses” in the Statements of Operations.
Expense Reimbursement Plan
The Manager contractually agreed to reduce fees and/or reimburse expenses for the R5 Class of the EAM International Small Cap Fund and R6 Class of the International Equity Fund, through February 29, 2024, to the extent that total operating expenses (excluding taxes, interest, brokerage commissions, acquired fund fees and expenses, securities lending fees, expenses associated with securities sold short, litigation, and other extraordinary expenses) exceed the Funds’ expense cap. During the year ended October 31, 2023, the Manager waived and/or reimbursed expenses as follows:
| | | | | | | | | | | | | | | | | | |
| | | | | Expense Cap | | | | | | | | | |
Fund | | Class | | 11/1/2022 -
2/28/2023 | | 3/1/2023 -
10/31/2023 | | Reimbursed
Expenses | | | (Recouped)
Expenses | | | Expiration of
Reimbursed
Expenses | |
EAM International Small Cap | | R5 | | 0.89% | | 0.89% | | $ | 23,655 | | | $ | - | | | | 2025-2026 | |
International Equity | | R6 | | 0.69% | | 0.69% | | | 241,021 | | | | (12,273 | )* | | | 2025-2026 | |
* This amount represents Recouped Expenses from prior fiscal years and is reflected in Other expenses on the Statements of Operations.
Of the above amounts, $10,453 and $41,266 were disclosed as a Receivable for expense reimbursement on the Statements of Assets and Liabilities at October 31, 2023 for the EAM International Small Cap Fund and International Equity Fund, respectively.
34
American Beacon FundsSM
Notes to Financial Statements
October 31, 2023
The Funds have adopted an Expense Reimbursement Plan whereby the Manager may seek repayment of contractual or voluntary fee reductions and expense reimbursements. Under the policy, the Manager can be reimbursed by the Funds for any contractual or voluntary fee reductions or expense reimbursements if reimbursement to the Manager (a) occurs within three years from the date of the Manager’s waiver/reimbursement and (b) does not cause the Funds’ annual operating expenses to exceed the lesser of the contractual percentage limit in effect at the time of the waiver/reimbursement or time of recoupment. The reimbursed expenses listed above will expire in 2025 and 2026. The Funds did not record a liability for potential contingent reimbursements due to the current assessment that reimbursements are uncertain. The carryover of excess expenses potentially reimbursable to the Manager, but not recorded as a liability are as follows:
| | | | | | | | | | | | | | | | |
Fund | | Recouped
Expenses | | | Excess Expense
Carryover | | | Expired Expense
Carryover | | | Expiration of
Reimbursed
Expenses | |
EAM International Small Cap | | $ | - | | | $ | - | | | $ | 1,018 | | | | 2022-2023 | |
EAM International Small Cap | | | - | | | | 2,785 | | | | - | | | | 2023-2024 | |
EAM International Small Cap | | | - | | | | 1,783 | | | | - | | | | 2024-2025 | |
International Equity | | | 12,273 | | | | - | | | | 23,827 | | | | 2022-2023 | |
International Equity | | | - | | | | 54,858 | | | | - | | | | 2023-2024 | |
International Equity | | | - | | | | 70,120 | | | | - | | | | 2024-2025 | |
Sales Commissions
The Funds’ Distributor, Resolute Investment Distributors, Inc. (“RID” or “Distributor”), may receive a portion of A Class sales charges from broker dealers which may be used to offset distribution related expenses. During the year ended October 31, 2023, RID collected $2,595 for International Equity Fund from the sale of A Class Shares. The EAM International Small Cap Fund does not offer A Class Shares.
A CDSC of 0.50% will be deducted with respect to A Class Shares on certain purchases of $1,000,000 or more that are redeemed in whole or part within 18 months of purchase, unless waived as discussed in the Funds’ Prospectus. Any applicable CDSC will be 0.50% of the lesser of the original purchase price or the value of the redemption of the A Class Shares redeemed. During the year ended October 31, 2023, there were no CDSC fees collected for the A Class Shares of the International Equity Fund.
A CDSC of 1.00% will be deducted with respect to C Class Shares of the International Equity Fund Shares redeemed within 12 months of purchase, unless waived as discussed in the Fund’s Prospectus. Any applicable CDSC will be 1.00% of the lesser of the original purchase price or the value of the redemption of the C Class Shares redeemed. During the year October 31, 2023, CDSC fees of $18 were collected for the C Class Shares of International Equity Fund. The EAM International Small Cap Fund does not offer C Class Shares.
Trustee Fees and Expenses
As compensation for their service to the American Beacon Funds Complex, including the Trust (collectively, the “Trusts”), each Trustee is compensated from the Trusts as follows: (1) an annual retainer of $130,000; (2) meeting attendance fee (for attendance in-person or via teleconference) of (a) $12,000 for in person attendance, or $5,000 for telephonic attendance, by Board members for each regularly scheduled or special Board meeting, (b) $2,500 for attendance by Committee members at meetings of the Audit and Compliance Committee and the Investment Committee, (c) $1,000 for attendance by Committee members at meetings of the Nominating and Governance Committee; and (d) $2,500 for attendance by Board members for each special telephonic Board meeting; and (3) reimbursement of reasonable expenses incurred in attending Board meetings, Committee meetings, and relevant educational seminars. For this purpose, the Board considers attendance at regular meetings held by video conference to constitute in-person attendance at a Board meeting. The Trustees also may be compensated for attendance at special Board and/or Committee meetings from time to time. For her service as Board Chair, Ms. Cline receives an additional annual retainer of $50,000. Although she attends several committee meetings at each quarterly Board meeting, she receives only a single $2,500 fee each quarter for her attendance at
35
American Beacon FundsSM
Notes to Financial Statements
October 31, 2023
those meetings. The chairpersons of the Audit and Compliance Committee and the Investment Committee each receive an additional annual retainer of $25,000 and the Chair of the Nominating and Governance Committee receives an additional annual retainer of $10,000.
3. Security Valuation and Fair Value Measurements
The price of each Fund’s shares is based on its net asset value (“NAV”) per share. Each Fund’s NAV is computed by adding total assets, subtracting all the Fund’s liabilities, and dividing the result by the total number of shares outstanding.
The NAV of each class of a Fund’s shares is determined based on a pro rata allocation of a Fund’s investment income, expenses and total capital gains and losses. A Fund’s NAV per share is determined each business day as of the regular close of trading on the New York Stock Exchange (“NYSE” or “Exchange”), which is typically 4:00 p.m. Eastern Time (“ET”). However, if trading on the NYSE closes at a time other than 4:00 p.m. ET, a Fund’s NAV per share typically would still be determined as of the regular close of trading on the NYSE. The Funds do not price their shares on days that the NYSE is closed. Foreign exchanges may permit trading in foreign securities on days when a Fund is not open for business, which may result in the value of a Fund’s portfolio investments being affected at a time when you are unable to buy or sell shares.
Equity securities, including shares of closed-end funds and exchange-traded funds (“ETFs”), are valued at the last sale price or official closing price taken from the primary exchange in which each security trades. Investments in other mutual funds are valued at the closing NAV per share on the day of valuation. Debt securities are valued at bid quotes from broker/dealers or evaluated bid prices from pricing services, who may consider a number of inputs and factors, such as prices of comparable securities, yield curves, spreads, credit ratings, coupon rates, maturity, default rates, and underlying collateral. Futures are valued based on their daily settlement prices. Exchange-traded and over-the-counter (“OTC”) options are valued at the last sale price. Options with no last sale for the day are priced at mid quote. Swaps are valued at evaluated mid prices from pricing services.
The valuation of securities traded on foreign markets and certain fixed-income securities will generally be based on prices determined as of the earlier closing time of the markets on which they primarily trade unless a significant event has occurred. When a Fund holds securities or other assets that are denominated in a foreign currency, a Fund will normally use the currency exchange rates as of 4:00 p.m. ET.
Rule 2a-5 under the Investment Company Act (the “Valuation Rule”) establishes requirements for determining fair value in good faith for purposes of the Investment Company Act, including related oversight and reporting requirements. The Valuation Rule also defines when market quotations are “readily available,” which is the threshold for determining whether a Fund must fair value a security. Among other things, the Valuation Rule permits the Board to designate the Manager as Valuation Designee to perform the Fund’s fair value determinations subject to board oversight and certain reporting and other requirements intended to ensure that the Board receives the information it needs to oversee the Manager’s fair value determinations.
Securities may be valued at fair value, as determined in good faith and pursuant to the Manager’s procedures, under certain limited circumstances. For example, fair value pricing will be used for fixed-income securities and when market quotations are not readily available or reliable, as determined by the Manager, such as when (i) trading for a security is restricted or stopped; (ii) a security’s trading market is closed (other than customary closings); or (iii) a security has been de-listed from a national exchange. A security with limited market liquidity may require fair value pricing if the Manager determines that the available price does not reflect the security’s true market value. In addition, if a significant event that the Manager determines to affect the value of one or more securities held by a Fund occurs after the close of a related exchange but before the determination of a Fund’s NAV, fair value pricing may be used on the affected security or securities. Securities of small-capitalization companies are also more likely to require a fair value determination using these procedures because they are more thinly traded and less liquid than the securities of larger-capitalization companies. The Funds may
36
American Beacon FundsSM
Notes to Financial Statements
October 31, 2023
fair value securities as a result of significant events occurring after the close of the foreign markets in which a Fund invests as described below. In addition, the Funds may invest in illiquid securities requiring these procedures.
A Fund may use fair value pricing for securities primarily traded in non-U.S. markets because most foreign markets close well before a Fund’s pricing time of 4:00 p.m. ET. The earlier close of these foreign markets gives rise to the possibility that significant events, including broad market moves, may have occurred in the interim and may materially affect the value of those securities. If the Manager determines that the last quoted prices of non-U.S. securities will, in its judgment, materially affect the value of some or all a Fund’s portfolio securities, the Manager can adjust the previous closing prices to reflect what it believes to be the fair value of the securities as of the close of the Exchange. In deciding whether it is necessary to adjust closing prices to reflect fair value, the Manager reviews a variety of factors, including developments in foreign markets, the performance of U.S. securities markets, and the performance of instruments trading in U.S. markets that represent foreign securities and baskets of foreign securities. These securities are fair valued using a pricing service, using methods approved by the Manager, that considers the correlation of the trading patterns of the foreign security to intraday trading in the U.S. markets, based on indices of domestic securities and other appropriate indicators such as prices of relevant American Depositary Receipts (“ADRs”) and futures contracts. The Manager’s Valuation Committee may also fair value securities in other situations, such as when a particular foreign market is closed but a Fund is open. A Fund uses outside pricing services to provide closing prices and information to evaluate and/or adjust those prices. As a means of evaluating its security valuation process, the Valuation Committee routinely compares closing prices, the next day’s opening prices in the same markets and adjusted prices.
Attempts to determine the fair value of securities introduce an element of subjectivity to the pricing of securities. As a result, the price of a security determined through fair valuation techniques may differ from the price quoted or published by other sources and may not accurately reflect the market value of the security when trading resumes. If a reliable market quotation becomes available for a security formerly valued through fair valuation techniques, the Manager compares the new market quotation to the fair value price to evaluate the effectiveness of a Fund’s fair valuation procedures. If any significant discrepancies are found, the Manager may adjust a Manager’s fair valuation procedures for the Funds.
Valuation Inputs
Various inputs may be used to determine the fair value of the Funds’ investments. These inputs are summarized in three broad levels for financial statement purposes. The inputs or methodologies used to value securities are not necessarily an indication of the risk associated with investing in those securities.
| | | | |
| Level 1 | | - | | Quoted prices in active markets for identical securities. |
| | |
| Level 2 | | - | | Prices determined using other significant observable inputs. These may include quoted prices for similar securities, interest rates, prepayment speeds, credit risk, and others. |
| | |
| Level 3 | | - | | Prices determined using other significant unobservable inputs. Unobservable inputs reflect a Fund’s own assumptions about the factors market participants would use in pricing an investment. |
Level 1 and Level 2 trading assets and trading liabilities, at fair value
Common stocks, preferred securities and financial derivative instruments, such as futures contracts that are traded on a national securities exchange, are stated at the last reported sale or settlement price on the day of valuation. To the extent these securities are actively traded and valuation adjustments are not applied, they are categorized as Level 1 of the fair value hierarchy. Preferred securities and other equities traded on inactive markets or valued by reference to similar instruments are generally categorized as Level 2 of the fair value hierarchy. Valuation adjustments may be applied to certain securities that are solely traded on a foreign exchange to account for the market movement between the close of the foreign market and the close of the Exchange. These securities are valued using pricing service providers that consider the correlation of the trading patterns of the foreign security to the intraday trading in the U.S. markets for investments. Securities using these valuation adjustments are categorized as Level 2 of the fair value hierarchy.
37
American Beacon FundsSM
Notes to Financial Statements
October 31, 2023
With respect to a Fund’s investments that do not have readily available market quotations, the Board has designated the Adviser as its valuation designee to perform fair valuations pursuant to Rule 2a-5 under the Act (the “Valuation Designee”). If market prices are not readily available or are deemed unreliable, the Valuation Designee will use the fair value of the security or other instrument as determined in good faith under policies and procedures established by the Manager and under the oversight of the Board (“Valuation Procedures”). Market prices are considered not readily available where there is an absence of current or reliable market-based data (e.g., trade information or broker quotes), including where events occur after the close of the relevant market, but prior to the NYSE Close, that materially affect the values of a Fund’s portfolio holdings or assets. In addition, market prices are considered not readily available when, due to extraordinary circumstances, the exchanges or markets on which the securities or other instruments trade do not open for trading for the entire day and no other market prices are available. Fair value pricing is subjective in nature and the use of fair value pricing by the Valuation Designee may cause the NAV of a Fund’s shares to differ significantly from the NAV that would have been calculated using market prices at the close of the exchange on which a portfolio holding is primarily traded. There can be no assurance that a Fund could obtain the fair value assigned to an investment if a Fund were to sell the investment at approximately the time at which a Fund determines its NAV.
Investments in registered open-end investment management companies will be valued based upon the NAVs of such investments and are categorized as Level 1 of the fair value hierarchy.
OTC financial derivative instruments, such as forward foreign currency contracts derive their value from underlying asset prices, indices, reference rates, and other inputs or a combination of these factors. These contracts are normally valued on the basis of broker dealer quotations or pricing service providers. Depending on the product and the terms of the transaction, the fair value of the financial derivative contracts can be estimated by a pricing service provider using a series of techniques, including simulation pricing models. The pricing models use inputs that are observed from actively quoted markets such as issuer details, indices, spreads, interest rates, curves, dividends, and exchange rates. Financial derivatives that use similar valuation techniques and inputs as described above are categorized as Level 2 of the fair value hierarchy.
4. Securities and Other Investments
Common Stock
Common stock generally takes the form of shares in a corporation which represent an ownership interest. It ranks below preferred stock and debt securities in claims for dividends and for assets of the company in a liquidation or bankruptcy. The value of a company’s common stock may fall as a result of factors directly relating to that company, such as decisions made by its management or decreased demand for the company’s products or services. A stock’s value may also decline because of factors affecting not just the company, but also companies in the same industry or sector. The price of a company’s stock may also be affected by changes in financial markets that are relatively unrelated to the company, such as changes in interest rates, currency exchange rates or industry regulation. Companies that elect to pay dividends on their common stock generally only do so after they invest in their own business and make required payments to bondholders and on other debt and preferred stock. Therefore, the value of a company’s common stock will usually be more volatile than its bonds, other debt and preferred stock. Common stock may be exchange-traded or OTC. OTC stock may be less liquid than exchange-traded stock.
Depositary Receipts and U.S. Dollar-Denominated Foreign Stocks Traded on U.S. Exchanges
ADRs are U.S. dollar-denominated receipts issued generally by domestic banks and represent the deposit with the bank of a security of a foreign issuer. Depositary receipts may not be denominated in the same currency as the securities into which they may be converted. Investing in depositary receipts entails substantially the same risks as direct investment in foreign securities. There is generally less publicly available information about foreign companies and there may be less governmental regulation and supervision of foreign stock exchanges, brokers, and listed companies. In addition, such companies may use different accounting and financial standards (and certain
38
American Beacon FundsSM
Notes to Financial Statements
October 31, 2023
currencies may become unavailable for transfer from a foreign currency), resulting in the Funds’ possible inability to convert immediately into U.S. currency proceeds realized upon the sale of portfolio securities of the affected foreign companies. In addition, the Funds may invest in unsponsored depositary receipts, the issuers of which are not obligated to disclose material information about the underlying securities to investors in the United States. Ownership of unsponsored depositary receipts may not entitle the Funds to the same benefits and rights as ownership of a sponsored depositary receipt or the underlying security.
Foreign Securities
The Funds may invest in U.S. dollar-denominated and non-U.S. dollar denominated equity and debt securities of foreign issuers and foreign branches of U.S. banks, including negotiable certificates of deposit (“CDs”), bankers’ acceptances, and commercial paper. Foreign issuers are issuers organized and doing business principally outside the United States and include corporations, banks, non-U.S. governments, and quasi-governmental organizations. While investments in foreign securities may be intended to reduce risk by providing further diversification, such investments involve sovereign and other risks, in addition to the credit and market risks normally associated with domestic securities. These additional risks include the possibility of adverse political and economic developments (including political or social instability, nationalization, expropriation, or confiscatory taxation); the potentially adverse effects of unavailability of public information regarding issuers, different governmental supervision and regulation of financial markets, reduced liquidity of certain financial markets, and the lack of uniform accounting, auditing, and financial reporting standards or the application of standards that are different or less stringent than those applied in the United States; different laws and customs governing securities tracking; and possibly limited access to the courts to enforce the Funds’ rights as an investor.
Illiquid and Restricted Securities
Generally, an illiquid asset is an asset that the Funds reasonably expect cannot be sold or disposed of in current market conditions in seven calendar days or less without the sale or disposition significantly changing the market value of the investment, as determined pursuant to Rule 22e-4 under the Act or as otherwise permitted or required by SEC rules and interpretations. Historically, illiquid securities have included securities that have not been registered under the Securities Act, securities that are otherwise not readily marketable, and repurchase agreements having a remaining maturity of longer than seven calendar days. Securities that have not been registered under the Securities Act are referred to as private placements or restricted securities and are purchased directly from the issuer or in the secondary market. These securities may be sold only in a privately negotiated transaction or pursuant to an exemption from registration. A large institutional market exists for certain securities that are not registered under the Securities Act, including repurchase agreements, commercial paper, foreign securities, municipal securities and corporate bonds and notes. Institutional investors depend on an efficient institutional market in which the unregistered security can be readily resold or on an issuer’s ability to honor a demand for repayment. However, the fact that there are contractual or legal restrictions on resale of such investments to the general public or to certain institutions may not be indicative of their liquidity.
Limitations on resale may have an adverse effect on the marketability of portfolio securities, and a Fund might be unable to dispose of restricted or other illiquid securities promptly or at reasonable prices and might thereby experience difficulty satisfying redemptions within seven calendar days. In addition, a Fund may get only limited information about an issuer, so it may be less able to predict a loss. A Fund also might have to register such restricted securities in order to dispose of them resulting in additional expense and delay. Adverse market conditions could impede such a public offering of securities.
In recognition of the increased size and liquidity of the institutional market for unregistered securities and the importance of institutional investors in the formation of capital, the SEC adopted Rule 144A under the Securities Act. Rule 144A is designed to facilitate efficient trading among institutional investors by permitting the sale of certain unregistered securities to qualified institutional buyers. To the extent privately placed securities held by a Fund qualify under Rule 144A and an institutional market develops for those securities, a Fund likely will
39
American Beacon FundsSM
Notes to Financial Statements
October 31, 2023
be able to dispose of the securities without registering them under the Securities Act. To the extent that institutional buyers become, for a time, uninterested in purchasing these securities, investing in Rule 144A securities could increase the level of a Fund’s illiquidity. The Manager or the Sub-Advisor, as applicable, may determine that certain securities qualified for trading under Rule 144A are liquid. Regulation S under the Securities Act permits the sale abroad of securities that are not registered for sale in the United States and includes a provision for U.S. investors, such as a Fund, to purchase such unregistered securities if certain conditions are met.
Securities sold in private placement offerings made in reliance on the “private placement” exemption from registration afforded by Section 4(a)(2) of the Securities Act and resold to qualified institutional buyers under Rule 144A under the Securities Act (“Section 4(a)(2) securities”) are restricted as to disposition under the federal securities laws, and generally are sold to institutional investors, such as a Fund, that agree they are purchasing the securities for investment and not with an intention to distribute to the public. Any resale by the purchaser must be pursuant to an exempt transaction and may be accomplished in accordance with Rule 144A. Section 4(a)(2) securities normally are resold to other institutional investors through or with the assistance of the issuer or dealers that make a market in the Section 4(a)(2) securities, thus providing liquidity. The Manager and the sub-advisor will carefully monitor a Fund’s investments in Section 4(a)(2) securities offered and sold under Rule 144A, focusing on such important factors, among others, as valuation, liquidity, and availability of information. Investments in Section 4(a)(2) securities could have the effect of reducing a Fund’s liquidity to the extent that qualified institutional buyers no longer wish to purchase these restricted securities.
Restricted securities outstanding during the year ended October 31, 2023 are disclosed in the Notes to the Schedules of Investments.
Other Investment Company Securities and Other Exchange-Traded Products
The Funds may invest in shares of other investment companies, including open-end funds, closed-end funds, business development companies (“BDCs”), ETFs, unit investment trusts, and other investment companies of the Trust. The Funds may invest in securities of an investment company advised by the Manager or the Sub-Advisor. Investments in the securities of other investment companies may involve duplication of advisory fees and certain other expenses. By investing in another investment company, the Funds become a shareholder of that investment company. As a result, the Funds’ shareholders indirectly will bear the Funds’ proportionate share of the fees and expenses paid by shareholders of the other investment company, in addition to the fees and expenses the Funds’ shareholders directly bear in connection with the Funds’ own operations. These other fees and expenses are reflected as Acquired Fund Fees and Expenses and are included in the Fees and Expenses Table for the Funds in their Prospectus, if applicable. Investments in other investment companies may involve the payment of substantial premiums above the value of such issuer’s portfolio securities.
The Funds can invest free cash balances in registered open-end investment companies regulated as money market funds under the Act, to provide liquidity or for defensive purposes. The Funds could invest in money market funds rather than purchasing individual short-term investments. If the Funds invest in money market funds, shareholders will bear their proportionate share of the expenses, including for example, advisory and administrative fees, of the money market funds in which the Funds invest, including advisory fees charged by the Manager to any applicable money market funds advised by the Manager.
Preferred Stock
Preferred stock blends the characteristics of a bond and common stock. It can offer the higher yield of a bond and has priority over common stock in equity ownership, but does not have the seniority of a bond and its participation in the issuer’s growth may be limited. Preferred stock has preference over common stock in the receipt of dividends and in any residual assets after payment to creditors should the issuer be dissolved. Although the dividend is typically set at a fixed annual rate, in some circumstances it can be variable, changed or omitted by the issuer. Preferred stocks are subject to the risks associated with other types of equity securities, as well as
40
American Beacon FundsSM
Notes to Financial Statements
October 31, 2023
additional risks, such as credit risk, interest rate risk, potentially greater volatility and risks related to deferral, non-cumulative dividends, subordination, liquidity, limited voting rights, and special redemption rights.
5. Financial Derivative Instruments
The Funds may utilize derivative instruments to gain market exposure on cash balances to hedge foreign currency exposure or reduce market exposure in anticipation of liquidity needs. When considering the Funds’ use of derivatives, it is important to note that the Funds do not use derivatives for the purpose of creating financial leverage.
Forward Foreign Currency Contracts
The Funds may enter into forward foreign currency contracts to hedge the exchange rate risk on investment transactions or to hedge the value of the Funds’ securities denominated in foreign currencies. Forward foreign currency contracts are valued at the forward exchange rate prevailing on the day of valuation. The Funds may also use currency contracts to increase exposure to a foreign currency or to shift exposure to foreign currency fluctuations from one country to another. The Funds bear the market risk that arises from changes in foreign exchange rates, and accordingly, the unrealized gain (loss) on these contracts is reflected in the accompanying financial statements. The Funds also bear the credit risk if the counterparty fails to perform under the contract.
During the year ended October 31, 2023, the EAM International Small Cap Fund did not enter into any forward foreign currency contracts and the International Equity Fund did not have any forward foreign currency contracts outstanding.
Futures Contracts
A futures contract is a contract to purchase or sell a particular security, or the cash value of an asset, such as securities, indices, or currencies, at a specified future date at a price agreed upon when the contract is made. Under many such contracts, no delivery of the actual underlying asset is required. Rather, upon the expiration of the contract, settlement is made by exchanging cash in an amount equal to the difference between the contract price and the closing price of the asset (e.g., a security or an index) at expiration, net of the initial and variation margin that was previously paid. An equity index futures contract is based on the value of an underlying index. A Fund may, from time to time, use futures positions to equitize cash and expose its portfolio to changes in securities prices or index prices. This can magnify gains and losses in a Fund. A Fund also may have to sell assets at inopportune times to satisfy its settlement or collateral obligations. The risks associated with the use of futures contracts also include that there may be an imperfect correlation between the changes in market value of the prices of futures contracts and the assets underlying such contracts and that there may not be a liquid secondary market for a futures contract.
During the year ended October 31, 2023, the International Equity Fund entered into futures contracts primarily for exposing cash to markets.
The Fund’s average futures contracts outstanding fluctuate throughout the operating year as required to meet strategic requirements. The following table illustrates the average quarterly volume of futures contracts. For the purpose of this disclosure, volume is measured by contracts outstanding at each quarter end.
| | | | |
Average Futures Contracts Outstanding | |
Fund | | Year Ended October 31, 2023 | |
International Equity | | | 477 | |
41
American Beacon FundsSM
Notes to Financial Statements
October 31, 2023
The following is a summary of the fair valuations of the Funds’ derivative instruments categorized by risk exposure(1):
International Equity Fund
| | | | | | | | | | | | | | | | | | | | | | | | | | | | | | | | | | | | | | | | | | | | | | | | | | | | | | | |
| Fair values of financial instruments on the Statements of Assets and Liabilities as of October 31, 2023: | |
| |
| | | Derivatives not accounted for as hedging instruments |
| | | | | | | | | | | |
Liabilities: | | Credit contracts | | | | Foreign exchange
contracts | | | | Commodity
contracts | | | | Interest rate
contracts | | | | Equity contracts | | | | Total |
| Payable for variation margin from open futures contracts | | | $ | - | | | | | | | | | $ | - | | | | | | | | | $ | - | | | | | | | | | $ | - | | | | | | | | | $ | (533,889 | ) | | | | | | | | $ | (533,889 | ) |
| | | | | | | | | | | | | | | | | | | | | | | | | | | | | | | | | | | | | | | | | | | | | | | | | | | | | | | |
| The effect of financial derivative instruments on the Statements of Operations as of October 31, 2023: | |
| |
| | | Derivatives not accounted for as hedging instruments |
| | | | | | | | | | | |
Realized gain (loss) from derivatives
recognized as a result of operations | | Credit contracts | | | | Foreign exchange
contracts | | | | Commodity
contracts | | | | Interest rate
contracts | | | | Equity contracts | | | | Total |
| Futures contracts | | | $ | - | | | | | | | | | $ | - | | | | | | | | | $ | - | | | | | | | | | $ | - | | | | | | | | | $ | 2,243,418 | | | | | | | | | $ | 2,243,418 | |
| | | | | | | | | | | |
Net change in unrealized appreciation
(depreciation) of derivatives recognized
as a result from operations: | | Credit contracts | | | | Foreign exchange
contracts | | | | Commodity
contracts | | | | Interest rate
contracts | | | | Equity contracts | | | | Total |
| Futures contracts | | | $ | - | | | | | | | | | $ | - | | | | | | | | | $ | - | | | | | | | | | $ | - | | | | | | | | | $ | (1,693,962 | ) | | | | | | | | $ | (1,693,962 | ) |
(1) See Note 3 in the Notes to Financial Statements for additional information.
(2) Includes cumulative appreciation (depreciation) of futures contracts as reported in the Fund’s Schedule of Investments footnotes. Only current day’s variation margin is reported within the Statements of Assets and Liabilities.
Master Agreements
Master Securities Forward Transaction Agreements (“Master Forward Agreements”) govern the considerations and factors surrounding the settlement of certain forward settling transactions, such as delayed delivery or sale-buyback financing transactions by and between the Fund and select counterparties. The Master Forward Agreements maintain provisions for, among other things, initiation and confirmation, payment and transfer, events of default, termination, and maintenance of collateral.
Offsetting Assets and Liabilities
The Funds are parties to enforceable master netting agreements between brokers and counterparties which provide for the right to offset under certain circumstances. The Funds employ multiple money managers and counterparties and have elected not to offset qualifying financial and derivative instruments on the Statements of Assets and Liabilities, as such all financial and derivative instruments are presented on a gross basis. The impacts of netting arrangements that provide the right to offset are detailed below, if applicable. The net amount represents the net receivable or payable that would be due from or to the counterparty in the event of default. Exposure from borrowings and other financing agreements such as repurchase agreements can only be netted across transactions governed by the same Master Agreement with the same legal entity. All amounts reported below represent the balance as of the report date, October 31, 2023.
42
American Beacon FundsSM
Notes to Financial Statements
October 31, 2023
EAM International Small Cap Fund
| | | | | | | | | | | | | | | | | | | | | | | | | | | | | | | | | | | | |
| | | Remaining Contractual Maturity of the Agreements
As of October 31, 2023 | |
| | | Overnight and
Continuous | | | | | | <30 days | | | | | | Between
30 & 90 days | | | | | | >90 days | | | | | | Total | |
Securities Lending Transactions | | | | | | | | | | | | | | | | | | | | | | | | | | | | | | | | | | | | |
Common Stocks | | $ | 258,291 | | | | | | | $ | - | | | | | | | $ | - | | | | | | | $ | - | | | | | | | $ | 258,291 | |
| | | | | | | | | | | | | | | | | | | | | | | | | | | | | | | | | | | | |
Total Borrowings | | $ | 258,291 | | | | | | | $ | - | | | | | | | $ | - | | | | | | | $ | - | | | | | | | $ | 258,291 | |
| | | | | | | | | | | | | | | | | | | | | | | | | | | | | | | | | | | | |
Gross amount of recognized liabilities for securities lending transactions | | | $ | 258,291 | |
| | | | | | | | | | | | | | | | | | | | | | | | | | | | | | | | | | | | |
International Equity Fund
| | | | | | | | | | | | |
| Offsetting of Financial and Derivative Assets as of October 31, 2023: | | | | | | | | | | | | |
| | Assets | | | | | | Liabilities | |
| Futures Contracts(1) | | $ | - | | | | | | | $ | (533,889 | ) |
| | | | | | | | | | | | |
| Total derivative assets and liabilities in the Statement of Assets and Liabilities | | $ | - | | | | | | | $ | (533,889 | ) |
| | | | | | | | | | | | |
| Derivatives not subject to a Master Netting Agreement or similar agreement (“MNA”) | | $ | - | | | | | | | $ | 533,889 | |
| | | | | | | | | | | | |
| | | | | | | | | | | | | | | | | | | | | | | | | | | | | | | | | | | | |
| | | Remaining Contractual Maturity of the Agreements
As of October 31, 2023 | |
| | | Overnight and
Continuous | | | | | | <30 days | | | | | | Between
30 & 90 days | | | | | | >90 days | | | | | | Total | |
Securities Lending Transactions | | | | | | | | | | | | | | | | | | | | | | | | | | | | | | | | | | | | |
Common Stocks | | $ | 171,336 | | | | | | | $ | - | | | | | | | $ | - | | | | | | | $ | - | | | | | | | $ | 171,336 | |
| | | | | | | | | | | | | | | | | | | | | | | | | | | | | | | | | | | | |
Total Borrowings | | $ | 171,336 | | | | | | | $ | - | | | | | | | $ | - | | | | | | | $ | - | | | | | | | $ | 171,336 | |
| | | | | | | | | | | | | | | | | | | | | | | | | | | | | | | | | | | | |
Gross amount of recognized liabilities for securities lending transactions | | | $ | 171,336 | |
| | | | | | | | | | | | | | | | | | | | | | | | | | | | | | | | | | | | |
(1) Includes cumulative appreciation (depreciation) of futures contracts as reported in the Fund’s Schedule of Investments footnotes. Only current day’s variation margin is reported within the Statements of Assets and Liabilities.
6. Principal Risks
Investing in the Funds may involve certain risks including, but not limited to, those described below.
Counterparty Risk
The Funds are subject to the risk that a party or participant to a transaction, such as a broker or derivative counterparty, will be unwilling or unable to satisfy its obligation to make timely principal, interest or settlement payments or to otherwise honor its obligations to the Funds. As a result the Fund may obtain no recovery of its investment or may only obtain a limited recovery, and any recovery may be delayed. Not all derivative transactions require a counterparty to post collateral, which may expose the Fund to greater losses in the event of a default by a counterparty.
Some of the markets in which the Funds may effect derivative transactions are OTC or “interdealer” markets. The participants in such markets are typically not subject to credit evaluation and regulatory oversight to the same extent as are members of “exchange-based” markets. This exposes the Funds to the risk that a counterparty will not settle a transaction in accordance with its terms and conditions because of a credit or liquidity problem with the counterparty and the recent turbulence in the financial markets highlights the importance of being aware of counterparty risk resulting from OTC derivative transactions. The Funds are subject to the risk that a party or participant to a transaction, such as a broker or derivative counterparty, will be unwilling or unable to satisfy its obligation to make timely principal, interest or settlement payments or to otherwise honor its obligations to the Funds. As a result, the Funds may obtain no recovery of its investment or may only obtain a limited recovery, and any recovery may be delayed. Not all derivative transactions require a counterparty to post collateral, which may expose the Funds to greater losses in the event of a default by a counterparty.
43
American Beacon FundsSM
Notes to Financial Statements
October 31, 2023
Credit Risk
The Funds are subject to the risk that the issuer or guarantor of a debt security, or the counterparty to a derivatives contract or a loan will fail to make timely payment of interest or principal or otherwise honor its obligations or default completely. A decline in the credit rating of an individual security held by the Funds may have an adverse impact on its price and make it difficult for the Funds to sell it. Ratings represent a rating agency’s opinion regarding the quality of the security and are not a guarantee of quality. Rating agencies might not always change their credit rating on an issuer or security in a timely manner to reflect events that could affect the issuer’s ability to make timely payments on its obligations. Credit risk is typically greater for securities with ratings that are below investment grade. Since the Funds can invest significantly in high-yield investments considered speculative in nature, this risk may be substantial.
Currency Risk
The Funds may have exposure to foreign currencies by making direct investments in non-U.S. currencies or in securities denominated in non-U.S. currencies, or by purchasing or selling forward currency exchange contracts in non-U.S. currencies. Foreign currencies may decline in value relative to the U.S. dollar, or, in the case of hedging positions, the U.S. dollar may decline in value relative to the currency being hedged, and thereby affect a Fund’s investments in foreign (non-U.S.) currencies or in securities that trade in, and receive revenues in, or in derivatives that provide exposure to, foreign (non-U.S.) currencies. Currency exchange rates may fluctuate significantly over short periods of time for a number of reasons, including changes in interest rates, intervention (or the failure to intervene) by U.S. or foreign governments, central banks or supranational entities such as the International Monetary Fund, or by the imposition of currency controls or other political developments in the United States or abroad. As a result, the Funds’ investments in foreign currency denominated securities may reduce the returns of the Funds. Currency futures, forwards, options or swaps may not always work as intended, and in specific cases, the Funds may be worse off than if it had not used such instrument(s). There may not always be suitable hedging instruments available. Even where suitable hedging instruments are available, the Funds may choose to not hedge their currency risks.
Environmental, Social, and/or Governance Investing Risk
The use of environmental, social, and/or governance (“ESG”) considerations by a sub-advisor may cause a Fund to make different investments than funds that have a similar investment style but do not incorporate such considerations in their strategy. As with the use of any investment considerations involved in investment decisions, there is no guarantee that the use of any ESG investment considerations will result in the selection of issuers that will outperform other issuers or help reduce risk in a Fund. A Fund may underperform funds that do not incorporate these considerations.
Equity Investments Risk
Equity securities are subject to investment risk and market risk. The Funds’ investments in equity securities may include common stocks, preferred stocks, securities convertible into or exchangeable for common stocks, REITs, depositary receipts, and U.S. dollar-denominated foreign stocks traded on U.S. exchanges. Such investments may expose the Funds to additional risk. The value of a company’s common stock may fall as a result of factors affecting the company, companies in the same industry or sector, or the financial markets overall. Common stock generally is subordinate to preferred stock upon the liquidation or bankruptcy of the issuing company. Preferred stocks and convertible securities are sensitive to movements in interest rates. Preferred stocks may be less liquid than common stocks and, unlike common stocks, participation in the growth of an issuer may be limited. Distributions on preferred stocks generally are payable at the discretion of an issuer and after required payments to bond holders. Convertible securities are subject to the risk that the credit standing of the issuer may have an effect on the convertible securities’ investment value. Investments in REITs are subject to the risks associated with investing in the real estate industry such as adverse developments affecting the real estate industry and real
44
American Beacon FundsSM
Notes to Financial Statements
October 31, 2023
property values. Depositary receipts and U.S. dollar-denominated foreign stocks traded on U.S. exchanges are subject to certain of the risks associated with investing directly in foreign securities, including, but not limited to, currency fluctuations and political and financial instability in the home country of a particular depositary receipt or foreign stock.
Foreign Investing and Emerging Markets Risk
Non-U.S. investments carry potential risks not associated with U.S. investments. Such risks include, but are not limited to: (1) currency exchange rate fluctuations, (2) political and financial instability, (3) less liquidity, (4) lack of uniform accounting, auditing and financial reporting standards, (5) increased price volatility, (6) less government regulation and supervision of foreign stock exchanges, brokers and listed companies, and (7) delays in transaction settlement in some foreign markets. To the extent the Funds invest a significant portion of its assets in securities of a single country or region, it is more likely to be affected by events or conditions of that country or region. In addition, the economies and political environments of emerging market countries tend to be more unstable than those of developed countries, resulting in more volatile rates of return than the developed markets and substantially greater risk to investors. There may be very limited oversight of certain foreign banks or securities depositories that hold foreign securities and currency and the laws of certain countries may limit the ability to recover such assets if a foreign bank or depository or their agents goes bankrupt. When investing in emerging markets, the risks of investing in foreign securities are heightened. Emerging markets have unique risks that are greater than, or in addition to, investing in developed markets because emerging markets are generally smaller, less developed, less liquid and more volatile than the securities markets of the U.S. and other developed markets. There are also risks of: greater political uncertainties; an economy’s dependence on revenues from particular commodities or on international aid or development assistance; currency transfer restrictions; a limited number of potential buyers for such securities, resulting in increased volatility and limited liquidity for emerging market securities; trading suspensions; and delays and disruptions in securities settlement procedures. In addition, there may be less information available to make investment decisions and more volatile rates of return.
Forward Foreign Currency Contracts Risk
Forward foreign currency contracts, including non-deliverable forwards, are derivative instruments pursuant to a contract with a counterparty to pay a fixed price for an agreed amount of securities or other underlying assets at an agreed date or to buy or sell a specific currency at a future date at a price set at the time of the contract. The use of forward foreign currency contracts may expose the Funds to additional risks that it would not be subject to if it invested directly in the securities or currencies underlying the forward foreign currency contract.
Futures Contracts Risk
Futures contracts are derivative instruments where one party pays a fixed price for an agreed amount of securities or other underlying assets at an agreed date. The use of such derivative instruments may expose the Funds to additional risks that they would not be subject to if they invested directly in the securities underlying those derivatives. There may at times be an imperfect correlation between the movement in the prices of futures contracts and the value of their underlying instruments or indexes. There can be no assurance that any strategy used will succeed. There also can be no assurance that, at all times, a liquid market will exist for offsetting a futures contract that a Fund has previously bought or sold and this may result in the inability to close a futures contract when desired. Futures contracts may experience potentially dramatic price changes, which will increase the volatility of a Fund and may involve a small investment of cash (the amount of initial and variation margin) relative to the magnitude of the risk assumed (the potential increase or decrease in the price of the futures contract).
Market Risk
The Funds are subject to the risk that the securities markets will move down, sometimes rapidly and unpredictably, based on overall economic conditions and other factors, which may negatively affect a Fund’s
45
American Beacon FundsSM
Notes to Financial Statements
October 31, 2023
performance. Equity securities generally have greater price volatility than fixed-income securities, although under certain market conditions fixed-income securities may have comparable or greater price volatility. During a general downturn in the securities markets, multiple assets may decline in value simultaneously. In some cases, traditional market participants have been less willing to make a market in some types of debt instruments, which has affected the liquidity of those instruments. During times of market turmoil, investors tend to look to the safety of securities issued or backed by the U.S. Treasury, causing the prices of these securities to rise and the yields to decline. Reduced liquidity in fixed-income and credit markets may negatively affect many issuers worldwide. Prices in many financial markets have increased significantly over the last decade, but there have also been periods of adverse market and financial developments and cyclical change during that timeframe, which have resulted in unusually high levels of volatility in domestic and foreign financial markets that has caused losses for investors and may occur again in the future, particularly if markets enter a period of uncertainty or economic weakness. The value of a security may decline due to adverse issuer-specific conditions, general market conditions unrelated to a particular issuer, or factors that affect a particular industry or industries. Changes in the financial condition of a single issuer or market segment also can impact the market as a whole.
Geopolitical and other events, including war, terrorism, economic uncertainty, trade disputes, pandemics, public health crises, natural disasters and related events have led, and in the future may continue to lead, to instability in world economies and markets generally and reduced liquidity in equity, credit and fixed-income markets, which may disrupt economies and markets and adversely affect the value of your investment. Changes in value may be temporary or may last for extended periods.
Policy changes by the U.S. government and/or Federal Reserve and political events within the U.S. and abroad, including the U.S. presidential election, the U.S. government’s inability at times to agree on a long-term budget and deficit reduction plan, the threat of a federal government shutdown and threats not to increase the federal government’s debt limit, may affect investor and consumer confidence and may adversely impact financial markets and the broader economy, perhaps suddenly and to a significant degree.
Markets and market participants are increasingly reliant upon both publicly available and proprietary information data systems. Data imprecision, software or other technology malfunctions, programming inaccuracies, unauthorized use or access, and similar circumstances may impair the performance of these systems and may have an adverse impact upon a single issuer, a group of issuers, or the market at large. The financial markets generally move in cycles, with periods of rising prices followed by periods of declining prices. The value of your investment may reflect these fluctuations.
Market Timing Risk
Funds that invest in high-yield, and, or have exposure to foreign securities through the derivatives it holds, are particularly subject to the risk of market timing activities. Frequent trading by Fund shareholders poses risks to other shareholders in the Funds, including (i) the dilution of the Funds’ NAV, (ii) an increase in the Funds’ expenses, and (iii) interference with the portfolio manager’s ability to execute efficient investment strategies. Because of specific securities in which the Funds may invest, it could be subject to the risk of market timing activities by shareholders. Some examples of these types of securities are high-yield and foreign securities. The limited trading activity of some high-yield securities may result in market prices that do not reflect the true market value of these securities. If a Fund trades foreign securities, it generally prices foreign securities using their closing prices from the foreign markets in which they trade, typically prior to the Funds’ calculation of its NAV. These prices may be affected by events that occur after the close of a foreign market but before the Funds price its shares. In such instances, the Funds may fair value high yield and foreign securities. However, some investors may engage in frequent short-term trading in the Funds to take advantage of any price differentials that may be reflected in the NAV of the Funds’ shares. While the Manager monitors trading in the Funds, there is no guarantee that it can detect all market timing activities.
46
American Beacon FundsSM
Notes to Financial Statements
October 31, 2023
Multiple Sub-Advisor Risk
The Manager may allocate the Funds’ assets among multiple sub-advisors, each of which is responsible for investing its allocated portion of the Funds’ assets. To a significant extent, the Funds’ performance will depend on the success of the Manager in allocating the Funds’ assets to sub-advisors and its selection and oversight of the sub-advisors. Because each sub-advisor manages its allocated portion of the Funds independently from another sub-advisor, the same security may be held in different portions of the Funds, or may be acquired for one portion of the Funds at a time when a sub-advisor to another portion deems it appropriate to dispose of the security from that other portion, resulting in higher expenses without accomplishing any net result in the Funds’ holdings. Similarly, under some market conditions, one sub-advisor may believe that temporary, defensive investments in short-term instruments or cash are appropriate when another sub-advisor believes continued exposure to the equity or debt markets is appropriate for its allocated portion of the Funds. Because each sub-advisor directs the trading for its own portion of the Funds, and does not aggregate its transactions with those of the other sub-advisors, the Funds may incur higher brokerage costs than would be the case if a single sub-adviser were managing the entire Fund. In addition, while the Manager seeks to allocate the Funds’ assets among the Funds’ sub-advisors in a manner that it believes is consistent with achieving the Funds’ investment objective(s), the Manager may be subject to potential conflicts of interest in allocating the Funds’ assets among sub-advisors, due to factors that could impact the Manager’s revenues and profits.
Recent Market Events Risk
Both U.S. and international markets have experienced significant volatility in recent months and years. As a result of such volatility, investment returns may fluctuate significantly. Moreover, the risks discussed herein associated with an investment in the Fund may be increased.
Although interest rates were unusually low in recent years in the U.S. and abroad, in 2022, the Federal Reserve and certain foreign central banks began to raise interest rates as part of their efforts to address rising inflation. It is difficult to accurately predict the pace at which interest rates may continue to increase, the timing, frequency or magnitude of any such increases, or when such increases might stop. Additionally, various economic and political factors could cause the Federal Reserve or another foreign central bank to change their approach in the future and such actions may result in an economic slowdown in the U.S. and abroad. Unexpected increases in interest rates could lead to market volatility or reduce liquidity in certain sectors of the market. Deteriorating economic fundamentals may, in turn, increase the risk of default or insolvency of particular issuers, negatively impact market value, cause credit spreads to widen, and reduce bank balance sheets. Any of these could cause an increase in market volatility, reduce liquidity across various markets or decrease confidence in the markets. Additionally, high public debt in the U.S. and other countries creates ongoing systemic and market risks and policymaking uncertainty.
In March 2023, the shutdown of certain financial institutions in the U.S. and questions regarding the viability of other financial institutions raised economic concerns over disruption in the U.S. and global banking systems. There can be no certainty that the actions taken by the U.S. or foreign governments will be effective in mitigating the effects of financial institution failures on the economy and restoring public confidence in the U.S. and global banking systems. Some countries, including the U.S., have in recent years adopted more protectionist trade policies. Slowing global economic growth; risks associated with a trade agreement between the United Kingdom and the European Union; the risks associated with ongoing trade negotiations with China; and the possibility of changes to some international trade agreements; political or economic dysfunction within some nations, including major producers of oil; and dramatic changes in commodity and currency prices could have adverse effects that cannot be foreseen at the present time.
Tensions, war, or open conflict between nations, such as between Russia and Ukraine, in the Middle East or in eastern Asia could affect the economies of many nations, including the United States. The duration of ongoing hostilities in the Middle East and between Russia and Ukraine, and any sanctions and related events cannot be
47
American Beacon FundsSM
Notes to Financial Statements
October 31, 2023
predicted. Those events present material uncertainty and risk with respect to markets globally and the performance of the Fund and its investments or operations could be negatively impacted.
Regulators in the U.S. have proposed and recently adopted a number of changes to regulations involving the markets and issuers, some of which apply to the Fund. The full effect of various newly-adopted regulations is not currently known. Additionally, it is not clear whether the proposed regulations will be adopted. However, due to the broad scope of the new and proposed regulations, certain changes could limit the Fund’s ability to pursue its investment strategies or make certain investments, or may make it more costly for the Fund to operate, which may impact performance.
Economists and others have expressed increasing concern about the potential effects of global climate change on property and security values. Certain issuers, industries and regions may be adversely affected by the impacts of climate change, including on the demand for and the development of goods and services and related production costs, and the impacts of legislation, regulation and international accords related to climate change, as well as any indirect consequences of regulation or business trends driven by climate change.
Other Investment Companies Risk
To the extent that a Fund invests in shares of other registered investment companies, a Fund will indirectly bear the fees and expenses, including, for example, advisory and administrative fees, charged by those investment companies in addition to a Fund’s direct fees and expenses. If a Fund invests in other investment companies, a Fund may receive distributions of taxable gains from portfolio transactions by that investment company and may recognize taxable gains from transactions in shares of that investment company, which could be taxable to a Fund’s shareholders when distributed to them. A Fund must rely on the investment company in which it invests to achieve its investment objective. If the investment company fails to achieve its investment objective, the value of a Fund’s investment may decline, adversely affecting a Fund’s performance. To the extent a Fund invests in other investment companies that invest in equity securities, fixed-income securities and/or foreign securities, or that track an index, a Fund is subject to the risks associated with the underlying investments held by the investment company or the index fluctuations to which the investment company is subject. A Fund will be subject to the risks associated with investments in those companies, including but not limited to interest rate risk, credit risk and market risk.
Securities Lending Risk
A Fund may lend its portfolio securities to brokers, dealers and financial institutions in order to obtain additional income. Borrowers of a Fund’s securities provide collateral either in the form of cash, which a Fund reinvests in securities or in the form of non-cash collateral consisting of securities issued or guaranteed by the U.S. government or one of its agencies or instrumentalities. A Fund will be responsible for the risks associated with the investment of cash collateral, including any collateral invested in an affiliated money market fund. A Fund may lose money on its investment of cash collateral or may fail to earn sufficient income on its investment to cover its payment to the borrower of a pre-negotiated fee or “rebate” for the use of that cash collateral in connection with the loan. A Fund could also lose money due to a decline in the value of non-cash collateral. In addition, delays may occur in the recovery of securities from borrowers, which could interfere with a Fund’s ability to vote proxies or to settle transactions or could result in increased costs. Moreover, if the borrower becomes subject to insolvency or similar proceedings, a Fund could incur delays in its ability to enforce its rights in its collateral. There also is a risk that a borrower may default on its obligation to return loaned securities at a time when the value of a Fund’s collateral is inadequate. Although a Fund’s securities lending agent may indemnify a Fund against that risk, it is also possible that the securities lending agent will be unable to satisfy its indemnification obligations. In any case in which the loaned securities are not returned to a Fund before an ex-dividend date, whether or not due to a default by the borrower, the payment in lieu of the dividend that a Fund receives from the securities’ borrower would not be treated as a dividend for federal income tax purposes and thus would not qualify for treatment as “qualified dividend income.”
48
American Beacon FundsSM
Notes to Financial Statements
October 31, 2023
Valuation Risk
This is the risk that a Fund has valued a security at a price different from the price at which it can be sold. This risk may be especially pronounced for investments, such as derivatives, which may be illiquid or which may become illiquid and for securities that trade in relatively thin markets and/or markets that experience extreme volatility. If market conditions make it difficult to value certain investments, a Fund may value these investments using more subjective methods, such as fair-value methodologies. Investors who purchase or redeem Fund shares on days when a Fund is holding fair-valued securities may receive fewer or more shares, or lower or higher redemption proceeds, than they would have received if the Fund had not fair-valued the securities or had used a different valuation methodology. The value of foreign securities, certain fixed-income securities and currencies, as applicable, may be materially affected by events after the close of the markets on which they are traded, but before a Fund determines its NAV. A Fund’s ability to value its investments in an accurate and timely manner may be impacted by technological issues and/or errors by third-party service providers, such as pricing services or accounting agents.
7. Federal Income and Excise Taxes
It is the policy of each Fund to qualify as a regulated investment company (“RIC”), by complying with all applicable provisions of Subchapter M of the Internal Revenue Code, as amended, and to make distributions of taxable income sufficient to relieve it from substantially all federal income and excise taxes. For federal income tax purposes, each Fund is treated as a single entity for the purpose of determining such qualification.
The Funds do not have any unrecorded tax liabilities in the accompanying financial statements. Each of the tax years in the four year period ended October 31, 2023 remain subject to examination by the Internal Revenue Service. If applicable, the Funds recognize interest accrued related to unrecognized tax benefits in interest expense and penalties in “Other expenses” on the Statements of Operations.
The Funds may be subject to taxes imposed by countries in which it invests. Such taxes are generally based on returns of income earned or gains realized or repatriated. Taxes are accrued and applied to net investment income, net realized capital gains and net unrealized appreciation (depreciation), as applicable, as the income is earned or capital gains are recorded.
Dividends are categorized in accordance with income tax regulations which may treat certain transactions differently than U.S. GAAP. Accordingly, the character of distributions and composition of net assets for tax purposes may differ from those reflected in the accompanying financial statements.
The tax character of distributions paid were as follows:
| | | | | | | | | | | | | | | | | | | | | | | | | | | | |
| | | EAM International Small Cap Fund | | | | | | International Equity Fund | |
| | | Year Ended
October 31, 2023 | | | | | | Year Ended
October 31, 2022 | | | | | | Year Ended
October 31, 2023 | | | | | | Year Ended
October 31, 2022 | |
Distributions paid from: | | | | | | | | | | | | | | | | | | | | | | | | | | | | |
Ordinary income* | | | | | | | | | | | | | | | | | | | | | | | | | | | | |
R5 Class | | $ | 284,205 | | | | | | | $ | 826,787 | | | | | | | $ | 19,840,233 | | | | | | | $ | 42,241,538 | |
Y Class | | | 1,719,644 | | | | | | | | 7,166,939 | | | | | | | | 2,512,663 | | | | | | | | 6,508,679 | |
Investor Class | | | 1,056,156 | | | | | | | | 5,498,436 | | | | | | | | 2,090,798 | | | | | | | | 3,608,436 | |
Advisor Class | | | - | | | | | | | | - | | | | | | | | 304,447 | | | | | | | | 495,897 | |
A Class | | | - | | | | | | | | - | | | | | | | | 188,613 | | | | | | | | 270,302 | |
C Class | | | - | | | | | | | | - | | | | | | | | 48,919 | | | | | | | | 91,689 | |
R6 Class | | | - | | | | | | | | - | | | | | | | | 8,756,091 | | | | | | | | 12,908,368 | |
49
American Beacon FundsSM
Notes to Financial Statements
October 31, 2023
| | | | | | | | | | | | | | | | | | | | | | | | | | | | |
| | | EAM International Small Cap Fund | | | | | | International Equity Fund | |
| | | Year Ended
October 31, 2023 | | | | | | Year Ended
October 31, 2022 | | | | | | Year Ended
October 31, 2023 | | | | | | Year Ended
October 31, 2022 | |
Long-term capital gains | | | | | | | | | | | | | | | | | | | | | | | | | | | | |
R5 Class | | $ | - | | | | | | | $ | - | | | | | | | $ | - | | | | | | | $ | 86,540,786 | |
Y Class | | | - | | | | | | | | - | | | | | | | | - | | | | | | | | 14,525,962 | |
Investor Class | | | - | | | | | | | | - | | | | | | | | - | | | | | | | | 8,176,155 | |
Advisor Class | | | - | | | | | | | | - | | | | | | | | - | | | | | | | | 1,198,627 | |
A Class | | | - | | | | | | | | - | | | | | | | | - | | | | | | | | 642,190 | |
C Class | | | - | | | | | | | | - | | | | | | | | - | | | | | | | | 291,901 | |
R6 Class | | | - | | | | | | | | - | | | | | | | | - | | | | | | | | 26,208,458 | |
| | | | | | | | | | | | | | | | | | | | | | | | | | | | |
Total distributions paid | | $ | 3,060,005 | | | | | | | $ | 13,492,162 | | | | | | | $ | 33,741,764 | | | | | | | $ | 203,708,988 | |
| | | | | | | | | | | | | | | | | | | | | | | | | | | | |
* For tax purposes, short-term capital gains are considered ordinary income distributions.
As of October 31, 2023, the tax cost for each Fund and their respective gross unrealized appreciation (depreciation) were as follows:
| | | | | | | | | | | | | | | | | | | | | | | | | | | | |
Fund | | Tax Cost | | | | | | Unrealized
Appreciation | | | | | | Unrealized
(Depreciation) | | | | | | Net Unrealized
Appreciation
(Depreciation) | |
EAM International Small Cap | | $ | 125,958,521 | | | | | | | $ | 7,155,463 | | | | | | | $ | (5,840,141 | ) | | | | | | $ | 1,315,322 | |
International Equity | | | 900,026,036 | | | | | | | | 73,901,099 | | | | | | | | (109,284,351 | ) | | | | | | | (35,383,252 | ) |
| | | | | | | | | | | | | | | | | | | | | | | | | | | | | | | | | | | | | | | | | | | | |
Fund | | Net Unrealized
Appreciation
(Depreciation) | | | | | | Undistributed
Ordinary
Income | | | | | | Undistributed
Long-Term
Capital Gains | | | | | | Accumulated
Capital and
Other (Losses) | | | | | | Other Temporary
Differences | | | | | | Distributable
Earnings | |
EAM International Small Cap | | $ | 1,315,322 | | | | | | | $ | 1,898,517 | | | | | | | $ | - | | | | | | | $ | (1,874,352 | ) | | | | | | $ | - | | | | | | | $ | 1,339,487 | |
International Equity | | | (35,383,252 | ) | | | | | | | 44,592,127 | | | | | | | | - | | | | | | | | - | | | | | | | | - | | | | | | | | 9,208,875 | |
Financial reporting records are adjusted for permanent book/tax differences to reflect tax character. Financial records are not adjusted for temporary differences. The temporary differences between financial reporting and tax-basis reporting of unrealized appreciation (depreciation) are attributable primarily to the tax deferral of losses from wash sales, differences in income and gain loss recognized for tax purposes in spin-offs, the realization for tax purposes of unrealized gains (losses) on certain derivative instruments, unused capital loss carryforwards, and the realization for tax purposes of unrealized gains from passive foreign investment companies.
Due to inherent differences in the recognition of income, expenses, and realized gains (losses) under U.S. GAAP and federal income tax regulations, permanent differences between book and tax reporting have been identified and appropriately reclassified on the Statements of Assets and Liabilities.
Accordingly, the following amounts represent current year permanent differences derived from equalization as of October 31, 2023:
| | | | | | | | | | | | |
Fund | | Paid-In-Capital | | | | | | Distributable
Earnings/(Deficits) | |
| EAM International Small Cap | | $ | - | | | | | | | $ | - | |
| International Equity | | | 2,852,658 | | | | | | | | (2,852,658 | ) |
For federal income tax purposes, the Funds measure their capital loss carryforwards annually at October 31, their fiscal year end. Capital loss carryforwards retain their character as short-term and/or long-term and may be carried forward and applied against future realized capital gains with no expiration date.
As of October 31, 2023 the Funds had the following capital loss carryforwards:
| | | | | | | | | | | | |
Fund | | Short-Term Capital
Loss Carryforwards | | | | | | Long-Term Capital
Loss Carryforwards | |
EAM International Small Cap | | $ | 1,874,352 | | | | | | | $ | - | |
International Equity | | | - | | | | | | | | - | |
50
American Beacon FundsSM
Notes to Financial Statements
October 31, 2023
The EAM International Small Cap Fund utilized $6,522,485 short-term and $5,035,968 long-term capital loss carryforwards. The International Equity Fund utilized $3,443,850 short-term and $24,885,542 long-term capital loss carryforwards.
8. Investment Transactions
The aggregate cost of purchases and proceeds from sales and maturities of investments, other than short-term obligations, for the year ended October 31, 2023 were as follows:
| | | | | | | | | | | | |
Fund | | Purchases
(non-U.S. Government
Securities) | | | | | | Sales
(non-U.S. Government
Securities) | |
EAM International Small Cap | | $ | 433,647,881 | | | | | | | $ | 517,146,960 | |
International Equity | | | 462,984,936 | | | | | | | | 1,218,258,856 | |
A summary of the Funds’ transactions in the USG Select Fund for the year ended October 31, 2023 were as follows:
| | | | | | | | | | | | | | | | | | | | | | | | | | | | | | | | | | |
Fund | | Type of
Transaction | | | | | October 31,
2022
Shares/Fair
Value | | | | | | Purchases | | | | | | Sales | | | | | | October 31,
2023
Shares/Fair
Value | |
| EAM International Small Cap | | Direct | | | | | | $ | 12,785,396 | | | | | | | $ | 169,759,000 | | | | | | | $ | 168,811,437 | | | | | | | $ | 13,732,959 | |
| EAM International Small Cap | | Securities Lending | | | | | | | 373,450 | | | | | | | | 45,537,653 | | | | | | | | 45,652,812 | | | | | | | | 258,291 | |
| International Equity | | Direct | | | | | | | 43,980,453 | | | | | | | | 1,124,431,896 | | | | | | | | 1,129,688,447 | | | | | | | | 38,723,902 | |
| International Equity | | Securities Lending | | | | | | | 13,115,544 | | | | | | | | 150,902,809 | | | | | | | | 163,847,017 | | | | | | | | 171,336 | |
9. Securities Lending
The Funds may lend their securities to qualified financial institutions, such as certain broker-dealers, to earn additional income. The borrowers are required to secure their loans continuously with collateral in an amount at least equal to the fair value of the securities loaned, initially in an amount at least equal to 102% of the fair value of domestic securities loaned and 105% of the fair value of international securities loaned. Collateral is monitored and marked-to-market daily. Daily mark-to-market amounts are required to be paid to the borrower or received from the borrower by the end of the following business day. This one day settlement for mark-to-market amounts may result in the collateral being temporarily less than the value of the securities on loan or temporarily more than the required minimum collateral.
To the extent that a loan is collateralized by cash, such cash collateral shall be invested by the securities lending agent (the “Agent”) in money market mutual funds and other short-term investments, provided the investments meet certain quality and diversification requirements. Securities purchased with cash collateral proceeds are listed in the Funds’ Schedule of Investments and the collateral is shown on the Statements of Assets and Liabilities as a payable.
Securities lending income is generated from the demand premium (if any) paid by the borrower to borrow a specific security and from the return on investment of cash collateral, reduced by negotiated rebate fees paid to the borrower and transaction costs. To the extent that a loan is secured by non-cash collateral, securities lending income is generated as a demand premium reduced by transaction costs. The Funds, the Agent, and the Manager retained 80%, 10%, and 10%, respectively, of the income generated from securities lending.
While securities are on loan, the Funds continue to receive certain income associated with that security and any gain or loss in the market price that may occur during the term of the loan. In the case of domestic equities, the value of any dividend is received in the form of a substitute payment approximately equal to the dividend. In the case of foreign securities, a negotiated amount is received that is less than the actual dividend, but higher than the dividend amount minus the foreign tax that the Funds would be subject to on the dividend.
51
American Beacon FundsSM
Notes to Financial Statements
October 31, 2023
Securities lending transactions pose certain risks to the Funds, including that the borrower may not provide additional collateral when required or return the securities when due, that the value of the short-term investments will be less than the amount of cash collateral required to be returned to the borrower, that non-cash collateral may be subject to legal constraints in the event of a borrower bankruptcy, and that the cash collateral investments could become illiquid and unable to be used to return collateral to the borrower. The Funds could also experience delays and costs in gaining access to the collateral. The Funds bear the risk of any deficiency in the amount of the cash collateral available for return to the borrower and any action which impairs its ability to liquidate non-cash collateral to satisfy a borrower default.
As of October 31, 2023, the value of outstanding securities on loan and the value of collateral were as follows:
| | | | | | | | | | | | | | | | | | | | | | | | | | | | |
Fund | | Fair Value of
Securities
on Loan | | | | | | Cash
Collateral Received | | | | | | Non-Cash
Collateral Received | | | | | | Total
Collateral Received | |
| EAM International Small Cap | | $ | 5,205,811 | | | | | | | $ | 258,291 | | | | | | | $ | 5,254,497 | | | | | | | $ | 5,512,788 | |
| International Equity | | | 12,610,607 | | | | | | | | 171,336 | | | | | | | | 13,021,995 | | | | | | | | 13,193,331 | |
Cash collateral is listed on the Funds’ Schedules of Investments and is shown on the Statements of Assets and Liabilities. Income earned on these investments is included in “Income derived from securities lending” on the Statements of Operations.
Non-cash collateral received by the Funds may not be sold or re-pledged except to satisfy a borrower default. Therefore, non-cash collateral is not included on the Funds’ Schedules of Investments or Statements of Assets and Liabilities.
10. Borrowing Arrangements
Effective November 10, 2023 (the “Effective Date”), the Funds, along with certain other funds managed by the Manager (“Participating Funds”), renewed a committed revolving line of credit (the “Committed Line”) agreement with State Street Bank and Trust Company (the “Bank”) to be used to facilitate portfolio liquidity. The maximum borrowing amount under the Committed Line is $100 million with interest at a rate equal to the higher of (a) Overnight Bank Funding Rate (“OBFR”) daily fluctuating rate per annum equal to 1.25% plus the sum of 0.10% or (b) the Federal Funds daily fluctuating rate per annum on amounts borrowed. Each of the Participating Funds paid a proportional amount of a quarterly commitment fee at a rate of 0.25% per annum on the unused portion of the Committed Line amount. The Committed Line expires November 8, 2024, unless extended by the Bank or terminated by the Participating Funds in accordance with the agreement. Prior to the Effective Date, the maximum borrowing amount under the Committed Line was $100 million with an expiration date November 9, 2023.
On the Effective Date, the Funds, along with certain other Participating Funds managed by the Manager, also renewed an uncommitted discretionary demand revolving line of credit (the “Uncommitted Line”) agreement with the Bank to be used to facilitate portfolio liquidity. The maximum borrowing amount under the Uncommitted Line is $100 million with interest at a rate equal to the higher of (a) OBFR daily fluctuating rate per annum equal to 1.25% plus the sum of 0.10% or (b) the Federal Funds daily fluctuating rate per annum on amounts borrowed on each outstanding loan. Each of the Participating Funds paid a proportional amount of a closing fee of $35,000 on the Effective Date. The Uncommitted Line expires November 8, 2024, unless extended by the Bank or terminated by the Participating Funds in accordance with the agreement. Prior to the Effective Date, the maximum borrowing amount under the Uncommitted Line was $100 million with an expiration date November 9, 2023.
The Participating Funds paid administration, legal and arrangement fees, which are recognized as a component of “Loan expense” on the Statements of Operations, along with commitment fees, that have been allocated among the Participating Funds based on average daily net assets.
During the year ended October 31, 2023, the Funds did not utilize these facilities.
52
American Beacon FundsSM
Notes to Financial Statements
October 31, 2023
11. Capital Share Transactions
The tables below summarize the activity in capital shares for each Class of the Funds:
| | | | | | | | | | | | | | | | | | | | | | | | | | | | |
| | | R5 Class | |
| | | Year Ended
October 31, 2023 | | | | | | Year Ended
October 31, 2022 | |
EAM International Small Cap Fund | | Shares | | | | | | Amount | | | | | | Shares | | | | | | Amount | |
| Shares sold | | | 312,073 | | | | | | | $ | 5,144,248 | | | | | | | | 196,632 | | | | | | | $ | 3,380,286 | |
| Reinvestment of dividends | | | 19,386 | | | | | | | | 284,204 | | | | | | | | 44,403 | | | | | | | | 826,787 | |
| Shares redeemed | | | (955,306 | ) | | | | | | | (15,218,036 | ) | | | | | | | (273,700 | ) | | | | | | | (4,430,781 | ) |
| | | | | | | | | | | | | | | | | | | | | | | | | | | | |
| Net (decrease) in shares outstanding | | | (623,847 | ) | | | | | | $ | (9,789,584 | ) | | | | | | | (32,665 | ) | | | | | | $ | (223,708 | ) |
| | | | | | | | | | | | | | | | | | | | | | | | | | | | |
| | | | |
| | | Y Class | |
| | | Year Ended
October 31, 2023 | | | | | | Year Ended
October 31, 2022 | |
EAM International Small Cap Fund | | Shares | | | | | | Amount | | | | | | Shares | | | | | | Amount | |
| Shares sold | | | 1,240,162 | | | | | | | $ | 19,805,259 | | | | | | | | 3,084,139 | | | | | | | $ | 52,511,772 | |
| Reinvestment of dividends | | | 98,686 | | | | | | | | 1,446,738 | | | | | | | | 326,947 | | | | | | | | 6,084,469 | |
| Shares redeemed | | | (4,391,009 | ) | | | | | | | (69,078,198 | ) | | | | | | | (4,486,794 | ) | | | | | | | (71,557,143 | ) |
| | | | | | | | | | | | | | | | | | | | | | | | | | | | |
| Net (decrease) in shares outstanding | | | (3,052,161 | ) | | | | | | $ | (47,826,201 | ) | | | | | | | (1,075,708 | ) | | | | | | $ | (12,960,902 | ) |
| | | | | | | | | | | | | | | | | | | | | | | | | | | | |
| | | | |
| | | Investor Class | |
| | | Year Ended
October 31, 2023 | | | | | | Year Ended
October 31, 2022 | |
EAM International Small Cap Fund | | Shares | | | | | | Amount | | | | | | Shares | | | | | | Amount | |
| Shares sold | | | 401,029 | | | | | | | $ | 6,463,963 | | | | | | | | 684,416 | | | | | | | $ | 12,141,498 | |
| Reinvestment of dividends | | | 64,362 | | | | | | | | 950,624 | | | | | | | | 272,708 | | | | | | | | 5,105,099 | |
| Shares redeemed | | | (1,829,605 | ) | | | | | | | (29,029,543 | ) | | | | | | | (4,819,082 | ) | | | | | | | (79,722,129 | ) |
| | | | | | | | | | | | | | | | | | | | | | | | | | | | |
| Net (decrease) in shares outstanding | | | (1,364,214 | ) | | | | | | $ | (21,614,956 | ) | | | | | | | (3,861,958 | ) | | | | | | $ | (62,475,532 | ) |
| | | | | | | | | | | | | | | | | | | | | | | | | | | | |
| | | | |
| | | R5 Class | |
| | | Year Ended
October 31, 2023 | | | | | | Year Ended
October 31, 2022 | |
International Equity Fund | | Shares | | | | | | Amount | | | | | | Shares | | | | | | Amount | |
| Shares sold | | | 6,600,545 | | | | | | | $ | 113,441,066 | | | | | | | | 16,792,798 | | | | | | | $ | 276,764,089 | |
| Reinvestment of dividends | | | 1,212,447 | | | | | | | | 18,950,544 | | | | | | | | 7,050,991 | | | | | | | | 125,789,676 | |
| Shares redeemed | | | (45,330,087 | ) | | | | | | | (757,798,935 | ) | | | | | | | (27,075,822 | ) | | | | | | | (451,636,773 | ) |
| | | | | | | | | | | | | | | | | | | | | | | | | | | | |
| Net (decrease) in shares outstanding | | | (37,517,095 | ) | | | | | | $ | (625,407,325 | ) | | | | | | | (3,232,033 | ) | | | | | | $ | (49,083,008 | ) |
| | | | | | | | | | | | | | | | | | | | | | | | | | | | |
| | | | |
| | | Y Class | |
| | | Year Ended
October 31, 2023 | | | | | | Year Ended
October 31, 2022 | |
International Equity Fund | | Shares | | | | | | Amount | | | | | | Shares | | | | | | Amount | |
| Shares sold | | | 764,908 | | | | | | | $ | 14,044,424 | | | | | | | | 1,302,957 | | | | | | | $ | 23,182,218 | |
| Reinvestment of dividends | | | 150,746 | | | | | | | | 2,481,284 | | | | | | | | 1,105,863 | | | | | | | | 20,734,939 | |
| Shares redeemed | | | (2,296,912 | ) | | | | | | | (41,098,087 | ) | | | | | | | (7,076,956 | ) | | | | | | | (129,054,193 | ) |
| | | | | | | | | | | | | | | | | | | | | | | | | | | | |
| Net (decrease) in shares outstanding | | | (1,381,258 | ) | | | | | | $ | (24,572,379 | ) | | | | | | | (4,668,136 | ) | | | | | | $ | (85,137,036 | ) |
| | | | | | | | | | | | | | | | | | | | | | | | | | | | |
| | | | |
| | | Investor Class | |
| | | Year Ended
October 31, 2023 | | | | | | Year Ended
October 31, 2022 | |
International Equity Fund | | Shares | | | | | | Amount | | | | | | Shares | | | | | | Amount | |
| Shares sold | | | 3,836,876 | | | | | | | $ | 66,690,147 | | | | | | | | 597,258 | | | | | | | $ | 9,871,121 | |
| Reinvestment of dividends | | | 130,163 | | | | | | | | 2,018,825 | | | | | | | | 648,703 | | | | | | | | 11,482,044 | |
| Shares redeemed | | | (5,876,228 | ) | | | | | | | (104,841,162 | ) | | | | | | | (1,777,126 | ) | | | | | | | (29,824,205 | ) |
| | | | | | | | | | | | | | | | | | | | | | | | | | | | |
| Net (decrease) in shares outstanding | | | (1,909,189 | ) | | | | | | $ | (36,132,190 | ) | | | | | | | (531,165 | ) | | | | | | $ | (8,471,040 | ) |
| | | | | | | | | | | | | | | | | | | | | | | | | | | | |
53
American Beacon FundsSM
Notes to Financial Statements
October 31, 2023
| | | | | | | | | | | | | | | | | | | | | | | | | | | | |
| | | Advisor Class | |
| | | Year Ended
October 31, 2023 | | | | | | Year Ended
October 31, 2022 | |
International Equity Fund | | Shares | | | | | | Amount | | | | | | Shares | | | | | | Amount | |
| Shares sold | | | 144,782 | | | | | | | $ | 2,579,144 | | | | | | | | 184,019 | | | | | | | $ | 3,110,548 | |
| Reinvestment of dividends | | | 18,959 | | | | | | | | 304,294 | | | | | | | | 92,552 | | | | | | | | 1,693,701 | |
| Shares redeemed | | | (384,344 | ) | | | | | | | (6,715,366 | ) | | | | | | | (245,221 | ) | | | | | | | (4,308,190 | ) |
| | | | | | | | | | | | | | | | | | | | | | | | | | | | |
| Net increase (decrease) in shares outstanding | | | (220,603 | ) | | | | | | $ | (3,831,928 | ) | | | | | | | 31,350 | | | | | | | $ | 496,059 | |
| | | | | | | | | | | | | | | | | | | | | | | | | | | | |
| | | | |
| | | A Class | |
| | | Year Ended
October 31, 2023 | | | | | | Year Ended
October 31, 2022 | |
International Equity Fund | | Shares | | | | | | Amount | | | | | | Shares | | | | | | Amount | |
| Shares sold | | | 284,959 | | | | | | | $ | 4,947,007 | | | | | | | | 202,944 | | | | | | | $ | 3,317,258 | |
| Reinvestment of dividends | | | 12,062 | | | | | | | | 186,717 | | | | | | | | 51,330 | | | | | | | | 907,507 | |
| Shares redeemed | | | (263,000 | ) | | | | | | | (4,512,860 | ) | | | | | | | (243,829 | ) | | | | | | | (4,081,681 | ) |
| | | | | | | | | | | | | | | | | | | | | | | | | | | | |
| Net increase in shares outstanding | | | 34,021 | | | | | | | $ | 620,864 | | | | | | | | 10,445 | | | | | | | $ | 143,084 | |
| | | | | | | | | | | | | | | | | | | | | | | | | | | | |
| | | | |
| | | C Class | |
| | | Year Ended
October 31, 2023 | | | | | | Year Ended
October 31, 2022 | |
International Equity Fund | | Shares | | | | | | Amount | | | | | | Shares | | | | | | Amount | |
| Shares sold | | | 33,973 | | | | | | | $ | 556,596 | | | | | | | | 51,231 | | | | | | | $ | 796,084 | |
| Reinvestment of dividends | | | 3,264 | | | | | | | | 48,699 | | | | | | | | 22,248 | | | | | | | | 379,100 | |
| Shares redeemed | | | (82,219 | ) | | | | | | | (1,373,591 | ) | | | | | | | (87,407 | ) | | | | | | | (1,372,377 | ) |
| | | | | | | | | | | | | | | | | | | | | | | | | | | | |
| Net (decrease) in shares outstanding | | | (44,982 | ) | | | | | | $ | (768,296 | ) | | | | | | | (13,928 | ) | | | | | | $ | (197,193 | ) |
| | | | | | | | | | | | | | | | | | | | | | | | | | | | |
| | | | |
| | | R6 Class | |
| | | Year Ended
October 31, 2023 | | | | | | Year Ended
October 31, 2022 | |
International Equity Fund | | Shares | | | | | | Amount | | | | | | Shares | | | | | | Amount | |
| Shares sold | | | 5,124,430 | | | | | | | $ | 89,384,894 | | | | | | | | 8,395,340 | | | | | | | $ | 138,392,024 | |
| Reinvestment of dividends | | | 543,022 | | | | | | | | 8,503,723 | | | | | | | | 2,092,651 | | | | | | | | 37,416,604 | |
| Shares redeemed | | | (8,993,730 | ) | | | | | | | (154,447,930 | ) | | | | | | | (9,375,438 | ) | | | | | | | (152,093,702 | ) |
| | | | | | | | | | | | | | | | | | | | | | | | | | | | |
| Net increase (decrease) in shares outstanding | | | (3,326,278 | ) | | | | | | $ | (56,559,313 | ) | | | | | | | 1,112,553 | | | | | | | $ | 23,714,926 | |
| | | | | | | | | | | | | | | | | | | | | | | | | | | | |
12. Subsequent Events
Management has evaluated subsequent events for possible recognition or disclosure in the financial statements through the date the financial statements are issued. Management has determined that there are no material events that would require disclosure in the Funds’ financial statements through this date.
54
American Beacon EAM International Small Cap FundSM
Financial Highlights
(For a share outstanding throughout the period)
| | | | | | | | | | | | | | | | | | | | | | | | | | | | | | | | | | | | |
| | | R5 ClassA | |
| | | Year Ended October 31, | | | | | | January 22,
2019B to
October 31, | |
| | | | | | | |
| | | 2023K | | | | | | 2022 | | | | | | 2021 | | | | | | 2020 | | | | | | 2019 | |
| | | | |
Net asset value, beginning of period | | $ | 13.47 | | | | | | | $ | 19.56 | | | | | | | $ | 15.58 | | | | | | | $ | 15.65 | | | | | | | $ | 14.78 | |
| | | | | | | | | | | | | | | | | | | | | | | | | | | | | | | | | | | | |
Income (loss) from investment operations: | | | | | | | | | | | | | | | | | | | | | | | | | | | | | | | | | | | | |
Net investment income | | | 0.15 | C D | | | | | | | 0.20 | | | | | | | | 0.60 | E | | | | | | | 0.03 | | | | | | | | 0.21 | |
Net gains (losses) on investments (both realized and unrealized) | | | 1.96 | | | | | | | | (5.53 | ) | | | | | | | 3.50 | | | | | | | | 0.29 | | | | | | | | 0.66 | |
| | | | | | | | | | | | | | | | | | | | | | | | | | | | | | | | | | | | |
Total income (loss) from investment operations | | | 2.11 | | | | | | | | (5.33 | ) | | | | | | | 4.10 | | | | | | | | 0.32 | | | | | | | | 0.87 | |
| | | | | | | | | | | | | | | | | | | | | | | | | | | | | | | | | | | | |
Less distributions: | | | | | | | | | | | | | | | | | | | | | | | | | | | | | | | | | | | | |
Dividends from net investment income | | | (0.27 | ) | | | | | | | (0.76 | ) | | | | | | | (0.12 | ) | | | | | | | (0.39 | ) | | | | | | | – | |
| | | | | | | | | | | | | | | | | | | | | | | | | | | | | | | | | | | | |
Total distributions | | | (0.27 | ) | | | | | | | (0.76 | ) | | | | | | | (0.12 | ) | | | | | | | (0.39 | ) | | | | | | | – | |
| | | | | | | | | | | | | | | | | | | | | | | | | | | | | | | | | | | | |
Net asset value, end of period | | $ | 15.31 | | | | | | | $ | 13.47 | | | | | | | $ | 19.56 | | | | | | | $ | 15.58 | | | | | | | $ | 15.65 | |
| | | | | | | | | | | | | | | | | | | | | | | | | | | | | | | | | | | | |
Total returnF | | | 15.75 | % | | | | | | | (28.31 | )% | | | | | | | 26.38 | % | | | | | | | 1.94 | % | | | | | | | 5.89 | %G |
| | | | | | | | | | | | | | | | | | | | | | | | | | | | | | | | | | | | |
| | | | | | | | | |
Ratios and supplemental data: | | | | | | | | | | | | | | | | | | | | | | | | | | | | | | | | | | | | |
Net assets, end of period | | $ | 6,316,496 | | | | | | | $ | 13,963,043 | | | | | | | $ | 20,907,091 | | | | | | | $ | 20,327,704 | | | | | | | $ | 37,138,368 | |
Ratios to average net assets: | | | | | | | | | | | | | | | | | | | | | | | | | | | | | | | | | | | | |
Expenses, before reimbursements and/or recoupments | | | 1.21 | % | | | | | | | 0.90 | % | | | | | | | 0.92 | % | | | | | | | 0.91 | % | | | | | | | 0.93 | %H |
Expenses, net of reimbursements and/or recoupments | | | 0.89 | % | | | | | | | 0.89 | % | | | | | | | 0.91 | %I | | | | | | | 0.89 | % | | | | | | | 0.89 | %H |
Net investment income, before expense reimbursements and/or recoupments | | | 0.63 | %D | | | | | | | 1.30 | % | | | | | | | 3.14 | %E | | | | | | | 0.84 | % | | | | | | | 2.18 | %H |
Net investment income, net of reimbursements and/or recoupments | | | 0.95 | %D | | | | | | | 1.31 | % | | | | | | | 3.15 | %E | | | | | | | 0.86 | % | | | | | | | 2.22 | %H |
Portfolio turnover rate | | | 292 | % | | | | | | | 21 | % | | | | | | | 34 | % | | | | | | | 28 | % | | | | | | | 35 | %J |
| A | Prior to February 28, 2020, the R5 Class was known as Institutional Class. |
| B | Commencement of operations. |
| C | Per share amounts have been calculated using the average shares method. |
| D | Net investment income includes a significant dividend payment from Keppel Corp, Ltd. amounting to $0.0312. |
| E | Net investment income includes a significant dividend payment from Vivendi SE amounting to $0.3366. |
| F | Based on net asset value, which does not reflect the sales charge, redemption fee, or contingent deferred sales charge, if applicable. May include adjustments in accordance with U.S. GAAP and as such, the net asset value for reporting purposes and the returns based upon those net asset values may differ from the net asset value and returns for shareholder transactions. |
| I | Expense ratios may exceed stated expense caps in Note 2 in the Annual Shareholder report due to security lending expenses. |
| J | Portfolio turnover rate is for the period from January 22, 2019 through October 31, 2019 and is not annualized. |
| K | On January 20, 2023 Tocqueville Asset Management LP was terminated and ceased managing assets of the Fund. On January 21, 2023, EAM Global Investors, LLC began managing assets of the Fund. |
See accompanying notes
55
American Beacon EAM International Small Cap FundSM
Financial Highlights
(For a share outstanding throughout the period)
| | | | | | | | | | | | | | | | | | | | | | | | | | | | | | | | | | | | |
| | | Y Class | |
| | | Year Ended October 31, | | | | | | January 22,
2019A to
October 31, | |
| | | | | | | |
| | | 2023I | | | | | | 2022 | | | | | | 2021 | | | | | | 2020 | | | | | | 2019 | |
| | | | |
Net asset value, beginning of period | | $ | 13.46 | | | | | | | $ | 19.54 | | | | | | | $ | 15.56 | | | | | | | $ | 15.64 | | | | | | | $ | 14.78 | |
| | | | | | | | | | | | | | | | | | | | | | | | | | | | | | | | | | | | |
Income (loss) from investment operations: | | | | | | | | | | | | | | | | | | | | | | | | | | | | | | | | | | | | |
Net investment income | | | 0.20 | B C | | | | | | | 0.04 | | | | | | | | 0.59 | D | | | | | | | 0.05 | | | | | | | | 0.23 | |
Net gains (losses) on investments (both realized and unrealized) | | | 1.84 | | | | | | | | (5.36 | ) | | | | | | | 3.49 | | | | | | | | 0.25 | | | | | | | | 0.63 | |
| | | | | | | | | | | | | | | | | | | | | | | | | | | | | | | | | | | | |
Total income (loss) from investment operations | | | 2.04 | | | | | | | | (5.32 | ) | | | | | | | 4.08 | | | | | | | | 0.30 | | | | | | | | 0.86 | |
| | | | | | | | | | | | | | | | | | | | | | | | | | | | | | | | | | | | |
Less distributions: | | | | | | | | | | | | | | | | | | | | | | | | | | | | | | | | | | | | |
Dividends from net investment income | | | (0.26 | ) | | | | | | | (0.76 | ) | | | | | | | (0.10 | ) | | | | | | | (0.38 | ) | | | | | | | – | |
| | | | | | | | | | | | | | | | | | | | | | | | | | | | | | | | | | | | |
Total distributions | | | (0.26 | ) | | | | | | | (0.76 | ) | | | | | | | (0.10 | ) | | | | | | | (0.38 | ) | | | | | | | – | |
| | | | | | | | | | | | | | | | | | | | | | | | | | | | | | | | | | | | |
Net asset value, end of period | | $ | 15.24 | | | | | | | $ | 13.46 | | | | | | | $ | 19.54 | | | | | | | $ | 15.56 | | | | | | | $ | 15.64 | |
| | | | | | | | | | | | | | | | | | | | | | | | | | | | | | | | | | | | |
Total returnE | | | 15.21 | % | | | | | | | (28.31 | )% | | | | | | | 26.25 | % | | | | | | | 1.84 | % | | | | | | | 5.82 | %F |
| | | | | | | | | | | | | | | | | | | | | | | | | | | | | | | | | | | | |
| | | | | | | | | |
Ratios and supplemental data: | | | | | | | | | | | | | | | | | | | | | | | | | | | | | | | | | | | | |
Net assets, end of period | | $ | 62,512,548 | | | | | | | $ | 96,269,149 | | | | | | | $ | 160,793,226 | | | | | | | $ | 136,563,697 | | | | | | | $ | 229,275,205 | |
Ratios to average net assets: | | | | | | | | | | | | | | | | | | | | | | | | | | | | | | | | | | | | |
Expenses, before reimbursements and/or recoupments | | | 1.26 | % | | | | | | | 0.95 | % | | | | | | | 0.98 | % | | | | | | | 0.99 | % | | | | | | | 0.98 | %G |
Expenses, net of reimbursements and/or recoupments | | | 1.26 | % | | | | | | | 0.95 | % | | | | | | | 0.98 | % | | | | | | | 0.99 | % | | | | | | | 0.98 | %G |
Net investment income, before expense reimbursements and/or recoupments | | | 1.24 | %C | | | | | | | 1.21 | % | | | | | | | 3.40 | %D | | | | | | | 0.78 | % | | | | | | | 2.10 | %G |
Net investment income, net of reimbursements and/or recoupments | | | 1.24 | %C | | | | | | | 1.21 | % | | | | | | | 3.40 | %D | | | | | | | 0.78 | % | | | | | | | 2.10 | %G |
Portfolio turnover rate | | | 292 | % | | | | | | | 21 | % | | | | | | | 34 | % | | | | | | | 28 | % | | | | | | | 35 | %H |
| A | Commencement of operations. |
| B | Per share amounts have been calculated using the average shares method. |
| C | Net investment income includes a significant dividend payment from Keppel Corp, Ltd. amounting to $0.0439. |
| D | Net investment income includes a significant dividend payment from Vivendi SE amounting to $0.3834. |
| E | Based on net asset value, which does not reflect the sales charge, redemption fee, or contingent deferred sales charge, if applicable. May include adjustments in accordance with U.S. GAAP and as such, the net asset value for reporting purposes and the returns based upon those net asset values may differ from the net asset value and returns for shareholder transactions. |
| H | Portfolio turnover rate is for the period from January 22, 2019 through October 31, 2019 and is not annualized. |
| I | On January 20, 2023 Tocqueville Asset Management LP was terminated and ceased managing assets of the Fund. On January 21, 2023, EAM Global Investors, LLC began managing assets of the Fund. |
See accompanying notes
56
American Beacon EAM International Small Cap FundSM
Financial Highlights
(For a share outstanding throughout the period)
| | | | | | | | | | | | | | | | | | | | | | | | | | | | | | | | | | | | |
| | | Investor Class | |
| | | Year Ended October 31, | |
| | | 2023E | | | | | | 2022 | | | | | | 2021 | | | | | | 2020 | | | | | | 2019 | |
| | | | |
Net asset value, beginning of period | | $ | 13.51 | | | | | | | $ | 19.59 | | | | | | | $ | 15.60 | | | | | | | $ | 15.61 | | | | | | | $ | 15.06 | |
| | | | | | | | | | | | | | | | | | | | | | | | | | | | | | | | | | | | |
Income (loss) from investment operations: | | | | | | | | | | | | | | | | | | | | | | | | | | | | | | | | | | | | |
Net investment income | | | 0.48 | A | | | | | | | 0.65 | | | | | | | | 0.76 | B | | | | | | | 0.25 | | | | | | | | 0.40 | C |
Net gains (losses) on investments (both realized and unrealized) | | | 1.55 | | | | | | | | (6.04 | ) | | | | | | | 3.29 | | | | | | | | 0.01 | | | | | | | | 0.34 | |
| | | | | | | | | | | | | | | | | | | | | | | | | | | | | | | | | | | | |
Total income (loss) from investment operations | | | 2.03 | | | | | | | | (5.39 | ) | | | | | | | 4.05 | | | | | | | | 0.26 | | | | | | | | 0.74 | |
| | | | | | | | | | | | | | | | | | | | | | | | | | | | | | | | | | | | |
Less distributions: | | | | | | | | | | | | | | | | | | | | | | | | | | | | | | | | | | | | |
Dividends from net investment income | | | (0.21 | ) | | | | | | | (0.69 | ) | | | | | | | (0.06 | ) | | | | | | | (0.27 | ) | | | | | | | (0.19 | ) |
| | | | | | | | | | | | | | | | | | | | | | | | | | | | | | | | | | | | |
Total distributions | | | (0.21 | ) | | | | | | | (0.69 | ) | | | | | | | (0.06 | ) | | | | | | | (0.27 | ) | | | | | | | (0.19 | ) |
| | | | | | | | | | | | | | | | | | | | | | | | | | | | | | | | | | | | |
Net asset value, end of period | | $ | 15.33 | | | | | | | $ | 13.51 | | | | | | | $ | 19.59 | | | | | | | $ | 15.60 | | | | | | | $ | 15.61 | |
| | | | | | | | | | | | | | | | | | | | | | | | | | | | | | | | | | | | |
Total returnD | | | 15.06 | % | | | | | | | (28.49 | )% | | | | | | | 26.01 | % | | | | | | | 1.63 | % | | | | | | | 5.03 | % |
| | | | | | | | | | | | | | | | | | | | | | | | | | | | | | | | | | | | |
| | | | | | | | | |
Ratios and supplemental data: | | | | | | | | | | | | | | | | | | | | | | | | | | | | | | | | | | | | |
Net assets, end of period | | $ | 60,994,147 | | | | | | | $ | 72,187,362 | | | | | | | $ | 180,324,267 | | | | | | | $ | 198,905,986 | | | | | | | $ | 355,423,059 | |
Ratios to average net assets: | | | | | | | | | | | | | | | | | | | | | | | | | | | | | | | | | | | | |
Expenses, before reimbursements and/or recoupments | | | 1.46 | % | | | | | | | 1.18 | % | | | | | | | 1.20 | % | | | | | | | 1.18 | % | | | | | | | 1.29 | % |
Expenses, net of reimbursements and/or recoupments | | | 1.46 | % | | | | | | | 1.18 | % | | | | | | | 1.20 | % | | | | | | | 1.18 | % | | | | | | | 1.18 | % |
Net investment income, before expense reimbursements and/or recoupments | | | 1.10 | %A | | | | | | | 1.03 | % | | | | | | | 2.81 | %B | | | | | | | 0.63 | % | | | | | | | 1.42 | % |
Net investment income, net of reimbursements and/or recoupments | | | 1.10 | %A | | | | | | | 1.03 | % | | | | | | | 2.81 | %B | | | | | | | 0.63 | % | | | | | | | 1.53 | % |
Portfolio turnover rate | | | 292 | % | | | | | | | 21 | % | | | | | | | 34 | % | | | | | | | 28 | % | | | | | | | 35 | % |
| A | Net investment income includes a significant dividend payment from Keppel Corp, Ltd. amounting to $0.0406. |
| B | Net investment income includes a significant dividend payment from Vivendi SE amounting to $0.3074. |
| C | Net investment income per share is calculated using the ending balance prior to consideration or adjustment for permanent book-to-tax differences. |
| D | Based on net asset value, which does not reflect the sales charge, redemption fee, or contingent deferred sales charge, if applicable. May include adjustments in accordance with U.S. GAAP and as such, the net asset value for reporting purposes and the returns based upon those net asset values may differ from the net asset value and returns for shareholder transactions. |
| E | On January 20, 2023 Tocqueville Asset Management LP was terminated and ceased managing assets of the Fund. On January 21, 2023, EAM Global Investors, LLC began managing assets of the Fund. |
See accompanying notes
57
American Beacon International Equity FundSM
Financial Highlights
(For a share outstanding throughout the period)
| | | | | | | | | | | | | | | | | | | | | | | | | | | | | | | | | | | | |
| | | R5 ClassA | |
| | | Year Ended October 31, | |
| | | 2023 | | | | | | 2022 | | | | | | 2021 | | | | | | 2020B | | | | | | 2019 | |
| | | | |
Net asset value, beginning of period | | $ | 14.31 | | | | | | | $ | 20.31 | | | | | | | $ | 14.73 | | | | | | | $ | 18.06 | | | | | | | $ | 18.71 | |
| | | | | | | | | | | | | | | | | | | | | | | | | | | | | | | | | | | | |
Income (loss) from investment operations: | | | | | | | | | | | | | | | | | | | | | | | | | | | | | | | | | | | | |
Net investment income | | | 0.56 | | | | | | | | 0.39 | | | | | | | | 0.45 | C | | | | | | | 0.36 | | | | | | | | 0.55 | |
Net gains (losses) on investments (both realized and unrealized) | | | 2.28 | | | | | | | | (4.40 | ) | | | | | | | 5.43 | | | | | | | | (3.15 | ) | | | | | | | 0.34 | |
| | | | | | | | | | | | | | | | | | | | | | | | | | | | | | | | | | | | |
Total income (loss) from investment operations | | | 2.84 | | | | | | | | (4.01 | ) | | | | | | | 5.88 | | | | | | | | (2.79 | ) | | | | | | | 0.89 | |
| | | | | | | | | | | | | | | | | | | | | | | | | | | | | | | | | | | | |
Less distributions: | | | | | | | | | | | | | | | | | | | | | | | | | | | | | | | | | | | | |
Dividends from net investment income | | | (0.43 | ) | | | | | | | (0.65 | ) | | | | | | | (0.30 | ) | | | | | | | (0.54 | ) | | | | | | | (0.40 | ) |
Distributions from net realized gains | | | – | | | | | | | | (1.34 | ) | | | | | | | – | | | | | | | | – | | | | | | | | (1.14 | ) |
| | | | | | | | | | | | | | | | | | | | | | | | | | | | | | | | | | | | |
Total distributions | | | (0.43 | ) | | | | | | | (1.99 | ) | | | | | | | (0.30 | ) | | | | | | | (0.54 | ) | | | | | | | (1.54 | ) |
| | | | | | | | | | | | | | | | | | | | | | | | | | | | | | | | | | | | |
Net asset value, end of period | | $ | 16.72 | | | | | | | $ | 14.31 | | | | | | | $ | 20.31 | | | | | | | $ | 14.73 | | | | | | | $ | 18.06 | |
| | | | | | | | | | | | | | | | | | | | | | | | | | | | | | | | | | | | |
Total returnD | | | 20.09 | % | | | | | | | (21.69 | )% | | | | | | | 40.18 | % | | | | | | | (16.04 | )% | | | | | | | 5.94 | % |
| | | | | | | | | | | | | | | | | | | | | | | | | | | | | | | | | | | | |
| | | | | | | | | |
Ratios and supplemental data: | | | | | | | | | | | | | | | | | | | | | | | | | | | | | | | | | | | | |
Net assets, end of period | | $ | 413,488,011 | | | | | | | $ | 891,001,265 | | | | | | | $ | 1,329,626,349 | | | | | | | $ | 968,859,543 | | | | | | | $ | 1,499,867,401 | |
Ratios to average net assets: | | | | | | | | | | | | | | | | | | | | | | | | | | | | | | | | | | | | |
Expenses, before reimbursements and/or recoupments | | | 0.79 | % | | | | | | | 0.72 | % | | | | | | | 0.73 | % | | | | | | | 0.72 | % | | | | | | | 0.73 | % |
Expenses, net of reimbursements and/or recoupments | | | 0.79 | % | | | | | | | 0.72 | % | | | | | | | 0.73 | % | | | | | | | 0.72 | % | | | | | | | 0.73 | % |
Net investment income, before expense reimbursements and/or recoupments | | | 2.30 | % | | | | | | | 2.17 | % | | | | | | | 2.31 | % | | | C | | | | 1.83 | % | | | | | | | 2.93 | % |
Net investment income, net of reimbursements and/or recoupments | | | 2.30 | % | | | | | | | 2.17 | % | | | | | | | 2.31 | % | | | C | | | | 1.83 | % | | | | | | | 2.93 | % |
Portfolio turnover rate | | | 46 | % | | | | | | | 38 | % | | | | | | | 41 | % | | | | | | | 77 | % | | | | | | | 36 | % |
| A | Prior to February 28, 2020, the R5 Class was known as Institutional Class. |
| B | On January 29, 2020, Templeton Investment Counsel, LLC, was terminated and ceased managing assets of the Fund. On January 30, 2020, American Century Investment Management, Inc. began managing assets of the Fund. |
| C | Net investment income includes significant dividend payment from SE amounting to $0.0746. |
| D | Based on net asset value, which does not reflect the sales charge, redemption fee, or contingent deferred sales charge, if applicable. May include adjustments in accordance with U.S. GAAP and as such, the net asset value for reporting purposes and the returns based upon those net asset values may differ from the net asset value and returns for shareholder transactions. |
See accompanying notes
58
American Beacon International Equity FundSM
Financial Highlights
(For a share outstanding throughout the period)
| | | | | | | | | | | | | | | | | | | | | | | | | | | | | | | | | | | | |
| | | Y Class | |
| | | Year Ended October 31, | |
| | | 2023 | | | | | | 2022 | | | | | | 2021 | | | | | | 2020A | | | | | | 2019 | |
| | | | |
Net asset value, beginning of period | | $ | 15.03 | | | | | | | $ | 21.18 | | | | | | | $ | 15.36 | | | | | | | $ | 18.81 | | | | | | | $ | 19.42 | |
| | | | | | | | | | | | | | | | | | | | | | | | | | | | | | | | | | | | |
Income (loss) from investment operations: | | | | | | | | | | | | | | | | | | | | | | | | | | | | | | | | | | | | |
Net investment income | | | 1.22 | | | | | | | | 1.53 | | | | | | | | 1.83 | B | | | | | | | 0.36 | | | | | | | | 0.54 | |
Net gains (losses) on investments (both realized and unrealized) | | | 1.76 | | | | | | | | (5.74 | ) | | | | | | | 4.27 | | | | | | | | (3.28 | ) | | | | | | | 0.37 | |
| | | | | | | | | | | | | | | | | | | | | | | | | | | | | | | | | | | | |
Total income (loss) from investment operations | | | 2.98 | | | | | | | | (4.21 | ) | | | | | | | 6.10 | | | | | | | | (2.92 | ) | | | | | | | 0.91 | |
| | | | | | | | | | | | | | | | | | | | | | | | | | | | | | | | | | | | |
Less distributions: | | | | | | | | | | | | | | | | | | | | | | | | | | | | | | | | | | | | |
Dividends from net investment income | | | (0.42 | ) | | | | | | | (0.60 | ) | | | | | | | (0.28 | ) | | | | | | | (0.53 | ) | | | | | | | (0.38 | ) |
Distributions from net realized gains | | | – | | | | | | | | (1.34 | ) | | | | | | | – | | | | | | | | – | | | | | | | | (1.14 | ) |
| | | | | | | | | | | | | | | | | | | | | | | | | | | | | | | | | | | | |
Total distributions | | | (0.42 | ) | | | | | | | (1.94 | ) | | | | | | | (0.28 | ) | | | | | | | (0.53 | ) | | | | | | | (1.52 | ) |
| | | | | | | | | | | | | | | | | | | | | | | | | | | | | | | | | | | | |
Net asset value, end of period | | $ | 17.59 | | | | | | | $ | 15.03 | | | | | | | $ | 21.18 | | | | | | | $ | 15.36 | | | | | | | $ | 18.81 | |
| | | | | | | | | | | | | | | | | | | | | | | | | | | | | | | | | | | | |
Total returnC | | | 20.01 | % | | | | | | | (21.71 | )% | | | | | | | 39.99 | % | | | | | | | (16.09 | )% | | | | | | | 5.83 | % |
| | | | | | | | | | | | | | | | | | | | | | | | | | | | | | | | | | | | |
| | | | | | | | | |
Ratios and supplemental data: | | | | | | | | | | | | | | | | | | | | | | | | | | | | | | | | | | | | |
Net assets, end of period | | $ | 87,634,823 | | | | | | | $ | 95,663,172 | | | | | | | $ | 233,692,916 | | | | | | | $ | 659,159,857 | | | | | | | $ | 896,442,437 | |
Ratios to average net assets: | | | | | | | | | | | | | | | | | | | | | | | | | | | | | | | | | | | | |
Expenses, before reimbursements and/or recoupments | | | 0.86 | % | | | | | | | 0.81 | % | | | | | | | 0.79 | % | | | | | | | 0.80 | % | | | | | | | 0.80 | % |
Expenses, net of reimbursements and/or recoupments | | | 0.86 | % | | | | | | | 0.81 | % | | | | | | | 0.79 | % | | | | | | | 0.80 | % | | | | | | | 0.80 | % |
Net investment income, before expense reimbursements and/or recoupments | | | 2.43 | % | | | | | | | 2.03 | % | | | | | | | 2.01 | %B | | | | | | | 1.77 | % | | | | | | | 2.87 | % |
Net investment income, net of reimbursements and/or recoupments | | | 2.43 | % | | | | | | | 2.03 | % | | | | | | | 2.01 | %B | | | | | | | 1.77 | % | | | | | | | 2.87 | % |
Portfolio turnover rate | | | 46 | % | | | | | | | 38 | % | | | | | | | 41 | % | | | | | | | 77 | % | | | | | | | 36 | % |
| A | On January 29, 2020, Templeton Investment Counsel, LLC, was terminated and ceased managing assets of the Fund. On January 30, 2020, American Century Investment Management, Inc. began managing assets of the Fund. |
| B | Net investment income includes significant dividend payment from Vivendi SE amounting to $0.0243. |
| C | Based on net asset value, which does not reflect the sales charge, redemption fee, or contingent deferred sales charge, if applicable. May include adjustments in accordance with U.S. GAAP and as such, the net asset value for reporting purposes and the returns based upon those net asset values may differ from the net asset value and returns for shareholder transactions. |
See accompanying notes
59
American Beacon International Equity FundSM
Financial Highlights
(For a share outstanding throughout the period)
| | | | | | | | | | | | | | | | | | | | | | | | | | | | | | | | | | | | |
| | | Investor Class | |
| | | Year Ended October 31, | |
| | | 2023 | | | | | | 2022 | | | | | | 2021 | | | | | | 2020A | | | | | | 2019 | |
| | | | |
Net asset value, beginning of period | | $ | 14.16 | | | | | | | $ | 20.11 | | | | | | | $ | 14.57 | | | | | | | $ | 17.87 | | | | | | | $ | 18.52 | |
| | | | | | | | | | | | | | | | | | | | | | | | | | | | | | | | | | | | |
Income (loss) from investment operations: | | | | | | | | | | | | | | | | | | | | | | | | | | | | | | | | | | | | |
Net investment income | | | 0.72 | | | | | | | | 0.35 | | | | | | | | 0.38 | B | | | | | | | 0.40 | | | | | | | | 0.49 | |
Net gains (losses) on investments (both realized and unrealized) | | | 2.04 | | | | | | | | (4.37 | ) | | | | | | | 5.38 | | | | | | | | (3.22 | ) | | | | | | | 0.33 | |
| | | | | | | | | | | | | | | | | | | | | | | | | | | | | | | | | | | | |
Total income (loss) from investment operations | | | 2.76 | | | | | | | | (4.02 | ) | | | | | | | 5.76 | | | | | | | | (2.82 | ) | | | | | | | 0.82 | |
| | | | | | | | | | | | | | | | | | | | | | | | | | | | | | | | | | | | |
Less distributions: | | | | | | | | | | | | | | | | | | | | | | | | | | | | | | | | | | | | |
Dividends from net investment income | | | (0.38 | ) | | | | | | | (0.59 | ) | | | | | | | (0.22 | ) | | | | | | | (0.48 | ) | | | | | | | (0.33 | ) |
Distributions from net realized gains | | | – | | | | | | | | (1.34 | ) | | | | | | | – | | | | | | | | – | | | | | | | | (1.14 | ) |
| | | | | | | | | | | | | | | | | | | | | | | | | | | | | | | | | | | | |
Total distributions | | | (0.38 | ) | | | | | | | (1.93 | ) | | | | | | | (0.22 | ) | | | | | | | (0.48 | ) | | | | | | | (1.47 | ) |
| | | | | | | | | | | | | | | | | | | | | | | | | | | | | | | | | | | | |
Net asset value, end of period | | $ | 16.54 | | | | | | | $ | 14.16 | | | | | | | $ | 20.11 | | | | | | | $ | 14.57 | | | | | | | $ | 17.87 | |
| | | | | | | | | | | | | | | | | | | | | | | | | | | | | | | | | | | | |
Total returnC | | | 19.64 | % | | | | | | | (21.93 | )% | | | | | | | 39.72 | % | | | | | | | (16.33 | )% | | | | | | | 5.55 | % |
| | | | | | | | | | | | | | | | | | | | | | | | | | | | | | | | | | | | |
| | | | | | | | | |
Ratios and supplemental data: | | | | | | | | | | | | | | | | | | | | | | | | | | | | | | | | | | | | |
Net assets, end of period | | $ | 63,864,486 | | | | | | | $ | 81,694,109 | | | | | | | $ | 126,691,864 | | | | | | | $ | 92,817,287 | | | | | | | $ | 221,043,036 | |
Ratios to average net assets: | | | | | | | | | | | | | | | | | | | | | | | | | | | | | | | | | | | | |
Expenses, before reimbursements and/or recoupments | | | 1.12 | % | | | | | | | 1.07 | % | | | | | | | 1.06 | % | | | | | | | 1.07 | % | | | | | | | 1.05 | % |
Expenses, net of reimbursements and/or recoupments | | | 1.12 | % | | | | | | | 1.07 | % | | | | | | | 1.06 | % | | | | | | | 1.07 | % | | | | | | | 1.05 | % |
Net investment income, before expense reimbursements and/or recoupments | | | 2.61 | % | | | | | | | 1.84 | % | | | | | | | 1.98 | %B | | | | | | | 1.35 | % | | | | | | | 2.59 | % |
Net investment income, net of reimbursements and/or recoupments | | | 2.61 | % | | | | | | | 1.84 | % | | | | | | | 1.98 | %B | | | | | | | 1.35 | % | | | | | | | 2.59 | % |
Portfolio turnover rate | | | 46 | % | | | | | | | 38 | % | | | | | | | 41 | % | | | | | | | 77 | % | | | | | | | 36 | % |
| A | On January 29, 2020, Templeton Investment Counsel, LLC, was terminated and ceased managing assets of the Fund. On January 30, 2020, American Century Investment Management, Inc. began managing assets of the Fund. |
| B | Net investment income includes significant dividend payment from Vivendi SE amounting to $0.0785. |
| C | Based on net asset value, which does not reflect the sales charge, redemption fee, or contingent deferred sales charge, if applicable. May include adjustments in accordance with U.S. GAAP and as such, the net asset value for reporting purposes and the returns based upon those net asset values may differ from the net asset value and returns for shareholder transactions. |
See accompanying notes
60
American Beacon International Equity FundSM
Financial Highlights
(For a share outstanding throughout the period)
| | | | | | | | | | | | | | | | | | | | | | | | | | | | | | | | | | | | |
| | | Advisor Class | |
| | | Year Ended October 31, | |
| | | 2023 | | | | | | 2022 | | | | | | 2021 | | | | | | 2020A | | | | | | 2019 | |
| | | | |
Net asset value, beginning of period | | $ | 14.62 | | | | | | | $ | 20.68 | | | | | | | $ | 14.94 | | | | | | | $ | 18.31 | | | | | | | $ | 18.93 | |
| | | | | | | | | | | | | | | | | | | | | | | | | | | | | | | | | | | | |
Income (loss) from investment operations: | | | | | | | | | | | | | | | | | | | | | | | | | | | | | | | | | | | | |
Net investment income | | | 0.43 | | | | | | | | 0.29 | | | | | | | | 0.41 | B | | | | | | | 0.37 | | | | | | | | 0.43 | |
Net gains (losses) on investments (both realized and unrealized) | | | 2.39 | | | | | | | | (4.46 | ) | | | | | | | 5.48 | | | | | | | | (3.29 | ) | | | | | | | 0.39 | |
| | | | | | | | | | | | | | | | | | | | | | | | | | | | | | | | | | | | |
Total income (loss) from investment operations | | | 2.82 | | | | | | | | (4.17 | ) | | | | | | | 5.89 | | | | | | | | (2.92 | ) | | | | | | | 0.82 | |
| | | | | | | | | | | | | | | | | | | | | | | | | | | | | | | | | | | | |
Less distributions: | | | | | | | | | | | | | | | | | | | | | | | | | | | | | | | | | | | | |
Dividends from net investment income | | | (0.35 | ) | | | | | | | (0.55 | ) | | | | | | | (0.15 | ) | | | | | | | (0.45 | ) | | | | | | | (0.30 | ) |
Distributions from net realized gains | | | – | | | | | | | | (1.34 | ) | | | | | | | – | | | | | | | | – | | | | | | | | (1.14 | ) |
| | | | | | | | | | | | | | | | | | | | | | | | | | | | | | | | | | | | |
Total distributions | | | (0.35 | ) | | | | | | | (1.89 | ) | | | | | | | (0.15 | ) | | | | | | | (0.45 | ) | | | | | | | (1.44 | ) |
| | | | | | | | | | | | | | | | | | | | | | | | | | | | | | | | | | | | |
Net asset value, end of period | | $ | 17.09 | | | | | | | $ | 14.62 | | | | | | | $ | 20.68 | | | | | | | $ | 14.94 | | | | | | | $ | 18.31 | |
| | | | | | | | | | | | | | | | | | | | | | | | | | | | | | | | | | | | |
Total returnC | | | 19.45 | % | | | | | | | (22.01 | )% | | | | | | | 39.53 | % | | | | | | | (16.43 | )% | | | | | | | 5.38 | % |
| | | | | | | | | | | | | | | | | | | | | | | | | | | | | | | | | | | | |
| | | | | | | | | |
Ratios and supplemental data: | | | | | | | | | | | | | | | | | | | | | | | | | | | | | | | | | | | | |
Net assets, end of period | | $ | 12,257,174 | | | | | | | $ | 13,706,977 | | | | | | | $ | 18,745,607 | | | | | | | $ | 16,387,094 | | | | | | | $ | 45,797,068 | |
Ratios to average net assets: | | | | | | | | | | | | | | | | | | | | | | | | | | | | | | | | | | | | |
Expenses, before reimbursements and/or recoupments | | | 1.27 | % | | | | | | | 1.20 | % | | | | | | | 1.20 | % | | | | | | | 1.20 | % | | | | | | | 1.20 | % |
Expenses, net of reimbursements and/or recoupments | | | 1.27 | % | | | | | | | 1.20 | % | | | | | | | 1.20 | % | | | | | | | 1.20 | % | | | | | | | 1.20 | % |
Net investment income, before expense reimbursements and/or recoupments | | | 2.08 | % | | | | | | | 1.67 | % | | | | | | | 1.79 | %B | | | | | | | 1.34 | % | | | | | | | 2.40 | % |
Net investment income, net of reimbursements and/or recoupments | | | 2.08 | % | | | | | | | 1.67 | % | | | | | | | 1.79 | %B | | | | | | | 1.34 | % | | | | | | | 2.40 | % |
Portfolio turnover rate | | | 46 | % | | | | | | | 38 | % | | | | | | | 41 | % | | | | | | | 77 | % | | | | | | | 36 | % |
| A | On January 29, 2020, Templeton Investment Counsel, LLC, was terminated and ceased managing assets of the Fund. On January 30, 2020, American Century Investment Management, Inc. began managing assets of the Fund. |
| B | Net investment income includes significant dividend payment from SE amounting to $0.0709. |
| C | Based on net asset value, which does not reflect the sales charge, redemption fee, or contingent deferred sales charge, if applicable. May include adjustments in accordance with U.S. GAAP and as such, the net asset value for reporting purposes and the returns based upon those net asset values may differ from the net asset value and returns for shareholder transactions. |
See accompanying notes
61
American Beacon International Equity FundSM
Financial Highlights
(For a share outstanding throughout the period)
| | | | | | | | | | | | | | | | | | | | | | | | | | | | | | | | | | | | |
| | | A Class | |
| | | Year Ended October 31, | |
| | | 2023 | | | | | | 2022 | | | | | | 2021 | | | | | | 2020A | | | | | | 2019 | |
| | | | |
Net asset value, beginning of period | | $ | 14.13 | | | | | | | $ | 20.06 | | | | | | | $ | 14.55 | | | | | | | $ | 17.85 | | | | | | | $ | 18.50 | |
| | | | | | | | | | | | | | | | | | | | | | | | | | | | | | | | | | | | |
Income (loss) from investment operations: | | | | | | | | | | | | | | | | | | | | | | | | | | | | | | | | | | | | |
Net investment income | | | 0.34 | | | | | | | | 0.33 | | | | | | | | 0.36 | B | | | | | | | 0.21 | | | | | | | | 0.45 | |
Net gains (losses) on investments (both realized and unrealized) | | | 2.40 | | | | | | | | (4.36 | ) | | | | | | | 5.38 | | | | | | | | (3.04 | ) | | | | | | | 0.36 | |
| | | | | | | | | | | | | | | | | | | | | | | | | | | | | | | | | | | | |
Total income (loss) from investment operations | | | 2.74 | | | | | | | | (4.03 | ) | | | | | | | 5.74 | | | | | | | | (2.83 | ) | | | | | | | 0.81 | |
| | | | | | | | | | | | | | | | | | | | | | | | | | | | | | | | | | | | |
Less distributions: | | | | | | | | | | | | | | | | | | | | | | | | | | | | | | | | | | | | |
Dividends from net investment income | | | (0.37 | ) | | | | | | | (0.56 | ) | | | | | | | (0.23 | ) | | | | | | | (0.47 | ) | | | | | | | (0.32 | ) |
Distributions from net realized gains | | | – | | | | | | | | (1.34 | ) | | | | | | | – | | | | | | | | – | | | | | | | | (1.14 | ) |
| | | | | | | | | | | | | | | | | | | | | | | | | | | | | | | | | | | | |
Total distributions | | | (0.37 | ) | | | | | | | (1.90 | ) | | | | | | | (0.23 | ) | | | | | | | (0.47 | ) | | | | | | | (1.46 | ) |
| | | | | | | | | | | | | | | | | | | | | | | | | | | | | | | | | | | | |
Net asset value, end of period | | $ | 16.50 | | | | | | | $ | 14.13 | | | | | | | $ | 20.06 | | | | | | | $ | 14.55 | | | | | | | $ | 17.85 | |
| | | | | | | | | | | | | | | | | | | | | | | | | | | | | | | | | | | | |
Total returnC | | | 19.55 | % | | | | | | | (22.00 | )% | | | | | | | 39.65 | % | | | | | | | (16.37 | )% | | | | | | | 5.46 | % |
| | | | | | | | | | | | | | | | | | | | | | | | | | | | | | | | | | | | |
| | | | | | | | | |
Ratios and supplemental data: | | | | | | | | | | | | | | | | | | | | | | | | | | | | | | | | | | | | |
Net assets, end of period | | $ | 8,977,482 | | | | | | | $ | 7,205,251 | | | | | | | $ | 10,017,801 | | | | | | | $ | 9,512,972 | | | | | | | $ | 13,973,709 | |
Ratios to average net assets: | | | | | | | | | | | | | | | | | | | | | | | | | | | | | | | | | | | | |
Expenses, before reimbursements and/or recoupments | | | 1.19 | % | | | | | | | 1.14 | % | | | | | | | 1.13 | % | | | | | | | 1.13 | % | | | | | | | 1.15 | % |
Expenses, net of reimbursements and/or recoupments | | | 1.19 | % | | | | | | | 1.14 | % | | | | | | | 1.13 | % | | | | | | | 1.13 | % | | | | | | | 1.15 | % |
Net investment income, before expense reimbursements and/or recoupments | | | 2.15 | % | | | | | | | 1.80 | % | | | | | | | 1.83 | %B | | | | | | | 1.35 | % | | | | | | | 2.50 | % |
Net investment income, net of reimbursements and/or recoupments | | | 2.15 | % | | | | | | | 1.80 | % | | | | | | | 1.83 | %B | | | | | | | 1.35 | % | | | | | | | 2.50 | % |
Portfolio turnover rate | | | 46 | % | | | | | | | 38 | % | | | | | | | 41 | % | | | | | | | 77 | % | | | | | | | 36 | % |
| A | On January 29, 2020, Templeton Investment Counsel, LLC, was terminated and ceased managing assets of the Fund. On January 30, 2020, American Century Investment Management, Inc. began managing assets of the Fund. |
| B | Net investment income includes significant dividend payment from Vivendi SE amounting to $0.0643. |
| C | Based on net asset value, which does not reflect the sales charge, redemption fee, or contingent deferred sales charge, if applicable. May include adjustments in accordance with U.S. GAAP and as such, the net asset value for reporting purposes and the returns based upon those net asset values may differ from the net asset value and returns for shareholder transactions. |
See accompanying notes
62
American Beacon International Equity FundSM
Financial Highlights
(For a share outstanding throughout the period)
| | | | | | | | | | | | | | | | | | | | | | | | | | | | | | | | | | | | |
| | | C Class | |
| | | Year Ended October 31, | |
| | | 2023 | | | | | | 2022 | | | | | | 2021 | | | | | | 2020A | | | | | | 2019 | |
| | | | |
Net asset value, beginning of period | | $ | 13.53 | | | | | | | $ | 19.27 | | | | | | | $ | 13.99 | | | | | | | $ | 17.18 | | | | | | | $ | 17.84 | |
| | | | | | | | | | | | | | | | | | | | | | | | | | | | | | | | | | | | |
Income (loss) from investment operations: | | | | | | | | | | | | | | | | | | | | | | | | | | | | | | | | | | | | |
Net investment income | | | 0.10 | | | | | | | | 0.16 | | | | | | | | 0.19 | B | | | | | | | 0.01 | | | | | | | | 0.29 | |
Net gains (losses) on investments (both realized and unrealized) | | | 2.41 | | | | | | | | (4.14 | ) | | | | | | | 5.19 | | | | | | | | (2.86 | ) | | | | | | | 0.37 | |
| | | | | | | | | | | | | | | | | | | | | | | | | | | | | | | | | | | | |
Total income (loss) from investment operations | | | 2.51 | | | | | | | | (3.98 | ) | | | | | | | 5.38 | | | | | | | | (2.85 | ) | | | | | | | 0.66 | |
| | | | | | | | | | | | | | | | | | | | | | | | | | | | | | | | | | | | |
Less distributions: | | | | | | | | | | | | | | | | | | | | | | | | | | | | | | | | | | | | |
Dividends from net investment income | | | (0.24 | ) | | | | | | | (0.42 | ) | | | | | | | (0.10 | ) | | | | | | | (0.34 | ) | | | | | | | (0.18 | ) |
Distributions from net realized gains | | | – | | | | | | | | (1.34 | ) | | | | | | | – | | | | | | | | – | | | | | | | | (1.14 | ) |
| | | | | | | | | | | | | | | | | | | | | | | | | | | | | | | | | | | | |
Total distributions | | | (0.24 | ) | | | | | | | (1.76 | ) | | | | | | | (0.10 | ) | | | | | | | (0.34 | ) | | | | | | | (1.32 | ) |
| | | | | | | | | | | | | | | | | �� | | | | | | | | | | | | | | | | | | | |
Net asset value, end of period | | $ | 15.80 | | | | | | | $ | 13.53 | | | | | | | $ | 19.27 | | | | | | | $ | 13.99 | | | | | | | $ | 17.18 | |
| | | | | | | | | | | | | | | | | | | | | | | | | | | | | | | | | | | | |
Total returnC | | | 18.66 | % | | | | | | | (22.55 | )% | | | | | | | 38.56 | % | | | | | | | (16.98 | )% | | | | | | | 4.69 | % |
| | | | | | | | | | | | | | | | | | | | | | | | | | | | | | | | | | | | |
| | | | | | | | | |
Ratios and supplemental data: | | | | | | | | | | | | | | | | | | | | | | | | | | | | | | | | | | | | |
Net assets, end of period | | $ | 2,608,270 | | | | | | | $ | 2,842,235 | | | | | | | $ | 4,317,179 | | | | | | | $ | 3,431,934 | | | | | | | $ | 6,174,460 | |
Ratios to average net assets: | | | | | | | | | | | | | | | | | | | | | | | | | | | | | | | | | | | | |
Expenses, before reimbursements and/or recoupments | | | 1.96 | % | | | | | | | 1.89 | % | | | | | | | 1.86 | % | | | | | | | 1.86 | % | | | | | | | 1.87 | % |
Expenses, net of reimbursements and/or recoupments | | | 1.96 | % | | | | | | | 1.89 | % | | | | | | | 1.86 | % | | | | | | | 1.86 | % | | | | | | | 1.87 | % |
Net investment income, before expense reimbursements and/or recoupments | | | 1.41 | % | | | | | | | 1.08 | % | | | | | | | 1.14 | %B | | | | | | | 0.61 | % | | | | | | | 1.73 | % |
Net investment income, net of reimbursements and/or recoupments | | | 1.41 | % | | | | | | | 1.08 | % | | | | | | | 1.14 | %B | | | | | | | 0.61 | % | | | | | | | 1.73 | % |
Portfolio turnover rate | | | 46 | % | | | | | | | 38 | % | | | | | | | 41 | % | | | | | | | 77 | % | | | | | | | 36 | % |
| A | On January 29, 2020, Templeton Investment Counsel, LLC, was terminated and ceased managing assets of the Fund. On January 30, 2020, American Century Investment Management, Inc. began managing assets of the Fund. |
| B | Net investment income includes significant dividend payment from Vivendi SE amounting to $0.0667. |
| C | Based on net asset value, which does not reflect the sales charge, redemption fee, or contingent deferred sales charge, if applicable. May include adjustments in accordance with U.S. GAAP and as such, the net asset value for reporting purposes and the returns based upon those net asset values may differ from the net asset value and returns for shareholder transactions. |
See accompanying notes
63
American Beacon International Equity FundSM
Financial Highlights
(For a share outstanding throughout the period)
| | | | | | | | | | | | | | | | | | | | | | | | | | | | | | | | | | | | |
| | | R6 Class | |
| | | Year Ended October 31, | |
| | | 2023 | | | | | | 2022 | | | | | | 2021 | | | | | | 2020A | | | | | | 2019 | |
| | | | |
Net asset value, beginning of period | | $ | 14.35 | | | | | | | $ | 20.35 | | | | | | | $ | 14.76 | | | | | | | $ | 18.08 | | | | | | | $ | 18.73 | |
| | | | | | | | | | | | | | | | | | | | | | | | | | | | | | | | | | | | |
Income from investment operations: | | | | | | | | | | | | | | | | | | | | | | | | | | | | | | | | | | | | |
Net investment income | | | 0.40 | | | | | | | | 0.41 | | | | | | | | 0.45 | B | | | | | | | 0.39 | | | | | | | | 0.51 | |
Net gains (losses) on investments (both realized and unrealized) | | | 2.46 | | | | | | | | (4.41 | ) | | | | | | | 5.44 | | | | | | | | (3.16 | ) | | | | | | | 0.39 | |
| | | | | | | | | | | | | | | | | | | | | | | | | | | | | | | | | | | | |
Total income (loss) from investment operations | | | 2.86 | | | | | | | | (4.00 | ) | | | | | | | 5.89 | | | | | | | | (2.77 | ) | | | | | | | 0.90 | |
| | | | | | | | | | | | | | | | | | | | | | | | | | | | | | | | | | | | |
Less distributions: | | | | | | | | | | | | | | | | | | | | | | | | | | | | | | | | | | | | |
Dividends from net investment income | | | (0.44 | ) | | | | | | | (0.66 | ) | | | | | | | (0.30 | ) | | | | | | | (0.55 | ) | | | | | | | (0.41 | ) |
Distributions from net realized gains | | | – | | | | | | | | (1.34 | ) | | | | | | | – | | | | | | | | – | | | | | | | | (1.14 | ) |
| | | | | | | | | | | | | | | | | | | | | | | | | | | | | | | | | | | | |
Total distributions | | | (0.44 | ) | | | | | | | (2.00 | ) | | | | | | | (0.30 | ) | | | | | | | (0.55 | ) | | | | | | | (1.55 | ) |
| | | | | | | | | | | | | | | | | | | | | | | | | | | | | | | | | | | | |
Net asset value, end of period | | $ | 16.77 | | | | | | | $ | 14.35 | | | | | | | $ | 20.35 | | | | | | | $ | 14.76 | | | | | | | $ | 18.08 | |
| | | | | | | | | | | | | | | | | | | | | | | | | | | | | | | | | | | | |
Total returnC | | | 20.15 | % | | | | | | | (21.62 | )% | | | | | | | 40.20 | % | | | | | | | (15.93 | )% | | | | | | | 5.98 | % |
| | | | | | | | | | | | | | | | | | | | | | | | | | | | | | | | | | | | |
| | | | | | | | | |
Ratios and supplemental data: | | | | | | | | | | | | | | | | | | | | | | | | | | | | | | | | | | | | |
Net assets, end of period | | $ | 290,693,353 | | | | | | | $ | 296,382,124 | | | | | | | $ | 397,732,934 | | | | | | | $ | 294,708,893 | | | | | | | $ | 179,802,437 | |
Ratios to average net assets: | | | | | | | | | | | | | | | | | | | | | | | | | | | | | | | | | | | | |
Expenses, before reimbursements and/or recoupments | | | 0.77 | % | | | | | | | 0.71 | % | | | | | | | 0.71 | % | | | | | | | 0.72 | % | | | | | | | 0.70 | % |
Expenses, net of reimbursements and/or recoupments | | | 0.69 | % | | | | | | | 0.69 | % | | | | | | | 0.70 | %D | | | | | | | 0.69 | % | | | | | | | 0.66 | % |
Net investment income, before expense reimbursements and/or recoupments | | | 2.54 | % | | | | | | | 2.22 | % | | | | | | | 2.30 | %B | | | | | | | 1.88 | % | | | | | | | 3.09 | % |
Net investment income, net of reimbursements and/or recoupments | | | 2.62 | % | | | | | | | 2.24 | % | | | | | | | 2.31 | %B | | | | | | | 1.91 | % | | | | | | | 3.13 | % |
Portfolio turnover rate | | | 46 | % | | | | | | | 38 | % | | | | | | | 41 | % | | | | | | | 77 | % | | | | | | | 36 | % |
| A | On January 29, 2020, Templeton Investment Counsel, LLC, was terminated and ceased managing assets of the Fund. On January 30, 2020, American Century Investment Management, Inc. began managing assets of the Fund. |
| B | Net investment income includes significant dividend payment from Vivendi SE amounting to $0.0738. |
| C | Based on net asset value, which does not reflect the sales charge, redemption fee, or contingent deferred sales charge, if applicable. May include adjustments in accordance with U.S. GAAP and as such, the net asset value for reporting purposes and the returns based upon those net asset values may differ from the net asset value and returns for shareholder transactions. |
| D | Expense ratios may exceed stated expense caps in Note 2 in the Annual Shareholder report due to security lending expenses. |
See accompanying notes
64
American Beacon FundsSM
Federal Tax Information
October 31, 2023 (Unaudited)
Certain tax information regarding the Funds is required to be provided to shareholders based upon the Funds’ income and distributions for the taxable year ended October 31, 2023. The information and distributions reported herein may differ from information and distributions taxable to the shareholders for the calendar year ended December 31, 2023.
The Funds designated the following items with regard to distributions paid during the fiscal year ended October 31, 2023. All designations are based on financial information available as of this annual report and, accordingly, are subject to change. For each item, it is the intention of the Funds to designate the maximum amount permitted under the Internal Revenue Code of 1986, as amended, and the regulations there under.
Corporate Dividends-Received Deduction:
| | | | |
EAM International Small Cap | | | N/A | |
International Equity | | | N/A | |
Qualified Dividend Income:
| | | | |
EAM International Small Cap | | | 100 | % |
International Equity | | | 100 | % |
Long-Term Capital Gain Distributions:
| | | | |
EAM International Small Cap | | $ | - | |
International Equity | | $ | - | |
Short-Term Capital Gain Distributions:
| | | | |
EAM International Small Cap | | $ | - | |
International Equity | | $ | - | |
Foreign tax credit:
| | | | |
EAM International Small Cap | | $ | 281,324 | |
International Equity | | $ | 1,453,743 | |
The foreign tax credits for EAM International Small Cap and International Equity are based on foreign source income of $3,910,286 and $35,601,901 respectively for the year ended October 31, 2023.
Shareholders will receive notification in January 2024 of the applicable tax information necessary to prepare their 2023 income tax returns.
65
Disclosure Regarding the Renewal and Approval of Current Management and Investment Advisory Agreements (Unaudited)
At meetings held on May 16, 2023 and June 6-7, 2023 (collectively, the “Meetings”), the Board of Trustees (“Board” or “Trustees”) considered and then, at its June 7, 2023 meeting, approved the renewal of:
(1) the Management Agreement between American Beacon Advisors, Inc. (“Manager”) and the American Beacon Funds (“Trust”) on behalf of the American Beacon International Equity Fund (“International Equity Fund”) and American Beacon EAM International Small Cap Fund (“EAM Fund”) (each, a “Fund” and collectively, the “Funds”); and
(2) the Investment Advisory Agreements among the Manager, the Trust, on behalf of the International Equity Fund, and each of Causeway Capital Management LLC (“Causeway”), Lazard Asset Management LLC (“Lazard”), and American Century Investments, Inc. (“ACI”) (each, a “sub-advisor” and collectively, the “sub-advisors”).
The Management Agreement and the Investment Advisory Agreements are referred to herein individually as an “Agreement” and collectively as the “Agreements.”
In preparation for its consideration of the renewal of the Agreements, the Board undertook steps to gather and consider information furnished by the Manager, the sub-advisors (for the International Equity Fund), Broadridge, Inc. (“Broadridge”) and Morningstar, Inc. (“Morningstar”). The Board, with the assistance of independent legal counsel, requested and received certain relevant information from the Manager and each sub-advisor.
In advance of the Meetings, the Board’s Investment Committee and/or the Manager coordinated the production of information from Broadridge and Morningstar regarding the performance, fees and expenses of the Funds as well as information from the Manager and the sub-advisors. At the Meetings, the Board considered the information provided in connection with the renewal process, as well as information furnished to the Board throughout the year at regular meetings of the Board and its committees. In connection with the Board’s consideration of the Agreements, the Trustees received and evaluated such information as they deemed necessary. This information is described below in the section summarizing the factors the Board considered in connection with its renewal and approval of the Agreements, as well as the section describing additional Board considerations with respect to each Fund.
The Board noted that the Manager provides management and administrative services to the Funds pursuant to the Management Agreement. The Board considered that many mutual funds have separate contracts governing each type of service and observed that, with respect to such mutual funds, the actual management fee rates provided by Broadridge for peer group funds reflect the combined advisory and administrative fees, reduced by any fee waivers and/or reimbursements.
The Manager or a sub-advisor may not have been able to, or opted not to, provide information in response to certain information requests, in which case the Board conducted its evaluation of the firm based on information that was provided. In such cases, the Board determined that the omission of any such information was not material to its considerations.
Provided below is an overview of certain factors the Board considered in connection with its decision to approve the renewal of the Agreements. The Board did not identify any particular information that was most relevant to its consideration of whether to approve the renewal of each Agreement, and each Trustee may have afforded different weight to the various factors. Legal counsel to the independent Trustees provided the Board with a memorandum regarding its responsibilities pertaining to the renewal of investment advisory contracts, such as the Agreements, and related regulatory guidelines. Based on its evaluation, the Board unanimously concluded that the terms of each Agreement were reasonable and fair and that the approval of the renewal of each Agreement was in the best interests of the Funds and their shareholders.
66
Disclosure Regarding the Renewal and Approval of Current Management and Investment Advisory Agreements (Unaudited)
Considerations With Respect to the Renewal of the Management Agreement and the Investment Advisory Agreements
In determining whether to approve the renewal of the Agreements, the Board considered each Fund’s investment management and, as applicable, sub-advisory, relationships separately. In each instance, the Board considered, among other things, the following factors: (1) the nature, extent and quality of the services provided; (2) the investment performance of the Fund and, with respect to the International Equity Fund, the investment performance of the sub-advisors; (3) the profits, if any, earned by the Manager in rendering services to the Funds; (4) comparisons of services and fee rates with contracts entered into by the Manager or a sub-advisor or their affiliates with other clients (such as pension funds and other institutional clients); (5) the extent to which economies of scale, if any, have been taken into account in setting each fee rate schedule; (6) whether fee rate levels reflect economies of scale, if any, for the benefit of Fund investors; and (7) any other benefits derived or anticipated to be derived by the Manager or a sub-advisor from their relationships with a Fund, as applicable.
Nature, Extent and Quality of Services. With respect to the renewal of the Management Agreement, the Board considered, among other factors: each Fund’s long-term performance; the length of service of key investment personnel at the Manager; the cost structure of each Fund; the financial condition of the Manager, including its parent company; the Manager’s culture of compliance and support that reduce risks to the Funds; the Manager’s quality of services; the Manager’s active role in monitoring and, as appropriate, recommending additional or replacement sub-advisors; and the Manager’s representations regarding its efforts to retain key employees and maintain staffing levels.
With respect to the renewal of each Investment Advisory Agreement for the International Equity Fund, the Board considered, among other factors: the representations made by each sub-advisor regarding the sub-advisor’s level of staffing; asset size; the financial stability of each sub-advisor; and its compliance program. Based on the foregoing and other information, the Board concluded that the nature, extent and quality of the management provided by the Manager were appropriate for each Fund and the advisory services provided by each sub-advisor were appropriate for the International Equity Fund.
Investment Performance. The Board evaluated the comparative information provided by Broadridge and the Manager regarding the performance of each Fund relative to its Broadridge Performance Universe, Morningstar Category, and/or benchmark index, as well as each Fund’s Morningstar rating. The Board considered the information provided by Broadridge regarding its independent methodology for selecting each Fund’s Broadridge Performance Universe. In addition, the Board considered the performance reports and discussions with management at meetings of the Board and its committees throughout the year. The Board also evaluated the comparative information provided by: (1) each of Causeway and Lazard regarding the performance of its portion of the International Equity Fund relative to the performance of a composite of comparable investment accounts managed by the sub-advisor; (2) each sub-advisor regarding the performance of the International Equity Fund relative to the International Equity Fund’s benchmark index; and (3) ACI regarding the performance of its portion of the International Equity Fund relative to an additional benchmark index. A discussion regarding the Board’s considerations with respect to each Fund’s performance appears below under “Additional Considerations and Conclusions with Respect to Each Fund.”
Costs of the Services Provided to the Funds and the Profits Realized by the Manager from its Relationship with the Funds. In analyzing the costs of services and profitability of the Manager, the Board considered the revenues earned and the expenses incurred by the Manager, before and after the payment of distribution-related expenses by the Manager. The profits or losses were noted at both an aggregate level for all funds within the group of mutual funds sponsored by the Manager (the “Fund Complex”) and at an individual fund level, with the Manager earning a profit before and after the payment of distribution-related expenses by the Manager with respect to each Fund. The Board also considered comparative information provided by the Manager regarding the Manager’s overall profitability with respect to the Fund Complex relative to the overall profitability of other firms in the mutual fund industry, as disclosed in publicly available sources. Although the Board noted that, in certain cases, the fee rates
67
Disclosure Regarding the Renewal and Approval of Current Management and Investment Advisory Agreements (Unaudited)
paid by other clients of the Manager are lower than the fee rates paid by the Funds, the Manager represented that the difference is attributable to, among other factors, the fact that the Manager does not perform administrative services for non-investment company clients and reflects the greater level of responsibility and regulatory requirements associated with managing the Funds. The Board also noted that, with respect to the R6 Class shares of the International Equity Fund and the R5 Class shares of the EAM Fund, the Manager is waiving fees and/or reimbursing expenses.
The Board further considered that, with respect to each Fund, the Management Agreement provides for the Manager to receive a management fee comprised of an annualized fee that is retained by the Manager. In addition, the Board considered that the Manager receives fees for administering and overseeing the securities lending program on behalf of the Funds. The Board also noted that certain share classes of the Funds maintain higher expense ratios in order to compensate third-party financial intermediaries.
In analyzing the fee rates charged by each sub-advisor in connection with its investment advisory services to the International Equity Fund, the Board considered representations made by Causeway and Lazard that the International Equity Fund’s sub-advisory fee rate schedules generally were favorable compared to other comparable client accounts. The Board considered ACI’s representation that it does not manage a comparable investment account in the strategy of the International Equity Fund. The Board did not request profitability data from the sub-advisors because the Board did not view this data as imperative to its deliberations given the arms-length nature of the relationship between the Manager and the sub-advisors with respect to the negotiation of sub-advisory fee rates. In addition, the Board noted that sub-advisors may not account for their profits on an account-by-account basis and that different firms likely employ different methodologies in connection with these calculations.
Based on the foregoing and other information, the Board concluded that the profitability levels of the Manager were reasonable in light of the services performed by the Manager. A discussion regarding the Board’s considerations with respect to each Fund’s fee rates is set forth below under “Additional Considerations and Conclusions with Respect to Each Fund.”
Economies of Scale. In considering the reasonableness of the management and investment advisory fees rates, the Board considered whether economies of scale will be realized as each Fund grows and whether fee rate levels reflect these economies of scale for the benefit of Fund shareholders. In this regard, the Board considered that, with respect to each sub-advisor, the Manager has negotiated breakpoints in the sub-advisory fee rate schedules for the International Equity Fund. The Board also noted that, for purposes of determining the fee rates chargeable to the International Equity Fund, certain sub-advisors have agreed to take into account other clients of the Manager whose assets are allocated to the sub-advisors by the Manager for purposes of calculating the Fund’s sub-advisory fee rate breakpoints.
In addition, the Board noted the Manager’s representation that the Management Agreement contains fee schedule breakpoints at higher asset levels with respect to each Fund. In this regard, the Board considered that neither of the Funds’ current assets exceeded the threshold necessary to reach the first management fee breakpoint. Based on the foregoing and other information, the Board concluded that the Manager’s and, with respect to the International Equity Fund, the sub-advisors’, fee rate schedules provide for a reasonable sharing of benefits from any economies of scale with each Fund.
Benefits Derived from the Relationship with the Funds. The Board considered the Manager and sub-advisors’ responses to inquiries regarding “fall-out” or ancillary benefits that accrue to the Manager and/or the sub-advisors as a result of the Manager’s advisory relationships with the Funds or the sub-advisors’ relationships with the International Equity Fund. For example, the Board considered that the Manager may invest the Funds’ cash balances and cash collateral provided by the borrowers of the Fund’s securities in the American Beacon U.S. Government Money Market Select Fund, which the Manager manages directly, and for which the Manager receives a fee. In addition, the Board noted that each sub-advisor for the International Equity Fund benefits from soft dollar
68
Disclosure Regarding the Renewal and Approval of Current Management and Investment Advisory Agreements (Unaudited)
arrangements for proprietary and third-party research. Based on the foregoing and other information, the Board concluded that the potential benefits accruing to the Manager and the sub-advisors by virtue of the Manager’s relationship with the Funds and the sub-advisors’ relationships with the International Equity Fund appear to be fair and reasonable.
Additional Considerations and Conclusions with Respect to Each Fund
The performance comparisons below were made for each Fund’s R5 Class shares relative to the Fund’s Broadridge Performance Universe and Morningstar Category. With respect to the Broadridge Performance Universe, the 1st Quintile represents the top 20 percent of the universe based on performance, and the 5th Quintile represents the bottom 20 percent of the universe based on performance. References to each Fund’s Broadridge Performance Universe are to the respective universe of mutual funds with comparable investment classifications and objectives as determined by Broadridge. With respect to the International Equity Fund, the performance of each sub-advisor was calculated by the Manager based on information provided by the Fund’s custodian.
In reviewing the performance, the Board viewed longer-term performance over a full market cycle, typically five years or longer, as the most important consideration because relative performance over shorter periods may be significantly impacted by market or economic events and not necessarily reflective of sub-advisor skill.
The expense comparisons below were made for each Fund’s R5 Class shares relative to the Fund’s Broadridge Expense Universe and Broadridge Expense Group, and Y Class shares relative to the Fund’s Morningstar Fee Level universe. The 1st Quintile represents the lowest 20 percent of the universe or group based on lowest total expense, and the 5th Quintile represents the highest 20 percent of the universe or group based on highest total expense. References to each Fund’s Expense Group and Expense Universe are to the respective group or universe of comparable mutual funds as determined by Broadridge. Broadridge Expense Groups consist of the Fund and a representative sample of funds with similar operating structures and asset sizes, as selected by Broadridge. A Broadridge Expense Universe includes all funds with comparable investment classifications/objectives and similar operating structures to that of the share class under review for each Fund, including funds in the Broadridge Expense Group. The Broadridge expense comparisons are based on the most recent audited financial information publicly available for a Fund as of December 31, 2022. References to each Fund’s Morningstar Fee Level ranking are to the institutional share class of comparable mutual funds as determined by Morningstar.
The Board considered a Fund’s Morningstar fee level category with the 1st Quintile representing the lowest 20 percent of the category constituents and the 5th Quintile representing the highest 20 percent of the category in terms of total expense.
Additional Considerations and Conclusions with Respect to the American Beacon International Equity Fund
In considering the renewal of the Agreements for the International Equity Fund, the Board considered the following additional factors:
Broadridge Total Expenses Excluding 12b-1 Fees and Morningstar Fee Level Ranking
| | | | |
Compared to Broadridge Expense Group | | | 1st Quintile | |
Compared to Broadridge Expense Universe | | | 2nd Quintile | |
Morningstar Fee Level Ranking | | | 2nd Quintile | |
Broadridge and Morningstar Performance Analysis (five-year period ended December 31, 2022)
| | | | |
Compared to Broadridge Performance Universe | | | 4th Quintile | |
Compared to Morningstar Category | | | 4th Quintile | |
69
Disclosure Regarding the Renewal and Approval of Current Management and Investment Advisory Agreements (Unaudited)
In considering the renewal of the Investment Advisory Agreements with Causeway, Lazard and ACI, the Board considered that the diversification of investment strategies facilitated by the International Equity Fund’s multi-manager structure permits the Fund to mitigate the risks associated with a single sub-advisor. The Board also considered the following additional factors:
Sub-advisor Performance (compared to Broadridge Performance Universe for period indicated ended December 31, 2022)
| | | | | | | | | | | | |
Causeway | | | 5 Years | | | | | | | | 2nd Quintile | |
Lazard | | | 5 Years | | | | | | | | 2nd Quintile | |
ACI | | | 1 Year | | | | | | | | 2nd Quintile | |
The Board also considered the Manager’s recommendation to continue to retain each sub-advisor.
Based on these and other considerations, the Board: (1) concluded that the fees paid to the Manager and the sub-advisors under the Agreements are fair and reasonable; and (2) determined that the International Equity Fund and its shareholders would benefit from the Manager’s and sub-advisors’ continued management of the International Equity Fund.
Additional Considerations and Conclusions with Respect to the American Beacon EAM International Small Cap Value Fund
In considering the renewal of the Management Agreement for the EAM Fund, the Board considered the following additional factors:
Broadridge Total Expenses Excluding 12b-1 Fees and Morningstar Fee Level Ranking
| | | | |
Compared to Broadridge Expense Group | | | 4th Quintile | |
Compared to Broadridge Expense Universe | | | 4th Quintile | |
Morningstar Fee Level Ranking | | | 5th Quintile | |
Broadridge and Morningstar Performance Analysis (five-year period ended December 31, 2022)*
| | | | |
Compared to Broadridge Performance Universe | | | 5th Quintile | |
Compared to Morningstar Category | | | 5th Quintile | |
* EAM Global Investors LLC began managing the Fund effective January 21, 2023. The performance reflected through December 31, 2022 reflects the Fund’s performance under the management of its prior sub-advisor.
The Board also considered that, at the Manager’s recommendation, the Board had approved the termination of the EAM Fund’s prior sub-advisor and the retention of EAM Global Investors LLC as the EAM Fund’s sub-advisor effective January 21, 2023.
Based on these and other considerations, the Board: (1) concluded that the fees paid to the Manager under the Management Agreement are fair and reasonable; and (2) determined that the EAM Fund and its shareholders would benefit from the Manager’s continued management of the EAM Fund.
70
Disclosure Regarding the Approval of New Management and Investment Advisory Agreements (Unaudited)
On July 11, 2023, (i) Resolute Investment Holdings, LLC (“RIH”), its indirect wholly-owned subsidiary, Resolute Investment Managers, Inc. (“RIM”), the parent company of American Beacon Advisors, Inc. (“Manager”), the investment manager of American Beacon Funds (“Trust”), and certain of their affiliates, and (ii) the current owners of approximately 93% of RIH (“Current Ownership Group”), entered into a transaction agreement (“Transaction Agreement”) with certain creditors of RIM (“Lender Group”) to strengthen the capital structure of RIH, the indirect 100% owner of RIM and the Manager (together with RIH, “Resolute”). Pursuant to the Transaction Agreement, (i) all equity interests in RIH would be cancelled, (ii) new equity interests would be issued to members of the Lender Group (“New Ownership Group”), and (iii) the existing credit agreements between RIM and the Lender Group would be terminated and a new credit agreement would be executed (“Transaction”).
Upon the closing of the Transaction (“Closing”), the Manager will be wholly owned indirectly by the New Ownership Group, rather than by the Current Ownership Group. This change in control will be deemed to be an “assignment” under the Investment Company Act of 1940 Act, as amended (“1940 Act”), of the Trust’s (i) existing management agreement (“Current Management Agreement”) with the Manager with respect to the American Beacon International Equity Fund (“International Equity Fund”) and American Beacon EAM International Small Cap Fund (“EAM Fund” and, collectively with the International Equity Fund, the “Funds”) and other series of the Trust (“Other Funds”), and (ii) existing investment advisory agreements (“Current Investment Advisory Agreements”) among the Manager, the Trust and each of Causeway Capital Management LLC (“Causeway”), Lazard Asset Management LLC (“Lazard”), and American Century Investments, Inc. (“ACI”), on behalf of the International Equity Fund, and EAM Global Investors LLC (“EAM”), on behalf of the EAM Fund. Causeway, Lazard, ACI, and EAM are collectively referred to herein as the “Sub-Advisors.” As required by the 1940 Act, the Current Management Agreement and Current Investment Advisory Agreements (“Current Agreements”) provide for their automatic termination in the event of an assignment, and, therefore, will terminate upon the Closing.
The Board of Trustees (“Trustees” or “Board”) of the Trust met by videoconference on July 7, 2023, and in-person on July 12, 2023 (“July Meetings”), to discuss the Transaction and consider the effect that the Transaction would have on the Funds and the Other Funds. In addition, the Board received various information from the Manager regarding the intended purposes and framework of the Transaction at its meetings in-person on February 28–March 1, 2023 (“March Meeting”) and June 6–7, 2023, and by videoconference on May 16, 2023 (“May-June Meetings”). Following the March Meeting, the Board designated an ad hoc special committee (“Committee”) to meet with representatives of the Manager and receive updates on the negotiations and, as appropriate, to provide input with respect to the process. Throughout this process, the Board and the Committee were advised by independent legal counsel and received guidance concerning, among other matters, the Trustees’ responsibilities in connection with their consideration with respect to the Funds of a new Management Agreement (“New Management Agreement”), and new Investment Advisory Agreements (each, a “New Investment Advisory Agreement” and, collectively with the New Management Agreement, the “New Agreements”). The Trustees were advised that the New Agreements would replace the Current Agreements, upon the assignment and termination of the Current Agreements upon the Closing.
In advance of the July Meetings, the Board requested and received detailed information from the Manager regarding the Transaction. In connection with the Transaction, the Board reviewed materials furnished by the Manager, which had been reviewed, as applicable, by representatives of the New Ownership Group and met with senior representatives of the Manager. The Board also reviewed the material terms of the Transaction and considered its possible effects on the Funds and their shareholders. During these meetings, representatives of the Manager indicated their belief that the Transaction would not adversely affect the continued operation of the Funds, the capabilities of the key personnel of the Manager who currently manage the Funds to continue to provide services to the Funds at the current levels, or the capabilities of the Sub-Advisors to provide the same level of services to the Funds.
In evaluating the New Management Agreement, the Trustees considered that they generally have been satisfied with the nature and quality of the services provided to the Funds by the Manager, including investment advisory and administrative services, and that the Funds would be best served by an arrangement that appeared
71
Disclosure Regarding the Approval of New Management and Investment Advisory Agreements (Unaudited)
likely to maintain the continuity and stability of these services. Accordingly, the Board considered information communicated by the Manager regarding the anticipated benefits of the substantially strengthened capital structure of Resolute that would result from the Transaction, and the related positive anticipated impact on the Manager’s resources available for future staffing, compensation, and staff retention. The Manager’s representatives also indicated that they believe that the Transaction best facilitates continuity of management and view such continuity as beneficial to the long-term success of the Funds, but noted that there could be no assurance of any particular benefits that may result.
In connection with the Board’s determination to approve the New Agreements, the Trustees considered, among other information, the following factors as they relate to the Transaction:
| | • | | The manner in which the Funds’ assets are managed will not change as a result of the Transaction, and the same people who currently manage the Funds’ assets are expected to continue to do so after the Transaction; |
| | • | | The fee rates payable by each Fund under the New Agreements are the same as the fee rates payable under the Current Agreements; |
| | • | | The Manager’s commitment to maintaining the contractual fee waiver/expense reimbursement agreement that is currently in effect with respect to each Fund for a period of two years following the Closing to ensure that shareholders do not face an increase in expenses; |
| | • | | The Manager’s commitment to maintaining the contractual fee waiver/expense reimbursement agreement that is currently in effect with respect to each Fund for a period of two years following the Closing to ensure that shareholders do not face an increase in expenses; |
| | • | | The New Agreements are identical in all material respects to the Current Agreements; |
| | • | | The Manager and the Sub-Advisors would provide the same services to the Funds pursuant to the New Agreements as they had been providing under the Current Agreements; |
| | • | | The Manager’s personnel who will provide management services to the Funds are not expected to change and the commitment of the New Ownership Group to retain key personnel currently employed by the Manager who currently provide services to the Funds; |
| | • | | The Sub-Advisors’ personnel who will provide advisory services to the Funds are not expected to change; |
| | • | | Resolute’s substantially strengthened capital structure following the Closing, which would enable Resolute to continue to provide the Manager with the financial resources necessary to continue to operate and grow the Funds; |
| | • | | The anticipated governance structure to be employed in the management of RIM and that following the Transaction the Manager is expected to maintain continuity of management, a similar degree of operational autonomy and its current culture of compliance; |
| | • | | The various measures in place and/or prepared to be employed to address any potential impact of the Transaction on the Manager’s business, including its day-to-day operations; |
| | • | | The anticipated absence of any adverse impact of the Transaction on the Funds’ Sub-Advisors and other key service providers; |
| | • | | The alignment of the strategic business objectives of the New Ownership Group with regard to its investment in the Manager and the Manager’s activities with respect to the Trust, which objectives are consistent with the Manager’s current objectives; |
| | • | | Fund shareholders will not bear any costs in connection with the Transaction, inasmuch as the Manager and, indirectly, the New Ownership Group will bear the costs, fees and expenses incurred by the Funds in connection with the Transaction, the proxy statement, the fees and expenses of accountants and attorneys relating to the Transaction, and the fees and expenses of the Board and the Committee for meetings held in connection with the Transaction; |
72
Disclosure Regarding the Approval of New Management and Investment Advisory Agreements (Unaudited)
| | • | | The Funds may realize benefits as a result of the Transaction, including that the Transaction is expected to maintain continuity of management of the Funds and may reduce the potential vulnerability to changes in control of the Manager that could be adverse to the Funds’ interests and affect the retention of key employees providing services to the Funds; |
| | • | | The Manager’s representation that there had been no material changes or developments relating to the Manager or the Sub-Advisors since the May-June Meetings, other than the changes or developments subsequently reported to the Board; and |
| | • | | The Trustees had requested and evaluated information relevant to the renewal of the Current Agreements at their May-June Meetings. |
In light of the proximity of the Board’s consideration of the renewal or approval of the Current Agreements at the May-June Meetings, the Trustees determined that it was not necessary to repeat certain aspects of the review conducted in connection with the approvals made the prior month. Based on the process undertaken and the considerations weighed by the Board with respect to the renewal of the Current Agreements, and the Board’s due diligence review in connection with the Transaction during the July Meetings, the Board approved the New Agreements at the July 12, 2023 meeting, and recommended that, as applicable, the shareholders of the Funds also approve the New Agreements. The factors considered by the Board in connection with the approval of the Current Agreements for the International Equity Fund and the Current Management Agreement for the EAM Fund are described in the section of this report titled “Disclosure Regarding Approval of the Current Management and Investment Advisory Agreements.” The factors considered by the Board in connection with the approval of the Current Investment Advisory Agreement for the EAM Fund are described in the section of the EAM Fund’s Semi-Annual Report dated April 30, 2023 titled “Approval Related to American Beacon Tocqueville International Value Fund – New Investment Advisory Agreement.”
73
American Beacon FundsSM
Results of Shareholder Meeting (Unaudited)
A special meeting of shareholders of each of the portfolios of the American Beacon Funds (the “Trust”) was held on October 27, 2023, and adjourned to November 17, 2023, and December 8, 2023. The shareholders of the American Beacon EAM International Small Cap Fund and American Beacon International Equity Fund (the “Funds”), two portfolios of the Trust, respectively, approved a new management agreement between American Beacon Advisors, Inc. (“American Beacon”) and the Trust with respect to the Funds on November 17, 2023, and December 8, 2023, that will become effective upon the change in control of American Beacon.
The following is the result of the shareholder votes for this proposal:
| | | | | | | | | | | | | | | | | | | | | | | | | | |
Fund | | For | | | | | Against | | | | | | Abstain | | | | | | Non-Voting | |
| American Beacon EAM International Small Cap Fund | | 3,661,126.36 | | | | | | | 85,236.84 | | | | | | | | 546,900.18 | | | | | | | | 4,101,913.66 | |
| American Beacon International Equity Fund | | 26,936,498.02 | | | | | | | 421,193.37 | | | | | | | | 2,969,460.76 | | | | | | | | 24,178,453.70 | |
74
Trustees and Officers of the American Beacon FundsSM (Unaudited)
The Trustees and officers of the American Beacon Funds (the “Trust”) are listed below, together with their principal occupations during the past five years. The address of each person listed below is 220 East Las Colinas Boulevard, Suite 1200, Irving, Texas 75039. Each Trustee oversees twenty-seven funds in the fund complex that includes the Trust, the American Beacon Select Funds, and the American Beacon Institutional Funds Trust. The Trust’s Statement of Additional Information contains additional information about the Trustees and is available without charge by calling 1-800-658-5811.
| | | | |
Name, Age | | Position, Term of Office and Length of Time Served with the Trust | | Principal Occupation(s) During Past 5 Years and Current Directorships |
| INTERESTED TRUSTEES | | Term | | |
| | Lifetime of Trust until removal, resignation or retirement* | | |
| | |
| Eugene J. Duffy (1954)** | | Trustee since 2008 | | Managing Director, Global Investment Management Distribution, Mesirow Financial Administrative Corporation (2016-Present); Managing Director, Institutional Services, Intercontinental Real Estate Corporation (2014-2016); Trustee, American Beacon Select Funds (2008-Present); Trustee, American Beacon Institutional Funds Trust (2017-Present); Trustee, American Beacon Sound Point Enhanced Income Fund (2018–2021); Trustee, American Beacon Apollo Total Return Fund (2018–2021). |
| | |
| NON-INTERESTED TRUSTEES | | Term | | |
| | Lifetime of Trust until removal, resignation or retirement* | | |
| | |
| Gilbert G. Alvarado (1969) | | Trustee since 2015 | | Chief Financial Officer (2022-Present), The Conrad Prebys Foundation; President, SJVIIF, LLC, Impact Investment Fund (2018-2022); Director, Kura MD, Inc. (local telehealth organization) (2015-2017); Senior Vice President & CFO, Sierra Health Foundation (health conversion private foundation) (2006-2022); Senior Vice President & CFO, Sierra Health Foundation: Center for Health Program Management (California public benefit corporation) (2012-2022); Director, Sacramento Regional Technology Alliance (2011-2016); Director, Valley Healthcare Staffing (2017–2018); Trustee, American Beacon Select Funds (2015-Present); Trustee, American Beacon Institutional Funds Trust (2017-Present); Trustee, American Beacon Sound Point Enhanced Income Fund (2018–2021); Trustee, American Beacon Apollo Total Return Fund (2018–2021). |
| | |
| Joseph B. Armes (1962) | | Trustee since 2015 | | Director, Switchback Energy Acquisition (2019-2021); Chairman & CEO, CSW Industrials f/k/a Capital Southwest Corporation (investment company) (2015-Present); Chairman of the Board of Capital Southwest Corporation, predecessor to CSW Industrials, Inc. (2014-2017) (investment company); President & CEO, JBA Investment Partners (family investment vehicle) (2010-Present); Director and Chair of Audit Committee, RSP Permian (oil and gas producer) (2013-2018); Trustee, American Beacon Select Funds (2015-Present); Trustee, American Beacon Institutional Funds Trust (2017-Present); Trustee, American Beacon Sound Point Enhanced Income Fund (2018–2021); Trustee, American Beacon Apollo Total Return Fund (2018–2021). |
| | |
| Gerard J. Arpey (1958) | | Trustee since 2012 | | Partner, Emerald Creek Group (private equity firm) (2011-Present); Director, S.C. Johnson & Son, Inc. (privately held company) (2008-present); Director, The Home Depot, Inc. (2015-Present); Trustee, American Beacon Select Funds (2012-Present); Trustee, American Beacon Institutional Funds Trust (2017-Present); Trustee, American Beacon Sound Point Enhanced Income Fund (2018–2021); Trustee, American Beacon Apollo Total Return Fund (2018–2021). |
75
Trustees and Officers of the American Beacon FundsSM (Unaudited)
| | | | |
Name, Age | | Position, Term of Office and Length of Time Served with the Trust | | Principal Occupation(s) During Past 5 Years and Current Directorships |
| NON-INTERESTED TRUSTEES (CONT.) | | Term | | |
| | Lifetime of Trust until removal, resignation or retirement* | | |
| | |
| Brenda A. Cline (1960) | | Trustee since 2004 Chair since 2019 Vice Chair 2018 | | Chief Financial Officer, Treasurer and Secretary, Kimbell Art Foundation (1993-Present); Director, Tyler Technologies, Inc. (public sector software solutions company) (2014-Present); Director, Range Resources Corporation (oil and natural gas company) (2015-Present); Trustee, Cushing Closed-End and Open-End Funds (2017-2021);Chair, (2019-Present), Vice Chair (2018), Trustee (2004-Present), American Beacon Select Funds; Chair (2019-Present), Vice Chair (2018), Trustee (2017-Present), American Beacon Institutional Funds Trust; Chair (2019-2021), Vice Chair (2018), Trustee (2018-2021), American Beacon Sound Point Enhanced Income Fund (2018–2021); Chair (2019-2021), Vice Chair (2018), Trustee (2018-2021), American Beacon Apollo Total Return Fund (2018–2021). |
| | |
| Claudia A. Holz (1957) | | Trustee since 2018 | | Independent Director, Blue Owl Capital, Inc. (2021-Present); Partner, KPMG LLP (1990 – 2017); Trustee, American Beacon Select Funds (2018-Present); Trustee, American Beacon Institutional Funds Trust (2018-Present); Trustee, American Beacon Sound Point Enhanced Income Fund (2018–2021); Trustee, American Beacon Apollo Total Return Fund (2018–2021). |
| | |
| Douglas A. Lindgren (1961) | | Trustee since 2018 | | Director, JLL Income Property Trust (2022-Present); CEO North America, Carne Global Financial Services (2016-2017); Consultant, Carne Financial Services (2017-2019); Managing Director, IPS Investment Management and Global Head, Content Management, UBS Wealth Management (2010-2016); Trustee, American Beacon Select Funds (2018-Present); Trustee, American Beacon Institutional Funds Trust (2018-Present); Trustee, American Beacon Sound Point Enhanced Income Fund (2018–2021); Trustee, American Beacon Apollo Total Return Fund (2018–2021). |
| | |
| Barbara J. McKenna, CFA (1963) | | Trustee since 2012 | | President/Managing Principal, Longfellow Investment Management Company (2005-Present, President since 2009); Member, External Diversity Council of the Federal Reserve Bank of Boston (2021-Present); Member, Federal Reserve Bank of Boston CEO Roundtable (2021-Present); Board Advisor, United States Tennis Association (2021-Present); Trustee, American Beacon Select Funds (2012-Present); Trustee, American Beacon Institutional Funds Trust (2017-Present); Trustee, American Beacon Sound Point Enhanced Income Fund (2018–2021); Trustee, American Beacon Apollo Total Return Fund (2018–2021). |
| | |
| OFFICERS | | Term | | |
| | One Year | | |
| | |
| Jeffrey K. Ringdahl (1975) | | President since 2022 Vice President (2010-2022) | | Director (2015-Present), President (2018-Present), Chief Executive Officer (2022-Present), Chief Operating Officer (2010-2022), Senior Vice President (2013-2018), American Beacon Advisors, Inc.; Director (2015-Present), President (2018-Present), Senior Vice President (2015-2018), Resolute Investment Holdings, LLC; Director (2015-Present), President (2018-Present), Senior Vice President (2015-2018), Resolute Topco, Inc.; Director (2015-Present), President (2018-Present), Senior Vice President (2015-2018), Resolute Acquisition, Inc.; Director (2015-Present), President (2018-Present), Chief Executive Officer (2022-Present); Chief Operating Officer (2018-2022), Senior Vice President (2015-2018), Resolute Investment Managers, Inc.; Director (2017-Present), President & Chief Executive Officer (2022-Present), Executive Vice President (2017-2022), Resolute Investment Distributors, Inc.; Director |
76
Trustees and Officers of the American Beacon FundsSM (Unaudited)
| | | | |
Name, Age | | Position, Term of Office and Length of Time Served with the Trust | | Principal Occupation(s) During Past 5 Years and Current Directorships |
| OFFICERS (CONT.) | | Term | | |
| | One Year | | |
| | | | (2017-Present), President (2018-Present), Chief Executive Officer (2022-Present), Chief Operating Officer (2018-2022), Executive Vice President (2017-2018), Resolute Investment Services, Inc.; President (2022-Present), Senior Vice President (2017-2022), Vice President (2012-2017), Manager (2015-Present), American Private Equity Management, L.L.C.; Trustee, American Beacon NextShares Trust (2015-2020); Director, Executive Vice President & Chief Operating Officer, Alpha Quant Advisors, LLC (2016-2020); Director, Shapiro Capital Management, LLC (2017-Present); Director and Executive Vice President, Continuous Capital, LLC (2018-2022); Director, RSW Investments Holdings LLC (2019-Present); Manager, SSI Investment Management, LLC (2019-Present); Director, National Investment Services of America, LLC (2019-Present); Director and Vice President American Beacon Cayman Transformational Innovation Company, Ltd. (2017-2018); Vice President, American Beacon Delaware Transformational Innovation Corporation (2017-2018); Director (2014-Present), President (2022-Present), Vice President (2014-2022), American Beacon Cayman Managed Futures Strategy Fund, Ltd.; Director (2018-Present), President (2022-Present), (Vice President (2018-2022), American Beacon Cayman TargetRisk Company, Ltd.; President (2022-Present); Vice President (2010-2022), Director and President, American Beacon Cayman Multi-Alternatives Company, Ltd.; (2023-Present); Director and President, American Beacon Cayman Trend Company, Ltd. (2023-Present); American Beacon Select Funds; President (2022-Present), Vice President (2017-2022), American Beacon Institutional Funds Trust; Vice President, American Beacon Sound Point Enhanced Income Fund (2018-2021); Vice President, American Beacon Apollo Total Return Fund (2018-2021). |
| | |
| Rosemary K. Behan (1959) | | VP, Secretary and Chief Legal Officer since 2006 | | Senior Vice President (2021-Present), Vice President (2006-2021), Secretary and General Counsel (2006-Present), American Beacon Advisors, Inc.; Secretary, Resolute Investment Holdings, LLC (2015-Present); Secretary, Resolute Topco, Inc. (2015-Present); Secretary, Resolute Acquisition, Inc. (2015–Present); Senior Vice President (2021-Present), Vice President (2015-2021), Secretary and General Counsel (2015-Present), Resolute Investment Managers, Inc.; Secretary, Resolute Investment Distributors, Inc. (2017-Present); Senior Vice President (2021-Present), Vice President (2017-2021), Secretary and General Counsel (2017-Present), Resolute Investment Services, Inc.; Secretary, American Private Equity Management, L.L.C. (2008-Present); Secretary and General Counsel, Alpha Quant Advisors, LLC (2016-2020); Vice President and Secretary, Continuous Capital, LLC (2018-2022); Secretary, Green Harvest Asset Management (2019-2021); Secretary, American Beacon Delaware Transformational Innovation Corporation (2017-2018); Secretary, American Beacon Cayman Transformational Innovation Company, Ltd. (2017-2018); Secretary, American Beacon Cayman Managed Futures Strategy Fund, Ltd. (2014-Present); Secretary, American Beacon Cayman TargetRisk Company, Ltd. (2018-Present); Secretary, American Beacon Cayman Multi-Alternatives Company, Ltd. (2023-Present); Secretary, American Beacon Cayman Trend Company, Ltd. (2023-Present); Chief Legal Officer, Vice President and Secretary, American Beacon Select Funds (2006-Present); Chief Legal Officer, Vice President and Secretary, American Beacon Institutional Funds Trust (2017-Present); Chief Legal Officer, Vice President and Secretary, American Beacon Sound Point Enhanced Income Fund (2018-2021); Chief Legal Officer, Vice President and Secretary, American Beacon Apollo Total Return Fund (2018-2021). |
77
Trustees and Officers of the American Beacon FundsSM (Unaudited)
| | | | |
Name, Age | | Position, Term of Office and Length of Time Served with the Trust | | Principal Occupation(s) During Past 5 Years and Current Directorships |
| OFFICERS (CONT.) | | Term | | |
| | One Year | | |
| | |
| Gregory J. Stumm (1981) | | VP since 2022 | | Senior Vice President, American Beacon Advisors, Inc. (2022-Present); Senior Vice President, Resolute Investment Managers, Inc. (2022-Present); Director and Senior Vice President, Resolute Investment Distributors, Inc. (2022-Present); Senior Vice President, Resolute Investment Services, Inc. (2022-Present); Vice President, American Beacon Select Funds (2022-Present); Vice President, American Beacon Institutional Funds Trust (2022-Present). |
| | |
| Paul B. Cavazos (1969) | | VP since 2016 | | Chief Investment Officer and Senior Vice President, American Beacon Advisors, Inc. (2016-Present); American Private Equity Management, L.L.C. (2017–Present); Vice President, American Beacon Select Funds (2016-Present); Vice President, American Beacon Institutional Funds Trust (2017-Present); Vice President, American Beacon Sound Point Enhanced Income Fund (2018-2021); Vice President, American Beacon Apollo Total Return Fund (2018-2021). |
| | |
| Erica Duncan (1970) | | VP since 2011 | | Vice President, American Beacon Advisors, Inc. (2011-Present); Vice President, Resolute Investment Managers (2018-Present); Vice President, Resolute Investment Services, Inc. (2018-Present); Vice President, American Beacon Select Funds (2011-Present); Vice President, American Beacon Institutional Funds Trust (2017-Present); Vice President, American Beacon Sound Point Enhanced Income Fund (2018-2021); Vice President, American Beacon Apollo Total Return Fund (2018-2021). |
| | |
| Melinda G. Heika (1961) | | VP since 2021 | | Senior Vice President (2021-Present), Treasurer and CFO (2010-Present), American Beacon Advisors, Inc.; Treasurer, Resolute Topco, Inc. (2015-Present); Treasurer, Resolute Investment Holdings, LLC. (2015-Present); Treasurer, Resolute Acquisition, Inc. (2015-Present); Senior Vice President (2021-Present), Treasurer and CFO (2017-Present), Resolute Investment Managers, Inc.; Treasurer, Resolute Investment Distributors, Inc. (2017); Senior Vice President (2021-Present); Treasurer and CFO (2017-Present), Resolute Investment Services, Inc.; Treasurer, American Private Equity Management, L.L.C. (2012-Present); Treasurer and CFO, Alpha Quant Advisors, LLC (2016-2020); Treasurer and CFO, Continuous Capital, LLC (2018-2022); Treasurer, American Beacon Cayman Transformational Innovation, Ltd. (2017-2018); Treasurer, American Beacon Delaware Transformational Innovation Corporation (2017-2018); Director (2014-Present), Vice President (2022-Present) and Treasurer (2014-2022), American Beacon Cayman Managed Futures Strategy Fund, Ltd.; Director and Vice President (2022-Present), and Treasurer(2018-2022), American Beacon Cayman TargetRisk Company, Ltd. (2018-Present); Director and Vice President, American Beacon Cayman Multi-Alternatives Company, Ltd. (2023-Present); Director and Vice President, American Beacon Cayman Trend Company, Ltd. (2023-Present) Principal Accounting Officer and Treasurer (2010-2021); American Beacon Funds; Vice President (2021-Present), Principal Accounting Officer (2017-2021) and Treasurer (2010-2021), American Beacon Select Funds; Vice President (2021–Present), Principal Accounting Officer and Treasurer (2017-2021), American Beacon Institutional Funds Trust; Vice President (2021), Principal Accounting Officer and Treasurer (2018-2021), American Beacon Sound Point Enhanced Income Fund; Vice President (2021), Principal Accounting Officer and Treasurer, American Beacon Apollo Total Return Fund (2018-2021). |
78
Trustees and Officers of the American Beacon FundsSM (Unaudited)
| | | | |
Name, Age | | Position, Term of Office and Length of Time Served with the Trust | | Principal Occupation(s) During Past 5 Years and Current Directorships |
| OFFICERS (CONT.) | | Term | | |
| | One Year | | |
| | |
| Terri L. McKinney (1963) | | VP since 2010 | | Senior Vice President (2021-Present), Vice President (2009-2021), American Beacon Advisors, Inc.; Senior Vice President (2021–Present); Vice President (2017-2021), Resolute Investment Managers, Inc.; Senior Vice President (2021-Present), Vice President (2018-2021), Resolute Investment Services, Inc; Vice President, Alpha Quant Advisors, LLC (2016-2020); Vice President, Continuous Capital, LLC (2018-2022); Vice President, American Beacon Select Funds (2010-Present); Vice President, American Beacon Institutional Funds Trust (2017-Present); Vice President, American Beacon Sound Point Enhanced Income Fund (2018-2021); Vice President, American Beacon Apollo Total Return Fund (2018-2021). |
| | |
| Samuel J. Silver (1963) | | VP since 2011 | | Vice President (2011-Present), Chief Fixed Income Officer (2016-Present), American Beacon Advisors, Inc.; Vice President, American Beacon Select Funds (2011-Present); Vice President, American Beacon Institutional Funds Trust (2017-Present); Vice President, American Beacon Sound Point Enhanced Income Fund (2018-2021); Vice President, American Beacon Apollo Total Return Fund (2018-2021). |
| | |
| Christina E. Sears (1971) | | Chief Compliance Officer since 2004 | | Chief Compliance Officer (2004-Present), Vice President (2019-Present); American Beacon Advisors, Inc.; Vice President, Resolute Investment Managers, Inc. (2017-Present); Vice President, Resolute Investment Distributors (2017-Present); Vice President, Resolute Investment Services, Inc. (2019-Present); Chief Compliance Officer, American Private Equity Management, L.L.C. (2012-Present); Chief Compliance Officer, Green Harvest Asset Management, LLC (2019-2021); Chief Compliance Officer, RSW Investments Holdings, LLC (2019-Present); Chief Compliance Officer (2016-2019) and Vice President (2016-2020), Alpha Quant Advisors, LLC ; Chief Compliance Officer (2018-2019), Vice President (2018-2022), Continuous Capital, LLC; Assistant Secretary, American Beacon Funds (1999-Present); Chief Compliance Officer (2004-Present) and Assistant Secretary (1999-Present), American Beacon Select Funds; Chief Compliance Officer and Assistant Secretary, American Beacon Institutional Funds Trust (2017-Present); Chief Compliance Officer and Assistant Secretary, American Beacon Sound Point Enhanced Income Fund (2018-2021); Chief Compliance Officer and Assistant Secretary, American Beacon Apollo Total Return Fund (2018-2021). |
| | |
| Sonia L. Bates (1956) | | Principal Accounting Officer and Treasurer since 2021 | | Assistant Treasurer, American Beacon Advisors, Inc. (2011-2018); Vice President, Fund and Tax Reporting (2023-Present), Director, Fund and Tax Reporting (2011-2023), Resolute Investment Services, Inc.; Assistant Treasurer, American Private Equity Management, L.L.C. (2012-Present); Assistant Treasurer, American Beacon Cayman Transformational Innovation Company, Ltd. (2017-2018); Treasurer, American Beacon Cayman Managed Futures Strategy Fund, Ltd. (2022-Present); Treasurer (2022-Present), Assistant Treasurer (2018-2022), American Beacon Cayman TargetRisk Company, Ltd.; Treasurer, American Beacon Cayman Multi-Alternatives Company, Ltd. (2023-Present); Treasurer, American Beacon Cayman Trend Company, Ltd. (2023-Present); Assistant Treasurer, American Beacon Funds (2011-2021); Principal Accounting Officer and Treasurer (2021-Present), Assistant Treasurer (2011-2021), American Beacon Select Funds; Principal Accounting Officer and Treasurer (2021-Present), Assistant Treasurer (2017-2021), American Beacon Institutional Funds Trust; Principal Accounting Officer and Treasurer (2021), Assistant Treasurer (2018-2021), American Beacon Sound Point Enhanced Income Fund; Principal Accounting Officer and Treasurer (2021), Assistant Treasurer (2018-2021), American Beacon Apollo Total Return Fund. |
79
Trustees and Officers of the American Beacon FundsSM (Unaudited)
| | | | |
Name, Age | | Position, Term of Office and Length of Time Served with the Trust | | Principal Occupation(s) During Past 5 Years and Current Directorships |
| OFFICERS (CONT.) | | Term | | |
| | One Year | | |
| | |
| Shelley L. Dyson (1969) | | Assistant Treasurer since 2021 | | Fund Tax Manager (2020-Present), Manager, Tax (2014-2020), Resolute Investment Services, Inc.; Assistant Treasurer American Beacon Cayman Managed Futures Strategy Fund, Ltd. (2022-Present); Assistant Treasurer, American Beacon Cayman TargetRisk Company, Ltd. (2022-Present); Assistant Treasurer, American Beacon Cayman Multi-Alternatives Company, Ltd. (2023-Present); Assistant Treasurer, American Beacon Cayman Trend Company, Ltd. (2023-Present); Assistant Treasurer, American Beacon Select Funds (2021-Present); Assistant Treasurer, American Beacon Institutional Funds Trust (2021-Present); Assistant Treasurer, American Beacon Sound Point Enhanced Income Fund (2021); Assistant Treasurer, American Beacon Apollo Total Return Fund (2021). |
| | |
| Shelley D. Abrahams (1974) | | Assistant Secretary since 2008 | | Corporate Governance Manager (2023-Present), Senior Corporate Governance & Regulatory Specialist (2020-2023), Corporate Governance & Regulatory Specialist (2017-2020), Resolute Investment Services, Inc.; Assistant Secretary, American Beacon Cayman Managed Futures Strategy Fund, Ltd. (2022-Present); Assistant Secretary, American Beacon Cayman TargetRisk Company, Ltd. (2022-Present); Assistant Secretary, American Beacon Cayman Multi-Alternatives Company, Ltd. (2023-Present); Assistant Secretary, American Beacon Cayman Trend Company, Ltd. (2023-Present); Assistant Secretary, American Beacon Select Funds (2008-Present); Assistant Secretary, American Beacon Institutional Funds Trust (2017-Present); Assistant Secretary, American Beacon Sound Point Enhanced Income Fund (2018-2021); Assistant Secretary, American Beacon Apollo Total Return Fund (2018-2021). |
| | |
| Rebecca L. Harris (1966) | | Vice President since 2022 | | Senior Vice President (2021-Present), Vice President (2011-2021), American Beacon Advisors, Inc.; Senior Vice President (2021-Present), Vice President (2017-2021), Resolute Investment Managers, Inc.; Senior Vice President (2021-Present), Vice President (2015-Present), Resolute Investment Services; Vice President, Alpha Quant Advisors, LLC (2016-2020); Vice President (2018-Present), Director (2022) Continuous Capital, LLC; Director, National Investment Services of American, LLC (2022-Present); Director, RSW Investments Holdings LLC (2022-Present); Director Shapiro Capital Management LLC (2022-Present); Director, SSI Investment Management LLC (2022-Present); Assistant Secretary, American Beacon Funds (2010-2022); Vice President (2022-Present), Assistant Secretary (2010-2022), American Beacon Select Funds; Vice President (2022-Present), Assistant Secretary (2017-2022), American Beacon Institutional Funds Trust; Assistant Secretary, American Beacon Sound Point Enhanced Income Fund (2018-2021); Assistant Secretary, American Beacon Apollo Total Return Fund (2018-2021). |
| | |
| Teresa A. Oxford (1958) | | Assistant Secretary since 2015 | | Assistant Secretary and Associate General Counsel, American Beacon Advisors, Inc. (2015-Present); Assistant Secretary, Resolute Investment Distributors (2018-2021); Assistant Secretary and Associate General Counsel, Resolute Investment Managers, Inc. (2017-Present); Assistant Secretary and Associate General Counsel, Resolute Investment Services (2018-Present); Assistant Secretary, Alpha Quant Advisors, LLC (2016-2020); Assistant Secretary, Continuous Capital, LLC (2020-2022); Assistant Secretary, American Beacon Select Funds (2015-Present); Assistant Secretary, American Beacon Institutional Funds Trust (2017-Present); Assistant Secretary, American Beacon Sound Point Enhanced Income Fund (2018-2021); Assistant Secretary, American Beacon Apollo Total Return Fund (2018-2021). |
80
Trustees and Officers of the American Beacon FundsSM (Unaudited)
| | | | |
Name, Age | | Position, Term of Office and Length of Time Served with the Trust | | Principal Occupation(s) During Past 5 Years and Current Directorships |
| | |
| Michael D. Jiang (1984) | | Assistant Secretary since 2021 | | Assistant Secretary (2022-Present), Associate General Counsel (2021-Present), American Beacon Advisors, Inc.; Assistant Secretary (2021-Present), Resolute Investment Distributors, Inc.; Assistant Secretary (2022-Present), Associate General Counsel (2021-Present), Resolute Investment Managers, Inc.; Assistant Secretary (2022–Present) and Associate General Counsel, (2021-Present), Resolute Investment Services, Inc.; Vice President (2018-2021), Second Vice President (2015-2018), The Northern Trust Company; Assistant Secretary, American Beacon Select Funds (2021-Present); Assistant Secretary, American Beacon Institutional Funds Trust (2021-Present); Assistant Secretary, American Beacon Sound Point Enhanced Income Fund (2021); Assistant Secretary, American Beacon Apollo Total Return Fund (2021). |
* As of 11/12/2014, the Board adopted a retirement plan that requires Trustees to retire no later than the last day of the calendar year in which they reach the age of 75.
** Mr. Duffy is being deemed to be an “interested person” of the Trust, as defined by the Investment Company Act of 1940, as amended, by virtue of his position with Mesirow Financial, Inc., a broker-dealer.
81
American Beacon FundsSM
Privacy Policy
October 31, 2023 (Unaudited)
The American Beacon Funds recognize and respect the privacy of our shareholders. We are providing this notice to you so you will understand how shareholder information may be collected and used.
We may collect nonpublic personal information about you from one or more of the following sources:
| | • | | information we receive from you on applications or other forms; |
| | • | | information about your transactions with us or our service providers; and |
| | • | | information we receive from third parties. |
We do not disclose any nonpublic personal information about our customers or former customers to anyone, except as permitted by law.
We restrict access to your nonpublic personal information to those employees or service providers who need to know that information to provide products or services to you. To ensure the confidentiality of your nonpublic personal information, we maintain safeguards that comply with federal standards.
82
This page intentionally left blank.
83
This page intentionally left blank.
84

Delivery of Documents
Shareholder reports are available online at www.americanbeaconfunds.com/reports. Please be advised that reports are no longer sent by mail. Instead, the reports are made available online, and you will be notified by mail each time a report is posted online. You will be provided with a website link to access the report. You may elect to receive all future reports in paper free of charge. You can request to continue receiving paper copies by calling 1-866-345-5954, or you may directly inform your financial intermediary. Detailed instructions are also included in your report notifications.
If you invest in the Fund through a financial institution, you may be able to receive the Fund’s regulatory mailings, such as the Prospectus, Annual Report and Semi-Annual Report, by e-mail. If you are interested in this option, please go to www.icsdelivery.com and search for your financial institution’s name or contact your financial institution directly.
To obtain more information about the Fund:
| | |
 | |  |
| | |
| By E-mail: | | On the Internet: |
| american_beacon.funds@ambeacon.com | | Visit our website at www.americanbeaconfunds.com |
| | | |
| | | |
| | |

By Telephone: Call (800) 658-5811 | | 
By Mail: American Beacon Funds P.O. Box 219643 Kansas City, MO 64121-9643 |
|
|
|
| | | |
| | | |
| Availability of Quarterly Portfolio Schedules | | Availability of Proxy Voting Policy and Records |
| | |
| In addition to the Schedule of Investments provided in each semi-annual and annual report, the Fund files a complete schedule of its portfolio holdings with the Securities and Exchange Commission (“SEC”) on Form N-PORT as of the end of each fiscal quarter. The Fund’s Forms N-PORT are available on the SEC’s website at www.sec.gov. The Forms N-PORT may also be reviewed and copied at the SEC’s Public Reference Section, 100 F Street, NE, Washington, D.C. 20549-2736. Information regarding the operation of the SEC’s Public Reference Room may be obtained by calling (800)-SEC-0330. A complete schedule of the Fund’s portfolio holdings is also available at www.americanbeaconfunds.com approximately twenty days after the end of each month. | | A description of the policies and procedures the Fund uses to determine how to vote proxies relating to portfolio securities is available in the Fund’s Statement of Additional Information, is available free of charge on the Fund’s website www.americanbeaconfunds.com and by calling 1-800-967-9009 or by accessing the SEC’s website at www.sec.gov. The Fund’s proxy voting record for the most recent year ended June 30 is filed annually with the SEC on Form N-PX. The Fund’s Forms N-PX are available on the SEC’s website at www.sec.gov. The Fund’s proxy voting record may also be obtained by calling 1-800-967-9009. |
Fund Service Providers:
| | | | | | | | | | | | |
CUSTODIAN State Street Bank and Trust Company Boston, Massachusetts | | | | TRANSFER AGENT SS&C GIDS, Inc. Quincy, Massachusetts | | | | INDEPENDENT REGISTERED PUBLIC ACCOUNTING FIRM PricewaterhouseCoopers LLP Boston, Massachusetts | | | | DISTRIBUTOR Resolute Investment Distributors, Inc. Irving, Texas |
This report is prepared for shareholders of the American Beacon Funds and may be distributed to others only if preceded or accompanied by a current Prospectus or Summary Prospectus.
American Beacon Funds, American Beacon EAM International Small Cap Fund and American Beacon International Equity Fund are service marks of American Beacon Advisors, Inc.
AR 10/23

About American Beacon Advisors
Since 1986, American Beacon Advisors, Inc. has offered a variety of products and investment advisory services to numerous institutional and retail clients, including a variety of mutual funds, corporate cash management, and separate account management.
Our clients include defined benefit plans, defined contribution plans, foundations, endowments, corporations, financial planners, and other institutional investors. With American Beacon Advisors, you can put the experience of a multi-billion dollar asset management firm to work for your company.
LARGE CAP VALUE FUND
Investing in value stocks may limit downside risk over time; however, the Fund may produce more modest gains than riskier stock funds as a trade-off for this potentially lower risk. Investing in foreign securities may involve heightened risk due to currency fluctuations and economic and political risks. To the extent the Fund invests more heavily in particular sectors, its performance will be sensitive to factors affecting those sectors. Financial sector companies are heavily regulated and particularly sensitive to interest rate fluctuations. The Fund’s incorporation of environmental, social and/or governance (ESG) considerations in its investment strategy may cause it to underperform funds that do not incorporate these considerations. The use of futures contracts for cash management may subject the Fund to losing more money than invested. The Fund participates in a securities lending program. Please see the prospectus for a complete discussion of the Fund’s risks. There can be no assurances that the investment objectives of this Fund will be met.
Any opinions herein, including forecasts, reflect our judgment as of the end of the reporting period and are subject to change. Each advisor’s strategies and the Fund’s portfolio composition will change depending on economic and market conditions. This report is not a complete analysis of market conditions and therefore, should not be relied upon as investment advice. Although economic and market information has been compiled from reliable sources, American Beacon Advisors, Inc. makes no representation as to the completeness or accuracy of the statements contained herein.
American Beacon Funds October 31, 2023 |
Contents
| | | | |
| |
Additional Fund Information | | | Back Cover | |
President’s Message
| | |
 | | Dear Shareholders, In the words of Theodor Seuss Geisel, the beloved children’s author and cartoonist known as Dr. Seuss, “Only you can control your future.” While we as individuals cannot control everything that’s happening in the world around us or within the global economy and markets, we can take steps to diversify our risk exposure as we seek to preserve and grow our personal savings. By making prudent adjustments to our investment portfolios with the help of trusted financial professionals, we may be better positioned to withstand the negative financial forces we’re likely to encounter in our lifetime – especially during periods like today’s geopolitical turmoil and economic uncertainty. |
At American Beacon, we endeavor to provide a broad range of disciplined investment strategies to help you potentially collect the fruits of your labor over the fullness of time. We work diligently to cultivate relationships with the investment managers who serve as sub-advisors to our investment products. Since our firm’s inception as a pension fiduciary in 1986 and the launch of our first sub-advised, multi-manager mutual funds in 1987, we have continued expanding our innovative product offerings. And we are committed to applying a solutions-based, risk-managed approach in our pursuit of institutional wisdom while striving to generate earned alpha and enduring value.
Thank you for entrusting your financial future with American Beacon. For more information about our investment products or to access your account information, please visit our website at www.americanbeaconfunds.com.
Best Regards,

Jeffrey K. Ringdahl
President
American Beacon Funds
1
Domestic Equity Market Overview
October 31, 2023 (Unaudited)
For the 12-month period ended October 31, 2023, domestic equity markets were mostly higher and had a range of risks and rewards under the surface. During the period, the Federal Reserve (“Fed”) continued to tighten monetary policy through six rate hikes totaling 2.25%. The last 0.25% hike in late July culminated in a target policy rate of 5.25% to 5.50% as inflation levels remained uncomfortably above the Fed’s target of 2%. The underlying U.S. economy remained on steady footing – despite many economists forecasting recession – as the unemployment rate remained below 4%, and third quarter U.S. real gross domestic product grew at an annualized rate of 4.9%.
In the U.S., the technology-heavy Nasdaq Composite® was up an impressive 18.0%. The S&P 500® Index was up 10.1% with mixed underlying sector performance. The top-performing S&P sectors, by a significant margin, were Communication Services (up 35.8%) and Information Technology (up 30.8%). Conversely, the worst-performing sectors were Utilities (down 7.7%) and Real Estate (down 6.5%).
From a style standpoint, Growth easily outpaced Value as shown by the 17.3% return for the Russell 3000® Growth Index compared to the Russell 3000® Value Index return of -0.5%.
In terms of market capitalization, small-cap stocks significantly underperformed their larger-capitalization peers, evidenced by the Russell 2000® Index return of -8.6% compared to the Russell 1000® Index return of 9.5%.
2
American Beacon Large Cap Value FundSM
Performance Overview
October 31, 2023 (Unaudited)
The Investor Class of the American Beacon Large Cap Value Fund (the “Fund”) returned 1.88% for the twelve months ended October 31, 2023, outperforming the Russell 1000® Value Index (the “Index”) return of 0.13% for the same period.
Comparison of Changes in Value of a $10,000 Investment for the period 10/31/2013 through 10/31/2023
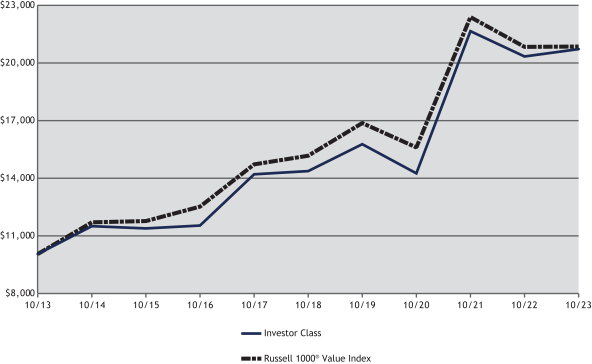
| | | | | | | | | | | | | | | | | | | | | | | | | | | | | | |
| Total Returns for the Period ended Oct 31, 2023 | |
| | | | | | |
| | | Ticker | | 1 Year | | 3 Years | | 5 Years | | 10 Years | | Value of $10,000
10/31/2013-
10/31/2023 |
R5 Class (1,6) | | AADEX | | | | 2.16 | % | | | | 13.68 | % | | | | 7.98 | % | | | | 7.88 | % | | | $ | 21,353 | |
Y Class (1,6) | | ABLYX | | | | 2.09 | % | | | | 13.61 | % | | | | 7.90 | % | | | | 7.80 | % | | | $ | 21,200 | |
Investor Class (1,6) | | AAGPX | | | | 1.88 | % | | | | 13.33 | % | | | | 7.63 | % | | | | 7.53 | % | | | $ | 20,667 | |
Advisor Class (1,6) | | AVASX | | | | 1.64 | % | | | | 13.15 | % | | | | 7.46 | % | | | | 7.37 | % | | | $ | 20,363 | |
A Class without sales charge (1,2,6) | | ALVAX | | | | 1.79 | % | | | | 13.35 | % | | | | 7.61 | % | | | | 7.49 | % | | | $ | 20,601 | |
A Class with sales Charge (1,2,6) | | ALVAX | | | | (4.04 | )% | | | | 11.13 | % | | | | 6.34 | % | | | | 6.86 | % | | | $ | 19,415 | |
C Class without sales charge (1,3,6) | | ALVCX | | | | 1.11 | % | | | | 12.51 | % | | | | 6.85 | % | | | | 6.89 | % | | | $ | 19,463 | |
C Class with sales charge (1,3,6) | | ALVCX | | | | 0.11 | % | | | | 12.51 | % | | | | 6.85 | % | | | | 6.89 | % | | | $ | 19,463 | |
R6 Class (1,4,6) | | AALRX | | | | 2.19 | % | | | | 13.72 | % | | | | 8.02 | % | | | | 7.91 | % | | | $ | 21,400 | |
| | | | | | | | | | | | | | | | | | | | | | | | | | | | | |
Russell 1000® Value Index (5) | | | | | | 0.13 | % | | | | 10.21 | % | | | | 6.60 | % | | | | 7.60 | % | | | $ | 20,799 | |
| 1. | Performance shown is historical and is not indicative of future returns. Investment returns and principal value will vary, and shares may be worth more or less at redemption than at original purchase. Performance shown is calculated based on the published end of day net asset values as of date indicated, and current performance may be lower or higher than the performance data quoted. To obtain performance as of the most recent month end, please visit www.americanbeaconfunds.com or call 1-800-967-9009. Fund performance in the table above does not reflect the deduction of taxes a shareholder would pay on distributions or the redemption of shares. Generally accepted accounting principles require adjustments to be made to the net assets of the Fund at period end for financial reporting purposes only; and as such, the total return based on the unadjusted net asset value per share may differ from the total return reported in the financial highlights. |
| 2. | A Class shares have a maximum sales charge of 5.75%. |
3
American Beacon Large Cap Value FundSM
Performance Overview
October 31, 2023 (Unaudited)
| 3. | A portion of the fees charged to the C Class was waived in 2018. Performance prior to waiving fees was lower than the actual returns shown for 2018. C Class shares have a maximum contingent deferred sales charge of 1.00% for shares redeemed within one year of the date of purchase. |
| 4. | Fund performance for the ten-year period represents the returns achieved by the R5 Class prior to 2/28/17, the inception date of the R6 Class, and the returns of the R6 Class since its inception. Expenses of the R6 Class are lower than those of the R5 Class. As a result, total returns shown may be lower than they would have been had the R6 Class been in existence since 10/31/2013. A portion of the fees charged to the R6 Class of the Fund were waived from Class inception to 2020. Performance prior to waiving fees was lower than the actual returns shown for 2017 to 2020. |
| 5. | The Russell 1000® Value Index is an unmanaged index of those stocks in the Russell 1000 Index with lower price-to-book ratios and lower forecasted growth values. Russell 1000 Value Index and Russell 1000 Index are registered trademarks of Frank Russell Company. American Beacon Funds is not promoted, sponsored or endorsed by, nor in any way affiliated with the London Stock Exchange Group plc and its group undertakings (collectively, the “LSE Group”). FTSE Russell is a trading name of certain of the LSE Group companies. LSE Group is not responsible for and has not reviewed the American Beacon Large Cap Value Fund nor any associated literature or publications and LSE Group makes no representation or warranty, express or implied, as to their accuracy, or completeness, or otherwise. All rights in the Russell 1000 Value Index (the “ Index”) vest in the relevant LSE Group company which owns the Index. Russell 1000® is a trademark of the relevant LSE Group company and is used by any other LSE Group company under license. The Index is calculated by or on behalf of FTSE International Limited or its affiliate, agent or partner. The LSE Group does not accept any liability whatsoever to any person arising out of (a) the use of, reliance on or any error in the Index or (b) investment in or operation of the Fund. The LSE Group makes no claim, prediction, warranty or representation either as to the results to be obtained from the Fund or the suitability of the Index for the purpose to which it is being put by the Manager. One cannot directly invest in an index. |
| 6. | The Total Annual Fund Operating Expense ratios set forth in the most recent Fund prospectus for the R5, Y, Investor, Advisor, A, C, and R6 Class shares were 0.63%, 0.70%, 0.95%, 1.10%, 0.89%, 1.69%, and 0.60%, respectively. The expense ratios above may vary from the expense ratios presented in other sections of this report that are based on expenses incurred during the period covered by this report. |
The Fund outperformed the Index during the period primarily due to security selection while sector allocation was moderately positive.
The Fund’s security selections in the Industrials and Information Technology sectors contributed positively to returns relative to the Index. In the Industrials sector, contributors included Vertiv Holdings Co. (up 173.8%) and FedEx Corp. (up 52.7%). Contributors in the Information Technology sector included Broadcom, Inc. (up 83.4%) and Microsoft Corp. (up 49.2%). Conversely, security selections in the Consumer Staples sector detracted from relative performance. In the Consumer Staples sector, detractors included Dollar General Corp. (down 56.4%) and Target Corp. (down 30.0%).
From a sector allocation perspective, an overweight allocation to the Industrials sector (up 6.6%) and an underweight allocation to the Real Estate sector (down 7.8%) contributed positively to relative performance. Conversely, an overweight allocation to the Financials sector (down 3.2%) detracted from relative returns during the period.
The sub-advisors continue to invest in a broadly diversified portfolio of companies that they believe have attractive valuations and above-average earnings growth potential. This approach should allow the Fund to benefit over the longer term.
4
American Beacon Large Cap Value FundSM
Performance Overview
October 31, 2023 (Unaudited)
| | | | | | | | |
| Top Ten Holdings (% Net Assets) | | | | | | | | |
| Comcast Corp., Class A | | | | | | | 2.5 | |
| Elevance Health, Inc. | | | | | | | 2.1 | |
| Vertiv Holdings Co. | | | | | | | 2.1 | |
| Wells Fargo & Co. | | | | | | | 2.0 | |
| American International Group, Inc. | | | | | | | 1.8 | |
| Pioneer Natural Resources Co. | | | | | | | 1.7 | |
| Citigroup, Inc. | | | | | | | 1.5 | |
| Fidelity National Information Services, Inc. | | | | | | | 1.5 | |
| Cigna Group | | | | | | | 1.4 | |
| U.S. Bancorp | | | | | | | 1.4 | |
| | |
| Total Fund Holdings | | | 164 | | | | | |
| | | | | | | | |
| Sector Allocation (% Equities) | | | | | | | | |
| Financials | | | | | | | 23.0 | |
| Health Care | | | | | | | 14.5 | |
| Industrials | | | | | | | 12.9 | |
| Energy | | | | | | | 11.1 | |
| Information Technology | | | | | | | 10.9 | |
| Consumer Discretionary | | | | | | | 7.0 | |
| Communication Services | | | | | | | 5.5 | |
| Consumer Staples | | | | | | | 4.6 | |
| Materials | | | | | | | 4.4 | |
| Utilities | | | | | | | 4.2 | |
| Real Estate | | | | | | | 1.9 | |
5
American Beacon Large Cap Value FundSM
Expense Examples
October 31, 2023 (Unaudited)
Fund Expense Example
As a shareholder of a Fund, you incur two types of costs: (1) transaction costs, including sales charges (loads) on purchase payments and redemption fees, if applicable, and (2) ongoing costs, including management fees, distribution (12b-1) fees, sub-transfer agent fees, and other Fund expenses. The Examples are intended to help you understand the ongoing cost (in dollars) of investing in the Fund and to compare these costs with the ongoing costs of investing in other mutual funds. The Examples are based on an investment of $1,000 invested at the beginning of the period in each Class and held for the entire period from May 1, 2023 through October 31, 2023.
Actual Expenses
The “Actual” lines of the tables provide information about actual account values and actual expenses. You may use the information on this page, together with the amount you invested, to estimate the expenses that you paid over the period. Simply divide your account value by $1,000 (for example, an $8,600 account value divided by $1,000 = $8.60), then multiply the result by the “Expenses Paid During Period” to estimate the expenses you paid on your account during this period. Shareholders of the Investor and R5 Classes that invest in the Fund through an IRA or Roth IRA may be subject to a custodial IRA fee of $15 that is typically deducted each December. If your account was subject to a custodial IRA fee during the period, your costs would have been $15 higher.
Hypothetical Example for Comparison Purposes
The “Hypothetical” lines of the tables provide information about hypothetical account values and hypothetical expenses based on the Fund’s actual expense ratio and an assumed 5% per year rate of return before expenses (not the Fund’s actual return). You may compare the ongoing costs of investing in the Fund with other funds by contrasting this 5% hypothetical example and the 5% hypothetical examples that appear in the shareholder reports of the other funds. The hypothetical account values and expenses may not be used to estimate the actual ending account balance or expenses you paid for the period. Shareholders of the Investor and R5 Classes that invest in the Fund through an IRA or Roth IRA may be subject to a custodial IRA fee of $15 that is typically deducted each December. If your account was subject to a custodial IRA fee during the period, your costs would have been $15 higher.
You should also be aware that the expenses shown in the table highlight only your ongoing costs and do not reflect any transaction costs charged by the Fund, such as sales charges (loads) or redemption fees, as applicable. Similarly, the expense examples for other funds do not reflect any transaction costs charged by those funds, such as sales charges (loads), redemption fees or exchange fees. Therefore, the “Hypothetical” lines of the tables are useful in comparing ongoing costs only and will not help you determine the relative total costs of owning different funds. If you were subject to any transaction costs during the period, your costs would have been higher.
6
American Beacon Large Cap Value FundSM
Expense Examples
October 31, 2023 (Unaudited)
| | | | | | | | | | | | | | | |
| American Beacon Large Cap Value Fund | |
| | | |
| | | Beginning Account Value
5/1/2023 | | Ending Account Value
10/31/2023 | | Expenses Paid During
Period
5/1/2023-10/31/2023* |
| R5 Class | | | | | | | | | | | | | | | |
| Actual | | | | $1,000.00 | | | | | $986.00 | | | | | $3.20 | |
| Hypothetical** | | | | $1,000.00 | | | | | $1,021.98 | | | | | $3.26 | |
| Y Class | | | | | | | | | | | | | | | |
| Actual | | | | $1,000.00 | | | | | $985.40 | | | | | $3.55 | |
| Hypothetical** | | | | $1,000.00 | | | | | $1,021.63 | | | | | $3.62 | |
| Investor Class | | | | | | | | | | | | | | | |
| Actual | | | | $1,000.00 | | | | | $984.50 | | | | | $4.70 | |
| Hypothetical** | | | | $1,000.00 | | | | | $1,020.47 | | | | | $4.79 | |
| Advisor Class | | | | | | | | | | | | | | | |
| Actual | | | | $1,000.00 | | | | | $983.70 | | | | | $5.60 | |
| Hypothetical** | | | | $1,000.00 | | | | | $1,019.56 | | | | | $5.70 | |
| A Class | | | | | | | | | | | | | | | |
| Actual | | | | $1,000.00 | | | | | $984.10 | | | | | $5.00 | |
| Hypothetical** | | | | $1,000.00 | | | | | $1,020.16 | | | | | $5.09 | |
| C Class | | | | | | | | | | | | | | | |
| Actual | | | | $1,000.00 | | | | | $981.10 | | | | | $8.49 | |
| Hypothetical** | | | | $1,000.00 | | | | | $1,016.64 | | | | | $8.64 | |
| R6 Class | | | | | | | | | | | | | | | |
| Actual | | | | $1,000.00 | | | | | $986.00 | | | | | $3.05 | |
| Hypothetical** | | | | $1,000.00 | | | | | $1,022.13 | | | | | $3.11 | |
| * | Expenses are equal to the Fund’s annualized expense ratios for the six-month period of 0.64%, 0.71%, 0.94%, 1.12%, 1.00%, 1.70%, and 0.61% for the R5, Y, Investor, Advisor, A, C, and R6 Classes, respectively, multiplied by the average account value over the period, multiplied by the number derived by dividing the number of days in the most recent fiscal half-year (184) by days in the year (365) to reflect the half-year period. |
| ** | 5% return before expenses. |
7
American Beacon Large Cap Value FundSM
Report of Independent Registered Public Accounting Firm
To the Board of Trustees of American Beacon Funds and Shareholders of American Beacon Large Cap Value Fund
Opinion on the Financial Statements
We have audited the accompanying statement of assets and liabilities, including the schedule of investments, of American Beacon Large Cap Value Fund (one of the funds constituting American Beacon Funds, referred hereafter as the “Fund”) as of October 31, 2023, the related statement of operations for the year ended October 31, 2023, the statement of changes in net assets for each of the two years in the period ended October 31, 2023, including the related notes, and the financial highlights for each of the two years in the period ended October 31, 2023 (collectively referred to as the “financial statements”). In our opinion, the financial statements present fairly, in all material respects, the financial position of the Fund as of October 31, 2023, the results of its operations for the year then ended, the changes in its net assets for each of the two years in the period ended October 31, 2023 and the financial highlights for each of the two years in the period ended October 31, 2023 in conformity with accounting principles generally accepted in the United States of America.
The financial statements of the Fund as of and for the year ended October 31, 2021 and the financial highlights for each of the periods ended on or prior to October 31, 2021 (not presented herein, other than the financial highlights) were audited by other auditors whose report dated December 30, 2021 expressed an unqualified opinion on those financial statements and financial highlights.
Basis for Opinion
These financial statements are the responsibility of the Fund’s management. Our responsibility is to express an opinion on the Fund’s financial statements based on our audits. We are a public accounting firm registered with the Public Company Accounting Oversight Board (United States) (PCAOB) and are required to be independent with respect to the Fund in accordance with the U.S. federal securities laws and the applicable rules and regulations of the Securities and Exchange Commission and the PCAOB.
We conducted our audits of these financial statements in accordance with the standards of the PCAOB. Those standards require that we plan and perform the audit to obtain reasonable assurance about whether the financial statements are free of material misstatement, whether due to error or fraud.
Our audits included performing procedures to assess the risks of material misstatement of the financial statements, whether due to error or fraud, and performing procedures that respond to those risks. Such procedures included examining, on a test basis, evidence regarding the amounts and disclosures in the financial statements. Our audits also included evaluating the accounting principles used and significant estimates made by management, as well as evaluating the overall presentation of the financial statements. Our procedures included confirmation of securities owned as of October 31, 2023 by correspondence with the custodians and brokers; when replies were not received from brokers, we performed other auditing procedures. We believe that our audits provide a reasonable basis for our opinion.
/s/ PricewaterhouseCoopers LLP
Boston, Massachusetts
December 27, 2023
We have served as the auditor of one or more investment companies in the American Beacon family of funds since 2016.
8
American Beacon Large Cap Value FundSM
Schedule of Investments
October 31, 2023
| | | | | | | | | | | | | | | |
| | | |
| | | Shares | | | | Fair Value |
| | | | | | | |
| | | |
| COMMON STOCKS - 92.79% | | | | | | |
| | | |
| Communication Services - 5.16% | | | | | | |
| | | |
| Entertainment - 0.84% | | | | | | |
| Electronic Arts, Inc. | | | | 124,808 | | | | | | | | | $ | 15,449,982 | |
| Warner Bros Discovery, Inc.A | | | | 930,700 | | | | | | | | | | 9,251,158 | |
| | | | | | | | | | | | | | | |
| | | | | | | | | | | | | | 24,701,140 | |
| | | | | | | | | | | | | | | |
| | | | | | | | | | | | | | | |
| | | |
| Interactive Media & Services - 1.18% | | | | | | |
| Alphabet, Inc., Class AA | | | | 281,734 | | | | | | | | | | 34,957,555 | |
| | | | | | | | | | | | | | | |
| | | | | | | | | | | | | | | |
| | | |
| Media - 3.14% | | | | | | |
| Charter Communications, Inc., Class AA | | | | 24,696 | | | | | | | | | | 9,947,549 | |
| Comcast Corp., Class A | | | | 1,789,042 | | | | | | | | | | 73,869,544 | |
| Omnicom Group, Inc. | | | | 67,078 | | | | | | | | | | 5,024,813 | |
| Paramount Global, Class B | | | | 338,300 | | | | | | | | | | 3,680,704 | |
| | | | | | | | | | | | | | | |
| | | | | | | | | | | | | | 92,522,610 | |
| | | | | | | | | | | | | | | |
| | | | | | | | | | | | | | | |
Total Communication Services | | | | | | | | | | | | | | 152,181,305 | |
| | | | | | | | | | | | | | | |
| | | | | | | | | | | | | | | |
| | | |
| Consumer Discretionary - 6.27% | | | | | | |
| | | |
| Automobile Components - 1.40% | | | | | | |
| Adient PLCA | | | | 98,498 | | | | | | | | | | 3,318,398 | |
| Aptiv PLCA | | | | 389,200 | | | | | | | | | | 33,938,240 | |
| BorgWarner, Inc. | | | | 108,100 | | | | | | | | | | 3,988,890 | |
| | | | | | | | | | | | | | | |
| | | | | | | | | | | | | | 41,245,528 | |
| | | | | | | | | | | | | | | |
| | | | | | | | | | | | | | | |
| | | |
| Automobiles - 0.73% | | | | | | |
| General Motors Co. | | | | 764,732 | | | | | | | | | | 21,565,442 | |
| | | | | | | | | | | | | | | |
| | | | | | | | | | | | | | | |
| | | |
| Hotels, Restaurants & Leisure - 2.95% | | | | | | |
| Aramark | | | | 870,827 | | | | | | | | | | 23,451,371 | |
| Booking Holdings, Inc.A | | | | 1,580 | | | | | | | | | | 4,407,505 | |
| Las Vegas Sands Corp. | | | | 662,605 | | | | | | | | | | 31,447,233 | |
| Marriott International, Inc., Class A | | | | 70,424 | | | | | | | | | | 13,279,149 | |
| Wynn Resorts Ltd. | | | | 163,428 | | | | | | | | | | 14,345,710 | |
| | | | | | | | | | | | | | | |
| | | | | | | | | | | | | | 86,930,968 | |
| | | | | | | | | | | | | | | |
| | | | | | | | | | | | | | | |
| | | |
| Specialty Retail - 1.19% | | | | | | |
| Lithia Motors, Inc. | | | | 64,460 | | | | | | | | | | 15,612,857 | |
| Lowe’s Cos., Inc. | | | | 102,588 | | | | | | | | | | 19,550,195 | |
| | | | | | | | | | | | | | | |
| | | | | | | | | | | | | | 35,163,052 | |
| | | | | | | | | | | | | | | |
| | | | | | | | | | | | | | | |
Total Consumer Discretionary | | | | | | | | | | | | | | 184,904,990 | |
| | | | | | | | | | | | | | | |
| | | | | | | | | | | | | | | |
| | | |
| Consumer Staples - 3.31% | | | | | | |
| | | |
| Beverages - 0.75% | | | | | | |
| Keurig Dr Pepper, Inc. | | | | 335,085 | | | | | | | | | | 10,163,128 | |
| PepsiCo, Inc. | | | | 72,502 | | | | | | | | | | 11,838,126 | |
| | | | | | | | | | | | | | | |
| | | | | | | | | | | | | | 22,001,254 | |
| | | | | | | | | | | | | | | |
| | | | | | | | | | | | | | | |
| | | |
| Consumer Staples Distribution & Retail - 0.39% | | | | | | |
| Target Corp. | | | | 103,439 | | | | | | | | | | 11,460,007 | |
| | | | | | | | | | | | | | | |
| | | | | | | | | | | | | | | |
| | | |
| Food Products - 0.63% | | | | | | |
| Archer-Daniels-Midland Co. | | | | 40,021 | | | | | | | | | | 2,864,303 | |
| Nestle SA, ADRB | | | | 145,689 | | | | | | | | | | 15,699,447 | |
| | | | | | | | | | | | | | | |
| | | | | | | | | | | | | | 18,563,750 | |
| | | | | | | | | | | | | | | |
| | | | | | | | | | | | | | | |
See accompanying notes
9
American Beacon Large Cap Value FundSM
Schedule of Investments
October 31, 2023
| | | | | | | | | | | | | | | |
| | | |
| | | Shares | | | | Fair Value |
| | | | | | | |
| | | |
| COMMON STOCKS - 92.79% (continued) | | | | | | |
| | | |
| Consumer Staples - 3.31% (continued) | | | | | | |
| | | |
| Household Products - 0.26% | | | | | | |
| Kimberly-Clark Corp. | | | | 63,049 | | | | | | | | | $ | 7,543,182 | |
| | | | | | | | | | | | | | | |
| | | | | | | | | | | | | | | |
| | | |
| Personal Products - 0.30% | | | | | | |
| Kenvue, Inc. | | | | 479,673 | | | | | | | | | | 8,921,918 | |
| | | | | | | | | | | | | | | |
| | | | | | | | | | | | | | | |
| | | |
| Tobacco - 0.98% | | | | | | |
| Philip Morris International, Inc. | | | | 325,783 | | | | | | | | | | 29,046,812 | |
| | | | | | | | | | | | | | | |
| | | | | | | | | | | | | | | |
Total Consumer Staples | | | | | | | | | | | | | | 97,536,923 | |
| | | | | | | | | | | | | | | |
| | | | | | | | | | | | | | | |
| | | |
| Energy - 9.36% | | | | | | |
| | | |
| Energy Equipment & Services - 2.24% | | | | | | |
| Baker Hughes Co. | | | | 139,500 | | | | | | | | | | 4,801,590 | |
| Halliburton Co. | | | | 947,460 | | | | | | | | | | 37,273,077 | |
| NOV, Inc. | | | | 960,200 | | | | | | | | | | 19,165,592 | |
| Schlumberger NV | | | | 85,200 | | | | | | | | | | 4,742,232 | |
| | | | | | | | | | | | | | | |
| | | | | | | | | | | | | | 65,982,491 | |
| | | | | | | | | | | | | | | |
| | | | | | | | | | | | | | | |
| | | |
| Oil, Gas & Consumable Fuels - 7.12% | | | | | | |
| APA Corp. | | | | 831,400 | | | | | | | | | | 33,023,208 | |
| ConocoPhillips | | | | 253,848 | | | | | | | | | | 30,157,142 | |
| EOG Resources, Inc. | | | | 80,966 | | | | | | | | | | 10,221,957 | |
| Hess Corp. | | | | 187,709 | | | | | | | | | | 27,105,180 | |
| Marathon Oil Corp. | | | | 711,986 | | | | | | | | | | 19,444,338 | |
| Murphy Oil Corp. | | | | 106,770 | | | | | | | | | | 4,790,770 | |
| Ovintiv, Inc. | | | | 264,000 | | | | | | | | | | 12,672,000 | |
| Phillips 66 | | | | 199,387 | | | | | | | | | | 22,744,075 | |
| Pioneer Natural Resources Co. | | | | 207,503 | | | | | | | | | | 49,593,217 | |
| | | | | | | | | | | | | | | |
| | | | | | | | | | | | | | 209,751,887 | |
| | | | | | | | | | | | | | | |
| | | | | | | | | | | | | | | |
Total Energy | | | | | | | | | | | | | | 275,734,378 | |
| | | | | | | | | | | | | | | |
| | | | | | | | | | | | | | | |
| | | |
| Financials - 22.50% | | | | | | |
| | | |
| Banks - 8.28% | | | | | | |
| Bank of America Corp. | | | | 278,400 | | | | | | | | | | 7,333,056 | |
| Citigroup, Inc. | | | | 1,153,522 | | | | | | | | | | 45,552,584 | |
| Citizens Financial Group, Inc. | | | | 883,153 | | | | | | | | | | 20,692,275 | |
| First Citizens BancShares, Inc., Class A | | | | 5,306 | | | | | | | | | | 7,326,206 | |
| JPMorgan Chase & Co. | | | | 282,730 | | | | | | | | | | 39,316,434 | |
| M&T Bank Corp. | | | | 142,576 | | | | | | | | | | 16,075,444 | |
| PNC Financial Services Group, Inc. | | | | 79,355 | | | | | | | | | | 9,083,767 | |
| U.S. Bancorp | | | | 1,249,066 | | | | | | | | | | 39,820,224 | |
| Wells Fargo & Co. | | | | 1,476,388 | | | | | | | | | | 58,715,950 | |
| | | | | | | | | | | | | | | |
| | | | | | | | | | | | | | 243,915,940 | |
| | | | | | | | | | | | | | | |
| | | | | | | | | | | | | | | |
| | | |
| Capital Markets - 3.37% | | | | | | |
| Bank of New York Mellon Corp. | | | | 476,700 | | | | | | | | | | 20,259,750 | |
| BlackRock, Inc. | | | | 15,585 | | | | | | | | | | 9,542,384 | |
| Goldman Sachs Group, Inc. | | | | 61,453 | | | | | | | | | | 18,657,745 | |
| KKR & Co., Inc. | | | | 115,051 | | | | | | | | | | 6,373,825 | |
| Morgan Stanley | | | | 230,525 | | | | | | | | | | 16,325,781 | |
| Nasdaq, Inc. | | | | 280,167 | | | | | | | | | | 13,896,283 | |
| State Street Corp. | | | | 222,180 | | | | | | | | | | 14,359,494 | |
| | | | | | | | | | | | | | | |
| | | | | | | | | | | | | | 99,415,262 | |
| | | | | | | | | | | | | | | |
| | | | | | | | | | | | | | | |
See accompanying notes
10
American Beacon Large Cap Value FundSM
Schedule of Investments
October 31, 2023
| | | | | | | | | | | | | | | |
| | | |
| | | Shares | | | | Fair Value |
| | | | | | | |
| | | |
| COMMON STOCKS - 92.79% (continued) | | | | | | |
| | | |
| Financials - 22.50% (continued) | | | | | | |
| | | |
| Consumer Finance - 1.36% | | | | | | |
| American Express Co. | | | | 208,617 | | | | | | | | | $ | 30,464,341 | |
| Capital One Financial Corp. | | | | 47,400 | | | | | | | | | | 4,801,146 | |
| Discover Financial Services | | | | 58,200 | | | | | | | | | | 4,777,056 | |
| | | | | | | | | | | | | | | |
| | | | | | | | | | | | | | 40,042,543 | |
| | | | | | | | | | | | | | | |
| | | | | | | | | | | | | | | |
| | | |
| Financial Services - 1.87% | | | | | | |
| Corebridge Financial, Inc. | | | | 249,400 | | | | | | | | | | 4,988,000 | |
| Equitable Holdings, Inc. | | | | 180,100 | | | | | | | | | | 4,785,257 | |
| Fidelity National Information Services, Inc. | | | | 924,718 | | | | | | | | | | 45,412,901 | |
| | | | | | | | | | | | | | | |
| | | | | | | | | | | | | | 55,186,158 | |
| | | | | | | | | | | | | | | |
| | | | | | | | | | | | | | | |
| | | |
| Insurance - 7.62% | | | | | | |
| Allstate Corp. | | | | 170,272 | | | | | | | | | | 21,816,951 | |
| American International Group, Inc. | | | | 870,351 | | | | | | | | | | 53,361,220 | |
| Aon PLC, Class A | | | | 80,631 | | | | | | | | | | 24,947,231 | |
| Chubb Ltd. | | | | 101,015 | | | | | | | | | | 21,679,839 | |
| Hartford Financial Services Group, Inc. | | | | 217,500 | | | | | | | | | | 15,975,375 | |
| Marsh & McLennan Cos., Inc. | | | | 140,205 | | | | | | | | | | 26,589,878 | |
| Progressive Corp. | | | | 180,444 | | | | | | | | | | 28,526,392 | |
| Travelers Cos., Inc. | | | | 93,386 | | | | | | | | | | 15,636,552 | |
| Willis Towers Watson PLC | | | | 68,050 | | | | | | | | | | 16,052,315 | |
| | | | | | | | | | | | | | | |
| | | | | | | | | | | | | | 224,585,753 | |
| | | | | | | | | | | | | | | |
| | | | | | | | | | | | | | | |
Total Financials | | | | | | | | | | | | | | 663,145,656 | |
| | | | | | | | | | | | | | | |
| | | | | | | | | | | | | | | |
| | | |
| Health Care - 14.26% | | | | | | |
| | | |
| Biotechnology - 0.34% | | | | | | |
| AbbVie, Inc. | | | | 72,041 | | | | | | | | | | 10,170,748 | |
| | | | | | | | | | | | | | | |
| | | | | | | | | | | | | | | |
| | | |
| Health Care Equipment & Supplies - 2.76% | | | | | | |
| Abbott Laboratories | | | | 118,158 | | | | | | | | | | 11,171,839 | |
| Boston Scientific Corp.A | | | | 163,509 | | | | | | | | | | 8,370,026 | |
| GE HealthCare Technologies, Inc. | | | | 265,320 | | | | | | | | | | 17,662,352 | |
| Medtronic PLC | | | | 542,569 | | | | | | | | | | 38,283,669 | |
| Zimmer Biomet Holdings, Inc. | | | | 55,367 | | | | | | | | | | 5,780,868 | |
| | | | | | | | | | | | | | | |
| | | | | | | | | | | | | | 81,268,754 | |
| | | | | | | | | | | | | | | |
| | | | | | | | | | | | | | | |
| | | |
| Health Care Providers & Services - 7.23% | | | | | | |
| Centene Corp.A | | | | 187,300 | | | | | | | | | | 12,919,954 | |
| Cigna Group | | | | 137,867 | | | | | | | | | | 42,628,476 | |
| CVS Health Corp. | | | | 438,647 | | | | | | | | | | 30,271,030 | |
| Elevance Health, Inc. | | | | 138,142 | | | | | | | | | | 62,176,333 | |
| HCA Healthcare, Inc. | | | | 43,500 | | | | | | | | | | 9,837,090 | |
| McKesson Corp. | | | | 53,253 | | | | | | | | | | 24,249,286 | |
| UnitedHealth Group, Inc. | | | | 58,079 | | | | | | | | | | 31,104,789 | |
| | | | | | | | | | | | | | | |
| | | | | | | | | | | | | | 213,186,958 | |
| | | | | | | | | | | | | | | |
| | | | | | | | | | | | | | | |
| | | |
| Life Sciences Tools & Services - 0.81% | | | | | | |
| Avantor, Inc.A | | | | 1,082,120 | | | | | | | | | | 18,861,352 | |
| Thermo Fisher Scientific, Inc. | | | | 10,982 | | | | | | | | | | 4,884,464 | |
| | | | | | | | | | | | | | | |
| | | | | | | | | | | | | | 23,745,816 | |
| | | | | | | | | | | | | | | |
| | | | | | | | | | | | | | | |
| | | |
| Pharmaceuticals - 3.12% | | | | | | |
| GSK PLC, ADR | | | | 137,227 | | | | | | | | | | 4,899,004 | |
| Johnson & Johnson | | | | 155,316 | | | | | | | | | | 23,039,576 | |
| Merck & Co., Inc. | | | | 373,591 | | | | | | | | | | 38,367,796 | |
| Pfizer, Inc. | | | | 572,381 | | | | | | | | | | 17,491,963 | |
See accompanying notes
11
American Beacon Large Cap Value FundSM
Schedule of Investments
October 31, 2023
| | | | | | | | | | | | | | | |
| | | |
| | | Shares | | | | Fair Value |
| | | | | | | |
| | | |
| COMMON STOCKS - 92.79% (continued) | | | | | | |
| | | |
| Health Care - 14.26% (continued) | | | | | | |
| | | |
| Pharmaceuticals - 3.12% (continued) | | | | | | |
| Roche Holding AG, ADR | | | | 91,798 | | | | | | | | | $ | 2,967,829 | |
| Sanofi SA, ADR | | | | 112,064 | | | | | | | | | | 5,070,896 | |
| | | | | | | | | | | | | | | |
| | | | | | | | | | | | | | 91,837,064 | |
| | | | | | | | | | | | | | | |
| | | | | | | | | | | | | | | |
Total Health Care | | | | | | | | | | | | | | 420,209,340 | |
| | | | | | | | | | | | | | | |
| | | | | | | | | | | | | | | |
| | | |
| Industrials - 12.21% | | | | | | |
| | | |
| Aerospace & Defense - 3.02% | | | | | | |
| Boeing Co.A | | | | 60,100 | | | | | | | | | | 11,227,882 | |
| General Dynamics Corp. | | | | 104,023 | | | | | | | | | | 25,101,790 | |
| Northrop Grumman Corp. | | | | 51,854 | | | | | | | | | | 24,445,531 | |
| RTX Corp. | | | | 345,663 | | | | | | | | | | 28,133,512 | |
| | | | | | | | | | | | | | | |
| | | | | | | | | | | | | | 88,908,715 | |
| | | | | | | | | | | | | | | |
| | | | | | | | | | | | | | | |
| | | |
| Air Freight & Logistics - 0.61% | | | | | | |
| FedEx Corp. | | | | 75,490 | | | | | | | | | | 18,125,149 | |
| | | | | | | | | | | | | | | |
| | | | | | | | | | | | | | | |
| | | |
| Building Products - 0.45% | | | | | | |
| Johnson Controls International PLC | | | | 125,037 | | | | | | | | | | 6,129,314 | |
| Trane Technologies PLC | | | | 36,862 | | | | | | | | | | 7,015,207 | |
| | | | | | | | | | | | | | | |
| | | | | | | | | | | | | | 13,144,521 | |
| | | | | | | | | | | | | | | |
| | | | | | | | | | | | | | | |
| | | |
| Commercial Services & Supplies - 0.02% | | | | | | |
| Veralto Corp.A | | | | 6,787 | | | | | | | | | | 468,303 | |
| | | | | | | | | | | | | | | |
| | | | | | | | | | | | | | | |
| | | |
| Construction & Engineering - 0.45% | | | | | | |
| AECOM | | | | 119,797 | | | | | | | | | | 9,170,460 | |
| Fluor Corp.A | | | | 126,300 | | | | | | | | | | 4,204,527 | |
| | | | | | | | | | | | | | | |
| | | | | | | | | | | | | | 13,374,987 | |
| | | | | | | | | | | | | | | |
| | | | | | | | | | | | | | | |
| | | |
| Electrical Equipment - 2.56% | | | | | | |
| Eaton Corp. PLC | | | | 65,756 | | | | | | | | | | 13,671,330 | |
| Vertiv Holdings Co. | | | | 1,573,018 | | | | | | | | | | 61,772,417 | |
| | | | | | | | | | | | | | | |
| | | | | | | | | | | | | | 75,443,747 | |
| | | | | | | | | | | | | | | |
| | | | | | | | | | | | | | | |
| | | |
| Ground Transportation - 1.45% | | | | | | |
| JB Hunt Transport Services, Inc. | | | | 131,706 | | | | | | | | | | 22,636,310 | |
| Union Pacific Corp. | | | | 96,291 | | | | | | | | | | 19,990,975 | |
| | | | | | | | | | | | | | | |
| | | | | | | | | | | | | | 42,627,285 | |
| | | | | | | | | | | | | | | |
| | | | | | | | | | | | | | | |
| | | |
| Industrial Conglomerates - 1.29% | | | | | | |
| General Electric Co. | | | | 194,262 | | | | | | | | | | 21,102,681 | |
| Honeywell International, Inc. | | | | 92,494 | | | | | | | | | | 16,950,450 | |
| | | | | | | | | | | | | | | |
| | | | | | | | | | | | | | 38,053,131 | |
| | | | | | | | | | | | | | | |
| | | | | | | | | | | | | | | |
| | | |
| Machinery - 2.06% | | | | | | |
| Cummins, Inc. | | | | 54,997 | | | | | | | | | | 11,895,851 | |
| Illinois Tool Works, Inc. | | | | 58,792 | | | | | | | | | | 13,176,463 | |
| Otis Worldwide Corp. | | | | 40,539 | | | | | | | | | | 3,130,016 | |
| PACCAR, Inc. | | | | 160,642 | | | | | | | | | | 13,257,784 | |
| Stanley Black & Decker, Inc. | | | | 175,827 | | | | | | | | | | 14,954,087 | |
| Timken Co. | | | | 64,000 | | | | | | | | | | 4,423,680 | |
| | | | | | | | | | | | | | | |
| | | | | | | | | | | | | | 60,837,881 | |
| | | | | | | | | | | | | | | |
| | | | | | | | | | | | | | | |
| | | |
| Passenger Airlines - 0.00% | | | | | | |
| Southwest Airlines Co. | | | | 6,451 | | | | | | | | | | 143,406 | |
| | | | | | | | | | | | | | | |
| | | | | | | | | | | | | | | |
See accompanying notes
12
American Beacon Large Cap Value FundSM
Schedule of Investments
October 31, 2023
| | | | | | | | | | | | | | | |
| | | |
| | | Shares | | | | Fair Value |
| | | | | | | |
| | | |
| COMMON STOCKS - 92.79% (continued) | | | | | | |
| | | |
| Industrials - 12.21% (continued) | | | | | | |
| | | |
| Professional Services - 0.30% | | | | | | |
| Equifax, Inc. | | | | 51,579 | | | | | | | | | $ | 8,746,251 | |
| | | | | | | | | | | | | | | |
| | | | | | | | | | | | | | | |
Total Industrials | | | | | | | | | | | | | | 359,873,376 | |
| | | | | | | | | | | | | | | |
| | | | | | | | | | | | | | | |
| | | |
| Information Technology - 9.40% | | | | | | |
| | | |
| Communications Equipment - 0.97% | | | | | | |
| F5, Inc.A | | | | 188,700 | | | | | | | | | | 28,605,033 | |
| | | | | | | | | | | | | | | |
| | | | | | | | | | | | | | | |
| | | |
| Electronic Equipment, Instruments & Components - 0.61% | | | | | | |
| Corning, Inc. | | | | 319,640 | | | | | | | | | | 8,553,566 | |
| TE Connectivity Ltd. | | | | 79,200 | | | | | | | | | | 9,333,720 | |
| | | | | | | | | | | | | | | |
| | | | | | | | | | | | | | 17,887,286 | |
| | | | | | | | | | | | | | | |
| | | | | | | | | | | | | | | |
| | | |
| IT Services - 1.19% | | | | | | |
| Accenture PLC, Class A | | | | 67,245 | | | | | | | | | | 19,977,817 | |
| Cognizant Technology Solutions Corp., Class A | | | | 236,290 | | | | | | | | | | 15,233,616 | |
| | | | | | | | | | | | | | | |
| | | | | | | | | | | | | | 35,211,433 | |
| | | | | | | | | | | | | | | |
| | | | | | | | | | | | | | | |
| | | |
| Semiconductors & Semiconductor Equipment - 4.22% | | | | | | |
| Analog Devices, Inc. | | | | 109,953 | | | | | | | | | | 17,298,905 | |
| Broadcom, Inc. | | | | 42,313 | | | | | | | | | | 35,600,889 | |
| KLA Corp. | | | | 32,338 | | | | | | | | | | 15,189,159 | |
| Micron Technology, Inc. | | | | 155,000 | | | | | | | | | | 10,364,850 | |
| QUALCOMM, Inc. | | | | 187,516 | | | | | | | | | | 20,437,369 | |
| Skyworks Solutions, Inc. | | | | 136,239 | | | | | | | | | | 11,817,371 | |
| Texas Instruments, Inc. | | | | 95,331 | | | | | | | | | | 13,537,955 | |
| | | | | | | | | | | | | | | |
| | | | | | | | | | | | | | 124,246,498 | |
| | | | | | | | | | | | | | | |
| | | | | | | | | | | | | | | |
| | | |
| Software - 2.41% | | | | | | |
| Microsoft Corp. | | | | 73,908 | | | | | | | | | | 24,989,034 | |
| Oracle Corp. | | | | 317,427 | | | | | | | | | | 32,821,952 | |
| Workday, Inc., Class AA | | | | 62,200 | | | | | | | | | | 13,168,362 | |
| | | | | | | | | | | | | | | |
| | | | | | | | | | | | | | 70,979,348 | |
| | | | | | | | | | | | | | | |
| | | | | | | | | | | | | | | |
Total Information Technology | | | | | | | | | | | | | | 276,929,598 | |
| | | | | | | | | | | | | | | |
| | | | | | | | | | | | | | | |
| | | |
| Materials - 4.30% | | | | | | |
| | | |
| Chemicals - 3.86% | | | | | | |
| Air Products & Chemicals, Inc. | | | | 100,706 | | | | | | | | | | 28,443,403 | |
| Axalta Coating Systems Ltd.A | | | | 806,349 | | | | | | | | | | 21,150,534 | |
| Corteva, Inc. | | | | 113,277 | | | | | | | | | | 5,453,155 | |
| DuPont de Nemours, Inc. | | | | 456,530 | | | | | | | | | | 33,271,906 | |
| Olin Corp. | | | | 263,100 | | | | | | | | | | 11,239,632 | |
| PPG Industries, Inc. | | | | 55,245 | | | | | | | | | | 6,782,429 | |
| Sherwin-Williams Co. | | | | 31,288 | | | | | | | | | | 7,453,114 | |
| | | | | | | | | | | | | | | |
| | | | | | | | | | | | | | 113,794,173 | |
| | | | | | | | | | | | | | | |
| | | | | | | | | | | | | | | |
| | | |
| Construction Materials - 0.33% | | | | | | |
| CRH PLC | | | | 181,183 | | | | | | | | | | 9,705,973 | |
| | | | | | | | | | | | | | | |
| | | | | | | | | | | | | | | |
| | | |
| Containers & Packaging - 0.11% | | | | | | |
| International Paper Co. | | | | 96,786 | | | | | | | | | | 3,264,592 | |
| | | | | | | | | | | | | | | |
| | | | | | | | | | | | | | | |
Total Materials | | | | | | | | | | | | | | 126,764,738 | |
| | | | | | | | | | | | | | | |
| | | | | | | | | | | | | | | |
| | | |
| Real Estate - 1.88% | | | | | | |
| | | |
| Industrial REITs - 0.53% | | | | | | |
| Prologis, Inc. | | | | 153,714 | | | | | | | | | | 15,486,686 | |
| | | | | | | | | | | | | | | |
| | | | | | | | | | | | | | | |
See accompanying notes
13
American Beacon Large Cap Value FundSM
Schedule of Investments
October 31, 2023
| | | | | | | | | | | | | | | |
| | | |
| | | Shares | | | | Fair Value |
| | | | | | | |
| | | |
| COMMON STOCKS - 92.79% (continued) | | | | | | |
| | | |
| Real Estate - 1.88% (continued) | | | | | | |
| | | |
| Specialized REITs - 1.35% | | | | | | |
| Public Storage | | | | 50,351 | | | | | | | | | $ | 12,019,287 | |
| VICI Properties, Inc. | | | | 997,568 | | | | | | | | | | 27,832,147 | |
| | | | | | | | | | | | | | | |
| | | | | | | | | | | | | | 39,851,434 | |
| | | | | | | | | | | | | | | |
| | | | | | | | | | | | | | | |
Total Real Estate | | | | | | | | | | | | | | 55,338,120 | |
| | | | | | | | | | | | | | | |
| | | | | | | | | | | | | | | |
| | | |
| Utilities - 4.14% | | | | | | |
| | | |
| Electric Utilities - 3.76% | | | | | | |
| American Electric Power Co., Inc. | | | | 62,722 | | | | | | | | | | 4,738,020 | |
| Duke Energy Corp. | | | | 201,828 | | | | | | | | | | 17,940,491 | |
| Entergy Corp. | | | | 101,469 | | | | | | | | | | 9,699,422 | |
| Exelon Corp. | | | | 216,503 | | | | | | | | | | 8,430,627 | |
| PG&E Corp.A | | | | 463,708 | | | | | | | | | | 7,558,441 | |
| Pinnacle West Capital Corp. | | | | 209,223 | | | | | | | | | | 15,520,162 | |
| PPL Corp. | | | | 791,454 | | | | | | | | | | 19,446,025 | |
| Southern Co. | | | | 278,931 | | | | | | | | | | 18,772,056 | |
| Xcel Energy, Inc. | | | | 147,177 | | | | | | | | | | 8,723,181 | |
| | | | | | | | | | | | | | | |
| | | | | | | | | | | | | | 110,828,425 | |
| | | | | | | | | | | | | | | |
| | | | | | | | | | | | | | | |
| | | |
| Multi-Utilities - 0.38% | | | | | | |
| Dominion Energy, Inc. | | | | 276,935 | | | | | | | | | | 11,166,019 | |
| | | | | | | | | | | | | | | |
| | | | | | | | | | | | | | | |
Total Utilities | | | | | | | | | | | | | | 121,994,444 | |
| | | | | | | | | | | | | | | |
| | | | | | | | | | | | | | | |
Total Common Stocks (Cost $2,082,177,971) | | | | | | | | | | | | | | 2,734,612,868 | |
| | | | | | | | | | | | | | | |
| | | | | | | | | | | | | | | |
| | | |
| FOREIGN COMMON STOCKS - 5.25% | | | | | | |
| | | |
| Communication Services - 0.27% | | | | | | |
| | | |
| Wireless Telecommunication Services - 0.27% | | | | | | |
| Vodafone Group PLC, ADR | | | | 850,250 | | | | | | | | | | 7,856,310 | |
| | | | | | | | | | | | | | | |
| | | | | | | | | | | | | | | |
| | | |
| Consumer Discretionary - 0.55% | | | | | | |
| | | |
| Automobile Components - 0.55% | | | | | | |
| Magna International, Inc. | | | | 340,100 | | | | | | | | | | 16,355,409 | |
| | | | | | | | | | | | | | | |
| | | | | | | | | | | | | | | |
| | | |
| Consumer Staples - 1.20% | | | | | | |
| | | |
| Beverages - 0.50% | | | | | | |
| Diageo PLC, ADR | | | | 96,004 | | | | | | | | | | 14,736,614 | |
| | | | | | | | | | | | | | | |
| | | | | | | | | | | | | | | |
| | | |
| Household Products - 0.16% | | | | | | |
| Reckitt Benckiser Group PLC, ADR | | | | 345,697 | | | | | | | | | | 4,608,141 | |
| | | | | | | | | | | | | | | |
| | | | | | | | | | | | | | | |
| | | |
| Personal Products - 0.54% | | | | | | |
| Unilever PLC, ADR | | | | 335,400 | | | | | | | | | | 15,881,190 | |
| | | | | | | | | | | | | | | |
| | | | | | | | | | | | | | | |
Total Consumer Staples | | | | | | | | | | | | | | 35,225,945 | |
| | | | | | | | | | | | | | | |
| | | | | | | | | | | | | | | |
| | | |
| Energy - 1.52% | | | | | | |
| | | |
| Oil, Gas & Consumable Fuels - 1.52% | | | | | | |
| Enbridge, Inc.B | | | | 611,490 | | | | | | | | | | 19,592,140 | |
| Cenovus Energy, Inc. | | | | 371,000 | | | | | | | | | | 7,078,680 | |
| Shell PLC, ADR | | | | 278,122 | | | | | | | | | | 18,116,867 | |
| | | | | | | | | | | | | | | |
| | | | | | | | | | | | | | 44,787,687 | |
| | | | | | | | | | | | | | | |
| | | | | | | | | | | | | | | |
Total Energy | | | | | | | | | | | | | | 44,787,687 | |
| | | | | | | | | | | | | | | |
| | | | | | | | | | | | | | | |
See accompanying notes
14
American Beacon Large Cap Value FundSM
Schedule of Investments
October 31, 2023
| | | | | | | | | | | | | | | |
| | | |
| | | Shares | | | | Fair Value |
| | | | | | | |
| | | |
| FOREIGN COMMON STOCKS - 5.25% (continued) | | | | | | |
| | | |
| Industrials - 0.44% | | | | | | |
| | | |
| Ground Transportation - 0.18% | | | | | | |
| Canadian National Railway Co.B | | | | 49,798 | | | | | | | | | $ | 5,267,633 | |
| | | | | | | | | | | | | | | |
| | | | | | | | | | | | | | | |
| | | |
| Machinery - 0.26% | | | | | | |
| CNH Industrial NV | | | | 714,439 | | | | | | | | | | 7,844,540 | |
| | | | | | | | | | | | | | | |
Total Industrials | | | | | | | | | | | | | | 13,112,173 | |
| | | | | | | | | | | | | | | |
| | | | | | | | | | | | | | | |
| | | |
| Information Technology - 1.27% | | | | | | |
| | | |
| Communications Equipment - 0.94% | | | | | | |
| Telefonaktiebolaget LM Ericsson, ADRB | | | | 6,201,320 | | | | | | | | | | 27,657,887 | |
| | | | | | | | | | | | | | | |
| | | | | | | | | | | | | | | |
| | | |
| Semiconductors & Semiconductor Equipment - 0.33% | | | | | | |
| NXP Semiconductors NV | | | | 56,924 | | | | | | | | | | 9,815,405 | |
| | | | | | | | | | | | | | | |
| | | | | | | | | | | | | | | |
Total Information Technology | | | | | | | | | | | | | | 37,473,292 | |
| | | | | | | | | | | | | | | |
| | | | | | | | | | | | | | | |
Total Foreign Common Stocks (Cost $147,170,465) | | | | | | | | | | | | | | 154,810,816 | |
| | | | | | | | | | | | | | | |
| | | | | | | | | | | | | | | |
| | | |
| SHORT-TERM INVESTMENTS - 1.86% (Cost $54,678,380) | | | | | | |
| | | |
| Investment Companies - 1.86% | | | | | | |
| American Beacon U.S. Government Money Market Select Fund, 5.19%C D | | | | 54,678,380 | | | | | | | | | | 54,678,380 | |
| | | | | | | | | | | | | | | |
| | | | | | | | | | | | | | | |
| | | |
| SECURITIES LENDING COLLATERAL – 0.97% (Cost $28,712,080) | | | | | | |
| | | |
| Investment Companies - 0.97% | | | | | | |
| American Beacon U.S. Government Money Market Select Fund, 5.19%C D | | | | 28,712,080 | | | | | | | | | | 28,712,080 | |
| | | | | | | | | | | | | | | |
| | | | | | | | | | | | | | | |
TOTAL INVESTMENTS - 100.87% (Cost $2,312,738,896) | | | | | | | | | | | | | | 2,972,814,144 | |
OTHER ASSETS, NET OF LIABILITIES - (0.87%) | | | | | | | | | | | | | | (25,659,144 | ) |
| | | | | | | | | | | | | | | |
TOTAL NET ASSETS - 100.00% | | | | | | | | | | | | | $ | 2,947,155,000 | |
| | | | | | | | | | | | | | | |
| | | | | | | |
| Percentages are stated as a percent of net assets. | | | | | | | | | | | | | | | |
A Non-income producing security.
B All or a portion of this security is on loan, collateralized by either cash and/or U.S. Treasuries, at October 31, 2023 (Note 9).
C The Fund is affiliated by having the same investment advisor.
D 7-day yield.
ADR - American Depositary Receipt.
PLC - Public Limited Company.
REIT - Real Estate Investment Trusts.
| | | | | | | | | | | | | | | | |
| Long Futures Contracts Open on October 31, 2023: | |
|
| Equity Futures Contracts | |
| Description | | Number of
Contracts | | Expiration Date | | Notional Amount | | | Contract Value | | | Unrealized
Appreciation
(Depreciation) | |
| CME e-Mini Standard & Poor’s 500 Index Futures | | 264 | | December
2023 | | $ | 58,550,830 | | | $ | 55,601,700 | | | $ | (2,949,130 | ) |
| | | | | | | | | | | | | | | | |
| | | | | | $ | 58,550,830 | | | $ | 55,601,700 | | | $ | (2,949,130 | ) |
| | | | | | | | | | | | | | | | |
| | |
|
| Index Abbreviations: |
| CME | | Chicago Mercantile Exchange. |
See accompanying notes
15
American Beacon Large Cap Value FundSM
Schedule of Investments
October 31, 2023
The Fund’s investments are summarized by level based on the inputs used to determine their values. As of October 31, 2023, the investments were classified as described below:
| | | | | | | | | | | | | | | | | | | | | | | | | | | | |
Large Cap Value Fund | | Level 1 | | | | | | Level 2 | | | | | | Level 3 | | | | | | Total | |
Assets | | | | | | | | | | | | | | | | | | | | | | | | | | | | |
Common Stocks | | $ | 2,734,612,868 | | | | | | | $ | - | | | | | | | $ | - | | | | | | | $ | 2,734,612,868 | |
Foreign Common Stocks | | | 154,810,816 | | | | | | | | - | | | | | | | | - | | | | | | | | 154,810,816 | |
Short-Term Investments | | | 54,678,380 | | | | | | | | - | | | | | | | | - | | | | | | | | 54,678,380 | |
Securities Lending Collateral | | | 28,712,080 | | | | | | | | - | | | | | | | | - | | | | | | | | 28,712,080 | |
| | | | | | | | | | | | | | | | | | | | | | | | | | | | |
Total Investments in Securities - Assets | | $ | 2,972,814,144 | | | | | | | $ | - | | | | | | | $ | - | | | | | | | $ | 2,972,814,144 | |
| | | | | | | | | | | | | | | | | | | | | | | | | | | | |
|
Financial Derivative Instruments - Liabilities | |
Futures Contracts | | $ | (2,949,130 | ) | | | | | | $ | - | | | | | | | $ | - | | | | | | | $ | (2,949,130 | ) |
| | | | | | | | | | | | | | | | | | | | | | | | | | | | |
Total Financial Derivative Instruments - Liabilities | | $ | (2,949,130 | ) | | | | | | $ | - | | | | | | | $ | - | | | | | | | $ | (2,949,130 | ) |
| | | | | | | | | | | | | | | | | | | | | | | | | | | | |
U.S. GAAP requires transfers between all levels to/from level 3 be disclosed. During the year ended October 31, 2023, there were no transfers into or out of Level 3.
See accompanying notes
16
American Beacon Large Cap Value FundSM
Statement of Assets and Liabilities
October 31, 2023
| | | | |
Assets: | |
Investments in unaffiliated securities, at fair value† § | | $ | 2,889,423,684 | |
Investments in affiliated securities, at fair value‡ | | | 83,390,460 | |
Cash | | | 23,419 | |
Cash collateral held at broker for futures contracts | | | 3,157,000 | |
Dividends and interest receivable | | | 3,581,957 | |
Deposits with broker for futures contracts | | | 3,298,093 | |
Receivable for investments sold | | | 8,496,340 | |
Receivable for fund shares sold | | | 1,479,640 | |
Receivable for tax reclaims | | | 545,621 | |
Prepaid expenses | | | 45,484 | |
| | | | |
Total assets | | | 2,993,441,698 | |
| | | | |
Liabilities: | |
Payable for investments purchased | | | 9,253,616 | |
Payable for fund shares redeemed | | | 1,828,805 | |
Management and sub-advisory fees payable (Note 2) | | | 2,944,147 | |
Service fees payable (Note 2) | | | 226,904 | |
Transfer agent fees payable (Note 2) | | | 65,122 | |
Payable upon return of securities loaned (Note 9)§ | | | 28,712,080 | |
Custody and fund accounting fees payable | | | 85,453 | |
Professional fees payable | | | 83,585 | |
Trustee fees payable (Note 2) | | | 20,191 | |
Payable for prospectus and shareholder reports | | | 29,455 | |
Payable for variation margin from open futures contracts (Note 5) | | | 2,948,564 | |
Other liabilities | | | 88,776 | |
| | | | |
Total liabilities | | | 46,286,698 | |
| | | | |
Commitments and contingent liabilities (Note 2) | | | | |
| | | | |
Net assets | | $ | 2,947,155,000 | |
| | | | |
Analysis of net assets: | |
Paid-in-capital | | $ | 2,185,117,571 | |
Total distributable earnings (deficits)A | | | 762,037,429 | |
| | | | |
Net assets | | $ | 2,947,155,000 | |
| | | | |
Shares outstanding at no par value (unlimited shares authorized): | |
R5 Class | | | 43,490,648 | |
| | | | |
Y Class | | | 7,679,496 | |
| | | | |
Investor Class | | | 25,043,732 | |
| | | | |
Advisor Class | | | 2,018,507 | |
| | | | |
A Class | | | 585,583 | |
| | | | |
C Class | | | 190,170 | |
| | | | |
R6 Class | | | 47,778,195 | |
| | | | |
Net assets: | |
R5 Class | | $ | 1,040,466,568 | |
| | | | |
Y Class | | $ | 181,490,071 | |
| | | | |
Investor Class | | $ | 525,063,555 | |
| | | | |
Advisor Class | | $ | 41,289,229 | |
| | | | |
A Class | | $ | 11,986,577 | |
| | | | |
C Class | | $ | 3,842,593 | |
| | | | |
R6 Class | | $ | 1,143,016,407 | |
| | | | |
Net asset value, offering and redemption price per share: | |
R5 Class | | $ | 23.92 | |
| | | | |
Y Class | | $ | 23.63 | |
| | | | |
Investor Class | | $ | 20.97 | |
| | | | |
Advisor Class | | $ | 20.46 | |
| | | | |
A Class | | $ | 20.47 | |
| | | | |
A Class (offering price) | | $ | 21.72 | |
| | | | |
C Class | | $ | 20.21 | |
| | | | |
R6 Class | | $ | 23.92 | |
| | | | |
| |
† Cost of investments in unaffiliated securities | | $ | 2,229,348,436 | |
‡ Cost of investments in affiliated securities | | $ | 83,390,460 | |
§ Fair value of securities on loan | | $ | 31,639,586 | |
|
| A The Fund’s investments in affiliated securities did not have unrealized appreciation (depreciation) at year end. | |
See accompanying notes
17
American Beacon Large Cap Value FundSM
Statement of Operations
For the year ended October 31, 2023
| | | | |
Investment income: | | | | |
Dividend income from unaffiliated securities (net of foreign taxes)† | | $ | 72,513,714 | |
Dividend income from affiliated securities (Note 2) | | | 3,363,462 | |
Interest income | | | 634,082 | |
Income derived from securities lending (Note 9) | | | 190,050 | |
| | | | |
Total investment income | | | 76,701,308 | |
| | | | |
Expenses: | |
Management and sub-advisory fees (Note 2) | | | 17,513,787 | |
Transfer agent fees: | | | | |
R5 Class (Note 2) | | | 438,554 | |
Y Class (Note 2) | | | 197,343 | |
Investor Class | | | 32,520 | |
Advisor Class | | | 3,105 | |
A Class | | | 1,067 | |
C Class | | | 404 | |
R6 Class | | | 47,680 | |
Custody and fund accounting fees | | | 381,450 | |
Professional fees | | | 298,723 | |
Registration fees and expenses | | | 108,153 | |
Service fees (Note 2): | | | | |
Investor Class | | | 1,991,555 | |
Advisor Class | | | 111,682 | |
A Class | | | 18,126 | |
C Class | | | 4,423 | |
Distribution fees (Note 2): | | | | |
Advisor Class | | | 111,427 | |
A Class | | | 33,113 | |
C Class | | | 50,298 | |
Prospectus and shareholder report expenses | | | 143,220 | |
Trustee fees (Note 2) | | | 310,077 | |
Loan expense (Note 10) | | | 18,940 | |
Other expenses | | | 338,873 | |
| | | | |
Total expenses | | | 22,154,520 | |
| | | | |
Net investment income | | | 54,546,788 | |
| | | | |
|
Realized and unrealized gain (loss) from investments: | |
Net realized gain from: | | | | |
Investments in unaffiliated securitiesA | | | 145,018,777 | |
Foreign currency transactions | | | 26,772 | |
Futures contracts | | | 10,656,461 | |
Change in net unrealized (depreciation) of: | | | | |
Investments in unaffiliated securitiesB | | | (128,179,070 | ) |
Futures contracts | | | (7,777,181 | ) |
| | | | |
Net gain from investments | | | 19,745,759 | |
| | | | |
Net increase in net assets resulting from operations | | $ | 74,292,547 | |
| | | | |
| |
† Foreign taxes | | $ | 356,339 | |
| |
A The Fund did not recognize net realized gains (losses) from the sale of investments in affiliated securities. | | | | |
B The Fund’s investments in affiliated securities did not have a change in unrealized appreciation (depreciation) at year end. | |
See accompanying notes
18
American Beacon Large Cap Value FundSM
Statement of Changes in Net Assets
| | | | | | | | | | | | |
| | | Year Ended
October 31, 2023 | | | | | | Year Ended
October 31, 2022 | |
Increase (decrease) in net assets: | |
Operations: | |
Net investment income | | $ | 54,546,788 | | | | | | | $ | 50,407,526 | |
Net realized gain from investments in unaffiliated securities, foreign currency transactions, and futures contracts | | | 155,702,010 | | | | | | | | 384,236,249 | |
Change in net unrealized (depreciation) of investments in unaffiliated securities and futures contracts | | | (135,956,251 | ) | | | | | | | (664,007,852 | ) |
| | | | | | | | | | | | |
Net increase (decrease) in net assets resulting from operations | | | 74,292,547 | | | | | | | | (229,364,077 | ) |
| | | | | | | | | | | | |
Distributions to shareholders: | |
Total retained earnings: | | | | | | | | | | | | |
R5 Class | | | (129,502,402 | ) | | | | | | | (169,358,524 | ) |
Y Class | | | (19,889,700 | ) | | | | | | | (26,008,609 | ) |
Investor Class | | | (74,955,616 | ) | | | | | | | (89,387,671 | ) |
Advisor Class | | | (5,569,451 | ) | | | | | | | (6,972,505 | ) |
A Class | | | (1,797,418 | ) | | | | | | | (1,276,472 | ) |
C Class | | | (612,572 | ) | | | | | | | (753,437 | ) |
R6 Class | | | (118,844,908 | ) | | | | | | | (128,445,097 | ) |
| | | | | | | | | | | | |
Net distributions to shareholders | | | (351,172,067 | ) | | | | | | | (422,202,315 | ) |
| | | | | | | | | | | | |
|
Capital share transactions (Note 11): | |
Proceeds from sales of shares | | | 500,807,392 | | | | | | | | 594,976,420 | |
Reinvestment of dividends and distributions | | | 311,461,669 | | | | | | | | 377,142,861 | |
Cost of shares redeemed | | | (808,500,555 | ) | | | | | | | (1,187,779,707 | ) |
| | | | | | | | | | | | |
Net increase (decrease) in net assets from capital share transactions | | | 3,768,506 | | | | | | | | (215,660,426 | ) |
| | | | | | | | | | | | |
Net (decrease) in net assets | | | (273,111,014 | ) | | | | | | | (867,226,818 | ) |
| | | | | | | | | | | | |
Net assets: | |
Beginning of year | | | 3,220,266,014 | | | | | | | | 4,087,492,832 | |
| | | | | | | | | | | | |
End of year | | $ | 2,947,155,000 | | | | | | | $ | 3,220,266,014 | |
| | | | | | | | | | | | |
See accompanying notes
19
American Beacon Large Cap Value FundSM
Notes to Financial Statements
October 31, 2023
1. Organization and Significant Accounting Policies
American Beacon Funds (the “Trust”) is organized as a Massachusetts business trust. The Fund, a series within the Trust, is registered under the Investment Company Act of 1940, as amended (the “Act”), as a diversified, open-end management investment company. As of October 31, 2023, the Trust consists of twenty-four active series, one of which is presented in this filing: American Beacon Large Cap Value Fund (the “Fund”). The remaining twenty-three active series are reported in separate filings.
American Beacon Advisors, Inc. (the “Manager”) is a Delaware corporation and a wholly-owned subsidiary of Resolute Investment Managers, Inc. (“RIM”) organized in 1986 to provide business management, advisory, administrative, and asset management consulting services to the Trust and other investors. The Manager is registered as an investment advisor under the Investment Advisers Act of 1940, as amended (the “Advisers Act”). RIM is, in turn, a wholly-owned subsidiary of Resolute Acquisition, Inc., which is a wholly-owned subsidiary of Resolute Topco, Inc., a wholly-owned subsidiary of Resolute Investment Holdings, LLC (“RIH”). RIH is owned primarily by Kelso Investment Associates VIII, L.P., KEP VI, LLC and Estancia Capital Partners L.P., investment funds affiliated with Kelso & Company, L.P. (“Kelso”) or Estancia Capital Management, LLC (“Estancia”), which are private equity firms.
On July 11, 2023, (i) RIH, RIM and certain of their affiliates, and (ii) the current owners of approximately 93% of RIH (the “Current Ownership Group”) entered into a transaction agreement with certain creditors of RIM (the “Lender Group”) pursuant to which (i) all equity interests in RIH would be cancelled, (ii) new equity interests would be issued to members of the Lender Group, and (iii) the existing credit agreements between RIM and the Lender Group would be terminated and a new credit agreement would be executed (“Transaction”). The Lender Group consists of various institutional investment funds (“New Ownership Group”) that are managed by financial institutions and other investment advisory firms.
Upon the closing of the Transaction, the Manager will be wholly-owned indirectly by the New Ownership Group, rather than the Current Ownership Group. The Transaction is expected to close in the fourth calendar quarter of 2023, subject to the satisfaction of certain closing conditions. The Transaction will result in a change of control of the Manager and the termination of the Fund’s management and investment advisory agreements (the “Current Management Agreement” and “Current Investment Advisory Agreements”, respectively). The Board has approved a new management agreement with the Manager (the “New Management Agreement”) and a new investment advisory agreement among the Manager, the sub-advisors and the Trust, on behalf of the Fund (“New Investment Advisory Agreements”) (collectively, the “Agreements”), that would become effective upon the closing of the Transaction. A special meeting of the shareholders of the Fund as of July 31, 2023, was held on October 27, 2023 to consider the Agreements. The shareholders of the Fund did not achieve a quorum in favor of the Agreements, therefore the meeting was adjourned to November 17, 2023. At the second meeting on November 17, 2023, the shareholders of the Fund did not achieve a quorum in favor of the Agreements, therefore the meeting was adjourned to December 8, 2023. At the third meeting on December 8, 2023, the shareholders of the Fund did not achieve a quorum in favor of the Agreements, therefore the meeting was adjourned to January 9, 2024. In advance of the meeting, proxy materials were sent to those shareholders regarding the New Management Agreement. There are no anticipated changes in the services provided by the Manager or sub-advisors or in the fee rates charged by the Manager to a Fund. Please see the Results of Shareholder Meeting for more information.
Recently Adopted Accounting Pronouncements
In March 2020, the Financial Accounting Standards Board (“FASB”) issued Accounting Standards Update (“ASU”) No. 2020-04, Reference Rate Reform (Topic 848); Facilitation of the Effects of Reference Rate Reform on Financial Reporting, which provides optional guidance for a limited period of time to ease the potential burden in accounting for (or recognizing the effects of) reference rate reform. The guidance is applicable to contracts referencing London Inter-bank Offered Rate (“LIBOR”) or another reference rate that is expected to be discontinued due to reference rate reform. The ASU is effective as of March 12, 2020 and generally can be applied through December 31, 2022. In December 2022, the FASB issued ASU No. 2022-06 Reference Rate Reform (Topic 848): Deferral of the Sunset Date of Topic 848 which updates and clarifies ASU No. 2020-04. The amendments in
20
American Beacon Large Cap Value FundSM
Notes to Financial Statements
October 31, 2023
this ASU defer the sunset date of Topic 848 from December 31, 2022, to December 31, 2024. Management expects these ASUs will not have a material impact on the Fund’s financial statements.
In June 2022, the FASB issued ASU No. 2022-03, Fair Value Measurement (Topic 820); Fair Value Measurement of Equity Securities Subject to Contractual Sale Restrictions, which provides clarifying guidance that a contractual restriction on the sale of an equity security is not considered part of the unit of account of the equity security and, therefore, is not considered in measuring fair value. The ASU is effective for fiscal years beginning after December 15, 2023, and interim periods within those fiscal years. Management expects the ASU will not have a material impact on the Fund’s financial statements.
Class Disclosure
The Fund has multiple classes of shares designed to meet the needs of different groups of investors. The following table sets forth the differences amongst the classes:
| | | | | | |
Class | | Eligible Investors | | Minimum Initial
Investments | |
| R5 Class | | Large institutional investors - sold directly or through intermediary channels. | | $ | 250,000 | |
| | |
| Y Class | | Large institutional retirement plan investors - sold directly or through intermediary channels. | | $ | 100,000 | |
| | |
| Investor Class | | All investors using intermediary organizations, such as broker-dealers or retirement plan sponsors. | | $ | 2,500 | |
| | |
| Advisor Class | | All investors who invest through intermediary organizations, such as broker-dealers or third party administrators. | | $ | 2,500 | |
| | |
| A Class | | All investors who invest through intermediary organizations, such as broker-dealers or third party administrator. Retail investors who invest directly through a financial intermediary such as a broker, bank, or registered investment advisor which may include a front-end sales charge and a contingent deferred sales charge (“CDSC”). | | $ | 2,500 | |
| | |
| C Class | | Retail investors who invest directly through a financial intermediary such as a broker or through employee directed benefit plans with applicable sales charges which may include CDSC. | | $ | 1,000 | |
| | |
| R6 Class | | Large institutional retirement plan investors - sold through retirement plan sponsors. | | | None | |
Each class offered by the Trust has equal rights as to assets and voting privileges. Income and non-class specific expenses are allocated daily to each class based on the relative net assets. Realized and unrealized capital gains and losses of each class are allocated daily based on the relative net assets of each class of the respective Fund. Class specific expenses, where applicable, currently include service, distribution, transfer agent fees, and sub-transfer agent fees that vary amongst the classes as described more fully in Note 2.
Significant Accounting Policies
The following is a summary of significant accounting policies, consistently followed by the Fund in preparation of the financial statements. The Fund is considered an investment company and accordingly, follows the investment company accounting and reporting guidance of the FASB Accounting Standards Codification Topic 946, Financial Services – Investment Companies, a part of Generally Accepted Accounting Principles (“U.S. GAAP”).
Security Transactions and Investment Income
Security transactions are recorded as of the trade date for financial reporting purposes. Securities purchased or sold on a when-issued or delayed-delivery basis may be settled beyond a standard settlement period for the security after the trade date.
Dividend income, net of foreign taxes, is recorded on the ex-dividend date, except certain dividends from foreign securities which are recorded as soon as the information is available to the Fund. Tax reclaim accruals are automatically generated on accounting and custody systems at the time of the income event based on the tax
21
American Beacon Large Cap Value FundSM
Notes to Financial Statements
October 31, 2023
databases maintained by the Fund’s custodian. Interest income, net of foreign taxes, is earned from settlement date, recorded on the accrual basis, and adjusted, if necessary, for accretion of discounts and amortization of premiums. Realized gains (losses) from securities sold are determined based on specific lot identification. Estimated tax liabilities on certain foreign securities are recorded on an accrual basis and are reflected as components of interest income or net change in unrealized appreciation (depreciation) on investments on the Statement of Operations, as appropriate. Tax liabilities realized as a result of such security sales are reflected as a component of net realized gain (loss) on investments on the Statement of Operations.
Distributions to Shareholders
The Fund distributes most or all of its net earnings and realized gains, if any, each taxable year in the form of dividends from net investment income and distributions of realized net capital gains and net gains from foreign currency transactions on an annual basis. The Fund does not have a fixed dividend rate and does not guarantee that it will pay any distributions in any particular period. Dividends to shareholders are determined in accordance with federal income tax regulations, which may differ in amount and character from net investment income and realized gains recognized for purposes of U.S. GAAP. To the extent necessary to fully distribute capital gains, the Fund may designate earnings and profits distributed to shareholders on the redemption of shares.
Commission Recapture
The Fund has established brokerage commission recapture arrangements with certain brokers or dealers. If the Fund’s investment advisor chooses to execute a transaction through a participating broker, the broker rebates a portion of the commission back to the Fund. Any collateral benefit received through participation in the commission recapture program is directed exclusively to the Fund. This amount is reported with the net realized gain (loss) in the Fund’s Statement of Operations, if applicable.
Allocation of Income, Trust Expenses, Gains, and Losses
Investment income and realized and unrealized gains and losses from investments of the Fund are allocated daily to each class of shares based upon the relative proportion of net assets of each class to the total net assets of the Fund. Expenses directly charged or attributable to the Fund will be paid from the assets of the Fund. Generally, expenses of the Trust will be allocated among and charged to the assets of the Fund on a basis that the Trust’s Board of Trustees (the “Board”) deems fair and equitable, which may be based on the relative net assets of the Fund or nature of the services performed and relative applicability to the Fund.
Use of Estimates
The preparation of financial statements in conformity with U.S. GAAP requires management to make estimates and assumptions that affect the amounts reported in the financial statements and accompanying notes. Actual results may differ from those estimated.
Other
Under the Trust’s organizational documents, its officers and trustees are indemnified against certain liabilities arising out of the performance of their duties to the Trust. In the normal course of business, the Trust enters into contracts that provide indemnification to the other party or parties against potential costs or liabilities. The Trust’s maximum exposure under these arrangements is dependent on claims that may be made in the future and, therefore, cannot be estimated. The Trust has had no prior claims or losses pursuant to any such agreement.
22
American Beacon Large Cap Value FundSM
Notes to Financial Statements
October 31, 2023
2. Transactions with Affiliates
Management and Investment Sub-Advisory Agreements
The Fund and the Manager are parties to a Management Agreement that obligates the Manager to provide the Fund with investment advisory and administrative services. As compensation for performing the duties under the Management Agreement, the Manager will receive an annualized management fee based on a percentage of the Fund’s average daily net assets that is calculated and accrued daily according to the following schedule:
| | | | |
First $15 billion | | | 0.35 | % |
Next $15 billion | | | 0.325 | % |
Over $30 billion | | | 0.30 | % |
The Trust, on behalf of the Fund, and the Manager have entered into Investment Advisory Agreements with Barrow, Hanley, Mewhinney & Strauss, LLC; Hotchkis and Wiley Capital Management, LLC; and Massachusetts Financial Services Company (“Sub-Advisors”) pursuant to which the Fund has agreed to pay an annualized sub-advisory fee that is calculated and accrued daily based on the Fund’s average daily net assets.
The Management and Sub-Advisory Fees paid by the Fund for the year ended October 31, 2023 were as follows:
| | | | | | | | | | | | |
| | | Effective Fee Rate | | | | | | Amount of Fees Paid | |
Management Fees | | | 0.35 | % | | | | | | $ | 11,152,815 | |
Sub-Advisory Fees | | | 0.20 | % | | | | | | | 6,360,972 | |
| | | | | | | | | | | | |
Total | | | 0.55 | % | | | | | | $ | 17,513,787 | |
| | | | | | | | | | | | |
As compensation for services provided by the Manager in connection with securities lending activities conducted by a Fund, the lending Fund pays to the Manager, with respect to cash collateral posted by borrowers, a fee of 10% of the net monthly investment income (the income earned in the form of interest dividends and realized capital gains from the investment of cash collateral, plus any negative rebate fees paid by borrowers, less the rebate amount paid to borrowers as well as related expenses) and, with respect to collateral other than cash, a fee up to 10% of loan fees and demand premiums paid by borrowers. These fees are included in “Income derived from securities lending” and “Management and sub-advisory fees” on the Statement of Operations. During the year ended October 31, 2023, the Manager received securities lending fees of $20,493 for the securities lending activities of the Fund.
Distribution Plans
Separate Distribution Plans (the “Distribution Plans”) have been adopted pursuant to Rule 12b-1 under the Act for the Advisor, A, and C Classes of the Fund. Under the Distribution Plans, as compensation for distribution and shareholder servicing assistance, the Manager receives an annual fee of 0.25% of the average daily net assets of the Advisor and A Classes and 1.00% of the average daily net assets of the C Class. The fee will be payable without regard to whether the amount of the fee is more or less than the actual expenses incurred in a particular month by the Manager for distribution assistance.
Service Plans
The Manager and the Trust entered into a Service Plan that obligates the Manager to oversee additional shareholder servicing of the Investor, Advisor, A, and C Classes of the Fund. As compensation for performing the duties required under the Service Plan, the Manager receives an annualized fee up to 0.25% of the average daily net assets of the Advisor, A, and C Classes, and up to 0.375% of the average daily net assets of the Investor Class of the Fund.
23
American Beacon Large Cap Value FundSM
Notes to Financial Statements
October 31, 2023
Sub-Transfer Agent Fees
The Manager has entered into agreements, which include servicing agreements, with financial intermediaries that provide recordkeeping, processing, shareholder communications and other services to customers of the intermediaries that hold positions in the R5 and Y Classes of the Fund and has agreed to compensate the intermediaries for providing these services. Intermediaries transact with the Fund primarily through the use of omnibus accounts on behalf of its customers who hold positions in the Fund. Certain services would have been provided by the Fund’s transfer agent and other service providers if the shareholders’ accounts were maintained directly by the Fund’s transfer agent. Accordingly, the Fund, pursuant to Board approval, has agreed to reimburse the Manager for certain non-distribution shareholder services provided by financial intermediaries for the R5 and Y Classes. The reimbursement amounts (sub-transfer agent fees) paid to the Manager are subject to a fee limit of up to 0.10% of an intermediary’s average net assets in the R5 and Y Classes on an annual basis. During the year ended October 31, 2023, the sub-transfer agent fees, as reflected in “Transfer agent fees” on the Statement of Operations, were as follows:
| | | | |
Fund | | Sub-Transfer Agent Fees | |
Large Cap Value | | $ | 576,850 | |
As of October 31, 2023, the Fund owed the Manager the following reimbursement of sub-transfer agent fees, as reflected in “Transfer agent fees payable” on the Statement of Assets and Liabilities:
| | | | |
Fund | | Reimbursement
Sub-Transfer Agent Fees | |
Large Cap Value | | $ | 43,180 | |
Investments in Affiliated Funds
The Fund may invest in the American Beacon U.S. Government Money Market Select Fund (the “USG Select Fund”). Cash collateral received by the Fund in connection with securities lending may also be invested in the USG Select Fund. The Fund listed below held the following shares with an October 31, 2023 fair value and dividend income earned from the investment in the USG Select Fund.
| | | | | | | | | | | | | | | | | | | | | | | | | | | | | | | | | | | | | | | | | | | | | | | | |
Affiliated Security | | Type of
Transaction | | | | | Fund | | | | | October 31,
2023
Shares/Principal | | | | | | Change in
Unrealized
Gain (Loss) | | | | | | Realized
Gain (Loss) | | | | | | Dividend
Income | | | | | | October 31,
2023
Fair Value | |
| U.S. Government Money Market Select | | Direct | | | | | | Large Cap Value | | | | | | $ | 54,678,380 | | | | | | | $ | - | | | | | | | $ | - | | | | | | | $ | 3,363,462 | | | | | | | $ | 54,678,380 | |
| U.S. Government Money Market Select | | Securities
Lending | | | | | | Large Cap Value | | | | | | | 28,712,080 | | | | | | | | - | | | | | | | | - | | | | | | | | N/A | | | | | | | | 28,712,080 | |
The Fund and the USG Select Fund have the same investment advisor and therefore, are considered to be affiliated. The Manager serves as investment advisor to the USG Select Fund and receives management fees and administrative fees totaling 0.10% of the average daily net assets of the USG Select Fund. During the year ended October 31, 2023, the Manager earned fees on the Fund’s direct investments and securities lending collateral investments in the USG Select Fund as shown below:
| | | | | | | | | | | | |
Fund | | Direct Investments in
USG Select Fund | | | Securities Lending
Collateral
Investments in USG
Select Fund | | | Total | |
Large Cap Value | | $ | 73,304 | | | $ | 23,623 | | | $ | 96,927 | |
24
American Beacon Large Cap Value FundSM
Notes to Financial Statements
October 31, 2023
Interfund Credit Facility
Pursuant to an exemptive order issued by the U.S. Securities and Exchange Commission (“SEC”), the Fund, along with other registered investment companies having management contracts with the Manager, may participate in a credit facility whereby each fund, under certain conditions, is permitted to lend money directly to and borrow directly from other participating funds for temporary purposes. The interfund credit facility is advantageous to the funds because it provides added liquidity and eliminates the need to maintain higher cash balances to meet redemptions. This situation could arise when shareholder redemptions exceed anticipated volumes and certain funds have insufficient cash on hand to satisfy such redemptions or when sales of securities do not settle as expected, resulting in a cash shortfall for the fund. When the fund liquidates portfolio securities to meet redemption requests, they often do not receive payment in settlement for up to two days (or longer for certain foreign transactions). Redemption requests normally are satisfied on the next business day. The credit facility provides a source of immediate, short-term liquidity pending settlement of the sale of portfolio securities. The credit facility is administered by a credit facility team consisting of professionals from the Manager’s asset management, compliance, and accounting areas who report the activities of the credit facility to the Board. During the year ended October 31, 2023, the Fund participated as a lender by loaning an average amount of $108,522 for 2 days at an average interest rate of 5.39% with interest charges earned of $32. This amount is included in “Interest income” on the Statement of Operations. During the year ended October 31, 2023, the Fund did not utilize the credit facility.
Expense Reimbursement Plan
The Manager contractually agreed to reduce fees and/or reimburse expenses for the classes of the Fund, through February 29, 2024, to the extent that total operating expenses (excluding taxes, interest, brokerage commissions, acquired fund fees and expenses, securities lending fees, expenses associated with securities sold short, litigation, and other extraordinary expenses) exceed the Fund’s expense cap. During the year ended October 31, 2023, the Manager waived and/or reimbursed expenses as follows:
| | | | | | | | | | | | | | | | | | | | | | | | |
| | | | | | Expense Cap | | | | | | | | | Expiration of
Reimbursed
Expenses | |
Fund | | Class | | | 11/1/2022 –
2/28/2023 | | | 3/1/2023 -
10/31/2023 | | | Reimbursed
Expenses | | | (Recouped)
Expenses | |
Large Cap Value | | | R6 | | | | N/A | | | | N/A | | | $ | - | | | $ | (2,555 | )* | | | 2025-2026 | |
* This amount represents Recouped Expenses from prior fiscal years and is reflected in Other expenses on the Statement of Operations.
The Fund has adopted an Expense Reimbursement Plan whereby the Manager may seek repayment of contractual or voluntary fee reductions and expense reimbursements. Under the policy, the Manager can be reimbursed by the Fund for any contractual or voluntary fee reductions or expense reimbursements if reimbursement to the Manager (a) occurs within three years from the date of the Manager’s waiver/reimbursement and (b) does not cause the Fund’s annual operating expenses to exceed the lesser of the contractual percentage limit in effect at the time of the waiver/reimbursement or time of recoupment. The reimbursed expenses listed above will expire in 2025 and 2026. The Fund did not record a liability for potential contingent reimbursement due to the current assessment that a reimbursement is uncertain. The carryover of excess expenses potentially reimbursable to the Manager, but not recorded as a liability are as follows:
| | | | | | | | | | | | | | | | |
Fund | | Recouped
Expenses | | | Excess Expense
Carryover | | | Expired Expense
Carryover | | | Expiration of
Reimbursed
Expenses | |
Large Cap Value | | $ | 2,555 | | | $ | - | | | $ | 153,977 | | | | 2022-2023 | |
Large Cap Value | | | - | | | | 18,227 | | | | - | | | | 2023-2024 | |
Sales Commissions
The Fund’s Distributor, Resolute Investment Distributors, Inc. (“RID” or “Distributor”), may receive a portion of A Class sales charges from broker dealers which may be used to offset distribution related expenses. During the year ended October 31, 2023, RID collected $589 from the sale of A Class Shares of the Fund.
25
American Beacon Large Cap Value FundSM
Notes to Financial Statements
October 31, 2023
A CDSC of 0.50% will be deducted with respect to A Class Shares on certain purchases of $1,000,000 or more that are redeemed in whole or part within 18 months of purchase, unless waived as discussed in the Fund’s Prospectus. Any applicable CDSC will be 0.50% of the lesser of the original purchase price or the value of the redemption of the A Class Shares redeemed. During the year ended October 31, 2023, there were no CDSC fees collected for the A Class Shares of the Fund.
A CDSC of 1.00% will be deducted with respect to C Class Shares redeemed within 12 months of purchase, unless waived as discussed in the Fund’s Prospectus. Any applicable CDSC will be 1.00% of the lesser of the original purchase price or the value of the redemption of the C Class Shares redeemed. During the year ended October 31, 2023, CDSC fees of $66 were collected for C Class Shares of the Fund.
Trustee Fees and Expenses
As compensation for their service to the American Beacon Funds Complex, including the Trust (collectively, the “Trusts”), each Trustee is compensated from the Trusts as follows: (1) an annual retainer of $130,000; (2) meeting attendance fee (for attendance in-person or via teleconference) of (a) $12,000 for in person attendance, or $5,000 for telephonic attendance, by Board members for each regularly scheduled or special Board meeting, (b) $2,500 for attendance by Committee members at meetings of the Audit and Compliance Committee and the Investment Committee, (c) $1,000 for attendance by Committee members at meetings of the Nominating and Governance Committee; and (d) $2,500 for attendance by Board members for each special telephonic Board meeting; and (3) reimbursement of reasonable expenses incurred in attending Board meetings, Committee meetings, and relevant educational seminars. For this purpose, the Board considers attendance at regular meetings held by video conference to constitute in-person attendance at a Board meeting. The Trustees also may be compensated for attendance at special Board and/or Committee meetings from time to time. For her service as Board Chair, Ms. Cline receives an additional annual retainer of $50,000. Although she attends several committee meetings at each quarterly Board meeting, she receives only a single $2,500 fee each quarter for her attendance at those meetings. The chairpersons of the Audit and Compliance Committee and the Investment Committee each receive an additional annual retainer of $25,000 and the Chair of the Nominating and Governance Committee receives an additional annual retainer of $10,000.
3. Security Valuation and Fair Value Measurements
The price of the Fund’s shares is based on its net asset value (“NAV”) per share. The Fund’s NAV is computed by adding total assets, subtracting all the Fund’s liabilities, and dividing the result by the total number of shares outstanding.
The NAV of each class of the Fund’s shares is determined based on a pro rata allocation of the Fund’s investment income, expenses and total capital gains and losses. The Fund’s NAV per share is determined each business day as of the regular close of trading on the New York Stock Exchange (“NYSE” or “Exchange”), which is typically 4:00 p.m. Eastern Time (“ET”). However, if trading on the NYSE closes at a time other than 4:00 p.m. ET, the Fund’s NAV per share typically would still be determined as of the regular close of trading on the NYSE. The Fund does not price its shares on days that the NYSE is closed. Foreign exchanges may permit trading in foreign securities on days when the Fund is not open for business, which may result in the value of the Fund’s portfolio investments being affected at a time when you are unable to buy or sell shares.
Equity securities, including shares of closed-end funds and exchange-traded funds (“ETFs”), are valued at the last sale price or official closing price taken from the primary exchange in which each security trades. Investments in other mutual funds are valued at the closing NAV per share on the day of valuation. Debt securities are valued at bid quotes from broker/dealers or evaluated bid prices from pricing services, who may consider a number of inputs and factors, such as prices of comparable securities, yield curves, spreads, credit ratings, coupon rates, maturity, default rates, and underlying collateral. Futures are valued based on their daily settlement prices. Exchange-traded and over-the-counter (“OTC”) options are valued at the last sale price. Options with no last sale for the day are priced at mid quote. Swaps are valued at evaluated mid prices from pricing services.
26
American Beacon Large Cap Value FundSM
Notes to Financial Statements
October 31, 2023
The valuation of securities traded on foreign markets and certain fixed-income securities will generally be based on prices determined as of the earlier closing time of the markets on which they primarily trade unless a significant event has occurred. When the Fund holds securities or other assets that are denominated in a foreign currency, the Fund will normally use the currency exchange rates as of 4:00 p.m. ET.
Rule 2a-5 under the Investment Company Act (the “Valuation Rule”) establishes requirements for determining fair value in good faith for purposes of the Investment Company Act, including related oversight and reporting requirements. The Valuation Rule also defines when market quotations are “readily available,” which is the threshold for determining whether a Fund must fair value a security. Among other things, the Valuation Rule permits the Board to designate the Manager as Valuation Designee to perform the Fund’s fair value determinations subject to board oversight and certain reporting and other requirements intended to ensure that the Board receives the information it needs to oversee the Manager’s fair value determinations. Effective September 8, 2022, the Board has designated the Manager as valuation designee to perform fair value functions in accordance with the requirements of the Valuation Rule.
Securities may be valued at fair value, as determined in good faith and pursuant to the Manager’s procedures, under certain limited circumstances. For example, fair value pricing will be used for fixed-income securities and when market quotations are not readily available or reliable, as determined by the Manager, such as when (i) trading for a security is restricted or stopped; (ii) a security’s trading market is closed (other than customary closings); or (iii) a security has been de-listed from a national exchange. A security with limited market liquidity may require fair value pricing if the Manager determines that the available price does not reflect the security’s true market value. In addition, if a significant event that the Manager determines to affect the value of one or more securities held by the Fund occurs after the close of a related exchange but before the determination of the Fund’s NAV, fair value pricing may be used on the affected security or securities. Securities of small-capitalization companies are also more likely to require a fair value determination using these procedures because they are more thinly traded and less liquid than the securities of larger-capitalization companies. The Fund may fair value securities as a result of significant events occurring after the close of the foreign markets in which the Fund invests as described below. In addition, the Fund may invest in illiquid securities requiring these procedures.
The Fund may use fair value pricing for securities primarily traded in non-U.S. markets because most foreign markets close well before the Fund’s pricing time of 4:00 p.m. ET. The earlier close of these foreign markets gives rise to the possibility that significant events, including broad market moves, may have occurred in the interim and may materially affect the value of those securities. If the Manager determines that the last quoted prices of non-U.S. securities will, in its judgment, materially affect the value of some or all the Fund’s portfolio securities, the Manager can adjust the previous closing prices to reflect what it believes to be the fair value of the securities as of the close of the Exchange. In deciding whether it is necessary to adjust closing prices to reflect fair value, the Manager reviews a variety of factors, including developments in foreign markets, the performance of U.S. securities markets, and the performance of instruments trading in U.S. markets that represent foreign securities and baskets of foreign securities. These securities are fair valued using a pricing service, using methods approved by the Manager, that considers the correlation of the trading patterns of the foreign security to intraday trading in the U.S. markets, based on indices of domestic securities and other appropriate indicators such as prices of relevant American Depositary Receipts (“ADRs”) and futures contracts. The Manager’s Valuation Committee may also fair value securities in other situations, such as when a particular foreign market is closed but the Fund is open. The Fund uses outside pricing services to provide closing prices and information to evaluate and/or adjust those prices. As a means of evaluating its security valuation process, the Valuation Committee routinely compares closing prices, the next day’s opening prices in the same markets and adjusted prices.
Attempts to determine the fair value of securities introduce an element of subjectivity to the pricing of securities. As a result, the price of a security determined through fair valuation techniques may differ from the price quoted or published by other sources and may not accurately reflect the market value of the security when trading resumes. If a reliable market quotation becomes available for a security formerly valued through fair valuation techniques, the Manager compares the new market quotation to the fair value price to evaluate the effectiveness of the Fund’s fair valuation procedures. If any significant discrepancies are found, the Manager may adjust Manager’s fair valuation procedures for the Fund.
27
American Beacon Large Cap Value FundSM
Notes to Financial Statements
October 31, 2023
Valuation Inputs
Various inputs may be used to determine the fair value of the Fund’s investments. These inputs are summarized in three broad levels for financial statement purposes. The inputs or methodologies used to value securities are not necessarily an indication of the risk associated with investing in those securities.
| | | | |
| Level 1 | | - | | Quoted prices in active markets for identical securities. |
| | |
| Level 2 | | - | | Prices determined using other significant observable inputs. These may include quoted prices for similar securities, interest rates, prepayment speeds, credit risk, and others. |
| | |
| Level 3 | | - | | Prices determined using other significant unobservable inputs. Unobservable inputs reflect the Fund’s own assumptions about the factors market participants would use in pricing an investment. |
Level 1 and Level 2 trading assets and trading liabilities, at fair value
Common stocks, preferred securities and financial derivative instruments, such as futures contracts that are traded on a national securities exchange, are stated at the last reported sale or settlement price on the day of valuation. To the extent these securities are actively traded and valuation adjustments are not applied, they are categorized as Level 1 of the fair value hierarchy. Preferred securities and other equities traded on inactive markets or valued by reference to similar instruments are generally categorized as Level 2 of the fair value hierarchy.
Investments in registered open-end investment management companies will be valued based upon the NAVs of such investments and are categorized as Level 1 of the fair value hierarchy.
4. Securities and Other Investments
American Depositary Receipts and Non-Voting Depositary Receipts
ADRs are depositary receipts for foreign issuers in registered form traded in U.S. securities markets. Non-Voting Depositary Receipts (“NVDRs”) represent financial interests in an issuer but the holder is not entitled to any voting rights. Depositary receipts may not be denominated in the same currency as the securities into which they may be converted. Investing in depositary receipts entails substantially the same risks as direct investment in foreign securities. There is generally less publicly available information about foreign companies and there may be less governmental regulation and supervision of foreign stock exchanges, brokers, and listed companies. In addition, such companies may use different accounting and financial standards (and certain currencies may become unavailable for transfer from a foreign currency), resulting in the Fund’s possible inability to convert immediately into U.S. currency proceeds realized upon the sale of portfolio securities of the affected foreign companies. In addition, the Fund may invest in unsponsored depositary receipts, the issuers of which are not obligated to disclose material information about the underlying securities to investors in the United States. Ownership of unsponsored depositary receipts may not entitle the Fund to the same benefits and rights as ownership of a sponsored depositary receipt or the underlying security.
Common Stock
Common stock generally takes the form of shares in a corporation which represent an ownership interest. It ranks below preferred stock and debt securities in claims for dividends and for assets of the company in a liquidation or bankruptcy. The value of a company’s common stock may fall as a result of factors directly relating to that company, such as decisions made by its management or decreased demand for the company’s products or services. A stock’s value may also decline because of factors affecting not just the company, but also companies in the same industry or sector. The price of a company’s stock may also be affected by changes in financial markets that are relatively unrelated to the company, such as changes in interest rates, currency exchange rates or industry
28
American Beacon Large Cap Value FundSM
Notes to Financial Statements
October 31, 2023
regulation. Companies that elect to pay dividends on their common stock generally only do so after they invest in their own business and make required payments to bondholders and on other debt and preferred stock. Therefore, the value of a company’s common stock will usually be more volatile than its bonds, other debt and preferred stock. Common stock may be exchange-traded or OTC. OTC stock may be less liquid than exchange-traded stock.
Other Investment Company Securities and Other Exchange-Traded Products
The Fund may invest in shares of other investment companies, including open-end funds, closed-end funds, business development companies (“BDCs”), ETFs, unit investment trusts, and other investment companies of the Trust. The Fund may invest in securities of an investment company advised by the Manager or the Sub-Advisor. Investments in the securities of other investment companies may involve duplication of advisory fees and certain other expenses. By investing in another investment company, the Fund becomes a shareholder of that investment company. As a result, the Fund shareholders indirectly will bear the Fund’s proportionate share of the fees and expenses paid by shareholders of the other investment company, in addition to the fees and expenses the Fund shareholders directly bear in connection with the Fund’s own operations. These other fees and expenses are reflected as Acquired Fund Fees and Expenses and are included in the Fees and Expenses Table for the Fund in its Prospectus, if applicable. Investments in other investment companies may involve the payment of substantial premiums above the value of such issuer’s portfolio securities.
Publicly Traded Partnerships/Master Limited Partnerships (“MLPs”)
The Fund may invest in publicly traded partnerships such as MLPs. MLPs issue units that are registered with the SEC and are freely tradable on a securities exchange or in the OTC market. An MLP may have one or more general partners, who conduct the business, and one or more limited partners, who contribute capital. The general partner or partners are jointly and severally responsible for the liabilities of the MLP. (An MLP also may be an entity similar to a limited partnership, such as an LLC, which has one or more managers or managing members and non-managing members (who are like limited partners)). The Fund invests in an MLP as a limited partner and normally would not be liable for the debts of an MLP beyond the amount the Fund has invested therein, but it would not be shielded to the same extent that a shareholder of a corporation would be. In certain instances, creditors of an MLP would have the right to seek a return of capital that had been distributed to a limited partner. The right of an MLP’s creditors would continue even after the Fund had sold its investment in the partnership. MLPs typically invest in real estate and oil and gas equipment leasing assets, but they also finance entertainment, research and development, and other projects.
Real Estate Investment Trusts (“REITs”)
REITs are pooled investment vehicles that own, and often operate, income producing real estate (known as “equity REITs”) or invest in mortgages secured by loans on such real estate (known as “mortgage REITs”) or both (known as “hybrid REITs”). REITs are susceptible to the risks associated with direct ownership of real estate, such as declines in property values, increase in property taxes, operating expenses, rising interest rates or overbuilding, zoning changes, and losses from casualty or condemnation. REITs typically are subject to management fees and other expenses that are separate from those of the Fund.
5. Financial Derivative Instruments
The Fund may utilize derivative instruments to gain market exposure on cash balances or reduce market exposure in anticipation of liquidity needs. When considering the Fund’s use of derivatives, it is important to note that the Fund does not use derivatives for the purpose of creating financial leverage.
Futures Contracts
A futures contract is a contract to purchase or sell a particular security, or the cash value of an asset, such as securities, indices, or currencies, at a specified future date at a price agreed upon when the contract is made.
29
American Beacon Large Cap Value FundSM
Notes to Financial Statements
October 31, 2023
Under many such contracts, no delivery of the actual underlying asset is required. Rather, upon the expiration of the contract, settlement is made by exchanging cash in an amount equal to the difference between the contract price and the closing price of the asset (e.g., a security or an index) at expiration, net of the initial and variation margin that was previously paid. An equity index futures contract is based on the value of an underlying index. The Fund may, from time to time, use futures positions to equitize cash and expose its portfolio to changes in securities prices or index prices. This can magnify gains and losses in the Fund. The Fund also may have to sell assets at inopportune times to satisfy its settlement or collateral obligations. The risks associated with the use of futures contracts also include that there may be an imperfect correlation between the changes in market value of the prices of futures contracts and the assets underlying such contracts and that there may not be a liquid secondary market for a futures contract.
During the year ended October 31, 2023, the Fund entered into futures contracts primarily for exposing cash to markets.
The Fund’s average futures contracts outstanding fluctuate throughout the operating year as required to meet strategic requirements. The following table illustrates the average quarterly volume of futures contracts. For the purpose of this disclosure, volume is measured by contracts outstanding at each quarter end.
| | | | |
Average Futures Contracts Outstanding | |
Fund | | Year Ended October 31, 2023 | |
Large Cap Value | | | 301 | |
The following is a summary of the fair valuations of the Fund’s derivative instruments categorized by risk exposure(1):
| | | | | | | | | | | | | | | | | | | | | | | | | | | | | | | | | | | | | | | | | | | | | | | | | | | | | | | |
| Fair values of financial instruments on the Statement of Assets and Liabilities as of October 31, 2023: | |
| |
| | | Derivatives not accounted for as hedging instruments |
| | | | | | | | | | | |
Liabilities: | | Credit contracts | | | | Foreign exchange
contracts | | | | Commodity
contracts | | | | Interest rate
contracts | | | | Equity contracts | | | | Total |
| Payable for variation margin from open futures contracts(2) | | | $ | - | | | | | | | | | $ | - | | | | | | | | | $ | - | | | | | | | | | $ | - | | | | | | | | | $ | (2,949,130 | ) | | | | | | | | $ | (2,949,130 | ) |
| | | | | | | | | | | | | | | | | | | | | | | | | | | | | | | | | | | | | | | | | | | | | | | | | | | | | | | |
| The effect of financial derivative instruments on the Statement of Operations as of October 31, 2023: | |
| |
| | | Derivatives not accounted for as hedging instruments |
| | | | | | | | | | | |
Realized gain (loss) from derivatives
recognized as a result of operations | | Credit contracts | | | | Foreign exchange
contracts | | | | Commodity
contracts | | | | Interest rate
contracts | | | | Equity contracts | | | | Total |
| Futures contracts | | | $ | - | | | | | | | | | $ | - | | | | | | | | | $ | - | | | | | | | | | $ | - | | | | | | | | | $ | 10,656,461 | | | | | | | | | $ | 10,656,461 | |
| | | | | | | | | | | |
Net change in unrealized appreciation (depreciation) of derivatives
recognized as a result from operations: | | Credit contracts | | | | Foreign exchange
contracts | | | | Commodity
contracts | | | | Interest rate
contracts | | | | Equity contracts | | | | Total |
| Futures contracts | | | $ | - | | | | | | | | | $ | - | | | | | | | | | | - | | | | | | | | | $ | - | | | | | | | | | $ | (7,777,181 | ) | | | | | | | | $ | (7,777,181 | ) |
(1) See Note 3 in the Notes to Financial Statements for additional information.
(2) Includes cumulative appreciation (depreciation) of futures contracts as reported in the Fund’s Schedule of Investments footnotes. Only current day’s variation margin is reported within the Statement of Assets and Liabilities.
Offsetting Assets and Liabilities
The Fund is a party to enforceable master netting agreements between brokers and counterparties which provide for the right to offset under certain circumstances. The Fund employs multiple money managers and counterparties and has elected not to offset qualifying financial and derivative instruments on the Statement of
30
American Beacon Large Cap Value FundSM
Notes to Financial Statements
October 31, 2023
Assets and Liabilities, as such all financial and derivative instruments are presented on a gross basis. The impacts of netting arrangements that provide the right to offset are detailed below, if applicable. The net amount represents the net receivable or payable that would be due from or to the counterparty in the event of default. Exposure from borrowings and other financing agreements such as repurchase agreements can only be netted across transactions governed by the same Master Agreement with the same legal entity. All amounts reported below represent the balance as of the report date, October 31, 2023.
| | | | | | | | | | | | |
| Offsetting of Financial and Derivative Assets as of October 31, 2023: | |
| | Assets | | | | | | Liabilities | |
| Futures Contracts(1) | | $ | - | | | | | | | $ | 2,949,130 | |
| | | | | | | | | | | | |
| Total derivative assets and liabilities in the Statement of Assets and Liabilities | | $ | - | | | | | | | $ | 2,949,130 | |
| | | | | | | | | | | | |
| Derivatives not subject to a Master Netting Agreement or similar agreement (“MNA”) | | $ | - | | | | | | | $ | (2,949,130 | ) |
| | | | | | | | | | | | |
| | | | | | | | | | | | | | | | | | | | | | | | | | | | | | | | | | | | |
| | | Remaining Contractual Maturity of the Agreements
As of October 31, 2023 | |
| | | Overnight and
Continuous | | | | | | <30 days | | | | | | Between
30 & 90 days | | | | | | >90 days | | | | | | Total | |
Securities Lending Transactions | | | | | | | | | | | | | | | | | | | | | | | | | | | | | | | | | | | | |
Common Stocks | | $ | 28,712,080 | | | | | | | $ | - | | | | | | | $ | - | | | | | | | $ | - | | | | | | | $ | 28,712,080 | |
| | | | | | | | | | | | | | | | | | | | | | | | | | | | | | | | | | | | |
Total Borrowings | | $ | 28,712,080 | | | | | | | $ | - | | | | | | | $ | - | | | | | | | $ | - | | | | | | | $ | 28,712,080 | |
| | | | | | | | | | | | | | | | | | | | | | | | | | | | | | | | | | | | |
Gross amount of recognized liabilities for securities lending transactions | | | $ | 28,712,080 | |
| | | | | | | | | | | | | | | | | | | | | | | | | | | | | | | | | | | | |
(1) Includes cumulative appreciation or (depreciation) of futures contracts as reported in the Schedule of Investments footnotes. Only current day’s variation margin is reported within the Statement of Assets and Liabilities.
6. Principal Risks
Investing in the Fund may involve certain risks including, but not limited to, those described below.
Environmental, Social, and/or Governance Investing Risk
The use of environmental, social, and/or governance (“ESG”) considerations by a sub-advisor may cause the Fund to make different investments than funds that have a similar investment style but do not incorporate such considerations in their strategy. As with the use of any investment considerations involved in investment decisions, there is no guarantee that the use of any ESG investment considerations will result in the selection of issuers that will outperform other issuers or help reduce risk in the Fund. The Fund may underperform funds that do not incorporate these considerations.
Equity Investments Risk
Equity securities are subject to market risk. The Fund’s investments in equity securities may include common stocks, preferred stocks, securities convertible into or exchangeable for common stocks, REITs, depositary receipts, and U.S. dollar-denominated foreign stocks traded on U.S. exchanges. Such investments may expose the Fund to additional risk. The value of a company’s common stock may fall as a result of factors affecting the company, companies in the same industry or sector, or the financial markets overall. Common stock generally is subordinate to preferred stock upon the liquidation or bankruptcy of the issuing company. Preferred stocks and convertible securities are sensitive to movements in interest rates. Preferred stocks may be less liquid than common stocks and, unlike common stocks, participation in the growth of an issuer may be limited. Distributions on preferred stocks generally are payable at the discretion of an issuer and after required payments to bond holders. Convertible securities are subject to the risk that the credit standing of the issuer may have an effect on the convertible securities’ investment value. Investments in REITs are subject to the risks associated with investing in the real estate industry such as adverse developments affecting the real estate industry and real property values. Depositary receipts and U.S. dollar-denominated foreign stocks traded on U.S. exchanges are subject to
31
American Beacon Large Cap Value FundSM
Notes to Financial Statements
October 31, 2023
certain of the risks associated with investing directly in foreign securities, including, but not limited to, currency exchange rate fluctuations, political and financial instability in the home country of a particular depositary receipt, less liquidity and more volatility, less government regulation and supervision and delays in transaction settlement.
Foreign Investing Risk
Non-U.S. investments carry potential risks not associated with U.S. investments. Such risks include, but are not limited to: (1) currency exchange rate fluctuations, (2) political and financial instability, (3) less liquidity, (4) lack of uniform accounting, auditing and financial reporting standards, (5) increased volatility, (6) different government regulation and supervision of foreign stock exchanges, brokers and listed companies, and (7) delays in transaction settlement in some foreign markets. To the extent the Fund invests a significant portion of its assets in securities of a single country or region, it is more likely to be affected by events or conditions of that country or region.
Futures Contracts Risk
Futures contracts are derivative instruments where one party pays a fixed price for an agreed amount of securities or other underlying assets at an agreed date. The use of such derivative instruments may expose the Fund to additional risks that it would not be subject to if it invested directly in the securities underlying those derivatives. There may at times be an imperfect correlation between the movement in the prices of futures contracts and the value of their underlying instruments or indexes. There can be no assurance that any strategy used will succeed. There also can be no assurance that, at all times, a liquid market will exist for offsetting a futures contract that the Fund has previously bought or sold and this may result in the inability to close a futures contract when desired. Futures contracts may experience potentially dramatic price changes, which will increase the volatility of the Fund and may involve a small investment of cash (the amount of initial and variation margin) relative to the magnitude of the risk assumed (the potential increase or decrease in the price of the futures contract).
Market Risk
The Fund is subject to the risk that the securities markets will move down, sometimes rapidly and unpredictably, based on overall economic conditions and other factors, which may negatively affect the Fund’s performance. Equity securities generally have greater price volatility than fixed-income securities, although under certain market conditions fixed-income securities may have comparable or greater price volatility. During a general downturn in the securities markets, multiple assets may decline in value simultaneously. In some cases, traditional market participants have been less willing to make a market in some types of debt instruments, which has affected the liquidity of those instruments. During times of market turmoil, investors tend to look to the safety of securities issued or backed by the U.S. Treasury, causing the prices of these securities to rise and the yields to decline. Reduced liquidity in fixed-income and credit markets may negatively affect many issuers worldwide. Prices in many financial markets have increased significantly over the last decade, but there have also been periods of adverse market and financial developments and cyclical change during that timeframe, which have resulted in unusually high levels of volatility in domestic and foreign financial markets that has caused losses for investors and may occur again in the future, particularly if markets enter a period of uncertainty or economic weakness. The value of a security may decline due to adverse issuer-specific conditions, general market conditions unrelated to a particular issuer, or factors that affect a particular industry or industries. Changes in the financial condition of a single issuer or market segment also can impact the market as a whole.
Geopolitical and other events, including war, terrorism, economic uncertainty, trade disputes, pandemics, public health crises, natural disasters and related events have led, and in the future may continue to lead, to instability in world economies and markets generally and reduced liquidity in equity, credit and fixed-income markets, which may disrupt economies and markets and adversely affect the value of your investment. Changes in value may be temporary or may last for extended periods.
32
American Beacon Large Cap Value FundSM
Notes to Financial Statements
October 31, 2023
Policy changes by the U.S. government and/or Federal Reserve and political events within the U.S. and abroad, including the U.S. presidential election, the U.S. government’s inability at times to agree on a long-term budget and deficit reduction plan, the threat of a federal government shutdown and threats not to increase the federal government’s debt limit, may affect investor and consumer confidence and may adversely impact financial markets and the broader economy, perhaps suddenly and to a significant degree.
Markets and market participants are increasingly reliant upon both publicly available and proprietary information data systems. Data imprecision, software or other technology malfunctions, programming inaccuracies, unauthorized use or access, and similar circumstances may impair the performance of these systems and may have an adverse impact upon a single issuer, a group of issuers, or the market at large. The financial markets generally move in cycles, with periods of rising prices followed by periods of declining prices. The value of your investment may reflect these fluctuations.
Multiple Sub-Advisor Risk
The Manager may allocate the Fund’s assets among multiple sub-advisors, each of which is responsible for investing its allocated portion of the Fund’s assets. To a significant extent, the Fund’s performance will depend on the success of the Manager in allocating the Fund’s assets to sub-advisors and its selection and oversight of the sub-advisors. Because each sub-advisor manages its allocated portion of the Fund independently from another sub-advisor, the same security may be held in different portions of the Fund, or may be acquired for one portion of the Fund at a time when a sub-advisor to another portion deems it appropriate to dispose of the security from that other portion, resulting in higher expenses without accomplishing any net result in the Fund’s holdings. Similarly, under some market conditions, one sub-advisor may believe that temporary, defensive investments in short-term instruments or cash are appropriate when another sub-advisor believes continued exposure to the equity or debt markets is appropriate for its allocated portion of the Fund. Because each sub-advisor directs the trading for its own portion of the Fund, and does not aggregate its transactions with those of the other sub-advisors, the Fund may incur higher brokerage costs than would be the case if a single sub-adviser were managing the entire Fund. In addition, while the Manager seeks to allocate the Fund’s assets among the Fund’s sub-advisors in a manner that it believes is consistent with achieving the Fund’s investment objective(s), the Manager may be subject to potential conflicts of interest in allocating the Fund’s assets among sub-advisors, due to factors that could impact the Manager’s revenues and profits.
Other Investment Companies Risk
The Fund may invest in shares of other registered investment companies, including money market funds that are advised by the Manager. To the extent that the Fund invests in shares of other registered investment companies, the Fund will indirectly bear the fees and expenses, including for example advisory and administrative fees, charged by those investment companies in addition to the Fund’s direct fees and expenses and will be subject to the risks associated with investments in those companies. For example, the Fund’s investments in money market funds are subject to interest rate risk, credit risk, and market risk. The Fund must rely on the investment company in which it invests to achieve its investment objective. If the investment company fails to achieve its investment objective, the value of the Fund’s investment will decline, adversely affecting the Fund’s performance. To the extent the Fund invests in other investment companies that invest in equity securities, fixed-income securities and/or foreign securities, or that track an index, the Fund is subject to the risks associated with the underlying investments held by the investment company or the index fluctuations to which the investment company is subject.
Recent Market Events Risk
Both U.S. and international markets have experienced significant volatility in recent months and years. As a result of such volatility, investment returns may fluctuate significantly. Moreover, the risks discussed herein associated with an investment in the Fund may be increased.
33
American Beacon Large Cap Value FundSM
Notes to Financial Statements
October 31, 2023
Although interest rates were unusually low in recent years in the U.S. and abroad, in 2022, the Federal Reserve and certain foreign central banks began to raise interest rates as part of their efforts to address rising inflation. It is difficult to accurately predict the pace at which interest rates may continue to increase, the timing, frequency or magnitude of any such increases, or when such increases might stop. Additionally, various economic and political factors could cause the Federal Reserve or another foreign central bank to change their approach in the future and such actions may result in an economic slowdown in the U.S. and abroad. Unexpected increases in interest rates could lead to market volatility or reduce liquidity in certain sectors of the market. Deteriorating economic fundamentals may, in turn, increase the risk of default or insolvency of particular issuers, negatively impact market value, cause credit spreads to widen, and reduce bank balance sheets. Any of these could cause an increase in market volatility, reduce liquidity across various markets or decrease confidence in the markets. Additionally, high public debt in the U.S. and other countries creates ongoing systemic and market risks and policymaking uncertainty.
In March 2023, the shutdown of certain financial institutions in the U.S. and questions regarding the viability of other financial institutions raised economic concerns over disruption in the U.S. and global banking systems. There can be no certainty that the actions taken by the U.S. or foreign governments will be effective in mitigating the effects of financial institution failures on the economy and restoring public confidence in the U.S. and global banking systems. Some countries, including the U.S., have in recent years adopted more protectionist trade policies. Slowing global economic growth; risks associated with a trade agreement between the United Kingdom and the European Union; the risks associated with ongoing trade negotiations with China; and the possibility of changes to some international trade agreements; political or economic dysfunction within some nations, including major producers of oil; and dramatic changes in commodity and currency prices could have adverse effects that cannot be foreseen at the present time.
Tensions, war, or open conflict between nations, such as between Russia and Ukraine, in the Middle East or in eastern Asia could affect the economies of many nations, including the United States. The duration of ongoing hostilities in the Middle East and between Russia and Ukraine, and any sanctions and related events cannot be predicted. Those events present material uncertainty and risk with respect to markets globally and the performance of the Fund and its investments or operations could be negatively impacted.
Regulators in the U.S. have proposed and recently adopted a number of changes to regulations involving the markets and issuers, some of which apply to the Fund. The full effect of various newly-adopted regulations is not currently known. Additionally, it is not clear whether the proposed regulations will be adopted. However, due to the broad scope of the new and proposed regulations, certain changes could limit the Fund’s ability to pursue its investment strategies or make certain investments, or may make it more costly for the Fund to operate, which may impact performance.
Economists and others have expressed increasing concern about the potential effects of global climate change on property and security values. Certain issuers, industries and regions may be adversely affected by the impacts of climate change, including on the demand for and the development of goods and services and related production costs, and the impacts of legislation, regulation and international accords related to climate change, as well as any indirect consequences of regulation or business trends driven by climate change.
Sector Risk
Sector risk is the risk associated with the Fund holding a significant amount of investments in similar businesses, which would be similarly affected by particular economic or market events, which may, in certain circumstances, cause the value of the equity and debt securities of companies in a particular sector of the market to change. To the extent the Fund has substantial holdings within a particular sector, the risks to the Fund associated with that sector increase.
34
American Beacon Large Cap Value FundSM
Notes to Financial Statements
October 31, 2023
To the extent the Fund invests significantly in the financial services sector, the value of the Fund’s shares may be particularly vulnerable to factors affecting that sector, such as the availability and cost of capital funds, changes in interest rates, the rate of corporate and consumer debt defaults, extensive government regulation and price competition. The value of the Fund’s shares could experience significantly greater volatility than investment companies investing more broadly.
Securities Lending Risk
The Fund may lend its portfolio securities to brokers, dealers and financial institutions in order to obtain additional income. Borrowers of the Fund’s securities provide collateral either in the form of cash, which the Fund reinvests in securities or in the form of non-cash collateral consisting of securities issued or guaranteed by the U.S. government or one of its agencies or instrumentalities. The Fund will be responsible for the risks associated with the investment of cash collateral, including any collateral invested in an affiliated money market fund. The Fund may lose money on its investment of cash collateral or may fail to earn sufficient income on its investment to cover its payment to the borrower of a pre-negotiated fee or “rebate” for the use of that cash collateral in connection with the loan. The Fund could also lose money due to a decline in the value of non-cash collateral. In addition, delays may occur in the recovery of securities from borrowers, which could interfere with the Fund’s ability to vote proxies or to settle transactions or could result in increased costs. Moreover, if the borrower becomes subject to insolvency or similar proceedings, the Fund could incur delays in its ability to enforce its rights in its collateral. There also is a risk that a borrower may default on its obligation to return loaned securities at a time when the value of the Fund’s collateral is inadequate. Although the Fund’s securities lending agent may indemnify the Fund against that risk, it is also possible that the securities lending agent will be unable to satisfy its indemnification obligations. In any case in which the loaned securities are not returned to the Fund before an ex-dividend date, whether or not due to a default by the borrower, the payment in lieu of the dividend that the Fund receives from the securities’ borrower would not be treated as a dividend for federal income tax purposes and thus would not qualify for treatment as “qualified dividend income.”
7. Federal Income and Excise Taxes
It is the policy of the Fund to qualify as a regulated investment company (“RIC”), by complying with all applicable provisions of Subchapter M of the Internal Revenue Code, as amended, and to make distributions of taxable income sufficient to relieve it from substantially all federal income and excise taxes. For federal income tax purposes, the Fund is treated as a single entity for the purpose of determining such qualification.
The Fund does not have any unrecorded tax liabilities in the accompanying financial statements. Each of the tax years in the four year period ended October 31, 2023 remain subject to examination by the Internal Revenue Service. If applicable, the Fund recognizes interest accrued related to unrecognized tax benefits in interest expense and penalties in “Other expenses” on the Statement of Operations.
The Fund may be subject to taxes imposed by countries in which it invests. Such taxes are generally based on returns of income earned or gains realized or repatriated. Taxes are accrued and applied to net investment income, net realized capital gains and net unrealized appreciation (depreciation), as applicable, as the income is earned or capital gains are recorded.
Dividends are categorized in accordance with income tax regulations which may treat certain transactions differently than U.S. GAAP. Accordingly, the character of distributions and composition of net assets for tax purposes may differ from those reflected in the accompanying financial statements.
35
American Beacon Large Cap Value FundSM
Notes to Financial Statements
October 31, 2023
The tax character of distributions paid were as follows:
| | | | | | | | | | | | |
| | | Year Ended
October 31, 2023 | | | | | | Year Ended
October 31, 2022 | |
Distributions paid from: | | | | | | | | | | | | |
Ordinary income* | | | | | | | | | | | | |
R5 Class | | $ | 19,554,206 | | | | | | | $ | 49,797,217 | |
Y Class | | | 2,880,165 | | | | | | | | 7,544,565 | |
Investor Class | | | 9,457,017 | | | | | | | | 24,294,437 | |
Advisor Class | | | 634,040 | | | | | | | | 1,854,812 | |
A Class | | | 245,474 | | | | | | | | 340,088 | |
C Class | | | 37,594 | | | | | | | | 173,788 | |
R6 Class | | | 18,258,942 | | | | | | | | 38,066,801 | |
Long-term capital gains | | | | | | | | | | | | |
R5 Class | | | 109,948,196 | | | | | | | | 119,561,307 | |
Y Class | | | 17,009,535 | | | | | | | | 18,464,044 | |
Investor Class | | | 65,498,599 | | | | | | | | 65,093,234 | |
Advisor Class | | | 4,935,411 | | | | | | | | 5,117,693 | |
A Class | | | 1,551,944 | | | | | | | | 936,384 | |
C Class | | | 574,978 | | | | | | | | 579,649 | |
R6 Class | | | 100,585,966 | | | | | | | | 90,378,296 | |
| | | | | | | | | | | | |
Total distributions paid | | $ | 351,172,067 | | | | | | | $ | 422,202,315 | |
| | | | | | | | | | | | |
* For tax purposes, short-term capital gains are considered ordinary income distributions.
As of October 31, 2023, the components of distributable earnings (deficits) on a tax basis were as follows:
| | | | | | | | | | | | | | | | | | | | | | | | | | | | |
Fund | | Tax Cost | | | | | | Unrealized
Appreciation | | | | | | Unrealized
(Depreciation) | | | | | | Net Unrealized
Appreciation
(Depreciation) | |
Large Cap Value | | $ | 2,374,118,258 | | | | | | | $ | 758,836,835 | | | | | | | $ | (160,140,949 | ) | | | | | | $ | 598,695,886 | |
| | | | | | | | | | | | | | | | | | | | | | | | | | | | | | | | | | | | | | | | | | | | |
Fund | | Net Unrealized
Appreciation
(Depreciation) | | | | | | Undistributed
Ordinary
Income | | | | | | Undistributed
Long-Term
Capital Gains | | | | | | Accumulated
Capital and
Other (Losses) | | | | | | Other Temporary
Differences | | | | | | Distributable
Earnings | |
Large Cap Value | | $ | 598,695,886 | | | | | | | $ | 59,085,857 | | | | | | | $ | 104,255,685 | | | | | | | $ | | | | | | | | $ | 1 | | | | | | | $ | 762,037,429 | |
Financial reporting records are adjusted for permanent book/tax differences to reflect tax character. Financial records are not adjusted for temporary differences. The temporary differences between financial reporting and tax-basis reporting of unrealized appreciation (depreciation) are attributable primarily to the tax deferral of losses from wash sales, the realization for tax purposes of unrealized gains (losses) on certain derivative instruments, and reclassifications of income from investments in real estate securities and other securities.
Due to inherent differences in the recognition of income, expenses, and realized gains (losses) under U.S. GAAP and federal income tax regulations, permanent differences between book and tax reporting have been identified and appropriately reclassified on the Statement of Assets and Liabilities.
Accordingly, the following amounts represent current year permanent differences derived from equalization as of October 31, 2023:
| | | | | | | | |
Fund | | Paid-In-Capital | | | Distributable
Earnings/(Deficits) | |
Large Cap Value | | $ | 15,009,747 | | | $ | (15,009,747 | ) |
For federal income tax purposes, the Fund measures its capital loss carryforwards annually at October 31, its fiscal year end. Capital loss carryforwards retain their character as short-term and/or long-term and may be carried forward and applied against future realized capital gains with no expiration date.
36
American Beacon Large Cap Value FundSM
Notes to Financial Statements
October 31, 2023
As of October 31, 2023, the Fund did not have any capital loss carryforwards.
8. Investment Transactions
The aggregate cost of purchases and proceeds from sales and maturities of investments, other than short-term obligations, for the year ended October 31, 2023 were as follows:
| | | | | | | | |
Fund | | Purchases
(non-U.S.
Government
Securities) | | | Sales
(non-U.S.
Government
Securities) | |
Large Cap Value | | $ | 772,091,757 | | | $ | 1,016,596,641 | |
A summary of the Fund’s transactions in the USG Select Fund for the year ended October 31, 2023 were as follows:
| | | | | | | | | | | | | | | | | | | | | | | | | | | | | | | | | | |
Fund | | Type of
Transaction | | | | | October 31,
2022
Shares/Fair
Value | | | | | | Purchases | | | | | | Sales | | | | | | October 31,
2023
Shares/Fair
Value | |
| Large Cap Value | | Direct | | | | | | $ | 94,588,422 | | | | | | | $ | 860,993,264 | | | | | | | $ | 900,903,306 | | | | | | | $ | 54,678,380 | |
| Large Cap Value | | Securities Lending | | | | | | | 5,511,730 | | | | | | | | 293,736,990 | | | | | | | | 270,536,640 | | | | | | | | 28,712,080 | |
Affiliated Trades
Cross trades for the period ended October 31, 2023, if any, were executed by the Fund pursuant to procedures adopted by the Board to ensure compliance with Rule 17a-7 under the Act. Cross trading is the buying or selling of portfolio securities between funds of investment companies, or between the fund of an investment company and another entity, that are or could be considered affiliates by virtue of a common investment advisor (or affiliated investment advisors), common Trustees and/or common Officers. At its regularly scheduled meetings, the Chief Compliance Officer (“CCO”) certifies to the Board that the 17a-7 transactions entered into by the funds complied with the Rule 17a-7 Procedures adopted by the Board.
For the period ended October 31, 2023, cross trades by the Fund under Rule 17a-7 were as follows:
| | | | | | | | | | | | |
Fund | | Purchases | | | Sales | | | Net Realized
Gain (Loss) | |
Large Cap Value | | $ | 131,458 | | | $ | 509,176 | | | $ | 218,201 | |
9. Securities Lending
The Fund may lend its securities to qualified financial institutions, such as certain broker-dealers, to earn additional income. The borrowers are required to secure their loans continuously with collateral in an amount at least equal to the fair value of the securities loaned, initially in an amount at least equal to 102% of the fair value of domestic securities loaned and 105% of the fair value of international securities loaned. Collateral is monitored and marked-to-market daily. Daily mark-to-market amounts are required to be paid to the borrower or received from the borrower by the end of the following business day. This one day settlement for mark-to-market amounts may result in the collateral being temporarily less than the value of the securities on loan or temporarily more than the required minimum collateral.
To the extent that a loan is collateralized by cash, such cash collateral shall be invested by the securities lending agent (the “Agent”) in money market mutual funds and other short-term investments, provided the investments meet certain quality and diversification requirements. Securities purchased with cash collateral proceeds are listed in the Fund’s Schedule of Investments and the collateral is shown on the Statement of Assets and Liabilities as a payable.
37
American Beacon Large Cap Value FundSM
Notes to Financial Statements
October 31, 2023
Securities lending income is generated from the demand premium (if any) paid by the borrower to borrow a specific security and from the return on investment of cash collateral, reduced by negotiated rebate fees paid to the borrower and transaction costs. To the extent that a loan is secured by non-cash collateral, securities lending income is generated as a demand premium reduced by transaction costs. The Fund, the Agent, and the Manager retained 80%, 10%, and 10%, respectively, of the income generated from securities lending.
While securities are on loan, the Fund continues to receive certain income associated with that security and any gain or loss in the market price that may occur during the term of the loan. In the case of domestic equities, the value of any dividend is received in the form of a substitute payment approximately equal to the dividend. In the case of foreign securities, a negotiated amount is received that is less than the actual dividend, but higher than the dividend amount minus the foreign tax that the Fund would be subject to on the dividend.
Securities lending transactions pose certain risks to the Fund, including that the borrower may not provide additional collateral when required or return the securities when due, that the value of the short-term investments will be less than the amount of cash collateral required to be returned to the borrower, that non-cash collateral may be subject to legal constraints in the event of a borrower bankruptcy, and that the cash collateral investments could become illiquid and unable to be used to return collateral to the borrower. The Fund could also experience delays and costs in gaining access to the collateral. The Fund bears the risk of any deficiency in the amount of the cash collateral available for return to the borrower and any action which impairs its ability to liquidate non-cash collateral to satisfy a borrower default.
As of October 31, 2023, the value of outstanding securities on loan and the value of collateral were as follows:
| | | | | | | | | | | | | | | | | | | | | | | | | | | | |
Fund | | Fair Value of
Securities on Loan | | | | | | Cash Collateral
Received | | | | | | Non-Cash Collateral
Received | | | | | | Total Collateral
Received | |
Large Cap Value | | $ | 31,639,586 | | | | | | | $ | 28,712,080 | | | | | | | $ | 3,280,204 | | | | | | | $ | 31,992,284 | |
Cash collateral is listed on the Fund’s Schedule of Investments and is shown on the Statement of Assets and Liabilities. Income earned on these investments is included in “Income derived from securities lending” on the Statement of Operations.
Non-cash collateral received by the Fund may not be sold or re-pledged except to satisfy a borrower default. Therefore, non-cash collateral is not included on the Fund’s Schedule of Investments or Statement of Assets and Liabilities.
10. Borrowing Arrangements
Effective November 10, 2023 (the “Effective Date”), the Fund, along with certain other funds managed by the Manager (“Participating Funds”), renewed a committed revolving line of credit (the “Committed Line”) agreement with State Street Bank and Trust Company (the “Bank”) to be used to facilitate portfolio liquidity. The maximum borrowing amount under the Committed Line is $100 million with interest at a rate equal to the higher of (a) Overnight Bank Funding Rate (“OBFR”) daily fluctuating rate per annum equal to 1.25% plus the sum of 0.10% or (b) the Federal Funds daily fluctuating rate per annum on amounts borrowed. Each of the Participating Funds paid a proportional amount of a quarterly commitment fee at a rate of 0.25% per annum on the unused portion of the Committed Line amount. The Committed Line expires November 8, 2024, unless extended by the Bank or terminated by the Participating Funds in accordance with the agreement.
On the Effective Date, the Fund, along with certain other Participating Funds managed by the Manager, also renewed an uncommitted discretionary demand revolving line of credit (the “Uncommitted Line”) agreement with the Bank to be used to facilitate portfolio liquidity. The maximum borrowing amount under the Uncommitted Line is $100 million with interest at a rate equal to the higher of (a) OBFR daily fluctuating rate per annum equal to
38
American Beacon Large Cap Value FundSM
Notes to Financial Statements
October 31, 2023
1.25% plus the sum of 0.10% or (b) the Federal Funds daily fluctuating rate per annum on amounts borrowed on each outstanding loan. Each of the Participating Funds paid a proportional amount of a closing fee of $35,000 on the Effective Date. The Uncommitted Line expires November 8, 2024, unless extended by the Bank or terminated by the Participating Funds in accordance with the agreement.
The Participating Funds paid administration, legal and arrangement fees, which are recognized as a component of “Loan expense” on the Statement of Operations, along with commitment fees, that have been allocated among the Participating Funds based on average daily net assets.
During the year ended October 31, 2023, the Fund did not utilize these facilities.
11. Capital Share Transactions
The tables below summarize the activity in capital shares for each Class of the Fund:
| | | | | | | | | | | | | | | | | | | | | | | | | | | | |
| | | R5 Class | |
| | | Year Ended October 31, | |
| | | 2023 | | | | | | 2022 | |
Large Cap Value Fund | | Shares | | | | | | Amount | | | | | | Shares | | | | | | Amount | |
| Shares sold | | | 5,030,633 | | | | | | | $ | 125,011,196 | | | | | | | | 5,438,071 | | | | | | | $ | 148,991,696 | |
| Reinvestment of dividends | | | 4,651,691 | | | | | | | | 109,872,932 | | | | | | | | 5,296,719 | | | | | | | | 146,507,237 | |
| Shares redeemed | | | (12,695,441 | ) | | | | | | | (315,457,120 | ) | | | | | | | (18,524,183 | ) | | | | | | | (505,754,019 | ) |
| | | | | | | | | | | | | | | | | | | | | | | | | | | | |
| Net (decrease) in shares outstanding | | | (3,013,117 | ) | | | | | | $ | (80,572,992 | ) | | | | | | | (7,789,393 | ) | | | | | | $ | (210,255,086 | ) |
| | | | | | | | | | | | | | | | | | | | | | | | | | | | |
| | | | |
| | | Y Class | |
| | | Year Ended October 31, | |
| | | 2023 | | | 2022 | |
Large Cap Value Fund | | Shares | | | | | | Amount | | | | | | Shares | | | | | | Amount | |
| Shares sold | | | 1,520,418 | | | | | | | $ | 37,053,578 | | | | | | | | 1,098,692 | | | | | | | $ | 29,828,324 | |
| Reinvestment of dividends | | | 822,067 | | | | | | | | 19,195,272 | | | | | | | | 921,340 | | | | | | | | 25,217,075 | |
| Shares redeemed | | | (1,920,702 | ) | | | | | | | (47,489,945 | ) | | | | | | | (3,176,984 | ) | | | | | | | (84,862,069 | ) |
| | | | | | | | | | | | | | | | | | | | | | | | | | | | |
| Net increase (decrease) in shares outstanding | | | 421,783 | | | | | | | $ | 8,758,905 | | | | | | | | (1,156,952 | ) | | | | | | $ | (29,816,670 | ) |
| | | | | | | | | | | | | | | | | | | | | | | | | | | | |
| | | | |
| | | Investor Class | |
| | | Year Ended October 31, | |
| | | 2023 | | | 2022 | |
Large Cap Value Fund | | Shares | | | | | | Amount | | | | | | Shares | | | | | | Amount | |
| Shares sold | | | 1,953,809 | | | | | | | $ | 42,458,307 | | | | | | | | 2,504,206 | | | | | | | $ | 61,083,605 | |
| Reinvestment of dividends | | | 3,564,808 | | | | | | | | 73,969,773 | | | | | | | | 3,581,099 | | | | | | | | 88,309,888 | |
| Shares redeemed | | | (8,345,996 | ) | | | | | | | (180,334,525 | ) | | | | | | | (7,663,306 | ) | | | | | | | (186,750,186 | ) |
| | | | | | | | | | | | | | | | | | | | | | | | | | | | |
| Net (decrease) in shares outstanding | | | (2,827,379 | ) | | | | | | $ | (63,906,445 | ) | | | | | | | (1,578,001 | ) | | | | | | $ | (37,356,693 | ) |
| | | | | | | | | | | | | | | | | | | | | | | | | | | | |
| | | | |
| | | Advisor Class | |
| | | Year Ended October 31, | |
| | | 2023 | | | 2022 | |
Large Cap Value Fund | | Shares | | | | | | Amount | | | | | | Shares | | | | | | Amount | |
| Shares sold | | | 112,111 | | | | | | | $ | 2,376,104 | | | | | | | | 198,414 | | | | | | | $ | 4,696,545 | |
| Reinvestment of dividends | | | 273,640 | | | | | | | | 5,549,426 | | | | | | | | 266,337 | | | | | | | | 6,432,037 | |
| Shares redeemed | | | (437,149 | ) | | | | | | | (9,075,373 | ) | | | | | | | (716,683 | ) | | | | | | | (16,989,798 | ) |
| | | | | | | | | | | | | | | | | | | | | | | | | | | | |
| Net (decrease) in shares outstanding | | | (51,398 | ) | | | | | | $ | (1,149,843 | ) | | | | | | | (251,932 | ) | | | | | | $ | (5,861,216 | ) |
| | | | | | | | | | | | | | | | | | | | | | | | | | | | |
| | | | |
| | | A Class | |
| | | Year Ended October 31, | |
| | | 2023 | | | 2022 | |
Large Cap Value Fund | | Shares | | | | | | Amount | | | | | | Shares | | | | | | Amount | |
| Shares sold | | | 191,336 | | | | | | | $ | 4,086,931 | | | | | | | | 495,949 | | | | | | | $ | 11,569,354 | |
| Reinvestment of dividends | | | 84,266 | | | | | | | | 1,708,076 | | | | | | | | 49,116 | | | | | | | | 1,187,641 | |
| Shares redeemed | | | (431,729 | ) | | | | | | | (9,293,236 | ) | | | | | | | (266,027 | ) | | | | | | | (6,441,035 | ) |
| | | | | | | | | | | | | | | | | | | | | | | | | | | | |
| Net increase (decrease) in shares outstanding | | | (156,127 | ) | | | | | | $ | (3,498,229 | ) | | | | | | | 279,038 | | | | | | | $ | 6,315,960 | |
| | | | | | | | | | | | | | | | | | | | | | | | | | | | |
| | | | |
39
American Beacon Large Cap Value FundSM
Notes to Financial Statements
October 31, 2023
| | | | | | | | | | | | | | | | | | | | | | | | | | | | |
| | | C Class | |
| | | Year Ended October 31, | |
| | | 2023 | | | 2022 | |
Large Cap Value Fund | | Shares | | | | | | Amount | | | | | | Shares | | | | | | Amount | |
| Shares sold | | | 23,936 | | | | | | | $ | 497,121 | | | | | | | | 46,214 | | | | | | | $ | 1,120,298 | |
| Reinvestment of dividends | | | 29,998 | | | | | | | | 603,851 | | | | | | | | 31,246 | | | | | | | | 749,292 | |
| Shares redeemed | | | (108,342 | ) | | | | | | | (2,280,316 | ) | | | | | | | (87,726 | ) | | | | | | | (2,032,852 | ) |
| | | | | | | | | | | | | | | | | | | | | | | | | | | | |
| Net (decrease) in shares outstanding | | | (54,408 | ) | | | | | | $ | (1,179,344 | ) | | | | | | | (10,266 | ) | | | | | | $ | (163,262 | ) |
| | | | | | | | | | | | | | | | | | | | | | | | | | | | |
| | | | |
| | | R6 Class | |
| | | Year Ended October 31, | |
| | | 2023 | | | 2022 | |
Large Cap Value Fund | | Shares | | | | | | Amount | | | | | | Shares | | | | | | Amount | |
| Shares sold | | | 11,725,900 | | | | | | | $ | 289,324,155 | | | | | | | | 12,284,725 | | | | | | | $ | 337,686,598 | |
| Reinvestment of dividends | | | 4,259,311 | | | | | | | | 100,562,339 | | | | | | | | 3,931,298 | | | | | | | | 108,739,691 | |
| Shares redeemed | | | (9,944,862 | ) | | | | | | | (244,570,040 | ) | | | | | | | (14,575,833 | ) | | | | | | | (384,949,748 | ) |
| | | | | | | | | | | | | | | | | | | | | | | | | | | | |
| Net increase in shares outstanding | | | 6,040,349 | | | | | | | $ | 145,316,454 | | | | | | | | 1,640,190 | | | | | | | $ | 61,476,541 | |
| | | | | | | | | | | | | | | | | | | | | | | | | | | | |
12. Subsequent Events
At a special Board Meeting held on December 13, 2023, the Board of the Trust, approved an Interim Management Agreement pursuant to Rule 15a-4(b)(1) under the Act, whereby the Manager was appointed to serve as Manager and Administrator of the Trust for the Fund, under the terms and conditions set forth in the Interim Management Agreement, effective immediately after the closing of the Transaction resulting in the change of control of the Manager and through the earlier of 150 days following the Transaction or shareholder approval of the new Management Agreement previously approved by the Board on July 12, 2023. The Board further approved the appointment of Barrow, Hanley, Mewhinney & Strauss, LLC, Hotchkis and Wiley Capital Management, LLC and Massachusetts Financial Services Co., (collectively, the “Advisors”) as investment advisors to the Fund in accordance with the Interim Investment Advisory Agreements amongst the Manager, the Advisors and the Trust, on behalf of the Fund, effective immediately after the closing of the Transaction, and through the earlier of 150 days following the Transaction or shareholder approval of the new Management Agreement previously approved by the Board on July 12, 2023.
40
American Beacon Large Cap Value FundSM
Financial Highlights
(For a share outstanding throughout the period)
| | | | | | | | | | | | | | | | | | | | | | | | | | | | | | | | | | | | |
| | | R5 ClassA | |
| | | Year Ended October 31, | |
| | | 2023 | | | | | | 2022 | | | | | | 2021 | | | | | | 2020B | | | | | | 2019 | |
| | | | |
Net asset value, beginning of period | | $ | 26.21 | | | | | | | $ | 30.99 | | | | | | | $ | 23.36 | | | | | | | $ | 28.32 | | | | | | | $ | 28.41 | |
| | | | | | | | | | | | | | | | | | | | | | | | | | | | | | | | | | | | |
Income (loss) from investment operations: | | | | | | | | | | | | | | | | | | | | | | | | | | | | | | | | | | | | |
Net investment income | | | 0.51 | | | | | | | | 0.50 | | | | | | | | 0.59 | | | | | | | | 0.65 | | | | | | | | 0.63 | |
Net gains (losses) on investments (both realized and unrealized) | | | 0.02 | | | | | | | | (2.11 | ) | | | | | | | 10.64 | | | | | | | | (2.89 | ) | | | | | | | 1.69 | |
| | | | | | | | | | | | | | | | | | | | | | | | | | | | | | | | | | | | |
Total income (loss) from investment operations | | | 0.53 | | | | | | | | (1.61 | ) | | | | | | | 11.23 | | | | | | | | (2.24 | ) | | | | | | | 2.32 | |
| | | | | | | | | | | | | | | | | | | | | | | | | | | | | | | | | | | | |
Less distributions: | | | | | | | | | | | | | | | | | | | | | | | | | | | | | | | | | | | | |
Dividends from net investment income | | | (0.43 | ) | | | | | | | (0.39 | ) | | | | | | | (0.49 | ) | | | | | | | (0.62 | ) | | | | | | | (0.55 | ) |
Distributions from net realized gains | | | (2.39 | ) | | | | | | | (2.78 | ) | | | | | | | (3.11 | ) | | | | | | | (2.10 | ) | | | | | | | (1.86 | ) |
| | | | | | | | | | | | | | | | | | | | | | | | | | | | | | | | | | | | |
Total distributions | | | (2.82 | ) | | | | | | | (3.17 | ) | | | | | | | (3.60 | ) | | | | | | | (2.72 | ) | | | | | | | (2.41 | ) |
| | | | | | | | | | | | | | | | | | | | | | | | | | | | | | | | | | | | |
Net asset value, end of period | | $ | 23.92 | | | | | | | $ | 26.21 | | | | | | | $ | 30.99 | | | | | | | $ | 23.36 | | | | | | | $ | 28.32 | |
| | | | | | | | | | | | | | | | | | | | | | | | | | | | | | | | | | | | |
Total returnC | | | 2.16 | % | | | | | | | (5.75 | )% | | | | | | | 52.60 | % | | | | | | | (9.29 | )% | | | | | | | 10.14 | % |
| | | | | | | | | | | | | | | | | | | | | | | | | | | | | | | | | | | | |
|
Ratios and supplemental data: | |
Net assets, end of period | | $ | 1,040,466,568 | | | | | | | $ | 1,218,988,715 | | | | | | | $ | 1,682,465,233 | | | | | | | $ | 1,807,587,315 | | | | | | | $ | 3,137,789,485 | |
Ratios to average net assets: | | | | | | | | | | | | | | | | | | | | | | | | | | | | | | | | | | | | |
Expenses, before reimbursements and/or recoupments | | | 0.64 | % | | | | | | | 0.63 | % | | | | | | | 0.63 | % | | | | | | | 0.63 | % | | | | | | | 0.63 | % |
Expenses, net of reimbursements and/or recoupments | | | 0.64 | % | | | | | | | 0.63 | % | | | | | | | 0.63 | % | | | | | | | 0.63 | % | | | | | | | 0.63 | % |
Net investment income, before expense reimbursements and/or recoupments | | | 1.78 | % | | | | | | | 1.45 | % | | | | | | | 1.30 | % | | | | | | | 1.90 | % | | | | | | | 2.07 | % |
Net investment income, net of reimbursements and/or recoupments | | | 1.78 | % | | | | | | | 1.45 | % | | | | | | | 1.30 | % | | | | | | | 1.90 | % | | | | | | | 2.07 | % |
Portfolio turnover rate | | | 25 | % | | | | | | | 25 | % | | | | | | | 23 | % | | | | | | | 67 | % | | | | | | | 23 | % |
| A | Prior to February 28, 2020, the R5 Class was known as Institutional Class. |
| B | On January 17, 2020, Brandywine Global Investment Management, LLC was terminated and ceased managing assets of the Fund. |
| C | Based on net asset value, which does not reflect the sales charge, redemption fee, or contingent deferred sales charge, if applicable. May include adjustments in accordance with U.S. GAAP and as such, the net asset value for reporting purposes and the returns based upon those net asset values may differ from the net asset value and returns for shareholder transactions. |
See accompanying notes
41
American Beacon Large Cap Value FundSM
Financial Highlights
(For a share outstanding throughout the period)
| | | | | | | | | | | | | | | | | | | | | | | | | | | | | | | | | | | | |
| | | Y Class | |
| | | Year Ended October 31, | |
| | | 2023 | | | | | | 2022 | | | | | | 2021 | | | | | | 2020A | | | | | | 2019 | |
| | | | |
Net asset value, beginning of period | | $ | 25.92 | | | | | | | $ | 30.68 | | | | | | | $ | 23.16 | | | | | | | $ | 28.10 | | | | | | | $ | 28.20 | |
| | | | | | | | | | | | | | | | | | | | | | | | | | | | | | | | | | | | |
Income (loss) from investment operations: | | | | | | | | | | | | | | | | | | | | | | | | | | | | | | | | | | | | |
Net investment income | | | 0.45 | | | | | | | | 0.37 | | | | | | | | 0.38 | | | | | | | | 0.39 | | | | | | | | 0.56 | |
Net gains (losses) on investments (both realized and unrealized) | | | 0.06 | | | | | | | | (1.98 | ) | | | | | | | 10.73 | | | | | | | | (2.63 | ) | | | | | | | 1.72 | |
| | | | | | | | | | | | | | | | | | | | | | | | | | | | | | | | | | | | |
Total income (loss) from investment operations | | | 0.51 | | | | | | | | (1.61 | ) | | | | | | | 11.11 | | | | | | | | (2.24 | ) | | | | | | | 2.28 | |
| | | | | | | | | | | | | | | | | | | | | | | | | | | | | | | | | | | | |
Less distributions: | | | | | | | | | | | | | | | | | | | | | | | | | | | | | | | | | | | | |
Dividends from net investment income | | | (0.41 | ) | | | | | | | (0.37 | ) | | | | | | | (0.48 | ) | | | | | | | (0.60 | ) | | | | | | | (0.52 | ) |
Distributions from net realized gains | | | (2.39 | ) | | | | | | | (2.78 | ) | | | | | | | (3.11 | ) | | | | | | | (2.10 | ) | | | | | | | (1.86 | ) |
| | | | | | | | | | | | | | | | | | | | | | | | | | | | | | | | | | | | |
Total distributions | | | (2.80 | ) | | | | | | | (3.15 | ) | | | | | | | (3.59 | ) | | | | | | | (2.70 | ) | | | | | | | (2.38 | ) |
| | | | | | | | | | | | | | | | | | | | | | | | | | | | | | | | | | | | |
Net asset value, end of period | | $ | 23.63 | | | | | | | $ | 25.92 | | | | | | | $ | 30.68 | | | | | | | $ | 23.16 | | | | | | | $ | 28.10 | |
| | | | | | | | | | | | | | | | | | | | | | | | | | | | | | | | | | | | |
Total returnB | | | 2.09 | % | | | | | | | (5.81 | )% | | | | | | | 52.47 | % | | | | | | | (9.35 | )% | | | | | | | 10.05 | % |
| | | | | | | | | | | | | | | | | | | | | | | | | | | | | | | | | | | | |
|
Ratios and supplemental data: | |
Net assets, end of period | | $ | 181,490,071 | | | | | | | $ | 188,140,776 | | | | | | | $ | 258,183,363 | | | | | | | $ | 178,065,442 | | | | | | | $ | 301,457,382 | |
Ratios to average net assets: | | | | | | | | | | | | | | | | | | | | | | | | | | | | | | | | | | | | |
Expenses, before reimbursements and/or recoupments | | | 0.71 | % | | | | | | | 0.70 | % | | | | | | | 0.69 | % | | | | | | | 0.70 | % | | | | | | | 0.70 | % |
Expenses, net of reimbursements and/or recoupments | | | 0.71 | % | | | | | | | 0.70 | % | | | | | | | 0.69 | % | | | | | | | 0.70 | % | | | | | | | 0.70 | % |
Net investment income, before expense reimbursements and/or recoupments | | | 1.70 | % | | | | | | | 1.38 | % | | | | | | | 1.21 | % | | | | | | | 1.84 | % | | | | | | | 1.98 | % |
Net investment income, net of reimbursements and/or recoupments | | | 1.70 | % | | | | | | | 1.38 | % | | | | | | | 1.21 | % | | | | | | | 1.84 | % | | | | | | | 1.98 | % |
Portfolio turnover rate | | | 25 | % | | | | | | | 25 | % | | | | | | | 23 | % | | | | | | | 67 | % | | | | | | | 23 | % |
| A | On January 17, 2020, Brandywine Global Investment Management, LLC was terminated and ceased managing assets of the Fund. |
| B | Based on net asset value, which does not reflect the sales charge, redemption fee, or contingent deferred sales charge, if applicable. May include adjustments in accordance with U.S. GAAP and as such, the net asset value for reporting purposes and the returns based upon those net asset values may differ from the net asset value and returns for shareholder transactions. |
See accompanying notes
42
American Beacon Large Cap Value FundSM
Financial Highlights
(For a share outstanding throughout the period)
| | | | | | | | | | | | | | | | | | | | | | | | | | | | | | | | | | | | |
| | | Investor Class | |
| | | Year Ended October 31, | |
| | | 2023 | | | | | | 2022 | | | | | | 2021 | | | | | | 2020A | | | | | | 2019 | |
| | | | |
Net asset value, beginning of period | | $ | 23.30 | | | | | | | $ | 27.88 | | | | | | | $ | 21.32 | | | | | | | $ | 26.06 | | | | | | | $ | 26.33 | |
| | | | | | | | | | | | | | | | | | | | | | | | | | | | | | | | | | | | |
Income (loss) from investment operations: | | | | | | | | | | | | | | | | | | | | | | | | | | | | | | | | | | | | |
Net investment income | | | 0.27 | | | | | | | | 0.25 | | | | | | | | 0.20 | | | | | | | | 0.29 | | | | | | | | 0.41 | |
Net gains (losses) on investments (both realized and unrealized) | | | 0.14 | | | | | | | | (1.76 | ) | | | | | | | 9.88 | | | | | | | | (2.41 | ) | | | | | | | 1.63 | |
| | | | | | | | | | | | | | | | | | | | | | | | | | | | | | | | | | | | |
Total income (loss) from investment operations | | | 0.41 | | | | | | | | (1.51 | ) | | | | | | | 10.08 | | | | | | | | (2.12 | ) | | | | | | | 2.04 | |
| | | | | | | | | | | | | | | | | | | | | | | | | | | | | | | | | | | | |
Less distributions: | | | | | | | | | | | | | | | | | | | | | | | | | | | | | | | | | | | | |
Dividends from net investment income | | | (0.35 | ) | | | | | | | (0.29 | ) | | | | | | | (0.41 | ) | | | | | | | (0.52 | ) | | | | | | | (0.45 | ) |
Distributions from net realized gains | | | (2.39 | ) | | | | | | | (2.78 | ) | | | | | | | (3.11 | ) | | | | | | | (2.10 | ) | | | | | | | (1.86 | ) |
| | | | | | | | | | | | | | | | | | | | | | | | | | | | | | | | | | | | |
Total distributions | | | (2.74 | ) | | | | | | | (3.07 | ) | | | | | | | (3.52 | ) | | | | | | | (2.62 | ) | | | | | | | (2.31 | ) |
| | | | | | | | | | | | | | | | | | | | | | | | | | | | | | | | | | | | |
Net asset value, end of period | | $ | 20.97 | | | | | | | $ | 23.30 | | | | | | | $ | 27.88 | | | | | | | $ | 21.32 | | | | | | | $ | 26.06 | |
| | | | | | | | | | | | | | | | | | | | | | | | | | | | | | | | | | | | |
Total returnB | | | 1.88 | % | | | | | | | (6.04 | )% | | | | | | | 52.04 | % | | | | | | | (9.59 | )% | | | | | | | 9.77 | % |
| | | | | | | | | | | | | | | | | | | | | | | | | | | | | | | | | | | | |
|
Ratios and supplemental data: | |
Net assets, end of period | | $ | 525,063,555 | | | | | | | $ | 649,409,067 | | | | | | | $ | 821,099,597 | | | | | | | $ | 707,970,431 | | | | | | | $ | 1,124,625,846 | |
Ratios to average net assets: | | | | | | | | | | | | | | | | | | | | | | | | | | | | | | | | | | | | |
Expenses, before reimbursements and/or recoupments | | | 0.94 | % | | | | | | | 0.95 | % | | | | | | | 0.98 | % | | | | | | | 0.96 | % | | | | | | | 0.96 | % |
Expenses, net of reimbursements and/or recoupments | | | 0.94 | % | | | | | | | 0.95 | % | | | | | | | 0.98 | % | | | | | | | 0.96 | % | | | | | | | 0.96 | % |
Net investment income, before expense reimbursements and/or recoupments | | | 1.48 | % | | | | | | | 1.13 | % | | | | | | | 0.93 | % | | | | | | | 1.57 | % | | | | | | | 1.74 | % |
Net investment income, net of reimbursements and/or recoupments | | | 1.48 | % | | | | | | | 1.13 | % | | | | | | | 0.93 | % | | | | | | | 1.57 | % | | | | | | | 1.74 | % |
Portfolio turnover rate | | | 25 | % | | | | | | | 25 | % | | | | | | | 23 | % | | | | | | | 67 | % | | | | | | | 23 | % |
| A | On January 17, 2020, Brandywine Global Investment Management, LLC was terminated and ceased managing assets of the Fund. |
| B | Based on net asset value, which does not reflect the sales charge, redemption fee, or contingent deferred sales charge, if applicable. May include adjustments in accordance with U.S. GAAP and as such, the net asset value for reporting purposes and the returns based upon those net asset values may differ from the net asset value and returns for shareholder transactions. |
See accompanying notes
43
American Beacon Large Cap Value FundSM
Financial Highlights
(For a share outstanding throughout the period)
| | | | | | | | | | | | | | | | | | | | | | | | | | | | | | | | | | | | |
| | | Advisor Class | |
| | | Year Ended October 31, | |
| | | 2023 | | | | | | 2022 | | | | | | 2021 | | | | | | 2020A | | | | | | 2019 | |
| | | | |
Net asset value, beginning of period | | $ | 22.80 | | | | | | | $ | 27.36 | | | | | | | $ | 20.97 | | | | | | | $ | 25.68 | | | | | | | $ | 25.95 | |
| | | | | | | | | | | | | | | | | | | | | | | | | | | | | | | | | | | | |
Income (loss) from investment operations: | | | | | | | | | | | | | | | | | | | | | | | | | | | | | | | | | | | | |
Net investment income | | | 0.26 | | | | | | | | 0.14 | | | | | | | | 0.26 | | | | | | | | 0.24 | | | | | | | | 0.47 | |
Net gains (losses) on investments (both realized and unrealized) | | | 0.10 | | | | | | | | (1.65 | ) | | | | | | | 9.62 | | | | | | | | (2.36 | ) | | | | | | | 1.52 | |
| | | | | | | | | | | | | | | | | | | | | | | | | | | | | | | | | | | | |
Total income (loss) from investment operations | | | 0.36 | | | | | | | | (1.51 | ) | | | | | | | 9.88 | | | | | | | | (2.12 | ) | | | | | | | 1.99 | |
| | | | | | | | | | | | | | | | | | | | | | | | | | | | | | | | | | | | |
Less distributions: | | | | | | | | | | | | | | | | | | | | | | | | | | | | | | | | | | | | |
Dividends from net investment income | | | (0.31 | ) | | | | | | | (0.27 | ) | | | | | | | (0.38 | ) | | | | | | | (0.49 | ) | | | | | | | (0.40 | ) |
Distributions from net realized gains | | | (2.39 | ) | | | | | | | (2.78 | ) | | | | | | | (3.11 | ) | | | | | | | (2.10 | ) | | | | | | | (1.86 | ) |
| | | | | | | | | | | | | | | | | | | | | | | | | | | | | | | | | | | | |
Total distributions | | | (2.70 | ) | | | | | | | (3.05 | ) | | | | | | | (3.49 | ) | | | | | | | (2.59 | ) | | | | | | | (2.26 | ) |
| | | | | | | | | | | | | | | | | | | | | | | | | | | | | | | | | | | | |
Net asset value, end of period | | $ | 20.46 | | | | | | | $ | 22.80 | | | | | | | $ | 27.36 | | | | | | | $ | 20.97 | | | | | | | $ | 25.68 | |
| | | | | | | | | | | | | | | | | | | | | | | | | | | | | | | | | | | | |
Total returnB | | | 1.69 | % | | | | | | | (6.17 | )% | | | | | | | 51.89 | % | | | | | | | (9.73 | )% | | | | | | | 9.64 | % |
| | | | | | | | | | | | | | | | | | | | | | | | | | | | | | | | | | | | |
|
Ratios and supplemental data: | |
Net assets, end of period | | $ | 41,289,229 | | | | | | | $ | 47,185,316 | | | | | | | $ | 63,521,926 | | | | | | | $ | 46,049,690 | | | | | | | $ | 66,077,449 | |
Ratios to average net assets: | | | | | | | | | | | | | | | | | | | | | | | | | | | | | | | | | | | | |
Expenses, before reimbursements and/or recoupments | | | 1.11 | % | | | | | | | 1.10 | % | | | | | | | 1.10 | % | | | | | | | 1.10 | % | | | | | | | 1.10 | % |
Expenses, net of reimbursements and/or recoupments | | | 1.11 | % | | | | | | | 1.10 | % | | | | | | | 1.10 | % | | | | | | | 1.10 | % | | | | | | | 1.10 | % |
Net investment income, before expense reimbursements and/or recoupments | | | 1.31 | % | | | | | | | 0.98 | % | | | | | | | 0.81 | % | | | | | | | 1.42 | % | | | | | | | 1.58 | % |
Net investment income, net of reimbursements and/or recoupments | | | 1.31 | % | | | | | | | 0.98 | % | | | | | | | 0.81 | % | | | | | | | 1.42 | % | | | | | | | 1.58 | % |
Portfolio turnover rate | | | 25 | % | | | | | | | 25 | % | | | | | | | 23 | % | | | | | | | 67 | % | | | | | | | 23 | % |
| A | On January 17, 2020, Brandywine Global Investment Management, LLC was terminated and ceased managing assets of the Fund. |
| B | Based on net asset value, which does not reflect the sales charge, redemption fee, or contingent deferred sales charge, if applicable. May include adjustments in accordance with U.S. GAAP and as such, the net asset value for reporting purposes and the returns based upon those net asset values may differ from the net asset value and returns for shareholder transactions. |
See accompanying notes
44
American Beacon Large Cap Value FundSM
Financial Highlights
(For a share outstanding throughout the period)
| | | | | | | | | | | | | | | | | | | | | | | | | | | | | | | | | | | | |
| | | A Class | |
| | | Year Ended October 31, | |
| | | 2023 | | | | | | 2022 | | | | | | 2021 | | | | | | 2020A | | | | | | 2019 | |
| | | | |
Net asset value, beginning of period | | $ | 22.86 | | | | | | | $ | 27.37 | | | | | | | $ | 20.96 | | | | | | | $ | 25.66 | | | | | | | $ | 26.00 | |
| | | | | | | | | | | | | | | | | | | | | | | | | | | | | | | | | | | | |
Income (loss) from investment operations: | | | | | | | | | | | | | | | | | | | | | | | | | | | | | | | | | | | | |
Net investment income | | | 0.30 | B | | | | | | | 1.05 | | | | | | | | 0.24 | B | | | | | | | 0.20 | | | | | | | | 0.40 | |
Net gains (losses) on investments (both realized and unrealized) | | | 0.08 | | | | | | | | (2.51 | ) | | | | | | | 9.68 | | | | | | | | (2.29 | ) | | | | | | | 1.59 | |
| | | | | | | | | | | | | | | | | | | | | | | | | | | | | | | | | | | | |
Total income (loss) from investment operations | | | 0.38 | | | | | | | | (1.46 | ) | | | | | | | 9.92 | | | | | | | | (2.09 | ) | | | | | | | 1.99 | |
| | | | | | | | | | | | | | | | | | | | | | | | | | | | | | | | | | | | |
Less distributions: | | | | | | | | | | | | | | | | | | | | | | | | | | | | | | | | | | | | |
Dividends from net investment income | | | (0.38 | ) | | | | | | | (0.27 | ) | | | | | | | (0.40 | ) | | | | | | | (0.51 | ) | | | | | | | (0.47 | ) |
Distributions from net realized gains | | | (2.39 | ) | | | | | | | (2.78 | ) | | | | | | | (3.11 | ) | | | | | | | (2.10 | ) | | | | | | | (1.86 | ) |
| | | | | | | | | | | | | | | | | | | | | | | | | | | | | | | | | | | | |
Total distributions | | | (2.77 | ) | | | | | | | (3.05 | ) | | | | | | | (3.51 | ) | | | | | | | (2.61 | ) | | | | | | | (2.33 | ) |
| | | | | | | | | | | | | | | | | | | | | | | | | | | | | | | | | | | | |
Net asset value, end of period | | $ | 20.47 | | | | | | | $ | 22.86 | | | | | | | $ | 27.37 | | | | | | | $ | 20.96 | | | | | | | $ | 25.66 | |
| | | | | | | | | | | | | | | | | | | | | | | | | | | | | | | | | | | | |
Total returnC | | | 1.79 | % | | | | | | | (5.96 | )% | | | | | | | 52.15 | % | | | | | | | (9.65 | )% | | | | | | | 9.72 | % |
| | | | | | | | | | | | | | | | | | | | | | | | | | | | | | | | | | | | |
|
Ratios and supplemental data: | |
Net assets, end of period | | $ | 11,986,577 | | | | | | | $ | 16,953,764 | | | | | | | $ | 12,661,833 | | | | | | | $ | 25,792,400 | | | | | | | $ | 39,157,098 | |
Ratios to average net assets: | | | | | | | | | | | | | | | | | | | | | | | | | | | | | | | | | | | | |
Expenses, before reimbursements and/or recoupments | | | 1.00 | % | | | | | | | 0.89 | % | | | | | | | 0.96 | % | | | | | | | 1.00 | % | | | | | | | 1.01 | % |
Expenses, net of reimbursements and/or recoupments | | | 1.00 | % | | | | | | | 0.89 | % | | | | | | | 0.96 | % | | | | | | | 1.00 | % | | | | | | | 1.01 | % |
Net investment income, before expense reimbursements and/or recoupments | | | 1.42 | % | | | | | | | 1.24 | % | | | | | | | 0.98 | % | | | | | | | 1.52 | % | | | | | | | 1.68 | % |
Net investment income, net of reimbursements and/or recoupments | | | 1.42 | % | | | | | | | 1.24 | % | | | | | | | 0.98 | % | | | | | | | 1.52 | % | | | | | | | 1.68 | % |
Portfolio turnover rate | | | 25 | % | | | | | | | 25 | % | | | | | | | 23 | % | | | | | | | 67 | % | | | | | | | 23 | % |
| A | On January 17, 2020, Brandywine Global Investment Management, LLC was terminated and ceased managing assets of the Fund. |
| B | Per share amounts have been calculated using the average shares method. |
| C | Based on net asset value, which does not reflect the sales charge, redemption fee, or contingent deferred sales charge, if applicable. May include adjustments in accordance with U.S. GAAP and as such, the net asset value for reporting purposes and the returns based upon those net asset values may differ from the net asset value and returns for shareholder transactions. |
See accompanying notes
45
American Beacon Large Cap Value FundSM
Financial Highlights
(For a share outstanding throughout the period)
| | | | | | | | | | | | | | | | | | | | | | | | | | | | | | | | | | | | |
| | | C Class | |
| | | Year Ended October 31, | |
| | | 2023 | | | | | | 2022 | | | | | | 2021 | | | | | | 2020A | | | | | | 2019 | |
| | | | |
Net asset value, beginning of period | | $ | 22.52 | | | | | | | $ | 27.07 | | | | | | | $ | 20.74 | | | | | | | $ | 25.43 | | | | | | | $ | 25.71 | |
| | | | | | | | | | | | | | | | | | | | | | | | | | | | | | | | | | | | |
Income (loss) from investment operations: | | | | | | | | | | | | | | | | | | | | | | | | | | | | | | | | | | | | |
Net investment income | | | 0.15 | B | | | | | | | 0.07 | | | | | | | | 0.16 | | | | | | | | 0.08 | | | | | | | | 0.26 | |
Net gains (losses) on investments (both realized and unrealized) | | | 0.09 | | | | | | | | (1.71 | ) | | | | | | | 9.49 | | | | | | | | (2.32 | ) | | | | | | | 1.57 | |
| | | | | | | | | | | | | | | | | | | | | | | | | | | | | | | | | | | | |
Total income (loss) from investment operations | | | 0.24 | | | | | | | | (1.64 | ) | | | | | | | 9.65 | | | | | | | | (2.24 | ) | | | | | | | 1.83 | |
| | | | | | | | | | | | | | | | | | | | | | | | | | | | | | | | | | | | |
Less distributions: | | | | | | | | | | | | | | | | | | | | | | | | | | | | | | | | | | | | |
Dividends from net investment income | | | (0.16 | ) | | | | | | | (0.13 | ) | | | | | | | (0.21 | ) | | | | | | | (0.35 | ) | | | | | | | (0.25 | ) |
Distributions from net realized gains | | | (2.39 | ) | | | | | | | (2.78 | ) | | | | | | | (3.11 | ) | | | | | | | (2.10 | ) | | | | | | | (1.86 | ) |
| | | | | | | | | | | | | | | | | | | | | | | | | | | | | | | | | | | | |
Total distributions | | | (2.55 | ) | | | | | | | (2.91 | ) | | | | | | | (3.32 | ) | | | | | | | (2.45 | ) | | | | | | | (2.11 | ) |
| | | | | | | | | | | | | | | | | | | | | | | | | | | | | | | | | | | | |
Net asset value, end of period | | $ | 20.21 | | | | | | | $ | 22.52 | | | | | | | $ | 27.07 | | | | | | | $ | 20.74 | | | | | | | $ | 25.43 | |
| | | | | | | | | | | | | | | | | | | | | | | | | | | | | | | | | | | | |
Total returnC | | | 1.11 | % | | | | | | | (6.74 | )% | | | | | | | 51.05 | % | | | | | | | (10.26 | )% | | | | | | | 8.94 | % |
| | | | | | | | | | | | | | | | | | | | | | | | | | | | | | | | | | | | |
|
Ratios and supplemental data: | |
Net assets, end of period | | $ | 3,842,593 | | | | | | | $ | 5,508,217 | | | | | | | $ | 6,898,120 | | | | | | | $ | 4,687,004 | | | | | | | $ | 6,811,169 | |
Ratios to average net assets: | | | | | | | | | | | | | | | | | | | | | | | | | | | | | | | | | | | | |
Expenses, before reimbursements and/or recoupments | | | 1.70 | % | | | | | | | 1.69 | % | | | | | | | 1.68 | % | | | | | | | 1.68 | % | | | | | | | 1.70 | % |
Expenses, net of reimbursements and/or recoupments | | | 1.70 | % | | | | | | | 1.69 | % | | | | | | | 1.68 | % | | | | | | | 1.68 | % | | | | | | | 1.70 | %D |
Net investment income, before expense reimbursements and/or recoupments | | | 0.71 | % | | | | | | | 0.40 | % | | | | | | | 0.22 | % | | | | | | | 0.84 | % | | | | | | | 0.99 | % |
Net investment income, net of reimbursements and/or recoupments | | | 0.71 | % | | | | | | | 0.40 | % | | | | | | | 0.22 | % | | | | | | | 0.84 | % | | | | | | | 0.99 | % |
Portfolio turnover rate | | | 25 | % | | | | | | | 25 | % | | | | | | | 23 | % | | | | | | | 67 | % | | | | | | | 23 | % |
| A | On January 17, 2020, Brandywine Global Investment Management, LLC was terminated and ceased managing assets of the Fund. |
| B | Per share amounts have been calculated using the average shares method. |
| C | Based on net asset value, which does not reflect the sales charge, redemption fee, or contingent deferred sales charge, if applicable. May include adjustments in accordance with U.S. GAAP and as such, the net asset value for reporting purposes and the returns based upon those net asset values may differ from the net asset value and returns for shareholder transactions. |
| D | This ratio does not include a voluntary reimbursement of service fees as included in the prior year. |
See accompanying notes
46
American Beacon Large Cap Value FundSM
Financial Highlights
(For a share outstanding throughout the period)
| | | | | | | | | | | | | | | | | | | | | | | | | | | | | | | | | | | | |
| | | R6 Class | |
| | | Year Ended October 31, | |
| | | 2023 | | | | | | 2022 | | | | | | 2021 | | | | | | 2020A | | | | | | 2019 | |
| | | | |
Net asset value, beginning of period | | $ | 26.21 | | | | | | | $ | 30.99 | | | | | | | $ | 23.36 | | | | | | | $ | 28.31 | | | | | | | $ | 28.41 | |
| | | | | | | | | | | | | | | | | | | | | | | | | | | | | | | | | | | | |
Income (loss) from investment operations: | | | | | | | | | | | | | | | | | | | | | | | | | | | | | | | | | | | | |
Net investment income | | | 0.48 | | | | | | | | 0.45 | | | | | | | | 0.36 | | | | | | | | 0.56 | | | | | | | | 0.61 | |
Net gains (losses) on investments (both realized and unrealized) | | | 0.05 | | | | | | | | (2.05 | ) | | | | | | | 10.88 | | | | | | | | (2.78 | ) | | | | | | | 1.71 | |
| | | | | | | | | | | | | | | | | | | | | | | | | | | | | | | | | | | | |
Total income (loss) from investment operations | | | 0.53 | | | | | | | | (1.60 | ) | | | | | | | 11.24 | | | | | | | | (2.22 | ) | | | | | | | 2.32 | |
| | | | | | | | | | | | | | | | | | | | | | | | | | | | | | | | | | | | |
Less distributions: | | | | | | | | | | | | | | | | | | | | | | | | | | | | | | | | | | | | |
Dividends from net investment income | | | (0.43 | ) | | | | | | | (0.40 | ) | | | | | | | (0.50 | ) | | | | | | | (0.63 | ) | | | | | | | (0.56 | ) |
Distributions from net realized gains | | | (2.39 | ) | | | | | | | (2.78 | ) | | | | | | | (3.11 | ) | | | | | | | (2.10 | ) | | | | | | | (1.86 | ) |
| | | | | | | | | | | | | | | | | | | | | | | | | | | | | | | | | | | | |
Total distributions | | | (2.82 | ) | | | | | | | (3.18 | ) | | | | | | | (3.61 | ) | | | | | | | (2.73 | ) | | | | | | | (2.42 | ) |
| | | | | | | | | | | | | | | | | | | | | | | | | | | | | | | | | | | | |
Net asset value, end of period | | $ | 23.92 | | | | | | | $ | 26.21 | | | | | | | $ | 30.99 | | | | | | | $ | 23.36 | | | | | | | $ | 28.31 | |
| | | | | | | | | | | | | | | | | | | | | | | | | | | | | | | | | | | | |
Total returnB | | | 2.19 | % | | | | | | | (5.72 | )% | | | | | | | 52.65 | % | | | | | | | (9.23 | )% | | | | | | | 10.15 | % |
| | | | | | | | | | | | | | | | | | | | | | | | | | | | | | | | | | | | |
|
Ratios and supplemental data: | |
Net assets, end of period | | $ | 1,143,016,407 | | | | | | | $ | 1,094,080,159 | | | | | | | $ | 1,242,662,760 | | | | | | | $ | 1,008,088,807 | | | | | | | $ | 739,517,062 | |
Ratios to average net assets: | | | | | | | | | | | | | | | | | | | | | | | | | | | | | | | | | | | | |
Expenses, before reimbursements and/or recoupments | | | 0.61 | % | | | | | | | 0.60 | % | | | | | | | 0.60 | % | | | | | | | 0.62 | % | | | | | | | 0.60 | % |
Expenses, net of reimbursements and/or recoupments | | | 0.61 | % | | | | | | | 0.60 | % | | | | | | | 0.60 | % | | | | | | | 0.59 | % | | | | | | | 0.58 | % |
Net investment income, before expense reimbursements and/or recoupments | | | 1.80 | % | | | | | | | 1.49 | % | | | | | | | 1.31 | % | | | | | | | 1.90 | % | | | | | | | 2.07 | % |
Net investment income, net of reimbursements and/or recoupments | | | 1.80 | % | | | | | | | 1.49 | % | | | | | | | 1.31 | % | | | | | | | 1.93 | % | | | | | | | 2.09 | % |
Portfolio turnover rate | | | 25 | % | | | | | | | 25 | % | | | | | | | 23 | % | | | | | | | 67 | % | | | | | | | 23 | % |
| A | On January 17, 2020, Brandywine Global Investment Management, LLC was terminated and ceased managing assets of the Fund. |
| B | Based on net asset value, which does not reflect the sales charge, redemption fee, or contingent deferred sales charge, if applicable. May include adjustments in accordance with U.S. GAAP and as such, the net asset value for reporting purposes and the returns based upon those net asset values may differ from the net asset value and returns for shareholder transactions. |
See accompanying notes
47
American Beacon FundsSM
Federal Tax Information
October 31, 2023 (Unaudited)
Certain tax information regarding the Funds are required to be provided to shareholders based upon the Funds’ income and distributions for the taxable year ended October 31, 2023. The information and distributions reported herein may differ from information and distributions taxable to the shareholders for the calendar year ended December 31, 2023.
The Fund designated the following items with regard to distributions paid during the fiscal year ended October 31, 2023. All designations are based on financial information available as of this annual report and, accordingly, are subject to change. For each item, it is the intention of the Funds to designate the maximum amount permitted under the Internal Revenue Code of 1986, as amended, and the regulations there under.
Corporate Dividends-Received Deduction:
Qualified Dividend Income:
Long-Term Capital Gain Distributions:
| | | | |
Large Cap Value | | $ | 315,114,376 | |
Short-Term Capital Gain Distributions:
Shareholders will receive notification in January 2024 of the applicable tax information necessary to prepare their 2023 income tax returns.
48
Disclosure Regarding the Renewal and Approval of Current Management and Investment Advisory Agreements (Unaudited)
At meetings held on May 16, 2023 and June 6-7, 2023 (collectively, the “Meetings”), the Board of Trustees (“Board” or “Trustees”) considered and then, at its June 7, 2023 meeting, approved the renewal of:
(1) the Management Agreement between American Beacon Advisors, Inc. (“Manager”) and the American Beacon Funds (“Trust”) on behalf of the American Beacon Large Cap Value Fund (“Fund”); and
(2) the Investment Advisory Agreements among the Manager, the Trust, on behalf of the Fund, and each of Barrow, Hanley, Mewhinney & Strauss, LLC (“Barrow”), Hotchkis and Wiley Capital Management, LLC (“Hotchkis”) and Massachusetts Financial Services Company (“MFS”) (each, a “sub-advisor” and collectively, the “sub-advisors”).
The Management Agreement and the Investment Advisory Agreements are referred to herein individually as an “Agreement” and collectively as the “Agreements.”
In preparation for its consideration of the renewal of the Agreements, the Board undertook steps to gather and consider information furnished by the Manager, the sub-advisors, Broadridge, Inc. (“Broadridge”) and Morningstar, Inc. (“Morningstar”). The Board, with the assistance of independent legal counsel, requested and received certain relevant information from the Manager and each sub-advisor.
In advance of the Meetings, the Board’s Investment Committee and/or the Manager coordinated the production of information from Broadridge and Morningstar regarding the performance, fees and expenses of the Fund as well as information from the Manager and the sub-advisors. At the Meetings, the Board considered the information provided in connection with the renewal process, as well as information furnished to the Board throughout the year at regular meetings of the Board and its committees. In connection with the Board’s consideration of the Agreements, the Trustees received and evaluated such information as they deemed necessary. This information is described below in the section summarizing the factors the Board considered in connection with its renewal and approval of the Agreements, as well as the section describing additional Board considerations with respect to the Fund.
The Board noted that the Manager provides management and administrative services to the Fund pursuant to the Management Agreement. The Board considered that many mutual funds have separate contracts governing each type of service and observed that, with respect to such mutual funds, the actual management fee rates provided by Broadridge for peer group funds reflect the combined advisory and administrative fees, reduced by any fee waivers and/or reimbursements.
The Manager or a sub-advisor may not have been able to, or opted not to, provide information in response to certain information requests, in which case the Board conducted its evaluation of the firm based on information that was provided. In such cases, the Board determined that the omission of any such information was not material to its considerations.
Provided below is an overview of certain factors the Board considered in connection with its decision to approve the renewal of the Agreements. The Board did not identify any particular information that was most relevant to its consideration of whether to approve the renewal of each Agreement, and each Trustee may have afforded different weight to the various factors. Legal counsel to the independent Trustees provided the Board with a memorandum regarding its responsibilities pertaining to the renewal of investment advisory contracts, such as the Agreements, and related regulatory guidelines. Based on its evaluation, the Board unanimously concluded that the terms of each Agreement were reasonable and fair and that the approval of the renewal of each Agreement was in the best interests of the Fund and its shareholders.
Considerations With Respect to the Renewal of the Management Agreement and the Investment Advisory Agreements
In determining whether to approve the renewal of the Agreements, the Board considered the Fund’s investment management and sub-advisory relationships separately. In each instance, the Board considered, among
49
Disclosure Regarding the Renewal and Approval of Current Management and Investment Advisory Agreements (Unaudited)
other things, the following factors: (1) the nature, extent and quality of the services provided; (2) the investment performance of the Fund and the sub-advisors for the Fund; (3) the profits, if any, earned by the Manager in rendering services to the Fund; (4) comparisons of services and fee rates with contracts entered into by the Manager or a sub-advisor or their affiliates with other clients (such as pension funds and other institutional clients); (5) the extent to which economies of scale, if any, have been taken into account in setting each fee rate schedule; (6) whether fee rate levels reflect economies of scale, if any, for the benefit of Fund investors; and (7) any other benefits derived or anticipated to be derived by the Manager or the sub-advisors from their relationships with the Fund.
Nature, Extent and Quality of Services. With respect to the renewal of the Management Agreement, the Board considered, among other factors: the Fund’s long-term performance; the length of service of key investment personnel at the Manager; the cost structure of the Fund; the financial condition of the Manager, including its parent company; the Manager’s culture of compliance and support that reduce risks to the Fund; the Manager’s quality of services; the Manager’s active role in monitoring and, as appropriate, recommending additional or replacement sub-advisors; and the Manager’s representations regarding its efforts to retain key employees and maintain staffing levels.
With respect to the renewal of each Investment Advisory Agreement, the Board considered, among other factors: the representations made by each sub-advisor regarding the sub-advisor’s level of staffing; asset size; the financial stability of each sub-advisor; and its compliance program. Based on the foregoing and other information, the Board concluded that the nature, extent and quality of the management and advisory services provided by the Manager and each sub-advisor were appropriate for the Fund.
Investment Performance. The Board evaluated the comparative information provided by Broadridge and the Manager regarding the performance of the Fund relative to its Broadridge Performance Universe, Morningstar Category, and/or benchmark index, as well as the Fund’s Morningstar rating. The Board considered the information provided by Broadridge regarding its independent methodology for selecting the Fund’s Broadridge Performance Universe. In addition, the Board considered the performance reports and discussions with management at meetings of the Board and its committees throughout the year. The Board also evaluated the comparative information provided by each sub-advisor, as applicable, regarding the performance of its portion of the Fund relative to the performance of comparable investment accounts and/or a composite of comparable investment accounts managed by the sub-advisor, and the Fund’s benchmark index. In addition, the Board considered the Manager’s recommendation to continue to retain each sub-advisor. A discussion regarding the Board’s considerations with respect to the Fund’s performance appears below under “Additional Considerations and Conclusions with Respect to the Fund.”
Costs of the Services Provided to the Fund and the Profits Realized by the Manager from its Relationship with the Fund. In analyzing the costs of services and profitability of the Manager, the Board considered the revenues earned and the expenses incurred by the Manager, before and after the payment of distribution-related expenses by the Manager. The profits or losses were noted at both an aggregate level for all funds within the group of mutual funds sponsored by the Manager (the “Fund Complex”) and at an individual fund level, with the Manager earning a profit before and after the payment of distribution-related expenses by the Manager with respect to the Fund. The Board also considered comparative information provided by the Manager regarding the Manager’s overall profitability with respect to the Fund Complex relative to the overall profitability of other firms in the mutual fund industry, as disclosed in publicly available sources. Although the Board noted that, in certain cases, the fee rates paid by other clients of the Manager are lower than the fee rates paid by the Fund, the Manager represented that the difference is attributable to, among other factors, the fact that the Manager does not perform administrative services for non-investment company clients and reflects the greater level of responsibility and regulatory requirements associated with managing the Fund.
The Board further considered that, with respect to the Fund, the Management Agreement provides for the Manager to receive a management fee comprised of an annualized fee that is retained by the Manager. In addition,
50
Disclosure Regarding the Renewal and Approval of Current Management and Investment Advisory Agreements (Unaudited)
the Board considered that the Manager receives fees for administering and overseeing the securities lending program on behalf of the Fund. The Board also noted that certain share classes of the Fund maintain higher expense ratios in order to compensate third-party financial intermediaries.
In analyzing the fee rates charged by each sub-advisor in connection with its investment advisory services to the Fund, the Board considered representations made by Barrow and Hotchkis that the Fund’s sub-advisory fee rate schedules generally were favorable compared to other comparable client accounts. The Board also considered the representations made by MFS regarding the sub-advisory fee rates that MFS charges to other comparable client accounts. The Board did not request profitability data from the sub-advisors because the Board did not view this data as imperative to its deliberations given the arms-length nature of the relationship between the Manager and the sub-advisors with respect to the negotiation of sub-advisory fee rates. In addition, the Board noted that sub-advisors may not account for their profits on an account-by-account basis and that different firms likely employ different methodologies in connection with these calculations.
Based on the foregoing and other information, the Board concluded that the profitability levels of the Manager were reasonable in light of the services performed by the Manager. A discussion regarding the Board’s considerations with respect to the Fund’s fee rates is set forth below under “Additional Considerations and Conclusions with Respect to the Fund.”
Economies of Scale. In considering the reasonableness of the management and investment advisory fees rates, the Board considered whether economies of scale will be realized as the Fund grows and whether fee rate levels reflect these economies of scale for the benefit of Fund shareholders. In this regard, the Board considered that, with respect to each sub-advisor, the Manager has negotiated breakpoints in the sub-advisory fee rate schedule. The Board also noted that, for purposes of determining the fee rates chargeable to the Fund, certain sub-advisors have agreed to take into account other clients of the Manager whose assets are allocated to the sub-advisors by the Manager for purposes of calculating the Fund’s sub-advisory fee rate breakpoints.
In addition, the Board noted the Manager’s representation that the Management Agreement contains fee schedule breakpoints at higher asset levels with respect to the Fund. In this regard, the Board considered that the Fund’s current assets did not exceed the threshold necessary to reach the first management fee breakpoint. Based on the foregoing and other information, the Board concluded that the Manager and sub-advisor fee rate schedules for the Fund provide for a reasonable sharing of benefits from any economies of scale with the Fund.
Benefits Derived from the Relationship with the Fund. The Board considered the Manager’s and sub-advisors’ responses to inquiries regarding “fall-out” or ancillary benefits that accrue to the Manager and/or the sub-advisors as a result of their advisory relationships with the Fund. For example, the Board considered that the Manager may invest the Fund’s cash balances and cash collateral provided by the borrowers of the Fund’s securities in the American Beacon U.S. Government Money Market Select Fund, which the Manager manages directly, and for which the Manager receives a fee. In addition, the Board noted that each sub-advisor benefits from soft dollar arrangements for proprietary and third-party research. Based on the foregoing and other information, the Board concluded that the potential benefits accruing to the Manager and the sub-advisors by virtue of their relationships with the Fund appear to be fair and reasonable.
Additional Considerations and Conclusions with Respect to the Fund
The performance comparisons below were made for the Fund’s R5 Class shares relative to the Fund’s Broadridge Performance Universe and Morningstar Category. With respect to the Broadridge Performance Universe, the 1st Quintile represents the top 20 percent of the universe based on performance, and the 5th Quintile represents the bottom 20 percent of the universe based on performance. References to the Fund’s Broadridge Performance Universe are to the respective universe of mutual funds with comparable investment classifications and objectives as determined by Broadridge. The performance of each sub-advisor was calculated by the Manager based on information provided by the Fund’s custodian.
51
Disclosure Regarding the Renewal and Approval of Current Management and Investment Advisory Agreements (Unaudited)
In reviewing the performance, the Board viewed longer-term performance over a full market cycle, typically five years or longer, as the most important consideration because relative performance over shorter periods may be significantly impacted by market or economic events and not necessarily reflective of sub-advisor skill.
The expense comparisons below were made for the Fund’s R5 Class shares relative to the Fund’s Broadridge Expense Universe and Broadridge Expense Group, and Y Class shares relative to the Fund’s Morningstar Fee Level universe. The 1st Quintile represents the lowest 20 percent of the universe or group based on lowest total expense, and the 5th Quintile represents the highest 20 percent of the universe or group based on highest total expense. References to the Fund’s Expense Group and Expense Universe are to the respective group or universe of comparable mutual funds as determined by Broadridge. Broadridge Expense Groups consist of the Fund and a representative sample of funds with similar operating structures and asset sizes, as selected by Broadridge. A Broadridge Expense Universe includes all funds with comparable investment classifications/objectives and similar operating structures to that of the share class under review for the Fund, including funds in the Broadridge Expense Group. The Broadridge expense comparisons are based on the most recent audited financial information publicly available for the Fund as of December 31, 2022. References to the Fund’s Morningstar Fee Level ranking are to the institutional share class of comparable mutual funds as determined by Morningstar.
The Board considered the Fund’s Morningstar fee level category with the 1st Quintile representing the lowest 20 percent of the category constituents and the 5th Quintile representing the highest 20 percent of the category in terms of total expense.
In considering the renewal of the Agreements for the Fund, the Board considered the following additional factors:
Broadridge Total Expenses Excluding 12b-1 Fees and Morningstar Fee Level Ranking
| | | | |
Compared to Broadridge Expense Group | | | 2 | nd Quintile |
Compared to Broadridge Expense Universe | | | 2 | nd Quintile |
Morningstar Fee Level Ranking | | | 3 | rd Quintile |
Broadridge and Morningstar Performance Analysis (five-year period ended December 31, 2022)
| | | | |
Compared to Broadridge Performance Universe | | | 2 | nd Quintile |
Compared to Morningstar Category | | | 3 | rd Quintile |
In considering the renewal of the Investment Advisory Agreements with Barrow, Hotchkis and MFS, the Board considered that the diversification of investment strategies facilitated by the Fund’s multi-manager structure permits the Fund to mitigate the risks associated with a single sub-advisor. The Board also considered the following additional factors:
Sub-advisor Performance (compared to Broadridge Performance Universe for period indicated ended December 31, 2022)
| | | | | | | | |
Barrow | | | 5 Years | | | | 1 | st Quintile |
Hotchkis | | | 5 Years | | | | 2 | nd Quintile |
MFS | | | 5 Years | | | | 1 | st Quintile |
The Board also considered the Manager’s recommendation to continue to retain each sub-advisor.
Based on these and other considerations, the Board: (1) concluded that the fees paid to the Manager and the sub-advisors under the Agreements are fair and reasonable; and (2) determined that the Fund and its shareholders would benefit from the Manager’s and sub-advisors’ continued management of the Fund.
52
Disclosure Regarding the Approval of New Management and Investment
Advisory Agreements (Unaudited)
On July 11, 2023, (i) Resolute Investment Holdings, LLC (“RIH”), its indirect wholly-owned subsidiary, Resolute Investment Managers, Inc. (“RIM”), the parent company of American Beacon Advisors, Inc. (“Manager”), the investment manager of American Beacon Funds (“Trust”), and certain of their affiliates, and (ii) the current owners of approximately 93% of RIH (“Current Ownership Group”), entered into a transaction agreement (“Transaction Agreement”) with certain creditors of RIM (“Lender Group”) to strengthen the capital structure of RIH, the indirect 100% owner of RIM and the Manager (together with RIH, “Resolute”). Pursuant to the Transaction Agreement, (i) all equity interests in RIH would be cancelled, (ii) new equity interests would be issued to members of the Lender Group (“New Ownership Group”), and (iii) the existing credit agreements between RIM and the Lender Group would be terminated and a new credit agreement would be executed (“Transaction”).
Upon the closing of the Transaction (“Closing”), the Manager will be wholly owned indirectly by the New Ownership Group, rather than by the Current Ownership Group. This change in control will be deemed to be an “assignment” under the Investment Company Act of 1940 Act, as amended (“1940 Act”), of the Trust’s (i) existing management agreement (“Current Management Agreement”) with the Manager with respect to the American Beacon Large Cap Value Fund (“Fund”) and other series of the Trust (“Other Funds”), and (ii) existing investment advisory agreements (“Current Investment Advisory Agreements”) among the Manager, the Trust and each of Barrow, Hanley, Mewhinney & Strauss, LLC (“Barrow”), Hotchkis and Wiley Capital Management, LLC (“Hotchkis”) and Massachusetts Financial Services Company (“MFS”) on behalf of the Fund. Barrow, Hotchkis and MFS are collectively referred to herein as the “Sub-Advisors.” As required by the 1940 Act, the Current Management Agreement and Current Investment Advisory Agreement (“Current Agreements”) provide for their automatic termination in the event of an assignment, and, therefore, will terminate upon the Closing.
The Board of Trustees (“Trustees” or “Board”) of the Trust met by videoconference on July 7, 2023, and in-person on July 12, 2023 (“July Meetings”), to discuss the Transaction and consider the effect that the Transaction would have on the Fund and the Other Funds. In addition, the Board received various information from the Manager regarding the intended purposes and framework of the Transaction at its meetings in-person on February 28–March 1, 2023 (“March Meeting”) and June 6–7, 2023, and by videoconference on May 16, 2023 (“May-June Meetings”). Following the March Meeting, the Board designated an ad hoc special committee (“Committee”) to meet with representatives of the Manager and receive updates on the negotiations and, as appropriate, to provide input with respect to the process. Throughout this process, the Board and the Committee were advised by independent legal counsel and received guidance concerning, among other matters, the Trustees’ responsibilities in connection with their consideration with respect to the Fund of a new Management Agreement (“New Management Agreement”), and new Investment Advisory Agreements (each, a “New Investment Advisory Agreement” and, collectively with the New Management Agreement, the “New Agreements”). The Trustees were advised that the New Agreements would replace the Current Agreements, upon the assignment and termination of the Current Agreements upon the Closing.
In advance of the July Meetings, the Board requested and received detailed information from the Manager regarding the Transaction. In connection with the Transaction, the Board reviewed materials furnished by the Manager, which had been reviewed, as applicable, by representatives of the New Ownership Group and met with senior representatives of the Manager. The Board also reviewed the material terms of the Transaction and considered its possible effects on the Fund and its shareholders. During these meetings, representatives of the Manager indicated their belief that the Transaction would not adversely affect the continued operation of the Fund, the capabilities of the key personnel of the Manager who currently manage the Fund to continue to provide services to the Fund at the current levels, or the capabilities of the Sub-Advisors to provide the same level of services to the Fund.
In evaluating the New Management Agreement, the Trustees considered that they generally have been satisfied with the nature and quality of the services provided to the Fund by the Manager, including investment advisory and administrative services, and that the Fund would be best served by an arrangement that appeared likely to maintain the continuity and stability of these services. Accordingly, the Board considered information communicated by the Manager regarding the anticipated benefits of the substantially strengthened capital
53
Disclosure Regarding the Approval of New Management and Investment
Advisory Agreements (Unaudited)
structure of Resolute that would result from the Transaction, and the related positive anticipated impact on the Manager’s resources available for future staffing, compensation, and staff retention. The Manager’s representatives also indicated that they believe that the Transaction best facilitates continuity of management and view such continuity as beneficial to the long-term success of the Fund, but noted that there could be no assurance of any particular benefits that may result.
In connection with the Board’s determination to approve the New Agreements, the Trustees considered, among other information, the following factors as they relate to the Transaction:
| | • | | The manner in which the Fund’s assets are managed will not change as a result of the Transaction, and the same people who currently manage the Fund’s assets are expected to continue to do so after the Transaction; |
| | • | | The fee rates payable by the Fund under the New Agreements are the same as the fee rates payable under the Current Agreements; |
| | • | | The New Agreements are identical in all material respects to the Current Agreements; |
| | • | | The Manager and the Sub-Advisors would provide the same services to the Fund pursuant to the New Agreements as they had been providing under the Current Agreements; |
| | • | | The Manager’s personnel who will provide management services to the Fund are not expected to change and the commitment of the New Ownership Group to retain key personnel currently employed by the Manager who currently provide services to the Fund; |
| | • | | The Sub-Advisors’ personnel who will provide advisory services to the Fund are not expected to change; |
| | • | | Resolute’s substantially strengthened capital structure following the Closing, which would enable Resolute to continue to provide the Manager with the financial resources necessary to continue to operate and grow the Fund; |
| | • | | The anticipated governance structure to be employed in the management of RIM and that following the Transaction the Manager is expected to maintain continuity of management, a similar degree of operational autonomy and its current culture of compliance; |
| | • | | The various measures in place and/or prepared to be employed to address any potential impact of the Transaction on the Manager’s business, including its day-to-day operations; |
| | • | | The anticipated absence of any adverse impact of the Transaction on the Fund’s Sub-Advisors and other key service providers; |
| | • | | The alignment of the strategic business objectives of the New Ownership Group with regard to its investment in the Manager and the Manager’s activities with respect to the Trust, which objectives are consistent with the Manager’s current objectives; |
| | • | | Fund shareholders will not bear any costs in connection with the Transaction, inasmuch as the Manager and, indirectly, the New Ownership Group will bear the costs, fees and expenses incurred by the Fund in connection with the Transaction, the proxy statement, the fees and expenses of accountants and attorneys relating to the Transaction, and the fees and expenses of the Board and the Committee for meetings held in connection with the Transaction; |
| | • | | The Fund may realize benefits as a result of the Transaction, including that the Transaction is expected to maintain continuity of management of the Fund and may reduce the potential vulnerability to changes in control of the Manager that could be adverse to the Fund’s interests and affect the retention of key employees providing services to the Fund; |
| | • | | The Manager’s representation that there had been no material changes or developments relating to the Manager or the Sub-Advisors since the May-June Meetings, other than the changes or developments subsequently reported to the Board; and |
54
Disclosure Regarding the Approval of New Management and Investment
Advisory Agreements (Unaudited)
| | • | | The Trustees had requested and evaluated information relevant to the renewal of the Current Agreements at their May-June Meetings. |
In light of the proximity of the Board’s consideration of the renewal or approval of the Current Agreements at the May-June Meetings, the Trustees determined that it was not necessary to repeat certain aspects of the review conducted in connection with the approvals made the prior month. Based on the process undertaken and the considerations weighed by the Board with respect to the renewal of the Current Agreements, and the Board’s due diligence review in connection with the Transaction during the July Meetings, the Board approved the New Agreements at the July 12, 2023 meeting, and recommended that, as applicable, the shareholders of the Fund also approve the New Agreements. The factors considered by the Board in connection with the approval of the Current Agreements are described in the section of this report titled “Disclosure Regarding Approval of the Current Management and Investment Advisory Agreements.”
55
American Beacon Large Cap Value FundSM
Results of Shareholder Meeting (Unaudited)
A special meeting of shareholders of each of the portfolios of the American Beacon Funds (the “Trust”) was held on October 27, 2023. The shareholders of the American Beacon Large Cap Value Fund (the “Fund”), a portfolio of the Trust, failed to approve a new management agreement between American Beacon Advisors, Inc. and the Trust, with respect to the Fund. This proposal required a majority of the shareholders of the Fund to achieve a quorum: however, a quorum was not present for the Fund and therefore not enough votes in favor of the proposal. The meeting was adjourned to November 17, 2023.
56
Trustees and Officers of the American Beacon FundsSM (Unaudited)
The Trustees and officers of the American Beacon Funds (the “Trust”) are listed below, together with their principal occupations during the past five years. The address of each person listed below is 220 East Las Colinas Boulevard, Suite 1200, Irving, Texas 75039. Each Trustee oversees twenty-seven funds in the fund complex that includes the Trust, the American Beacon Select Funds, and the American Beacon Institutional Funds Trust. The Trust’s Statement of Additional Information contains additional information about the Trustees and is available without charge by calling 1-800-658-5811.
| | | | |
Name, Age | | Position, Term of Office and Length of Time Served with the Trust | | Principal Occupation(s) During Past 5 Years and Current Directorships |
| INTERESTED TRUSTEES | | Term | | |
| | Lifetime of Trust until removal, resignation or retirement* | | |
| | |
| Eugene J. Duffy (1954)** | | Trustee since 2008 | | Managing Director, Global Investment Management Distribution, Mesirow Financial Administrative Corporation (2016-Present); Managing Director, Institutional Services, Intercontinental Real Estate Corporation (2014-2016); Trustee, American Beacon Select Funds (2008-Present); Trustee, American Beacon Institutional Funds Trust (2017-Present); Trustee, American Beacon Sound Point Enhanced Income Fund (2018–2021); Trustee, American Beacon Apollo Total Return Fund (2018–2021). |
| | |
| NON-INTERESTED TRUSTEES | | Term | | |
| | Lifetime of Trust until removal, resignation or retirement* | | |
| | |
| Gilbert G. Alvarado (1969) | | Trustee since 2015 | | Chief Financial Officer (2022-Present), The Conrad Prebys Foundation; President, SJVIIF, LLC, Impact Investment Fund (2018-2022); Director, Kura MD, Inc. (local telehealth organization) (2015-2017); Senior Vice President & CFO, Sierra Health Foundation (health conversion private foundation) (2006-2022); Senior Vice President & CFO, Sierra Health Foundation: Center for Health Program Management (California public benefit corporation) (2012-2022); Director, Sacramento Regional Technology Alliance (2011-2016); Director, Valley Healthcare Staffing (2017–2018); Trustee, American Beacon Select Funds (2015-Present); Trustee, American Beacon Institutional Funds Trust (2017-Present); Trustee, American Beacon Sound Point Enhanced Income Fund (2018–2021); Trustee, American Beacon Apollo Total Return Fund (2018–2021). |
| | |
| Joseph B. Armes (1962) | | Trustee since 2015 | | Director, Switchback Energy Acquisition (2019-2021); Chairman & CEO, CSW Industrials f/k/a Capital Southwest Corporation (investment company) (2015-Present); Chairman of the Board of Capital Southwest Corporation, predecessor to CSW Industrials, Inc. (2014-2017) (investment company); President & CEO, JBA Investment Partners (family investment vehicle) (2010-Present); Director and Chair of Audit Committee, RSP Permian (oil and gas producer) (2013-2018); Trustee, American Beacon Select Funds (2015-Present); Trustee, American Beacon Institutional Funds Trust (2017-Present); Trustee, American Beacon Sound Point Enhanced Income Fund (2018–2021); Trustee, American Beacon Apollo Total Return Fund (2018–2021). |
| | |
| Gerard J. Arpey (1958) | | Trustee since 2012 | | Partner, Emerald Creek Group (private equity firm) (2011-Present); Director, S.C. Johnson & Son, Inc. (privately held company) (2008-present); Director, The Home Depot, Inc. (2015-Present); Trustee, American Beacon Select Funds (2012-Present); Trustee, American Beacon Institutional Funds Trust (2017-Present); Trustee, American Beacon Sound Point Enhanced Income Fund (2018–2021); Trustee, American Beacon Apollo Total Return Fund (2018–2021). |
57
Trustees and Officers of the American Beacon FundsSM (Unaudited)
| | | | |
Name, Age | | Position, Term of Office and Length of Time Served with the Trust | | Principal Occupation(s) During Past 5 Years and Current Directorships |
| NON-INTERESTED TRUSTEES (CONT.) | | Term | | |
| | Lifetime of Trust until removal, resignation or retirement* | | |
| | |
| Brenda A. Cline (1960) | | Trustee since 2004 Chair since 2019 Vice Chair 2018 | | Chief Financial Officer, Treasurer and Secretary, Kimbell Art Foundation (1993-Present); Director, Tyler Technologies, Inc. (public sector software solutions company) (2014-Present); Director, Range Resources Corporation (oil and natural gas company) (2015-Present); Trustee, Cushing Closed-End and Open-End Funds (2017-2021);Chair, (2019-Present), Vice Chair (2018), Trustee (2004-Present), American Beacon Select Funds; Chair (2019-Present), Vice Chair (2018), Trustee (2017-Present), American Beacon Institutional Funds Trust; Chair (2019-2021), Vice Chair (2018), Trustee (2018-2021), American Beacon Sound Point Enhanced Income Fund (2018–2021); Chair (2019-2021), Vice Chair (2018), Trustee (2018-2021), American Beacon Apollo Total Return Fund (2018–2021). |
| | |
| Claudia A. Holz (1957) | | Trustee since 2018 | | Independent Director, Blue Owl Capital, Inc. (2021-Present); Partner, KPMG LLP (1990 – 2017); Trustee, American Beacon Select Funds (2018-Present); Trustee, American Beacon Institutional Funds Trust (2018-Present); Trustee, American Beacon Sound Point Enhanced Income Fund (2018–2021); Trustee, American Beacon Apollo Total Return Fund (2018–2021). |
| | |
| Douglas A. Lindgren (1961) | | Trustee since 2018 | | Director, JLL Income Property Trust (2022-Present); CEO North America, Carne Global Financial Services (2016-2017); Consultant, Carne Financial Services (2017-2019); Managing Director, IPS Investment Management and Global Head, Content Management, UBS Wealth Management (2010-2016); Trustee, American Beacon Select Funds (2018-Present); Trustee, American Beacon Institutional Funds Trust (2018-Present); Trustee, American Beacon Sound Point Enhanced Income Fund (2018–2021); Trustee, American Beacon Apollo Total Return Fund (2018–2021). |
| | |
| Barbara J. McKenna, CFA (1963) | | Trustee since 2012 | | President/Managing Principal, Longfellow Investment Management Company (2005-Present, President since 2009); Member, External Diversity Council of the Federal Reserve Bank of Boston (2021-Present); Member, Federal Reserve Bank of Boston CEO Roundtable (2021-Present); Board Advisor, United States Tennis Association (2021-Present); Trustee, American Beacon Select Funds (2012-Present); Trustee, American Beacon Institutional Funds Trust (2017-Present); Trustee, American Beacon Sound Point Enhanced Income Fund (2018–2021); Trustee, American Beacon Apollo Total Return Fund (2018–2021). |
58
Trustees and Officers of the American Beacon FundsSM (Unaudited)
| | | | |
Name, Age | | Position, Term of Office and Length of Time Served with the Trust | | Principal Occupation(s) During Past 5 Years and Current Directorships |
| OFFICERS | | Term | | |
| | One Year | | |
| | |
| Jeffrey K. Ringdahl (1975) | | President since 2022 Vice President (2010-2022) | | Director (2015-Present), President (2018-Present), Chief Executive Officer (2022-Present), Chief Operating Officer (2010-2022), Senior Vice President (2013-2018), American Beacon Advisors, Inc.; Director (2015-Present), President (2018-Present), Senior Vice President (2015-2018), Resolute Investment Holdings, LLC; Director (2015-Present), President (2018-Present), Senior Vice President (2015-2018), Resolute Topco, Inc.; Director (2015-Present), President (2018-Present), Senior Vice President (2015-2018), Resolute Acquisition, Inc.; Director (2015-Present), President (2018-Present), Chief Executive Officer (2022-Present); Chief Operating Officer (2018-2022), Senior Vice President (2015-2018), Resolute Investment Managers, Inc.; Director (2017-Present), President & Chief Executive Officer (2022-Present), Executive Vice President (2017-2022), Resolute Investment Distributors, Inc.; Director (2017-Present), President (2018-Present), Chief Executive Officer (2022-Present), Chief Operating Officer (2018-2022), Executive Vice President (2017-2018), Resolute Investment Services, Inc.; President (2022-Present), Senior Vice President (2017-2022), Vice President (2012-2017), Manager (2015-Present), American Private Equity Management, L.L.C.; Trustee, American Beacon NextShares Trust (2015-2020); Director, Executive Vice President & Chief Operating Officer, Alpha Quant Advisors, LLC (2016-2020); Director, Shapiro Capital Management, LLC (2017-Present); Director and Executive Vice President, Continuous Capital, LLC (2018-2022); Director, RSW Investments Holdings LLC (2019-Present); Manager, SSI Investment Management, LLC (2019-Present); Director, National Investment Services of America, LLC (2019-Present); Director and Vice President American Beacon Cayman Transformational Innovation Company, Ltd. (2017-2018); Vice President, American Beacon Delaware Transformational Innovation Corporation (2017-2018); Director (2014-Present), President (2022-Present), Vice President (2014-2022), American Beacon Cayman Managed Futures Strategy Fund, Ltd.; Director (2018-Present), President (2022-Present), (Vice President (2018-2022), American Beacon Cayman TargetRisk Company, Ltd.; President (2022-Present); Vice President (2010-2022), Director and President, American Beacon Cayman Multi-Alternatives Company, Ltd.; (2023-Present); Director and President, American Beacon Cayman Trend Company, Ltd. (2023-Present); American Beacon Select Funds; President (2022-Present), Vice President (2017-2022), American Beacon Institutional Funds Trust; Vice President, American Beacon Sound Point Enhanced Income Fund (2018-2021); Vice President, American Beacon Apollo Total Return Fund (2018-2021). |
59
Trustees and Officers of the American Beacon FundsSM (Unaudited)
| | | | |
Name, Age | | Position, Term of Office and Length of Time Served with the Trust | | Principal Occupation(s) During Past 5 Years and Current Directorships |
| OFFICERS (CONT.) | | Term | | |
| | One Year | | |
| | |
| Rosemary K. Behan (1959) | | VP, Secretary and Chief Legal Officer since 2006 | | Senior Vice President (2021-Present), Vice President (2006-2021), Secretary and General Counsel (2006-Present), American Beacon Advisors, Inc.; Secretary, Resolute Investment Holdings, LLC (2015-Present); Secretary, Resolute Topco, Inc. (2015-Present); Secretary, Resolute Acquisition, Inc. (2015–Present); Senior Vice President (2021-Present), Vice President (2015-2021), Secretary and General Counsel (2015-Present), Resolute Investment Managers, Inc.; Secretary, Resolute Investment Distributors, Inc. (2017-Present); Senior Vice President (2021-Present), Vice President (2017-2021), Secretary and General Counsel (2017-Present), Resolute Investment Services, Inc.; Secretary, American Private Equity Management, L.L.C. (2008-Present); Secretary and General Counsel, Alpha Quant Advisors, LLC (2016-2020); Vice President and Secretary, Continuous Capital, LLC (2018-2022); Secretary, Green Harvest Asset Management (2019-2021); Secretary, American Beacon Delaware Transformational Innovation Corporation (2017-2018); Secretary, American Beacon Cayman Transformational Innovation Company, Ltd. (2017-2018); Secretary, American Beacon Cayman Managed Futures Strategy Fund, Ltd. (2014-Present); Secretary, American Beacon Cayman TargetRisk Company, Ltd. (2018-Present); Secretary, American Beacon Cayman Multi-Alternatives Company, Ltd. (2023-Present); Secretary, American Beacon Cayman Trend Company, Ltd. (2023-Present); Chief Legal Officer, Vice President and Secretary, American Beacon Select Funds (2006-Present); Chief Legal Officer, Vice President and Secretary, American Beacon Institutional Funds Trust (2017-Present); Chief Legal Officer, Vice President and Secretary, American Beacon Sound Point Enhanced Income Fund (2018-2021); Chief Legal Officer, Vice President and Secretary, American Beacon Apollo Total Return Fund (2018-2021). |
| | |
| Gregory J. Stumm (1981) | | VP since 2022 | | Senior Vice President, American Beacon Advisors, Inc. (2022-Present); Senior Vice President, Resolute Investment Managers, Inc. (2022-Present); Director and Senior Vice President, Resolute Investment Distributors, Inc. (2022-Present); Senior Vice President, Resolute Investment Services, Inc. (2022-Present); Vice President, American Beacon Select Funds (2022-Present); Vice President, American Beacon Institutional Funds Trust (2022-Present). |
| | |
| Paul B. Cavazos (1969) | | VP since 2016 | | Chief Investment Officer and Senior Vice President, American Beacon Advisors, Inc. (2016-Present); American Private Equity Management, L.L.C. (2017–Present); Vice President, American Beacon Select Funds (2016-Present); Vice President, American Beacon Institutional Funds Trust (2017-Present); Vice President, American Beacon Sound Point Enhanced Income Fund (2018-2021); Vice President, American Beacon Apollo Total Return Fund (2018-2021). |
| | |
| Erica Duncan (1970) | | VP since 2011 | | Vice President, American Beacon Advisors, Inc. (2011-Present); Vice President, Resolute Investment Managers (2018-Present); Vice President, Resolute Investment Services, Inc. (2018-Present); Vice President, American Beacon Select Funds (2011-Present); Vice President, American Beacon Institutional Funds Trust (2017-Present); Vice President, American Beacon Sound Point Enhanced Income Fund (2018-2021); Vice President, American Beacon Apollo Total Return Fund (2018-2021). |
60
Trustees and Officers of the American Beacon FundsSM (Unaudited)
| | | | |
Name, Age | | Position, Term of Office and Length of Time Served with the Trust | | Principal Occupation(s) During Past 5 Years and Current Directorships |
| OFFICERS (CONT.) | | Term | | |
| | One Year | | |
| | |
| Melinda G. Heika (1961) | | VP since 2021 | | Senior Vice President (2021-Present), Treasurer and CFO (2010-Present), American Beacon Advisors, Inc.; Treasurer, Resolute Topco, Inc. (2015-Present); Treasurer, Resolute Investment Holdings, LLC. (2015-Present); Treasurer, Resolute Acquisition, Inc. (2015-Present); Senior Vice President (2021-Present), Treasurer and CFO (2017-Present), Resolute Investment Managers, Inc.; Treasurer, Resolute Investment Distributors, Inc. (2017); Senior Vice President (2021-Present); Treasurer and CFO (2017-Present), Resolute Investment Services, Inc.; Treasurer, American Private Equity Management, L.L.C. (2012-Present); Treasurer and CFO, Alpha Quant Advisors, LLC (2016-2020); Treasurer and CFO, Continuous Capital, LLC (2018-2022); Treasurer, American Beacon Cayman Transformational Innovation, Ltd. (2017-2018); Treasurer, American Beacon Delaware Transformational Innovation Corporation (2017-2018); Director (2014-Present), Vice President (2022-Present) and Treasurer (2014-2022), American Beacon Cayman Managed Futures Strategy Fund, Ltd.; Director and Vice President (2022-Present), and Treasurer(2018-2022), American Beacon Cayman TargetRisk Company, Ltd. (2018-Present); Director and Vice President, American Beacon Cayman Multi-Alternatives Company, Ltd. (2023-Present); Director and Vice President, American Beacon Cayman Trend Company, Ltd. (2023-Present) Principal Accounting Officer and Treasurer (2010-2021); American Beacon Funds; Vice President (2021-Present), Principal Accounting Officer (2017-2021) and Treasurer (2010-2021), American Beacon Select Funds; Vice President (2021–Present), Principal Accounting Officer and Treasurer (2017-2021), American Beacon Institutional Funds Trust; Vice President (2021), Principal Accounting Officer and Treasurer (2018-2021), American Beacon Sound Point Enhanced Income Fund; Vice President (2021), Principal Accounting Officer and Treasurer, American Beacon Apollo Total Return Fund (2018-2021). |
| | |
| Terri L. McKinney (1963) | | VP since 2010 | | Senior Vice President (2021-Present), Vice President (2009-2021), American Beacon Advisors, Inc.; Senior Vice President (2021–Present); Vice President (2017-2021), Resolute Investment Managers, Inc.; Senior Vice President (2021-Present), Vice President (2018-2021), Resolute Investment Services, Inc; Vice President, Alpha Quant Advisors, LLC (2016-2020); Vice President, Continuous Capital, LLC (2018-2022); Vice President, American Beacon Select Funds (2010-Present); Vice President, American Beacon Institutional Funds Trust (2017-Present); Vice President, American Beacon Sound Point Enhanced Income Fund (2018-2021); Vice President, American Beacon Apollo Total Return Fund (2018-2021). |
| | |
| Samuel J. Silver (1963) | | VP since 2011 | | Vice President (2011-Present), Chief Fixed Income Officer (2016-Present), American Beacon Advisors, Inc.; Vice President, American Beacon Select Funds (2011-Present); Vice President, American Beacon Institutional Funds Trust (2017-Present); Vice President, American Beacon Sound Point Enhanced Income Fund (2018-2021); Vice President, American Beacon Apollo Total Return Fund (2018-2021). |
61
Trustees and Officers of the American Beacon FundsSM (Unaudited)
| | | | |
Name, Age | | Position, Term of Office and Length of Time Served with the Trust | | Principal Occupation(s) During Past 5 Years and Current Directorships |
| OFFICERS (CONT.) | | Term | | |
| | One Year | | |
| | |
| Christina E. Sears (1971) | | Chief Compliance Officer since 2004 | | Chief Compliance Officer (2004-Present), Vice President (2019-Present); American Beacon Advisors, Inc.; Vice President, Resolute Investment Managers, Inc. (2017-Present); Vice President, Resolute Investment Distributors (2017-Present); Vice President, Resolute Investment Services, Inc. (2019-Present); Chief Compliance Officer, American Private Equity Management, L.L.C. (2012-Present); Chief Compliance Officer, Green Harvest Asset Management, LLC (2019-2021); Chief Compliance Officer, RSW Investments Holdings, LLC (2019-Present); Chief Compliance Officer (2016-2019) and Vice President (2016-2020), Alpha Quant Advisors, LLC ; Chief Compliance Officer (2018-2019), Vice President (2018-2022), Continuous Capital, LLC; Assistant Secretary, American Beacon Funds (1999-Present); Chief Compliance Officer (2004-Present) and Assistant Secretary (1999-Present), American Beacon Select Funds; Chief Compliance Officer and Assistant Secretary, American Beacon Institutional Funds Trust (2017-Present); Chief Compliance Officer and Assistant Secretary, American Beacon Sound Point Enhanced Income Fund (2018-2021); Chief Compliance Officer and Assistant Secretary, American Beacon Apollo Total Return Fund (2018-2021). |
| | |
| Sonia L. Bates (1956) | | Principal Accounting Officer and Treasurer since 2021 | | Assistant Treasurer, American Beacon Advisors, Inc. (2011-2018); Vice President, Fund and Tax Reporting (2023-Present), Director, Fund and Tax Reporting (2011-2023), Resolute Investment Services, Inc.; Assistant Treasurer, American Private Equity Management, L.L.C. (2012-Present); Assistant Treasurer, American Beacon Cayman Transformational Innovation Company, Ltd. (2017-2018); Treasurer, American Beacon Cayman Managed Futures Strategy Fund, Ltd. (2022-Present); Treasurer (2022-Present), Assistant Treasurer (2018-2022), American Beacon Cayman TargetRisk Company, Ltd.; Treasurer, American Beacon Cayman Multi-Alternatives Company, Ltd. (2023-Present); Treasurer, American Beacon Cayman Trend Company, Ltd. (2023-Present); Assistant Treasurer, American Beacon Funds (2011-2021); Principal Accounting Officer and Treasurer (2021-Present), Assistant Treasurer (2011-2021), American Beacon Select Funds; Principal Accounting Officer and Treasurer (2021-Present), Assistant Treasurer (2017-2021), American Beacon Institutional Funds Trust; Principal Accounting Officer and Treasurer (2021), Assistant Treasurer (2018-2021), American Beacon Sound Point Enhanced Income Fund; Principal Accounting Officer and Treasurer (2021), Assistant Treasurer (2018-2021), American Beacon Apollo Total Return Fund. |
| | |
| Shelley L. Dyson (1969) | | Assistant Treasurer since 2021 | | Fund Tax Manager (2020-Present), Manager, Tax (2014-2020), Resolute Investment Services, Inc.; Assistant Treasurer American Beacon Cayman Managed Futures Strategy Fund, Ltd. (2022-Present); Assistant Treasurer, American Beacon Cayman TargetRisk Company, Ltd. (2022-Present); Assistant Treasurer, American Beacon Cayman Multi-Alternatives Company, Ltd. (2023-Present); Assistant Treasurer, American Beacon Cayman Trend Company, Ltd. (2023-Present); Assistant Treasurer, American Beacon Select Funds (2021-Present); Assistant Treasurer, American Beacon Institutional Funds Trust (2021-Present); Assistant Treasurer, American Beacon Sound Point Enhanced Income Fund (2021); Assistant Treasurer, American Beacon Apollo Total Return Fund (2021). |
62
Trustees and Officers of the American Beacon FundsSM (Unaudited)
| | | | |
Name, Age | | Position, Term of Office and Length of Time Served with the Trust | | Principal Occupation(s) During Past 5 Years and Current Directorships |
| OFFICERS (CONT.) | | Term | | |
| | One Year | | |
| | |
| Shelley D. Abrahams (1974) | | Assistant Secretary since 2008 | | Corporate Governance Manager (2023-Present), Senior Corporate Governance & Regulatory Specialist (2020-2023), Corporate Governance & Regulatory Specialist (2017-2020), Resolute Investment Services, Inc.; Assistant Secretary, American Beacon Cayman Managed Futures Strategy Fund, Ltd. (2022-Present); Assistant Secretary, American Beacon Cayman TargetRisk Company, Ltd. (2022-Present); Assistant Secretary, American Beacon Cayman Multi-Alternatives Company, Ltd. (2023-Present); Assistant Secretary, American Beacon Cayman Trend Company, Ltd. (2023-Present); Assistant Secretary, American Beacon Select Funds (2008-Present); Assistant Secretary, American Beacon Institutional Funds Trust (2017-Present); Assistant Secretary, American Beacon Sound Point Enhanced Income Fund (2018-2021); Assistant Secretary, American Beacon Apollo Total Return Fund (2018-2021). |
| | |
| Rebecca L. Harris (1966) | | Vice President since 2022 | | Senior Vice President (2021-Present), Vice President (2011-2021), American Beacon Advisors, Inc.; Senior Vice President (2021-Present), Vice President (2017-2021), Resolute Investment Managers, Inc.; Senior Vice President (2021-Present), Vice President (2015-Present), Resolute Investment Services; Vice President, Alpha Quant Advisors, LLC (2016-2020); Vice President (2018-Present), Director (2022) Continuous Capital, LLC; Director, National Investment Services of American, LLC (2022-Present); Director, RSW Investments Holdings LLC (2022-Present); Director Shapiro Capital Management LLC (2022-Present); Director, SSI Investment Management LLC (2022-Present); Assistant Secretary, American Beacon Funds (2010-2022); Vice President (2022-Present), Assistant Secretary (2010-2022), American Beacon Select Funds; Vice President (2022-Present), Assistant Secretary (2017-2022), American Beacon Institutional Funds Trust; Assistant Secretary, American Beacon Sound Point Enhanced Income Fund (2018-2021); Assistant Secretary, American Beacon Apollo Total Return Fund (2018-2021). |
| | |
| Teresa A. Oxford (1958) | | Assistant Secretary since 2015 | | Assistant Secretary and Associate General Counsel, American Beacon Advisors, Inc. (2015-Present); Assistant Secretary, Resolute Investment Distributors (2018-2021); Assistant Secretary and Associate General Counsel, Resolute Investment Managers, Inc. (2017-Present); Assistant Secretary and Associate General Counsel, Resolute Investment Services (2018-Present); Assistant Secretary, Alpha Quant Advisors, LLC (2016-2020); Assistant Secretary, Continuous Capital, LLC (2020-2022); Assistant Secretary, American Beacon Select Funds (2015-Present); Assistant Secretary, American Beacon Institutional Funds Trust (2017-Present); Assistant Secretary, American Beacon Sound Point Enhanced Income Fund (2018-2021); Assistant Secretary, American Beacon Apollo Total Return Fund (2018-2021). |
| | |
| Michael D. Jiang (1984) | | Assistant Secretary since 2021 | | Assistant Secretary (2022-Present), Associate General Counsel (2021-Present), American Beacon Advisors, Inc.; Assistant Secretary (2021-Present), Resolute Investment Distributors, Inc.; Assistant Secretary (2022-Present), Associate General Counsel (2021-Present), Resolute Investment Managers, Inc.; Assistant Secretary (2022–Present) and Associate General Counsel, (2021-Present), Resolute Investment Services, Inc.; Vice President (2018-2021), Second Vice President (2015-2018), The Northern Trust Company; Assistant Secretary, American Beacon Select Funds (2021-Present); Assistant Secretary, American Beacon Institutional Funds Trust (2021-Present); Assistant Secretary, American Beacon Sound Point Enhanced Income Fund (2021); Assistant Secretary, American Beacon Apollo Total Return Fund (2021). |
* As of 11/12/2014, the Board adopted a retirement plan that requires Trustees to retire no later than the last day of the calendar year in which they reach the age of 75.
** Mr. Duffy is being deemed to be an “interested person” of the Trust, as defined by the Investment Company Act of 1940, as amended, by virtue of his position with Mesirow Financial, Inc., a broker-dealer.
63
American Beacon FundsSM
Privacy Policy
October 31, 2023 (Unaudited)
The American Beacon Funds recognize and respect the privacy of our shareholders. We are providing this notice to you so you will understand how shareholder information may be collected and used.
We may collect nonpublic personal information about you from one or more of the following sources:
| | • | | information we receive from you on applications or other forms; |
| | • | | information about your transactions with us or our service providers; and |
| | • | | information we receive from third parties. |
We do not disclose any nonpublic personal information about our customers or former customers to anyone, except as permitted by law.
We restrict access to your nonpublic personal information to those employees or service providers who need to know that information to provide products or services to you. To ensure the confidentiality of your nonpublic personal information, we maintain safeguards that comply with federal standards.
64

Delivery of Documents
Shareholder reports are available online at www.americanbeaconfunds.com/reports. Please be advised that reports are no longer sent by mail. Instead, the reports are made available online, and you will be notified by mail each time a report is posted online. You will be provided with a website link to access the report. You may elect to receive all future reports in paper free of charge. You can request to continue receiving paper copies by calling 1-866-345-5954, or you may directly inform your financial intermediary. Detailed instructions are also included in your report notifications.
If you invest in the Fund through a financial institution, you may be able to receive the Fund’s regulatory mailings, such as the Prospectus, Annual Report and Semi-Annual Report, by e-mail. If you are interested in this option, please go to www.icsdelivery.com and search for your financial institution’s name or contact your financial institution directly.
To obtain more information about the Fund:
| | |
 | |  |
| | |
| By E-mail: | | On the Internet: |
| american_beacon.funds@ambeacon.com | | Visit our website at www.americanbeaconfunds.com |
| | | |
| | | |
| | |

By Telephone: Call (800) 658-5811 | | 
By Mail: American Beacon Funds P.O. Box 219643 Kansas City, MO 64121-9643 |
|
|
|
| | | |
| | | |
| Availability of Quarterly Portfolio Schedules | | Availability of Proxy Voting Policy and Records |
| | |
| In addition to the Schedule of Investments provided in each semi-annual and annual report, the Fund files a complete schedule of its portfolio holdings with the Securities and Exchange Commission (“SEC”) on Form N-PORT as of the end of each fiscal quarter. The Fund’s Forms N-PORT are available on the SEC’s website at www.sec.gov. The Forms N-PORT may also be reviewed and copied at the SEC’s Public Reference Section, 100 F Street, NE, Washington, D.C. 20549-1520. Information regarding the operation of the SEC’s Public Reference Room may be obtained by calling (800)-SEC-0330. A complete schedule of the Fund’s portfolio holdings is also available at www.americanbeaconfunds.com approximately twenty days after the end of each month. | | A description of the policies and procedures the Fund uses to determine how to vote proxies relating to portfolio securities is available in the Fund’s Statement of Additional Information, is available free of charge on the Fund’s website www.americanbeaconfunds.com and by calling 1-800-967-9009 or by accessing the SEC’s website at www.sec.gov. The Fund’s proxy voting record for the most recent year ended June 30 is filed annually with the SEC on Form N-PX. The Fund’s Forms N-PX are available on the SEC’s website at www.sec.gov. The Fund’s proxy voting record may also be obtained by calling 1-800-967-9009. |
Fund Service Providers:
| | | | | | | | | | | | |
CUSTODIAN State Street Bank and Trust Company Boston, Massachusetts | | | | TRANSFER AGENT SS&C GIDS, Inc. Quincy, Massachusetts | | | | INDEPENDENT REGISTERED PUBLIC ACCOUNTING FIRM PricewaterhouseCoopers LLP Boston, Massachusetts | | | | DISTRIBUTOR Resolute Investment Distributors, Inc. Irving, Texas |
This report is prepared for shareholders of the American Beacon Funds and may be distributed to others only if preceded or accompanied by a current Prospectus or Summary Prospectus.
American Beacon Funds and American Beacon Large Cap Value Fund are service marks of American Beacon Advisors, Inc.
AR 10/23

About American Beacon Advisors
Since 1986, American Beacon Advisors, Inc. has offered a variety of products and investment advisory services to numerous institutional and retail clients, including a variety of mutual funds, corporate cash management, and separate account management.
Our clients include defined benefit plans, defined contribution plans, foundations, endowments, corporations, financial planners, and other institutional investors. With American Beacon Advisors, you can put the experience of a multi-billion dollar asset management firm to work for your company.
SMALL CAP VALUE FUND
Investing in small-capitalization stocks may involve greater volatility and lower liquidity than larger company stocks. Investing in value stocks may limit downside risk over time; however, the Fund may produce more modest gains than riskier stock funds as a trade-off for this potentially lower risk. Investing in foreign securities may involve heightened risk due to currency fluctuations and economic and political risks. To the extent the Fund invests more heavily in particular sectors, its performance will be sensitive to factors affecting those sectors. Financial sector companies are heavily regulated and particularly sensitive to interest rate fluctuations. The Fund’s incorporation of environmental, social and/or governance (ESG) considerations in its investment strategy may cause it to underperform funds that do not incorporate these considerations. The use of futures contracts for cash management may subject the Fund to losing more money than invested. The Fund participates in a securities lending program. Please see the prospectus for a complete discussion of the Fund’s risks. There can be no assurances that the investment objectives of this Fund will be met.
Any opinions herein, including forecasts, reflect our judgment as of the end of the reporting period and are subject to change. Each advisor’s strategies and the Fund’s portfolio composition will change depending on economic and market conditions. This report is not a complete analysis of market conditions and therefore, should not be relied upon as investment advice. Although economic and market information has been compiled from reliable sources, American Beacon Advisors, Inc. makes no representation as to the completeness or accuracy of the statements contained herein.
American Beacon Funds | October 31, 2023 |
Contents
| | | | |
| |
Additional Fund Information | | | Back Cover | |
President’s Message
| | |
 | | Dear Shareholders, In the words of Theodor Seuss Geisel, the beloved children’s author and cartoonist known as Dr. Seuss, “Only you can control your future.” While we as individuals cannot control everything that’s happening in the world around us or within the global economy and markets, we can take steps to diversify our risk exposure as we seek to preserve and grow our personal savings. By making prudent adjustments to our investment portfolios with the help of trusted financial professionals, we may be better positioned to withstand the negative financial forces we’re likely to encounter in our lifetime – especially during periods like today’s geopolitical turmoil and economic uncertainty. |
At American Beacon, we endeavor to provide a broad range of disciplined investment strategies to help you potentially collect the fruits of your labor over the fullness of time. We work diligently to cultivate relationships with the investment managers who serve as sub-advisors to our investment products. Since our firm’s inception as a pension fiduciary in 1986 and the launch of our first sub-advised, multi-manager mutual funds in 1987, we have continued expanding our innovative product offerings. And we are committed to applying a solutions-based, risk-managed approach in our pursuit of institutional wisdom while striving to generate earned alpha and enduring value.
Thank you for entrusting your financial future with American Beacon. For more information about our investment products or to access your account information, please visit our website at www.americanbeaconfunds.com.
Best Regards,

Jeffrey K. Ringdahl
President
American Beacon Funds
1
Domestic Equity Market Overview
October 31, 2023 (Unaudited)
For the 12-month period ended October 31, 2023, domestic equity markets were mostly higher and had a range of risks and rewards under the surface. During the period, the Federal Reserve (“Fed”) continued to tighten monetary policy through six rate hikes totaling 2.25%. The last 0.25% hike in late July culminated in a target policy rate of 5.25% to 5.50% as inflation levels remained uncomfortably above the Fed’s target of 2%. The underlying U.S. economy remained on steady footing – despite many economists forecasting recession – as the unemployment rate remained below 4%, and third quarter U.S. real gross domestic product grew at an annualized rate of 4.9%.
In the U.S., the technology-heavy Nasdaq Composite® was up an impressive 18.0%. The S&P 500® Index was up 10.1% with mixed underlying sector performance. The top-performing S&P sectors, by a significant margin, were Communication Services (up 35.8%) and Information Technology (up 30.8%). Conversely, the worst-performing sectors were Utilities (down 7.7%) and Real Estate (down 6.5%).
From a style standpoint, Growth easily outpaced Value as shown by the 17.3% return for the Russell 3000® Growth Index compared to the Russell 3000® Value Index return of -0.5%.
In terms of market capitalization, small-cap stocks significantly underperformed their larger-capitalization peers, evidenced by the Russell 2000® Index return of -8.6% compared to the Russell 1000® Index return of 9.5%.
2
American Beacon Small Cap Value FundSM
Performance Overview
October 31, 2023 (Unaudited)
The Investor Class of the American Beacon Small Cap Value Fund (the “Fund”) returned -4.41% for the twelve months ended October 31, 2023, outperforming the Russell 2000® Value Index (the “Index”) return of -9.93% for the same period.
Comparison of Changes in Value of a $10,000 Investment for the period 10/31/2013 through 10/31/2023
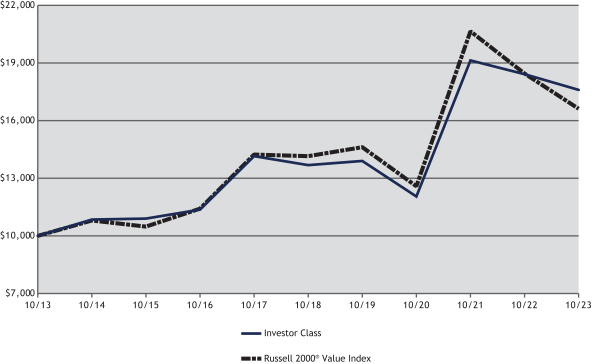
| | | | | | | | | | | | | | | | | | | | | | | | | | | | | | |
| Total Returns for the Period ended October 31, 2023 | |
| | | | | | |
| | | Ticker | | 1 Year | | 3 Years | | 5 Years | | 10 Years | | Value of $10,000
10/31/2013-
10/31/2023 |
R5 Class (1,6) | | AVFIX | | | | (4.09 | )% | | | | 13.81 | % | | | | 5.52 | % | | | | 6.16 | % | | | $ | 18,183 | |
Y Class (1,6) | | ABSYX | | | | (4.19 | )% | | | | 13.72 | % | | | | 5.44 | % | | | | 6.07 | % | | | $ | 18,034 | |
Investor Class (1,6) | | AVPAX | | | | (4.41 | )% | | | | 13.43 | % | | | | 5.17 | % | | | | 5.81 | % | | | $ | 17,590 | |
Advisor Class (1,6) | | AASSX | | | | (4.57 | )% | | | | 13.27 | % | | | | 5.01 | % | | | | 5.65 | % | | | $ | 17,319 | |
A Class without sales charge (1,2,6) | | ABSAX | | | | (4.50 | )% | | | | 13.33 | % | | | | 5.07 | % | | | | 5.72 | % | | | $ | 17,438 | |
A Class with sales Charge (1,2,6) | | ABSAX | | | | (10.00 | )% | | | | 11.11 | % | | | | 3.84 | % | | | | 5.09 | % | | | $ | 16,434 | |
C Class without sales charge (1,3,6) | | ASVCX | | | | (5.23 | )% | | | | 12.52 | % | | | | 4.32 | % | | | | 5.12 | % | | | $ | 16,471 | |
C Class with sales charge (1,3,6) | | ASVCX | | | | (6.23 | )% | | | | 12.52 | % | | | | 4.32 | % | | | | 5.12 | % | | | $ | 16,471 | |
R6 Class (1,4,6) | | AASRX | | | | (4.09 | )% | | | | 13.85 | % | | | | 5.55 | % | | | | 6.18 | % | | | $ | 18,211 | |
| | | | | | | | | | | | | | | | | | | | | | | | | | | | | |
Russell 2000® Value Index (5) | | | | | | (9.93 | )% | | | | 9.73 | % | | | | 3.26 | % | | | | 5.20 | % | | | $ | 16,605 | |
| 1. | Performance shown is historical and is not indicative of future returns. Investment returns and principal value will vary, and shares may be worth more or less at redemption than at original purchase. Performance shown is calculated based on the published end of day net asset values as of date indicated, and current performance may be lower or higher than the performance data quoted. To obtain performance as of the most recent month end, please visit www.americanbeaconfunds.com or call 1-800-967-9009. Fund performance in the table above does not reflect the deduction of taxes a shareholder would pay on distributions or the redemption of shares. Generally accepted accounting principles require adjustments to be made to the net assets of the Fund at period end for financial reporting purposes only; and as such, the total return based on the unadjusted net asset value per share may differ from the total return reported in the financial highlights. |
| 2. | A portion of the fees charged to the A Class of the Fund was waived in 2013 and 2014 and fully recovered in 2015. Performance prior to waiving fees was lower than the actual returns shown for 2013 and 2014. The maximum sales charge for A Class is 5.75%. |
3
American Beacon Small Cap Value FundSM
Performance Overview
October 31, 2023 (Unaudited)
| 3. | A portion of the fees charged to the C Class of the Fund was waived in 2013, fully recovered in 2015, and waived in 2018. Performance prior to waiving fees was lower than the actual returns shown in 2013 and 2018. The maximum contingent deferred sales charge for C Class is 1.00% for shares redeemed within one year of the date of purchase. |
| 4. | Fund performance for the five-year and ten-year periods represents the returns achieved by the R5 Class from 10/31/2013 through 2/28/20, the inception date of the R6 Class, and the returns of the R6 Class since its inception. Expenses of the R6 Class are lower than those of the R5 Class. As a result, total returns shown may be lower than they would have been had the R6 Class been in existence since 10/31/2013. |
| 5. | The Russell 2000® Value Index is an unmanaged index of those stocks in the Russell 2000 Index with lower price-to-book ratios and lower forecasted growth values. The Russell 2000® Index is an unmanaged index comprised of approximately 2,000 smaller-capitalization stocks. Russell 2000 Value Index and Russell 2000 Index are registered trademarks of Frank Russell Company. American Beacon Funds is not promoted, sponsored or endorsed by, nor in any way affiliated with the London Stock Exchange Group plc and its group undertakings (collectively, the “LSE Group”). FTSE Russell is a trading name of certain of the LSE Group companies. LSE Group is not responsible for and has not reviewed the American Beacon Small Cap Value Fund nor any associated literature or publications and LSE Group makes no representation or warranty, express or implied, as to their accuracy, or completeness, or otherwise. All rights in the Russell 2000 Index and the Russell 2000 Value Index (the “Indexes”) vest in the relevant LSE Group company which owns the Indexes. Russell 2000® is a trademark of the relevant LSE Group company and is used by any other LSE Group company under license. The Indexes are calculated by or on behalf of FTSE International Limited or its affiliate, agent or partner. The LSE Group does not accept any liability whatsoever to any person arising out of (a) the use of, reliance on or any error in the Indexes or (b) investment in or operation of the Fund. The LSE Group makes no claim, prediction, warranty or representation either as to the results to be obtained from the Fund or the suitability of the Indexes for the purpose to which it is being put by the Manager. One cannot directly invest in an index. |
| 6. | The Total Annual Fund Operating Expense ratios set forth in the most recent Fund prospectus for the R5, Y, Investor, Advisor, A, C, and R6 Class shares were 0.79%, 0.86%, 1.12%, 1.28%, 1.21%, 1.93%, and 0.77%, respectively. The expense ratios above may vary from the expense ratios presented in other sections of this report that are based on expenses incurred during the period covered by this report. |
The Fund outperformed the Index during the period due to both security selection and sector allocation.
Most of the Fund’s security selection outperformance was attributable to holdings in the Financials, Information Technology, and Industrials sectors. Within the Financials sector, the top contributors were Evercore, Inc., Class A (up 34.4%) and Enstar Group Ltd. (up 19.6%). In the Information Technology sector, Super Micro Computer, Inc. (up 225.1%) and F5, Inc. (up 6.7%), contributed to returns relative to the Index. Within the Industrials sector, Flowserve Corp. (up 30.6%) and Allison Transmission Holdings, Inc. (up 34.2%) contributed during the period. Conversely, security selection in the Consumer Staples sector detracted from relative returns; detractors included Darling Ingredients, Inc. (down 44.2%) and SunOpta, Inc. (down 65.4%).
From a sector allocation selection perspective, underweight allocations to the Health Care and Financials sectors, and an overweight allocation to the Industrials sector contributed positively to relative performance. This performance was marginally offset by an overweight allocation to the Consumer Staples sector.
The sub-advisors continue to focus on uncovering investment opportunities through stock selection that should benefit the Fund’s performance over the longer term.
| | | | | | | | |
| Top Ten Holdings (% Net Assets) | | | | | | | | |
| F5, Inc. | | | | | | | 1.2 | |
| Flowserve Corp. | | | | | | | 1.2 | |
| Adient PLC | | | | | | | 1.1 | |
| Texas Capital Bancshares, Inc. | | | | | | | 1.1 | |
| Columbia Banking System, Inc. | | | | | | | 0.9 | |
| Fluor Corp. | | | | | | | 0.9 | |
| Greenbrier Cos., Inc. | | | | | | | 0.9 | |
| Kaiser Aluminum Corp. | | | | | | | 0.9 | |
| Popular, Inc. | | | | | | | 0.9 | |
| SLM Corp. | | | | | | | 0.9 | |
| | |
| Total Fund Holdings | | | 484 | | | | | |
| | | | | | | | |
4
American Beacon Small Cap Value FundSM
Performance Overview
October 31, 2023 (Unaudited)
| | | | | | | | |
| Sector Allocation (% Equities) | | | | | | | | |
| Financials | | | | | | | 24.4 | |
| Industrials | | | | | | | 20.1 | |
| Consumer Discretionary | | | | | | | 13.3 | |
| Energy | | | | | | | 9.5 | |
| Materials | | | | | | | 8.8 | |
| Information Technology | | | | | | | 8.1 | |
| Utilities | | | | | | | 4.0 | |
| Real Estate | | | | | | | 3.4 | |
| Consumer Staples | | | | | | | 3.3 | |
| Health Care | | | | | | | 2.8 | |
| Communication Services | | | | | | | 2.3 | |
5
American Beacon Small Cap Value FundSM
Expense Examples
October 31, 2023 (Unaudited)
Fund Expense Example
As a shareholder of a Fund, you incur two types of costs: (1) transaction costs, including sales charges (loads) on purchase payments and redemption fees, if applicable, and (2) ongoing costs, including management fees, distribution (12b-1) fees, sub-transfer agent fees, and other Fund expenses. The Examples are intended to help you understand the ongoing cost (in dollars) of investing in the Fund and to compare these costs with the ongoing costs of investing in other mutual funds. The Examples are based on an investment of $1,000 invested at the beginning of the period in each Class and held for the entire period from May 1, 2023 through October 31, 2023.
Actual Expenses
The “Actual” lines of the tables provide information about actual account values and actual expenses. You may use the information on this page, together with the amount you invested, to estimate the expenses that you paid over the period. Simply divide your account value by $1,000 (for example, an $8,600 account value divided by $1,000 = $8.60), then multiply the result by the “Expenses Paid During Period” to estimate the expenses you paid on your account during this period. Shareholders of the Investor and R5 Classes that invest in the Fund through an IRA or Roth IRA may be subject to a custodial IRA fee of $15 that is typically deducted each December. If your account was subject to a custodial IRA fee during the period, your costs would have been $15 higher.
Hypothetical Example for Comparison Purposes
The “Hypothetical” lines of the tables provide information about hypothetical account values and hypothetical expenses based on the Fund’s actual expense ratio and an assumed 5% per year rate of return before expenses (not the Fund’s actual return). You may compare the ongoing costs of investing in the Fund with other funds by contrasting this 5% hypothetical example and the 5% hypothetical examples that appear in the shareholder reports of the other funds. The hypothetical account values and expenses may not be used to estimate the actual ending account balance or expenses you paid for the period. Shareholders of the Investor and R5 Classes that invest in the Fund through an IRA or Roth IRA may be subject to a custodial IRA fee of $15 that is typically deducted each December. If your account was subject to a custodial IRA fee during the period, your costs would have been $15 higher.
You should also be aware that the expenses shown in the table highlight only your ongoing costs and do not reflect any transaction costs charged by the Fund, such as sales charges (loads) or redemption fees, as applicable. Similarly, the expense examples for other funds do not reflect any transaction costs charged by those funds, such as sales charges (loads), redemption fees or exchange fees. Therefore, the “Hypothetical” lines of the tables are useful in comparing ongoing costs only and will not help you determine the relative total costs of owning different funds. If you were subject to any transaction costs during the period, your costs would have been higher.
6
American Beacon Small Cap Value FundSM
Expense Examples
October 31, 2023 (Unaudited)
| | | | | | | | | | | | | | | |
| American Beacon Small Cap Value Fund | |
| | | |
| | | Beginning Account Value
5/1/2023 | | Ending Account Value
10/31/2023 | | Expenses Paid During
Period
5/1/2023-10/31/2023* |
| R5 Class | | | | | | | | | | | | | | | |
| Actual | | | | $1,000.00 | | | | | $980.70 | | | | | $3.99 | |
| Hypothetical** | | | | $1,000.00 | | | | | $1,021.17 | | | | | $4.08 | |
| Y Class | | | | | | | | | | | | | | | |
| Actual | | | | $1,000.00 | | | | | $980.30 | | | | | $4.34 | |
| Hypothetical** | | | | $1,000.00 | | | | | $1,020.82 | | | | | $4.43 | |
| Investor Class | | | | | | | | | | | | | | | |
| Actual | | | | $1,000.00 | | | | | $979.10 | | | | | $5.64 | |
| Hypothetical** | | | | $1,000.00 | | | | | $1,019.51 | | | | | $5.75 | |
| Advisor Class | | | | | | | | | | | | | | | |
| Actual | | | | $1,000.00 | | | | | $978.20 | | | | | $6.38 | |
| Hypothetical** | | | | $1,000.00 | | | | | $1,018.75 | | | | | $6.51 | |
| A Class | | | | | | | | | | | | | | | |
| Actual | | | | $1,000.00 | | | | | $978.50 | | | | | $6.03 | |
| Hypothetical** | | | | $1,000.00 | | | | | $1,019.11 | | | | | $6.16 | |
| C Class | | | | | | | | | | | | | | | |
| Actual | | | | $1,000.00 | | | | | $975.10 | | | | | $9.61 | |
| Hypothetical** | | | | $1,000.00 | | | | | $1,015.48 | | | | | $9.80 | |
| R6 Class | | | | | | | | | | | | | | | |
| Actual | | | | $1,000.00 | | | | | $980.70 | | | | | $3.84 | |
| Hypothetical** | | | | $1,000.00 | | | | | $1,021.32 | | | | | $3.92 | |
| * | Expenses are equal to the Fund’s annualized expense ratios for the six-month period of 0.80%, 0.87%, 1.13%, 1.28%, 1.21%, 1.93%, and 0.77% for the R5, Y, Investor, Advisor, A, C, and R6 Classes, respectively, multiplied by the average account value over the period, multiplied by the number derived by dividing the number of days in the most recent fiscal half-year (184) by days in the year (365) to reflect the half-year period. |
| ** | 5% return before expenses. |
7
American Beacon Small Cap Value FundSM
Report of Independent Registered Public Accounting Firm
To the Board of Trustees of American Beacon Funds and Shareholders of American Beacon Small Cap Value Fund
Opinion on the Financial Statements
We have audited the accompanying statement of assets and liabilities, including the schedule of investments, of American Beacon Small Cap Value Fund (one of the funds constituting American Beacon Funds, referred hereafter as the “Fund”) as of October 31, 2023, the related statement of operations for the year ended October 31, 2023, the statement of changes in net assets for each of the two years in the period ended October 31, 2023, including the related notes, and the financial highlights for each of the two years in the period ended October 31, 2023 (collectively referred to as the “financial statements”). In our opinion, the financial statements present fairly, in all material respects, the financial position of the Fund as of October 31, 2023, the results of its operations for the year then ended, the changes in its net assets for each of the two years in the period ended October 31, 2023 and the financial highlights for each of the two years in the period ended October 31, 2023 in conformity with accounting principles generally accepted in the United States of America.
The financial statements of the Fund as of and for the year ended October 31, 2021 and the financial highlights for each of the periods ended on or prior to October 31, 2021 (not presented herein, other than the financial highlights) were audited by other auditors whose report dated December 30, 2021 expressed an unqualified opinion on those financial statements and financial highlights.
Basis for Opinion
These financial statements are the responsibility of the Fund’s management. Our responsibility is to express an opinion on the Fund’s financial statements based on our audits. We are a public accounting firm registered with the Public Company Accounting Oversight Board (United States) (PCAOB) and are required to be independent with respect to the Fund in accordance with the U.S. federal securities laws and the applicable rules and regulations of the Securities and Exchange Commission and the PCAOB.
We conducted our audits of these financial statements in accordance with the standards of the PCAOB. Those standards require that we plan and perform the audit to obtain reasonable assurance about whether the financial statements are free of material misstatement, whether due to error or fraud.
Our audits included performing procedures to assess the risks of material misstatement of the financial statements, whether due to error or fraud, and performing procedures that respond to those risks. Such procedures included examining, on a test basis, evidence regarding the amounts and disclosures in the financial statements. Our audits also included evaluating the accounting principles used and significant estimates made by management, as well as evaluating the overall presentation of the financial statements. Our procedures included confirmation of securities owned as of October 31, 2023 by correspondence with the custodians and brokers; when replies were not received from brokers, we performed other auditing procedures. We believe that our audits provide a reasonable basis for our opinion.
/s/PricewaterhouseCoopers LLP
Boston, Massachusetts
December 27, 2023
We have served as the auditor of one or more investment companies in the American Beacon family of funds since 2016.
8
American Beacon Small Cap Value FundSM
Schedule of Investments
October 31, 2023
| | | | | | | | | | | | | | | |
| | | |
| | | Shares | | | | Fair Value |
| | | | | | | |
| | | |
| COMMON STOCKS - 90.43% | | | | | | |
| | | |
| Communication Services - 2.18% | | | | | | |
| | | |
| Diversified Telecommunication Services - 0.02% | | | | | | |
| ATN International, Inc. | | | | 28,665 | | | | | | | | | $ | 887,182 | |
| | | | | | | | | | | | | | | |
| | | | | | | | | | | | | | | |
| | | |
| Entertainment - 0.37% | | | | | | |
| IMAX Corp.A | | | | 219,617 | | | | | | | | | | 3,999,226 | |
| Lions Gate Entertainment Corp., Class AA | | | | 649,939 | | | | | | | | | | 5,108,520 | |
| Lions Gate Entertainment Corp., Class BA | | | | 696,230 | | | | | | | | | | 5,193,876 | |
| Marcus Corp.B | | | | 52,346 | | | | | | | | | | 813,457 | |
| | | | | | | | | | | | | | | |
| | | | | | | | | | | | | | 15,115,079 | |
| | | | | | | | | | | | | | | |
| | | | | | | | | | | | | | | |
| | | |
| Interactive Media & Services - 0.36% | | | | | | |
| IAC, Inc.A | | | | 163,087 | | | | | | | | | | 6,939,352 | |
| Shutterstock, Inc. | | | | 115,824 | | | | | | | | | | 4,711,720 | |
| Ziff Davis, Inc.A | | | | 50,570 | | | | | | | | | | 3,057,462 | |
| | | | | | | | | | | | | | | |
| | | | | | | | | | | | | | 14,708,534 | |
| | | | | | | | | | | | | | | |
| | | | | | | | | | | | | | | |
| | | |
| Media - 1.43% | | | | | | |
| John Wiley & Sons, Inc., Class A | | | | 132,263 | | | | | | | | | | 4,003,601 | |
| Magnite, Inc.A | | | | 523,047 | | | | | | | | | | 3,473,032 | |
| National CineMedia, Inc.A B | | | | 1,602,600 | | | | | | | | | | 6,266,166 | |
| Scholastic Corp. | | | | 196,118 | | | | | | | | | | 7,236,754 | |
| Stagwell, Inc.A | | | | 5,526,749 | | | | | | | | | | 22,770,206 | |
| TEGNA, Inc. | | | | 1,051,351 | | | | | | | | | | 15,255,103 | |
| | | | | | | | | | | | | | | |
| | | | | | | | | | | | | | 59,004,862 | |
| | | | | | | | | | | | | | | |
| | | | | | | | | | | | | | | |
Total Communication Services | | | | | | | | | | | | | | 89,715,657 | |
| | | | | | | | | | | | | | | |
| | | | | | | | | | | | | | | |
| | | |
| Consumer Discretionary - 12.50% | | | | | | |
| | | |
| Automobile Components - 2.86% | | | | | | |
| Adient PLCA | | | | 1,366,795 | | | | | | | | | | 46,047,324 | |
| American Axle & Manufacturing Holdings, Inc.A | | | | 2,720,523 | | | | | | | | | | 18,363,530 | |
| Atmus Filtration Technologies, Inc.A | | | | 640,200 | | | | | | | | | | 12,010,152 | |
| Gentherm, Inc.A | | | | 583,313 | | | | | | | | | | 23,460,849 | |
| Goodyear Tire & Rubber Co.A | | | | 603,148 | | | | | | | | | | 7,177,461 | |
| Patrick Industries, Inc. | | | | 46,648 | | | | | | | | | | 3,505,597 | |
| Standard Motor Products, Inc. | | | | 35,769 | | | | | | | | | | 1,249,411 | |
| Visteon Corp.A | | | | 50,079 | | | | | | | | | | 5,765,596 | |
| | | | | | | | | | | | | | | |
| | | | | | | | | | | | | | 117,579,920 | |
| | | | | | | | | | | | | | | |
| | | | | | | | | | | | | | | |
| | | |
| Automobiles - 0.16% | | | | | | |
| Harley-Davidson, Inc. | | | | 105,500 | | | | | | | | | | 2,832,675 | |
| Winnebago Industries, Inc. | | | | 64,308 | | | | | | | | | | 3,726,649 | |
| | | | | | | | | | | | | | | |
| | | | | | | | | | | | | | 6,559,324 | |
| | | | | | | | | | | | | | | |
| | | | | | | | | | | | | | | |
| | | |
| Broadline Retail - 0.35% | | | | | | |
| Kohl’s Corp.B | | | | 224,298 | | | | | | | | | | 5,057,920 | |
| Macy’s, Inc. | | | | 763,731 | | | | | | | | | | 9,302,243 | |
| | | | | | | | | | | | | | | |
| | | | | | | | | | | | | | 14,360,163 | |
| | | | | | | | | | | | | | | |
| | | | | | | | | | | | | | | |
| | | |
| Diversified Consumer Services - 1.01% | | | | | | |
| Adtalem Global Education, Inc.A | | | | 569,237 | | | | | | | | | | 29,486,477 | |
| Graham Holdings Co., Class B | | | | 9,334 | | | | | | | | | | 5,401,772 | |
| Perdoceo Education Corp. | | | | 140,906 | | | | | | | | | | 2,548,990 | |
| Strategic Education, Inc. | | | | 51,362 | | | | | | | | | | 4,227,606 | |
| | | | | | | | | | | | | | | |
| | | | | | | | | | | | | | 41,664,845 | |
| | | | | | | | | | | | | | | |
| | | | | | | | | | | | | | | |
See accompanying notes
9
American Beacon Small Cap Value FundSM
Schedule of Investments
October 31, 2023
| | | | | | | | | | | | | | | |
| | | |
| | | Shares | | | | Fair Value |
| | | | | | | |
| | | |
| COMMON STOCKS - 90.43% (continued) | | | | | | |
| | | |
| Consumer Discretionary - 12.50% (continued) | | | | | | |
| | | |
| Hotels, Restaurants & Leisure - 1.14% | | | | | | |
| Bloomin’ Brands, Inc. | | | | 159,663 | | | | | | | | | $ | 3,726,534 | |
| Bluegreen Vacations Holding Corp.B | | | | 29,251 | | | | | | | | | | 980,201 | |
| Chuy’s Holdings, Inc.A | | | | 71,262 | | | | | | | | | | 2,398,679 | |
| International Game Technology PLC | | | | 725,975 | | | | | | | | | | 18,454,285 | |
| Monarch Casino & Resort, Inc. | | | | 41,776 | | | | | | | | | | 2,514,497 | |
| Papa John’s International, Inc. | | | | 213,436 | | | | | | | | | | 13,877,609 | |
| Travel & Leisure Co. | | | | 150,556 | | | | | | | | | | 5,123,421 | |
| | | | | | | | | | | | | | | |
| | | | | | | | | | | | | | 47,075,226 | |
| | | | | | | | | | | | | | | |
| | | | | | | | | | | | | | | |
| | | |
| Household Durables - 2.38% | | | | | | |
| Beazer Homes USA, Inc.A | | | | 56,996 | | | | | | | | | | 1,378,733 | |
| Cavco Industries, Inc.A | | | | 19,468 | | | | | | | | | | 4,857,461 | |
| Century Communities, Inc. | | | | 75,817 | | | | | | | | | | 4,662,745 | |
| Dream Finders Homes, Inc., Class AA B | | | | 54,877 | | | | | | | | | | 1,080,528 | |
| Ethan Allen Interiors, Inc. | | | | 53,968 | | | | | | | | | | 1,417,200 | |
| GoPro, Inc., Class AA | | | | 474,427 | | | | | | | | | | 1,190,812 | |
| Green Brick Partners, Inc.A | | | | 106,877 | | | | | | | | | | 4,136,140 | |
| KB Home | | | | 203,723 | | | | | | | | | | 9,004,557 | |
| La-Z-Boy, Inc. | | | | 90,454 | | | | | | | | | | 2,644,875 | |
| Legacy Housing Corp.A | | | | 44,381 | | | | | | | | | | 821,492 | |
| Lovesac Co.A | | | | 150,529 | | | | | | | | | | 2,477,707 | |
| M/I Homes, Inc.A | | | | 76,061 | | | | | | | | | | 6,242,326 | |
| MDC Holdings, Inc. | | | | 164,012 | | | | | | | | | | 6,224,255 | |
| Meritage Homes Corp. | | | | 93,007 | | | | | | | | | | 10,604,658 | |
| Newell Brands, Inc. | | | | 3,309,616 | | | | | | | | | | 22,240,620 | |
| Sonos, Inc.A | | | | 222,048 | | | | | | | | | | 2,393,677 | |
| Taylor Morrison Home Corp.A | | | | 203,122 | | | | | | | | | | 7,783,635 | |
| Tri Pointe Homes, Inc.A | | | | 347,009 | | | | | | | | | | 8,696,046 | |
| | | | | | | | | | | | | | | |
| | | | | | | | | | | | | | 97,857,467 | |
| | | | | | | | | | | | | | | |
| | | | | | | | | | | | | | | |
| | | |
| Leisure Products - 0.15% | | | | | | |
| Malibu Boats, Inc., Class AA | | | | 43,077 | | | | | | | | | | 1,879,019 | |
| MasterCraft Boat Holdings, Inc.A | | | | 36,538 | | | | | | | | | | 746,837 | |
| Solo Brands, Inc., Class AA | | | | 132,958 | | | | | | | | | | 511,888 | |
| YETI Holdings, Inc.A | | | | 69,949 | | | | | | | | | | 2,974,231 | |
| | | | | | | | | | | | | | | |
| | | | | | | | | | | | | | 6,111,975 | |
| | | | | | | | | | | | | | | |
| | | | | | | | | | | | | | | |
| | | |
| Specialty Retail - 2.96% | | | | | | |
| 1-800-Flowers.com, Inc., Class AA | | | | 78,725 | | | | | | | | | | 591,225 | |
| Aaron’s Co., Inc. | | | | 64,546 | | | | | | | | | | 478,286 | |
| Academy Sports & Outdoors, Inc. | | | | 159,634 | | | | | | | | | | 7,157,989 | |
| America’s Car-Mart, Inc.A | | | | 11,602 | | | | | | | | | | 777,102 | |
| American Eagle Outfitters, Inc. | | | | 599,099 | | | | | | | | | | 10,466,259 | |
| Arhaus, Inc.A | | | | 96,312 | | | | | | | | | | 830,209 | |
| Asbury Automotive Group, Inc.A | | | | 45,040 | | | | | | | | �� | | 8,619,305 | |
| Buckle, Inc. | | | | 105,384 | | | | | | | | | | 3,558,818 | |
| Build-A-Bear Workshop, Inc. | | | | 29,640 | | | | | | | | | | 735,072 | |
| Caleres, Inc. | | | | 75,763 | | | | | | | | | | 1,938,017 | |
| Citi Trends, Inc.A | | | | 99,422 | | | | | | | | | | 2,396,070 | |
| Designer Brands, Inc., Class A | | | | 107,268 | | | | | | | | | | 1,084,479 | |
| Group 1 Automotive, Inc. | | | | 42,411 | | | | | | | | | | 10,701,568 | |
| Guess?, Inc. | | | | 113,978 | | | | | | | | | | 2,450,527 | |
| Haverty Furniture Cos., Inc. | | | | 32,137 | | | | | | | | | | 837,169 | |
| Leslie’s, Inc.A | | | | 312,773 | | | | | | | | | | 1,545,099 | |
| MarineMax, Inc.A | | | | 46,591 | | | | | | | | | | 1,275,662 | |
| Monro, Inc. | | | | 314,359 | | | | | | | | | | 7,802,390 | |
See accompanying notes
10
American Beacon Small Cap Value FundSM
Schedule of Investments
October 31, 2023
| | | | | | | | | | | | | | | |
| | | |
| | | Shares | | | | Fair Value |
| | | | | | | |
| | | |
| COMMON STOCKS - 90.43% (continued) | | | | | | |
| | | |
| Consumer Discretionary - 12.50% (continued) | | | | | | |
| | | |
| Specialty Retail - 2.96% (continued) | | | | | | |
| ODP Corp.A | | | | 502,379 | | | | | | | | | $ | 22,566,865 | |
| OneWater Marine, Inc., Class AA B | | | | 29,867 | | | | | | | | | | 675,890 | |
| Shoe Carnival, Inc. | | | | 58,261 | | | | | | | | | | 1,333,012 | |
| Signet Jewelers Ltd.B | | | | 95,522 | | | | | | | | | | 6,670,301 | |
| Sonic Automotive, Inc., Class A | | | | 397,264 | | | | | | | | | | 19,009,082 | |
| Urban Outfitters, Inc.A | | | | 231,818 | | | | | | | | | | 8,025,539 | |
| | | | | | | | | | | | | | | |
| | | | | | | | | | | | | | 121,525,935 | |
| | | | | | | | | | | | | | | |
| | | | | | | | | | | | | | | |
| | | |
| Textiles, Apparel & Luxury Goods - 1.49% | | | | | | |
| Carter’s, Inc. | | | | 271,955 | | | | | | | | | | 18,264,498 | |
| Columbia Sportswear Co. | | | | 119,915 | | | | | | | | | | 8,849,727 | |
| G-III Apparel Group Ltd.A | | | | 95,206 | | | | | | | | | | 2,432,513 | |
| Levi Strauss & Co., Class AB | | | | 1,257,597 | | | | | | | | | | 17,191,351 | |
| Movado Group, Inc. | | | | 28,555 | | | | | | | | | | 795,542 | |
| Oxford Industries, Inc. | | | | 5,217 | | | | | | | | | | 440,315 | |
| Skechers USA, Inc., Class AA | | | | 81,476 | | | | | | | | | | 3,928,773 | |
| VF Corp. | | | | 609,683 | | | | | | | | | | 9,420,700 | |
| | | | | | | | | | | | | | | |
| | | | | | | | | | | | | | 61,323,419 | |
| | | | | | | | | | | | | | | |
| | | | | | | | | | | | | | | |
Total Consumer Discretionary | | | | | | | | | | | | | | 514,058,274 | |
| | | | | | | | | | | | | | | |
| | | | | | | | | | | | | | | |
| | | |
| Consumer Staples - 2.95% | | | | | | |
| | | |
| Beverages - 0.68% | | | | | | |
| Boston Beer Co., Inc., Class AA | | | | 19,217 | | | | | | | | | | 6,417,517 | |
| Primo Water Corp. | | | | 1,638,384 | | | | | | | | | | 21,397,295 | |
| | | | | | | | | | | | | | | |
| | | | | | | | | | | | | | 27,814,812 | |
| | | | | | | | | | | | | | | |
| | | | | | | | | | | | | | | |
| | | |
| Consumer Staples Distribution & Retail - 0.07% | | | | | | |
| Ingles Markets, Inc., Class A | | | | 37,729 | | | | | | | | | | 3,026,620 | |
| | | | | | | | | | | | | | | |
| | | | | | | | | | | | | | | |
| | | |
| Food Products - 2.06% | | | | | | |
| Darling Ingredients, Inc.A | | | | 589,168 | | | | | | | | | | 26,094,251 | |
| Fresh Del Monte Produce, Inc. | | | | 268,231 | | | | | | | | | | 6,705,775 | |
| Hain Celestial Group, Inc.A | | | | 1,731,164 | | | | | | | | | | 19,129,362 | |
| J & J Snack Foods Corp. | | | | 198,498 | | | | | | | | | | 31,086,772 | |
| Mission Produce, Inc.A | | | | 97,880 | | | | | | | | | | 921,051 | |
| Seneca Foods Corp., Class AA | | | | 12,548 | | | | | | | | | | 685,748 | |
| | | | | | | | | | | | | | | |
| | | | | | | | | | | | | | 84,622,959 | |
| | | | | | | | | | | | | | | |
| | | | | | | | | | | | | | | |
| | | |
| Personal Products - 0.08% | | | | | | |
| Herbalife Ltd.A | | | | 227,655 | | | | | | | | | | 3,244,084 | |
| | | | | | | | | | | | | | | |
| | | | | | | | | | | | | | | |
| | | |
| Tobacco - 0.06% | | | | | | |
| Universal Corp. | | | | 57,300 | | | | | | | | | | 2,578,500 | |
| | | | | | | | | | | | | | | |
| | | | | | | | | | | | | | | |
Total Consumer Staples | | | | | | | | | | | | | | 121,286,975 | |
| | | | | | | | | | | | | | | |
| | | | | | | | | | | | | | | |
| | | |
| Energy - 7.89% | | | | | | |
| | | |
| Energy Equipment & Services - 3.06% | | | | | | |
| Atlas Energy Solutions, Inc. | | | | 719,852 | | | | | | | | | | 13,108,505 | |
| Bristow Group, Inc.A | | | | 59,917 | | | | | | | | | | 1,566,230 | |
| Cactus, Inc., Class A | | | | 145,560 | | | | | | | | | | 6,832,586 | |
| ChampionX Corp. | | | | 194,568 | | | | | | | | | | 5,992,694 | |
| Dril-Quip, Inc.A | | | | 300,034 | | | | | | | | | | 6,498,737 | |
| Expro Group Holdings NVA | | | | 1,700,443 | | | | | | | | | | 26,781,977 | |
| Helix Energy Solutions Group, Inc.A | | | | 646,279 | | | | | | | | | | 6,333,534 | |
| Helmerich & Payne, Inc. | | | | 223,388 | | | | | | | | | | 8,839,463 | |
See accompanying notes
11
American Beacon Small Cap Value FundSM
Schedule of Investments
October 31, 2023
| | | | | | | | | | | | | | | |
| | | |
| | | Shares | | | | Fair Value |
| | | | | | | |
| | | |
| COMMON STOCKS - 90.43% (continued) | | | | | | |
| | | |
| Energy - 7.89% (continued) | | | | | | |
| | | |
| Energy Equipment & Services - 3.06% (continued) | | | | | | |
| Liberty Energy, Inc. | | | | 674,525 | | | | | | | | | $ | 13,288,143 | |
| Oil States International, Inc.A | | | | 135,998 | | | | | | | | | | 987,346 | |
| Patterson-UTI Energy, Inc. | | | | 2,061,057 | | | | | | | | | | 26,175,424 | |
| ProPetro Holding Corp.A | | | | 240,594 | | | | | | | | | | 2,521,425 | |
| RPC, Inc. | | | | 460,473 | | | | | | | | | | 3,831,135 | |
| Select Water Solutions, Inc. | | | | 145,877 | | | | | | | | | | 1,085,325 | |
| U.S. Silica Holdings, Inc.A | | | | 164,081 | | | | | | | | | | 1,980,458 | |
| | | | | | | | | | | | | | | |
| | | | | | | | | | | | | | 125,822,982 | |
| | | | | | | | | | | | | | | |
| | | | | | | | | | | | | | | |
| | | |
| Oil, Gas & Consumable Fuels - 4.83% | | | | | | |
| Antero Resources Corp.A | | | | 203,895 | | | | | | | | | | 6,002,669 | |
| Berry Corp. | | | | 1,736,135 | | | | | | | | | | 14,496,727 | |
| California Resources Corp. | | | | 147,322 | | | | | | | | | | 7,747,664 | |
| CNX Resources Corp.A | | | | 864,015 | | | | | | | | | | 18,766,406 | |
| Comstock Resources, Inc.B | | | | 662,423 | | | | | | | | | | 8,346,530 | |
| CONSOL Energy, Inc. | | | | 70,807 | | | | | | | | | | 6,506,455 | |
| Crescent Energy Co., Class A | | | | 197,000 | | | | | | | | | | 2,399,460 | |
| Delek U.S. Holdings, Inc. | | | | 367,191 | | | | | | | | | | 9,675,483 | |
| Earthstone Energy, Inc., Class AA | | | | 142,717 | | | | | | | | | | 3,021,319 | |
| Equitrans Midstream Corp. | | | | 1,975,603 | | | | | | | | | | 17,523,599 | |
| International Seaways, Inc. | | | | 104,047 | | | | | | | | | | 5,003,620 | |
| Kinetik Holdings, Inc.B | | | | 58,387 | | | | | | | | | | 2,069,235 | |
| Magnolia Oil & Gas Corp., Class A | | | | 346,023 | | | | | | | | | | 7,768,216 | |
| Murphy Oil Corp. | | | | 411,206 | | | | | | | | | | 18,450,813 | |
| Northern Oil & Gas, Inc. | | | | 255,012 | | | | | | | | | | 9,777,160 | |
| Overseas Shipholding Group, Inc., Class AA | | | | 147,957 | | | | | | | | | | 723,510 | |
| Par Pacific Holdings, Inc.A | | | | 129,920 | | | | | | | | | | 4,263,975 | |
| PBF Energy, Inc., Class A | | | | 84,925 | | | | | | | | | | 4,036,485 | |
| Peabody Energy Corp. | | | | 270,431 | | | | | | | | | | 6,379,467 | |
| Range Resources Corp. | | | | 318,106 | | | | | | | | | | 11,400,919 | |
| REX American Resources Corp.A | | | | 31,568 | | | | | | | | | | 1,199,900 | |
| Riley Exploration Permian, Inc. | | | | 35,007 | | | | | | | | | | 1,107,972 | |
| SilverBow Resources, Inc.A | | | | 47,234 | | | | | | | | | | 1,610,679 | |
| Sitio Royalties Corp., Class A | | | | 793,699 | | | | | | | | | | 19,620,239 | |
| Viper Energy Partners LP | | | | 370,929 | | | | | | | | | | 10,564,058 | |
| | | | | | | | | | | | | | | |
| | | | | | | | | | | | | | 198,462,560 | |
| | | | | | | | | | | | | | | |
| | | | | | | | | | | | | | | |
Total Energy | | | | | | | | | | | | | | 324,285,542 | |
| | | | | | | | | | | | | | | |
| | | | | | | | | | | | | | | |
| | | |
| Financials - 20.81% | | | | | | |
| | | |
| Banks - 10.82% | | | | | | |
| Amalgamated Financial Corp. | | | | 52,110 | | | | | | | | | | 950,486 | |
| Ameris Bancorp | | | | 140,845 | | | | | | | | | | 5,253,519 | |
| Associated Banc-Corp. | | | | 372,850 | | | | | | | | | | 6,043,899 | |
| Atlantic Union Bankshares Corp. | | | | 152,718 | | | | | | | | | | 4,399,806 | |
| Axos Financial, Inc.A | | | | 127,654 | | | | | | | | | | 4,599,374 | |
| Bank OZK | | | | 234,404 | | | | | | | | | | 8,394,007 | |
| Bar Harbor Bankshares | | | | 22,370 | | | | | | | | | | 559,697 | |
| Business First Bancshares, Inc. | | | | 27,685 | | | | | | | | | | 540,965 | |
| Byline Bancorp, Inc. | | | | 92,945 | | | | | | | | | | 1,763,167 | |
| Cadence Bank | | | | 375,549 | | | | | | | | | | 7,954,128 | |
| Cathay General Bancorp | | | | 151,780 | | | | | | | | | | 5,146,860 | |
| Central Pacific Financial Corp. | | | | 15,949 | | | | | | | | | | 251,675 | |
| Columbia Banking System, Inc. | | | | 1,846,042 | | | | | | | | | | 36,311,646 | |
| Community Trust Bancorp, Inc. | | | | 35,082 | | | | | | | | | | 1,317,680 | |
| CrossFirst Bankshares, Inc.A | | | | 100,359 | | | | | | | | | | 1,061,798 | |
See accompanying notes
12
American Beacon Small Cap Value FundSM
Schedule of Investments
October 31, 2023
| | | | | | | | | | | | | | | |
| | | |
| | | Shares | | | | Fair Value |
| | | | | | | |
| | | |
| COMMON STOCKS - 90.43% (continued) | | | | | | |
| | | |
| Financials - 20.81% (continued) | | | | | | |
| | | |
| Banks - 10.82% (continued) | | | | | | |
| Customers Bancorp, Inc.A | | | | 66,571 | | | | | | | | | $ | 2,676,820 | |
| CVB Financial Corp. | | | | 196,907 | | | | | | | | | | 3,075,687 | |
| Enterprise Financial Services Corp. | | | | 67,867 | | | | | | | | | | 2,359,736 | |
| Farmers National Banc Corp. | | | | 78,204 | | | | | | | | | | 882,923 | |
| FB Financial Corp. | | | | 95,264 | | | | | | | | | | 2,797,904 | |
| First Bancorp | | | | 79,622 | | | | | | | | | | 2,310,630 | |
| First Bancshares, Inc. | | | | 63,029 | | | | | | | | | | 1,526,562 | |
| First Busey Corp. | | | | 115,380 | | | | | | | | | | 2,291,447 | |
| First Commonwealth Financial Corp. | | | | 217,897 | | | | | | | | | | 2,653,985 | |
| First Financial Bancorp | | | | 193,761 | | | | | | | | | | 3,584,579 | |
| First Hawaiian, Inc. | | | | 695,125 | | | | | | | | | | 12,463,591 | |
| FNB Corp. | | | | 730,816 | | | | | | | | | | 7,812,423 | |
| Fulton Financial Corp. | | | | 335,616 | | | | | | | | | | 4,359,652 | |
| Glacier Bancorp, Inc. | | | | 451,230 | | | | | | | | | | 13,622,634 | |
| Great Southern Bancorp, Inc. | | | | 22,147 | | | | | | | | | | 1,101,149 | |
| Hancock Whitney Corp. | | | | 81,797 | | | | | | | | | | 2,816,271 | |
| HarborOne Bancorp, Inc. | | | | 142,509 | | | | | | | | | | 1,402,289 | |
| Heritage Commerce Corp. | | | | 156,236 | | | | | | | | | | 1,278,010 | |
| Heritage Financial Corp. | | | | 242,921 | | | | | | | | | | 3,952,325 | |
| Hilltop Holdings, Inc. | | | | 145,423 | | | | | | | | | | 4,016,583 | |
| HomeTrust Bancshares, Inc. | | | | 36,922 | | | | | | | | | | 760,962 | |
| Independent Bank Corp. | | | | 20,112 | | | | | | | | | | 401,234 | |
| International Bancshares Corp. | | | | 132,041 | | | | | | | | | | 5,787,357 | |
| Lakeland Bancorp, Inc. | | | | 37,459 | | | | | | | | | | 422,538 | |
| Live Oak Bancshares, Inc. | | | | 824,811 | | | | | | | | | | 23,795,797 | |
| Luther Burbank Corp. | | | | 227,597 | | | | | | | | | | 1,852,640 | |
| Mercantile Bank Corp. | | | | 34,072 | | | | | | | | | | 1,122,332 | |
| Midland States Bancorp, Inc. | | | | 44,411 | | | | | | | | | | 969,048 | |
| National Bank Holdings Corp., Class A | | | | 267,495 | | | | | | | | | | 8,340,494 | |
| Nicolet Bankshares, Inc. | | | | 15,920 | | | | | | | | | | 1,159,294 | |
| Northwest Bancshares, Inc. | | | | 215,229 | | | | | | | | | | 2,242,686 | |
| OceanFirst Financial Corp. | | | | 100,256 | | | | | | | | | | 1,269,241 | |
| Old National Bancorp | | | | 2,059,013 | | | | | | | | | | 28,208,478 | |
| Old Second Bancorp, Inc. | | | | 93,273 | | | | | | | | | | 1,264,782 | |
| Origin Bancorp, Inc. | | | | 27,899 | | | | | | | | | | 825,531 | |
| Pathward Financial, Inc. | | | | 53,220 | | | | | | | | | | 2,410,334 | |
| Peoples Bancorp, Inc. | | | | 75,293 | | | | | | | | | | 2,076,581 | |
| Pinnacle Financial Partners, Inc. | | | | 161,806 | | | | | | | | | | 10,090,222 | |
| Preferred Bank | | | | 31,674 | | | | | | | | | | 1,886,820 | |
| Prosperity Bancshares, Inc. | | | | 285,643 | | | | | | | | | | 15,578,969 | |
| Provident Financial Services, Inc. | | | | 123,207 | | | | | | | | | | 1,731,058 | |
| QCR Holdings, Inc. | | | | 35,589 | | | | | | | | | | 1,688,698 | |
| S&T Bancorp, Inc. | | | | 77,873 | | | | | | | | | | 2,006,009 | |
| Seacoast Banking Corp. of Florida | | | | 857,902 | | | | | | | | | | 17,338,199 | |
| Simmons First National Corp., Class A | | | | 175,202 | | | | | | | | | | 2,489,620 | |
| SmartFinancial, Inc. | | | | 22,652 | | | | | | | | | | 472,294 | |
| Southern Missouri Bancorp, Inc. | | | | 23,435 | | | | | | | | | | 947,946 | |
| SouthState Corp. | | | | 105,349 | | | | | | | | | | 6,963,569 | |
| Synovus Financial Corp. | | | | 215,500 | | | | | | | | | | 5,618,085 | |
| Texas Capital Bancshares, Inc.A | | | | 845,310 | | | | | | | | | | 46,542,769 | |
| Triumph Financial, Inc. | | | | 440,941 | | | | | | | | | | 27,448,577 | |
| TrustCo Bank Corp. | | | | 34,646 | | | | | | | | | | 884,512 | |
| UMB Financial Corp. | | | | 190,261 | | | | | | | | | | 11,933,170 | |
| United Community Banks, Inc. | | | | 322,262 | | | | | | | | | | 7,118,768 | |
| Valley National Bancorp | | | | 1,037,297 | | | | | | | | | | 8,070,171 | |
| WaFd, Inc. | | | | 119,673 | | | | | | | | | | 2,953,530 | |
See accompanying notes
13
American Beacon Small Cap Value FundSM
Schedule of Investments
October 31, 2023
| | | | | | | | | | | | | | | |
| | | |
| | | Shares | | | | Fair Value |
| | | | | | | |
| | | |
| COMMON STOCKS - 90.43% (continued) | | | | | | |
| | | |
| Financials - 20.81% (continued) | | | | | | |
| | | |
| Banks - 10.82% (continued) | | | | | | |
| Webster Financial Corp. | | | | 230,763 | | | | | | | | | $ | 8,762,071 | |
| Westamerica BanCorp | | | | 365,663 | | | | | | | | | | 17,273,920 | |
| WSFS Financial Corp. | | | | 81,020 | | | | | | | | | | 2,868,108 | |
| | | | | | | | | | | | | | | |
| | | | | | | | | | | | | | 445,110,321 | |
| | | | | | | | | | | | | | | |
| | | | | | | | | | | | | | | |
| | | |
| Capital Markets - 2.34% | | | | | | |
| Cohen & Steers, Inc. | | | | 319,089 | | | | | | | | | | 16,669,209 | |
| Evercore, Inc., Class A | | | | 170,859 | | | | | | | | | | 22,242,425 | |
| Federated Hermes, Inc. | | | | 206,006 | | | | | | | | | | 6,530,390 | |
| Janus Henderson Group PLC | | | | 337,340 | | | | | | | | | | 7,782,434 | |
| Oppenheimer Holdings, Inc., Class A | | | | 22,835 | | | | | | | | | | 800,823 | |
| Perella Weinberg Partners | | | | 623,806 | | | | | | | | | | 6,119,537 | |
| StepStone Group, Inc., Class A | | | | 178,931 | | | | | | | | | | 5,063,747 | |
| Stifel Financial Corp. | | | | 220,597 | | | | | | | | | | 12,574,029 | |
| StoneX Group, Inc.A | | | | 44,349 | | | | | | | | | | 4,227,347 | |
| Victory Capital Holdings, Inc., Class A | | | | 139,964 | | | | | | | | | | 4,123,339 | |
| Virtu Financial, Inc., Class A | | | | 128,999 | | | | | | | | | | 2,385,192 | |
| Virtus Investment Partners, Inc. | | | | 12,412 | | | | | | | | | | 2,286,663 | |
| WisdomTree, Inc.B | | | | 878,131 | | | | | | | | | | 5,444,412 | |
| | | | | | | | | | | | | | | |
| | | | | | | | | | | | | | 96,249,547 | |
| | | | | | | | | | | | | | | |
| | | | | | | | | | | | | | | |
| | | |
| Consumer Finance - 1.56% | | | | | | |
| Atlanticus Holdings Corp.A | | | | 11,325 | | | | | | | | | | 331,370 | |
| Bread Financial Holdings, Inc. | | | | 250,357 | | | | | | | | | | 6,767,150 | |
| Encore Capital Group, Inc.A | | | | 50,008 | | | | | | | | | | 1,884,301 | |
| Enova International, Inc.A | | | | 65,492 | | | | | | | | | | 2,611,821 | |
| EZCORP, Inc., Class AA | | | | 110,907 | | | | | | | | | | 909,437 | |
| Navient Corp. | | | | 285,856 | | | | | | | | | | 4,547,969 | |
| Nelnet, Inc., Class A | | | | 37,167 | | | | | | | | | | 3,152,133 | |
| PRA Group, Inc.A | | | | 162,342 | | | | | | | | | | 1,998,430 | |
| PROG Holdings, Inc.A | | | | 231,807 | | | | | | | | | | 6,349,194 | |
| SLM Corp. | | | | 2,738,966 | | | | | | | | | | 35,606,558 | |
| | | | | | | | | | | | | | | |
| | | | | | | | | | | | | | 64,158,363 | |
| | | | | | | | | | | | | | | |
| | | | | | | | | | | | | | | |
| | | |
| Financial Services - 2.37% | | | | | | |
| A-Mark Precious Metals, Inc. | | | | 49,632 | | | | | | | | | | 1,344,035 | |
| Acacia Research Corp.A | | | | 174,137 | | | | | | | | | | 625,152 | |
| Burford Capital Ltd. | | | | 1,414,914 | | | | | | | | | | 17,601,530 | |
| Cannae Holdings, Inc.A | | | | 314,229 | | | | | | | | | | 5,137,644 | |
| Essent Group Ltd. | | | | 293,348 | | | | | | | | | | 13,857,759 | |
| Euronet Worldwide, Inc.A | | | | 179,892 | | | | | | | | | | 13,822,901 | |
| Jackson Financial, Inc., Class A | | | | 174,289 | | | | | | | | | | 6,398,149 | |
| Merchants Bancorp | | | | 57,795 | | | | | | | | | | 1,727,493 | |
| MGIC Investment Corp. | | | | 539,508 | | | | | | | | | | 9,085,315 | |
| NMI Holdings, Inc., Class AA | | | | 175,104 | | | | | | | | | | 4,789,094 | |
| PennyMac Financial Services, Inc. | | | | 106,150 | | | | | | | | | | 7,133,280 | |
| Radian Group, Inc. | | | | 334,978 | | | | | | | | | | 8,488,342 | |
| WEX, Inc.A | | | | 44,743 | | | | | | | | | | 7,448,815 | |
| | | | | | | | | | | | | | | |
| | | | | | | | | | | | | | 97,459,509 | |
| | | | | | | | | | | | | | | |
| | | | | | | | | | | | | | | |
| | | |
| Insurance - 3.43% | | | | | | |
| Ambac Financial Group, Inc.A | | | | 94,646 | | | | | | | | | | 1,148,056 | |
| Assured Guaranty Ltd. | | | | 124,670 | | | | | | | | | | 7,779,408 | |
| Axis Capital Holdings Ltd. | | | | 177,880 | | | | | | | | | | 10,156,948 | |
| Brighthouse Financial, Inc.A | | | | 139,613 | | | | | | | | | | 6,324,469 | |
| CNO Financial Group, Inc. | | | | 376,721 | | | | | | | | | | 8,732,393 | |
See accompanying notes
14
American Beacon Small Cap Value FundSM
Schedule of Investments
October 31, 2023
| | | | | | | | | | | | | | | |
| | | |
| | | Shares | | | | Fair Value |
| | | | | | | |
| | | |
| COMMON STOCKS - 90.43% (continued) | | | | | | |
| | | |
| Financials - 20.81% (continued) | | | | | | |
| | | |
| Insurance - 3.43% (continued) | | | | | | |
| Donegal Group, Inc., Class A | | | | 57,102 | | | | | | | | | $ | 806,280 | |
| Employers Holdings, Inc. | | | | 56,109 | | | | | | | | | | 2,132,142 | |
| Enstar Group Ltd.A | | | | 143,244 | | | | | | | | | | 33,944,531 | |
| First American Financial Corp. | | | | 170,971 | | | | | | | | | | 8,794,748 | |
| Genworth Financial, Inc., Class AA | | | | 997,944 | | | | | | | | | | 5,977,685 | |
| Global Indemnity Group LLC, Class A | | | | 335,812 | | | | | | | | | | 11,733,271 | |
| Horace Mann Educators Corp. | | | | 593,413 | | | | | | | | | | 18,828,995 | |
| Kemper Corp. | | | | 133,575 | | | | | | | | | | 5,326,971 | |
| Mercury General Corp. | | | | 105,930 | | | | | | | | | | 3,271,118 | |
| ProAssurance Corp. | | | | 110,768 | | | | | | | | | | 1,883,056 | |
| Safety Insurance Group, Inc. | | | | 5,482 | | | | | | | | | | 412,082 | |
| Selective Insurance Group, Inc. | | | | 76,080 | | | | | | | | | | 7,920,689 | |
| White Mountains Insurance Group Ltd. | | | | 4,015 | | | | | | | | | | 5,744,461 | |
| | | | | | | | | | | | | | | |
| | | | | | | | | | | | | | 140,917,303 | |
| | | | | | | | | | | | | | | |
| | | | | | | | | | | | | | | |
| | | |
| Mortgage Real Estate Investment Trusts (REITs) - 0.29% | | | | | | |
| Hannon Armstrong Sustainable Infrastructure Capital, Inc.B | | | | 692,074 | | | | | | | | | | 11,862,148 | |
| | | | | | | | | | | | | | | |
| | | | | | | | | | | | | | | |
Total Financials | | | | | | | | | | | | | | 855,757,191 | |
| | | | | | | | | | | | | | | |
| | | | | | | | | | | | | | | |
| | | |
| Health Care - 2.66% | | | | | | |
| | | |
| Biotechnology - 0.18% | | | | | | |
| Alkermes PLCA | | | | 304,224 | | | | | | | | | | 7,359,179 | |
| | | | | | | | | | | | | | | |
| | | | | | | | | | | | | | | |
| | | |
| Health Care Equipment & Supplies - 0.56% | | | | | | |
| Globus Medical, Inc., Class AA | | | | 207,758 | | | | | | | | | | 9,496,618 | |
| Merit Medical Systems, Inc.A | | | | 85,928 | | | | | | | | | | 5,906,691 | |
| Omnicell, Inc.A | | | | 192,645 | | | | | | | | | | 6,846,603 | |
| OraSure Technologies, Inc.A | | | | 156,253 | | | | | | | | | | 806,266 | |
| | | | | | | | | | | | | | | |
| | | | | | | | | | | | | | 23,056,178 | |
| | | | | | | | | | | | | | | |
| | | | | | | | | | | | | | | |
| | | |
| Health Care Providers & Services - 0.81% | | | | | | |
| Acadia Healthcare Co., Inc.A | | | | 109,750 | | | | | | | | | | 8,067,722 | |
| AMN Healthcare Services, Inc.A | | | | 78,725 | | | | | | | | | | 5,972,079 | |
| Cross Country Healthcare, Inc.A | | | | 72,950 | | | | | | | | | | 1,689,522 | |
| Encompass Health Corp. | | | | 155,894 | | | | | | | | | | 9,752,729 | |
| Fulgent Genetics, Inc.A | | | | 63,717 | | | | | | | | | | 1,525,385 | |
| National HealthCare Corp. | | | | 31,995 | | | | | | | | | | 2,155,183 | |
| R1 RCM, Inc.A | | | | 367,665 | | | | | | | | | | 4,334,770 | |
| | | | | | | | | | | | | | | |
| | | | | | | | | | | | | | 33,497,390 | |
| | | | | | | | | | | | | | | |
| | | | | | | | | | | | | | | |
| | | |
| Health Care Technology - 0.29% | | | | | | |
| Evolent Health, Inc., Class AA | | | | 412,068 | | | | | | | | | | 10,066,821 | |
| Health Catalyst, Inc.A | | | | 230,470 | | | | | | | | | | 1,726,220 | |
| | | | | | | | | | | | | | | |
| | | | | | | | | | | | | | 11,793,041 | |
| | | | | | | | | | | | | | | |
| | | | | | | | | | | | | | | |
| | | |
| Life Sciences Tools & Services - 0.15% | | | | | | |
| Azenta, Inc.A | | | | 136,089 | | | | | | | | | | 6,185,245 | |
| | | | | | | | | | | | | | | |
| | | | | | | | | | | | | | | |
| | | |
| Pharmaceuticals - 0.67% | | | | | | |
| Amneal Pharmaceuticals, Inc.A | | | | 320,149 | | | | | | | | | | 1,238,977 | |
| Perrigo Co. PLC | | | | 953,472 | | | | | | | | | | 26,353,966 | |
| | | | | | | | | | | | | | | |
| | | | | | | | | | | | | | 27,592,943 | |
| | | | | | | | | | | | | | | |
| | | | | | | | | | | | | | | |
Total Health Care | | | | | | | | | | | | | | 109,483,976 | |
| | | | | | | | | | | | | | | |
| | | | | | | | | | | | | | | |
See accompanying notes
15
American Beacon Small Cap Value FundSM
Schedule of Investments
October 31, 2023
| | | | | | | | | | | | | | | |
| | | |
| | | Shares | | | | Fair Value |
| | | | | | | |
| | | |
| COMMON STOCKS - 90.43% (continued) | | | | | | |
| | | |
| Industrials - 19.13% | | | | | | |
| | | |
| Aerospace & Defense - 1.18% | | | | | | |
| AeroVironment, Inc.A | | | | 61,717 | | | | | | | | | $ | 7,076,471 | |
| BWX Technologies, Inc. | | | | 249,190 | | | | | | | | | | 18,509,833 | |
| Ducommun, Inc.A | | | | 31,030 | | | | | | | | | | 1,484,475 | |
| Kaman Corp. | | | | 459,976 | | | | | | | | | | 8,560,153 | |
| Kratos Defense & Security Solutions, Inc.A | | | | 382,995 | | | | | | | | | | 6,530,065 | |
| Mercury Systems, Inc.A | | | | 175,063 | | | | | | | | | | 6,298,767 | |
| | | | | | | | | | | | | | | |
| | | | | | | | | | | | | | 48,459,764 | |
| | | | | | | | | | | | | | | |
| | | | | | | | | | | | | | | |
| | | |
| Air Freight & Logistics - 0.64% | | | | | | |
| Air Transport Services Group, Inc.A | | | | 1,212,639 | | | | | | | | | | 23,731,345 | |
| Hub Group, Inc., Class AA | | | | 35,388 | | | | | | | | | | 2,432,925 | |
| | | | | | | | | | | | | | | |
| | | | | | | | | | | | | | 26,164,270 | |
| | | | | | | | | | | | | | | |
| | | | | | | | | | | | | | | |
| | | |
| Building Products - 1.43% | | | | | | |
| AZEK Co., Inc.A | | | | 115,990 | | | | | | | | | | 3,038,938 | |
| Gibraltar Industries, Inc.A | | | | 474,912 | | | | | | | | | | 28,903,144 | |
| Griffon Corp. | | | | 96,864 | | | | | | | | | | 3,868,748 | |
| Masonite International Corp.A | | | | 258,696 | | | | | | | | | | 20,473,202 | |
| Zurn Elkay Water Solutions Corp. | | | | 92,633 | | | | | | | | | | 2,451,069 | |
| | | | | | | | | | | | | | | |
| | | | | | | | | | | | | | 58,735,101 | |
| | | | | | | | | | | | | | | |
| | | | | | | | | | | | | | | |
| | | |
| Commercial Services & Supplies - 1.93% | | | | | | |
| ACCO Brands Corp. | | | | 201,964 | | | | | | | | | | 1,021,938 | |
| Aris Water Solutions, Inc., Class A | | | | 572,187 | | | | | | | | | | 4,777,762 | |
| Brink’s Co. | | | | 148,520 | | | | | | | | | | 9,930,047 | |
| CoreCivic, Inc.A | | | | 241,700 | | | | | | | | | | 3,069,590 | |
| Deluxe Corp. | | | | 799,539 | | | | | | | | | | 13,632,140 | |
| Enviri Corp.A | | | | 2,247,422 | | | | | | | | | | 12,900,202 | |
| GEO Group, Inc.A | | | | 229,270 | | | | | | | | | | 2,003,820 | |
| Interface, Inc. | | | | 1,350,070 | | | | | | | | | | 12,002,122 | |
| MillerKnoll, Inc. | | | | 759,834 | | | | | | | | | | 17,856,099 | |
| Quad/Graphics, Inc.A | | | | 481,638 | | | | | | | | | | 2,355,210 | |
| | | | | | | | | | | | | | | |
| | | | | | | | | | | | | | 79,548,930 | |
| | | | | | | | | | | | | | | |
| | | | | | | | | | | | | | | |
| | | |
| Construction & Engineering - 2.54% | | | | | | |
| Dycom Industries, Inc.A | | | | 48,202 | | | | | | | | | | 4,105,846 | |
| EMCOR Group, Inc. | | | | 61,767 | | | | | | | | | | 12,764,151 | |
| Fluor Corp.A | | | | 1,081,538 | | | | | | | | | | 36,004,400 | |
| Granite Construction, Inc. | | | | 492,388 | | | | | | | | | | 19,931,866 | |
| Matrix Service Co.A | | | | 181,906 | | | | | | | | | | 2,119,205 | |
| MDU Resources Group, Inc. | | | | 211,341 | | | | | | | | | | 3,933,056 | |
| Tutor Perini Corp.A | | | | 110,584 | | | | | | | | | | 797,311 | |
| WillScot Mobile Mini Holdings Corp.A | | | | 630,571 | | | | | | | | | | 24,850,803 | |
| | | | | | | | | | | | | | | |
| | | | | | | | | | | | | | 104,506,638 | |
| | | | | | | | | | | | | | | |
| | | | | | | | | | | | | | | |
| | | |
| Electrical Equipment - 0.64% | | | | | | |
| Encore Wire Corp. | | | | 36,712 | | | | | | | | | | 6,565,207 | |
| EnerSys | | | | 214,849 | | | | | | | | | | 18,386,777 | |
| GrafTech International Ltd. | | | | 358,224 | | | | | | | | | | 1,235,873 | |
| | | | | | | | | | | | | | | |
| | | | | | | | | | | | | | 26,187,857 | |
| | | | | | | | | | | | | | | |
| | | | | | | | | | | | | | | |
| | | |
| Ground Transportation - 0.81% | | | | | | |
| Covenant Logistics Group, Inc. | | | | 22,099 | | | | | | | | | | 872,579 | |
| Ryder System, Inc. | | | | 97,051 | | | | | | | | | | 9,466,354 | |
| Universal Logistics Holdings, Inc. | | | | 38,949 | | | | | | | | | | 871,679 | |
| Werner Enterprises, Inc. | | | | 614,343 | | | | | | | | | | 22,312,938 | |
| | | | | | | | | | | | | | | |
| | | | | | | | | | | | | | 33,523,550 | |
| | | | | | | | | | | | | | | |
| | | | | | | | | | | | | | | |
See accompanying notes
16
American Beacon Small Cap Value FundSM
Schedule of Investments
October 31, 2023
| | | | | | | | | | | | | | | |
| | | |
| | | Shares | | | | Fair Value |
| | | | | | | |
| | | |
| COMMON STOCKS - 90.43% (continued) | | | | | | |
| | | |
| Industrials - 19.13% (continued) | | | | | | |
| | | |
| Machinery - 5.62% | | | | | | |
| Allison Transmission Holdings, Inc. | | | | 103,782 | | | | | | | | | $ | 5,232,688 | |
| Astec Industries, Inc. | | | | 82,775 | | | | | | | | | | 3,314,311 | |
| Barnes Group, Inc. | | | | 382,818 | | | | | | | | | | 7,958,786 | |
| Energy Recovery, Inc.A | | | | 41,408 | | | | | | | | | | 629,402 | |
| Enerpac Tool Group Corp. | | | | 1,207,760 | | | | | | | | | | 34,179,608 | |
| EnPro Industries, Inc. | | | | 51,276 | | | | | | | | | | 5,694,713 | |
| Flowserve Corp. | | | | 1,289,348 | | | | | | | | | | 47,344,859 | |
| Greenbrier Cos., Inc. | | | | 1,115,373 | | | | | | | �� | | | 38,580,752 | |
| Kennametal, Inc. | | | | 768,004 | | | | | | | | | | 17,748,572 | |
| Lindsay Corp. | | | | 53,325 | | | | | | | | | | 6,661,359 | |
| Manitowoc Co., Inc.A | | | | 74,544 | | | | | | | | | | 954,163 | |
| Miller Industries, Inc. | | | | 119,424 | | | | | | | | | | 4,343,451 | |
| Mueller Industries, Inc. | | | | 241,633 | | | | | | | | | | 9,111,980 | |
| Proto Labs, Inc.A | | | | 188,428 | | | | | | | | | | 4,448,785 | |
| Standex International Corp. | | | | 121,264 | | | | | | | | | | 17,409,873 | |
| Tennant Co. | | | | 130,197 | | | | | | | | | | 9,663,221 | |
| Terex Corp. | | | | 137,255 | | | | | | | | | | 6,286,279 | |
| Timken Co. | | | | 114,400 | | | | | | | | | | 7,907,328 | |
| Titan International, Inc.A | | | | 133,913 | | | | | | | | | | 1,521,252 | |
| Wabash National Corp. | | | | 99,995 | | | | | | | | | | 2,068,897 | |
| | | | | | | | | | | | | | | |
| | | | | | | | | | | | | | 231,060,279 | |
| | | | | | | | | | | | | | | |
| | | | | | | | | | | | | | | |
| | | |
| Marine Transportation - 1.01% | | | | | | |
| Eagle Bulk Shipping, Inc.B | | | | 24,985 | | | | | | | | | | 1,019,388 | |
| Genco Shipping & Trading Ltd. | | | | 90,533 | | | | | | | | | | 1,192,320 | |
| Kirby Corp.A | | | | 347,622 | | | | | | | | | | 25,967,363 | |
| Matson, Inc. | | | | 151,345 | | | | | | | | | | 13,174,582 | |
| | | | | | | | | | | | | | | |
| | | | | | | | | | | | | | 41,353,653 | |
| | | | | | | | | | | | | | | |
| | | |
| Passenger Airlines - 0.29% | | | | | | |
| Alaska Air Group, Inc.A | | | | 214,347 | | | | | | | | | | 6,779,796 | |
| Allegiant Travel Co. | | | | 37,634 | | | | | | | | | | 2,507,177 | |
| SkyWest, Inc.A | | | | 64,361 | | | | | | | | | | 2,714,103 | |
| | | | | | | | | | | | | | | |
| | | | | | | | | | | | | | 12,001,076 | |
| | | | | | | | | | | | | | | |
| | | |
| Professional Services - 1.89% | | | | | | |
| Heidrick & Struggles International, Inc. | | | | 41,845 | | | | | | | | | | 1,018,507 | |
| Hudson Global, Inc.A | | | | 57,162 | | | | | | | | | | 838,567 | |
| KBR, Inc. | | | | 239,239 | | | | | | | | | | 13,911,748 | |
| Kelly Services, Inc., Class A | | | | 68,385 | | | | | | | | | | 1,220,672 | |
| Korn Ferry | | | | 756,065 | | | | | | | | | | 34,416,079 | |
| ManpowerGroup, Inc. | | | | 317,266 | | | | | | | | | | 22,199,102 | |
| Resources Connection, Inc. | | | | 61,047 | | | | | | | | | | 822,303 | |
| TrueBlue, Inc.A | | | | 302,473 | | | | | | | | | | 3,348,376 | |
| | | | | | | | | | | | | | | |
| | | | | | | | | | | | | | 77,775,354 | |
| | | | | | | | | | | | | | | |
| | | |
| Trading Companies & Distributors - 1.15% | | | | | | |
| Air Lease Corp. | | | | 236,249 | | | | | | | | | | 8,181,303 | |
| BlueLinx Holdings, Inc.A | | | | 19,164 | | | | | | | | | | 1,362,752 | |
| Boise Cascade Co. | | | | 108,803 | | | | | | | | | | 10,200,281 | |
| GMS, Inc.A | | | | 86,377 | | | | | | | | | | 5,051,327 | |
| Hudson Technologies, Inc.A | | | | 96,587 | | | | | | | | | | 1,244,041 | |
| MSC Industrial Direct Co., Inc., Class A | | | | 64,114 | | | | | | | | | | 6,074,801 | |
| NOW, Inc.A | | | | 1,164,132 | | | | | | | | | | 12,828,735 | |
| Rush Enterprises, Inc., Class A | | | | 68,809 | | | | | | | | | | 2,448,224 | |
| | | | | | | | | | | | | | | |
| | | | | | | | | | | | | | 47,391,464 | |
| | | | | | | | | | | | | | | |
| | | | | | | | | | | | | | | |
Total Industrials | | | | | | | | | | | | | | 786,707,936 | |
| | | | | | | | | | | | | | | |
| | | | | | | | | | | | | | | |
See accompanying notes
17
American Beacon Small Cap Value FundSM
Schedule of Investments
October 31, 2023
| | | | | | | | | | | | | | | |
| | | |
| | | Shares | | | | Fair Value |
| | | | | | | |
| | | |
| COMMON STOCKS - 90.43% (continued) | | | | | | |
| | | |
| Information Technology - 7.12% | | | | | | |
| | | |
| Communications Equipment - 2.22% | | | | | | |
| Ciena Corp.A | | | | 623,973 | | | | | | | | | $ | 26,331,661 | |
| F5, Inc.A | | | | 318,124 | | | | | | | | | | 48,224,417 | |
| Infinera Corp.A B | | | | 2,623,905 | | | | | | | | | | 7,688,042 | |
| Lumentum Holdings, Inc.A | | | | 149,811 | | | | | | | | | | 5,874,089 | |
| Viavi Solutions, Inc.A | | | | 423,891 | | | | | | | | | | 3,297,872 | |
| | | | | | | | | | | | | | | |
| | | | | | | | | | | | | | 91,416,081 | |
| | | | | | | | | | | | | | | |
| | | | | | | | | | | | | | | |
| | | |
| Electronic Equipment, Instruments & Components - 3.16% | | | | | | |
| Arrow Electronics, Inc.A | | | | 123,441 | | | | | | | | | | 13,999,444 | |
| Avnet, Inc. | | | | 386,600 | | | | | | | | | | 17,911,178 | |
| Bel Fuse, Inc., Class B | | | | 22,651 | | | | | | | | | | 1,227,231 | |
| Belden, Inc. | | | | 287,948 | | | | | | | | | | 20,415,513 | |
| Benchmark Electronics, Inc. | | | | 74,417 | | | | | | | | | | 1,801,636 | |
| Coherent Corp.A | | | | 902,424 | | | | | | | | | | 26,711,751 | |
| Itron, Inc.A | | | | 74,063 | | | | | | | | | | 4,242,329 | |
| Kimball Electronics, Inc.A | | | | 26,810 | | | | | | | | | | 702,422 | |
| Knowles Corp.A | | | | 184,881 | | | | | | | | | | 2,401,604 | |
| nLight, Inc.A | | | | 423,425 | | | | | | | | | | 3,527,130 | |
| Plexus Corp.A | | | | 164,240 | | | | | | | | | | 16,148,077 | |
| ScanSource, Inc.A | | | | 52,851 | | | | | | | | | | 1,606,670 | |
| TTM Technologies, Inc.A | | | | 214,214 | | | | | | | | | | 2,461,319 | |
| Vishay Intertechnology, Inc. | | | | 270,128 | | | | | | | | | | 6,007,647 | |
| Vishay Precision Group, Inc.A | | | | 216,310 | | | | | | | | | | 6,471,995 | |
| Vontier Corp. | | | | 150,856 | | | | | | | | | | 4,459,303 | |
| | | | | | | | | | | | | | | |
| | | | | | | | | | | | | | 130,095,249 | |
| | | | | | | | | | | | | | | |
| | | | | | | | | | | | | | | |
| | | |
| Semiconductors & Semiconductor Equipment - 1.03% | | | | | | |
| Alpha & Omega Semiconductor Ltd.A | | | | 58,880 | | | | | | | | | | 1,396,634 | |
| Diodes, Inc.A | | | | 355,176 | | | | | | | | | | 23,114,854 | |
| MaxLinear, Inc.A | | | | 236,407 | | | | | | | | | | 3,593,386 | |
| MKS Instruments, Inc. | | | | 104,562 | | | | | | | | | | 6,865,541 | |
| Synaptics, Inc.A | | | | 87,191 | | | | | | | | | | 7,294,399 | |
| | | | | | | | | | | | | | | |
| | | | | | | | | | | | | | 42,264,814 | |
| | | | | | | | | | | | | | | |
| | | | | | | | | | | | | | | |
| | | |
| Software - 0.49% | | | | | | |
| A10 Networks, Inc. | | | | 721,360 | | | | | | | | | | 7,841,183 | |
| Adeia, Inc. | | | | 219,149 | | | | | | | | | | 1,847,426 | |
| Progress Software Corp. | | | | 95,020 | | | | | | | | | | 4,882,127 | |
| Zuora, Inc., Class AA | | | | 768,226 | | | | | | | | | | 5,692,555 | |
| | | | | | | | | | | | | | | |
| | | | | | | | | | | | | | 20,263,291 | |
| | | | | | | | | | | | | | | |
| | | | | | | | | | | | | | | |
| | | |
| Technology Hardware, Storage & Peripherals - 0.22% | | | | | | |
| Corsair Gaming, Inc.A | | | | 357,797 | | | | | | | | | | 4,576,223 | |
| Xerox Holdings Corp. | | | | 334,421 | | | | | | | | | | 4,293,966 | |
| | | | | | | | | | | | | | | |
| | | | | | | | | | | | | | 8,870,189 | |
| | | | | | | | | | | | | | | |
| | | | | | | | | | | | | | | |
Total Information Technology | | | | | | | | | | | | | | 292,909,624 | |
| | | | | | | | | | | | | | | |
| | | | | | | | | | | | | | | |
| | | |
| Materials - 8.08% | | | | | | |
| | | |
| Chemicals - 2.98% | | | | | | |
| AdvanSix, Inc. | | | | 57,533 | | | | | | | | | | 1,585,034 | |
| Ashland, Inc. | | | | 134,581 | | | | | | | | | | 10,312,942 | |
| Avient Corp. | | | | 347,392 | | | | | | | | | | 10,984,535 | |
| Cabot Corp. | | | | 357,744 | | | | | | | | | | 23,782,821 | |
| Chemours Co. | | | | 157,864 | | | | | | | | | | 3,806,101 | |
| Ecovyst, Inc.A | | | | 2,090,816 | | | | | | | | | | 19,235,507 | |
| Element Solutions, Inc. | | | | 688,945 | | | | | | | | | | 12,559,468 | |
See accompanying notes
18
American Beacon Small Cap Value FundSM
Schedule of Investments
October 31, 2023
| | | | | | | | | | | | | | | |
| | | |
| | | Shares | | | | Fair Value |
| | | | | | | |
| | | |
| COMMON STOCKS - 90.43% (continued) | | | | | | |
| | | |
| Materials - 8.08% (continued) | | | | | | |
| | | |
| Chemicals - 2.98% (continued) | | | | | | |
| Koppers Holdings, Inc. | | | | 43,488 | | | | | | | | | $ | 1,590,356 | |
| Livent Corp.A B | | | | 386,353 | | | | | | | | | | 5,636,890 | |
| Olin Corp. | | | | 162,175 | | | | | | | | | | 6,928,116 | |
| Scotts Miracle-Gro Co.B | | | | 233,098 | | | | | | | | | | 10,358,875 | |
| Stepan Co. | | | | 160,538 | | | | | | | | | | 12,008,243 | |
| Tronox Holdings PLC | | | | 333,651 | | | | | | | | | | 3,566,729 | |
| | | | | | | | | | | | | | | |
| | | | | | | | | | | | | | 122,355,617 | |
| | | | | | | | | | | | | | | |
| | | | | | | | | | | | | | | |
| | | |
| Construction Materials - 0.12% | | | | | | |
| Knife River Corp.A | | | | 98,704 | | | | | | | | | | 4,966,785 | |
| | | | | | | | | | | | | | | |
| | | | | | | | | | | | | | | |
| | | |
| Containers & Packaging - 0.87% | | | | | | |
| Greif, Inc., Class A | | | | 53,197 | | | | | | | | | | 3,378,010 | |
| O-I Glass, Inc.A | | | | 333,453 | | | | | | | | | | 5,151,849 | |
| Sealed Air Corp. | | | | 480,765 | | | | | | | | | | 14,802,754 | |
| Sonoco Products Co. | | | | 242,404 | | | | | | | | | | 12,558,951 | |
| | | | | | | | | | | | | | | |
| | | | | | | | | | | | | | 35,891,564 | |
| | | | | | | | | | | | | | | |
| | | | | | | | | | | | | | | |
| | | |
| Metals & Mining - 3.99% | | | | | | |
| Alpha Metallurgical Resources, Inc. | | | | 30,207 | | | | | | | | | | 6,644,332 | |
| Arch Resources, Inc. | | | | 36,936 | | | | | | | | | | 5,571,057 | |
| ATI, Inc.A | | | | 636,531 | | | | | | | | | | 24,041,776 | |
| Carpenter Technology Corp. | | | | 165,026 | | | | | | | | | | 10,350,431 | |
| Coeur Mining, Inc.A | | | | 605,954 | | | | | | | | | | 1,520,944 | |
| Elah Holdings, Inc.A | | | | 3,209 | | | | | | | | | | 144,405 | |
| Ferroglobe PLCA | | | | 3,111,546 | | | | | | | | | | 14,157,534 | |
| Hecla Mining Co. | | | | 978,282 | | | | | | | | | | 3,981,608 | |
| Kaiser Aluminum Corp. | | | | 663,482 | | | | | | | | | | 37,685,778 | |
| Materion Corp. | | | | 237,283 | | | | | | | | | | 23,011,705 | |
| MP Materials Corp.A B | | | | 223,204 | | | | | | | | | | 3,660,546 | |
| Olympic Steel, Inc. | | | | 23,664 | | | | | | | | | | 1,201,421 | |
| Ramaco Resources, Inc., Class A | | | | 92,720 | | | | | | | | | | 1,092,242 | |
| Royal Gold, Inc. | | | | 142,747 | | | | | | | | | | 14,892,794 | |
| Ryerson Holding Corp. | | | | 69,995 | | | | | | | | | | 2,033,355 | |
| Schnitzer Steel Industries, Inc., Class A | | | | 232,715 | | | | | | | | | | 5,284,958 | |
| SunCoke Energy, Inc. | | | | 174,816 | | | | | | | | | | 1,662,500 | |
| TimkenSteel Corp.A | | | | 82,606 | | | | | | | | | | 1,679,380 | |
| Warrior Met Coal, Inc. | | | | 108,591 | | | | | | | | | | 5,291,639 | |
| | | | | | | | | | | | | | | |
| | | | | | | | | | | | | | 163,908,405 | |
| | | | | | | | | | | | | | | |
| | | | | | | | | | | | | | | |
| | | |
| Paper & Forest Products - 0.12% | | | | | | |
| Clearwater Paper Corp.A | | | | 35,574 | | | | | | | | | | 1,202,757 | |
| Sylvamo Corp. | | | | 88,853 | | | | | | | | | | 3,936,188 | |
| | | | | | | | | | | | | | | |
| | | | | | | | | | | | | | 5,138,945 | |
| | | | | | | | | | | | | | | |
| | | | | | | | | | | | | | | |
Total Materials | | | | | | | | | | | | | | 332,261,316 | |
| | | | | | | | | | | | | | | |
| | | | | | | | | | | | | | | |
| | | |
| Real Estate - 3.26% | | | | | | |
| | | |
| Health Care REITs - 0.20% | | | | | | |
| CareTrust REIT, Inc. | | | | 114,307 | | | | | | | | | | 2,459,887 | |
| Physicians Realty Trust | | | | 526,289 | | | | | | | | | | 5,715,498 | |
| | | | | | | | | | | | | | | |
| | | | | | | | | | | | | | 8,175,385 | |
| | | | | | | | | | | | | | | |
| | | | | | | | | | | | | | | |
| | | |
| Hotel & Resort REITs - 0.14% | | | | | | |
| Sunstone Hotel Investors, Inc. | | | | 624,791 | | | | | | | | | | 5,810,556 | |
| | | | | | | | | | | | | | | |
| | | | | | | | | | | | | | | |
See accompanying notes
19
American Beacon Small Cap Value FundSM
Schedule of Investments
October 31, 2023
| | | | | | | | | | | | | | | |
| | | |
| | | Shares | | | | Fair Value |
| | | | | | | |
| | | |
| COMMON STOCKS - 90.43% (continued) | | | | | | |
| | | |
| Real Estate - 3.26% (continued) | | | | | | |
| | | |
| Industrial REITs - 0.66% | | | | | | |
| STAG Industrial, Inc. | | | | 699,936 | | | | | | | | | $ | 23,251,874 | |
| Terreno Realty Corp. | | | | 73,713 | | | | | | | | | | 3,927,429 | |
| | | | | | | | | | | | | | | |
| | | | | | | | | | | | | | 27,179,303 | |
| | | | | | | | | | | | | | | |
| | | | | | | | | | | | | | | |
| | | |
| Office REITs - 0.01% | | | | | | |
| Highwoods Properties, Inc. | | | | 26,294 | | | | | | | | | | 470,400 | |
| | | | | | | | | | | | | | | |
| | | | | | | | | | | | | | | |
| | | |
| Real Estate Management & Development - 0.70% | | | | | | |
| Douglas Elliman, Inc. | | | | 528,162 | | | | | | | | | | 934,847 | |
| Howard Hughes Holdings, Inc.A | | | | 102,009 | | | | | | | | | | 6,766,257 | |
| Jones Lang LaSalle, Inc.A | | | | 30,000 | | | | | | | | | | 3,837,600 | |
| Newmark Group, Inc., Class A | | | | 92,455 | | | | | | | | | | 524,220 | |
| RMR Group, Inc., Class A | | | | 358,673 | | | | | | | | | | 8,077,316 | |
| Seritage Growth Properties, Class AA B | | | | 1,108,139 | | | | | | | | | | 8,022,926 | |
| Tejon Ranch Co.A | | | | 56,910 | | | | | | | | | | 883,243 | |
| | | | | | | | | | | | | | | |
| | | | | | | | | | | | | | 29,046,409 | |
| | | | | | | | | | | | | | | |
| | | | | | | | | | | | | | | |
| | | |
| Retail REITs - 1.37% | | | | | | |
| Agree Realty Corp. | | | | 581,415 | | | | | | | | | | 32,524,355 | |
| NETSTREIT Corp. | | | | 1,253,939 | | | | | | | | | | 17,868,631 | |
| Urban Edge Properties | | | | 367,647 | | | | | | | | | | 5,830,881 | |
| | | | | | | | | | | | | | | |
| | | | | | | | | | | | | | 56,223,867 | |
| | | | | | | | | | | | | | | |
| | | | | | | | | | | | | | | |
| | | |
| Specialized REITs - 0.18% | | | | | | |
| PotlatchDeltic Corp. | | | | 170,769 | | | | | | | | | | 7,317,452 | |
| | | | | | | | | | | | | | | |
| | | | | | | | | | | | | | | |
Total Real Estate | | | | | | | | | | | | | | 134,223,372 | |
| | | | | | | | | | | | | | | |
| | | | | | | | | | | | | | | |
| | | |
| Utilities - 3.85% | | | | | | |
| | | |
| Electric Utilities - 1.62% | | | | | | |
| ALLETE, Inc. | | | | 467,747 | | | | | | | | | | 25,043,175 | |
| Genie Energy Ltd., Class B | | | | 55,062 | | | | | | | | | | 1,092,430 | |
| IDACORP, Inc. | | | | 134,772 | | | | | | | | | | 12,764,256 | |
| PNM Resources, Inc. | | | | 128,869 | | | | | | | | | | 5,446,004 | |
| Portland General Electric Co. | | | | 561,464 | | | | | | | | | | 22,469,789 | |
| | | | | | | | | | | | | | | |
| | | | | | | | | | | | | | 66,815,654 | |
| | | | | | | | | | | | | | | |
| | | | | | | | | | | | | | | |
| | | |
| Gas Utilities - 0.94% | | | | | | |
| Chesapeake Utilities Corp. | | | | 63,762 | | | | | | | | | | 5,649,951 | |
| Northwest Natural Holding Co. | | | | 247,586 | | | | | | | | | | 9,088,882 | |
| Southwest Gas Holdings, Inc. | | | | 113,435 | | | | | | | | | | 6,648,425 | |
| Spire, Inc. | | | | 22,265 | | | | | | | | | | 1,238,602 | |
| UGI Corp. | | | | 781,811 | | | | | | | | | | 16,261,669 | |
| | | | | | | | | | | | | | | |
| | | | | | | | | | | | | | 38,887,529 | |
| | | | | | | | | | | | | | | |
| | | | | | | | | | | | | | | |
| | | |
| Multi-Utilities - 0.95% | | | | | | |
| Avista Corp. | | | | 948,473 | | | | | | | | | | 30,057,109 | |
| Northwestern Energy Group, Inc. | | | | 186,132 | | | | | | | | | | 8,936,197 | |
| | | | | | | | | | | | | | | |
| | | | | | | | | | | | | | 38,993,306 | |
| | | | | | | | | | | | | | | |
| | | | | | | | | | | | | | | |
| | | |
| Water Utilities - 0.34% | | | | | | |
| California Water Service Group | | | | 284,206 | | | | | | | | | | 13,835,148 | |
| | | | | | | | | | | | | | | |
| | | | | | | | | | | | | | | |
Total Utilities | | | | | | | | | | | | | | 158,531,637 | |
| | | | | | | | | | | | | | | |
| | | | | | | | | | | | | | | |
Total Common Stocks (Cost $3,685,862,673) | | | | | | | | | | | | | | 3,719,221,500 | |
| | | | | | | | | | | | | | | |
| | | | | | | | | | | | | | | |
See accompanying notes
20
American Beacon Small Cap Value FundSM
Schedule of Investments
October 31, 2023
| | | | | | | | | | | | | | | |
| | | |
| | | Shares | | | | Fair Value |
| | | | | | | |
| | | |
| FOREIGN COMMON STOCKS - 4.75% | | | | | | |
| | | |
| Consumer Discretionary - 0.13% | | | | | | |
| | | |
| Hotels, Restaurants & Leisure - 0.13% | | | | | | |
| Genius Sports Ltd.A | | | | 1,131,141 | | | | | | | | | $ | 5,519,968 | |
| | | | | | | | | | | | | | | |
| | | | | | | | | | | | | | | |
| | | |
| Consumer Staples - 0.22% | | | | | | |
| | | |
| Food Products - 0.22% | | | | | | |
| SunOpta, Inc.A | | | | 2,347,348 | | | | | | | | | | 9,013,816 | |
| | | | | | | | | | | | | | | |
| | | | | | | | | | | | | | | |
| | | |
| Energy - 1.12% | | | | | | |
| | | |
| Oil, Gas & Consumable Fuels - 1.12% | | | | | | |
| Kosmos Energy Ltd.A | | | | 4,257,931 | | | | | | | | | | 30,827,421 | |
| Frontline PLCB | | | | 123,445 | | | | | | | | | | 2,746,651 | |
| Baytex Energy Corp. | | | | 2,920,942 | | | | | | | | | | 12,618,469 | |
| | | | | | | | | | | | | | | |
| | | | | | | | | | | | | | 46,192,541 | |
| | | | | | | | | | | | | | | |
| | | | | | | | | | | | | | | |
Total Energy | | | | | | | | | | | | | | 46,192,541 | |
| | | | | | | | | | | | | | | |
| | | | | | | | | | | | | | | |
| | | |
| Financials - 2.41% | | | | | | |
| | | |
| Banks - 2.32% | | | | | | |
| OFG Bancorp | | | | 1,190,153 | | | | | | | | | | 35,252,332 | |
| First BanCorp | | | | 176,282 | | | | | | | | | | 2,353,365 | |
| Popular, Inc. | | | | 584,547 | | | | | | | | | | 38,018,937 | |
| Bank of NT Butterfield & Son Ltd. | | | | 785,986 | | | | | | | | | | 19,854,006 | |
| | | | | | | | | | | | | | | |
| | | | | | | | | | | | | | 95,478,640 | |
| | | | | | | | | | | | | | | |
| | | | | | | | | | | | | | | |
| | | |
| Insurance - 0.09% | | | | | | |
| SiriusPoint Ltd.A | | | | 349,982 | | | | | | | | | | 3,447,323 | |
| | | | | | | | | | | | | | | |
| | | | | | | | | | | | | | | |
Total Financials | | | | | | | | | | | | | | 98,925,963 | |
| | | | | | | | | | | | | | | |
| | | | | | | | | | | | | | | |
| | | |
| Information Technology - 0.55% | | | | | | |
| | | |
| Semiconductors & Semiconductor Equipment - 0.40% | | | | | | |
| Kulicke & Soffa Industries, Inc. | | | | 395,258 | | | | | | | | | | 16,446,686 | |
| | | | | | | | | | | | | | | |
| | | | | | | | | | | | | | | |
| | | |
| Communications Equipment - 0.15% | | | | | | |
| Telefonaktiebolaget LM Ericsson, ADR | | | | 1,358,000 | | | | | | | | | | 6,075,579 | |
| | | | | | | | | | | | | | | |
| | | | | | | | | | | | | | | |
Total Information Technology | | | | | | | | | | | | | | 22,522,265 | |
| | | | | | | | | | | | | | | |
| | | | | | | | | | | | | | | |
| | | |
| Materials - 0.32% | | | | | | |
| | | |
| Metals & Mining - 0.32% | | | | | | |
| Alamos Gold, Inc., Class A | | | | 570,478 | | | | | | | | | | 7,062,518 | |
| SSR Mining, Inc. | | | | 433,771 | | | | | | | | | | 6,020,741 | |
| | | | | | | | | | | | | | | |
| | | | | | | | | | | | | | 13,083,259 | |
| | | | | | | | | | | | | | | |
| | | | | | | | | | | | | | | |
Total Materials | | | | | | | | | | | | | | 13,083,259 | |
| | | | | | | | | | | | | | | |
| | | | | | | | | | | | | | | |
Total Foreign Common Stocks (Cost $154,490,806) | | | | | | | | | | | | | | 195,257,812 | |
| | | | | | | | | | | | | | | |
| | | | | | | | | | | | | | | |
| | | |
| SHORT-TERM INVESTMENTS - 4.98% (Cost $204,763,294) | | | | | | |
| | | |
| Investment Companies - 4.98% | | | | | | |
American Beacon U.S. Government Money Market Select Fund, 5.19%C D | | | | 204,763,294 | | | | | | | | | | 204,763,294 | |
| | | | | | | | | | | | | | | |
| | | | | | | | | | | | | | | |
| | | |
| SECURITIES LENDING COLLATERAL - 0.58% (Cost $23,784,921) | | | | | | |
| | | |
| Investment Companies - 0.58% | | | | | | |
American Beacon U.S. Government Money Market Select Fund, 5.19%C D | | | | 23,784,921 | | | | | | | | | | 23,784,921 | |
| | | | | | | | | | | | | | | |
| | | | | | | | | | | | | | | |
TOTAL INVESTMENTS - 100.74% (Cost $4,068,901,694) | | | | | | | | | | | | | | 4,143,027,527 | |
LIABILITIES, NET OF OTHER ASSETS - (0.74%) | | | | | | | | | | | | | | (30,459,927 | ) |
| | | | | | | | | | | | | | | |
TOTAL NET ASSETS - 100.00% | | | | | | | | | | | | | $ | 4,112,567,600 | |
| | | | | | | | | | | | | | | |
| | | | | | | |
| Percentages are stated as a percent of net assets. | | | | | | | | | | | | | | | |
See accompanying notes
21
American Beacon Small Cap Value FundSM
Schedule of Investments
October 31, 2023
A Non-income producing security.
B All or a portion of this security is on loan, collateralized by either cash and/or U.S. Treasuries, at October 31, 2023 (Note 9).
C The Fund is affiliated by having the same investment advisor.
D 7-day yield.
ADR – American Depositary Receipt.
LLC - Limited Liability Company.
LP - Limited Partnership.
PLC - Public Limited Company.
REIT - Real Estate Investment Trusts.
| | | | | | | | | | | | | | | | |
| Long Futures Contracts Open on October 31, 2023: | |
|
| Equity Futures Contracts | |
| Description | | Number of
Contracts | | Expiration Date | | Notional Amount | | | Contract Value | | | Unrealized
Appreciation
(Depreciation) | |
| CME e-Mini Russell 2000 Index Futures | | 2,427 | | December 2023 | | $ | 217,576,556 | | | $ | 202,460,340 | | | $ | (15,116,216 | ) |
| | | | | | | | | | | | | | | | |
| | | | | | $ | 217,576,556 | | | $ | 202,460,340 | | | $ | (15,116,216 | ) |
| | | | | | | | | | | | | | | | |
| | |
|
| Index Abbreviations: |
| CME | | Chicago Mercantile Exchange. |
The Fund’s investments are summarized by level based on the inputs used to determine their values. As of October 31, 2023, the investments were classified as described below:
| | | | | | | | | | | | | | | | | | | | | | | | | | | | |
Small Cap Value Fund | | Level 1 | | | | | | Level 2 | | | | | | Level 3 | | | | | | Total | |
Assets | | | | | | | | | | | | | | | | | | | | | | | | | | | | |
Common Stocks | | $ | 3,719,221,500 | | | | | | | $ | - | | | | | | | $ | - | | | | | | | $ | 3,719,221,500 | |
Foreign Common Stocks | | | 195,257,812 | | | | | | | | - | | | | | | | | - | | | | | | | | 195,257,812 | |
Short-Term Investments | | | 204,763,294 | | | | | | | | - | | | | | | | | - | | | | | | | | 204,763,294 | |
Securities Lending Collateral | | | 23,784,921 | | | | | | | | - | | | | | | | | - | | | | | | | | 23,784,921 | |
| | | | | | | | | | | | | | | | | | | | | | | | | | | | |
Total Investments in Securities - Assets | | $ | 4,143,027,527 | | | | | | | $ | - | | | | | | | $ | - | | | | | | | $ | 4,143,027,527 | |
| | | | | | | | | | | | | | | | | | | | | | | | | | | | |
| | | | | | | |
Financial Derivative Instruments - Liabilities | | | | | | | | | | | | | | | | | | | | | | | | | | | | |
Futures Contracts | | $ | (15,116,216 | ) | | | | | | $ | - | | | | | | | $ | - | | | | | | | $ | (15,116,216 | ) |
| | | | | | | | | | | | | | | | | | | | | | | | | | | | |
Total Financial Derivative Instruments - Liabilities | | $ | (15,116,216 | ) | | | | | | $ | - | | | | | | | $ | - | | | | | | | $ | (15,116,216 | ) |
| | | | | | | | | | | | | | | | | | | | | | | | | | | | |
U.S. GAAP requires transfers between all levels to/from level 3 be disclosed. During the year ended October 31, 2023, there were no transfers into or out of Level 3.
See accompanying notes
22
American Beacon Small Cap Value FundSM
Statement of Assets and Liabilities
October 31, 2023
| | | | |
Assets: | |
Investments in unaffiliated securities, at fair value† § | | $ | 3,914,479,312 | |
Investments in affiliated securities, at fair value‡ | | | 228,548,215 | |
Cash | | | 12,863 | |
Cash collateral held at broker for futures contracts | | | 16,614,000 | |
Dividends and interest receivable | | | 2,521,398 | |
Deposits with broker for futures contracts | | | 16,894,025 | |
Receivable for investments sold | | | 24,662,246 | |
Receivable for fund shares sold | | | 3,929,662 | |
Prepaid expenses | | | 44,996 | |
| | | | |
Total assets | | | 4,207,706,717 | |
| | | | |
Liabilities: | |
Payable for investments purchased | | | 33,330,375 | |
Payable for fund shares redeemed | | | 19,587,611 | |
Management and sub-advisory fees payable (Note 2) | | | 2,621,015 | |
Service fees payable (Note 2) | | | 75,929 | |
Transfer agent fees payable (Note 2) | | | 72,433 | |
Payable upon return of securities loaned (Note 9)§ | | | 23,784,921 | |
Custody and fund accounting fees payable | | | 121,137 | |
Professional fees payable | | | 111,248 | |
Trustee fees payable (Note 2) | | | 29,973 | |
Payable for prospectus and shareholder reports | | | 130,549 | |
Payable for variation margin from open futures contracts (Note 5) | | | 15,111,765 | |
Other liabilities | | | 162,161 | |
| | | | |
Total liabilities | | | 95,139,117 | |
| | | | |
Commitments and contingent liabilities (Note 2) | | | | |
Net assets | | $ | 4,112,567,600 | |
| | | | |
Analysis of net assets: | |
Paid-in-capital | | $ | 3,930,201,026 | |
Total distributable earnings (deficits)A | | | 182,366,574 | |
| | | | |
Net assets | | $ | 4,112,567,600 | |
| | | | |
Shares outstanding at no par value (unlimited shares authorized): | |
R5 Class | | | 84,798,112 | |
| | | | |
Y Class | | | 16,624,991 | |
| | | | |
Investor Class | | | 12,267,357 | |
| | | | |
Advisor Class | | | 1,265,710 | |
| | | | |
A Class | | | 1,873,837 | |
| | | | |
C Class | | | 373,304 | |
| | | | |
R6 Class | | | 72,528,128 | |
| | | | |
Net assets: | |
R5 Class | | $ | 1,851,818,875 | |
| | | | |
Y Class | | $ | 355,150,002 | |
| | | | |
Investor Class | | $ | 252,350,988 | |
| | | | |
Advisor Class | | $ | 25,580,739 | |
| | | | |
A Class | | $ | 37,440,788 | |
| | | | |
C Class | | $ | 6,883,174 | |
| | | | |
R6 Class | | $ | 1,583,343,034 | |
| | | | |
Net asset value, offering and redemption price per share: | |
R5 Class | | $ | 21.84 | |
| | | | |
Y Class | | $ | 21.36 | |
| | | | |
Investor Class | | $ | 20.57 | |
| | | | |
Advisor Class | | $ | 20.21 | |
| | | | |
A Class | | $ | 19.98 | |
| | | | |
A Class (offering price) | | $ | 21.20 | |
| | | | |
C Class | | $ | 18.44 | |
| | | | |
R6 Class | | $ | 21.83 | |
| | | | |
| |
† Cost of investments in unaffiliated securities | | $ | 3,840,353,479 | |
‡ Cost of investments in affiliated securities | | $ | 228,548,215 | |
§ Fair value of securities on loan | | $ | 48,254,458 | |
| |
A The Fund’s investments in affiliated securities did not have unrealized appreciation (depreciation) at year end. | | | | |
See accompanying notes
23
American Beacon Small Cap Value FundSM
Statement of Operations
For the year ended October 31, 2023
| | | | |
Investment income: | |
Dividend income from unaffiliated securities (net of foreign taxes)† | | $ | 82,029,878 | |
Dividend income from affiliated securities (Note 2) | | | 8,736,196 | |
Interest income | | | 551,842 | |
Income derived from securities lending (Note 9) | | | 130,101 | |
| | | | |
Total investment income | | | 91,448,017 | |
| | | | |
Expenses: | |
Management and sub-advisory fees (Note 2) | | | 31,786,017 | |
Transfer agent fees: | | | | |
R5 Class (Note 2) | | | 711,150 | |
Y Class (Note 2) | | | 443,652 | |
Investor Class | | | 28,048 | |
Advisor Class | | | 5,498 | |
A Class | | | 6,079 | |
C Class | | | 4,042 | |
R6 Class | | | 74,383 | |
Custody and fund accounting fees | | | 492,395 | |
Professional fees | | | 481,770 | |
Registration fees and expenses | | | 133,217 | |
Service fees (Note 2): | | | | |
Investor Class | | | 996,291 | |
Advisor Class | | | 75,523 | |
A Class | | | 80,529 | |
C Class | | | 9,725 | |
Distribution fees (Note 2): | | | | |
Advisor Class | | | 75,508 | |
A Class | | | 105,096 | |
C Class | | | 82,251 | |
Prospectus and shareholder report expenses | | | 532,158 | |
Trustee fees (Note 2) | | | 439,642 | |
Loan expense (Note 10) | | | 26,877 | |
Other expenses | | | 523,087 | |
| | | | |
Total expenses | | | 37,112,938 | |
| | | | |
Net investment income | | | 54,335,079 | |
| | | | |
|
Realized and unrealized gain (loss) from investments: | |
Net realized gain (loss) from: | | | | |
Investments in unaffiliated securitiesA | | | 203,670,515 | |
Commission recapture (Note 1) | | | 66,859 | |
Foreign currency transactions | | | 17 | |
Futures contracts | | | (10,641,725 | ) |
Change in net unrealized (depreciation) of: | | | | |
Investments in unaffiliated securitiesB | | | (414,993,877 | ) |
Foreign currency transactions | | | (347 | ) |
Futures contracts | | | (19,315,907 | ) |
| | | | |
Net (loss) from investments | | | (241,214,465 | ) |
| | | | |
Net (decrease) in net assets resulting from operations | | $ | (186,879,386 | ) |
| | | | |
| |
† Foreign taxes | | $ | 264,944 | |
| |
A The Fund did not recognize net realized gains (losses) from the sale of investments in affiliated securities. | | | | |
B The Fund’s investments in affiliated securities did not have a change in unrealized appreciation (depreciation) at year end. | |
See accompanying notes
24
American Beacon Small Cap Value FundSM
Statement of Changes in Net Assets
| | | | | | | | | | | | |
| | | Year Ended
October 31, 2023 | | | | | | Year Ended
October 31, 2022 | |
Increase (decrease) in net assets: | |
Operations: | |
Net investment income | | $ | 54,335,079 | | | | | | | $ | 41,822,911 | |
Net realized gain from investments in unaffiliated securities, commission recapture, foreign currency transactions, and futures contracts | | | 193,095,666 | | | | | | | | 832,578,342 | |
Change in net unrealized (depreciation) of investments in unaffiliated securities, foreign currency transactions, and futures contracts | | | (434,310,131 | ) | | | | | | | (1,085,926,628 | ) |
| | | | | | | | | | | | |
Net (decrease) in net assets resulting from operations | | | (186,879,386 | ) | | | | | | | (211,525,375 | ) |
| | | | | | | | | | | | |
Distributions to shareholders: | |
Total retained earnings: | | | | | | | | | | | | |
R5 Class | | | (326,083,778 | ) | | | | | | | (357,424,073 | ) |
Y Class | | | (63,996,701 | ) | | | | | | | (28,029,058 | ) |
Investor Class | | | (42,913,279 | ) | | | | | | | (39,069,782 | ) |
Advisor Class | | | (4,957,456 | ) | | | | | | | (3,807,082 | ) |
A Class | | | (6,416,908 | ) | | | | | | | (6,970,754 | ) |
C Class | | | (1,424,006 | ) | | | | | | | (1,119,552 | ) |
R6 Class | | | (231,084,710 | ) | | | | | | | (202,391,660 | ) |
| | | | | | | | | | | | |
Net distributions to shareholders | | | (676,876,838 | ) | | | | | | | (638,811,961 | ) |
| | | | | | | | | | | | |
|
Capital share transactions (Note 11): | |
Proceeds from sales of shares | | | 1,240,960,045 | | | | | | | | 1,257,113,565 | |
Reinvestment of dividends and distributions | | | 639,145,734 | | | | | | | | 605,168,502 | |
Cost of shares redeemed | | | (1,448,856,561 | ) | | | | | | | (2,407,719,098 | ) |
| | | | | | | | | | | | |
Net increase (decrease) in net assets from capital share transactions | | | 431,249,218 | | | | | | | | (545,437,031 | ) |
| | | | | | | | | | | | |
Net (decrease) in net assets | | | (432,507,006 | ) | | | | | | | (1,395,774,367 | ) |
| | | | | | | | | | | | |
Net assets: | |
Beginning of year | | | 4,545,074,606 | | | | | | | | 5,940,848,973 | |
| | | | | | | | | | | | |
End of year | | $ | 4,112,567,600 | | | | | | | $ | 4,545,074,606 | |
| | | | | | | | | | | | |
See accompanying notes
25
American Beacon Small Cap Value FundSM
Notes to Financial Statements
October 31, 2023
1. Organization and Significant Accounting Policies
American Beacon Funds (the “Trust”) is organized as a Massachusetts business trust. The Fund, a series within the Trust, is registered under the Investment Company Act of 1940, as amended (the “Act”), as a diversified, open-end management investment company. As of October 31, 2023, the Trust consists of twenty-four active series, one of which is presented in this filing: American Beacon Small Cap Value Fund (the “Fund”). The remaining twenty-three active series are reported in separate filings.
American Beacon Advisors, Inc. (the “Manager”) is a Delaware corporation and a wholly-owned subsidiary of Resolute Investment Managers, Inc. (“RIM”) organized in 1986 to provide business management, advisory, administrative, and asset management consulting services to the Trust and other investors. The Manager is registered as an investment advisor under the Investment Advisers Act of 1940, as amended (the “Advisers Act”). RIM is, in turn, a wholly-owned subsidiary of Resolute Acquisition, Inc., which is a wholly-owned subsidiary of Resolute Topco, Inc., a wholly-owned subsidiary of Resolute Investment Holdings, LLC (“RIH”). RIH is owned primarily by Kelso Investment Associates VIII, L.P., KEP VI, LLC and Estancia Capital Partners L.P., investment funds affiliated with Kelso & Company, L.P. (“Kelso”) or Estancia Capital Management, LLC (“Estancia”), which are private equity firms.
On July 11, 2023, (i) RIH, RIM and certain of their affiliates, and (ii) the current owners of approximately 93% of RIH (the “Current Ownership Group”) entered into a transaction agreement with certain creditors of RIM (the “Lender Group”) pursuant to which (i) all equity interests in RIH would be cancelled, (ii) new equity interests would be issued to members of the Lender Group, and (iii) the existing credit agreements between RIM and the Lender Group would be terminated and a new credit agreement would be executed (“Transaction”). The Lender Group consists of various institutional investment funds (“New Ownership Group”) that are managed by financial institutions and other investment advisory firms.
Upon the closing of the Transaction, the Manager will be wholly-owned indirectly by the New Ownership Group, rather than the Current Ownership Group. The Transaction is expected to close in the fourth calendar quarter of 2023, subject to the satisfaction of certain closing conditions. The Transaction will result in a change of control of the Manager and the termination of the Fund’s management and investment advisory agreements (the “Current Management Agreement” and “Current Investment Advisory Agreements”, respectively). The Board has approved a new management agreement with the Manager (the “New Management Agreement”) and a new investment advisory agreement among the Manager, the sub-advisors and the Trust, on behalf of the Fund (“New Investment Advisory Agreements”) (collectively, the “Agreements”), that would become effective upon the closing of the Transaction. A special meeting of the shareholders of the Fund as of July 31, 2023, was held on October 27, 2023 to consider the Agreements. The shareholders of the Fund did not achieve a quorum in favor of the Agreements, therefore the meeting was adjourned to November 17, 2023. At the second meeting on November 17, 2023, the shareholders of the Fund did not achieve a quorum in favor of the Agreements, therefore the meeting was adjourned to December 8, 2023. At the third meeting on December 8, 2023, the shareholders of the Fund did not achieve a quorum in favor of the Agreements, therefore the meeting was adjourned to January 9, 2024. In advance of the meeting, proxy materials were sent to those shareholders regarding the New Management Agreement. There are no anticipated changes in the services provided by the Manager or sub-advisors or in the fee rates charged by the Manager to a Fund. Please see the Results of Shareholder Meeting for more information.
Recently Adopted Accounting Pronouncements
In March 2020, the Financial Accounting Standards Board (“FASB”) issued Accounting Standards Update (“ASU”) No. 2020-04, Reference Rate Reform (Topic 848); Facilitation of the Effects of Reference Rate Reform on Financial Reporting, which provides optional guidance for a limited period of time to ease the potential burden in accounting for (or recognizing the effects of) reference rate reform. The guidance is applicable to contracts referencing London Inter-bank Offered Rate (“LIBOR”) or another reference rate that is expected to be discontinued due to reference rate reform. The ASU is effective as of March 12, 2020 and generally can be applied through December 31, 2022. In December 2022, the FASB issued ASU No. 2022-06 Reference Rate Reform (Topic 848): Deferral of the Sunset Date of Topic 848 which updates and clarifies ASU No. 2020-04. The amendments in
26
American Beacon Small Cap Value FundSM
Notes to Financial Statements
October 31, 2023
this ASU defer the sunset date of Topic 848 from December 31, 2022, to December 31, 2024. Management expects these ASUs will not have a material impact on the Fund’s financial statements.
In June 2022, the FASB issued ASU No. 2022-03, Fair Value Measurement (Topic 820); Fair Value Measurement of Equity Securities Subject to Contractual Sale Restrictions, which provides clarifying guidance that a contractual restriction on the sale of an equity security is not considered part of the unit of account of the equity security and, therefore, is not considered in measuring fair value. The ASU is effective for fiscal years beginning after December 15, 2023, and interim periods within those fiscal years. Management expects the ASU will not have a material impact on the Fund’s financial statements.
Class Disclosure
The Fund has multiple classes of shares designed to meet the needs of different groups of investors. The following table sets forth the differences amongst the classes:
| | | | | | |
Class | | Eligible Investors | | Minimum Initial
Investments | |
| R5 Class | | Large institutional investors - sold directly or through intermediary channels. | | $ | 250,000 | |
| | |
| Y Class | | Large institutional retirement plan investors - sold directly or through intermediary channels. | | $ | 100,000 | |
| | |
| Investor Class | | All investors using intermediary organizations, such as broker-dealers or retirement plan sponsors. | | $ | 2,500 | |
| | |
| Advisor Class | | All investors who invest through intermediary organizations, such as broker-dealers or third party administrators. | | $ | 2,500 | |
| | |
| A Class | | All investors who invest through intermediary organizations, such as broker-dealers or third party administrator. Retail investors who invest directly through a financial intermediary such as a broker, bank, or registered investment advisor which may include a front-end sales charge and a contingent deferred sales charge (“CDSC”). | | $ | 2,500 | |
| | |
| C Class | | Retail investors who invest directly through a financial intermediary, such as a broker or through employee directed benefit plans with applicable sales charges which may include CDSC. | | $ | 1,000 | |
| | |
| R6 Class | | Large institutional retirement plan investors - sold through retirement plan sponsors. | | | None | |
Each class offered by the Trust has equal rights as to assets and voting privileges. Income and non-class specific expenses are allocated daily to each class based on the relative net assets. Realized and unrealized capital gains and losses of each class are allocated daily based on the relative net assets of each class of the respective Fund. Class specific expenses, where applicable, currently include service, distribution, transfer agent fees, and sub-transfer agent fees that vary amongst the classes as described more fully in Note 2.
Significant Accounting Policies
The following is a summary of significant accounting policies, consistently followed by the Fund in preparation of the financial statements. The Fund is considered an investment company and accordingly, follows the investment company accounting and reporting guidance of the FASB Accounting Standards Codification Topic 946, Financial Services – Investment Companies, a part of Generally Accepted Accounting Principles (“U.S. GAAP”).
Security Transactions and Investment Income
Security transactions are recorded as of the trade date for financial reporting purposes. Securities purchased or sold on a when-issued or delayed-delivery basis may be settled beyond a standard settlement period for the security after the trade date.
Dividend income, net of foreign taxes, is recorded on the ex-dividend date, except certain dividends from foreign securities which are recorded as soon as the information is available to the Fund. Tax reclaim accruals are automatically generated on accounting and custody systems at the time of the income event based on the tax
27
American Beacon Small Cap Value FundSM
Notes to Financial Statements
October 31, 2023
databases maintained by the Fund’s custodian. Reconciliations are performed between custody and accounting systems to help ensure reclaim accruals are in line. Interest income, net of foreign taxes, is earned from settlement date, recorded on the accrual basis, and adjusted, if necessary, for accretion of discounts and amortization of premiums. Realized gains (losses) from securities sold are determined based on specific lot identification.
Distributions to Shareholders
The Fund distributes most or all of its net earnings and realized gains, if any, each taxable year in the form of dividends from net investment income and distributions of realized net capital gains and net gains from foreign currency transactions on an annual basis. The Fund does not have a fixed dividend rate and does not guarantee that it will pay any distributions in any particular period. Dividends to shareholders are determined in accordance with federal income tax regulations, which may differ in amount and character from net investment income and realized gains recognized for purposes of U.S. GAAP. To the extent necessary to fully distribute capital gains, the Fund may designate earnings and profits distributed to shareholders on the redemption of shares.
Commission Recapture
The Fund has established brokerage commission recapture arrangements with certain brokers or dealers. If the Fund’s investment advisor chooses to execute a transaction through a participating broker, the broker rebates a portion of the commission back to the Fund. Any collateral benefit received through participation in the commission recapture program is directed exclusively to the Fund. This amount is reported with the net realized gain (loss) in the Fund’s Statement of Operations, if applicable.
Allocation of Income, Trust Expenses, Gains, and Losses
Investment income and realized and unrealized gains and losses from investments of the Fund are allocated daily to each class of shares based upon the relative proportion of net assets of each class to the total net assets of the Fund. Expenses directly charged or attributable to the Fund will be paid from the assets of the Fund. Generally, expenses of the Trust will be allocated among and charged to the assets of the Fund on a basis that the Trust’s Board of Trustees (the “Board”) deems fair and equitable, which may be based on the relative net assets of the Fund or nature of the services performed and relative applicability to the Fund.
Use of Estimates
The preparation of financial statements in conformity with U.S. GAAP requires management to make estimates and assumptions that affect the amounts reported in the financial statements and accompanying notes. Actual results may differ from those estimated.
Other
Under the Trust’s organizational documents, its officers and trustees are indemnified against certain liabilities arising out of the performance of their duties to the Trust. In the normal course of business, the Trust enters into contracts that provide indemnification to the other party or parties against potential costs or liabilities. The Trust’s maximum exposure under these arrangements is dependent on claims that may be made in the future and, therefore, cannot be estimated. The Trust has had no prior claims or losses pursuant to any such agreement.
2. Transactions with Affiliates
Management and Investment Sub-Advisory Agreements
The Fund and the Manager are parties to a Management Agreement that obligates the Manager to provide the Fund with investment advisory and administrative services. As compensation for performing the duties under
28
American Beacon Small Cap Value FundSM
Notes to Financial Statements
October 31, 2023
the Management Agreement, the Manager will receive an annualized management fee based on a percentage of the Fund’s average daily net assets that is calculated and accrued daily according to the following schedule:
| | | | |
First $15 billion | | | 0.35 | % |
Next $15 billion | | | 0.325 | % |
Over $30 billion | | | 0.30 | % |
The Trust, on behalf of the Fund, and the Manager have entered into Investment Advisory Agreements with Barrow, Hanley, Mewhinney & Strauss, LLC; Brandywine Global Investment Management, LLC; DePrince, Race & Zollo, Inc.; Hotchkis and Wiley Capital Management, LLC; and Newton Investment Management North America, LLC (“Sub-Advisors”) pursuant to which the Fund has agreed to pay an annualized sub-advisory fee that is calculated and accrued daily based on the Fund’s average daily net assets.
The Management and Sub-Advisory Fees paid by the Fund for the year ended October 31, 2023 were as follows:
| | | | | | | | | | | | |
| | | Effective Fee Rate | | | | | | Amount of Fees Paid | |
Management Fees | | | 0.35 | % | | | | | | $ | 15,897,278 | |
Sub-Advisory Fees | |
| 0.35
| %
| | | | | | | 15,888,739 | |
| | | | | | | | | | | | |
Total | | | 0.70 | % | | | | | | $ | 31,786,017 | |
| | | | | | | | | | | | |
As compensation for services provided by the Manager in connection with securities lending activities conducted by a Fund, the lending Fund pays to the Manager, with respect to cash collateral posted by borrowers, a fee of 10% of the net monthly investment income (the income earned in the form of interest, dividends and realized capital gains from the investment of cash collateral, plus any negative rebate fees paid by borrowers, less the rebate amount paid to borrowers as well as related expenses) and, with respect to collateral other than cash, a fee up to 10% of loan fees and demand premiums paid by borrowers. These fees are included in “Income derived from securities lending” and “Management and sub-advisory fees” on the Statement of Operations. During the year ended October 31, 2023, the Manager received securities lending fees of $14,838 for the securities lending activities of the Fund.
Distribution Plans
Separate Distribution Plans (the “Distribution Plans”) have been adopted pursuant to Rule 12b-1 under the Act for the Advisor, A, and C Classes of the Fund. Under the Distribution Plans, as compensation for distribution and shareholder servicing assistance, the Manager receives an annual fee of 0.25% of the average daily net assets of the Advisor and A Classes and 1.00% of the average daily net assets of the C Class. The fee will be payable without regard to whether the amount of the fee is more or less than the actual expenses incurred in a particular month by the Manager for distribution assistance.
Service Plans
The Manager and the Trust entered into a Service Plan that obligates the Manager to oversee additional shareholder servicing of the Investor, Advisor, A, and C Classes of the Fund. As compensation for performing the duties required under the Service Plan, the Manager receives an annualized fee up to 0.25% of the average daily net assets of the A and C Classes, up to 0.25% of the average daily net assets of the Advisor Class, and up to 0.375% of the average daily net assets of the Investor Class of the Fund.
Sub-Transfer Agent Fees
The Manager has entered into agreements, which include servicing agreements, with financial intermediaries that provide recordkeeping, processing, shareholder communications and other services to customers of the intermediaries that hold positions in the R5 and Y Classes of the Fund and has agreed to
29
American Beacon Small Cap Value FundSM
Notes to Financial Statements
October 31, 2023
compensate the intermediaries for providing these services. Intermediaries transact with the Fund primarily through the use of omnibus accounts on behalf of its customers who hold positions in the Fund. Certain services would have been provided by the Fund’s transfer agent and other service providers if the shareholders’ accounts were maintained directly by the Fund’s transfer agent. Accordingly, the Fund, pursuant to Board approval, has agreed to reimburse the Manager for certain non-distribution shareholder services provided by financial intermediaries for the R5 and Y Classes. The reimbursement amounts (sub-transfer agent fees) paid to the Manager are subject to a fee limit of up to 0.10% of an intermediary’s average net assets in the R5 and Y Classes on an annual basis. During the year ended October 31, 2023, the sub-transfer agent fees, as reflected in “Transfer agent fees” on the Statement of Operations, were as follows:
| | | | |
Fund | | Sub-Transfer Agent Fees | |
Small Cap Value | | $ | 1,034,924 | |
As of October 31, 2023, the Fund owed the Manager the following reimbursement of sub-transfer agent fees, as reflected in “Transfer agent fees payable” on the Statement of Assets and Liabilities:
| | | | |
Fund | | Reimbursement
Sub-Transfer Agent Fees | |
Small Cap Value | | $ | 34,770 | |
Brokerage Commissions
Affiliated entities of a sub-advisor to the Fund received commissions on purchases and sales of the Fund’s portfolio securities totaling $150,156 for the year ended October 31, 2023.
Investments in Affiliated Funds
The Fund may invest in the American Beacon U.S. Government Money Market Select Fund (the “USG Select Fund”). The Fund listed below held the following shares with an October 31, 2023 fair value and dividend income earned from the investment in the USG Select Fund.
| | | | | | | | | | | | | | | | | | | | | | | | | | | | | | | | | | | | | | | | | | | | | | | | |
Affiliated Security | | Type of
Transaction | | | | | Fund | | | | | October 31,
2023
Shares/Principal | | | | | | Change in
Unrealized
Gain (Loss) | | | | | | Realized
Gain
(Loss) | | | | | | Dividend
Income | | | | | | October 31,
2023
Fair Value | |
| U.S. Government Money Market Select | | Direct | | | | | | Small Cap Value | | | | | | $ | 204,763,294 | | | | | | | $ | - | | | | | | | $ | - | | | | | | | $ | 8,736,196 | | | | | | | $ | 204,763,294 | |
| U.S. Government Money Market Select | | Securities Lending | | | | | | Small Cap Value | | | | | | | 23,784,921 | | | | | | | | - | | | | | | | | - | | | | | | | | N/A | | | | | | | | 23,784,921 | |
The Fund and the USG Select Fund have the same investment advisor and therefore, are considered to be affiliated. The Manager serves as investment advisor to the USG Select Fund and receives management fees and administrative fees totaling 0.10% of the average daily net assets of the USG Select Fund. During the year ended October 31, 2023, the Manager earned fees on the Fund’s direct investments and securities lending collateral investments in the USG Select Fund as shown below:
| | | | | | | | | | | | |
Fund | | Direct Investments in
USG Select Fund | | | Securities Lending
Collateral
Investments in USG
Select Fund | | | Total | |
Small Cap Value | | $ | 189,449 | | | $ | 12,001 | | | $ | 201,450 | |
30
American Beacon Small Cap Value FundSM
Notes to Financial Statements
October 31, 2023
Interfund Credit Facility
Pursuant to an exemptive order issued by the U.S. Securities and Exchange Commission (“SEC”), the Fund, along with other registered investment companies having management contracts with the Manager, may participate in a credit facility whereby each fund, under certain conditions, is permitted to lend money directly to and borrow directly from other participating funds for temporary purposes. The interfund credit facility is advantageous to the funds because it provides added liquidity and eliminates the need to maintain higher cash balances to meet redemptions. This situation could arise when shareholder redemptions exceed anticipated volumes and certain funds have insufficient cash on hand to satisfy such redemptions or when sales of securities do not settle as expected, resulting in a cash shortfall for the fund. When the fund liquidates portfolio securities to meet redemption requests, they often do not receive payment in settlement for up to two days (or longer for certain foreign transactions). Redemption requests normally are satisfied on the next business day. The credit facility provides a source of immediate, short-term liquidity pending settlement of the sale of portfolio securities. The credit facility is administered by a credit facility team consisting of professionals from the Manager’s asset management, compliance, and accounting areas who report the activities of the credit facility to the Board. During the year ended October 31, 2023, the Fund participated as a lender by loaning an average amount of $3,154,924 for 124 days at an average interest rate of 5.19% with interest charges earned of $56,769. This amount is included in “Interest income” on the Statement of Operations. During the year ended October 31, 2023, the Fund did not utilize the credit facility.
Expense Reimbursement Plan
The Fund has adopted an Expense Reimbursement Plan whereby the Manager may seek repayment of contractual or voluntary fee reductions and expense reimbursements. Under the policy, the Manager can be reimbursed by the Fund for any contractual or voluntary fee reductions or expense reimbursements if reimbursement to the Manager (a) occurs within three years from the date of the Manager’s waiver/reimbursement and (b) does not cause the Fund’s annual operating expenses to exceed the lesser of the contractual percentage limit in effect at the time of the waiver/reimbursement or time of recoupment. During the year ended October 31, 2023 there were no waived fees, expenses reimbursed, or recouped expenses, and no commitment or contingent liability is expected.
Sales Commissions
The Fund’s Distributor, Resolute Investment Distributors, Inc. (“RID” or “Distributor”), may receive a portion of A Class sales charges from broker dealers which may be used to offset distribution related expenses. During the year ended October 31, 2023, RID collected $1,294 from the sale of A Class Shares of the Fund.
A CDSC of 0.50% will be deducted with respect to A Class Shares on certain purchases of $1,000,000 or more that are redeemed in whole or part within 18 months of purchase, unless waived as discussed in the Fund’s Prospectus. Any applicable CDSC will be 0.50% of the lesser of the original purchase price or the value of the redemption of the A Class Shares redeemed. During the year ended October 31, 2023, there were no CDSC fees collected for the A Class Shares of the Fund.
A CDSC of 1.00% will be deducted with respect to C Class Shares redeemed within 12 months of purchase, unless waived as discussed in the Fund’s Prospectus. Any applicable CDSC will be 1.00% of the lesser of the original purchase price or the value of the redemption of the C Class Shares redeemed. During the year ended October 31, 2023, CDSC fees of $109 were collected for C Class Shares of the Fund.
Trustee Fees and Expenses
As compensation for their service to the American Beacon Funds Complex, including the Trust (collectively, the “Trusts”), each Trustee is compensated from the Trusts as follows: (1) an annual retainer of $130,000; (2) meeting attendance fee (for attendance in-person or via teleconference) of (a) $12,000 for in person attendance,
31
American Beacon Small Cap Value FundSM
Notes to Financial Statements
October 31, 2023
or $5,000 for telephonic attendance, by Board members for each regularly scheduled or special Board meeting, (b) $2,500 for attendance by Committee members at meetings of the Audit and Compliance Committee and the Investment Committee, (c) $1,000 for attendance by Committee members at meetings of the Nominating and Governance Committee; and (d) $2,500 for attendance by Board members for each special telephonic Board meeting; and (3) reimbursement of reasonable expenses incurred in attending Board meetings, Committee meetings, and relevant educational seminars. For this purpose, the Board considers attendance at regular meetings held by video conference to constitute in-person attendance at a Board meeting. The Trustees also may be compensated for attendance at special Board and/or Committee meetings from time to time. For her service as Board Chair, Ms. Cline receives an additional annual retainer of $50,000. Although she attends several committee meetings at each quarterly Board meeting, she receives only a single $2,500 fee each quarter for her attendance at those meetings. The chairpersons of the Audit and Compliance Committee and the Investment Committee each receive an additional annual retainer of $25,000 and the Chair of the Nominating and Governance Committee receives an additional annual retainer of $10,000.
3. Security Valuation and Fair Value Measurements
The price of the Fund’s shares is based on its net asset value (“NAV”) per share. The Fund’s NAV is computed by adding total assets, subtracting all the Fund’s liabilities, and dividing the result by the total number of shares outstanding.
The NAV of each class of the Fund’s shares is determined based on a pro rata allocation of the Fund’s investment income, expenses and total capital gains and losses. The Fund’s NAV per share is determined each business day as of the regular close of trading on the New York Stock Exchange (“NYSE” or “Exchange”), which is typically 4:00 p.m. Eastern Time (“ET”). However, if trading on the NYSE closes at a time other than 4:00 p.m. ET, the Fund’s NAV per share typically would still be determined as of the regular close of trading on the NYSE. The Fund does not price its shares on days that the NYSE is closed. Foreign exchanges may permit trading in foreign securities on days when the Fund is not open for business, which may result in the value of the Fund’s portfolio investments being affected at a time when you are unable to buy or sell shares.
Equity securities, including shares of closed-end funds and exchange-traded funds (“ETFs”), are valued at the last sale price or official closing price taken from the primary exchange in which each security trades. Investments in other mutual funds are valued at the closing NAV per share on the day of valuation. Debt securities are valued at bid quotes from broker/dealers or evaluated bid prices from pricing services, who may consider a number of inputs and factors, such as prices of comparable securities, yield curves, spreads, credit ratings, coupon rates, maturity, default rates, and underlying collateral. Futures are valued based on their daily settlement prices. Exchange-traded and over-the-counter (“OTC”) options are valued at the last sale price. Options with no last sale for the day are priced at mid quote. Swaps are valued at evaluated mid prices from pricing services.
The valuation of securities traded on foreign markets and certain fixed-income securities will generally be based on prices determined as of the earlier closing time of the markets on which they primarily trade unless a significant event has occurred. When the Fund holds securities or other assets that are denominated in a foreign currency, the Fund will normally use the currency exchange rates as of 4:00 p.m. ET.
Rule 2a-5 under the Investment Company Act (the “Valuation Rule”) establishes requirements for determining fair value in good faith for purposes of the Investment Company Act, including related oversight and reporting requirements. The Valuation Rule also defines when market quotations are “readily available,” which is the threshold for determining whether a Fund must fair value a security. Among other things, the Valuation Rule permits the Board to designate the Manager as Valuation Designee to perform the Fund’s fair value determinations subject to board oversight and certain reporting and other requirements intended to ensure that the Board receives the information it needs to oversee the Manager’s fair value determinations. Effective September 8, 2022, the Board has designated the Manager as valuation designee to perform fair value functions in accordance with the requirements of the Valuation Rule.
32
American Beacon Small Cap Value FundSM
Notes to Financial Statements
October 31, 2023
Securities may be valued at fair value, as determined in good faith and pursuant to the Manager’s procedures, under certain limited circumstances. For example, fair value pricing will be used for fixed-income securities and when market quotations are not readily available or reliable, as determined by the Manager, such as when (i) trading for a security is restricted or stopped; (ii) a security’s trading market is closed (other than customary closings); or (iii) a security has been de-listed from a national exchange. A security with limited market liquidity may require fair value pricing if the Manager determines that the available price does not reflect the security’s true market value. In addition, if a significant event that the Manager determines to affect the value of one or more securities held by the Fund occurs after the close of a related exchange but before the determination of the Fund’s NAV, fair value pricing may be used on the affected security or securities. Securities of small-capitalization companies are also more likely to require a fair value determination using these procedures because they are more thinly traded and less liquid than the securities of larger-capitalization companies. The Fund may fair value securities as a result of significant events occurring after the close of the foreign markets in which the Fund invests as described below. In addition, the Fund may invest in illiquid securities requiring these procedures.
The Fund may use fair value pricing for securities primarily traded in non-U.S. markets because most foreign markets close well before the Fund’s pricing time of 4:00 p.m. ET. The earlier close of these foreign markets gives rise to the possibility that significant events, including broad market moves, may have occurred in the interim and may materially affect the value of those securities. If the Manager determines that the last quoted prices of non-U.S. securities will, in its judgment, materially affect the value of some or all the Fund’s portfolio securities, the Manager can adjust the previous closing prices to reflect what it believes to be the fair value of the securities as of the close of the Exchange. In deciding whether it is necessary to adjust closing prices to reflect fair value, the Manager reviews a variety of factors, including developments in foreign markets, the performance of U.S. securities markets, and the performance of instruments trading in U.S. markets that represent foreign securities and baskets of foreign securities. These securities are fair valued using a pricing service, using methods approved by the Manager, that considers the correlation of the trading patterns of the foreign security to intraday trading in the U.S. markets, based on indices of domestic securities and other appropriate indicators such as prices of relevant American Depositary Receipts (“ADRs”) and futures contracts. The Manager’s Valuation Committee may also fair value securities in other situations, such as when a particular foreign market is closed but the Fund is open. The Fund uses outside pricing services to provide closing prices and information to evaluate and/or adjust those prices. As a means of evaluating its security valuation process, the Valuation Committee routinely compares closing prices, the next day’s opening prices in the same markets and adjusted prices.
Attempts to determine the fair value of securities introduce an element of subjectivity to the pricing of securities. As a result, the price of a security determined through fair valuation techniques may differ from the price quoted or published by other sources and may not accurately reflect the market value of the security when trading resumes. If a reliable market quotation becomes available for a security formerly valued through fair valuation techniques, the Manager compares the new market quotation to the fair value price to evaluate the effectiveness of the Fund’s fair valuation procedures. If any significant discrepancies are found, the Manager may adjust Manager’s fair valuation procedures for the Fund.
Valuation Inputs
Various inputs may be used to determine the fair value of the Fund’s investments. These inputs are summarized in three broad levels for financial statement purposes. The inputs or methodologies used to value securities are not necessarily an indication of the risk associated with investing in those securities.
| | | | |
| Level 1 | | - | | Quoted prices in active markets for identical securities. |
| | |
| Level 2 | | - | | Prices determined using other significant observable inputs. These may include quoted prices for similar securities, interest rates, prepayment speeds, credit risk, and others. |
| | |
| Level 3 | | - | | Prices determined using other significant unobservable inputs. Unobservable inputs reflect the Fund’s own assumptions about the factors market participants would use in pricing an investment. |
33
American Beacon Small Cap Value FundSM
Notes to Financial Statements
October 31, 2023
Level 1 and Level 2 trading assets and trading liabilities, at fair value
Common stocks, ETFs, preferred securities and financial derivative instruments, such as futures contracts that are traded on a national securities exchange, are stated at the last reported sale or settlement price on the day of valuation. To the extent these securities are actively traded and valuation adjustments are not applied, they are categorized as Level 1 of the fair value hierarchy. Preferred securities and other equities traded on inactive markets or valued by reference to similar instruments are generally categorized as Level 2 of the fair value hierarchy.
Investments in registered open-end investment management companies will be valued based upon the NAVs of such investments and are categorized as Level 1 of the fair value hierarchy.
4. Securities and Other Investments
Common Stock
Common stock generally takes the form of shares in a corporation which represent an ownership interest. It ranks below preferred stock and debt securities in claims for dividends and for assets of the company in a liquidation or bankruptcy. The value of a company’s common stock may fall as a result of factors directly relating to that company, such as decisions made by its management or decreased demand for the company’s products or services. A stock’s value may also decline because of factors affecting not just the company, but also companies in the same industry or sector. The price of a company’s stock may also be affected by changes in financial markets that are relatively unrelated to the company, such as changes in interest rates, currency exchange rates or industry regulation. Companies that elect to pay dividends on their common stock generally only do so after they invest in their own business and make required payments to bondholders and on other debt and preferred stock. Therefore, the value of a company’s common stock will usually be more volatile than its bonds, other debt and preferred stock. Common stock may be exchange-traded or OTC. OTC stock may be less liquid than exchange-traded stock.
Depositary Receipts and U.S. Dollar-Denominated Foreign Stocks Traded on U.S. Exchanges
ADRs are U.S. dollar-denominated receipts issued generally by domestic banks and represent the deposit with the bank of a security of a foreign issuer. Depositary receipts may not be denominated in the same currency as the securities into which they may be converted. Investing in depositary receipts entails substantially the same risks as direct investment in foreign securities. There is generally less publicly available information about foreign companies and there may be less governmental regulation and supervision of foreign stock exchanges, brokers, and listed companies. In addition, such companies may use different accounting and financial standards (and certain currencies may become unavailable for transfer from a foreign currency), resulting in the Fund’s possible inability to convert immediately into U.S. currency proceeds realized upon the sale of portfolio securities of the affected foreign companies. In addition, the Fund may invest in unsponsored depositary receipts, the issuers of which are not obligated to disclose material information about the underlying securities to investors in the United States. Ownership of unsponsored depositary receipts may not entitle the Fund to the same benefits and rights as ownership of a sponsored depositary receipt or the underlying security.
Other Investment Company Securities and Other Exchange-Traded Products
The Fund may invest in shares of other investment companies, including open-end funds, closed-end funds, business development companies (“BDCs”), ETFs, unit investment trusts, and other investment companies of the Trust. The Fund may invest in securities of an investment company advised by the Manager or the Sub-Advisor. Investments in the securities of other investment companies may involve duplication of advisory fees and certain other expenses. By investing in another investment company, the Fund becomes a shareholder of that investment company. As a result, the Fund shareholders indirectly will bear the Fund’s proportionate share of the fees and expenses paid by shareholders of the other investment company, in addition to the fees and expenses the Fund
34
American Beacon Small Cap Value FundSM
Notes to Financial Statements
October 31, 2023
shareholders directly bear in connection with the Fund’s own operations. These other fees and expenses are reflected as Acquired Fund Fees and Expenses and are included in the Fees and Expenses Table for the Fund in its Prospectus, if applicable. Investments in other investment companies may involve the payment of substantial premiums above the value of such issuer’s portfolio securities.
Publicly Traded Partnerships/Master Limited Partnerships (“MLPs”)
The Fund may invest in publicly traded partnerships such as MLPs. MLPs issue units that are registered with the SEC and are freely tradable on a securities exchange or in the OTC market. An MLP may have one or more general partners, who conduct the business, and one or more limited partners, who contribute capital. The general partner or partners are jointly and severally responsible for the liabilities of the MLP. (An MLP also may be an entity similar to a limited partnership, such as an LLC, which has one or more managers or managing members and non-managing members (who are like limited partners)). The Fund invests in an MLP as a limited partner and normally would not be liable for the debts of an MLP beyond the amount the Fund has invested therein, but it would not be shielded to the same extent that a shareholder of a corporation would be. In certain instances, creditors of an MLP would have the right to seek a return of capital that had been distributed to a limited partner. The right of an MLP’s creditors would continue even after the Fund had sold its investment in the partnership. MLPs typically invest in real estate and oil and gas equipment leasing assets, but they also finance entertainment, research and development, and other projects.
Real Estate Investment Trusts (“REITs”)
REITs are pooled investment vehicles that own, and often operate, income producing real estate (known as “equity REITs”) or invest in mortgages secured by loans on such real estate (known as “mortgage REITs”) or both (known as “hybrid REITs”). REITs are susceptible to the risks associated with direct ownership of real estate, such as declines in property values, increase in property taxes, operating expenses, rising interest rates or overbuilding, zoning changes, and losses from casualty or condemnation. REITs typically are subject to management fees and other expenses that are separate from those of the Fund.
5. Financial Derivative Instruments
The Fund may utilize derivative instruments to gain market exposure on cash balances or reduce market exposure in anticipation of liquidity needs. When considering the Fund’s use of derivatives, it is important to note that the Fund does not use derivatives for the purpose of creating financial leverage.
Futures Contracts
A futures contract is a contract to purchase or sell a particular security, or the cash value of an asset, such as securities, indices, or currencies, at a specified future date at a price agreed upon when the contract is made. Under many such contracts, no delivery of the actual underlying asset is required. Rather, upon the expiration of the contract, settlement is made by exchanging cash in an amount equal to the difference between the contract price and the closing price of the asset (e.g., a security or an index) at expiration, net of the initial and variation margin that was previously paid. An equity index futures contract is based on the value of an underlying index. The Fund may, from time to time, use futures positions to equitize cash and expose its portfolio to changes in securities prices or index prices. This can magnify gains and losses in the Fund. The Fund also may have to sell assets at inopportune times to satisfy its settlement or collateral obligations. The risks associated with the use of futures contracts also include that there may be an imperfect correlation between the changes in market value of the prices of futures contracts and the assets underlying such contracts and that there may not be a liquid secondary market for a futures contract.
During the year ended October 31, 2023, the Fund entered into futures contracts primarily for exposing cash to markets.
35
American Beacon Small Cap Value FundSM
Notes to Financial Statements
October 31, 2023
The Fund’s average futures contracts outstanding fluctuate throughout the operating year as required to meet strategic requirements. The following table illustrates the average quarterly volume of futures contracts. For the purpose of this disclosure, volume is measured by contracts outstanding at each quarter end.
| | | | |
Average Futures Contracts Outstanding | |
Fund | | Year Ended October 31, 2023 | |
Small Cap Value | | | 1,966 | |
The following is a summary of the fair valuations of the Fund’s derivative instruments categorized by risk exposure(1):
| | | | | | | | | | | | | | | | | | | | | | | | | | | | | | | | | | | | | | | | | | | | | | | | | | | | | | | |
| Fair values of financial instruments on the Statement of Assets and Liabilities as of October 31, 2023: | |
| |
| | | Derivatives not accounted for as hedging instruments |
| | | | | | | | | | | |
Liabilities: | | Credit contracts | | | | Foreign exchange
contracts | | | | Commodity
contracts | | | | Interest rate
contracts | | | | Equity contracts | | | | Total |
| Payable for variation margin from open futures contracts(2) | | | $ | - | | | | | | | | | $ | - | | | | | | | | | $ | - | | | | | | | | | $ | - | | | | | | | | | $ | (15,116,216 | ) | | | | | | | | $ | (15,116,216 | ) |
| | | | | | | | | | | | | | | | | | | | | | | | | | | | | | | | | | | | | | | | | | | | | | | | | | | | | | | |
| The effect of financial derivative instruments on the Statement of Operations as of October 31, 2023: | |
| |
| | | Derivatives not accounted for as hedging instruments |
| | | | | | | | | | | |
Realized gain (loss) from derivatives
recognized as a result of operations | | Credit contracts | | | | Foreign exchange
contracts | | | | Commodity
contracts | | | | Interest rate
contracts | | | | Equity contracts | | | | Total |
| Futures contracts | | | $ | - | | | | | | | | | $ | - | | | | | | | | | $ | - | | | | | | | | | $ | - | | | | | | | | | $ | (10,641,725 | ) | | | | | | | | $ | (10,641,725 | ) |
| | | | | | | | | | | |
Net change in unrealized
appreciation (depreciation) of
derivatives recognized as a result
from operations: | | Credit contracts | | | | Foreign exchange
contracts | | | | Commodity
contracts | | | | Interest rate
contracts | | | | Equity contracts | | | | Total |
| Futures contracts | | | $ | - | | | | | | | | | $ | - | | | | | | | | | $ | - | | | | | | | | | $ | - | | | | | | | | | $ | (19,315,907 | ) | | | | | | | | $ | (19,315,907 | ) |
(1) See Note 3 in the Notes to Financial Statements for additional information.
(2) Includes cumulative appreciation (depreciation) of futures contracts as reported in the Fund’s Schedule of Investments footnotes. Only current day’s variation margin is reported within the Statement of Assets and Liabilities.
Offsetting Assets and Liabilities
The Fund is a party to enforceable master netting agreements between brokers and counterparties which provide for the right to offset under certain circumstances. The Fund employs multiple money managers and counterparties and has elected not to offset qualifying financial and derivative instruments on the Statement of Assets and Liabilities, as such all financial and derivative instruments are presented on a gross basis. The impacts of netting arrangements that provide the right to offset are detailed below, if applicable. The net amount represents the net receivable or payable that would be due from or to the counterparty in the event of default. Exposure from borrowings and other financing agreements such as repurchase agreements can only be netted across transactions governed by the same Master Agreement with the same legal entity. All amounts reported below represent the balance as of the report date, October 31, 2023.
| | | | | | | | | | | | |
| Offsetting of Financial and Derivative Assets as of October 31, 2023: | |
| | Assets | | | | | | Liabilities | |
| Futures Contracts(1) | | $ | - | | | | | | | $ | 15,116,216 | |
| | | | | | | | | | | | |
| Total derivative assets and liabilities in the Statement of Assets and Liabilities | | $ | - | | | | | | | $ | 15,116,216 | |
| | | | | | | | | | | | |
| Derivatives not subject to a Master Netting Agreement or similar agreement (“MNA”) | | $ | - | | | | | | | $ | (15,116,216 | ) |
| | | | | | | | | | | | |
36
American Beacon Small Cap Value FundSM
Notes to Financial Statements
October 31, 2023
| | | | | | | | | | | | | | | | | | | | | | | | | | | | | | | | | | | | |
| | | Remaining Contractual Maturity of the Agreements
As of October 31, 2023 | |
| | | Overnight and
Continuous | | | | | | <30 days | | | | | | Between
30 & 90 days | | | | | | >90 days | | | | | | Total | |
Securities Lending Transactions | | | | | | | | | | | | | | | | | | | | | | | | | | | | | | | | | | | | |
Common Stocks | | $ | 23,784,921 | | | | | | | $ | - | | | | | | | $ | - | | | | | | | $ | - | | | | | | | $ | 23,784,921 | |
| | | | | | | | | | | | | | | | | | | | | | | | | | | | | | | | | | | | |
Total Borrowings | | $ | 23,784,921 | | | | | | | $ | - | | | | | | | $ | - | | | | | | | $ | - | | | | | | | $ | 23,784,921 | |
| | | | | | | | | | | | | | | | | | | | | | | | | | | | | | | | | | | | |
Gross amount of recognized liabilities for securities lending transactions | | | $ | 23,784,921 | |
| | | | | | | | | | | | | | | | | | | | | | | | | | | | | | | | | | | | |
(1) Includes cumulative appreciation or (depreciation) of futures contracts as reported in the Schedule of Investments footnotes. Only current day’s variation margin is reported within the Statement of Assets and Liabilities.
6. Principal Risks
Investing in the Fund may involve certain risks including, but not limited to, those described below.
Environmental, Social, and/or Governance Investing Risk
The use of environmental, social, and/or governance (“ESG”) considerations by a sub-advisor may cause the Fund to make different investments than funds that have a similar investment style but do not incorporate such considerations in their strategy. As with the use of any investment considerations involved in investment decisions, there is no guarantee that the use of any ESG investment considerations will result in the selection of issuers that will outperform other issuers or help reduce risk in the Fund. The Fund may underperform funds that do not incorporate these considerations.
Equity Investments Risk
Equity securities are subject to market risk. The Fund’s investments in equity securities may include common stocks, preferred stocks, securities convertible into or exchangeable for common stocks, REITs, depositary receipts, and U.S. dollar-denominated foreign stocks traded on U.S. exchanges. Such investments may expose the Fund to additional risk. The value of a company’s common stock may fall as a result of factors affecting the company, companies in the same industry or sector, or the financial markets overall. Common stock generally is subordinate to preferred stock upon the liquidation or bankruptcy of the issuing company. Preferred stocks and convertible securities are sensitive to movements in interest rates. Preferred stocks may be less liquid than common stocks and, unlike common stocks, participation in the growth of an issuer may be limited. Distributions on preferred stocks generally are payable at the discretion of an issuer and after required payments to bond holders. Convertible securities are subject to the risk that the credit standing of the issuer may have an effect on the convertible securities’ investment value. Investments in REITs are subject to the risks associated with investing in the real estate industry such as adverse developments affecting the real estate industry and real property values. Depositary receipts and U.S. dollar-denominated foreign stocks traded on U.S. exchanges are subject to certain of the risks associated with investing directly in foreign securities, including, but not limited to, currency fluctuations and political and financial instability in the home country of a particular depositary receipt, less liquidity and more volatility, less government regulation and supervision and delays in transaction settlement.
Foreign Investing Risk
Non-U.S. investments carry potential risks not associated with U.S. investments. Such risks include, but are not limited to: (1) currency exchange rate fluctuations, (2) political and financial instability, (3) less liquidity, (4) lack of uniform accounting, auditing and financial reporting standards, (5) increased volatility, (6) different government regulation and supervision of foreign stock exchanges, brokers and listed companies, and (7) delays in transaction settlement in some foreign markets. To the extent the Fund invests a significant portion of its assets in securities of a single country or region, it is more likely to be affected by events or conditions of that country or region.
37
American Beacon Small Cap Value FundSM
Notes to Financial Statements
October 31, 2023
Futures Contracts Risk
Futures contracts are derivative instruments where one party pays a fixed price for an agreed amount of securities or other underlying assets at an agreed date. The use of such derivative instruments may expose the Fund to additional risks that it would not be subject to if it invested directly in the securities underlying those derivatives. There may at times be an imperfect correlation between the movement in the prices of futures contracts and the value of their underlying instruments or indexes. There can be no assurance that any strategy used will succeed. There also can be no assurance that, at all times, a liquid market will exist for offsetting a futures contract that the Fund has previously bought or sold and this may result in the inability to close a futures contract when desired. Futures contracts may experience potentially dramatic price changes, which will increase the volatility of the Fund and may involve a small investment of cash (the amount of initial and variation margin) relative to the magnitude of the risk assumed (the potential increase or decrease in the price of the futures contract).
Market Risk
The Fund is subject to the risk that the securities markets will move down, sometimes rapidly and unpredictably, based on overall economic conditions and other factors, which may negatively affect the Fund’s performance. Equity securities generally have greater price volatility than fixed-income securities, although under certain market conditions fixed-income securities may have comparable or greater price volatility. During a general downturn in the securities markets, multiple assets may decline in value simultaneously. In some cases, traditional market participants have been less willing to make a market in some types of debt instruments, which has affected the liquidity of those instruments. During times of market turmoil, investors tend to look to the safety of securities issued or backed by the U.S. Treasury, causing the prices of these securities to rise and the yields to decline. Reduced liquidity in fixed-income and credit markets may negatively affect many issuers worldwide. Prices in many financial markets have increased significantly over the last decade, but there have also been periods of adverse market and financial developments and cyclical change during that timeframe, which have resulted in unusually high levels of volatility in domestic and foreign financial markets that has caused losses for investors and may occur again in the future, particularly if markets enter a period of uncertainty or economic weakness. The value of a security may decline due to adverse issuer-specific conditions, general market conditions unrelated to a particular issuer, or factors that affect a particular industry or industries. Changes in the financial condition of a single issuer or market segment also can impact the market as a whole.
Geopolitical and other events, including war, terrorism, economic uncertainty, trade disputes, pandemics, public health crises, natural disasters and related events have led, and in the future may continue to lead, to instability in world economies and markets generally and reduced liquidity in equity, credit and fixed-income markets, which may disrupt economies and markets and adversely affect the value of your investment. Changes in value may be temporary or may last for extended periods.
Policy changes by the U.S. government and/or Federal Reserve and political events within the U.S. and abroad, including the U.S. presidential election, the U.S. government’s inability at times to agree on a long-term budget and deficit reduction plan, the threat of a federal government shutdown and threats not to increase the federal government’s debt limit, may affect investor and consumer confidence and may adversely impact financial markets and the broader economy, perhaps suddenly and to a significant degree.
Markets and market participants are increasingly reliant upon both publicly available and proprietary information data systems. Data imprecision, software or other technology malfunctions, programming inaccuracies, unauthorized use or access, and similar circumstances may impair the performance of these systems and may have an adverse impact upon a single issuer, a group of issuers, or the market at large. The financial markets generally move in cycles, with periods of rising prices followed by periods of declining prices. The value of your investment may reflect these fluctuations.
38
American Beacon Small Cap Value FundSM
Notes to Financial Statements
October 31, 2023
Multiple Sub-Advisor Risk
The Manager may allocate the Fund’s assets among multiple sub-advisors, each of which is responsible for investing its allocated portion of the Fund’s assets. To a significant extent, the Fund’s performance will depend on the success of the Manager in allocating the Fund’s assets to sub-advisors and its selection and oversight of the sub-advisors. Because each sub-advisor manages its allocated portion of the Fund independently from another sub-advisor, the same security may be held in different portions of the Fund, or may be acquired for one portion of the Fund at a time when a sub-advisor to another portion deems it appropriate to dispose of the security from that other portion, resulting in higher expenses without accomplishing any net result in the Fund’s holdings. Similarly, under some market conditions, one sub-advisor may believe that temporary, defensive investments in short-term instruments or cash are appropriate when another sub-advisor believes continued exposure to the equity or debt markets is appropriate for its allocated portion of the Fund. Because each sub-advisor directs the trading for its own portion of the Fund, and does not aggregate its transactions with those of the other sub-advisors, the Fund may incur higher brokerage costs than would be the case if a single sub-adviser were managing the entire Fund. In addition, while the Manager seeks to allocate the Fund’s assets among the Fund’s sub-advisors in a manner that it believes is consistent with achieving the Fund’s investment objective(s), the Manager may be subject to potential conflicts of interest in allocating the Fund’s assets among sub-advisors, due to factors that could impact the Manager’s revenues and profits.
Other Investment Companies Risk
The Fund may invest in shares of other registered investment companies, including money market funds and ETFs. To the extent that the Fund invests in shares of other registered investment companies, the Fund will indirectly bear the fees and expenses, including for example, advisory and administrative fees, charged by those investment companies in addition to the Fund’s direct fees and expenses and will be subject to the risks associated with investments in those companies. For example, the Fund’s investments in money market funds are subject to interest rate risk, credit risk, and market risk. The Fund must rely on the investment company in which it invests to achieve its investment objective. If the investment company fails to achieve its investment objective, the value of the Fund’s investment may decline, adversely affecting the Fund’s performance. ETFs are subject to the following risks that do not apply to conventional funds: (1) the market price of an ETF’s shares may trade at a discount or premium to its NAV; (2) an active trading market for an ETF’s shares may not develop or be maintained; or (3) trading of an ETF’s shares may be halted if the listing exchange’s officials deem such action appropriate, the shares are delisted from the exchange, or the activation of market-wide “circuit breakers” (which are tied to large decreases in stock prices) halts stock trading generally. An ETF that tracks an index may not precisely replicate the returns of its benchmark index. To the extent the Fund invests in other investment companies that invest in equity securities, fixed-income securities and/or foreign securities, or that track an index, the Fund is subject to the risks associated with the underlying investments held by the investment company or the index fluctuations to which the investment company is subject. ETFs have expenses associated with their operation, typically including advisory fees.
Recent Market Events Risk
Both U.S. and international markets have experienced significant volatility in recent months and years. As a result of such volatility, investment returns may fluctuate significantly. Moreover, the risks discussed herein associated with an investment in the Fund may be increased.
Although interest rates were unusually low in recent years in the U.S. and abroad, in 2022, the Federal Reserve and certain foreign central banks began to raise interest rates as part of their efforts to address rising inflation. It is difficult to accurately predict the pace at which interest rates may continue to increase, the timing, frequency or magnitude of any such increases, or when such increases might stop. Additionally, various economic and political factors could cause the Federal Reserve or another foreign central bank to change their approach in the future and such actions may result in an economic slowdown in the U.S. and abroad. Unexpected increases in
39
American Beacon Small Cap Value FundSM
Notes to Financial Statements
October 31, 2023
interest rates could lead to market volatility or reduce liquidity in certain sectors of the market. Deteriorating economic fundamentals may, in turn, increase the risk of default or insolvency of particular issuers, negatively impact market value, cause credit spreads to widen, and reduce bank balance sheets. Any of these could cause an increase in market volatility, reduce liquidity across various markets or decrease confidence in the markets. Additionally, high public debt in the U.S. and other countries creates ongoing systemic and market risks and policymaking uncertainty.
In March 2023, the shutdown of certain financial institutions in the U.S. and questions regarding the viability of other financial institutions raised economic concerns over disruption in the U.S. and global banking systems. There can be no certainty that the actions taken by the U.S. or foreign governments will be effective in mitigating the effects of financial institution failures on the economy and restoring public confidence in the U.S. and global banking systems. Some countries, including the U.S., have in recent years adopted more protectionist trade policies. Slowing global economic growth; risks associated with a trade agreement between the United Kingdom and the European Union; the risks associated with ongoing trade negotiations with China; and the possibility of changes to some international trade agreements; political or economic dysfunction within some nations, including major producers of oil; and dramatic changes in commodity and currency prices could have adverse effects that cannot be foreseen at the present time.
Tensions, war, or open conflict between nations, such as between Russia and Ukraine, in the Middle East or in eastern Asia could affect the economies of many nations, including the United States. The duration of ongoing hostilities in the Middle East and between Russia and Ukraine, and any sanctions and related events cannot be predicted. Those events present material uncertainty and risk with respect to markets globally and the performance of the Fund and its investments or operations could be negatively impacted.
Regulators in the U.S. have proposed and recently adopted a number of changes to regulations involving the markets and issuers, some of which apply to the Fund. The full effect of various newly-adopted regulations is not currently known. Additionally, it is not clear whether the proposed regulations will be adopted. However, due to the broad scope of the new and proposed regulations, certain changes could limit the Fund’s ability to pursue its investment strategies or make certain investments, or may make it more costly for the Fund to operate, which may impact performance.
Economists and others have expressed increasing concern about the potential effects of global climate change on property and security values. Certain issuers, industries and regions may be adversely affected by the impacts of climate change, including on the demand for and the development of goods and services and related production costs, and the impacts of legislation, regulation and international accords related to climate change, as well as any indirect consequences of regulation or business trends driven by climate change.
Sector Risk
Sector risk is the risk associated with the Fund holding a significant amount of investments in similar businesses, which would be similarly affected by particular economic or market events, which may, in certain circumstances, cause the value of the equity and debt securities of companies in a particular sector of the market to change. To the extent the Fund has substantial holdings within a particular sector, the risks to the Fund associated with that sector increase.
To the extent the Fund invests significantly in the financial services sector, the value of the Fund’s shares may be particularly vulnerable to factors affecting that sector, such as the availability and cost of capital funds, changes in interest rates, the rate of corporate and consumer debt defaults, extensive government regulation and price competition. The value of the Fund’s shares could experience significantly greater volatility than investment companies investing more broadly.
40
American Beacon Small Cap Value FundSM
Notes to Financial Statements
October 31, 2023
Securities Lending Risk
The Fund may lend its portfolio securities to brokers, dealers and financial institutions in order to obtain additional income. Borrowers of the Fund’s securities provide collateral either in the form of cash, which the Fund reinvests in securities or in the form of non-cash collateral consisting of securities issued or guaranteed by the U.S. government or one of its agencies or instrumentalities. The Fund will be responsible for the risks associated with the investment of cash collateral, including any collateral invested in an affiliated money market fund. The Fund may lose money on its investment of cash collateral or may fail to earn sufficient income on its investment to cover its payment to the borrower of a pre-negotiated fee or “rebate” for the use of that cash collateral in connection with the loan. The Fund could also lose money due to a decline in the value of non-cash collateral. In addition, delays may occur in the recovery of securities from borrowers, which could interfere with the Fund’s ability to vote proxies or to settle transactions or could result in increased costs. Moreover, if the borrower becomes subject to insolvency or similar proceedings, the Fund could incur delays in its ability to enforce its rights in its collateral. There also is a risk that a borrower may default on its obligation to return loaned securities at a time when the value of the Fund’s collateral is inadequate. Although the Fund’s securities lending agent may indemnify the Fund against that risk, it is also possible that the securities lending agent will be unable to satisfy its indemnification obligations. In any case in which the loaned securities are not returned to the Fund before an ex-dividend date, whether or not due to a default by the borrower, the payment in lieu of the dividend that the Fund receives from the securities’ borrower would not be treated as a dividend for federal income tax purposes and thus would not qualify for treatment as “qualified dividend income.”
7. Federal Income and Excise Taxes
It is the policy of the Fund to qualify as a regulated investment company (“RIC”), by complying with all applicable provisions of Subchapter M of the Internal Revenue Code, as amended, and to make distributions of taxable income sufficient to relieve it from substantially all federal income and excise taxes. For federal income tax purposes, the Fund is treated as a single entity for the purpose of determining such qualification.
The Fund does not have any unrecorded tax liabilities in the accompanying financial statements. Each of the tax years in the four year period ended October 31, 2023 remain subject to examination by the Internal Revenue Service. If applicable, the Fund recognizes interest accrued related to unrecognized tax benefits in interest expense and penalties in “Other expenses” on the Statement of Operations.
The Fund may be subject to taxes imposed by countries in which it invests. Such taxes are generally based on returns of income earned or gains realized or repatriated. Taxes are accrued and applied to net investment income, net realized capital gains and net unrealized appreciation (depreciation), as applicable, as the income is earned or capital gains are recorded.
Dividends are categorized in accordance with income tax regulations which may treat certain transactions differently than U.S. GAAP. Accordingly, the character of distributions and composition of net assets for tax purposes may differ from those reflected in the accompanying financial statements.
The tax character of distributions paid were as follows:
| | | | | | | | | | | | |
| | | Year Ended
October 31, 2023 | | | | | | Year Ended
October 31, 2022 | |
Distributions paid from: | | | | | | | | | | | | |
Ordinary income* | | | | | | | | | | | | |
R5 Class | | $ | 32,743,510 | | | | | | | $ | 164,287,101 | |
Y Class | | | 6,211,878 | | | | | | | | 12,785,145 | |
Investor Class | | | 3,433,341 | | | | | | | | 17,245,639 | |
Advisor Class | | | 351,820 | | | | | | | | 1,620,504 | |
A Class | | | 452,172 | | | | | | | | 3,057,181 | |
C Class | | | 52,058 | | | | | | | | 467,844 | |
R6 Class | | | 23,648,255 | | | | | | | | 93,342,009 | |
41
American Beacon Small Cap Value FundSM
Notes to Financial Statements
October 31, 2023
| | | | | | | | | | | | |
| | | Year Ended
October 31, 2023 | | | | | | Year Ended
October 31, 2022 | |
Long-term capital gains | | | | | | | | | | | | |
R5 Class | | $ | 293,340,268 | | | | | | | $ | 193,136,972 | |
Y Class | | | 57,784,823 | | | | | | | | 15,243,913 | |
Investor Class | | | 39,479,938 | | | | | | | | 21,824,143 | |
Advisor Class | | | 4,605,636 | | | | | | | | 2,186,578 | |
A Class | | | 5,964,736 | | | | | | | | 3,913,573 | |
C Class | | | 1,371,948 | | | | | | | | 651,708 | |
R6 Class | | | 207,436,455 | | | | | | | | 109,049,651 | |
| | | | | | | | | | | | |
Total distributions paid | | $ | 676,876,838 | | | | | | | $ | 638,811,961 | |
| | | | | | | | | | | | |
* For tax purposes, short-term capital gains are considered ordinary income distributions.
As of October 31, 2023, the components of distributable earnings (deficits) on a tax basis were as follows:
| | | | | | | | | | | | | | | | | | | | | | | | | | | | |
Fund | | Tax Cost | | | | | | Unrealized
Appreciation | | | | | | Unrealized
(Depreciation) | | | | | | Net Unrealized
Appreciation
(Depreciation) | |
Small Cap Value | | $ | 4,172,145,331 | | | | | | | $ | 483,660,816 | | | | | | | $ | (512,778,967 | ) | | | | | | $ | (29,118,151 | ) |
| | | | | | | | | | | | | | | | | | | | | | | | | | | | | | | | | | | | | | | | | | | | |
Fund | | Net Unrealized
Appreciation
(Depreciation) | | | | | | Undistributed
Ordinary
Income | | | | | | Undistributed
Long-Term
Capital Gains | | | | | | Accumulated
Capital and
Other (Losses) | | | | | | Other Temporary
Differences | | | | | | Distributable
Earnings | |
Small Cap Value | | $ | (29,118,151 | ) | | | | | | $ | 60,614,535 | | | | | | | $ | 150,870,190 | | | | | | | $ | - | | | | | | | $ | | | | | | | | $ | 182,366,574 | |
Financial reporting records are adjusted for permanent book/tax differences to reflect tax character. Financial records are not adjusted for temporary differences. The temporary differences between financial reporting and tax-basis reporting of unrealized appreciation (depreciation) are attributable primarily to the tax deferral of losses from wash sales, the realization for tax purposes of unrealized gains from passive foreign investment companies and reclassifications of income from investments in real estate investment securities and publicly traded partnerships.
Due to inherent differences in the recognition of income, expenses, and realized gains (losses) under U.S. GAAP and federal income tax regulations, permanent differences between book and tax reporting have been identified and appropriately reclassified on the Statement of Assets and Liabilities.
Accordingly, the following amounts represent current year permanent differences derived from tax-exempt interest and nondeductible expenses from investments in publicly traded partnerships and equalization as of October 31, 2023:
| | | | | | | | |
Fund | | Paid-In-Capital | | | Distributable
Earnings/(Deficits) | |
Small Cap Value | | $ | 17,335,050 | | | $ | (17,335,050 | ) |
For federal income tax purposes, the Fund measures its capital loss carryforwards annually at October 31, its fiscal year end. Capital loss carryforwards retain their character as short-term and/or long-term and may be carried forward and applied against future realized capital gains with no expiration date.
As of October 31, 2023, the Fund did not have any capital loss carryforwards.
42
American Beacon Small Cap Value FundSM
Notes to Financial Statements
October 31, 2023
8. Investment Transactions
The aggregate cost of purchases and proceeds from sales and maturities of investments, other than short-term obligations, for the year ended October 31, 2023 were as follows:
| | | | | | | | |
Fund | | Purchases
(non-U.S.
Government
Securities) | | | Sales
(non-U.S.
Government
Securities) | |
Small Cap Value | | $ | 2,267,218,767 | | | $ | 2,485,979,562 | |
A summary of the Fund’s transactions in the USG Select Fund for the year ended October 31, 2023 were as follows:
| | | | | | | | | | | | | | | | | | | | | | | | | | | | | | | | | | |
Fund | | Type of
Transaction | | | | | October 31,
2022
Shares/Fair
Value | | | | | | Purchases | | | | | | Sales | | | | | | October 31,
2023
Shares/Fair
Value | |
| Small Cap Value | | Direct | | | | | | $ | 179,000,571 | | | | | | | $ | 1,985,497,050 | | | | | | | $ | 1,959,734,327 | | | | | | | $ | 204,763,294 | |
| Small Cap Value | | Securities Lending | | | | | | | 19,585,521 | | | | | | | | 218,646,984 | | | | | | | | 214,447,584 | | | | | | | | 23,784,921 | |
9. Securities Lending
The Fund may lend its securities to qualified financial institutions, such as certain broker-dealers, to earn additional income. The borrowers are required to secure their loans continuously with collateral in an amount at least equal to the fair value of the securities loaned, initially in an amount at least equal to 102% of the fair value of domestic securities loaned and 105% of the fair value of international securities loaned. Collateral is monitored and marked-to-market daily. Daily mark-to-market amounts are required to be paid to the borrower or received from the borrower by the end of the following business day. This one day settlement for mark-to-market amounts may result in the collateral being temporarily less than the value of the securities on loan or temporarily more than the required minimum collateral.
To the extent that a loan is collateralized by cash, such cash collateral shall be invested by the securities lending agent (the “Agent”) in money market mutual funds and other short-term investments, provided the investments meet certain quality and diversification requirements. Securities purchased with cash collateral proceeds are listed in the Fund’s Schedule of Investments and the collateral is shown on the Statement of Assets and Liabilities as a payable.
Securities lending income is generated from the demand premium (if any) paid by the borrower to borrow a specific security and from the return on investment of cash collateral, reduced by negotiated rebate fees paid to the borrower and transaction costs. To the extent that a loan is secured by non-cash collateral, securities lending income is generated as a demand premium reduced by transaction costs. The Fund, the Agent, and the Manager retained 80%, 10%, and 10%, respectively, of the income generated from securities lending.
While securities are on loan, the Fund continues to receive certain income associated with that security and any gain or loss in the market price that may occur during the term of the loan. In the case of domestic equities, the value of any dividend is received in the form of a substitute payment approximately equal to the dividend. In the case of foreign securities, a negotiated amount is received that is less than the actual dividend, but higher than the dividend amount minus the foreign tax that the Fund would be subject to on the dividend.
Securities lending transactions pose certain risks to the Fund, including that the borrower may not provide additional collateral when required or return the securities when due, that the value of the short-term investments will be less than the amount of cash collateral required to be returned to the borrower, that non-cash collateral
43
American Beacon Small Cap Value FundSM
Notes to Financial Statements
October 31, 2023
may be subject to legal constraints in the event of a borrower bankruptcy, and that the cash collateral investments could become illiquid and unable to be used to return collateral to the borrower. The Fund could also experience delays and costs in gaining access to the collateral. The Fund bears the risk of any deficiency in the amount of the cash collateral available for return to the borrower and any action which impairs its ability to liquidate non-cash collateral to satisfy a borrower default.
As of October 31, 2023, the value of outstanding securities on loan and the value of collateral were as follows:
| | | | | | | | | | | | | | | | | | | | | | | | | | | | |
Fund | | Fair Value of
Securities on Loan | | | | | | Cash Collateral
Received | | | | | | Non-Cash Collateral
Received | | | | | | Total Collateral
Received | |
Small Cap Value | | $ | 48,254,458 | | | | | | | $ | 23,784,921 | | | | | | | $ | 25,535,646 | | | | | | | $ | 49,320,567 | |
Cash collateral is listed on the Fund’s Schedule of Investments and is shown on the Statement of Assets and Liabilities. Income earned on these investments is included in “Income derived from securities lending” on the Statement of Operations.
Non-cash collateral received by the Fund may not be sold or re-pledged except to satisfy a borrower default. Therefore, non-cash collateral is not included on the Fund’s Schedule of Investments or Statement of Assets and Liabilities.
10. Borrowing Arrangements
Effective November 10, 2023 (the “Effective Date”), the Fund, along with certain other funds managed by the Manager (“Participating Funds”), renewed a committed revolving line of credit (the “Committed Line”) agreement with State Street Bank and Trust Company (the “Bank”) to be used to facilitate portfolio liquidity. The maximum borrowing amount under the Committed Line is $100 million with interest at a rate equal to the higher of (a) Overnight Bank Funding Rate (“OBFR”) daily fluctuating rate per annum equal to 1.25% plus the sum of 0.10% or (b) the Federal Funds daily fluctuating rate per annum on amounts borrowed. Each of the Participating Funds paid a proportional amount of a quarterly commitment fee at a rate of 0.25% per annum on the unused portion of the Committed Line amount. The Committed Line expires November 8, 2024, unless extended by the Bank or terminated by the Participating Funds in accordance with the agreement.
On the Effective Date, the Fund, along with certain other Participating Funds managed by the Manager, also renewed an uncommitted discretionary demand revolving line of credit (the “Uncommitted Line”) agreement with the Bank to be used to facilitate portfolio liquidity. The maximum borrowing amount under the Uncommitted Line is $100 million with interest at a rate equal to the higher of (a) OBFR daily fluctuating rate per annum equal to 1.25% plus the sum of 0.10% or (b) the Federal Funds daily fluctuating rate per annum on amounts borrowed on each outstanding loan. Each of the Participating Funds paid a proportional amount of a closing fee of $35,000 on the Effective Date. The Uncommitted Line expires November 8, 2024, unless extended by the Bank or terminated by the Participating Funds in accordance with the agreement.
The Participating Funds paid administration, legal and arrangement fees, which are recognized as a component of “Loan expense” on the Statement of Operations, along with commitment fees, that have been allocated among the Participating Funds based on average daily net assets.
During the year ended October 31, 2023, the Fund did not utilize these facilities.
44
American Beacon Small Cap Value FundSM
Notes to Financial Statements
October 31, 2023
11. Capital Share Transactions
The tables below summarize the activity in capital shares for each Class of the Fund:
| | | | | | | | | | | | | | | | | | | | | | | | | | | | |
| | | R5 Class | |
| | | Year Ended October 31, | |
| | | 2023 | | | | | | 2022 | |
Small Cap Value Fund | | Shares | | | | | | Amount | | | | | | Shares | | | | | | Amount | |
| Shares sold | | | 16,023,370 | | | | | | | $ | 382,297,679 | | | | | | | | 14,609,426 | | | | | | | $ | 401,775,308 | |
| Reinvestment of dividends | | | 13,677,213 | | | | | | | | 303,497,363 | | | | | | | | 11,929,156 | | | | | | | | 334,851,407 | |
| Shares redeemed | | | (28,074,996 | ) | | | | | | | (665,420,420 | ) | | | | | | | (51,725,047 | ) | | | | | | | (1,432,501,991 | ) |
| | | | | | | | | | | | | | | | | | | | | | | | | | | | |
| Net increase (decrease) in shares outstanding | | | 1,625,587 | | | | | | | $ | 20,374,622 | | | | | | | | (25,186,465 | ) | | | | | | $ | (695,875,276 | ) |
| | | | | | | | | | | | | | | | | | | | | | | | | | | | |
| | | | |
| | | Y Class | |
| | | Year Ended October 31, | |
| | | 2023 | | | 2022 | |
Small Cap Value Fund | | Shares | | | | | | Amount | | | | | | Shares | | | | | | Amount | |
| Shares sold | | | 4,130,995 | | | | | | | $ | 96,442,821 | | | | | | | | 11,294,480 | | | | | | | $ | 297,266,327 | |
| Reinvestment of dividends | | | 2,834,617 | | | | | | | | 61,567,884 | | | | | | | | 947,000 | | | | | | | | 26,108,801 | |
| Shares redeemed | | | (6,565,174 | ) | | | | | | | (150,252,529 | ) | | | | | | | (4,356,048 | ) | | | | | | | (115,861,624 | ) |
| | | | | | | | | | | | | | | | | | | | | | | | | | | | |
| Net increase in shares outstanding | | | 400,438 | | | | | | | $ | 7,758,176 | | | | | | | | 7,885,432 | | | | | | | $ | 207,513,504 | |
| | | | | | | | | | | | | | | | | | | | | | | | | | | | |
| | | | |
| | | Investor Class | |
| | | Year Ended October 31, | |
| | | 2023 | | | 2022 | |
Small Cap Value Fund | | Shares | | | | | | Amount | | | | | | Shares | | | | | | Amount | |
| Shares sold | | | 2,539,215 | | | | | | | $ | 56,904,858 | | | | | | | | 2,268,052 | | | | | | | $ | 60,820,837 | |
| Reinvestment of dividends | | | 1,985,940 | | | | | | | | 41,625,307 | | | | | | | | 1,371,166 | | | | | | | | 36,678,687 | |
| Shares redeemed | | | (3,423,498 | ) | | | | | | | (76,432,322 | ) | | | | | | | (4,820,035 | ) | | | | | | | (127,493,799 | ) |
| | | | | | | | | | | | | | | | | | | | | | | | | | | | |
| Net increase (decrease) in shares outstanding | | | 1,101,657 | | | | | | | $ | 22,097,843 | | | | | | | | (1,180,817 | ) | | | | | | $ | (29,994,275 | ) |
| | | | | | | | | | | | | | | | | | | | | | | | | | | | |
| | | | |
| | | Advisor Class | |
| | | Year Ended October 31, | |
| | | 2023 | | | 2022 | |
Small Cap Value Fund | | Shares | | | | | | Amount | | | | | | Shares | | | | | | Amount | |
| Shares sold | | | 431,436 | | | | | | | $ | 9,772,480 | | | | | | | | 646,963 | | | | | | | $ | 17,496,956 | |
| Reinvestment of dividends | | | 240,420 | | | | | | | | 4,957,456 | | | | | | | | 144,317 | | | | | | | | 3,807,082 | |
| Shares redeemed | | | (705,870 | ) | | | | | | | (15,796,260 | ) | | | | | | | (609,666 | ) | | | | | | | (15,724,384 | ) |
| | | | | | | | | | | | | | | | | | | | | | | | | | | | |
| Net increase (decrease) in shares outstanding | | | (34,014 | ) | | | | | | $ | (1,066,324 | ) | | | | | | | 181,614 | | | | | | | $ | 5,579,654 | |
| | | | | | | | | | | | | | | | | | | | | | | | | | | | |
| | | | |
| | | A Class | |
| | | Year Ended October 31, | |
| | | 2023 | | | 2022 | |
Small Cap Value Fund | | Shares | | | | | | Amount | | | | | | Shares | | | | | | Amount | |
| Shares sold | | | 574,753 | | | | | | | $ | 12,701,046 | | | | | | | | 485,535 | | | | | | | $ | 12,525,731 | |
| Reinvestment of dividends | | | 311,738 | | | | | | | | 6,353,229 | | | | | | | | 265,394 | | | | | | | | 6,924,127 | |
| Shares redeemed | | | (963,167 | ) | | | | | | | (21,926,330 | ) | | | | | | | (964,427 | ) | | | | | | | (24,677,194 | ) |
| | | | | | | | | | | | | | | | | | | | | | | | | | | | |
| Net (decrease) in shares outstanding | | | (76,676 | ) | | | | | | $ | (2,872,055 | ) | | | | | | | (213,498 | ) | | | | | | $ | (5,227,336 | ) |
| | | | | | | | | | | | | | | | | | | | | | | | | | | | |
| | | | |
| | | C Class | |
| | | Year Ended October 31, | |
| | | 2023 | | | | | | 2022 | |
Small Cap Value Fund | | Shares | | | | | | Amount | | | | | | Shares | | | | | | Amount | |
| Shares sold | | | 55,288 | | | | | | | $ | 1,159,689 | | | | | | | | 71,426 | | | | | | | $ | 1,736,352 | |
| Reinvestment of dividends | | | 74,042 | | | | | | | | 1,401,614 | | | | | | | | 45,316 | | | | | | | | 1,112,972 | |
| Shares redeemed | | | (136,832 | ) | | | | | | | (2,733,032 | ) | | | | | | | (145,230 | ) | | | | | | | (3,676,773 | ) |
| | | | | | | | | | | | | | | | | | | | | | | | | | | | |
| Net (decrease) in shares outstanding | | | (7,502 | ) | | | | | | $ | (171,729 | ) | | | | | | | (28,488 | ) | | | | | | $ | (827,449 | ) |
| | | | | | | | | | | | | | | | | | | | | | | | | | | | |
| | | | |
45
American Beacon Small Cap Value FundSM
Notes to Financial Statements
October 31, 2023
| | | | | | | | | | | | | | | | | | | | | | | | | | | | |
| | | R6 Class | |
| | | Year Ended October 31, | |
| | | 2023 | | | 2022 | |
Small Cap Value Fund | | Shares | | | | | | Amount | | | | | | Shares | | | | | | Amount | |
| Shares sold | | | 28,669,350 | | | | | | | $ | 681,681,472 | | | | | | | | 16,843,167 | | | | | | | $ | 465,492,054 | |
| Reinvestment of dividends | | | 9,907,253 | | | | | | | | 219,742,881 | | | | | | | | 6,973,822 | | | | | | | | 195,685,426 | |
| Shares redeemed | | | (22,261,110 | ) | | | | | | | (516,295,668 | ) | | | | | | | (26,289,532 | ) | | | | | | | (687,783,333 | ) |
| | | | | | | | | | | | | | | | | | | | | | | | | | | | |
| Net increase (decrease) in shares outstanding | | | 16,315,493 | | | | | | | $ | 385,128,685 | | | | | | | | (2,472,543 | ) | | | | | | $ | (26,605,853 | ) |
| | | | | | | | | | | | | | | | | | | | | | | | | | | | |
| | | | |
12. Subsequent Events
At a special Board Meeting held on December 13, 2023, the Board of the Trust, approved an Interim Management Agreement pursuant to Rule 15a-4(b)(1) under the Act, whereby the Manager was appointed to serve as Manager and Administrator of the Trust for the Fund, under the terms and conditions set forth in the Interim Management Agreement, effective immediately after the closing of the Transaction resulting in the change of control of the Manager and through the earlier of 150 days following the Transaction or shareholder approval of the new Management Agreement previously approved by the Board on July 12, 2023. The Board further approved the appointment of Barrow, Hanley, Mewhinney & Strauss, LLC; Brandywine Global Investment Management, LLC; DePrince, Race & Zollo, Inc.; Hotchkis and Wiley Capital Management, LLC; and Newton Investment Management North America, L.L.C., (collectively, the “Advisors”) as investment advisors to the Fund in accordance with the Interim Investment Advisory Agreements amongst the Manager, the Advisors and the Trust, on behalf of the Fund, effective immediately after the closing of the Transaction, and through the earlier of 150 days following the Transaction or shareholder approval of the new Management Agreement previously approved by the Board on July 12, 2023.
46
American Beacon Small Cap Value FundSM
Financial Highlights
(For a share outstanding throughout the period)
| | | | | | | | | | | | | | | | | | | | | | | | | | | | | | | | | | | | |
| | | R5 ClassA | |
| | | Year Ended October 31, | |
| | | 2023 | | | | | | 2022B | | | | | | 2021 | | | | | | 2020 | | | | | | 2019 | |
| | | | |
Net asset value, beginning of period | | $ | 26.85 | | | | | | | $ | 31.19 | | | | | | | $ | 19.76 | | | | | | | $ | 23.13 | | | | | | | $ | 26.14 | |
| | | | | | | | | | | | | | | | | | | | | | | | | | | | | | | | | | | | |
Income (loss) from investment operations: | | | | | | | | | | | | | | | | | | | | | | | | | | | | | | | | | | | | |
Net investment income | | | 0.31 | | | | | | | | 0.31 | | | | | | | | 0.25 | | | | | | | | 0.26 | | | | | | | | 0.26 | |
Net gains (losses) on investments (both realized and unrealized) | | | (1.35 | ) | | | | | | | (1.25 | ) | | | | | | | 11.40 | | | | | | | | (3.18 | ) | | | | | | | (0.25 | ) |
| | | | | | | | | | | | | | | | | | | | | | | | | | | | | | | | | | | | |
Total income (loss) from investment operations | | | (1.04 | ) | | | | | | | (0.94 | ) | | | | | | | 11.65 | | | | | | | | (2.92 | ) | | | | | | | 0.01 | |
| | | | | | | | | | | | | | | | | | | | | | | | | | | | | | | | | | | | |
Less distributions: | | | | | | | | | | | | | | | | | | | | | | | | | | | | | | | | | | | | |
Dividends from net investment income | | | (0.40 | ) | | | | | | | (0.24 | ) | | | | | | | (0.22 | ) | | | | | | | (0.29 | ) | | | | | | | (0.18 | ) |
Distributions from net realized gains | | | (3.57 | ) | | | | | | | (3.16 | ) | | | | | | | - | | | | | | | | (0.16 | ) | | | | | | | (2.84 | ) |
| | | | | | | | | | | | | | | | | | | | | | | | | | | | | | | | | | | | |
Total distributions | | | (3.97 | ) | | | | | | | (3.40 | ) | | | | | | | (0.22 | ) | | | | | | | (0.45 | ) | | | | | | | (3.02 | ) |
| | | | | | | | | | | | | | | | | | | | | | | | | | | | | | | | | | | | |
Net asset value, end of period | | $ | 21.84 | | | | | | | $ | 26.85 | | | | | | | $ | 31.19 | | | | | | | $ | 19.76 | | | | | | | $ | 23.13 | |
| | | | | | | | | | | | | | | | | | | | | | | | | | | | | | | | | | | | |
Total returnC | | | (4.09 | )% | | | | | | | (3.49 | )% | | | | | | | 59.26 | % | | | | | | | (13.00 | )% | | | | | | | 2.01 | % |
| | | | | | | | | | | | | | | | | | | | | | | | | | | | | | | | | | | | |
|
Ratios and supplemental data: | |
Net assets, end of period | | $ | 1,851,818,875 | | | | | | | $ | 2,233,390,067 | | | | | | | $ | 3,380,005,813 | | | | | | | $ | 2,799,722,660 | | | | | | | $ | 4,073,332,655 | |
Ratios to average net assets: | | | | | | | | | | | | | | | | | | | | | | | | | | | | | | | | | | | | |
Expenses, before reimbursements and/or recoupments | | | 0.79 | % | | | | | | | 0.79 | % | | | | | | | 0.81 | % | | | | | | | 0.82 | % | | | | | | | 0.83 | % |
Expenses, net of reimbursements and/or recoupments | | | 0.79 | % | | | | | | | 0.79 | % | | | | | | | 0.81 | % | | | | | | | 0.82 | % | | | | | | | 0.83 | % |
Net investment income, before expense reimbursements and/or recoupments | | | 1.23 | % | | | | | | | 0.84 | % | | | | | | | 0.65 | % | | | | | | | 1.04 | % | | | | | | | 1.07 | % |
Net investment income, net of reimbursements and/or recoupments | | | 1.23 | % | | | | | | | 0.84 | % | | | | | | | 0.65 | % | | | | | | | 1.04 | % | | | | | | | 1.07 | % |
Portfolio turnover rate | | | 52 | % | | | | | | | 72 | % | | | | | | | 48 | % | | | | | | | 61 | % | | | | | | | 48 | % |
| A | Prior to February 28, 2020, the R5 Class was known as Institutional Class. |
| B | On February 8. 2022, Foundry Partners, LLC and Hillcrest Asset Management, LLC, were terminated and ceased managing assets of the Fund. On March 10, 2022, DePrince, Race & Zollo, Inc., began managing assets of the Fund. |
| C | Based on net asset value, which does not reflect the sales charge, redemption fee, or contingent deferred sales charge, if applicable. May include adjustments in accordance with U.S. GAAP and as such, the net asset value for reporting purposes and the returns based upon those net asset values may differ from the net asset value and returns for shareholder transactions. |
See accompanying notes
47
American Beacon Small Cap Value FundSM
Financial Highlights
(For a share outstanding throughout the period)
| | | | | | | | | | | | | | | | | | | | | | | | | | | | | | | | | | | | |
| | | Y Class | |
| | | Year Ended October 31, | |
| | | 2023 | | | | | | 2022A | | | | | | 2021 | | | | | | 2020 | | | | | | 2019 | |
| | | | |
Net asset value, beginning of period | | $ | 26.36 | | | | | | | $ | 30.68 | | | | | | | $ | 19.44 | | | | | | | $ | 22.76 | | | | | | | $ | 25.77 | |
| | | | | | | | | | | | | | | | | | | | | | | | | | | | | | | | | | | | |
Income (loss) from investment operations: | | | | | | | | | | | | | | | | | | | | | | | | | | | | | | | | | | | | |
Net investment income | | | 0.30 | | | | | | | | 0.22 | | | | | | | | 0.16 | | | | | | | | 0.22 | | | | | | | | 0.26 | |
Net gains (losses) on investments (both realized and unrealized) | | | (1.34 | ) | | | | | | | (1.16 | ) | | | | | | | 11.28 | | | | | | | | (3.11 | ) | | | | | | | (0.27 | ) |
| | | | | | | | | | | | | | | | | | | | | | | | | | | | | | | | | | | | |
Total income (loss) from investment operations | | | (1.04 | ) | | | | | | | (0.94 | ) | | | | | | | 11.44 | | | | | | | | (2.89 | ) | | | | | | | (0.01 | ) |
| | | | | | | | | | | | | | | | | | | | | | | | | | | | | | | | | | | | |
Less distributions: | | | | | | | | | | | | | | | | | | | | | | | | | | | | | | | | | | | | |
Dividends from net investment income | | | (0.39 | ) | | | | | | | (0.22 | ) | | | | | | | (0.20 | ) | | | | | | | (0.27 | ) | | | | | | | (0.16 | ) |
Distributions from net realized gains | | | (3.57 | ) | | | | | | | (3.16 | ) | | | | | | | - | | | | | | | | (0.16 | ) | | | | | | | (2.84 | ) |
| | | | | | | | | | | | | | | | | | | | | | | | | | | | | | | | | | | | |
Total distributions | | | (3.96 | ) | | | | | | | (3.38 | ) | | | | | | | (0.20 | ) | | | | | | | (0.43 | ) | | | | | | | (3.00 | ) |
| | | | | | | | | | | | | | | | | | | | | | | | | | | | | | | | | | | | |
Net asset value, end of period | | $ | 21.36 | | | | | | | $ | 26.36 | | | | | | | $ | 30.68 | | | | | | | $ | 19.44 | | | | | | | $ | 22.76 | |
| | | | | | | | | | | | | | | | | | | | | | | | | | | | | | | | | | | | |
Total returnB | | | (4.19 | )% | | | | | | | (3.55 | )% | | | | | | | 59.15 | % | | | | | | | (13.06 | )% | | | | | | | 1.93 | % |
| | | | | | | | | | | | | | | | | | | | | | | | | | | | | | | | | | | | |
|
Ratios and supplemental data: | |
Net assets, end of period | | $ | 355,150,002 | | | | | | | $ | 427,638,978 | | | | | | | $ | 255,837,301 | | | | | | | $ | 170,726,299 | | | | | | | $ | 254,599,477 | |
Ratios to average net assets: | | | | | | | | | | | | | | | | | | | | | | | | | | | | | | | | | | | | |
Expenses, before reimbursements and/or recoupments | | | 0.86 | % | | | | | | | 0.86 | % | | | | | | | 0.89 | % | | | | | | | 0.89 | % | | | | | | | 0.90 | % |
Expenses, net of reimbursements and/or recoupments | | | 0.86 | % | | | | | | | 0.86 | % | | | | | | | 0.89 | % | | | | | | | 0.89 | % | | | | | | | 0.90 | % |
Net investment income, before expense reimbursements and/or recoupments | | | 1.15 | % | | | | | | | 0.79 | % | | | | | | | 0.56 | % | | | | | | | 0.96 | % | | | | | | | 1.00 | % |
Net investment income, net of reimbursements and/or recoupments | | | 1.15 | % | | | | | | | 0.79 | % | | | | | | | 0.56 | % | | | | | | | 0.96 | % | | | | | | | 1.00 | % |
Portfolio turnover rate | | | 52 | % | | | | | | | 72 | % | | | | | | | 48 | % | | | | | | | 61 | % | | | | | | | 48 | % |
| A | On February 8. 2022, Foundry Partners, LLC and Hillcrest Asset Management, LLC, were terminated and ceased managing assets of the Fund. On March 10, 2022, DePrince, Race & Zollo, Inc., began managing assets of the Fund. |
| B | Based on net asset value, which does not reflect the sales charge, redemption fee, or contingent deferred sales charge, if applicable. May include adjustments in accordance with U.S. GAAP and as such, the net asset value for reporting purposes and the returns based upon those net asset values may differ from the net asset value and returns for shareholder transactions. |
See accompanying notes
48
American Beacon Small Cap Value FundSM
Financial Highlights
(For a share outstanding throughout the period)
| | | | | | | | | | | | | | | | | | | | | | | | | | | | | | | | | | | | |
| | | Investor Class | |
| | | Year Ended October 31, | |
| | | 2023 | | | | | | 2022A | | | | | | 2021 | | | | | | 2020 | | | | | | 2019 | |
| | | | |
Net asset value, beginning of period | | $ | 25.51 | | | | | | | $ | 29.78 | | | | | | | $ | 18.88 | | | | | | | $ | 22.12 | | | | | | | $ | 25.12 | |
| | | | | | | | | | | | | | | | | | | | | | | | | | | | | | | | | | | | |
Income (loss) from investment operations: | | | | | | | | | | | | | | | | | | | | | | | | | | | | | | | | | | | | |
Net investment income | | | 0.18 | | | | | | | | 0.19 | | | | | | | | 0.20 | | | | | | | | 0.21 | | | | | | | | 0.22 | |
Net gains (losses) on investments (both realized and unrealized) | | | (1.24 | ) | | | | | | | (1.17 | ) | | | | | | | 10.85 | | | | | | | | (3.08 | ) | | | | | | | (0.29 | ) |
| | | | | | | | | | | | | | | | | | | | | | | | | | | | | | | | | | | | |
Total income (loss) from investment operations | | | (1.06 | ) | | | | | | | (0.98 | ) | | | | | | | 11.05 | | | | | | | | (2.87 | ) | | | | | | | (0.07 | ) |
| | | | | | | | | | | | | | | | | | | | | | | | | | | | | | | | | | | | |
Less distributions: | | | | | | | | | | | | | | | | | | | | | | | | | | | | | | | | | | | | |
Dividends from net investment income | | | (0.31 | ) | | | | | | | (0.13 | ) | | | | | | | (0.15 | ) | | | | | | | (0.21 | ) | | | | | | | (0.09 | ) |
Distributions from net realized gains | | | (3.57 | ) | | | | | | | (3.16 | ) | | | | | | | - | | | | | | | | (0.16 | ) | | | | | | | (2.84 | ) |
| | | | | | | | | | | | | | | | | | | | | | | | | | | | | | | | | | | | |
Total distributions | | | (3.88 | ) | | | | | | | (3.29 | ) | | | | | | | (0.15 | ) | | | | | | | (0.37 | ) | | | | | | | (2.93 | ) |
| | | | | | | | | | | | | | | | | | | | | | | | | | | | | | | | | | | | |
Net asset value, end of period | | $ | 20.57 | | | | | | | $ | 25.51 | | | | | | | $ | 29.78 | | | | | | | $ | 18.88 | | | | | | | $ | 22.12 | |
| | | | | | | | | | | | | | | | | | | | | | | | | | | | | | | | | | | | |
Total returnB | | | (4.41 | )% | | | | | | | (3.81 | )% | | | | | | | 58.74 | % | | | | | | | (13.30 | )% | | | | | | | 1.67 | % |
| | | | | | | | | | | | | | | | | | | | | | | | | | | | | | | | | | | | |
|
Ratios and supplemental data: | |
Net assets, end of period | | $ | 252,350,988 | | | | | | | $ | 284,880,016 | | | | | | | $ | 367,726,622 | | | | | | | $ | 302,626,954 | | | | | | | $ | 424,569,237 | |
Ratios to average net assets: | | | | | | | | | | | | | | | | | | | | | | | | | | | | | | | | | | | | |
Expenses, before reimbursements and/or recoupments | | | 1.13 | % | | | | | | | 1.12 | % | | | | | | | 1.15 | % | | | | | | | 1.15 | % | | | | | | | 1.14 | % |
Expenses, net of reimbursements and/or recoupments | | | 1.13 | % | | | | | | | 1.12 | % | | | | | | | 1.15 | % | | | | | | | 1.15 | % | | | | | | | 1.14 | % |
Net investment income, before expense reimbursements and/or recoupments | | | 0.89 | % | | | | | | | 0.50 | % | | | | | | | 0.32 | % | | | | | | | 0.70 | % | | | | | | | 0.76 | % |
Net investment income, net of reimbursements and/or recoupments | | | 0.89 | % | | | | | | | 0.50 | % | | | | | | | 0.32 | % | | | | | | | 0.70 | % | | | | | | | 0.76 | % |
Portfolio turnover rate | | | 52 | % | | | | | | | 72 | % | | | | | | | 48 | % | | | | | | | 61 | % | | | | | | | 48 | % |
| A | On February 8. 2022, Foundry Partners, LLC and Hillcrest Asset Management, LLC, were terminated and ceased managing assets of the Fund. On March 10, 2022, DePrince, Race & Zollo, Inc., began managing assets of the Fund. |
| B | Based on net asset value, which does not reflect the sales charge, redemption fee, or contingent deferred sales charge, if applicable. May include adjustments in accordance with U.S. GAAP and as such, the net asset value for reporting purposes and the returns based upon those net asset values may differ from the net asset value and returns for shareholder transactions. |
See accompanying notes
49
American Beacon Small Cap Value FundSM
Financial Highlights
(For a share outstanding throughout the period)
| | | | | | | | | | | | | | | | | | | | | | | | | | | | | | | | | | | | |
| | | Advisor Class | |
| | | Year Ended October 31, | |
| | | 2023 | | | | | | 2022A | | | | | | 2021 | | | | | | 2020 | | | | | | 2019 | |
| | | | |
Net asset value, beginning of period | | $ | 25.13 | | | | | | | $ | 29.34 | | | | | | | $ | 18.60 | | | | | | | $ | 21.79 | | | | | | | $ | 24.77 | |
| | | | | | | | | | | | | | | | | | | | | | | | | | | | | | | | | | | | |
Income (loss) from investment operations: | | | | | | | | | | | | | | | | | | | | | | | | | | | | | | | | | | | | |
Net investment income | | | 0.18 | | | | | | | | 0.06 | | | | | | | | 0.17 | | | | | | | | 0.15 | | | | | | | | 0.14 | |
Net gains (losses) on investments (both realized and unrealized) | | | (1.25 | ) | | | | | | | (1.07 | ) | | | | | | | 10.69 | | | | | | | | (3.01 | ) | | | | | | | (0.25 | ) |
| | | | | | | | | | | | | | | | | | | | | | | | | | | | | | | | | | | | |
Total income (loss) from investment operations | | | (1.07 | ) | | | | | | | (1.01 | ) | | | | | | | 10.86 | | | | | | | | (2.86 | ) | | | | | | | (0.11 | ) |
| | | | | | | | | | | | | | | | | | | | | | | | | | | | | | | | | | | | |
Less distributions: | | | | | | | | | | | | | | | | | | | | | | | | | | | | | | | | | | | | |
Dividends from net investment income | | | (0.28 | ) | | | | | | | (0.04 | ) | | | | | | | (0.12 | ) | | | | | | | (0.17 | ) | | | | | | | (0.03 | ) |
Distributions from net realized gains | | | (3.57 | ) | | | | | | | (3.16 | ) | | | | | | | - | | | | | | | | (0.16 | ) | | | | | | | (2.84 | ) |
| | | | | | | | | | | | | | | | | | | | | | | | | | | | | | | | | | | | |
Total distributions | | | (3.85 | ) | | | | | | | (3.20 | ) | | | | | | | (0.12 | ) | | | | | | | (0.33 | ) | | | | | | | (2.87 | ) |
| | | | | | | | | | | | | | | | | | | | | | | | | | | | | | | | | | | | |
Net asset value, end of period | | $ | 20.21 | | | | | | | $ | 25.13 | | | | | | | $ | 29.34 | | | | | | | $ | 18.60 | | | | | | | $ | 21.79 | |
| | | | | | | | | | | | | | | | | | | | | | | | | | | | | | | | | | | | |
Total returnB | | | (4.57 | )% | | | | | | | (3.96 | )% | | | | | | | 58.56 | % | | | | | | | (13.40 | )% | | | | | | | 1.48 | % |
| | | | | | | | | | | | | | | | | | | | | | | | | | | | | | | | | | | | |
|
Ratios and supplemental data: | |
Net assets, end of period | | $ | 25,580,739 | | | | | | | $ | 32,662,818 | | | | | | | $ | 32,801,309 | | | | | | | $ | 42,987,242 | | | | | | | $ | 61,618,406 | |
Ratios to average net assets: | | | | | | | | | | | | | | | | | | | | | | | | | | | | | | | | | | | | |
Expenses, before reimbursements and/or recoupments | | | 1.28 | % | | | | | | | 1.28 | % | | | | | | | 1.29 | % | | | | | | | 1.25 | % | | | | | | | 1.34 | % |
Expenses, net of reimbursements and/or recoupments | | | 1.28 | % | | | | | | | 1.28 | % | | | | | | | 1.29 | % | | | | | | | 1.25 | % | | | | | | | 1.34 | % |
Net investment income, before expense reimbursements and/or recoupments | | | 0.75 | % | | | | | | | 0.36 | % | | | | | | | 0.20 | % | | | | | | | 0.60 | % | | | | | | | 0.56 | % |
Net investment income, net of reimbursements and/or recoupments | | | 0.75 | % | | | | | | | 0.36 | % | | | | | | | 0.20 | % | | | | | | | 0.60 | % | | | | | | | 0.56 | % |
Portfolio turnover rate | | | 52 | % | | | | | | | 72 | % | | | | | | | 48 | % | | | | | | | 61 | % | | | | | | | 48 | % |
| A | On February 8. 2022, Foundry Partners, LLC and Hillcrest Asset Management, LLC, were terminated and ceased managing assets of the Fund. On March 10, 2022, DePrince, Race & Zollo, Inc., began managing assets of the Fund. |
| B | Based on net asset value, which does not reflect the sales charge, redemption fee, or contingent deferred sales charge, if applicable. May include adjustments in accordance with U.S. GAAP and as such, the net asset value for reporting purposes and the returns based upon those net asset values may differ from the net asset value and returns for shareholder transactions. |
See accompanying notes
50
American Beacon Small Cap Value FundSM
Financial Highlights
(For a share outstanding throughout the period)
| | | | | | | | | | | | | | | | | | | | | | | | | | | | | | | | | | | | |
| | | A Class | |
| | | Year Ended October 31, | |
| | | 2023 | | | | | | 2022A | | | | | | 2021 | | | | | | 2020 | | | | | | 2019 | |
| | | | |
Net asset value, beginning of period | | $ | 24.87 | | | | | | | $ | 29.12 | | | | | | | $ | 18.47 | | | | | | | $ | 21.64 | | | | | | | $ | 24.65 | |
| | | | | | | | | | | | | | | | | | | | | | | | | | | | | | | | | | | | |
Income (loss) from investment operations: | | | | | | | | | | | | | | | | | | | | | | | | | | | | | | | | | | | | |
Net investment income | | | 0.21 | | | | | | | | 0.10 | | | | | | | | 0.06 | | | | | | | | 0.12 | | | | | | | | 0.14 | |
Net gains (losses) on investments (both realized and unrealized) | | | (1.26 | ) | | | | | | | (1.07 | ) | | | | | | | 10.72 | | | | | | | | (2.95 | ) | | | | | | | (0.24 | ) |
| | | | | | | | | | | | | | | | | | | | | | | | | | | | | | | | | | | | |
Total income (loss) from investment operations | | | (1.05 | ) | | | | | | | (0.97 | ) | | | | | | | 10.78 | | | | | | | | (2.83 | ) | | | | | | | (0.10 | ) |
| | | | | | | | | | | | | | | | | | | | | | | | | | | | | | | | | | | | |
Less distributions: | | | | | | | | | | | | | | | | | | | | | | | | | | | | | | | | | | | | |
Dividends from net investment income | | | (0.27 | ) | | | | | | | (0.12 | ) | | | | | | | (0.13 | ) | | | | | | | (0.18 | ) | | | | | | | (0.07 | ) |
Distributions from net realized gains | | | (3.57 | ) | | | | | | | (3.16 | ) | | | | | | | - | | | | | | | | (0.16 | ) | | | | | | | (2.84 | ) |
| | | | | | | | | | | | | | | | | | | | | | | | | | | | | | | | | | | | |
Total distributions | | | (3.84 | ) | | | | | | | (3.28 | ) | | | | | | | (0.13 | ) | | | | | | | (0.34 | ) | | | | | | | (2.91 | ) |
| | | | | | | | | | | | | | | | | | | | | | | | | | | | | | | | | | | | |
Net asset value, end of period | | $ | 19.98 | | | | | | | $ | 24.87 | | | | | | | $ | 29.12 | | | | | | | $ | 18.47 | | | | | | | $ | 21.64 | |
| | | | | | | | | | | | | | | | | | | | | | | | | | | | | | | | | | | | |
Total returnB | | | (4.50 | )% | | | | | | | (3.88 | )% | | | | | | | 58.57 | % | | | | | | | (13.38 | )% | | | | | | | 1.56 | % |
| | | | | | | | | | | | | | | | | | | | | | | | | | | | | | | | | | | | |
|
Ratios and supplemental data: | |
Net assets, end of period | | $ | 37,440,788 | | | | | | | $ | 48,515,547 | | | | | | | $ | 63,024,594 | | | | | | | $ | 46,067,043 | | | | | | | $ | 63,246,155 | |
Ratios to average net assets: | | | | | | | | | | | | | | | | | | | | | | | | | | | | | | | | | | | | |
Expenses, before reimbursements and/or recoupments | | | 1.21 | % | | | | | | | 1.21 | % | | | | | | | 1.24 | % | | | | | | | 1.26 | % | | | | | | | 1.26 | % |
Expenses, net of reimbursements and/or recoupments | | | 1.21 | % | | | | | | | 1.21 | % | | | | | | | 1.24 | % | | | | | | | 1.26 | % | | | | | | | 1.26 | % |
Net investment income, before expense reimbursements and/or recoupments | | | 0.81 | % | | | | | | | 0.42 | % | | | | | | | 0.21 | % | | | | | | | 0.59 | % | | | | | | | 0.64 | % |
Net investment income, net of reimbursements and/or recoupments | | | 0.81 | % | | | | | | | 0.42 | % | | | | | | | 0.21 | % | | | | | | | 0.59 | % | | | | | | | 0.64 | % |
Portfolio turnover rate | | | 52 | % | | | | | | | 72 | % | | | | | | | 48 | % | | | | | | | 61 | % | | | | | | | 48 | % |
| A | On February 8. 2022, Foundry Partners, LLC and Hillcrest Asset Management, LLC, were terminated and ceased managing assets of the Fund. On March 10, 2022, DePrince, Race & Zollo, Inc., began managing assets of the Fund. |
| B | Based on net asset value, which does not reflect the sales charge, redemption fee, or contingent deferred sales charge, if applicable. May include adjustments in accordance with U.S. GAAP and as such, the net asset value for reporting purposes and the returns based upon those net asset values may differ from the net asset value and returns for shareholder transactions. |
See accompanying notes
51
American Beacon Small Cap Value FundSM
Financial Highlights
(For a share outstanding throughout the period)
| | | | | | | | | | | | | | | | | | | | | | | | | | | | | | | | | | | | |
| | | C Class | |
| | | Year Ended October 31, | |
| | | 2023 | | | | | | 2022A | | | | | | 2021 | | | | | | 2020 | | | | | | 2019 | |
| | | | |
Net asset value, beginning of period | | $ | 23.27 | | | | | | | $ | 27.51 | | | | | | | $ | 17.47 | | | | | | | $ | 20.51 | | | | | | | $ | 23.60 | |
| | | | | | | | | | | | | | | | | | | | | | | | | | | | | | | | | | | | |
Income (loss) from investment operations: | | | | | | | | | | | | | | | | | | | | | | | | | | | | | | | | | | | | |
Net investment income (loss) | | | 0.02 | | | | | | | | (0.14 | ) | | | | | | | (0.22 | ) | | | | | | | (0.17 | ) | | | | | | | (0.01 | )B |
Net gains (losses) on investments (both realized and unrealized) | | | (1.14 | ) | | | | | | | (0.94 | ) | | | | | | | 10.26 | | | | | | | | (2.66 | ) | | | | | | | (0.24 | ) |
| | | | | | | | | | | | | | | | | | | | | | | | | | | | | | | | | | | | |
Total income (loss) from investment operations | | | (1.12 | ) | | | | | | | (1.08 | ) | | | | | | | 10.04 | | | | | | | | (2.83 | ) | | | | | | | (0.25 | ) |
| | | | | | | | | | | | | | | | | | | | | | | | | | | | | | | | | | | | |
Less distributions: | | | | | | | | | | | | | | | | | | | | | | | | | | | | | | | | | | | | |
Dividends from net investment income | | | (0.14 | ) | | | | | | | - | | | | | | | | - | | | | | | | | (0.05 | ) | | | | | | | - | |
Distributions from net realized gains | | | (3.57 | ) | | | | | | | (3.16 | ) | | | | | | | - | | | | | | | | (0.16 | ) | | | | | | | (2.84 | ) |
| | | | | | | | | | | | | | | | | | | | | | | | | | | | | | | | | | | | |
Total distributions | | | (3.71 | ) | | | | | | | (3.16 | ) | | | | | | | - | | | | | | | | (0.21 | ) | | | | | | | (2.84 | ) |
| | | | | | | | | | | | | | | | | | | | | | | | | | | | | | | | | | | | |
Net asset value, end of period | | $ | 18.44 | | | | | | | $ | 23.27 | | | | | | | $ | 27.51 | | | | | | | $ | 17.47 | | | | | | | $ | 20.51 | |
| | | | | | | | | | | | | | | | | | | | | | | | | | | | | | | | | | | | |
Total returnC | | | (5.23 | )% | | | | | | | (4.54 | )% | | | | | | | 57.47 | % | | | | | | | (14.00 | )% | | | | | | | 0.85 | % |
| | | | | | | | | | | | | | | | | | | | | | | | | | | | | | | | | | | | |
|
Ratios and supplemental data: | |
Net assets, end of period | | $ | 6,883,174 | | | | | | | $ | 8,859,738 | | | | | | | $ | 11,261,210 | | | | | | | $ | 8,057,935 | | | | | | | $ | 12,619,613 | |
Ratios to average net assets: | | | | | | | | | | | | | | | | | | | | | | | | | | | | | | | | | | | | |
Expenses, before reimbursements and/or recoupments | | | 1.93 | % | | | | | | | 1.93 | % | | | | | | | 1.95 | % | | | | | | | 1.96 | % | | | | | | | 1.95 | % |
Expenses, net of reimbursements and/or recoupments | | | 1.93 | % | | | | | | | 1.93 | % | | | | | | | 1.95 | % | | | | | | | 1.96 | % | | | | | | | 1.95 | %D |
Net investment income (loss), before expense reimbursements and/or recoupments | | | 0.09 | % | | | | | | | (0.29 | )% | | | | | | | (0.50 | )% | | | | | | | (0.10 | )% | | | | | | | (0.06 | )% |
Net investment income (loss), net of reimbursements and/or recoupments | | | 0.09 | % | | | | | | | (0.29 | )% | | | | | | | (0.50 | )% | | | | | | | (0.10 | )% | | | | | | | (0.06 | )% |
Portfolio turnover rate | | | 52 | % | | | | | | | 72 | % | | | | | | | 48 | % | | | | | | | 61 | % | | | | | | | 48 | % |
| A | On February 8. 2022, Foundry Partners, LLC and Hillcrest Asset Management, LLC, were terminated and ceased managing assets of the Fund. On March 10, 2022, DePrince, Race & Zollo, Inc., began managing assets of the Fund. |
| B | Per share amounts have been calculated using the average shares method. |
| C | Based on net asset value, which does not reflect the sales charge, redemption fee, or contingent deferred sales charge, if applicable. May include adjustments in accordance with U.S. GAAP and as such, the net asset value for reporting purposes and the returns based upon those net asset values may differ from the net asset value and returns for shareholder transactions. |
| D | This ratio does not include a voluntary reimbursement of service fees as included in the prior year. |
See accompanying notes
52
American Beacon Small Cap Value FundSM
Financial Highlights
(For a share outstanding throughout the period)
| | | | | | | | | | | | | | | | | | | | | | | | | | | | | | | | | | | | |
| | | R6 Class | |
| | | Year Ended October 31, | |
| | | 2023 | | | | | | 2022A | | | | | | 2021 | | | | | | 2020 | | | | | | 2019 | |
| | | | |
Net asset value, beginning of period | | $ | 26.85 | | | | | | | $ | 31.19 | | | | | | | $ | 19.75 | | | | | | | $ | 23.12 | | | | | | | $ | 26.14 | |
| | | | | | | | | | | | | | | | | | | | | | | | | | | | | | | | | | | | |
Income (loss) from investment operations: | | | | | | | | | | | | | | | | | | | | | | | | | | | | | | | | | | | | |
Net investment income | | | 0.36 | | | | | | | | 0.25 | | | | | | | | 0.19 | | | | | | | | 0.22 | | | | | | | | 0.26 | |
Net gains (losses) on investments (both realized and unrealized) | | | (1.40 | ) | | | | | | | (1.18 | ) | | | | | | | 11.48 | | | | | | | | (3.14 | ) | | | | | | | (0.25 | ) |
| | | | | | | | | | | | | | | | | | | | | | | | | | | | | | | | | | | | |
Total income (loss) from investment operations | | | (1.04 | ) | | | | | | | (0.93 | ) | | | | | | | 11.67 | | | | | | | | (2.92 | ) | | | | | | | 0.01 | |
| | | | | | | | | | | | | | | | | | | | | | | | | | | | | | | | | | | | |
Less distributions: | | | | | | | | | | | | | | | | | | | | | | | | | | | | | | | | | | | | |
Dividends from net investment income | | | (0.41 | ) | | | | | | | (0.25 | ) | | | | | | | (0.23 | ) | | | | | | | (0.29 | ) | | | | | | | (0.19 | ) |
Distributions from net realized gains | | | (3.57 | ) | | | | | | | (3.16 | ) | | | | | | | - | | | | | | | | (0.16 | ) | | | | | | | (2.84 | ) |
| | | | | | | | | | | | | | | | | | | | | | | | | | | | | | | | | | | | |
Total distributions | | | (3.98 | ) | | | | | | | (3.41 | ) | | | | | | | (0.23 | ) | | | | | | | (0.45 | ) | | | | | | | (3.03 | ) |
| | | | | | | | | | | | | | | | | | | | | | | | | | | | | | | | | | | | |
Net asset value, end of period | | $ | 21.83 | | | | | | | $ | 26.85 | | | | | | | $ | 31.19 | | | | | | | $ | 19.75 | | | | | | | $ | 23.12 | |
| | | | | | | | | | | | | | | | | | | | | | | | | | | | | | | | | | | | |
Total returnB | | | (4.09 | )% | | | | | | | (3.45 | )% | | | | | | | 59.38 | % | | | | | | | (12.98 | )% | | | | | | | 2.01 | % |
| | | | | | | | | | | | | | | | | | | | | | | | | | | | | | | | | | | | |
|
Ratios and supplemental data: | |
Net assets, end of period | | $ | 1,583,343,034 | | | | | | | $ | 1,509,127,442 | | | | | | | $ | 1,830,192,124 | | | | | | | $ | 1,187,578,766 | | | | | | | $ | 1,308,284,613 | |
Ratios to average net assets: | | | | | | | | | | | | | | | | | | | | | | | | | | | | | | | | | | | | |
Expenses, before reimbursements and/or recoupments | | | 0.76 | % | | | | | | | 0.77 | % | | | | | | | 0.79 | % | | | | | | | 0.79 | % | | | | | | | 0.80 | % |
Expenses, net of reimbursements and/or recoupments | | | 0.76 | % | | | | | | | 0.77 | % | | | | | | | 0.79 | % | | | | | | | 0.79 | % | | | | | | | 0.80 | % |
Net investment income, before expense reimbursements and/or recoupments | | | 1.25 | % | | | | | | | 0.86 | % | | | | | | | 0.66 | % | | | | | | | 1.06 | % | | | | | | | 1.08 | % |
Net investment income, net of reimbursements and/or recoupments | | | 1.25 | % | | | | | | | 0.86 | % | | | | | | | 0.66 | % | | | | | | | 1.06 | % | | | | | | | 1.08 | % |
Portfolio turnover rate | | | 52 | % | | | | | | | 72 | % | | | | | | | 48 | % | | | | | | | 61 | % | | | | | | | 48 | % |
| A | On February 8. 2022, Foundry Partners, LLC and Hillcrest Asset Management, LLC, were terminated and ceased managing assets of the Fund. On March 10, 2022, DePrince, Race & Zollo, Inc., began managing assets of the Fund. |
| B | Based on net asset value, which does not reflect the sales charge, redemption fee, or contingent deferred sales charge, if applicable. May include adjustments in accordance with U.S. GAAP and as such, the net asset value for reporting purposes and the returns based upon those net asset values may differ from the net asset value and returns for shareholder transactions. |
See accompanying notes
53
American Beacon FundsSM
Federal Tax Information
October 31, 2023 (Unaudited)
Certain tax information regarding the Funds are required to be provided to shareholders based upon the Funds’ income and distributions for the taxable year ended October 31, 2023. The information and distributions reported herein may differ from information and distributions taxable to the shareholders for the calendar year ended December 31, 2023.
The Fund designated the following items with regard to distributions paid during the fiscal year ended October 31, 2023. All designations are based on financial information available as of this annual report and, accordingly, are subject to change. For each item, it is the intention of the Funds to designate the maximum amount permitted under the Internal Revenue Code of 1986, as amended, and the regulations there under.
Corporate Dividends-Received Deduction:
Qualified Dividend Income:
Long-Term Capital Gain Distributions:
| | | | |
Small Cap Value | | $ | 627,183,345 | |
Short-Term Capital Gain Distributions:
Shareholders will receive notification in January 2024 of the applicable tax information necessary to prepare their 2023 income tax returns.
54
Disclosure Regarding the Renewal and Approval of Current Management and Investment Advisory Agreements (Unaudited)
At meetings held on May 16, 2023 and June 6-7, 2023 (collectively, the “Meetings”), the Board of Trustees (“Board” or “Trustees”) considered and then, at its June 7, 2023 meeting, approved the renewal of:
(1) the Management Agreement between American Beacon Advisors, Inc. (“Manager”) and the American Beacon Funds (“Trust”) on behalf of the American Beacon Small Cap Value Fund (“Fund”); and
(2) the Investment Advisory Agreements among the Manager and the Trust, on behalf of the Fund, and each of Barrow, Hanley, Mewhinney & Strauss, LLC (“Barrow”), Brandywine Global Investment Management, LLC (“Brandywine”), DePrince, Race, and Zollo, Inc. (“DRZ”), Hotchkis and Wiley Capital Management, LLC (“Hotchkis”) and Newton Investment Management North America, LLC (“Newton”) (each, a “sub-advisor” and collectively, the “sub-advisors”).
The Management Agreement and the Investment Advisory Agreements are referred to herein individually as an “Agreement” and collectively as the “Agreements.”
In preparation for its consideration of the renewal of the Agreements, the Board undertook steps to gather and consider information furnished by the Manager, the sub-advisors, Broadridge, Inc. (“Broadridge”) and Morningstar, Inc. (“Morningstar”). The Board, with the assistance of independent legal counsel, requested and received certain relevant information from the Manager and each sub-advisor.
In advance of the Meetings, the Board’s Investment Committee and/or the Manager coordinated the production of information from Broadridge and Morningstar regarding the performance, fees and expenses of the Fund as well as information from the Manager and the sub-advisors. At the Meetings, the Board considered the information provided in connection with the renewal process, as well as information furnished to the Board throughout the year at regular meetings of the Board and its committees. In connection with the Board’s consideration of the Agreements, the Trustees received and evaluated such information as they deemed necessary. This information is described below in the section summarizing the factors the Board considered in connection with its renewal and approval of the Agreements, as well as the section describing additional Board considerations with respect to the Fund.
The Board noted that the Manager provides management and administrative services to the Fund pursuant to the Management Agreement. The Board considered that many mutual funds have separate contracts governing each type of service and observed that, with respect to such mutual funds, the actual management fee rates provided by Broadridge for peer group funds reflect the combined advisory and administrative fees, reduced by any fee waivers and/or reimbursements.
The Manager or a sub-advisor may not have been able to, or opted not to, provide information in response to certain information requests, in which case the Board conducted its evaluation of the firm based on information that was provided. In such cases, the Board determined that the omission of any such information was not material to its considerations.
Provided below is an overview of certain factors the Board considered in connection with its decision to approve the renewal of the Agreements. The Board did not identify any particular information that was most relevant to its consideration of whether to approve the renewal of each Agreement, and each Trustee may have afforded different weight to the various factors. Legal counsel to the independent Trustees provided the Board with a memorandum regarding its responsibilities pertaining to the renewal of investment advisory contracts, such as the Agreements, and related regulatory guidelines. Based on its evaluation, the Board unanimously concluded that the terms of each Agreement were reasonable and fair and that the approval of the renewal of each Agreement was in the best interests of the Fund and its shareholders.
55
Disclosure Regarding the Renewal and Approval of Current Management and Investment Advisory Agreements (Unaudited)
Considerations With Respect to the Renewal of the Management Agreement and the Investment Advisory Agreements
In determining whether to approve the renewal of the Agreements, the Board considered the Fund’s investment management and sub-advisory relationships separately. In each instance, the Board considered, among other things, the following factors: (1) the nature, extent and quality of the services provided; (2) the investment performance of the Fund and the sub-advisors for the Fund; (3) the profits, if any, earned by the Manager in rendering services to the Fund; (4) comparisons of services and fee rates with contracts entered into by the Manager or a sub-advisor or their affiliates with other clients (such as pension funds and other institutional clients); (5) the extent to which economies of scale, if any, have been taken into account in setting each fee rate schedule; (6) whether fee rate levels reflect economies of scale, if any, for the benefit of Fund investors; and (7) any other benefits derived or anticipated to be derived by the Manager or a sub-advisor from its relationship with the Fund.
Nature, Extent and Quality of Services. With respect to the renewal of the Management Agreement, the Board considered, among other factors: the Fund’s long-term performance; the length of service of key investment personnel at the Manager; the cost structure of the Fund; the financial condition of the Manager, including its parent company; the Manager’s culture of compliance and support that reduce risks to the Fund; the Manager’s quality of services; the Manager’s active role in monitoring and, as appropriate, recommending additional or replacement sub-advisors; and the Manager’s representations regarding its efforts to retain key employees and maintain staffing levels.
With respect to the renewal of each Investment Advisory Agreement, the Board considered, among other factors: the representations made by each sub-advisor regarding the sub-advisor’s level of staffing; asset size; the financial stability of each sub-advisor; and its compliance program. Based on the foregoing and other information, the Board concluded that the nature, extent and quality of the management and advisory services provided by the Manager and each sub-advisor were appropriate for the Fund.
Investment Performance. The Board evaluated the comparative information provided by Broadridge and the Manager regarding the performance of the Fund relative to its Broadridge Performance Universe, Morningstar Category, and/or benchmark index, as well as the Fund’s Morningstar rating. The Board considered the information provided by Broadridge regarding its independent methodology for selecting the Fund’s Broadridge Performance Universe. In addition, the Board considered the performance reports and discussions with management at meetings of the Board and its committees throughout the year. The Board also evaluated the comparative information provided by each sub-advisor, as applicable, regarding the performance of its portion of the Fund relative to the performance of other comparable investment accounts and/or one or more composites of comparable investment accounts managed by the sub-advisor and the Fund’s benchmark index. In addition, the Board considered the Manager’s recommendation to continue to retain each sub-advisor. A discussion regarding the Board’s considerations with respect to the Fund’s performance appears below under “Additional Considerations and Conclusions with Respect to the Fund.”
Costs of the Services Provided to the Fund and the Profits Realized by the Manager from its Relationship with the Fund. In analyzing the costs of services and profitability of the Manager, the Board considered the revenues earned and the expenses incurred by the Manager, before and after the payment of distribution-related expenses by the Manager. The profits or losses were noted at both an aggregate level for all funds within the group of mutual funds sponsored by the Manager (the “Fund Complex”) and at an individual fund level, with the Manager earning a profit before and after the payment of distribution-related expenses by the Manager with respect to the Fund. The Board also considered comparative information provided by the Manager regarding the Manager’s overall profitability with respect to the Fund Complex relative to the overall profitability of other firms in the mutual fund industry, as disclosed in publicly available sources. Although the Board noted that, in certain cases, the fee rates paid by other clients of the Manager are lower than the fee rates paid by the Fund, the Manager represented that the difference is attributable to, among other factors, the fact that the Manager does not perform administrative services for non-investment company clients and reflects the greater level of responsibility and regulatory requirements associated with managing the Fund.
56
Disclosure Regarding the Renewal and Approval of Current Management and Investment Advisory Agreements (Unaudited)
The Board further considered that, with respect to the Fund, the Management Agreement provides for the Manager to receive a management fee comprised of an annualized fee that is retained by the Manager. In addition, the Board considered that the Manager receives fees for administering and overseeing the securities lending program on behalf of the Fund. The Board also noted that certain share classes of the Fund maintain higher expense ratios in order to compensate third-party financial intermediaries.
In analyzing the fee rates charged by each sub-advisor in connection with its investment advisory services to the Fund, the Board considered representations made by Barrow, Brandywine, DRZ, Hotchkis and Newton that the Fund’s sub-advisory fee rate schedules generally were favorable compared to other comparable client accounts. The Board did not request profitability data from the sub-advisors because the Board did not view this data as imperative to its deliberations given the arms-length nature of the relationship between the Manager and the sub-advisors with respect to the negotiation of sub-advisory fee rates. In addition, the Board noted that sub-advisors may not account for their profits on an account-by-account basis and that different firms likely employ different methodologies in connection with these calculations.
Based on the foregoing and other information, the Board concluded that the profitability levels of the Manager were reasonable in light of the services performed by the Manager. A discussion regarding the Board’s considerations with respect to the Fund’s fee rates is set forth below under “Additional Considerations and Conclusions with Respect to the Fund.”
Economies of Scale. In considering the reasonableness of the management and investment advisory fees rates, the Board considered whether economies of scale will be realized as the Fund grows and whether fee rate levels reflect these economies of scale for the benefit of Fund shareholders. In this regard, the Board considered that, with respect to each sub-advisor, other than Brandywine and DRZ, the Manager has negotiated breakpoints in the sub-advisory fee rate schedule. The Board also noted that, for purposes of determining the fee rates chargeable to the Fund, certain sub-advisors have agreed to take into account other clients of the Manager whose assets are allocated to the sub-advisors by the Manager for purposes of calculating the Fund’s sub-advisory fee rate breakpoints.
In addition, the Board noted the Manager’s representation that the Management Agreement contains fee schedule breakpoints at higher asset levels with respect to the Fund. In this regard, the Board considered that the Fund’s current assets did not exceed the threshold necessary to reach the first management fee breakpoint. Based on the foregoing and other information, the Board concluded that the Manager and sub-advisor fee rate schedules for the Fund provide for a reasonable sharing of benefits from any economies of scale with the Fund.
Benefits Derived from the Relationship with the Fund. The Board considered the Manager’s and sub-advisors’ responses to inquiries regarding “fall-out” or ancillary benefits that accrue to the Manager and/or the sub-advisors as a result of their advisory relationships with the Fund. For example, the Board considered that the Manager may invest the Fund’s cash balances and cash collateral provided by the borrowers of the Fund’s securities in the American Beacon U.S. Government Money Market Select Fund, which the Manager manages directly, and for which the Manager receives a fee. In addition, the Board noted that each sub-advisor benefits from soft dollar arrangements for proprietary and third-party research. Based on the foregoing and other information, the Board concluded that the potential benefits accruing to the Manager and the sub-advisors by virtue of their relationships with the Fund appear to be fair and reasonable.
Additional Considerations and Conclusions with Respect to the Fund
The performance comparisons below were made for the Fund’s R5 Class shares relative to the Fund’s Broadridge Performance Universe and Morningstar Category. With respect to the Broadridge Performance Universe, the 1st Quintile represents the top 20 percent of the universe based on performance, and the 5th Quintile represents the bottom 20 percent of the universe based on performance. References to the Fund’s Broadridge Performance Universe are to the respective universe of mutual funds with comparable investment classifications and objectives
57
Disclosure Regarding the Renewal and Approval of Current Management and Investment Advisory Agreements (Unaudited)
as determined by Broadridge. The performance of each sub-advisor was calculated by the Manager based on information provided by the Fund’s custodian.
In reviewing the performance, the Board viewed longer-term performance over a full market cycle, typically five years or longer, as the most important consideration because relative performance over shorter periods may be significantly impacted by market or economic events and not necessarily reflective of sub-advisor skill.
The expense comparisons below were made for the Fund’s R5 Class shares relative to the Fund’s Broadridge Expense Universe and Broadridge Expense Group, and Y Class shares relative to the Fund’s Morningstar Fee Level universe. The 1st Quintile represents the lowest 20 percent of the universe or group based on lowest total expense, and the 5th Quintile represents the highest 20 percent of the universe or group based on highest total expense. References to the Fund’s Expense Group and Expense Universe are to the respective group or universe of comparable mutual funds as determined by Broadridge. Broadridge Expense Groups consist of the Fund and a representative sample of funds with similar operating structures and asset sizes, as selected by Broadridge. A Broadridge Expense Universe includes all funds with comparable investment classifications/objectives and similar operating structures to that of the share class under review for the Fund, including funds in the Broadridge Expense Group. The Broadridge expense comparisons are based on the most recent audited financial information publicly available for the Fund as of December 31, 2022. References to the Fund’s Morningstar Fee Level ranking are to the institutional share class of comparable mutual funds as determined by Morningstar.
The Board considered the Fund’s Morningstar fee level category with the 1st Quintile representing the lowest 20 percent of the category constituents and the 5th Quintile representing the highest 20 percent of the category in terms of total expense.
In considering the renewal of the Agreements for the Fund, the Board considered the following additional factors:
Broadridge Total Expenses Excluding 12b-1 Fees and Morningstar Fee Level Ranking
| | | | |
Compared to Broadridge Expense Group | | | 1 | st Quintile |
Compared to Broadridge Expense Universe | | | 2 | nd Quintile |
Morningstar Fee Level Ranking | | | 2 | nd Quintile |
Broadridge and Morningstar Performance Analysis (five-year period ended December 31, 2022)
| | | | |
Compared to Broadridge Performance Universe | | | 3 | rd Quintile |
Compared to Morningstar Category | | | 3 | rd Quintile |
In considering the renewal of the Investment Advisory Agreements with Barrow, Brandywine, DRZ, Hotchkis, and Newton, the Board considered that the diversification of investment strategies facilitated by the Fund’s multi-manager structure permits the Fund to mitigate the risks associated with a single sub-advisor. The Board also considered the following additional factors:
Sub-advisor Performance (compared to Broadridge Performance Universe for period indicated ended December 31, 2022)*
| | | | | | | | | | | | |
Barrow | | | 5 Years | | | | | | | | 1 | st Quintile |
Brandywine | | | 5 Years | | | | | | | | 4 | th Quintile |
Hotchkis | | | 5 Years | | | | | | | | 1 | st Quintile |
Newton | | | 5 Years | | | | | | | | 1 | st Quintile |
* The Board considered that, as DRZ began managing a portion of the Fund’s assets on March 10, 2022, information was not yet available with respect to DRZ’s performance for a 1-Year period.
58
Disclosure Regarding the Renewal and Approval of Current Management and Investment Advisory Agreements (Unaudited)
The Board also considered: (1) the Manager’s representation that Brandywine’s process, which focuses primarily on selecting stocks with low price to earnings multiples, has been out of favor, adversely affecting longer-term performance; (2) the addition of DRZ in the first quarter of 2022, the termination of certain prior sub-advisors and the reallocation of the Fund’s assets accordingly; and (3) the Manager’s recommendation to continue to retain each sub-advisor.
Based on these and other considerations, the Board: (1) concluded that the fees paid to the Manager and the sub-advisors under the Agreements are fair and reasonable; and (2) determined that the Fund and its shareholders would benefit from the Manager’s and sub-advisors’ continued management of the Fund.
59
Disclosure Regarding the Approval of New Management and Investment Advisory Agreements (Unaudited)
On July 11, 2023, (i) Resolute Investment Holdings, LLC (“RIH”), its indirect wholly-owned subsidiary, Resolute Investment Managers, Inc. (“RIM”), the parent company of American Beacon Advisors, Inc. (“Manager”), the investment manager of American Beacon Funds (“Trust”), and certain of their affiliates, and (ii) the current owners of approximately 93% of RIH (“Current Ownership Group”), entered into a transaction agreement (“Transaction Agreement”) with certain creditors of RIM (“Lender Group”) to strengthen the capital structure of RIH, the indirect 100% owner of RIM and the Manager (together with RIH, “Resolute”). Pursuant to the Transaction Agreement, (i) all equity interests in RIH would be cancelled, (ii) new equity interests would be issued to members of the Lender Group (“New Ownership Group”), and (iii) the existing credit agreements between RIM and the Lender Group would be terminated and a new credit agreement would be executed (“Transaction”).
Upon the closing of the Transaction (“Closing”), the Manager will be wholly owned indirectly by the New Ownership Group, rather than by the Current Ownership Group. This change in control will be deemed to be an “assignment” under the Investment Company Act of 1940 Act, as amended (“1940 Act”), of the Trust’s (i) existing management agreement (“Current Management Agreement”) with the Manager with respect to the American Beacon Small Cap Value Fund (“Fund”) and other series of the Trust (“Other Funds”), and (ii) existing investment advisory agreements (“Current Investment Advisory Agreements”) among the Manager, the Trust and each of Barrow, Hanley, Mewhinney & Strauss, LLC (“Barrow”), Brandywine Global Investment Management, LLC (“Brandywine”), DePrince, Race, and Zollo, Inc. (“DRZ”), Hotchkis and Wiley Capital Management, LLC (“Hotchkis”) and Newton Investment Management North America, LLC (“Newton”) on behalf of the Fund. Barrow, Brandywine, DRZ, Hotchkis and Newton are collectively referred to herein as the “Sub-Advisors.” As required by the 1940 Act, the Current Management Agreement and Current Investment Advisory Agreement (“Current Agreements”) provide for their automatic termination in the event of an assignment, and, therefore, will terminate upon the Closing.
The Board of Trustees (“Trustees” or “Board”) of the Trust met by videoconference on July 7, 2023, and in-person on July 12, 2023 (“July Meetings”), to discuss the Transaction and consider the effect that the Transaction would have on the Fund and the Other Funds. In addition, the Board received various information from the Manager regarding the intended purposes and framework of the Transaction at its meetings in-person on February 28–March 1, 2023 (“March Meeting”) and June 6–7, 2023, and by videoconference on May 16, 2023 (“May-June Meetings”). Following the March Meeting, the Board designated an ad hoc special committee (“Committee”) to meet with representatives of the Manager and receive updates on the negotiations and, as appropriate, to provide input with respect to the process. Throughout this process, the Board and the Committee were advised by independent legal counsel and received guidance concerning, among other matters, the Trustees’ responsibilities in connection with their consideration with respect to the Fund of a new Management Agreement (“New Management Agreement”), and new Investment Advisory Agreements (each, a “New Investment Advisory Agreement” and, collectively with the New Management Agreement, the “New Agreements”). The Trustees were advised that the New Agreements would replace the Current Agreements, upon the assignment and termination of the Current Agreements upon the Closing.
In advance of the July Meetings, the Board requested and received detailed information from the Manager regarding the Transaction. In connection with the Transaction, the Board reviewed materials furnished by the Manager, which had been reviewed, as applicable, by representatives of the New Ownership Group and met with senior representatives of the Manager. The Board also reviewed the material terms of the Transaction and considered its possible effects on the Fund and its shareholders. During these meetings, representatives of the Manager indicated their belief that the Transaction would not adversely affect the continued operation of the Fund, the capabilities of the key personnel of the Manager who currently manage the Fund to continue to provide services to the Fund at the current levels, or the capabilities of the Sub-Advisors to provide the same level of services to the Fund.
In evaluating the New Management Agreement, the Trustees considered that they generally have been satisfied with the nature and quality of the services provided to the Fund by the Manager, including investment advisory and administrative services, and that the Fund would be best served by an arrangement that appeared
60
Disclosure Regarding the Approval of New Management and Investment Advisory Agreements (Unaudited)
likely to maintain the continuity and stability of these services. Accordingly, the Board considered information communicated by the Manager regarding the anticipated benefits of the substantially strengthened capital structure of Resolute that would result from the Transaction, and the related positive anticipated impact on the Manager’s resources available for future staffing, compensation, and staff retention. The Manager’s representatives also indicated that they believe that the Transaction best facilitates continuity of management and view such continuity as beneficial to the long-term success of the Fund, but noted that there could be no assurance of any particular benefits that may result.
In connection with the Board’s determination to approve the New Agreements, the Trustees considered, among other information, the following factors as they relate to the Transaction:
| | • | | The manner in which the Fund’s assets are managed will not change as a result of the Transaction, and the same people who currently manage the Fund’s assets are expected to continue to do so after the Transaction; |
| | • | | The fee rates payable by the Fund under the New Agreements are the same as the fee rates payable under the Current Agreements; |
| | • | | The New Agreements are identical in all material respects to the Current Agreements; |
| | • | | The Manager and the Sub-Advisors would provide the same services to the Fund pursuant to the New Agreements as they had been providing under the Current Agreements; |
| | • | | The Manager’s personnel who will provide management services to the Fund are not expected to change and the commitment of the New Ownership Group to retain key personnel currently employed by the Manager who currently provide services to the Fund; |
| | • | | The Sub-Advisors’ personnel who will provide advisory services to the Fund are not expected to change; |
| | • | | Resolute’s substantially strengthened capital structure following the Closing, which would enable Resolute to continue to provide the Manager with the financial resources necessary to continue to operate and grow the Fund; |
| | • | | The anticipated governance structure to be employed in the management of RIM and that following the Transaction the Manager is expected to maintain continuity of management, a similar degree of operational autonomy and its current culture of compliance; |
| | • | | The various measures in place and/or prepared to be employed to address any potential impact of the Transaction on the Manager’s business, including its day-to-day operations; |
| | • | | The anticipated absence of any adverse impact of the Transaction on the Fund’s Sub-Advisors and other key service providers; |
| | • | | The alignment of the strategic business objectives of the New Ownership Group with regard to its investment in the Manager and the Manager’s activities with respect to the Trust, which objectives are consistent with the Manager’s current objectives; |
| | • | | Fund shareholders will not bear any costs in connection with the Transaction, inasmuch as the Manager and, indirectly, the New Ownership Group will bear the costs, fees and expenses incurred by the Fund in connection with the Transaction, the proxy statement, the fees and expenses of accountants and attorneys relating to the Transaction, and the fees and expenses of the Board and the Committee for meetings held in connection with the Transaction; |
| | • | | The Fund may realize benefits as a result of the Transaction, including that the Transaction is expected to maintain continuity of management of the Fund and may reduce the potential vulnerability to changes in control of the Manager that could be adverse to the Fund’s interests and affect the retention of key employees providing services to the Fund; |
61
Disclosure Regarding the Approval of New Management and Investment Advisory Agreements (Unaudited)
| | • | | The Manager’s representation that there had been no material changes or developments relating to the Manager or the Sub-Advisors since the May-June Meetings, other than the changes or developments subsequently reported to the Board; and |
| | • | | The Trustees had requested and evaluated information relevant to the renewal of the Current Agreements at their May-June Meetings. |
In light of the proximity of the Board’s consideration of the renewal or approval of the Current Agreements at the May-June Meetings, the Trustees determined that it was not necessary to repeat certain aspects of the review conducted in connection with the approvals made the prior month. Based on the process undertaken and the considerations weighed by the Board with respect to the renewal of the Current Agreements, and the Board’s due diligence review in connection with the Transaction during the July Meetings, the Board approved the New Agreements at the July 12, 2023 meeting, and recommended that, as applicable, the shareholders of the Fund also approve the New Agreements. The factors considered by the Board in connection with the approval of the Current Agreements are described in the section of this report titled “Disclosure Regarding Approval of the Current Management and Investment Advisory Agreements.”
62
American Beacon American Beacon Small Cap Value FundSM
Results of Shareholder Meeting (Unaudited)
A special meeting of shareholders of each of the portfolios of the American Beacon Funds (the “Trust”) was held on October 27, 2023. The shareholders of the American Beacon Small Cap Value Fund (the “Fund”), a portfolio of the Trust, failed to approve a new management agreement between American Beacon Advisors, Inc. and the Trust, with respect to the Fund. This proposal required a majority of the shareholders of the Fund to achieve a quorum: however, a quorum was not present for the Fund and therefore not enough votes in favor of the proposal. The meeting was adjourned to November 17, 2023.
63
Trustees and Officers of the American Beacon FundsSM (Unaudited)
The Trustees and officers of the American Beacon Funds (the “Trust”) are listed below, together with their principal occupations during the past five years. The address of each person listed below is 220 East Las Colinas Boulevard, Suite 1200, Irving, Texas 75039. Each Trustee oversees twenty-seven funds in the fund complex that includes the Trust, the American Beacon Select Funds, and the American Beacon Institutional Funds Trust. The Trust’s Statement of Additional Information contains additional information about the Trustees and is available without charge by calling 1-800-658-5811.
| | | | |
Name, Age | | Position, Term of Office and Length of Time Served with the Trust | | Principal Occupation(s) During Past 5 Years and Current Directorships |
| INTERESTED TRUSTEES | | Term | | |
| | Lifetime of Trust until removal, resignation or retirement* | | |
| | |
| Eugene J. Duffy (1954)** | | Trustee since 2008 | | Managing Director, Global Investment Management Distribution, Mesirow Financial Administrative Corporation (2016-Present); Managing Director, Institutional Services, Intercontinental Real Estate Corporation (2014-2016); Trustee, American Beacon Select Funds (2008-Present); Trustee, American Beacon Institutional Funds Trust (2017-Present); Trustee, American Beacon Sound Point Enhanced Income Fund (2018–2021); Trustee, American Beacon Apollo Total Return Fund (2018–2021). |
| | |
| NON-INTERESTED TRUSTEES | | Term | | |
| | Lifetime of Trust until removal, resignation or retirement* | | |
| | |
| Gilbert G. Alvarado (1969) | | Trustee since 2015 | | Chief Financial Officer (2022-Present), The Conrad Prebys Foundation; President, SJVIIF, LLC, Impact Investment Fund (2018-2022); Director, Kura MD, Inc. (local telehealth organization) (2015-2017); Senior Vice President & CFO, Sierra Health Foundation (health conversion private foundation) (2006-2022); Senior Vice President & CFO, Sierra Health Foundation: Center for Health Program Management (California public benefit corporation) (2012-2022); Director, Sacramento Regional Technology Alliance (2011-2016); Director, Valley Healthcare Staffing (2017–2018); Trustee, American Beacon Select Funds (2015-Present); Trustee, American Beacon Institutional Funds Trust (2017-Present); Trustee, American Beacon Sound Point Enhanced Income Fund (2018–2021); Trustee, American Beacon Apollo Total Return Fund (2018–2021). |
| | |
| Joseph B. Armes (1962) | | Trustee since 2015 | | Director, Switchback Energy Acquisition (2019-2021); Chairman & CEO, CSW Industrials f/k/a Capital Southwest Corporation (investment company) (2015-Present); Chairman of the Board of Capital Southwest Corporation, predecessor to CSW Industrials, Inc. (2014-2017) (investment company); President & CEO, JBA Investment Partners (family investment vehicle) (2010-Present); Director and Chair of Audit Committee, RSP Permian (oil and gas producer) (2013-2018); Trustee, American Beacon Select Funds (2015-Present); Trustee, American Beacon Institutional Funds Trust (2017-Present); Trustee, American Beacon Sound Point Enhanced Income Fund (2018–2021); Trustee, American Beacon Apollo Total Return Fund (2018–2021). |
| | |
| Gerard J. Arpey (1958) | | Trustee since 2012 | | Partner, Emerald Creek Group (private equity firm) (2011-Present); Director, S.C. Johnson & Son, Inc. (privately held company) (2008-present); Director, The Home Depot, Inc. (2015-Present); Trustee, American Beacon Select Funds (2012-Present); Trustee, American Beacon Institutional Funds Trust (2017-Present); Trustee, American Beacon Sound Point Enhanced Income Fund (2018–2021); Trustee, American Beacon Apollo Total Return Fund (2018–2021). |
64
Trustees and Officers of the American Beacon FundsSM (Unaudited)
| | | | |
Name, Age | | Position, Term of Office and Length of Time Served with the Trust | | Principal Occupation(s) During Past 5 Years and Current Directorships |
| NON-INTERESTED TRUSTEES (CONT.) | | Term | | |
| | Lifetime of Trust until removal, resignation or retirement* | | |
| | |
| Brenda A. Cline (1960) | | Trustee since 2004 Chair since 2019 Vice Chair 2018 | | Chief Financial Officer, Treasurer and Secretary, Kimbell Art Foundation (1993-Present); Director, Tyler Technologies, Inc. (public sector software solutions company) (2014-Present); Director, Range Resources Corporation (oil and natural gas company) (2015-Present); Trustee, Cushing Closed-End and Open-End Funds (2017-2021);Chair, (2019-Present), Vice Chair (2018), Trustee (2004-Present), American Beacon Select Funds; Chair (2019-Present), Vice Chair (2018), Trustee (2017-Present), American Beacon Institutional Funds Trust; Chair (2019-2021), Vice Chair (2018), Trustee (2018-2021), American Beacon Sound Point Enhanced Income Fund (2018–2021); Chair (2019-2021), Vice Chair (2018), Trustee (2018-2021), American Beacon Apollo Total Return Fund (2018–2021). |
| | |
| Claudia A. Holz (1957) | | Trustee since 2018 | | Independent Director, Blue Owl Capital, Inc. (2021-Present); Partner, KPMG LLP (1990 – 2017); Trustee, American Beacon Select Funds (2018-Present); Trustee, American Beacon Institutional Funds Trust (2018-Present); Trustee, American Beacon Sound Point Enhanced Income Fund (2018–2021); Trustee, American Beacon Apollo Total Return Fund (2018–2021). |
| | |
| Douglas A. Lindgren (1961) | | Trustee since 2018 | | Director, JLL Income Property Trust (2022-Present); CEO North America, Carne Global Financial Services (2016-2017); Consultant, Carne Financial Services (2017-2019); Managing Director, IPS Investment Management and Global Head, Content Management, UBS Wealth Management (2010-2016); Trustee, American Beacon Select Funds (2018-Present); Trustee, American Beacon Institutional Funds Trust (2018-Present); Trustee, American Beacon Sound Point Enhanced Income Fund (2018–2021); Trustee, American Beacon Apollo Total Return Fund (2018–2021). |
| | |
| Barbara J. McKenna, CFA (1963) | | Trustee since 2012 | | President/Managing Principal, Longfellow Investment Management Company (2005-Present, President since 2009); Member, External Diversity Council of the Federal Reserve Bank of Boston (2021-Present); Member, Federal Reserve Bank of Boston CEO Roundtable (2021-Present); Board Advisor, United States Tennis Association (2021-Present); Trustee, American Beacon Select Funds (2012-Present); Trustee, American Beacon Institutional Funds Trust (2017-Present); Trustee, American Beacon Sound Point Enhanced Income Fund (2018–2021); Trustee, American Beacon Apollo Total Return Fund (2018–2021). |
65
Trustees and Officers of the American Beacon FundsSM (Unaudited)
| | | | |
Name, Age | | Position, Term of Office and Length of Time Served with the Trust | | Principal Occupation(s) During Past 5 Years and Current Directorships |
| OFFICERS | | Term | | |
| | One Year | | |
| | |
| Jeffrey K. Ringdahl (1975) | | President since 2022 Vice President (2010-2022) | | Director (2015-Present), President (2018-Present), Chief Executive Officer (2022-Present), Chief Operating Officer (2010-2022), Senior Vice President (2013-2018), American Beacon Advisors, Inc.; Director (2015-Present), President (2018-Present), Senior Vice President (2015-2018), Resolute Investment Holdings, LLC; Director (2015-Present), President (2018-Present), Senior Vice President (2015-2018), Resolute Topco, Inc.; Director (2015-Present), President (2018-Present), Senior Vice President (2015-2018), Resolute Acquisition, Inc.; Director (2015-Present), President (2018-Present), Chief Executive Officer (2022-Present); Chief Operating Officer (2018-2022), Senior Vice President (2015-2018), Resolute Investment Managers, Inc.; Director (2017-Present), President & Chief Executive Officer (2022-Present), Executive Vice President (2017-2022), Resolute Investment Distributors, Inc.; Director (2017-Present), President (2018-Present), Chief Executive Officer (2022-Present), Chief Operating Officer (2018-2022), Executive Vice President (2017-2018), Resolute Investment Services, Inc.; President (2022-Present), Senior Vice President (2017-2022), Vice President (2012-2017), Manager (2015-Present), American Private Equity Management, L.L.C.; Trustee, American Beacon NextShares Trust (2015-2020); Director, Executive Vice President & Chief Operating Officer, Alpha Quant Advisors, LLC (2016-2020); Director, Shapiro Capital Management, LLC (2017-Present); Director and Executive Vice President, Continuous Capital, LLC (2018-2022); Director, RSW Investments Holdings LLC (2019-Present); Manager, SSI Investment Management, LLC (2019-Present); Director, National Investment Services of America, LLC (2019-Present); Director and Vice President American Beacon Cayman Transformational Innovation Company, Ltd. (2017-2018); Vice President, American Beacon Delaware Transformational Innovation Corporation (2017-2018); Director (2014-Present), President (2022-Present), Vice President (2014-2022), American Beacon Cayman Managed Futures Strategy Fund, Ltd.; Director (2018-Present), President (2022-Present), (Vice President (2018-2022), American Beacon Cayman TargetRisk Company, Ltd.; President (2022-Present); Vice President (2010-2022), Director and President, American Beacon Cayman Multi-Alternatives Company, Ltd.; (2023-Present); Director and President, American Beacon Cayman Trend Company, Ltd. (2023-Present); American Beacon Select Funds; President (2022-Present), Vice President (2017-2022), American Beacon Institutional Funds Trust; Vice President, American Beacon Sound Point Enhanced Income Fund (2018-2021); Vice President, American Beacon Apollo Total Return Fund (2018-2021). |
66
Trustees and Officers of the American Beacon FundsSM (Unaudited)
| | | | |
Name, Age | | Position, Term of Office and Length of Time Served with the Trust | | Principal Occupation(s) During Past 5 Years and Current Directorships |
| OFFICERS (CONT.) | | Term | | |
| | One Year | | |
| | |
| Rosemary K. Behan (1959) | | VP, Secretary and Chief Legal Officer since 2006 | | Senior Vice President (2021-Present), Vice President (2006-2021), Secretary and General Counsel (2006-Present), American Beacon Advisors, Inc.; Secretary, Resolute Investment Holdings, LLC (2015-Present); Secretary, Resolute Topco, Inc. (2015-Present); Secretary, Resolute Acquisition, Inc. (2015–Present); Senior Vice President (2021-Present), Vice President (2015-2021), Secretary and General Counsel (2015-Present), Resolute Investment Managers, Inc.; Secretary, Resolute Investment Distributors, Inc. (2017-Present); Senior Vice President (2021-Present), Vice President (2017-2021), Secretary and General Counsel (2017-Present), Resolute Investment Services, Inc.; Secretary, American Private Equity Management, L.L.C. (2008-Present); Secretary and General Counsel, Alpha Quant Advisors, LLC (2016-2020); Vice President and Secretary, Continuous Capital, LLC (2018-2022); Secretary, Green Harvest Asset Management (2019-2021); Secretary, American Beacon Delaware Transformational Innovation Corporation (2017-2018); Secretary, American Beacon Cayman Transformational Innovation Company, Ltd. (2017-2018); Secretary, American Beacon Cayman Managed Futures Strategy Fund, Ltd. (2014-Present); Secretary, American Beacon Cayman TargetRisk Company, Ltd. (2018-Present); Secretary, American Beacon Cayman Multi-Alternatives Company, Ltd. (2023-Present); Secretary, American Beacon Cayman Trend Company, Ltd. (2023-Present); Chief Legal Officer, Vice President and Secretary, American Beacon Select Funds (2006-Present); Chief Legal Officer, Vice President and Secretary, American Beacon Institutional Funds Trust (2017-Present); Chief Legal Officer, Vice President and Secretary, American Beacon Sound Point Enhanced Income Fund (2018-2021); Chief Legal Officer, Vice President and Secretary, American Beacon Apollo Total Return Fund (2018-2021). |
| | |
| Gregory J. Stumm (1981) | | VP since 2022 | | Senior Vice President, American Beacon Advisors, Inc. (2022-Present); Senior Vice President, Resolute Investment Managers, Inc. (2022-Present); Director and Senior Vice President, Resolute Investment Distributors, Inc. (2022-Present); Senior Vice President, Resolute Investment Services, Inc. (2022-Present); Vice President, American Beacon Select Funds (2022-Present); Vice President, American Beacon Institutional Funds Trust (2022-Present). |
| | |
| Paul B. Cavazos (1969) | | VP since 2016 | | Chief Investment Officer and Senior Vice President, American Beacon Advisors, Inc. (2016-Present); American Private Equity Management, L.L.C. (2017–Present); Vice President, American Beacon Select Funds (2016-Present); Vice President, American Beacon Institutional Funds Trust (2017-Present); Vice President, American Beacon Sound Point Enhanced Income Fund (2018-2021); Vice President, American Beacon Apollo Total Return Fund (2018-2021). |
| | |
| Erica Duncan (1970) | | VP since 2011 | | Vice President, American Beacon Advisors, Inc. (2011-Present); Vice President, Resolute Investment Managers (2018-Present); Vice President, Resolute Investment Services, Inc. (2018-Present); Vice President, American Beacon Select Funds (2011-Present); Vice President, American Beacon Institutional Funds Trust (2017-Present); Vice President, American Beacon Sound Point Enhanced Income Fund (2018-2021); Vice President, American Beacon Apollo Total Return Fund (2018-2021). |
67
Trustees and Officers of the American Beacon FundsSM (Unaudited)
| | | | |
Name, Age | | Position, Term of Office and Length of Time Served with the Trust | | Principal Occupation(s) During Past 5 Years and Current Directorships |
| OFFICERS (CONT.) | | Term | | |
| | One Year | | |
| | |
| Melinda G. Heika (1961) | | VP since 2021 | | Senior Vice President (2021-Present), Treasurer and CFO (2010-Present), American Beacon Advisors, Inc.; Treasurer, Resolute Topco, Inc. (2015-Present); Treasurer, Resolute Investment Holdings, LLC. (2015-Present); Treasurer, Resolute Acquisition, Inc. (2015-Present); Senior Vice President (2021-Present), Treasurer and CFO (2017-Present), Resolute Investment Managers, Inc.; Treasurer, Resolute Investment Distributors, Inc. (2017); Senior Vice President (2021-Present); Treasurer and CFO (2017-Present), Resolute Investment Services, Inc.; Treasurer, American Private Equity Management, L.L.C. (2012-Present); Treasurer and CFO, Alpha Quant Advisors, LLC (2016-2020); Treasurer and CFO, Continuous Capital, LLC (2018-2022); Treasurer, American Beacon Cayman Transformational Innovation, Ltd. (2017-2018); Treasurer, American Beacon Delaware Transformational Innovation Corporation (2017-2018); Director (2014-Present), Vice President (2022-Present) and Treasurer (2014-2022), American Beacon Cayman Managed Futures Strategy Fund, Ltd.; Director and Vice President (2022-Present), and Treasurer(2018-2022), American Beacon Cayman TargetRisk Company, Ltd. (2018-Present); Director and Vice President, American Beacon Cayman Multi-Alternatives Company, Ltd. (2023-Present); Director and Vice President, American Beacon Cayman Trend Company, Ltd. (2023-Present) Principal Accounting Officer and Treasurer (2010-2021); American Beacon Funds; Vice President (2021-Present), Principal Accounting Officer (2017-2021) and Treasurer (2010-2021), American Beacon Select Funds; Vice President (2021–Present), Principal Accounting Officer and Treasurer (2017-2021), American Beacon Institutional Funds Trust; Vice President (2021), Principal Accounting Officer and Treasurer (2018-2021), American Beacon Sound Point Enhanced Income Fund; Vice President (2021), Principal Accounting Officer and Treasurer, American Beacon Apollo Total Return Fund (2018-2021). |
| | |
| Terri L. McKinney (1963) | | VP since 2010 | | Senior Vice President (2021-Present), Vice President (2009-2021), American Beacon Advisors, Inc.; Senior Vice President (2021–Present); Vice President (2017-2021), Resolute Investment Managers, Inc.; Senior Vice President (2021-Present), Vice President (2018-2021), Resolute Investment Services, Inc; Vice President, Alpha Quant Advisors, LLC (2016-2020); Vice President, Continuous Capital, LLC (2018-2022); Vice President, American Beacon Select Funds (2010-Present); Vice President, American Beacon Institutional Funds Trust (2017-Present); Vice President, American Beacon Sound Point Enhanced Income Fund (2018-2021); Vice President, American Beacon Apollo Total Return Fund (2018-2021). |
| | |
| Samuel J. Silver (1963) | | VP since 2011 | | Vice President (2011-Present), Chief Fixed Income Officer (2016-Present), American Beacon Advisors, Inc.; Vice President, American Beacon Select Funds (2011-Present); Vice President, American Beacon Institutional Funds Trust (2017-Present); Vice President, American Beacon Sound Point Enhanced Income Fund (2018-2021); Vice President, American Beacon Apollo Total Return Fund (2018-2021). |
68
Trustees and Officers of the American Beacon FundsSM (Unaudited)
| | | | |
Name, Age | | Position, Term of Office and Length of Time Served with the Trust | | Principal Occupation(s) During Past 5 Years and Current Directorships |
| OFFICERS (CONT.) | | Term | | |
| | One Year | | |
| | |
| Christina E. Sears (1971) | | Chief Compliance Officer since 2004 | | Chief Compliance Officer (2004-Present), Vice President (2019-Present); American Beacon Advisors, Inc.; Vice President, Resolute Investment Managers, Inc. (2017-Present); Vice President, Resolute Investment Distributors (2017-Present); Vice President, Resolute Investment Services, Inc. (2019-Present); Chief Compliance Officer, American Private Equity Management, L.L.C. (2012-Present); Chief Compliance Officer, Green Harvest Asset Management, LLC (2019-2021); Chief Compliance Officer, RSW Investments Holdings, LLC (2019-Present); Chief Compliance Officer (2016-2019) and Vice President (2016-2020), Alpha Quant Advisors, LLC ; Chief Compliance Officer (2018-2019), Vice President (2018-2022), Continuous Capital, LLC; Assistant Secretary, American Beacon Funds (1999-Present); Chief Compliance Officer (2004-Present) and Assistant Secretary (1999-Present), American Beacon Select Funds; Chief Compliance Officer and Assistant Secretary, American Beacon Institutional Funds Trust (2017-Present); Chief Compliance Officer and Assistant Secretary, American Beacon Sound Point Enhanced Income Fund (2018-2021); Chief Compliance Officer and Assistant Secretary, American Beacon Apollo Total Return Fund (2018-2021). |
| | |
| Sonia L. Bates (1956) | | Principal Accounting Officer and Treasurer since 2021 | | Assistant Treasurer, American Beacon Advisors, Inc. (2011-2018); Vice President, Fund and Tax Reporting (2023-Present), Director, Fund and Tax Reporting (2011-2023), Resolute Investment Services, Inc.; Assistant Treasurer, American Private Equity Management, L.L.C. (2012-Present); Assistant Treasurer, American Beacon Cayman Transformational Innovation Company, Ltd. (2017-2018); Treasurer, American Beacon Cayman Managed Futures Strategy Fund, Ltd. (2022-Present); Treasurer (2022-Present), Assistant Treasurer (2018-2022), American Beacon Cayman TargetRisk Company, Ltd.; Treasurer, American Beacon Cayman Multi-Alternatives Company, Ltd. (2023-Present); Treasurer, American Beacon Cayman Trend Company, Ltd. (2023-Present); Assistant Treasurer, American Beacon Funds (2011-2021); Principal Accounting Officer and Treasurer (2021-Present), Assistant Treasurer (2011-2021), American Beacon Select Funds; Principal Accounting Officer and Treasurer (2021-Present), Assistant Treasurer (2017-2021), American Beacon Institutional Funds Trust; Principal Accounting Officer and Treasurer (2021), Assistant Treasurer (2018-2021), American Beacon Sound Point Enhanced Income Fund; Principal Accounting Officer and Treasurer (2021), Assistant Treasurer (2018-2021), American Beacon Apollo Total Return Fund. |
| | |
| Shelley L. Dyson (1969) | | Assistant Treasurer since 2021 | | Fund Tax Manager (2020-Present), Manager, Tax (2014-2020), Resolute Investment Services, Inc.; Assistant Treasurer American Beacon Cayman Managed Futures Strategy Fund, Ltd. (2022-Present); Assistant Treasurer, American Beacon Cayman TargetRisk Company, Ltd. (2022-Present); Assistant Treasurer, American Beacon Cayman Multi-Alternatives Company, Ltd. (2023-Present); Assistant Treasurer, American Beacon Cayman Trend Company, Ltd. (2023-Present); Assistant Treasurer, American Beacon Select Funds (2021-Present); Assistant Treasurer, American Beacon Institutional Funds Trust (2021-Present); Assistant Treasurer, American Beacon Sound Point Enhanced Income Fund (2021); Assistant Treasurer, American Beacon Apollo Total Return Fund (2021). |
69
Trustees and Officers of the American Beacon FundsSM (Unaudited)
| | | | |
Name, Age | | Position, Term of Office and Length of Time Served with the Trust | | Principal Occupation(s) During Past 5 Years and Current Directorships |
| OFFICERS (CONT.) | | Term | | |
| | One Year | | |
| | |
| Shelley D. Abrahams (1974) | | Assistant Secretary since 2008 | | Corporate Governance Manager (2023-Present), Senior Corporate Governance & Regulatory Specialist (2020-2023), Corporate Governance & Regulatory Specialist (2017-2020), Resolute Investment Services, Inc.; Assistant Secretary, American Beacon Cayman Managed Futures Strategy Fund, Ltd. (2022-Present); Assistant Secretary, American Beacon Cayman TargetRisk Company, Ltd. (2022-Present); Assistant Secretary, American Beacon Cayman Multi-Alternatives Company, Ltd. (2023-Present); Assistant Secretary, American Beacon Cayman Trend Company, Ltd. (2023-Present); Assistant Secretary, American Beacon Select Funds (2008-Present); Assistant Secretary, American Beacon Institutional Funds Trust (2017-Present); Assistant Secretary, American Beacon Sound Point Enhanced Income Fund (2018-2021); Assistant Secretary, American Beacon Apollo Total Return Fund (2018-2021). |
| | |
| Rebecca L. Harris (1966) | | Vice President since 2022 | | Senior Vice President (2021-Present), Vice President (2011-2021), American Beacon Advisors, Inc.; Senior Vice President (2021-Present), Vice President (2017-2021), Resolute Investment Managers, Inc.; Senior Vice President (2021-Present), Vice President (2015-Present), Resolute Investment Services; Vice President, Alpha Quant Advisors, LLC (2016-2020); Vice President (2018-Present), Director (2022) Continuous Capital, LLC; Director, National Investment Services of American, LLC (2022-Present); Director, RSW Investments Holdings LLC (2022-Present); Director Shapiro Capital Management LLC (2022-Present); Director, SSI Investment Management LLC (2022-Present); Assistant Secretary, American Beacon Funds (2010-2022); Vice President (2022-Present), Assistant Secretary (2010-2022), American Beacon Select Funds; Vice President (2022-Present), Assistant Secretary (2017-2022), American Beacon Institutional Funds Trust; Assistant Secretary, American Beacon Sound Point Enhanced Income Fund (2018-2021); Assistant Secretary, American Beacon Apollo Total Return Fund (2018-2021). |
| | |
| Teresa A. Oxford (1958) | | Assistant Secretary since 2015 | | Assistant Secretary and Associate General Counsel, American Beacon Advisors, Inc. (2015-Present); Assistant Secretary, Resolute Investment Distributors (2018-2021); Assistant Secretary and Associate General Counsel, Resolute Investment Managers, Inc. (2017-Present); Assistant Secretary and Associate General Counsel, Resolute Investment Services (2018-Present); Assistant Secretary, Alpha Quant Advisors, LLC (2016-2020); Assistant Secretary, Continuous Capital, LLC (2020-2022); Assistant Secretary, American Beacon Select Funds (2015-Present); Assistant Secretary, American Beacon Institutional Funds Trust (2017-Present); Assistant Secretary, American Beacon Sound Point Enhanced Income Fund (2018-2021); Assistant Secretary, American Beacon Apollo Total Return Fund (2018-2021). |
| | |
| Michael D. Jiang (1984) | | Assistant Secretary since 2021 | | Assistant Secretary (2022-Present), Associate General Counsel (2021-Present), American Beacon Advisors, Inc.; Assistant Secretary (2021-Present), Resolute Investment Distributors, Inc.; Assistant Secretary (2022-Present), Associate General Counsel (2021-Present), Resolute Investment Managers, Inc.; Assistant Secretary (2022–Present) and Associate General Counsel, (2021-Present), Resolute Investment Services, Inc.; Vice President (2018-2021), Second Vice President (2015-2018), The Northern Trust Company; Assistant Secretary, American Beacon Select Funds (2021-Present); Assistant Secretary, American Beacon Institutional Funds Trust (2021-Present); Assistant Secretary, American Beacon Sound Point Enhanced Income Fund (2021); Assistant Secretary, American Beacon Apollo Total Return Fund (2021). |
* As of 11/12/2014, the Board adopted a retirement plan that requires Trustees to retire no later than the last day of the calendar year in which they reach the age of 75.
** Mr. Duffy is being deemed to be an “interested person” of the Trust, as defined by the Investment Company Act of 1940, as amended, by virtue of his position with Mesirow Financial, Inc., a broker-dealer.
70
American Beacon FundsSM
Privacy Policy
October 31, 2023 (Unaudited)
The American Beacon Funds recognize and respect the privacy of our shareholders. We are providing this notice to you so you will understand how shareholder information may be collected and used.
We may collect nonpublic personal information about you from one or more of the following sources:
| | • | | information we receive from you on applications or other forms; |
| | • | | information about your transactions with us or our service providers; and |
| | • | | information we receive from third parties. |
We do not disclose any nonpublic personal information about our customers or former customers to anyone, except as permitted by law.
We restrict access to your nonpublic personal information to those employees or service providers who need to know that information to provide products or services to you. To ensure the confidentiality of your nonpublic personal information, we maintain safeguards that comply with federal standards.
71
This page intentionally left blank.
72

Delivery of Documents
Shareholder reports are available online at www.americanbeaconfunds.com/reports. Please be advised that reports are no longer sent by mail. Instead, the reports are made available online, and you will be notified by mail each time a report is posted online. You will be provided with a website link to access the report. You may elect to receive all future reports in paper free of charge. You can request to continue receiving paper copies by calling 1-866-345-5954, or you may directly inform your financial intermediary. Detailed instructions are also included in your report notifications.
If you invest in the Fund through a financial institution, you may be able to receive the Fund’s regulatory mailings, such as the Prospectus, Annual Report and Semi-Annual Report, by e-mail. If you are interested in this option, please go to www.icsdelivery.com and search for your financial institution’s name or contact your financial institution directly.
To obtain more information about the Fund:
| | |
 | |  |
| | |
| By E-mail: | | On the Internet: |
| american_beacon.funds@ambeacon.com | | Visit our website at www.americanbeaconfunds.com |
| | | |
| | | |
| | |

By Telephone: Call (800) 658-5811 | | 
By Mail: American Beacon Funds P.O. Box 219643 Kansas City, MO 64121-9643 |
|
|
|
| | | |
| | | |
| Availability of Quarterly Portfolio Schedules | | Availability of Proxy Voting Policy and Records |
| | |
| In addition to the Schedule of Investments provided in each semi-annual and annual report, the Fund files a complete schedule of its portfolio holdings with the Securities and Exchange Commission (“SEC”) on Form N-PORT as of the end of each fiscal quarter. The Fund’s Forms N-PORT are available on the SEC’s website at www.sec.gov. The Forms N-PORT may also be reviewed and copied at the SEC’s Public Reference Section, 100 F Street, NE, Washington, D.C. 20549-1520. Information regarding the operation of the SEC’s Public Reference Room may be obtained by calling (800)-SEC-0330. A complete schedule of the Fund’s portfolio holdings is also available at www.americanbeaconfunds.com approximately twenty days after the end of each month. | | A description of the policies and procedures the Fund uses to determine how to vote proxies relating to portfolio securities is available in the Fund’s Statement of Additional Information, is available free of charge on the Fund’s website www.americanbeaconfunds.com and by calling 1-800-967-9009 or by accessing the SEC’s website at www.sec.gov. The Fund’s proxy voting record for the most recent year ended June 30 is filed annually with the SEC on Form N-PX. The Fund’s Forms N-PX are available on the SEC’s website at www.sec.gov. The Fund’s proxy voting record may also be obtained by calling 1-800-967-9009. |
Fund Service Providers:
| | | | | | | | | | | | |
CUSTODIAN State Street Bank and Trust Company Boston, Massachusetts | | | | TRANSFER AGENT SS&C GIDS, Inc. Quincy, Massachusetts | | | | INDEPENDENT REGISTERED PUBLIC ACCOUNTING FIRM PricewaterhouseCoopers LLP Boston, Massachusetts | | | | DISTRIBUTOR Resolute Investment Distributors, Inc. Irving, Texas |
This report is prepared for shareholders of the American Beacon Funds and may be distributed to others only if preceded or accompanied by a current Prospectus or Summary Prospectus.
American Beacon Funds and American Beacon Small Cap Value Fund are service marks of American Beacon Advisors, Inc.
AR 10/23
The registrant adopted a code of ethics (the “Code”) that applies to the registrant’s principal executive officer and principal financial officer. The registrant amended its code July 6, 2021 to remove two terminated investment companies and update the Principal Financial Officer. The registrant has not granted any waivers from the provisions of the Code during the period covered by the shareholder reports presented in Item 1. The Code is filed herewith as Exhibit 99.CODE ETH.
| ITEM 3. | AUDIT COMMITTEE FINANCIAL EXPERT. |
The registrant’s Board of Trustees of the Trust has determined that Claudia Holz, a member of the Trust’s Audit and Compliance Committee, is the “audit committee financial expert” as defined in Form N-CSR. Ms. Claudia is considered “independent” as defined in Item 3 of Form N-CSR.
| ITEM 4. | PRINCIPAL ACCOUNTANT FEES AND SERVICES. |
The registrant has engaged its principal accountant to perform audit services, audit-related services, tax services and other services during the past two fiscal years. “Audit services” refer to performing an audit of the registrant’s annual financial statements or services that are normally provided by the accountant in connection with statutory and regulatory filings or engagements for those fiscal years. “Audit-related services” refer to the assurance and related services by the principal accountant that are reasonably related to the performance of the audit. “Tax services” refer to professional services rendered by the principal accountant for tax compliance, tax advice, and tax planning. “Other services” refer to all other fees category would consist of service related to internal control reviews, strategy, and other consulting, financial information systems design and implementation, consulting on other information systems, and other tax services unrelated to the registrant. The following table details the aggregate fees billed for each of the last two fiscal years for audit fees, audit-related fees, tax fees, and all other fees by the principal accountant.
(a)
| | | | |
Audit Fees | | Fiscal Year Ended | |
$269,734 | | | 10/31/2022 | |
$269,734 | | | 10/31/2023 | |
(b)
| | | | |
Audit Related Fees | | Fiscal Year Ended | |
| $0 | | | 10/31/2022 | |
| $0 | | | 10/31/2023 | |
(c)
| | | | |
Tax Fees (1) | | Fiscal Year Ended | |
$210,899 | | | 10/31/2022 | |
$128,195 | | | 10/31/2023 | |
(d)
| | | | |
All Other Fees | | Fiscal Year Ended | |
| $0 | | | 10/31/2022 | |
| $0 | | | 10/31/2023 | |
| (1) | “Tax Fees” are the aggregate fees billed for professional services for tax advice, tax compliance, tax planning, filing assistance for EU reclaims and PFIC tax services. These fees include international, federal, state, and excise tax reviews. |
(e)(1) Pursuant to its charter, the Trust’s Audit and Compliance Committee shall have the following duties and powers pertaining to pre-approval of audit and non-audit services provided by the registrant’s principal accountant:
- to approve, prior to appointment, the engagement of auditors to annually audit and provide their opinion on the Trusts’ financial statements, and, in connection therewith, reviewing and evaluating matters potentially affecting the independence and capabilities of the auditors;
- to approve, prior to appointment, the engagement of the auditors to provide non-audit services to the Trusts, an investment adviser to any series of the Trusts or any entity controlling, controlled by, or under common control with an investment adviser (“adviser affiliate”) that provides ongoing services to the Trusts, if the engagement relates directly to the operations and financial reporting of the Trusts;
- to consider whether the non-audit services provided by a Trust’s auditor to an investment adviser or any adviser affiliate that provides ongoing services to a series of the Trusts, which services were not pre-approved by the Committee, are compatible with maintaining the auditor’s independence;
- to review the arrangements for and scope of the annual audit and any special audits; and
- to review and approving the fees proposed to be charged to the Trusts by the auditors for each audit and non-audit service.
The Audit and Compliance Committee may delegate any portion of its authority, including the authority to grant pre-approvals of audit and permitted non-audit services, to a subcommittee of one or more members. Any decisions of the subcommittee to grant pre-approvals shall be presented to the full audit committee at its next regularly scheduled meeting.
(e)(2) None of the fees disclosed in paragraphs (b) through (d) above were approved by the audit committee pursuant to paragraph (c)(7)(i)(C) of Rule 2-01 of Regulation S-X.
| (g) | Aggregate Non-Audit Fees for Services Rendered to the: |
| | | | | | | | | | |
Registrant | | Adviser | | | Adviser’s Affiliates Providing Ongoing Services to Registrant | | Fiscal Year Ended | |
$210,899 | | $ | 149,467 | | | N/A | | | 10/31/2022 | |
$128,195 | | $ | 32,969 | | | N/A | | | 10/31/2023 | |
| ITEM 5. | AUDIT COMMITTEE OF LISTED REGISTRANTS. |
Not applicable.
| ITEM 6. | SCHEDULE OF INVESTMENTS. |
| (a) | The schedules of investments for each series of the Trust are included in the shareholder reports presented in Item 1. |
| ITEM 7. | DISCLOSURE OF PROXY VOTING POLICIES AND PROCEDURES FOR CLOSED-END MANAGEMENT INVESTMENT COMPANIES. |
Not applicable.
| ITEM 8. | PORTFOLIO MANAGERS OF CLOSED-END MANAGEMENT INVESTMENT COMPANIES. |
Not applicable.
| ITEM 9. | PURCHASES OF EQUITY SECURITIES BY CLOSED-END MANAGEMENT INVESTMENT COMPANY AND AFFILIATED PURCHASERS. |
Not applicable.
| ITEM 10. | SUBMISSION OF MATTERS TO A VOTE OF SECURITY HOLDERS. |
The registrant has made no material changes to the procedures by which shareholders may recommend nominees to the Trust’s Board of Trustees.
| ITEM 11. | CONTROLS AND PROCEDURES. |
(a) The registrant’s principal executive officer and principal financial officer have reviewed the registrant’s disclosure controls and procedures (as defined in Rule 30a-3(c) under the Investment Company Act of 1940, as amended) as of a date within 90 days of the filing of this report as required by Rule 30a-3(b) under the Act and Rules 13a-15(b) or 15d-15(b) under the Securities Exchange Act of 1934. Based upon their review, such officers have concluded that the registrant’s disclosure controls and procedures are effective in ensuring that information required to be disclosed in the report is appropriately recorded, processed, summarized and reported and made know to them by others within the registrant and by the registrant’s service provider.
(b) The registrant’s principal executive officer and principal financial officer are aware of no changes in the registrant’s internal control over financial reporting (as defined in Rule 30a-3(d) under the Act) that occurred during the period covered by this report that has materially affected, or is reasonably likely to materially affect, the registrant’s internal control over financial reporting.
| ITEM 12 | DISCLOSURE OF SECURITIES LENDING ACTIVITIES FOR CLOSED-END MANAGEMENT INVESTMENT COMPANIES. |
Not Applicable.
(a)(1) Filed herewith as EX-99.CODE ETH.
(a)(2) A separate certification for each principal executive officer and principal financial officer of the registrant as required by Rule 30a-2(a) under the Investment Company Act of 1940 (17 CFR 270.30a-2(a)) is attached hereto as EX-99.CERT.
(a)(3) Not applicable.
(a)(4) Not applicable.
(b) The certifications of each principal executive officer and principal financial officer pursuant to Rule 30a-2(b) under the Investment Company Act of 1940, as amended, (17 CFR 270.30a-2(b), Rule 13a-14(b) or Rule 15d-14(b)) are attached hereto as EX-99.906CERT.
SIGNATURES
Pursuant to the requirements of the Securities Exchange Act of 1934 and the Investment Company Act of 1940, the registrant has duly caused this report to be signed on its behalf by the undersigned, thereunto duly authorized.
(Registrant): American Beacon Funds
|
By /s/ Jeffrey K. Ringdahl |
| Jeffrey K. Ringdahl |
| President |
| American Beacon Funds |
| Date: January 3, 2024 |
Pursuant to the requirements of the Securities Exchange Act of 1934 and the Investment Company Act of 1940, this report has been signed below by the following persons on behalf of the registrant and in the capacities and on the dates indicated.
|
By /s/ Jeffrey K. Ringdahl |
| Jeffrey K. Ringdahl |
| President |
| American Beacon Funds |
| Date: January 3, 2024 |
|
By /s/ Sonia L. Bates |
| Sonia L. Bates |
| Chief Accounting Officer and Treasurer |
| American Beacon Funds |
| Date: January 3, 2024 |