0000809593americanbeacon:BalancedCompositeIndex40BloombergUSAggregateBondIndex60Russell1000ValueIndex6728AdditionalIndexMember2021-07-310000809593americanbeacon:BalancedCompositeIndex40BloombergUSAggregateBondIndex60Russell1000ValueIndex6730AdditionalIndexMember2017-05-310000809593americanbeacon:AMERICANBEACONINDEXRUSSELL1000VALUEINDEX6731AdditionalIndexMember2024-05-310000809593americanbeacon:AMERICANBEACONINDEXRUSSELL1000VALUEINDEX6737AdditionalIndexMember2023-08-310000809593americanbeacon:AMERICANBEACONINDEXSP500TR6763BroadBasedIndexMember2020-08-310000809593americanbeacon:C000004786Member2015-04-300000809593americanbeacon:C000185593Member2016-11-300000809593americanbeacon:C000211731Memberamericanbeacon:AssetUSTreasuryObligationsCTIMember2024-10-310000809593americanbeacon:AMERICANBEACONINDEXMSCIEAFEIndexNet11900BroadBasedIndexMember2023-03-31
UNITED STATES
SECURITIES AND EXCHANGE COMMISSION
Washington, D.C. 20549
FORM N-CSR
CERTIFIED SHAREHOLDER REPORT OF REGISTERED
MANAGEMENT INVESTMENT COMPANIES
Investment Company Act file number: 811-4984
AMERICAN BEACON FUNDS
(Exact name of registrant as specified in charter)
220 East Las Colinas Boulevard, Suite 1200
Irving, Texas 75039
(Address of principal executive offices)-(Zip code)
GREGORY J. STUMM, PRESIDENT
220 East Las Colinas Boulevard, Suite 1200
Irving, Texas 75039
(Name and address of agent for service)
Registrant’s telephone number, including area code: (817) 391-6100
Date of fiscal year end: October 31, 2024
Date of reporting period: October 31, 2024
Form N-CSR is to be used by management investment companies to file reports with the Commission not later than 10 days after the transmission to stockholders of any report that is required to be transmitted to stockholders under Rule 30e-1 under the Investment Company Act of 1940 (17 CFR 270.30e-1). The Commission may use the information provided on Form N-CSR in its regulatory, disclosure review, inspection, and policymaking roles.
A registrant is required to disclose the information specified by Form N-CSR, and the Commission will make this information public. A registrant is not required to respond to the collection of information contained in Form N-CSR unless the Form displays a currently valid Office of Management and Budget (“OMB”) control number. Please direct comments concerning the accuracy of the information collection burden estimate and any suggestions for reducing the burden to Secretary, Securities and Exchange Commission, 450 Fifth Street, NW, Washington, DC 20549-0609. The OMB has reviewed this collection of information under the clearance requirements of 44 U.S.C. § 3507.
Item 1. Reports to Shareholders
Annual Shareholder Report - October 31, 2024
This annual shareholder report contains important information about American Beacon Balanced Fund for the period of November 1, 2023 to October 31, 2024. You can find additional information about the Fund at www.americanbeaconfunds.com/literature. You can also request this information by contacting us at 800-658-5811.
What were the Fund costs for the last year?
(based on a hypothetical $10,000 investment)
| Class Name | Costs of a $10,000 investment | Costs paid as a percentage of a $10,000 investment |
|---|
| R5 | $94 | 0.84% |
How did the Fund perform and what affected its performance?
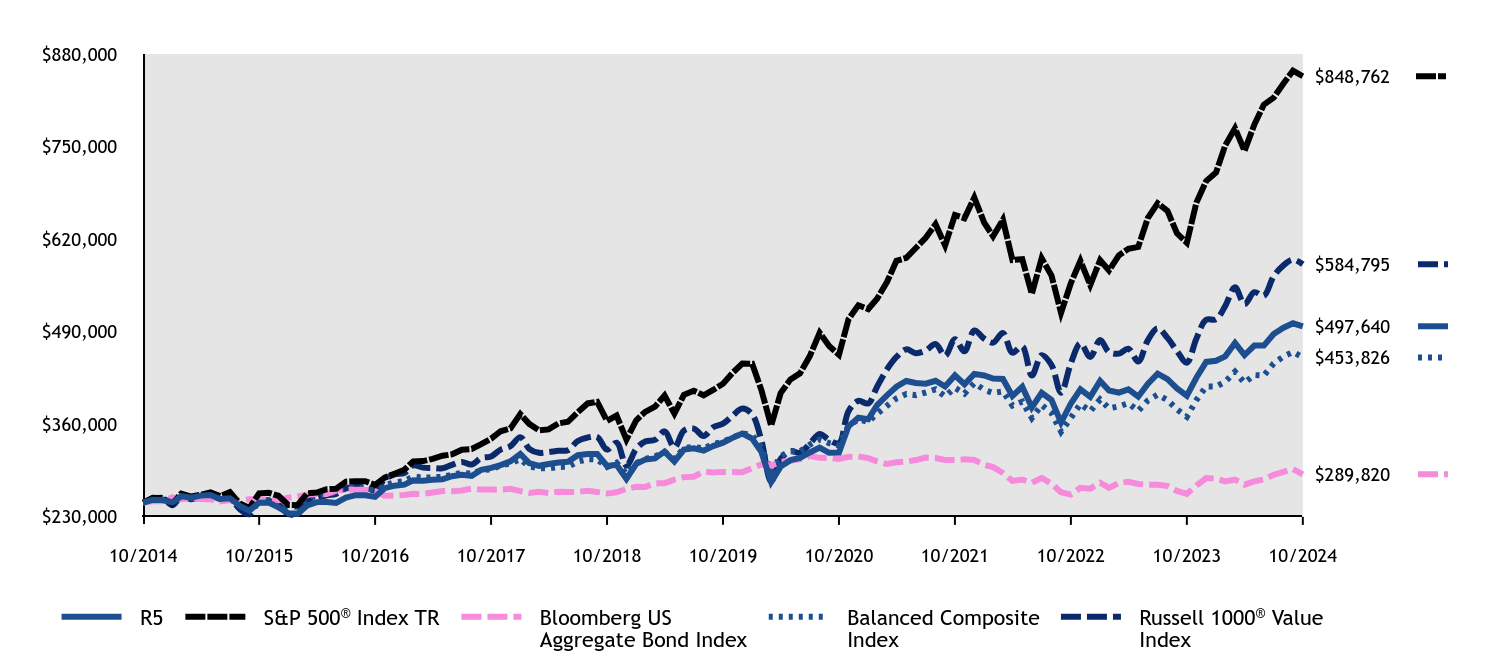
The R5 Class of the Fund returned 24.37% for the twelve months ended October 31, 2024, compared to the S&P 500 Index return of 38.02%, the Bloomberg U.S. Aggregate Bond Index return of 10.55% and the Balanced Composite Index return of 22.49%.
• Broad market performance rallied during the twelve-month period as central banks cut rates globally and the probability of a soft landing increased.
• The Fund’s diversified strategy of equity and fixed income investing achieved returns through capital appreciation and income.
• The Fund's holdings in the Information Technology and Financials sectors contributed materially to the Fund's performance, while holdings in the Energy sector detracted from the Fund’s performance over the period. The Fund’s fixed-income holdings contributed negatively to performance during the twelve-month period.
Cumulative Performance from October 31, 2014 through October 31, 2024
The initial investment, based on a $250,000 investment, is adjusted to reflect the maximum applicable sales charge, if any.
| R5 | S&P 500® Index TR | Bloomberg US Aggregate Bond Index | Balanced Composite Index | Russell 1000® Value Index |
|---|
| 10/2014 | $250,000 | $250,000 | $250,000 | $250,000 | $250,000 |
| 11/2014 | $253,871 | $256,724 | $251,773 | $253,781 | $255,119 |
| 12/2014 | $253,678 | $256,077 | $252,009 | $254,810 | $256,684 |
| 01/2015 | $250,246 | $248,389 | $257,293 | $250,836 | $246,423 |
| 02/2015 | $258,983 | $262,665 | $254,874 | $257,175 | $258,348 |
| 03/2015 | $256,955 | $258,511 | $256,058 | $255,552 | $254,831 |
| 04/2015 | $259,847 | $260,991 | $255,139 | $256,619 | $257,213 |
| 05/2015 | $260,631 | $264,347 | $254,525 | $258,222 | $260,304 |
| 06/2015 | $255,146 | $259,230 | $251,749 | $254,002 | $255,107 |
| 07/2015 | $256,181 | $264,661 | $253,499 | $255,377 | $256,225 |
| 08/2015 | $245,316 | $248,693 | $253,135 | $246,104 | $240,965 |
| 09/2015 | $238,703 | $242,539 | $254,847 | $242,312 | $233,691 |
| 10/2015 | $249,830 | $262,999 | $254,890 | $253,298 | $251,323 |
| 11/2015 | $250,147 | $263,781 | $254,216 | $253,612 | $252,285 |
| 12/2015 | $243,245 | $259,620 | $253,395 | $250,012 | $246,860 |
| 01/2016 | $235,414 | $246,737 | $256,882 | $243,637 | $234,104 |
| 02/2016 | $234,248 | $246,404 | $258,704 | $244,291 | $234,045 |
| 03/2016 | $245,910 | $263,120 | $261,078 | $255,746 | $250,904 |
| 04/2016 | $250,706 | $264,140 | $262,080 | $259,362 | $256,175 |
| 05/2016 | $250,874 | $268,883 | $262,147 | $261,806 | $260,154 |
| 06/2016 | $249,534 | $269,580 | $266,857 | $265,046 | $262,403 |
| 07/2016 | $256,935 | $279,519 | $268,545 | $270,334 | $270,022 |
| 08/2016 | $260,471 | $279,912 | $268,237 | $271,461 | $272,104 |
| 09/2016 | $260,471 | $279,964 | $268,080 | $271,058 | $271,537 |
| 10/2016 | $258,062 | $274,857 | $266,030 | $267,711 | $267,335 |
| 11/2016 | $270,238 | $285,037 | $259,737 | $274,353 | $282,603 |
| 12/2016 | $273,750 | $290,671 | $260,103 | $278,621 | $289,666 |
| 01/2017 | $275,280 | $296,184 | $260,614 | $280,031 | $291,730 |
| 02/2017 | $281,227 | $307,944 | $262,365 | $286,821 | $302,213 |
| 03/2017 | $280,887 | $308,303 | $262,228 | $285,008 | $299,134 |
| 04/2017 | $282,032 | $311,470 | $264,251 | $285,567 | $298,573 |
| 05/2017 | $282,716 | $315,853 | $266,285 | $286,278 | $298,280 |
| 06/2017 | $287,169 | $317,824 | $266,017 | $288,971 | $303,156 |
| 07/2017 | $289,243 | $324,360 | $267,162 | $291,773 | $307,185 |
| 08/2017 | $287,522 | $325,353 | $269,559 | $290,780 | $303,607 |
| 09/2017 | $296,126 | $332,064 | $268,275 | $295,394 | $312,599 |
| 10/2017 | $298,883 | $339,813 | $268,430 | $296,749 | $314,869 |
| 11/2017 | $302,684 | $350,235 | $268,086 | $302,049 | $324,511 |
| 12/2017 | $307,949 | $354,129 | $269,316 | $305,249 | $329,248 |
| 01/2018 | $318,403 | $374,404 | $266,214 | $310,923 | $341,977 |
| 02/2018 | $305,381 | $360,605 | $263,691 | $300,836 | $325,647 |
| 03/2018 | $301,713 | $351,441 | $265,382 | $298,433 | $319,919 |
| 04/2018 | $304,226 | $352,789 | $263,408 | $298,136 | $320,975 |
| 05/2018 | $306,437 | $361,285 | $265,288 | $300,049 | $322,880 |
| 06/2018 | $307,358 | $363,509 | $264,962 | $300,347 | $323,680 |
| 07/2018 | $316,675 | $377,036 | $265,025 | $307,508 | $336,491 |
| 08/2018 | $318,342 | $389,322 | $266,730 | $311,027 | $341,464 |
| 09/2018 | $318,342 | $391,538 | $265,012 | $310,596 | $342,142 |
| 10/2018 | $301,406 | $364,776 | $262,918 | $299,964 | $324,425 |
| 11/2018 | $303,267 | $372,210 | $264,488 | $306,054 | $334,111 |
| 12/2018 | $283,226 | $338,603 | $269,347 | $290,670 | $302,028 |
| 01/2019 | $304,533 | $365,737 | $272,207 | $305,479 | $325,536 |
| 02/2019 | $310,362 | $377,480 | $272,049 | $311,264 | $335,937 |
| 03/2019 | $312,171 | $384,815 | $277,273 | $314,842 | $338,073 |
| 04/2019 | $321,575 | $400,396 | $277,344 | $321,575 | $350,065 |
| 05/2019 | $307,831 | $374,952 | $282,267 | $311,453 | $327,557 |
| 06/2019 | $324,405 | $401,377 | $285,812 | $326,432 | $351,070 |
| 07/2019 | $326,188 | $407,146 | $286,441 | $328,343 | $353,980 |
| 08/2019 | $322,936 | $400,696 | $293,863 | $325,953 | $343,572 |
| 09/2019 | $329,440 | $408,193 | $292,298 | $332,236 | $355,829 |
| 10/2019 | $334,221 | $417,035 | $293,178 | $335,423 | $360,803 |
| 11/2019 | $340,963 | $432,173 | $293,029 | $341,576 | $371,958 |
| 12/2019 | $347,106 | $445,216 | $292,825 | $347,119 | $382,190 |
| 01/2020 | $340,085 | $445,042 | $298,460 | $345,310 | $373,968 |
| 02/2020 | $321,435 | $408,406 | $303,832 | $327,731 | $337,751 |
| 03/2020 | $279,089 | $357,963 | $302,044 | $293,355 | $280,031 |
| 04/2020 | $300,616 | $403,852 | $307,413 | $315,229 | $311,512 |
| 05/2020 | $309,665 | $423,086 | $308,844 | $322,297 | $322,187 |
| 06/2020 | $312,755 | $431,500 | $310,790 | $321,826 | $320,049 |
| 07/2020 | $320,410 | $455,830 | $315,432 | $331,382 | $332,702 |
| 08/2020 | $327,275 | $488,596 | $312,886 | $338,534 | $346,459 |
| 09/2020 | $319,967 | $470,031 | $312,714 | $333,471 | $337,949 |
| 10/2020 | $320,381 | $457,531 | $311,318 | $330,245 | $333,507 |
| 11/2020 | $357,219 | $507,614 | $314,373 | $358,195 | $378,368 |
| 12/2020 | $369,224 | $527,131 | $314,806 | $366,632 | $392,875 |
| 01/2021 | $366,979 | $521,809 | $312,549 | $363,566 | $389,277 |
| 02/2021 | $386,937 | $536,198 | $308,035 | $374,649 | $412,802 |
| 03/2021 | $400,658 | $559,681 | $304,189 | $386,005 | $437,093 |
| 04/2021 | $412,834 | $589,551 | $306,592 | $396,487 | $454,573 |
| 05/2021 | $420,846 | $593,668 | $307,594 | $402,559 | $465,185 |
| 06/2021 | $418,092 | $607,527 | $309,755 | $400,924 | $459,857 |
| 07/2021 | $417,097 | $621,959 | $313,218 | $404,640 | $463,533 |
| 08/2021 | $421,115 | $640,870 | $312,622 | $409,146 | $472,725 |
| 09/2021 | $413,079 | $611,063 | $309,915 | $399,185 | $456,271 |
| 10/2021 | $428,673 | $653,876 | $309,830 | $411,302 | $479,439 |
| 11/2021 | $416,266 | $649,345 | $310,747 | $403,092 | $462,544 |
| 12/2021 | $430,792 | $678,446 | $309,951 | $417,938 | $491,724 |
| 01/2022 | $428,607 | $643,338 | $303,274 | $408,495 | $480,270 |
| 02/2022 | $424,236 | $624,076 | $299,890 | $403,828 | $474,696 |
| 03/2022 | $423,690 | $647,248 | $291,559 | $406,180 | $488,097 |
| 04/2022 | $399,821 | $590,806 | $280,495 | $386,268 | $460,566 |
| 05/2022 | $412,700 | $591,890 | $282,303 | $391,770 | $469,519 |
| 06/2022 | $383,652 | $543,033 | $277,875 | $368,774 | $428,496 |
| 07/2022 | $404,279 | $593,104 | $284,664 | $387,051 | $456,911 |
| 08/2022 | $394,096 | $568,916 | $276,621 | $375,756 | $443,297 |
| 09/2022 | $362,447 | $516,519 | $264,669 | $349,493 | $404,426 |
| 10/2022 | $389,254 | $558,337 | $261,241 | $369,182 | $445,892 |
| 11/2022 | $409,174 | $589,540 | $270,848 | $388,456 | $473,756 |
| 12/2022 | $398,463 | $555,574 | $269,626 | $378,359 | $454,658 |
| 01/2023 | $420,835 | $590,482 | $277,921 | $394,779 | $478,219 |
| 02/2023 | $407,533 | $576,075 | $270,735 | $382,345 | $461,357 |
| 03/2023 | $404,510 | $597,225 | $277,613 | $385,173 | $459,233 |
| 04/2023 | $409,112 | $606,547 | $279,295 | $389,589 | $466,152 |
| 05/2023 | $398,786 | $609,184 | $276,254 | $378,877 | $448,173 |
| 06/2023 | $416,705 | $649,436 | $275,269 | $393,437 | $477,944 |
| 07/2023 | $431,063 | $670,299 | $275,077 | $401,628 | $494,751 |
| 08/2023 | $423,430 | $659,627 | $273,320 | $394,097 | $481,395 |
| 09/2023 | $410,303 | $628,177 | $266,374 | $380,966 | $462,818 |
| 10/2023 | $400,141 | $614,969 | $262,171 | $370,496 | $446,489 |
| 11/2023 | $425,303 | $671,131 | $274,043 | $393,980 | $480,176 |
| 12/2023 | $447,630 | $701,621 | $284,534 | $413,107 | $506,774 |
| 01/2024 | $449,178 | $713,411 | $283,752 | $412,910 | $507,299 |
| 02/2024 | $455,370 | $751,504 | $279,743 | $419,715 | $526,013 |
| 03/2024 | $474,253 | $775,683 | $282,326 | $433,856 | $552,311 |
| 04/2024 | $457,167 | $744,001 | $275,195 | $418,353 | $528,719 |
| 05/2024 | $470,540 | $780,892 | $279,861 | $429,147 | $545,479 |
| 06/2024 | $470,540 | $808,912 | $282,510 | $428,350 | $540,348 |
| 07/2024 | $486,820 | $818,758 | $289,109 | $445,491 | $567,972 |
| 08/2024 | $495,575 | $838,619 | $293,263 | $455,222 | $583,208 |
| 09/2024 | $501,828 | $856,529 | $297,190 | $461,451 | $591,302 |
| 10/2024 | $497,640 | $848,762 | $289,820 | $453,826 | $584,795 |
Average Annual Total Returns (%)
| HEADER | 1 Year | 5 Years | 10 Years |
|---|
Class R5Footnote Reference1 | 24.37% | 8.29% | 7.13% |
S&P 500® Index TR | 38.02% | 15.27% | 13.00% |
| Bloomberg US Aggregate Bond Index | 10.55% | (0.23)% | 1.49% |
| Balanced Composite Index | 22.49% | 6.23% | 6.14% |
Russell 1000® Value Index | 30.98% | 10.14% | 8.87% |
| Footnote | Description |
Footnote1 | Return may differ from actual shareholder return due to accounting adjustments for financial reporting purposes. |
Performance shown is historical and is not indicative of future returns. Investment returns and principal value will vary, and shares may be worth more or less at redemption than at original purchase. Performance shown is as of date indicated, and current performance may be lower or higher than the performance data quoted. To obtain performance as of the most recent month end, please visit americanbeaconfunds.com or call 800-967-9009. The graph and table do not reflect the deduction of taxes that a shareholder would pay on fund distributions or redemption of fund shares.
The S&P 500 Index TR and Bloomberg US Aggregate Bond Index are replacing the Balanced Composite Index and the Russell 1000® Value Index as the broad-based securities market indices to comply with a new regulatory requirement. The Balanced Composite Index reflects the market sectors in which the Fund invests.
| Total Net Assets | $114,132,015 |
| # of Portfolio Holdings | 398 |
| Portfolio Turnover Rate | 38% |
| Total Management Fees Paid | $585,364 |
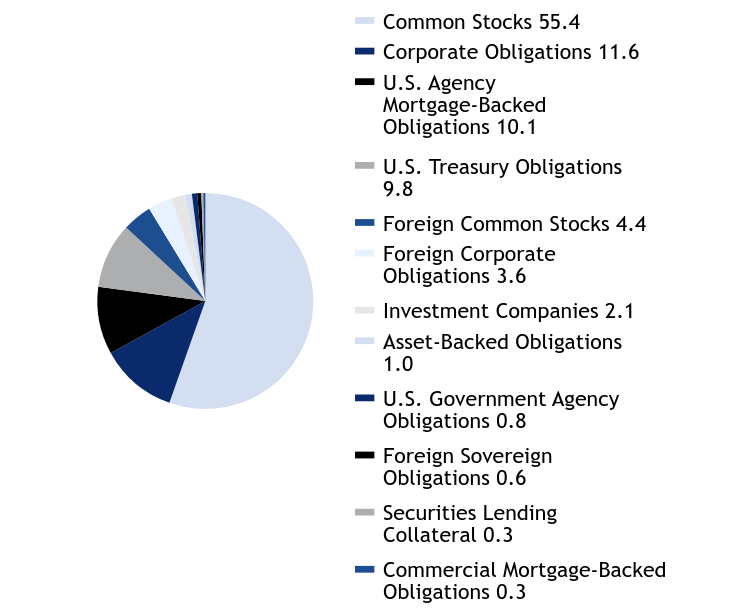
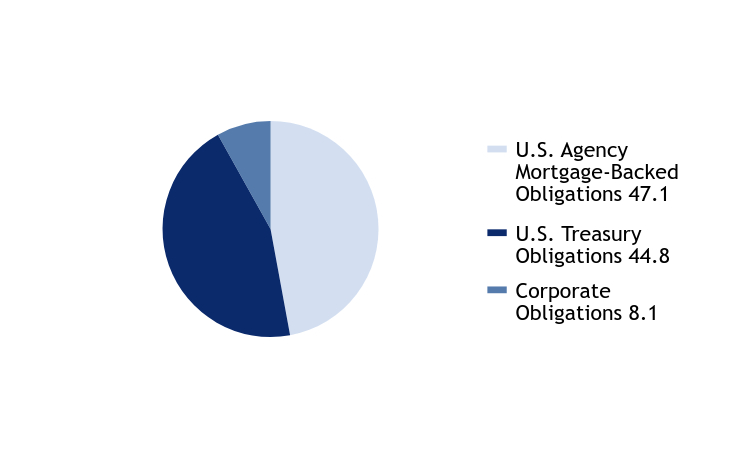
Asset Allocation - % Investments
| Value | Value |
|---|
| Common Stocks | 55.4 |
| Corporate Obligations | 11.6 |
| U.S. Agency Mortgage-Backed Obligations | 10.1 |
| U.S. Treasury Obligations | 9.8 |
| Foreign Common Stocks | 4.4 |
| Foreign Corporate Obligations | 3.6 |
| Investment Companies | 2.1 |
| Asset-Backed Obligations | 1.0 |
| U.S. Government Agency Obligations | 0.8 |
| Foreign Sovereign Obligations | 0.6 |
| Securities Lending Collateral | 0.3 |
| Commercial Mortgage-Backed Obligations | 0.3 |
The Fund may purchase and sell futures contracts to gain market exposure on cash balances.
What did the Fund invest in?
Top Ten Holdings - % Net Assets
| Fidelity National Information Services, Inc. | 1.6 |
| Comcast Corp., Class A | 1.4 |
| Wells Fargo & Co. | 1.3 |
| Entergy Corp. | 1.2 |
| Bank of America Corp. | 1.2 |
| Citigroup, Inc. | 1.2 |
| F5, Inc. | 1.2 |
| Carnival Corp. | 1.2 |
| Elevance Health, Inc. | 1.1 |
| Air Products & Chemicals, Inc. | 1.1 |
Excludes cash equivalents.
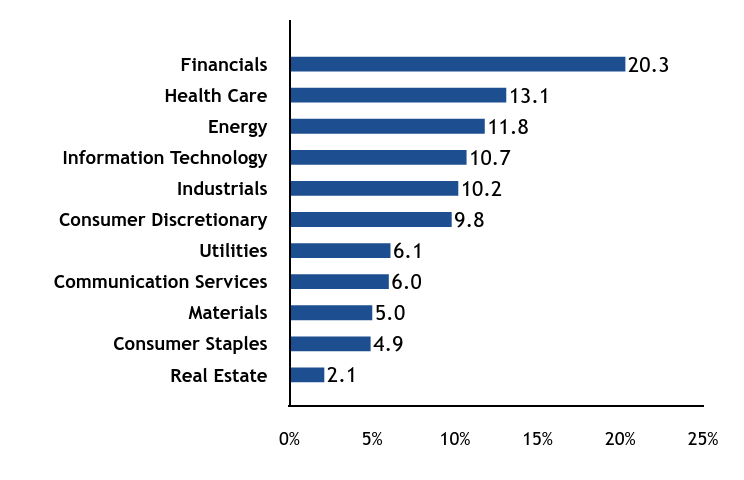
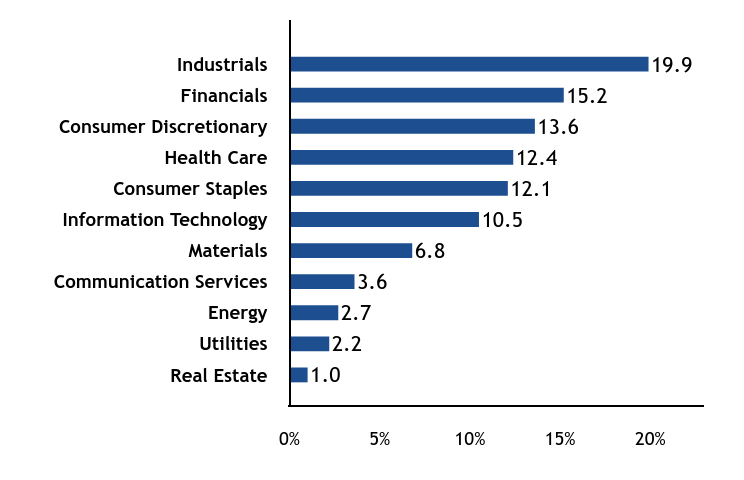
Sector Allocation - % Equities
| Value | Value |
|---|
| Real Estate | 2.1 |
| Consumer Staples | 4.9 |
| Materials | 5.0 |
| Communication Services | 6.0 |
| Utilities | 6.1 |
| Consumer Discretionary | 9.8 |
| Industrials | 10.2 |
| Information Technology | 10.7 |
| Energy | 11.8 |
| Health Care | 13.1 |
| Financials | 20.3 |
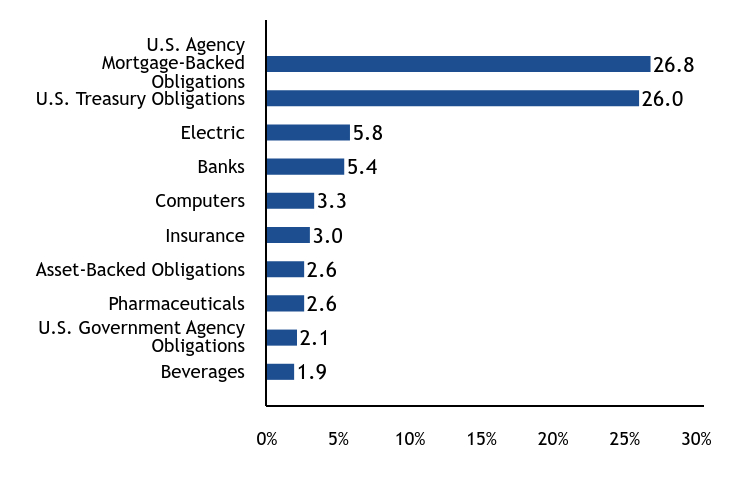
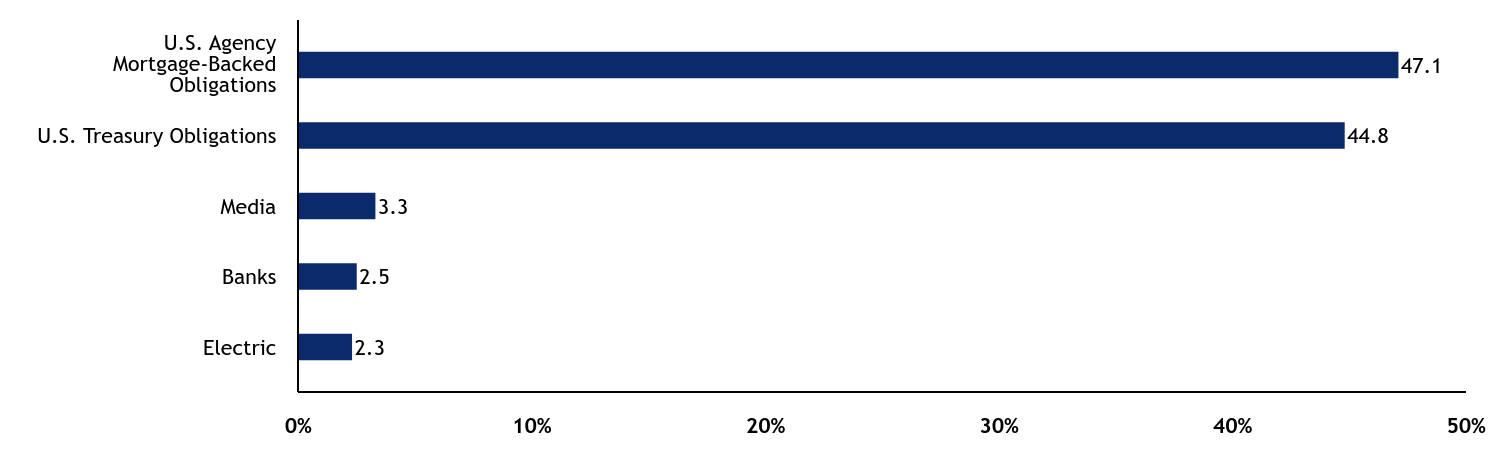
Top Ten Industry Allocations - % Fixed Income
| Value | Value |
|---|
| Beverages | 1.9 |
| U.S. Government Agency Obligations | 2.1 |
| Pharmaceuticals | 2.6 |
| Asset-Backed Obligations | 2.6 |
| Insurance | 3.0 |
| Computers | 3.3 |
| Banks | 5.4 |
| Electric | 5.8 |
| U.S. Treasury Obligations | 26.0 |
| U.S. Agency Mortgage-Backed Obligations | 26.8 |
For additional information about the Fund, including its prospectus, financial statements, holdings, and proxy voting information, please visit www.americanbeaconfunds.com/literature or call 1-800-658-5811.
If your financial institution mailed only one copy of this Report to an address shared by more than one account, you can request an individual copy by contacting your financial institution.
Distributed by:
Resolute Investment Distributors, Inc.
Annual Shareholder Report - October 31, 2024
Annual Shareholder Report - October 31, 2024
This annual shareholder report contains important information about American Beacon Balanced Fund for the period of November 1, 2023 to October 31, 2024. You can find additional information about the Fund at www.americanbeaconfunds.com/literature. You can also request this information by contacting us at 800-658-5811.
What were the Fund costs for the last year?
(based on a hypothetical $10,000 investment)
| Class Name | Costs of a $10,000 investment | Costs paid as a percentage of a $10,000 investment |
|---|
| Investor | $131 | 1.17% |
How did the Fund perform and what affected its performance?
The Investor Class of the Fund returned 24.01% for the twelve months ended October 31, 2024, compared to the S&P 500 Index return of 38.02%, the Bloomberg U.S. Aggregate Bond Index return of 10.55% and the Balanced Composite Index return of 22.49%.
• Broad market performance rallied during the twelve-month period as central banks cut rates globally and the probability of a soft landing increased.
• The Fund’s diversified strategy of equity and fixed income investing achieved returns through capital appreciation and income.
• The Fund's holdings in the Information Technology and Financials sectors contributed materially to the Fund's performance, while holdings in the Energy sector detracted from the Fund’s performance over the period. The Fund’s fixed-income holdings contributed negatively to performance during the twelve-month period.
Cumulative Performance from October 31, 2014 through October 31, 2024
The initial investment, based on a $10,000 investment, is adjusted to reflect the maximum applicable sales charge, if any.

| Investor | S&P 500® Index TR | Bloomberg US Aggregate Bond Index | Balanced Composite Index | Russell 1000® Value Index |
|---|
| 10/2014 | $10,000 | $10,000 | $10,000 | $10,000 | $10,000 |
| 11/2014 | $10,157 | $10,269 | $10,071 | $10,151 | $10,205 |
| 12/2014 | $10,142 | $10,243 | $10,080 | $10,192 | $10,267 |
| 01/2015 | $10,004 | $9,936 | $10,292 | $10,033 | $9,857 |
| 02/2015 | $10,348 | $10,507 | $10,195 | $10,287 | $10,334 |
| 03/2015 | $10,266 | $10,340 | $10,242 | $10,222 | $10,193 |
| 04/2015 | $10,378 | $10,440 | $10,206 | $10,265 | $10,289 |
| 05/2015 | $10,405 | $10,574 | $10,181 | $10,329 | $10,412 |
| 06/2015 | $10,178 | $10,369 | $10,070 | $10,160 | $10,204 |
| 07/2015 | $10,223 | $10,586 | $10,140 | $10,215 | $10,249 |
| 08/2015 | $9,786 | $9,948 | $10,125 | $9,844 | $9,639 |
| 09/2015 | $9,522 | $9,702 | $10,194 | $9,692 | $9,348 |
| 10/2015 | $9,965 | $10,520 | $10,196 | $10,132 | $10,053 |
| 11/2015 | $9,972 | $10,551 | $10,169 | $10,144 | $10,091 |
| 12/2015 | $9,694 | $10,385 | $10,136 | $10,000 | $9,874 |
| 01/2016 | $9,377 | $9,869 | $10,275 | $9,745 | $9,364 |
| 02/2016 | $9,326 | $9,856 | $10,348 | $9,772 | $9,362 |
| 03/2016 | $9,790 | $10,525 | $10,443 | $10,230 | $10,036 |
| 04/2016 | $9,980 | $10,566 | $10,483 | $10,374 | $10,247 |
| 05/2016 | $9,980 | $10,755 | $10,486 | $10,472 | $10,406 |
| 06/2016 | $9,929 | $10,783 | $10,674 | $10,602 | $10,496 |
| 07/2016 | $10,215 | $11,181 | $10,742 | $10,813 | $10,801 |
| 08/2016 | $10,349 | $11,196 | $10,729 | $10,858 | $10,884 |
| 09/2016 | $10,341 | $11,199 | $10,723 | $10,842 | $10,861 |
| 10/2016 | $10,248 | $10,994 | $10,641 | $10,708 | $10,693 |
| 11/2016 | $10,727 | $11,401 | $10,389 | $10,974 | $11,304 |
| 12/2016 | $10,859 | $11,627 | $10,404 | $11,145 | $11,587 |
| 01/2017 | $10,926 | $11,847 | $10,425 | $11,201 | $11,669 |
| 02/2017 | $11,152 | $12,318 | $10,495 | $11,473 | $12,089 |
| 03/2017 | $11,137 | $12,332 | $10,489 | $11,400 | $11,965 |
| 04/2017 | $11,179 | $12,459 | $10,570 | $11,423 | $11,943 |
| 05/2017 | $11,202 | $12,634 | $10,651 | $11,451 | $11,931 |
| 06/2017 | $11,376 | $12,713 | $10,641 | $11,559 | $12,126 |
| 07/2017 | $11,459 | $12,974 | $10,686 | $11,671 | $12,287 |
| 08/2017 | $11,383 | $13,014 | $10,782 | $11,631 | $12,144 |
| 09/2017 | $11,725 | $13,283 | $10,731 | $11,816 | $12,504 |
| 10/2017 | $11,839 | $13,593 | $10,737 | $11,870 | $12,595 |
| 11/2017 | $11,984 | $14,009 | $10,723 | $12,082 | $12,980 |
| 12/2017 | $12,185 | $14,165 | $10,773 | $12,210 | $13,170 |
| 01/2018 | $12,601 | $14,976 | $10,649 | $12,437 | $13,679 |
| 02/2018 | $12,079 | $14,424 | $10,548 | $12,033 | $13,026 |
| 03/2018 | $11,932 | $14,058 | $10,615 | $11,937 | $12,797 |
| 04/2018 | $12,027 | $14,112 | $10,536 | $11,925 | $12,839 |
| 05/2018 | $12,117 | $14,451 | $10,612 | $12,002 | $12,915 |
| 06/2018 | $12,142 | $14,540 | $10,598 | $12,014 | $12,947 |
| 07/2018 | $12,511 | $15,081 | $10,601 | $12,300 | $13,460 |
| 08/2018 | $12,585 | $15,573 | $10,669 | $12,441 | $13,659 |
| 09/2018 | $12,585 | $15,662 | $10,600 | $12,424 | $13,686 |
| 10/2018 | $11,913 | $14,591 | $10,517 | $11,999 | $12,977 |
| 11/2018 | $11,987 | $14,888 | $10,580 | $12,242 | $13,364 |
| 12/2018 | $11,187 | $13,544 | $10,774 | $11,627 | $12,081 |
| 01/2019 | $12,026 | $14,629 | $10,888 | $12,219 | $13,021 |
| 02/2019 | $12,252 | $15,099 | $10,882 | $12,451 | $13,437 |
| 03/2019 | $12,324 | $15,393 | $11,091 | $12,594 | $13,523 |
| 04/2019 | $12,691 | $16,016 | $11,094 | $12,863 | $14,003 |
| 05/2019 | $12,147 | $14,998 | $11,291 | $12,458 | $13,102 |
| 06/2019 | $12,800 | $16,055 | $11,432 | $13,057 | $14,043 |
| 07/2019 | $12,860 | $16,286 | $11,458 | $13,134 | $14,159 |
| 08/2019 | $12,723 | $16,028 | $11,755 | $13,038 | $13,743 |
| 09/2019 | $12,988 | $16,328 | $11,692 | $13,289 | $14,233 |
| 10/2019 | $13,164 | $16,681 | $11,727 | $13,417 | $14,432 |
| 11/2019 | $13,430 | $17,287 | $11,721 | $13,663 | $14,878 |
| 12/2019 | $13,659 | $17,809 | $11,713 | $13,885 | $15,288 |
| 01/2020 | $13,380 | $17,802 | $11,938 | $13,812 | $14,959 |
| 02/2020 | $12,654 | $16,336 | $12,153 | $13,109 | $13,510 |
| 03/2020 | $10,983 | $14,319 | $12,082 | $11,734 | $11,201 |
| 04/2020 | $11,827 | $16,154 | $12,297 | $12,609 | $12,460 |
| 05/2020 | $12,168 | $16,923 | $12,354 | $12,892 | $12,887 |
| 06/2020 | $12,298 | $17,260 | $12,432 | $12,873 | $12,802 |
| 07/2020 | $12,595 | $18,233 | $12,617 | $13,255 | $13,308 |
| 08/2020 | $12,866 | $19,544 | $12,515 | $13,541 | $13,858 |
| 09/2020 | $12,565 | $18,801 | $12,509 | $13,339 | $13,518 |
| 10/2020 | $12,583 | $18,301 | $12,453 | $13,210 | $13,340 |
| 11/2020 | $14,021 | $20,305 | $12,575 | $14,328 | $15,135 |
| 12/2020 | $14,494 | $21,085 | $12,592 | $14,665 | $15,715 |
| 01/2021 | $14,391 | $20,872 | $12,502 | $14,543 | $15,571 |
| 02/2021 | $15,174 | $21,448 | $12,321 | $14,986 | $16,512 |
| 03/2021 | $15,715 | $22,387 | $12,168 | $15,440 | $17,484 |
| 04/2021 | $16,185 | $23,582 | $12,264 | $15,859 | $18,183 |
| 05/2021 | $16,497 | $23,747 | $12,304 | $16,102 | $18,607 |
| 06/2021 | $16,393 | $24,301 | $12,390 | $16,037 | $18,394 |
| 07/2021 | $16,347 | $24,878 | $12,529 | $16,186 | $18,541 |
| 08/2021 | $16,498 | $25,635 | $12,505 | $16,366 | $18,909 |
| 09/2021 | $16,173 | $24,443 | $12,397 | $15,967 | $18,251 |
| 10/2021 | $16,776 | $26,155 | $12,393 | $16,452 | $19,178 |
| 11/2021 | $16,297 | $25,974 | $12,430 | $16,124 | $18,502 |
| 12/2021 | $16,862 | $27,138 | $12,398 | $16,718 | $19,669 |
| 01/2022 | $16,772 | $25,734 | $12,131 | $16,340 | $19,211 |
| 02/2022 | $16,593 | $24,963 | $11,996 | $16,153 | $18,988 |
| 03/2022 | $16,568 | $25,890 | $11,662 | $16,247 | $19,524 |
| 04/2022 | $15,630 | $23,632 | $11,220 | $15,451 | $18,423 |
| 05/2022 | $16,130 | $23,676 | $11,292 | $15,671 | $18,781 |
| 06/2022 | $14,989 | $21,721 | $11,115 | $14,751 | $17,140 |
| 07/2022 | $15,786 | $23,724 | $11,387 | $15,482 | $18,276 |
| 08/2022 | $15,400 | $22,757 | $11,065 | $15,030 | $17,732 |
| 09/2022 | $14,151 | $20,661 | $10,587 | $13,980 | $16,177 |
| 10/2022 | $15,199 | $22,333 | $10,450 | $14,767 | $17,836 |
| 11/2022 | $15,976 | $23,582 | $10,834 | $15,538 | $18,950 |
| 12/2022 | $15,540 | $22,223 | $10,785 | $15,134 | $18,186 |
| 01/2023 | $16,419 | $23,619 | $11,117 | $15,791 | $19,129 |
| 02/2023 | $15,886 | $23,043 | $10,829 | $15,294 | $18,454 |
| 03/2023 | $15,771 | $23,889 | $11,105 | $15,407 | $18,369 |
| 04/2023 | $15,950 | $24,262 | $11,172 | $15,584 | $18,646 |
| 05/2023 | $15,544 | $24,367 | $11,050 | $15,155 | $17,927 |
| 06/2023 | $16,239 | $25,977 | $11,011 | $15,737 | $19,118 |
| 07/2023 | $16,783 | $26,812 | $11,003 | $16,065 | $19,790 |
| 08/2023 | $16,492 | $26,385 | $10,933 | $15,764 | $19,256 |
| 09/2023 | $15,968 | $25,127 | $10,655 | $15,239 | $18,513 |
| 10/2023 | $15,574 | $24,599 | $10,487 | $14,820 | $17,860 |
| 11/2023 | $16,555 | $26,845 | $10,962 | $15,759 | $19,207 |
| 12/2023 | $17,415 | $28,065 | $11,381 | $16,524 | $20,271 |
| 01/2024 | $17,474 | $28,536 | $11,350 | $16,516 | $20,292 |
| 02/2024 | $17,711 | $30,060 | $11,190 | $16,789 | $21,041 |
| 03/2024 | $18,435 | $31,027 | $11,293 | $17,354 | $22,092 |
| 04/2024 | $17,770 | $29,760 | $11,008 | $16,734 | $21,149 |
| 05/2024 | $18,290 | $31,236 | $11,194 | $17,166 | $21,819 |
| 06/2024 | $18,290 | $32,356 | $11,300 | $17,134 | $21,614 |
| 07/2024 | $18,922 | $32,750 | $11,564 | $17,820 | $22,719 |
| 08/2024 | $19,251 | $33,545 | $11,731 | $18,209 | $23,328 |
| 09/2024 | $19,475 | $34,261 | $11,888 | $18,458 | $23,652 |
| 10/2024 | $19,314 | $33,950 | $11,593 | $18,153 | $23,392 |
Average Annual Total Returns (%)
| HEADER | 1 Year | 5 Years | 10 Years |
|---|
Investor ClassFootnote Reference1 | 24.01% | 7.97% | 6.80% |
S&P 500® Index TR | 38.02% | 15.27% | 13.00% |
| Bloomberg US Aggregate Bond Index | 10.55% | (0.23)% | 1.49% |
| Balanced Composite Index | 22.49% | 6.23% | 6.14% |
Russell 1000® Value Index | 30.98% | 10.14% | 8.87% |
| Footnote | Description |
Footnote1 | Return may differ from actual shareholder return due to accounting adjustments for financial reporting purposes. |
Performance shown is historical and is not indicative of future returns. Investment returns and principal value will vary, and shares may be worth more or less at redemption than at original purchase. Performance shown is as of date indicated, and current performance may be lower or higher than the performance data quoted. To obtain performance as of the most recent month end, please visit americanbeaconfunds.com or call 800-967-9009. The graph and table do not reflect the deduction of taxes that a shareholder would pay on fund distributions or redemption of fund shares.
The S&P 500 Index TR and Bloomberg US Aggregate Bond Index are replacing the Balanced Composite Index and the Russell 1000® Value Index as the broad-based securities market indices to comply with a new regulatory requirement. The Balanced Composite Index reflects the market sectors in which the Fund invests.
| Total Net Assets | $114,132,015 |
| # of Portfolio Holdings | 398 |
| Portfolio Turnover Rate | 38% |
| Total Management Fees Paid | $585,364 |
Asset Allocation - % Investments
| Value | Value |
|---|
| Common Stocks | 55.4 |
| Corporate Obligations | 11.6 |
| U.S. Agency Mortgage-Backed Obligations | 10.1 |
| U.S. Treasury Obligations | 9.8 |
| Foreign Common Stocks | 4.4 |
| Foreign Corporate Obligations | 3.6 |
| Investment Companies | 2.1 |
| Asset-Backed Obligations | 1.0 |
| U.S. Government Agency Obligations | 0.8 |
| Foreign Sovereign Obligations | 0.6 |
| Securities Lending Collateral | 0.3 |
| Commercial Mortgage-Backed Obligations | 0.3 |
The Fund may purchase and sell futures contracts to gain market exposure on cash balances.
What did the Fund invest in?
Top Ten Holdings - % Net Assets
| Fidelity National Information Services, Inc. | 1.6 |
| Comcast Corp., Class A | 1.4 |
| Wells Fargo & Co. | 1.3 |
| Entergy Corp. | 1.2 |
| Bank of America Corp. | 1.2 |
| Citigroup, Inc. | 1.2 |
| F5, Inc. | 1.2 |
| Carnival Corp. | 1.2 |
| Elevance Health, Inc. | 1.1 |
| Air Products & Chemicals, Inc. | 1.1 |
Excludes cash equivalents.
Sector Allocation - % Equities
| Value | Value |
|---|
| Real Estate | 2.1 |
| Consumer Staples | 4.9 |
| Materials | 5.0 |
| Communication Services | 6.0 |
| Utilities | 6.1 |
| Consumer Discretionary | 9.8 |
| Industrials | 10.2 |
| Information Technology | 10.7 |
| Energy | 11.8 |
| Health Care | 13.1 |
| Financials | 20.3 |
Top Ten Industry Allocations - % Fixed Income
| Value | Value |
|---|
| Beverages | 1.9 |
| U.S. Government Agency Obligations | 2.1 |
| Pharmaceuticals | 2.6 |
| Asset-Backed Obligations | 2.6 |
| Insurance | 3.0 |
| Computers | 3.3 |
| Banks | 5.4 |
| Electric | 5.8 |
| U.S. Treasury Obligations | 26.0 |
| U.S. Agency Mortgage-Backed Obligations | 26.8 |
For additional information about the Fund, including its prospectus, financial statements, holdings, and proxy voting information, please visit www.americanbeaconfunds.com/literature or call 1-800-658-5811.
If your financial institution mailed only one copy of this Report to an address shared by more than one account, you can request an individual copy by contacting your financial institution.
Distributed by:
Resolute Investment Distributors, Inc.
Annual Shareholder Report - October 31, 2024
Annual Shareholder Report - October 31, 2024
This annual shareholder report contains important information about American Beacon Balanced Fund for the period of November 1, 2023 to October 31, 2024. You can find additional information about the Fund at www.americanbeaconfunds.com/literature. You can also request this information by contacting us at 800-658-5811.
What were the Fund costs for the last year?
(based on a hypothetical $10,000 investment)
| Class Name | Costs of a $10,000 investment | Costs paid as a percentage of a $10,000 investment |
|---|
| Advisor Class | $151 | 1.35% |
How did the Fund perform and what affected its performance?
The Advisor Class of the Fund returned 23.74% for the twelve months ended October 31, 2024, compared to the S&P 500 Index return of 38.02%, the Bloomberg U.S. Aggregate Bond Index return of 10.55% and the Balanced Composite Index return of 22.49%.
• Broad market performance rallied during the twelve-month period as central banks cut rates globally and the probability of a soft landing increased.
• The Fund’s diversified strategy of equity and fixed income investing achieved returns through capital appreciation and income.
• The Fund's holdings in the Information Technology and Financials sectors contributed materially to the Fund's performance, while holdings in the Energy sector detracted from the Fund’s performance over the period. The Fund’s fixed-income holdings contributed negatively to performance during the twelve-month period.
Cumulative Performance from October 31, 2014 through October 31, 2024
The initial investment, based on a $10,000 investment, is adjusted to reflect the maximum applicable sales charge, if any.
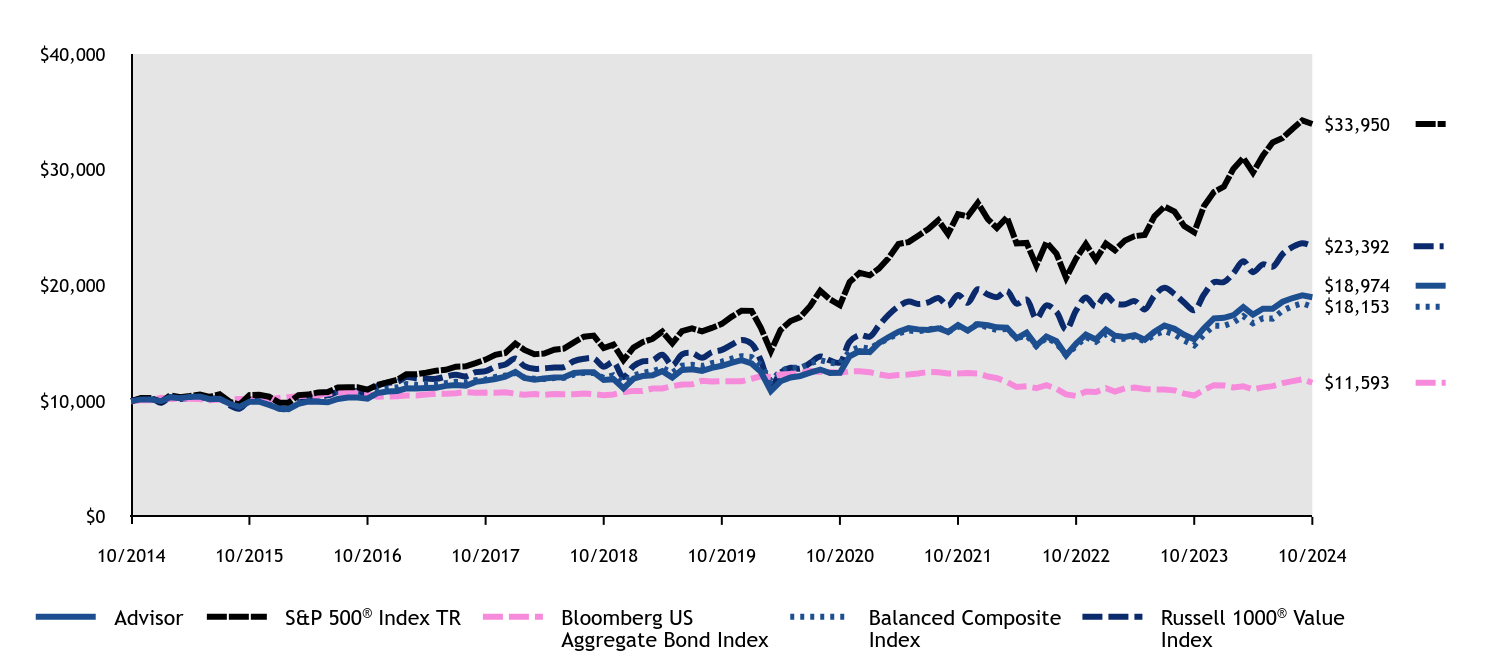
| Advisor | S&P 500® Index TR | Bloomberg US Aggregate Bond Index | Balanced Composite Index | Russell 1000® Value Index |
|---|
| 10/2014 | $10,000 | $10,000 | $10,000 | $10,000 | $10,000 |
| 11/2014 | $10,150 | $10,269 | $10,071 | $10,151 | $10,205 |
| 12/2014 | $10,142 | $10,243 | $10,080 | $10,192 | $10,267 |
| 01/2015 | $9,998 | $9,936 | $10,292 | $10,033 | $9,857 |
| 02/2015 | $10,345 | $10,507 | $10,195 | $10,287 | $10,334 |
| 03/2015 | $10,260 | $10,340 | $10,242 | $10,222 | $10,193 |
| 04/2015 | $10,369 | $10,440 | $10,206 | $10,265 | $10,289 |
| 05/2015 | $10,395 | $10,574 | $10,181 | $10,329 | $10,412 |
| 06/2015 | $10,172 | $10,369 | $10,070 | $10,160 | $10,204 |
| 07/2015 | $10,209 | $10,586 | $10,140 | $10,215 | $10,249 |
| 08/2015 | $9,774 | $9,948 | $10,125 | $9,844 | $9,639 |
| 09/2015 | $9,510 | $9,702 | $10,194 | $9,692 | $9,348 |
| 10/2015 | $9,942 | $10,520 | $10,196 | $10,132 | $10,053 |
| 11/2015 | $9,955 | $10,551 | $10,169 | $10,144 | $10,091 |
| 12/2015 | $9,674 | $10,385 | $10,136 | $10,000 | $9,874 |
| 01/2016 | $9,360 | $9,869 | $10,275 | $9,745 | $9,364 |
| 02/2016 | $9,304 | $9,856 | $10,348 | $9,772 | $9,362 |
| 03/2016 | $9,764 | $10,525 | $10,443 | $10,230 | $10,036 |
| 04/2016 | $9,954 | $10,566 | $10,483 | $10,374 | $10,247 |
| 05/2016 | $9,954 | $10,755 | $10,486 | $10,472 | $10,406 |
| 06/2016 | $9,898 | $10,783 | $10,674 | $10,602 | $10,496 |
| 07/2016 | $10,184 | $11,181 | $10,742 | $10,813 | $10,801 |
| 08/2016 | $10,318 | $11,196 | $10,729 | $10,858 | $10,884 |
| 09/2016 | $10,311 | $11,199 | $10,723 | $10,842 | $10,861 |
| 10/2016 | $10,211 | $10,994 | $10,641 | $10,708 | $10,693 |
| 11/2016 | $10,692 | $11,401 | $10,389 | $10,974 | $11,304 |
| 12/2016 | $10,825 | $11,627 | $10,404 | $11,145 | $11,587 |
| 01/2017 | $10,882 | $11,847 | $10,425 | $11,201 | $11,669 |
| 02/2017 | $11,109 | $12,318 | $10,495 | $11,473 | $12,089 |
| 03/2017 | $11,094 | $12,332 | $10,489 | $11,400 | $11,965 |
| 04/2017 | $11,129 | $12,459 | $10,570 | $11,423 | $11,943 |
| 05/2017 | $11,150 | $12,634 | $10,651 | $11,451 | $11,931 |
| 06/2017 | $11,322 | $12,713 | $10,641 | $11,559 | $12,126 |
| 07/2017 | $11,402 | $12,974 | $10,686 | $11,671 | $12,287 |
| 08/2017 | $11,330 | $13,014 | $10,782 | $11,631 | $12,144 |
| 09/2017 | $11,667 | $13,283 | $10,731 | $11,816 | $12,504 |
| 10/2017 | $11,775 | $13,593 | $10,737 | $11,870 | $12,595 |
| 11/2017 | $11,919 | $14,009 | $10,723 | $12,082 | $12,980 |
| 12/2017 | $12,116 | $14,165 | $10,773 | $12,210 | $13,170 |
| 01/2018 | $12,529 | $14,976 | $10,649 | $12,437 | $13,679 |
| 02/2018 | $12,009 | $14,424 | $10,548 | $12,033 | $13,026 |
| 03/2018 | $11,856 | $14,058 | $10,615 | $11,937 | $12,797 |
| 04/2018 | $11,956 | $14,112 | $10,536 | $11,925 | $12,839 |
| 05/2018 | $12,041 | $14,451 | $10,612 | $12,002 | $12,915 |
| 06/2018 | $12,071 | $14,540 | $10,598 | $12,014 | $12,947 |
| 07/2018 | $12,429 | $15,081 | $10,601 | $12,300 | $13,460 |
| 08/2018 | $12,506 | $15,573 | $10,669 | $12,441 | $13,659 |
| 09/2018 | $12,498 | $15,662 | $10,600 | $12,424 | $13,686 |
| 10/2018 | $11,833 | $14,591 | $10,517 | $11,999 | $12,977 |
| 11/2018 | $11,902 | $14,888 | $10,580 | $12,242 | $13,364 |
| 12/2018 | $11,108 | $13,544 | $10,774 | $11,627 | $12,081 |
| 01/2019 | $11,939 | $14,629 | $10,888 | $12,219 | $13,021 |
| 02/2019 | $12,166 | $15,099 | $10,882 | $12,451 | $13,437 |
| 03/2019 | $12,233 | $15,393 | $11,091 | $12,594 | $13,523 |
| 04/2019 | $12,594 | $16,016 | $11,094 | $12,863 | $14,003 |
| 05/2019 | $12,046 | $14,998 | $11,291 | $12,458 | $13,102 |
| 06/2019 | $12,695 | $16,055 | $11,432 | $13,057 | $14,043 |
| 07/2019 | $12,763 | $16,286 | $11,458 | $13,134 | $14,159 |
| 08/2019 | $12,619 | $16,028 | $11,755 | $13,038 | $13,743 |
| 09/2019 | $12,873 | $16,328 | $11,692 | $13,289 | $14,233 |
| 10/2019 | $13,056 | $16,681 | $11,727 | $13,417 | $14,432 |
| 11/2019 | $13,311 | $17,287 | $11,721 | $13,663 | $14,878 |
| 12/2019 | $13,541 | $17,809 | $11,713 | $13,885 | $15,288 |
| 01/2020 | $13,256 | $17,802 | $11,938 | $13,812 | $14,959 |
| 02/2020 | $12,531 | $16,336 | $12,153 | $13,109 | $13,510 |
| 03/2020 | $10,877 | $14,319 | $12,082 | $11,734 | $11,201 |
| 04/2020 | $11,715 | $16,154 | $12,297 | $12,609 | $12,460 |
| 05/2020 | $12,047 | $16,923 | $12,354 | $12,892 | $12,887 |
| 06/2020 | $12,177 | $17,260 | $12,432 | $12,873 | $12,802 |
| 07/2020 | $12,464 | $18,233 | $12,617 | $13,255 | $13,308 |
| 08/2020 | $12,732 | $19,544 | $12,515 | $13,541 | $13,858 |
| 09/2020 | $12,436 | $18,801 | $12,509 | $13,339 | $13,518 |
| 10/2020 | $12,448 | $18,301 | $12,453 | $13,210 | $13,340 |
| 11/2020 | $13,875 | $20,305 | $12,575 | $14,328 | $15,135 |
| 12/2020 | $14,332 | $21,085 | $12,592 | $14,665 | $15,715 |
| 01/2021 | $14,237 | $20,872 | $12,502 | $14,543 | $15,571 |
| 02/2021 | $15,014 | $21,448 | $12,321 | $14,986 | $16,512 |
| 03/2021 | $15,539 | $22,387 | $12,168 | $15,440 | $17,484 |
| 04/2021 | $16,002 | $23,582 | $12,264 | $15,859 | $18,183 |
| 05/2021 | $16,307 | $23,747 | $12,304 | $16,102 | $18,607 |
| 06/2021 | $16,202 | $24,301 | $12,390 | $16,037 | $18,394 |
| 07/2021 | $16,152 | $24,878 | $12,529 | $16,186 | $18,541 |
| 08/2021 | $16,300 | $25,635 | $12,505 | $16,366 | $18,909 |
| 09/2021 | $15,983 | $24,443 | $12,397 | $15,967 | $18,251 |
| 10/2021 | $16,577 | $26,155 | $12,393 | $16,452 | $19,178 |
| 11/2021 | $16,098 | $25,974 | $12,430 | $16,124 | $18,502 |
| 12/2021 | $16,655 | $27,138 | $12,398 | $16,718 | $19,669 |
| 01/2022 | $16,563 | $25,734 | $12,131 | $16,340 | $19,211 |
| 02/2022 | $16,378 | $24,963 | $11,996 | $16,153 | $18,988 |
| 03/2022 | $16,355 | $25,890 | $11,662 | $16,247 | $19,524 |
| 04/2022 | $15,432 | $23,632 | $11,220 | $15,451 | $18,423 |
| 05/2022 | $15,917 | $23,676 | $11,292 | $15,671 | $18,781 |
| 06/2022 | $14,796 | $21,721 | $11,115 | $14,751 | $17,140 |
| 07/2022 | $15,578 | $23,724 | $11,387 | $15,482 | $18,276 |
| 08/2022 | $15,183 | $22,757 | $11,065 | $15,030 | $17,732 |
| 09/2022 | $13,965 | $20,661 | $10,587 | $13,980 | $16,177 |
| 10/2022 | $14,982 | $22,333 | $10,450 | $14,767 | $17,836 |
| 11/2022 | $15,751 | $23,582 | $10,834 | $15,538 | $18,950 |
| 12/2022 | $15,328 | $22,223 | $10,785 | $15,134 | $18,186 |
| 01/2023 | $16,187 | $23,619 | $11,117 | $15,791 | $19,129 |
| 02/2023 | $15,661 | $23,043 | $10,829 | $15,294 | $18,454 |
| 03/2023 | $15,546 | $23,889 | $11,105 | $15,407 | $18,369 |
| 04/2023 | $15,710 | $24,262 | $11,172 | $15,584 | $18,646 |
| 05/2023 | $15,311 | $24,367 | $11,050 | $15,155 | $17,927 |
| 06/2023 | $15,993 | $25,977 | $11,011 | $15,737 | $19,118 |
| 07/2023 | $16,532 | $26,812 | $11,003 | $16,065 | $19,790 |
| 08/2023 | $16,248 | $26,385 | $10,933 | $15,764 | $19,256 |
| 09/2023 | $15,730 | $25,127 | $10,655 | $15,239 | $18,513 |
| 10/2023 | $15,334 | $24,599 | $10,487 | $14,820 | $17,860 |
| 11/2023 | $16,295 | $26,845 | $10,962 | $15,759 | $19,207 |
| 12/2023 | $17,151 | $28,065 | $11,381 | $16,524 | $20,271 |
| 01/2024 | $17,204 | $28,536 | $11,350 | $16,516 | $20,292 |
| 02/2024 | $17,426 | $30,060 | $11,190 | $16,789 | $21,041 |
| 03/2024 | $18,134 | $31,027 | $11,293 | $17,354 | $22,092 |
| 04/2024 | $17,483 | $29,760 | $11,008 | $16,734 | $21,149 |
| 05/2024 | $17,983 | $31,236 | $11,194 | $17,166 | $21,819 |
| 06/2024 | $17,983 | $32,356 | $11,300 | $17,134 | $21,614 |
| 07/2024 | $18,596 | $32,750 | $11,564 | $17,820 | $22,719 |
| 08/2024 | $18,914 | $33,545 | $11,731 | $18,209 | $23,328 |
| 09/2024 | $19,138 | $34,261 | $11,888 | $18,458 | $23,652 |
| 10/2024 | $18,974 | $33,950 | $11,593 | $18,153 | $23,392 |
Average Annual Total Returns (%)
| HEADER | 1 Year | 5 Years | 10 Years |
|---|
Advisor ClassFootnote Reference1 | 23.74% | 7.76% | 6.61% |
S&P 500® Index TR | 38.02% | 15.27% | 13.00% |
| Bloomberg US Aggregate Bond Index | 10.55% | (0.23)% | 1.49% |
| Balanced Composite Index | 22.49% | 6.23% | 6.14% |
Russell 1000® Value Index | 30.98% | 10.14% | 8.87% |
| Footnote | Description |
Footnote1 | Return may differ from actual shareholder return due to accounting adjustments for financial reporting purposes. |
Performance shown is historical and is not indicative of future returns. Investment returns and principal value will vary, and shares may be worth more or less at redemption than at original purchase. Performance shown is as of date indicated, and current performance may be lower or higher than the performance data quoted. To obtain performance as of the most recent month end, please visit americanbeaconfunds.com or call 800-967-9009. The graph and table do not reflect the deduction of taxes that a shareholder would pay on fund distributions or redemption of fund shares.
The S&P 500 Index TR and Bloomberg US Aggregate Bond Index are replacing the Balanced Composite Index and the Russell 1000® Value Index as the broad-based securities market indices to comply with a new regulatory requirement. The Balanced Composite Index reflects the market sectors in which the Fund invests.
| Total Net Assets | $114,132,015 |
| # of Portfolio Holdings | 398 |
| Portfolio Turnover Rate | 38% |
| Total Management Fees Paid | $585,364 |
Asset Allocation - % Investments
| Value | Value |
|---|
| Common Stocks | 55.4 |
| Corporate Obligations | 11.6 |
| U.S. Agency Mortgage-Backed Obligations | 10.1 |
| U.S. Treasury Obligations | 9.8 |
| Foreign Common Stocks | 4.4 |
| Foreign Corporate Obligations | 3.6 |
| Investment Companies | 2.1 |
| Asset-Backed Obligations | 1.0 |
| U.S. Government Agency Obligations | 0.8 |
| Foreign Sovereign Obligations | 0.6 |
| Securities Lending Collateral | 0.3 |
| Commercial Mortgage-Backed Obligations | 0.3 |
The Fund may purchase and sell futures contracts to gain market exposure on cash balances.
What did the Fund invest in?
Top Ten Holdings - % Net Assets
| Fidelity National Information Services, Inc. | 1.6 |
| Comcast Corp., Class A | 1.4 |
| Wells Fargo & Co. | 1.3 |
| Entergy Corp. | 1.2 |
| Bank of America Corp. | 1.2 |
| Citigroup, Inc. | 1.2 |
| F5, Inc. | 1.2 |
| Carnival Corp. | 1.2 |
| Elevance Health, Inc. | 1.1 |
| Air Products & Chemicals, Inc. | 1.1 |
Excludes cash equivalents.
Sector Allocation - % Equities
| Value | Value |
|---|
| Real Estate | 2.1 |
| Consumer Staples | 4.9 |
| Materials | 5.0 |
| Communication Services | 6.0 |
| Utilities | 6.1 |
| Consumer Discretionary | 9.8 |
| Industrials | 10.2 |
| Information Technology | 10.7 |
| Energy | 11.8 |
| Health Care | 13.1 |
| Financials | 20.3 |
Top Ten Industry Allocations - % Fixed Income
| Value | Value |
|---|
| Beverages | 1.9 |
| U.S. Government Agency Obligations | 2.1 |
| Pharmaceuticals | 2.6 |
| Asset-Backed Obligations | 2.6 |
| Insurance | 3.0 |
| Computers | 3.3 |
| Banks | 5.4 |
| Electric | 5.8 |
| U.S. Treasury Obligations | 26.0 |
| U.S. Agency Mortgage-Backed Obligations | 26.8 |
For additional information about the Fund, including its prospectus, financial statements, holdings, and proxy voting information, please visit www.americanbeaconfunds.com/literature or call 1-800-658-5811.
If your financial institution mailed only one copy of this Report to an address shared by more than one account, you can request an individual copy by contacting your financial institution.
Distributed by:
Resolute Investment Distributors, Inc.
Annual Shareholder Report - October 31, 2024
Annual Shareholder Report - October 31, 2024
This annual shareholder report contains important information about American Beacon Balanced Fund for the period of November 1, 2023 to October 31, 2024. You can find additional information about the Fund at www.americanbeaconfunds.com/literature. You can also request this information by contacting us at 800-658-5811.
What were the Fund costs for the last year?
(based on a hypothetical $10,000 investment)
| Class Name | Costs of a $10,000 investment | Costs paid as a percentage of a $10,000 investment |
|---|
| Y | $104 | 0.93% |
How did the Fund perform and what affected its performance?
The Y Class of the Fund returned 24.33% for the twelve months ended October 31, 2024, compared to the S&P 500 Index return of 38.02%, the Bloomberg U.S. Aggregate Bond Index return of 10.55% and the Balanced Composite Index return of 22.49%.
• Broad market performance rallied during the twelve-month period as central banks cut rates globally and the probability of a soft landing increased.
• The Fund’s diversified strategy of equity and fixed income investing achieved returns through capital appreciation and income.
• The Fund's holdings in the Information Technology and Financials sectors contributed materially to the Fund's performance, while holdings in the Energy sector detracted from the Fund’s performance over the period. The Fund’s fixed-income holdings contributed negatively to performance during the twelve-month period.
Cumulative Performance from October 31, 2014 through October 31, 2024
The initial investment, based on a $100,000 investment, is adjusted to reflect the maximum applicable sales charge, if any.
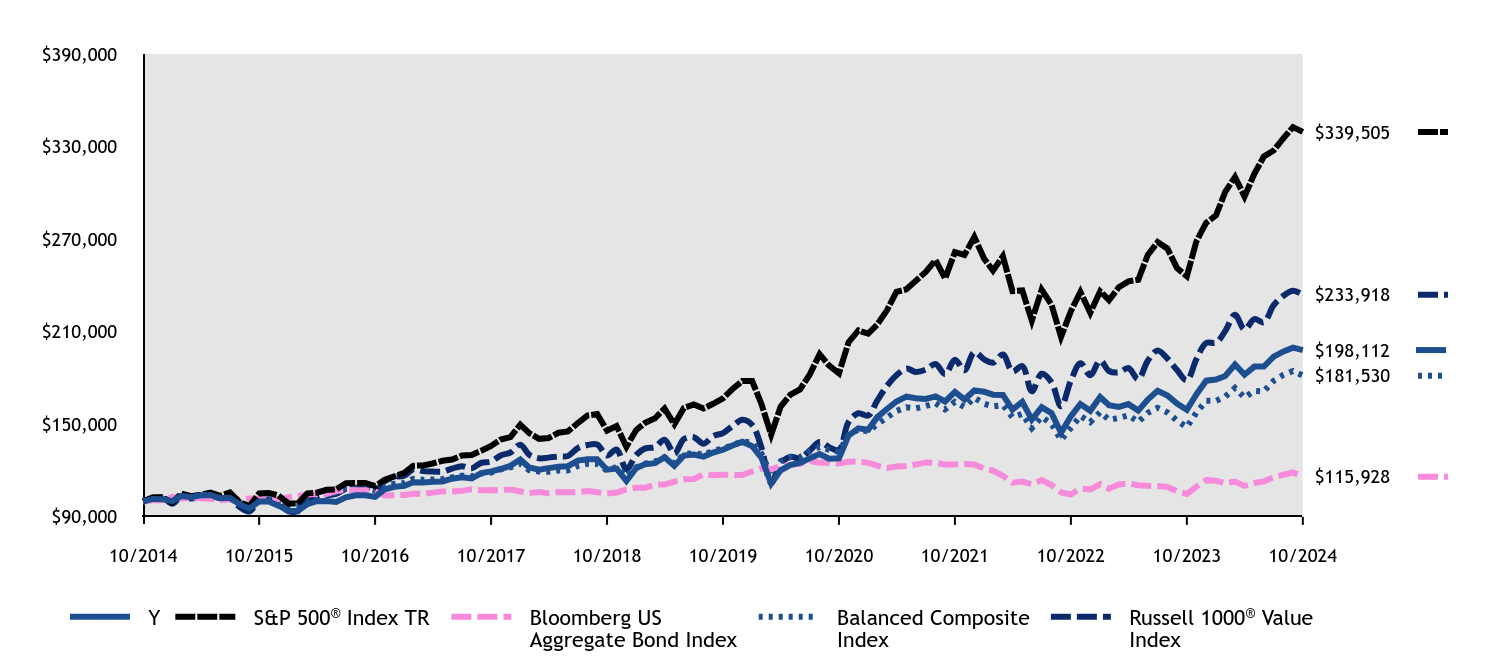
| #ERROR:A result could not be returned because the conditional could not be evaluated to a True/False value (#ERROR:Invalid Formula (#!=""), 'Multiple values from an iterator cannot be used in a formula unless they are aggregrated.') | Y | S&P 500® Index TR | Bloomberg US Aggregate Bond Index | Balanced Composite Index | Russell 1000® Value Index |
|---|
| 10/2014 | $100,000 | $100,000 | $100,000 | $100,000 | $100,000 |
| 11/2014 | $101,604 | $102,689 | $100,709 | $101,512 | $102,048 |
| 12/2014 | $101,468 | $102,431 | $100,804 | $101,924 | $102,674 |
| 01/2015 | $100,161 | $99,356 | $102,917 | $100,334 | $98,569 |
| 02/2015 | $103,584 | $105,066 | $101,950 | $102,870 | $103,339 |
| 03/2015 | $102,775 | $103,404 | $102,423 | $102,221 | $101,932 |
| 04/2015 | $103,971 | $104,396 | $102,056 | $102,648 | $102,885 |
| 05/2015 | $104,221 | $105,739 | $101,810 | $103,289 | $104,122 |
| 06/2015 | $102,033 | $103,692 | $100,700 | $101,601 | $102,043 |
| 07/2015 | $102,423 | $105,864 | $101,400 | $102,151 | $102,490 |
| 08/2015 | $98,090 | $99,477 | $101,254 | $98,442 | $96,386 |
| 09/2015 | $95,452 | $97,016 | $101,939 | $96,925 | $93,476 |
| 10/2015 | $99,924 | $105,199 | $101,956 | $101,319 | $100,529 |
| 11/2015 | $99,987 | $105,512 | $101,687 | $101,445 | $100,914 |
| 12/2015 | $97,267 | $103,848 | $101,358 | $100,005 | $98,744 |
| 01/2016 | $94,080 | $98,695 | $102,753 | $97,455 | $93,642 |
| 02/2016 | $93,615 | $98,562 | $103,482 | $97,717 | $93,618 |
| 03/2016 | $98,263 | $105,248 | $104,431 | $102,299 | $100,362 |
| 04/2016 | $100,201 | $105,656 | $104,832 | $103,745 | $102,470 |
| 05/2016 | $100,267 | $107,553 | $104,859 | $104,722 | $104,061 |
| 06/2016 | $99,667 | $107,832 | $106,743 | $106,018 | $104,961 |
| 07/2016 | $102,619 | $111,808 | $107,418 | $108,134 | $108,009 |
| 08/2016 | $103,959 | $111,965 | $107,295 | $108,584 | $108,842 |
| 09/2016 | $103,959 | $111,986 | $107,232 | $108,423 | $108,615 |
| 10/2016 | $102,978 | $109,943 | $106,412 | $107,085 | $106,934 |
| 11/2016 | $107,824 | $114,015 | $103,895 | $109,741 | $113,041 |
| 12/2016 | $109,474 | $116,268 | $104,041 | $111,449 | $115,867 |
| 01/2017 | $110,082 | $118,473 | $104,246 | $112,012 | $116,692 |
| 02/2017 | $112,449 | $123,178 | $104,946 | $114,729 | $120,885 |
| 03/2017 | $112,314 | $123,321 | $104,891 | $114,003 | $119,654 |
| 04/2017 | $112,747 | $124,588 | $105,701 | $114,227 | $119,429 |
| 05/2017 | $112,951 | $126,341 | $106,514 | $114,511 | $119,312 |
| 06/2017 | $114,722 | $127,130 | $106,407 | $115,588 | $121,263 |
| 07/2017 | $115,622 | $129,744 | $106,865 | $116,709 | $122,874 |
| 08/2017 | $114,869 | $130,141 | $107,823 | $116,312 | $121,443 |
| 09/2017 | $118,360 | $132,826 | $107,310 | $118,158 | $125,040 |
| 10/2017 | $119,506 | $135,925 | $107,372 | $118,700 | $125,948 |
| 11/2017 | $121,018 | $140,094 | $107,234 | $120,820 | $129,804 |
| 12/2017 | $123,084 | $141,652 | $107,726 | $122,100 | $131,699 |
| 01/2018 | $127,240 | $149,762 | $106,486 | $124,369 | $136,791 |
| 02/2018 | $121,990 | $144,242 | $105,476 | $120,335 | $130,259 |
| 03/2018 | $120,532 | $140,576 | $106,153 | $119,373 | $127,968 |
| 04/2018 | $121,582 | $141,116 | $105,363 | $119,254 | $128,390 |
| 05/2018 | $122,461 | $144,514 | $106,115 | $120,020 | $129,152 |
| 06/2018 | $122,827 | $145,403 | $105,985 | $120,139 | $129,472 |
| 07/2018 | $126,508 | $150,814 | $106,010 | $123,003 | $134,596 |
| 08/2018 | $127,318 | $155,729 | $106,692 | $124,411 | $136,586 |
| 09/2018 | $127,318 | $156,615 | $106,005 | $124,238 | $136,857 |
| 10/2018 | $120,563 | $145,910 | $105,167 | $119,986 | $129,770 |
| 11/2018 | $121,303 | $148,884 | $105,795 | $122,422 | $133,644 |
| 12/2018 | $113,266 | $135,441 | $107,739 | $116,268 | $120,811 |
| 01/2019 | $121,727 | $146,295 | $108,883 | $122,191 | $130,214 |
| 02/2019 | $124,121 | $150,992 | $108,820 | $124,506 | $134,375 |
| 03/2019 | $124,840 | $153,926 | $110,909 | $125,937 | $135,229 |
| 04/2019 | $128,629 | $160,158 | $110,938 | $128,630 | $140,026 |
| 05/2019 | $123,092 | $149,981 | $112,907 | $124,581 | $131,023 |
| 06/2019 | $129,752 | $160,551 | $114,325 | $130,573 | $140,428 |
| 07/2019 | $130,435 | $162,858 | $114,576 | $131,337 | $141,592 |
| 08/2019 | $129,064 | $160,278 | $117,545 | $130,381 | $137,429 |
| 09/2019 | $131,726 | $163,277 | $116,919 | $132,894 | $142,332 |
| 10/2019 | $133,520 | $166,814 | $117,271 | $134,169 | $144,321 |
| 11/2019 | $136,276 | $172,869 | $117,212 | $136,630 | $148,783 |
| 12/2019 | $138,627 | $178,087 | $117,130 | $138,848 | $152,876 |
| 01/2020 | $135,842 | $178,017 | $119,384 | $138,124 | $149,587 |
| 02/2020 | $128,445 | $163,363 | $121,533 | $131,092 | $135,100 |
| 03/2020 | $111,476 | $143,185 | $120,818 | $117,342 | $112,012 |
| 04/2020 | $120,159 | $161,541 | $122,965 | $126,092 | $124,605 |
| 05/2020 | $123,659 | $169,235 | $123,538 | $128,919 | $128,875 |
| 06/2020 | $124,972 | $172,600 | $124,316 | $128,730 | $128,020 |
| 07/2020 | $127,983 | $182,332 | $126,173 | $132,553 | $133,081 |
| 08/2020 | $130,704 | $195,438 | $125,154 | $135,414 | $138,583 |
| 09/2020 | $127,720 | $188,012 | $125,086 | $133,388 | $135,179 |
| 10/2020 | $127,948 | $183,012 | $124,527 | $132,098 | $133,403 |
| 11/2020 | $142,636 | $203,046 | $125,749 | $143,278 | $151,347 |
| 12/2020 | $147,370 | $210,852 | $125,922 | $146,653 | $157,150 |
| 01/2021 | $146,481 | $208,724 | $125,020 | $145,427 | $155,711 |
| 02/2021 | $154,482 | $214,479 | $123,214 | $149,860 | $165,121 |
| 03/2021 | $159,915 | $223,872 | $121,676 | $154,402 | $174,837 |
| 04/2021 | $164,799 | $235,820 | $122,637 | $158,595 | $181,829 |
| 05/2021 | $167,970 | $237,467 | $123,038 | $161,024 | $186,074 |
| 06/2021 | $166,880 | $243,011 | $123,902 | $160,370 | $183,943 |
| 07/2021 | $166,460 | $248,784 | $125,287 | $161,856 | $185,413 |
| 08/2021 | $168,050 | $256,348 | $125,049 | $163,659 | $189,090 |
| 09/2021 | $164,771 | $244,425 | $123,966 | $159,674 | $182,508 |
| 10/2021 | $171,009 | $261,550 | $123,932 | $164,521 | $191,776 |
| 11/2021 | $166,100 | $259,738 | $124,299 | $161,237 | $185,017 |
| 12/2021 | $171,918 | $271,378 | $123,981 | $167,175 | $196,689 |
| 01/2022 | $171,054 | $257,335 | $121,310 | $163,398 | $192,108 |
| 02/2022 | $169,218 | $249,630 | $119,956 | $161,531 | $189,879 |
| 03/2022 | $169,002 | $258,899 | $116,624 | $162,472 | $195,239 |
| 04/2022 | $159,534 | $236,323 | $112,198 | $154,507 | $184,226 |
| 05/2022 | $164,516 | $236,756 | $112,921 | $156,708 | $187,808 |
| 06/2022 | $153,036 | $217,213 | $111,150 | $147,509 | $171,399 |
| 07/2022 | $161,153 | $237,241 | $113,866 | $154,820 | $182,764 |
| 08/2022 | $157,238 | $227,566 | $110,648 | $150,303 | $177,319 |
| 09/2022 | $144,515 | $206,608 | $105,868 | $139,797 | $161,770 |
| 10/2022 | $155,185 | $223,335 | $104,496 | $147,673 | $178,357 |
| 11/2022 | $163,162 | $235,816 | $108,339 | $155,382 | $189,502 |
| 12/2022 | $158,784 | $222,229 | $107,851 | $151,344 | $181,863 |
| 01/2023 | $167,731 | $236,193 | $111,168 | $157,912 | $191,288 |
| 02/2023 | $162,363 | $230,430 | $108,294 | $152,938 | $184,543 |
| 03/2023 | $161,289 | $238,890 | $111,045 | $154,069 | $183,693 |
| 04/2023 | $163,074 | $242,619 | $111,718 | $155,836 | $186,461 |
| 05/2023 | $158,881 | $243,673 | $110,502 | $151,551 | $179,269 |
| 06/2023 | $166,070 | $259,774 | $110,108 | $157,375 | $191,178 |
| 07/2023 | $171,693 | $268,119 | $110,031 | $160,651 | $197,900 |
| 08/2023 | $168,683 | $263,851 | $109,328 | $157,639 | $192,558 |
| 09/2023 | $163,385 | $251,271 | $106,550 | $152,386 | $185,127 |
| 10/2023 | $159,345 | $245,987 | $104,868 | $148,199 | $178,595 |
| 11/2023 | $169,387 | $268,452 | $109,617 | $157,592 | $192,070 |
| 12/2023 | $178,270 | $280,648 | $113,813 | $165,243 | $202,710 |
| 01/2024 | $179,002 | $285,364 | $113,501 | $165,164 | $202,920 |
| 02/2024 | $181,320 | $300,602 | $111,897 | $167,886 | $210,405 |
| 03/2024 | $188,764 | $310,273 | $112,931 | $173,542 | $220,924 |
| 04/2024 | $182,120 | $297,600 | $110,078 | $167,341 | $211,488 |
| 05/2024 | $187,389 | $312,357 | $111,944 | $171,659 | $218,192 |
| 06/2024 | $187,389 | $323,565 | $113,004 | $171,340 | $216,139 |
| 07/2024 | $193,894 | $327,503 | $115,644 | $178,196 | $227,189 |
| 08/2024 | $197,220 | $335,447 | $117,305 | $182,089 | $233,283 |
| 09/2024 | $199,684 | $342,612 | $118,876 | $184,580 | $236,521 |
| 10/2024 | $198,112 | $339,505 | $115,928 | $181,530 | $233,918 |
Average Annual Total Returns (%)
| HEADER | 1 Year | 5 Years | 10 Years |
|---|
Class YFootnote Reference1 | 24.33% | 8.21% | 7.08% |
S&P 500® Index TR | 38.02% | 15.27% | 13.00% |
| Bloomberg US Aggregate Bond Index | 10.55% | (0.23)% | 1.49% |
| Balanced Composite Index | 22.49% | 6.23% | 6.14% |
Russell 1000® Value Index | 30.98% | 10.14% | 8.87% |
| Footnote | Description |
Footnote1 | Return may differ from actual shareholder return due to accounting adjustments for financial reporting purposes. |
Performance shown is historical and is not indicative of future returns. Investment returns and principal value will vary, and shares may be worth more or less at redemption than at original purchase. Performance shown is as of date indicated, and current performance may be lower or higher than the performance data quoted. To obtain performance as of the most recent month end, please visit americanbeaconfunds.com or call 800-967-9009. The graph and table do not reflect the deduction of taxes that a shareholder would pay on fund distributions or redemption of fund shares.
The S&P 500 Index TR and Bloomberg US Aggregate Bond Index are replacing the Balanced Composite Index and the Russell 1000® Value Index as the broad-based securities market indices to comply with a new regulatory requirement. The Balanced Composite Index reflects the market sectors in which the Fund invests.
| Total Net Assets | $114,132,015 |
| # of Portfolio Holdings | 398 |
| Portfolio Turnover Rate | 38% |
| Total Management Fees Paid | $585,364 |
Asset Allocation - % Investments
| Value | Value |
|---|
| Common Stocks | 55.4 |
| Corporate Obligations | 11.6 |
| U.S. Agency Mortgage-Backed Obligations | 10.1 |
| U.S. Treasury Obligations | 9.8 |
| Foreign Common Stocks | 4.4 |
| Foreign Corporate Obligations | 3.6 |
| Investment Companies | 2.1 |
| Asset-Backed Obligations | 1.0 |
| U.S. Government Agency Obligations | 0.8 |
| Foreign Sovereign Obligations | 0.6 |
| Securities Lending Collateral | 0.3 |
| Commercial Mortgage-Backed Obligations | 0.3 |
The Fund may purchase and sell futures contracts to gain market exposure on cash balances.
What did the Fund invest in?
Top Ten Holdings - % Net Assets
| Fidelity National Information Services, Inc. | 1.6 |
| Comcast Corp., Class A | 1.4 |
| Wells Fargo & Co. | 1.3 |
| Entergy Corp. | 1.2 |
| Bank of America Corp. | 1.2 |
| Citigroup, Inc. | 1.2 |
| F5, Inc. | 1.2 |
| Carnival Corp. | 1.2 |
| Elevance Health, Inc. | 1.1 |
| Air Products & Chemicals, Inc. | 1.1 |
Excludes cash equivalents.
Sector Allocation - % Equities
| Value | Value |
|---|
| Real Estate | 2.1 |
| Consumer Staples | 4.9 |
| Materials | 5.0 |
| Communication Services | 6.0 |
| Utilities | 6.1 |
| Consumer Discretionary | 9.8 |
| Industrials | 10.2 |
| Information Technology | 10.7 |
| Energy | 11.8 |
| Health Care | 13.1 |
| Financials | 20.3 |
Top Ten Industry Allocations - % Fixed Income
| Value | Value |
|---|
| Beverages | 1.9 |
| U.S. Government Agency Obligations | 2.1 |
| Pharmaceuticals | 2.6 |
| Asset-Backed Obligations | 2.6 |
| Insurance | 3.0 |
| Computers | 3.3 |
| Banks | 5.4 |
| Electric | 5.8 |
| U.S. Treasury Obligations | 26.0 |
| U.S. Agency Mortgage-Backed Obligations | 26.8 |
For additional information about the Fund, including its prospectus, financial statements, holdings, and proxy voting information, please visit www.americanbeaconfunds.com/literature or call 1-800-658-5811.
If your financial institution mailed only one copy of this Report to an address shared by more than one account, you can request an individual copy by contacting your financial institution.
Distributed by:
Resolute Investment Distributors, Inc.
Annual Shareholder Report - October 31, 2024
Annual Shareholder Report - October 31, 2024
This annual shareholder report contains important information about American Beacon Balanced Fund for the period of November 1, 2023 to October 31, 2024. You can find additional information about the Fund at www.americanbeaconfunds.com/literature. You can also request this information by contacting us at 800-658-5811.
What were the Fund costs for the last year?
(based on a hypothetical $10,000 investment)
| Class Name | Costs of a $10,000 investment | Costs paid as a percentage of a $10,000 investment |
|---|
| Class A | $131 | 1.17% |
How did the Fund perform and what affected its performance?
The A Class of the Fund returned 16.86% (with sales charges) and 24.03% (without sales charges) for the twelve months ended October 31, 2024, compared to the S&P 500 Index return of 38.02%, the Bloomberg U.S. Aggregate Bond Index return of 10.55% and the Balanced Composite Index return of 22.49%.
• Broad market performance rallied during the twelve-month period as central banks cut rates globally and the probability of a soft landing increased.
• The Fund’s diversified strategy of equity and fixed income investing achieved returns through capital appreciation and income.
• The Fund's holdings in the Information Technology and Financials sectors contributed materially to the Fund's performance, while holdings in the Energy sector detracted from the Fund’s performance over the period. The Fund’s fixed-income holdings contributed negatively to performance during the twelve-month period.
Cumulative Performance from October 31, 2014 through October 31, 2024
The initial investment, based on a $10,000 investment, is adjusted to reflect the maximum applicable sales charge, if any.
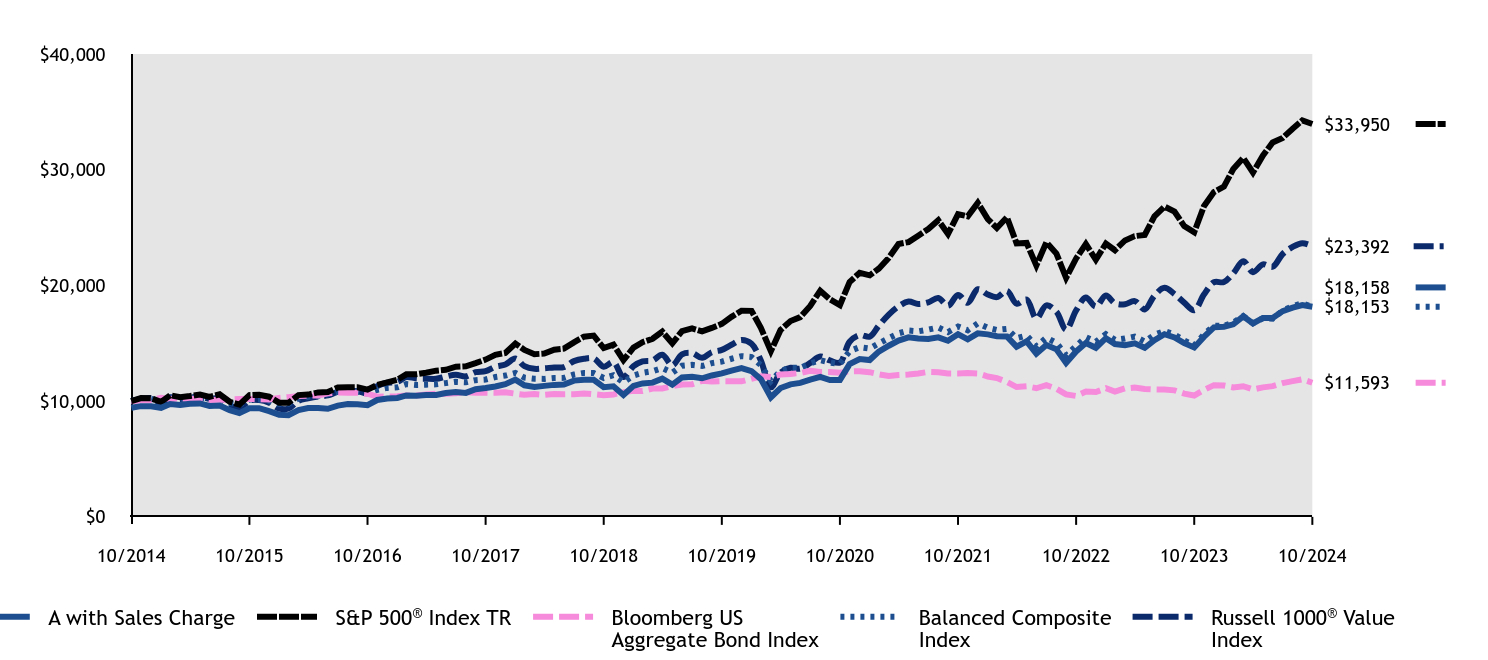
| A with Sales Charge | S&P 500® Index TR | Bloomberg US Aggregate Bond Index | Balanced Composite Index | Russell 1000® Value Index |
|---|
| 10/2014 | $9,427 | $10,000 | $10,000 | $10,000 | $10,000 |
| 11/2014 | $9,568 | $10,269 | $10,071 | $10,151 | $10,205 |
| 12/2014 | $9,561 | $10,243 | $10,080 | $10,192 | $10,267 |
| 01/2015 | $9,424 | $9,936 | $10,292 | $10,033 | $9,857 |
| 02/2015 | $9,749 | $10,507 | $10,195 | $10,287 | $10,334 |
| 03/2015 | $9,671 | $10,340 | $10,242 | $10,222 | $10,193 |
| 04/2015 | $9,777 | $10,440 | $10,206 | $10,265 | $10,289 |
| 05/2015 | $9,803 | $10,574 | $10,181 | $10,329 | $10,412 |
| 06/2015 | $9,588 | $10,369 | $10,070 | $10,160 | $10,204 |
| 07/2015 | $9,630 | $10,586 | $10,140 | $10,215 | $10,249 |
| 08/2015 | $9,217 | $9,948 | $10,125 | $9,844 | $9,639 |
| 09/2015 | $8,968 | $9,702 | $10,194 | $9,692 | $9,348 |
| 10/2015 | $9,381 | $10,520 | $10,196 | $10,132 | $10,053 |
| 11/2015 | $9,388 | $10,551 | $10,169 | $10,144 | $10,091 |
| 12/2015 | $9,130 | $10,385 | $10,136 | $10,000 | $9,874 |
| 01/2016 | $8,831 | $9,869 | $10,275 | $9,745 | $9,364 |
| 02/2016 | $8,783 | $9,856 | $10,348 | $9,772 | $9,362 |
| 03/2016 | $9,221 | $10,525 | $10,443 | $10,230 | $10,036 |
| 04/2016 | $9,399 | $10,566 | $10,483 | $10,374 | $10,247 |
| 05/2016 | $9,399 | $10,755 | $10,486 | $10,472 | $10,406 |
| 06/2016 | $9,343 | $10,783 | $10,674 | $10,602 | $10,496 |
| 07/2016 | $9,618 | $11,181 | $10,742 | $10,813 | $10,801 |
| 08/2016 | $9,745 | $11,196 | $10,729 | $10,858 | $10,884 |
| 09/2016 | $9,738 | $11,199 | $10,723 | $10,842 | $10,861 |
| 10/2016 | $9,648 | $10,994 | $10,641 | $10,708 | $10,693 |
| 11/2016 | $10,099 | $11,401 | $10,389 | $10,974 | $11,304 |
| 12/2016 | $10,221 | $11,627 | $10,404 | $11,145 | $11,587 |
| 01/2017 | $10,278 | $11,847 | $10,425 | $11,201 | $11,669 |
| 02/2017 | $10,497 | $12,318 | $10,495 | $11,473 | $12,089 |
| 03/2017 | $10,476 | $12,332 | $10,489 | $11,400 | $11,965 |
| 04/2017 | $10,521 | $12,459 | $10,570 | $11,423 | $11,943 |
| 05/2017 | $10,535 | $12,634 | $10,651 | $11,451 | $11,931 |
| 06/2017 | $10,699 | $12,713 | $10,641 | $11,559 | $12,126 |
| 07/2017 | $10,782 | $12,974 | $10,686 | $11,671 | $12,287 |
| 08/2017 | $10,711 | $13,014 | $10,782 | $11,631 | $12,144 |
| 09/2017 | $11,026 | $13,283 | $10,731 | $11,816 | $12,504 |
| 10/2017 | $11,130 | $13,593 | $10,737 | $11,870 | $12,595 |
| 11/2017 | $11,267 | $14,009 | $10,723 | $12,082 | $12,980 |
| 12/2017 | $11,470 | $14,165 | $10,773 | $12,210 | $13,170 |
| 01/2018 | $11,862 | $14,976 | $10,649 | $12,437 | $13,679 |
| 02/2018 | $11,370 | $14,424 | $10,548 | $12,033 | $13,026 |
| 03/2018 | $11,231 | $14,058 | $10,615 | $11,937 | $12,797 |
| 04/2018 | $11,321 | $14,112 | $10,536 | $11,925 | $12,839 |
| 05/2018 | $11,406 | $14,451 | $10,612 | $12,002 | $12,915 |
| 06/2018 | $11,437 | $14,540 | $10,598 | $12,014 | $12,947 |
| 07/2018 | $11,775 | $15,081 | $10,601 | $12,300 | $13,460 |
| 08/2018 | $11,853 | $15,573 | $10,669 | $12,441 | $13,659 |
| 09/2018 | $11,845 | $15,662 | $10,600 | $12,424 | $13,686 |
| 10/2018 | $11,212 | $14,591 | $10,517 | $11,999 | $12,977 |
| 11/2018 | $11,282 | $14,888 | $10,580 | $12,242 | $13,364 |
| 12/2018 | $10,536 | $13,544 | $10,774 | $11,627 | $12,081 |
| 01/2019 | $11,319 | $14,629 | $10,888 | $12,219 | $13,021 |
| 02/2019 | $11,531 | $15,099 | $10,882 | $12,451 | $13,437 |
| 03/2019 | $11,600 | $15,393 | $11,091 | $12,594 | $13,523 |
| 04/2019 | $11,946 | $16,016 | $11,094 | $12,863 | $14,003 |
| 05/2019 | $11,433 | $14,998 | $11,291 | $12,458 | $13,102 |
| 06/2019 | $12,049 | $16,055 | $11,432 | $13,057 | $14,043 |
| 07/2019 | $12,106 | $16,286 | $11,458 | $13,134 | $14,159 |
| 08/2019 | $11,977 | $16,028 | $11,755 | $13,038 | $13,743 |
| 09/2019 | $12,218 | $16,328 | $11,692 | $13,289 | $14,233 |
| 10/2019 | $12,393 | $16,681 | $11,727 | $13,417 | $14,432 |
| 11/2019 | $12,644 | $17,287 | $11,721 | $13,663 | $14,878 |
| 12/2019 | $12,861 | $17,809 | $11,713 | $13,885 | $15,288 |
| 01/2020 | $12,598 | $17,802 | $11,938 | $13,812 | $14,959 |
| 02/2020 | $11,903 | $16,336 | $12,153 | $13,109 | $13,510 |
| 03/2020 | $10,335 | $14,319 | $12,082 | $11,734 | $11,201 |
| 04/2020 | $11,133 | $16,154 | $12,297 | $12,609 | $12,460 |
| 05/2020 | $11,454 | $16,923 | $12,354 | $12,892 | $12,887 |
| 06/2020 | $11,576 | $17,260 | $12,432 | $12,873 | $12,802 |
| 07/2020 | $11,857 | $18,233 | $12,617 | $13,255 | $13,308 |
| 08/2020 | $12,103 | $19,544 | $12,515 | $13,541 | $13,858 |
| 09/2020 | $11,829 | $18,801 | $12,509 | $13,339 | $13,518 |
| 10/2020 | $11,836 | $18,301 | $12,453 | $13,210 | $13,340 |
| 11/2020 | $13,202 | $20,305 | $12,575 | $14,328 | $15,135 |
| 12/2020 | $13,638 | $21,085 | $12,592 | $14,665 | $15,715 |
| 01/2021 | $13,551 | $20,872 | $12,502 | $14,543 | $15,571 |
| 02/2021 | $14,279 | $21,448 | $12,321 | $14,986 | $16,512 |
| 03/2021 | $14,789 | $22,387 | $12,168 | $15,440 | $17,484 |
| 04/2021 | $15,232 | $23,582 | $12,264 | $15,859 | $18,183 |
| 05/2021 | $15,515 | $23,747 | $12,304 | $16,102 | $18,607 |
| 06/2021 | $15,417 | $24,301 | $12,390 | $16,037 | $18,394 |
| 07/2021 | $15,374 | $24,878 | $12,529 | $16,186 | $18,541 |
| 08/2021 | $15,516 | $25,635 | $12,505 | $16,366 | $18,909 |
| 09/2021 | $15,220 | $24,443 | $12,397 | $15,967 | $18,251 |
| 10/2021 | $15,789 | $26,155 | $12,393 | $16,452 | $19,178 |
| 11/2021 | $15,336 | $25,974 | $12,430 | $16,124 | $18,502 |
| 12/2021 | $15,857 | $27,138 | $12,398 | $16,718 | $19,669 |
| 01/2022 | $15,773 | $25,734 | $12,131 | $16,340 | $19,211 |
| 02/2022 | $15,604 | $24,963 | $11,996 | $16,153 | $18,988 |
| 03/2022 | $15,592 | $25,890 | $11,662 | $16,247 | $19,524 |
| 04/2022 | $14,707 | $23,632 | $11,220 | $15,451 | $18,423 |
| 05/2022 | $15,167 | $23,676 | $11,292 | $15,671 | $18,781 |
| 06/2022 | $14,102 | $21,721 | $11,115 | $14,751 | $17,140 |
| 07/2022 | $14,856 | $23,724 | $11,387 | $15,482 | $18,276 |
| 08/2022 | $14,480 | $22,757 | $11,065 | $15,030 | $17,732 |
| 09/2022 | $13,312 | $20,661 | $10,587 | $13,980 | $16,177 |
| 10/2022 | $14,291 | $22,333 | $10,450 | $14,767 | $17,836 |
| 11/2022 | $15,024 | $23,582 | $10,834 | $15,538 | $18,950 |
| 12/2022 | $14,612 | $22,223 | $10,785 | $15,134 | $18,186 |
| 01/2023 | $15,441 | $23,619 | $11,117 | $15,791 | $19,129 |
| 02/2023 | $14,938 | $23,043 | $10,829 | $15,294 | $18,454 |
| 03/2023 | $14,829 | $23,889 | $11,105 | $15,407 | $18,369 |
| 04/2023 | $14,998 | $24,262 | $11,172 | $15,584 | $18,646 |
| 05/2023 | $14,615 | $24,367 | $11,050 | $15,155 | $17,927 |
| 06/2023 | $15,271 | $25,977 | $11,011 | $15,737 | $19,118 |
| 07/2023 | $15,783 | $26,812 | $11,003 | $16,065 | $19,790 |
| 08/2023 | $15,508 | $26,385 | $10,933 | $15,764 | $19,256 |
| 09/2023 | $15,013 | $25,127 | $10,655 | $15,239 | $18,513 |
| 10/2023 | $14,640 | $24,599 | $10,487 | $14,820 | $17,860 |
| 11/2023 | $15,552 | $26,845 | $10,962 | $15,759 | $19,207 |
| 12/2023 | $16,376 | $28,065 | $11,381 | $16,524 | $20,271 |
| 01/2024 | $16,432 | $28,536 | $11,350 | $16,516 | $20,292 |
| 02/2024 | $16,642 | $30,060 | $11,190 | $16,789 | $21,041 |
| 03/2024 | $17,326 | $31,027 | $11,293 | $17,354 | $22,092 |
| 04/2024 | $16,711 | $29,760 | $11,008 | $16,734 | $21,149 |
| 05/2024 | $17,188 | $31,236 | $11,194 | $17,166 | $21,819 |
| 06/2024 | $17,188 | $32,356 | $11,300 | $17,134 | $21,614 |
| 07/2024 | $17,783 | $32,750 | $11,564 | $17,820 | $22,719 |
| 08/2024 | $18,079 | $33,545 | $11,731 | $18,209 | $23,328 |
| 09/2024 | $18,305 | $34,261 | $11,888 | $18,458 | $23,652 |
| 10/2024 | $18,158 | $33,950 | $11,593 | $18,153 | $23,392 |
Average Annual Total Returns (%)
| HEADER | 1 Year | 5 Years | 10 Years |
|---|
Class A without Sales ChargeFootnote Reference1 | 24.03% | 7.94% | 6.78% |
Class A with Maximum Sales Charge - 5.75%Footnote Reference1 | 16.86% | 6.67% | 6.15% |
S&P 500® Index TR | 38.02% | 15.27% | 13.00% |
| Bloomberg US Aggregate Bond Index | 10.55% | (0.23)% | 1.49% |
| Balanced Composite Index | 22.49% | 6.23% | 6.14% |
Russell 1000® Value Index | 30.98% | 10.14% | 8.87% |
| Footnote | Description |
Footnote1 | Return may differ from actual shareholder return due to accounting adjustments for financial reporting purposes. |
Performance shown is historical and is not indicative of future returns. Investment returns and principal value will vary, and shares may be worth more or less at redemption than at original purchase. Performance shown is as of date indicated, and current performance may be lower or higher than the performance data quoted. To obtain performance as of the most recent month end, please visit americanbeaconfunds.com or call 800-967-9009. The graph and table do not reflect the deduction of taxes that a shareholder would pay on fund distributions or redemption of fund shares.
The S&P 500 Index TR and Bloomberg US Aggregate Bond Index are replacing the Balanced Composite Index and the Russell 1000® Value Index as the broad-based securities market indices to comply with a new regulatory requirement. The Balanced Composite Index reflects the market sectors in which the Fund invests.
| Total Net Assets | $114,132,015 |
| # of Portfolio Holdings | 398 |
| Portfolio Turnover Rate | 38% |
| Total Management Fees Paid | $585,364 |
Asset Allocation - % Investments
| Value | Value |
|---|
| Common Stocks | 55.4 |
| Corporate Obligations | 11.6 |
| U.S. Agency Mortgage-Backed Obligations | 10.1 |
| U.S. Treasury Obligations | 9.8 |
| Foreign Common Stocks | 4.4 |
| Foreign Corporate Obligations | 3.6 |
| Investment Companies | 2.1 |
| Asset-Backed Obligations | 1.0 |
| U.S. Government Agency Obligations | 0.8 |
| Foreign Sovereign Obligations | 0.6 |
| Securities Lending Collateral | 0.3 |
| Commercial Mortgage-Backed Obligations | 0.3 |
The Fund may purchase and sell futures contracts to gain market exposure on cash balances.
What did the Fund invest in?
Top Ten Holdings - % Net Assets
| Fidelity National Information Services, Inc. | 1.6 |
| Comcast Corp., Class A | 1.4 |
| Wells Fargo & Co. | 1.3 |
| Entergy Corp. | 1.2 |
| Bank of America Corp. | 1.2 |
| Citigroup, Inc. | 1.2 |
| F5, Inc. | 1.2 |
| Carnival Corp. | 1.2 |
| Elevance Health, Inc. | 1.1 |
| Air Products & Chemicals, Inc. | 1.1 |
Excludes cash equivalents.
Sector Allocation - % Equities
| Value | Value |
|---|
| Real Estate | 2.1 |
| Consumer Staples | 4.9 |
| Materials | 5.0 |
| Communication Services | 6.0 |
| Utilities | 6.1 |
| Consumer Discretionary | 9.8 |
| Industrials | 10.2 |
| Information Technology | 10.7 |
| Energy | 11.8 |
| Health Care | 13.1 |
| Financials | 20.3 |
Top Ten Industry Allocations - % Fixed Income
| Value | Value |
|---|
| Beverages | 1.9 |
| U.S. Government Agency Obligations | 2.1 |
| Pharmaceuticals | 2.6 |
| Asset-Backed Obligations | 2.6 |
| Insurance | 3.0 |
| Computers | 3.3 |
| Banks | 5.4 |
| Electric | 5.8 |
| U.S. Treasury Obligations | 26.0 |
| U.S. Agency Mortgage-Backed Obligations | 26.8 |
For additional information about the Fund, including its prospectus, financial statements, holdings, and proxy voting information, please visit www.americanbeaconfunds.com/literature or call 1-800-658-5811.
If your financial institution mailed only one copy of this Report to an address shared by more than one account, you can request an individual copy by contacting your financial institution.
Distributed by:
Resolute Investment Distributors, Inc.
Annual Shareholder Report - October 31, 2024
Annual Shareholder Report - October 31, 2024
This annual shareholder report contains important information about American Beacon Balanced Fund for the period of November 1, 2023 to October 31, 2024. You can find additional information about the Fund at www.americanbeaconfunds.com/literature. You can also request this information by contacting us at 800-658-5811.
What were the Fund costs for the last year?
(based on a hypothetical $10,000 investment)
| Class Name | Costs of a $10,000 investment | Costs paid as a percentage of a $10,000 investment |
|---|
| Class C | $216 | 1.94% |
How did the Fund perform and what affected its performance?
The C Class of the Fund returned 22.03% (with sales charges) and 23.03% (without sales charges) for the twelve months ended October 31, 2024, compared to the S&P 500 Index return of 38.02%, the Bloomberg U.S. Aggregate Bond Index return of 10.55% and the Balanced Composite Index return of 22.49%.
• Broad market performance rallied during the twelve-month period as central banks cut rates globally and the probability of a soft landing increased.
• The Fund’s diversified strategy of equity and fixed income investing achieved returns through capital appreciation and income.
• The Fund's holdings in the Information Technology and Financials sectors contributed materially to the Fund's performance, while holdings in the Energy sector detracted from the Fund’s performance over the period. The Fund’s fixed-income holdings contributed negatively to performance during the twelve-month period.
Cumulative Performance from October 31, 2014 through October 31, 2024
The initial investment, based on a $10,000 investment, is adjusted to reflect the maximum applicable sales charge, if any.
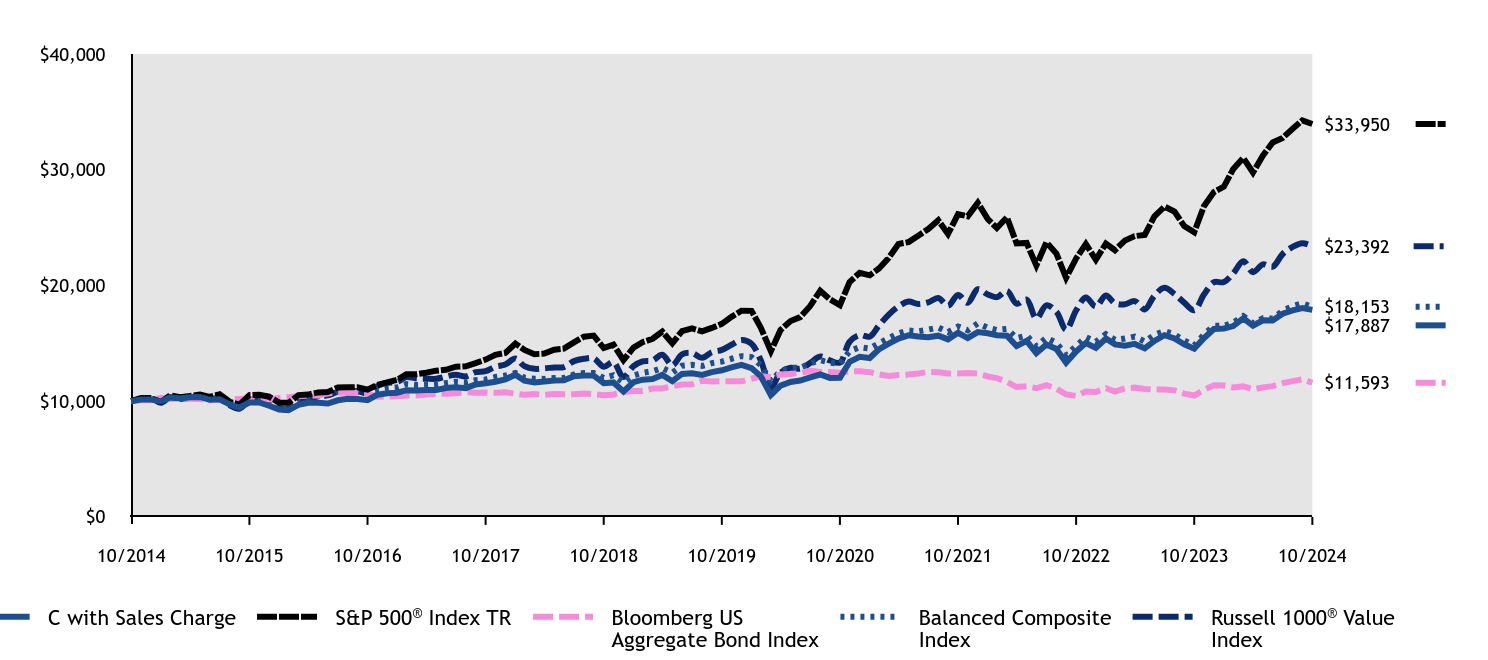
| C with Sales Charge | S&P 500® Index TR | Bloomberg US Aggregate Bond Index | Balanced Composite Index | Russell 1000® Value Index |
|---|
| 10/2014 | $10,000 | $10,000 | $10,000 | $10,000 | $10,000 |
| 11/2014 | $10,149 | $10,269 | $10,071 | $10,151 | $10,205 |
| 12/2014 | $10,134 | $10,243 | $10,080 | $10,192 | $10,267 |
| 01/2015 | $9,984 | $9,936 | $10,292 | $10,033 | $9,857 |
| 02/2015 | $10,324 | $10,507 | $10,195 | $10,287 | $10,334 |
| 03/2015 | $10,236 | $10,340 | $10,242 | $10,222 | $10,193 |
| 04/2015 | $10,343 | $10,440 | $10,206 | $10,265 | $10,289 |
| 05/2015 | $10,363 | $10,574 | $10,181 | $10,329 | $10,412 |
| 06/2015 | $10,131 | $10,369 | $10,070 | $10,160 | $10,204 |
| 07/2015 | $10,163 | $10,586 | $10,140 | $10,215 | $10,249 |
| 08/2015 | $9,719 | $9,948 | $10,125 | $9,844 | $9,639 |
| 09/2015 | $9,452 | $9,702 | $10,194 | $9,692 | $9,348 |
| 10/2015 | $9,885 | $10,520 | $10,196 | $10,132 | $10,053 |
| 11/2015 | $9,885 | $10,551 | $10,169 | $10,144 | $10,091 |
| 12/2015 | $9,605 | $10,385 | $10,136 | $10,000 | $9,874 |
| 01/2016 | $9,286 | $9,869 | $10,275 | $9,745 | $9,364 |
| 02/2016 | $9,228 | $9,856 | $10,348 | $9,772 | $9,362 |
| 03/2016 | $9,684 | $10,525 | $10,443 | $10,230 | $10,036 |
| 04/2016 | $9,866 | $10,566 | $10,483 | $10,374 | $10,247 |
| 05/2016 | $9,859 | $10,755 | $10,486 | $10,472 | $10,406 |
| 06/2016 | $9,793 | $10,783 | $10,674 | $10,602 | $10,496 |
| 07/2016 | $10,074 | $11,181 | $10,742 | $10,813 | $10,801 |
| 08/2016 | $10,198 | $11,196 | $10,729 | $10,858 | $10,884 |
| 09/2016 | $10,184 | $11,199 | $10,723 | $10,842 | $10,861 |
| 10/2016 | $10,087 | $10,994 | $10,641 | $10,708 | $10,693 |
| 11/2016 | $10,553 | $11,401 | $10,389 | $10,974 | $11,304 |
| 12/2016 | $10,675 | $11,627 | $10,404 | $11,145 | $11,587 |
| 01/2017 | $10,726 | $11,847 | $10,425 | $11,201 | $11,669 |
| 02/2017 | $10,945 | $12,318 | $10,495 | $11,473 | $12,089 |
| 03/2017 | $10,923 | $12,332 | $10,489 | $11,400 | $11,965 |
| 04/2017 | $10,957 | $12,459 | $10,570 | $11,423 | $11,943 |
| 05/2017 | $10,971 | $12,634 | $10,651 | $11,451 | $11,931 |
| 06/2017 | $11,133 | $12,713 | $10,641 | $11,559 | $12,126 |
| 07/2017 | $11,205 | $12,974 | $10,686 | $11,671 | $12,287 |
| 08/2017 | $11,124 | $13,014 | $10,782 | $11,631 | $12,144 |
| 09/2017 | $11,448 | $13,283 | $10,731 | $11,816 | $12,504 |
| 10/2017 | $11,549 | $13,593 | $10,737 | $11,870 | $12,595 |
| 11/2017 | $11,682 | $14,009 | $10,723 | $12,082 | $12,980 |
| 12/2017 | $11,885 | $14,165 | $10,773 | $12,210 | $13,170 |
| 01/2018 | $12,286 | $14,976 | $10,649 | $12,437 | $13,679 |
| 02/2018 | $11,767 | $14,424 | $10,548 | $12,033 | $13,026 |
| 03/2018 | $11,617 | $14,058 | $10,615 | $11,937 | $12,797 |
| 04/2018 | $11,702 | $14,112 | $10,536 | $11,925 | $12,839 |
| 05/2018 | $11,781 | $14,451 | $10,612 | $12,002 | $12,915 |
| 06/2018 | $11,813 | $14,540 | $10,598 | $12,014 | $12,947 |
| 07/2018 | $12,159 | $15,081 | $10,601 | $12,300 | $13,460 |
| 08/2018 | $12,223 | $15,573 | $10,669 | $12,441 | $13,659 |
| 09/2018 | $12,207 | $15,662 | $10,600 | $12,424 | $13,686 |
| 10/2018 | $11,554 | $14,591 | $10,517 | $11,999 | $12,977 |
| 11/2018 | $11,618 | $14,888 | $10,580 | $12,242 | $13,364 |
| 12/2018 | $10,842 | $13,544 | $10,774 | $11,627 | $12,081 |
| 01/2019 | $11,638 | $14,629 | $10,888 | $12,219 | $13,021 |
| 02/2019 | $11,855 | $15,099 | $10,882 | $12,451 | $13,437 |
| 03/2019 | $11,915 | $15,393 | $11,091 | $12,594 | $13,523 |
| 04/2019 | $12,262 | $16,016 | $11,094 | $12,863 | $14,003 |
| 05/2019 | $11,723 | $14,998 | $11,291 | $12,458 | $13,102 |
| 06/2019 | $12,349 | $16,055 | $11,432 | $13,057 | $14,043 |
| 07/2019 | $12,401 | $16,286 | $11,458 | $13,134 | $14,159 |
| 08/2019 | $12,261 | $16,028 | $11,755 | $13,038 | $13,743 |
| 09/2019 | $12,505 | $16,328 | $11,692 | $13,289 | $14,233 |
| 10/2019 | $12,667 | $16,681 | $11,727 | $13,417 | $14,432 |
| 11/2019 | $12,921 | $17,287 | $11,721 | $13,663 | $14,878 |
| 12/2019 | $13,130 | $17,809 | $11,713 | $13,885 | $15,288 |
| 01/2020 | $12,855 | $17,802 | $11,938 | $13,812 | $14,959 |
| 02/2020 | $12,143 | $16,336 | $12,153 | $13,109 | $13,510 |
| 03/2020 | $10,531 | $14,319 | $12,082 | $11,734 | $11,201 |
| 04/2020 | $11,339 | $16,154 | $12,297 | $12,609 | $12,460 |
| 05/2020 | $11,662 | $16,923 | $12,354 | $12,892 | $12,887 |
| 06/2020 | $11,777 | $17,260 | $12,432 | $12,873 | $12,802 |
| 07/2020 | $12,057 | $18,233 | $12,617 | $13,255 | $13,308 |
| 08/2020 | $12,304 | $19,544 | $12,515 | $13,541 | $13,858 |
| 09/2020 | $12,009 | $18,801 | $12,509 | $13,339 | $13,518 |
| 10/2020 | $12,022 | $18,301 | $12,453 | $13,210 | $13,340 |
| 11/2020 | $13,394 | $20,305 | $12,575 | $14,328 | $15,135 |
| 12/2020 | $13,826 | $21,085 | $12,592 | $14,665 | $15,715 |
| 01/2021 | $13,728 | $20,872 | $12,502 | $14,543 | $15,571 |
| 02/2021 | $14,468 | $21,448 | $12,321 | $14,986 | $16,512 |
| 03/2021 | $14,968 | $22,387 | $12,168 | $15,440 | $17,484 |
| 04/2021 | $15,405 | $23,582 | $12,264 | $15,859 | $18,183 |
| 05/2021 | $15,688 | $23,747 | $12,304 | $16,102 | $18,607 |
| 06/2021 | $15,579 | $24,301 | $12,390 | $16,037 | $18,394 |
| 07/2021 | $15,525 | $24,878 | $12,529 | $16,186 | $18,541 |
| 08/2021 | $15,656 | $25,635 | $12,505 | $16,366 | $18,909 |
| 09/2021 | $15,340 | $24,443 | $12,397 | $15,967 | $18,251 |
| 10/2021 | $15,907 | $26,155 | $12,393 | $16,452 | $19,178 |
| 11/2021 | $15,446 | $25,974 | $12,430 | $16,124 | $18,502 |
| 12/2021 | $15,967 | $27,138 | $12,398 | $16,718 | $19,669 |
| 01/2022 | $15,871 | $25,734 | $12,131 | $16,340 | $19,211 |
| 02/2022 | $15,691 | $24,963 | $11,996 | $16,153 | $18,988 |
| 03/2022 | $15,655 | $25,890 | $11,662 | $16,247 | $19,524 |
| 04/2022 | $14,760 | $23,632 | $11,220 | $15,451 | $18,423 |
| 05/2022 | $15,215 | $23,676 | $11,292 | $15,671 | $18,781 |
| 06/2022 | $14,137 | $21,721 | $11,115 | $14,751 | $17,140 |
| 07/2022 | $14,889 | $23,724 | $11,387 | $15,482 | $18,276 |
| 08/2022 | $14,505 | $22,757 | $11,065 | $15,030 | $17,732 |
| 09/2022 | $13,328 | $20,661 | $10,587 | $13,980 | $16,177 |
| 10/2022 | $14,299 | $22,333 | $10,450 | $14,767 | $17,836 |
| 11/2022 | $15,022 | $23,582 | $10,834 | $15,538 | $18,950 |
| 12/2022 | $14,599 | $22,223 | $10,785 | $15,134 | $18,186 |
| 01/2023 | $15,414 | $23,619 | $11,117 | $15,791 | $19,129 |
| 02/2023 | $14,906 | $23,043 | $10,829 | $15,294 | $18,454 |
| 03/2023 | $14,799 | $23,889 | $11,105 | $15,407 | $18,369 |
| 04/2023 | $14,948 | $24,262 | $11,172 | $15,584 | $18,646 |
| 05/2023 | $14,560 | $24,367 | $11,050 | $15,155 | $17,927 |
| 06/2023 | $15,203 | $25,977 | $11,011 | $15,737 | $19,118 |
| 07/2023 | $15,701 | $26,812 | $11,003 | $16,065 | $19,790 |
| 08/2023 | $15,419 | $26,385 | $10,933 | $15,764 | $19,256 |
| 09/2023 | $14,921 | $25,127 | $10,655 | $15,239 | $18,513 |
| 10/2023 | $14,539 | $24,599 | $10,487 | $14,820 | $17,860 |
| 11/2023 | $15,443 | $26,845 | $10,962 | $15,759 | $19,207 |
| 12/2023 | $16,233 | $28,065 | $11,381 | $16,524 | $20,271 |
| 01/2024 | $16,287 | $28,536 | $11,350 | $16,516 | $20,292 |
| 02/2024 | $16,491 | $30,060 | $11,190 | $16,789 | $21,041 |
| 03/2024 | $17,157 | $31,027 | $11,293 | $17,354 | $22,092 |
| 04/2024 | $16,526 | $29,760 | $11,008 | $16,734 | $21,149 |
| 05/2024 | $16,989 | $31,236 | $11,194 | $17,166 | $21,819 |
| 06/2024 | $16,975 | $32,356 | $11,300 | $17,134 | $21,614 |
| 07/2024 | $17,554 | $32,750 | $11,564 | $17,820 | $22,719 |
| 08/2024 | $17,841 | $33,545 | $11,731 | $18,209 | $23,328 |
| 09/2024 | $18,046 | $34,261 | $11,888 | $18,458 | $23,652 |
| 10/2024 | $17,887 | $33,950 | $11,593 | $18,153 | $23,392 |
Average Annual Total Returns (%)
| HEADER | 1 Year | 5 Years | 10 Years |
|---|
Class C without Deferred Sales ChargeFootnote Reference1 | 23.03% | 7.15% | 5.99% |
Class C with Maximum Deferred Sales Charge -1.00%Footnote Reference1 | 22.03% | 7.15% | 5.99% |
S&P 500® Index TR | 38.02% | 15.27% | 13.00% |
| Bloomberg US Aggregate Bond Index | 10.55% | (0.23)% | 1.49% |
| Balanced Composite Index | 22.49% | 6.23% | 6.14% |
Russell 1000® Value Index | 30.98% | 10.14% | 8.87% |
| Footnote | Description |
Footnote1 | Return may differ from actual shareholder return due to accounting adjustments for financial reporting purposes. |
Performance shown is historical and is not indicative of future returns. Investment returns and principal value will vary, and shares may be worth more or less at redemption than at original purchase. Performance shown is as of date indicated, and current performance may be lower or higher than the performance data quoted. To obtain performance as of the most recent month end, please visit americanbeaconfunds.com or call 800-967-9009. The graph and table do not reflect the deduction of taxes that a shareholder would pay on fund distributions or redemption of fund shares. The Fund's performance benefited from fee waivers. For more information, visit americanbeaconfunds.com/Performance_Disclaimers.aspx.
The S&P 500 Index TR and Bloomberg US Aggregate Bond Index are replacing the Balanced Composite Index and the Russell 1000® Value Index as the broad-based securities market indices to comply with a new regulatory requirement. The Balanced Composite Index reflects the market sectors in which the Fund invests.
| Total Net Assets | $114,132,015 |
| # of Portfolio Holdings | 398 |
| Portfolio Turnover Rate | 38% |
| Total Management Fees Paid | $585,364 |
Asset Allocation - % Investments
| Value | Value |
|---|
| Common Stocks | 55.4 |
| Corporate Obligations | 11.6 |
| U.S. Agency Mortgage-Backed Obligations | 10.1 |
| U.S. Treasury Obligations | 9.8 |
| Foreign Common Stocks | 4.4 |
| Foreign Corporate Obligations | 3.6 |
| Investment Companies | 2.1 |
| Asset-Backed Obligations | 1.0 |
| U.S. Government Agency Obligations | 0.8 |
| Foreign Sovereign Obligations | 0.6 |
| Securities Lending Collateral | 0.3 |
| Commercial Mortgage-Backed Obligations | 0.3 |
The Fund may purchase and sell futures contracts to gain market exposure on cash balances.
What did the Fund invest in?
Top Ten Holdings - % Net Assets
| Fidelity National Information Services, Inc. | 1.6 |
| Comcast Corp., Class A | 1.4 |
| Wells Fargo & Co. | 1.3 |
| Entergy Corp. | 1.2 |
| Bank of America Corp. | 1.2 |
| Citigroup, Inc. | 1.2 |
| F5, Inc. | 1.2 |
| Carnival Corp. | 1.2 |
| Elevance Health, Inc. | 1.1 |
| Air Products & Chemicals, Inc. | 1.1 |
Excludes cash equivalents.
Sector Allocation - % Equities
| Value | Value |
|---|
| Real Estate | 2.1 |
| Consumer Staples | 4.9 |
| Materials | 5.0 |
| Communication Services | 6.0 |
| Utilities | 6.1 |
| Consumer Discretionary | 9.8 |
| Industrials | 10.2 |
| Information Technology | 10.7 |
| Energy | 11.8 |
| Health Care | 13.1 |
| Financials | 20.3 |
Top Ten Industry Allocations - % Fixed Income
| Value | Value |
|---|
| Beverages | 1.9 |
| U.S. Government Agency Obligations | 2.1 |
| Pharmaceuticals | 2.6 |
| Asset-Backed Obligations | 2.6 |
| Insurance | 3.0 |
| Computers | 3.3 |
| Banks | 5.4 |
| Electric | 5.8 |
| U.S. Treasury Obligations | 26.0 |
| U.S. Agency Mortgage-Backed Obligations | 26.8 |
For additional information about the Fund, including its prospectus, financial statements, holdings, and proxy voting information, please visit www.americanbeaconfunds.com/literature or call 1-800-658-5811.
If your financial institution mailed only one copy of this Report to an address shared by more than one account, you can request an individual copy by contacting your financial institution.
Distributed by:
Resolute Investment Distributors, Inc.
Annual Shareholder Report - October 31, 2024
Annual Shareholder Report - October 31, 2024
This annual shareholder report contains important information about American Beacon Large Cap Value Fund for the period of November 1, 2023 to October 31, 2024. You can find additional information about the Fund at www.americanbeaconfunds.com/literature. You can also request this information by contacting us at 800-658-5811.
What were the Fund costs for the last year?
(based on a hypothetical $10,000 investment)
| Class Name | Costs of a $10,000 investment | Costs paid as a percentage of a $10,000 investment |
|---|
| R5 | $75 | 0.65% |
How did the Fund perform and what affected its performance?
The R5 Class of the Fund returned 31.97% for the twelve months ended October 31, 2024, compared to the S&P 500® Index TR return of 38.02% and the Russell 1000® Value Index return of 30.98%.
• Broad market performance during the twelve-month period benefited from the loosening of monetary policy as inflation eased, coinciding with the increased prospect of a soft landing.
• The Fund’s strategy of selecting undervalued securities through a bottom-up approach provided strong returns during the period.
• The Fund's holdings in the Information Technology and Financials sectors contributed materially to the Fund's performance, while holdings in the Energy sector detracted from the Fund’s performance over the period.
Cumulative Performance from October 31, 2014 through October 31, 2024
The initial investment, based on a $250,000 investment, is adjusted to reflect the maximum applicable sales charge, if any.
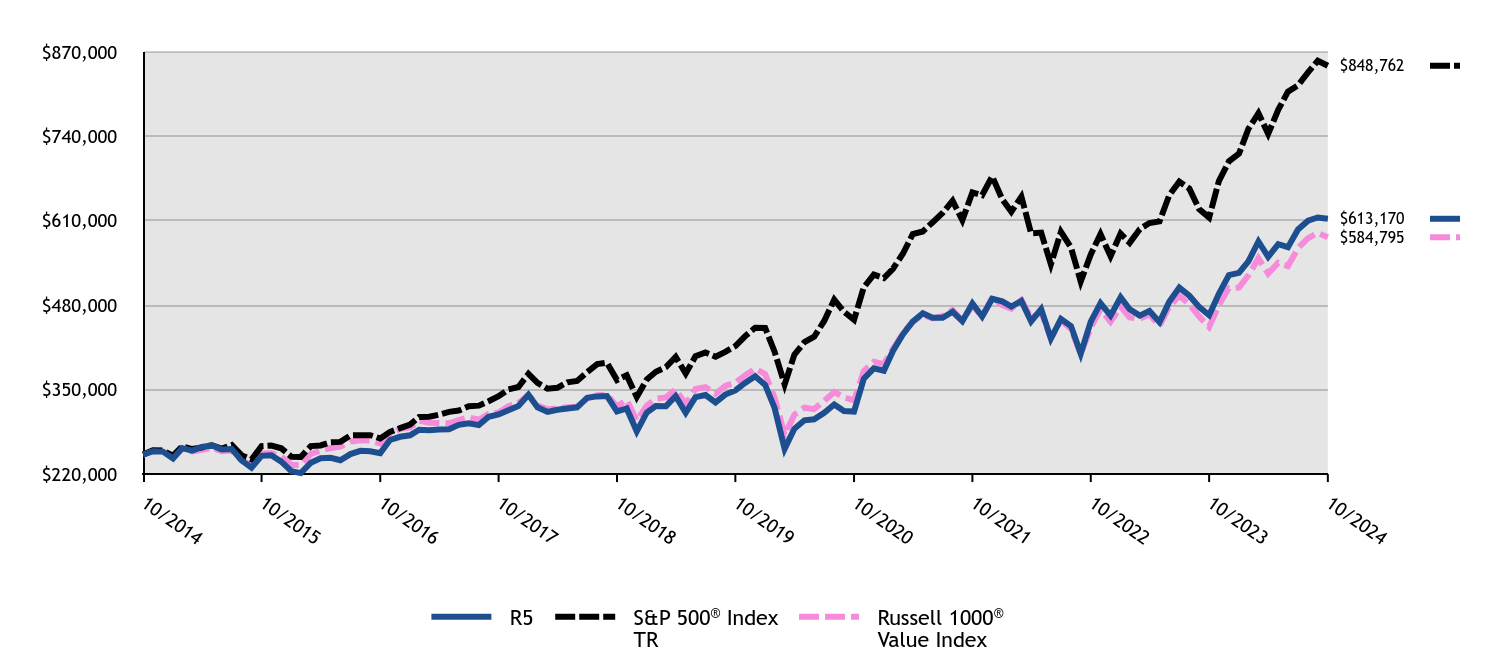
| R5 | S&P 500® Index TR | Russell 1000® Value Index |
|---|
| 10/2014 | $250,000 | $250,000 | $250,000 |
| 11/2014 | $255,207 | $256,724 | $255,119 |
| 12/2014 | $254,587 | $256,077 | $256,684 |
| 01/2015 | $244,008 | $248,389 | $246,423 |
| 02/2015 | $259,920 | $262,665 | $258,348 |
| 03/2015 | $256,073 | $258,511 | $254,831 |
| 04/2015 | $261,756 | $260,991 | $257,213 |
| 05/2015 | $264,116 | $264,347 | $260,304 |
| 06/2015 | $257,821 | $259,230 | $255,107 |
| 07/2015 | $258,521 | $264,661 | $256,225 |
| 08/2015 | $240,686 | $248,693 | $240,965 |
| 09/2015 | $229,932 | $242,539 | $233,691 |
| 10/2015 | $248,117 | $262,999 | $251,323 |
| 11/2015 | $248,991 | $263,781 | $252,285 |
| 12/2015 | $239,208 | $259,620 | $246,860 |
| 01/2016 | $224,539 | $246,737 | $234,104 |
| 02/2016 | $221,507 | $246,404 | $234,045 |
| 03/2016 | $237,545 | $263,120 | $250,904 |
| 04/2016 | $244,293 | $264,140 | $256,175 |
| 05/2016 | $245,076 | $268,883 | $260,154 |
| 06/2016 | $241,359 | $269,580 | $262,403 |
| 07/2016 | $250,748 | $279,519 | $270,022 |
| 08/2016 | $255,735 | $279,912 | $272,104 |
| 09/2016 | $255,246 | $279,964 | $271,537 |
| 10/2016 | $252,313 | $274,857 | $267,335 |
| 11/2016 | $272,458 | $285,037 | $282,603 |
| 12/2016 | $277,432 | $290,671 | $289,666 |
| 01/2017 | $279,646 | $296,184 | $291,730 |
| 02/2017 | $288,303 | $307,944 | $302,213 |
| 03/2017 | $287,599 | $308,303 | $299,134 |
| 04/2017 | $288,505 | $311,470 | $298,573 |
| 05/2017 | $288,907 | $315,853 | $298,280 |
| 06/2017 | $295,853 | $317,824 | $303,156 |
| 07/2017 | $298,370 | $324,360 | $307,185 |
| 08/2017 | $295,350 | $325,353 | $303,607 |
| 09/2017 | $308,134 | $332,064 | $312,599 |
| 10/2017 | $311,859 | $339,813 | $314,869 |
| 11/2017 | $318,301 | $350,235 | $324,511 |
| 12/2017 | $324,808 | $354,129 | $329,248 |
| 01/2018 | $342,191 | $374,404 | $341,977 |
| 02/2018 | $322,914 | $360,605 | $325,647 |
| 03/2018 | $315,782 | $351,441 | $319,919 |
| 04/2018 | $319,014 | $352,789 | $320,975 |
| 05/2018 | $321,131 | $361,285 | $322,880 |
| 06/2018 | $322,802 | $363,509 | $323,680 |
| 07/2018 | $337,511 | $377,036 | $336,491 |
| 08/2018 | $339,628 | $389,322 | $341,464 |
| 09/2018 | $340,296 | $391,538 | $342,142 |
| 10/2018 | $316,562 | $364,776 | $324,425 |
| 11/2018 | $321,020 | $372,210 | $334,111 |
| 12/2018 | $285,874 | $338,603 | $302,028 |
| 01/2019 | $314,930 | $365,737 | $325,536 |
| 02/2019 | $324,656 | $377,480 | $335,937 |
| 03/2019 | $324,533 | $384,815 | $338,073 |
| 04/2019 | $340,045 | $400,396 | $350,065 |
| 05/2019 | $314,437 | $374,952 | $327,557 |
| 06/2019 | $338,445 | $401,377 | $351,070 |
| 07/2019 | $341,769 | $407,146 | $353,980 |
| 08/2019 | $330,442 | $400,696 | $343,572 |
| 09/2019 | $342,384 | $408,193 | $355,829 |
| 10/2019 | $348,786 | $417,035 | $360,803 |
| 11/2019 | $360,359 | $432,173 | $371,958 |
| 12/2019 | $370,683 | $445,216 | $382,190 |
| 01/2020 | $357,280 | $445,042 | $373,968 |
| 02/2020 | $321,809 | $408,406 | $337,751 |
| 03/2020 | $258,855 | $357,963 | $280,031 |
| 04/2020 | $289,723 | $403,852 | $311,512 |
| 05/2020 | $302,855 | $423,086 | $322,187 |
| 06/2020 | $304,345 | $431,500 | $320,049 |
| 07/2020 | $314,499 | $455,830 | $332,702 |
| 08/2020 | $327,225 | $488,596 | $346,459 |
| 09/2020 | $317,206 | $470,031 | $337,949 |
| 10/2020 | $316,259 | $457,531 | $333,507 |
| 11/2020 | $366,757 | $507,614 | $378,368 |
| 12/2020 | $382,783 | $527,131 | $392,875 |
| 01/2021 | $379,202 | $521,809 | $389,277 |
| 02/2021 | $409,569 | $536,198 | $412,802 |
| 03/2021 | $435,420 | $559,681 | $437,093 |
| 04/2021 | $454,731 | $589,551 | $454,573 |
| 05/2021 | $467,656 | $593,668 | $465,185 |
| 06/2021 | $460,648 | $607,527 | $459,857 |
| 07/2021 | $460,804 | $621,959 | $463,533 |
| 08/2021 | $469,992 | $640,870 | $472,725 |
| 09/2021 | $455,509 | $611,063 | $456,271 |
| 10/2021 | $482,606 | $653,876 | $479,439 |
| 11/2021 | $462,673 | $649,345 | $462,544 |
| 12/2021 | $489,891 | $678,446 | $491,724 |
| 01/2022 | $486,073 | $643,338 | $480,270 |
| 02/2022 | $477,917 | $624,076 | $474,696 |
| 03/2022 | $486,767 | $647,248 | $488,097 |
| 04/2022 | $455,010 | $590,806 | $460,566 |
| 05/2022 | $474,099 | $591,890 | $469,519 |
| 06/2022 | $428,633 | $543,033 | $428,496 |
| 07/2022 | $458,828 | $593,104 | $456,911 |
| 08/2022 | $447,895 | $568,916 | $443,297 |
| 09/2022 | $405,379 | $516,519 | $404,426 |
| 10/2022 | $454,837 | $558,337 | $445,892 |
| 11/2022 | $483,296 | $589,540 | $473,756 |
| 12/2022 | $464,060 | $555,574 | $454,658 |
| 01/2023 | $492,227 | $590,482 | $478,219 |
| 02/2023 | $473,773 | $576,075 | $461,357 |
| 03/2023 | $464,060 | $597,225 | $459,233 |
| 04/2023 | $471,248 | $606,547 | $466,152 |
| 05/2023 | $453,960 | $609,184 | $448,173 |
| 06/2023 | $485,234 | $649,436 | $477,944 |
| 07/2023 | $507,184 | $670,299 | $494,751 |
| 08/2023 | $494,752 | $659,627 | $481,395 |
| 09/2023 | $477,464 | $628,177 | $462,818 |
| 10/2023 | $464,643 | $614,969 | $446,489 |
| 11/2023 | $497,666 | $671,131 | $480,176 |
| 12/2023 | $526,422 | $701,621 | $506,774 |
| 01/2024 | $529,900 | $713,411 | $507,299 |
| 02/2024 | $547,700 | $751,504 | $526,013 |
| 03/2024 | $578,184 | $775,683 | $552,311 |
| 04/2024 | $554,656 | $744,001 | $528,719 |
| 05/2024 | $574,092 | $780,892 | $545,479 |
| 06/2024 | $569,387 | $808,912 | $540,348 |
| 07/2024 | $596,598 | $818,758 | $567,972 |
| 08/2024 | $610,306 | $838,619 | $583,208 |
| 09/2024 | $615,216 | $856,529 | $591,302 |
| 10/2024 | $613,170 | $848,762 | $584,795 |
Average Annual Total Returns (%)
| HEADER | 1 Year | 5 Years | 10 Years |
|---|
Class R5Footnote Reference1 | 31.97% | 11.94% | 9.39% |
S&P 500® Index TR | 38.02% | 15.27% | 13.00% |
Russell 1000® Value Index | 30.98% | 10.14% | 8.87% |
| Footnote | Description |
Footnote1 | Return may differ from actual shareholder return due to accounting adjustments for financial reporting purposes. |
Performance shown is historical and is not indicative of future returns. Investment returns and principal value will vary, and shares may be worth more or less at redemption than at original purchase. Performance shown is as of date indicated, and current performance may be lower or higher than the performance data quoted. To obtain performance as of the most recent month end, please visit americanbeaconfunds.com or call 800-967-9009. The graph and table do not reflect the deduction of taxes that a shareholder would pay on fund distributions or redemption of fund shares.
The S&P 500 Index TR is replacing the Russell 1000 Value Index as the broad-based securities market index to comply with a new regulatory requirement. The Russell 1000 Value Index reflects the market sectors in which the Fund invests.
| Total Net Assets | $3,483,740,480 |
| # of Portfolio Holdings | 170 |
| Portfolio Turnover Rate | 26% |
| Total Management Fees Paid | $18,952,178 |
What did the Fund invest in?
Top Ten Holdings - % Net Assets
| Citigroup, Inc. | 1.8 |
| Fidelity National Information Services, Inc. | 1.8 |
| Comcast Corp., Class A | 1.8 |
| Elevance Health, Inc. | 1.6 |
| JPMorgan Chase & Co. | 1.5 |
| Exxon Mobil Corp. | 1.5 |
| Wells Fargo & Co. | 1.4 |
| American Express Co. | 1.3 |
| Entergy Corp. | 1.3 |
| F5, Inc. | 1.3 |
Excludes cash equivalents.
Asset Allocation - % Investments
| Value | Value |
|---|
| Common Stocks | 89.8 |
| Foreign Common Stocks | 6.2 |
| Investment Companies | 3.9 |
| Securities Lending Collateral | 0.1 |
The Fund may purchase and sell futures contracts to gain market exposure on cash balances.
Sector Allocation - % Equities
| Value | Value |
|---|
| Real Estate | 2.0 |
| Materials | 4.1 |
| Communication Services | 4.3 |
| Consumer Staples | 6.0 |
| Utilities | 6.9 |
| Consumer Discretionary | 7.6 |
| Information Technology | 9.8 |
| Energy | 9.9 |
| Industrials | 12.4 |
| Health Care | 13.6 |
| Financials | 23.4 |
For additional information about the Fund, including its prospectus, financial statements, holdings, and proxy voting information, please visit www.americanbeaconfunds.com/literature or call 1-800-658-5811.
If your financial institution mailed only one copy of this Report to an address shared by more than one account, you can request an individual copy by contacting your financial institution.
Distributed by:
Resolute Investment Distributors, Inc.
Annual Shareholder Report - October 31, 2024
Annual Shareholder Report - October 31, 2024
This annual shareholder report contains important information about American Beacon Large Cap Value Fund for the period of November 1, 2023 to October 31, 2024. You can find additional information about the Fund at www.americanbeaconfunds.com/literature. You can also request this information by contacting us at 800-658-5811.
What were the Fund costs for the last year?
(based on a hypothetical $10,000 investment)
| Class Name | Costs of a $10,000 investment | Costs paid as a percentage of a $10,000 investment |
|---|
| Investor | $109 | 0.94% |
How did the Fund perform and what affected its performance?
The Investor Class of the Fund returned 31.54% for the twelve months ended October 31, 2024, compared to the S&P 500® Index TR return of 38.02% and the Russell 1000® Value Index return of 30.98%.
• Broad market performance during the twelve-month period benefited from the loosening of monetary policy as inflation eased, coinciding with the increased prospect of a soft landing.
• The Fund’s strategy of selecting undervalued securities through a bottom-up approach provided strong returns during the period.
• The Fund's holdings in the Information Technology and Financials sectors contributed materially to the Fund's performance, while holdings in the Energy sector detracted from the Fund’s performance over the period.
Cumulative Performance from October 31, 2014 through October 31, 2024
The initial investment, based on a $10,000 investment, is adjusted to reflect the maximum applicable sales charge, if any.
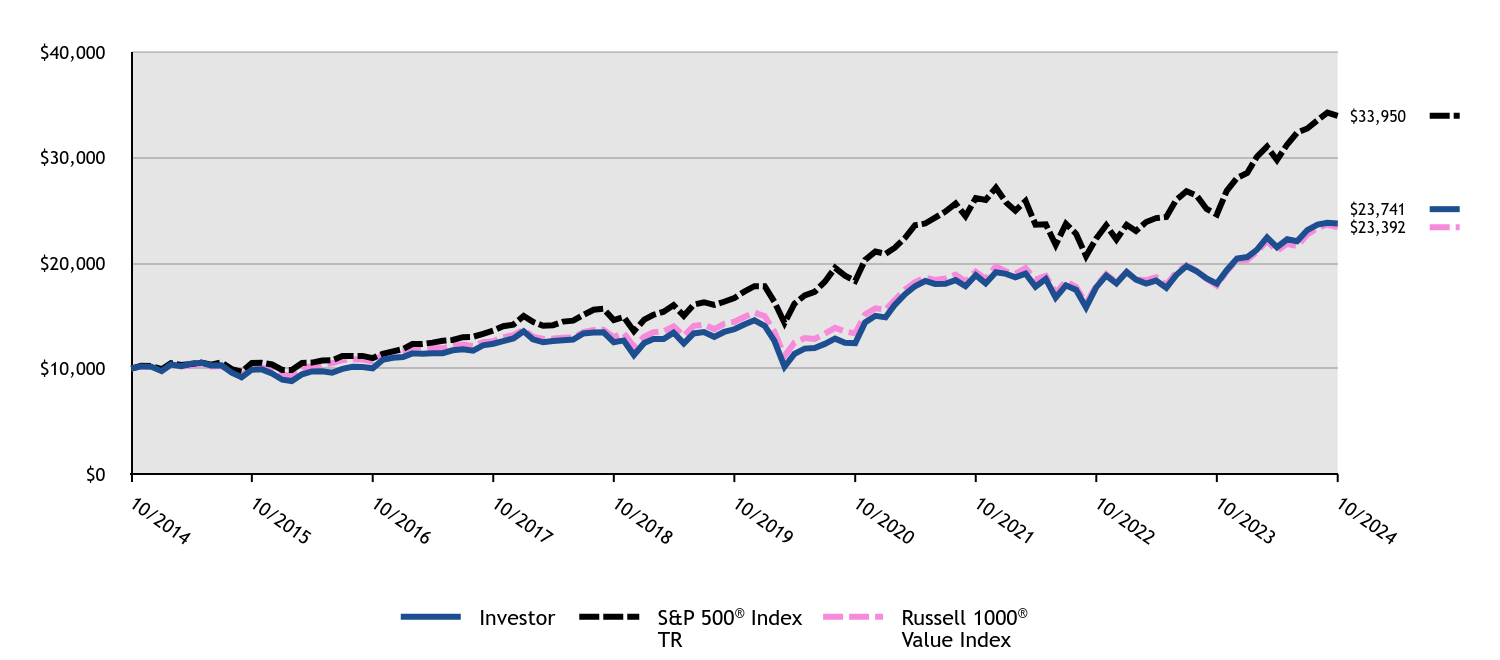
| Investor | S&P 500® Index TR | Russell 1000® Value Index |
|---|
| 10/2014 | $10,000 | $10,000 | $10,000 |
| 11/2014 | $10,203 | $10,269 | $10,205 |
| 12/2014 | $10,178 | $10,243 | $10,267 |
| 01/2015 | $9,752 | $9,936 | $9,857 |
| 02/2015 | $10,386 | $10,507 | $10,334 |
| 03/2015 | $10,227 | $10,340 | $10,193 |
| 04/2015 | $10,453 | $10,440 | $10,289 |
| 05/2015 | $10,542 | $10,574 | $10,412 |
| 06/2015 | $10,290 | $10,369 | $10,204 |
| 07/2015 | $10,316 | $10,586 | $10,249 |
| 08/2015 | $9,600 | $9,948 | $9,639 |
| 09/2015 | $9,171 | $9,702 | $9,348 |
| 10/2015 | $9,893 | $10,520 | $10,053 |
| 11/2015 | $9,923 | $10,551 | $10,091 |
| 12/2015 | $9,530 | $10,385 | $9,874 |
| 01/2016 | $8,944 | $9,869 | $9,364 |
| 02/2016 | $8,820 | $9,856 | $9,362 |
| 03/2016 | $9,455 | $10,525 | $10,036 |
| 04/2016 | $9,725 | $10,566 | $10,247 |
| 05/2016 | $9,750 | $10,755 | $10,406 |
| 06/2016 | $9,601 | $10,783 | $10,496 |
| 07/2016 | $9,970 | $11,181 | $10,801 |
| 08/2016 | $10,166 | $11,196 | $10,884 |
| 09/2016 | $10,141 | $11,199 | $10,861 |
| 10/2016 | $10,024 | $10,994 | $10,693 |
| 11/2016 | $10,822 | $11,401 | $11,304 |
| 12/2016 | $11,018 | $11,627 | $11,587 |
| 01/2017 | $11,099 | $11,847 | $11,669 |
| 02/2017 | $11,441 | $12,318 | $12,089 |
| 03/2017 | $11,411 | $12,332 | $11,965 |
| 04/2017 | $11,445 | $12,459 | $11,943 |
| 05/2017 | $11,458 | $12,634 | $11,931 |
| 06/2017 | $11,731 | $12,713 | $12,126 |
| 07/2017 | $11,829 | $12,974 | $12,287 |
| 08/2017 | $11,701 | $13,014 | $12,144 |
| 09/2017 | $12,205 | $13,283 | $12,504 |
| 10/2017 | $12,350 | $13,593 | $12,595 |
| 11/2017 | $12,602 | $14,009 | $12,980 |
| 12/2017 | $12,856 | $14,165 | $13,170 |
| 01/2018 | $13,540 | $14,976 | $13,679 |
| 02/2018 | $12,776 | $14,424 | $13,026 |
| 03/2018 | $12,491 | $14,058 | $12,797 |
| 04/2018 | $12,614 | $14,112 | $12,839 |
| 05/2018 | $12,690 | $14,451 | $12,915 |
| 06/2018 | $12,757 | $14,540 | $12,947 |
| 07/2018 | $13,331 | $15,081 | $13,460 |
| 08/2018 | $13,412 | $15,573 | $13,659 |
| 09/2018 | $13,435 | $15,662 | $13,686 |
| 10/2018 | $12,496 | $14,591 | $12,977 |
| 11/2018 | $12,666 | $14,888 | $13,364 |
| 12/2018 | $11,280 | $13,544 | $12,081 |
| 01/2019 | $12,417 | $14,629 | $13,021 |
| 02/2019 | $12,801 | $15,099 | $13,437 |
| 03/2019 | $12,790 | $15,393 | $13,523 |
| 04/2019 | $13,401 | $16,016 | $14,003 |
| 05/2019 | $12,385 | $14,998 | $13,102 |
| 06/2019 | $13,327 | $16,055 | $14,043 |
| 07/2019 | $13,454 | $16,286 | $14,159 |
| 08/2019 | $13,006 | $16,028 | $13,743 |
| 09/2019 | $13,469 | $16,328 | $14,233 |
| 10/2019 | $13,722 | $16,681 | $14,432 |
| 11/2019 | $14,169 | $17,287 | $14,878 |
| 12/2019 | $14,571 | $17,809 | $15,288 |
| 01/2020 | $14,041 | $17,802 | $14,959 |
| 02/2020 | $12,645 | $16,336 | $13,510 |
| 03/2020 | $10,173 | $14,319 | $11,201 |
| 04/2020 | $11,383 | $16,154 | $12,460 |
| 05/2020 | $11,889 | $16,923 | $12,887 |
| 06/2020 | $11,947 | $17,260 | $12,802 |
| 07/2020 | $12,337 | $18,233 | $13,308 |
| 08/2020 | $12,837 | $19,544 | $13,858 |
| 09/2020 | $12,442 | $18,801 | $13,518 |
| 10/2020 | $12,401 | $18,301 | $13,340 |
| 11/2020 | $14,379 | $20,305 | $15,135 |
| 12/2020 | $14,999 | $21,085 | $15,715 |
| 01/2021 | $14,851 | $20,872 | $15,571 |
| 02/2021 | $16,041 | $21,448 | $16,512 |
| 03/2021 | $17,049 | $22,387 | $17,484 |
| 04/2021 | $17,799 | $23,582 | $18,183 |
| 05/2021 | $18,300 | $23,747 | $18,607 |
| 06/2021 | $18,022 | $24,301 | $18,394 |
| 07/2021 | $18,029 | $24,878 | $18,541 |
| 08/2021 | $18,381 | $25,635 | $18,909 |
| 09/2021 | $17,806 | $24,443 | $18,251 |
| 10/2021 | $18,854 | $26,155 | $19,178 |
| 11/2021 | $18,070 | $25,974 | $18,502 |
| 12/2021 | $19,130 | $27,138 | $19,669 |
| 01/2022 | $18,978 | $25,734 | $19,211 |
| 02/2022 | $18,651 | $24,963 | $18,988 |
| 03/2022 | $18,993 | $25,890 | $19,524 |
| 04/2022 | $17,754 | $23,632 | $18,423 |
| 05/2022 | $18,491 | $23,676 | $18,781 |
| 06/2022 | $16,712 | $21,721 | $17,140 |
| 07/2022 | $17,883 | $23,724 | $18,276 |
| 08/2022 | $17,450 | $22,757 | $17,732 |
| 09/2022 | $15,792 | $20,661 | $16,177 |
| 10/2022 | $17,716 | $22,333 | $17,836 |
| 11/2022 | $18,818 | $23,582 | $18,950 |
| 12/2022 | $18,066 | $22,223 | $18,186 |
| 01/2023 | $19,159 | $23,619 | $19,129 |
| 02/2023 | $18,436 | $23,043 | $18,454 |
| 03/2023 | $18,049 | $23,889 | $18,369 |
| 04/2023 | $18,333 | $24,262 | $18,646 |
| 05/2023 | $17,653 | $24,367 | $17,927 |
| 06/2023 | $18,858 | $25,977 | $19,118 |
| 07/2023 | $19,710 | $26,812 | $19,790 |
| 08/2023 | $19,220 | $26,385 | $19,256 |
| 09/2023 | $18,548 | $25,127 | $18,513 |
| 10/2023 | $18,049 | $24,599 | $17,860 |
| 11/2023 | $19,323 | $26,845 | $19,207 |
| 12/2023 | $20,427 | $28,065 | $20,271 |
| 01/2024 | $20,564 | $28,536 | $20,292 |
| 02/2024 | $21,247 | $30,060 | $21,041 |
| 03/2024 | $22,430 | $31,027 | $22,092 |
| 04/2024 | $21,501 | $29,760 | $21,149 |
| 05/2024 | $22,248 | $31,236 | $21,819 |
| 06/2024 | $22,066 | $32,356 | $21,614 |
| 07/2024 | $23,122 | $32,750 | $22,719 |
| 08/2024 | $23,641 | $33,545 | $23,328 |
| 09/2024 | $23,823 | $34,261 | $23,652 |
| 10/2024 | $23,741 | $33,950 | $23,392 |
Average Annual Total Returns (%)
| HEADER | 1 Year | 5 Years | 10 Years |
|---|
Investor ClassFootnote Reference1 | 31.54% | 11.59% | 9.03% |
S&P 500® Index TR | 38.02% | 15.27% | 13.00% |
Russell 1000® Value Index | 30.98% | 10.14% | 8.87% |
| Footnote | Description |
Footnote1 | Return may differ from actual shareholder return due to accounting adjustments for financial reporting purposes. |
Performance shown is historical and is not indicative of future returns. Investment returns and principal value will vary, and shares may be worth more or less at redemption than at original purchase. Performance shown is as of date indicated, and current performance may be lower or higher than the performance data quoted. To obtain performance as of the most recent month end, please visit americanbeaconfunds.com or call 800-967-9009. The graph and table do not reflect the deduction of taxes that a shareholder would pay on fund distributions or redemption of fund shares.
The S&P 500 Index TR is replacing the Russell 1000 Value Index as the broad-based securities market index to comply with a new regulatory requirement. The Russell 1000 Value Index reflects the market sectors in which the Fund invests.
| Total Net Assets | $3,483,740,480 |
| # of Portfolio Holdings | 170 |
| Portfolio Turnover Rate | 26% |
| Total Management Fees Paid | $18,952,178 |
What did the Fund invest in?
Top Ten Holdings - % Net Assets
| Citigroup, Inc. | 1.8 |
| Fidelity National Information Services, Inc. | 1.8 |
| Comcast Corp., Class A | 1.8 |
| Elevance Health, Inc. | 1.6 |
| JPMorgan Chase & Co. | 1.5 |
| Exxon Mobil Corp. | 1.5 |
| Wells Fargo & Co. | 1.4 |
| American Express Co. | 1.3 |
| Entergy Corp. | 1.3 |
| F5, Inc. | 1.3 |
Excludes cash equivalents.
Asset Allocation - % Investments
| Value | Value |
|---|
| Common Stocks | 89.8 |
| Foreign Common Stocks | 6.2 |
| Investment Companies | 3.9 |
| Securities Lending Collateral | 0.1 |
The Fund may purchase and sell futures contracts to gain market exposure on cash balances.
Sector Allocation - % Equities
| Value | Value |
|---|
| Real Estate | 2.0 |
| Materials | 4.1 |
| Communication Services | 4.3 |
| Consumer Staples | 6.0 |
| Utilities | 6.9 |
| Consumer Discretionary | 7.6 |
| Information Technology | 9.8 |
| Energy | 9.9 |
| Industrials | 12.4 |
| Health Care | 13.6 |
| Financials | 23.4 |
For additional information about the Fund, including its prospectus, financial statements, holdings, and proxy voting information, please visit www.americanbeaconfunds.com/literature or call 1-800-658-5811.
If your financial institution mailed only one copy of this Report to an address shared by more than one account, you can request an individual copy by contacting your financial institution.
Distributed by:
Resolute Investment Distributors, Inc.
Annual Shareholder Report - October 31, 2024
Annual Shareholder Report - October 31, 2024
This annual shareholder report contains important information about American Beacon Large Cap Value Fund for the period of November 1, 2023 to October 31, 2024. You can find additional information about the Fund at www.americanbeaconfunds.com/literature. You can also request this information by contacting us at 800-658-5811.
What were the Fund costs for the last year?
(based on a hypothetical $10,000 investment)
| Class Name | Costs of a $10,000 investment | Costs paid as a percentage of a $10,000 investment |
|---|
| Advisor Class | $128 | 1.11% |
How did the Fund perform and what affected its performance?
The Advisor Class of the Fund returned 31.28% for the twelve months ended October 31, 2024, compared to the S&P 500® Index TR return of 38.02% and the Russell 1000® Value Index return of 30.98%.
• Broad market performance during the twelve-month period benefited from the loosening of monetary policy as inflation eased, coinciding with the increased prospect of a soft landing.
• The Fund’s strategy of selecting undervalued securities through a bottom-up approach provided strong returns during the period.
• The Fund's holdings in the Information Technology and Financials sectors contributed materially to the Fund's performance, while holdings in the Energy sector detracted from the Fund’s performance over the period.
Cumulative Performance from October 31, 2014 through October 31, 2024
The initial investment, based on a $10,000 investment, is adjusted to reflect the maximum applicable sales charge, if any.
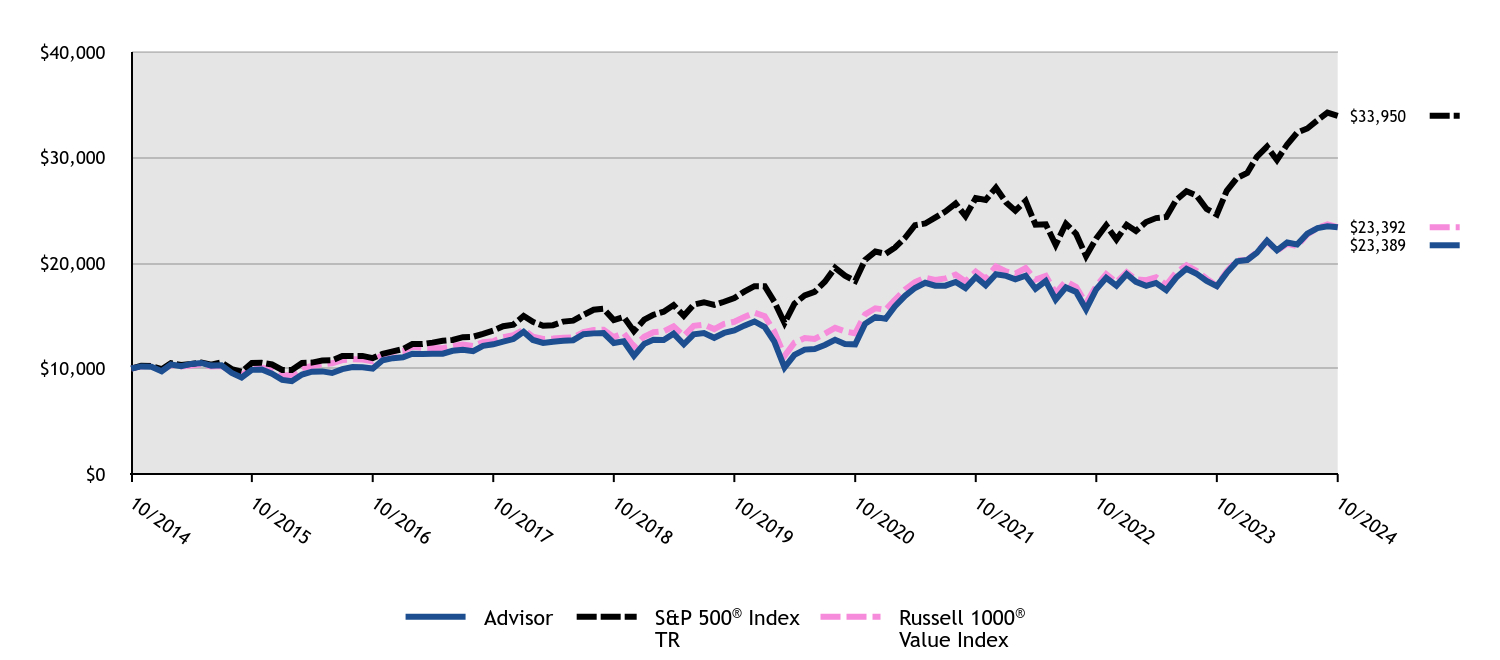
| Advisor | S&P 500® Index TR | Russell 1000® Value Index |
|---|
| 10/2014 | $10,000 | $10,000 | $10,000 |
| 11/2014 | $10,202 | $10,269 | $10,205 |
| 12/2014 | $10,177 | $10,243 | $10,267 |
| 01/2015 | $9,746 | $9,936 | $9,857 |
| 02/2015 | $10,382 | $10,507 | $10,334 |
| 03/2015 | $10,222 | $10,340 | $10,193 |
| 04/2015 | $10,442 | $10,440 | $10,289 |
| 05/2015 | $10,532 | $10,574 | $10,412 |
| 06/2015 | $10,278 | $10,369 | $10,204 |
| 07/2015 | $10,304 | $10,586 | $10,249 |
| 08/2015 | $9,589 | $9,948 | $9,639 |
| 09/2015 | $9,155 | $9,702 | $9,348 |
| 10/2015 | $9,877 | $10,520 | $10,053 |
| 11/2015 | $9,904 | $10,551 | $10,091 |
| 12/2015 | $9,515 | $10,385 | $9,874 |
| 01/2016 | $8,927 | $9,869 | $9,364 |
| 02/2016 | $8,805 | $9,856 | $9,362 |
| 03/2016 | $9,435 | $10,525 | $10,036 |
| 04/2016 | $9,704 | $10,566 | $10,247 |
| 05/2016 | $9,729 | $10,755 | $10,406 |
| 06/2016 | $9,578 | $10,783 | $10,496 |
| 07/2016 | $9,947 | $11,181 | $10,801 |
| 08/2016 | $10,140 | $11,196 | $10,884 |
| 09/2016 | $10,115 | $11,199 | $10,861 |
| 10/2016 | $9,997 | $10,994 | $10,693 |
| 11/2016 | $10,791 | $11,401 | $11,304 |
| 12/2016 | $10,983 | $11,627 | $11,587 |
| 01/2017 | $11,065 | $11,847 | $11,669 |
| 02/2017 | $11,401 | $12,318 | $12,089 |
| 03/2017 | $11,371 | $12,332 | $11,965 |
| 04/2017 | $11,401 | $12,459 | $11,943 |
| 05/2017 | $11,414 | $12,634 | $11,931 |
| 06/2017 | $11,685 | $12,713 | $12,126 |
| 07/2017 | $11,780 | $12,974 | $12,287 |
| 08/2017 | $11,651 | $13,014 | $12,144 |
| 09/2017 | $12,155 | $13,283 | $12,504 |
| 10/2017 | $12,297 | $13,593 | $12,595 |
| 11/2017 | $12,543 | $14,009 | $12,980 |
| 12/2017 | $12,798 | $14,165 | $13,170 |
| 01/2018 | $13,473 | $14,976 | $13,679 |
| 02/2018 | $12,712 | $14,424 | $13,026 |
| 03/2018 | $12,425 | $14,058 | $12,797 |
| 04/2018 | $12,549 | $14,112 | $12,839 |
| 05/2018 | $12,626 | $14,451 | $12,915 |
| 06/2018 | $12,688 | $14,540 | $12,947 |
| 07/2018 | $13,258 | $15,081 | $13,460 |
| 08/2018 | $13,334 | $15,573 | $13,659 |
| 09/2018 | $13,358 | $15,662 | $13,686 |
| 10/2018 | $12,425 | $14,591 | $12,977 |
| 11/2018 | $12,593 | $14,888 | $13,364 |
| 12/2018 | $11,210 | $13,544 | $12,081 |
| 01/2019 | $12,340 | $14,629 | $13,021 |
| 02/2019 | $12,722 | $15,099 | $13,437 |
| 03/2019 | $12,706 | $15,393 | $13,523 |
| 04/2019 | $13,310 | $16,016 | $14,003 |
| 05/2019 | $12,303 | $14,998 | $13,102 |
| 06/2019 | $13,241 | $16,055 | $14,043 |
| 07/2019 | $13,363 | $16,286 | $14,159 |
| 08/2019 | $12,913 | $16,028 | $13,743 |
| 09/2019 | $13,374 | $16,328 | $14,233 |
| 10/2019 | $13,612 | $16,681 | $14,432 |
| 11/2019 | $14,069 | $17,287 | $14,878 |
| 12/2019 | $14,462 | $17,809 | $15,288 |
| 01/2020 | $13,935 | $17,802 | $14,959 |
| 02/2020 | $12,551 | $16,336 | $13,510 |
| 03/2020 | $10,089 | $14,319 | $11,201 |
| 04/2020 | $11,291 | $16,154 | $12,460 |
| 05/2020 | $11,795 | $16,923 | $12,887 |
| 06/2020 | $11,853 | $17,260 | $12,802 |
| 07/2020 | $12,234 | $18,233 | $13,308 |
| 08/2020 | $12,727 | $19,544 | $13,858 |
| 09/2020 | $12,334 | $18,801 | $13,518 |
| 10/2020 | $12,293 | $18,301 | $13,340 |
| 11/2020 | $14,251 | $20,305 | $15,135 |
| 12/2020 | $14,871 | $21,085 | $15,715 |
| 01/2021 | $14,721 | $20,872 | $15,571 |
| 02/2021 | $15,894 | $21,448 | $16,512 |
| 03/2021 | $16,891 | $22,387 | $17,484 |
| 04/2021 | $17,635 | $23,582 | $18,183 |
| 05/2021 | $18,126 | $23,747 | $18,607 |
| 06/2021 | $17,853 | $24,301 | $18,394 |
| 07/2021 | $17,853 | $24,878 | $18,541 |
| 08/2021 | $18,201 | $25,635 | $18,909 |
| 09/2021 | $17,628 | $24,443 | $18,251 |
| 10/2021 | $18,672 | $26,155 | $19,178 |
| 11/2021 | $17,894 | $25,974 | $18,502 |
| 12/2021 | $18,942 | $27,138 | $19,669 |
| 01/2022 | $18,780 | $25,734 | $19,211 |
| 02/2022 | $18,465 | $24,963 | $18,988 |
| 03/2022 | $18,796 | $25,890 | $19,524 |
| 04/2022 | $17,566 | $23,632 | $18,423 |
| 05/2022 | $18,296 | $23,676 | $18,781 |
| 06/2022 | $16,529 | $21,721 | $17,140 |
| 07/2022 | $17,689 | $23,724 | $18,276 |
| 08/2022 | $17,259 | $22,757 | $17,732 |
| 09/2022 | $15,614 | $20,661 | $16,177 |
| 10/2022 | $17,520 | $22,333 | $17,836 |
| 11/2022 | $18,603 | $23,582 | $18,950 |
| 12/2022 | $17,859 | $22,223 | $18,186 |
| 01/2023 | $18,939 | $23,619 | $19,129 |
| 02/2023 | $18,216 | $23,043 | $18,454 |
| 03/2023 | $17,833 | $23,889 | $18,369 |
| 04/2023 | $18,112 | $24,262 | $18,646 |
| 05/2023 | $17,433 | $24,367 | $17,927 |
| 06/2023 | $18,626 | $25,977 | $19,118 |
| 07/2023 | $19,462 | $26,812 | $19,790 |
| 08/2023 | $18,974 | $26,385 | $19,256 |
| 09/2023 | $18,312 | $25,127 | $18,513 |
| 10/2023 | $17,816 | $24,599 | $17,860 |
| 11/2023 | $19,070 | $26,845 | $19,207 |
| 12/2023 | $20,157 | $28,065 | $20,271 |
| 01/2024 | $20,286 | $28,536 | $20,292 |
| 02/2024 | $20,967 | $30,060 | $21,041 |
| 03/2024 | $22,118 | $31,027 | $22,092 |
| 04/2024 | $21,207 | $29,760 | $21,149 |
| 05/2024 | $21,944 | $31,236 | $21,819 |
| 06/2024 | $21,759 | $32,356 | $21,614 |
| 07/2024 | $22,791 | $32,750 | $22,719 |
| 08/2024 | $23,306 | $33,545 | $23,328 |
| 09/2024 | $23,481 | $34,261 | $23,652 |
| 10/2024 | $23,389 | $33,950 | $23,392 |
Average Annual Total Returns (%)
| HEADER | 1 Year | 5 Years | 10 Years |
|---|
Advisor ClassFootnote Reference1 | 31.28% | 11.43% | 8.87% |
S&P 500® Index TR | 38.02% | 15.27% | 13.00% |
Russell 1000® Value Index | 30.98% | 10.14% | 8.87% |
| Footnote | Description |
Footnote1 | Return may differ from actual shareholder return due to accounting adjustments for financial reporting purposes. |
Performance shown is historical and is not indicative of future returns. Investment returns and principal value will vary, and shares may be worth more or less at redemption than at original purchase. Performance shown is as of date indicated, and current performance may be lower or higher than the performance data quoted. To obtain performance as of the most recent month end, please visit americanbeaconfunds.com or call 800-967-9009. The graph and table do not reflect the deduction of taxes that a shareholder would pay on fund distributions or redemption of fund shares.
The S&P 500 Index TR is replacing the Russell 1000 Value Index as the broad-based securities market index to comply with a new regulatory requirement. The Russell 1000 Value Index reflects the market sectors in which the Fund invests.
| Total Net Assets | $3,483,740,480 |
| # of Portfolio Holdings | 170 |
| Portfolio Turnover Rate | 26% |
| Total Management Fees Paid | $18,952,178 |
What did the Fund invest in?
Top Ten Holdings - % Net Assets
| Citigroup, Inc. | 1.8 |
| Fidelity National Information Services, Inc. | 1.8 |
| Comcast Corp., Class A | 1.8 |
| Elevance Health, Inc. | 1.6 |
| JPMorgan Chase & Co. | 1.5 |
| Exxon Mobil Corp. | 1.5 |
| Wells Fargo & Co. | 1.4 |
| American Express Co. | 1.3 |
| Entergy Corp. | 1.3 |
| F5, Inc. | 1.3 |
Excludes cash equivalents.
Asset Allocation - % Investments
| Value | Value |
|---|
| Common Stocks | 89.8 |
| Foreign Common Stocks | 6.2 |
| Investment Companies | 3.9 |
| Securities Lending Collateral | 0.1 |
The Fund may purchase and sell futures contracts to gain market exposure on cash balances.
Sector Allocation - % Equities
| Value | Value |
|---|
| Real Estate | 2.0 |
| Materials | 4.1 |
| Communication Services | 4.3 |
| Consumer Staples | 6.0 |
| Utilities | 6.9 |
| Consumer Discretionary | 7.6 |
| Information Technology | 9.8 |
| Energy | 9.9 |
| Industrials | 12.4 |
| Health Care | 13.6 |
| Financials | 23.4 |
For additional information about the Fund, including its prospectus, financial statements, holdings, and proxy voting information, please visit www.americanbeaconfunds.com/literature or call 1-800-658-5811.
If your financial institution mailed only one copy of this Report to an address shared by more than one account, you can request an individual copy by contacting your financial institution.
Distributed by:
Resolute Investment Distributors, Inc.
Annual Shareholder Report - October 31, 2024
Annual Shareholder Report - October 31, 2024
This annual shareholder report contains important information about American Beacon Large Cap Value Fund for the period of November 1, 2023 to October 31, 2024. You can find additional information about the Fund at www.americanbeaconfunds.com/literature. You can also request this information by contacting us at 800-658-5811.
What were the Fund costs for the last year?
(based on a hypothetical $10,000 investment)
| Class Name | Costs of a $10,000 investment | Costs paid as a percentage of a $10,000 investment |
|---|
| Y | $83 | 0.72% |
How did the Fund perform and what affected its performance?
The Y Class of the Fund returned 31.84% for the twelve months ended October 31, 2024, compared to the S&P 500® Index TR return of 38.02% and the Russell 1000® Value Index return of 30.98%.
• Broad market performance during the twelve-month period benefited from the loosening of monetary policy as inflation eased, coinciding with the increased prospect of a soft landing.
• The Fund’s strategy of selecting undervalued securities through a bottom-up approach provided strong returns during the period.
• The Fund's holdings in the Information Technology and Financials sectors contributed materially to the Fund's performance, while holdings in the Energy sector detracted from the Fund’s performance over the period.
Cumulative Performance from October 31, 2014 through October 31, 2024
The initial investment, based on a $100,000 investment, is adjusted to reflect the maximum applicable sales charge, if any.
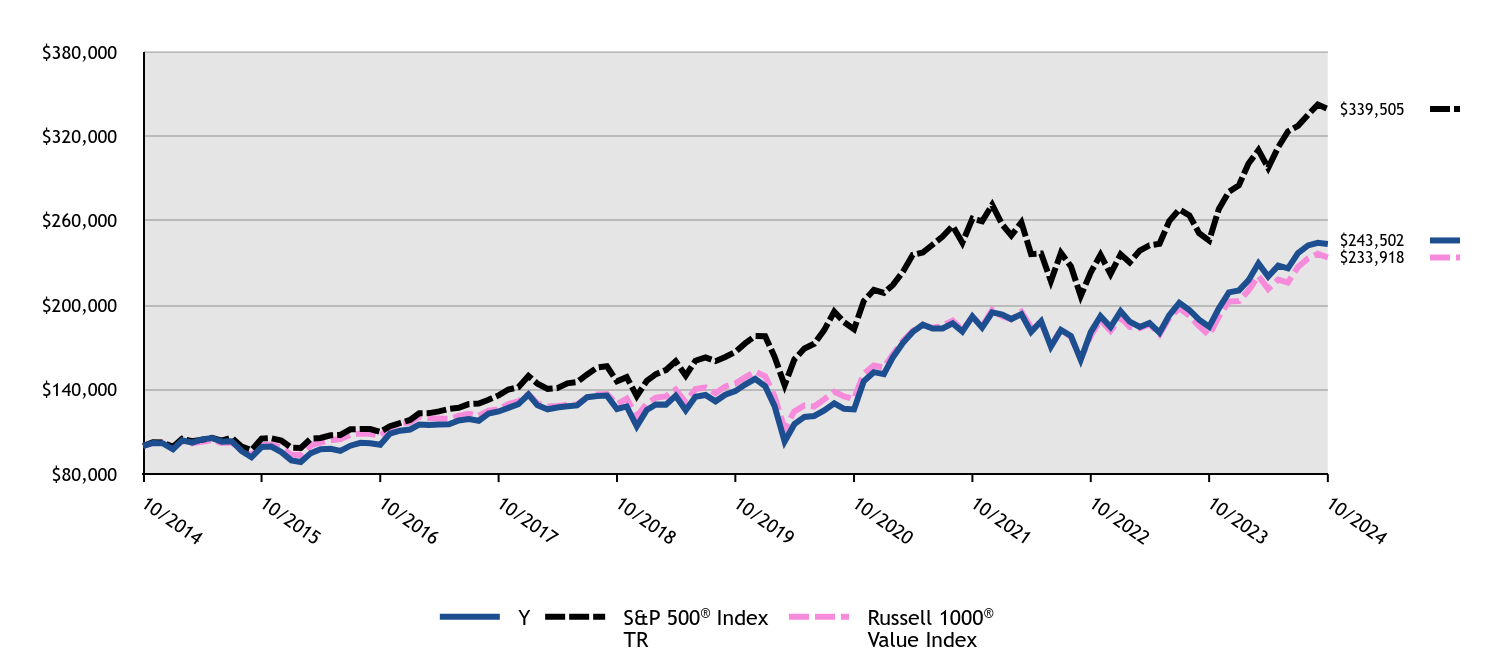
| #ERROR:A result could not be returned because the conditional could not be evaluated to a True/False value (#ERROR:Invalid Formula (#!=""), 'Multiple values from an iterator cannot be used in a formula unless they are aggregrated.') | Y | S&P 500® Index TR | Russell 1000® Value Index |
|---|
| 10/2014 | $100,000 | $100,000 | $100,000 |
| 11/2014 | $102,094 | $102,689 | $102,048 |
| 12/2014 | $101,836 | $102,431 | $102,674 |
| 01/2015 | $97,616 | $99,356 | $98,569 |
| 02/2015 | $103,981 | $105,066 | $103,339 |
| 03/2015 | $102,399 | $103,404 | $101,932 |
| 04/2015 | $104,684 | $104,396 | $102,885 |
| 05/2015 | $105,599 | $105,739 | $104,122 |
| 06/2015 | $103,067 | $103,692 | $102,043 |
| 07/2015 | $103,348 | $105,864 | $102,490 |
| 08/2015 | $96,245 | $99,477 | $96,386 |
| 09/2015 | $91,920 | $97,016 | $93,476 |
| 10/2015 | $99,199 | $105,199 | $100,529 |
| 11/2015 | $99,515 | $105,512 | $100,914 |
| 12/2015 | $95,610 | $103,848 | $98,744 |
| 01/2016 | $89,753 | $98,695 | $93,642 |
| 02/2016 | $88,534 | $98,562 | $93,618 |
| 03/2016 | $94,903 | $105,248 | $100,362 |
| 04/2016 | $97,615 | $105,656 | $102,470 |
| 05/2016 | $97,930 | $107,553 | $104,061 |
| 06/2016 | $96,436 | $107,832 | $104,961 |
| 07/2016 | $100,171 | $111,808 | $108,009 |
| 08/2016 | $102,176 | $111,965 | $108,842 |
| 09/2016 | $101,940 | $111,986 | $108,615 |
| 10/2016 | $100,800 | $109,943 | $106,934 |
| 11/2016 | $108,820 | $114,015 | $113,041 |
| 12/2016 | $110,824 | $116,268 | $115,867 |
| 01/2017 | $111,674 | $118,473 | $116,692 |
| 02/2017 | $115,152 | $123,178 | $120,885 |
| 03/2017 | $114,869 | $123,321 | $119,654 |
| 04/2017 | $115,192 | $124,588 | $119,429 |
| 05/2017 | $115,354 | $126,341 | $119,312 |
| 06/2017 | $118,145 | $127,130 | $121,263 |
| 07/2017 | $119,156 | $129,744 | $122,874 |
| 08/2017 | $117,902 | $130,141 | $121,443 |
| 09/2017 | $122,958 | $132,826 | $125,040 |
| 10/2017 | $124,495 | $135,925 | $125,948 |
| 11/2017 | $127,043 | $140,094 | $129,804 |
| 12/2017 | $129,671 | $141,652 | $131,699 |
| 01/2018 | $136,566 | $149,762 | $136,791 |
| 02/2018 | $128,865 | $144,242 | $130,259 |
| 03/2018 | $126,044 | $140,576 | $127,968 |
| 04/2018 | $127,343 | $141,116 | $128,390 |
| 05/2018 | $128,149 | $144,514 | $129,152 |
| 06/2018 | $128,820 | $145,403 | $129,472 |
| 07/2018 | $134,641 | $150,814 | $134,596 |
| 08/2018 | $135,492 | $155,729 | $136,586 |
| 09/2018 | $135,760 | $156,615 | $136,857 |
| 10/2018 | $126,268 | $145,910 | $129,770 |
| 11/2018 | $128,059 | $148,884 | $133,644 |
| 12/2018 | $113,988 | $135,441 | $120,811 |
| 01/2019 | $125,560 | $146,295 | $130,214 |
| 02/2019 | $129,466 | $150,992 | $134,375 |
| 03/2019 | $129,368 | $153,926 | $135,229 |
| 04/2019 | $135,599 | $160,158 | $140,026 |
| 05/2019 | $125,362 | $149,981 | $131,023 |
| 06/2019 | $134,906 | $160,551 | $140,428 |
| 07/2019 | $136,241 | $162,858 | $141,592 |
| 08/2019 | $131,692 | $160,278 | $137,429 |
| 09/2019 | $136,439 | $163,277 | $142,332 |
| 10/2019 | $138,961 | $166,814 | $144,321 |
| 11/2019 | $143,610 | $172,869 | $148,783 |
| 12/2019 | $147,724 | $178,087 | $152,876 |
| 01/2020 | $142,394 | $178,017 | $149,587 |
| 02/2020 | $128,253 | $163,363 | $135,100 |
| 03/2020 | $103,179 | $143,185 | $112,012 |
| 04/2020 | $115,471 | $161,541 | $124,605 |
| 05/2020 | $120,638 | $169,235 | $128,875 |
| 06/2020 | $121,291 | $172,600 | $128,020 |
| 07/2020 | $125,261 | $182,332 | $133,081 |
| 08/2020 | $130,319 | $195,438 | $138,583 |
| 09/2020 | $126,349 | $188,012 | $135,179 |
| 10/2020 | $125,968 | $183,012 | $133,403 |
| 11/2020 | $146,038 | $203,046 | $151,347 |
| 12/2020 | $152,435 | $210,852 | $157,150 |
| 01/2021 | $150,996 | $208,724 | $155,711 |
| 02/2021 | $163,078 | $214,479 | $165,121 |
| 03/2021 | $173,344 | $223,872 | $174,837 |
| 04/2021 | $181,045 | $235,820 | $181,829 |
| 05/2021 | $186,178 | $237,467 | $186,074 |
| 06/2021 | $183,423 | $243,011 | $183,943 |
| 07/2021 | $183,486 | $248,784 | $185,413 |
| 08/2021 | $187,117 | $256,348 | $189,090 |
| 09/2021 | $181,295 | $244,425 | $182,508 |
| 10/2021 | $192,062 | $261,550 | $191,776 |
| 11/2021 | $184,112 | $259,738 | $185,017 |
| 12/2021 | $194,938 | $271,378 | $196,689 |
| 01/2022 | $193,403 | $257,335 | $192,108 |
| 02/2022 | $190,192 | $249,630 | $189,879 |
| 03/2022 | $193,682 | $258,899 | $195,239 |
| 04/2022 | $181,049 | $236,323 | $184,226 |
| 05/2022 | $188,656 | $236,756 | $187,808 |
| 06/2022 | $170,510 | $217,213 | $171,399 |
| 07/2022 | $182,515 | $237,241 | $182,764 |
| 08/2022 | $178,117 | $227,566 | $177,319 |
| 09/2022 | $161,227 | $206,608 | $161,770 |
| 10/2022 | $180,909 | $223,335 | $178,357 |
| 11/2022 | $192,216 | $235,816 | $189,502 |
| 12/2022 | $184,539 | $222,229 | $181,863 |
| 01/2023 | $195,794 | $236,193 | $191,288 |
| 02/2023 | $188,369 | $230,430 | $184,543 |
| 03/2023 | $184,539 | $238,890 | $183,693 |
| 04/2023 | $187,431 | $242,619 | $186,461 |
| 05/2023 | $180,475 | $243,673 | $179,269 |
| 06/2023 | $192,902 | $259,774 | $191,178 |
| 07/2023 | $201,656 | $268,119 | $197,900 |
| 08/2023 | $196,654 | $263,851 | $192,558 |
| 09/2023 | $189,776 | $251,271 | $185,127 |
| 10/2023 | $184,695 | $245,987 | $178,595 |
| 11/2023 | $197,826 | $268,452 | $192,070 |
| 12/2023 | $209,174 | $280,648 | $202,710 |
| 01/2024 | $210,574 | $285,364 | $202,920 |
| 02/2024 | $217,653 | $300,602 | $210,405 |
| 03/2024 | $229,754 | $310,273 | $220,924 |
| 04/2024 | $220,370 | $297,600 | $211,488 |
| 05/2024 | $228,108 | $312,357 | $218,192 |
| 06/2024 | $226,214 | $323,565 | $216,139 |
| 07/2024 | $237,081 | $327,503 | $227,189 |
| 08/2024 | $242,514 | $335,447 | $233,283 |
| 09/2024 | $244,407 | $342,612 | $236,521 |
| 10/2024 | $243,502 | $339,505 | $233,918 |
Average Annual Total Returns (%)
| HEADER | 1 Year | 5 Years | 10 Years |
|---|
Class YFootnote Reference1 | 31.84% | 11.87% | 9.31% |
S&P 500® Index TR | 38.02% | 15.27% | 13.00% |
Russell 1000® Value Index | 30.98% | 10.14% | 8.87% |
| Footnote | Description |
Footnote1 | Return may differ from actual shareholder return due to accounting adjustments for financial reporting purposes. |
Performance shown is historical and is not indicative of future returns. Investment returns and principal value will vary, and shares may be worth more or less at redemption than at original purchase. Performance shown is as of date indicated, and current performance may be lower or higher than the performance data quoted. To obtain performance as of the most recent month end, please visit americanbeaconfunds.com or call 800-967-9009. The graph and table do not reflect the deduction of taxes that a shareholder would pay on fund distributions or redemption of fund shares.
The S&P 500 Index TR is replacing the Russell 1000 Value Index as the broad-based securities market index to comply with a new regulatory requirement. The Russell 1000 Value Index reflects the market sectors in which the Fund invests.
| Total Net Assets | $3,483,740,480 |
| # of Portfolio Holdings | 170 |
| Portfolio Turnover Rate | 26% |
| Total Management Fees Paid | $18,952,178 |
What did the Fund invest in?
Top Ten Holdings - % Net Assets
| Citigroup, Inc. | 1.8 |
| Fidelity National Information Services, Inc. | 1.8 |
| Comcast Corp., Class A | 1.8 |
| Elevance Health, Inc. | 1.6 |
| JPMorgan Chase & Co. | 1.5 |
| Exxon Mobil Corp. | 1.5 |
| Wells Fargo & Co. | 1.4 |
| American Express Co. | 1.3 |
| Entergy Corp. | 1.3 |
| F5, Inc. | 1.3 |
Excludes cash equivalents.
Asset Allocation - % Investments
| Value | Value |
|---|
| Common Stocks | 89.8 |
| Foreign Common Stocks | 6.2 |
| Investment Companies | 3.9 |
| Securities Lending Collateral | 0.1 |
The Fund may purchase and sell futures contracts to gain market exposure on cash balances.
Sector Allocation - % Equities
| Value | Value |
|---|
| Real Estate | 2.0 |
| Materials | 4.1 |
| Communication Services | 4.3 |
| Consumer Staples | 6.0 |
| Utilities | 6.9 |
| Consumer Discretionary | 7.6 |
| Information Technology | 9.8 |
| Energy | 9.9 |
| Industrials | 12.4 |
| Health Care | 13.6 |
| Financials | 23.4 |
For additional information about the Fund, including its prospectus, financial statements, holdings, and proxy voting information, please visit www.americanbeaconfunds.com/literature or call 1-800-658-5811.
If your financial institution mailed only one copy of this Report to an address shared by more than one account, you can request an individual copy by contacting your financial institution.
Distributed by:
Resolute Investment Distributors, Inc.
Annual Shareholder Report - October 31, 2024
Annual Shareholder Report - October 31, 2024
This annual shareholder report contains important information about American Beacon Large Cap Value Fund for the period of November 1, 2023 to October 31, 2024. You can find additional information about the Fund at www.americanbeaconfunds.com/literature. You can also request this information by contacting us at 800-658-5811.
What were the Fund costs for the last year?
(based on a hypothetical $10,000 investment)
| Class Name | Costs of a $10,000 investment | Costs paid as a percentage of a $10,000 investment |
|---|
| Class A | $116 | 1.00% |
How did the Fund perform and what affected its performance?
The A Class of the Fund returned 23.96% (with sales charges) and 31.53% (without sales charges) for the twelve months ended October 31, 2024, compared to the S&P 500® Index TR return of 38.02% and the Russell 1000® Value Index return of 30.98%.
• Broad market performance during the twelve-month period benefited from the loosening of monetary policy as inflation eased, coinciding with the increased prospect of a soft landing.
• The Fund’s strategy of selecting undervalued securities through a bottom-up approach provided strong returns during the period.
• The Fund's holdings in the Information Technology and Financials sectors contributed materially to the Fund's performance, while holdings in the Energy sector detracted from the Fund’s performance over the period.
Cumulative Performance from October 31, 2014 through October 31, 2024
The initial investment, based on a $10,000 investment, is adjusted to reflect the maximum applicable sales charge, if any.
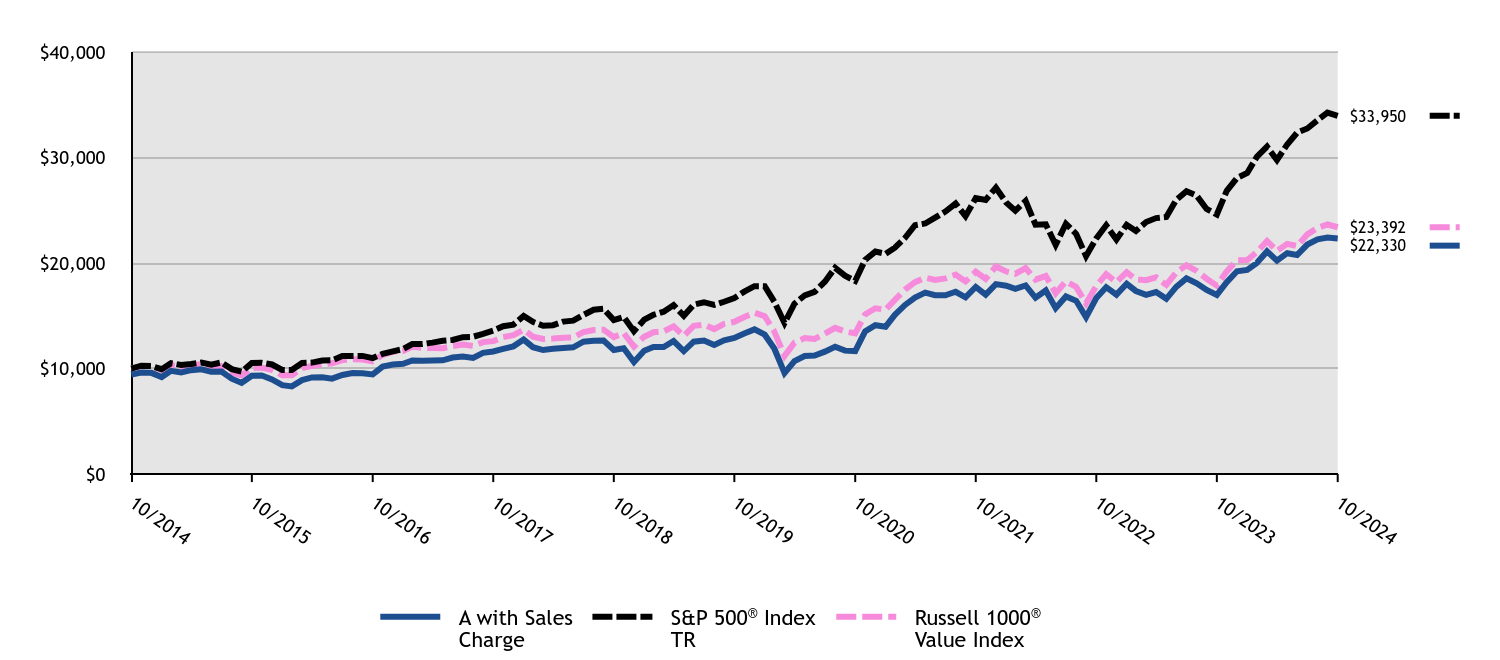
| A with Sales Charge | S&P 500® Index TR | Russell 1000® Value Index |
|---|
| 10/2014 | $9,426 | $10,000 | $10,000 |
| 11/2014 | $9,618 | $10,269 | $10,205 |
| 12/2014 | $9,592 | $10,243 | $10,267 |
| 01/2015 | $9,192 | $9,936 | $9,857 |
| 02/2015 | $9,789 | $10,507 | $10,334 |
| 03/2015 | $9,638 | $10,340 | $10,193 |
| 04/2015 | $9,849 | $10,440 | $10,289 |
| 05/2015 | $9,933 | $10,574 | $10,412 |
| 06/2015 | $9,694 | $10,369 | $10,204 |
| 07/2015 | $9,719 | $10,586 | $10,249 |
| 08/2015 | $9,044 | $9,948 | $9,639 |
| 09/2015 | $8,640 | $9,702 | $9,348 |
| 10/2015 | $9,318 | $10,520 | $10,053 |
| 11/2015 | $9,346 | $10,551 | $10,091 |
| 12/2015 | $8,976 | $10,385 | $9,874 |
| 01/2016 | $8,423 | $9,869 | $9,364 |
| 02/2016 | $8,309 | $9,856 | $9,362 |
| 03/2016 | $8,905 | $10,525 | $10,036 |
| 04/2016 | $9,158 | $10,566 | $10,247 |
| 05/2016 | $9,182 | $10,755 | $10,406 |
| 06/2016 | $9,043 | $10,783 | $10,496 |
| 07/2016 | $9,391 | $11,181 | $10,801 |
| 08/2016 | $9,573 | $11,196 | $10,884 |
| 09/2016 | $9,553 | $11,199 | $10,861 |
| 10/2016 | $9,442 | $10,994 | $10,693 |
| 11/2016 | $10,189 | $11,401 | $11,304 |
| 12/2016 | $10,375 | $11,627 | $11,587 |
| 01/2017 | $10,452 | $11,847 | $11,669 |
| 02/2017 | $10,773 | $12,318 | $12,089 |
| 03/2017 | $10,745 | $12,332 | $11,965 |
| 04/2017 | $10,773 | $12,459 | $11,943 |
| 05/2017 | $10,785 | $12,634 | $11,931 |
| 06/2017 | $11,041 | $12,713 | $12,126 |
| 07/2017 | $11,135 | $12,974 | $12,287 |
| 08/2017 | $11,013 | $13,014 | $12,144 |
| 09/2017 | $11,488 | $13,283 | $12,504 |
| 10/2017 | $11,622 | $13,593 | $12,595 |
| 11/2017 | $11,858 | $14,009 | $12,980 |
| 12/2017 | $12,104 | $14,165 | $13,170 |
| 01/2018 | $12,746 | $14,976 | $13,679 |
| 02/2018 | $12,027 | $14,424 | $13,026 |
| 03/2018 | $11,755 | $14,058 | $12,797 |
| 04/2018 | $11,873 | $14,112 | $12,839 |
| 05/2018 | $11,945 | $14,451 | $12,915 |
| 06/2018 | $12,009 | $14,540 | $12,947 |
| 07/2018 | $12,551 | $15,081 | $13,460 |
| 08/2018 | $12,624 | $15,573 | $13,659 |
| 09/2018 | $12,646 | $15,662 | $13,686 |
| 10/2018 | $11,764 | $14,591 | $12,977 |
| 11/2018 | $11,923 | $14,888 | $13,364 |
| 12/2018 | $10,615 | $13,544 | $12,081 |
| 01/2019 | $11,691 | $14,629 | $13,021 |
| 02/2019 | $12,048 | $15,099 | $13,437 |
| 03/2019 | $12,038 | $15,393 | $13,523 |
| 04/2019 | $12,611 | $16,016 | $14,003 |
| 05/2019 | $11,656 | $14,998 | $13,102 |
| 06/2019 | $12,546 | $16,055 | $14,043 |
| 07/2019 | $12,661 | $16,286 | $14,159 |
| 08/2019 | $12,239 | $16,028 | $13,743 |
| 09/2019 | $12,676 | $16,328 | $14,233 |
| 10/2019 | $12,903 | $16,681 | $14,432 |
| 11/2019 | $13,330 | $17,287 | $14,878 |
| 12/2019 | $13,710 | $17,809 | $15,288 |
| 01/2020 | $13,210 | $17,802 | $14,959 |
| 02/2020 | $11,897 | $16,336 | $13,510 |
| 03/2020 | $9,567 | $14,319 | $11,201 |
| 04/2020 | $10,701 | $16,154 | $12,460 |
| 05/2020 | $11,185 | $16,923 | $12,887 |
| 06/2020 | $11,235 | $17,260 | $12,802 |
| 07/2020 | $11,602 | $18,233 | $13,308 |
| 08/2020 | $12,070 | $19,544 | $13,858 |
| 09/2020 | $11,697 | $18,801 | $13,518 |
| 10/2020 | $11,658 | $18,301 | $13,340 |
| 11/2020 | $13,516 | $20,305 | $15,135 |
| 12/2020 | $14,108 | $21,085 | $15,715 |
| 01/2021 | $13,966 | $20,872 | $15,571 |
| 02/2021 | $15,087 | $21,448 | $16,512 |
| 03/2021 | $16,026 | $22,387 | $17,484 |
| 04/2021 | $16,733 | $23,582 | $18,183 |
| 05/2021 | $17,199 | $23,747 | $18,607 |
| 06/2021 | $16,947 | $24,301 | $18,394 |
| 07/2021 | $16,947 | $24,878 | $18,541 |
| 08/2021 | $17,277 | $25,635 | $18,909 |
| 09/2021 | $16,746 | $24,443 | $18,251 |
| 10/2021 | $17,737 | $26,155 | $19,178 |
| 11/2021 | $17,005 | $25,974 | $18,502 |
| 12/2021 | $18,000 | $27,138 | $19,669 |
| 01/2022 | $17,854 | $25,734 | $19,211 |
| 02/2022 | $17,547 | $24,963 | $18,988 |
| 03/2022 | $17,876 | $25,890 | $19,524 |
| 04/2022 | $16,708 | $23,632 | $18,423 |
| 05/2022 | $17,402 | $23,676 | $18,781 |
| 06/2022 | $15,723 | $21,721 | $17,140 |
| 07/2022 | $16,832 | $23,724 | $18,276 |
| 08/2022 | $16,424 | $22,757 | $17,732 |
| 09/2022 | $14,870 | $20,661 | $16,177 |
| 10/2022 | $16,679 | $22,333 | $17,836 |
| 11/2022 | $17,715 | $23,582 | $18,950 |
| 12/2022 | $17,003 | $22,223 | $18,186 |
| 01/2023 | $18,031 | $23,619 | $19,129 |
| 02/2023 | $17,351 | $23,043 | $18,454 |
| 03/2023 | $16,986 | $23,889 | $18,369 |
| 04/2023 | $17,252 | $24,262 | $18,646 |
| 05/2023 | $16,605 | $24,367 | $17,927 |
| 06/2023 | $17,741 | $25,977 | $19,118 |
| 07/2023 | $18,546 | $26,812 | $19,790 |
| 08/2023 | $18,081 | $26,385 | $19,256 |
| 09/2023 | $17,451 | $25,127 | $18,513 |
| 10/2023 | $16,978 | $24,599 | $17,860 |
| 11/2023 | $18,181 | $26,845 | $19,207 |
| 12/2023 | $19,222 | $28,065 | $20,271 |
| 01/2024 | $19,345 | $28,536 | $20,292 |
| 02/2024 | $19,995 | $30,060 | $21,041 |
| 03/2024 | $21,101 | $31,027 | $22,092 |
| 04/2024 | $20,232 | $29,760 | $21,149 |
| 05/2024 | $20,934 | $31,236 | $21,819 |
| 06/2024 | $20,759 | $32,356 | $21,614 |
| 07/2024 | $21,751 | $32,750 | $22,719 |
| 08/2024 | $22,243 | $33,545 | $23,328 |
| 09/2024 | $22,410 | $34,261 | $23,652 |
| 10/2024 | $22,330 | $33,950 | $23,392 |
Average Annual Total Returns (%)
| HEADER | 1 Year | 5 Years | 10 Years |
|---|
Class A without Sales ChargeFootnote Reference1 | 31.53% | 11.59% | 9.01% |
Class A with Maximum Sales Charge - 5.75%Footnote Reference1 | 23.96% | 10.28% | 8.37% |
S&P 500® Index TR | 38.02% | 15.27% | 13.00% |
Russell 1000® Value Index | 30.98% | 10.14% | 8.87% |
| Footnote | Description |
Footnote1 | Return may differ from actual shareholder return due to accounting adjustments for financial reporting purposes. |
Performance shown is historical and is not indicative of future returns. Investment returns and principal value will vary, and shares may be worth more or less at redemption than at original purchase. Performance shown is as of date indicated, and current performance may be lower or higher than the performance data quoted. To obtain performance as of the most recent month end, please visit americanbeaconfunds.com or call 800-967-9009. The graph and table do not reflect the deduction of taxes that a shareholder would pay on fund distributions or redemption of fund shares.
The S&P 500 Index TR is replacing the Russell 1000 Value Index as the broad-based securities market index to comply with a new regulatory requirement. The Russell 1000 Value Index reflects the market sectors in which the Fund invests.
| Total Net Assets | $3,483,740,480 |
| # of Portfolio Holdings | 170 |
| Portfolio Turnover Rate | 26% |
| Total Management Fees Paid | $18,952,178 |
What did the Fund invest in?
Top Ten Holdings - % Net Assets
| Citigroup, Inc. | 1.8 |
| Fidelity National Information Services, Inc. | 1.8 |
| Comcast Corp., Class A | 1.8 |
| Elevance Health, Inc. | 1.6 |
| JPMorgan Chase & Co. | 1.5 |
| Exxon Mobil Corp. | 1.5 |
| Wells Fargo & Co. | 1.4 |
| American Express Co. | 1.3 |
| Entergy Corp. | 1.3 |
| F5, Inc. | 1.3 |
Excludes cash equivalents.
Asset Allocation - % Investments
| Value | Value |
|---|
| Common Stocks | 89.8 |
| Foreign Common Stocks | 6.2 |
| Investment Companies | 3.9 |
| Securities Lending Collateral | 0.1 |
The Fund may purchase and sell futures contracts to gain market exposure on cash balances.
Sector Allocation - % Equities
| Value | Value |
|---|
| Real Estate | 2.0 |
| Materials | 4.1 |
| Communication Services | 4.3 |
| Consumer Staples | 6.0 |
| Utilities | 6.9 |
| Consumer Discretionary | 7.6 |
| Information Technology | 9.8 |
| Energy | 9.9 |
| Industrials | 12.4 |
| Health Care | 13.6 |
| Financials | 23.4 |
For additional information about the Fund, including its prospectus, financial statements, holdings, and proxy voting information, please visit www.americanbeaconfunds.com/literature or call 1-800-658-5811.
If your financial institution mailed only one copy of this Report to an address shared by more than one account, you can request an individual copy by contacting your financial institution.
Distributed by:
Resolute Investment Distributors, Inc.
Annual Shareholder Report - October 31, 2024
Annual Shareholder Report - October 31, 2024
This annual shareholder report contains important information about American Beacon Large Cap Value Fund for the period of November 1, 2023 to October 31, 2024. You can find additional information about the Fund at www.americanbeaconfunds.com/literature. You can also request this information by contacting us at 800-658-5811.
What were the Fund costs for the last year?
(based on a hypothetical $10,000 investment)
| Class Name | Costs of a $10,000 investment | Costs paid as a percentage of a $10,000 investment |
|---|
| Class C | $198 | 1.72% |
How did the Fund perform and what affected its performance?
The C Class of the Fund returned 29.51% (with sales charges) and 30.51% (without sales charges) for the twelve months ended October 31, 2024, compared to the S&P 500® Index TR return of 38.02% and the Russell 1000® Value Index return of 30.98%.
• Broad market performance during the twelve-month period benefited from the loosening of monetary policy as inflation eased, coinciding with the increased prospect of a soft landing.
• The Fund’s strategy of selecting undervalued securities through a bottom-up approach provided strong returns during the period.
• The Fund's holdings in the Information Technology and Financials sectors contributed materially to the Fund's performance, while holdings in the Energy sector detracted from the Fund’s performance over the period.
Cumulative Performance from October 31, 2014 through October 31, 2024
The initial investment, based on a $10,000 investment, is adjusted to reflect the maximum applicable sales charge, if any.
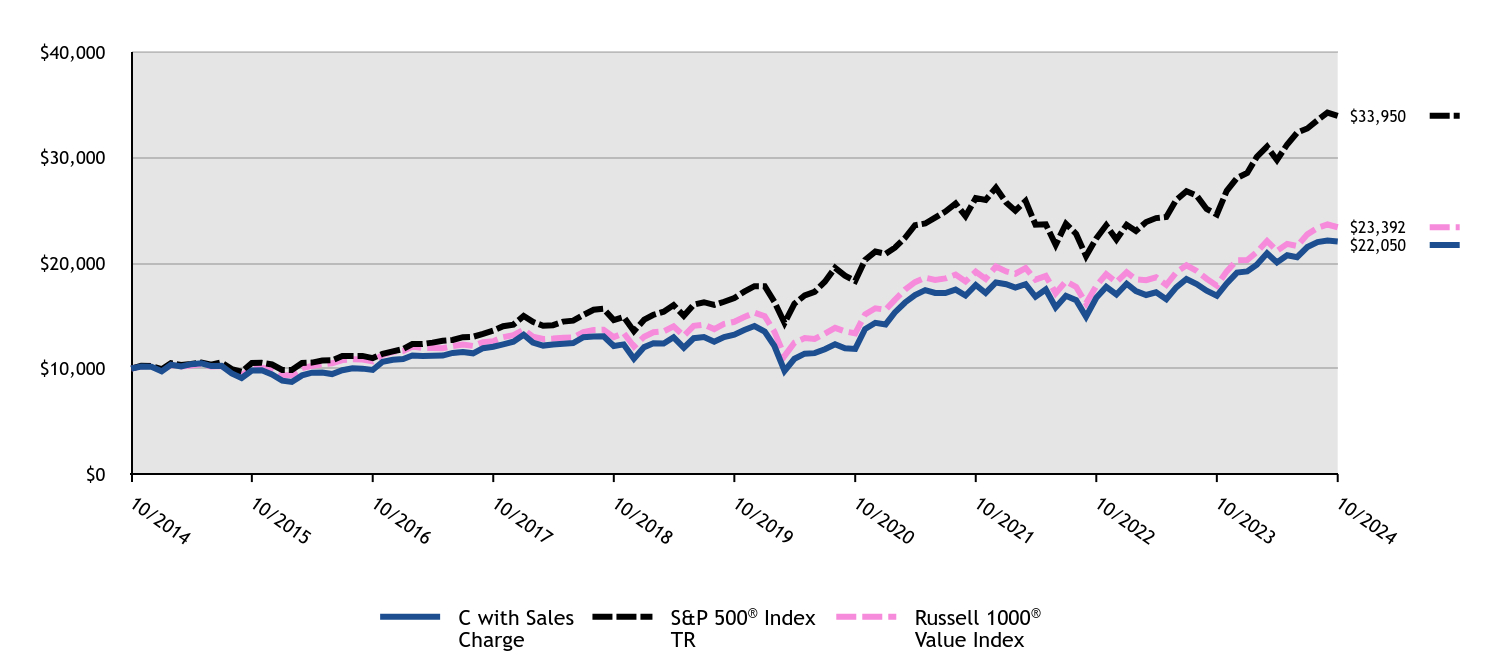
| C with Sales Charge | S&P 500® Index TR | Russell 1000® Value Index |
|---|
| 10/2014 | $10,000 | $10,000 | $10,000 |
| 11/2014 | $10,200 | $10,269 | $10,205 |
| 12/2014 | $10,166 | $10,243 | $10,267 |
| 01/2015 | $9,735 | $9,936 | $9,857 |
| 02/2015 | $10,361 | $10,507 | $10,334 |
| 03/2015 | $10,196 | $10,340 | $10,193 |
| 04/2015 | $10,414 | $10,440 | $10,289 |
| 05/2015 | $10,496 | $10,574 | $10,412 |
| 06/2015 | $10,238 | $10,369 | $10,204 |
| 07/2015 | $10,256 | $10,586 | $10,249 |
| 08/2015 | $9,540 | $9,948 | $9,639 |
| 09/2015 | $9,105 | $9,702 | $9,348 |
| 10/2015 | $9,817 | $10,520 | $10,053 |
| 11/2015 | $9,840 | $10,551 | $10,091 |
| 12/2015 | $9,444 | $10,385 | $9,874 |
| 01/2016 | $8,858 | $9,869 | $9,364 |
| 02/2016 | $8,733 | $9,856 | $9,362 |
| 03/2016 | $9,352 | $10,525 | $10,036 |
| 04/2016 | $9,612 | $10,566 | $10,247 |
| 05/2016 | $9,629 | $10,755 | $10,406 |
| 06/2016 | $9,478 | $10,783 | $10,496 |
| 07/2016 | $9,838 | $11,181 | $10,801 |
| 08/2016 | $10,022 | $11,196 | $10,884 |
| 09/2016 | $9,993 | $11,199 | $10,861 |
| 10/2016 | $9,867 | $10,994 | $10,693 |
| 11/2016 | $10,646 | $11,401 | $11,304 |
| 12/2016 | $10,831 | $11,627 | $11,587 |
| 01/2017 | $10,908 | $11,847 | $11,669 |
| 02/2017 | $11,232 | $12,318 | $12,089 |
| 03/2017 | $11,198 | $12,332 | $11,965 |
| 04/2017 | $11,219 | $12,459 | $11,943 |
| 05/2017 | $11,228 | $12,634 | $11,931 |
| 06/2017 | $11,484 | $12,713 | $12,126 |
| 07/2017 | $11,573 | $12,974 | $12,287 |
| 08/2017 | $11,445 | $13,014 | $12,144 |
| 09/2017 | $11,932 | $13,283 | $12,504 |
| 10/2017 | $12,064 | $13,593 | $12,595 |
| 11/2017 | $12,299 | $14,009 | $12,980 |
| 12/2017 | $12,553 | $14,165 | $13,170 |
| 01/2018 | $13,213 | $14,976 | $13,679 |
| 02/2018 | $12,458 | $14,424 | $13,026 |
| 03/2018 | $12,175 | $14,058 | $12,797 |
| 04/2018 | $12,288 | $14,112 | $12,839 |
| 05/2018 | $12,359 | $14,451 | $12,915 |
| 06/2018 | $12,416 | $14,540 | $12,947 |
| 07/2018 | $12,968 | $15,081 | $13,460 |
| 08/2018 | $13,034 | $15,573 | $13,659 |
| 09/2018 | $13,053 | $15,662 | $13,686 |
| 10/2018 | $12,133 | $14,591 | $12,977 |
| 11/2018 | $12,288 | $14,888 | $13,364 |
| 12/2018 | $10,936 | $13,544 | $12,081 |
| 01/2019 | $12,032 | $14,629 | $13,021 |
| 02/2019 | $12,396 | $15,099 | $13,437 |
| 03/2019 | $12,375 | $15,393 | $13,523 |
| 04/2019 | $12,963 | $16,016 | $14,003 |
| 05/2019 | $11,975 | $14,998 | $13,102 |
| 06/2019 | $12,874 | $16,055 | $14,043 |
| 07/2019 | $12,994 | $16,286 | $14,159 |
| 08/2019 | $12,547 | $16,028 | $13,743 |
| 09/2019 | $12,989 | $16,328 | $14,233 |
| 10/2019 | $13,217 | $16,681 | $14,432 |
| 11/2019 | $13,649 | $17,287 | $14,878 |
| 12/2019 | $14,029 | $17,809 | $15,288 |
| 01/2020 | $13,509 | $17,802 | $14,959 |
| 02/2020 | $12,159 | $16,336 | $13,510 |
| 03/2020 | $9,774 | $14,319 | $11,201 |
| 04/2020 | $10,929 | $16,154 | $12,460 |
| 05/2020 | $11,410 | $16,923 | $12,887 |
| 06/2020 | $11,461 | $17,260 | $12,802 |
| 07/2020 | $11,827 | $18,233 | $13,308 |
| 08/2020 | $12,296 | $19,544 | $13,858 |
| 09/2020 | $11,913 | $18,801 | $13,518 |
| 10/2020 | $11,862 | $18,301 | $13,340 |
| 11/2020 | $13,749 | $20,305 | $15,135 |
| 12/2020 | $14,336 | $21,085 | $15,715 |
| 01/2021 | $14,184 | $20,872 | $15,571 |
| 02/2021 | $15,316 | $21,448 | $16,512 |
| 03/2021 | $16,262 | $22,387 | $17,484 |
| 04/2021 | $16,971 | $23,582 | $18,183 |
| 05/2021 | $17,434 | $23,747 | $18,607 |
| 06/2021 | $17,163 | $24,301 | $18,394 |
| 07/2021 | $17,156 | $24,878 | $18,541 |
| 08/2021 | $17,480 | $25,635 | $18,909 |
| 09/2021 | $16,924 | $24,443 | $18,251 |
| 10/2021 | $17,917 | $26,155 | $19,178 |
| 11/2021 | $17,163 | $25,974 | $18,502 |
| 12/2021 | $18,156 | $27,138 | $19,669 |
| 01/2022 | $17,993 | $25,734 | $19,211 |
| 02/2022 | $17,681 | $24,963 | $18,988 |
| 03/2022 | $17,993 | $25,890 | $19,524 |
| 04/2022 | $16,806 | $23,632 | $18,423 |
| 05/2022 | $17,496 | $23,676 | $18,781 |
| 06/2022 | $15,797 | $21,721 | $17,140 |
| 07/2022 | $16,895 | $23,724 | $18,276 |
| 08/2022 | $16,479 | $22,757 | $17,732 |
| 09/2022 | $14,906 | $20,661 | $16,177 |
| 10/2022 | $16,709 | $22,333 | $17,836 |
| 11/2022 | $17,741 | $23,582 | $18,950 |
| 12/2022 | $17,021 | $22,223 | $18,186 |
| 01/2023 | $18,040 | $23,619 | $19,129 |
| 02/2023 | $17,347 | $23,043 | $18,454 |
| 03/2023 | $16,970 | $23,889 | $18,369 |
| 04/2023 | $17,221 | $24,262 | $18,646 |
| 05/2023 | $16,577 | $24,367 | $17,927 |
| 06/2023 | $17,698 | $25,977 | $19,118 |
| 07/2023 | $18,492 | $26,812 | $19,790 |
| 08/2023 | $18,015 | $26,385 | $19,256 |
| 09/2023 | $17,372 | $25,127 | $18,513 |
| 10/2023 | $16,895 | $24,599 | $17,860 |
| 11/2023 | $18,074 | $26,845 | $19,207 |
| 12/2023 | $19,096 | $28,065 | $20,271 |
| 01/2024 | $19,210 | $28,536 | $20,292 |
| 02/2024 | $19,841 | $30,060 | $21,041 |
| 03/2024 | $20,928 | $31,027 | $22,092 |
| 04/2024 | $20,051 | $29,760 | $21,149 |
| 05/2024 | $20,735 | $31,236 | $21,819 |
| 06/2024 | $20,551 | $32,356 | $21,614 |
| 07/2024 | $21,515 | $32,750 | $22,719 |
| 08/2024 | $21,989 | $33,545 | $23,328 |
| 09/2024 | $22,138 | $34,261 | $23,652 |
| 10/2024 | $22,050 | $33,950 | $23,392 |
Average Annual Total Returns (%)
| HEADER | 1 Year | 5 Years | 10 Years |
|---|
Class C without Deferred Sales ChargeFootnote Reference1 | 30.51% | 10.78% | 8.23% |
Class C with Maximum Deferred Sales Charge -1.00%Footnote Reference1 | 29.51% | 10.78% | 8.23% |
S&P 500® Index TR | 38.02% | 15.27% | 13.00% |
Russell 1000® Value Index | 30.98% | 10.14% | 8.87% |
| Footnote | Description |
Footnote1 | Return may differ from actual shareholder return due to accounting adjustments for financial reporting purposes. |
Performance shown is historical and is not indicative of future returns. Investment returns and principal value will vary, and shares may be worth more or less at redemption than at original purchase. Performance shown is as of date indicated, and current performance may be lower or higher than the performance data quoted. To obtain performance as of the most recent month end, please visit americanbeaconfunds.com or call 800-967-9009. The graph and table do not reflect the deduction of taxes that a shareholder would pay on fund distributions or redemption of fund shares.
The S&P 500 Index TR is replacing the Russell 1000 Value Index as the broad-based securities market index to comply with a new regulatory requirement. The Russell 1000 Value Index reflects the market sectors in which the Fund invests.
| Total Net Assets | $3,483,740,480 |
| # of Portfolio Holdings | 170 |
| Portfolio Turnover Rate | 26% |
| Total Management Fees Paid | $18,952,178 |
What did the Fund invest in?
Top Ten Holdings - % Net Assets
| Citigroup, Inc. | 1.8 |
| Fidelity National Information Services, Inc. | 1.8 |
| Comcast Corp., Class A | 1.8 |
| Elevance Health, Inc. | 1.6 |
| JPMorgan Chase & Co. | 1.5 |
| Exxon Mobil Corp. | 1.5 |
| Wells Fargo & Co. | 1.4 |
| American Express Co. | 1.3 |
| Entergy Corp. | 1.3 |
| F5, Inc. | 1.3 |
Excludes cash equivalents.
Asset Allocation - % Investments
| Value | Value |
|---|
| Common Stocks | 89.8 |
| Foreign Common Stocks | 6.2 |
| Investment Companies | 3.9 |
| Securities Lending Collateral | 0.1 |
The Fund may purchase and sell futures contracts to gain market exposure on cash balances.
Sector Allocation - % Equities
| Value | Value |
|---|
| Real Estate | 2.0 |
| Materials | 4.1 |
| Communication Services | 4.3 |
| Consumer Staples | 6.0 |
| Utilities | 6.9 |
| Consumer Discretionary | 7.6 |
| Information Technology | 9.8 |
| Energy | 9.9 |
| Industrials | 12.4 |
| Health Care | 13.6 |
| Financials | 23.4 |
For additional information about the Fund, including its prospectus, financial statements, holdings, and proxy voting information, please visit www.americanbeaconfunds.com/literature or call 1-800-658-5811.
If your financial institution mailed only one copy of this Report to an address shared by more than one account, you can request an individual copy by contacting your financial institution.
Distributed by:
Resolute Investment Distributors, Inc.
Annual Shareholder Report - October 31, 2024
Annual Shareholder Report - October 31, 2024
This annual shareholder report contains important information about American Beacon Large Cap Value Fund for the period of November 1, 2023 to October 31, 2024. You can find additional information about the Fund at www.americanbeaconfunds.com/literature. You can also request this information by contacting us at 800-658-5811.
What were the Fund costs for the last year?
(based on a hypothetical $10,000 investment)
| Class Name | Costs of a $10,000 investment | Costs paid as a percentage of a $10,000 investment |
|---|
| R6 | $71 | 0.61% |
How did the Fund perform and what affected its performance?
The R6 Class of the Fund returned 32.02% for the twelve months ended October 31, 2024, compared to the S&P 500® Index TR return of 38.02% and the Russell 1000® Value Index return of 30.98%.
• Broad market performance during the twelve-month period benefited from the loosening of monetary policy as inflation eased, coinciding with the increased prospect of a soft landing.
• The Fund’s strategy of selecting undervalued securities through a bottom-up approach provided strong returns during the period.
• The Fund's holdings in the Information Technology and Financials sectors contributed materially to the Fund's performance, while holdings in the Energy sector detracted from the Fund’s performance over the period.
Cumulative Performance from October 31, 2014 through October 31, 2024
The initial investment, based on a $10,000 investment, is adjusted to reflect the maximum applicable sales charge, if any.
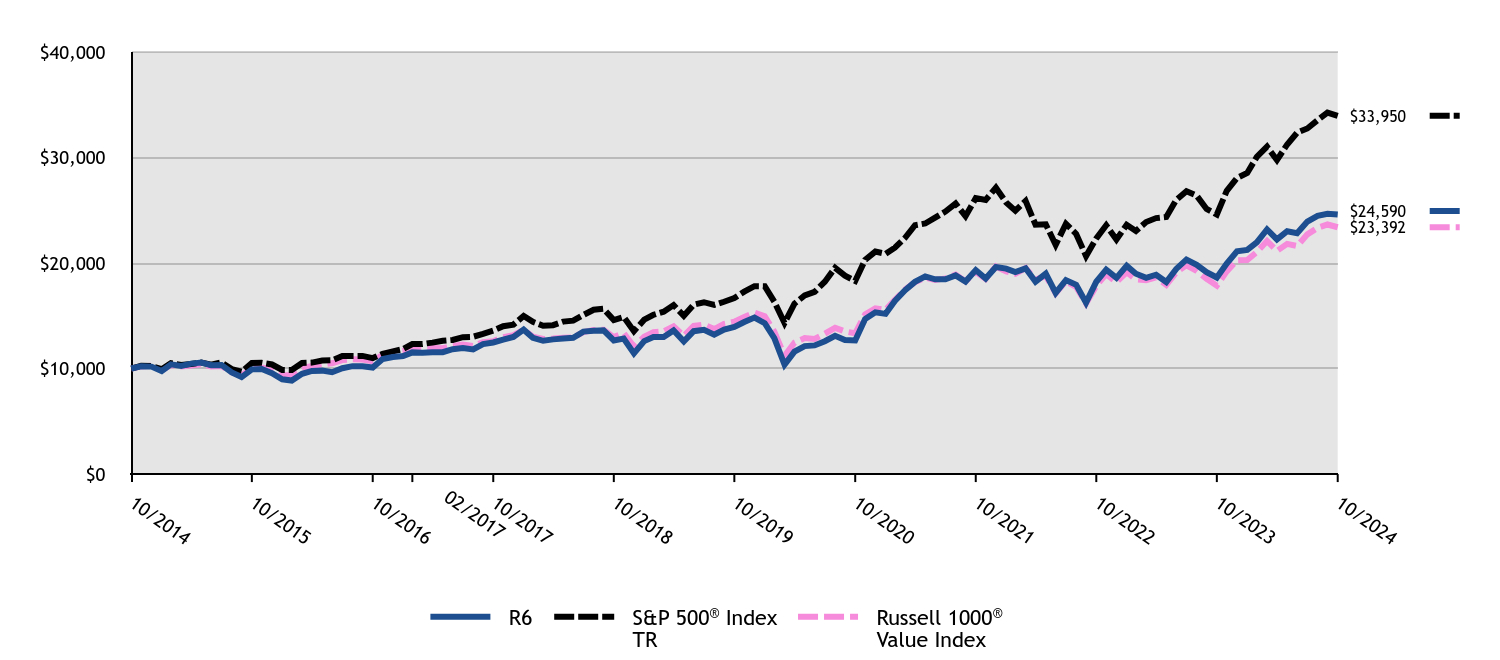
| R6 | S&P 500® Index TR | Russell 1000® Value Index |
|---|
| 10/2014 | $10,000 | $10,000 | $10,000 |
| 11/2014 | $10,208 | $10,269 | $10,205 |
| 12/2014 | $10,183 | $10,243 | $10,267 |
| 01/2015 | $9,760 | $9,936 | $9,857 |
| 02/2015 | $10,397 | $10,507 | $10,334 |
| 03/2015 | $10,243 | $10,340 | $10,193 |
| 04/2015 | $10,470 | $10,440 | $10,289 |
| 05/2015 | $10,565 | $10,574 | $10,412 |
| 06/2015 | $10,313 | $10,369 | $10,204 |
| 07/2015 | $10,341 | $10,586 | $10,249 |
| 08/2015 | $9,627 | $9,948 | $9,639 |
| 09/2015 | $9,197 | $9,702 | $9,348 |
| 10/2015 | $9,925 | $10,520 | $10,053 |
| 11/2015 | $9,960 | $10,551 | $10,091 |
| 12/2015 | $9,568 | $10,385 | $9,874 |
| 01/2016 | $8,982 | $9,869 | $9,364 |
| 02/2016 | $8,860 | $9,856 | $9,362 |
| 03/2016 | $9,502 | $10,525 | $10,036 |
| 04/2016 | $9,772 | $10,566 | $10,247 |
| 05/2016 | $9,803 | $10,755 | $10,406 |
| 06/2016 | $9,654 | $10,783 | $10,496 |
| 07/2016 | $10,030 | $11,181 | $10,801 |
| 08/2016 | $10,229 | $11,196 | $10,884 |
| 09/2016 | $10,210 | $11,199 | $10,861 |
| 10/2016 | $10,092 | $10,994 | $10,693 |
| 11/2016 | $10,898 | $11,401 | $11,304 |
| 12/2016 | $11,097 | $11,627 | $11,587 |
| 01/2017 | $11,186 | $11,847 | $11,669 |
| 02/2017 | $11,532 | $12,318 | $12,089 |
| 03/2017 | $11,504 | $12,332 | $11,965 |
| 04/2017 | $11,536 | $12,459 | $11,943 |
| 05/2017 | $11,556 | $12,634 | $11,931 |
| 06/2017 | $11,834 | $12,713 | $12,126 |
| 07/2017 | $11,935 | $12,974 | $12,287 |
| 08/2017 | $11,810 | $13,014 | $12,144 |
| 09/2017 | $12,325 | $13,283 | $12,504 |
| 10/2017 | $12,474 | $13,593 | $12,595 |
| 11/2017 | $12,732 | $14,009 | $12,980 |
| 12/2017 | $12,992 | $14,165 | $13,170 |
| 01/2018 | $13,688 | $14,976 | $13,679 |
| 02/2018 | $12,917 | $14,424 | $13,026 |
| 03/2018 | $12,631 | $14,058 | $12,797 |
| 04/2018 | $12,765 | $14,112 | $12,839 |
| 05/2018 | $12,845 | $14,451 | $12,915 |
| 06/2018 | $12,912 | $14,540 | $12,947 |
| 07/2018 | $13,501 | $15,081 | $13,460 |
| 08/2018 | $13,585 | $15,573 | $13,659 |
| 09/2018 | $13,617 | $15,662 | $13,686 |
| 10/2018 | $12,667 | $14,591 | $12,977 |
| 11/2018 | $12,845 | $14,888 | $13,364 |
| 12/2018 | $11,439 | $13,544 | $12,081 |
| 01/2019 | $12,602 | $14,629 | $13,021 |
| 02/2019 | $12,992 | $15,099 | $13,437 |
| 03/2019 | $12,987 | $15,393 | $13,523 |
| 04/2019 | $13,608 | $16,016 | $14,003 |
| 05/2019 | $12,578 | $14,998 | $13,102 |
| 06/2019 | $13,544 | $16,055 | $14,043 |
| 07/2019 | $13,677 | $16,286 | $14,159 |
| 08/2019 | $13,218 | $16,028 | $13,743 |
| 09/2019 | $13,696 | $16,328 | $14,233 |
| 10/2019 | $13,953 | $16,681 | $14,432 |
| 11/2019 | $14,416 | $17,287 | $14,878 |
| 12/2019 | $14,833 | $17,809 | $15,288 |
| 01/2020 | $14,297 | $17,802 | $14,959 |
| 02/2020 | $12,882 | $16,336 | $13,510 |
| 03/2020 | $10,361 | $14,319 | $11,201 |
| 04/2020 | $11,602 | $16,154 | $12,460 |
| 05/2020 | $12,128 | $16,923 | $12,887 |
| 06/2020 | $12,193 | $17,260 | $12,802 |
| 07/2020 | $12,594 | $18,233 | $13,308 |
| 08/2020 | $13,104 | $19,544 | $13,858 |
| 09/2020 | $12,708 | $18,801 | $13,518 |
| 10/2020 | $12,665 | $18,301 | $13,340 |
| 11/2020 | $14,687 | $20,305 | $15,135 |
| 12/2020 | $15,334 | $21,085 | $15,715 |
| 01/2021 | $15,184 | $20,872 | $15,571 |
| 02/2021 | $16,407 | $21,448 | $16,512 |
| 03/2021 | $17,436 | $22,387 | $17,484 |
| 04/2021 | $18,216 | $23,582 | $18,183 |
| 05/2021 | $18,728 | $23,747 | $18,607 |
| 06/2021 | $18,453 | $24,301 | $18,394 |
| 07/2021 | $18,460 | $24,878 | $18,541 |
| 08/2021 | $18,828 | $25,635 | $18,909 |
| 09/2021 | $18,247 | $24,443 | $18,251 |
| 10/2021 | $19,333 | $26,155 | $19,178 |
| 11/2021 | $18,534 | $25,974 | $18,502 |
| 12/2021 | $19,625 | $27,138 | $19,669 |
| 01/2022 | $19,472 | $25,734 | $19,211 |
| 02/2022 | $19,152 | $24,963 | $18,988 |
| 03/2022 | $19,499 | $25,890 | $19,524 |
| 04/2022 | $18,234 | $23,632 | $18,423 |
| 05/2022 | $18,999 | $23,676 | $18,781 |
| 06/2022 | $17,170 | $21,721 | $17,140 |
| 07/2022 | $18,380 | $23,724 | $18,276 |
| 08/2022 | $17,942 | $22,757 | $17,732 |
| 09/2022 | $16,245 | $20,661 | $16,177 |
| 10/2022 | $18,227 | $22,333 | $17,836 |
| 11/2022 | $19,367 | $23,582 | $18,950 |
| 12/2022 | $18,596 | $22,223 | $18,186 |
| 01/2023 | $19,733 | $23,619 | $19,129 |
| 02/2023 | $18,985 | $23,043 | $18,454 |
| 03/2023 | $18,596 | $23,889 | $18,369 |
| 04/2023 | $18,892 | $24,262 | $18,646 |
| 05/2023 | $18,198 | $24,367 | $17,927 |
| 06/2023 | $19,444 | $25,977 | $19,118 |
| 07/2023 | $20,332 | $26,812 | $19,790 |
| 08/2023 | $19,834 | $26,385 | $19,256 |
| 09/2023 | $19,141 | $25,127 | $18,513 |
| 10/2023 | $18,627 | $24,599 | $17,860 |
| 11/2023 | $19,951 | $26,845 | $19,207 |
| 12/2023 | $21,103 | $28,065 | $20,271 |
| 01/2024 | $21,243 | $28,536 | $20,292 |
| 02/2024 | $21,965 | $30,060 | $21,041 |
| 03/2024 | $23,187 | $31,027 | $22,092 |
| 04/2024 | $22,235 | $29,760 | $21,149 |
| 05/2024 | $23,015 | $31,236 | $21,819 |
| 06/2024 | $22,834 | $32,356 | $21,614 |
| 07/2024 | $23,926 | $32,750 | $22,719 |
| 08/2024 | $24,475 | $33,545 | $23,328 |
| 09/2024 | $24,672 | $34,261 | $23,652 |
| 10/2024 | $24,590 | $33,950 | $23,392 |
Average Annual Total Returns (%)
| HEADER | 1 Year | 5 Years | 10 Years |
|---|
R6 ClassFootnote Reference1 | 32.02% | 12.00% | 9.41% |
S&P 500® Index TR | 38.02% | 15.27% | 13.00% |
Russell 1000® Value Index | 30.98% | 10.14% | 8.87% |
| Footnote | Description |
Footnote1 | Return may differ from actual shareholder return due to accounting adjustments for financial reporting purposes. |
Performance shown is historical and is not indicative of future returns. Investment returns and principal value will vary, and shares may be worth more or less at redemption than at original purchase. Performance shown is as of date indicated, and current performance may be lower or higher than the performance data quoted. To obtain performance as of the most recent month end, please visit americanbeaconfunds.com or call 800-967-9009. The graph and table do not reflect the deduction of taxes that a shareholder would pay on fund distributions or redemption of fund shares. Performance includes historical performance of another Class of the Fund.
The S&P 500 Index TR is replacing the Russell 1000 Value Index as the broad-based securities market index to comply with a new regulatory requirement. The Russell 1000 Value Index reflects the market sectors in which the Fund invests.
| Total Net Assets | $3,483,740,480 |
| # of Portfolio Holdings | 170 |
| Portfolio Turnover Rate | 26% |
| Total Management Fees Paid | $18,952,178 |
What did the Fund invest in?
Top Ten Holdings - % Net Assets
| Citigroup, Inc. | 1.8 |
| Fidelity National Information Services, Inc. | 1.8 |
| Comcast Corp., Class A | 1.8 |
| Elevance Health, Inc. | 1.6 |
| JPMorgan Chase & Co. | 1.5 |
| Exxon Mobil Corp. | 1.5 |
| Wells Fargo & Co. | 1.4 |
| American Express Co. | 1.3 |
| Entergy Corp. | 1.3 |
| F5, Inc. | 1.3 |
Excludes cash equivalents.
Asset Allocation - % Investments
| Value | Value |
|---|
| Common Stocks | 89.8 |
| Foreign Common Stocks | 6.2 |
| Investment Companies | 3.9 |
| Securities Lending Collateral | 0.1 |
The Fund may purchase and sell futures contracts to gain market exposure on cash balances.
Sector Allocation - % Equities
| Value | Value |
|---|
| Real Estate | 2.0 |
| Materials | 4.1 |
| Communication Services | 4.3 |
| Consumer Staples | 6.0 |
| Utilities | 6.9 |
| Consumer Discretionary | 7.6 |
| Information Technology | 9.8 |
| Energy | 9.9 |
| Industrials | 12.4 |
| Health Care | 13.6 |
| Financials | 23.4 |
For additional information about the Fund, including its prospectus, financial statements, holdings, and proxy voting information, please visit www.americanbeaconfunds.com/literature or call 1-800-658-5811.
If your financial institution mailed only one copy of this Report to an address shared by more than one account, you can request an individual copy by contacting your financial institution.
Distributed by:
Resolute Investment Distributors, Inc.
Annual Shareholder Report - October 31, 2024
Annual Shareholder Report - October 31, 2024
This annual shareholder report contains important information about American Beacon Small Cap Value Fund for the period of November 1, 2023 to October 31, 2024. You can find additional information about the Fund at www.americanbeaconfunds.com/literature. You can also request this information by contacting us at 800-658-5811.
What were the Fund costs for the last year?
(based on a hypothetical $10,000 investment)
| Class Name | Costs of a $10,000 investment | Costs paid as a percentage of a $10,000 investment |
|---|
| R5 | $90 | 0.79% |
How did the Fund perform and what affected its performance?
The R5 Class of the Fund returned 28.05% for the twelve months ended October 31, 2024, compared to the S&P 500® Index TR return of 38.02% and the Russell 2000® Value Index return of 31.77%.
• Broad market performance during the period was primarily driven by a 50-basis point interest rate cut, the first since the pandemic and increasing optimism that the U.S. economy could avoid a recession.
• The Fund’s focus is on finding undervalued, high-quality companies with above average earnings growth.
• The Fund's performance was positive in ten of the eleven sectors where it invested, except for the Energy sector. The Fund's holdings in the Information Technology, Industrials and Financials sectors were the top contributors to the Fund's positive relative performance, while holdings in the Consumer Discretionary, Materials and Health Care sectors detracted from relative returns.
Cumulative Performance from October 31, 2014 through October 31, 2024
The initial investment, based on a $250,000 investment, is adjusted to reflect the maximum applicable sales charge, if any.
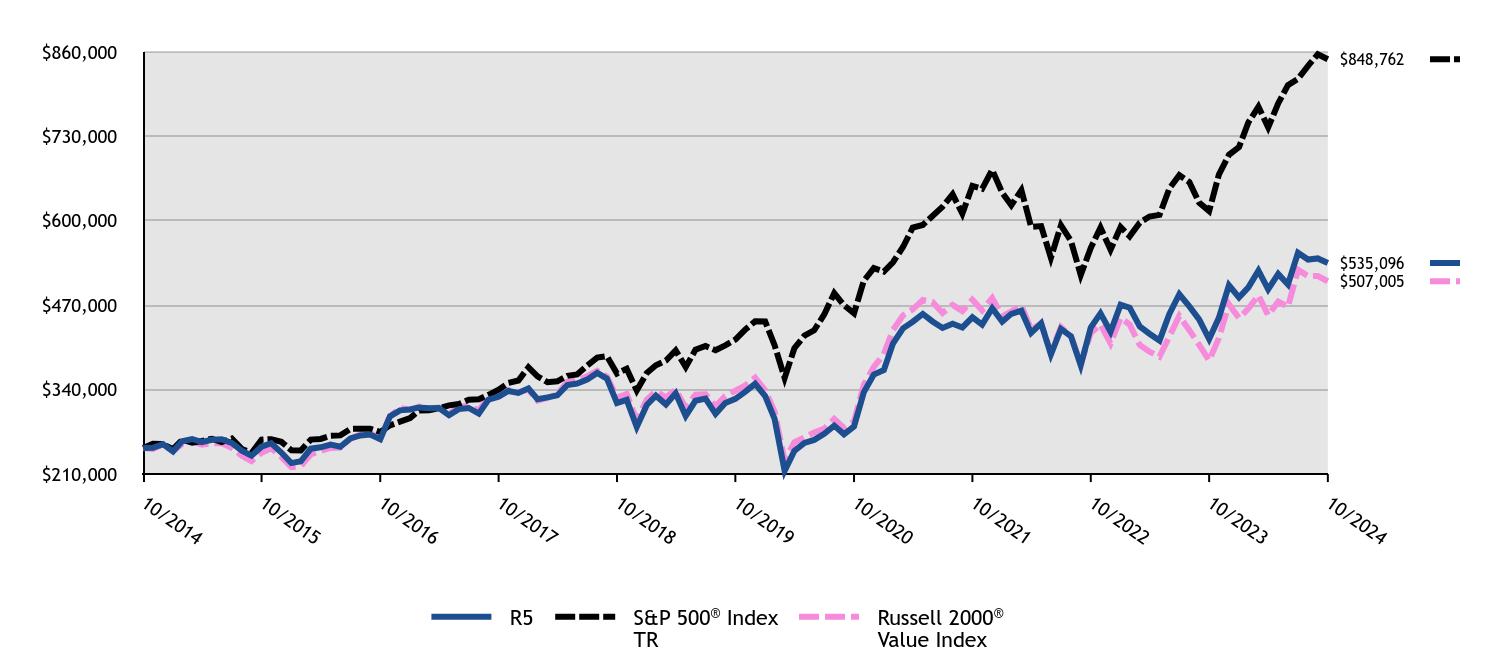
| R5 | S&P 500® Index TR | Russell 2000® Value Index |
|---|
| 10/2014 | $250,000 | $250,000 | $250,000 |
| 11/2014 | $250,450 | $256,724 | $248,838 |
| 12/2014 | $256,061 | $256,077 | $255,637 |
| 01/2015 | $244,928 | $248,389 | $244,997 |
| 02/2015 | $260,453 | $262,665 | $256,374 |
| 03/2015 | $264,028 | $258,511 | $260,700 |
| 04/2015 | $259,330 | $260,991 | $255,132 |
| 05/2015 | $262,700 | $264,347 | $257,246 |
| 06/2015 | $263,517 | $259,230 | $257,582 |
| 07/2015 | $258,002 | $264,661 | $250,477 |
| 08/2015 | $246,052 | $248,693 | $238,176 |
| 09/2015 | $238,289 | $242,539 | $229,931 |
| 10/2015 | $252,180 | $262,999 | $242,805 |
| 11/2015 | $257,491 | $263,781 | $249,708 |
| 12/2015 | $243,165 | $259,620 | $236,544 |
| 01/2016 | $226,925 | $246,737 | $220,653 |
| 02/2016 | $229,740 | $246,404 | $222,158 |
| 03/2016 | $249,120 | $263,120 | $240,572 |
| 04/2016 | $251,177 | $264,140 | $245,668 |
| 05/2016 | $255,508 | $268,883 | $250,171 |
| 06/2016 | $252,043 | $269,580 | $250,932 |
| 07/2016 | $264,818 | $279,519 | $264,471 |
| 08/2016 | $269,474 | $279,912 | $271,043 |
| 09/2016 | $270,881 | $279,964 | $273,179 |
| 10/2016 | $263,628 | $274,857 | $264,201 |
| 11/2016 | $298,922 | $285,037 | $299,267 |
| 12/2016 | $308,170 | $290,671 | $311,626 |
| 01/2017 | $309,508 | $296,184 | $309,401 |
| 02/2017 | $312,631 | $307,944 | $313,878 |
| 03/2017 | $311,404 | $308,303 | $311,221 |
| 04/2017 | $311,739 | $311,470 | $312,446 |
| 05/2017 | $300,697 | $315,853 | $302,716 |
| 06/2017 | $310,066 | $317,824 | $313,306 |
| 07/2017 | $311,739 | $324,360 | $315,288 |
| 08/2017 | $303,039 | $325,353 | $307,539 |
| 09/2017 | $324,677 | $332,064 | $329,314 |
| 10/2017 | $329,138 | $339,813 | $329,746 |
| 11/2017 | $337,950 | $350,235 | $339,288 |
| 12/2017 | $334,907 | $354,129 | $336,050 |
| 01/2018 | $341,994 | $374,404 | $340,191 |
| 02/2018 | $325,255 | $360,605 | $323,182 |
| 03/2018 | $328,187 | $351,441 | $327,179 |
| 04/2018 | $331,242 | $352,789 | $332,850 |
| 05/2018 | $347,248 | $361,285 | $352,214 |
| 06/2018 | $349,447 | $363,509 | $354,347 |
| 07/2018 | $355,434 | $377,036 | $360,603 |
| 08/2018 | $365,820 | $389,322 | $369,193 |
| 09/2018 | $357,023 | $391,538 | $360,033 |
| 10/2018 | $319,390 | $364,776 | $327,797 |
| 11/2018 | $324,277 | $372,210 | $333,082 |
| 12/2018 | $282,568 | $338,603 | $292,821 |
| 01/2019 | $316,375 | $365,737 | $324,849 |
| 02/2019 | $330,743 | $377,480 | $337,475 |
| 03/2019 | $317,220 | $384,815 | $327,745 |
| 04/2019 | $334,546 | $400,396 | $340,139 |
| 05/2019 | $299,472 | $374,952 | $312,357 |
| 06/2019 | $322,855 | $401,377 | $332,252 |
| 07/2019 | $326,095 | $407,146 | $332,786 |
| 08/2019 | $302,712 | $400,696 | $314,214 |
| 09/2019 | $319,333 | $408,193 | $330,348 |
| 10/2019 | $325,813 | $417,035 | $338,350 |
| 11/2019 | $336,518 | $432,173 | $346,272 |
| 12/2019 | $349,008 | $445,216 | $358,395 |
| 01/2020 | $330,073 | $445,042 | $339,064 |
| 02/2020 | $294,928 | $408,406 | $306,116 |
| 03/2020 | $214,884 | $357,963 | $230,590 |
| 04/2020 | $245,582 | $403,852 | $259,035 |
| 05/2020 | $257,919 | $423,086 | $266,469 |
| 06/2020 | $262,652 | $431,500 | $274,184 |
| 07/2020 | $271,976 | $455,830 | $279,840 |
| 08/2020 | $284,600 | $488,596 | $294,915 |
| 09/2020 | $271,259 | $470,031 | $281,192 |
| 10/2020 | $283,452 | $457,531 | $291,249 |
| 11/2020 | $335,811 | $507,614 | $347,479 |
| 12/2020 | $363,131 | $527,131 | $375,004 |
| 01/2021 | $370,223 | $521,809 | $394,734 |
| 02/2021 | $411,037 | $536,198 | $431,819 |
| 03/2021 | $434,339 | $559,681 | $454,385 |
| 04/2021 | $444,615 | $589,551 | $463,576 |
| 05/2021 | $456,628 | $593,668 | $478,002 |
| 06/2021 | $445,049 | $607,527 | $475,105 |
| 07/2021 | $435,063 | $621,959 | $458,099 |
| 08/2021 | $441,431 | $640,870 | $470,365 |
| 09/2021 | $435,786 | $611,063 | $460,942 |
| 10/2021 | $451,417 | $653,876 | $478,517 |
| 11/2021 | $440,273 | $649,345 | $462,172 |
| 12/2021 | $465,369 | $678,446 | $481,020 |
| 01/2022 | $444,762 | $643,338 | $452,974 |
| 02/2022 | $456,769 | $624,076 | $460,469 |
| 03/2022 | $461,637 | $647,248 | $469,479 |
| 04/2022 | $427,400 | $590,806 | $433,045 |
| 05/2022 | $442,166 | $591,890 | $441,356 |
| 06/2022 | $394,136 | $543,033 | $397,756 |
| 07/2022 | $433,566 | $593,104 | $436,265 |
| 08/2022 | $422,207 | $568,916 | $422,470 |
| 09/2022 | $377,423 | $516,519 | $379,419 |
| 10/2022 | $435,675 | $558,337 | $427,185 |
| 11/2022 | $457,418 | $589,540 | $440,236 |
| 12/2022 | $429,162 | $555,574 | $411,352 |
| 01/2023 | $470,681 | $590,482 | $450,606 |
| 02/2023 | $466,281 | $576,075 | $440,217 |
| 03/2023 | $437,389 | $597,225 | $408,650 |
| 04/2023 | $426,101 | $606,547 | $398,459 |
| 05/2023 | $415,577 | $609,184 | $390,621 |
| 06/2023 | $456,331 | $649,436 | $421,651 |
| 07/2023 | $486,945 | $670,299 | $453,470 |
| 08/2023 | $468,194 | $659,627 | $431,656 |
| 09/2023 | $448,104 | $628,177 | $409,174 |
| 10/2023 | $417,873 | $614,969 | $384,767 |
| 11/2023 | $450,591 | $671,131 | $419,401 |
| 12/2023 | $500,761 | $701,621 | $471,601 |
| 01/2024 | $481,887 | $713,411 | $450,178 |
| 02/2024 | $497,549 | $751,504 | $464,906 |
| 03/2024 | $523,249 | $775,683 | $485,281 |
| 04/2024 | $494,537 | $744,001 | $454,360 |
| 05/2024 | $518,230 | $780,892 | $475,609 |
| 06/2024 | $501,966 | $808,912 | $467,593 |
| 07/2024 | $550,757 | $818,758 | $524,580 |
| 08/2024 | $540,316 | $838,619 | $514,733 |
| 09/2024 | $542,123 | $856,529 | $515,062 |
| 10/2024 | $535,096 | $848,762 | $507,005 |
Average Annual Total Returns (%)
| HEADER | 1 Year | 5 Years | 10 Years |
|---|
Class R5Footnote Reference1 | 28.05% | 10.43% | 7.91% |
S&P 500® Index TR | 38.02% | 15.27% | 13.00% |
Russell 2000® Value Index | 31.77% | 8.42% | 7.33% |
| Footnote | Description |
Footnote1 | Return may differ from actual shareholder return due to accounting adjustments for financial reporting purposes. |
Performance shown is historical and is not indicative of future returns. Investment returns and principal value will vary, and shares may be worth more or less at redemption than at original purchase. Performance shown is as of date indicated, and current performance may be lower or higher than the performance data quoted. To obtain performance as of the most recent month end, please visit americanbeaconfunds.com or call 800-967-9009. The graph and table do not reflect the deduction of taxes that a shareholder would pay on fund distributions or redemption of fund shares.
The S&P 500 Index TR is replacing the Russell 2000 Value Index as the broad-based securities market index to comply with a new regulatory requirement. The Russell 2000 Value Index reflects the market sectors in which the Fund invests.
| Total Net Assets | $4,602,724,944 |
| # of Portfolio Holdings | 454 |
| Portfolio Turnover Rate | 52% |
| Total Management Fees Paid | $32,443,065 |
What did the Fund invest in?
Top Ten Holdings - % Net Assets
| F5, Inc. | 1.3 |
| Columbia Banking System, Inc. | 1.3 |
| NOV, Inc. | 1.2 |
| Greenbrier Cos., Inc. | 1.1 |
| Avnet, Inc. | 1.1 |
| Texas Capital Bancshares, Inc. | 1.0 |
| Coherent Corp. | 1.0 |
| HA Sustainable Infrastructure Capital, Inc. | 0.9 |
| Enerpac Tool Group Corp. | 0.9 |
| Fluor Corp. | 0.9 |
Excludes cash equivalents.
Asset Allocation - % Investments
| Value | Value |
|---|
| Common Stocks | 91.0 |
| Investment Companies | 4.5 |
| Foreign Common Stocks | 4.1 |
| Securities Lending Collateral | 0.4 |
The Fund may purchase and sell futures contracts to gain market exposure on cash balances.
Sector Allocation - % Equities
| Value | Value |
|---|
| Consumer Staples | 2.3 |
| Communication Services | 2.4 |
| Utilities | 2.7 |
| Health Care | 3.4 |
| Real Estate | 5.5 |
| Materials | 7.2 |
| Energy | 7.3 |
| Information Technology | 10.6 |
| Consumer Discretionary | 12.6 |
| Industrials | 20.7 |
| Financials | 25.3 |
For additional information about the Fund, including its prospectus, financial statements, holdings, and proxy voting information, please visit www.americanbeaconfunds.com/literature or call 1-800-658-5811.
If your financial institution mailed only one copy of this Report to an address shared by more than one account, you can request an individual copy by contacting your financial institution.
Distributed by:
Resolute Investment Distributors, Inc.
Annual Shareholder Report - October 31, 2024
Annual Shareholder Report - October 31, 2024
This annual shareholder report contains important information about American Beacon Small Cap Value Fund for the period of November 1, 2023 to October 31, 2024. You can find additional information about the Fund at www.americanbeaconfunds.com/literature. You can also request this information by contacting us at 800-658-5811.
What were the Fund costs for the last year?
(based on a hypothetical $10,000 investment)
| Class Name | Costs of a $10,000 investment | Costs paid as a percentage of a $10,000 investment |
|---|
| Investor | $130 | 1.14% |
How did the Fund perform and what affected its performance?
The Investor Class of the Fund returned 27.60% for the twelve months ended October 31, 2024, compared to the S&P 500® Index TR return of 38.02% and the Russell 2000® Value Index return of 31.77%.
• Broad market performance during the period was primarily driven by a 50-basis point interest rate cut, the first since the pandemic and increasing optimism that the U.S. economy could avoid a recession.
• The Fund’s focus is on finding undervalued, high-quality companies with above average earnings growth.
• The Fund's performance was positive in ten of the eleven sectors where it invested, except for the Energy sector. The Fund's holdings in the Information Technology, Industrials and Financials sectors were the top contributors to the Fund's positive relative performance, while holdings in the Consumer Discretionary, Materials and Health Care sectors detracted from relative returns.
Cumulative Performance from October 31, 2014 through October 31, 2024
The initial investment, based on a $10,000 investment, is adjusted to reflect the maximum applicable sales charge, if any.
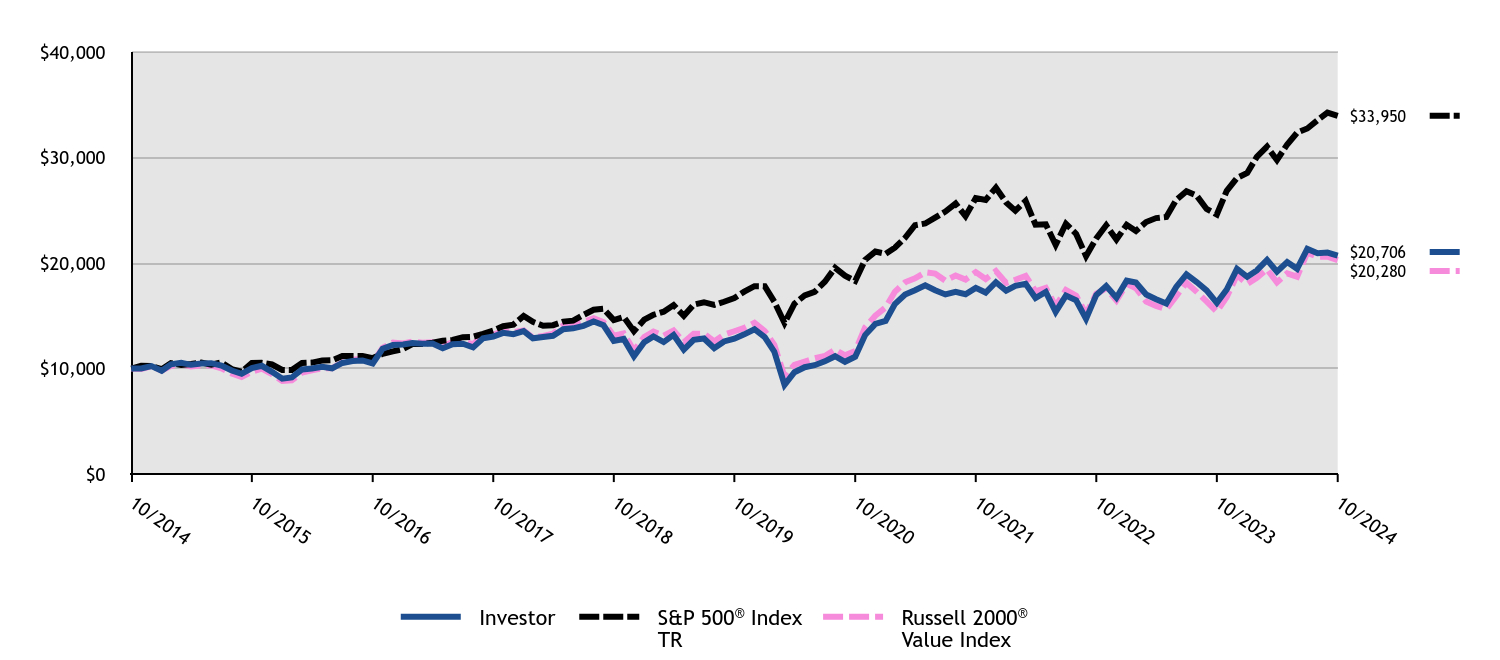
| Investor | S&P 500® Index TR | Russell 2000® Value Index |
|---|
| 10/2014 | $10,000 | $10,000 | $10,000 |
| 11/2014 | $10,015 | $10,269 | $9,954 |
| 12/2014 | $10,235 | $10,243 | $10,225 |
| 01/2015 | $9,789 | $9,936 | $9,800 |
| 02/2015 | $10,404 | $10,507 | $10,255 |
| 03/2015 | $10,547 | $10,340 | $10,428 |
| 04/2015 | $10,353 | $10,440 | $10,205 |
| 05/2015 | $10,484 | $10,574 | $10,290 |
| 06/2015 | $10,513 | $10,369 | $10,303 |
| 07/2015 | $10,290 | $10,586 | $10,019 |
| 08/2015 | $9,814 | $9,948 | $9,527 |
| 09/2015 | $9,498 | $9,702 | $9,197 |
| 10/2015 | $10,050 | $10,520 | $9,712 |
| 11/2015 | $10,261 | $10,551 | $9,988 |
| 12/2015 | $9,686 | $10,385 | $9,462 |
| 01/2016 | $9,036 | $9,869 | $8,826 |
| 02/2016 | $9,152 | $9,856 | $8,886 |
| 03/2016 | $9,918 | $10,525 | $9,623 |
| 04/2016 | $9,998 | $10,566 | $9,827 |
| 05/2016 | $10,168 | $10,755 | $10,007 |
| 06/2016 | $10,025 | $10,783 | $10,037 |
| 07/2016 | $10,533 | $11,181 | $10,579 |
| 08/2016 | $10,711 | $11,196 | $10,842 |
| 09/2016 | $10,765 | $11,199 | $10,927 |
| 10/2016 | $10,480 | $10,994 | $10,568 |
| 11/2016 | $11,874 | $11,401 | $11,971 |
| 12/2016 | $12,238 | $11,627 | $12,465 |
| 01/2017 | $12,289 | $11,847 | $12,376 |
| 02/2017 | $12,412 | $12,318 | $12,555 |
| 03/2017 | $12,357 | $12,332 | $12,449 |
| 04/2017 | $12,367 | $12,459 | $12,498 |
| 05/2017 | $11,927 | $12,634 | $12,109 |
| 06/2017 | $12,298 | $12,713 | $12,532 |
| 07/2017 | $12,357 | $12,974 | $12,612 |
| 08/2017 | $12,009 | $13,014 | $12,302 |
| 09/2017 | $12,866 | $13,283 | $13,173 |
| 10/2017 | $13,040 | $13,593 | $13,190 |
| 11/2017 | $13,384 | $14,009 | $13,572 |
| 12/2017 | $13,260 | $14,165 | $13,442 |
| 01/2018 | $13,542 | $14,976 | $13,608 |
| 02/2018 | $12,869 | $14,424 | $12,927 |
| 03/2018 | $12,984 | $14,058 | $13,087 |
| 04/2018 | $13,100 | $14,112 | $13,314 |
| 05/2018 | $13,732 | $14,451 | $14,089 |
| 06/2018 | $13,813 | $14,540 | $14,174 |
| 07/2018 | $14,044 | $15,081 | $14,424 |
| 08/2018 | $14,455 | $15,573 | $14,768 |
| 09/2018 | $14,104 | $15,662 | $14,401 |
| 10/2018 | $12,613 | $14,591 | $13,112 |
| 11/2018 | $12,803 | $14,888 | $13,323 |
| 12/2018 | $11,153 | $13,544 | $11,713 |
| 01/2019 | $12,487 | $14,629 | $12,994 |
| 02/2019 | $13,049 | $15,099 | $13,499 |
| 03/2019 | $12,510 | $15,393 | $13,110 |
| 04/2019 | $13,188 | $16,016 | $13,606 |
| 05/2019 | $11,803 | $14,998 | $12,494 |
| 06/2019 | $12,719 | $16,055 | $13,290 |
| 07/2019 | $12,846 | $16,286 | $13,311 |
| 08/2019 | $11,924 | $16,028 | $12,569 |
| 09/2019 | $12,568 | $16,328 | $13,214 |
| 10/2019 | $12,823 | $16,681 | $13,534 |
| 11/2019 | $13,240 | $17,287 | $13,851 |
| 12/2019 | $13,727 | $17,809 | $14,336 |
| 01/2020 | $12,979 | $17,802 | $13,563 |
| 02/2020 | $11,595 | $16,336 | $12,245 |
| 03/2020 | $8,444 | $14,319 | $9,224 |
| 04/2020 | $9,652 | $16,154 | $10,361 |
| 05/2020 | $10,129 | $16,923 | $10,659 |
| 06/2020 | $10,317 | $17,260 | $10,967 |
| 07/2020 | $10,682 | $18,233 | $11,194 |
| 08/2020 | $11,171 | $19,544 | $11,797 |
| 09/2020 | $10,641 | $18,801 | $11,248 |
| 10/2020 | $11,118 | $18,301 | $11,650 |
| 11/2020 | $13,173 | $20,305 | $13,899 |
| 12/2020 | $14,235 | $21,085 | $15,000 |
| 01/2021 | $14,513 | $20,872 | $15,789 |
| 02/2021 | $16,107 | $21,448 | $17,273 |
| 03/2021 | $17,014 | $22,387 | $18,175 |
| 04/2021 | $17,417 | $23,582 | $18,543 |
| 05/2021 | $17,879 | $23,747 | $19,120 |
| 06/2021 | $17,417 | $24,301 | $19,004 |
| 07/2021 | $17,026 | $24,878 | $18,324 |
| 08/2021 | $17,269 | $25,635 | $18,815 |
| 09/2021 | $17,044 | $24,443 | $18,438 |
| 10/2021 | $17,648 | $26,155 | $19,141 |
| 11/2021 | $17,204 | $25,974 | $18,487 |
| 12/2021 | $18,181 | $27,138 | $19,241 |
| 01/2022 | $17,376 | $25,734 | $18,119 |
| 02/2022 | $17,842 | $24,963 | $18,419 |
| 03/2022 | $18,028 | $25,890 | $18,779 |
| 04/2022 | $16,684 | $23,632 | $17,322 |
| 05/2022 | $17,256 | $23,676 | $17,654 |
| 06/2022 | $15,379 | $21,721 | $15,910 |
| 07/2022 | $16,910 | $23,724 | $17,451 |
| 08/2022 | $16,464 | $22,757 | $16,899 |
| 09/2022 | $14,707 | $20,661 | $15,177 |
| 10/2022 | $16,976 | $22,333 | $17,087 |
| 11/2022 | $17,822 | $23,582 | $17,609 |
| 12/2022 | $16,716 | $22,223 | $16,454 |
| 01/2023 | $18,326 | $23,619 | $18,024 |
| 02/2023 | $18,152 | $23,043 | $17,609 |
| 03/2023 | $17,016 | $23,889 | $16,346 |
| 04/2023 | $16,574 | $24,262 | $15,938 |
| 05/2023 | $16,164 | $24,367 | $15,625 |
| 06/2023 | $17,742 | $25,977 | $16,866 |
| 07/2023 | $18,933 | $26,812 | $18,139 |
| 08/2023 | $18,199 | $26,385 | $17,266 |
| 09/2023 | $17,411 | $25,127 | $16,367 |
| 10/2023 | $16,227 | $24,599 | $15,391 |
| 11/2023 | $17,489 | $26,845 | $16,776 |
| 12/2023 | $19,440 | $28,065 | $18,864 |
| 01/2024 | $18,696 | $28,536 | $18,007 |
| 02/2024 | $19,300 | $30,060 | $18,596 |
| 03/2024 | $20,301 | $31,027 | $19,411 |
| 04/2024 | $19,176 | $29,760 | $18,174 |
| 05/2024 | $20,086 | $31,236 | $19,024 |
| 06/2024 | $19,449 | $32,356 | $18,704 |
| 07/2024 | $21,335 | $32,750 | $20,983 |
| 08/2024 | $20,929 | $33,545 | $20,589 |
| 09/2024 | $20,987 | $34,261 | $20,602 |
| 10/2024 | $20,706 | $33,950 | $20,280 |
Average Annual Total Returns (%)
| HEADER | 1 Year | 5 Years | 10 Years |
|---|
Investor ClassFootnote Reference1 | 27.60% | 10.06% | 7.55% |
S&P 500® Index TR | 38.02% | 15.27% | 13.00% |
Russell 2000® Value Index | 31.77% | 8.42% | 7.33% |
| Footnote | Description |
Footnote1 | Return may differ from actual shareholder return due to accounting adjustments for financial reporting purposes. |
Performance shown is historical and is not indicative of future returns. Investment returns and principal value will vary, and shares may be worth more or less at redemption than at original purchase. Performance shown is as of date indicated, and current performance may be lower or higher than the performance data quoted. To obtain performance as of the most recent month end, please visit americanbeaconfunds.com or call 800-967-9009. The graph and table do not reflect the deduction of taxes that a shareholder would pay on fund distributions or redemption of fund shares.
The S&P 500 Index TR is replacing the Russell 2000 Value Index as the broad-based securities market index to comply with a new regulatory requirement. The Russell 2000 Value Index reflects the market sectors in which the Fund invests.
| Total Net Assets | $4,602,724,944 |
| # of Portfolio Holdings | 454 |
| Portfolio Turnover Rate | 52% |
| Total Management Fees Paid | $32,443,065 |
What did the Fund invest in?
Top Ten Holdings - % Net Assets
| F5, Inc. | 1.3 |
| Columbia Banking System, Inc. | 1.3 |
| NOV, Inc. | 1.2 |
| Greenbrier Cos., Inc. | 1.1 |
| Avnet, Inc. | 1.1 |
| Texas Capital Bancshares, Inc. | 1.0 |
| Coherent Corp. | 1.0 |
| HA Sustainable Infrastructure Capital, Inc. | 0.9 |
| Enerpac Tool Group Corp. | 0.9 |
| Fluor Corp. | 0.9 |
Excludes cash equivalents.
Asset Allocation - % Investments
| Value | Value |
|---|
| Common Stocks | 91.0 |
| Investment Companies | 4.5 |
| Foreign Common Stocks | 4.1 |
| Securities Lending Collateral | 0.4 |
The Fund may purchase and sell futures contracts to gain market exposure on cash balances.
Sector Allocation - % Equities
| Value | Value |
|---|
| Consumer Staples | 2.3 |
| Communication Services | 2.4 |
| Utilities | 2.7 |
| Health Care | 3.4 |
| Real Estate | 5.5 |
| Materials | 7.2 |
| Energy | 7.3 |
| Information Technology | 10.6 |
| Consumer Discretionary | 12.6 |
| Industrials | 20.7 |
| Financials | 25.3 |
For additional information about the Fund, including its prospectus, financial statements, holdings, and proxy voting information, please visit www.americanbeaconfunds.com/literature or call 1-800-658-5811.
If your financial institution mailed only one copy of this Report to an address shared by more than one account, you can request an individual copy by contacting your financial institution.
Distributed by:
Resolute Investment Distributors, Inc.
Annual Shareholder Report - October 31, 2024
Annual Shareholder Report - October 31, 2024
This annual shareholder report contains important information about American Beacon Small Cap Value Fund for the period of November 1, 2023 to October 31, 2024. You can find additional information about the Fund at www.americanbeaconfunds.com/literature. You can also request this information by contacting us at 800-658-5811.
What were the Fund costs for the last year?
(based on a hypothetical $10,000 investment)
| Class Name | Costs of a $10,000 investment | Costs paid as a percentage of a $10,000 investment |
|---|
| Advisor Class | $147 | 1.29% |
How did the Fund perform and what affected its performance?
The Advisor Class of the Fund returned 27.40% for the twelve months ended October 31, 2024, compared to the S&P 500® Index TR return of 38.02% and the Russell 2000® Value Index return of 31.77%.
• Broad market performance during the period was primarily driven by a 50-basis point interest rate cut, the first since the pandemic and increasing optimism that the U.S. economy could avoid a recession.
• The Fund’s focus is on finding undervalued, high-quality companies with above average earnings growth.
• The Fund's performance was positive in ten of the eleven sectors where it invested, except for the Energy sector. The Fund's holdings in the Information Technology, Industrials and Financials sectors were the top contributors to the Fund's positive relative performance, while holdings in the Consumer Discretionary, Materials and Health Care sectors detracted from relative returns.
Cumulative Performance from October 31, 2014 through October 31, 2024
The initial investment, based on a $10,000 investment, is adjusted to reflect the maximum applicable sales charge, if any.
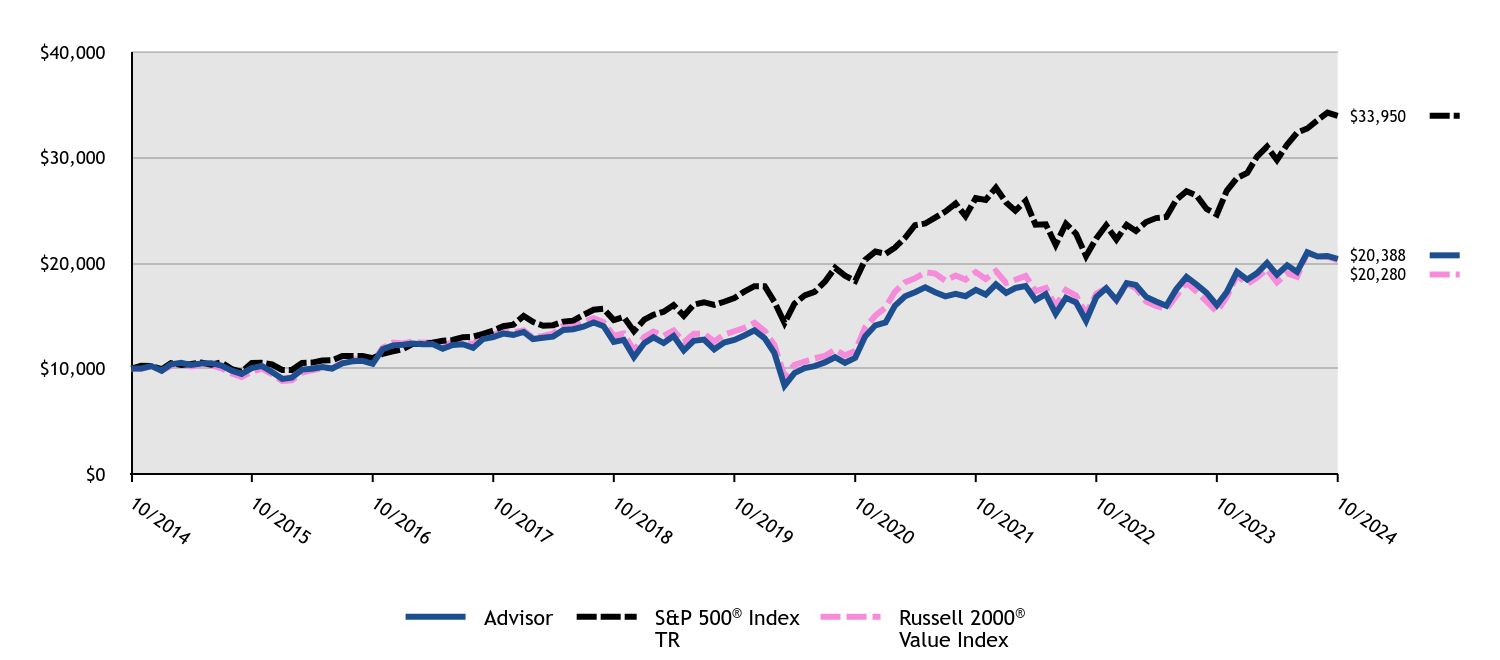
| Advisor | S&P 500® Index TR | Russell 2000® Value Index |
|---|
| 10/2014 | $10,000 | $10,000 | $10,000 |
| 11/2014 | $10,015 | $10,269 | $9,954 |
| 12/2014 | $10,232 | $10,243 | $10,225 |
| 01/2015 | $9,790 | $9,936 | $9,800 |
| 02/2015 | $10,402 | $10,507 | $10,255 |
| 03/2015 | $10,543 | $10,340 | $10,428 |
| 04/2015 | $10,347 | $10,440 | $10,205 |
| 05/2015 | $10,479 | $10,574 | $10,290 |
| 06/2015 | $10,509 | $10,369 | $10,303 |
| 07/2015 | $10,283 | $10,586 | $10,019 |
| 08/2015 | $9,802 | $9,948 | $9,527 |
| 09/2015 | $9,488 | $9,702 | $9,197 |
| 10/2015 | $10,041 | $10,520 | $9,712 |
| 11/2015 | $10,249 | $10,551 | $9,988 |
| 12/2015 | $9,670 | $10,385 | $9,462 |
| 01/2016 | $9,023 | $9,869 | $8,826 |
| 02/2016 | $9,135 | $9,856 | $8,886 |
| 03/2016 | $9,900 | $10,525 | $9,623 |
| 04/2016 | $9,976 | $10,566 | $9,827 |
| 05/2016 | $10,142 | $10,755 | $10,007 |
| 06/2016 | $9,999 | $10,783 | $10,037 |
| 07/2016 | $10,502 | $11,181 | $10,579 |
| 08/2016 | $10,682 | $11,196 | $10,842 |
| 09/2016 | $10,732 | $11,199 | $10,927 |
| 10/2016 | $10,444 | $10,994 | $10,568 |
| 11/2016 | $11,838 | $11,401 | $11,971 |
| 12/2016 | $12,197 | $11,627 | $12,465 |
| 01/2017 | $12,248 | $11,847 | $12,376 |
| 02/2017 | $12,368 | $12,318 | $12,555 |
| 03/2017 | $12,313 | $12,332 | $12,449 |
| 04/2017 | $12,322 | $12,459 | $12,498 |
| 05/2017 | $11,878 | $12,634 | $12,109 |
| 06/2017 | $12,243 | $12,713 | $12,532 |
| 07/2017 | $12,303 | $12,974 | $12,612 |
| 08/2017 | $11,957 | $13,014 | $12,302 |
| 09/2017 | $12,807 | $13,283 | $13,173 |
| 10/2017 | $12,978 | $13,593 | $13,190 |
| 11/2017 | $13,315 | $14,009 | $13,572 |
| 12/2017 | $13,194 | $14,165 | $13,442 |
| 01/2018 | $13,467 | $14,976 | $13,608 |
| 02/2018 | $12,800 | $14,424 | $12,927 |
| 03/2018 | $12,911 | $14,058 | $13,087 |
| 04/2018 | $13,027 | $14,112 | $13,314 |
| 05/2018 | $13,650 | $14,451 | $14,089 |
| 06/2018 | $13,731 | $14,540 | $14,174 |
| 07/2018 | $13,963 | $15,081 | $14,424 |
| 08/2018 | $14,368 | $15,573 | $14,768 |
| 09/2018 | $14,014 | $15,662 | $14,401 |
| 10/2018 | $12,532 | $14,591 | $13,112 |
| 11/2018 | $12,719 | $14,888 | $13,323 |
| 12/2018 | $11,077 | $13,544 | $11,713 |
| 01/2019 | $12,396 | $14,629 | $12,994 |
| 02/2019 | $12,956 | $15,099 | $13,499 |
| 03/2019 | $12,419 | $15,393 | $13,110 |
| 04/2019 | $13,090 | $16,016 | $13,606 |
| 05/2019 | $11,713 | $14,998 | $12,494 |
| 06/2019 | $12,624 | $16,055 | $13,290 |
| 07/2019 | $12,740 | $16,286 | $13,311 |
| 08/2019 | $11,824 | $16,028 | $12,569 |
| 09/2019 | $12,466 | $16,328 | $13,214 |
| 10/2019 | $12,717 | $16,681 | $13,534 |
| 11/2019 | $13,131 | $17,287 | $13,851 |
| 12/2019 | $13,617 | $17,809 | $14,336 |
| 01/2020 | $12,871 | $17,802 | $13,563 |
| 02/2020 | $11,498 | $16,336 | $12,245 |
| 03/2020 | $8,378 | $14,319 | $9,224 |
| 04/2020 | $9,568 | $16,154 | $10,361 |
| 05/2020 | $10,047 | $16,923 | $10,659 |
| 06/2020 | $10,225 | $17,260 | $10,967 |
| 07/2020 | $10,586 | $18,233 | $11,194 |
| 08/2020 | $11,071 | $19,544 | $11,797 |
| 09/2020 | $10,545 | $18,801 | $11,248 |
| 10/2020 | $11,012 | $18,301 | $11,650 |
| 11/2020 | $13,049 | $20,305 | $13,899 |
| 12/2020 | $14,098 | $21,085 | $15,000 |
| 01/2021 | $14,372 | $20,872 | $15,789 |
| 02/2021 | $15,949 | $21,448 | $17,273 |
| 03/2021 | $16,842 | $22,387 | $18,175 |
| 04/2021 | $17,240 | $23,582 | $18,543 |
| 05/2021 | $17,693 | $23,747 | $19,120 |
| 06/2021 | $17,240 | $24,301 | $19,004 |
| 07/2021 | $16,848 | $24,878 | $18,324 |
| 08/2021 | $17,086 | $25,635 | $18,815 |
| 09/2021 | $16,860 | $24,443 | $18,438 |
| 10/2021 | $17,461 | $26,155 | $19,141 |
| 11/2021 | $17,014 | $25,974 | $18,487 |
| 12/2021 | $17,983 | $27,138 | $19,241 |
| 01/2022 | $17,176 | $25,734 | $18,119 |
| 02/2022 | $17,636 | $24,963 | $18,419 |
| 03/2022 | $17,816 | $25,890 | $18,779 |
| 04/2022 | $16,488 | $23,632 | $17,322 |
| 05/2022 | $17,056 | $23,676 | $17,654 |
| 06/2022 | $15,194 | $21,721 | $15,910 |
| 07/2022 | $16,709 | $23,724 | $17,451 |
| 08/2022 | $16,262 | $22,757 | $16,899 |
| 09/2022 | $14,527 | $20,661 | $15,177 |
| 10/2022 | $16,769 | $22,333 | $17,087 |
| 11/2022 | $17,603 | $23,582 | $17,609 |
| 12/2022 | $16,501 | $22,223 | $16,454 |
| 01/2023 | $18,093 | $23,619 | $18,024 |
| 02/2023 | $17,919 | $23,043 | $17,609 |
| 03/2023 | $16,794 | $23,889 | $16,346 |
| 04/2023 | $16,359 | $24,262 | $15,938 |
| 05/2023 | $15,947 | $24,367 | $15,625 |
| 06/2023 | $17,507 | $25,977 | $16,866 |
| 07/2023 | $18,679 | $26,812 | $18,139 |
| 08/2023 | $17,950 | $26,385 | $17,266 |
| 09/2023 | $17,167 | $25,127 | $16,367 |
| 10/2023 | $16,003 | $24,599 | $15,391 |
| 11/2023 | $17,246 | $26,845 | $16,776 |
| 12/2023 | $19,160 | $28,065 | $18,864 |
| 01/2024 | $18,430 | $28,536 | $18,007 |
| 02/2024 | $19,027 | $30,060 | $18,596 |
| 03/2024 | $20,006 | $31,027 | $19,411 |
| 04/2024 | $18,894 | $29,760 | $18,174 |
| 05/2024 | $19,791 | $31,236 | $19,024 |
| 06/2024 | $19,160 | $32,356 | $18,704 |
| 07/2024 | $21,010 | $32,750 | $20,983 |
| 08/2024 | $20,612 | $33,545 | $20,589 |
| 09/2024 | $20,670 | $34,261 | $20,602 |
| 10/2024 | $20,388 | $33,950 | $20,280 |
Average Annual Total Returns (%)
| HEADER | 1 Year | 5 Years | 10 Years |
|---|
Advisor ClassFootnote Reference1 | 27.40% | 9.90% | 7.38% |
S&P 500® Index TR | 38.02% | 15.27% | 13.00% |
Russell 2000® Value Index | 31.77% | 8.42% | 7.33% |
| Footnote | Description |
Footnote1 | Return may differ from actual shareholder return due to accounting adjustments for financial reporting purposes. |
Performance shown is historical and is not indicative of future returns. Investment returns and principal value will vary, and shares may be worth more or less at redemption than at original purchase. Performance shown is as of date indicated, and current performance may be lower or higher than the performance data quoted. To obtain performance as of the most recent month end, please visit americanbeaconfunds.com or call 800-967-9009. The graph and table do not reflect the deduction of taxes that a shareholder would pay on fund distributions or redemption of fund shares.
The S&P 500 Index TR is replacing the Russell 2000 Value Index as the broad-based securities market index to comply with a new regulatory requirement. The Russell 2000 Value Index reflects the market sectors in which the Fund invests.
| Total Net Assets | $4,602,724,944 |
| # of Portfolio Holdings | 454 |
| Portfolio Turnover Rate | 52% |
| Total Management Fees Paid | $32,443,065 |
What did the Fund invest in?
Top Ten Holdings - % Net Assets
| F5, Inc. | 1.3 |
| Columbia Banking System, Inc. | 1.3 |
| NOV, Inc. | 1.2 |
| Greenbrier Cos., Inc. | 1.1 |
| Avnet, Inc. | 1.1 |
| Texas Capital Bancshares, Inc. | 1.0 |
| Coherent Corp. | 1.0 |
| HA Sustainable Infrastructure Capital, Inc. | 0.9 |
| Enerpac Tool Group Corp. | 0.9 |
| Fluor Corp. | 0.9 |
Excludes cash equivalents.
Asset Allocation - % Investments
| Value | Value |
|---|
| Common Stocks | 91.0 |
| Investment Companies | 4.5 |
| Foreign Common Stocks | 4.1 |
| Securities Lending Collateral | 0.4 |
The Fund may purchase and sell futures contracts to gain market exposure on cash balances.
Sector Allocation - % Equities
| Value | Value |
|---|
| Consumer Staples | 2.3 |
| Communication Services | 2.4 |
| Utilities | 2.7 |
| Health Care | 3.4 |
| Real Estate | 5.5 |
| Materials | 7.2 |
| Energy | 7.3 |
| Information Technology | 10.6 |
| Consumer Discretionary | 12.6 |
| Industrials | 20.7 |
| Financials | 25.3 |
For additional information about the Fund, including its prospectus, financial statements, holdings, and proxy voting information, please visit www.americanbeaconfunds.com/literature or call 1-800-658-5811.
If your financial institution mailed only one copy of this Report to an address shared by more than one account, you can request an individual copy by contacting your financial institution.
Distributed by:
Resolute Investment Distributors, Inc.
Annual Shareholder Report - October 31, 2024
Annual Shareholder Report - October 31, 2024
This annual shareholder report contains important information about American Beacon Small Cap Value Fund for the period of November 1, 2023 to October 31, 2024. You can find additional information about the Fund at www.americanbeaconfunds.com/literature. You can also request this information by contacting us at 800-658-5811.
What were the Fund costs for the last year?
(based on a hypothetical $10,000 investment)
| Class Name | Costs of a $10,000 investment | Costs paid as a percentage of a $10,000 investment |
|---|
| Y | $98 | 0.86% |
How did the Fund perform and what affected its performance?
The Y Class of the Fund returned 27.97% for the twelve months ended October 31, 2024, compared to the S&P 500® Index TR return of 38.02% and the Russell 2000® Value Index return of 31.77%.
• Broad market performance during the period was primarily driven by a 50-basis point interest rate cut, the first since the pandemic and increasing optimism that the U.S. economy could avoid a recession.
• The Fund’s focus is on finding undervalued, high-quality companies with above average earnings growth.
• The Fund's performance was positive in ten of the eleven sectors where it invested, except for the Energy sector. The Fund's holdings in the Information Technology, Industrials and Financials sectors were the top contributors to the Fund's positive relative performance, while holdings in the Consumer Discretionary, Materials and Health Care sectors detracted from relative returns.
Cumulative Performance from October 31, 2014 through October 31, 2024
The initial investment, based on a $100,000 investment, is adjusted to reflect the maximum applicable sales charge, if any.
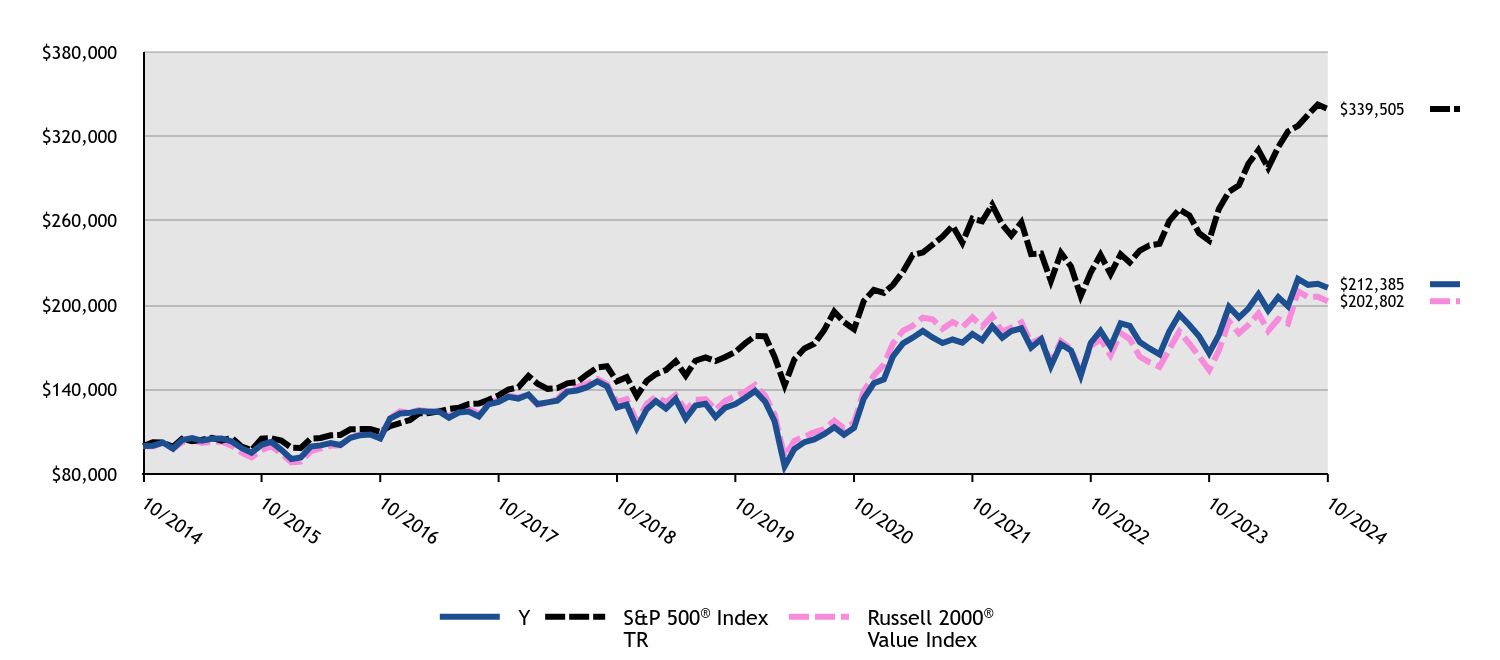
| #ERROR:A result could not be returned because the conditional could not be evaluated to a True/False value (#ERROR:Invalid Formula (#!=""), 'Multiple values from an iterator cannot be used in a formula unless they are aggregrated.') | Y | S&P 500® Index TR | Russell 2000® Value Index |
|---|
| 10/2014 | $100,000 | $100,000 | $100,000 |
| 11/2014 | $100,182 | $102,689 | $99,535 |
| 12/2014 | $102,405 | $102,431 | $102,255 |
| 01/2015 | $97,987 | $99,356 | $97,999 |
| 02/2015 | $104,139 | $105,066 | $102,550 |
| 03/2015 | $105,585 | $103,404 | $104,280 |
| 04/2015 | $103,685 | $104,396 | $102,053 |
| 05/2015 | $105,048 | $105,739 | $102,899 |
| 06/2015 | $105,337 | $103,692 | $103,033 |
| 07/2015 | $103,148 | $105,864 | $100,191 |
| 08/2015 | $98,358 | $99,477 | $95,271 |
| 09/2015 | $95,220 | $97,016 | $91,973 |
| 10/2015 | $100,795 | $105,199 | $97,122 |
| 11/2015 | $102,901 | $105,512 | $99,883 |
| 12/2015 | $97,181 | $103,848 | $94,618 |
| 01/2016 | $90,659 | $98,695 | $88,261 |
| 02/2016 | $91,797 | $98,562 | $88,863 |
| 03/2016 | $99,545 | $105,248 | $96,229 |
| 04/2016 | $100,377 | $105,656 | $98,267 |
| 05/2016 | $102,084 | $107,553 | $100,069 |
| 06/2016 | $100,683 | $107,832 | $100,373 |
| 07/2016 | $105,761 | $111,808 | $105,788 |
| 08/2016 | $107,643 | $111,965 | $108,417 |
| 09/2016 | $108,169 | $111,986 | $109,272 |
| 10/2016 | $105,323 | $109,943 | $105,680 |
| 11/2016 | $119,375 | $114,015 | $119,707 |
| 12/2016 | $123,045 | $116,268 | $124,650 |
| 01/2017 | $123,586 | $118,473 | $123,761 |
| 02/2017 | $124,848 | $123,178 | $125,551 |
| 03/2017 | $124,352 | $123,321 | $124,488 |
| 04/2017 | $124,443 | $124,588 | $124,978 |
| 05/2017 | $120,069 | $126,341 | $121,086 |
| 06/2017 | $123,766 | $127,130 | $125,322 |
| 07/2017 | $124,443 | $129,744 | $126,115 |
| 08/2017 | $120,926 | $130,141 | $123,016 |
| 09/2017 | $129,583 | $132,826 | $131,726 |
| 10/2017 | $131,341 | $135,925 | $131,898 |
| 11/2017 | $134,858 | $140,094 | $135,715 |
| 12/2017 | $133,684 | $141,652 | $134,420 |
| 01/2018 | $136,501 | $149,762 | $136,076 |
| 02/2018 | $129,780 | $144,242 | $129,273 |
| 03/2018 | $130,966 | $140,576 | $130,872 |
| 04/2018 | $132,152 | $141,116 | $133,140 |
| 05/2018 | $138,527 | $144,514 | $140,886 |
| 06/2018 | $139,417 | $145,403 | $141,739 |
| 07/2018 | $141,740 | $150,814 | $144,241 |
| 08/2018 | $145,940 | $155,729 | $147,677 |
| 09/2018 | $142,431 | $156,615 | $144,013 |
| 10/2018 | $127,358 | $145,910 | $131,119 |
| 11/2018 | $129,335 | $148,884 | $133,233 |
| 12/2018 | $112,701 | $135,441 | $117,128 |
| 01/2019 | $126,161 | $146,295 | $129,940 |
| 02/2019 | $131,865 | $150,992 | $134,990 |
| 03/2019 | $126,503 | $153,926 | $131,098 |
| 04/2019 | $133,348 | $160,158 | $136,056 |
| 05/2019 | $119,374 | $149,981 | $124,943 |
| 06/2019 | $128,671 | $160,551 | $132,901 |
| 07/2019 | $129,983 | $162,858 | $133,115 |
| 08/2019 | $120,629 | $160,278 | $125,686 |
| 09/2019 | $127,245 | $163,277 | $132,139 |
| 10/2019 | $129,812 | $166,814 | $135,340 |
| 11/2019 | $134,089 | $172,869 | $138,509 |
| 12/2019 | $139,036 | $178,087 | $143,358 |
| 01/2020 | $131,489 | $178,017 | $135,626 |
| 02/2020 | $117,499 | $163,363 | $122,446 |
| 03/2020 | $85,628 | $143,185 | $92,236 |
| 04/2020 | $97,819 | $161,541 | $103,614 |
| 05/2020 | $102,695 | $169,235 | $106,588 |
| 06/2020 | $104,611 | $172,600 | $109,674 |
| 07/2020 | $108,326 | $182,332 | $111,936 |
| 08/2020 | $113,319 | $195,438 | $117,966 |
| 09/2020 | $107,978 | $188,012 | $112,477 |
| 10/2020 | $112,854 | $183,012 | $116,500 |
| 11/2020 | $133,695 | $203,046 | $138,992 |
| 12/2020 | $144,537 | $210,852 | $150,002 |
| 01/2021 | $147,347 | $208,724 | $157,894 |
| 02/2021 | $163,563 | $214,479 | $172,727 |
| 03/2021 | $172,871 | $223,872 | $181,754 |
| 04/2021 | $176,969 | $235,820 | $185,430 |
| 05/2021 | $181,710 | $237,467 | $191,201 |
| 06/2021 | $177,086 | $243,011 | $190,042 |
| 07/2021 | $173,105 | $248,784 | $183,240 |
| 08/2021 | $175,622 | $256,348 | $188,146 |
| 09/2021 | $173,398 | $244,425 | $184,377 |
| 10/2021 | $179,603 | $261,550 | $191,407 |
| 11/2021 | $175,095 | $259,738 | $184,869 |
| 12/2021 | $185,116 | $271,378 | $192,408 |
| 01/2022 | $176,901 | $257,335 | $181,190 |
| 02/2022 | $181,633 | $249,630 | $184,188 |
| 03/2022 | $183,604 | $258,899 | $187,792 |
| 04/2022 | $170,002 | $236,323 | $173,218 |
| 05/2022 | $175,850 | $236,756 | $176,542 |
| 06/2022 | $156,727 | $217,213 | $159,102 |
| 07/2022 | $172,367 | $237,241 | $174,506 |
| 08/2022 | $167,833 | $227,566 | $168,988 |
| 09/2022 | $150,025 | $206,608 | $151,768 |
| 10/2022 | $173,222 | $223,335 | $170,874 |
| 11/2022 | $181,830 | $235,816 | $176,095 |
| 12/2022 | $170,622 | $222,229 | $164,541 |
| 01/2023 | $187,094 | $236,193 | $180,242 |
| 02/2023 | $185,385 | $230,430 | $176,087 |
| 03/2023 | $173,808 | $238,890 | $163,460 |
| 04/2023 | $169,301 | $242,619 | $159,384 |
| 05/2023 | $165,106 | $243,673 | $156,249 |
| 06/2023 | $181,267 | $259,774 | $168,660 |
| 07/2023 | $193,465 | $268,119 | $181,388 |
| 08/2023 | $186,006 | $263,851 | $172,662 |
| 09/2023 | $178,004 | $251,271 | $163,670 |
| 10/2023 | $165,961 | $245,987 | $153,907 |
| 11/2023 | $178,936 | $268,452 | $167,761 |
| 12/2023 | $198,927 | $280,648 | $188,640 |
| 01/2024 | $191,342 | $285,364 | $180,071 |
| 02/2024 | $197,622 | $300,602 | $185,962 |
| 03/2024 | $207,817 | $310,273 | $194,112 |
| 04/2024 | $196,399 | $297,600 | $181,744 |
| 05/2024 | $205,778 | $312,357 | $190,244 |
| 06/2024 | $199,335 | $323,565 | $187,037 |
| 07/2024 | $218,665 | $327,503 | $209,832 |
| 08/2024 | $214,505 | $335,447 | $205,893 |
| 09/2024 | $215,239 | $342,612 | $206,025 |
| 10/2024 | $212,385 | $339,505 | $202,802 |
Average Annual Total Returns (%)
| HEADER | 1 Year | 5 Years | 10 Years |
|---|
Class YFootnote Reference1 | 27.97% | 10.35% | 7.82% |
S&P 500® Index TR | 38.02% | 15.27% | 13.00% |
Russell 2000® Value Index | 31.77% | 8.42% | 7.33% |
| Footnote | Description |
Footnote1 | Return may differ from actual shareholder return due to accounting adjustments for financial reporting purposes. |
Performance shown is historical and is not indicative of future returns. Investment returns and principal value will vary, and shares may be worth more or less at redemption than at original purchase. Performance shown is as of date indicated, and current performance may be lower or higher than the performance data quoted. To obtain performance as of the most recent month end, please visit americanbeaconfunds.com or call 800-967-9009. The graph and table do not reflect the deduction of taxes that a shareholder would pay on fund distributions or redemption of fund shares.
The S&P 500 Index TR is replacing the Russell 2000 Value Index as the broad-based securities market index to comply with a new regulatory requirement. The Russell 2000 Value Index reflects the market sectors in which the Fund invests.
| Total Net Assets | $4,602,724,944 |
| # of Portfolio Holdings | 454 |
| Portfolio Turnover Rate | 52% |
| Total Management Fees Paid | $32,443,065 |
What did the Fund invest in?
Top Ten Holdings - % Net Assets
| F5, Inc. | 1.3 |
| Columbia Banking System, Inc. | 1.3 |
| NOV, Inc. | 1.2 |
| Greenbrier Cos., Inc. | 1.1 |
| Avnet, Inc. | 1.1 |
| Texas Capital Bancshares, Inc. | 1.0 |
| Coherent Corp. | 1.0 |
| HA Sustainable Infrastructure Capital, Inc. | 0.9 |
| Enerpac Tool Group Corp. | 0.9 |
| Fluor Corp. | 0.9 |
Excludes cash equivalents.
Asset Allocation - % Investments
| Value | Value |
|---|
| Common Stocks | 91.0 |
| Investment Companies | 4.5 |
| Foreign Common Stocks | 4.1 |
| Securities Lending Collateral | 0.4 |
The Fund may purchase and sell futures contracts to gain market exposure on cash balances.
Sector Allocation - % Equities
| Value | Value |
|---|
| Consumer Staples | 2.3 |
| Communication Services | 2.4 |
| Utilities | 2.7 |
| Health Care | 3.4 |
| Real Estate | 5.5 |
| Materials | 7.2 |
| Energy | 7.3 |
| Information Technology | 10.6 |
| Consumer Discretionary | 12.6 |
| Industrials | 20.7 |
| Financials | 25.3 |
For additional information about the Fund, including its prospectus, financial statements, holdings, and proxy voting information, please visit www.americanbeaconfunds.com/literature or call 1-800-658-5811.
If your financial institution mailed only one copy of this Report to an address shared by more than one account, you can request an individual copy by contacting your financial institution.
Distributed by:
Resolute Investment Distributors, Inc.
Annual Shareholder Report - October 31, 2024
Annual Shareholder Report - October 31, 2024
This annual shareholder report contains important information about American Beacon Small Cap Value Fund for the period of November 1, 2023 to October 31, 2024. You can find additional information about the Fund at www.americanbeaconfunds.com/literature. You can also request this information by contacting us at 800-658-5811.
What were the Fund costs for the last year?
(based on a hypothetical $10,000 investment)
| Class Name | Costs of a $10,000 investment | Costs paid as a percentage of a $10,000 investment |
|---|
| Class A | $138 | 1.21% |
How did the Fund perform and what affected its performance?
The A Class of the Fund returned 20.16% (with sales charges) and 27.50% (without sales charges) for the twelve months ended October 31, 2024, compared to the S&P 500® Index TR return of 38.02% and the Russell 2000® Value Index return of 31.77%.
• Broad market performance during the period was primarily driven by a 50-basis point interest rate cut, the first since the pandemic and increasing optimism that the U.S. economy could avoid a recession.
• The Fund’s focus is on finding undervalued, high-quality companies with above average earnings growth.
• The Fund's performance was positive in ten of the eleven sectors where it invested, except for the Energy sector. The Fund's holdings in the Information Technology, Industrials and Financials sectors were the top contributors to the Fund's positive relative performance, while holdings in the Consumer Discretionary, Materials and Health Care sectors detracted from relative returns.
Cumulative Performance from October 31, 2014 through October 31, 2024
The initial investment, based on a $10,000 investment, is adjusted to reflect the maximum applicable sales charge, if any.
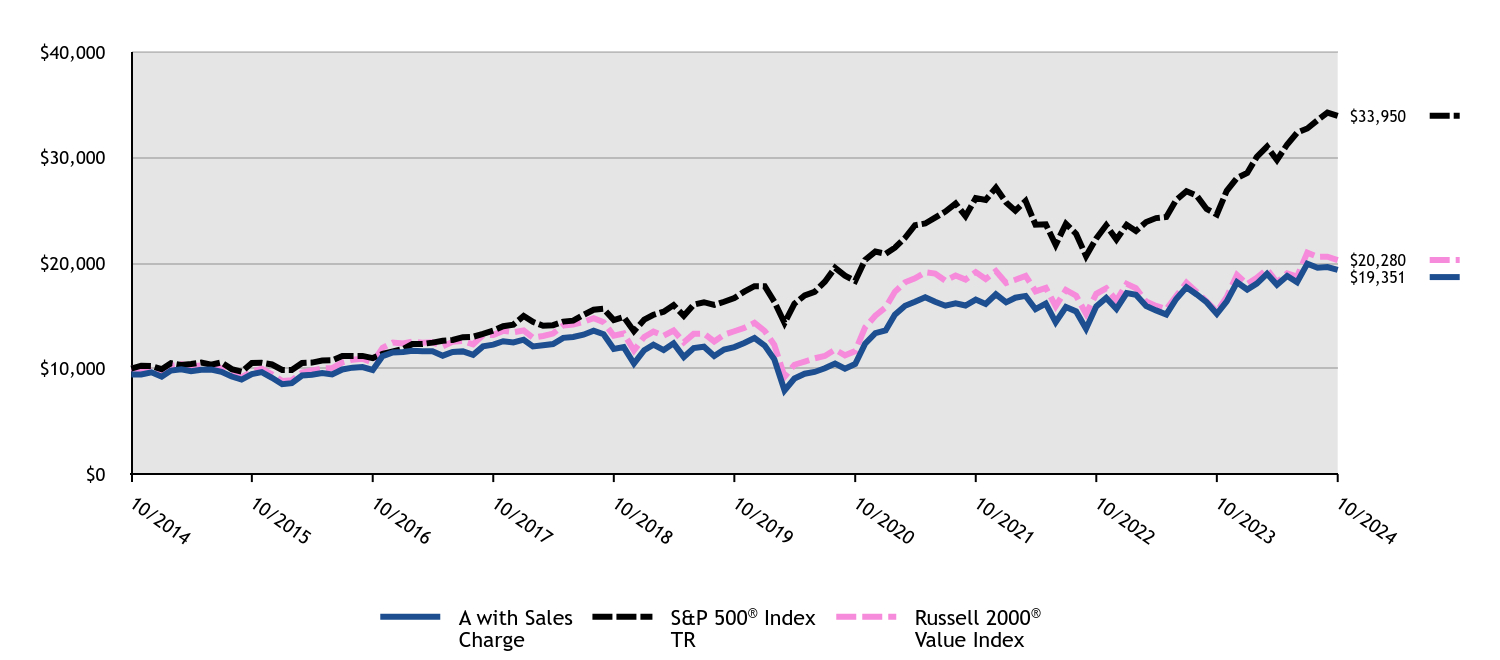
| A with Sales Charge | S&P 500® Index TR | Russell 2000® Value Index |
|---|
| 10/2014 | $9,427 | $10,000 | $10,000 |
| 11/2014 | $9,441 | $10,269 | $9,954 |
| 12/2014 | $9,645 | $10,243 | $10,225 |
| 01/2015 | $9,227 | $9,936 | $9,800 |
| 02/2015 | $9,806 | $10,507 | $10,255 |
| 03/2015 | $9,939 | $10,340 | $10,428 |
| 04/2015 | $9,758 | $10,440 | $10,205 |
| 05/2015 | $9,879 | $10,574 | $10,290 |
| 06/2015 | $9,907 | $10,369 | $10,303 |
| 07/2015 | $9,698 | $10,586 | $10,019 |
| 08/2015 | $9,247 | $9,948 | $9,527 |
| 09/2015 | $8,950 | $9,702 | $9,197 |
| 10/2015 | $9,468 | $10,520 | $9,712 |
| 11/2015 | $9,666 | $10,551 | $9,988 |
| 12/2015 | $9,122 | $10,385 | $9,462 |
| 01/2016 | $8,512 | $9,869 | $8,826 |
| 02/2016 | $8,619 | $9,856 | $8,886 |
| 03/2016 | $9,339 | $10,525 | $9,623 |
| 04/2016 | $9,416 | $10,566 | $9,827 |
| 05/2016 | $9,573 | $10,755 | $10,007 |
| 06/2016 | $9,441 | $10,783 | $10,037 |
| 07/2016 | $9,914 | $11,181 | $10,579 |
| 08/2016 | $10,085 | $11,196 | $10,842 |
| 09/2016 | $10,136 | $11,199 | $10,927 |
| 10/2016 | $9,863 | $10,994 | $10,568 |
| 11/2016 | $11,180 | $11,401 | $11,971 |
| 12/2016 | $11,521 | $11,627 | $12,465 |
| 01/2017 | $11,565 | $11,847 | $12,376 |
| 02/2017 | $11,683 | $12,318 | $12,555 |
| 03/2017 | $11,631 | $12,332 | $12,449 |
| 04/2017 | $11,639 | $12,459 | $12,498 |
| 05/2017 | $11,223 | $12,634 | $12,109 |
| 06/2017 | $11,569 | $12,713 | $12,532 |
| 07/2017 | $11,626 | $12,974 | $12,612 |
| 08/2017 | $11,298 | $13,014 | $12,302 |
| 09/2017 | $12,104 | $13,283 | $13,173 |
| 10/2017 | $12,266 | $13,593 | $13,190 |
| 11/2017 | $12,586 | $14,009 | $13,572 |
| 12/2017 | $12,473 | $14,165 | $13,442 |
| 01/2018 | $12,733 | $14,976 | $13,608 |
| 02/2018 | $12,103 | $14,424 | $12,927 |
| 03/2018 | $12,213 | $14,058 | $13,087 |
| 04/2018 | $12,319 | $14,112 | $13,314 |
| 05/2018 | $12,911 | $14,451 | $14,089 |
| 06/2018 | $12,987 | $14,540 | $14,174 |
| 07/2018 | $13,204 | $15,081 | $14,424 |
| 08/2018 | $13,589 | $15,573 | $14,768 |
| 09/2018 | $13,257 | $15,662 | $14,401 |
| 10/2018 | $11,853 | $14,591 | $13,112 |
| 11/2018 | $12,031 | $14,888 | $13,323 |
| 12/2018 | $10,480 | $13,544 | $11,713 |
| 01/2019 | $11,732 | $14,629 | $12,994 |
| 02/2019 | $12,261 | $15,099 | $13,499 |
| 03/2019 | $11,754 | $15,393 | $13,110 |
| 04/2019 | $12,389 | $16,016 | $13,606 |
| 05/2019 | $11,087 | $14,998 | $12,494 |
| 06/2019 | $11,949 | $16,055 | $13,290 |
| 07/2019 | $12,066 | $16,286 | $13,311 |
| 08/2019 | $11,198 | $16,028 | $12,569 |
| 09/2019 | $11,804 | $16,328 | $13,214 |
| 10/2019 | $12,038 | $16,681 | $13,534 |
| 11/2019 | $12,427 | $17,287 | $13,851 |
| 12/2019 | $12,890 | $17,809 | $14,336 |
| 01/2020 | $12,184 | $17,802 | $13,563 |
| 02/2020 | $10,880 | $16,336 | $12,245 |
| 03/2020 | $7,927 | $14,319 | $9,224 |
| 04/2020 | $9,056 | $16,154 | $10,361 |
| 05/2020 | $9,508 | $16,923 | $10,659 |
| 06/2020 | $9,677 | $17,260 | $10,967 |
| 07/2020 | $10,021 | $18,233 | $11,194 |
| 08/2020 | $10,479 | $19,544 | $11,797 |
| 09/2020 | $9,982 | $18,801 | $11,248 |
| 10/2020 | $10,428 | $18,301 | $11,650 |
| 11/2020 | $12,353 | $20,305 | $13,899 |
| 12/2020 | $13,350 | $21,085 | $15,000 |
| 01/2021 | $13,605 | $20,872 | $15,789 |
| 02/2021 | $15,099 | $21,448 | $17,273 |
| 03/2021 | $15,950 | $22,387 | $18,175 |
| 04/2021 | $16,325 | $23,582 | $18,543 |
| 05/2021 | $16,757 | $23,747 | $19,120 |
| 06/2021 | $16,325 | $24,301 | $19,004 |
| 07/2021 | $15,956 | $24,878 | $18,324 |
| 08/2021 | $16,183 | $25,635 | $18,815 |
| 09/2021 | $15,973 | $24,443 | $18,438 |
| 10/2021 | $16,535 | $26,155 | $19,141 |
| 11/2021 | $16,121 | $25,974 | $18,487 |
| 12/2021 | $17,037 | $27,138 | $19,241 |
| 01/2022 | $16,277 | $25,734 | $18,119 |
| 02/2022 | $16,711 | $24,963 | $18,419 |
| 03/2022 | $16,884 | $25,890 | $18,779 |
| 04/2022 | $15,625 | $23,632 | $17,322 |
| 05/2022 | $16,162 | $23,676 | $17,654 |
| 06/2022 | $14,398 | $21,721 | $15,910 |
| 07/2022 | $15,836 | $23,724 | $17,451 |
| 08/2022 | $15,414 | $22,757 | $16,899 |
| 09/2022 | $13,772 | $20,661 | $15,177 |
| 10/2022 | $15,893 | $22,333 | $17,087 |
| 11/2022 | $16,686 | $23,582 | $17,609 |
| 12/2022 | $15,649 | $22,223 | $16,454 |
| 01/2023 | $17,153 | $23,619 | $18,024 |
| 02/2023 | $16,994 | $23,043 | $17,609 |
| 03/2023 | $15,922 | $23,889 | $16,346 |
| 04/2023 | $15,512 | $24,262 | $15,938 |
| 05/2023 | $15,125 | $24,367 | $15,625 |
| 06/2023 | $16,598 | $25,977 | $16,866 |
| 07/2023 | $17,708 | $26,812 | $18,139 |
| 08/2023 | $17,024 | $26,385 | $17,266 |
| 09/2023 | $16,287 | $25,127 | $16,367 |
| 10/2023 | $15,178 | $24,599 | $15,391 |
| 11/2023 | $16,363 | $26,845 | $16,776 |
| 12/2023 | $18,179 | $28,065 | $18,864 |
| 01/2024 | $17,486 | $28,536 | $18,007 |
| 02/2024 | $18,052 | $30,060 | $18,596 |
| 03/2024 | $18,977 | $31,027 | $19,411 |
| 04/2024 | $17,932 | $29,760 | $18,174 |
| 05/2024 | $18,777 | $31,236 | $19,024 |
| 06/2024 | $18,187 | $32,356 | $18,704 |
| 07/2024 | $19,941 | $32,750 | $20,983 |
| 08/2024 | $19,559 | $33,545 | $20,589 |
| 09/2024 | $19,622 | $34,261 | $20,602 |
| 10/2024 | $19,351 | $33,950 | $20,280 |
Average Annual Total Returns (%)
| HEADER | 1 Year | 5 Years | 10 Years |
|---|
Class A without Sales ChargeFootnote Reference1 | 27.50% | 9.96% | 7.46% |
Class A with Maximum Sales Charge - 5.75%Footnote Reference1 | 20.16% | 8.66% | 6.82% |
S&P 500® Index TR | 38.02% | 15.27% | 13.00% |
Russell 2000® Value Index | 31.77% | 8.42% | 7.33% |
| Footnote | Description |
Footnote1 | Return may differ from actual shareholder return due to accounting adjustments for financial reporting purposes. |
Performance shown is historical and is not indicative of future returns. Investment returns and principal value will vary, and shares may be worth more or less at redemption than at original purchase. Performance shown is as of date indicated, and current performance may be lower or higher than the performance data quoted. To obtain performance as of the most recent month end, please visit americanbeaconfunds.com or call 800-967-9009. The graph and table do not reflect the deduction of taxes that a shareholder would pay on fund distributions or redemption of fund shares.
The S&P 500 Index TR is replacing the Russell 2000 Value Index as the broad-based securities market index to comply with a new regulatory requirement. The Russell 2000 Value Index reflects the market sectors in which the Fund invests.
| Total Net Assets | $4,602,724,944 |
| # of Portfolio Holdings | 454 |
| Portfolio Turnover Rate | 52% |
| Total Management Fees Paid | $32,443,065 |
What did the Fund invest in?
Top Ten Holdings - % Net Assets
| F5, Inc. | 1.3 |
| Columbia Banking System, Inc. | 1.3 |
| NOV, Inc. | 1.2 |
| Greenbrier Cos., Inc. | 1.1 |
| Avnet, Inc. | 1.1 |
| Texas Capital Bancshares, Inc. | 1.0 |
| Coherent Corp. | 1.0 |
| HA Sustainable Infrastructure Capital, Inc. | 0.9 |
| Enerpac Tool Group Corp. | 0.9 |
| Fluor Corp. | 0.9 |
Excludes cash equivalents.
Asset Allocation - % Investments
| Value | Value |
|---|
| Common Stocks | 91.0 |
| Investment Companies | 4.5 |
| Foreign Common Stocks | 4.1 |
| Securities Lending Collateral | 0.4 |
The Fund may purchase and sell futures contracts to gain market exposure on cash balances.
Sector Allocation - % Equities
| Value | Value |
|---|
| Consumer Staples | 2.3 |
| Communication Services | 2.4 |
| Utilities | 2.7 |
| Health Care | 3.4 |
| Real Estate | 5.5 |
| Materials | 7.2 |
| Energy | 7.3 |
| Information Technology | 10.6 |
| Consumer Discretionary | 12.6 |
| Industrials | 20.7 |
| Financials | 25.3 |
For additional information about the Fund, including its prospectus, financial statements, holdings, and proxy voting information, please visit www.americanbeaconfunds.com/literature or call 1-800-658-5811.
If your financial institution mailed only one copy of this Report to an address shared by more than one account, you can request an individual copy by contacting your financial institution.
Distributed by:
Resolute Investment Distributors, Inc.
Annual Shareholder Report - October 31, 2024
Annual Shareholder Report - October 31, 2024
This annual shareholder report contains important information about American Beacon Small Cap Value Fund for the period of November 1, 2023 to October 31, 2024. You can find additional information about the Fund at www.americanbeaconfunds.com/literature. You can also request this information by contacting us at 800-658-5811.
What were the Fund costs for the last year?
(based on a hypothetical $10,000 investment)
| Class Name | Costs of a $10,000 investment | Costs paid as a percentage of a $10,000 investment |
|---|
| Class C | $221 | 1.95% |
How did the Fund perform and what affected its performance?
The C Class of the Fund returned 25.56% (with sales charges) and 26.56% (without sales charges) for the twelve months ended October 31, 2024, compared to the S&P 500® Index TR return of 38.02% and the Russell 2000® Value Index return of 31.77%.
• Broad market performance during the period was primarily driven by a 50-basis point interest rate cut, the first since the pandemic and increasing optimism that the U.S. economy could avoid a recession.
• The Fund’s focus is on finding undervalued, high-quality companies with above average earnings growth.
• The Fund's performance was positive in ten of the eleven sectors where it invested, except for the Energy sector. The Fund's holdings in the Information Technology, Industrials and Financials sectors were the top contributors to the Fund's positive relative performance, while holdings in the Consumer Discretionary, Materials and Health Care sectors detracted from relative returns.
Cumulative Performance from October 31, 2014 through October 31, 2024
The initial investment, based on a $10,000 investment, is adjusted to reflect the maximum applicable sales charge, if any.
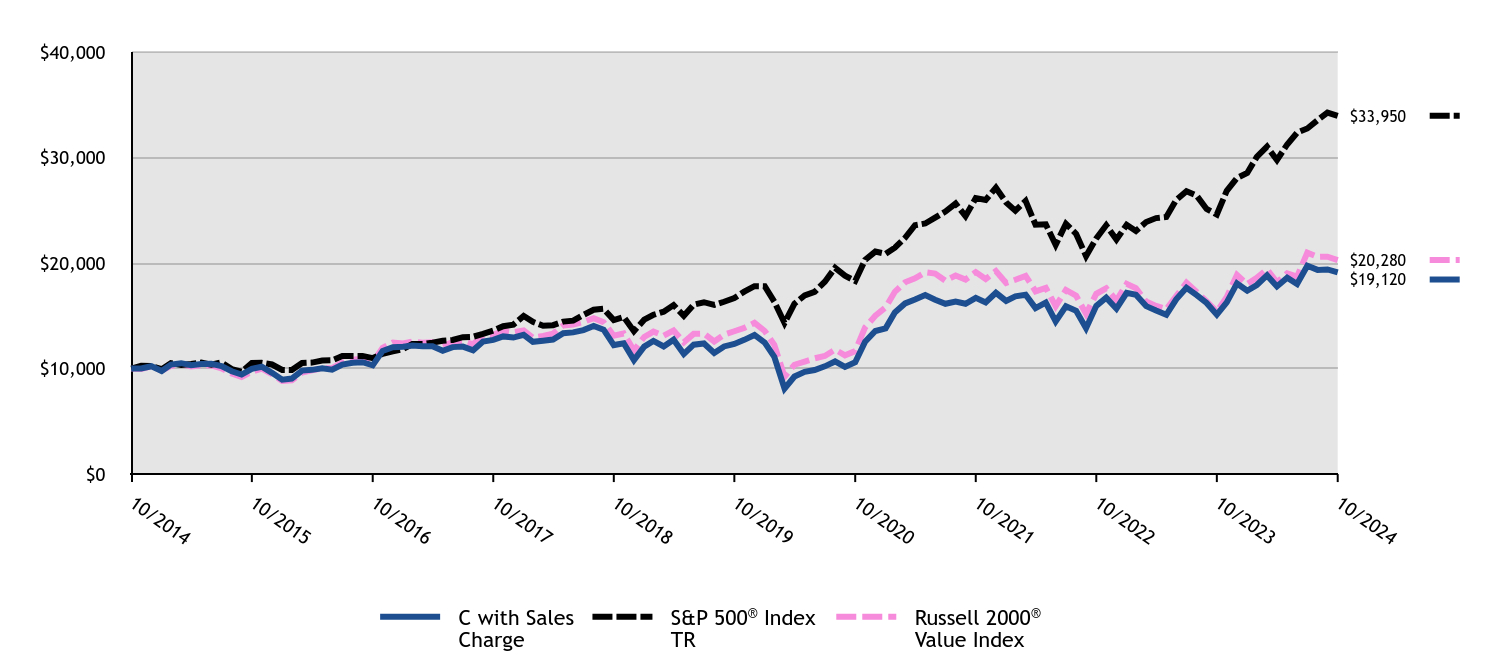
| C with Sales Charge | S&P 500® Index TR | Russell 2000® Value Index |
|---|
| 10/2014 | $10,000 | $10,000 | $10,000 |
| 11/2014 | $10,008 | $10,269 | $9,954 |
| 12/2014 | $10,222 | $10,243 | $10,225 |
| 01/2015 | $9,768 | $9,936 | $9,800 |
| 02/2015 | $10,375 | $10,507 | $10,255 |
| 03/2015 | $10,510 | $10,340 | $10,428 |
| 04/2015 | $10,314 | $10,440 | $10,205 |
| 05/2015 | $10,436 | $10,574 | $10,290 |
| 06/2015 | $10,458 | $10,369 | $10,303 |
| 07/2015 | $10,231 | $10,586 | $10,019 |
| 08/2015 | $9,747 | $9,948 | $9,527 |
| 09/2015 | $9,428 | $9,702 | $9,197 |
| 10/2015 | $9,969 | $10,520 | $9,712 |
| 11/2015 | $10,170 | $10,551 | $9,988 |
| 12/2015 | $9,596 | $10,385 | $9,462 |
| 01/2016 | $8,947 | $9,869 | $8,826 |
| 02/2016 | $9,048 | $9,856 | $8,886 |
| 03/2016 | $9,804 | $10,525 | $9,623 |
| 04/2016 | $9,877 | $10,566 | $9,827 |
| 05/2016 | $10,034 | $10,755 | $10,007 |
| 06/2016 | $9,891 | $10,783 | $10,037 |
| 07/2016 | $10,379 | $11,181 | $10,579 |
| 08/2016 | $10,554 | $11,196 | $10,842 |
| 09/2016 | $10,600 | $11,199 | $10,927 |
| 10/2016 | $10,305 | $10,994 | $10,568 |
| 11/2016 | $11,673 | $11,401 | $11,971 |
| 12/2016 | $12,023 | $11,627 | $12,465 |
| 01/2017 | $12,066 | $11,847 | $12,376 |
| 02/2017 | $12,179 | $12,318 | $12,555 |
| 03/2017 | $12,118 | $12,332 | $12,449 |
| 04/2017 | $12,118 | $12,459 | $12,498 |
| 05/2017 | $11,679 | $12,634 | $12,109 |
| 06/2017 | $12,033 | $12,713 | $12,532 |
| 07/2017 | $12,085 | $12,974 | $12,612 |
| 08/2017 | $11,736 | $13,014 | $12,302 |
| 09/2017 | $12,561 | $13,283 | $13,173 |
| 10/2017 | $12,721 | $13,593 | $13,190 |
| 11/2017 | $13,046 | $14,009 | $13,572 |
| 12/2017 | $12,936 | $14,165 | $13,442 |
| 01/2018 | $13,200 | $14,976 | $13,608 |
| 02/2018 | $12,537 | $14,424 | $12,927 |
| 03/2018 | $12,640 | $14,058 | $13,087 |
| 04/2018 | $12,749 | $14,112 | $13,314 |
| 05/2018 | $13,355 | $14,451 | $14,089 |
| 06/2018 | $13,428 | $14,540 | $14,174 |
| 07/2018 | $13,645 | $15,081 | $14,424 |
| 08/2018 | $14,029 | $15,573 | $14,768 |
| 09/2018 | $13,682 | $15,662 | $14,401 |
| 10/2018 | $12,226 | $14,591 | $13,112 |
| 11/2018 | $12,402 | $14,888 | $13,323 |
| 12/2018 | $10,797 | $13,544 | $11,713 |
| 01/2019 | $12,078 | $14,629 | $12,994 |
| 02/2019 | $12,613 | $15,099 | $13,499 |
| 03/2019 | $12,090 | $15,393 | $13,110 |
| 04/2019 | $12,733 | $16,016 | $13,606 |
| 05/2019 | $11,386 | $14,998 | $12,494 |
| 06/2019 | $12,264 | $16,055 | $13,290 |
| 07/2019 | $12,378 | $16,286 | $13,311 |
| 08/2019 | $11,483 | $16,028 | $12,569 |
| 09/2019 | $12,096 | $16,328 | $13,214 |
| 10/2019 | $12,330 | $16,681 | $13,534 |
| 11/2019 | $12,721 | $17,287 | $13,851 |
| 12/2019 | $13,184 | $17,809 | $14,336 |
| 01/2020 | $12,456 | $17,802 | $13,563 |
| 02/2020 | $11,120 | $16,336 | $12,245 |
| 03/2020 | $8,097 | $14,319 | $9,224 |
| 04/2020 | $9,245 | $16,154 | $10,361 |
| 05/2020 | $9,694 | $16,923 | $10,659 |
| 06/2020 | $9,864 | $17,260 | $10,967 |
| 07/2020 | $10,210 | $18,233 | $11,194 |
| 08/2020 | $10,671 | $19,544 | $11,797 |
| 09/2020 | $10,161 | $18,801 | $11,248 |
| 10/2020 | $10,604 | $18,301 | $11,650 |
| 11/2020 | $12,553 | $20,305 | $13,899 |
| 12/2020 | $13,560 | $21,085 | $15,000 |
| 01/2021 | $13,815 | $20,872 | $15,789 |
| 02/2021 | $15,321 | $21,448 | $17,273 |
| 03/2021 | $16,170 | $22,387 | $18,175 |
| 04/2021 | $16,547 | $23,582 | $18,543 |
| 05/2021 | $16,972 | $23,747 | $19,120 |
| 06/2021 | $16,529 | $24,301 | $19,004 |
| 07/2021 | $16,140 | $24,878 | $18,324 |
| 08/2021 | $16,359 | $25,635 | $18,815 |
| 09/2021 | $16,140 | $24,443 | $18,438 |
| 10/2021 | $16,699 | $26,155 | $19,141 |
| 11/2021 | $16,268 | $25,974 | $18,487 |
| 12/2021 | $17,180 | $27,138 | $19,241 |
| 01/2022 | $16,406 | $25,734 | $18,119 |
| 02/2022 | $16,837 | $24,963 | $18,419 |
| 03/2022 | $17,002 | $25,890 | $18,779 |
| 04/2022 | $15,728 | $23,632 | $17,322 |
| 05/2022 | $16,248 | $23,676 | $17,654 |
| 06/2022 | $14,474 | $21,721 | $15,910 |
| 07/2022 | $15,906 | $23,724 | $17,451 |
| 08/2022 | $15,474 | $22,757 | $16,899 |
| 09/2022 | $13,817 | $20,661 | $15,177 |
| 10/2022 | $15,940 | $22,333 | $17,087 |
| 11/2022 | $16,721 | $23,582 | $17,609 |
| 12/2022 | $15,672 | $22,223 | $16,454 |
| 01/2023 | $17,171 | $23,619 | $18,024 |
| 02/2023 | $16,999 | $23,043 | $17,609 |
| 03/2023 | $15,918 | $23,889 | $16,346 |
| 04/2023 | $15,492 | $24,262 | $15,938 |
| 05/2023 | $15,090 | $24,367 | $15,625 |
| 06/2023 | $16,557 | $25,977 | $16,866 |
| 07/2023 | $17,655 | $26,812 | $18,139 |
| 08/2023 | $16,958 | $26,385 | $17,266 |
| 09/2023 | $16,213 | $25,127 | $16,367 |
| 10/2023 | $15,107 | $24,599 | $15,391 |
| 11/2023 | $16,270 | $26,845 | $16,776 |
| 12/2023 | $18,066 | $28,065 | $18,864 |
| 01/2024 | $17,373 | $28,536 | $18,007 |
| 02/2024 | $17,921 | $30,060 | $18,596 |
| 03/2024 | $18,828 | $31,027 | $19,411 |
| 04/2024 | $17,784 | $29,760 | $18,174 |
| 05/2024 | $18,614 | $31,236 | $19,024 |
| 06/2024 | $18,006 | $32,356 | $18,704 |
| 07/2024 | $19,736 | $32,750 | $20,983 |
| 08/2024 | $19,351 | $33,545 | $20,589 |
| 09/2024 | $19,393 | $34,261 | $20,602 |
| 10/2024 | $19,120 | $33,950 | $20,280 |
Average Annual Total Returns (%)
| HEADER | 1 Year | 5 Years | 10 Years |
|---|
Class C without Deferred Sales ChargeFootnote Reference1 | 26.56% | 9.17% | 6.70% |
Class C with Maximum Deferred Sales Charge -1.00%Footnote Reference1 | 25.56% | 9.17% | 6.70% |
S&P 500® Index TR | 38.02% | 15.27% | 13.00% |
Russell 2000® Value Index | 31.77% | 8.42% | 7.33% |
| Footnote | Description |
Footnote1 | Return may differ from actual shareholder return due to accounting adjustments for financial reporting purposes. |
Performance shown is historical and is not indicative of future returns. Investment returns and principal value will vary, and shares may be worth more or less at redemption than at original purchase. Performance shown is as of date indicated, and current performance may be lower or higher than the performance data quoted. To obtain performance as of the most recent month end, please visit americanbeaconfunds.com or call 800-967-9009. The graph and table do not reflect the deduction of taxes that a shareholder would pay on fund distributions or redemption of fund shares.
The S&P 500 Index TR is replacing the Russell 2000 Value Index as the broad-based securities market index to comply with a new regulatory requirement. The Russell 2000 Value Index reflects the market sectors in which the Fund invests.
| Total Net Assets | $4,602,724,944 |
| # of Portfolio Holdings | 454 |
| Portfolio Turnover Rate | 52% |
| Total Management Fees Paid | $32,443,065 |
What did the Fund invest in?
Top Ten Holdings - % Net Assets
| F5, Inc. | 1.3 |
| Columbia Banking System, Inc. | 1.3 |
| NOV, Inc. | 1.2 |
| Greenbrier Cos., Inc. | 1.1 |
| Avnet, Inc. | 1.1 |
| Texas Capital Bancshares, Inc. | 1.0 |
| Coherent Corp. | 1.0 |
| HA Sustainable Infrastructure Capital, Inc. | 0.9 |
| Enerpac Tool Group Corp. | 0.9 |
| Fluor Corp. | 0.9 |
Excludes cash equivalents.
Asset Allocation - % Investments
| Value | Value |
|---|
| Common Stocks | 91.0 |
| Investment Companies | 4.5 |
| Foreign Common Stocks | 4.1 |
| Securities Lending Collateral | 0.4 |
The Fund may purchase and sell futures contracts to gain market exposure on cash balances.
Sector Allocation - % Equities
| Value | Value |
|---|
| Consumer Staples | 2.3 |
| Communication Services | 2.4 |
| Utilities | 2.7 |
| Health Care | 3.4 |
| Real Estate | 5.5 |
| Materials | 7.2 |
| Energy | 7.3 |
| Information Technology | 10.6 |
| Consumer Discretionary | 12.6 |
| Industrials | 20.7 |
| Financials | 25.3 |
For additional information about the Fund, including its prospectus, financial statements, holdings, and proxy voting information, please visit www.americanbeaconfunds.com/literature or call 1-800-658-5811.
If your financial institution mailed only one copy of this Report to an address shared by more than one account, you can request an individual copy by contacting your financial institution.
Distributed by:
Resolute Investment Distributors, Inc.
Annual Shareholder Report - October 31, 2024
Annual Shareholder Report - October 31, 2024
This annual shareholder report contains important information about American Beacon Small Cap Value Fund for the period of November 1, 2023 to October 31, 2024. You can find additional information about the Fund at www.americanbeaconfunds.com/literature. You can also request this information by contacting us at 800-658-5811.
What were the Fund costs for the last year?
(based on a hypothetical $10,000 investment)
| Class Name | Costs of a $10,000 investment | Costs paid as a percentage of a $10,000 investment |
|---|
| R6 | $87 | 0.76% |
How did the Fund perform and what affected its performance?
The R6 Class of the Fund returned 28.10% for the twelve months ended October 31, 2024, compared to the S&P 500® Index TR return of 38.02% and the Russell 2000® Value Index return of 31.77%.
• Broad market performance during the period was primarily driven by a 50-basis point interest rate cut, the first since the pandemic and increasing optimism that the U.S. economy could avoid a recession.
• The Fund’s focus is on finding undervalued, high-quality companies with above average earnings growth.
• The Fund's performance was positive in ten of the eleven sectors where it invested, except for the Energy sector. The Fund's holdings in the Information Technology, Industrials and Financials sectors were the top contributors to the Fund's positive relative performance, while holdings in the Consumer Discretionary, Materials and Health Care sectors detracted from relative returns.
Cumulative Performance from October 31, 2014 through October 31, 2024
The initial investment, based on a $10,000 investment, is adjusted to reflect the maximum applicable sales charge, if any.
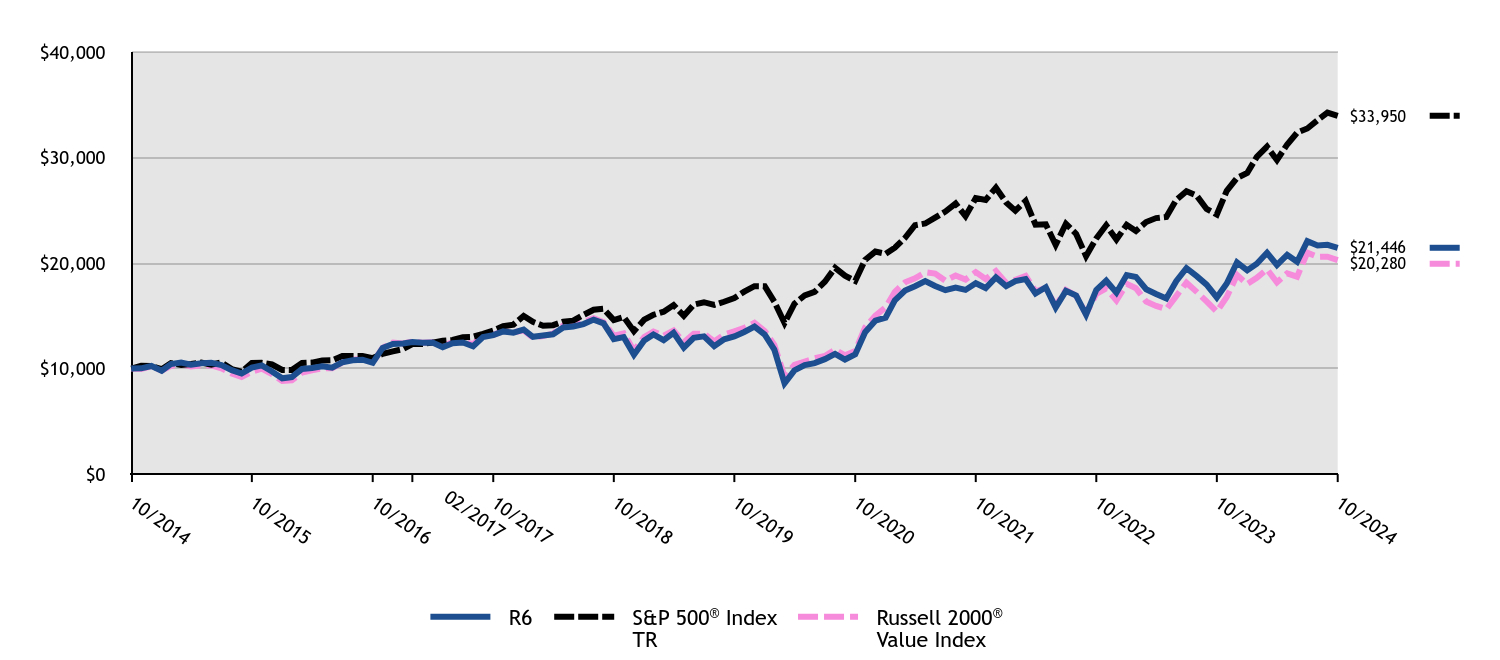
| R6 | S&P 500® Index TR | Russell 2000® Value Index |
|---|
| 10/2014 | $10,000 | $10,000 | $10,000 |
| 11/2014 | $10,018 | $10,269 | $9,954 |
| 12/2014 | $10,242 | $10,243 | $10,225 |
| 01/2015 | $9,797 | $9,936 | $9,800 |
| 02/2015 | $10,418 | $10,507 | $10,255 |
| 03/2015 | $10,561 | $10,340 | $10,428 |
| 04/2015 | $10,373 | $10,440 | $10,205 |
| 05/2015 | $10,508 | $10,574 | $10,290 |
| 06/2015 | $10,541 | $10,369 | $10,303 |
| 07/2015 | $10,320 | $10,586 | $10,019 |
| 08/2015 | $9,842 | $9,948 | $9,527 |
| 09/2015 | $9,532 | $9,702 | $9,197 |
| 10/2015 | $10,087 | $10,520 | $9,712 |
| 11/2015 | $10,300 | $10,551 | $9,988 |
| 12/2015 | $9,727 | $10,385 | $9,462 |
| 01/2016 | $9,077 | $9,869 | $8,826 |
| 02/2016 | $9,190 | $9,856 | $8,886 |
| 03/2016 | $9,965 | $10,525 | $9,623 |
| 04/2016 | $10,047 | $10,566 | $9,827 |
| 05/2016 | $10,220 | $10,755 | $10,007 |
| 06/2016 | $10,082 | $10,783 | $10,037 |
| 07/2016 | $10,593 | $11,181 | $10,579 |
| 08/2016 | $10,779 | $11,196 | $10,842 |
| 09/2016 | $10,835 | $11,199 | $10,927 |
| 10/2016 | $10,545 | $10,994 | $10,568 |
| 11/2016 | $11,957 | $11,401 | $11,971 |
| 12/2016 | $12,327 | $11,627 | $12,465 |
| 01/2017 | $12,380 | $11,847 | $12,376 |
| 02/2017 | $12,505 | $12,318 | $12,555 |
| 03/2017 | $12,456 | $12,332 | $12,449 |
| 04/2017 | $12,470 | $12,459 | $12,498 |
| 05/2017 | $12,028 | $12,634 | $12,109 |
| 06/2017 | $12,398 | $12,713 | $12,532 |
| 07/2017 | $12,465 | $12,974 | $12,612 |
| 08/2017 | $12,117 | $13,014 | $12,302 |
| 09/2017 | $12,987 | $13,283 | $13,173 |
| 10/2017 | $13,166 | $13,593 | $13,190 |
| 11/2017 | $13,518 | $14,009 | $13,572 |
| 12/2017 | $13,401 | $14,165 | $13,442 |
| 01/2018 | $13,684 | $14,976 | $13,608 |
| 02/2018 | $13,010 | $14,424 | $12,927 |
| 03/2018 | $13,132 | $14,058 | $13,087 |
| 04/2018 | $13,249 | $14,112 | $13,314 |
| 05/2018 | $13,894 | $14,451 | $14,089 |
| 06/2018 | $13,982 | $14,540 | $14,174 |
| 07/2018 | $14,217 | $15,081 | $14,424 |
| 08/2018 | $14,638 | $15,573 | $14,768 |
| 09/2018 | $14,286 | $15,662 | $14,401 |
| 10/2018 | $12,780 | $14,591 | $13,112 |
| 11/2018 | $12,975 | $14,888 | $13,323 |
| 12/2018 | $11,311 | $13,544 | $11,713 |
| 01/2019 | $12,659 | $14,629 | $12,994 |
| 02/2019 | $13,234 | $15,099 | $13,499 |
| 03/2019 | $12,693 | $15,393 | $13,110 |
| 04/2019 | $13,386 | $16,016 | $13,606 |
| 05/2019 | $11,982 | $14,998 | $12,494 |
| 06/2019 | $12,918 | $16,055 | $13,290 |
| 07/2019 | $13,048 | $16,286 | $13,311 |
| 08/2019 | $12,118 | $16,028 | $12,569 |
| 09/2019 | $12,777 | $16,328 | $13,214 |
| 10/2019 | $13,037 | $16,681 | $13,534 |
| 11/2019 | $13,465 | $17,287 | $13,851 |
| 12/2019 | $13,969 | $17,809 | $14,336 |
| 01/2020 | $13,211 | $17,802 | $13,563 |
| 02/2020 | $11,804 | $16,336 | $12,245 |
| 03/2020 | $8,604 | $14,319 | $9,224 |
| 04/2020 | $9,828 | $16,154 | $10,361 |
| 05/2020 | $10,322 | $16,923 | $10,659 |
| 06/2020 | $10,511 | $17,260 | $10,967 |
| 07/2020 | $10,890 | $18,233 | $11,194 |
| 08/2020 | $11,390 | $19,544 | $11,797 |
| 09/2020 | $10,856 | $18,801 | $11,248 |
| 10/2020 | $11,344 | $18,301 | $11,650 |
| 11/2020 | $13,446 | $20,305 | $13,899 |
| 12/2020 | $14,532 | $21,085 | $15,000 |
| 01/2021 | $14,822 | $20,872 | $15,789 |
| 02/2021 | $16,457 | $21,448 | $17,273 |
| 03/2021 | $17,390 | $22,387 | $18,175 |
| 04/2021 | $17,802 | $23,582 | $18,543 |
| 05/2021 | $18,283 | $23,747 | $19,120 |
| 06/2021 | $17,819 | $24,301 | $19,004 |
| 07/2021 | $17,425 | $24,878 | $18,324 |
| 08/2021 | $17,674 | $25,635 | $18,815 |
| 09/2021 | $17,454 | $24,443 | $18,438 |
| 10/2021 | $18,080 | $26,155 | $19,141 |
| 11/2021 | $17,628 | $25,974 | $18,487 |
| 12/2021 | $18,632 | $27,138 | $19,241 |
| 01/2022 | $17,813 | $25,734 | $18,119 |
| 02/2022 | $18,294 | $24,963 | $18,419 |
| 03/2022 | $18,489 | $25,890 | $18,779 |
| 04/2022 | $17,118 | $23,632 | $17,322 |
| 05/2022 | $17,709 | $23,676 | $17,654 |
| 06/2022 | $15,785 | $21,721 | $15,910 |
| 07/2022 | $17,365 | $23,724 | $17,451 |
| 08/2022 | $16,910 | $22,757 | $16,899 |
| 09/2022 | $15,115 | $20,661 | $15,177 |
| 10/2022 | $17,456 | $22,333 | $17,087 |
| 11/2022 | $18,327 | $23,582 | $17,609 |
| 12/2022 | $17,194 | $22,223 | $16,454 |
| 01/2023 | $18,858 | $23,619 | $18,024 |
| 02/2023 | $18,682 | $23,043 | $17,609 |
| 03/2023 | $17,516 | $23,889 | $16,346 |
| 04/2023 | $17,071 | $24,262 | $15,938 |
| 05/2023 | $16,649 | $24,367 | $15,625 |
| 06/2023 | $18,283 | $25,977 | $16,866 |
| 07/2023 | $19,510 | $26,812 | $18,139 |
| 08/2023 | $18,758 | $26,385 | $17,266 |
| 09/2023 | $17,953 | $25,127 | $16,367 |
| 10/2023 | $16,741 | $24,599 | $15,391 |
| 11/2023 | $18,053 | $26,845 | $16,776 |
| 12/2023 | $20,062 | $28,065 | $18,864 |
| 01/2024 | $19,305 | $28,536 | $18,007 |
| 02/2024 | $19,933 | $30,060 | $18,596 |
| 03/2024 | $20,972 | $31,027 | $19,411 |
| 04/2024 | $19,820 | $29,760 | $18,174 |
| 05/2024 | $20,770 | $31,236 | $19,024 |
| 06/2024 | $20,118 | $32,356 | $18,704 |
| 07/2024 | $22,074 | $32,750 | $20,983 |
| 08/2024 | $21,656 | $33,545 | $20,589 |
| 09/2024 | $21,728 | $34,261 | $20,602 |
| 10/2024 | $21,446 | $33,950 | $20,280 |
Average Annual Total Returns (%)
| HEADER | 1 Year | 5 Years | 10 Years |
|---|
R6 ClassFootnote Reference1 | 28.10% | 10.47% | 7.93% |
S&P 500® Index TR | 38.02% | 15.27% | 13.00% |
Russell 2000® Value Index | 31.77% | 8.42% | 7.33% |
| Footnote | Description |
Footnote1 | Return may differ from actual shareholder return due to accounting adjustments for financial reporting purposes. |
Performance shown is historical and is not indicative of future returns. Investment returns and principal value will vary, and shares may be worth more or less at redemption than at original purchase. Performance shown is as of date indicated, and current performance may be lower or higher than the performance data quoted. To obtain performance as of the most recent month end, please visit americanbeaconfunds.com or call 800-967-9009. The graph and table do not reflect the deduction of taxes that a shareholder would pay on fund distributions or redemption of fund shares. Performance includes historical performance of another Class of the Fund.
The S&P 500 Index TR is replacing the Russell 2000 Value Index as the broad-based securities market index to comply with a new regulatory requirement. The Russell 2000 Value Index reflects the market sectors in which the Fund invests.
| Total Net Assets | $4,602,724,944 |
| # of Portfolio Holdings | 454 |
| Portfolio Turnover Rate | 52% |
| Total Management Fees Paid | $32,443,065 |
What did the Fund invest in?
Top Ten Holdings - % Net Assets
| F5, Inc. | 1.3 |
| Columbia Banking System, Inc. | 1.3 |
| NOV, Inc. | 1.2 |
| Greenbrier Cos., Inc. | 1.1 |
| Avnet, Inc. | 1.1 |
| Texas Capital Bancshares, Inc. | 1.0 |
| Coherent Corp. | 1.0 |
| HA Sustainable Infrastructure Capital, Inc. | 0.9 |
| Enerpac Tool Group Corp. | 0.9 |
| Fluor Corp. | 0.9 |
Excludes cash equivalents.
Asset Allocation - % Investments
| Value | Value |
|---|
| Common Stocks | 91.0 |
| Investment Companies | 4.5 |
| Foreign Common Stocks | 4.1 |
| Securities Lending Collateral | 0.4 |
The Fund may purchase and sell futures contracts to gain market exposure on cash balances.
Sector Allocation - % Equities
| Value | Value |
|---|
| Consumer Staples | 2.3 |
| Communication Services | 2.4 |
| Utilities | 2.7 |
| Health Care | 3.4 |
| Real Estate | 5.5 |
| Materials | 7.2 |
| Energy | 7.3 |
| Information Technology | 10.6 |
| Consumer Discretionary | 12.6 |
| Industrials | 20.7 |
| Financials | 25.3 |
For additional information about the Fund, including its prospectus, financial statements, holdings, and proxy voting information, please visit www.americanbeaconfunds.com/literature or call 1-800-658-5811.
If your financial institution mailed only one copy of this Report to an address shared by more than one account, you can request an individual copy by contacting your financial institution.
Distributed by:
Resolute Investment Distributors, Inc.
Annual Shareholder Report - October 31, 2024
International Equity Fund
Annual Shareholder Report - October 31, 2024
This annual shareholder report contains important information about American Beacon International Equity Fund for the period of November 1, 2023 to October 31, 2024. You can find additional information about the Fund at www.americanbeaconfunds.com/literature. You can also request this information by contacting us at 800-658-5811.
What were the Fund costs for the last year?
(based on a hypothetical $10,000 investment)
| Class Name | Costs of a $10,000 investment | Costs paid as a percentage of a $10,000 investment |
|---|
| R5 | $85 | 0.77% |
How did the Fund perform and what affected its performance?
The R5 Class of the Fund returned 22.05% for the twelve months ended October 31, 2024, compared to the MSCI® EAFE Index (Net) return of 22.97%.
• Broad market performance during the last twelve months benefited from many developed nations loosening monetary policy as inflation eased and the increased prospect of a soft landing even as an interest rate hike by the Bank of Japan in late July caused some market turmoil.
• The Fund’s focus on value through a bottom-up approach and diversification through its multi manager strategy provided strong returns during the period.
• The Fund's holdings in the Industrials and Financials sectors contributed to the Fund's performance, while holdings in the Information Technology sector detracted from performance.
Cumulative Performance from October 31, 2014 through October 31, 2024
The initial investment, based on a $250,000 investment, is adjusted to reflect the maximum applicable sales charge, if any.

| R5 | MSCI® EAFE Index (Net) |
|---|
| 10/2014 | $250,000 | $250,000 |
| 11/2014 | $252,691 | $253,400 |
| 12/2014 | $242,385 | $244,622 |
| 01/2015 | $243,439 | $245,818 |
| 02/2015 | $257,666 | $260,513 |
| 03/2015 | $255,163 | $256,556 |
| 04/2015 | $266,492 | $267,031 |
| 05/2015 | $265,569 | $265,664 |
| 06/2015 | $258,851 | $258,137 |
| 07/2015 | $262,276 | $263,497 |
| 08/2015 | $244,229 | $244,113 |
| 09/2015 | $231,978 | $231,718 |
| 10/2015 | $247,522 | $249,831 |
| 11/2015 | $244,756 | $245,945 |
| 12/2015 | $238,069 | $242,631 |
| 01/2016 | $223,223 | $225,085 |
| 02/2016 | $215,666 | $220,961 |
| 03/2016 | $230,646 | $235,339 |
| 04/2016 | $237,124 | $242,152 |
| 05/2016 | $236,585 | $239,952 |
| 06/2016 | $226,732 | $231,898 |
| 07/2016 | $234,830 | $243,651 |
| 08/2016 | $237,124 | $243,823 |
| 09/2016 | $240,093 | $246,819 |
| 10/2016 | $234,965 | $241,770 |
| 11/2016 | $232,671 | $236,955 |
| 12/2016 | $238,792 | $245,057 |
| 01/2017 | $245,571 | $252,166 |
| 02/2017 | $246,263 | $255,772 |
| 03/2017 | $255,394 | $262,813 |
| 04/2017 | $262,035 | $269,500 |
| 05/2017 | $270,612 | $279,392 |
| 06/2017 | $270,197 | $278,898 |
| 07/2017 | $278,360 | $286,943 |
| 08/2017 | $276,423 | $286,835 |
| 09/2017 | $285,001 | $293,971 |
| 10/2017 | $288,874 | $298,435 |
| 11/2017 | $293,025 | $301,566 |
| 12/2017 | $298,031 | $306,406 |
| 01/2018 | $311,448 | $321,775 |
| 02/2018 | $293,606 | $307,252 |
| 03/2018 | $292,465 | $301,714 |
| 04/2018 | $297,603 | $308,603 |
| 05/2018 | $292,179 | $301,666 |
| 06/2018 | $287,754 | $297,980 |
| 07/2018 | $294,035 | $305,315 |
| 08/2018 | $286,184 | $299,419 |
| 09/2018 | $290,038 | $302,017 |
| 10/2018 | $267,058 | $277,979 |
| 11/2018 | $265,488 | $277,629 |
| 12/2018 | $249,235 | $264,152 |
| 01/2019 | $266,623 | $281,512 |
| 02/2019 | $274,926 | $288,688 |
| 03/2019 | $273,359 | $290,508 |
| 04/2019 | $280,722 | $298,676 |
| 05/2019 | $263,647 | $284,332 |
| 06/2019 | $279,312 | $301,200 |
| 07/2019 | $271,636 | $297,376 |
| 08/2019 | $262,707 | $289,672 |
| 09/2019 | $273,046 | $297,973 |
| 10/2019 | $282,915 | $308,679 |
| 11/2019 | $286,518 | $312,159 |
| 12/2019 | $297,699 | $322,304 |
| 01/2020 | $282,540 | $315,571 |
| 02/2020 | $256,898 | $287,044 |
| 03/2020 | $208,518 | $248,733 |
| 04/2020 | $222,710 | $264,802 |
| 05/2020 | $232,547 | $276,333 |
| 06/2020 | $240,772 | $285,742 |
| 07/2020 | $244,965 | $292,402 |
| 08/2020 | $260,124 | $307,435 |
| 09/2020 | $249,158 | $299,446 |
| 10/2020 | $237,546 | $287,490 |
| 11/2020 | $288,346 | $332,055 |
| 12/2020 | $300,863 | $347,494 |
| 01/2021 | $294,633 | $343,792 |
| 02/2021 | $309,717 | $351,503 |
| 03/2021 | $320,210 | $359,585 |
| 04/2021 | $325,621 | $370,405 |
| 05/2021 | $339,065 | $382,484 |
| 06/2021 | $329,228 | $378,180 |
| 07/2021 | $325,949 | $381,027 |
| 08/2021 | $331,195 | $387,748 |
| 09/2021 | $325,621 | $376,495 |
| 10/2021 | $332,999 | $385,755 |
| 11/2021 | $312,504 | $367,801 |
| 12/2021 | $329,841 | $386,634 |
| 01/2022 | $331,299 | $367,950 |
| 02/2022 | $320,911 | $361,444 |
| 03/2022 | $309,431 | $363,767 |
| 04/2022 | $294,488 | $340,233 |
| 05/2022 | $306,515 | $342,784 |
| 06/2022 | $278,633 | $310,978 |
| 07/2022 | $288,110 | $326,474 |
| 08/2022 | $268,064 | $310,968 |
| 09/2022 | $243,463 | $281,878 |
| 10/2022 | $260,775 | $297,036 |
| 11/2022 | $294,852 | $330,493 |
| 12/2022 | $294,051 | $330,758 |
| 01/2023 | $325,517 | $357,542 |
| 02/2023 | $321,396 | $350,082 |
| 03/2023 | $330,012 | $358,758 |
| 04/2023 | $338,252 | $368,887 |
| 05/2023 | $323,269 | $353,276 |
| 06/2023 | $341,811 | $369,354 |
| 07/2023 | $353,236 | $381,305 |
| 08/2023 | $342,748 | $366,696 |
| 09/2023 | $328,513 | $354,170 |
| 10/2023 | $313,155 | $339,812 |
| 11/2023 | $342,373 | $371,352 |
| 12/2023 | $360,096 | $391,082 |
| 01/2024 | $353,582 | $393,333 |
| 02/2024 | $364,242 | $400,532 |
| 03/2024 | $377,864 | $413,706 |
| 04/2024 | $367,006 | $403,111 |
| 05/2024 | $388,130 | $418,726 |
| 06/2024 | $375,100 | $411,966 |
| 07/2024 | $392,276 | $424,051 |
| 08/2024 | $403,529 | $437,840 |
| 09/2024 | $405,108 | $441,883 |
| 10/2024 | $382,208 | $417,853 |
Average Annual Total Returns (%)
| HEADER | 1 Year | 5 Years | 10 Years |
|---|
Class R5Footnote Reference1 | 22.05% | 6.20% | 4.34% |
MSCI® EAFE Index (Net) | 22.97% | 6.24% | 5.27% |
| Footnote | Description |
Footnote1 | Return may differ from actual shareholder return due to accounting adjustments for financial reporting purposes. |
Performance shown is historical and is not indicative of future returns. Investment returns and principal value will vary, and shares may be worth more or less at redemption than at original purchase. Performance shown is as of date indicated, and current performance may be lower or higher than the performance data quoted. To obtain performance as of the most recent month end, please visit americanbeaconfunds.com or call 800-967-9009. The graph and table do not reflect the deduction of taxes that a shareholder would pay on fund distributions or redemption of fund shares.
| Total Net Assets | $598,097,805 |
| # of Portfolio Holdings | 162 |
| Portfolio Turnover Rate | 43% |
| Total Management Fees Paid | $4,713,132 |
Asset Allocation - % Investments
| Value | Value |
|---|
| Foreign Common Stocks | 82.8 |
| Common Stocks | 13.2 |
| Investment Companies | 3.3 |
| Securities Lending Collateral | 0.4 |
| Foreign Preferred Stocks | 0.3 |
The Fund may purchase and sell futures contracts to gain market exposure on cash balances.
What did the Fund invest in?
Top Ten Holdings - % Net Assets
| Roche Holding AG | 3.2 |
| Reckitt Benckiser Group PLC | 2.4 |
| British American Tobacco PLC | 2.4 |
| Samsung Electronics Co. Ltd. | 2.2 |
| GSK PLC | 2.2 |
| Barclays PLC | 2.1 |
| Sanofi SA | 2.1 |
| Orange SA | 1.6 |
| RELX PLC | 1.6 |
| ING Groep NV | 1.6 |
Excludes cash equivalents.
Sector Allocation - % Equities
| Value | Value |
|---|
| Real Estate | 1.0 |
| Utilities | 2.2 |
| Energy | 2.7 |
| Communication Services | 3.6 |
| Materials | 6.8 |
| Information Technology | 10.5 |
| Consumer Staples | 12.1 |
| Health Care | 12.4 |
| Consumer Discretionary | 13.6 |
| Financials | 15.2 |
| Industrials | 19.9 |
Top Ten Country Exposure - % Equities
| Value | Value |
|---|
| Italy | 2.7 |
| Canada | 3.2 |
| China | 3.5 |
| Netherlands | 4.7 |
| Republic Of Korea | 4.9 |
| Germany | 9.4 |
| Japan | 11.6 |
| United States | 13.2 |
| France | 14.2 |
| United Kingdom | 20.1 |
For additional information about the Fund, including its prospectus, financial statements, holdings, and proxy voting information, please visit www.americanbeaconfunds.com/literature or call 1-800-658-5811.
If your financial institution mailed only one copy of this Report to an address shared by more than one account, you can request an individual copy by contacting your financial institution.
International Equity Fund
Distributed by:
Resolute Investment Distributors, Inc.
Annual Shareholder Report - October 31, 2024
International Equity Fund
Annual Shareholder Report - October 31, 2024
This annual shareholder report contains important information about American Beacon International Equity Fund for the period of November 1, 2023 to October 31, 2024. You can find additional information about the Fund at www.americanbeaconfunds.com/literature. You can also request this information by contacting us at 800-658-5811.
What were the Fund costs for the last year?
(based on a hypothetical $10,000 investment)
| Class Name | Costs of a $10,000 investment | Costs paid as a percentage of a $10,000 investment |
|---|
| Investor | $122 | 1.10% |
How did the Fund perform and what affected its performance?
The Investor Class of the Fund returned 21.71% for the twelve months ended October 31, 2024, compared to the MSCI® EAFE Index (Net) return of 22.97%.
• Broad market performance during the last twelve months benefited from many developed nations loosening monetary policy as inflation eased and the increased prospect of a soft landing even as an interest rate hike by the Bank of Japan in late July caused some market turmoil.
• The Fund’s focus on value through a bottom-up approach and diversification through its multi manager strategy provided strong returns during the period.
• The Fund's holdings in the Industrials and Financials sectors contributed to the Fund's performance, while holdings in the Information Technology sector detracted from performance.
Cumulative Performance from October 31, 2014 through October 31, 2024
The initial investment, based on a $10,000 investment, is adjusted to reflect the maximum applicable sales charge, if any.
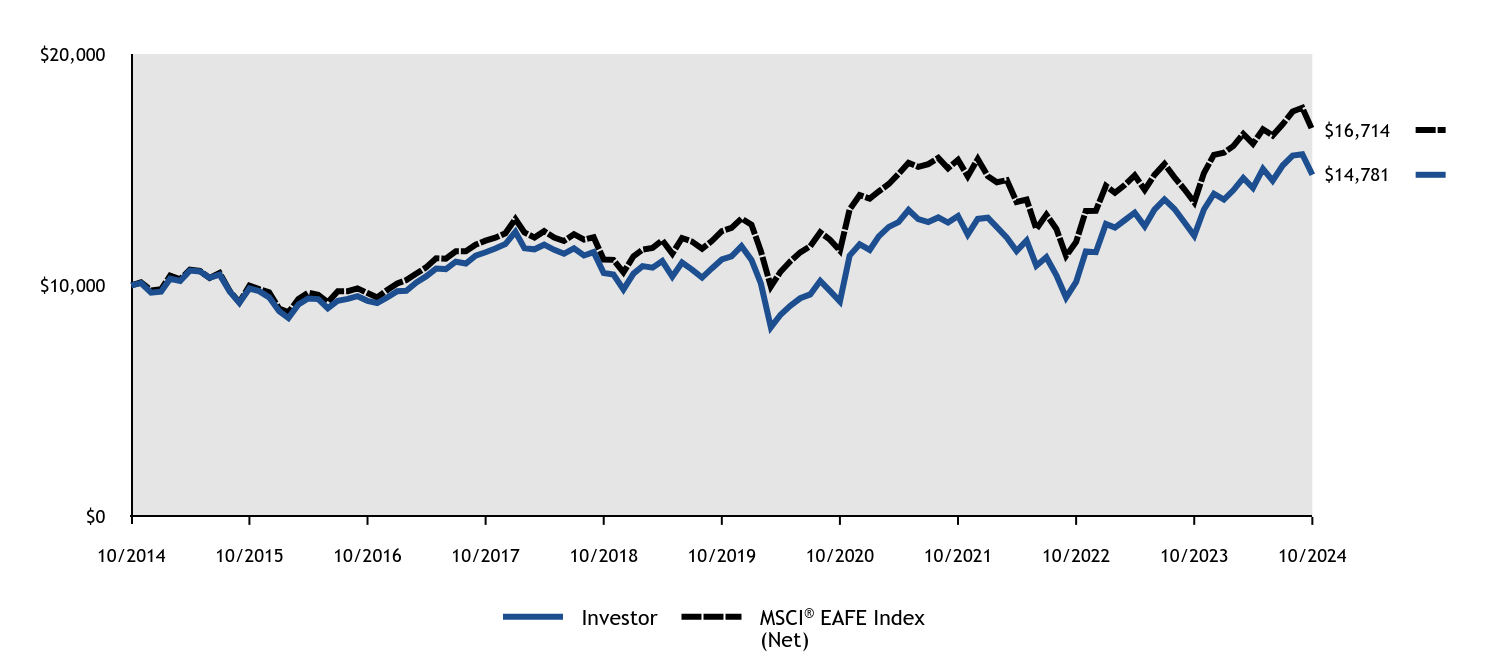
| Investor | MSCI® EAFE Index (Net) |
|---|
| 10/2014 | $10,000 | $10,000 |
| 11/2014 | $10,104 | $10,136 |
| 12/2014 | $9,685 | $9,785 |
| 01/2015 | $9,728 | $9,833 |
| 02/2015 | $10,290 | $10,421 |
| 03/2015 | $10,194 | $10,262 |
| 04/2015 | $10,640 | $10,681 |
| 05/2015 | $10,603 | $10,627 |
| 06/2015 | $10,332 | $10,325 |
| 07/2015 | $10,465 | $10,540 |
| 08/2015 | $9,743 | $9,765 |
| 09/2015 | $9,250 | $9,269 |
| 10/2015 | $9,865 | $9,993 |
| 11/2015 | $9,754 | $9,838 |
| 12/2015 | $9,486 | $9,705 |
| 01/2016 | $8,891 | $9,003 |
| 02/2016 | $8,588 | $8,838 |
| 03/2016 | $9,178 | $9,414 |
| 04/2016 | $9,438 | $9,686 |
| 05/2016 | $9,411 | $9,598 |
| 06/2016 | $9,015 | $9,276 |
| 07/2016 | $9,340 | $9,746 |
| 08/2016 | $9,421 | $9,753 |
| 09/2016 | $9,535 | $9,873 |
| 10/2016 | $9,335 | $9,671 |
| 11/2016 | $9,237 | $9,478 |
| 12/2016 | $9,477 | $9,802 |
| 01/2017 | $9,748 | $10,087 |
| 02/2017 | $9,770 | $10,231 |
| 03/2017 | $10,130 | $10,513 |
| 04/2017 | $10,390 | $10,780 |
| 05/2017 | $10,727 | $11,176 |
| 06/2017 | $10,705 | $11,156 |
| 07/2017 | $11,026 | $11,478 |
| 08/2017 | $10,949 | $11,473 |
| 09/2017 | $11,286 | $11,759 |
| 10/2017 | $11,435 | $11,937 |
| 11/2017 | $11,596 | $12,063 |
| 12/2017 | $11,788 | $12,256 |
| 01/2018 | $12,317 | $12,871 |
| 02/2018 | $11,612 | $12,290 |
| 03/2018 | $11,561 | $12,069 |
| 04/2018 | $11,760 | $12,344 |
| 05/2018 | $11,538 | $12,067 |
| 06/2018 | $11,367 | $11,919 |
| 07/2018 | $11,606 | $12,213 |
| 08/2018 | $11,293 | $11,977 |
| 09/2018 | $11,441 | $12,081 |
| 10/2018 | $10,537 | $11,119 |
| 11/2018 | $10,468 | $11,105 |
| 12/2018 | $9,827 | $10,566 |
| 01/2019 | $10,511 | $11,260 |
| 02/2019 | $10,835 | $11,548 |
| 03/2019 | $10,766 | $11,620 |
| 04/2019 | $11,053 | $11,947 |
| 05/2019 | $10,380 | $11,373 |
| 06/2019 | $10,990 | $12,048 |
| 07/2019 | $10,685 | $11,895 |
| 08/2019 | $10,337 | $11,587 |
| 09/2019 | $10,735 | $11,919 |
| 10/2019 | $11,121 | $12,347 |
| 11/2019 | $11,258 | $12,486 |
| 12/2019 | $11,694 | $12,892 |
| 01/2020 | $11,100 | $12,623 |
| 02/2020 | $10,084 | $11,482 |
| 03/2020 | $8,188 | $9,949 |
| 04/2020 | $8,737 | $10,592 |
| 05/2020 | $9,127 | $11,053 |
| 06/2020 | $9,446 | $11,430 |
| 07/2020 | $9,612 | $11,696 |
| 08/2020 | $10,199 | $12,297 |
| 09/2020 | $9,765 | $11,978 |
| 10/2020 | $9,305 | $11,500 |
| 11/2020 | $11,292 | $13,282 |
| 12/2020 | $11,780 | $13,900 |
| 01/2021 | $11,534 | $13,752 |
| 02/2021 | $12,122 | $14,060 |
| 03/2021 | $12,530 | $14,383 |
| 04/2021 | $12,737 | $14,816 |
| 05/2021 | $13,260 | $15,299 |
| 06/2021 | $12,866 | $15,127 |
| 07/2021 | $12,737 | $15,241 |
| 08/2021 | $12,937 | $15,510 |
| 09/2021 | $12,717 | $15,060 |
| 10/2021 | $13,002 | $15,430 |
| 11/2021 | $12,200 | $14,712 |
| 12/2021 | $12,875 | $15,465 |
| 01/2022 | $12,925 | $14,718 |
| 02/2022 | $12,517 | $14,458 |
| 03/2022 | $12,065 | $14,551 |
| 04/2022 | $11,484 | $13,609 |
| 05/2022 | $11,943 | $13,711 |
| 06/2022 | $10,854 | $12,439 |
| 07/2022 | $11,219 | $13,059 |
| 08/2022 | $10,438 | $12,439 |
| 09/2022 | $9,477 | $11,275 |
| 10/2022 | $10,151 | $11,881 |
| 11/2022 | $11,470 | $13,220 |
| 12/2022 | $11,439 | $13,230 |
| 01/2023 | $12,658 | $14,302 |
| 02/2023 | $12,497 | $14,003 |
| 03/2023 | $12,827 | $14,350 |
| 04/2023 | $13,143 | $14,755 |
| 05/2023 | $12,556 | $14,131 |
| 06/2023 | $13,275 | $14,774 |
| 07/2023 | $13,716 | $15,252 |
| 08/2023 | $13,304 | $14,668 |
| 09/2023 | $12,739 | $14,167 |
| 10/2023 | $12,144 | $13,592 |
| 11/2023 | $13,282 | $14,854 |
| 12/2023 | $13,964 | $15,643 |
| 01/2024 | $13,710 | $15,733 |
| 02/2024 | $14,111 | $16,021 |
| 03/2024 | $14,642 | $16,548 |
| 04/2024 | $14,211 | $16,124 |
| 05/2024 | $15,035 | $16,749 |
| 06/2024 | $14,526 | $16,479 |
| 07/2024 | $15,181 | $16,962 |
| 08/2024 | $15,612 | $17,514 |
| 09/2024 | $15,666 | $17,675 |
| 10/2024 | $14,781 | $16,714 |
Average Annual Total Returns (%)
| HEADER | 1 Year | 5 Years | 10 Years |
|---|
Investor ClassFootnote Reference1 | 21.71% | 5.85% | 3.98% |
MSCI® EAFE Index (Net) | 22.97% | 6.24% | 5.27% |
| Footnote | Description |
Footnote1 | Return may differ from actual shareholder return due to accounting adjustments for financial reporting purposes. |
Performance shown is historical and is not indicative of future returns. Investment returns and principal value will vary, and shares may be worth more or less at redemption than at original purchase. Performance shown is as of date indicated, and current performance may be lower or higher than the performance data quoted. To obtain performance as of the most recent month end, please visit americanbeaconfunds.com or call 800-967-9009. The graph and table do not reflect the deduction of taxes that a shareholder would pay on fund distributions or redemption of fund shares.
| Total Net Assets | $598,097,805 |
| # of Portfolio Holdings | 162 |
| Portfolio Turnover Rate | 43% |
| Total Management Fees Paid | $4,713,132 |
Asset Allocation - % Investments
| Value | Value |
|---|
| Foreign Common Stocks | 82.8 |
| Common Stocks | 13.2 |
| Investment Companies | 3.3 |
| Securities Lending Collateral | 0.4 |
| Foreign Preferred Stocks | 0.3 |
The Fund may purchase and sell futures contracts to gain market exposure on cash balances.
What did the Fund invest in?
Top Ten Holdings - % Net Assets
| Roche Holding AG | 3.2 |
| Reckitt Benckiser Group PLC | 2.4 |
| British American Tobacco PLC | 2.4 |
| Samsung Electronics Co. Ltd. | 2.2 |
| GSK PLC | 2.2 |
| Barclays PLC | 2.1 |
| Sanofi SA | 2.1 |
| Orange SA | 1.6 |
| RELX PLC | 1.6 |
| ING Groep NV | 1.6 |
Excludes cash equivalents.
Sector Allocation - % Equities
| Value | Value |
|---|
| Real Estate | 1.0 |
| Utilities | 2.2 |
| Energy | 2.7 |
| Communication Services | 3.6 |
| Materials | 6.8 |
| Information Technology | 10.5 |
| Consumer Staples | 12.1 |
| Health Care | 12.4 |
| Consumer Discretionary | 13.6 |
| Financials | 15.2 |
| Industrials | 19.9 |
Top Ten Country Exposure - % Equities
| Value | Value |
|---|
| Italy | 2.7 |
| Canada | 3.2 |
| China | 3.5 |
| Netherlands | 4.7 |
| Republic Of Korea | 4.9 |
| Germany | 9.4 |
| Japan | 11.6 |
| United States | 13.2 |
| France | 14.2 |
| United Kingdom | 20.1 |
For additional information about the Fund, including its prospectus, financial statements, holdings, and proxy voting information, please visit www.americanbeaconfunds.com/literature or call 1-800-658-5811.
If your financial institution mailed only one copy of this Report to an address shared by more than one account, you can request an individual copy by contacting your financial institution.
International Equity Fund
Distributed by:
Resolute Investment Distributors, Inc.
Annual Shareholder Report - October 31, 2024
International Equity Fund
Annual Shareholder Report - October 31, 2024
This annual shareholder report contains important information about American Beacon International Equity Fund for the period of November 1, 2023 to October 31, 2024. You can find additional information about the Fund at www.americanbeaconfunds.com/literature. You can also request this information by contacting us at 800-658-5811.
What were the Fund costs for the last year?
(based on a hypothetical $10,000 investment)
| Class Name | Costs of a $10,000 investment | Costs paid as a percentage of a $10,000 investment |
|---|
| Advisor Class | $138 | 1.25% |
How did the Fund perform and what affected its performance?
The Advisor Class of the Fund returned 21.50% for the twelve months ended October 31, 2024, compared to the MSCI® EAFE Index (Net) return of 22.97%.
• Broad market performance during the last twelve months benefited from many developed nations loosening monetary policy as inflation eased and the increased prospect of a soft landing even as an interest rate hike by the Bank of Japan in late July caused some market turmoil.
• The Fund’s focus on value through a bottom-up approach and diversification through its multi manager strategy provided strong returns during the period.
• The Fund's holdings in the Industrials and Financials sectors contributed to the Fund's performance, while holdings in the Information Technology sector detracted from performance.
Cumulative Performance from October 31, 2014 through October 31, 2024
The initial investment, based on a $10,000 investment, is adjusted to reflect the maximum applicable sales charge, if any.
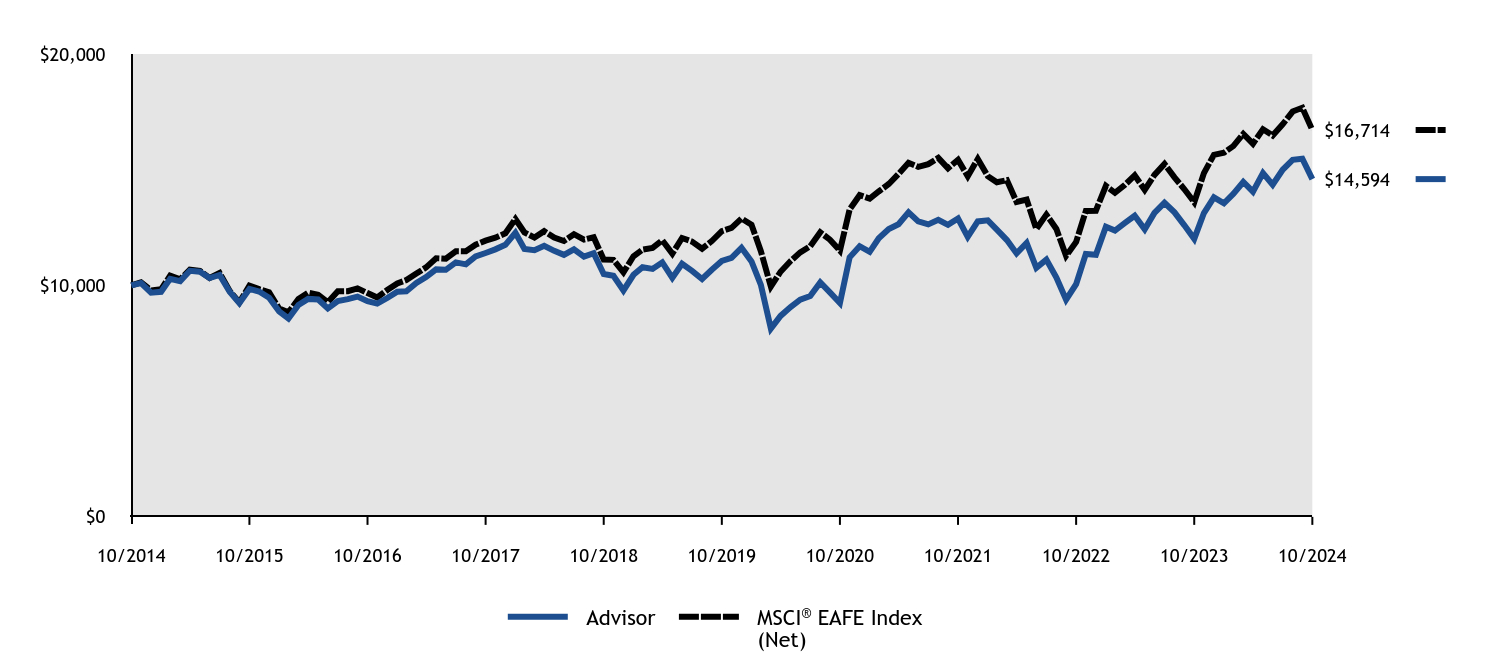
| Advisor | MSCI® EAFE Index (Net) |
|---|
| 10/2014 | $10,000 | $10,000 |
| 11/2014 | $10,101 | $10,136 |
| 12/2014 | $9,684 | $9,785 |
| 01/2015 | $9,725 | $9,833 |
| 02/2015 | $10,285 | $10,421 |
| 03/2015 | $10,186 | $10,262 |
| 04/2015 | $10,632 | $10,681 |
| 05/2015 | $10,591 | $10,627 |
| 06/2015 | $10,321 | $10,325 |
| 07/2015 | $10,451 | $10,540 |
| 08/2015 | $9,730 | $9,765 |
| 09/2015 | $9,238 | $9,269 |
| 10/2015 | $9,850 | $9,993 |
| 11/2015 | $9,736 | $9,838 |
| 12/2015 | $9,471 | $9,705 |
| 01/2016 | $8,879 | $9,003 |
| 02/2016 | $8,572 | $8,838 |
| 03/2016 | $9,159 | $9,414 |
| 04/2016 | $9,418 | $9,686 |
| 05/2016 | $9,392 | $9,598 |
| 06/2016 | $9,006 | $9,276 |
| 07/2016 | $9,323 | $9,746 |
| 08/2016 | $9,407 | $9,753 |
| 09/2016 | $9,518 | $9,873 |
| 10/2016 | $9,318 | $9,671 |
| 11/2016 | $9,217 | $9,478 |
| 12/2016 | $9,456 | $9,802 |
| 01/2017 | $9,726 | $10,087 |
| 02/2017 | $9,748 | $10,231 |
| 03/2017 | $10,103 | $10,513 |
| 04/2017 | $10,362 | $10,780 |
| 05/2017 | $10,696 | $11,176 |
| 06/2017 | $10,675 | $11,156 |
| 07/2017 | $10,998 | $11,478 |
| 08/2017 | $10,912 | $11,473 |
| 09/2017 | $11,252 | $11,759 |
| 10/2017 | $11,403 | $11,937 |
| 11/2017 | $11,559 | $12,063 |
| 12/2017 | $11,755 | $12,256 |
| 01/2018 | $12,276 | $12,871 |
| 02/2018 | $11,572 | $12,290 |
| 03/2018 | $11,522 | $12,069 |
| 04/2018 | $11,716 | $12,344 |
| 05/2018 | $11,495 | $12,067 |
| 06/2018 | $11,323 | $11,919 |
| 07/2018 | $11,561 | $12,213 |
| 08/2018 | $11,245 | $11,977 |
| 09/2018 | $11,395 | $12,081 |
| 10/2018 | $10,492 | $11,119 |
| 11/2018 | $10,420 | $11,105 |
| 12/2018 | $9,782 | $10,566 |
| 01/2019 | $10,459 | $11,260 |
| 02/2019 | $10,785 | $11,548 |
| 03/2019 | $10,712 | $11,620 |
| 04/2019 | $10,996 | $11,947 |
| 05/2019 | $10,326 | $11,373 |
| 06/2019 | $10,936 | $12,048 |
| 07/2019 | $10,628 | $11,895 |
| 08/2019 | $10,278 | $11,587 |
| 09/2019 | $10,676 | $11,919 |
| 10/2019 | $11,056 | $12,347 |
| 11/2019 | $11,195 | $12,486 |
| 12/2019 | $11,628 | $12,892 |
| 01/2020 | $11,034 | $12,623 |
| 02/2020 | $10,026 | $11,482 |
| 03/2020 | $8,133 | $9,949 |
| 04/2020 | $8,684 | $10,592 |
| 05/2020 | $9,067 | $11,053 |
| 06/2020 | $9,383 | $11,430 |
| 07/2020 | $9,543 | $11,696 |
| 08/2020 | $10,131 | $12,297 |
| 09/2020 | $9,698 | $11,978 |
| 10/2020 | $9,240 | $11,500 |
| 11/2020 | $11,213 | $13,282 |
| 12/2020 | $11,696 | $13,900 |
| 01/2021 | $11,453 | $13,752 |
| 02/2021 | $12,039 | $14,060 |
| 03/2021 | $12,438 | $14,383 |
| 04/2021 | $12,643 | $14,816 |
| 05/2021 | $13,161 | $15,299 |
| 06/2021 | $12,768 | $15,127 |
| 07/2021 | $12,637 | $15,241 |
| 08/2021 | $12,837 | $15,510 |
| 09/2021 | $12,618 | $15,060 |
| 10/2021 | $12,893 | $15,430 |
| 11/2021 | $12,101 | $14,712 |
| 12/2021 | $12,765 | $15,465 |
| 01/2022 | $12,814 | $14,718 |
| 02/2022 | $12,408 | $14,458 |
| 03/2022 | $11,961 | $14,551 |
| 04/2022 | $11,383 | $13,609 |
| 05/2022 | $11,837 | $13,711 |
| 06/2022 | $10,757 | $12,439 |
| 07/2022 | $11,115 | $13,059 |
| 08/2022 | $10,344 | $12,439 |
| 09/2022 | $9,388 | $11,275 |
| 10/2022 | $10,056 | $11,881 |
| 11/2022 | $11,362 | $13,220 |
| 12/2022 | $11,323 | $13,230 |
| 01/2023 | $12,532 | $14,302 |
| 02/2023 | $12,370 | $14,003 |
| 03/2023 | $12,700 | $14,350 |
| 04/2023 | $13,010 | $14,755 |
| 05/2023 | $12,426 | $14,131 |
| 06/2023 | $13,136 | $14,774 |
| 07/2023 | $13,572 | $15,252 |
| 08/2023 | $13,157 | $14,668 |
| 09/2023 | $12,609 | $14,167 |
| 10/2023 | $12,012 | $13,592 |
| 11/2023 | $13,129 | $14,854 |
| 12/2023 | $13,806 | $15,643 |
| 01/2024 | $13,549 | $15,733 |
| 02/2024 | $13,953 | $16,021 |
| 03/2024 | $14,469 | $16,548 |
| 04/2024 | $14,049 | $16,124 |
| 05/2024 | $14,851 | $16,749 |
| 06/2024 | $14,351 | $16,479 |
| 07/2024 | $14,998 | $16,962 |
| 08/2024 | $15,425 | $17,514 |
| 09/2024 | $15,477 | $17,675 |
| 10/2024 | $14,594 | $16,714 |
Average Annual Total Returns (%)
| HEADER | 1 Year | 5 Years | 10 Years |
|---|
Advisor ClassFootnote Reference1 | 21.50% | 5.71% | 3.85% |
MSCI® EAFE Index (Net) | 22.97% | 6.24% | 5.27% |
| Footnote | Description |
Footnote1 | Return may differ from actual shareholder return due to accounting adjustments for financial reporting purposes. |
Performance shown is historical and is not indicative of future returns. Investment returns and principal value will vary, and shares may be worth more or less at redemption than at original purchase. Performance shown is as of date indicated, and current performance may be lower or higher than the performance data quoted. To obtain performance as of the most recent month end, please visit americanbeaconfunds.com or call 800-967-9009. The graph and table do not reflect the deduction of taxes that a shareholder would pay on fund distributions or redemption of fund shares.
| Total Net Assets | $598,097,805 |
| # of Portfolio Holdings | 162 |
| Portfolio Turnover Rate | 43% |
| Total Management Fees Paid | $4,713,132 |
Asset Allocation - % Investments
| Value | Value |
|---|
| Foreign Common Stocks | 82.8 |
| Common Stocks | 13.2 |
| Investment Companies | 3.3 |
| Securities Lending Collateral | 0.4 |
| Foreign Preferred Stocks | 0.3 |
The Fund may purchase and sell futures contracts to gain market exposure on cash balances.
What did the Fund invest in?
Top Ten Holdings - % Net Assets
| Roche Holding AG | 3.2 |
| Reckitt Benckiser Group PLC | 2.4 |
| British American Tobacco PLC | 2.4 |
| Samsung Electronics Co. Ltd. | 2.2 |
| GSK PLC | 2.2 |
| Barclays PLC | 2.1 |
| Sanofi SA | 2.1 |
| Orange SA | 1.6 |
| RELX PLC | 1.6 |
| ING Groep NV | 1.6 |
Excludes cash equivalents.
Sector Allocation - % Equities
| Value | Value |
|---|
| Real Estate | 1.0 |
| Utilities | 2.2 |
| Energy | 2.7 |
| Communication Services | 3.6 |
| Materials | 6.8 |
| Information Technology | 10.5 |
| Consumer Staples | 12.1 |
| Health Care | 12.4 |
| Consumer Discretionary | 13.6 |
| Financials | 15.2 |
| Industrials | 19.9 |
Top Ten Country Exposure - % Equities
| Value | Value |
|---|
| Italy | 2.7 |
| Canada | 3.2 |
| China | 3.5 |
| Netherlands | 4.7 |
| Republic Of Korea | 4.9 |
| Germany | 9.4 |
| Japan | 11.6 |
| United States | 13.2 |
| France | 14.2 |
| United Kingdom | 20.1 |
For additional information about the Fund, including its prospectus, financial statements, holdings, and proxy voting information, please visit www.americanbeaconfunds.com/literature or call 1-800-658-5811.
If your financial institution mailed only one copy of this Report to an address shared by more than one account, you can request an individual copy by contacting your financial institution.
International Equity Fund
Distributed by:
Resolute Investment Distributors, Inc.
Annual Shareholder Report - October 31, 2024
International Equity Fund
Annual Shareholder Report - October 31, 2024
This annual shareholder report contains important information about American Beacon International Equity Fund for the period of November 1, 2023 to October 31, 2024. You can find additional information about the Fund at www.americanbeaconfunds.com/literature. You can also request this information by contacting us at 800-658-5811.
What were the Fund costs for the last year?
(based on a hypothetical $10,000 investment)
| Class Name | Costs of a $10,000 investment | Costs paid as a percentage of a $10,000 investment |
|---|
| Y | $93 | 0.84% |
How did the Fund perform and what affected its performance?
The Y Class of the Fund returned 22.01% for the twelve months ended October 31, 2024, compared to the MSCI® EAFE Index (Net) return of 22.97%.
• Broad market performance during the last twelve months benefited from many developed nations loosening monetary policy as inflation eased and the increased prospect of a soft landing even as an interest rate hike by the Bank of Japan in late July caused some market turmoil.
• The Fund’s focus on value through a bottom-up approach and diversification through its multi manager strategy provided strong returns during the period.
• The Fund's holdings in the Industrials and Financials sectors contributed to the Fund's performance, while holdings in the Information Technology sector detracted from performance.
Cumulative Performance from October 31, 2014 through October 31, 2024
The initial investment, based on a $100,000 investment, is adjusted to reflect the maximum applicable sales charge, if any.
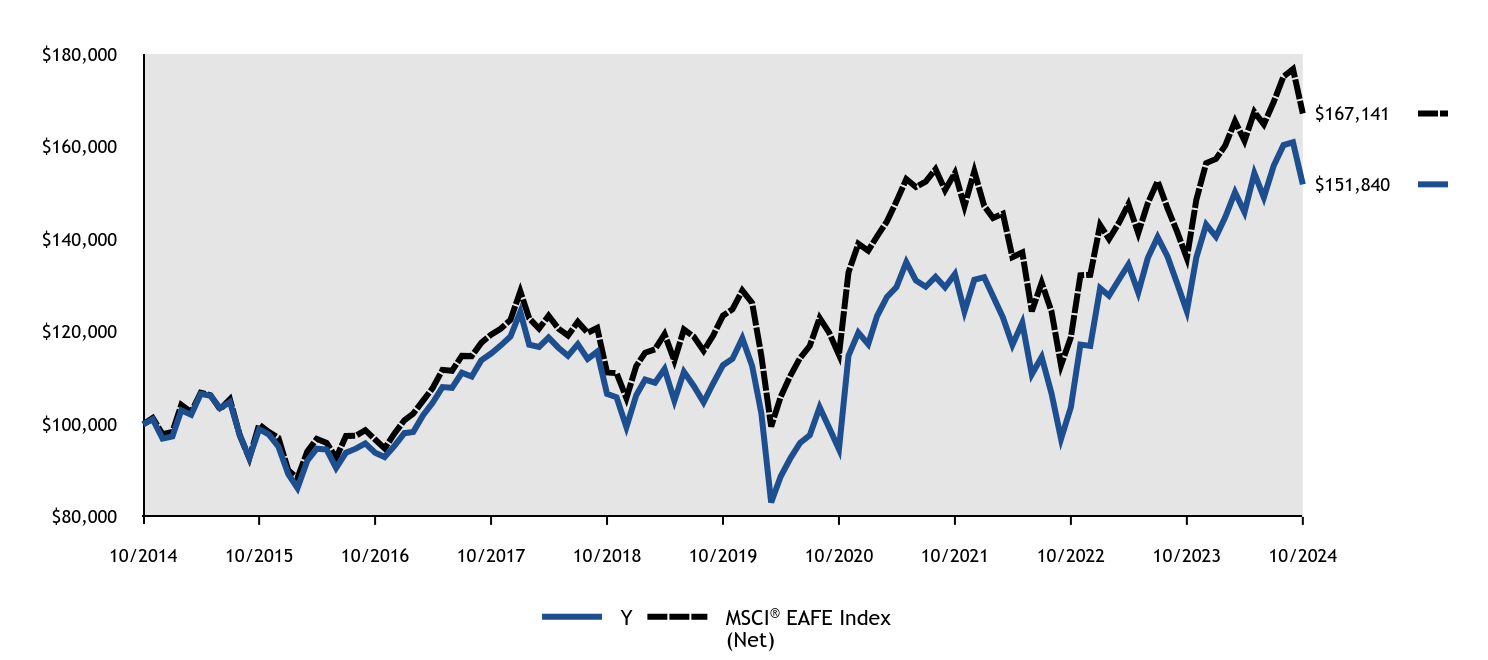
| #ERROR:A result could not be returned because the conditional could not be evaluated to a True/False value (#ERROR:Invalid Formula (#!=""), 'Multiple values from an iterator cannot be used in a formula unless they are aggregrated.') | Y | MSCI® EAFE Index (Net) |
|---|
| 10/2014 | $100,000 | $100,000 |
| 11/2014 | $101,089 | $101,360 |
| 12/2014 | $96,904 | $97,849 |
| 01/2015 | $97,361 | $98,327 |
| 02/2015 | $103,005 | $104,205 |
| 03/2015 | $102,039 | $102,622 |
| 04/2015 | $106,564 | $106,812 |
| 05/2015 | $106,157 | $106,266 |
| 06/2015 | $103,462 | $103,255 |
| 07/2015 | $104,835 | $105,399 |
| 08/2015 | $97,667 | $97,645 |
| 09/2015 | $92,735 | $92,687 |
| 10/2015 | $98,938 | $99,932 |
| 11/2015 | $97,819 | $98,378 |
| 12/2015 | $95,155 | $97,052 |
| 01/2016 | $89,221 | $90,034 |
| 02/2016 | $86,202 | $88,385 |
| 03/2016 | $92,136 | $94,136 |
| 04/2016 | $94,739 | $96,861 |
| 05/2016 | $94,531 | $95,981 |
| 06/2016 | $90,574 | $92,759 |
| 07/2016 | $93,854 | $97,460 |
| 08/2016 | $94,739 | $97,529 |
| 09/2016 | $95,884 | $98,727 |
| 10/2016 | $93,854 | $96,708 |
| 11/2016 | $92,917 | $94,782 |
| 12/2016 | $95,368 | $98,023 |
| 01/2017 | $98,085 | $100,866 |
| 02/2017 | $98,352 | $102,309 |
| 03/2017 | $101,975 | $105,125 |
| 04/2017 | $104,639 | $107,800 |
| 05/2017 | $108,048 | $111,757 |
| 06/2017 | $107,889 | $111,559 |
| 07/2017 | $111,139 | $114,777 |
| 08/2017 | $110,339 | $114,734 |
| 09/2017 | $113,802 | $117,589 |
| 10/2017 | $115,294 | $119,374 |
| 11/2017 | $116,999 | $120,626 |
| 12/2017 | $118,961 | $122,562 |
| 01/2018 | $124,284 | $128,710 |
| 02/2018 | $117,205 | $122,901 |
| 03/2018 | $116,712 | $120,686 |
| 04/2018 | $118,742 | $123,441 |
| 05/2018 | $116,547 | $120,666 |
| 06/2018 | $114,791 | $119,192 |
| 07/2018 | $117,315 | $122,126 |
| 08/2018 | $114,133 | $119,768 |
| 09/2018 | $115,669 | $120,807 |
| 10/2018 | $106,560 | $111,192 |
| 11/2018 | $105,847 | $111,052 |
| 12/2018 | $99,400 | $105,661 |
| 01/2019 | $106,295 | $112,605 |
| 02/2019 | $109,652 | $115,475 |
| 03/2019 | $108,992 | $116,203 |
| 04/2019 | $111,930 | $119,470 |
| 05/2019 | $105,095 | $113,733 |
| 06/2019 | $111,330 | $120,480 |
| 07/2019 | $108,273 | $118,950 |
| 08/2019 | $104,736 | $115,869 |
| 09/2019 | $108,812 | $119,189 |
| 10/2019 | $112,769 | $123,471 |
| 11/2019 | $114,148 | $124,863 |
| 12/2019 | $118,583 | $128,921 |
| 01/2020 | $112,607 | $126,229 |
| 02/2020 | $102,381 | $114,818 |
| 03/2020 | $83,100 | $99,493 |
| 04/2020 | $88,706 | $105,921 |
| 05/2020 | $92,710 | $110,533 |
| 06/2020 | $95,975 | $114,297 |
| 07/2020 | $97,638 | $116,961 |
| 08/2020 | $103,675 | $122,974 |
| 09/2020 | $99,240 | $119,779 |
| 10/2020 | $94,620 | $114,996 |
| 11/2020 | $114,825 | $132,822 |
| 12/2020 | $119,828 | $138,998 |
| 01/2021 | $117,326 | $137,517 |
| 02/2021 | $123,392 | $140,601 |
| 03/2021 | $127,520 | $143,834 |
| 04/2021 | $129,646 | $148,162 |
| 05/2021 | $135,025 | $152,994 |
| 06/2021 | $131,085 | $151,272 |
| 07/2021 | $129,709 | $152,411 |
| 08/2021 | $131,835 | $155,099 |
| 09/2021 | $129,584 | $150,598 |
| 10/2021 | $132,461 | $154,302 |
| 11/2021 | $124,393 | $147,120 |
| 12/2021 | $131,227 | $154,653 |
| 01/2022 | $131,779 | $147,180 |
| 02/2022 | $127,640 | $144,578 |
| 03/2022 | $123,086 | $145,507 |
| 04/2022 | $117,152 | $136,093 |
| 05/2022 | $121,913 | $137,114 |
| 06/2022 | $110,805 | $124,391 |
| 07/2022 | $114,531 | $130,590 |
| 08/2022 | $106,665 | $124,387 |
| 09/2022 | $96,868 | $112,751 |
| 10/2022 | $103,699 | $118,814 |
| 11/2022 | $117,221 | $132,197 |
| 12/2022 | $116,947 | $132,303 |
| 01/2023 | $129,399 | $143,017 |
| 02/2023 | $127,772 | $140,033 |
| 03/2023 | $131,239 | $143,503 |
| 04/2023 | $134,493 | $147,555 |
| 05/2023 | $128,479 | $141,310 |
| 06/2023 | $135,908 | $147,741 |
| 07/2023 | $140,436 | $152,522 |
| 08/2023 | $136,262 | $146,678 |
| 09/2023 | $130,531 | $141,668 |
| 10/2023 | $124,447 | $135,925 |
| 11/2023 | $136,050 | $148,541 |
| 12/2023 | $143,144 | $156,433 |
| 01/2024 | $140,543 | $157,333 |
| 02/2024 | $144,705 | $160,213 |
| 03/2024 | $150,130 | $165,482 |
| 04/2024 | $145,820 | $161,244 |
| 05/2024 | $154,218 | $167,490 |
| 06/2024 | $149,016 | $164,786 |
| 07/2024 | $155,853 | $169,621 |
| 08/2024 | $160,313 | $175,136 |
| 09/2024 | $160,907 | $176,753 |
| 10/2024 | $151,840 | $167,141 |
Average Annual Total Returns (%)
| HEADER | 1 Year | 5 Years | 10 Years |
|---|
Class YFootnote Reference1 | 22.01% | 6.13% | 4.27% |
MSCI® EAFE Index (Net) | 22.97% | 6.24% | 5.27% |
| Footnote | Description |
Footnote1 | Return may differ from actual shareholder return due to accounting adjustments for financial reporting purposes. |
Performance shown is historical and is not indicative of future returns. Investment returns and principal value will vary, and shares may be worth more or less at redemption than at original purchase. Performance shown is as of date indicated, and current performance may be lower or higher than the performance data quoted. To obtain performance as of the most recent month end, please visit americanbeaconfunds.com or call 800-967-9009. The graph and table do not reflect the deduction of taxes that a shareholder would pay on fund distributions or redemption of fund shares.
| Total Net Assets | $598,097,805 |
| # of Portfolio Holdings | 162 |
| Portfolio Turnover Rate | 43% |
| Total Management Fees Paid | $4,713,132 |
Asset Allocation - % Investments
| Value | Value |
|---|
| Foreign Common Stocks | 82.8 |
| Common Stocks | 13.2 |
| Investment Companies | 3.3 |
| Securities Lending Collateral | 0.4 |
| Foreign Preferred Stocks | 0.3 |
The Fund may purchase and sell futures contracts to gain market exposure on cash balances.
What did the Fund invest in?
Top Ten Holdings - % Net Assets
| Roche Holding AG | 3.2 |
| Reckitt Benckiser Group PLC | 2.4 |
| British American Tobacco PLC | 2.4 |
| Samsung Electronics Co. Ltd. | 2.2 |
| GSK PLC | 2.2 |
| Barclays PLC | 2.1 |
| Sanofi SA | 2.1 |
| Orange SA | 1.6 |
| RELX PLC | 1.6 |
| ING Groep NV | 1.6 |
Excludes cash equivalents.
Sector Allocation - % Equities
| Value | Value |
|---|
| Real Estate | 1.0 |
| Utilities | 2.2 |
| Energy | 2.7 |
| Communication Services | 3.6 |
| Materials | 6.8 |
| Information Technology | 10.5 |
| Consumer Staples | 12.1 |
| Health Care | 12.4 |
| Consumer Discretionary | 13.6 |
| Financials | 15.2 |
| Industrials | 19.9 |
Top Ten Country Exposure - % Equities
| Value | Value |
|---|
| Italy | 2.7 |
| Canada | 3.2 |
| China | 3.5 |
| Netherlands | 4.7 |
| Republic Of Korea | 4.9 |
| Germany | 9.4 |
| Japan | 11.6 |
| United States | 13.2 |
| France | 14.2 |
| United Kingdom | 20.1 |
For additional information about the Fund, including its prospectus, financial statements, holdings, and proxy voting information, please visit www.americanbeaconfunds.com/literature or call 1-800-658-5811.
If your financial institution mailed only one copy of this Report to an address shared by more than one account, you can request an individual copy by contacting your financial institution.
International Equity Fund
Distributed by:
Resolute Investment Distributors, Inc.
Annual Shareholder Report - October 31, 2024
International Equity Fund
Annual Shareholder Report - October 31, 2024
This annual shareholder report contains important information about American Beacon International Equity Fund for the period of November 1, 2023 to October 31, 2024. You can find additional information about the Fund at www.americanbeaconfunds.com/literature. You can also request this information by contacting us at 800-658-5811.
What were the Fund costs for the last year?
(based on a hypothetical $10,000 investment)
| Class Name | Costs of a $10,000 investment | Costs paid as a percentage of a $10,000 investment |
|---|
| Class A | $131 | 1.18% |
How did the Fund perform and what affected its performance?
The A Class of the Fund returned 14.61% (with sales charges) and 21.63% (without sales charges) for the twelve months ended October 31, 2024, compared to the MSCI® EAFE Index (Net) return of 22.97%.
• Broad market performance during the last twelve months benefited from many developed nations loosening monetary policy as inflation eased and the increased prospect of a soft landing even as an interest rate hike by the Bank of Japan in late July caused some market turmoil.
• The Fund’s focus on value through a bottom-up approach and diversification through its multi manager strategy provided strong returns during the period.
• The Fund's holdings in the Industrials and Financials sectors contributed to the Fund's performance, while holdings in the Information Technology sector detracted from performance.
Cumulative Performance from October 31, 2014 through October 31, 2024
The initial investment, based on a $10,000 investment, is adjusted to reflect the maximum applicable sales charge, if any.
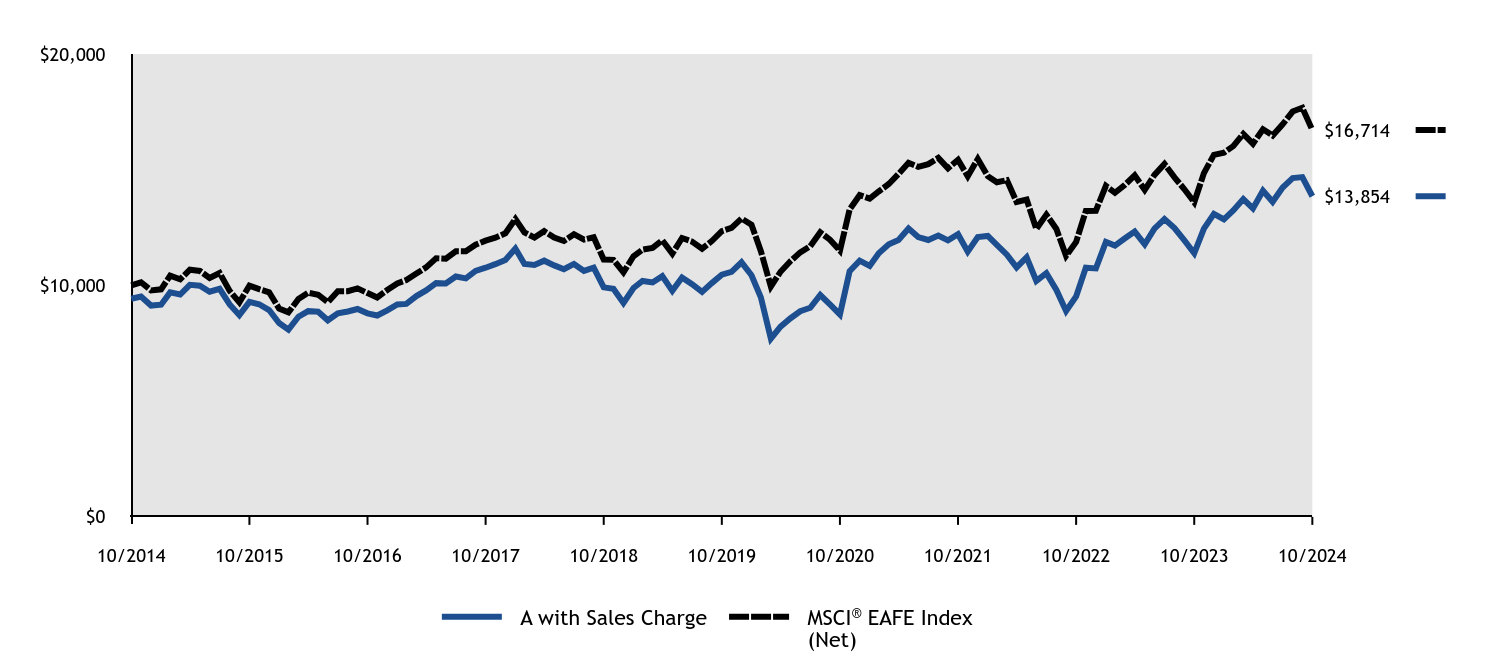
| A with Sales Charge | MSCI® EAFE Index (Net) |
|---|
| 10/2014 | $9,424 | $10,000 |
| 11/2014 | $9,522 | $10,136 |
| 12/2014 | $9,131 | $9,785 |
| 01/2015 | $9,166 | $9,833 |
| 02/2015 | $9,700 | $10,421 |
| 03/2015 | $9,606 | $10,262 |
| 04/2015 | $10,025 | $10,681 |
| 05/2015 | $9,990 | $10,627 |
| 06/2015 | $9,730 | $10,325 |
| 07/2015 | $9,855 | $10,540 |
| 08/2015 | $9,181 | $9,765 |
| 09/2015 | $8,716 | $9,269 |
| 10/2015 | $9,291 | $9,993 |
| 11/2015 | $9,186 | $9,838 |
| 12/2015 | $8,937 | $9,705 |
| 01/2016 | $8,376 | $9,003 |
| 02/2016 | $8,090 | $8,838 |
| 03/2016 | $8,646 | $9,414 |
| 04/2016 | $8,891 | $9,686 |
| 05/2016 | $8,866 | $9,598 |
| 06/2016 | $8,493 | $9,276 |
| 07/2016 | $8,794 | $9,746 |
| 08/2016 | $8,876 | $9,753 |
| 09/2016 | $8,983 | $9,873 |
| 10/2016 | $8,794 | $9,671 |
| 11/2016 | $8,702 | $9,478 |
| 12/2016 | $8,924 | $9,802 |
| 01/2017 | $9,180 | $10,087 |
| 02/2017 | $9,201 | $10,231 |
| 03/2017 | $9,540 | $10,513 |
| 04/2017 | $9,785 | $10,780 |
| 05/2017 | $10,104 | $11,176 |
| 06/2017 | $10,083 | $11,156 |
| 07/2017 | $10,385 | $11,478 |
| 08/2017 | $10,307 | $11,473 |
| 09/2017 | $10,626 | $11,759 |
| 10/2017 | $10,766 | $11,937 |
| 11/2017 | $10,918 | $12,063 |
| 12/2017 | $11,102 | $12,256 |
| 01/2018 | $11,595 | $12,871 |
| 02/2018 | $10,930 | $12,290 |
| 03/2018 | $10,882 | $12,069 |
| 04/2018 | $11,070 | $12,344 |
| 05/2018 | $10,866 | $12,067 |
| 06/2018 | $10,700 | $11,919 |
| 07/2018 | $10,930 | $12,213 |
| 08/2018 | $10,630 | $11,977 |
| 09/2018 | $10,769 | $12,081 |
| 10/2018 | $9,917 | $11,119 |
| 11/2018 | $9,853 | $11,105 |
| 12/2018 | $9,245 | $10,566 |
| 01/2019 | $9,890 | $11,260 |
| 02/2019 | $10,194 | $11,548 |
| 03/2019 | $10,130 | $11,620 |
| 04/2019 | $10,400 | $11,947 |
| 05/2019 | $9,767 | $11,373 |
| 06/2019 | $10,341 | $12,048 |
| 07/2019 | $10,054 | $11,895 |
| 08/2019 | $9,720 | $11,587 |
| 09/2019 | $10,101 | $11,919 |
| 10/2019 | $10,464 | $12,347 |
| 11/2019 | $10,587 | $12,486 |
| 12/2019 | $11,000 | $12,892 |
| 01/2020 | $10,441 | $12,623 |
| 02/2020 | $9,485 | $11,482 |
| 03/2020 | $7,700 | $9,949 |
| 04/2020 | $8,217 | $10,592 |
| 05/2020 | $8,583 | $11,053 |
| 06/2020 | $8,884 | $11,430 |
| 07/2020 | $9,034 | $11,696 |
| 08/2020 | $9,587 | $12,297 |
| 09/2020 | $9,179 | $11,978 |
| 10/2020 | $8,746 | $11,500 |
| 11/2020 | $10,615 | $13,282 |
| 12/2020 | $11,069 | $13,900 |
| 01/2021 | $10,844 | $13,752 |
| 02/2021 | $11,392 | $14,060 |
| 03/2021 | $11,775 | $14,383 |
| 04/2021 | $11,964 | $14,816 |
| 05/2021 | $12,457 | $15,299 |
| 06/2021 | $12,092 | $15,127 |
| 07/2021 | $11,964 | $15,241 |
| 08/2021 | $12,159 | $15,510 |
| 09/2021 | $11,946 | $15,060 |
| 10/2021 | $12,214 | $15,430 |
| 11/2021 | $11,459 | $14,712 |
| 12/2021 | $12,089 | $15,465 |
| 01/2022 | $12,137 | $14,718 |
| 02/2022 | $11,752 | $14,458 |
| 03/2022 | $11,327 | $14,551 |
| 04/2022 | $10,781 | $13,609 |
| 05/2022 | $11,213 | $13,711 |
| 06/2022 | $10,195 | $12,439 |
| 07/2022 | $10,532 | $13,059 |
| 08/2022 | $9,804 | $12,439 |
| 09/2022 | $8,900 | $11,275 |
| 10/2022 | $9,527 | $11,881 |
| 11/2022 | $10,768 | $13,220 |
| 12/2022 | $10,734 | $13,230 |
| 01/2023 | $11,880 | $14,302 |
| 02/2023 | $11,721 | $14,003 |
| 03/2023 | $12,039 | $14,350 |
| 04/2023 | $12,329 | $14,755 |
| 05/2023 | $11,777 | $14,131 |
| 06/2023 | $12,453 | $14,774 |
| 07/2023 | $12,867 | $15,252 |
| 08/2023 | $12,481 | $14,668 |
| 09/2023 | $11,956 | $14,167 |
| 10/2023 | $11,390 | $13,592 |
| 11/2023 | $12,453 | $14,854 |
| 12/2023 | $13,092 | $15,643 |
| 01/2024 | $12,852 | $15,733 |
| 02/2024 | $13,237 | $16,021 |
| 03/2024 | $13,730 | $16,548 |
| 04/2024 | $13,324 | $16,124 |
| 05/2024 | $14,093 | $16,749 |
| 06/2024 | $13,614 | $16,479 |
| 07/2024 | $14,231 | $16,962 |
| 08/2024 | $14,638 | $17,514 |
| 09/2024 | $14,681 | $17,675 |
| 10/2024 | $13,854 | $16,714 |
Average Annual Total Returns (%)
| HEADER | 1 Year | 5 Years | 10 Years |
|---|
Class A without Sales ChargeFootnote Reference1 | 21.63% | 5.77% | 3.93% |
Class A with Maximum Sales Charge - 5.75%Footnote Reference1 | 14.61% | 4.53% | 3.31% |
MSCI® EAFE Index (Net) | 22.97% | 6.24% | 5.27% |
| Footnote | Description |
Footnote1 | Return may differ from actual shareholder return due to accounting adjustments for financial reporting purposes. |
Performance shown is historical and is not indicative of future returns. Investment returns and principal value will vary, and shares may be worth more or less at redemption than at original purchase. Performance shown is as of date indicated, and current performance may be lower or higher than the performance data quoted. To obtain performance as of the most recent month end, please visit americanbeaconfunds.com or call 800-967-9009. The graph and table do not reflect the deduction of taxes that a shareholder would pay on fund distributions or redemption of fund shares.
| Total Net Assets | $598,097,805 |
| # of Portfolio Holdings | 162 |
| Portfolio Turnover Rate | 43% |
| Total Management Fees Paid | $4,713,132 |
Asset Allocation - % Investments
| Value | Value |
|---|
| Foreign Common Stocks | 82.8 |
| Common Stocks | 13.2 |
| Investment Companies | 3.3 |
| Securities Lending Collateral | 0.4 |
| Foreign Preferred Stocks | 0.3 |
The Fund may purchase and sell futures contracts to gain market exposure on cash balances.
What did the Fund invest in?
Top Ten Holdings - % Net Assets
| Roche Holding AG | 3.2 |
| Reckitt Benckiser Group PLC | 2.4 |
| British American Tobacco PLC | 2.4 |
| Samsung Electronics Co. Ltd. | 2.2 |
| GSK PLC | 2.2 |
| Barclays PLC | 2.1 |
| Sanofi SA | 2.1 |
| Orange SA | 1.6 |
| RELX PLC | 1.6 |
| ING Groep NV | 1.6 |
Excludes cash equivalents.
Sector Allocation - % Equities
| Value | Value |
|---|
| Real Estate | 1.0 |
| Utilities | 2.2 |
| Energy | 2.7 |
| Communication Services | 3.6 |
| Materials | 6.8 |
| Information Technology | 10.5 |
| Consumer Staples | 12.1 |
| Health Care | 12.4 |
| Consumer Discretionary | 13.6 |
| Financials | 15.2 |
| Industrials | 19.9 |
Top Ten Country Exposure - % Equities
| Value | Value |
|---|
| Italy | 2.7 |
| Canada | 3.2 |
| China | 3.5 |
| Netherlands | 4.7 |
| Republic Of Korea | 4.9 |
| Germany | 9.4 |
| Japan | 11.6 |
| United States | 13.2 |
| France | 14.2 |
| United Kingdom | 20.1 |
For additional information about the Fund, including its prospectus, financial statements, holdings, and proxy voting information, please visit www.americanbeaconfunds.com/literature or call 1-800-658-5811.
If your financial institution mailed only one copy of this Report to an address shared by more than one account, you can request an individual copy by contacting your financial institution.
International Equity Fund
Distributed by:
Resolute Investment Distributors, Inc.
Annual Shareholder Report - October 31, 2024
International Equity Fund
Annual Shareholder Report - October 31, 2024
This annual shareholder report contains important information about American Beacon International Equity Fund for the period of November 1, 2023 to October 31, 2024. You can find additional information about the Fund at www.americanbeaconfunds.com/literature. You can also request this information by contacting us at 800-658-5811.
What were the Fund costs for the last year?
(based on a hypothetical $10,000 investment)
| Class Name | Costs of a $10,000 investment | Costs paid as a percentage of a $10,000 investment |
|---|
| Class C | $218 | 1.98% |
How did the Fund perform and what affected its performance?
The C Class of the Fund returned 19.59% (with sales charges) and 20.59% (without sales charges) for the twelve months ended October 31, 2024, compared to the MSCI® EAFE Index (Net) return of 22.97%.
• Broad market performance during the last twelve months benefited from many developed nations loosening monetary policy as inflation eased and the increased prospect of a soft landing even as an interest rate hike by the Bank of Japan in late July caused some market turmoil.
• The Fund’s focus on value through a bottom-up approach and diversification through its multi manager strategy provided strong returns during the period.
• The Fund's holdings in the Industrials and Financials sectors contributed to the Fund's performance, while holdings in the Information Technology sector detracted from performance.
Cumulative Performance from October 31, 2014 through October 31, 2024
The initial investment, based on a $10,000 investment, is adjusted to reflect the maximum applicable sales charge, if any.
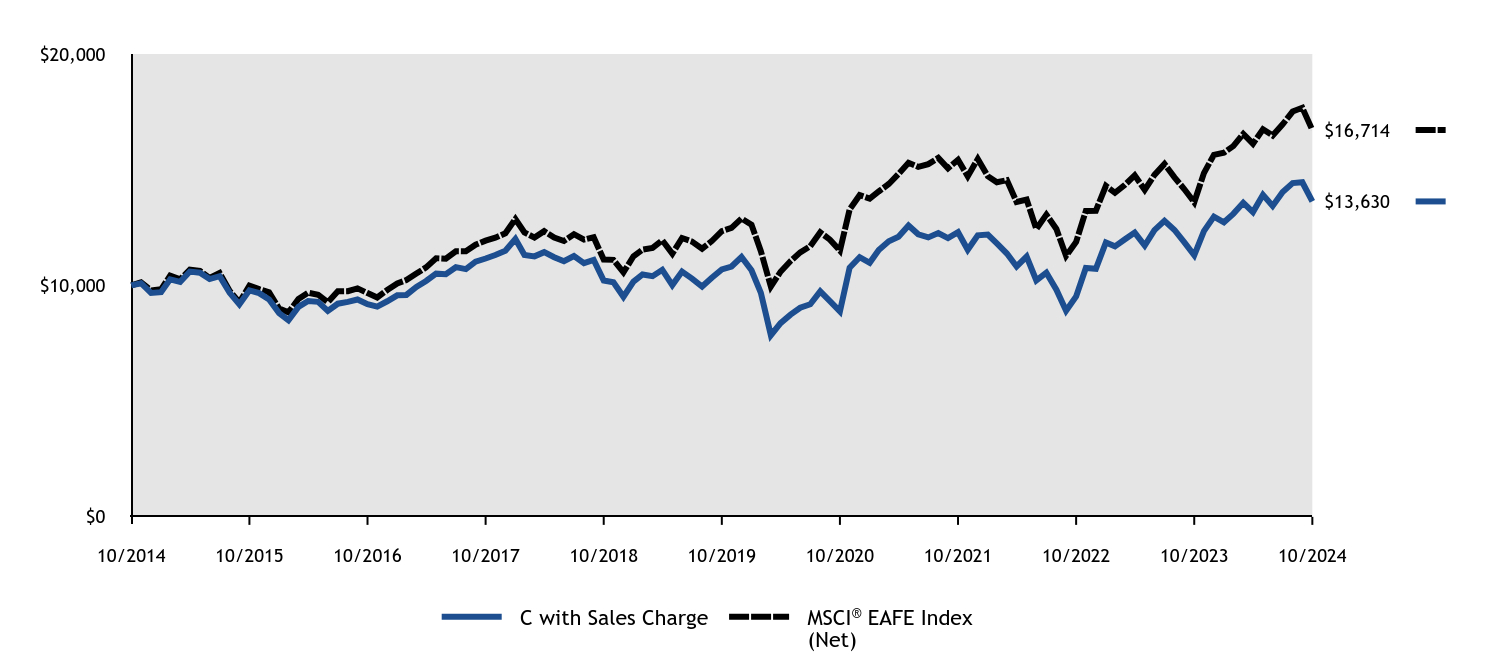
| C with Sales Charge | MSCI® EAFE Index (Net) |
|---|
| 10/2014 | $10,000 | $10,000 |
| 11/2014 | $10,096 | $10,136 |
| 12/2014 | $9,675 | $9,785 |
| 01/2015 | $9,707 | $9,833 |
| 02/2015 | $10,264 | $10,421 |
| 03/2015 | $10,156 | $10,262 |
| 04/2015 | $10,600 | $10,681 |
| 05/2015 | $10,551 | $10,627 |
| 06/2015 | $10,275 | $10,325 |
| 07/2015 | $10,400 | $10,540 |
| 08/2015 | $9,680 | $9,765 |
| 09/2015 | $9,182 | $9,269 |
| 10/2015 | $9,788 | $9,993 |
| 11/2015 | $9,669 | $9,838 |
| 12/2015 | $9,397 | $9,705 |
| 01/2016 | $8,804 | $9,003 |
| 02/2016 | $8,497 | $8,838 |
| 03/2016 | $9,073 | $9,414 |
| 04/2016 | $9,326 | $9,686 |
| 05/2016 | $9,293 | $9,598 |
| 06/2016 | $8,898 | $9,276 |
| 07/2016 | $9,211 | $9,746 |
| 08/2016 | $9,288 | $9,753 |
| 09/2016 | $9,392 | $9,873 |
| 10/2016 | $9,189 | $9,671 |
| 11/2016 | $9,084 | $9,478 |
| 12/2016 | $9,316 | $9,802 |
| 01/2017 | $9,573 | $10,087 |
| 02/2017 | $9,590 | $10,231 |
| 03/2017 | $9,937 | $10,513 |
| 04/2017 | $10,190 | $10,780 |
| 05/2017 | $10,509 | $11,176 |
| 06/2017 | $10,486 | $11,156 |
| 07/2017 | $10,789 | $11,478 |
| 08/2017 | $10,705 | $11,473 |
| 09/2017 | $11,030 | $11,759 |
| 10/2017 | $11,164 | $11,937 |
| 11/2017 | $11,316 | $12,063 |
| 12/2017 | $11,502 | $12,256 |
| 01/2018 | $12,006 | $12,871 |
| 02/2018 | $11,313 | $12,290 |
| 03/2018 | $11,256 | $12,069 |
| 04/2018 | $11,439 | $12,344 |
| 05/2018 | $11,221 | $12,067 |
| 06/2018 | $11,044 | $11,919 |
| 07/2018 | $11,273 | $12,213 |
| 08/2018 | $10,964 | $11,977 |
| 09/2018 | $11,101 | $12,081 |
| 10/2018 | $10,214 | $11,119 |
| 11/2018 | $10,139 | $11,105 |
| 12/2018 | $9,510 | $10,566 |
| 01/2019 | $10,163 | $11,260 |
| 02/2019 | $10,474 | $11,548 |
| 03/2019 | $10,400 | $11,620 |
| 04/2019 | $10,674 | $11,947 |
| 05/2019 | $10,014 | $11,373 |
| 06/2019 | $10,599 | $12,048 |
| 07/2019 | $10,294 | $11,895 |
| 08/2019 | $9,952 | $11,587 |
| 09/2019 | $10,331 | $11,919 |
| 10/2019 | $10,692 | $12,347 |
| 11/2019 | $10,817 | $12,486 |
| 12/2019 | $11,230 | $12,892 |
| 01/2020 | $10,653 | $12,623 |
| 02/2020 | $9,676 | $11,482 |
| 03/2020 | $7,849 | $9,949 |
| 04/2020 | $8,369 | $10,592 |
| 05/2020 | $8,737 | $11,053 |
| 06/2020 | $9,035 | $11,430 |
| 07/2020 | $9,187 | $11,696 |
| 08/2020 | $9,746 | $12,297 |
| 09/2020 | $9,321 | $11,978 |
| 10/2020 | $8,876 | $11,500 |
| 11/2020 | $10,767 | $13,282 |
| 12/2020 | $11,220 | $13,900 |
| 01/2021 | $10,978 | $13,752 |
| 02/2021 | $11,533 | $14,060 |
| 03/2021 | $11,910 | $14,383 |
| 04/2021 | $12,101 | $14,816 |
| 05/2021 | $12,593 | $15,299 |
| 06/2021 | $12,210 | $15,127 |
| 07/2021 | $12,076 | $15,241 |
| 08/2021 | $12,261 | $15,510 |
| 09/2021 | $12,044 | $15,060 |
| 10/2021 | $12,299 | $15,430 |
| 11/2021 | $11,540 | $14,712 |
| 12/2021 | $12,165 | $15,465 |
| 01/2022 | $12,201 | $14,718 |
| 02/2022 | $11,813 | $14,458 |
| 03/2022 | $11,377 | $14,551 |
| 04/2022 | $10,821 | $13,609 |
| 05/2022 | $11,250 | $13,711 |
| 06/2022 | $10,215 | $12,439 |
| 07/2022 | $10,553 | $13,059 |
| 08/2022 | $9,814 | $12,439 |
| 09/2022 | $8,906 | $11,275 |
| 10/2022 | $9,525 | $11,881 |
| 11/2022 | $10,757 | $13,220 |
| 12/2022 | $10,717 | $13,230 |
| 01/2023 | $11,854 | $14,302 |
| 02/2023 | $11,689 | $14,003 |
| 03/2023 | $11,997 | $14,350 |
| 04/2023 | $12,283 | $14,755 |
| 05/2023 | $11,725 | $14,131 |
| 06/2023 | $12,391 | $14,774 |
| 07/2023 | $12,791 | $15,252 |
| 08/2023 | $12,398 | $14,668 |
| 09/2023 | $11,868 | $14,167 |
| 10/2023 | $11,303 | $13,592 |
| 11/2023 | $12,348 | $14,854 |
| 12/2023 | $12,974 | $15,643 |
| 01/2024 | $12,727 | $15,733 |
| 02/2024 | $13,093 | $16,021 |
| 03/2024 | $13,570 | $16,548 |
| 04/2024 | $13,168 | $16,124 |
| 05/2024 | $13,914 | $16,749 |
| 06/2024 | $13,436 | $16,479 |
| 07/2024 | $14,033 | $16,962 |
| 08/2024 | $14,421 | $17,514 |
| 09/2024 | $14,458 | $17,675 |
| 10/2024 | $13,630 | $16,714 |
Average Annual Total Returns (%)
| HEADER | 1 Year | 5 Years | 10 Years |
|---|
Class C without Deferred Sales ChargeFootnote Reference1 | 20.59% | 4.98% | 3.15% |
Class C with Maximum Deferred Sales Charge -1.00%Footnote Reference1 | 19.59% | 4.98% | 3.15% |
MSCI® EAFE Index (Net) | 22.97% | 6.24% | 5.27% |
| Footnote | Description |
Footnote1 | Return may differ from actual shareholder return due to accounting adjustments for financial reporting purposes. |
Performance shown is historical and is not indicative of future returns. Investment returns and principal value will vary, and shares may be worth more or less at redemption than at original purchase. Performance shown is as of date indicated, and current performance may be lower or higher than the performance data quoted. To obtain performance as of the most recent month end, please visit americanbeaconfunds.com or call 800-967-9009. The graph and table do not reflect the deduction of taxes that a shareholder would pay on fund distributions or redemption of fund shares.
| Total Net Assets | $598,097,805 |
| # of Portfolio Holdings | 162 |
| Portfolio Turnover Rate | 43% |
| Total Management Fees Paid | $4,713,132 |
Asset Allocation - % Investments
| Value | Value |
|---|
| Foreign Common Stocks | 82.8 |
| Common Stocks | 13.2 |
| Investment Companies | 3.3 |
| Securities Lending Collateral | 0.4 |
| Foreign Preferred Stocks | 0.3 |
The Fund may purchase and sell futures contracts to gain market exposure on cash balances.
What did the Fund invest in?
Top Ten Holdings - % Net Assets
| Roche Holding AG | 3.2 |
| Reckitt Benckiser Group PLC | 2.4 |
| British American Tobacco PLC | 2.4 |
| Samsung Electronics Co. Ltd. | 2.2 |
| GSK PLC | 2.2 |
| Barclays PLC | 2.1 |
| Sanofi SA | 2.1 |
| Orange SA | 1.6 |
| RELX PLC | 1.6 |
| ING Groep NV | 1.6 |
Excludes cash equivalents.
Sector Allocation - % Equities
| Value | Value |
|---|
| Real Estate | 1.0 |
| Utilities | 2.2 |
| Energy | 2.7 |
| Communication Services | 3.6 |
| Materials | 6.8 |
| Information Technology | 10.5 |
| Consumer Staples | 12.1 |
| Health Care | 12.4 |
| Consumer Discretionary | 13.6 |
| Financials | 15.2 |
| Industrials | 19.9 |
Top Ten Country Exposure - % Equities
| Value | Value |
|---|
| Italy | 2.7 |
| Canada | 3.2 |
| China | 3.5 |
| Netherlands | 4.7 |
| Republic Of Korea | 4.9 |
| Germany | 9.4 |
| Japan | 11.6 |
| United States | 13.2 |
| France | 14.2 |
| United Kingdom | 20.1 |
For additional information about the Fund, including its prospectus, financial statements, holdings, and proxy voting information, please visit www.americanbeaconfunds.com/literature or call 1-800-658-5811.
If your financial institution mailed only one copy of this Report to an address shared by more than one account, you can request an individual copy by contacting your financial institution.
International Equity Fund
Distributed by:
Resolute Investment Distributors, Inc.
Annual Shareholder Report - October 31, 2024
International Equity Fund
Annual Shareholder Report - October 31, 2024
This annual shareholder report contains important information about American Beacon International Equity Fund for the period of November 1, 2023 to October 31, 2024. You can find additional information about the Fund at www.americanbeaconfunds.com/literature. You can also request this information by contacting us at 800-658-5811.
What were the Fund costs for the last year?
(based on a hypothetical $10,000 investment)
| Class Name | Costs of a $10,000 investment | Costs paid as a percentage of a $10,000 investment |
|---|
| R6 | $77 | 0.69% |
How did the Fund perform and what affected its performance?
The R6 Class of the Fund returned 22.17% for the twelve months ended October 31, 2024, compared to the MSCI® EAFE Index (Net) return of 22.97%.
• Broad market performance during the last twelve months benefited from many developed nations loosening monetary policy as inflation eased and the increased prospect of a soft landing even as an interest rate hike by the Bank of Japan in late July caused some market turmoil.
• The Fund’s focus on value through a bottom-up approach and diversification through its multi manager strategy provided strong returns during the period.
• The Fund's holdings in the Industrials and Financials sectors contributed to the Fund's performance, while holdings in the Information Technology sector detracted from performance.
Cumulative Performance from October 31, 2014 through October 31, 2024
The initial investment, based on a $10,000 investment, is adjusted to reflect the maximum applicable sales charge, if any.
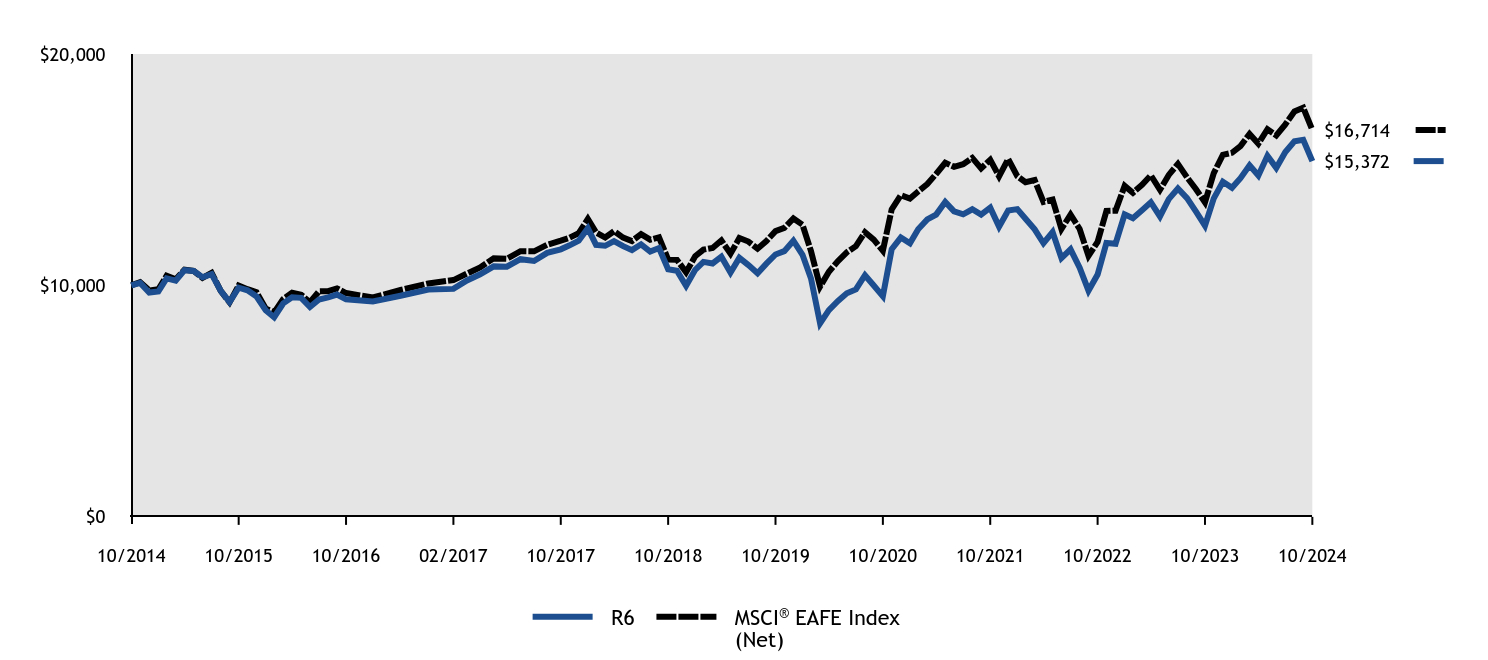
| R6 | MSCI® EAFE Index (Net) |
|---|
| 10/2014 | $10,000 | $10,000 |
| 11/2014 | $10,108 | $10,136 |
| 12/2014 | $9,695 | $9,785 |
| 01/2015 | $9,738 | $9,833 |
| 02/2015 | $10,307 | $10,421 |
| 03/2015 | $10,207 | $10,262 |
| 04/2015 | $10,660 | $10,681 |
| 05/2015 | $10,623 | $10,627 |
| 06/2015 | $10,354 | $10,325 |
| 07/2015 | $10,491 | $10,540 |
| 08/2015 | $9,769 | $9,765 |
| 09/2015 | $9,279 | $9,269 |
| 10/2015 | $9,901 | $9,993 |
| 11/2015 | $9,790 | $9,838 |
| 12/2015 | $9,523 | $9,705 |
| 01/2016 | $8,929 | $9,003 |
| 02/2016 | $8,627 | $8,838 |
| 03/2016 | $9,226 | $9,414 |
| 04/2016 | $9,485 | $9,686 |
| 05/2016 | $9,463 | $9,598 |
| 06/2016 | $9,069 | $9,276 |
| 07/2016 | $9,393 | $9,746 |
| 08/2016 | $9,485 | $9,753 |
| 09/2016 | $9,604 | $9,873 |
| 10/2016 | $9,399 | $9,671 |
| 11/2016 | $9,307 | $9,478 |
| 12/2016 | $9,552 | $9,802 |
| 01/2017 | $9,823 | $10,087 |
| 02/2017 | $9,851 | $10,231 |
| 03/2017 | $10,216 | $10,513 |
| 04/2017 | $10,481 | $10,780 |
| 05/2017 | $10,824 | $11,176 |
| 06/2017 | $10,808 | $11,156 |
| 07/2017 | $11,134 | $11,478 |
| 08/2017 | $11,057 | $11,473 |
| 09/2017 | $11,406 | $11,759 |
| 10/2017 | $11,561 | $11,937 |
| 11/2017 | $11,732 | $12,063 |
| 12/2017 | $11,930 | $12,256 |
| 01/2018 | $12,467 | $12,871 |
| 02/2018 | $11,753 | $12,290 |
| 03/2018 | $11,713 | $12,069 |
| 04/2018 | $11,913 | $12,344 |
| 05/2018 | $11,696 | $12,067 |
| 06/2018 | $11,525 | $11,919 |
| 07/2018 | $11,776 | $12,213 |
| 08/2018 | $11,462 | $11,977 |
| 09/2018 | $11,616 | $12,081 |
| 10/2018 | $10,697 | $11,119 |
| 11/2018 | $10,634 | $11,105 |
| 12/2018 | $9,982 | $10,566 |
| 01/2019 | $10,678 | $11,260 |
| 02/2019 | $11,017 | $11,548 |
| 03/2019 | $10,948 | $11,620 |
| 04/2019 | $11,243 | $11,947 |
| 05/2019 | $10,559 | $11,373 |
| 06/2019 | $11,192 | $12,048 |
| 07/2019 | $10,879 | $11,895 |
| 08/2019 | $10,528 | $11,587 |
| 09/2019 | $10,942 | $11,919 |
| 10/2019 | $11,337 | $12,347 |
| 11/2019 | $11,481 | $12,486 |
| 12/2019 | $11,932 | $12,892 |
| 01/2020 | $11,325 | $12,623 |
| 02/2020 | $10,299 | $11,482 |
| 03/2020 | $8,362 | $9,949 |
| 04/2020 | $8,930 | $10,592 |
| 05/2020 | $9,330 | $11,053 |
| 06/2020 | $9,659 | $11,430 |
| 07/2020 | $9,827 | $11,696 |
| 08/2020 | $10,441 | $12,297 |
| 09/2020 | $9,995 | $11,978 |
| 10/2020 | $9,530 | $11,500 |
| 11/2020 | $11,564 | $13,282 |
| 12/2020 | $12,068 | $13,900 |
| 01/2021 | $11,819 | $13,752 |
| 02/2021 | $12,430 | $14,060 |
| 03/2021 | $12,850 | $14,383 |
| 04/2021 | $13,060 | $14,816 |
| 05/2021 | $13,605 | $15,299 |
| 06/2021 | $13,204 | $15,127 |
| 07/2021 | $13,073 | $15,241 |
| 08/2021 | $13,290 | $15,510 |
| 09/2021 | $13,060 | $15,060 |
| 10/2021 | $13,362 | $15,430 |
| 11/2021 | $12,541 | $14,712 |
| 12/2021 | $13,239 | $15,465 |
| 01/2022 | $13,298 | $14,718 |
| 02/2022 | $12,882 | $14,458 |
| 03/2022 | $12,422 | $14,551 |
| 04/2022 | $11,823 | $13,609 |
| 05/2022 | $12,305 | $13,711 |
| 06/2022 | $11,181 | $12,439 |
| 07/2022 | $11,561 | $13,059 |
| 08/2022 | $10,765 | $12,439 |
| 09/2022 | $9,773 | $11,275 |
| 10/2022 | $10,473 | $11,881 |
| 11/2022 | $11,838 | $13,220 |
| 12/2022 | $11,803 | $13,230 |
| 01/2023 | $13,071 | $14,302 |
| 02/2023 | $12,906 | $14,003 |
| 03/2023 | $13,251 | $14,350 |
| 04/2023 | $13,589 | $14,755 |
| 05/2023 | $12,981 | $14,131 |
| 06/2023 | $13,731 | $14,774 |
| 07/2023 | $14,189 | $15,252 |
| 08/2023 | $13,769 | $14,668 |
| 09/2023 | $13,198 | $14,167 |
| 10/2023 | $12,583 | $13,592 |
| 11/2023 | $13,761 | $14,854 |
| 12/2023 | $14,478 | $15,643 |
| 01/2024 | $14,217 | $15,733 |
| 02/2024 | $14,637 | $16,021 |
| 03/2024 | $15,190 | $16,548 |
| 04/2024 | $14,747 | $16,124 |
| 05/2024 | $15,602 | $16,749 |
| 06/2024 | $15,080 | $16,479 |
| 07/2024 | $15,768 | $16,962 |
| 08/2024 | $16,227 | $17,514 |
| 09/2024 | $16,290 | $17,675 |
| 10/2024 | $15,372 | $16,714 |
Average Annual Total Returns (%)
| HEADER | 1 Year | 5 Years | 10 Years |
|---|
R6 ClassFootnote Reference1 | 22.17% | 6.28% | 4.39% |
MSCI® EAFE Index (Net) | 22.97% | 6.24% | 5.27% |
| Footnote | Description |
Footnote1 | Return may differ from actual shareholder return due to accounting adjustments for financial reporting purposes. |
Performance shown is historical and is not indicative of future returns. Investment returns and principal value will vary, and shares may be worth more or less at redemption than at original purchase. Performance shown is as of date indicated, and current performance may be lower or higher than the performance data quoted. To obtain performance as of the most recent month end, please visit americanbeaconfunds.com or call 800-967-9009. The graph and table do not reflect the deduction of taxes that a shareholder would pay on fund distributions or redemption of fund shares. Performance includes historical performance of another Class of the Fund. The Fund's performance benefited from fee waivers. For more information, visit americanbeaconfunds.com/Performance_Disclaimers.aspx.
| Total Net Assets | $598,097,805 |
| # of Portfolio Holdings | 162 |
| Portfolio Turnover Rate | 43% |
| Total Management Fees Paid | $4,713,132 |
Asset Allocation - % Investments
| Value | Value |
|---|
| Foreign Common Stocks | 82.8 |
| Common Stocks | 13.2 |
| Investment Companies | 3.3 |
| Securities Lending Collateral | 0.4 |
| Foreign Preferred Stocks | 0.3 |
The Fund may purchase and sell futures contracts to gain market exposure on cash balances.
What did the Fund invest in?
Top Ten Holdings - % Net Assets
| Roche Holding AG | 3.2 |
| Reckitt Benckiser Group PLC | 2.4 |
| British American Tobacco PLC | 2.4 |
| Samsung Electronics Co. Ltd. | 2.2 |
| GSK PLC | 2.2 |
| Barclays PLC | 2.1 |
| Sanofi SA | 2.1 |
| Orange SA | 1.6 |
| RELX PLC | 1.6 |
| ING Groep NV | 1.6 |
Excludes cash equivalents.
Sector Allocation - % Equities
| Value | Value |
|---|
| Real Estate | 1.0 |
| Utilities | 2.2 |
| Energy | 2.7 |
| Communication Services | 3.6 |
| Materials | 6.8 |
| Information Technology | 10.5 |
| Consumer Staples | 12.1 |
| Health Care | 12.4 |
| Consumer Discretionary | 13.6 |
| Financials | 15.2 |
| Industrials | 19.9 |
Top Ten Country Exposure - % Equities
| Value | Value |
|---|
| Italy | 2.7 |
| Canada | 3.2 |
| China | 3.5 |
| Netherlands | 4.7 |
| Republic Of Korea | 4.9 |
| Germany | 9.4 |
| Japan | 11.6 |
| United States | 13.2 |
| France | 14.2 |
| United Kingdom | 20.1 |
For additional information about the Fund, including its prospectus, financial statements, holdings, and proxy voting information, please visit www.americanbeaconfunds.com/literature or call 1-800-658-5811.
If your financial institution mailed only one copy of this Report to an address shared by more than one account, you can request an individual copy by contacting your financial institution.
International Equity Fund
Distributed by:
Resolute Investment Distributors, Inc.
Annual Shareholder Report - October 31, 2024
Garcia Hamilton Quality Bond Fund
Annual Shareholder Report - October 31, 2024
This annual shareholder report contains important information about American Beacon Garcia Hamilton Quality Bond Fund for the period of November 1, 2023 to October 31, 2024. You can find additional information about the Fund at www.americanbeaconfunds.com/literature. You can also request this information by contacting us at 800-658-5811.
What were the Fund costs for the last year?
(based on a hypothetical $10,000 investment)
| Class Name | Costs of a $10,000 investment | Costs paid as a percentage of a $10,000 investment |
|---|
| R5 | $48 | 0.45% |
How did the Fund perform and what affected its performance?
The R5 Class of the Fund returned 11.40% for the twelve months ended October 31, 2024, compared to the Bloomberg U.S. Aggregate Bond Index return of 10.55%.
• The Federal Reserve cut the Federal Funds Rate by 0.50% in September 2024.
• In anticipation of a slower economy, the Fund ended the period with a longer duration of 7.5 years compared to 6.1 years for the Index, which led to outperformance.
• The Fund was underweight in Corporates due to narrow credit spreads. This detracted from performance as Corporates were the best performing sector in the Index, returning 13.6%. Lower-quality Corporate bonds outperformed, while the Fund holds only higher-quality bonds.
• The Fund’s overweighting of Agency Mortgages performed well, although returns were in line with duration-equivalent Treasury bonds.
Cumulative Performance from April 4, 2016 through October 31, 2024
The initial investment, based on a $250,000 investment, is adjusted to reflect the maximum applicable sales charge, if any.
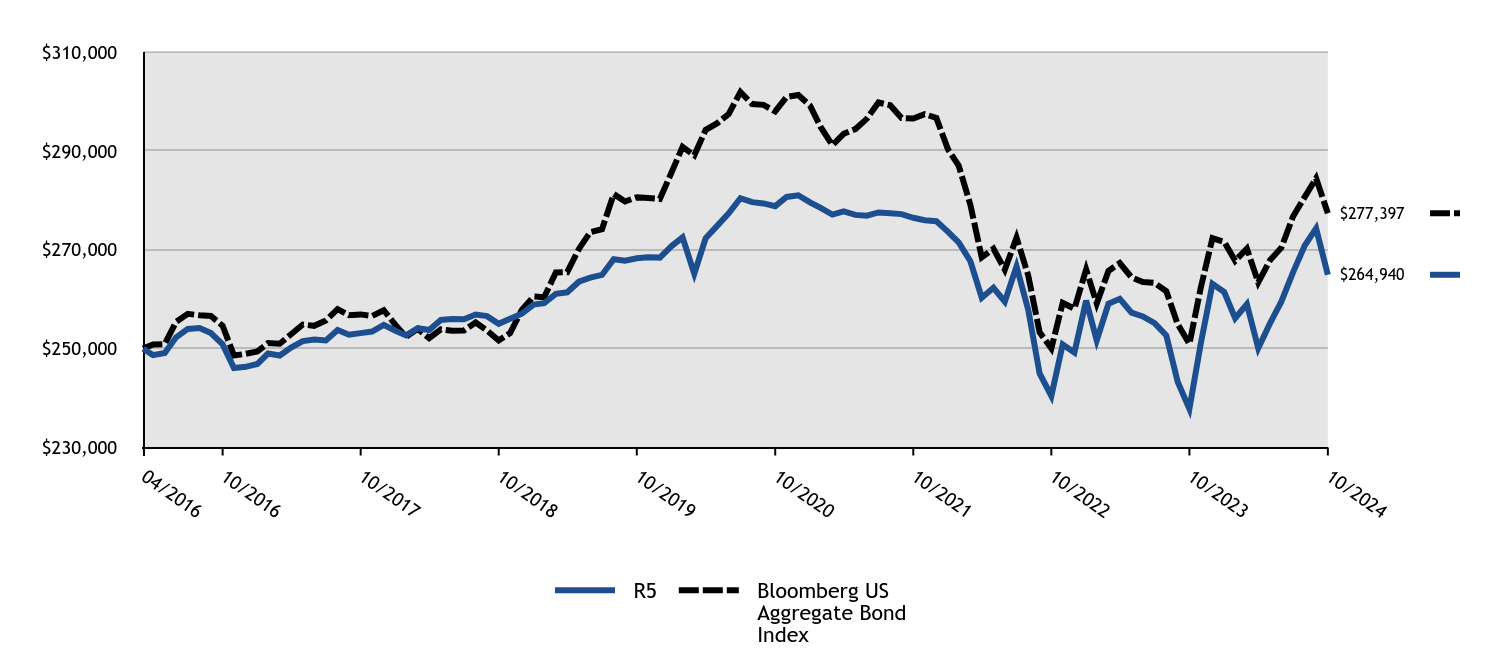
| R5 | Bloomberg US Aggregate Bond Index |
|---|
| 04/2016 | $250,000 | $250,000 |
| 04/2016 | $248,686 | $250,846 |
| 05/2016 | $249,135 | $250,910 |
| 06/2016 | $252,291 | $255,418 |
| 07/2016 | $253,991 | $257,033 |
| 08/2016 | $254,185 | $256,739 |
| 09/2016 | $253,133 | $256,589 |
| 10/2016 | $250,858 | $254,626 |
| 11/2016 | $246,090 | $248,603 |
| 12/2016 | $246,318 | $248,954 |
| 01/2017 | $246,905 | $249,442 |
| 02/2017 | $249,001 | $251,119 |
| 03/2017 | $248,612 | $250,987 |
| 04/2017 | $250,205 | $252,924 |
| 05/2017 | $251,535 | $254,871 |
| 06/2017 | $251,845 | $254,614 |
| 07/2017 | $251,663 | $255,710 |
| 08/2017 | $253,771 | $258,004 |
| 09/2017 | $252,814 | $256,775 |
| 10/2017 | $253,140 | $256,924 |
| 11/2017 | $253,459 | $256,594 |
| 12/2017 | $254,811 | $257,772 |
| 01/2018 | $253,618 | $254,803 |
| 02/2018 | $252,671 | $252,387 |
| 03/2018 | $254,124 | $254,006 |
| 04/2018 | $253,770 | $252,117 |
| 05/2018 | $255,794 | $253,916 |
| 06/2018 | $256,000 | $253,604 |
| 07/2018 | $255,935 | $253,664 |
| 08/2018 | $256,902 | $255,296 |
| 09/2018 | $256,575 | $253,652 |
| 10/2018 | $255,015 | $251,648 |
| 11/2018 | $256,031 | $253,150 |
| 12/2018 | $257,055 | $257,801 |
| 01/2019 | $258,908 | $260,539 |
| 02/2019 | $259,179 | $260,388 |
| 03/2019 | $261,084 | $265,387 |
| 04/2019 | $261,386 | $265,455 |
| 05/2019 | $263,541 | $270,168 |
| 06/2019 | $264,354 | $273,560 |
| 07/2019 | $264,907 | $274,162 |
| 08/2019 | $268,086 | $281,266 |
| 09/2019 | $267,765 | $279,768 |
| 10/2019 | $268,267 | $280,611 |
| 11/2019 | $268,472 | $280,468 |
| 12/2019 | $268,408 | $280,273 |
| 01/2020 | $270,737 | $285,666 |
| 02/2020 | $272,510 | $290,808 |
| 03/2020 | $265,165 | $289,096 |
| 04/2020 | $272,331 | $294,236 |
| 05/2020 | $274,873 | $295,605 |
| 06/2020 | $277,376 | $297,468 |
| 07/2020 | $280,423 | $301,911 |
| 08/2020 | $279,638 | $299,474 |
| 09/2020 | $279,367 | $299,310 |
| 10/2020 | $278,815 | $297,973 |
| 11/2020 | $280,683 | $300,897 |
| 12/2020 | $281,023 | $301,312 |
| 01/2021 | $279,582 | $299,151 |
| 02/2021 | $278,452 | $294,831 |
| 03/2021 | $277,123 | $291,150 |
| 04/2021 | $277,779 | $293,450 |
| 05/2021 | $277,049 | $294,409 |
| 06/2021 | $276,884 | $296,477 |
| 07/2021 | $277,553 | $299,792 |
| 08/2021 | $277,385 | $299,221 |
| 09/2021 | $277,213 | $296,631 |
| 10/2021 | $276,469 | $296,549 |
| 11/2021 | $275,977 | $297,426 |
| 12/2021 | $275,779 | $296,665 |
| 01/2022 | $273,627 | $290,274 |
| 02/2022 | $271,482 | $287,035 |
| 03/2022 | $267,677 | $279,061 |
| 04/2022 | $260,301 | $268,471 |
| 05/2022 | $262,315 | $270,202 |
| 06/2022 | $259,495 | $265,963 |
| 07/2022 | $266,635 | $272,462 |
| 08/2022 | $257,818 | $264,763 |
| 09/2022 | $244,974 | $253,324 |
| 10/2022 | $240,419 | $250,043 |
| 11/2022 | $250,842 | $259,238 |
| 12/2022 | $249,214 | $258,069 |
| 01/2023 | $259,708 | $266,008 |
| 02/2023 | $251,692 | $259,130 |
| 03/2023 | $259,069 | $265,713 |
| 04/2023 | $260,073 | $267,323 |
| 05/2023 | $257,273 | $264,412 |
| 06/2023 | $256,508 | $263,469 |
| 07/2023 | $255,165 | $263,286 |
| 08/2023 | $252,642 | $261,604 |
| 09/2023 | $243,315 | $254,956 |
| 10/2023 | $237,824 | $250,933 |
| 11/2023 | $251,009 | $262,296 |
| 12/2023 | $263,112 | $272,337 |
| 01/2024 | $261,449 | $271,589 |
| 02/2024 | $256,154 | $267,752 |
| 03/2024 | $259,013 | $270,224 |
| 04/2024 | $250,088 | $263,399 |
| 05/2024 | $255,095 | $267,864 |
| 06/2024 | $259,495 | $270,400 |
| 07/2024 | $265,442 | $276,716 |
| 08/2024 | $270,850 | $280,692 |
| 09/2024 | $274,318 | $284,451 |
| 10/2024 | $264,940 | $277,397 |
Average Annual Total Returns (%)
| HEADER | 1 Year | 5 Years | Since Inception (4/4/16) |
|---|
Class R5Footnote Reference1 | 11.40% | (0.25)% | 0.68% |
| Bloomberg US Aggregate Bond Index | 10.55% | (0.23)% | 1.22% |
| Footnote | Description |
Footnote1 | Return may differ from actual shareholder return due to accounting adjustments for financial reporting purposes. |
Performance shown is historical and is not indicative of future returns. Investment returns and principal value will vary, and shares may be worth more or less at redemption than at original purchase. Performance shown is as of date indicated, and current performance may be lower or higher than the performance data quoted. To obtain performance as of the most recent month end, please visit americanbeaconfunds.com or call 800-967-9009. The graph and table do not reflect the deduction of taxes that a shareholder would pay on fund distributions or redemption of fund shares. The Fund's performance benefited from fee waivers. For more information, visit americanbeaconfunds.com/Performance_Disclaimers.aspx.
| Total Net Assets | $264,850,242 |
| # of Portfolio Holdings | 27 |
| Portfolio Turnover Rate | 34% |
| Total Management Fees Paid | $759,409 |
What did the Fund invest in?
Top Ten Holdings - % Net Assets
| U.S. Treasury Notes, 3.500%, Due 2/15/2033 | 12.7 |
| U.S. Treasury Notes, 1.875%, Due 2/15/2032 | 10.6 |
| U.S. Treasury Notes, 4.000%, Due 2/15/2034 | 7.9 |
| U.S. Treasury Bonds, 2.500%, Due 2/15/2045 | 6.4 |
| Federal Home Loan Mortgage Corp., 4.000%, Due 11/1/2052 | 3.9 |
| Federal Home Loan Mortgage Corp., 2.500%, Due 3/1/2052 | 3.9 |
| Federal Home Loan Mortgage Corp., 2.500%, Due 4/1/2052 | 3.9 |
| Federal Home Loan Mortgage Corp., 4.000%, Due 10/1/2052 | 3.9 |
| Federal Home Loan Mortgage Corp., 2.500%, Due 9/1/2042 | 3.7 |
| Federal National Mortgage Association, 3.000%, Due 5/1/2052 | 3.7 |
Excludes cash equivalents.
Asset Allocation - % Investments
| Value | Value |
|---|
| U.S. Agency Mortgage-Backed Obligations | 47.1 |
| U.S. Treasury Obligations | 44.8 |
| Corporate Obligations | 8.1 |
Industry Allocation - % Investments
| Value | Value |
|---|
| Electric | 2.3 |
| Banks | 2.5 |
| Media | 3.3 |
| U.S. Treasury Obligations | 44.8 |
| U.S. Agency Mortgage-Backed Obligations | 47.1 |
For additional information about the Fund, including its prospectus, financial statements, holdings, and proxy voting information, please visit www.americanbeaconfunds.com/literature or call 1-800-658-5811.
If your financial institution mailed only one copy of this Report to an address shared by more than one account, you can request an individual copy by contacting your financial institution.
Garcia Hamilton Quality Bond Fund
Distributed by:
Resolute Investment Distributors, Inc.
Annual Shareholder Report - October 31, 2024
Garcia Hamilton Quality Bond Fund
Annual Shareholder Report - October 31, 2024
This annual shareholder report contains important information about American Beacon Garcia Hamilton Quality Bond Fund for the period of November 1, 2023 to October 31, 2024. You can find additional information about the Fund at www.americanbeaconfunds.com/literature. You can also request this information by contacting us at 800-658-5811.
What were the Fund costs for the last year?
(based on a hypothetical $10,000 investment)
| Class Name | Costs of a $10,000 investment | Costs paid as a percentage of a $10,000 investment |
|---|
| Investor | $88 | 0.83% |
How did the Fund perform and what affected its performance?
The Investor Class of the Fund returned 11.29% for the twelve months ended October 31, 2024, compared to the Bloomberg U.S. Aggregate Bond Index return of 10.55%.
• The Federal Reserve cut the Federal Funds Rate by 0.50% in September 2024.
• In anticipation of a slower economy, the Fund ended the period with a longer duration of 7.5 years compared to 6.1 years for the Index, which led to outperformance.
• The Fund was underweight in Corporates due to narrow credit spreads. This detracted from performance as Corporates were the best performing sector in the Index, returning 13.6%. Lower-quality Corporate bonds outperformed, while the Fund holds only higher-quality bonds.
• The Fund’s overweighting of Agency Mortgages performed well, although returns were in line with duration-equivalent Treasury bonds.
Cumulative Performance from April 4, 2016 through October 31, 2024
The initial investment, based on a $10,000 investment, is adjusted to reflect the maximum applicable sales charge, if any.
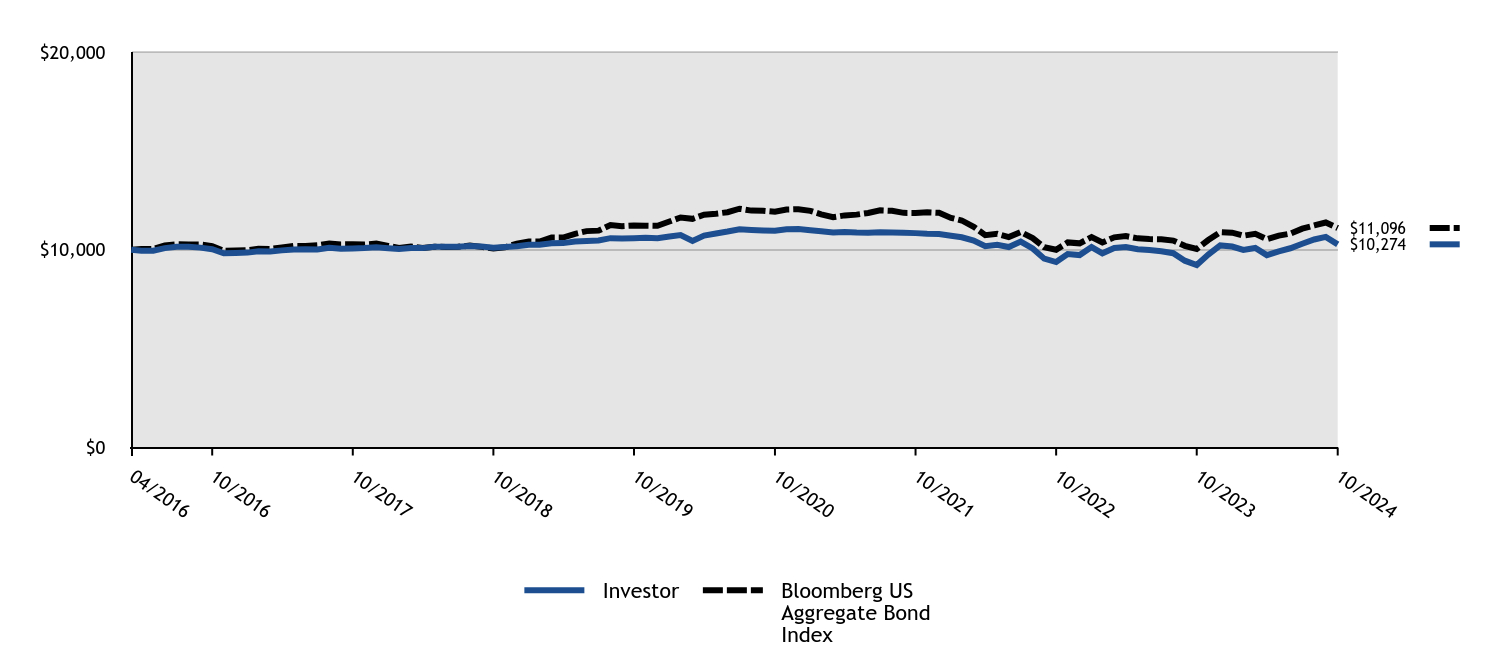
| Investor | Bloomberg US Aggregate Bond Index |
|---|
| 04/2016 | $10,000 | $10,000 |
| 04/2016 | $9,947 | $10,034 |
| 05/2016 | $9,951 | $10,036 |
| 06/2016 | $10,083 | $10,217 |
| 07/2016 | $10,148 | $10,281 |
| 08/2016 | $10,153 | $10,270 |
| 09/2016 | $10,108 | $10,264 |
| 10/2016 | $10,024 | $10,185 |
| 11/2016 | $9,820 | $9,944 |
| 12/2016 | $9,836 | $9,958 |
| 01/2017 | $9,856 | $9,978 |
| 02/2017 | $9,927 | $10,045 |
| 03/2017 | $9,908 | $10,039 |
| 04/2017 | $9,969 | $10,117 |
| 05/2017 | $10,018 | $10,195 |
| 06/2017 | $10,028 | $10,185 |
| 07/2017 | $10,017 | $10,228 |
| 08/2017 | $10,098 | $10,320 |
| 09/2017 | $10,057 | $10,271 |
| 10/2017 | $10,066 | $10,277 |
| 11/2017 | $10,086 | $10,264 |
| 12/2017 | $10,126 | $10,311 |
| 01/2018 | $10,076 | $10,192 |
| 02/2018 | $10,035 | $10,095 |
| 03/2018 | $10,090 | $10,160 |
| 04/2018 | $10,083 | $10,085 |
| 05/2018 | $10,150 | $10,157 |
| 06/2018 | $10,155 | $10,144 |
| 07/2018 | $10,149 | $10,147 |
| 08/2018 | $10,184 | $10,212 |
| 09/2018 | $10,168 | $10,146 |
| 10/2018 | $10,103 | $10,066 |
| 11/2018 | $10,140 | $10,126 |
| 12/2018 | $10,177 | $10,312 |
| 01/2019 | $10,247 | $10,422 |
| 02/2019 | $10,255 | $10,416 |
| 03/2019 | $10,327 | $10,615 |
| 04/2019 | $10,336 | $10,618 |
| 05/2019 | $10,417 | $10,807 |
| 06/2019 | $10,446 | $10,942 |
| 07/2019 | $10,465 | $10,966 |
| 08/2019 | $10,587 | $11,251 |
| 09/2019 | $10,571 | $11,191 |
| 10/2019 | $10,587 | $11,224 |
| 11/2019 | $10,603 | $11,219 |
| 12/2019 | $10,586 | $11,211 |
| 01/2020 | $10,674 | $11,427 |
| 02/2020 | $10,741 | $11,632 |
| 03/2020 | $10,447 | $11,564 |
| 04/2020 | $10,717 | $11,769 |
| 05/2020 | $10,825 | $11,824 |
| 06/2020 | $10,920 | $11,899 |
| 07/2020 | $11,037 | $12,076 |
| 08/2020 | $11,002 | $11,979 |
| 09/2020 | $10,977 | $11,972 |
| 10/2020 | $10,963 | $11,919 |
| 11/2020 | $11,033 | $12,036 |
| 12/2020 | $11,043 | $12,052 |
| 01/2021 | $10,982 | $11,966 |
| 02/2021 | $10,935 | $11,793 |
| 03/2021 | $10,868 | $11,646 |
| 04/2021 | $10,901 | $11,738 |
| 05/2021 | $10,869 | $11,776 |
| 06/2021 | $10,859 | $11,859 |
| 07/2021 | $10,882 | $11,992 |
| 08/2021 | $10,872 | $11,969 |
| 09/2021 | $10,862 | $11,865 |
| 10/2021 | $10,841 | $11,862 |
| 11/2021 | $10,807 | $11,897 |
| 12/2021 | $10,796 | $11,867 |
| 01/2022 | $10,708 | $11,611 |
| 02/2022 | $10,632 | $11,481 |
| 03/2022 | $10,468 | $11,162 |
| 04/2022 | $10,176 | $10,739 |
| 05/2022 | $10,252 | $10,808 |
| 06/2022 | $10,138 | $10,639 |
| 07/2022 | $10,414 | $10,898 |
| 08/2022 | $10,066 | $10,591 |
| 09/2022 | $9,550 | $10,133 |
| 10/2022 | $9,380 | $10,002 |
| 11/2022 | $9,784 | $10,370 |
| 12/2022 | $9,729 | $10,323 |
| 01/2023 | $10,135 | $10,640 |
| 02/2023 | $9,820 | $10,365 |
| 03/2023 | $10,093 | $10,629 |
| 04/2023 | $10,139 | $10,693 |
| 05/2023 | $10,027 | $10,576 |
| 06/2023 | $9,983 | $10,539 |
| 07/2023 | $9,927 | $10,531 |
| 08/2023 | $9,826 | $10,464 |
| 09/2023 | $9,448 | $10,198 |
| 10/2023 | $9,231 | $10,037 |
| 11/2023 | $9,753 | $10,492 |
| 12/2023 | $10,220 | $10,893 |
| 01/2024 | $10,164 | $10,864 |
| 02/2024 | $9,993 | $10,710 |
| 03/2024 | $10,090 | $10,809 |
| 04/2024 | $9,728 | $10,536 |
| 05/2024 | $9,919 | $10,715 |
| 06/2024 | $10,075 | $10,816 |
| 07/2024 | $10,303 | $11,069 |
| 08/2024 | $10,521 | $11,228 |
| 09/2024 | $10,653 | $11,378 |
| 10/2024 | $10,274 | $11,096 |
Average Annual Total Returns (%)
| HEADER | 1 Year | 5 Years | Since Inception (4/4/16) |
|---|
Investor ClassFootnote Reference1 | 11.29% | (0.60)% | 0.32% |
| Bloomberg US Aggregate Bond Index | 10.55% | (0.23)% | 1.22% |
| Footnote | Description |
Footnote1 | Return may differ from actual shareholder return due to accounting adjustments for financial reporting purposes. |
Performance shown is historical and is not indicative of future returns. Investment returns and principal value will vary, and shares may be worth more or less at redemption than at original purchase. Performance shown is as of date indicated, and current performance may be lower or higher than the performance data quoted. To obtain performance as of the most recent month end, please visit americanbeaconfunds.com or call 800-967-9009. The graph and table do not reflect the deduction of taxes that a shareholder would pay on fund distributions or redemption of fund shares. The Fund's performance benefited from fee waivers. For more information, visit americanbeaconfunds.com/Performance_Disclaimers.aspx.
| Total Net Assets | $264,850,242 |
| # of Portfolio Holdings | 27 |
| Portfolio Turnover Rate | 34% |
| Total Management Fees Paid | $759,409 |
What did the Fund invest in?
Top Ten Holdings - % Net Assets
| U.S. Treasury Notes, 3.500%, Due 2/15/2033 | 12.7 |
| U.S. Treasury Notes, 1.875%, Due 2/15/2032 | 10.6 |
| U.S. Treasury Notes, 4.000%, Due 2/15/2034 | 7.9 |
| U.S. Treasury Bonds, 2.500%, Due 2/15/2045 | 6.4 |
| Federal Home Loan Mortgage Corp., 4.000%, Due 11/1/2052 | 3.9 |
| Federal Home Loan Mortgage Corp., 2.500%, Due 3/1/2052 | 3.9 |
| Federal Home Loan Mortgage Corp., 2.500%, Due 4/1/2052 | 3.9 |
| Federal Home Loan Mortgage Corp., 4.000%, Due 10/1/2052 | 3.9 |
| Federal Home Loan Mortgage Corp., 2.500%, Due 9/1/2042 | 3.7 |
| Federal National Mortgage Association, 3.000%, Due 5/1/2052 | 3.7 |
Excludes cash equivalents.
Asset Allocation - % Investments
| Value | Value |
|---|
| U.S. Agency Mortgage-Backed Obligations | 47.1 |
| U.S. Treasury Obligations | 44.8 |
| Corporate Obligations | 8.1 |
Industry Allocation - % Investments
| Value | Value |
|---|
| Electric | 2.3 |
| Banks | 2.5 |
| Media | 3.3 |
| U.S. Treasury Obligations | 44.8 |
| U.S. Agency Mortgage-Backed Obligations | 47.1 |
For additional information about the Fund, including its prospectus, financial statements, holdings, and proxy voting information, please visit www.americanbeaconfunds.com/literature or call 1-800-658-5811.
If your financial institution mailed only one copy of this Report to an address shared by more than one account, you can request an individual copy by contacting your financial institution.
Garcia Hamilton Quality Bond Fund
Distributed by:
Resolute Investment Distributors, Inc.
Annual Shareholder Report - October 31, 2024
Garcia Hamilton Quality Bond Fund
Annual Shareholder Report - October 31, 2024
This annual shareholder report contains important information about American Beacon Garcia Hamilton Quality Bond Fund for the period of November 1, 2023 to October 31, 2024. You can find additional information about the Fund at www.americanbeaconfunds.com/literature. You can also request this information by contacting us at 800-658-5811.
What were the Fund costs for the last year?
(based on a hypothetical $10,000 investment)
| Class Name | Costs of a $10,000 investment | Costs paid as a percentage of a $10,000 investment |
|---|
| Y | $54 | 0.51% |
How did the Fund perform and what affected its performance?
The Y Class of the Fund returned 11.22% for the twelve months ended October 31, 2024, compared to the Bloomberg U.S. Aggregate Bond Index return of 10.55%.
• The Federal Reserve cut the Federal Funds Rate by 0.50% in September 2024.
• In anticipation of a slower economy, the Fund ended the period with a longer duration of 7.5 years compared to 6.1 years for the Index, which led to outperformance.
• The Fund was underweight in Corporates due to narrow credit spreads. This detracted from performance as Corporates were the best performing sector in the Index, returning 13.6%. Lower-quality Corporate bonds outperformed, while the Fund holds only higher-quality bonds.
• The Fund’s overweighting of Agency Mortgages performed well, although returns were in line with duration-equivalent Treasury bonds.
Cumulative Performance from April 4, 2016 through October 31, 2024
The initial investment, based on a $100,000 investment, is adjusted to reflect the maximum applicable sales charge, if any.
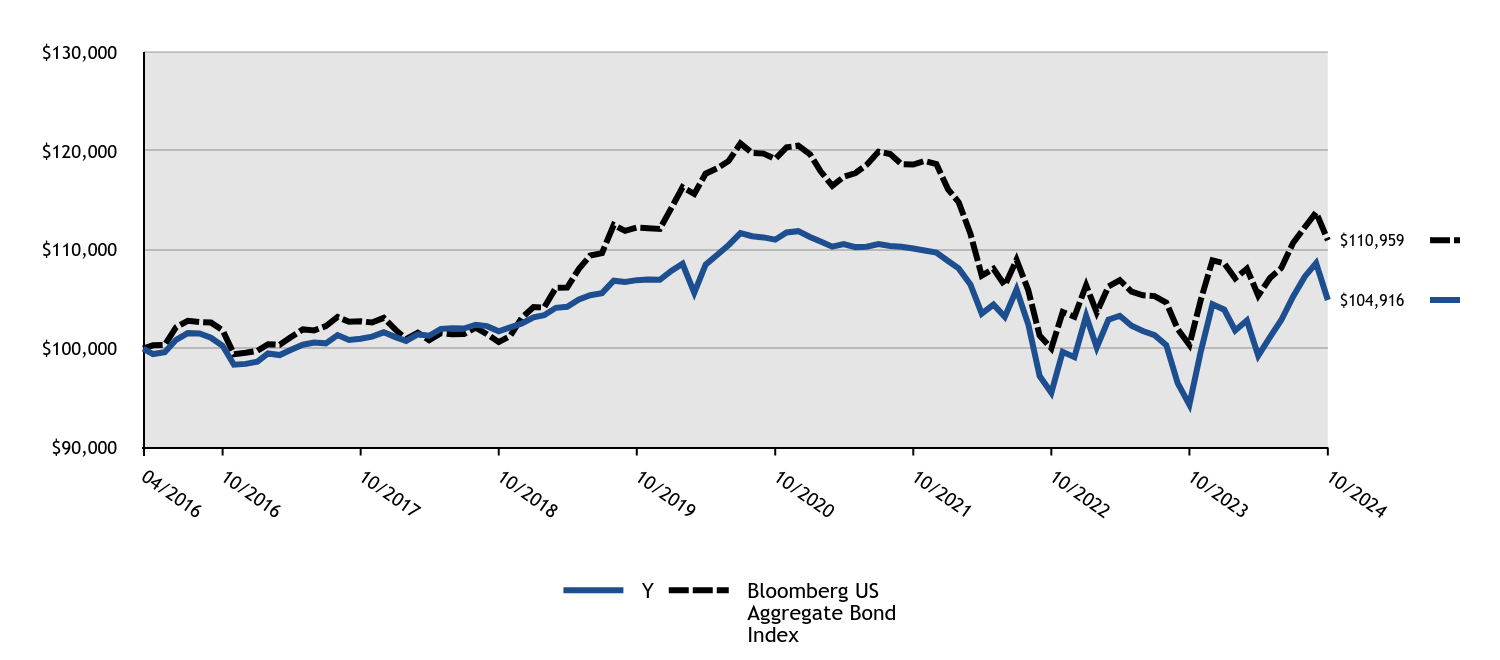
| #ERROR:A result could not be returned because the conditional could not be evaluated to a True/False value (#ERROR:Invalid Formula (#!=""), 'Multiple values from an iterator cannot be used in a formula unless they are aggregrated.') | Y | Bloomberg US Aggregate Bond Index |
|---|
| 04/2016 | $100,000 | $100,000 |
| 04/2016 | $99,450 | $100,338 |
| 05/2016 | $99,642 | $100,364 |
| 06/2016 | $100,896 | $102,167 |
| 07/2016 | $101,567 | $102,813 |
| 08/2016 | $101,535 | $102,696 |
| 09/2016 | $101,108 | $102,636 |
| 10/2016 | $100,290 | $101,850 |
| 11/2016 | $98,375 | $99,441 |
| 12/2016 | $98,457 | $99,582 |
| 01/2017 | $98,683 | $99,777 |
| 02/2017 | $99,513 | $100,448 |
| 03/2017 | $99,350 | $100,395 |
| 04/2017 | $99,877 | $101,170 |
| 05/2017 | $100,399 | $101,948 |
| 06/2017 | $100,616 | $101,846 |
| 07/2017 | $100,535 | $102,284 |
| 08/2017 | $101,369 | $103,201 |
| 09/2017 | $100,876 | $102,710 |
| 10/2017 | $100,998 | $102,769 |
| 11/2017 | $101,219 | $102,638 |
| 12/2017 | $101,648 | $103,109 |
| 01/2018 | $101,163 | $101,921 |
| 02/2018 | $100,777 | $100,955 |
| 03/2018 | $101,451 | $101,602 |
| 04/2018 | $101,301 | $100,847 |
| 05/2018 | $101,998 | $101,566 |
| 06/2018 | $102,072 | $101,442 |
| 07/2018 | $102,037 | $101,466 |
| 08/2018 | $102,414 | $102,119 |
| 09/2018 | $102,275 | $101,461 |
| 10/2018 | $101,748 | $100,659 |
| 11/2018 | $102,145 | $101,260 |
| 12/2018 | $102,544 | $103,120 |
| 01/2019 | $103,170 | $104,215 |
| 02/2019 | $103,375 | $104,155 |
| 03/2019 | $104,126 | $106,155 |
| 04/2019 | $104,238 | $106,182 |
| 05/2019 | $104,983 | $108,067 |
| 06/2019 | $105,404 | $109,424 |
| 07/2019 | $105,615 | $109,665 |
| 08/2019 | $106,873 | $112,506 |
| 09/2019 | $106,736 | $111,907 |
| 10/2019 | $106,927 | $112,244 |
| 11/2019 | $107,001 | $112,187 |
| 12/2019 | $106,966 | $112,109 |
| 01/2020 | $107,885 | $114,266 |
| 02/2020 | $108,584 | $116,323 |
| 03/2020 | $105,649 | $115,639 |
| 04/2020 | $108,493 | $117,694 |
| 05/2020 | $109,496 | $118,242 |
| 06/2020 | $110,483 | $118,987 |
| 07/2020 | $111,687 | $120,764 |
| 08/2020 | $111,366 | $119,790 |
| 09/2020 | $111,249 | $119,724 |
| 10/2020 | $111,020 | $119,189 |
| 11/2020 | $111,755 | $120,359 |
| 12/2020 | $111,881 | $120,525 |
| 01/2021 | $111,299 | $119,660 |
| 02/2021 | $110,841 | $117,933 |
| 03/2021 | $110,307 | $116,460 |
| 04/2021 | $110,563 | $117,380 |
| 05/2021 | $110,267 | $117,763 |
| 06/2021 | $110,306 | $118,591 |
| 07/2021 | $110,567 | $119,917 |
| 08/2021 | $110,383 | $119,689 |
| 09/2021 | $110,309 | $118,652 |
| 10/2021 | $110,119 | $118,620 |
| 11/2021 | $109,918 | $118,970 |
| 12/2021 | $109,721 | $118,666 |
| 01/2022 | $108,859 | $116,110 |
| 02/2022 | $108,114 | $114,814 |
| 03/2022 | $106,483 | $111,624 |
| 04/2022 | $103,544 | $107,388 |
| 05/2022 | $104,450 | $108,081 |
| 06/2022 | $103,210 | $106,385 |
| 07/2022 | $105,983 | $108,985 |
| 08/2022 | $102,469 | $105,905 |
| 09/2022 | $97,240 | $101,329 |
| 10/2022 | $95,536 | $100,017 |
| 11/2022 | $99,677 | $103,695 |
| 12/2022 | $99,138 | $103,227 |
| 01/2023 | $103,314 | $106,403 |
| 02/2023 | $100,122 | $103,652 |
| 03/2023 | $102,936 | $106,285 |
| 04/2023 | $103,323 | $106,929 |
| 05/2023 | $102,321 | $105,765 |
| 06/2023 | $101,779 | $105,388 |
| 07/2023 | $101,356 | $105,314 |
| 08/2023 | $100,348 | $104,642 |
| 09/2023 | $96,516 | $101,982 |
| 10/2023 | $94,328 | $100,373 |
| 11/2023 | $99,685 | $104,919 |
| 12/2023 | $104,490 | $108,935 |
| 01/2024 | $103,942 | $108,636 |
| 02/2024 | $101,832 | $107,101 |
| 03/2024 | $102,843 | $108,090 |
| 04/2024 | $99,288 | $105,360 |
| 05/2024 | $101,153 | $107,146 |
| 06/2024 | $102,896 | $108,160 |
| 07/2024 | $105,253 | $110,686 |
| 08/2024 | $107,277 | $112,277 |
| 09/2024 | $108,649 | $113,780 |
| 10/2024 | $104,916 | $110,959 |
Average Annual Total Returns (%)
| HEADER | 1 Year | 5 Years | Since Inception (4/4/16) |
|---|
Class YFootnote Reference1 | 11.22% | (0.38)% | 0.56% |
| Bloomberg US Aggregate Bond Index | 10.55% | (0.23)% | 1.22% |
| Footnote | Description |
Footnote1 | Return may differ from actual shareholder return due to accounting adjustments for financial reporting purposes. |
Performance shown is historical and is not indicative of future returns. Investment returns and principal value will vary, and shares may be worth more or less at redemption than at original purchase. Performance shown is as of date indicated, and current performance may be lower or higher than the performance data quoted. To obtain performance as of the most recent month end, please visit americanbeaconfunds.com or call 800-967-9009. The graph and table do not reflect the deduction of taxes that a shareholder would pay on fund distributions or redemption of fund shares. The Fund's performance benefited from fee waivers. For more information, visit americanbeaconfunds.com/Performance_Disclaimers.aspx.
| Total Net Assets | $264,850,242 |
| # of Portfolio Holdings | 27 |
| Portfolio Turnover Rate | 34% |
| Total Management Fees Paid | $759,409 |
What did the Fund invest in?
Top Ten Holdings - % Net Assets
| U.S. Treasury Notes, 3.500%, Due 2/15/2033 | 12.7 |
| U.S. Treasury Notes, 1.875%, Due 2/15/2032 | 10.6 |
| U.S. Treasury Notes, 4.000%, Due 2/15/2034 | 7.9 |
| U.S. Treasury Bonds, 2.500%, Due 2/15/2045 | 6.4 |
| Federal Home Loan Mortgage Corp., 4.000%, Due 11/1/2052 | 3.9 |
| Federal Home Loan Mortgage Corp., 2.500%, Due 3/1/2052 | 3.9 |
| Federal Home Loan Mortgage Corp., 2.500%, Due 4/1/2052 | 3.9 |
| Federal Home Loan Mortgage Corp., 4.000%, Due 10/1/2052 | 3.9 |
| Federal Home Loan Mortgage Corp., 2.500%, Due 9/1/2042 | 3.7 |
| Federal National Mortgage Association, 3.000%, Due 5/1/2052 | 3.7 |
Excludes cash equivalents.
Asset Allocation - % Investments
| Value | Value |
|---|
| U.S. Agency Mortgage-Backed Obligations | 47.1 |
| U.S. Treasury Obligations | 44.8 |
| Corporate Obligations | 8.1 |
Industry Allocation - % Investments
| Value | Value |
|---|
| Electric | 2.3 |
| Banks | 2.5 |
| Media | 3.3 |
| U.S. Treasury Obligations | 44.8 |
| U.S. Agency Mortgage-Backed Obligations | 47.1 |
For additional information about the Fund, including its prospectus, financial statements, holdings, and proxy voting information, please visit www.americanbeaconfunds.com/literature or call 1-800-658-5811.
If your financial institution mailed only one copy of this Report to an address shared by more than one account, you can request an individual copy by contacting your financial institution.
Garcia Hamilton Quality Bond Fund
Distributed by:
Resolute Investment Distributors, Inc.
Annual Shareholder Report - October 31, 2024
Garcia Hamilton Quality Bond Fund
Annual Shareholder Report - October 31, 2024
This annual shareholder report contains important information about American Beacon Garcia Hamilton Quality Bond Fund for the period of November 1, 2023 to October 31, 2024. You can find additional information about the Fund at www.americanbeaconfunds.com/literature. You can also request this information by contacting us at 800-658-5811.
What were the Fund costs for the last year?
(based on a hypothetical $10,000 investment)
| Class Name | Costs of a $10,000 investment | Costs paid as a percentage of a $10,000 investment |
|---|
| R6 | $43 | 0.41% |
How did the Fund perform and what affected its performance?
The R6 Class of the Fund returned 11.46% for the twelve months ended October 31, 2024, compared to the Bloomberg U.S. Aggregate Bond Index return of 10.55%.
• The Federal Reserve cut the Federal Funds Rate by 0.50% in September 2024.
• In anticipation of a slower economy, the Fund ended the period with a longer duration of 7.5 years compared to 6.1 years for the Index, which led to outperformance.
• The Fund was underweight in Corporates due to narrow credit spreads. This detracted from performance as Corporates were the best performing sector in the Index, returning 13.6%. Lower-quality Corporate bonds outperformed, while the Fund holds only higher-quality bonds.
• The Fund’s overweighting of Agency Mortgages performed well, although returns were in line with duration-equivalent Treasury bonds.
Cumulative Performance from April 4, 2016 through October 31, 2024
The initial investment, based on a $10,000 investment, is adjusted to reflect the maximum applicable sales charge, if any.
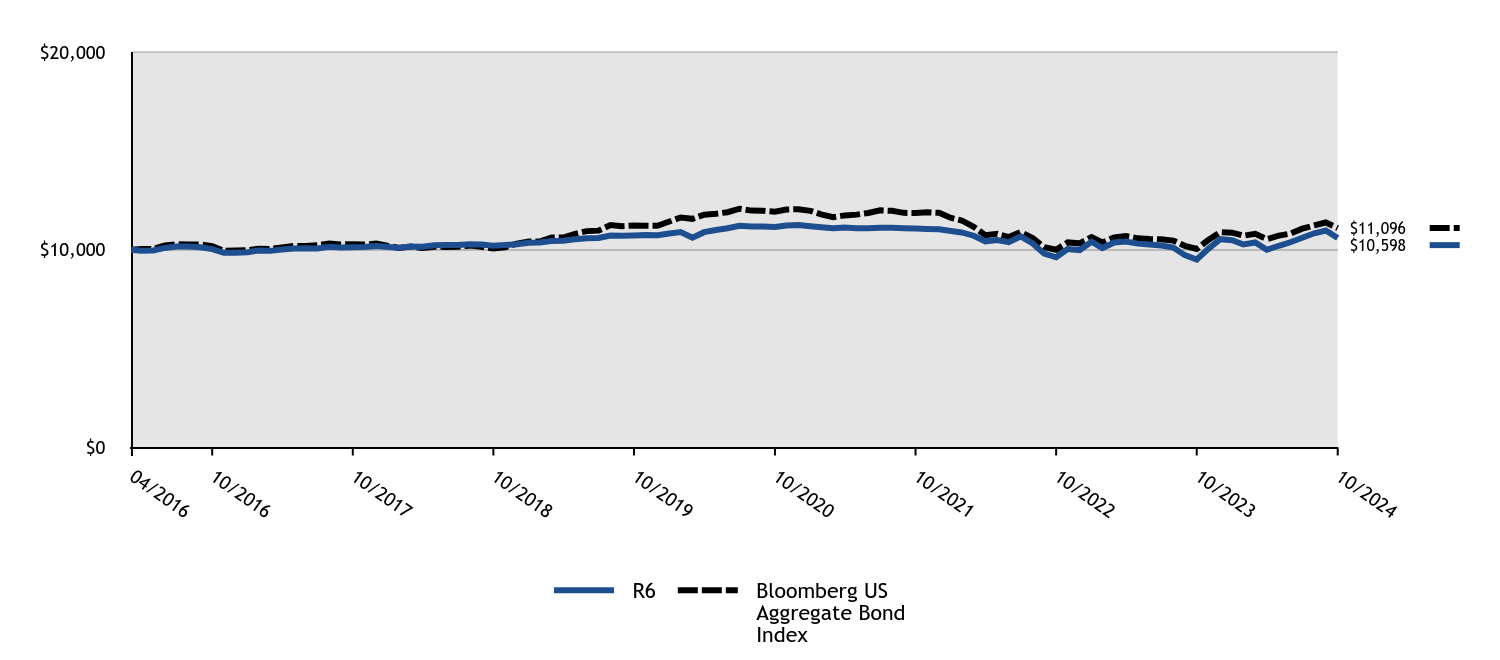
| R6 | Bloomberg US Aggregate Bond Index |
|---|
| 04/2016 | $10,000 | $10,000 |
| 04/2016 | $9,947 | $10,034 |
| 05/2016 | $9,965 | $10,036 |
| 06/2016 | $10,092 | $10,217 |
| 07/2016 | $10,160 | $10,281 |
| 08/2016 | $10,167 | $10,270 |
| 09/2016 | $10,125 | $10,264 |
| 10/2016 | $10,034 | $10,185 |
| 11/2016 | $9,844 | $9,944 |
| 12/2016 | $9,853 | $9,958 |
| 01/2017 | $9,876 | $9,978 |
| 02/2017 | $9,960 | $10,045 |
| 03/2017 | $9,944 | $10,039 |
| 04/2017 | $10,008 | $10,117 |
| 05/2017 | $10,061 | $10,195 |
| 06/2017 | $10,074 | $10,185 |
| 07/2017 | $10,067 | $10,228 |
| 08/2017 | $10,151 | $10,320 |
| 09/2017 | $10,113 | $10,271 |
| 10/2017 | $10,126 | $10,277 |
| 11/2017 | $10,138 | $10,264 |
| 12/2017 | $10,192 | $10,311 |
| 01/2018 | $10,145 | $10,192 |
| 02/2018 | $10,107 | $10,095 |
| 03/2018 | $10,165 | $10,160 |
| 04/2018 | $10,151 | $10,085 |
| 05/2018 | $10,232 | $10,157 |
| 06/2018 | $10,240 | $10,144 |
| 07/2018 | $10,237 | $10,147 |
| 08/2018 | $10,276 | $10,212 |
| 09/2018 | $10,263 | $10,146 |
| 10/2018 | $10,201 | $10,066 |
| 11/2018 | $10,241 | $10,126 |
| 12/2018 | $10,282 | $10,312 |
| 01/2019 | $10,356 | $10,422 |
| 02/2019 | $10,367 | $10,416 |
| 03/2019 | $10,444 | $10,615 |
| 04/2019 | $10,456 | $10,618 |
| 05/2019 | $10,532 | $10,807 |
| 06/2019 | $10,576 | $10,942 |
| 07/2019 | $10,598 | $10,966 |
| 08/2019 | $10,715 | $11,251 |
| 09/2019 | $10,704 | $11,191 |
| 10/2019 | $10,724 | $11,224 |
| 11/2019 | $10,743 | $11,219 |
| 12/2019 | $10,730 | $11,211 |
| 01/2020 | $10,824 | $11,427 |
| 02/2020 | $10,895 | $11,632 |
| 03/2020 | $10,612 | $11,564 |
| 04/2020 | $10,889 | $11,769 |
| 05/2020 | $11,001 | $11,824 |
| 06/2020 | $11,091 | $11,899 |
| 07/2020 | $11,213 | $12,076 |
| 08/2020 | $11,182 | $11,979 |
| 09/2020 | $11,172 | $11,972 |
| 10/2020 | $11,150 | $11,919 |
| 11/2020 | $11,225 | $12,036 |
| 12/2020 | $11,250 | $12,052 |
| 01/2021 | $11,193 | $11,966 |
| 02/2021 | $11,137 | $11,793 |
| 03/2021 | $11,084 | $11,646 |
| 04/2021 | $11,122 | $11,738 |
| 05/2021 | $11,093 | $11,776 |
| 06/2021 | $11,087 | $11,859 |
| 07/2021 | $11,114 | $11,992 |
| 08/2021 | $11,107 | $11,969 |
| 09/2021 | $11,090 | $11,865 |
| 10/2021 | $11,071 | $11,862 |
| 11/2021 | $11,053 | $11,897 |
| 12/2021 | $11,034 | $11,867 |
| 01/2022 | $10,948 | $11,611 |
| 02/2022 | $10,874 | $11,481 |
| 03/2022 | $10,710 | $11,162 |
| 04/2022 | $10,427 | $10,739 |
| 05/2022 | $10,496 | $10,808 |
| 06/2022 | $10,384 | $10,639 |
| 07/2022 | $10,670 | $10,898 |
| 08/2022 | $10,317 | $10,591 |
| 09/2022 | $9,803 | $10,133 |
| 10/2022 | $9,621 | $10,002 |
| 11/2022 | $10,038 | $10,370 |
| 12/2022 | $9,985 | $10,323 |
| 01/2023 | $10,406 | $10,640 |
| 02/2023 | $10,085 | $10,365 |
| 03/2023 | $10,369 | $10,629 |
| 04/2023 | $10,421 | $10,693 |
| 05/2023 | $10,309 | $10,576 |
| 06/2023 | $10,267 | $10,539 |
| 07/2023 | $10,214 | $10,531 |
| 08/2023 | $10,113 | $10,464 |
| 09/2023 | $9,727 | $10,198 |
| 10/2023 | $9,508 | $10,037 |
| 11/2023 | $10,048 | $10,492 |
| 12/2023 | $10,534 | $10,893 |
| 01/2024 | $10,479 | $10,864 |
| 02/2024 | $10,267 | $10,710 |
| 03/2024 | $10,370 | $10,809 |
| 04/2024 | $10,001 | $10,536 |
| 05/2024 | $10,202 | $10,715 |
| 06/2024 | $10,378 | $10,816 |
| 07/2024 | $10,605 | $11,069 |
| 08/2024 | $10,834 | $11,228 |
| 09/2024 | $10,973 | $11,378 |
| 10/2024 | $10,598 | $11,096 |
Average Annual Total Returns (%)
| HEADER | 1 Year | 5 Years | Since Inception (4/4/16) |
|---|
R6 ClassFootnote Reference1 | 11.46% | (0.24)% | 0.68% |
| Bloomberg US Aggregate Bond Index | 10.55% | (0.23)% | 1.22% |
| Footnote | Description |
Footnote1 | Return may differ from actual shareholder return due to accounting adjustments for financial reporting purposes. |
Performance shown is historical and is not indicative of future returns. Investment returns and principal value will vary, and shares may be worth more or less at redemption than at original purchase. Performance shown is as of date indicated, and current performance may be lower or higher than the performance data quoted. To obtain performance as of the most recent month end, please visit americanbeaconfunds.com or call 800-967-9009. The graph and table do not reflect the deduction of taxes that a shareholder would pay on fund distributions or redemption of fund shares. The Fund's performance benefited from fee waivers. Performance includes historical performance of another Class of the Fund. For more information, visit americanbeaconfunds.com/Performance_Disclaimers.aspx.
| Total Net Assets | $264,850,242 |
| # of Portfolio Holdings | 27 |
| Portfolio Turnover Rate | 34% |
| Total Management Fees Paid | $759,409 |
What did the Fund invest in?
Top Ten Holdings - % Net Assets
| U.S. Treasury Notes, 3.500%, Due 2/15/2033 | 12.7 |
| U.S. Treasury Notes, 1.875%, Due 2/15/2032 | 10.6 |
| U.S. Treasury Notes, 4.000%, Due 2/15/2034 | 7.9 |
| U.S. Treasury Bonds, 2.500%, Due 2/15/2045 | 6.4 |
| Federal Home Loan Mortgage Corp., 4.000%, Due 11/1/2052 | 3.9 |
| Federal Home Loan Mortgage Corp., 2.500%, Due 3/1/2052 | 3.9 |
| Federal Home Loan Mortgage Corp., 2.500%, Due 4/1/2052 | 3.9 |
| Federal Home Loan Mortgage Corp., 4.000%, Due 10/1/2052 | 3.9 |
| Federal Home Loan Mortgage Corp., 2.500%, Due 9/1/2042 | 3.7 |
| Federal National Mortgage Association, 3.000%, Due 5/1/2052 | 3.7 |
Excludes cash equivalents.
Asset Allocation - % Investments
| Value | Value |
|---|
| U.S. Agency Mortgage-Backed Obligations | 47.1 |
| U.S. Treasury Obligations | 44.8 |
| Corporate Obligations | 8.1 |
Industry Allocation - % Investments
| Value | Value |
|---|
| Electric | 2.3 |
| Banks | 2.5 |
| Media | 3.3 |
| U.S. Treasury Obligations | 44.8 |
| U.S. Agency Mortgage-Backed Obligations | 47.1 |
For additional information about the Fund, including its prospectus, financial statements, holdings, and proxy voting information, please visit www.americanbeaconfunds.com/literature or call 1-800-658-5811.
If your financial institution mailed only one copy of this Report to an address shared by more than one account, you can request an individual copy by contacting your financial institution.
Garcia Hamilton Quality Bond Fund
Distributed by:
Resolute Investment Distributors, Inc.
Annual Shareholder Report - October 31, 2024
EAM International Small Cap Fund
Annual Shareholder Report - October 31, 2024
This annual shareholder report contains important information about American Beacon EAM International Small Cap Fund for the period of November 1, 2023 to October 31, 2024. You can find additional information about the Fund at www.americanbeaconfunds.com/literature. You can also request this information by contacting us at 800-658-5811.
What were the Fund costs for the last year?
(based on a hypothetical $10,000 investment)
| Class Name | Costs of a $10,000 investment | Costs paid as a percentage of a $10,000 investment |
|---|
| R5 | $97 | 0.89% |
How did the Fund perform and what affected its performance?
The R5 Class of the Fund returned 18.52% for the twelve months ended October 31, 2024, compared to the MSCI® EAFE Index (Net) return of 22.97% and the MSCI® ACWI ex USA Small Cap Index (Net) return of 23.73%.
• The Fund’s strategy of informed momentum investing struggled as investors rotated into lower momentum and weaker quality stocks in the latter part of the twelve-month period with the loosening of global monetary policy and the prospect of a soft landing among international markets.
• The Fund's holdings in the Financials, Consumer Discretionary, and Materials sectors detracted from the Fund's performance. Conversely, holdings in the Information Technology and Health Care sectors contributed to performance. The Fund’s holdings in Taiwan detracted from performance, while holdings in Korea contributed positively to performance during the period.
Cumulative Performance from October 31, 2014 through October 31, 2024
The initial investment, based on a $250,000 investment, is adjusted to reflect the maximum applicable sales charge, if any.
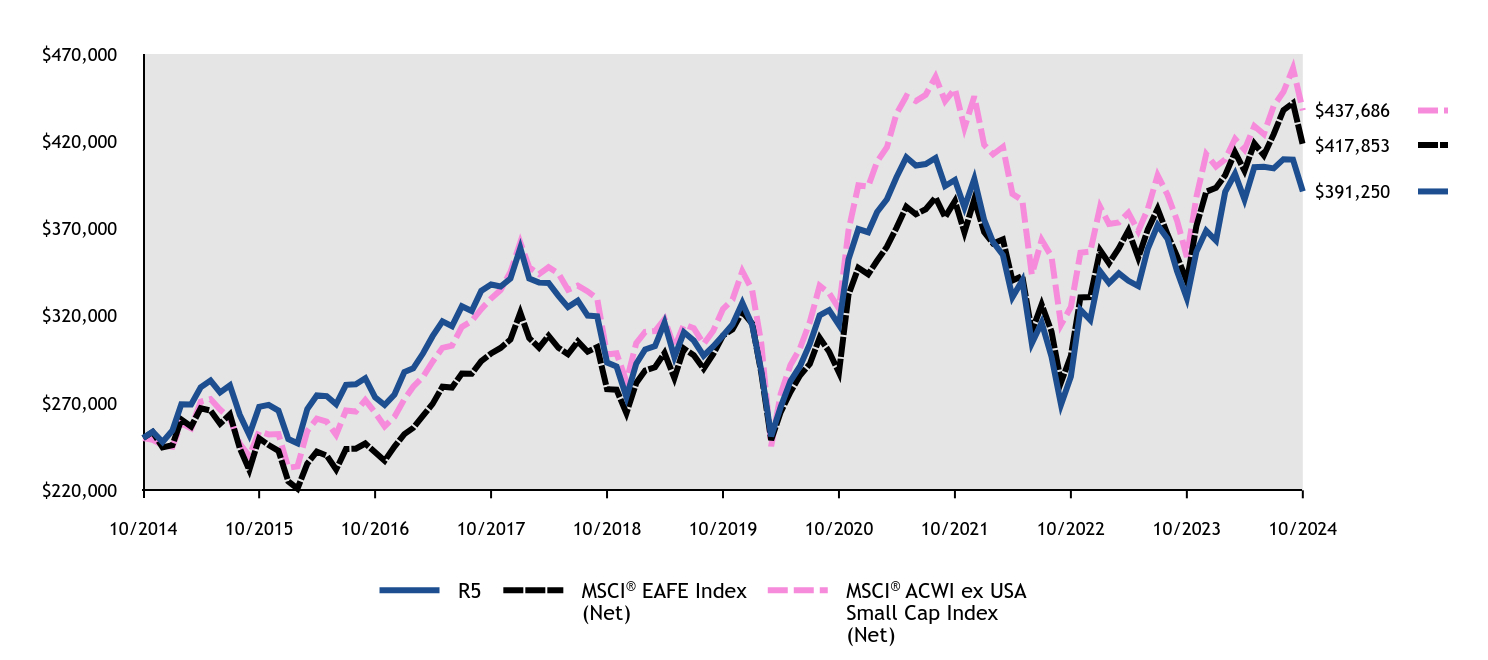
| R5 | MSCI® EAFE Index (Net) | MSCI® ACWI ex USA Small Cap Index (Net) |
|---|
| 10/2014 | $250,000 | $250,000 | $250,000 |
| 11/2014 | $253,626 | $253,400 | $248,950 |
| 12/2014 | $247,670 | $244,622 | $245,858 |
| 01/2015 | $254,279 | $245,818 | $244,956 |
| 02/2015 | $269,334 | $260,513 | $258,322 |
| 03/2015 | $269,150 | $256,556 | $255,524 |
| 04/2015 | $279,064 | $267,031 | $270,792 |
| 05/2015 | $282,920 | $265,664 | $272,305 |
| 06/2015 | $276,127 | $258,137 | $266,303 |
| 07/2015 | $280,166 | $263,497 | $261,228 |
| 08/2015 | $263,275 | $244,113 | $246,655 |
| 09/2015 | $251,709 | $231,718 | $239,612 |
| 10/2015 | $267,865 | $249,831 | $253,815 |
| 11/2015 | $268,967 | $245,945 | $252,000 |
| 12/2015 | $265,667 | $242,631 | $252,257 |
| 01/2016 | $249,394 | $225,085 | $232,914 |
| 02/2016 | $246,935 | $220,961 | $233,704 |
| 03/2016 | $266,614 | $235,339 | $253,980 |
| 04/2016 | $274,372 | $242,152 | $261,082 |
| 05/2016 | $273,993 | $239,952 | $259,364 |
| 06/2016 | $269,263 | $231,898 | $251,758 |
| 07/2016 | $280,427 | $243,651 | $265,768 |
| 08/2016 | $280,805 | $243,823 | $265,131 |
| 09/2016 | $284,211 | $246,819 | $271,675 |
| 10/2016 | $273,236 | $241,770 | $264,522 |
| 11/2016 | $268,884 | $236,955 | $256,668 |
| 12/2016 | $274,866 | $245,057 | $262,116 |
| 01/2017 | $287,744 | $252,166 | $272,161 |
| 02/2017 | $289,858 | $255,772 | $279,330 |
| 03/2017 | $298,508 | $262,813 | $285,121 |
| 04/2017 | $308,311 | $269,500 | $293,674 |
| 05/2017 | $316,768 | $279,392 | $301,639 |
| 06/2017 | $314,077 | $278,898 | $302,906 |
| 07/2017 | $325,418 | $286,943 | $313,607 |
| 08/2017 | $322,727 | $286,835 | $317,005 |
| 09/2017 | $334,260 | $293,971 | $323,814 |
| 10/2017 | $337,912 | $298,435 | $329,860 |
| 11/2017 | $336,758 | $301,566 | $334,773 |
| 12/2017 | $341,328 | $306,406 | $345,064 |
| 01/2018 | $358,852 | $321,775 | $362,027 |
| 02/2018 | $341,328 | $307,252 | $347,785 |
| 03/2018 | $338,991 | $301,714 | $343,844 |
| 04/2018 | $338,796 | $308,603 | $347,820 |
| 05/2018 | $331,397 | $301,666 | $344,299 |
| 06/2018 | $324,972 | $297,980 | $334,916 |
| 07/2018 | $328,671 | $305,315 | $337,250 |
| 08/2018 | $320,104 | $299,419 | $333,968 |
| 09/2018 | $319,715 | $302,017 | $329,847 |
| 10/2018 | $293,234 | $277,979 | $297,764 |
| 11/2018 | $290,898 | $277,629 | $298,505 |
| 12/2018 | $273,445 | $264,152 | $282,264 |
| 01/2019 | $292,582 | $281,512 | $304,371 |
| 02/2019 | $300,671 | $288,688 | $310,755 |
| 03/2019 | $302,644 | $290,508 | $311,228 |
| 04/2019 | $316,060 | $298,676 | $318,111 |
| 05/2019 | $296,331 | $284,332 | $301,695 |
| 06/2019 | $310,536 | $301,200 | $315,007 |
| 07/2019 | $305,801 | $297,376 | $312,903 |
| 08/2019 | $297,120 | $289,672 | $303,885 |
| 09/2019 | $302,447 | $297,973 | $311,268 |
| 10/2019 | $308,760 | $308,679 | $323,865 |
| 11/2019 | $315,073 | $312,159 | $329,302 |
| 12/2019 | $327,474 | $322,304 | $345,544 |
| 01/2020 | $314,747 | $315,571 | $334,757 |
| 02/2020 | $288,282 | $287,044 | $303,969 |
| 03/2020 | $250,908 | $248,733 | $245,318 |
| 04/2020 | $267,676 | $264,802 | $275,134 |
| 05/2020 | $282,625 | $276,333 | $291,815 |
| 06/2020 | $291,110 | $285,742 | $301,324 |
| 07/2020 | $303,838 | $292,402 | $316,395 |
| 08/2020 | $320,201 | $307,435 | $337,206 |
| 09/2020 | $323,231 | $299,446 | $332,935 |
| 10/2020 | $314,747 | $287,490 | $324,107 |
| 11/2020 | $352,322 | $332,055 | $368,956 |
| 12/2020 | $369,713 | $347,494 | $394,757 |
| 01/2021 | $367,882 | $343,792 | $394,063 |
| 02/2021 | $379,474 | $351,503 | $408,320 |
| 03/2021 | $386,795 | $359,585 | $416,596 |
| 04/2021 | $399,404 | $370,405 | $435,728 |
| 05/2021 | $410,792 | $382,484 | $445,825 |
| 06/2021 | $406,114 | $378,180 | $443,060 |
| 07/2021 | $406,928 | $381,027 | $446,615 |
| 08/2021 | $410,385 | $387,748 | $456,933 |
| 09/2021 | $394,319 | $376,495 | $443,040 |
| 10/2021 | $397,777 | $385,755 | $449,967 |
| 11/2021 | $382,118 | $367,801 | $427,690 |
| 12/2021 | $398,448 | $386,634 | $445,773 |
| 01/2022 | $374,948 | $367,950 | $417,946 |
| 02/2022 | $362,245 | $361,444 | $412,534 |
| 03/2022 | $354,835 | $363,767 | $416,733 |
| 04/2022 | $330,699 | $340,233 | $389,832 |
| 05/2022 | $340,226 | $342,784 | $386,240 |
| 06/2022 | $304,235 | $310,978 | $343,604 |
| 07/2022 | $316,091 | $326,474 | $363,458 |
| 08/2022 | $296,613 | $310,968 | $353,925 |
| 09/2022 | $269,090 | $281,878 | $314,853 |
| 10/2022 | $285,180 | $297,036 | $325,085 |
| 11/2022 | $323,501 | $330,493 | $356,152 |
| 12/2022 | $317,604 | $330,758 | $356,748 |
| 01/2023 | $345,419 | $357,542 | $382,430 |
| 02/2023 | $338,735 | $350,082 | $372,659 |
| 03/2023 | $344,341 | $358,758 | $373,502 |
| 04/2023 | $340,029 | $368,887 | $379,003 |
| 05/2023 | $337,010 | $353,276 | $368,495 |
| 06/2023 | $358,356 | $369,354 | $381,154 |
| 07/2023 | $371,940 | $381,305 | $400,511 |
| 08/2023 | $364,178 | $366,696 | $389,346 |
| 09/2023 | $345,635 | $354,170 | $374,692 |
| 10/2023 | $330,110 | $339,812 | $353,742 |
| 11/2023 | $356,631 | $371,352 | $387,972 |
| 12/2023 | $368,804 | $391,082 | $412,609 |
| 01/2024 | $363,083 | $393,333 | $405,530 |
| 02/2024 | $391,030 | $400,532 | $409,592 |
| 03/2024 | $401,372 | $413,706 | $421,310 |
| 04/2024 | $386,629 | $403,111 | $415,177 |
| 05/2024 | $405,113 | $418,726 | $428,628 |
| 06/2024 | $405,333 | $411,966 | $424,083 |
| 07/2024 | $404,453 | $424,051 | $440,232 |
| 08/2024 | $409,734 | $437,840 | $448,341 |
| 09/2024 | $409,514 | $441,883 | $461,820 |
| 10/2024 | $391,250 | $417,853 | $437,686 |
Average Annual Total Returns (%)
| HEADER | 1 Year | 5 Years | 10 Years |
|---|
Class R5Footnote Reference1 | 18.52% | 4.85% | 4.58% |
MSCI® EAFE Index (Net) | 22.97% | 6.24% | 5.27% |
MSCI® ACWI ex USA Small Cap Index (Net) | 23.73% | 6.21% | 5.76% |
| Footnote | Description |
Footnote1 | Return may differ from actual shareholder return due to accounting adjustments for financial reporting purposes. |
Performance shown is historical and is not indicative of future returns. Investment returns and principal value will vary, and shares may be worth more or less at redemption than at original purchase. Performance shown is as of date indicated, and current performance may be lower or higher than the performance data quoted. To obtain performance as of the most recent month end, please visit americanbeaconfunds.com or call 800-967-9009. The graph and table do not reflect the deduction of taxes that a shareholder would pay on fund distributions or redemption of fund shares. The Fund's performance benefited from fee waivers. Performance includes historical performance of another Class of the Fund. For more information, visit americanbeaconfunds.com/Performance_Disclaimers.aspx.
The MSCI® EAFE Index (Net) is replacing the MSCI® ACWI ex USA Small Cap Index (Net) as the broad-based securities market index to comply with a new regulatory requirement. The MSCI® ACWI ex USA Small Cap Index (Net) reflects the market sectors in which the Fund invests.
| Total Net Assets | $126,424,066 |
| # of Portfolio Holdings | 137 |
| Portfolio Turnover Rate | 260% |
| Total Management Fees Paid | $813,252 |
Asset Allocation - % Investments
| Value | Value |
|---|
| Foreign Common Stocks | 94.7 |
| Investment Companies | 2.9 |
| Common Stocks | 1.5 |
| Foreign Preferred Stocks | 0.8 |
| Securities Lending Collateral | 0.1 |
The Fund may purchase and sell futures contracts to gain market exposure on cash balances.
What did the Fund invest in?
Top Ten Holdings - % Net Assets
| Hanwha Aerospace Co. Ltd. | 1.1 |
| Telix Pharmaceuticals Ltd. | 1.0 |
| Jentech Precision Industrial Co. Ltd. | 1.0 |
| HUB24 Ltd. | 1.0 |
| Lotus Bakeries NV | 1.0 |
| Yangzijiang Shipbuilding Holdings Ltd. | 0.9 |
| Van Lanschot Kempen NV | 0.9 |
| LIG Nex1 Co. Ltd. | 0.9 |
| Qifu Technology, Inc., ADR | 0.9 |
| InPost SA | 0.9 |
Excludes cash equivalents.
Sector Allocation - % Equities
| Value | Value |
|---|
| Communication Services | 1.4 |
| Utilities | 1.4 |
| Real Estate | 1.7 |
| Energy | 1.9 |
| Consumer Staples | 6.1 |
| Materials | 8.8 |
| Health Care | 9.7 |
| Information Technology | 10.8 |
| Consumer Discretionary | 13.3 |
| Financials | 13.6 |
| Industrials | 31.3 |
Top Ten Country Exposure - % Equities
| Value | Value |
|---|
| Sweden | 3.6 |
| Switzerland | 4.9 |
| China | 5.8 |
| United Kingdom | 5.8 |
| Taiwan | 7.7 |
| Republic Of Korea | 8.0 |
| Canada | 9.4 |
| Australia | 9.4 |
| India | 11.6 |
| Japan | 13.2 |
For additional information about the Fund, including its prospectus, financial statements, holdings, and proxy voting information, please visit www.americanbeaconfunds.com/literature or call 1-800-658-5811.
If your financial institution mailed only one copy of this Report to an address shared by more than one account, you can request an individual copy by contacting your financial institution.
EAM International Small Cap Fund
Distributed by:
Resolute Investment Distributors, Inc.
Annual Shareholder Report - October 31, 2024
EAM International Small Cap Fund
Annual Shareholder Report - October 31, 2024
This annual shareholder report contains important information about American Beacon EAM International Small Cap Fund for the period of November 1, 2023 to October 31, 2024. You can find additional information about the Fund at www.americanbeaconfunds.com/literature. You can also request this information by contacting us at 800-658-5811. This report describes material changes to the Fund that occurred during the reporting period.
What were the Fund costs for the last year?
(based on a hypothetical $10,000 investment)
| Class Name | Costs of a $10,000 investment | Costs paid as a percentage of a $10,000 investment |
|---|
| Investor | $146 | 1.34% |
How did the Fund perform and what affected its performance?
The Investor Class of the Fund returned 18.07% for the twelve months ended October 31, 2024, compared to the MSCI® EAFE Index (Net) return of 22.97% and the MSCI® ACWI ex USA Small Cap Index (Net) return of 23.73%.
• The Fund’s strategy of informed momentum investing struggled as investors rotated into lower momentum and weaker quality stocks in the latter part of the twelve-month period with the loosening of global monetary policy and the prospect of a soft landing among international markets.
• The Fund's holdings in the Financials, Consumer Discretionary, and Materials sectors detracted from the Fund's performance. Conversely, holdings in the Information Technology and Health Care sectors contributed to performance. The Fund’s holdings in Taiwan detracted from performance, while holdings in Korea contributed positively to performance during the period.
Cumulative Performance from October 31, 2014 through October 31, 2024
The initial investment, based on a $10,000 investment, is adjusted to reflect the maximum applicable sales charge, if any.
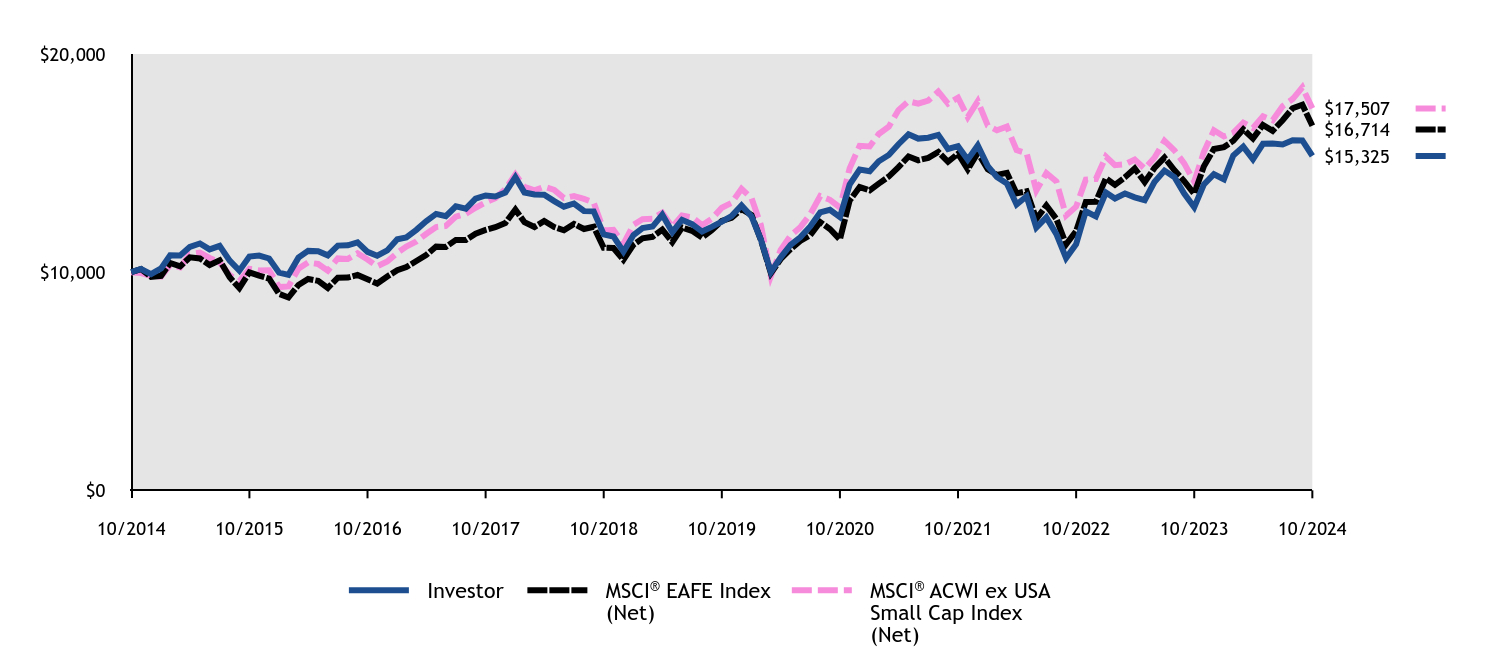
| Investor | MSCI® EAFE Index (Net) | MSCI® ACWI ex USA Small Cap Index (Net) |
|---|
| 10/2014 | $10,000 | $10,000 | $10,000 |
| 11/2014 | $10,145 | $10,136 | $9,958 |
| 12/2014 | $9,907 | $9,785 | $9,834 |
| 01/2015 | $10,171 | $9,833 | $9,798 |
| 02/2015 | $10,773 | $10,421 | $10,333 |
| 03/2015 | $10,766 | $10,262 | $10,221 |
| 04/2015 | $11,163 | $10,681 | $10,832 |
| 05/2015 | $11,317 | $10,627 | $10,892 |
| 06/2015 | $11,045 | $10,325 | $10,652 |
| 07/2015 | $11,207 | $10,540 | $10,449 |
| 08/2015 | $10,531 | $9,765 | $9,866 |
| 09/2015 | $10,068 | $9,269 | $9,584 |
| 10/2015 | $10,715 | $9,993 | $10,153 |
| 11/2015 | $10,759 | $9,838 | $10,080 |
| 12/2015 | $10,627 | $9,705 | $10,090 |
| 01/2016 | $9,976 | $9,003 | $9,317 |
| 02/2016 | $9,877 | $8,838 | $9,348 |
| 03/2016 | $10,665 | $9,414 | $10,159 |
| 04/2016 | $10,975 | $9,686 | $10,443 |
| 05/2016 | $10,960 | $9,598 | $10,375 |
| 06/2016 | $10,771 | $9,276 | $10,070 |
| 07/2016 | $11,217 | $9,746 | $10,631 |
| 08/2016 | $11,232 | $9,753 | $10,605 |
| 09/2016 | $11,368 | $9,873 | $10,867 |
| 10/2016 | $10,929 | $9,671 | $10,581 |
| 11/2016 | $10,755 | $9,478 | $10,267 |
| 12/2016 | $10,995 | $9,802 | $10,485 |
| 01/2017 | $11,510 | $10,087 | $10,886 |
| 02/2017 | $11,594 | $10,231 | $11,173 |
| 03/2017 | $11,940 | $10,513 | $11,405 |
| 04/2017 | $12,332 | $10,780 | $11,747 |
| 05/2017 | $12,671 | $11,176 | $12,066 |
| 06/2017 | $12,563 | $11,156 | $12,116 |
| 07/2017 | $13,017 | $11,478 | $12,544 |
| 08/2017 | $12,909 | $11,473 | $12,680 |
| 09/2017 | $13,370 | $11,759 | $12,953 |
| 10/2017 | $13,516 | $11,937 | $13,194 |
| 11/2017 | $13,470 | $12,063 | $13,391 |
| 12/2017 | $13,653 | $12,256 | $13,803 |
| 01/2018 | $14,354 | $12,871 | $14,481 |
| 02/2018 | $13,653 | $12,290 | $13,911 |
| 03/2018 | $13,560 | $12,069 | $13,754 |
| 04/2018 | $13,552 | $12,344 | $13,913 |
| 05/2018 | $13,256 | $12,067 | $13,772 |
| 06/2018 | $12,999 | $11,919 | $13,397 |
| 07/2018 | $13,147 | $12,213 | $13,490 |
| 08/2018 | $12,804 | $11,977 | $13,359 |
| 09/2018 | $12,789 | $12,081 | $13,194 |
| 10/2018 | $11,729 | $11,119 | $11,911 |
| 11/2018 | $11,636 | $11,105 | $11,940 |
| 12/2018 | $10,938 | $10,566 | $11,291 |
| 01/2019 | $11,703 | $11,260 | $12,175 |
| 02/2019 | $12,019 | $11,548 | $12,430 |
| 03/2019 | $12,090 | $11,620 | $12,449 |
| 04/2019 | $12,627 | $11,947 | $12,724 |
| 05/2019 | $11,837 | $11,373 | $12,068 |
| 06/2019 | $12,398 | $12,048 | $12,600 |
| 07/2019 | $12,200 | $11,895 | $12,516 |
| 08/2019 | $11,861 | $11,587 | $12,155 |
| 09/2019 | $12,074 | $11,919 | $12,451 |
| 10/2019 | $12,319 | $12,347 | $12,955 |
| 11/2019 | $12,571 | $12,486 | $13,172 |
| 12/2019 | $13,058 | $12,892 | $13,822 |
| 01/2020 | $12,552 | $12,623 | $13,390 |
| 02/2020 | $11,493 | $11,482 | $12,159 |
| 03/2020 | $10,000 | $9,949 | $9,813 |
| 04/2020 | $10,666 | $10,592 | $11,005 |
| 05/2020 | $11,252 | $11,053 | $11,673 |
| 06/2020 | $11,597 | $11,430 | $12,053 |
| 07/2020 | $12,095 | $11,696 | $12,656 |
| 08/2020 | $12,745 | $12,297 | $13,488 |
| 09/2020 | $12,857 | $11,978 | $13,317 |
| 10/2020 | $12,520 | $11,500 | $12,964 |
| 11/2020 | $14,013 | $13,282 | $14,758 |
| 12/2020 | $14,705 | $13,900 | $15,790 |
| 01/2021 | $14,625 | $13,752 | $15,763 |
| 02/2021 | $15,084 | $14,060 | $16,333 |
| 03/2021 | $15,374 | $14,383 | $16,664 |
| 04/2021 | $15,865 | $14,816 | $17,429 |
| 05/2021 | $16,316 | $15,299 | $17,833 |
| 06/2021 | $16,123 | $15,127 | $17,722 |
| 07/2021 | $16,163 | $15,241 | $17,865 |
| 08/2021 | $16,292 | $15,510 | $18,277 |
| 09/2021 | $15,647 | $15,060 | $17,722 |
| 10/2021 | $15,776 | $15,430 | $17,999 |
| 11/2021 | $15,156 | $14,712 | $17,108 |
| 12/2021 | $15,807 | $15,465 | $17,831 |
| 01/2022 | $14,863 | $14,718 | $16,718 |
| 02/2022 | $14,362 | $14,458 | $16,501 |
| 03/2022 | $14,061 | $14,551 | $16,669 |
| 04/2022 | $13,101 | $13,609 | $15,593 |
| 05/2022 | $13,477 | $13,711 | $15,450 |
| 06/2022 | $12,041 | $12,439 | $13,744 |
| 07/2022 | $12,508 | $13,059 | $14,538 |
| 08/2022 | $11,740 | $12,439 | $14,157 |
| 09/2022 | $10,646 | $11,275 | $12,594 |
| 10/2022 | $11,281 | $11,881 | $13,003 |
| 11/2022 | $12,792 | $13,220 | $14,246 |
| 12/2022 | $12,556 | $13,230 | $14,270 |
| 01/2023 | $13,648 | $14,302 | $15,297 |
| 02/2023 | $13,377 | $14,003 | $14,906 |
| 03/2023 | $13,606 | $14,350 | $14,940 |
| 04/2023 | $13,428 | $14,755 | $15,160 |
| 05/2023 | $13,301 | $14,131 | $14,740 |
| 06/2023 | $14,131 | $14,774 | $15,246 |
| 07/2023 | $14,656 | $15,252 | $16,020 |
| 08/2023 | $14,351 | $14,668 | $15,574 |
| 09/2023 | $13,606 | $14,167 | $14,988 |
| 10/2023 | $12,979 | $13,592 | $14,150 |
| 11/2023 | $14,021 | $14,854 | $15,519 |
| 12/2023 | $14,490 | $15,643 | $16,504 |
| 01/2024 | $14,258 | $15,733 | $16,221 |
| 02/2024 | $15,351 | $16,021 | $16,384 |
| 03/2024 | $15,756 | $16,548 | $16,852 |
| 04/2024 | $15,170 | $16,124 | $16,607 |
| 05/2024 | $15,885 | $16,749 | $17,145 |
| 06/2024 | $15,894 | $16,479 | $16,963 |
| 07/2024 | $15,850 | $16,962 | $17,609 |
| 08/2024 | $16,048 | $17,514 | $17,934 |
| 09/2024 | $16,040 | $17,675 | $18,473 |
| 10/2024 | $15,325 | $16,714 | $17,507 |
Average Annual Total Returns (%)
| HEADER | 1 Year | 5 Years | 10 Years |
|---|
Investor ClassFootnote Reference1 | 18.07% | 4.46% | 4.36% |
MSCI® EAFE Index (Net) | 22.97% | 6.24% | 5.27% |
MSCI® ACWI ex USA Small Cap Index (Net) | 23.73% | 6.21% | 5.76% |
| Footnote | Description |
Footnote1 | Return may differ from actual shareholder return due to accounting adjustments for financial reporting purposes. |
Performance shown is historical and is not indicative of future returns. Investment returns and principal value will vary, and shares may be worth more or less at redemption than at original purchase. Performance shown is as of date indicated, and current performance may be lower or higher than the performance data quoted. To obtain performance as of the most recent month end, please visit americanbeaconfunds.com or call 800-967-9009. The graph and table do not reflect the deduction of taxes that a shareholder would pay on fund distributions or redemption of fund shares. The Fund's performance benefited from fee waivers. For more information, visit americanbeaconfunds.com/Performance_Disclaimers.aspx.
The MSCI® EAFE Index (Net) is replacing the MSCI® ACWI ex USA Small Cap Index (Net) as the broad-based securities market index to comply with a new regulatory requirement. The MSCI® ACWI ex USA Small Cap Index (Net) reflects the market sectors in which the Fund invests.
| Total Net Assets | $126,424,066 |
| # of Portfolio Holdings | 137 |
| Portfolio Turnover Rate | 260% |
| Total Management Fees Paid | $813,252 |
Asset Allocation - % Investments
| Value | Value |
|---|
| Foreign Common Stocks | 94.7 |
| Investment Companies | 2.9 |
| Common Stocks | 1.5 |
| Foreign Preferred Stocks | 0.8 |
| Securities Lending Collateral | 0.1 |
The Fund may purchase and sell futures contracts to gain market exposure on cash balances.
What did the Fund invest in?
Top Ten Holdings - % Net Assets
| Hanwha Aerospace Co. Ltd. | 1.1 |
| Telix Pharmaceuticals Ltd. | 1.0 |
| Jentech Precision Industrial Co. Ltd. | 1.0 |
| HUB24 Ltd. | 1.0 |
| Lotus Bakeries NV | 1.0 |
| Yangzijiang Shipbuilding Holdings Ltd. | 0.9 |
| Van Lanschot Kempen NV | 0.9 |
| LIG Nex1 Co. Ltd. | 0.9 |
| Qifu Technology, Inc., ADR | 0.9 |
| InPost SA | 0.9 |
Excludes cash equivalents.
Sector Allocation - % Equities
| Value | Value |
|---|
| Communication Services | 1.4 |
| Utilities | 1.4 |
| Real Estate | 1.7 |
| Energy | 1.9 |
| Consumer Staples | 6.1 |
| Materials | 8.8 |
| Health Care | 9.7 |
| Information Technology | 10.8 |
| Consumer Discretionary | 13.3 |
| Financials | 13.6 |
| Industrials | 31.3 |
Top Ten Country Exposure - % Equities
| Value | Value |
|---|
| Sweden | 3.6 |
| Switzerland | 4.9 |
| China | 5.8 |
| United Kingdom | 5.8 |
| Taiwan | 7.7 |
| Republic Of Korea | 8.0 |
| Canada | 9.4 |
| Australia | 9.4 |
| India | 11.6 |
| Japan | 13.2 |
This is a summary of certain changes to the Fund since October 31, 2023. For more complete information, you may review the Fund's next prospectus, which we expect to be available by March 1, 2025 at www.americanbeaconfunds.com/literature or upon request at 800-658-5811.
Effective March 1, 2024, the contractual expense limitation the Investor was increased from 0.00% to 1.30% (excluding taxes, interest, brokerage commissions, acquired fund fees and expenses, security lending fees, expenses associated with securities sold short, litigation and other extraordinary expenses).
For additional information about the Fund, including its prospectus, financial statements, holdings, and proxy voting information, please visit www.americanbeaconfunds.com/literature or call 1-800-658-5811.
If your financial institution mailed only one copy of this Report to an address shared by more than one account, you can request an individual copy by contacting your financial institution.
EAM International Small Cap Fund
Distributed by:
Resolute Investment Distributors, Inc.
Annual Shareholder Report - October 31, 2024
EAM International Small Cap Fund
Annual Shareholder Report - October 31, 2024
This annual shareholder report contains important information about American Beacon EAM International Small Cap Fund for the period of November 1, 2023 to October 31, 2024. You can find additional information about the Fund at www.americanbeaconfunds.com/literature. You can also request this information by contacting us at 800-658-5811. This report describes material changes to the Fund that occurred during the reporting period.
What were the Fund costs for the last year?
(based on a hypothetical $10,000 investment)
| Class Name | Costs of a $10,000 investment | Costs paid as a percentage of a $10,000 investment |
|---|
| Y | $123 | 1.13% |
How did the Fund perform and what affected its performance?
The Y Class of the Fund returned 18.31% for the twelve months ended October 31, 2024, compared to the MSCI® EAFE Index (Net) return of 22.97% and the MSCI® ACWI ex USA Small Cap Index (Net) return of 23.73%.
• The Fund’s strategy of informed momentum investing struggled as investors rotated into lower momentum and weaker quality stocks in the latter part of the twelve-month period with the loosening of global monetary policy and the prospect of a soft landing among international markets.
• The Fund's holdings in the Financials, Consumer Discretionary, and Materials sectors detracted from the Fund's performance. Conversely, holdings in the Information Technology and Health Care sectors contributed to performance. The Fund’s holdings in Taiwan detracted from performance, while holdings in Korea contributed positively to performance during the period.
Cumulative Performance from October 31, 2014 through October 31, 2024
The initial investment, based on a $100,000 investment, is adjusted to reflect the maximum applicable sales charge, if any.
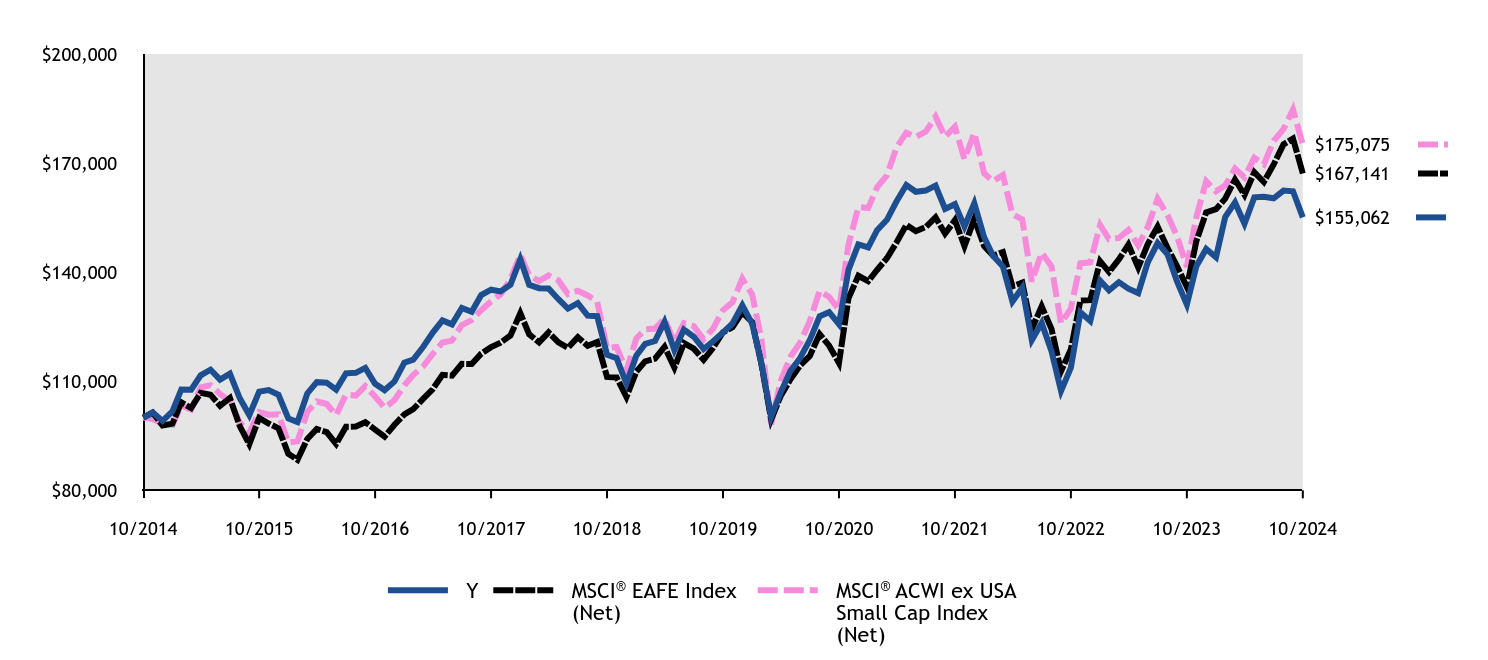
| #ERROR:A result could not be returned because the conditional could not be evaluated to a True/False value (#ERROR:Invalid Formula (#!=""), 'Multiple values from an iterator cannot be used in a formula unless they are aggregrated.') | Y | MSCI® EAFE Index (Net) | MSCI® ACWI ex USA Small Cap Index (Net) |
|---|
| 10/2014 | $100,000 | $100,000 | $100,000 |
| 11/2014 | $101,450 | $101,360 | $99,580 |
| 12/2014 | $99,068 | $97,849 | $98,343 |
| 01/2015 | $101,712 | $98,327 | $97,982 |
| 02/2015 | $107,734 | $104,205 | $103,329 |
| 03/2015 | $107,660 | $102,622 | $102,210 |
| 04/2015 | $111,626 | $106,812 | $108,317 |
| 05/2015 | $113,168 | $106,266 | $108,922 |
| 06/2015 | $110,451 | $103,255 | $106,521 |
| 07/2015 | $112,066 | $105,399 | $104,491 |
| 08/2015 | $105,310 | $97,645 | $98,662 |
| 09/2015 | $100,684 | $92,687 | $95,845 |
| 10/2015 | $107,146 | $99,932 | $101,526 |
| 11/2015 | $107,587 | $98,378 | $100,800 |
| 12/2015 | $106,267 | $97,052 | $100,903 |
| 01/2016 | $99,758 | $90,034 | $93,165 |
| 02/2016 | $98,774 | $88,385 | $93,481 |
| 03/2016 | $106,645 | $94,136 | $101,592 |
| 04/2016 | $109,749 | $96,861 | $104,433 |
| 05/2016 | $109,597 | $95,981 | $103,745 |
| 06/2016 | $107,705 | $92,759 | $100,703 |
| 07/2016 | $112,171 | $97,460 | $106,307 |
| 08/2016 | $112,322 | $97,529 | $106,052 |
| 09/2016 | $113,685 | $98,727 | $108,670 |
| 10/2016 | $109,295 | $96,708 | $105,809 |
| 11/2016 | $107,554 | $94,782 | $102,667 |
| 12/2016 | $109,946 | $98,023 | $104,846 |
| 01/2017 | $115,098 | $100,866 | $108,864 |
| 02/2017 | $115,943 | $102,309 | $111,732 |
| 03/2017 | $119,403 | $105,125 | $114,048 |
| 04/2017 | $123,324 | $107,800 | $117,469 |
| 05/2017 | $126,707 | $111,757 | $120,656 |
| 06/2017 | $125,631 | $111,559 | $121,162 |
| 07/2017 | $130,167 | $114,777 | $125,443 |
| 08/2017 | $129,091 | $114,734 | $126,802 |
| 09/2017 | $133,704 | $117,589 | $129,526 |
| 10/2017 | $135,165 | $119,374 | $131,944 |
| 11/2017 | $134,703 | $120,626 | $133,909 |
| 12/2017 | $136,531 | $122,562 | $138,026 |
| 01/2018 | $143,541 | $128,710 | $144,811 |
| 02/2018 | $136,531 | $122,901 | $139,114 |
| 03/2018 | $135,596 | $120,686 | $137,537 |
| 04/2018 | $135,519 | $123,441 | $139,128 |
| 05/2018 | $132,559 | $120,666 | $137,720 |
| 06/2018 | $129,989 | $119,192 | $133,966 |
| 07/2018 | $131,469 | $122,126 | $134,900 |
| 08/2018 | $128,042 | $119,768 | $133,587 |
| 09/2018 | $127,886 | $120,807 | $131,939 |
| 10/2018 | $117,294 | $111,192 | $119,106 |
| 11/2018 | $116,359 | $111,052 | $119,402 |
| 12/2018 | $109,378 | $105,661 | $112,906 |
| 01/2019 | $117,033 | $112,605 | $121,748 |
| 02/2019 | $120,268 | $115,475 | $124,302 |
| 03/2019 | $121,058 | $116,203 | $124,491 |
| 04/2019 | $126,345 | $119,470 | $127,244 |
| 05/2019 | $118,532 | $113,733 | $120,678 |
| 06/2019 | $124,214 | $120,480 | $126,003 |
| 07/2019 | $122,241 | $118,950 | $125,161 |
| 08/2019 | $118,848 | $115,869 | $121,554 |
| 09/2019 | $120,979 | $119,189 | $124,507 |
| 10/2019 | $123,425 | $123,471 | $129,546 |
| 11/2019 | $125,872 | $124,863 | $131,721 |
| 12/2019 | $130,865 | $128,921 | $138,218 |
| 01/2020 | $125,776 | $126,229 | $133,903 |
| 02/2020 | $115,113 | $114,818 | $121,588 |
| 03/2020 | $100,169 | $99,493 | $98,127 |
| 04/2020 | $106,873 | $105,921 | $110,054 |
| 05/2020 | $112,851 | $110,533 | $116,726 |
| 06/2020 | $116,325 | $114,297 | $120,530 |
| 07/2020 | $121,333 | $116,961 | $126,558 |
| 08/2020 | $127,876 | $122,974 | $134,882 |
| 09/2020 | $129,007 | $119,779 | $133,174 |
| 10/2020 | $125,695 | $114,996 | $129,643 |
| 11/2020 | $140,640 | $132,822 | $147,582 |
| 12/2020 | $147,649 | $138,998 | $157,903 |
| 01/2021 | $146,837 | $137,517 | $157,625 |
| 02/2021 | $151,548 | $140,601 | $163,328 |
| 03/2021 | $154,390 | $143,834 | $166,638 |
| 04/2021 | $159,426 | $148,162 | $174,291 |
| 05/2021 | $163,974 | $152,994 | $178,330 |
| 06/2021 | $162,106 | $151,272 | $177,224 |
| 07/2021 | $162,431 | $152,411 | $178,646 |
| 08/2021 | $163,811 | $155,099 | $182,773 |
| 09/2021 | $157,395 | $150,598 | $177,216 |
| 10/2021 | $158,695 | $154,302 | $179,987 |
| 11/2021 | $152,522 | $147,120 | $171,076 |
| 12/2021 | $158,980 | $154,653 | $178,309 |
| 01/2022 | $149,598 | $147,180 | $167,178 |
| 02/2022 | $144,527 | $144,578 | $165,014 |
| 03/2022 | $141,569 | $145,507 | $166,693 |
| 04/2022 | $131,934 | $136,093 | $155,933 |
| 05/2022 | $135,737 | $137,114 | $154,496 |
| 06/2022 | $121,285 | $124,391 | $137,442 |
| 07/2022 | $126,018 | $130,590 | $145,383 |
| 08/2022 | $118,242 | $124,387 | $141,570 |
| 09/2022 | $107,339 | $112,751 | $125,941 |
| 10/2022 | $113,762 | $118,814 | $130,034 |
| 11/2022 | $128,976 | $132,197 | $142,461 |
| 12/2022 | $126,589 | $132,303 | $142,699 |
| 01/2023 | $137,682 | $143,017 | $152,972 |
| 02/2023 | $135,016 | $140,033 | $149,064 |
| 03/2023 | $137,252 | $143,503 | $149,401 |
| 04/2023 | $135,446 | $147,555 | $151,601 |
| 05/2023 | $134,242 | $141,310 | $147,398 |
| 06/2023 | $142,670 | $147,741 | $152,461 |
| 07/2023 | $148,002 | $152,522 | $160,204 |
| 08/2023 | $144,906 | $146,678 | $155,738 |
| 09/2023 | $137,424 | $141,668 | $149,877 |
| 10/2023 | $131,060 | $135,925 | $141,497 |
| 11/2023 | $141,638 | $148,541 | $155,189 |
| 12/2023 | $146,384 | $156,433 | $165,044 |
| 01/2024 | $144,105 | $157,333 | $162,212 |
| 02/2024 | $155,150 | $160,213 | $163,837 |
| 03/2024 | $159,182 | $165,482 | $168,524 |
| 04/2024 | $153,309 | $161,244 | $166,071 |
| 05/2024 | $160,584 | $167,490 | $171,451 |
| 06/2024 | $160,760 | $164,786 | $169,633 |
| 07/2024 | $160,321 | $169,621 | $176,093 |
| 08/2024 | $162,425 | $175,136 | $179,337 |
| 09/2024 | $162,250 | $176,753 | $184,728 |
| 10/2024 | $155,062 | $167,141 | $175,075 |
Average Annual Total Returns (%)
| HEADER | 1 Year | 5 Years | 10 Years |
|---|
Class YFootnote Reference1 | 18.31% | 4.67% | 4.48% |
MSCI® EAFE Index (Net) | 22.97% | 6.24% | 5.27% |
MSCI® ACWI ex USA Small Cap Index (Net) | 23.73% | 6.21% | 5.76% |
| Footnote | Description |
Footnote1 | Return may differ from actual shareholder return due to accounting adjustments for financial reporting purposes. |
Performance shown is historical and is not indicative of future returns. Investment returns and principal value will vary, and shares may be worth more or less at redemption than at original purchase. Performance shown is as of date indicated, and current performance may be lower or higher than the performance data quoted. To obtain performance as of the most recent month end, please visit americanbeaconfunds.com or call 800-967-9009. The graph and table do not reflect the deduction of taxes that a shareholder would pay on fund distributions or redemption of fund shares. The Fund's performance benefited from fee waivers. Performance includes historical performance of another Class of the Fund. For more information, visit americanbeaconfunds.com/Performance_Disclaimers.aspx.
The MSCI® EAFE Index (Net) is replacing the MSCI® ACWI ex USA Small Cap Index (Net) as the broad-based securities market index to comply with a new regulatory requirement. The MSCI® ACWI ex USA Small Cap Index (Net) reflects the market sectors in which the Fund invests.
| Total Net Assets | $126,424,066 |
| # of Portfolio Holdings | 137 |
| Portfolio Turnover Rate | 260% |
| Total Management Fees Paid | $813,252 |
Asset Allocation - % Investments
| Value | Value |
|---|
| Foreign Common Stocks | 94.7 |
| Investment Companies | 2.9 |
| Common Stocks | 1.5 |
| Foreign Preferred Stocks | 0.8 |
| Securities Lending Collateral | 0.1 |
The Fund may purchase and sell futures contracts to gain market exposure on cash balances.
What did the Fund invest in?
Top Ten Holdings - % Net Assets
| Hanwha Aerospace Co. Ltd. | 1.1 |
| Telix Pharmaceuticals Ltd. | 1.0 |
| Jentech Precision Industrial Co. Ltd. | 1.0 |
| HUB24 Ltd. | 1.0 |
| Lotus Bakeries NV | 1.0 |
| Yangzijiang Shipbuilding Holdings Ltd. | 0.9 |
| Van Lanschot Kempen NV | 0.9 |
| LIG Nex1 Co. Ltd. | 0.9 |
| Qifu Technology, Inc., ADR | 0.9 |
| InPost SA | 0.9 |
Excludes cash equivalents.
Sector Allocation - % Equities
| Value | Value |
|---|
| Communication Services | 1.4 |
| Utilities | 1.4 |
| Real Estate | 1.7 |
| Energy | 1.9 |
| Consumer Staples | 6.1 |
| Materials | 8.8 |
| Health Care | 9.7 |
| Information Technology | 10.8 |
| Consumer Discretionary | 13.3 |
| Financials | 13.6 |
| Industrials | 31.3 |
Top Ten Country Exposure - % Equities
| Value | Value |
|---|
| Sweden | 3.6 |
| Switzerland | 4.9 |
| China | 5.8 |
| United Kingdom | 5.8 |
| Taiwan | 7.7 |
| Republic Of Korea | 8.0 |
| Canada | 9.4 |
| Australia | 9.4 |
| India | 11.6 |
| Japan | 13.2 |
This is a summary of certain changes to the Fund since October 31, 2023. For more complete information, you may review the Fund's next prospectus, which we expect to be available by March 1, 2025 at www.americanbeaconfunds.com/literature or upon request at 800-658-5811.
Effective March 1, 2024, the contractual expense limitation the Y was increased from 0.00% to 1.10% (excluding taxes, interest, brokerage commissions, acquired fund fees and expenses, security lending fees, expenses associated with securities sold short, litigation and other extraordinary expenses).
For additional information about the Fund, including its prospectus, financial statements, holdings, and proxy voting information, please visit www.americanbeaconfunds.com/literature or call 1-800-658-5811.
If your financial institution mailed only one copy of this Report to an address shared by more than one account, you can request an individual copy by contacting your financial institution.
EAM International Small Cap Fund
Distributed by:
Resolute Investment Distributors, Inc.
Annual Shareholder Report - October 31, 2024
Item 2. Code of Ethics
The registrant adopted a code of ethics (the “Code”) that applies to the registrant’s Principal Executive Officer and Principal Financial Officer. The registrant amended the Code on June 14, 2024 to update the name of the Principal Executive Officer. The registrant has not granted any waivers from the provisions of the Code during the period covered by the shareholder reports presented in Item 1. The Code is filed herewith as Exhibit 99.CODE ETH.
Item 3. Audit Committee Financial Expert
The registrant’s Board of Trustees of the Trust has determined that Claudia Holz, a member of the Trust’s Audit and Compliance Committee, is the “audit committee financial expert” as defined in Form N-CSR. Ms. Holz is considered “independent” as defined in Item 3 of Form N-CSR.
Item 4. Principal Account Fees and Services
The registrant has engaged its principal accountant to perform audit services, audit-related services, tax services and other services during the past two fiscal years. “Audit services” refer to performing an audit of the registrant’s annual financial statements or services that are normally provided by the accountant in connection with statutory and regulatory filings or engagements for those fiscal years. “Audit-related services” refer to the assurance and related services by the principal accountant that are reasonably related to the performance of the audit. “Tax services” refer to professional services rendered by the principal accountant for tax compliance, tax advice, and tax planning. “Other services” refer to all other fees category would consist of service related to internal control reviews, strategy, and other consulting, financial information systems design and implementation, consulting on other information systems, and other tax services unrelated to the registrant. The following table details the aggregate fees billed for each of the last two fiscal years for audit fees, audit-related fees, tax fees, and all other fees by the principal accountant.
| | | | |
| (a) | | | |
| |
Audit Fees | | Fiscal Year
Ended | |
$269,734 | | | 10/31/23 | |
$277,657 | | | 10/31/24 | |
| |
| (b) | | | |
Audit Related Fees | | Fiscal Year
Ended | |
$0 | | | 10/31/23 | |
$0 | | | 10/31/24 | |
| |
| (c) | | | |
Tax Fees(1) | | Fiscal Year
Ended | |
$128,195 | | | 10/31/23 | |
$182,187 | | | 10/31/24 | |
| |
| (d) | | | |
All Other Fees | | Fiscal Year
Ended | |
$0 | | | 10/31/23 | |
$0 | | | 10/31/24 | |
(1) “Tax Fees” are the aggregate fees billed for professional services for tax advice, tax compliance, tax planning, filing assistance for EU reclaims and PFIC tax services. These fees include international, federal, state, and excise tax reviews.
(e)(1) Pursuant to its charter, the Trust’s Audit and Compliance Committee shall have the following duties and powers pertaining to pre-approval of audit and non-audit services provided by the registrant’s principal accountant:
| | • | | to approve, prior to appointment, the engagement of auditors to annually audit and provide their opinion on the Trusts’ financial statements, and, in connection therewith, reviewing and evaluating matters potentially affecting the independence and capabilities of the auditors; |
| | • | | to approve, prior to appointment, the engagement of the auditors to provide non-audit services to the Trusts, an investment adviser to any series of the Trusts or any entity controlling, controlled by, or under common control with an investment adviser (“adviser affiliate”) that provides ongoing services to the Trusts, if the engagement relates directly to the operations and financial reporting of the Trusts; |
| | • | | to consider whether the non-audit services provided by a Trust’s auditor to an investment adviser or any adviser affiliate that provides ongoing services to a series of the Trusts, which services were not pre-approved by the Committee, are compatible with maintaining the auditor’s independence; |
| | • | | to review the arrangements for and scope of the annual audit and any special audits; and |
| | • | | to review and approving the fees proposed to be charged to the Trusts by the auditors for each audit and non-audit service. |
The Audit and Compliance Committee may delegate any portion of its authority, including the authority to grant pre-approvals of audit and permitted non-audit services, to a subcommittee of one or more members. Any decisions of the subcommittee to grant pre-approvals shall be presented to the full audit committee at its next regularly scheduled meeting.
(e)(2) None of the fees disclosed in paragraphs (b) through (d) above were approved by the audit committee pursuant to paragraph (c)(7)(i)(C) of Rule 2-01 of Regulation S-X.
(f) Not applicable.
(g) Aggregate Non-Audit Fees for Services Rendered to the:
| | | | | | | | | | | | | | | | | | |
Registrant | | Adviser | | | | | Adviser’s Affiliates Providing
Ongoing Services to Registrant | | | | | | Fiscal Year
Ended | |
| $128,195 | | $32,969 | | | | | | | N/A | | | | | | | | 10/31/23 | |
| $182,187 | | $31,575 | | | | | | | N/A | | | | | | | | 10/31/24 | |
(h) Not applicable.
Item 5. Audit Committee of Listed Registrants
Not applicable.
Item 6. Investments
| (a) | The schedules of investments for each series of the Trust are included in the shareholder reports presented in Item 7. |
Financial Statements and Other Information
Name of registrant: American Beacon Funds
Date of fiscal year end: October 31, 2024
Date of reporting period: October 31, 2024
Item 7. Financial Statements and Financial Highlights for Open-End Management Investment Companies
American Beacon Funds
Although information has been compiled from reliable sources, American Beacon Advisors, Inc. makes no representation as to the completeness or accuracy of the statements contained herein. All information is as of the end of the reporting period, unless noted otherwise, and is subject to change. Each Fund’s portfolio composition will change depending on economic and market conditions.
American Beacon Funds | October 31, 2024 |
Contents
American Beacon Balanced FundSM
Report of Independent Registered Public Accounting Firm
To the Board of Trustees of American Beacon Funds and Shareholders of American Beacon Balanced Fund
Opinion on the Financial Statements
We have audited the accompanying statement of assets and liabilities, including the schedule of investments, of American Beacon Balanced Fund (one of the funds constituting American Beacon Funds, referred hereafter as the “Fund”) as of October 31, 2024, the related statement of operations for the year ended October 31, 2024, the statement of changes in net assets for each of the two years in the period ended October 31, 2024, including the related notes, and the financial highlights for each of the three years in the period ended October 31, 2024 (collectively referred to as the “financial statements”). In our opinion, the financial statements present fairly, in all material respects, the financial position of the Fund as of October 31, 2024, the results of its operations for the year then ended, the changes in its net assets for each of the two years in the period ended October 31, 2024 and the financial highlights for each of the three years in the period ended October 31, 2024 in conformity with accounting principles generally accepted in the United States of America.
The financial statements of the Fund as of and for the year ended October 31, 2021 and the financial highlights for each of the periods ended on or prior to October 31, 2021 (not presented herein, other than the financial highlights) were audited by other auditors whose report dated December 30, 2021 expressed an unqualified opinion on those financial statements and financial highlights.
Basis for Opinion
These financial statements are the responsibility of the Fund’s management. Our responsibility is to express an opinion on the Fund’s financial statements based on our audits. We are a public accounting firm registered with the Public Company Accounting Oversight Board (United States) (PCAOB) and are required to be independent with respect to the Fund in accordance with the U.S. federal securities laws and the applicable rules and regulations of the Securities and Exchange Commission and the PCAOB.
We conducted our audits of these financial statements in accordance with the standards of the PCAOB. Those standards require that we plan and perform the audit to obtain reasonable assurance about whether the financial statements are free of material misstatement, whether due to error or fraud.
Our audits included performing procedures to assess the risks of material misstatement of the financial statements, whether due to error or fraud, and performing procedures that respond to those risks. Such procedures included examining, on a test basis, evidence regarding the amounts and disclosures in the financial statements. Our audits also included evaluating the accounting principles used and significant estimates made by management, as well as evaluating the overall presentation of the financial statements. Our procedures included confirmation of securities owned as of October 31, 2024 by correspondence with the custodian and brokers; when replies were not received from brokers, we performed other auditing procedures. We believe that our audits provide a reasonable basis for our opinion.
/s/ PricewaterhouseCoopers LLP
Boston, Massachusetts
December 27, 2024
We have served as the auditor of one or more investment companies in the American Beacon family of funds since 2016.
1
American Beacon Balanced FundSM
Schedule of Investments
October 31, 2024
| | | | | | | | | | | | | | | |
| | | |
| | | Shares | | | | Fair Value |
| | | | | | | |
| | | |
| COMMON STOCKS - 55.34% | | | | | | |
| | | |
| Communication Services - 3.27% | | | | | | |
| | | |
| Entertainment - 0.59% | | | | | | |
| Electronic Arts, Inc. | | | | 3,077 | | | | | | | | | $ | 464,166 | |
| Warner Bros Discovery, Inc.A | | | | 24,999 | | | | | | | | | | 203,242 | |
| | | | | | | | | | | | | | | |
| | | | | | | | | | | | | | 667,408 | |
| | | | | | | | | | | | | | | |
| | | | | | | | | | | | | | | |
| | | |
| Interactive Media & Services - 1.04% | | | | | | |
| Alphabet, Inc., Class A | | | | 6,967 | | | | | | | | | | 1,192,123 | |
| | | | | | | | | | | | | | | |
| | | | | | | | | | | | | | | |
| | | |
| Media -1.64% | | | | | | |
| Comcast Corp., Class A | | | | 36,666 | | | | | | | | | | 1,601,204 | |
| Omnicom Group, Inc. | | | | 1,786 | | | | | | | | | | 180,386 | |
| Paramount Global, Class B | | | | 8,500 | | | | | | | | | | 92,990 | |
| | | | | | | | | | | | | | | |
| | | | | | | | | | | | | | 1,874,580 | |
| | | | | | | | | | | | | | | |
| | | | | | | | | | | | | | | |
Total Communication Services | | | | | | | | | | | | | | 3,734,111 | |
| | | | | | | | | | | | | | | |
| | | | | | | | | | | | | | | |
| | | |
| Consumer Discretionary - 5.30% | | | | | | |
| | | |
| Automobile Components - 0.93% | | | | | | |
| Adient PLCA | | | | 3,332 | | | | | | | | | | 65,074 | |
| Aptiv PLCA | | | | 14,539 | | | | | | | | | | 826,251 | |
| BorgWarner, Inc. | | | | 5,200 | | | | | | | | | | 174,876 | |
| | | | | | | | | | | | | | | |
| | | | | | | | | | | | | | 1,066,201 | |
| | | | | | | | | | | | | | | |
| | | | | | | | | | | | | | | |
| | | |
| Automobiles - 0.91% | | | | | | |
| General Motors Co. | | | | 20,542 | | | | | | | | | | 1,042,712 | |
| | | | | | | | | | | | | | | |
| | | | | | | | | | | | | | | |
| | | |
| Hotels, Restaurants & Leisure - 2.76% | | | | | | |
| Aramark | | | | 9,098 | | | | | | | | | | 344,177 | |
| Booking Holdings, Inc. | | | | 43 | | | | | | | | | | 201,079 | |
| Carnival Corp.A | | | | 60,240 | | | | | | | | | | 1,325,280 | |
| Las Vegas Sands Corp. | | | | 16,457 | | | | | | | | | | 853,296 | |
| Wynn Resorts Ltd. | | | | 4,354 | | | | | | | | | | 418,071 | |
| | | | | | | | | | | | | | | |
| | | | | | | | | | | | | | 3,141,903 | |
| | | | | | | | | | | | | | | |
| | | | | | | | | | | | | | | |
| | | |
| Specialty Retail - 0.70% | | | | | | |
| Lithia Motors, Inc. | | | | 2,402 | | | | | | | | | | 798,353 | |
| | | | | | | | | | | | | | | |
| | | | | | | | | | | | | | | |
Total Consumer Discretionary | | | | | | | | | | | | | | 6,049,169 | |
| | | | | | | | | | | | | | | |
| | | | | | | | | | | | | | | |
| | | |
| Consumer Staples - 2.30% | | | | | | |
| | | |
| Beverages - 0.62% | | | | | | |
| Keurig Dr. Pepper, Inc. | | | | 21,327 | | | | | | | | | | 702,725 | |
| | | | | | | | | | | | | | | |
| | | | | | | | | | | | | | | |
| | | |
| Food Products - 0.68% | | | | | | |
| Conagra Brands, Inc. | | | | 8,400 | | | | | | | | | | 243,096 | |
| Kraft Heinz Co. | | | | 16,100 | | | | | | | | | | 538,706 | |
| | | | | | | | | | | | | | | |
| | | | | | | | | | | | | | 781,802 | |
| | | | | | | | | | | | | | | |
| | | | | | | | | | | | | | | |
| | | |
| Tobacco - 1.00% | | | | | | |
| Philip Morris International, Inc. | | | | 8,563 | | | | | | | | | | 1,136,310 | |
| | | | | | | | | | | | | | | |
| | | | | | | | | | | | | | | |
Total Consumer Staples | | | | | | | | | | | | | | 2,620,837 | |
| | | | | | | | | | | | | | | |
| | | | | | | | | | | | | | | |
| | | |
| Energy - 5.93% | | | | | | |
| | | |
| Energy Equipment & Services - 1.69% | | | | | | |
| Baker Hughes Co. | | | | 14,000 | | | | | | | | | | 533,120 | |
| Halliburton Co. | | | | 22,374 | | | | | | | | | | 620,655 | |
| NOV, Inc. | | | | 41,200 | | | | | | | | | | 639,012 | |
| Schlumberger NV | | | | 3,500 | | | | | | | | | | 140,245 | |
| | | | | | | | | | | | | | | |
| | | | | | | | | | | | | | 1,933,032 | |
| | | | | | | | | | | | | | | |
| | | | | | | | | | | | | | | |
See accompanying notes
2
American Beacon Balanced FundSM
Schedule of Investments
October 31, 2024
| | | | | | | | | | | | | | | |
| | | |
| | | Shares | | | | Fair Value |
| | | | | | | |
| | | |
| COMMON STOCKS - 55.34% (continued) | | | | | | |
| | | |
| Energy - 5.93% (continued) | | | | | | |
| | | |
| Oil, Gas & Consumable Fuels - 4.24% | | | | | | |
| APA Corp. | | | | 39,114 | | | | | | | | | $ | 923,090 | |
| Exxon Mobil Corp. | | | | 8,451 | | | | | | | | | | 986,908 | |
| Hess Corp. | | | | 4,278 | | | | | | | | | | 575,306 | |
| Marathon Oil Corp. | | | | 11,531 | | | | | | | | | | 319,409 | |
| Murphy Oil Corp. | | | | 3,500 | | | | | | | | | | 110,180 | |
| Ovintiv, Inc. | | | | 11,400 | | | | | | | | | | 446,880 | |
| Permian Resources Corp. | | | | 25,586 | | | | | | | | | | 348,737 | |
| Phillips 66 | | | | 3,454 | | | | | | | | | | 420,766 | |
| Shell PLC, ADR | | | | 10,435 | | | | | | | | | | 704,884 | |
| | | | | | | | | | | | | | | |
| | | | | | | | | | | | | | 4,836,160 | |
| | | | | | | | | | | | | | | |
| | | | | | | | | | | | | | | |
Total Energy | | | | | | | | | | | | | | 6,769,192 | |
| | | | | | | | | | | | | | | |
| | | | | | | | | | | | | | | |
| | | |
| Financials - 11.67% | | | | | | |
| | | |
| Banks - 5.76% | | | | | | |
| Bank of America Corp. | | | | 33,159 | | | | | | | | | | 1,386,709 | |
| Citigroup, Inc. | | | | 21,257 | | | | | | | | | | 1,364,062 | |
| Citizens Financial Group, Inc. | | | | 11,868 | | | | | | | | | | 499,880 | |
| First Citizens BancShares, Inc., Class A | | | | 85 | | | | | | | | | | 164,675 | |
| M&T Bank Corp. | | | | 2,224 | | | | | | | | | | 432,968 | |
| Trust Financial Corp. | | | | 5,700 | | | | | | | | | | 245,385 | |
| U.S. Bancorp | | | | 20,750 | | | | | | | | | | 1,002,433 | |
| Wells Fargo & Co. | | | | 22,840 | | | | | | | | | | 1,482,773 | |
| | | | | | | | | | | | | | | |
| | | | | | | | | | | | | | 6,578,885 | |
| | | | | | | | | | | | | | | |
| | | | | | | | | | | | | | | |
| | | |
| Capital Markets - 1.12% | | | | | | |
| Bank of New York Mellon Corp. | | | | 5,715 | | | | | | | | | | 430,682 | |
| Goldman Sachs Group, Inc. | | | | 337 | | | | | | | | | | 174,495 | |
| State Street Corp. | | | | 7,276 | | | | | | | | | | 675,213 | |
| | | | | | | | | | | | | | | |
| | | | | | | | | | | | | | 1,280,390 | |
| | | | | | | | | | | | | | | |
| | | | | | | | | | | | | | | |
| | | |
| Consumer Finance - 0.88% | | | | | | |
| American Express Co. | | | | 2,205 | | | | | | | | | | 595,526 | |
| Capital One Financial Corp. | | | | 1,200 | | | | | | | | | | 195,348 | |
| Discover Financial Services | | | | 1,500 | | | | | | | | | | 222,645 | |
| | | | | | | | | | | | | | | |
| | | | | | | | | | | | | | 1,013,519 | |
| | | | | | | | | | | | | | | |
| | | | | | | | | | | | | | | |
| | | |
| Financial Services - 1.96% | | | | | | |
| Corebridge Financial, Inc. | | | | 11,400 | | | | | | | | | | 362,178 | |
| Fidelity National Information Services, Inc. | | | | 20,839 | | | | | | | | | | 1,869,884 | |
| | | | | | | | | | | | | | | |
| | | | | | | | | | | | | | 2,232,062 | |
| | | | | | | | | | | | | | | |
| | | | | | | | | | | | | | | |
| | | |
| Insurance -1.95% | | | | | | |
| American International Group, Inc. | | | | 16,499 | | | | | | | | | | 1,251,944 | |
| Hartford Financial Services Group, Inc. | | | | 4,400 | | | | | | | | | | 485,936 | |
| Willis Towers Watson PLC | | | | 1,570 | | | | | | | | | | 474,438 | |
| | | | | | | | | | | | | | | |
| | | | | | | | | | | | | | 2,212,318 | |
| | | | | | | | | | | | | | | |
| | | | | | | | | | | | | | | |
Total Financials | | | | | | | | | | | | | | 13,317,174 | |
| | | | | | | | | | | | | | | |
| | | | | | | | | | | | | | | |
| | | |
| Health Care - 7.81% | | | | | | |
| | | |
| Health Care Equipment & Supplies - 2.00% | | | | | | |
| GE Healthcare Technologies, Inc. | | | | 7,587 | | | | | | | | | | 662,724 | |
| Medtronic PLC | | | | 13,537 | | | | | | | | | | 1,208,177 | |
| Solventum Corp.A | | | | 2,500 | | | | | | | | | | 181,450 | |
| Zimmer Biomet Holdings, Inc. | | | | 2,172 | | | | | | | | | | 232,230 | |
| | | | | | | | | | | | | | | |
| | | | | | | | | | | | | | 2,284,581 | |
| | | | | | | | | | | | | | | |
| | | | | | | | | | | | | | | |
See accompanying notes
3
American Beacon Balanced FundSM
Schedule of Investments
October 31, 2024
| | | | | | | | | | | | | | | |
| | | |
| | | Shares | | | | Fair Value |
| | | | | | | |
| | | |
| COMMON STOCKS - 55.34% (continued) | | | | | | |
| | | |
| Health Care -7.81% (continued) | | | | | | |
| | | |
| Health Care Providers & Services - 3.92% | | | | | | |
| Centene Corp.A | | | | 6,260 | | | | | | | | | $ | 389,748 | |
| Cigna Group | | | | 1,000 | | | | | | | | | | 314,810 | |
| CVS Health Corp. | | | | 13,230 | | | | | | | | | | 746,966 | |
| Elevance Health, Inc. | | | | 3,229 | | | | | | | | | | 1,310,199 | |
| HCA Healthcare, Inc. | | | | 630 | | | | | | | | | | 226,006 | |
| Humana, Inc. | | | | 1,550 | | | | | | | | | | 399,637 | |
| Labcorp Holdings, Inc. | | | | 800 | | | | | | | | | | 182,616 | |
| UnitedHealth Group, Inc. | | | | 1,598 | | | | | | | | | | 902,071 | |
| | | | | | | | | | | | | | | |
| | | | | | | | | | | | | | 4,472,053 | |
| | | | | | | | | | | | | | | |
| | | | | | | | | | | | | | | |
| | | |
| Life Sciences Tools & Services - 0.48% | | | | | | |
| Avantor, Inc.A | | | | 24,332 | | | | | | | | | | 544,307 | |
| | | | | | | | | | | | | | | |
| | | |
| Pharmaceuticals - 1.41% | | | | | | |
| GSK PLC, ADR B | | | | 3,854 | | | | | | | | | | 141,673 | |
| Merck & Co., Inc. | | | | 5,928 | | | | | | | | | | 606,553 | |
| Sanofi SA, ADR | | | | 16,364 | | | | | | | | | | 865,328 | |
| | | | | | | | | | | | | | | |
| | | | | | | | | | | | | | 1,613,554 | |
| | | | | | | | | | | | | | | |
| | | | | | | | | | | | | | | |
Total Health Care | | | | | | | | | | | | | | 8,914,495 | |
| | | | | | | | | | | | | | | |
| | | | | | | | | | | | | | | |
| | | |
| Industrial - 6.11% | | | | | | |
| | | |
| Aerospace & Defense - 0.85% | | | | | | |
| Boeing Co.A | | | | 2,100 | | | | | | | | | | 313,551 | |
| General Dynamics Corp. | | | | 600 | | | | | | | | | | 174,966 | |
| RTX Corp. | | | | 4,100 | | | | | | | | | | 496,059 | |
| | | | | | | | | | | | | | | |
| | | | | | | | | | | | | | 984,576 | |
| | | | | | | | | | | | | | | |
| | | | | | | | | | | | | | | |
| | | |
| Air Freight & Logistics - 0.63% | | | | | | |
| FedEx Corp.A | | | | 2,630 | | | | | | | | | | 720,226 | |
| | | | | | | | | | | | | | | |
| | | | | | | | | | | | | | | |
| | | |
| Building Products - 0.64% | | | | | | |
| Johnson Controls International PLC | | | | 9,598 | | | | | | | | | | 725,129 | |
| | | | | | | | | | | | | | | |
| | | | | | | | | | | | | | | |
| | | |
| Construction & Engineering - 0.42% | | | | | | |
| AECOM | | | | 3,073 | | | | | | | | | | 328,196 | |
| Fluor Corp.A | | | | 2,800 | | | | | | | | | | 146,384 | |
| | | | | | | | | | | | | | | |
| | | | | | | | | | | | | | 474,580 | |
| | | | | | | | | | | | | | | |
| | | | | | | | | | | | | | | |
| | | |
| Electrical Equipment - 0.70% | | | | | | |
| Vertiv Holdings Co., Class A | | | | 7,317 | | | | | | | | | | 799,675 | |
| | | | | | | | | | | | | | | |
| | | | | | | | | | | | | | | |
| | | |
| Ground Transportation - 0.70% | | | | | | |
| JB Hunt Transport Services, Inc. | | | | 2,905 | | | | | | | | | | 524,701 | |
| Norfolk Southern Corp. | | | | 1,100 | | | | | | | | | | 275,473 | |
| | | | | | | | | | | | | | | |
| | | | | | | | | | | | | | 800,174 | |
| | | | | | | | | | | | | | | |
| | | | | | | | | | | | | | | |
| | | |
| Machinery - 1.65% | | | | | | |
| CNH Industrial NV | | | | 31,380 | | | | | | | | | | 352,397 | |
| Cummins, Inc. | | | | 1,652 | | | | | | | | | | 543,475 | |
| Deere & Co. | | | | 400 | | | | | | | | | | 161,876 | |
| PACCAR, Inc. | | | | 3,058 | | | | | | | | | | 318,888 | |
| Stanley Black & Decker, Inc. | | | | 3,712 | | | | | | | | | | 344,993 | |
| Timken Co. | | | | 1,900 | | | | | | | | | | 157,700 | |
| | | | | | | | | | | | | | | |
| | | | | | | | | | | | | | 1,879,329 | |
| | | | | | | | | | | | | | | |
| | | | | | | | | | | | | | | |
| | | |
| Professional Services - 0.52% | | | | | | |
| Jacobs Solutions, Inc. | | | | 4,184 | | | | | | | | | | 588,187 | |
| | | | | | | | | | | | | | | |
| | | | | | | | | | | | | | | |
Total Industrials | | | | | | | | | | | | | | 6,971,876 | |
| | | | | | | | | | | | | | | |
| | | | | | | | | | | | | | | |
See accompanying notes
4
American Beacon Balanced FundSM
Schedule of Investments
October 31, 2024
| | | | | | | | | | | | | | | |
| | | |
| | | Shares | | | | Fair Value |
| | | | | | | |
| | | |
| COMMON STOCKS - 55.34% (continued) | | | | | | |
| | | |
| Information Technology - 5.11% | | | | | | |
| | | |
| Communications Equipment - 1.17% | | | | | | |
| F5, Inc.A | | | | 5,700 | | | | | | | | | $ | 1,333,116 | |
| | | | | | | | | | | | | | | |
| | | | | | | | | | | | | | | |
| | | |
| Electronic Equipment, Instruments & Component - 0.16% | | | | | | |
| Corning, Inc. | | | | 3,735 | | | | | | | | | | 177,749 | |
| | | | | | | | | | | | | | | |
| | | | | | | | | | | | | | | |
| | | |
| IT Services - 0.44% | | | | | | |
| Cognizant Technology Solutions Corp., Class A | | | | 6,792 | | | | | | | | | | 506,615 | |
| | | | | | | | | | | | | | | |
| | | | | | | | | | | | | | | |
| | | |
| Semiconductors & Semiconductor Equipment - 1.85% | | | | | | |
| Broadcom, Inc. | | | | 5,330 | | | | | | | | | | 904,874 | |
| Micron Technology, Inc. | | | | 2,680 | | | | | | | | | | 267,062 | |
| QUALCOMM, Inc. | | | | 5,778 | | | | | | | | | | 940,485 | |
| | | | | | | | | | | | | | | |
| | | | | | | | | | | | | | 2,112,421 | |
| | | | | | | | | | | | | | | |
| | | | | | | | | | | | | | | |
| | | |
| Software - 1.49% | | | | | | |
| Oracle Corp. | | | | 4,147 | | | | | | | | | | 696,033 | |
| Workday, Inc., Class AA | | | | 4,300 | | | | | | | | | | 1,005,555 | |
| | | | | | | | | | | | | | | |
| | | | | | | | | | | | | | 1,701,588 | |
| | | | | | | | | | | | | | | |
| | | | | | | | | | | | | | | |
Total Information Technology | | | | | | | | | | | | | | 5,831,489 | |
| | | | | | | | | | | | | | | |
| | | | | | | | | | | | | | | |
| | | |
| Materials - 2.97% | | | | | | |
| | | |
| Chemicals - 2.09% | | | | | | |
| Air Products & Chemicals, Inc. | | | | 4,060 | | | | | | | | | | 1,260,752 | |
| Axalta Coating Systems Ltd.A | | | | 19,338 | | | | | | | | | | 733,297 | |
| Olin Corp. | | | | 9,500 | | | | | | | | | | 389,785 | |
| | | | | | | | | | | | | | | |
| | | | | | | | | | | | | | 2,383,834 | |
| | | | | | | | | | | | | | | |
| | | | | | | | | | | | | | | |
| | | |
| Construction Materials - 0.88% | | | | | | |
| CRH PLC | | | | 10,522 | | | | | | | | | | 1,004,114 | |
| | | | | | | | | | | | | | | |
| | | | | | | | | | | | | | | |
Total Materials | | | | | | | | | | | | | | 3,387,948 | |
| | | | | | | | | | | | | | | |
| | | | | | | | | | | | | | | |
| | | |
| Real Estate - 1.26% | | | | | | |
| | | |
| Specialized REITs - 1.26% | | | | | | |
| Public Storage | | | | 2,025 | | | | | | | | | | 666,346 | |
| VICI Properties, Inc. | | | | 24,292 | | | | | | | | | | 771,514 | |
| | | | | | | | | | | | | | | |
| | | | | | | | | | | | | | 1,437,860 | |
| | | | | | | | | | | | | | | |
| | | | | | | | | | | | | | | |
Total Real Estate | | | | | | | | | | | | | | 1,437,860 | |
| | | | | | | | | | | | | | | |
| | | | | | | | | | | | | | | |
| | | |
| Utilities - 3.61% | | | | | | |
| | | |
| Electric Utilities - 3.03% | | | | | | |
| Entergy Corp. | | | | 9,053 | | | | | | | | | | 1,401,224 | |
| Pinnacle West Capital Corp. | | | | 7,939 | | | | | | | | | | 697,124 | |
| PPL Corp. | | | | 19,447 | | | | | | | | | | 633,194 | |
| Xcel Energy, Inc. | | | | 10,946 | | | | | | | | | | 731,302 | |
| | | | | | | | | | | | | | | |
| | | | | | | | | | | | | | 3,462,844 | |
| | | | | | | | | | | | | | | |
| | | |
| Multi-Utilities - 0.58% | | | | | | |
| Dominion Energy, Inc. | | | | 11,100 | | | | | | | | | | 660,783 | |
| | | | | | | | | | | | | | | |
| | | | | | | | | | | | | | | |
Total Utilities | | | | | | | | | | | | | | 4,123,627 | |
| | | | | | | | | | | | | | | |
| | | | | | | | | | | | | | | |
Total Common Stocks (Cost $44,186,194) | | | | | | | | | | | | | | 63,157,778 | |
| | | | | | | | | | | | | | | |
| | | | | | | | | | | | | | | |
See accompanying notes
5
American Beacon Balanced FundSM
Schedule of Investments
October 31, 2024
| | | | | | | | | | | | | | | |
| | | |
| | | Principal Amount | | | | Fair Value |
| | | | | | | | | | | | | | | |
| | | |
| CORPORATE OBLIGATIONS - 11.61% | | | | | | |
| | | |
| Basic Materials - 0.05% | | | | | | |
| | | |
| Chemicals - 0.05% | | | | | | |
| EIDP, Inc., 1.700%, Due 7/15/2025 | | | $ | 55,000 | | | | | | | | | $ | 53,852 | |
| | | | | | | | | | | | | | | |
| | | | | | | | | | | | | | | |
| | | |
| Communications - 1.32% | | | | | | |
| | | |
| Internet - 0.42% | | | | | | |
| Amazon.com, Inc., | | | | | | | | | | | | | | | |
1.200%, Due 6/3/2027 | | | | 250,000 | | | | | | | | | | 230,958 | |
4.650%, Due 12/1/2029 | | | | 250,000 | | | | | | | | | | 252,236 | |
| | | | | | | | | | | | | | | |
| | | | | | | | | | | | | | 483,194 | |
| | | | | | | | | | | | | | | |
| | | | | | | | | | | | | | | |
| | | |
| Media - 0.59% | | | | | | |
| Charter Communications Operating LLC/Charter Communications Operating Capital, 6.550%, Due 6/1/2034 | | | | 145,000 | | | | | | | | | | 147,729 | |
| Comcast Corp., 6.550%, Due 7/1/2039 | | | | 217,000 | | | | | | | | | | 240,479 | |
| Cox Communications, Inc., | | | | | | | | | | | | | | | |
5.450%, Due 9/1/2034C | | | | 145,000 | | | | | | | | | | 141,341 | |
5.950%, Due 9/1/2054C | | | | 150,000 | | | | | | | | | | 143,114 | |
| | | | | | | | | | | | | | | |
| | | | | | | | | | | | | | 672,663 | |
| | | | | | | | | | | | | | | |
| | | |
| Telecommunications - 0.31% | | | | | | |
| AT&T, Inc., | | | | | | | | | | | | | | | |
3.800%, Due 12/1/2057 | | | | 70,000 | | | | | | | | | | 50,315 | |
3.650%, Due 9/15/2059 | | | | 175,000 | | | | | | | | | | 120,472 | |
| Verizon Communications, Inc., 4.780%, Due 2/15/2035c | | | | 181,000 | | | | | | | | | | 174,376 | |
| | | | | | | | | | | | | | | |
| | | | | | | | | | | | | | 345,163 | |
| | | | | | | | | | | | | | | |
| | | | | | | | | | | | | | | |
Total Communications | | | | | | | | | | | | | | 1,501,020 | |
| | | | | | | | | | | | | | | |
| | | | | | | | | | | | | | | |
| | | |
| Consumer, Cyclical - 1.07% | | | | | | |
| | | |
| Airlines - 0.05% | | | | | | |
| American Airlines Pass-Through Trust, 3.150%, Due 8/15/2033, 2019-1, AA | | | | 64,248 | | | | | | | | | | 58,864 | |
| | | | | | | | | | | | | | | |
| | | | | | | | | | | | | | | |
| | | |
| Apparel - 0.22% | | | | | | |
| Tapestry, Inc., 7.850%, Due 11/27/2033 | | | | 250,000 | | | | | | | | | | 255,444 | |
| | | | | | | | | | | | | | | |
| | | | | | | | | | | | | | | |
| | | |
| Home Furnishings - 0.10% | | | | | | |
| Whirlpool Corp., 5.150%, Due 3/1/2043 | | | | 125,000 | | | | | | | | | | 111,371 | |
| | | | | | | | | | | | | | | |
| | | | | | | | | | | | | | | |
| | | |
| Retail - 0.70% | | | | | | |
| Home Depot, Inc., 2.950%, Due 6/15/2029 | | | | 500,000 | | | | | | | | | | 466,524 | |
| Walmart, Inc., | | | | | | | | | | | | | | | |
2.375%, Due 9/24/2029 | | | | 150,000 | | | | | | | | | | 137,465 | |
7.550%, Due 2/15/2030 | | | | 169,000 | | | | | | | | | | 194,699 | |
| | | | | | | | | | | | | | | |
| | | | | | | | | | | | | | 798,688 | |
| | | | | | | | | | | | | | | |
| | | | | | | | | | | | | | | |
Total Consumer, Cyclical | | | | | | | | | | | | | | 1,224,367 | |
| | | | | | | | | | | | | | | |
| | | | | | | | | | | | | | | |
| | | |
| Consumer, Non-Cyclical - 0.75% | | | | | | |
| | | |
| Beverages - 0.26% | | | | | | |
| PepsiCo, Inc., 4.450%, Due 5/15/2028 | | | | 300,000 | | | | | | | | | | 301,376 | |
| | | | | | | | | | | | | | | |
| | | | | | | | | | | | | | | |
| | | |
| Commercial Services - 0.02% | | | | | | |
| Moody’s Corp., 2.550%, Due 8/18/2060 | | | | 50,000 | | | | | | | | | | 26,869 | |
| | | | | | | | | | | | | | | |
| | | | | | | | | | | | | | | |
| | | |
| Pharmaceuticals - 0.47% | | | | | | |
| Bristol-Myers Squibb Co., 3.400%, Due 7/26/2029 | | | | 560,000 | | | | | | | | | | 532,285 | |
| | | | | | | | | | | | | | | |
| | | | | | | | | | | | | | | |
Total Consumer, Non-Cyclical | | | | | | | | | | | | | | 860,530 | |
| | | | | | | | | | | | | | | |
| | | | | | | | | | | | | | | |
See accompanying notes
6
American Beacon Balanced FundSM
Schedule of Investments
October 31, 2024
| | | | | | | | | | | | | | | |
| | | |
| | | Principal Amount | | | | Fair Value |
| | | | | | | |
| | | |
| CORPORATE OBLIGATIONS - 11.61% (continued) | | | | | | |
| | | |
| Energy - 0.26% | | | | | | |
| | | |
| Oil & Gas - 0.14% | | | | | | |
| BP Capital Markets PLC, 6.450%, Due 12/1/2033, (5 yr. CMT + 2.153%)D E | | | $ | 150,000 | | | | | | | | | $ | 156,592 | |
| | | | | | | | | | | | | | | |
| | | | | | | | | | | | | | | |
| | | |
| Pipelines - 0.12% | | | | | | |
| Enterprise Products Operating LLC, 4.950%, Due 2/15/2035 | | | | 40,000 | | | | | | | | | | 39,350 | |
| ONEOK Partners LP, 6.850%, Due 10/15/2037 | | | | 45,000 | | | | | | | | | | 49,489 | |
| Sempra Infrastructure Partners LP, 3.250%, Due 1/15/2032c | | | | 65,000 | | | | | | | | | | 54,073 | |
| | | | | | | | | | | | | | | |
| | | | | | | | | | | | | | 142,912 | |
| | | | | | | | | | | | | | | |
| | | | | | | | | | | | | | | |
Total Energy | | | | | | | | | | | | | | 299,504 | |
| | | | | | | | | | | | | | | |
| | | | | | | | | | | | | | | |
| | | |
| Financial - 2.84% | | | | | | |
| | | |
| Banks - 1.83% | | | | | | |
| Bank of America Corp., | | | | | | | | | | | | | | | |
1.734%, Due 7/22/2027, (1 day USD SOFR + 0.960%)D | | | | 350,000 | | | | | | | | | | 332,221 | |
6.110%, Due 1/29/2037 | | | | 176,000 | | | | | | | | | | 186,414 | |
| Citigroup, Inc., | | | | | | | | | | | | | | | |
3.400%, Due 5/1/2026 | | | | 350,000 | | | | | | | | | | 343,601 | |
5.875%, Due 1/30/2042 | | | | 145,000 | | | | | | | | | | 152,341 | |
| Fifth Third Bank NA, 2.250%, Due 2/1/2027 | | | | 250,000 | | | | | | | | | | 237,298 | |
| JPMorgan Chase & Co., | | | | | | | | | | | | | | | |
1.561%, Due 12/10/2025, (1 day USD SOFR + 0.605%)D | | | | 35,000 | | | | | | | | | | 34,856 | |
5.500%, Due 10/15/2040 | | | | 313,000 | | | | | | | | | | 320,334 | |
| Morgan Stanley, 2.484%, Due 9/16/2036, (1 day USD SOFR + 1.360%)D | | | | 60,000 | | | | | | | | | | 48,930 | |
| PNC Financial Services Group, Inc., 2.550%, Due 1/22/2030 | | | | 500,000 | | | | | | | | | | 447,169 | |
| | | | | | | | | | | | | | | |
| | | | | | | | | | | | | | 2,103,164 | |
| | | | | | | | | | | | | | | |
| | | | | | | | | | | | | | | |
| | | |
| Insurance - 1.01% | | | | | | |
| Berkshire Hathaway Finance Corp., 2.300%, Due 3/15/2027 | | | | 300,000 | | | | | | | | | | 287,159 | |
| Fidelity National Financial, Inc., 3.200%, Due 9/17/2051 | | | | 55,000 | | | | | | | | | | 35,255 | |
| Markel Group, Inc., | | | | | | | | | | | | | | | |
5.000%, Due 5/20/2049 | | | | 100,000 | | | | | | | | | | 89,808 | |
3.450%, Due 5/7/2052 | | | | 125,000 | | | | | | | | | | 85,241 | |
| MetLife, Inc., | | | | | | | | | | | | | | | |
6.375%, Due 6/15/2034 | | | | 169,000 | | | | | | | | | | 185,189 | |
4.721%, Due 12/15/2044 | | | | 193,000 | | | | | | | | | | 175,176 | |
| Prudential Financial, Inc., 4.600%, Due 5/15/2044 | | | | 313,000 | | | | | | | | | | 283,093 | |
| | | | | | | | | | | | | | | |
| | | | | | | | | | | | | | 1,140,921 | |
| | | | | | | | | | | | | | | |
| | | | | | | | | | | | | | | |
Total Financial | | | | | | | | | | | | | | 3,244,085 | |
| | | | | | | | | | | | | | | |
| | | | | | | | | | | | | | | |
| | | |
| Industrial - 1.41% | | | | | | |
| | | |
| Aerospace/Defense - 0.20% | | | | | | |
| RTX Corp., 6.125%, Due 7/15/2038 | | | | 217,000 | | | | | | | | | | 233,564 | |
| | | | | | | | | | | | | | | |
| | | | | | | | | | | | | | | |
| | | |
| Machinery - Construction & Mining - 0.48% | | | | | | |
| Caterpillar Financial Services Corp., | | | | | | | | | | | | | | | |
4.900%, Due 1/17/2025 | | | | 350,000 | | | | | | | | | | 350,008 | |
4.375%, Due 8/16/2029 | | | | 200,000 | | | | | | | | | | 198,231 | |
| | | | | | | | | | | | | | | |
| | | | | | | | | | | | | | 548,239 | |
| | | | | | | | | | | | | | | |
| | | | | | | | | | | | | | | |
| | | |
| Machinery - Diversified - 0.40% | | | | | | |
| John Deere Capital Corp., 2.450%, Due 1/9/2030 | | | | 500,000 | | | | | | | | | | 450,723 | |
| | | | | | | | | | | | | | | |
| | | | | | | | | | | | | | | |
| | | |
| Transportation - 0.33% | | | | | | |
| Burlington Northern Santa Fe LLC, 5.750%, Due 5/1/2040 | | | | 202,000 | | | | | | | | | | 212,532 | |
| CSX Corp., 5.500%, Due 4/15/2041 | | | | 157,000 | | | | | | | | | | 160,033 | |
| | | | | | | | | | | | | | | |
| | | | | | | | | | | | | | 372,565 | |
| | | | | | | | | | | | | | | |
| | | | | | | | | | | | | | | |
Total Industrial | | | | | | | | | | | | | | 1,605,091 | |
| | | | | | | | | | | | | | | |
| | | | | | | | | | | | | | | |
See accompanying notes
7
American Beacon Balanced FundSM
Schedule of Investments
October 31, 2024
| | | | | | | | | | | | | | | |
| | | Principal Amount | | | | Fair Value |
| | | | | | | |
| | | |
| CORPORATE OBLIGATIONS - 11.61% (continued) | | | | | | |
| | | |
| Technology - 1.64% | | | | | | |
| | | |
| Computers - 1.24% | | | | | | |
| Apple, Inc., | | | | | | | | | | | | | | | |
1.400%, Due 8/5/2028 | | | $ | 200,000 | | | | | | | | | $ | 179,686 | |
2.200%, Due 9/11/2029 | | | | 300,000 | | | | | | | | | | 271,448 | |
| Dell International LLC/EMC Corp., 3.450%, Due 12/15/2051 | | | | 26,000 | | | | | | | | | | 18,192 | |
| Hewlett Packard Enterprise Co., 6.350%, Due 10/15/2045 | | | | 500,000 | | | | | | | | | | 531,858 | |
| International Business Machines Corp., 4.250%, Due 5/15/2049 | | | | 500,000 | | | | | | | | | | 415,464 | |
| | | | | | | | | | | | | | | |
| | | | | | | | | | | | | | 1,416,648 | |
| | | | | | | | | | | | | | | |
| | | | | | | | | | | | | | | |
| | | |
| Semiconductors - 0.40% | | | | | | |
| NVIDIA Corp., 1.550%, Due 6/15/2028 | | | | 500,000 | | | | | | | | | | 453,908 | |
| | | | | | | | | | | | | | | |
| | | | | | | | | | | | | | | |
Total Technology | | | | | | | | | | | | | | 1,870,556 | |
| | | | | | | | | | | | | | | |
| | | | | | | | | | | | | | | |
| | | |
| Utilities - 2.27% | | | | | | |
| | | |
| Electric - 2.16% | | | | | | |
| Appalachian Power Co., 4.500%, Due 3/1/2049, Y | | | | 210,000 | | | | | | | | | | 176,271 | |
| Arizona Public Service Co., 2.650%, Due 9/15/2050 | | | | 30,000 | | | | | | | | | | 18,004 | |
| Berkshire Hathaway Energy Co., 6.125%, Due 4/1/2036 | | | | 235,000 | | | | | | | | | | 250,808 | |
| Consolidated Edison Co. of New York, Inc., 5.500%, Due 12/1/2039, 09-C | | | | 169,000 | | | | | | | | | | 170,972 | |
| Consumers Energy Co., 2.500%, Due 5/1/2060 | | | | 32,000 | | | | | | | | | | 18,347 | |
| DTE Energy Co., 1.050%, Due 6/1/2025, F | | | | 75,000 | | | | | | | | | | 73,388 | |
| Duke Energy Carolinas LLC, | | | | | | | | | | | | | | | |
6.000%, Due 1/15/2038 | | | | 40,000 | | | | | | | | | | 42,606 | |
6.050%, Due 4/15/2038 | | | | 115,000 | | | | | | | | | | 123,365 | |
3.200%, Due 8/15/2049 | | | | 45,000 | | | | | | | | | | 31,226 | |
| Duke Energy Corp., 5.800%, Due 6/15/2054 | | | | 95,000 | | | | | | | | | | 95,353 | |
| Duke Energy Progress LLC, | | | | | | | | | | | | | | | |
4.150%, Due 12/1/2044 | | | | 75,000 | | | | | | | | | | 62,879 | |
4.200%, Due 8/15/2045 | | | | 30,000 | | | | | | | | | | 25,124 | |
| Duke Energy Progress NC Storm Funding LLC, 2.387%, Due 7/1/2039, A-2 | | | | 265,000 | | | | | | | | | | 216,345 | |
| Entergy Arkansas LLC, 3.350%, Due 6/15/2052 | | | | 55,000 | | | | | | | | | | 38,940 | |
| Entergy Corp., | | | | | | | | | | | | | | | |
2.800%, Due 6/15/2030 | | | | 30,000 | | | | | | | | | | 26,838 | |
7.125%, Due 12/1/2054, (5 yr. CMT + 2.670%)D | | | | 45,000 | | | | | | | | | | 46,016 | |
| Entergy Louisiana LLC, | | | | | | | | | | | | | | | |
4.000%, Due 3/15/2033 | | | | 47,000 | | | | | | | | | | 43,646 | |
5.350%, Due 3/15/2034 | | | | 105,000 | | | | | | | | | | 106,969 | |
| Florida Power & Light Co., 3.950%, Due 3/1/2048 | | | | 50,000 | | | | | | | | | | 40,803 | |
| Kentucky Utilities Co., 3.300%, Due 6/1/2050 | | | | 55,000 | | | | | | | | | | 38,560 | |
| National Rural Utilities Cooperative Finance Corp., 5.450%, Due 10/30/2025 | | | | 70,000 | | | | | | | | | | 70,676 | |
| Pacific Gas & Electric Co., 5.550%, Due 5/15/2029 | | | | 40,000 | | | | | | | | | | 40,768 | |
| PacifiCorp, | | | | | | | | | | | | | | | |
4.150%, Due 2/15/2050 | | | | 125,000 | | | | | | | | | | 98,340 | |
5.350%, Due 12/1/2053 | | | | 95,000 | | | | | | | | | | 89,785 | |
5.500%, Due 5/15/2054 | | | | 155,000 | | | | | | | | | | 149,354 | |
| Public Service Enterprise Group, Inc., 5.450%, Due 4/1/2034 | | | | 45,000 | | | | | | | | | | 45,516 | |
| Sempra, | | | | | | | | | | | | | | | |
3.300%, Due 4/1/2025 | | | | 85,000 | | | | | | | | | | 84,415 | |
6.400%, Due 10/1/2054, (5 yr. CMT + 2.632%)D | | | | 135,000 | | | | | | | | | | 134,600 | |
6.875%, Due 10/1/2054, (5 yr. CMT + 2.789%)D | | | | 100,000 | | | | | | | | | | 101,796 | |
| | | | | | | | | | | | | | | |
| | | | | | | | | | | | | | 2,461,710 | |
| | | | | | | | | | | | | | | |
| | | | | | | | | | | | | | | |
| | | |
| Gas - 0.11% | | | | | | |
| National Fuel Gas Co., | | | | | | | | | | | | | | | |
3.950%, Due 9/15/2027 | | | | 50,000 | | | | | | | | | | 48,680 | |
2.950%, Due 3/1/2031 | | | | 95,000 | | | | | | | | | | 82,392 | |
| | | | | | | | | | | | | | | |
| | | | | | | | | | | | | | 131,072 | |
| | | | | | | | | | | | | | | |
| | | | | | | | | | | | | | | |
Total Utilities | | | | | | | | | | | | | | 2,592,782 | |
| | | | | | | | | | | | | | | |
| | | | | | | | | | | | | | | |
Total Corporate Obligations (Cost $13,790,649) | | | | | | | | | | | | | | 13,251,787 | |
| | | | | | | | | | | | | | | |
| | | | | | | | | | | | | | | |
See accompanying notes
8
American Beacon Balanced FundSM
Schedule of Investments
October 31, 2024
| | | | | | | | | | | | | | | |
| | | |
| | | Principal Amount | | | | Fair Value |
| | | | | | | |
| | | |
| FOREIGN CORPORATE OBLIGATIONS - 3.62% | | | | | | |
| | | |
| Communications - 0.66% | | | | | | |
| | | |
| Internet - 0.28% | | | | | | |
| Alibaba Group Holding Ltd., 3.600%, Due 11/28/2024 | | | $ | 313,000 | | | | | | | | | $ | 312,566 | |
| | | | | | | | | | | | | | | |
| | | | | | | | | | | | | | | |
| | | |
| Telecommunications - 0.38% | | | | | | |
| America Movil SAB de CV, 6.375%, Due 3/1/2035 | | | | 169,000 | | | | | | | | | | 182,765 | |
| Deutsche Telekom International Finance BV, 4.875%, Due 3/6/2042C | | | | 150,000 | | | | | | | | | | 138,519 | |
| Rogers Communications, Inc., 4.300%, Due 2/15/2048 | | | | 140,000 | | | | | | | | | | 112,993 | |
| | | | | | | | | | | | | | | |
| | | | | | | | | | | | | | 434,277 | |
| | | | | | | | | | | | | | | |
| | | | | | | | | | | | | | | |
Total Communications | | | | | | | | | | | | | | 746,843 | |
| | | | | | | | | | | | | | | |
| | | | | | | | | | | | | | | |
| | | |
| Consumer, Cyclical - 0.31% | | | | | | |
| | | |
| Auto Manufacturers - 0.31% | | | | | | |
| Mercedes-Benz Finance North America LLC, 5.250%, Due 11/29/2027C | | | | 350,000 | | | | | | | | | | 354,950 | |
| | | | | | | | | | | | | | | |
| | | | | | | | | | | | | | | |
| | | |
| Consumer, Non-Cyclical - 1.33% | | | | | | |
| | | |
| Agriculture - 0.37% | | | | | | |
| BAT Capital Corp., | | | | | | | | | | | | | | | |
6.000%, Due 2/20/2034 | | | | 35,000 | | | | | | | | | | 36,218 | |
4.540%, Due 8/15/2047 | | | | 260,000 | | | | | | | | | | 208,385 | |
| Reynolds American, Inc., 5.700%, Due 8/15/2035 | | | | 175,000 | | | | | | | | | | 176,645 | |
| | | | | | | | | | | | | | | |
| | | | | | | | | | | | | | 421,248 | |
| | | | | | | | | | | | | | | |
| | | | | | | | | | | | | | | |
| | | |
| Beverages - 0.45% | | | | | | |
| Anheuser-Busch InBev Worldwide, Inc., 5.450%, Due 1/23/2039 | | | | 500,000 | | | | | | | | | | 509,535 | |
| | | | | | | | | | | | | | | |
| | | | | | | | | | | | | | | |
| | | |
| Pharmaceuticals - 0.51% | | | | | | |
| Bayer U.S. Finance II LLC, 3.950%, Due 4/15/2045C | | | | 245,000 | | | | | | | | | | 174,496 | |
| Bayer U.S. Finance LLC, | | | | | | | | | | | | | | | |
6.125%, Due 11/21/2026C | | | | 200,000 | | | | | | | | | | 204,367 | |
6.500%, Due 11/21/2033C | | | | 200,000 | | | | | | | | | | 209,660 | |
| | | | | | | | | | | | | | | |
| | | | | | | | | | | | | | 588,523 | |
| | | | | | | | | | | | | | | |
| | | | | | | | | | | | | | | |
Total Consumer, Non-Cyclical | | | | | | | | | | | | | | 1,519,306 | |
| | | | | | | | | | | | | | | |
| | | | | | | | | | | | | | | |
| | | |
| Energy - 0.80% | | | | | | |
| | | |
| Oil & Gas - 0.36% | | | | | | |
| Saudi Arabian Oil Co., 4.375%, Due 4/16/2049C | | | | 500,000 | | | | | | | | | | 412,590 | |
| | | | | | | | | | | | | | | |
| | | | | | | | | | | | | | | |
| | | |
| Pipelines - 0.44% | | | | | | |
| Enbridge, Inc., | | | | | | | | | | | | | | | |
7.200%, Due 6/27/2054, (5 yr. CMT + 2.970%)D | | | | 115,000 | | | | | | | | | | 118,776 | |
7.375%, Due 3/15/2055, (5 yr. CMT + 3.122%)D | | | | 290,000 | | | | | | | | | | 297,606 | |
| TransCanada PipeLines Ltd., 6.100%, Due 6/1/2040 | | | | 82,000 | | | | | | | | | | 85,092 | |
| | | | | | | | | | | | | | | |
| | | | | | | | | | | | | | 501,474 | |
| | | | | | | | | | | | | | | |
| | | | | | | | | | | | | | | |
Total Energy | | | | | | | | | | | | | | 914,064 | |
| | | | | | | | | | | | | | | |
| | | | | | | | | | | | | | | |
| | | |
| Financial - 0.47% | | | | | | |
| | | |
| Banks - 0.21 % | | | | | | |
| Royal Bank of Canada, 1.200%, Due 4/27/2026 | | | | 250,000 | | | | | | | | | | 238,051 | |
| | | | | | | | | | | | | | | |
| | | | | | | | | | | | | | | |
| | | |
| Diversified Financial Services - 0.13% | | | | | | |
| AerCap Ireland Capital DAC/AerCap Global Aviation Trust, 6.950%, Due 3/10/2055, (5 yr. CMT + 2.720%)D | | | | 150,000 | | | | | | | | | | 154,610 | |
| | | | | | | | | | | | | | | |
| | | | | | | | | | | | | | | |
| | | |
| Insurance - 0.13% | | | | | | |
| Fairfax Financial Holdings Ltd., 6.350%, Due 3/22/2054 | | | | 140,000 | | | | | | | | | | 145,772 | |
| | | | | | | | | | | | | | | |
| | | | | | | | | | | | | | | |
Total Financial | | | | | | | | | | | | | | 538,433 | |
| | | | | | | | | | | | | | | |
| | | | | | | | | | | | | | | |
See accompanying notes
9
American Beacon Balanced FundSM
Schedule of Investments
October 31, 2024
| | | | | | | | | | | | | | | |
| | | |
| | | Principal Amount | | | | Fair Value |
| | | | | | | |
| | | |
| FOREIGN CORPORATE OBLIGATIONS - 3.62% (continued) | | | | | | |
| | | |
| Utilities - 0.05% | | | | | | |
| | | |
| Electric - 0.05% | | | | | | |
| National Grid PLC, 5.809%, Due 6/12/2033 | | | $ | 50,000 | | | | | | | | | $ | 51,885 | |
| | | | | | | | | | | | | | | |
| | | | | | | | | | | | | | | |
Total Foreign Corporate Obligations (Cost $4,138,860) | | | | | | | | | | | | | | 4,125,481 | |
| | | | | | | | | | | | | | | |
| | | | | | | | | | | | | | | |
| | | |
| FOREIGN SOVEREIGN OBLIGATIONS - 0.58% | | | | | | |
| Israel Government International Bonds, 5.500%, Due 3/12/2034 | | | | 200,000 | | | | | | | | | | 194,500 | |
| Mexico Government International Bonds, | | | | | | | | | | | | | | | |
4.280%, Due 8/14/2041 | | | | 250,000 | | | | | | | | | | 192,605 | |
3.771%, Due 5/24/2061 | | | | 450,000 | | | | | | | | | | 270,091 | |
| | | | | | | | | | | | | | | |
| | | | | | | | | | | | | | | |
Total Foreign Sovereign Obligations (Cost $679,790) | | | | | | | | | | | | | | 657,196 | |
| | | | | | | | | | | | | | | |
| | | | | | | | | | | | | | | |
| | | |
| ASSET-BACKED OBLIGATIONS - 0.99% | | | | | | |
| Ally Auto Receivables Trust, 3.310%, Due 11/15/2026,2022-1 A3 | | | | 47,254 | | | | | | | | | | 46,961 | |
| AmeriCredit Automobile Receivables Trust, | | | | | | | | | | | | | | | |
5.840%, Due 10/19/2026,2023-1 A2A | | | | 27,464 | | | | | | | | | | 27,496 | |
4.380%, Due 4/18/2028,2022-2 A3 | | | | 56,592 | | | | | | | | | | 56,470 | |
| BMW Vehicle Owner Trust, 3.210%, Due 8/25/2026, 2022-AA3 | | | | 23,132 | | | | | | | | | | 22,996 | |
| CNH Equipment Trust, | | | | | | | | | | | | | | | |
0.400%, Due 12/15/2025, 2021-AA3 | | | | 1,781 | | | | | | | | | | 1,778 | |
5.420%, Due 10/15/2027, 2024-B A2A | | | | 45,000 | | | | | | | | | | 45,237 | |
| Ford Credit Auto Owner Trust, 1.530%, Due 5/15/2034, 2021-2 Ac | | | | 110.000 | | | | | | | | | | 103,311 | |
| GM Financial Revolving Receivables Trust, 1.170%, Due 6/12/2034,2021-1 Ac | | | | 90,000 | | | | | | | | | | 84,384 | |
| Honda Auto Receivables Owner Trust, | | | | | | | | | | | | | | | |
1.880%, Due 5/15/2026,2022-1 A3 | | | | 49,274 | | | | | | | | | | 48,707 | |
4.930%, Due 11/15/2027,2023-2 A3 | | | | 100,000 | | | | | | | | | | 100,444 | |
| John Deere Owner Trust, | | | | | | | | | | | | | | | |
2.320%, Due 9/15/2026, 2022-AA3 | | | | 36,663 | | | | | | | | | | 36,255 | |
3.740% Due 2/16/2027, 2022-B A3 | | | | 70,737 | | | | | | | | | | 70,290 | |
| New Economy Assets Phase 1 Sponsor LLC, 1.910%, Due 10/20/2061, 2021-1 Alc | | | | 125,000 | | | | | | | | | | 114,213 | |
| Porsche Innovative Lease Owner Trust, 4.670%, Due 11/22/2027, 2024-1AA3C | | | | 100,000 | | | | | | | | | | 99,914 | |
| Taco Bell Funding LLC, 2.294%, Due 8/25/2051, 2021-1A A2IIC | | | | 98,250 | | | | | | | | | | 86,554 | |
| Toyota Auto Loan Extended Note Trust, 1.350% Due 5/25/2033, 2020-1A Ac | | | | 135,000 | | | | | | | | | | 132,401 | |
| Toyota Auto Receivables Owner Trust, 1.230% Due 6/15/2026, 2022-AA3 | | | | 30,163 | | | | | | | | | | 29,818 | |
| Volkswagen Auto Loan Enhanced Trust, 1.020%, Due 6/22/2026, 2021-1 A3 | | | | 22,135 | | | | | | | | | | 21,928 | |
| | | | | | | | | | | | | | | |
| | | | | | | | | | | | | | | |
Total Asset-Backed Obligations (Cost $1,166,228) | | | | | | | | | | | | | | 1,129,157 | |
| | | | | | | | | | | | | | | |
| | | | | | | | | | | | | | | |
| | | |
| COMMERCIAL MORTGAGE-BACKED OBLIGATIONS - 0.21% | | | | | | |
| BX Commercial Mortgage Trust, 5.618% Due 9/15/2036, 2021- VOLT A, (1 mo. USD Term SOFR+ 0.814%)C D | | | | 140,000 | | | | | | | | | | 139,212 | |
| NRTH Mortgage Trust, 6.445%, Due 3/15/2039, 2024-PARK A, (1 mo. USD Term SOFR + 1.641%)C D | | | | 100,000 | | | | | | | | | | 100,081 | |
| | | | | | | | | | | | | | | |
| | | | | | | | | | | | | | | |
Total Commercial Mortgage-Backed Obligations (Cost $239,754) | | | | | | | | | | | | | | 239,293 | |
| | | | | | | | | | | | | | | |
| | | | | | | | | | | | | | | |
| | | |
| U.S. AGENCY MORTGAGE-BACKED OBLIGATIONS - 10.09% | | | | | | |
| Federal Home Loan Mortgage Corp., | | | | | | | | | | | | | | | |
3.500% Due 9/1/2028 | | | | 7,161 | | | | | | | | | | 7,018 | |
3.000% Due 11/1/2032 | | | | 35,851 | | | | | | | | | | 34,305 | |
5.000% Due 8/1/2033 | | | | 13,214 | | | | | | | | | | 13,224 | |
5.500% Due 2/1/2034 | | | | 12,842 | | | | | | | | | | 12,988 | |
2.500% Due 6/1/2035 | | | | 57,338 | | | | | | | | | | 52,745 | |
2.000% Due 3/1/2036 | | | | 166,305 | | | | | | | | | | 148,632 | |
4.000% Due 1/1/2041 | | | | 39,998 | | | | | | | | | | 38,197 | |
4.500% Due 2/1/2041 | | | | 28,634 | | | | | | | | | | 28,065 | |
2.500% Due 9/1/2041 | | | | 132,017 | | | | | | | | | | 114,645 | |
3.500% Due 5/1/2042 | | | | 129,918 | | | | | | | | | | 120,144 | |
3.500% Due 6/1/2042 | | | | 132,416 | | | | | | | | | | 121,984 | |
3.000%, Due 4/1/2047 | | | | 116,212 | | | | | | | | | | 100,482 | |
3.000%, Due 8/1/2048 | | | | 107,705 | | | | | | | | | | 94,896 | |
2.500%, Due 7/1/2050 | | | | 72,310 | | | | | | | | | | 60,498 | |
2.500% Due 12/1/2050 | | | | 66,181 | | | | | | | | | | 55,901 | |
2.500% Due 11/1/2051 | | | | 130,661 | | | | | | | | | | 109,808 | |
2.000% Due 2/1/2052 | | | | 120,494 | | | | | | | | | | 96,644 | |
2.000%, Due 3/1/2052 | | | | 212,264 | | | | | | | | | | 168,872 | |
2.500% Due 5/1/2052 | | | | 105,965 | | | | | | | | | | 88,970 | |
See accompanying notes
10
American Beacon Balanced FundSM
Schedule of Investments
October 31, 2024
| | | | | | | | | | | | | | | |
| | | |
| | | Principal Amount | | | | Fair Value |
| | | | | | | |
| | | |
| U.S. AGENCY MORTGAGE-BACKED OBLIGATIONS - 10.09% (continued) | | | | | | |
| Federal Home Loan Mortgage Corp., (continued) | | | | | | | | | | | | | | | |
6.000%, Due 3/1/2053 | | | $ | 68,482 | | | | | | | | | $ | 70,101 | |
4.500%, Due 5/1/2053 | | | | 101,784 | | | | | | | | | | 96,751 | |
5.000%, Due 8/1/2053 | | | | 205,545 | | | | | | | | | | 199,840 | |
5.500%, Due 9/1/2053 | | | | 110,315 | | | | | | | | | | 110,540 | |
5.500%, Due 2/1/2054 | | | | 317,980 | | | | | | | | | | 316,168 | |
5.500%, Due 4/1/2054 | | | | 301,888 | | | | | | | | | | 299,264 | |
6.000%, Due 4/1/2054 | | | | 154,154 | | | | | | | | | | 156,652 | |
6.000%, Due 8/1/2054 | | | | 103,854 | | | | | | | | | | 105,159 | |
5.000%, Due 9/1/2054 | | | | 158,394 | | | | | | | | | | 154,714 | |
| | | | | | | | | | | | | | | |
| | | | | | | | | | | | | | 2,977,207 | |
| | | | | | | | | | | | | | | |
| Federal National Mortgage Association, | | | | | | | | | | | | | | | |
3.500%, Due 1/1/2028 | | | | 6,369 | | | | | | | | | | 6,262 | |
5.000%, Due 3/1/2034 | | | | 14,487 | | | | | | | | | | 14,459 | |
4.500%, Due 4/1/2034 | | | | 24,660 | | | | | | | | | | 24,381 | |
3.000%, Due 10/1/2034 | | | | 3,369 | | | | | | | | | | 3,175 | |
2.000%, Due 11/1/2035 | | | | 112,063 | | | | | | | | | | 100,750 | |
2.000%, Due 12/1/2035 | | | | 52,707 | | | | | | | | | | 47,304 | |
3.500%, Due 6/1/2037 | | | | 75,520 | | | | | | | | | | 71,582 | |
5.500%, Due 6/1/2038 | | | | 3,131 | | | | | | | | | | 3,152 | |
4.500%, Due 1/1/2040 | | | | 29,129 | | | | | | | | | | 28,460 | |
5.000%, Due 5/1/2040 | | | | 48,305 | | | | | | | | | | 48,434 | |
5.000%, Due 6/1/2040 | | | | 37,230 | | | | | | | | | | 37,329 | |
4.000%, Due 9/1/2040 | | | | 27,580 | | | | | | | | | | 26,305 | |
4.000%, Due 1/1/2041 | | | | 55,132 | | | | | | | | | | 52,583 | |
2.500%, Due 11/1/2041 | | | | 105,453 | | | | | | | | | | 91,577 | |
3.000%, Due 6/1/2043 | | | | 256,176 | | | | | | | | | | 228,408 | |
3.000%, Due 8/1/2043 | | | | 230,791 | | | | | | | | | | 205,778 | |
4.000%, Due 7/1/2045 | | | | 56,017 | | | | | | | | | | 52,734 | |
3.500%, Due 8/1/2045 | | | | 25,470 | | | | | | | | | | 23,186 | |
3.500%, Due 11/1/2045 | | | | 250,113 | | | | | | | | | | 227,679 | |
3.500%, Due 1/1/2046 | | | | 97,256 | | | | | | | | | | 88,784 | |
3.500%, Due 5/1/2046 | | | | 25,369 | | | | | | | | | | 23,082 | |
4.000%, Due 7/1/2046 | | | | 54,519 | | | | | | | | | | 51,325 | |
3.000%, Due 10/1/2046 | | | | 20,406 | | | | | | | | | | 17,926 | |
3.000%, Due 11/1/2046 | | | | 121,583 | | | | | | | | | | 107,652 | |
3.500%, Due 3/1/2047 | | | | 28,737 | | | | | | | | | | 26,118 | |
4.500%, Due 7/1/2047 | | | | 13,300 | | | | | | | | | | 12,837 | |
4.500%, Due 8/1/2047 | | | | 23,303 | | | | | | | | | | 22,523 | |
3.500%, Due 9/1/2047 | | | | 37,895 | | | | | | | | | | 34,493 | |
4.500%, Due 4/1/2048 | | | | 10,793 | | | | | | | | | | 10,356 | |
4.500%, Due 7/1/2048 | | | | 64,396 | | | | | | | | | | 61,708 | |
4.500%, Due 10/1/2049 | | | | 76,081 | | | | | | | | | | 73,142 | |
4.000%, Due 11/1/2049 | | | | 148,386 | | | | | | | | | | 139,133 | |
2.500%, Due 8/1/2050 | | | | 317,398 | | | | | | | | | | 266,514 | |
3.000%, Due 8/1/2050 | | | | 91,917 | | | | | | | | | | 80,512 | |
2.500%, Due 9/1/2050 | | | | 105,685 | | | | | | | | | | 88,484 | |
2.500%, Due 10/1/2050 | | | | 48,390 | | | | | | | | | | 40,526 | |
3.000%, Due 10/1/2050 | | | | 99,035 | | | | | | | | | | 86,870 | |
2.000%, Due 3/1/2051 | | | | 153,659 | | | | | | | | | | 124,277 | |
2.000%, Due 4/1/2051 | | | | 239,362 | | | | | | | | | | 191,794 | |
3.000%, Due 5/1/2051 | | | | 110,972 | | | | | | | | | | 97,037 | |
3.000%, Due 6/1/2051 | | | | 112,413 | | | | | | | | | | 97,880 | |
3.500%, Due 6/1/2051 | | | | 126,867 | | | | | | | | | | 114,149 | |
2.000%, Due 7/1/2051 | | | | 246,529 | | | | | | | | | | 197,185 | |
3.500%, Due 7/1/2051 | | | | 110,782 | | | | | | | | | | 100,564 | |
2.500%, Due 8/1/2051 | | | | 231,696 | | | | | | | | | | 194,007 | |
3.000%, Due 11/1/2051 | | | | 85,126 | | | | | | | | | | 73,545 | |
2.000%, Due 1/1/2052 | | | | 377,978 | | | | | | | | | | 304,187 | |
2.500%, Due 2/1/2052 | | | | 522,617 | | | | | | | | | | 437,465 | |
3.500%, Due 5/1/2052 | | | | 146,224 | | | | | | | | | | 131,104 | |
4.000%, Due 6/1/2052 | | | | 175,200 | | | | | | | | | | 162,854 | |
5.000%, Due 6/1/2052 | | | | 271,373 | | | | | | | | | | 267,828 | |
3.000%, Due 7/1/2052 | | | | 113,812 | | | | | | | | | | 99,265 | |
4.500%, Due 10/1/2052 | | | | 167,378 | | | | | | | | | | 160,028 | |
5.000%, Due 12/1/2052 | | | | 127,012 | | | | | | | | | | 123,744 | |
5.000%, Due 4/1/2053 | | | | 86,623 | | | | | | | | | | 84,848 | |
4.500%, Due 6/1/2053 | | | | 107,263 | | | | | | | | | | 103,182 | |
5.500%, Due 10/1/2053 | | | | 202,731 | | | | | | | | | | 200,907 | |
6.000%, Due 1/1/2054 | | | | 227,238 | | | | | | | | | | 230,134 | |
5.500%, Due 2/1/2054 | | | | 208,756 | | | | | | | | | | 208,102 | |
6.500%, Due 6/1/2054 | | | | 44,329 | | | | | | | | | | 45,741 | |
5.500%, Due 11/1/2054 | | | | 220,000 | | | | | | | | | | 218,088 | |
| | | | | | | | | | | | | | | |
| | | | | | | | | | | | | | 6,493,438 | |
| | | | | | | | | | | | | | | |
See accompanying notes
11
American Beacon Balanced FundSM
Schedule of Investments
October 31, 2024
| | | | | | | | | | | | | | | |
| | | |
| | | Principal Amount | | | | Fair Value |
| | | | | | | |
| | | |
| U.S. AGENCY MORTGAGE-BACKED OBLIGATIONS - 10.09% (continued) | | | | | | |
| Government National Mortgage Association, | | | | | | | | | | | | | | | |
6.500%, Due 8/15/2027 | | | $ | 3,395 | | | | | | | | | $ | 3,450 | |
6.500%, Due 11/15/2027 | | | | 4,070 | | | | | | | | | | 4,140 | |
7.500%, Due 12/15/2028 | | | | 5,347 | | | | | | | | | | 5,486 | |
5.500%, Due 7/15/2033 | | | | 13,586 | | | | | | | | | | 13,933 | |
6.000%, Due 12/15/2033 | | | | 18,669 | | | | | | | | | | 19,169 | |
5.500%, Due 2/20/2034 | | | | 19,224 | | | | | | | | | | 19,727 | |
5.000%, Due 10/15/2039 | | | | 36,781 | | | | | | | | | | 36,950 | |
3.500%, Due 9/15/2041 | | | | 72,738 | | | | | | | | | | 67,542 | |
3.500%, Due 8/20/2047 | | | | 14,043 | | | | | | | | | | 12,860 | |
3.500%, Due 10/20/2047 | | | | 12,855 | | | | | | | | | | 11,749 | |
4.000%, Due 1/20/2048 | | | | 64,220 | | | | | | | | | | 60,542 | |
5.000%, Due 1/20/2050 | | | | 30,095 | | | | | | | | | | 29,819 | |
4.500%, Due 2/20/2050 | | | | 27,991 | | | | | | | | | | 27,083 | |
5.000%, Due 2/20/2050 | | | | 15,421 | | | | | | | | | | 15,305 | |
2.500%, Due 4/20/2050 | | | | 136,059 | | | | | | | | | | 115,860 | |
2.500%, Due 6/20/2051 | | | | 136,314 | | | | | | | | | | 115,710 | |
3.000%, Due 6/20/2051 | | | | 58,924 | | | | | | | | | | 51,795 | |
2.500%, Due 7/20/2051 | | | | 214,095 | | | | | | | | | | 181,690 | |
3.000%, Due 8/20/2051 | | | | 136,121 | | | | | | | | | | 121,020 | |
2.500%, Due 11/20/2051 | | | | 109,366 | | | | | | | | | | 92,759 | |
3.000%, Due 12/20/2051 | | | | 262,757 | | | | | | | | | | 230,826 | |
3.500%, Due 1/20/2052 | | | | 96,206 | | | | | | | | | | 87,121 | |
4.000%, Due 3/20/2052 | | | | 99,666 | | | | | | | | | | 92,845 | |
2.500%, Due 4/20/2052 | | | | 61,742 | | | | | | | | | | 52,365 | |
4.500%, Due 9/20/2052 | | | | 130,250 | | | | | | | | | | 124,597 | |
5.000%, Due 4/20/2053 | | | | 253,418 | | | | | | | | | | 247,969 | |
5.500%, Due 7/20/2053 | | | | 207,989 | | | | | | | | | | 207,176 | |
| | | | | | | | | | | | | | | |
| | | | | | | | | | | | | | 2,049,488 | |
| | | | | | | | | | | | | | | |
| | | | | | | | | | | | | | | |
Total U.S. Agency Mortgage-Backed Obligations (Cost $12,439,312) | | | | | | | | | | | | | | 11,520,133 | |
| | | | | | | | | | | | | | | |
| | | | | | | | | | | | | | | |
| | | |
| U.S. GOVERNMENT AGENCY OBLIGATIONS - 0.79% | | | | | | |
| Federal Farm Credit Banks Funding Corp., | | | | | | | | | | | | | | | |
4.375%, Due 10/24/2029 | | | | 250,000 | | | | | | | | | | 252,067 | |
3.750%, Due 1/25/2030 | | | | 300,000 | | | | | | | | | | 293,492 | |
| Federal Home Loan Banks, 4.500%, Due 12/14/2029 | | | | 350,000 | | | | | | | | | | 354,759 | |
| | | | | | | | | | | | | | | |
| | | | | | | | | | | | | | 900,318 | |
| | | | | | | | | | | | | | | |
| | | | | | | | | | | | | | | |
Total U.S. Government Agency Obligations (Cost $905,032) | | | | | | | | | | | | | | 900,318 | |
| | | | | | | | | | | | | | | |
| | | | | | | | | | | | | | | |
| | | |
| U.S. TREASURY OBLIGATIONS - 9.78% | | | | | | |
| U.S. Treasury Bonds, | | | | | | | | | | | | | | | |
6.875%, Due 8/15/2025 | | | | 279,000 | | | | | | | | | | 285,147 | |
5.250%, Due 11/15/2028 | | | | 217,000 | | | | | | | | | | 225,807 | |
4.750%, Due 2/15/2037 | | | | 304,000 | | | | | | | | | | 317,371 | |
4.500%, Due 8/15/2039 | | | | 241,000 | | | | | | | | | | 242,930 | |
2.750%, Due 8/15/2042 | | | | 250,000 | | | | | | | | | | 194,531 | |
4.500%, Due 2/15/2044 | | | | 165,000 | | | | | | | | | | 163,247 | |
2.875%, Due 5/15/2049 | | | | 500,000 | | | | | | | | | | 372,519 | |
| | | | | | | | | | | | | | | |
| | | | | | | | | | | | | | 1,801,552 | |
| | | | | | | | | | | | | | | |
| U.S. Treasury Notes, | | | | | | | | | | | | | | | |
4.500%, Due 11/30/2024 | | | | 795,000 | | | | | | | | | | 794,840 | |
1.125%, Due 1/15/2025 | | | | 250,000 | | | | | | | | | | 248,218 | |
1.500%, Due 2/15/2025 | | | | 270,000 | | | | | | | | | | 267,593 | |
1.125%, Due 2/28/2025 | | | | 150,000 | | | | | | | | | | 148,330 | |
4.250%, Due 10/15/2025 | | | | 250,000 | | | | | | | | | | 249,822 | |
4.875%, Due 4/30/2026 | | | | 860,000 | | | | | | | | | | 867,962 | |
2.000%, Due 11/15/2026 | | | | 500,000 | | | | | | | | | | 479,238 | |
2.500%, Due 3/31/2027 | | | | 250,000 | | | | | | | | | | 240,752 | |
4.125%, Due 10/31/2027 | | | | 250,000 | | | | | | | | | | 249,912 | |
2.875%, Due 5/15/2028 | | | | 200,000 | | | | | | | | | | 191,570 | |
2.875%, Due 8/15/2028 | | | | 300,000 | | | | | | | | | | 286,477 | |
2.625%, Due 2/15/2029 | | | | 450,000 | | | | | | | | | | 422,930 | |
2.875%, Due 4/30/2029 | | | | 300,000 | | | | | | | | | | 284,180 | |
4.625%, Due 4/30/2029 | | | | 330,000 | | | | | | | | | | 336,200 | |
2.375%, Due 5/15/2029 | | | | 450,000 | | | | | | | | | | 417,041 | |
1.625%, Due 8/15/2029 | | | | 350,000 | | | | | | | | | | 312,170 | |
1.750%, Due 11/15/2029 | | | | 850,000 | | | | | | | | | | 758,858 | |
3.500%, Due 1/31/2030 | | | | 350,000 | | | | | | | | | | 338,817 | |
4.000%, Due 2/28/2030 | | | | 250,000 | | | | | | | | | | 247,861 | |
See accompanying notes
12
American Beacon Balanced FundSM
Schedule of Investments
October 31, 2024
| | | | | | | | | | | | | | | |
| | | |
| | | Principal Amount | | | | Fair Value |
| | | | | | | |
| | | |
| U.S. TREASURY OBLIGATIONS - 9.78% (continued) | | | | | | |
| U.S. Treasury Notes, (continued) | | | | | | | | | | | | | | | |
4.625%, Due 4/30/2031 | | | $ | 445,000 | | | | | | | | | $ | 455,065 | |
3.625%, Due 9/30/2031 | | | | 100,000 | | | | | | | | | | 96,422 | |
4.125%, Due 11/15/2032 | | | | 250,000 | | | | | | | | | | 248,115 | |
3.500%, Due 2/15/2033 | | | | 250,000 | | | | | | | | | | 236,797 | |
3.875%, Due 8/15/2033 | | | | 200,000 | | | | | | | | | | 194,195 | |
4.000%, Due 2/15/2034 | | | | 300,000 | | | | | | | | | | 293,531 | |
4.375%, Due 5/15/2034 | | | | 405,000 | | | | | | | | | | 407,911 | |
3.875%, Due 8/15/2034 | | | | 300,000 | | | | | | | | | | 290,250 | |
| | | | | | | | | | | | | | | |
| | | | | | | | | | | | | | 9,365,057 | |
| | | | | | | | | | | | | | | |
| | | | | | | | | | | | | | | |
Total U.S. Treasury Obligations (Cost $11,751,475) | | | | | | | | | | | | | | 11,166,609 | |
| | | | | | | | | | | | | | | |
| | | |
| | | Shares | | | | |
| | | | | | | |
| | | |
| FOREIGN COMMON STOCKS - 4.38% | | | | | | |
| | | |
| Communication Services - 0.33% | | | | | | |
| | | |
| Media - 0.33% | | | | | | |
| WPP PLC, ADRB | | | | 7,200 | | | | | | | | | | 377,928 | |
| | | | | | | | | | | | | | | |
| | | |
| Consumer Discretionary - 0.54% | | | | | | |
| | | |
| Automobile Components - 0.54% | | | | | | |
| Magna International, Inc.B | | | | 15,604 | | | | | | | | | | 615,890 | |
| | | | | | | | | | | | | | | |
| | | |
| Consumer Staples - 0.64% | | | | | | |
| | | |
| Beverages - 0.22% | | | | | | |
| Anheuser-Busch InBev SA, ADR | | | | 4,200 | | | | | | | | | | 249,354 | |
| | | | | | | | | | | | | | | |
| | | |
| Personal Products - 0.42% | | | | | | |
| Unilever PLC, ADR | | | | 7,840 | | | | | | | | | | 477,534 | |
| | | | | | | | | | | | | | | |
| | | | | | | | | | | | | | | |
Total Consumer Staples | | | | | | | | | | | | | | 726,888 | |
| | | | | | | | | | | | | | | |
| | | | | | | | | | | | | | | |
| | | |
| Energy - 1.10% | | | | | | |
| | | |
| Oil, Gas & Consumable Fuels-1.10% | | | | | | |
| Cenovus Energy, Inc. | | | | 10,700 | | | | | | | | | | 171,949 | |
| Enbridge, Inc. | | | | 26,720 | | | | | | | | | | 1,079,488 | |
| | | | | | | | | | | | | | | |
| | | | | | | | | | | | | | 1,251,437 | |
| | | | | | | | | | | | | | | |
Total Energy | | | | | | | | | | | | | | 1,251,437 | |
| | | | | | | | | | | | | | | |
| | | | | | | | | | | | | | | |
| | | |
| Financials - 0.48% | | | | | | |
| | | |
| Banks - 0.48% | | | | | | |
| Bank of Nova Scotia | | | | 10,606 | | | | | | | | | | 546,103 | |
| | | | | | | | | | | | | | | |
| | | |
| Information Technology - 1.29% | | | | | | |
| | | |
| Communications Equipment - 1.01% | | | | | | |
| Telefonaktiebolaget LM Ericsson, ADRB | | | | 137,590 | | | | | | | | | | 1,153,004 | |
| | | | | | | | | | | | | | | |
| | | |
| Electronic Equipment, Instruments & Components - 0.28% | | | | | | |
| TE Connectivity PLC | | | | 2,208 | | | | | | | | | | 325,504 | |
| | | | | | | | | | | | | | | |
| | | | | | | | | | | | | | | |
Total Information Technology | | | | | | | | | | | | | | 1,478,508 | |
| | | | | | | | | | | | | | | |
| | | | | | | | | | | | | | | |
Total Foreign Common Stocks (Cost $4,024,178) | | | | | | | | | | | | | | 4,996,754 | |
| | | | | | | | | | | | | | | |
| | | | | | | | | | | | | | | |
| | | |
| SHORT-TERM INVESTMENTS - 2.10% (Cost $2,401,833) | | | | | | |
| | | |
| Investment Companies - 2.10% | | | | | | |
| American Beacon U.S. Government Money Market Select Fund, 4.76% F G | | | | 2,401,833 | | | | | | | | | | 2,401,833 | |
| | | | | | | | | | | | | | | |
| | | |
| SECURITIES LENDING COLLATERAL - 0.35% (Cost $398,300) | | | | | | |
| | | |
| Investment Companies - 0.35% | | | | | | |
| American Beacon U.S. Government Money Market Select Fund, 4.76% F G | | | | 398,300 | | | | | | | | | | 398,300 | |
| | | | | | | | | | | | | | | |
| | | | | | | | | | | | | | | |
TOTAL INVESTMENTS - 99.84% (Cost $96,121,605) | | | | | | | | | | | | | | 113,944,639 | |
OTHER ASSETS, NET OF LIABILITIES - 0.16% | | | | | | | | | | | | | | 187,376 | |
| | | | | | | | | | | | | | | |
TOTAL NET ASSETS - 100.00% | | | | | | | | | | | | | | $114,132,015 | |
| | | | | | | | | | | | | | | |
See accompanying notes
13
American Beacon Balanced FundSM
Schedule of Investments
October 31, 2024
| | | | | | | | | | | | | | | |
| Percentages are stated as a percent of net assets. | | | | | | | | | | | | | | | |
A Non-income producing security.
B All or a portion of this security is on loan, collateralized by either cash and/or U.S. Treasuries at October 31, 2024 (Note 9).
c Security exempt from registration under the Securities Act of 1933. These securities may be resold to qualified institutional buyers pursuant to Rule 144A. At the period end, the value of these securities amounted to $2,867,556 or 2.51% of net assets. The Fund has no right to demand registration of these securities.
D Variable, floating, or adjustable rate securities with an interest rate that changes periodically. Rates are periodically reset with rates that are based on a predetermined benchmark such as a widely followed interest rate such as T-bills, SOFR or PRIME plus a fixed spread. The interest rate disclosed reflects the rate in effect on October 31, 2024.
E Perpetual maturity. The date shown, if any, is the next call date.
F The Fund is affiliated by having the same investment advisor.
G 7-day yield.
ADR - American Depositary Receipt.
CMT - Constant Maturity Treasury.
DAC - Designated Activity Company.
LLC - Limited Liability Company.
LP - Limited Partnership.
PLC - Public Limited Company.
PRIME - A rate, charged by banks, based on the U.S. Federal Funds rate.
REITs - Real Estate Investment Trusts.
SOFR - Secured Overnight Financing Rate.
USD - United States Dollar.
| | | | | | | | | | | | | | | | |
| Long Futures Contracts Open on October 31, 2024: | | | | | | | | | |
| | | | | |
| Equity Futures Contracts | | | | | | | | | | | | | |
| Description | | Number of
Contracts | | Expiration Date | | Notional Amount | | | Contract Value | | | Unrealized
Appreciation
(Depreciation) | |
| CME E-Mini S&P 500 Index Futures | | 9 | | December 2024 | | $ | 2,594,834 | | | $ | 2,582,325 | | | $ | (12,509 | ) |
| | | | | | | | | | | | | | | | |
| | | | | | $ | 2,594,834 | | | $ | 2,582,325 | | | $ | (12,509 | ) |
| | | | | | | | | | | | | | | | |
| | |
| Glossary: |
| | |
| Index Abbreviations: |
| S&P 500 | | Standard & Poor’s 500 Index - U.S. Equity Large-Cap Index. |
|
| Exchange Abbreviations: |
| CME | | Chicago Mercantile Exchange. |
See accompanying notes
14
American Beacon Balanced FundSM
Schedule of Investments
October 31, 2024
The Fund’s investments are summarized by level based on the inputs used to determine their values. As of October 31, 2024, the investments were classified as described below:
| | | | | | | | | | | | | | | | | | | | | | | | | | | | |
Balanced Fund | | Level 1 | | | | | | Level 2 | | | | | | Level 3 | | | | | | Total | |
Assets | | | | | | | | | | | | | | | | | | | | | | | | | | | | |
Common Stocks | | $ | 63,157,778 | | | | | | | $ | - | | | | | | | $ | - | | | | | | | $ | 63,157,778 | |
Corporate Obligations | | | - | | | | | | | | 13,251,787 | | | | | | | | - | | | | | | | | 13,251,787 | |
Foreign Corporate Obligations | | | - | | | | | | | | 4,125,481 | | | | | | | | - | | | | | | | | 4,125,481 | |
Foreign Sovereign Obligations | | | - | | | | | | | | 657,196 | | | | | | | | - | | | | | | | | 657,196 | |
Asset-Backed Obligations | | | - | | | | | | | | 1,129,157 | | | | | | | | - | | | | | | | | 1,129,157 | |
Commercial Mortgage-Backed Obligations | | | - | | | | | | | | 239,293 | | | | | | | | - | | | | | | | | 239,293 | |
U.S. Agency Mortgage-Backed Obligations | | | - | | | | | | | | 11,520,133 | | | | | | | | - | | | | | | | | 11,520,133 | |
U.S. Government Agency Obligations | | | - | | | | | | | | 900,318 | | | | | | | | - | | | | | | | | 900,318 | |
U.S. Treasury Obligations | | | - | | | | | | | | 11,166,609 | | | | | | | | - | | | | | | | | 11,166,609 | |
Foreign Common Stocks | | | 4,996,754 | | | | | | | | - | | | | | | | | - | | | | | | | | 4,996,754 | |
Short-Term Investments | | | 2,401,833 | | | | | | | | - | | | | | | | | - | | | | | | | | 2,401,833 | |
Securities Lending Collateral | | | 398,300 | | | | | | | | - | | | | | | | | - | | | | | | | | 398,300 | |
| | | | | | | | | | | | | | | | | | | | | | | | | | | | |
Total Investments in Securities - Assets | | $ | 70,954,665 | | | | | | | $ | 42,989,974 | | | | | | | $ | - | | | | | | | $ | 113,944,639 | |
| | | | | | | | | | | | | | | | | | | | | | | | | | | | |
Financial Derivative Instruments - Liabilities | | | | | | | | | | | | | | | | | | | | | | | | | | | | |
Futures Contracts | | $ | (12,509 | ) | | | | | | $ | - | | | | | | | $ | - | | | | | | | $ | (12,509 | ) |
| | | | | | | | | | | | | | | | | | | | | | | | | | | | |
Total Financial Derivative Instruments - Liabilities | | $ | (12,509 | ) | | | | | | $ | - | | | | | | | $ | - | | | | | | | $ | (12,509 | ) |
| | | | | | | | | | | | | | | | | | | | | | | | | | | | |
U.S. GAAP requires transfers between all levels to/from level 3 be disclosed. During the year ended October 31, 2024, there were no transfers into or out of Level 3.
See accompanying notes
15
American Beacon Balanced FundSM
Statement of Assets and Liabilities
October 31, 2024
| | | | |
Assets: | | | | |
Investments in unaffiliated securities, at fair value† § | | $ | 111,144,506 | |
Investments in affiliated securities, at fair value‡ | | | 2,800,133 | |
Cash collateral held at broker for futures contracts | | | 155,000 | |
Dividends and interest receivable | | | 433,833 | |
Receivable for investments sold | | | 265,000 | |
Receivable for fund shares sold | | | 6,858 | |
Receivable for tax reclaims | | | 1,969 | |
Prepaid expenses | | | 35,940 | |
| | | | |
Total assets | | | 114,843,239 | |
| | | | |
Liabilities: | | | | |
Payable for fund shares redeemed . | | | 9,938 | |
Cash due to broker for futures contracts . . . . | | | 38,587 | |
Management and sub-advisory fees payable (Note 2) | | | 84,019 | |
Service fees payable (Note 2) | | | 22,082 | |
Transfer agent fees payable (Note 2) | | | 7,459 | |
Payable upon return of securities loaned (Note 9)§ | | | 398,300 | |
Custody and fund accounting fees payable | | | 44,847 | |
Professional fees payable | | | 69,751 | |
Trustee fees payable (Note 2) | | | 837 | |
Payable for prospectus and shareholder reports | | | 17,884 | |
Payable for variation margin from open futures contracts (Note 5) | | | 12,523 | |
Other liabilities | | | 4,997 | |
| | | | |
Total liabilities | | | 711,224 | |
| | | | |
Commitments and contingent liabilities (Note 2) | | | | |
| | | | |
Net assets | | $ | 114,132,015 | |
| | | | |
| | | | |
Analysis of net assets: | |
Paid-in-capital | | $
| 87,246,048
|
|
Total distributable earnings (deficits)A | | | 26,885,967 | |
| | | | |
Net assets | | $ | 114,132,015 | |
| | | | |
See accompanying notes
16
American Beacon Balanced FundSM
Statement of Assets and Liabilities
October 31, 2024
| | | | |
Shares outstanding at no par value (unlimited shares authorized): | | | | |
R5 Class | | | 736,373 | |
| | | | |
Y Class | | | 1,876,780 | |
| | | | |
Investor Class | | | 3,566,607 | |
| | | | |
Advisor Class | | | 81,182 | |
| | | | |
A Class | | | 1,568,103 | |
| | | | |
C Class . | | | 414,895 | |
| | | | |
Net assets: | | | | |
R5 Class | | $ | 11,658,021 | |
| | | | |
Y Class | | $ | 30,023,632 | |
| | | | |
Investor Class . . | | $ | 45,826,006 | |
| | | | |
Advisor Class | | $ | 1,160,350 | |
| | | | |
A Class | | $ | 20,055,093 | |
| | | | |
C Class | | $ | 5,408,913 | |
| | | | |
Net asset value, offering and redemption price per share: | | | | |
R5 Class . . | | $ | 15.83 | |
| | | | |
Y Class . . | | $ | 16.00 | |
| | | | |
Investor Class | | $ | 12.85 | |
| | | | |
Advisor Class | | $ | 14.29 | |
| | | | |
A Class | | $ | 12.79 | |
| | | | |
A Class (offering price) | | $ | 13.57 | |
| | | | |
C Class | | $ | 13.04 | |
| | | | |
| |
† Cost of investments in unaffiliated securities | | $ | 93,321,472 | |
‡ Cost of investments in affiliated securities | | $ | 2,800,133 | |
§ Fair value of securities on loan . | | $ | 2,174,024 | |
A The Fund’s investments in affiliated securities did not have unrealized appreciation (depreciation) at year end.
See accompanying notes
17
American Beacon Balanced FundSM
Statement of Operations
For the year ended October 31, 2024
| | | | |
Investment income: | |
Dividend income from unaffiliated securities (net of foreign taxes)† | | $ | 1,539,834 | |
Dividend income from affiliated securities (Note 2) | | | 156,335 | |
Interest income | | | 1,783,385 | |
Income derived from securities lending (Note 9) | | | 10,892 | |
| | | | |
Total investment income | | | 3,490,446 | |
| | | | |
Expenses: | | | | |
Management and sub-advisory fees (Note 2) | | | 585,364 | |
Transfer agent fees: | | | | |
R5 Class (Note 2) | | | 1,767 | |
Y Class (Note 2) | | | 27,328 | |
Investor Class | | | 17,673 | |
Advisor Class | | | 149 | |
A Class | | | 1,091 | |
C Class | | | 752 | |
Custody and fund accounting fees | | | 104,596 | |
Professional fees | | | 74,296 | |
Registration fees and expenses . | | | 86,801 | |
Service fees (Note 2): | | | | |
Investor Class | | | 141,461 | |
Advisor Class . . . . | | | 2,827 | |
A Class | | | 13,537 | |
C Class | | | 8,259 | |
Distribution fees (Note 2): | | | | |
Advisor Class | | | 2,721 | |
A Class | | | 42,086 | |
C Class | | | 92,965 | |
Prospectus and shareholder report expenses | | | 41,775 | |
Trustee fees (Note 2) | | | 11,195 | |
Line of credit interest expense (Note 10) | | | 1,212 | |
Other expenses | | | 31,032 | |
| | | | |
Total expenses . | | | 1,288,887 | |
| | | | |
Net investment income | | | 2,201,559 | |
| | | | |
| |
Realized and unrealized gain from investments: | | | | |
Net realized gain from: | | | | |
Investments in unaffiliated securitiesA | | | 10,014,617 | |
Foreign currency transactions | | | 28 | |
Futures contracts | | | 697,746 | |
Change in net unrealized appreciation of: | | | | |
Investments in unaffiliated securitiesB | | | 11,201,788 | |
Futures contracts | | | 60,277 | |
| | | | |
Net gain from investments | | | 21,974,456 | |
| | | | |
Net increase in net assets resulting from operations | | $ | 24,176,015 | |
| | | | |
† Foreign taxes | | $ | 23,956 | |
A The Fund did not recognize net realized gains (losses) from the sale of investments in affiliated securities.
B The Fund’s investments in affiliated securities did not have a change in unrealized appreciation (depreciation) at year end.
See accompanying notes
18
American Beacon Balanced FundSM
Statement of Changes in Net Assets
| | | | | | | | | | | | |
| | | Year Ended
October 31, 2024 | | | | | | Year Ended
October 31, 2023 | |
Increase in net assets: | | | | | | | | | | | | |
Operations: | | | | | | | | | | | | |
Net investment income | | $ | 2,201,559 | | | | | | | $ | 2,423,611 | |
Net realized gain from investments in unaffiliated securities, foreign currency transactions, and futures contracts | | | 10,712,391 | | | | | | | | 1,330,651 | |
Change in net unrealized appreciation of investments in unaffiliated securities, and futures contracts | | | 11,262,065 | | | | | | | | 381,669 | |
| | | | | | | | | | | | |
Net increase in net assets resulting from operations | | | 24,176,015 | | | | | | | | 4,135,931 | |
| | | | | | | | | | | | |
Distributions to shareholders: | | | | | | | | | | | | |
Total retained earnings: | | | | | | | | | | | | |
R5 Class | | | (279,743 | ) | | | | | | | (1,266,660 | ) |
Y Class | | | (642,271 | ) | | | | | | | (4,232,877 | ) |
Investor Class | | | (1,254,933 | ) | | | | | | | (6,394,827 | ) |
Advisor Class | | | (23,498 | ) | | | | | | | (117,843 | ) |
A Class | | | (436,711 | ) | | | | | | | (1,592,314 | ) |
C Class . | | | (167,049 | ) | | | | | | | (1,686,923 | ) |
| | | | | | | | | | | | |
Net distributions to shareholders . . | | | (2,804,205 | ) | | | | | | | (15,291,444 | ) |
| | | | | | | | | | | | |
| | | |
Capital share transactions (Note 11): | | | | | | | | | | | | |
Proceeds from sales of shares | | | 17,376,789 | | | | | | | | 35,647,313 | |
Reinvestment of dividends and distributions | | | 2,717,398 | | | | | | | | 13,509,118 | |
Cost of shares redeemed | | | (34,058,581 | ) | | | | | | | (59,755,583 | ) |
| | | | | | | | | | | | |
Net (decrease) in net assets from capital share transactions | | | (13,964,394 | ) | | | | | | | (10,599,152 | ) |
| | | | | | | | | | | | |
Net increase (decrease) in net assets | | | 7,407,416 | | | | | | | | (21,754,665 | ) |
| | | | | | | | | | | | |
Net assets: | | | | | | | | | | | | |
Beginning of year | | | 106,724,599 | | | | | | | | 128,479,264 | |
| | | | | | | | | | | | |
End of year. | | $ | 114,132,015 | | | | | | | $ | 106,724,599 | |
| | | | | | | | | | | | |
See accompanying notes
19
American Beacon Balanced FundSM
Notes to Financial Statements
October 31, 2024
1. Organization and Significant Accounting Policies
American Beacon Funds (the “Trust”) is organized as a Massachusetts business trust. The Fund, a series within the Trust, is registered under the Investment Company Act of 1940, as amended (the “Act”), as a diversified, open-end management investment company. As of October 31, 2024, the Trust consists of twenty-four active series, one of which is presented in this filing: American Beacon Balanced Fund (the “Fund”). The remaining twenty-three active series are reported in separate filings.
American Beacon Advisors, Inc. (the “Manager”) is a Delaware corporation and a wholly-owned subsidiary of Resolute Investment Managers, Inc. (“RIM”) organized in 1986 to provide business management, advisory, administrative, and asset management consulting services to the Trust and other investors. The Manager is registered as an investment advisor under the Investment Advisers Act of 1940, as amended (the “Advisers Act”). The Manager is an indirect wholly-owned subsidiary of Resolute Topco, Inc. (“Topco”), which is owned primarily by various institutional investment funds that are managed by financial institutions and other investment advisory firms. No owner of Topco owns 25% or more of the outstanding equity or voting interests of Topco.
Effective December 29, 2023, the Manager underwent a change of control, which resulted in the termination of the Fund’s previous management and investment advisory agreements. The Board of Trustees (“the “Board”) approved a new Management Agreement with the Manager and a new Investment Advisory Agreement among the Manager, each sub-advisor and the Trust, on behalf of the Fund, that were effective on December 29, 2023.
Recently Adopted Accounting Pronouncements
In March 2020, the Financial Accounting Standards Board (“FASB”) issued Accounting Standards Update (“ASU”) No. 2020-04, Reference Rate Reform (Topic 848); Facilitation of the Effects of Reference Rate Reform on Financial Reporting, which provides optional guidance for a limited period of time to ease the potential burden in accounting for (or recognizing the effects of) reference rate reform. The guidance is applicable to contracts referencing London Interbank Offered Rate (“LIBOR”) or another reference rate that is expected to be discontinued due to reference rate reform. The ASU is effective as of March 12, 2020 and generally can be applied through December 31, 2022. In December 2022, the FASB issued ASU No. 2022-06 Reference Rate Reform (Topic 848): Deferral of the Sunset Date of Topic 848 which updates and clarifies ASU No. 2020-04. The amendments in this ASU defer the sunset date of Topic 848 from December 31, 2022, to December 31, 2024. Management has concluded that these ASUs will not have a material impact on the Fund’s financial statements.
In June 2022, the FASB issued ASU No. 2022-03, Fair Value Measurement (Topic 820); Fair Value Measurement of Equity Securities Subject to Contractual Sale Restrictions, which provides clarifying guidance that a contractual restriction on the sale of an equity security is not considered part of the unit of account of the equity security and, therefore, is not considered in measuring fair value. The ASU is effective for fiscal years beginning after December 15, 2023, and interim periods within those fiscal years. Management has concluded that the ASU will not have a material impact on the Fund’s financial statements.
20
American Beacon Balanced FundSM
Notes to Financial Statements
October 31, 2024
Class Disclosure
The Fund has multiple classes of shares designed to meet the needs of different groups of investors. The following table sets forth the differences amongst the classes:
| | | | | | |
Class | | Eligible Investors | | Minimum Initial
Investments | |
| R5 Class | | Large institutional investors - sold directly or through intermediary channels. | | $ | 250,000 | |
| | |
| Y Class | | Large institutional retirement plan investors - sold directly or through intermediary channels. | | $ | 100,000 | |
| | |
| Investor Class | | All investors using intermediary organizations, such as broker-dealers or retirement plan sponsors. | | $ | 2,500 | |
| | |
| Advisor Class | | All investors who invest through intermediary organizations, such as broker-dealers or third party administrators. | | $ | 2,500 | |
| | |
| A Class | | All investors who invest through intermediary organizations, such as broker-dealers or third party administrator. Retail investors who invest directly through a financial intermediary such as a broker, bank, or registered investment advisor which may include a front-end sales charge and a contingent deferred sales charge (“CDSC”). | | $ | 2,500 | |
| | |
| C Class | | Retail investors who invest directly through a financial intermediary such as a broker or through employee directed benefit plans with applicable sales charges which may include CDSC. | | $ | 1,000 | |
Each class offered by the Trust has equal rights as to assets and voting privileges. Income and non-class specific expenses are allocated daily to each class based on the relative net assets. Realized and unrealized capital gains and losses of each class are allocated daily based on the relative net assets of each class of the respective Fund. Class specific expenses, where applicable, currently include service, distribution, transfer agent fees, and sub-transfer agent fees that vary amongst the classes as described more fully in Note 2.
Significant Accounting Policies
The following is a summary of significant accounting policies, consistently followed by the Fund in preparation of the financial statements. The Fund is considered an investment company and accordingly, follows the investment company accounting and reporting guidance of the FASB Accounting Standards Codification Topic 946, Financial Services – Investment Companies, a part of Generally Accepted Accounting Principles (“U.S. GAAP”).
Security Transactions and Investment Income
Security transactions are recorded as of the trade date for financial reporting purposes. Securities purchased or sold on a when-issued or delayed-delivery basis may be settled beyond a standard settlement period for the security after the trade date.
Dividend income, net of foreign taxes, is recorded on the ex-dividend date, except certain dividends from foreign securities which are recorded as soon as the information is available to the Fund. Tax reclaim accruals are automatically generated on accounting and custody systems at the time of the income event based on the tax databases maintained by the Fund’s custodian. Reconciliations are performed between custody and accounting systems to help ensure reclaim accruals are in line. Interest income, net of foreign taxes, is earned from settlement date, recorded on the accrual basis, and adjusted, if necessary, for accretion of discounts and amortization of premiums. For convertible securities, premiums attributable to the conversion feature are not amortized. Realized gains (losses) from securities sold are determined on the basis of specific lot identification. Estimated tax liabilities on certain foreign securities are recorded on an accrual basis and are reflected as components of interest income or net change in unrealized appreciation (depreciation) on investments on the Statement of Operations, as appropriate. Tax liabilities realized as a result of such security sales are reflected as a component of net realized gain (loss) on investments on the Statement of Operations. Paydown gains (losses)
21
American Beacon Balanced FundSM
Notes to Financial Statements
October 31, 2024
on mortgage-related and other asset-backed securities, if any, are recorded as components of interest income on the Statement of Operations. Income or short-term capital gain distributions received from registered investment companies, if any, are recorded as dividend income. Long-term gain distributions received from registered investment companies, if any, are recorded as realized gains.
Debt obligations may be placed on a non-accrual status and related interest income may be reduced by ceasing current accruals and writing off interest receivable when the collection of all or a portion of interest has become doubtful based on consistently applied procedures. A debt obligation is removed for non-accrual when the issuer resumes interest payments or when collectability of interest is probable. Realized gains (losses) from securities sold are determined on the basis of specific lot identification.
Distributions to Shareholders
The Fund distributes most or all of its net earnings and realized gains, if any, each taxable year in the form of dividends from net investment income on a quarterly basis and distributions of realized net capital gains and net gains or losses from foreign currency transactions on an annual basis. The Fund does not have a fixed dividend rate and does not guarantee that it will pay any distributions in any particular period. Dividends to shareholders are determined in accordance with federal income tax regulations, which may differ in amount and character from net investment income and realized gains recognized for purposes of U.S. GAAP. To the extent necessary to fully distribute capital gains, the Fund may designate earnings and profits distributed to shareholders on the redemption of shares.
Commission Recapture
The Fund has established brokerage commission recapture arrangements with certain brokers or dealers. If the Fund’s investment advisor chooses to execute a transaction through a participating broker, the broker rebates a portion of the commission back to the Fund. Any collateral benefit received through participation in the commission recapture program is directed exclusively to the Fund. This amount is reported with the net realized gain (loss) in the Fund’s Statement of Operations, if applicable.
Allocation of Income, Trust Expenses, Gains, and Losses
Investment income and realized and unrealized gains and losses from investments of the Fund are allocated daily to each class of shares based upon the relative proportion of net assets of each class to the total net assets of the Fund. Expenses directly charged or attributable to the Fund will be paid from the assets of the Fund. Generally, expenses of the Trust will be allocated among and charged to the assets of the Fund on a basis that the Trust’s Board deems fair and equitable, which may be based on the relative net assets of the Fund or nature of the services performed and relative applicability to the Fund.
Use of Estimates
The preparation of financial statements in conformity with U.S. GAAP requires management to make estimates and assumptions that affect the amounts reported in the financial statements and accompanying notes. Actual results may differ from those estimated.
Other
Under the Trust’s organizational documents, its officers and trustees are indemnified against certain liabilities arising out of the performance of their duties to the Trust. In the normal course of business, the Trust enters into contracts that provide indemnification to the other party or parties against potential costs or liabilities. The Trust’s maximum exposure under these arrangements is dependent on claims that may be made in the future and, therefore, cannot be estimated. The Trust has had no prior claims or losses pursuant to any such agreement.
22
American Beacon Balanced FundSM
Notes to Financial Statements
October 31, 2024
2. Transactions with Affiliates
Management and Investment Sub-Advisory Agreements
The Fund and the Manager are parties to a Management Agreement that obligates the Manager to provide the Fund with investment advisory and administrative services. As compensation for performing the duties under the Management Agreement, the Manager will receive an annualized management fee based on a percentage of the Fund’s average daily net assets that is calculated and accrued daily according to the following schedule:
| | | | |
First $ 15 billion | | | 0.35 | % |
Next $15 billion | | | 0.325 | % |
Over $30 billion | | | 0.30 | % |
The Manager also receives a fee of 0.15% of the average daily net assets of the Fund as compensation for the management of a portion of the Fund’s assets.
The Trust, on behalf of the Fund, and the Manager have entered into Investment Advisory Agreements with Barrow, Hanley, Mewhinney & Strauss, LLC and Hotchkis and Wiley Capital Management, LLC (the “Sub-Advisors”) pursuant to which the Fund has agreed to pay an annualized sub-advisory fee that is calculated and accrued daily based on the Fund’s average daily net assets.
The Management and Sub-Advisory Fees paid by the Fund for the year ended October 31, 2024 were as follows:
| | | | | | | | | | | | |
| | | Effective Fee Rate | | | | | | Amount of Fees Paid | |
Management Fees | | | 0.35 | % | | | | | | $ | 396,763 | |
Sub-Advisory Fees | | | 0.17 | % | | | | | | | 188,601 | |
| | | | | | | | | | | | |
Total | | | 0.52 | % | | | | | | $ | 585,364 | |
| | | | | | | | | | | | |
As compensation for services provided by the Manager in connection with securities lending activities conducted by a Fund, the lending Fund pays to the Manager, with respect to cash collateral posted by borrowers, a fee of 10% of the net monthly investment income (the income earned in the form of interest, dividends and realized capital gains from the investment of cash collateral, plus any negative rebate fees paid by borrowers, less the rebate amount paid to borrowers as well as related expenses) and, with respect to collateral other than cash, a fee up to 10% of loan fees and demand premiums paid by borrowers. These fees are included in “Income derived from securities lending” and “Management and sub-advisory fees” on the Statement of Operations. During the year ended October 31, 2024, the Manager received securities lending fees of $1,301 for the securities lending activities of the Fund.
Distribution Plans
Separate Distribution Plans (the “Distribution Plans”) have been adopted pursuant to Rule 12b-1 under the Act for the Advisor, A, and C Classes of the Fund. Under the Distribution Plans, as compensation for distribution and shareholder servicing assistance, the Manager receives an annual fee of 0.25% of the average daily net assets of the Advisor and A Classes and 1.00% of the average daily net assets of the C Class. The fee will be payable without regard to whether the amount of the fee is more or less than the actual expenses incurred in a particular month by the Manager for distribution assistance.
Service Plans
The Manager and the Trust entered into a Service Plan that obligates the Manager to oversee additional shareholder servicing of the Investor, Advisor, A, and C Classes of the Fund. As compensation for performing the duties required under the Service Plan, the Manager receives an annualized fee up to 0.25% of the average daily
23
American Beacon Balanced FundSM
Notes to Financial Statements
October 31, 2024
net assets of the A and C Classes, up to 0.25% of the average daily net assets of the Advisor Class, and up to 0.375% of the average daily net assets of the Investor Class of the Fund.
Sub-Transfer Agent Fees
The Manager has entered into agreements, which include servicing agreements, with financial intermediaries that provide recordkeeping, processing, shareholder communications and other services to customers of the intermediaries that hold positions in the R5 and Y Classes of the Fund and has agreed to compensate the intermediaries for providing these services. Intermediaries transact with the Fund primarily through the use of omnibus accounts on behalf of its customers who hold positions in the Fund. Certain services would have been provided by the Fund’s transfer agent and other service providers if the shareholders’ accounts were maintained directly by the Fund’s transfer agent. Accordingly, the Fund, pursuant to Board approval, has agreed to reimburse the Manager for certain non-distribution shareholder services provided by financial intermediaries for the R5 and Y Classes. The reimbursement amounts (sub-transfer agent fees) paid to the Manager are subject to a fee limit of up to 0.10% of an intermediary’s average net assets in the R5 and Y Classes on an annual basis. During the year ended October 31, 2024, the sub-transfer agent fees, as reflected in “Transfer agent fees” on the Statement of Operations, were as follows:
| | | | |
Fund | | Sub-Transfer Agent Fees | |
Balanced | | $ | 26,864 | |
As of October 31, 2024, the Fund owed the Manager the following reimbursement of sub-transfer agent fees, as reflected in “Transfer agent fees payable” on the Statement of Assets and Liabilities:
| | | | |
Fund | | Reimbursement
Sub-Transfer Agent Fees | |
Balanced | | $ | 2,680 | |
Investments in Affiliated Funds
The Fund may invest in the American Beacon U.S. Government Money Market Select Fund (the “USG Select Fund”). Cash collateral received by the Fund in connection with securities lending may also be invested in the USG Select Fund. The Fund listed below held the following shares with an October 31, 2024 fair value and dividend income earned from the investment in the USG Select Fund.
| | | | | | | | | | | | | | | | | | | | | | | | | | | | | | | | | | | | | | | | | | | | | | | | | | |
Affiliated Security | | Type of
Transaction | | | | | Fund | | | | | | October 31,
2024
Shares/Principal | | | | | | Change in
Unrealized
Gain (Loss) | | | | | | Realized
Gain
(Loss) | | | | | | Dividend
Income | | | | | | October 31,
2024
Fair Value | |
| U.S. Government Money Market Select | | Direct | | | | | | | Balanced | | | | | | | $ | 2,401,833 | | | | | | | $ | - | | | | | | | $ | - | | | | | | | $ | 156,335 | | | | | | | $ | 2,401,833 | |
| U.S. Government Money Market Select | | Securities
Lending | | | | | | | Balanced | | | | | | | | 398,300 | | | | | | | | - | | | | | | | | - | | | | | | | | N/A | | | | | | | | 398,300 | |
The Fund and the USG Select Fund have the same investment advisor and therefore, are considered to be affiliated. The Manager serves as investment advisor to the USG Select Fund and receives management fees and administrative fees totaling 0.10% of the average daily net assets of the USG Select Fund. During the year ended October 31, 2024, the Manager earned fees on the Fund’s direct investments and securities lending collateral investments in the USG Select Fund as shown below:
| | | | | | | | | | | | |
Fund | | Direct Investments in
USG Select Fund | | | Securities Lending
Collateral
Investments in USG
Select Fund | | | Total | |
Balanced | | $ | 3,021 | | | $ | 688 | | | $ | 3,709 | |
24
American Beacon Balanced FundSM
Notes to Financial Statements
October 31, 2024
Interfund Credit Facility
Pursuant to an exemptive order issued by the U.S. Securities and Exchange Commission (“SEC”), the Fund, along with other registered investment companies having management contracts with the Manager, may participate in a credit facility whereby each fund, under certain conditions, is permitted to lend money directly to and borrow directly from other participating funds for temporary purposes. The interfund credit facility is advantageous to the funds because it provides added liquidity and eliminates the need to maintain higher cash balances to meet redemptions. This situation could arise when shareholder redemptions exceed anticipated volumes and certain funds have insufficient cash on hand to satisfy such redemptions or when sales of securities do not settle as expected, resulting in a cash shortfall for the fund. When the fund liquidates portfolio securities to meet redemption requests, they often do not receive payment in settlement for up to two days (or longer for certain foreign transactions). Redemption requests normally are satisfied on the next business day. The credit facility provides a source of immediate, short-term liquidity pending settlement of the sale of portfolio securities. The credit facility is administered by a credit facility team consisting of professionals from the Manager’s asset management, compliance, and accounting areas who report the activities of the credit facility to the Board. During the year ended October 31, 2024, the Fund did not utilize the credit facility.
Expense Reimbursement Plan
The Fund has adopted an Expense Reimbursement Plan whereby the Manager may seek repayment of contractual or voluntary fee reductions and expense reimbursements. Under the policy, the Manager can be reimbursed by the Fund for any contractual or voluntary fee reductions or expense reimbursements if reimbursement to the Manager (a) occurs within three years from the date of the Manager’s waiver/reimbursement and (b) does not cause the Fund’s annual operating expenses to exceed the lesser of the contractual percentage limit in effect at the time of the waiver/reimbursement or time of recoupment. During the year ended October 31, 2024 there were no waived fees, expenses reimbursed, or recouped expenses, and no commitment or contingent liability is expected.
Sales Commissions
The Fund’s Distributor, Resolute Investment Distributors, Inc. (“RID” or “Distributor”), may receive a portion of A Class sales charges from broker dealers which may be used to offset distribution related expenses. During the year ended October 31, 2024, RID collected $5,161 from the sale of A Class Shares of the Fund.
A CDSC of 0.50% will be deducted with respect to A Class Shares on certain purchases of $1,000,000 or more that are redeemed in whole or part within 18 months of purchase, unless waived as discussed in the Fund’s Prospectus. Any applicable CDSC will be 0.50% of the lesser of the original purchase price or the value of the redemption of the A Class Shares redeemed. During the year ended October 31, 2024, there were no CDSC fees collected for the A Class Shares of the Fund.
A CDSC of 1.00% will be deducted with respect to C Class Shares redeemed within 12 months of purchase, unless waived as discussed in the Fund’s Prospectus. Any applicable CDSC will be 1.00% of the lesser of the original purchase price or the value of the redemption of the C Class Shares redeemed. During the year ended October 31, 2024, CDSC fees of $300 were collected for C Class Shares of the Fund.
Trustee Fees and Expenses
As compensation for their service to the American Beacon Funds Complex, including the Trust (collectively, the “Trusts”), each Trustee is compensated from the Trusts as follows: (1) an annual retainer of $140,000; (2) meeting attendance fee (for attendance in-person or via teleconference) of (a) $12,000 for in person attendance, or $5,000 for telephonic attendance, by Board members for each regularly scheduled or special Board meeting, (b) $2,500 for attendance by Committee members at meetings of the Audit and Compliance Committee and the
25
American Beacon Balanced FundSM
Notes to Financial Statements
October 31, 2024
Investment Committee, (c) $1,000 for attendance by Committee members at meetings of the Nominating and Governance Committee; and (d) $2,500 for attendance by Board members for each special telephonic Board meeting; and (3) reimbursement of reasonable expenses incurred in attending Board meetings, Committee meetings, and relevant educational seminars. For this purpose, the Board considers attendance at regular meetings held by video conference to constitute in-person attendance at a Board meeting. The Trustees also may be compensated for attendance at special Board and/or Committee meetings from time to time. For her service as Board Chair, Ms. Cline receives an additional annual retainer of $50,000. Although she attends several committee meetings at each quarterly Board meeting, she receives only a single $2,500 fee each quarter for her attendance at the Audit and Compliance Committee and Investment Committee meetings. The chairpersons of the Audit and Compliance Committee and the Investment Committee each receive an additional annual retainer of $25,000 and the Chair of the Nominating and Governance Committee receives an additional annual retainer of $10,000.
3. Security Valuation and Fair Value Measurements
The price of the Fund’s shares is based on its net asset value (“NAV”) per share. The Fund’s NAV is computed by adding total assets, subtracting all the Fund’s liabilities, and dividing the result by the total number of shares outstanding.
The NAV of each class of the Fund’s shares is determined based on a pro rata allocation of the Fund’s investment income, expenses and total capital gains and losses. The Fund’s NAV per share is determined each business day as of the regular close of trading on the New York Stock Exchange (“NYSE” or “Exchange”), which is typically 4:00 p.m. Eastern Time (“ET”). However, if trading on the NYSE closes at a time other than 4:00 p.m. ET, the Fund’s NAV per share typically would still be determined as of the regular close of trading on the NYSE. The Fund does not price its shares on days that the NYSE is closed. Foreign exchanges may permit trading in foreign securities on days when the Fund is not open for business, which may result in the value of the Fund’s portfolio investments being affected at a time when you are unable to buy or sell shares.
Equity securities, including shares of closed-end funds and exchange-traded funds (“ETFs”), are valued at the last sale price or official closing price taken from the primary exchange in which each security trades. Investments in other mutual funds are valued at the closing NAV per share on the day of valuation. Debt securities are valued at bid quotes from broker/dealers or evaluated bid prices from pricing services, who may consider a number of inputs and factors, such as prices of comparable securities, yield curves, spreads, credit ratings, coupon rates, maturity, default rates, and underlying collateral. Futures are valued based on their daily settlement prices. Exchange-traded and over-the-counter (“OTC”) options are valued at the last sale price. Options with no last sale for the day are priced at mid quote. Swaps are valued at evaluated mid prices from pricing services.
The valuation of securities traded on foreign markets and certain fixed-income securities will generally be based on prices determined as of the earlier closing time of the markets on which they primarily trade unless a significant event has occurred. When the Fund holds securities or other assets that are denominated in a foreign currency, the Fund will normally use the currency exchange rates as of 4:00 p.m. ET.
Rule 2a-5 under the Investment Company Act (the “Valuation Rule”) establishes requirements for determining fair value in good faith for purposes of the Investment Company Act, including related oversight and reporting requirements. The Valuation Rule also defines when market quotations are “readily available,” which is the threshold for determining whether a Fund must fair value a security. Among other things, the Valuation Rule permits the Board to designate the Manager as Valuation Designee to perform the Fund’s fair value determinations subject to board oversight and certain reporting and other requirements intended to ensure that the Board receives the information it needs to oversee the Manager’s fair value determinations.
Securities may be valued at fair value, as determined in good faith and pursuant to the Manager’s procedures, under certain limited circumstances. For example, fair value pricing will be used for fixed-income securities and when market quotations are not readily available or reliable, as determined by the Manager, such as
26
American Beacon Balanced FundSM
Notes to Financial Statements
October 31, 2024
when (i) trading for a security is restricted or stopped; (ii) a security’s trading market is closed (other than customary closings); or (iii) a security has been de-listed from a national exchange. A security with limited market liquidity may require fair value pricing if the Manager determines that the available price does not reflect the security’s true market value. In addition, if a significant event that the Manager determines to affect the value of one or more securities held by the Fund occurs after the close of a related exchange but before the determination of the Fund’s NAV, fair value pricing may be used on the affected security or securities. Securities of small-capitalization companies are also more likely to require a fair value determination using these procedures because they are more thinly traded and less liquid than the securities of larger-capitalization companies. The Fund may fair value securities as a result of significant events occurring after the close of the foreign markets in which the Fund invests as described below. In addition, the Fund may invest in illiquid securities requiring these procedures.
The Fund may use fair value pricing for securities primarily traded in non-U.S. markets because most foreign markets close well before the Fund’s pricing time of 4:00 p.m. ET. The earlier close of these foreign markets gives rise to the possibility that significant events, including broad market moves, may have occurred in the interim and may materially affect the value of those securities. If the Manager determines that the last quoted prices of non-U.S. securities will, in its judgment, materially affect the value of some or all the Fund’s portfolio securities, the Manager can adjust the previous closing prices to reflect what it believes to be the fair value of the securities as of the close of the Exchange. In deciding whether it is necessary to adjust closing prices to reflect fair value, the Manager reviews a variety of factors, including developments in foreign markets, the performance of U.S. securities markets, and the performance of instruments trading in U.S. markets that represent foreign securities and baskets of foreign securities. These securities are fair valued using a pricing service, using methods approved by the Manager, that considers the correlation of the trading patterns of the foreign security to intraday trading in the U.S. markets, based on indices of domestic securities and other appropriate indicators such as prices of relevant American Depositary Receipts (“ADRs”) and futures contracts. The Manager’s Valuation Committee may also fair value securities in other situations, such as when a particular foreign market is closed but the Fund is open. The Fund uses outside pricing services to provide closing prices and information to evaluate and/or adjust those prices. As a means of evaluating its security valuation process, the Valuation Committee routinely compares closing prices, the next day’s opening prices in the same markets and adjusted prices.
Attempts to determine the fair value of securities introduce an element of subjectivity to the pricing of securities. As a result, the price of a security determined through fair valuation techniques may differ from the price quoted or published by other sources and may not accurately reflect the market value of the security when trading resumes. If a reliable market quotation becomes available for a security formerly valued through fair valuation techniques, the Manager compares the new market quotation to the fair value price to evaluate the effectiveness of the Fund’s fair valuation procedures. If any significant discrepancies are found, the Manager may adjust Manager’s fair valuation procedures for the Fund.
Valuation Inputs
Various inputs may be used to determine the fair value of the Fund’s investments. These inputs are summarized in three broad levels for financial statement purposes. The inputs or methodologies used to value securities are not necessarily an indication of the risk associated with investing in those securities.
| | | | |
| Level 1 | | - | | Quoted prices in active markets for identical securities. |
| | |
| Level 2 | | - | | Prices determined using other significant observable inputs. These may include quoted prices for similar securities, interest rates, prepayment speeds, credit risk, and others. |
| | |
| Level 3 | | - | | Prices determined using other significant unobservable inputs. Unobservable inputs reflect the Fund’s own assumptions about the factors market participants would use in pricing an investment. |
27
American Beacon Balanced FundSM
Notes to Financial Statements
October 31, 2024
Level 1 and Level 2 trading assets and trading liabilities, at fair value
Common stocks, preferred securities and financial derivative instruments, such as futures contracts that are traded on a national securities exchange, are stated at the last reported sale or settlement price on the day of valuation. To the extent these securities are actively traded and valuation adjustments are not applied, they are categorized as Level 1 of the fair value hierarchy. Preferred securities and other equities traded on inactive markets or valued by reference to similar instruments are generally categorized as Level 2 of the fair value hierarchy.
With respect to the Fund’s investments that do not have readily available market quotations, the Board has designated the Adviser as its valuation designee to perform fair valuations pursuant to Rule 2a-5 under the Act (the “Valuation Designee”). If market prices are not readily available or are deemed unreliable, the Valuation Designee will use the fair value of the security or other instrument as determined in good faith under policies and procedures established by and under the oversight of the Board (“Valuation Procedures”). Market prices are considered not readily available where there is an absence of current or reliable market-based data (e.g., trade information or broker quotes), including where events occur after the close of the relevant market, but prior to the NYSE Close, that materially affect the values of the Fund’s portfolio holdings or assets. In addition, market prices are considered not readily available when, due to extraordinary circumstances, the exchanges or markets on which the securities or other instruments trade do not open for trading for the entire day and no other market prices are available. Fair value pricing is subjective in nature and the use of fair value pricing by the Valuation Designee may cause the NAV of the Fund’s shares to differ significantly from the NAV that would have been calculated using market prices at the close of the exchange on which a portfolio holding is primarily traded. There can be no assurance that the Fund could obtain the fair value assigned to an investment if the Fund were to sell the investment at approximately the time at which the Fund determines its NAV.
Fixed-income securities including corporate, convertible and municipal bonds and notes, U.S. government agencies, U.S. Treasury obligations, sovereign issues, bank loans, convertible preferred securities, and non-U.S. bonds are normally valued by pricing service providers that use broker dealer quotations, reported trades or valuation estimates from their internal pricing models. The service providers’ internal models use inputs that are observable such as issuer details, interest rates, yield curves, prepayment speeds, credit risks/spreads, default rates, and quoted prices for similar assets. Securities that use similar valuation techniques and inputs as described above are categorized as Level 2 of the fair value hierarchy. Fixed-income securities purchased on a delayed-delivery basis are marked-to- market daily until settlement at the forward settlement date and are categorized as Level 2 of the fair value hierarchy.
Mortgage-related and asset-backed securities (“ABS”) are usually issued as separate tranches, or classes, of securities within each deal. These securities are also normally valued by pricing service providers that use broker-dealer quotations or valuation estimates from their internal pricing models. The pricing models for these securities usually consider tranche-level attributes, current market data, estimated cash flows, and market-based yield spreads for each tranche, and incorporates deal collateral performance, as available. Mortgage-related and ABS that use similar valuation techniques and inputs as described above are categorized as Level 2 of the fair value hierarchy.
Investments in registered open-end investment management companies will be valued based upon the NAVs of such investments and are categorized as Level 1 of the fair value hierarchy.
4. Securities and Other Investments
Agency Mortgage-Backed Securities
Certain mortgage-backed securities (“MBS”) may be issued or guaranteed by the U.S. government or a government sponsored entity, such as the Federal National Mortgage Association (“Fannie Mae”) or the Federal Home Loan Mortgage Corporation (“Freddie Mac”). Although these instruments may be guaranteed by the U.S. government or a government sponsored entity, many such MBS are not backed by the full faith and credit of the United States and are still exposed to the risk of non-payment.
28
American Beacon Balanced FundSM
Notes to Financial Statements
October 31, 2024
American Depositary Receipts and Non-Voting Depositary Receipts
ADRs are depositary receipts for foreign issuers in registered form traded in U.S. securities markets. Non-Voting Depositary Receipts (“NVDRs”) represent financial interests in an issuer but the holder is not entitled to any voting rights. Depositary receipts may not be denominated in the same currency as the securities into which they may be converted. Investing in depositary receipts entails substantially the same risks as direct investment in foreign securities. There is generally less publicly available information about foreign companies and there may be less governmental regulation and supervision of foreign stock exchanges, brokers, and listed companies. In addition, such companies may use different accounting and financial standards (and certain currencies may become unavailable for transfer from a foreign currency), resulting in the Fund’s possible inability to convert immediately into U.S. currency proceeds realized upon the sale of portfolio securities of the affected foreign companies. In addition, the Fund may invest in unsponsored depositary receipts, the issuers of which are not obligated to disclose material information about the underlying securities to investors in the United States. Ownership of unsponsored depositary receipts may not entitle the Fund to the same benefits and rights as ownership of a sponsored depositary receipt or the underlying security.
Asset-Backed Securities (“ABS”)
ABS are securities issued by trusts and special purpose entities that are backed by pools of assets, such as automobile and credit-card receivables, home equity loans, and student loans, which pass through the payments on the underlying obligations to the security holders (less servicing fees paid to the originator or fees for any credit enhancement). Typically, loans or accounts receivable paper are transferred from the originator to a specially created trust, which repackages the trust’s interests as securities with a minimum denomination and a specific term. The securities are then privately placed or publicly offered. Examples include certificates for automobile receivables and so-called plastic bonds, backed by credit card receivables. The Fund is permitted to invest in ABS, subject to the Fund’s rating and quality requirements.
The value of an ABS is affected by, among other things, changes in the market’s perception of the asset backing the security, the creditworthiness of the servicing agent for the loan pool, the originator of the loans and the financial institution providing any credit enhancement. Payments of principal and interest passed through to holders of ABS are frequently supported by some form of credit enhancement, such as a letter of credit, surety bond, limited guarantee by another entity or by having a priority to certain of the borrower’s other assets. The degree of credit enhancement varies, and generally applies to only a portion of the ABS’s par value. Value is also affected if any credit enhancement has been exhausted.
Common Stock
Common stock generally takes the form of shares in a corporation which represent an ownership interest. It ranks below preferred stock and debt securities in claims for dividends and for assets of the company in a liquidation or bankruptcy. The value of a company’s common stock may fall as a result of factors directly relating to that company, such as decisions made by its management or decreased demand for the company’s products or services. A stock’s value may also decline because of factors affecting not just the company, but also companies in the same industry or sector. The price of a company’s stock may also be affected by changes in financial markets that are relatively unrelated to the company, such as changes in interest rates, currency exchange rates or industry regulation. Companies that elect to pay dividends on their common stock generally only do so after they invest in their own business and make required payments to bondholders and on other debt and preferred stock. Therefore, the value of a company’s common stock will usually be more volatile than its bonds, other debt and preferred stock. Common stock may be exchange-traded or OTC. OTC stock may be less liquid than exchange-traded stock.
Fixed-Income Investments
The Fund may hold debt, including government and corporate debt, and other fixed-income securities. Typically, the values of fixed-income securities change inversely with prevailing interest rates. Therefore, a
29
American Beacon Balanced FundSM
Notes to Financial Statements
October 31, 2024
fundamental risk of fixed-income securities is interest rate risk, which is the risk that their value will generally decline as prevailing interest rates rise, which may cause the Fund’s NAV to likewise decrease, and vice versa. How specific fixed-income securities may react to changes in interest rates will depend on the specific characteristics of each security. For example, while securities with longer maturities tend to produce higher yields, they also tend to be more sensitive to changes in prevailing interest rates and are, therefore, more volatile than shorter-term securities and are subject to greater market fluctuations as a result of changes in interest rates. Fixed-income securities are also subject to credit risk, which is the risk that the credit strength of an issuer of a fixed-income security will weaken and/or that the issuer will be unable to make timely principal and interest payments and that the security may go into default. In addition, there is prepayment risk, which is the risk that during periods of falling interest rates, certain fixed-income securities with higher interest rates, such as MBS and ABS, may be prepaid by their issuers thereby reducing the amount of interest payments. This may result in the Fund having to reinvest its proceeds in lower yielding securities. Securities underlying MBS and ABS, which may include subprime mortgages, also may be subject to a higher degree of credit risk, valuation risk, and liquidity risk.
Illiquid and Restricted Securities
Generally, an illiquid asset is an asset that the Fund reasonably expects cannot be sold or disposed of in current market conditions in seven calendar days or less without the sale or disposition significantly changing the market value of the investment, as determined pursuant to Rule 22e-4 under the Act or as otherwise permitted or required by SEC rules and interpretations. Historically, illiquid securities have included securities that have not been registered under the Securities Act, securities that are otherwise not readily marketable, and repurchase agreements having a remaining maturity of longer than seven calendar days. Securities that have not been registered under the Securities Act are referred to as private placements or restricted securities and are purchased directly from the issuer or in the secondary market. These securities may be sold only in a privately negotiated transaction or pursuant to an exemption from registration. A large institutional market exists for certain securities that are not registered under the Securities Act, including repurchase agreements, commercial paper, foreign securities, municipal securities and corporate bonds and notes. Institutional investors depend on an efficient institutional market in which the unregistered security can be readily resold or on an issuer’s ability to honor a demand for repayment. However, the fact that there are contractual or legal restrictions on resale of such investments to the general public or to certain institutions may not be indicative of their liquidity.
Limitations on resale may have an adverse effect on the marketability of portfolio securities, and the Fund might be unable to dispose of restricted or other illiquid securities promptly or at reasonable prices and might thereby experience difficulty satisfying redemptions within seven calendar days. In addition, the Fund may get only limited information about an issuer, so it may be less able to predict a loss. The Fund also might have to register such restricted securities in order to dispose of them resulting in additional expense and delay. Adverse market conditions could impede such a public offering of securities.
In recognition of the increased size and liquidity of the institutional market for unregistered securities and the importance of institutional investors in the formation of capital, the SEC adopted Rule 144A under the Securities Act. Rule 144A is designed to facilitate efficient trading among institutional investors by permitting the sale of certain unregistered securities to qualified institutional buyers. To the extent privately placed securities held by the Fund qualify under Rule 144A and an institutional market develops for those securities, the Fund likely will be able to dispose of the securities without registering them under the Securities Act. To the extent that institutional buyers become, for a time, uninterested in purchasing these securities, investing in Rule 144A securities could increase the level of the Fund’s illiquidity. The Manager or the Sub-Advisor, as applicable, may determine that certain securities qualified for trading under Rule 144A are liquid. Regulation S under the Securities Act permits the sale abroad of securities that are not registered for sale in the United States and includes a provision for U.S. investors, such as the Fund, to purchase such unregistered securities if certain conditions are met.
Securities sold in private placement offerings made in reliance on the “private placement” exemption from registration afforded by Section 4(a)(2) of the Securities Act and resold to qualified institutional buyers under Rule 144A under the Securities Act (“Section 4(a)(2) securities”) are restricted as to disposition under the federal
30
American Beacon Balanced FundSM
Notes to Financial Statements
October 31, 2024
securities laws, and generally are sold to institutional investors, such as the Fund, that agree they are purchasing the securities for investment and not with an intention to distribute to the public. Any resale by the purchaser must be pursuant to an exempt transaction and may be accomplished in accordance with Rule 144A. Section 4(a)(2) securities normally are resold to other institutional investors through or with the assistance of the issuer or dealers that make a market in the Section 4(a)(2) securities, thus providing liquidity. The Manager and the sub-advisor will carefully monitor the Fund’s investments in Section 4(a)(2) securities offered and sold under Rule 144A, focusing on such important factors, among others, as valuation, liquidity, and availability of information. Investments in Section 4(a)(2) securities could have the effect of reducing the Fund’s liquidity to the extent that qualified institutional buyers no longer wish to purchase these restricted securities.
Restricted securities outstanding during the year ended October 31, 2024 are disclosed in the Notes to the Schedule of Investments.
Mortgage-Backed Securities
MBS often have stated maturities of up to thirty years when they are issued, depending upon the length of the mortgages underlying the securities. In practice however, unscheduled or early payments of principal and interest on the underlying mortgages may make the securities’ effective maturity shorter than this, and the prevailing interest rates may be higher or lower than the current yield of the Fund’s portfolio at the time resulting in reinvestment risk.
Rising or high interest rates may result in slower than expected principal payments which may tend to extend the duration of MBS, making them more volatile and more sensitive to changes in interest rates. This is known as extension risk.
MBS may have less potential for capital appreciation than comparable fixed-income securities due to the likelihood of increased prepayments of mortgages resulting from foreclosures or declining interest rates. These foreclosed or refinanced mortgages are paid off at face value (par) or less, causing a loss, particularly for any investor who may have purchased the security at a premium or a price above par. In such an environment, this risk limits the potential price appreciation of these securities.
Mortgage-Related and Other Asset-Backed Securities
The Fund may invest in mortgage or other ABS. These securities may include mortgage instruments issued by U.S. government agencies (“agency mortgages”) or those issued by private entities (“non-agency mortgages”). Specific types of instruments may include mortgage pass-through securities, collateralized mortgage obligations (“CMOs”), commercial mortgage-backed securities, mortgage dollar rolls, CMO residuals, stripped mortgage-backed securities and other securities that directly or indirectly represent a participation in, or are secured by a payable from, mortgage loans on real property. The value of the Fund’s MBS may be affected by, among other things, changes or perceived changes in interest rates, factors concerning the interests in and structure of the issuer or the originator of the mortgage, or the quality of the underlying assets. The mortgages underlying the securities may default or decline in quality or value. Through its investments in MBS, the Fund has exposure to subprime loans, Alt-A loans and non-conforming loans as well as to the mortgage and credit markets generally. Underlying collateral related to subprime, Alt-A and non-conforming mortgage loans has become increasingly susceptible to defaults and declines in quality or value, especially in a declining residential real estate market. In addition, regulatory or tax changes may adversely affect the mortgage securities markets as a whole.
Other Investment Company Securities and Other Exchange-Traded Products
The Fund may invest in shares of other investment companies, including open-end funds, closed-end funds, business development companies (“BDCs”), ETFs, unit investment trusts, and other investment companies of the Trust. The Fund may invest in securities of an investment company advised by the Manager or the Sub-Advisor.
31
American Beacon Balanced FundSM
Notes to Financial Statements
October 31, 2024
Investments in the securities of other investment companies may involve duplication of advisory fees and certain other expenses. By investing in another investment company, the Fund becomes a shareholder of that investment company. As a result, the Fund shareholders indirectly will bear the Fund’s proportionate share of the fees and expenses paid by shareholders of the other investment company, in addition to the fees and expenses the Fund shareholders directly bear in connection with the Fund’s own operations. These other fees and expenses are reflected as Acquired Fund Fees and Expenses and are included in the Fees and Expenses Table for the Fund in its Prospectus, if applicable. Investments in other investment companies may involve the payment of substantial premiums above the value of such issuer’s portfolio securities.
Privately Issued Mortgage-Backed Securities
Pools created by non-governmental issuers generally offer a higher rate of interest than government and government-related pools because there are no direct or indirect government guarantees of payments in such pools. However, timely payment of interest and principal of these pools is often partially supported by various enhancements such as over-collateralization and senior/subordination structures and by various forms of insurance or guarantees, including individual loan, title, pool and hazard insurance. The insurance and guarantees are issued by government entities, private insurers or the mortgage poolers. Although the market for such securities is becoming increasingly liquid, securities issued by certain private organizations may not be readily marketable.
Publicly Traded Partnerships/Master Limited Partnerships (“MLPs”)
The Fund may invest in publicly traded partnerships such as MLPs. MLPs issue units that are registered with the SEC and are freely tradable on a securities exchange or in the OTC market. An MLP may have one or more general partners, who conduct the business, and one or more limited partners, who contribute capital. The general partner or partners are jointly and severally responsible for the liabilities of the MLP. (An MLP also may be an entity similar to a limited partnership, such as an LLC, which has one or more managers or managing members and non-managing members (who are like limited partners)). The Fund invests in an MLP as a limited partner and normally would not be liable for the debts of an MLP beyond the amount the Fund has invested therein, but it would not be shielded to the same extent that a shareholder of a corporation would be. In certain instances, creditors of an MLP would have the right to seek a return of capital that had been distributed to a limited partner. The right of an MLP’s creditors would continue even after the Fund had sold its investment in the partnership. MLPs typically invest in real estate and oil and gas equipment leasing assets, but they also finance entertainment, research and development, and other projects.
Real Estate Investment Trusts (“REITs”)
REITs are pooled investment vehicles that own, and often operate, income producing real estate or invest in mortgages secured by loans on such real estate or both. REITs are susceptible to the risks associated with direct ownership of real estate, such as declines in property values, increase in property taxes, operating expenses, rising interest rates or overbuilding, zoning changes, and losses from casualty or condemnation. REITs typically are subject to management fees and other expenses that are separate from those of the Fund.
U.S. Government Agency Securities
U.S. Government agency securities are issued or guaranteed by the U.S. Government or its agencies or instrumentalities. Some obligations issued by U.S. Government agencies and instrumentalities are supported by the full faith and credit of the U.S. Treasury; others by the right of the issuer to borrow from the U.S. Treasury; others by discretionary authority of the U.S. Government to purchase certain obligations of the agency or instrumentality; and others only by the credit of the agency or instrumentality. U.S. Government securities bear fixed, floating or variable rates of interest. While the U.S. Government currently provides financial support to certain U.S. Government-sponsored agencies or instrumentalities, no assurance can be given that it will always do so, since it is not so obligated by law. U.S. Government securities include U.S. Treasury bills, notes and bonds, Federal Home
32
American Beacon Balanced FundSM
Notes to Financial Statements
October 31, 2024
Loan Bank (“FHLB”) obligations, Federal Farm Credit Bank (“FFCB”) obligations, U.S. Government agency obligations and repurchase agreements secured thereby. U.S. Government agency securities are subject to credit risk and interest rate risk.
U.S. Treasury Obligations
U.S. Treasury obligations include bills (initial maturities of one year or less), notes (initial maturities between two and ten years), and bonds (initial maturities over ten years) issued by the U.S. Treasury, Separately Traded Registered Interest and Principal component parts of such obligations (known as “STRIPS”) and inflation-indexed securities. The prices of these securities (like all debt securities) change between issuance and maturity in response to fluctuating market interest rates. U.S. Treasury obligations are subject to credit risk and interest rate risk.
Variable or Floating Rate Obligations
The interest rates payable on certain fixed-income securities in which the Fund may invest are not fixed and may fluctuate based upon changes in market rates. A variable rate obligation has an interest rate which is adjusted at predesignated periods in response to changes in the market rate of interest on which the interest rate is based. Variable and floating rate obligations are less effective than fixed rate instruments at locking in a particular yield. Nevertheless, such obligations may fluctuate in value in response to interest rate changes if there is a delay between changes in market interest rates and the interest reset date for the obligation, or for other reasons.
5. Financial Derivative Instruments
The Fund may utilize derivative instruments to gain market exposure on cash balances or reduce market exposure in anticipation of liquidity needs. When considering the Fund’s use of derivatives, it is important to note that the Fund does not use derivatives for the purpose of creating financial leverage.
Futures Contracts
A futures contract is a contract to purchase or sell a particular security, or the cash value of an asset, such as securities, indices, or currencies, at a specified future date at a price agreed upon when the contract is made. Under many such contracts, no delivery of the actual underlying asset is required. Rather, upon the expiration of the contract, settlement is made by exchanging cash in an amount equal to the difference between the contract price and the closing price of the asset (e.g., a security or an index) at expiration, net of the initial and variation margin that was previously paid. An equity index futures contract is based on the value of an underlying index. The Fund may, from time to time, use futures positions to equitize cash and expose its portfolio to changes in securities prices or index prices. This can magnify gains and losses in the Fund. The Fund also may have to sell assets at inopportune times to satisfy its settlement or collateral obligations. The risks associated with the use of futures contracts also include that there may be an imperfect correlation between the changes in market value of the prices of futures contracts and the assets underlying such contracts and that there may not be a liquid secondary market for a futures contract.
During the year ended October 31, 2024, the Fund entered into futures contracts primarily for exposing cash to markets.
The Fund’s average futures contracts outstanding fluctuate throughout the operating year as required to meet strategic requirements. The following table illustrates the average monthly volume of futures contracts. For the purpose of this disclosure, volume is measured by contracts outstanding at each month end.
| | | | |
Average Futures Contracts Outstanding | |
Fund | | Year Ended October 31, 2024 | |
Balanced | | | 12 | |
33
American Beacon Balanced FundSM
Notes to Financial Statements
October 31, 2024
The following is a summary of the fair valuations of the Fund’s derivative instruments categorized by risk exposure(1):
| | | | | | | | | | | | | | | | | | | | | | | | | | | | | | | | | | | | | | | | | | | | | | | | | | | | | | | |
| Fair values of financial instruments on the Statement of Assets and Liabilities as of October 31, 2024: | |
| | | |
| | | Derivatives not accounted for as hedging instruments | | | | |
| | | | | | | | | | | |
Liabilities: | | Credit contracts | | | | Foreign exchange
contracts | | | | Commodity
contracts | | | | Interest rate
contracts | | | | Equity contracts | | | | Total |
| Payable for variation margin from open futures contracts(2) | | | $ | – | | | | | | | | | $ | – | | | | | | | | | $ | – | | | | | | | | | $ | – | | | | | | | | | $ | (12,509 | ) | | | | | | | | $ | (12,509 | ) |
| | | | | | | | | | | | | | | | | | | | | | | | | | | | | | | | | | | | | | | | | | | | | | | | | | | | | | | |
| The effect of financial derivative instruments on the Statement of Operations as of October 31, 2024: | |
| | | |
| | | Derivatives not accounted for as hedging instruments | | | | |
| | | | | | | | | | | |
Realized gain (loss) from derivatives
recognized as a result of operations | | Credit contracts | | | | Foreign exchange
contracts | | | | Commodity
contracts | | | | Interest rate
contracts | | | | Equity contracts | | | | Total |
| Futures contracts | | | $ | – | | | | | | | | | $ | – | | | | | | | | | $ | – | | | | | | | | | $ | – | | | | | | | | | $ | 697,746 | | | | | | | | | $ | 697,746 | |
| | | | | | | | | | | |
Net change in unrealized appreciation
(depreciation) of derivatives recognized
as a result from operations: | | Credit contracts | | | | Foreign exchange
contracts | | | | Commodity
contracts | | | | Interest rate
contracts | | | | Equity contracts | | | | Total |
| Futures contracts | | | $ | – | | | | | | | | | $ | – | | | | | | | | | $ | – | | | | | | | | | $ | – | | | | | | | | | $ | 60,277 | | | | | | | | | $ | 60,277 | |
(1) See Note 3 in the Notes to Financial Statements for additional information.
(2) Includes cumulative appreciation (depreciation) of futures contracts as reported in the Fund’s Schedule of Investments footnotes. Only current day’s variation margin is reported within the Statement of Assets and Liabilities.
Offsetting Assets and Liabilities
The Fund is a party to enforceable master netting agreements between brokers and counterparties which provide for the right to offset under certain circumstances. The Fund employs multiple money managers and counterparties and has elected not to offset qualifying financial and derivative instruments on the Statement of Assets and Liabilities, as such all financial and derivative instruments are presented on a gross basis. The impacts of netting arrangements that provide the right to offset are detailed below, if applicable. The net amount represents the net receivable or payable that would be due from or to the counterparty in the event of default. Exposure from borrowings and other financing agreements such as repurchase agreements can only be netted across transactions governed by the same Master Agreement with the same legal entity. All amounts reported below represent the balance as of the report date, October 31, 2024.
| | | | | | | | | | | | |
| Offsetting of Financial and Derivative Assets as of October 31, 2024: | | | | | | | | | | | | |
| | Assets | | | | | | Liabilities | |
| Futures Contracts(1) | | $ | - | | | | | | | $ | 12,509 | |
| | | | | | | | | | | | |
| Total derivative assets and liabilities in the Statement of Assets and Liabilities | | $ | - | | | | | | | $ | 12,509 | |
| | | | | | | | | | | | |
| Derivatives not subject to a Master Netting Agreement or similar agreement (“MNA”) | | $ | - | | | | | | | $ | (12,509 | ) |
| | | | | | | | | | | | |
| | | | | | | | | | | | | | | | | | | | | | | | | | | | | | | | | | | | |
| | | Remaining Contractual Maturity of the Agreements
As of October 31, 2024 | |
| | | Overnight and
Continuous | | | | | | <30 days | | | | | | Between
30 & 90 days | | | | | | >90 days | | | | | | Total | |
Securities Lending Transactions | | | | | | | | | | | | | | | | | | | | | | | | | | | | | | | | | | | | |
Common Stocks | | $ | 398,300 | | | | | | | $ | - | | | | | | | | - | | | | | | | $ | - | | | | | | | $ | 398,300 | |
| | | | | | | | | | | | | | | | | | | | | | | | | | | | | | | | | | | | |
Total Borrowings | | $ | 398,300 | | | | | | | $ | - | | | | | | | $ | - | | | | | | | $ | - | | | | | | | $ | 398,300 | |
| | | | | | | | | | | | | | | | | | | | | | | | | | | | | | | | | | | | |
Gross amount of recognized liabilities for securities lending transactions | | | $ | 398,300 | |
| | | | | | | | | | | | | | | | | | | | | | | | | | | | | | | | | | | | |
(1) Includes cumulative appreciation or (depreciation) of futures contracts as reported in the Schedule of Investments footnotes. Only current day’s variation margin is reported within the Statement of Assets and Liabilities.
34
American Beacon Balanced FundSM
Notes to Financial Statements
October 31, 2024
6. Principal Risks
Investing in the Fund may involve certain risks including, but not limited to, those described below.
Asset-Backed Securities Risk
Investments in asset-backed securities are influenced by factors affecting the assets underlying the securities, including the broader market sector and individual markets, such as the auto markets. These securities may be more sensitive to changes in interest rates than other types of debt securities. Investments in asset-backed securities also are subject to risks of fixed-income securities, which include, but are not limited to, credit risk, interest rate risk, prepayment and extension risk, callable securities risk, valuation risk, liquidity risk, and restricted securities risk. A decline in the credit quality of the issuers of asset-backed securities or instability in the markets for such securities may affect the value and liquidity of such securities, which could result in losses to theFund. These securities are also subject to the risk of default on the underlying assets, particularly during periods of market downturn, and an unexpectedly high rate of defaults on the underlying assets will adversely affect the security’s value.
Credit Risk
The Fund is subject to the risk that the issuer or guarantor of a debt security, or the counterparty to a derivatives contract or a loan will fail to make timely payment of interest or principal or otherwise honor its obligations or default completely. A decline in the credit rating of an individual security held by the Fund may have an adverse impact on its price and make it difficult for the Fund to sell it. Ratings represent a rating agency’s opinion regarding the quality of the security and are not a guarantee of quality. Rating agencies might not always change their credit rating on an issuer or security in a timely manner to reflect events that could affect the issuer’s ability to make timely payments on its obligations. Credit risk is typically greater for securities with ratings that are below investment grade.
Environmental, Social, and/or Governance Investing Risk
The use of environmental, social, and/or governance (“ESG”) considerations by a sub-advisor may cause the Fund to make different investments than funds that have a similar investment style but do not incorporate such considerations in their strategy. As with the use of any investment considerations involved in investment decisions, there is no guarantee that the use of any ESG investment considerations will result in the selection of issuers that will outperform other issuers or help reduce risk in the Fund. The Fund may underperform funds that do not incorporate these considerations.
Equity Investments Risk
Equity securities are subject to investment risk and market risk. The Fund’s investments in equity securities may include common stocks, preferred stocks, securities convertible into or exchangeable for common stocks, real estate investment trusts (“REITs”), depositary receipts, and U.S. dollar-denominated foreign stocks traded on U.S. exchanges. Such investments may expose the Fund to additional risk. The value of a company’s common stock may fall as a result of factors affecting the company, companies in the same industry or sector, or the financial markets overall. Common stock generally is subordinate to preferred stock upon the liquidation or bankruptcy of the issuing company. Preferred stocks and convertible securities are sensitive to movements in interest rates. Preferred stocks may be less liquid than common stocks and, unlike common stocks, participation in the growth of an issuer may be limited. Distributions on preferred stocks generally are payable at the discretion of an issuer and after required payments to bond holders. Convertible securities are subject to the risk that the credit standing of the issuer may have an effect on the convertible securities’ investment value. Investments in REITs are subject to the risks associated with investing in the real estate industry such as adverse developments affecting the real estate industry and real property values. Depositary receipts and U.S. dollar-denominated foreign stocks traded on U.S. exchanges are subject to certain of the risks associated with investing directly in foreign securities, including, but
35
American Beacon Balanced FundSM
Notes to Financial Statements
October 31, 2024
not limited to, currency fluctuations and political and financial instability in the home country of a particular depositary receipt or foreign stock.
Foreign Exposure Risk
The Fund’s exposure to a foreign issuer may subject the Fund to regulatory, political, currency, security, economic and other risks associated with that country. Global economic and financial markets have become increasingly interconnected and conditions (including recent volatility, terrorism, war and political instability) and events (including natural disasters) in one country, region or financial marketmay adversely impact issuers in a different country, region or financial market.
Futures Contracts Risk
Futures contracts are derivative instruments where one party pays a fixed price for an agreed amount of securities or other underlying assets at an agreed date. The use of such derivative instruments may expose the Fund to additional risks that it would not be subject to if it invested directly in the securities underlying those derivatives. There may at times be an imperfect correlation between the movement in the prices of futures contracts and the value of their underlying instruments or indexes. There can be no assurance that any strategy used will succeed. There also can be no assurance that, at all times, a liquid market will exist for offsetting a futures contract that the Fund has previously bought or sold and this may result in the inability to close a futures contract when desired. Futures contracts may experience potentially dramatic price changes, which will increase the volatility of the Fund and may involve a small investment of cash (the amount of initial and variation margin) relative to the magnitude of the risk assumed (the potential increase or decrease in the price of the futures contract). Futures contracts on indices expose the Fund to volatility in an underlying index. Use of derivatives is a highly specialized activity that can involve investment techniques and risks different from, and in some respects greater than, those associated with investing in more traditional investments. Derivatives can be highly complex and highly volatile and may perform in unanticipated ways.
Illiquid and Restricted Securities Risk
Securities not registered in the U.S. under the Securities Act, including Rule 144A securities, are restricted as to their resale. Such securities may not be listed on an exchange and may have no active trading market. They may be more difficult to purchase or sell at an advantageous time or price because such securities may not be readily marketable in broad public markets. The Fund may not be able to sell a restricted security when the sub-advisor considers it desirable to do so and/or may have to sell the security at a lower price than the Fund believes is its fair market value. In addition, transaction costs may be higher for restricted securities and the Fund may receive only limited information regarding the issuer of a restricted security. The Fund may have to bear the expense of registering restricted securities for resale and the risk of substantial delays in effecting the registration.
Interest Rate Risk
Generally, the value of investments with interest rate risk, such as fixed-income securities or derivatives, will move in the opposite direction to movements in interest rates. Factors including central bank monetary policy, rising inflation rates, and changes in general economic conditions may cause interest rates to rise, which could cause the value of the Fund’s investments to decline. Interest rates may rise, perhaps significantly and/or rapidly, potentially resulting in substantial losses to the Fund. Interest rate changes may have a more pronounced effect on the market value of fixed-rate instruments than on floating-rate instruments. The value of floating rate and variable securities may decline if their interest rates do not rise as quickly, or as much, as general interest rates. The prices of fixed-income securities or derivatives are also affected by their durations. Fixed-income securities or derivatives with longer durations generally have greater sensitivity to changes in interest rates. Rising interest rates may cause the value of the Fund’s investments with longer durations and terms to maturity to decline, which may adversely affect the value of the Fund. For example, if a bond has a duration of eight years, a 1% increase in
36
American Beacon Balanced FundSM
Notes to Financial Statements
October 31, 2024
interest rates could be expected to result in an 8% decrease in the value of the bond. An increase in interest rates can impact markets broadly as well. To the extent the Fund holds an investment with a negative interest rate to maturity, the Fund may generate a negative return on that investment.
Liquidity Risk
The Fund is susceptible to the risk that certain investments held by the Fund may have limited marketability, be subject to restrictions on sale, be difficult or impossible to purchase or sell at favorable times or prices, or become less liquid in response to market developments or adverse credit events that may affect issuers or guarantors of a security. An inability to sell a portfolio position can adversely affect the Fund’s value or prevent the Fund from being able to take advantage of other investment opportunities. Market prices for such instruments may be volatile. The Fund could lose money if it is unable to dispose of an investment at a time that is most beneficial to the Fund. The Fund may be required to dispose of investments at unfavorable times or prices to satisfy obligations, which may result in losses or may be costly to the Fund. For example, liquidity risk may be magnified in rising interest rate environments due to higher than normal redemption rates. Unexpected redemptions may force the Fund to sell certain investments at unfavorable prices to meet redemption requests or other cash needs. Judgment plays a greater role in pricing illiquid investments than in investments with more active markets.
Market Risk
The Fund is subject to the risk that the securities markets will move down, sometimes rapidly and unpredictably, based on overall economic conditions and other factors, which may negatively affect the Fund’s performance. Equity securities generally have greater price volatility than fixed-income securities, although under certain market conditions fixed-income securities may have comparable or greater price volatility. During a general downturn in the securities markets, multiple assets may decline in value simultaneously. In some cases, traditional market participants have been less willing to make a market in some types of debt instruments, which has affected the liquidity of those instruments. During times of market turmoil, investors tend to look to the safety of securities issued or backed by the U.S. Treasury, causing the prices of these securities to rise and the yields to decline. Reduced liquidity in fixed-income and credit markets may negatively affect many issuers worldwide. Prices in many financial markets have increased significantly over the last decade, but there have also been periods of adverse market and financial developments and cyclical change during that timeframe, which have resulted in unusually high levels of volatility in domestic and foreign financial markets that has caused losses for investors and may occur again in the future, particularly if markets enter a period of uncertainty or economic weakness. The value of a security may decline due to adverse issuer-specific conditions, general market conditions unrelated to a particular issuer, or factors that affect a particular industry or industries. Changes in the financial condition of a single issuer or market segment also can impact the market as a whole.
Geopolitical and other events, including war, terrorism, economic uncertainty, trade disputes, pandemics, public health crises, natural disasters and related events have led, and in the future may continue to lead, to instability in world economies and markets generally and reduced liquidity in equity, credit and fixed-income markets, which may disrupt economies and markets and adversely affect the value of your investment. Changes in value may be temporary or may last for extended periods.
Policy changes by the U.S. government and/or Federal Reserve and political events within the U.S. and abroad, including the U.S. presidential election, the U.S. government’s inability at times to agree on a long-term budget and deficit reduction plan, the threat of a federal government shutdown and threats not to increase the federal government’s debt limit, may affect investor and consumer confidence and may adversely impact financial markets and the broader economy, perhaps suddenly and to a significant degree.
Markets and market participants are increasingly reliant upon both publicly available and proprietary information data systems. Data imprecision, software or other technology malfunctions, programming inaccuracies,
37
American Beacon Balanced FundSM
Notes to Financial Statements
October 31, 2024
unauthorized use or access, and similar circumstances may impair the performance of these systems and may have an adverse impact upon a single issuer, a group of issuers, or the market at large. The financial markets generally move in cycles, with periods of rising prices followed by periods of declining prices. The value of your investment may reflect these fluctuations.
Mortgage-Backed and Mortgage Related Securities Risk
Investments in mortgage-backed and mortgage-related securities are influenced by the factors affecting the mortgages underlying the securities or the housing market. Investments in mortgage-backed and mortgage-related securities also are subject to market risks for fixed-income securities, which include, but are not limited to, credit risk, interest rate risk, prepayment risk, extension risk, callable securities risk, and valuation risk. A decline in the credit quality of the issuers of mortgage-backed and mortgage-related securities or instability in the markets for such securities may affect the value and liquidity of such securities, which could result in losses to the Fund. These securities are also subject to the risk of default on the underlying mortgages, particularly during periods of market downturn, and an unexpectedly high rate of defaults on the underlying assets will adversely affect the security’s value.
Multiple Sub-Advisor Risk
The Manager may allocate the Fund’s assets among multiple sub-advisors, each of which is responsible for investing its allocated portion of the Fund’s assets. To a significant extent, the Fund’s performance will depend on the success of the Manager in selecting and overseeing the sub-advisors and allocating the Fund’s assets to sub-advisors. The sub-advisors’ investment styles may not work together as planned, which could adversely affect the performance of the Fund. In addition, because each sub-advisor makes its trading decisions independently, the sub-advisors may purchase or sell the same security at the same time without aggregating their transactions. This may cause unnecessary brokerage and other expenses.
Other Investment Companies Risk
The Fund may invest in shares of other registered investment companies, including money market funds that are advised by the Manager. To the extent that the Fund invests in shares of other registered investment companies, the Fund will indirectly bear the fees and expenses, including for example advisory and administrative fees, charged by those investment companies in addition to the Fund’s direct fees and expenses and will be subject to the risks associated with investments in those companies. To the extent the Fund invests in other investment companies that invest in equity securities, fixed-income securities and/or foreign securities, or that track an index, the Fund is subject to the risks associated with the underlying investments held by the investment company or the index fluctuations to which the investment company is subject.
Prepayment and Extension Risk
Prepayment and extension risk is the risk that a bond or other fixed-income security or investment might, in the case of prepayment risk, be called or otherwise converted, prepaid or redeemed before maturity and, in the case of extension risk, that the investment might not be prepaid as expected. Due to a decline in interest rates or excess cash flow into the issuer, a debt security may be called or otherwise converted, prepaid or redeemed before maturity. If this occurs, no additional interest will be paid on the investment. The Fund may have to reinvest the proceeds in another investment at a lower rate, may not benefit from an increase in value that may result from declining interest rates, and may lose any premium it paid to acquire the security, any of which could result in a reduced yield to the Fund. The rate of prepayments tends to increase as interest rates fall, which could cause the average maturity of the portfolioto shorten. Conversely, extension risk is the risk that a decrease in prepayments may, as a result of higher interest rates or other factors, result in the extension of a security’s effective maturity, increase the risk of default or delayed payment, heighten interest rate risk and increase the potential for a decline in an investment’s price. In addition, as a consequence of a decrease in prepayments, the
38
American Beacon Balanced FundSM
Notes to Financial Statements
October 31, 2024
amount of principal available to the Fund for investment would be reduced. Extensions of obligations could cause the Fund to exhibit additional volatility and hold securities paying lower-than-market rates of interest. Either case could hurt the Fund’s performance.
Recent Market Events Risk
Both U.S. and international markets have experienced significant volatility in recent months and years. As a result of such volatility, investment returns may fluctuate significantly. Moreover, the risks discussed herein associated with an investment in the Fund may be increased.
Although interest rates were unusually low in recent years in the U.S. and abroad, in 2022, the Federal Reserve and certain foreign central banks began to raise interest rates as part of their efforts to address rising inflation. It is difficult to accurately predict the pace at which interest rates may continue to increase, the timing, frequency or magnitude of any such increases, or when such increases might stop. Additionally, various economic and political factors could cause the Federal Reserve or another foreign central bank to change their approach in the future and such actions may result in an economic slowdown in the U.S. and abroad. Unexpected increases in interest rates could lead to market volatility or reduce liquidity in certain sectors of the market. Deteriorating economic fundamentals may, in turn, increase the risk of default or insolvency of particular issuers, negatively impact market value, cause credit spreads to widen, and reduce bank balance sheets. Any of these could cause an increase in market volatility, reduce liquidity across various markets or decrease confidence in the markets. Additionally, high public debt in the U.S. and other countries creates ongoing systemic and market risks and policymaking uncertainty.
In March 2023, the shutdown of certain financial institutions in the U.S. and questions regarding the viability of other financial institutions raised economic concerns over disruption in the U.S. and global banking systems. There can be no certainty that the actions taken by the U.S. or foreign governments will be effective in mitigating the effects of financial institution failures on the economy and restoring public confidence in the U.S. and global banking systems.
Some countries, including the U.S., have in recent years adopted more protectionist trade policies. Slowing global economic growth; risks associated with a trade agreement between the United Kingdom and the European Union; the risks associated with ongoing trade negotiations with China; and the possibility of changes to some international trade agreements; political or economic dysfunction within some nations, including major producers of oil; and dramatic changes in commodity and currency prices could have adverse effects that cannot be foreseen at the present time.
Tensions, war, or open conflict between nations, such as between Russia and Ukraine, in the Middle East or in eastern Asia could affect the economies of many nations, including the United States. The duration of ongoing hostilities in the Middle East and between Russia and Ukraine, and any sanctions and related events cannot be predicted. Those events present material uncertainty and risk with respect to markets globally and the performance of the Fund and its investments or operations could be negatively impacted.
Regulators in the U.S. have proposed and recently adopted a number of changes to regulations involving the markets and issuers, some of which apply to the Fund. The full effect of various newly-adopted regulations is not currently known. Additionally, it is not clear whether the proposed regulations will be adopted. However, due to the broad scope of the new and proposed regulations, certain changes could limit the Fund’s ability to pursue its investment strategies or make certain investments, or may make it more costly for the Fund to operate, which may impact performance.
Economists and others have expressed increasing concern about the potential effects of global climate change on property and security values. Certain issuers, industries and regions may be adversely affected by the impacts of climate change, including on the demand for and the development of goods and services and related production costs, and the impacts of legislation, regulation and international accords related to climate change, as well as any indirect consequences of regulation or business trends driven by climate change.
39
American Beacon Balanced FundSM
Notes to Financial Statements
October 31, 2024
Redemption Risk
The Fund may experience periods of heavy redemptions that could cause the Fund to sell assets at inopportune times or at a loss or depressed value. Redemption risk is greater to the extent that one or more investors or intermediaries control a large percentage of investments in the Fund, have short investment horizons, or have unpredictable cash flow needs. A general rise in interest rates has the potential to cause investors to move out of fixed-income securities on a large scale, which may increase redemptions from mutual funds that hold large amounts of fixed-income securities. This, coupled with a reduction in the ability or willingness of dealers and other institutional investors to buy or hold fixed-income securities, may result in decreased liquidity and increased volatility in the fixed-income markets, and heightened redemption risk. Heavy redemptions, whether by a few large investors or many smaller investors, could hurt the Fund’s performance. This risk is heightened if the Fund invests in emerging market securities, which are generally less liquid than the securities of U.S. and other developed markets. The sale of assets to meet redemption requests may create net capital gains or losses, which could cause the Fund to have to distribute substantial capital gains.
Sector Risk
Sector risk is the risk associated with the Fund holding a significant amount of investments in similar businesses, which would be similarly affected by particular economic or market events, which may, in certain circumstances, cause the value of the equity and debt securities of companies in a particular sector of the market to change. To the extent the Fund has substantial holdings within a particular sector, the risks to the Fund associated with that sector increase.
In addition, when the Fund focuses its investments in certain sectors of the economy, its performance may be driven largely by sector performance and could fluctuate more widely than if the Fund were invested more evenly across sectors. Individual sectors may be more volatile, and may perform differently, than the broader market. The businesses that constitute a sector may all react the same way to economic, political or regulatory events. The Fund’s performance could also be affected if the sectors do not perform as expected. The lack of exposure to one or more sectors may adversely affect performance. As the Fund’s portfolio changes over time, the Fund’s exposure to a particular sector may become higher or lower.
Securities Lending Risk
To the extent the Fund lends its securities, it may be subject to the following risks: (i) the securities in which the Fund reinvests cash collateral may decrease in value, causing the Fund to incur a loss, or may not perform sufficiently to cover the Fund’s payment to the borrower of a pre-negotiated fee or “rebate” for the use of that cash collateral in connection with the loan; (ii) non-cash collateral may decline in value, resulting in the Fund becoming under-secured; (iii) delays may occur in the recovery of loaned securities from borrowers, which could result in the Fund being unable to vote proxies or settle transactions or cause the Fund to incur increased costs; and (iv) if the borrower becomes subject to insolvency or similar proceedings, the Fund could incur delays in its ability to enforce its rights in its collateral.
U.S. Government Securities and Government-Sponsored Enterprises Risk
A security backed by the U.S. Treasury or the full faith and credit of the United States is guaranteed only as to the stated interest rate and face value at maturity, not its current market price. The market prices for such securities are not guaranteed and will fluctuate. Certain securities held by the Fund that are issued by government-sponsored enterprises, such as the Federal National Mortgage Association (‘‘Fannie Mae’’), Federal Home Loan Mortgage Corporation(‘‘Freddie Mac’’), Federal Home Loan Bank (‘‘FHLB’’), and Federal Farm Credit Bank (“FFCB”), are not guaranteed by the U.S. Treasury and are not backed bythe full faith and credit of the U.S. government, and no assurance can be given that the U.S. government will provide financial support if these organizations do not have the funds to meet future payment obligations. U.S. government securities and securities of government-sponsored enterprises are also subject to credit risk, interest rate risk and market risk. The rising U.S. national debt may lead to adverse impacts on the value of U.S. government securities due to potentially
40
American Beacon Balanced FundSM
Notes to Financial Statements
October 31, 2024
higher costs for the U.S. government to obtain new financing. It is possible that the U.S. government and government-sponsored enterprises will not have the funds to meet their payment obligations in the future.
Variable and Floating Rate Securities Risk
The coupons on variable and floating-rate securities are not fixed and may fluctuate based upon changes in market rates. A variable rate security has a coupon that is adjusted at pre-designated periods in response to changes in the market rate of interest on which the coupon is based. The coupon on a floating rate security is generally based on an interest rate, such as a money-market index, Secured Overnight Financing Rate (“SOFR”), or a Treasury bill rate. Variable and floating rate securities are subject to interest rate risk and credit risk. As short-term interest rates decline, the coupons on variable and floating-rate securities typically decrease. Alternatively, during periods of rising short-term interest rates, the coupons on variable and floating-rate securities typically increase. Changes in the coupons of variable and floating-rate securities may lag behind changes in market rates or may have limits on the maximum increases in the coupon rates. The value of variable and floating-rate securities may decline if their coupons do not rise as much, or as quickly, as interest rates in general. Conversely, variable and floating rate securities will not generally increase in value if interest rates decline. Certain types of variable and floating rate instruments may be subject to greater liquidity risk than other debt securities.
7. Federal Income and Excise Taxes
It is the policy of the Fund to qualify as a regulated investment company (“RIC”), by complying with all applicable provisions of Subchapter M of the Internal Revenue Code, as amended, and to make distributions of taxable income sufficient to relieve it from substantially all federal income and excise taxes. For federal income tax purposes, the Fund is treated as a single entity for the purpose of determining such qualification.
The Fund does not have any unrecorded tax liabilities in the accompanying financial statements. Each of the tax years in the four year period ended October 31, 2024 remain subject to examination by the Internal Revenue Service. If applicable, the Fund recognizes interest accrued related to unrecognized tax benefits in interest expense and penalties in “Other expenses” on the Statement of Operations.
The Fund may be subject to taxes imposed by countries in which it invests. Such taxes are generally based on returns of income earned or gains realized or repatriated. Taxes are accrued and applied to net investment income, net realized capital gains and net unrealized appreciation (depreciation), as applicable, as the income is earned or capital gains are recorded.
Dividends are categorized in accordance with income tax regulations which may treat certain transactions differently than U.S. GAAP. Accordingly, the character of distributions and composition of net assets for tax purposes may differ from those reflected in the accompanying financial statements.
41
American Beacon Balanced FundSM
Notes to Financial Statements
October 31, 2024
As of October 31, 2024, the tax cost for the Fund and their respective gross unrealized appreciation (depreciation) were as follows:
| | | | | | | | | | | | |
| | | Year Ended
October 31, 2024 | | | | | | Year Ended
October 31, 2023 | |
Distributions paid from: | | | | | | | | | | | | |
Ordinary income* | | | | | | | | | | | | |
R5 Class | | $ | 260,888 | | | | | | | $ | 221,835 | |
Y Class | | | 600,285 | | | | | | | | 632,021 | |
Investor Class | | | 1,158,983 | | | | | | | | 1,060,072 | |
Advisor Class | | | 21,658 | | | | | | | | 15,766 | |
A Class | | | 408,600 | | | | | | | | 270,624 | |
C Class | | | 143,432 | | | | | | | | 163,337 | |
Long-term capital gains | | | | | | | | | | | | |
R5 Class | | | 18,855 | | | | | | | | 1,044,825 | |
Y Class | | | 41,986 | | | | | | | | 3,600,856 | |
Investor Class | | | 95,950 | | | | | | | | 5,334,755 | |
Advisor Class | | | 1,840 | | | | | | | | 102,077 | |
A Class | | | 28,111 | | | | | | | | 1,321,690 | |
C Class | | | 23,617 | | | | | | | | 1,523,586 | |
| | | | | | | | | | | | |
Total distributions paid | | $ | 2,804,205 | | | | | | | $ | 15,291,444 | |
| | | | | | | | | | | | |
* For tax purposes, short-term capital gains are considered ordinary income distributions.
As of October 31, 2024, the components of distributable earnings (deficits) on a tax basis were as follows:
| | | | | | | | | | | | | | | | | | | | | | | | | | | | |
Fund | | Tax Cost | | | | | | Unrealized
Appreciation | | | | | | Unrealized
(Depreciation) | | | | | | Net Unrealized
Appreciation
(Depreciation) | |
Balanced | | $ | 98,096,110 | | | | | | | $ | 19,908,346 | | | | | | | $ | (4,059,817 | ) | | | | | | $ | 15,848,529 | |
| | | | | | | | | | | | | | | | | | | | | | | | | | | | | | | | | | | | | | | | | | | | |
Fund | | Net Unrealized
Appreciation
(Depreciation) | | | | | | Undistributed
Ordinary
Income | | | | | | Undistributed
Long-Term
Capital Gains | | | | | | Accumulated
Capital and
Other (Losses) | | | | | | Other Temporary
Differences | | | | | | Distributable
Earnings | |
Balanced | | $ | 15,848,529 | | | | | | | $ | 3,314,790 | | | | | | | $ | 7,722,647 | | | | | | | $ | – | | | | | | | $ | 1 | | | | | | | $ | 26,885,967 | |
Financial reporting records are adjusted for permanent book/tax differences to reflect tax character. Financial records are not adjusted for temporary differences. The temporary differences between financial reporting and tax-basis reporting of unrealized appreciation (depreciation) are attributable primarily to the tax deferral of losses from wash sales, premium amortization and the realization for tax purposes of unrealized gains (losses) on certain derivative instruments.
Due to inherent differences in the recognition of income, expenses, and realized gains (losses) under U.S. GAAP and federal income tax regulations, permanent differences between book and tax reporting have been identified and appropriately reclassified on the Statement of Assets and Liabilities.
Accordingly, the following amounts represent current year permanent differences derived from equalization as of October 31, 2024:
| | | | | | | | | | | | |
Fund | | Paid-In-Capital | | | | | | Distributable
Earnings/(Deficits) | |
Balanced | | $ | 1,279,295 | | | | | | | $ | (1,279,295 | ) |
For federal income tax purposes, the Fund measures its capital loss carryforwards annually at October 31, its fiscal year end. Capital loss carryforwards retain their character as short-term and/or long-term and may be carried forward and applied against future realized capital gains with no expiration date.
42
American Beacon Balanced FundSM
Notes to Financial Statements
October 31, 2024
As of October 31, 2024, the Fund did not have any capital loss carryforwards.
8. Investment Transactions
The aggregate cost of purchases and proceeds from sales and maturities of investments, other than short-term obligations, for the year ended October 31, 2024 were as follows:
| | | | | | | | | | | | | | | | | | | | | | | | | | | | |
Fund | | Purchases
(non-U.S.
Government
Securities) | | | | | | Purchases
of U.S.
Government
Securities | | | | | | Sales
(non-U.S.
Government
Securities) | | | | | | Sales
of U.S.
Government
Securities | |
| Balanced | | $ | 29,006,173 | | | | | | | $ | 12,278,434 | | | | | | | $ | 42,242,346 | | | | | | | $ | 12,029,710 | |
A summary of the Fund’s transactions in the USG Select Fund for the year ended October 31, 2024 were as follows:
| | | | | | | | | | | | | | | | | | | | | | | | | | | | | | | | | | |
Fund | | Type of
Transaction | | | | | October 31,
2023 Shares/
Fair Value | | | | | | Purchases | | | | | | Sales | | | | | | October 31,
2024 Shares/
Fair Value | |
| Balanced | | Direct | | | | | | $ | 2,210,473 | | | | | | | $ | 45,107,722 | | | | | | | $ | 44,916,362 | | | | | | | $ | 2,401,833 | |
| Balanced | | Securities Lending | | | | | | | 870,903 | | | | | | | | 15,070,453 | | | | | | | | 15,543,056 | | | | | | | | 398,300 | |
9. Securities Lending
The Fund may lend its securities to qualified financial institutions, such as certain broker-dealers, to earn additional income. The borrowers are required to secure their loans continuously with collateral in an amount at least equal to the fair value of the securities loaned, initially in an amount at least equal to 102% of the fair value of domestic securities loaned and 105% of the fair value of international securities loaned. Collateral is monitored and marked-to-market daily. Daily mark-to-market amounts are required to be paid to the borrower or received from the borrower by the end of the following business day. This one day settlement for mark-to-market amounts may result in the collateral being temporarily less than the value of the securities on loan or temporarily more than the required minimum collateral.
To the extent that a loan is collateralized by cash, such cash collateral shall be invested by the securities lending agent (the “Agent”) in money market mutual funds and other short-term investments, provided the investments meet certain quality and diversification requirements. Securities purchased with cash collateral proceeds are listed in the Fund’s Schedule of Investments and the collateral is shown on the Statement of Assets and Liabilities as a payable.
Securities lending income is generated from the demand premium (if any) paid by the borrower to borrow a specific security and from the return on investment of cash collateral, reduced by negotiated rebate fees paid to the borrower and transaction costs. To the extent that a loan is secured by non-cash collateral, securities lending income is generated as a demand premium reduced by transaction costs. The Fund, the Agent, and the Manager retained 80%, 10%, and 10%, respectively, of the income generated from securities lending.
While securities are on loan, the Fund continues to receive certain income associated with that security and any gain or loss in the market price that may occur during the term of the loan. In the case of domestic equities, the value of any dividend is received in the form of a substitute payment approximately equal to the dividend. In the case of foreign securities, a negotiated amount is received that is less than the actual dividend, but higher than the dividend amount minus the foreign tax that the Fund would be subject to on the dividend.
43
American Beacon Balanced FundSM
Notes to Financial Statements
October 31, 2024
Securities lending transactions pose certain risks to the Fund, including that the borrower may not provide additional collateral when required or return the securities when due, that the value of the short-term investments will be less than the amount of cash collateral required to be returned to the borrower, that non-cash collateral may be subject to legal constraints in the event of a borrower bankruptcy, and that the cash collateral investments could become illiquid and unable to be used to return collateral to the borrower. The Fund could also experience delays and costs in gaining access to the collateral. The Fund bears the risk of any deficiency in the amount of the cash collateral available for return to the borrower and any action which impairs its ability to liquidate non-cash collateral to satisfy a borrower default.
As of October 31, 2024, the value of outstanding securities on loan and the value of collateral were as follows:
| | | | | | | | | | | | | | | | | | | | | | | | | | |
Fund | | Fair Value of
Securities on
Loan | | | | | Cash Collateral
Received | | | | | | Non-Cash
Collateral
Received | | | | | | Total
Collateral
Received | |
| Balanced | | $2,174,024 | | | | | | $ | 398,300 | | | | | | | $ | 1,883,582 | | | | | | | $ | 2,281,882 | |
Cash collateral is listed on the Fund’s Schedule of Investments and is shown on the Statement of Assets and Liabilities. Income earned on these investments is included in “Income derived from securities lending” on the Statement of Operations.
Non-cash collateral received by the Fund may not be sold or re-pledged except to satisfy a borrower default. Therefore, non-cash collateral is not included on the Fund’s Schedule of Investments or Statement of Assets and Liabilities.
10. Borrowing Arrangements
Effective November 8, 2024 (the “Effective Date”), the Fund, along with certain other funds managed by the Manager (“Participating Funds”), renewed a committed revolving line of credit (the “Committed Line”) agreement with State Street Bank and Trust Company (the “Bank”) to be used to facilitate portfolio liquidity. The maximum borrowing amount under the Committed Line is $100 million with interest at a rate equal to the higher of (a) Overnight Bank Funding Rate (“OBFR”) daily fluctuating rate per annum equal to 1.25% plus the sum of 0.10% or (b) the Federal Funds daily fluctuating rate per annum on amounts borrowed. Each of the Participating Funds paid a proportional amount of a quarterly commitment fee at a rate of 0.25% per annum on the unused portion of the Committed Line amount. The Committed Line expires November 7, 2025, unless extended by the Bank or terminated by the Participating Funds in accordance with the agreement. Prior to the Effective Date, the maximum borrowing amount under the Committed Line was $100 million with an expiration date November 7, 2024.
On the Effective Date, the Fund, along with certain other Participating Funds managed by the Manager, also renewed an uncommitted discretionary demand revolving line of credit (the “Uncommitted Line”) agreement with the Bank to be used to facilitate portfolio liquidity. The maximum borrowing amount under the Uncommitted Line is $100 million with interest at a rate equal to the higher of (a) OBFR daily fluctuating rate per annum equal to 1.25% plus the sum of 0.10% or (b) the Federal Funds daily fluctuating rate per annum on amounts borrowed on each outstanding loan. Each of the Participating Funds paid a proportional amount of a closing fee of $35,000 on the Effective Date. The Uncommitted Line expires November 7, 2025, unless extended by the Bank or terminated by the Participating Funds in accordance with the agreement. Prior to the Effective Date, the maximum borrowing amount under the Uncommitted Line was $100 million with an expiration date November 7, 2024.
The Participating Funds paid administration, legal and arrangement fees, which are recognized as a component of “Line of credit interest expense” on the Statement of Operations, along with commitment fees, that have been allocated among the Participating Funds based on average daily net assets.
During the year ended October 31, 2024, the Fund did not utilize these facilities.
44
American Beacon Balanced FundSM
Notes to Financial Statements
October 31, 2024
11. Capital Share Transactions
The tables below summarize the activity in capital shares for each Class of the Fund:
| | | | | | | | | | | | | | | | | | | | | | | | | | | | |
| | | R5 Class | |
| | | Year Ended
October 31, 2024 | | | | | | Year Ended
October 31, 2023 | |
Balanced Fund | | Shares | | | | | | Amount | | | | | | Shares | | | | | | Amount | |
| Shares sold | | | 60,329 | | | | | | | $ | 924,138 | | | | | | | | 114,738 | | | | | | | $ | 1,572,317 | |
| Reinvestment of dividends | | | 18,468 | | | | | | | | 276,820 | | | | | | | | 95,464 | | | | | | | | 1,256,702 | |
| Shares redeemed | | | (173,087 | ) | | | | | | | (2,554,177 | ) | | | | | | | (301,917 | ) | | | | | | | (4,114,926 | ) |
| | | | | | | | | | | | | | | | | | | | | | | | | | | | |
| Net (decrease) in shares outstanding | | | (94,290 | ) | | | | | | $ | (1,353,219 | ) | | | | | | | (91,715 | ) | | | | | | $ | (1,285,907 | ) |
| | | | | | | | | | | | | | | | | | | | | | | | | | | | |
| | | | |
| | | Y Class | |
| | | Year Ended
October 31, 2024 | | | | | | Year Ended
October 31, 2023 | |
Balanced Fund | | Shares | | | | | | Amount | | | | | | Shares | | | | | | Amount | |
| Shares sold | | | 413,947 | | | | | | | $ | 6,236,582 | | | | | | | | 1,683,854 | | | | | | | $ | 23,540,169 | |
| Reinvestment of dividends | | | 40,750 | | | | | | | | 618,183 | | | | | | | | 206,059 | | | | | | | | 2,741,669 | |
| Shares redeemed | | | (423,575 | ) | | | | | | | (6,325,862 | ) | | | | | | | (2,176,175 | ) | | | | | | | (29,436,634 | ) |
| | | | | | | | | | | | | | | | | | | | | | | | | | | | |
| Net increase (decrease) in shares outstanding | | | 31,122 | | | | | | | $ | 528,903 | | | | | | | | (286,262 | ) | | | | | | $ | (3,154,796 | ) |
| | | | | | | | | | | | | | | | | | | | | | | | | | | | |
| | | | |
| | | Investor Class | |
| | | Year Ended
October 31, 2024 | | | | | | Year Ended
October 31, 2023 | |
Balanced Fund | | Shares | | | | | | Amount | | | | | | Shares | | | | | | Amount | |
| Shares sold | | | 214,763 | | | | | | | $ | 2,638,751 | | | | | | | | 609,884 | | | | | | | $ | 6,849,318 | |
| Reinvestment of dividends | | | 100,027 | | | | | | | | 1,217,295 | | | | | | | | 578,977 | | | | | | | | 6,243,097 | |
| Shares redeemed | | | (1,076,464 | ) | | | | | | | (12,997,707 | ) | | | | | | | (1,500,258 | ) | | | | | | | (16,655,877 | ) |
| | | | | | | | | | | | | | | | | | | | | | | | | | | | |
| Net (decrease) in shares outstanding | | | (761,674 | ) | | | | | | $ | (9,141,661 | ) | | | | | | | (311,397 | ) | | | | | | $ | (3,563,462 | ) |
| | | | | | | | | | | | | | | | | | | | | | | | | | | | |
| | | | |
| | | Advisor Class | |
| | | Year Ended
October 31, 2024 | | | | | | Year Ended
October 31, 2023 | |
Balanced Fund | | Shares | | | | | | Amount | | | | | | Shares | | | | | | Amount | |
| Shares sold | | | 3,896 | | | | | | | $ | 52,880 | | | | | | | | 10,764 | | | | | | | $ | 132,209 | |
| Reinvestment of dividends | | | 1,733 | | | | | | | | 23,498 | | | | | | | | 9,879 | | | | | | | | 117,843 | |
| Shares redeemed | | | (5,846 | ) | | | | | | | (77,173 | ) | | | | | | | (26,647 | ) | | | | | | | (318,598 | ) |
| | | | | | | | | | | | | | | | | | | | | | | | | | | | |
| Net (decrease) in shares outstanding | | | (217 | ) | | | | | | $ | (795 | ) | | | | | | | (6,004 | ) | | | | | | $ | (68,546 | ) |
| | | | | | | | | | | | | | | | | | | | | | | | | | | | |
| | | | |
| | | A Class | |
| | | Year Ended
October 31, 2024 | | | | | | Year Ended
October 31, 2023 | |
Balanced Fund | | Shares | | | | | | Amount | | | | | | Shares | | | | | | Amount | |
| Shares sold | | | 594,828 | | | | | | | $ | 7,200,212 | | | | | | | | 253,745 | | | | | | | $ | 2,817,904 | |
| Reinvestment of dividends | | | 34,038 | | | | | | | | 415,050 | | | | | | | | 137,291 | | | | | | | | 1,473,679 | |
| Shares redeemed | | | (280,517 | ) | | | | | | | (3,394,424 | ) | | | | | | | (324,640 | ) | | | | | | | (3,594,051 | ) |
| | | | | | | | | | | | | | | | | | | | | | | | | | | | |
| Net increase in shares outstanding | | | 348,349 | | | | | | | $ | 4,220,838 | | | | | | | | 66,396 | | | | | | | $ | 697,532 | |
| | | | | | | | | | | | | | | | | | | | | | | | | | | | |
| | | | |
| | | C Class | |
| | | Year Ended
October 31, 2024 | | | | | | Year Ended
October 31, 2023 | |
Balanced Fund | | Shares | | | | | | Amount | | | | | | Shares | | | | | | Amount | |
| Shares sold | | | 25,949 | | | | | | | $ | 324,226 | | | | | | | | 64,838 | | | | | | | $ | 735,396 | |
| Reinvestment of dividends | | | 13,624 | | | | | | | | 166,552 | | | | | | | | 153,620 | | | | | | | | 1,676,128 | |
| Shares redeemed | | | (707,569 | ) | | | | | | | (8,709,238 | ) | | | | | | | (498,554 | ) | | | | | | | (5,635,497 | ) |
| | | | | | | | | | | | | | | | | | | | | | | | | | | | |
| Net (decrease) in shares outstanding | | | (667,996 | ) | | | | | | $ | (8,218,460 | ) | | | | | | | (280,096 | ) | | | | | | $ | (3,223,973 | ) |
| | | | | | | | | | | | | | | | | | | | | | | | | | | | |
12. Subsequent Events
Management has evaluated subsequent events for possible recognition or disclosure in the financial statements through the date the financial statements are issued. Management has determined that there are no material events that would require disclosure in the Fund’s financial statements through this date.
45
American Beacon Balanced FundSM
Financial Highlights
(For a share outstanding throughout the period)
| | | | | | | | | | | | | | | | | | | | | | | | | | | | | | | | | | | | |
| | | R5 ClassA | |
| | | Year Ended October 31, | |
| | | | |
| | | 2024 | | | | | | 2023 | | | | | | 2022 | | | | | | 2021 | | | | | | 2020B | |
| | | | |
Net asset value, beginning of period | | $ | 13.04 | | | | | | | $ | 14.07 | | | | | | | $ | 16.93 | | | | | | | $ | 14.35 | | | | | | | $ | 16.36 | |
| | | | | | | | | | | | | | | | | | | | | | | | | | | | | | | | | | | | |
Income (loss) from investment operations: | | | | | | | | | | | | | | | | | | | | | | | | | | | | | | | | | | | | |
Net investment income | | | 0.28 | | | | | | | | 0.24 | | | | | | | | 0.11 | | | | | | | | 0.19 | | | | | | | | 0.20 | |
Net gains (losses) on investments (both realized and unrealized) | | | 2.87 | | | | | | | | 0.15 | | | | | | | | (1.56 | ) | | | | | | | 4.34 | | | | | | | | (0.80 | ) |
| | | | | | | | | | | | | | | | | | | | | | | | | | | | | | | | | | | | |
Total income (loss) from investment operations | | | 3.15 | | | | | | | | 0.39 | | | | | | | | (1.45 | ) | | | | | | | 4.53 | | | | | | | | (0.60 | ) |
| | | | | | | | | | | | | | | | | | | | | | | | | | | | | | | | | | | | |
Less distributions: | | | | | | | | | | | | | | | | | | | | | | | | | | | | | | | | | | | | |
Dividends from net investment income | | | (0.30 | ) | | | | | | | (0.26 | ) | | | | | | | (0.23 | ) | | | | | | | (0.30 | ) | | | | | | | (0.24 | ) |
Distributions from net realized gains | | | (0.06 | ) | | | | | | | (1.16 | ) | | | | | | | (1.18 | ) | | | | | | | (1.65 | ) | | | | | | | (1.17 | ) |
| | | | | | | | | | | | | | | | | | | | | | | | | | | | | | | | | | | | |
Total distributions | | | (0.36 | ) | | | | | | | (1.42 | ) | | | | | | | (1.41 | ) | | | | | | | (1.95 | ) | | | | | | | (1.41 | ) |
| | | | | | | | | | | | | | | | | | | | | | | | | | | | | | | | | | | | |
Net asset value, end of period | | $ | 15.83 | | | | | | | $ | 13.04 | | | | | | | $ | 14.07 | | | | | | | $ | 16.93 | | | | | | | $ | 14.35 | |
| | | | | | | | | | | | | | | | | | | | | | | | | | | | | | | | | | | | |
Total returnC | | | 24.37 | % | | | | | | | 2.80 | % | | | | | | | (9.20 | )% | | | | | | | 33.80 | % | | | | | | | (4.14 | )% |
| | | | | | | | | | | | | | | | | | | | | | | | | | | | | | | | | | | | |
| | | | | | | | | |
Ratios and supplemental data: | | | | | | | | | | | | | | | | | | | | | | | | | | | | | | | | | | | | |
Net assets, end of period | | $ | 11,658,021 | | | | | | | $ | 10,827,923 | | | | | | | $ | 12,977,305 | | | | | | | $ | 22,687,613 | | | | | | | $ | 22,476,942 | |
Ratios to average net assets: | | | | | | | | | | | | | | | | | | | | | | | | | | | | | | | | | | | | |
Expenses, before reimbursements and/or recoupments | | | 0.84 | % | | | | | | | 0.78 | % | | | | | | | 0.72 | % | | | | | | | 0.70 | % | | | | | | | 0.88 | % |
Expenses, net of reimbursements and/or recoupments | | | 0.84 | % | | | | | | | 0.78 | % | | | | | | | 0.72 | % | | | | | | | 0.70 | % | | | | | | | 0.88 | % |
Net investment income, before expense reimbursements and/or recoupments | | | 2.25 | % | | | | | | | 2.10 | % | | | | | | | 1.51 | % | | | | | | | 1.37 | % | | | | | | | 1.82 | % |
Net investment income, net of reimbursements and/or recoupments | | | 2.25 | % | | | | | | | 2.10 | % | | | | | | | 1.51 | % | | | | | | | 1.37 | % | | | | | | | 1.82 | % |
Portfolio turnover rate | | | 38 | % | | | | | | | 48 | % | | | | | | | 30 | % | | | | | | | 37 | % | | | | | | | 82 | % |
| A | Prior to February 28, 2020, the R5 Class was known as Institutional Class. |
| B | On January 23, 2020, Brandywine Global Investment Management, LLC was terminated and ceased managing assets of the Fund. |
| C | Based on net asset value, which does not reflect the sales charge, redemption fee, or contingent deferred sales charge, if applicable. May include adjustments in accordance with U.S. GAAP and as such, the net asset value for reporting purposes and the returns based upon those net asset values may differ from the net asset value and returns for shareholder transactions. |
See accompanying notes
46
American Beacon Balanced FundSM
Financial Highlights
(For a share outstanding throughout the period)
| | | | | | | | | | | | | | | | | | | | | | | | | | | | | | | | | | | | |
| | | Y Class | |
| | | Year Ended October 31, | |
| | | | |
| | | 2024 | | | | | | 2023 | | | | | | 2022 | | | | | | 2021 | | | | | | 2020A | |
| | | | |
Net asset value, beginning of period | | $ | 13.17 | | | | | | | $ | 14.20 | | | | | | | $ | 17.07 | | | | | | | $ | 14.46 | | | | | | | $ | 16.47 | |
| | | | | | | | | | | | | | | | | | | | | | | | | | | | | | | | | | | | |
Income (loss) from investment operations: | | | | | | | | | | | | | | | | | | | | | | | | | | | | | | | | | | | | |
Net investment income | | | 0.33 | | | | | | | | 0.29 | | | | | | | | 0.21 | | | | | | | | 0.20 | | | | | | | | 0.25 | |
Net gains (losses) on investments (both realized and unrealized) | | | 2.85 | | | | | | | | 0.08 | | | | | | | | (1.68 | ) | | | | | | | 4.35 | | | | | | | | (0.86 | ) |
| | | | | | | | | | | | | | | | | | | | | | | | | | | | | | | | | | | | |
Total income (loss) from investment operations | | | 3.18 | | | | | | | | 0.37 | | | | | | | | (1.47 | ) | | | | | | | 4.55 | | | | | | | | (0.61 | ) |
| | | | | | | | | | | | | | | | | | | | | | | | | | | | | | | | | | | | |
Less distributions: | | | | | | | | | | | | | | | | | | | | | | | | | | | | | | | | | | | | |
Dividends from net investment income | | | (0.29 | ) | | | | | | | (0.24 | ) | | | | | | | (0.22 | ) | | | | | | | (0.29 | ) | | | | | | | (0.23 | ) |
Distributions from net realized gains | | | (0.06 | ) | | | | | | | (1.16 | ) | | | | | | | (1.18 | ) | | | | | | | (1.65 | ) | | | | | | | (1.17 | ) |
| | | | | | | | | | | | | | | | | | | | | | | | | | | | | | | | | | | | |
Total distributions | | | (0.35 | ) | | | | | | | (1.40 | ) | | | | | | | (1.40 | ) | | | | | | | (1.94 | ) | | | | | | | (1.40 | ) |
| | | | | | | | | | | | | | | | | | | | | | | | | | | | | | | | | | | | |
Net asset value, end of period | | $ | 16.00 | | | | | | | $ | 13.17 | | | | | | | $ | 14.20 | | | | | | | $ | 17.07 | | | | | | | $ | 14.46 | |
| | | | | | | | | | | | | | | | | | | | | | | | | | | | | | | | | | | | |
Total returnB | | | 24.33 | % | | | | | | | 2.68 | % | | | | | | | (9.25 | )% | | | | | | | 33.66 | % | | | | | | | (4.17 | )% |
| | | | | | | | | | | | | | | | | | | | | | | | | | | | | | | | | | | | |
| | | | | | | | | |
Ratios and supplemental data: | | | | | | | | | | | | | | | | | | | | | | | | | | | | | | | | | | | | |
Net assets, end of period | | $ | 30,023,632 | | | | | | | $ | 24,304,867 | | | | | | | $ | 30,273,662 | | | | | | | $ | 40,858,765 | | | | | | | $ | 43,550,846 | |
Ratios to average net assets: | | | | | | | | | | | | | | | | | | | | | | | | | | | | | | | | | | | | |
Expenses, before reimbursements and/or recoupments | | | 0.93 | % | | | | | | | 0.84 | % | | | | | | | 0.80 | % | | | | | | | 0.77 | % | | | | | | | 0.96 | % |
Expenses, net of reimbursements and/or recoupments | | | 0.93 | % | | | | | | | 0.84 | % | | | | | | | 0.80 | % | | | | | | | 0.77 | % | | | | | | | 0.96 | % |
Net investment income, before expense reimbursements and/or recoupments | | | 2.16 | % | | | | | | | 2.01 | % | | | | | | | 1.46 | % | | | | | | | 1.31 | % | | | | | | | 1.71 | % |
Net investment income, net of reimbursements and/or recoupments | | | 2.16 | % | | | | | | | 2.01 | % | | | | | | | 1.46 | % | | | | | | | 1.31 | % | | | | | | | 1.71 | % |
Portfolio turnover rate | | | 38 | % | | | | | | | 48 | % | | | | | | | 30 | % | | | | | | | 37 | % | | | | | | | 82 | % |
| A | On January 23, 2020, Brandywine Global Investment Management, LLC was terminated and ceased managing assets of the Fund. |
| B | Based on net asset value, which does not reflect the sales charge, redemption fee, or contingent deferred sales charge, if applicable. May include adjustments in accordance with U.S. GAAP and as such, the net asset value for reporting purposes and the returns based upon those net asset values may differ from the net asset value and returns for shareholder transactions. |
See accompanying notes
47
American Beacon Balanced FundSM
Financial Highlights
(For a share outstanding throughout the period)
| | | | | | | | | | | | | | | | | | | | | | | | | | | | | | | | | | | | |
| | | Investor Class | |
| | | Year Ended October 31, | |
| | | | |
| | | 2024 | | | | | | 2023 | | | | | | 2022 | | | | | | 2021 | | | | | | 2020A | |
| | | | |
Net asset value, beginning of period | | $ | 10.64 | | | | | | | $ | 11.74 | | | | | | | $ | 14.35 | | | | | | | $ | 12.43 | | | | | | | $ | 14.36 | |
| | | | | | | | | | | | | | | | | | | | | | | | | | | | | | | | | | | | |
Income (loss) from investment operations: | | | | | | | | | | | | | | | | | | | | | | | | | | | | | | | | | | | | |
Net investment income | | | 0.23 | B | | | | | | | 0.11 | | | | | | | | 0.15 | B | | | | | | | 0.22 | | | | | | | | 0.03 | |
Net gains (losses) on investments (both realized and unrealized) | | | 2.30 | | | | | | | | 0.17 | | | | | | | | (1.39 | ) | | | | | | | 3.61 | | | | | | | | (0.58 | ) |
| | | | | | | | | | | | | | | | | | | | | | | | | | | | | | | | | | | | |
Total income (loss) from investment operations | | | 2.53 | | | | | | | | 0.28 | | | | | | | | (1.24 | ) | | | | | | | 3.83 | | | | | | | | (0.55 | ) |
| | | | | | | | | | | | | | | | | | | | | | | | | | | | | | | | | | | | |
Less distributions: | | | | | | | | | | | | | | | | | | | | | | | | | | | | | | | | | | | | |
Dividends from net investment income | | | (0.26 | ) | | | | | | | (0.22 | ) | | | | | | | (0.19 | ) | | | | | | | (0.26 | ) | | | | | | | (0.21 | ) |
Distributions from net realized gains | | | (0.06 | ) | | | | | | | (1.16 | ) | | | | | | | (1.18 | ) | | | | | | | (1.65 | ) | | | | | | | (1.17 | ) |
| | | | | | | | | | | | | | | | | | | | | | | | | | | | | | | | | | | | |
Total distributions | | | (0.32 | ) | | | | | | | (1.38 | ) | | | | | | | (1.37 | ) | | | | | | | (1.91 | ) | | | | | | | (1.38 | ) |
| | | | | | | | | | | | | | | | | | | | | | | | | | | | | | | | | | | | |
Net asset value, end of period | | $ | 12.85 | | | | | | | $ | 10.64 | | | | | | | $ | 11.74 | | | | | | | $ | 14.35 | | | | | | | $ | 12.43 | |
| | | | | | | | | | | | | | | | | | | | | | | | | | | | | | | | | | | | |
Total returnC | | | 24.01 | % | | | | | | | 2.46 | % | | | | | | | (9.40 | )% | | | | | | | 33.32 | % | | | | | | | (4.41 | )% |
| | | | | | | | | | | | | | | | | | | | | | | | | | | | | | | | | | | | |
| | | | | | | | | |
Ratios and supplemental data: | | | | | | | | | | | | | | | | | | | | | | | | | | | | | | | | | | | | |
Net assets, end of period | | $ | 45,826,006 | | | | | | | $ | 46,044,377 | | | | | | | $ | 54,447,528 | | | | | | | $ | 85,251,213 | | | | | | | $ | 68,284,615 | |
Ratios to average net assets: | | | | | | | | | | | | | | | | | | | | | | | | | | | | | | | | | | | | |
Expenses, before reimbursements and/or recoupments | | | 1.17 | % | | | | | | | 1.04 | % | | | | | | | 1.03 | % | | | | | | | 0.99 | % | | | | | | | 1.20 | % |
Expenses, net of reimbursements and/or recoupments | | | 1.17 | % | | | | | | | 1.04 | % | | | | | | | 1.03 | % | | | | | | | 0.99 | % | | | | | | | 1.20 | % |
Net investment income, before expense reimbursements and/or recoupments | | | 1.93 | % | | | | | | | 1.84 | % | | | | | | | 1.22 | % | | | | | | | 1.07 | % | | | | | | | 1.47 | % |
Net investment income, net of reimbursements and/or recoupments | | | 1.93 | % | | | | | | | 1.84 | % | | | | | | | 1.22 | % | | | | | | | 1.07 | % | | | | | | | 1.47 | % |
Portfolio turnover rate | | | 38 | % | | | | | | | 48 | % | | | | | | | 30 | % | | | | | | | 37 | % | | | | | | | 82 | % |
| A | On January 23, 2020, Brandywine Global Investment Management, LLC was terminated and ceased managing assets of the Fund. |
| B | Per share amounts have been calculated using the average shares method. |
| C | Based on net asset value, which does not reflect the sales charge, redemption fee, or contingent deferred sales charge, if applicable. May include adjustments in accordance with U.S. GAAP and as such, the net asset value for reporting purposes and the returns based upon those net asset values may differ from the net asset value and returns for shareholder transactions. |
See accompanying notes
48
American Beacon Balanced FundSM
Financial Highlights
(For a share outstanding throughout the period)
| | | | | | | | | | | | | | | | | | | | | | | | | | | | | | | | | | | | |
| | | Advisor Class | |
| | | Year Ended October 31, | |
| | | | |
| | | 2024 | | | | | | 2023 | | | | | | 2022 | | | | | | 2021 | | | | | | 2020A | |
| | | | |
Net asset value, beginning of period | | $ | 11.80 | | | | | | | $ | 12.86 | | | | | | | $ | 15.59 | | | | | | | $ | 13.35 | | | | | | | $ | 15.34 | |
| | | | | | | | | | | | | | | | | | | | | | | | | | | | | | | | | | | | |
Income (loss) from investment operations: | | | | | | | | | | | | | | | | | | | | | | | | | | | | | | | | | | | | |
Net investment income | | | 0.23 | | | | | | | | 0.15 | | | | | | | | 0.15 | B | | | | | | | 0.15 | | | | | | | | 0.18 | B |
Net gains (losses) on investments (both realized and unrealized) | | | 2.55 | | | | | | | | 0.15 | | | | | | | | (1.54 | ) | | | | | | | 3.97 | | | | | | | | (0.81 | ) |
| | | | | | | | | | | | | | | | | | | | | | | | | | | | | | | | | | | | |
Total income (loss) from investment operations | | | 2.78 | | | | | | | | 0.30 | | | | | | | | (1.39 | ) | | | | | | | 4.12 | | | | | | | | (0.63 | ) |
| | | | | | | | | | | | | | | | | | | | | | | | | | | | | | | | | | | | |
Less distributions: | | | | | | | | | | | | | | | | | | | | | | | | | | | | | | | | | | | | |
Dividends from net investment income | | | (0.23 | ) | | | | | | | (0.20 | ) | | | | | | | (0.16 | ) | | | | | | | (0.23 | ) | | | | | | | (0.19 | ) |
Distributions from net realized gains | | | (0.06 | ) | | | | | | | (1.16 | ) | | | | | | | (1.18 | ) | | | | | | | (1.65 | ) | | | | | | | (1.17 | ) |
| | | | | | | | | | | | | | | | | | | | | | | | | | | | | | | | | | | | |
Total distributions | | | (0.29 | ) | | | | | | | (1.36 | ) | | | | | | | (1.34 | ) | | | | | | | (1.88 | ) | | | | | | | (1.36 | ) |
| | | | | | | | | | | | | | | | | | | | | | | | | | | | | | | | | | | | |
Net asset value, end of period | | $ | 14.29 | | | | | | | $ | 11.80 | | | | | | | $ | 12.86 | | | | | | | $ | 15.59 | | | | | | | $ | 13.35 | |
| | | | | | | | | | | | | | | | | | | | | | | | | | | | | | | | | | | | |
Total returnC | | | 23.74 | % | | | | | | | 2.35 | % | | | | | | | (9.62 | )% | | | | | | | 33.17 | % | | | | | | | (4.65 | )% |
| | | | | | | | | | | | | | | | | | | | | | | | | | | | | | | | | | | | |
| | | | | | | | | |
Ratios and supplemental data: | | | | | | | | | | | | | | | | | | | | | | | | | | | | | | | | | | | | |
Net assets, end of period | | $ | 1,160,350 | | | | | | | $ | 960,288 | | | | | | | $ | 1,124,266 | | | | | | | $ | 2,120,450 | | | | | | | $ | 1,760,622 | |
Ratios to average net assets: | | | | | | | | | | | | | | | | | | | | | | | | | | | | | | | | | | | | |
Expenses, before reimbursements and/or recoupments | | | 1.35 | % | | | | | | | 1.24 | % | | | | | | | 1.19 | % | | | | | | | 1.16 | % | | | | | | | 1.36 | % |
Expenses, net of reimbursements and/or recoupments | | | 1.35 | % | | | | | | | 1.24 | % | | | | | | | 1.19 | % | | | | | | | 1.16 | % | | | | | | | 1.36 | % |
Net investment income, before expense reimbursements and/or recoupments | | | 1.73 | % | | | | | | | 1.66 | % | | | | | | | 1.05 | % | | | | | | | 0.91 | % | | | | | | | 1.29 | % |
Net investment income, net of reimbursements and/or recoupments | | | 1.73 | % | | | | | | | 1.66 | % | | | | | | | 1.05 | % | | | | | | | 0.91 | % | | | | | | | 1.29 | % |
Portfolio turnover rate | | | 38 | % | | | | | | | 48 | % | | | | | | | 30 | % | | | | | | | 37 | % | | | | | | | 82 | % |
| A | On January 23, 2020, Brandywine Global Investment Management, LLC was terminated and ceased managing assets of the Fund. |
| B | Per share amounts have been calculated using the average shares method. |
| C | Based on net asset value, which does not reflect the sales charge, redemption fee, or contingent deferred sales charge, if applicable. May include adjustments in accordance with U.S. GAAP and as such, the net asset value for reporting purposes and the returns based upon those net asset values may differ from the net asset value and returns for shareholder transactions. |
See accompanying notes
49
American Beacon Balanced FundSM
Financial Highlights
(For a share outstanding throughout the period)
| | | | | | | | | | | | | | | | | | | | | | | | | | | | | | | | | | | | |
| | | A Class | |
| | | Year Ended October 31, | |
| | | | |
| | | 2024 | | | | | | 2023 | | | | | | 2022 | | | | | | 2021 | | | | | | 2020A | |
| | | | |
Net asset value, beginning of period | | $ | 10.59 | | | | | | | $ | 11.69 | | | | | | | $ | 14.31 | | | | | | | $ | 12.39 | | | | | | | $ | 14.33 | |
| | | | | | | | | | | | | | | | | | | | | | | | | | | | | | | | | | | | |
Income (loss) from investment operations: | | | | | | | | | | | | | | | | | | | | | | | | | | | | | | | | | | | | |
Net investment income | | | 0.36 | | | | | | | | 0.23 | | | | | | | | 0.25 | | | | | | | | 0.11 | | | | | | | | 0.15 | |
Net gains (losses) on investments (both realized and unrealized) | | | 2.16 | | | | | | | | 0.05 | | | | | | | | (1.50 | ) | | | | | | | 3.71 | | | | | | | | (0.71 | ) |
| | | | | | | | | | | | | | | | | | | | | | | | | | | | | | | | | | | | |
Total income (loss) from investment operations | | | 2.52 | | | | | | | | 0.28 | | | | | | | | (1.25 | ) | | | | | | | 3.82 | | | | | | | | (0.56 | ) |
| | | | | | | | | | | | | | | | | | | | | | | | | | | | | | | | | | | | |
Less distributions: | | | | | | | | | | | | | | | | | | | | | | | | | | | | | | | | | | | | |
Dividends from net investment income | | | (0.26 | ) | | | | | | | (0.22 | ) | | | | | | | (0.19 | ) | | | | | | | (0.25 | ) | | | | | | | (0.21 | ) |
Distributions from net realized gains | | | (0.06 | ) | | | | | | | (1.16 | ) | | | | | | | (1.18 | ) | | | | | | | (1.65 | ) | | | | | | | (1.17 | ) |
| | | | | | | | | | | | | | | | | | | | | | | | | | | | | | | | | | | | |
Total distributions | | | (0.32 | ) | | | | | | | (1.38 | ) | | | | | | | (1.37 | ) | | | | | | | (1.90 | ) | | | | | | | (1.38 | ) |
| | | | | | | | | | | | | | | | | | | | | | | | | | | | | | | | | | | | |
Net asset value, end of period | | $ | 12.79 | | | | | | | $ | 10.59 | | | | | | | $ | 11.69 | | | | | | | $ | 14.31 | | | | | | | $ | 12.39 | |
| | | | | | | | | | | | | | | | | | | | | | | | | | | | | | | | | | | | |
Total returnB | | | 24.03 | % | | | | | | | 2.44 | % | | | | | | | (9.49 | )% | | | | | | | 33.39 | % | | | | | | | (4.49 | )% |
| | | | | | | | | | | | | | | | | | | | | | | | | | | | | | | | | | | | |
| | | | | | | | | |
Ratios and supplemental data: | | | | | | | | | | | | | | | | | | | | | | | | | | | | | | | | | | | | |
Net assets, end of period | | $ | 20,055,093 | | | | | | | $ | 12,917,238 | | | | | | | $ | 13,482,666 | | | | | | | $ | 13,922,687 | | | | | | | $ | 12,863,938 | |
Ratios to average net assets: | | | | | | | | | | | | | | | | | | | | | | | | | | | | | | | | | | | | |
Expenses, before reimbursements and/or recoupments | | | 1.17 | % | | | | | | | 1.09 | % | | | | | | | 1.04 | % | | | | | | | 1.02 | % | | | | | | | 1.21 | % |
Expenses, net of reimbursements and/or recoupments | | | 1.17 | % | | | | | | | 1.09 | % | | | | | | | 1.04 | % | | | | | | | 1.02 | % | | | | | | | 1.21 | % |
Net investment income, before expense reimbursements and/or recoupments | | | 1.91 | % | | | | | | | 1.80 | % | | | | | | | 1.22 | % | | | | | | | 1.04 | % | | | | | | | 1.46 | % |
Net investment income, net of reimbursements and/or recoupments | | | 1.91 | % | | | | | | | 1.80 | % | | | | | | | 1.22 | % | | | | | | | 1.04 | % | | | | | | | 1.46 | % |
Portfolio turnover rate | | | 38 | % | | | | | | | 48 | % | | | | | | | 30 | % | | | | | | | 37 | % | | | | | | | 82 | % |
| A | On January 23, 2020, Brandywine Global Investment Management, LLC was terminated and ceased managing assets of the Fund. |
| B | Based on net asset value, which does not reflect the sales charge, redemption fee, or contingent deferred sales charge, if applicable. May include adjustments in accordance with U.S. GAAP and as such, the net asset value for reporting purposes and the returns based upon those net asset values may differ from the net asset value and returns for shareholder transactions. |
See accompanying notes
50
American Beacon Balanced FundSM
Financial Highlights
(For a share outstanding throughout the period)
| | | | | | | | | | | | | | | | | | | | | | | | | | | | | | | | | | | | |
| | | C Class | |
| | | Year Ended October 31, | |
| | | | |
| | | 2024 | | | | | | 2023 | | | | | | 2022 | | | | | | 2021 | | | | | | 2020A | |
| | | | |
Net asset value, beginning of period | | $ | 10.78 | | | | | | | $ | 11.87 | | | | | | | $ | 14.49 | | | | | | | $ | 12.53 | | | | | | | $ | 14.48 | |
| | | | | | | | | | | | | | | | | | | | | | | | | | | | | | | | | | | | |
Income (loss) from investment operations: | | | | | | | | | | | | | | | | | | | | | | | | | | | | | | | | | | | | |
Net investment income | | | 0.14 | B | | | | | | | 0.12 | B | | | | | | | 0.06 | B | | | | | | | 0.04 | B | | | | | | | 0.05 | |
Net gains (losses) on investments (both realized and unrealized) | | | 2.33 | | | | | | | | 0.08 | | | | | | | | (1.41 | ) | | | | | | | 3.72 | | | | | | | | (0.70 | ) |
| | | | | | | | | | | | | | | | | | | | | | | | | | | | | | | | | | | | |
Total income (loss) from investment operations | | | 2.47 | | | | | | | | 0.20 | | | | | | | | (1.35 | ) | | | | | | | 3.76 | | | | | | | | (0.65 | ) |
| | | | | | | | | | | | | | | | | | | | | | | | | | | | | | | | | | | | |
Less distributions: | | | | | | | | | | | | | | | | | | | | | | | | | | | | | | | | | | | | |
Dividends from net investment income | | | (0.15 | ) | | | | | | | (0.13 | ) | | | | | | | (0.09 | ) | | | | | | | (0.15 | ) | | | | | | | (0.13 | ) |
Distributions from net realized gains | | | (0.06 | ) | | | | | | | (1.16 | ) | | | | | | | (1.18 | ) | | | | | | | (1.65 | ) | | | | | | | (1.17 | ) |
| | | | | | | | | | | | | | | | | | | | | | | | | | | | | | | | | | | | |
Total distributions | | | (0.21 | ) | | | | | | | (1.29 | ) | | | | | | | (1.27 | ) | | | | | | | (1.80 | ) | | | | | | | (1.30 | ) |
| | | | | | | | | | | | | | | | | | | | | | | | | | | | | | | | | | | | |
Net asset value, end of period | | $ | 13.04 | | | | | | | $ | 10.78 | | | | | | | $ | 11.87 | | | | | | | $ | 14.49 | | | | | | | $ | 12.53 | |
| | | | | | | | | | | | | | | | | | | | | | | | | | | | | | | | | | | | |
Total returnC | | | 23.03 | % | | | | | | | 1.68 | % | | | | | | | (10.11 | )% | | | | | | | 32.32 | % | | | | | | | (5.09 | )% |
| | | | | | | | | | | | | | | | | | | | | | | | | | | | | | | | | | | | |
| | | | | | | | | |
Ratios and supplemental data: | | | | | | | | | | | | | | | | | | | | | | | | | | | | | | | | | | | | |
Net assets, end of period | | $ | 5,408,913 | | | | | | | $ | 11,669,906 | | | | | | | $ | 16,173,837 | | | | | | | $ | 23,737,711 | | | | | | | $ | 23,951,798 | |
Ratios to average net assets: | | | | | | | | | | | | | | | | | | | | | | | | | | | | | | | | | | | | |
Expenses, before reimbursements and/or recoupments | | | 1.94 | % | | | | | | | 1.83 | % | | | | | | | 1.78 | % | | | | | | | 1.75 | % | | | | | | | 1.95 | % |
Expenses, net of reimbursements and/or recoupments | | | 1.94 | % | | | | | | | 1.83 | % | | | | | | | 1.78 | % | | | | | | | 1.75 | % | | | | | | | 1.95 | % |
Net investment income, before expense reimbursements and/or recoupments | | | 1.17 | % | | | | | | | 1.04 | % | | | | | | | 0.47 | % | | | | | | | 0.32 | % | | | | | | | 0.72 | % |
Net investment income, net of reimbursements and/or recoupments | | | 1.17 | % | | | | | | | 1.04 | % | | | | | | | 0.47 | % | | | | | | | 0.32 | % | | | | | | | 0.72 | % |
Portfolio turnover rate | | | 38 | % | | | | | | | 48 | % | | | | | | | 30 | % | | | | | | | 37 | % | | | | | | | 82 | % |
| A | On January 23, 2020, Brandywine Global Investment Management, LLC was terminated and ceased managing assets of the Fund. |
| B | Per share amounts have been calculated using the average shares method. |
| C | Based on net asset value, which does not reflect the sales charge, redemption fee, or contingent deferred sales charge, if applicable. May include adjustments in accordance with U.S. GAAP and as such, the net asset value for reporting purposes and the returns based upon those net asset values may differ from the net asset value and returns for shareholder transactions. |
See accompanying notes
51
American Beacon Balanced FundSM
Federal Tax Information
October 31, 2024 (Unaudited)
Certain tax information regarding the Funds is required to be provided to shareholders based upon the Funds’ income and distributions for the taxable year ended October 31, 2024. The information and distributions reported herein may differ from information and distributions taxable to the shareholders for the calendar year ended December 31, 2024.
The Funds designated the following items with regard to distributions paid during the fiscal year ended October 31, 2024. All designations are based on financial information available as of this annual report and, accordingly, are subject to change. For each item, it is the intention of the Funds to designate the maximum amount permitted under the Internal Revenue Code of 1986, as amended, and the regulations there under.
Corporate Dividends-Received Deduction:
Qualified Dividend Income:
Long-Term Capital Gain Distributions:
Short-Term Capital Gain Distributions:
Shareholders will receive notification in January 2025 of the applicable tax information necessary to prepare their 2024 income tax returns.
52

Delivery of Documents
If you invest in the Fund through a financial institution, you may be able to receive the Fund’s regulatory mailings, such as the Prospectus, Annual Report, Semi-Annual Report and Financial Statement Reports, by e-mail. If you are interested in this option, please go to www.icsdelivery.com and search for your financial institution’s name or contact your financial institution directly.
You may request a paper copy of this document at no charge by contacting your financial institution. This document is also available for download at www.americanbeaconfunds.com or you can request an electronic copy by contacting your financial institution.
To obtain more information about the Fund:
| | |
 | |  |
| | |
| By E-mail: | | On the Internet: |
| american_beacon.funds@ambeacon.com | | Visit our website at www.americanbeaconfunds.com |
| | | |
| | | |
| | |

By Telephone: Call (800) 658-5811 | | 
By Mail: American Beacon Funds P.O. Box 219643 Kansas City, MO 64121-9643 |
|
|
|
| | | |
Fund Service Providers:
| | | | | | | | | | | | |
CUSTODIAN State Street Bank and Trust Company Boston, Massachusetts | | | | TRANSFER AGENT SS&C GIDS, Inc. Quincy, Massachusetts | | | | INDEPENDENT REGISTERED PUBLIC ACCOUNTING FIRM PricewaterhouseCoopers LLP Boston, Massachusetts | | | | DISTRIBUTOR Resolute Investment Distributors, Inc. Irving, Texas |
This report is prepared for shareholders of the American Beacon Funds and may be distributed to others only if preceded or accompanied by a current Prospectus or Summary Prospectus.
American Beacon Funds and American Beacon Balanced Fund are service marks of American Beacon Advisors, Inc.
AR 10/24

American Beacon Funds
Although information has been compiled from reliable sources, American Beacon Advisors, Inc. makes no representation as to the completeness or accuracy of the statements contained herein. All information is as of the end of the reporting period, unless noted otherwise, and is subject to change. Each Fund’s portfolio composition will change depending on economic and market conditions.
American Beacon Funds | October 31, 2024 |
Contents
American Beacon FundsSM
Report of Independent Registered Public Accounting Firm
To the Board of Trustees of American Beacon Funds and Shareholders of American Beacon EAM International Small Cap Fund and American Beacon International Equity Fund
Opinions on the Financial Statements
We have audited the accompanying statements of assets and liabilities, including the schedules of investments, of American Beacon EAM International Small Cap Fund and American Beacon International Equity Fund (two of the funds constituting American Beacon Funds, hereafter collectively referred to as the “Funds”) as of October 31, 2024, the related statements of operations for the year ended October 31, 2024, the statements of changes in net assets for each of the two years in the period ended October 31, 2024, including the related notes, and the financial highlights for each of the three years in the period ended October 31, 2024 (collectively referred to as the “financial statements”). In our opinion, the financial statements present fairly, in all material respects, the financial position of each of the Funds as of October 31, 2024, the results of each of their operations for the year then ended, the changes in each of their net assets for each of the two years in the period ended October 31, 2024 and each of the financial highlights for the three years in the period ended October 31, 2024 in conformity with accounting principles generally accepted in the United States of America.
The financial statements of the Funds as of and for the year ended October 31, 2021 and the financial highlights for each of the periods ended on or prior to October 31, 2021 (not presented herein, other than the financial highlights) were audited by other auditors whose report dated December 30, 2021 expressed an unqualified opinion on those financial statements and financial highlights.
Basis for Opinions
These financial statements are the responsibility of the Funds’ management. Our responsibility is to express an opinion on the Funds’ financial statements based on our audits. We are a public accounting firm registered with the Public Company Accounting Oversight Board (United States) (PCAOB) and are required to be independent with respect to the Funds in accordance with the U.S. federal securities laws and the applicable rules and regulations of the Securities and Exchange Commission and the PCAOB.
We conducted our audits of these financial statements in accordance with the standards of the PCAOB. Those standards require that we plan and perform the audit to obtain reasonable assurance about whether the financial statements are free of material misstatement, whether due to error or fraud.
Our audits included performing procedures to assess the risks of material misstatement of the financial statements, whether due to error or fraud, and performing procedures that respond to those risks. Such procedures included examining, on a test basis, evidence regarding the amounts and disclosures in the financial statements. Our audits also included evaluating the accounting principles used and significant estimates made by management, as well as evaluating the overall presentation of the financial statements. Our procedures included confirmation of securities owned as of October 31, 2024 by correspondence with the custodian and brokers; when replies were not received from brokers, we performed other auditing procedures. We believe that our audits provide a reasonable basis for our opinions.
/s/PricewaterhouseCoopers LLP
Boston, Massachusetts
December 27, 2024
We have served as the auditor of one or more investment companies in the American Beacon family of funds since 2016.
1
American Beacon EAM International Small Cap FundSM
Schedule of Investments
October 31, 2024
| | | | | | | | | | | | | | | |
| | | |
| | | Shares | | | | Fair Value |
| | | | | | | |
| | | |
| Australia - 9.44% | | | | | | |
| | | |
| Foreign Common Stocks - 9.44% | | | | | | |
| AMP Ltd.A | | | | 861,587 | | | | | | | | | $ | 805,321 | |
| Guzman y Gomez Ltd.A B | | | | 34,702 | | | | | | | | | | 857,080 | |
| HMC Capital Ltd.A | | | | 139,180 | | | | | | | | | | 927,814 | |
| HUB24 Ltd.A C | | | | 27,737 | | | | | | | | | | 1,245,546 | |
| JB Hi-Fi Ltd.A | | | | 17,074 | | | | | | | | | | 913,232 | |
| Netwealth Group Ltd.A | | | | 45,262 | | | | | | | | | | 810,890 | |
| Pro Medicus Ltd.A | | | | 8,385 | | | | | | | | | | 1,066,611 | |
| Resolute Mining Ltd.A B | | | | 1,822,353 | | | | | | | | | | 975,207 | |
| Technology One Ltd.A | | | | 67,717 | | | | | | | | | | 1,078,466 | |
| Telix Pharmaceuticals Ltd.A B C | | | | 92,377 | | | | | | | | | | 1,252,418 | |
| West African Resources Ltd.A B | | | | 850,204 | | | | | | | | | | 1,016,195 | |
| Westgold Resources Ltd.A C | | | | 472,050 | | | | | | | | | | 991,224 | |
| | | | | | | | | | | | | | | |
Total Foreign Common Stocks | | | | | | | | | | | | | | 11,940,004 | |
| | | | | | | | | | | | | | | |
| | | | | | | | | | | | | | | |
Total Australia (Cost $10,419,896) | | | | | | | | | | | | | | 11,940,004 | |
| | | | | | | | | | | | | | | |
| | | | | | | | | | | | | | | |
| | | |
| Austria - 0.72% (Cost $906,661) | | | | | | |
| | | |
| Foreign Common Stocks - 0.72% | | | | | | |
| BAWAG Group AGA D | | | | 11,730 | | | | | | | | | | 906,705 | |
| | | | | | | | | | | | | | | |
| | | | | | | | | | | | | | | |
| | | |
| Belgium - 0.96% (Cost $736,928) | | | | | | |
| | | |
| Foreign Common Stocks - 0.96% | | | | | | |
| Lotus Bakeries NVA | | | | 93 | | | | | | | | | | 1,216,237 | |
| | | | | | | | | | | | | | | |
| | | | | | | | | | | | | | | |
| | | |
| Brazil - 2.25% | | | | | | |
| | | |
| Foreign Common Stocks - 1.44% | | | | | | |
| BRF SAB | | | | 171,119 | | | | | | | | | | 776,428 | |
| Embraer SAB | | | | 124,425 | | | | | | | | | | 1,043,457 | |
| | | | | | | | | | | | | | | |
| | | | | | | | | | | | | | | |
Total Foreign Common Stocks | | | | | | | | | | | | | | 1,819,885 | |
| | | | | | | | | | | | | | | |
| | | | | | | | | | | | | | | |
| | | |
| Foreign Preferred Stocks - 0.81% | | | | | | |
| Marcopolo SAE | | | | 701,539 | | | | | | | | | | 1,026,660 | |
| | | | | | | | | | | | | | | |
| | | | | | | | | | | | | | | |
Total Brazil (Cost $2,510,843) | | | | | | | | | | | | | | 2,846,545 | |
| | | | | | | | | | | | | | | |
| | | | | | | | | | | | | | | |
| | | |
| Burkina Faso - 0.72% (Cost $1,007,157) | | | | | | |
| | | |
| Foreign Common Stocks - 0.72% | | | | | | |
| IAMGOLD Corp.B C | | | | 164,090 | | | | | | | | | | 910,989 | |
| | | | | | | | | | | | | | | |
| | | | | | | | | | | | | | | |
| | | |
| Canada - 9.40% | | | | | | |
| | | |
| Foreign Common Stocks - 9.40% | | | | | | |
| Alamos Gold, Inc., Class A | | | | 49,074 | | | | | | | | | | 991,454 | |
| Aritzia, Inc.B C | | | | 24,204 | | | | | | | | | | 779,305 | |
| AtkinsRealis Group, Inc.C | | | | 18,985 | | | | | | | | | | 913,560 | |
| Aya Gold & Silver, Inc.B | | | | 71,705 | | | | | | | | | | 921,322 | |
| Calibre Mining Corp.B | | | | 434,954 | | | | | | | | | | 790,343 | |
| Capital Power Corp. | | | | 22,761 | | | | | | | | | | 918,143 | |
| Celestica, Inc.B C | | | | 12,294 | | | | | | | | | | 841,291 | |
| Colliers International Group, Inc. | | | | 7,249 | | | | | | | | | | 1,108,110 | |
| Definity Financial Corp.C | | | | 25,057 | | | | | | | | | | 966,935 | |
| Lundin Gold, Inc. | | | | 41,183 | | | | | | | | | | 995,893 | |
| North West Co., Inc.C | | | | 24,208 | | | | | | | | | | 911,223 | |
| Secure Energy Services, Inc.C | | | | 74,231 | | | | | | | | | | 826,892 | |
| TerraVest Industries, Inc. | | | | 12,806 | | | | | | | | | | 917,257 | |
| | | | | | | | | | | | | | | |
Total Foreign Common Stocks | | | | | | | | | | | | | | 11,881,728 | |
| | | | | | | | | | | | | | | |
| | | | | | | | | | | | | | | |
Total Canada (Cost $11,328,427) | | | | | | | | | | | | | | 11,881,728 | |
| | | | | | | | | | | | | | | |
See accompanying notes
2
American Beacon EAM International Small Cap FundSM
Schedule of Investments
October 31, 2024
| | | | | | | | | | | | | | | |
| | | |
| | | Shares | | | | Fair Value |
| | | | | | | |
| | | |
| China - 5.79% | | | | | | |
| | | |
| Foreign Common Stocks - 5.79% | | | | | | |
| AAC Technologies Holdings, Inc.A | | | | 205,528 | | | | | | | | | $ | 828,255 | |
| China Suntien Green Energy Corp. Ltd., Class HA | | | | 1,290,967 | | | | | | | | | | 586,101 | |
| First Tractor Co. Ltd., Class HA | | | | 126,773 | | | | | | | | | | 113,126 | |
| Goldwind Science & Technology Co. Ltd., Class HA | | | | 1,147,851 | | | | | | | | | | 971,879 | |
| Pop Mart International Group Ltd.A D | | | | 125,081 | | | | | | | | | | 1,134,049 | |
| Qifu Technology, Inc., ADR | | | | 34,646 | | | | | | | | | | 1,136,735 | |
| Smoore International Holdings Ltd.A D | | | | 421,750 | | | | | | | | | | 550,143 | |
| United Laboratories International Holdings Ltd.A | | | | 609,072 | | | | | | | | | | 827,086 | |
| Yangzijiang Shipbuilding Holdings Ltd.A | | | | 603,099 | | | | | | | | | | 1,170,665 | |
| | | | | | | | | | | | | | | |
Total Foreign Common Stocks | | | | | | | | | | | | | | 7,318,039 | |
| | | | | | | | | | | | | | | |
| | | | | | | | | | | | | | | |
Total China (Cost $7,017,464) | | | | | | | | | | | | | | 7,318,039 | |
| | | | | | | | | | | | | | | |
| | | | | | | | | | | | | | | |
| | | |
| Denmark - 1.39% | | | | | | |
| | | |
| Foreign Common Stocks - 1.39% | | | | | | |
| ALK-Abello ASA B | | | | 31,468 | | | | | | | | | | 736,728 | |
| NKT ASA B | | | | 10,941 | | | | | | | | | | 1,025,173 | |
| | | | | | | | | | | | | | | |
Total Foreign Common Stocks | | | | | | | | | | | | | | 1,761,901 | |
| | | | | | | | | | | | | | | |
| | | | | | | | | | | | | | | |
Total Denmark (Cost $1,540,713) | | | | | | | | | | | | | | 1,761,901 | |
| | | | | | | | | | | | | | | |
| | | | | | | | | | | | | | | |
| | | |
| Finland - 1.68% | | | | | | |
| | | |
| Foreign Common Stocks - 1.68% | | | | | | |
| Cargotec OYJ, Class BA | | | | 17,362 | | | | | | | | | | 1,050,209 | |
| Konecranes OYJA | | | | 15,447 | | | | | | | | | | 1,071,310 | |
| | | | | | | | | | | | | | | |
Total Foreign Common Stocks | | | | | | | | | | | | | | 2,121,519 | |
| | | | | | | | | | | | | | | |
| | | | | | | | | | | | | | | |
Total Finland (Cost $1,544,244) | | | | | | | | | | | | | | 2,121,519 | |
| | | | | | | | | | | | | | | |
| | | | | | | | | | | | | | | |
| | | |
| France - 0.84% (Cost $894,344) | | | | | | |
| | | |
| Foreign Common Stocks - 0.84% | | | | | | |
| Nexans SAA | | | | 7,605 | | | | | | | | | | 1,055,493 | |
| | | | | | | | | | | | | | | |
| | | | | | | | | | | | | | | |
| | | |
| Germany - 0.75% (Cost $803,747) | | | | | | |
| | | |
| Foreign Common Stocks - 0.75% | | | | | | |
| CTS Eventim AG & Co. KGaAA | | | | 9,021 | | | | | | | | | | 946,659 | |
| | | | | | | | | | | | | | | |
| | | | | | | | | | | | | | | |
| | | |
| India - 11.57% | | | | | | |
| | | |
| Foreign Common Stocks - 11.57% | | | | | | |
| Ajanta Pharma Ltd.A | | | | 20,390 | | | | | | | | | | 739,621 | |
| CESC Ltd.A | | | | 370,929 | | | | | | | | | | 826,004 | |
| eMudhra Ltd.A | | | | 89,604 | | | | | | | | | | 966,417 | |
| Epack Durable Ltd.A B | | | | 218,609 | | | | | | | | | | 1,064,028 | |
| Firstsource Solutions Ltd.A | | | | 256,468 | | | | | | | | | | 1,026,340 | |
| Inox Wind Ltd.A B | | | | 291,214 | | | | | | | | | | 762,351 | |
| Ipca Laboratories Ltd.A | | | | 46,893 | | | | | | | | | | 886,707 | |
| ITD Cementation India Ltd.A | | | | 117,837 | | | | | | | | | | 794,763 | |
| Kfin Technologies Ltd.A | | | | 72,027 | | | | | | | | | | 847,938 | |
| Minda Corp. Ltd.A | | | | 126,290 | | | | | | | | | | 768,392 | |
| Nuvama Wealth Management Ltd.A | | | | 12,600 | | | | | | | | | | 1,040,860 | |
| Radico Khaitan Ltd.A | | | | 37,487 | | | | | | | | | | 1,056,703 | |
| Solar Industries India Ltd.A | | | | 4,726 | | | | | | | | | | 571,969 | |
| Trent Ltd.A | | | | 10,680 | | | | | | | | | | 904,401 | |
| Triveni Turbine Ltd.A | | | | 86,830 | | | | | | | | | | 712,483 | |
| Voltas Ltd.A | | | | 38,530 | | | | | | | | | | 755,679 | |
| Zomato Ltd.A B | | | | 316,300 | | | | | | | | | | 907,326 | |
| | | | | | | | | | | | | | | |
Total Foreign Common Stocks | | | | | | | | | | | | | | 14,631,982 | |
| | | | | | | | | | | | | | | |
| | | | | | | | | | | | | | | |
Total India (Cost $13,710,645) | | | | | | | | | | | | | | 14,631,982 | |
| | | | | | | | | | | | | | | |
See accompanying notes
3
American Beacon EAM International Small Cap FundSM
Schedule of Investments
October 31, 2024
| | | | | | | | | | | | | | | |
| | | |
| | | Shares | | | | Fair Value |
| | | | | | | |
| | | |
| Israel - 0.89% (Cost $753,097) | | | | | | |
| | | |
| Foreign Common Stocks - 0.89% | | | | | | |
| Wix.com Ltd.B | | | | 6,724 | | | | | | | | | $ | 1,123,715 | |
| | | | | | | | | | | | | | | |
| | | | | | | | | | | | | | | |
| | | |
| Italy - 0.72% (Cost $953,036) | | | | | | |
| | | |
| Foreign Common Stocks - 0.72% | | | | | | |
| BPER Banca SpAA | | | | 148,509 | | | | | | | | | | 905,596 | |
| | | | | | | | | | | | | | | |
| | | | | | | | | | | | | | | |
| | | |
| Japan - 13.19% | | | | | | |
| | | |
| Foreign Common Stocks - 13.19% | | | | | | |
| Fujitec Co. Ltd.A | | | | 29,797 | | | | | | | | | | 1,072,833 | |
| GENDA, Inc.A B | | | | 39,088 | | | | | | | | | | 684,327 | |
| Japan Securities Finance Co. Ltd.A | | | | 73,186 | | | | | | | | | | 957,280 | |
| Japan Steel Works Ltd.A | | | | 25,956 | | | | | | | | | | 880,164 | |
| JVCKenwood Corp.A | | | | 98,121 | | | | | | | | | | 775,116 | |
| Kandenko Co. Ltd.A | | | | 56,230 | | | | | | | | | | 819,905 | |
| Kinden Corp.A | | | | 33,337 | | | | | | | | | | 690,473 | |
| Kuraray Co. Ltd.A | | | | 67,918 | | | | | | | | | | 919,203 | |
| Lifedrink Co., Inc.A | | | | 82,800 | | | | | | | | | | 959,276 | |
| Nagase & Co. Ltd.A | | | | 28,387 | | | | | | | | | | 592,065 | |
| Nichias Corp.A | | | | 22,005 | | | | | | | | | | 795,188 | |
| NOF Corp.A | | | | 52,933 | | | | | | | | | | 860,961 | |
| NS Solutions Corp.A | | | | 29,339 | | | | | | | | | | 740,792 | |
| PAL GROUP Holdings Co. Ltd.A | | | | 48,600 | | | | | | | | | | 977,412 | |
| Sankyo Co. Ltd.A | | | | 46,669 | | | | | | | | | | 617,843 | |
| Sanrio Co. Ltd.A | | | | 38,808 | | | | | | | | | | 1,053,030 | |
| Sumitomo Forestry Co. Ltd.A | | | | 17,089 | | | | | | | | | | 654,552 | |
| SWCC Corp.A | | | | 29,979 | | | | | | | | | | 1,044,959 | |
| Tamron Co. Ltd.A | | | | 32,179 | | | | | | | | | | 902,120 | |
| Yonex Co. Ltd.A | | | | 53,914 | | | | | | | | | | 675,534 | |
| | | | | | | | | | | | | | | |
Total Foreign Common Stocks | | | | | | | | | | | | | | 16,673,033 | |
| | | | | | | | | | | | | | | |
| | | | | | | | | | | | | | | |
Total Japan (Cost $15,765,246) | | | | | | | | | | | | | | 16,673,033 | |
| | | | | | | | | | | | | | | |
| | | | | | | | | | | | | | | |
| | | |
| Netherlands - 0.92% (Cost $1,024,084) | | | | | | |
| | | |
| Foreign Common Stocks - 0.92% | | | | | | |
| Van Lanschot Kempen NVA | | | | 25,286 | | | | | | | | | | 1,160,868 | |
| | | | | | | | | | | | | | | |
| | | | | | | | | | | | | | | |
| | | |
| New Zealand - 0.63% (Cost $828,969) | | | | | | |
| | | |
| Foreign Common Stocks - 0.63% | | | | | | |
| Infratil Ltd.A | | | | 106,765 | | | | | | | | | | 800,608 | |
| | | | | | | | | | | | | | | |
| | | | | | | | | | | | | | | |
| | | |
| Norway - 0.54% | | | | | | |
| | | |
| Foreign Common Stocks - 0.54% | | | | | | |
| Protector Forsikring ASAA | | | | 21,462 | | | | | | | | | | 555,937 | |
| Wallenius Wilhelmsen ASAA | | | | 12,781 | | | | | | | | | | 125,829 | |
| | | | | | | | | | | | | | | |
Total Foreign Common Stocks | | | | | | | | | | | | | | 681,766 | |
| | | | | | | | | | | | | | | |
| | | | | | | | | | | | | | | |
Total Norway (Cost $727,315) | | | | | | | | | | | | | | 681,766 | |
| | | | | | | | | | | | | | | |
| | | | | | | | | | | | | | | |
| | | |
| Peru - 0.69% (Cost $918,839) | | | | | | |
| | | |
| Foreign Common Stocks - 0.69% | | | | | | |
| Hochschild Mining PLCA B | | | | 295,717 | | | | | | | | | | 877,468 | |
| | | | | | | | | | | | | | | |
| | | | | | | | | | | | | | | |
| | | |
| Poland - 0.90% (Cost $805,809) | | | | | | |
| | | |
| Foreign Common Stocks - 0.90% | | | | | | |
| InPost SAA B | | | | 58,248 | | | | | | | | | | 1,136,727 | |
| | | | | | | | | | | | | | | |
| | | | | | | | | | | | | | | |
| | | |
| Republic of Korea - 8.05% | | | | | | |
| | | |
| Foreign Common Stocks - 8.05% | | | | | | |
| Classys, Inc.A | | | | 23,491 | | | | | | | | | | 860,192 | |
| Hanwha Aerospace Co. Ltd.A | | | | 5,333 | | | | | | | | | | 1,416,246 | |
See accompanying notes
4
American Beacon EAM International Small Cap FundSM
Schedule of Investments
October 31, 2024
| | | | | | | | | | | | | | | |
| | | |
| | | Shares | | | | Fair Value |
| | | | | | | |
| | | |
| Republic of Korea - 8.05% (continued) | | | | | | |
| | | |
| Foreign Common Stocks - 8.05% (continued) | | | | | | |
| HD Hyundai Electric Co. Ltd.A | | | | 3,560 | | | | | | | | | $ | 818,159 | |
| Hyundai Rotem Co. Ltd.A | | | | 24,773 | | | | | | | | | | 1,116,861 | |
| JB Financial Group Co. Ltd.A | | | | 65,515 | | | | | | | | | | 848,419 | |
| Kyung Dong Navien Co. Ltd.A | | | | 15,617 | | | | | | | | | | 978,379 | |
| LIG Nex1 Co. Ltd.A | | | | 6,430 | | | | | | | | | | 1,145,132 | |
| LigaChem Biosciences, Inc.A B | | | | 11,325 | | | | | | | | | | 1,050,066 | |
| PharmaResearch Co. Ltd.A | | | | 6,989 | | | | | | | | | | 1,132,099 | |
| SK Biopharmaceuticals Co. Ltd.A B | | | | 9,644 | | | | | | | | | | 814,081 | |
| | | | | | | | | | | | | | | |
Total Foreign Common Stocks | | | | | | | | | | | | | | 10,179,634 | |
| | | | | | | | | | | | | | | |
| | | | | | | | | | | | | | | |
Total Republic of Korea (Cost $8,046,862) | | | | | | | | | | | | | | 10,179,634 | |
| | | | | | | | | | | | | | | |
| | | | | | | | | | | | | | | |
| | | |
| South Africa - 0.88% (Cost $910,107) | | | | | | |
| | | |
| Foreign Common Stocks - 0.88% | | | | | | |
| Truworths International Ltd.A | | | | 174,816 | | | | | | | | | | 1,108,468 | |
| | | | | | | | | | | | | | | |
| | | | | | | | | | | | | | | |
| | | |
| Sweden - 3.57% | | | | | | |
| | | |
| Foreign Common Stocks - 3.57% | | | | | | |
| AAK ABA | | | | 34,131 | | | | | | | | | | 977,476 | |
| Camurus ABA B | | | | 13,562 | | | | | | | | | | 763,397 | |
| Hemnet Group ABA | | | | 24,233 | | | | | | | | | | 757,667 | |
| Lagercrantz Group AB, Class BA | | | | 49,216 | | | | | | | | | | 959,284 | |
| Yubico ABA B C | | | | 43,718 | | | | | | | | | | 1,059,836 | |
| | | | | | | | | | | | | | | |
Total Foreign Common Stocks | | | | | | | | | | | | | | 4,517,660 | |
| | | | | | | | | | | | | | | |
| | | | | | | | | | | | | | | |
Total Sweden (Cost $4,606,057) | | | | | | | | | | | | | | 4,517,660 | |
| | | | | | | | | | | | | | | |
| | | | | | | | | | | | | | | |
| | | |
| Switzerland - 4.86% | | | | | | |
| | | |
| Foreign Common Stocks - 4.86% | | | | | | |
| Accelleron Industries AGA | | | | 20,866 | | | | | | | | | | 1,122,864 | |
| Belimo Holding AGA | | | | 1,477 | | | | | | | | | | 981,937 | |
| dormakaba Holding AGA | | | | 1,448 | | | | | | | | | | 1,106,532 | |
| Siegfried Holding AGA | | | | 757 | | | | | | | | | | 991,332 | |
| Sulzer AGA | | | | 7,247 | | | | | | | | | | 1,124,063 | |
| Ypsomed Holding AGA | | | | 1,827 | | | | | | | | | | 811,635 | |
| | | | | | | | | | | | | | | |
Total Foreign Common Stocks | | | | | | | | | | | | | | 6,138,363 | |
| | | | | | | | | | | | | | | |
| | | | | | | | | | | | | | | |
Total Switzerland (Cost $5,194,046) | | | | | | | | | | | | | | 6,138,363 | |
| | | | | | | | | | | | | | | |
| | | | | | | | | | | | | | | |
| | | |
| Taiwan - 7.68% | | | | | | |
| | | |
| Foreign Common Stocks - 7.68% | | | | | | |
| Acter Group Corp. Ltd.A | | | | 66,769 | | | | | | | | | | 721,955 | |
| Chang Wah Electromaterials, Inc.A | | | | 398,616 | | | | | | | | | | 663,586 | |
| Chroma ATE, Inc.A | | | | 90,659 | | | | | | | | | | 1,134,576 | |
| E Ink Holdings, Inc.A | | | | 115,021 | | | | | | | | | | 1,066,497 | |
| eMemory Technology, Inc.A | | | | 8,154 | | | | | | | | | | 772,777 | |
| Fusheng Precision Co. Ltd.A | | | | 69,299 | | | | | | | | | | 639,461 | |
| Gudeng Precision Industrial Co. Ltd.A | | | | 58,291 | | | | | | | | | | 973,400 | |
| Jentech Precision Industrial Co. Ltd.A | | | | 28,343 | | | | | | | | | | 1,246,474 | |
| King Yuan Electronics Co. Ltd.A | | | | 207,833 | | | | | | | | | | 763,769 | |
| Lai Yih Footwear Co. Ltd.A | | | | 74,583 | | | | | | | | | | 910,768 | |
| Voltronic Power Technology Corp.A | | | | 12,433 | | | | | | | | | | 816,934 | |
| | | | | | | | | | | | | | | |
Total Foreign Common Stocks | | | | | | | | | | | | | | 9,710,197 | |
| | | | | | | | | | | | | | | |
| | | | | | | | | | | | | | | |
Total Taiwan (Cost $9,012,907) | | | | | | | | | | | | | | 9,710,197 | |
| | | | | | | | | | | | | | | |
| | | | | | | | | | | | | | | |
| | | |
| Thailand - 0.72% (Cost $950,663) | | | | | | |
| | | |
| Foreign Common Stocks - 0.72% | | | | | | |
| WHA Corp. PCLA | | | | 5,286,638 | | | | | | | | | | 913,928 | |
| | | | | | | | | | | | | | | |
See accompanying notes
5
American Beacon EAM International Small Cap FundSM
Schedule of Investments
October 31, 2024
| | | | | | | | | | | | | | | |
| | | |
| | | Shares | | | | Fair Value |
| | | | | | | |
| | | |
| United Kingdom - 5.82% | | | | | | |
| | | |
| Foreign Common Stocks - 5.82% | | | | | | |
| Bridgepoint Group PLCA D | | | | 222,034 | | | | | | | | | $ | 892,235 | |
| Diploma PLCA | | | | 18,306 | | | | | | | | | | 1,012,674 | |
| Just Group PLCA | | | | 510,739 | | | | | | | | | | 884,894 | |
| Keller Group PLCA | | | | 51,133 | | | | | | | | | | 1,079,353 | |
| Marks & Spencer Group PLCA | | | | 217,742 | | | | | | | | | | 1,054,518 | |
| Morgan Sindall Group PLCA | | | | 16,735 | | | | | | | | | | 804,961 | |
| QinetiQ Group PLCA | | | | 110,254 | | | | | | | | | | 648,636 | |
| XPS Pensions Group PLCA F | | | | 212,568 | | | | | | | | | | 981,293 | |
| | | | | | | | | | | | | | | |
Total Foreign Common Stocks | | | | | | | | | | | | | | 7,358,564 | |
| | | | | | | | | | | | | | | |
| | | | | | | | | | | | | | | |
Total United Kingdom (Cost $7,257,792) | | | | | | | | | | | | | | 7,358,564 | |
| | | | | | | | | | | | | | | |
| | | | | | | | | | | | | | | |
| | | |
| United States - 1.55% | | | | | | |
| | | |
| Common Stocks - 1.55% | | | | | | |
| MDA Space Ltd.B | | | | 69,832 | | | | | | | | | | 1,068,281 | |
| Tecnoglass, Inc.C | | | | 13,001 | | | | | | | | | | 890,959 | |
| | | | | | | | | | | | | | | |
Total Common Stocks | | | | | | | | | | | | | | 1,959,240 | |
| | | | | | | | | | | | | | | |
| | | | | | | | | | | | | | | |
Total United States (Cost $1,955,690) | | | | | | | | | | | | | | 1,959,240 | |
| | | | | | | | | | | | | | | |
| | | | | | | | | | | | | | | |
| | | |
| SHORT-TERM INVESTMENTS - 2.91% (Cost $3,672,653) | | | | | | |
| | | |
| Investment Companies - 2.91% | | | | | | |
| American Beacon U.S. Government Money Market Select Fund, 4.76% G H | | | | 3,672,653 | | | | | | | | | | 3,672,653 | |
| | | | | | | | | | | | | | | |
| | | | | | | | | | | | | | | |
| | | |
| SECURITIES LENDING COLLATERAL- 0.05% (Cost $67,200) | | | | | | |
| | | |
| Investment Companies - 0.05% | | | | | | |
| American Beacon U.S. Government Money Market Select Fund, 4.76% G H | | | | 67,200 | | | | | | | | | | 67,200 | |
| | | | | | | | | | | | | | | |
| | | | | | | | | | | | | | | |
TOTAL INVESTMENTS - 100.08% (Cost $115,871,441) | | | | | | | | | | | | | | 126,523,489 | |
LIABILITIES, NET OF ASSETS - (0.08)% | | | | | | | | | | | | | | (99,423 | ) |
| | | | | | | | | | | | | | | |
TOTAL NET ASSETS - 100.00% | | | | | | | | | | | | | $ | 126,424,066 | |
| | | | | | | | | | | | | | | |
| | | | | | | |
| Percentages are stated as a percent of net assets. | | | | | | | | | | | | | | | |
A Security has been fair valued pursuant to the Manager’s procedures related to pricing that is not available after the close of exchange or the available price does not reflect the security’s true market value. At period end, the value of these securities amounted to $102,924,684 or 81.41% of net assets.
B Non-income producing security.
C All or a portion of this security is on loan, collateralized by either cash and/or U.S. Treasuries at October 31, 2024 (Note 9).
D Security exempt from registration under the Securities Act of 1933. These securities may be resold to qualified institutional buyers pursuant to Rule 144A. At the period end, the value of these securities amounted to $3,483,132 or 2.76% of net assets. The Fund has no right to demand registration of these securities.
E A type of Preferred Stock that has no maturity date.
F Reg S - Security purchased under the Securities Act of 1933, which exempts from registration securities offered and sold outside of the United States. Such a security cannot be sold in the United States without either an effective registration statement filed pursuant to the Securities Act of 1933, or pursuant to an exemption from registration.
G 7-day yield.
H The Fund is affiliated by having the same investment advisor.
ADR - American Depositary Receipt.
PCL - Public Company Limited (Thailand).
PLC - Public Limited Company.
See accompanying notes
6
American Beacon EAM International Small Cap FundSM
Schedule of Investments
October 31, 2024
The Fund’s investments are summarized by level based on the inputs used to determine their values. As of October 31, 2024, the investments were classified as described below:
| | | | | | | | | | | | | | | | | | | | | | | | | | | | |
EAM International Small Cap Fund | | Level 1 | | | | | | Level 2 | | | | | | Level 3 | | | | | | Total | |
Assets | | | | | | | | | | | | | | | | | | | | | | | | | | | | |
Foreign Common Stocks | | | | | | | | | | | | | | | | | | | | | | | | | | | | |
Australia | | $ | - | | | | | | | $ | 11,940,004 | | | | | | | $ | – | | | | | | | $ | 11,940,004 | |
Austria | | | - | | | | | | | | 906,705 | | | | | | | | - | | | | | | | | 906,705 | |
Belgium | | | - | | | | | | | | 1,216,237 | | | | | | | | - | | | | | | | | 1,216,237 | |
Brazil | | | 1,819,885 | | | | | | | | - | | | | | | | | - | | | | | | | | 1,819,885 | |
Burkina Faso | | | 910,989 | | | | | | | | - | | | | | | | | - | | | | | | | | 910,989 | |
Canada | | | 11,881,728 | | | | | | | | - | | | | | | | | - | | | | | | | | 11,881,728 | |
China | | | 1,136,735 | | | | | | | | 6,181,304 | | | | | | | | - | | | | | | | | 7,318,039 | |
Denmark | | | - | | | | | | | | 1,761,901 | | | | | | | | - | | | | | | | | 1,761,901 | |
Finland | | | - | | | | | | | | 2,121,519 | | | | | | | | - | | | | | | | | 2,121,519 | |
France | | | - | | | | | | | | 1,055,493 | | | | | | | | - | | | | | | | | 1,055,493 | |
Germany | | | - | | | | | | | | 946,659 | | | | | | | | - | | | | | | | | 946,659 | |
India | | | - | | | | | | | | 14,631,982 | | | | | | | | - | | | | | | | | 14,631,982 | |
Israel | | | 1,123,715 | | | | | | | | - | | | | | | | | - | | | | | | | | 1,123,715 | |
Italy | | | - | | | | | | | | 905,596 | | | | | | | | - | | | | | | | | 905,596 | |
Japan | | | - | | | | | | | | 16,673,033 | | | | | | | | - | | | | | | | | 16,673,033 | |
Netherlands | | | - | | | | | | | | 1,160,868 | | | | | | | | - | | | | | | | | 1,160,868 | |
New Zealand | | | - | | | | | | | | 800,608 | | | | | | | | - | | | | | | | | 800,608 | |
Norway | | | - | | | | | | | | 681,766 | | | | | | | | - | | | | | | | | 681,766 | |
Peru | | | - | | | | | | | | 877,468 | | | | | | | | - | | | | | | | | 877,468 | |
Poland | | | - | | | | | | | | 1,136,727 | | | | | | | | - | | | | | | | | 1,136,727 | |
Republic of Korea | | | - | | | | | | | | 10,179,634 | | | | | | | | - | | | | | | | | 10,179,634 | |
South Africa | | | - | | | | | | | | 1,108,468 | | | | | | | | - | | | | | | | | 1,108,468 | |
Sweden | | | - | | | | | | | | 4,517,660 | | | | | | | | - | | | | | | | | 4,517,660 | |
Switzerland | | | - | | | | | | | | 6,138,363 | | | | | | | | - | | | | | | | | 6,138,363 | |
Taiwan | | | - | | | | | | | | 9,710,197 | | | | | | | | - | | | | | | | | 9,710,197 | |
Thailand | | | - | | | | | | | | 913,928 | | | | | | | | - | | | | | | | | 913,928 | |
United Kingdom | | | - | | | | | | | | 7,358,564 | | | | | | | | - | | | | | | | | 7,358,564 | |
Foreign Preferred Stocks | | | | | | | | | | | | | | | | | | | | | | | | | | | | |
Brazil | | | 1,026,660 | | | | | | | | - | | | | | | | | - | | | | | | | | 1,026,660 | |
Common Stocks | | | | | | | | | | | | | | | | | | | | | | | | | | | | |
United States | | | 1,959,240 | | | | | | | | - | | | | | | | | - | | | | | | | | 1,959,240 | |
Short-Term Investments | | | 3,672,653 | | | | | | | | - | | | | | | | | - | | | | | | | | 3,672,653 | |
Securities Lending Collateral | | | 67,200 | | | | | | | | - | | | | | | | | - | | | | | | | | 67,200 | |
| | | | | | | | | | | | | | | | | | | | | | | | | | | | |
Total Investments in Securities - Assets | | $ | 23,598,805 | | | | | | | $ | 102,924,684 | | | | | | | $ | - | | | | | | | $ | 126,523,489 | |
| | | | | | | | | | | | | | | | | | | | | | | | | | | | |
U.S. GAAP requires transfers between all levels to/from level 3 be disclosed. During the year ended October 31, 2024, there were no transfers into or out of Level 3.
See accompanying notes
7
American Beacon International Equity FundSM
Schedule of Investments
October 31, 2024
| | | | | | | | | | | | | | | |
| | | |
| | | Shares | | | | Fair Value |
| | | | | | | |
| | | |
| Australia - 0.47% (Cost $2,958,929) | | | | | | |
| | | |
| Foreign Common Stocks - 0.47% | | | | | | |
| Rio Tinto PLCA | | | | 43,601 | | | | | | | | | $ | 2,820,779 | |
| | | | | | | | | | | | | | | |
| | | | | | | | | | | | | | | |
| | | |
| Belgium - 1.09% | | | | | | |
| | | |
| Foreign Common Stocks - 1.09% | | | | | | |
| Anheuser-Busch InBev SAA | | | | 60,712 | | | | | | | | | | 3,615,041 | |
| KBC Group NVA | | | | 39,822 | | | | | | | | | | 2,888,310 | |
| | | | | | | | | | | | | | | |
Total Foreign Common Stocks | | | | | | | | | | | | | | 6,503,351 | |
| | | | | | | | | | | | | | | |
| | | | | | | | | | | | | | | |
Total Belgium (Cost $6,358,884) | | | | | | | | | | | | | | 6,503,351 | |
| | | | | | | | | | | | | | | |
| | | | | | | | | | | | | | | |
| | | |
| Brazil - 0.15% (Cost $695,327) | | | | | | |
| | | |
| Foreign Common Stocks - 0.15% | | | | | | |
| ERO Copper Corp.B C | | | | 47,192 | | | | | | | | | | 866,664 | |
| | | | | | | | | | | | | | | |
| | | | | | | | | | | | | | | |
| | | |
| Canada - 3.17% | | | | | | |
| | | |
| Foreign Common Stocks - 3.17% | | | | | | |
| Barrick Gold Corp. | | | | 44,987 | | | | | | | | | | 869,465 | |
| Canadian Pacific Kansas City Ltd. | | | | 41,096 | | | | | | | | | | 3,170,267 | |
| Gildan Activewear, Inc. | | | | 88,175 | | | | | | | | | | 4,315,183 | |
| Linamar Corp.C | | | | 66,775 | | | | | | | | | | 2,732,195 | |
| Open Text Corp. | | | | 44,612 | | | | | | | | | | 1,338,024 | |
| Parkland Corp.C | | | | 108,256 | | | | | | | | | | 2,519,118 | |
| Suncor Energy, Inc. | | | | 106,982 | | | | | | | | | | 4,038,477 | |
| | | | | | | | | | | | | | | |
Total Foreign Common Stocks | | | | | | | | | | | | | | 18,982,729 | |
| | | | | | | | | | | | | | | |
| | | | | | | | | | | | | | | |
Total Canada (Cost $18,058,511) | | | | | | | | | | | | | | 18,982,729 | |
| | | | | | | | | | | | | | | |
| | | | | | | | | | | | | | | |
| | | |
| China - 3.46% | | | | | | |
| | | |
| Foreign Common Stocks - 3.46% | | | | | | |
| AIA Group Ltd.A | | | | 423,200 | | | | | | | | | | 3,367,486 | |
| ArcelorMittal SAA | | | | 115,640 | | | | | | | | | | 2,865,856 | |
| ESR Group Ltd.A D | | | | 905,400 | | | | | | | | | | 1,226,601 | |
| Link REITA | | | | 244,400 | | | | | | | | | | 1,139,426 | |
| Prudential PLCA | | | | 1,048,678 | | | | | | | | | | 8,640,524 | |
| Techtronic Industries Co. Ltd.A | | | | 241,000 | | | | | | | | | | 3,452,357 | |
| | | | | | | | | | | | | | | |
Total Foreign Common Stocks | | | | | | | | | | | | | | 20,692,250 | |
| | | | | | | | | | | | | | | |
| | | | | | | | | | | | | | | |
Total China (Cost $24,692,301) | | | | | | | | | | | | | | 20,692,250 | |
| | | | | | | | | | | | | | | |
| | | | | | | | | | | | | | | |
| | | |
| Finland - 0.80% | | | | | | |
| | | |
| Foreign Common Stocks - 0.80% | | | | | | |
| Fortum OYJA | | | | 143,504 | | | | | | | | | | 2,116,034 | |
| Nordea Bank AbpA | | | | 228,658 | | | | | | | | | | 2,677,680 | |
| | | | | | | | | | | | | | | |
Total Foreign Common Stocks | | | | | | | | | | | | | | 4,793,714 | |
| | | | | | | | | | | | | | | |
| | | | | | | | | | | | | | | |
Total Finland (Cost $4,351,959) | | | | | | | | | | | | | | 4,793,714 | |
| | | | | | | | | | | | | | | |
| | | | | | | | | | | | | | | |
| | | |
| France - 14.13% | | | | | | |
| | | |
| Foreign Common Stocks - 14.13% | | | | | | |
| Air Liquide SAA | | | | 33,408 | | | | | | | | | | 5,986,548 | |
| Alstom SAA B | | | | 373,681 | | | | | | | | | | 8,196,070 | |
| Arkema SAA | | | | 31,182 | | | | | | | | | | 2,741,304 | |
| AXA SAA | | | | 64,416 | | | | | | | | | | 2,414,994 | |
| BNP Paribas SAA | | | | 37,661 | | | | | | | | | | 2,572,742 | |
| Bureau Veritas SAA | | | | 117,481 | | | | | | | | | | 3,717,670 | |
| Capgemini SEA | | | | 18,982 | | | | | | | | | | 3,272,376 | |
| Carrefour SAA | | | | 111,562 | | | | | | | | | | 1,768,073 | |
| Cie de Saint-Gobain SAA | | | | 43,095 | | | | | | | | | | 3,910,886 | |
| Danone SAA | | | | 40,077 | | | | | | | | | | 2,863,479 | |
| Eiffage SAA | | | | 55,848 | | | | | | | | | | 5,194,171 | |
See accompanying notes
8
American Beacon International Equity FundSM
Schedule of Investments
October 31, 2024
| | | | | | | | | | | | | | | |
| | | |
| | | Shares | | | | Fair Value |
| | | | | | | |
| | | |
| France - 14.13% (continued) | | | | | | |
| | | |
| Foreign Common Stocks - 14.13% (continued) | | | | | | |
| Engie SAA | | | | 195,046 | | | | | | | | | $ | 3,267,882 | |
| Kering SAA | | | | 25,867 | | | | | | | | | | 6,447,026 | |
| Orange SAA | | | | 861,997 | | | | | | | | | | 9,466,638 | |
| Pernod Ricard SAA | | | | 17,093 | | | | | | | | | | 2,134,351 | |
| Rexel SAA | | | | 121,759 | | | | | | | | | | 3,353,429 | |
| Sodexo SAA | | | | 14,976 | | | | | | | | | | 1,300,133 | |
| Teleperformance SEA | | | | 70,374 | | | | | | | | | | 7,386,919 | |
| Thales SAA | | | | 19,915 | | | | | | | | | | 3,210,653 | |
| Verallia SAA D | | | | 148,393 | | | | | | | | | | 4,260,294 | |
| Worldline SAA B D | | | | 148,646 | | | | | | | | | | 1,033,130 | |
| | | | | | | | | | | | | | | |
Total Foreign Common Stocks | | | | | | | | | | | | | | 84,498,768 | |
| | | | | | | | | | | | | | | |
| | | | | | | | | | | | | | | |
Total France (Cost $87,821,453) | | | | | | | | | | | | | | 84,498,768 | |
| | | | | | | | | | | | | | | |
| | | | | | | | | | | | | | | |
| | | |
| Germany - 9.38% | | | | | | |
| | | |
| Foreign Common Stocks - 9.06% | | | | | | |
| Allianz SEA | | | | 4,938 | | | | | | | | | | 1,555,240 | |
| Bayerische Motoren Werke AGA | | | | 56,250 | | | | | | | | | | 4,425,405 | |
| Brenntag SEA | | | | 33,604 | | | | | | | | | | 2,189,580 | |
| Continental AGA | | | | 110,117 | | | | | | | | | | 6,859,240 | |
| Daimler Truck Holding AGA | | | | 52,154 | | | | | | | | | | 2,157,814 | |
| Deutsche Telekom AGA | | | | 133,156 | | | | | | | | | | 4,032,100 | |
| Infineon Technologies AGA | | | | 115,535 | | | | | | | | | | 3,648,448 | |
| Lanxess AGA | | | | 88,068 | | | | | | | | | | 2,547,672 | |
| Mercedes-Benz Group AGA | | | | 78,639 | | | | | | | | | | 4,764,539 | |
| Merck KGaAA | | | | 20,084 | | | | | | | | | | 3,321,139 | |
| MTU Aero Engines AGA | | | | 8,598 | | | | | | | | | | 2,812,269 | |
| Puma SEA | | | | 52,126 | | | | | | | | | | 2,368,999 | |
| Rheinmetall AGA | | | | 3,393 | | | | | | | | | | 1,748,180 | |
| RWE AGA | | | | 69,715 | | | | | | | | | | 2,258,452 | |
| SAP SEA | | | | 16,928 | | | | | | | | | | 3,956,601 | |
| Siemens AGA | | | | 14,301 | | | | | | | | | | 2,776,068 | |
| Siemens Healthineers AGA D | | | | 52,815 | | | | | | | | | | 2,756,038 | |
| | | | | | | | | | | | | | | |
| | | | | | | | | | | | | | | |
Total Foreign Common Stocks | | | | | | | | | | | | | | 54,177,784 | |
| | | | | | | | | | | | | | | |
| | | | | | | | | | | | | | | |
| | | |
| Foreign Preferred Stocks - 0.32% | | | | | | |
| Henkel AG & Co. KGaAA E | | | | 22,500 | | | | | | | | | | 1,947,702 | |
| | | | | | | | | | | | | | | |
| | | | | | | | | | | | | | | |
Total Germany (Cost $57,171,150) | | | | | | | | | | | | | | 56,125,486 | |
| | | | | | | | | | | | | | | |
| | | | | | | | | | | | | | | |
| | | |
| Israel - 0.52% | | | | | | |
| | | |
| Foreign Common Stocks - 0.52% | | | | | | |
| Check Point Software Technologies Ltd.B | | | | 4,653 | | | | | | | | | | 805,946 | |
| Wix.com Ltd.B | | | | 13,863 | | | | | | | | | | 2,316,785 | |
| | | | | | | | | | | | | | | |
Total Foreign Common Stocks | | | | | | | | | | | | | | 3,122,731 | |
| | | | | | | | | | | | | | | |
| | | | | | | | | | | | | | | |
Total Israel (Cost $2,733,988) | | | | | | | | | | | | | | 3,122,731 | |
| | | | | | | | | | | | | | | |
| | | | | | | | | | | | | | | |
| | | |
| Italy - 2.69% | | | | | | |
| | | |
| Foreign Common Stocks - 2.69% | | | | | | |
| Enel SpAA | | | | 624,549 | | | | | | | | | | 4,737,042 | |
| Eni SpAA | | | | 68,490 | | | | | | | | | | 1,043,335 | |
| Ryanair Holdings PLC, ADR | | | | 70,797 | | | | | | | | | | 3,133,475 | |
| UniCredit SpAA | | | | 162,437 | | | | | | | | | | 7,196,458 | |
| | | | | | | | | | | | | | | |
Total Foreign Common Stocks | | | | | | | | | | | | | | 16,110,310 | |
| | | | | | | | | | | | | | | |
| | | | | | | | | | | | | | | |
Total Italy (Cost $12,450,480) | | | | | | | | | | | | | | 16,110,310 | |
| | | | | | | | | | | | | | | |
See accompanying notes
9
American Beacon International Equity FundSM
Schedule of Investments
October 31, 2024
| | | | | | | | | | | | | | | |
| | | |
| | | Shares | | | | Fair Value |
| | | | | | | |
| | | |
| Japan - 11.57% | | | | | | |
| | | |
| Foreign Common Stocks - 11.57% | | | | | | |
| Asics Corp.A | | | | 114,800 | | | | | | | | | $ | 2,019,902 | |
| Bandai Namco Holdings, Inc.A | | | | 78,700 | | | | | | | | | | 1,648,790 | |
| FANUC Corp.A | | | | 168,800 | | | | | | | | | | 4,464,399 | |
| Fujitsu Ltd.A | | | | 173,200 | | | | | | | | | | 3,182,862 | |
| Hitachi Ltd.A | | | | 95,500 | | | | | | | | | | 2,403,563 | |
| Kokusai Electric Corp.A C | | | | 58,600 | | | | | | | | | | 1,076,775 | |
| MatsukiyoCocokara & Co.A | | | | 192,100 | | | | | | | | | | 2,602,058 | |
| Mitsui Fudosan Co. Ltd.A | | | | 213,900 | | | | | | | | | | 1,820,961 | |
| Mizuho Financial Group, Inc.A | | | | 161,400 | | | | | | | | | | 3,370,310 | |
| Murata Manufacturing Co. Ltd.A | | | | 112,400 | | | | | | | | | | 1,955,864 | |
| NEC Corp.A | | | | 38,800 | | | | | | | | | | 3,294,518 | |
| Nintendo Co. Ltd.A | | | | 19,600 | | | | | | | | | | 1,037,542 | |
| Nippon Sanso Holdings Corp.A | | | | 86,500 | | | | | | | | | | 2,991,862 | |
| Nitori Holdings Co. Ltd.A | | | | 25,900 | | | | | | | | | | 3,288,787 | |
| Otsuka Holdings Co. Ltd.A | | | | 48,600 | | | | | | | | | | 2,932,370 | |
| Renesas Electronics Corp.A | | | | 461,833 | | | | | | | | | | 6,197,477 | |
| Seven & i Holdings Co. Ltd.A | | | | 163,800 | | | | | | | | | | 2,346,526 | |
| Shimadzu Corp.A | | | | 79,200 | | | | | | | | | | 2,334,761 | |
| SMC Corp.A | | | | 5,600 | | | | | | | | | | 2,393,699 | |
| SUMCO Corp.A C | | | | 890,600 | | | | | | | | | | 8,521,737 | |
| Suzuki Motor Corp.A | | | | 291,200 | | | | | | | | | | 2,871,702 | |
| Takeda Pharmaceutical Co. Ltd.A | | | | 68,700 | | | | | | | | | | 1,913,687 | |
| Tokyo Electron Ltd.A | | | | 18,100 | | | | | | | | | | 2,691,185 | |
| Toyo Suisan Kaisha Ltd.A | | | | 31,100 | | | | | | | | | | 1,826,854 | |
| | | | | | | | | | | | | | | |
Total Foreign Common Stocks | | | | | | | | | | | | | | 69,188,191 | |
| | | | | | | | | | | | | | | |
| | | | | | | | | | | | | | | |
Total Japan (Cost $72,538,629) | | | | | | | | | | | | | | 69,188,191 | |
| | | | | | | | | | | | | | | |
| | | | | | | | | | | | | | | |
| | | |
| Jordan - 0.37% (Cost $2,225,019) | | | | | | |
| | | |
| Foreign Common Stocks - 0.37% | | | | | | |
| Hikma Pharmaceuticals PLCA | | | | 93,419 | | | | | | | | | | 2,233,090 | |
| | | | | | | | | | | | | | | |
| | | | | | | | | | | | | | | |
| | | |
| Netherlands - 4.72% | | | | | | |
| | | |
| Foreign Common Stocks - 4.72% | | | | | | |
| Akzo Nobel NVA | | | | 82,970 | | | | | | | | | | 5,293,636 | |
| ASML Holding NVA | | | | 2,969 | | | | | | | | | | 1,996,376 | |
| Heineken NVA | | | | 23,367 | | | | | | | | | | 1,916,897 | |
| ING Groep NVA | | | | 550,869 | | | | | | | | | | 9,350,835 | |
| Koninklijke Philips NVA B | | | | 155,099 | | | | | | | | | | 4,071,383 | |
| NN Group NVA | | | | 113,578 | | | | | | | | | | 5,589,841 | |
| | | | | | | | | | | | | | | |
Total Foreign Common Stocks | | | | | | | | | | | | | | 28,218,968 | |
| | | | | | | | | | | | | | | |
| | | | | | | | | | | | | | | |
Total Netherlands (Cost $26,623,942) | | | | | | | | | | | | | | 28,218,968 | |
| | | | | | | | | | | | | | | |
| | | | | | | | | | | | | | | |
| | | |
| Republic of Korea - 4.87% | | | | | | |
| | | |
| Foreign Common Stocks - 4.87% | | | | | | |
| BGF retail Co. Ltd.A | | | | 23,888 | | | | | | | | | | 1,994,434 | |
| Hyundai Mobis Co. Ltd.A | | | | 29,990 | | | | | | | | | | 5,388,634 | |
| Kia Corp.A | | | | 13,943 | | | | | | | | | | 920,318 | |
| KT&G Corp.A | | | | 50,288 | | | | | | | | | | 3,981,146 | |
| LG Corp.A | | | | 45,679 | | | | | | | | | | 2,499,348 | |
| Samsung Electronics Co. Ltd.A | | | | 317,357 | | | | | | | | | | 13,413,224 | |
| Shinhan Financial Group Co. Ltd.A | | | | 25,237 | | | | | | | | | | 930,634 | |
| | | | | | | | | | | | | | | |
Total Foreign Common Stocks | | | | | | | | | | | | | | 29,127,738 | |
| | | | | | | | | | | | | | | |
| | | | | | | | | | | | | | | |
Total Republic of Korea (Cost $29,287,920) | | | | | | | | | | | | | | 29,127,738 | |
| | | | | | | | | | | | | | | |
| | | | | | | | | | | | | | | |
| | | |
| Singapore - 0.84% | | | | | | |
| | | |
| Foreign Common Stocks - 0.84% | | | | | | |
| DBS Group Holdings Ltd.A | | | | 103,651 | | | | | | | | | | 2,982,993 | |
See accompanying notes
10
American Beacon International Equity FundSM
Schedule of Investments
October 31, 2024
| | | | | | | | | | | | | | | |
| | | |
| | | Shares | | | | Fair Value |
| | | | | | | |
| | | |
| Singapore - 0.84% (continued) | | | | | | |
| | | |
| Foreign Common Stocks - 0.84% (continued) | | | | | | |
| United Overseas Bank Ltd.A | | | | 85,500 | | | | | | | | | $ | 2,059,034 | |
| | | | | | | | | | | | | | | |
Total Foreign Common Stocks | | | | | | | | | | | | | | 5,042,027 | |
| | | | | | | | | | | | | | | |
| | | | | | | | | | | | | | | |
Total Singapore (Cost $3,386,825) | | | | | | | | | | | | | | 5,042,027 | |
| | | | | | | | | | | | | | | |
| | | | | | | | | | | | | | | |
| | | |
| Spain - 1.20% | | | | | | |
| | | |
| Foreign Common Stocks - 1.20% | | | | | | |
| Aena SME SAA D | | | | 5,386 | | | | | | | | | | 1,189,739 | |
| Amadeus IT Group SAA | | | | 17,918 | | | | | | | | | | 1,300,575 | |
| Bankinter SAA | | | | 168,828 | | | | | | | | | | 1,373,363 | |
| Industria de Diseno Textil SAA | | | | 40,934 | | | | | | | | | | 2,332,566 | |
| Repsol SAA | | | | 80,014 | | | | | | | | | | 996,973 | |
| | | | | | | | | | | | | | | |
Total Foreign Common Stocks | | | | | | | | | | | | | | 7,193,216 | |
| | | | | | | | | | | | | | | |
| | | | | | | | | | | | | | | |
Total Spain (Cost $5,825,160) | | | | | | | | | | | | | | 7,193,216 | |
| | | | | | | | | | | | | | | |
| | | | | | | | | | | | | | | |
| | | |
| Sweden - 0.72% | | | | | | |
| | | |
| Foreign Common Stocks - 0.72% | | | | | | |
| Electrolux AB, Class BA B | | | | 29,040 | | | | | | | | | | 243,296 | |
| Sandvik ABA | | | | 117,550 | | | | | | | | | | 2,322,024 | |
| Volvo Car AB, Class BA B C | | | | 805,255 | | | | | | | | | | 1,731,636 | |
| | | | | | | | | | | | | | | |
Total Foreign Common Stocks | | | | | | | | | | | | | | 4,296,956 | |
| | | | | | | | | | | | | | | |
| | | | | | | | | | | | | | | |
Total Sweden (Cost $6,424,384) | | | | | | | | | | | | | | 4,296,956 | |
| | | | | | | | | | | | | | | |
| | | | | | | | | | | | | | | |
| | | |
| Switzerland - 2.60% | | | | | | |
| | | |
| Foreign Common Stocks - 2.60% | | | | | | |
| ABB Ltd.A | | | | 73,721 | | | | | | | | | | 4,094,418 | |
| Adecco Group AGA | | | | 230,327 | | | | | | | | | | 7,222,078 | |
| Cie Financiere Richemont SA, Class AA | | | | 17,305 | | | | | | | | | | 2,524,467 | |
| Julius Baer Group Ltd.A | | | | 28,285 | | | | | | | | | | 1,730,907 | |
| | | | | | | | | | | | | | | |
Total Foreign Common Stocks | | | | | | | | | | | | | | 15,571,870 | |
| | | | | | | | | | | | | | | |
| | | | | | | | | | | | | | | |
Total Switzerland (Cost $14,248,746) | | | | | | | | | | | | | | 15,571,870 | |
| | | | | | | | | | | | | | | |
| | | | | | | | | | | | | | | |
| | | |
| United Kingdom - 19.96% | | | | | | |
| | | |
| Foreign Common Stocks - 19.96% | | | | | | |
| 3i Group PLCA | | | | 84,934 | | | | | | | | | | 3,476,554 | |
| AstraZeneca PLCA | | | | 43,433 | | | | | | | | | | 6,174,956 | |
| Barclays PLCA | | | | 4,081,077 | | | | | | | | | | 12,511,421 | |
| Barratt Redrow PLCA | | | | 411,421 | | | | | | | | | | 2,381,720 | |
| Berkeley Group Holdings PLCA | | | | 21,974 | | | | | | | | | | 1,259,479 | |
| British American Tobacco PLCA | | | | 408,614 | | | | | | | | | | 14,230,222 | |
| Coca-Cola Europacific Partners PLCA | | | | 27,419 | | | | | | | | | | 2,075,531 | |
| Compass Group PLCA | | | | 129,593 | | | | | | | | | | 4,197,407 | |
| Croda International PLCA | | | | 28,139 | | | | | | | | | | 1,353,551 | |
| Diageo PLCA | | | | 134,666 | | | | | | | | | | 4,198,853 | |
| JD Sports Fashion PLCA | | | | 908,202 | | | | | | | | | | 1,453,132 | |
| Kingfisher PLCA | | | | 449,732 | | | | | | | | | | 1,707,107 | |
| Legal & General Group PLCA | | | | 635,673 | | | | | | | | | | 1,791,279 | |
| National Grid PLCA | | | | 45,782 | | | | | | | | | | 575,397 | |
| NatWest Group PLCA | | | | 250,448 | | | | | | | | | | 1,184,977 | |
| Nomad Foods Ltd. | | | | 80,787 | | | | | | | | | | 1,417,812 | |
| Reckitt Benckiser Group PLCA | | | | 239,169 | | | | | | | | | | 14,444,894 | |
| RELX PLCA | | | | 203,646 | | | | | | | | | | 9,379,752 | |
| Rolls-Royce Holdings PLCA B | | | | 1,263,337 | | | | | | | | | | 8,768,934 | |
| RS Group PLCA | | | | 237,720 | | | | | | | | | | 2,129,745 | |
| Segro PLC, REITA | | | | 134,828 | | | | | | | | | | 1,370,807 | |
See accompanying notes
11
American Beacon International Equity FundSM
Schedule of Investments
October 31, 2024
| | | | | | | | | | | | | | | |
| | | |
| | | Shares | | | | Fair Value |
| | | | | | | |
| | | |
| United Kingdom - 19.96% (continued) | | | | | | |
| | | |
| Foreign Common Stocks - 19.96% (continued) | | | | | | |
| Smith & Nephew PLCA | | | | 70,782 | | | | | | | | | $ | 877,251 | |
| Standard Chartered PLCA | | | | 196,255 | | | | | | | | | | 2,263,638 | |
| Taylor Wimpey PLCA | | | | 2,418,757 | | | | | | | | | | 4,588,975 | |
| Unilever PLCA | | | | 98,732 | | | | | | | | | | 6,042,655 | |
| WH Smith PLCA | | | | 118,021 | | | | | | | | | | 2,003,272 | |
| Whitbread PLCA | | | | 41,353 | | | | | | | | | | 1,615,613 | |
| WPP PLCA | | | | 559,453 | | | | | | | | | | 5,892,756 | |
| | | | | | | | | | | | | | | |
Total Foreign Common Stocks | | | | | | | | | | | | | | 119,367,690 | |
| | | | | | | | | | | | | | | |
| | | | | | | | | | | | | | | |
Total United Kingdom (Cost $104,471,485) | | | | | | | | | | | | | | 119,367,690 | |
| | | | | | | | | | | | | | | |
| | | | | | | | | | | | | | | |
| | | |
| United States - 13.18% | | | | | | |
| | | |
| Common Stocks - 13.18% | | | | | | |
| Aon PLC, Class A | | | | 11,798 | | | | | | | | | | 4,328,332 | |
| BP PLCA | | | | 949,259 | | | | | | | | | | 4,613,743 | |
| Chubb Ltd. | | | | 6,902 | | | | | | | | | | 1,949,401 | |
| CNH Industrial NV | | | | 456,236 | | | | | | | | | | 5,123,530 | |
| Constellium SEB | | | | 56,192 | | | | | | | | | | 623,731 | |
| CRH PLC | | | | 27,661 | | | | | | | | | | 2,639,689 | |
| Experian PLCA | | | | 53,625 | | | | | | | | | | 2,619,442 | |
| GSK PLCA | | | | 725,911 | | | | | | | | | | 13,261,536 | |
| ICON PLCB | | | | 11,045 | | | | | | | | | | 2,453,205 | |
| Roche Holding AGA | | | | 60,722 | | | | | | | | | | 18,858,683 | |
| Sanofi SAA | | | | 117,965 | | | | | | | | | | 12,446,477 | |
| Shell PLCA | | | | 62,553 | | | | | | | | | | 2,097,782 | |
| Signify NVA D | | | | 133,073 | | | | | | | | | | 3,259,770 | |
| Smurfit WestRock PLC | | | | 66,137 | | | | | | | | | | 3,406,055 | |
| Stellantis NVA | | | | 81,449 | | | | | | | | | | 1,122,143 | |
| | | | | | | | | | | | | | | |
Total Common Stocks | | | | | | | | | | | | | | 78,803,519 | |
| | | | | | | | | | | | | | | |
| | | | | | | | | | | | | | | |
Total United States (Cost $81,318,008) | | | | | | | | | | | | | | 78,803,519 | |
| | | | | | | | | | | | | | | |
| | | | | | | | | | | | | | | |
| | | |
| SHORT-TERM INVESTMENTS - 3.24% (Cost $19,354,297) | | | | | | |
| | | |
| Investment Companies - 3.24% | | | | | | |
| American Beacon U.S. Government Money Market Select Fund, 4.76% F G | | | | 19,354,297 | | | | | | | | | | 19,354,297 | |
| | | | | | | | | | | | | | | |
| | | | | | | | | | | | | | | |
| | | |
| SECURITIES LENDING COLLATERAL- 0.41% (Cost $2,442,760) | | | | | | |
| | | |
| Investment Companies - 0.41% | | | | | | |
| American Beacon U.S. Government Money Market Select Fund, 4.76% F G | | | | 2,442,760 | | | | | | | | | | 2,442,760 | |
| | | | | | | | | | | | | | | |
| | | | | | | | | | | | | | | |
TOTAL INVESTMENTS - 99.54% (Cost $585,440,157) | | | | | | | | | | | | | | 595,357,104 | |
OTHER ASSETS, NET OF LIABILITIES - 0.46% | | | | | | | | | | | | | | 2,740,701 | |
| | | | | | | | | | | | | | | |
TOTAL NET ASSETS - 100.00% | | | | | | | | | | | | | $ | 598,097,805 | |
| | | | | | | | | | | | | | | |
| | | | | | | |
| Percentages are stated as a percent of net assets. | | | | | | | | | | | | | | | |
A Security has been fair valued pursuant to the Manager’s procedures related to pricing that is not available after the close of exchange or the available price does not reflect the security’s true market value. At period end, the value of these securities amounted to $525,512,693 or 87.86% of net assets.
B Non-income producing security.
C All or a portion of this security is on loan, collateralized by either cash and/or U.S. Treasuries at October 31, 2024 (Note 9).
D Security exempt from registration under the Securities Act of 1933. These securities may be resold to qualified institutional buyers pursuant to Rule 144A. At the period end, the value of these securities amounted to $13,725,572 or 2.29% of net assets. The Fund has no right to demand registration of these securities.
E A type of Preferred Stock that has no maturity date.
F 7-day yield.
G The Fund is affiliated by having the same investment advisor.
ADR - American Depositary Receipt.
PLC - Public Limited Company.
REITs - Real Estate Investment Trusts.
See accompanying notes
12
American Beacon International Equity FundSM
Schedule of Investments
October 31, 2024
| | | | | | | | | | | | | | | | |
| Long Futures Contracts Open on October 31, 2024: | |
|
| Equity Futures Contracts | |
| Description | | Number of
Contracts | | Expiration Date | | Notional Amount | | | Contract Value | | | Unrealized
Appreciation
(Depreciation) | |
| ICE U.S. mini MSCI EAFE Index Futures | | 215 | | December 2024 | | $ | 26,183,468 | | | $ | 25,264,650 | | | $ | (918,818 | ) |
| | | | | | | | | | | | | | | | |
| | | | | | $ | 26,183,468 | | | $ | 25,264,650 | | | $ | (918,818 | ) |
| | | | | | | | | | | | | | | | |
| | |
| Glossary: | | |
| | |
| Index Abbreviations: |
| MSCI EAFE | | Morgan Stanley Capital International - Europe, Australasia, and Far East Index. |
|
| Exchange Abbreviations: |
| ICE | | Intercontinental Exchange. |
The Fund’s investments are summarized by level based on the inputs used to determine their values. As of October 31, 2024, the investments were classified as described below:
| | | | | | | | | | | | | | | | | | | | | | | | | | | | |
International Equity Fund | | Level 1 | | | | | | Level 2 | | | | | | Level 3 | | | | | | Total | |
Assets | | | | | | | | | | | | | | | | | | | | | | | | | | | | |
Foreign Common Stocks | | | | | | | | | | | | | | | | | | | | | | | | | | | | |
Australia | | $ | - | | | | | | | $ | 2,820,779 | | | | | | | $ | - | | | | | | | $ | 2,820,779 | |
Belgium | | | - | | | | | | | | 6,503,351 | | | | | | | | - | | | | | | | | 6,503,351 | |
Brazil | | | 866,664 | | | | | | | | - | | | | | | | | - | | | | | | | | 866,664 | |
Canada | | | 18,982,729 | | | | | | | | - | | | | | | | | - | | | | | | | | 18,982,729 | |
China | | | - | | | | | | | | 20,692,250 | | | | | | | | - | | | | | | | | 20,692,250 | |
Finland | | | - | | | | | | | | 4,793,714 | | | | | | | | - | | | | | | | | 4,793,714 | |
France | | | - | | | | | | | | 84,498,768 | | | | | | | | - | | | | | | | | 84,498,768 | |
Germany | | | - | | | | | | | | 54,177,784 | | | | | | | | - | | | | | | | | 54,177,784 | |
Israel | | | 3,122,731 | | | | | | | | - | | | | | | | | - | | | | | | | | 3,122,731 | |
Italy | | | 3,133,475 | | | | | | | | 12,976,835 | | | | | | | | - | | | | | | | | 16,110,310 | |
Japan | | | - | | | | | | | | 69,188,191 | | | | | | | | - | | | | | | | | 69,188,191 | |
Jordan | | | - | | | | | | | | 2,233,090 | | | | | | | | - | | | | | | | | 2,233,090 | |
Netherlands | | | - | | | | | | | | 28,218,968 | | | | | | | | - | | | | | | | | 28,218,968 | |
Republic of Korea | | | - | | | | | | | | 29,127,738 | | | | | | | | - | | | | | | | | 29,127,738 | |
Singapore | | | - | | | | | | | | 5,042,027 | | | | | | | | - | | | | | | | | 5,042,027 | |
Spain | | | - | | | | | | | | 7,193,216 | | | | | | | | - | | | | | | | | 7,193,216 | |
Sweden | | | - | | | | | | | | 4,296,956 | | | | | | | | - | | | | | | | | 4,296,956 | |
Switzerland | | | - | | | | | | | | 15,571,870 | | | | | | | | - | | | | | | | | 15,571,870 | |
United Kingdom | | | 1,417,812 | | | | | | | | 117,949,878 | | | | | | | | - | | | | | | | | 119,367,690 | |
Foreign Preferred Stocks | | | | | | | | | | | | | | | | | | | | | | | | | | | | |
Germany | | | - | | | | | | | | 1,947,702 | | | | | | | | - | | | | | | | | 1,947,702 | |
Common Stocks | | | | | | | | | | | | | | | | | | | | | | | | | | | | |
United States | | | 20,523,943 | | | | | | | | 58,279,576 | | | | | | | | - | | | | | | | | 78,803,519 | |
Short-Term Investments | | | 19,354,297 | | | | | | | | - | | | | | | | | - | | | | | | | | 19,354,297 | |
Securities Lending Collateral | | | 2,442,760 | | | | | | | | - | | | | | | | | - | | | | | | | | 2,442,760 | |
| | | | | | | | | | | | | | | | | | | | | | | | | | | | |
Total Investments in Securities - Assets | | $ | 69,844,411 | | | | | | | $ | 525,512,693 | | | | | | | $ | - | | | | | | | $ | 595,357,104 | |
| | | | | | | | | | | | | | | | | | | | | | | | | | | | |
|
Financial Derivative Instruments - Liabilities | |
Futures Contracts | | $ | (918,818 | ) | | | | | | $ | - | | | | | | | $ | - | | | | | | | $ | (918,818 | ) |
| | | | | | | | | | | | | | | | | | | | | | | | | | | | |
Total Financial Derivative Instruments - Liabilities | | $ | (918,818 | ) | | | | | | $ | - | | | | | | | $ | - | | | | | | | $ | (918,818 | ) |
| | | | | | | | | | | | | | | | | | | | | | | | | | | | |
U.S. GAAP requires transfers between all levels to/from level 3 be disclosed. During the year ended October 31, 2024, there were no transfers into or out of Level 3.
See accompanying notes
13
American Beacon FundsSM
Statements of Assets and Liabilities
October 31, 2024
| | | | | | | | | | | | |
| | | EAM International
Small Cap Fund | | | | | | International Equity
Fund | |
Assets: | | | | | | | | | | | | |
Investments in unaffiliated securities, at fair value† § | | $ | 122,783,636 | | | | | | | $ | 573,560,047 | |
Investments in affiliated securities, at fair value‡ | | | 3,739,853 | | | | | | | | 21,797,057 | |
Foreign currency, at fair value^ | | | 31,203 | | | | | | | | 37,165 | |
Cash collateral held at broker for futures contracts | | | - | | | | | | | | 955,000 | |
Dividends and interest receivable | | | 168,615 | | | | | | | | 1,291,928 | |
Deposits with broker for futures contracts | | | - | | | | | | | | 778,592 | |
Receivable for investments sold | | | 1,802,158 | | | | | | | | 1,662,643 | |
Receivable for fund shares sold | | | 8,178 | | | | | | | | 225,135 | |
Receivable for tax reclaims | | | 1,150,391 | | | | | | | | 4,392,443 | |
Receivable for expense reimbursement (Note 2) | | | 78,178 | | | | | | | | 57,587 | |
Prepaid expenses | | | 15,465 | | | | | | | | 43,891 | |
| | | | | | | | | | | | |
Total assets | | | 129,777,677 | | | | | | | | 604,801,488 | |
| | | | | | | | | | | | |
Liabilities: | | | | | | | | | | | | |
Payable for investments purchased | | | 2,611,250 | | | | | | | | 700,749 | |
Payable for fund shares redeemed | | | 154,663 | | | | | | | | 1,403,046 | |
Management and sub-advisory fees payable (Note 2) | | | 83,607 | | | | | | | | 747,416 | |
Service fees payable (Note 2) | | | 14,604 | | | | | | | | 27,743 | |
Transfer agent fees payable (Note 2) | | | 7,981 | | | | | | | | 32,470 | |
Payable upon return of securities loaned (Note 9)§ | | | 67,200 | | | | | | | | 2,442,760 | |
Custody and fund accounting fees payable | | | 102,486 | | | | | | | | 166,883 | |
Professional fees payable | | | 117,361 | | | | | | | | 122,877 | |
Trustee fees payable (Note 2) | | | 1,014 | | | | | | | | 6,409 | |
Payable for prospectus and shareholder reports | | | 20,613 | | | | | | | | 98,185 | |
Payable for variation margin from open futures contracts (Note 5) | | | - | | | | | | | | 918,340 | |
Capital gains tax liability | | | 144,404 | | | | | | | | - | |
Other liabilities | | | 28,428 | | | | | | | | 36,805 | |
| | | | | | | | | | | | |
Total liabilities | | | 3,353,611 | | | | | | | | 6,703,683 | |
| | | | | | | | | | | | |
Commitments and contingent liabilities (Note 2) | | | | | | | | | | | | |
| | | | | | | | | | | | |
Net assets | | $ | 126,424,066 | | | | | | | $ | 598,097,805 | |
| | | | | | | | | | | | |
Analysis of net assets: | | | | | | | | | | | | |
Paid-in-capital | | $ | 105,572,790 | | | | | | | $ | 490,396,405 | |
Total distributable earnings (deficits)A | | | 20,851,276 | | | | | | | | 107,701,400 | |
| | | | | | | | | | | | |
Net assets | | $ | 126,424,066 | | | | | | | $ | 598,097,805 | |
| | | | | | | | | | | | |
Shares outstanding at no par value (unlimited shares authorized): | | | | | | | | | | | | |
R5 Class | | | 460,807 | | | | | | | | 15,548,980 | |
| | | | | | | | | | | | |
Y Class | | | 3,527,420 | | | | | | | | 4,175,149 | |
| | | | | | | | | | | | |
Investor Class | | | 3,137,417 | | | | | | | | 2,712,804 | |
| | | | | | | | | | | | |
Advisor Class | | | N/A | | | | | | | | 707,325 | |
| | | | | | | | | | | | |
A Class | | | N/A | | | | | | | | 518,159 | |
| | | | | | | | | | | | |
C Class | | | N/A | | | | | | | | 143,296 | |
| | | | | | | | | | | | |
R6 Class | | | N/A | | | | | | | | 6,851,767 | |
| | | | | | | | | | | | |
Net assets: | | | | | | | | | | | | |
R5 Class | | $ | 8,195,147 | | | | | | | $ | 301,082,293 | |
| | | | | | | | | | | | |
Y Class | | $ | 62,393,608 | | | | | | | $ | 85,292,074 | |
| | | | | | | | | | | | |
Investor Class | | $ | 55,835,311 | | | | | | | $ | 52,061,716 | |
| | | | | | | | | | | | |
Advisor Class | | | N/A | | | | | | | $ | 14,029,585 | |
| | | | | | | | | | | | |
A Class | | | N/A | | | | | | | $ | 9,890,341 | |
| | | | | | | | | | | | |
C Class | | | N/A | | | | | | | $ | 2,618,564 | |
| | | | | | | | | | | | |
R6 Class | | | N/A | | | | | | | $ | 133,123,232 | |
| | | | | | | | | | | | |
See accompanying notes
14
American Beacon FundsSM
Statements of Assets and Liabilities
October 31, 2024
| | | | | | | | | | | | |
| | | EAM International
Small Cap Fund | | | | | | International Equity
Fund | |
Net asset value, offering and redemption price per share: | | | | | | | | | | | | |
R5 Class | | $ | 17.78 | | | | | | | $ | 19.36 | |
| | | | | | | | | | | | |
Y Class | | $ | 17.69 | | | | | | | $ | 20.43 | |
| | | | | | | | | | | | |
Investor Class | | $ | 17.80 | | | | | | | $ | 19.19 | |
| | | | | | | | | | | | |
Advisor Class | | | N/A | | | | | | | $ | 19.83 | |
| | | | | | | | | | | | |
A Class | | | N/A | | | | | | | $ | 19.09 | |
| | | | | | | | | | | | |
A Class (offering price) | | | N/A | | | | | | | $ | 20.25 | |
| | | | | | | | | | | | |
C Class | | | N/A | | | | | | | $ | 18.27 | |
| | | | | | | | | | | | |
R6 Class | | | N/A | | | | | | | $ | 19.43 | |
| | | | | | | | | | | | |
| | | |
† Cost of investments in unaffiliated securities | | $ | 112,131,588 | | | | | | | $ | 563,643,100 | |
‡ Cost of investments in affiliated securities | | $ | 3,739,853 | | | | | | | $ | 21,797,057 | |
§ Fair value of securities on loan | | $ | 5,695,370 | | | | | | | $ | 12,007,072 | |
^ Cost of foreign currency | | $ | 31,143 | | | | | | | $ | 37,120 | |
A The Fund’s investments in affiliated securities did not have unrealized appreciation (depreciation) at year end.
See accompanying notes
15
American Beacon FundsSM
Statements of Operations
October 31, 2024
| | | | | | | | | | | | |
| | | EAM International
Small Cap Fund | | | | | | International Equity
Fund | |
Investment income: | | | | | | | | | | | | |
Dividend income from unaffiliated securities (net of foreign taxes)† | | $ | 2,655,032 | | | | | | | $ | 26,099,042 | |
Dividend income from affiliated securities (Note 2) | | | 305,517 | | | | | | | | 1,550,970 | |
Interest income | | | - | | | | | | | | 58,123 | |
Income derived from securities lending (Note 9) | | | 42,004 | | | | | | | | 93,821 | |
Other income | | | 302 | | | | | | | | 537 | |
| | | | | | | | | | | | |
Total investment income | | | 3,002,855 | | | | | | | | 27,802,493 | |
| | | | | | | | | | | | |
Expenses: | | | | | | | | | | | | |
Management and sub-advisory fees (Note 2) | | | 1,039,394 | | | | | | | | 4,933,640 | |
Transfer agent fees: | | | | | | | | | | | | |
R5 Class (Note 2) | | | 2,884 | | | | | | | | 120,733 | |
Y Class (Note 2) | | | 70,390 | | | | | | | | 96,554 | |
Investor Class | | | 7,131 | | | | | | | | 16,806 | |
Advisor Class | | | - | | | | | | | | 1,726 | |
A Class | | | - | | | | | | | | 4,337 | |
C Class | | | - | | | | | | | | 3,625 | |
R6 Class | | | - | | | | | | | | 36,525 | |
Custody and fund accounting fees | | | 177,087 | | | | | | | | 300,892 | |
Professional fees | | | 122,078 | | | | | | | | 139,648 | |
Registration fees and expenses | | | 53,213 | | | | | | | | 113,413 | |
Service fees (Note 2): | | | | | | | | | | | | |
Investor Class | | | 202,898 | | | | | | | | 191,657 | |
Advisor Class | | | - | | | | | | | | 35,298 | |
A Class | | | - | | | | | | | | 16,413 | |
C Class | | | - | | | | | | | | 3,131 | |
Distribution fees (Note 2): | | | | | | | | | | | | |
Advisor Class | | | - | | | | | | | | 35,223 | |
A Class | | | - | | | | | | | | 26,986 | |
C Class | | | - | | | | | | | | 27,845 | |
ICI membership dues and license expenses | | | 134,234 | | | | | | | | - | |
Prospectus and shareholder report expenses | | | 32,856 | | | | | | | | 118,985 | |
Trustee fees (Note 2) | | | 13,646 | | | | | | | | 83,923 | |
Loan interest expense (Note 2) | | | 973 | | | | | | | | - | |
Line of credit interest expense (Note 10) | | | 1,473 | | | | | | | | 9,200 | |
Other expenses | | | 17,736 | | | | | | | | 307,837 | |
| | | | | | | | | | | | |
Total expenses | | | 1,875,993 | | | | | | | | 6,624,397 | |
| | | | | | | | | | | | |
Net fees waived and expenses (reimbursed) (Note 2) | | | (226,142 | ) | | | | | | | (220,508 | ) |
| | | | | | | | | | | | |
Net expenses | | | 1,649,851 | | | | | | | | 6,403,889 | |
| | | | | | | | | | | | |
Net investment income | | | 1,353,004 | | | | | | | | 21,398,604 | |
| | | | | | | | | | | | |
| | | |
Realized and unrealized gain (loss) from investments: | | | | | | | | | | | | |
Net realized gain (loss) from: | | | | | | | | | | | | |
Investments in unaffiliated securities‡ A | | $ | 13,224,744 | | | | | | | $ | 133,296,125 | |
Commission recapture (Note 1) | | | - | | | | | | | | (3 | ) |
Foreign currency transactions | | | (424,251 | ) | | | | | | | (208,777 | ) |
Futures contracts | | | - | | | | | | | | 5,812,603 | |
Change in net unrealized appreciation (depreciation) of: | | | | | | | | | | | | |
Investments in unaffiliated securitiesB | | | 8,846,508 | | | | | | | | 23,622,957 | |
Foreign currency transactions | | | 23,575 | | | | | | | | 113,569 | |
Futures contracts | | | - | | | | | | | | (384,929 | ) |
| | | | | | | | | | | | |
Net gain from investments | | | 21,670,576 | | | | | | | | 162,251,545 | |
| | | | | | | | | | | | |
Net increase in net assets resulting from operations. | | $ | 23,023,580 | | | | | | | $ | 183,650,149 | |
| | | | | | | | | | | | |
† Foreign taxes | | $ | 382,800 | | | | | | | $ | 1,940,380 | |
‡ Net of foreign withholding taxes on capital gains | | $ | 43,457 | | | | | | | $ | - | |
A The Fund did not recognize net realized gains (losses) from the sale of investments in affiliated securities.
B The Fund’s investments in affiliated securities did not have a change in unrealized appreciation (depreciation) at year end.
See accompanying notes
16
American Beacon FundsSM
Statements of Changes in Net Assets
| | | | | | | | | | | | | | | | | | | | | | | | | | | | |
| | | EAM International Small Cap Fund | | | | | | International Equity Fund | |
| | | Year Ended
October 31, 2024 | | | | | | Year Ended
October 31, 2023 | | | | | | Year Ended
October 31, 2024 | | | | | | Year Ended
October 31, 2023 | |
Increase in net assets: | | | | | | | | | | | | | | | | | | | | | | | | | | | | |
Operations: | | | | | | | | | | | | | | | | | | | | | | | | | | | | |
Net investment income | | $ | 1,353,004 | | | | | | | $ | 1,893,150 | | | | | | | $ | 21,398,604 | | | | | | | $ | 26,845,048 | |
Net realized gain from investments in unaffiliated securities, commission recapture, foreign currency transactions, and futures contracts | | | 12,800,493 | | | | | | | | 13,910,493 | | | | | | | | 138,899,948 | | | | | | | | 62,266,166 | |
Change in net unrealized appreciation of investments in unaffiliated securities, foreign currency transactions, and futures contracts | | | 8,870,083 | | | | | | | | 13,890,740 | | | | | | | | 23,351,597 | | | | | | | | 182,309,583 | |
| | | | | | | | | | | | | | | | | | | | | | | | | | | | |
Net increase in net assets resulting from operations | | | 23,023,580 | | | | | | | | 29,694,383 | | | | | | | | 183,650,149 | | | | | | | | 271,420,797 | |
| | | | | | | | | | | | | | | | | | | | | | | | | | | | |
Distributions to shareholders: | |
Total retained earnings: | | | | | | | | | | | | | | | | | | | | | | | | | | | | |
R5 Class | | | (138,937 | ) | | | | | | | (284,205 | ) | | | | | | | (20,300,284 | ) | | | | | | | (19,840,233 | ) |
Y Class | | | (1,243,710 | ) | | | | | | | (1,719,644 | ) | | | | | | | (4,658,524 | ) | | | | | | | (2,512,663 | ) |
Investor Class | | | (1,067,041 | ) | | | | | | | (1,056,156 | ) | | | | | | | (3,138,410 | ) | | | | | | | (2,090,798 | ) |
Advisor Class | | | — | | | | | | | | — | | | | | | | | (617,707 | ) | | | | | | | (304,447 | ) |
A Class | | | — | | | | | | | | — | | | | | | | | (525,588 | ) | | | | | | | (188,613 | ) |
C Class | | | — | | | | | | | | — | | | | | | | | (119,521 | ) | | | | | | | (48,919 | ) |
R6 Class | | | — | | | | | | | | — | | | | | | | | (17,067,264 | ) | | | | | | | (8,756,091 | ) |
| | | | | | | | | | | | | | | | | | | | | | | | | | | | |
Net distributions to shareholders | | | (2,449,688 | ) | | | | | | | (3,060,005 | ) | | | | | | | (46,427,298 | ) | | | | | | | (33,741,764 | ) |
| | | | | | | | | | | | | | | | | | | | | | | | | | | | |
| | | | | | | |
Capital share transactions (Note 11): | | | | | | | | | | | | | | | | | | | | | | | | | | | | |
Proceeds from sales of shares | | | 17,327,215 | | | | | | | | 31,413,470 | | | | | | | | 112,495,053 | | | | | | | | 291,643,278 | |
Reinvestment of dividends and distributions | | | 1,985,343 | | | | | | | | 2,681,566 | | | | | | | | 45,531,550 | | | | | | | | 32,494,086 | |
Cost of shares redeemed | | | (43,285,575 | ) | | | | | | | (113,325,777 | ) | | | | | | | (576,675,248 | ) | | | | | | | (1,070,787,931 | ) |
| | | | | | | | | | | | | | | | | | | | | | | | | | | | |
Net (decrease) in net assets from capital share transactions | | | (23,973,017 | ) | | | | | | | (79,230,741 | ) | | | | | | | (418,648,645 | ) | | | | | | | (746,650,567 | ) |
| | | | | | | | | | | | | | | | | | | | | | | | | | | | |
Net (decrease) in net assets | | | (3,399,125 | ) | | | | | | | (52,596,363 | ) | | | | | | | (281,425,794 | ) | | | | | | | (508,971,534 | ) |
| | | | | | | | | | | | | | | | | | | | | | | | | | | | |
Net assets: | | | | | | | | | | | | | | | | | | | | | | | | | | | | |
Beginning of year | | | 129,823,191 | | | | | | | | 182,419,554 | | | | | | | | 879,523,599 | | | | | | | | 1,388,495,133 | |
| | | | | | | | | | | | | | | | | | | | | | | | | | | | |
End of year | | $ | 126,424,066 | | | | | | | $ | 129,823,191 | | | | | | | $ | 598,097,805 | | | | | | | $ | 879,523,599 | |
| | | | | | | | | | | | | | | | | | | | | | | | | | | | |
See accompanying notes
17
American Beacon FundsSM
Notes to Financial Statements
October 31, 2024
1. Organization and Significant Accounting Policies
American Beacon Funds (the “Trust”) is organized as a Massachusetts business trust. The Funds, each a series within the Trust, are registered under the Investment Company Act of 1940, as amended (the “Act”), as diversified, open-end management investment companies. As of October 31, 2024, the Trust consists of twenty-four active series, two of which are presented in this filing: American Beacon EAM International Small Cap Fund and American Beacon International Equity Fund (collectively, the “Funds” and each individually a “Fund”). The remaining twenty-two active series are reported in separate filings.
American Beacon Advisors, Inc. (the “Manager”) is a Delaware corporation and a wholly-owned subsidiary of Resolute Investment Managers, Inc. (“RIM”) organized in 1986 to provide business management, advisory, administrative, and asset management consulting services to the Trust and other investors. The Manager is registered as an investment advisor under the Investment Advisers Act of 1940, as amended (the “Advisers Act”). The Manager is an indirect wholly-owned subsidiary of Resolute Topco, Inc. (“Topco”), which is owned primarily by various institutional investment funds that are managed by financial institutions and other investment advisory firms. No owner of Topco owns 25% or more of the outstanding equity or voting interests of Topco.
Effective December 29, 2023, the Manager underwent a change of control, which resulted in the termination of the Funds’ previous management and investment advisory agreements. The Board of Trustees (“the “Board”) approved a new Management Agreement with the Manager and a new Investment Advisory Agreement among the Manager, each sub-advisor and the Trust, on behalf of the Funds, that were effective on December 29, 2023.
Recently Adopted Accounting Pronouncements
In March 2020, the Financial Accounting Standards Board (“FASB”) issued Accounting Standards Update (“ASU”) No. 2020-04, Reference Rate Reform (Topic 848); Facilitation of the Effects of Reference Rate Reform on Financial Reporting, which provides optional guidance for a limited period of time to ease the potential burden in accounting for (or recognizing the effects of) reference rate reform. The guidance is applicable to contracts referencing London Inter-bank Offered Rate (“LIBOR”) or another reference rate that is expected to be discontinued due to reference rate reform. The ASU is effective as of March 12, 2020 and generally can be applied through December 31, 2022. In December 2022, the FASB issued ASU No. 2022-06 Reference Rate Reform (Topic 848): Deferral of the Sunset Date of Topic 848 which updates and clarifies ASU No. 2020-04. The amendments in this ASU defer the sunset date of Topic 848 from December 31, 2022, to December 31, 2024. Management has concluded that these ASUs will not have a material impact on the Funds’ financial statements.
In June 2022, the FASB issued ASU No. 2022-03, Fair Value Measurement (Topic 820); Fair Value Measurement of Equity Securities Subject to Contractual Sale Restrictions, which provides clarifying guidance that a contractual restriction on the sale of an equity security is not considered part of the unit of account of the equity security and, therefore, is not considered in measuring fair value. The ASU is effective for fiscal years beginning after December 15, 2023, and interim periods within those fiscal years. Management has concluded that the ASU will not have a material impact on the Funds’ financial statements.
18
American Beacon FundsSM
Notes to Financial Statements
October 31, 2024
Class Disclosure
Each Fund has multiple classes of shares designed to meet the needs of different groups of investors; however, not all of the Funds offer all classes. The following table sets forth the differences amongst the classes:
| | | | | | |
Class | | Eligible Investors | | Minimum Initial
Investments | |
| R5 Class | | Large institutional investors - sold directly or through intermediary channels. | | $ | 250,000 | |
| | |
| Y Class | | Large institutional retirement plan investors - sold directly or through intermediary channels. | | $ | 100,000 | |
| | |
| Investor Class | | All investors using intermediary organizations, such as broker-dealers or retirement plan sponsors. | | $ | 2,500 | |
| | |
| Advisor Class | | All investors who invest through intermediary organizations, such as broker-dealers or third party administrators. | | $ | 2,500 | |
| | |
| A Class | | All investors who invest through intermediary organizations, such as broker-dealers or third party administrator. Retail investors who invest directly through a financial intermediary such as a broker, bank, or registered investment advisor which may include a front-end sales charge and a contingent deferred sales charge (“CDSC”). | | $ | 2,500 | |
| | |
| C Class | | Retail investors who invest directly through a financial intermediary such as a broker or through employee directed benefit plans with applicable sales charges which may include CDSC. | | $ | 1,000 | |
| | |
| R6 Class | | Large institutional retirement plan investors - sold through retirement plan sponsors. | | | None | |
Each class offered by the Trust has equal rights as to assets and voting privileges. Income and non-class specific expenses are allocated daily to each class based on the relative net assets. Realized and unrealized capital gains and losses of each class are allocated daily based on the relative net assets of each class of the respective Fund. Class specific expenses, where applicable, currently include service, distribution, transfer agent fees, and sub-transfer agent fees that vary amongst the classes as described more fully in Note 2.
Significant Accounting Policies
The following is a summary of significant accounting policies, consistently followed by the Funds in preparation of the financial statements. The Funds are considered investment companies and accordingly, follow the investment company accounting and reporting guidance of the FASB Accounting Standards Codification Topic 946, Financial Services – Investment Companies, a part of Generally Accepted Accounting Principles (“U.S. GAAP”).
Security Transactions and Investment Income
Security transactions are recorded as of the trade date for financial reporting purposes. Securities purchased or sold on a when-issued or delayed-delivery basis may be settled beyond a standard settlement period for the security after the trade date.
Dividend income, net of foreign taxes, is recorded on the ex-dividend date, except certain dividends from foreign securities which are recorded as soon as the information is available to the Funds. Tax reclaim accruals are automatically generated on accounting and custody systems at the time of the income event based on the tax databases maintained by the Funds’ custodian. Reconciliations are performed between custody and accounting systems to help ensure reclaim accruals are in line. Estimated tax liabilities on certain foreign securities are recorded on an accrual basis and are reflected as components of interest income or net change in unrealized appreciation (depreciation) on investments on the Statements of Operations, as appropriate. Tax liabilities realized as a result of such security sales are reflected as a component of net realized gain (loss) on investments on the Statements of Operations. Interest income, net of foreign taxes, is earned from settlement date, recorded on the accrual basis, and adjusted, if necessary, for accretion of discounts and amortization of premiums. Realized gains (losses) from securities sold are determined based on specific lot identification.
19
American Beacon FundsSM
Notes to Financial Statements
October 31, 2024
Currency Translation
All assets and liabilities initially expressed in foreign currency values are converted into U.S. dollar values at the mean of the bid and ask prices of such currencies against U.S. dollars as last quoted by a recognized dealer. Income, expenses, and purchases and sales of investments are translated into U.S. dollars at the rate of the exchange prevailing on the respective dates of such transactions. The effect of changes in foreign currency exchange rates on investments is separately identified from the fluctuations arising from changes in market values of securities held and is reported with all other foreign currency gains and losses on the Funds’ Statements of Operations.
Distributions to Shareholders
The Funds distribute most or all of their net earnings and realized gains, if any, each taxable year in the form of dividends from net investment income and distributions of realized net capital gains and net gains or losses from foreign currency transactions on an annual basis. The Funds do not have a fixed dividend rate and do not guarantee that they will pay any distributions in any particular period. Dividends to shareholders are determined in accordance with federal income tax regulations, which may differ in amount and character from net investment income and realized gains recognized for purposes of U.S. GAAP. To the extent necessary to fully distribute capital gains, the Funds may designate earnings and profits distributed to shareholders on the redemption of shares.
Commission Recapture
The Funds have established brokerage commission recapture arrangements with certain brokers or dealers. If the Funds’ investment advisor chooses to execute a transaction through a participating broker, the broker rebates a portion of the commission back to the Funds. Any collateral benefit received through participation in the commission recapture program is directed exclusively to the Funds. This amount is reported with the net realized gain (loss) in the Funds’ Statements of Operations, if applicable.
Allocation of Income, Trust Expenses, Gains, and Losses
Investment income and realized and unrealized gains and losses from investments of the Funds are allocated daily to each class of shares based upon the relative proportion of net assets of each class to the total net assets of the Funds. Expenses directly charged or attributable to a Fund will be paid from the assets of a Fund. Generally, expenses of the Trust will be allocated among and charged to the assets of the Funds on a basis that the Trust’s Board deems fair and equitable, which may be based on the relative net assets of the Funds or nature of the services performed and relative applicability to the Funds.
Use of Estimates
The preparation of financial statements in conformity with U.S. GAAP requires management to make estimates and assumptions that affect the amounts reported in the financial statements and accompanying notes. Actual results may differ from those estimated.
Other
Under the Trust’s organizational documents, its officers and trustees are indemnified against certain liabilities arising out of the performance of their duties to the Trust. In the normal course of business, the Trust enters into contracts that provide indemnification to the other party or parties against potential costs or liabilities. The Trust’s maximum exposure under these arrangements is dependent on claims that may be made in the future and, therefore, cannot be estimated. The Trust has had no prior claims or losses pursuant to any such agreement.
20
American Beacon FundsSM
Notes to Financial Statements
October 31, 2024
2. Transactions with Affiliates
Management and Investment Sub-Advisory Agreements
The Funds and the Manager are parties to a Management Agreement that obligates the Manager to provide the Funds with investment advisory and administrative services. As compensation for performing the duties under the Management Agreement, the Manager will receive an annualized management fee based on a percentage of each Fund’s average daily net assets that is calculated and accrued daily according to the following schedules:
EAM International Small Cap Fund
| | | | |
First $5 billion | | | 0.35 | % |
Next $5 billion | | | 0.325 | % |
Next $10 billion | | | 0.30 | % |
Over $20 billion | | | 0.275 | % |
International Equity Fund
| | | | |
First $15 billion | | | 0.35 | % |
Next $15 billion | | | 0.325 | % |
Over $30 billion | | | 0.30 | % |
The Trust, on behalf of the American Beacon International Equity Fund, and the Manager have entered into Investment Advisory Agreements with Causeway Capital Management LLC; Lazard Asset Management LLC; and American Century Investment Management Inc. (“Sub-Advisors”) pursuant to which the Fund has agreed to pay an annualized sub-advisory fee that is calculated and accrued daily based on each Fund’s average daily net assets.
The Trust, on behalf of the American Beacon EAM International Small Cap Fund, and the Manager have entered into an Investment Advisory Agreement with EAM Global Investors, LLC pursuant to which the Fund has agreed to pay an annualized sub-advisory fee that is calculated and accrued daily according to the following schedule:
| | | | |
First $1 billion | | | 0.40 | % |
Next $1 billion | | | 0.35 | % |
Over $2 billion | | | 0.325 | % |
The Management and Sub-Advisory Fees paid by the Funds for the year ended October 31, 2024 were as follows:
EAM International Small Cap Fund
| | | | | | | | | | | | |
| | | Effective Fee Rate | | | | | | Amount of Fees Paid | |
Management Fees | | | 0.35 | % | | | | | | $ | 494,044 | |
Sub-Advisory Fees | | | 0.40 | % | | | | | | | 545,350 | |
| | | | | | | | | | | | |
Total | | | 0.75 | % | | | | | | $ | 1,039,394 | |
| | | | | | | | | | | | |
International Equity Fund
| | | | | | | | | | | | |
| | | Effective Fee Rate | | | | | | Amount of Fees Paid | |
Management Fees | | | 0.35 | % | | | | | | $ | 2,839,642 | |
Sub-Advisory Fees | | | 0.26 | % | | | | | | | 2,093,998 | |
| | | | | | | | | | | | |
Total | | | 0.61 | % | | | | | | $ | 4,933,640 | |
| | | | | | | | | | | | |
21
American Beacon FundsSM
Notes to Financial Statements
October 31, 2024
As compensation for services provided by the Manager in connection with securities lending activities conducted by a Fund, the lending Fund pays to the Manager, with respect to cash collateral posted by borrowers, a fee of 10% of the net monthly investment income (the income earned in the form of interest, dividends and realized capital gains from the investment of cash collateral, plus any negative rebate fees paid by borrowers, less the rebate amount paid to borrowers as well as related expenses) and, with respect to collateral other than cash, a fee up to 10% of loan fees and demand premiums paid by borrowers. These fees are included in “Income derived from securities lending” and “Management and sub-advisory fees” on the Statements of Operations. During the year ended October 31, 2024, the Manager received securities lending fees of $4,603 and $10,454 for the securities lending activities of the EAM International Small Cap Fund and International Equity Fund, respectively.
Distribution Plans
Separate Distribution Plans (the “Distribution Plans”) have been adopted pursuant to Rule 12b-1 under the Act for the Advisor, A, and C Classes of the Funds. Under the Distribution Plans, as compensation for distribution and shareholder servicing assistance, the Manager receives an annual fee of 0.25% of the average daily net assets of the Advisor and A Classes and 1.00% of the average daily net assets of the C Class. The fee will be payable without regard to whether the amount of the fee is more or less than the actual expenses incurred in a particular month by the Manager for distribution assistance.
Service Plans
The Manager and the Trust entered into a Service Plan that obligates the Manager to oversee additional shareholder servicing of the Investor, Advisor, A, and C Classes of the Funds. As compensation for performing the duties required under the Service Plan, the Manager receives an annualized fee up to 0.25% of the average daily net assets of the A and C Classes, up to 0.25% of the average daily net assets of the Advisor Class, and up to 0.375% of the average daily net assets of the Investor Class of the Funds.
Sub-Transfer Agent Fees
The Manager has entered into agreements, which include servicing agreements, with financial intermediaries that provide recordkeeping, processing, shareholder communications and other services to customers of the intermediaries that hold positions in the R5 and Y Classes of the Funds and has agreed to compensate the intermediaries for providing these services. Intermediaries transact with the Funds primarily through the use of omnibus accounts on behalf of their customers who hold positions in the Funds. Certain services would have been provided by the Funds’ transfer agent and other service providers if the shareholders’ accounts were maintained directly by the Funds’ transfer agent. Accordingly, the Funds, pursuant to Board approval, have agreed to reimburse the Manager for certain non-distribution shareholder services provided by financial intermediaries for the R5 and Y Classes. The reimbursement amounts (sub-transfer agent fees) paid to the Manager are subject to a fee limit of up to 0.10% of an intermediary’s average net assets in the R5 and Y Classes on an annual basis. During the year ended October 31, 2024, the sub-transfer agent fees, as reflected in “Transfer agent fees” on the Statements of Operations, were as follows:
| | | | |
Fund | | Sub-Transfer Agent Fees | |
EAM International Small Cap | | $ | 68,993 | |
International Equity | | | 186,912 | |
As of October 31, 2024, the Funds owed the Manager the following reimbursement of sub-transfer agent fees, as reflected in “Transfer agent fees payable” on the Statements of Assets and Liabilities:
| | | | |
Fund | | Reimbursement
Sub-Transfer Agent Fees | |
EAM International Small Cap | | $ | 5,678 | |
International Equity | | | 15,436 | |
22
American Beacon FundsSM
Notes to Financial Statements
October 31, 2024
Investments in Affiliated Funds
The Funds may invest in the American Beacon U.S. Government Money Market Select Fund (the “USG Select Fund”). Cash collateral received by the Funds in connection with securities lending may also be invested in the USG Select Fund. The Funds listed below held the following shares with an October 31, 2024 fair value and dividend income earned from the investment in the USG Select Fund.
| | | | | | | | | | | | | | | | | | | | | | | | | | | | | | | | | | | | | | | | | | | | | | | | |
Affiliated Security | | Type of
Transaction | | | | | Fund | | | | | October 31,
2024
Shares/Principal | | | | | | Change in
Unrealized
Gain (Loss) | | | | | | Realized
Gain
(Loss) | | | | | | Dividend
Income | | | | | | October 31,
2024
Fair Value | |
| U.S. Government Money Market Select | | Direct | | | | | | EAM
International
Small Cap | | | | | | $ | 3,672,653 | | | | | | | $ | - | | | | | | | $ | - | | | | | | | $ | 305,517 | | | | | | | $ | 3,672,653 | |
| U.S. Government Money Market Select | | Securities Lending | | | | | | EAM
International
Small Cap | | | | | | | 67,200 | | | | | | | | - | | | | | | | | - | | | | | | | | N/A | | | | | | | | 67,200 | |
| U.S. Government Money Market Select | | Direct | | | | | | International
Equity | | | | | | | 19,354,297 | | | | | | | | - | | | | | | | | - | | | | | | | | 1,550,970 | | | | | | | | 19,354,297 | |
| U.S. Government Money Market Select | | Securities Lending | | | | | | International
Equity | | | | | | | 2,442,760 | | | | | | | | - | | | | | | | | - | | | | | | | | N/A | | | | | | | | 2,442,760 | |
The Funds and the USG Select Fund have the same investment advisor and therefore, are considered to be affiliated. The Manager serves as investment advisor to the USG Select Fund and receives management fees and administrative fees totaling 0.10% of the average daily net assets of the USG Select Fund. During the year ended October 31, 2024, the Manager earned fees on the Funds’ direct investments and securities lending collateral investments in the USG Select Fund as shown below:
| | | | | | | | | | | | |
Fund | | Direct Investments in
USG Select Fund | | | Securities Lending
Collateral
Investments in USG
Select Fund | | | Total | |
EAM International Small Cap | | $ | 5,876 | | | $ | 1,310 | | | $ | 7,186 | |
International Equity | | | 29,879 | | | | 2,971 | | | | 32,850 | |
Interfund Credit Facility
Pursuant to an exemptive order issued by the U.S. Securities and Exchange Commission (“SEC”), the Funds, along with other registered investment companies having management contracts with the Manager, may participate in a credit facility whereby each fund, under certain conditions, is permitted to lend money directly to and borrow directly from other participating funds for temporary purposes. The interfund credit facility is advantageous to the funds because it provides added liquidity and eliminates the need to maintain higher cash balances to meet redemptions. This situation could arise when shareholder redemptions exceed anticipated volumes and certain funds have insufficient cash on hand to satisfy such redemptions or when sales of securities do not settle as expected, resulting in a cash shortfall for a fund. The credit facility is administered by a credit facility team consisting of professionals from the Manager’s asset management, compliance, and accounting areas who report the activities of the credit facility to the Board. During the year ended October 31, 2024, the EAM International Small Cap Fund borrowed on average $996,857 for 4 days at an average interest rate of 6.02% with interest charges of $973. This amount is recorded as “Loan interest expense” in the Statements of Operations. The International Equity Fund participated as a lender and loaned on average $268,164 for 1 day at an interest rate of 6.14% with interest charges of $45. This amount is recorded as “Interest income” in the Statements of Operations.
Expense Reimbursement Plan
The Manager contractually agreed to reduce fees and/or reimburse expenses for certain classes of the International Equity Fund and the EAM International Small Cap Fund, through December 31, 2025, to the extent
23
American Beacon FundsSM
Notes to Financial Statements
October 31, 2024
that total operating expenses (excluding taxes, interest, brokerage commissions, acquired fund fees and other extraordinary expenses) exceed the expense cap. During the year ended October 31, 2024, the Manager waived and/or reimbursed expenses as follows:
| | | | | | | | | | | | | | | | | | | | | | |
| | | | | Expense Cap | | | | | | | | | Expiration of
Reimbursed
Expenses | |
Fund | | Class | | 11/1/2023 -
2/29/2024 | | | 3/1/2024 -
10/31/2024 | | | Reimbursed
Expenses | | | (Recouped)
Expenses | |
EAM International Small Cap | | R5 | | | 0.89 | % | | | 0.89 | % | | $ | 23,323 | | | $ | - | | | | 2026-2027 | |
EAM International Small Cap | | Y | | | N/A | | | | 1.10 | % | | | 96,015 | | | | - | | | | 2026-2027 | |
EAM International Small Cap | | Investor | | | N/A | | | | 1.30 | % | | | 106,804 | | | | - | | | | 2026-2027 | |
International Equity | | R6 | | | 0.69 | % | | | 0.69 | % | | | 220,508 | | | | (68,400 | )* | | | 2026-2027 | |
* This amount represents Recouped Expenses from prior fiscal years and is reflected in Other expenses on the Statements of Operations.
Of the above amounts, $78,178 and $57,587 were disclosed as a Receivable for expense reimbursement on the Statements of Assets and Liabilities at October 31, 2024 for the EAM International Small Cap Fund and International Equity Fund, respectively.
The Funds have adopted an Expense Reimbursement Plan whereby the Manager may seek repayment of contractual or voluntary fee reductions and expense reimbursements. Under the policy, the Manager can be reimbursed by the Funds for any contractual or voluntary fee reductions or expense reimbursements if reimbursement to the Manager (a) occurs within three years from the date of the Manager’s waiver/reimbursement and (b) does not cause the Funds’ annual operating expenses to exceed the lesser of the contractual percentage limit in effect at the time of the waiver/reimbursement or time of recoupment. The reimbursed expenses listed above will expire in 2026 and 2027. The Funds did not record a liability for potential contingent reimbursements due to the current assessment that reimbursements are uncertain. The carryover of excess expenses potentially reimbursable to the Manager, but not recorded as a liability are as follows:
| | | | | | | | | | | | | | | | |
Fund | | Recouped
Expenses | | | Excess Expense
Carryover | | | Expired Expense
Carryover | | | Expiration of
Reimbursed
Expenses | |
EAM International Small Cap | | $ | - | | | $ | - | | | $ | 2,785 | | | | 2023-2024 | |
EAM International Small Cap | | | - | | | | 1,783 | | | | - | | | | 2024-2025 | |
EAM International Small Cap | | | - | | | | 23,655 | | | | - | | | | 2025-2026 | |
International Equity | | | 54,858 | | | | - | | | | - | | | | 2023-2024 | |
International Equity | | | 13,542 | | | | 56,578 | | | | - | | | | 2024-2025 | |
International Equity | | | - | | | | 241,021 | | | | - | | | | 2025-2026 | |
Sales Commissions
The Funds’ Distributor, Resolute Investment Distributors, Inc. (“RID” or “Distributor”), may receive a portion of A Class sales charges from broker dealers which may be used to offset distribution related expenses. During the year ended October 31, 2024, RID collected $461 for International Equity Fund from the sale of A Class Shares. The EAM International Small Cap Fund does not offer A Class Shares.
A CDSC of 0.50% will be deducted with respect to A Class Shares on certain purchases of $1,000,000 or more that are redeemed in whole or part within 18 months of purchase, unless waived as discussed in the Funds’ Prospectus. Any applicable CDSC will be 0.50% of the lesser of the original purchase price or the value of the redemption of the A Class Shares redeemed. During the year ended October 31, 2024, there were no CDSC fees collected for the A Class Shares of the International Equity Fund.
A CDSC of 1.00% will be deducted with respect to C Class Shares of the International Equity Fund Shares redeemed within 12 months of purchase, unless waived as discussed in the Fund’s Prospectus. Any applicable CDSC will be 1.00% of the lesser of the original purchase price or the value of the redemption of the C Class Shares redeemed. During the year ended October 31, 2024, no CDSC fees were collected for the C Class Shares of International Equity Fund. The EAM International Small Cap Fund does not offer C Class Shares.
24
American Beacon FundsSM
Notes to Financial Statements
October 31, 2024
Trustee Fees and Expenses
As compensation for their service to the American Beacon Funds Complex, including the Trust (collectively, the “Trusts”), each Trustee is compensated from the Trusts as follows: (1) an annual retainer of $140,000; (2) meeting attendance fee (for attendance in-person or via teleconference) of (a) $12,000 for in person attendance, or $5,000 for telephonic attendance, by Board members for each regularly scheduled or special Board meeting, (b) $2,500 for attendance by Committee members at meetings of the Audit and Compliance Committee and the Investment Committee, (c) $1,000 for attendance by Committee members at meetings of the Nominating and Governance Committee; and (d) $2,500 for attendance by Board members for each special telephonic Board meeting; and (3) reimbursement of reasonable expenses incurred in attending Board meetings, Committee meetings, and relevant educational seminars. For this purpose, the Board considers attendance at regular meetings held by video conference to constitute in-person attendance at a Board meeting. The Trustees also may be compensated for attendance at special Board and/or Committee meetings from time to time. For her service as Board Chair, Ms. Cline receives an additional annual retainer of $50,000. Although she attends several committee meetings at each quarterly Board meeting, she receives only a single $2,500 fee each quarter for her attendance at the Audit and Compliance Committee and Investment Committee meetings. The chairpersons of the Audit and Compliance Committee and the Investment Committee each receive an additional annual retainer of $25,000 and the Chair of the Nominating and Governance Committee receives an additional annual retainer of $10,000.
3. Security Valuation and Fair Value Measurements
The price of each Fund’s shares is based on its net asset value (“NAV”) per share. Each Fund’s NAV is computed by adding total assets, subtracting all the Fund’s liabilities, and dividing the result by the total number of shares outstanding.
The NAV of each class of a Fund’s shares is determined based on a pro rata allocation of a Fund’s investment income, expenses and total capital gains and losses. A Fund’s NAV per share is determined each business day as of the regular close of trading on the New York Stock Exchange (“NYSE” or “Exchange”), which is typically 4:00 p.m. Eastern Time (“ET”). However, if trading on the NYSE closes at a time other than 4:00 p.m. ET, a Fund’s NAV per share typically would still be determined as of the regular close of trading on the NYSE. The Funds do not price their shares on days that the NYSE is closed. Foreign exchanges may permit trading in foreign securities on days when a Fund is not open for business, which may result in the value of a Fund’s portfolio investments being affected at a time when you are unable to buy or sell shares.
Equity securities, including shares of closed-end funds and exchange-traded funds (“ETFs”), are valued at the last sale price or official closing price taken from the primary exchange in which each security trades. Investments in other mutual funds are valued at the closing NAV per share on the day of valuation. Debt securities are valued at bid quotes from broker/dealers or evaluated bid prices from pricing services, who may consider a number of inputs and factors, such as prices of comparable securities, yield curves, spreads, credit ratings, coupon rates, maturity, default rates, and underlying collateral. Futures are valued based on their daily settlement prices. Exchange-traded and over-the-counter (“OTC”) options are valued at the last sale price. Options with no last sale for the day are priced at mid quote. Swaps are valued at evaluated mid prices from pricing services.
The valuation of securities traded on foreign markets and certain fixed-income securities will generally be based on prices determined as of the earlier closing time of the markets on which they primarily trade unless a significant event has occurred. When a Fund holds securities or other assets that are denominated in a foreign currency, a Fund will normally use the currency exchange rates as of 4:00 p.m. ET.
Rule 2a-5 under the Investment Company Act (the “Valuation Rule”) establishes requirements for determining fair value in good faith for purposes of the Investment Company Act, including related oversight and reporting requirements. The Valuation Rule also defines when market quotations are “readily available,” which is the threshold for determining whether a Fund must fair value a security. Among other things, the Valuation Rule permits the Board to designate the Manager as Valuation Designee to perform the Fund’s fair value determinations
25
American Beacon FundsSM
Notes to Financial Statements
October 31, 2024
subject to board oversight and certain reporting and other requirements intended to ensure that the Board receives the information it needs to oversee the Manager’s fair value determinations.
Securities may be valued at fair value, as determined in good faith and pursuant to the Manager’s procedures, under certain limited circumstances. For example, fair value pricing will be used for fixed-income securities and when market quotations are not readily available or reliable, as determined by the Manager, such as when (i) trading for a security is restricted or stopped; (ii) a security’s trading market is closed (other than customary closings); or (iii) a security has been de-listed from a national exchange. A security with limited market liquidity may require fair value pricing if the Manager determines that the available price does not reflect the security’s true market value. In addition, if a significant event that the Manager determines to affect the value of one or more securities held by a Fund occurs after the close of a related exchange but before the determination of a Fund’s NAV, fair value pricing may be used on the affected security or securities. Securities of small-capitalization companies are also more likely to require a fair value determination using these procedures because they are more thinly traded and less liquid than the securities of larger-capitalization companies. The Funds may fair value securities as a result of significant events occurring after the close of the foreign markets in which a Fund invests as described below. In addition, the Funds may invest in illiquid securities requiring these procedures.
A Fund may use fair value pricing for securities primarily traded in non-U.S. markets because most foreign markets close well before a Fund’s pricing time of 4:00 p.m. ET. The earlier close of these foreign markets gives rise to the possibility that significant events, including broad market moves, may have occurred in the interim and may materially affect the value of those securities. If the Manager determines that the last quoted prices of non-U.S. securities will, in its judgment, materially affect the value of some or all a Fund’s portfolio securities, the Manager can adjust the previous closing prices to reflect what it believes to be the fair value of the securities as of the close of the Exchange. In deciding whether it is necessary to adjust closing prices to reflect fair value, the Manager reviews a variety of factors, including developments in foreign markets, the performance of U.S. securities markets, and the performance of instruments trading in U.S. markets that represent foreign securities and baskets of foreign securities. These securities are fair valued using a pricing service, using methods approved by the Manager, that considers the correlation of the trading patterns of the foreign security to intraday trading in the U.S. markets, based on indices of domestic securities and other appropriate indicators such as prices of relevant American Depositary Receipts (“ADRs”) and futures contracts. The Manager’s Valuation Committee may also fair value securities in other situations, such as when a particular foreign market is closed but a Fund is open. A Fund uses outside pricing services to provide closing prices and information to evaluate and/or adjust those prices. As a means of evaluating its security valuation process, the Valuation Committee routinely compares closing prices, the next day’s opening prices in the same markets and adjusted prices.
Attempts to determine the fair value of securities introduce an element of subjectivity to the pricing of securities. As a result, the price of a security determined through fair valuation techniques may differ from the price quoted or published by other sources and may not accurately reflect the market value of the security when trading resumes. If a reliable market quotation becomes available for a security formerly valued through fair valuation techniques, the Manager compares the new market quotation to the fair value price to evaluate the effectiveness of a Fund’s fair valuation procedures. If any significant discrepancies are found, the Manager may adjust Manager’s fair valuation procedures for a the Funds.
Valuation Inputs
Various inputs may be used to determine the fair value of the Funds’ investments. These inputs are summarized in three broad levels for financial statement purposes. The inputs or methodologies used to value securities are not necessarily an indication of the risk associated with investing in those securities.
| | | | |
| Level 1 | | - | | Quoted prices in active markets for identical securities. |
| | |
| Level 2 | | - | | Prices determined using other significant observable inputs. These may include quoted prices for similar securities, interest rates, prepayment speeds, credit risk, and others. |
| | |
| Level 3 | | - | | Prices determined using other significant unobservable inputs. Unobservable inputs reflect a Fund’s own assumptions about the factors market participants would use in pricing an investment. |
26
American Beacon FundsSM
Notes to Financial Statements
October 31, 2024
Level 1 and Level 2 trading assets and trading liabilities, at fair value
Common stocks, preferred securities and financial derivative instruments, such as futures contracts that are traded on a national securities exchange, are stated at the last reported sale or settlement price on the day of valuation. To the extent these securities are actively traded and valuation adjustments are not applied, they are categorized as Level 1 of the fair value hierarchy. Preferred securities and other equities traded on inactive markets or valued by reference to similar instruments are generally categorized as Level 2 of the fair value hierarchy. Valuation adjustments may be applied to certain securities that are solely traded on a foreign exchange to account for the market movement between the close of the foreign market and the close of the Exchange. These securities are valued using pricing service providers that consider the correlation of the trading patterns of the foreign security to the intraday trading in the U.S. markets for investments. Securities using these valuation adjustments are categorized as Level 2 of the fair value hierarchy.
With respect to a Fund’s investments that do not have readily available market quotations, the Board has designated the Adviser as its valuation designee to perform fair valuations pursuant to Rule 2a-5 under the Act (the “Valuation Designee”). If market prices are not readily available or are deemed unreliable, the Valuation Designee will use the fair value of the security or other instrument as determined in good faith under policies and procedures established by and under the supervision of the Board (“Valuation Procedures”). Market prices are considered not readily available where there is an absence of current or reliable market-based data (e.g., trade information or broker quotes), including where events occur after the close of the relevant market, but prior to the NYSE Close, that materially affect the values of a Fund’s portfolio holdings or assets. In addition, market prices are considered not readily available when, due to extraordinary circumstances, the exchanges or markets on which the securities or other instruments trade do not open for trading for the entire day and no other market prices are available. Fair value pricing is subjective in nature and the use of fair value pricing by the Valuation Designee may cause the NAV of a Fund’s shares to differ significantly from the NAV that would have been calculated using market prices at the close of the exchange on which a portfolio holding is primarily traded. There can be no assurance that a Fund could obtain the fair value assigned to an investment if a Fund were to sell the investment at approximately the time at which a Fund determines its NAV.
Investments in registered open-end investment management companies will be valued based upon the NAVs of such investments and are categorized as Level 1 of the fair value hierarchy.
OTC financial derivative instruments, such as forward foreign currency contracts derive their value from underlying asset prices, indices, reference rates, and other inputs or a combination of these factors. These contracts are normally valued on the basis of broker dealer quotations or pricing service providers. Depending on the product and the terms of the transaction, the fair value of the financial derivative contracts can be estimated by a pricing service provider using a series of techniques, including simulation pricing models. The pricing models use inputs that are observed from actively quoted markets such as issuer details, indices, spreads, interest rates, curves, dividends, and exchange rates. Financial derivatives that use similar valuation techniques and inputs as described above are categorized as Level 2 of the fair value hierarchy.
4. Securities and Other Investments
Common Stock
Common stock generally takes the form of shares in a corporation which represent an ownership interest. It ranks below preferred stock and debt securities in claims for dividends and for assets of the company in a liquidation or bankruptcy. The value of a company’s common stock may fall as a result of factors directly relating to that company, such as decisions made by its management or decreased demand for the company’s products or services. A stock’s value may also decline because of factors affecting not just the company, but also companies in the same industry or sector. The price of a company’s stock may also be affected by changes in financial markets that are relatively unrelated to the company, such as changes in interest rates, currency
27
American Beacon FundsSM
Notes to Financial Statements
October 31, 2024
exchange rates or industry regulation. Companies that elect to pay dividends on their common stock generally only do so after they invest in their own business and make required payments to bondholders and on other debt and preferred stock. Therefore, the value of a company’s common stock will usually be more volatile than its bonds, other debt and preferred stock. Common stock may be exchange-traded or OTC. OTC stock may be less liquid than exchange-traded stock.
Depositary Receipts and U.S. Dollar-Denominated Foreign Stocks Traded on U.S. Exchanges
ADRs are U.S. dollar-denominated receipts issued generally by domestic banks and represent the deposit with the bank of a security of a foreign issuer. Depositary receipts may not be denominated in the same currency as the securities into which they may be converted. Investing in depositary receipts entails substantially the same risks as direct investment in foreign securities. There is generally less publicly available information about foreign companies and there may be less governmental regulation and supervision of foreign stock exchanges, brokers, and listed companies. In addition, such companies may use different accounting and financial standards (and certain currencies may become unavailable for transfer from a foreign currency), resulting in the Funds’ possible inability to convert immediately into U.S. currency proceeds realized upon the sale of portfolio securities of the affected foreign companies. In addition, the Funds may invest in unsponsored depositary receipts, the issuers of which are not obligated to disclose material information about the underlying securities to investors in the United States. Ownership of unsponsored depositary receipts may not entitle the Funds to the same benefits and rights as ownership of a sponsored depositary receipt or the underlying security.
Foreign Securities
The Funds may invest in U.S. dollar-denominated and non-U.S. dollar denominated equity and debt securities of foreign issuers and foreign branches of U.S. banks, including negotiable certificates of deposit (“CDs”), bankers’ acceptances, and commercial paper. Foreign issuers are issuers organized and doing business principally outside the United States and include corporations, banks, non-U.S. governments, and quasi-governmental organizations. While investments in foreign securities may be intended to reduce risk by providing further diversification, such investments involve sovereign and other risks, in addition to the credit and market risks normally associated with domestic securities. These additional risks include the possibility of adverse political and economic developments (including political or social instability, nationalization, expropriation, or confiscatory taxation); the potentially adverse effects of unavailability of public information regarding issuers, different governmental supervision and regulation of financial markets, reduced liquidity of certain financial markets, and the lack of uniform accounting, auditing, and financial reporting standards or the application of standards that are different or less stringent than those applied in the United States; different laws and customs governing securities tracking; and possibly limited access to the courts to enforce the Funds’ rights as an investor.
Illiquid and Restricted Securities
Generally, an illiquid asset is an asset that the Funds reasonably expect cannot be sold or disposed of in current market conditions in seven calendar days or less without the sale or disposition significantly changing the market value of the investment, as determined pursuant to Rule 22e-4 under the Act or as otherwise permitted or required by SEC rules and interpretations. Historically, illiquid securities have included securities that have not been registered under the Securities Act, securities that are otherwise not readily marketable, and repurchase agreements having a remaining maturity of longer than seven calendar days. Securities that have not been registered under the Securities Act are referred to as private placements or restricted securities and are purchased directly from the issuer or in the secondary market. These securities may be sold only in a privately negotiated transaction or pursuant to an exemption from registration. A large institutional market exists for certain securities that are not registered under the Securities Act, including repurchase agreements, commercial paper, foreign securities, municipal securities and corporate bonds and notes. Institutional investors depend on an efficient institutional market in which the unregistered security can be readily resold or on an issuer’s ability to honor a demand for repayment. However, the fact that there are contractual or legal restrictions on resale of such investments to the general public or to certain institutions may not be indicative of their liquidity.
28
American Beacon FundsSM
Notes to Financial Statements
October 31, 2024
Limitations on resale may have an adverse effect on the marketability of portfolio securities, and a Fund might be unable to dispose of restricted or other illiquid securities promptly or at reasonable prices and might thereby experience difficulty satisfying redemptions within seven calendar days. In addition, a Fund may get only limited information about an issuer, so it may be less able to predict a loss. A Fund also might have to register such restricted securities in order to dispose of them resulting in additional expense and delay. Adverse market conditions could impede such a public offering of securities.
In recognition of the increased size and liquidity of the institutional market for unregistered securities and the importance of institutional investors in the formation of capital, the SEC adopted Rule 144A under the Securities Act. Rule 144A is designed to facilitate efficient trading among institutional investors by permitting the sale of certain unregistered securities to qualified institutional buyers. To the extent privately placed securities held by a Fund qualify under Rule 144A and an institutional market develops for those securities, a Fund likely will be able to dispose of the securities without registering them under the Securities Act. To the extent that institutional buyers become, for a time, uninterested in purchasing these securities, investing in Rule 144A securities could increase the level of a Fund’s illiquidity. The Manager or the Sub-Advisor, as applicable, may determine that certain securities qualified for trading under Rule 144A are liquid. Regulation S under the Securities Act permits the sale abroad of securities that are not registered for sale in the United States and includes a provision for U.S. investors, such as a Fund, to purchase such unregistered securities if certain conditions are met.
Securities sold in private placement offerings made in reliance on the “private placement” exemption from registration afforded by Section 4(a)(2) of the Securities Act and resold to qualified institutional buyers under Rule 144A under the Securities Act (“Section 4(a)(2) securities”) are restricted as to disposition under the federal securities laws, and generally are sold to institutional investors, such as a Fund, that agree they are purchasing the securities for investment and not with an intention to distribute to the public. Any resale by the purchaser must be pursuant to an exempt transaction and may be accomplished in accordance with Rule 144A. Section 4(a)(2) securities normally are resold to other institutional investors through or with the assistance of the issuer or dealers that make a market in the Section 4(a)(2) securities, thus providing liquidity. The Manager and the sub-advisor will carefully monitor a Fund’s investments in Section 4(a)(2) securities offered and sold under Rule 144A, focusing on such important factors, among others, as valuation, liquidity, and availability of information. Investments in Section 4(a)(2) securities could have the effect of reducing a Fund’s liquidity to the extent that qualified institutional buyers no longer wish to purchase these restricted securities.
Restricted securities outstanding during the year ended October 31, 2024 are disclosed in the Notes to the Schedules of Investments.
Other Investment Company Securities and Other Exchange-Traded Products
The Funds at times may invest in shares of other investment companies, including open-end funds, closed-end funds, business development companies (“BDCs”), ETFs, unit investment trusts, and other investment companies of the Trust. The Funds may invest in securities of an investment company advised by the Manager or the Sub-Advisor. Investments in the securities of other investment companies may involve duplication of advisory fees and certain other expenses. By investing in another investment company, the Funds become a shareholder of that investment company. As a result, the Funds’ shareholders indirectly will bear the Funds’ proportionate share of the fees and expenses paid by shareholders of the other investment company, in addition to the fees and expenses the Funds’ shareholders directly bear in connection with the Funds’ own operations. These other fees and expenses are reflected as Acquired Fund Fees and Expenses and are included in the Fees and Expenses Table for the Funds in their Prospectus, if applicable. Investments in other investment companies may involve the payment of substantial premiums above the value of such issuer’s portfolio securities.
The Funds can invest free cash balances in registered open-end investment companies regulated as government money market funds under the Act, to provide liquidity or for defensive purposes. The Funds could invest in government money market funds rather than purchasing individual short-term investments. If the Funds
29
American Beacon FundsSM
Notes to Financial Statements
October 31, 2024
invest in government money market funds, shareholders will bear their proportionate share of the expenses, including for example, advisory and administrative fees, of the money market funds in which the Funds invest, including advisory fees charged by the Manager to any applicable money market funds advised by the Manager.
Preferred Stock
Preferred stock blends the characteristics of a bond and common stock. It can offer the higher yield of a bond and has priority over common stock in equity ownership, but does not have the seniority of a bond and its participation in the issuer’s growth may be limited. Preferred stock has preference over common stock in the receipt of dividends and in any residual assets after payment to creditors should the issuer be dissolved. Although the dividend is typically set at a fixed annual rate, in some circumstances it can be variable, changed or omitted by the issuer. Preferred stocks are subject to the risks associated with other types of equity securities, as well as additional risks, such as credit risk, interest rate risk, potentially greater volatility and risks related to deferral, non-cumulative dividends, subordination, liquidity, limited voting rights, and special redemption rights.
5. Financial Derivative Instruments
The Funds may utilize derivative instruments to gain market exposure on cash balances to hedge foreign currency exposure or reduce market exposure in anticipation of liquidity needs. When considering the Funds’ use of derivatives, it is important to note that the Funds do not use derivatives for the purpose of creating financial leverage.
Forward Foreign Currency Contracts
The Funds may enter into forward foreign currency contracts to hedge the exchange rate risk on investment transactions or to hedge the value of the Funds’ securities denominated in foreign currencies. Forward foreign currency contracts are valued at the forward exchange rate prevailing on the day of valuation. The Funds may also use currency contracts to increase exposure to a foreign currency or to shift exposure to foreign currency fluctuations from one country to another. The Funds bear the market risk that arises from changes in foreign exchange rates, and accordingly, the unrealized gain (loss) on these contracts is reflected in the accompanying financial statements. The Funds also bear the credit risk if the counterparty fails to perform under the contract.
During the year ended October 31, 2024, the EAM International Small Cap Fund did not enter into any forward foreign currency contracts and the International Equity Fund entered into forward foreign currency contracts primarily for hedging foreign currency fluctuations. At October 31, 2024, the International Equity Fund did not have any forward foreign currency contracts outstanding.
Futures Contracts
A futures contract is a contract to purchase or sell a particular security, or the cash value of an asset, such as securities, indices, or currencies, at a specified future date at a price agreed upon when the contract is made. Under many such contracts, no delivery of the actual underlying asset is required. Rather, upon the expiration of the contract, settlement is made by exchanging cash in an amount equal to the difference between the contract price and the closing price of the asset (e.g., a security or an index) at expiration, net of the initial and variation margin that was previously paid. An equity index futures contract is based on the value of an underlying index. A Fund may, from time to time, use futures positions to equitize cash and expose its portfolio to changes in securities prices or index prices. This can magnify gains and losses in a Fund. A Fund also may have to sell assets at inopportune times to satisfy its settlement or collateral obligations. The risks associated with the use of futures contracts also include that there may be an imperfect correlation between the changes in market value of the prices of futures contracts and the assets underlying such contracts and that there may not be a liquid secondary market for a futures contract.
30
American Beacon FundsSM
Notes to Financial Statements
October 31, 2024
During the year ended October 31, 2024, the International Equity Fund entered into futures contracts primarily for exposing cash to markets.
The Fund’s average futures contracts outstanding fluctuate throughout the operating year as required to meet strategic requirements. The following table illustrates the average monthly volume of futures contracts. For the purpose of this disclosure, volume is measured by contracts outstanding at each month end.
| | | | |
Average Futures Contracts Outstanding | |
Fund | | Year Ended October 31, 2024 | |
International Equity | | | 297 | |
The following is a summary of the fair valuations of the Funds’ derivative instruments categorized by risk exposure(1):
International Equity Fund
| | | | | | | | | | | | | | | | | | | | | | | | | | | | | | | | | | | | | | | | | | | | |
| Fair values of financial instruments on the Statements of Assets and Liabilities as of October 31, 2024: | |
| | | |
| | | Derivatives not accounted for as hedging instruments | | | | | | | |
| | | | | | | | | | | |
Liabilities: | | Credit contracts | | | | | | Foreign exchange
contracts | | | | | | Commodity
contracts | | | | | | Interest rate
contracts | | | | | | Equity contracts | | | | | | Total | |
| Payable for variation margin from open futures contracts(2) | | $ | - | | | | | | | $ | - | | | | | | | $ | - | | | | | | | $ | - | | | | | | | $ | (918,818 | ) | | | | | | $ | (918,818 | ) |
| | | | | | | | | | | | | | | | | | | | | | | | | | | | | | | | | | | | | | | | | | | | |
| The effect of financial derivative instruments on the Statements of Operations as of October 31, 2024: | |
| | | |
| | | Derivatives not accounted for as hedging instruments | | | | | | | |
| | | | | | | | | | | |
Realized gain (loss) from derivatives recognized as a result of operations | | Credit contracts | | | | | | Foreign exchange
contracts | | | | | | Commodity
contracts | | | | | | Interest rate
contracts | | | | | | Equity contracts | | | | | | Total | |
| Futures contracts | | $ | - | | | | | | | $ | - | | | | | | | $ | – | | | | | | | $ | - | | | | | | | $ | 5,812,603 | | | | | | | $ | 5,812,603 | |
| | | | | | | | | | | |
Net change in unrealized appreciation (depreciation) of derivatives recognized as a result from operations: | | Credit contracts | | | | | | Foreign exchange
contracts | | | | | | Commodity
contracts | | | | | | Interest rate
contracts | | | | | | Equity contracts | | | | | | Total | |
| Futures contracts | | $ | - | | | | | | | $ | - | | | | | | | $ | - | | | | | | | $ | - | | | | | | | $ | (384,929 | ) | | | | | | $ | (384,929 | ) |
(1) See Note 3 in the Notes to Financial Statements for additional information.
(2) Includes cumulative appreciation (depreciation) of futures contracts as reported in the Fund’s Schedule of Investments footnotes. Only current day’s variation margin is reported within the Statements of Assets and Liabilities.
Master Agreements
Master Securities Forward Transaction Agreements (“Master Forward Agreements”) govern the considerations and factors surrounding the settlement of certain forward settling transactions, such as delayed delivery or sale-buyback financing transactions by and between the Fund and select counterparties. The Master Forward Agreements maintain provisions for, among other things, initiation and confirmation, payment and transfer, events of default, termination, and maintenance of collateral.
Offsetting Assets and Liabilities
The Funds are parties to enforceable master netting agreements between brokers and counterparties which provide for the right to offset under certain circumstances. The Funds employ multiple money managers and counterparties and have elected not to offset qualifying financial and derivative instruments on the Statements of Assets and Liabilities, as such all financial and derivative instruments are presented on a gross basis. The impacts of netting arrangements that provide the right to offset are detailed below, if applicable. The net amount
31
American Beacon FundsSM
Notes to Financial Statements
October 31, 2024
represents the net receivable or payable that would be due from or to the counterparty in the event of default. Exposure from borrowings and other financing agreements such as repurchase agreements can only be netted across transactions governed by the same Master Agreement with the same legal entity. All amounts reported below represent the balance as of the report date, October 31, 2024.
EAM International Small Cap Fund
| | | | | | | | | | | | | | | | | | | | | | | | | | | | | | | | | | | | |
| | | Remaining Contractual Maturity of the Agreements
As of October 31, 2024 | |
| | | Overnight and
Continuous | | | | | | <30 days | | | | | | Between
30 & 90 days | | | | | | >90 days | | | | | | Total | |
Securities Lending Transactions | | | | | | | | | | | | | | | | | | | | | | | | | | | | | | | | | | | | |
Common Stocks | | $ | 67,200 | | | | | | | $ | - | | | | | | | $ | - | | | | | | | $ | - | | | | | | | $ | 67,200 | |
| | | | | | | | | | | | | | | | | | | | | | | | | | | | | | | | | | | | |
Total Borrowings | | $ | 67,200 | | | | | | | $ | - | | | | | | | $ | - | | | | | | | $ | - | | | | | | | $ | 67,200 | |
| | | | | | | | | | | | | | | | | | | | | | | | | | | | | | | | | | | | |
Gross amount of recognized liabilities for securities lending transactions | | | $ | 67,200 | |
| | | | | | | | | | | | | | | | | | | | | | | | | | | | | | | | | | | | |
International Equity Fund
| | | | | | | | | | | | |
| Offsetting of Financial and Derivative Assets as of October 31, 2024: | | | | | | | | | | | | |
| | Assets | | | | | | Liabilities | |
| Futures Contracts(1) | | $ | - | | | | | | | $ | 918,818 | |
| | | | | | | | | | | | |
| Total derivative assets and liabilities in the Statement of Assets and Liabilities | | $ | - | | | | | | | $ | 918,818 | |
| | | | | | | | | | | | |
| Derivatives not subject to a Master Netting Agreement or similar agreement (“MNA”) | | $ | - | | | | | | | $ | (918,818 | ) |
| | | | | | | | | | | | |
| | | | | | | | | | | | | | | | | | | | | | | | | | | | | | | | | | | | |
| | | Remaining Contractual Maturity of the Agreements
As of October 31, 2024 | |
| | | Overnight and
Continuous | | | | | | <30 days | | | | | | Between
30 & 90 days | | | | | | >90 days | | | | | | Total | |
Securities Lending Transactions | | | | | | | | | | | | | | | | | | | | | | | | | | | | | | | | | | | | |
Common Stocks | | $ | 2,442,760 | | | | | | | $ | - | | | | | | | $ | - | | | | | | | $ | - | | | | | | | $ | 2,442,760 | |
| | | | | | | | | | | | | | | | | | | | | | | | | | | | | | | | | | | | |
Total Borrowings | | $ | 2,442,760 | | | | | | | $ | - | | | | | | | $ | - | | | | | | | $ | - | | | | | | | $ | 2,442,760 | |
| | | | | | | | | | | | | | | | | | | | | | | | | | | | | | | | | | | | |
Gross amount of recognized liabilities for securities lending transactions | | | $ | 2,442,760 | |
| | | | | | | | | | | | | | | | | | | | | | | | | | | | | | | | | | | | |
(1) Includes cumulative appreciation (depreciation) of futures contracts as reported in the Fund’s Schedule of Investments footnotes. Only current day’s variation margin is reported within the Statements of Assets and Liabilities.
6. Principal Risks
Investing in the Funds may involve certain risks including, but not limited to, those described below.
Counterparty Risk
The Funds are subject to the risk that a party or participant to a transaction, such as a broker or derivative counterparty, will be unwilling or unable to satisfy its obligation to make timely principal, interest or settlement payments or to otherwise honor its obligations to the Funds. As a result the Fund may obtain no recovery of its investment or may only obtain a limited recovery, and any recovery may be delayed. Not all derivative transactions require a counterparty to post collateral, which may expose the Fund to greater losses in the event of a default by a counterparty.
Some of the markets in which the Funds may effect derivative transactions are OTC or “interdealer” markets. The participants in such markets are typically not subject to credit evaluation and regulatory oversight to the same extent as are members of “exchange-based” markets. This exposes the Funds to the risk that a counterparty will not settle a transaction in accordance with its terms and conditions because of a credit or
32
American Beacon FundsSM
Notes to Financial Statements
October 31, 2024
liquidity problem with the counterparty and the recent turbulence in the financial markets highlights the importance of being aware of counterparty risk resulting from OTC derivative transactions. The Funds are subject to the risk that a party or participant to a transaction, such as a broker or derivative counterparty, will be unwilling or unable to satisfy its obligation to make timely principal, interest or settlement payments or to otherwise honor its obligations to the Funds. As a result, the Funds may obtain no recovery of its investment or may only obtain a limited recovery, and any recovery may be delayed. Not all derivative transactions require a counterparty to post collateral, which may expose the Funds to greater losses in the event of a default by a counterparty.
Credit Risk
The Funds are subject to the risk that the issuer or guarantor of a debt security, or the counterparty to a derivatives contract or a loan will fail to make timely payment of interest or principal or otherwise honor its obligations or default completely. A decline in the credit rating of an individual security held by the Funds may have an adverse impact on its price and make it difficult for the Funds to sell it. Ratings represent a rating agency’s opinion regarding the quality of the security and are not a guarantee of quality. Rating agencies might not always change their credit rating on an issuer or security in a timely manner to reflect events that could affect the issuer’s ability to make timely payments on its obligations. Credit risk is typically greater for securities with ratings that are below investment grade. Since the Funds can invest significantly in high-yield investments considered speculative in nature, this risk may be substantial.
Currency Risk
The Funds may have exposure to foreign currencies by making direct investments in non-U.S. currencies or in securities denominated in non-U.S. currencies, or by purchasing or selling forward currency exchange contracts in non-U.S. currencies. Foreign currencies may decline in value relative to the U.S. dollar, or, in the case of hedging positions, the U.S. dollar may decline in value relative to the currency being hedged, and thereby affect a Fund’s investments in foreign (non-U.S.) currencies or in securities that trade in, and receive revenues in, or in derivatives that provide exposure to, foreign (non-U.S.) currencies. Currency exchange rates may fluctuate significantly over short periods of time for a number of reasons, including changes in interest rates, intervention (or the failure to intervene) by U.S. or foreign governments, central banks or supranational entities such as the International Monetary Fund, or by the imposition of currency controls or other political developments in the United States or abroad. As a result, the Funds’ investments in foreign currency denominated securities may reduce the returns of the Funds. Currency futures, forwards, options or swaps may not always work as intended, and in specific cases, the Funds may be worse off than if it had not used such instrument(s). There may not always be suitable hedging instruments available. Even where suitable hedging instruments are available, the Funds may choose to not hedge their currency risks.
Environmental, Social, and/or Governance Investing Risk
The use of environmental, social, and/or governance (“ESG”) considerations by a sub-advisor may cause a Fund to make different investments than funds that have a similar investment style but do not incorporate such considerations in their strategy. As with the use of any investment considerations involved in investment decisions, there is no guarantee that the use of any ESG investment considerations will result in the selection of issuers that will outperform other issuers or help reduce risk in a Fund. A Fund may underperform funds that do not incorporate these considerations.
Equity Investments Risk
Equity securities are subject to investment risk and market risk. The Funds’ investments in equity securities may include common stocks, preferred stocks, securities convertible into or exchangeable for common stocks, REITs, depositary receipts, and U.S. dollar-denominated foreign stocks traded on U.S. exchanges. Such investments
33
American Beacon FundsSM
Notes to Financial Statements
October 31, 2024
may expose the Funds to additional risk. The value of a company’s common stock may fall as a result of factors affecting the company, companies in the same industry or sector, or the financial markets overall. Common stock generally is subordinate to preferred stock upon the liquidation or bankruptcy of the issuing company. Preferred stocks and convertible securities are sensitive to movements in interest rates. Preferred stocks may be less liquid than common stocks and, unlike common stocks, participation in the growth of an issuer may be limited. Distributions on preferred stocks generally are payable at the discretion of an issuer and after required payments to bond holders. Convertible securities are subject to the risk that the credit standing of the issuer may have an effect on the convertible securities’ investment value. Investments in REITs are subject to the risks associated with investing in the real estate industry such as adverse developments affecting the real estate industry and real property values. Depositary receipts and U.S. dollar-denominated foreign stocks traded on U.S. exchanges are subject to certain of the risks associated with investing directly in foreign securities, including, but not limited to, currency fluctuations and political and financial instability in the home country of a particular depositary receipt or foreign stock.
Foreign Investing and Emerging Markets Risk
Non-U.S. investments carry potential risks not associated with U.S. investments. Such risks include, but are not limited to: (1) currency exchange rate fluctuations, (2) political and financial instability, (3) less liquidity, (4) lack of uniform accounting, auditing and financial reporting standards, (5) increased price volatility, (6) less government regulation and supervision of foreign stock exchanges, brokers and listed companies, and (7) delays in transaction settlement in some foreign markets. To the extent the Funds invest a significant portion of its assets in securities of a single country or region, it is more likely to be affected by events or conditions of that country or region. In addition, the economies and political environments of emerging market countries tend to be more unstable than those of developed countries, resulting in more volatile rates of return than the developed markets and substantially greater risk to investors. There may be very limited oversight of certain foreign banks or securities depositories that hold foreign securities and currency and the laws of certain countries may limit the ability to recover such assets if a foreign bank or depository or their agents goes bankrupt. When investing in emerging markets, the risks of investing in foreign securities are heightened. Emerging markets have unique risks that are greater than, or in addition to, investing in developed markets because emerging markets are generally smaller, less developed, less liquid and more volatile than the securities markets of the U.S. and other developed markets. There are also risks of: greater political uncertainties; an economy’s dependence on revenues from particular commodities or on international aid or development assistance; currency transfer restrictions; a limited number of potential buyers for such securities, resulting in increased volatility and limited liquidity for emerging market securities; trading suspensions; and delays and disruptions in securities settlement procedures. In addition, there may be less information available to make investment decisions and more volatile rates of return.
Forward Foreign Currency Contracts Risk
Forward foreign currency contracts, including non-deliverable forwards, are derivative instruments pursuant to a contract with a counterparty to pay a fixed price for an agreed amount of securities or other underlying assets at an agreed date or to buy or sell a specific currency at a future date at a price set at the time of the contract. The use of forward foreign currency contracts may expose the Funds to additional risks that it would not be subject to if it invested directly in the securities or currencies underlying the forward foreign currency contract.
Futures Contracts Risk
Futures contracts are derivative instruments where one party pays a fixed price for an agreed amount of securities or other underlying assets at an agreed date. The use of such derivative instruments may expose the Funds to additional risks that they would not be subject to if they invested directly in the securities underlying those derivatives. There may at times be an imperfect correlation between the movement in the prices of futures contracts and the value of their underlying instruments or indexes. There can be no assurance that any strategy used will succeed. There also can be no assurance that, at all times, a liquid market will exist for offsetting a
34
American Beacon FundsSM
Notes to Financial Statements
October 31, 2024
futures contract that a Fund has previously bought or sold and this may result in the inability to close a futures contract when desired. Futures contracts may experience potentially dramatic price changes, which will increase the volatility of a Fund and may involve a small investment of cash (the amount of initial and variation margin) relative to the magnitude of the risk assumed (the potential increase or decrease in the price of the futures contract).
Market Risk
The Funds are subject to the risk that the securities markets will move down, sometimes rapidly and unpredictably, based on overall economic conditions and other factors, which may negatively affect a Fund’s performance. Equity securities generally have greater price volatility than fixed-income securities, although under certain market conditions fixed-income securities may have comparable or greater price volatility. During a general downturn in the securities markets, multiple assets may decline in value simultaneously. In some cases, traditional market participants have been less willing to make a market in some types of debt instruments, which has affected the liquidity of those instruments. During times of market turmoil, investors tend to look to the safety of securities issued or backed by the U.S. Treasury, causing the prices of these securities to rise and the yields to decline. Reduced liquidity in fixed-income and credit markets may negatively affect many issuers worldwide. Prices in many financial markets have increased significantly over the last decade, but there have also been periods of adverse market and financial developments and cyclical change during that timeframe, which have resulted in unusually high levels of volatility in domestic and foreign financial markets that has caused losses for investors and may occur again in the future, particularly if markets enter a period of uncertainty or economic weakness. The value of a security may decline due to adverse issuer-specific conditions, general market conditions unrelated to a particular issuer, or factors that affect a particular industry or industries. Changes in the financial condition of a single issuer or market segment also can impact the market as a whole.
Geopolitical and other events, including war, terrorism, economic uncertainty, trade disputes, pandemics, public health crises, natural disasters and related events have led, and in the future may continue to lead, to instability in world economies and markets generally and reduced liquidity in equity, credit and fixed-income markets, which may disrupt economies and markets and adversely affect the value of your investment. Changes in value may be temporary or may last for extended periods.
Policy changes by the U.S. government and/or Federal Reserve and political events within the U.S. and abroad, including the U.S. presidential election, the U.S. government’s inability at times to agree on a long-term budget and deficit reduction plan, the threat of a federal government shutdown and threats not to increase the federal government’s debt limit, may affect investor and consumer confidence and may adversely impact financial markets and the broader economy, perhaps suddenly and to a significant degree.
Markets and market participants are increasingly reliant upon both publicly available and proprietary information data systems. Data imprecision, software or other technology malfunctions, programming inaccuracies, unauthorized use or access, and similar circumstances may impair the performance of these systems and may have an adverse impact upon a single issuer, a group of issuers, or the market at large. The financial markets generally move in cycles, with periods of rising prices followed by periods of declining prices. The value of your investment may reflect these fluctuations.
Market Timing Risk
Funds that invest in high-yield, and, or have exposure to foreign securities through the derivatives it holds, are particularly subject to the risk of market timing activities. Frequent trading by Fund shareholders poses risks to other shareholders in the Funds, including (i) the dilution of the Funds’ NAV, (ii) an increase in the Funds’ expenses, and (iii) interference with the portfolio manager’s ability to execute efficient investment strategies. Because of specific securities in which the Funds may invest, it could be subject to the risk of market timing activities by shareholders. Some examples of these types of securities are high-yield and foreign securities. The
35
American Beacon FundsSM
Notes to Financial Statements
October 31, 2024
limited trading activity of some high-yield securities may result in market prices that do not reflect the true market value of these securities. If a Fund trades foreign securities, it generally prices foreign securities using their closing prices from the foreign markets in which they trade, typically prior to the Funds’ calculation of its NAV. These prices may be affected by events that occur after the close of a foreign market but before the Funds price its shares. In such instances, the Funds may fair value high yield and foreign securities. However, some investors may engage in frequent short-term trading in the Funds to take advantage of any price differentials that may be reflected in the NAV of the Funds’ shares. While the Manager monitors trading in the Funds, there is no guarantee that it can detect all market timing activities.
Multiple Sub-Advisor Risk
The Manager allocates the International Equity Fund’s assets among multiple sub-advisors, each of which is responsible for investing its allocated portion of the Fund’s assets. To a significant extent, the Fund’s performance will depend on the success of the Manager in allocating the Fund’s assets to sub-advisors and its selection and oversight of the sub-advisors. Because each sub-advisor manages its allocated portion of the Fund independently from another sub-advisor, the same security may be held in different portions of the Fund, or may be acquired for one portion of the Fund at a time when a sub-advisor to another portion deems it appropriate to dispose of the security from that other portion, resulting in higher expenses without accomplishing any net result in the Fund’s holdings. Similarly, under some market conditions, one sub-advisor may believe that temporary, defensive investments in short-term instruments or cash are appropriate when another sub-advisor believes continued exposure to the equity or debt markets is appropriate for its allocated portion of the Fund. Because each sub-advisor directs the trading for its own portion of the Fund, and does not aggregate its transactions with those of the other sub-advisors, the Fund may incur higher brokerage costs than would be the case if a single sub-adviser were managing the entire Fund. In addition, while the Manager seeks to allocate the Fund’s assets among the Fund’s sub-advisors in a manner that it believes is consistent with achieving the Fund’s investment objective(s), the Manager may be subject to potential conflicts of interest in allocating the Fund’s assets among sub-advisors, due to factors that could impact the Manager’s revenues and profits.
Recent Market Events Risk
Both U.S. and international markets have experienced significant volatility in recent months and years. As a result of such volatility, investment returns may fluctuate significantly. Moreover, the risks discussed herein associated with an investment in the Funds may be increased.
Although interest rates were unusually low in recent years in the U.S. and abroad, in 2022, the Federal Reserve and certain foreign central banks began to raise interest rates as part of their efforts to address rising inflation. It is difficult to accurately predict the pace at which interest rates may continue to increase, the timing, frequency or magnitude of any such increases, or when such increases might stop. Additionally, various economic and political factors could cause the Federal Reserve or another foreign central bank to change their approach in the future and such actions may result in an economic slowdown in the U.S. and abroad. Unexpected increases in interest rates could lead to market volatility or reduce liquidity in certain sectors of the market. Deteriorating economic fundamentals may, in turn, increase the risk of default or insolvency of particular issuers, negatively impact market value, cause credit spreads to widen, and reduce bank balance sheets. Any of these could cause an increase in market volatility, reduce liquidity across various markets or decrease confidence in the markets. Additionally, high public debt in the U.S. and other countries creates ongoing systemic and market risks and policymaking uncertainty.
In March 2023, the shutdown of certain financial institutions in the U.S. and questions regarding the viability of other financial institutions raised economic concerns over disruption in the U.S. and global banking systems. There can be no certainty that the actions taken by the U.S. or foreign governments will be effective in mitigating the effects of financial institution failures on the economy and restoring public confidence in the U.S. and global banking systems.
36
American Beacon FundsSM
Notes to Financial Statements
October 31, 2024
Some countries, including the U.S., have in recent years adopted more protectionist trade policies. Slowing global economic growth; risks associated with a trade agreement between the United Kingdom and the European Union; the risks associated with ongoing trade negotiations with China; and the possibility of changes to some international trade agreements; political or economic dysfunction within some nations, including major producers of oil; and dramatic changes in commodity and currency prices could have adverse effects that cannot be foreseen at the present time.
Tensions, war, or open conflict between nations, such as between Russia and Ukraine, in the Middle East or in eastern Asia could affect the economies of many nations, including the United States. The duration of ongoing hostilities in the Middle East and between Russia and Ukraine, and any sanctions and related events cannot be predicted. Those events present material uncertainty and risk with respect to markets globally and the performance of a Fund and its investments or operations could be negatively impacted.
Economists and others have expressed increasing concern about the potential effects of global climate change on property and security values. Certain issuers, industries and regions may be adversely affected by the impacts of climate change, including on the demand for and the development of goods and services and related production costs, and the impacts of legislation, regulation and international accords related to climate change, as well as any indirect consequences of regulation or business trends driven by climate change.
Other Investment Companies Risk
To the extent that a Fund invests in shares of other registered investment companies, a Fund will indirectly bear the fees and expenses, including, for example, advisory and administrative fees, charged by those investment companies in addition to a Fund’s direct fees and expenses. If a Fund invests in other investment companies, a Fund may receive distributions of taxable gains from portfolio transactions by that investment company and may recognize taxable gains from transactions in shares of that investment company, which could be taxable to a Fund’s shareholders when distributed to them. A Fund must rely on the investment company in which it invests to achieve its investment objective. If the investment company fails to achieve its investment objective, the value of a Fund’s investment may decline, adversely affecting a Fund’s performance. To the extent a Fund invests in other investment companies that invest in equity securities, fixed-income securities and/or foreign securities, or that track an index, a Fund is subject to the risks associated with the underlying investments held by the investment company or the index fluctuations to which the investment company is subject. A Fund will be subject to the risks associated with investments in those companies, including but not limited to interest rate risk, credit risk and market risk.
Securities Lending Risk
A Fund may lend its portfolio securities to brokers, dealers and financial institutions in order to obtain additional income. Borrowers of a Fund’s securities provide collateral either in the form of cash, which a Fund reinvests in securities or in the form of non-cash collateral consisting of securities issued or guaranteed by the U.S. government or one of its agencies or instrumentalities. A Fund will be responsible for the risks associated with the investment of cash collateral, including any collateral invested in an affiliated money market fund. A Fund may lose money on its investment of cash collateral or may fail to earn sufficient income on its investment to cover its payment to the borrower of a pre-negotiated fee or “rebate” for the use of that cash collateral in connection with the loan. A Fund could also lose money due to a decline in the value of non-cash collateral. In addition, delays may occur in the recovery of securities from borrowers, which could interfere with a Fund’s ability to vote proxies or to settle transactions or could result in increased costs. Moreover, if the borrower becomes subject to insolvency or similar proceedings, a Fund could incur delays in its ability to enforce its rights in its collateral. There also is a risk that a borrower may default on its obligation to return loaned securities at a time when the value of a Fund’s collateral is inadequate. Although a Fund’s securities lending agent may indemnify a Fund against that risk, it is also possible that the securities lending agent will be unable to satisfy its indemnification obligations. In any case in which the loaned securities are not returned to a Fund before an ex-dividend date, whether or not due to a
37
American Beacon FundsSM
Notes to Financial Statements
October 31, 2024
default by the borrower, the payment in lieu of the dividend that a Fund receives from the securities’ borrower would not be treated as a dividend for federal income tax purposes and thus would not qualify for treatment as “qualified dividend income.”
Valuation Risk
This is the risk that a Fund has valued a security at a price different from the price at which it can be sold. This risk may be especially pronounced for investments, such as derivatives, which may be illiquid or which may become illiquid and for securities that trade in relatively thin markets and/or markets that experience extreme volatility. If market conditions make it difficult to value certain investments, a Fund may value these investments using more subjective methods, such as fair-value methodologies. Investors who purchase or redeem Fund shares on days when a Fund is holding fair-valued securities may receive fewer or more shares, or lower or higher redemption proceeds, than they would have received if the Fund had not fair-valued the securities or had used a different valuation methodology. The value of foreign securities, certain fixed-income securities and currencies, as applicable, may be materially affected by events after the close of the markets on which they are traded, but before a Fund determines its NAV. A Fund’s ability to value its investments in an accurate and timely manner may be impacted by technological issues and/or errors by third-party service providers, such as pricing services or accounting agents.
7. Federal Income and Excise Taxes
It is the policy of each Fund to qualify as a regulated investment company (“RIC”), by complying with all applicable provisions of Subchapter M of the Internal Revenue Code, as amended, and to make distributions of taxable income sufficient to relieve it from substantially all federal income and excise taxes. For federal income tax purposes, each Fund is treated as a single entity for the purpose of determining such qualification.
The Funds do not have any unrecorded tax liabilities in the accompanying financial statements. Each of the tax years in the four year period ended October 31, 2024 remain subject to examination by the Internal Revenue Service. If applicable, the Funds recognize interest accrued related to unrecognized tax benefits in interest expense and penalties in “Other expenses” on the Statements of Operations.
The Funds may be subject to taxes imposed by countries in which it invests. Such taxes are generally based on returns of income earned or gains realized or repatriated. Taxes are accrued and applied to net investment income, net realized capital gains and net unrealized appreciation (depreciation), as applicable, as the income is earned or capital gains are recorded.
Dividends are categorized in accordance with income tax regulations which may treat certain transactions differently than U.S. GAAP. Accordingly, the character of distributions and composition of net assets for tax purposes may differ from those reflected in the accompanying financial statements.
The tax character of distributions paid were as follows:
| | | | | | | | | | | | | | | | | | | | | | | | | | | | |
| | | EAM International Small Cap Fund | | | | | | International Equity | |
| | | Year Ended
October 31, 2024 | | | | | | Year Ended
October 31, 2023 | | | | | | Year Ended
October 31, 2024 | | | | | | Year Ended
October 31, 2023 | |
Distributions paid from: | |
Ordinary income* | |
R5 Class | | $ | 138,937 | | | | | | | $ | 284,205 | | | | | | | $ | 20,300,284 | | | | | | | $ | 19,840,233 | |
Y Class | | | 1,243,710 | | | | | | | | 1,719,644 | | | | | | | | 4,658,524 | | | | | | | | 2,512,663 | |
Investor Class | | | 1,067,041 | | | | | | | | 1,056,156 | | | | | | | | 3,138,410 | | | | | | | | 2,090,798 | |
Advisor Class | | | - | | | | | | | | - | | | | | | | | 617,707 | | | | | | | | 304,447 | |
A Class | | | - | | | | | | | | - | | | | | | | | 525,588 | | | | | | | | 188,613 | |
C Class | | | - | | | | | | | | - | | | | | | | | 119,521 | | | | | | | | 48,919 | |
R6 Class | | | - | | | | | | | | - | | | | | | | | 17,067,264 | | | | | | | | 8,756,091 | |
| | | | | | | | | | | | | | | | | | | | | | | | | | | | |
Total distributions paid | | $ | 2,449,688 | | | | | | | $ | 3,060,005 | | | | | | | $ | 46,427,298 | | | | | | | $ | 33,741,764 | |
| | | | | | | | | | | | | | | | | | | | | | | | | | | | |
* For tax purposes, short-term capital gains are considered ordinary income distributions.
38
American Beacon FundsSM
Notes to Financial Statements
October 31, 2024
As of October 31, 2024, the tax cost for each Fund and their respective gross unrealized appreciation (depreciation) were as follows:
| | | | | | | | | | | | | | | | | | | | | | | | | | | | |
Fund | | Tax Cost | | | | | | Unrealized
Appreciation | | | | | | Unrealized
(Depreciation) | | | | | | Net Unrealized
Appreciation
(Depreciation) | |
EAM International Small Cap | | $ | 116,366,849 | | | | | | | $ | 13,453,004 | | | | | | | $ | (3,473,903 | ) | | | | | | $ | 9,979,101 | |
International Equity | | | 595,959,576 | | | | | | | | 53,943,859 | | | | | | | | (54,611,190 | ) | | | | | | | (667,331 | ) |
| | | | | | | | | | | | | | | | | | | | | | | | | | | | | | | | | | | | | | | | | | | | |
Fund | | Net Unrealized
Appreciation
(Depreciation) | | | | | | Undistributed
Ordinary
Income | | | | | | Undistributed
Long-Term
Capital Gains | | | | | | Accumulated
Capital and
Other (Losses) | | | | | | Other Temporary
Differences | | | | | | Distributable
Earnings | |
EAM International Small Cap | | $ | 9,979,101 | | | | | | | $ | 8,960,327 | | | | | | | $ | 1,911,848 | | | | | | | $ | - | | | | | | | $ | - | | | | | | | $ | 20,851,276 | |
International Equity | | | (667,331 | ) | | | | | | | 46,551,216 | | | | | | | | 61,817,516 | | | | | | | | - | | | | | | | | (1 | ) | | | | | | | 107,701,400 | |
Financial reporting records are adjusted for permanent book/tax differences to reflect tax character. Financial records are not adjusted for temporary differences. The temporary differences between financial reporting and tax-basis reporting of unrealized appreciation (depreciation) are attributable primarily to the tax deferral of losses from wash sales, the realization for tax purposes of unrealized gains from passive foreign investment companies and the realization for tax purposes of unrealized gains (losses) on certain derivative instruments.
Due to inherent differences in the recognition of income, expenses, and realized gains (losses) under U.S. GAAP and federal income tax regulations, permanent differences between book and tax reporting have been identified and appropriately reclassified on the Statements of Assets and Liabilities.
Accordingly, the following amounts represent current year permanent differences derived from equalization as of October 31, 2024:
| | | | | | | | | | |
Fund | | Paid-In-Capital | | | | | Distributable
Earnings/(Deficits) | |
EAM International Small Cap | | $ | 1,062,103 | | | | | $ | (1,062,103 | ) |
International Equity | | | 38,730,326 | | | | | | (38,730,326 | ) |
For federal income tax purposes, the Funds measure their capital loss carryforwards annually at October 31, their fiscal year end. Capital loss carryforwards retain their character as short-term and/or long-term and may be carried forward and applied against future realized capital gains with no expiration date.
As of October 31, 2024, the Funds did not have any capital loss carryforwards.
The EAM International Small Cap Fund utilized $1,874,352 short-term capital loss carryforwards.
8. Investment Transactions
The aggregate cost of purchases and proceeds from sales and maturities of investments, other than short-term obligations, for the year ended October 31, 2024 were as follows:
| | | | | | | | | | | | |
Fund | | Purchases (non-U.S. Government
Securities) | | | | | | Sales (non-U.S. Government
Securities) | |
| EAM International Small Cap | | $ | 333,148,026 | | | | | | | $ | 345,603,270 | |
| International Equity | | | 330,551,096 | | | | | | | | 739,811,304 | |
39
American Beacon FundsSM
Notes to Financial Statements
October 31, 2024
A summary of the Funds’ transactions in the USG Select Fund for the year ended October 31, 2024 were as follows:
| | | | | | | | | | | | | | | | | | | | | | | | | | | | | | | | | | |
Fund | | Type of
Transaction | | | | | October 31,
2023
Shares/Fair
Value | | | | | | Purchases | | | | | | Sales | | | | | | October 31,
2024
Shares/Fair
Value | |
| EAM International Small Cap | | Direct | | | | | | $ | 13,732,959 | | | | | | | $ | 107,137,763 | | | | | | | $ | 117,198,069 | | | | | | | $ | 3,672,653 | |
| EAM International Small Cap | | Securities Lending | | | | | | | 258,291 | | | | | | | | 23,845,488 | | | | | | | | 24,036,579 | | | | | | | | 67,200 | |
| International Equity | | Direct | | | | | | | 38,723,902 | | | | | | | | 526,948,780 | | | | | | | | 546,318,385 | | | | | | | | 19,354,297 | |
| International Equity | | Securities Lending | | | | | | | 171,336 | | | | | | | | 53,039,566 | | | | | | | | 50,768,142 | | | | | | | | 2,442,760 | |
9. Securities Lending
The Funds may lend their securities to qualified financial institutions, such as certain broker-dealers, to earn additional income. The borrowers are required to secure their loans continuously with collateral in an amount at least equal to the fair value of the securities loaned, initially in an amount at least equal to 102% of the fair value of domestic securities loaned and 105% of the fair value of international securities loaned. Collateral is monitored and marked-to-market daily. Daily mark-to-market amounts are required to be paid to the borrower or received from the borrower by the end of the following business day. This one day settlement for mark-to-market amounts may result in the collateral being temporarily less than the value of the securities on loan or temporarily more than the required minimum collateral.
To the extent that a loan is collateralized by cash, such cash collateral shall be invested by the securities lending agent (the “Agent”) in money market mutual funds and other short-term investments, provided the investments meet certain quality and diversification requirements. Securities purchased with cash collateral proceeds are listed in the Funds’ Schedule of Investments and the collateral is shown on the Statements of Assets and Liabilities as a payable.
Securities lending income is generated from the demand premium (if any) paid by the borrower to borrow a specific security and from the return on investment of cash collateral, reduced by negotiated rebate fees paid to the borrower and transaction costs. To the extent that a loan is secured by non-cash collateral, securities lending income is generated as a demand premium reduced by transaction costs. The Funds, the Agent, and the Manager retained 80%, 10%, and 10%, respectively, of the income generated from securities lending.
While securities are on loan, the Funds continue to receive certain income associated with that security and any gain or loss in the market price that may occur during the term of the loan. In the case of domestic equities, the value of any dividend is received in the form of a substitute payment approximately equal to the dividend. In the case of foreign securities, a negotiated amount is received that is less than the actual dividend, but higher than the dividend amount minus the foreign tax that the Funds would be subject to on the dividend.
Securities lending transactions pose certain risks to the Funds, including that the borrower may not provide additional collateral when required or return the securities when due, that the value of the short-term investments will be less than the amount of cash collateral required to be returned to the borrower, that non-cash collateral may be subject to legal constraints in the event of a borrower bankruptcy, and that the cash collateral investments could become illiquid and unable to be used to return collateral to the borrower. The Funds could also experience delays and costs in gaining access to the collateral. The Funds bear the risk of any deficiency in the amount of the cash collateral available for return to the borrower and any action which impairs its ability to liquidate non-cash collateral to satisfy a borrower default.
40
American Beacon FundsSM
Notes to Financial Statements
October 31, 2024
As of October 31, 2024, the value of outstanding securities on loan and the value of collateral were as follows:
| | | | | | | | | | | | | | | | | | | | | | | | | | | | |
Fund | | Fair Value
of Securities
on Loan | | | | | | Cash
Collateral
Received | | | | | | Non-Cash
Collateral
Received | | | | | | Total
Collateral
Received | |
| EAM International Small Cap | | $ | 5,695,370 | | | | | | | $ | 67,200 | | | | | | | $ | 5,976,531 | | | | | | | $ | 6,043,731 | |
| International Equity | | | 12,007,072 | | | | | | | | 2,442,760 | | | | | | | | 10,235,842 | | | | | | | | 12,678,602 | |
Cash collateral is listed on the Funds’ Schedules of Investments and is shown on the Statements of Assets and Liabilities. Income earned on these investments is included in “Income derived from securities lending” on the Statements of Operations.
Non-cash collateral received by the Funds may not be sold or re-pledged except to satisfy a borrower default. Therefore, non-cash collateral is not included on the Funds’ Schedules of Investments or Statements of Assets and Liabilities.
10. Borrowing Arrangements
Effective November 8, 2024 (the “Effective Date”), the Funds, along with certain other funds managed by the Manager (“Participating Funds”), renewed a committed revolving line of credit (the “Committed Line”) agreement with State Street Bank and Trust Company (the “Bank”) to be used to facilitate portfolio liquidity. The maximum borrowing amount under the Committed Line is $100 million with interest at a rate equal to the higher of (a) Overnight Bank Funding Rate (“OBFR”) daily fluctuating rate per annum equal to 1.25% plus the sum of 0.10% or (b) the Federal Funds daily fluctuating rate per annum on amounts borrowed. Each of the Participating Funds paid a proportional amount of a quarterly commitment fee at a rate of 0.25% per annum on the unused portion of the Committed Line amount. The Committed Line expires November 7, 2025, unless extended by the Bank or terminated by the Participating Funds in accordance with the agreement. Prior to the Effective Date, the maximum borrowing amount under the Committed Line was $100 million with an expiration date November 7, 2024.
On the Effective Date, the Funds, along with certain other Participating Funds managed by the Manager, also renewed an uncommitted discretionary demand revolving line of credit (the “Uncommitted Line”) agreement with the Bank to be used to facilitate portfolio liquidity. The maximum borrowing amount under the Uncommitted Line is $100 million with interest at a rate equal to the higher of (a) OBFR daily fluctuating rate per annum equal to 1.25% plus the sum of 0.10% or (b) the Federal Funds daily fluctuating rate per annum on amounts borrowed on each outstanding loan. Each of the Participating Funds paid a proportional amount of a closing fee of $35,000 on the Effective Date. The Uncommitted Line expires November 7, 2025, unless extended by the Bank or terminated by the Participating Funds in accordance with the agreement. Prior to the Effective Date, the maximum borrowing amount under the Uncommitted Line was $100 million with an expiration date November 7, 2024.
The Participating Funds paid administration, legal and arrangement fees, which are recognized as a component of “Line of credit interest expense” on the Statements of Operations, along with commitment fees, that have been allocated among the Participating Funds based on average daily net assets.
During the year ended October 31, 2024, the Funds did not utilize these facilities.
41
American Beacon FundsSM
Notes to Financial Statements
October 31, 2024
11. Capital Share Transactions
The tables below summarize the activity in capital shares for each Class of the Funds:
| | | | | | | | | | | | | | | | | | | | | | | | | | | | |
| | | R5 Class | |
| | | Year Ended
October 31, 2024 | | | | | | Year Ended
October 31, 2023 | |
EAM International Small Cap Fund | | Shares | | | | | | Amount | | | | | | Shares | | | | | | Amount | |
| Shares sold | | | 91,304 | | | | | | | $ | 1,649,842 | | | | | | | | 312,073 | | | | | | | $ | 5,144,248 | |
| Reinvestment of dividends | | | 8,451 | | | | | | | | 138,937 | | | | | | | | 19,386 | | | | | | | | 284,204 | |
| Shares redeemed | | | (51,572 | ) | | | | | | | (928,768 | ) | | | | | | | (955,306 | ) | | | | | | | (15,218,036 | ) |
| | | | | | | | | | | | | | | | | | | | | | | | | | | | |
| Net increase (decrease) in shares outstanding | | | 48,183 | | | | | | | $ | 860,011 | | | | | | | | (623,847 | ) | | | | | | $ | (9,789,584 | ) |
| | | | | | | | | | | | | | | | | | | | | | | | | | | | |
| | | | |
| | | Y Class | |
| | | Year Ended
October 31, 2024 | | | | | | Year Ended
October 31, 2023 | |
EAM International Small Cap Fund | | Shares | | | | | | Amount | | | | | | Shares | | | | | | Amount | |
| Shares sold | | | 474,289 | | | | | | | $ | 8,271,875 | | | | | | | | 1,240,162 | | | | | | | $ | 19,805,259 | |
| Reinvestment of dividends | | | 55,611 | | | | | | | | 911,458 | | | | | | | | 98,686 | | | | | | | | 1,446,738 | |
| Shares redeemed | | | (1,103,789 | ) | | | | | | | (19,105,361 | ) | | | | | | | (4,391,009 | ) | | | | | | | (69,078,198 | ) |
| | | | | | | | | | | | | | | | | | | | | | | | | | | | |
| Net (decrease) in shares outstanding | | | (573,889 | ) | | | | | | $ | (9,922,028 | ) | | | | | | | (3,052,161 | ) | | | | | | $ | (47,826,201 | ) |
| | | | | | | | | | | | | | | | | | | | | | | | | | | | |
| | | | |
| | | Investor Class | |
| | | Year Ended
October 31, 2024 | | | | | | Year Ended
October 31, 2023 | |
EAM International Small Cap Fund | | Shares | | | | | | Amount | | | | | | Shares | | | | | | Amount | |
| Shares sold | | | 416,836 | | | | | | | $ | 7,405,498 | | | | | | | | 401,029 | | | | | | | $ | 6,463,963 | |
| Reinvestment of dividends | | | 56,629 | | | | | | | | 934,948 | | | | | | | | 64,362 | | | | | | | | 950,624 | |
| Shares redeemed | | | (1,314,525 | ) | | | | | | | (23,251,446 | ) | | | | | | | (1,829,605 | ) | | | | | | | (29,029,543 | ) |
| | | | | | | | | | | | | | | | | | | | | | | | | | | | |
| Net (decrease) in shares outstanding | | | (841,060 | ) | | | | | | $ | (14,911,000 | ) | | | | | | | (1,364,214 | ) | | | | | | $ | (21,614,956 | ) |
| | | | | | | | | | | | | | | | | | | | | | | | | | | | |
| | | | |
| | | R5 Class | |
| | | Year Ended
October 31, 2024 | | | | | | Year Ended
October 31, 2023 | |
International Equity Fund | | Shares | | | | | | Amount | | | | | | Shares | | | | | | Amount | |
| Shares sold | | | 1,275,928 | | | | | | | $ | 23,962,085 | | | | | | | | 6,600,545 | | | | | | | $ | 113,441,066 | |
| Reinvestment of dividends | | | 1,101,966 | | | | | | | | 19,912,534 | | | | | | | | 1,212,447 | | | | | | | | 18,950,544 | |
| Shares redeemed | | | (11,561,436 | ) | | | | | | | (214,281,949 | ) | | | | | | | (45,330,087 | ) | | | | | | | (757,798,935 | ) |
| | | | | | | | | | | | | | | | | | | | | | | | | | | | |
| Net (decrease) in shares outstanding | | | (9,183,542 | ) | | | | | | $ | (170,407,330 | ) | | | | | | | (37,517,095 | ) | | | | | | $ | (625,407,325 | ) |
| | | | | | | | | | | | | | | | | | | | | | | | | | | | |
| | | | |
| | | Y Class | |
| | | Year Ended
October 31, 2024 | | | | | | Year Ended
October 31, 2023 | |
International Equity Fund | | Shares | | | | | | Amount | | | | | | Shares | | | | | | Amount | |
| Shares sold | | | 533,844 | | | | | | | $ | 10,553,834 | | | | | | | | 764,908 | | | | | | | $ | 14,044,424 | |
| Reinvestment of dividends | | | 240,581 | | | | | | | | 4,587,876 | | | | | | | | 150,746 | | | | | | | | 2,481,284 | |
| Shares redeemed | | | (1,581,261 | ) | | | | | | | (31,258,707 | ) | | | | | | | (2,296,912 | ) | | | | | | | (41,098,087 | ) |
| | | | | | | | | | | | | | | | | | | | | | | | | | | | |
| Net (decrease) in shares outstanding | | | (806,836 | ) | | | | | | $ | (16,116,997 | ) | | | | | | | (1,381,258 | ) | | | | | | $ | (24,572,379 | ) |
| | | | | | | | | | | | | | | | | | | | | | | | | | | | |
| | | | |
| | | Investor Class | |
| | | Year Ended
October 31, 2024 | | | | | | Year Ended
October 31, 2023 | |
International Equity Fund | | Shares | | | | | | Amount | | | | | | Shares | | | | | | Amount | |
| Shares sold | | | 150,953 | | | | | | | $ | 2,813,915 | | | | | | | | 3,836,876 | | | | | | | $ | 66,690,147 | |
| Reinvestment of dividends | | | 172,001 | | | | | | | | 3,089,134 | | | | | | | | 130,163 | | | | | | | | 2,018,825 | |
| Shares redeemed | | | (1,470,504 | ) | | | | | | | (26,829,824 | ) | | | | | | | (5,876,228 | ) | | | | | | | (104,841,162 | ) |
| | | | | | | | | | | | | | | | | | | | | | | | | | | | |
| Net (decrease) in shares outstanding | | | (1,147,550 | ) | | | | | | $ | (20,926,775 | ) | | | | | | | (1,909,189 | ) | | | | | | $ | (36,132,190 | ) |
| | | | | | | | | | | | | | | | | | | | | | | | | | | | |
| | | | |
42
American Beacon FundsSM
Notes to Financial Statements
October 31, 2024
| | | | | | | | | | | | | | | | | | | | | | | | | | | | |
| | | Advisor Class | |
| | | Year Ended
October 31, 2024 | | | | | | Year Ended
October 31, 2023 | |
International Equity Fund | | Shares | | | | | | Amount | | | | | | Shares | | | | | | Amount | |
| Shares sold | | | 76,294 | | | | | | | $ | 1,499,384 | | | | | | | | 144,782 | | | | | | | $ | 2,579,144 | |
| Reinvestment of dividends | | | 33,225 | | | | | | | | 617,326 | | | | | | | | 18,959 | | | | | | | | 304,294 | |
| Shares redeemed | | | (119,270 | ) | | | | | | | (2,322,072 | ) | | | | | | | (384,344 | ) | | | | | | | (6,715,366 | ) |
| | | | | | | | | | | | | | | | | | | | | | | | | | | | |
| Net (decrease) in shares outstanding | | | (9,751 | ) | | | | | | $ | (205,362 | ) | | | | | | | (220,603 | ) | | | | | | $ | (3,831,928 | ) |
| | | | | | | | | | | | | | | | | | | | | | | | | | | | |
| | | | |
| | | A Class | |
| | | Year Ended
October 31, 2024 | | | | | | Year Ended
October 31, 2023 | |
International Equity Fund | | Shares | | | | | | Amount | | | | | | Shares | | | | | | Amount | |
| Shares sold | | | 159,796 | | | | | | | $ | 2,963,199 | | | | | | | | 284,959 | | | | | | | $ | 4,947,007 | |
| Reinvestment of dividends | | | 29,150 | | | | | | | | 520,904 | | | | | | | | 12,062 | | | | | | | | 186,717 | |
| Shares redeemed | | | (214,751 | ) | | | | | | | (4,077,761 | ) | | | | | | | (263,000 | ) | | | | | | | (4,512,860 | ) |
| | | | | | | | | | | | | | | | | | | | | | | | | | | | |
| Net increase (decrease) in shares outstanding | | | (25,805 | ) | | | | | | $ | (593,658 | ) | | | | | | | 34,021 | | | | | | | $ | 620,864 | |
| | | | | | | | | | | | | | | | | | | | | | | | | | | | |
| | | | |
| | | C Class | |
| | | Year Ended
October 31, 2024 | | | | | | Year Ended
October 31, 2023 | |
International Equity Fund | | Shares | | | | | | Amount | | | | | | Shares | | | | | | Amount | |
| Shares sold | | | 23,520 | | | | | | | $ | 419,997 | | | | | | | | 33,973 | | | | | | | $ | 556,596 | |
| Reinvestment of dividends | | | 6,898 | | | | | | | | 118,845 | | | | | | | | 3,264 | | | | | | | | 48,699 | |
| Shares redeemed | | | (52,208 | ) | | | | | | | (929,371 | ) | | | | | | | (82,219 | ) | | | | | | | (1,373,591 | ) |
| | | | | | | | | | | | | | | | | | | | | | | | | | | | |
| Net (decrease) in shares outstanding | | | (21,790 | ) | | | | | | $ | (390,529 | ) | | | | | | | (44,982 | ) | | | | | | $ | (768,296 | ) |
| | | | | | | | | | | | | | | | | | | | | | | | | | | | |
| | | | |
| | | R6 Class | |
| | | Year Ended
October 31, 2024 | | | | | | Year Ended
October 31, 2023 | |
International Equity Fund | | Shares | | | | | | Amount | | | | | | Shares | | | | | | Amount | |
| Shares sold | | | 3,731,057 | | | | | | | $ | 70,282,639 | | | | | | | | 5,124,430 | | | | | | | $ | 89,384,894 | |
| Reinvestment of dividends | | | 920,802 | | | | | | | | 16,684,931 | | | | | | | | 543,022 | | | | | | | | 8,503,723 | |
| Shares redeemed | | | (15,134,620 | ) | | | | | | | (296,975,564 | ) | | | | | | | (8,993,730 | ) | | | | | | | (154,447,930 | ) |
| | | | | | | | | | | | | | | | | | | | | | | | | | | | |
| Net (decrease) in shares outstanding | | | (10,482,761 | ) | | | | | | $ | (210,007,994 | ) | | | | | | | (3,326,278 | ) | | | | | | $ | (56,559,313 | ) |
| | | | | | | | | | | | | | | | | | | | | | | | | | | | |
12. Subsequent Events
Management has evaluated subsequent events for possible recognition or disclosure in the financial statements through the date the financial statements are issued. Management has determined that there are no material events that would require disclosure in the Funds’ financial statements through this date.
43
American Beacon EAM International Small Cap FundSM
Financial Highlights
(For a share outstanding throughout the period)
| | | | | | | | | | | | | | | | | | | | | | | | | | | | | | | | | | | | |
| | | R5 ClassA | |
| | | Year Ended October 31, | |
| | | 2024 | | | | | | 2023B | | | | | | 2022 | | | | | | 2021 | | | | | | 2020 | |
| | | | |
Net asset value, beginning of period | | $ | 15.31 | | | | | | | $ | 13.47 | | | | | | | $ | 19.56 | | | | | | | $ | 15.58 | | | | | | | $ | 15.65 | |
| | | | | | | | | | | | | | | | | | | | | | | | | | | | | | | | | | | | |
Income (loss) from investment operations: | | | | | | | | | | | | | | | | | | | | | | | | | | | | | | | | | | | | |
Net investment income | | | 0.36 | | | | | | | | 0.15 | C D | | | | | | | 0.20 | | | | | | | | 0.60 | E | | | | | | | 0.03 | |
Net gains (losses) on investments (both realized and unrealized) | | | 2.45 | | | | | | | | 1.96 | | | | | | | | (5.53 | ) | | | | | | | 3.50 | | | | | | | | 0.29 | |
| | | | | | | | | | | | | | | | | | | | | | | | | | | | | | | | | | | | |
Total income (loss) from investment operations | | | 2.81 | | | | | | | | 2.11 | | | | | | | | (5.33 | ) | | | | | | | 4.10 | | | | | | | | 0.32 | |
| | | | | | | | | | | | | | | | | | | | | | | | | | | | | | | | | | | | |
Less distributions: | | | | | | | | | | | | | | | | | | | | | | | | | | | | | | | | | | | | |
Dividends from net investment income | | | (0.34 | ) | | | | | | | (0.27 | ) | | | | | | | (0.76 | ) | | | | | | | (0.12 | ) | | | | | | | (0.39 | ) |
| | | | | | | | | | | | | | | | | | | | | | | | | | | | | | | | | | | | |
Total distributions | | | (0.34 | ) | | | | | | | (0.27 | ) | | | | | | | (0.76 | ) | | | | | | | (0.12 | ) | | | | | | | (0.39 | ) |
| | | | | | | | | | | | | | | | | | | | | | | | | | | | | | | | | | | | |
Net asset value, end of period | | $ | 17.78 | | | | | | | $ | 15.31 | | | | | | | $ | 13.47 | | | | | | | $ | 19.56 | | | | | | | $ | 15.58 | |
| | | | | | | | | | | | | | | | | | | | | | | | | | | | | | | | | | | | |
Total returnF | | | 18.52 | % | | | | | | | 15.75 | % | | | | | | | (28.31 | )% | | | | | | | 26.38 | % | | | | | | | 1.94 | % |
| | | | | | | | | | | | | | | | | | | | | | | | | | | | | | | | | | | | |
| | | | | | | | | |
Ratios and supplemental data: | | | | | | | | | | | | | | | | | | | | | | | | | | | | | | | | | | | | |
Net assets, end of period | | $ | 8,195,147 | | | | | | | $ | 6,316,496 | | | | | | | $ | 13,963,043 | | | | | | | $ | 20,907,091 | | | | | | | $ | 20,327,704 | |
Ratios to average net assets: | | | | | | | | | | | | | | | | | | | | | | | | | | | | | | | | | | | | |
Expenses, before reimbursements and/or recoupments | | | 1.21 | % | | | | | | | 1.21 | % | | | | | | | 0.90 | % | | | | | | | 0.92 | % | | | | | | | 0.91 | % |
Expenses, net of reimbursements and/or recoupments | | | 0.89 | % | | | | | | | 0.89 | % | | | | | | | 0.89 | % | | | | | | | 0.91 | %G | | | | | | | 0.89 | % |
Net investment income, before expense reimbursements and/or recoupments | | | 0.97 | % | | | | | | | 0.63 | %D | | | | | | | 1.30 | % | | | | | | | 3.14 | %E | | | | | | | 0.84 | % |
Net investment income, net of reimbursements and/or recoupments | | | 1.29 | % | | | | | | | 0.95 | %D | | | | | | | 1.31 | % | | | | | | | 3.15 | %E | | | | | | | 0.86 | % |
Portfolio turnover rate | | | 260 | % | | | | | | | 292 | % | | | | | | | 21 | % | | | | | | | 34 | % | | | | | | | 28 | % |
| A | Prior to February 28, 2020, the R5 Class was known as Institutional Class. |
| B | On January 20, 2023 Tocqueville Asset Management LP was terminated and ceased managing assets of the Fund. On January 21, 2023, EAM Global Investors, LLC began managing assets of the Fund. |
| C | Per share amounts have been calculated using the average shares method. |
| D | Net investment income includes a significant dividend payment from Keppel Corp, Ltd. amounting to $0.0312. |
| E | Net investment income includes a significant dividend payment from Vivendi SE amounting to $0.3366. |
| F | Based on net asset value, which does not reflect the sales charge, redemption fee, or contingent deferred sales charge, if applicable. May include adjustments in accordance with U.S. GAAP and as such, the net asset value for reporting purposes and the returns based upon those net asset values may differ from the net asset value and returns for shareholder transactions. |
| G | Expense ratios may exceed stated expense caps in Note 2 in the Annual Shareholder report due to security lending expenses. |
See accompanying notes
44
American Beacon EAM International Small Cap FundSM
Financial Highlights
(For a share outstanding throughout the period)
| | | | | | | | | | | | | | | | | | | | | | | | | | | | | | | | | | | | |
| | | Y Class | |
| | | Year Ended October 31, | |
| | | 2024 | | | | | | 2023A | | | | | | 2022 | | | | | | 2021 | | | | | | 2020 | |
| | | | |
Net asset value, beginning of period | | $ | 15.24 | | | | | | | $ | 13.46 | | | | | | | $ | 19.54 | | | | | | | $ | 15.56 | | | | | | | $ | 15.64 | |
| | | | | | | | | | | | | | | | | | | | | | | | | | | | | | | | | | | | |
Income (loss) from investment operations: | | | | | | | | | | | | | | | | | | | | | | | | | | | | | | | | | | | | |
Net investment income | | | 0.05 | | | | | | | | 0.20 | B C | | | | | | | 0.04 | | | | | | | | 0.59 | D | | | | | | | 0.05 | |
Net gains (losses) on investments (both realized and unrealized) | | | 2.72 | | | | | | | | 1.84 | | | | | | | | (5.36 | ) | | | | | | | 3.49 | | | | | | | | 0.25 | |
| | | | | | | | | | | | | | | | | | | | | | | | | | | | | | | | | | | | |
Total income (loss) from investment operations | | | 2.77 | | | | | | | | 2.04 | | | | | | | | (5.32 | ) | | | | | | | 4.08 | | | | | | | | 0.30 | |
| | | | | | | | | | | | | | | | | | | | | | | | | | | | | | | | | | | | |
Less distributions: | | | | | | | | | | | | | | | | | | | | | | | | | | | | | | | | | | | | |
Dividends from net investment income | | | (0.32 | ) | | | | | | | (0.26 | ) | | | | | | | (0.76 | ) | | | | | | | (0.10 | ) | | | | | | | (0.38 | ) |
| | | | | | | | | | | | | | | | | | | | | | | | | | | | | | | | | | | | |
Total distributions | | | (0.32 | ) | | | | | | | (0.26 | ) | | | | | | | (0.76 | ) | | | | | | | (0.10 | ) | | | | | | | (0.38 | ) |
| | | | | | | | | | | | | | | | | | | | | | | | | | | | | | | | | | | | |
Net asset value, end of period | | $ | 17.69 | | | | | | | $ | 15.24 | | | | | | | $ | 13.46 | | | | | | | $ | 19.54 | | | | | | | $ | 15.56 | |
| | | | | | | | | | | | | | | | | | | | | | | | | | | | | | | | | | | | |
Total returnE | | | 18.31 | % | | | | | | | 15.21 | % | | | | | | | (28.31 | )% | | | | | | | 26.25 | % | | | | | | | 1.84 | % |
| | | | | | | | | | | | | | | | | | | | | | | | | | | | | | | | | | | | |
| | | | | | | | | |
Ratios and supplemental data: | | | | | | | | | | | | | | | | | | | | | | | | | | | | | | | | | | | | |
Net assets, end of period | | $ | 62,393,608 | | | | | | | $ | 62,512,548 | | | | | | | $ | 96,269,149 | | | | | | | $ | 160,793,226 | | | | | | | $ | 136,563,697 | |
Ratios to average net assets: | | | | | | | | | | | | | | | | | | | | | | | | | | | | | | | | | | | | |
Expenses, before reimbursements and/or recoupments | | | 1.27 | % | | | | | | | 1.26 | % | | | | | | | 0.95 | % | | | | | | | 0.98 | % | | | | | | | 0.99 | % |
Expenses, net of reimbursements and/or recoupments | | | 1.13 | %F | | | | | | | 1.26 | % | | | | | | | 0.95 | % | | | | | | | 0.98 | % | | | | | | | 0.99 | % |
Net investment income, before expense reimbursements and/or recoupments | | | 0.93 | % | | | | | | | 1.24 | %C | | | | | | | 1.21 | % | | | | | | | 3.40 | %D | | | | | | | 0.78 | % |
Net investment income, net of reimbursements and/or recoupments | | | 1.07 | % | | | | | | | 1.24 | %C | | | | | | | 1.21 | % | | | | | | | 3.40 | %D | | | | | | | 0.78 | % |
Portfolio turnover rate | | | 260 | % | | | | | | | 292 | % | | | | | | | 21 | % | | | | | | | 34 | % | | | | | | | 28 | % |
| A | On January 20, 2023 Tocqueville Asset Management LP was terminated and ceased managing assets of the Fund. On January 21, 2023, EAM Global Investors, LLC began managing assets of the Fund. |
| B | Per share amounts have been calculated using the average shares method. |
| C | Net investment income includes a significant dividend payment from Keppel Corp, Ltd. amounting to $0.0439. |
| D | Net investment income includes a significant dividend payment from Vivendi SE amounting to $0.3834. |
| E | Based on net asset value, which does not reflect the sales charge, redemption fee, or contingent deferred sales charge, if applicable. May include adjustments in accordance with U.S. GAAP and as such, the net asset value for reporting purposes and the returns based upon those net asset values may differ from the net asset value and returns for shareholder transactions. |
| F | Expense ratios may exceed stated expense caps in Note 2 due to the change in the contractual expense caps on February 29, 2024. |
See accompanying notes
45
American Beacon EAM International Small Cap FundSM
Financial Highlights
(For a share outstanding throughout the period)
| | | | | | | | | | | | | | | | | | | | | | | | | | | | | | | | | | | | |
| | | Investor Class | |
| | | Year Ended October 31, | |
| | | 2024 | | | | | | 2023A | | | | | | 2022 | | | | | | 2021 | | | | | | 2020 | |
| | | | |
Net asset value, beginning of period | | $ | 15.33 | | | | | | | $ | 13.51 | | | | | | | $ | 19.59 | | | | | | | $ | 15.60 | | | | | | | $ | 15.61 | |
| | | | | | | | | | | | | | | | | | | | | | | | | | | | | | | | | | | | |
Income (loss) from investment operations: | | | | | | | | | | | | | | | | | | | | | | | | | | | | | | | | | | | | |
Net investment income | | | 0.45 | | | | | | | | 0.48 | B | | | | | | | 0.65 | | | | | | | | 0.76 | C | | | | | | | 0.25 | |
Net gains (losses) on investments (both realized and unrealized) | | | 2.30 | | | | | | | | 1.55 | | | | | | | | (6.04 | ) | | | | | | | 3.29 | | | | | | | | 0.01 | |
| | | | | | | | | | | | | | | | | | | | | | | | | | | | | | | | | | | | |
Total income (loss) from investment operations | | | 2.75 | | | | | | | | 2.03 | | | | | | | | (5.39 | ) | | | | | | | 4.05 | | | | | | | | 0.26 | |
| | | | | | | | | | | | | | | | | | | | | | | | | | | | | | | | | | | | |
Less distributions: | | | | | | | | | | | | | | | | | | | | | | | | | | | | | | | | | | | | |
Dividends from net investment income | | | (0.28 | ) | | | | | | | (0.21 | ) | | | | | | | (0.69 | ) | | | | | | | (0.06 | ) | | | | | | | (0.27 | ) |
| | | | | | | | | | | | | | | | | | | | | | | | | | | | | | | | | | | | |
Total distributions | | | (0.28 | ) | | | | | | | (0.21 | ) | | | | | | | (0.69 | ) | | | | | | | (0.06 | ) | | | | | | | (0.27 | ) |
| | | | | | | | | | | | | | | | | | | | | | | | | | | | | | | | | | | | |
Net asset value, end of period | | $ | 17.80 | | | | | | | $ | 15.33 | | | | | | | $ | 13.51 | | | | | | | $ | 19.59 | | | | | | | $ | 15.60 | |
| | | | | | | | | | | | | | | | | | | | | | | | | | | | | | | | | | | | |
Total returnD | | | 18.07 | % | | | | | | | 15.06 | % | | | | | | | (28.49 | )% | | | | | | | 26.01 | % | | | | | | | 1.63 | % |
| | | | | | | | | | | | | | | | | | | | | | | | | | | | | | | | | | | | |
| | | | | | | | | |
Ratios and supplemental data: | | | | | | | | | | | | | | | | | | | | | | | | | | | | | | | | | | | | |
Net assets, end of period | | $ | 55,835,311 | | | | | | | $ | 60,994,147 | | | | | | | $ | 72,187,362 | | | | | | | $ | 180,324,267 | | | | | | | $ | 198,905,986 | |
Ratios to average net assets: | | | | | | | | | | | | | | | | | | | | | | | | | | | | | | | | | | | | |
Expenses, before reimbursements and/or recoupments | | | 1.51 | % | | | | | | | 1.46 | % | | | | | | | 1.18 | % | | | | | | | 1.20 | % | | | | | | | 1.18 | % |
Expenses, net of reimbursements and/or recoupments | | | 1.34 | %E | | | | | | | 1.46 | % | | | | | | | 1.18 | % | | | | | | | 1.20 | % | | | | | | | 1.18 | % |
Net investment income, before expense reimbursements and/or recoupments | | | 0.70 | % | | | | | | | 1.10 | %B | | | | | | | 1.03 | % | | | | | | | 2.81 | %C | | | | | | | 0.63 | % |
Net investment income, net of reimbursements and/or recoupments | | | 0.87 | % | | | | | | | 1.10 | %B | | | | | | | 1.03 | % | | | | | | | 2.81 | %C | | | | | | | 0.63 | % |
Portfolio turnover rate | | | 260 | % | | | | | | | 292 | % | | | | | | | 21 | % | | | | | | | 34 | % | | | | | | | 28 | % |
| A | On January 20, 2023 Tocqueville Asset Management LP was terminated and ceased managing assets of the Fund. On January 21, 2023, EAM Global Investors, LLC began managing assets of the Fund. |
| B | Net investment income includes a significant dividend payment from Keppel Corp, Ltd. amounting to $0.0406. |
| C | Net investment income includes a significant dividend payment from Vivendi SE amounting to $0.3074. |
| D | Based on net asset value, which does not reflect the sales charge, redemption fee, or contingent deferred sales charge, if applicable. May include adjustments in accordance with U.S. GAAP and as such, the net asset value for reporting purposes and the returns based upon those net asset values may differ from the net asset value and returns for shareholder transactions. |
| E | Expense ratios may exceed stated expense caps in Note 2 due to the change in the contractual expense caps on February 29, 2024. |
See accompanying notes
46
American Beacon International Equity FundSM
Financial Highlights
(For a share outstanding throughout the period)
| | | | | | | | | | | | | | | | | | | | | | | | | | | | | | | | | | | | |
| | | R5 ClassA | |
| | | Year Ended October 31, | |
| | | 2024 | | | | | | 2023 | | | | | | 2022 | | | | | | 2021 | | | | | | 2020B | |
| | | | |
Net asset value, beginning of period | | $ | 16.72 | | | | | | | $ | 14.31 | | | | | | | $ | 20.31 | | | | | | | $ | 14.73 | | | | | | | $ | 18.06 | |
| | | | | | | | | | | | | | | | | | | | | | | | | | | | | | | | | | | | |
Income (loss) from investment operations: | | | | | | | | | | | | | | | | | | | | | | | | | | | | | | | | | | | | |
Net investment income | | | 0.61 | | | | | | | | 0.56 | | | | | | | | 0.39 | | | | | | | | 0.45 | C | | | | | | | 0.36 | |
Net gains (losses) on investments (both realized and unrealized) | | | 3.01 | | | | | | | | 2.28 | | | | | | | | (4.40 | ) | | | | | | | 5.43 | | | | | | | | (3.15 | ) |
| | | | | | | | | | | | | | | | | | | | | | | | | | | | | | | | | | | | |
Total income (loss) from investment operations | | | 3.62 | | | | | | | | 2.84 | | | | | | | | (4.01 | ) | | | | | | | 5.88 | | | | | | | | (2.79 | ) |
| | | | | | | | | | | | | | | | | | | | | | | | | | | | | | | | | | | | |
Less distributions: | | | | | | | | | | | | | | | | | | | | | | | | | | | | | | | | | | | | |
Dividends from net investment income | | | (0.61 | ) | | | | | | | (0.43 | ) | | | | | | | (0.65 | ) | | | | | | | (0.30 | ) | | | | | | | (0.54 | ) |
Distributions from net realized gains | | | (0.37 | ) | | | | | | | - | | | | | | | | (1.34 | ) | | | | | | | - | | | | | | | | - | |
| | | | | | | | | | | | | | | | | | | | | | | | | | | | | | | | | | | | |
Total distributions | | | (0.98 | ) | | | | | | | (0.43 | ) | | | | | | | (1.99 | ) | | | | | | | (0.30 | ) | | | | | | | (0.54 | ) |
| | | | | | | | | | | | | | | | | | | | | | | | | | | | | | | | | | | | |
Net asset value, end of period | | $ | 19.36 | | | | | | | $ | 16.72 | | | | | | | $ | 14.31 | | | | | | | $ | 20.31 | | | | | | | $ | 14.73 | |
| | | | | | | | | | | | | | | | | | | | | | | | | | | | | | | | | | | | |
Total returnD | | | 22.05 | % | | | | | | | 20.09 | % | | | | | | | (21.69 | )% | | | | | | | 40.18 | % | | | | | | | (16.04 | )% |
| | | | | | | | | | | | | | | | | | | | | | | | | | | | | | | | | | | | |
| | | | | | | | | |
Ratios and supplemental data: | | | | | | | | | | | | | | | | | | | | | | | | | | | | | | | | | | | | |
Net assets, end of period | | $ | 301,082,293 | | | | | | | $ | 413,488,011 | | | | | | | $ | 891,001,265 | | | | | | | $ | 1,329,626,349 | | | | | | | $ | 968,859,543 | |
Ratios to average net assets: | | | | | | | | | | | | | | | | | | | | | | | | | | | | | | | | | | | | |
Expenses, before reimbursements and/or recoupments | | | 0.77 | % | | | | | | | 0.79 | % | | | | | | | 0.72 | % | | | | | | | 0.73 | % | | | | | | | 0.72 | % |
Expenses, net of reimbursements and/or recoupments | | | 0.77 | % | | | | | | | 0.79 | % | | | | | | | 0.72 | % | | | | | | | 0.73 | % | | | | | | | 0.72 | % |
Net investment income, before expense reimbursements and/or recoupments | | | 2.57 | % | | | | | | | 2.30 | % | | | | | | | 2.17 | % | | | | | | | 2.31 | %C | | | | | | | 1.83 | % |
Net investment income, net of reimbursements and/or recoupments | | | 2.57 | % | | | | | | | 2.30 | % | | | | | | | 2.17 | % | | | | | | | 2.31 | %C | | | | | | | 1.83 | % |
Portfolio turnover rate | | | 43 | % | | | | | | | 46 | % | | | | | | | 38 | % | | | | | | | 41 | % | | | | | | | 77 | % |
| A | Prior to February 28, 2020, the R5 Class was known as Institutional Class. |
| B | On January 29, 2020, Templeton Investment Counsel, LLC, was terminated and ceased managing assets of the Fund. On January 30, 2020, American Century Investment Management, Inc. began managing assets of the Fund. |
| C | Net investment income includes a significant dividend payment from Vivendi SE amounting to $0.0746. |
| D | Based on net asset value, which does not reflect the sales charge, redemption fee, or contingent deferred sales charge, if applicable. May include adjustments in accordance with U.S. GAAP and as such, the net asset value for reporting purposes and the returns based upon those net asset values may differ from the net asset value and returns for shareholder transactions. |
See accompanying notes
47
American Beacon International Equity FundSM
Financial Highlights
(For a share outstanding throughout the period)
| | | | | | | | | | | | | | | | | | | | | | | | | | | | | | | | | | | | |
| | | Y Class | |
| | | Year Ended October 31, | |
| | | 2024 | | | | | | 2023 | | | | | | 2022 | | | | | | 2021 | | | | | | 2020A | |
| | | | |
Net asset value, beginning of period | | $ | 17.59 | | | | | | | $ | 15.03 | | | | | | | $ | 21.18 | | | | | | | $ | 15.36 | | | | | | | $ | 18.81 | |
| | | | | | | | | | | | | | | | | | | | | | | | | | | | | | | | | | | | |
Income (loss) from investment operations: | | | | | | | | | | | | | | | | | | | | | | | | | | | | | | | | | | | | |
Net investment income | | | 1.18 | | | | | | | | 1.22 | | | | | | | | 1.53 | | | | | | | | 1.83 | B | | | | | | | 0.36 | |
Net gains (losses) on investments (both realized and unrealized) | | | 2.62 | | | | | | | | 1.76 | | | | | | | | (5.74 | ) | | | | | | | 4.27 | | | | | | | | (3.28 | ) |
| | | | | | | | | | | | | | | | | | | | | | | | | | | | | | | | | | | | |
Total income (loss) from investment operations | | | 3.80 | | | | | | | | 2.98 | | | | | | | | (4.21 | ) | | | | | | | 6.10 | | | | | | | | (2.92 | ) |
| | | | | | | | | | | | | | | | | | | | | | | | | | | | | | | | | | | | |
Less distributions: | | | | | | | | | | | | | | | | | | | | | | | | | | | | | | | | | | | | |
Dividends from net investment income | | | (0.59 | ) | | | | | | | (0.42 | ) | | | | | | | (0.60 | ) | | | | | | | (0.28 | ) | | | | | | | (0.53 | ) |
Distributions from net realized gains | | | (0.37 | ) | | | | | | | - | | | | | | | | (1.34 | ) | | | | | | | - | | | | | | | | - | |
| | | | | | | | | | | | | | | | | | | | | | | | | | | | | | | | | | | | |
Total distributions | | | (0.96 | ) | | | | | | | (0.42 | ) | | | | | | | (1.94 | ) | | | | | | | (0.28 | ) | | | | | | | (0.53 | ) |
| | | | | | | | | | | | | | | | | | | | | | | | | | | | | | | | | | | | |
Net asset value, end of period | | $ | 20.43 | | | | | | | $ | 17.59 | | | | | | | $ | 15.03 | | | | | | | $ | 21.18 | | | | | | | $ | 15.36 | |
| | | | | | | | | | | | | | | | | | | | | | | | | | | | | | | | | | | | |
Total returnC | | | 22.01 | % | | | | | | | 20.01 | % | | | | | | | (21.71 | )% | | | | | | | 39.99 | % | | | | | | | (16.09 | )% |
| | | | | | | | | | | | | | | | | | | | | | | | | | | | | | | | | | | | |
| | | | | | | | | |
Ratios and supplemental data: | | | | | | | | | | | | | | | | | | | | | | | | | | | | | | | | | | | | |
Net assets, end of period | | $ | 85,292,074 | | | | | | | $ | 87,634,823 | | | | | | | $ | 95,663,172 | | | | | | | $ | 233,692,916 | | | | | | | $ | 659,159,857 | |
Ratios to average net assets: | | | | | | | | | | | | | | | | | | | | | | | | | | | | | | | | | | | | |
Expenses, before reimbursements and/or recoupments | | | 0.84 | % | | | | | | | 0.86 | % | | | | | | | 0.81 | % | | | | | | | 0.79 | % | | | | | | | 0.80 | % |
Expenses, net of reimbursements and/or recoupments | | | 0.84 | % | | | | | | | 0.86 | % | | | | | | | 0.81 | % | | | | | | | 0.79 | % | | | | | | | 0.80 | % |
Net investment income, before expense reimbursements and/or recoupments | | | 2.51 | % | | | | | | | 2.43 | % | | | | | | | 2.03 | % | | | | | | | 2.01 | %B | | | | | | | 1.77 | % |
Net investment income, net of reimbursements and/or recoupments | | | 2.51 | % | | | | | | | 2.43 | % | | | | | | | 2.03 | % | | | | | | | 2.01 | %B | | | | | | | 1.77 | % |
Portfolio turnover rate | | | 43 | % | | | | | | | 46 | % | | | | | | | 38 | % | | | | | | | 41 | % | | | | | | | 77 | % |
| A | On January 29, 2020, Templeton Investment Counsel, LLC, was terminated and ceased managing assets of the Fund. On January 30, 2020, American Century Investment Management, Inc. began managing assets of the Fund. |
| B | Net investment income includes a significant dividend payment from Vivendi SE amounting to $0.0243. |
| C | Based on net asset value, which does not reflect the sales charge, redemption fee, or contingent deferred sales charge, if applicable. May include adjustments in accordance with U.S. GAAP and as such, the net asset value for reporting purposes and the returns based upon those net asset values may differ from the net asset value and returns for shareholder transactions. |
See accompanying notes
48
American Beacon International Equity FundSM
Financial Highlights
(For a share outstanding throughout the period)
| | | | | | | | | | | | | | | | | | | | | | | | | | | | | | | | | | | | |
| | | Investor Class | |
| | | Year Ended October 31, | |
| | | 2024 | | | | | | 2023 | | | | | | 2022 | | | | | | 2021 | | | | | | 2020A | |
| | | | |
Net asset value, beginning of period | | $ | 16.54 | | | | | | | $ | 14.16 | | | | | | | $ | 20.11 | | | | | | | $ | 14.57 | | | | | | | $ | 17.87 | |
| | | | | | | | | | | | | | | | | | | | | | | | | | | | | | | | | | | | |
Income (loss) from investment operations: | | | | | | | | | | | | | | | | | | | | | | | | | | | | | | | | | | | | |
Net investment income | | | 0.62 | | | | | | | | 0.72 | | | | | | | | 0.35 | | | | | | | | 0.38 | B | | | | | | | 0.40 | |
Net gains (losses) on investments (both realized and unrealized) | | | 2.91 | | | | | | | | 2.04 | | | | | | | | (4.37 | ) | | | | | | | 5.38 | | | | | | | | (3.22 | ) |
| | | | | | | | | | | | | | | | | | | | | | | | | | | | | | | | | | | | |
Total income (loss) from investment operations | | | 3.53 | | | | | | | | 2.76 | | | | | | | | (4.02 | ) | | | | | | | 5.76 | | | | | | | | (2.82 | ) |
| | | | | | | | | | | | | | | | | | | | | | | | | | | | | | | | | | | | |
Less distributions: | | | | | | | | | | | | | | | | | | | | | | | | | | | | | | | | | | | | |
Dividends from net investment income | | | (0.51 | ) | | | | | | | (0.38 | ) | | | | | | | (0.59 | ) | | | | | | | (0.22 | ) | | | | | | | (0.48 | ) |
Distributions from net realized gains | | | (0.37 | ) | | | | | | | - | | | | | | | | (1.34 | ) | | | | | | | - | | | | | | | | - | |
| | | | | | | | | | | | | | | | | | | | | | | | | | | | | | | | | | | | |
Total distributions | | | (0.88 | ) | | | | | | | (0.38 | ) | | | | | | | (1.93 | ) | | | | | | | (0.22 | ) | | | | | | | (0.48 | ) |
| | | | | | | | | | | | | | | | | | | | | | | | | | | | | | | | | | | | |
Net asset value, end of period | | $ | 19.19 | | | | | | | $ | 16.54 | | | | | | | $ | 14.16 | | | | | | | $ | 20.11 | | | | | | | $ | 14.57 | |
| | | | | | | | | | | | | | | | | | | | | | | | | | | | | | | | | | | | |
Total returnC | | | 21.71 | % | | | | | | | 19.64 | % | | | | | | | (21.93 | )% | | | | | | | 39.72 | % | | | | | | | (16.33 | )% |
| | | | | | | | | | | | | | | | | | | | | | | | | | | | | | | | | | | | |
| | | | | | | | | |
Ratios and supplemental data: | | | | | | | | | | | | | | | | | | | | | | | | | | | | | | | | | | | | |
Net assets, end of period | | $ | 52,061,716 | | | | | | | $ | 63,864,486 | | | | | | | $ | 81,694,109 | | | | | | | $ | 126,691,864 | | | | | | | $ | 92,817,287 | |
Ratios to average net assets: | | | | | | | | | | | | | | | | | | | | | | | | | | | | | | | | | | | | |
Expenses, before reimbursements and/or recoupments | | | 1.10 | % | | | | | | | 1.12 | % | | | | | | | 1.07 | % | | | | | | | 1.06 | % | | | | | | | 1.07 | % |
Expenses, net of reimbursements and/or recoupments | | | 1.10 | % | | | | | | | 1.12 | % | | | | | | | 1.07 | % | | | | | | | 1.06 | % | | | | | | | 1.07 | % |
Net investment income, before expense reimbursements and/or recoupments | | | 2.18 | % | | | | | | | 2.61 | % | | | | | | | 1.84 | % | | | | | | | 1.98 | %B | | | | | | | 1.35 | % |
Net investment income, net of reimbursements and/or recoupments | | | 2.18 | % | | | | | | | 2.61 | % | | | | | | | 1.84 | % | | | | | | | 1.98 | %B | | | | | | | 1.35 | % |
Portfolio turnover rate | | | 43 | % | | | | | | | 46 | % | | | | | | | 38 | % | | | | | | | 41 | % | | | | | | | 77 | % |
| A | On January 29, 2020, Templeton Investment Counsel, LLC, was terminated and ceased managing assets of the Fund. On January 30, 2020, American Century Investment Management, Inc. began managing assets of the Fund. |
| B | Net investment income includes a significant dividend payment from Vivendi SE amounting to $0.0785. |
| C | Based on net asset value, which does not reflect the sales charge, redemption fee, or contingent deferred sales charge, if applicable. May include adjustments in accordance with U.S. GAAP and as such, the net asset value for reporting purposes and the returns based upon those net asset values may differ from the net asset value and returns for shareholder transactions. |
See accompanying notes
49
American Beacon International Equity FundSM
Financial Highlights
(For a share outstanding throughout the period)
| | | | | | | | | | | | | | | | | | | | | | | | | | | | | | | | | | | | |
| | | Advisor Class | |
| | | Year Ended October 31, | |
| | | 2024 | | | | | | 2023 | | | | | | 2022 | | | | | | 2021 | | | | | | 2020A | |
| | | | |
Net asset value, beginning of period | | $ | 17.09 | | | | | | | $ | 14.62 | | | | | | | $ | 20.68 | | | | | | | $ | 14.94 | | | | | | | $ | 18.31 | |
| | | | | | | | | | | | | | | | | | | | | | | | | | | | | | | | | | | | |
Income (loss) from investment operations: | | | | | | | | | | | | | | | | | | | | | | | | | | | | | | | | | | | | |
Net investment income | | | 0.42 | | | | | | | | 0.43 | | | | | | | | 0.29 | | | | | | | | 0.41 | B | | | | | | | 0.37 | |
Net gains (losses) on investments (both realized and unrealized) | | | 3.20 | | | | | | | | 2.39 | | | | | | | | (4.46 | ) | | | | | | | 5.48 | | | | | | | | (3.29 | ) |
| | | | | | | | | | | | | | | | | | | | | | | | | | | | | | | | | | | | |
Total income (loss) from investment operations | | | 3.62 | | | | | | | | 2.82 | | | | | | | | (4.17 | ) | | | | | | | 5.89 | | | | | | | | (2.92 | ) |
| | | | | | | | | | | | | | | | | | | | | | | | | | | | | | | | | | | | |
Less distributions: | | | | | | | | | | | | | | | | | | | | | | | | | | | | | | | | | | | | |
Dividends from net investment income | | | (0.51 | ) | | | | | | | (0.35 | ) | | | | | | | (0.55 | ) | | | | | | | (0.15 | ) | | | | | | | (0.45 | ) |
Distributions from net realized gains | | | (0.37 | ) | | | | | | | - | | | | | | | | (1.34 | ) | | | | | | | - | | | | | | | | - | |
| | | | | | | | | | | | | | | | | | | | | | | | | | | | | | | | | | | | |
Total distributions | | | (0.88 | ) | | | | | | | (0.35 | ) | | | | | | | (1.89 | ) | | | | | | | (0.15 | ) | | | | | | | (0.45 | ) |
| | | | | | | | | | | | | | | | | | | | | | | | | | | | | | | | | | | | |
Net asset value, end of period | | $ | 19.83 | | | | | | | $ | 17.09 | | | | | | | $ | 14.62 | | | | | | | $ | 20.68 | | | | | | | $ | 14.94 | |
| | | | | | | | | | | | | | | | | | | | | | | | | | | | | | | | | | | | |
Total returnC | | | 21.50 | % | | | | | | | 19.45 | % | | | | | | | (22.01 | )% | | | | | | | 39.53 | % | | | | | | | (16.43 | )% |
| | | | | | | | | | | | | | | | | | | | | | | | | | | | | | | | | | | | |
| | | | | | | | | |
Ratios and supplemental data: | | | | | | | | | | | | | | | | | | | | | | | | | | | | | | | | | | | | |
Net assets, end of period | | $ | 14,029,585 | | | | | | | $ | 12,257,174 | | | | | | | $ | 13,706,977 | | | | | | | $ | 18,745,607 | | | | | | | $ | 16,387,094 | |
Ratios to average net assets: | | | | | | | | | | | | | | | | | | | | | | | | | | | | | | | | | | | | |
Expenses, before reimbursements and/or recoupments | | | 1.25 | % | | | | | | | 1.27 | % | | | | | | | 1.20 | % | | | | | | | 1.20 | % | | | | | | | 1.20 | % |
Expenses, net of reimbursements and/or recoupments | | | 1.25 | % | | | | | | | 1.27 | % | | | | | | | 1.20 | % | | | | | | | 1.20 | % | | | | | | | 1.20 | % |
Net investment income, before expense reimbursements and/or recoupments | | | 2.11 | % | | | | | | | 2.08 | % | | | | | | | 1.67 | % | | | | | | | 1.79 | %B | | | | | | | 1.34 | % |
Net investment income, net of reimbursements and/or recoupments | | | 2.11 | % | | | | | | | 2.08 | % | | | | | | | 1.67 | % | | | | | | | 1.79 | %B | | | | | | | 1.34 | % |
Portfolio turnover rate | | | 43 | % | | | | | | | 46 | % | | | | | | | 38 | % | | | | | | | 41 | % | | | | | | | 77 | % |
| A | On January 29, 2020, Templeton Investment Counsel, LLC, was terminated and ceased managing assets of the Fund. On January 30, 2020, American Century Investment Management, Inc. began managing assets of the Fund. |
| B | Net investment income includes a significant dividend payment from Vivendi SE amounting to $0.0709. |
| C | Based on net asset value, which does not reflect the sales charge, redemption fee, or contingent deferred sales charge, if applicable. May include adjustments in accordance with U.S. GAAP and as such, the net asset value for reporting purposes and the returns based upon those net asset values may differ from the net asset value and returns for shareholder transactions. |
See accompanying notes
50
American Beacon International Equity FundSM
Financial Highlights
(For a share outstanding throughout the period)
| | | | | | | | | | | | | | | | | | | | | | | | | | | | | | | | | | | | |
| | | A Class | |
| | | Year Ended October 31, | |
| | | 2024 | | | | | | 2023 | | | | | | 2022 | | | | | | 2021 | | | | | | 2020A | |
| | | | |
Net asset value, beginning of period | | $ | 16.50 | | | | | | | $ | 14.13 | | | | | | | $ | 20.06 | | | | | | | $ | 14.55 | | | | | | | $ | 17.85 | |
| | | | | | | | | | | | | | | | | | | | | | | | | | | | | | | | | | | | |
Income (loss) from investment operations: | | | | | | | | | | | | | | | | | | | | | | | | | | | | | | | | | | | | |
Net investment income | | | 0.40 | | | | | | | | 0.34 | | | | | | | | 0.33 | | | | | | | | 0.36 | B | | | | | | | 0.21 | |
Net gains (losses) on investments (both realized and unrealized) | | | 3.11 | | | | | | | | 2.40 | | | | | | | | (4.36 | ) | | | | | | | 5.38 | | | | | | | | (3.04 | ) |
| | | | | | | | | | | | | | | | | | | | | | | | | | | | | | | | | | | | |
Total income (loss) from investment operations | | | 3.51 | | | | | | | | 2.74 | | | | | | | | (4.03 | ) | | | | | | | 5.74 | | | | | | | | (2.83 | ) |
| | | | | | | | | | | | | | | | | | | | | | | | | | | | | | | | | | | | |
Less distributions: | | | | | | | | | | | | | | | | | | | | | | | | | | | | | | | | | | | | |
Dividends from net investment income | | | (0.55 | ) | | | | | | | (0.37 | ) | | | | | | | (0.56 | ) | | | | | | | (0.23 | ) | | | | | | | (0.47 | ) |
Distributions from net realized gains | | | (0.37 | ) | | | | | | | - | | | | | | | | (1.34 | ) | | | | | | | - | | | | | | | | - | |
| | | | | | | | | | | | | | | | | | | | | | | | | | | | | | | | | | | | |
Total distributions | | | (0.92 | ) | | | | | | | (0.37 | ) | | | | | | | (1.90 | ) | | | | | | | (0.23 | ) | | | | | | | (0.47 | ) |
| | | | | | | | | | | | | | | | | | | | | | | | | | | | | | | | | | | | |
Net asset value, end of period | | $ | 19.09 | | | | | | | $ | 16.50 | | | | | | | $ | 14.13 | | | | | | | $ | 20.06 | | | | | | | $ | 14.55 | |
| | | | | | | | | | | | | | | | | | | | | | | | | | | | | | | | | | | | |
Total returnC | | | 21.63 | % | | | | | | | 19.55 | % | | | | | | | (22.00 | )% | | | | | | | 39.65 | % | | | | | | | (16.37 | )% |
| | | | | | | | | | | | | | | | | | | | | | | | | | | | | | | | | | | | |
| | | | | | | | | |
Ratios and supplemental data: | | | | | | | | | | | | | | | | | | | | | | | | | | | | | | | | | | | | |
Net assets, end of period | | $ | 9,890,341 | | | | | | | $ | 8,977,482 | | | | | | | $ | 7,205,251 | | | | | | | $ | 10,017,801 | | | | | | | $ | 9,512,972 | |
Ratios to average net assets: | | | | | | | | | | | | | | | | | | | | | | | | | | | | | | | | | | | | |
Expenses, before reimbursements and/or recoupments | | | 1.18 | % | | | | | | | 1.19 | % | | | | | | | 1.14 | % | | | | | | | 1.13 | % | | | | | | | 1.13 | % |
Expenses, net of reimbursements and/or recoupments | | | 1.18 | % | | | | | | | 1.19 | % | | | | | | | 1.14 | % | | | | | | | 1.13 | % | | | | | | | 1.13 | % |
Net investment income, before expense reimbursements and/or recoupments | | | 2.22 | % | | | | | | | 2.15 | % | | | | | | | 1.80 | % | | | | | | | 1.83 | %B | | | | | | | 1.35 | % |
Net investment income, net of reimbursements and/or recoupments | | | 2.22 | % | | | | | | | 2.15 | % | | | | | | | 1.80 | % | | | | | | | 1.83 | %B | | | | | | | 1.35 | % |
Portfolio turnover rate | | | 43 | % | | | | | | | 46 | % | | | | | | | 38 | % | | | | | | | 41 | % | | | | | | | 77 | % |
| A | On January 29, 2020, Templeton Investment Counsel, LLC, was terminated and ceased managing assets of the Fund. On January 30, 2020, American Century Investment Management, Inc. began managing assets of the Fund. |
| B | Net investment income includes a significant dividend payment from Vivendi SE amounting to $0.0643. |
| C | Based on net asset value, which does not reflect the sales charge, redemption fee, or contingent deferred sales charge, if applicable. May include adjustments in accordance with U.S. GAAP and as such, the net asset value for reporting purposes and the returns based upon those net asset values may differ from the net asset value and returns for shareholder transactions. |
See accompanying notes
51
American Beacon International Equity FundSM
Financial Highlights
(For a share outstanding throughout the period)
| | | | | | | | | | | | | | | | | | | | | | | | | | | | | | | | | | | | |
| | | C Class | |
| | | Year Ended October 31, | |
| | | 2024 | | | | | | 2023 | | | | | | 2022 | | | | | | 2021 | | | | | | 2020A | |
| | | | |
Net asset value, beginning of period | | $ | 15.80 | | | | | | | $ | 13.53 | | | | | | | $ | 19.27 | | | | | | | $ | 13.99 | | | | | | | $ | 17.18 | |
| | | | | | | | | | | | | | | | | | | | | | | | | | | | | | | | | | | | |
Income (loss) from investment operations: | | | | | | | | | | | | | | | | | | | | | | | | | | | | | | | | | | | | |
Net investment income | | | 0.13 | | | | | | | | 0.10 | | | | | | | | 0.16 | | | | | | | | 0.19 | B | | | | | | | 0.01 | |
Net gains (losses) on investments (both realized and unrealized) | | | 3.08 | | | | | | | | 2.41 | | | | | | | | (4.14 | ) | | | | | | | 5.19 | | | | | | | | (2.86 | ) |
| | | | | | | | | | | | | | | | | | | | | | | | | | | | | | | | | | | | |
Total income (loss) from investment operations | | | 3.21 | | | | | | | | 2.51 | | | | | | | | (3.98 | ) | | | | | | | 5.38 | | | | | | | | (2.85 | ) |
| | | | | | | | | | | | | | | | | | | | | | | | | | | | | | | | | | | | |
Less distributions: | | | | | | | | | | | | | | | | | | | | | | | | | | | | | | | | | | | | |
Dividends from net investment income | | | (0.37 | ) | | | | | | | (0.24 | ) | | | | | | | (0.42 | ) | | | | | | | (0.10 | ) | | | | | | | (0.34 | ) |
Distributions from net realized gains | | | (0.37 | ) | | | | | | | - | | | | | | | | (1.34 | ) | | | | | | | - | | | | | | | | - | |
| | | | | | | | | | | | | | | | | | | | | | | | | | | | | | | | | | | | |
Total distributions | | | (0.74 | ) | | | | | | | (0.24 | ) | | | | | | | (1.76 | ) | | | | | | | (0.10 | ) | | | | | | | (0.34 | ) |
| | | | | | | | | | | | | | | | | | | | | | | | | | | | | | | | | | | | |
Net asset value, end of period | | $ | 18.27 | | | | | | | $ | 15.80 | | | | | | | $ | 13.53 | | | | | | | $ | 19.27 | | | | | | | $ | 13.99 | |
| | | | | | | | | | | | | | | | | | | | | | | | | | | | | | | | | | | | |
Total returnC | | | 20.59 | % | | | | | | | 18.66 | % | | | | | | | (22.55 | )% | | | | | | | 38.56 | % | | | | | | | (16.98 | )% |
| | | | | | | | | | | | | | | | | | | | | | | | | | | | | | | | | | | | |
| | | | | | | | | |
Ratios and supplemental data: | | | | | | | | | | | | | | | | | | | | | | | | | | | | | | | | | | | | |
Net assets, end of period | | $ | 2,618,564 | | | | | | | $ | 2,608,270 | | | | | | | $ | 2,842,235 | | | | | | | $ | 4,317,179 | | | | | | | $ | 3,431,934 | |
Ratios to average net assets: | | | | | | | | | | | | | | | | | | | | | | | | | | | | | | | | | | | | |
Expenses, before reimbursements and/or recoupments | | | 1.98 | % | | | | | | | 1.96 | % | | | | | | | 1.89 | % | | | | | | | 1.86 | % | | | | | | | 1.86 | % |
Expenses, net of reimbursements and/or recoupments | | | 1.98 | % | | | | | | | 1.96 | % | | | | | | | 1.89 | % | | | | | | | 1.86 | % | | | | | | | 1.86 | % |
Net investment income, before expense reimbursements and/or recoupments | | | 1.37 | % | | | | | | | 1.41 | % | | | | | | | 1.08 | % | | | | | | | 1.14 | %B | | | | | | | 0.61 | % |
Net investment income, net of reimbursements and/or recoupments | | | 1.37 | % | | | | | | | 1.41 | % | | | | | | | 1.08 | % | | | | | | | 1.14 | %B | | | | | | | 0.61 | % |
Portfolio turnover rate | | | 43 | % | | | | | | | 46 | % | | | | | | | 38 | % | | | | | | | 41 | % | | | | | | | 77 | % |
| A | On January 29, 2020, Templeton Investment Counsel, LLC, was terminated and ceased managing assets of the Fund. On January 30, 2020, American Century Investment Management, Inc. began managing assets of the Fund. |
| B | Net investment income includes a significant dividend payment from Vivendi SE amounting to $0.0667. |
| C | Based on net asset value, which does not reflect the sales charge, redemption fee, or contingent deferred sales charge, if applicable. May include adjustments in accordance with U.S. GAAP and as such, the net asset value for reporting purposes and the returns based upon those net asset values may differ from the net asset value and returns for shareholder transactions. |
See accompanying notes
52
American Beacon International Equity FundSM
Financial Highlights
(For a share outstanding throughout the period)
| | | | | | | | | | | | | | | | | | | | | | | | | | | | | | | | | | | | |
| | | R6 Class | |
| | | Year Ended October 31, | |
| | | 2024 | | | | | | 2023 | | | | | | 2022 | | | | | | 2021 | | | | | | 2020A | |
| | | | |
Net asset value, beginning of period | | $ | 16.77 | | | | | | | $ | 14.35 | | | | | | | $ | 20.35 | | | | | | | $ | 14.76 | | | | | | | $ | 18.08 | |
| | | | | | | | | | | | | | | | | | | | | | | | | | | | | | | | | | | | |
Income (loss) from investment operations: | | | | | | | | | | | | | | | | | | | | | | | | | | | | | | | | | | | | |
Net investment income | | | 0.12 | | | | | | | | 0.40 | | | | | | | | 0.41 | | | | | | | | 0.45 | B | | | | | | | 0.39 | |
Net gains (losses) on investments (both realized and unrealized) | | | 3.53 | | | | | | | | 2.46 | | | | | | | | (4.41 | ) | | | | | | | 5.44 | | | | | | | | (3.16 | ) |
| | | | | | | | | | | | | | | | | | | | | | | | | | | | | | | | | | | | |
Total income (loss) from investment operations | | | 3.65 | | | | | | | | 2.86 | | | | | | | | (4.00 | ) | | | | | | | 5.89 | | | | | | | | (2.77 | ) |
| | | | | | | | | | | | | | | | | | | | | | | | | | | | | | | | | | | | |
Less distributions: | | | | | | | | | | | | | | | | | | | | | | | | | | | | | | | | | | | | |
Dividends from net investment income | | | (0.62 | ) | | | | | | | (0.44 | ) | | | | | | | (0.66 | ) | | | | | | | (0.30 | ) | | | | | | | (0.55 | ) |
Distributions from net realized gains | | | (0.37 | ) | | | | | | | - | | | | | | | | (1.34 | ) | | | | | | | - | | | | | | | | - | |
| | | | | | | | | | | | | | | | | | | | | | | | | | | | | | | | | | | | |
Total distributions | | | (0.99 | ) | | | | | | | (0.44 | ) | | | | | | | (2.00 | ) | | | | | | | (0.30 | ) | | | | | | | (0.55 | ) |
| | | | | | | | | | | | | | | | | | | | | | | | | | | | | | | | | | | | |
Net asset value, end of period | | $ | 19.43 | | | | | | | $ | 16.77 | | | | | | | $ | 14.35 | | | | | | | $ | 20.35 | | | | | | | $ | 14.76 | |
| | | | | | | | | | | | | | | | | | | | | | | | | | | | | | | | | | | | |
Total returnC | | | 22.17 | % | | | | | | | 20.15 | % | | | | | | | (21.62 | )% | | | | | | | 40.20 | % | | | | | | | (15.93 | )% |
| | | | | | | | | | | | | | | | | | | | | | | | | | | | | | | | | | | | |
| | | | | | | | | |
Ratios and supplemental data: | | | | | | | | | | | | | | | | | | | | | | | | | | | | | | | | | | | | |
Net assets, end of period | | $ | 133,123,232 | | | | | | | $ | 290,693,353 | | | | | | | $ | 296,382,124 | | | | | | | $ | 397,732,934 | | | | | | | $ | 294,708,893 | |
Ratios to average net assets: | | | | | | | | | | | | | | | | | | | | | | | | | | | | | | | | | | | | |
Expenses, before reimbursements and/or recoupments | | | 0.77 | % | | | | | | | 0.77 | % | | | | | | | 0.71 | % | | | | | | | 0.71 | % | | | | | | | 0.72 | % |
Expenses, net of reimbursements and/or recoupments | | | 0.69 | % | | | | | | | 0.69 | % | | | | | | | 0.69 | % | | | | | | | 0.70 | %D | | | | | | | 0.69 | % |
Net investment income, before expense reimbursements and/or recoupments | | | 2.86 | % | | | | | | | 2.54 | % | | | | | | | 2.22 | % | | | | | | | 2.30 | %B | | | | | | | 1.88 | % |
Net investment income, net of reimbursements and/or recoupments | | | 2.94 | % | | | | | | | 2.62 | % | | | | | | | 2.24 | % | | | | | | | 2.31 | %B | | | | | | | 1.91 | % |
Portfolio turnover rate | | | 43 | % | | | | | | | 46 | % | | | | | | | 38 | % | | | | | | | 41 | % | | | | | | | 77 | % |
| A | On January 29, 2020, Templeton Investment Counsel, LLC, was terminated and ceased managing assets of the Fund. On January 30, 2020, American Century Investment Management, Inc. began managing assets of the Fund. |
| B | Net investment income includes a significant dividend payment from Vivendi SE amounting to $0.0738. |
| C | Based on net asset value, which does not reflect the sales charge, redemption fee, or contingent deferred sales charge, if applicable. May include adjustments in accordance with U.S. GAAP and as such, the net asset value for reporting purposes and the returns based upon those net asset values may differ from the net asset value and returns for shareholder transactions. |
| D | Expense ratios may exceed stated expense caps in Note 2 in the Annual Shareholder report due to security lending expenses. |
See accompanying notes
53
American Beacon FundsSM
Federal Tax Information
October 31, 2024 (Unaudited)
Certain tax information regarding the Funds is required to be provided to shareholders based upon the Funds’ income and distributions for the taxable year ended October 31, 2024. The information and distributions reported herein may differ from information and distributions taxable to the shareholders for the calendar year ended December 31, 2024.
The Funds designated the following items with regard to distributions paid during the fiscal year ended October 31, 2024. All designations are based on financial information available as of this annual report and, accordingly, are subject to change. For each item, it is the intention of the Funds to designate the maximum amount permitted under the Internal Revenue Code of 1986, as amended, and the regulations there under.
Corporate Dividends-Received Deduction:
| | | | |
EAM International Small Cap | | | 0.17 | % |
International Equity | | | N/A | |
Qualified Dividend Income:
| | | | |
EAM International Small Cap | | | 73.19 | % |
International Equity | | | 59.05 | % |
Long-Term Capital Gain Distributions:
| | | | |
EAM International Small Cap | | $ | 1,062,103 | |
International Equity | | $ | 38,730,326 | |
Short-Term Capital Gain Distributions:
| | | | |
EAM International Small Cap | | | N/A | |
International Equity | | $ | 17,676,343 | |
Foreign tax credit:
| | | | |
EAM International Small Cap | | $ | 301,865 | |
International Equity | | $ | 1,508,617 | |
The foreign tax credits for EAM International Small Cap and International Equity are based on foreign source income of $3,092,903 and $28,039,423 respectively for the year ended October 31, 2024.
Shareholders will receive notification in January 2025 of the applicable tax information necessary to prepare their 2024 income tax returns.
54

Delivery of Documents
If you invest in the Fund through a financial institution, you may be able to receive the Fund’s regulatory mailings, such as the Prospectus, Annual Report, Semi-Annual Report and Financial Statement Reports, by e-mail. If you are interested in this option, please go to www.icsdelivery.com and search for your financial institution’s name or contact your financial institution directly.
You may request a paper copy of this document at no charge by contacting your financial institution. This document is also available for download at www.americanbeaconfunds.com or you can request an electronic copy by contacting your financial institution.
To obtain more information about the Fund:
| | |
 | |  |
| | |
| By E-mail: | | On the Internet: |
| american_beacon.funds@ambeacon.com | | Visit our website at www.americanbeaconfunds.com |
| | | |
| | | |
| | |

By Telephone: Call (800) 658-5811 | | 
By Mail: American Beacon Funds P.O. Box 219643 Kansas City, MO 64121-9643 |
|
|
|
| | | |
Fund Service Providers:
| | | | | | | | | | | | |
CUSTODIAN State Street Bank and Trust Company Boston, Massachusetts | | | | TRANSFER AGENT SS&C GIDS, Inc. Quincy, Massachusetts | | | | INDEPENDENT REGISTERED PUBLIC ACCOUNTING FIRM PricewaterhouseCoopers LLP Boston, Massachusetts | | | | DISTRIBUTOR Resolute Investment Distributors, Inc. Irving, Texas |
This report is prepared for shareholders of the American Beacon Funds and may be distributed to others only if preceded or accompanied by a current Prospectus or Summary Prospectus.
American Beacon Funds, American Beacon EAM International Small Cap Fund and American Beacon International Equity Fund are service marks of American Beacon Advisors, Inc.
AR 10/24

American Beacon Funds
Although information has been compiled from reliable sources, American Beacon Advisors, Inc. makes no representation as to the completeness or accuracy of the statements contained herein. All information is as of the end of the reporting period, unless noted otherwise, and is subject to change. Each Fund’s portfolio composition will change depending on economic and market conditions.
American Beacon Funds | October 31, 2024 |
Contents
American Beacon Garcia Hamilton Quality Bond FundSM
Report of Independent Registered Public Accounting Firm
To the Board of Trustees of American Beacon Funds and Shareholders of American Beacon Garcia Hamilton Quality Bond Fund
Opinion on the Financial Statements
We have audited the accompanying statement of assets and liabilities, including the schedule of investments, of American Beacon Garcia Hamilton Quality Bond Fund (one of the funds constituting American Beacon Funds, referred hereafter as the “Fund”) as of October 31, 2024, the related statement of operations for the year ended October 31, 2024, the statement of changes in net assets for each of the two years in the period ended October 31, 2024, including the related notes, and the financial highlights for each of the three years in the period ended October 31, 2024 (collectively referred to as the “financial statements”). In our opinion, the financial statements present fairly, in all material respects, the financial position of the Fund as of October 31, 2024, the results of its operations for the year then ended, the changes in its net assets for each of the two years in the period ended October 31, 2024 and the financial highlights for each of the three years in the period ended October 31, 2024 in conformity with accounting principles generally accepted in the United States of America.
The financial statements of the Fund as of and for the year ended October 31, 2021 and the financial highlights for each of the periods ended on or prior to October 31, 2021 (not presented herein, other than the financial highlights) were audited by other auditors whose report dated December 30, 2021 expressed an unqualified opinion on those financial statements and financial highlights.
Basis for Opinion
These financial statements are the responsibility of the Fund’s management. Our responsibility is to express an opinion on the Fund’s financial statements based on our audits. We are a public accounting firm registered with the Public Company Accounting Oversight Board (United States) (PCAOB) and are required to be independent with respect to the Fund in accordance with the U.S. federal securities laws and the applicable rules and regulations of the Securities and Exchange Commission and the PCAOB.
We conducted our audits of these financial statements in accordance with the standards of the PCAOB. Those standards require that we plan and perform the audit to obtain reasonable assurance about whether the financial statements are free of material misstatement, whether due to error or fraud.
Our audits included performing procedures to assess the risks of material misstatement of the financial statements, whether due to error or fraud, and performing procedures that respond to those risks. Such procedures included examining, on a test basis, evidence regarding the amounts and disclosures in the financial statements. Our audits also included evaluating the accounting principles used and significant estimates made by management, as well as evaluating the overall presentation of the financial statements. Our procedures included confirmation of securities owned as of October 31, 2024 by correspondence with the custodian and brokers; when replies were not received from brokers, we performed other auditing procedures. We believe that our audits provide a reasonable basis for our opinion.
/s/PricewaterhouseCoopers LLP
Boston, Massachusetts
December 27, 2024
We have served as the auditor of one or more investment companies in the American Beacon family of funds since 2016.
1
American Beacon Garcia Hamilton Quality Bond FundSM
Schedule of Investments
October 31, 2024
| | | | | | | | | | | | | | | |
| | | |
| | | Principal Amount | | | | Fair Value |
| | | | | | | |
| | | |
| CORPORATE OBLIGATIONS - 8.01% | | | | | | |
| | | |
| Communications - 3.24% | | | | | | |
| | | |
| Media - 3.24% | | | | | | |
| Walt Disney Co., 3.800%, Due 3/22/2030 | | | $ | 8,950,000 | | | | | | | | | $ | 8,592,013 | |
| | | | | | | | | | | | | | | |
| | | | | | | | | | | | | | | |
| | | |
| Financial - 2.47% | | | | | | |
| | | |
| Banks - 2.47% | | | | | | |
| JPMorgan Chase & Co., 2.739%, Due 10/15/2030, (3 mo. USD Term SOFR + 1.510%)A | | | | 2,890,000 | | | | | | | | | | 2,614,799 | |
| Wells Fargo & Co., 4.478%, Due 4/4/2031, (3 mo. USD Term SOFR + 4.032%)A | | | | 4,030,000 | | | | | | | | | | 3,934,127 | |
| | | | | | | | | | | | | | | |
| | | | | | | | | | | | | | 6,548,926 | |
| | | | | | | | | | | | | | | |
| | | | | | | | | | | | | | | |
Total Financial | | | | | | | | | | | | | | 6,548,926 | |
| | | | | | | | | | | | | | | |
| | | | | | | | | | | | | | | |
| | | |
| Utilities - 2.30% | | | | | | |
| | | |
| Electric - 2.30% | | | | | | |
| Florida Power & Light Co., 5.000%, Due 8/1/2034 | | | | 6,020,000 | | | | | | | | | | 6,080,482 | |
| | | | | | | | | | | | | | | |
| | | | | | | | | | | | | | | |
Total Corporate Obligations (Cost $22,191,221) | | | | | | | | | | | | | | 21,221,421 | |
| | | | | | | | | | | | | | | |
| | | | | | | | | | | | | | | |
| | | |
| U.S. AGENCY MORTGAGE-BACKED OBLIGATIONS - 46.74% | | | | | | |
| Federal Home Loan Mortgage Corp., | | | | | | | | | | | | | | | |
4.000%, Due 2/1/2039 | | | | 3,627,976 | | | | | | | | | | 3,510,396 | |
2.500%, Due 9/1/2042 | | | | 11,454,372 | | | | | | | | | | 9,889,585 | |
2.500%, Due 3/1/2052 | | | | 12,503,165 | | | | | | | | | | 10,425,495 | |
2.500%, Due 4/1/2052 | | | | 12,505,937 | | | | | | | | | | 10,381,336 | |
3.000%, Due 5/1/2052 | | | | 11,000,621 | | | | | | | | | | 9,569,813 | |
4.000%, Due 10/1/2052 | | | | 11,073,479 | | | | | | | | | | 10,251,785 | |
4.000%, Due 11/1/2052 | | | | 11,271,275 | | | | | | | | | | 10,429,265 | |
| | | | | | | | | | | | | | | |
| | | | | | | | | | | | | | 64,457,675 | |
| | | | | | | | | | | | | | | |
| Federal National Mortgage Association, | | | | | | | | | | | | | | | |
3.500%, Due 10/1/2039 | | | | 4,791,622 | | | | | | | | | | 4,488,784 | |
3.000%, Due 7/1/2040 | | | | 6,039,403 | | | | | | | | | | 5,524,342 | |
3.000%, Due 8/1/2040 | | | | 3,975,605 | | | | | | | | | | 3,632,690 | |
4.000%, Due 6/1/2049 | | | | 6,298,236 | | | | | | | | | | 5,906,148 | |
2.500%, Due 11/1/2050 | | | | 6,163,495 | | | | | | | | | | 5,114,553 | |
2.500%, Due 5/1/2051 | | | | 10,103,930 | | | | | | | | | | 8,371,957 | |
3.000%, Due 5/1/2052 | | | | 19,422,076 | | | | | | | | | | 16,758,258 | |
3.500%, Due 10/1/2052 | | | | 10,638,587 | | | | | | | | | | 9,527,232 | |
| | | | | | | | | | | | | | | |
| | | | | | | | | | | | | | 59,323,964 | |
| | | | | | | | | | | | | | | |
| | | | | | | | | | | | | | | |
Total U.S. Agency Mortgage-Backed Obligations (Cost $127,920,120) | | | | | | | | | | | | | | 123,781,639 | |
| | | | | | | | | | | | | | | |
| | | | | | | | | | | | | | | |
| | | |
| U.S. TREASURY OBLIGATIONS - 44.48% | | | | | | |
| U.S. Treasury Bonds, | | | | | | | | | | | | | | | |
3.750%, Due 8/15/2041 | | | | 7,760,000 | | | | | | | | | | 7,083,122 | |
2.500%, Due 2/15/2045 | | | | 23,500,000 | | | | | | | | | | 16,927,344 | |
2.500%, Due 5/15/2046 | | | | 11,975,000 | | | | | | | | | | 8,502,718 | |
| | | | | | | | | | | | | | | |
| | | | | | | | | | | | | | 32,513,184 | |
| | | | | | | | | | | | | | | |
| U.S. Treasury Notes, | | | | | | | | | | | | | | | |
1.125%, Due 2/15/2031 | | | | 3,160,000 | | | | | | | | | | 2,632,428 | |
1.875%, Due 2/15/2032 | | | | 32,850,000 | | | | | | | | | | 28,005,908 | |
3.500%, Due 2/15/2033 | | | | 35,640,000 | | | | | | | | | | 33,757,763 | |
4.000%, Due 2/15/2034 | | | | 21,370,000 | | | | | | | | | | 20,909,209 | |
| | | | | | | | | | | | | | | |
| | | | | | | | | | | | | | 85,305,308 | |
| | | | | | | | | | | | | | | |
Total U.S. Treasury Obligations (Cost $123,322,121) | | | | | | | | | | | | | | 117,818,492 | |
| | | | | | | | | | | | | | | |
| | | | | | | | | | | | | | | |
TOTAL INVESTMENTS - 99.23% (Cost $273,433,462) | | | | | | | | | | | | | | 262,821,552 | |
OTHER ASSETS, NET OF LIABILITIES - 0.77% | | | | | | | | | | | | | | 2,028,690 | |
| | | | | | | | | | | | | | | |
TOTAL NET ASSETS - 100.00% | | | | | | | | | | | | | $ | 264,850,242 | |
| | | | | | | | | | | | | | | |
See accompanying notes
2
American Beacon Garcia Hamilton Quality Bond FundSM
Schedule of Investments
October 31, 2024
| | | | | | | | | | | | | | | |
| Percentages are stated as a percent of net assets. | | | | | | | | | | | | | | | |
A Variable, floating, or adjustable rate securities with an interest rate that changes periodically. Rates are periodically reset with rates that are based on a predetermined benchmark such as a widely followed interest rate such as T-bills, SOFR or PRIME plus a fixed spread. The interest rate disclosed reflects the rate in effect on October 31, 2024.
PRIME - A rate, charged by banks, based on the U.S. Federal Funds rate.
SOFR - Secured Overnight Financing Rate.
USD - United States Dollar.
The Fund’s investments are summarized by level based on the inputs used to determine their values. As of October 31, 2024, the investments were classified as described below:
| | | | | | | | | | | | | | | | | | | | | | | | | | | | |
Garcia Hamilton Quality Bond Fund | | Level 1 | | | | | | Level 2 | | | | | | Level 3 | | | | | | Total | |
Assets | | | | | | | | | | | | | | | | | | | | | | | | | | | | |
Corporate Obligations | | $ | – | | | | | | | $ | 21,221,421 | | | | | | | $ | – | | | | | | | $ | 21,221,421 | |
U.S. Agency Mortgage-Backed Obligations | | | – | | | | | | | | 123,781,639 | | | | | | | | – | | | | | | | | 123,781,639 | |
U.S. Treasury Obligations | | | – | | | | | | | | 117,818,492 | | | | | | | | – | | | | | | | | 117,818,492 | |
| | | | | | | | | | | | | | | | | | | | | | | | | | | | |
Total Investments in Securities - Assets | | $ | – | | | | | | | $ | 262,821,552 | | | | | | | $ | – | | | | | | | $ | 262,821,552 | |
| | | | | | | | | | | | | | | | | | | | | | | | | | | | |
U.S. GAAP requires transfers between all levels to/from level 3 be disclosed. During the year ended October 31, 2024, there were no transfers into or out of Level 3.
See accompanying notes
3
American Beacon Garcia Hamilton Quality Bond FundSM
Statement of Assets and Liabilities
October 31, 2024
| | | | |
Assets: | | | | |
Investments in unaffiliated securities, at fair value† | | $ | 262,821,552 | |
Cash | | | 1,172,912 | |
Interest receivable | | | 1,403,548 | |
Receivable for fund shares sold | | | 311,396 | |
Receivable for expense reimbursement (Note 2) | | | 61,316 | |
Prepaid expenses | | | 19,990 | |
| | | | |
Total assets | | | 265,790,714 | |
| | | | |
Liabilities: | | | | |
Payable for investments purchased | | | 660,353 | |
Payable for fund shares redeemed | | | 40,010 | |
Dividends payable | | | 965 | |
Management and sub-advisory fees payable (Note 2) | | | 124,060 | |
Service fees payable (Note 2) | | | 988 | |
Transfer agent fees payable (Note 2) | | | 4,026 | |
Custody and fund accounting fees payable | | | 32,083 | |
Professional fees payable | | | 62,423 | |
Trustee fees payable (Note 2) | | | 1,974 | |
Payable for prospectus and shareholder reports | | | 10,826 | |
Other liabilities | | | 2,764 | |
| | | | |
Total liabilities | | | 940,472 | |
| | | | |
Commitments and contingent liabilities (Note 2) | | | | |
| | | | |
Net assets | | $ | 264,850,242 | |
| | | | |
Analysis of net assets: | | | | |
Paid-in-capital | | $ | 325,579,346 | |
Total distributable earnings (deficits) | | | (60,729,104 | ) |
| | | | |
Net assets | | $ | 264,850,242 | |
| | | | |
Shares outstanding at no par value (unlimited shares authorized): | | | | |
R5 Class | | | 1,093,434 | |
| | | | |
Y Class | | | 2,411,529 | |
| | | | |
Investor Class | | | 356,564 | |
| | | | |
R6 Class | | | 27,053,114 | |
| | | | |
Net assets: | | | | |
R5 Class | | $ | 9,390,194 | |
| | | | |
Y Class | | $ | 20,651,157 | |
| | | | |
Investor Class | | $ | 3,064,413 | |
| | | | |
R6 Class | | $ | 231,744,478 | |
| | | | |
Net asset value, offering and redemption price per share: | | | | |
R5 Class | | $ | 8.59 | |
| | | | |
Y Class | | $ | 8.56 | |
| | | | |
Investor Class | | $ | 8.59 | |
| | | | |
R6 Class | | $ | 8.57 | |
| | | | |
| |
† Cost of investments in unaffiliated securities | | $ | 273,433,462 | |
See accompanying notes
4
American Beacon Garcia Hamilton Quality Bond FundSM
Statement of Operations
For the year ended October 31, 2024
| | | | |
Investment income: | | | | |
Interest income | | $ | 10,898,514 | |
| | | | |
Total investment income | | | 10,898,514 | |
| | | | |
Expenses: | | | | |
Management and sub-advisory fees (Note 2) | | | 1,437,876 | |
Transfer agent fees: | | | | |
R5 Class | | | 1,238 | |
Y Class | | | 27,571 | |
Investor Class | | | 1,463 | |
R6 Class | | | 8,873 | |
Custody and fund accounting fees | | | 67,872 | |
Professional fees | | | 73,495 | |
Registration fees and expenses | | | 67,577 | |
Service fees (Note 2): | | | | |
Investor Class | | | 9,164 | |
Distribution fees (Note 2): | | | | |
Prospectus and shareholder report expenses | | | 22,530 | |
Trustee fees (Note 2) | | | 25,932 | |
Loan interest expense (Note 2) | | | 2,307 | |
Line of credit interest expense (Note 8) | | | 2,856 | |
Other expenses | | | 44,214 | |
| | | | |
Total expenses | | | 1,792,968 | |
| | | | |
Net fees waived and expenses (reimbursed) (Note 2) | | | (678,467 | ) |
| | | | |
Net expenses | | | 1,114,501 | |
| | | | |
Net investment income | | | 9,784,013 | |
| | | | |
| |
Realized and unrealized gain (loss) from investments: | | | | |
Net realized (loss) from: | | | | |
Investments in unaffiliated securities | | | (4,175,091 | ) |
Change in net unrealized appreciation of: | | | | |
Investments in unaffiliated securities | | | 23,594,247 | |
| | | | |
Net gain from investments | | | 19,419,156 | |
| | | | |
Net increase in net assets resulting from operations. | | $ | 29,203,169 | |
| | | | |
See accompanying notes
5
American Beacon Garcia Hamilton Quality Bond FundSM
Statement of Changes in Net Assets
| | | | | | | | | | | | |
| | | Year Ended
October 31, 2024 | | | | | | Year Ended
October 31, 2023 | |
Increase (decrease) in net assets: | | | | | | | | | | | | |
Operations: | | | | | | | | | | | | |
Net investment income | | $ | 9,784,013 | | | | | | | $ | 10,907,666 | |
Net realized (loss) from investments in unaffiliated securities | | | (4,175,091 | ) | | | | | | | (13,497,511 | ) |
Change in net unrealized appreciation of investments in unaffiliated securities | | | 23,594,247 | | | | | | | | 2,948,027 | |
| | | | | | | | | | | | |
Net increase in net assets resulting from operations | | | 29,203,169 | | | | | | | | 358,182 | |
| | | | | | | | | | | | |
Distributions to shareholders: | |
Total retained earnings: | | | | | | | | | | | | |
R5 Class | | | (357,969 | ) | | | | | | | (1,870,733 | ) |
Y Class | | | (1,078,617 | ) | | | | | | | (1,567,482 | ) |
Investor Class | | | (78,201 | ) | | | | | | | (25,683 | ) |
R6 Class | | | (8,576,658 | ) | | | | | | | (6,783,410 | ) |
| | | | | | | | | | | | |
Net distributions to shareholders | | | (10,091,445 | ) | | | | | | | (10,247,308 | ) |
| | | | | | | | | | | | |
| | | |
Capital share transactions (Note 9): | | | | | | | | | | | | |
Proceeds from sales of shares | | | 41,299,971 | | | | | | | | 82,037,288 | |
Reinvestment of dividends and distributions | | | 10,065,168 | | | | | | | | 9,615,714 | |
Cost of shares redeemed | | | (70,637,828 | ) | | | | | | | (173,589,366 | ) |
| | | | | | | | | | | | |
Net (decrease) in net assets from capital share transactions | | | (19,272,689 | ) | | | | | | | (81,936,364 | ) |
| | | | | | | | | | | | |
Net (decrease) in net assets | | | (160,965 | ) | | | | | | | (91,825,490 | ) |
| | | | | | | | | | | | |
Net assets: | | | | | | | | | | | | |
Beginning of year | | | 265,011,207 | | | | | | | | 356,836,697 | |
| | | | | | | | | | | | |
End of year | | $ | 264,850,242 | | | | | | | $ | 265,011,207 | |
| | | | | | | | | | | | |
See accompanying notes
6
American Beacon Garcia Hamilton Quality Bond FundSM
Notes to Financial Statements
October 31, 2024
1. Organization and Significant Accounting Policies
American Beacon Funds (the “Trust”) is organized as a Massachusetts business trust. The Fund, a series within the Trust, is registered under the Investment Company Act of 1940, as amended (the “Act”), as a diversified, open-end management investment company. As of October 31, 2024, the Trust consists of twenty-four active series, one of which is presented in this filing: American Beacon Garcia Hamilton Quality Bond Fund (the “Fund”). The remaining twenty-three active series are reported in separate filings.
American Beacon Advisors, Inc. (the “Manager”) is a Delaware corporation and a wholly-owned subsidiary of Resolute Investment Managers, Inc. (“RIM”) organized in 1986 to provide business management, advisory, administrative, and asset management consulting services to the Trust and other investors. The Manager is registered as an investment advisor under the Investment Advisers Act of 1940, as amended (the “Advisers Act”). The Manager is an indirect wholly-owned subsidiary of Resolute Topco, Inc. (“Topco”), which is owned primarily by various institutional investment funds that are managed by financial institutions and other investment advisory firms. No owner of Topco owns 25% or more of the outstanding equity or voting interests of Topco.
Effective December 29, 2023, the Manager underwent a change of control, which resulted in the termination of the Fund’s previous management and investment advisory agreements. The Board of Trustees (“the “Board”) approved a new Management Agreement with the Manager and a new Investment Advisory Agreement among the Manager, the sub-advisor and the Trust, on behalf of the Fund, that were effective on December 29, 2023.
Recently Adopted Accounting Pronouncements
In March 2020, the Financial Accounting Standards Board (“FASB”) issued Accounting Standards Update (“ASU”) No. 2020-04, Reference Rate Reform (Topic 848); Facilitation of the Effects of Reference Rate Reform on Financial Reporting, which provides optional guidance for a limited period of time to ease the potential burden in accounting for (or recognizing the effects of) reference rate reform. The guidance is applicable to contracts referencing London Inter-bank Offered Rate (“LIBOR”) or another reference rate that is expected to be discontinued due to reference rate reform. The ASU is effective as of March 12, 2020 and generally can be applied through December 31, 2022. In December 2022, the FASB issued ASU No. 2022-06 Reference Rate Reform (Topic 848): Deferral of the Sunset Date of Topic 848 which updates and clarifies ASU No. 2020-04. The amendments in this ASU defer the sunset date of Topic 848 from December 31, 2022, to December 31, 2024. Management has concluded that these ASUs will not have a material impact on the Fund’s financial statements.
In June 2022, the FASB issued ASU No. 2022-03, Fair Value Measurement (Topic 820); Fair Value Measurement of Equity Securities Subject to Contractual Sale Restrictions, which provides clarifying guidance that a contractual restriction on the sale of an equity security is not considered part of the unit of account of the equity security and, therefore, is not considered in measuring fair value. The ASU is effective for fiscal years beginning after December 15, 2023, and interim periods within those fiscal years. Management has concluded that the ASU will not have a material impact on the Fund’s financial statements.
Class Disclosure
The Fund has multiple classes of shares designed to meet the needs of different groups of investors. The following table sets forth the differences amongst the classes:
| | | | | | |
Class | | Eligible Investors | | Minimum Initial
Investments | |
| R5 Class | | Large institutional investors - sold directly or through intermediary channels. | | $ | 250,000 | |
| | |
| Y Class | | Large institutional retirement plan investors - sold directly or through intermediary channels. | | $ | 100,000 | |
| | |
| Investor Class | | All investors using intermediary organizations, such as broker-dealers or retirement plan sponsors. | | $ | 2,500 | |
| | |
| R6 Class | | Large institutional retirement plan investors - sold through retirement plan sponsors. | | | None | |
7
American Beacon Garcia Hamilton Quality Bond FundSM
Notes to Financial Statements
October 31, 2024
Each class offered by the Trust has equal rights as to assets and voting privileges. Income and non-class specific expenses are allocated daily to each class based on the relative net assets. Realized and unrealized capital gains and losses of each class are allocated daily based on the relative net assets of each class of the respective Fund. Class specific expenses, where applicable, currently include service, distribution, transfer agent fees, and sub-transfer agent fees that vary amongst the classes as described more fully in Note 2.
Significant Accounting Policies
The following is a summary of significant accounting policies, consistently followed by the Fund in preparation of the financial statements. The Fund is considered an investment company and accordingly, follows the investment company accounting and reporting guidance of the FASB Accounting Standards Codification Topic 946, Financial Services – Investment Companies, a part of Generally Accepted Accounting Principles (“U.S. GAAP”).
Security Transactions and Investment Income
Security transactions are recorded as of the trade date for financial reporting purposes. Securities purchased or sold on a when-issued or delayed-delivery basis may be settled beyond a standard settlement period for the security after the trade date.
Dividend income, net of foreign taxes, is recorded on the ex-dividend date, except certain dividends from foreign securities which are recorded as soon as the information is available to the Fund. Interest income, net of foreign taxes, is earned from settlement date, recorded on the accrual basis, and adjusted, if necessary, for accretion of discounts and amortization of premiums. Realized gains (losses) from securities sold are determined based on specific lot identification.
Distributions to Shareholders
The Fund distributes most or all of its net earnings and realized gains, if any, each taxable year in the form of dividends from net investment income on a monthly basis and distributions of realized net capital gains and net gains or losses from foreign currency transactions on an annual basis. The Fund does not have a fixed dividend rate and does not guarantee that it will pay any distributions in any particular period. Dividends to shareholders are determined in accordance with federal income tax regulations, which may differ in amount and character from net investment income and realized gains recognized for purposes of U.S. GAAP. To the extent necessary to fully distribute capital gains, the Fund may designate earnings and profits distributed to shareholders on the redemption of shares.
Allocation of Income, Trust Expenses, Gains, and Losses
Investment income and realized and unrealized gains and losses from investments of the Fund are allocated daily to each class of shares based upon the relative proportion of net assets of each class to the total net assets of the Fund. Expenses directly charged or attributable to the Fund will be paid from the assets of the Fund. Generally, expenses of the Trust will be allocated among and charged to the assets of the Fund on a basis that the Trust’s Board deems fair and equitable, which may be based on the relative net assets of the Fund or nature of the services performed and relative applicability to the Fund.
Use of Estimates
The preparation of financial statements in conformity with U.S. GAAP requires management to make estimates and assumptions that affect the amounts reported in the financial statements and accompanying notes. Actual results may differ from those estimated.
8
American Beacon Garcia Hamilton Quality Bond FundSM
Notes to Financial Statements
October 31, 2024
Other
Under the Trust’s organizational documents, its officers and trustees are indemnified against certain liabilities arising out of the performance of their duties to the Trust. In the normal course of business, the Trust enters into contracts that provide indemnification to the other party or parties against potential costs or liabilities. The Trust’s maximum exposure under these arrangements is dependent on claims that may be made in the future and, therefore, cannot be estimated. The Trust has had no prior claims or losses pursuant to any such agreement.
2. Transactions with Affiliates
Management and Investment Sub-Advisory Agreements
The Fund and the Manager are parties to a Management Agreement that obligates the Manager to provide the Fund with investment advisory and administrative services. As compensation for performing the duties under the Management Agreement, the Manager will receive an annualized management fee based on a percentage of the Fund’s average daily net assets that is calculated and accrued daily according to the following schedule:
| | | | |
First $5 billion | | | 0.35 | % |
Next $5 billion | | | 0.325 | % |
Next $10 billion | | | 0.30 | % |
Over $20 billion | | | 0.275 | % |
The Trust, on behalf of the Fund, and the Manager have entered into an Investment Advisory Agreement with Garcia Hamilton & Associates, L.P. (the “Sub-Advisor”) pursuant to which the Fund has agreed to pay an annualized sub-advisory fee that is calculated and accrued daily based on the Fund’s average daily net assets according to the following schedule:
| | | | |
First $1 billion | | | 0.20 | % |
Over $1 billion | | | 0.15 | % |
The Management and Sub-Advisory Fees paid by the Fund for the year ended October 31, 2024 were as follows:
| | | | | | | | | | | | |
| | | Effective Fee Rate | | | | | | Amount of Fees Paid | |
Management Fees | | | 0.35 | % | | | | | | $ | 915,012 | |
Sub-Advisory Fees | | | 0.20 | % | | | | | | | 522,864 | |
| | | | | | | | | | | | |
Total | | | 0.55 | % | | | | | | $ | 1,437,876 | |
| | | | | | | | | | | | |
Distribution Plans
The Fund has adopted a Distribution Plan (the “Plan”) in accordance with Rule 12b-1 under the Act, pursuant to which no separate fees may be charged to the Fund for distribution purposes. However, the Plan authorizes the management fees received by the Manager and/or the investment advisors hired by the Manager to be used for distribution purposes. Under this Plan, the Fund does not intend to compensate the Manager or any other party, either directly or indirectly, for the distribution of Fund shares.
Service Plans
The Manager and the Trust entered into a Service Plan that obligates the Manager to oversee additional shareholder servicing of the Investor Class of the Fund. As compensation for performing the duties required under the Service Plan, the Manager receives an annualized fee up to 0.375% of the average daily net assets of the Investor Class of the Fund.
9
American Beacon Garcia Hamilton Quality Bond FundSM
Notes to Financial Statements
October 31, 2024
Sub-Transfer Agent Fees
The Manager has entered into agreements, which include servicing agreements, with financial intermediaries that provide recordkeeping, processing, shareholder communications and other services to customers of the intermediaries that hold positions in the R5 and Y Classes of the Fund and has agreed to compensate the intermediaries for providing these services. Intermediaries transact with the Fund primarily through the use of omnibus accounts on behalf of its customers who hold positions in the Fund. Certain services would have been provided by the Fund’s transfer agent and other service providers if the shareholders’ accounts were maintained directly by the Fund’s transfer agent. Accordingly, the Fund, pursuant to Board approval, has agreed to reimburse the Manager for certain non-distribution shareholder services provided by financial intermediaries for the R5 and Y Classes. The reimbursement amounts (sub-transfer agent fees) paid to the Manager are subject to a fee limit of up to 0.10% of an intermediary’s average net assets in the R5 and Y Classes on an annual basis. During the year ended October 31, 2024, the sub-transfer agent fees, as reflected in “Transfer agent fees” on the Statement of Operations, were as follows:
| | | | |
Fund | | Sub-Transfer Agent Fees | |
Garcia Hamilton Quality Bond | | $ | 26,965 | |
As of October 31, 2024, the Fund owed the Manager the following reimbursement of sub-transfer agent fees, as reflected in “Transfer agent fees payable” on the Statement of Assets and Liabilities:
| | | | |
Fund | | Reimbursement
Sub-Transfer Agent Fees | |
Garcia Hamilton Quality Bond | | $ | 1,906 | |
Interfund Credit Facility
Pursuant to an exemptive order issued by the U.S. Securities and Exchange Commission (“SEC”), the Fund, along with other registered investment companies having management contracts with the Manager, may participate in a credit facility whereby each fund, under certain conditions, is permitted to lend money directly to and borrow directly from other participating funds for temporary purposes. The interfund credit facility is advantageous to the funds because it provides added liquidity and eliminates the need to maintain higher cash balances to meet redemptions. This situation could arise when shareholder redemptions exceed anticipated volumes and certain funds have insufficient cash on hand to satisfy such redemptions or when sales of securities do not settle as expected, resulting in a cash shortfall for the fund. The credit facility is administered by a credit facility team consisting of professionals from the Manager’s asset management, compliance, and accounting areas who report the activities of the credit facility to the Board. During the year ended October 31, 2024, the Fund borrowed $13,717,885 for 1 day at an interest rate of 6.14% with interest charges of $2,307. This amount is recorded as “Loan interest expense” in the Statement of Operations.
10
American Beacon Garcia Hamilton Quality Bond FundSM
Notes to Financial Statements
October 31, 2024
Expense Reimbursement Plan
The Manager contractually agreed to reduce fees and/or reimburse expenses for the classes of the Fund, through December 31, 2025, to the extent that total operating expenses (excluding taxes, interest, brokerage commissions, acquired fund fees and expenses, securities lending fees, expenses associated with securities sold short, litigation, and other extraordinary expenses) exceed the Fund’s expense cap. During the year ended October 31, 2024, the Manager waived and/or reimbursed expenses as follows:
| | | | | | | | | | | | | | | | | | | | | | |
| | | | | Expense Cap | | | | | | | | | Expiration of
Reimbursed
Expenses | |
Fund | | Class | | 11/1/2023 –
2/29/2024 | | | 3/1/2024 -
10/31/2024 | | | Reimbursed
Expenses | | | (Recouped)
Expenses | |
Garcia Hamilton Quality Bond | | R5 | | | 0.45 | % | | | 0.45 | % | | $ | 21,788 | | | $ | - | | | | 2026-2027 | |
Garcia Hamilton Quality Bond | | Y | | | 0.51 | % | | | 0.51 | % | | | 68,453 | | | | - | | | | 2026-2027 | |
Garcia Hamilton Quality Bond | | Investor | | | 0.83 | % | | | 0.83 | % | | | 6,670 | | | | - | | | | 2026-2027 | |
Garcia Hamilton Quality Bond | | R6 | | | 0.41 | % | | | 0.41 | % | | | 581,556 | | | | - | | | | 2026-2027 | |
Of the above amounts, $61,316 was disclosed as a Receivable for expense reimbursement on the Statement of Assets and Liabilities at October 31, 2024.
The Fund has adopted an Expense Reimbursement Plan whereby the Manager may seek repayment of contractual or voluntary fee reductions and expense reimbursements. Under the policy, the Manager can be reimbursed by the Fund for any contractual or voluntary fee reductions or expense reimbursements if reimbursement to the Manager (a) occurs within three years from the date of the Manager’s waiver/reimbursement and (b) does not cause the Fund’s annual operating expenses to exceed the lesser of the contractual percentage limit in effect at the time of the waiver/reimbursement or time of recoupment. The reimbursed expenses listed above will expire in 2026 and 2027. The Fund did not record a liability for potential contingent reimbursements due to the current assessment that reimbursements are uncertain. The carryover of excess expenses potentially reimbursable to the Manager, but not recorded as a liability are as follows:
| | | | | | | | | | | | | | | | |
Fund | | Recouped
Expenses | | | Excess Expense
Carryover | | | Expired Expense
Carryover | | | Expiration of
Reimbursed
Expenses | |
Garcia Hamilton Quality Bond | | $ | - | | | $ | - | | | $ | 814,374 | | | | 2023-2024 | |
Garcia Hamilton Quality Bond | | | - | | | | 876,814 | | | | - | | | | 2024-2025 | |
Garcia Hamilton Quality Bond | | | - | | | | 753,949 | | | | - | | | | 2025-2026 | |
Trustee Fees and Expenses
As compensation for their service to the American Beacon Funds Complex, including the Trust (collectively, the “Trusts”), each Trustee is compensated from the Trusts as follows: (1) an annual retainer of $140,000; (2) meeting attendance fee (for attendance in-person or via teleconference) of (a) $12,000 for in person attendance, or $5,000 for telephonic attendance, by Board members for each regularly scheduled or special Board meeting, (b) $2,500 for attendance by Committee members at meetings of the Audit and Compliance Committee and the Investment Committee, (c) $1,000 for attendance by Committee members at meetings of the Nominating and Governance Committee; and (d) $2,500 for attendance by Board members for each special telephonic Board meeting; and (3) reimbursement of reasonable expenses incurred in attending Board meetings, Committee meetings, and relevant educational seminars. For this purpose, the Board considers attendance at regular meetings held by video conference to constitute in-person attendance at a Board meeting. The Trustees also may be compensated for attendance at special Board and/or Committee meetings from time to time. For her service as Board Chair, Ms. Cline receives an additional annual retainer of $50,000. Although she attends several committee
11
American Beacon Garcia Hamilton Quality Bond FundSM
Notes to Financial Statements
October 31, 2024
meetings at each quarterly Board meeting, she receives only a single $2,500 fee each quarter for her attendance at the Audit and Compliance Committee and Investment Committee meetings. The chairpersons of the Audit and Compliance Committee and the Investment Committee each receive an additional annual retainer of $25,000 and the Chair of the Nominating and Governance Committee receives an additional annual retainer of $10,000.
3. Security Valuation and Fair Value Measurements
The price of the Fund’s shares is based on the Fund’s Net Asset Value (“NAV”). The NAV of the Fund, or each of its share classes, as applicable, is determined by dividing the total value of portfolio investments and other assets, less any liabilities attributable to the Fund or class, by the total number of shares outstanding of the Fund or class.
Investments are valued at the close of the New York Stock Exchange (the “Exchange”), normally at 4:00 p.m. Eastern Time, each day that the Exchange is open for business.
Debt securities are valued at bid quotes from broker/dealers or evaluated bid prices from pricing services, who may consider a number of inputs and factors, such as prices of comparable securities, yield curves, spreads, credit ratings, coupon rates, maturity, default rates, and underlying collateral.
Investments in open-end mutual funds are valued at the closing NAV per share of the mutual fund on the day of valuation.
Rule 2a-5 under the Investment Company Act (the “Valuation Rule”) establishes requirements for determining fair value in good faith for purposes of the Investment Company Act, including related oversight and reporting requirements. The Valuation Rule also defines when market quotations are “readily available,” which is the threshold for determining whether a Fund must fair value a security. Among other things, the Valuation Rule permits the Board to designate the Manager as Valuation Designee to perform the Fund’s fair value determinations subject to board oversight and certain reporting and other requirements intended to ensure that the Board receives the information it needs to oversee the Manager’s fair value determinations. Effective September 8, 2022, the Board has designated the Manager as valuation designee to perform fair value functions in accordance with the requirements of the Valuation Rule.
Securities may be valued at fair value, as determined in good faith and pursuant to the Manager’s procedures, under certain limited circumstances. For example, fair value pricing will be used for fixed-income securities and when market quotations are not readily available or reliable, as determined by the Manager, such as when (i) trading for a security is restricted or stopped; (ii) a security’s trading market is closed (other than customary closings); or (iii) a security has been de-listed from a national exchange. A security with limited market liquidity may require fair value pricing if the Manager determines that the available price does not reflect the security’s true market value.
Other investments, including restricted securities and those financial instruments for which the above valuation procedures are inappropriate or are deemed not to reflect fair value, are stated at fair value, as determined in good faith by the Manager’s Valuation Committee, pursuant to procedures established by the Board.
12
American Beacon Garcia Hamilton Quality Bond FundSM
Notes to Financial Statements
October 31, 2024
Valuation Inputs
Various inputs may be used to determine the fair value of the Fund’s investments. These inputs are summarized in three broad levels for financial statement purposes. The inputs or methodologies used to value securities are not necessarily an indication of the risk associated with investing in those securities.
| | | | |
| Level 1 | | - | | Quoted prices in active markets for identical securities. |
| | |
| Level 2 | | - | | Prices determined using other significant observable inputs. These may include quoted prices for similar securities, interest rates, prepayment speeds, credit risk, and others. |
| | |
| Level 3 | | - | | Prices determined using other significant unobservable inputs. Unobservable inputs reflect the Fund’s own assumptions about the factors market participants would use in pricing an investment. |
Level 1 and Level 2 trading assets and trading liabilities, at fair value
With respect to the Fund’s investments that do not have readily available market quotations, the Board has designated the Adviser as its valuation designee to perform fair valuations pursuant to Rule 2a-5 under the Act (the “Valuation Designee”). If market prices are not readily available or are deemed unreliable, the Valuation Designee will use the fair value of the security or other instrument as determined in good faith under policies and procedures established by and under the supervision of the Board (“Valuation Procedures”). Market prices are considered not readily available where there is an absence of current or reliable market-based data (e.g., trade information or broker quotes), including where events occur after the close of the relevant market, but prior to the NYSE Close, that materially affect the values of the Fund’s portfolio holdings or assets. In addition, market prices are considered not readily available when, due to extraordinary circumstances, the exchanges or markets on which the securities or other instruments trade do not open for trading for the entire day and no other market prices are available. Fair value pricing is subjective in nature and the use of fair value pricing by the Valuation Designee may cause the NAV of the Fund’s shares to differ significantly from the NAV that would have been calculated using market prices at the close of the exchange on which a portfolio holding is primarily traded. There can be no assurance that the Fund could obtain the fair value assigned to an investment if the Fund were to sell the investment at approximately the time at which the Fund determines its NAV.
Fixed-income securities including corporate, convertible and municipal bonds and notes, U.S. government agencies, U.S. Treasury obligations, sovereign issues, bank loans, convertible preferred securities, and non-U.S. bonds are normally valued by pricing service providers that use broker dealer quotations, reported trades or valuation estimates from their internal pricing models. The service providers’ internal models use inputs that are observable such as issuer details, interest rates, yield curves, prepayment speeds, credit risks/spreads, default rates, and quoted prices for similar assets. Securities that use similar valuation techniques and inputs as described above are categorized as Level 2 of the fair value hierarchy. Fixed-income securities purchased on a delayed-delivery basis are marked-to-market daily until settlement at the forward settlement date and are categorized as Level 2 of the fair value hierarchy.
Mortgage-related and asset-backed securities (“ABS”) are usually issued as separate tranches, or classes, of securities within each deal. These securities are also normally valued by pricing service providers that use broker-dealer quotations or valuation estimates from their internal pricing models. The pricing models for these securities usually consider tranche-level attributes, current market data, estimated cash flows, and market-based yield spreads for each tranche, and incorporates deal collateral performance, as available. Mortgage-related and ABS that use similar valuation techniques and inputs as described above are categorized as Level 2 of the fair value hierarchy.
Investments in registered open-end investment management companies will be valued based upon the NAVs of such investments and are categorized as Level 1 of the fair value hierarchy.
13
American Beacon Garcia Hamilton Quality Bond FundSM
Notes to Financial Statements
October 31, 2024
4. Securities and Other Investments
Agency Mortgage-Backed Securities
Certain mortgage-backed securities (“MBS”) may be issued or guaranteed by the U.S. government or a government sponsored entity, such as the Federal National Mortgage Association (“Fannie Mae”) or the Federal Home Loan Mortgage Corporation (“Freddie Mac”). Although these instruments may be guaranteed by the U.S. government or a government sponsored entity, many such MBS are not backed by the full faith and credit of the United States and are still exposed to the risk of non-payment.
Fixed-Income Investments
The Fund may hold debt, including government and corporate debt, and other fixed-income securities. Typically, the values of fixed-income securities change inversely with prevailing interest rates. Therefore, a fundamental risk of fixed-income securities is interest rate risk, which is the risk that their value will generally decline as prevailing interest rates rise, which may cause the Fund’s NAV to likewise decrease, and vice versa. How specific fixed-income securities may react to changes in interest rates will depend on the specific characteristics of each security. For example, while securities with longer maturities tend to produce higher yields, they also tend to be more sensitive to changes in prevailing interest rates and are, therefore, more volatile than shorter-term securities and are subject to greater market fluctuations as a result of changes in interest rates. Fixed-income securities are also subject to credit risk, which is the risk that the credit strength of an issuer of a fixed-income security will weaken and/or that the issuer will be unable to make timely principal and interest payments and that the security may go into default. In addition, there is prepayment risk, which is the risk that during periods of falling interest rates, certain fixed-income securities with higher interest rates, such as MBS and ABS, may be prepaid by their issuers thereby reducing the amount of interest payments. This may result in the Fund having to reinvest its proceeds in lower yielding securities. Securities underlying MBS and ABS, which may include subprime mortgages, also may be subject to a higher degree of credit risk, valuation risk, and liquidity risk.
Mortgage-Backed Securities
MBS often have stated maturities of up to thirty years when they are issued, depending upon the length of the mortgages underlying the securities. In practice however, unscheduled or early payments of principal and interest on the underlying mortgages may make the securities’ effective maturity shorter than this, and the prevailing interest rates may be higher or lower than the current yield of the Fund’s portfolio at the time resulting in reinvestment risk.
Rising or high interest rates may result in slower than expected principal payments which may tend to extend the duration of MBS, making them more volatile and more sensitive to changes in interest rates. This is known as extension risk.
MBS may have less potential for capital appreciation than comparable fixed-income securities due to the likelihood of increased prepayments of mortgages resulting from foreclosures or declining interest rates. These foreclosed or refinanced mortgages are paid off at face value (par) or less, causing a loss, particularly for any investor who may have purchased the security at a premium or a price above par. In such an environment, this risk limits the potential price appreciation of these securities.
Mortgage-Related and Other Asset-Backed Securities
The Fund may invest in mortgage or other ABS. These securities may include mortgage instruments issued by U.S. government agencies (“agency mortgages”) or those issued by private entities (“non-agency mortgages”). Specific types of instruments may include mortgage pass-through securities, collateralized mortgage obligations (“CMOs”), commercial mortgage-backed securities, mortgage dollar rolls, CMO residuals, stripped mortgage-backed
14
American Beacon Garcia Hamilton Quality Bond FundSM
Notes to Financial Statements
October 31, 2024
securities and other securities that directly or indirectly represent a participation in, or are secured by a payable from, mortgage loans on real property. The value of the Fund’s MBS may be affected by, among other things, changes or perceived changes in interest rates, factors concerning the interests in and structure of the issuer or the originator of the mortgage, or the quality of the underlying assets. The mortgages underlying the securities may default or decline in quality or value. Through its investments in MBS, the Fund has exposure to subprime loans, Alt-A loans and non-conforming loans as well as to the mortgage and credit markets generally. Underlying collateral related to subprime, Alt-A and non-conforming mortgage loans has become increasingly susceptible to defaults and declines in quality or value, especially in a declining residential real estate market. In addition, regulatory or tax changes may adversely affect the mortgage securities markets as a whole.
Other Investment Company Securities and Other Exchange-Traded Products
The Fund may invest in shares of other investment companies, including open-end funds, closed-end funds, business development companies (“BDCs”), ETFs, unit investment trusts, and other investment companies of the Trust. The Fund may invest in securities of an investment company advised by the Manager or the Sub-Advisor. Investments in the securities of other investment companies may involve duplication of advisory fees and certain other expenses. By investing in another investment company, the Fund becomes a shareholder of that investment company. As a result, the Fund shareholders indirectly will bear the Fund’s proportionate share of the fees and expenses paid by shareholders of the other investment company, in addition to the fees and expenses the Fund shareholders directly bear in connection with the Fund’s own operations. These other fees and expenses are reflected as Acquired Fund Fees and Expenses and are included in the Fees and Expenses Table for the Fund in its Prospectus, if applicable. Investments in other investment companies may involve the payment of substantial premiums above the value of such issuer’s portfolio securities.
U.S. Government Agency Securities
U.S. Government agency securities are issued or guaranteed by the U.S. Government or its agencies or instrumentalities. Some obligations issued by U.S. Government agencies and instrumentalities are supported by the full faith and credit of the U.S. Treasury; others by the right of the issuer to borrow from the U.S. Treasury; others by discretionary authority of the U.S. Government to purchase certain obligations of the agency or instrumentality; and others only by the credit of the agency or instrumentality. U.S. Government securities bear fixed, floating or variable rates of interest. While the U.S. Government currently provides financial support to certain U.S. Government-sponsored agencies or instrumentalities, no assurance can be given that it will always do so, since it is not so obligated by law. U.S. Government securities include U.S. Treasury bills, notes and bonds, Federal Home Loan Bank (“FHLB”) obligations, Federal Farm Credit Bank (“FFCB”) obligations, U.S. Government agency obligations and repurchase agreements secured thereby. U.S. Government agency securities are subject to credit risk and interest rate risk.
U. S. Treasury Obligations
U.S. Treasury obligations include bills (initial maturities of one year or less), notes (initial maturities between two and ten years), and bonds (initial maturities over ten years) issued by the U.S. Treasury, Separately Traded Registered Interest and Principal component parts of such obligations (known as “STRIPS”) and inflation-indexed securities. The prices of these securities (like all debt securities) change between issuance and maturity in response to fluctuating market interest rates. U.S. Treasury obligations are subject to credit risk and interest rate risk.
15
American Beacon Garcia Hamilton Quality Bond FundSM
Notes to Financial Statements
October 31, 2024
5. Principal Risks
Investing in the Fund may involve certain risks including, but not limited to, those described below.
Credit Risk
The Fund is subject to the risk that the issuer or guarantor of a debt security, or the counterparty to a derivatives contract or a loan will fail to make timely payment of interest or principal or otherwise honor its obligations or default completely. A decline in the credit rating of an individual security held by the Fund may have an adverse impact on its price and make it difficult for the Fund to sell it. Ratings represent a rating agency’s opinion regarding the quality of the security and are not a guarantee of quality. Rating agencies might not always change their credit rating on an issuer or security in a timely manner to reflect events that could affect the issuer’s ability to make timely payments on its obligations. Credit risk is typically greater for securities with ratings that are below investment grade. Since the Fund can invest significantly in high-yield investments considered speculative in nature, this risk may be substantial.
Environmental, Social, and/or Governance Investing Risk
The use of environmental, social, and/or governance (“ESG”) considerations by the sub-advisor may cause the Fund to make different investments than funds that have a similar investment style but do not incorporate such considerations in their strategy. As with the use of any investment considerations involved in investment decisions, there is no guarantee that the use of any ESG investment considerations will result in the selection of issuers that will outperform other issuers or help reduce risk in the Fund. The Fund may choose not to, or may not be able to, take advantage of certain investment opportunities due to these considerations, which may adversely affect performance. The Fund may underperform funds that do not incorporate these considerations.
Floating Rate Securities Risk
The coupons on certain fixed income securities in which the Fund may invest are not fixed and may fluctuate based upon changes in market rates. The coupon on a floating rate security is generally based on an interest rate such as a money-market index, Secured Overnight Financing Rate (“SOFR”), or a Treasury bill rate. Such securities are subject to interest rate risk and may fluctuate in value in response to interest rate changes if there is a delay between changes in market interest rates and the interest reset date for the obligation, or for other reasons. As short-term interest rates decline, the coupons on floating rate securities typically decrease. Alternatively, during periods of rising interest rates, changes in the coupons of floating rate securities may lag behind changes in market rates or may have limits on the maximum increases in the coupon rates. The value of floating rate securities may decline if their coupons do not rise as much, or as quickly, as interest rates in general. Conversely, floating rate securities will not generally increase in value if interest rates decline. Floating rate obligations are less effective than fixed rate obligations at locking in a particular yield and are subject to credit risk.
Interest Rate Risk
Generally, the value of investments with interest rate risk, such as fixed-income securities or derivatives, will move in the opposite direction to movements in interest rates. Factors including central bank monetary policy, rising inflation rates, and changes in general economic conditions may cause interest rates to rise, which could cause the value of the Fund’s investments to decline. Interest rates may rise, perhaps significantly and/or rapidly, potentially resulting in substantial losses to the Fund. Interest rate changes may have a more pronounced effect on the market value of fixed-rate instruments than on floating-rate instruments. The value of floating rate and variable securities may decline if their interest rates do not rise as quickly, or as much, as general interest rates. The prices of fixed-income securities or derivatives are also affected by their durations. Fixed-income securities or derivatives with longer durations generally have greater sensitivity to changes in interest rates. Rising interest
16
American Beacon Garcia Hamilton Quality Bond FundSM
Notes to Financial Statements
October 31, 2024
rates may cause the value of the Fund’s investments with longer durations and terms to maturity to decline, which may adversely affect the value of the Fund. For example, if a bond has a duration of eight years, a 1% increase in interest rates could be expected to result in an 8% decrease in the value of the bond. An increase in interest rates can impact markets broadly as well. To the extent the Fund holds an investment with a negative interest rate to maturity, the Fund may generate a negative return on that investment.
Investment Risk
An investment in the Fund is not a deposit with a bank and is not insured or guaranteed by the Federal Deposit Insurance Corporation or any other government agency. When you sell your shares of the Fund, they could be worth less than what you paid for them. Therefore, you may lose money by investing in the Fund.
Liquidity Risk
When there is little or no active trading market for a specific type of security it can become more difficult to purchase or sell the securities at or near their perceived value. During such periods, certain investments held by the Fund may be difficult to sell or other investments may be difficult to purchase at favorable times or prices. As a result, the Fund may have to lower the price on certain securities that it is trying to sell, sell other securities instead or forgo an investment opportunity, any of which could have a negative effect on Fund management or performance. Redemptions by a few large investors in the Fund at such times may have a significant adverse effect on the Fund’s NAV per share and remaining Fund shareholders. In addition, the market-making capacity of dealers in certain types of securities has been reduced in recent years, in part as a result of structural and regulatory changes, such as fewer proprietary trading desks and increased regulatory capital requirements for broker-dealers. Further, many broker-dealers have reduced their inventory of certain debt securities. This could negatively affect the Fund’s ability to buy or sell debt securities and increase the related volatility and trading costs. The Fund may lose money if it is forced to sell certain investments at unfavorable prices to meet redemption requests or other cash needs.
Market Risk
The Fund is subject to the risk that the securities markets will move down, sometimes rapidly and unpredictably, based on overall economic conditions and other factors, which may negatively affect the Fund’s performance. Equity securities generally have greater price volatility than fixed-income securities, although under certain market conditions fixed-income securities may have comparable or greater price volatility. During a general downturn in the securities markets, multiple assets may decline in value simultaneously. In some cases, traditional market participants have been less willing to make a market in some types of debt instruments, which has affected the liquidity of those instruments. During times of market turmoil, investors tend to look to the safety of securities issued or backed by the U.S. Treasury, causing the prices of these securities to rise and the yields to decline. Reduced liquidity in fixed-income and credit markets may negatively affect many issuers worldwide. Prices in many financial markets have increased significantly over the last decade, but there have also been periods of adverse market and financial developments and cyclical change during that timeframe, which have resulted in unusually high levels of volatility in domestic and foreign financial markets that has caused losses for investors and may occur again in the future, particularly if markets enter a period of uncertainty or economic weakness. The value of a security may decline due to adverse issuer-specific conditions, general market conditions unrelated to a particular issuer, or factors that affect a particular industry or industries. Changes in the financial condition of a single issuer or market segment also can impact the market as a whole.
Geopolitical and other events, including war, terrorism, economic uncertainty, trade disputes, pandemics, public health crises, natural disasters and related events have led, and in the future may continue to lead, to instability in world economies and markets generally and reduced liquidity in equity, credit and fixed-income markets, which may disrupt economies and markets and adversely affect the value of your investment. Changes in value may be temporary or may last for extended periods.
17
American Beacon Garcia Hamilton Quality Bond FundSM
Notes to Financial Statements
October 31, 2024
Policy changes by the U.S. government and/or Federal Reserve and political events within the U.S. and abroad, including the U.S. presidential election, the U.S. government’s inability at times to agree on a long-term budget and deficit reduction plan, the threat of a federal government shutdown and threats not to increase the federal government’s debt limit, may affect investor and consumer confidence and may adversely impact financial markets and the broader economy, perhaps suddenly and to a significant degree.
Markets and market participants are increasingly reliant upon both publicly available and proprietary information data systems. Data imprecision, software or other technology malfunctions, programming inaccuracies, unauthorized use or access, and similar circumstances may impair the performance of these systems and may have an adverse impact upon a single issuer, a group of issuers, or the market at large. The financial markets generally move in cycles, with periods of rising prices followed by periods of declining prices. The value of your investment may reflect these fluctuations.
Mortgage-Backed and Mortgage Related Securities Risk
Investments in mortgage-backed and mortgage-related securities are influenced by the factors affecting the mortgages underlying the securities or the housing market. Investments in mortgage-backed and mortgage-related securities also are subject to market risks for fixed-income securities, which include, but are not limited to, credit risk, interest rate risk, prepayment risk, extension risk, callable securities risk, and valuation risk. A decline in the credit quality of the issuers of mortgage-backed and mortgage-related securities or instability in the markets for such securities may affect the value and liquidity of such securities, which could result in losses to the Fund. These securities are also subject to the risk of default on the underlying mortgages, particularly during periods of market downturn, and an unexpectedly high rate of defaults on the underlying assets will adversely affect the security’s value.
Other Investment Companies Risk
The Fund may invest in shares of other registered investment companies, including money market funds that are advised by the Manager. To the extent that the Fund invests in shares of other registered investment companies, the Fund will indirectly bear the fees and expenses, including for example advisory and administrative fees, charged by those investment companies in addition to the Fund’s direct fees and expenses and will be subject to the risks associated with investments in those companies. To the extent the Fund invests in other investment companies that invest in equity securities, fixed-income securities and/or foreign securities, or that track an index, the Fund is subject to the risks associated with the underlying investments held by the investment company or the index fluctuations to which the investment company is subject.
Prepayment and Extension Risk
Prepayment and extension risk is the risk that a bond or other fixed-income security or investment might, in the case of prepayment risk, be called or otherwise converted, prepaid or redeemed before maturity and, in the case of extension risk, that the investment might not be prepaid as expected. Due to a decline in interest rates or excess cash flow into the issuer, a debt security may be called or otherwise converted, prepaid or redeemed before maturity. If this occurs, no additional interest will be paid on the investment. The Fund may have to reinvest the proceeds in another investment at a lower rate, may not benefit from an increase in value that may result from declining interest rates, and may lose any premium it paid to acquire the security, any of which could result in a reduced yield to the Fund. The rate of prepayments tends to increase as interest rates fall, which could cause the average maturity of the portfolio to shorten. Conversely, extension risk is the risk that a decrease in prepayments may, as a result of higher interest rates or other factors, result in the extension of a security’s effective maturity, increase the risk of default or delayed payment, heighten interest rate risk and increase the potential for a decline in an investment’s price. In addition, as a consequence of a decrease in prepayments, the amount of principal available to the Fund for investment would be reduced. Extensions of obligations could cause the Fund to exhibit additional volatility and hold securities paying lower-than-market rates of interest. Either case could hurt the Fund’s performance.
18
American Beacon Garcia Hamilton Quality Bond FundSM
Notes to Financial Statements
October 31, 2024
Recent Market Events Risk
Both U.S. and international markets have experienced significant volatility in recent months and years. As a result of such volatility, investment returns may fluctuate significantly. Moreover, the risks discussed herein associated with an investment in the Fund may be increased.
Although interest rates were unusually low in recent years in the U.S. and abroad, in 2022, the Federal Reserve and certain foreign central banks began to raise interest rates as part of their efforts to address rising inflation. It is difficult to accurately predict the pace at which interest rates may continue to increase, the timing, frequency or magnitude of any such increases, or when such increases might stop. Additionally, various economic and political factors could cause the Federal Reserve or another foreign central bank to change their approach in the future and such actions may result in an economic slowdown in the U.S. and abroad. Unexpected increases in interest rates could lead to market volatility or reduce liquidity in certain sectors of the market. Deteriorating economic fundamentals may, in turn, increase the risk of default or insolvency of particular issuers, negatively impact market value, cause credit spreads to widen, and reduce bank balance sheets. Any of these could cause an increase in market volatility, reduce liquidity across various markets or decrease confidence in the markets. Additionally, high public debt in the U.S. and other countries creates ongoing systemic and market risks and policymaking uncertainty.
In March 2023, the shutdown of certain financial institutions in the U.S. and questions regarding the viability of other financial institutions raised economic concerns over disruption in the U.S. and global banking systems. There can be no certainty that the actions taken by the U.S. or foreign governments will be effective in mitigating the effects of financial institution failures on the economy and restoring public confidence in the U.S. and global banking systems.
Some countries, including the U.S., have in recent years adopted more protectionist trade policies. Slowing global economic growth; risks associated with a trade agreement between the United Kingdom and the European Union; the risks associated with ongoing trade negotiations with China; and the possibility of changes to some international trade agreements; political or economic dysfunction within some nations, including major producers of oil; and dramatic changes in commodity and currency prices could have adverse effects that cannot be foreseen at the present time.
Tensions, war, or open conflict between nations, such as between Russia and Ukraine, in the Middle East or in eastern Asia could affect the economies of many nations, including the United States. The duration of ongoing hostilities in the Middle East and between Russia and Ukraine, and any sanctions and related events cannot be predicted. Those events present material uncertainty and risk with respect to markets globally and the performance of the Fund and its investments or operations could be negatively impacted.
Regulators in the U.S. have proposed and recently adopted a number of changes to regulations involving the markets and issuers, some of which apply to the Fund. The full effect of various newly-adopted regulations is not currently known. Additionally, it is not clear whether the proposed regulations will be adopted. However, due to the broad scope of the new and proposed regulations, certain changes could limit the Fund’s ability to pursue its investment strategies or make certain investments, or may make it more costly for the Fund to operate, which may impact performance.
Economists and others have expressed increasing concern about the potential effects of global climate change on property and security values. Certain issuers, industries and regions may be adversely affected by the impacts of climate change, including on the demand for and the development of goods and services and related production costs, and the impacts of legislation, regulation and international accords related to climate change, as well as any indirect consequences of regulation or business trends driven by climate change.
19
American Beacon Garcia Hamilton Quality Bond FundSM
Notes to Financial Statements
October 31, 2024
Redemption Risk
The Fund may experience periods of high levels of redemptions that could cause the Fund to sell assets at inopportune times or at a loss or depressed value. The sale of assets to meet redemption requests may create net capital gains, which could cause the Fund to have to distribute substantial capital gains. Redemption risk is heightened during periods of declining or illiquid markets. During periods of heavy redemptions, the Fund may borrow funds through the interfund credit facility or from a bank line of credit, which may increase costs. A rise in interest rates or other market developments may cause investors to move out of fixed-income securities on a large scale. Heavy redemptions could hurt the Fund’s performance.
Sector Risk
Sector risk is the risk associated with the Fund holding a significant amount of investments in similar businesses, which would be similarly affected by particular economic or market events, which may, in certain circumstances, cause the value of the equity and debt securities of companies in a particular sector of the market to change. To the extent a Fund has substantial holdings within a particular sector, the risks to the Fund associated with that sector increase. In addition, when a Fund focuses its investments in certain sectors of the economy, its performance may be driven largely by sector performance and could fluctuate more widely than if the Fund were invested more evenly across sectors. Individual sectors may be more volatile, and may perform differently, than the broader market. The businesses that constitute a sector may all react the same way to economic, political or regulatory events. The Fund’s performance could also be affected if the sectors do not perform as expected. The lack of exposure to one or more sectors may adversely affect performance. As the Fund’s portfolio changes over time, the Fund’s exposure to a particular sector may become higher or lower.
U.S. Government Securities and Government-Sponsored Enterprises Risk
A security backed by the U.S. Treasury or the full faith and credit of the United States is guaranteed only as to the stated interest rate and face value at maturity, not its current market price. The market prices for such securities are not guaranteed and will fluctuate. Certain securities held by the Fund that are issued by government-sponsored enterprises, such as the Federal National Mortgage Association (“Fannie Mae”), Federal Home Loan Mortgage Corporation (“Freddie Mac”), Federal Home Loan Bank (“FHLB”), and Federal Farm Credit Bank (“FFCB”), are not guaranteed by the U.S. Treasury and are not backed by the full faith and credit of the U.S. government, and no assurance can be given that the U.S. government will provide financial support if these organizations do not have the funds to meet future payment obligations. U.S. government securities and securities of government-sponsored enterprises are also subject to credit risk, interest rate risk and market risk. The rising U.S. national debt may lead to adverse impacts on the value of U.S. government securities due to potentially higher costs for the U.S. government to obtain new financing. It is possible that the U.S. government and government-sponsored enterprises will not have the funds to meet their payment obligations in the future.
Variable and Floating Rate Securities Risk
The coupons on certain fixed-income securities in which the Fund may invest are not fixed and may fluctuate based upon changes in market rates. The coupon on a floating rate security is generally based on an interest rate such as a money-market index, SOFR, or a Treasury bill rate. Such securities are subject to interest rate risk and may fluctuate in value in response to interest rate changes if there is a delay between changes in market interest rates and the interest reset date for the obligation, or for other reasons. As short-term interest rates decline, the coupons on variable and floating rate securities typically decrease. Alternatively, during periods of rising interest rates, changes in the coupons of variable and floating rate securities may lag behind changes in market rates or may have limits on the maximum increases in the coupon rates. The value of variable and floating rate securities may decline if their coupons do not rise as much, or as quickly, as interest rates in general. Conversely, variable and floating rate securities will not generally increase in value if interest rates decline. Variable and floating rate securities are less effective at locking in a particular yield and are subject to credit risk. Certain types of floating rate instruments may also be subject to greater liquidity risk than other debt securities.
20
American Beacon Garcia Hamilton Quality Bond FundSM
Notes to Financial Statements
October 31, 2024
6. Federal Income and Excise Taxes
It is the policy of the Fund to qualify as a regulated investment company (“RIC”), by complying with all applicable provisions of Subchapter M of the Internal Revenue Code, as amended, and to make distributions of taxable income sufficient to relieve it from substantially all federal income and excise taxes. For federal income tax purposes, the Fund is treated as a single entity for the purpose of determining such qualification.
The Fund does not have any unrecorded tax liabilities in the accompanying financial statements. Each of the tax years in the four year period ended October 31, 2024 remain subject to examination by the Internal Revenue Service. If applicable, the Fund recognizes interest accrued related to unrecognized tax benefits in interest expense and penalties in “Other expenses” on the Statement of Operations.
The Fund may be subject to taxes imposed by countries in which it invests. Such taxes are generally based on returns of income earned or gains realized or repatriated. Taxes are accrued and applied to net investment income, net realized capital gains and net unrealized appreciation (depreciation), as applicable, as the income is earned or capital gains are recorded.
Dividends are categorized in accordance with income tax regulations which may treat certain transactions differently than U.S. GAAP. Accordingly, the character of distributions and composition of net assets for tax purposes may differ from those reflected in the accompanying financial statements.
The tax character of distributions paid were as follows:
| | | | | | | | | | | | |
| | | Year Ended
October 31, 2024 | | | | | | Year Ended
October 31, 2023 | |
Distributions paid from: | |
Ordinary income* | |
R5 Class | | $ | 357,969 | | | | | | | $ | 1,870,733 | |
Y Class | | | 1,078,617 | | | | | | | | 1,567,482 | |
Investor Class | | | 78,201 | | | | | | | | 25,683 | |
R6 Class | | | 8,576,658 | | | | | | | | 6,783,410 | |
| | | | | | | | | | | | |
Total distributions paid | | $ | 10,091,445 | | | | | | | $ | 10,247,308 | |
| | | | | | | | | | | | |
* For tax purposes, short-term capital gains are considered ordinary income distributions.
As of October 31, 2024, components of distributable earnings (deficits) on a tax basis were as follows:
| | | | | | | | | | | | | | | | | | | | | | | | | | | | |
Fund | | Tax Cost | | | | | | Unrealized
Appreciation | | | | | | Unrealized
(Depreciation) | | | | | | Net Unrealized
Appreciation
(Depreciation) | |
Garcia Hamilton Quality Bond | | $ | 275,063,132 | | | | | | | $ | 321,632 | | | | | | | $ | (12,563,212 | ) | | | | | | $ | (12,241,580 | ) |
| | | | | | | | | | | | | | | | | | | | | | | | | | | | | | | | | | | | | | | | | | | | |
Fund | | Net Unrealized
Appreciation
(Depreciation) | | | | | | Undistributed
Ordinary
Income | | | | | | Undistributed
Long-Term
Capital Gains | | | | | | Accumulated
Capital and
Other (Losses) | | | | | | Other Temporary
Differences | | | | | | Distributable
Earnings | |
Garcia Hamilton Quality Bond | | $ | (12,241,580 | ) | | | | | | $ | 883,178 | | | | | | | $ | - | | | | | | | $ | (49,369,737 | ) | | | | | | $ | (965 | ) | | | | | | $ | (60,729,104 | ) |
Financial reporting records are adjusted for permanent book/tax differences to reflect tax character. Financial records are not adjusted for temporary differences. The temporary differences between financial reporting and tax-basis reporting of unrealized appreciation (depreciation) are attributable primarily to the tax deferral of losses from wash sales, unused capital loss carryforwards, book amortization of premiums, and dividends payable.
21
American Beacon Garcia Hamilton Quality Bond FundSM
Notes to Financial Statements
October 31, 2024
Due to inherent differences in the recognition of income, expenses, and realized gains (losses) under U.S. GAAP and federal income tax regulations, permanent differences between book and tax reporting have been identified and appropriately reclassified on the Statement of Assets and Liabilities. The Fund had no permanent differences as of October 31, 2024.
For federal income tax purposes, the Fund measures its capital loss carryforwards annually at October 31, its fiscal year end. Capital loss carryforwards retain their character as short-term and/or long-term and may be carried forward and applied against future realized capital gains with no expiration date.
As of October 31, 2024, the Fund had $27,077,799 short-term and $22,291,938 long-term capital loss carryforwards.
7. Investment Transactions
The aggregate cost of purchases and proceeds from sales and maturities of investments, other than short-term obligations, for the year ended October 31, 2024 were as follows:
| | | | | | | | | | | | | | | | | | | | | | | | | | | | |
Fund | | Purchases (non-U.S.
Government
Securities) | | | | | | Purchases of U.S.
Government
Securities | | | | | | Sales (non-U.S.
Government
Securities) | | | | | | Sales of U.S.
Government
Securities | |
| Garcia Hamilton Quality Bond | | $ | 6,017,652 | | | | | | | $ | 80,950,645 | | | | | | | $ | 20,232,295 | | | | | | | $ | 78,842,201 | |
8. Borrowing Arrangements
Effective November 8, 2024 (the “Effective Date”), the Fund, along with certain other funds managed by the Manager (“Participating Funds”), renewed a committed revolving line of credit (the “Committed Line”) agreement with State Street Bank and Trust Company (the “Bank”) to be used to facilitate portfolio liquidity. The maximum borrowing amount under the Committed Line is $100 million with interest at a rate equal to the higher of (a) Overnight Bank Funding Rate (“OBFR”) daily fluctuating rate per annum equal to 1.25% plus the sum of 0.10% or (b) the Federal Funds daily fluctuating rate per annum on amounts borrowed. Each of the Participating Funds paid a proportional amount of a quarterly commitment fee at a rate of 0.25% per annum on the unused portion of the Committed Line amount. The Committed Line expires November 7, 2025, unless extended by the Bank or terminated by the Participating Funds in accordance with the agreement. Prior to the Effective Date, the maximum borrowing amount under the Committed Line was $100 million with an expiration date November 7, 2024.
On the Effective Date, the Fund, along with certain other Participating Funds managed by the Manager, also renewed an uncommitted discretionary demand revolving line of credit (the “Uncommitted Line”) agreement with the Bank to be used to facilitate portfolio liquidity. The maximum borrowing amount under the Uncommitted Line is $100 million with interest at a rate equal to the higher of (a) OBFR daily fluctuating rate per annum equal to 1.25% plus the sum of 0.10% or (b) the Federal Funds daily fluctuating rate per annum on amounts borrowed on each outstanding loan. Each of the Participating Funds paid a proportional amount of a closing fee of $35,000 on the Effective Date. The Uncommitted Line expires November 7, 2025, unless extended by the Bank or terminated by the Participating Funds in accordance with the agreement. Prior to the Effective Date, the maximum borrowing amount under the Uncommitted Line was $100 million with an expiration date November 7, 2024.
The Participating Funds paid administration, legal and arrangement fees, which are recognized as a component of “Line of credit interest expense” on the Statement of Operations, along with commitment fees, that have been allocated among the Participating Funds based on average daily net assets.
During the year ended October 31, 2024, the Fund did not utilize these facilities.
22
American Beacon Garcia Hamilton Quality Bond FundSM
Notes to Financial Statements
October 31, 2024
9. Capital Share Transactions
The tables below summarize the activity in capital shares for each Class of the Fund:
| | | | | | | | | | | | | | | | | | | | | | | | | | | | |
| | | R5 Class | |
| | | Year Ended
October 31, 2024 | | | | | | Year Ended
October 31, 2023 | |
Garcia Hamilton Quality Bond Fund | | Shares | | | | | | Amount | | | | | | Shares | | | | | | Amount | |
| Shares sold | | | 334,945 | | | | | | | $ | 2,859,516 | | | | | | | | 2,557,082 | | | | | | | $ | 22,072,236 | |
| Reinvestment of dividends | | | 38,557 | | | | | | | | 331,694 | | | | | | | | 142,894 | | | | | | | | 1,246,251 | |
| Shares redeemed | | | (1,166,864 | ) | | | | | | | (9,654,898 | ) | | | | | | | (16,884,928 | ) | | | | | | | (146,350,750 | ) |
| | | | | | | | | | | | | | | | | | | | | | | | | | | | |
| Net (decrease) in shares outstanding | | | (793,362 | ) | | | | | | $ | (6,463,688 | ) | | | | | | | (14,184,952 | ) | | | | | | $ | (123,032,263 | ) |
| | | | | | | | | | | | | | | | | | | | | | | | | | | | |
| | | | |
| | | Y Class | |
| | | Year Ended
October 31, 2024 | | | | | | Year Ended
October 31, 2023 | |
Garcia Hamilton Quality Bond Fund | | Shares | | | | | | Amount | | | | | | Shares | | | | | | Amount | |
| Shares sold | | | 1,108,993 | | | | | | | $ | 9,542,563 | | | | | | | | 4,151,066 | | | | | | | $ | 36,683,765 | |
| Reinvestment of dividends | | | 125,258 | | | | | | | | 1,078,616 | | | | | | | | 182,068 | | | | | | | | 1,567,034 | |
| Shares redeemed | | | (4,912,913 | ) | | | | | | | (42,243,014 | ) | | | | | | | (1,769,579 | ) | | | | | | | (14,889,312 | ) |
| | | | | | | | | | | | | | | | | | | | | | | | | | | | |
| Net increase (decrease) in shares outstanding | | | (3,678,662 | ) | | | | | | $ | (31,621,835 | ) | | | | | | | 2,563,555 | | | | | | | $ | 23,361,487 | |
| | | | | | | | | | | | | | | | | | | | | | | | | | | | |
| | | | |
| | | Investor Class | |
| | | Year Ended
October 31, 2024 | | | | | | Year Ended
October 31, 2023 | |
Garcia Hamilton Quality Bond Fund | | Shares | | | | | | Amount | | | | | | Shares | | | | | | Amount | |
| Shares sold | | | 262,461 | | | | | | | $ | 2,254,600 | | | | | | | | 18,623 | | | | | | | $ | 161,268 | |
| Reinvestment of dividends | | | 9,096 | | | | | | | | 78,201 | | | | | | | | 2,973 | | | | | | | | 25,683 | |
| Shares redeemed | | | (7,661 | ) | | | | | | | (66,128 | ) | | | | | | | (31,030 | ) | | | | | | | (267,389 | ) |
| | | | | | | | | | | | | | | | | | | | | | | | | | | | |
| Net increase (decrease) in shares outstanding | | | 263,896 | | | | | | | $ | 2,266,673 | | | | | | | | (9,434 | ) | | | | | | $ | (80,438 | ) |
| | | | | | | | | | | | | | | | | | | | | | | | | | | | |
| | | | |
| | | R6 Class | |
| | | Year Ended
October 31, 2024 | | | | | | Year Ended
October 31, 2023 | |
Garcia Hamilton Quality Bond Fund | | Shares | | | | | | Amount | | | | | | Shares | | | | | | Amount | |
| Shares sold | | | 3,121,227 | | | | | | | $ | 26,643,292 | | | | | | | | 2,709,351 | | | | | | | $ | 23,120,019 | |
| Reinvestment of dividends | | | 998,354 | | | | | | | | 8,576,657 | | | | | | | | 785,921 | | | | | | | | 6,776,746 | |
| Shares redeemed | | | (2,147,023 | ) | | | | | | | (18,673,788 | ) | | | | | | | (1,381,439 | ) | | | | | | | (12,081,915 | ) |
| | | | | | | | | | | | | | | | | | | | | | | | | | | | |
| Net increase in shares outstanding | | | 1,972,558 | | | | | | | $ | 16,546,161 | | | | | | | | 2,113,833 | | | | | | | $ | 17,814,850 | |
| | | | | | | | | | | | | | | | | | | | | | | | | | | | |
10. Subsequent Events
Management has evaluated subsequent events for possible recognition or disclosure in the financial statements through the date the financial statements are issued. Management has determined that there are no material events that would require disclosure in the Fund’s financial statements through this date.
23
American Beacon Garcia Hamilton Quality Bond FundSM
Financial Highlights
(For a share outstanding throughout the period)
| | | | | | | | | | | | | | | | | | | | | | | | | | | | | | | | | | | | |
| | | R5 ClassA | |
| | | Year Ended October 31, | |
| | | 2024 | | | | | | 2023 | | | | | | 2022 | | | | | | 2021 | | | | | | 2020 | |
| | | | |
Net asset value, beginning of period | | $ | 8.01 | | | | | | | $ | 8.37 | | | | | | | $ | 9.85 | | | | | | | $ | 10.27 | | | | | | | $ | 10.05 | |
| | | | | | | | | | | | | | | | | | | | | | | | | | | | | | | | | | | | |
Income (loss) from investment operations: | | | | | | | | | | | | | | | | | | | | | | | | | | | | | | | | | | | | |
Net investment income (loss) | | | 0.32 | B | | | | | | | 0.30 | B | | | | | | | 0.06 | | | | | | | | (0.01 | )B | | | | | | | 0.11 | |
Net gains (losses) on investments (both realized and unrealized) | | | 0.59 | | | | | | | | (0.37 | ) | | | | | | | (1.33 | ) | | | | | | | (0.08 | ) | | | | | | | 0.28 | |
| | | | | | | | | | | | | | | | | | | | | | | | | | | | | | | | | | | | |
Total income (loss) from investment operations | | | 0.91 | | | | | | | | (0.07 | ) | | | | | | | (1.27 | ) | | | | | | | (0.09 | ) | | | | | | | 0.39 | |
| | | | | | | | | | | | | | | | | | | | | | | | | | | | | | | | | | | | |
Less distributions: | | | | | | | | | | | | | | | | | | | | | | | | | | | | | | | | | | | | |
Dividends from net investment income | | | (0.33 | ) | | | | | | | (0.29 | ) | | | | | | | (0.21 | ) | | | | | | | (0.14 | ) | | | | | | | (0.17 | ) |
Distributions from net realized gains | | | - | | | | | | | | - | | | | | | | | - | | | | | | | | (0.19 | ) | | | | | | | - | |
| | | | | | | | | | | | | | | | | | | | | | | | | | | | | | | | | | | | |
Total distributions | | | (0.33 | ) | | | | | | | (0.29 | ) | | | | | | | (0.21 | ) | | | | | | | (0.33 | ) | | | | | | | (0.17 | ) |
| | | | | | | | | | | | | | | | | | | | | | | | | | | | | | | | | | | | |
Net asset value, end of period | | $ | 8.59 | | | | | | | $ | 8.01 | | | | | | | $ | 8.37 | | | | | | | $ | 9.85 | | | | | | | $ | 10.27 | |
| | | | | | | | | | | | | | | | | | | | | | | | | | | | | | | | | | | | |
Total returnC | | | 11.40 | % | | | | | | | (1.08 | )% | | | | | | | (13.04 | )% | | | | | | | (0.84 | )% | | | | | | | 3.93 | % |
| | | | | | | | | | | | | | | | | | | | | | | | | | | | | | | | | | | | |
| | | | | | | | | |
Ratios and supplemental data: | | | | | | | | | | | | | | | | | | | | | | | | | | | | | | | | | | | | |
Net assets, end of period | | $ | 9,390,194 | | | | | | | $ | 15,104,966 | | | | | | | $ | 134,519,084 | | | | | | | $ | 192,774,622 | | | | | | | $ | 172,774,140 | |
Ratios to average net assets: | | | | | | | | | | | | | | | | | | | | | | | | | | | | | | | | | | | | |
Expenses, before reimbursements and/or recoupments | | | 0.68 | % | | | | | | | 0.69 | % | | | | | | | 0.66 | % | | | | | | | 0.67 | % | | | | | | | 0.68 | % |
Expenses, net of reimbursements and/or recoupments | | | 0.45 | % | | | | | | | 0.45 | % | | | | | | | 0.45 | % | | | | | | | 0.45 | % | | | | | | | 0.45 | % |
Net investment income (loss), before expense reimbursements and/or recoupments | | | 3.49 | % | | | | | | | 3.20 | % | | | | | | | 1.06 | % | | | | | | | (0.32 | )% | | | | | | | 1.15 | % |
Net investment income (loss), net of reimbursements and/or recoupments | | | 3.72 | % | | | | | | | 3.44 | % | | | | | | | 1.27 | % | | | | | | | (0.10 | )% | | | | | | | 1.38 | % |
Portfolio turnover rate | | | 34 | % | | | | | | | 72 | % | | | | | | | 158 | % | | | | | | | 71 | % | | | | | | | 122 | % |
| A | Prior to February 28, 2020, the R5 Class was known as Institutional Class. |
| B | Per share amounts have been calculated using the average shares method. |
| C | Based on net asset value, which does not reflect the sales charge, redemption fee, or contingent deferred sales charge, if applicable. May include adjustments in accordance with U.S. GAAP and as such, the net asset value for reporting purposes and the returns based upon those net asset values may differ from the net asset value and returns for shareholder transactions. |
See accompanying notes
24
American Beacon Garcia Hamilton Quality Bond FundSM
Financial Highlights
(For a share outstanding throughout the period)
| | | | | | | | | | | | | | | | | | | | | | | | | | | | | | | | | | | | |
| | | Y Class | |
| | | Year Ended October 31, | |
| | | 2024 | | | | | | 2023 | | | | | | 2022 | | | | | | 2021 | | | | | | 2020 | |
| | | | |
Net asset value, beginning of period | | $ | 7.99 | | | | | | | $ | 8.36 | | | | | | | $ | 9.86 | | | | | | | $ | 10.27 | | | | | | | $ | 10.05 | |
| | | | | | | | | | | | | | | | | | | | | | | | | | | | | | | | | | | | |
Income (loss) from investment operations: | | | | | | | | | | | | | | | | | | | | | | | | | | | | | | | | | | | | |
Net investment income | | | 0.15 | | | | | | | | 0.37 | | | | | | | | 0.22 | | | | | | | | (0.00 | )A | | | | | | | 0.13 | |
Net gains (losses) on investments (both realized and unrealized) | | | 0.74 | | | | | | | | (0.46 | ) | | | | | | | (1.51 | ) | | | | | | | (0.08 | ) | | | | | | | 0.25 | |
| | | | | | | | | | | | | | | | | | | | | | | | | | | | | | | | | | | | |
Total income (loss) from investment operations | | | 0.89 | | | | | | | | (0.09 | ) | | | | | | | (1.29 | ) | | | | | | | (0.08 | ) | | | | | | | 0.38 | |
| | | | | | | | | | | | | | | | | | | | | | | | | | | | | | | | | | | | |
Less distributions: | | | | | | | | | | | | | | | | | | | | | | | | | | | | | | | | | | | | |
Dividends from net investment income | | | (0.32 | ) | | | | | | | (0.28 | ) | | | | | | | (0.21 | ) | | | | | | | (0.14 | ) | | | | | | | (0.16 | ) |
Distributions from net realized gains | | | - | | | | | | | | - | | | | | | | | - | | | | | | | | (0.19 | ) | | | | | | | - | |
| | | | | | | | | | | | | | | | | | | | | | | | | | | | | | | | | | | | |
Total distributions | | | (0.32 | ) | | | | | | | (0.28 | ) | | | | | | | (0.21 | ) | | | | | | | (0.33 | ) | | | | | | | (0.16 | ) |
| | | | | | | | | | | | | | | | | | | | | | | | | | | | | | | | | | | | |
Net asset value, end of period | | $ | 8.56 | | | | | | | $ | 7.99 | | | | | | | $ | 8.36 | | | | | | | $ | 9.86 | | | | | | | $ | 10.27 | |
| | | | | | | | | | | | | | | | | | | | | | | | | | | | | | | | | | | | |
Total returnB | | | 11.22 | % | | | | | | | (1.27 | )% | | | | | | | (13.24 | )% | | | | | | | (0.81 | )% | | | | | | | 3.83 | % |
| | | | | | | | | | | | | | | | | | | | | | | | | | | | | | | | | | | | |
| | | | | | | | | |
Ratios and supplemental data: | | | | | | | | | | | | | | | | | | | | | | | | | | | | | | | | | | | | |
Net assets, end of period | | $ | 20,651,157 | | | | | | | $ | 48,666,569 | | | | | | | $ | 29,473,503 | | | | | | | $ | 21,340,613 | | | | | | | $ | 18,928,869 | |
Ratios to average net assets: | | | | | | | | | | | | | | | | | | | | | | | | | | | | | | | | | | | | |
Expenses, before reimbursements and/or recoupments | | | 0.77 | % | | | | | | | 0.75 | % | | | | | | | 0.73 | % | | | | | | | 0.74 | % | | | | | | | 0.74 | % |
Expenses, net of reimbursements and/or recoupments | | | 0.51 | % | | | | | | | 0.51 | % | | | | | | | 0.51 | % | | | | | | | 0.52 | %C | | | | | | | 0.55 | % |
Net investment income (loss), before expense reimbursements and/or recoupments | | | 3.38 | % | | | | | | | 3.23 | % | | | | | | | 1.10 | % | | | | | | | (0.38 | )% | | | | | | | 1.03 | % |
Net investment income (loss), net of reimbursements and/or recoupments | | | 3.64 | % | | | | | | | 3.47 | % | | | | | | | 1.32 | % | | | | | | | (0.16 | )% | | | | | | | 1.22 | % |
Portfolio turnover rate | | | 34 | % | | | | | | | 72 | % | | | | | | | 158 | % | | | | | | | 71 | % | | | | | | | 122 | % |
| A | Amount represents less than $0.01 per share. |
| B | Based on net asset value, which does not reflect the sales charge, redemption fee, or contingent deferred sales charge, if applicable. May include adjustments in accordance with U.S. GAAP and as such, the net asset value for reporting purposes and the returns based upon those net asset values may differ from the net asset value and returns for shareholder transactions. |
| C | Expense ratios may exceed stated expense caps in Note 2 due to the change in the contractual expense caps on February 28, 2021 |
See accompanying notes
25
American Beacon Garcia Hamilton Quality Bond FundSM
Financial Highlights
(For a share outstanding throughout the period)
| | | | | | | | | | | | | | | | | | | | | | | | | | | | | | | | | | | | |
| | | Investor Class | |
| | | Year Ended October 31, | |
| | | 2024 | | | | | | 2023 | | | | | | 2022 | | | | | | 2021 | | | | | | 2020 | |
| | | | |
Net asset value, beginning of period | | $ | 7.99 | | | | | | | $ | 8.36 | | | | | | | $ | 9.85 | | | | | | | $ | 10.26 | | | | | | | $ | 10.05 | |
| | | | | | | | | | | | | | | | | | | | | | | | | | | | | | | | | | | | |
Income (loss) from investment operations: | | | | | | | | | | | | | | | | | | | | | | | | | | | | | | | | | | | | |
Net investment income (loss) | | | 0.81 | | | | | | | | 0.21 | | | | | | | | 0.09 | | | | | | | | (0.04 | )A | | | | | | | 0.13 | A |
Net gains (losses) on investments (both realized and unrealized) | | | 0.09 | | | | | | | | (0.33 | ) | | | | | | | (1.40 | ) | | | | | | | (0.07 | ) | | | | | | | 0.22 | |
| | | | | | | | | | | | | | | | | | | | | | | | | | | | | | | | | | | | |
Total income (loss) from investment operations | | | 0.90 | | | | | | | | (0.12 | ) | | | | | | | (1.31 | ) | | | | | | | (0.11 | ) | | | | | | | 0.35 | |
| | | | | | | | | | | | | | | | | | | | | | | | | | | | | | | | | | | | |
Less distributions: | | | | | | | | | | | | | | | | | | | | | | | | | | | | | | | | | | | | |
Dividends from net investment income | | | (0.30 | ) | | | | | | | (0.25 | ) | | | | | | | (0.18 | ) | | | | | | | (0.11 | ) | | | | | | | (0.14 | ) |
Distributions from net realized gains | | | - | | | | | | | | - | | | | | | | | - | | | | | | | | (0.19 | ) | | | | | | | - | |
| | | | | | | | | | | | | | | | | | | | | | | | | | | | | | | | | | | | |
Total distributions | | | (0.30 | ) | | | | | | | (0.25 | ) | | | | | | | (0.18 | ) | | | | | | | (0.30 | ) | | | | | | | (0.14 | ) |
| | | | | | | | | | | | | | | | | | | | | | | | | | | | | | | | | | | | |
Net asset value, end of period | | $ | 8.59 | | | | | | | $ | 7.99 | | | | | | | $ | 8.36 | | | | | | | $ | 9.85 | | | | | | | $ | 10.26 | |
| | | | | | | | | | | | | | | | | | | | | | | | | | | | | | | | | | | | |
Total returnB | | | 11.29 | % | | | | | | | (1.59 | )% | | | | | | | (13.47 | )% | | | | | | | (1.11 | )% | | | | | | | 3.54 | % |
| | | | | | | | | | | | | | | | | | | | | | | | | | | | | | | | | | | | |
| | | | | | | | | |
Ratios and supplemental data: | | | | | | | | | | | | | | | | | | | | | | | | | | | | | | | | | | | | |
Net assets, end of period | | $ | 3,064,413 | | | | | | | $ | 740,628 | | | | | | | $ | 853,503 | | | | | | | $ | 991,788 | | | | | | | $ | 365,190 | |
Ratios to average net assets: | | | | | | | | | | | | | | | | | | | | | | | | | | | | | | | | | | | | |
Expenses, before reimbursements and/or recoupments | | | 1.10 | % | | | | | | | 1.17 | % | | | | | | | 1.13 | % | | | | | | | 1.29 | % | | | | | | | 1.20 | % |
Expenses, net of reimbursements and/or recoupments | | | 0.83 | % | | | | | | | 0.83 | % | | | | | | | 0.83 | % | | | | | | | 0.83 | % | | | | | | | 0.83 | % |
Net investment income (loss), before expense reimbursements and/or recoupments | | | 3.08 | % | | | | | | | 2.78 | % | | | | | | | 0.63 | % | | | | | | | (0.91 | )% | | | | | | | 0.90 | % |
Net investment income (loss), net of reimbursements and/or recoupments | | | 3.36 | % | | | | | | | 3.12 | % | | | | | | | 0.93 | % | | | | | | | (0.45 | )% | | | | | | | 1.27 | % |
Portfolio turnover rate | | | 34 | % | | | | | | | 72 | % | | | | | | | 158 | % | | | | | | | 71 | % | | | | | | | 122 | % |
| A | Per share amounts have been calculated using the average shares method. |
| B | Based on net asset value, which does not reflect the sales charge, redemption fee, or contingent deferred sales charge, if applicable. May include adjustments in accordance with U.S. GAAP and as such, the net asset value for reporting purposes and the returns based upon those net asset values may differ from the net asset value and returns for shareholder transactions. |
See accompanying notes
26
American Beacon Garcia Hamilton Quality Bond FundSM
Financial Highlights
(For a share outstanding throughout the period)
| | | | | | | | | | | | | | | | | | | | | | | | | | | | | | | | | | | | |
| | | R6 Class | |
| | | Year Ended October 31, | |
| | | 2024 | | | | | | 2023 | | | | | | 2022 | | | | | | 2021 | | | | | | 2020 | |
| | | | |
Net asset value, beginning of period | | $ | 7.99 | | | | | | | $ | 8.36 | | | | | | | $ | 9.85 | | | | | | | $ | 10.26 | | | | | | | $ | 10.04 | |
| | | | | | | | | | | | | | | | | | | | | | | | | | | | | | | | | | | | |
Income (loss) from investment operations: | | | | | | | | | | | | | | | | | | | | | | | | | | | | | | | | | | | | |
Net investment income (loss) | | | 0.34 | | | | | | | | 0.32 | | | | | | | | 0.17 | | | | | | | | (0.01 | )A | | | | | | | 0.14 | |
Net gains (losses) on investments (both realized and unrealized) | | | 0.57 | | | | | | | | (0.40 | ) | | | | | | | (1.44 | ) | | | | | | | (0.06 | ) | | | | | | | 0.25 | |
| | | | | | | | | | | | | | | | | | | | | | | | | | | | | | | | | | | | |
Total income (loss) from investment operations | | | 0.91 | | | | | | | | (0.08 | ) | | | | | | | (1.27 | ) | | | | | | | (0.07 | ) | | | | | | | 0.39 | |
| | | | | | | | | | | | | | | | | | | | | | | | | | | | | | | | | | | | |
Less distributions: | | | | | | | | | | | | | | | | | | | | | | | | | | | | | | | | | | | | |
Dividends from net investment income | | | (0.33 | ) | | | | | | | (0.29 | ) | | | | | | | (0.22 | ) | | | | | | | (0.15 | ) | | | | | | | (0.17 | ) |
Distributions from net realized gains | | | - | | | | | | | | - | | | | | | | | - | | | | | | | | (0.19 | ) | | | | | | | - | |
| | | | | | | | | | | | | | | | | | | | | | | | | | | | | | | | | | | | |
Total distributions | | | (0.33 | ) | | | | | | | (0.29 | ) | | | | | | | (0.22 | ) | | | | | | | (0.34 | ) | | | | | | | (0.17 | ) |
| | | | | | | | | | | | | | | | | | | | | | | | | | | | | | | | | | | | |
Net asset value, end of period | | $ | 8.57 | | | | | | | $ | 7.99 | | | | | | | $ | 8.36 | | | | | | | $ | 9.85 | | | | | | | $ | 10.26 | |
| | | | | | | | | | | | | | | | | | | | | | | | | | | | | | | | | | | | |
Total returnB | | | 11.46 | % | | | | | | | (1.17 | )% | | | | | | | (13.11 | )% | | | | | | | (0.70 | )% | | | | | | | 3.97 | % |
| | | | | | | | | | | | | | | | | | | | | | | | | | | | | | | | | | | | |
| | | | | | | | | |
Ratios and supplemental data: | | | | | | | | | | | | | | | | | | | | | | | | | | | | | | | | | | | | |
Net assets, end of period | | $ | 231,744,478 | | | | | | | $ | 200,499,044 | | | | | | | $ | 191,990,607 | | | | | | | $ | 166,304,291 | | | | | | | $ | 141,893,384 | |
Ratios to average net assets: | | | | | | | | | | | | | | | | | | | | | | | | | | | | | | | | | | | | |
Expenses, before reimbursements and/or recoupments | | | 0.67 | % | | | | | | | 0.65 | % | | | | | | | 0.63 | % | | | | | | | 0.64 | % | | | | | | | 0.64 | % |
Expenses, net of reimbursements and/or recoupments | | | 0.41 | % | | | | | | | 0.41 | % | | | | | | | 0.41 | % | | | | | | | 0.41 | % | | | | | | | 0.41 | % |
Net investment income (loss), before expense reimbursements and/or recoupments | | | 3.50 | % | | | | | | | 3.31 | % | | | | | | | 1.14 | % | | | | | | | (0.28 | )% | | | | | | | 1.13 | % |
Net investment income (loss), net of reimbursements and/or recoupments | | | 3.76 | % | | | | | | | 3.55 | % | | | | | | | 1.36 | % | | | | | | | (0.05 | )% | | | | | | | 1.36 | % |
Portfolio turnover rate | | | 34 | % | | | | | | | 72 | % | | | | | | | 158 | % | | | | | | | 71 | % | | | | | | | 122 | % |
| A | Per share amounts have been calculated using the average shares method. |
| B | Based on net asset value, which does not reflect the sales charge, redemption fee, or contingent deferred sales charge, if applicable. May include adjustments in accordance with U.S. GAAP and as such, the net asset value for reporting purposes and the returns based upon those net asset values may differ from the net asset value and returns for shareholder transactions. |
See accompanying notes
27
American Beacon FundsSM
Federal Tax Information
October 31, 2024 (Unaudited)
Certain tax information regarding the Funds are required to be provided to shareholders based upon the Funds’ income and distributions for the taxable year ended October 31, 2024. The information and distributions reported herein may differ from information and distributions taxable to the shareholders for the calendar year ended December 31, 2024.
The Fund designated the following items with regard to distributions paid during the fiscal year ended October 31, 2024. All designations are based on financial information available as of this annual report and, accordingly, are subject to change. For each item, it is the intention of the Funds to designate the maximum amount permitted under the Internal Revenue Code of 1986, as amended, and the regulations there under.
Corporate Dividends-Received Deduction:
| | | | |
Garcia Hamilton Quality Bond | | | 0.00 | % |
Qualified Dividend Income:
| | | | |
Garcia Hamilton Quality Bond | | | 0.00 | % |
Long-Term Capital Gain Distributions:
| | | | |
Garcia Hamilton Quality Bond | | $ | 0 | |
Short-Term Capital Gain Distributions:
| | | | |
Garcia Hamilton Quality Bond | | $ | 0 | |
Shareholders will receive notification in January 2025 of the applicable tax information necessary to prepare their 2024 income tax returns.
28

Delivery of Documents
If you invest in the Fund through a financial institution, you may be able to receive the Fund’s regulatory mailings, such as the Prospectus, Annual Report, Semi-Annual Report and Financial Statement Reports, by e-mail. If you are interested in this option, please go to www.icsdelivery.com and search for your financial institution’s name or contact your financial institution directly.
You may request a paper copy of this document at no charge by contacting your financial institution. This document is also available for download at www.americanbeaconfunds.com or you can request an electronic copy by contacting your financial institution.
To obtain more information about the Fund:
| | |
 | |  |
| | |
| By E-mail: | | On the Internet: |
| american_beacon.funds@ambeacon.com | | Visit our website at www.americanbeaconfunds.com |
| | | |
| | | |
| | |

By Telephone: Call (800) 658-5811 | | 
By Mail: American Beacon Funds P.O. Box 219643 Kansas City, MO 64121-9643 |
|
|
|
| | | |
Fund Service Providers:
| | | | | | | | | | | | |
CUSTODIAN State Street Bank and Trust Company Boston, Massachusetts | | | | TRANSFER AGENT SS&C GIDS, Inc. Quincy, Massachusetts | | | | INDEPENDENT REGISTERED PUBLIC ACCOUNTING FIRM PricewaterhouseCoopers LLP Boston, Massachusetts | | | | DISTRIBUTOR Resolute Investment Distributors, Inc. Irving, Texas |
This report is prepared for shareholders of the American Beacon Funds and may be distributed to others only if preceded or accompanied by a current Prospectus or Summary Prospectus.
American Beacon Funds and American Beacon Garcia Hamilton Quality Bond Fund are service marks of American Beacon Advisors, Inc
AR 10/24

American Beacon Funds
Although information has been compiled from reliable sources, American Beacon Advisors, Inc. makes no representation as to the completeness or accuracy of the statements contained herein. All information is as of the end of the reporting period, unless noted otherwise, and is subject to change. Each Fund’s portfolio composition will change depending on economic and market conditions.
American Beacon Funds | October 31, 2024 |
Contents
American Beacon Large Cap Value FundSM
Report of Independent Registered Public Accounting Firm
To the Board of Trustees of American Beacon Funds and Shareholders of American Beacon Large Cap Value Fund
Opinion on the Financial Statements
We have audited the accompanying statement of assets and liabilities, including the schedule of investments, of American Beacon Large Cap Value Fund (one of the funds constituting American Beacon Funds, referred hereafter as the “Fund”) as of October 31, 2024, the related statement of operations for the year ended October 31, 2024, the statement of changes in net assets for each of the two years in the period ended October 31, 2024, including the related notes, and the financial highlights for each of the three years in the period ended October 31, 2024 (collectively referred to as the “financial statements”). In our opinion, the financial statements present fairly, in all material respects, the financial position of the Fund as of October 31, 2024, the results of its operations for the year then ended, the changes in its net assets for each of the two years in the period ended October 31, 2024 and the financial highlights for each of the three years in the period ended October 31, 2024 in conformity with accounting principles generally accepted in the United States of America.
The financial statements of the Fund as of and for the year ended October 31, 2021 and the financial highlights for each of the periods ended on or prior to October 31, 2021 (not presented herein, other than the financial highlights) were audited by other auditors whose report dated December 30, 2021 expressed an unqualified opinion on those financial statements and financial highlights.
Basis for Opinion
These financial statements are the responsibility of the Fund’s management. Our responsibility is to express an opinion on the Fund’s financial statements based on our audits. We are a public accounting firm registered with the Public Company Accounting Oversight Board (United States) (PCAOB) and are required to be independent with respect to the Fund in accordance with the U.S. federal securities laws and the applicable rules and regulations of the Securities and Exchange Commission and the PCAOB.
We conducted our audits of these financial statements in accordance with the standards of the PCAOB. Those standards require that we plan and perform the audit to obtain reasonable assurance about whether the financial statements are free of material misstatement, whether due to error or fraud.
Our audits included performing procedures to assess the risks of material misstatement of the financial statements, whether due to error or fraud, and performing procedures that respond to those risks. Such procedures included examining, on a test basis, evidence regarding the amounts and disclosures in the financial statements. Our audits also included evaluating the accounting principles used and significant estimates made by management, as well as evaluating the overall presentation of the financial statements. Our procedures included confirmation of securities owned as of October 31, 2024 by correspondence with the custodian and brokers; when replies were not received from brokers, we performed other auditing procedures. We believe that our audits provide a reasonable basis for our opinion.
/s/PricewaterhouseCoopers LLP
Boston, Massachusetts
December 27, 2024
We have served as the auditor of one or more investment companies in the American Beacon family of funds since 2016.
1
American Beacon Large Cap Value FundSM
Schedule of Investments
October 31, 2024
| | | | | | | | | | | | | | | |
| | | |
| | | Shares | | | | Fair Value |
| | | | | | | |
| | | |
| COMMON STOCKS - 89.75% | | | | | | |
| | | |
| Communication Services - 3.73% | | | | | | |
| | | |
| Entertainment - 0.62% | | | | | | |
| Electronic Arts, Inc. | | | | 102,291 | | | | | | | | | $ | 15,430,597 | |
| Warner Bros Discovery, Inc.A | | | | 758,361 | | | | | | | | | | 6,165,475 | |
| | | | | | | | | | | | | | | |
| | | | | | | | | | | | | | | |
| | | | | | | | | | | | | | 21,596,072 | |
| | | | | | | | | | | | | | | |
| | | | | | | | | | | | | | | |
| | | |
| Interactive Media & Services - 1.10% | | | | | | |
| Alphabet, Inc., Class A | | | | 224,790 | | | | | | | | | | 38,463,817 | |
| | | | | | | | | | | | | | | |
| | | | | | | | | | | | | | | |
| | | |
| Media - 2.01% | | | | | | |
| Comcast Corp., Class A | | | | 1,400,291 | | | | | | | | | | 61,150,708 | |
| Omnicom Group, Inc. | | | | 58,075 | | | | | | | | | | 5,865,575 | |
| Paramount Global, Class B | | | | 276,315 | | | | | | | | | | 3,022,886 | |
| | | | | | | | | | | | | | | |
| | | | | | | | | | | | | | | |
| | | | | | | | | | | | | | 70,039,169 | |
| | | | | | | | | | | | | | | |
| | | | | | | | | | | | | | | |
Total Communication Services | | | | | | | | | | | | | | 130,099,058 | |
| | | | | | | | | | | | | | | |
| | | | | | | | | | | | | | | |
| | | |
| Consumer Discretionary - 6.72% | | | | | | |
| | | |
| Automobile Components - 0.97% | | | | | | |
| Adient PLCA | | | | 110,287 | | | | | | | | | | 2,153,905 | |
| Aptiv PLCA | | | | 455,241 | | | | | | | | | | 25,871,346 | |
| BorgWarner, Inc. | | | | 172,525 | | | | | | | | | | 5,802,016 | |
| | | | | | | | | | | | | | | |
| | | | | | | | | | | | | | | |
| | | | | | | | | | | | | | 33,827,267 | |
| | | | | | | | | | | | | | | |
| | | | | | | | | | | | | | | |
| | | |
| Automobiles - 1.00% | | | | | | |
| General Motors Co. | | | | 683,564 | | | | | | | | | | 34,697,708 | |
| | | | | | | | | | | | | | | |
| | | | | | | | | | | | | | | |
| | | |
| Hotels, Restaurants & Leisure - 3.32% | | | | | | |
| Aramark | | | | 294,547 | | | | | | | | | | 11,142,713 | |
| Booking Holdings, Inc. | | | | 1,361 | | | | | | | | | | 6,364,376 | |
| Carnival Corp.A | | | | 1,896,499 | | | | | | | | | | 41,722,978 | |
| Las Vegas Sands Corp. | | | | 539,029 | | | | | | | | | | 27,948,654 | |
| Marriott International, Inc., Class A | | | | 57,647 | | | | | | | | | | 14,989,373 | |
| Wynn Resorts Ltd. | | | | 140,033 | | | | | | | | | | 13,445,969 | |
| | | | | | | | | | | | | | | |
| | | | | | | | | | | | | | | |
| | | | | | | | | | | | | | 115,614,063 | |
| | | | | | | | | | | | | | | |
| | | |
| Specialty Retail - 1.43% | | | | | | |
| Lithia Motors, Inc. | | | | 76,490 | | | | | | | | | | 25,422,981 | |
| Lowe’s Cos., Inc. | | | | 93,576 | | | | | | | | | | 24,501,004 | |
| | | | | | | | | | | | | | | |
| | | | | | | | | | | | | | | |
| | | | | | | | | | | | | | 49,923,985 | |
| | | | | | | | | | | | | | | |
| | | | | | | | | | | | | | | |
Total Consumer Discretionary | | | | | | | | | | | | | | 234,063,023 | |
| | | | | | | | | | | | | | | |
| | | | | | | | | | | | | | | |
| | | |
| Consumer Staples - 4.59% | | | | | | |
| | | |
| Beverages - 1.05% | | | | | | |
| Keurig Dr. Pepper, Inc. | | | | 696,497 | | | | | | | | | | 22,949,576 | |
| PepsiCo, Inc. | | | | 82,484 | | | | | | | | | | 13,698,943 | |
| | | | | | | | | | | | | | | |
| | | | | | | | | | | | | | | |
| | | | | | | | | | | | | | 36,648,519 | |
| | | | | | | | | | | | | | | |
| | | | | | | | | | | | | | | |
| | | |
| Consumer Staples Distribution & Retail - 0.44% | | | | | | |
| Target Corp. | | | | 103,213 | | | | | | | | | | 15,486,079 | |
| | | | | | | | | | | | | | | |
| | | | | | | | | | | | | | | |
| | | |
| Food Products - 1.51% | | | | | | |
| Conagra Brands, Inc. | | | | 287,186 | | | | | | | | | | 8,311,163 | |
| Kraft Heinz Co. | | | | 544,825 | | | | | | | | | | 18,229,844 | |
See accompanying notes
2
American Beacon Large Cap Value FundSM
Schedule of Investments
October 31, 2024
| | | | | | | | | | | | | | | |
| | | |
| | | Shares | | | | Fair Value |
| | | | | | | |
| | | |
| COMMON STOCKS - 89.75% (continued) | | | | | | |
| | | |
| Consumer Staples - 4.59% (continued) | | | | | | |
| | | |
| Food Products - 1.51% (continued) | | | | | | |
| Mondelez International, Inc., Class A | | | | 195,973 | | | | | | | | | $ | 13,420,231 | |
| Nestle SA, ADR | | | | 132,892 | | | | | | | | | | 12,560,952 | |
| | | | | | | | | | | | | | | |
| | | | | | | | | | | | | | | |
| | | | | | | | | | | | | | 52,522,190 | |
| | | | | | | | | | | | | | | |
| | | | | | | | | | | | | | | |
| | | |
| Household Products - 0.22% | | | | | | |
| Kimberly-Clark Corp. | | | | 57,511 | | | | | | | | | | 7,716,826 | |
| | | | | | | | | | | | | | | |
| | | | | | | | | | | | | | | |
| | | |
| Personal Products - 0.35% | | | | | | |
| Kenvue, Inc. | | | | 529,208 | | | | | | | | | | 12,134,739 | |
| | | | | | | | | | | | | | | |
| | | | | | | | | | | | | | | |
| | | |
| Tobacco - 1.02% | | | | | | |
| Philip Morris International, Inc. | | | | 267,012 | | | | | | | | | | 35,432,492 | |
| | | | | | | | | | | | | | | |
| | | | | | | | | | | | | | | |
Total Consumer Staples | | | | | | | | | | | | | | 159,940,845 | |
| | | | | | | | | | | | | | | |
| | | | | | | | | | | | | | | |
| | | |
| Energy - 8.48% | | | | | | |
| | | |
| Energy Equipment & Services - 1.87% | | | | | | |
| Baker Hughes Co. | | | | 466,706 | | | | | | | | | | 17,772,164 | |
| Halliburton Co. | | | | 748,563 | | | | | | | | | | 20,765,138 | |
| NOV, Inc. | | | | 1,390,346 | | | | | | | | | | 21,564,266 | |
| Schlumberger NV | | | | 120,468 | | | | | | | | | | 4,827,153 | |
| | | | | | | | | | | | | | | |
| | | | | | | | | | | | | | | |
| | | | | | | | | | | | | | 64,928,721 | |
| | | | | | | | | | | | | | | |
| | | | | | | | | | | | | | | |
| | | |
| Oil, Gas & Consumable Fuels - 6.61% | | | | | | |
| APA Corp. | | | | 1,321,886 | | | | | | | | | | 31,196,510 | |
| Chevron Corp. | | | | 105,773 | | | | | | | | | | 15,741,138 | |
| ConocoPhillips | | | | 231,550 | | | | | | | | | | 25,363,987 | |
| EOG Resources, Inc. | | | | 73,854 | | | | | | | | | | 9,007,234 | |
| Exxon Mobil Corp. | | | | 443,242 | | | | | | | | | | 51,761,801 | |
| Hess Corp. | | | | 137,662 | | | | | | | | | | 18,512,786 | |
| Marathon Oil Corp. | | | | 386,195 | | | | | | | | | | 10,697,601 | |
| Murphy Oil Corp. | | | | 121,229 | | | | | | | | | | 3,816,289 | |
| Ovintiv, Inc. | | | | 386,380 | | | | | | | | | | 15,146,096 | |
| Permian Resources Corp. | | | | 837,726 | | | | | | | | | | 11,418,205 | |
| Phillips 66 | | | | 114,195 | | | | | | | | | | 13,911,235 | |
| Shell PLC, ADR | | | | 353,436 | | | | | | | | | | 23,874,602 | |
| | | | | | | | | | | | | | | |
| | | | | | | | | | | | | | | |
| | | | | | | | | | | | | | 230,447,484 | |
| | | | | | | | | | | | | | | |
| | | | | | | | | | | | | | | |
Total Energy | | | | | | | | | | | | | | 295,376,205 | |
| | | | | | | | | | | | | | | |
| | | | | | | | | | | | | | | |
| | | |
| Financials - 21.93% | | | | | | |
| | | |
| Banks - 8.62% | | | | | | |
| Bank of America Corp. | | | | 1,040,848 | | | | | | | | | | 43,528,263 | |
| Citigroup, Inc. | | | | 977,127 | | | | | | | | | | 62,702,240 | |
| Citizens Financial Group, Inc. | | | | 400,075 | | | | | | | | | | 16,851,159 | |
| First Citizens BancShares, Inc., Class A | | | | 2,865 | | | | | | | | | | 5,550,508 | |
| JPMorgan Chase & Co. | | | | 242,283 | | | | | | | | | | 53,767,443 | |
| M&T Bank Corp. | | | | 71,190 | | | | | | | | | | 13,859,269 | |
| PNC Financial Services Group, Inc. | | | | 72,384 | | | | | | | | | | 13,627,736 | |
| Truist Financial Corp. | | | | 192,894 | | | | | | | | | | 8,304,087 | |
| U.S. Bancorp | | | | 686,603 | | | | | | | | | | 33,169,791 | |
| Wells Fargo & Co. | | | | 757,053 | | | | | | | | | | 49,147,881 | |
| | | | | | | | | | | | | | | |
| | | | | | | | | | | | | | | |
| | | | | | | | | | | | | | 300,508,377 | |
| | | | | | | | | | | | | | | |
See accompanying notes
3
American Beacon Large Cap Value FundSM
Schedule of Investments
October 31, 2024
| | | | | | | | | | | | | | | |
| | | |
| | | Shares | | | | Fair Value |
| | | | | | | |
| | | |
| COMMON STOCKS - 89.75% (continued) | | | | | | |
| | | |
| Financials - 21.93% (continued) | | | | | | |
| | | |
| Capital Markets - 3.31% | | | | | | |
| Bank of New York Mellon Corp. | | | | 192,710 | | | | | | | | | $ | 14,522,626 | |
| Blackrock, Inc. | | | | 14,216 | | | | | | | | | | 13,946,323 | |
| Goldman Sachs Group, Inc. | | | | 11,414 | | | | | | | | | | 5,910,055 | |
| KKR & Co., Inc. | | | | 104,943 | | | | | | | | | | 14,507,320 | |
| Morgan Stanley | | | | 210,274 | | | | | | | | | | 24,444,353 | |
| Nasdaq, Inc. | | | | 255,557 | | | | | | | | | | 18,890,773 | |
| State Street Corp. | | | | 246,521 | | | | | | | | | | 22,877,149 | |
| | | | | | | | | | | | | | | |
| | | | | | | | | | | | | | | |
| | | | | | | | | | | | | | 115,098,599 | |
| | | | | | | | | | | | | | | |
| | | | | | | | | | | | | | | |
| | | |
| Consumer Finance - 1.70% | | | | | | |
| American Express Co. | | | | 170,016 | | | | | | | | | | 45,917,921 | |
| Capital One Financial Corp. | | | | 35,544 | | | | | | | | | | 5,786,208 | |
| Discover Financial Services | | | | 49,980 | | | | | | | | | | 7,418,531 | |
| | | | | | | | | | | | | | | |
| | | | | | | | | | | | | | | |
| | | | | | | | | | | | | | 59,122,660 | |
| | | | | | | | | | | | | | | |
| | | | | | | | | | | | | | | |
| | | |
| Financial Services - 2.10% | | | | | | |
| Corebridge Financial, Inc. | | | | 369,043 | | | | | | | | | | 11,724,496 | |
| Fidelity National Information Services, Inc. | | | | 684,025 | | | | | | | | | | 61,377,563 | |
| | | | | | | | | | | | | | | |
| | | | | | | | | | | | | | | |
| | | | | | | | | | | | | | 73,102,059 | |
| | | | | | | | | | | | | | | |
| | | | | | | | | | | | | | | |
| | | |
| Insurance - 6.20% | | | | | | |
| American International Group, Inc. | | | | 561,303 | | | | | | | | | | 42,591,672 | |
| Aon PLC, Class A | | | | 78,653 | | | | | | | | | | 28,855,426 | |
| Chubb Ltd. | | | | 75,834 | | | | | | | | | | 21,418,555 | |
| Hartford Financial Services Group, Inc. | | | | 150,303 | | | | | | | | | | 16,599,463 | |
| Marsh & McLennan Cos., Inc. | | | | 121,466 | | | | | | | | | | 26,508,740 | |
| Progressive Corp. | | | | 174,798 | | | | | | | | | | 42,446,198 | |
| Travelers Cos., Inc. | | | | 85,184 | | | | | | | | | | 20,950,153 | |
| Willis Towers Watson PLC | | | | 55,776 | | | | | | | | | | 16,854,949 | |
| | | | | | | | | | | | | | | |
| | | | | | | | | | | | | | | |
| | | | | | | | | | | | | | 216,225,156 | |
| | | | | | | | | | | | | | | |
| | | | | | | | | | | | | | | |
Total Financials | | | | | | | | | | | | | | 764,056,851 | |
| | | | | | | | | | | | | | | |
| | | | | | | | | | | | | | | |
| | | |
| Health Care - 12.99% | | | | | | |
| | | |
| Biotechnology - 0.51% | | | | | | |
| AbbVie, Inc. | | | | 87,426 | | | | | | | | | | 17,823,539 | |
| | | | | | | | | | | | | | | |
| | | | | | | | | | | | | | | |
| | | |
| Health Care Equipment & Supplies - 2.69% | | | | | | |
| Abbott Laboratories | | | | 129,652 | | | | | | | | | | 14,698,647 | |
| GE HealthCare Technologies, Inc. | | | | 250,937 | | | | | | | | | | 21,919,347 | |
| Medtronic PLC | | | | 485,673 | | | | | | | | | | 43,346,315 | |
| Solventum Corp.A | | | | 79,500 | | | | | | | | | | 5,770,110 | |
| Zimmer Biomet Holdings, Inc. | | | | 73,749 | | | | | | | | | | 7,885,243 | |
| | | | | | | | | | | | | | | |
| | | | | | | | | | | | | | | |
| | | | | | | | | | | | | | 93,619,662 | |
| | | | | | | | | | | | | | | |
| | | | | | | | | | | | | | | |
| | | |
| Health Care Providers & Services - 6.26% | | | | | | |
| Centene Corp.A | | | | 209,410 | | | | | | | | | | 13,037,867 | |
| Cigna Group | | | | 132,689 | | | | | | | | | | 41,771,824 | |
| CVS Health Corp. | | | | 447,685 | | | | | | | | | | 25,276,295 | |
| Elevance Health, Inc. | | | | 141,149 | | | | | | | | | | 57,272,618 | |
| HCA Healthcare, Inc. | | | | 21,221 | | | | | | | | | | 7,612,822 | |
| Humana, Inc. | | | | 51,337 | | | | | | | | | | 13,236,219 | |
| Labcorp Holdings, Inc. | | | | 25,280 | | | | | | | | | | 5,770,666 | |
See accompanying notes
4
American Beacon Large Cap Value FundSM
Schedule of Investments
October 31, 2024
| | | | | | | | | | | | | | | |
| | | |
| | | Shares | | | | Fair Value |
| | | | | | | |
| | | |
| COMMON STOCKS - 89.75% (continued) | | | | | | |
| | | |
| Health Care - 12.99% (continued) | | | | | | |
| | | |
| Health Care Providers & Services - 6.26% (continued) | | | | | | |
| McKesson Corp. | | | | 51,953 | | | | | | | | | $ | 26,007,152 | |
| UnitedHealth Group, Inc. | | | | 49,481 | | | | | | | | | | 27,932,025 | |
| | | | | | | | | | | | | | | |
| | | | | | | | | | | | | | | |
| | | | | | | | | | | | | | 217,917,488 | |
| | | | | | | | | | | | | | | |
| | | | | | | | | | | | | | | |
| | | |
| Life Sciences Tools & Services - 0.51% | | | | | | |
| Avantor, Inc.A | | | | 799,312 | | | | | | | | | | 17,880,609 | |
| | | | | | | | | | | | | | | |
| | | | | | | | | | | | | | | |
| | | |
| Pharmaceuticals - 3.02% | | | | | | |
| GSK PLC, ADRB | | | | 135,615 | | | | | | | | | | 4,985,207 | |
| Johnson & Johnson | | | | 153,750 | | | | | | | | | | 24,578,475 | |
| Merck & Co., Inc. | | | | 306,889 | | | | | | | | | | 31,400,882 | |
| Pfizer, Inc. | | | | 559,282 | | | | | | | | | | 15,827,681 | |
| Sanofi SA, ADR | | | | 535,931 | | | | | | | | | | 28,340,031 | |
| | | | | | | | | | | | | | | |
| | | | | | | | | | | | | | | |
| | | | | | | | | | | | | | 105,132,276 | |
| | | | | | | | | | | | | | | |
| | | | | | | | | | | | | | | |
Total Health Care | | | | | | | | | | | | | | 452,373,574 | |
| | | | | | | | | | | | | | | |
| | | | | | | | | | | | | | | |
| | | |
| Industrials - 11.78% | | | | | | |
| | | |
| Aerospace & Defense - 3.30% | | | | | | |
| Boeing Co.A | | | | 207,842 | | | | | | | | | | 31,032,889 | |
| General Dynamics Corp. | | | | 101,906 | | | | | | | | | | 29,716,809 | |
| Northrop Grumman Corp. | | | | 28,387 | | | | | | | | | | 14,449,551 | |
| RTX Corp. | | | | 328,536 | | | | | | | | | | 39,749,571 | |
| | | | | | | | | | | | | | | |
| | | | | | | | | | | | | | | |
| | | | | | | | | | | | | | 114,948,820 | |
| | | | | | | | | | | | | | | |
| | | | | | | | | | | | | | | |
| | | |
| Air Freight & Logistics - 0.67% | | | | | | |
| FedEx Corp. | | | | 85,336 | | | | | | | | | | 23,369,264 | |
| | | | | | | | | | | | | | | |
| | | | | | | | | | | | | | | |
| | | |
| Building Products - 0.81% | | | | | | |
| Johnson Controls International PLC | | | | 310,045 | | | | | | | | | | 23,423,900 | |
| Trane Technologies PLC | | | | 13,086 | | | | | | | | | | 4,843,914 | |
| | | | | | | | | | | | | | | |
| | | | | | | | | | | | | | | |
| | | | | | | | | | | | | | 28,267,814 | |
| | | | | | | | | | | | | | | |
| | | | | | | | | | | | | | | |
| | | |
| Construction & Engineering - 0.43% | | | | | | |
| AECOM | | | | 98,183 | | | | | | | | | | 10,485,944 | |
| Fluor Corp.A | | | | 88,964 | | | | | | | | | | 4,651,038 | |
| | | | | | | | | | | | | | | |
| | | | | | | | | | | | | | | |
| | | | | | | | | | | | | | 15,136,982 | |
| | | | | | | | | | | | | | | |
| | | | | | | | | | | | | | | |
| | | |
| Electrical Equipment - 1.16% | | | | | | |
| Eaton Corp. PLC | | | | 41,423 | | | | | | | | | | 13,735,038 | |
| Vertiv Holdings Co., Class A | | | | 242,920 | | | | | | | | | | 26,548,727 | |
| | | | | | | | | | | | | | | |
| | | | | | | | | | | | | | | |
| | | | | | | | | | | | | | 40,283,765 | |
| | | | | | | | | | | | | | | |
| | | | | | | | | | | | | | | |
| | | |
| Ground Transportation - 1.34% | | | | | | |
| JB Hunt Transport Services, Inc. | | | | 92,931 | | | | | | | | | | 16,785,197 | |
| Norfolk Southern Corp. | | | | 36,961 | | | | | | | | | | 9,256,143 | |
| Union Pacific Corp. | | | | 87,832 | | | | | | | | | | 20,383,172 | |
| | | | | | | | | | | | | | | |
| | | | | | | | | | | | | | | |
| | | | | | | | | | | | | | 46,424,512 | |
| | | | | | | | | | | | | | | |
| | | | | | | | | | | | | | | |
| | | |
| Industrial Conglomerates - 0.50% | | | | | | |
| Honeywell International, Inc. | | | | 84,369 | | | | | | | | | | 17,353,016 | |
| | | | | | | | | | | | | | | |
See accompanying notes
5
American Beacon Large Cap Value FundSM
Schedule of Investments
October 31, 2024
| | | | | | | | | | | | | | | |
| | | |
| | | Shares | | | | Fair Value |
| | | | | | | |
| | | |
| COMMON STOCKS - 89.75% (continued) | | | | | | |
| | | |
| Industrials - 11.78% (continued) | | | | | | |
| | | |
| Machinery - 2.58% | | | | | | |
| CNH Industrial NV | | | | 1,035,817 | | | | | | | | | $ | 11,632,225 | |
| Cummins, Inc. | | | | 56,413 | | | | | | | | | | 18,558,749 | |
| Deere & Co. | | | | 13,800 | | | | | | | | | | 5,584,722 | |
| Illinois Tool Works, Inc. | | | | 43,555 | | | | | | | | | | 11,373,517 | |
| Otis Worldwide Corp. | | | | 36,978 | | | | | | | | | | 3,631,240 | |
| PACCAR, Inc. | | | | 218,855 | | | | | | | | | | 22,822,199 | |
| Stanley Black & Decker, Inc. | | | | 120,995 | | | | | | | | | | 11,245,275 | |
| Timken Co. | | | | 64,632 | | | | | | | | | | 5,364,456 | |
| | | | | | | | | | | | | | | |
| | | | | | | | | | | | | | | |
| | | | | | | | | | | | | | 90,212,383 | |
| | | | | | | | | | | | | | | |
| | | | | | | | | | | | | | | |
| | | |
| Professional Services - 0.85% | | | | | | |
| Equifax, Inc. | | | | 40,345 | | | | | | | | | | 10,692,232 | |
| Jacobs Solutions, Inc. | | | | 133,912 | | | | | | | | | | 18,825,349 | |
| | | | | | | | | | | | | | | |
| | | | | | | | | | | | | | | |
| | | | | | | | | | | | | | 29,517,581 | |
| | | | | | | | | | | | | | | |
| | | | | | | | | | | | | | | |
| | | |
| Trading Companies & Distributors - 0.14% | | | | | | |
| WW Grainger, Inc. | | | | 4,232 | | | | | | | | | | 4,694,261 | |
| | | | | | | | | | | | | | | |
| | | | | | | | | | | | | | | |
Total Industrials | | | | | | | | | | | | | | 410,208,398 | |
| | | | | | | | | | | | | | | |
| | | | | | | | | | | | | | | |
| | | |
| Information Technology - 7.01% | | | | | | |
| | | |
| Communications Equipment - 1.26% | | | | | | |
| F5, Inc.A | | | | 187,903 | | | | | | | | | | 43,946,754 | |
| | | | | | | | | | | | | | | |
| | | | | | | | | | | | | | | |
| | | |
| Electronic Equipment, Instruments & Components - 0.24% | | | | | | |
| CDW Corp. | | | | 12,490 | | | | | | | | | | 2,350,993 | |
| Corning, Inc. | | | | 125,097 | | | | | | | | | | 5,953,366 | |
| | | | | | | | | | | | | | | |
| | | | | | | | | | | | | | | |
| | | | | | | | | | | | | | 8,304,359 | |
| | | | | | | | | | | | | | | |
| | | | | | | | | | | | | | | |
| | | |
| IT Services - 0.48% | | | | | | |
| Cognizant Technology Solutions Corp., Class A | | | | 222,927 | | | | | | | | | | 16,628,125 | |
| | | | | | | | | | | | | | | |
| | | | | | | | | | | | | | | |
| | | |
| Semiconductors & Semiconductor Equipment - 3.47% | | | | | | |
| Analog Devices, Inc. | | | | 100,294 | | | | | | | | | | 22,376,594 | |
| Broadcom, Inc. | | | | 167,710 | | | | | | | | | | 28,472,127 | |
| KLA Corp. | | | | 21,825 | | | | | | | | | | 14,540,470 | |
| Micron Technology, Inc. | | | | 80,235 | | | | | | | | | | 7,995,418 | |
| QUALCOMM, Inc. | | | | 184,779 | | | | | | | | | | 30,076,478 | |
| Texas Instruments, Inc. | | | | 86,103 | | | | | | | | | | 17,492,685 | |
| | | | | | | | | | | | | | | |
| | | | | | | | | | | | | | | |
| | | | | | | | | | | | | | 120,953,772 | |
| | | | | | | | | | | | | | | |
| | | | | | | | | | | | | | | |
| | | |
| Software - 1.56% | | | | | | |
| Oracle Corp. | | | | 121,511 | | | | | | | | | | 20,394,406 | |
| Workday, Inc., Class AA | | | | 145,957 | | | | | | | | | | 34,132,044 | |
| | | | | | | | | | | | | | | |
| | | | | | | | | | | | | | | |
| | | | | | | | | | | | | | 54,526,450 | |
| | | | | | | | | | | | | | | |
| | | | | | | | | | | | | | | |
Total Information Technology | | | | | | | | | | | | | | 244,359,460 | |
| | | | | | | | | | | | | | | |
| | | | | | | | | | | | | | | |
| | | |
| Materials - 3.95% | | | | | | |
| | | |
| Chemicals - 3.03% | | | | | | |
| Air Products & Chemicals, Inc. | | | | 126,930 | | | | | | | | | | 39,415,573 | |
| Axalta Coating Systems Ltd.A | | | | 660,889 | | | | | | | | | | 25,060,911 | |
| Corteva, Inc. | | | | 103,326 | | | | | | | | | | 6,294,620 | |
| DuPont de Nemours, Inc. | | | | 140,840 | | | | | | | | | | 11,688,311 | |
| Olin Corp. | | | | 320,726 | | | | | | | | | | 13,159,388 | |
See accompanying notes
6
American Beacon Large Cap Value FundSM
Schedule of Investments
October 31, 2024
| | | | | | | | | | | | | | | |
| | | |
| | | Shares | | | | Fair Value |
| | | | | | | |
| | | |
| COMMON STOCKS - 89.75% (continued) | | | | | | |
| | | |
| Materials - 3.95% (continued) | | | | | | |
| | | |
| Chemicals - 3.03% (continued) | | | | | | |
| PPG Industries, Inc. | | | | 37,419 | | | | | | | | | $ | 4,659,040 | |
| Sherwin-Williams Co. | | | | 14,510 | | | | | | | | | | 5,205,753 | |
| | | | | | | | | | | | | | | |
| | | | | | | | | | | | | | | |
| | | | | | | | | | | | | | 105,483,596 | |
| | | | | | | | | | | | | | | |
| | | | | | | | | | | | | | | |
| | | |
| Construction Materials - 0.92% | | | | | | |
| CRH PLC | | | | 335,514 | | | | | | | | | | 32,018,101 | |
| | | | | | | | | | | | | | | |
| | | | | | | | | | | | | | | |
Total Materials | | | | | | | | | | | | | | 137,501,697 | |
| | | | | | | | | | | | | | | |
| | | | | | | | | | | | | | | |
| | | |
| Real Estate - 1.92% | | | | | | |
| | | |
| Industrial REITs - 0.45% | | | | | | |
| Prologis, Inc. | | | | 140,211 | | | | | | | | | | 15,835,431 | |
| | | | | | | | | | | | | | | |
| | | | | | | | | | | | | | | |
| | | |
| Specialized REITs - 1.47% | | | | | | |
| Public Storage | | | | 77,650 | | | | | | | | | | 25,551,509 | |
| VICI Properties, Inc. | | | | 806,553 | | | | | | | | | | 25,616,123 | |
| | | | | | | | | | | | | | | |
| | | | | | | | | | | | | | | |
| | | | | | | | | | | | | | 51,167,632 | |
| | | | | | | | | | | | | | | |
| | | | | | | | | | | | | | | |
Total Real Estate | | | | | | | | | | | | | | 67,003,063 | |
| | | | | | | | | | | | | | | |
| | | | | | | | | | | | | | | |
| | | |
| Utilities - 6.65% | | | | | | |
| | | |
| Electric Utilities - 5.48% | | | | | | |
| American Electric Power Co., Inc. | | | | 50,272 | | | | | | | | | | 4,964,360 | |
| Duke Energy Corp. | | | | 200,909 | | | | | | | | | | 23,158,780 | |
| Entergy Corp. | | | | 288,947 | | | | | | | | | | 44,723,217 | |
| Exelon Corp. | | | | 197,484 | | | | | | | | | | 7,761,121 | |
| PG&E Corp. | | | | 666,094 | | | | | | | | | | 13,468,421 | |
| Pinnacle West Capital Corp. | | | | 257,624 | | | | | | | | | | 22,621,963 | |
| PPL Corp. | | | | 643,973 | | | | | | | | | | 20,967,761 | |
| Southern Co. | | | | 238,595 | | | | | | | | | | 21,719,303 | |
| Xcel Energy, Inc. | | | | 470,611 | | | | | | | | | | 31,441,521 | |
| | | | | | | | | | | | | | | |
| | | | | | | | | | | | | | | |
| | | | | | | | | | | | | | 190,826,447 | |
| | | | | | | | | | | | | | | |
| | | | | | | | | | | | | | | |
| | | |
| Multi-Utilities - 1.17% | | | | | | |
| Dominion Energy, Inc. | | | | 684,797 | | | | | | | | | | 40,765,965 | |
| | | | | | | | | | | | | | | |
| | | | | | | | | | | | | | | |
Total Utilities | | | | | | | | | | | | | | 231,592,412 | |
| | | | | | | | | | | | | | | |
| | | | | | | | | | | | | | | |
Total Common Stocks (Cost $2,054,604,953) | | | | | | | | | | | | | | 3,126,574,586 | |
| | | | | | | | | | | | | | | |
| | | | | | | | | | | | | | | |
| | | |
| FOREIGN COMMON STOCKS - 6.20% | | | | | | |
| | | |
| Communication Services - 0.36% | | | | | | |
| | | |
| Media - 0.36% | | | | | | |
| WPP PLC, ADRB | | | | 238,746 | | | | | | | | | | 12,531,778 | |
| | | | | | | | | | | | | | | |
| | | | | | | | | | | | | | | |
| | | |
| Consumer Discretionary - 0.60% | | | | | | |
| | | |
| Automobile Components - 0.60% | | | | | | |
| Magna International, Inc.B | | | | 526,522 | | | | | | | | | | 20,781,823 | |
| | | | | | | | | | | | | | | |
| | | | | | | | | | | | | | | |
| | | |
| Consumer Staples - 1.20% | | | | | | |
| | | |
| Beverages - 0.54% | | | | | | |
| Anheuser-Busch InBev SA, ADR | | | | 136,181 | | | | | | | | | | 8,085,066 | |
| Diageo PLC, ADR | | | | 87,571 | | | | | | | | | | 10,872,815 | |
| | | | | | | | | | | | | | | |
| | | | | | | | | | | | | | | |
| | | | | | | | | | | | | | 18,957,881 | |
| | | | | | | | | | | | | | | |
See accompanying notes
7
American Beacon Large Cap Value FundSM
Schedule of Investments
October 31, 2024
| | | | | | | | | | | | | | | |
| | | |
| | | Shares | | | | Fair Value |
| | | | | | | |
| | | |
| FOREIGN COMMON STOCKS - 6.20% (continued) | | | | | | |
| | | |
| Consumer Staples - 1.20% (continued) | | | | | | |
| | | |
| Household Products - 0.19% | | | | | | |
| Reckitt Benckiser Group PLC, ADR | | | | 525,690 | | | | | | | | | $ | 6,355,592 | |
| | | | | | | | | | | | | | | |
| | | | | | | | | | | | | | | |
| | | |
| Personal Products - 0.47% | | | | | | |
| Unilever PLC, ADR | | | | 268,317 | | | | | | | | | | 16,343,189 | |
| | | | | | | | | | | | | | | |
| | | | | | | | | | | | | | | |
Total Consumer Staples | | | | | | | | | | | | | | 41,656,662 | |
| | | | | | | | | | | | | | | |
| | | | | | | | | | | | | | | |
| | | |
| Energy - 1.02% | | | | | | |
| | | |
| Oil, Gas & Consumable Fuels - 1.02% | | | | | | |
| Cenovus Energy, Inc. | | | | 346,128 | | | | | | | | | | 5,562,277 | |
| Enbridge, Inc.B | | | | 742,417 | | | | | | | | | | 29,993,647 | |
| | | | | | | | | | | | | | | |
| | | | | | | | | | | | | | | |
| | | | | | | | | | | | | | 35,555,924 | |
| | | | | | | | | | | | | | | |
| | | | | | | | | | | | | | | |
Total Energy | | | | | | | | | | | | | | 35,555,924 | |
| | | | | | | | | | | | | | | |
| | | | | | | | | | | | | | | |
| | | |
| Financials - 0.50% | | | | | | |
| | | |
| Banks - 0.50% | | | | | | |
| Bank of Nova Scotia | | | | 338,455 | | | | | | | | | | 17,427,048 | |
| | | | | | | | | | | | | | | |
| | | | | | | | | | | | | | | |
| | | |
| Industrials - 0.14% | | | | | | |
| | | |
| Ground Transportation - 0.14% | | | | | | |
| Canadian National Railway Co. | | | | 45,424 | | | | | | | | | | 4,902,158 | |
| | | | | | | | | | | | | | | |
| | | | | | | | | | | | | | | |
| | | |
| Information Technology - 2.38% | | | | | | |
| | | |
| Communications Equipment - 1.12% | | | | | | |
| Telefonaktiebolaget LM Ericsson, ADRB | | | | 4,668,590 | | | | | | | | | | 39,122,784 | |
| | | | | | | | | | | | | | | |
| | | | | | | | | | | | | | | |
| | | |
| Electronic Equipment, Instruments & Components - 0.32% | | | | | | |
| TE Connectivity PLC | | | | 74,909 | | | | | | | | | | 11,043,085 | |
| | | | | | | | | | | | | | | |
| | | | | | | | | | | | | | | |
| | | |
| IT Services - 0.59% | | | | | | |
| Accenture PLC, Class A | | | | 60,116 | | | | | | | | | | 20,729,199 | |
| | | | | | | | | | | | | | | |
| | | | | | | | | | | | | | | |
| | | |
| Semiconductors & Semiconductor Equipment - 0.35% | | | | | | |
| NXP Semiconductors NV | | | | 51,924 | | | | | | | | | | 12,176,178 | |
| | | | | | | | | | | | | | | |
| | | | | | | | | | | | | | | |
Total Information Technology | | | | | | | | | | | | | | 83,071,246 | |
| | | | | | | | | | | | | | | |
| | | | | | | | | | | | | | | |
Total Foreign Common Stocks (Cost $153,966,868) | | | | | | | | | | | | | | 215,926,639 | |
| | | | | | | | | | | | | | | |
| | | | | | | | | | | | | | | |
| | | |
| SHORT-TERM INVESTMENTS - 3.91% (Cost $136,122,309) | | | | | | |
| | | |
| Investment Companies - 3.91% | | | | | | |
| American Beacon U.S. Government Money Market Select Fund, 4.76%C D | | | | 136,122,309 | | | | | | | | | | 136,122,309 | |
| | | | | | | | | | | | | | | |
| | | | | | | | | | | | | | | |
| | | |
| SECURITIES LENDING COLLATERAL - 0.13% (Cost $4,685,167) | | | | | | |
| | | |
| Investment Companies - 0.13% | | | | | | |
| American Beacon U.S. Government Money Market Select Fund, 4.76%C D | | | | 4,685,167 | | | | | | | | | | 4,685,167 | |
| | | | | | | | | | | | | | | |
| | | | | | | | | | | | | | | |
TOTAL INVESTMENTS - 99.99% (Cost $2,349,379,297) | | | | | | | | | | | | | | 3,483,308,701 | |
OTHER ASSETS, NET OF LIABILITIES - 0.01% | | | | | | | | | | | | | | 431,779 | |
| | | | | | | | | | | | | | | |
TOTAL NET ASSETS - 100.00% | | | | | | | | | | | | | $ | 3,483,740,480 | |
| | | | | | | | | | | | | | | |
| | | | | | | | | | | | | | | |
| Percentages are stated as a percent of net assets. | | | | | | | | | | | | | | | |
A Non-income producing security.
B All or a portion of this security is on loan, collateralized by either cash and/or U.S. Treasuries at October 31, 2024 (Note 8).
C The Fund is affiliated by having the same investment advisor.
D 7-day yield.
ADR - American Depositary Receipt.
PLC - Public Limited Company.
See accompanying notes
8
American Beacon Large Cap Value FundSM
Schedule of Investments
October 31, 2024
REITs – Real Estate Investment Trusts.
| | | | | | | | | | | | | | | | |
| Long Futures Contracts Open on October 31, 2024: | | | | | | | | | | | | |
| | | | | |
| Equity Futures Contracts | | | | | | | | | | | | | |
| Description | | Number of
Contracts | | Expiration Date | | Notional Amount | | | Contract Value | | | Unrealized
Appreciation
(Depreciation) | |
| CME E-Mini S&P 500 Index Futures | | 508 | | December 2024 | | $ | 146,843,722 | | | $ | 145,757,900 | | | $ | (1,085,822 | ) |
| | | | | | | | | | | | | | | | |
| | | | | | $ | 146,843,722 | | | $ | 145,757,900 | | | $ | (1,085,822 | ) |
| | | | | | | | | | | | | | | | |
| | |
| Glossary: | | |
| | |
| Index Abbreviations: | | |
| S&P 500 | | Standard & Poor’s 500 Index - U.S. Equity Large-Cap Index. |
| |
| Exchange Abbreviations: | | |
| CME | | Chicago Mercantile Exchange. |
The Fund’s investments are summarized by level based on the inputs used to determine their values. As of October 31, 2024, the investments were classified as described below:
| | | | | | | | | | | | | | | | | | | | | | | | | | | | |
Large Cap Value Fund | | Level 1 | | | | | | Level 2 | | | | | | Level 3 | | | | | | Total | |
Assets | | | | | | | | | | | | | | | | | | | | | | | | | | | | |
Common Stocks | | $ | 3,126,574,586 | | | | | | | $ | – | | | | | | | $ | – | | | | | | | $ | 3,126,574,586 | |
Foreign Common Stocks | | | 215,926,639 | | | | | | | | – | | | | | | | | – | | | | | | | | 215,926,639 | |
Short-Term Investments | | | 136,122,309 | | | | | | | | – | | | | | | | | – | | | | | | | | 136,122,309 | |
Securities Lending Collateral | | | 4,685,167 | | | | | | | | – | | | | | | | | – | | | | | | | | 4,685,167 | |
| | | | | | | | | | | | | | | | | | | | | | | | | | | | |
Total Investments in Securities - Assets | | $ | 3,483,308,701 | | | | | | | $ | – | | | | | | | $ | – | | | | | | | $ | 3,483,308,701 | |
| | | | | | | | | | | | | | | | | | | | | | | | | | | | |
Financial Derivative Instruments - Liabilities | | | | | | | | | | | | | | | | | | | | | | | | | | | | |
Futures Contracts | | $ | (1,085,822 | ) | | | | | | $ | – | | | | | | | $ | – | | | | | | | $ | (1,085,822 | ) |
| | | | | | | | | | | | | | | | | | | | | | | | | | | | |
Total Financial Derivative Instruments - Liabilities | | $ | (1,085,822 | ) | | | | | | $ | – | | | | | | | $ | – | | | | | | | $ | (1,085,822 | ) |
| | | | | | | | | | | | | | | | | | | | | | | | | | | | |
U.S. GAAP requires transfers between all levels to/from level 3 be disclosed. During the year ended October 31, 2024, there were no transfers into or out of Level 3.
See accompanying notes
9
American Beacon Large Cap Value FundSM
Statement of Assets and Liabilities
October 31, 2024
| | | | |
Assets: | | | | |
Investments in unaffiliated securities, at fair value† § | | $ | 3,342,501,225 | |
Investments in affiliated securities, at fair value‡ | | | 140,807,476 | |
Cash collateral held at broker for futures contracts | | | 9,244,000 | |
Dividends and interest receivable | | | 3,139,324 | |
Receivable for investments sold | | | 480,977 | |
Receivable for fund shares sold | | | 667,822 | |
Receivable for tax reclaims | | | 590,591 | |
Prepaid expenses | | | 45,336 | |
| | | | |
Total assets. | | | 3,497,476,751 | |
| | | | |
Liabilities: | | | | |
Payable for fund shares redeemed | | | 1,856,050 | |
Cash due to broker for futures contracts | | | 1,927,936 | |
Management and sub-advisory fees payable (Note 2) | | | 3,352,481 | |
Service fees payable (Note 2) | | | 199,442 | |
Transfer agent fees payable (Note 2) | | | 75,731 | |
Payable upon return of securities loaned (Note 9)§ | | | 4,685,167 | |
Custody and fund accounting fees payable | | | 217,886 | |
Professional fees payable | | | 129,830 | |
Trustee fees payable (Note 2) | | | 26,069 | |
Payable for prospectus and shareholder reports | | | 78,520 | |
Payable for variation margin from open futures contracts (Note 5) | | | 1,084,655 | |
Other liabilities | | | 102,504 | |
| | | | |
Total liabilities | | | 13,736,271 | |
| | | | |
Commitments and contingent liabilities (Note 2) | | | | |
| | | | |
Net assets | | $ | 3,483,740,480 | |
| | | | |
See accompanying notes
10
American Beacon Large Cap Value FundSM
Statement of Assets and Liabilities
October 31, 2024
| | | | |
Analysis of net assets: | | | | |
Paid-in-capital | | $ | 2,015,901,929 | |
Total distributable earnings (deficits)A | | | 1,467,838,551 | |
| | | | |
Net assets | | $ | 3,483,740,480 | |
| | | | |
Shares outstanding at no par value (unlimited shares authorized): | | | | |
R5 Class | | | 38,280,492 | |
| | | | |
Y Class | | | 6,634,060 | |
| | | | |
Investor Class | | | 19,684,006 | |
| | | | |
Advisor Class | | | 1,791,345 | |
| | | | |
A Class | | | 3,474,460 | |
| | | | |
C Class | | | 92,860 | |
| | | | |
R6 Class | | | 49,751,911 | |
| | | | |
Net assets: | | | | |
R5 Class | | $ | 1,147,150,395 | |
| | | | |
Y Class | | $ | 196,267,664 | |
| | | | |
Investor Class | | $ | 513,291,440 | |
| | | | |
Advisor Class | | $ | 45,504,706 | |
| | | | |
A Class | | $ | 88,343,465 | |
| | | | |
C Class | | $ | 2,335,004 | |
| | | | |
R6 Class | | $ | 1,490,847,806 | |
| | | | |
Net asset value, offering and redemption price per share: | | | | |
R5 Class | | $ | 29.97 | |
| | | | |
Y Class | | $ | 29.58 | |
| | | | |
Investor Class | | $ | 26.08 | |
| | | | |
Advisor Class | | $ | 25.40 | |
| | | | |
A Class | | $ | 25.43 | |
| | | | |
A Class (offering price) | | $ | 26.98 | |
| | | | |
C Class | | $ | 25.15 | |
| | | | |
R6 Class | | $ | 29.97 | |
| | | | |
| |
† Cost of investments in unaffiliated securities | | $ | 2,208,571,821 | |
‡ Cost of investments in affiliated securities | | $ | 140,807,476 | |
§ Fair value of securities on loan | | $ | 42,653,227 | |
|
A The Fund’s investments in affiliated securities did not have unrealized appreciation (depreciation) at year end. | |
See accompanying notes
11
American Beacon Large Cap Value FundSM
Statement of Operations
For the year ended October 31, 2024
| | | | |
Investment income: | | | | |
Dividend income from unaffiliated securities (net of foreign taxes)† | | $ | 76,068,050 | |
Dividend income from affiliated securities (Note 2) | | | 5,482,981 | |
Interest income | | | 263,854 | |
Income derived from securities lending (Note 9) | | | 301,673 | |
| | | | |
Total investment income | | | 82,116,558 | |
| | | | |
Expenses: | | | | |
Management and sub-advisory fees (Note 2) | | | 18,952,178 | |
Transfer agent fees: | | | | |
R5 Class (Note 2) | | | 452,405 | |
Y Class (Note 2) | | | 200,937 | |
Investor Class | | | 28,810 | |
Advisor Class | | | 3,124 | |
A Class | | | 1,679 | |
C Class | | | 253 | |
R6 Class | | | 59,507 | |
Custody and fund accounting fees | | | 394,725 | |
Professional fees | | | 332,339 | |
Registration fees and expenses | | | 105,323 | |
Service fees (Note 2): | | | | |
Investor Class | | | 1,727,999 | |
Advisor Class | | | 112,088 | |
A Class | | | 49,962 | |
C Class | | | 3,197 | |
Distribution fees (Note 2): | | | | |
Advisor Class | | | 108,575 | |
A Class | | | 96,407 | |
C Class | | | 32,576 | |
Prospectus and shareholder report expenses | | | 176,995 | |
Trustee fees (Note 2) | | | 336,900 | |
Line of credit interest expense (Note 10) | | | 35,579 | |
Other expenses | | | 396,435 | |
| | | | |
Total expenses | | | 23,607,993 | |
| | | | |
Net investment income | | | 58,508,565 | |
| | | | |
| |
Realized and unrealized gain (loss) from investments: | | | | |
Net realized gain (loss) from: | | | | |
Investments in unaffiliated securitiesA | | | 352,494,927 | |
Commission recapture (Note 1) | | | 702 | |
Foreign currency transactions | | | (86 | ) |
Futures contracts | | | 27,646,199 | |
Change in net unrealized appreciation of: | | | | |
Investments in unaffiliated securitiesB | | | 473,854,156 | |
Futures contracts | | | 1,863,308 | |
| | | | |
Net gain from investments | | | 855,859,206 | |
| | | | |
Net increase in net assets resulting from operations. | | $ | 914,367,771 | |
| | | | |
† Foreign taxes | | $ | 912,754 | |
|
A The Fund did not recognize net realized gains (losses) from the sale of investments in affiliated securities. | |
B The Fund’s investments in affiliated securities did not have a change in unrealized appreciation (depreciation) at year end. | |
See accompanying notes
12
American Beacon Large Cap Value FundSM
Statement of Changes in Net Assets
| | | | | | | | | | | | |
| | | Year Ended
October 31, 2024 | | | | | | Year Ended
October 31, 2023 | |
Increase (decrease) in net assets: | | | | | | | | | | | | |
Operations: | | | | | | | | | | | | |
Net investment income | | $ | 58,508,565 | | | | | | | $ | 54,546,788 | |
Net realized gain from investments in unaffiliated securities, commission recapture, foreign currency transactions, and futures contracts | | | 380,141,742 | | | | | | | | 155,702,010 | |
Change in net unrealized appreciation (depreciation) of investments in unaffiliated securities and futures contracts | | | 475,717,464 | | | | | | | | (135,956,251 | ) |
| | | | | | | | | | | | |
Net increase in net assets resulting from operations | | | 914,367,771 | | | | | | | | 74,292,547 | |
| | | | | | | | | | | | |
Distributions to shareholders: | | | | | | | | | | | | |
Total retained earnings: | | | | | | | | | | | | |
R5 Class | | | (58,861,420 | ) | | | | | | | (129,502,402 | ) |
Y Class | | | (9,951,947 | ) | | | | | | | (19,889,700 | ) |
Investor Class | | | (31,275,864 | ) | | | | | | | (74,955,616 | ) |
Advisor Class | | | (2,492,025 | ) | | | | | | | (5,569,451 | ) |
A Class | | | (714,235 | ) | | | | | | | (1,797,418 | ) |
C Class | | | (185,530 | ) | | | | | | | (612,572 | ) |
R6 Class | | | (65,153,532 | ) | | | | | | | (118,844,908 | ) |
| | | | | | | | | | | | |
Net distributions to shareholders | | | (168,634,553 | ) | | | | | | | (351,172,067 | ) |
| | | | | | | | | | | | |
Capital share transactions (Note 11): | | | | | | | | | | | | |
Proceeds from sales of shares | | | 589,953,923 | | | | | | | | 500,807,392 | |
Reinvestment of dividends and distributions | | | 149,512,376 | | | | | | | | 311,461,669 | |
Cost of shares redeemed | | | (948,614,037 | ) | | | | | | | (808,500,555 | ) |
| | | | | | | | | | | | |
Net increase (decrease) in net assets from capital share transactions | | | (209,147,738 | ) | | | | | | | 3,768,506 | |
| | | | | | | | | | | | |
Net increase (decrease) in net assets | | | 536,585,480 | | | | | | | | (273,111,014 | ) |
| | | | | | | | | | | | |
Net assets: | | | | | | | | | | | | |
Beginning of year | | | 2,947,155,000 | | | | | | | | 3,220,266,014 | |
| | | | | | | | | | | | |
End of year | | $ | 3,483,740,480 | | | | | | | $ | 2,947,155,000 | |
| | | | | | | | | | | | |
See accompanying notes
13
American Beacon Large Cap Value FundSM
Notes to Financial Statements
October 31, 2024
1. Organization and Significant Accounting Policies
American Beacon Funds (the “Trust”) is organized as a Massachusetts business trust. The Fund, a series within the Trust, is registered under the Investment Company Act of 1940, as amended (the “Act”), as a diversified, open-end management investment company. As of October 31, 2024, the Trust consists of twenty-four active series, one of which is presented in this filing: American Beacon Large Cap Value Fund (the “Fund”). The remaining twenty-three active series are reported in separate filings.
American Beacon Advisors, Inc. (the “Manager”) is a Delaware corporation and a wholly-owned subsidiary of Resolute Investment Managers, Inc. (“RIM”) organized in 1986 to provide business management, advisory, administrative, and asset management consulting services to the Trust and other investors. The Manager is registered as an investment advisor under the Investment Advisers Act of 1940, as amended (the “Advisers Act”). The Manager is an indirect wholly-owned subsidiary of Resolute Topco, Inc. (“Topco”), which is owned primarily by various institutional investment funds that are managed by financial institutions and other investment advisory firms. No owner of Topco owns 25% or more of the outstanding equity or voting interests of Topco.
Effective December 29, 2023, the Manager underwent a change of control, which resulted in the termination of the Fund’s previous management and investment advisory agreements. The Board of Trustees (“the “Board”) approved a new Management Agreement with the Manager and a new Investment Advisory Agreement among the Manager, each sub-advisor and the Trust, on behalf of the Fund, that were effective on December 29, 2023.
Recently Adopted Accounting Pronouncements
In March 2020, the Financial Accounting Standards Board (“FASB”) issued Accounting Standards Update (“ASU”) No. 2020-04, Reference Rate Reform (Topic 848); Facilitation of the Effects of Reference Rate Reform on Financial Reporting, which provides optional guidance for a limited period of time to ease the potential burden in accounting for (or recognizing the effects of) reference rate reform. The guidance is applicable to contracts referencing London Inter-bank Offered Rate (“LIBOR”) or another reference rate that is expected to be discontinued due to reference rate reform. The ASU is effective as of March 12, 2020 and generally can be applied through December 31, 2022. In December 2022, the FASB issued ASU No. 2022-06 Reference Rate Reform (Topic 848): Deferral of the Sunset Date of Topic 848 which updates and clarifies ASU No. 2020-04. The amendments in this ASU defer the sunset date of Topic 848 from December 31, 2022, to December 31, 2024. Management has concluded that these ASUs will not have a material impact on the Fund’s financial statements.
In June 2022, the FASB issued ASU No. 2022-03, Fair Value Measurement (Topic 820); Fair Value Measurement of Equity Securities Subject to Contractual Sale Restrictions, which provides clarifying guidance that a contractual restriction on the sale of an equity security is not considered part of the unit of account of the equity security and, therefore, is not considered in measuring fair value. The ASU is effective for fiscal years beginning after December 15, 2023, and interim periods within those fiscal years. Management has concluded that the ASU will not have a material impact on the Fund’s financial statements.
14
American Beacon Large Cap Value FundSM
Notes to Financial Statements
October 31, 2024
Class Disclosure
The Fund has multiple classes of shares designed to meet the needs of different groups of investors. The following table sets forth the differences amongst the classes:
| | | | | | |
Class | | Eligible Investors | | Minimum Initial
Investments | |
R5 Class | | Large institutional investors - sold directly or through intermediary channels. | | $ | 250,000 | |
| | |
| Y Class | | Large institutional retirement plan investors - sold directly or through intermediary channels. | | $ | 100,000 | |
| | |
| Investor Class | | All investors using intermediary organizations, such as broker-dealers or retirement plan sponsors. | | $ | 2,500 | |
| | |
| Advisor Class | | All investors who invest through intermediary organizations, such as broker-dealers or third party administrators. | | $ | 2,500 | |
| | |
| A Class | | All investors who invest through intermediary organizations, such as broker-dealers or third party administrator. Retail investors who invest directly through a financial intermediary such as a broker, bank, or registered investment advisor which may include a front-end sales charge and a contingent deferred sales charge (“CDSC”). | | $ | 2,500 | |
| | |
| C Class | | Retail investors who invest directly through a financial intermediary such as a broker or through employee directed benefit plans with applicable sales charges which may include CDSC. | | $ | 1,000 | |
| | |
| R6 Class | | Large institutional retirement plan investors - sold through retirement plan sponsors. | | | None | |
Each class offered by the Trust has equal rights as to assets and voting privileges. Income and non-class specific expenses are allocated daily to each class based on the relative net assets. Realized and unrealized capital gains and losses of each class are allocated daily based on the relative net assets of each class of the respective Fund. Class specific expenses, where applicable, currently include service, distribution, transfer agent fees, and sub-transfer agent fees that vary amongst the classes as described more fully in Note 2.
Significant Accounting Policies
The following is a summary of significant accounting policies, consistently followed by the Fund in preparation of the financial statements. The Fund is considered an investment company and accordingly, follows the investment company accounting and reporting guidance of the FASB Accounting Standards Codification Topic 946, Financial Services – Investment Companies, a part of Generally Accepted Accounting Principles (“U.S. GAAP”).
Security Transactions and Investment Income
Security transactions are recorded as of the trade date for financial reporting purposes. Securities purchased or sold on a when-issued or delayed-delivery basis may be settled beyond a standard settlement period for the security after the trade date.
Dividend income, net of foreign taxes, is recorded on the ex-dividend date, except certain dividends from foreign securities which are recorded as soon as the information is available to the Fund. Tax reclaim accruals are automatically generated on accounting and custody systems at the time of the income event based on the tax databases maintained by the Fund’s custodian. Interest income, net of foreign taxes, is earned from settlement date, recorded on the accrual basis, and adjusted, if necessary, for accretion of discounts and amortization of premiums. Realized gains (losses) from securities sold are determined on the basis of specific lot identification. Estimated tax liabilities on certain foreign securities are recorded on an accrual basis and are reflected as components of interest income or net change in unrealized appreciation (depreciation) on investments on the Statement of Operations, as appropriate. Tax liabilities realized as a result of such security sales are reflected as a component of net realized gain (loss) on investments on the Statement of Operations.
15
American Beacon Large Cap Value FundSM
Notes to Financial Statements
October 31, 2024
Distributions to Shareholders
The Fund distributes most or all of its net earnings and realized gains, if any, each taxable year in the form of dividends from net investment income and distributions of realized net capital gains and net gains from foreign currency transactions on an annual basis. The Fund does not have a fixed dividend rate and does not guarantee that it will pay any distributions in any particular period. Dividends to shareholders are determined in accordance with federal income tax regulations, which may differ in amount and character from net investment income and realized gains recognized for purposes of U.S. GAAP. To the extent necessary to fully distribute capital gains, the Fund may designate earnings and profits distributed to shareholders on the redemption of shares.
Commission Recapture
The Fund has established brokerage commission recapture arrangements with certain brokers or dealers. If the Fund’s investment advisor chooses to execute a transaction through a participating broker, the broker rebates a portion of the commission back to the Fund. Any collateral benefit received through participation in the commission recapture program is directed exclusively to the Fund. This amount is reported with the net realized gain (loss) in the Fund’s Statement of Operations, if applicable.
Allocation of Income, Trust Expenses, Gains, and Losses
Investment income and realized and unrealized gains and losses from investments of the Fund are allocated daily to each class of shares based upon the relative proportion of net assets of each class to the total net assets of the Fund. Expenses directly charged or attributable to the Fund will be paid from the assets of the Fund. Generally, expenses of the Trust will be allocated among and charged to the assets of the Fund on a basis that the Trust’s Board deems fair and equitable, which may be based on the relative net assets of the Fund or nature of the services performed and relative applicability to the Fund.
Use of Estimates
The preparation of financial statements in conformity with U.S. GAAP requires management to make estimates and assumptions that affect the amounts reported in the financial statements and accompanying notes. Actual results may differ from those estimated.
Other
Under the Trust’s organizational documents, its officers and trustees are indemnified against certain liabilities arising out of the performance of their duties to the Trust. In the normal course of business, the Trust enters into contracts that provide indemnification to the other party or parties against potential costs or liabilities. The Trust’s maximum exposure under these arrangements is dependent on claims that may be made in the future and, therefore, cannot be estimated. The Trust has had no prior claims or losses pursuant to any such agreement.
2. Transactions with Affiliates
Management and Investment Sub-Advisory Agreements
The Fund and the Manager are parties to a Management Agreement that obligates the Manager to provide the Fund with investment advisory and administrative services. As compensation for performing the duties under the Management Agreement, the Manager will receive an annualized management fee based on a percentage of the Fund’s average daily net assets that is calculated and accrued daily according to the following schedule:
| | | | |
First $15 billion | | | 0.35 | % |
Next $15 billion | | | 0.325 | % |
Over $30 billion | | | 0.30 | % |
16
American Beacon Large Cap Value FundSM
Notes to Financial Statements
October 31, 2024
The Trust, on behalf of the Fund, and the Manager have entered into Investment Advisory Agreements with Barrow, Hanley, Mewhinney & Strauss, LLC; Hotchkis and Wiley Capital Management, LLC; and Massachusetts Financial Services Company (“Sub-Advisors”) pursuant to which the Fund has agreed to pay an annualized sub-advisory fee that is calculated and accrued daily based on the Fund’s average daily net assets.
The Management and Sub-Advisory Fees paid by the Fund for the year ended October 31, 2024 were as follows:
| | | | | | | | | | | | |
| | | Effective Fee Rate | | | | | | Amount of Fees Paid | |
Management Fees | | | 0.35 | % | | | | | | $ | 11,942,695 | |
Sub-Advisory Fees | | | 0.20 | % | | | | | | | 7,009,483 | |
| | | | | | | | | | | | |
Total | | | 0.55 | % | | | | | | $ | 18,952,178 | |
| | | | | | | | | | | | |
As compensation for services provided by the Manager in connection with securities lending activities conducted by a Fund, the lending Fund pays to the Manager, with respect to cash collateral posted by borrowers, a fee of 10% of the net monthly investment income (the income earned in the form of interest, dividends and realized capital gains from the investment of cash collateral, plus any negative rebate fees paid by borrowers, less the rebate amount paid to borrowers as well as related expenses) and, with respect to collateral other than cash, a fee up to 10% of loan fees and demand premiums paid by borrowers. These fees are included in “Income derived from securities lending” and “Management and sub-advisory fees” on the Statement of Operations. During the year ended October 31, 2024, the Manager received securities lending fees of $36,895 for the securities lending activities of the Fund.
Distribution Plans
Separate Distribution Plans (the “Distribution Plans”) have been adopted pursuant to Rule 12b-1 under the Act for the Advisor, A, and C Classes of the Fund. Under the Distribution Plans, as compensation for distribution and shareholder servicing assistance, the Manager receives an annual fee of 0.25% of the average daily net assets of the Advisor and A Classes and 1.00% of the average daily net assets of the C Class. The fee will be payable without regard to whether the amount of the fee is more or less than the actual expenses incurred in a particular month by the Manager for distribution assistance.
Service Plans
The Manager and the Trust entered into a Service Plan that obligates the Manager to oversee additional shareholder servicing of the Investor, Advisor, A, and C Classes of the Fund. As compensation for performing the duties required under the Service Plan, the Manager receives an annualized fee up to 0.25% of the average daily net assets of the Advisor, A, and C Classes, and up to 0.375% of the average daily net assets of the Investor Class of the Fund.
Sub-Transfer Agent Fees
The Manager has entered into agreements, which include servicing agreements, with financial intermediaries that provide recordkeeping, processing, shareholder communications and other services to customers of the intermediaries that hold positions in the R5 and Y Classes of the Fund and has agreed to compensate the intermediaries for providing these services. Intermediaries transact with the Fund primarily through the use of omnibus accounts on behalf of its customers who hold positions in the Fund. Certain services would have been provided by the Fund’s transfer agent and other service providers if the shareholders’ accounts were maintained directly by the Fund’s transfer agent. Accordingly, the Fund, pursuant to Board approval, has agreed to reimburse the Manager for certain non-distribution shareholder services provided by financial intermediaries for the R5 and Y Classes. The reimbursement amounts (sub-transfer agent fees) paid to the Manager
17
American Beacon Large Cap Value FundSM
Notes to Financial Statements
October 31, 2024
are subject to a fee limit of up to 0.10% of an intermediary’s average net assets in the R5 and Y Classes on an annual basis. During the year ended October 31, 2024, the sub-transfer agent fees, as reflected in “Transfer agent fees” on the Statement of Operations, were as follows:
| | | | |
Fund | | Sub-Transfer Agent Fees | |
Large Cap Value | | $ | 593,332 | |
As of October 31, 2024, the Fund owed the Manager the following reimbursement of sub-transfer agent fees, as reflected in “Transfer agent fees payable” on the Statement of Assets and Liabilities:
| | | | |
Fund | | Reimbursement Sub-
Transfer Agent Fees | |
Large Cap Value | | $ | 50,115 | |
Investments in Affiliated Funds
The Fund may invest in the American Beacon U.S. Government Money Market Select Fund (the “USG Select Fund”). Cash collateral received by the Fund in connection with securities lending may also be invested in the USG Select Fund. The Fund listed below held the following shares with an October 31, 2024 fair value and dividend income earned from the investment in the USG Select Fund.
| | | | | | | | | | | | | | | | | | | | | | | | | | | | | | | | | | | | | | | | | | | | | | | | | | |
Affiliated Security | | Type of
Transaction | | | | | Fund | | | | | | October 31,
2024
Shares/Principal | | | | | | Change in
Unrealized
Gain (Loss) | | | | | | Realized
Gain
(Loss) | | | | | | Dividend
Income | | | | | | October 31,
2024
Fair Value | |
| U.S. Government Money Market Select | | Direct | | | | | |
| Large Cap
Value |
| | | | | | $ | 136,122,309 | | | | | | | $ | - | | | | | | | $ | - | | | | | | | $ | 5,482,981 | | | | | | | $ | 136,122,309 | |
| U.S. Government Money Market Select | | Securities Lending | | | | | |
| Large Cap
Value |
| | | | | | | 4,685,167 | | | | | | | | - | | | | | | | | - | | | | | | | | N/A | | | | | | | | 4,685,167 | |
The Fund and the USG Select Fund have the same investment advisor and therefore, are considered to be affiliated. The Manager serves as investment advisor to the USG Select Fund and receives management fees and administrative fees totaling 0.10% of the average daily net assets of the USG Select Fund. During the year ended October 31, 2024, the Manager earned fees on the Fund’s direct investments and securities lending collateral investments in the USG Select Fund as shown below:
| | | | | | | | | | | | |
Fund | | Direct Investments in
USG Select Fund | | | Securities Lending
Collateral
Investments in USG
Select Fund | | | Total | |
Large Cap Value | | $ | 105,910 | | | $ | 25,349 | | | $ | 131,259 | |
Interfund Credit Facility
Pursuant to an exemptive order issued by the U.S. Securities and Exchange Commission (“SEC”), the Fund, along with other registered investment companies having management contracts with the Manager, may participate in a credit facility whereby each fund, under certain conditions, is permitted to lend money directly to and borrow directly from other participating funds for temporary purposes. The interfund credit facility is advantageous to the funds because it provides added liquidity and eliminates the need to maintain higher cash balances to meet redemptions. This situation could arise when shareholder redemptions exceed anticipated volumes and certain funds have insufficient cash on hand to satisfy such redemptions or when sales of securities do not settle as expected, resulting in a cash shortfall for the fund. The credit facility is administered by a credit facility team consisting of professionals from the Manager’s asset management, compliance, and accounting areas who report the activities of the credit facility to the Board. During the year ended October 31, 2024, the Fund participated as a lender by loaning an average amount of $24,940,502 for 2 days at an average interest rate of 6.14% with interest charges earned of $18,765. This amount is included in “Interest income” on the Statement of Operations. During the year ended October 31, 2024, the Fund did not borrow from the credit facility.
18
American Beacon Large Cap Value FundSM
Notes to Financial Statements
October 31, 2024
Expense Reimbursement Plan
The Fund has adopted an Expense Reimbursement Plan whereby the Manager may seek repayment of contractual or voluntary fee reductions and expense reimbursements. Under the policy, the Manager can be reimbursed by the Fund for any contractual or voluntary fee reductions or expense reimbursements if reimbursement to the Manager (a) occurs within three years from the date of the Manager’s waiver/reimbursement and (b) does not cause the Fund’s annual operating expenses to exceed the lesser of the contractual percentage limit in effect at the time of the waiver/reimbursement or time of recoupment. During the year ended October 31, 2024 there were no waived fees, expenses reimbursed, or recouped expenses, and no commitment or contingent liability is expected. The carryover of excess expenses potentially reimbursable to the Manager, but not recorded as a liability are as follows:
| | | | | | | | | | | | | | | | |
Fund | | Recouped
Expenses | | | Excess Expense
Carryover | | | Expired Expense
Carryover | | | Expiration of
Reimbursed
Expenses | |
Large Cap Value | | $ | - | | | $ | - | | | $ | 18,227 | | | | 2023-2024 | |
Sales Commissions
The Fund’s Distributor, Resolute Investment Distributors, Inc. (“RID” or “Distributor”), may receive a portion of A Class sales charges from broker dealers which may be used to offset distribution related expenses. During the year ended October 31, 2024, RID collected $2,897 from the sale of A Class Shares of the Fund.
A CDSC of 0.50% will be deducted with respect to A Class Shares on certain purchases of $1,000,000 or more that are redeemed in whole or part within 18 months of purchase, unless waived as discussed in the Fund’s Prospectus. Any applicable CDSC will be 0.50% of the lesser of the original purchase price or the value of the redemption of the A Class Shares redeemed. During the year ended October 31, 2024, there were no CDSC fees collected for the A Class Shares of the Fund.
A CDSC of 1.00% will be deducted with respect to C Class Shares redeemed within 12 months of purchase, unless waived as discussed in the Fund’s Prospectus. Any applicable CDSC will be 1.00% of the lesser of the original purchase price or the value of the redemption of the C Class Shares redeemed. During the year ended October 31, 2024, CDSC fees of $622 were collected for C Class Shares of the Fund.
Trustee Fees and Expenses
As compensation for their service to the American Beacon Funds Complex, including the Trust (collectively, the “Trusts”), each Trustee is compensated from the Trusts as follows: (1) an annual retainer of $140,000; (2) meeting attendance fee (for attendance in-person or via teleconference) of (a) $12,000 for in person attendance, or $5,000 for telephonic attendance, by Board members for each regularly scheduled or special Board meeting, (b) $2,500 for attendance by Committee members at meetings of the Audit and Compliance Committee and the Investment Committee, (c) $1,000 for attendance by Committee members at meetings of the Nominating and Governance Committee; and (d) $2,500 for attendance by Board members for each special telephonic Board meeting; and (3) reimbursement of reasonable expenses incurred in attending Board meetings, Committee meetings, and relevant educational seminars. For this purpose, the Board considers attendance at regular meetings held by video conference to constitute in-person attendance at a Board meeting. The Trustees also may be compensated for attendance at special Board and/or Committee meetings from time to time. For her service as Board Chair, Ms. Cline receives an additional annual retainer of $50,000. Although she attends several committee meetings at each quarterly Board meeting, she receives only a single $2,500 fee each quarter for her attendance at the Audit and Compliance Committee and Investment Committee meetings. The chairpersons of the Audit and Compliance Committee and the Investment Committee each receive an additional annual retainer of $25,000 and the Chair of the Nominating and Governance Committee receives an additional annual retainer of $10,000.
19
American Beacon Large Cap Value FundSM
Notes to Financial Statements
October 31, 2024
3. Security Valuation and Fair Value Measurements
The price of the Fund’s shares is based on its net asset value (“NAV”) per share. The Fund’s NAV is computed by adding total assets, subtracting all the Fund’s liabilities, and dividing the result by the total number of shares outstanding.
The NAV of each class of the Fund’s shares is determined based on a pro rata allocation of the Fund’s investment income, expenses and total capital gains and losses. The Fund’s NAV per share is determined each business day as of the regular close of trading on the New York Stock Exchange (“NYSE” or “Exchange”), which is typically 4:00 p.m. Eastern Time (“ET”). However, if trading on the NYSE closes at a time other than 4:00 p.m. ET, the Fund’s NAV per share typically would still be determined as of the regular close of trading on the NYSE. The Fund does not price its shares on days that the NYSE is closed. Foreign exchanges may permit trading in foreign securities on days when the Fund is not open for business, which may result in the value of the Fund’s portfolio investments being affected at a time when you are unable to buy or sell shares.
Equity securities, including shares of closed-end funds and exchange-traded funds (“ETFs”), are valued at the last sale price or official closing price taken from the primary exchange in which each security trades. Investments in other mutual funds are valued at the closing NAV per share on the day of valuation. Debt securities are valued at bid quotes from broker/dealers or evaluated bid prices from pricing services, who may consider a number of inputs and factors, such as prices of comparable securities, yield curves, spreads, credit ratings, coupon rates, maturity, default rates, and underlying collateral. Futures are valued based on their daily settlement prices. Exchange-traded and over-the-counter (“OTC”) options are valued at the last sale price. Options with no last sale for the day are priced at mid quote. Swaps are valued at evaluated mid prices from pricing services.
The valuation of securities traded on foreign markets and certain fixed-income securities will generally be based on prices determined as of the earlier closing time of the markets on which they primarily trade unless a significant event has occurred. When the Fund holds securities or other assets that are denominated in a foreign currency, the Fund will normally use the currency exchange rates as of 4:00 p.m. ET.
Rule 2a-5 under the Investment Company Act (the “Valuation Rule”) establishes requirements for determining fair value in good faith for purposes of the Investment Company Act, including related oversight and reporting requirements. The Valuation Rule also defines when market quotations are “readily available,” which is the threshold for determining whether a Fund must fair value a security. Among other things, the Valuation Rule permits the Board to designate the Manager as Valuation Designee to perform the Fund’s fair value determinations subject to board oversight and certain reporting and other requirements intended to ensure that the Board receives the information it needs to oversee the Manager’s fair value determinations. Effective September 8, 2022, the Board has designated the Manager as valuation designee to perform fair value functions in accordance with the requirements of the Valuation Rule.
Securities may be valued at fair value, as determined in good faith and pursuant to the Manager’s procedures, under certain limited circumstances. For example, fair value pricing will be used for fixed-income securities and when market quotations are not readily available or reliable, as determined by the Manager, such as when (i) trading for a security is restricted or stopped; (ii) a security’s trading market is closed (other than customary closings); or (iii) a security has been de-listed from a national exchange. A security with limited market liquidity may require fair value pricing if the Manager determines that the available price does not reflect the security’s true market value. In addition, if a significant event that the Manager determines to affect the value of one or more securities held by the Fund occurs after the close of a related exchange but before the determination of the Fund’s NAV, fair value pricing may be used on the affected security or securities. Securities of small-capitalization companies are also more likely to require a fair value determination using these procedures because they are more thinly traded and less liquid than the securities of larger-capitalization companies. The Fund may fair value securities as a result of significant events occurring after the close of the foreign markets in which the Fund invests as described below. In addition, the Fund may invest in illiquid securities requiring these procedures.
20
American Beacon Large Cap Value FundSM
Notes to Financial Statements
October 31, 2024
The Fund may use fair value pricing for securities primarily traded in non-U.S. markets because most foreign markets close well before the Fund’s pricing time of 4:00 p.m. ET. The earlier close of these foreign markets gives rise to the possibility that significant events, including broad market moves, may have occurred in the interim and may materially affect the value of those securities. If the Manager determines that the last quoted prices of non-U.S. securities will, in its judgment, materially affect the value of some or all the Fund’s portfolio securities, the Manager can adjust the previous closing prices to reflect what it believes to be the fair value of the securities as of the close of the Exchange. In deciding whether it is necessary to adjust closing prices to reflect fair value, the Manager reviews a variety of factors, including developments in foreign markets, the performance of U.S. securities markets, and the performance of instruments trading in U.S. markets that represent foreign securities and baskets of foreign securities. These securities are fair valued using a pricing service, using methods approved by the Manager, that considers the correlation of the trading patterns of the foreign security to intraday trading in the U.S. markets, based on indices of domestic securities and other appropriate indicators such as prices of relevant American Depositary Receipts (“ADRs”) and futures contracts. The Manager’s Valuation Committee may also fair value securities in other situations, such as when a particular foreign market is closed but the Fund is open. The Fund uses outside pricing services to provide closing prices and information to evaluate and/or adjust those prices. As a means of evaluating its security valuation process, the Valuation Committee routinely compares closing prices, the next day’s opening prices in the same markets and adjusted prices.
Attempts to determine the fair value of securities introduce an element of subjectivity to the pricing of securities. As a result, the price of a security determined through fair valuation techniques may differ from the price quoted or published by other sources and may not accurately reflect the market value of the security when trading resumes. If a reliable market quotation becomes available for a security formerly valued through fair valuation techniques, the Manager compares the new market quotation to the fair value price to evaluate the effectiveness of the Fund’s fair valuation procedures. If any significant discrepancies are found, the Manager may adjust Manager’s fair valuation procedures for the Fund.
Valuation Inputs
Various inputs may be used to determine the fair value of the Fund’s investments. These inputs are summarized in three broad levels for financial statement purposes. The inputs or methodologies used to value securities are not necessarily an indication of the risk associated with investing in those securities.
| | | | |
| Level 1 | | - | | Quoted prices in active markets for identical securities. |
| | |
| Level 2 | | - | | Prices determined using other significant observable inputs. These may include quoted prices for similar securities, interest rates, prepayment speeds, credit risk, and others. |
| | |
| Level 3 | | - | | Prices determined using other significant unobservable inputs. Unobservable inputs reflect the Fund’s own assumptions about the factors market participants would use in pricing an investment. |
Level 1 and Level 2 trading assets and trading liabilities, at fair value
Common stocks, preferred securities and financial derivative instruments, such as futures contracts that are traded on a national securities exchange, are stated at the last reported sale or settlement price on the day of valuation. To the extent these securities are actively traded and valuation adjustments are not applied, they are categorized as Level 1 of the fair value hierarchy. Preferred securities and other equities traded on inactive markets or valued by reference to similar instruments are generally categorized as Level 2 of the fair value hierarchy.
Investments in registered open-end investment management companies will be valued based upon the NAVs of such investments and are categorized as Level 1 of the fair value hierarchy.
21
American Beacon Large Cap Value FundSM
Notes to Financial Statements
October 31, 2024
4. Securities and Other Investments
American Depositary Receipts and Non-Voting Depositary Receipts
ADRs are depositary receipts for foreign issuers in registered form traded in U.S. securities markets. Non-Voting Depositary Receipts (“NVDRs”) represent financial interests in an issuer but the holder is not entitled to any voting rights. Depositary receipts may not be denominated in the same currency as the securities into which they may be converted. Investing in depositary receipts entails substantially the same risks as direct investment in foreign securities. There is generally less publicly available information about foreign companies and there may be less governmental regulation and supervision of foreign stock exchanges, brokers, and listed companies. In addition, such companies may use different accounting and financial standards (and certain currencies may become unavailable for transfer from a foreign currency), resulting in the Fund’s possible inability to convert immediately into U.S. currency proceeds realized upon the sale of portfolio securities of the affected foreign companies. In addition, the Fund may invest in unsponsored depositary receipts, the issuers of which are not obligated to disclose material information about the underlying securities to investors in the United States. Ownership of unsponsored depositary receipts may not entitle the Fund to the same benefits and rights as ownership of a sponsored depositary receipt or the underlying security.
Common Stock
Common stock generally takes the form of shares in a corporation which represent an ownership interest. It ranks below preferred stock and debt securities in claims for dividends and for assets of the company in a liquidation or bankruptcy. The value of a company’s common stock may fall as a result of factors directly relating to that company, such as decisions made by its management or decreased demand for the company’s products or services. A stock’s value may also decline because of factors affecting not just the company, but also companies in the same industry or sector. The price of a company’s stock may also be affected by changes in financial markets that are relatively unrelated to the company, such as changes in interest rates, currency exchange rates or industry regulation. Companies that elect to pay dividends on their common stock generally only do so after they invest in their own business and make required payments to bondholders and on other debt and preferred stock. Therefore, the value of a company’s common stock will usually be more volatile than its bonds, other debt and preferred stock. Common stock may be exchange-traded or OTC. OTC stock may be less liquid than exchange-traded stock.
Other Investment Company Securities and Exchange-Traded Products
The Fund may invest in shares of other investment companies, including open-end funds, closed-end funds, business development companies (“BDCs”), ETFs, unit investment trusts, and other investment companies of the Trust. The Fund may invest in securities of an investment company advised by the Manager or the Sub-Advisor. Investments in the securities of other investment companies may involve duplication of advisory fees and certain other expenses. By investing in another investment company, the Fund becomes a shareholder of that investment company. As a result, the Fund shareholders indirectly will bear the Fund’s proportionate share of the fees and expenses paid by shareholders of the other investment company, in addition to the fees and expenses the Fund shareholders directly bear in connection with the Fund’s own operations. These other fees and expenses are reflected as Acquired Fund Fees and Expenses and are included in the Fees and Expenses Table for the Fund in its Prospectus, if applicable. Investments in other investment companies may involve the payment of substantial premiums above the value of such issuer’s portfolio securities.
Publicly Traded Partnerships/Master Limited Partnerships (“MLPs”)
The Fund may invest in publicly traded partnerships such as MLPs. MLPs issue units that are registered with the SEC and are freely tradable on a securities exchange or in the OTC market. An MLP may have one or more general partners, who conduct the business, and one or more limited partners, who contribute capital. The general partner or partners are jointly and severally responsible for the liabilities of the MLP. (An MLP also may be an
22
American Beacon Large Cap Value FundSM
Notes to Financial Statements
October 31, 2024
entity similar to a limited partnership, such as an LLC, which has one or more managers or managing members and non-managing members (who are like limited partners)). The Fund invests in an MLP as a limited partner and normally would not be liable for the debts of an MLP beyond the amount the Fund has invested therein, but it would not be shielded to the same extent that a shareholder of a corporation would be. In certain instances, creditors of an MLP would have the right to seek a return of capital that had been distributed to a limited partner. The right of an MLP’s creditors would continue even after the Fund had sold its investment in the partnership. MLPs typically invest in real estate and oil and gas equipment leasing assets, but they also finance entertainment, research and development, and other projects.
Real Estate Investment Trusts (“REITs”)
REITs are pooled investment vehicles that own, and often operate, income producing real estate (known as “equity REITs”) or invest in mortgages secured by loans on such real estate (known as “mortgage REITs”) or both (known as “hybrid REITs”). REITs are susceptible to the risks associated with direct ownership of real estate, such as declines in property values, increase in property taxes, operating expenses, rising interest rates or overbuilding, zoning changes, and losses from casualty or condemnation. REITs typically are subject to management fees and other expenses that are separate from those of the Fund.
5. Financial Derivative Instruments
The Fund may utilize derivative instruments to gain market exposure on cash balances or reduce market exposure in anticipation of liquidity needs. When considering the Fund’s use of derivatives, it is important to note that the Fund does not use derivatives for the purpose of creating financial leverage.
Futures Contracts
A futures contract is a contract to purchase or sell a particular security, or the cash value of an asset, such as securities, indices, or currencies, at a specified future date at a price agreed upon when the contract is made. Under many such contracts, no delivery of the actual underlying asset is required. Rather, upon the expiration of the contract, settlement is made by exchanging cash in an amount equal to the difference between the contract price and the closing price of the asset (e.g., a security or an index) at expiration, net of the initial and variation margin that was previously paid. An equity index futures contract is based on the value of an underlying index. The Fund may, from time to time, use futures positions to equitize cash and expose its portfolio to changes in securities prices or index prices. This can magnify gains and losses in the Fund. The Fund also may have to sell assets at inopportune times to satisfy its settlement or collateral obligations. The risks associated with the use of futures contracts also include that there may be an imperfect correlation between the changes in market value of the futures contracts and the assets underlying such contracts and that there may not be a liquid secondary market for a futures contract.
During the year ended October 31, 2024, the Fund entered into futures contracts primarily for exposing cash to markets.
The Fund’s average futures contracts outstanding fluctuate throughout the operating year as required to meet strategic requirements. The following table illustrates the average monthly volume of futures contracts. For the purpose of this disclosure, volume is measured by contracts outstanding at each month end.
| | | | |
Average Futures Contracts Outstanding | |
Fund | | Year Ended October 31, 2024 | |
Large Cap Value | | | 450 | |
23
American Beacon Large Cap Value FundSM
Notes to Financial Statements
October 31, 2024
The following is a summary of the fair valuations of the Fund’s derivative instruments categorized by risk exposure(1):
| | | | | | | | | | | | | | | | | | | | | | | | | | | | | | | | | | | | | | | | | | | | |
| Fair values of financial instruments on the Statement of Assets and Liabilities as of October 31, 2024: | |
| | | |
| | | Derivatives not accounted for as hedging instruments | | | | | | | |
| | | | | | | | | | | |
Liabilities: | | Credit contracts | | | | | | Foreign exchange
contracts | | | | | | Commodity
contracts | | | | | | Interest
rate
contracts | | | | | | Equity contracts | | | | | | Total | |
| Payable for variation margin from open futures contracts(2) | | $ | - | | | | | | | $ | - | | | | | | | $ | - | | | | | | | $ | - | | | | | | | $ | (1,085,822 | ) | | | | | | $ | (1,085,822 | ) |
| | | | | | | | | | | | | | | | | | | | | | | | | | | | | | | | | | | | | | | | | | | | |
| The effect of financial derivative instruments on the Statement of Operations as of October 31, 2024: | |
| | | |
| | | Derivatives not accounted for as hedging instruments | | | | | | | |
| | | | | | | | | | | |
Realized gain (loss) from derivatives
recognized as a result of operations | | Credit contracts | | | | | | Foreign exchange
contracts | | | | | | Commodity
contracts | | | | | | Interest
rate
contracts | | | | | | Equity contracts | | | | | | Total | |
| Futures contracts | | $ | - | | | | | | | $ | - | | | | | | | $ | - | | | | | | | $ | - | | | | | | | $ | 27,646,199 | | | | | | | $ | 27,646,199 | |
| | | | | | | | | | | |
Net change in unrealized appreciation
(depreciation) of derivatives recognized as
a result from operations: | | Credit contracts | | | | | | Foreign exchange
contracts | | | | | | Commodity
contracts | | | | | | Interest
rate
contracts | | | | | | Equity contracts | | | | | | Total | |
| Futures contracts | | $ | - | | | | | | | $ | - | | | | | | | $ | - | | | | | | | $ | - | | | | | | | $ | 1,863,308 | | | | | | | $ | 1,863,308 | |
(1) See Note 3 in the Notes to Financial Statements for additional information.
(2) Includes cumulative appreciation (depreciation) of futures contracts as reported in the Fund’s Schedule of Investments footnotes. Only current day’s variation margin is reported within the Statement of Assets and Liabilities.
Offsetting Assets and Liabilities
The Fund is a party to enforceable master netting agreements between brokers and counterparties which provide for the right to offset under certain circumstances. The Fund employs multiple money managers and counterparties and has elected not to offset qualifying financial and derivative instruments on the Statement of Assets and Liabilities, as such all financial and derivative instruments are presented on a gross basis. The impacts of netting arrangements that provide the right to offset are detailed below, if applicable. The net amount represents the net receivable or payable that would be due from or to the counterparty in the event of default. Exposure from borrowings and other financing agreements such as repurchase agreements can only be netted across transactions governed by the same Master Agreement with the same legal entity. All amounts reported below represent the balance as of the report date, October 31, 2024.
| | | | | | | | | | | | |
| Offsetting of Financial and Derivative Assets as of October 31, 2024: | | | | | | | | | | | | |
| | Assets | | | | | | Liabilities | |
| Futures Contracts(1) | | $ | - | | | | | | | $ | 1,085,822 | |
| | | | | | | | | | | | |
| Total derivative assets and liabilities in the Statement of Assets and Liabilities | | $ | - | | | | | | | $ | 1,085,822 | |
| | | | | | | | | | | | |
| Derivatives not subject to a Master Netting Agreement or similar agreement (“MNA”) | | $ | - | | | | | | | $ | (1,085,822 | ) |
| | | | | | | | | | | | |
| | | | | | | | | | | | | | | | | | | | | | | | | | | | | | | | | | | | |
| | | Remaining Contractual Maturity of the Agreements
As of October 31, 2024 | |
| | | Overnight and
Continuous | | | | | | <30 days | | | | | | Between 30 &
90 days | | | | | | >90 days | | | | | | Total | |
Securities Lending Transactions
| | | | | | | | | | | | | | | | | | | | | | | | | | | | | | | | | | | | |
Common Stocks | | $ | 4,685,167 | | | | | | | $ | - | | | | | | | $ | - | | | | | | | $ | - | | | | | | | $ | 4,685,167 | |
| | | | | | | | | | | | | | | | | | | | | | | | | | | | | | | | | | | | |
Total Borrowings | | $ | 4,685,167 | | | | | | | $ | - | | | | | | | $ | - | | | | | | | $ | - | | | | | | | $ | 4,685,167 | |
| | | | | | | | | | | | | | | | | | | | | | | | | | | | | | | | | | | | |
Gross amount of recognized liabilities for securities lending transactions | | | $ | 4,685,167 | |
| | | | | | | | | | | | | | | | | | | | | | | | | | | | | | | | | | | | |
(1)Includes cumulative appreciation or (depreciation) of futures contracts as reported in the Schedule of Investments footnotes. Only current day’s variation margin is reported within the Statement of Assets and Liabilities.
24
American Beacon Large Cap Value FundSM
Notes to Financial Statements
October 31, 2024
6. Principal Risks
Investing in the Fund may involve certain risks including, but not limited to, those described below.
Environmental, Social, and/or Governance Investing Risk
The use of environmental, social, and/or governance (“ESG”) considerations by a sub-advisor may cause the Fund to make different investments than funds that have a similar investment style but do not incorporate such considerations in their strategy. As with the use of any investment considerations involved in investment decisions, there is no guarantee that the use of any ESG investment considerations will result in the selection of issuers that will outperform other issuers or help reduce risk in the Fund. The Fund may underperform funds that do not incorporate these considerations.
Equity Investments Risk
Equity securities are subject to market risk. The Fund’s investments in equity securities may include common stocks, preferred stocks, securities convertible into or exchangeable for common stocks, REITs, depositary receipts, and U.S. dollar-denominated foreign stocks traded on U.S. exchanges. Such investments may expose the Fund to additional risk. The value of a company’s common stock may fall as a result of factors affecting the company, companies in the same industry or sector, or the financial markets overall. Common stock generally is subordinate to preferred stock upon the liquidation or bankruptcy of the issuing company. Preferred stocks and convertible securities are sensitive to movements in interest rates. Preferred stocks may be less liquid than common stocks and, unlike common stocks, participation in the growth of an issuer may be limited. Distributions on preferred stocks generally are payable at the discretion of an issuer and after required payments to bond holders. Convertible securities are subject to the risk that the credit standing of the issuer may have an effect on the convertible securities’ investment value. Investments in REITs are subject to the risks associated with investing in the real estate industry such as adverse developments affecting the real estate industry and real property values. Depositary receipts and U.S. dollar-denominated foreign stocks traded on U.S. exchanges are subject to certain of the risks associated with investing directly in foreign securities, including, but not limited to, currency exchange rate fluctuations, political and financial instability in the home country of a particular depositary receipt, less liquidity and more volatility, less government regulation and supervision and delays in transaction settlement.
Foreign Exposure Risk
The Fund’s exposure to a foreign issuer may subject the Fund to regulatory, political, currency, security, economic and other risks associated with that country. Global economic and financial markets have become increasingly interconnected and conditions (including recent volatility, terrorism, war and political instability) and events (including natural disasters) in one country, region or financial market may adversely impact issuers in a different country, region or financial market.
Futures Contracts Risk
Futures contracts are derivative instruments where one party pays a fixed price for an agreed amount of securities or other underlying assets at an agreed date. The use of such derivative instruments may expose the Fund to additional risks that it would not be subject to if it invested directly in the securities underlying those derivatives. There may at times be an imperfect correlation between the movement in the prices of futures contracts and the value of their underlying instruments or indexes. There can be no assurance that any strategy used will succeed. There also can be no assurance that, at all times, a liquid market will exist for offsetting a futures contract that the Fund has previously bought or sold and this may result in the inability to close a futures contract when desired. Futures contracts may experience potentially dramatic price changes, which will increase the volatility of the Fund and may involve a small investment of cash (the amount of initial and variation margin) relative to the magnitude of the risk assumed (the potential increase or decrease in the price of the futures
25
American Beacon Large Cap Value FundSM
Notes to Financial Statements
October 31, 2024
contract). Futures contracts on indices expose the Fund to volatility in an underlying index. Use of derivatives is a highly specialized activity that can involve investment techniques and risks different from, and in some respects greater than, those associated with investing in more traditional investments. Derivatives can be highly complex and highly volatile and may perform in unanticipated ways.
Market Risk
The Fund is subject to the risk that the securities markets will move down, sometimes rapidly and unpredictably, based on overall economic conditions and other factors, which may negatively affect the Fund’s performance. Equity securities generally have greater price volatility than fixed-income securities, although under certain market conditions fixed-income securities may have comparable or greater price volatility. During a general downturn in the securities markets, multiple assets may decline in value simultaneously. In some cases, traditional market participants have been less willing to make a market in some types of debt instruments, which has affected the liquidity of those instruments. During times of market turmoil, investors tend to look to the safety of securities issued or backed by the U.S. Treasury, causing the prices of these securities to rise and the yields to decline. Reduced liquidity in fixed-income and credit markets may negatively affect many issuers worldwide. Prices in many financial markets have increased significantly over the last decade, but there have also been periods of adverse market and financial developments and cyclical change during that timeframe, which have resulted in unusually high levels of volatility in domestic and foreign financial markets that has caused losses for investors and may occur again in the future, particularly if markets enter a period of uncertainty or economic weakness. The value of a security may decline due to adverse issuer-specific conditions, general market conditions unrelated to a particular issuer, or factors that affect a particular industry or industries. Changes in the financial condition of a single issuer or market segment also can impact the market as a whole.
Geopolitical and other events, including war, terrorism, economic uncertainty, trade disputes, pandemics, public health crises, natural disasters and related events have led, and in the future may continue to lead, to instability in world economies and markets generally and reduced liquidity in equity, credit and fixed-income markets, which may disrupt economies and markets and adversely affect the value of your investment. Changes in value may be temporary or may last for extended periods.
Policy changes by the U.S. government and/or Federal Reserve and political events within the U.S. and abroad, including the U.S. presidential election, the U.S. government’s inability at times to agree on a long-term budget and deficit reduction plan, the threat of a federal government shutdown and threats not to increase the federal government’s debt limit, may affect investor and consumer confidence and may adversely impact financial markets and the broader economy, perhaps suddenly and to a significant degree.
Markets and market participants are increasingly reliant upon both publicly available and proprietary information data systems. Data imprecision, software or other technology malfunctions, programming inaccuracies, unauthorized use or access, and similar circumstances may impair the performance of these systems and may have an adverse impact upon a single issuer, a group of issuers, or the market at large. The financial markets generally move in cycles, with periods of rising prices followed by periods of declining prices. The value of your investment may reflect these fluctuations.
Multiple Sub-Advisor Risk
The Manager may allocate the Fund’s assets among multiple sub-advisors, each of which is responsible for investing its allocated portion of the Fund’s assets. To a significant extent, the Fund’s performance will depend on the success of the Manager in selecting and overseeing the sub-advisors and allocating the Fund’s assets to sub-advisors. The sub-advisors’ investment styles may not work together as planned, which could adversely affect the performance of the Fund. In addition, because each sub-advisor makes its trading decisions independently, the sub-advisors may purchase or sell the same security at the same time without aggregating their transactions. This may cause unnecessary brokerage and other expenses.
26
American Beacon Large Cap Value FundSM
Notes to Financial Statements
October 31, 2024
Other Investment Companies Risk
The Fund may invest in shares of other registered investment companies, including money market funds that are advised by the Manager. To the extent that the Fund invests in shares of other registered investment companies, the Fund will indirectly bear the fees and expenses, including for example advisory and administrative fees, charged by those investment companies in addition to the Fund’s direct fees and expenses and will be subject to the risks associated with investments in those companies. To the extent the Fund invests in other investment companies that invest in equity securities, fixed-income securities and/or foreign securities, or that track an index, the Fund is subject to the risks associated with the underlying investments held by the investment company or the index fluctuations to which the investment company is subject.
Recent Market Events Risk
Both U.S. and international markets have experienced significant volatility in recent months and years. As a result of such volatility, investment returns may fluctuate significantly. Moreover, the risks discussed herein associated with an investment in the Fund may be increased.
Although interest rates were unusually low in recent years in the U.S. and abroad, in 2022, the Federal Reserve and certain foreign central banks began to raise interest rates as part of their efforts to address rising inflation. It is difficult to accurately predict the pace at which interest rates may continue to increase, the timing, frequency or magnitude of any such increases, or when such increases might stop. Additionally, various economic and political factors could cause the Federal Reserve or another foreign central bank to change their approach in the future and such actions may result in an economic slowdown in the U.S. and abroad. Unexpected increases in interest rates could lead to market volatility or reduce liquidity in certain sectors of the market. Deteriorating economic fundamentals may, in turn, increase the risk of default or insolvency of particular issuers, negatively impact market value, cause credit spreads to widen, and reduce bank balance sheets. Any of these could cause an increase in market volatility, reduce liquidity across various markets or decrease confidence in the markets. Additionally, high public debt in the U.S. and other countries creates ongoing systemic and market risks and policymaking uncertainty.
In March 2023, the shutdown of certain financial institutions in the U.S. and questions regarding the viability of other financial institutions raised economic concerns over disruption in the U.S. and global banking systems. There can be no certainty that the actions taken by the U.S. or foreign governments will be effective in mitigating the effects of financial institution failures on the economy and restoring public confidence in the U.S. and global banking systems.
Some countries, including the U.S., have in recent years adopted more protectionist trade policies. Slowing global economic growth; risks associated with a trade agreement between the United Kingdom and the European Union; the risks associated with ongoing trade negotiations with China; and the possibility of changes to some international trade agreements; political or economic dysfunction within some nations, including major producers of oil; and dramatic changes in commodity and currency prices could have adverse effects that cannot be foreseen at the present time.
Tensions, war, or open conflict between nations, such as between Russia and Ukraine, in the Middle East or in eastern Asia could affect the economies of many nations, including the United States. The duration of ongoing hostilities in the Middle East and between Russia and Ukraine, and any sanctions and related events cannot be predicted. Those events present material uncertainty and risk with respect to markets globally and the performance of the Fund and its investments or operations could be negatively impacted.
Regulators in the U.S. have proposed and recently adopted a number of changes to regulations involving the markets and issuers, some of which apply to the Fund. The full effect of various newly-adopted regulations is not currently known. Additionally, it is not clear whether the proposed regulations will be adopted. However, due to
27
American Beacon Large Cap Value FundSM
Notes to Financial Statements
October 31, 2024
the broad scope of the new and proposed regulations, certain changes could limit the Fund’s ability to pursue its investment strategies or make certain investments, or may make it more costly for the Fund to operate, which may impact performance.
Economists and others have expressed increasing concern about the potential effects of global climate change on property and security values. Certain issuers, industries and regions may be adversely affected by the impacts of climate change, including on the demand for and the development of goods and services and related production costs, and the impacts of legislation, regulation and international accords related to climate change, as well as any indirect consequences of regulation or business trends driven by climate change.
Sector Risk
Sector risk is the risk associated with the Fund holding a significant amount of investments in similar businesses, which would be similarly affected by particular economic or market events, which may, in certain circumstances, cause the value of the equity and debt securities of companies in a particular sector of the market to change. To the extent the Fund has substantial holdings within a particular sector, the risks to the Fund associated with that sector increase.
To the extent the Fund invests significantly in the financial services sector, the value of the Fund’s shares may be particularly vulnerable to factors affecting that sector, such as the availability and cost of capital funds, changes in interest rates, the rate of corporate and consumer debt defaults, extensive government regulation and price competition. The value of the Fund’s shares could experience significantly greater volatility than investment companies investing more broadly.
Securities Lending Risk
The Fund may lend its portfolio securities to brokers, dealers and financial institutions in order to obtain additional income. Borrowers of the Fund’s securities provide collateral either in the form of cash, which the Fund reinvests in securities or in the form of non-cash collateral consisting of securities issued or guaranteed by the U.S. government or one of its agencies or instrumentalities. The Fund will be responsible for the risks associated with the investment of cash collateral, including any collateral invested in an affiliated money market fund. The Fund may lose money on its investment of cash collateral or may fail to earn sufficient income on its investment to cover its payment to the borrower of a pre-negotiated fee or “rebate” for the use of that cash collateral in connection with the loan. The Fund could also lose money due to a decline in the value of non-cash collateral. In addition, delays may occur in the recovery of securities from borrowers, which could interfere with the Fund’s ability to vote proxies or to settle transactions or could result in increased costs. Moreover, if the borrower becomes subject to insolvency or similar proceedings, the Fund could incur delays in its ability to enforce its rights in its collateral. There also is a risk that a borrower may default on its obligation to return loaned securities at a time when the value of the Fund’s collateral is inadequate. Although the Fund’s securities lending agent may indemnify the Fund against that risk, it is also possible that the securities lending agent will be unable to satisfy its indemnification obligations. In any case in which the loaned securities are not returned to the Fund before an ex-dividend date, whether or not due to a default by the borrower, the payment in lieu of the dividend that the Fund receives from the securities’ borrower would not be treated as a dividend for federal income tax purposes and thus would not qualify for treatment as “qualified dividend income.”
7. Federal Income and Excise Taxes
It is the policy of the Fund to qualify as a regulated investment company (“RIC”), by complying with all applicable provisions of Subchapter M of the Internal Revenue Code, as amended, and to make distributions of taxable income sufficient to relieve it from substantially all federal income and excise taxes. For federal income tax purposes, the Fund is treated as a single entity for the purpose of determining such qualification.
28
American Beacon Large Cap Value FundSM
Notes to Financial Statements
October 31, 2024
The Fund does not have any unrecorded tax liabilities in the accompanying financial statements. Each of the tax years in the four year period ended October 31, 2024 remain subject to examination by the Internal Revenue Service. If applicable, the Fund recognizes interest accrued related to unrecognized tax benefits in interest expense and penalties in “Other expenses” on the Statement of Operations.
The Fund may be subject to taxes imposed by countries in which it invests. Such taxes are generally based on returns of income earned or gains realized or repatriated. Taxes are accrued and applied to net investment income, net realized capital gains and net unrealized appreciation (depreciation), as applicable, as the income is earned or capital gains are recorded.
Dividends are categorized in accordance with income tax regulations which may treat certain transactions differently than U.S. GAAP. Accordingly, the character of distributions and composition of net assets for tax purposes may differ from those reflected in the accompanying financial statements.
The tax character of distributions paid were as follows:
| | | | | | | | | | | | |
| | | Year Ended
October 31, 2024 | | | | | | Year Ended
October 31, 2023 | |
Distributions paid from: | | | | | | | | | | | | |
Ordinary income* | | | | | | | | | | | | |
R5 Class | | $ | 22,865,530 | | | | | | | $ | 19,554,206 | |
Y Class | | | 3,784,293 | | | | | | | | 2,880,165 | |
Investor Class | | | 11,008,851 | | | | | | | | 9,457,017 | |
Advisor Class | | | 833,468 | | | | | | | | 634,040 | |
A Class | | | 248,573 | | | | | | | | 245,474 | |
C Class | | | 39,204 | | | | | | | | 37,594 | |
R6 Class | | | 25,589,230 | | | | | | | | 18,258,942 | |
Long-term capital gains | | | | | | | | | | | | |
R5 Class | | | 35,995,890 | | | | | | | | 109,948,196 | |
Y Class | | | 6,167,654 | | | | | | | | 17,009,535 | |
Investor Class | | | 20,267,013 | | | | | | | | 65,498,599 | |
Advisor Class | | | 1,658,557 | | | | | | | | 4,935,411 | |
A Class | | | 465,662 | | | | | | | | 1,551,944 | |
C Class | | | 146,326 | | | | | | | | 574,978 | |
R6 Class | | | 39,564,302 | | | | | | | | 100,585,966 | |
| | | | | | | | | | | | |
Total distributions paid | | $ | 168,634,553 | | | | | | | $ | 351,172,067 | |
| | | | | | | | | | | | |
* For tax purposes, short-term capital gains are considered ordinary income distributions.
As of October 31, 2024, the components of distributable earnings (deficits) on a tax basis were as follows:
| | | | | | | | | | | | | | | | | | | | | | | | | | | | |
Fund | | Tax Cost | | | | | | Unrealized
Appreciation | | | | | | Unrealized
(Depreciation) | | | | | | Net Unrealized
Appreciation
(Depreciation) | |
Large Cap Value | | $ | 2,398,097,494 | | | | | | | $ | 1,145,718,077 | | | | | | | $ | (60,506,870 | ) | | | | | | $ | , 1,085,211,207 | |
| | | | | | | | | | | | | | | | | | | | | | | | | | | | | | | | | | | | | | | | | | | | |
Fund | | Net Unrealized
Appreciation
(Depreciation) | | | | | | Undistributed
Ordinary
Income | | | | | | Undistributed
Long-Term
Capital Gains | | | | | | Accumulated
Capital and
Other (Losses) | | | | | | Other Temporary
Differences | | | | | | Distributable
Earnings | |
Large Cap Value | | $ | 1,085,211,207 | | | | | | | $ | 83,369,843 | | | | | | | $ | 299,257,501 | | | | | | | $ | - | | | | | | | $ | - | | | | | | | $ | 1,467,838,551 | |
Financial reporting records are adjusted for permanent book/tax differences to reflect tax character. Financial records are not adjusted for temporary differences. The temporary differences between financial reporting and tax basis reporting of unrealized appreciation (depreciation) are attributable primarily to the tax deferral of losses from wash sales, the realization for tax purposes of unrealized gains (losses) on certain derivative instruments, and reclassifications of income from investments in real estate securities and other securities.
29
American Beacon Large Cap Value FundSM
Notes to Financial Statements
October 31, 2024
Due to inherent differences in the recognition of income, expenses, and realized gains (losses) under U.S. GAAP and federal income tax regulations, permanent differences between book and tax reporting have been identified and appropriately reclassified on the Statement of Assets and Liabilities.
Accordingly, the following amounts represent current year permanent differences derived from equalization as of October 31, 2024:
| | | | | | | | | | | | |
Fund | | Paid-In-Capital | | | | | | Distributable
Earnings/(Deficits) | |
| Large Cap Value | | $ | 39,932,096 | | | | | | | $ | (39,932,096 | ) |
For federal income tax purposes, the Fund measures its capital loss carryforwards annually at October 31, its fiscal year end. Capital loss carryforwards retain their character as short-term and/or long-term and may be carried forward and applied against future realized capital gains with no expiration date.
As of October 31, 2024, the Fund did not have any capital loss carryforwards.
8. Investment Transactions
The aggregate cost of purchases and proceeds from sales and maturities of investments, other than short-term obligations, for the year ended October 31, 2024 were as follows:
| | | | | | | | | | | | |
Fund | | Purchases (non-U.S.
Government
Securities) | | | | | | Sales (non-U.S.
Government
Securities) | |
| Large Cap Value | | $ | 850,794,367 | | | | | | | $ | 1,182,500,719 | |
A summary of the Fund’s transactions in the USG Select Fund for the year ended October 31, 2024 were as follows:
| | | | | | | | | | | | | | | | | | | | | | | | | | | | | | | | | | |
Fund | | Type of
Transaction | | | | | October 31,
2023
Shares/Fair
Value | | | | | | Purchases | | | | | | Sales | | | | | | October 31,
2024
Shares/Fair
Value | |
| Large Cap Value | | Direct | | | | | | $ | 54,678,380 | | | | | | | $ | 1,198,273,210 | | | | | | | $ | 1,116,829,281 | | | | | | | $ | 136,122,309 | |
| Large Cap Value | | Securities Lending | | | | | | | 28,712,080 | | | | | | | | 408,386,863 | | | | | | | | 432,413,776 | | | | | | | | 4,685,167 | |
Affiliated Trades
Cross trades for the period ended October 31, 2024, if any, were executed by the Fund pursuant to procedures adopted by the Board to ensure compliance with Rule 17a-7 under the Act. Cross trading is the buying or selling of portfolio securities between funds of investment companies, or between the fund of an investment company and another entity, that are or could be considered affiliates by virtue of a common investment advisor (or affiliated investment advisors), common Trustees and/or common Officers. At its regularly scheduled meetings, the Chief Compliance Officer (“CCO”) certifies to the Board that the 17a-7 transactions entered into by the funds complied with the Rule 17a-7 Procedures adopted by the Board.
For the period ended October 31, 2024, cross trades by the Fund under Rule 17a-7 were as follows:
| | | | | | | | | | | | | | | | | | | | |
Fund | | Purchases | | | | | | Sales | | | | | | Net Realized Gain (Loss) | |
Large Cap Value | | $ | 385,837 | | | | | | | $ | - | | | | | | | $ | - | |
30
American Beacon Large Cap Value FundSM
Notes to Financial Statements
October 31, 2024
9. Securities Lending
The Fund may lend its securities to qualified financial institutions, such as certain broker-dealers, to earn additional income. The borrowers are required to secure their loans continuously with collateral in an amount at least equal to the fair value of the securities loaned, initially in an amount at least equal to 102% of the fair value of domestic securities loaned and 105% of the fair value of international securities loaned. Collateral is monitored and marked-to-market daily. Daily mark-to-market amounts are required to be paid to the borrower or received from the borrower by the end of the following business day. This one day settlement for mark-to-market amounts may result in the collateral being temporarily less than the value of the securities on loan or temporarily more than the required minimum collateral.
To the extent that a loan is collateralized by cash, such cash collateral shall be invested by the securities lending agent (the “Agent”) in money market mutual funds and other short-term investments, provided the investments meet certain quality and diversification requirements. Securities purchased with cash collateral proceeds are listed in the Fund’s Schedule of Investments and the collateral is shown on the Statement of Assets and Liabilities as a payable.
Securities lending income is generated from the demand premium (if any) paid by the borrower to borrow a specific security and from the return on investment of cash collateral, reduced by negotiated rebate fees paid to the borrower and transaction costs. To the extent that a loan is secured by non-cash collateral, securities lending income is generated as a demand premium reduced by transaction costs. The Fund, the Agent, and the Manager retained 80%, 10%, and 10%, respectively, of the income generated from securities lending.
While securities are on loan, the Fund continues to receive certain income associated with that security and any gain or loss in the market price that may occur during the term of the loan. In the case of domestic equities, the value of any dividend is received in the form of a substitute payment approximately equal to the dividend. In the case of foreign securities, a negotiated amount is received that is less than the actual dividend, but higher than the dividend amount minus the foreign tax that the Fund would be subject to on the dividend.
Securities lending transactions pose certain risks to the Fund, including that the borrower may not provide additional collateral when required or return the securities when due, that the value of the short-term investments will be less than the amount of cash collateral required to be returned to the borrower, that non-cash collateral may be subject to legal constraints in the event of a borrower bankruptcy, and that the cash collateral investments could become illiquid and unable to be used to return collateral to the borrower. The Fund could also experience delays and costs in gaining access to the collateral. The Fund bears the risk of any deficiency in the amount of the cash collateral available for return to the borrower and any action which impairs its ability to liquidate non-cash collateral to satisfy a borrower default.
As of October 31, 2024, the value of outstanding securities on loan and the value of collateral were as follows:
| | | | | | | | | | | | | | | | | | | | | | | | | | | | |
Fund | | Fair Value of
Securities on Loan | | | | | | Cash Collateral
Received | | | | | | Non-Cash Collateral
Received | | | | | | Total Collateral
Received | |
| Large Cap Value | | $ | 42,653,227 | | | | | | | $ | 4,685,167 | | | | | | | $ | 39,941,123 | | | | | | | $ | 44,626,290 | |
Cash collateral is listed on the Fund’s Schedule of Investments and is shown on the Statement of Assets and Liabilities. Income earned on these investments is included in “Income derived from securities lending” on the Statement of Operations.
Non-cash collateral received by the Fund may not be sold or re-pledged except to satisfy a borrower default. Therefore, non-cash collateral is not included on the Fund’s Schedule of Investments or Statement of Assets and Liabilities.
31
American Beacon Large Cap Value FundSM
Notes to Financial Statements
October 31, 2024
10. Borrowing Arrangements
Effective November 8, 2024 (the “Effective Date”), the Fund, along with certain other funds managed by the Manager (“Participating Funds”), renewed a committed revolving line of credit (the “Committed Line”) agreement with State Street Bank and Trust Company (the “Bank”) to be used to facilitate portfolio liquidity. The maximum borrowing amount under the Committed Line is $100 million with interest at a rate equal to the higher of (a) Overnight Bank Funding Rate (“OBFR”) daily fluctuating rate per annum equal to 1.25% plus the sum of 0.10% or (b) the Federal Funds daily fluctuating rate per annum on amounts borrowed. Each of the Participating Funds paid a proportional amount of a quarterly commitment fee at a rate of 0.25% per annum on the unused portion of the Committed Line amount. The Committed Line expires November 7, 2025, unless extended by the Bank or terminated by the Participating Funds in accordance with the agreement. Prior to the Effective Date, the maximum borrowing amount under the Committed Line was $100 million with an expiration date November 7, 2024.
On the Effective Date, the Fund, along with certain other Participating Funds managed by the Manager, also renewed an uncommitted discretionary demand revolving line of credit (the “Uncommitted Line”) agreement with the Bank to be used to facilitate portfolio liquidity. The maximum borrowing amount under the Uncommitted Line is $100 million with interest at a rate equal to the higher of (a) OBFR daily fluctuating rate per annum equal to 1.25% plus the sum of 0.10% or (b) the Federal Funds daily fluctuating rate per annum on amounts borrowed on each outstanding loan. Each of the Participating Funds paid a proportional amount of a closing fee of $35,000 on the Effective Date. The Uncommitted Line expires November 7, 2025, unless extended by the Bank or terminated by the Participating Funds in accordance with the agreement. Prior to the Effective Date, the maximum borrowing amount under the Uncommitted Line was $100 million with an expiration date November 7, 2024.
The Participating Funds paid administration, legal and arrangement fees, which are recognized as a component of “Line of credit interest expense” on the Statement of Operations, along with commitment fees, that have been allocated among the Participating Funds based on average daily net assets.
During the year ended October 31, 2024, the Fund did not utilize these facilities.
32
American Beacon Large Cap Value FundSM
Notes to Financial Statements
October 31, 2024
11. Capital Share Transactions
The tables below summarize the activity in capital shares for each Class of the Fund:
| | | | | | | | | | | | | | | | | | | | | | | | | | | | |
| | | R5 Class | |
| | | Year Ended October 31, | |
| | | 2024 | | | | | | 2023 | |
Large Cap Value Fund | | Shares | | | | | | Amount | | | | | | Shares | | | | | | Amount | |
| Shares sold | | | 5,154,821 | | | | | | | $ | 137,077,412 | | | | | | | | 5,030,633 | | | | | | | $ | 125,011,196 | |
| Reinvestment of dividends | | | 1,914,494 | | | | | | | | 48,857,903 | | | | | | | | 4,651,691 | | | | | | | | 109,872,932 | |
| Shares redeemed | | | (12,279,471 | ) | | | | | | | (341,357,215 | ) | | | | | | | (12,695,441 | ) | | | | | | | (315,457,120 | ) |
| | | | | | | | | | | | | | | | | | | | | | | | | | | | |
| Net (decrease) in shares outstanding | | | (5,210,156 | ) | | | | | | $ | (155,421,900 | ) | | | | | | | (3,013,117 | ) | | | | | | $ | (80,572,992 | ) |
| | | | | | | | | | | | | | | | | | | | | | | | | | | | |
| | | | | | | | | | | | | | | | | | | | | | | | | | | | |
| | | Y Class | |
| | | Year Ended October 31, | |
| | | 2024 | | | 2023 | |
Large Cap Value Fund | | Shares | | | | | | Amount | | | | | | Shares | | | | | | Amount | |
| Shares sold | | | 1,023,027 | | | | | | | $ | 27,565,083 | | | | | | | | 1,520,418 | | | | | | | $ | 37,053,578 | |
| Reinvestment of dividends | | | 381,834 | | | | | | | | 9,626,029 | | | | | | | | 822,067 | | | | | | | | 19,195,272 | |
| Shares redeemed | | | (2,450,297 | ) | | | | | | | (64,956,349 | ) | | | | | | | (1,920,702 | ) | | | | | | | (47,489,945 | ) |
| | | | | | | | | | | | | | | | | | | | | | | | | | | | |
| Net increase (decrease) in shares outstanding | | | (1,045,436 | ) | | | | | | $ | (27,765,237 | ) | | | | | | | 421,783 | | | | | | | $ | 8,758,905 | |
| | | | | | | | | | | | | | | | | | | | | | | | | | | | |
| | | | | | | | | | | | | | | | | | | | | | | | | | | | |
| | | Investor Class | |
| | | Year Ended October 31, | |
| | | 2024 | | | 2023 | |
Large Cap Value Fund | | Shares | | | | | | Amount | | | | | | Shares | | | | | | Amount | |
| Shares sold | | | 1,500,707 | | | | | | | $ | 35,547,391 | | | | | | | | 1,953,809 | | | | | | | $ | 42,458,307 | |
| Reinvestment of dividends | | | 1,368,028 | | | | | | | | 30,452,306 | | | | | | | | 3,564,808 | | | | | | | | 73,969,773 | |
| Shares redeemed | | | (8,228,461 | ) | | | | | | | (190,944,429 | ) | | | | | | | (8,345,996 | ) | | | | | | | (180,334,525 | ) |
| | | | | | | | | | | | | | | | | | | | | | | | | | | | |
| Net (decrease) in shares outstanding | | | (5,359,726 | ) | | | | | | $ | (124,944,732 | ) | | | | | | | (2,827,379 | ) | | | | | | $ | (63,906,445 | ) |
| | | | | | | | | | | | | | | | | | | | | | | | | | | | |
| | | | | | | | | | | | | | | | | | | | | | | | | | | | |
| | | Advisor Class | |
| | | Year Ended October 31, | |
| | | 2024 | | | 2023 | |
Large Cap Value Fund | | Shares | | | | | | Amount | | | | | | Shares | | | | | | Amount | |
| Shares sold | | | 91,954 | | | | | | | $ | 2,152,524 | | | | | | | | 112,111 | | | | | | | $ | 2,376,104 | |
| Reinvestment of dividends | | | 114,269 | | | | | | | | 2,481,915 | | | | | | | | 273,640 | | | | | | | | 5,549,426 | |
| Shares redeemed | | | (433,385 | ) | | | | | | | (10,039,317 | ) | | | | | | | (437,149 | ) | | | | | | | (9,075,373 | ) |
| | | | | | | | | | | | | | | | | | | | | | | | | | | | |
| Net (decrease) in shares outstanding | | | (227,162 | ) | | | | | | $ | (5,404,878 | ) | | | | | | | (51,398 | ) | | | | | | $ | (1,149,843 | ) |
| | | | | | | | | | | | | | | | | | | | | | | | | | | | |
| | | | |
| | | A Class | |
| | | Year Ended October 31, | |
| | | 2024 | | | 2023 | |
Large Cap Value Fund | | Shares | | | | | | Amount | | | | | | Shares | | | | | | Amount | |
| Shares sold | | | 3,329,508 | | | | | | | $ | 79,786,438 | | | | | | | | 191,336 | | | | | | | $ | 4,086,931 | |
| Reinvestment of dividends | | | 30,925 | | | | | | | | 671,373 | | | | | | | | 84,266 | | | | | | | | 1,708,076 | |
| Shares redeemed | | | (471,556 | ) | | | | | | | (11,261,293 | ) | | | | | | | (431,729 | ) | | | | | | | (9,293,236 | ) |
| | | | | | | | | | | | | | | | | | | | | | | | | | | | |
| Net increase (decrease) in shares outstanding | | | 2,888,877 | | | | | | | $ | 69,196,518 | | | | | | | | (156,127 | ) | | | | | | $ | (3,498,229 | ) |
| | | | | | | | | | | | | | | | | | | | | | | | | | | | |
| | | | | | | | | | | | | | | | | | | | | | | | | | | | |
| | | C Class | |
| | | Year Ended October 31, | |
| | | 2024 | | | 2023 | |
Large Cap Value Fund | | Shares | | | | | | Amount | | | | | | Shares | | | | | | Amount | |
| Shares sold | | | 17,307 | | | | | | | $ | 397,627 | | | | | | | | 23,936 | | | | | | | $ | 497,121 | |
| Reinvestment of dividends | | | 8,424 | | | | | | | | 182,049 | | | | | | | | 29,998 | | | | | | | | 603,851 | |
| Shares redeemed | | | (123,041 | ) | | | | | | | (2,824,875 | ) | | | | | | | (108,342 | ) | | | | | | | (2,280,316 | ) |
| | | | | | | | | | | | | | | | | | | | | | | | | | | | |
| Net (decrease) in shares outstanding | | | (97,310 | ) | | | | | | $ | (2,245,199 | ) | | | | | | | (54,408 | ) | | | | | | $ | (1,179,344 | ) |
| | | | | | | | | | | | | | | | | | | | | | | | | | | | |
| | | | | | | | | | | | | | | | | | | | | | | | | | | | |
33
American Beacon Large Cap Value FundSM
Notes to Financial Statements
October 31, 2024
| | | | | | | | | | | | | | | | | | | | | | | | | | | | |
| | | R6 Class | |
| | | Year Ended October 31, | |
| | | 2024 | | | 2023 | |
Large Cap Value Fund | | Shares | | | | | | Amount | | | | | | Shares | | | | | | Amount | |
| Shares sold | | | 11,525,607 | | | | | | | $ | 307,427,448 | | | | | | | | 11,725,900 | | | | | | | $ | 289,324,155 | |
| Reinvestment of dividends | | | 2,243,857 | | | | | | | | 57,240,801 | | | | | | | | 4,259,311 | | | | | | | | 100,562,339 | |
| Shares redeemed | | | (11,795,748 | ) | | | | | | | (327,230,559 | ) | | | | | | | (9,944,862 | ) | | | | | | | (244,570,040 | ) |
| | | | | | | | | | | | | | | | | | | | | | | | | | | | |
| Net increase in shares outstanding | | | 1,973,716 | | | | | | | $ | 37,437,690 | | | | | | | | 6,040,349 | | | | | | | $ | 145,316,454 | |
| | | | | | | | | | | | | | | | | | | | | | | | | | | | |
12. Subsequent Events
Management has evaluated subsequent events for possible recognition or disclosure in the financial statements through the date the financial statements are issued. Management has determined that there are no material events that would require disclosure in the Fund’s financial statements through this date.
34
American Beacon Large Cap Value FundSM
Financial Highlights
(For a share outstanding throughout the period)
| | | | | | | | | | | | | | | | | | | | | | | | | | | | | | | | | | | | |
| | | R5 ClassA | |
| | | Year Ended October 31, | |
| | | 2024 | | | | | | 2023 | | | | | | 2022 | | | | | | 2021 | | | | | | 2020B | |
| | | | |
Net asset value, beginning of period | | $ | 23.92 | | | | | | | $ | 26.21 | | | | | | | $ | 30.99 | | | | | | | $ | 23.36 | | | | | | | $ | 28.32 | |
| | | | | | | | | | | | | | | | | | | | | | | | | | | | | | | | | | | | |
Income (loss) from investment operations: | | | | | | | | | | | | | | | | | | | | | | | | | | | | | | | | | | | | |
Net investment income | | | 0.62 | | | | | | | | 0.51 | | | | | | | | 0.50 | | | | | | | | 0.59 | | | | | | | | 0.65 | |
Net gains (losses) on investments (both realized and unrealized) | | | 6.79 | | | | | | | | 0.02 | | | | | | | | (2.11 | ) | | | | | | | 10.64 | | | | | | | | (2.89 | ) |
| | | | | | | | | | | | | | | | | | | | | | | | | | | | | | | | | | | | |
Total income (loss) from investment operations | | | 7.41 | | | | | | | | 0.53 | | | | | | | | (1.61 | ) | | | | | | | 11.23 | | | | | | | | (2.24 | ) |
| | | | | | | | | | | | | | | | | | | | | | | | | | | | | | | | | | | | |
Less distributions: | | | | | | | | | | | | | | | | | | | | | | | | | | | | | | | | | | | | |
Dividends from net investment income | | | (0.46 | ) | | | | | | | (0.43 | ) | | | | | | | (0.39 | ) | | | | | | | (0.49 | ) | | | | | | | (0.62 | ) |
Distributions from net realized gains | | | (0.90 | ) | | | | | | | (2.39 | ) | | | | | | | (2.78 | ) | | | | | | | (3.11 | ) | | | | | | | (2.10 | ) |
| | | | | | | | | | | | | | | | | | | | | | | | | | | | | | | | | | | | |
Total distributions | | | (1.36 | ) | | | | | | | (2.82 | ) | | | | | | | (3.17 | ) | | | | | | | (3.60 | ) | | | | | | | (2.72 | ) |
| | | | | | | | | | | | | | | | | | | | | | | | | | | | | | | | | | | | |
Net asset value, end of period | | $ | 29.97 | | | | | | | $ | 23.92 | | | | | | | $ | 26.21 | | | | | | | $ | 30.99 | | | | | | | $ | 23.36 | |
| | | | | | | | | | | | | | | | | | | | | | | | | | | | | | | | | | | | |
Total returnC | | | 31.97 | % | | | | | | | 2.16 | % | | | | | | | (5.75 | )% | | | | | | | 52.60 | % | | | | | | | (9.29 | )% |
| | | | | | | | | | | | | | | | | | | | | | | | | | | | | | | | | | | | |
| | | | | | | | | |
Ratios and supplemental data: | | | | | | | | | | | | | | | | | | | | | | | | | | | | | | | | | | | | |
Net assets, end of period | | $ | 1,147,150,395 | | | | | | | $ | 1,040,466,568 | | | | | | | $ | 1,218,988,715 | | | | | | | $ | 1,682,465,233 | | | | | | | $ | 1,807,587,315 | |
| | | | | | | | | |
Ratios to average net assets: | | | | | | | | | | | | | | | | | | | | | | | | | | | | | | | | | | | | |
Expenses, before reimbursements and/or recoupments | | | 0.65 | % | | | | | | | 0.64 | % | | | | | | | 0.63 | % | | | | | | | 0.63 | % | | | | | | | 0.63 | % |
Expenses, net of reimbursements and/or recoupments | | | 0.65 | % | | | | | | | 0.64 | % | | | | | | | 0.63 | % | | | | | | | 0.63 | % | | | | | | | 0.63 | % |
Net investment income, before expense reimbursements and/or recoupments | | | 1.77 | % | | | | | | | 1.78 | % | | | | | | | 1.45 | % | | | | | | | 1.30 | % | | | | | | | 1.90 | % |
Net investment income, net of reimbursements and/or recoupments | | | 1.77 | % | | | | | | | 1.78 | % | | | | | | | 1.45 | % | | | | | | | 1.30 | % | | | | | | | 1.90 | % |
Portfolio turnover rate | | | 26 | % | | | | | | | 25 | % | | | | | | | 25 | % | | | | | | | 23 | % | | | | | | | 67 | % |
| A | Prior to February 28, 2020, the R5 Class was known as Institutional Class. |
| B | On January 17, 2020, Brandywine Global Investment Management, LLC was terminated and ceased managing assets of the Fund. |
| C | Based on net asset value, which does not reflect the sales charge, redemption fee, or contingent deferred sales charge, if applicable. May include adjustments in accordance with U.S. GAAP and as such, the net asset value for reporting purposes and the returns based upon those net asset values may differ from the net asset value and returns for shareholder transactions. |
See accompanying notes
35
American Beacon Large Cap Value FundSM
Financial Highlights
(For a share outstanding throughout the period)
| | | | | | | | | | | | | | | | | | | | | | | | | | | | | | | | | | | | |
| | | Y Class | |
| | | Year Ended October 31, | |
| | | 2024 | | | | | | 2023 | | | | | | 2022 | | | | | | 2021 | | | | | | 2020A | |
| | | | |
Net asset value, beginning of period | | $ | 23.63 | | | | | | | $ | 25.92 | | | | | | | $ | 30.68 | | | | | | | $ | 23.16 | | | | | | | $ | 28.10 | |
| | | | | | | | | | | | | | | | | | | | | | | | | | | | | | | | | | | | |
Income (loss) from investment operations: | | | | | | | | | | | | | | | | | | | | | | | | | | | | | | | | | | | | |
Net investment income | | | 0.45 | | | | | | | | 0.45 | | | | | | | | 0.37 | | | | | | | | 0.38 | | | | | | | | 0.39 | |
Net gains (losses) on investments (both realized and unrealized) | | | 6.84 | | | | | | | | 0.06 | | | | | | | | (1.98 | ) | | | | | | | 10.73 | | | | | | | | (2.63 | ) |
| | | | | | | | | | | | | | | | | | | | | | | | | | | | | | | | | | | | |
Total income (loss) from investment operations | | | 7.29 | | | | | | | | 0.51 | | | | | | | | (1.61 | ) | | | | | | | 11.11 | | | | | | | | (2.24 | ) |
| | | | | | | | | | | | | | | | | | | | | | | | | | | | | | | | | | | | |
Less distributions: | | | | | | | | | | | | | | | | | | | | | | | | | | | | | | | | | | | | |
Dividends from net investment income | | | (0.44 | ) | | | | | | | (0.41 | ) | | | | | | | (0.37 | ) | | | | | | | (0.48 | ) | | | | | | | (0.60 | ) |
Distributions from net realized gains | | | (0.90 | ) | | | | | | | (2.39 | ) | | | | | | | (2.78 | ) | | | | | | | (3.11 | ) | | | | | | | (2.10 | ) |
| | | | | | | | | | | | | | | | | | | | | | | | | | | | | | | | | | | | |
Total distributions | | | (1.34 | ) | | | | | | | (2.80 | ) | | | | | | | (3.15 | ) | | | | | | | (3.59 | ) | | | | | | | (2.70 | ) |
| | | | | | | | | | | | | | | | | | | | | | | | | | | | | | | | | | | | |
Net asset value, end of period | | $ | 29.58 | | | | | | | $ | 23.63 | | | | | | | $ | 25.92 | | | | | | | $ | 30.68 | | | | | | | $ | 23.16 | |
| | | | | | | | | | | | | | | | | | | | | | | | | | | | | | | | | | | | |
Total returnB | | | 31.84 | % | | | | | | | 2.09 | % | | | | | | | (5.81 | )% | | | | | | | 52.47 | % | | | | | | | (9.35 | )% |
| | | | | | | | | | | | | | | | | | | | | | | | | | | | | | | | | | | | |
| | | | | | | | | |
Ratios and supplemental data: | | | | | | | | | | | | | | | | | | | | | | | | | | | | | | | | | | | | |
Net assets, end of period | | $ | 196,267,664 | | | | | | | $ | 181,490,071 | | | | | | | $ | 188,140,776 | | | | | | | $ | 258,183,363 | | | | | | | $ | 178,065,442 | |
| | | | | | | | | |
Ratios to average net assets: | | | | | | | | | | | | | | | | | | | | | | | | | | | | | | | | | | | | |
Expenses, before reimbursements and/or recoupments | | | 0.72 | % | | | | | | | 0.71 | % | | | | | | | 0.70 | % | | | | | | | 0.69 | % | | | | | | | 0.70 | % |
Expenses, net of reimbursements and/or recoupments | | | 0.72 | % | | | | | | | 0.71 | % | | | | | | | 0.70 | % | | | | | | | 0.69 | % | | | | | | | 0.70 | % |
Net investment income, before expense reimbursements and/or recoupments | | | 1.71 | % | | | | | | | 1.70 | % | | | | | | | 1.38 | % | | | | | | | 1.21 | % | | | | | | | 1.84 | % |
Net investment income, net of reimbursements and/or recoupments | | | 1.71 | % | | | | | | | 1.70 | % | | | | | | | 1.38 | % | | | | | | | 1.21 | % | | | | | | | 1.84 | % |
Portfolio turnover rate | | | 26 | % | | | | | | | 25 | % | | | | | | | 25 | % | | | | | | | 23 | % | | | | | | | 67 | % |
| A | On January 17, 2020, Brandywine Global Investment Management, LLC was terminated and ceased managing assets of the Fund. |
| B | Based on net asset value, which does not reflect the sales charge, redemption fee, or contingent deferred sales charge, if applicable. May include adjustments in accordance with U.S. GAAP and as such, the net asset value for reporting purposes and the returns based upon those net asset values may differ from the net asset value and returns for shareholder transactions. |
See accompanying notes
36
American Beacon Large Cap Value FundSM
Financial Highlights
(For a share outstanding throughout the period)
| | | | | | | | | | | | | | | | | | | | | | | | | | | | | | | | | | | | |
| | | Investor Class | |
| | | Year Ended October 31, | |
| | | 2024 | | | | | | 2023 | | | | | | 2022 | | | | | | 2021 | | | | | | 2020A | |
| | | | |
Net asset value, beginning of period | | $ | 20.97 | | | | | | | $ | 23.30 | | | | | | | $ | 27.88 | | | | | | | $ | 21.32 | | | | | | | $ | 26.06 | |
| | | | | | | | | | | | | | | | | | | | | | | | | | | | | | | | | | | | |
Income (loss) from investment operations: | | | | | | | | | | | | | | | | | | | | | | | | | | | | | | | | | | | | |
Net investment income | | | 0.16 | | | | | | | | 0.27 | | | | | | | | 0.25 | | | | | | | | 0.20 | | | | | | | | 0.29 | |
Net gains (losses) on investments (both realized and unrealized) | | | 6.23 | | | | | | | | 0.14 | | | | | | | | (1.76 | ) | | | | | | | 9.88 | | | | | | | | (2.41 | ) |
| | | | | | | | | | | | | | | | | | | | | | | | | | | | | | | | | | | | |
Total income (loss) from investment operations | | | 6.39 | | | | | | | | 0.41 | | | | | | | | (1.51 | ) | | | | | | | 10.08 | | | | | | | | (2.12 | ) |
| | | | | | | | | | | | | | | | | | | | | | | | | | | | | | | | | | | | |
Less distributions: | | | | | | | | | | | | | | | | | | | | | | | | | | | | | | | | | | | | |
Dividends from net investment income | | | (0.38 | ) | | | | | | | (0.35 | ) | | | | | | | (0.29 | ) | | | | | | | (0.41 | ) | | | | | | | (0.52 | ) |
Distributions from net realized gains | | | (0.90 | ) | | | | | | | (2.39 | ) | | | | | | | (2.78 | ) | | | | | | | (3.11 | ) | | | | | | | (2.10 | ) |
| | | | | | | | | | | | | | | | | | | | | | | | | | | | | | | | | | | | |
Total distributions | | | (1.28 | ) | | | | | | | (2.74 | ) | | | | | | | (3.07 | ) | | | | | | | (3.52 | ) | | | | | | | (2.62 | ) |
| | | | | | | | | | | | | | | | | | | | | | | | | | | | | | | | | | | | |
Net asset value, end of period | | $ | 26.08 | | | | | | | $ | 20.97 | | | | | | | $ | 23.30 | | | | | | | $ | 27.88 | | | | | | | $ | 21.32 | |
| | | | | | | | | | | | | | | | | | | | | | | | | | | | | | | | | | | | |
Total returnB | | | 31.54 | % | | | | | | | 1.88 | % | | | | | | | (6.04 | )% | | | | | | | 52.04 | % | | | | | | | (9.59 | )% |
| | | | | | | | | | | | | | | | | | | | | | | | | | | | | | | | | | | | |
| | | | | | | | | |
Ratios and supplemental data: | | | | | | | | | | | | | | | | | | | | | | | | | | | | | | | | | | | | |
Net assets, end of period | | $ | 513,291,440 | | | | | | | $ | 525,063,555 | | | | | | | $ | 649,409,067 | | | | | | | $ | 821,099,597 | | | | | | | $ | 707,970,431 | |
| | | | | | | | | |
Ratios to average net assets: | | | | | | | | | | | | | | | | | | | | | | | | | | | | | | | | | | | | |
Expenses, before reimbursements and/or recoupments | | | 0.94 | % | | | | | | | 0.94 | % | | | | | | | 0.95 | % | | | | | | | 0.98 | % | | | | | | | 0.96 | % |
Expenses, net of reimbursements and/or recoupments | | | 0.94 | % | | | | | | | 0.94 | % | | | | | | | 0.95 | % | | | | | | | 0.98 | % | | | | | | | 0.96 | % |
Net investment income, before expense reimbursements and/or recoupments | | | 1.49 | % | | | | | | | 1.48 | % | | | | | | | 1.13 | % | | | | | | | 0.93 | % | | | | | | | 1.57 | % |
Net investment income, net of reimbursements and/or recoupments | | | 1.49 | % | | | | | | | 1.48 | % | | | | | | | 1.13 | % | | | | | | | 0.93 | % | | | | | | | 1.57 | % |
Portfolio turnover rate | | | 26 | % | | | | | | | 25 | % | | | | | | | 25 | % | | | | | | | 23 | % | | | | | | | 67 | % |
| A | On January 17, 2020, Brandywine Global Investment Management, LLC was terminated and ceased managing assets of the Fund. |
| B | Based on net asset value, which does not reflect the sales charge, redemption fee, or contingent deferred sales charge, if applicable. May include adjustments in accordance with U.S. GAAP and as such, the net asset value for reporting purposes and the returns based upon those net asset values may differ from the net asset value and returns for shareholder transactions. |
See accompanying notes
37
American Beacon Large Cap Value FundSM
Financial Highlights
(For a share outstanding throughout the period)
| | | | | | | | | | | | | | | | | | | | | | | | | | | | | | | | | | | | |
| | | Advisor Class | |
| | | Year Ended October 31, | |
| | | 2024 | | | | | | 2023 | | | | | | 2022 | | | | | | 2021 | | | | | | 2020A | |
| | | | |
Net asset value, beginning of period | | $ | 20.46 | | | | | | | $ | 22.80 | | | | | | | $ | 27.36 | | | | | | | $ | 20.97 | | | | | | | $ | 25.68 | |
| | | | | | | | | | | | | | | | | | | | | | | | | | | | | | | | | | | | |
Income (loss) from investment operations: | | | | | | | | | | | | | | | | | | | | | | | | | | | | | | | | | | | | |
Net investment income | | | 0.18 | | | | | | | | 0.26 | | | | | | | | 0.14 | | | | | | | | 0.26 | | | | | | | | 0.24 | |
Net gains (losses) on investments (both realized and unrealized) | | | 6.01 | | | | | | | | 0.10 | | | | | | | | (1.65 | ) | | | | | | | 9.62 | | | | | | | | (2.36 | ) |
| | | | | | | | | | | | | | | | | | | | | | | | | | | | | | | | | | | | |
Total income (loss) from investment operations | | | 6.19 | | | | | | | | 0.36 | | | | | | | | (1.51 | ) | | | | | | | 9.88 | | | | | | | | (2.12 | ) |
| | | | | | | | | | | | | | | | | | | | | | | | | | | | | | | | | | | | |
Less distributions: | | | | | | | | | | | | | | | | | | | | | | | | | | | | | | | | | | | | |
Dividends from net investment income | | | (0.35 | ) | | | | | | | (0.31 | ) | | | | | | | (0.27 | ) | | | | | | | (0.38 | ) | | | | | | | (0.49 | ) |
Distributions from net realized gains | | | (0.90 | ) | | | | | | | (2.39 | ) | | | | | | | (2.78 | ) | | | | | | | (3.11 | ) | | | | | | | (2.10 | ) |
| | | | | | | | | | | | | | | | | | | | | | | | | | | | | | | | | | | | |
Total distributions | | | (1.25 | ) | | | | | | | (2.70 | ) | | | | | | | (3.05 | ) | | | | | | | (3.49 | ) | | | | | | | (2.59 | ) |
| | | | | | | | | | | | | | | | | | | | | | | | | | | | | | | | | | | | |
Net asset value, end of period | | $ | 25.40 | | | | | | | $ | 20.46 | | | | | | | $ | 22.80 | | | | | | | $ | 27.36 | | | | | | | $ | 20.97 | |
| | | | | | | | | | | | | | | | | | | | | | | | | | | | | | | | | | | | |
Total returnB | | | 31.28 | % | | | | | | | 1.69 | % | | | | | | | (6.17 | )% | | | | | | | 51.89 | % | | | | | | | (9.73 | )% |
| | | | | | | | | | | | | | | | | | | | | | | | | | | | | | | | | | | | |
| | | | | | | | | |
Ratios and supplemental data: | | | | | | | | | | | | | | | | | | | | | | | | | | | | | | | | | | | | |
Net assets, end of period | | $ | 45,504,706 | | | | | | | $ | 41,289,229 | | | | | | | $ | 47,185,316 | | | | | | | $ | 63,521,926 | | | | | | | $ | 46,049,690 | |
| | | | | | | | | |
Ratios to average net assets: | | | | | | | | | | | | | | | | | | | | | | | | | | | | | | | | | | | | |
Expenses, before reimbursements and/or recoupments | | | 1.11 | % | | | | | | | 1.11 | % | | | | | | | 1.10 | % | | | | | | | 1.10 | % | | | | | | | 1.10 | % |
Expenses, net of reimbursements and/or recoupments | | | 1.11 | % | | | | | | | 1.11 | % | | | | | | | 1.10 | % | | | | | | | 1.10 | % | | | | | | | 1.10 | % |
Net investment income, before expense reimbursements and/or recoupments | | | 1.30 | % | | | | | | | 1.31 | % | | | | | | | 0.98 | % | | | | | | | 0.81 | % | | | | | | | 1.42 | % |
Net investment income, net of reimbursements and/or recoupments | | | 1.30 | % | | | | | | | 1.31 | % | | | | | | | 0.98 | % | | | | | | | 0.81 | % | | | | | | | 1.42 | % |
Portfolio turnover rate | | | 26 | % | | | | | | | 25 | % | | | | | | | 25 | % | | | | | | | 23 | % | | | | | | | 67 | % |
| A | On January 17, 2020, Brandywine Global Investment Management, LLC was terminated and ceased managing assets of the Fund. |
| B | Based on net asset value, which does not reflect the sales charge, redemption fee, or contingent deferred sales charge, if applicable. May include adjustments in accordance with U.S. GAAP and as such, the net asset value for reporting purposes and the returns based upon those net asset values may differ from the net asset value and returns for shareholder transactions. |
See accompanying notes
38
American Beacon Large Cap Value FundSM
Financial Highlights
(For a share outstanding throughout the period)
| | | | | | | | | | | | | | | | | | | | | | | | | | | | | | | | | | | | |
| | | A Class | |
| | | Year Ended October 31, | |
| | | 2024 | | | | | | 2023 | | | | | | 2022 | | | | | | 2021 | | | | | | 2020A | |
| | | | |
Net asset value, beginning of period | | $ | 20.47 | | | | | | | $ | 22.86 | | | | | | | $ | 27.37 | | | | | | | $ | 20.96 | | | | | | | $ | 25.66 | |
| | | | | | | | | | | | | | | | | | | | | | | | | | | | | | | | | | | | |
Income (loss) from investment operations: | | | | | | | | | | | | | | | | | | | | | | | | | | | | | | | | | | | | |
Net investment income | | | 1.80 | | | | | | | | 0.30 | B | | | | | | | 1.05 | | | | | | | | 0.24 | B | | | | | | | 0.20 | |
Net gains (losses) on investments (both realized and unrealized) | | | 4.43 | | | | | | | | 0.08 | | | | | | | | (2.51 | ) | | | | | | | 9.68 | | | | | | | | (2.29 | ) |
| | | | | | | | | | | | | | | | | | | | | | | | | | | | | | | | | | | | |
Total income (loss) from investment operations | | | 6.23 | | | | | | | | 0.38 | | | | | | | | (1.46 | ) | | | | | | | 9.92 | | | | | | | | (2.09 | ) |
| | | | | | | | | | | | | | | | | | | | | | | | | | | | | | | | | | | | |
Less distributions: | | | | | | | | | | | | | | | | | | | | | | | | | | | | | | | | | | | | |
Dividends from net investment income | | | (0.37 | ) | | | | | | | (0.38 | ) | | | | | | | (0.27 | ) | | | | | | | (0.40 | ) | | | | | | | (0.51 | ) |
Distributions from net realized gains | | | (0.90 | ) | | | | | | | (2.39 | ) | | | | | | | (2.78 | ) | | | | | | | (3.11 | ) | | | | | | | (2.10 | ) |
| | | | | | | | | | | | | | | | | | | | | | | | | | | | | | | | | | | | |
Total distributions | | | (1.27 | ) | | | | | | | (2.77 | ) | | | | | | | (3.05 | ) | | | | | | | (3.51 | ) | | | | | | | (2.61 | ) |
| | | | | | | | | | | | | | | | | | | | | | | | | | | | | | | | | | | | |
Net asset value, end of period | | $ | 25.43 | | | | | | | $ | 20.47 | | | | | | | $ | 22.86 | | | | | | | $ | 27.37 | | | | | | | $ | 20.96 | |
| | | | | | | | | | | | | | | | | | | | | | | | | | | | | | | | | | | | |
Total returnC | | | 31.53 | % | | | | | | | 1.79 | % | | | | | | | (5.96 | )% | | | | | | | 52.15 | % | | | | | | | (9.65 | )% |
| | | | | | | | | | | | | | | | | | | | | | | | | | | | | | | | | | | | |
| | | | | | | | | |
Ratios and supplemental data: | | | | | | | | | | | | | | | | | | | | | | | | | | | | | | | | | | | | |
Net assets, end of period | | $ | 88,343,465 | | | | | | | $ | 11,986,577 | | | | | | | $ | 16,953,764 | | | | | | | $ | 12,661,833 | | | | | | | $ | 25,792,400 | |
Ratios to average net assets: | | | | | | | | | | | | | | | | | | | | | | | | | | | | | | | | | | | | |
Expenses, before reimbursements and/or recoupments | | | 1.00 | % | | | | | | | 1.00 | % | | | | | | | 0.89 | % | | | | | | | 0.96 | % | | | | | | | 1.00 | % |
Expenses, net of reimbursements and/or recoupments | | | 1.00 | % | | | | | | | 1.00 | % | | | | | | | 0.89 | % | | | | | | | 0.96 | % | | | | | | | 1.00 | % |
Net investment income, before expense reimbursements and/or recoupments | | | 1.33 | % | | | | | | | 1.42 | % | | | | | | | 1.24 | % | | | | | | | 0.98 | % | | | | | | | 1.52 | % |
Net investment income, net of reimbursements and/or recoupments | | | 1.33 | % | | | | | | | 1.42 | % | | | | | | | 1.24 | % | | | | | | | 0.98 | % | | | | | | | 1.52 | % |
Portfolio turnover rate | | | 26 | % | | | | | | | 25 | % | | | | | | | 25 | % | | | | | | | 23 | % | | | | | | | 67 | % |
| A | On January 17, 2020, Brandywine Global Investment Management, LLC was terminated and ceased managing assets of the Fund. |
| B | Per share amounts have been calculated using the average shares method. |
| C | Based on net asset value, which does not reflect the sales charge, redemption fee, or contingent deferred sales charge, if applicable. May include adjustments in accordance with U.S. GAAP and as such, the net asset value for reporting purposes and the returns based upon those net asset values may differ from the net asset value and returns for shareholder transactions. |
See accompanying notes
39
American Beacon Large Cap Value FundSM
Financial Highlights
(For a share outstanding throughout the period)
| | | | | | | | | | | | | | | | | | | | | | | | | | | | | | | | | | | | |
| | | C Class | |
| | | Year Ended October 31, | |
| | | 2024 | | | | | | 2023 | | | | | | 2022 | | | | | | 2021 | | | | | | 2020A | |
| | | | |
Net asset value, beginning of period | | $ | 20.21 | | | | | | | $ | 22.52 | | | | | | | $ | 27.07 | | | | | | | $ | 20.74 | | | | | | | $ | 25.43 | |
| | | | | | | | | | | | | | | | | | | | | | | | | | | | | | | | | | | | |
Income (loss) from investment operations: | | | | | | | | | | | | | | | | | | | | | | | | | | | | | | | | | | | | |
Net investment income (loss) | | | 0.17 | B | | | | | | | 0.15 | B | | | | | | | 0.07 | | | | | | | | 0.16 | | | | | | | | 0.08 | |
Net gains (losses) on investments (both realized and unrealized) | | | 5.82 | | | | | | | | 0.09 | | | | | | | | (1.71 | ) | | | | | | | 9.49 | | | | | | | | (2.32 | ) |
| | | | | | | | | | | | | | | | | | | | | | | | | | | | | | | | | | | | |
Total income (loss) from investment operations | | | 5.99 | | | | | | | | 0.24 | | | | | | | | (1.64 | ) | | | | | | | 9.65 | | | | | | | | (2.24 | ) |
| | | | | | | | | | | | | | | | | | | | | | | | | | | | | | | | | | | | |
Less distributions: | | | | | | | | | | | | | | | | | | | | | | | | | | | | | | | | | | | | |
Dividends from net investment income | | | (0.15 | ) | | | | | | | (0.16 | ) | | | | | | | (0.13 | ) | | | | | | | (0.21 | ) | | | | | | | (0.35 | ) |
Distributions from net realized gains | | | (0.90 | ) | | | | | | | (2.39 | ) | | | | | | | (2.78 | ) | | | | | | | (3.11 | ) | | | | | | | (2.10 | ) |
| | | | | | | | | | | | | | | | | | | | | | | | | | | | | | | | | | | | |
Total distributions | | | (1.05 | ) | | | | | | | (2.55 | ) | | | | | | | (2.91 | ) | | | | | | | (3.32 | ) | | | | | | | (2.45 | ) |
| | | | | | | | | | | | | | | | | | | | | | | | | | | | | | | | | | | | |
Net asset value, end of period | | $ | 25.15 | | | | | | | $ | 20.21 | | | | | | | $ | 22.52 | | | | | | | $ | 27.07 | | | | | | | $ | 20.74 | |
| | | | | | | | | | | | | | | | | | | | | | | | | | | | | | | | | | | | |
Total returnC | | | 30.51 | % | | | | | | | 1.11 | % | | | | | | | (6.74 | )% | | | | | | | 51.05 | % | | | | | | | (10.26 | )% |
| | | | | | | | | | | | | | | | | | | | | | | | | | | | | | | | | | | | |
| | | | | | | | | |
Ratios and supplemental data: | | | | | | | | | | | | | | | | | | | | | | | | | | | | | | | | | | | | |
Net assets, end of period | | $ | 2,335,004 | | | | | | | $ | 3,842,593 | | | | | | | $ | 5,508,217 | | | | | | | $ | 6,898,120 | | | | | | | $ | 4,687,004 | |
Ratios to average net assets: | | | | | | | | | | | | | | | | | | | | | | | | | | | | | | | | | | | | |
Expenses, before reimbursements and/or recoupments | | | 1.72 | % | | | | | | | 1.70 | % | | | | | | | 1.69 | % | | | | | | | 1.68 | % | | | | | | | 1.68 | % |
Expenses, net of reimbursements and/or recoupments | | | 1.72 | % | | | | | | | 1.70 | % | | | | | | | 1.69 | % | | | | | | | 1.68 | % | | | | | | | 1.68 | % |
Net investment income, before expense reimbursements and/or recoupments | | | 0.74 | % | | | | | | | 0.71 | % | | | | | | | 0.40 | % | | | | | | | 0.22 | % | | | | | | | 0.84 | % |
Net investment income, net of reimbursements and/or recoupments | | | 0.74 | % | | | | | | | 0.71 | % | | | | | | | 0.40 | % | | | | | | | 0.22 | % | | | | | | | 0.84 | % |
Portfolio turnover rate | | | 26 | % | | | | | | | 25 | % | | | | | | | 25 | % | | | | | | | 23 | % | | | | | | | 67 | % |
| A | On January 17, 2020, Brandywine Global Investment Management, LLC was terminated and ceased managing assets of the Fund. |
| B | Per share amounts have been calculated using the average shares method. |
| C | Based on net asset value, which does not reflect the sales charge, redemption fee, or contingent deferred sales charge, if applicable. May include adjustments in accordance with U.S. GAAP and as such, the net asset value for reporting purposes and the returns based upon those net asset values may differ from the net asset value and returns for shareholder transactions. |
See accompanying notes
40
American Beacon Large Cap Value FundSM
Financial Highlights
(For a share outstanding throughout the period)
| | | | | | | | | | | | | | | | | | | | | | | | | | | | | | | | | | | | |
| | | R6 Class | |
| | | Year Ended October 31, | |
| | | 2024 | | | | | | 2023 | | | | | | 2022 | | | | | | 2021 | | | | | | 2020A | |
| | | | |
Net asset value, beginning of period | | $ | 23.92 | | | | | | | $ | 26.21 | | | | | | | $ | 30.99 | | | | | | | $ | 23.36 | | | | | | | $ | 28.31 | |
| | | | | | | | | | | | | | | | | | | | | | | | | | | | | | | | | | | | |
Income (loss) from investment operations: | | | | | | | | | | | | | | | | | | | | | | | | | | | | | | | | | | | | |
Net investment income | | | 0.53 | | | | | | | | 0.48 | | | | | | | | 0.45 | | | | | | | | 0.36 | | | | | | | | 0.56 | |
Net gains (losses) on investments (both realized and unrealized) | | | 6.89 | | | | | | | | 0.05 | | | | | | | | (2.05 | ) | | | | | | | 10.88 | | | | | | | | (2.78 | ) |
| | | | | | | | | | | | | | | | | | | | | | | | | | | | | | | | | | | | |
Total income (loss) from investment operations | | | 7.42 | | | | | | | | 0.53 | | | | | | | | (1.60 | ) | | | | | | | 11.24 | | | | | | | | (2.22 | ) |
| | | | | | | | | | | | | | | | | | | | | | | | | | | | | | | | | | | | |
Less distributions: | | | | | | | | | | | | | | | | | | | | | | | | | | | | | | | | | | | | |
Dividends from net investment income | | | (0.47 | ) | | | | | | | (0.43 | ) | | | | | | | (0.40 | ) | | | | | | | (0.50 | ) | | | | | | | (0.63 | ) |
Distributions from net realized gains | | | (0.90 | ) | | | | | | | (2.39 | ) | | | | | | | (2.78 | ) | | | | | | | (3.11 | ) | | | | | | | (2.10 | ) |
| | | | | | | | | | | | | | | | | | | | | | | | | | | | | | | | | | | | |
Total distributions | | | (1.37 | ) | | | | | | | (2.82 | ) | | | | | | | (3.18 | ) | | | | | | | (3.61 | ) | | | | | | | (2.73 | ) |
| | | | | | | | | | | | | | | | | | | | | | | | | | | | | | | | | | | | |
Net asset value, end of period | | $ | 29.97 | | | | | | | $ | 23.92 | | | | | | | $ | 26.21 | | | | | | | $ | 30.99 | | | | | | | $ | 23.36 | |
| | | | | | | | | | | | | | | | | | | | | | | | | | | | | | | | | | | | |
Total returnB | | | 32.02 | % | | | | | | | 2.19 | % | | | | | | | (5.72 | )% | | | | | | | 52.65 | % | | | | | | | (9.23 | )% |
| | | | | | | | | | | | | | | | | | | | | | | | | | | | | | | | | | | | |
| | | | | | | | | |
Ratios and supplemental data: | | | | | | | | | | | | | | | | | | | | | | | | | | | | | | | | | | | | |
Net assets, end of period | | $ | 1,490,847,806 | | | | | | | $ | 1,143,016,407 | | | | | | | $ | 1,094,080,159 | | | | | | | $ | 1,242,662,760 | | | | | | | $ | 1,008,088,807 | |
Ratios to average net assets: | | | | | | | | | | | | | | | | | | | | | | | | | | | | | | | | | | | | |
Expenses, before reimbursements and/or recoupments | | | 0.61 | % | | | | | | | 0.61 | % | | | | | | | 0.60 | % | | | | | | | 0.60 | % | | | | | | | 0.62 | % |
Expenses, net of reimbursements and/or recoupments | | | 0.61 | % | | | | | | | 0.61 | % | | | | | | | 0.60 | % | | | | | | | 0.60 | % | | | | | | | 0.59 | % |
Net investment income, before expense reimbursements and/or recoupments | | | 1.79 | % | | | | | | | 1.80 | % | | | | | | | 1.49 | % | | | | | | | 1.31 | % | | | | | | | 1.90 | % |
Net investment income, net of reimbursements and/or recoupments | | | 1.79 | % | | | | | | | 1.80 | % | | | | | | | 1.49 | % | | | | | | | 1.31 | % | | | | | | | 1.93 | % |
Portfolio turnover rate | | | 26 | % | | | | | | | 25 | % | | | | | | | 25 | % | | | | | | | 23 | % | | | | | | | 67 | % |
| A | On January 17, 2020, Brandywine Global Investment Management, LLC was terminated and ceased managing assets of the Fund. |
| B | Based on net asset value, which does not reflect the sales charge, redemption fee, or contingent deferred sales charge, if applicable. May include adjustments in accordance with U.S. GAAP and as such, the net asset value for reporting purposes and the returns based upon those net asset values may differ from the net asset value and returns for shareholder transactions. |
See accompanying notes
41
American Beacon FundsSM
Federal Tax Information
October 31, 2024 (Unaudited)
Certain tax information regarding the Funds are required to be provided to shareholders based upon the Funds’ income and distributions for the taxable year ended October 31, 2024. The information and distributions reported herein may differ from information and distributions taxable to the shareholders for the calendar year ended December 31, 2024.
The Fund designated the following items with regard to distributions paid during the fiscal year ended October 31, 2024. All designations are based on financial information available as of this annual report and, accordingly, are subject to change. For each item, it is the intention of the Funds to designate the maximum amount permitted under the Internal Revenue Code of 1986, as amended, and the regulations there under.
Corporate Dividends-Received Deduction:
Qualified Dividend Income:
Long-Term Capital Gain Distributions:
| | | | |
Large Cap Value | | $ | 144,197,500 | |
Short-Term Capital Gain Distributions:
| | | | |
Large Cap Value | | $ | 8,893,668 | |
Shareholders will receive notification in January 2025 of the applicable tax information necessary to prepare their 2024 income tax returns.
42

Delivery of Documents
If you invest in the Fund through a financial institution, you may be able to receive the Fund’s regulatory mailings, such as the Prospectus, Annual Report, Semi-Annual Report and Financial Statement Reports, by e-mail. If you are interested in this option, please go to www.icsdelivery.com and search for your financial institution’s name or contact your financial institution directly.
You may request a paper copy of this document at no charge by contacting your financial institution. This document is also available for download at www.americanbeaconfunds.com or you can request an electronic copy by contacting your financial institution.
To obtain more information about the Fund:
| | |
 | |  |
| | |
| By E-mail: | | On the Internet: |
| american_beacon.funds@ambeacon.com | | Visit our website at www.americanbeaconfunds.com |
| | | |
| | | |
| | |

By Telephone: Call (800) 658-5811 | | 
By Mail: American Beacon Funds P.O. Box 219643 Kansas City, MO 64121-9643 |
|
|
|
| | | |
Fund Service Providers:
| | | | | | | | | | | | |
CUSTODIAN State Street Bank and Trust Company Boston, Massachusetts | | | | TRANSFER AGENT SS&C GIDS, Inc. Quincy, Massachusetts | | | | INDEPENDENT REGISTERED PUBLIC ACCOUNTING FIRM PricewaterhouseCoopers LLP Boston, Massachusetts | | | | DISTRIBUTOR Resolute Investment Distributors, Inc. Irving, Texas |
This report is prepared for shareholders of the American Beacon Funds and may be distributed to others only if preceded or accompanied by a current Prospectus or Summary Prospectus.
American Beacon Funds and American Beacon Large Cap Value Fund are service marks of American Beacon Advisors, Inc.
AR 10/24

American Beacon Funds
Although information has been compiled from reliable sources, American Beacon Advisors, Inc. makes no representation as to the completeness or accuracy of the statements contained herein. All information is as of the end of the reporting period, unless noted otherwise, and is subject to change. Each Fund’s portfolio composition will change depending on economic and market conditions.
American Beacon Funds | October 31, 2024 |
Contents
American Beacon Small Cap Value FundSM
Report of Independent Registered Public Accounting Firm
To the Board of Trustees of American Beacon Funds and Shareholders of American Beacon Small Cap Value Fund
Opinion on the Financial Statements
We have audited the accompanying statement of assets and liabilities, including the schedule of investments, of American Beacon Small Cap Value Fund (one of the funds constituting American Beacon Funds, referred hereafter as the “Fund”) as of October 31, 2024, the related statement of operations for the year ended October 31, 2024, the statement of changes in net assets for each of the two years in the period ended October 31, 2024, including the related notes, and the financial highlights for each of the three years in the period ended October 31, 2024 (collectively referred to as the “financial statements”). In our opinion, the financial statements present fairly, in all material respects, the financial position of the Fund as of October 31, 2024, the results of its operations for the year then ended, the changes in its net assets for each of the two years in the period ended October 31, 2024 and the financial highlights for each of the three years in the period ended October 31, 2024 in conformity with accounting principles generally accepted in the United States of America.
The financial statements of the Fund as of and for the year ended October 31, 2021 and the financial highlights for each of the periods ended on or prior to October 31, 2021 (not presented herein, other than the financial highlights) were audited by other auditors whose report dated December 30, 2021 expressed an unqualified opinion on those financial statements and financial highlights.
Basis for Opinion
These financial statements are the responsibility of the Fund’s management. Our responsibility is to express an opinion on the Fund’s financial statements based on our audits. We are a public accounting firm registered with the Public Company Accounting Oversight Board (United States) (PCAOB) and are required to be independent with respect to the Fund in accordance with the U.S. federal securities laws and the applicable rules and regulations of the Securities and Exchange Commission and the PCAOB.
We conducted our audits of these financial statements in accordance with the standards of the PCAOB. Those standards require that we plan and perform the audit to obtain reasonable assurance about whether the financial statements are free of material misstatement, whether due to error or fraud.
Our audits included performing procedures to assess the risks of material misstatement of the financial statements, whether due to error or fraud, and performing procedures that respond to those risks. Such procedures included examining, on a test basis, evidence regarding the amounts and disclosures in the financial statements. Our audits also included evaluating the accounting principles used and significant estimates made by management, as well as evaluating the overall presentation of the financial statements. Our procedures included confirmation of securities owned as of October 31, 2024 by correspondence with the custodian and brokers; when replies were not received from brokers, we performed other auditing procedures. We believe that our audits provide a reasonable basis for our opinion.
/s/ PricewaterhouseCoopers LLP
Boston, Massachusetts
December 27, 2024
We have served as the auditor of one or more investment companies in the American Beacon family of funds since 2016.
1
American Beacon Small Cap Value FundSM
Schedule of Investments
October 31, 2024
| | | | | | | | | | | | | | | |
| | | |
| | | Shares | | | | Fair Value |
| | | | | | | |
| | | |
| COMMON STOCKS - 91.44% | | | | | | |
| | | |
| Communication Services - 2.27% | | | | | | |
| | | |
| Entertainment - 0.42% | | | | | | |
| IMAX Corp.A | | | | 289,887 | | | | | | | | | $ | 7,044,254 | |
| Lions Gate Entertainment Corp., Class AA B | | | | 571,547 | | | | | | | | | | 4,515,221 | |
| Lions Gate Entertainment Corp., Class BA | | | | 645,820 | | | | | | | | | | 4,553,031 | |
| Marcus Corp. | | | | 36,300 | | | | | | | | | | 684,981 | |
| Sphere Entertainment Co.A B | | | | 58,600 | | | | | | | | | | 2,450,066 | |
| | | | | | | | | | | | | | | |
| | | | | | | | | | | | | | 19,247,553 | |
| | | | | | | | | | | | | | | |
| | | | | | | | | | | | | | | |
| | | |
| Interactive Media & Services - 0.27% | | | | | | |
| IAC, Inc.A | | | | 177,200 | | | | | | | | | | 8,496,740 | |
| Shutterstock, Inc.B | | | | 130,800 | | | | | | | | | | 4,197,372 | |
| | | | | | | | | | | | | | | |
| | | | | | | | | | | | | | 12,694,112 | |
| | | | | | | | | | | | | | | |
| | | | | | | | | | | | | | | |
| | | |
| Media - 1.58% | | | | | | |
| Boston Omaha Corp., Class AA | | | | 44,600 | | | | | | | | | | 658,296 | |
| John Wiley & Sons, Inc., Class A | | | | 194,059 | | | | | | | | | | 9,567,109 | |
| Magnite, Inc.A | | | | 586,429 | | | | | | | | | | 7,318,634 | |
| National CineMedia, Inc.A | | | | 1,925,900 | | | | | | | | | | 13,847,221 | |
| Stagwell, Inc.A | | | | 5,526,749 | | | | | | | | | | 34,321,111 | |
| TEGNA, Inc. | | | | 423,850 | | | | | | | | | | 6,963,856 | |
| | | | | | | | | | | | | | | |
| | | | | | | | | | | | | | 72,676,227 | |
| | | | | | | | | | | | | | | |
| | | | | | | | | | | | | | | |
Total Communication Services | | | | | | | | | | | | | | 104,617,892 | |
| | | | | | | | | | | | | | | |
| | | | | | | | | | | | | | | |
| | | |
| Consumer Discretionary - 11.91% | | | | | | |
| | | |
| Automobile Components - 1.85% | | | | | | |
| Adient PLCA | | | | 1,629,578 | | | | | | | | | | 31,825,658 | |
| American Axle & Manufacturing Holdings, Inc.A | | | | 2,357,127 | | | | | | | | | | 13,317,768 | |
| BorgWarner, Inc. | | | | 294,613 | | | | | | | | | | 9,907,835 | |
| Gentherm, Inc.A | | | | 507,243 | | | | | | | | | | 21,278,844 | |
| Visteon Corp.A | | | | 95,364 | | | | | | | | | | 8,606,601 | |
| | | | | | | | | | | | | | | |
| | | | | | | | | | | | | | 84,936,706 | |
| | | | | | | | | | | | | | | |
| | | | | | | | | | | | | | | |
| | | |
| Automobiles - 0.60% | | | | | | |
| Harley-Davidson, Inc. | | | | 325,500 | | | | | | | | | | 10,399,725 | |
| Thor Industries, Inc.B | | | | 138,944 | | | | | | | | | | 14,461,292 | |
| Winnebago Industries, Inc. | | | | 53,100 | | | | | | | | | | 2,975,724 | |
| | | | | | | | | | | | | | | |
| | | | | | | | | | | | | | 27,836,741 | |
| | | | | | | | | | | | | | | |
| | | | | | | | | | | | | | | |
| | | |
| Broadline Retail - 0.16% | | | | | | |
| Nordstrom, Inc. | | | | 323,210 | | | | | | | | | | 7,307,778 | |
| | | | | | | | | | | | | | | |
| | | | | | | | | | | | | | | |
| | | |
| Diversified Consumer Services - 0.22% | | | | | | |
| Graham Holdings Co., Class B | | | | 7,760 | | | | | | | | | | 6,544,008 | |
| Perdoceo Education Corp. | | | | 158,820 | | | | | | | | | | 3,549,627 | |
| | | | | | | | | | | | | | | |
| | | | | | | | | | | | | | 10,093,635 | |
| | | | | | | | | | | | | | | |
| | | | | | | | | | | | | | | |
| | | |
| Hotels, Restaurants & Leisure - 2.62% | | | | | | |
| Bloomin’ Brands, Inc. | | | | 967,938 | | | | | | | | | | 16,058,092 | |
| Cheesecake Factory, Inc.B | | | | 221,788 | | | | | | | | | | 10,251,041 | |
| Dave & Buster’s Entertainment, Inc.A B | | | | 569,458 | | | | | | | | | | 21,030,084 | |
| International Game Technology PLC | | | | 1,055,934 | | | | | | | | | | 21,456,579 | |
| Marriott Vacations Worldwide Corp. | | | | 321,200 | | | | | | | | | | 24,742,036 | |
| Papa John’s International, Inc. | | | | 353,473 | | | | | | | | | | 18,518,451 | |
| Travel & Leisure Co. | | | | 172,440 | | | | | | | | | | 8,244,356 | |
| | | | | | | | | | | | | | | |
| | | | | | | | | | | | | | 120,300,639 | |
| | | | | | | | | | | | | | | |
| | | | | | | | | | | | | | | |
See accompanying notes
2
American Beacon Small Cap Value FundSM
Schedule of Investments
October 31, 2024
| | | | | | | | | | | | | | | |
| | | |
| | | Shares | | | | Fair Value |
| | | | | | | |
| | | |
| COMMON STOCKS - 91.44% (continued) | | | | | | |
| | | |
| Consumer Discretionary - 11.91% (continued) | | | | | | |
| | | |
| Household Durables - 2.21% | | | | | | |
| Beazer Homes USA, Inc.A | | | | 76,290 | | | | | | | | | $ | 2,346,680 | |
| Cavco Industries, Inc.A | | | | 12,579 | | | | | | | | | | 5,154,811 | |
| Century Communities, Inc. | | | | 76,900 | | | | | | | | | | 6,817,954 | |
| Dream Finders Homes, Inc., Class AA B | | | | 83,550 | | | | | | | | | | 2,493,968 | |
| Ethan Allen Interiors, Inc. | | | | 54,120 | | | | | | | | | | 1,497,500 | |
| Green Brick Partners, Inc.A | | | | 108,650 | | | | | | | | | | 7,497,937 | |
| Helen of Troy Ltd.A | | | | 76,249 | | | | | | | | | | 4,853,249 | |
| KB Home | | | | 167,900 | | | | | | | | | | 13,180,150 | |
| Landsea Homes Corp.A | | | | 74,540 | | | | | | | | | | 773,725 | |
| Legacy Housing Corp.A | | | | 36,640 | | | | | | | | | | 908,672 | |
| Lovesac Co.A B | | | | 164,844 | | | | | | | | | | 4,806,851 | |
| M/I Homes, Inc.A | | | | 67,060 | | | | | | | | | | 10,165,625 | |
| Meritage Homes Corp. | | | | 44,242 | | | | | | | | | | 8,016,650 | |
| Newell Brands, Inc. | | | | 2,497,816 | | | | | | | | | | 21,980,781 | |
| Tri Pointe Homes, Inc.A | | | | 285,910 | | | | | | | | | | 11,559,341 | |
| | | | | | | | | | | | | | | |
| | | | | | | | | | | | | | 102,053,894 | |
| | | | | | | | | | | | | | | |
| | | | | | | | | | | | | | | |
| | | |
| Leisure Products - 0.47% | | | | | | |
| Brunswick Corp. | | | | 153,458 | | | | | | | | | | 12,236,741 | |
| Malibu Boats, Inc., Class AA | | | | 98,072 | | | | | | | | | | 4,401,471 | |
| YETI Holdings, Inc.A | | | | 126,744 | | | | | | | | | | 4,462,656 | |
| | | | | | | | | | | | | | | |
| | | | | | | | | | | | | | 21,100,868 | |
| | | | | | | | | | | | | | | |
| | | | | | | | | | | | | | | |
| | | |
| Specialty Retail - 2.99% | | | | | | |
| 1-800-Flowers.com, Inc., Class AA B | | | | 64,670 | | | | | | | | | | 538,054 | |
| Academy Sports & Outdoors, Inc. | | | | 174,450 | | | | | | | | | | 8,872,527 | |
| American Eagle Outfitters, Inc. | | | | 276,900 | | | | | | | | | | 5,424,471 | |
| Arhaus, Inc. | | | | 620,028 | | | | | | | | | | 5,257,838 | |
| Asbury Automotive Group, Inc.A | | | | 48,830 | | | | | | | | | | 11,125,427 | |
| Buckle, Inc. | | | | 122,870 | | | | | | | | | | 5,229,347 | |
| Build-A-Bear Workshop, Inc. | | | | 31,360 | | | | | | | | | | 1,194,503 | |
| Caleres, Inc. | | | | 84,930 | | | | | | | | | | 2,535,161 | |
| Foot Locker, Inc.A | | | | 572,729 | | | | | | | | | | 13,281,586 | |
| Group 1 Automotive, Inc. | | | | 34,950 | | | | | | | | | | 12,732,984 | |
| Guess?, Inc. | | | | 129,460 | | | | | | | | | | 2,199,525 | |
| Lithia Motors, Inc. | | | | 30,200 | | | | | | | | | | 10,037,574 | |
| MarineMax, Inc.A | | | | 54,070 | | | | | | | | | | 1,575,059 | |
| ODP Corp.A | | | | 426,946 | | | | | | | | | | 13,248,134 | |
| Sally Beauty Holdings, Inc.A | | | | 250,240 | | | | | | | | | | 3,253,120 | |
| Signet Jewelers Ltd. | | | | 107,950 | | | | | | | | | | 9,896,856 | |
| Sonic Automotive, Inc., Class A | | | | 325,871 | | | | | | | | | | 18,486,662 | |
| Urban Outfitters, Inc.A | | | | 219,657 | | | | | | | | | | 7,896,669 | |
| Victoria’s Secret & Co.A | | | | 175,370 | | | | | | | | | | 5,306,696 | |
| | | | | | | | | | | | | | | |
| | | | | | | | | | | | | | 138,092,193 | |
| | | | | | | | | | | | | | | |
| | | | | | | | | | | | | | | |
| | | |
| Textiles, Apparel & Luxury Goods - 0.79% | | | | | | |
| Capri Holdings Ltd.A | | | | 222,255 | | | | | | | | | | 4,387,314 | |
| Carter’s, Inc. | | | | 88,371 | | | | | | | | | | 4,833,894 | |
| Figs, Inc., Class AA | | | | 570,164 | | | | | | | | | | 3,563,525 | |
| G-III Apparel Group Ltd.A | | | | 108,760 | | | | | | | | | | 3,293,253 | |
| Levi Strauss & Co., Class A | | | | 474,051 | | | | | | | | | | 8,101,532 | |
| Oxford Industries, Inc. | | | | 34,450 | | | | | | | | | | 2,501,759 | |
| PVH Corp. | | | | 37,103 | | | | | | | | | | 3,653,161 | |
| VF Corp.B | | | | 287,679 | | | | | | | | | | 5,957,832 | |
| | | | | | | | | | | | | | | |
| | | | | | | | | | | | | | 36,292,270 | |
| | | | | | | | | | | | | | | |
| | | | | | | | | | | | | | | |
Total Consumer Discretionary | | | | | | | | | | | | | | 548,014,724 | |
| | | | | | | | | | | | | | | |
| | | | | | | | | | | | | | | |
See accompanying notes
3
American Beacon Small Cap Value FundSM
Schedule of Investments
October 31, 2024
| | | | | | | | | | | | | | | |
| | | |
| | | Shares | | | | Fair Value |
| | | | | | | |
| | | |
| COMMON STOCKS - 91.44% (continued) | | | | | | |
| | | |
| Consumer Staples - 1.90% | | | | | | |
| | | |
| Beverages - 0.64% | | | | | | |
| Boston Beer Co., Inc., Class AA | | | | 31,784 | | | | | | | | | $ | 9,251,369 | |
| Primo Water Corp.B | | | | 767,707 | | | | | | | | | | 20,136,955 | |
| | | | | | | | | | | | | | | |
| | | | | | | | | | | | | | 29,388,324 | |
| | | | | | | | | | | | | | | |
| | | | | | | | | | | | | | | |
| | | |
| Consumer Staples Distribution & Retail - 0.06% | | | | | | |
| SpartanNash Co. | | | | 16,400 | | | | | | | | | | 345,056 | |
| United Natural Foods, Inc.A | | | | 85,800 | | | | | | | | | | 1,745,172 | |
| Village Super Market, Inc., Class A | | | | 23,700 | | | | | | | | | | 676,398 | |
| | | | | | | | | | | | | | | |
| | | | | | | | | | | | | | 2,766,626 | |
| | | | | | | | | | | | | | | |
| | | | | | | | | | | | | | | |
| | | |
| Food Products - 1.03% | | | | | | |
| Darling Ingredients, Inc.A | | | | 598,292 | | | | | | | | | | 23,399,200 | |
| Fresh Del Monte Produce, Inc. | | | | 100,600 | | | | | | | | | | 3,230,266 | |
| Hain Celestial Group, Inc.A | | | | 2,285,043 | | | | | | | | | | 19,948,425 | |
| Seneca Foods Corp., Class AA | | | | 12,890 | | | | | | | | | | 796,989 | |
| | | | | | | | | | | | | | | |
| | | | | | | | | | | | | | 47,374,880 | |
| | | | | | | | | | | | | | | |
| | | | | | | | | | | | | | | |
| | | |
| Household Products - 0.07% | | | | | | |
| Energizer Holdings, Inc. | | | | 103,500 | | | | | | | | | | 3,319,245 | |
| | | | | | | | | | | | | | | |
| | | | | | | | | | | | | | | |
| | | |
| Personal Products - 0.04% | | | | | | |
| Herbalife Ltd.A B | | | | 227,655 | | | | | | | | | | 1,718,795 | |
| | | | | | | | | | | | | | | |
| | | | | | | | | | | | | | | |
| | | |
| Tobacco - 0.06% | | | | | | |
| Universal Corp. | | | | 59,440 | | | | | | | | | | 3,026,685 | |
| | | | | | | | | | | | | | | |
| | | | | | | | | | | | | | | |
Total Consumer Staples | | | | | | | | | | | | | | 87,594,555 | |
| | | | | | | | | | | | | | | |
| | | | | | | | | | | | | | | |
| | | |
| Energy - 6.49% | | | | | | |
| | | |
| Energy Equipment & Services - 3.30% | | | | | | |
| Atlas Energy Solutions, Inc.B | | | | 1,196,584 | | | | | | | | | | 23,417,149 | |
| Bristow Group, Inc.A | | | | 62,430 | | | | | | | | | | 2,070,803 | |
| Cactus, Inc., Class A | | | | 110,810 | | | | | | | | | | 6,569,925 | |
| Expro Group Holdings NVA | | | | 242,745 | | | | | | | | | | 3,094,999 | |
| Helix Energy Solutions Group, Inc.A | | | | 368,740 | | | | | | | | | | 3,410,845 | |
| Helmerich & Payne, Inc. | | | | 476,342 | | | | | | | | | | 16,005,091 | |
| Liberty Energy, Inc.B | | | | 799,193 | | | | | | | | | | 13,642,225 | |
| NOV, Inc. | | | | 3,599,688 | | | | | | | | | | 55,831,161 | |
| Oceaneering International, Inc.A | | | | 220,579 | | | | | | | | | | 5,382,128 | |
| Patterson-UTI Energy, Inc. | | | | 1,920,060 | | | | | | | | | | 14,726,860 | |
| ProPetro Holding Corp.A | | | | 75,100 | | | | | | | | | | 518,941 | |
| Select Water Solutions, Inc. | | | | 221,110 | | | | | | | | | | 2,343,766 | |
| Weatherford International PLC | | | | 62,934 | | | | | | | | | | 4,971,786 | |
| | | | | | | | | | | | | | | |
| | | | | | | | | | | | | | 151,985,679 | |
| | | | | | | | | | | | | | | |
| | | | | | | | | | | | | | | |
| | | |
| Oil, Gas & Consumable Fuels - 3.19% | | | | | | |
| Antero Resources Corp.A | | | | 505,660 | | | | | | | | | | 13,086,481 | |
| APA Corp. | | | | 153,239 | | | | | | | | | | 3,616,440 | |
| Berry Corp. | | | | 234,310 | | | | | | | | | | 1,176,236 | |
| Centrus Energy Corp., Class AA B | | | | 97,952 | | | | | | | | | | 10,168,397 | |
| CNX Resources Corp.A | | | | 616,926 | | | | | | | | | | 20,993,992 | |
| CONSOL Energy, Inc. | | | | 71,110 | | | | | | | | | | 7,887,521 | |
| Crescent Energy Co., Class A | | | | 750,921 | | | | | | | | | | 9,333,948 | |
| International Seaways, Inc. | | | | 117,780 | | | | | | | | | | 5,128,141 | |
| Kinetik Holdings, Inc. | | | | 58,387 | | | | | | | | | | 2,841,695 | |
| Magnolia Oil & Gas Corp., Class AB | | | | 320,233 | | | | | | | | | | 8,095,490 | |
| Murphy Oil Corp. | | | | 118,000 | | | | | | | | | | 3,714,640 | |
See accompanying notes
4
American Beacon Small Cap Value FundSM
Schedule of Investments
October 31, 2024
| | | | | | | | | | | | | | | |
| | | |
| | | Shares | | | | Fair Value |
| | | | | | | |
| | | |
| COMMON STOCKS - 91.44% (continued) | | | | | | |
| | | |
| Energy - 6.49% (continued) | | | | | | |
| | | |
| Oil, Gas & Consumable Fuels - 3.19% (continued) | | | | | | |
| NextDecade Corp.A B | | | | 946,760 | | | | | | | | | $ | 5,529,078 | |
| Northern Oil & Gas, Inc. | | | | 226,230 | | | | | | | | | | 8,200,838 | |
| PBF Energy, Inc., Class A | | | | 234,516 | | | | | | | | | | 6,688,396 | |
| Peabody Energy Corp. | | | | 282,780 | | | | | | | | | | 7,428,631 | |
| REX American Resources Corp.A | | | | 12,700 | | | | | | | | | | 568,071 | |
| Riley Exploration Permian, Inc. | | | | 44,400 | | | | | | | | | | 1,185,924 | |
| Sitio Royalties Corp., Class A | | | | 737,739 | | | | | | | | | | 16,444,202 | |
| SM Energy Co. | | | | 82,500 | | | | | | | | | | 3,462,525 | |
| VAALCO Energy, Inc. | | | | 213,600 | | | | | | | | | | 1,140,624 | |
| Viper Energy, Inc. | | | | 133,674 | | | | | | | | | | 6,937,681 | |
| World Kinect Corp. | | | | 121,700 | | | | | | | | | | 3,182,455 | |
| | | | | | | | | | | | | | | |
| | | | | | | | | | | | | | 146,811,406 | |
| | | | | | | | | | | | | | | |
| | | | | | | | | | | | | | | |
Total Energy | | | | | | | | | | | | | | 298,797,085 | |
| | | | | | | | | | | | | | | |
| | | | | | | | | | | | | | | |
| | | |
| Financials - 22.39% | | | | | | |
| | | |
| Banks - 13.64% | | | | | | |
| Amalgamated Financial Corp. | | | | 43,040 | | | | | | | | | | 1,427,422 | |
| Ameris Bancorp | | | | 116,090 | | | | | | | | | | 7,196,419 | |
| Associated Banc-Corp. | | | | 327,933 | | | | | | | | | | 7,785,129 | |
| Atlantic Union Bankshares Corp. | | | | 125,850 | | | | | | | | | | 4,757,130 | |
| Axos Financial, Inc.A | | | | 105,130 | | | | | | | | | | 7,119,404 | |
| Bank OZK | | | | 193,210 | | | | | | | | | | 8,452,937 | |
| BankUnited, Inc. | | | | 39,230 | | | | | | | | | | 1,386,388 | |
| Bar Harbor Bankshares | | | | 24,080 | | | | | | | | | | 774,172 | |
| Business First Bancshares, Inc. | | | | 34,190 | | | | | | | | | | 895,436 | |
| Byline Bancorp, Inc. | | | | 76,560 | | | | | | | | | | 2,060,230 | |
| Cadence Bank | | | | 309,490 | | | | | | | | | | 10,346,251 | |
| Cathay General Bancorp | | | | 125,200 | | | | | | | | | | 5,756,696 | |
| Central Pacific Financial Corp. | | | | 13,060 | | | | | | | | | | 351,836 | |
| Columbia Banking System, Inc. | | | | 2,063,675 | | | | | | | | | | 58,835,374 | |
| Community Financial System, Inc. | | | | 110,339 | | | | | | | | | | 6,746,126 | |
| Community Trust Bancorp, Inc. | | | | 31,090 | | | | | | | | | | 1,610,462 | |
| CrossFirst Bankshares, Inc.A | | | | 82,580 | | | | | | | | | | 1,296,506 | |
| Cullen/Frost Bankers, Inc. | | | | 152,969 | | | | | | | | | | 19,480,602 | |
| Customers Bancorp, Inc.A | | | | 54,950 | | | | | | | | | | 2,534,843 | |
| Eastern Bankshares, Inc. | | | | 155,230 | | | | | | | | | | 2,534,906 | |
| Enterprise Financial Services Corp. | | | | 55,830 | | | | | | | | | | 2,943,358 | |
| Farmers National Banc Corp. | | | | 64,290 | | | | | | | | | | 884,630 | |
| FB Financial Corp. | | | | 78,560 | | | | | | | | | | 3,865,152 | |
| First Bancshares, Inc. | | | | 51,940 | | | | | | | | | | 1,738,432 | |
| First Busey Corp. | | | | 95,110 | | | | | | | | | | 2,312,124 | |
| First Commonwealth Financial Corp. | | | | 179,250 | | | | | | | | | | 2,946,870 | |
| First Financial Bancorp | | | | 159,770 | | | | | | | | | | 4,086,917 | |
| First Hawaiian, Inc. | | | | 1,572,404 | | | | | | | | | | 38,901,275 | |
| First Horizon Corp. | | | | 1,547,172 | | | | | | | | | | 26,812,491 | |
| First Merchants Corp. | | | | 228,638 | | | | | | | | | | 8,471,038 | |
| FNB Corp. | | | | 602,090 | | | | | | | | | | 8,730,305 | |
| Fulton Financial Corp. | | | | 378,225 | | | | | | | | | | 6,849,655 | |
| Glacier Bancorp, Inc. | | | | 552,149 | | | | | | | | | | 28,794,570 | |
| Great Southern Bancorp, Inc. | | | | 20,480 | | | | | | | | | | 1,161,011 | |
| Hancock Whitney Corp. | | | | 67,260 | | | | | | | | | | 3,502,901 | |
| Heritage Financial Corp. | | | | 91,637 | | | | | | | | | | 2,106,735 | |
| Hilltop Holdings, Inc. | | | | 322,376 | | | | | | | | | | 9,874,377 | |
| HomeTrust Bancshares, Inc. | | | | 30,470 | | | | | | | | | | 1,010,080 | |
| Independent Bank Corp. | | | | 279,646 | | | | | | | | | | 17,091,849 | |
| International Bancshares Corp. | | | | 108,710 | | | | | | | | | | 6,659,575 | |
See accompanying notes
5
American Beacon Small Cap Value FundSM
Schedule of Investments
October 31, 2024
| | | | | | | | | | | | | | | |
| | | |
| | | Shares | | | | Fair Value |
| | | | | | | |
| | | |
| COMMON STOCKS - 91.44% (continued) | | | | | | |
| | | |
| Financials - 22.39% (continued) | | | | | | |
| | | |
| Banks - 13.64% (continued) | | | | | | |
| Live Oak Bancshares, Inc. | | | | 638,035 | | | | | | | | | $ | 25,336,370 | |
| Mercantile Bank Corp. | | | | 28,090 | | | | | | | | | | 1,203,937 | |
| Midland States Bancorp, Inc. | | | | 36,560 | | | | | | | | | | 907,054 | |
| National Bank Holdings Corp., Class A | | | | 459,011 | | | | | | | | | | 20,637,135 | |
| NBT Bancorp, Inc. | | | | 412,637 | | | | | | | | | | 18,354,094 | |
| Nicolet Bankshares, Inc. | | | | 13,130 | | | | | | | | | | 1,335,190 | |
| Northwest Bancshares, Inc. | | | | 177,330 | | | | | | | | | | 2,356,716 | |
| Old National Bancorp | | | | 47,539 | | | | | | | | | | 915,601 | |
| Old Second Bancorp, Inc.B | | | | 76,660 | | | | | | | | | | 1,258,757 | |
| Origin Bancorp, Inc. | | | | 22,890 | | | | | | | | | | 718,517 | |
| Pacific Premier Bancorp, Inc. | | | | 50,470 | | | | | | | | | | 1,287,490 | |
| Pathward Financial, Inc. | | | | 43,850 | | | | | | | | | | 3,102,826 | |
| Peoples Bancorp, Inc. | | | | 62,060 | | | | | | | | | | 1,910,207 | |
| Preferred Bank | | | | 26,210 | | | | | | | | | | 2,211,338 | |
| Prosperity Bancshares, Inc. | | | | 200,903 | | | | | | | | | | 14,706,100 | |
| Provident Financial Services, Inc. | | | | 127,050 | | | | | | | | | | 2,373,294 | |
| QCR Holdings, Inc. | | | | 29,360 | | | | | | | | | | 2,322,376 | |
| Renasant Corp. | | | | 422,286 | | | | | | | | | | 14,404,175 | |
| S&T Bancorp, Inc. | | | | 64,200 | | | | | | | | | | 2,438,316 | |
| Seacoast Banking Corp. of Florida | | | | 1,135,256 | | | | | | | | | | 30,311,335 | |
| ServisFirst Bancshares, Inc. | | | | 194,896 | | | | | | | | | | 16,203,653 | |
| Simmons First National Corp., Class A | | | | 144,340 | | | | | | | | | | 3,348,688 | |
| SmartFinancial, Inc. | | | | 18,730 | | | | | | | | | | 621,087 | |
| Southern Missouri Bancorp, Inc. | | | | 19,440 | | | | | | | | | | 1,152,792 | |
| SouthState Corp. | | | | 65,503 | | | | | | | | | | 6,388,508 | |
| Synovus Financial Corp. | | | | 71,000 | | | | | | | | | | 3,540,770 | |
| Texas Capital Bancshares, Inc.A | | | | 615,281 | | | | | | | | | | 47,345,873 | |
| Triumph Financial, Inc.A | | | | 353,208 | | | | | | | | | | 31,212,991 | |
| TrustCo Bank Corp. | | | | 28,610 | | | | | | | | | | 943,558 | |
| Trustmark Corp. | | | | 16,950 | | | | | | | | | | 588,504 | |
| UMB Financial Corp. | | | | 44,854 | | | | | | | | | | 4,921,829 | |
| United Bankshares, Inc. | | | | 97,460 | | | | | | | | | | 3,672,293 | |
| United Community Banks, Inc. | | | | 308,661 | | | | | | | | | | 8,784,492 | |
| WaFd, Inc. | | | | 174,913 | | | | | | | | | | 5,943,544 | |
| Webster Financial Corp. | | | | 158,839 | | | | | | | | | | 8,227,860 | |
| WesBanco, Inc. | | | | 30,810 | | | | | | | | | | 968,975 | |
| Westamerica BanCorp | | | | 45,160 | | | | | | | | | | 2,326,643 | |
| WSFS Financial Corp. | | | | 66,850 | | | | | | | | | | 3,287,015 | |
| | | | | | | | | | | | | | | |
| | | | | | | | | | | | | | 627,661,517 | |
| | | | | | | | | | | | | | | |
| | | | | | | | | | | | | | | |
| | | |
| Capital Markets - 1.77% | | | | | | |
| Cohen & Steers, Inc. | | | | 48,390 | | | | | | | | | | 4,779,480 | |
| Federated Hermes, Inc. | | | | 266,276 | | | | | | | | | | 10,685,656 | |
| Janus Henderson Group PLC | | | | 277,940 | | | | | | | | | | 11,481,701 | |
| Oppenheimer Holdings, Inc., Class A | | | | 18,900 | | | | | | | | | | 1,066,527 | |
| Perella Weinberg Partners | | | | 231,891 | | | | | | | | | | 4,691,155 | |
| StepStone Group, Inc., Class A | | | | 243,650 | | | | | | | | | | 14,650,675 | |
| Stifel Financial Corp. | | | | 133,297 | | | | | | | | | | 13,812,235 | |
| StoneX Group, Inc.A | | | | 54,810 | | | | | | | | | | 4,935,092 | |
| Victory Capital Holdings, Inc., Class A | | | | 115,290 | | | | | | | | | | 6,909,330 | |
| Virtus Investment Partners, Inc. | | | | 10,250 | | | | | | | | | | 2,217,792 | |
| WisdomTree, Inc.B | | | | 640,991 | | | | | | | | | | 6,634,257 | |
| | | | | | | | | | | | | | | |
| | | | | | | | | | | | | | 81,863,900 | |
| | | | | | | | | | | | | | | |
| | | | | | | | | | | | | | | |
| | | |
| Consumer Finance - 1.19% | | | | | | |
| Bread Financial Holdings, Inc. | | | | 88,110 | | | | | | | | | | 4,392,284 | |
| Encore Capital Group, Inc.A | | | | 41,140 | | | | | | | | | | 1,879,275 | |
See accompanying notes
6
American Beacon Small Cap Value FundSM
Schedule of Investments
October 31, 2024
| | | | | | | | | | | | | | | |
| | | |
| | | Shares | | | | Fair Value |
| | | | | | | |
| | | |
| COMMON STOCKS - 91.44% (continued) | | | | | | |
| | | |
| Financials - 22.39% (continued) | | | | | | |
| | | |
| Consumer Finance - 1.19% (continued) | | | | | | |
| Enova International, Inc.A | | | | 54,070 | | | | | | | | | $ | 4,699,224 | |
| EZCORP, Inc., Class AA | | | | 91,140 | | | | | | | | | | 1,047,199 | |
| Green Dot Corp., Class AA | | | | 38,700 | | | | | | | | | | 439,632 | |
| LendingClub Corp.A | | | | 80,600 | | | | | | | | | | 1,142,908 | |
| Navient Corp. | | | | 235,460 | | | | | | | | | | 3,350,596 | |
| Nelnet, Inc., Class A | | | | 30,590 | | | | | | | | | | 3,447,493 | |
| PRA Group, Inc.A | | | | 97,031 | | | | | | | | | | 1,956,145 | |
| SLM Corp. | | | | 1,469,872 | | | | | | | | | | 32,381,280 | |
| | | | | | | | | | | | | | | |
| | | | | | | | | | | | | | 54,736,036 | |
| | | | | | | | | | | | | | | |
| | | | | | | | | | | | | | | |
| | | |
| Financial Services - 2.89% | | | | | | |
| Acacia Research Corp.A B | | | | 170,910 | | | | | | | | | | 772,513 | |
| Burford Capital Ltd. | | | | 1,225,417 | | | | | | | | | | 16,543,129 | |
| Essent Group Ltd. | | | | 257,975 | | | | | | | | | | 15,481,080 | |
| Euronet Worldwide, Inc.A | | | | 43,422 | | | | | | | | | | 4,275,764 | |
| HA Sustainable Infrastructure Capital, Inc.B | | | | 1,200,434 | | | | | | | | | | 42,003,186 | |
| Merchants Bancorp | | | | 47,700 | | | | | | | | | | 1,762,038 | |
| MGIC Investment Corp. | | | | 444,640 | | | | | | | | | | 11,133,786 | |
| NMI Holdings, Inc.A | | | | 144,350 | | | | | | | | | | 5,583,458 | |
| PennyMac Financial Services, Inc. | | | | 87,530 | | | | | | | | | | 8,724,990 | |
| Radian Group, Inc. | | | | 276,010 | | | | | | | | | | 9,635,509 | |
| Western Union Co. | | | | 177,690 | | | | | | | | | | 1,911,944 | |
| WEX, Inc.A | | | | 87,643 | | | | | | | | | | 15,127,182 | |
| | | | | | | | | | | | | | | |
| | | | | | | | | | | | | | 132,954,579 | |
| | | | | | | | | | | | | | | |
| | | | | | | | | | | | | | | |
| | | |
| Insurance - 2.90% | | | | | | |
| Assured Guaranty Ltd. | | | | 102,720 | | | | | | | | | | 8,573,011 | |
| Brighthouse Financial, Inc.A | | | | 114,980 | | | | | | | | | | 5,438,554 | |
| CNO Financial Group, Inc. | | | | 343,870 | | | | | | | | | | 11,829,128 | |
| Donegal Group, Inc., Class A | | | | 46,870 | | | | | | | | | | 710,549 | |
| Employers Holdings, Inc. | | | | 46,170 | | | | | | | | | | 2,249,402 | |
| Enstar Group Ltd.A | | | | 28,129 | | | | | | | | | | 9,071,602 | |
| First American Financial Corp. | | | | 236,017 | | | | | | | | | | 15,140,491 | |
| Genworth Financial, Inc.A | | | | 821,980 | | | | | | | | | | 5,540,145 | |
| Global Indemnity Group LLC, Class A | | | | 335,812 | | | | | | | | | | 11,410,892 | |
| HCI Group, Inc.B | | | | 7,500 | | | | | | | | | | 849,825 | |
| Horace Mann Educators Corp. | | | | 646,680 | | | | | | | | | | 24,082,363 | |
| Kemper Corp. | | | | 381,720 | | | | | | | | | | 23,769,704 | |
| Lincoln National Corp. | | | | 82,930 | | | | | | | | | | 2,881,817 | |
| Oscar Health, Inc., Class AA | | | | 294,330 | | | | | | | | | | 4,944,744 | |
| ProAssurance Corp.A | | | | 36,900 | | | | | | | | | | 549,441 | |
| Universal Insurance Holdings, Inc. | | | | 20,500 | | | | | | | | | | 408,770 | |
| White Mountains Insurance Group Ltd. | | | | 3,240 | | | | | | | | | | 5,822,734 | |
| | | | | | | | | | | | | | | |
| | | | | | | | | | | | | | 133,273,172 | |
| | | | | | | | | | | | | | | |
| | | | | | | | | | | | | | | |
Total Financials | | | | | | | | | | | | | | 1,030,489,204 | |
| | | | | | | | | | | | | | | |
| | | | | | | | | | | | | | | |
| | | |
| Health Care - 3.28% | | | | | | |
| | | |
| Biotechnology - 0.21% | | | | | | |
| Alkermes PLCA | | | | 370,281 | | | | | | | | | | 9,516,222 | |
| | | | | | | | | | | | | | | |
| | | | | | | | | | | | | | | |
| | | |
| Health Care Equipment & Supplies - 0.82% | | | | | | |
| Globus Medical, Inc., Class AA | | | | 160,832 | | | | | | | | | | 11,827,585 | |
| Integer Holdings Corp.A | | | | 40,412 | | | | | | | | | | 5,021,191 | |
| Omnicell, Inc.A | | | | 90,193 | | | | | | | | | | 4,386,988 | |
| Solventum Corp.A | | | | 220,900 | | | | | | | | | | 16,032,922 | |
| | | | | | | | | | | | | | | |
| | | | | | | | | | | | | | 37,268,686 | |
| | | | | | | | | | | | | | | |
| | | | | | | | | | | | | | | |
See accompanying notes
7
American Beacon Small Cap Value FundSM
Schedule of Investments
October 31, 2024
| | | | | | | | | | | | | | | |
| | | |
| | | Shares | | | | Fair Value |
| | | | | | | |
| | | |
| COMMON STOCKS - 91.44% (continued) | | | | | | |
| | | |
| Health Care - 3.28% (continued) | | | | | | |
| | | |
| Health Care Providers & Services - 0.54% | | | | | | |
| Acadia Healthcare Co., Inc.A | | | | 134,402 | | | | | | | | | $ | 5,737,621 | |
| Encompass Health Corp. | | | | 106,208 | | | | | | | | | | 10,563,448 | |
| Ensign Group, Inc. | | | | 27,697 | | | | | | | | | | 4,292,758 | |
| ModivCare, Inc.A | | | | 273,916 | | | | | | | | | | 4,429,222 | |
| | | | | | | | | | | | | | | |
| | | | | | | | | | | | | | 25,023,049 | |
| | | | | | | | | | | | | | | |
| | | | | | | | | | | | | | | |
| | | |
| Health Care Technology - 0.32% | | | | | | |
| Certara, Inc.A | | | | 219,626 | | | | | | | | | | 2,240,185 | |
| Evolent Health, Inc., Class AA | | | | 314,902 | | | | | | | | | | 7,352,962 | |
| Health Catalyst, Inc.A | | | | 660,056 | | | | | | | | | | 5,128,635 | |
| | | | | | | | | | | | | | | |
| | | | | | | | | | | | | | 14,721,782 | |
| | | | | | | | | | | | | | | |
| | | | | | | | | | | | | | | |
| | | |
| Pharmaceuticals - 1.39% | | | | | | |
| Biote Corp., Class AA | | | | 60,850 | | | | | | | | | | 310,335 | |
| Collegium Pharmaceutical, Inc.A | | | | 72,100 | | | | | | | | | | 2,461,494 | |
| Organon & Co. | | | | 1,401,005 | | | | | | | | | | 26,310,874 | |
| Perrigo Co. PLC | | | | 1,140,742 | | | | | | | | | | 29,237,217 | |
| SIGA Technologies, Inc. | | | | 849,600 | | | | | | | | | | 6,134,112 | |
| | | | | | | | | | | | | | | |
| | | | | | | | | | | | | | 64,454,032 | |
| | | | | | | | | | | | | | | |
| | | | | | | | | | | | | | | |
Total Health Care | | | | | | | | | | | | | | 150,983,771 | |
| | | | | | | | | | | | | | | |
| | | | | | | | | | | | | | | |
| | | |
| Industrials - 19.79% | | | | | | |
| | | |
| Aerospace & Defense - 0.56% | | | | | | |
| BWX Technologies, Inc. | | | | 135,583 | | | | | | | | | | 16,507,230 | |
| Ducommun, Inc.A | | | | 25,620 | | | | | | | | | | 1,506,200 | |
| Kratos Defense & Security Solutions, Inc.A | | | | 343,943 | | | | | | | | | | 7,814,385 | |
| | | | | | | | | | | | | | | |
| | | | | | | | | | | | | | 25,827,815 | |
| | | | | | | | | | | | | | | |
| | | | | | | | | | | | | | | |
| | | |
| Air Freight & Logistics - 0.54% | | | | | | |
| Air Transport Services Group, Inc.A | | | | 1,429,084 | | | | | | | | | | 24,637,408 | |
| | | | | | | | | | | | | | | |
| | | | | | | | | | | | | | | |
| | | |
| Building Products - 0.99% | | | | | | |
| Gibraltar Industries, Inc.A | | | | 443,572 | | | | | | | | | | 29,936,674 | |
| Masterbrand, Inc.A | | | | 261,500 | | | | | | | | | | 4,696,540 | |
| Resideo Technologies, Inc.A | | | | 301,400 | | | | | | | | | | 5,928,538 | |
| Zurn Elkay Water Solutions Corp. | | | | 139,255 | | | | | | | | | | 5,027,105 | |
| | | | | | | | | | | | | | | |
| | | | | | | | | | | | | | 45,588,857 | |
| | | | | | | | | | | | | | | |
| | | | | | | | | | | | | | | |
| | | |
| Commercial Services & Supplies - 1.71% | | | | | | |
| ACCO Brands Corp. | | | | 208,820 | | | | | | | | | | 1,023,218 | |
| ACV Auctions, Inc., Class AA | | | | 116,476 | | | | | | | | | | 2,013,870 | |
| Brink’s Co. | | | | 101,020 | | | | | | | | | | 10,383,846 | |
| CoreCivic, Inc.A | | | | 247,850 | | | | | | | | | | 3,422,809 | |
| Deluxe Corp. | | | | 733,604 | | | | | | | | | | 13,762,411 | |
| Enviri Corp.A | | | | 2,140,876 | | | | | | | | | | 16,399,110 | |
| GEO Group, Inc.A | | | | 268,490 | | | | | | | | | | 4,075,678 | |
| Interface, Inc. | | | | 1,160,542 | | | | | | | | | | 20,274,669 | |
| MillerKnoll, Inc. | | | | 112,644 | | | | | | | | | | 2,518,720 | |
| Montrose Environmental Group, Inc.A | | | | 70,637 | | | | | | | | | | 1,862,698 | |
| Quad/Graphics, Inc. | | | | 481,638 | | | | | | | | | | 3,058,401 | |
| | | | | | | | | | | | | | | |
| | | | | | | | | | | | | | 78,795,430 | |
| | | | | | | | | | | | | | | |
| | | | | | | | | | | | | | | |
| | | |
| Construction & Engineering - 1.74% | | | | | | |
| Fluor Corp.A | | | | 768,100 | | | | | | | | | | 40,156,268 | |
| Granite Construction, Inc. | | | | 91,884 | | | | | | | | | | 7,722,850 | |
| MYR Group, Inc.A | | | | 48,866 | | | | | | | | | | 6,401,446 | |
See accompanying notes
8
American Beacon Small Cap Value FundSM
Schedule of Investments
October 31, 2024
| | | | | | | | | | | | | | | |
| | | |
| | | Shares | | | | Fair Value |
| | | | | | | |
| | | |
| COMMON STOCKS - 91.44% (continued) | | | | | | |
| | | |
| Industrials - 19.79% (continued) | | | | | | |
| | | |
| Construction & Engineering - 1.74% (continued) | | | | | | |
| Tutor Perini Corp.A | | | | 110,720 | | | | | | | | | $ | 2,869,862 | |
| Valmont Industries, Inc. | | | | 15,820 | | | | | | | | | | 4,930,778 | |
| WillScot Holdings Corp.A | | | | 547,833 | | | | | | | | | | 18,155,186 | |
| | | | | | | | | | | | | | | |
| | | | | | | | | | | | | | 80,236,390 | |
| | | | | | | | | | | | | | | |
| | | | | | | | | | | | | | | |
| | | |
| Electrical Equipment - 0.84% | | | | | | |
| EnerSys | | | | 331,114 | | | | | | | | | | 32,071,702 | |
| Sunrun, Inc.A | | | | 460,200 | | | | | | | | | | 6,649,890 | |
| | | | | | | | | | | | | | | |
| | | | | | | | | | | | | | 38,721,592 | |
| | | | | | | | | | | | | | | |
| | | | | | | | | | | | | | | |
| | | |
| Ground Transportation - 1.74% | | | | | | |
| Covenant Logistics Group, Inc. | | | | 18,230 | | | | | | | | | | 922,438 | |
| Lyft, Inc., Class AA | | | | 205,758 | | | | | | | | | | 2,668,681 | |
| Ryder System, Inc. | | | | 79,890 | | | | | | | | | | 11,686,309 | |
| Schneider National, Inc., Class B | | | | 370,276 | | | | | | | | | | 10,471,405 | |
| U-Haul Holding Co. | | | | 418,100 | | | | | | | | | | 28,539,506 | |
| Universal Logistics Holdings, Inc.B | | | | 32,010 | | | | | | | | | | 1,345,700 | |
| Werner Enterprises, Inc. | | | | 666,301 | | | | | | | | | | 24,579,844 | |
| | | | | | | | | | | | | | | |
| | | | | | | | | | | | | | 80,213,883 | |
| | | | | | | | | | | | | | | |
| | | | | | | | | | | | | | | |
| | | |
| Machinery - 6.45% | | | | | | |
| AGCO Corp. | | | | 149,251 | | | | | | | | | | 14,901,220 | |
| Allison Transmission Holdings, Inc. | | | | 103,782 | | | | | | | | | | 11,090,145 | |
| Astec Industries, Inc. | | | | 47,000 | | | | | | | | | | 1,493,660 | |
| Atmus Filtration Technologies, Inc. | | | | 145,500 | | | | | | | | | | 5,665,770 | |
| Barnes Group, Inc. | | | | 140,254 | | | | | | | | | | 6,558,277 | |
| Columbus McKinnon Corp. | | | | 547,833 | | | | | | | | | | 17,426,568 | |
| Enerpac Tool Group Corp. | | | | 951,500 | | | | | | | | | | 41,980,180 | |
| Enpro, Inc. | | | | 34,519 | | | | | | | | | | 5,026,312 | |
| Flowserve Corp. | | | | 511,618 | | | | | | | | | | 26,931,572 | |
| Gates Industrial Corp. PLCA | | | | 109,681 | | | | | | | | | | 2,122,327 | |
| Greenbrier Cos., Inc. | | | | 866,212 | | | | | | | | | | 51,340,385 | |
| Helios Technologies, Inc. | | | | 548,270 | | | | | | | | | | 25,291,695 | |
| Hyster-Yale, Inc. | | | | 33,910 | | | | | | | | | | 2,152,268 | |
| Kennametal, Inc. | | | | 821,750 | | | | | | | | | | 20,806,710 | |
| Lindsay Corp. | | | | 20,070 | | | | | | | | | | 2,402,379 | |
| Middleby Corp.A | | | | 51,314 | | | | | | | | | | 6,655,426 | |
| Miller Industries, Inc. | | | | 147,194 | | | | | | | | | | 9,661,814 | |
| Standex International Corp. | | | | 100,916 | | | | | | | | | | 18,556,434 | |
| Terex Corp. | | | | 150,770 | | | | | | | | | | 7,796,317 | |
| Timken Co. | | | | 228,900 | | | | | | | | | | 18,998,700 | |
| | | | | | | | | | | | | | | |
| | | | | | | | | | | | | | 296,858,159 | |
| | | | | | | | | | | | | | | |
| | | | | | | | | | | | | | | |
| | | |
| Marine Transportation - 0.76% | | | | | | |
| Genco Shipping & Trading Ltd. | | | | 103,300 | | | | | | | | | | 1,625,942 | |
| Kirby Corp.A | | | | 288,333 | | | | | | | | | | 33,089,095 | |
| | | | | | | | | | | | | | | |
| | | | | | | | | | | | | | 34,715,037 | |
| | | | | | | | | | | | | | | |
| | | | | | | | | | | | | | | |
| | | |
| Passenger Airlines - 0.29% | | | | | | |
| Alaska Air Group, Inc.A | | | | 279,800 | | | | | | | | | | 13,405,218 | |
| | | | | | | | | | | | | | | |
| | | | | | | | | | | | | | | |
| | | |
| Professional Services - 1.75% | | | | | | |
| Concentrix Corp. | | | | 265,523 | | | | | | | | | | 11,287,383 | |
| CSG Systems International, Inc. | | | | 162,781 | | | | | | | | | | 7,587,222 | |
| Heidrick & Struggles International, Inc. | | | | 44,610 | | | | | | | | | | 1,742,467 | |
| Hudson Global, Inc.A | | | | 57,162 | | | | | | | | | | 862,003 | |
See accompanying notes
9
American Beacon Small Cap Value FundSM
Schedule of Investments
October 31, 2024
| | | | | | | | | | | | | | | |
| | | |
| | | Shares | | | | Fair Value |
| | | | | | | |
| | | |
| COMMON STOCKS - 91.44% (continued) | | | | | | |
| | | |
| Industrials - 19.79% (continued) | | | | | | |
| | | |
| Professional Services - 1.75% (continued) | | | | | | |
| KBR, Inc. | | | | 221,998 | | | | | | | | | $ | 14,876,086 | |
| Kelly Services, Inc., Class A | | | | 70,450 | | | | | | | | | | 1,408,295 | |
| Korn Ferry | | | | 193,137 | | | | | | | | | | 13,645,129 | |
| ManpowerGroup, Inc. | | | | 225,866 | | | | | | | | | | 14,195,678 | |
| Robert Half, Inc. | | | | 214,693 | | | | | | | | | | 14,622,740 | |
| | | | | | | | | | | | | | | |
| | | | | | | | | | | | | | 80,227,003 | |
| | | | | | | | | | | | | | | |
| | | | | | | | | | | | | | | |
| | | |
| Trading Companies & Distributors - 2.42% | | | | | | |
| Air Lease Corp. | | | | 236,570 | | | | | | | | | | 10,491,879 | |
| BlueLinx Holdings, Inc.A | | | | 19,570 | | | | | | | | | | 2,142,132 | |
| Boise Cascade Co. | | | | 125,200 | | | | | | | | | | 16,655,356 | |
| DNOW, Inc.A | | | | 1,638,417 | | | | | | | | | | 19,382,473 | |
| DXP Enterprises, Inc.A | | | | 34,500 | | | | | | | | | | 1,693,260 | |
| GMS, Inc.A | | | | 71,210 | | | | | | | | | | 6,401,067 | |
| H&E Equipment Services, Inc. | | | | 88,400 | | | | | | | | | | 4,618,900 | |
| Herc Holdings, Inc. | | | | 58,400 | | | | | | | | | | 12,213,776 | |
| MRC Global, Inc.A | | | | 179,260 | | | | | | | | | | 2,197,728 | |
| MSC Industrial Direct Co., Inc., Class A | | | | 79,510 | | | | | | | | | | 6,286,856 | |
| Rush Enterprises, Inc., Class A | | | | 209,580 | | | | | | | | | | 11,858,036 | |
| WESCO International, Inc. | | | | 91,800 | | | | | | | | | | 17,622,846 | |
| | | | | | | | | | | | | | | |
| | | | | | | | | | | | | | 111,564,309 | |
| | | | | | | | | | | | | | | |
| | | | | | | | | | | | | | | |
Total Industrials | | | | | | | | | | | | | | 910,791,101 | |
| | | | | | | | | | | | | | | |
| | | | | | | | | | | | | | | |
| | | |
| Information Technology - 9.01% | | | | | | |
| | | |
| Communications Equipment - 3.12% | | | | | | |
| Calix, Inc.A | | | | 133,611 | | | | | | | | | | 4,727,157 | |
| Ciena Corp.A | | | | 540,625 | | | | | | | | | | 34,335,094 | |
| F5, Inc.A | | | | 259,124 | | | | | | | | | | 60,603,921 | |
| Lumentum Holdings, Inc.A | | | | 556,414 | | | | | | | | | | 35,538,162 | |
| NETGEAR, Inc.A | | | | 70,230 | | | | | | | | | | 1,539,442 | |
| Viavi Solutions, Inc.A | | | | 766,445 | | | | | | | | | | 7,066,623 | |
| | | | | | | | | | | | | | | |
| | | | | | | | | | | | | | 143,810,399 | |
| | | | | | | | | | | | | | | |
| | | | | | | | | | | | | | | |
| | | |
| Electronic Equipment, Instruments & Components - 4.07% | | | | | | |
| Arrow Electronics, Inc.A | | | | 85,841 | | | | | | | | | | 10,186,751 | |
| Avnet, Inc. | | | | 894,790 | | | | | | | | | | 48,506,566 | |
| Bel Fuse, Inc., Class B | | | | 23,300 | | | | | | | | | | 1,757,286 | |
| Belden, Inc. | | | | 255,570 | | | | | | | | | | 29,101,756 | |
| Benchmark Electronics, Inc. | | | | 78,880 | | | | | | | | | | 3,415,504 | |
| Coherent Corp.A | | | | 497,375 | | | | | | | | | | 45,977,345 | |
| nLight, Inc.A | | | | 400,176 | | | | | | | | | | 4,994,197 | |
| Plexus Corp.A | | | | 63,326 | | | | | | | | | | 9,125,277 | |
| ScanSource, Inc.A | | | | 55,490 | | | | | | | | | | 2,353,331 | |
| TTM Technologies, Inc.A | | | | 224,280 | | | | | | | | | | 5,032,843 | |
| Vishay Intertechnology, Inc. | | | | 1,415,572 | | | | | | | | | | 24,008,101 | |
| Vontier Corp. | | | | 75,000 | | | | | | | | | | 2,781,000 | |
| | | | | | | | | | | | | | | |
| | | | | | | | | | | | | | 187,239,957 | |
| | | | | | | | | | | | | | | |
| | | | | | | | | | | | | | | |
| | | |
| IT Services - 0.23% | | | | | | |
| ASGN, Inc.A | | | | 113,300 | | | | | | | | | | 10,434,930 | |
| | | | | | | | | | | | | | | |
| | | | | | | | | | | | | | | |
| | | |
| Semiconductors & Semiconductor Equipment - 0.93% | | | | | | |
| Alpha & Omega Semiconductor Ltd.A | | | | 43,100 | | | | | | | | | | 1,424,024 | |
| Cohu, Inc.A | | | | 199,975 | | | | | | | | | | 4,983,377 | |
| Diodes, Inc.A | | | | 418,369 | | | | | | | | | | 24,466,219 | |
See accompanying notes
10
American Beacon Small Cap Value FundSM
Schedule of Investments
October 31, 2024
| | | | | | | | | | | | | | | |
| | | |
| | | Shares | | | | Fair Value |
| | | | | | | |
| | | |
| COMMON STOCKS - 91.44% (continued) | | | | | | |
| | | |
| Information Technology - 9.01% (continued) | | | | | | |
| | | |
| Semiconductors & Semiconductor Equipment - 0.93% (continued) | | | | | | |
| Rambus, Inc.A | | | | 135,038 | | | | | | | | | $ | 6,457,517 | |
| Synaptics, Inc.A | | | | 80,847 | | | | | | | | | | 5,551,764 | |
| | | | | | | | | | | | | | | |
| | | | | | | | | | | | | | 42,882,901 | |
| | | | | | | | | | | | | | | |
| | | | | | | | | | | | | | | |
| | | |
| Software - 0.56% | | | | | | |
| A10 Networks, Inc. | | | | 1,175,029 | | | | | | | | | | 17,214,175 | |
| Adeia, Inc. | | | | 236,510 | | | | | | | | | | 2,939,819 | |
| Blackbaud, Inc.A | | | | 12,386 | | | | | | | | | | 940,284 | |
| Dolby Laboratories, Inc., Class A | | | | 62,699 | | | | | | | | | | 4,570,757 | |
| | | | | | | | | | | | | | | |
| | | | | | | | | | | | | | 25,665,035 | |
| | | | | | | | | | | | | | | |
| | | | | | | | | | | | | | | |
| | | |
| Technology Hardware, Storage & Peripherals - 0.10% | | | | | | |
| Corsair Gaming, Inc.A | | | | 557,834 | | | | | | | | | | 3,578,505 | |
| Eastman Kodak Co.A B | | | | 193,600 | | | | | | | | | | 913,792 | |
| | | | | | | | | | | | | | | |
| | | | | | | | | | | | | | 4,492,297 | |
| | | | | | | | | | | | | | | |
| | | | | | | | | | | | | | | |
Total Information Technology | | | | | | | | | | | | | | 414,525,519 | |
| | | | | | | | | | | | | | | |
| | | | | | | | | | | | | | | |
| | | |
| Materials - 6.55% | | | | | | |
| | | |
| Chemicals - 2.29% | | | | | | |
| AdvanSix, Inc. | | | | 55,000 | | | | | | | | | | 1,560,350 | |
| Ashland, Inc. | | | | 244,993 | | | | | | | | | | 20,719,058 | |
| Avient Corp. | | | | 260,539 | | | | | | | | | | 12,143,723 | |
| Ecovyst, Inc.A | | | | 2,330,816 | | | | | | | | | | 15,523,235 | |
| Huntsman Corp. | | | | 580,515 | | | | | | | | | | 12,771,330 | |
| Koppers Holdings, Inc. | | | | 3,768 | | | | | | | | | | 128,150 | |
| Olin Corp. | | | | 439,975 | | | | | | | | | | 18,052,174 | |
| Quaker Chemical Corp. | | | | 54,263 | | | | | | | | | | 8,225,185 | |
| Rayonier Advanced Materials, Inc.A | | | | 155,060 | | | | | | | | | | 1,234,278 | |
| Stepan Co. | | | | 158,143 | | | | | | | | | | 11,440,065 | |
| Tronox Holdings PLC | | | | 325,100 | | | | | | | | | | 3,940,212 | |
| | | | | | | | | | | | | | | |
| | | | | | | | | | | | | | 105,737,760 | |
| | | | | | | | | | | | | | | |
| | | | | | | | | | | | | | | |
| | | |
| Construction Materials - 0.23% | | | | | | |
| Knife River Corp.A | | | | 110,470 | | | | | | | | | | 10,750,940 | |
| | | | | | | | | | | | | | | |
| | | | | | | | | | | | | | | |
| | | |
| Containers & Packaging - 1.04% | | | | | | |
| Greif, Inc., Class A | | | | 197,126 | | | | | | | | | | 12,308,547 | |
| Sealed Air Corp. | | | | 300,000 | | | | | | | | | | 10,854,000 | |
| Silgan Holdings, Inc. | | | | 194,144 | | | | | | | | | | 10,045,011 | |
| Sonoco Products Co. | | | | 272,915 | | | | | | | | | | 14,333,496 | |
| | | | | | | | | | | | | | | |
| | | | | | | | | | | | | | 47,541,054 | |
| | | | | | | | | | | | | | | |
| | | | | | | | | | | | | | | |
| | | |
| Metals & Mining - 2.80% | | | | | | |
| Alcoa Corp. | | | | 224,770 | | | | | | | | | | 9,011,029 | |
| ATI, Inc.A | | | | 547,833 | | | | | | | | | | 28,876,277 | |
| Carpenter Technology Corp. | | | | 49,618 | | | | | | | | | | 7,417,891 | |
| Elah Holdings, Inc.A | | | | 3,209 | | | | | | | | | | 100,153 | |
| Ferroglobe PLC | | | | 3,063,544 | | | | | | | | | | 12,836,249 | |
| Kaiser Aluminum Corp. | | | | 331,583 | | | | | | | | | | 24,623,354 | |
| Materion Corp. | | | | 258,334 | | | | | | | | | | 26,254,484 | |
| MP Materials Corp.A B | | | | 483,289 | | | | | | | | | | 8,694,369 | |
| Radius Recycling, Inc. | | | | 106,881 | | | | | | | | | | 1,730,403 | |
| SunCoke Energy, Inc. | | | | 143,890 | | | | | | | | | | 1,483,506 | |
| Warrior Met Coal, Inc. | | | | 126,570 | | | | | | | | | | 7,990,364 | |
| | | | | | | | | | | | | | | |
| | | | | | | | | | | | | | 129,018,079 | |
| | | | | | | | | | | | | | | |
| | | | | | | | | | | | | | | |
See accompanying notes
11
American Beacon Small Cap Value FundSM
Schedule of Investments
October 31, 2024
| | | | | | | | | | | | | | | |
| | | |
| | | Shares | | | | Fair Value |
| | | | | | | |
| | | |
| COMMON STOCKS - 91.44% (continued) | | | | | | |
| | | |
| Materials - 6.55% (continued) | | | | | | |
| | | |
| Paper & Forest Products - 0.19% | | | | | | |
| Clearwater Paper Corp.A | | | | 35,280 | | | | | | | | | $ | 888,703 | |
| Sylvamo Corp. | | | | 90,680 | | | | | | | | | | 7,709,614 | |
| | | | | | | | | | | | | | | |
| | | | | | | | | | | | | | 8,598,317 | |
| | | | | | | | | | | | | | | |
| | | | | | | | | | | | | | | |
Total Materials | | | | | | | | | | | | | | 301,646,150 | |
| | | | | | | | | | | | | | | |
| | | | | | | | | | | | | | | |
| | | |
| Real Estate - 5.28% | | | | | | |
| | | |
| Health Care REITs - 0.32% | | | | | | |
| CareTrust REIT, Inc. | | | | 150,565 | | | | | | | | | | 4,918,959 | |
| Healthcare Realty Trust, Inc. | | | | 167,425 | | | | | | | | | | 2,876,361 | |
| Healthpeak Properties, Inc. | | | | 312,938 | | | | | | | | | | 7,025,458 | |
| | | | | | | | | | | | | | | |
| | | | | | | | | | | | | | 14,820,778 | |
| | | | | | | | | | | | | | | |
| | | | | | | | | | | | | | | |
| | | |
| Hotel & Resort REITs - 0.18% | | | | | | |
| Ryman Hospitality Properties, Inc. | | | | 75,320 | | | | | | | | | | 8,063,006 | |
| | | | | | | | | | | | | | | |
| | | | | | | | | | | | | | | |
| | | |
| Industrial REITs - 0.89% | | | | | | |
| Americold Realty Trust, Inc. | | | | 240,578 | | | | | | | | | | 6,178,043 | |
| First Industrial Realty Trust, Inc. | | | | 244,777 | | | | | | | | | | 12,848,345 | |
| STAG Industrial, Inc. | | | | 135,198 | | | | | | | | | | 5,040,181 | |
| Terreno Realty Corp. | | | | 287,423 | | | | | | | | | | 17,231,009 | |
| | | | | | | | | | | | | | | |
| | | | | | | | | | | | | | 41,297,578 | |
| | | | | | | | | | | | | | | |
| | | | | | | | | | | | | | | |
| | | |
| Office REITs - 0.36% | | | | | | |
| Douglas Emmett, Inc.B | | | | 466,880 | | | | | | | | | | 8,305,795 | |
| Highwoods Properties, Inc. | | | | 241,769 | | | | | | | | | | 8,108,932 | |
| | | | | | | | | | | | | | | |
| | | | | | | | | | | | | | 16,414,727 | |
| | | | | | | | | | | | | | | |
| | | | | | | | | | | | | | | |
| | | |
| Real Estate Management & Development - 1.36% | | | | | | |
| Howard Hughes Holdings, Inc.A | | | | 84,090 | | | | | | | | | | 6,394,204 | |
| Jones Lang LaSalle, Inc.A | | | | 123,300 | | | | | | | | | | 33,409,368 | |
| Newmark Group, Inc., Class A | | | | 555,976 | | | | | | | | | | 8,334,080 | |
| RMR Group, Inc., Class A | | | | 358,673 | | | | | | | | | | 8,633,259 | |
| Seritage Growth Properties, Class AA B | | | | 1,108,139 | | | | | | | | | | 4,643,102 | |
| Tejon Ranch Co.A | | | | 58,860 | | | | | | | | | | 936,463 | |
| | | | | | | | | | | | | | | |
| | | | | | | | | | | | | | 62,350,476 | |
| | | | | | | | | | | | | | | |
| | | | | | | | | | | | | | | |
| | | |
| Retail REITs - 1.33% | | | | | | |
| Acadia Realty Trust | | | | 581,611 | | | | | | | | | | 14,243,653 | |
| Agree Realty Corp. | | | | 356,266 | | | | | | | | | | 26,452,751 | |
| NETSTREIT Corp.B | | | | 895,716 | | | | | | | | | | 13,883,598 | |
| Urban Edge Properties | | | | 301,061 | | | | | | | | | | 6,695,597 | |
| | | | | | | | | | | | | | | |
| | | | | | | | | | | | | | 61,275,599 | |
| | | | | | | | | | | | | | | |
| | | | | | | | | | | | | | | |
| | | |
| Specialized REITs - 0.84% | | | | | | |
| PotlatchDeltic Corp. | | | | 934,230 | | | | | | | | | | 38,835,941 | |
| | | | | | | | | | | | | | | |
| | | | | | | | | | | | | | | |
Total Real Estate | | | | | | | | | | | | | | 243,058,105 | |
| | | | | | | | | | | | | | | |
| | | | | | | | | | | | | | | |
| | | |
| Utilities - 2.57% | | | | | | |
| | | |
| Electric Utilities - 1.00% | | | | | | |
| IDACORP, Inc. | | | | 150,230 | | | | | | | | | | 15,545,801 | |
| OGE Energy Corp. | | | | 250,100 | | | | | | | | | | 10,001,499 | |
| Otter Tail Corp. | | | | 20,400 | | | | | | | | | | 1,601,808 | |
| Portland General Electric Co. | | | | 180,642 | | | | | | | | | | 8,562,431 | |
| TXNM Energy, Inc. | | | | 231,625 | | | | | | | | | | 10,084,953 | |
| | | | | | | | | | | | | | | |
| | | | | | | | | | | | | | 45,796,492 | |
| | | | | | | | | | | | | | | |
| | | | | | | | | | | | | | | |
See accompanying notes
12
American Beacon Small Cap Value FundSM
Schedule of Investments
October 31, 2024
| | | | | | | | | | | | | | | |
| | | |
| | | Shares | | | | Fair Value |
| | | | | | | |
| | | |
| COMMON STOCKS - 91.44% (continued) | | | | | | |
| | | |
| Utilities - 2.57% (continued) | | | | | | |
| | | |
| Gas Utilities - 0.84% | | | | | | |
| Chesapeake Utilities Corp. | | | | 125,994 | | | | | | | | | $ | 15,092,821 | |
| Northwest Natural Holding Co. | | | | 79,700 | | | | | | | | | | 3,099,533 | |
| Southwest Gas Holdings, Inc. | | | | 125,452 | | | | | | | | | | 9,189,359 | |
| Spire, Inc. | | | | 136,840 | | | | | | | | | | 8,738,602 | |
| UGI Corp. | | | | 104,600 | | | | | | | | | | 2,500,986 | |
| | | | | | | | | | | | | | | |
| | | | | | | | | | | | | | 38,621,301 | |
| | | | | | | | | | | | | | | |
| | | | | | | | | | | | | | | |
| | | |
| Multi-Utilities - 0.73% | | | | | | |
| Avista Corp. | | | | 436,909 | | | | | | | | | | 16,375,349 | |
| Black Hills Corp. | | | | 164,230 | | | | | | | | | | 9,720,774 | |
| Northwestern Energy Group, Inc. | | | | 148,390 | | | | | | | | | | 7,932,929 | |
| | | | | | | | | | | | | | | |
| | | | | | | | | | | | | | 34,029,052 | |
| | | | | | | | | | | | | | | |
| | | | | | | | | | | | | | | |
Total Utilities | | | | | | | | | | | | | | 118,446,845 | |
| | | | | | | | | | | | | | | |
| | | | | | | | | | | | | | | |
Total Common Stocks (Cost $3,485,220,890) | | | | | | | | | | | | | | 4,208,964,951 | |
| | | | | | | | | | | | | | | |
| | | | | | | | | | | | | | | |
| | | |
| FOREIGN COMMON STOCKS - 4.08% | | | | | | |
| | | |
| Consumer Discretionary - 0.10% | | | | | | |
| | | |
| Hotels, Restaurants & Leisure - 0.10% | | | | | | |
| Genius Sports Ltd.A B | | | | 686,097 | | | | | | | | | | 4,699,764 | |
| | | | | | | | | | | | | | | |
| | | | | | | | | | | | | | | |
| | | |
| Consumer Staples - 0.29% | | | | | | |
| | | |
| Food Products - 0.29% | | | | | | |
| SunOpta, Inc.A | | | | 2,032,751 | | | | | | | | | | 13,304,355 | |
| | | | | | | | | | | | | | | |
| | | | | | | | | | | | | | | |
| | | |
| Energy - 0.49% | | | | | | |
| | | |
| Oil, Gas & Consumable Fuels - 0.49% | | | | | | |
| Baytex Energy Corp.B | | | | 1,958,742 | | | | | | | | | | 5,543,240 | |
| Kosmos Energy Ltd.A | | | | 4,502,631 | | | | | | | | | | 16,929,892 | |
| | | | | | | | | | | | | | | |
| | | | | | | | | | | | | | 22,473,132 | |
| | | | | | | | | | | | | | | |
| | | | | | | | | | | | | | | |
Total Energy | | | | | | | | | | | | | | 22,473,132 | |
| | | | | | | | | | | | | | | |
| | | | | | | | | | | | | | | |
| | | |
| Financials - 1.80% | | | | | | |
| | | |
| Banks - 1.72% | | | | | | |
| Bank of NT Butterfield & Son Ltd. | | | | 419,886 | | | | | | | | | | 15,355,231 | |
| First BanCorp | | | | 145,220 | | | | | | | | | | 2,799,842 | |
| OFG Bancorp | | | | 724,252 | | | | | | | | | | 29,165,628 | |
| Popular, Inc. | | | | 355,047 | | | | | | | | | | 31,680,844 | |
| | | | | | | | | | | | | | | |
| | | | | | | | | | | | | | 79,001,545 | |
| | | | | | | | | | | | | | | |
| | | | | | | | | | | | | | | |
| | | |
| Insurance - 0.08% | | | | | | |
| SiriusPoint Ltd.A | | | | 288,200 | | | | | | | | | | 3,786,948 | |
| | | | | | | | | | | | | | | |
| | | | | | | | | | | | | | | |
Total Financials | | | | | | | | | | | | | | 82,788,493 | |
| | | | | | | | | | | | | | | |
| | | | | | | | | | | | | | | |
| | | |
| Information Technology - 1.11% | | | | | | |
| | | |
| Communications Equipment - 0.39% | | | | | | |
| Telefonaktiebolaget LM Ericsson, ADRB | | | | 2,158,400 | | | | | | | | | | 18,087,392 | |
| | | | | | | | | | | | | | | |
| | | | | | | | | | | | | | | |
| | | |
| Semiconductors & Semiconductor Equipment - 0.72% | | | | | | |
| Tower Semiconductor Ltd.A | | | | 785,709 | | | | | | | | | | 32,968,350 | |
| | | | | | | | | | | | | | | |
| | | | | | | | | | | | | | | |
Total Information Technology | | | | | | | | | | | | | | 51,055,742 | |
| | | | | | | | | | | | | | | |
| | | | | | | | | | | | | | | |
See accompanying notes
13
American Beacon Small Cap Value FundSM
Schedule of Investments
October 31, 2024
| | | | | | | | | | | | | | | |
| | | |
| | | Shares | | | | Fair Value |
| | | | | | | |
| | | |
| FOREIGN COMMON STOCKS - 4.08% (continued) | | | | | | |
| | | |
| Materials - 0.29% | | | | | | |
| | | |
| Metals & Mining - 0.29% | | | | | | |
| Alamos Gold, Inc., Class A | | | | 660,598 | | | | | | | | | $ | 13,330,868 | |
| | | | | | | | | | | | | | | |
| | | | | | | | | | | | | | | |
Total Foreign Common Stocks (Cost $113,823,968) | | | | | | | | | | | | | | 187,652,354 | |
| | | | | | | | | | | | | | | |
| | | | | | | | | | | | | | | |
| | | |
| SHORT-TERM INVESTMENTS - 4.52% (Cost $208,082,316) | | | | | | |
| | | |
| Investment Companies - 4.52% | | | | | | |
| American Beacon U.S. Government Money Market Select Fund, 4.76%C D | | | | 208,082,316 | | | | | | | | | | 208,082,316 | |
| | | | | | | | | | | | | | | |
| | | | | | | | | | | | | | | |
| | | |
| SECURITIES LENDING COLLATERAL - 0.39% (Cost $17,968,331) | | | | | | |
| | | |
| Investment Companies - 0.39% | | | | | | |
| American Beacon U.S. Government Money Market Select Fund, 4.76%C D | | | | 17,968,331 | | | | | | | | | | 17,968,331 | |
| | | | | | | | | | | | | | | |
| | | | | | | | | | | | | | | |
TOTAL INVESTMENTS - 100.43% (Cost $3,825,095,505) | | | | | | | | | | | | | | 4,622,667,952 | |
LIABILITIES, NET OF OTHER ASSETS - (0.43)% | | | | | | | | | | | | | | (19,943,008 | ) |
| | | | | | | | | | | | | | | |
TOTAL NET ASSETS - 100.00% | | | | | | | | | | | | | $ | 4,602,724,944 | |
| | | | | | | | | | | | | | | |
| | | | | | | |
| Percentages are stated as a percent of net assets. | | | | | | | | | | | | | | | |
A Non-income producing security.
B All or a portion of this security is on loan, collateralized by either cash and/or U.S. Treasuries at October 31, 2024 (Note 8).
C The Fund is affiliated by having the same investment advisor.
D 7-day yield.
ADR - American Depositary Receipt.
LLC - Limited Liability Company.
PLC - Public Limited Company.
REITs - Real Estate Investment Trusts.
| | | | | | | | | | | | | | | | |
| Long Futures Contracts Open on October 31, 2024: | | | | | | | | | |
| | | | | |
| Equity Futures Contracts | | | | | | | | | | | | | |
| Description | | Number of
Contracts | | Expiration Date | | Notional Amount | | | Contract Value | | | Unrealized
Appreciation
(Depreciation) | |
| CME E-Mini Russell 2000 Index Futures | | 2,031 | | December 2024 | | $ | 226,009,648 | | | $ | 224,283,330 | | | $ | (1,726,318 | ) |
| | | | | | | | | | | | | | | | |
| | | | | | $ | 226,009,648 | | | $ | 224,283,330 | | | $ | (1,726,318 | ) |
| | | | | | | | | | | | | | | | |
| | |
| Glossary: |
| | |
| Index Abbreviations: |
| Russell 2000 | | Russell 2000 Index - U.S. Small-Cap Stock Market Index. |
|
| Exchange Abbreviations: |
| CME | | Chicago Mercantile Exchange. |
See accompanying notes
14
American Beacon Small Cap Value FundSM
Schedule of Investments
October 31, 2024
The Fund’s investments are summarized by level based on the inputs used to determine their values. As of October 31, 2024, the investments were classified as described below:
| | | | | | | | | | | | | | | | | | | | | | | | | | | | |
Small Cap Value Fund | | Level 1 | | | | | | Level 2 | | | | | | Level 3 | | | | | | Total | |
Assets | | | | | | | | | | | | | | | | | | | | | | | | | | | | |
Common Stocks | | $ | 4,208,964,951 | | | | | | | $ | - | | | | | | | $ | - | | | | | | | $ | 4,208,964,951 | |
Foreign Common Stocks | | | 187,652,354 | | | | | | | | - | | | | | | | | - | | | | | | | | 187,652,354 | |
Short-Term Investments | | | 208,082,316 | | | | | | | | - | | | | | | | | - | | | | | | | | 208,082,316 | |
Securities Lending Collateral | | | 17,968,331 | | | | | | | | - | | | | | | | | - | | | | | | | | 17,968,331 | |
| | | | | | | | | | | | | | | | | | | | | | | | | | | | |
Total Investments in Securities - Assets | | $ | 4,622,667,952 | | | | | | | $ | - | | | | | | | $ | - | | | | | | | $ | 4,622,667,952 | |
| | | | | | | | | | | | | | | | | | | | | | | | | | | | |
|
Financial Derivative Instruments - Liabilities | |
Futures Contracts | | $ | (1,726,318 | ) | | | | | | $ | - | | | | | | | $ | - | | | | | | | $ | (1,726,318 | ) |
| | | | | | | | | | | | | | | | | | | | | | | | | | | | |
Total Financial Derivative Instruments - Liabilities | | $ | (1,726,318 | ) | | | | | | $ | - | | | | | | | $ | - | | | | | | | $ | (1,726,318 | ) |
| | | | | | | | | | | | | | | | | | | | | | | | | | | | |
U.S. GAAP requires transfers between all levels to/from level 3 be disclosed. During the year ended October 31, 2024, there were no transfers into or out of Level 3.
See accompanying notes
15
American Beacon Small Cap Value FundSM
Statement of Assets and Liabilities
October 31, 2024
| | | | |
Assets: | | | | |
Investments in unaffiliated securities, at fair value† § | | $ | 4,396,617,305 | |
Investments in affiliated securities, at fair value‡ | | | 226,050,647 | |
Cash collateral held at broker for futures contracts | | | 17,124,000 | |
Dividends and interest receivable | | | 1,874,348 | |
Receivable for investments sold | | | 1,220,436 | |
Receivable for fund shares sold | | | 1,696,704 | |
Prepaid expenses | | | 39,404 | |
| | | | |
Total assets. | | | 4,644,622,844 | |
| | | | |
Liabilities: | | | | |
Payable for investments purchased | | | 11,651,314 | |
Payable for fund shares redeemed | | | 4,561,738 | |
Cash due to broker for futures contracts | | | 2,171,601 | |
Management and sub-advisory fees payable (Note 2) | | | 2,806,177 | |
Service fees payable (Note 2) | | | 113,344 | |
Transfer agent fees payable (Note 2) | | | 126,389 | |
Payable upon return of securities loaned (Note 9)§ | | | 17,968,331 | |
Custody and fund accounting fees payable | | | 288,691 | |
Professional fees payable | | | 130,178 | |
Trustee fees payable (Note 2) | | | 34,168 | |
Payable for prospectus and shareholder reports | | | 195,384 | |
Payable for variation margin from open futures contracts (Note 5) | | | 1,721,011 | |
Other liabilities | | | 129,574 | |
| | | | |
Total liabilities | | | 41,897,900 | |
| | | | |
Commitments and contingent liabilities (Note 2) | | | | |
| | | | |
Net assets | | $ | 4,602,724,944 | |
| | | | |
Analysis of net assets: | | | | |
Paid-in-capital | | $ | 3,563,981,866 | |
Total distributable earnings (deficits)A | | | 1,038,743,078 | |
| | | | |
Net assets | | $ | 4,602,724,944 | |
| | | | |
Shares outstanding at no par value (unlimited shares authorized): | | | | |
R5 Class | | | 71,859,309 | |
| | | | |
Y Class | | | 16,181,124 | |
| | | | |
Investor Class | | | 10,067,478 | |
| | | | |
Advisor Class | | | 864,811 | |
| | | | |
A Class | | | 2,115,141 | |
| | | | |
C Class | | | 266,705 | |
| | | | |
R6 Class | | | 72,686,184 | |
| | | | |
Net assets: | | | | |
R5 Class | | $ | 1,914,739,045 | |
| | | | |
Y Class | | $ | 421,344,447 | |
| | | | |
Investor Class | | $ | 251,989,854 | |
| | | | |
Advisor Class | | $ | 21,248,218 | |
| | | | |
A Class | | $ | 51,343,675 | |
| | | | |
C Class | | $ | 5,955,619 | |
| | | | |
R6 Class | | $ | 1,936,104,086 | |
| | | | |
Net asset value, offering and redemption price per share: | | | | |
R5 Class | | $ | 26.65 | |
| | | | |
Y Class | | $ | 26.04 | |
| | | | |
Investor Class | | $ | 25.03 | |
| | | | |
Advisor Class | | $ | 24.57 | |
| | | | |
A Class | | $ | 24.27 | |
| | | | |
A Class (offering price) | | $ | 25.75 | |
| | | | |
C Class | | $ | 22.33 | |
| | | | |
R6 Class | | $ | 26.64 | |
| | | | |
| |
† Cost of investments in unaffiliated securities | | $ | 3,599,044,858 | |
‡ Cost of investments in affiliated securities | | $ | 226,050,647 | |
§ Fair value of securities on loan | | $ | 131,711,387 | |
|
A The Fund’s investments in affiliated securities did not have unrealized appreciation (depreciation) at year end. | |
See accompanying notes
16
American Beacon Small Cap Value FundSM
Statement of Operations
For the year ended October 31, 2024
| | | | |
Investment income: | | | | |
Dividend income from unaffiliated securities (net of foreign taxes)† | | $ | 84,124,048 | |
Dividend income from affiliated securities (Note 2) | | | 8,655,531 | |
Interest income | | | 630,568 | |
Income derived from securities lending (Note 9) | | | 960,872 | |
| | | | |
Total investment income | | | 94,371,019 | |
| | | | |
Expenses: | | | | |
Management and sub-advisory fees (Note 2) | | | 32,443,065 | |
Transfer agent fees: | | | | |
R5 Class (Note 2) | | | 742,499 | |
Y Class (Note 2) | | | 436,065 | |
Investor Class | | | 31,956 | |
Advisor Class | | | 5,414 | |
A Class | | | 6,229 | |
C Class | | | 4,345 | |
R6 Class | | | 86,562 | |
Custody and fund accounting fees | | | 516,771 | |
Professional fees | | | 370,651 | |
Registration fees and expenses | | | 126,336 | |
Service fees (Note 2): | | | | |
Investor Class | | | 976,487 | |
Advisor Class | | | 61,608 | |
A Class | | | 89,969 | |
C Class | | | 8,009 | |
Distribution fees (Note 2): | | | | |
Advisor Class | | | 61,130 | |
A Class | | | 120,799 | |
C Class | | | 67,806 | |
Prospectus and shareholder report expenses | | | 365,752 | |
Trustee fees (Note 2) | | | 458,501 | |
Line of credit interest expense (Note 10) | | | 19,135 | |
Other expenses | | | 612,595 | |
| | | | |
Total expenses | | | 37,611,684 | |
| | | | |
Net investment income | | | 56,759,335 | |
| | | | |
| |
Realized and unrealized gain from investments: | | | | |
Net realized gain from: | | | | |
Investments in unaffiliated securitiesA | | | 288,016,426 | |
Commission recapture (Note 1) | | | 127,767 | |
Foreign currency transactions | | | 131 | |
Futures contracts | | | 26,999,127 | |
Change in net unrealized appreciation of: | | | | |
Investments in unaffiliated securitiesB | | | 723,446,614 | |
Foreign currency transactions | | | 347 | |
Futures contracts | | | 13,389,898 | |
| | | | |
Net gain from investments | | | 1,051,980,310 | |
| | | | |
Net increase in net assets resulting from operations. | | $ | 1,108,739,645 | |
| | | | |
| |
† Foreign taxes | | $ | 395,948 | |
| |
A The Fund did not recognize net realized gains (losses) from the sale of investments in affiliated securities. | | | | |
B The Fund’s investments in affiliated securities did not have a change in unrealized appreciation (depreciation) at year end. | |
See accompanying notes
17
American Beacon Small Cap Value FundSM
Statement of Changes in Net Assets
| | | | | | | | | | | | |
| | | Year Ended
October 31, 2024 | | | | | | Year Ended
October 31, 2023 | |
Increase (decrease) in net assets: | | | | | | | | | | | | |
Operations: | | | | | | | | | | | | |
Net investment income | | $ | 56,759,335 | | | | | | | $ | 54,335,079 | |
Net realized gain from investments in unaffiliated securities, commission recapture, foreign currency transactions, and futures contracts | | | 315,143,451 | | | | | | | | 193,095,666 | |
Change in net unrealized appreciation (depreciation) of investments in unaffiliated securities, foreign currency transactions, and futures contracts | | | 736,836,859 | | | | | | | | (434,310,131 | ) |
| | | | | | | | | | | | |
Net increase (decrease) in net assets resulting from operations | | | 1,108,739,645 | | | | | | | | (186,879,386 | ) |
| | | | | | | | | | | | |
Distributions to shareholders: | | | | | | | | | | | | |
Total retained earnings: | | | | | | | | | | | | |
R5 Class | | | (101,939,743 | ) | | | | | | | (326,083,778 | ) |
Y Class | | | (20,112,285 | ) | | | | | | | (63,996,701 | ) |
Investor Class | | | (12,666,625 | ) | | | | | | | (42,913,279 | ) |
Advisor Class | | | (1,368,389 | ) | | | | | | | (4,957,456 | ) |
A Class | | | (2,079,077 | ) | | | | | | | (6,416,908 | ) |
C Class | | | (332,570 | ) | | | | | | | (1,424,006 | ) |
R6 Class | | | (88,614,195 | ) | | | | | | | (231,084,710 | ) |
| | | | | | | | | | | | |
Net distributions to shareholders | | | (227,112,884 | ) | | | | | | | (676,876,838 | ) |
| | | | | | | | | | | | |
| | | |
Capital share transactions (Note 11): | | | | | | | | | | | | |
Proceeds from sales of shares | | | 828,352,969 | | | | | | | | 1,240,960,045 | |
Reinvestment of dividends and distributions | | | 214,480,906 | | | | | | | | 639,145,734 | |
Cost of shares redeemed | | | (1,434,303,292 | ) | | | | | | | (1,448,856,561 | ) |
| | | | | | | | | | | | |
Net increase (decrease) in net assets from capital share transactions | | | (391,469,417 | ) | | | | | | | 431,249,218 | |
| | | | | | | | | | | | |
Net increase (decrease) in net assets | | | 490,157,344 | | | | | | | | (432,507,006 | ) |
| | | | | | | | | | | | |
Net assets: | | | | | | | | | | | | |
Beginning of year | | | 4,112,567,600 | | | | | | | | 4,545,074,606 | |
| | | | | | | | | | | | |
End of year | | $ | 4,602,724,944 | | | | | | | $ | 4,112,567,600 | |
| | | | | | | | | | | | |
See accompanying notes
18
American Beacon Small Cap Value FundSM
Notes to Financial Statements
October 31, 2024
1. Organization and Significant Accounting Policies
American Beacon Funds (the “Trust”) is organized as a Massachusetts business trust. The Fund, a series within the Trust, is registered under the Investment Company Act of 1940, as amended (the “Act”), as a diversified, open-end management investment company. As of October 31, 2024, the Trust consists of twenty-four active series, one of which is presented in this filing: American Beacon Small Cap Value Fund (the “Fund”). The remaining twenty-three active series are reported in separate filings.
American Beacon Advisors, Inc. (the “Manager”) is a Delaware corporation and a wholly-owned subsidiary of Resolute Investment Managers, Inc. (“RIM”) organized in 1986 to provide business management, advisory, administrative, and asset management consulting services to the Trust and other investors. The Manager is registered as an investment advisor under the Investment Advisers Act of 1940, as amended (the “Advisers Act”). The Manager is an indirect wholly-owned subsidiary of Resolute Topco, Inc. (“Topco”), which is owned primarily by various institutional investment funds that are managed by financial institutions and other investment advisory firms. No owner of Topco owns 25% or more of the outstanding equity or voting interests of Topco.
Effective December 29, 2023, the Manager underwent a change of control, which resulted in the termination of the Fund’s previous management and investment advisory agreements. The Board of Trustees (“the “Board”) approved a new Management Agreement with the Manager and a new Investment Advisory Agreement among the Manager, each sub-advisor and the Trust, on behalf of the Fund, that were effective on December 29, 2023.
Recently Adopted Accounting Pronouncements
In March 2020, the Financial Accounting Standards Board (“FASB”) issued Accounting Standards Update (“ASU”) No. 2020-04, Reference Rate Reform (Topic 848); Facilitation of the Effects of Reference Rate Reform on Financial Reporting, which provides optional guidance for a limited period of time to ease the potential burden in accounting for (or recognizing the effects of) reference rate reform. The guidance is applicable to contracts referencing London Inter-bank Offered Rate (“LIBOR”) or another reference rate that is expected to be discontinued due to reference rate reform. The ASU is effective as of March 12, 2020 and generally can be applied through December 31, 2022. In December 2022, the FASB issued ASU No. 2022-06 Reference Rate Reform (Topic 848): Deferral of the Sunset Date of Topic 848 which updates and clarifies ASU No. 2020-04. The amendments in this ASU defer the sunset date of Topic 848 from December 31, 2022, to December 31, 2024. Management has concluded that these ASUs will not have a material impact on the Fund’s financial statements.
In June 2022, the FASB issued ASU No. 2022-03, Fair Value Measurement (Topic 820); Fair Value Measurement of Equity Securities Subject to Contractual Sale Restrictions, which provides clarifying guidance that a contractual restriction on the sale of an equity security is not considered part of the unit of account of the equity security and, therefore, is not considered in measuring fair value. The ASU is effective for fiscal years beginning after December 15, 2023, and interim periods within those fiscal years. Management has concluded that the ASU will not have a material impact on the Fund’s financial statements.
19
American Beacon Small Cap Value FundSM
Notes to Financial Statements
October 31, 2024
Class Disclosure
The Fund has multiple classes of shares designed to meet the needs of different groups of investors. The following table sets forth the differences amongst the classes:
| | | | | | |
Class | | Eligible Investors | | Minimum Initial
Investments | |
| R5 Class | | Large institutional investors - sold directly or through intermediary channels. | | $ | 250,000 | |
| | |
| Y Class | | Large institutional retirement plan investors - sold directly or through intermediary channels. | | $ | 100,000 | |
| | |
| Investor Class | | All investors using intermediary organizations, such as broker-dealers or retirement plan sponsors. | | $ | 2,500 | |
| | |
| Advisor Class | | All investors who invest through intermediary organizations, such as broker-dealers or third party administrators. | | $ | 2,500 | |
| | |
| A Class | | All investors who invest through intermediary organizations, such as broker-dealers or third party administrator. Retail investors who invest directly through a financial intermediary such as a broker, bank, or registered investment advisor which may include a front-end sales charge and a contingent deferred sales charge (“CDSC”). | | $ | 2,500 | |
| | |
| C Class | | Retail investors who invest directly through a financial intermediary, such as a broker or through employee directed benefit plans with applicable sales charges which may include CDSC. | | $ | 1,000 | |
| | |
| R6 Class | | Large institutional retirement plan investors - sold through retirement plan sponsors. | | | None | |
Each class offered by the Trust has equal rights as to assets and voting privileges. Income and non-class specific expenses are allocated daily to each class based on the relative net assets. Realized and unrealized capital gains and losses of each class are allocated daily based on the relative net assets of each class of the respective Fund. Class specific expenses, where applicable, currently include service, distribution, transfer agent fees, and sub-transfer agent fees that vary amongst the classes as described more fully in Note 2.
Significant Accounting Policies
The following is a summary of significant accounting policies, consistently followed by the Fund in preparation of the financial statements. The Fund is considered an investment company and accordingly, follows the investment company accounting and reporting guidance of the FASB Accounting Standards Codification Topic 946, Financial Services – Investment Companies, a part of Generally Accepted Accounting Principles (“U.S. GAAP”).
Security Transactions and Investment Income
Security transactions are recorded as of the trade date for financial reporting purposes. Securities purchased or sold on a when-issued or delayed-delivery basis may be settled beyond a standard settlement period for the security after the trade date.
Dividend income, net of foreign taxes, is recorded on the ex-dividend date, except certain dividends from foreign securities which are recorded as soon as the information is available to the Fund. Tax reclaim accruals are automatically generated on accounting and custody systems at the time of the income event based on the tax databases maintained by the Fund’s custodian. Reconciliations are performed between custody and accounting systems to help ensure reclaim accruals are in line. Interest income, net of foreign taxes, is earned from settlement date, recorded on the accrual basis, and adjusted, if necessary, for accretion of discounts and amortization of premiums. Realized gains (losses) from securities sold are determined on the basis of specific lot identification.
20
American Beacon Small Cap Value FundSM
Notes to Financial Statements
October 31, 2024
Distributions to Shareholders
The Fund distributes most or all of its net earnings and realized gains, if any, each taxable year in the form of dividends from net investment income and distributions of realized net capital gains and net gains from foreign currency transactions on an annual basis. The Fund does not have a fixed dividend rate and does not guarantee that it will pay any distributions in any particular period. Dividends to shareholders are determined in accordance with federal income tax regulations, which may differ in amount and character from net investment income and realized gains recognized for purposes of U.S. GAAP. To the extent necessary to fully distribute capital gains, the Fund may designate earnings and profits distributed to shareholders on the redemption of shares.
Commission Recapture
The Fund has established brokerage commission recapture arrangements with certain brokers or dealers. If the Fund’s investment advisor chooses to execute a transaction through a participating broker, the broker rebates a portion of the commission back to the Fund. Any collateral benefit received through participation in the commission recapture program is directed exclusively to the Fund. This amount is reported with the net realized gain (loss) in the Fund’s Statement of Operations, if applicable.
Allocation of Income, Trust Expenses, Gains, and Losses
Investment income and realized and unrealized gains and losses from investments of the Fund are allocated daily to each class of shares based upon the relative proportion of net assets of each class to the total net assets of the Fund. Expenses directly charged or attributable to the Fund will be paid from the assets of the Fund. Generally, expenses of the Trust will be allocated among and charged to the assets of the Fund on a basis that the Trust’s Board deems fair and equitable, which may be based on the relative net assets of the Fund or nature of the services performed and relative applicability to the Fund.
Use of Estimates
The preparation of financial statements in conformity with U.S. GAAP requires management to make estimates and assumptions that affect the amounts reported in the financial statements and accompanying notes. Actual results may differ from those estimated.
Other
Under the Trust’s organizational documents, its officers and trustees are indemnified against certain liabilities arising out of the performance of their duties to the Trust. In the normal course of business, the Trust enters into contracts that provide indemnification to the other party or parties against potential costs or liabilities. The Trust’s maximum exposure under these arrangements is dependent on claims that may be made in the future and, therefore, cannot be estimated. The Trust has had no prior claims or losses pursuant to any such agreement.
2. Transactions with Affiliates
Management and Investment Sub-Advisory Agreements
The Fund and the Manager are parties to a Management Agreement that obligates the Manager to provide the Fund with investment advisory and administrative services. As compensation for performing the duties under the Management Agreement, the Manager will receive an annualized management fee based on a percentage of the Fund’s average daily net assets that is calculated and accrued daily according to the following schedule:
| | | | |
First $ 15 billion | | | 0.35 | % |
Next $15 billion | | | 0.325 | % |
Over $30 billion | | | 0.30 | % |
21
American Beacon Small Cap Value FundSM
Notes to Financial Statements
October 31, 2024
The Trust, on behalf of the Fund, and the Manager have entered into Investment Advisory Agreements with Barrow, Hanley, Mewhinney & Strauss, LLC; Brandywine Global Investment Management, LLC; DePrince, Race & Zollo, Inc.; Hotchkis and Wiley Capital Management, LLC; and Newton Investment Management North America, LLC (“Sub-Advisors”) pursuant to which the Fund has agreed to pay an annualized sub-advisory fee that is calculated and accrued daily based on the Fund’s average daily net assets.
The Management and Sub-Advisory Fees paid by the Fund for the year ended October 31, 2024 were as follows:
| | | | | | | | | | | | |
| | | Effective Fee Rate | | | | | | Amount of Fees Paid | |
Management Fees | | | 0.35 | % | | | | | | $ | 16,274,900 | |
Sub-Advisory Fees | | | 0.35 | % | | | | | | | 16,168,165 | |
| | | | | | | | | | | | |
Total | | | 0.70 | % | | | | | | $ | 32,443,065 | |
| | | | | | | | | | | | |
As compensation for services provided by the Manager in connection with securities lending activities conducted by a Fund, the lending Fund pays to the Manager, with respect to cash collateral posted by borrowers, a fee of 10% of the net monthly investment income (the income earned in the form of interest, dividends and realized capital gains from the investment of cash collateral, plus any negative rebate fees paid by borrowers, less the rebate amount paid to borrowers as well as related expenses) and, with respect to collateral other than cash, a fee up to 10% of loan fees and demand premiums paid by borrowers. These fees are included in “Income derived from securities lending” and “Management and sub-advisory fees” on the Statement of Operations. During the year ended October 31, 2024, the Manager received securities lending fees of $109,218 for the securities lending activities of the Fund.
Distribution Plans
Separate Distribution Plans (the “Distribution Plans”) have been adopted pursuant to Rule 12b-1 under the Act for the Advisor, A, and C Classes of the Fund. Under the Distribution Plans, as compensation for distribution and shareholder servicing assistance, the Manager receives an annual fee of 0.25% of the average daily net assets of the Advisor and A Classes and 1.00% of the average daily net assets of the C Class. The fee will be payable without regard to whether the amount of the fee is more or less than the actual expenses incurred in a particular month by the Manager for distribution assistance.
Service Plans
The Manager and the Trust entered into a Service Plan that obligates the Manager to oversee additional shareholder servicing of the Investor, Advisor, A, and C Classes of the Fund. As compensation for performing the duties required under the Service Plan, the Manager receives an annualized fee up to 0.25% of the average daily net assets of the A and C Classes, up to 0.25% of the average daily net assets of the Advisor Class, and up to 0.375% of the average daily net assets of the Investor Class of the Fund.
Sub-Transfer Agent Fees
The Manager has entered into agreements, which include servicing agreements, with financial intermediaries that provide recordkeeping, processing, shareholder communications and other services to customers of the intermediaries that hold positions in the R5 and Y Classes of the Fund and has agreed to compensate the intermediaries for providing these services. Intermediaries transact with the Fund primarily through the use of omnibus accounts on behalf of its customers who hold positions in the Fund. Certain services would have been provided by the Fund’s transfer agent and other service providers if the shareholders’ accounts were maintained directly by the Fund’s transfer agent. Accordingly, the Fund, pursuant to Board approval, has agreed to reimburse the Manager for certain non-distribution shareholder services provided by financial intermediaries for the R5 and Y Classes. The reimbursement amounts (sub-transfer agent fees) paid to the Manager
22
American Beacon Small Cap Value FundSM
Notes to Financial Statements
October 31, 2024
are subject to a fee limit of up to 0.10% of an intermediary’s average net assets in the R5 and Y Classes on an annual basis. During the year ended October 31, 2024, the sub-transfer agent fees, as reflected in “Transfer agent fees” on the Statement of Operations, were as follows:
| | | | |
Fund | | Sub-Transfer Agent Fees | |
Small Cap Value | | $ | 1,062,346 | |
As of October 31, 2024, the Fund owed the Manager the following reimbursement of sub-transfer agent fees, as reflected in “Transfer agent fees payable” on the Statement of Assets and Liabilities:
| | | | |
Fund | | Reimbursement
Sub-Transfer Agent Fees | |
Small Cap Value | | $ | 84,778 | |
Brokerage Commissions
Affiliated entities of a sub-advisor to the Fund received commissions on purchases and sales of the Fund’s portfolio securities totaling $190,439 for the year ended October 31, 2024.
Investments in Affiliated Funds
The Fund may invest in the American Beacon U.S. Government Money Market Select Fund (the “USG Select Fund”). Cash collateral received by the Fund in connection with securities lending may also be invested in the USG Select Fund. The Fund listed below held the following shares with an October 31, 2024 fair value and dividend income earned from the investment in the USG Select Fund.
| | | | | | | | | | | | | | | | | | | | | | | | | | | | | | | | | | | | | | | | | | | | | | | | |
Affiliated Security | | Type of
Transaction | | | | | Fund | | | | | October 31,
2024
Shares/Principal | | | | | | Change in
Unrealized
Gain (Loss) | | | | | | Realized
Gain
(Loss) | | | | | | Dividend
Income | | | | | | October 31,
2024
Fair Value | |
| U.S. Government Money Market Select | | Direct | | | | | | Small Cap
Value | | | | | | $ | 208,082,316 | | | | | | | $ | - | | | | | | | $ | - | | | | | | | $ | 8,655,531 | | | | | | | $ | 208,082,316 | |
| U.S. Government Money Market Select | | Securities Lending | | | | | | Small Cap
Value | | | | | | | 17,968,331 | | | | | | | | - | | | | | | | | - | | | | | | | | N/A | | | | | | | | 17,968,331 | |
The Fund and the USG Select Fund have the same investment advisor and therefore, are considered to be affiliated. The Manager serves as investment advisor to the USG Select Fund and receives management fees and administrative fees totaling 0.10% of the average daily net assets of the USG Select Fund. During the year ended October 31, 2024, the Manager earned fees on the Fund’s direct investments and securities lending collateral investments in the USG Select Fund as shown below:
| | | | | | | | | | | | |
Fund | | Direct Investments in
USG Select Fund | | | Securities Lending
Collateral
Investments in USG
Select Fund | | | Total | |
Small Cap Value | | $ | 167,211 | | | $ | 22,980 | | | $ | 190,191 | |
Interfund Credit Facility
Pursuant to an exemptive order issued by the U.S. Securities and Exchange Commission (“SEC”), the Fund, along with other registered investment companies having management contracts with the Manager, may participate in a credit facility whereby each fund, under certain conditions, is permitted to lend money directly to and borrow directly from other participating funds for temporary purposes. The interfund credit facility is advantageous to the funds because it provides added liquidity and eliminates the need to maintain higher cash balances to meet redemptions. This situation could arise when shareholder redemptions exceed anticipated
23
American Beacon Small Cap Value FundSM
Notes to Financial Statements
October 31, 2024
volumes and certain funds have insufficient cash on hand to satisfy such redemptions or when sales of securities do not settle as expected, resulting in a cash shortfall for the fund. The credit facility is administered by a credit facility team consisting of professionals from the Manager’s asset management, compliance, and accounting areas who report the activities of the credit facility to the Board. During the year ended October 31, 2024, the Fund participated as a lender by loaning an average amount of $5,923,998 for 51 days at an average interest rate of 6.13% with interest charges earned of $76,362. This amount is included in “Interest income” on the Statement of Operations. During the year ended October 31, 2024, the Fund did not borrow from the credit facility.
Expense Reimbursement Plan
The Fund has adopted an Expense Reimbursement Plan whereby the Manager may seek repayment of contractual or voluntary fee reductions and expense reimbursements. Under the policy, the Manager can be reimbursed by the Fund for any contractual or voluntary fee reductions or expense reimbursements if reimbursement to the Manager (a) occurs within three years from the date of the Manager’s waiver/reimbursement and (b) does not cause the Fund’s annual operating expenses to exceed the lesser of the contractual percentage limit in effect at the time of the waiver/reimbursement or time of recoupment. During the year ended October 31, 2024 there were no waived fees, expenses reimbursed, or recouped expenses, and no commitment or contingent liability is expected.
Sales Commissions
The Fund’s Distributor, Resolute Investment Distributors, Inc. (“RID” or “Distributor”), may receive a portion of A Class sales charges from broker dealers which may be used to offset distribution related expenses. During the year ended October 31, 2024, RID collected $2,289 from the sale of A Class Shares of the Fund.
A CDSC of 0.50% will be deducted with respect to A Class Shares on certain purchases of $1,000,000 or more that are redeemed in whole or part within 18 months of purchase, unless waived as discussed in the Fund’s Prospectus. Any applicable CDSC will be 0.50% of the lesser of the original purchase price or the value of the redemption of the A Class Shares redeemed. During the year ended October 31, 2024, there were no CDSC fees collected for the A Class Shares of the Fund.
A CDSC of 1.00% will be deducted with respect to C Class Shares redeemed within 12 months of purchase, unless waived as discussed in the Fund’s Prospectus. Any applicable CDSC will be 1.00% of the lesser of the original purchase price or the value of the redemption of the C Class Shares redeemed. During the year ended October 31, 2024, CDSC fees of $127 were collected for C Class Shares of the Fund.
Trustee Fees and Expenses
As compensation for their service to the American Beacon Funds Complex, including the Trust (collectively, the “Trusts”), each Trustee is compensated from the Trusts as follows: (1) an annual retainer of $140,000; (2) meeting attendance fee (for attendance in-person or via teleconference) of (a) $12,000 for in person attendance, or $5,000 for telephonic attendance, by Board members for each regularly scheduled or special Board meeting, (b) $2,500 for attendance by Committee members at meetings of the Audit and Compliance Committee and the Investment Committee, (c) $1,000 for attendance by Committee members at meetings of the Nominating and Governance Committee; and (d) $2,500 for attendance by Board members for each special telephonic Board meeting; and (3) reimbursement of reasonable expenses incurred in attending Board meetings, Committee meetings, and relevant educational seminars. For this purpose, the Board considers attendance at regular meetings held by video conference to constitute in-person attendance at a Board meeting. The Trustees also may be compensated for attendance at special Board and/or Committee meetings from time to time. For her service as Board Chair, Ms. Cline receives an additional annual retainer of $50,000. Although she attends several committee meetings at each quarterly Board meeting, she receives only a single $2,500 fee each quarter for her attendance at the Audit and Compliance Committee and Investment Committee meetings. The chairpersons of the Audit and
24
American Beacon Small Cap Value FundSM
Notes to Financial Statements
October 31, 2024
Compliance Committee and the Investment Committee each receive an additional annual retainer of $25,000 and the Chair of the Nominating and Governance Committee receives an additional annual retainer of $10,000.
3. Security Valuation and Fair Value Measurements
The price of the Fund’s shares is based on its net asset value (“NAV”) per share. The Fund’s NAV is computed by adding total assets, subtracting all the Fund’s liabilities, and dividing the result by the total number of shares outstanding.
The NAV of each class of the Fund’s shares is determined based on a pro rata allocation of the Fund’s investment income, expenses and total capital gains and losses. The Fund’s NAV per share is determined each business day as of the regular close of trading on the New York Stock Exchange (“NYSE” or “Exchange”), which is typically 4:00 p.m. Eastern Time (“ET”). However, if trading on the NYSE closes at a time other than 4:00 p.m. ET, the Fund’s NAV per share typically would still be determined as of the regular close of trading on the NYSE. The Fund does not price its shares on days that the NYSE is closed. Foreign exchanges may permit trading in foreign securities on days when the Fund is not open for business, which may result in the value of the Fund’s portfolio investments being affected at a time when you are unable to buy or sell shares.
Equity securities, including shares of closed-end funds and exchange-traded funds (“ETFs”), are valued at the last sale price or official closing price taken from the primary exchange in which each security trades. Investments in other mutual funds are valued at the closing NAV per share on the day of valuation. Debt securities are valued at bid quotes from broker/dealers or evaluated bid prices from pricing services, who may consider a number of inputs and factors, such as prices of comparable securities, yield curves, spreads, credit ratings, coupon rates, maturity, default rates, and underlying collateral. Futures are valued based on their daily settlement prices. Exchange-traded and over-the-counter (“OTC”) options are valued at the last sale price. Options with no last sale for the day are priced at mid quote. Swaps are valued at evaluated mid prices from pricing services.
The valuation of securities traded on foreign markets and certain fixed-income securities will generally be based on prices determined as of the earlier closing time of the markets on which they primarily trade unless a significant event has occurred. When the Fund holds securities or other assets that are denominated in a foreign currency, the Fund will normally use the currency exchange rates as of 4:00 p.m. ET.
Rule 2a-5 under the Investment Company Act (the “Valuation Rule”) establishes requirements for determining fair value in good faith for purposes of the Investment Company Act, including related oversight and reporting requirements. The Valuation Rule also defines when market quotations are “readily available,” which is the threshold for determining whether a Fund must fair value a security. Among other things, the Valuation Rule permits the Board to designate the Manager as Valuation Designee to perform the Fund’s fair value determinations subject to board oversight and certain reporting and other requirements intended to ensure that the Board receives the information it needs to oversee the Manager’s fair value determinations. Effective September 8, 2022, the Board has designated the Manager as valuation designee to perform fair value functions in accordance with the requirements of the Valuation Rule.
Securities may be valued at fair value, as determined in good faith and pursuant to the Manager’s procedures, under certain limited circumstances. For example, fair value pricing will be used for fixed-income securities and when market quotations are not readily available or reliable, as determined by the Manager, such as when (i) trading for a security is restricted or stopped; (ii) a security’s trading market is closed (other than customary closings); or (iii) a security has been de-listed from a national exchange. A security with limited market liquidity may require fair value pricing if the Manager determines that the available price does not reflect the security’s true market value. In addition, if a significant event that the Manager determines to affect the value of one or more securities held by the Fund occurs after the close of a related exchange but before the determination of the Fund’s NAV, fair value pricing may be used on the affected security or securities. Securities of small-capitalization companies are also more likely to require a fair value determination using these procedures because
25
American Beacon Small Cap Value FundSM
Notes to Financial Statements
October 31, 2024
they are more thinly traded and less liquid than the securities of larger-capitalization companies. The Fund may fair value securities as a result of significant events occurring after the close of the foreign markets in which the Fund invests as described below. In addition, the Fund may invest in illiquid securities requiring these procedures.
The Fund may use fair value pricing for securities primarily traded in non-U.S. markets because most foreign markets close well before the Fund’s pricing time of 4:00 p.m. ET. The earlier close of these foreign markets gives rise to the possibility that significant events, including broad market moves, may have occurred in the interim and may materially affect the value of those securities. If the Manager determines that the last quoted prices of non-U.S. securities will, in its judgment, materially affect the value of some or all the Fund’s portfolio securities, the Manager can adjust the previous closing prices to reflect what it believes to be the fair value of the securities as of the close of the Exchange. In deciding whether it is necessary to adjust closing prices to reflect fair value, the Manager reviews a variety of factors, including developments in foreign markets, the performance of U.S. securities markets, and the performance of instruments trading in U.S. markets that represent foreign securities and baskets of foreign securities. These securities are fair valued using a pricing service, using methods approved by the Manager, that considers the correlation of the trading patterns of the foreign security to intraday trading in the U.S. markets, based on indices of domestic securities and other appropriate indicators such as prices of relevant American Depositary Receipts (“ADRs”) and futures contracts. The Manager’s Valuation Committee may also fair value securities in other situations, such as when a particular foreign market is closed but the Fund is open. The Fund uses outside pricing services to provide closing prices and information to evaluate and/or adjust those prices. As a means of evaluating its security valuation process, the Valuation Committee routinely compares closing prices, the next day’s opening prices in the same markets and adjusted prices.
Attempts to determine the fair value of securities introduce an element of subjectivity to the pricing of securities. As a result, the price of a security determined through fair valuation techniques may differ from the price quoted or published by other sources and may not accurately reflect the market value of the security when trading resumes. If a reliable market quotation becomes available for a security formerly valued through fair valuation techniques, the Manager compares the new market quotation to the fair value price to evaluate the effectiveness of the Fund’s fair valuation procedures. If any significant discrepancies are found, the Manager may adjust Manager’s fair valuation procedures for the Fund.
Valuation Inputs
Various inputs may be used to determine the fair value of the Fund’s investments. These inputs are summarized in three broad levels for financial statement purposes. The inputs or methodologies used to value securities are not necessarily an indication of the risk associated with investing in those securities.
| | | | |
| Level 1 | | - | | Quoted prices in active markets for identical securities. |
| | |
| Level 2 | | - | | Prices determined using other significant observable inputs. These may include quoted prices for similar securities, interest rates, prepayment speeds, credit risk, and others. |
| | |
| Level 3 | | - | | Prices determined using other significant unobservable inputs. Unobservable inputs reflect the Fund’s own assumptions about the factors market participants would use in pricing an investment. |
Level 1 and Level 2 trading assets and trading liabilities, at fair value
Common stocks, ETFs, preferred securities and financial derivative instruments, such as futures contracts that are traded on a national securities exchange, are stated at the last reported sale or settlement price on the day of valuation. To the extent these securities are actively traded and valuation adjustments are not applied, they are categorized as Level 1 of the fair value hierarchy. Preferred securities and other equities traded on inactive markets or valued by reference to similar instruments are generally categorized as Level 2 of the fair value hierarchy.
Investments in registered open-end investment management companies will be valued based upon the NAVs of such investments and are categorized as Level 1 of the fair value hierarchy.
26
American Beacon Small Cap Value FundSM
Notes to Financial Statements
October 31, 2024
4. Securities and Other Investments
Common Stock
Common stock generally takes the form of shares in a corporation which represent an ownership interest. It ranks below preferred stock and debt securities in claims for dividends and for assets of the company in a liquidation or bankruptcy. The value of a company’s common stock may fall as a result of factors directly relating to that company, such as decisions made by its management or decreased demand for the company’s products or services. A stock’s value may also decline because of factors affecting not just the company, but also companies in the same industry or sector. The price of a company’s stock may also be affected by changes in financial markets that are relatively unrelated to the company, such as changes in interest rates, currency exchange rates or industry regulation. Companies that elect to pay dividends on their common stock generally only do so after they invest in their own business and make required payments to bondholders and on other debt and preferred stock. Therefore, the value of a company’s common stock will usually be more volatile than its bonds, other debt and preferred stock. Common stock may be exchange-traded or OTC. OTC stock may be less liquid than exchange-traded stock.
Depositary Receipts and U.S. Dollar-Denominated Foreign Stocks Traded on U.S. Exchanges
ADRs are U.S. dollar-denominated receipts issued generally by domestic banks and represent the deposit with the bank of a security of a foreign issuer. Depositary receipts may not be denominated in the same currency as the securities into which they may be converted. Investing in depositary receipts entails substantially the same risks as direct investment in foreign securities. There is generally less publicly available information about foreign companies and there may be less governmental regulation and supervision of foreign stock exchanges, brokers, and listed companies. In addition, such companies may use different accounting and financial standards (and certain currencies may become unavailable for transfer from a foreign currency), resulting in the Fund’s possible inability to convert immediately into U.S. currency proceeds realized upon the sale of portfolio securities of the affected foreign companies. In addition, the Fund may invest in unsponsored depositary receipts, the issuers of which are not obligated to disclose material information about the underlying securities to investors in the United States. Ownership of unsponsored depositary receipts may not entitle the Fund to the same benefits and rights as ownership of a sponsored depositary receipt or the underlying security.
Other Investment Company Securities and Exchange-Traded Products
The Fund may invest in shares of other investment companies, including open-end funds, closed-end funds, business development companies (“BDCs”), ETFs, unit investment trusts, and other investment companies of the Trust. The Fund may invest in securities of an investment company advised by the Manager or the Sub-Advisor. Investments in the securities of other investment companies may involve duplication of advisory fees and certain other expenses. By investing in another investment company, the Fund becomes a shareholder of that investment company. As a result, the Fund shareholders indirectly will bear the Fund’s proportionate share of the fees and expenses paid by shareholders of the other investment company, in addition to the fees and expenses the Fund shareholders directly bear in connection with the Fund’s own operations. These other fees and expenses are reflected as Acquired Fund Fees and Expenses and are included in the Fees and Expenses Table for the Fund in its Prospectus, if applicable. Investments in other investment companies may involve the payment of substantial premiums above the value of such issuer’s portfolio securities.
Publicly Traded Partnerships/Master Limited Partnerships (“MLPs”)
The Fund may invest in publicly traded partnerships such as MLPs. MLPs issue units that are registered with the SEC and are freely tradable on a securities exchange or in the OTC market. An MLP may have one or more general partners, who conduct the business, and one or more limited partners, who contribute capital. The general partner or partners are jointly and severally responsible for the liabilities of the MLP. (An MLP also may be an entity similar to a limited partnership, such as an LLC, which has one or more managers or managing members and
27
American Beacon Small Cap Value FundSM
Notes to Financial Statements
October 31, 2024
non-managing members (who are like limited partners)). The Fund invests in an MLP as a limited partner and normally would not be liable for the debts of an MLP beyond the amount the Fund has invested therein, but it would not be shielded to the same extent that a shareholder of a corporation would be. In certain instances, creditors of an MLP would have the right to seek a return of capital that had been distributed to a limited partner. The right of an MLP’s creditors would continue even after the Fund had sold its investment in the partnership. MLPs typically invest in real estate and oil and gas equipment leasing assets, but they also finance entertainment, research and development, and other projects.
Real Estate Investment Trusts (“REITs”)
REITs are pooled investment vehicles that own, and often operate, income producing real estate (known as “equity REITs”) or invest in mortgages secured by loans on such real estate (known as “mortgage REITs”) or both (known as “hybrid REITs”). REITs are susceptible to the risks associated with direct ownership of real estate, such as declines in property values, increase in property taxes, operating expenses, rising interest rates or overbuilding, zoning changes, and losses from casualty or condemnation. REITs typically are subject to management fees and other expenses that are separate from those of the Fund.
5. Financial Derivative Instruments
The Fund may utilize derivative instruments to gain market exposure on cash balances or reduce market exposure in anticipation of liquidity needs. When considering the Fund’s use of derivatives, it is important to note that the Fund does not use derivatives for the purpose of creating financial leverage.
Futures Contracts
A futures contract is a contract to purchase or sell a particular security, or the cash value of an asset, such as securities, indices, or currencies, at a specified future date at a price agreed upon when the contract is made. Under many such contracts, no delivery of the actual underlying asset is required. Rather, upon the expiration of the contract, settlement is made by exchanging cash in an amount equal to the difference between the contract price and the closing price of the asset (e.g., a security or an index) at expiration, net of the initial and variation margin that was previously paid. An equity index futures contract is based on the value of an underlying index. The Fund may, from time to time, use futures positions to equitize cash and expose its portfolio to changes in securities prices or index prices. This can magnify gains and losses in the Fund. The Fund also may have to sell assets at inopportune times to satisfy its settlement or collateral obligations. The risks associated with the use of futures contracts also include that there may be an imperfect correlation between the changes in market value of the futures contracts and the assets underlying such contracts and that there may not be a liquid secondary market for a futures contract.
During the year ended October 31, 2024, the Fund entered into futures contracts primarily for exposing cash to markets.
The Fund’s average futures contracts outstanding fluctuate throughout the operating year as required to meet strategic requirements. The following table illustrates the average monthly volume of futures contracts. For the purpose of this disclosure, volume is measured by contracts outstanding at each month end.
| | | | |
Average Futures Contracts Outstanding | |
Fund | | Year Ended October 31, 2024 | |
Small Cap Value | | | 1,914 | |
28
American Beacon Small Cap Value FundSM
Notes to Financial Statements
October 31, 2024
The following is a summary of the fair valuations of the Fund’s derivative instruments categorized by risk exposure(1):
| | | | | | | | | | | | | | | | | | | | | | | | | | | | | | | | | | | | | | | | | | | | |
| Fair values of financial instruments on the Statement of Assets and Liabilities as of October 31, 2024: | |
| | | |
| | | Derivatives not accounted for as hedging instruments | | | | | | | |
| | | | | | | | | | | |
Liabilities: | | Credit contracts | | | | | | Foreign exchange
contracts | | | | | | Commodity
contracts | | | | | | Interest rate
contracts | | | | | | Equity contracts | | | | | | Total | |
| Payable for variation margin from open futures contracts(2) | | $ | - | | | | | | | $ | - | | | | | | | $ | - | | | | | | | $ | - | | | | | | | $ | (1,726,318 | ) | | | | | | $ | (1,726,318 | ) |
| | | | | | | | | | | | | | | | | | | | | | | | | | | | | | | | | | | | | | | | | | | | |
| The effect of financial derivative instruments on the Statement of Operations as of October 31, 2024: | |
| | | |
| | | Derivatives not accounted for as hedging instruments | | | | | | | |
| | | | | | | | | | | |
Realized gain (loss) from derivatives
recognized as a result of operations | | Credit contracts | | | | | | Foreign exchange
contracts | | | | | | Commodity
contracts | | | | | | Interest rate
contracts | | | | | | Equity contracts | | | | | | Total | |
| Futures contracts | | $ | - | | | | | | | $ | - | | | | | | | $ | - | | | | | | | $ | - | | | | | | | $ | 26,999,127 | | | | | | | $ | 26,999,127 | |
| | | | | | | | | | | |
Net change in unrealized appreciation
(depreciation) of derivatives recognized
as a result from operations: | | Credit contracts | | | | | | Foreign exchange
contracts | | | | | | Commodity
contracts | | | | | | Interest rate
contracts | | | | | | Equity contracts | | | | | | Total | |
| Futures contracts | | $ | - | | | | | | | $ | - | | | | | | | $ | - | | | | | | | $ | - | | | | | | | $ | 13,389,898 | | | | | | | $ | 13,389,898 | |
(1) See Note 3 in the Notes to Financial Statements for additional information.
(2) Includes cumulative appreciation (depreciation) of futures contracts as reported in the Fund’s Schedule of Investments footnotes. Only current day’s variation margin is reported within the Statement of Assets and Liabilities.
Offsetting Assets and Liabilities
The Fund is a party to enforceable master netting agreements between brokers and counterparties which provide for the right to offset under certain circumstances. The Fund employs multiple money managers and counterparties and has elected not to offset qualifying financial and derivative instruments on the Statement of Assets and Liabilities, as such all financial and derivative instruments are presented on a gross basis. The impacts of netting arrangements that provide the right to offset are detailed below, if applicable. The net amount represents the net receivable or payable that would be due from or to the counterparty in the event of default. Exposure from borrowings and other financing agreements such as repurchase agreements can only be netted across transactions governed by the same Master Agreement with the same legal entity. All amounts reported below represent the balance as of the report date, October 31, 2024.
| | | | | | | | | | | | |
| Offsetting of Financial and Derivative Assets as of October 31, 2024: | | | | | | | | | | | | |
| | Assets | | | | | | Liabilities | |
| Futures Contracts(1) | | $ | - | | | | | | | $ | 1,726,318 | |
| | | | | | | | | | | | |
| Total derivative assets and liabilities in the Statement of Assets and Liabilities | | $ | - | | | | | | | $ | 1,726,318 | |
| | | | | | | | | | | | |
| Derivatives not subject to a Master Netting Agreement or similar agreement (“MNA”) | | $ | - | | | | | | | $ | (1,726,318 | ) |
| | | | | | | | | | | | |
| | | | | | | | | | | | | | | | | | | | | | | | | | | | | | | | | | | | |
| | | Remaining Contractual Maturity of the Agreements
As of October 31, 2024 | |
| | | Overnight and
Continuous | | | | | | <30 days | | | | | | Between
30 & 90 days | | | | | | >90 days | | | | | | Total | |
Securities Lending Transactions | | | | | | | | | | | | | | | | | | | | | | | | | | | | | | | | | | | | |
Common Stocks | | $ | 17,968,331 | | | | | | | $ | - | | | | | | | $ | - | | | | | | | $ | - | | | | | | | $ | 17,968,331 | |
| | | | | | | | | | | | | | | | | | | | | | | | | | | | | | | | | | | | |
Total Borrowings | | $ | 17,968,331 | | | | | | | $ | - | | | | | | | $ | - | | | | | | | $ | - | | | | | | | $ | 17,968,331 | |
| | | | | | | | | | | | | | | | | | | | | | | | | | | | | | | | | | | | |
Gross amount of recognized liabilities for securities lending transactions | | | $ | 17,968,331 | |
| | | | | | | | | | | | | | | | | | | | | | | | | | | | | | | | | | | | |
(1) Includes cumulative appreciation or (depreciation) of futures contracts as reported in the Schedule of Investments footnotes. Only current day’s variation margin is reported within the Statement of Assets and Liabilities.
29
American Beacon Small Cap Value FundSM
Notes to Financial Statements
October 31, 2024
6. Principal Risks
Investing in the Fund may involve certain risks including, but not limited to, those described below.
Environmental, Social, and/or Governance Investing Risk
The use of environmental, social, and/or governance (“ESG”) considerations by a sub-advisor may cause the Fund to make different investments than funds that have a similar investment style but do not incorporate such considerations in their strategy. As with the use of any investment considerations involved in investment decisions, there is no guarantee that the use of any ESG investment considerations will result in the selection of issuers that will outperform other issuers or help reduce risk in the Fund. The Fund may underperform funds that do not incorporate these considerations.
Equity Investments Risk
Equity securities are subject to market risk. The Fund’s investments in equity securities may include common stocks, preferred stocks, securities convertible into or exchangeable for common stocks, REITs, depositary receipts, and U.S. dollar-denominated foreign stocks traded on U.S. exchanges. Such investments may expose the Fund to additional risk. The value of a company’s common stock may fall as a result of factors affecting the company, companies in the same industry or sector, or the financial markets overall. Common stock generally is subordinate to preferred stock upon the liquidation or bankruptcy of the issuing company. Preferred stocks and convertible securities are sensitive to movements in interest rates. Preferred stocks may be less liquid than common stocks and, unlike common stocks, participation in the growth of an issuer may be limited. Distributions on preferred stocks generally are payable at the discretion of an issuer and after required payments to bond holders. Convertible securities are subject to the risk that the credit standing of the issuer may have an effect on the convertible securities’ investment value. Investments in REITs are subject to the risks associated with investing in the real estate industry such as adverse developments affecting the real estate industry and real property values. Depositary receipts and U.S. dollar-denominated foreign stocks traded on U.S. exchanges are subject to certain of the risks associated with investing directly in foreign securities, including, but not limited to, currency exchange rate fluctuations, political and financial instability in the home country of a particular depositary receipt, less liquidity and more volatility, less government regulation and supervision and delays in transaction settlement.
Foreign Exposure Risk
The Fund’s exposure to a foreign issuer may subject the Fund to regulatory, political, currency, security, economic and other risks associated with that country. Global economic and financial markets have become increasingly interconnected and conditions (including recent volatility, terrorism, war and political instability) and events (including natural disasters) in one country, region or financial market may adversely impact issuers in a different country, region or financial market.
Futures Contracts Risk
Futures contracts are derivative instruments where one party pays a fixed price for an agreed amount of securities or other underlying assets at an agreed date. The use of such derivative instruments may expose the Fund to additional risks that it would not be subject to if it invested directly in the securities underlying those derivatives. There may at times be an imperfect correlation between the movement in the prices of futures contracts and the value of their underlying instruments or indexes. There can be no assurance that any strategy used will succeed. There also can be no assurance that, at all times, a liquid market will exist for offsetting a futures contract that the Fund has previously bought or sold and this may result in the inability to close a futures contract when desired. Futures contracts may experience potentially dramatic price changes, which will increase the volatility of the Fund and may involve a small investment of cash (the amount of initial and variation margin) relative to the magnitude of the risk assumed (the potential increase or decrease in the price of the futures
30
American Beacon Small Cap Value FundSM
Notes to Financial Statements
October 31, 2024
contract). Futures contracts on indices expose the Fund to volatility in an underlying index. Use of derivatives is a highly specialized activity that can involve investment techniques and risks different from, and in some respects greater than, those associated with investing in more traditional investments. Derivatives can be highly complex and highly volatile and may perform in unanticipated ways.
Market Risk
The Fund is subject to the risk that the securities markets will move down, sometimes rapidly and unpredictably, based on overall economic conditions and other factors, which may negatively affect the Fund’s performance. Equity securities generally have greater price volatility than fixed-income securities, although under certain market conditions fixed-income securities may have comparable or greater price volatility. During a general downturn in the securities markets, multiple assets may decline in value simultaneously. In some cases, traditional market participants have been less willing to make a market in some types of debt instruments, which has affected the liquidity of those instruments. During times of market turmoil, investors tend to look to the safety of securities issued or backed by the U.S. Treasury, causing the prices of these securities to rise and the yields to decline. Reduced liquidity in fixed-income and credit markets may negatively affect many issuers worldwide. Prices in many financial markets have increased significantly over the last decade, but there have also been periods of adverse market and financial developments and cyclical change during that timeframe, which have resulted in unusually high levels of volatility in domestic and foreign financial markets that has caused losses for investors and may occur again in the future, particularly if markets enter a period of uncertainty or economic weakness. The value of a security may decline due to adverse issuer-specific conditions, general market conditions unrelated to a particular issuer, or factors that affect a particular industry or industries. Changes in the financial condition of a single issuer or market segment also can impact the market as a whole.
Geopolitical and other events, including war, terrorism, economic uncertainty, trade disputes, pandemics, public health crises, natural disasters and related events have led, and in the future may continue to lead, to instability in world economies and markets generally and reduced liquidity in equity, credit and fixed-income markets, which may disrupt economies and markets and adversely affect the value of your investment. Changes in value may be temporary or may last for extended periods.
Policy changes by the U.S. government and/or Federal Reserve and political events within the U.S. and abroad, including the U.S. presidential election, the U.S. government’s inability at times to agree on a long-term budget and deficit reduction plan, the threat of a federal government shutdown and threats not to increase the federal government’s debt limit, may affect investor and consumer confidence and may adversely impact financial markets and the broader economy, perhaps suddenly and to a significant degree.
Markets and market participants are increasingly reliant upon both publicly available and proprietary information data systems. Data imprecision, software or other technology malfunctions, programming inaccuracies, unauthorized use or access, and similar circumstances may impair the performance of these systems and may have an adverse impact upon a single issuer, a group of issuers, or the market at large. The financial markets generally move in cycles, with periods of rising prices followed by periods of declining prices. The value of your investment may reflect these fluctuations.
Multiple Sub-Advisor Risk
The Manager may allocate the Fund’s assets among multiple sub-advisors, each of which is responsible for investing its allocated portion of the Fund’s assets. To a significant extent, the Fund’s performance will depend on the success of the Manager in selecting and overseeing the sub-advisors and allocating the Fund’s assets to sub-advisors. The sub-advisors’ investment styles may not work together as planned, which could adversely affect the performance of the Fund. In addition, because each sub-advisor makes its trading decisions independently, the sub-advisors may purchase or sell the same security at the same time without aggregating their transactions. This may cause unnecessary brokerage and other expenses.
31
American Beacon Small Cap Value FundSM
Notes to Financial Statements
October 31, 2024
Other Investment Companies Risk
The Fund may invest in shares of other registered investment companies, including money market funds and ETFs. To the extent that the Fund invests in shares of other registered investment companies, the Fund will indirectly bear the fees and expenses, including for example, advisory and administrative fees, charged by those investment companies in addition to the Fund’s direct fees and expenses and will be subject to the risks associated with investments in those companies. To the extent the Fund invests in other investment companies that invest in equity securities, fixed-income securities and/or foreign securities, or that track an index, the Fund is subject to the risks associated with the underlying investments held by the investment company or the index fluctuations to which the investment company is subject. ETFs have expenses associated with their operation, typically including advisory fees.
Recent Market Events Risk
Both U.S. and international markets have experienced significant volatility in recent months and years. As a result of such volatility, investment returns may fluctuate significantly. Moreover, the risks discussed herein associated with an investment in the Fund may be increased.
Although interest rates were unusually low in recent years in the U.S. and abroad, in 2022, the Federal Reserve and certain foreign central banks began to raise interest rates as part of their efforts to address rising inflation. It is difficult to accurately predict the pace at which interest rates may continue to increase, the timing, frequency or magnitude of any such increases, or when such increases might stop. Additionally, various economic and political factors could cause the Federal Reserve or another foreign central bank to change their approach in the future and such actions may result in an economic slowdown in the U.S. and abroad. Unexpected increases in interest rates could lead to market volatility or reduce liquidity in certain sectors of the market. Deteriorating economic fundamentals may, in turn, increase the risk of default or insolvency of particular issuers, negatively impact market value, cause credit spreads to widen, and reduce bank balance sheets. Any of these could cause an increase in market volatility, reduce liquidity across various markets or decrease confidence in the markets. Additionally, high public debt in the U.S. and other countries creates ongoing systemic and market risks and policymaking uncertainty.
In March 2023, the shutdown of certain financial institutions in the U.S. and questions regarding the viability of other financial institutions raised economic concerns over disruption in the U.S. and global banking systems. There can be no certainty that the actions taken by the U.S. or foreign governments will be effective in mitigating the effects of financial institution failures on the economy and restoring public confidence in the U.S. and global banking systems.
Some countries, including the U.S., have in recent years adopted more protectionist trade policies. Slowing global economic growth; risks associated with a trade agreement between the United Kingdom and the European Union; the risks associated with ongoing trade negotiations with China; and the possibility of changes to some international trade agreements; political or economic dysfunction within some nations, including major producers of oil; and dramatic changes in commodity and currency prices could have adverse effects that cannot be foreseen at the present time.
Tensions, war, or open conflict between nations, such as between Russia and Ukraine, in the Middle East or in eastern Asia could affect the economies of many nations, including the United States. The duration of ongoing hostilities in the Middle East and between Russia and Ukraine, and any sanctions and related events cannot be predicted. Those events present material uncertainty and risk with respect to markets globally and the performance of the Fund and its investments or operations could be negatively impacted.
Regulators in the U.S. have proposed and recently adopted a number of changes to regulations involving the markets and issuers, some of which apply to the Fund. The full effect of various newly-adopted regulations is not currently known. Additionally, it is not clear whether the proposed regulations will be adopted. However, due to
32
American Beacon Small Cap Value FundSM
Notes to Financial Statements
October 31, 2024
the broad scope of the new and proposed regulations, certain changes could limit the Fund’s ability to pursue its investment strategies or make certain investments, or may make it more costly for the Fund to operate, which may impact performance.
Economists and others have expressed increasing concern about the potential effects of global climate change on property and security values. Certain issuers, industries and regions may be adversely affected by the impacts of climate change, including on the demand for and the development of goods and services and related production costs, and the impacts of legislation, regulation and international accords related to climate change, as well as any indirect consequences of regulation or business trends driven by climate change.
Sector Risk
Sector risk is the risk associated with the Fund holding a significant amount of investments in similar businesses, which would be similarly affected by particular economic or market events, which may, in certain circumstances, cause the value of the equity and debt securities of companies in a particular sector of the market to change. To the extent the Fund has substantial holdings within a particular sector, the risks to the Fund associated with that sector increase.
To the extent the Fund invests significantly in the financial services sector, the value of the Fund’s shares may be particularly vulnerable to factors affecting that sector, such as the availability and cost of capital funds, changes in interest rates, the rate of corporate and consumer debt defaults, extensive government regulation and price competition. The value of the Fund’s shares could experience significantly greater volatility than investment companies investing more broadly.
Securities Lending Risk
The Fund may lend its portfolio securities to brokers, dealers and financial institutions in order to obtain additional income. Borrowers of the Fund’s securities provide collateral either in the form of cash, which the Fund reinvests in securities or in the form of non-cash collateral consisting of securities issued or guaranteed by the U.S. government or one of its agencies or instrumentalities. The Fund will be responsible for the risks associated with the investment of cash collateral, including any collateral invested in an affiliated money market fund. The Fund may lose money on its investment of cash collateral or may fail to earn sufficient income on its investment to cover its payment to the borrower of a pre-negotiated fee or “rebate” for the use of that cash collateral in connection with the loan. The Fund could also lose money due to a decline in the value of non-cash collateral. In addition, delays may occur in the recovery of securities from borrowers, which could interfere with the Fund’s ability to vote proxies or to settle transactions or could result in increased costs. Moreover, if the borrower becomes subject to insolvency or similar proceedings, the Fund could incur delays in its ability to enforce its rights in its collateral. There also is a risk that a borrower may default on its obligation to return loaned securities at a time when the value of the Fund’s collateral is inadequate. Although the Fund’s securities lending agent may indemnify the Fund against that risk, it is also possible that the securities lending agent will be unable to satisfy its indemnification obligations. In any case in which the loaned securities are not returned to the Fund before an ex-dividend date, whether or not due to a default by the borrower, the payment in lieu of the dividend that the Fund receives from the securities’ borrower would not be treated as a dividend for federal income tax purposes and thus would not qualify for treatment as “qualified dividend income.”
7. Federal Income and Excise Taxes
It is the policy of the Fund to qualify as a regulated investment company (“RIC”), by complying with all applicable provisions of Subchapter M of the Internal Revenue Code, as amended, and to make distributions of taxable income sufficient to relieve it from substantially all federal income and excise taxes. For federal income tax purposes, the Fund is treated as a single entity for the purpose of determining such qualification.
The Fund does not have any unrecorded tax liabilities in the accompanying financial statements. Each of the tax years in the four year period ended October 31, 2024 remain subject to examination by the Internal Revenue Service. If applicable, the Fund recognizes interest accrued related to unrecognized tax benefits in interest expense and penalties in “Other expenses” on the Statement of Operations.
33
American Beacon Small Cap Value FundSM
Notes to Financial Statements
October 31, 2024
The Fund may be subject to taxes imposed by countries in which it invests. Such taxes are generally based on returns of income earned or gains realized or repatriated. Taxes are accrued and applied to net investment income, net realized capital gains and net unrealized appreciation (depreciation), as applicable, as the income is earned or capital gains are recorded.
Dividends are categorized in accordance with income tax regulations which may treat certain transactions differently than U.S. GAAP. Accordingly, the character of distributions and composition of net assets for tax purposes may differ from those reflected in the accompanying financial statements.
The tax character of distributions paid were as follows:
| | | | | | | | | | | | |
| | | Year Ended
October 31, 2024 | | | | | | Year Ended
October 31, 2023 | |
Distributions paid from: | | | | | | | | | | | | |
Ordinary income* | | | | | | | | | | | | |
R5 Class | | $ | 34,562,332 | | | | | | | $ | 32,743,510 | |
Y Class | | | 6,607,369 | | | | | | | | 6,211,878 | |
Investor Class | | | 3,641,167 | | | | | | | | 3,433,341 | |
Advisor Class | | | 362,561 | | | | | | | | 351,820 | |
A Class | | | 582,378 | | | | | | | | 452,172 | |
C Class | | | 48,512 | | | | | | | | 52,058 | |
R6 Class | | | 30,424,302 | | | | | | | | 23,648,255 | |
Long-term capital gains | | | | | | | | | | | | |
R5 Class | | | 67,377,411 | | | | | | | | 293,340,268 | |
Y Class | | | 13,504,916 | | | | | | | | 57,784,823 | |
Investor Class | | | 9,025,458 | | | | | | | | 39,479,938 | |
Advisor Class | | | 1,005,828 | | | | | | | | 4,605,636 | |
A Class | | | 1,496,699 | | | | | | | | 5,964,736 | |
C Class | | | 284,058 | | | | | | | | 1,371,948 | |
R6 Class | | | 58,189,893 | | | | | | | | 207,436,455 | |
| | | | | | | | | | | | |
Total distributions paid | | $ | 227,112,884 | | | | | | | $ | 676,876,838 | |
| | | | | | | | | | | | |
* For tax purposes, short-term capital gains are considered ordinary income distributions.
As of October 31, 2024, the components of distributable earnings (deficits) on a tax basis were as follows:
| | | | | | | | | | | | | | | | | | | | | | | | | | | | |
Fund | | Tax Cost | | | | | | Unrealized
Appreciation | | | | | | Unrealized
(Depreciation) | | | | | | Net Unrealized
Appreciation
(Depreciation) | |
Small Cap Value | | $ | 3,921,473,441 | | | | | | | $ | 970,020,297 | | | | | | | $ | (268,825,786) | | | | | | | $ | 701,194,511 | |
| | | | | | | | | | | | | | | | | | | | | | | | | | | | | | | | | | | | | | | | | | | | |
Fund | | Net Unrealized
Appreciation
(Depreciation) | | | | | | Undistributed
Ordinary
Income | | | | | | Undistributed
Long-Term
Capital Gains | | | | | | Accumulated
Capital and
Other (Losses) | | | | | | Other Temporary
Differences | | | | | | Distributable
Earnings | |
Small Cap Value | | $ | 701,194,511 | | | | | | | $ | 126,284,093 | | | | | | | $ | 211,264,473 | | | | | | | $ | - | | | | | | | $ | 1 | | | | | | | $ | 1,038,743,078 | |
Financial reporting records are adjusted for permanent book/tax differences to reflect tax character. Financial records are not adjusted for temporary differences. The temporary differences between financial reporting and tax-basis reporting of unrealized appreciation (depreciation) are attributable primarily to the tax deferral of losses from wash sales, the realization for tax purposes of unrealized gains from passive foreign investment companies and reclassifications of income from investments in real estate investment securities.
Due to inherent differences in the recognition of income, expenses, and realized gains (losses) under U.S. GAAP and federal income tax regulations, permanent differences between book and tax reporting have been identified and appropriately reclassified on the Statement of Assets and Liabilities.
34
American Beacon Small Cap Value FundSM
Notes to Financial Statements
October 31, 2024
Accordingly, the following amounts represent current year permanent differences derived from equalization as of October 31, 2024:
| | | | | | | | | | | | |
Fund | | Paid-In-Capital | | | | | | Distributable
Earnings/(Deficits) | |
Small Cap Value | | $ | 25,250,257 | | | | | | | $ | (25,250,257 | ) |
For federal income tax purposes, the Fund measures its capital loss carryforwards annually at October 31, its fiscal year end. Capital loss carryforwards retain their character as short-term and/or long-term and may be carried forward and applied against future realized capital gains with no expiration date.
As of October 31, 2024, the Fund did not have any capital loss carryforwards.
8. Investment Transactions
The aggregate cost of purchases and proceeds from sales and maturities of investments, other than short-term obligations, for the year ended October 31, 2024 were as follows:
| | | | | | | | | | | | |
Fund | | Purchases (non-U.S. Government
Securities) | | | | | | Sales (non-U.S. Government
Securities) | |
Small Cap Value | | $ | 2,328,170,188 | | | | | | | $ | 2,855,385,510 | |
A summary of the Fund’s transactions in the USG Select Fund for the year ended October 31, 2024 were as follows:
| | | | | | | | | | | | | | | | | | | | | | | | | | | | | | | | | | |
Fund | | Type of
Transaction | | | | | October 31,
2023
Shares/Fair
Value | | | | | | Purchases | | | | | | Sales | | | | | | October 31,
2024
Shares/Fair
Value | |
| Small Cap Value | | Direct | | | | | | $ | 204,763,294 | | | | | | | $ | 2,039,440,813 | | | | | | | $ | 2,036,121,791 | | | | | | | $ | 208,082,316 | |
| Small Cap Value | | Securities Lending | | | | | | | 23,784,921 | | | | | | | | 319,921,262 | | | | | | | | 325,737,852 | | | | | | | | 17,968,331 | |
9. Securities Lending
The Fund may lend its securities to qualified financial institutions, such as certain broker-dealers, to earn additional income. The borrowers are required to secure their loans continuously with collateral in an amount at least equal to the fair value of the securities loaned, initially in an amount at least equal to 102% of the fair value of domestic securities loaned and 105% of the fair value of international securities loaned. Collateral is monitored and marked-to-market daily. Daily mark-to-market amounts are required to be paid to the borrower or received from the borrower by the end of the following business day. This one day settlement for mark-to-market amounts may result in the collateral being temporarily less than the value of the securities on loan or temporarily more than the required minimum collateral.
To the extent that a loan is collateralized by cash, such cash collateral shall be invested by the securities lending agent (the “Agent”) in money market mutual funds and other short-term investments, provided the investments meet certain quality and diversification requirements. Securities purchased with cash collateral proceeds are listed in the Fund’s Schedule of Investments and the collateral is shown on the Statement of Assets and Liabilities as a payable.
Securities lending income is generated from the demand premium (if any) paid by the borrower to borrow a specific security and from the return on investment of cash collateral, reduced by negotiated rebate fees paid to the borrower and transaction costs. To the extent that a loan is secured by non-cash collateral, securities lending income is generated as a demand premium reduced by transaction costs. The Fund, the Agent, and the Manager retained 80%, 10%, and 10%, respectively, of the income generated from securities lending.
35
American Beacon Small Cap Value FundSM
Notes to Financial Statements
October 31, 2024
While securities are on loan, the Fund continues to receive certain income associated with that security and any gain or loss in the market price that may occur during the term of the loan. In the case of domestic equities, the value of any dividend is received in the form of a substitute payment approximately equal to the dividend. In the case of foreign securities, a negotiated amount is received that is less than the actual dividend, but higher than the dividend amount minus the foreign tax that the Fund would be subject to on the dividend.
Securities lending transactions pose certain risks to the Fund, including that the borrower may not provide additional collateral when required or return the securities when due, that the value of the short-term investments will be less than the amount of cash collateral required to be returned to the borrower, that non-cash collateral may be subject to legal constraints in the event of a borrower bankruptcy, and that the cash collateral investments could become illiquid and unable to be used to return collateral to the borrower. The Fund could also experience delays and costs in gaining access to the collateral. The Fund bears the risk of any deficiency in the amount of the cash collateral available for return to the borrower and any action which impairs its ability to liquidate non-cash collateral to satisfy a borrower default.
As of October 31, 2024, the value of outstanding securities on loan and the value of collateral were as follows:
| | | | | | | | | | | | | | | | | | | | | | | | | | | | |
Fund | | Fair Value of
Securities on
Loan | | | | | | Cash
Collateral
Received | | | | | | Non-Cash
Collateral
Received | | | | | | Total
Collateral
Received | |
| Small Cap Value | | $ | 131,711,387 | | | | | | | $ | 17,968,331 | | | | | | | $ | 119,447,029 | | | | | | | $ | 137,415,360 | |
Cash collateral is listed on the Fund’s Schedule of Investments and is shown on the Statement of Assets and Liabilities. Income earned on these investments is included in “Income derived from securities lending” on the Statement of Operations.
Non-cash collateral received by the Fund may not be sold or re-pledged except to satisfy a borrower default. Therefore, non-cash collateral is not included on the Fund’s Schedule of Investments or Statement of Assets and Liabilities.
10. Borrowing Arrangements
Effective November 8, 2024 (the “Effective Date”), the Fund, along with certain other funds managed by the Manager (“Participating Funds”), renewed a committed revolving line of credit (the “Committed Line”) agreement with State Street Bank and Trust Company (the “Bank”) to be used to facilitate portfolio liquidity. The maximum borrowing amount under the Committed Line is $100 million with interest at a rate equal to the higher of (a) Overnight Bank Funding Rate (“OBFR”) daily fluctuating rate per annum equal to 1.25% plus the sum of 0.10% or (b) the Federal Funds daily fluctuating rate per annum on amounts borrowed. Each of the Participating Funds paid a proportional amount of a quarterly commitment fee at a rate of 0.25% per annum on the unused portion of the Committed Line amount. The Committed Line expires November 7, 2025, unless extended by the Bank or terminated by the Participating Funds in accordance with the agreement. Prior to the Effective Date, the maximum borrowing amount under the Committed Line was $100 million with an expiration date November 7, 2024.
On the Effective Date, the Fund, along with certain other Participating Funds managed by the Manager, also renewed an uncommitted discretionary demand revolving line of credit (the “Uncommitted Line”) agreement with the Bank to be used to facilitate portfolio liquidity. The maximum borrowing amount under the Uncommitted Line is $100 million with interest at a rate equal to the higher of (a) OBFR daily fluctuating rate per annum equal to 1.25% plus the sum of 0.10% or (b) the Federal Funds daily fluctuating rate per annum on amounts borrowed on each outstanding loan. Each of the Participating Funds paid a proportional amount of a closing fee of $35,000 on the Effective Date. The Uncommitted Line expires November 7, 2025, unless extended by the Bank or terminated by the Participating Funds in accordance with the agreement. Prior to the Effective Date, the maximum borrowing amount under the Uncommitted Line was $100 million with an expiration date November 7, 2024.
The Participating Funds paid administration, legal and arrangement fees, which are recognized as a component of “Line of credit interest expense” on the Statement of Operations, along with commitment fees, that have been allocated among the Participating Funds based on average daily net assets.
36
American Beacon Small Cap Value FundSM
Notes to Financial Statements
October 31, 2024
During the year ended October 31, 2024, the Fund did not utilize these facilities.
11. Capital Share Transactions
The tables below summarize the activity in capital shares for each Class of the Fund:
| | | | | | | | | | | | | | | | | | | | | | | | | | | | |
| | | R5 Class | |
| | | Year Ended October 31, | |
| | | 2024 | | | | | | 2023 | |
Small Cap Value Fund | | Shares | | | | | | Amount | | | | | | Shares | | | | | | Amount | |
| Shares sold | | | 9,558,671 | | | | | | | $ | 239,579,287 | | | | | | | | 16,023,370 | | | | | | | $ | 382,297,679 | |
| Reinvestment of dividends | | | 3,852,667 | | | | | | | | 95,546,135 | | | | | | | | 13,677,213 | | | | | | | | 303,497,363 | |
| Shares redeemed | | | (26,350,141 | ) | | | | | | | (662,120,181 | ) | | | | | | | (28,074,996 | ) | | | | | | | (665,420,420 | ) |
| | | | | | | | | | | | | | | | | | | | | | | | | | | | |
| Net increase (decrease) in shares outstanding | | | (12,938,803 | ) | | | | | | $ | (326,994,759 | ) | | | | | | | 1,625,587 | | | | | | | $ | 20,374,622 | |
| | | | | | | | | | | | | | | | | | | | | | | | | | | | |
| | | | |
| | | Y Class | |
| | | Year Ended October 31, | |
| | | 2024 | | | | | | 2023 | |
Small Cap Value Fund | | Shares | | | | | | Amount | | | | | | Shares | | | | | | Amount | |
| Shares sold | | | 3,735,423 | | | | | | | $ | 90,279,428 | | | | | | | | 4,130,995 | | | | | | | $ | 96,442,821 | |
| Reinvestment of dividends | | | 795,992 | | | | | | | | 19,302,824 | | | | | | | | 2,834,617 | | | | | | | | 61,567,884 | |
| Shares redeemed | | | (4,975,282 | ) | | | | | | | (121,704,460 | ) | | | | | | | (6,565,174 | ) | | | | | | | (150,252,529 | ) |
| | | | | | | | | | | | | | | | | | | | | | | | | | | | |
| Net increase (decrease) in shares outstanding | | | (443,867 | ) | | | | | | $ | (12,122,208 | ) | | | | | | | 400,438 | | | | | | | $ | 7,758,176 | |
| | | | | | | | | | | | | | | | | | | | | | | | | | | | |
| | | | |
| | | Investor Class | |
| | | Year Ended October 31, | |
| | | 2024 | | | | | | 2023 | |
Small Cap Value Fund | | Shares | | | | | | Amount | | | | | | Shares | | | | | | Amount | |
| Shares sold | | | 1,762,779 | | | | | | | $ | 41,610,571 | | | | | | | | 2,539,215 | | | | | | | $ | 56,904,858 | |
| Reinvestment of dividends | | | 523,771 | | | | | | | | 12,240,547 | | | | | | | | 1,985,940 | | | | | | | | 41,625,307 | |
| Shares redeemed | | | (4,486,429 | ) | | | | | | | (104,718,516 | ) | | | | | | | (3,423,498 | ) | | | | | | | (76,432,322 | ) |
| | | | | | | | | | | | | | | | | | | | | | | | | | | | |
| Net increase (decrease) in shares outstanding | | | (2,199,879 | ) | | | | | | $ | (50,867,398 | ) | | | | | | | 1,101,657 | | | | | | | $ | 22,097,843 | |
| | | | | | | | | | | | | | | | | | | | | | | | | | | | |
| | | | |
| | | Advisor Class | |
| | | Year Ended October 31, | |
| | | 2024 | | | | | | 2023 | |
Small Cap Value Fund | | Shares | | | | | | Amount | | | | | | Shares | | | | | | Amount | |
| Shares sold | | | 202,945 | | | | | | | $ | 4,725,246 | | | | | | | | 431,436 | | | | | | | $ | 9,772,480 | |
| Reinvestment of dividends | | | 59,573 | | | | | | | | 1,368,388 | | | | | | | | 240,420 | | | | | | | | 4,957,456 | |
| Shares redeemed | | | (663,417 | ) | | | | | | | (15,195,329 | ) | | | | | | | (705,870 | ) | | | | | | | (15,796,260 | ) |
| | | | | | | | | | | | | | | | | | | | | | | | | | | | |
| Net (decrease) in shares outstanding | | | (400,899 | ) | | | | | | $ | (9,101,695 | ) | | | | | | | (34,014 | ) | | | | | | $ | (1,066,324 | ) |
| | | | | | | | | | | | | | | | | | | | | | | | | | | | |
| | | | |
| | | A Class | |
| | | Year Ended October 31, | |
| | | 2024 | | | | | | 2023 | |
Small Cap Value Fund | | Shares | | | | | | Amount | | | | | | Shares | | | | | | Amount | |
| Shares sold | | | 710,431 | | | | | | | $ | 16,121,464 | | | | | | | | 574,753 | | | | | | | $ | 12,701,046 | |
| Reinvestment of dividends | | | 90,779 | | | | | | | | 2,058,860 | | | | | | | | 311,738 | | | | | | | | 6,353,229 | |
| Shares redeemed | | | (559,906 | ) | | | | | | | (12,864,414 | ) | | | | | | | (963,167 | ) | | | | | | | (21,926,330 | ) |
| | | | | | | | | | | | | | | | | | | | | | | | | | | | |
| Net increase (decrease) in shares outstanding | | | 241,304 | | | | | | | $ | 5,315,910 | | | | | | | | (76,676 | ) | | | | | | $ | (2,872,055 | ) |
| | | | | | | | | | | | | | | | | | | | | | | | | | | | |
| | | | |
| | | C Class | |
| | | Year Ended October 31, | |
| | | 2024 | | | | | | 2023 | |
Small Cap Value Fund | | Shares | | | | | | Amount | | | | | | Shares | | | | | | Amount | |
| Shares sold | | | 46,412 | | | | | | | $ | 982,693 | | | | | | | | 55,288 | | | | | | | $ | 1,159,689 | |
| Reinvestment of dividends | | | 15,624 | | | | | | | | 328,099 | | | | | | | | 74,042 | | | | | | | | 1,401,614 | |
| Shares redeemed | | | (168,635 | ) | | | | | | | (3,566,437 | ) | | | | | | | (136,832 | ) | | | | | | | (2,733,032 | ) |
| | | | | | | | | | | | | | | | | | | | | | | | | | | | |
| Net (decrease) in shares outstanding | | | (106,599 | ) | | | | | | $ | (2,255,645 | ) | | | | | | | (7,502 | ) | | | | | | $ | (171,729 | ) |
| | | | | | | | | | | | | | | | | | | | | | | | | | | | |
37
American Beacon Small Cap Value FundSM
Notes to Financial Statements
October 31, 2024
| | | | | | | | | | | | | | | | | | | | | | | | | | | | |
| | | | |
| | | R6 Class | |
| | | Year Ended October 31, | |
| | | 2024 | | | | | | 2023 | |
Small Cap Value Fund | | Shares | | | | | | Amount | | | | | | Shares | | | | | | Amount | |
| Shares sold | | | 17,294,968 | | | | | | | $ | 435,054,280 | | | | | | | | 28,669,350 | | | | | | | $ | 681,681,472 | |
| Reinvestment of dividends | | | 3,373,782 | | | | | | | | 83,636,053 | | | | | | | | 9,907,253 | | | | | | | | 219,742,881 | |
| Shares redeemed | | | (20,510,694 | ) | | | | | | | (514,133,955 | ) | | | | | | | (22,261,110 | ) | | | | | | | (516,295,668 | ) |
| | | | | | | | | | | | | | | | | | | | | | | | | | | | |
| Net increase in shares outstanding | | | 158,056 | | | | | | | $ | 4,556,378 | | | | | | | | 16,315,493 | | | | | | | $ | 385,128,685 | |
| | | | | | | | | | | | | | | | | | | | | | | | | | | | |
12. Subsequent Events
Management has evaluated subsequent events for possible recognition or disclosure in the financial statements through the date the financial statements are issued. Management has determined that there are no material events that would require disclosure in the Fund’s financial statements through this date.
38
American Beacon Small Cap Value FundSM
Financial Highlights
(For a share outstanding throughout the period)
| | | | | | | | | | | | | | | | | | | | | | | | | | | | | | | | | | | | |
| | | R5 ClassA | |
| | | Year Ended October 31, | |
| | | 2024 | | | | | | 2023 | | | | | | 2022B | | | | | | 2021 | | | | | | 2020 | |
| | | | |
Net asset value, beginning of period | | $ | 21.84 | | | | | | | $ | 26.85 | | | | | | | $ | 31.19 | | | | | | | $ | 19.76 | | | | | | | $ | 23.13 | |
| | | | | | | | | | | | | | | | | | | | | | | | | | | | | | | | | | | | |
Income (loss) from investment operations: | | | | | | | | | | | | | | | | | | | | | | | | | | | | | | | | | | | | |
Net investment income | | | 0.35 | | | | | | | | 0.31 | | | | | | | | 0.31 | | | | | | | | 0.25 | | | | | | | | 0.26 | |
Net gains (losses) on investments (both realized and unrealized) | | | 5.69 | | | | | | | | (1.35 | ) | | | | | | | (1.25 | ) | | | | | | | 11.40 | | | | | | | | (3.18 | ) |
| | | | | | | | | | | | | | | | | | | | | | | | | | | | | | | | | | | | |
Total income (loss) from investment operations | | | 6.04 | | | | | | | | (1.04 | ) | | | | | | | (0.94 | ) | | | | | | | 11.65 | | | | | | | | (2.92 | ) |
| | | | | | | | | | | | | | | | | | | | | | | | | | | | | | | | | | | | |
Less distributions: | | | | | | | | | | | | | | | | | | | | | | | | | | | | | | | | | | | | |
Dividends from net investment income | | | (0.38 | ) | | | | | | | (0.40 | ) | | | | | | | (0.24 | ) | | | | | | | (0.22 | ) | | | | | | | (0.29 | ) |
Distributions from net realized gains | | | (0.85 | ) | | | | | | | (3.57 | ) | | | | | | | (3.16 | ) | | | | | | | - | | | | | | | | (0.16 | ) |
| | | | | | | | | | | | | | | | | | | | | | | | | | | | | | | | | | | | |
Total distributions | | | (1.23 | ) | | | | | | | (3.97 | ) | | | | | | | (3.40 | ) | | | | | | | (0.22 | ) | | | | | | | (0.45 | ) |
| | | | | | | | | | | | | | | | | | | | | | | | | | | | | | | | | | | | |
Net asset value, end of period | | $ | 26.65 | | | | | | | $ | 21.84 | | | | | | | $ | 26.85 | | | | | | | $ | 31.19 | | | | | | | $ | 19.76 | |
| | | | | | | | | | | | | | | | | | | | | | | | | | | | | | | | | | | | |
Total returnC | | | 28.05 | % | | | | | | | (4.09 | )% | | | | | | | (3.49 | )% | | | | | | | 59.26 | % | | | | | | | (13.00 | )% |
| | | | | | | | | | | | | | | | | | | | | | | | | | | | | | | | | | | | |
| | | | | | | | | |
Ratios and supplemental data: | | | | | | | | | | | | | | | | | | | | | | | | | | | | | | | | | | | | |
Net assets, end of period | | $ | 1,914,739,045 | | | | | | | $ | 1,851,818,875 | | | | | | | $ | 2,233,390,067 | | | | | | | $ | 3,380,005,813 | | | | | | | $ | 2,799,722,660 | |
Ratios to average net assets: | | | | | | | | | | | | | | | | | | | | | | | | | | | | | | | | | | | | |
Expenses, before reimbursements and/or recoupments | | | 0.79 | % | | | | | | | 0.79 | % | | | | | | | 0.79 | % | | | | | | | 0.81 | % | | | | | | | 0.82 | % |
Expenses, net of reimbursements and/or recoupments | | | 0.79 | % | | | | | | | 0.79 | % | | | | | | | 0.79 | % | | | | | | | 0.81 | % | | | | | | | 0.82 | % |
Net investment income, before expense reimbursements and/or recoupments | | | 1.26 | % | | | | | | | 1.23 | % | | | | | | | 0.84 | % | | | | | | | 0.65 | % | | | | | | | 1.04 | % |
Net investment income, net of reimbursements and/or recoupments | | | 1.26 | % | | | | | | | 1.23 | % | | | | | | | 0.84 | % | | | | | | | 0.65 | % | | | | | | | 1.04 | % |
Portfolio turnover rate | | | 52 | % | | | | | | | 52 | % | | | | | | | 72 | % | | | | | | | 48 | % | | | | | | | 61 | % |
| A | Prior to February 28, 2020, the R5 Class was known as Institutional Class. |
| B | On February 8. 2022, Foundry Partners, LLC and Hillcrest Asset Management, LLC, were terminated and ceased managing assets of the Fund. On March 10, 2022, DePrince, Race & Zollo, Inc., began managing assets of the Fund. |
| C | Based on net asset value, which does not reflect the sales charge, redemption fee, or contingent deferred sales charge, if applicable. May include adjustments in accordance with U.S. GAAP and as such, the net asset value for reporting purposes and the returns based upon those net asset values may differ from the net asset value and returns for shareholder transactions. |
See accompanying notes
39
American Beacon Small Cap Value FundSM
Financial Highlights
(For a share outstanding throughout the period)
| | | | | | | | | | | | | | | | | | | | | | | | | | | | | | | | | | | | |
| | | Y Class | |
| | | Year Ended October 31, | |
| | | 2024 | | | | | | 2023 | | | | | | 2022A | | | | | | 2021 | | | | | | 2020 | |
| | | | |
Net asset value, beginning of period | | $ | 21.36 | | | | | | | $ | 26.36 | | | | | | | $ | 30.68 | | | | | | | $ | 19.44 | | | | | | | $ | 22.76 | |
| | | | | | | | | | | | | | | | | | | | | | | | | | | | | | | | | | | | |
Income (loss) from investment operations: | | | | | | | | | | | | | | | | | | | | | | | | | | | | | | | | | | | | |
Net investment income | | | 0.29 | | | | | | | | 0.30 | | | | | | | | 0.22 | | | | | | | | 0.16 | | | | | | | | 0.22 | |
Net gains (losses) on investments (both realized and unrealized) | | | 5.60 | | | | | | | | (1.34 | ) | | | | | | | (1.16 | ) | | | | | | | 11.28 | | | | | | | | (3.11 | ) |
| | | | | | | | | | | | | | | | | | | | | | | | | | | | | | | | | | | | |
Total income (loss) from investment operations | | | 5.89 | | | | | | | | (1.04 | ) | | | | | | | (0.94 | ) | | | | | | | 11.44 | | | | | | | | (2.89 | ) |
| | | | | | | | | | | | | | | | | | | | | | | | | | | | | | | | | | | | |
Less distributions: | | | | | | | | | | | | | | | | | | | | | | | | | | | | | | | | | | | | |
Dividends from net investment income | | | (0.36 | ) | | | | | | | (0.39 | ) | | | | | | | (0.22 | ) | | | | | | | (0.20 | ) | | | | | | | (0.27 | ) |
Distributions from net realized gains | | | (0.85 | ) | | | | | | | (3.57 | ) | | | | | | | (3.16 | ) | | | | | | | - | | | | | | | | (0.16 | ) |
| | | | | | | | | | | | | | | | | | | | | | | | | | | | | | | | | | | | |
Total distributions | | | (1.21 | ) | | | | | | | (3.96 | ) | | | | | | | (3.38 | ) | | | | | | | (0.20 | ) | | | | | | | (0.43 | ) |
| | | | | | | | | | | | | | | | | | | | | | | | | | | | | | | | | | | | |
Net asset value, end of period | | $ | 26.04 | | | | | | | $ | 21.36 | | | | | | | $ | 26.36 | | | | | | | $ | 30.68 | | | | | | | $ | 19.44 | |
| | | | | | | | | | | | | | | | | | | | | | | | | | | | | | | | | | | | |
Total returnB | | | 27.97 | % | | | | | | | (4.19 | )% | | | | | | | (3.55 | )% | | | | | | | 59.15 | % | | | | | | | (13.06 | )% |
| | | | | | | | | | | | | | | | | | | | | | | | | | | | | | | | | | | | |
| | | | | | | | | |
Ratios and supplemental data: | | | | | | | | | | | | | | | | | | | | | | | | | | | | | | | | | | | | |
Net assets, end of period | | $ | 421,344,447 | | | | | | | $ | 355,150,002 | | | | | | | $ | 427,638,978 | | | | | | | $ | 255,837,301 | | | | | | | $ | 170,726,299 | |
Ratios to average net assets: | | | | | | | | | | | | | | | | | | | | | | | | | | | | | | | | | | | | |
Expenses, before reimbursements and/or recoupments | | | 0.86 | % | | | | | | | 0.86 | % | | | | | | | 0.86 | % | | | | | | | 0.89 | % | | | | | | | 0.89 | % |
Expenses, net of reimbursements and/or recoupments | | | 0.86 | % | | | | | | | 0.86 | % | | | | | | | 0.86 | % | | | | | | | 0.89 | % | | | | | | | 0.89 | % |
Net investment income, before expense reimbursements and/or recoupments | | | 1.18 | % | | | | | | | 1.15 | % | | | | | | | 0.79 | % | | | | | | | 0.56 | % | | | | | | | 0.96 | % |
Net investment income, net of reimbursements and/or recoupments | | | 1.18 | % | | | | | | | 1.15 | % | | | | | | | 0.79 | % | | | | | | | 0.56 | % | | | | | | | 0.96 | % |
Portfolio turnover rate | | | 52 | % | | | | | | | 52 | % | | | | | | | 72 | % | | | | | | | 48 | % | | | | | | | 61 | % |
| A | On February 8. 2022, Foundry Partners, LLC and Hillcrest Asset Management, LLC, were terminated and ceased managing assets of the Fund. On March 10, 2022, DePrince, Race & Zollo, Inc., began managing assets of the Fund. |
| B | Based on net asset value, which does not reflect the sales charge, redemption fee, or contingent deferred sales charge, if applicable. May include adjustments in accordance with U.S. GAAP and as such, the net asset value for reporting purposes and the returns based upon those net asset values may differ from the net asset value and returns for shareholder transactions. |
See accompanying notes
40
American Beacon Small Cap Value FundSM
Financial Highlights
(For a share outstanding throughout the period)
| | | | | | | | | | | | | | | | | | | | | | | | | | | | | | | | | | | | |
| | | Investor Class | |
| | | Year Ended October 31, | |
| | | 2024 | | | | | | 2023 | | | | | | 2022A | | | | | | 2021 | | | | | | 2020 | |
| | | | |
Net asset value, beginning of period | | $ | 20.57 | | | | | | | $ | 25.51 | | | | | | | $ | 29.78 | | | | | | | $ | 18.88 | | | | | | | $ | 22.12 | |
| | | | | | | | | | | | | | | | | | | | | | | | | | | | | | | | | | | | |
Income (loss) from investment operations: | | | | | | | | | | | | | | | | | | | | | | | | | | | | | | | | | | | | |
Net investment income | | | 0.30 | | | | | | | | 0.18 | | | | | | | | 0.19 | | | | | | | | 0.20 | | | | | | | | 0.21 | |
Net gains (losses) on investments (both realized and unrealized) | | | 5.30 | | | | | | | | (1.24 | ) | | | | | | | (1.17 | ) | | | | | | | 10.85 | | | | | | | | (3.08 | ) |
| | | | | | | | | | | | | | | | | | | | | | | | | | | | | | | | | | | | |
Total income (loss) from investment operations | | | 5.60 | | | | | | | | (1.06 | ) | | | | | | | (0.98 | ) | | | | | | | 11.05 | | | | | | | | (2.87 | ) |
| | | | | | | | | | | | | | | | | | | | | | | | | | | | | | | | | | | | |
Less distributions: | | | | | | | | | | | | | | | | | | | | | | | | | | | | | | | | | | | | |
Dividends from net investment income | | | (0.29 | ) | | | | | | | (0.31 | ) | | | | | | | (0.13 | ) | | | | | | | (0.15 | ) | | | | | | | (0.21 | ) |
Distributions from net realized gains | | | (0.85 | ) | | | | | | | (3.57 | ) | | | | | | | (3.16 | ) | | | | | | | - | | | | | | | | (0.16 | ) |
| | | | | | | | | | | | | | | | | | | | | | | | | | | | | | | | | | | | |
Total distributions | | | (1.14 | ) | | | | | | | (3.88 | ) | | | | | | | (3.29 | ) | | | | | | | (0.15 | ) | | | | | | | (0.37 | ) |
| | | | | | | | | | | | | | | | | | | | | | | | | | | | | | | | | | | | |
Net asset value, end of period | | $ | 25.03 | | | | | | | $ | 20.57 | | | | | | | $ | 25.51 | | | | | | | $ | 29.78 | | | | | | | $ | 18.88 | |
| | | | | | | | | | | | | | | | | | | | | | | | | | | | | | | | | | | | |
Total returnB | | | 27.60 | % | | | | | | | (4.41 | )% | | | | | | | (3.81 | )% | | | | | | | 58.74 | % | | | | | | | (13.30 | )% |
| | | | | | | | | | | | | | | | | | | | | | | | | | | | | | | | | | | | |
| | | | | | | | | |
Ratios and supplemental data: | | | | | | | | | | | | | | | | | | | | | | | | | | | | | | | | | | | | |
Net assets, end of period | | $ | 251,989,854 | | | | | | | $ | 252,350,988 | | | | | | | $ | 284,880,016 | | | | | | | $ | 367,726,622 | | | | | | | $ | 302,626,954 | |
Ratios to average net assets: | | | | | | | | | | | | | | | | | | | | | | | | | | | | | | | | | | | | |
Expenses, before reimbursements and/or recoupments | | | 1.14 | % | | | | | | | 1.13 | % | | | | | | | 1.12 | % | | | | | | | 1.15 | % | | | | | | | 1.15 | % |
Expenses, net of reimbursements and/or recoupments | | | 1.14 | % | | | | | | | 1.13 | % | | | | | | | 1.12 | % | | | | | | | 1.15 | % | | | | | | | 1.15 | % |
Net investment income, before expense reimbursements and/or recoupments | | | 0.90 | % | | | | | | | 0.89 | % | | | | | | | 0.50 | % | | | | | | | 0.32 | % | | | | | | | 0.70 | % |
Net investment income, net of reimbursements and/or recoupments | | | 0.90 | % | | | | | | | 0.89 | % | | | | | | | 0.50 | % | | | | | | | 0.32 | % | | | | | | | 0.70 | % |
Portfolio turnover rate | | | 52 | % | | | | | | | 52 | % | | | | | | | 72 | % | | | | | | | 48 | % | | | | | | | 61 | % |
| A | On February 8. 2022, Foundry Partners, LLC and Hillcrest Asset Management, LLC, were terminated and ceased managing assets of the Fund. On March 10, 2022, DePrince, Race & Zollo, Inc., began managing assets of the Fund. |
| B | Based on net asset value, which does not reflect the sales charge, redemption fee, or contingent deferred sales charge, if applicable. May include adjustments in accordance with U.S. GAAP and as such, the net asset value for reporting purposes and the returns based upon those net asset values may differ from the net asset value and returns for shareholder transactions. |
See accompanying notes
41
American Beacon Small Cap Value FundSM
Financial Highlights
(For a share outstanding throughout the period)
| | | | | | | | | | | | | | | | | | | | | | | | | | | | | | | | | | | | |
| | | Advisor Class | |
| | | Year Ended October 31, | |
| | | 2024 | | | | | | 2023 | | | | | | 2022A | | | | | | 2021 | | | | | | 2020 | |
| | | | |
Net asset value, beginning of period | | $ | 20.21 | | | | | | | $ | 25.13 | | | | | | | $ | 29.34 | | | | | | | $ | 18.60 | | | | | | | $ | 21.79 | |
| | | | | | | | | | | | | | | | | | | | | | | | | | | | | | | | | | | | |
Income (loss) from investment operations: | | | | | | | | | | | | | | | | | | | | | | | | | | | | | | | | | | | | |
Net investment income | | | 0.17 | | | | | | | | 0.18 | | | | | | | | 0.06 | | | | | | | | 0.17 | | | | | | | | 0.15 | |
Net gains (losses) on investments (both realized and unrealized) | | | 5.29 | | | | | | | | (1.25 | ) | | | | | | | (1.07 | ) | | | | | | | 10.69 | | | | | | | | (3.01 | ) |
| | | | | | | | | | | | | | | | | | | | | | | | | | | | | | | | | | | | |
Total income (loss) from investment operations | | | 5.46 | | | | | | | | (1.07 | ) | | | | | | | (1.01 | ) | | | | | | | 10.86 | | | | | | | | (2.86 | ) |
| | | | | | | | | | | | | | | | | | | | | | | | | | | | | | | | | | | | |
Less distributions: | | | | | | | | | | | | | | | | | | | | | | | | | | | | | | | | | | | | |
Dividends from net investment income | | | (0.25 | ) | | | | | | | (0.28 | ) | | | | | | | (0.04 | ) | | | | | | | (0.12 | ) | | | | | | | (0.17 | ) |
Distributions from net realized gains | | | (0.85 | ) | | | | | | | (3.57 | ) | | | | | | | (3.16 | ) | | | | | | | - | | | | | | | | (0.16 | ) |
| | | | | | | | | | | | | | | | | | | | | | | | | | | | | | | | | | | | |
Total distributions | | | (1.10 | ) | | | | | | | (3.85 | ) | | | | | | | (3.20 | ) | | | | | | | (0.12 | ) | | | | | | | (0.33 | ) |
| | | | | | | | | | | | | | | | | | | | | | | | | | | | | | | | | | | | |
Net asset value, end of period | | $ | 24.57 | | | | | | | $ | 20.21 | | | | | | | $ | 25.13 | | | | | | | $ | 29.34 | | | | | | | $ | 18.60 | |
| | | | | | | | | | | | | | | | | | | | | | | | | | | | | | | | | | | | |
Total returnB | | | 27.40 | % | | | | | | | (4.57 | )% | | | | | | | (3.96 | )% | | | | | | | 58.56 | % | | | | | | | (13.40 | )% |
| | | | | | | | | | | | | | | | | | | | | | | | | | | | | | | | | | | | |
| | | | | | | | | |
Ratios and supplemental data: | | | | | | | | | | | | | | | | | | | | | | | | | | | | | | | | | | | | |
Net assets, end of period | | $ | 21,248,218 | | | | | | | $ | 25,580,739 | | | | | | | $ | 32,662,818 | | | | | | | $ | 32,801,309 | | | | | | | $ | 42,987,242 | |
Ratios to average net assets: | | | | | | | | | | | | | | | | | | | | | | | | | | | | | | | | | | | | |
Expenses, before reimbursements and/or recoupments | | | 1.29 | % | | | | | | | 1.28 | % | | | | | | | 1.28 | % | | | | | | | 1.29 | % | | | | | | | 1.25 | % |
Expenses, net of reimbursements and/or recoupments | | | 1.29 | % | | | | | | | 1.28 | % | | | | | | | 1.28 | % | | | | | | | 1.29 | % | | | | | | | 1.25 | % |
Net investment income, before expense reimbursements and/or recoupments | | | 0.77 | % | | | | | | | 0.75 | % | | | | | | | 0.36 | % | | | | | | | 0.20 | % | | | | | | | 0.60 | % |
Net investment income, net of reimbursements and/or recoupments | | | 0.77 | % | | | | | | | 0.75 | % | | | | | | | 0.36 | % | | | | | | | 0.20 | % | | | | | | | 0.60 | % |
Portfolio turnover rate | | | 52 | % | | | | | | | 52 | % | | | | | | | 72 | % | | | | | | | 48 | % | | | | | | | 61 | % |
| A | On February 8. 2022, Foundry Partners, LLC and Hillcrest Asset Management, LLC, were terminated and ceased managing assets of the Fund. On March 10, 2022, DePrince, Race & Zollo, Inc., began managing assets of the Fund. |
| B | Based on net asset value, which does not reflect the sales charge, redemption fee, or contingent deferred sales charge, if applicable. May include adjustments in accordance with U.S. GAAP and as such, the net asset value for reporting purposes and the returns based upon those net asset values may differ from the net asset value and returns for shareholder transactions. |
See accompanying notes
42
American Beacon Small Cap Value FundSM
Financial Highlights
(For a share outstanding throughout the period)
| | | | | | | | | | | | | | | | | | | | | | | | | | | | | | | | | | | | |
| | | A Class | |
| | | Year Ended October 31, | |
| | | 2024 | | | | | | 2023 | | | | | | 2022A | | | | | | 2021 | | | | | | 2020 | |
| | | | |
Net asset value, beginning of period | | $ | 19.98 | | | | | | | $ | 24.87 | | | | | | | $ | 29.12 | | | | | | | $ | 18.47 | | | | | | | $ | 21.64 | |
| | | | | | | | | | | | | | | | | | | | | | | | | | | | | | | | | | | | |
Income (loss) from investment operations: | | | | | | | | | | | | | | | | | | | | | | | | | | | | | | | | | | | | |
Net investment income | | | 0.23 | | | | | | | | 0.21 | | | | | | | | 0.10 | | | | | | | | 0.06 | | | | | | | | 0.12 | |
Net gains (losses) on investments (both realized and unrealized) | | | 5.19 | | | | | | | | (1.26 | ) | | | | | | | (1.07 | ) | | | | | | | 10.72 | | | | | | | | (2.95 | ) |
| | | | | | | | | | | | | | | | | | | | | | | | | | | | | | | | | | | | |
Total income (loss) from investment operations | | | 5.42 | | | | | | | | (1.05 | ) | | | | | | | (0.97 | ) | | | | | | | 10.78 | | | | | | | | (2.83 | ) |
| | | | | | | | | | | | | | | | | | | | | | | | | | | | | | | | | | | | |
Less distributions: | | | | | | | | | | | | | | | | | | | | | | | | | | | | | | | | | | | | |
Dividends from net investment income | | | (0.28 | ) | | | | | | | (0.27 | ) | | | | | | | (0.12 | ) | | | | | | | (0.13 | ) | | | | | | | (0.18 | ) |
Distributions from net realized gains | | | (0.85 | ) | | | | | | | (3.57 | ) | | | | | | | (3.16 | ) | | | | | | | - | | | | | | | | (0.16 | ) |
| | | | | | | | | | | | | | | | | | | | | | | | | | | | | | | | | | | | |
Total distributions | | | (1.13 | ) | | | | | | | (3.84 | ) | | | | | | | (3.28 | ) | | | | | | | (0.13 | ) | | | | | | | (0.34 | ) |
| | | | | | | | | | | | | | | | | | | | | | | | | | | | | | | | | | | | |
Net asset value, end of period | | $ | 24.27 | | | | | | | $ | 19.98 | | | | | | | $ | 24.87 | | | | | | | $ | 29.12 | | | | | | | $ | 18.47 | |
| | | | | | | | | | | | | | | | | | | | | | | | | | | | | | | | | | | | |
Total returnB | | | 27.50 | % | | | | | | | (4.50 | )% | | | | | | | (3.88 | )% | | | | | | | 58.57 | % | | | | | | | (13.38 | )% |
| | | | | | | | | | | | | | | | | | | | | | | | | | | | | | | | | | | | |
| | | | | | | | | |
Ratios and supplemental data: | | | | | | | | | | | | | | | | | | | | | | | | | | | | | | | | | | | | |
Net assets, end of period | | $ | 51,343,675 | | | | | | | $ | 37,440,788 | | | | | | | $ | 48,515,547 | | | | | | | $ | 63,024,594 | | | | | | | $ | 46,067,043 | |
Ratios to average net assets: | | | | | | | | | | | | | | | | | | | | | | | | | | | | | | | | | | | | |
Expenses, before reimbursements and/or recoupments | | | 1.21 | % | | | | | | | 1.21 | % | | | | | | | 1.21 | % | | | | | | | 1.24 | % | | | | | | | 1.26 | % |
Expenses, net of reimbursements and/or recoupments | | | 1.21 | % | | | | | | | 1.21 | % | | | | | | | 1.21 | % | | | | | | | 1.24 | % | | | | | | | 1.26 | % |
Net investment income, before expense reimbursements and/or recoupments | | | 0.82 | % | | | | | | | 0.81 | % | | | | | | | 0.42 | % | | | | | | | 0.21 | % | | | | | | | 0.59 | % |
Net investment income, net of reimbursements and/or recoupments | | | 0.82 | % | | | | | | | 0.81 | % | | | | | | | 0.42 | % | | | | | | | 0.21 | % | | | | | | | 0.59 | % |
Portfolio turnover rate | | | 52 | % | | | | | | | 52 | % | | | | | | | 72 | % | | | | | | | 48 | % | | | | | | | 61 | % |
| A | On February 8. 2022, Foundry Partners, LLC and Hillcrest Asset Management, LLC, were terminated and ceased managing assets of the Fund. On March 10, 2022, DePrince, Race & Zollo, Inc., began managing assets of the Fund. |
| B | Based on net asset value, which does not reflect the sales charge, redemption fee, or contingent deferred sales charge, if applicable. May include adjustments in accordance with U.S. GAAP and as such, the net asset value for reporting purposes and the returns based upon those net asset values may differ from the net asset value and returns for shareholder transactions. |
See accompanying notes
43
American Beacon Small Cap Value FundSM
Financial Highlights
(For a share outstanding throughout the period)
| | | | | | | | | | | | | | | | | | | | | | | | | | | | | | | | | | | | |
| | | C Class | |
| | | Year Ended October 31, | |
| | | 2024 | | | | | | 2023 | | | | | | 2022A | | | | | | 2021 | | | | | | 2020 | |
| | | | |
Net asset value, beginning of period | | $ | 18.44 | | | | | | | $ | 23.27 | | | | | | | $ | 27.51 | | | | | | | $ | 17.47 | | | | | | | $ | 20.51 | |
| | | | | | | | | | | | | | | | | | | | | | | | | | | | | | | | | | | | |
Income (loss) from investment operations: | | | | | | | | | | | | | | | | | | | | | | | | | | | | | | | | | | | | |
Net investment income (loss) | | | 0.02 | B | | | | | | | 0.02 | | | | | | | | (0.14 | ) | | | | | | | (0.22 | ) | | | | | | | (0.17 | ) |
Net gains (losses) on investments (both realized and unrealized) | | | 4.82 | | | | | | | | (1.14 | ) | | | | | | | (0.94 | ) | | | | | | | 10.26 | | | | | | | | (2.66 | ) |
| | | | | | | | | | | | | | | | | | | | | | | | | | | | | | | | | | | | |
Total income (loss) from investment operations | | | 4.84 | | | | | | | | (1.12 | ) | | | | | | | (1.08 | ) | | | | | | | 10.04 | | | | | | | | (2.83 | ) |
| | | | | | | | | | | | | | | | | | | | | | | | | | | | | | | | | | | | |
Less distributions: | | | | | | | | | | | | | | | | | | | | | | | | | | | | | | | | | | | | |
Dividends from net investment income | | | (0.10 | ) | | | | | | | (0.14 | ) | | | | | | | - | | | | | | | | - | | | | | | | | (0.05 | ) |
Distributions from net realized gains | | | (0.85 | ) | | | | | | | (3.57 | ) | | | | | | | (3.16 | ) | | | | | | | - | | | | | | | | (0.16 | ) |
| | | | | | | | | | | | | | | | | | | | | | | | | | | | | | | | | | | | |
Total distributions | | | (0.95 | ) | | | | | | | (3.71 | ) | | | | | | | (3.16 | ) | | | | | | | - | | | | | | | | (0.21 | ) |
| | | | | | | | | | | | | | | | | | | | | | | | | | | | | | | | | | | | |
Net asset value, end of period | | $ | 22.33 | | | | | | | $ | 18.44 | | | | | | | $ | 23.27 | | | | | | | $ | 27.51 | | | | | | | $ | 17.47 | |
| | | | | | | | | | | | | | | | | | | | | | | | | | | | | | | | | | | | |
Total returnC | | | 26.56 | % | | | | | | | (5.23 | )% | | | | | | | (4.54 | )% | | | | | | | 57.47 | % | | | | | | | (14.00 | )% |
| | | | | | | | | | | | | | | | | | | | | | | | | | | | | | | | | | | | |
| | | | | | | | | |
Ratios and supplemental data: | | | | | | | | | | | | | | | | | | | | | | | | | | | | | | | | | | | | |
Net assets, end of period | | $ | 5,955,619 | | | | | | | $ | 6,883,174 | | | | | | | $ | 8,859,738 | | | | | | | $ | 11,261,210 | | | | | | | $ | 8,057,935 | |
Ratios to average net assets: | | | | | | | | | | | | | | | | | | | | | | | | | | | | | | | | | | | | |
Expenses, before reimbursements and/or recoupments | | | 1.95 | % | | | | | | | 1.93 | % | | | | | | | 1.93 | % | | | | | | | 1.95 | % | | | | | | | 1.96 | % |
Expenses, net of reimbursements and/or recoupments | | | 1.95 | % | | | | | | | 1.93 | % | | | | | | | 1.93 | % | | | | | | | 1.95 | % | | | | | | | 1.96 | % |
Net investment income (loss), before expense reimbursements and/or recoupments | | | 0.12 | % | | | | | | | 0.09 | % | | | | | | | (0.29 | )% | | | | | | | (0.50 | )% | | | | | | | (0.10 | )% |
Net investment income (loss), net of reimbursements and/or recoupments | | | 0.12 | % | | | | | | | 0.09 | % | | | | | | | (0.29 | )% | | | | | | | (0.50 | )% | | | | | | | (0.10 | )% |
Portfolio turnover rate | | | 52 | % | | | | | | | 52 | % | | | | | | | 72 | % | | | | | | | 48 | % | | | | | | | 61 | % |
| A | On February 8. 2022, Foundry Partners, LLC and Hillcrest Asset Management, LLC, were terminated and ceased managing assets of the Fund. On March 10, 2022, DePrince, Race & Zollo, Inc., began managing assets of the Fund. |
| B | Per share amounts have been calculated using the average shares method. |
| C | Based on net asset value, which does not reflect the sales charge, redemption fee, or contingent deferred sales charge, if applicable. May include adjustments in accordance with U.S. GAAP and as such, the net asset value for reporting purposes and the returns based upon those net asset values may differ from the net asset value and returns for shareholder transactions. |
See accompanying notes
44
American Beacon Small Cap Value FundSM
Financial Highlights
(For a share outstanding throughout the period)
| | | | | | | | | | | | | | | | | | | | | | | | | | | | | | | | | | | | |
| | | R6 Class | |
| | | Year Ended October 31, | |
| | | 2024 | | | | | | 2023 | | | | | | 2022A | | | | | | 2021 | | | | | | 2020 | |
| | | | |
Net asset value, beginning of period | | $ | 21.83 | | | | | | | $ | 26.85 | | | | | | | $ | 31.19 | | | | | | | $ | 19.75 | | | | | | | $ | 23.12 | |
| | | | | | | | | | | | | | | | | | | | | | | | | | | | | | | | | | | | |
Income (loss) from investment operations: | | | | | | | | | | | | | | | | | | | | | | | | | | | | | | | | | | | | |
Net investment income | | | 0.32 | | | | | | | | 0.36 | | | | | | | | 0.25 | | | | | | | | 0.19 | | | | | | | | 0.22 | |
Net gains (losses) on investments (both realized and unrealized) | | | 5.72 | | | | | | | | (1.40 | ) | | | | | | | (1.18 | ) | | | | | | | 11.48 | | | | | | | | (3.14 | ) |
| | | | | | | | | | | | | | | | | | | | | | | | | | | | | | | | | | | | |
Total income (loss) from investment operations | | | 6.04 | | | | | | | | (1.04 | ) | | | | | | | (0.93 | ) | | | | | | | 11.67 | | | | | | | | (2.92 | ) |
| | | | | | | | | | | | | | | | | | | | | | | | | | | | | | | | | | | | |
Less distributions: | | | | | | | | | | | | | | | | | | | | | | | | | | | | | | | | | | | | |
Dividends from net investment income | | | (0.38 | ) | | | | | | | (0.41 | ) | | | | | | | (0.25 | ) | | | | | | | (0.23 | ) | | | | | | | (0.29 | ) |
Distributions from net realized gains | | | (0.85 | ) | | | | | | | (3.57 | ) | | | | | | | (3.16 | ) | | | | | | | - | | | | | | | | (0.16 | ) |
| | | | | | | | | | | | | | | | | | | | | | | | | | | | | | | | | | | | |
Total distributions | | | (1.23 | ) | | | | | | | (3.98 | ) | | | | | | | (3.41 | ) | | | | | | | (0.23 | ) | | | | | | | (0.45 | ) |
| | | | | | | | | | | | | | | | | | | | | | | | | | | | | | | | | | | | |
Net asset value, end of period | | $ | 26.64 | | | | | | | $ | 21.83 | | | | | | | $ | 26.85 | | | | | | | $ | 31.19 | | | | | | | $ | 19.75 | |
| | | | | | | | | | | | | | | | | | | | | | | | | | | | | | | | | | | | |
Total returnB | | | 28.10 | % | | | | | | | (4.09 | )% | | | | | | | (3.45 | )% | | | | | | | 59.38 | % | | | | | | | (12.98 | )% |
| | | | | | | | | | | | | | | | | | | | | | | | | | | | | | | | | | | | |
| | | | | | | | | |
Ratios and supplemental data: | | | | | | | | | | | | | | | | | | | | | | | | | | | | | | | | | | | | |
Net assets, end of period | | $ | 1,936,104,086 | | | | | | | $ | 1,583,343,034 | | | | | | | $ | 1,509,127,442 | | | | | | | $ | 1,830,192,124 | �� | | | | | | $ | 1,187,578,766 | |
Ratios to average net assets: | | | | | | | | | | | | | | | | | | | | | | | | | | | | | | | | | | | | |
Expenses, before reimbursements and/or recoupments | | | 0.76 | % | | | | | | | 0.76 | % | | | | | | | 0.77 | % | | | | | | | 0.79 | % | | | | | | | 0.79 | % |
Expenses, net of reimbursements and/or recoupments | | | 0.76 | % | | | | | | | 0.76 | % | | | | | | | 0.77 | % | | | | | | | 0.79 | % | | | | | | | 0.79 | % |
Net investment income, before expense reimbursements and/or recoupments | | | 1.28 | % | | | | | | | 1.25 | % | | | | | | | 0.86 | % | | | | | | | 0.66 | % | | | | | | | 1.06 | % |
Net investment income, net of reimbursements and/or recoupments | | | 1.28 | % | | | | | | | 1.25 | % | | | | | | | 0.86 | % | | | | | | | 0.66 | % | | | | | | | 1.06 | % |
Portfolio turnover rate | | | 52 | % | | | | | | | 52 | % | | | | | | | 72 | % | | | | | | | 48 | % | | | | | | | 61 | % |
| A | On February 8. 2022, Foundry Partners, LLC and Hillcrest Asset Management, LLC, were terminated and ceased managing assets of the Fund. On March 10, 2022, DePrince, Race & Zollo, Inc., began managing assets of the Fund. |
| B | Based on net asset value, which does not reflect the sales charge, redemption fee, or contingent deferred sales charge, if applicable. May include adjustments in accordance with U.S. GAAP and as such, the net asset value for reporting purposes and the returns based upon those net asset values may differ from the net asset value and returns for shareholder transactions. |
See accompanying notes
45
American Beacon FundsSM
Federal Tax Information
October 31, 2024 (Unaudited)
Certain tax information regarding the Funds are required to be provided to shareholders based upon the Funds’ income and distributions for the taxable year ended October 31, 2024. The information and distributions reported herein may differ from information and distributions taxable to the shareholders for the calendar year ended December 31, 2024.
The Fund designated the following items with regard to distributions paid during the fiscal year ended October 31, 2024. All designations are based on financial information available as of this annual report and, accordingly, are subject to change. For each item, it is the intention of the Funds to designate the maximum amount permitted under the Internal Revenue Code of 1986, as amended, and the regulations there under.
Corporate Dividends-Received Deduction:
Qualified Dividend Income:
Long-Term Capital Gain Distributions:
| | | | |
Small Cap Value | | $ | 176,134,520 | |
Short-Term Capital Gain Distributions:
| | | | |
Small Cap Value | | $ | 6,838,049 | |
Shareholders will receive notification in January 2025 of the applicable tax information necessary to prepare their 2024 income tax returns.
46

Delivery of Documents
If you invest in the Fund through a financial institution, you may be able to receive the Fund’s regulatory mailings, such as the Prospectus, Annual Report, Semi-Annual Report and Financial Statement Reports, by e-mail. If you are interested in this option, please go to www.icsdelivery.com and search for your financial institution’s name or contact your financial institution directly.
You may request a paper copy of this document at no charge by contacting your financial institution. This document is also available for download at www.americanbeaconfunds.com or you can request an electronic copy by contacting your financial institution.
To obtain more information about the Fund:
| | |
 | |  |
| | |
| By E-mail: | | On the Internet: |
| american_beacon.funds@ambeacon.com | | Visit our website at www.americanbeaconfunds.com |
| | | |
| | | |
| | |

By Telephone: Call (800) 658-5811 | | 
By Mail: American Beacon Funds P.O. Box 219643 Kansas City, MO 64121-9643 |
|
|
|
| | | |
Fund Service Providers:
| | | | | | | | | | | | |
CUSTODIAN State Street Bank and Trust Company Boston, Massachusetts | | | | TRANSFER AGENT SS&C GIDS, Inc. Quincy, Massachusetts | | | | INDEPENDENT REGISTERED PUBLIC ACCOUNTING FIRM PricewaterhouseCoopers LLP Boston, Massachusetts | | | | DISTRIBUTOR Resolute Investment Distributors, Inc. Irving, Texas |
This report is prepared for shareholders of the American Beacon Funds and may be distributed to others only if preceded or accompanied by a current Prospectus or Summary Prospectus.
American Beacon Funds and American Beacon Small Cap Value Fund are service marks of American Beacon Advisors, Inc.
AR 10/24
Item 8. Changes in and Disagreements with Accountants for Open-End Management Investment Companies
Not applicable.
Item 9. Proxy Disclosures for Open-End Management Investment Companies
Not applicable.
Item 10. Renumeration Paid to Directors, Officers, and Others of Open-End Management Investment Companies
The remuneration paid to directors, officers and others is included as part of the report to stockholders filed under Item 7 of this Form.
Item 11. Statement Regarding Basis for Approval of Investment Advisory Contract
Not applicable.
Item 12. Disclosure of Proxy Voting Policies and Procedures for Closed-End Management Investment Companies
Not applicable.
Item 13. Portfolio Managers of Closed-End Management Investment Companies
Not applicable.
Item 14. Purchase of Equity Securities by Closed-End Management Investment Company and Affiliated Purchasers
Not applicable.
Item 15. Submission of Matters to a Vote of Security Holders
The registrant has made no material changes to the procedures by which shareholders may recommend nominees to the Trust’s Board of Trustees.
Item 16. Controls and Procedures
(a) The registrant’s principal executive officer and principal financial officer have reviewed the registrant’s disclosure controls and procedures (as defined in Rule 30a-3(c) under the Investment Company Act of 1940, as amended) as of a date within 90 days of the filing of this report as required by Rule 30a-3(b) under the Act and Rules 13a-15(b) or 15d-15(b) under the Securities Exchange Act of 1934. Based upon their review, such officers have concluded that the registrant’s disclosure controls and procedures are effective in ensuring that information required to be disclosed in the report is appropriately recorded, processed, summarized and reported and made know to them by others within the registrant and by the registrant’s service provider.
(b) The registrant’s principal executive officer and principal financial officer are aware of no changes in the registrant’s internal control over financial reporting (as defined in Rule 30a-3(d) under the Act) that occurred during the period covered by this report that has materially affected, or is reasonably likely to materially affect, the registrant’s internal control over financial reporting.
Item 17. Disclosure of Securities Lending Activities for Closed-End Management Investment Companies
Not Applicable.
Item 18. Recovery of Erroneously Awarded Compensation
Not Applicable.
Item 19. Exhibits
(a)(1) Filed herewith as EX-99.CODE ETH.
(a)(2) A separate certification for each principal executive officer and principal financial officer of the registrant as required by Rule 30a-2(a) under the Investment Company Act of 1940 (17 CFR 270.30a-2(a)) is attached hereto as EX-99.CERT.
(a)(3) Not applicable.
(a)(4) Not applicable.
(b) The certifications of each principal executive officer and principal financial officer pursuant to Rule 30a-2(b) under the Investment Company Act of 1940, as amended, (17 CFR 270.30a-2(b), Rule 13a-14(b) or Rule 15d-14(b)) are attached hereto as EX-99.906CERT.
SIGNATURES
Pursuant to the requirements of the Securities Exchange Act of 1934 and the Investment Company Act of 1940, the registrant has duly caused this report to be signed on its behalf by the undersigned, thereunto duly authorized.
(Registrant): American Beacon Funds
| | |
| By | | /s/ Gregory J. Stumm |
|
| Gregory J. Stumm |
| President |
| American Beacon Funds |
| Date: January 3, 2025 |
Pursuant to the requirements of the Securities Exchange Act of 1934 and the Investment Company Act of 1940, this report has been signed below by the following persons on behalf of the registrant and in the capacities and on the dates indicated.
| | |
| By | | /s/ Gregory J. Stumm |
|
| Gregory J. Stumm |
| President |
| American Beacon Funds |
| Date: January 3, 2025 |
| | |
| By | | /s/ Sonia L. Bates |
|
| Sonia L. Bates |
| Chief Accounting Officer and Treasurer |
| American Beacon Funds |
| Date: January 3, 2025 |