0000809593americanbeacon:AMERICANBEACONINDEXRUSSELL2000GROWTHINDEX7099AdditionalIndexMember2016-08-310000809593americanbeacon:C000110032Member2021-09-300000809593americanbeacon:AMERICANBEACONINDEXSP500TR7108BroadBasedIndexMember2023-07-310000809593americanbeacon:AMERICANBEACONINDEXRUSSELL1000VALUEINDEX7095AdditionalIndexMember2017-12-310000809593americanbeacon:AMERICANBEACONINDEXSP500TR6935BroadBasedIndexMember2020-10-310000809593americanbeacon:C000144088Member2022-06-300000809593americanbeacon:AMERICANBEACONINDEXSP500TR6725BroadBasedIndexMember2019-05-310000809593americanbeacon:AMERICANBEACONINDEXSP500TR6722BroadBasedIndexMember2022-07-310000809593americanbeacon:C000244411Memberamericanbeacon:FRTSRTop10COFFEECTIMember2024-12-31
UNITED STATES
SECURITIES AND EXCHANGE COMMISSION
Washington, D.C. 20549
FORM N-CSR
CERTIFIED SHAREHOLDER REPORT OF REGISTERED
MANAGEMENT INVESTMENT COMPANIES
Investment Company Act file number: 811-4984
AMERICAN BEACON FUNDS
(Exact name of registrant as specified in charter)
220 East Las Colinas Boulevard, Suite 1200
Irving, Texas 75039
(Address of principal executive offices)-(Zip code)
GREGORY J. STUMM, PRESIDENT
220 East Las Colinas Boulevard, Suite 1200
Irving, Texas 75039
(Name and address of agent for service)
Registrant’s telephone number, including area code: (817) 391-6100
Date of fiscal year end: December 31, 2024
Date of reporting period: December 31, 2024
Form N-CSR is to be used by management investment companies to file reports with the Commission not later than 10 days after the transmission to stockholders of any report that is required to be transmitted to stockholders under Rule 30e-1 under the Investment Company Act of 1940 (17 CFR 270.30e-1). The Commission may use the information provided on Form N-CSR in its regulatory, disclosure review, inspection, and policymaking roles.
A registrant is required to disclose the information specified by Form N-CSR, and the Commission will make this information public. A registrant is not required to respond to the collection of information contained in Form N-CSR unless the Form displays a currently valid Office of Management and Budget (“OMB”) control number. Please direct comments concerning the accuracy of the information collection burden estimate and any suggestions for reducing the burden to Secretary, Securities and Exchange Commission, 450 Fifth Street, NW, Washington, DC 20549-0609. The OMB has reviewed this collection of information under the clearance requirements of 44 U.S.C. § 3507.
Item 1. Reports to Shareholders
Stephens Small Cap Growth Fund
Annual Shareholder Report - December 31, 2024
This annual shareholder report contains important information about American Beacon Stephens Small Cap Growth Fund for the period of January 1, 2024 to December 31, 2024. You can find additional information about the Fund at www.americanbeaconfunds.com/literature. You can also request this information by contacting us at 800-658-5811.
What were the Fund costs for the last year?
(based on a hypothetical $10,000 investment)
| Class Name | Costs of a $10,000 investment | Costs paid as a percentage of a $10,000 investment |
|---|
| Class A | $138 | 1.28% |
|---|
How did the Fund perform and what affected its performance?
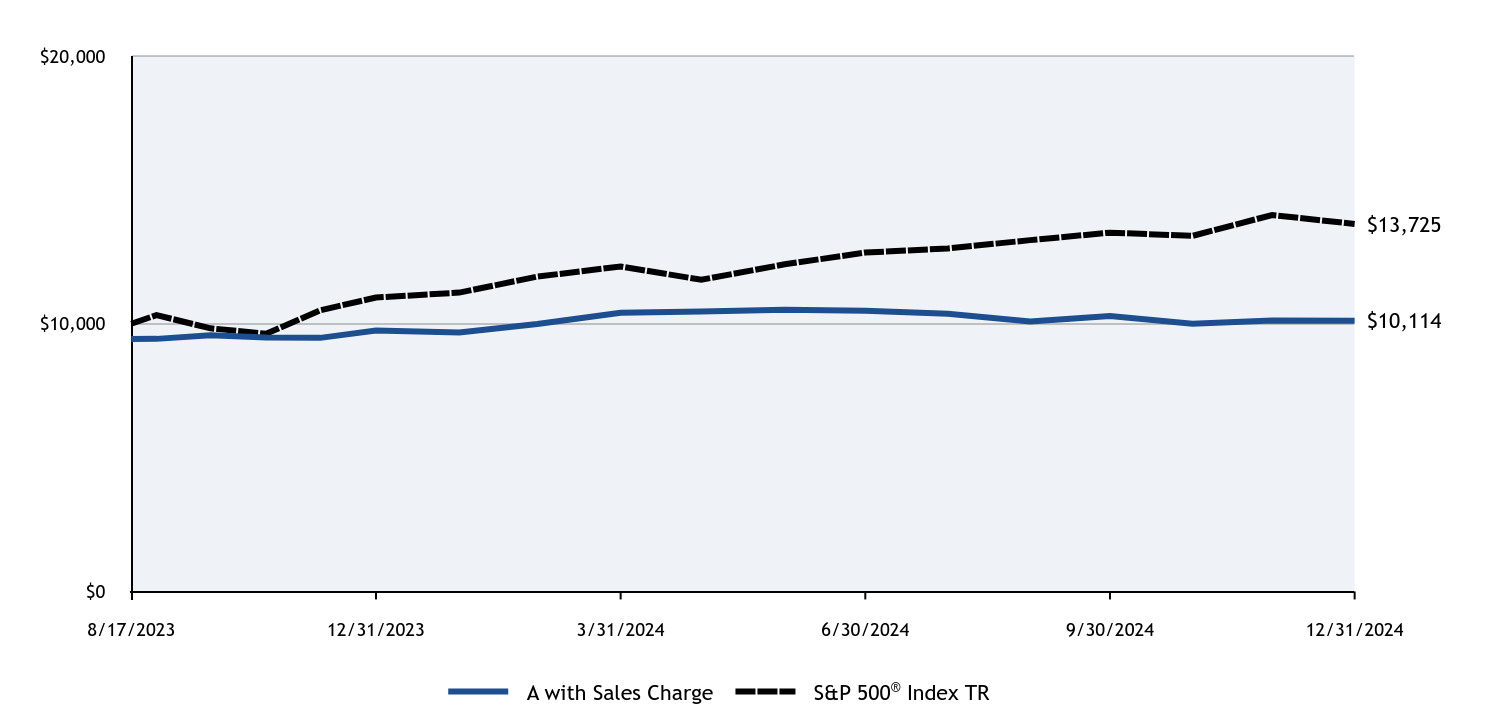
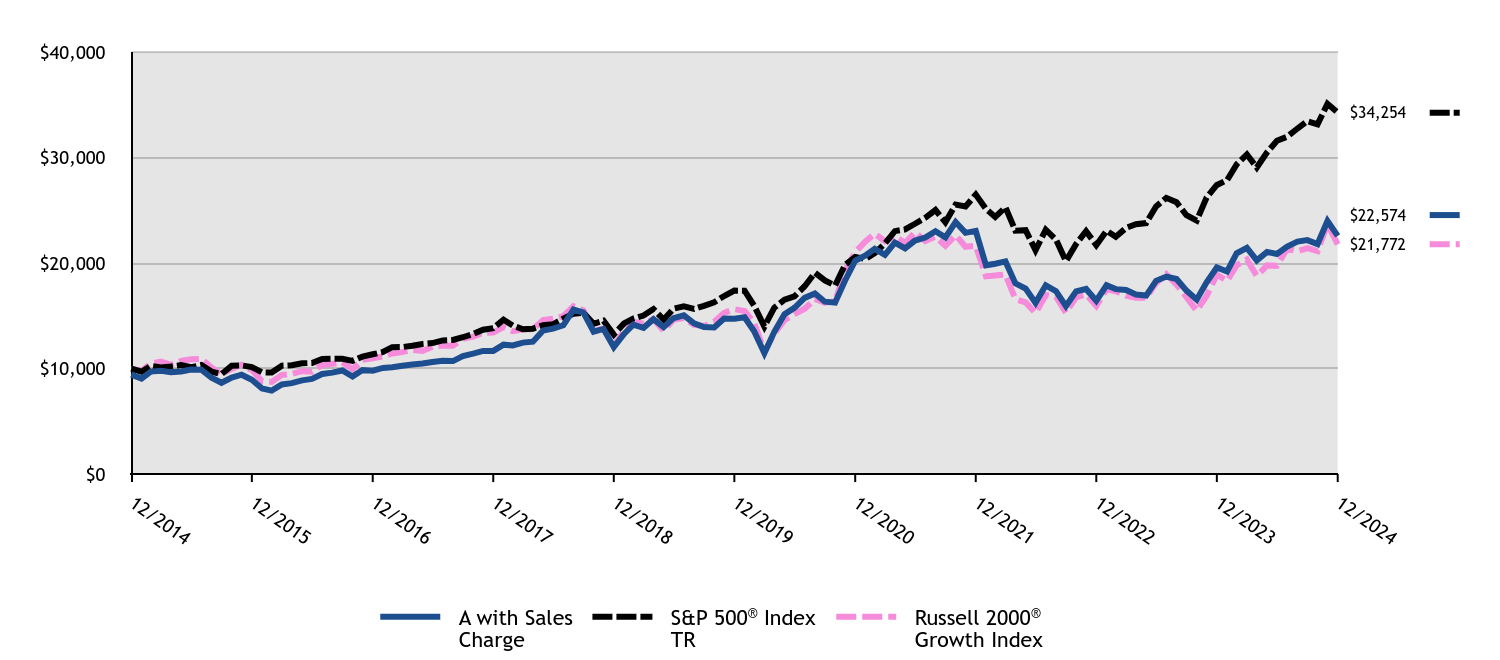
The A Class of the Fund returned 8.69% (with sales charges) and 15.31% (without sales charges) for the twelve months ended December 31, 2024, compared to the S&P 500 Index return of 25.02% and the Russell 2000 Growth Index return of 15.15%.
• Overall market performance during the period was driven by mega-cap growth companies, while the Fund focuses its investments on small capitalization companies.
• The Fund’s performance was positive in all sectors where it invested. Holdings in the Energy and Financials sectors contributed materially to the Fund’s outperformance of the Russell 2000® Growth Index, while holdings in the Information Technology sector detracted.
Cumulative Performance from December 31, 2014 through December 31, 2024
The initial investment, based on a $10,000 investment, is adjusted to reflect the maximum applicable sales charge, if any.
| A with Sales Charge | S&P 500® Index TR | Russell 2000® Growth Index |
|---|
| 12/2014 | $9,426 | $10,000 | $10,000 |
|---|
| 01/2015 | $9,046 | $9,700 | $9,772 |
|---|
| 02/2015 | $9,710 | $10,257 | $10,475 |
|---|
| 03/2015 | $9,789 | $10,095 | $10,663 |
|---|
| 04/2015 | $9,662 | $10,192 | $10,349 |
|---|
| 05/2015 | $9,716 | $10,323 | $10,730 |
|---|
| 06/2015 | $9,909 | $10,123 | $10,874 |
|---|
| 07/2015 | $9,897 | $10,335 | $10,918 |
|---|
| 08/2015 | $9,124 | $9,712 | $10,091 |
|---|
| 09/2015 | $8,653 | $9,471 | $9,453 |
|---|
| 10/2015 | $9,149 | $10,270 | $9,990 |
|---|
| 11/2015 | $9,414 | $10,301 | $10,356 |
|---|
| 12/2015 | $8,945 | $10,138 | $9,862 |
|---|
| 01/2016 | $8,107 | $9,635 | $8,793 |
|---|
| 02/2016 | $7,904 | $9,622 | $8,731 |
|---|
| 03/2016 | $8,488 | $10,275 | $9,400 |
|---|
| 04/2016 | $8,621 | $10,315 | $9,494 |
|---|
| 05/2016 | $8,881 | $10,500 | $9,750 |
|---|
| 06/2016 | $9,021 | $10,527 | $9,705 |
|---|
| 07/2016 | $9,490 | $10,915 | $10,339 |
|---|
| 08/2016 | $9,611 | $10,931 | $10,449 |
|---|
| 09/2016 | $9,820 | $10,933 | $10,600 |
|---|
| 10/2016 | $9,243 | $10,733 | $9,941 |
|---|
| 11/2016 | $9,864 | $11,131 | $10,830 |
|---|
| 12/2016 | $9,804 | $11,351 | $10,978 |
|---|
| 01/2017 | $10,060 | $11,566 | $11,156 |
|---|
| 02/2017 | $10,124 | $12,025 | $11,430 |
|---|
| 03/2017 | $10,259 | $12,039 | $11,565 |
|---|
| 04/2017 | $10,393 | $12,163 | $11,778 |
|---|
| 05/2017 | $10,476 | $12,334 | $11,671 |
|---|
| 06/2017 | $10,617 | $12,411 | $12,073 |
|---|
| 07/2017 | $10,745 | $12,666 | $12,176 |
|---|
| 08/2017 | $10,707 | $12,705 | $12,161 |
|---|
| 09/2017 | $11,174 | $12,967 | $12,823 |
|---|
| 10/2017 | $11,411 | $13,270 | $13,022 |
|---|
| 11/2017 | $11,667 | $13,677 | $13,396 |
|---|
| 12/2017 | $11,674 | $13,829 | $13,411 |
|---|
| 01/2018 | $12,264 | $14,621 | $13,934 |
|---|
| 02/2018 | $12,191 | $14,082 | $13,538 |
|---|
| 03/2018 | $12,457 | $13,724 | $13,720 |
|---|
| 04/2018 | $12,543 | $13,777 | $13,733 |
|---|
| 05/2018 | $13,611 | $14,108 | $14,598 |
|---|
| 06/2018 | $13,777 | $14,195 | $14,712 |
|---|
| 07/2018 | $14,096 | $14,724 | $14,965 |
|---|
| 08/2018 | $15,596 | $15,203 | $15,897 |
|---|
| 09/2018 | $15,310 | $15,290 | $15,525 |
|---|
| 10/2018 | $13,499 | $14,245 | $13,560 |
|---|
| 11/2018 | $13,757 | $14,535 | $13,772 |
|---|
| 12/2018 | $12,028 | $13,223 | $12,163 |
|---|
| 01/2019 | $13,287 | $14,282 | $13,568 |
|---|
| 02/2019 | $14,156 | $14,741 | $14,444 |
|---|
| 03/2019 | $13,863 | $15,027 | $14,248 |
|---|
| 04/2019 | $14,683 | $15,636 | $14,682 |
|---|
| 05/2019 | $13,922 | $14,642 | $13,593 |
|---|
| 06/2019 | $14,781 | $15,674 | $14,640 |
|---|
| 07/2019 | $15,044 | $15,899 | $14,783 |
|---|
| 08/2019 | $14,283 | $15,648 | $14,145 |
|---|
| 09/2019 | $13,931 | $15,940 | $14,029 |
|---|
| 10/2019 | $13,892 | $16,286 | $14,428 |
|---|
| 11/2019 | $14,742 | $16,877 | $15,278 |
|---|
| 12/2019 | $14,731 | $17,386 | $15,628 |
|---|
| 01/2020 | $14,862 | $17,379 | $15,456 |
|---|
| 02/2020 | $13,541 | $15,949 | $14,340 |
|---|
| 03/2020 | $11,455 | $13,979 | $11,601 |
|---|
| 04/2020 | $13,486 | $15,771 | $13,329 |
|---|
| 05/2020 | $15,157 | $16,522 | $14,589 |
|---|
| 06/2020 | $15,757 | $16,850 | $15,149 |
|---|
| 07/2020 | $16,697 | $17,801 | $15,670 |
|---|
| 08/2020 | $17,111 | $19,080 | $16,589 |
|---|
| 09/2020 | $16,336 | $18,355 | $16,234 |
|---|
| 10/2020 | $16,249 | $17,867 | $16,357 |
|---|
| 11/2020 | $18,324 | $19,823 | $19,241 |
|---|
| 12/2020 | $20,218 | $20,585 | $21,040 |
|---|
| 01/2021 | $20,717 | $20,377 | $22,054 |
|---|
| 02/2021 | $21,339 | $20,939 | $22,782 |
|---|
| 03/2021 | $20,766 | $21,856 | $22,066 |
|---|
| 04/2021 | $21,935 | $23,022 | $22,547 |
|---|
| 05/2021 | $21,387 | $23,183 | $21,903 |
|---|
| 06/2021 | $22,130 | $23,724 | $22,930 |
|---|
| 07/2021 | $22,410 | $24,288 | $22,095 |
|---|
| 08/2021 | $23,007 | $25,026 | $22,496 |
|---|
| 09/2021 | $22,435 | $23,863 | $21,634 |
|---|
| 10/2021 | $23,884 | $25,534 | $22,647 |
|---|
| 11/2021 | $22,861 | $25,357 | $21,541 |
|---|
| 12/2021 | $23,047 | $26,494 | $21,636 |
|---|
| 01/2022 | $19,787 | $25,123 | $18,736 |
|---|
| 02/2022 | $19,938 | $24,371 | $18,818 |
|---|
| 03/2022 | $20,151 | $25,276 | $18,904 |
|---|
| 04/2022 | $18,073 | $23,071 | $16,585 |
|---|
| 05/2022 | $17,573 | $23,114 | $16,272 |
|---|
| 06/2022 | $16,224 | $21,206 | $15,264 |
|---|
| 07/2022 | $17,892 | $23,161 | $16,973 |
|---|
| 08/2022 | $17,331 | $22,217 | $16,814 |
|---|
| 09/2022 | $15,920 | $20,170 | $15,301 |
|---|
| 10/2022 | $17,315 | $21,804 | $16,754 |
|---|
| 11/2022 | $17,543 | $23,022 | $17,026 |
|---|
| 12/2022 | $16,424 | $21,696 | $15,933 |
|---|
| 01/2023 | $17,895 | $23,059 | $17,518 |
|---|
| 02/2023 | $17,527 | $22,496 | $17,329 |
|---|
| 03/2023 | $17,439 | $23,322 | $16,901 |
|---|
| 04/2023 | $17,019 | $23,686 | $16,705 |
|---|
| 05/2023 | $16,914 | $23,789 | $16,708 |
|---|
| 06/2023 | $18,315 | $25,361 | $18,093 |
|---|
| 07/2023 | $18,717 | $26,176 | $18,939 |
|---|
| 08/2023 | $18,490 | $25,759 | $17,953 |
|---|
| 09/2023 | $17,387 | $24,531 | $16,769 |
|---|
| 10/2023 | $16,529 | $24,015 | $15,476 |
|---|
| 11/2023 | $18,175 | $26,208 | $16,885 |
|---|
| 12/2023 | $19,578 | $27,399 | $18,906 |
|---|
| 01/2024 | $19,204 | $27,859 | $18,300 |
|---|
| 02/2024 | $20,929 | $29,347 | $19,787 |
|---|
| 03/2024 | $21,445 | $30,291 | $20,340 |
|---|
| 04/2024 | $20,253 | $29,054 | $18,774 |
|---|
| 05/2024 | $21,054 | $30,494 | $19,779 |
|---|
| 06/2024 | $20,858 | $31,589 | $19,746 |
|---|
| 07/2024 | $21,569 | $31,973 | $21,363 |
|---|
| 08/2024 | $22,032 | $32,749 | $21,126 |
|---|
| 09/2024 | $22,174 | $33,448 | $21,407 |
|---|
| 10/2024 | $21,800 | $33,145 | $21,123 |
|---|
| 11/2024 | $23,987 | $35,090 | $23,713 |
|---|
| 12/2024 | $22,574 | $34,254 | $21,772 |
|---|
Average Annual Total Returns (%)
| HEADER | 1 Year | 5 Years | 10 Years |
|---|
Class A without Sales ChargeFootnote Reference1 | 15.31% | 8.91% | 9.13% |
|---|
Class A with Maximum Sales Charge - 5.75%Footnote Reference1 | 8.69% | 7.63% | 8.48% |
|---|
S&P 500® Index TR | 25.02% | 14.53% | 13.10% |
|---|
Russell 2000® Growth Index | 15.15% | 6.86% | 8.09% |
|---|
| Footnote | Description |
Footnote1 | Return may differ from actual shareholder return due to accounting adjustments for financial reporting purposes. |
Performance shown is historical and is not indicative of future returns. Investment returns and principal value will vary, and shares may be worth more or less at redemption than at original purchase. Performance shown is as of date indicated, and current performance may be lower or higher than the performance data quoted. To obtain performance as of the most recent month end, please visit americanbeaconfunds.com or call 800-967-9009. The graph and table do not reflect the deduction of taxes that a shareholder would pay on fund distributions or redemption of fund shares. The Fund's performance benefited from fee waivers. For more information, visit americanbeaconfunds.com/Performance_Disclaimers.aspx.
The S&P 500 Index TR is replacing the Russell 2000 Growth Index as broad-based securities market index to comply with a new regulatory requirement. The Russell 2000 Growth Index reflects the market sectors in which the Fund invests.
| Total Net Assets | $364,382,179 |
|---|
| # of Portfolio Holdings | 105 |
|---|
| Portfolio Turnover Rate | 37% |
|---|
| Total Management Fees Paid | $2,854,258 |
|---|
What did the Fund invest in?
Top Ten Holdings - % Net Assets
| CyberArk Software Ltd. | 2.2 |
| BellRing Brands, Inc. | 2.1 |
| Kratos Defense & Security Solutions, Inc. | 2.0 |
| Viper Energy, Inc. | 1.9 |
| Manhattan Associates, Inc. | 1.7 |
| HealthEquity, Inc. | 1.7 |
| Leonardo DRS, Inc. | 1.6 |
| RBC Bearings, Inc. | 1.6 |
| Ryan Specialty Holdings, Inc. | 1.5 |
| Descartes Systems Group, Inc. | 1.5 |
Excludes cash equivalents.
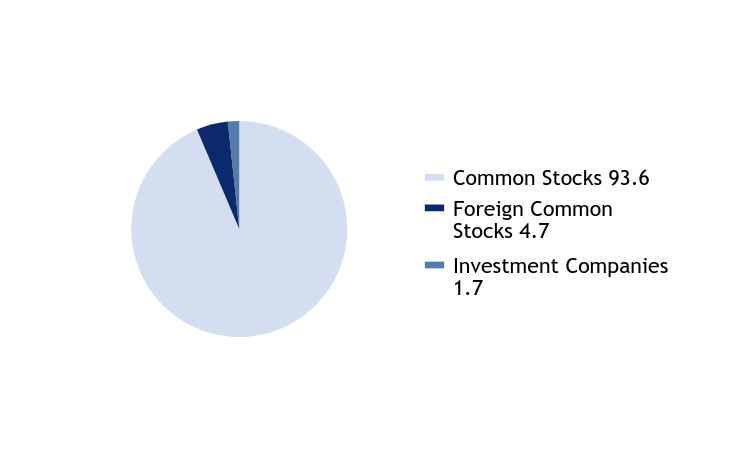
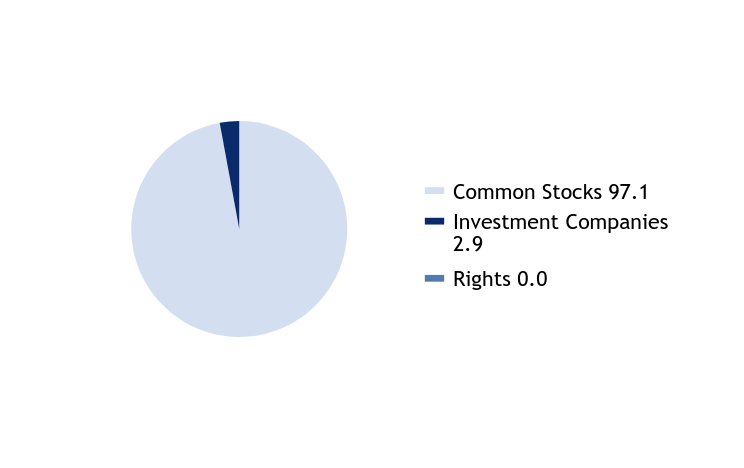
Asset Allocation - % Investments
| Value | Value |
|---|
| Common Stocks | 93.6 |
| Foreign Common Stocks | 4.7 |
| Investment Companies | 1.7 |
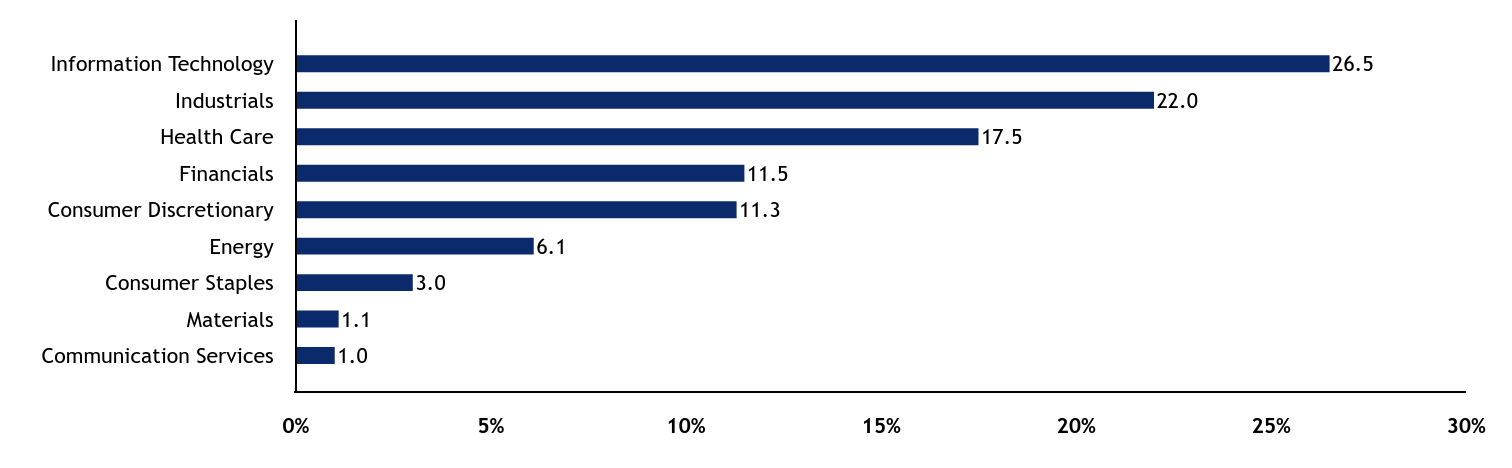
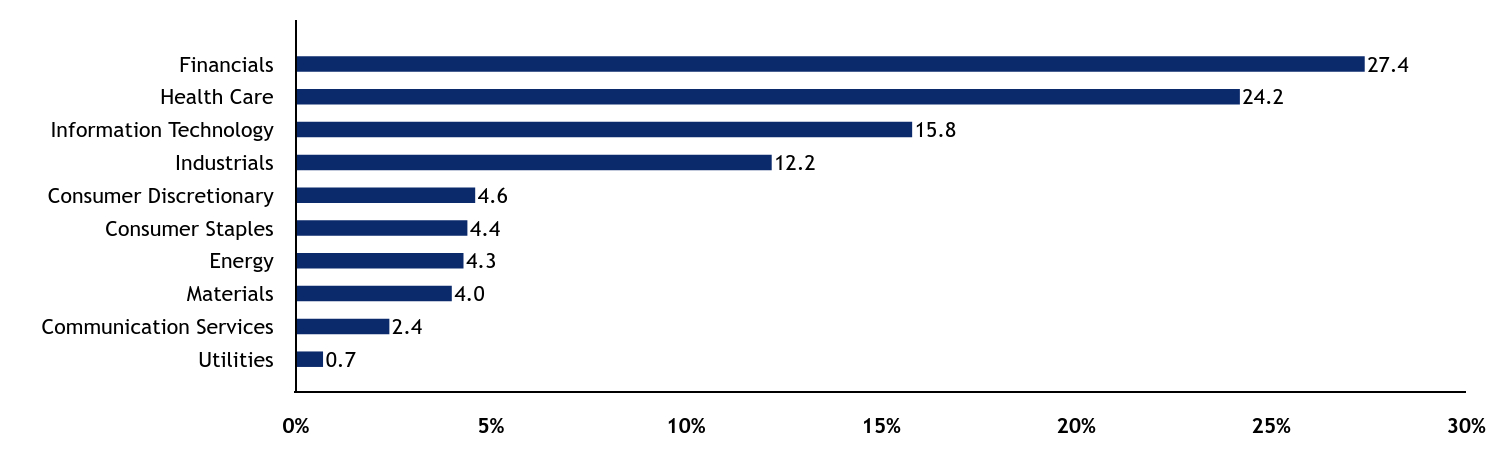
Sector Allocation - % Equities
| Value | Value |
|---|
| Communication Services | 1.0 |
| Materials | 1.1 |
| Consumer Staples | 3.0 |
| Energy | 6.1 |
| Consumer Discretionary | 11.3 |
| Financials | 11.5 |
| Health Care | 17.5 |
| Industrials | 22.0 |
| Information Technology | 26.5 |
For additional information about the Fund, including its prospectus, financial statements, holdings, and proxy voting information, please visit www.americanbeaconfunds.com/literature or call 1-800-658-5811.
If your financial institution mailed only one copy of this Report to an address shared by more than one account, you can request an individual copy by contacting your financial institution.
Stephens Small Cap Growth Fund
Distributed by:
Resolute Investment Distributors, Inc.
Annual Shareholder Report - December 31, 2024
Stephens Small Cap Growth Fund
Annual Shareholder Report - December 31, 2024
This annual shareholder report contains important information about American Beacon Stephens Small Cap Growth Fund for the period of January 1, 2024 to December 31, 2024. You can find additional information about the Fund at www.americanbeaconfunds.com/literature. You can also request this information by contacting us at 800-658-5811.
What were the Fund costs for the last year?
(based on a hypothetical $10,000 investment)
| Class Name | Costs of a $10,000 investment | Costs paid as a percentage of a $10,000 investment |
|---|
| Class C | $221 | 2.06% |
|---|
How did the Fund perform and what affected its performance?
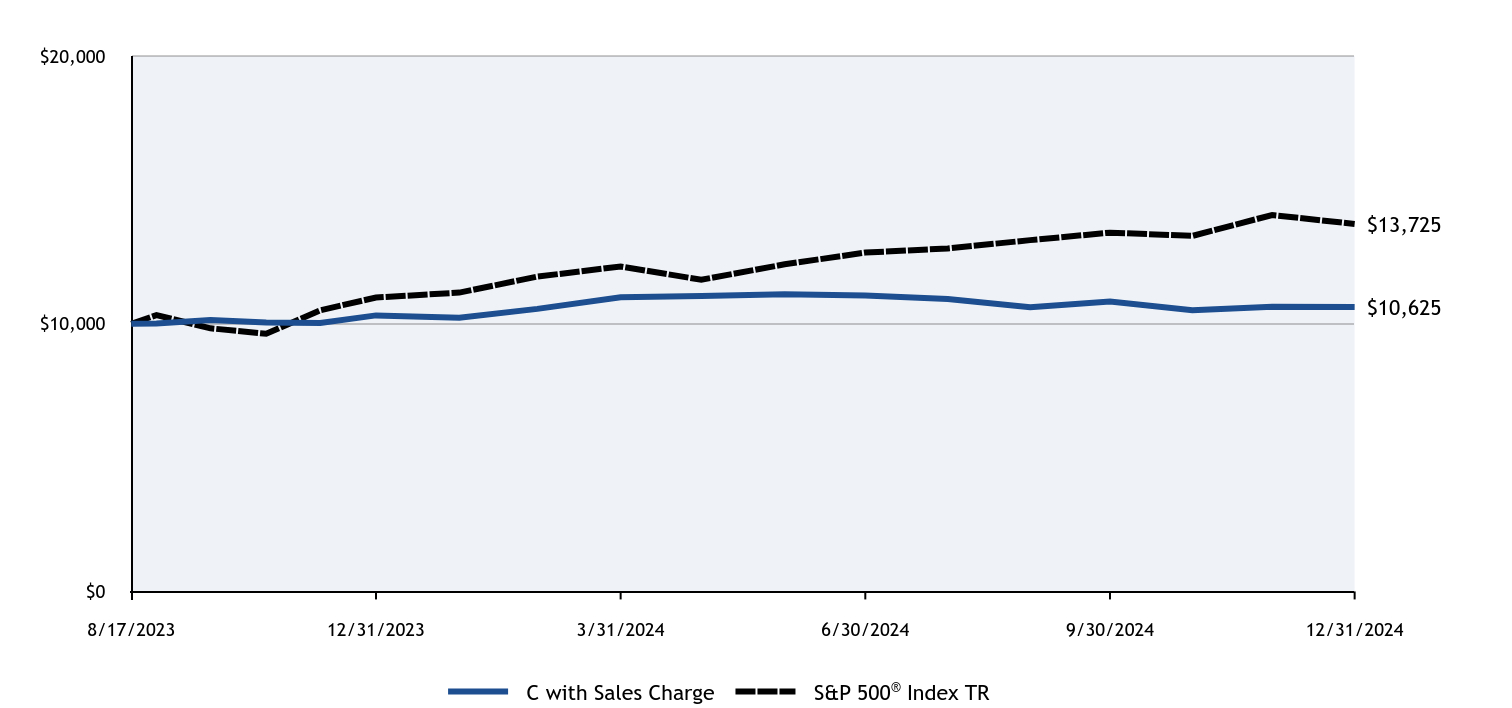
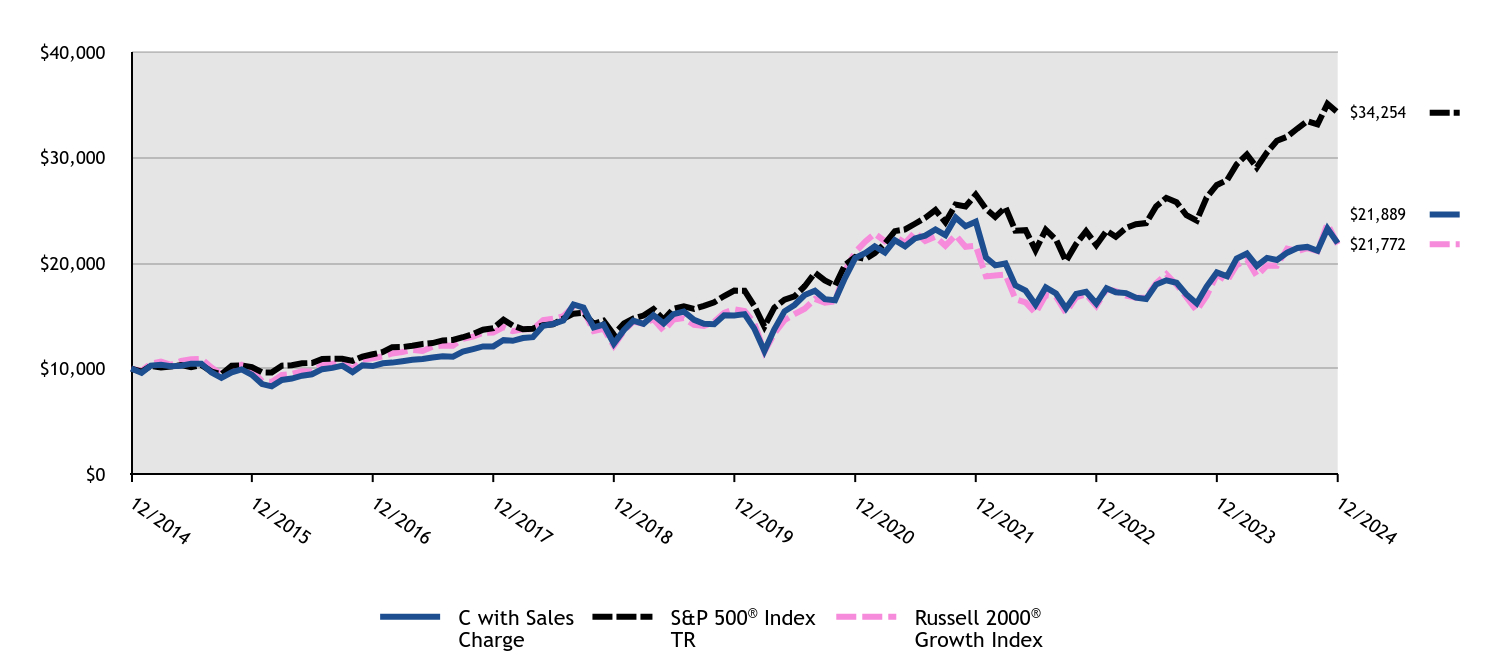
The C Class of the Fund returned 13.51% (with sales charges) and 14.51% (without sales charges) for the twelve months ended December 31, 2024, compared to the S&P 500 Index return of 25.02% and the Russell 2000 Growth Index return of 15.15%.
• Overall market performance during the period was driven by mega-cap growth companies, while the Fund focuses its investments on small capitalization companies.
• The Fund’s performance was positive in all sectors where it invested. Holdings in the Energy and Financials sectors contributed materially to the Fund’s outperformance of the Russell 2000® Growth Index, while holdings in the Information Technology sector detracted.
Cumulative Performance from December 31, 2014 through December 31, 2024
The initial investment, based on a $10,000 investment, is adjusted to reflect the maximum applicable sales charge, if any.
| C with Sales Charge | S&P 500® Index TR | Russell 2000® Growth Index |
|---|
| 12/2014 | $10,000 | $10,000 | $10,000 |
|---|
| 01/2015 | $9,587 | $9,700 | $9,772 |
|---|
| 02/2015 | $10,282 | $10,257 | $10,475 |
|---|
| 03/2015 | $10,360 | $10,095 | $10,663 |
|---|
| 04/2015 | $10,223 | $10,192 | $10,349 |
|---|
| 05/2015 | $10,275 | $10,323 | $10,730 |
|---|
| 06/2015 | $10,465 | $10,123 | $10,874 |
|---|
| 07/2015 | $10,452 | $10,335 | $10,918 |
|---|
| 08/2015 | $9,633 | $9,712 | $10,091 |
|---|
| 09/2015 | $9,122 | $9,471 | $9,453 |
|---|
| 10/2015 | $9,640 | $10,270 | $9,990 |
|---|
| 11/2015 | $9,915 | $10,301 | $10,356 |
|---|
| 12/2015 | $9,411 | $10,138 | $9,862 |
|---|
| 01/2016 | $8,529 | $9,635 | $8,793 |
|---|
| 02/2016 | $8,308 | $9,622 | $8,731 |
|---|
| 03/2016 | $8,922 | $10,275 | $9,400 |
|---|
| 04/2016 | $9,053 | $10,315 | $9,494 |
|---|
| 05/2016 | $9,322 | $10,500 | $9,750 |
|---|
| 06/2016 | $9,460 | $10,527 | $9,705 |
|---|
| 07/2016 | $9,942 | $10,915 | $10,339 |
|---|
| 08/2016 | $10,066 | $10,931 | $10,449 |
|---|
| 09/2016 | $10,273 | $10,933 | $10,600 |
|---|
| 10/2016 | $9,667 | $10,733 | $9,941 |
|---|
| 11/2016 | $10,308 | $11,131 | $10,830 |
|---|
| 12/2016 | $10,236 | $11,351 | $10,978 |
|---|
| 01/2017 | $10,500 | $11,566 | $11,156 |
|---|
| 02/2017 | $10,563 | $12,025 | $11,430 |
|---|
| 03/2017 | $10,695 | $12,039 | $11,565 |
|---|
| 04/2017 | $10,827 | $12,163 | $11,778 |
|---|
| 05/2017 | $10,910 | $12,334 | $11,671 |
|---|
| 06/2017 | $11,043 | $12,411 | $12,073 |
|---|
| 07/2017 | $11,175 | $12,666 | $12,176 |
|---|
| 08/2017 | $11,126 | $12,705 | $12,161 |
|---|
| 09/2017 | $11,599 | $12,967 | $12,823 |
|---|
| 10/2017 | $11,843 | $13,270 | $13,022 |
|---|
| 11/2017 | $12,100 | $13,677 | $13,396 |
|---|
| 12/2017 | $12,101 | $13,829 | $13,411 |
|---|
| 01/2018 | $12,708 | $14,621 | $13,934 |
|---|
| 02/2018 | $12,628 | $14,082 | $13,538 |
|---|
| 03/2018 | $12,889 | $13,724 | $13,720 |
|---|
| 04/2018 | $12,975 | $13,777 | $13,733 |
|---|
| 05/2018 | $14,060 | $14,108 | $14,598 |
|---|
| 06/2018 | $14,226 | $14,195 | $14,712 |
|---|
| 07/2018 | $14,544 | $14,724 | $14,965 |
|---|
| 08/2018 | $16,076 | $15,203 | $15,897 |
|---|
| 09/2018 | $15,780 | $15,290 | $15,525 |
|---|
| 10/2018 | $13,901 | $14,245 | $13,560 |
|---|
| 11/2018 | $14,161 | $14,535 | $13,772 |
|---|
| 12/2018 | $12,366 | $13,223 | $12,163 |
|---|
| 01/2019 | $13,667 | $14,282 | $13,568 |
|---|
| 02/2019 | $14,542 | $14,741 | $14,444 |
|---|
| 03/2019 | $14,235 | $15,027 | $14,248 |
|---|
| 04/2019 | $15,066 | $15,636 | $14,682 |
|---|
| 05/2019 | $14,279 | $14,642 | $13,593 |
|---|
| 06/2019 | $15,154 | $15,674 | $14,640 |
|---|
| 07/2019 | $15,405 | $15,899 | $14,783 |
|---|
| 08/2019 | $14,618 | $15,648 | $14,145 |
|---|
| 09/2019 | $14,246 | $15,940 | $14,029 |
|---|
| 10/2019 | $14,203 | $16,286 | $14,428 |
|---|
| 11/2019 | $15,055 | $16,877 | $15,278 |
|---|
| 12/2019 | $15,032 | $17,386 | $15,628 |
|---|
| 01/2020 | $15,156 | $17,379 | $15,456 |
|---|
| 02/2020 | $13,808 | $15,949 | $14,340 |
|---|
| 03/2020 | $11,667 | $13,979 | $11,601 |
|---|
| 04/2020 | $13,721 | $15,771 | $13,329 |
|---|
| 05/2020 | $15,428 | $16,522 | $14,589 |
|---|
| 06/2020 | $16,022 | $16,850 | $15,149 |
|---|
| 07/2020 | $16,962 | $17,801 | $15,670 |
|---|
| 08/2020 | $17,383 | $19,080 | $16,589 |
|---|
| 09/2020 | $16,579 | $18,355 | $16,234 |
|---|
| 10/2020 | $16,480 | $17,867 | $16,357 |
|---|
| 11/2020 | $18,571 | $19,823 | $19,241 |
|---|
| 12/2020 | $20,468 | $20,585 | $21,040 |
|---|
| 01/2021 | $20,958 | $20,377 | $22,054 |
|---|
| 02/2021 | $21,587 | $20,939 | $22,782 |
|---|
| 03/2021 | $21,000 | $21,856 | $22,066 |
|---|
| 04/2021 | $22,161 | $23,022 | $22,547 |
|---|
| 05/2021 | $21,587 | $23,183 | $21,903 |
|---|
| 06/2021 | $22,329 | $23,724 | $22,930 |
|---|
| 07/2021 | $22,595 | $24,288 | $22,095 |
|---|
| 08/2021 | $23,182 | $25,026 | $22,496 |
|---|
| 09/2021 | $22,637 | $23,863 | $21,634 |
|---|
| 10/2021 | $24,316 | $25,534 | $22,647 |
|---|
| 11/2021 | $23,490 | $25,357 | $21,541 |
|---|
| 12/2021 | $23,916 | $26,494 | $21,636 |
|---|
| 01/2022 | $20,515 | $25,123 | $18,736 |
|---|
| 02/2022 | $19,781 | $24,371 | $18,818 |
|---|
| 03/2022 | $19,960 | $25,276 | $18,904 |
|---|
| 04/2022 | $17,884 | $23,071 | $16,585 |
|---|
| 05/2022 | $17,382 | $23,114 | $16,272 |
|---|
| 06/2022 | $16,040 | $21,206 | $15,264 |
|---|
| 07/2022 | $17,687 | $23,161 | $16,973 |
|---|
| 08/2022 | $17,114 | $22,217 | $16,814 |
|---|
| 09/2022 | $15,700 | $20,170 | $15,301 |
|---|
| 10/2022 | $17,078 | $21,804 | $16,754 |
|---|
| 11/2022 | $17,275 | $23,022 | $17,026 |
|---|
| 12/2022 | $16,168 | $21,696 | $15,933 |
|---|
| 01/2023 | $17,619 | $23,059 | $17,518 |
|---|
| 02/2023 | $17,235 | $22,496 | $17,329 |
|---|
| 03/2023 | $17,150 | $23,322 | $16,901 |
|---|
| 04/2023 | $16,723 | $23,686 | $16,705 |
|---|
| 05/2023 | $16,595 | $23,789 | $16,708 |
|---|
| 06/2023 | $17,960 | $25,361 | $18,093 |
|---|
| 07/2023 | $18,365 | $26,176 | $18,939 |
|---|
| 08/2023 | $18,131 | $25,759 | $17,953 |
|---|
| 09/2023 | $17,022 | $24,531 | $16,769 |
|---|
| 10/2023 | $16,168 | $24,015 | $15,476 |
|---|
| 11/2023 | $17,768 | $26,208 | $16,885 |
|---|
| 12/2023 | $19,114 | $27,399 | $18,906 |
|---|
| 01/2024 | $18,745 | $27,859 | $18,300 |
|---|
| 02/2024 | $20,419 | $29,347 | $19,787 |
|---|
| 03/2024 | $20,898 | $30,291 | $20,340 |
|---|
| 04/2024 | $19,723 | $29,054 | $18,774 |
|---|
| 05/2024 | $20,484 | $30,494 | $19,779 |
|---|
| 06/2024 | $20,289 | $31,589 | $19,746 |
|---|
| 07/2024 | $20,985 | $31,973 | $21,363 |
|---|
| 08/2024 | $21,420 | $32,749 | $21,126 |
|---|
| 09/2024 | $21,528 | $33,448 | $21,407 |
|---|
| 10/2024 | $21,159 | $33,145 | $21,123 |
|---|
| 11/2024 | $23,268 | $35,090 | $23,713 |
|---|
| 12/2024 | $21,889 | $34,254 | $21,772 |
|---|
Average Annual Total Returns (%)
| HEADER | 1 Year | 5 Years | 10 Years |
|---|
Class C without Deferred Sales ChargeFootnote Reference1 | 14.51% | 7.80% | 8.15% |
|---|
Class C with Maximum Deferred Sales Charge -1.00%Footnote Reference1 | 13.51% | 7.80% | 8.15% |
|---|
S&P 500® Index TR | 25.02% | 14.53% | 13.10% |
|---|
Russell 2000® Growth Index | 15.15% | 6.86% | 8.09% |
|---|
| Footnote | Description |
Footnote1 | Return may differ from actual shareholder return due to accounting adjustments for financial reporting purposes. |
Performance shown is historical and is not indicative of future returns. Investment returns and principal value will vary, and shares may be worth more or less at redemption than at original purchase. Performance shown is as of date indicated, and current performance may be lower or higher than the performance data quoted. To obtain performance as of the most recent month end, please visit americanbeaconfunds.com or call 800-967-9009. The graph and table do not reflect the deduction of taxes that a shareholder would pay on fund distributions or redemption of fund shares. The Fund's performance benefited from fee waivers. For more information, visit americanbeaconfunds.com/Performance_Disclaimers.aspx.
The S&P 500 Index TR is replacing the Russell 2000 Growth Index as broad-based securities market index to comply with a new regulatory requirement. The Russell 2000 Growth Index reflects the market sectors in which the Fund invests.
| Total Net Assets | $364,382,179 |
|---|
| # of Portfolio Holdings | 105 |
|---|
| Portfolio Turnover Rate | 37% |
|---|
| Total Management Fees Paid | $2,854,258 |
|---|
What did the Fund invest in?
Top Ten Holdings - % Net Assets
| CyberArk Software Ltd. | 2.2 |
| BellRing Brands, Inc. | 2.1 |
| Kratos Defense & Security Solutions, Inc. | 2.0 |
| Viper Energy, Inc. | 1.9 |
| Manhattan Associates, Inc. | 1.7 |
| HealthEquity, Inc. | 1.7 |
| Leonardo DRS, Inc. | 1.6 |
| RBC Bearings, Inc. | 1.6 |
| Ryan Specialty Holdings, Inc. | 1.5 |
| Descartes Systems Group, Inc. | 1.5 |
Excludes cash equivalents.
Asset Allocation - % Investments
| Value | Value |
|---|
| Common Stocks | 93.6 |
| Foreign Common Stocks | 4.7 |
| Investment Companies | 1.7 |
Sector Allocation - % Equities
| Value | Value |
|---|
| Communication Services | 1.0 |
| Materials | 1.1 |
| Consumer Staples | 3.0 |
| Energy | 6.1 |
| Consumer Discretionary | 11.3 |
| Financials | 11.5 |
| Health Care | 17.5 |
| Industrials | 22.0 |
| Information Technology | 26.5 |
For additional information about the Fund, including its prospectus, financial statements, holdings, and proxy voting information, please visit www.americanbeaconfunds.com/literature or call 1-800-658-5811.
If your financial institution mailed only one copy of this Report to an address shared by more than one account, you can request an individual copy by contacting your financial institution.
Stephens Small Cap Growth Fund
Distributed by:
Resolute Investment Distributors, Inc.
Annual Shareholder Report - December 31, 2024
Stephens Small Cap Growth Fund
Annual Shareholder Report - December 31, 2024
This annual shareholder report contains important information about American Beacon Stephens Small Cap Growth Fund for the period of January 1, 2024 to December 31, 2024. You can find additional information about the Fund at www.americanbeaconfunds.com/literature. You can also request this information by contacting us at 800-658-5811.
What were the Fund costs for the last year?
(based on a hypothetical $10,000 investment)
| Class Name | Costs of a $10,000 investment | Costs paid as a percentage of a $10,000 investment |
|---|
| R5 | $107 | 0.99% |
|---|
How did the Fund perform and what affected its performance?
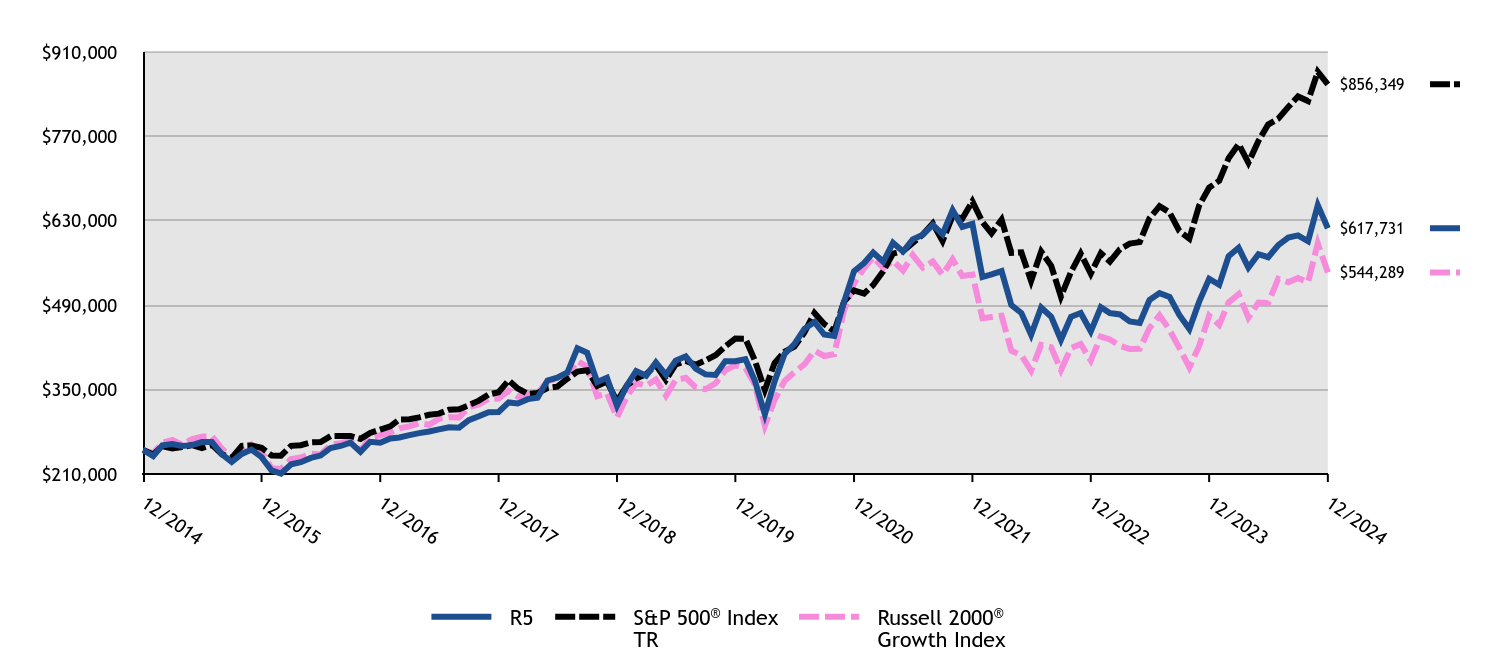
The R5 Class of the Fund returned 15.69% for the twelve months ended December 31, 2024, compared to the S&P 500 Index return of 25.02% and the Russell 2000 Growth Index return of 15.15%.
• Overall market performance during the period was driven by mega-cap growth companies, while the Fund focuses its investments on small capitalization companies.
• The Fund’s performance was positive in all sectors where it invested. Holdings in the Energy and Financials sectors contributed materially to the Fund’s outperformance of the Russell 2000® Growth Index, while holdings in the Information Technology sector detracted.
Cumulative Performance from December 31, 2014 through December 31, 2024
The initial investment, based on a $250,000 investment, is adjusted to reflect the maximum applicable sales charge, if any.
| R5 | S&P 500® Index TR | Russell 2000® Growth Index |
|---|
| 12/2014 | $250,000 | $250,000 | $250,000 |
|---|
| 01/2015 | $239,747 | $242,495 | $244,293 |
|---|
| 02/2015 | $257,539 | $256,432 | $261,873 |
|---|
| 03/2015 | $259,650 | $252,376 | $266,574 |
|---|
| 04/2015 | $256,484 | $254,798 | $258,733 |
|---|
| 05/2015 | $257,992 | $258,074 | $268,239 |
|---|
| 06/2015 | $263,118 | $253,078 | $271,844 |
|---|
| 07/2015 | $263,118 | $258,381 | $272,955 |
|---|
| 08/2015 | $242,762 | $242,791 | $252,270 |
|---|
| 09/2015 | $230,097 | $236,784 | $236,337 |
|---|
| 10/2015 | $243,366 | $256,758 | $249,743 |
|---|
| 11/2015 | $250,603 | $257,521 | $258,895 |
|---|
| 12/2015 | $238,129 | $253,459 | $246,546 |
|---|
| 01/2016 | $216,021 | $240,882 | $219,833 |
|---|
| 02/2016 | $210,652 | $240,557 | $218,279 |
|---|
| 03/2016 | $226,285 | $256,876 | $235,000 |
|---|
| 04/2016 | $229,759 | $257,872 | $237,344 |
|---|
| 05/2016 | $236,865 | $262,503 | $243,738 |
|---|
| 06/2016 | $240,655 | $263,183 | $242,617 |
|---|
| 07/2016 | $253,288 | $272,886 | $258,481 |
|---|
| 08/2016 | $256,604 | $273,269 | $261,229 |
|---|
| 09/2016 | $262,131 | $273,320 | $264,989 |
|---|
| 10/2016 | $246,972 | $268,335 | $248,522 |
|---|
| 11/2016 | $263,552 | $278,273 | $270,757 |
|---|
| 12/2016 | $262,058 | $283,773 | $274,450 |
|---|
| 01/2017 | $268,904 | $289,155 | $278,906 |
|---|
| 02/2017 | $270,655 | $300,637 | $285,745 |
|---|
| 03/2017 | $274,476 | $300,987 | $289,130 |
|---|
| 04/2017 | $277,978 | $304,078 | $294,455 |
|---|
| 05/2017 | $280,526 | $308,357 | $291,777 |
|---|
| 06/2017 | $284,188 | $310,282 | $301,819 |
|---|
| 07/2017 | $287,690 | $316,662 | $304,388 |
|---|
| 08/2017 | $286,894 | $317,632 | $304,033 |
|---|
| 09/2017 | $299,312 | $324,184 | $320,587 |
|---|
| 10/2017 | $305,840 | $331,749 | $325,554 |
|---|
| 11/2017 | $312,686 | $341,924 | $334,901 |
|---|
| 12/2017 | $313,017 | $345,725 | $335,287 |
|---|
| 01/2018 | $328,825 | $365,519 | $348,357 |
|---|
| 02/2018 | $327,013 | $352,047 | $338,439 |
|---|
| 03/2018 | $334,259 | $343,101 | $342,996 |
|---|
| 04/2018 | $336,728 | $344,417 | $343,332 |
|---|
| 05/2018 | $365,214 | $352,712 | $364,948 |
|---|
| 06/2018 | $369,825 | $354,882 | $367,804 |
|---|
| 07/2018 | $378,387 | $368,089 | $374,127 |
|---|
| 08/2018 | $418,729 | $380,083 | $397,419 |
|---|
| 09/2018 | $411,154 | $382,247 | $388,118 |
|---|
| 10/2018 | $362,745 | $356,120 | $339,008 |
|---|
| 11/2018 | $369,660 | $363,377 | $344,310 |
|---|
| 12/2018 | $323,212 | $330,567 | $304,078 |
|---|
| 01/2019 | $357,333 | $357,058 | $339,194 |
|---|
| 02/2019 | $380,704 | $368,522 | $361,099 |
|---|
| 03/2019 | $372,991 | $375,683 | $356,212 |
|---|
| 04/2019 | $395,193 | $390,895 | $367,059 |
|---|
| 05/2019 | $374,627 | $366,054 | $339,827 |
|---|
| 06/2019 | $397,998 | $391,852 | $366,001 |
|---|
| 07/2019 | $405,242 | $397,484 | $369,578 |
|---|
| 08/2019 | $384,677 | $391,188 | $353,630 |
|---|
| 09/2019 | $375,328 | $398,507 | $350,727 |
|---|
| 10/2019 | $374,394 | $407,138 | $360,708 |
|---|
| 11/2019 | $397,297 | $421,917 | $381,938 |
|---|
| 12/2019 | $397,282 | $434,651 | $390,691 |
|---|
| 01/2020 | $400,636 | $434,481 | $386,389 |
|---|
| 02/2020 | $365,293 | $398,715 | $358,492 |
|---|
| 03/2020 | $309,054 | $349,468 | $290,030 |
|---|
| 04/2020 | $363,745 | $394,268 | $333,227 |
|---|
| 05/2020 | $409,407 | $413,046 | $364,717 |
|---|
| 06/2020 | $425,401 | $421,261 | $378,732 |
|---|
| 07/2020 | $450,941 | $445,013 | $391,747 |
|---|
| 08/2020 | $462,292 | $477,001 | $414,729 |
|---|
| 09/2020 | $441,396 | $458,877 | $405,842 |
|---|
| 10/2020 | $439,074 | $446,674 | $408,926 |
|---|
| 11/2020 | $495,313 | $495,568 | $481,033 |
|---|
| 12/2020 | $546,504 | $514,622 | $525,996 |
|---|
| 01/2021 | $560,117 | $509,426 | $551,356 |
|---|
| 02/2021 | $577,417 | $523,474 | $569,561 |
|---|
| 03/2021 | $562,103 | $546,400 | $551,639 |
|---|
| 04/2021 | $593,583 | $575,560 | $563,667 |
|---|
| 05/2021 | $579,119 | $579,580 | $547,569 |
|---|
| 06/2021 | $599,255 | $593,110 | $573,250 |
|---|
| 07/2021 | $606,912 | $607,200 | $552,371 |
|---|
| 08/2021 | $623,361 | $625,662 | $562,410 |
|---|
| 09/2021 | $607,763 | $596,563 | $540,846 |
|---|
| 10/2021 | $647,467 | $638,359 | $566,172 |
|---|
| 11/2021 | $619,958 | $633,936 | $538,520 |
|---|
| 12/2021 | $624,855 | $662,346 | $540,906 |
|---|
| 01/2022 | $536,808 | $628,072 | $468,409 |
|---|
| 02/2022 | $541,245 | $609,266 | $470,453 |
|---|
| 03/2022 | $546,705 | $631,888 | $472,604 |
|---|
| 04/2022 | $490,396 | $576,786 | $414,619 |
|---|
| 05/2022 | $477,087 | $577,845 | $406,789 |
|---|
| 06/2022 | $440,913 | $530,147 | $381,607 |
|---|
| 07/2022 | $486,301 | $579,029 | $424,333 |
|---|
| 08/2022 | $470,944 | $555,415 | $420,345 |
|---|
| 09/2022 | $432,723 | $504,262 | $382,530 |
|---|
| 10/2022 | $470,944 | $545,088 | $418,840 |
|---|
| 11/2022 | $477,087 | $575,550 | $425,661 |
|---|
| 12/2022 | $446,772 | $542,390 | $398,337 |
|---|
| 01/2023 | $486,690 | $576,470 | $437,961 |
|---|
| 02/2023 | $477,094 | $562,405 | $433,216 |
|---|
| 03/2023 | $474,791 | $583,053 | $422,527 |
|---|
| 04/2023 | $463,277 | $592,154 | $417,618 |
|---|
| 05/2023 | $460,590 | $594,728 | $417,693 |
|---|
| 06/2023 | $498,588 | $634,024 | $452,326 |
|---|
| 07/2023 | $510,103 | $654,392 | $473,473 |
|---|
| 08/2023 | $503,962 | $643,973 | $448,827 |
|---|
| 09/2023 | $474,024 | $613,270 | $419,222 |
|---|
| 10/2023 | $450,610 | $600,375 | $386,891 |
|---|
| 11/2023 | $495,518 | $655,205 | $422,113 |
|---|
| 12/2023 | $533,950 | $684,971 | $472,661 |
|---|
| 01/2024 | $523,846 | $696,481 | $457,503 |
|---|
| 02/2024 | $571,257 | $733,670 | $494,663 |
|---|
| 03/2024 | $585,247 | $757,276 | $508,497 |
|---|
| 04/2024 | $552,603 | $726,345 | $469,343 |
|---|
| 05/2024 | $574,754 | $762,361 | $494,477 |
|---|
| 06/2024 | $569,702 | $789,716 | $493,653 |
|---|
| 07/2024 | $589,521 | $799,329 | $534,064 |
|---|
| 08/2024 | $602,346 | $818,718 | $528,151 |
|---|
| 09/2024 | $605,843 | $836,203 | $535,170 |
|---|
| 10/2024 | $596,128 | $828,620 | $528,069 |
|---|
| 11/2024 | $655,974 | $877,261 | $592,819 |
|---|
| 12/2024 | $617,731 | $856,349 | $544,289 |
|---|
Average Annual Total Returns (%)
| HEADER | 1 Year | 5 Years | 10 Years |
|---|
Class R5Footnote Reference1 | 15.69% | 9.23% | 9.47% |
|---|
S&P 500® Index TR | 25.02% | 14.53% | 13.10% |
|---|
Russell 2000® Growth Index | 15.15% | 6.86% | 8.09% |
|---|
| Footnote | Description |
Footnote1 | Return may differ from actual shareholder return due to accounting adjustments for financial reporting purposes. |
Performance shown is historical and is not indicative of future returns. Investment returns and principal value will vary, and shares may be worth more or less at redemption than at original purchase. Performance shown is as of date indicated, and current performance may be lower or higher than the performance data quoted. To obtain performance as of the most recent month end, please visit americanbeaconfunds.com or call 800-967-9009. The graph and table do not reflect the deduction of taxes that a shareholder would pay on fund distributions or redemption of fund shares. The Fund's performance benefited from fee waivers. For more information, visit americanbeaconfunds.com/Performance_Disclaimers.aspx.
The S&P 500 Index TR is replacing the Russell 2000 Growth Index as broad-based securities market index to comply with a new regulatory requirement. The Russell 2000 Growth Index reflects the market sectors in which the Fund invests.
| Total Net Assets | $364,382,179 |
|---|
| # of Portfolio Holdings | 105 |
|---|
| Portfolio Turnover Rate | 37% |
|---|
| Total Management Fees Paid | $2,854,258 |
|---|
What did the Fund invest in?
Top Ten Holdings - % Net Assets
| CyberArk Software Ltd. | 2.2 |
| BellRing Brands, Inc. | 2.1 |
| Kratos Defense & Security Solutions, Inc. | 2.0 |
| Viper Energy, Inc. | 1.9 |
| Manhattan Associates, Inc. | 1.7 |
| HealthEquity, Inc. | 1.7 |
| Leonardo DRS, Inc. | 1.6 |
| RBC Bearings, Inc. | 1.6 |
| Ryan Specialty Holdings, Inc. | 1.5 |
| Descartes Systems Group, Inc. | 1.5 |
Excludes cash equivalents.
Asset Allocation - % Investments
| Value | Value |
|---|
| Common Stocks | 93.6 |
| Foreign Common Stocks | 4.7 |
| Investment Companies | 1.7 |
Sector Allocation - % Equities
| Value | Value |
|---|
| Communication Services | 1.0 |
| Materials | 1.1 |
| Consumer Staples | 3.0 |
| Energy | 6.1 |
| Consumer Discretionary | 11.3 |
| Financials | 11.5 |
| Health Care | 17.5 |
| Industrials | 22.0 |
| Information Technology | 26.5 |
For additional information about the Fund, including its prospectus, financial statements, holdings, and proxy voting information, please visit www.americanbeaconfunds.com/literature or call 1-800-658-5811.
If your financial institution mailed only one copy of this Report to an address shared by more than one account, you can request an individual copy by contacting your financial institution.
Stephens Small Cap Growth Fund
Distributed by:
Resolute Investment Distributors, Inc.
Annual Shareholder Report - December 31, 2024
Stephens Small Cap Growth Fund
Annual Shareholder Report - December 31, 2024
This annual shareholder report contains important information about American Beacon Stephens Small Cap Growth Fund for the period of January 1, 2024 to December 31, 2024. You can find additional information about the Fund at www.americanbeaconfunds.com/literature. You can also request this information by contacting us at 800-658-5811.
What were the Fund costs for the last year?
(based on a hypothetical $10,000 investment)
| Class Name | Costs of a $10,000 investment | Costs paid as a percentage of a $10,000 investment |
|---|
| Y | $113 | 1.05% |
|---|
How did the Fund perform and what affected its performance?
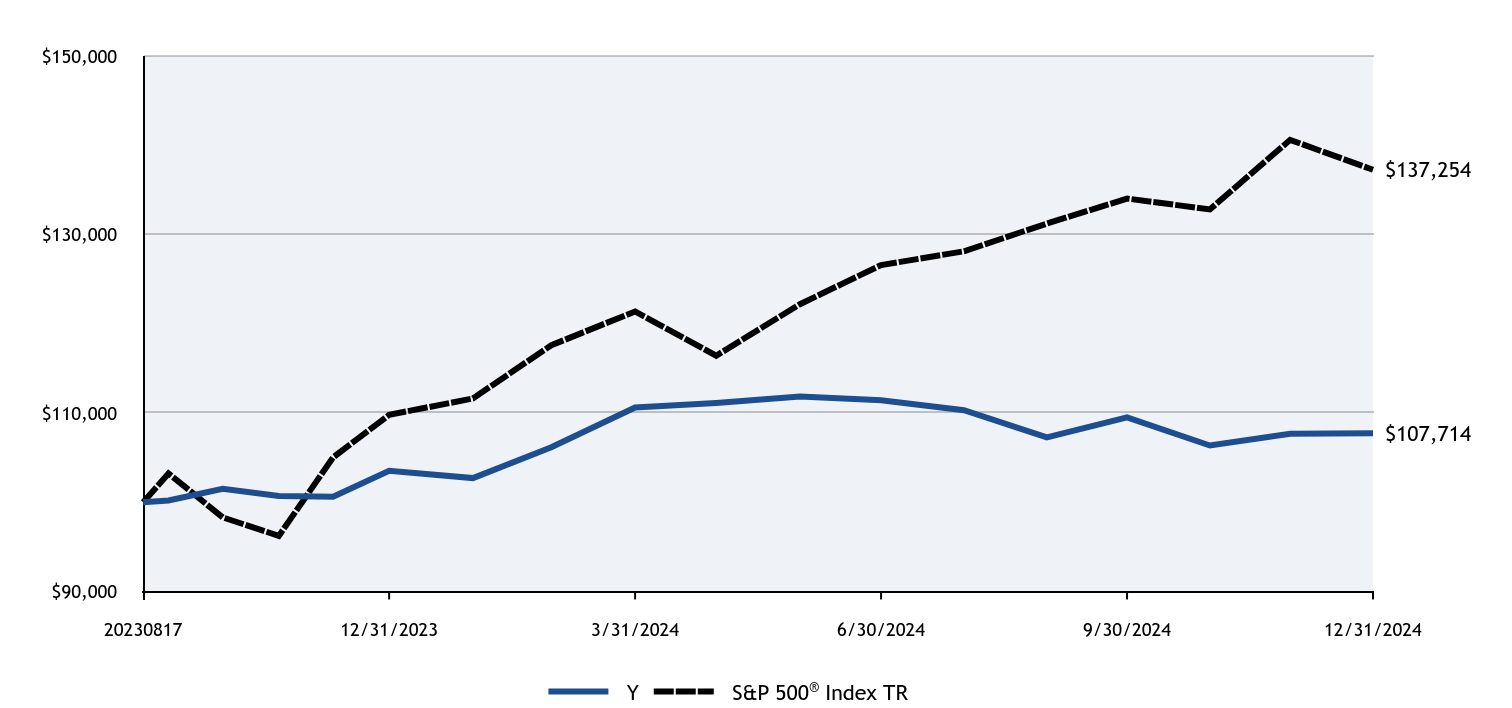
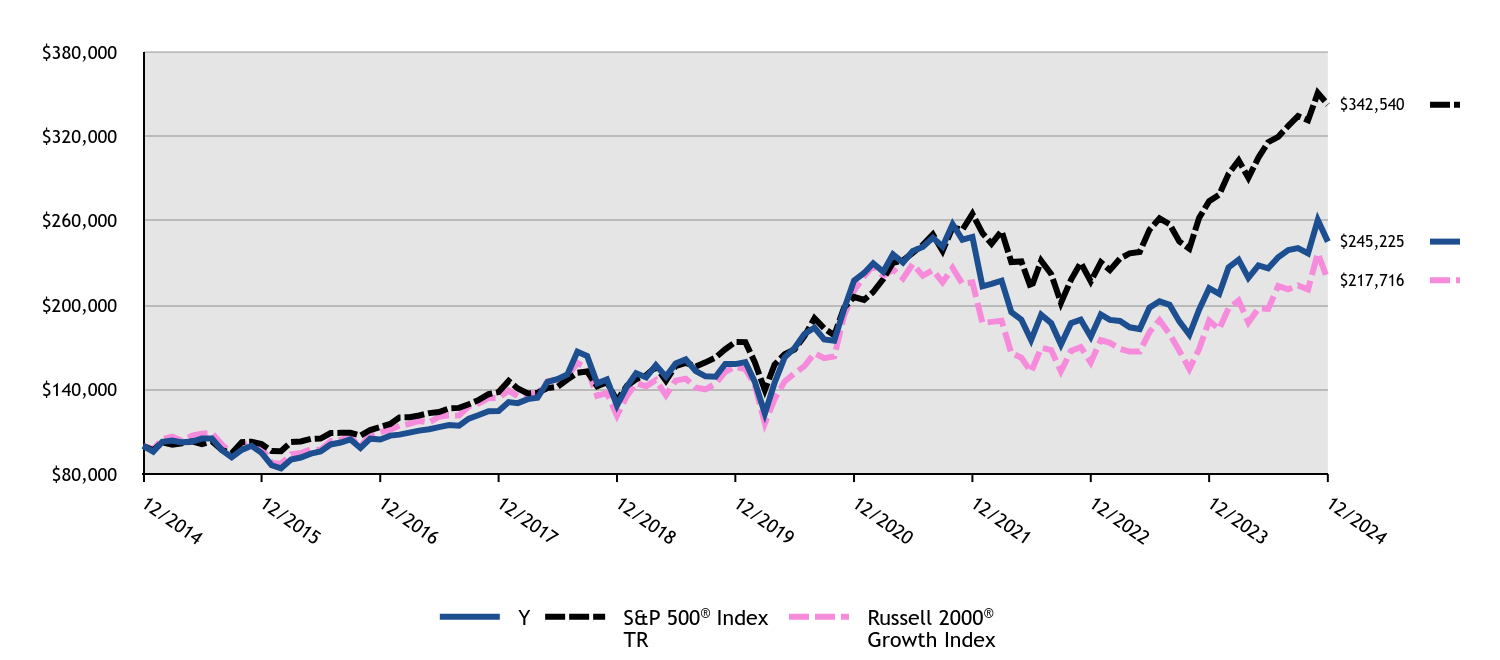
The Y Class of the Fund returned 15.61% for the twelve months ended December 31, 2024, compared to the S&P 500 Index return of 25.02% and the Russell 2000 Growth Index return of 15.15%.
• Overall market performance during the period was driven by mega-cap growth companies, while the Fund focuses its investments on small capitalization companies.
• The Fund’s performance was positive in all sectors where it invested. Holdings in the Energy and Financials sectors contributed materially to the Fund’s outperformance of the Russell 2000® Growth Index, while holdings in the Information Technology sector detracted.
Cumulative Performance from December 31, 2014 through December 31, 2024
The initial investment, based on a $100,000 investment, is adjusted to reflect the maximum applicable sales charge, if any.
| #ERROR:A result could not be returned because the conditional could not be evaluated to a True/False value (#ERROR:Invalid Formula (#!=""), 'Multiple values from an iterator cannot be used in a formula unless they are aggregrated.') | Y | S&P 500® Index TR | Russell 2000® Growth Index |
|---|
| 12/2014 | $100,000 | $100,000 | $100,000 |
|---|
| 01/2015 | $95,952 | $96,998 | $97,717 |
|---|
| 02/2015 | $102,961 | $102,573 | $104,749 |
|---|
| 03/2015 | $103,867 | $100,951 | $106,630 |
|---|
| 04/2015 | $102,538 | $101,919 | $103,493 |
|---|
| 05/2015 | $103,142 | $103,230 | $107,295 |
|---|
| 06/2015 | $105,196 | $101,231 | $108,738 |
|---|
| 07/2015 | $105,196 | $103,352 | $109,182 |
|---|
| 08/2015 | $96,918 | $97,117 | $100,908 |
|---|
| 09/2015 | $91,903 | $94,714 | $94,535 |
|---|
| 10/2015 | $97,160 | $102,703 | $99,897 |
|---|
| 11/2015 | $100,060 | $103,008 | $103,558 |
|---|
| 12/2015 | $95,059 | $101,384 | $98,618 |
|---|
| 01/2016 | $86,262 | $96,353 | $87,933 |
|---|
| 02/2016 | $84,110 | $96,223 | $87,311 |
|---|
| 03/2016 | $90,312 | $102,750 | $94,000 |
|---|
| 04/2016 | $91,768 | $103,149 | $94,938 |
|---|
| 05/2016 | $94,552 | $105,001 | $97,495 |
|---|
| 06/2016 | $96,071 | $105,273 | $97,047 |
|---|
| 07/2016 | $101,071 | $109,154 | $103,392 |
|---|
| 08/2016 | $102,400 | $109,308 | $104,491 |
|---|
| 09/2016 | $104,615 | $109,328 | $105,996 |
|---|
| 10/2016 | $98,540 | $107,334 | $99,409 |
|---|
| 11/2016 | $105,185 | $111,309 | $108,303 |
|---|
| 12/2016 | $104,522 | $113,509 | $109,780 |
|---|
| 01/2017 | $107,330 | $115,662 | $111,562 |
|---|
| 02/2017 | $108,032 | $120,255 | $114,298 |
|---|
| 03/2017 | $109,499 | $120,395 | $115,652 |
|---|
| 04/2017 | $110,903 | $121,631 | $117,782 |
|---|
| 05/2017 | $111,860 | $123,343 | $116,711 |
|---|
| 06/2017 | $113,328 | $124,113 | $120,728 |
|---|
| 07/2017 | $114,796 | $126,665 | $121,755 |
|---|
| 08/2017 | $114,413 | $127,053 | $121,613 |
|---|
| 09/2017 | $119,390 | $129,674 | $128,235 |
|---|
| 10/2017 | $121,942 | $132,700 | $130,222 |
|---|
| 11/2017 | $124,686 | $136,769 | $133,960 |
|---|
| 12/2017 | $124,819 | $138,290 | $134,115 |
|---|
| 01/2018 | $131,156 | $146,208 | $139,343 |
|---|
| 02/2018 | $130,430 | $140,819 | $135,376 |
|---|
| 03/2018 | $133,268 | $137,240 | $137,199 |
|---|
| 04/2018 | $134,258 | $137,767 | $137,333 |
|---|
| 05/2018 | $145,611 | $141,085 | $145,979 |
|---|
| 06/2018 | $147,459 | $141,953 | $147,121 |
|---|
| 07/2018 | $150,826 | $147,236 | $149,651 |
|---|
| 08/2018 | $166,931 | $152,033 | $158,968 |
|---|
| 09/2018 | $163,895 | $152,899 | $155,247 |
|---|
| 10/2018 | $144,555 | $142,448 | $135,603 |
|---|
| 11/2018 | $147,327 | $145,351 | $137,724 |
|---|
| 12/2018 | $128,783 | $132,227 | $121,631 |
|---|
| 01/2019 | $142,403 | $142,823 | $135,678 |
|---|
| 02/2019 | $151,703 | $147,409 | $144,440 |
|---|
| 03/2019 | $148,697 | $150,273 | $142,485 |
|---|
| 04/2019 | $157,432 | $156,358 | $146,824 |
|---|
| 05/2019 | $149,260 | $146,422 | $135,931 |
|---|
| 06/2019 | $158,560 | $156,741 | $146,400 |
|---|
| 07/2019 | $161,472 | $158,994 | $147,831 |
|---|
| 08/2019 | $153,205 | $156,475 | $141,452 |
|---|
| 09/2019 | $149,448 | $159,403 | $140,291 |
|---|
| 10/2019 | $149,166 | $162,855 | $144,283 |
|---|
| 11/2019 | $158,278 | $168,767 | $152,775 |
|---|
| 12/2019 | $158,177 | $173,861 | $156,276 |
|---|
| 01/2020 | $159,630 | $173,792 | $154,556 |
|---|
| 02/2020 | $145,514 | $159,486 | $143,397 |
|---|
| 03/2020 | $122,992 | $139,787 | $116,012 |
|---|
| 04/2020 | $144,892 | $157,707 | $133,291 |
|---|
| 05/2020 | $162,951 | $165,219 | $145,887 |
|---|
| 06/2020 | $169,386 | $168,504 | $151,493 |
|---|
| 07/2020 | $179,558 | $178,005 | $156,699 |
|---|
| 08/2020 | $184,021 | $190,801 | $165,891 |
|---|
| 09/2020 | $175,718 | $183,551 | $162,337 |
|---|
| 10/2020 | $174,783 | $178,669 | $163,570 |
|---|
| 11/2020 | $197,098 | $198,227 | $192,413 |
|---|
| 12/2020 | $217,589 | $205,849 | $210,398 |
|---|
| 01/2021 | $222,958 | $203,771 | $220,542 |
|---|
| 02/2021 | $229,811 | $209,390 | $227,824 |
|---|
| 03/2021 | $223,757 | $218,560 | $220,656 |
|---|
| 04/2021 | $236,207 | $230,224 | $225,467 |
|---|
| 05/2021 | $230,382 | $231,832 | $219,027 |
|---|
| 06/2021 | $238,492 | $237,244 | $229,300 |
|---|
| 07/2021 | $241,461 | $242,880 | $220,948 |
|---|
| 08/2021 | $247,972 | $250,265 | $224,964 |
|---|
| 09/2021 | $241,804 | $238,625 | $216,338 |
|---|
| 10/2021 | $257,566 | $255,344 | $226,469 |
|---|
| 11/2021 | $246,601 | $253,574 | $215,408 |
|---|
| 12/2021 | $248,558 | $264,939 | $216,363 |
|---|
| 01/2022 | $213,423 | $251,229 | $187,364 |
|---|
| 02/2022 | $215,214 | $243,707 | $188,181 |
|---|
| 03/2022 | $217,419 | $252,755 | $189,042 |
|---|
| 04/2022 | $195,098 | $230,715 | $165,848 |
|---|
| 05/2022 | $189,725 | $231,138 | $162,716 |
|---|
| 06/2022 | $175,258 | $212,059 | $152,643 |
|---|
| 07/2022 | $193,307 | $231,612 | $169,733 |
|---|
| 08/2022 | $187,245 | $222,166 | $168,138 |
|---|
| 09/2022 | $172,089 | $201,705 | $153,012 |
|---|
| 10/2022 | $187,245 | $218,035 | $167,536 |
|---|
| 11/2022 | $189,725 | $230,220 | $170,264 |
|---|
| 12/2022 | $177,625 | $216,956 | $159,335 |
|---|
| 01/2023 | $193,462 | $230,588 | $175,184 |
|---|
| 02/2023 | $189,581 | $224,962 | $173,287 |
|---|
| 03/2023 | $188,804 | $233,221 | $169,011 |
|---|
| 04/2023 | $184,302 | $236,861 | $167,047 |
|---|
| 05/2023 | $183,059 | $237,891 | $167,077 |
|---|
| 06/2023 | $198,276 | $253,610 | $180,930 |
|---|
| 07/2023 | $202,778 | $261,757 | $189,389 |
|---|
| 08/2023 | $200,294 | $257,589 | $179,531 |
|---|
| 09/2023 | $188,494 | $245,308 | $167,689 |
|---|
| 10/2023 | $179,023 | $240,150 | $154,756 |
|---|
| 11/2023 | $196,878 | $262,082 | $168,845 |
|---|
| 12/2023 | $212,115 | $273,988 | $189,064 |
|---|
| 01/2024 | $208,026 | $278,593 | $183,001 |
|---|
| 02/2024 | $226,895 | $293,468 | $197,865 |
|---|
| 03/2024 | $232,398 | $302,910 | $203,399 |
|---|
| 04/2024 | $219,505 | $290,538 | $187,737 |
|---|
| 05/2024 | $228,310 | $304,944 | $197,791 |
|---|
| 06/2024 | $226,266 | $315,886 | $197,461 |
|---|
| 07/2024 | $234,128 | $319,732 | $213,626 |
|---|
| 08/2024 | $239,160 | $327,487 | $211,260 |
|---|
| 09/2024 | $240,575 | $334,481 | $214,068 |
|---|
| 10/2024 | $236,801 | $331,448 | $211,228 |
|---|
| 11/2024 | $260,544 | $350,904 | $237,127 |
|---|
| 12/2024 | $245,225 | $342,540 | $217,716 |
|---|
Average Annual Total Returns (%)
| HEADER | 1 Year | 5 Years | 10 Years |
|---|
Class YFootnote Reference1 | 15.61% | 9.17% | 9.38% |
|---|
S&P 500® Index TR | 25.02% | 14.53% | 13.10% |
|---|
Russell 2000® Growth Index | 15.15% | 6.86% | 8.09% |
|---|
| Footnote | Description |
Footnote1 | Return may differ from actual shareholder return due to accounting adjustments for financial reporting purposes. |
Performance shown is historical and is not indicative of future returns. Investment returns and principal value will vary, and shares may be worth more or less at redemption than at original purchase. Performance shown is as of date indicated, and current performance may be lower or higher than the performance data quoted. To obtain performance as of the most recent month end, please visit americanbeaconfunds.com or call 800-967-9009. The graph and table do not reflect the deduction of taxes that a shareholder would pay on fund distributions or redemption of fund shares. The Fund's performance benefited from fee waivers. For more information, visit americanbeaconfunds.com/Performance_Disclaimers.aspx.
The S&P 500 Index TR is replacing the Russell 2000 Growth Index as broad-based securities market index to comply with a new regulatory requirement. The Russell 2000 Growth Index reflects the market sectors in which the Fund invests.
| Total Net Assets | $364,382,179 |
|---|
| # of Portfolio Holdings | 105 |
|---|
| Portfolio Turnover Rate | 37% |
|---|
| Total Management Fees Paid | $2,854,258 |
|---|
What did the Fund invest in?
Top Ten Holdings - % Net Assets
| CyberArk Software Ltd. | 2.2 |
| BellRing Brands, Inc. | 2.1 |
| Kratos Defense & Security Solutions, Inc. | 2.0 |
| Viper Energy, Inc. | 1.9 |
| Manhattan Associates, Inc. | 1.7 |
| HealthEquity, Inc. | 1.7 |
| Leonardo DRS, Inc. | 1.6 |
| RBC Bearings, Inc. | 1.6 |
| Ryan Specialty Holdings, Inc. | 1.5 |
| Descartes Systems Group, Inc. | 1.5 |
Excludes cash equivalents.
Asset Allocation - % Investments
| Value | Value |
|---|
| Common Stocks | 93.6 |
| Foreign Common Stocks | 4.7 |
| Investment Companies | 1.7 |
Sector Allocation - % Equities
| Value | Value |
|---|
| Communication Services | 1.0 |
| Materials | 1.1 |
| Consumer Staples | 3.0 |
| Energy | 6.1 |
| Consumer Discretionary | 11.3 |
| Financials | 11.5 |
| Health Care | 17.5 |
| Industrials | 22.0 |
| Information Technology | 26.5 |
For additional information about the Fund, including its prospectus, financial statements, holdings, and proxy voting information, please visit www.americanbeaconfunds.com/literature or call 1-800-658-5811.
If your financial institution mailed only one copy of this Report to an address shared by more than one account, you can request an individual copy by contacting your financial institution.
Stephens Small Cap Growth Fund
Distributed by:
Resolute Investment Distributors, Inc.
Annual Shareholder Report - December 31, 2024
Stephens Small Cap Growth Fund
Annual Shareholder Report - December 31, 2024
This annual shareholder report contains important information about American Beacon Stephens Small Cap Growth Fund for the period of January 1, 2024 to December 31, 2024. You can find additional information about the Fund at www.americanbeaconfunds.com/literature. You can also request this information by contacting us at 800-658-5811.
What were the Fund costs for the last year?
(based on a hypothetical $10,000 investment)
| Class Name | Costs of a $10,000 investment | Costs paid as a percentage of a $10,000 investment |
|---|
| Investor | $137 | 1.27% |
|---|
How did the Fund perform and what affected its performance?
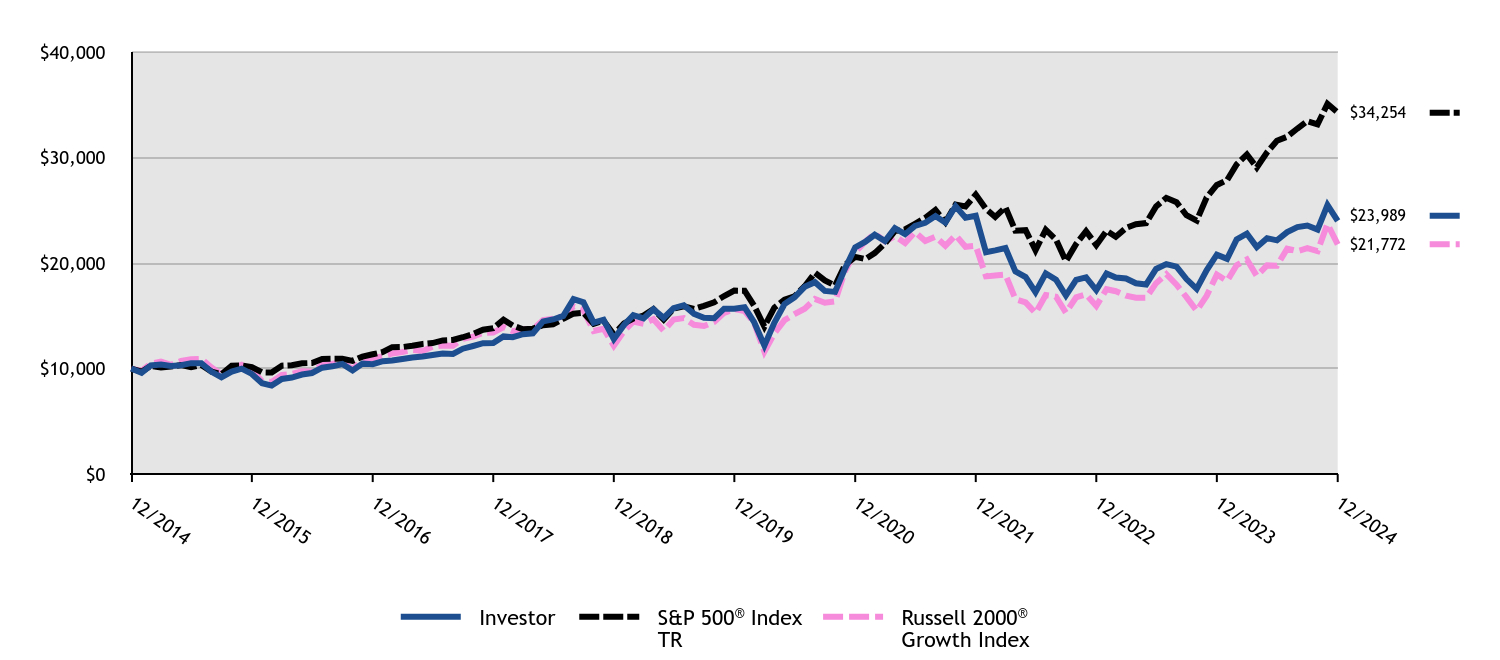
The Investor Class of the Fund returned 15.40% for the twelve months ended December 31, 2024, compared to the S&P 500 Index return of 25.02% and the Russell 2000 Growth Index return of 15.15%.
• Overall market performance during the period was driven by mega-cap growth companies, while the Fund focuses its investments on small capitalization companies.
• The Fund’s performance was positive in all sectors where it invested. Holdings in the Energy and Financials sectors contributed materially to the Fund’s outperformance of the Russell 2000® Growth Index, while holdings in the Information Technology sector detracted.
Cumulative Performance from December 31, 2014 through December 31, 2024
The initial investment, based on a $10,000 investment, is adjusted to reflect the maximum applicable sales charge, if any.
| Investor | S&P 500® Index TR | Russell 2000® Growth Index |
|---|
| 12/2014 | $10,000 | $10,000 | $10,000 |
|---|
| 01/2015 | $9,593 | $9,700 | $9,772 |
|---|
| 02/2015 | $10,299 | $10,257 | $10,475 |
|---|
| 03/2015 | $10,382 | $10,095 | $10,663 |
|---|
| 04/2015 | $10,248 | $10,192 | $10,349 |
|---|
| 05/2015 | $10,312 | $10,323 | $10,730 |
|---|
| 06/2015 | $10,509 | $10,123 | $10,874 |
|---|
| 07/2015 | $10,509 | $10,335 | $10,918 |
|---|
| 08/2015 | $9,688 | $9,712 | $10,091 |
|---|
| 09/2015 | $9,179 | $9,471 | $9,453 |
|---|
| 10/2015 | $9,707 | $10,270 | $9,990 |
|---|
| 11/2015 | $9,994 | $10,301 | $10,356 |
|---|
| 12/2015 | $9,492 | $10,138 | $9,862 |
|---|
| 01/2016 | $8,610 | $9,635 | $8,793 |
|---|
| 02/2016 | $8,389 | $9,622 | $8,731 |
|---|
| 03/2016 | $9,011 | $10,275 | $9,400 |
|---|
| 04/2016 | $9,151 | $10,315 | $9,494 |
|---|
| 05/2016 | $9,432 | $10,500 | $9,750 |
|---|
| 06/2016 | $9,579 | $10,527 | $9,705 |
|---|
| 07/2016 | $10,080 | $10,915 | $10,339 |
|---|
| 08/2016 | $10,214 | $10,931 | $10,449 |
|---|
| 09/2016 | $10,435 | $10,933 | $10,600 |
|---|
| 10/2016 | $9,820 | $10,733 | $9,941 |
|---|
| 11/2016 | $10,482 | $11,131 | $10,830 |
|---|
| 12/2016 | $10,418 | $11,351 | $10,978 |
|---|
| 01/2017 | $10,695 | $11,566 | $11,156 |
|---|
| 02/2017 | $10,762 | $12,025 | $11,430 |
|---|
| 03/2017 | $10,911 | $12,039 | $11,565 |
|---|
| 04/2017 | $11,045 | $12,163 | $11,778 |
|---|
| 05/2017 | $11,147 | $12,334 | $11,671 |
|---|
| 06/2017 | $11,288 | $12,411 | $12,073 |
|---|
| 07/2017 | $11,430 | $12,666 | $12,176 |
|---|
| 08/2017 | $11,389 | $12,705 | $12,161 |
|---|
| 09/2017 | $11,882 | $12,967 | $12,823 |
|---|
| 10/2017 | $12,138 | $13,270 | $13,022 |
|---|
| 11/2017 | $12,408 | $13,677 | $13,396 |
|---|
| 12/2017 | $12,422 | $13,829 | $13,411 |
|---|
| 01/2018 | $13,044 | $14,621 | $13,934 |
|---|
| 02/2018 | $12,974 | $14,082 | $13,538 |
|---|
| 03/2018 | $13,254 | $13,724 | $13,720 |
|---|
| 04/2018 | $13,344 | $13,777 | $13,733 |
|---|
| 05/2018 | $14,470 | $14,108 | $14,598 |
|---|
| 06/2018 | $14,652 | $14,195 | $14,712 |
|---|
| 07/2018 | $14,987 | $14,724 | $14,965 |
|---|
| 08/2018 | $16,581 | $15,203 | $15,897 |
|---|
| 09/2018 | $16,280 | $15,290 | $15,525 |
|---|
| 10/2018 | $14,351 | $14,245 | $13,560 |
|---|
| 11/2018 | $14,624 | $14,535 | $13,772 |
|---|
| 12/2018 | $12,786 | $13,223 | $12,163 |
|---|
| 01/2019 | $14,138 | $14,282 | $13,568 |
|---|
| 02/2019 | $15,059 | $14,741 | $14,444 |
|---|
| 03/2019 | $14,752 | $15,027 | $14,248 |
|---|
| 04/2019 | $15,612 | $15,636 | $14,682 |
|---|
| 05/2019 | $14,803 | $14,642 | $13,593 |
|---|
| 06/2019 | $15,724 | $15,674 | $14,640 |
|---|
| 07/2019 | $16,001 | $15,899 | $14,783 |
|---|
| 08/2019 | $15,182 | $15,648 | $14,145 |
|---|
| 09/2019 | $14,803 | $15,940 | $14,029 |
|---|
| 10/2019 | $14,772 | $16,286 | $14,428 |
|---|
| 11/2019 | $15,673 | $16,877 | $15,278 |
|---|
| 12/2019 | $15,662 | $17,386 | $15,628 |
|---|
| 01/2020 | $15,799 | $17,379 | $15,456 |
|---|
| 02/2020 | $14,393 | $15,949 | $14,340 |
|---|
| 03/2020 | $12,175 | $13,979 | $11,601 |
|---|
| 04/2020 | $14,336 | $15,771 | $13,329 |
|---|
| 05/2020 | $16,119 | $16,522 | $14,589 |
|---|
| 06/2020 | $16,748 | $16,850 | $15,149 |
|---|
| 07/2020 | $17,743 | $17,801 | $15,670 |
|---|
| 08/2020 | $18,188 | $19,080 | $16,589 |
|---|
| 09/2020 | $17,354 | $18,355 | $16,234 |
|---|
| 10/2020 | $17,262 | $17,867 | $16,357 |
|---|
| 11/2020 | $19,469 | $19,823 | $19,241 |
|---|
| 12/2020 | $21,485 | $20,585 | $21,040 |
|---|
| 01/2021 | $22,020 | $20,377 | $22,054 |
|---|
| 02/2021 | $22,682 | $20,939 | $22,782 |
|---|
| 03/2021 | $22,084 | $21,856 | $22,066 |
|---|
| 04/2021 | $23,306 | $23,022 | $22,547 |
|---|
| 05/2021 | $22,733 | $23,183 | $21,903 |
|---|
| 06/2021 | $23,522 | $23,724 | $22,930 |
|---|
| 07/2021 | $23,815 | $24,288 | $22,095 |
|---|
| 08/2021 | $24,451 | $25,026 | $22,496 |
|---|
| 09/2021 | $23,827 | $23,863 | $21,634 |
|---|
| 10/2021 | $25,380 | $25,534 | $22,647 |
|---|
| 11/2021 | $24,298 | $25,357 | $21,541 |
|---|
| 12/2021 | $24,478 | $26,494 | $21,636 |
|---|
| 01/2022 | $21,022 | $25,123 | $18,736 |
|---|
| 02/2022 | $21,196 | $24,371 | $18,818 |
|---|
| 03/2022 | $21,417 | $25,276 | $18,904 |
|---|
| 04/2022 | $19,207 | $23,071 | $16,585 |
|---|
| 05/2022 | $18,671 | $23,114 | $16,272 |
|---|
| 06/2022 | $17,234 | $21,206 | $15,264 |
|---|
| 07/2022 | $19,018 | $23,161 | $16,973 |
|---|
| 08/2022 | $18,418 | $22,217 | $16,814 |
|---|
| 09/2022 | $16,919 | $20,170 | $15,301 |
|---|
| 10/2022 | $18,402 | $21,804 | $16,754 |
|---|
| 11/2022 | $18,639 | $23,022 | $17,026 |
|---|
| 12/2022 | $17,442 | $21,696 | $15,933 |
|---|
| 01/2023 | $19,005 | $23,059 | $17,518 |
|---|
| 02/2023 | $18,623 | $22,496 | $17,329 |
|---|
| 03/2023 | $18,532 | $23,322 | $16,901 |
|---|
| 04/2023 | $18,078 | $23,686 | $16,705 |
|---|
| 05/2023 | $17,969 | $23,789 | $16,708 |
|---|
| 06/2023 | $19,441 | $25,361 | $18,093 |
|---|
| 07/2023 | $19,895 | $26,176 | $18,939 |
|---|
| 08/2023 | $19,659 | $25,759 | $17,953 |
|---|
| 09/2023 | $18,478 | $24,531 | $16,769 |
|---|
| 10/2023 | $17,551 | $24,015 | $15,476 |
|---|
| 11/2023 | $19,314 | $26,208 | $16,885 |
|---|
| 12/2023 | $20,788 | $27,399 | $18,906 |
|---|
| 01/2024 | $20,400 | $27,859 | $18,300 |
|---|
| 02/2024 | $22,245 | $29,347 | $19,787 |
|---|
| 03/2024 | $22,780 | $30,291 | $20,340 |
|---|
| 04/2024 | $21,507 | $29,054 | $18,774 |
|---|
| 05/2024 | $22,356 | $30,494 | $19,779 |
|---|
| 06/2024 | $22,153 | $31,589 | $19,746 |
|---|
| 07/2024 | $22,927 | $31,973 | $21,363 |
|---|
| 08/2024 | $23,407 | $32,749 | $21,126 |
|---|
| 09/2024 | $23,554 | $33,448 | $21,407 |
|---|
| 10/2024 | $23,167 | $33,145 | $21,123 |
|---|
| 11/2024 | $25,491 | $35,090 | $23,713 |
|---|
| 12/2024 | $23,989 | $34,254 | $21,772 |
|---|
Average Annual Total Returns (%)
| HEADER | 1 Year | 5 Years | 10 Years |
|---|
Investor ClassFootnote Reference1 | 15.40% | 8.90% | 9.14% |
|---|
S&P 500® Index TR | 25.02% | 14.53% | 13.10% |
|---|
Russell 2000® Growth Index | 15.15% | 6.86% | 8.09% |
|---|
| Footnote | Description |
Footnote1 | Return may differ from actual shareholder return due to accounting adjustments for financial reporting purposes. |
Performance shown is historical and is not indicative of future returns. Investment returns and principal value will vary, and shares may be worth more or less at redemption than at original purchase. Performance shown is as of date indicated, and current performance may be lower or higher than the performance data quoted. To obtain performance as of the most recent month end, please visit americanbeaconfunds.com or call 800-967-9009. The graph and table do not reflect the deduction of taxes that a shareholder would pay on fund distributions or redemption of fund shares. The Fund's performance benefited from fee waivers. For more information, visit americanbeaconfunds.com/Performance_Disclaimers.aspx.
The S&P 500 Index TR is replacing the Russell 2000 Growth Index as broad-based securities market index to comply with a new regulatory requirement. The Russell 2000 Growth Index reflects the market sectors in which the Fund invests.
| Total Net Assets | $364,382,179 |
|---|
| # of Portfolio Holdings | 105 |
|---|
| Portfolio Turnover Rate | 37% |
|---|
| Total Management Fees Paid | $2,854,258 |
|---|
What did the Fund invest in?
Top Ten Holdings - % Net Assets
| CyberArk Software Ltd. | 2.2 |
| BellRing Brands, Inc. | 2.1 |
| Kratos Defense & Security Solutions, Inc. | 2.0 |
| Viper Energy, Inc. | 1.9 |
| Manhattan Associates, Inc. | 1.7 |
| HealthEquity, Inc. | 1.7 |
| Leonardo DRS, Inc. | 1.6 |
| RBC Bearings, Inc. | 1.6 |
| Ryan Specialty Holdings, Inc. | 1.5 |
| Descartes Systems Group, Inc. | 1.5 |
Excludes cash equivalents.
Asset Allocation - % Investments
| Value | Value |
|---|
| Common Stocks | 93.6 |
| Foreign Common Stocks | 4.7 |
| Investment Companies | 1.7 |
Sector Allocation - % Equities
| Value | Value |
|---|
| Communication Services | 1.0 |
| Materials | 1.1 |
| Consumer Staples | 3.0 |
| Energy | 6.1 |
| Consumer Discretionary | 11.3 |
| Financials | 11.5 |
| Health Care | 17.5 |
| Industrials | 22.0 |
| Information Technology | 26.5 |
For additional information about the Fund, including its prospectus, financial statements, holdings, and proxy voting information, please visit www.americanbeaconfunds.com/literature or call 1-800-658-5811.
If your financial institution mailed only one copy of this Report to an address shared by more than one account, you can request an individual copy by contacting your financial institution.
Stephens Small Cap Growth Fund
Distributed by:
Resolute Investment Distributors, Inc.
Annual Shareholder Report - December 31, 2024
Stephens Small Cap Growth Fund
Annual Shareholder Report - December 31, 2024
This annual shareholder report contains important information about American Beacon Stephens Small Cap Growth Fund for the period of January 1, 2024 to December 31, 2024. You can find additional information about the Fund at www.americanbeaconfunds.com/literature. You can also request this information by contacting us at 800-658-5811.
What were the Fund costs for the last year?
(based on a hypothetical $10,000 investment)
| Class Name | Costs of a $10,000 investment | Costs paid as a percentage of a $10,000 investment |
|---|
| R6 | $104 | 0.96% |
|---|
How did the Fund perform and what affected its performance?
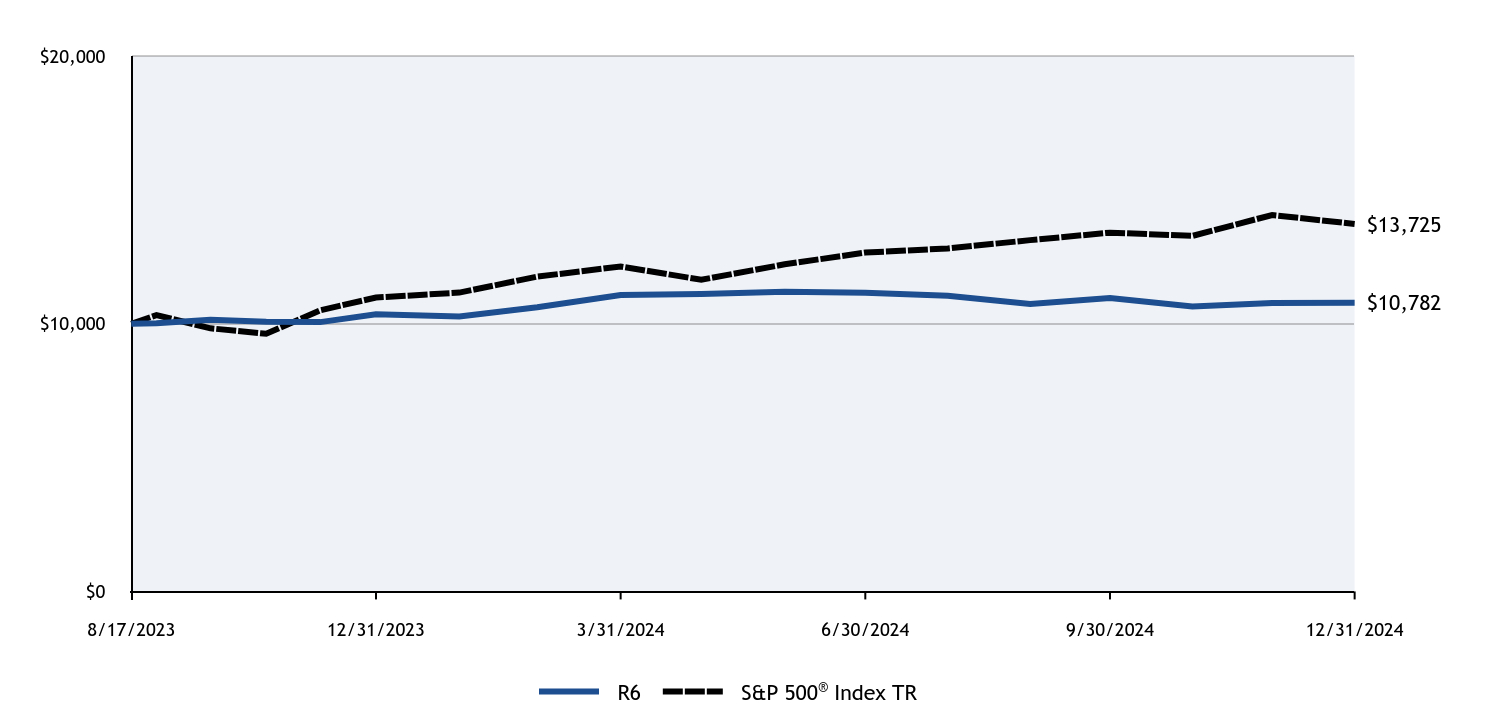
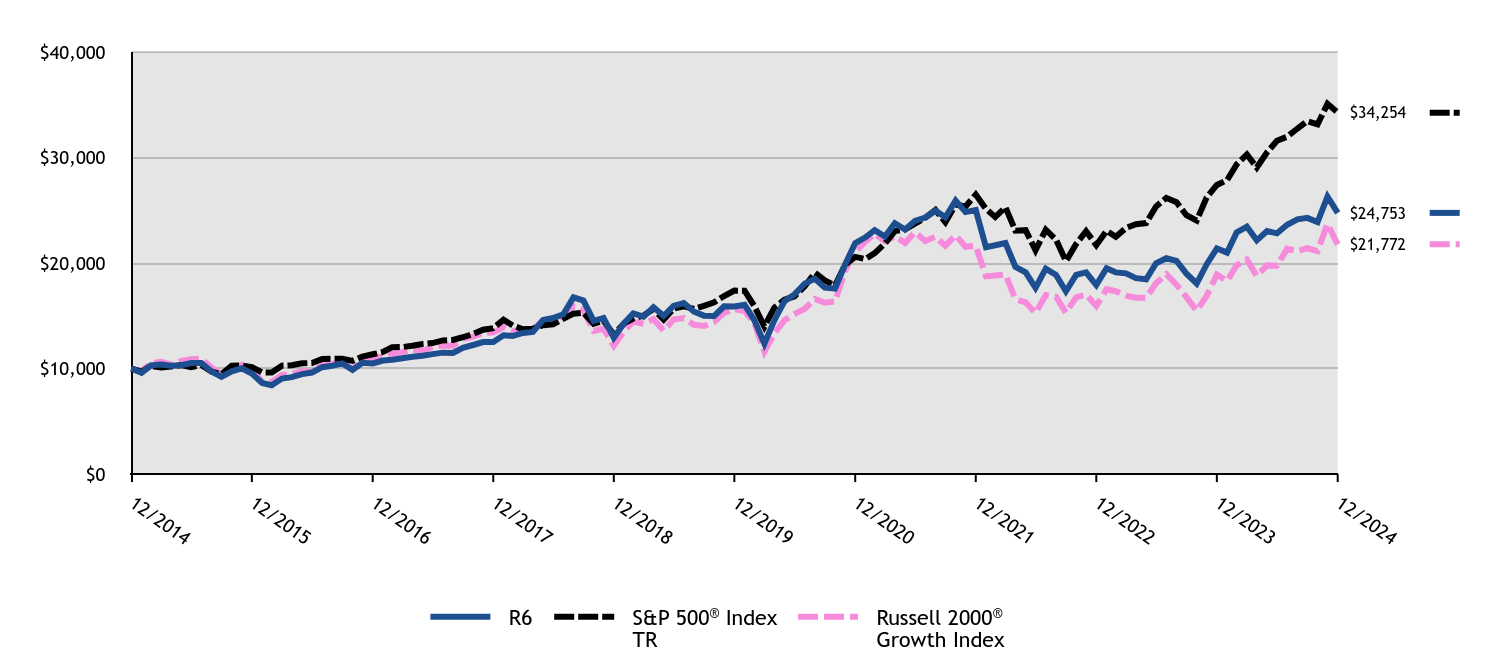
The R6 Class of the Fund returned 15.73% for the twelve months ended December 31, 2024, compared to the S&P 500 Index return of 25.02% and the Russell 2000 Growth Index return of 15.15%.
• Overall market performance during the period was driven by mega-cap growth companies, while the Fund focuses its investments on small capitalization companies.
• The Fund’s performance was positive in all sectors where it invested. Holdings in the Energy and Financials sectors contributed materially to the Fund’s outperformance of the Russell 2000® Growth Index, while holdings in the Information Technology sector detracted.
Cumulative Performance from December 31, 2014 through December 31, 2024
The initial investment, based on a $10,000 investment, is adjusted to reflect the maximum applicable sales charge, if any.
| R6 | S&P 500® Index TR | Russell 2000® Growth Index |
|---|
| 12/2014 | $10,000 | $10,000 | $10,000 |
|---|
| 01/2015 | $9,590 | $9,700 | $9,772 |
|---|
| 02/2015 | $10,302 | $10,257 | $10,475 |
|---|
| 03/2015 | $10,386 | $10,095 | $10,663 |
|---|
| 04/2015 | $10,259 | $10,192 | $10,349 |
|---|
| 05/2015 | $10,320 | $10,323 | $10,730 |
|---|
| 06/2015 | $10,525 | $10,123 | $10,874 |
|---|
| 07/2015 | $10,525 | $10,335 | $10,918 |
|---|
| 08/2015 | $9,710 | $9,712 | $10,091 |
|---|
| 09/2015 | $9,204 | $9,471 | $9,453 |
|---|
| 10/2015 | $9,735 | $10,270 | $9,990 |
|---|
| 11/2015 | $10,024 | $10,301 | $10,356 |
|---|
| 12/2015 | $9,525 | $10,138 | $9,862 |
|---|
| 01/2016 | $8,641 | $9,635 | $8,793 |
|---|
| 02/2016 | $8,426 | $9,622 | $8,731 |
|---|
| 03/2016 | $9,051 | $10,275 | $9,400 |
|---|
| 04/2016 | $9,190 | $10,315 | $9,494 |
|---|
| 05/2016 | $9,475 | $10,500 | $9,750 |
|---|
| 06/2016 | $9,626 | $10,527 | $9,705 |
|---|
| 07/2016 | $10,132 | $10,915 | $10,339 |
|---|
| 08/2016 | $10,264 | $10,931 | $10,449 |
|---|
| 09/2016 | $10,485 | $10,933 | $10,600 |
|---|
| 10/2016 | $9,879 | $10,733 | $9,941 |
|---|
| 11/2016 | $10,542 | $11,131 | $10,830 |
|---|
| 12/2016 | $10,482 | $11,351 | $10,978 |
|---|
| 01/2017 | $10,756 | $11,566 | $11,156 |
|---|
| 02/2017 | $10,826 | $12,025 | $11,430 |
|---|
| 03/2017 | $10,979 | $12,039 | $11,565 |
|---|
| 04/2017 | $11,119 | $12,163 | $11,778 |
|---|
| 05/2017 | $11,221 | $12,334 | $11,671 |
|---|
| 06/2017 | $11,368 | $12,411 | $12,073 |
|---|
| 07/2017 | $11,508 | $12,666 | $12,176 |
|---|
| 08/2017 | $11,476 | $12,705 | $12,161 |
|---|
| 09/2017 | $11,972 | $12,967 | $12,823 |
|---|
| 10/2017 | $12,234 | $13,270 | $13,022 |
|---|
| 11/2017 | $12,507 | $13,677 | $13,396 |
|---|
| 12/2017 | $12,521 | $13,829 | $13,411 |
|---|
| 01/2018 | $13,153 | $14,621 | $13,934 |
|---|
| 02/2018 | $13,081 | $14,082 | $13,538 |
|---|
| 03/2018 | $13,370 | $13,724 | $13,720 |
|---|
| 04/2018 | $13,469 | $13,777 | $13,733 |
|---|
| 05/2018 | $14,609 | $14,108 | $14,598 |
|---|
| 06/2018 | $14,793 | $14,195 | $14,712 |
|---|
| 07/2018 | $15,135 | $14,724 | $14,965 |
|---|
| 08/2018 | $16,749 | $15,203 | $15,897 |
|---|
| 09/2018 | $16,446 | $15,290 | $15,525 |
|---|
| 10/2018 | $14,510 | $14,245 | $13,560 |
|---|
| 11/2018 | $14,786 | $14,535 | $13,772 |
|---|
| 12/2018 | $12,928 | $13,223 | $12,163 |
|---|
| 01/2019 | $14,293 | $14,282 | $13,568 |
|---|
| 02/2019 | $15,228 | $14,741 | $14,444 |
|---|
| 03/2019 | $14,920 | $15,027 | $14,248 |
|---|
| 04/2019 | $15,808 | $15,636 | $14,682 |
|---|
| 05/2019 | $14,994 | $14,642 | $13,593 |
|---|
| 06/2019 | $15,929 | $15,674 | $14,640 |
|---|
| 07/2019 | $16,210 | $15,899 | $14,783 |
|---|
| 08/2019 | $15,387 | $15,648 | $14,145 |
|---|
| 09/2019 | $15,013 | $15,940 | $14,029 |
|---|
| 10/2019 | $14,985 | $16,286 | $14,428 |
|---|
| 11/2019 | $15,901 | $16,877 | $15,278 |
|---|
| 12/2019 | $15,891 | $17,386 | $15,628 |
|---|
| 01/2020 | $16,036 | $17,379 | $15,456 |
|---|
| 02/2020 | $14,622 | $15,949 | $14,340 |
|---|
| 03/2020 | $12,362 | $13,979 | $11,601 |
|---|
| 04/2020 | $14,560 | $15,771 | $13,329 |
|---|
| 05/2020 | $16,387 | $16,522 | $14,589 |
|---|
| 06/2020 | $17,026 | $16,850 | $15,149 |
|---|
| 07/2020 | $18,048 | $17,801 | $15,670 |
|---|
| 08/2020 | $18,512 | $19,080 | $16,589 |
|---|
| 09/2020 | $17,666 | $18,355 | $16,234 |
|---|
| 10/2020 | $17,584 | $17,867 | $16,357 |
|---|
| 11/2020 | $19,833 | $19,823 | $19,241 |
|---|
| 12/2020 | $21,891 | $20,585 | $21,040 |
|---|
| 01/2021 | $22,436 | $20,377 | $22,054 |
|---|
| 02/2021 | $23,116 | $20,939 | $22,782 |
|---|
| 03/2021 | $22,515 | $21,856 | $22,066 |
|---|
| 04/2021 | $23,774 | $23,022 | $22,547 |
|---|
| 05/2021 | $23,184 | $23,183 | $21,903 |
|---|
| 06/2021 | $24,001 | $23,724 | $22,930 |
|---|
| 07/2021 | $24,307 | $24,288 | $22,095 |
|---|
| 08/2021 | $24,965 | $25,026 | $22,496 |
|---|
| 09/2021 | $24,341 | $23,863 | $21,634 |
|---|
| 10/2021 | $25,929 | $25,534 | $22,647 |
|---|
| 11/2021 | $24,829 | $25,357 | $21,541 |
|---|
| 12/2021 | $25,022 | $26,494 | $21,636 |
|---|
| 01/2022 | $21,502 | $25,123 | $18,736 |
|---|
| 02/2022 | $21,680 | $24,371 | $18,818 |
|---|
| 03/2022 | $21,898 | $25,276 | $18,904 |
|---|
| 04/2022 | $19,647 | $23,071 | $16,585 |
|---|
| 05/2022 | $19,115 | $23,114 | $16,272 |
|---|
| 06/2022 | $17,655 | $21,206 | $15,264 |
|---|
| 07/2022 | $19,469 | $23,161 | $16,973 |
|---|
| 08/2022 | $18,869 | $22,217 | $16,814 |
|---|
| 09/2022 | $17,327 | $20,170 | $15,301 |
|---|
| 10/2022 | $18,869 | $21,804 | $16,754 |
|---|
| 11/2022 | $19,115 | $23,022 | $17,026 |
|---|
| 12/2022 | $17,904 | $21,696 | $15,933 |
|---|
| 01/2023 | $19,500 | $23,059 | $17,518 |
|---|
| 02/2023 | $19,116 | $22,496 | $17,329 |
|---|
| 03/2023 | $19,024 | $23,322 | $16,901 |
|---|
| 04/2023 | $18,564 | $23,686 | $16,705 |
|---|
| 05/2023 | $18,457 | $23,789 | $16,708 |
|---|
| 06/2023 | $19,976 | $25,361 | $18,093 |
|---|
| 07/2023 | $20,451 | $26,176 | $18,939 |
|---|
| 08/2023 | $20,206 | $25,759 | $17,953 |
|---|
| 09/2023 | $18,994 | $24,531 | $16,769 |
|---|
| 10/2023 | $18,058 | $24,015 | $15,476 |
|---|
| 11/2023 | $19,868 | $26,208 | $16,885 |
|---|
| 12/2023 | $21,389 | $27,399 | $18,906 |
|---|
| 01/2024 | $20,985 | $27,859 | $18,300 |
|---|
| 02/2024 | $22,896 | $29,347 | $19,787 |
|---|
| 03/2024 | $23,439 | $30,291 | $20,340 |
|---|
| 04/2024 | $22,150 | $29,054 | $18,774 |
|---|
| 05/2024 | $23,035 | $30,494 | $19,779 |
|---|
| 06/2024 | $22,818 | $31,589 | $19,746 |
|---|
| 07/2024 | $23,626 | $31,973 | $21,363 |
|---|
| 08/2024 | $24,138 | $32,749 | $21,126 |
|---|
| 09/2024 | $24,278 | $33,448 | $21,407 |
|---|
| 10/2024 | $23,890 | $33,145 | $21,123 |
|---|
| 11/2024 | $26,297 | $35,090 | $23,713 |
|---|
| 12/2024 | $24,753 | $34,254 | $21,772 |
|---|
Average Annual Total Returns (%)
| HEADER | 1 Year | 5 Years | 10 Years |
|---|
R6 ClassFootnote Reference1 | 15.73% | 9.27% | 9.49% |
|---|
S&P 500® Index TR | 25.02% | 14.53% | 13.10% |
|---|
Russell 2000® Growth Index | 15.15% | 6.86% | 8.09% |
|---|
| Footnote | Description |
Footnote1 | Return may differ from actual shareholder return due to accounting adjustments for financial reporting purposes. |
Performance shown is historical and is not indicative of future returns. Investment returns and principal value will vary, and shares may be worth more or less at redemption than at original purchase. Performance shown is as of date indicated, and current performance may be lower or higher than the performance data quoted. To obtain performance as of the most recent month end, please visit americanbeaconfunds.com or call 800-967-9009. The graph and table do not reflect the deduction of taxes that a shareholder would pay on fund distributions or redemption of fund shares. The Fund's performance benefited from fee waivers. Performance includes historical performance of another Class of the Fund. For more information, visit americanbeaconfunds.com/Performance_Disclaimers.aspx.
The S&P 500 Index TR is replacing the Russell 2000 Growth Index as broad-based securities market index to comply with a new regulatory requirement. The Russell 2000 Growth Index reflects the market sectors in which the Fund invests.
| Total Net Assets | $364,382,179 |
|---|
| # of Portfolio Holdings | 105 |
|---|
| Portfolio Turnover Rate | 37% |
|---|
| Total Management Fees Paid | $2,854,258 |
|---|
What did the Fund invest in?
Top Ten Holdings - % Net Assets
| CyberArk Software Ltd. | 2.2 |
| BellRing Brands, Inc. | 2.1 |
| Kratos Defense & Security Solutions, Inc. | 2.0 |
| Viper Energy, Inc. | 1.9 |
| Manhattan Associates, Inc. | 1.7 |
| HealthEquity, Inc. | 1.7 |
| Leonardo DRS, Inc. | 1.6 |
| RBC Bearings, Inc. | 1.6 |
| Ryan Specialty Holdings, Inc. | 1.5 |
| Descartes Systems Group, Inc. | 1.5 |
Excludes cash equivalents.
Asset Allocation - % Investments
| Value | Value |
|---|
| Common Stocks | 93.6 |
| Foreign Common Stocks | 4.7 |
| Investment Companies | 1.7 |
Sector Allocation - % Equities
| Value | Value |
|---|
| Communication Services | 1.0 |
| Materials | 1.1 |
| Consumer Staples | 3.0 |
| Energy | 6.1 |
| Consumer Discretionary | 11.3 |
| Financials | 11.5 |
| Health Care | 17.5 |
| Industrials | 22.0 |
| Information Technology | 26.5 |
For additional information about the Fund, including its prospectus, financial statements, holdings, and proxy voting information, please visit www.americanbeaconfunds.com/literature or call 1-800-658-5811.
If your financial institution mailed only one copy of this Report to an address shared by more than one account, you can request an individual copy by contacting your financial institution.
Stephens Small Cap Growth Fund
Distributed by:
Resolute Investment Distributors, Inc.
Annual Shareholder Report - December 31, 2024
Stephens Mid-Cap Growth Fund
Annual Shareholder Report - December 31, 2024
This annual shareholder report contains important information about American Beacon Stephens Mid-Cap Growth Fund for the period of January 1, 2024 to December 31, 2024. You can find additional information about the Fund at www.americanbeaconfunds.com/literature. You can also request this information by contacting us at 800-658-5811.
What were the Fund costs for the last year?
(based on a hypothetical $10,000 investment)
| Class Name | Costs of a $10,000 investment | Costs paid as a percentage of a $10,000 investment |
|---|
| Class A | $128 | 1.20% |
|---|
How did the Fund perform and what affected its performance?
The A Class of the Fund returned 6.51% (with sales charges) and 13.03% (without sales charges) for the twelve months ended December 31, 2024, compared to the S&P 500 Index return of 25.02% and the Russell Midcap Growth Index return of 22.10%.
• Overall market performance during the period was driven by mega-cap growth companies, while the Fund focuses its investments on medium-capitalization companies.
• The Fund’s performance was mixed across all sectors where it invested. The Fund saw positive performance in all sectors except Consumer Staples, Real Estate and Health Care. The Fund’s holdings in the Information Technology, Consumer Discretionary, and Health Care sectors detracted materially from performance relative to the Russell Midcap® Growth Index.
Cumulative Performance from December 31, 2014 through December 31, 2024
The initial investment, based on a $10,000 investment, is adjusted to reflect the maximum applicable sales charge, if any.
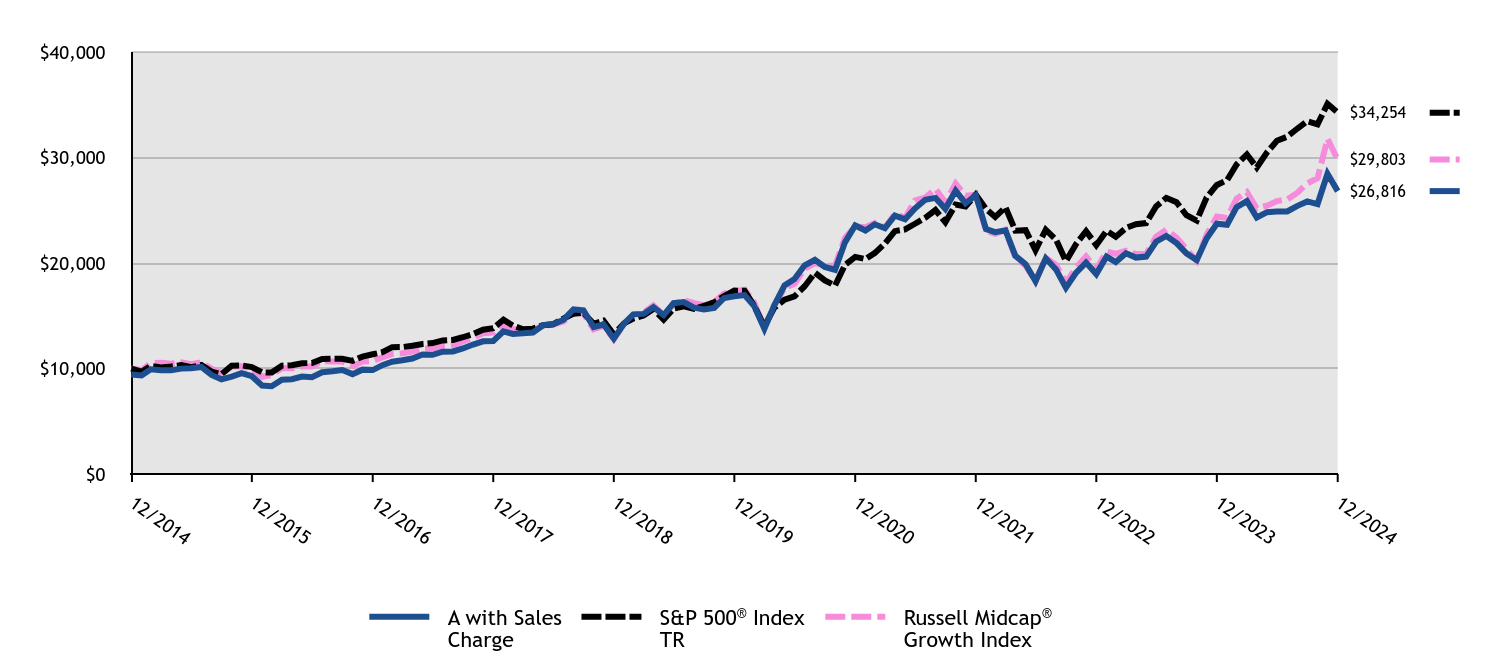
| A with Sales Charge | S&P 500® Index TR | Russell Midcap® Growth Index |
|---|
| 12/2014 | $9,427 | $10,000 | $10,000 |
|---|
| 01/2015 | $9,343 | $9,700 | $9,832 |
|---|
| 02/2015 | $9,928 | $10,257 | $10,508 |
|---|
| 03/2015 | $9,833 | $10,095 | $10,538 |
|---|
| 04/2015 | $9,833 | $10,192 | $10,464 |
|---|
| 05/2015 | $9,994 | $10,323 | $10,588 |
|---|
| 06/2015 | $10,033 | $10,123 | $10,418 |
|---|
| 07/2015 | $10,150 | $10,335 | $10,586 |
|---|
| 08/2015 | $9,399 | $9,712 | $9,970 |
|---|
| 09/2015 | $8,976 | $9,471 | $9,585 |
|---|
| 10/2015 | $9,232 | $10,270 | $10,189 |
|---|
| 11/2015 | $9,572 | $10,301 | $10,211 |
|---|
| 12/2015 | $9,273 | $10,138 | $9,980 |
|---|
| 01/2016 | $8,391 | $9,635 | $9,225 |
|---|
| 02/2016 | $8,320 | $9,622 | $9,369 |
|---|
| 03/2016 | $8,943 | $10,275 | $10,038 |
|---|
| 04/2016 | $8,996 | $10,315 | $10,032 |
|---|
| 05/2016 | $9,249 | $10,500 | $10,196 |
|---|
| 06/2016 | $9,179 | $10,527 | $10,195 |
|---|
| 07/2016 | $9,649 | $10,915 | $10,700 |
|---|
| 08/2016 | $9,749 | $10,931 | $10,668 |
|---|
| 09/2016 | $9,867 | $10,933 | $10,663 |
|---|
| 10/2016 | $9,473 | $10,733 | $10,230 |
|---|
| 11/2016 | $9,896 | $11,131 | $10,674 |
|---|
| 12/2016 | $9,857 | $11,351 | $10,711 |
|---|
| 01/2017 | $10,346 | $11,566 | $11,068 |
|---|
| 02/2017 | $10,653 | $12,025 | $11,387 |
|---|
| 03/2017 | $10,785 | $12,039 | $11,450 |
|---|
| 04/2017 | $10,954 | $12,163 | $11,620 |
|---|
| 05/2017 | $11,331 | $12,334 | $11,897 |
|---|
| 06/2017 | $11,305 | $12,411 | $11,932 |
|---|
| 07/2017 | $11,594 | $12,666 | $12,132 |
|---|
| 08/2017 | $11,619 | $12,705 | $12,217 |
|---|
| 09/2017 | $11,907 | $12,967 | $12,563 |
|---|
| 10/2017 | $12,277 | $13,270 | $12,914 |
|---|
| 11/2017 | $12,585 | $13,677 | $13,346 |
|---|
| 12/2017 | $12,610 | $13,829 | $13,418 |
|---|
| 01/2018 | $13,536 | $14,621 | $14,177 |
|---|
| 02/2018 | $13,285 | $14,082 | $13,732 |
|---|
| 03/2018 | $13,337 | $13,724 | $13,710 |
|---|
| 04/2018 | $13,417 | $13,777 | $13,580 |
|---|
| 05/2018 | $14,104 | $14,108 | $14,088 |
|---|
| 06/2018 | $14,223 | $14,195 | $14,143 |
|---|
| 07/2018 | $14,606 | $14,724 | $14,446 |
|---|
| 08/2018 | $15,604 | $15,203 | $15,279 |
|---|
| 09/2018 | $15,519 | $15,290 | $15,214 |
|---|
| 10/2018 | $13,939 | $14,245 | $13,707 |
|---|
| 11/2018 | $14,177 | $14,535 | $14,056 |
|---|
| 12/2018 | $12,838 | $13,223 | $12,780 |
|---|
| 01/2019 | $14,245 | $14,282 | $14,249 |
|---|
| 02/2019 | $15,136 | $14,741 | $15,085 |
|---|
| 03/2019 | $15,180 | $15,027 | $15,288 |
|---|
| 04/2019 | $15,818 | $15,636 | $15,976 |
|---|
| 05/2019 | $15,056 | $14,642 | $15,057 |
|---|
| 06/2019 | $16,195 | $15,674 | $16,114 |
|---|
| 07/2019 | $16,296 | $15,899 | $16,490 |
|---|
| 08/2019 | $15,774 | $15,648 | $16,190 |
|---|
| 09/2019 | $15,600 | $15,940 | $16,005 |
|---|
| 10/2019 | $15,752 | $16,286 | $16,302 |
|---|
| 11/2019 | $16,687 | $16,877 | $17,113 |
|---|
| 12/2019 | $16,846 | $17,386 | $17,314 |
|---|
| 01/2020 | $16,966 | $17,379 | $17,476 |
|---|
| 02/2020 | $15,922 | $15,949 | $16,271 |
|---|
| 03/2020 | $13,774 | $13,979 | $13,844 |
|---|
| 04/2020 | $15,989 | $15,771 | $16,012 |
|---|
| 05/2020 | $17,882 | $16,522 | $17,620 |
|---|
| 06/2020 | $18,475 | $16,850 | $18,033 |
|---|
| 07/2020 | $19,782 | $17,801 | $19,474 |
|---|
| 08/2020 | $20,300 | $19,080 | $20,004 |
|---|
| 09/2020 | $19,632 | $18,355 | $19,724 |
|---|
| 10/2020 | $19,347 | $17,867 | $19,748 |
|---|
| 11/2020 | $21,960 | $19,823 | $22,400 |
|---|
| 12/2020 | $23,559 | $20,585 | $23,475 |
|---|
| 01/2021 | $23,079 | $20,377 | $23,397 |
|---|
| 02/2021 | $23,673 | $20,939 | $23,796 |
|---|
| 03/2021 | $23,300 | $21,856 | $23,342 |
|---|
| 04/2021 | $24,496 | $23,022 | $24,654 |
|---|
| 05/2021 | $24,146 | $23,183 | $24,277 |
|---|
| 06/2021 | $25,167 | $23,724 | $25,927 |
|---|
| 07/2021 | $25,990 | $24,288 | $26,194 |
|---|
| 08/2021 | $26,173 | $25,026 | $27,039 |
|---|
| 09/2021 | $25,136 | $23,863 | $25,730 |
|---|
| 10/2021 | $26,851 | $25,534 | $27,534 |
|---|
| 11/2021 | $25,654 | $25,357 | $26,370 |
|---|
| 12/2021 | $26,426 | $26,494 | $26,463 |
|---|
| 01/2022 | $23,219 | $25,123 | $23,048 |
|---|
| 02/2022 | $22,923 | $24,371 | $22,768 |
|---|
| 03/2022 | $23,096 | $25,276 | $23,134 |
|---|
| 04/2022 | $20,676 | $23,071 | $20,529 |
|---|
| 05/2022 | $19,881 | $23,114 | $19,734 |
|---|
| 06/2022 | $18,273 | $21,206 | $18,259 |
|---|
| 07/2022 | $20,447 | $23,161 | $20,494 |
|---|
| 08/2022 | $19,397 | $22,217 | $19,822 |
|---|
| 09/2022 | $17,650 | $20,170 | $18,140 |
|---|
| 10/2022 | $19,085 | $21,804 | $19,566 |
|---|
| 11/2022 | $20,045 | $23,022 | $20,630 |
|---|
| 12/2022 | $18,956 | $21,696 | $19,392 |
|---|
| 01/2023 | $20,611 | $23,059 | $21,084 |
|---|
| 02/2023 | $20,093 | $22,496 | $20,876 |
|---|
| 03/2023 | $20,924 | $23,322 | $21,163 |
|---|
| 04/2023 | $20,517 | $23,686 | $20,857 |
|---|
| 05/2023 | $20,611 | $23,789 | $20,870 |
|---|
| 06/2023 | $22,019 | $25,361 | $22,483 |
|---|
| 07/2023 | $22,562 | $26,176 | $23,163 |
|---|
| 08/2023 | $21,892 | $25,759 | $22,399 |
|---|
| 09/2023 | $20,916 | $24,531 | $21,308 |
|---|
| 10/2023 | $20,271 | $24,015 | $20,221 |
|---|
| 11/2023 | $22,316 | $26,208 | $22,688 |
|---|
| 12/2023 | $23,725 | $27,399 | $24,408 |
|---|
| 01/2024 | $23,623 | $27,859 | $24,276 |
|---|
| 02/2024 | $25,303 | $29,347 | $26,102 |
|---|
| 03/2024 | $25,871 | $30,291 | $26,726 |
|---|
| 04/2024 | $24,319 | $29,054 | $25,174 |
|---|
| 05/2024 | $24,819 | $30,494 | $25,442 |
|---|
| 06/2024 | $24,879 | $31,589 | $25,867 |
|---|
| 07/2024 | $24,887 | $31,973 | $26,024 |
|---|
| 08/2024 | $25,422 | $32,749 | $26,670 |
|---|
| 09/2024 | $25,837 | $33,448 | $27,559 |
|---|
| 10/2024 | $25,591 | $33,145 | $28,040 |
|---|
| 11/2024 | $28,459 | $35,090 | $31,778 |
|---|
| 12/2024 | $26,816 | $34,254 | $29,803 |
|---|
Average Annual Total Returns (%)
| HEADER | 1 Year | 5 Years | 10 Years |
|---|
Class A without Sales ChargeFootnote Reference1 | 13.03% | 9.74% | 11.02% |
|---|
Class A with Maximum Sales Charge - 5.75%Footnote Reference1 | 6.51% | 8.45% | 10.37% |
|---|
S&P 500® Index TR | 25.02% | 14.53% | 13.10% |
|---|
Russell Midcap® Growth Index | 22.10% | 11.47% | 11.54% |
|---|
| Footnote | Description |
Footnote1 | Return may differ from actual shareholder return due to accounting adjustments for financial reporting purposes. |
Performance shown is historical and is not indicative of future returns. Investment returns and principal value will vary, and shares may be worth more or less at redemption than at original purchase. Performance shown is as of date indicated, and current performance may be lower or higher than the performance data quoted. To obtain performance as of the most recent month end, please visit americanbeaconfunds.com or call 800-967-9009. The graph and table do not reflect the deduction of taxes that a shareholder would pay on fund distributions or redemption of fund shares. The Fund's performance benefited from fee waivers. For more information, visit americanbeaconfunds.com/Performance_Disclaimers.aspx.
The S&P 500 Index TR is replacing the Russell Midcap Growth Index as broad-based securities market index to comply with a new regulatory requirement. The Russell Midcap Growth Index reflects the market sectors in which the Fund invests.
| Total Net Assets | $800,155,455 |
|---|
| # of Portfolio Holdings | 93 |
|---|
| Portfolio Turnover Rate | 24% |
|---|
| Total Management Fees Paid | $5,993,794 |
|---|
What did the Fund invest in?
Top Ten Holdings - % Net Assets
| Palantir Technologies, Inc., Class A | 2.7 |
| Axon Enterprise, Inc. | 2.3 |
| Spotify Technology SA | 2.1 |
| Tradeweb Markets, Inc., Class A | 2.1 |
| Copart, Inc. | 2.0 |
| Guidewire Software, Inc. | 2.0 |
| Burlington Stores, Inc. | 1.9 |
| Marvell Technology, Inc. | 1.8 |
| Take-Two Interactive Software, Inc. | 1.8 |
| Manhattan Associates, Inc. | 1.8 |
Excludes cash equivalents.
Asset Allocation - % Investments
| Value | Value |
|---|
| Common Stocks | 96.7 |
| Investment Companies | 2.0 |
| Foreign Common Stocks | 1.3 |
Sector Allocation - % Equities
| Value | Value |
|---|
| Consumer Staples | 0.2 |
| Utilities | 0.8 |
| Real Estate | 0.9 |
| Energy | 5.8 |
| Communication Services | 8.8 |
| Financials | 9.0 |
| Consumer Discretionary | 10.2 |
| Health Care | 15.1 |
| Industrials | 19.3 |
| Information Technology | 29.9 |
For additional information about the Fund, including its prospectus, financial statements, holdings, and proxy voting information, please visit www.americanbeaconfunds.com/literature or call 1-800-658-5811.
If your financial institution mailed only one copy of this Report to an address shared by more than one account, you can request an individual copy by contacting your financial institution.
Stephens Mid-Cap Growth Fund
Distributed by:
Resolute Investment Distributors, Inc.
Annual Shareholder Report - December 31, 2024
Stephens Mid-Cap Growth Fund
Annual Shareholder Report - December 31, 2024
This annual shareholder report contains important information about American Beacon Stephens Mid-Cap Growth Fund for the period of January 1, 2024 to December 31, 2024. You can find additional information about the Fund at www.americanbeaconfunds.com/literature. You can also request this information by contacting us at 800-658-5811.
What were the Fund costs for the last year?
(based on a hypothetical $10,000 investment)
| Class Name | Costs of a $10,000 investment | Costs paid as a percentage of a $10,000 investment |
|---|
| Class C | $206 | 1.94% |
|---|
How did the Fund perform and what affected its performance?
The C Class of the Fund returned 11.20% (with sales charges) and 12.20% (without sales charges) for the twelve months ended December 31, 2024, compared to the S&P 500 Index return of 25.02% and the Russell Midcap Growth Index return of 22.10%.
• Overall market performance during the period was driven by mega-cap growth companies, while the Fund focuses its investments on medium-capitalization companies.
• The Fund’s performance was mixed across all sectors where it invested. The Fund saw positive performance in all sectors except Consumer Staples, Real Estate and Health Care. The Fund’s holdings in the Information Technology, Consumer Discretionary, and Health Care sectors detracted materially from performance relative to the Russell Midcap® Growth Index.
Cumulative Performance from December 31, 2014 through December 31, 2024
The initial investment, based on a $10,000 investment, is adjusted to reflect the maximum applicable sales charge, if any.
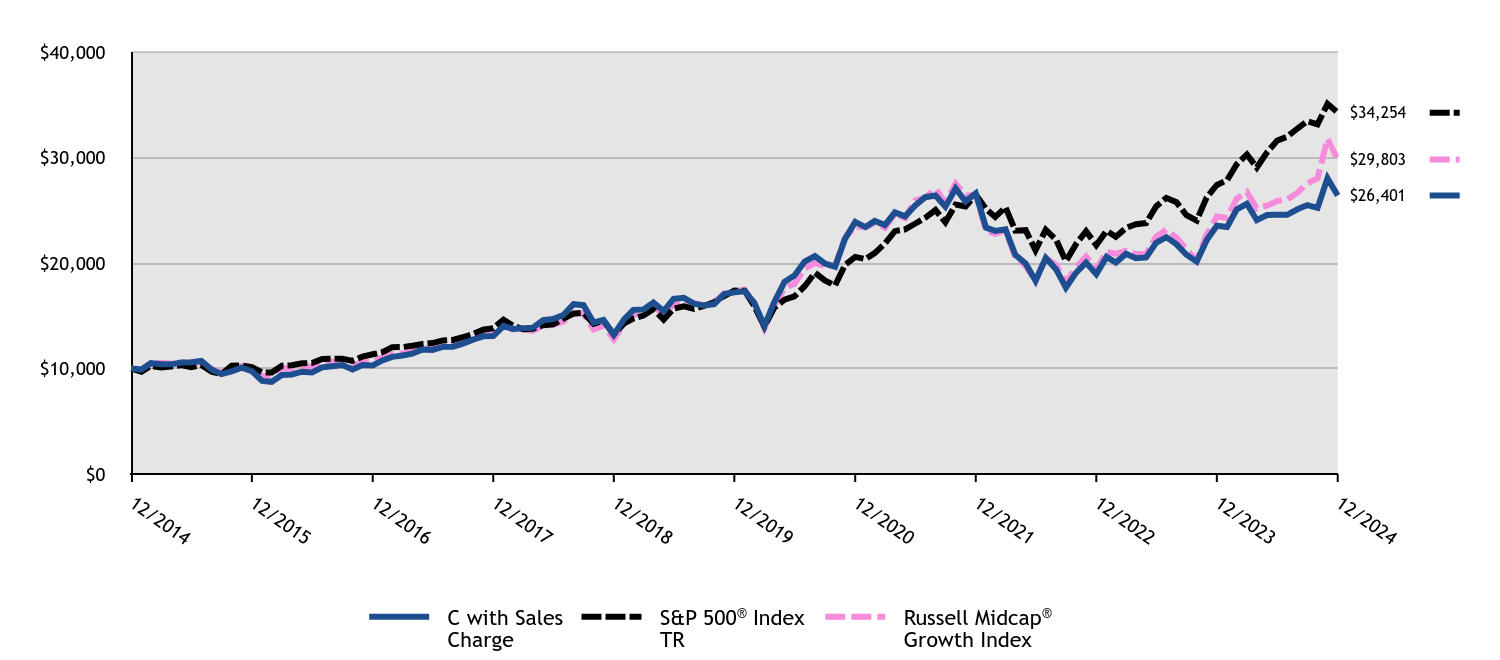
| C with Sales Charge | S&P 500® Index TR | Russell Midcap® Growth Index |
|---|
| 12/2014 | $10,000 | $10,000 | $10,000 |
|---|
| 01/2015 | $9,903 | $9,700 | $9,832 |
|---|
| 02/2015 | $10,519 | $10,257 | $10,508 |
|---|
| 03/2015 | $10,410 | $10,095 | $10,538 |
|---|
| 04/2015 | $10,398 | $10,192 | $10,464 |
|---|
| 05/2015 | $10,567 | $10,323 | $10,588 |
|---|
| 06/2015 | $10,603 | $10,123 | $10,418 |
|---|
| 07/2015 | $10,718 | $10,335 | $10,586 |
|---|
| 08/2015 | $9,916 | $9,712 | $9,970 |
|---|
| 09/2015 | $9,469 | $9,471 | $9,585 |
|---|
| 10/2015 | $9,728 | $10,270 | $10,189 |
|---|
| 11/2015 | $10,084 | $10,301 | $10,211 |
|---|
| 12/2015 | $9,754 | $10,138 | $9,980 |
|---|
| 01/2016 | $8,828 | $9,635 | $9,225 |
|---|
| 02/2016 | $8,745 | $9,622 | $9,369 |
|---|
| 03/2016 | $9,390 | $10,275 | $10,038 |
|---|
| 04/2016 | $9,441 | $10,315 | $10,032 |
|---|
| 05/2016 | $9,703 | $10,500 | $10,196 |
|---|
| 06/2016 | $9,626 | $10,527 | $10,195 |
|---|
| 07/2016 | $10,112 | $10,915 | $10,700 |
|---|
| 08/2016 | $10,214 | $10,931 | $10,668 |
|---|
| 09/2016 | $10,329 | $10,933 | $10,663 |
|---|
| 10/2016 | $9,907 | $10,733 | $10,230 |
|---|
| 11/2016 | $10,342 | $11,131 | $10,674 |
|---|
| 12/2016 | $10,299 | $11,351 | $10,711 |
|---|
| 01/2017 | $10,798 | $11,566 | $11,068 |
|---|
| 02/2017 | $11,112 | $12,025 | $11,387 |
|---|
| 03/2017 | $11,242 | $12,039 | $11,450 |
|---|
| 04/2017 | $11,413 | $12,163 | $11,620 |
|---|
| 05/2017 | $11,802 | $12,334 | $11,897 |
|---|
| 06/2017 | $11,768 | $12,411 | $11,932 |
|---|
| 07/2017 | $12,055 | $12,666 | $12,132 |
|---|
| 08/2017 | $12,075 | $12,705 | $12,217 |
|---|
| 09/2017 | $12,369 | $12,967 | $12,563 |
|---|
| 10/2017 | $12,744 | $13,270 | $12,914 |
|---|
| 11/2017 | $13,052 | $13,677 | $13,346 |
|---|
| 12/2017 | $13,073 | $13,829 | $13,418 |
|---|
| 01/2018 | $14,033 | $14,621 | $14,177 |
|---|
| 02/2018 | $13,759 | $14,082 | $13,732 |
|---|
| 03/2018 | $13,809 | $13,724 | $13,710 |
|---|
| 04/2018 | $13,874 | $13,777 | $13,580 |
|---|
| 05/2018 | $14,582 | $14,108 | $14,088 |
|---|
| 06/2018 | $14,690 | $14,195 | $14,143 |
|---|
| 07/2018 | $15,080 | $14,724 | $14,446 |
|---|
| 08/2018 | $16,098 | $15,203 | $15,279 |
|---|
| 09/2018 | $16,004 | $15,290 | $15,214 |
|---|
| 10/2018 | $14,365 | $14,245 | $13,707 |
|---|
| 11/2018 | $14,603 | $14,535 | $14,056 |
|---|
| 12/2018 | $13,213 | $13,223 | $12,780 |
|---|
| 01/2019 | $14,655 | $14,282 | $14,249 |
|---|
| 02/2019 | $15,563 | $14,741 | $15,085 |
|---|
| 03/2019 | $15,595 | $15,027 | $15,288 |
|---|
| 04/2019 | $16,248 | $15,636 | $15,976 |
|---|
| 05/2019 | $15,451 | $14,642 | $15,057 |
|---|
| 06/2019 | $16,606 | $15,674 | $16,114 |
|---|
| 07/2019 | $16,702 | $15,899 | $16,490 |
|---|
| 08/2019 | $16,152 | $15,648 | $16,190 |
|---|
| 09/2019 | $15,969 | $15,940 | $16,005 |
|---|
| 10/2019 | $16,112 | $16,286 | $16,302 |
|---|
| 11/2019 | $17,060 | $16,877 | $17,113 |
|---|
| 12/2019 | $17,218 | $17,386 | $17,314 |
|---|
| 01/2020 | $17,326 | $17,379 | $17,476 |
|---|
| 02/2020 | $16,259 | $15,949 | $16,271 |
|---|
| 03/2020 | $14,049 | $13,979 | $13,844 |
|---|
| 04/2020 | $16,308 | $15,771 | $16,012 |
|---|
| 05/2020 | $18,220 | $16,522 | $17,620 |
|---|
| 06/2020 | $18,815 | $16,850 | $18,033 |
|---|
| 07/2020 | $20,139 | $17,801 | $19,474 |
|---|
| 08/2020 | $20,652 | $19,080 | $20,004 |
|---|
| 09/2020 | $19,957 | $18,355 | $19,724 |
|---|
| 10/2020 | $19,651 | $17,867 | $19,748 |
|---|
| 11/2020 | $22,290 | $19,823 | $22,400 |
|---|
| 12/2020 | $23,903 | $20,585 | $23,475 |
|---|
| 01/2021 | $23,407 | $20,377 | $23,397 |
|---|
| 02/2021 | $23,987 | $20,939 | $23,796 |
|---|
| 03/2021 | $23,600 | $21,856 | $23,342 |
|---|
| 04/2021 | $24,802 | $23,022 | $24,654 |
|---|
| 05/2021 | $24,424 | $23,183 | $24,277 |
|---|
| 06/2021 | $25,424 | $23,724 | $25,927 |
|---|
| 07/2021 | $26,240 | $24,288 | $26,194 |
|---|
| 08/2021 | $26,408 | $25,026 | $27,039 |
|---|
| 09/2021 | $25,340 | $23,863 | $25,730 |
|---|
| 10/2021 | $27,063 | $25,534 | $27,534 |
|---|
| 11/2021 | $25,836 | $25,357 | $26,370 |
|---|
| 12/2021 | $26,603 | $26,494 | $26,463 |
|---|
| 01/2022 | $23,349 | $25,123 | $23,048 |
|---|
| 02/2022 | $23,048 | $24,371 | $22,768 |
|---|
| 03/2022 | $23,203 | $25,276 | $23,134 |
|---|
| 04/2022 | $20,761 | $23,071 | $20,529 |
|---|
| 05/2022 | $19,950 | $23,114 | $19,734 |
|---|
| 06/2022 | $18,327 | $21,206 | $18,259 |
|---|
| 07/2022 | $20,487 | $23,161 | $20,494 |
|---|
| 08/2022 | $19,421 | $22,217 | $19,822 |
|---|
| 09/2022 | $17,662 | $20,170 | $18,140 |
|---|
| 10/2022 | $19,093 | $21,804 | $19,566 |
|---|
| 11/2022 | $20,041 | $23,022 | $20,630 |
|---|
| 12/2022 | $18,940 | $21,696 | $19,392 |
|---|
| 01/2023 | $20,578 | $23,059 | $21,084 |
|---|
| 02/2023 | $20,048 | $22,496 | $20,876 |
|---|
| 03/2023 | $20,871 | $23,322 | $21,163 |
|---|
| 04/2023 | $20,455 | $23,686 | $20,857 |
|---|
| 05/2023 | $20,530 | $23,789 | $20,870 |
|---|
| 06/2023 | $21,922 | $25,361 | $22,483 |
|---|
| 07/2023 | $22,452 | $26,176 | $23,163 |
|---|
| 08/2023 | $21,770 | $25,759 | $22,399 |
|---|
| 09/2023 | $20,786 | $24,531 | $21,308 |
|---|
| 10/2023 | $20,133 | $24,015 | $20,221 |
|---|
| 11/2023 | $22,149 | $26,208 | $22,688 |
|---|
| 12/2023 | $23,531 | $27,399 | $24,408 |
|---|
| 01/2024 | $23,417 | $27,859 | $24,276 |
|---|
| 02/2024 | $25,074 | $29,347 | $26,102 |
|---|
| 03/2024 | $25,613 | $30,291 | $26,726 |
|---|
| 04/2024 | $24,061 | $29,054 | $25,174 |
|---|
| 05/2024 | $24,544 | $30,494 | $25,442 |
|---|
| 06/2024 | $24,581 | $31,589 | $25,867 |
|---|
| 07/2024 | $24,572 | $31,973 | $26,024 |
|---|
| 08/2024 | $25,093 | $32,749 | $26,670 |
|---|
| 09/2024 | $25,490 | $33,448 | $27,559 |
|---|
| 10/2024 | $25,225 | $33,145 | $28,040 |
|---|
| 11/2024 | $28,036 | $35,090 | $31,778 |
|---|
| 12/2024 | $26,401 | $34,254 | $29,803 |
|---|
Average Annual Total Returns (%)
| HEADER | 1 Year | 5 Years | 10 Years |
|---|
Class C without Deferred Sales ChargeFootnote Reference1 | 12.20% | 8.92% | 10.20% |
|---|
Class C with Maximum Deferred Sales Charge -1.00%Footnote Reference1 | 11.20% | 8.92% | 10.20% |
|---|
S&P 500® Index TR | 25.02% | 14.53% | 13.10% |
|---|
Russell Midcap® Growth Index | 22.10% | 11.47% | 11.54% |
|---|
| Footnote | Description |
Footnote1 | Return may differ from actual shareholder return due to accounting adjustments for financial reporting purposes. |
Performance shown is historical and is not indicative of future returns. Investment returns and principal value will vary, and shares may be worth more or less at redemption than at original purchase. Performance shown is as of date indicated, and current performance may be lower or higher than the performance data quoted. To obtain performance as of the most recent month end, please visit americanbeaconfunds.com or call 800-967-9009. The graph and table do not reflect the deduction of taxes that a shareholder would pay on fund distributions or redemption of fund shares. The Fund's performance benefited from fee waivers. For more information, visit americanbeaconfunds.com/Performance_Disclaimers.aspx.
The S&P 500 Index TR is replacing the Russell Midcap Growth Index as broad-based securities market index to comply with a new regulatory requirement. The Russell Midcap Growth Index reflects the market sectors in which the Fund invests.
| Total Net Assets | $800,155,455 |
|---|
| # of Portfolio Holdings | 93 |
|---|
| Portfolio Turnover Rate | 24% |
|---|
| Total Management Fees Paid | $5,993,794 |
|---|
What did the Fund invest in?
Top Ten Holdings - % Net Assets
| Palantir Technologies, Inc., Class A | 2.7 |
| Axon Enterprise, Inc. | 2.3 |
| Spotify Technology SA | 2.1 |
| Tradeweb Markets, Inc., Class A | 2.1 |
| Copart, Inc. | 2.0 |
| Guidewire Software, Inc. | 2.0 |
| Burlington Stores, Inc. | 1.9 |
| Marvell Technology, Inc. | 1.8 |
| Take-Two Interactive Software, Inc. | 1.8 |
| Manhattan Associates, Inc. | 1.8 |
Excludes cash equivalents.
Asset Allocation - % Investments
| Value | Value |
|---|
| Common Stocks | 96.7 |
| Investment Companies | 2.0 |
| Foreign Common Stocks | 1.3 |
Sector Allocation - % Equities
| Value | Value |
|---|
| Consumer Staples | 0.2 |
| Utilities | 0.8 |
| Real Estate | 0.9 |
| Energy | 5.8 |
| Communication Services | 8.8 |
| Financials | 9.0 |
| Consumer Discretionary | 10.2 |
| Health Care | 15.1 |
| Industrials | 19.3 |
| Information Technology | 29.9 |
For additional information about the Fund, including its prospectus, financial statements, holdings, and proxy voting information, please visit www.americanbeaconfunds.com/literature or call 1-800-658-5811.
If your financial institution mailed only one copy of this Report to an address shared by more than one account, you can request an individual copy by contacting your financial institution.
Stephens Mid-Cap Growth Fund
Distributed by:
Resolute Investment Distributors, Inc.
Annual Shareholder Report - December 31, 2024
Stephens Mid-Cap Growth Fund
Annual Shareholder Report - December 31, 2024
This annual shareholder report contains important information about American Beacon Stephens Mid-Cap Growth Fund for the period of January 1, 2024 to December 31, 2024. You can find additional information about the Fund at www.americanbeaconfunds.com/literature. You can also request this information by contacting us at 800-658-5811.
What were the Fund costs for the last year?
(based on a hypothetical $10,000 investment)
| Class Name | Costs of a $10,000 investment | Costs paid as a percentage of a $10,000 investment |
|---|
| R5 | $95 | 0.89% |
|---|
How did the Fund perform and what affected its performance?
The R5 Class of the Fund returned 13.41% for the twelve months ended December 31, 2024, compared to the S&P 500 Index return of 25.02% and the Russell Midcap Growth Index return of 22.10%.
• Overall market performance during the period was driven by mega-cap growth companies, while the Fund focuses its investments on medium-capitalization companies.
• The Fund’s performance was mixed across all sectors where it invested. The Fund saw positive performance in all sectors except Consumer Staples, Real Estate and Health Care. The Fund’s holdings in the Information Technology, Consumer Discretionary, and Health Care sectors detracted materially from performance relative to the Russell Midcap® Growth Index.
Cumulative Performance from December 31, 2014 through December 31, 2024
The initial investment, based on a $250,000 investment, is adjusted to reflect the maximum applicable sales charge, if any.

| R5 | S&P 500® Index TR | Russell Midcap® Growth Index |
|---|
| 12/2014 | $250,000 | $250,000 | $250,000 |
|---|
| 01/2015 | $247,921 | $242,495 | $245,788 |
|---|
| 02/2015 | $263,514 | $256,432 | $262,705 |
|---|
| 03/2015 | $261,045 | $252,376 | $263,445 |
|---|
| 04/2015 | $261,045 | $254,798 | $261,596 |
|---|
| 05/2015 | $265,463 | $258,074 | $264,702 |
|---|
| 06/2015 | $266,632 | $253,078 | $260,439 |
|---|
| 07/2015 | $269,880 | $258,381 | $264,660 |
|---|
| 08/2015 | $249,870 | $242,791 | $249,261 |
|---|
| 09/2015 | $238,825 | $236,784 | $239,632 |
|---|
| 10/2015 | $245,712 | $256,758 | $254,713 |
|---|
| 11/2015 | $254,808 | $257,521 | $255,270 |
|---|
| 12/2015 | $246,791 | $253,459 | $249,500 |
|---|
| 01/2016 | $223,612 | $240,882 | $230,613 |
|---|
| 02/2016 | $221,703 | $240,557 | $234,227 |
|---|
| 03/2016 | $238,337 | $256,876 | $250,945 |
|---|
| 04/2016 | $239,837 | $257,872 | $250,792 |
|---|
| 05/2016 | $246,655 | $262,503 | $254,905 |
|---|
| 06/2016 | $245,019 | $263,183 | $254,866 |
|---|
| 07/2016 | $257,563 | $272,886 | $267,488 |
|---|
| 08/2016 | $260,426 | $273,269 | $266,703 |
|---|
| 09/2016 | $263,562 | $273,320 | $266,569 |
|---|
| 10/2016 | $253,063 | $268,335 | $255,740 |
|---|
| 11/2016 | $264,516 | $278,273 | $266,857 |
|---|
| 12/2016 | $263,615 | $283,773 | $267,785 |
|---|
| 01/2017 | $276,731 | $289,155 | $276,712 |
|---|
| 02/2017 | $284,946 | $300,637 | $284,669 |
|---|
| 03/2017 | $288,693 | $300,987 | $286,247 |
|---|
| 04/2017 | $293,306 | $304,078 | $290,493 |
|---|
| 05/2017 | $303,539 | $308,357 | $297,430 |
|---|
| 06/2017 | $302,962 | $310,282 | $298,312 |
|---|
| 07/2017 | $310,745 | $316,662 | $303,295 |
|---|
| 08/2017 | $311,610 | $317,632 | $305,436 |
|---|
| 09/2017 | $319,393 | $324,184 | $314,072 |
|---|
| 10/2017 | $329,338 | $331,749 | $322,860 |
|---|
| 11/2017 | $337,698 | $341,924 | $333,651 |
|---|
| 12/2017 | $338,435 | $345,725 | $335,448 |
|---|
| 01/2018 | $363,611 | $365,519 | $354,427 |
|---|
| 02/2018 | $356,827 | $352,047 | $343,302 |
|---|
| 03/2018 | $358,485 | $343,101 | $342,742 |
|---|
| 04/2018 | $360,596 | $344,417 | $339,505 |
|---|
| 05/2018 | $379,289 | $352,712 | $352,203 |
|---|
| 06/2018 | $382,455 | $354,882 | $353,564 |
|---|
| 07/2018 | $392,856 | $368,089 | $361,154 |
|---|
| 08/2018 | $419,841 | $380,083 | $381,970 |
|---|
| 09/2018 | $417,730 | $382,247 | $380,345 |
|---|
| 10/2018 | $375,369 | $356,120 | $342,682 |
|---|
| 11/2018 | $382,002 | $363,377 | $351,399 |
|---|
| 12/2018 | $345,892 | $330,567 | $319,512 |
|---|
| 01/2019 | $384,016 | $357,058 | $356,228 |
|---|
| 02/2019 | $408,292 | $368,522 | $377,116 |
|---|
| 03/2019 | $409,433 | $375,683 | $382,204 |
|---|
| 04/2019 | $426,866 | $390,895 | $399,392 |
|---|
| 05/2019 | $406,500 | $366,054 | $376,415 |
|---|
| 06/2019 | $437,130 | $391,852 | $402,850 |
|---|
| 07/2019 | $440,063 | $397,484 | $412,255 |
|---|
| 08/2019 | $426,051 | $391,188 | $404,746 |
|---|
| 09/2019 | $421,652 | $398,507 | $400,137 |
|---|
| 10/2019 | $425,888 | $407,138 | $407,554 |
|---|
| 11/2019 | $451,305 | $421,917 | $427,831 |
|---|
| 12/2019 | $455,843 | $434,651 | $432,842 |
|---|
| 01/2020 | $459,198 | $434,481 | $436,893 |
|---|
| 02/2020 | $431,180 | $398,715 | $406,766 |
|---|
| 03/2020 | $372,962 | $349,468 | $346,101 |
|---|
| 04/2020 | $433,193 | $394,268 | $400,298 |
|---|
| 05/2020 | $484,532 | $413,046 | $440,509 |
|---|
| 06/2020 | $500,638 | $421,261 | $450,834 |
|---|
| 07/2020 | $536,374 | $445,013 | $486,852 |
|---|
| 08/2020 | $550,635 | $477,001 | $500,096 |
|---|
| 09/2020 | $532,516 | $458,877 | $493,094 |
|---|
| 10/2020 | $524,966 | $446,674 | $493,698 |
|---|
| 11/2020 | $595,934 | $495,568 | $560,011 |
|---|
| 12/2020 | $639,539 | $514,622 | $586,876 |
|---|
| 01/2021 | $626,805 | $509,426 | $584,916 |
|---|
| 02/2021 | $642,934 | $523,474 | $594,905 |
|---|
| 03/2021 | $633,087 | $546,400 | $583,559 |
|---|
| 04/2021 | $665,854 | $575,560 | $616,347 |
|---|
| 05/2021 | $656,516 | $579,580 | $606,928 |
|---|
| 06/2021 | $684,019 | $593,110 | $648,171 |
|---|
| 07/2021 | $706,429 | $607,200 | $654,847 |
|---|
| 08/2021 | $711,692 | $625,662 | $675,984 |
|---|
| 09/2021 | $683,510 | $596,563 | $643,245 |
|---|
| 10/2021 | $730,368 | $638,359 | $688,346 |
|---|
| 11/2021 | $697,941 | $633,936 | $659,262 |
|---|
| 12/2021 | $719,205 | $662,346 | $661,575 |
|---|
| 01/2022 | $631,963 | $628,072 | $576,202 |
|---|
| 02/2022 | $624,213 | $609,266 | $569,208 |
|---|
| 03/2022 | $628,899 | $631,888 | $578,346 |
|---|
| 04/2022 | $563,287 | $576,786 | $513,225 |
|---|
| 05/2022 | $541,837 | $577,845 | $493,359 |
|---|
| 06/2022 | $498,036 | $530,147 | $456,479 |
|---|
| 07/2022 | $557,339 | $579,029 | $512,341 |
|---|
| 08/2022 | $528,859 | $555,415 | $495,559 |
|---|
| 09/2022 | $481,453 | $504,262 | $453,498 |
|---|
| 10/2022 | $520,928 | $545,088 | $489,139 |
|---|
| 11/2022 | $547,065 | $575,550 | $515,750 |
|---|
| 12/2022 | $517,550 | $542,390 | $484,796 |
|---|
| 01/2023 | $562,748 | $576,470 | $527,100 |
|---|
| 02/2023 | $548,855 | $562,405 | $521,896 |
|---|
| 03/2023 | $571,639 | $583,053 | $529,086 |
|---|
| 04/2023 | $560,896 | $592,154 | $521,422 |
|---|
| 05/2023 | $563,674 | $594,728 | $521,744 |
|---|
| 06/2023 | $602,203 | $634,024 | $562,071 |
|---|
| 07/2023 | $617,207 | $654,392 | $579,078 |
|---|
| 08/2023 | $599,054 | $643,973 | $559,987 |
|---|
| 09/2023 | $572,380 | $613,270 | $532,708 |
|---|
| 10/2023 | $554,968 | $600,375 | $505,525 |
|---|
| 11/2023 | $611,095 | $655,205 | $567,198 |
|---|
| 12/2023 | $649,809 | $684,971 | $610,197 |
|---|
| 01/2024 | $647,216 | $696,481 | $606,910 |
|---|
| 02/2024 | $693,525 | $733,670 | $652,541 |
|---|
| 03/2024 | $709,085 | $757,276 | $668,145 |
|---|
| 04/2024 | $666,851 | $726,345 | $629,342 |
|---|
| 05/2024 | $680,744 | $762,361 | $636,050 |
|---|
| 06/2024 | $682,411 | $789,716 | $646,675 |
|---|
| 07/2024 | $682,781 | $799,329 | $650,594 |
|---|
| 08/2024 | $697,785 | $818,718 | $666,758 |
|---|
| 09/2024 | $709,455 | $836,203 | $688,976 |
|---|
| 10/2024 | $702,787 | $828,620 | $701,012 |
|---|
| 11/2024 | $781,697 | $877,261 | $794,448 |
|---|
| 12/2024 | $736,928 | $856,349 | $745,069 |
|---|
Average Annual Total Returns (%)
| HEADER | 1 Year | 5 Years | 10 Years |
|---|
Class R5Footnote Reference1 | 13.41% | 10.08% | 11.42% |
|---|
S&P 500® Index TR | 25.02% | 14.53% | 13.10% |
|---|
Russell Midcap® Growth Index | 22.10% | 11.47% | 11.54% |
|---|
| Footnote | Description |
Footnote1 | Return may differ from actual shareholder return due to accounting adjustments for financial reporting purposes. |
Performance shown is historical and is not indicative of future returns. Investment returns and principal value will vary, and shares may be worth more or less at redemption than at original purchase. Performance shown is as of date indicated, and current performance may be lower or higher than the performance data quoted. To obtain performance as of the most recent month end, please visit americanbeaconfunds.com or call 800-967-9009. The graph and table do not reflect the deduction of taxes that a shareholder would pay on fund distributions or redemption of fund shares. The Fund's performance benefited from fee waivers. For more information, visit americanbeaconfunds.com/Performance_Disclaimers.aspx.
The S&P 500 Index TR is replacing the Russell Midcap Growth Index as broad-based securities market index to comply with a new regulatory requirement. The Russell Midcap Growth Index reflects the market sectors in which the Fund invests.
| Total Net Assets | $800,155,455 |
|---|
| # of Portfolio Holdings | 93 |
|---|
| Portfolio Turnover Rate | 24% |
|---|
| Total Management Fees Paid | $5,993,794 |
|---|
What did the Fund invest in?
Top Ten Holdings - % Net Assets
| Palantir Technologies, Inc., Class A | 2.7 |
| Axon Enterprise, Inc. | 2.3 |
| Spotify Technology SA | 2.1 |
| Tradeweb Markets, Inc., Class A | 2.1 |
| Copart, Inc. | 2.0 |
| Guidewire Software, Inc. | 2.0 |
| Burlington Stores, Inc. | 1.9 |
| Marvell Technology, Inc. | 1.8 |
| Take-Two Interactive Software, Inc. | 1.8 |
| Manhattan Associates, Inc. | 1.8 |
Excludes cash equivalents.
Asset Allocation - % Investments
| Value | Value |
|---|
| Common Stocks | 96.7 |
| Investment Companies | 2.0 |
| Foreign Common Stocks | 1.3 |
Sector Allocation - % Equities
| Value | Value |
|---|
| Consumer Staples | 0.2 |
| Utilities | 0.8 |
| Real Estate | 0.9 |
| Energy | 5.8 |
| Communication Services | 8.8 |
| Financials | 9.0 |
| Consumer Discretionary | 10.2 |
| Health Care | 15.1 |
| Industrials | 19.3 |
| Information Technology | 29.9 |
For additional information about the Fund, including its prospectus, financial statements, holdings, and proxy voting information, please visit www.americanbeaconfunds.com/literature or call 1-800-658-5811.
If your financial institution mailed only one copy of this Report to an address shared by more than one account, you can request an individual copy by contacting your financial institution.
Stephens Mid-Cap Growth Fund
Distributed by:
Resolute Investment Distributors, Inc.
Annual Shareholder Report - December 31, 2024
Stephens Mid-Cap Growth Fund
Annual Shareholder Report - December 31, 2024
This annual shareholder report contains important information about American Beacon Stephens Mid-Cap Growth Fund for the period of January 1, 2024 to December 31, 2024. You can find additional information about the Fund at www.americanbeaconfunds.com/literature. You can also request this information by contacting us at 800-658-5811.
What were the Fund costs for the last year?
(based on a hypothetical $10,000 investment)
| Class Name | Costs of a $10,000 investment | Costs paid as a percentage of a $10,000 investment |
|---|
| Y | $101 | 0.95% |
|---|
How did the Fund perform and what affected its performance?
The Y Class of the Fund returned 13.30% for the twelve months ended December 31, 2024, compared to the S&P 500 Index return of 25.02% and the Russell Midcap Growth Index return of 22.10%.
• Overall market performance during the period was driven by mega-cap growth companies, while the Fund focuses its investments on medium-capitalization companies.
• The Fund’s performance was mixed across all sectors where it invested. The Fund saw positive performance in all sectors except Consumer Staples, Real Estate and Health Care. The Fund’s holdings in the Information Technology, Consumer Discretionary, and Health Care sectors detracted materially from performance relative to the Russell Midcap® Growth Index.
Cumulative Performance from December 31, 2014 through December 31, 2024
The initial investment, based on a $100,000 investment, is adjusted to reflect the maximum applicable sales charge, if any.
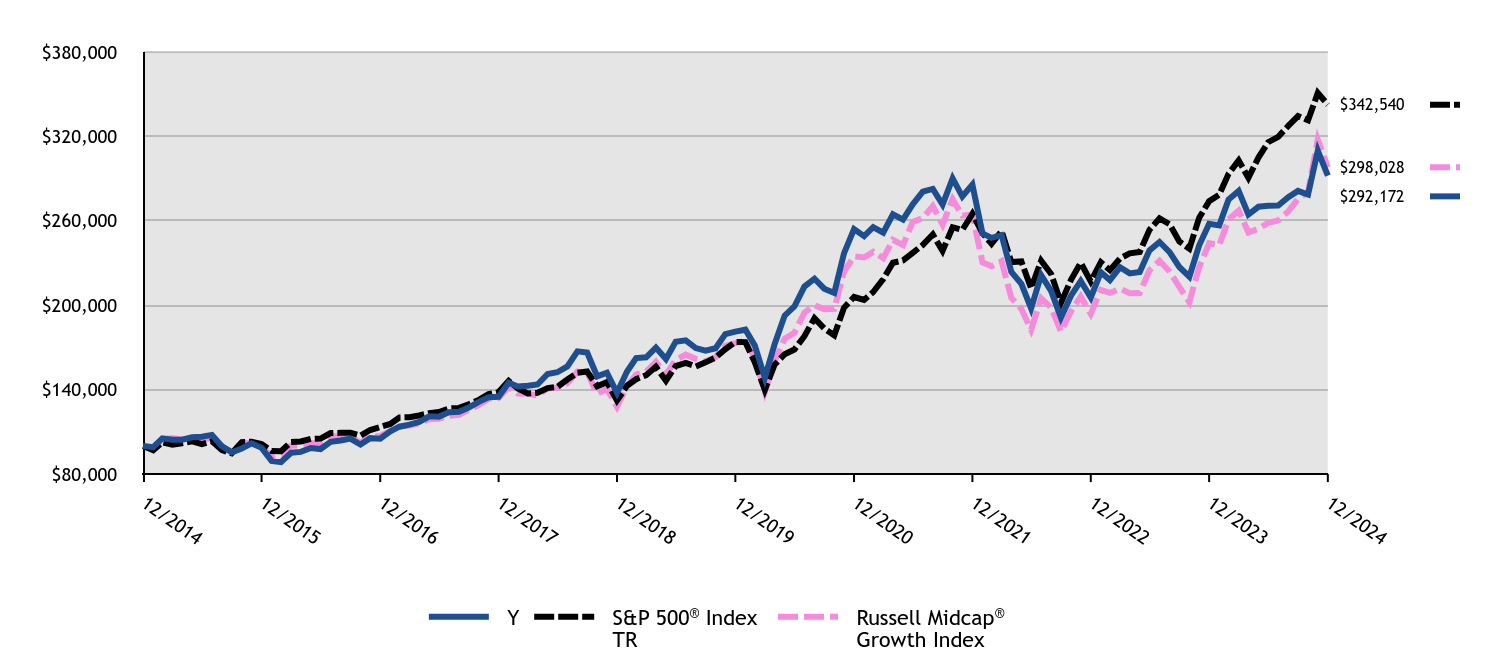
| #ERROR:A result could not be returned because the conditional could not be evaluated to a True/False value (#ERROR:Invalid Formula (#!=""), 'Multiple values from an iterator cannot be used in a formula unless they are aggregrated.') | Y | S&P 500® Index TR | Russell Midcap® Growth Index |
|---|
| 12/2014 | $100,000 | $100,000 | $100,000 |
|---|
| 01/2015 | $99,116 | $96,998 | $98,315 |
|---|
| 02/2015 | $105,359 | $102,573 | $105,082 |
|---|
| 03/2015 | $104,370 | $100,951 | $105,378 |
|---|
| 04/2015 | $104,370 | $101,919 | $104,638 |
|---|
| 05/2015 | $106,139 | $103,230 | $105,881 |
|---|
| 06/2015 | $106,556 | $101,231 | $104,176 |
|---|
| 07/2015 | $107,856 | $103,352 | $105,864 |
|---|
| 08/2015 | $99,844 | $97,117 | $99,705 |
|---|
| 09/2015 | $95,421 | $94,714 | $95,853 |
|---|
| 10/2015 | $98,179 | $102,703 | $101,885 |
|---|
| 11/2015 | $101,821 | $103,008 | $102,108 |
|---|
| 12/2015 | $98,611 | $101,384 | $99,800 |
|---|
| 01/2016 | $89,329 | $96,353 | $92,245 |
|---|
| 02/2016 | $88,510 | $96,223 | $93,691 |
|---|
| 03/2016 | $95,171 | $102,750 | $100,378 |
|---|
| 04/2016 | $95,772 | $103,149 | $100,317 |
|---|
| 05/2016 | $98,502 | $105,001 | $101,962 |
|---|
| 06/2016 | $97,792 | $105,273 | $101,946 |
|---|
| 07/2016 | $102,870 | $109,154 | $106,995 |
|---|
| 08/2016 | $103,907 | $109,308 | $106,681 |
|---|
| 09/2016 | $105,218 | $109,328 | $106,628 |
|---|
| 10/2016 | $101,014 | $107,334 | $102,296 |
|---|
| 11/2016 | $105,546 | $111,309 | $106,743 |
|---|
| 12/2016 | $105,184 | $113,509 | $107,114 |
|---|
| 01/2017 | $110,380 | $115,662 | $110,685 |
|---|
| 02/2017 | $113,671 | $120,255 | $113,868 |
|---|
| 03/2017 | $115,172 | $120,395 | $114,499 |
|---|
| 04/2017 | $117,019 | $121,631 | $116,197 |
|---|
| 05/2017 | $121,060 | $123,343 | $118,972 |
|---|
| 06/2017 | $120,829 | $124,113 | $119,325 |
|---|
| 07/2017 | $123,889 | $126,665 | $121,318 |
|---|
| 08/2017 | $124,235 | $127,053 | $122,174 |
|---|
| 09/2017 | $127,353 | $129,674 | $125,629 |
|---|
| 10/2017 | $131,336 | $132,700 | $129,144 |
|---|
| 11/2017 | $134,627 | $136,769 | $133,461 |
|---|
| 12/2017 | $134,922 | $138,290 | $134,179 |
|---|
| 01/2018 | $144,887 | $146,208 | $141,771 |
|---|
| 02/2018 | $142,230 | $140,819 | $137,321 |
|---|
| 03/2018 | $142,834 | $137,240 | $137,097 |
|---|
| 04/2018 | $143,679 | $137,767 | $135,802 |
|---|
| 05/2018 | $151,108 | $141,085 | $140,881 |
|---|
| 06/2018 | $152,376 | $141,953 | $141,426 |
|---|
| 07/2018 | $156,483 | $147,236 | $144,461 |
|---|
| 08/2018 | $167,233 | $152,033 | $152,788 |
|---|
| 09/2018 | $166,388 | $152,899 | $152,138 |
|---|
| 10/2018 | $149,477 | $142,448 | $137,073 |
|---|
| 11/2018 | $152,074 | $145,351 | $140,559 |
|---|
| 12/2018 | $137,730 | $132,227 | $127,805 |
|---|
| 01/2019 | $152,881 | $142,823 | $142,491 |
|---|
| 02/2019 | $162,481 | $147,409 | $150,846 |
|---|
| 03/2019 | $163,003 | $150,273 | $152,882 |
|---|
| 04/2019 | $169,926 | $156,358 | $159,757 |
|---|
| 05/2019 | $161,762 | $146,422 | $150,566 |
|---|
| 06/2019 | $173,975 | $156,741 | $161,140 |
|---|
| 07/2019 | $175,085 | $158,994 | $164,902 |
|---|
| 08/2019 | $169,534 | $156,475 | $161,898 |
|---|
| 09/2019 | $167,771 | $159,403 | $160,055 |
|---|
| 10/2019 | $169,403 | $162,855 | $163,022 |
|---|
| 11/2019 | $179,526 | $168,767 | $171,132 |
|---|
| 12/2019 | $181,279 | $173,861 | $173,137 |
|---|
| 01/2020 | $182,624 | $173,792 | $174,757 |
|---|
| 02/2020 | $171,458 | $159,486 | $162,706 |
|---|
| 03/2020 | $148,319 | $139,787 | $138,440 |
|---|
| 04/2020 | $172,266 | $157,707 | $160,119 |
|---|
| 05/2020 | $192,647 | $165,219 | $176,204 |
|---|
| 06/2020 | $199,104 | $168,504 | $180,334 |
|---|
| 07/2020 | $213,297 | $178,005 | $194,741 |
|---|
| 08/2020 | $218,880 | $190,801 | $200,039 |
|---|
| 09/2020 | $211,750 | $183,551 | $197,237 |
|---|
| 10/2020 | $208,723 | $178,669 | $197,479 |
|---|
| 11/2020 | $236,907 | $198,227 | $224,004 |
|---|
| 12/2020 | $254,187 | $205,849 | $234,750 |
|---|
| 01/2021 | $249,150 | $203,771 | $233,966 |
|---|
| 02/2021 | $255,549 | $209,390 | $237,962 |
|---|
| 03/2021 | $251,601 | $218,560 | $233,423 |
|---|
| 04/2021 | $264,603 | $230,224 | $246,539 |
|---|
| 05/2021 | $260,859 | $231,832 | $242,771 |
|---|
| 06/2021 | $271,750 | $237,244 | $259,268 |
|---|
| 07/2021 | $280,736 | $242,880 | $261,939 |
|---|
| 08/2021 | $282,710 | $250,265 | $270,394 |
|---|
| 09/2021 | $271,546 | $238,625 | $257,298 |
|---|
| 10/2021 | $290,198 | $255,344 | $275,339 |
|---|
| 11/2021 | $277,264 | $253,574 | $263,705 |
|---|
| 12/2021 | $285,725 | $264,939 | $264,630 |
|---|
| 01/2022 | $251,013 | $251,229 | $230,481 |
|---|
| 02/2022 | $247,903 | $243,707 | $227,683 |
|---|
| 03/2022 | $249,856 | $252,755 | $231,339 |
|---|
| 04/2022 | $223,749 | $230,715 | $205,290 |
|---|
| 05/2022 | $215,216 | $231,138 | $197,343 |
|---|
| 06/2022 | $197,787 | $212,059 | $182,591 |
|---|
| 07/2022 | $221,363 | $231,612 | $204,936 |
|---|
| 08/2022 | $210,009 | $222,166 | $198,224 |
|---|
| 09/2022 | $191,207 | $201,705 | $181,399 |
|---|
| 10/2022 | $206,827 | $218,035 | $195,656 |
|---|
| 11/2022 | $217,241 | $230,220 | $206,300 |
|---|
| 12/2022 | $205,470 | $216,956 | $193,918 |
|---|
| 01/2023 | $223,386 | $230,588 | $210,840 |
|---|
| 02/2023 | $217,885 | $224,962 | $208,759 |
|---|
| 03/2023 | $226,954 | $233,221 | $211,634 |
|---|
| 04/2023 | $222,642 | $236,861 | $208,569 |
|---|
| 05/2023 | $223,683 | $237,891 | $208,698 |
|---|
| 06/2023 | $238,997 | $253,610 | $224,828 |
|---|
| 07/2023 | $244,944 | $261,757 | $231,631 |
|---|
| 08/2023 | $237,733 | $257,589 | $223,995 |
|---|
| 09/2023 | $227,177 | $245,308 | $213,083 |
|---|
| 10/2023 | $220,263 | $240,150 | $202,210 |
|---|
| 11/2023 | $242,416 | $262,082 | $226,879 |
|---|
| 12/2023 | $257,878 | $273,988 | $244,079 |
|---|
| 01/2024 | $256,763 | $278,593 | $242,764 |
|---|
| 02/2024 | $275,125 | $293,468 | $261,017 |
|---|
| 03/2024 | $281,295 | $302,910 | $267,258 |
|---|
| 04/2024 | $264,494 | $290,538 | $251,737 |
|---|
| 05/2024 | $269,996 | $304,944 | $254,420 |
|---|
| 06/2024 | $270,665 | $315,886 | $258,670 |
|---|
| 07/2024 | $270,813 | $319,732 | $260,238 |
|---|
| 08/2024 | $276,760 | $327,487 | $266,703 |
|---|
| 09/2024 | $281,295 | $334,481 | $275,590 |
|---|
| 10/2024 | $278,693 | $331,448 | $280,405 |
|---|
| 11/2024 | $309,915 | $350,904 | $317,779 |
|---|
| 12/2024 | $292,172 | $342,540 | $298,028 |
|---|
Average Annual Total Returns (%)
| HEADER | 1 Year | 5 Years | 10 Years |
|---|
Class YFootnote Reference1 | 13.30% | 10.02% | 11.32% |
|---|
S&P 500® Index TR | 25.02% | 14.53% | 13.10% |
|---|
Russell Midcap® Growth Index | 22.10% | 11.47% | 11.54% |
|---|
| Footnote | Description |
Footnote1 | Return may differ from actual shareholder return due to accounting adjustments for financial reporting purposes. |
Performance shown is historical and is not indicative of future returns. Investment returns and principal value will vary, and shares may be worth more or less at redemption than at original purchase. Performance shown is as of date indicated, and current performance may be lower or higher than the performance data quoted. To obtain performance as of the most recent month end, please visit americanbeaconfunds.com or call 800-967-9009. The graph and table do not reflect the deduction of taxes that a shareholder would pay on fund distributions or redemption of fund shares. The Fund's performance benefited from fee waivers. For more information, visit americanbeaconfunds.com/Performance_Disclaimers.aspx.
The S&P 500 Index TR is replacing the Russell Midcap Growth Index as broad-based securities market index to comply with a new regulatory requirement. The Russell Midcap Growth Index reflects the market sectors in which the Fund invests.
| Total Net Assets | $800,155,455 |
|---|
| # of Portfolio Holdings | 93 |
|---|
| Portfolio Turnover Rate | 24% |
|---|
| Total Management Fees Paid | $5,993,794 |
|---|
What did the Fund invest in?
Top Ten Holdings - % Net Assets
| Palantir Technologies, Inc., Class A | 2.7 |
| Axon Enterprise, Inc. | 2.3 |
| Spotify Technology SA | 2.1 |
| Tradeweb Markets, Inc., Class A | 2.1 |
| Copart, Inc. | 2.0 |
| Guidewire Software, Inc. | 2.0 |
| Burlington Stores, Inc. | 1.9 |
| Marvell Technology, Inc. | 1.8 |
| Take-Two Interactive Software, Inc. | 1.8 |
| Manhattan Associates, Inc. | 1.8 |
Excludes cash equivalents.
Asset Allocation - % Investments
| Value | Value |
|---|
| Common Stocks | 96.7 |
| Investment Companies | 2.0 |
| Foreign Common Stocks | 1.3 |
Sector Allocation - % Equities
| Value | Value |
|---|
| Consumer Staples | 0.2 |
| Utilities | 0.8 |
| Real Estate | 0.9 |
| Energy | 5.8 |
| Communication Services | 8.8 |
| Financials | 9.0 |
| Consumer Discretionary | 10.2 |
| Health Care | 15.1 |
| Industrials | 19.3 |
| Information Technology | 29.9 |
For additional information about the Fund, including its prospectus, financial statements, holdings, and proxy voting information, please visit www.americanbeaconfunds.com/literature or call 1-800-658-5811.
If your financial institution mailed only one copy of this Report to an address shared by more than one account, you can request an individual copy by contacting your financial institution.
Stephens Mid-Cap Growth Fund
Distributed by:
Resolute Investment Distributors, Inc.
Annual Shareholder Report - December 31, 2024
Stephens Mid-Cap Growth Fund
Annual Shareholder Report - December 31, 2024
This annual shareholder report contains important information about American Beacon Stephens Mid-Cap Growth Fund for the period of January 1, 2024 to December 31, 2024. You can find additional information about the Fund at www.americanbeaconfunds.com/literature. You can also request this information by contacting us at 800-658-5811.
What were the Fund costs for the last year?
(based on a hypothetical $10,000 investment)
| Class Name | Costs of a $10,000 investment | Costs paid as a percentage of a $10,000 investment |
|---|
| Investor | $123 | 1.15% |
|---|
How did the Fund perform and what affected its performance?
The Investor Class of the Fund returned 13.05% for the twelve months ended December 31, 2024, compared to the S&P 500 Index return of 25.02% and the Russell Midcap Growth Index return of 22.10%.
• Overall market performance during the period was driven by mega-cap growth companies, while the Fund focuses its investments on medium-capitalization companies.
• The Fund’s performance was mixed across all sectors where it invested. The Fund saw positive performance in all sectors except Consumer Staples, Real Estate and Health Care. The Fund’s holdings in the Information Technology, Consumer Discretionary, and Health Care sectors detracted materially from performance relative to the Russell Midcap® Growth Index.
Cumulative Performance from December 31, 2014 through December 31, 2024
The initial investment, based on a $10,000 investment, is adjusted to reflect the maximum applicable sales charge, if any.
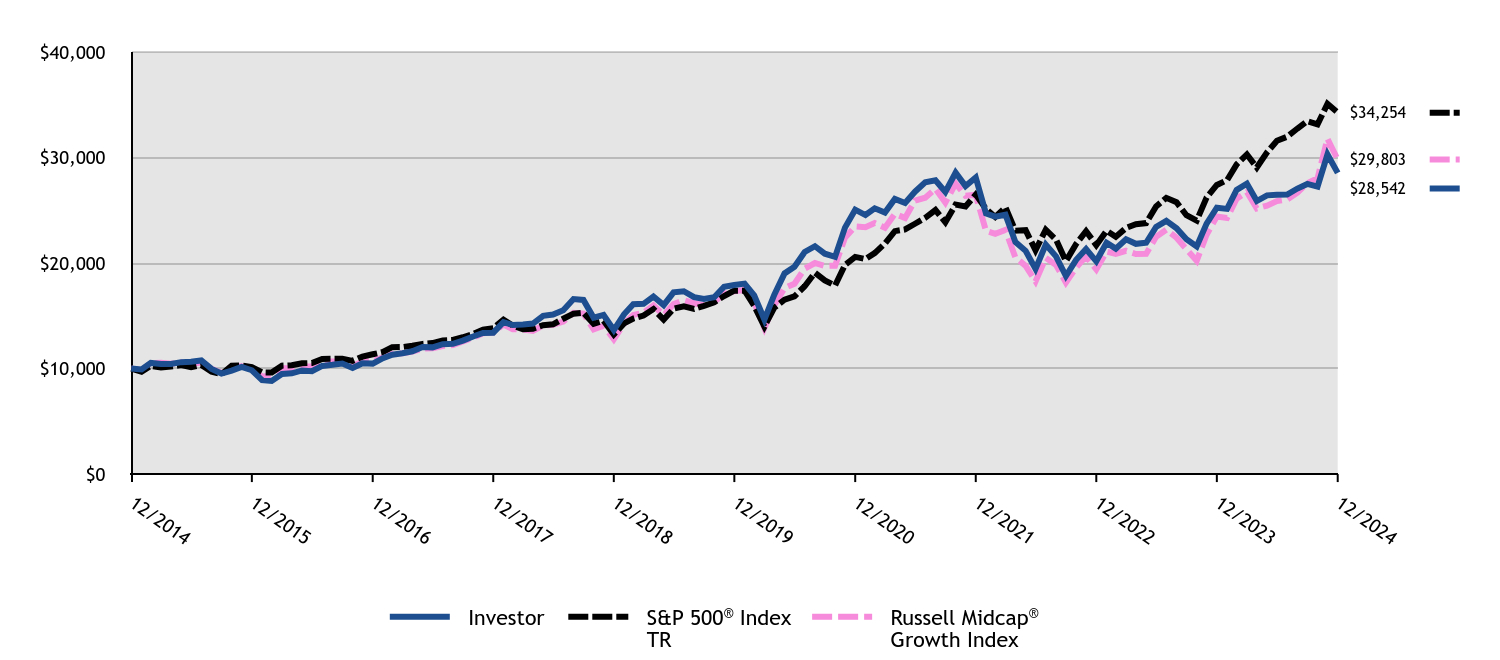
| Investor | S&P 500® Index TR | Russell Midcap® Growth Index |
|---|
| 12/2014 | $10,000 | $10,000 | $10,000 |
|---|
| 01/2015 | $9,912 | $9,700 | $9,832 |
|---|
| 02/2015 | $10,536 | $10,257 | $10,508 |
|---|
| 03/2015 | $10,436 | $10,095 | $10,538 |
|---|
| 04/2015 | $10,430 | $10,192 | $10,464 |
|---|
| 05/2015 | $10,607 | $10,323 | $10,588 |
|---|
| 06/2015 | $10,648 | $10,123 | $10,418 |
|---|
| 07/2015 | $10,772 | $10,335 | $10,586 |
|---|
| 08/2015 | $9,971 | $9,712 | $9,970 |
|---|
| 09/2015 | $9,529 | $9,471 | $9,585 |
|---|
| 10/2015 | $9,800 | $10,270 | $10,189 |
|---|
| 11/2015 | $10,159 | $10,301 | $10,211 |
|---|
| 12/2015 | $9,837 | $10,138 | $9,980 |
|---|
| 01/2016 | $8,909 | $9,635 | $9,225 |
|---|
| 02/2016 | $8,828 | $9,622 | $9,369 |
|---|
| 03/2016 | $9,488 | $10,275 | $10,038 |
|---|
| 04/2016 | $9,550 | $10,315 | $10,032 |
|---|
| 05/2016 | $9,818 | $10,500 | $10,196 |
|---|
| 06/2016 | $9,743 | $10,527 | $10,195 |
|---|
| 07/2016 | $10,248 | $10,915 | $10,700 |
|---|
| 08/2016 | $10,354 | $10,931 | $10,668 |
|---|
| 09/2016 | $10,478 | $10,933 | $10,663 |
|---|
| 10/2016 | $10,055 | $10,733 | $10,230 |
|---|
| 11/2016 | $10,509 | $11,131 | $10,674 |
|---|
| 12/2016 | $10,468 | $11,351 | $10,711 |
|---|
| 01/2017 | $10,986 | $11,566 | $11,068 |
|---|
| 02/2017 | $11,311 | $12,025 | $11,387 |
|---|
| 03/2017 | $11,450 | $12,039 | $11,450 |
|---|
| 04/2017 | $11,636 | $12,163 | $11,620 |
|---|
| 05/2017 | $12,035 | $12,334 | $11,897 |
|---|
| 06/2017 | $12,008 | $12,411 | $11,932 |
|---|
| 07/2017 | $12,313 | $12,666 | $12,132 |
|---|
| 08/2017 | $12,340 | $12,705 | $12,217 |
|---|
| 09/2017 | $12,645 | $12,967 | $12,563 |
|---|
| 10/2017 | $13,043 | $13,270 | $12,914 |
|---|
| 11/2017 | $13,369 | $13,677 | $13,346 |
|---|
| 12/2017 | $13,396 | $13,829 | $13,418 |
|---|
| 01/2018 | $14,389 | $14,621 | $14,177 |
|---|
| 02/2018 | $14,124 | $14,082 | $13,732 |
|---|
| 03/2018 | $14,180 | $13,724 | $13,710 |
|---|
| 04/2018 | $14,263 | $13,777 | $13,580 |
|---|
| 05/2018 | $14,998 | $14,108 | $14,088 |
|---|
| 06/2018 | $15,117 | $14,195 | $14,143 |
|---|
| 07/2018 | $15,530 | $14,724 | $14,446 |
|---|
| 08/2018 | $16,586 | $15,203 | $15,279 |
|---|
| 09/2018 | $16,502 | $15,290 | $15,214 |
|---|
| 10/2018 | $14,823 | $14,245 | $13,707 |
|---|
| 11/2018 | $15,082 | $14,535 | $14,056 |
|---|
| 12/2018 | $13,652 | $13,223 | $12,780 |
|---|
| 01/2019 | $15,147 | $14,282 | $14,249 |
|---|
| 02/2019 | $16,098 | $14,741 | $15,085 |
|---|
| 03/2019 | $16,137 | $15,027 | $15,288 |
|---|
| 04/2019 | $16,827 | $15,636 | $15,976 |
|---|
| 05/2019 | $16,014 | $14,642 | $15,057 |
|---|
| 06/2019 | $17,218 | $15,674 | $16,114 |
|---|
| 07/2019 | $17,325 | $15,899 | $16,490 |
|---|
| 08/2019 | $16,773 | $15,648 | $16,190 |
|---|
| 09/2019 | $16,589 | $15,940 | $16,005 |
|---|
| 10/2019 | $16,750 | $16,286 | $16,302 |
|---|
| 11/2019 | $17,747 | $16,877 | $17,113 |
|---|
| 12/2019 | $17,922 | $17,386 | $17,314 |
|---|
| 01/2020 | $18,050 | $17,379 | $17,476 |
|---|
| 02/2020 | $16,937 | $15,949 | $16,271 |
|---|
| 03/2020 | $14,649 | $13,979 | $13,844 |
|---|
| 04/2020 | $17,009 | $15,771 | $16,012 |
|---|
| 05/2020 | $19,019 | $16,522 | $17,620 |
|---|
| 06/2020 | $19,646 | $16,850 | $18,033 |
|---|
| 07/2020 | $21,045 | $17,801 | $19,474 |
|---|
| 08/2020 | $21,593 | $19,080 | $20,004 |
|---|
| 09/2020 | $20,886 | $18,355 | $19,724 |
|---|
| 10/2020 | $20,584 | $17,867 | $19,748 |
|---|
| 11/2020 | $23,356 | $19,823 | $22,400 |
|---|
| 12/2020 | $25,055 | $20,585 | $23,475 |
|---|
| 01/2021 | $24,548 | $20,377 | $23,397 |
|---|
| 02/2021 | $25,184 | $20,939 | $23,796 |
|---|
| 03/2021 | $24,790 | $21,856 | $23,342 |
|---|
| 04/2021 | $26,071 | $23,022 | $24,654 |
|---|
| 05/2021 | $25,692 | $23,183 | $24,277 |
|---|
| 06/2021 | $26,764 | $23,724 | $25,927 |
|---|
| 07/2021 | $27,642 | $24,288 | $26,194 |
|---|
| 08/2021 | $27,836 | $25,026 | $27,039 |
|---|
| 09/2021 | $26,732 | $23,863 | $25,730 |
|---|
| 10/2021 | $28,561 | $25,534 | $27,534 |
|---|
| 11/2021 | $27,288 | $25,357 | $26,370 |
|---|
| 12/2021 | $28,112 | $26,494 | $26,463 |
|---|
| 01/2022 | $24,696 | $25,123 | $23,048 |
|---|
| 02/2022 | $24,392 | $24,371 | $22,768 |
|---|
| 03/2022 | $24,574 | $25,276 | $23,134 |
|---|
| 04/2022 | $21,999 | $23,071 | $20,529 |
|---|
| 05/2022 | $21,158 | $23,114 | $19,734 |
|---|
| 06/2022 | $19,441 | $21,206 | $18,259 |
|---|
| 07/2022 | $21,747 | $23,161 | $20,494 |
|---|
| 08/2022 | $20,637 | $22,217 | $19,822 |
|---|
| 09/2022 | $18,773 | $20,170 | $18,140 |
|---|
| 10/2022 | $20,308 | $21,804 | $19,566 |
|---|
| 11/2022 | $21,322 | $23,022 | $20,630 |
|---|
| 12/2022 | $20,163 | $21,696 | $19,392 |
|---|
| 01/2023 | $21,920 | $23,059 | $21,084 |
|---|
| 02/2023 | $21,364 | $22,496 | $20,876 |
|---|
| 03/2023 | $22,252 | $23,322 | $21,163 |
|---|
| 04/2023 | $21,822 | $23,686 | $20,857 |
|---|
| 05/2023 | $21,920 | $23,789 | $20,870 |
|---|
| 06/2023 | $23,427 | $25,361 | $22,483 |
|---|
| 07/2023 | $24,001 | $26,176 | $23,163 |
|---|
| 08/2023 | $23,293 | $25,759 | $22,399 |
|---|
| 09/2023 | $22,252 | $24,531 | $21,308 |
|---|
| 10/2023 | $21,571 | $24,015 | $20,221 |
|---|
| 11/2023 | $23,741 | $26,208 | $22,688 |
|---|
| 12/2023 | $25,248 | $27,399 | $24,408 |
|---|
| 01/2024 | $25,131 | $27,859 | $24,276 |
|---|
| 02/2024 | $26,925 | $29,347 | $26,102 |
|---|
| 03/2024 | $27,526 | $30,291 | $26,726 |
|---|
| 04/2024 | $25,876 | $29,054 | $25,174 |
|---|
| 05/2024 | $26,414 | $30,494 | $25,442 |
|---|
| 06/2024 | $26,468 | $31,589 | $25,867 |
|---|
| 07/2024 | $26,486 | $31,973 | $26,024 |
|---|
| 08/2024 | $27,060 | $32,749 | $26,670 |
|---|
| 09/2024 | $27,499 | $33,448 | $27,559 |
|---|
| 10/2024 | $27,239 | $33,145 | $28,040 |
|---|
| 11/2024 | $30,289 | $35,090 | $31,778 |
|---|
| 12/2024 | $28,542 | $34,254 | $29,803 |
|---|
Average Annual Total Returns (%)
| HEADER | 1 Year | 5 Years | 10 Years |
|---|
Investor ClassFootnote Reference1 | 13.05% | 9.75% | 11.06% |
|---|
S&P 500® Index TR | 25.02% | 14.53% | 13.10% |
|---|
Russell Midcap® Growth Index | 22.10% | 11.47% | 11.54% |
|---|
| Footnote | Description |
Footnote1 | Return may differ from actual shareholder return due to accounting adjustments for financial reporting purposes. |
Performance shown is historical and is not indicative of future returns. Investment returns and principal value will vary, and shares may be worth more or less at redemption than at original purchase. Performance shown is as of date indicated, and current performance may be lower or higher than the performance data quoted. To obtain performance as of the most recent month end, please visit americanbeaconfunds.com or call 800-967-9009. The graph and table do not reflect the deduction of taxes that a shareholder would pay on fund distributions or redemption of fund shares. The Fund's performance benefited from fee waivers. For more information, visit americanbeaconfunds.com/Performance_Disclaimers.aspx.
The S&P 500 Index TR is replacing the Russell Midcap Growth Index as broad-based securities market index to comply with a new regulatory requirement. The Russell Midcap Growth Index reflects the market sectors in which the Fund invests.
| Total Net Assets | $800,155,455 |
|---|
| # of Portfolio Holdings | 93 |
|---|
| Portfolio Turnover Rate | 24% |
|---|
| Total Management Fees Paid | $5,993,794 |
|---|
What did the Fund invest in?
Top Ten Holdings - % Net Assets
| Palantir Technologies, Inc., Class A | 2.7 |
| Axon Enterprise, Inc. | 2.3 |
| Spotify Technology SA | 2.1 |
| Tradeweb Markets, Inc., Class A | 2.1 |
| Copart, Inc. | 2.0 |
| Guidewire Software, Inc. | 2.0 |
| Burlington Stores, Inc. | 1.9 |
| Marvell Technology, Inc. | 1.8 |
| Take-Two Interactive Software, Inc. | 1.8 |
| Manhattan Associates, Inc. | 1.8 |
Excludes cash equivalents.
Asset Allocation - % Investments
| Value | Value |
|---|
| Common Stocks | 96.7 |
| Investment Companies | 2.0 |
| Foreign Common Stocks | 1.3 |
Sector Allocation - % Equities
| Value | Value |
|---|
| Consumer Staples | 0.2 |
| Utilities | 0.8 |
| Real Estate | 0.9 |
| Energy | 5.8 |
| Communication Services | 8.8 |
| Financials | 9.0 |
| Consumer Discretionary | 10.2 |
| Health Care | 15.1 |
| Industrials | 19.3 |
| Information Technology | 29.9 |
For additional information about the Fund, including its prospectus, financial statements, holdings, and proxy voting information, please visit www.americanbeaconfunds.com/literature or call 1-800-658-5811.
If your financial institution mailed only one copy of this Report to an address shared by more than one account, you can request an individual copy by contacting your financial institution.
Stephens Mid-Cap Growth Fund
Distributed by:
Resolute Investment Distributors, Inc.
Annual Shareholder Report - December 31, 2024
Stephens Mid-Cap Growth Fund
Annual Shareholder Report - December 31, 2024
This annual shareholder report contains important information about American Beacon Stephens Mid-Cap Growth Fund for the period of January 1, 2024 to December 31, 2024. You can find additional information about the Fund at www.americanbeaconfunds.com/literature. You can also request this information by contacting us at 800-658-5811.
What were the Fund costs for the last year?
(based on a hypothetical $10,000 investment)
| Class Name | Costs of a $10,000 investment | Costs paid as a percentage of a $10,000 investment |
|---|
| R6 | $94 | 0.88% |
|---|
How did the Fund perform and what affected its performance?
The R6 Class of the Fund returned 13.39% for the twelve months ended December 31, 2024, compared to the S&P 500 Index return of 25.02% and the Russell Midcap Growth Index return of 22.10%.
• Overall market performance during the period was driven by mega-cap growth companies, while the Fund focuses its investments on medium-capitalization companies.
• The Fund’s performance was mixed across all sectors where it invested. The Fund saw positive performance in all sectors except Consumer Staples, Real Estate and Health Care. The Fund’s holdings in the Information Technology, Consumer Discretionary, and Health Care sectors detracted materially from performance relative to the Russell Midcap® Growth Index.
Cumulative Performance from December 31, 2014 through December 31, 2024
The initial investment, based on a $10,000 investment, is adjusted to reflect the maximum applicable sales charge, if any.
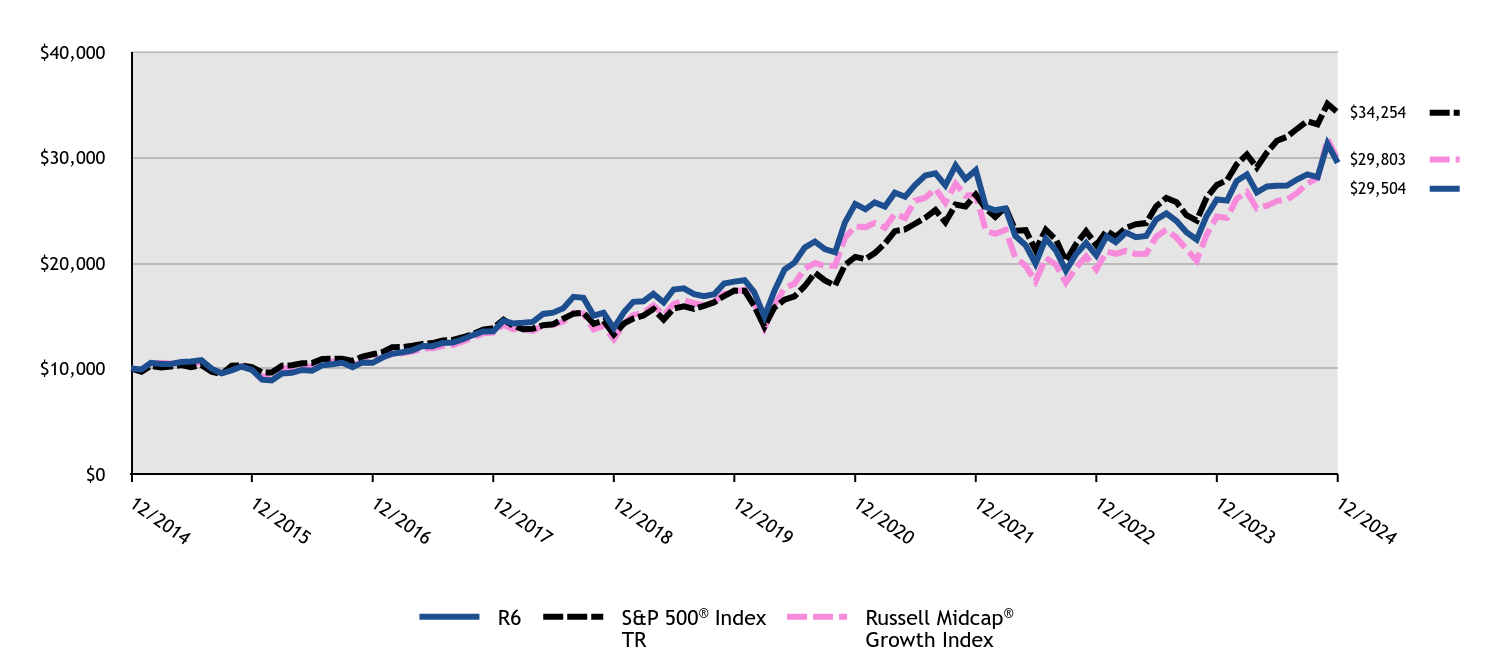
| R6 | S&P 500® Index TR | Russell Midcap® Growth Index |
|---|
| 12/2014 | $10,000 | $10,000 | $10,000 |
|---|
| 01/2015 | $9,917 | $9,700 | $9,832 |
|---|
| 02/2015 | $10,541 | $10,257 | $10,508 |
|---|
| 03/2015 | $10,442 | $10,095 | $10,538 |
|---|
| 04/2015 | $10,442 | $10,192 | $10,464 |
|---|
| 05/2015 | $10,619 | $10,323 | $10,588 |
|---|
| 06/2015 | $10,665 | $10,123 | $10,418 |
|---|
| 07/2015 | $10,795 | $10,335 | $10,586 |
|---|
| 08/2015 | $9,995 | $9,712 | $9,970 |
|---|
| 09/2015 | $9,553 | $9,471 | $9,585 |
|---|
| 10/2015 | $9,828 | $10,270 | $10,189 |
|---|
| 11/2015 | $10,192 | $10,301 | $10,211 |
|---|
| 12/2015 | $9,872 | $10,138 | $9,980 |
|---|
| 01/2016 | $8,944 | $9,635 | $9,225 |
|---|
| 02/2016 | $8,868 | $9,622 | $9,369 |
|---|
| 03/2016 | $9,533 | $10,275 | $10,038 |
|---|
| 04/2016 | $9,593 | $10,315 | $10,032 |
|---|
| 05/2016 | $9,866 | $10,500 | $10,196 |
|---|
| 06/2016 | $9,801 | $10,527 | $10,195 |
|---|
| 07/2016 | $10,303 | $10,915 | $10,700 |
|---|
| 08/2016 | $10,417 | $10,931 | $10,668 |
|---|
| 09/2016 | $10,542 | $10,933 | $10,663 |
|---|
| 10/2016 | $10,123 | $10,733 | $10,230 |
|---|
| 11/2016 | $10,581 | $11,131 | $10,674 |
|---|
| 12/2016 | $10,545 | $11,351 | $10,711 |
|---|
| 01/2017 | $11,069 | $11,566 | $11,068 |
|---|
| 02/2017 | $11,398 | $12,025 | $11,387 |
|---|
| 03/2017 | $11,548 | $12,039 | $11,450 |
|---|
| 04/2017 | $11,732 | $12,163 | $11,620 |
|---|
| 05/2017 | $12,142 | $12,334 | $11,897 |
|---|
| 06/2017 | $12,118 | $12,411 | $11,932 |
|---|
| 07/2017 | $12,430 | $12,666 | $12,132 |
|---|
| 08/2017 | $12,464 | $12,705 | $12,217 |
|---|
| 09/2017 | $12,776 | $12,967 | $12,563 |
|---|
| 10/2017 | $13,174 | $13,270 | $12,914 |
|---|
| 11/2017 | $13,508 | $13,677 | $13,346 |
|---|
| 12/2017 | $13,537 | $13,829 | $13,418 |
|---|
| 01/2018 | $14,544 | $14,621 | $14,177 |
|---|
| 02/2018 | $14,273 | $14,082 | $13,732 |
|---|
| 03/2018 | $14,339 | $13,724 | $13,710 |
|---|
| 04/2018 | $14,424 | $13,777 | $13,580 |
|---|
| 05/2018 | $15,172 | $14,108 | $14,088 |
|---|
| 06/2018 | $15,298 | $14,195 | $14,143 |
|---|
| 07/2018 | $15,714 | $14,724 | $14,446 |
|---|
| 08/2018 | $16,794 | $15,203 | $15,279 |
|---|
| 09/2018 | $16,709 | $15,290 | $15,214 |
|---|
| 10/2018 | $15,015 | $14,245 | $13,707 |
|---|
| 11/2018 | $15,280 | $14,535 | $14,056 |
|---|
| 12/2018 | $13,836 | $13,223 | $12,780 |
|---|
| 01/2019 | $15,354 | $14,282 | $14,249 |
|---|
| 02/2019 | $16,325 | $14,741 | $15,085 |
|---|
| 03/2019 | $16,377 | $15,027 | $15,288 |
|---|
| 04/2019 | $17,075 | $15,636 | $15,976 |
|---|
| 05/2019 | $16,260 | $14,642 | $15,057 |
|---|
| 06/2019 | $17,492 | $15,674 | $16,114 |
|---|
| 07/2019 | $17,603 | $15,899 | $16,490 |
|---|
| 08/2019 | $17,049 | $15,648 | $16,190 |
|---|
| 09/2019 | $16,866 | $15,940 | $16,005 |
|---|
| 10/2019 | $17,036 | $16,286 | $16,302 |
|---|
| 11/2019 | $18,059 | $16,877 | $17,113 |
|---|
| 12/2019 | $18,240 | $17,386 | $17,314 |
|---|
| 01/2020 | $18,375 | $17,379 | $17,476 |
|---|
| 02/2020 | $17,254 | $15,949 | $16,271 |
|---|
| 03/2020 | $14,925 | $13,979 | $13,844 |
|---|
| 04/2020 | $17,334 | $15,771 | $16,012 |
|---|
| 05/2020 | $19,395 | $16,522 | $17,620 |
|---|
| 06/2020 | $20,039 | $16,850 | $18,033 |
|---|
| 07/2020 | $21,468 | $17,801 | $19,474 |
|---|
| 08/2020 | $22,039 | $19,080 | $20,004 |
|---|
| 09/2020 | $21,321 | $18,355 | $19,724 |
|---|
| 10/2020 | $21,012 | $17,867 | $19,748 |
|---|
| 11/2020 | $23,857 | $19,823 | $22,400 |
|---|
| 12/2020 | $25,602 | $20,585 | $23,475 |
|---|
| 01/2021 | $25,092 | $20,377 | $23,397 |
|---|
| 02/2021 | $25,744 | $20,939 | $23,796 |
|---|
| 03/2021 | $25,350 | $21,856 | $23,342 |
|---|
| 04/2021 | $26,661 | $23,022 | $24,654 |
|---|
| 05/2021 | $26,281 | $23,183 | $24,277 |
|---|
| 06/2021 | $27,381 | $23,724 | $25,927 |
|---|
| 07/2021 | $28,284 | $24,288 | $26,194 |
|---|
| 08/2021 | $28,495 | $25,026 | $27,039 |
|---|
| 09/2021 | $27,367 | $23,863 | $25,730 |
|---|
| 10/2021 | $29,248 | $25,534 | $27,534 |
|---|
| 11/2021 | $27,951 | $25,357 | $26,370 |
|---|
| 12/2021 | $28,795 | $26,494 | $26,463 |
|---|
| 01/2022 | $25,306 | $25,123 | $23,048 |
|---|
| 02/2022 | $24,996 | $24,371 | $22,768 |
|---|
| 03/2022 | $25,183 | $25,276 | $23,134 |
|---|
| 04/2022 | $22,559 | $23,071 | $20,529 |
|---|
| 05/2022 | $21,694 | $23,114 | $19,734 |
|---|
| 06/2022 | $19,942 | $21,206 | $18,259 |
|---|
| 07/2022 | $22,314 | $23,161 | $20,494 |
|---|
| 08/2022 | $21,182 | $22,217 | $19,822 |
|---|
| 09/2022 | $19,278 | $20,170 | $18,140 |
|---|
| 10/2022 | $20,857 | $21,804 | $19,566 |
|---|
| 11/2022 | $21,910 | $23,022 | $20,630 |
|---|
| 12/2022 | $20,722 | $21,696 | $19,392 |
|---|
| 01/2023 | $22,537 | $23,059 | $21,084 |
|---|
| 02/2023 | $21,974 | $22,496 | $20,876 |
|---|
| 03/2023 | $22,893 | $23,322 | $21,163 |
|---|
| 04/2023 | $22,456 | $23,686 | $20,857 |
|---|
| 05/2023 | $22,567 | $23,789 | $20,870 |
|---|
| 06/2023 | $24,115 | $25,361 | $22,483 |
|---|
| 07/2023 | $24,708 | $26,176 | $23,163 |
|---|
| 08/2023 | $23,982 | $25,759 | $22,399 |
|---|
| 09/2023 | $22,923 | $24,531 | $21,308 |
|---|
| 10/2023 | $22,226 | $24,015 | $20,221 |
|---|
| 11/2023 | $24,464 | $26,208 | $22,688 |
|---|
| 12/2023 | $26,019 | $27,399 | $24,408 |
|---|
| 01/2024 | $25,916 | $27,859 | $24,276 |
|---|
| 02/2024 | $27,768 | $29,347 | $26,102 |
|---|
| 03/2024 | $28,398 | $30,291 | $26,726 |
|---|
| 04/2024 | $26,701 | $29,054 | $25,174 |
|---|
| 05/2024 | $27,257 | $30,494 | $25,442 |
|---|
| 06/2024 | $27,323 | $31,589 | $25,867 |
|---|
| 07/2024 | $27,346 | $31,973 | $26,024 |
|---|
| 08/2024 | $27,938 | $32,749 | $26,670 |
|---|
| 09/2024 | $28,405 | $33,448 | $27,559 |
|---|
| 10/2024 | $28,138 | $33,145 | $28,040 |
|---|
| 11/2024 | $31,302 | $35,090 | $31,778 |
|---|
| 12/2024 | $29,504 | $34,254 | $29,803 |
|---|
Average Annual Total Returns (%)
| HEADER | 1 Year | 5 Years | 10 Years |
|---|
R6 ClassFootnote Reference1 | 13.39% | 10.10% | 11.43% |
|---|
S&P 500® Index TR | 25.02% | 14.53% | 13.10% |
|---|
Russell Midcap® Growth Index | 22.10% | 11.47% | 11.54% |
|---|
| Footnote | Description |
Footnote1 | Return may differ from actual shareholder return due to accounting adjustments for financial reporting purposes. |
Performance shown is historical and is not indicative of future returns. Investment returns and principal value will vary, and shares may be worth more or less at redemption than at original purchase. Performance shown is as of date indicated, and current performance may be lower or higher than the performance data quoted. To obtain performance as of the most recent month end, please visit americanbeaconfunds.com or call 800-967-9009. The graph and table do not reflect the deduction of taxes that a shareholder would pay on fund distributions or redemption of fund shares. The Fund's performance benefited from fee waivers. Performance includes historical performance of another Class of the Fund. For more information, visit americanbeaconfunds.com/Performance_Disclaimers.aspx.
The S&P 500 Index TR is replacing the Russell Midcap Growth Index as broad-based securities market index to comply with a new regulatory requirement. The Russell Midcap Growth Index reflects the market sectors in which the Fund invests.
| Total Net Assets | $800,155,455 |
|---|
| # of Portfolio Holdings | 93 |
|---|
| Portfolio Turnover Rate | 24% |
|---|
| Total Management Fees Paid | $5,993,794 |
|---|
What did the Fund invest in?
Top Ten Holdings - % Net Assets
| Palantir Technologies, Inc., Class A | 2.7 |
| Axon Enterprise, Inc. | 2.3 |
| Spotify Technology SA | 2.1 |
| Tradeweb Markets, Inc., Class A | 2.1 |
| Copart, Inc. | 2.0 |
| Guidewire Software, Inc. | 2.0 |
| Burlington Stores, Inc. | 1.9 |
| Marvell Technology, Inc. | 1.8 |
| Take-Two Interactive Software, Inc. | 1.8 |
| Manhattan Associates, Inc. | 1.8 |
Excludes cash equivalents.
Asset Allocation - % Investments
| Value | Value |
|---|
| Common Stocks | 96.7 |
| Investment Companies | 2.0 |
| Foreign Common Stocks | 1.3 |
Sector Allocation - % Equities
| Value | Value |
|---|
| Consumer Staples | 0.2 |
| Utilities | 0.8 |
| Real Estate | 0.9 |
| Energy | 5.8 |
| Communication Services | 8.8 |
| Financials | 9.0 |
| Consumer Discretionary | 10.2 |
| Health Care | 15.1 |
| Industrials | 19.3 |
| Information Technology | 29.9 |
For additional information about the Fund, including its prospectus, financial statements, holdings, and proxy voting information, please visit www.americanbeaconfunds.com/literature or call 1-800-658-5811.
If your financial institution mailed only one copy of this Report to an address shared by more than one account, you can request an individual copy by contacting your financial institution.
Stephens Mid-Cap Growth Fund
Distributed by:
Resolute Investment Distributors, Inc.
Annual Shareholder Report - December 31, 2024
Annual Shareholder Report - December 31, 2024
This annual shareholder report contains important information about Man Large Cap Value Fund for the period of January 1, 2024 to December 31, 2024. You can find additional information about the Fund at www.americanbeaconfunds.com/literature. You can also request this information by contacting us at 800-658-5811. This report describes material changes to the Fund that occurred during the reporting period.
What were the Fund costs for the last year?
(based on a hypothetical $10,000 investment)
| Class Name | Costs of a $10,000 investment | Costs paid as a percentage of a $10,000 investment |
|---|
| Class A | $129 | 1.20% |
|---|
How did the Fund perform and what affected its performance?
The A Class of the Fund returned 9.14% (with sales charges) and 15.80% (without sales charges) for the twelve months ended December 31, 2024, compared to the S&P 500 Index return of 25.02% and the Russell 1000 Value Index return of 14.37%.
• Broad market performance was driven significantly by a small number of mega-cap growth companies while the Fund focuses its investments on large-capitalization value companies.
• The Fund generated positive performance in all sectors where it invested, except for Materials and Real Estate. The Fund’s holdings in the Financials sector contributed significantly to positive performance.
Cumulative Performance from December 31, 2014 through December 31, 2024
The initial investment, based on a $10,000 investment, is adjusted to reflect the maximum applicable sales charge, if any.
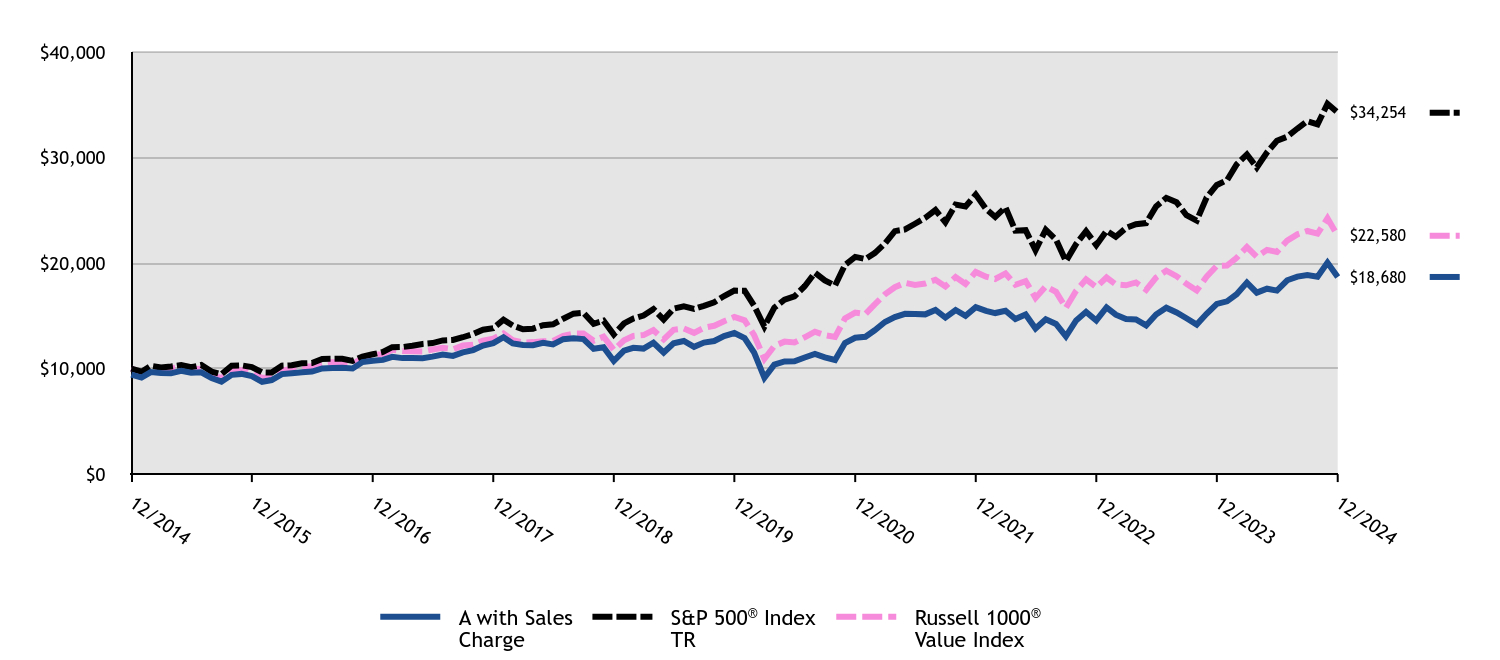
| A with Sales Charge | S&P 500® Index TR | Russell 1000® Value Index |
|---|
| 12/2014 | $9,426 | $10,000 | $10,000 |
|---|
| 01/2015 | $9,143 | $9,700 | $9,600 |
|---|
| 02/2015 | $9,661 | $10,257 | $10,065 |
|---|
| 03/2015 | $9,590 | $10,095 | $9,928 |
|---|
| 04/2015 | $9,550 | $10,192 | $10,021 |
|---|
| 05/2015 | $9,781 | $10,323 | $10,141 |
|---|
| 06/2015 | $9,606 | $10,123 | $9,939 |
|---|
| 07/2015 | $9,645 | $10,335 | $9,982 |
|---|
| 08/2015 | $9,100 | $9,712 | $9,388 |
|---|
| 09/2015 | $8,761 | $9,471 | $9,104 |
|---|
| 10/2015 | $9,406 | $10,270 | $9,791 |
|---|
| 11/2015 | $9,494 | $10,301 | $9,829 |
|---|
| 12/2015 | $9,279 | $10,138 | $9,617 |
|---|
| 01/2016 | $8,748 | $9,635 | $9,120 |
|---|
| 02/2016 | $8,909 | $9,622 | $9,118 |
|---|
| 03/2016 | $9,477 | $10,275 | $9,775 |
|---|
| 04/2016 | $9,555 | $10,315 | $9,980 |
|---|
| 05/2016 | $9,646 | $10,500 | $10,135 |
|---|
| 06/2016 | $9,712 | $10,527 | $10,223 |
|---|
| 07/2016 | $10,008 | $10,915 | $10,520 |
|---|
| 08/2016 | $10,045 | $10,931 | $10,601 |
|---|
| 09/2016 | $10,082 | $10,933 | $10,579 |
|---|
| 10/2016 | $10,004 | $10,733 | $10,415 |
|---|
| 11/2016 | $10,618 | $11,131 | $11,010 |
|---|
| 12/2016 | $10,745 | $11,351 | $11,285 |
|---|
| 01/2017 | $10,819 | $11,566 | $11,365 |
|---|
| 02/2017 | $11,115 | $12,025 | $11,774 |
|---|
| 03/2017 | $10,990 | $12,039 | $11,654 |
|---|
| 04/2017 | $10,998 | $12,163 | $11,632 |
|---|
| 05/2017 | $10,978 | $12,334 | $11,621 |
|---|
| 06/2017 | $11,132 | $12,411 | $11,811 |
|---|
| 07/2017 | $11,327 | $12,666 | $11,967 |
|---|
| 08/2017 | $11,202 | $12,705 | $11,828 |
|---|
| 09/2017 | $11,531 | $12,967 | $12,178 |
|---|
| 10/2017 | $11,752 | $13,270 | $12,267 |
|---|
| 11/2017 | $12,172 | $13,677 | $12,642 |
|---|
| 12/2017 | $12,402 | $13,829 | $12,827 |
|---|
| 01/2018 | $12,967 | $14,621 | $13,323 |
|---|
| 02/2018 | $12,375 | $14,082 | $12,687 |
|---|
| 03/2018 | $12,235 | $13,724 | $12,464 |
|---|
| 04/2018 | $12,218 | $13,777 | $12,505 |
|---|
| 05/2018 | $12,441 | $14,108 | $12,579 |
|---|
| 06/2018 | $12,292 | $14,195 | $12,610 |
|---|
| 07/2018 | $12,787 | $14,724 | $13,109 |
|---|
| 08/2018 | $12,862 | $15,203 | $13,303 |
|---|
| 09/2018 | $12,796 | $15,290 | $13,329 |
|---|
| 10/2018 | $11,872 | $14,245 | $12,639 |
|---|
| 11/2018 | $12,016 | $14,535 | $13,016 |
|---|
| 12/2018 | $10,719 | $13,223 | $11,767 |
|---|
| 01/2019 | $11,690 | $14,282 | $12,682 |
|---|
| 02/2019 | $11,968 | $14,741 | $13,088 |
|---|
| 03/2019 | $11,891 | $15,027 | $13,171 |
|---|
| 04/2019 | $12,446 | $15,636 | $13,638 |
|---|
| 05/2019 | $11,518 | $14,642 | $12,761 |
|---|
| 06/2019 | $12,403 | $15,674 | $13,677 |
|---|
| 07/2019 | $12,614 | $15,899 | $13,791 |
|---|
| 08/2019 | $12,059 | $15,648 | $13,385 |
|---|
| 09/2019 | $12,465 | $15,940 | $13,863 |
|---|
| 10/2019 | $12,609 | $16,286 | $14,056 |
|---|
| 11/2019 | $13,082 | $16,877 | $14,491 |
|---|
| 12/2019 | $13,367 | $17,386 | $14,890 |
|---|
| 01/2020 | $12,895 | $17,379 | $14,569 |
|---|
| 02/2020 | $11,500 | $15,949 | $13,158 |
|---|
| 03/2020 | $9,121 | $13,979 | $10,910 |
|---|
| 04/2020 | $10,373 | $15,771 | $12,136 |
|---|
| 05/2020 | $10,676 | $16,522 | $12,552 |
|---|
| 06/2020 | $10,690 | $16,850 | $12,469 |
|---|
| 07/2020 | $11,053 | $17,801 | $12,962 |
|---|
| 08/2020 | $11,395 | $19,080 | $13,497 |
|---|
| 09/2020 | $11,063 | $18,355 | $13,166 |
|---|
| 10/2020 | $10,810 | $17,867 | $12,993 |
|---|
| 11/2020 | $12,423 | $19,823 | $14,741 |
|---|
| 12/2020 | $12,915 | $20,585 | $15,306 |
|---|
| 01/2021 | $13,014 | $20,377 | $15,166 |
|---|
| 02/2021 | $13,631 | $20,939 | $16,082 |
|---|
| 03/2021 | $14,414 | $21,856 | $17,028 |
|---|
| 04/2021 | $14,877 | $23,022 | $17,709 |
|---|
| 05/2021 | $15,191 | $23,183 | $18,123 |
|---|
| 06/2021 | $15,169 | $23,724 | $17,915 |
|---|
| 07/2021 | $15,136 | $24,288 | $18,059 |
|---|
| 08/2021 | $15,555 | $25,026 | $18,417 |
|---|
| 09/2021 | $14,833 | $23,863 | $17,776 |
|---|
| 10/2021 | $15,549 | $25,534 | $18,678 |
|---|
| 11/2021 | $15,004 | $25,357 | $18,020 |
|---|
| 12/2021 | $15,822 | $26,494 | $19,157 |
|---|
| 01/2022 | $15,466 | $25,123 | $18,711 |
|---|
| 02/2022 | $15,260 | $24,371 | $18,493 |
|---|
| 03/2022 | $15,472 | $25,276 | $19,015 |
|---|
| 04/2022 | $14,692 | $23,071 | $17,943 |
|---|
| 05/2022 | $15,121 | $23,114 | $18,292 |
|---|
| 06/2022 | $13,792 | $21,206 | $16,694 |
|---|
| 07/2022 | $14,674 | $23,161 | $17,801 |
|---|
| 08/2022 | $14,227 | $22,217 | $17,270 |
|---|
| 09/2022 | $13,054 | $20,170 | $15,756 |
|---|
| 10/2022 | $14,559 | $21,804 | $17,371 |
|---|
| 11/2022 | $15,375 | $23,022 | $18,457 |
|---|
| 12/2022 | $14,557 | $21,696 | $17,713 |
|---|
| 01/2023 | $15,797 | $23,059 | $18,631 |
|---|
| 02/2023 | $15,107 | $22,496 | $17,974 |
|---|
| 03/2023 | $14,696 | $23,322 | $17,891 |
|---|
| 04/2023 | $14,658 | $23,686 | $18,161 |
|---|
| 05/2023 | $14,089 | $23,789 | $17,460 |
|---|
| 06/2023 | $15,126 | $25,361 | $18,620 |
|---|
| 07/2023 | $15,771 | $26,176 | $19,275 |
|---|
| 08/2023 | $15,316 | $25,759 | $18,754 |
|---|
| 09/2023 | $14,766 | $24,531 | $18,031 |
|---|
| 10/2023 | $14,172 | $24,015 | $17,395 |
|---|
| 11/2023 | $15,196 | $26,208 | $18,707 |
|---|
| 12/2023 | $16,132 | $27,399 | $19,743 |
|---|
| 01/2024 | $16,372 | $27,859 | $19,764 |
|---|
| 02/2024 | $17,044 | $29,347 | $20,493 |
|---|
| 03/2024 | $18,147 | $30,291 | $21,517 |
|---|
| 04/2024 | $17,192 | $29,054 | $20,598 |
|---|
| 05/2024 | $17,567 | $30,494 | $21,251 |
|---|
| 06/2024 | $17,390 | $31,589 | $21,051 |
|---|
| 07/2024 | $18,366 | $31,973 | $22,127 |
|---|
| 08/2024 | $18,713 | $32,749 | $22,721 |
|---|
| 09/2024 | $18,869 | $33,448 | $23,036 |
|---|
| 10/2024 | $18,706 | $33,145 | $22,783 |
|---|
| 11/2024 | $20,043 | $35,090 | $24,238 |
|---|
| 12/2024 | $18,680 | $34,254 | $22,580 |
|---|
Average Annual Total Returns (%)
| HEADER | 1 Year | 5 Years | 10 Years |
|---|
Class A without Sales ChargeFootnote Reference1 | 15.80% | 6.92% | 7.08% |
|---|
Class A with Maximum Sales Charge - 5.75%Footnote Reference1 | 9.14% | 5.67% | 6.45% |
|---|
S&P 500® Index TR | 25.02% | 14.53% | 13.10% |
|---|
Russell 1000® Value Index | 14.37% | 8.68% | 8.49% |
|---|
| Footnote | Description |
Footnote1 | Return may differ from actual shareholder return due to accounting adjustments for financial reporting purposes. |
Performance shown is historical and is not indicative of future returns. Investment returns and principal value will vary, and shares may be worth more or less at redemption than at original purchase. Performance shown is as of date indicated, and current performance may be lower or higher than the performance data quoted. To obtain performance as of the most recent month end, please visit americanbeaconfunds.com or call 800-967-9009. The graph and table do not reflect the deduction of taxes that a shareholder would pay on fund distributions or redemption of fund shares. The Fund's performance benefited from fee waivers. For more information, visit americanbeaconfunds.com/Performance_Disclaimers.aspx.
The S&P 500 Index TR is replacing the Russell 1000 Value Index as the broad-based securities market index to comply with a new regulatory requirement. The Russell 1000 Value Index reflects the market sectors in which the Fund invests.
| Total Net Assets | $239,711,367 |
|---|
| # of Portfolio Holdings | 104 |
|---|
| Portfolio Turnover Rate | 64% |
|---|
| Total Management Fees Paid | $1,736,726 |
|---|
What did the Fund invest in?
Top Ten Holdings - % Net Assets
| Synchrony Financial | 3.5 |
| JPMorgan Chase & Co. | 2.9 |
| Salesforce, Inc. | 2.9 |
| RTX Corp. | 2.8 |
| Cisco Systems, Inc. | 2.7 |
| Capital One Financial Corp. | 2.2 |
| MetLife, Inc. | 2.1 |
| eBay, Inc. | 2.1 |
| Builders FirstSource, Inc. | 2.0 |
| Johnson & Johnson | 1.9 |
Excludes cash equivalents.
Asset Allocation - % Investments
| Value | Value |
|---|
| Common Stocks | 97.3 |
| Investment Companies | 2.3 |
| Foreign Common Stocks | 0.4 |
The Fund may purchase and sell futures contracts to gain market exposure on cash balances.
Sector Allocation - % Equities
| Value | Value |
|---|
| Utilities | 0.7 |
| Communication Services | 2.4 |
| Materials | 4.0 |
| Energy | 4.3 |
| Consumer Staples | 4.4 |
| Consumer Discretionary | 4.6 |
| Industrials | 12.2 |
| Information Technology | 15.8 |
| Health Care | 24.2 |
| Financials | 27.4 |
This is a summary of certain changes to the Fund since December 31, 2023. For more complete information, you may review the Fund's next prospectus, which we expect to be available by March 1, 2025 at www.americanbeaconfunds.com/literature or upon request at 800-658-5811.
The Board of the Trust, at the recommendation of the Manager, approved; (i) the termination of the investment advisory agreement among the Manager, Bridgeway Capital Management, LLC and the Trust, on behalf of the American Beacon Man Large Cap Value Fund (formerly known as American Beacon Bridgeway Large Cap Value Fund), effective April 30, 2024, and (ii) a new investment advisory agreement among the Manager, Numeric Investors LLC, and the Trust on behalf of the Funds, effective May 1, 2024.
For additional information about the Fund, including its prospectus, financial statements, holdings, and proxy voting information, please visit www.americanbeaconfunds.com/literature or call 1-800-658-5811.
If your financial institution mailed only one copy of this Report to an address shared by more than one account, you can request an individual copy by contacting your financial institution.
Distributed by:
Resolute Investment Distributors, Inc.
Annual Shareholder Report - December 31, 2024
Annual Shareholder Report - December 31, 2024
This annual shareholder report contains important information about Man Large Cap Value Fund for the period of January 1, 2024 to December 31, 2024. You can find additional information about the Fund at www.americanbeaconfunds.com/literature. You can also request this information by contacting us at 800-658-5811. This report describes material changes to the Fund that occurred during the reporting period.
What were the Fund costs for the last year?
(based on a hypothetical $10,000 investment)
| Class Name | Costs of a $10,000 investment | Costs paid as a percentage of a $10,000 investment |
|---|
| Class C | $207 | 1.93% |
|---|
How did the Fund perform and what affected its performance?
The C Class of the Fund returned 13.96% (with sales charges) and 14.96% (without sales charges) for the twelve months ended December 31, 2024, compared to the S&P 500 Index return of 25.02% and the Russell 1000 Value Index return of 14.37%.
• Broad market performance was driven significantly by a small number of mega-cap growth companies while the Fund focuses its investments on large-capitalization value companies.
• The Fund generated positive performance in all sectors where it invested, except for Materials and Real Estate. The Fund’s holdings in the Financials sector contributed significantly to positive performance.
Cumulative Performance from December 31, 2014 through December 31, 2024
The initial investment, based on a $10,000 investment, is adjusted to reflect the maximum applicable sales charge, if any.
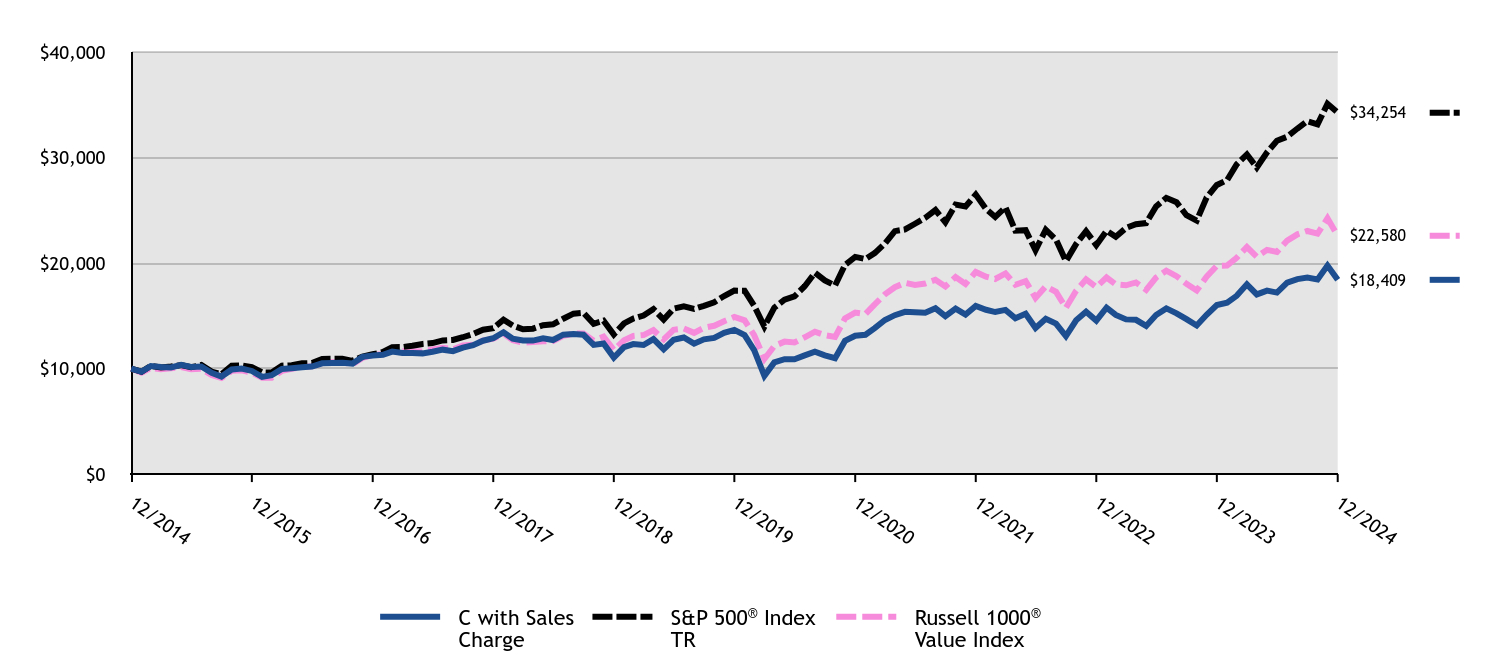
| C with Sales Charge | S&P 500® Index TR | Russell 1000® Value Index |
|---|
| 12/2014 | $10,000 | $10,000 | $10,000 |
|---|
| 01/2015 | $9,695 | $9,700 | $9,600 |
|---|
| 02/2015 | $10,236 | $10,257 | $10,065 |
|---|
| 03/2015 | $10,155 | $10,095 | $9,928 |
|---|
| 04/2015 | $10,107 | $10,192 | $10,021 |
|---|
| 05/2015 | $10,344 | $10,323 | $10,141 |
|---|
| 06/2015 | $10,155 | $10,123 | $9,939 |
|---|
| 07/2015 | $10,193 | $10,335 | $9,982 |
|---|
| 08/2015 | $9,605 | $9,712 | $9,388 |
|---|
| 09/2015 | $9,244 | $9,471 | $9,104 |
|---|
| 10/2015 | $9,918 | $10,270 | $9,791 |
|---|
| 11/2015 | $10,004 | $10,301 | $9,829 |
|---|
| 12/2015 | $9,773 | $10,138 | $9,617 |
|---|
| 01/2016 | $9,211 | $9,635 | $9,120 |
|---|
| 02/2016 | $9,370 | $9,622 | $9,118 |
|---|
| 03/2016 | $9,963 | $10,275 | $9,775 |
|---|
| 04/2016 | $10,039 | $10,315 | $9,980 |
|---|
| 05/2016 | $10,127 | $10,500 | $10,135 |
|---|
| 06/2016 | $10,189 | $10,527 | $10,223 |
|---|
| 07/2016 | $10,494 | $10,915 | $10,520 |
|---|
| 08/2016 | $10,525 | $10,931 | $10,601 |
|---|
| 09/2016 | $10,556 | $10,933 | $10,579 |
|---|
| 10/2016 | $10,472 | $10,733 | $10,415 |
|---|
| 11/2016 | $11,105 | $11,131 | $11,010 |
|---|
| 12/2016 | $11,230 | $11,351 | $11,285 |
|---|
| 01/2017 | $11,301 | $11,566 | $11,365 |
|---|
| 02/2017 | $11,604 | $12,025 | $11,774 |
|---|
| 03/2017 | $11,466 | $12,039 | $11,654 |
|---|
| 04/2017 | $11,470 | $12,163 | $11,632 |
|---|
| 05/2017 | $11,439 | $12,334 | $11,621 |
|---|
| 06/2017 | $11,590 | $12,411 | $11,811 |
|---|
| 07/2017 | $11,790 | $12,666 | $11,967 |
|---|
| 08/2017 | $11,652 | $12,705 | $11,828 |
|---|
| 09/2017 | $11,986 | $12,967 | $12,178 |
|---|
| 10/2017 | $12,212 | $13,270 | $12,267 |
|---|
| 11/2017 | $12,639 | $13,677 | $12,642 |
|---|
| 12/2017 | $12,868 | $13,829 | $12,827 |
|---|
| 01/2018 | $13,445 | $14,621 | $13,323 |
|---|
| 02/2018 | $12,826 | $14,082 | $12,687 |
|---|
| 03/2018 | $12,667 | $13,724 | $12,464 |
|---|
| 04/2018 | $12,649 | $13,777 | $12,505 |
|---|
| 05/2018 | $12,868 | $14,108 | $12,579 |
|---|
| 06/2018 | $12,705 | $14,195 | $12,610 |
|---|
| 07/2018 | $13,212 | $14,724 | $13,109 |
|---|
| 08/2018 | $13,278 | $15,203 | $13,303 |
|---|
| 09/2018 | $13,203 | $15,290 | $13,329 |
|---|
| 10/2018 | $12,239 | $14,245 | $12,639 |
|---|
| 11/2018 | $12,378 | $14,535 | $13,016 |
|---|
| 12/2018 | $11,041 | $13,223 | $11,767 |
|---|
| 01/2019 | $12,031 | $14,282 | $12,682 |
|---|
| 02/2019 | $12,314 | $14,741 | $13,088 |
|---|
| 03/2019 | $12,228 | $15,027 | $13,171 |
|---|
| 04/2019 | $12,789 | $15,636 | $13,638 |
|---|
| 05/2019 | $11,829 | $14,642 | $12,761 |
|---|
| 06/2019 | $12,728 | $15,674 | $13,677 |
|---|
| 07/2019 | $12,940 | $15,899 | $13,791 |
|---|
| 08/2019 | $12,359 | $15,648 | $13,385 |
|---|
| 09/2019 | $12,768 | $15,940 | $13,863 |
|---|
| 10/2019 | $12,905 | $16,286 | $14,056 |
|---|
| 11/2019 | $13,385 | $16,877 | $14,491 |
|---|
| 12/2019 | $13,667 | $17,386 | $14,890 |
|---|
| 01/2020 | $13,173 | $17,379 | $14,569 |
|---|
| 02/2020 | $11,741 | $15,949 | $13,158 |
|---|
| 03/2020 | $9,309 | $13,979 | $10,910 |
|---|
| 04/2020 | $10,580 | $15,771 | $12,136 |
|---|
| 05/2020 | $10,882 | $16,522 | $12,552 |
|---|
| 06/2020 | $10,887 | $16,850 | $12,469 |
|---|
| 07/2020 | $11,252 | $17,801 | $12,962 |
|---|
| 08/2020 | $11,595 | $19,080 | $13,497 |
|---|
| 09/2020 | $11,252 | $18,355 | $13,166 |
|---|
| 10/2020 | $10,986 | $17,867 | $12,993 |
|---|
| 11/2020 | $12,621 | $19,823 | $14,741 |
|---|
| 12/2020 | $13,110 | $20,585 | $15,306 |
|---|
| 01/2021 | $13,203 | $20,377 | $15,166 |
|---|
| 02/2021 | $13,823 | $20,939 | $16,082 |
|---|
| 03/2021 | $14,601 | $21,856 | $17,028 |
|---|
| 04/2021 | $15,059 | $23,022 | $17,709 |
|---|
| 05/2021 | $15,372 | $23,183 | $18,123 |
|---|
| 06/2021 | $15,338 | $23,724 | $17,915 |
|---|
| 07/2021 | $15,291 | $24,288 | $18,059 |
|---|
| 08/2021 | $15,709 | $25,026 | $18,417 |
|---|
| 09/2021 | $14,966 | $23,863 | $17,776 |
|---|
| 10/2021 | $15,680 | $25,534 | $18,678 |
|---|
| 11/2021 | $15,123 | $25,357 | $18,020 |
|---|
| 12/2021 | $15,939 | $26,494 | $19,157 |
|---|
| 01/2022 | $15,572 | $25,123 | $18,711 |
|---|
| 02/2022 | $15,356 | $24,371 | $18,493 |
|---|
| 03/2022 | $15,559 | $25,276 | $19,015 |
|---|
| 04/2022 | $14,761 | $23,071 | $17,943 |
|---|
| 05/2022 | $15,185 | $23,114 | $18,292 |
|---|
| 06/2022 | $13,843 | $21,206 | $16,694 |
|---|
| 07/2022 | $14,717 | $23,161 | $17,801 |
|---|
| 08/2022 | $14,254 | $22,217 | $17,270 |
|---|
| 09/2022 | $13,070 | $20,170 | $15,756 |
|---|
| 10/2022 | $14,577 | $21,804 | $17,371 |
|---|
| 11/2022 | $15,382 | $23,022 | $18,457 |
|---|
| 12/2022 | $14,547 | $21,696 | $17,713 |
|---|
| 01/2023 | $15,777 | $23,059 | $18,631 |
|---|
| 02/2023 | $15,087 | $22,496 | $17,974 |
|---|
| 03/2023 | $14,659 | $23,322 | $17,891 |
|---|
| 04/2023 | $14,619 | $23,686 | $18,161 |
|---|
| 05/2023 | $14,041 | $23,789 | $17,460 |
|---|
| 06/2023 | $15,067 | $25,361 | $18,620 |
|---|
| 07/2023 | $15,699 | $26,176 | $19,275 |
|---|
| 08/2023 | $15,231 | $25,759 | $18,754 |
|---|
| 09/2023 | $14,685 | $24,531 | $18,031 |
|---|
| 10/2023 | $14,080 | $24,015 | $17,395 |
|---|
| 11/2023 | $15,093 | $26,208 | $18,707 |
|---|
| 12/2023 | $16,013 | $27,399 | $19,743 |
|---|
| 01/2024 | $16,241 | $27,859 | $19,764 |
|---|
| 02/2024 | $16,893 | $29,347 | $20,493 |
|---|
| 03/2024 | $17,978 | $30,291 | $21,517 |
|---|
| 04/2024 | $17,025 | $29,054 | $20,598 |
|---|
| 05/2024 | $17,384 | $30,494 | $21,251 |
|---|
| 06/2024 | $17,201 | $31,589 | $21,051 |
|---|
| 07/2024 | $18,147 | $31,973 | $22,127 |
|---|
| 08/2024 | $18,477 | $32,749 | $22,721 |
|---|
| 09/2024 | $18,631 | $33,448 | $23,036 |
|---|
| 10/2024 | $18,448 | $33,145 | $22,783 |
|---|
| 11/2024 | $19,760 | $35,090 | $24,238 |
|---|
| 12/2024 | $18,409 | $34,254 | $22,580 |
|---|
Average Annual Total Returns (%)
| HEADER | 1 Year | 5 Years | 10 Years |
|---|
Class C without Deferred Sales ChargeFootnote Reference1 | 14.96% | 6.14% | 6.29% |
|---|
Class C with Maximum Deferred Sales Charge -1.00%Footnote Reference1 | 13.96% | 6.14% | 6.29% |
|---|
S&P 500® Index TR | 25.02% | 14.53% | 13.10% |
|---|
Russell 1000® Value Index | 14.37% | 8.68% | 8.49% |
|---|
| Footnote | Description |
Footnote1 | Return may differ from actual shareholder return due to accounting adjustments for financial reporting purposes. |
Performance shown is historical and is not indicative of future returns. Investment returns and principal value will vary, and shares may be worth more or less at redemption than at original purchase. Performance shown is as of date indicated, and current performance may be lower or higher than the performance data quoted. To obtain performance as of the most recent month end, please visit americanbeaconfunds.com or call 800-967-9009. The graph and table do not reflect the deduction of taxes that a shareholder would pay on fund distributions or redemption of fund shares. The Fund's performance benefited from fee waivers. For more information, visit americanbeaconfunds.com/Performance_Disclaimers.aspx.
The S&P 500 Index TR is replacing the Russell 1000 Value Index as the broad-based securities market index to comply with a new regulatory requirement. The Russell 1000 Value Index reflects the market sectors in which the Fund invests.
| Total Net Assets | $239,711,367 |
|---|
| # of Portfolio Holdings | 104 |
|---|
| Portfolio Turnover Rate | 64% |
|---|
| Total Management Fees Paid | $1,736,726 |
|---|
What did the Fund invest in?
Top Ten Holdings - % Net Assets
| Synchrony Financial | 3.5 |
| JPMorgan Chase & Co. | 2.9 |
| Salesforce, Inc. | 2.9 |
| RTX Corp. | 2.8 |
| Cisco Systems, Inc. | 2.7 |
| Capital One Financial Corp. | 2.2 |
| MetLife, Inc. | 2.1 |
| eBay, Inc. | 2.1 |
| Builders FirstSource, Inc. | 2.0 |
| Johnson & Johnson | 1.9 |
Excludes cash equivalents.
Asset Allocation - % Investments
| Value | Value |
|---|
| Common Stocks | 97.3 |
| Investment Companies | 2.3 |
| Foreign Common Stocks | 0.4 |
The Fund may purchase and sell futures contracts to gain market exposure on cash balances.
Sector Allocation - % Equities
| Value | Value |
|---|
| Utilities | 0.7 |
| Communication Services | 2.4 |
| Materials | 4.0 |
| Energy | 4.3 |
| Consumer Staples | 4.4 |
| Consumer Discretionary | 4.6 |
| Industrials | 12.2 |
| Information Technology | 15.8 |
| Health Care | 24.2 |
| Financials | 27.4 |
This is a summary of certain changes to the Fund since December 31, 2023. For more complete information, you may review the Fund's next prospectus, which we expect to be available by March 1, 2025 at www.americanbeaconfunds.com/literature or upon request at 800-658-5811.
The Board of the Trust, at the recommendation of the Manager, approved; (i) the termination of the investment advisory agreement among the Manager, Bridgeway Capital Management, LLC and the Trust, on behalf of the American Beacon Man Large Cap Value Fund (formerly known as American Beacon Bridgeway Large Cap Value Fund), effective April 30, 2024, and (ii) a new investment advisory agreement among the Manager, Numeric Investors LLC, and the Trust on behalf of the Funds, effective May 1, 2024.
For additional information about the Fund, including its prospectus, financial statements, holdings, and proxy voting information, please visit www.americanbeaconfunds.com/literature or call 1-800-658-5811.
If your financial institution mailed only one copy of this Report to an address shared by more than one account, you can request an individual copy by contacting your financial institution.
Distributed by:
Resolute Investment Distributors, Inc.
Annual Shareholder Report - December 31, 2024
Annual Shareholder Report - December 31, 2024
This annual shareholder report contains important information about Man Large Cap Value Fund for the period of January 1, 2024 to December 31, 2024. You can find additional information about the Fund at www.americanbeaconfunds.com/literature. You can also request this information by contacting us at 800-658-5811. This report describes material changes to the Fund that occurred during the reporting period.
What were the Fund costs for the last year?
(based on a hypothetical $10,000 investment)
| Class Name | Costs of a $10,000 investment | Costs paid as a percentage of a $10,000 investment |
|---|
| R5 | $88 | 0.81% |
|---|
How did the Fund perform and what affected its performance?
The R5 Class of the Fund returned 16.24% for the twelve months ended December 31, 2024, compared to the S&P 500 Index return of 25.02% and the Russell 1000 Value Index return of 14.37%.
• Broad market performance was driven significantly by a small number of mega-cap growth companies while the Fund focuses its investments on large-capitalization value companies.
• The Fund generated positive performance in all sectors where it invested, except for Materials and Real Estate. The Fund’s holdings in the Financials sector contributed significantly to positive performance.
Cumulative Performance from December 31, 2014 through December 31, 2024
The initial investment, based on a $250,000 investment, is adjusted to reflect the maximum applicable sales charge, if any.
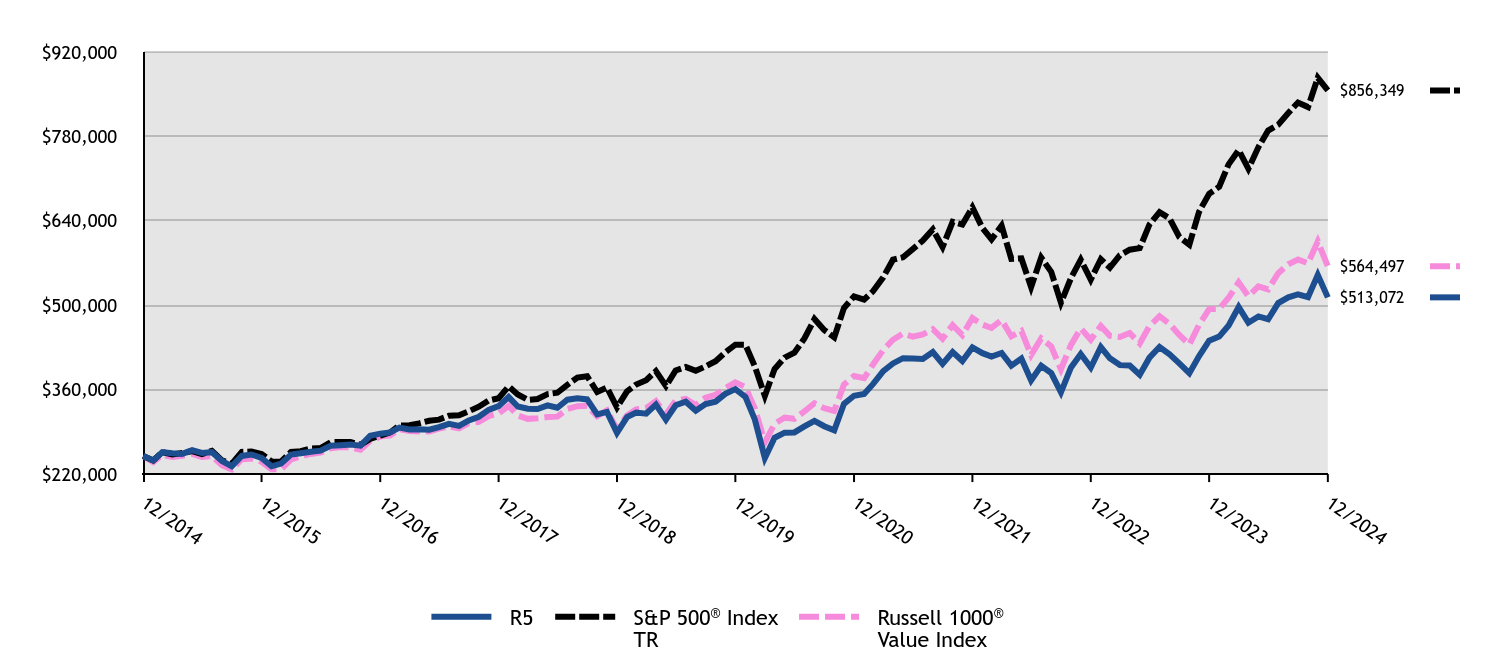
| R5 | S&P 500® Index TR | Russell 1000® Value Index |
|---|
| 12/2014 | $250,000 | $250,000 | $250,000 |
|---|
| 01/2015 | $242,570 | $242,495 | $240,007 |
|---|
| 02/2015 | $256,279 | $256,432 | $251,620 |
|---|
| 03/2015 | $254,500 | $252,376 | $248,195 |
|---|
| 04/2015 | $253,453 | $254,798 | $250,516 |
|---|
| 05/2015 | $259,627 | $258,074 | $253,526 |
|---|
| 06/2015 | $255,128 | $253,078 | $248,464 |
|---|
| 07/2015 | $256,279 | $258,381 | $249,554 |
|---|
| 08/2015 | $241,733 | $242,791 | $234,691 |
|---|
| 09/2015 | $232,838 | $236,784 | $227,606 |
|---|
| 10/2015 | $250,105 | $256,758 | $244,779 |
|---|
| 11/2015 | $252,512 | $257,521 | $245,716 |
|---|
| 12/2015 | $246,913 | $253,459 | $240,432 |
|---|
| 01/2016 | $232,913 | $240,882 | $228,008 |
|---|
| 02/2016 | $237,254 | $240,557 | $227,950 |
|---|
| 03/2016 | $252,340 | $256,876 | $244,371 |
|---|
| 04/2016 | $254,511 | $257,872 | $249,504 |
|---|
| 05/2016 | $257,007 | $262,503 | $253,380 |
|---|
| 06/2016 | $258,852 | $263,183 | $255,571 |
|---|
| 07/2016 | $266,884 | $272,886 | $262,991 |
|---|
| 08/2016 | $267,969 | $273,269 | $265,019 |
|---|
| 09/2016 | $269,054 | $273,320 | $264,467 |
|---|
| 10/2016 | $267,101 | $268,335 | $260,374 |
|---|
| 11/2016 | $283,489 | $278,273 | $275,245 |
|---|
| 12/2016 | $287,022 | $283,773 | $282,124 |
|---|
| 01/2017 | $289,113 | $289,155 | $284,134 |
|---|
| 02/2017 | $297,037 | $300,637 | $294,344 |
|---|
| 03/2017 | $293,845 | $300,987 | $291,345 |
|---|
| 04/2017 | $294,175 | $304,078 | $290,798 |
|---|
| 05/2017 | $293,625 | $308,357 | $290,513 |
|---|
| 06/2017 | $297,917 | $310,282 | $295,263 |
|---|
| 07/2017 | $303,200 | $316,662 | $299,187 |
|---|
| 08/2017 | $300,008 | $317,632 | $295,702 |
|---|
| 09/2017 | $308,922 | $324,184 | $304,460 |
|---|
| 10/2017 | $314,975 | $331,749 | $306,670 |
|---|
| 11/2017 | $326,421 | $341,924 | $316,061 |
|---|
| 12/2017 | $332,594 | $345,725 | $320,675 |
|---|
| 01/2018 | $347,728 | $365,519 | $333,072 |
|---|
| 02/2018 | $332,012 | $352,047 | $317,168 |
|---|
| 03/2018 | $328,287 | $343,101 | $311,588 |
|---|
| 04/2018 | $327,938 | $344,417 | $312,617 |
|---|
| 05/2018 | $333,991 | $352,712 | $314,473 |
|---|
| 06/2018 | $330,033 | $354,882 | $315,252 |
|---|
| 07/2018 | $343,421 | $368,089 | $327,729 |
|---|
| 08/2018 | $345,516 | $380,083 | $332,573 |
|---|
| 09/2018 | $343,770 | $382,247 | $333,233 |
|---|
| 10/2018 | $319,090 | $356,120 | $315,977 |
|---|
| 11/2018 | $323,048 | $363,377 | $325,411 |
|---|
| 12/2018 | $288,416 | $330,567 | $294,163 |
|---|
| 01/2019 | $314,566 | $357,058 | $317,059 |
|---|
| 02/2019 | $322,092 | $368,522 | $327,190 |
|---|
| 03/2019 | $320,178 | $375,683 | $329,270 |
|---|
| 04/2019 | $335,231 | $390,895 | $340,950 |
|---|
| 05/2019 | $310,356 | $366,054 | $319,028 |
|---|
| 06/2019 | $334,210 | $391,852 | $341,929 |
|---|
| 07/2019 | $340,078 | $397,484 | $344,763 |
|---|
| 08/2019 | $325,153 | $391,188 | $334,625 |
|---|
| 09/2019 | $336,124 | $398,507 | $346,564 |
|---|
| 10/2019 | $340,078 | $407,138 | $351,408 |
|---|
| 11/2019 | $352,962 | $421,917 | $362,272 |
|---|
| 12/2019 | $360,829 | $434,651 | $372,238 |
|---|
| 01/2020 | $348,066 | $434,481 | $364,230 |
|---|
| 02/2020 | $310,574 | $398,715 | $328,956 |
|---|
| 03/2020 | $246,491 | $349,468 | $272,739 |
|---|
| 04/2020 | $280,261 | $394,268 | $303,401 |
|---|
| 05/2020 | $288,637 | $413,046 | $313,798 |
|---|
| 06/2020 | $289,036 | $421,261 | $311,715 |
|---|
| 07/2020 | $299,007 | $445,013 | $324,038 |
|---|
| 08/2020 | $308,314 | $477,001 | $337,437 |
|---|
| 09/2020 | $299,406 | $458,877 | $329,149 |
|---|
| 10/2020 | $292,758 | $446,674 | $324,823 |
|---|
| 11/2020 | $336,499 | $495,568 | $368,516 |
|---|
| 12/2020 | $349,971 | $514,622 | $382,645 |
|---|
| 01/2021 | $352,772 | $509,426 | $379,140 |
|---|
| 02/2021 | $369,577 | $523,474 | $402,053 |
|---|
| 03/2021 | $390,806 | $546,400 | $425,711 |
|---|
| 04/2021 | $403,484 | $575,560 | $442,736 |
|---|
| 05/2021 | $412,181 | $579,580 | $453,072 |
|---|
| 06/2021 | $411,592 | $593,110 | $447,883 |
|---|
| 07/2021 | $410,855 | $607,200 | $451,463 |
|---|
| 08/2021 | $422,353 | $625,662 | $460,416 |
|---|
| 09/2021 | $402,747 | $596,563 | $444,390 |
|---|
| 10/2021 | $422,353 | $638,359 | $466,955 |
|---|
| 11/2021 | $407,611 | $633,936 | $450,499 |
|---|
| 12/2021 | $430,033 | $662,346 | $478,920 |
|---|
| 01/2022 | $420,477 | $628,072 | $467,764 |
|---|
| 02/2022 | $414,970 | $609,266 | $462,336 |
|---|
| 03/2022 | $420,801 | $631,888 | $475,387 |
|---|
| 04/2022 | $399,745 | $576,786 | $448,573 |
|---|
| 05/2022 | $411,568 | $577,845 | $457,294 |
|---|
| 06/2022 | $375,449 | $530,147 | $417,339 |
|---|
| 07/2022 | $399,583 | $579,029 | $445,014 |
|---|
| 08/2022 | $387,435 | $555,415 | $431,754 |
|---|
| 09/2022 | $355,526 | $504,262 | $393,895 |
|---|
| 10/2022 | $396,829 | $545,088 | $434,281 |
|---|
| 11/2022 | $419,019 | $575,550 | $461,420 |
|---|
| 12/2022 | $396,740 | $542,390 | $442,819 |
|---|
| 01/2023 | $430,722 | $576,470 | $465,766 |
|---|
| 02/2023 | $412,032 | $562,405 | $449,344 |
|---|
| 03/2023 | $400,988 | $583,053 | $447,275 |
|---|
| 04/2023 | $400,138 | $592,154 | $454,014 |
|---|
| 05/2023 | $384,676 | $594,728 | $436,503 |
|---|
| 06/2023 | $413,051 | $634,024 | $465,499 |
|---|
| 07/2023 | $430,722 | $654,392 | $481,868 |
|---|
| 08/2023 | $418,488 | $643,973 | $468,860 |
|---|
| 09/2023 | $403,706 | $613,270 | $450,767 |
|---|
| 10/2023 | $387,395 | $600,375 | $434,863 |
|---|
| 11/2023 | $415,600 | $655,205 | $467,673 |
|---|
| 12/2023 | $441,374 | $684,971 | $493,579 |
|---|
| 01/2024 | $448,039 | $696,481 | $494,090 |
|---|
| 02/2024 | $466,509 | $733,670 | $512,316 |
|---|
| 03/2024 | $496,975 | $757,276 | $537,930 |
|---|
| 04/2024 | $471,079 | $726,345 | $514,952 |
|---|
| 05/2024 | $481,361 | $762,361 | $531,276 |
|---|
| 06/2024 | $476,791 | $789,716 | $526,278 |
|---|
| 07/2024 | $503,639 | $799,329 | $553,182 |
|---|
| 08/2024 | $513,160 | $818,718 | $568,021 |
|---|
| 09/2024 | $517,920 | $836,203 | $575,906 |
|---|
| 10/2024 | $513,350 | $828,620 | $569,567 |
|---|
| 11/2024 | $550,290 | $877,261 | $605,939 |
|---|
| 12/2024 | $513,072 | $856,349 | $564,497 |
|---|
Average Annual Total Returns (%)
| HEADER | 1 Year | 5 Years | 10 Years |
|---|
Class R5Footnote Reference1 | 16.24% | 7.29% | 7.45% |
|---|
S&P 500® Index TR | 25.02% | 14.53% | 13.10% |
|---|
Russell 1000® Value Index | 14.37% | 8.68% | 8.49% |
|---|
| Footnote | Description |
Footnote1 | Return may differ from actual shareholder return due to accounting adjustments for financial reporting purposes. |
Performance shown is historical and is not indicative of future returns. Investment returns and principal value will vary, and shares may be worth more or less at redemption than at original purchase. Performance shown is as of date indicated, and current performance may be lower or higher than the performance data quoted. To obtain performance as of the most recent month end, please visit americanbeaconfunds.com or call 800-967-9009. The graph and table do not reflect the deduction of taxes that a shareholder would pay on fund distributions or redemption of fund shares. The Fund's performance benefited from fee waivers. For more information, visit americanbeaconfunds.com/Performance_Disclaimers.aspx.
The S&P 500 Index TR is replacing the Russell 1000 Value Index as the broad-based securities market index to comply with a new regulatory requirement. The Russell 1000 Value Index reflects the market sectors in which the Fund invests.
| Total Net Assets | $239,711,367 |
|---|
| # of Portfolio Holdings | 104 |
|---|
| Portfolio Turnover Rate | 64% |
|---|
| Total Management Fees Paid | $1,736,726 |
|---|
What did the Fund invest in?
Top Ten Holdings - % Net Assets
| Synchrony Financial | 3.5 |
| JPMorgan Chase & Co. | 2.9 |
| Salesforce, Inc. | 2.9 |
| RTX Corp. | 2.8 |
| Cisco Systems, Inc. | 2.7 |
| Capital One Financial Corp. | 2.2 |
| MetLife, Inc. | 2.1 |
| eBay, Inc. | 2.1 |
| Builders FirstSource, Inc. | 2.0 |
| Johnson & Johnson | 1.9 |
Excludes cash equivalents.
Asset Allocation - % Investments
| Value | Value |
|---|
| Common Stocks | 97.3 |
| Investment Companies | 2.3 |
| Foreign Common Stocks | 0.4 |
The Fund may purchase and sell futures contracts to gain market exposure on cash balances.
Sector Allocation - % Equities
| Value | Value |
|---|
| Utilities | 0.7 |
| Communication Services | 2.4 |
| Materials | 4.0 |
| Energy | 4.3 |
| Consumer Staples | 4.4 |
| Consumer Discretionary | 4.6 |
| Industrials | 12.2 |
| Information Technology | 15.8 |
| Health Care | 24.2 |
| Financials | 27.4 |
This is a summary of certain changes to the Fund since December 31, 2023. For more complete information, you may review the Fund's next prospectus, which we expect to be available by March 1, 2025 at www.americanbeaconfunds.com/literature or upon request at 800-658-5811.
The Board of the Trust, at the recommendation of the Manager, approved; (i) the termination of the investment advisory agreement among the Manager, Bridgeway Capital Management, LLC and the Trust, on behalf of the American Beacon Man Large Cap Value Fund (formerly known as American Beacon Bridgeway Large Cap Value Fund), effective April 30, 2024, and (ii) a new investment advisory agreement among the Manager, Numeric Investors LLC, and the Trust on behalf of the Funds, effective May 1, 2024.
For additional information about the Fund, including its prospectus, financial statements, holdings, and proxy voting information, please visit www.americanbeaconfunds.com/literature or call 1-800-658-5811.
If your financial institution mailed only one copy of this Report to an address shared by more than one account, you can request an individual copy by contacting your financial institution.
Distributed by:
Resolute Investment Distributors, Inc.
Annual Shareholder Report - December 31, 2024
Annual Shareholder Report - December 31, 2024
This annual shareholder report contains important information about Man Large Cap Value Fund for the period of January 1, 2024 to December 31, 2024. You can find additional information about the Fund at www.americanbeaconfunds.com/literature. You can also request this information by contacting us at 800-658-5811. This report describes material changes to the Fund that occurred during the reporting period.
What were the Fund costs for the last year?
(based on a hypothetical $10,000 investment)
| Class Name | Costs of a $10,000 investment | Costs paid as a percentage of a $10,000 investment |
|---|
| Y | $97 | 0.90% |
|---|
How did the Fund perform and what affected its performance?
The Y Class of the Fund returned 16.13% for the twelve months ended December 31, 2024, compared to the S&P 500 Index return of 25.02% and the Russell 1000 Value Index return of 14.37%.
• Broad market performance was driven significantly by a small number of mega-cap growth companies while the Fund focuses its investments on large-capitalization value companies.
• The Fund generated positive performance in all sectors where it invested, except for Materials and Real Estate. The Fund’s holdings in the Financials sector contributed significantly to positive performance.
Cumulative Performance from December 31, 2014 through December 31, 2024
The initial investment, based on a $100,000 investment, is adjusted to reflect the maximum applicable sales charge, if any.
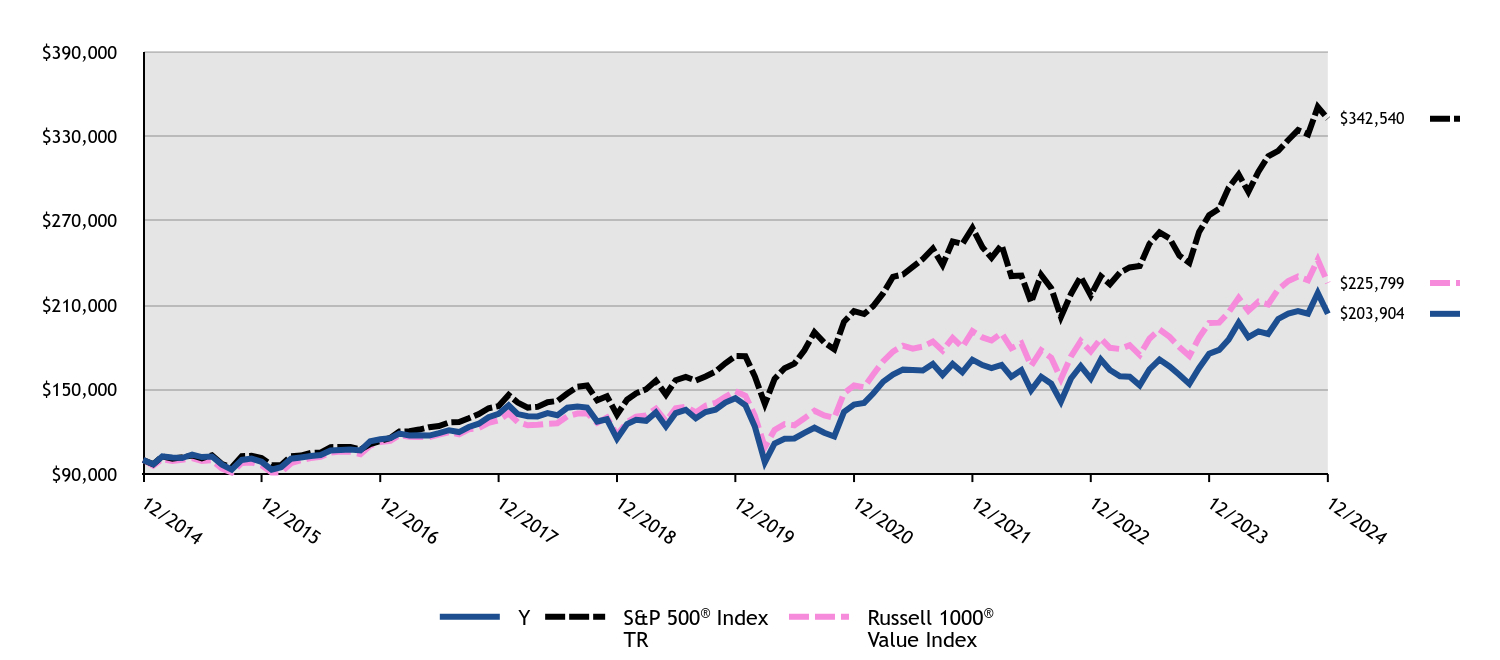
| #ERROR:A result could not be returned because the conditional could not be evaluated to a True/False value (#ERROR:Invalid Formula (#!=""), 'Multiple values from an iterator cannot be used in a formula unless they are aggregrated.') | Y | S&P 500® Index TR | Russell 1000® Value Index |
|---|
| 12/2014 | $100,000 | $100,000 | $100,000 |
|---|
| 01/2015 | $97,022 | $96,998 | $96,003 |
|---|
| 02/2015 | $102,517 | $102,573 | $100,648 |
|---|
| 03/2015 | $101,804 | $100,951 | $99,278 |
|---|
| 04/2015 | $101,426 | $101,919 | $100,206 |
|---|
| 05/2015 | $103,901 | $103,230 | $101,411 |
|---|
| 06/2015 | $102,097 | $101,231 | $99,386 |
|---|
| 07/2015 | $102,517 | $103,352 | $99,821 |
|---|
| 08/2015 | $96,728 | $97,117 | $93,876 |
|---|
| 09/2015 | $93,163 | $94,714 | $91,042 |
|---|
| 10/2015 | $100,042 | $102,703 | $97,912 |
|---|
| 11/2015 | $101,007 | $103,008 | $98,286 |
|---|
| 12/2015 | $98,743 | $101,384 | $96,173 |
|---|
| 01/2016 | $93,129 | $96,353 | $91,203 |
|---|
| 02/2016 | $94,870 | $96,223 | $91,180 |
|---|
| 03/2016 | $100,919 | $102,750 | $97,748 |
|---|
| 04/2016 | $101,789 | $103,149 | $99,802 |
|---|
| 05/2016 | $102,790 | $105,001 | $101,352 |
|---|
| 06/2016 | $103,530 | $105,273 | $102,228 |
|---|
| 07/2016 | $106,706 | $109,154 | $105,196 |
|---|
| 08/2016 | $107,142 | $109,308 | $106,008 |
|---|
| 09/2016 | $107,533 | $109,328 | $105,787 |
|---|
| 10/2016 | $106,794 | $107,334 | $104,149 |
|---|
| 11/2016 | $113,321 | $111,309 | $110,098 |
|---|
| 12/2016 | $114,710 | $113,509 | $112,849 |
|---|
| 01/2017 | $115,548 | $115,662 | $113,653 |
|---|
| 02/2017 | $118,767 | $120,255 | $117,737 |
|---|
| 03/2017 | $117,444 | $120,395 | $116,538 |
|---|
| 04/2017 | $117,577 | $121,631 | $116,319 |
|---|
| 05/2017 | $117,356 | $123,343 | $116,205 |
|---|
| 06/2017 | $119,032 | $124,113 | $118,105 |
|---|
| 07/2017 | $121,149 | $126,665 | $119,675 |
|---|
| 08/2017 | $119,870 | $127,053 | $118,281 |
|---|
| 09/2017 | $123,442 | $129,674 | $121,784 |
|---|
| 10/2017 | $125,824 | $132,700 | $122,668 |
|---|
| 11/2017 | $130,366 | $136,769 | $126,424 |
|---|
| 12/2017 | $132,855 | $138,290 | $128,270 |
|---|
| 01/2018 | $138,870 | $146,208 | $133,229 |
|---|
| 02/2018 | $132,621 | $140,819 | $126,867 |
|---|
| 03/2018 | $131,129 | $137,240 | $124,635 |
|---|
| 04/2018 | $130,989 | $137,767 | $125,047 |
|---|
| 05/2018 | $133,367 | $141,085 | $125,789 |
|---|
| 06/2018 | $131,782 | $141,953 | $126,101 |
|---|
| 07/2018 | $137,145 | $147,236 | $131,092 |
|---|
| 08/2018 | $137,937 | $152,033 | $133,029 |
|---|
| 09/2018 | $137,285 | $152,899 | $133,293 |
|---|
| 10/2018 | $127,352 | $142,448 | $126,391 |
|---|
| 11/2018 | $128,937 | $145,351 | $130,164 |
|---|
| 12/2018 | $115,115 | $132,227 | $117,665 |
|---|
| 01/2019 | $125,585 | $142,823 | $126,824 |
|---|
| 02/2019 | $128,598 | $147,409 | $130,876 |
|---|
| 03/2019 | $127,832 | $150,273 | $131,708 |
|---|
| 04/2019 | $133,807 | $156,358 | $136,380 |
|---|
| 05/2019 | $123,848 | $146,422 | $127,611 |
|---|
| 06/2019 | $133,347 | $156,741 | $136,772 |
|---|
| 07/2019 | $135,697 | $158,994 | $137,905 |
|---|
| 08/2019 | $129,721 | $156,475 | $133,850 |
|---|
| 09/2019 | $134,113 | $159,403 | $138,626 |
|---|
| 10/2019 | $135,697 | $162,855 | $140,563 |
|---|
| 11/2019 | $140,804 | $168,767 | $144,909 |
|---|
| 12/2019 | $143,961 | $173,861 | $148,895 |
|---|
| 01/2020 | $138,854 | $173,792 | $145,692 |
|---|
| 02/2020 | $123,852 | $159,486 | $131,582 |
|---|
| 03/2020 | $98,315 | $139,787 | $109,096 |
|---|
| 04/2020 | $111,775 | $157,707 | $121,360 |
|---|
| 05/2020 | $115,073 | $165,219 | $125,519 |
|---|
| 06/2020 | $115,286 | $168,504 | $124,686 |
|---|
| 07/2020 | $119,223 | $178,005 | $129,615 |
|---|
| 08/2020 | $122,947 | $190,801 | $134,975 |
|---|
| 09/2020 | $119,383 | $183,551 | $131,659 |
|---|
| 10/2020 | $116,723 | $178,669 | $129,929 |
|---|
| 11/2020 | $134,173 | $198,227 | $147,406 |
|---|
| 12/2020 | $139,441 | $205,849 | $153,058 |
|---|
| 01/2021 | $140,563 | $203,771 | $151,656 |
|---|
| 02/2021 | $147,290 | $209,390 | $160,821 |
|---|
| 03/2021 | $155,728 | $218,560 | $170,285 |
|---|
| 04/2021 | $160,744 | $230,224 | $177,094 |
|---|
| 05/2021 | $164,226 | $231,832 | $181,229 |
|---|
| 06/2021 | $163,990 | $237,244 | $179,153 |
|---|
| 07/2021 | $163,636 | $242,880 | $180,585 |
|---|
| 08/2021 | $168,238 | $250,265 | $184,166 |
|---|
| 09/2021 | $160,449 | $238,625 | $177,756 |
|---|
| 10/2021 | $168,238 | $255,344 | $186,782 |
|---|
| 11/2021 | $162,396 | $253,574 | $180,200 |
|---|
| 12/2021 | $171,283 | $264,939 | $191,568 |
|---|
| 01/2022 | $167,459 | $251,229 | $187,106 |
|---|
| 02/2022 | $165,321 | $243,707 | $184,934 |
|---|
| 03/2022 | $167,589 | $252,755 | $190,155 |
|---|
| 04/2022 | $159,164 | $230,715 | $179,429 |
|---|
| 05/2022 | $163,895 | $231,138 | $182,917 |
|---|
| 06/2022 | $149,508 | $212,059 | $166,936 |
|---|
| 07/2022 | $159,099 | $231,612 | $178,005 |
|---|
| 08/2022 | $154,239 | $222,166 | $172,702 |
|---|
| 09/2022 | $141,537 | $201,705 | $157,558 |
|---|
| 10/2022 | $157,933 | $218,035 | $173,712 |
|---|
| 11/2022 | $166,811 | $230,220 | $184,568 |
|---|
| 12/2022 | $157,907 | $216,956 | $177,128 |
|---|
| 01/2023 | $171,428 | $230,588 | $186,307 |
|---|
| 02/2023 | $164,022 | $224,962 | $179,738 |
|---|
| 03/2023 | $159,537 | $233,221 | $178,910 |
|---|
| 04/2023 | $159,197 | $236,861 | $181,606 |
|---|
| 05/2023 | $153,082 | $237,891 | $174,601 |
|---|
| 06/2023 | $164,361 | $253,610 | $186,200 |
|---|
| 07/2023 | $171,360 | $261,757 | $192,747 |
|---|
| 08/2023 | $166,468 | $257,589 | $187,544 |
|---|
| 09/2023 | $160,624 | $245,308 | $180,307 |
|---|
| 10/2023 | $154,102 | $240,150 | $173,945 |
|---|
| 11/2023 | $165,381 | $262,082 | $187,069 |
|---|
| 12/2023 | $175,576 | $273,988 | $197,431 |
|---|
| 01/2024 | $178,241 | $278,593 | $197,636 |
|---|
| 02/2024 | $185,550 | $293,468 | $204,927 |
|---|
| 03/2024 | $197,656 | $302,910 | $215,172 |
|---|
| 04/2024 | $187,302 | $290,538 | $205,981 |
|---|
| 05/2024 | $191,413 | $304,944 | $212,510 |
|---|
| 06/2024 | $189,586 | $315,886 | $210,511 |
|---|
| 07/2024 | $200,245 | $319,732 | $221,273 |
|---|
| 08/2024 | $204,052 | $327,487 | $227,209 |
|---|
| 09/2024 | $205,879 | $334,481 | $230,362 |
|---|
| 10/2024 | $204,052 | $331,448 | $227,827 |
|---|
| 11/2024 | $218,747 | $350,904 | $242,376 |
|---|
| 12/2024 | $203,904 | $342,540 | $225,799 |
|---|
Average Annual Total Returns (%)
| HEADER | 1 Year | 5 Years | 10 Years |
|---|
Class YFootnote Reference1 | 16.13% | 7.21% | 7.38% |
|---|
S&P 500® Index TR | 25.02% | 14.53% | 13.10% |
|---|
Russell 1000® Value Index | 14.37% | 8.68% | 8.49% |
|---|
| Footnote | Description |
Footnote1 | Return may differ from actual shareholder return due to accounting adjustments for financial reporting purposes. |
Performance shown is historical and is not indicative of future returns. Investment returns and principal value will vary, and shares may be worth more or less at redemption than at original purchase. Performance shown is as of date indicated, and current performance may be lower or higher than the performance data quoted. To obtain performance as of the most recent month end, please visit americanbeaconfunds.com or call 800-967-9009. The graph and table do not reflect the deduction of taxes that a shareholder would pay on fund distributions or redemption of fund shares. The Fund's performance benefited from fee waivers. For more information, visit americanbeaconfunds.com/Performance_Disclaimers.aspx.
The S&P 500 Index TR is replacing the Russell 1000 Value Index as the broad-based securities market index to comply with a new regulatory requirement. The Russell 1000 Value Index reflects the market sectors in which the Fund invests.
| Total Net Assets | $239,711,367 |
|---|
| # of Portfolio Holdings | 104 |
|---|
| Portfolio Turnover Rate | 64% |
|---|
| Total Management Fees Paid | $1,736,726 |
|---|
What did the Fund invest in?
Top Ten Holdings - % Net Assets
| Synchrony Financial | 3.5 |
| JPMorgan Chase & Co. | 2.9 |
| Salesforce, Inc. | 2.9 |
| RTX Corp. | 2.8 |
| Cisco Systems, Inc. | 2.7 |
| Capital One Financial Corp. | 2.2 |
| MetLife, Inc. | 2.1 |
| eBay, Inc. | 2.1 |
| Builders FirstSource, Inc. | 2.0 |
| Johnson & Johnson | 1.9 |
Excludes cash equivalents.
Asset Allocation - % Investments
| Value | Value |
|---|
| Common Stocks | 97.3 |
| Investment Companies | 2.3 |
| Foreign Common Stocks | 0.4 |
The Fund may purchase and sell futures contracts to gain market exposure on cash balances.
Sector Allocation - % Equities
| Value | Value |
|---|
| Utilities | 0.7 |
| Communication Services | 2.4 |
| Materials | 4.0 |
| Energy | 4.3 |
| Consumer Staples | 4.4 |
| Consumer Discretionary | 4.6 |
| Industrials | 12.2 |
| Information Technology | 15.8 |
| Health Care | 24.2 |
| Financials | 27.4 |
This is a summary of certain changes to the Fund since December 31, 2023. For more complete information, you may review the Fund's next prospectus, which we expect to be available by March 1, 2025 at www.americanbeaconfunds.com/literature or upon request at 800-658-5811.
The Board of the Trust, at the recommendation of the Manager, approved; (i) the termination of the investment advisory agreement among the Manager, Bridgeway Capital Management, LLC and the Trust, on behalf of the American Beacon Man Large Cap Value Fund (formerly known as American Beacon Bridgeway Large Cap Value Fund), effective April 30, 2024, and (ii) a new investment advisory agreement among the Manager, Numeric Investors LLC, and the Trust on behalf of the Funds, effective May 1, 2024.
For additional information about the Fund, including its prospectus, financial statements, holdings, and proxy voting information, please visit www.americanbeaconfunds.com/literature or call 1-800-658-5811.
If your financial institution mailed only one copy of this Report to an address shared by more than one account, you can request an individual copy by contacting your financial institution.
Distributed by:
Resolute Investment Distributors, Inc.
Annual Shareholder Report - December 31, 2024
Annual Shareholder Report - December 31, 2024
This annual shareholder report contains important information about Man Large Cap Value Fund for the period of January 1, 2024 to December 31, 2024. You can find additional information about the Fund at www.americanbeaconfunds.com/literature. You can also request this information by contacting us at 800-658-5811. This report describes material changes to the Fund that occurred during the reporting period.
What were the Fund costs for the last year?
(based on a hypothetical $10,000 investment)
| Class Name | Costs of a $10,000 investment | Costs paid as a percentage of a $10,000 investment |
|---|
| Investor | $128 | 1.19% |
|---|
How did the Fund perform and what affected its performance?
The Investor Class of the Fund returned 15.78% for the twelve months ended December 31, 2024, compared to the S&P 500 Index return of 25.02% and the Russell 1000 Value Index return of 14.37%.
• Broad market performance was driven significantly by a small number of mega-cap growth companies while the Fund focuses its investments on large-capitalization value companies.
• The Fund generated positive performance in all sectors where it invested, except for Materials and Real Estate. The Fund’s holdings in the Financials sector contributed significantly to positive performance.
Cumulative Performance from December 31, 2014 through December 31, 2024
The initial investment, based on a $10,000 investment, is adjusted to reflect the maximum applicable sales charge, if any.
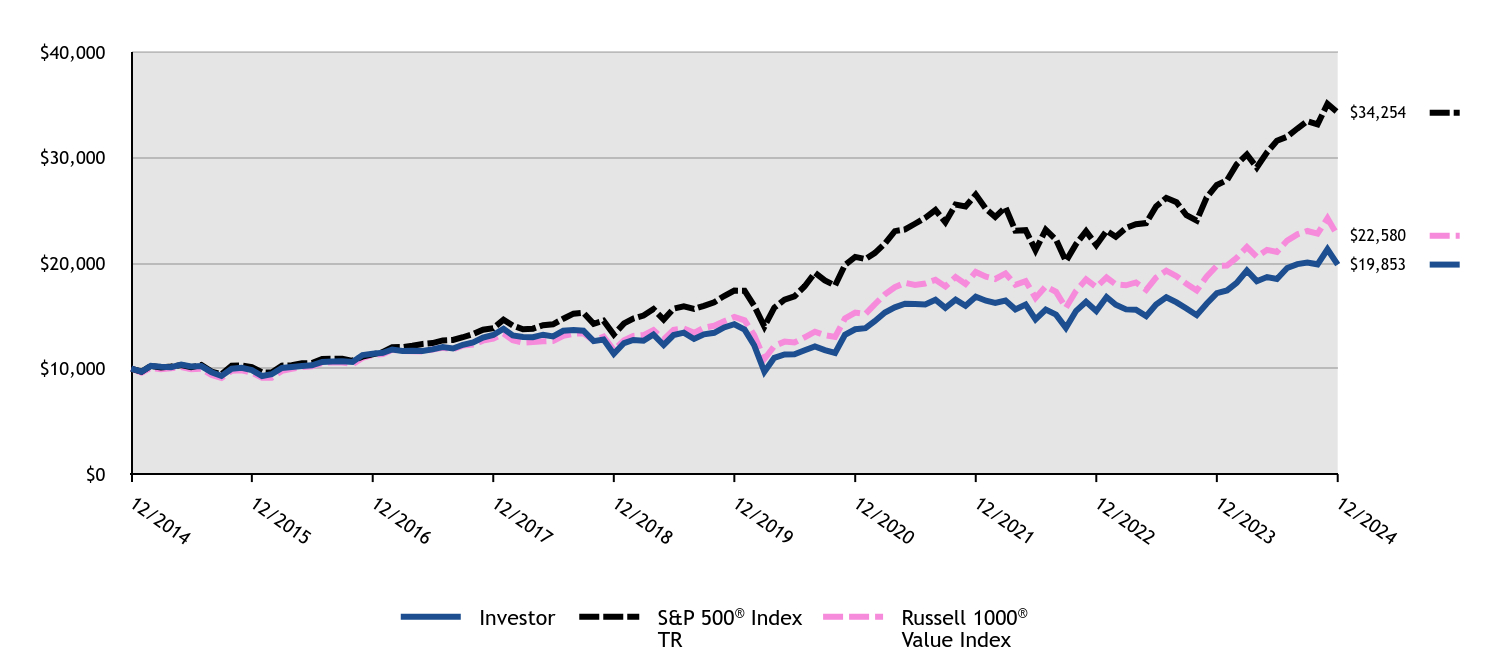
| Investor | S&P 500® Index TR | Russell 1000® Value Index |
|---|
| 12/2014 | $10,000 | $10,000 | $10,000 |
|---|
| 01/2015 | $9,701 | $9,700 | $9,600 |
|---|
| 02/2015 | $10,248 | $10,257 | $10,065 |
|---|
| 03/2015 | $10,172 | $10,095 | $9,928 |
|---|
| 04/2015 | $10,135 | $10,192 | $10,021 |
|---|
| 05/2015 | $10,379 | $10,323 | $10,141 |
|---|
| 06/2015 | $10,194 | $10,123 | $9,939 |
|---|
| 07/2015 | $10,236 | $10,335 | $9,982 |
|---|
| 08/2015 | $9,655 | $9,712 | $9,388 |
|---|
| 09/2015 | $9,297 | $9,471 | $9,104 |
|---|
| 10/2015 | $9,983 | $10,270 | $9,791 |
|---|
| 11/2015 | $10,076 | $10,301 | $9,829 |
|---|
| 12/2015 | $9,849 | $10,138 | $9,617 |
|---|
| 01/2016 | $9,288 | $9,635 | $9,120 |
|---|
| 02/2016 | $9,458 | $9,622 | $9,118 |
|---|
| 03/2016 | $10,058 | $10,275 | $9,775 |
|---|
| 04/2016 | $10,141 | $10,315 | $9,980 |
|---|
| 05/2016 | $10,237 | $10,500 | $10,135 |
|---|
| 06/2016 | $10,311 | $10,527 | $10,223 |
|---|
| 07/2016 | $10,624 | $10,915 | $10,520 |
|---|
| 08/2016 | $10,667 | $10,931 | $10,601 |
|---|
| 09/2016 | $10,702 | $10,933 | $10,579 |
|---|
| 10/2016 | $10,624 | $10,733 | $10,415 |
|---|
| 11/2016 | $11,272 | $11,131 | $11,010 |
|---|
| 12/2016 | $11,406 | $11,351 | $11,285 |
|---|
| 01/2017 | $11,490 | $11,566 | $11,365 |
|---|
| 02/2017 | $11,802 | $12,025 | $11,774 |
|---|
| 03/2017 | $11,670 | $12,039 | $11,654 |
|---|
| 04/2017 | $11,679 | $12,163 | $11,632 |
|---|
| 05/2017 | $11,657 | $12,334 | $11,621 |
|---|
| 06/2017 | $11,820 | $12,411 | $11,811 |
|---|
| 07/2017 | $12,031 | $12,666 | $11,967 |
|---|
| 08/2017 | $11,899 | $12,705 | $11,828 |
|---|
| 09/2017 | $12,251 | $12,967 | $12,178 |
|---|
| 10/2017 | $12,484 | $13,270 | $12,267 |
|---|
| 11/2017 | $12,933 | $13,677 | $12,642 |
|---|
| 12/2017 | $13,177 | $13,829 | $12,827 |
|---|
| 01/2018 | $13,770 | $14,621 | $13,323 |
|---|
| 02/2018 | $13,144 | $14,082 | $12,687 |
|---|
| 03/2018 | $12,996 | $13,724 | $12,464 |
|---|
| 04/2018 | $12,977 | $13,777 | $12,505 |
|---|
| 05/2018 | $13,209 | $14,108 | $12,579 |
|---|
| 06/2018 | $13,051 | $14,195 | $12,610 |
|---|
| 07/2018 | $13,580 | $14,724 | $13,109 |
|---|
| 08/2018 | $13,654 | $15,203 | $13,303 |
|---|
| 09/2018 | $13,585 | $15,290 | $13,329 |
|---|
| 10/2018 | $12,601 | $14,245 | $12,639 |
|---|
| 11/2018 | $12,754 | $14,535 | $13,016 |
|---|
| 12/2018 | $11,389 | $13,223 | $11,767 |
|---|
| 01/2019 | $12,416 | $14,282 | $12,682 |
|---|
| 02/2019 | $12,710 | $14,741 | $13,088 |
|---|
| 03/2019 | $12,634 | $15,027 | $13,171 |
|---|
| 04/2019 | $13,221 | $15,636 | $13,638 |
|---|
| 05/2019 | $12,234 | $14,642 | $12,761 |
|---|
| 06/2019 | $13,175 | $15,674 | $13,677 |
|---|
| 07/2019 | $13,398 | $15,899 | $13,791 |
|---|
| 08/2019 | $12,806 | $15,648 | $13,385 |
|---|
| 09/2019 | $13,241 | $15,940 | $13,863 |
|---|
| 10/2019 | $13,388 | $16,286 | $14,056 |
|---|
| 11/2019 | $13,894 | $16,877 | $14,491 |
|---|
| 12/2019 | $14,200 | $17,386 | $14,890 |
|---|
| 01/2020 | $13,691 | $17,379 | $14,569 |
|---|
| 02/2020 | $12,211 | $15,949 | $13,158 |
|---|
| 03/2020 | $9,691 | $13,979 | $10,910 |
|---|
| 04/2020 | $11,019 | $15,771 | $12,136 |
|---|
| 05/2020 | $11,339 | $16,522 | $12,552 |
|---|
| 06/2020 | $11,355 | $16,850 | $12,469 |
|---|
| 07/2020 | $11,738 | $17,801 | $12,962 |
|---|
| 08/2020 | $12,106 | $19,080 | $13,497 |
|---|
| 09/2020 | $11,754 | $18,355 | $13,166 |
|---|
| 10/2020 | $11,486 | $17,867 | $12,993 |
|---|
| 11/2020 | $13,198 | $19,823 | $14,741 |
|---|
| 12/2020 | $13,723 | $20,585 | $15,306 |
|---|
| 01/2021 | $13,828 | $20,377 | $15,166 |
|---|
| 02/2021 | $14,486 | $20,939 | $16,082 |
|---|
| 03/2021 | $15,313 | $21,856 | $17,028 |
|---|
| 04/2021 | $15,802 | $23,022 | $17,709 |
|---|
| 05/2021 | $16,140 | $23,183 | $18,123 |
|---|
| 06/2021 | $16,117 | $23,724 | $17,915 |
|---|
| 07/2021 | $16,082 | $24,288 | $18,059 |
|---|
| 08/2021 | $16,525 | $25,026 | $18,417 |
|---|
| 09/2021 | $15,756 | $23,863 | $17,776 |
|---|
| 10/2021 | $16,519 | $25,534 | $18,678 |
|---|
| 11/2021 | $15,942 | $25,357 | $18,020 |
|---|
| 12/2021 | $16,811 | $26,494 | $19,157 |
|---|
| 01/2022 | $16,429 | $25,123 | $18,711 |
|---|
| 02/2022 | $16,218 | $24,371 | $18,493 |
|---|
| 03/2022 | $16,441 | $25,276 | $19,015 |
|---|
| 04/2022 | $15,612 | $23,071 | $17,943 |
|---|
| 05/2022 | $16,071 | $23,114 | $18,292 |
|---|
| 06/2022 | $14,655 | $21,206 | $16,694 |
|---|
| 07/2022 | $15,586 | $23,161 | $17,801 |
|---|
| 08/2022 | $15,114 | $22,217 | $17,270 |
|---|
| 09/2022 | $13,864 | $20,170 | $15,756 |
|---|
| 10/2022 | $15,472 | $21,804 | $17,371 |
|---|
| 11/2022 | $16,333 | $23,022 | $18,457 |
|---|
| 12/2022 | $15,460 | $21,696 | $17,713 |
|---|
| 01/2023 | $16,781 | $23,059 | $18,631 |
|---|
| 02/2023 | $16,047 | $22,496 | $17,974 |
|---|
| 03/2023 | $15,607 | $23,322 | $17,891 |
|---|
| 04/2023 | $15,573 | $23,686 | $18,161 |
|---|
| 05/2023 | $14,966 | $23,789 | $17,460 |
|---|
| 06/2023 | $16,067 | $25,361 | $18,620 |
|---|
| 07/2023 | $16,754 | $26,176 | $19,275 |
|---|
| 08/2023 | $16,267 | $25,759 | $18,754 |
|---|
| 09/2023 | $15,693 | $24,531 | $18,031 |
|---|
| 10/2023 | $15,060 | $24,015 | $17,395 |
|---|
| 11/2023 | $16,147 | $26,208 | $18,707 |
|---|
| 12/2023 | $17,148 | $27,399 | $19,743 |
|---|
| 01/2024 | $17,402 | $27,859 | $19,764 |
|---|
| 02/2024 | $18,118 | $29,347 | $20,493 |
|---|
| 03/2024 | $19,289 | $30,291 | $21,517 |
|---|
| 04/2024 | $18,282 | $29,054 | $20,598 |
|---|
| 05/2024 | $18,677 | $30,494 | $21,251 |
|---|
| 06/2024 | $18,491 | $31,589 | $21,051 |
|---|
| 07/2024 | $19,527 | $31,973 | $22,127 |
|---|
| 08/2024 | $19,893 | $32,749 | $22,721 |
|---|
| 09/2024 | $20,057 | $33,448 | $23,036 |
|---|
| 10/2024 | $19,878 | $33,145 | $22,783 |
|---|
| 11/2024 | $21,303 | $35,090 | $24,238 |
|---|
| 12/2024 | $19,853 | $34,254 | $22,580 |
|---|
Average Annual Total Returns (%)
| HEADER | 1 Year | 5 Years | 10 Years |
|---|
Investor ClassFootnote Reference1 | 15.78% | 6.93% | 7.10% |
|---|
S&P 500® Index TR | 25.02% | 14.53% | 13.10% |
|---|
Russell 1000® Value Index | 14.37% | 8.68% | 8.49% |
|---|
| Footnote | Description |
Footnote1 | Return may differ from actual shareholder return due to accounting adjustments for financial reporting purposes. |
Performance shown is historical and is not indicative of future returns. Investment returns and principal value will vary, and shares may be worth more or less at redemption than at original purchase. Performance shown is as of date indicated, and current performance may be lower or higher than the performance data quoted. To obtain performance as of the most recent month end, please visit americanbeaconfunds.com or call 800-967-9009. The graph and table do not reflect the deduction of taxes that a shareholder would pay on fund distributions or redemption of fund shares. The Fund's performance benefited from fee waivers. For more information, visit americanbeaconfunds.com/Performance_Disclaimers.aspx.
The S&P 500 Index TR is replacing the Russell 1000 Value Index as the broad-based securities market index to comply with a new regulatory requirement. The Russell 1000 Value Index reflects the market sectors in which the Fund invests.
| Total Net Assets | $239,711,367 |
|---|
| # of Portfolio Holdings | 104 |
|---|
| Portfolio Turnover Rate | 64% |
|---|
| Total Management Fees Paid | $1,736,726 |
|---|
What did the Fund invest in?
Top Ten Holdings - % Net Assets
| Synchrony Financial | 3.5 |
| JPMorgan Chase & Co. | 2.9 |
| Salesforce, Inc. | 2.9 |
| RTX Corp. | 2.8 |
| Cisco Systems, Inc. | 2.7 |
| Capital One Financial Corp. | 2.2 |
| MetLife, Inc. | 2.1 |
| eBay, Inc. | 2.1 |
| Builders FirstSource, Inc. | 2.0 |
| Johnson & Johnson | 1.9 |
Excludes cash equivalents.
Asset Allocation - % Investments
| Value | Value |
|---|
| Common Stocks | 97.3 |
| Investment Companies | 2.3 |
| Foreign Common Stocks | 0.4 |
The Fund may purchase and sell futures contracts to gain market exposure on cash balances.
Sector Allocation - % Equities
| Value | Value |
|---|
| Utilities | 0.7 |
| Communication Services | 2.4 |
| Materials | 4.0 |
| Energy | 4.3 |
| Consumer Staples | 4.4 |
| Consumer Discretionary | 4.6 |
| Industrials | 12.2 |
| Information Technology | 15.8 |
| Health Care | 24.2 |
| Financials | 27.4 |
This is a summary of certain changes to the Fund since December 31, 2023. For more complete information, you may review the Fund's next prospectus, which we expect to be available by March 1, 2025 at www.americanbeaconfunds.com/literature or upon request at 800-658-5811.
The Board of the Trust, at the recommendation of the Manager, approved; (i) the termination of the investment advisory agreement among the Manager, Bridgeway Capital Management, LLC and the Trust, on behalf of the American Beacon Man Large Cap Value Fund (formerly known as American Beacon Bridgeway Large Cap Value Fund), effective April 30, 2024, and (ii) a new investment advisory agreement among the Manager, Numeric Investors LLC, and the Trust on behalf of the Funds, effective May 1, 2024.
For additional information about the Fund, including its prospectus, financial statements, holdings, and proxy voting information, please visit www.americanbeaconfunds.com/literature or call 1-800-658-5811.
If your financial institution mailed only one copy of this Report to an address shared by more than one account, you can request an individual copy by contacting your financial institution.
Distributed by:
Resolute Investment Distributors, Inc.
Annual Shareholder Report - December 31, 2024
Annual Shareholder Report - December 31, 2024
This annual shareholder report contains important information about Man Large Cap Value Fund for the period of January 1, 2024 to December 31, 2024. You can find additional information about the Fund at www.americanbeaconfunds.com/literature. You can also request this information by contacting us at 800-658-5811. This report describes material changes to the Fund that occurred during the reporting period.
What were the Fund costs for the last year?
(based on a hypothetical $10,000 investment)
| Class Name | Costs of a $10,000 investment | Costs paid as a percentage of a $10,000 investment |
|---|
| R6 | $88 | 0.81% |
|---|
How did the Fund perform and what affected its performance?
The R6 Class of the Fund returned 16.49% for the twelve months ended December 31, 2024, compared to the S&P 500 Index return of 25.02% and the Russell 1000 Value Index return of 14.37%.
• Broad market performance was driven significantly by a small number of mega-cap growth companies while the Fund focuses its investments on large-capitalization value companies.
• The Fund generated positive performance in all sectors where it invested, except for Materials and Real Estate. The Fund’s holdings in the Financials sector contributed significantly to positive performance.
Cumulative Performance from December 31, 2014 through December 31, 2024
The initial investment, based on a $10,000 investment, is adjusted to reflect the maximum applicable sales charge, if any.
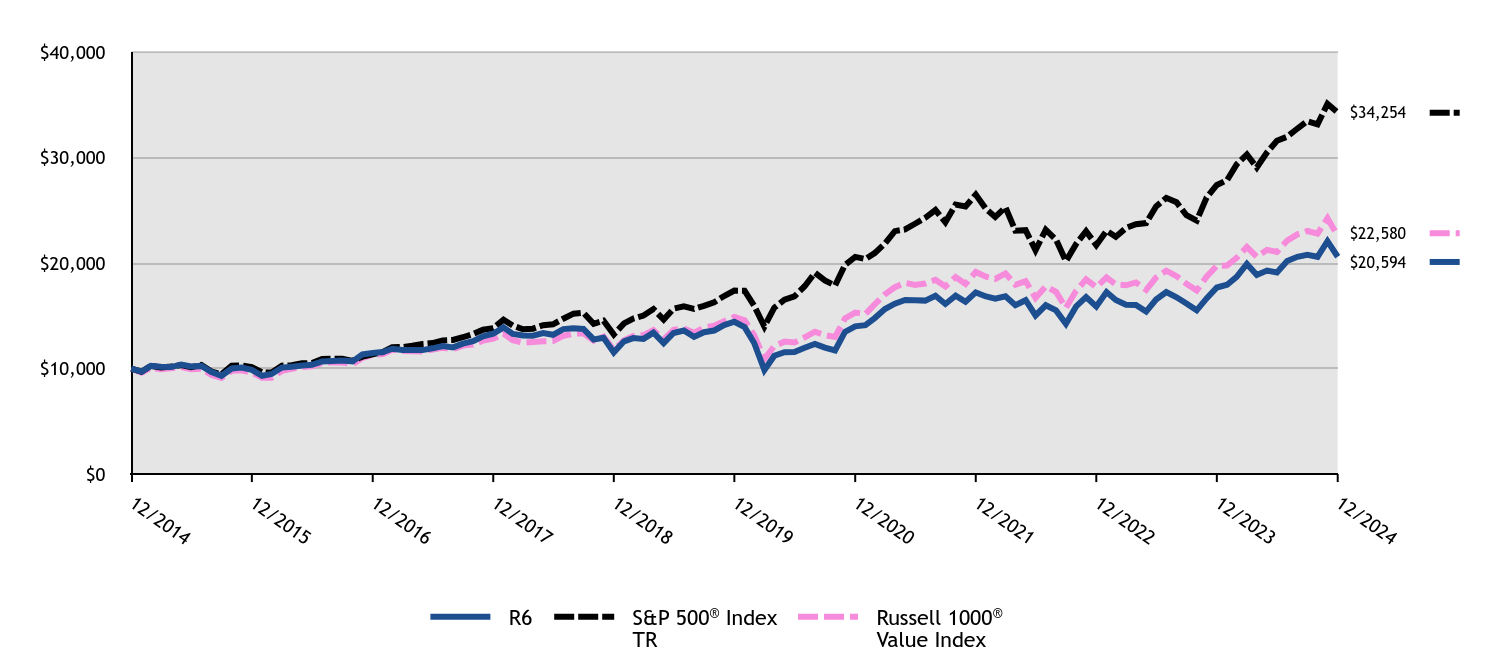
| R6 | S&P 500® Index TR | Russell 1000® Value Index |
|---|
| 12/2014 | $10,000 | $10,000 | $10,000 |
|---|
| 01/2015 | $9,703 | $9,700 | $9,600 |
|---|
| 02/2015 | $10,251 | $10,257 | $10,065 |
|---|
| 03/2015 | $10,180 | $10,095 | $9,928 |
|---|
| 04/2015 | $10,138 | $10,192 | $10,021 |
|---|
| 05/2015 | $10,385 | $10,323 | $10,141 |
|---|
| 06/2015 | $10,205 | $10,123 | $9,939 |
|---|
| 07/2015 | $10,251 | $10,335 | $9,982 |
|---|
| 08/2015 | $9,669 | $9,712 | $9,388 |
|---|
| 09/2015 | $9,314 | $9,471 | $9,104 |
|---|
| 10/2015 | $10,004 | $10,270 | $9,791 |
|---|
| 11/2015 | $10,100 | $10,301 | $9,829 |
|---|
| 12/2015 | $9,877 | $10,138 | $9,617 |
|---|
| 01/2016 | $9,316 | $9,635 | $9,120 |
|---|
| 02/2016 | $9,490 | $9,622 | $9,118 |
|---|
| 03/2016 | $10,094 | $10,275 | $9,775 |
|---|
| 04/2016 | $10,180 | $10,315 | $9,980 |
|---|
| 05/2016 | $10,280 | $10,500 | $10,135 |
|---|
| 06/2016 | $10,354 | $10,527 | $10,223 |
|---|
| 07/2016 | $10,675 | $10,915 | $10,520 |
|---|
| 08/2016 | $10,719 | $10,931 | $10,601 |
|---|
| 09/2016 | $10,762 | $10,933 | $10,579 |
|---|
| 10/2016 | $10,684 | $10,733 | $10,415 |
|---|
| 11/2016 | $11,340 | $11,131 | $11,010 |
|---|
| 12/2016 | $11,481 | $11,351 | $11,285 |
|---|
| 01/2017 | $11,565 | $11,566 | $11,365 |
|---|
| 02/2017 | $11,881 | $12,025 | $11,774 |
|---|
| 03/2017 | $11,754 | $12,039 | $11,654 |
|---|
| 04/2017 | $11,767 | $12,163 | $11,632 |
|---|
| 05/2017 | $11,749 | $12,334 | $11,621 |
|---|
| 06/2017 | $11,917 | $12,411 | $11,811 |
|---|
| 07/2017 | $12,132 | $12,666 | $11,967 |
|---|
| 08/2017 | $12,005 | $12,705 | $11,828 |
|---|
| 09/2017 | $12,357 | $12,967 | $12,178 |
|---|
| 10/2017 | $12,595 | $13,270 | $12,267 |
|---|
| 11/2017 | $13,052 | $13,677 | $12,642 |
|---|
| 12/2017 | $13,298 | $13,829 | $12,827 |
|---|
| 01/2018 | $13,904 | $14,621 | $13,323 |
|---|
| 02/2018 | $13,275 | $14,082 | $12,687 |
|---|
| 03/2018 | $13,126 | $13,724 | $12,464 |
|---|
| 04/2018 | $13,116 | $13,777 | $12,505 |
|---|
| 05/2018 | $13,354 | $14,108 | $12,579 |
|---|
| 06/2018 | $13,196 | $14,195 | $12,610 |
|---|
| 07/2018 | $13,736 | $14,724 | $13,109 |
|---|
| 08/2018 | $13,815 | $15,203 | $13,303 |
|---|
| 09/2018 | $13,750 | $15,290 | $13,329 |
|---|
| 10/2018 | $12,758 | $14,245 | $12,639 |
|---|
| 11/2018 | $12,916 | $14,535 | $13,016 |
|---|
| 12/2018 | $11,534 | $13,223 | $11,767 |
|---|
| 01/2019 | $12,580 | $14,282 | $12,682 |
|---|
| 02/2019 | $12,886 | $14,741 | $13,088 |
|---|
| 03/2019 | $12,810 | $15,027 | $13,171 |
|---|
| 04/2019 | $13,407 | $15,636 | $13,638 |
|---|
| 05/2019 | $12,412 | $14,642 | $12,761 |
|---|
| 06/2019 | $13,372 | $15,674 | $13,677 |
|---|
| 07/2019 | $13,601 | $15,899 | $13,791 |
|---|
| 08/2019 | $13,004 | $15,648 | $13,385 |
|---|
| 09/2019 | $13,448 | $15,940 | $13,863 |
|---|
| 10/2019 | $13,606 | $16,286 | $14,056 |
|---|
| 11/2019 | $14,122 | $16,877 | $14,491 |
|---|
| 12/2019 | $14,437 | $17,386 | $14,890 |
|---|
| 01/2020 | $13,926 | $17,379 | $14,569 |
|---|
| 02/2020 | $12,425 | $15,949 | $13,158 |
|---|
| 03/2020 | $9,859 | $13,979 | $10,910 |
|---|
| 04/2020 | $11,216 | $15,771 | $12,136 |
|---|
| 05/2020 | $11,546 | $16,522 | $12,552 |
|---|
| 06/2020 | $11,562 | $16,850 | $12,469 |
|---|
| 07/2020 | $11,962 | $17,801 | $12,962 |
|---|
| 08/2020 | $12,339 | $19,080 | $13,497 |
|---|
| 09/2020 | $11,983 | $18,355 | $13,166 |
|---|
| 10/2020 | $11,711 | $17,867 | $12,993 |
|---|
| 11/2020 | $13,468 | $19,823 | $14,741 |
|---|
| 12/2020 | $14,000 | $20,585 | $15,306 |
|---|
| 01/2021 | $14,112 | $20,377 | $15,166 |
|---|
| 02/2021 | $14,785 | $20,939 | $16,082 |
|---|
| 03/2021 | $15,636 | $21,856 | $17,028 |
|---|
| 04/2021 | $16,143 | $23,022 | $17,709 |
|---|
| 05/2021 | $16,492 | $23,183 | $18,123 |
|---|
| 06/2021 | $16,474 | $23,724 | $17,915 |
|---|
| 07/2021 | $16,439 | $24,288 | $18,059 |
|---|
| 08/2021 | $16,899 | $25,026 | $18,417 |
|---|
| 09/2021 | $16,120 | $23,863 | $17,776 |
|---|
| 10/2021 | $16,905 | $25,534 | $18,678 |
|---|
| 11/2021 | $16,321 | $25,357 | $18,020 |
|---|
| 12/2021 | $17,218 | $26,494 | $19,157 |
|---|
| 01/2022 | $16,829 | $25,123 | $18,711 |
|---|
| 02/2022 | $16,615 | $24,371 | $18,493 |
|---|
| 03/2022 | $16,848 | $25,276 | $19,015 |
|---|
| 04/2022 | $16,005 | $23,071 | $17,943 |
|---|
| 05/2022 | $16,478 | $23,114 | $18,292 |
|---|
| 06/2022 | $15,031 | $21,206 | $16,694 |
|---|
| 07/2022 | $15,998 | $23,161 | $17,801 |
|---|
| 08/2022 | $15,511 | $22,217 | $17,270 |
|---|
| 09/2022 | $14,233 | $20,170 | $15,756 |
|---|
| 10/2022 | $15,888 | $21,804 | $17,371 |
|---|
| 11/2022 | $16,777 | $23,022 | $18,457 |
|---|
| 12/2022 | $15,885 | $21,696 | $17,713 |
|---|
| 01/2023 | $17,248 | $23,059 | $18,631 |
|---|
| 02/2023 | $16,498 | $22,496 | $17,974 |
|---|
| 03/2023 | $16,056 | $23,322 | $17,891 |
|---|
| 04/2023 | $16,022 | $23,686 | $18,161 |
|---|
| 05/2023 | $15,402 | $23,789 | $17,460 |
|---|
| 06/2023 | $16,539 | $25,361 | $18,620 |
|---|
| 07/2023 | $17,248 | $26,176 | $19,275 |
|---|
| 08/2023 | $16,757 | $25,759 | $18,754 |
|---|
| 09/2023 | $16,165 | $24,531 | $18,031 |
|---|
| 10/2023 | $15,517 | $24,015 | $17,395 |
|---|
| 11/2023 | $16,648 | $26,208 | $18,707 |
|---|
| 12/2023 | $17,679 | $27,399 | $19,743 |
|---|
| 01/2024 | $17,946 | $27,859 | $19,764 |
|---|
| 02/2024 | $18,687 | $29,347 | $20,493 |
|---|
| 03/2024 | $19,910 | $30,291 | $21,517 |
|---|
| 04/2024 | $18,871 | $29,054 | $20,598 |
|---|
| 05/2024 | $19,283 | $30,494 | $21,251 |
|---|
| 06/2024 | $19,100 | $31,589 | $21,051 |
|---|
| 07/2024 | $20,200 | $31,973 | $22,127 |
|---|
| 08/2024 | $20,590 | $32,749 | $22,721 |
|---|
| 09/2024 | $20,773 | $33,448 | $23,036 |
|---|
| 10/2024 | $20,590 | $33,145 | $22,783 |
|---|
| 11/2024 | $22,072 | $35,090 | $24,238 |
|---|
| 12/2024 | $20,594 | $34,254 | $22,580 |
|---|
Average Annual Total Returns (%)
| HEADER | 1 Year | 5 Years | 10 Years |
|---|
R6 ClassFootnote Reference1 | 16.49% | 7.36% | 7.49% |
|---|
S&P 500® Index TR | 25.02% | 14.53% | 13.10% |
|---|
Russell 1000® Value Index | 14.37% | 8.68% | 8.49% |
|---|
| Footnote | Description |
Footnote1 | Return may differ from actual shareholder return due to accounting adjustments for financial reporting purposes. |
Performance shown is historical and is not indicative of future returns. Investment returns and principal value will vary, and shares may be worth more or less at redemption than at original purchase. Performance shown is as of date indicated, and current performance may be lower or higher than the performance data quoted. To obtain performance as of the most recent month end, please visit americanbeaconfunds.com or call 800-967-9009. The graph and table do not reflect the deduction of taxes that a shareholder would pay on fund distributions or redemption of fund shares. The Fund's performance benefited from fee waivers. Performance includes historical performance of another Class of the Fund. For more information, visit americanbeaconfunds.com/Performance_Disclaimers.aspx.
The S&P 500 Index TR is replacing the Russell 1000 Value Index as the broad-based securities market index to comply with a new regulatory requirement. The Russell 1000 Value Index reflects the market sectors in which the Fund invests.
| Total Net Assets | $239,711,367 |
|---|
| # of Portfolio Holdings | 104 |
|---|
| Portfolio Turnover Rate | 64% |
|---|
| Total Management Fees Paid | $1,736,726 |
|---|
What did the Fund invest in?
Top Ten Holdings - % Net Assets
| Synchrony Financial | 3.5 |
| JPMorgan Chase & Co. | 2.9 |
| Salesforce, Inc. | 2.9 |
| RTX Corp. | 2.8 |
| Cisco Systems, Inc. | 2.7 |
| Capital One Financial Corp. | 2.2 |
| MetLife, Inc. | 2.1 |
| eBay, Inc. | 2.1 |
| Builders FirstSource, Inc. | 2.0 |
| Johnson & Johnson | 1.9 |
Excludes cash equivalents.
Asset Allocation - % Investments
| Value | Value |
|---|
| Common Stocks | 97.3 |
| Investment Companies | 2.3 |
| Foreign Common Stocks | 0.4 |
The Fund may purchase and sell futures contracts to gain market exposure on cash balances.
Sector Allocation - % Equities
| Value | Value |
|---|
| Utilities | 0.7 |
| Communication Services | 2.4 |
| Materials | 4.0 |
| Energy | 4.3 |
| Consumer Staples | 4.4 |
| Consumer Discretionary | 4.6 |
| Industrials | 12.2 |
| Information Technology | 15.8 |
| Health Care | 24.2 |
| Financials | 27.4 |
This is a summary of certain changes to the Fund since December 31, 2023. For more complete information, you may review the Fund's next prospectus, which we expect to be available by March 1, 2025 at www.americanbeaconfunds.com/literature or upon request at 800-658-5811.
The Board of the Trust, at the recommendation of the Manager, approved; (i) the termination of the investment advisory agreement among the Manager, Bridgeway Capital Management, LLC and the Trust, on behalf of the American Beacon Man Large Cap Value Fund (formerly known as American Beacon Bridgeway Large Cap Value Fund), effective April 30, 2024, and (ii) a new investment advisory agreement among the Manager, Numeric Investors LLC, and the Trust on behalf of the Funds, effective May 1, 2024.
For additional information about the Fund, including its prospectus, financial statements, holdings, and proxy voting information, please visit www.americanbeaconfunds.com/literature or call 1-800-658-5811.
If your financial institution mailed only one copy of this Report to an address shared by more than one account, you can request an individual copy by contacting your financial institution.
Distributed by:
Resolute Investment Distributors, Inc.
Annual Shareholder Report - December 31, 2024
AHL Managed Futures Strategy Fund
Annual Shareholder Report - December 31, 2024
This annual shareholder report contains important information about American Beacon AHL Managed Futures Strategy Fund for the period of January 1, 2024 to December 31, 2024. You can find additional information about the Fund at www.americanbeaconfunds.com/literature. You can also request this information by contacting us at 800-658-5811.
What were the Fund costs for the last year?
(based on a hypothetical $10,000 investment)
| Class Name | Costs of a $10,000 investment | Costs paid as a percentage of a $10,000 investment |
|---|
| Class A | $194 | 1.92% |
|---|
How did the Fund perform and what affected its performance?
The A Class of the Fund returned -4.11% (with sales charges) and 1.71% (without sales charges) for the twelve months ended December 31, 2024, compared to the S&P 500 Index return of 25.02%.
• The investment strategy of the Fund’s sub-advisor is designed to capitalize on price trends in a broad range of global markets across multiple asset classes.
• Overall, the market environment over the twelve-month period was conducive to the sub-advisor’s trend following strategy led by performance in U.S. equities.
• Positions in equities and U.S. dollar were the top contributors during the period.
• Positions in fixed income and commodities detracted from performance.
Cumulative Performance from December 31, 2014 through December 31, 2024
The initial investment, based on a $10,000 investment, is adjusted to reflect the maximum applicable sales charge, if any.
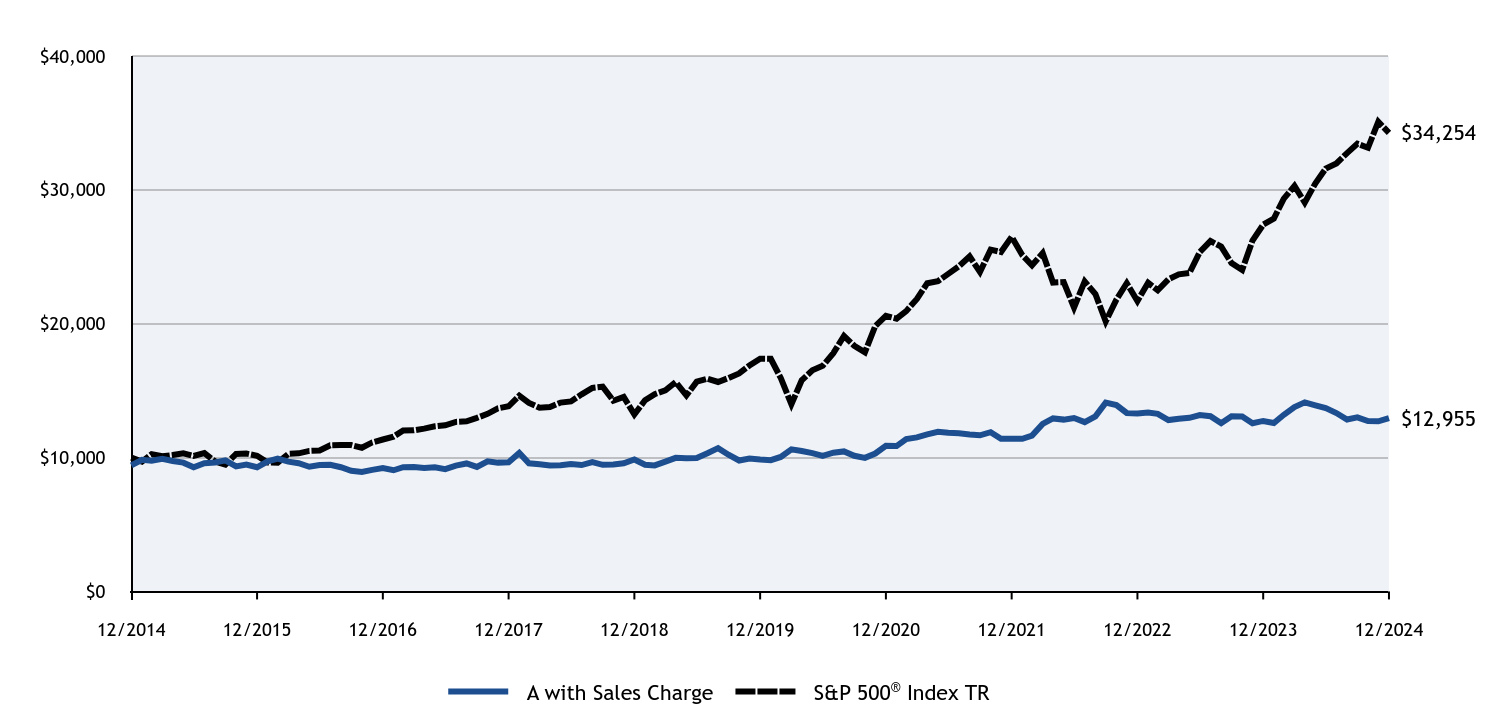
| A with Sales Charge | S&P 500® Index TR |
|---|
| 12/2014 | $9,422 | $10,000 |
|---|
| 01/2015 | $9,828 | $9,700 |
|---|
| 02/2015 | $9,767 | $10,257 |
|---|
| 03/2015 | $9,905 | $10,095 |
|---|
| 04/2015 | $9,750 | $10,192 |
|---|
| 05/2015 | $9,621 | $10,323 |
|---|
| 06/2015 | $9,276 | $10,123 |
|---|
| 07/2015 | $9,578 | $10,335 |
|---|
| 08/2015 | $9,629 | $9,712 |
|---|
| 09/2015 | $9,793 | $9,471 |
|---|
| 10/2015 | $9,345 | $10,270 |
|---|
| 11/2015 | $9,483 | $10,301 |
|---|
| 12/2015 | $9,277 | $10,138 |
|---|
| 01/2016 | $9,721 | $9,635 |
|---|
| 02/2016 | $9,926 | $9,622 |
|---|
| 03/2016 | $9,695 | $10,275 |
|---|
| 04/2016 | $9,579 | $10,315 |
|---|
| 05/2016 | $9,312 | $10,500 |
|---|
| 06/2016 | $9,437 | $10,527 |
|---|
| 07/2016 | $9,463 | $10,915 |
|---|
| 08/2016 | $9,277 | $10,931 |
|---|
| 09/2016 | $9,010 | $10,933 |
|---|
| 10/2016 | $8,921 | $10,733 |
|---|
| 11/2016 | $9,081 | $11,131 |
|---|
| 12/2016 | $9,214 | $11,351 |
|---|
| 01/2017 | $9,054 | $11,566 |
|---|
| 02/2017 | $9,285 | $12,025 |
|---|
| 03/2017 | $9,294 | $12,039 |
|---|
| 04/2017 | $9,214 | $12,163 |
|---|
| 05/2017 | $9,277 | $12,334 |
|---|
| 06/2017 | $9,134 | $12,411 |
|---|
| 07/2017 | $9,401 | $12,666 |
|---|
| 08/2017 | $9,561 | $12,705 |
|---|
| 09/2017 | $9,303 | $12,967 |
|---|
| 10/2017 | $9,721 | $13,270 |
|---|
| 11/2017 | $9,623 | $13,677 |
|---|
| 12/2017 | $9,645 | $13,829 |
|---|
| 01/2018 | $10,348 | $14,621 |
|---|
| 02/2018 | $9,571 | $14,082 |
|---|
| 03/2018 | $9,506 | $13,724 |
|---|
| 04/2018 | $9,404 | $13,777 |
|---|
| 05/2018 | $9,422 | $14,108 |
|---|
| 06/2018 | $9,515 | $14,195 |
|---|
| 07/2018 | $9,441 | $14,724 |
|---|
| 08/2018 | $9,654 | $15,203 |
|---|
| 09/2018 | $9,459 | $15,290 |
|---|
| 10/2018 | $9,487 | $14,245 |
|---|
| 11/2018 | $9,571 | $14,535 |
|---|
| 12/2018 | $9,857 | $13,223 |
|---|
| 01/2019 | $9,463 | $14,282 |
|---|
| 02/2019 | $9,416 | $14,741 |
|---|
| 03/2019 | $9,697 | $15,027 |
|---|
| 04/2019 | $9,979 | $15,636 |
|---|
| 05/2019 | $9,951 | $14,642 |
|---|
| 06/2019 | $9,961 | $15,674 |
|---|
| 07/2019 | $10,318 | $15,899 |
|---|
| 08/2019 | $10,703 | $15,648 |
|---|
| 09/2019 | $10,214 | $15,940 |
|---|
| 10/2019 | $9,782 | $16,286 |
|---|
| 11/2019 | $9,932 | $16,877 |
|---|
| 12/2019 | $9,853 | $17,386 |
|---|
| 01/2020 | $9,804 | $17,379 |
|---|
| 02/2020 | $10,049 | $15,949 |
|---|
| 03/2020 | $10,616 | $13,979 |
|---|
| 04/2020 | $10,489 | $15,771 |
|---|
| 05/2020 | $10,333 | $16,522 |
|---|
| 06/2020 | $10,127 | $16,850 |
|---|
| 07/2020 | $10,362 | $17,801 |
|---|
| 08/2020 | $10,460 | $19,080 |
|---|
| 09/2020 | $10,137 | $18,355 |
|---|
| 10/2020 | $9,980 | $17,867 |
|---|
| 11/2020 | $10,303 | $19,823 |
|---|
| 12/2020 | $10,880 | $20,585 |
|---|
| 01/2021 | $10,859 | $20,377 |
|---|
| 02/2021 | $11,385 | $20,939 |
|---|
| 03/2021 | $11,508 | $21,856 |
|---|
| 04/2021 | $11,735 | $23,022 |
|---|
| 05/2021 | $11,931 | $23,183 |
|---|
| 06/2021 | $11,848 | $23,724 |
|---|
| 07/2021 | $11,817 | $24,288 |
|---|
| 08/2021 | $11,725 | $25,026 |
|---|
| 09/2021 | $11,663 | $23,863 |
|---|
| 10/2021 | $11,900 | $25,534 |
|---|
| 11/2021 | $11,405 | $25,357 |
|---|
| 12/2021 | $11,411 | $26,494 |
|---|
| 01/2022 | $11,400 | $25,123 |
|---|
| 02/2022 | $11,643 | $24,371 |
|---|
| 03/2022 | $12,517 | $25,276 |
|---|
| 04/2022 | $12,926 | $23,071 |
|---|
| 05/2022 | $12,837 | $23,114 |
|---|
| 06/2022 | $12,959 | $21,206 |
|---|
| 07/2022 | $12,649 | $23,161 |
|---|
| 08/2022 | $13,081 | $22,217 |
|---|
| 09/2022 | $14,109 | $20,170 |
|---|
| 10/2022 | $13,921 | $21,804 |
|---|
| 11/2022 | $13,335 | $23,022 |
|---|
| 12/2022 | $13,297 | $21,696 |
|---|
| 01/2023 | $13,362 | $23,059 |
|---|
| 02/2023 | $13,271 | $22,496 |
|---|
| 03/2023 | $12,801 | $23,322 |
|---|
| 04/2023 | $12,905 | $23,686 |
|---|
| 05/2023 | $12,971 | $23,789 |
|---|
| 06/2023 | $13,179 | $25,361 |
|---|
| 07/2023 | $13,088 | $26,176 |
|---|
| 08/2023 | $12,566 | $25,759 |
|---|
| 09/2023 | $13,088 | $24,531 |
|---|
| 10/2023 | $13,062 | $24,015 |
|---|
| 11/2023 | $12,566 | $26,208 |
|---|
| 12/2023 | $12,737 | $27,399 |
|---|
| 01/2024 | $12,580 | $27,859 |
|---|
| 02/2024 | $13,196 | $29,347 |
|---|
| 03/2024 | $13,772 | $30,291 |
|---|
| 04/2024 | $14,125 | $29,054 |
|---|
| 05/2024 | $13,902 | $30,494 |
|---|
| 06/2024 | $13,693 | $31,589 |
|---|
| 07/2024 | $13,326 | $31,973 |
|---|
| 08/2024 | $12,842 | $32,749 |
|---|
| 09/2024 | $12,999 | $33,448 |
|---|
| 10/2024 | $12,724 | $33,145 |
|---|
| 11/2024 | $12,711 | $35,090 |
|---|
| 12/2024 | $12,955 | $34,254 |
|---|
Average Annual Total Returns (%)
| HEADER | 1 Year | 5 Years | 10 Years |
|---|
Class A without Sales ChargeFootnote Reference1 | 1.71% | 5.63% | 3.24% |
|---|
Class A with Maximum Sales Charge - 5.75%Footnote Reference1 | (4.11)% | 4.39% | 2.62% |
|---|
S&P 500® Index TR | 25.02% | 14.53% | 13.10% |
|---|
| Footnote | Description |
Footnote1 | Return may differ from actual shareholder return due to accounting adjustments for financial reporting purposes. |
Performance shown is historical and is not indicative of future returns. Investment returns and principal value will vary, and shares may be worth more or less at redemption than at original purchase. Performance shown is as of date indicated, and current performance may be lower or higher than the performance data quoted. To obtain performance as of the most recent month end, please visit americanbeaconfunds.com or call 800-967-9009. The graph and table do not reflect the deduction of taxes that a shareholder would pay on fund distributions or redemption of fund shares. The Fund's performance benefited from fee waivers. For more information, visit americanbeaconfunds.com/Performance_Disclaimers.aspx.
The S&P 500 Index TR is replacing the ICE BofA US 3-Month Treasury Bill Index as broad-based securities market index to comply with a new regulatory requirement.
| Total Net Assets | $3,072,928,252 |
|---|
| # of Portfolio Holdings | 16 |
|---|
| Total Management Fees Paid | $44,861,883 |
|---|
Asset Class Exposure % of VaR*
| Value | Value |
|---|
| Currencies | 32.7 |
| Commodities | 28.8 |
| Equities | 19.6 |
| Fixed Income | 18.9 |
*Value at Risk (“VaR”) is a measure of the potential loss in value of a portfolio over a defined period for a given confidence interval. A one-day VaR at the 95% confidence level represents that there is a 5% probability that the mark-to-market loss on the portfolio over a one day horizon will exceed this value (assuming normal markets and no trading in the portfolio).
What did the Fund invest in?
Top Active Exposures by Asset Class % of VaR*
| Commodities | Header | % of VaR |
| Copper | Short | 4.0 |
| Natural Gas | Long | 3.9 |
| Coffee | Long | 2.4 |
| Cocoa | Long | 2.3 |
| Soybeans | Short | 2.1 |
| Currencies | Header | % of VaR |
| Japanese Yen/US Dollar | Short | 7.2 |
| Swiss Franc/US Dollar | Short | 2.1 |
| Norwegian Krone/US Dollar | Short | 1.7 |
| Swedish Krona/US Dollar | Short | 1.6 |
| Canadian Dollar/US Dollar | Short | 1.6 |
| Equities | Header | % of VaR |
| Nikkei | Long | 2.6 |
| FTSE Taiwan Index | Long | 2.0 |
| NASDAQ 100 Index | Long | 1.6 |
| Tokyo Stock Exchange Index | Long | 1.5 |
| DAX Index | Long | 1.4 |
| Fixed Income | Header | % of VaR |
| US Treasuries | Short | 6.2 |
| Euribor | Long | 2.7 |
| SOFR 3Mth Index | Short | 2.6 |
| Australian Bonds | Short | 2.1 |
| SONIA 3Mth Index | Short | 1.9 |
| Number of Currency Pairs | 37 |
| Number of Short Holdings | 32 |
| Number of Long Holdings | 30 |
Top Ten Holdings - % of VaR*
| Japanese Yen/US Dollar | Short | 7.2 |
| US Treasuries | Short | 6.2 |
| Copper | Short | 4.0 |
| Natural Gas | Long | 3.9 |
| Euribor | Long | 2.7 |
| Nikkei | Long | 2.6 |
| SOFR 3Mth Index | Short | 2.6 |
| Coffee | Long | 2.4 |
| Cocoa | Long | 2.3 |
| Australian Bonds | Short | 2.1 |
Includes long positions only.
For additional information about the Fund, including its prospectus, financial statements, holdings, and proxy voting information, please visit www.americanbeaconfunds.com/literature or call 1-800-658-5811.
If your financial institution mailed only one copy of this Report to an address shared by more than one account, you can request an individual copy by contacting your financial institution.
Annual Shareholder Report - December 31, 2024
Distributed by:
Resolute Investment Distributors, Inc.
AHL Managed Futures Strategy Fund
AHL Managed Futures Strategy Fund
Annual Shareholder Report - December 31, 2024
This annual shareholder report contains important information about American Beacon AHL Managed Futures Strategy Fund for the period of January 1, 2024 to December 31, 2024. You can find additional information about the Fund at www.americanbeaconfunds.com/literature. You can also request this information by contacting us at 800-658-5811.
What were the Fund costs for the last year?
(based on a hypothetical $10,000 investment)
| Class Name | Costs of a $10,000 investment | Costs paid as a percentage of a $10,000 investment |
|---|
| Class C | $260 | 2.59% |
|---|
How did the Fund perform and what affected its performance?
The C Class of the Fund returned -0.04% (with sales charges) and 0.96% (without sales charges) for the twelve months ended December 31, 2024, compared to the S&P 500 Index return of 25.02%.
• The investment strategy of the Fund’s sub-advisor is designed to capitalize on price trends in a broad range of global markets across multiple asset classes.
• Overall, the market environment over the twelve-month period was conducive to the sub-advisor’s trend following strategy led by performance in U.S. equities.
• Positions in equities and U.S. dollar were the top contributors during the period.
• Positions in fixed income and commodities detracted from performance.
Cumulative Performance from December 31, 2014 through December 31, 2024
The initial investment, based on a $10,000 investment, is adjusted to reflect the maximum applicable sales charge, if any.
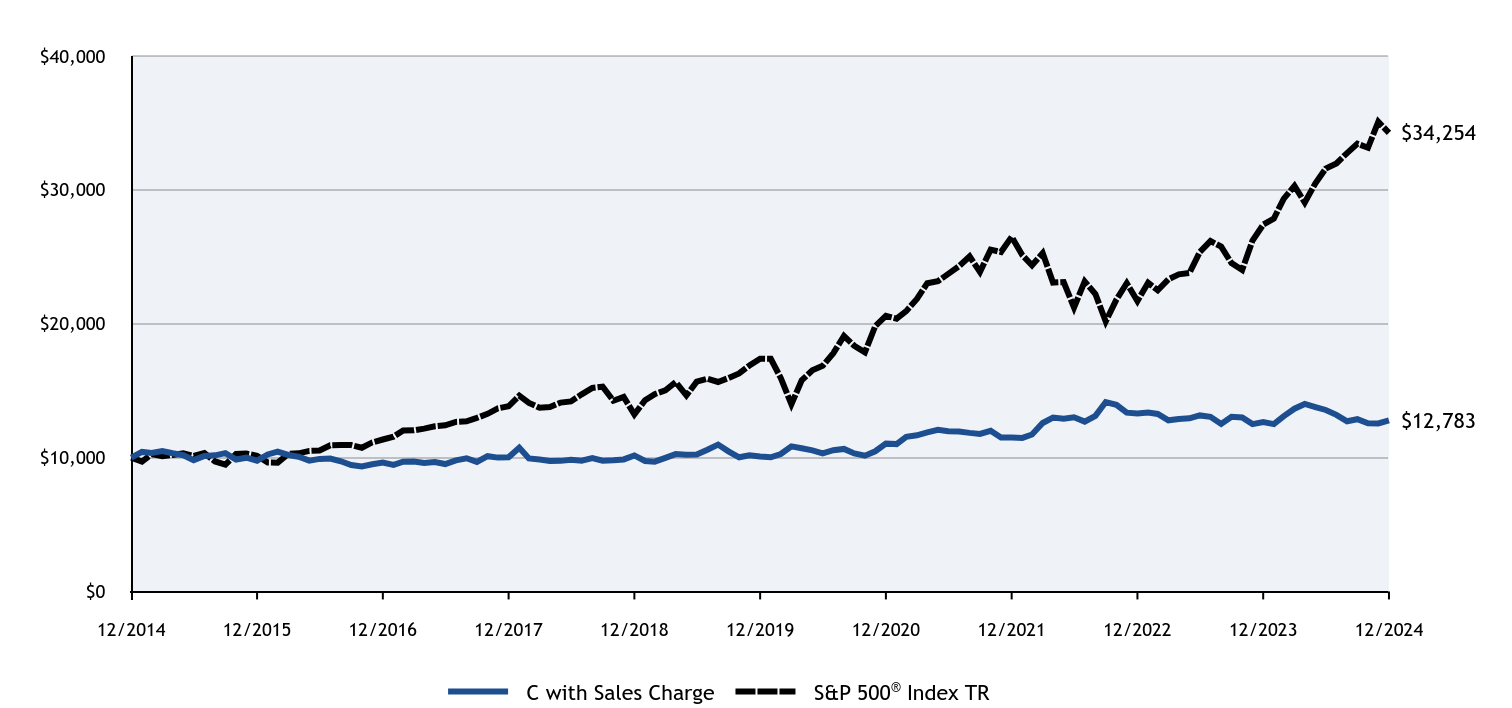
| C with Sales Charge | S&P 500® Index TR |
|---|
| 12/2014 | $10,000 | $10,000 |
|---|
| 01/2015 | $10,422 | $9,700 |
|---|
| 02/2015 | $10,349 | $10,257 |
|---|
| 03/2015 | $10,486 | $10,095 |
|---|
| 04/2015 | $10,321 | $10,192 |
|---|
| 05/2015 | $10,174 | $10,323 |
|---|
| 06/2015 | $9,807 | $10,123 |
|---|
| 07/2015 | $10,119 | $10,335 |
|---|
| 08/2015 | $10,165 | $9,712 |
|---|
| 09/2015 | $10,330 | $9,471 |
|---|
| 10/2015 | $9,853 | $10,270 |
|---|
| 11/2015 | $9,991 | $10,301 |
|---|
| 12/2015 | $9,770 | $10,138 |
|---|
| 01/2016 | $10,233 | $9,635 |
|---|
| 02/2016 | $10,441 | $9,622 |
|---|
| 03/2016 | $10,195 | $10,275 |
|---|
| 04/2016 | $10,063 | $10,315 |
|---|
| 05/2016 | $9,770 | $10,500 |
|---|
| 06/2016 | $9,902 | $10,527 |
|---|
| 07/2016 | $9,931 | $10,915 |
|---|
| 08/2016 | $9,723 | $10,931 |
|---|
| 09/2016 | $9,439 | $10,933 |
|---|
| 10/2016 | $9,335 | $10,733 |
|---|
| 11/2016 | $9,496 | $11,131 |
|---|
| 12/2016 | $9,628 | $11,351 |
|---|
| 01/2017 | $9,458 | $11,566 |
|---|
| 02/2017 | $9,694 | $12,025 |
|---|
| 03/2017 | $9,704 | $12,039 |
|---|
| 04/2017 | $9,600 | $12,163 |
|---|
| 05/2017 | $9,666 | $12,334 |
|---|
| 06/2017 | $9,515 | $12,411 |
|---|
| 07/2017 | $9,789 | $12,666 |
|---|
| 08/2017 | $9,950 | $12,705 |
|---|
| 09/2017 | $9,676 | $12,967 |
|---|
| 10/2017 | $10,101 | $13,270 |
|---|
| 11/2017 | $9,997 | $13,677 |
|---|
| 12/2017 | $10,019 | $13,829 |
|---|
| 01/2018 | $10,738 | $14,621 |
|---|
| 02/2018 | $9,931 | $14,082 |
|---|
| 03/2018 | $9,852 | $13,724 |
|---|
| 04/2018 | $9,744 | $13,777 |
|---|
| 05/2018 | $9,754 | $14,108 |
|---|
| 06/2018 | $9,842 | $14,195 |
|---|
| 07/2018 | $9,763 | $14,724 |
|---|
| 08/2018 | $9,970 | $15,203 |
|---|
| 09/2018 | $9,763 | $15,290 |
|---|
| 10/2018 | $9,793 | $14,245 |
|---|
| 11/2018 | $9,862 | $14,535 |
|---|
| 12/2018 | $10,160 | $13,223 |
|---|
| 01/2019 | $9,743 | $14,282 |
|---|
| 02/2019 | $9,694 | $14,741 |
|---|
| 03/2019 | $9,981 | $15,027 |
|---|
| 04/2019 | $10,259 | $15,636 |
|---|
| 05/2019 | $10,219 | $14,642 |
|---|
| 06/2019 | $10,229 | $15,674 |
|---|
| 07/2019 | $10,586 | $15,899 |
|---|
| 08/2019 | $10,972 | $15,648 |
|---|
| 09/2019 | $10,467 | $15,940 |
|---|
| 10/2019 | $10,021 | $16,286 |
|---|
| 11/2019 | $10,170 | $16,877 |
|---|
| 12/2019 | $10,080 | $17,386 |
|---|
| 01/2020 | $10,018 | $17,379 |
|---|
| 02/2020 | $10,265 | $15,949 |
|---|
| 03/2020 | $10,840 | $13,979 |
|---|
| 04/2020 | $10,696 | $15,771 |
|---|
| 05/2020 | $10,542 | $16,522 |
|---|
| 06/2020 | $10,316 | $16,850 |
|---|
| 07/2020 | $10,552 | $17,801 |
|---|
| 08/2020 | $10,645 | $19,080 |
|---|
| 09/2020 | $10,306 | $18,355 |
|---|
| 10/2020 | $10,142 | $17,867 |
|---|
| 11/2020 | $10,470 | $19,823 |
|---|
| 12/2020 | $11,050 | $20,585 |
|---|
| 01/2021 | $11,007 | $20,377 |
|---|
| 02/2021 | $11,545 | $20,939 |
|---|
| 03/2021 | $11,663 | $21,856 |
|---|
| 04/2021 | $11,889 | $23,022 |
|---|
| 05/2021 | $12,072 | $23,183 |
|---|
| 06/2021 | $11,975 | $23,724 |
|---|
| 07/2021 | $11,943 | $24,288 |
|---|
| 08/2021 | $11,846 | $25,026 |
|---|
| 09/2021 | $11,771 | $23,863 |
|---|
| 10/2021 | $11,997 | $25,534 |
|---|
| 11/2021 | $11,491 | $25,357 |
|---|
| 12/2021 | $11,493 | $26,494 |
|---|
| 01/2022 | $11,470 | $25,123 |
|---|
| 02/2022 | $11,723 | $24,371 |
|---|
| 03/2022 | $12,585 | $25,276 |
|---|
| 04/2022 | $12,987 | $23,071 |
|---|
| 05/2022 | $12,895 | $23,114 |
|---|
| 06/2022 | $13,010 | $21,206 |
|---|
| 07/2022 | $12,688 | $23,161 |
|---|
| 08/2022 | $13,113 | $22,217 |
|---|
| 09/2022 | $14,148 | $20,170 |
|---|
| 10/2022 | $13,941 | $21,804 |
|---|
| 11/2022 | $13,355 | $23,022 |
|---|
| 12/2022 | $13,299 | $21,696 |
|---|
| 01/2023 | $13,366 | $23,059 |
|---|
| 02/2023 | $13,258 | $22,496 |
|---|
| 03/2023 | $12,783 | $23,322 |
|---|
| 04/2023 | $12,878 | $23,686 |
|---|
| 05/2023 | $12,932 | $23,789 |
|---|
| 06/2023 | $13,149 | $25,361 |
|---|
| 07/2023 | $13,041 | $26,176 |
|---|
| 08/2023 | $12,512 | $25,759 |
|---|
| 09/2023 | $13,041 | $24,531 |
|---|
| 10/2023 | $13,000 | $24,015 |
|---|
| 11/2023 | $12,499 | $26,208 |
|---|
| 12/2023 | $12,661 | $27,399 |
|---|
| 01/2024 | $12,499 | $27,859 |
|---|
| 02/2024 | $13,095 | $29,347 |
|---|
| 03/2024 | $13,651 | $30,291 |
|---|
| 04/2024 | $14,003 | $29,054 |
|---|
| 05/2024 | $13,773 | $30,494 |
|---|
| 06/2024 | $13,556 | $31,589 |
|---|
| 07/2024 | $13,190 | $31,973 |
|---|
| 08/2024 | $12,716 | $32,749 |
|---|
| 09/2024 | $12,865 | $33,448 |
|---|
| 10/2024 | $12,566 | $33,145 |
|---|
| 11/2024 | $12,553 | $35,090 |
|---|
| 12/2024 | $12,783 | $34,254 |
|---|
Average Annual Total Returns (%)
| HEADER | 1 Year | 5 Years | 10 Years |
|---|
Class C without Deferred Sales ChargeFootnote Reference1 | 0.96% | 4.87% | 2.49% |
|---|
Class C with Maximum Deferred Sales Charge -1.00%Footnote Reference1 | (0.04)% | 4.87% | 2.49% |
|---|
S&P 500® Index TR | 25.02% | 14.53% | 13.10% |
|---|
| Footnote | Description |
Footnote1 | Return may differ from actual shareholder return due to accounting adjustments for financial reporting purposes. |
Performance shown is historical and is not indicative of future returns. Investment returns and principal value will vary, and shares may be worth more or less at redemption than at original purchase. Performance shown is as of date indicated, and current performance may be lower or higher than the performance data quoted. To obtain performance as of the most recent month end, please visit americanbeaconfunds.com or call 800-967-9009. The graph and table do not reflect the deduction of taxes that a shareholder would pay on fund distributions or redemption of fund shares. The Fund's performance benefited from fee waivers. For more information, visit americanbeaconfunds.com/Performance_Disclaimers.aspx.
The S&P 500 Index TR is replacing the ICE BofA US 3-Month Treasury Bill Index as broad-based securities market index to comply with a new regulatory requirement.
| Total Net Assets | $3,072,928,252 |
|---|
| # of Portfolio Holdings | 16 |
|---|
| Total Management Fees Paid | $44,861,883 |
|---|
Asset Class Exposure % of VaR*
| Value | Value |
|---|
| Currencies | 32.7 |
| Commodities | 28.8 |
| Equities | 19.6 |
| Fixed Income | 18.9 |
*Value at Risk (“VaR”) is a measure of the potential loss in value of a portfolio over a defined period for a given confidence interval. A one-day VaR at the 95% confidence level represents that there is a 5% probability that the mark-to-market loss on the portfolio over a one day horizon will exceed this value (assuming normal markets and no trading in the portfolio).
What did the Fund invest in?
Top Active Exposures by Asset Class % of VaR*
| Commodities | Header | % of VaR |
| Copper | Short | 4.0 |
| Natural Gas | Long | 3.9 |
| Coffee | Long | 2.4 |
| Cocoa | Long | 2.3 |
| Soybeans | Short | 2.1 |
| Currencies | Header | % of VaR |
| Japanese Yen/US Dollar | Short | 7.2 |
| Swiss Franc/US Dollar | Short | 2.1 |
| Norwegian Krone/US Dollar | Short | 1.7 |
| Swedish Krona/US Dollar | Short | 1.6 |
| Canadian Dollar/US Dollar | Short | 1.6 |
| Equities | Header | % of VaR |
| Nikkei | Long | 2.6 |
| FTSE Taiwan Index | Long | 2.0 |
| NASDAQ 100 Index | Long | 1.6 |
| Tokyo Stock Exchange Index | Long | 1.5 |
| DAX Index | Long | 1.4 |
| Fixed Income | Header | % of VaR |
| US Treasuries | Short | 6.2 |
| Euribor | Long | 2.7 |
| SOFR 3Mth Index | Short | 2.6 |
| Australian Bonds | Short | 2.1 |
| SONIA 3Mth Index | Short | 1.9 |
| Number of Currency Pairs | 37 |
| Number of Short Holdings | 32 |
| Number of Long Holdings | 30 |
Top Ten Holdings - % of VaR*
| Japanese Yen/US Dollar | Short | 7.2 |
| US Treasuries | Short | 6.2 |
| Copper | Short | 4.0 |
| Natural Gas | Long | 3.9 |
| Euribor | Long | 2.7 |
| Nikkei | Long | 2.6 |
| SOFR 3Mth Index | Short | 2.6 |
| Coffee | Long | 2.4 |
| Cocoa | Long | 2.3 |
| Australian Bonds | Short | 2.1 |
Includes long positions only.
For additional information about the Fund, including its prospectus, financial statements, holdings, and proxy voting information, please visit www.americanbeaconfunds.com/literature or call 1-800-658-5811.
If your financial institution mailed only one copy of this Report to an address shared by more than one account, you can request an individual copy by contacting your financial institution.
Annual Shareholder Report - December 31, 2024
Distributed by:
Resolute Investment Distributors, Inc.
AHL Managed Futures Strategy Fund
AHL Managed Futures Strategy Fund
Annual Shareholder Report - December 31, 2024
This annual shareholder report contains important information about American Beacon AHL Managed Futures Strategy Fund for the period of January 1, 2024 to December 31, 2024. You can find additional information about the Fund at www.americanbeaconfunds.com/literature. You can also request this information by contacting us at 800-658-5811.
What were the Fund costs for the last year?
(based on a hypothetical $10,000 investment)
| Class Name | Costs of a $10,000 investment | Costs paid as a percentage of a $10,000 investment |
|---|
| R5 | $155 | 1.53% |
|---|
How did the Fund perform and what affected its performance?
The R5 Class of the Fund returned 2.07% for the twelve months ended December 31, 2024, compared to the S&P 500 Index return of 25.02%.
• The investment strategy of the Fund’s sub-advisor is designed to capitalize on price trends in a broad range of global markets across multiple asset classes.
• Overall, the market environment over the twelve-month period was conducive to the sub-advisor’s trend following strategy led by performance in U.S. equities.
• Positions in equities and U.S. dollar were the top contributors during the period.
• Positions in fixed income and commodities detracted from performance.
Cumulative Performance from December 31, 2014 through December 31, 2024
The initial investment, based on a $250,000 investment, is adjusted to reflect the maximum applicable sales charge, if any.
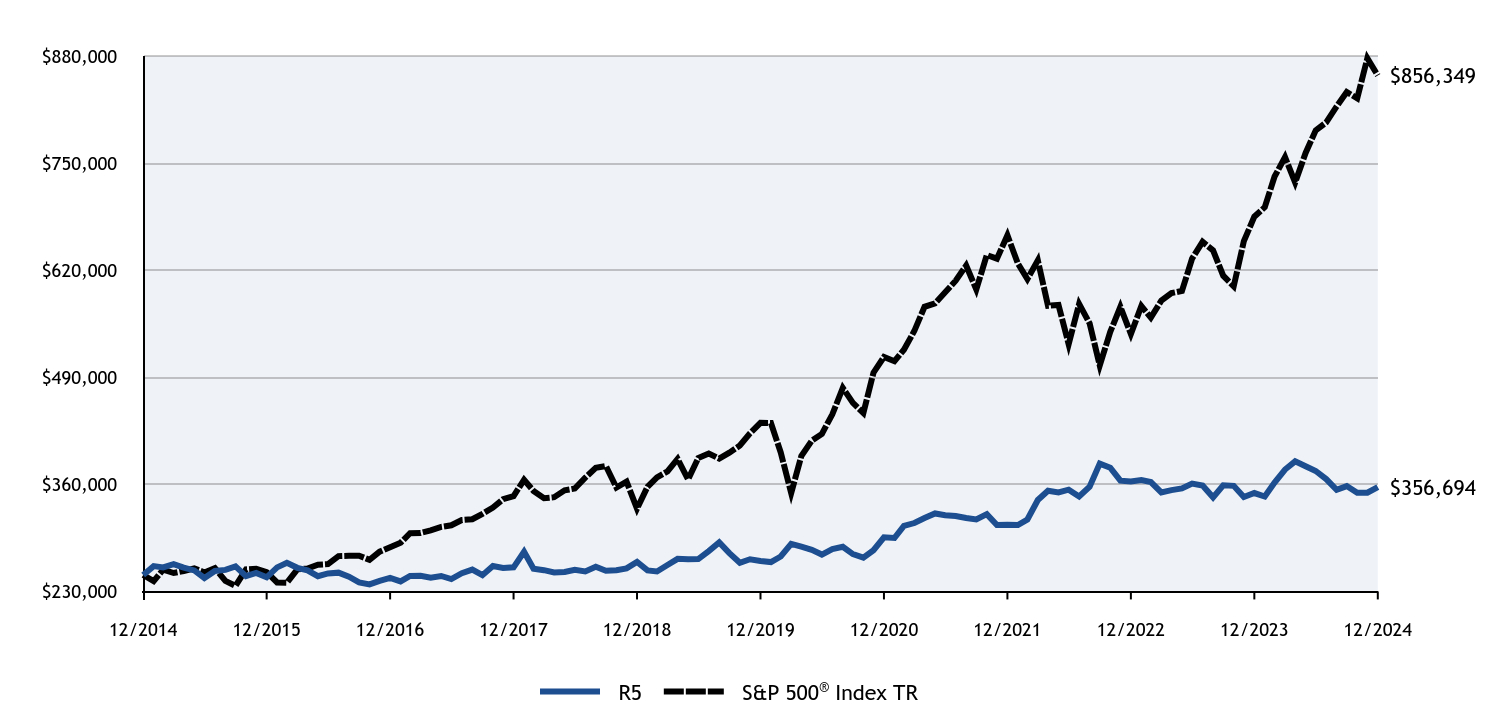
| R5 | S&P 500® Index TR |
|---|
| 12/2014 | $250,000 | $250,000 |
|---|
| 01/2015 | $260,731 | $242,495 |
|---|
| 02/2015 | $259,132 | $256,432 |
|---|
| 03/2015 | $263,014 | $252,376 |
|---|
| 04/2015 | $258,904 | $254,798 |
|---|
| 05/2015 | $255,479 | $258,074 |
|---|
| 06/2015 | $246,347 | $253,078 |
|---|
| 07/2015 | $254,795 | $258,381 |
|---|
| 08/2015 | $256,164 | $242,791 |
|---|
| 09/2015 | $260,502 | $236,784 |
|---|
| 10/2015 | $248,630 | $256,758 |
|---|
| 11/2015 | $252,511 | $257,521 |
|---|
| 12/2015 | $247,121 | $253,459 |
|---|
| 01/2016 | $259,170 | $240,882 |
|---|
| 02/2016 | $264,840 | $240,557 |
|---|
| 03/2016 | $258,698 | $256,876 |
|---|
| 04/2016 | $255,627 | $257,872 |
|---|
| 05/2016 | $248,539 | $262,503 |
|---|
| 06/2016 | $251,846 | $263,183 |
|---|
| 07/2016 | $252,791 | $272,886 |
|---|
| 08/2016 | $247,830 | $273,269 |
|---|
| 09/2016 | $240,979 | $273,320 |
|---|
| 10/2016 | $238,616 | $268,335 |
|---|
| 11/2016 | $242,869 | $278,273 |
|---|
| 12/2016 | $246,413 | $283,773 |
|---|
| 01/2017 | $242,160 | $289,155 |
|---|
| 02/2017 | $248,775 | $300,637 |
|---|
| 03/2017 | $249,011 | $300,987 |
|---|
| 04/2017 | $246,649 | $304,078 |
|---|
| 05/2017 | $248,775 | $308,357 |
|---|
| 06/2017 | $244,995 | $310,282 |
|---|
| 07/2017 | $252,083 | $316,662 |
|---|
| 08/2017 | $256,572 | $317,632 |
|---|
| 09/2017 | $249,720 | $324,184 |
|---|
| 10/2017 | $260,824 | $331,749 |
|---|
| 11/2017 | $258,462 | $341,924 |
|---|
| 12/2017 | $259,260 | $345,725 |
|---|
| 01/2018 | $278,182 | $365,519 |
|---|
| 02/2018 | $257,540 | $352,047 |
|---|
| 03/2018 | $255,820 | $343,101 |
|---|
| 04/2018 | $253,117 | $344,417 |
|---|
| 05/2018 | $253,608 | $352,712 |
|---|
| 06/2018 | $256,311 | $354,882 |
|---|
| 07/2018 | $254,345 | $368,089 |
|---|
| 08/2018 | $259,997 | $380,083 |
|---|
| 09/2018 | $255,082 | $382,247 |
|---|
| 10/2018 | $255,820 | $356,120 |
|---|
| 11/2018 | $258,031 | $363,377 |
|---|
| 12/2018 | $265,782 | $330,567 |
|---|
| 01/2019 | $255,521 | $357,058 |
|---|
| 02/2019 | $254,269 | $368,522 |
|---|
| 03/2019 | $262,028 | $375,683 |
|---|
| 04/2019 | $269,535 | $390,895 |
|---|
| 05/2019 | $269,035 | $366,054 |
|---|
| 06/2019 | $269,285 | $391,852 |
|---|
| 07/2019 | $279,046 | $397,484 |
|---|
| 08/2019 | $289,557 | $391,188 |
|---|
| 09/2019 | $276,543 | $398,507 |
|---|
| 10/2019 | $264,780 | $407,138 |
|---|
| 11/2019 | $269,035 | $421,917 |
|---|
| 12/2019 | $266,925 | $434,651 |
|---|
| 01/2020 | $265,618 | $434,481 |
|---|
| 02/2020 | $272,416 | $398,715 |
|---|
| 03/2020 | $287,840 | $349,468 |
|---|
| 04/2020 | $284,442 | $394,268 |
|---|
| 05/2020 | $280,520 | $413,046 |
|---|
| 06/2020 | $274,768 | $421,261 |
|---|
| 07/2020 | $281,304 | $445,013 |
|---|
| 08/2020 | $284,180 | $477,001 |
|---|
| 09/2020 | $275,291 | $458,877 |
|---|
| 10/2020 | $271,108 | $446,674 |
|---|
| 11/2020 | $279,997 | $495,568 |
|---|
| 12/2020 | $295,685 | $514,622 |
|---|
| 01/2021 | $294,857 | $509,426 |
|---|
| 02/2021 | $309,476 | $523,474 |
|---|
| 03/2021 | $313,062 | $546,400 |
|---|
| 04/2021 | $319,130 | $575,560 |
|---|
| 05/2021 | $324,647 | $579,580 |
|---|
| 06/2021 | $322,440 | $593,110 |
|---|
| 07/2021 | $321,613 | $607,200 |
|---|
| 08/2021 | $319,130 | $625,662 |
|---|
| 09/2021 | $317,475 | $596,563 |
|---|
| 10/2021 | $323,819 | $638,359 |
|---|
| 11/2021 | $310,580 | $633,936 |
|---|
| 12/2021 | $310,819 | $662,346 |
|---|
| 01/2022 | $310,522 | $628,072 |
|---|
| 02/2022 | $317,337 | $609,266 |
|---|
| 03/2022 | $341,041 | $631,888 |
|---|
| 04/2022 | $352,301 | $576,786 |
|---|
| 05/2022 | $350,227 | $577,845 |
|---|
| 06/2022 | $353,486 | $530,147 |
|---|
| 07/2022 | $345,190 | $579,029 |
|---|
| 08/2022 | $357,042 | $555,415 |
|---|
| 09/2022 | $385,190 | $504,262 |
|---|
| 10/2022 | $380,153 | $545,088 |
|---|
| 11/2022 | $364,449 | $575,550 |
|---|
| 12/2022 | $363,428 | $542,390 |
|---|
| 01/2023 | $365,172 | $576,470 |
|---|
| 02/2023 | $362,731 | $562,405 |
|---|
| 03/2023 | $350,175 | $583,053 |
|---|
| 04/2023 | $352,965 | $592,154 |
|---|
| 05/2023 | $355,058 | $594,728 |
|---|
| 06/2023 | $360,987 | $634,024 |
|---|
| 07/2023 | $358,546 | $654,392 |
|---|
| 08/2023 | $344,246 | $643,973 |
|---|
| 09/2023 | $358,894 | $613,270 |
|---|
| 10/2023 | $358,197 | $600,375 |
|---|
| 11/2023 | $344,594 | $655,205 |
|---|
| 12/2023 | $349,443 | $684,971 |
|---|
| 01/2024 | $345,212 | $696,481 |
|---|
| 02/2024 | $362,138 | $733,670 |
|---|
| 03/2024 | $378,005 | $757,276 |
|---|
| 04/2024 | $387,879 | $726,345 |
|---|
| 05/2024 | $381,884 | $762,361 |
|---|
| 06/2024 | $376,242 | $789,716 |
|---|
| 07/2024 | $366,369 | $799,329 |
|---|
| 08/2024 | $353,322 | $818,718 |
|---|
| 09/2024 | $357,906 | $836,203 |
|---|
| 10/2024 | $349,796 | $828,620 |
|---|
| 11/2024 | $349,796 | $877,261 |
|---|
| 12/2024 | $356,694 | $856,349 |
|---|
Average Annual Total Returns (%)
| HEADER | 1 Year | 5 Years | 10 Years |
|---|
Class R5Footnote Reference1 | 2.07% | 5.97% | 3.62% |
|---|
S&P 500® Index TR | 25.02% | 14.53% | 13.10% |
|---|
| Footnote | Description |
Footnote1 | Return may differ from actual shareholder return due to accounting adjustments for financial reporting purposes. |
Performance shown is historical and is not indicative of future returns. Investment returns and principal value will vary, and shares may be worth more or less at redemption than at original purchase. Performance shown is as of date indicated, and current performance may be lower or higher than the performance data quoted. To obtain performance as of the most recent month end, please visit americanbeaconfunds.com or call 800-967-9009. The graph and table do not reflect the deduction of taxes that a shareholder would pay on fund distributions or redemption of fund shares. The Fund's performance benefited from fee waivers. For more information, visit americanbeaconfunds.com/Performance_Disclaimers.aspx.
The S&P 500 Index TR is replacing the ICE BofA US 3-Month Treasury Bill Index as broad-based securities market index to comply with a new regulatory requirement.
| Total Net Assets | $3,072,928,252 |
|---|
| # of Portfolio Holdings | 16 |
|---|
| Total Management Fees Paid | $44,861,883 |
|---|
Asset Class Exposure % of VaR*
| Value | Value |
|---|
| Currencies | 32.7 |
| Commodities | 28.8 |
| Equities | 19.6 |
| Fixed Income | 18.9 |
*Value at Risk (“VaR”) is a measure of the potential loss in value of a portfolio over a defined period for a given confidence interval. A one-day VaR at the 95% confidence level represents that there is a 5% probability that the mark-to-market loss on the portfolio over a one day horizon will exceed this value (assuming normal markets and no trading in the portfolio).
What did the Fund invest in?
Top Active Exposures by Asset Class % of VaR*
| Commodities | Header | % of VaR |
| Copper | Short | 4.0 |
| Natural Gas | Long | 3.9 |
| Coffee | Long | 2.4 |
| Cocoa | Long | 2.3 |
| Soybeans | Short | 2.1 |
| Currencies | Header | % of VaR |
| Japanese Yen/US Dollar | Short | 7.2 |
| Swiss Franc/US Dollar | Short | 2.1 |
| Norwegian Krone/US Dollar | Short | 1.7 |
| Swedish Krona/US Dollar | Short | 1.6 |
| Canadian Dollar/US Dollar | Short | 1.6 |
| Equities | Header | % of VaR |
| Nikkei | Long | 2.6 |
| FTSE Taiwan Index | Long | 2.0 |
| NASDAQ 100 Index | Long | 1.6 |
| Tokyo Stock Exchange Index | Long | 1.5 |
| DAX Index | Long | 1.4 |
| Fixed Income | Header | % of VaR |
| US Treasuries | Short | 6.2 |
| Euribor | Long | 2.7 |
| SOFR 3Mth Index | Short | 2.6 |
| Australian Bonds | Short | 2.1 |
| SONIA 3Mth Index | Short | 1.9 |
| Number of Currency Pairs | 37 |
| Number of Short Holdings | 32 |
| Number of Long Holdings | 30 |
Top Ten Holdings - % of VaR*
| Japanese Yen/US Dollar | Short | 7.2 |
| US Treasuries | Short | 6.2 |
| Copper | Short | 4.0 |
| Natural Gas | Long | 3.9 |
| Euribor | Long | 2.7 |
| Nikkei | Long | 2.6 |
| SOFR 3Mth Index | Short | 2.6 |
| Coffee | Long | 2.4 |
| Cocoa | Long | 2.3 |
| Australian Bonds | Short | 2.1 |
Includes long positions only.
For additional information about the Fund, including its prospectus, financial statements, holdings, and proxy voting information, please visit www.americanbeaconfunds.com/literature or call 1-800-658-5811.
If your financial institution mailed only one copy of this Report to an address shared by more than one account, you can request an individual copy by contacting your financial institution.
Annual Shareholder Report - December 31, 2024
Distributed by:
Resolute Investment Distributors, Inc.
AHL Managed Futures Strategy Fund
AHL Managed Futures Strategy Fund
Annual Shareholder Report - December 31, 2024
This annual shareholder report contains important information about American Beacon AHL Managed Futures Strategy Fund for the period of January 1, 2024 to December 31, 2024. You can find additional information about the Fund at www.americanbeaconfunds.com/literature. You can also request this information by contacting us at 800-658-5811.
What were the Fund costs for the last year?
(based on a hypothetical $10,000 investment)
| Class Name | Costs of a $10,000 investment | Costs paid as a percentage of a $10,000 investment |
|---|
| Y | $165 | 1.63% |
|---|
How did the Fund perform and what affected its performance?
The Y Class of the Fund returned 1.99% for the twelve months ended December 31, 2024, compared to the S&P 500 Index return of 25.02%.
• The investment strategy of the Fund’s sub-advisor is designed to capitalize on price trends in a broad range of global markets across multiple asset classes.
• Overall, the market environment over the twelve-month period was conducive to the sub-advisor’s trend following strategy led by performance in U.S. equities.
• Positions in equities and U.S. dollar were the top contributors during the period.
• Positions in fixed income and commodities detracted from performance.
Cumulative Performance from December 31, 2014 through December 31, 2024
The initial investment, based on a $100,000 investment, is adjusted to reflect the maximum applicable sales charge, if any.
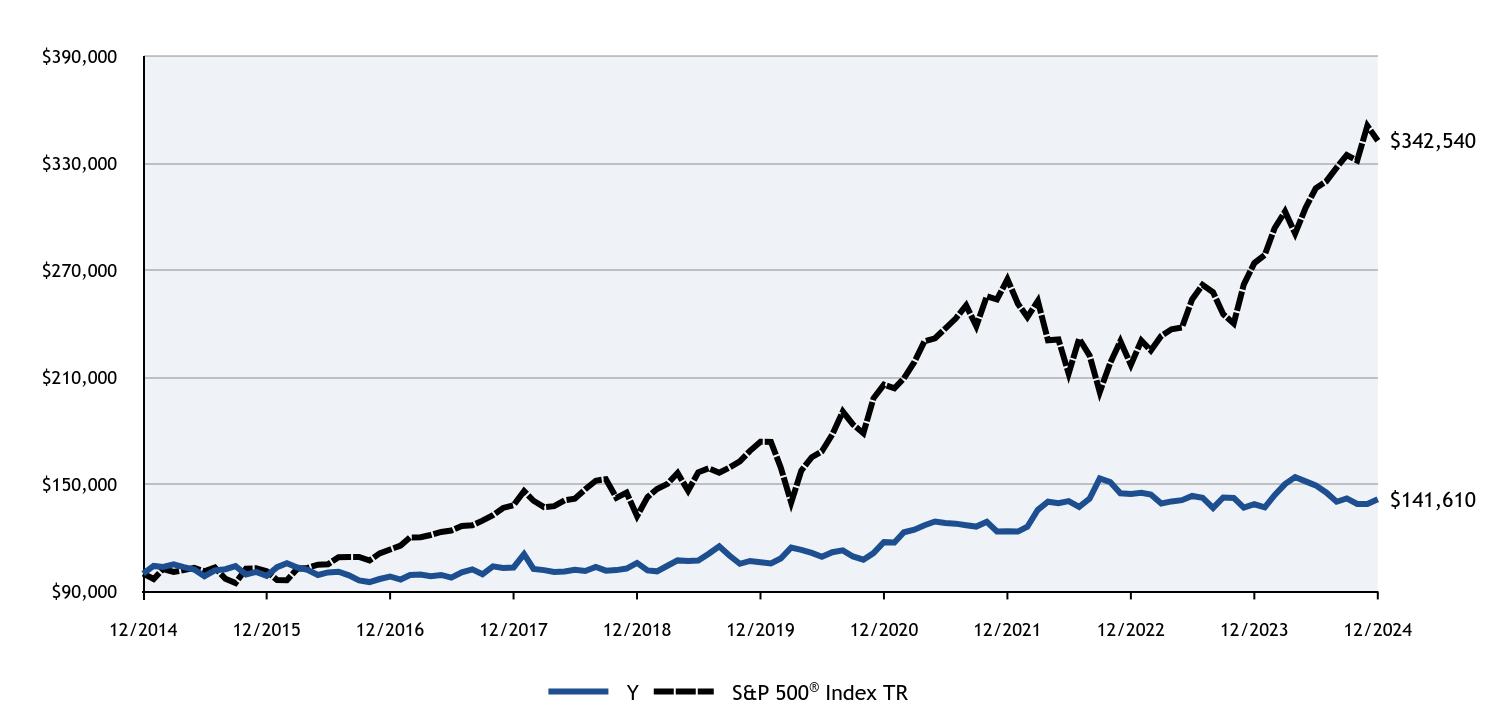
| #ERROR:A result could not be returned because the conditional could not be evaluated to a True/False value (#ERROR:Invalid Formula (#!=""), 'Multiple values from an iterator cannot be used in a formula unless they are aggregrated.') | Y | S&P 500® Index TR |
|---|
| 12/2014 | $100,000 | $100,000 |
|---|
| 01/2015 | $104,296 | $96,998 |
|---|
| 02/2015 | $103,748 | $102,573 |
|---|
| 03/2015 | $105,210 | $100,951 |
|---|
| 04/2015 | $103,656 | $101,919 |
|---|
| 05/2015 | $102,285 | $103,230 |
|---|
| 06/2015 | $98,537 | $101,231 |
|---|
| 07/2015 | $101,828 | $103,352 |
|---|
| 08/2015 | $102,468 | $97,117 |
|---|
| 09/2015 | $104,205 | $94,714 |
|---|
| 10/2015 | $99,452 | $102,703 |
|---|
| 11/2015 | $100,914 | $103,008 |
|---|
| 12/2015 | $98,756 | $101,384 |
|---|
| 01/2016 | $103,580 | $96,353 |
|---|
| 02/2016 | $105,756 | $96,223 |
|---|
| 03/2016 | $103,391 | $102,750 |
|---|
| 04/2016 | $102,161 | $103,149 |
|---|
| 05/2016 | $99,229 | $105,001 |
|---|
| 06/2016 | $100,648 | $105,273 |
|---|
| 07/2016 | $101,026 | $109,154 |
|---|
| 08/2016 | $99,040 | $109,308 |
|---|
| 09/2016 | $96,202 | $109,328 |
|---|
| 10/2016 | $95,256 | $107,334 |
|---|
| 11/2016 | $96,959 | $111,309 |
|---|
| 12/2016 | $98,378 | $113,509 |
|---|
| 01/2017 | $96,675 | $115,662 |
|---|
| 02/2017 | $99,229 | $120,255 |
|---|
| 03/2017 | $99,418 | $120,395 |
|---|
| 04/2017 | $98,472 | $121,631 |
|---|
| 05/2017 | $99,229 | $123,343 |
|---|
| 06/2017 | $97,716 | $124,113 |
|---|
| 07/2017 | $100,648 | $126,665 |
|---|
| 08/2017 | $102,351 | $127,053 |
|---|
| 09/2017 | $99,607 | $129,674 |
|---|
| 10/2017 | $104,053 | $132,700 |
|---|
| 11/2017 | $103,107 | $136,769 |
|---|
| 12/2017 | $103,427 | $138,290 |
|---|
| 01/2018 | $110,906 | $146,208 |
|---|
| 02/2018 | $102,640 | $140,819 |
|---|
| 03/2018 | $101,951 | $137,240 |
|---|
| 04/2018 | $100,869 | $137,767 |
|---|
| 05/2018 | $101,164 | $141,085 |
|---|
| 06/2018 | $102,148 | $141,953 |
|---|
| 07/2018 | $101,459 | $147,236 |
|---|
| 08/2018 | $103,722 | $152,033 |
|---|
| 09/2018 | $101,656 | $152,899 |
|---|
| 10/2018 | $101,951 | $142,448 |
|---|
| 11/2018 | $102,837 | $145,351 |
|---|
| 12/2018 | $105,983 | $132,227 |
|---|
| 01/2019 | $101,776 | $142,823 |
|---|
| 02/2019 | $101,275 | $147,409 |
|---|
| 03/2019 | $104,380 | $150,273 |
|---|
| 04/2019 | $107,385 | $156,358 |
|---|
| 05/2019 | $107,085 | $146,422 |
|---|
| 06/2019 | $107,285 | $156,741 |
|---|
| 07/2019 | $111,092 | $158,994 |
|---|
| 08/2019 | $115,299 | $156,475 |
|---|
| 09/2019 | $110,090 | $159,403 |
|---|
| 10/2019 | $105,482 | $162,855 |
|---|
| 11/2019 | $107,085 | $168,767 |
|---|
| 12/2019 | $106,339 | $173,861 |
|---|
| 01/2020 | $105,711 | $173,792 |
|---|
| 02/2020 | $108,430 | $159,486 |
|---|
| 03/2020 | $114,599 | $139,787 |
|---|
| 04/2020 | $113,240 | $157,707 |
|---|
| 05/2020 | $111,567 | $165,219 |
|---|
| 06/2020 | $109,371 | $168,504 |
|---|
| 07/2020 | $111,985 | $178,005 |
|---|
| 08/2020 | $113,031 | $190,801 |
|---|
| 09/2020 | $109,580 | $183,551 |
|---|
| 10/2020 | $107,803 | $178,669 |
|---|
| 11/2020 | $111,462 | $198,227 |
|---|
| 12/2020 | $117,722 | $205,849 |
|---|
| 01/2021 | $117,391 | $203,771 |
|---|
| 02/2021 | $123,129 | $209,390 |
|---|
| 03/2021 | $124,563 | $218,560 |
|---|
| 04/2021 | $127,101 | $230,224 |
|---|
| 05/2021 | $129,197 | $231,832 |
|---|
| 06/2021 | $128,314 | $237,244 |
|---|
| 07/2021 | $127,983 | $242,880 |
|---|
| 08/2021 | $127,101 | $250,265 |
|---|
| 09/2021 | $126,328 | $238,625 |
|---|
| 10/2021 | $128,976 | $255,344 |
|---|
| 11/2021 | $123,570 | $253,574 |
|---|
| 12/2021 | $123,771 | $264,939 |
|---|
| 01/2022 | $123,534 | $251,229 |
|---|
| 02/2022 | $126,261 | $243,707 |
|---|
| 03/2022 | $135,746 | $252,755 |
|---|
| 04/2022 | $140,251 | $230,715 |
|---|
| 05/2022 | $139,421 | $231,138 |
|---|
| 06/2022 | $140,606 | $212,059 |
|---|
| 07/2022 | $137,405 | $231,612 |
|---|
| 08/2022 | $142,029 | $222,166 |
|---|
| 09/2022 | $153,292 | $201,705 |
|---|
| 10/2022 | $151,276 | $218,035 |
|---|
| 11/2022 | $144,993 | $230,220 |
|---|
| 12/2022 | $144,618 | $216,956 |
|---|
| 01/2023 | $145,316 | $230,588 |
|---|
| 02/2023 | $144,339 | $224,962 |
|---|
| 03/2023 | $139,313 | $233,221 |
|---|
| 04/2023 | $140,430 | $236,861 |
|---|
| 05/2023 | $141,128 | $237,891 |
|---|
| 06/2023 | $143,501 | $253,610 |
|---|
| 07/2023 | $142,524 | $261,757 |
|---|
| 08/2023 | $136,801 | $257,589 |
|---|
| 09/2023 | $142,664 | $245,308 |
|---|
| 10/2023 | $142,384 | $240,150 |
|---|
| 11/2023 | $136,940 | $262,082 |
|---|
| 12/2023 | $138,851 | $273,988 |
|---|
| 01/2024 | $137,160 | $278,593 |
|---|
| 02/2024 | $143,926 | $293,468 |
|---|
| 03/2024 | $150,128 | $302,910 |
|---|
| 04/2024 | $154,076 | $290,538 |
|---|
| 05/2024 | $151,679 | $304,944 |
|---|
| 06/2024 | $149,424 | $315,886 |
|---|
| 07/2024 | $145,477 | $319,732 |
|---|
| 08/2024 | $140,261 | $327,487 |
|---|
| 09/2024 | $142,093 | $334,481 |
|---|
| 10/2024 | $138,992 | $331,448 |
|---|
| 11/2024 | $138,992 | $350,904 |
|---|
| 12/2024 | $141,610 | $342,540 |
|---|
Average Annual Total Returns (%)
| HEADER | 1 Year | 5 Years | 10 Years |
|---|
Class YFootnote Reference1 | 1.99% | 5.90% | 3.54% |
|---|
S&P 500® Index TR | 25.02% | 14.53% | 13.10% |
|---|
| Footnote | Description |
Footnote1 | Return may differ from actual shareholder return due to accounting adjustments for financial reporting purposes. |
Performance shown is historical and is not indicative of future returns. Investment returns and principal value will vary, and shares may be worth more or less at redemption than at original purchase. Performance shown is as of date indicated, and current performance may be lower or higher than the performance data quoted. To obtain performance as of the most recent month end, please visit americanbeaconfunds.com or call 800-967-9009. The graph and table do not reflect the deduction of taxes that a shareholder would pay on fund distributions or redemption of fund shares. The Fund's performance benefited from fee waivers. For more information, visit americanbeaconfunds.com/Performance_Disclaimers.aspx.
The S&P 500 Index TR is replacing the ICE BofA US 3-Month Treasury Bill Index as broad-based securities market index to comply with a new regulatory requirement.
| Total Net Assets | $3,072,928,252 |
|---|
| # of Portfolio Holdings | 16 |
|---|
| Total Management Fees Paid | $44,861,883 |
|---|
Asset Class Exposure % of VaR*
| Value | Value |
|---|
| Currencies | 32.7 |
| Commodities | 28.8 |
| Equities | 19.6 |
| Fixed Income | 18.9 |
*Value at Risk (“VaR”) is a measure of the potential loss in value of a portfolio over a defined period for a given confidence interval. A one-day VaR at the 95% confidence level represents that there is a 5% probability that the mark-to-market loss on the portfolio over a one day horizon will exceed this value (assuming normal markets and no trading in the portfolio).
What did the Fund invest in?
Top Active Exposures by Asset Class % of VaR*
| Commodities | Header | % of VaR |
| Copper | Short | 4.0 |
| Natural Gas | Long | 3.9 |
| Coffee | Long | 2.4 |
| Cocoa | Long | 2.3 |
| Soybeans | Short | 2.1 |
| Currencies | Header | % of VaR |
| Japanese Yen/US Dollar | Short | 7.2 |
| Swiss Franc/US Dollar | Short | 2.1 |
| Norwegian Krone/US Dollar | Short | 1.7 |
| Swedish Krona/US Dollar | Short | 1.6 |
| Canadian Dollar/US Dollar | Short | 1.6 |
| Equities | Header | % of VaR |
| Nikkei | Long | 2.6 |
| FTSE Taiwan Index | Long | 2.0 |
| NASDAQ 100 Index | Long | 1.6 |
| Tokyo Stock Exchange Index | Long | 1.5 |
| DAX Index | Long | 1.4 |
| Fixed Income | Header | % of VaR |
| US Treasuries | Short | 6.2 |
| Euribor | Long | 2.7 |
| SOFR 3Mth Index | Short | 2.6 |
| Australian Bonds | Short | 2.1 |
| SONIA 3Mth Index | Short | 1.9 |
| Number of Currency Pairs | 37 |
| Number of Short Holdings | 32 |
| Number of Long Holdings | 30 |
Top Ten Holdings - % of VaR*
| Japanese Yen/US Dollar | Short | 7.2 |
| US Treasuries | Short | 6.2 |
| Copper | Short | 4.0 |
| Natural Gas | Long | 3.9 |
| Euribor | Long | 2.7 |
| Nikkei | Long | 2.6 |
| SOFR 3Mth Index | Short | 2.6 |
| Coffee | Long | 2.4 |
| Cocoa | Long | 2.3 |
| Australian Bonds | Short | 2.1 |
Includes long positions only.
For additional information about the Fund, including its prospectus, financial statements, holdings, and proxy voting information, please visit www.americanbeaconfunds.com/literature or call 1-800-658-5811.
If your financial institution mailed only one copy of this Report to an address shared by more than one account, you can request an individual copy by contacting your financial institution.
Annual Shareholder Report - December 31, 2024
Distributed by:
Resolute Investment Distributors, Inc.
AHL Managed Futures Strategy Fund
AHL Managed Futures Strategy Fund
Annual Shareholder Report - December 31, 2024
This annual shareholder report contains important information about American Beacon AHL Managed Futures Strategy Fund for the period of January 1, 2024 to December 31, 2024. You can find additional information about the Fund at www.americanbeaconfunds.com/literature. You can also request this information by contacting us at 800-658-5811.
What were the Fund costs for the last year?
(based on a hypothetical $10,000 investment)
| Class Name | Costs of a $10,000 investment | Costs paid as a percentage of a $10,000 investment |
|---|
| Investor | $193 | 1.91% |
|---|
How did the Fund perform and what affected its performance?
The Investor Class of the Fund returned 1.74% for the twelve months ended December 31, 2024, compared to the S&P 500 Index return of 25.02%.
• The investment strategy of the Fund’s sub-advisor is designed to capitalize on price trends in a broad range of global markets across multiple asset classes.
• Overall, the market environment over the twelve-month period was conducive to the sub-advisor’s trend following strategy led by performance in U.S. equities.
• Positions in equities and U.S. dollar were the top contributors during the period.
• Positions in fixed income and commodities detracted from performance.
Cumulative Performance from December 31, 2014 through December 31, 2024
The initial investment, based on a $10,000 investment, is adjusted to reflect the maximum applicable sales charge, if any.
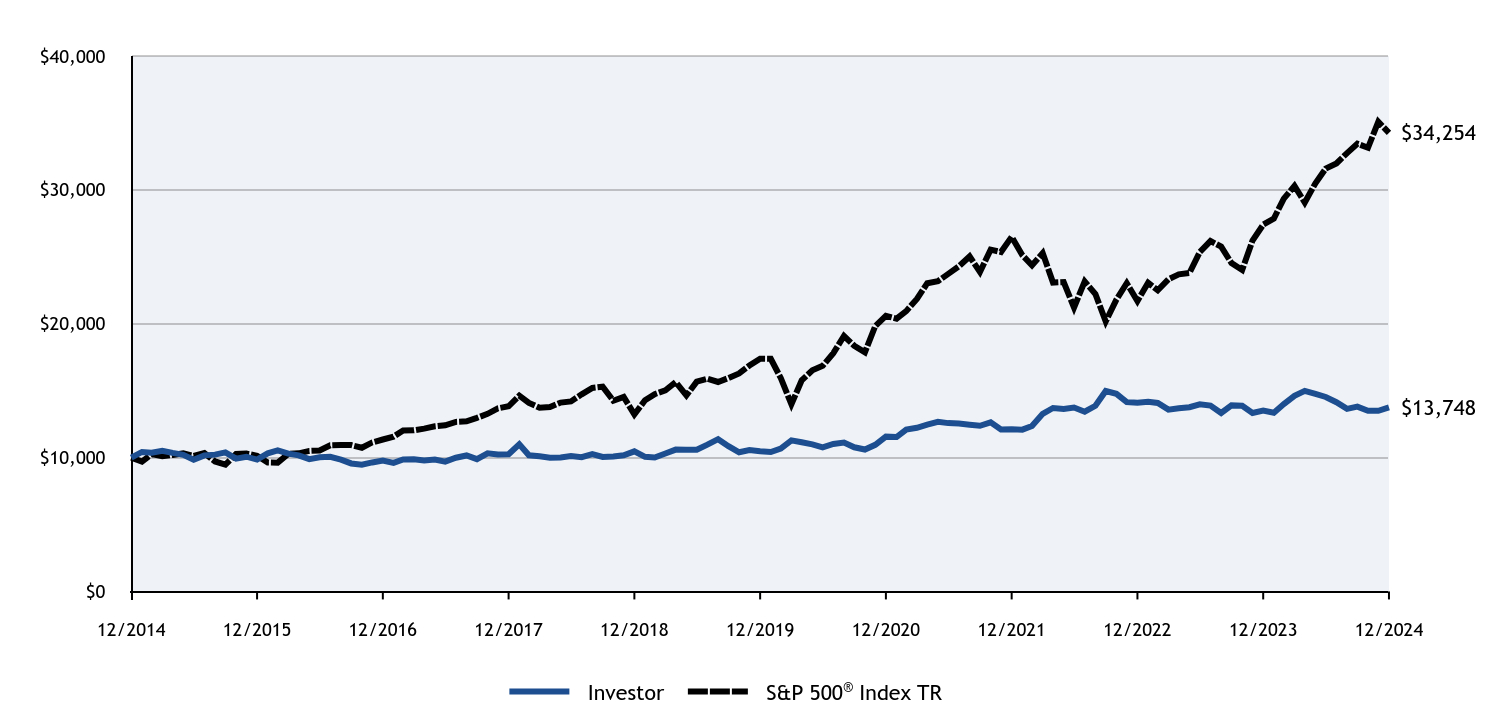
| Investor | S&P 500® Index TR |
|---|
| 12/2014 | $10,000 | $10,000 |
|---|
| 01/2015 | $10,421 | $9,700 |
|---|
| 02/2015 | $10,366 | $10,257 |
|---|
| 03/2015 | $10,512 | $10,095 |
|---|
| 04/2015 | $10,348 | $10,192 |
|---|
| 05/2015 | $10,210 | $10,323 |
|---|
| 06/2015 | $9,844 | $10,123 |
|---|
| 07/2015 | $10,165 | $10,335 |
|---|
| 08/2015 | $10,220 | $9,712 |
|---|
| 09/2015 | $10,393 | $9,471 |
|---|
| 10/2015 | $9,918 | $10,270 |
|---|
| 11/2015 | $10,064 | $10,301 |
|---|
| 12/2015 | $9,846 | $10,138 |
|---|
| 01/2016 | $10,319 | $9,635 |
|---|
| 02/2016 | $10,536 | $9,622 |
|---|
| 03/2016 | $10,290 | $10,275 |
|---|
| 04/2016 | $10,167 | $10,315 |
|---|
| 05/2016 | $9,884 | $10,500 |
|---|
| 06/2016 | $10,016 | $10,527 |
|---|
| 07/2016 | $10,054 | $10,915 |
|---|
| 08/2016 | $9,846 | $10,931 |
|---|
| 09/2016 | $9,562 | $10,933 |
|---|
| 10/2016 | $9,468 | $10,733 |
|---|
| 11/2016 | $9,638 | $11,131 |
|---|
| 12/2016 | $9,780 | $11,351 |
|---|
| 01/2017 | $9,609 | $11,566 |
|---|
| 02/2017 | $9,865 | $12,025 |
|---|
| 03/2017 | $9,874 | $12,039 |
|---|
| 04/2017 | $9,780 | $12,163 |
|---|
| 05/2017 | $9,855 | $12,334 |
|---|
| 06/2017 | $9,695 | $12,411 |
|---|
| 07/2017 | $9,988 | $12,666 |
|---|
| 08/2017 | $10,158 | $12,705 |
|---|
| 09/2017 | $9,884 | $12,967 |
|---|
| 10/2017 | $10,319 | $13,270 |
|---|
| 11/2017 | $10,224 | $13,677 |
|---|
| 12/2017 | $10,247 | $13,829 |
|---|
| 01/2018 | $10,995 | $14,621 |
|---|
| 02/2018 | $10,168 | $14,082 |
|---|
| 03/2018 | $10,099 | $13,724 |
|---|
| 04/2018 | $9,991 | $13,777 |
|---|
| 05/2018 | $10,010 | $14,108 |
|---|
| 06/2018 | $10,109 | $14,195 |
|---|
| 07/2018 | $10,030 | $14,724 |
|---|
| 08/2018 | $10,257 | $15,203 |
|---|
| 09/2018 | $10,050 | $15,290 |
|---|
| 10/2018 | $10,079 | $14,245 |
|---|
| 11/2018 | $10,168 | $14,535 |
|---|
| 12/2018 | $10,467 | $13,223 |
|---|
| 01/2019 | $10,057 | $14,282 |
|---|
| 02/2019 | $10,007 | $14,741 |
|---|
| 03/2019 | $10,307 | $15,027 |
|---|
| 04/2019 | $10,597 | $15,636 |
|---|
| 05/2019 | $10,577 | $14,642 |
|---|
| 06/2019 | $10,587 | $15,674 |
|---|
| 07/2019 | $10,966 | $15,899 |
|---|
| 08/2019 | $11,376 | $15,648 |
|---|
| 09/2019 | $10,856 | $15,940 |
|---|
| 10/2019 | $10,397 | $16,286 |
|---|
| 11/2019 | $10,557 | $16,877 |
|---|
| 12/2019 | $10,475 | $17,386 |
|---|
| 01/2020 | $10,413 | $17,379 |
|---|
| 02/2020 | $10,673 | $15,949 |
|---|
| 03/2020 | $11,287 | $13,979 |
|---|
| 04/2020 | $11,141 | $15,771 |
|---|
| 05/2020 | $10,985 | $16,522 |
|---|
| 06/2020 | $10,767 | $16,850 |
|---|
| 07/2020 | $11,016 | $17,801 |
|---|
| 08/2020 | $11,120 | $19,080 |
|---|
| 09/2020 | $10,767 | $18,355 |
|---|
| 10/2020 | $10,600 | $17,867 |
|---|
| 11/2020 | $10,954 | $19,823 |
|---|
| 12/2020 | $11,567 | $20,585 |
|---|
| 01/2021 | $11,535 | $20,377 |
|---|
| 02/2021 | $12,093 | $20,939 |
|---|
| 03/2021 | $12,225 | $21,856 |
|---|
| 04/2021 | $12,466 | $23,022 |
|---|
| 05/2021 | $12,674 | $23,183 |
|---|
| 06/2021 | $12,575 | $23,724 |
|---|
| 07/2021 | $12,542 | $24,288 |
|---|
| 08/2021 | $12,455 | $25,026 |
|---|
| 09/2021 | $12,378 | $23,863 |
|---|
| 10/2021 | $12,630 | $25,534 |
|---|
| 11/2021 | $12,104 | $25,357 |
|---|
| 12/2021 | $12,110 | $26,494 |
|---|
| 01/2022 | $12,087 | $25,123 |
|---|
| 02/2022 | $12,357 | $24,371 |
|---|
| 03/2022 | $13,272 | $25,276 |
|---|
| 04/2022 | $13,706 | $23,071 |
|---|
| 05/2022 | $13,624 | $23,114 |
|---|
| 06/2022 | $13,741 | $21,206 |
|---|
| 07/2022 | $13,425 | $23,161 |
|---|
| 08/2022 | $13,870 | $22,217 |
|---|
| 09/2022 | $14,974 | $20,170 |
|---|
| 10/2022 | $14,762 | $21,804 |
|---|
| 11/2022 | $14,152 | $23,022 |
|---|
| 12/2022 | $14,105 | $21,696 |
|---|
| 01/2023 | $14,174 | $23,059 |
|---|
| 02/2023 | $14,078 | $22,496 |
|---|
| 03/2023 | $13,580 | $23,322 |
|---|
| 04/2023 | $13,691 | $23,686 |
|---|
| 05/2023 | $13,760 | $23,789 |
|---|
| 06/2023 | $13,981 | $25,361 |
|---|
| 07/2023 | $13,884 | $26,176 |
|---|
| 08/2023 | $13,332 | $25,759 |
|---|
| 09/2023 | $13,898 | $24,531 |
|---|
| 10/2023 | $13,871 | $24,015 |
|---|
| 11/2023 | $13,332 | $26,208 |
|---|
| 12/2023 | $13,513 | $27,399 |
|---|
| 01/2024 | $13,346 | $27,859 |
|---|
| 02/2024 | $13,999 | $29,347 |
|---|
| 03/2024 | $14,611 | $30,291 |
|---|
| 04/2024 | $14,986 | $29,054 |
|---|
| 05/2024 | $14,750 | $30,494 |
|---|
| 06/2024 | $14,527 | $31,589 |
|---|
| 07/2024 | $14,138 | $31,973 |
|---|
| 08/2024 | $13,638 | $32,749 |
|---|
| 09/2024 | $13,805 | $33,448 |
|---|
| 10/2024 | $13,499 | $33,145 |
|---|
| 11/2024 | $13,499 | $35,090 |
|---|
| 12/2024 | $13,748 | $34,254 |
|---|
Average Annual Total Returns (%)
| HEADER | 1 Year | 5 Years | 10 Years |
|---|
Investor ClassFootnote Reference1 | 1.74% | 5.59% | 3.23% |
|---|
S&P 500® Index TR | 25.02% | 14.53% | 13.10% |
|---|
| Footnote | Description |
Footnote1 | Return may differ from actual shareholder return due to accounting adjustments for financial reporting purposes. |
Performance shown is historical and is not indicative of future returns. Investment returns and principal value will vary, and shares may be worth more or less at redemption than at original purchase. Performance shown is as of date indicated, and current performance may be lower or higher than the performance data quoted. To obtain performance as of the most recent month end, please visit americanbeaconfunds.com or call 800-967-9009. The graph and table do not reflect the deduction of taxes that a shareholder would pay on fund distributions or redemption of fund shares. The Fund's performance benefited from fee waivers. For more information, visit americanbeaconfunds.com/Performance_Disclaimers.aspx.
The S&P 500 Index TR is replacing the ICE BofA US 3-Month Treasury Bill Index as broad-based securities market index to comply with a new regulatory requirement.
| Total Net Assets | $3,072,928,252 |
|---|
| # of Portfolio Holdings | 16 |
|---|
| Total Management Fees Paid | $44,861,883 |
|---|
Asset Class Exposure % of VaR*
| Value | Value |
|---|
| Currencies | 32.7 |
| Commodities | 28.8 |
| Equities | 19.6 |
| Fixed Income | 18.9 |
*Value at Risk (“VaR”) is a measure of the potential loss in value of a portfolio over a defined period for a given confidence interval. A one-day VaR at the 95% confidence level represents that there is a 5% probability that the mark-to-market loss on the portfolio over a one day horizon will exceed this value (assuming normal markets and no trading in the portfolio).
What did the Fund invest in?
Top Active Exposures by Asset Class % of VaR*
| Commodities | Header | % of VaR |
| Copper | Short | 4.0 |
| Natural Gas | Long | 3.9 |
| Coffee | Long | 2.4 |
| Cocoa | Long | 2.3 |
| Soybeans | Short | 2.1 |
| Currencies | Header | % of VaR |
| Japanese Yen/US Dollar | Short | 7.2 |
| Swiss Franc/US Dollar | Short | 2.1 |
| Norwegian Krone/US Dollar | Short | 1.7 |
| Swedish Krona/US Dollar | Short | 1.6 |
| Canadian Dollar/US Dollar | Short | 1.6 |
| Equities | Header | % of VaR |
| Nikkei | Long | 2.6 |
| FTSE Taiwan Index | Long | 2.0 |
| NASDAQ 100 Index | Long | 1.6 |
| Tokyo Stock Exchange Index | Long | 1.5 |
| DAX Index | Long | 1.4 |
| Fixed Income | Header | % of VaR |
| US Treasuries | Short | 6.2 |
| Euribor | Long | 2.7 |
| SOFR 3Mth Index | Short | 2.6 |
| Australian Bonds | Short | 2.1 |
| SONIA 3Mth Index | Short | 1.9 |
| Number of Currency Pairs | 37 |
| Number of Short Holdings | 32 |
| Number of Long Holdings | 30 |
Top Ten Holdings - % of VaR*
| Japanese Yen/US Dollar | Short | 7.2 |
| US Treasuries | Short | 6.2 |
| Copper | Short | 4.0 |
| Natural Gas | Long | 3.9 |
| Euribor | Long | 2.7 |
| Nikkei | Long | 2.6 |
| SOFR 3Mth Index | Short | 2.6 |
| Coffee | Long | 2.4 |
| Cocoa | Long | 2.3 |
| Australian Bonds | Short | 2.1 |
Includes long positions only.
For additional information about the Fund, including its prospectus, financial statements, holdings, and proxy voting information, please visit www.americanbeaconfunds.com/literature or call 1-800-658-5811.
If your financial institution mailed only one copy of this Report to an address shared by more than one account, you can request an individual copy by contacting your financial institution.
Annual Shareholder Report - December 31, 2024
Distributed by:
Resolute Investment Distributors, Inc.
AHL Managed Futures Strategy Fund
Man Large Cap Growth Fund
Annual Shareholder Report - December 31, 2024
This annual shareholder report contains important information about Large Cap Growth Fund for the period of January 1, 2024 to December 31, 2024. You can find additional information about the Fund at www.americanbeaconfunds.com/literature. You can also request this information by contacting us at 800-658-5811. This report describes material changes to the Fund that occurred during the reporting period.
What were the Fund costs for the last year?
(based on a hypothetical $10,000 investment)
| Class Name | Costs of a $10,000 investment | Costs paid as a percentage of a $10,000 investment |
|---|
| Class A | $122 | 1.09% |
|---|
How did the Fund perform and what affected its performance?
The A Class of the Fund returned 16.47% (with sales charges) and 23.58% (without sales charges) for the twelve months ended December 31, 2024, compared to the S&P 500 Index return of 25.02% and the Russell 1000 Growth Index return of 33.36%.
• Broad market performance was driven by a small number of mega-cap growth companies not held by the Fund, resulting in underperformance for the strategy.
• The Fund generated positive performance in all sectors where it invested, except for Materials, which slightly detracted from returns. Information Technology sector holdings contributed materially.
Cumulative Performance from December 31, 2014 through December 31, 2024
The initial investment, based on a $10,000 investment, is adjusted to reflect the maximum applicable sales charge, if any.
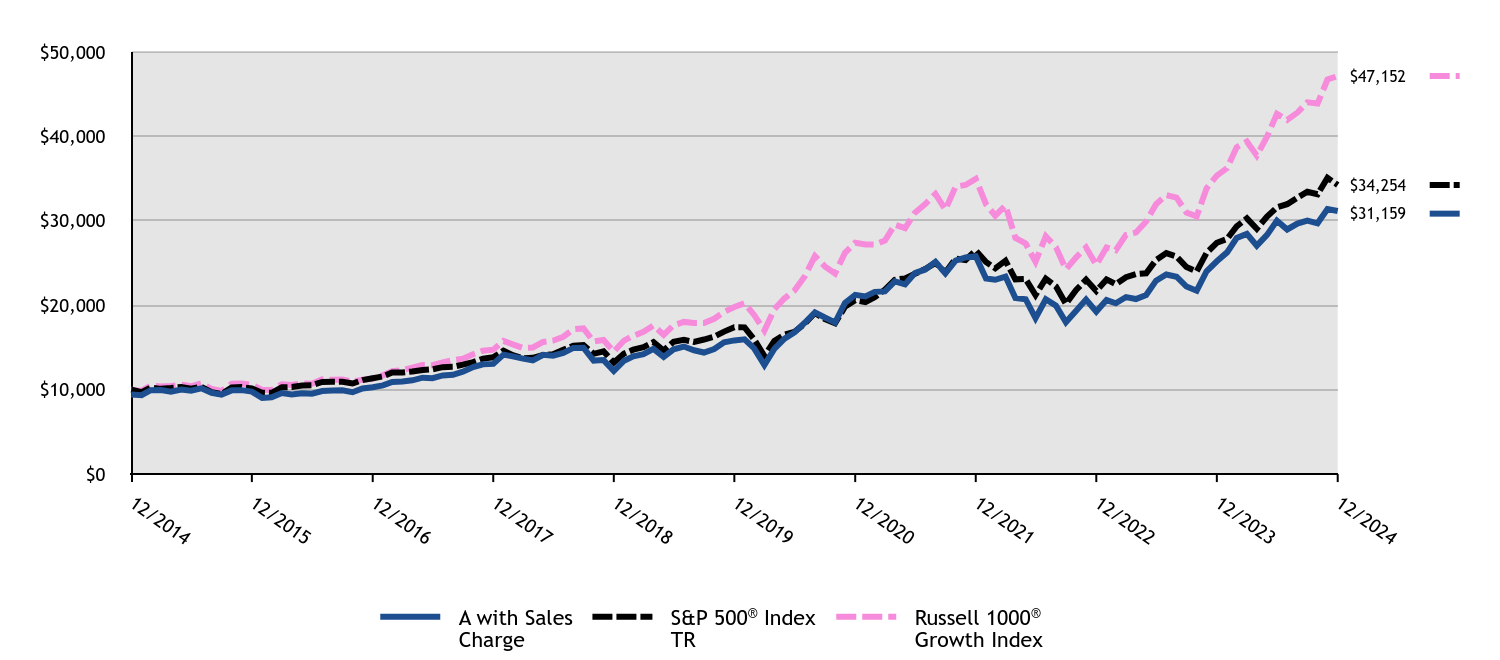
| A with Sales Charge | S&P 500® Index TR | Russell 1000® Growth Index |
|---|
| 12/2014 | $9,425 | $10,000 | $10,000 |
|---|
| 01/2015 | $9,337 | $9,700 | $9,847 |
|---|
| 02/2015 | $9,937 | $10,257 | $10,503 |
|---|
| 03/2015 | $9,967 | $10,095 | $10,384 |
|---|
| 04/2015 | $9,750 | $10,192 | $10,436 |
|---|
| 05/2015 | $10,021 | $10,323 | $10,583 |
|---|
| 06/2015 | $9,883 | $10,123 | $10,396 |
|---|
| 07/2015 | $10,163 | $10,335 | $10,749 |
|---|
| 08/2015 | $9,625 | $9,712 | $10,096 |
|---|
| 09/2015 | $9,416 | $9,471 | $9,846 |
|---|
| 10/2015 | $9,917 | $10,270 | $10,694 |
|---|
| 11/2015 | $9,942 | $10,301 | $10,724 |
|---|
| 12/2015 | $9,766 | $10,138 | $10,567 |
|---|
| 01/2016 | $9,020 | $9,635 | $9,977 |
|---|
| 02/2016 | $9,104 | $9,622 | $9,973 |
|---|
| 03/2016 | $9,602 | $10,275 | $10,645 |
|---|
| 04/2016 | $9,418 | $10,315 | $10,548 |
|---|
| 05/2016 | $9,560 | $10,500 | $10,753 |
|---|
| 06/2016 | $9,527 | $10,527 | $10,711 |
|---|
| 07/2016 | $9,833 | $10,915 | $11,216 |
|---|
| 08/2016 | $9,908 | $10,931 | $11,160 |
|---|
| 09/2016 | $9,921 | $10,933 | $11,201 |
|---|
| 10/2016 | $9,699 | $10,733 | $10,938 |
|---|
| 11/2016 | $10,143 | $11,131 | $11,176 |
|---|
| 12/2016 | $10,279 | $11,351 | $11,314 |
|---|
| 01/2017 | $10,502 | $11,566 | $11,696 |
|---|
| 02/2017 | $10,907 | $12,025 | $12,182 |
|---|
| 03/2017 | $10,962 | $12,039 | $12,322 |
|---|
| 04/2017 | $11,105 | $12,163 | $12,604 |
|---|
| 05/2017 | $11,421 | $12,334 | $12,932 |
|---|
| 06/2017 | $11,362 | $12,411 | $12,898 |
|---|
| 07/2017 | $11,687 | $12,666 | $13,241 |
|---|
| 08/2017 | $11,758 | $12,705 | $13,483 |
|---|
| 09/2017 | $12,125 | $12,967 | $13,659 |
|---|
| 10/2017 | $12,677 | $13,270 | $14,188 |
|---|
| 11/2017 | $13,001 | $13,677 | $14,619 |
|---|
| 12/2017 | $13,054 | $13,829 | $14,733 |
|---|
| 01/2018 | $14,151 | $14,621 | $15,776 |
|---|
| 02/2018 | $13,941 | $14,082 | $15,363 |
|---|
| 03/2018 | $13,677 | $13,724 | $14,941 |
|---|
| 04/2018 | $13,458 | $13,777 | $14,994 |
|---|
| 05/2018 | $14,121 | $14,108 | $15,651 |
|---|
| 06/2018 | $14,024 | $14,195 | $15,801 |
|---|
| 07/2018 | $14,358 | $14,724 | $16,265 |
|---|
| 08/2018 | $14,946 | $15,203 | $17,155 |
|---|
| 09/2018 | $14,968 | $15,290 | $17,251 |
|---|
| 10/2018 | $13,445 | $14,245 | $15,708 |
|---|
| 11/2018 | $13,502 | $14,535 | $15,875 |
|---|
| 12/2018 | $12,205 | $13,223 | $14,510 |
|---|
| 01/2019 | $13,430 | $14,282 | $15,814 |
|---|
| 02/2019 | $13,959 | $14,741 | $16,380 |
|---|
| 03/2019 | $14,217 | $15,027 | $16,846 |
|---|
| 04/2019 | $14,829 | $15,636 | $17,607 |
|---|
| 05/2019 | $13,877 | $14,642 | $16,495 |
|---|
| 06/2019 | $14,776 | $15,674 | $17,628 |
|---|
| 07/2019 | $15,106 | $15,899 | $18,026 |
|---|
| 08/2019 | $14,664 | $15,648 | $17,888 |
|---|
| 09/2019 | $14,397 | $15,940 | $17,890 |
|---|
| 10/2019 | $14,810 | $16,286 | $18,394 |
|---|
| 11/2019 | $15,606 | $16,877 | $19,210 |
|---|
| 12/2019 | $15,835 | $17,386 | $19,790 |
|---|
| 01/2020 | $15,969 | $17,379 | $20,232 |
|---|
| 02/2020 | $14,896 | $15,949 | $18,854 |
|---|
| 03/2020 | $12,916 | $13,979 | $17,000 |
|---|
| 04/2020 | $14,837 | $15,771 | $19,515 |
|---|
| 05/2020 | $16,033 | $16,522 | $20,825 |
|---|
| 06/2020 | $16,774 | $16,850 | $21,732 |
|---|
| 07/2020 | $17,922 | $17,801 | $23,404 |
|---|
| 08/2020 | $19,151 | $19,080 | $25,819 |
|---|
| 09/2020 | $18,544 | $18,355 | $24,604 |
|---|
| 10/2020 | $17,954 | $17,867 | $23,769 |
|---|
| 11/2020 | $20,267 | $19,823 | $26,203 |
|---|
| 12/2020 | $21,236 | $20,585 | $27,408 |
|---|
| 01/2021 | $21,052 | $20,377 | $27,205 |
|---|
| 02/2021 | $21,586 | $20,939 | $27,199 |
|---|
| 03/2021 | $21,640 | $21,856 | $27,666 |
|---|
| 04/2021 | $22,839 | $23,022 | $29,548 |
|---|
| 05/2021 | $22,471 | $23,183 | $29,140 |
|---|
| 06/2021 | $23,813 | $23,724 | $30,968 |
|---|
| 07/2021 | $24,240 | $24,288 | $31,988 |
|---|
| 08/2021 | $25,148 | $25,026 | $33,184 |
|---|
| 09/2021 | $23,771 | $23,863 | $31,326 |
|---|
| 10/2021 | $25,279 | $25,534 | $34,039 |
|---|
| 11/2021 | $25,659 | $25,357 | $34,247 |
|---|
| 12/2021 | $25,794 | $26,494 | $34,971 |
|---|
| 01/2022 | $23,164 | $25,123 | $31,970 |
|---|
| 02/2022 | $23,013 | $24,371 | $30,612 |
|---|
| 03/2022 | $23,392 | $25,276 | $31,809 |
|---|
| 04/2022 | $20,869 | $23,071 | $27,968 |
|---|
| 05/2022 | $20,718 | $23,114 | $27,318 |
|---|
| 06/2022 | $18,481 | $21,206 | $25,154 |
|---|
| 07/2022 | $20,704 | $23,161 | $28,173 |
|---|
| 08/2022 | $19,939 | $22,217 | $26,861 |
|---|
| 09/2022 | $17,980 | $20,170 | $24,249 |
|---|
| 10/2022 | $19,353 | $21,804 | $25,667 |
|---|
| 11/2022 | $20,668 | $23,022 | $26,836 |
|---|
| 12/2022 | $19,247 | $21,696 | $24,782 |
|---|
| 01/2023 | $20,609 | $23,059 | $26,847 |
|---|
| 02/2023 | $20,230 | $22,496 | $26,528 |
|---|
| 03/2023 | $20,970 | $23,322 | $28,342 |
|---|
| 04/2023 | $20,735 | $23,686 | $28,621 |
|---|
| 05/2023 | $21,214 | $23,789 | $29,926 |
|---|
| 06/2023 | $22,912 | $25,361 | $31,972 |
|---|
| 07/2023 | $23,643 | $26,176 | $33,050 |
|---|
| 08/2023 | $23,382 | $25,759 | $32,753 |
|---|
| 09/2023 | $22,214 | $24,531 | $30,972 |
|---|
| 10/2023 | $21,726 | $24,015 | $30,531 |
|---|
| 11/2023 | $24,029 | $26,208 | $33,859 |
|---|
| 12/2023 | $25,213 | $27,399 | $35,358 |
|---|
| 01/2024 | $26,262 | $27,859 | $36,240 |
|---|
| 02/2024 | $27,962 | $29,347 | $38,713 |
|---|
| 03/2024 | $28,453 | $30,291 | $39,394 |
|---|
| 04/2024 | $27,057 | $29,054 | $37,723 |
|---|
| 05/2024 | $28,334 | $30,494 | $39,981 |
|---|
| 06/2024 | $30,026 | $31,589 | $42,677 |
|---|
| 07/2024 | $28,977 | $31,973 | $41,951 |
|---|
| 08/2024 | $29,679 | $32,749 | $42,825 |
|---|
| 09/2024 | $30,034 | $33,448 | $44,038 |
|---|
| 10/2024 | $29,704 | $33,145 | $43,893 |
|---|
| 11/2024 | $31,396 | $35,090 | $46,740 |
|---|
| 12/2024 | $31,159 | $34,254 | $47,152 |
|---|
Average Annual Total Returns (%)
| HEADER | 1 Year | 5 Years | 10 Years |
|---|
Class A without Sales ChargeFootnote Reference1 | 23.58% | 14.50% | 12.70% |
|---|
Class A with Maximum Sales Charge - 5.75%Footnote Reference1 | 16.47% | 13.15% | 12.04% |
|---|
S&P 500® Index TR | 25.02% | 14.53% | 13.10% |
|---|
Russell 1000® Growth Index | 33.36% | 18.96% | 16.78% |
|---|
| Footnote | Description |
Footnote1 | Return may differ from actual shareholder return due to accounting adjustments for financial reporting purposes. |
Performance shown is historical and is not indicative of future returns. Investment returns and principal value will vary, and shares may be worth more or less at redemption than at original purchase. Performance shown is as of date indicated, and current performance may be lower or higher than the performance data quoted. To obtain performance as of the most recent month end, please visit americanbeaconfunds.com or call 800-967-9009. The graph and table do not reflect the deduction of taxes that a shareholder would pay on fund distributions or redemption of fund shares. The Fund's performance benefited from fee waivers. Performance includes historical performance of another Class of the Fund. For more information, visit americanbeaconfunds.com/Performance_Disclaimers.aspx.
The S&P 500 Index TR is replacing the Russell 1000 Growth Index as broad-based securities market index to comply with a new regulatory requirement. The Russell 1000 Growth Index reflects the market sectors in which the Fund invests.
| Total Net Assets | $201,325,898 |
|---|
| # of Portfolio Holdings | 71 |
|---|
| Portfolio Turnover Rate | 52% |
|---|
| Total Management Fees Paid | $1,095,857 |
|---|
What did the Fund invest in?
Top Ten Holdings - % Net Assets
| Alphabet, Inc., Class A | 6.6 |
| Amazon.com, Inc. | 6.1 |
| NVIDIA Corp. | 6.0 |
| Microsoft Corp. | 5.2 |
| Apple, Inc. | 4.8 |
| Mastercard, Inc., Class A | 4.3 |
| Meta Platforms, Inc., Class A | 4.2 |
| Booking Holdings, Inc. | 3.1 |
| Fortinet, Inc. | 2.6 |
| McKesson Corp. | 2.4 |
Excludes cash equivalents.
Asset Allocation - % Investments
| Value | Value |
|---|
| Common Stocks | 97.1 |
| Investment Companies | 2.9 |
| Rights | 0.0 |
The Fund may purchase and sell futures contracts to gain market exposure on cash balances.
Sector Allocation - % Equities
| Value | Value |
|---|
| Consumer Staples | 2.0 |
| Industrials | 3.3 |
| Financials | 6.7 |
| Consumer Discretionary | 12.2 |
| Communication Services | 12.8 |
| Health Care | 13.5 |
| Information Technology | 49.5 |
This is a summary of certain changes to the Fund since December 31, 2023. For more complete information, you may review the Fund's next prospectus, which we expect to be available by May 1, 2025 at www.americanbeaconfunds.com/literature or upon request at 800-658-5811.
The Board of the Trust, at the recommendation of the Manager, approved; (i) the termination of the investment advisory agreement among the Manager, Bridgeway Capital Management, LLC and the Trust, on behalf of the American Beacon Man Large Cap Growth Fund (formerly known as American Beacon Bridgeway Large Cap Growth Fund), effective April 30, 2024, and (ii) a new investment advisory agreement among the Manager, Numeric Investors LLC, and the Trust on behalf of the Funds, effective May 1, 2024.
For additional information about the Fund, including its prospectus, financial statements, holdings, and proxy voting information, please visit www.americanbeaconfunds.com/literature or call 1-800-658-5811.
If your financial institution mailed only one copy of this Report to an address shared by more than one account, you can request an individual copy by contacting your financial institution.
Man Large Cap Growth Fund
Distributed by:
Resolute Investment Distributors, Inc.
Annual Shareholder Report - December 31, 2024
Man Large Cap Growth Fund
Annual Shareholder Report - December 31, 2024
This annual shareholder report contains important information about Large Cap Growth Fund for the period of January 1, 2024 to December 31, 2024. You can find additional information about the Fund at www.americanbeaconfunds.com/literature. You can also request this information by contacting us at 800-658-5811. This report describes material changes to the Fund that occurred during the reporting period.
What were the Fund costs for the last year?
(based on a hypothetical $10,000 investment)
| Class Name | Costs of a $10,000 investment | Costs paid as a percentage of a $10,000 investment |
|---|
| Class C | $204 | 1.83% |
|---|
How did the Fund perform and what affected its performance?
The C Class of the Fund returned 21.75% (with sales charges) and 22.75% (without sales charges) for the twelve months ended December 31, 2024, compared to the S&P 500 Index return of 25.02% and the Russell 1000 Growth Index return of 33.36%.
• Broad market performance was driven by a small number of mega-cap growth companies not held by the Fund, resulting in underperformance for the strategy.
• The Fund generated positive performance in all sectors where it invested, except for Materials, which slightly detracted from returns. Information Technology sector holdings contributed materially.
Cumulative Performance from December 31, 2014 through December 31, 2024
The initial investment, based on a $10,000 investment, is adjusted to reflect the maximum applicable sales charge, if any.
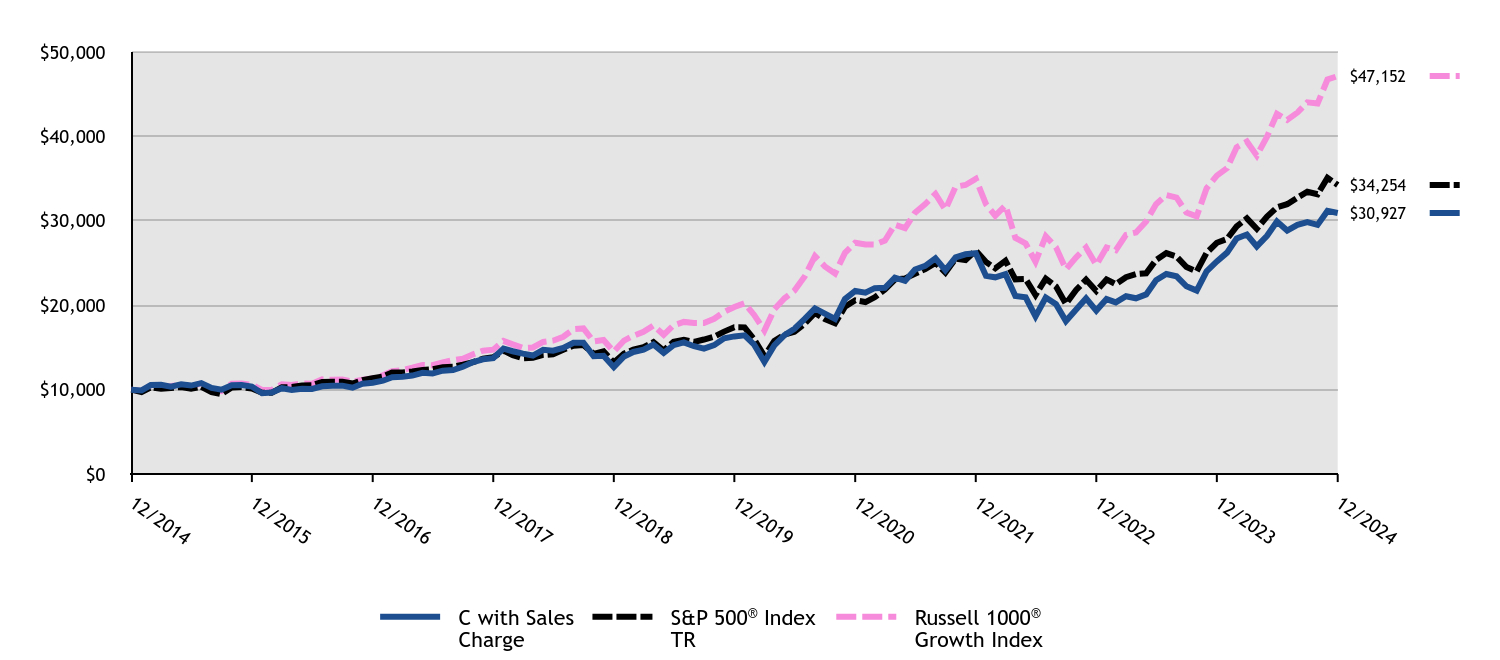
| C with Sales Charge | S&P 500® Index TR | Russell 1000® Growth Index |
|---|
| 12/2014 | $10,000 | $10,000 | $10,000 |
|---|
| 01/2015 | $9,907 | $9,700 | $9,847 |
|---|
| 02/2015 | $10,544 | $10,257 | $10,503 |
|---|
| 03/2015 | $10,575 | $10,095 | $10,384 |
|---|
| 04/2015 | $10,345 | $10,192 | $10,436 |
|---|
| 05/2015 | $10,632 | $10,323 | $10,583 |
|---|
| 06/2015 | $10,487 | $10,123 | $10,396 |
|---|
| 07/2015 | $10,783 | $10,335 | $10,749 |
|---|
| 08/2015 | $10,212 | $9,712 | $10,096 |
|---|
| 09/2015 | $9,991 | $9,471 | $9,846 |
|---|
| 10/2015 | $10,522 | $10,270 | $10,694 |
|---|
| 11/2015 | $10,548 | $10,301 | $10,724 |
|---|
| 12/2015 | $10,362 | $10,138 | $10,567 |
|---|
| 01/2016 | $9,571 | $9,635 | $9,977 |
|---|
| 02/2016 | $9,655 | $9,622 | $9,973 |
|---|
| 03/2016 | $10,175 | $10,275 | $10,645 |
|---|
| 04/2016 | $9,971 | $10,315 | $10,548 |
|---|
| 05/2016 | $10,117 | $10,500 | $10,753 |
|---|
| 06/2016 | $10,077 | $10,527 | $10,711 |
|---|
| 07/2016 | $10,397 | $10,915 | $11,216 |
|---|
| 08/2016 | $10,468 | $10,931 | $11,160 |
|---|
| 09/2016 | $10,473 | $10,933 | $11,201 |
|---|
| 10/2016 | $10,233 | $10,733 | $10,938 |
|---|
| 11/2016 | $10,695 | $11,131 | $11,176 |
|---|
| 12/2016 | $10,826 | $11,351 | $11,314 |
|---|
| 01/2017 | $11,059 | $11,566 | $11,696 |
|---|
| 02/2017 | $11,479 | $12,025 | $12,182 |
|---|
| 03/2017 | $11,528 | $12,039 | $12,322 |
|---|
| 04/2017 | $11,671 | $12,163 | $12,604 |
|---|
| 05/2017 | $11,993 | $12,334 | $12,932 |
|---|
| 06/2017 | $11,926 | $12,411 | $12,898 |
|---|
| 07/2017 | $12,253 | $12,666 | $13,241 |
|---|
| 08/2017 | $12,320 | $12,705 | $13,483 |
|---|
| 09/2017 | $12,704 | $12,967 | $13,659 |
|---|
| 10/2017 | $13,277 | $13,270 | $14,188 |
|---|
| 11/2017 | $13,599 | $13,677 | $14,619 |
|---|
| 12/2017 | $13,730 | $13,829 | $14,733 |
|---|
| 01/2018 | $14,873 | $14,621 | $15,776 |
|---|
| 02/2018 | $14,552 | $14,082 | $15,363 |
|---|
| 03/2018 | $14,264 | $13,724 | $14,941 |
|---|
| 04/2018 | $14,041 | $13,777 | $14,994 |
|---|
| 05/2018 | $14,724 | $14,108 | $15,651 |
|---|
| 06/2018 | $14,608 | $14,195 | $15,801 |
|---|
| 07/2018 | $14,948 | $14,724 | $16,265 |
|---|
| 08/2018 | $15,547 | $15,203 | $17,155 |
|---|
| 09/2018 | $15,561 | $15,290 | $17,251 |
|---|
| 10/2018 | $13,971 | $14,245 | $15,708 |
|---|
| 11/2018 | $14,018 | $14,535 | $15,875 |
|---|
| 12/2018 | $12,667 | $13,223 | $14,510 |
|---|
| 01/2019 | $13,926 | $14,282 | $15,814 |
|---|
| 02/2019 | $14,467 | $14,741 | $16,380 |
|---|
| 03/2019 | $14,725 | $15,027 | $16,846 |
|---|
| 04/2019 | $15,350 | $15,636 | $17,607 |
|---|
| 05/2019 | $14,354 | $14,642 | $16,495 |
|---|
| 06/2019 | $15,272 | $15,674 | $17,628 |
|---|
| 07/2019 | $15,603 | $15,899 | $18,026 |
|---|
| 08/2019 | $15,143 | $15,648 | $17,888 |
|---|
| 09/2019 | $14,854 | $15,940 | $17,890 |
|---|
| 10/2019 | $15,272 | $16,286 | $18,394 |
|---|
| 11/2019 | $16,082 | $16,877 | $19,210 |
|---|
| 12/2019 | $16,309 | $17,386 | $19,790 |
|---|
| 01/2020 | $16,440 | $17,379 | $20,232 |
|---|
| 02/2020 | $15,326 | $15,949 | $18,854 |
|---|
| 03/2020 | $13,279 | $13,979 | $17,000 |
|---|
| 04/2020 | $15,245 | $15,771 | $19,515 |
|---|
| 05/2020 | $16,463 | $16,522 | $20,825 |
|---|
| 06/2020 | $17,212 | $16,850 | $21,732 |
|---|
| 07/2020 | $18,384 | $17,801 | $23,404 |
|---|
| 08/2020 | $19,624 | $19,080 | $25,819 |
|---|
| 09/2020 | $18,995 | $18,355 | $24,604 |
|---|
| 10/2020 | $18,378 | $17,867 | $23,769 |
|---|
| 11/2020 | $20,733 | $19,823 | $26,203 |
|---|
| 12/2020 | $21,697 | $20,585 | $27,408 |
|---|
| 01/2021 | $21,493 | $20,377 | $27,205 |
|---|
| 02/2021 | $22,027 | $20,939 | $27,199 |
|---|
| 03/2021 | $22,065 | $21,856 | $27,666 |
|---|
| 04/2021 | $23,272 | $23,022 | $29,548 |
|---|
| 05/2021 | $22,885 | $23,183 | $29,140 |
|---|
| 06/2021 | $24,238 | $23,724 | $30,968 |
|---|
| 07/2021 | $24,657 | $24,288 | $31,988 |
|---|
| 08/2021 | $25,566 | $25,026 | $33,184 |
|---|
| 09/2021 | $24,156 | $23,863 | $31,326 |
|---|
| 10/2021 | $25,668 | $25,534 | $34,039 |
|---|
| 11/2021 | $26,036 | $25,357 | $34,247 |
|---|
| 12/2021 | $26,161 | $26,494 | $34,971 |
|---|
| 01/2022 | $23,476 | $25,123 | $31,970 |
|---|
| 02/2022 | $23,306 | $24,371 | $30,612 |
|---|
| 03/2022 | $23,685 | $25,276 | $31,809 |
|---|
| 04/2022 | $21,108 | $23,071 | $27,968 |
|---|
| 05/2022 | $20,946 | $23,114 | $27,318 |
|---|
| 06/2022 | $18,679 | $21,206 | $25,154 |
|---|
| 07/2022 | $20,907 | $23,161 | $28,173 |
|---|
| 08/2022 | $20,126 | $22,217 | $26,861 |
|---|
| 09/2022 | $18,129 | $20,170 | $24,249 |
|---|
| 10/2022 | $19,507 | $21,804 | $25,667 |
|---|
| 11/2022 | $20,814 | $23,022 | $26,836 |
|---|
| 12/2022 | $19,367 | $21,696 | $24,782 |
|---|
| 01/2023 | $20,731 | $23,059 | $26,847 |
|---|
| 02/2023 | $20,344 | $22,496 | $26,528 |
|---|
| 03/2023 | $21,072 | $23,322 | $28,342 |
|---|
| 04/2023 | $20,823 | $23,686 | $28,621 |
|---|
| 05/2023 | $21,284 | $23,789 | $29,926 |
|---|
| 06/2023 | $22,971 | $25,361 | $31,972 |
|---|
| 07/2023 | $23,699 | $26,176 | $33,050 |
|---|
| 08/2023 | $23,423 | $25,759 | $32,753 |
|---|
| 09/2023 | $22,243 | $24,531 | $30,972 |
|---|
| 10/2023 | $21,736 | $24,015 | $30,531 |
|---|
| 11/2023 | $24,022 | $26,208 | $33,859 |
|---|
| 12/2023 | $25,194 | $27,399 | $35,358 |
|---|
| 01/2024 | $26,231 | $27,859 | $36,240 |
|---|
| 02/2024 | $27,908 | $29,347 | $38,713 |
|---|
| 03/2024 | $28,380 | $30,291 | $39,394 |
|---|
| 04/2024 | $26,972 | $29,054 | $37,723 |
|---|
| 05/2024 | $28,232 | $30,494 | $39,981 |
|---|
| 06/2024 | $29,918 | $31,589 | $42,677 |
|---|
| 07/2024 | $28,852 | $31,973 | $41,951 |
|---|
| 08/2024 | $29,529 | $32,749 | $42,825 |
|---|
| 09/2024 | $29,862 | $33,448 | $44,038 |
|---|
| 10/2024 | $29,519 | $33,145 | $43,893 |
|---|
| 11/2024 | $31,177 | $35,090 | $46,740 |
|---|
| 12/2024 | $30,927 | $34,254 | $47,152 |
|---|
Average Annual Total Returns (%)
| HEADER | 1 Year | 5 Years | 10 Years |
|---|
Class C without Deferred Sales ChargeFootnote Reference1 | 22.75% | 13.65% | 11.95% |
|---|
Class C with Maximum Deferred Sales Charge -1.00%Footnote Reference1 | 21.75% | 13.65% | 11.95% |
|---|
S&P 500® Index TR | 25.02% | 14.53% | 13.10% |
|---|
Russell 1000® Growth Index | 33.36% | 18.96% | 16.78% |
|---|
| Footnote | Description |
Footnote1 | Return may differ from actual shareholder return due to accounting adjustments for financial reporting purposes. |
Performance shown is historical and is not indicative of future returns. Investment returns and principal value will vary, and shares may be worth more or less at redemption than at original purchase. Performance shown is as of date indicated, and current performance may be lower or higher than the performance data quoted. To obtain performance as of the most recent month end, please visit americanbeaconfunds.com or call 800-967-9009. The graph and table do not reflect the deduction of taxes that a shareholder would pay on fund distributions or redemption of fund shares. The Fund's performance benefited from fee waivers. Performance includes historical performance of another Class of the Fund. For more information, visit americanbeaconfunds.com/Performance_Disclaimers.aspx.
The S&P 500 Index TR is replacing the Russell 1000 Growth Index as broad-based securities market index to comply with a new regulatory requirement. The Russell 1000 Growth Index reflects the market sectors in which the Fund invests.
| Total Net Assets | $201,325,898 |
|---|
| # of Portfolio Holdings | 71 |
|---|
| Portfolio Turnover Rate | 52% |
|---|
| Total Management Fees Paid | $1,095,857 |
|---|
What did the Fund invest in?
Top Ten Holdings - % Net Assets
| Alphabet, Inc., Class A | 6.6 |
| Amazon.com, Inc. | 6.1 |
| NVIDIA Corp. | 6.0 |
| Microsoft Corp. | 5.2 |
| Apple, Inc. | 4.8 |
| Mastercard, Inc., Class A | 4.3 |
| Meta Platforms, Inc., Class A | 4.2 |
| Booking Holdings, Inc. | 3.1 |
| Fortinet, Inc. | 2.6 |
| McKesson Corp. | 2.4 |
Excludes cash equivalents.
Asset Allocation - % Investments
| Value | Value |
|---|
| Common Stocks | 97.1 |
| Investment Companies | 2.9 |
| Rights | 0.0 |
The Fund may purchase and sell futures contracts to gain market exposure on cash balances.
Sector Allocation - % Equities
| Value | Value |
|---|
| Consumer Staples | 2.0 |
| Industrials | 3.3 |
| Financials | 6.7 |
| Consumer Discretionary | 12.2 |
| Communication Services | 12.8 |
| Health Care | 13.5 |
| Information Technology | 49.5 |
This is a summary of certain changes to the Fund since December 31, 2023. For more complete information, you may review the Fund's next prospectus, which we expect to be available by May 1, 2025 at www.americanbeaconfunds.com/literature or upon request at 800-658-5811.
The Board of the Trust, at the recommendation of the Manager, approved; (i) the termination of the investment advisory agreement among the Manager, Bridgeway Capital Management, LLC and the Trust, on behalf of the American Beacon Man Large Cap Growth Fund (formerly known as American Beacon Bridgeway Large Cap Growth Fund), effective April 30, 2024, and (ii) a new investment advisory agreement among the Manager, Numeric Investors LLC, and the Trust on behalf of the Funds, effective May 1, 2024.
For additional information about the Fund, including its prospectus, financial statements, holdings, and proxy voting information, please visit www.americanbeaconfunds.com/literature or call 1-800-658-5811.
If your financial institution mailed only one copy of this Report to an address shared by more than one account, you can request an individual copy by contacting your financial institution.
Man Large Cap Growth Fund
Distributed by:
Resolute Investment Distributors, Inc.
Annual Shareholder Report - December 31, 2024
Man Large Cap Growth Fund
Annual Shareholder Report - December 31, 2024
This annual shareholder report contains important information about Large Cap Growth Fund for the period of January 1, 2024 to December 31, 2024. You can find additional information about the Fund at www.americanbeaconfunds.com/literature. You can also request this information by contacting us at 800-658-5811. This report describes material changes to the Fund that occurred during the reporting period.
What were the Fund costs for the last year?
(based on a hypothetical $10,000 investment)
| Class Name | Costs of a $10,000 investment | Costs paid as a percentage of a $10,000 investment |
|---|
| R5 | $90 | 0.80% |
|---|
How did the Fund perform and what affected its performance?
The R5 Class of the Fund returned 23.93% for the twelve months ended December 31, 2024, compared to the S&P 500 Index return of 25.02% and the Russell 1000 Growth Index return of 33.36%.
• Broad market performance was driven by a small number of mega-cap growth companies not held by the Fund, resulting in underperformance for the strategy.
• The Fund generated positive performance in all sectors where it invested, except for Materials, which slightly detracted from returns. Information Technology sector holdings contributed materially.
Cumulative Performance from December 31, 2014 through December 31, 2024
The initial investment, based on a $250,000 investment, is adjusted to reflect the maximum applicable sales charge, if any.
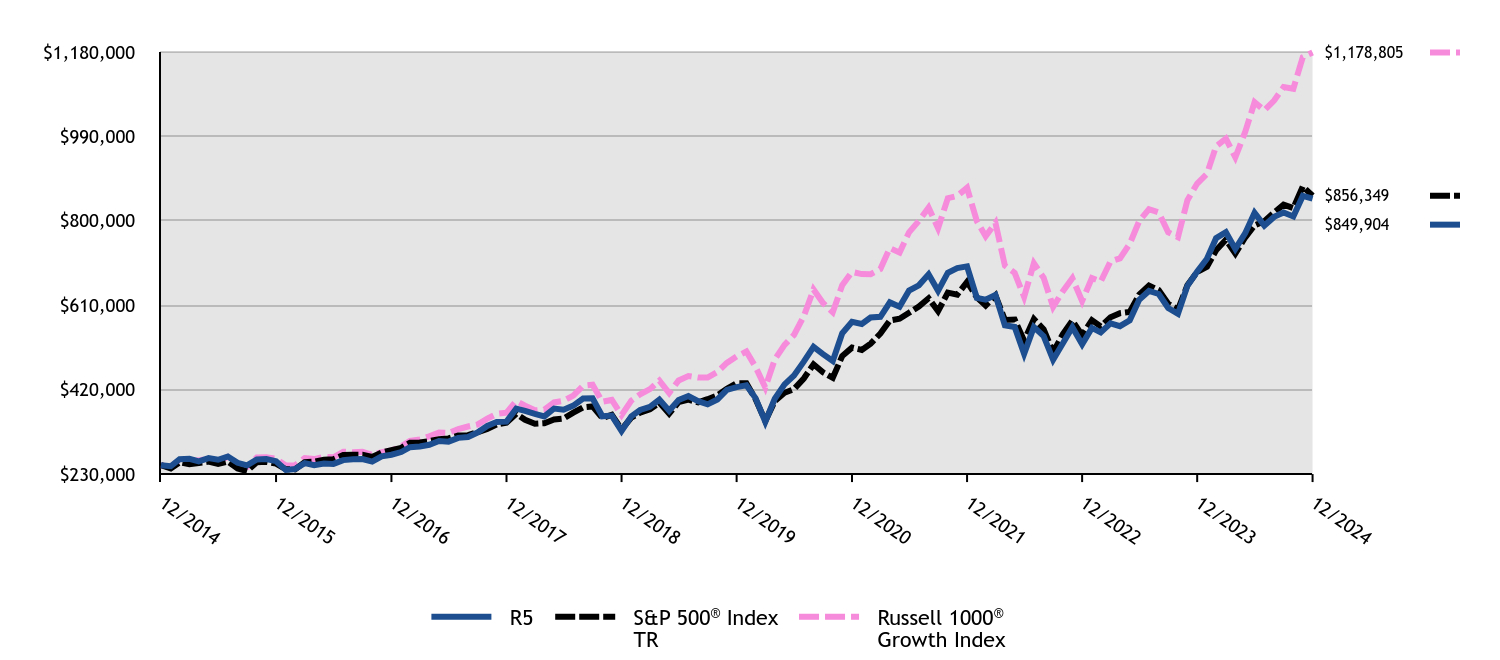
| R5 | S&P 500® Index TR | Russell 1000® Growth Index |
|---|
| 12/2014 | $250,000 | $250,000 | $250,000 |
|---|
| 01/2015 | $247,678 | $242,495 | $246,172 |
|---|
| 02/2015 | $263,600 | $256,432 | $262,580 |
|---|
| 03/2015 | $264,374 | $252,376 | $259,594 |
|---|
| 04/2015 | $258,624 | $254,798 | $260,894 |
|---|
| 05/2015 | $265,812 | $258,074 | $264,567 |
|---|
| 06/2015 | $262,163 | $253,078 | $259,906 |
|---|
| 07/2015 | $269,571 | $258,381 | $268,719 |
|---|
| 08/2015 | $255,307 | $242,791 | $252,400 |
|---|
| 09/2015 | $249,779 | $236,784 | $246,157 |
|---|
| 10/2015 | $263,047 | $256,758 | $267,352 |
|---|
| 11/2015 | $263,711 | $257,521 | $268,102 |
|---|
| 12/2015 | $259,043 | $253,459 | $264,168 |
|---|
| 01/2016 | $239,270 | $240,882 | $249,420 |
|---|
| 02/2016 | $241,492 | $240,557 | $249,314 |
|---|
| 03/2016 | $254,711 | $256,876 | $266,128 |
|---|
| 04/2016 | $249,934 | $257,872 | $263,698 |
|---|
| 05/2016 | $253,822 | $262,503 | $268,819 |
|---|
| 06/2016 | $252,933 | $263,183 | $267,763 |
|---|
| 07/2016 | $261,375 | $272,886 | $280,402 |
|---|
| 08/2016 | $263,375 | $273,269 | $279,009 |
|---|
| 09/2016 | $263,708 | $273,320 | $280,029 |
|---|
| 10/2016 | $257,932 | $268,335 | $273,453 |
|---|
| 11/2016 | $269,818 | $278,273 | $279,403 |
|---|
| 12/2016 | $273,547 | $283,773 | $282,862 |
|---|
| 01/2017 | $279,583 | $289,155 | $292,394 |
|---|
| 02/2017 | $290,427 | $300,637 | $304,539 |
|---|
| 03/2017 | $291,992 | $300,987 | $308,061 |
|---|
| 04/2017 | $295,904 | $304,078 | $315,107 |
|---|
| 05/2017 | $304,400 | $308,357 | $323,300 |
|---|
| 06/2017 | $302,947 | $310,282 | $322,448 |
|---|
| 07/2017 | $311,555 | $316,662 | $331,019 |
|---|
| 08/2017 | $313,567 | $317,632 | $337,087 |
|---|
| 09/2017 | $323,404 | $324,184 | $341,470 |
|---|
| 10/2017 | $338,272 | $331,749 | $354,701 |
|---|
| 11/2017 | $346,992 | $341,924 | $365,476 |
|---|
| 12/2017 | $347,970 | $345,725 | $368,322 |
|---|
| 01/2018 | $377,200 | $365,519 | $394,409 |
|---|
| 02/2018 | $372,425 | $352,047 | $384,067 |
|---|
| 03/2018 | $365,554 | $343,101 | $373,534 |
|---|
| 04/2018 | $359,732 | $344,417 | $374,839 |
|---|
| 05/2018 | $377,549 | $352,712 | $391,269 |
|---|
| 06/2018 | $374,987 | $354,882 | $395,036 |
|---|
| 07/2018 | $384,187 | $368,089 | $406,633 |
|---|
| 08/2018 | $399,909 | $380,083 | $428,867 |
|---|
| 09/2018 | $400,724 | $382,247 | $431,264 |
|---|
| 10/2018 | $360,081 | $356,120 | $392,697 |
|---|
| 11/2018 | $361,595 | $363,377 | $396,868 |
|---|
| 12/2018 | $327,113 | $330,567 | $362,746 |
|---|
| 01/2019 | $359,979 | $357,058 | $395,352 |
|---|
| 02/2019 | $374,213 | $368,522 | $409,498 |
|---|
| 03/2019 | $381,200 | $375,683 | $421,153 |
|---|
| 04/2019 | $397,763 | $390,895 | $440,181 |
|---|
| 05/2019 | $372,401 | $366,054 | $412,373 |
|---|
| 06/2019 | $396,598 | $391,852 | $440,694 |
|---|
| 07/2019 | $405,656 | $397,484 | $450,645 |
|---|
| 08/2019 | $394,010 | $391,188 | $447,194 |
|---|
| 09/2019 | $386,893 | $398,507 | $447,249 |
|---|
| 10/2019 | $398,022 | $407,138 | $459,858 |
|---|
| 11/2019 | $419,631 | $421,917 | $480,258 |
|---|
| 12/2019 | $425,824 | $434,651 | $494,748 |
|---|
| 01/2020 | $429,678 | $434,481 | $505,809 |
|---|
| 02/2020 | $400,985 | $398,715 | $471,362 |
|---|
| 03/2020 | $347,740 | $349,468 | $424,992 |
|---|
| 04/2020 | $399,558 | $394,268 | $487,878 |
|---|
| 05/2020 | $431,962 | $413,046 | $520,631 |
|---|
| 06/2020 | $452,090 | $421,261 | $543,302 |
|---|
| 07/2020 | $483,067 | $445,013 | $585,103 |
|---|
| 08/2020 | $516,328 | $477,001 | $645,482 |
|---|
| 09/2020 | $500,054 | $458,877 | $615,112 |
|---|
| 10/2020 | $484,352 | $446,674 | $594,221 |
|---|
| 11/2020 | $546,733 | $495,568 | $655,065 |
|---|
| 12/2020 | $572,653 | $514,622 | $685,192 |
|---|
| 01/2021 | $567,912 | $509,426 | $680,122 |
|---|
| 02/2021 | $582,292 | $523,474 | $679,965 |
|---|
| 03/2021 | $583,872 | $546,400 | $691,647 |
|---|
| 04/2021 | $616,423 | $575,560 | $738,705 |
|---|
| 05/2021 | $606,626 | $579,580 | $728,488 |
|---|
| 06/2021 | $642,970 | $593,110 | $774,192 |
|---|
| 07/2021 | $654,821 | $607,200 | $799,706 |
|---|
| 08/2021 | $679,472 | $625,662 | $829,607 |
|---|
| 09/2021 | $642,496 | $596,563 | $783,144 |
|---|
| 10/2021 | $683,265 | $638,359 | $850,976 |
|---|
| 11/2021 | $693,694 | $633,936 | $856,179 |
|---|
| 12/2021 | $697,627 | $662,346 | $874,281 |
|---|
| 01/2022 | $626,688 | $628,072 | $799,246 |
|---|
| 02/2022 | $622,705 | $609,266 | $765,299 |
|---|
| 03/2022 | $633,137 | $631,888 | $795,236 |
|---|
| 04/2022 | $564,854 | $576,786 | $699,202 |
|---|
| 05/2022 | $561,061 | $577,845 | $682,947 |
|---|
| 06/2022 | $500,554 | $530,147 | $628,850 |
|---|
| 07/2022 | $560,871 | $579,029 | $704,325 |
|---|
| 08/2022 | $540,386 | $555,415 | $671,515 |
|---|
| 09/2022 | $487,277 | $504,262 | $606,233 |
|---|
| 10/2022 | $524,643 | $545,088 | $641,666 |
|---|
| 11/2022 | $560,492 | $575,550 | $670,905 |
|---|
| 12/2022 | $522,025 | $542,390 | $619,543 |
|---|
| 01/2023 | $559,122 | $576,470 | $671,180 |
|---|
| 02/2023 | $548,903 | $562,405 | $663,209 |
|---|
| 03/2023 | $569,340 | $583,053 | $708,544 |
|---|
| 04/2023 | $562,898 | $592,154 | $715,534 |
|---|
| 05/2023 | $576,004 | $594,728 | $748,147 |
|---|
| 06/2023 | $622,209 | $634,024 | $799,309 |
|---|
| 07/2023 | $642,202 | $654,392 | $826,238 |
|---|
| 08/2023 | $635,315 | $643,973 | $818,819 |
|---|
| 09/2023 | $603,772 | $613,270 | $774,289 |
|---|
| 10/2023 | $590,665 | $600,375 | $763,265 |
|---|
| 11/2023 | $653,531 | $655,205 | $846,469 |
|---|
| 12/2023 | $685,786 | $684,971 | $883,952 |
|---|
| 01/2024 | $714,659 | $696,481 | $905,999 |
|---|
| 02/2024 | $760,990 | $733,670 | $967,813 |
|---|
| 03/2024 | $774,419 | $757,276 | $984,851 |
|---|
| 04/2024 | $736,817 | $726,345 | $943,077 |
|---|
| 05/2024 | $771,733 | $762,361 | $999,535 |
|---|
| 06/2024 | $818,064 | $789,716 | $1,066,935 |
|---|
| 07/2024 | $789,415 | $799,329 | $1,048,786 |
|---|
| 08/2024 | $808,887 | $818,718 | $1,070,630 |
|---|
| 09/2024 | $818,735 | $836,203 | $1,100,962 |
|---|
| 10/2024 | $809,783 | $828,620 | $1,097,318 |
|---|
| 11/2024 | $856,114 | $877,261 | $1,168,491 |
|---|
| 12/2024 | $849,904 | $856,349 | $1,178,805 |
|---|
Average Annual Total Returns (%)
| HEADER | 1 Year | 5 Years | 10 Years |
|---|
Class R5Footnote Reference1 | 23.93% | 14.82% | 13.02% |
|---|
S&P 500® Index TR | 25.02% | 14.53% | 13.10% |
|---|
Russell 1000® Growth Index | 33.36% | 18.96% | 16.78% |
|---|
| Footnote | Description |
Footnote1 | Return may differ from actual shareholder return due to accounting adjustments for financial reporting purposes. |
Performance shown is historical and is not indicative of future returns. Investment returns and principal value will vary, and shares may be worth more or less at redemption than at original purchase. Performance shown is as of date indicated, and current performance may be lower or higher than the performance data quoted. To obtain performance as of the most recent month end, please visit americanbeaconfunds.com or call 800-967-9009. The graph and table do not reflect the deduction of taxes that a shareholder would pay on fund distributions or redemption of fund shares. The Fund's performance benefited from fee waivers. For more information, visit americanbeaconfunds.com/Performance_Disclaimers.aspx.
The S&P 500 Index TR is replacing the Russell 1000 Growth Index as broad-based securities market index to comply with a new regulatory requirement. The Russell 1000 Growth Index reflects the market sectors in which the Fund invests.
| Total Net Assets | $201,325,898 |
|---|
| # of Portfolio Holdings | 71 |
|---|
| Portfolio Turnover Rate | 52% |
|---|
| Total Management Fees Paid | $1,095,857 |
|---|
What did the Fund invest in?
Top Ten Holdings - % Net Assets
| Alphabet, Inc., Class A | 6.6 |
| Amazon.com, Inc. | 6.1 |
| NVIDIA Corp. | 6.0 |
| Microsoft Corp. | 5.2 |
| Apple, Inc. | 4.8 |
| Mastercard, Inc., Class A | 4.3 |
| Meta Platforms, Inc., Class A | 4.2 |
| Booking Holdings, Inc. | 3.1 |
| Fortinet, Inc. | 2.6 |
| McKesson Corp. | 2.4 |
Excludes cash equivalents.
Asset Allocation - % Investments
| Value | Value |
|---|
| Common Stocks | 97.1 |
| Investment Companies | 2.9 |
| Rights | 0.0 |
The Fund may purchase and sell futures contracts to gain market exposure on cash balances.
Sector Allocation - % Equities
| Value | Value |
|---|
| Consumer Staples | 2.0 |
| Industrials | 3.3 |
| Financials | 6.7 |
| Consumer Discretionary | 12.2 |
| Communication Services | 12.8 |
| Health Care | 13.5 |
| Information Technology | 49.5 |
This is a summary of certain changes to the Fund since December 31, 2023. For more complete information, you may review the Fund's next prospectus, which we expect to be available by May 1, 2025 at www.americanbeaconfunds.com/literature or upon request at 800-658-5811.
The Board of the Trust, at the recommendation of the Manager, approved; (i) the termination of the investment advisory agreement among the Manager, Bridgeway Capital Management, LLC and the Trust, on behalf of the American Beacon Man Large Cap Growth Fund (formerly known as American Beacon Bridgeway Large Cap Growth Fund), effective April 30, 2024, and (ii) a new investment advisory agreement among the Manager, Numeric Investors LLC, and the Trust on behalf of the Funds, effective May 1, 2024.
For additional information about the Fund, including its prospectus, financial statements, holdings, and proxy voting information, please visit www.americanbeaconfunds.com/literature or call 1-800-658-5811.
If your financial institution mailed only one copy of this Report to an address shared by more than one account, you can request an individual copy by contacting your financial institution.
Man Large Cap Growth Fund
Distributed by:
Resolute Investment Distributors, Inc.
Annual Shareholder Report - December 31, 2024
Man Large Cap Growth Fund
Annual Shareholder Report - December 31, 2024
This annual shareholder report contains important information about Large Cap Growth Fund for the period of January 1, 2024 to December 31, 2024. You can find additional information about the Fund at www.americanbeaconfunds.com/literature. You can also request this information by contacting us at 800-658-5811. This report describes material changes to the Fund that occurred during the reporting period.
What were the Fund costs for the last year?
(based on a hypothetical $10,000 investment)
| Class Name | Costs of a $10,000 investment | Costs paid as a percentage of a $10,000 investment |
|---|
| Y | $93 | 0.83% |
|---|
How did the Fund perform and what affected its performance?
The Y Class of the Fund returned 24.00% for the twelve months ended December 31, 2024, compared to the S&P 500 Index return of 25.02% and the Russell 1000 Growth Index return of 33.36%.
• Broad market performance was driven by a small number of mega-cap growth companies not held by the Fund, resulting in underperformance for the strategy.
• The Fund generated positive performance in all sectors where it invested, except for Materials, which slightly detracted from returns. Information Technology sector holdings contributed materially.
Cumulative Performance from December 31, 2014 through December 31, 2024
The initial investment, based on a $100,000 investment, is adjusted to reflect the maximum applicable sales charge, if any.
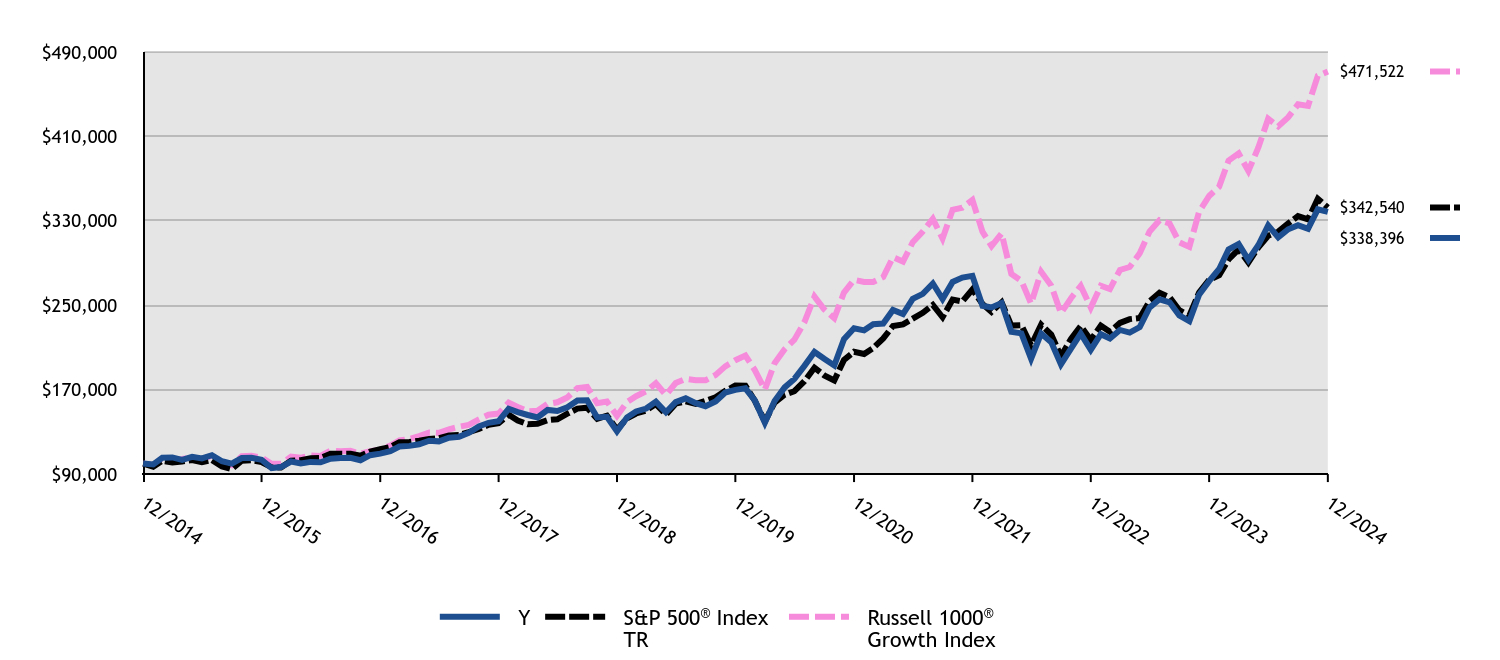
| #ERROR:A result could not be returned because the conditional could not be evaluated to a True/False value (#ERROR:Invalid Formula (#!=""), 'Multiple values from an iterator cannot be used in a formula unless they are aggregrated.') | Y | S&P 500® Index TR | Russell 1000® Growth Index |
|---|
| 12/2014 | $100,000 | $100,000 | $100,000 |
|---|
| 01/2015 | $99,071 | $96,998 | $98,469 |
|---|
| 02/2015 | $105,440 | $102,573 | $105,032 |
|---|
| 03/2015 | $105,750 | $100,951 | $103,838 |
|---|
| 04/2015 | $103,450 | $101,919 | $104,358 |
|---|
| 05/2015 | $106,325 | $103,230 | $105,827 |
|---|
| 06/2015 | $104,865 | $101,231 | $103,962 |
|---|
| 07/2015 | $107,828 | $103,352 | $107,488 |
|---|
| 08/2015 | $102,123 | $97,117 | $100,960 |
|---|
| 09/2015 | $99,912 | $94,714 | $98,463 |
|---|
| 10/2015 | $105,219 | $102,703 | $106,941 |
|---|
| 11/2015 | $105,484 | $103,008 | $107,241 |
|---|
| 12/2015 | $103,617 | $101,384 | $105,667 |
|---|
| 01/2016 | $95,708 | $96,353 | $99,768 |
|---|
| 02/2016 | $96,641 | $96,223 | $99,726 |
|---|
| 03/2016 | $101,884 | $102,750 | $106,451 |
|---|
| 04/2016 | $99,974 | $103,149 | $105,479 |
|---|
| 05/2016 | $101,529 | $105,001 | $107,527 |
|---|
| 06/2016 | $101,173 | $105,273 | $107,105 |
|---|
| 07/2016 | $104,506 | $109,154 | $112,161 |
|---|
| 08/2016 | $105,306 | $109,308 | $111,603 |
|---|
| 09/2016 | $105,439 | $109,328 | $112,012 |
|---|
| 10/2016 | $103,128 | $107,334 | $109,381 |
|---|
| 11/2016 | $107,883 | $111,309 | $111,761 |
|---|
| 12/2016 | $109,330 | $113,509 | $113,145 |
|---|
| 01/2017 | $111,744 | $115,662 | $116,958 |
|---|
| 02/2017 | $116,082 | $120,255 | $121,816 |
|---|
| 03/2017 | $116,708 | $120,395 | $123,224 |
|---|
| 04/2017 | $118,228 | $121,631 | $126,043 |
|---|
| 05/2017 | $121,627 | $123,343 | $129,320 |
|---|
| 06/2017 | $121,001 | $124,113 | $128,979 |
|---|
| 07/2017 | $124,444 | $126,665 | $132,408 |
|---|
| 08/2017 | $125,249 | $127,053 | $134,835 |
|---|
| 09/2017 | $129,184 | $129,674 | $136,588 |
|---|
| 10/2017 | $135,086 | $132,700 | $141,880 |
|---|
| 11/2017 | $138,574 | $136,769 | $146,191 |
|---|
| 12/2017 | $140,125 | $138,290 | $147,329 |
|---|
| 01/2018 | $151,911 | $146,208 | $157,763 |
|---|
| 02/2018 | $148,790 | $140,819 | $153,627 |
|---|
| 03/2018 | $145,995 | $137,240 | $149,414 |
|---|
| 04/2018 | $143,665 | $137,767 | $149,936 |
|---|
| 05/2018 | $150,793 | $141,085 | $156,508 |
|---|
| 06/2018 | $149,721 | $141,953 | $158,015 |
|---|
| 07/2018 | $153,355 | $147,236 | $162,653 |
|---|
| 08/2018 | $159,644 | $152,033 | $171,547 |
|---|
| 09/2018 | $159,923 | $152,899 | $172,505 |
|---|
| 10/2018 | $143,712 | $142,448 | $157,079 |
|---|
| 11/2018 | $144,318 | $145,351 | $158,747 |
|---|
| 12/2018 | $130,520 | $132,227 | $145,099 |
|---|
| 01/2019 | $143,618 | $142,823 | $158,141 |
|---|
| 02/2019 | $149,313 | $147,409 | $163,799 |
|---|
| 03/2019 | $152,109 | $150,273 | $168,461 |
|---|
| 04/2019 | $158,684 | $156,358 | $176,072 |
|---|
| 05/2019 | $148,588 | $146,422 | $164,949 |
|---|
| 06/2019 | $158,218 | $156,741 | $176,277 |
|---|
| 07/2019 | $161,791 | $158,994 | $180,258 |
|---|
| 08/2019 | $157,131 | $156,475 | $178,877 |
|---|
| 09/2019 | $154,284 | $159,403 | $178,900 |
|---|
| 10/2019 | $158,736 | $162,855 | $183,943 |
|---|
| 11/2019 | $167,330 | $168,767 | $192,103 |
|---|
| 12/2019 | $169,814 | $173,861 | $197,899 |
|---|
| 01/2020 | $171,299 | $173,792 | $202,323 |
|---|
| 02/2020 | $159,815 | $159,486 | $188,545 |
|---|
| 03/2020 | $138,616 | $139,787 | $169,997 |
|---|
| 04/2020 | $159,243 | $157,707 | $195,151 |
|---|
| 05/2020 | $172,156 | $165,219 | $208,253 |
|---|
| 06/2020 | $180,156 | $168,504 | $217,321 |
|---|
| 07/2020 | $192,555 | $178,005 | $234,041 |
|---|
| 08/2020 | $205,753 | $190,801 | $258,193 |
|---|
| 09/2020 | $199,240 | $183,551 | $246,045 |
|---|
| 10/2020 | $192,954 | $178,669 | $237,689 |
|---|
| 11/2020 | $217,867 | $198,227 | $262,026 |
|---|
| 12/2020 | $228,127 | $205,849 | $274,077 |
|---|
| 01/2021 | $226,228 | $203,771 | $272,049 |
|---|
| 02/2021 | $231,987 | $209,390 | $271,986 |
|---|
| 03/2021 | $232,620 | $218,560 | $276,659 |
|---|
| 04/2021 | $245,529 | $230,224 | $295,482 |
|---|
| 05/2021 | $241,605 | $231,832 | $291,395 |
|---|
| 06/2021 | $256,097 | $237,244 | $309,677 |
|---|
| 07/2021 | $260,779 | $242,880 | $319,883 |
|---|
| 08/2021 | $270,588 | $250,265 | $331,843 |
|---|
| 09/2021 | $255,844 | $238,625 | $313,258 |
|---|
| 10/2021 | $272,107 | $255,344 | $340,390 |
|---|
| 11/2021 | $276,220 | $253,574 | $342,472 |
|---|
| 12/2021 | $277,798 | $264,939 | $349,712 |
|---|
| 01/2022 | $249,509 | $251,229 | $319,698 |
|---|
| 02/2022 | $247,912 | $243,707 | $306,120 |
|---|
| 03/2022 | $252,095 | $252,755 | $318,094 |
|---|
| 04/2022 | $224,870 | $230,715 | $279,681 |
|---|
| 05/2022 | $223,349 | $231,138 | $273,179 |
|---|
| 06/2022 | $199,318 | $212,059 | $251,540 |
|---|
| 07/2022 | $223,273 | $231,612 | $281,730 |
|---|
| 08/2022 | $215,060 | $222,166 | $268,606 |
|---|
| 09/2022 | $193,995 | $201,705 | $242,493 |
|---|
| 10/2022 | $208,824 | $218,035 | $256,667 |
|---|
| 11/2022 | $223,045 | $230,220 | $268,362 |
|---|
| 12/2022 | $207,774 | $216,956 | $247,817 |
|---|
| 01/2023 | $222,577 | $230,588 | $268,472 |
|---|
| 02/2023 | $218,475 | $224,962 | $265,284 |
|---|
| 03/2023 | $226,590 | $233,221 | $283,417 |
|---|
| 04/2023 | $224,093 | $236,861 | $286,214 |
|---|
| 05/2023 | $229,265 | $237,891 | $299,259 |
|---|
| 06/2023 | $247,635 | $253,610 | $319,724 |
|---|
| 07/2023 | $255,660 | $261,757 | $330,495 |
|---|
| 08/2023 | $252,807 | $257,589 | $327,528 |
|---|
| 09/2023 | $240,322 | $245,308 | $309,715 |
|---|
| 10/2023 | $234,972 | $240,150 | $305,306 |
|---|
| 11/2023 | $260,030 | $262,082 | $338,588 |
|---|
| 12/2023 | $272,889 | $273,988 | $353,581 |
|---|
| 01/2024 | $284,390 | $278,593 | $362,400 |
|---|
| 02/2024 | $302,811 | $293,468 | $387,125 |
|---|
| 03/2024 | $308,112 | $302,910 | $393,940 |
|---|
| 04/2024 | $293,106 | $290,538 | $377,231 |
|---|
| 05/2024 | $307,124 | $304,944 | $399,814 |
|---|
| 06/2024 | $325,724 | $315,886 | $426,774 |
|---|
| 07/2024 | $314,312 | $319,732 | $419,514 |
|---|
| 08/2024 | $322,039 | $327,487 | $428,252 |
|---|
| 09/2024 | $325,903 | $334,481 | $440,385 |
|---|
| 10/2024 | $322,399 | $331,448 | $438,927 |
|---|
| 11/2024 | $340,909 | $350,904 | $467,396 |
|---|
| 12/2024 | $338,396 | $342,540 | $471,522 |
|---|
Average Annual Total Returns (%)
| HEADER | 1 Year | 5 Years | 10 Years |
|---|
Class YFootnote Reference1 | 24.00% | 14.79% | 12.96% |
|---|
S&P 500® Index TR | 25.02% | 14.53% | 13.10% |
|---|
Russell 1000® Growth Index | 33.36% | 18.96% | 16.78% |
|---|
| Footnote | Description |
Footnote1 | Return may differ from actual shareholder return due to accounting adjustments for financial reporting purposes. |
Performance shown is historical and is not indicative of future returns. Investment returns and principal value will vary, and shares may be worth more or less at redemption than at original purchase. Performance shown is as of date indicated, and current performance may be lower or higher than the performance data quoted. To obtain performance as of the most recent month end, please visit americanbeaconfunds.com or call 800-967-9009. The graph and table do not reflect the deduction of taxes that a shareholder would pay on fund distributions or redemption of fund shares. The Fund's performance benefited from fee waivers. Performance includes historical performance of another Class of the Fund. For more information, visit americanbeaconfunds.com/Performance_Disclaimers.aspx.
The S&P 500 Index TR is replacing the Russell 1000 Growth Index as broad-based securities market index to comply with a new regulatory requirement. The Russell 1000 Growth Index reflects the market sectors in which the Fund invests.
| Total Net Assets | $201,325,898 |
|---|
| # of Portfolio Holdings | 71 |
|---|
| Portfolio Turnover Rate | 52% |
|---|
| Total Management Fees Paid | $1,095,857 |
|---|
What did the Fund invest in?
Top Ten Holdings - % Net Assets
| Alphabet, Inc., Class A | 6.6 |
| Amazon.com, Inc. | 6.1 |
| NVIDIA Corp. | 6.0 |
| Microsoft Corp. | 5.2 |
| Apple, Inc. | 4.8 |
| Mastercard, Inc., Class A | 4.3 |
| Meta Platforms, Inc., Class A | 4.2 |
| Booking Holdings, Inc. | 3.1 |
| Fortinet, Inc. | 2.6 |
| McKesson Corp. | 2.4 |
Excludes cash equivalents.
Asset Allocation - % Investments
| Value | Value |
|---|
| Common Stocks | 97.1 |
| Investment Companies | 2.9 |
| Rights | 0.0 |
The Fund may purchase and sell futures contracts to gain market exposure on cash balances.
Sector Allocation - % Equities
| Value | Value |
|---|
| Consumer Staples | 2.0 |
| Industrials | 3.3 |
| Financials | 6.7 |
| Consumer Discretionary | 12.2 |
| Communication Services | 12.8 |
| Health Care | 13.5 |
| Information Technology | 49.5 |
This is a summary of certain changes to the Fund since December 31, 2023. For more complete information, you may review the Fund's next prospectus, which we expect to be available by May 1, 2025 at www.americanbeaconfunds.com/literature or upon request at 800-658-5811.
The Board of the Trust, at the recommendation of the Manager, approved; (i) the termination of the investment advisory agreement among the Manager, Bridgeway Capital Management, LLC and the Trust, on behalf of the American Beacon Man Large Cap Growth Fund (formerly known as American Beacon Bridgeway Large Cap Growth Fund), effective April 30, 2024, and (ii) a new investment advisory agreement among the Manager, Numeric Investors LLC, and the Trust on behalf of the Funds, effective May 1, 2024.
For additional information about the Fund, including its prospectus, financial statements, holdings, and proxy voting information, please visit www.americanbeaconfunds.com/literature or call 1-800-658-5811.
If your financial institution mailed only one copy of this Report to an address shared by more than one account, you can request an individual copy by contacting your financial institution.
Man Large Cap Growth Fund
Distributed by:
Resolute Investment Distributors, Inc.
Annual Shareholder Report - December 31, 2024
Man Large Cap Growth Fund
Annual Shareholder Report - December 31, 2024
This annual shareholder report contains important information about Large Cap Growth Fund for the period of January 1, 2024 to December 31, 2024. You can find additional information about the Fund at www.americanbeaconfunds.com/literature. You can also request this information by contacting us at 800-658-5811. This report describes material changes to the Fund that occurred during the reporting period.
What were the Fund costs for the last year?
(based on a hypothetical $10,000 investment)
| Class Name | Costs of a $10,000 investment | Costs paid as a percentage of a $10,000 investment |
|---|
| Investor | $125 | 1.12% |
|---|
How did the Fund perform and what affected its performance?
The Investor Class of the Fund returned 23.60% for the twelve months ended December 31, 2024, compared to the S&P 500 Index return of 25.02% and the Russell 1000 Growth Index return of 33.36%.
• Broad market performance was driven by a small number of mega-cap growth companies not held by the Fund, resulting in underperformance for the strategy.
• The Fund generated positive performance in all sectors where it invested, except for Materials, which slightly detracted from returns. Information Technology sector holdings contributed materially.
Cumulative Performance from December 31, 2014 through December 31, 2024
The initial investment, based on a $10,000 investment, is adjusted to reflect the maximum applicable sales charge, if any.

| Investor | S&P 500® Index TR | Russell 1000® Growth Index |
|---|
| 12/2014 | $10,000 | $10,000 | $10,000 |
|---|
| 01/2015 | $9,907 | $9,700 | $9,847 |
|---|
| 02/2015 | $10,544 | $10,257 | $10,503 |
|---|
| 03/2015 | $10,575 | $10,095 | $10,384 |
|---|
| 04/2015 | $10,345 | $10,192 | $10,436 |
|---|
| 05/2015 | $10,632 | $10,323 | $10,583 |
|---|
| 06/2015 | $10,487 | $10,123 | $10,396 |
|---|
| 07/2015 | $10,783 | $10,335 | $10,749 |
|---|
| 08/2015 | $10,212 | $9,712 | $10,096 |
|---|
| 09/2015 | $9,991 | $9,471 | $9,846 |
|---|
| 10/2015 | $10,522 | $10,270 | $10,694 |
|---|
| 11/2015 | $10,548 | $10,301 | $10,724 |
|---|
| 12/2015 | $10,362 | $10,138 | $10,567 |
|---|
| 01/2016 | $9,571 | $9,635 | $9,977 |
|---|
| 02/2016 | $9,660 | $9,622 | $9,973 |
|---|
| 03/2016 | $10,184 | $10,275 | $10,645 |
|---|
| 04/2016 | $9,988 | $10,315 | $10,548 |
|---|
| 05/2016 | $10,144 | $10,500 | $10,753 |
|---|
| 06/2016 | $10,104 | $10,527 | $10,711 |
|---|
| 07/2016 | $10,433 | $10,915 | $11,216 |
|---|
| 08/2016 | $10,508 | $10,931 | $11,160 |
|---|
| 09/2016 | $10,522 | $10,933 | $11,201 |
|---|
| 10/2016 | $10,286 | $10,733 | $10,938 |
|---|
| 11/2016 | $10,757 | $11,131 | $11,176 |
|---|
| 12/2016 | $10,902 | $11,351 | $11,314 |
|---|
| 01/2017 | $11,139 | $11,566 | $11,696 |
|---|
| 02/2017 | $11,568 | $12,025 | $12,182 |
|---|
| 03/2017 | $11,626 | $12,039 | $12,322 |
|---|
| 04/2017 | $11,778 | $12,163 | $12,604 |
|---|
| 05/2017 | $12,114 | $12,334 | $12,932 |
|---|
| 06/2017 | $12,051 | $12,411 | $12,898 |
|---|
| 07/2017 | $12,391 | $12,666 | $13,241 |
|---|
| 08/2017 | $12,467 | $12,705 | $13,483 |
|---|
| 09/2017 | $12,856 | $12,967 | $13,659 |
|---|
| 10/2017 | $13,437 | $13,270 | $14,188 |
|---|
| 11/2017 | $13,782 | $13,677 | $14,619 |
|---|
| 12/2017 | $13,815 | $13,829 | $14,733 |
|---|
| 01/2018 | $14,975 | $14,621 | $15,776 |
|---|
| 02/2018 | $14,784 | $14,082 | $15,363 |
|---|
| 03/2018 | $14,504 | $13,724 | $14,941 |
|---|
| 04/2018 | $14,271 | $13,777 | $14,994 |
|---|
| 05/2018 | $14,975 | $14,108 | $15,651 |
|---|
| 06/2018 | $14,868 | $14,195 | $15,801 |
|---|
| 07/2018 | $15,222 | $14,724 | $16,265 |
|---|
| 08/2018 | $15,842 | $15,203 | $17,155 |
|---|
| 09/2018 | $15,865 | $15,290 | $17,251 |
|---|
| 10/2018 | $14,253 | $14,245 | $15,708 |
|---|
| 11/2018 | $14,313 | $14,535 | $15,875 |
|---|
| 12/2018 | $12,940 | $13,223 | $14,510 |
|---|
| 01/2019 | $14,237 | $14,282 | $15,814 |
|---|
| 02/2019 | $14,795 | $14,741 | $16,380 |
|---|
| 03/2019 | $15,068 | $15,027 | $16,846 |
|---|
| 04/2019 | $15,719 | $15,636 | $17,607 |
|---|
| 05/2019 | $14,712 | $14,642 | $16,495 |
|---|
| 06/2019 | $15,662 | $15,674 | $17,628 |
|---|
| 07/2019 | $16,008 | $15,899 | $18,026 |
|---|
| 08/2019 | $15,549 | $15,648 | $17,888 |
|---|
| 09/2019 | $15,259 | $15,940 | $17,890 |
|---|
| 10/2019 | $15,699 | $16,286 | $18,394 |
|---|
| 11/2019 | $16,546 | $16,877 | $19,210 |
|---|
| 12/2019 | $16,783 | $17,386 | $19,790 |
|---|
| 01/2020 | $16,931 | $17,379 | $20,232 |
|---|
| 02/2020 | $15,795 | $15,949 | $18,854 |
|---|
| 03/2020 | $13,695 | $13,979 | $17,000 |
|---|
| 04/2020 | $15,733 | $15,771 | $19,515 |
|---|
| 05/2020 | $16,999 | $16,522 | $20,825 |
|---|
| 06/2020 | $17,787 | $16,850 | $21,732 |
|---|
| 07/2020 | $19,002 | $17,801 | $23,404 |
|---|
| 08/2020 | $20,303 | $19,080 | $25,819 |
|---|
| 09/2020 | $19,659 | $18,355 | $24,604 |
|---|
| 10/2020 | $19,037 | $17,867 | $23,769 |
|---|
| 11/2020 | $21,485 | $19,823 | $26,203 |
|---|
| 12/2020 | $22,492 | $20,585 | $27,408 |
|---|
| 01/2021 | $22,303 | $20,377 | $27,205 |
|---|
| 02/2021 | $22,865 | $20,939 | $27,199 |
|---|
| 03/2021 | $22,922 | $21,856 | $27,666 |
|---|
| 04/2021 | $24,192 | $23,022 | $29,548 |
|---|
| 05/2021 | $23,800 | $23,183 | $29,140 |
|---|
| 06/2021 | $25,221 | $23,724 | $30,968 |
|---|
| 07/2021 | $25,676 | $24,288 | $31,988 |
|---|
| 08/2021 | $26,636 | $25,026 | $33,184 |
|---|
| 09/2021 | $25,177 | $23,863 | $31,326 |
|---|
| 10/2021 | $26,775 | $25,534 | $34,039 |
|---|
| 11/2021 | $27,173 | $25,357 | $34,247 |
|---|
| 12/2021 | $27,324 | $26,494 | $34,971 |
|---|
| 01/2022 | $24,537 | $25,123 | $31,970 |
|---|
| 02/2022 | $24,370 | $24,371 | $30,612 |
|---|
| 03/2022 | $24,773 | $25,276 | $31,809 |
|---|
| 04/2022 | $22,101 | $23,071 | $27,968 |
|---|
| 05/2022 | $21,941 | $23,114 | $27,318 |
|---|
| 06/2022 | $19,573 | $21,206 | $25,154 |
|---|
| 07/2022 | $21,926 | $23,161 | $28,173 |
|---|
| 08/2022 | $21,119 | $22,217 | $26,861 |
|---|
| 09/2022 | $19,041 | $20,170 | $24,249 |
|---|
| 10/2022 | $20,495 | $21,804 | $25,667 |
|---|
| 11/2022 | $21,880 | $23,022 | $26,836 |
|---|
| 12/2022 | $20,373 | $21,696 | $24,782 |
|---|
| 01/2023 | $21,824 | $23,059 | $26,847 |
|---|
| 02/2023 | $21,421 | $22,496 | $26,528 |
|---|
| 03/2023 | $22,209 | $23,322 | $28,342 |
|---|
| 04/2023 | $21,959 | $23,686 | $28,621 |
|---|
| 05/2023 | $22,460 | $23,789 | $29,926 |
|---|
| 06/2023 | $24,252 | $25,361 | $31,972 |
|---|
| 07/2023 | $25,032 | $26,176 | $33,050 |
|---|
| 08/2023 | $24,745 | $25,759 | $32,753 |
|---|
| 09/2023 | $23,517 | $24,531 | $30,972 |
|---|
| 10/2023 | $22,998 | $24,015 | $30,531 |
|---|
| 11/2023 | $25,435 | $26,208 | $33,859 |
|---|
| 12/2023 | $26,691 | $27,399 | $35,358 |
|---|
| 01/2024 | $27,799 | $27,859 | $36,240 |
|---|
| 02/2024 | $29,601 | $29,347 | $38,713 |
|---|
| 03/2024 | $30,115 | $30,291 | $39,394 |
|---|
| 04/2024 | $28,637 | $29,054 | $37,723 |
|---|
| 05/2024 | $29,989 | $30,494 | $39,981 |
|---|
| 06/2024 | $31,800 | $31,589 | $42,677 |
|---|
| 07/2024 | $30,683 | $31,973 | $41,951 |
|---|
| 08/2024 | $31,431 | $32,749 | $42,825 |
|---|
| 09/2024 | $31,800 | $33,448 | $44,038 |
|---|
| 10/2024 | $31,449 | $33,145 | $43,893 |
|---|
| 11/2024 | $33,242 | $35,090 | $46,740 |
|---|
| 12/2024 | $32,989 | $34,254 | $47,152 |
|---|
Average Annual Total Returns (%)
| HEADER | 1 Year | 5 Years | 10 Years |
|---|
Investor ClassFootnote Reference1 | 23.60% | 14.47% | 12.68% |
|---|
S&P 500® Index TR | 25.02% | 14.53% | 13.10% |
|---|
Russell 1000® Growth Index | 33.36% | 18.96% | 16.78% |
|---|
| Footnote | Description |
Footnote1 | Return may differ from actual shareholder return due to accounting adjustments for financial reporting purposes. |
Performance shown is historical and is not indicative of future returns. Investment returns and principal value will vary, and shares may be worth more or less at redemption than at original purchase. Performance shown is as of date indicated, and current performance may be lower or higher than the performance data quoted. To obtain performance as of the most recent month end, please visit americanbeaconfunds.com or call 800-967-9009. The graph and table do not reflect the deduction of taxes that a shareholder would pay on fund distributions or redemption of fund shares. The Fund's performance benefited from fee waivers. Performance includes historical performance of another Class of the Fund. For more information, visit americanbeaconfunds.com/Performance_Disclaimers.aspx.
The S&P 500 Index TR is replacing the Russell 1000 Growth Index as broad-based securities market index to comply with a new regulatory requirement. The Russell 1000 Growth Index reflects the market sectors in which the Fund invests.
| Total Net Assets | $201,325,898 |
|---|
| # of Portfolio Holdings | 71 |
|---|
| Portfolio Turnover Rate | 52% |
|---|
| Total Management Fees Paid | $1,095,857 |
|---|
What did the Fund invest in?
Top Ten Holdings - % Net Assets
| Alphabet, Inc., Class A | 6.6 |
| Amazon.com, Inc. | 6.1 |
| NVIDIA Corp. | 6.0 |
| Microsoft Corp. | 5.2 |
| Apple, Inc. | 4.8 |
| Mastercard, Inc., Class A | 4.3 |
| Meta Platforms, Inc., Class A | 4.2 |
| Booking Holdings, Inc. | 3.1 |
| Fortinet, Inc. | 2.6 |
| McKesson Corp. | 2.4 |
Excludes cash equivalents.
Asset Allocation - % Investments
| Value | Value |
|---|
| Common Stocks | 97.1 |
| Investment Companies | 2.9 |
| Rights | 0.0 |
The Fund may purchase and sell futures contracts to gain market exposure on cash balances.
Sector Allocation - % Equities
| Value | Value |
|---|
| Consumer Staples | 2.0 |
| Industrials | 3.3 |
| Financials | 6.7 |
| Consumer Discretionary | 12.2 |
| Communication Services | 12.8 |
| Health Care | 13.5 |
| Information Technology | 49.5 |
This is a summary of certain changes to the Fund since December 31, 2023. For more complete information, you may review the Fund's next prospectus, which we expect to be available by May 1, 2025 at www.americanbeaconfunds.com/literature or upon request at 800-658-5811.
The Board of the Trust, at the recommendation of the Manager, approved; (i) the termination of the investment advisory agreement among the Manager, Bridgeway Capital Management, LLC and the Trust, on behalf of the American Beacon Man Large Cap Growth Fund (formerly known as American Beacon Bridgeway Large Cap Growth Fund), effective April 30, 2024, and (ii) a new investment advisory agreement among the Manager, Numeric Investors LLC, and the Trust on behalf of the Funds, effective May 1, 2024.
For additional information about the Fund, including its prospectus, financial statements, holdings, and proxy voting information, please visit www.americanbeaconfunds.com/literature or call 1-800-658-5811.
If your financial institution mailed only one copy of this Report to an address shared by more than one account, you can request an individual copy by contacting your financial institution.
Man Large Cap Growth Fund
Distributed by:
Resolute Investment Distributors, Inc.
Annual Shareholder Report - December 31, 2024
Man Large Cap Growth Fund
Annual Shareholder Report - December 31, 2024
This annual shareholder report contains important information about Large Cap Growth Fund for the period of January 1, 2024 to December 31, 2024. You can find additional information about the Fund at www.americanbeaconfunds.com/literature. You can also request this information by contacting us at 800-658-5811. This report describes material changes to the Fund that occurred during the reporting period.
What were the Fund costs for the last year?
(based on a hypothetical $10,000 investment)
| Class Name | Costs of a $10,000 investment | Costs paid as a percentage of a $10,000 investment |
|---|
| R6 | $86 | 0.77% |
|---|
How did the Fund perform and what affected its performance?
The R6 Class of the Fund returned 24.12% for the twelve months ended December 31, 2024, compared to the S&P 500 Index return of 25.02% and the Russell 1000 Growth Index return of 33.36%.
• Broad market performance was driven by a small number of mega-cap growth companies not held by the Fund, resulting in underperformance for the strategy.
• The Fund generated positive performance in all sectors where it invested, except for Materials, which slightly detracted from returns. Information Technology sector holdings contributed materially.
Cumulative Performance from December 31, 2014 through December 31, 2024
The initial investment, based on a $10,000 investment, is adjusted to reflect the maximum applicable sales charge, if any.
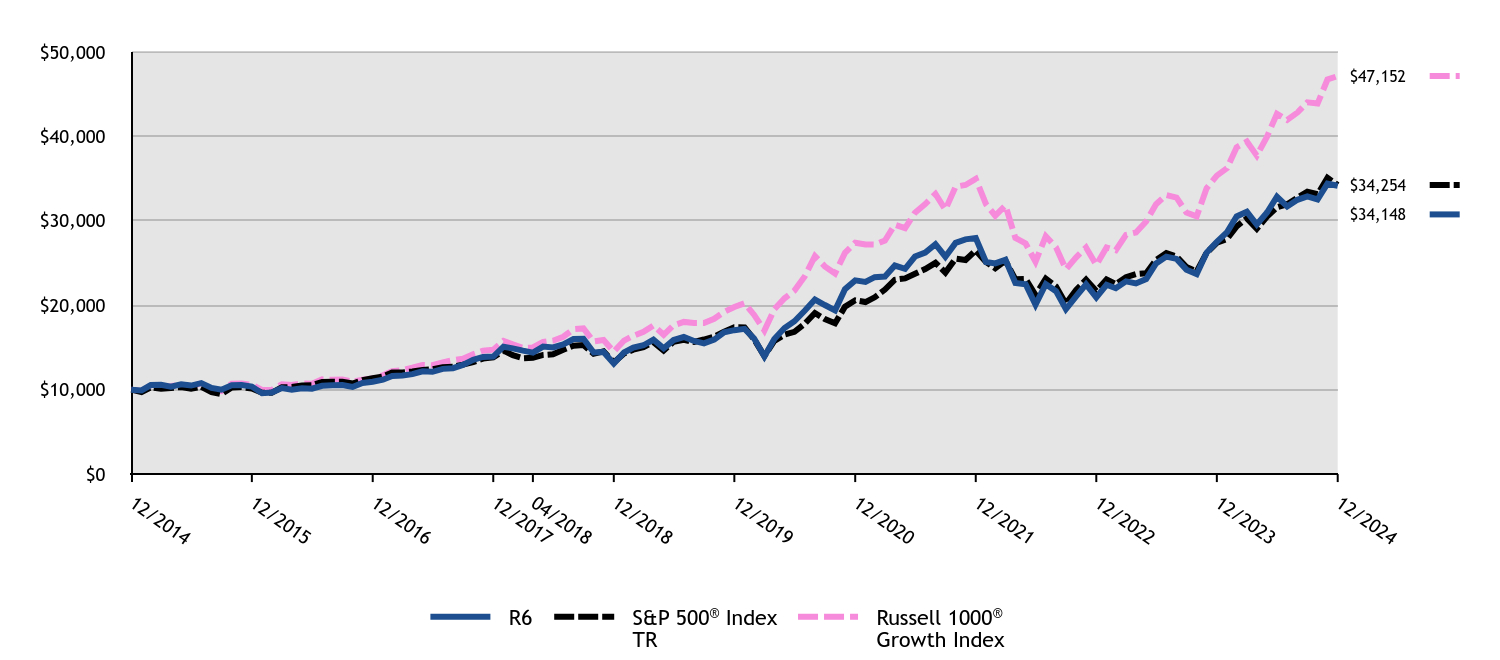
| R6 | S&P 500® Index TR | Russell 1000® Growth Index |
|---|
| 12/2014 | $10,000 | $10,000 | $10,000 |
|---|
| 01/2015 | $9,907 | $9,700 | $9,847 |
|---|
| 02/2015 | $10,544 | $10,257 | $10,503 |
|---|
| 03/2015 | $10,575 | $10,095 | $10,384 |
|---|
| 04/2015 | $10,345 | $10,192 | $10,436 |
|---|
| 05/2015 | $10,632 | $10,323 | $10,583 |
|---|
| 06/2015 | $10,487 | $10,123 | $10,396 |
|---|
| 07/2015 | $10,783 | $10,335 | $10,749 |
|---|
| 08/2015 | $10,212 | $9,712 | $10,096 |
|---|
| 09/2015 | $9,991 | $9,471 | $9,846 |
|---|
| 10/2015 | $10,522 | $10,270 | $10,694 |
|---|
| 11/2015 | $10,548 | $10,301 | $10,724 |
|---|
| 12/2015 | $10,362 | $10,138 | $10,567 |
|---|
| 01/2016 | $9,571 | $9,635 | $9,977 |
|---|
| 02/2016 | $9,660 | $9,622 | $9,973 |
|---|
| 03/2016 | $10,188 | $10,275 | $10,645 |
|---|
| 04/2016 | $9,997 | $10,315 | $10,548 |
|---|
| 05/2016 | $10,153 | $10,500 | $10,753 |
|---|
| 06/2016 | $10,117 | $10,527 | $10,711 |
|---|
| 07/2016 | $10,455 | $10,915 | $11,216 |
|---|
| 08/2016 | $10,535 | $10,931 | $11,160 |
|---|
| 09/2016 | $10,548 | $10,933 | $11,201 |
|---|
| 10/2016 | $10,317 | $10,733 | $10,938 |
|---|
| 11/2016 | $10,793 | $11,131 | $11,176 |
|---|
| 12/2016 | $10,942 | $11,351 | $11,314 |
|---|
| 01/2017 | $11,183 | $11,566 | $11,696 |
|---|
| 02/2017 | $11,617 | $12,025 | $12,182 |
|---|
| 03/2017 | $11,680 | $12,039 | $12,322 |
|---|
| 04/2017 | $11,836 | $12,163 | $12,604 |
|---|
| 05/2017 | $12,176 | $12,334 | $12,932 |
|---|
| 06/2017 | $12,118 | $12,411 | $12,898 |
|---|
| 07/2017 | $12,462 | $12,666 | $13,241 |
|---|
| 08/2017 | $12,543 | $12,705 | $13,483 |
|---|
| 09/2017 | $12,936 | $12,967 | $13,659 |
|---|
| 10/2017 | $13,531 | $13,270 | $14,188 |
|---|
| 11/2017 | $13,880 | $13,677 | $14,619 |
|---|
| 12/2017 | $13,919 | $13,829 | $14,733 |
|---|
| 01/2018 | $15,088 | $14,621 | $15,776 |
|---|
| 02/2018 | $14,897 | $14,082 | $15,363 |
|---|
| 03/2018 | $14,622 | $13,724 | $14,941 |
|---|
| 04/2018 | $14,389 | $13,777 | $14,994 |
|---|
| 05/2018 | $15,107 | $14,108 | $15,651 |
|---|
| 06/2018 | $15,004 | $14,195 | $15,801 |
|---|
| 07/2018 | $15,367 | $14,724 | $16,265 |
|---|
| 08/2018 | $16,001 | $15,203 | $17,155 |
|---|
| 09/2018 | $16,029 | $15,290 | $17,251 |
|---|
| 10/2018 | $14,403 | $14,245 | $15,708 |
|---|
| 11/2018 | $14,468 | $14,535 | $15,875 |
|---|
| 12/2018 | $13,084 | $13,223 | $14,510 |
|---|
| 01/2019 | $14,404 | $14,282 | $15,814 |
|---|
| 02/2019 | $14,978 | $14,741 | $16,380 |
|---|
| 03/2019 | $15,258 | $15,027 | $16,846 |
|---|
| 04/2019 | $15,920 | $15,636 | $17,607 |
|---|
| 05/2019 | $14,906 | $14,642 | $16,495 |
|---|
| 06/2019 | $15,874 | $15,674 | $17,628 |
|---|
| 07/2019 | $16,236 | $15,899 | $18,026 |
|---|
| 08/2019 | $15,770 | $15,648 | $17,888 |
|---|
| 09/2019 | $15,485 | $15,940 | $17,890 |
|---|
| 10/2019 | $15,936 | $16,286 | $18,394 |
|---|
| 11/2019 | $16,800 | $16,877 | $19,210 |
|---|
| 12/2019 | $17,048 | $17,386 | $19,790 |
|---|
| 01/2020 | $17,202 | $17,379 | $20,232 |
|---|
| 02/2020 | $16,054 | $15,949 | $18,854 |
|---|
| 03/2020 | $13,925 | $13,979 | $17,000 |
|---|
| 04/2020 | $16,003 | $15,771 | $19,515 |
|---|
| 05/2020 | $17,299 | $16,522 | $20,825 |
|---|
| 06/2020 | $18,104 | $16,850 | $21,732 |
|---|
| 07/2020 | $19,349 | $17,801 | $23,404 |
|---|
| 08/2020 | $20,673 | $19,080 | $25,819 |
|---|
| 09/2020 | $20,028 | $18,355 | $24,604 |
|---|
| 10/2020 | $19,400 | $17,867 | $23,769 |
|---|
| 11/2020 | $21,906 | $19,823 | $26,203 |
|---|
| 12/2020 | $22,944 | $20,585 | $27,408 |
|---|
| 01/2021 | $22,754 | $20,377 | $27,205 |
|---|
| 02/2021 | $23,329 | $20,939 | $27,199 |
|---|
| 03/2021 | $23,392 | $21,856 | $27,666 |
|---|
| 04/2021 | $24,700 | $23,022 | $29,548 |
|---|
| 05/2021 | $24,308 | $23,183 | $29,140 |
|---|
| 06/2021 | $25,768 | $23,724 | $30,968 |
|---|
| 07/2021 | $26,242 | $24,288 | $31,988 |
|---|
| 08/2021 | $27,228 | $25,026 | $33,184 |
|---|
| 09/2021 | $25,749 | $23,863 | $31,326 |
|---|
| 10/2021 | $27,386 | $25,534 | $34,039 |
|---|
| 11/2021 | $27,803 | $25,357 | $34,247 |
|---|
| 12/2021 | $27,967 | $26,494 | $34,971 |
|---|
| 01/2022 | $25,117 | $25,123 | $31,970 |
|---|
| 02/2022 | $24,958 | $24,371 | $30,612 |
|---|
| 03/2022 | $25,382 | $25,276 | $31,809 |
|---|
| 04/2022 | $22,645 | $23,071 | $27,968 |
|---|
| 05/2022 | $22,494 | $23,114 | $27,318 |
|---|
| 06/2022 | $20,068 | $21,206 | $25,154 |
|---|
| 07/2022 | $22,486 | $23,161 | $28,173 |
|---|
| 08/2022 | $21,667 | $22,217 | $26,861 |
|---|
| 09/2022 | $19,537 | $20,170 | $24,249 |
|---|
| 10/2022 | $21,038 | $21,804 | $25,667 |
|---|
| 11/2022 | $22,471 | $23,022 | $26,836 |
|---|
| 12/2022 | $20,934 | $21,696 | $24,782 |
|---|
| 01/2023 | $22,424 | $23,059 | $26,847 |
|---|
| 02/2023 | $22,016 | $22,496 | $26,528 |
|---|
| 03/2023 | $22,833 | $23,322 | $28,342 |
|---|
| 04/2023 | $22,584 | $23,686 | $28,621 |
|---|
| 05/2023 | $23,108 | $23,789 | $29,926 |
|---|
| 06/2023 | $24,953 | $25,361 | $31,972 |
|---|
| 07/2023 | $25,761 | $26,176 | $33,050 |
|---|
| 08/2023 | $25,486 | $25,759 | $32,753 |
|---|
| 09/2023 | $24,217 | $24,531 | $30,972 |
|---|
| 10/2023 | $23,693 | $24,015 | $30,531 |
|---|
| 11/2023 | $26,213 | $26,208 | $33,859 |
|---|
| 12/2023 | $27,511 | $27,399 | $35,358 |
|---|
| 01/2024 | $28,664 | $27,859 | $36,240 |
|---|
| 02/2024 | $30,524 | $29,347 | $38,713 |
|---|
| 03/2024 | $31,069 | $30,291 | $39,394 |
|---|
| 04/2024 | $29,558 | $29,054 | $37,723 |
|---|
| 05/2024 | $30,980 | $30,494 | $39,981 |
|---|
| 06/2024 | $32,849 | $31,589 | $42,677 |
|---|
| 07/2024 | $31,704 | $31,973 | $41,951 |
|---|
| 08/2024 | $32,491 | $32,749 | $42,825 |
|---|
| 09/2024 | $32,884 | $33,448 | $44,038 |
|---|
| 10/2024 | $32,527 | $33,145 | $43,893 |
|---|
| 11/2024 | $34,395 | $35,090 | $46,740 |
|---|
| 12/2024 | $34,148 | $34,254 | $47,152 |
|---|
Average Annual Total Returns (%)
| HEADER | 1 Year | 5 Years | 10 Years |
|---|
R6 ClassFootnote Reference1 | 24.12% | 14.90% | 13.07% |
|---|
S&P 500® Index TR | 25.02% | 14.53% | 13.10% |
|---|
Russell 1000® Growth Index | 33.36% | 18.96% | 16.78% |
|---|
| Footnote | Description |
Footnote1 | Return may differ from actual shareholder return due to accounting adjustments for financial reporting purposes. |
Performance shown is historical and is not indicative of future returns. Investment returns and principal value will vary, and shares may be worth more or less at redemption than at original purchase. Performance shown is as of date indicated, and current performance may be lower or higher than the performance data quoted. To obtain performance as of the most recent month end, please visit americanbeaconfunds.com or call 800-967-9009. The graph and table do not reflect the deduction of taxes that a shareholder would pay on fund distributions or redemption of fund shares. The Fund's performance benefited from fee waivers. Performance includes historical performance of another Class of the Fund. For more information, visit americanbeaconfunds.com/Performance_Disclaimers.aspx.
The S&P 500 Index TR is replacing the Russell 1000 Growth Index as broad-based securities market index to comply with a new regulatory requirement. The Russell 1000 Growth Index reflects the market sectors in which the Fund invests.
| Total Net Assets | $201,325,898 |
|---|
| # of Portfolio Holdings | 71 |
|---|
| Portfolio Turnover Rate | 52% |
|---|
| Total Management Fees Paid | $1,095,857 |
|---|
What did the Fund invest in?
Top Ten Holdings - % Net Assets
| Alphabet, Inc., Class A | 6.6 |
| Amazon.com, Inc. | 6.1 |
| NVIDIA Corp. | 6.0 |
| Microsoft Corp. | 5.2 |
| Apple, Inc. | 4.8 |
| Mastercard, Inc., Class A | 4.3 |
| Meta Platforms, Inc., Class A | 4.2 |
| Booking Holdings, Inc. | 3.1 |
| Fortinet, Inc. | 2.6 |
| McKesson Corp. | 2.4 |
Excludes cash equivalents.
Asset Allocation - % Investments
| Value | Value |
|---|
| Common Stocks | 97.1 |
| Investment Companies | 2.9 |
| Rights | 0.0 |
The Fund may purchase and sell futures contracts to gain market exposure on cash balances.
Sector Allocation - % Equities
| Value | Value |
|---|
| Consumer Staples | 2.0 |
| Industrials | 3.3 |
| Financials | 6.7 |
| Consumer Discretionary | 12.2 |
| Communication Services | 12.8 |
| Health Care | 13.5 |
| Information Technology | 49.5 |
This is a summary of certain changes to the Fund since December 31, 2023. For more complete information, you may review the Fund's next prospectus, which we expect to be available by May 1, 2025 at www.americanbeaconfunds.com/literature or upon request at 800-658-5811.
The Board of the Trust, at the recommendation of the Manager, approved; (i) the termination of the investment advisory agreement among the Manager, Bridgeway Capital Management, LLC and the Trust, on behalf of the American Beacon Man Large Cap Growth Fund (formerly known as American Beacon Bridgeway Large Cap Growth Fund), effective April 30, 2024, and (ii) a new investment advisory agreement among the Manager, Numeric Investors LLC, and the Trust on behalf of the Funds, effective May 1, 2024.
For additional information about the Fund, including its prospectus, financial statements, holdings, and proxy voting information, please visit www.americanbeaconfunds.com/literature or call 1-800-658-5811.
If your financial institution mailed only one copy of this Report to an address shared by more than one account, you can request an individual copy by contacting your financial institution.
Man Large Cap Growth Fund
Distributed by:
Resolute Investment Distributors, Inc.
Annual Shareholder Report - December 31, 2024
Annual Shareholder Report - December 31, 2024
This annual shareholder report contains important information about American Beacon AHL TargetRisk Fund for the period of January 1, 2024 to December 31, 2024. You can find additional information about the Fund at www.americanbeaconfunds.com/literature. You can also request this information by contacting us at 800-658-5811. This report describes material changes to the Fund that occurred during the reporting period.
What were the Fund costs for the last year?
(based on a hypothetical $10,000 investment)
| Class Name | Costs of a $10,000 investment | Costs paid as a percentage of a $10,000 investment |
|---|
| Class A | $156 | 1.51% |
|---|
How did the Fund perform and what affected its performance?
The A Class of the Fund returned 0.49% (with sales charges) and 6.63% (without sales charges) for the twelve months ended December 31, 2024, compared to the 60/40 Global Index (Hedged to USD) return of 5.55%, the Bloomberg Global-Aggregate Total Return Index Value Hedged USD return of 3.26% and the S&P 500 Index return of 25.02%.
• The investment strategy of the Fund’s sub-advisor is designed to maintain a targeted risk profile through dynamic implementation and investing across a broad range of asset classes.
• Overall, the market environment over the twelve-month period was conducive to the sub-advisor’s investment strategy led by performance in U.S. equities despite headwinds from the unwinding of the U.S. dollar Japanese yen carry trade, political instability in South Korea and negative sentiment surrounding the first budget proposal of the new Labour Party in the U.K.
• Equities, credit, and inflation assets were contributors during the period.
• Fixed income was the lone detracting asset class during the period.
Cumulative Performance from December 31, 2018 through December 31, 2024
The initial investment, based on a $10,000 investment, is adjusted to reflect the maximum applicable sales charge, if any.
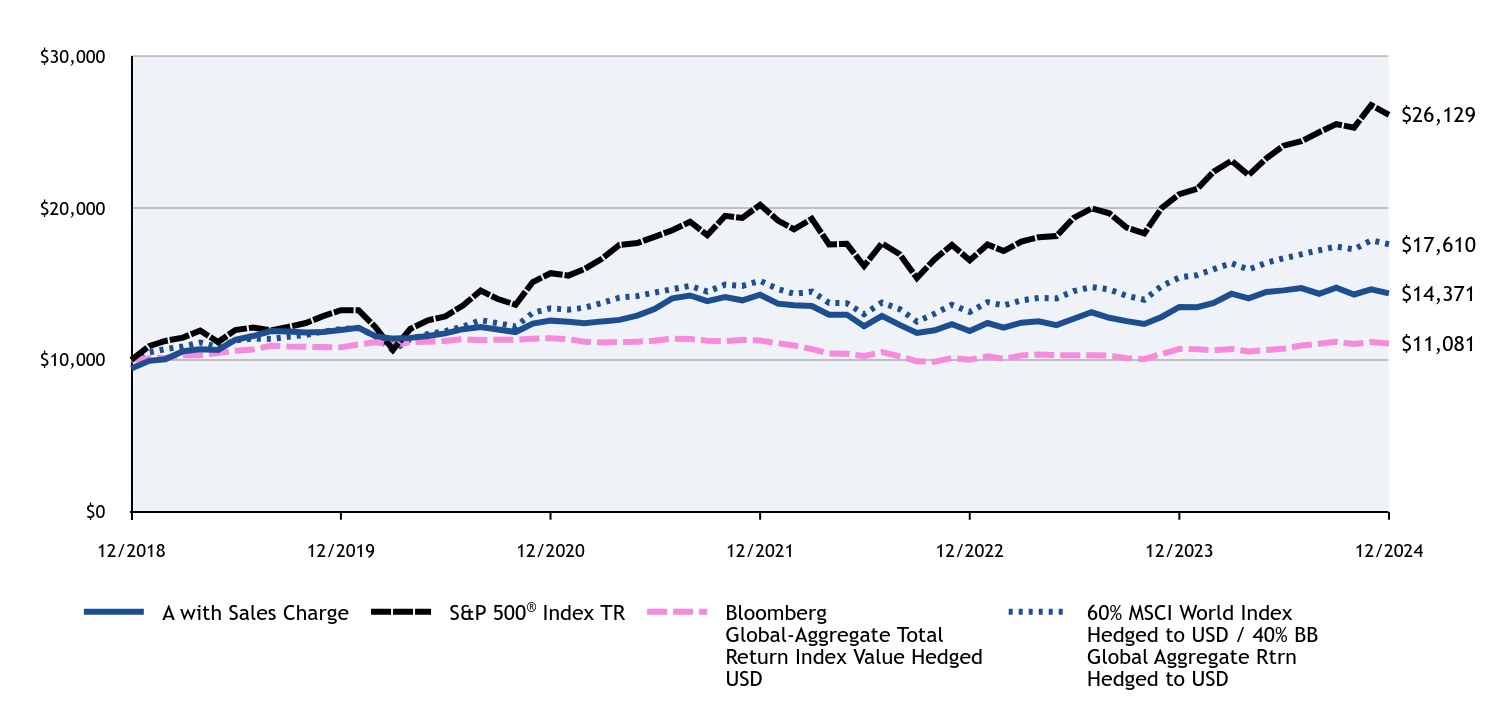
| A with Sales Charge | S&P 500® Index TR | Bloomberg Global-Aggregate Total Return Index Value Hedged USD | 60% MSCI World Index Hedged to USD / 40% BB Global Aggregate Rtrn Hedged to USD |
|---|
| 12/2018 | $9,425 | $10,000 | $10,000 | $10,000 |
|---|
| 01/2019 | $9,934 | $10,894 | $10,106 | $10,484 |
|---|
| 02/2019 | $10,038 | $11,244 | $10,118 | $10,702 |
|---|
| 03/2019 | $10,566 | $11,463 | $10,299 | $10,887 |
|---|
| 04/2019 | $10,688 | $11,927 | $10,305 | $11,140 |
|---|
| 05/2019 | $10,650 | $11,169 | $10,454 | $10,828 |
|---|
| 06/2019 | $11,311 | $11,956 | $10,600 | $11,279 |
|---|
| 07/2019 | $11,566 | $12,128 | $10,684 | $11,399 |
|---|
| 08/2019 | $11,897 | $11,936 | $10,926 | $11,374 |
|---|
| 09/2019 | $11,859 | $12,159 | $10,875 | $11,516 |
|---|
| 10/2019 | $11,802 | $12,423 | $10,857 | $11,643 |
|---|
| 11/2019 | $11,830 | $12,873 | $10,844 | $11,860 |
|---|
| 12/2019 | $11,968 | $13,262 | $10,822 | $12,018 |
|---|
| 01/2020 | $12,107 | $13,257 | $11,017 | $12,090 |
|---|
| 02/2020 | $11,554 | $12,166 | $11,152 | $11,569 |
|---|
| 03/2020 | $11,396 | $10,663 | $10,978 | $10,619 |
|---|
| 04/2020 | $11,445 | $12,030 | $11,156 | $11,361 |
|---|
| 05/2020 | $11,574 | $12,603 | $11,188 | $11,697 |
|---|
| 06/2020 | $11,741 | $12,853 | $11,243 | $11,887 |
|---|
| 07/2020 | $12,018 | $13,578 | $11,366 | $12,184 |
|---|
| 08/2020 | $12,166 | $14,554 | $11,284 | $12,608 |
|---|
| 09/2020 | $11,998 | $14,001 | $11,325 | $12,410 |
|---|
| 10/2020 | $11,830 | $13,629 | $11,326 | $12,185 |
|---|
| 11/2020 | $12,383 | $15,121 | $11,391 | $13,095 |
|---|
| 12/2020 | $12,580 | $15,702 | $11,426 | $13,390 |
|---|
| 01/2021 | $12,510 | $15,544 | $11,364 | $13,301 |
|---|
| 02/2021 | $12,401 | $15,972 | $11,187 | $13,430 |
|---|
| 03/2021 | $12,530 | $16,672 | $11,143 | $13,747 |
|---|
| 04/2021 | $12,629 | $17,561 | $11,173 | $14,097 |
|---|
| 05/2021 | $12,907 | $17,684 | $11,197 | $14,199 |
|---|
| 06/2021 | $13,343 | $18,097 | $11,252 | $14,425 |
|---|
| 07/2021 | $14,048 | $18,527 | $11,392 | $14,646 |
|---|
| 08/2021 | $14,236 | $19,090 | $11,369 | $14,870 |
|---|
| 09/2021 | $13,859 | $18,202 | $11,262 | $14,487 |
|---|
| 10/2021 | $14,127 | $19,478 | $11,232 | $14,952 |
|---|
| 11/2021 | $13,919 | $19,343 | $11,312 | $14,865 |
|---|
| 12/2021 | $14,286 | $20,209 | $11,267 | $15,201 |
|---|
| 01/2022 | $13,696 | $19,164 | $11,090 | $14,658 |
|---|
| 02/2022 | $13,589 | $18,590 | $10,942 | $14,347 |
|---|
| 03/2022 | $13,542 | $19,280 | $10,706 | $14,494 |
|---|
| 04/2022 | $12,975 | $17,599 | $10,418 | $13,748 |
|---|
| 05/2022 | $12,975 | $17,631 | $10,404 | $13,723 |
|---|
| 06/2022 | $12,208 | $16,176 | $10,246 | $13,008 |
|---|
| 07/2022 | $12,893 | $17,667 | $10,507 | $13,766 |
|---|
| 08/2022 | $12,302 | $16,947 | $10,233 | $13,342 |
|---|
| 09/2022 | $11,771 | $15,386 | $9,904 | $12,516 |
|---|
| 10/2022 | $11,948 | $16,632 | $9,870 | $13,040 |
|---|
| 11/2022 | $12,350 | $17,561 | $10,122 | $13,626 |
|---|
| 12/2022 | $11,900 | $16,549 | $10,003 | $13,150 |
|---|
| 01/2023 | $12,422 | $17,589 | $10,233 | $13,792 |
|---|
| 02/2023 | $12,112 | $17,160 | $10,070 | $13,581 |
|---|
| 03/2023 | $12,447 | $17,790 | $10,293 | $13,910 |
|---|
| 04/2023 | $12,534 | $18,068 | $10,346 | $14,079 |
|---|
| 05/2023 | $12,285 | $18,146 | $10,305 | $14,044 |
|---|
| 06/2023 | $12,708 | $19,345 | $10,299 | $14,526 |
|---|
| 07/2023 | $13,130 | $19,967 | $10,302 | $14,789 |
|---|
| 08/2023 | $12,770 | $19,649 | $10,289 | $14,632 |
|---|
| 09/2023 | $12,546 | $18,712 | $10,112 | $14,213 |
|---|
| 10/2023 | $12,360 | $18,319 | $10,040 | $13,954 |
|---|
| 11/2023 | $12,820 | $19,992 | $10,385 | $14,852 |
|---|
| 12/2023 | $13,478 | $20,900 | $10,717 | $15,420 |
|---|
| 01/2024 | $13,465 | $21,251 | $10,696 | $15,577 |
|---|
| 02/2024 | $13,748 | $22,386 | $10,623 | $15,969 |
|---|
| 03/2024 | $14,352 | $23,106 | $10,719 | $16,357 |
|---|
| 04/2024 | $14,044 | $22,162 | $10,546 | $15,941 |
|---|
| 05/2024 | $14,468 | $23,261 | $10,640 | $16,393 |
|---|
| 06/2024 | $14,571 | $24,096 | $10,732 | $16,684 |
|---|
| 07/2024 | $14,725 | $24,389 | $10,939 | $16,944 |
|---|
| 08/2024 | $14,352 | $24,981 | $11,059 | $17,212 |
|---|
| 09/2024 | $14,751 | $25,514 | $11,187 | $17,454 |
|---|
| 10/2024 | $14,301 | $25,283 | $11,036 | $17,272 |
|---|
| 11/2024 | $14,635 | $26,767 | $11,167 | $17,864 |
|---|
| 12/2024 | $14,371 | $26,129 | $11,081 | $17,610 |
|---|
Average Annual Total Returns (%)
HEADER | 1 Year | 5 Years | Since Inception (12/31/18) |
|---|
Class A without Sales ChargeFootnote Reference1 | 6.63% | 3.73% | 7.28% |
|---|
Class A with Maximum Sales Charge - 5.75%Footnote Reference1 | 0.49% | 2.50% | 6.23% |
|---|
S&P 500® Index TR | 25.02% | 14.53% | 17.36% |
|---|
| Bloomberg Global-Aggregate Total Return Index Value Hedged USD | 3.40% | 0.48% | 1.73% |
|---|
| 60% MSCI World Index Hedged to USD / 40% BB Global Aggregate Rtrn Hedged to USD | 14.21% | 7.94% | 9.89% |
|---|
| Footnote | Description |
Footnote1 | Return may differ from actual shareholder return due to accounting adjustments for financial reporting purposes. |
Performance shown is historical and is not indicative of future returns. Investment returns and principal value will vary, and shares may be worth more or less at redemption than at original purchase. Performance shown is as of date indicated, and current performance may be lower or higher than the performance data quoted. To obtain performance as of the most recent month end, please visit americanbeaconfunds.com or call 800-967-9009. The graph and table do not reflect the deduction of taxes that a shareholder would pay on fund distributions or redemption of fund shares. The Fund's performance benefited from fee waivers. For more information, visit americanbeaconfunds.com/Performance_Disclaimers.aspx.
The S&P 500 Index TR and Bloomberg Global-Aggregate Total Return Index Value Hedged USD are replacing the 60% MSCI ® World Index Hedged to USD / 40% Bloomberg Global-Aggregate Total Return Index Value Hedged to USD and the MSCI World Index as the broad-based securities market indices to comply with a new regulatory requirement. The 60% MSCI ® World Index Hedged to USD / 40% Bloomberg Global-Aggregate Total Return Index Value Hedged to USD reflects the market sectors in which the Fund invests.
| Total Net Assets | $277,718,436 |
|---|
| # of Portfolio Holdings | 18 |
|---|
| Portfolio Turnover Rate | 138% |
|---|
| Total Management Fees Paid | $2,597,444 |
|---|
Asset Class Exposure % of VaR*
| Header | Net (%) | % of VaR |
| Stocks | 34.1 | 51.3 |
| Bonds and Rates | 49.3 | 27.3 |
| Credit | 43.8 | 7.3 |
| Commodities | 11.2 | 14.0 |
What did the Fund invest in?
Top Ten Exposures - % of VaR*
| BBG Commodity ex-Agriculturals Index | Long | 14.0 |
| US Treasuries | Long | 12.6 |
| Tokyo Stock Exchange Index | Long | 7.3 |
| S&P 500 Index | Long | 7.1 |
| Nikkei | Long | 4.7 |
| Gilts | Long | 4.4 |
| NASDAQ 100 Index | Long | 4.2 |
| S&P TSX 60 Index | Long | 3.1 |
| Euro-STOXX | Long | 3.1 |
| US High Yield CDX Index | Long | 2.9 |
* Value at Risk (“VaR”) is a measure of the potential loss in value of a portfolio over a defined period for a given confidence interval. A one-day VaR at the 95% confidence level represents that there is a 5% probability that the mark-to-market loss on the portfolio over a one day horizon will exceed this value (assuming normal markets and no trading in the portfolio).
| Value | Value |
|---|
| Standard Deviation | 11.42 |
| Sharpe Ratio | (0.26) |
This is a summary of certain changes to the Fund since December 31, 2023. For more complete information, you may review the Fund's next prospectus, which we expect to be available by March 1, 2025 at www.americanbeaconfunds.com/literature or upon request at 800-658-5811.
Effective May 1, 2024, the contractual expense limitation for the A Class was increased from 0.00% to 1.44% (excluding taxes, interest, brokerage commissions, acquired fund fees and expenses, securities lending fees, expenses related to securities sold short, litigation and other extraordinary expenses).
For additional information about the Fund, including its prospectus, financial statements, holdings, and proxy voting information, please visit www.americanbeaconfunds.com/literature or call 1-800-658-5811.
If your financial institution mailed only one copy of this Report to an address shared by more than one account, you can request an individual copy by contacting your financial institution.
Annual Shareholder Report - December 31, 2024
Distributed by:
Resolute Investment Distributors, Inc.
Annual Shareholder Report - December 31, 2024
This annual shareholder report contains important information about American Beacon AHL TargetRisk Fund for the period of January 1, 2024 to December 31, 2024. You can find additional information about the Fund at www.americanbeaconfunds.com/literature. You can also request this information by contacting us at 800-658-5811.
What were the Fund costs for the last year?
(based on a hypothetical $10,000 investment)
| Class Name | Costs of a $10,000 investment | Costs paid as a percentage of a $10,000 investment |
|---|
| Class C | $225 | 2.19% |
|---|
How did the Fund perform and what affected its performance?
The C Class of the Fund returned 4.91% (with sales charges) and 5.91% (without sales charges) for the twelve months ended December 31, 2024, compared to the 60/40 Global Index (Hedged to USD) return of 5.55%, the Bloomberg Global-Aggregate Total Return Index Value Hedged USD return of 3.26% and the S&P 500 Index return of 25.02%.
• The investment strategy of the Fund’s sub-advisor is designed to maintain a targeted risk profile through dynamic implementation and investing across a broad range of asset classes.
• Overall, the market environment over the twelve-month period was conducive to the sub-advisor’s investment strategy led by performance in U.S. equities despite headwinds from the unwinding of the U.S. dollar Japanese yen carry trade, political instability in South Korea and negative sentiment surrounding the first budget proposal of the new Labour Party in the U.K.
• Equities, credit, and inflation assets were contributors during the period.
• Fixed income was the lone detracting asset class during the period.
Cumulative Performance from December 31, 2018 through December 31, 2024
The initial investment, based on a $10,000 investment, is adjusted to reflect the maximum applicable sales charge, if any.

| C with Sales Charge | S&P 500® Index TR | Bloomberg Global-Aggregate Total Return Index Value Hedged USD | 60% MSCI World Index Hedged to USD / 40% BB Global Aggregate Rtrn Hedged to USD |
|---|
| 12/2018 | $10,000 | $10,000 | $10,000 | $10,000 |
|---|
| 01/2019 | $10,540 | $10,894 | $10,106 | $10,484 |
|---|
| 02/2019 | $10,650 | $11,244 | $10,118 | $10,702 |
|---|
| 03/2019 | $11,210 | $11,463 | $10,299 | $10,887 |
|---|
| 04/2019 | $11,340 | $11,927 | $10,305 | $11,140 |
|---|
| 05/2019 | $11,290 | $11,169 | $10,454 | $10,828 |
|---|
| 06/2019 | $11,991 | $11,956 | $10,600 | $11,279 |
|---|
| 07/2019 | $12,252 | $12,128 | $10,684 | $11,399 |
|---|
| 08/2019 | $12,602 | $11,936 | $10,926 | $11,374 |
|---|
| 09/2019 | $12,552 | $12,159 | $10,875 | $11,516 |
|---|
| 10/2019 | $12,482 | $12,423 | $10,857 | $11,643 |
|---|
| 11/2019 | $12,502 | $12,873 | $10,844 | $11,860 |
|---|
| 12/2019 | $12,635 | $13,262 | $10,822 | $12,018 |
|---|
| 01/2020 | $12,782 | $13,257 | $11,017 | $12,090 |
|---|
| 02/2020 | $12,186 | $12,166 | $11,152 | $11,569 |
|---|
| 03/2020 | $12,008 | $10,663 | $10,978 | $10,619 |
|---|
| 04/2020 | $12,061 | $12,030 | $11,156 | $11,361 |
|---|
| 05/2020 | $12,186 | $12,603 | $11,188 | $11,697 |
|---|
| 06/2020 | $12,353 | $12,853 | $11,243 | $11,887 |
|---|
| 07/2020 | $12,635 | $13,578 | $11,366 | $12,184 |
|---|
| 08/2020 | $12,792 | $14,554 | $11,284 | $12,608 |
|---|
| 09/2020 | $12,604 | $14,001 | $11,325 | $12,410 |
|---|
| 10/2020 | $12,416 | $13,629 | $11,326 | $12,185 |
|---|
| 11/2020 | $12,991 | $15,121 | $11,391 | $13,095 |
|---|
| 12/2020 | $13,188 | $15,702 | $11,426 | $13,390 |
|---|
| 01/2021 | $13,104 | $15,544 | $11,364 | $13,301 |
|---|
| 02/2021 | $12,978 | $15,972 | $11,187 | $13,430 |
|---|
| 03/2021 | $13,104 | $16,672 | $11,143 | $13,747 |
|---|
| 04/2021 | $13,199 | $17,561 | $11,173 | $14,097 |
|---|
| 05/2021 | $13,493 | $17,684 | $11,197 | $14,199 |
|---|
| 06/2021 | $13,934 | $18,097 | $11,252 | $14,425 |
|---|
| 07/2021 | $14,659 | $18,527 | $11,392 | $14,646 |
|---|
| 08/2021 | $14,848 | $19,090 | $11,369 | $14,870 |
|---|
| 09/2021 | $14,449 | $18,202 | $11,262 | $14,487 |
|---|
| 10/2021 | $14,712 | $19,478 | $11,232 | $14,952 |
|---|
| 11/2021 | $14,491 | $19,343 | $11,312 | $14,865 |
|---|
| 12/2021 | $14,863 | $20,209 | $11,267 | $15,201 |
|---|
| 01/2022 | $14,241 | $19,164 | $11,090 | $14,658 |
|---|
| 02/2022 | $14,116 | $18,590 | $10,942 | $14,347 |
|---|
| 03/2022 | $14,054 | $19,280 | $10,706 | $14,494 |
|---|
| 04/2022 | $13,469 | $17,599 | $10,418 | $13,748 |
|---|
| 05/2022 | $13,456 | $17,631 | $10,404 | $13,723 |
|---|
| 06/2022 | $12,647 | $16,176 | $10,246 | $13,008 |
|---|
| 07/2022 | $13,344 | $17,667 | $10,507 | $13,766 |
|---|
| 08/2022 | $12,734 | $16,947 | $10,233 | $13,342 |
|---|
| 09/2022 | $12,174 | $15,386 | $9,904 | $12,516 |
|---|
| 10/2022 | $12,349 | $16,632 | $9,870 | $13,040 |
|---|
| 11/2022 | $12,759 | $17,561 | $10,122 | $13,626 |
|---|
| 12/2022 | $12,287 | $16,549 | $10,003 | $13,150 |
|---|
| 01/2023 | $12,818 | $17,589 | $10,233 | $13,792 |
|---|
| 02/2023 | $12,481 | $17,160 | $10,070 | $13,581 |
|---|
| 03/2023 | $12,818 | $17,790 | $10,293 | $13,910 |
|---|
| 04/2023 | $12,909 | $18,068 | $10,346 | $14,079 |
|---|
| 05/2023 | $12,637 | $18,146 | $10,305 | $14,044 |
|---|
| 06/2023 | $13,090 | $19,345 | $10,299 | $14,526 |
|---|
| 07/2023 | $13,504 | $19,967 | $10,302 | $14,789 |
|---|
| 08/2023 | $13,129 | $19,649 | $10,289 | $14,632 |
|---|
| 09/2023 | $12,896 | $18,712 | $10,112 | $14,213 |
|---|
| 10/2023 | $12,701 | $18,319 | $10,040 | $13,954 |
|---|
| 11/2023 | $13,168 | $19,992 | $10,385 | $14,852 |
|---|
| 12/2023 | $13,834 | $20,900 | $10,717 | $15,420 |
|---|
| 01/2024 | $13,808 | $21,251 | $10,696 | $15,577 |
|---|
| 02/2024 | $14,101 | $22,386 | $10,623 | $15,969 |
|---|
| 03/2024 | $14,713 | $23,106 | $10,719 | $16,357 |
|---|
| 04/2024 | $14,394 | $22,162 | $10,546 | $15,941 |
|---|
| 05/2024 | $14,806 | $23,261 | $10,640 | $16,393 |
|---|
| 06/2024 | $14,913 | $24,096 | $10,732 | $16,684 |
|---|
| 07/2024 | $15,059 | $24,389 | $10,939 | $16,944 |
|---|
| 08/2024 | $14,673 | $24,981 | $11,059 | $17,212 |
|---|
| 09/2024 | $15,073 | $25,514 | $11,187 | $17,454 |
|---|
| 10/2024 | $14,593 | $25,283 | $11,036 | $17,272 |
|---|
| 11/2024 | $14,940 | $26,767 | $11,167 | $17,864 |
|---|
| 12/2024 | $14,652 | $26,129 | $11,081 | $17,610 |
|---|
Average Annual Total Returns (%)
| HEADER | 1 Year | 5 Years | Since Inception (12/31/18) |
|---|
Class C without Deferred Sales ChargeFootnote Reference1 | 5.91% | 3.01% | 6.57% |
|---|
Class C with Maximum Deferred Sales Charge -1.00%Footnote Reference1 | 4.91% | 3.01% | 6.57% |
|---|
S&P 500® Index TR | 25.02% | 14.53% | 17.36% |
|---|
| Bloomberg Global-Aggregate Total Return Index Value Hedged USD | 3.40% | 0.48% | 1.73% |
|---|
| 60% MSCI World Index Hedged to USD / 40% BB Global Aggregate Rtrn Hedged to USD | 14.21% | 7.94% | 9.89% |
|---|
| Footnote | Description |
Footnote1 | Return may differ from actual shareholder return due to accounting adjustments for financial reporting purposes. |
Performance shown is historical and is not indicative of future returns. Investment returns and principal value will vary, and shares may be worth more or less at redemption than at original purchase. Performance shown is as of date indicated, and current performance may be lower or higher than the performance data quoted. To obtain performance as of the most recent month end, please visit americanbeaconfunds.com or call 800-967-9009. The graph and table do not reflect the deduction of taxes that a shareholder would pay on fund distributions or redemption of fund shares. The Fund's performance benefited from fee waivers. For more information, visit americanbeaconfunds.com/Performance_Disclaimers.aspx.
The S&P 500 Index TR and Bloomberg Global-Aggregate Total Return Index Value Hedged USD are replacing the 60% MSCI ® World Index Hedged to USD / 40% Bloomberg Global-Aggregate Total Return Index Value Hedged to USD and the MSCI World Index as the broad-based securities market indices to comply with a new regulatory requirement. The 60% MSCI ® World Index Hedged to USD / 40% Bloomberg Global-Aggregate Total Return Index Value Hedged to USD reflects the market sectors in which the Fund invests.
| Total Net Assets | $277,718,436 |
|---|
| # of Portfolio Holdings | 18 |
|---|
| Portfolio Turnover Rate | 138% |
|---|
| Total Management Fees Paid | $2,597,444 |
|---|
Asset Class Exposure % of VaR*
| Header | Net (%) | % of VaR |
| Stocks | 34.1 | 51.3 |
| Bonds and Rates | 49.3 | 27.3 |
| Credit | 43.8 | 7.3 |
| Commodities | 11.2 | 14.0 |
What did the Fund invest in?
Top Ten Exposures - % of VaR*
| BBG Commodity ex-Agriculturals Index | Long | 14.0 |
| US Treasuries | Long | 12.6 |
| Tokyo Stock Exchange Index | Long | 7.3 |
| S&P 500 Index | Long | 7.1 |
| Nikkei | Long | 4.7 |
| Gilts | Long | 4.4 |
| NASDAQ 100 Index | Long | 4.2 |
| S&P TSX 60 Index | Long | 3.1 |
| Euro-STOXX | Long | 3.1 |
| US High Yield CDX Index | Long | 2.9 |
* Value at Risk (“VaR”) is a measure of the potential loss in value of a portfolio over a defined period for a given confidence interval. A one-day VaR at the 95% confidence level represents that there is a 5% probability that the mark-to-market loss on the portfolio over a one day horizon will exceed this value (assuming normal markets and no trading in the portfolio).
| Value | Value |
|---|
| Standard Deviation | 11.42 |
| Sharpe Ratio | (0.26) |
For additional information about the Fund, including its prospectus, financial statements, holdings, and proxy voting information, please visit www.americanbeaconfunds.com/literature or call 1-800-658-5811.
If your financial institution mailed only one copy of this Report to an address shared by more than one account, you can request an individual copy by contacting your financial institution.
Annual Shareholder Report - December 31, 2024
Distributed by:
Resolute Investment Distributors, Inc.
Annual Shareholder Report - December 31, 2024
This annual shareholder report contains important information about American Beacon AHL TargetRisk Fund for the period of January 1, 2024 to December 31, 2024. You can find additional information about the Fund at www.americanbeaconfunds.com/literature. You can also request this information by contacting us at 800-658-5811.
What were the Fund costs for the last year?
(based on a hypothetical $10,000 investment)
| Class Name | Costs of a $10,000 investment | Costs paid as a percentage of a $10,000 investment |
|---|
| R5 | $108 | 1.04% |
|---|
How did the Fund perform and what affected its performance?
The R5 Class of the Fund returned 7.13% for the twelve months ended December 31, 2024, compared to the 60/40 Global Index (Hedged to USD) return of 5.55%, the Bloomberg Global-Aggregate Total Return Index Value Hedged USD return of 3.26% and the S&P 500 Index return of 25.02%.
• The investment strategy of the Fund’s sub-advisor is designed to maintain a targeted risk profile through dynamic implementation and investing across a broad range of asset classes.
• Overall, the market environment over the twelve-month period was conducive to the sub-advisor’s investment strategy led by performance in U.S. equities despite headwinds from the unwinding of the U.S. dollar Japanese yen carry trade, political instability in South Korea and negative sentiment surrounding the first budget proposal of the new Labour Party in the U.K.
• Equities, credit, and inflation assets were contributors during the period.
• Fixed income was the lone detracting asset class during the period.
Cumulative Performance from December 31, 2018 through December 31, 2024
The initial investment, based on a $250,000 investment, is adjusted to reflect the maximum applicable sales charge, if any.
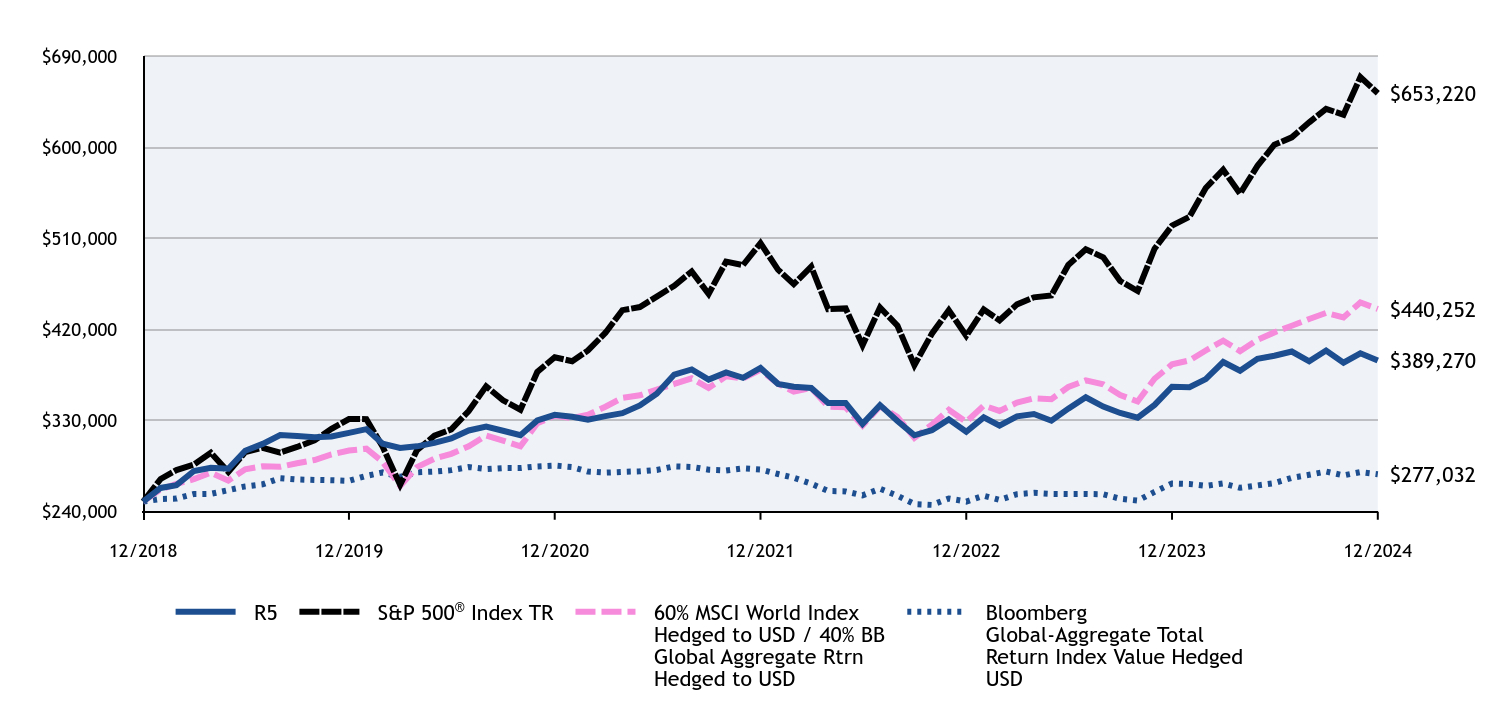
| R5 | S&P 500® Index TR | 60% MSCI World Index Hedged to USD / 40% BB Global Aggregate Rtrn Hedged to USD | Bloomberg Global-Aggregate Total Return Index Value Hedged USD |
|---|
| 12/2018 | $250,000 | $250,000 | $250,000 | $250,000 |
|---|
| 01/2019 | $263,500 | $272,362 | $262,091 | $252,648 |
|---|
| 02/2019 | $266,250 | $281,107 | $267,554 | $252,952 |
|---|
| 03/2019 | $280,250 | $286,570 | $272,171 | $257,482 |
|---|
| 04/2019 | $283,500 | $298,173 | $278,493 | $257,635 |
|---|
| 05/2019 | $282,500 | $279,225 | $270,711 | $261,343 |
|---|
| 06/2019 | $300,250 | $298,903 | $281,974 | $265,007 |
|---|
| 07/2019 | $307,000 | $303,199 | $284,970 | $267,092 |
|---|
| 08/2019 | $315,750 | $298,396 | $284,345 | $273,150 |
|---|
| 09/2019 | $314,750 | $303,979 | $287,902 | $271,884 |
|---|
| 10/2019 | $313,500 | $310,564 | $291,073 | $271,414 |
|---|
| 11/2019 | $314,250 | $321,837 | $296,510 | $271,096 |
|---|
| 12/2019 | $317,913 | $331,550 | $300,457 | $270,540 |
|---|
| 01/2020 | $321,570 | $331,420 | $302,257 | $275,422 |
|---|
| 02/2020 | $307,202 | $304,138 | $289,216 | $278,793 |
|---|
| 03/2020 | $303,023 | $266,573 | $265,468 | $274,455 |
|---|
| 04/2020 | $304,590 | $300,746 | $284,018 | $278,897 |
|---|
| 05/2020 | $307,986 | $315,070 | $292,418 | $279,688 |
|---|
| 06/2020 | $312,427 | $321,336 | $297,177 | $281,084 |
|---|
| 07/2020 | $320,264 | $339,455 | $304,602 | $284,156 |
|---|
| 08/2020 | $324,182 | $363,855 | $315,214 | $282,096 |
|---|
| 09/2020 | $320,002 | $350,029 | $310,257 | $283,127 |
|---|
| 10/2020 | $315,562 | $340,721 | $304,619 | $283,147 |
|---|
| 11/2020 | $330,190 | $378,018 | $327,385 | $284,763 |
|---|
| 12/2020 | $335,698 | $392,552 | $334,763 | $285,638 |
|---|
| 01/2021 | $333,855 | $388,588 | $332,526 | $284,106 |
|---|
| 02/2021 | $330,959 | $399,304 | $335,757 | $279,687 |
|---|
| 03/2021 | $334,382 | $416,792 | $343,683 | $278,585 |
|---|
| 04/2021 | $337,278 | $439,035 | $352,439 | $279,313 |
|---|
| 05/2021 | $344,913 | $442,102 | $354,970 | $279,936 |
|---|
| 06/2021 | $356,498 | $452,422 | $360,624 | $281,301 |
|---|
| 07/2021 | $375,455 | $463,170 | $366,154 | $284,798 |
|---|
| 08/2021 | $380,458 | $477,253 | $371,744 | $284,227 |
|---|
| 09/2021 | $370,453 | $455,056 | $362,172 | $281,544 |
|---|
| 10/2021 | $377,562 | $486,938 | $373,810 | $280,808 |
|---|
| 11/2021 | $372,296 | $483,564 | $371,630 | $282,811 |
|---|
| 12/2021 | $381,967 | $505,235 | $380,035 | $281,664 |
|---|
| 01/2022 | $366,287 | $479,091 | $366,448 | $277,238 |
|---|
| 02/2022 | $363,465 | $464,746 | $358,690 | $273,551 |
|---|
| 03/2022 | $362,210 | $482,002 | $362,343 | $267,654 |
|---|
| 04/2022 | $347,471 | $439,970 | $343,698 | $260,460 |
|---|
| 05/2022 | $347,471 | $440,778 | $343,088 | $260,102 |
|---|
| 06/2022 | $326,773 | $404,394 | $325,198 | $256,155 |
|---|
| 07/2022 | $345,276 | $441,681 | $344,148 | $262,679 |
|---|
| 08/2022 | $329,596 | $423,669 | $333,565 | $255,822 |
|---|
| 09/2022 | $315,484 | $384,649 | $312,913 | $247,609 |
|---|
| 10/2022 | $320,501 | $415,791 | $325,994 | $246,762 |
|---|
| 11/2022 | $331,164 | $439,027 | $340,657 | $253,050 |
|---|
| 12/2022 | $318,978 | $413,733 | $328,747 | $250,064 |
|---|
| 01/2023 | $333,207 | $439,729 | $344,810 | $255,823 |
|---|
| 02/2023 | $324,934 | $429,000 | $339,518 | $251,743 |
|---|
| 03/2023 | $334,199 | $444,751 | $347,766 | $257,325 |
|---|
| 04/2023 | $336,516 | $451,693 | $351,977 | $258,650 |
|---|
| 05/2023 | $329,898 | $453,656 | $351,115 | $257,631 |
|---|
| 06/2023 | $341,810 | $483,631 | $363,162 | $257,478 |
|---|
| 07/2023 | $353,060 | $499,168 | $369,718 | $257,561 |
|---|
| 08/2023 | $343,795 | $491,220 | $365,795 | $257,237 |
|---|
| 09/2023 | $337,508 | $467,800 | $355,316 | $252,801 |
|---|
| 10/2023 | $332,876 | $457,964 | $348,856 | $251,007 |
|---|
| 11/2023 | $345,450 | $499,788 | $371,292 | $259,637 |
|---|
| 12/2023 | $363,376 | $522,493 | $385,493 | $267,934 |
|---|
| 01/2024 | $363,032 | $531,273 | $389,423 | $267,409 |
|---|
| 02/2024 | $370,954 | $559,641 | $399,235 | $265,574 |
|---|
| 03/2024 | $387,831 | $577,647 | $408,929 | $267,969 |
|---|
| 04/2024 | $379,220 | $554,054 | $398,525 | $263,655 |
|---|
| 05/2024 | $390,931 | $581,526 | $409,824 | $265,988 |
|---|
| 06/2024 | $394,031 | $602,392 | $417,095 | $268,296 |
|---|
| 07/2024 | $398,164 | $609,725 | $423,595 | $273,479 |
|---|
| 08/2024 | $388,520 | $624,515 | $430,316 | $276,474 |
|---|
| 09/2024 | $399,197 | $637,853 | $436,352 | $279,682 |
|---|
| 10/2024 | $387,142 | $632,068 | $431,797 | $275,897 |
|---|
| 11/2024 | $396,442 | $669,171 | $446,607 | $279,175 |
|---|
| 12/2024 | $389,270 | $653,220 | $440,252 | $277,032 |
|---|
Average Annual Total Returns (%)
| HEADER | 1 Year | 5 Years | Since Inception (12/31/18) |
|---|
Class R5Footnote Reference1 | 7.13% | 4.13% | 7.66% |
|---|
S&P 500® Index TR | 25.02% | 14.53% | 17.36% |
|---|
| Bloomberg Global-Aggregate Total Return Index Value Hedged USD | 3.40% | 0.48% | 1.73% |
|---|
| 60% MSCI World Index Hedged to USD / 40% BB Global Aggregate Rtrn Hedged to USD | 14.21% | 7.94% | 9.89% |
|---|
| Footnote | Description |
Footnote1 | Return may differ from actual shareholder return due to accounting adjustments for financial reporting purposes. |
Performance shown is historical and is not indicative of future returns. Investment returns and principal value will vary, and shares may be worth more or less at redemption than at original purchase. Performance shown is as of date indicated, and current performance may be lower or higher than the performance data quoted. To obtain performance as of the most recent month end, please visit americanbeaconfunds.com or call 800-967-9009. The graph and table do not reflect the deduction of taxes that a shareholder would pay on fund distributions or redemption of fund shares. The Fund's performance benefited from fee waivers. For more information, visit americanbeaconfunds.com/Performance_Disclaimers.aspx.
The S&P 500 Index TR and Bloomberg Global-Aggregate Total Return Index Value Hedged USD are replacing the 60% MSCI ® World Index Hedged to USD / 40% Bloomberg Global-Aggregate Total Return Index Value Hedged to USD and the MSCI World Index as the broad-based securities market indices to comply with a new regulatory requirement. The 60% MSCI ® World Index Hedged to USD / 40% Bloomberg Global-Aggregate Total Return Index Value Hedged to USD reflects the market sectors in which the Fund invests.
| Total Net Assets | $277,718,436 |
|---|
| # of Portfolio Holdings | 18 |
|---|
| Portfolio Turnover Rate | 138% |
|---|
| Total Management Fees Paid | $2,597,444 |
|---|
Asset Class Exposure % of VaR*
| Header | Net (%) | % of VaR |
| Stocks | 34.1 | 51.3 |
| Bonds and Rates | 49.3 | 27.3 |
| Credit | 43.8 | 7.3 |
| Commodities | 11.2 | 14.0 |
What did the Fund invest in?
Top Ten Exposures - % of VaR*
| BBG Commodity ex-Agriculturals Index | Long | 14.0 |
| US Treasuries | Long | 12.6 |
| Tokyo Stock Exchange Index | Long | 7.3 |
| S&P 500 Index | Long | 7.1 |
| Nikkei | Long | 4.7 |
| Gilts | Long | 4.4 |
| NASDAQ 100 Index | Long | 4.2 |
| S&P TSX 60 Index | Long | 3.1 |
| Euro-STOXX | Long | 3.1 |
| US High Yield CDX Index | Long | 2.9 |
* Value at Risk (“VaR”) is a measure of the potential loss in value of a portfolio over a defined period for a given confidence interval. A one-day VaR at the 95% confidence level represents that there is a 5% probability that the mark-to-market loss on the portfolio over a one day horizon will exceed this value (assuming normal markets and no trading in the portfolio).
| Value | Value |
|---|
| Standard Deviation | 11.42 |
| Sharpe Ratio | (0.26) |
For additional information about the Fund, including its prospectus, financial statements, holdings, and proxy voting information, please visit www.americanbeaconfunds.com/literature or call 1-800-658-5811.
If your financial institution mailed only one copy of this Report to an address shared by more than one account, you can request an individual copy by contacting your financial institution.
Annual Shareholder Report - December 31, 2024
Distributed by:
Resolute Investment Distributors, Inc.
Annual Shareholder Report - December 31, 2024
This annual shareholder report contains important information about American Beacon AHL TargetRisk Fund for the period of January 1, 2024 to December 31, 2024. You can find additional information about the Fund at www.americanbeaconfunds.com/literature. You can also request this information by contacting us at 800-658-5811.
What were the Fund costs for the last year?
(based on a hypothetical $10,000 investment)
| Class Name | Costs of a $10,000 investment | Costs paid as a percentage of a $10,000 investment |
|---|
| Y | $123 | 1.19% |
|---|
How did the Fund perform and what affected its performance?
The Y Class of the Fund returned 7.00% for the twelve months ended December 31, 2024, compared to the 60/40 Global Index (Hedged to USD) return of 5.55%, the Bloomberg Global-Aggregate Total Return Index Value Hedged USD return of 3.26% and the S&P 500 Index return of 25.02%.
• The investment strategy of the Fund’s sub-advisor is designed to maintain a targeted risk profile through dynamic implementation and investing across a broad range of asset classes.
• Overall, the market environment over the twelve-month period was conducive to the sub-advisor’s investment strategy led by performance in U.S. equities despite headwinds from the unwinding of the U.S. dollar Japanese yen carry trade, political instability in South Korea and negative sentiment surrounding the first budget proposal of the new Labour Party in the U.K.
• Equities, credit, and inflation assets were contributors during the period.
• Fixed income was the lone detracting asset class during the period.
Cumulative Performance from December 31, 2018 through December 31, 2024
The initial investment, based on a $100,000 investment, is adjusted to reflect the maximum applicable sales charge, if any.
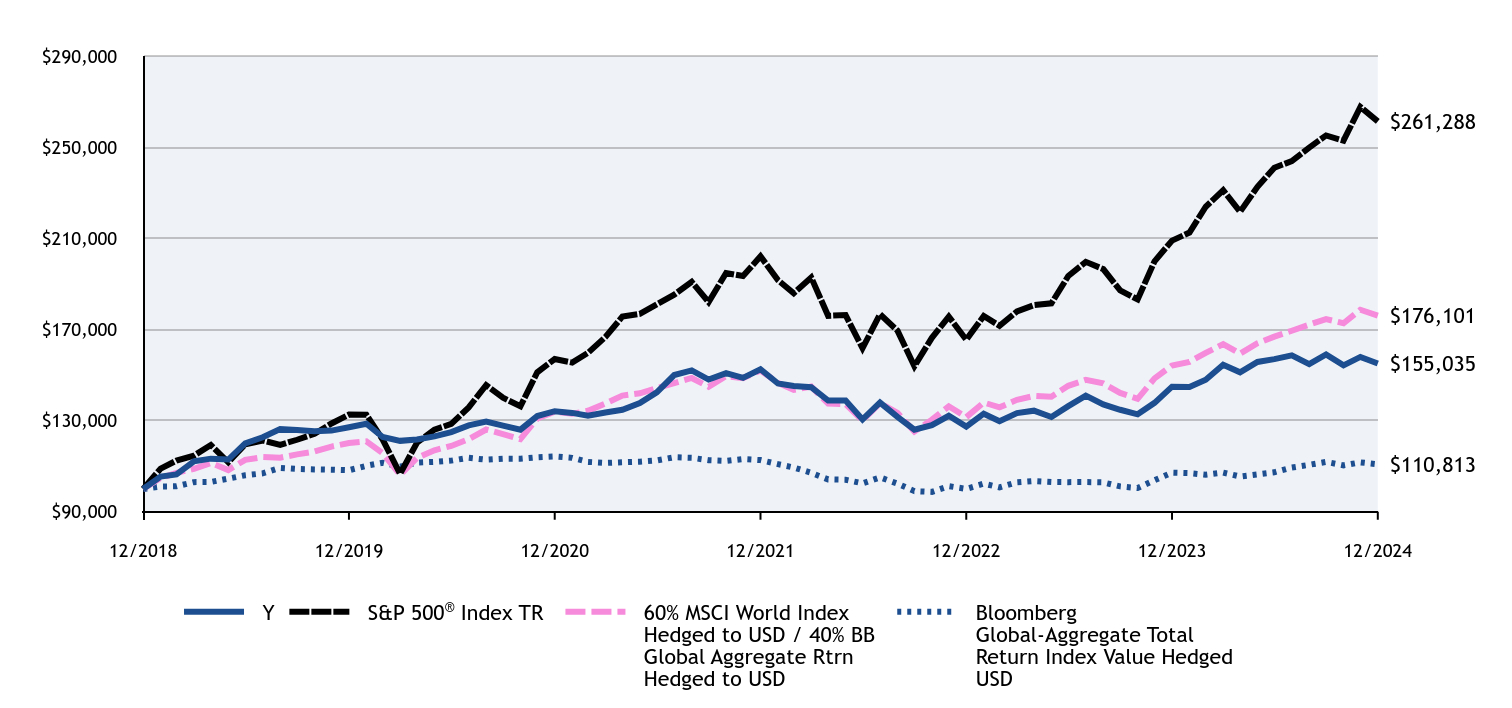
| #ERROR:A result could not be returned because the conditional could not be evaluated to a True/False value (#ERROR:Invalid Formula (#!=""), 'Multiple values from an iterator cannot be used in a formula unless they are aggregrated.') | Y | S&P 500® Index TR | 60% MSCI World Index Hedged to USD / 40% BB Global Aggregate Rtrn Hedged to USD | Bloomberg Global-Aggregate Total Return Index Value Hedged USD |
|---|
| 12/2018 | $100,000 | $100,000 | $100,000 | $100,000 |
|---|
| 01/2019 | $105,400 | $108,945 | $104,837 | $101,059 |
|---|
| 02/2019 | $106,400 | $112,443 | $107,022 | $101,181 |
|---|
| 03/2019 | $112,100 | $114,628 | $108,868 | $102,993 |
|---|
| 04/2019 | $113,300 | $119,269 | $111,397 | $103,054 |
|---|
| 05/2019 | $112,900 | $111,690 | $108,284 | $104,537 |
|---|
| 06/2019 | $120,000 | $119,561 | $112,789 | $106,003 |
|---|
| 07/2019 | $122,700 | $121,280 | $113,988 | $106,837 |
|---|
| 08/2019 | $126,300 | $119,359 | $113,738 | $109,260 |
|---|
| 09/2019 | $125,900 | $121,592 | $115,161 | $108,754 |
|---|
| 10/2019 | $125,300 | $124,225 | $116,429 | $108,566 |
|---|
| 11/2019 | $125,600 | $128,735 | $118,604 | $108,438 |
|---|
| 12/2019 | $127,061 | $132,620 | $120,183 | $108,216 |
|---|
| 01/2020 | $128,628 | $132,568 | $120,903 | $110,169 |
|---|
| 02/2020 | $122,776 | $121,655 | $115,686 | $111,517 |
|---|
| 03/2020 | $121,105 | $106,629 | $106,187 | $109,782 |
|---|
| 04/2020 | $121,732 | $120,298 | $113,607 | $111,559 |
|---|
| 05/2020 | $123,090 | $126,028 | $116,967 | $111,875 |
|---|
| 06/2020 | $124,971 | $128,534 | $118,871 | $112,433 |
|---|
| 07/2020 | $127,896 | $135,782 | $121,841 | $113,662 |
|---|
| 08/2020 | $129,568 | $145,542 | $126,085 | $112,839 |
|---|
| 09/2020 | $127,792 | $140,012 | $124,103 | $113,251 |
|---|
| 10/2020 | $126,016 | $136,288 | $121,847 | $113,259 |
|---|
| 11/2020 | $131,972 | $151,207 | $130,954 | $113,905 |
|---|
| 12/2020 | $134,109 | $157,021 | $133,905 | $114,255 |
|---|
| 01/2021 | $133,372 | $155,435 | $133,010 | $113,642 |
|---|
| 02/2021 | $132,109 | $159,722 | $134,303 | $111,875 |
|---|
| 03/2021 | $133,582 | $166,717 | $137,473 | $111,434 |
|---|
| 04/2021 | $134,740 | $175,614 | $140,976 | $111,725 |
|---|
| 05/2021 | $137,688 | $176,841 | $141,988 | $111,975 |
|---|
| 06/2021 | $142,425 | $180,969 | $144,250 | $112,521 |
|---|
| 07/2021 | $150,004 | $185,268 | $146,462 | $113,919 |
|---|
| 08/2021 | $152,004 | $190,901 | $148,698 | $113,691 |
|---|
| 09/2021 | $148,004 | $182,022 | $144,869 | $112,618 |
|---|
| 10/2021 | $150,846 | $194,775 | $149,524 | $112,323 |
|---|
| 11/2021 | $148,741 | $193,425 | $148,652 | $113,124 |
|---|
| 12/2021 | $152,552 | $202,094 | $152,014 | $112,666 |
|---|
| 01/2022 | $146,285 | $191,636 | $146,579 | $110,895 |
|---|
| 02/2022 | $145,157 | $185,898 | $143,476 | $109,420 |
|---|
| 03/2022 | $144,655 | $192,801 | $144,937 | $107,062 |
|---|
| 04/2022 | $138,764 | $175,988 | $137,479 | $104,184 |
|---|
| 05/2022 | $138,764 | $176,311 | $137,235 | $104,041 |
|---|
| 06/2022 | $130,491 | $161,758 | $130,079 | $102,462 |
|---|
| 07/2022 | $137,886 | $176,672 | $137,659 | $105,072 |
|---|
| 08/2022 | $131,619 | $169,467 | $133,426 | $102,329 |
|---|
| 09/2022 | $125,978 | $153,860 | $125,165 | $99,044 |
|---|
| 10/2022 | $127,984 | $166,316 | $130,398 | $98,705 |
|---|
| 11/2022 | $132,120 | $175,611 | $136,263 | $101,220 |
|---|
| 12/2022 | $127,353 | $165,493 | $131,499 | $100,025 |
|---|
| 01/2023 | $133,034 | $175,892 | $137,924 | $102,329 |
|---|
| 02/2023 | $129,731 | $171,600 | $135,807 | $100,697 |
|---|
| 03/2023 | $133,298 | $177,900 | $139,106 | $102,930 |
|---|
| 04/2023 | $134,355 | $180,677 | $140,791 | $103,460 |
|---|
| 05/2023 | $131,581 | $181,462 | $140,446 | $103,053 |
|---|
| 06/2023 | $136,337 | $193,453 | $145,265 | $102,991 |
|---|
| 07/2023 | $140,961 | $199,667 | $147,887 | $103,024 |
|---|
| 08/2023 | $137,129 | $196,488 | $146,318 | $102,895 |
|---|
| 09/2023 | $134,751 | $187,120 | $142,127 | $101,121 |
|---|
| 10/2023 | $132,770 | $183,186 | $139,542 | $100,403 |
|---|
| 11/2023 | $137,790 | $199,915 | $148,517 | $103,855 |
|---|
| 12/2023 | $144,889 | $208,997 | $154,197 | $107,174 |
|---|
| 01/2024 | $144,752 | $212,509 | $155,769 | $106,964 |
|---|
| 02/2024 | $147,910 | $223,856 | $159,694 | $106,230 |
|---|
| 03/2024 | $154,503 | $231,059 | $163,571 | $107,188 |
|---|
| 04/2024 | $151,207 | $221,621 | $159,410 | $105,462 |
|---|
| 05/2024 | $155,739 | $232,610 | $163,930 | $106,395 |
|---|
| 06/2024 | $156,975 | $240,957 | $166,838 | $107,318 |
|---|
| 07/2024 | $158,623 | $243,890 | $169,438 | $109,391 |
|---|
| 08/2024 | $154,777 | $249,806 | $172,126 | $110,590 |
|---|
| 09/2024 | $159,035 | $255,141 | $174,541 | $111,873 |
|---|
| 10/2024 | $154,228 | $252,827 | $172,719 | $110,359 |
|---|
| 11/2024 | $157,936 | $267,669 | $178,643 | $111,670 |
|---|
| 12/2024 | $155,035 | $261,288 | $176,101 | $110,813 |
|---|
Average Annual Total Returns (%)
| HEADER | 1 Year | 5 Years | Since Inception (12/31/18) |
|---|
Class YFootnote Reference1 | 7.00% | 4.06% | 7.58% |
|---|
S&P 500® Index TR | 25.02% | 14.53% | 17.36% |
|---|
| Bloomberg Global-Aggregate Total Return Index Value Hedged USD | 3.40% | 0.48% | 1.73% |
|---|
| 60% MSCI World Index Hedged to USD / 40% BB Global Aggregate Rtrn Hedged to USD | 14.21% | 7.94% | 9.89% |
|---|
| Footnote | Description |
Footnote1 | Return may differ from actual shareholder return due to accounting adjustments for financial reporting purposes. |
Performance shown is historical and is not indicative of future returns. Investment returns and principal value will vary, and shares may be worth more or less at redemption than at original purchase. Performance shown is as of date indicated, and current performance may be lower or higher than the performance data quoted. To obtain performance as of the most recent month end, please visit americanbeaconfunds.com or call 800-967-9009. The graph and table do not reflect the deduction of taxes that a shareholder would pay on fund distributions or redemption of fund shares. The Fund's performance benefited from fee waivers. For more information, visit americanbeaconfunds.com/Performance_Disclaimers.aspx.
The S&P 500 Index TR and Bloomberg Global-Aggregate Total Return Index Value Hedged USD are replacing the 60% MSCI ® World Index Hedged to USD / 40% Bloomberg Global-Aggregate Total Return Index Value Hedged to USD and the MSCI World Index as the broad-based securities market indices to comply with a new regulatory requirement. The 60% MSCI ® World Index Hedged to USD / 40% Bloomberg Global-Aggregate Total Return Index Value Hedged to USD reflects the market sectors in which the Fund invests.
| Total Net Assets | $277,718,436 |
|---|
| # of Portfolio Holdings | 18 |
|---|
| Portfolio Turnover Rate | 138% |
|---|
| Total Management Fees Paid | $2,597,444 |
|---|
Asset Class Exposure % of VaR*
| Header | Net (%) | % of VaR |
| Stocks | 34.1 | 51.3 |
| Bonds and Rates | 49.3 | 27.3 |
| Credit | 43.8 | 7.3 |
| Commodities | 11.2 | 14.0 |
What did the Fund invest in?
Top Ten Exposures - % of VaR*
| BBG Commodity ex-Agriculturals Index | Long | 14.0 |
| US Treasuries | Long | 12.6 |
| Tokyo Stock Exchange Index | Long | 7.3 |
| S&P 500 Index | Long | 7.1 |
| Nikkei | Long | 4.7 |
| Gilts | Long | 4.4 |
| NASDAQ 100 Index | Long | 4.2 |
| S&P TSX 60 Index | Long | 3.1 |
| Euro-STOXX | Long | 3.1 |
| US High Yield CDX Index | Long | 2.9 |
* Value at Risk (“VaR”) is a measure of the potential loss in value of a portfolio over a defined period for a given confidence interval. A one-day VaR at the 95% confidence level represents that there is a 5% probability that the mark-to-market loss on the portfolio over a one day horizon will exceed this value (assuming normal markets and no trading in the portfolio).
| Value | Value |
|---|
| Standard Deviation | 11.42 |
| Sharpe Ratio | (0.26) |
For additional information about the Fund, including its prospectus, financial statements, holdings, and proxy voting information, please visit www.americanbeaconfunds.com/literature or call 1-800-658-5811.
If your financial institution mailed only one copy of this Report to an address shared by more than one account, you can request an individual copy by contacting your financial institution.
Annual Shareholder Report - December 31, 2024
Distributed by:
Resolute Investment Distributors, Inc.
Annual Shareholder Report - December 31, 2024
This annual shareholder report contains important information about American Beacon AHL TargetRisk Fund for the period of January 1, 2024 to December 31, 2024. You can find additional information about the Fund at www.americanbeaconfunds.com/literature. You can also request this information by contacting us at 800-658-5811.
What were the Fund costs for the last year?
(based on a hypothetical $10,000 investment)
| Class Name | Costs of a $10,000 investment | Costs paid as a percentage of a $10,000 investment |
|---|
| Investor | $158 | 1.53% |
|---|
How did the Fund perform and what affected its performance?
The Investor Class of the Fund returned 6.71% for the twelve months ended December 31, 2024, compared to the 60/40 Global Index (Hedged to USD) return of 5.55%, the Bloomberg Global-Aggregate Total Return Index Value Hedged USD return of 3.26% and the S&P 500 Index return of 25.02%.
• The investment strategy of the Fund’s sub-advisor is designed to maintain a targeted risk profile through dynamic implementation and investing across a broad range of asset classes.
• Overall, the market environment over the twelve-month period was conducive to the sub-advisor’s investment strategy led by performance in U.S. equities despite headwinds from the unwinding of the U.S. dollar Japanese yen carry trade, political instability in South Korea and negative sentiment surrounding the first budget proposal of the new Labour Party in the U.K.
• Equities, credit, and inflation assets were contributors during the period.
• Fixed income was the lone detracting asset class during the period.
Cumulative Performance from December 31, 2018 through December 31, 2024
The initial investment, based on a $10,000 investment, is adjusted to reflect the maximum applicable sales charge, if any.
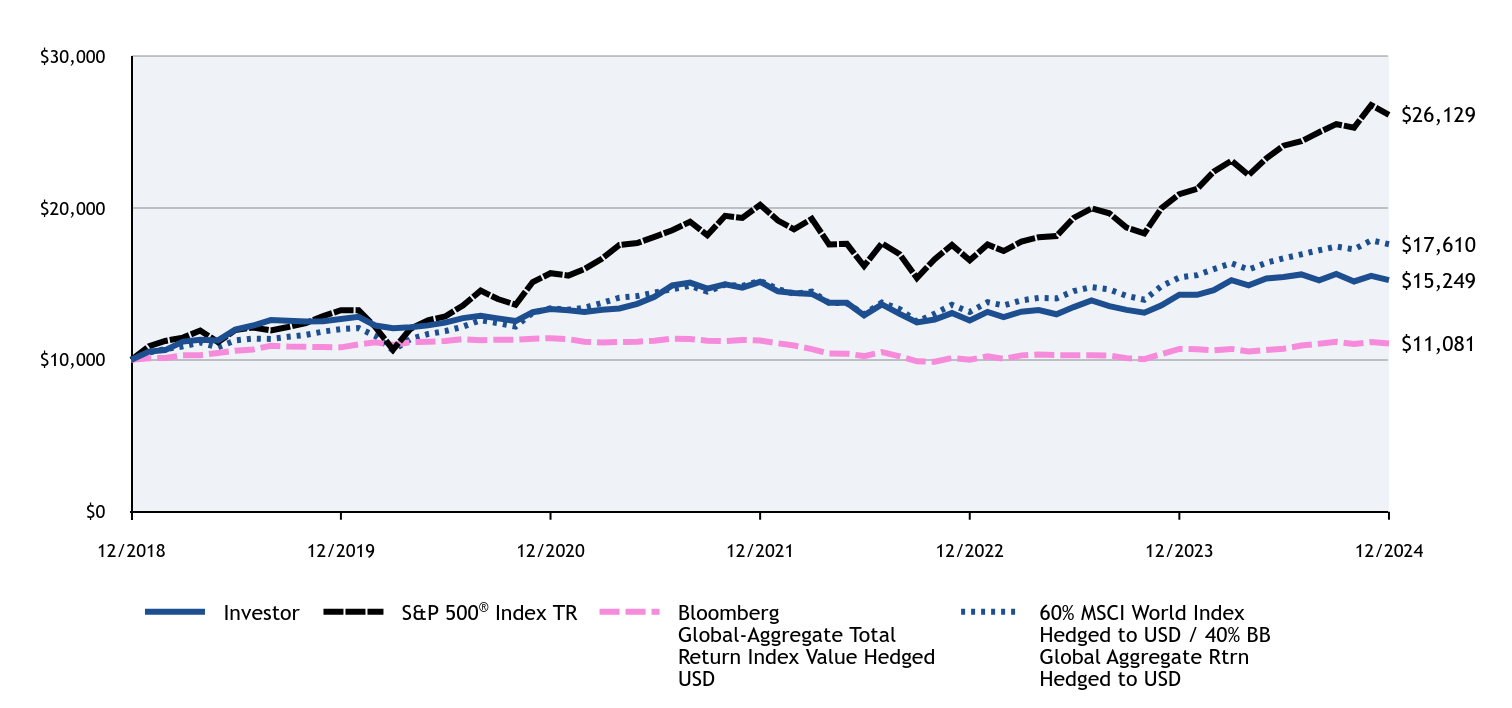
| Investor | S&P 500® Index TR | Bloomberg Global-Aggregate Total Return Index Value Hedged USD | 60% MSCI World Index Hedged to USD / 40% BB Global Aggregate Rtrn Hedged to USD |
|---|
| 12/2018 | $10,000 | $10,000 | $10,000 | $10,000 |
|---|
| 01/2019 | $10,540 | $10,894 | $10,106 | $10,484 |
|---|
| 02/2019 | $10,640 | $11,244 | $10,118 | $10,702 |
|---|
| 03/2019 | $11,200 | $11,463 | $10,299 | $10,887 |
|---|
| 04/2019 | $11,320 | $11,927 | $10,305 | $11,140 |
|---|
| 05/2019 | $11,280 | $11,169 | $10,454 | $10,828 |
|---|
| 06/2019 | $11,990 | $11,956 | $10,600 | $11,279 |
|---|
| 07/2019 | $12,260 | $12,128 | $10,684 | $11,399 |
|---|
| 08/2019 | $12,620 | $11,936 | $10,926 | $11,374 |
|---|
| 09/2019 | $12,580 | $12,159 | $10,875 | $11,516 |
|---|
| 10/2019 | $12,520 | $12,423 | $10,857 | $11,643 |
|---|
| 11/2019 | $12,540 | $12,873 | $10,844 | $11,860 |
|---|
| 12/2019 | $12,685 | $13,262 | $10,822 | $12,018 |
|---|
| 01/2020 | $12,832 | $13,257 | $11,017 | $12,090 |
|---|
| 02/2020 | $12,257 | $12,166 | $11,152 | $11,569 |
|---|
| 03/2020 | $12,079 | $10,663 | $10,978 | $10,619 |
|---|
| 04/2020 | $12,142 | $12,030 | $11,156 | $11,361 |
|---|
| 05/2020 | $12,267 | $12,603 | $11,188 | $11,697 |
|---|
| 06/2020 | $12,445 | $12,853 | $11,243 | $11,887 |
|---|
| 07/2020 | $12,748 | $13,578 | $11,366 | $12,184 |
|---|
| 08/2020 | $12,905 | $14,554 | $11,284 | $12,608 |
|---|
| 09/2020 | $12,727 | $14,001 | $11,325 | $12,410 |
|---|
| 10/2020 | $12,550 | $13,629 | $11,326 | $12,185 |
|---|
| 11/2020 | $13,135 | $15,121 | $11,391 | $13,095 |
|---|
| 12/2020 | $13,342 | $15,702 | $11,426 | $13,390 |
|---|
| 01/2021 | $13,269 | $15,544 | $11,364 | $13,301 |
|---|
| 02/2021 | $13,143 | $15,972 | $11,187 | $13,430 |
|---|
| 03/2021 | $13,290 | $16,672 | $11,143 | $13,747 |
|---|
| 04/2021 | $13,384 | $17,561 | $11,173 | $14,097 |
|---|
| 05/2021 | $13,689 | $17,684 | $11,197 | $14,199 |
|---|
| 06/2021 | $14,151 | $18,097 | $11,252 | $14,425 |
|---|
| 07/2021 | $14,897 | $18,527 | $11,392 | $14,646 |
|---|
| 08/2021 | $15,086 | $19,090 | $11,369 | $14,870 |
|---|
| 09/2021 | $14,687 | $18,202 | $11,262 | $14,487 |
|---|
| 10/2021 | $14,971 | $19,478 | $11,232 | $14,952 |
|---|
| 11/2021 | $14,750 | $19,343 | $11,312 | $14,865 |
|---|
| 12/2021 | $15,134 | $20,209 | $11,267 | $15,201 |
|---|
| 01/2022 | $14,510 | $19,164 | $11,090 | $14,658 |
|---|
| 02/2022 | $14,398 | $18,590 | $10,942 | $14,347 |
|---|
| 03/2022 | $14,336 | $19,280 | $10,706 | $14,494 |
|---|
| 04/2022 | $13,749 | $17,599 | $10,418 | $13,748 |
|---|
| 05/2022 | $13,749 | $17,631 | $10,404 | $13,723 |
|---|
| 06/2022 | $12,926 | $16,176 | $10,246 | $13,008 |
|---|
| 07/2022 | $13,649 | $17,667 | $10,507 | $13,766 |
|---|
| 08/2022 | $13,026 | $16,947 | $10,233 | $13,342 |
|---|
| 09/2022 | $12,464 | $15,386 | $9,904 | $12,516 |
|---|
| 10/2022 | $12,651 | $16,632 | $9,870 | $13,040 |
|---|
| 11/2022 | $13,076 | $17,561 | $10,122 | $13,626 |
|---|
| 12/2022 | $12,593 | $16,549 | $10,003 | $13,150 |
|---|
| 01/2023 | $13,157 | $17,589 | $10,233 | $13,792 |
|---|
| 02/2023 | $12,816 | $17,160 | $10,070 | $13,581 |
|---|
| 03/2023 | $13,170 | $17,790 | $10,293 | $13,910 |
|---|
| 04/2023 | $13,275 | $18,068 | $10,346 | $14,079 |
|---|
| 05/2023 | $12,999 | $18,146 | $10,305 | $14,044 |
|---|
| 06/2023 | $13,471 | $19,345 | $10,299 | $14,526 |
|---|
| 07/2023 | $13,917 | $19,967 | $10,302 | $14,789 |
|---|
| 08/2023 | $13,537 | $19,649 | $10,289 | $14,632 |
|---|
| 09/2023 | $13,288 | $18,712 | $10,112 | $14,213 |
|---|
| 10/2023 | $13,104 | $18,319 | $10,040 | $13,954 |
|---|
| 11/2023 | $13,589 | $19,992 | $10,385 | $14,852 |
|---|
| 12/2023 | $14,291 | $20,900 | $10,717 | $15,420 |
|---|
| 01/2024 | $14,277 | $21,251 | $10,696 | $15,577 |
|---|
| 02/2024 | $14,589 | $22,386 | $10,623 | $15,969 |
|---|
| 03/2024 | $15,241 | $23,106 | $10,719 | $16,357 |
|---|
| 04/2024 | $14,902 | $22,162 | $10,546 | $15,941 |
|---|
| 05/2024 | $15,350 | $23,261 | $10,640 | $16,393 |
|---|
| 06/2024 | $15,459 | $24,096 | $10,732 | $16,684 |
|---|
| 07/2024 | $15,622 | $24,389 | $10,939 | $16,944 |
|---|
| 08/2024 | $15,228 | $24,981 | $11,059 | $17,212 |
|---|
| 09/2024 | $15,649 | $25,514 | $11,187 | $17,454 |
|---|
| 10/2024 | $15,160 | $25,283 | $11,036 | $17,272 |
|---|
| 11/2024 | $15,527 | $26,767 | $11,167 | $17,864 |
|---|
| 12/2024 | $15,249 | $26,129 | $11,081 | $17,610 |
|---|
Average Annual Total Returns (%)
| HEADER | 1 Year | 5 Years | Since Inception (12/31/18) |
|---|
Investor ClassFootnote Reference1 | 6.71% | 3.75% | 7.29% |
|---|
S&P 500® Index TR | 25.02% | 14.53% | 17.36% |
|---|
| Bloomberg Global-Aggregate Total Return Index Value Hedged USD | 3.40% | 0.48% | 1.73% |
|---|
| 60% MSCI World Index Hedged to USD / 40% BB Global Aggregate Rtrn Hedged to USD | 14.21% | 7.94% | 9.89% |
|---|
| Footnote | Description |
Footnote1 | Return may differ from actual shareholder return due to accounting adjustments for financial reporting purposes. |
Performance shown is historical and is not indicative of future returns. Investment returns and principal value will vary, and shares may be worth more or less at redemption than at original purchase. Performance shown is as of date indicated, and current performance may be lower or higher than the performance data quoted. To obtain performance as of the most recent month end, please visit americanbeaconfunds.com or call 800-967-9009. The graph and table do not reflect the deduction of taxes that a shareholder would pay on fund distributions or redemption of fund shares. The Fund's performance benefited from fee waivers. For more information, visit americanbeaconfunds.com/Performance_Disclaimers.aspx.
The S&P 500 Index TR and Bloomberg Global-Aggregate Total Return Index Value Hedged USD are replacing the 60% MSCI ® World Index Hedged to USD / 40% Bloomberg Global-Aggregate Total Return Index Value Hedged to USD and the MSCI World Index as the broad-based securities market indices to comply with a new regulatory requirement. The 60% MSCI ® World Index Hedged to USD / 40% Bloomberg Global-Aggregate Total Return Index Value Hedged to USD reflects the market sectors in which the Fund invests.
| Total Net Assets | $277,718,436 |
|---|
| # of Portfolio Holdings | 18 |
|---|
| Portfolio Turnover Rate | 138% |
|---|
| Total Management Fees Paid | $2,597,444 |
|---|
Asset Class Exposure % of VaR*
| Header | Net (%) | % of VaR |
| Stocks | 34.1 | 51.3 |
| Bonds and Rates | 49.3 | 27.3 |
| Credit | 43.8 | 7.3 |
| Commodities | 11.2 | 14.0 |
What did the Fund invest in?
Top Ten Exposures - % of VaR*
| BBG Commodity ex-Agriculturals Index | Long | 14.0 |
| US Treasuries | Long | 12.6 |
| Tokyo Stock Exchange Index | Long | 7.3 |
| S&P 500 Index | Long | 7.1 |
| Nikkei | Long | 4.7 |
| Gilts | Long | 4.4 |
| NASDAQ 100 Index | Long | 4.2 |
| S&P TSX 60 Index | Long | 3.1 |
| Euro-STOXX | Long | 3.1 |
| US High Yield CDX Index | Long | 2.9 |
* Value at Risk (“VaR”) is a measure of the potential loss in value of a portfolio over a defined period for a given confidence interval. A one-day VaR at the 95% confidence level represents that there is a 5% probability that the mark-to-market loss on the portfolio over a one day horizon will exceed this value (assuming normal markets and no trading in the portfolio).
| Value | Value |
|---|
| Standard Deviation | 11.42 |
| Sharpe Ratio | (0.26) |
For additional information about the Fund, including its prospectus, financial statements, holdings, and proxy voting information, please visit www.americanbeaconfunds.com/literature or call 1-800-658-5811.
If your financial institution mailed only one copy of this Report to an address shared by more than one account, you can request an individual copy by contacting your financial institution.
Annual Shareholder Report - December 31, 2024
Distributed by:
Resolute Investment Distributors, Inc.
AHL Multi-Alternatives Fund
Annual Shareholder Report - December 31, 2024
This annual shareholder report contains important information about American Beacon AHL Multi-Alternatives Fund for the period of January 1, 2024 to December 31, 2024. You can find additional information about the Fund at www.americanbeaconfunds.com/literature. You can also request this information by contacting us at 800-658-5811.
What were the Fund costs for the last year?
(based on a hypothetical $10,000 investment)
| Class Name | Costs of a $10,000 investment | Costs paid as a percentage of a $10,000 investment |
|---|
| Class A | $159 | 1.56% |
|---|
How did the Fund perform and what affected its performance?
The A Class of the Fund returned -2.18% (with sales charges) and 3.77% (without sales charges) for the twelve months ended December 31, 2024, compared to the S&P 500 Index return of 25.02%.
• The investment strategy of the Fund’s sub-advisor combines two strategies: (1) capitalizing on price trends in a broad range of asset classes and (2) maintaining a targeted risk profile through dynamic implementation and investing in a broad range of asset classes.
• Overall, the market environment over the twelve-month period was conducive to the sub-advisor’s investment strategy led by performance in U.S. equities despite the unwinding of the U.S. dollar Japanese yen carry trade, political instability in South Korea and negative sentiment surrounding the first budget proposal of the new Labour Party in the U.K.
• Positioning in equities, commodities, currencies, and credit asset classes were the top contributors during the period.
• Positioning within fixed income was the lone detracting asset class during the period.
Cumulative Performance from August 17, 2023 through December 31, 2024
The initial investment, based on a $10,000 investment, is adjusted to reflect the maximum applicable sales charge, if any.
| A with Sales Charge | S&P 500® Index TR |
|---|
| 8/17/2023 | $9,425 | $10,000 |
|---|
| 8/31/2023 | $9,434 | $10,321 |
|---|
| 9/30/2023 | $9,566 | $9,829 |
|---|
| 10/31/2023 | $9,482 | $9,623 |
|---|
| 11/30/2023 | $9,472 | $10,501 |
|---|
| 12/31/2023 | $9,747 | $10,979 |
|---|
| 1/31/2024 | $9,670 | $11,163 |
|---|
| 2/29/2024 | $9,986 | $11,759 |
|---|
| 3/31/2024 | $10,407 | $12,137 |
|---|
| 4/30/2024 | $10,454 | $11,642 |
|---|
| 5/31/2024 | $10,521 | $12,219 |
|---|
| 6/30/2024 | $10,483 | $12,657 |
|---|
| 7/31/2024 | $10,368 | $12,811 |
|---|
| 8/31/2024 | $10,081 | $13,122 |
|---|
| 9/30/2024 | $10,292 | $13,402 |
|---|
| 10/31/2024 | $9,995 | $13,281 |
|---|
| 11/30/2024 | $10,120 | $14,061 |
|---|
| 12/31/2024 | $10,114 | $13,725 |
|---|
Average Annual Total Returns (%)
| HEADER | 1 Year | Since Inception (8/17/23) |
|---|
Class A without Sales ChargeFootnote Reference1 | 3.77% | 5.27% |
|---|
Class A with Maximum Sales Charge - 5.75%Footnote Reference1 | (2.18)% | 0.83% |
|---|
S&P 500® Index TR | 25.02% | 25.95% |
|---|
| Footnote | Description |
Footnote1 | Return may differ from actual shareholder return due to accounting adjustments for financial reporting purposes. |
Performance shown is historical and is not indicative of future returns. Investment returns and principal value will vary, and shares may be worth more or less at redemption than at original purchase. Performance shown is as of date indicated, and current performance may be lower or higher than the performance data quoted. To obtain performance as of the most recent month end, please visit americanbeaconfunds.com or call 800-967-9009. The graph and table do not reflect the deduction of taxes that a shareholder would pay on fund distributions or redemption of fund shares. The Fund's performance benefited from fee waivers. For more information, visit americanbeaconfunds.com/Performance_Disclaimers.aspx.
The S&P 500 Index TR is replacing the ICE BofA US 3-Month Treasury Bill Index as broad-based securities market index to comply with a new regulatory requirement.
| Total Net Assets | $37,959,237 |
|---|
| # of Portfolio Holdings | 15 |
|---|
| Portfolio Turnover Rate | 141% |
|---|
| Total Management Fees Paid | $0 |
|---|
Asset Class Exposure % of VaR*
| Value | Value |
|---|
| Currencies | 29.2 |
| Equities | 29.1 |
| Commodities | 27.1 |
| Fixed Income | 13.5 |
| Credit | 1.1 |
*Value at Risk (“VaR”) is a measure of the potential loss in value of a portfolio over a defined period for a given confidence interval. A one-day VaR at the 95% confidence level represents that there is a 5% probability that the mark-to-market loss on the portfolio over a one day horizon will exceed this value (assuming normal markets and no trading in the portfolio).
What did the Fund invest in?
Top Active Exposures by Asset Class % of VaR*
| Commodities | Header | % of VaR |
| BBG Commodity ex-Agriculturals Index | Long | 4.0 |
| Copper | Short | 3.4 |
| Cocoa | Long | 2.3 |
| Coffee | Long | 1.9 |
| Soybeans | Short | 1.9 |
| Credit | Header | % of VaR |
| US 5yr CDX Index | Long | 1.1 |
| Currencies | Header | % of VaR |
| Japanese Yen/US Dollar | Short | 6.4 |
| Swiss Franc/US Dollar | Short | 1.9 |
| Norwegian Krone/US Dollar | Short | 1.5 |
| Swedish Krona/US Dollar | Short | 1.4 |
| South Korean Won/US Dollar | Short | 1.4 |
| Equities | Header | % of VaR |
| Nikkei | Long | 3.7 |
| S&P 500 Index | Long | 3.5 |
| Tokyo Stock Exchange Index | Long | 3.1 |
| NASDAQ 100 Index | Long | 2.3 |
| FTSE Taiwan Index | Long | 1.9 |
| Fixed Income | Header | % of VaR |
| Euribor | Long | 2.4 |
| US Treasuries | Short | 2.4 |
| SOFR 3Mth Index | Short | 2.3 |
| SONIA 3Mth Index | Short | 1.7 |
| Australian Bonds | Short | 1.6 |
| Number of Long Holdings | 39 |
| Number of Currency Pairs | 35 |
| Number of Short Holdings | 24 |
Top Ten Holdings - % of VaR*
| Japanese Yen/US Dollar | Short | 6.4 |
| BBG Commodity ex-Agriculturals Index | Long | 4.0 |
| Nikkei | Long | 3.7 |
| S&P 500 Index | Long | 3.5 |
| Copper | Short | 3.4 |
| Tokyo Stock Exchange Index | Long | 3.1 |
| Euribor | Long | 2.4 |
| US Treasuries | Short | 2.4 |
| Cocoa | Long | 2.3 |
| SOFR 3Mth Index | Short | 2.3 |
Includes long positions only.
For additional information about the Fund, including its prospectus, financial statements, holdings, and proxy voting information, please visit www.americanbeaconfunds.com/literature or call 1-800-658-5811.
If your financial institution mailed only one copy of this Report to an address shared by more than one account, you can request an individual copy by contacting your financial institution.
Annual Shareholder Report - December 31, 2024
Distributed by:
Resolute Investment Distributors, Inc.
AHL Multi-Alternatives Fund
AHL Multi-Alternatives Fund
Annual Shareholder Report - December 31, 2024
This annual shareholder report contains important information about American Beacon AHL Multi-Alternatives Fund for the period of January 1, 2024 to December 31, 2024. You can find additional information about the Fund at www.americanbeaconfunds.com/literature. You can also request this information by contacting us at 800-658-5811.
What were the Fund costs for the last year?
(based on a hypothetical $10,000 investment)
| Class Name | Costs of a $10,000 investment | Costs paid as a percentage of a $10,000 investment |
|---|
| Class C | $235 | 2.31% |
|---|
How did the Fund perform and what affected its performance?
The C Class of the Fund returned 2.04% (with sales charges) and 3.04% (without sales charges) for the twelve months ended December 31, 2024, compared to the S&P 500 Index return of 25.02%.
• The investment strategy of the Fund’s sub-advisor combines two strategies: (1) capitalizing on price trends in a broad range of asset classes and (2) maintaining a targeted risk profile through dynamic implementation and investing in a broad range of asset classes.
• Overall, the market environment over the twelve-month period was conducive to the sub-advisor’s investment strategy led by performance in U.S. equities despite the unwinding of the U.S. dollar Japanese yen carry trade, political instability in South Korea and negative sentiment surrounding the first budget proposal of the new Labour Party in the U.K.
• Positioning in equities, commodities, currencies, and credit asset classes were the top contributors during the period.
• Positioning within fixed income was the lone detracting asset class during the period.
Cumulative Performance from August 17, 2023 through December 31, 2024
The initial investment, based on a $10,000 investment, is adjusted to reflect the maximum applicable sales charge, if any.
| C with Sales Charge | S&P 500® Index TR |
|---|
| 8/17/2023 | $10,000 | $10,000 |
|---|
| 8/31/2023 | $10,010 | $10,321 |
|---|
| 9/30/2023 | $10,140 | $9,829 |
|---|
| 10/31/2023 | $10,050 | $9,623 |
|---|
| 11/30/2023 | $10,030 | $10,501 |
|---|
| 12/31/2023 | $10,311 | $10,979 |
|---|
| 1/31/2024 | $10,220 | $11,163 |
|---|
| 2/29/2024 | $10,555 | $11,759 |
|---|
| 3/31/2024 | $10,991 | $12,137 |
|---|
| 4/30/2024 | $11,032 | $11,642 |
|---|
| 5/31/2024 | $11,103 | $12,219 |
|---|
| 6/30/2024 | $11,052 | $12,657 |
|---|
| 7/31/2024 | $10,920 | $12,811 |
|---|
| 8/31/2024 | $10,616 | $13,122 |
|---|
| 9/30/2024 | $10,829 | $13,402 |
|---|
| 10/31/2024 | $10,504 | $13,281 |
|---|
| 11/30/2024 | $10,636 | $14,061 |
|---|
| 12/31/2024 | $10,625 | $13,725 |
|---|
Average Annual Total Returns (%)
| HEADER | 1 Year | Since Inception (8/17/23) |
|---|
Class C without Deferred Sales ChargeFootnote Reference1 | 3.04% | 4.51% |
|---|
Class C with Maximum Deferred Sales Charge -1.00%Footnote Reference1 | 2.04% | 4.51% |
|---|
S&P 500® Index TR | 25.02% | 25.95% |
|---|
| Footnote | Description |
Footnote1 | Return may differ from actual shareholder return due to accounting adjustments for financial reporting purposes. |
Performance shown is historical and is not indicative of future returns. Investment returns and principal value will vary, and shares may be worth more or less at redemption than at original purchase. Performance shown is as of date indicated, and current performance may be lower or higher than the performance data quoted. To obtain performance as of the most recent month end, please visit americanbeaconfunds.com or call 800-967-9009. The graph and table do not reflect the deduction of taxes that a shareholder would pay on fund distributions or redemption of fund shares. The Fund's performance benefited from fee waivers. For more information, visit americanbeaconfunds.com/Performance_Disclaimers.aspx.
The S&P 500 Index TR is replacing the ICE BofA US 3-Month Treasury Bill Index as broad-based securities market index to comply with a new regulatory requirement.
| Total Net Assets | $37,959,237 |
|---|
| # of Portfolio Holdings | 15 |
|---|
| Portfolio Turnover Rate | 141% |
|---|
| Total Management Fees Paid | $0 |
|---|
Asset Class Exposure % of VaR*
| Value | Value |
|---|
| Currencies | 29.2 |
| Equities | 29.1 |
| Commodities | 27.1 |
| Fixed Income | 13.5 |
| Credit | 1.1 |
*Value at Risk (“VaR”) is a measure of the potential loss in value of a portfolio over a defined period for a given confidence interval. A one-day VaR at the 95% confidence level represents that there is a 5% probability that the mark-to-market loss on the portfolio over a one day horizon will exceed this value (assuming normal markets and no trading in the portfolio).
What did the Fund invest in?
Top Active Exposures by Asset Class % of VaR*
| Commodities | Header | % of VaR |
| BBG Commodity ex-Agriculturals Index | Long | 4.0 |
| Copper | Short | 3.4 |
| Cocoa | Long | 2.3 |
| Coffee | Long | 1.9 |
| Soybeans | Short | 1.9 |
| Credit | Header | % of VaR |
| US 5yr CDX Index | Long | 1.1 |
| Currencies | Header | % of VaR |
| Japanese Yen/US Dollar | Short | 6.4 |
| Swiss Franc/US Dollar | Short | 1.9 |
| Norwegian Krone/US Dollar | Short | 1.5 |
| Swedish Krona/US Dollar | Short | 1.4 |
| South Korean Won/US Dollar | Short | 1.4 |
| Equities | Header | % of VaR |
| Nikkei | Long | 3.7 |
| S&P 500 Index | Long | 3.5 |
| Tokyo Stock Exchange Index | Long | 3.1 |
| NASDAQ 100 Index | Long | 2.3 |
| FTSE Taiwan Index | Long | 1.9 |
| Fixed Income | Header | % of VaR |
| Euribor | Long | 2.4 |
| US Treasuries | Short | 2.4 |
| SOFR 3Mth Index | Short | 2.3 |
| SONIA 3Mth Index | Short | 1.7 |
| Australian Bonds | Short | 1.6 |
| Number of Long Holdings | 39 |
| Number of Currency Pairs | 35 |
| Number of Short Holdings | 24 |
Top Ten Holdings - % of VaR*
| Japanese Yen/US Dollar | Short | 6.4 |
| BBG Commodity ex-Agriculturals Index | Long | 4.0 |
| Nikkei | Long | 3.7 |
| S&P 500 Index | Long | 3.5 |
| Copper | Short | 3.4 |
| Tokyo Stock Exchange Index | Long | 3.1 |
| Euribor | Long | 2.4 |
| US Treasuries | Short | 2.4 |
| Cocoa | Long | 2.3 |
| SOFR 3Mth Index | Short | 2.3 |
Includes long positions only.
For additional information about the Fund, including its prospectus, financial statements, holdings, and proxy voting information, please visit www.americanbeaconfunds.com/literature or call 1-800-658-5811.
If your financial institution mailed only one copy of this Report to an address shared by more than one account, you can request an individual copy by contacting your financial institution.
Annual Shareholder Report - December 31, 2024
Distributed by:
Resolute Investment Distributors, Inc.
AHL Multi-Alternatives Fund
AHL Multi-Alternatives Fund
Annual Shareholder Report - December 31, 2024
This annual shareholder report contains important information about American Beacon AHL Multi-Alternatives Fund for the period of January 1, 2024 to December 31, 2024. You can find additional information about the Fund at www.americanbeaconfunds.com/literature. You can also request this information by contacting us at 800-658-5811.
What were the Fund costs for the last year?
(based on a hypothetical $10,000 investment)
| Class Name | Costs of a $10,000 investment | Costs paid as a percentage of a $10,000 investment |
|---|
| Y | $136 | 1.33% |
|---|
How did the Fund perform and what affected its performance?
The Y Class of the Fund returned 4.06% for the twelve months ended December 31, 2024, compared to the S&P 500 Index return of 25.02%.
• The investment strategy of the Fund’s sub-advisor combines two strategies: (1) capitalizing on price trends in a broad range of asset classes and (2) maintaining a targeted risk profile through dynamic implementation and investing in a broad range of asset classes.
• Overall, the market environment over the twelve-month period was conducive to the sub-advisor’s investment strategy led by performance in U.S. equities despite the unwinding of the U.S. dollar Japanese yen carry trade, political instability in South Korea and negative sentiment surrounding the first budget proposal of the new Labour Party in the U.K.
• Positioning in equities, commodities, currencies, and credit asset classes were the top contributors during the period.
• Positioning within fixed income was the lone detracting asset class during the period.
Cumulative Performance from August 17, 2023 through December 31, 2024
The initial investment, based on a $100,000 investment, is adjusted to reflect the maximum applicable sales charge, if any.
| #ERROR:A result could not be returned because the conditional could not be evaluated to a True/False value (#ERROR:Invalid Formula (#!=""), 'Multiple values from an iterator cannot be used in a formula unless they are aggregrated.') | Y | S&P 500® Index TR |
|---|
| 20230817 | $100,000 | $100,000 |
|---|
| 20230831 | $100,200 | $103,215 |
|---|
| 20230930 | $101,500 | $98,294 |
|---|
| 20231031 | $100,700 | $96,227 |
|---|
| 20231130 | $100,600 | $105,015 |
|---|
| 20231231 | $103,511 | $109,786 |
|---|
| 20240131 | $102,699 | $111,631 |
|---|
| 20240229 | $106,149 | $117,591 |
|---|
| 20240331 | $110,615 | $121,375 |
|---|
| 20240430 | $111,122 | $116,417 |
|---|
| 20240531 | $111,832 | $122,190 |
|---|
| 20240630 | $111,426 | $126,574 |
|---|
| 20240731 | $110,310 | $128,115 |
|---|
| 20240831 | $107,266 | $131,222 |
|---|
| 20240930 | $109,498 | $134,025 |
|---|
| 20241031 | $106,352 | $132,809 |
|---|
| 20241130 | $107,672 | $140,605 |
|---|
| 20241231 | $107,714 | $137,254 |
|---|
Average Annual Total Returns (%)
| HEADER | 1 Year | Since Inception (8/17/23) |
|---|
Class YFootnote Reference1 | 4.06% | 5.56% |
|---|
S&P 500® Index TR | 25.02% | 25.95% |
|---|
| Footnote | Description |
Footnote1 | Return may differ from actual shareholder return due to accounting adjustments for financial reporting purposes. |
Performance shown is historical and is not indicative of future returns. Investment returns and principal value will vary, and shares may be worth more or less at redemption than at original purchase. Performance shown is as of date indicated, and current performance may be lower or higher than the performance data quoted. To obtain performance as of the most recent month end, please visit americanbeaconfunds.com or call 800-967-9009. The graph and table do not reflect the deduction of taxes that a shareholder would pay on fund distributions or redemption of fund shares. The Fund's performance benefited from fee waivers. For more information, visit americanbeaconfunds.com/Performance_Disclaimers.aspx.
The S&P 500 Index TR is replacing the ICE BofA US 3-Month Treasury Bill Index as broad-based securities market index to comply with a new regulatory requirement.
| Total Net Assets | $37,959,237 |
|---|
| # of Portfolio Holdings | 15 |
|---|
| Portfolio Turnover Rate | 141% |
|---|
| Total Management Fees Paid | $0 |
|---|
Asset Class Exposure % of VaR*
| Value | Value |
|---|
| Currencies | 29.2 |
| Equities | 29.1 |
| Commodities | 27.1 |
| Fixed Income | 13.5 |
| Credit | 1.1 |
*Value at Risk (“VaR”) is a measure of the potential loss in value of a portfolio over a defined period for a given confidence interval. A one-day VaR at the 95% confidence level represents that there is a 5% probability that the mark-to-market loss on the portfolio over a one day horizon will exceed this value (assuming normal markets and no trading in the portfolio).
What did the Fund invest in?
Top Active Exposures by Asset Class % of VaR*
| Commodities | Header | % of VaR |
| BBG Commodity ex-Agriculturals Index | Long | 4.0 |
| Copper | Short | 3.4 |
| Cocoa | Long | 2.3 |
| Coffee | Long | 1.9 |
| Soybeans | Short | 1.9 |
| Credit | Header | % of VaR |
| US 5yr CDX Index | Long | 1.1 |
| Currencies | Header | % of VaR |
| Japanese Yen/US Dollar | Short | 6.4 |
| Swiss Franc/US Dollar | Short | 1.9 |
| Norwegian Krone/US Dollar | Short | 1.5 |
| Swedish Krona/US Dollar | Short | 1.4 |
| South Korean Won/US Dollar | Short | 1.4 |
| Equities | Header | % of VaR |
| Nikkei | Long | 3.7 |
| S&P 500 Index | Long | 3.5 |
| Tokyo Stock Exchange Index | Long | 3.1 |
| NASDAQ 100 Index | Long | 2.3 |
| FTSE Taiwan Index | Long | 1.9 |
| Fixed Income | Header | % of VaR |
| Euribor | Long | 2.4 |
| US Treasuries | Short | 2.4 |
| SOFR 3Mth Index | Short | 2.3 |
| SONIA 3Mth Index | Short | 1.7 |
| Australian Bonds | Short | 1.6 |
| Number of Long Holdings | 39 |
| Number of Currency Pairs | 35 |
| Number of Short Holdings | 24 |
Top Ten Holdings - % of VaR*
| Japanese Yen/US Dollar | Short | 6.4 |
| BBG Commodity ex-Agriculturals Index | Long | 4.0 |
| Nikkei | Long | 3.7 |
| S&P 500 Index | Long | 3.5 |
| Copper | Short | 3.4 |
| Tokyo Stock Exchange Index | Long | 3.1 |
| Euribor | Long | 2.4 |
| US Treasuries | Short | 2.4 |
| Cocoa | Long | 2.3 |
| SOFR 3Mth Index | Short | 2.3 |
Includes long positions only.
For additional information about the Fund, including its prospectus, financial statements, holdings, and proxy voting information, please visit www.americanbeaconfunds.com/literature or call 1-800-658-5811.
If your financial institution mailed only one copy of this Report to an address shared by more than one account, you can request an individual copy by contacting your financial institution.
Annual Shareholder Report - December 31, 2024
Distributed by:
Resolute Investment Distributors, Inc.
AHL Multi-Alternatives Fund
AHL Multi-Alternatives Fund
Annual Shareholder Report - December 31, 2024
This annual shareholder report contains important information about American Beacon AHL Multi-Alternatives Fund for the period of January 1, 2024 to December 31, 2024. You can find additional information about the Fund at www.americanbeaconfunds.com/literature. You can also request this information by contacting us at 800-658-5811.
What were the Fund costs for the last year?
(based on a hypothetical $10,000 investment)
| Class Name | Costs of a $10,000 investment | Costs paid as a percentage of a $10,000 investment |
|---|
| R6 | $125 | 1.23% |
|---|
How did the Fund perform and what affected its performance?
The R6 Class of the Fund returned 4.16% for the twelve months ended December 31, 2024, compared to the S&P 500 Index return of 25.02%.
• The investment strategy of the Fund’s sub-advisor combines two strategies: (1) capitalizing on price trends in a broad range of asset classes and (2) maintaining a targeted risk profile through dynamic implementation and investing in a broad range of asset classes.
• Overall, the market environment over the twelve-month period was conducive to the sub-advisor’s investment strategy led by performance in U.S. equities despite the unwinding of the U.S. dollar Japanese yen carry trade, political instability in South Korea and negative sentiment surrounding the first budget proposal of the new Labour Party in the U.K.
• Positioning in equities, commodities, currencies, and credit asset classes were the top contributors during the period.
• Positioning within fixed income was the lone detracting asset class during the period.
Cumulative Performance from August 17, 2023 through December 31, 2024
The initial investment, based on a $10,000 investment, is adjusted to reflect the maximum applicable sales charge, if any.
| R6 | S&P 500® Index TR |
|---|
| 8/17/2023 | $10,000 | $10,000 |
|---|
| 8/31/2023 | $10,020 | $10,321 |
|---|
| 9/30/2023 | $10,150 | $9,829 |
|---|
| 10/31/2023 | $10,070 | $9,623 |
|---|
| 11/30/2023 | $10,060 | $10,501 |
|---|
| 12/31/2023 | $10,351 | $10,979 |
|---|
| 1/31/2024 | $10,270 | $11,163 |
|---|
| 2/29/2024 | $10,615 | $11,759 |
|---|
| 3/31/2024 | $11,072 | $12,137 |
|---|
| 4/30/2024 | $11,112 | $11,642 |
|---|
| 5/31/2024 | $11,193 | $12,219 |
|---|
| 6/30/2024 | $11,153 | $12,657 |
|---|
| 7/31/2024 | $11,041 | $12,811 |
|---|
| 8/31/2024 | $10,737 | $13,122 |
|---|
| 9/30/2024 | $10,960 | $13,402 |
|---|
| 10/31/2024 | $10,645 | $13,281 |
|---|
| 11/30/2024 | $10,777 | $14,061 |
|---|
| 12/31/2024 | $10,782 | $13,725 |
|---|
Average Annual Total Returns (%)
| HEADER | 1 Year | Since Inception (8/17/23) |
|---|
R6 ClassFootnote Reference1 | 4.16% | 5.64% |
|---|
S&P 500® Index TR | 25.02% | 25.95% |
|---|
| Footnote | Description |
Footnote1 | Return may differ from actual shareholder return due to accounting adjustments for financial reporting purposes. |
Performance shown is historical and is not indicative of future returns. Investment returns and principal value will vary, and shares may be worth more or less at redemption than at original purchase. Performance shown is as of date indicated, and current performance may be lower or higher than the performance data quoted. To obtain performance as of the most recent month end, please visit americanbeaconfunds.com or call 800-967-9009. The graph and table do not reflect the deduction of taxes that a shareholder would pay on fund distributions or redemption of fund shares. The Fund's performance benefited from fee waivers. Performance includes historical performance of another Class of the Fund. For more information, visit americanbeaconfunds.com/Performance_Disclaimers.aspx.
The S&P 500 Index TR is replacing the ICE BofA US 3-Month Treasury Bill Index as broad-based securities market index to comply with a new regulatory requirement.
| Total Net Assets | $37,959,237 |
|---|
| # of Portfolio Holdings | 15 |
|---|
| Portfolio Turnover Rate | 141% |
|---|
| Total Management Fees Paid | $0 |
|---|
Asset Class Exposure % of VaR*
| Value | Value |
|---|
| Currencies | 29.2 |
| Equities | 29.1 |
| Commodities | 27.1 |
| Fixed Income | 13.5 |
| Credit | 1.1 |
*Value at Risk (“VaR”) is a measure of the potential loss in value of a portfolio over a defined period for a given confidence interval. A one-day VaR at the 95% confidence level represents that there is a 5% probability that the mark-to-market loss on the portfolio over a one day horizon will exceed this value (assuming normal markets and no trading in the portfolio).
What did the Fund invest in?
Top Active Exposures by Asset Class % of VaR*
| Commodities | Header | % of VaR |
| BBG Commodity ex-Agriculturals Index | Long | 4.0 |
| Copper | Short | 3.4 |
| Cocoa | Long | 2.3 |
| Coffee | Long | 1.9 |
| Soybeans | Short | 1.9 |
| Credit | Header | % of VaR |
| US 5yr CDX Index | Long | 1.1 |
| Currencies | Header | % of VaR |
| Japanese Yen/US Dollar | Short | 6.4 |
| Swiss Franc/US Dollar | Short | 1.9 |
| Norwegian Krone/US Dollar | Short | 1.5 |
| Swedish Krona/US Dollar | Short | 1.4 |
| South Korean Won/US Dollar | Short | 1.4 |
| Equities | Header | % of VaR |
| Nikkei | Long | 3.7 |
| S&P 500 Index | Long | 3.5 |
| Tokyo Stock Exchange Index | Long | 3.1 |
| NASDAQ 100 Index | Long | 2.3 |
| FTSE Taiwan Index | Long | 1.9 |
| Fixed Income | Header | % of VaR |
| Euribor | Long | 2.4 |
| US Treasuries | Short | 2.4 |
| SOFR 3Mth Index | Short | 2.3 |
| SONIA 3Mth Index | Short | 1.7 |
| Australian Bonds | Short | 1.6 |
| Number of Long Holdings | 39 |
| Number of Currency Pairs | 35 |
| Number of Short Holdings | 24 |
Top Ten Holdings - % of VaR*
| Japanese Yen/US Dollar | Short | 6.4 |
| BBG Commodity ex-Agriculturals Index | Long | 4.0 |
| Nikkei | Long | 3.7 |
| S&P 500 Index | Long | 3.5 |
| Copper | Short | 3.4 |
| Tokyo Stock Exchange Index | Long | 3.1 |
| Euribor | Long | 2.4 |
| US Treasuries | Short | 2.4 |
| Cocoa | Long | 2.3 |
| SOFR 3Mth Index | Short | 2.3 |
Includes long positions only.
For additional information about the Fund, including its prospectus, financial statements, holdings, and proxy voting information, please visit www.americanbeaconfunds.com/literature or call 1-800-658-5811.
If your financial institution mailed only one copy of this Report to an address shared by more than one account, you can request an individual copy by contacting your financial institution.
Annual Shareholder Report - December 31, 2024
Distributed by:
Resolute Investment Distributors, Inc.
AHL Multi-Alternatives Fund
Item 2. Code of Ethics
The registrant adopted a code of ethics (the “Code”) that applies to the registrant’s Principal Executive Officer and Principal Financial Officer. The registrant amended the Code on June 14, 2024 to update the name of the Principal Executive Officer. The registrant has not granted any waivers from the provisions of the Code during the period covered by the shareholder reports presented in Item 1. The Code is filed herewith as Exhibit 99.CODE ETH.
Item 3. Audit Committee Financial Expert
The registrant’s Board of Trustees of the Trust has determined that Claudia Holz, a member of the Trust’s Audit and Compliance Committee, is the “audit committee financial expert” as defined in Form N-CSR. Ms. Holz is considered “independent” as defined in Item 3 of Form N-CSR.
Item 4. Principal Account Fees and Services
The registrant has engaged its principal accountant to perform audit services, audit-related services, tax services and other services during the past two fiscal years. “Audit services” refer to performing an audit of the registrant’s annual financial statements or services that are normally provided by the accountant in connection with statutory and regulatory filings or engagements for those fiscal years. “Audit-related services” refer to the assurance and related services by the principal accountant that are reasonably related to the performance of the audit. “Tax services” refer to professional services rendered by the principal accountant for tax compliance, tax advice, and tax planning. “Other services” refer to all other fees category would consist of service related to internal control reviews, strategy, and other consulting, financial information systems design and implementation, consulting on other information systems, and other tax services unrelated to the registrant. The following table details the aggregate fees billed for each of the last two fiscal years for audit fees, audit-related fees, tax fees, and all other fees by the principal accountant.
| | | | |
| (a) | | | |
| |
Audit Fees | | Fiscal Year
Ended | |
$296,362 | | | 12/31/23 | |
$299,371 | | | 12/31/24 | |
| |
| (b) | | | |
Audit Related Fees | | Fiscal Year
Ended | |
$0 | | | 12/31/23 | |
$0 | | | 12/31/24 | |
| |
| (c) | | | |
Tax Fees(1) | | Fiscal Year
Ended | |
$110,350 | | | 12/31/23 | |
$65,500 | | | 12/31/24 | |
| |
| (d) | | | |
All Other Fees | | Fiscal Year
Ended | |
$0 | | | 12/31/23 | |
$0 | | | 12/31/24 | |
(1) “Tax Fees” are the aggregate fees billed for professional services for tax advice, tax compliance, tax planning, filing assistance for EU reclaims and PFIC tax services. These fees include international, federal, state, and excise tax reviews.
(e)(1) Pursuant to its charter, the Trust’s Audit and Compliance Committee shall have the following duties and powers pertaining to pre-approval of audit and non-audit services provided by the registrant’s principal accountant:
| | • | | to approve, prior to appointment, the engagement of auditors to annually audit and provide their opinion on the Trusts’ financial statements, and, in connection therewith, reviewing and evaluating matters potentially affecting the independence and capabilities of the auditors; |
| | • | | to approve, prior to appointment, the engagement of the auditors to provide non-audit services to the Trusts, an investment adviser to any series of the Trusts or any entity controlling, controlled by, or under common control with an investment adviser (“adviser affiliate”) that provides ongoing services to the Trusts, if the engagement relates directly to the operations and financial reporting of the Trusts; |
| | • | | to consider whether the non-audit services provided by a Trust’s auditor to an investment adviser or any adviser affiliate that provides ongoing services to a series of the Trusts, which services were not pre-approved by the Committee, are compatible with maintaining the auditor’s independence; |
| | • | | to review the arrangements for and scope of the annual audit and any special audits; and |
| | • | | to review and approving the fees proposed to be charged to the Trusts by the auditors for each audit and non-audit service. |
The Audit and Compliance Committee may delegate any portion of its authority, including the authority to grant pre-approvals of audit and permitted non-audit services, to a subcommittee of one or more members. Any decisions of the subcommittee to grant pre-approvals shall be presented to the full audit committee at its next regularly scheduled meeting.
(e)(2) None of the fees disclosed in paragraphs (b) through (d) above were approved by the audit committee pursuant to paragraph (c)(7)(i)(C) of Rule 2-01 of Regulation S-X.
(f) Not applicable.
(g) Aggregate Non-Audit Fees for Services Rendered to the:
| | | | | | | | | | | | | | | | | | |
Registrant | | Adviser | | | | | Adviser’s Affiliates Providing
Ongoing Services to Registrant | | | | | | Fiscal Year
Ended | |
$110,350 | | $32,969 | | | | | | | N/A | | | | | | | | 12/31/23 | |
$65,500 | | $107,469 | | | | | | | N/A | | | | | | | | 12/31/24 | |
(h) Not applicable.
Item 5. Audit Committee of Listed Registrants
Not applicable.
Item 6. Investments
| (a) | The schedules of investments for each series of the Trust are included in the shareholder reports presented in Item 7. |
Financial Statements and Other Information
Name of registrant: American Beacon Funds
Date of fiscal year end: December 31, 2024
Date of reporting period: December 31, 2024
Item 7. Financial Statements and Financial Highlights for Open-End Management Investment Companies
American Beacon Funds
Although information has been compiled from reliable sources, American Beacon Advisors, Inc. makes no representation as to the completeness or accuracy of the statements contained herein. All information is as of the end of the reporting period, unless noted otherwise, and is subject to change. Each Fund’s portfolio composition will change depending on economic and market conditions.
American Beacon Funds | December 31, 2024 |
Contents
American Beacon FundsSM
Report of Independent Registered Public Accounting Firm
To the Board of Trustees of American Beacon Funds and Shareholders of American Beacon AHL Managed Futures Strategy Fund, American Beacon AHL Multi-Alternatives Fund, and American Beacon AHL TargetRisk Fund
Opinions on the Financial Statements
We have audited the accompanying consolidated statements of assets and liabilities, including the consolidated schedules of investments, of American Beacon AHL Managed Futures Strategy Fund, American Beacon AHL Multi-Alternatives Fund, and American Beacon AHL TargetRisk Fund and their subsidiaries (three of the funds constituting American Beacon Funds, hereafter collectively referred to as the “Funds”) as of December 31 2024, the related consolidated statements of operations and consolidated statement of changes in net assets for each of the periods indicated in the table below, including the related notes, and the consolidated financial highlights for each of the periods indicated in the table below (collectively referred to as the “consolidated financial statements”). In our opinion, the consolidated financial statements present fairly, in all material respects, the financial position of each of the Funds as of December 31, 2024, the results of each of their operations, the changes in each of their net assets and each of the financial highlights for each of the periods indicated in the table below, in conformity with accounting principles generally accepted in the United States of America.
| | | | | | |
Fund Name | | Consolidated Statements of
Operations | | Consolidated Statements of
Changes in Net Assets | | Consolidated Financial
Highlights |
| American Beacon AHL Managed Futures Strategy Fund | | For the year ended December 31, 2024. | | For each of the two years in the period ended December 31, 2024. | | For each of the three years in the period ended December 31, 2024. |
| | | |
| American Beacon AHL Multi-Alternatives Fund | | For the year ended December 31, 2024. | | For the year ended December 31, 2024, and for the period August 17, 2023 (commencement of operations) through December 31, 2023. | | For the year ended December 31, 2024, and for the period August 17, 2023 (commencement of operations) through December 31, 2023. |
| | | |
| American Beacon AHL TargetRisk Fund | | For the year ended December 31, 2024. | | For each of the two years in the period ended December 31, 2024. | | For each of the three years in the period ended December 31, 2024. |
The consolidated financial statements of American Beacon AHL Managed Futures Strategy Fund and American Beacon AHL TargetRisk Fund as of and for the year ended December 31, 2021 and the consolidated financial highlights for each of the periods ended on or prior to December 31, 2021 (not presented herein, other than the consolidated financial highlights) were audited by other auditors whose report dated February 28, 2022 expressed an unqualified opinion on those consolidated financial statements and consolidated financial highlights.
Basis for Opinions
These consolidated financial statements are the responsibility of the Funds’ management. Our responsibility is to express an opinion on the Funds’ consolidated financial statements based on our audits. We are a public accounting firm registered with the Public Company Accounting Oversight Board (United States) (PCAOB) and are required to be independent with respect to the Funds in accordance with the U.S. federal securities laws and the applicable rules and regulations of the Securities and Exchange Commission and the PCAOB.
We conducted our audits of these consolidated financial statements in accordance with the standards of the PCAOB. Those standards require that we plan and perform the audit to obtain reasonable assurance about whether the consolidated financial statements are free of material misstatement, whether due to error or fraud.
Our audits included performing procedures to assess the risks of material misstatement of the consolidated financial statements, whether due to error or fraud, and performing procedures that respond to those risks. Such procedures included examining, on a test basis, evidence regarding the amounts and disclosures in the consolidated financial statements. Our audits also included evaluating the accounting principles used and significant estimates made by management, as well as evaluating the overall presentation of the consolidated financial statements. Our
1
American Beacon FundsSM
Report of Independent Registered Public Accounting Firm
procedures included confirmation of securities owned as of December 31, 2024 by correspondence with the custodian and brokers; when replies were not received from brokers, we performed other auditing procedures. We believe that our audits provide a reasonable basis for our opinions.
/s/PricewaterhouseCoopers LLP
Boston, Massachusetts
February 27, 2025
We have served as the auditor of one or more investment companies in the American Beacon family of funds since 2016.
2
American Beacon AHL Managed Futures Strategy FundSM
Consolidated Schedule of Investments
December 31, 2024
| | | | | | | | | | | | | | | |
| | | |
| | | Principal Amount | | | | Fair Value |
| | | | | | | |
| | | |
| SHORT-TERM INVESTMENTS - 86.32% | | | | | | |
| | | |
| U.S. Treasury Obligations - 86.32% | | | | | | |
| U.S. Treasury Bills, | | | | | | | | | | | | | | | |
5.201%, Due 1/9/2025 | | | $ | 175,000,000 | | | | | | | | | $ | 174,856,862 | |
5.134%, Due 1/16/2025 | | | | 200,000,000 | | | | | | | | | | 199,670,766 | |
5.029%, Due 1/23/2025A | | | | 240,000,000 | | | | | | | | | | 239,406,091 | |
4.951%, Due 2/6/2025A | | | | 250,000,000 | | | | | | | | | | 248,973,850 | |
4.593%, Due 2/13/2025 | | | | 125,000,000 | | | | | | | | | | 124,381,904 | |
4.926%, Due 2/20/2025A | | | | 180,000,000 | | | | | | | | | | 178,976,941 | |
4.739%, Due 3/6/2025A | | | | 55,000,000 | | | | | | | | | | 54,597,194 | |
4.557%, Due 3/13/2025A | | | | 50,000,000 | | | | | | | | | | 49,593,611 | |
4.397%, Due 3/20/2025A | | | | 200,000,000 | | | | | | | | | | 198,213,280 | |
4.406%, Due 3/27/2025A | | | | 250,000,000 | | | | | | | | | | 247,555,832 | |
4.465%, Due 4/10/2025A | | | | 50,000,000 | | | | | | | | | | 49,434,084 | |
4.414%, Due 4/17/2025A | | | | 250,000,000 | | | | | | | | | | 246,966,065 | |
4.419%, Due 4/24/2025A | | | | 200,000,000 | | | | | | | | | | 197,413,112 | |
4.409%, Due 5/22/2025A | | | | 250,000,000 | | | | | | | | | | 245,980,793 | |
4.299%, Due 6/5/2025A | | | | 150,000,000 | | | | | | | | | | 147,345,211 | |
4.293%, Due 6/12/2025A | | | | 50,000,000 | | | | | | | | | | 49,074,586 | |
| | | | | | | | | | | | | | | |
| | | | | | | | | | | | | | | |
Total Short-Term Investments (Cost $2,651,532,323) | | | | | | | | | | | | | | 2,652,440,182 | |
| | | | | | | | | | | | | | | |
| | | | | | | | | | | | | | | |
TOTAL INVESTMENTS - 86.32% (Cost $2,651,532,323) | | | | | | | | | | | | | | 2,652,440,182 | |
OTHER ASSETS, NET OF LIABILITIES - 13.68% | | | | | | | | | | | | | | 420,488,070 | |
| | | | | | | | | | | | | | | |
TOTAL NET ASSETS - 100.00% | | | | | | | | | | | | | $ | 3,072,928,252 | |
| | | | | | | | | | | | | | | |
| | | | | | | |
| Percentages are stated as a percent of net assets. | | | | | | | | | | | | | | | |
A All or a portion represents positions held by the American Beacon Cayman Managed Futures Strategy Fund, Ltd.
| | | | | | | | | | | | | | | | |
| Long Futures Contracts Open on December 31, 2024: | | | | | | | | | | | | |
| | | | | |
| Commodity Futures Contracts | | | | | | | | | | | | | |
| Description | | Number of
Contracts | | Expiration Date | | Notional Amount | | | Contract Value | | | Unrealized Appreciation (Depreciation) | |
| CBOT Corn FuturesA | | 252 | | March 2025 | | $ | 5,735,970 | | | $ | 5,777,100 | | | $ | 41,130 | |
| CBOT Corn FuturesA | | 899 | | May 2025 | | | 20,664,134 | | | | 20,935,463 | | | | 271,329 | |
| CME Lean Hogs FuturesA | | 147 | | February 2025 | | | 5,183,534 | | | | 4,780,440 | | | | (403,094 | ) |
| CME Lean Hogs FuturesA | | 72 | | April 2025 | | | 2,571,633 | | | | 2,493,360 | | | | (78,273 | ) |
| COMEX Gold 100 Troy Ounces FuturesA | | 370 | | February 2025 | | | 99,918,691 | | | | 97,717,000 | | | | (2,201,691 | ) |
| COMEX Silver FuturesA | | 58 | | March 2025 | | | 9,496,752 | | | | 8,480,180 | | | | (1,016,572 | ) |
| Euronext Rapeseed FuturesA | | 532 | | January 2025 | | | 14,653,453 | | | | 14,086,779 | | | | (566,674 | ) |
| ICE Cocoa FuturesA | | 163 | | March 2025 | | | 11,680,202 | | | | 18,657,175 | | | | 6,976,973 | |
| ICE Robusta Coffee Futures 10-TonneA | | 361 | | March 2025 | | | 18,741,455 | | | | 17,598,750 | | | | (1,142,705 | ) |
| ICE U.S. - Henry Ld1 Fixed Price FuturesA | | 20 | | March 2025 | | | 171,325 | | | | 153,500 | | | | (17,825 | ) |
| ICE U.S. - Henry Ld1 Fixed Price FuturesA | | 20 | | April 2025 | | | 171,325 | | | | 157,850 | | | | (13,475 | ) |
| ICE U.S. - Henry Ld1 Fixed Price FuturesA | | 20 | | May 2025 | | | 171,325 | | | | 166,750 | | | | (4,575 | ) |
| ICE U.S. - Henry Ld1 Fixed Price FuturesA | | 20 | | June 2025 | | | 171,325 | | | | 176,100 | | | | 4,775 | |
| ICE U.S. - Henry Ld1 Fixed Price FuturesA | | 20 | | July 2025 | | | 171,325 | | | | 178,000 | | | | 6,675 | |
| ICE U.S. - Henry Ld1 Fixed Price FuturesA | | 20 | | August 2025 | | | 171,325 | | | | 177,100 | | | | 5,775 | |
| ICE U.S. - Henry Ld1 Fixed Price FuturesA | | 20 | | September 2025 | | | 171,325 | | | | 180,950 | | | | 9,625 | |
| ICE U.S. - Henry Ld1 Fixed Price FuturesA | | 80 | | October 2025 | | | 807,300 | | | | 781,200 | | | | (26,100 | ) |
| ICE U.S. - Henry Ld1 Fixed Price FuturesA | | 80 | | November 2025 | | | 807,300 | | | | 872,800 | | | | 65,500 | |
| ICE U.S. - Henry Ld1 Fixed Price FuturesA | | 80 | | December 2025 | | | 807,300 | | | | 931,200 | | | | 123,900 | |
| ICE U.S. - Henry Ld1 Fixed Price FuturesA | | 80 | | January 2026 | | | 807,300 | | | | 868,600 | | | | 61,300 | |
| ICE U.S. - Henry Ld1 Fixed Price FuturesA | | 80 | | February 2026 | | | 807,300 | | | | 755,400 | | | | (51,900 | ) |
| ICE U.S. - Henry Ld1 Fixed Price FuturesA | | 304 | | December 2026 | | | 2,872,680 | | | | 3,621,400 | | | | 748,720 | |
| ICE U.S. - Henry Ld1 Fixed Price FuturesA | | 304 | | January 2027 | | | 2,872,680 | | | | 3,385,040 | | | | 512,360 | |
| ICE U.S. - Henry Ld1 Fixed Price FuturesA | | 304 | | February 2027 | | | 2,872,680 | | | | 2,859,880 | | | | (12,800 | ) |
| ICE U.S. - Henry Ld1 Fixed Price FuturesA | | 304 | | March 2027 | | | 2,872,680 | | | | 2,520,920 | | | | (351,760 | ) |
| ICE U.S. - Henry Ld1 Fixed Price FuturesA | | 304 | | April 2027 | | | 2,872,680 | | | | 2,539,920 | | | | (332,760 | ) |
| ICE U.S. - Henry Ld1 Fixed Price FuturesA | | 304 | | May 2027 | | | 2,872,680 | | | | 2,650,120 | | | | (222,560 | ) |
| ICE U.S. - Henry Ld1 Fixed Price FuturesA | | 304 | | June 2027 | | | 2,872,680 | | | | 2,764,120 | | | | (108,560 | ) |
See accompanying notes
3
American Beacon AHL Managed Futures Strategy FundSM
Consolidated Schedule of Investments
December 31, 2024
| | | | | | | | | | | | | | | | | | |
| Commodity Futures Contracts (continued) | | | | | | | | | | | | | | |
| Description | | Number of Contracts | | Expiration Date | | | Notional Amount | | | Contract Value | | | Unrealized Appreciation (Depreciation) | |
| ICE U.S. - Henry Ld1 Fixed Price FuturesA | | 304 | | | July 2027 | | | $ | 2,872,680 | | | $ | 2,786,920 | | | $ | (85,760 | ) |
| ICE U.S. - Henry Ld1 Fixed Price FuturesA | | 304 | | | August 2027 | | | | 2,872,680 | | | | 2,767,920 | | | | (104,760 | ) |
| ICE U.S. - Henry Ld1 Fixed Price FuturesA | | 304 | | | September 2027 | | | | 2,872,680 | | | | 2,813,520 | | | | (59,160 | ) |
| ICE U.S. - Henry Ld1 Fixed Price FuturesA | | 304 | | | October 2027 | | | | 2,872,680 | | | | 3,011,120 | | | | 138,440 | |
| ICE U.S. - Henry Ld1 Fixed Price FuturesA | | 304 | | | November 2027 | | | | 2,872,680 | | | | 3,310,560 | | | | 437,880 | |
| LME Copper FuturesA | | 68 | | | January 2025 | | | | 16,417,079 | | | | 14,744,491 | | | | (1,672,588 | ) |
| LME Lead FuturesA | | 509 | | | January 2025 | | | | 26,170,881 | | | | 24,593,480 | | | | (1,577,401 | ) |
| LME Nickel FuturesA | | 107 | | | January 2025 | | | | 10,186,306 | | | | 9,719,925 | | | | (466,381 | ) |
| LME Nickel FuturesA | | 12 | | | February 2025 | | | | 1,140,823 | | | | 1,096,647 | | | | (44,176 | ) |
| LME Primary Aluminum FuturesA | | 250 | | | January 2025 | | | | 16,594,189 | | | | 15,853,000 | | | | (741,189 | ) |
| LME Primary Aluminum FuturesA | | 256 | | | February 2025 | | | | 16,973,834 | | | | 16,299,648 | | | | (674,186 | ) |
| LME Zinc FuturesA | | 138 | | | January 2025 | | | | 10,774,749 | | | | 10,213,518 | | | | (561,231 | ) |
| LME Zinc FuturesA | | 234 | | | February 2025 | | | | 18,190,525 | | | | 17,400,182 | | | | (790,343 | ) |
| MDE Crude Palm Oil FuturesA | | 1,564 | | | March 2025 | | | | 41,848,704 | | | | 38,894,510 | | | | (2,954,194 | ) |
| NYBOT CSC C Coffee FuturesA | | 549 | | | March 2025 | | | | 54,898,011 | | | | 65,828,531 | | | | 10,930,520 | |
| NYBOT CSC Cocoa FuturesA | | 267 | | | March 2025 | | | | 20,727,609 | | | | 31,172,250 | | | | 10,444,641 | |
| NYMEX Henry Hub Natural Gas FuturesA | | 1,483 | | | February 2025 | | | | 43,670,118 | | | | 45,943,340 | | | | 2,273,222 | |
| NYMEX Light Sweet Crude Oil FuturesA | | 443 | | | February 2025 | | | | 31,527,065 | | | | 31,563,750 | | | | 36,685 | |
| | | | | | | | | | | | | | | | | | |
| | | $ | 537,473,652 | | | $ | 554,280,409 | | | $ | 16,806,757 | |
| | | | | | | | | | | | | | | | | | |
|
| Currency Futures Contracts | |
| Description | | Number of Contracts | | Expiration Date | | | Notional Amount | | | Contract Value | | | Unrealized Appreciation (Depreciation) | |
| NYBOT FINEX U.S. Dollar Index Futures | | 1,968 | | | March 2025 | | | $ | 209,147,942 | | | $ | 213,126,528 | | | $ | 3,978,586 | |
| | | | | | | | | | | | | | | | | | |
| | | $ | 209,147,942 | | | $ | 213,126,528 | | | $ | 3,978,586 | |
| | | | | | | | | | | | | | | | | | |
|
| Equity Futures Contracts | |
| Description | | Number of Contracts | | Expiration Date | | | Notional Amount | | | Contract Value | | | Unrealized Appreciation (Depreciation) | |
| Borsa Italiana FTSE/MIB Index Futures | | 433 | | | March 2025 | | | $ | 78,549,970 | | | $ | 76,921,683 | | | $ | (1,628,287 | ) |
| CME E-Mini NASDAQ 100 Index Futures | | 209 | | | March 2025 | | | | 92,332,419 | | | | 88,726,770 | | | | (3,605,649 | ) |
| CME E-Mini Russell 2000 Index Futures | | 310 | | | March 2025 | | | | 36,712,018 | | | | 34,871,900 | | | | (1,840,118 | ) |
| CME E-Mini S&P 500 Index Futures | | 329 | | | March 2025 | | | | 100,726,611 | | | | 97,643,088 | | | | (3,083,523 | ) |
| Eurex DAX Index Futures | | 229 | | | March 2025 | | | | 122,381,735 | | | | 118,913,166 | | | | (3,468,569 | ) |
| Eurex EURO STOXX 50 Futures | | 1,241 | | | March 2025 | | | | 64,169,563 | | | | 62,744,743 | | | | (1,424,820 | ) |
| HKG Hang Seng China Enterprises Index Futures | | 707 | | | January 2025 | | | | 32,872,236 | | | | 33,125,904 | | | | 253,668 | |
| HKG Hang Seng Index Futures | | 292 | | | January 2025 | | | | 37,516,101 | | | | 37,760,193 | | | | 244,092 | |
| Montreal Exchange S&P/TSX 60 Index Futures | | 568 | | | March 2025 | | | | 119,880,610 | | | | 117,365,724 | | | | (2,514,886 | ) |
| NSE IFSC NIFTY 50 Index Futures | | 225 | | | January 2025 | | | | 10,770,747 | | | | 10,696,275 | | | | (74,472 | ) |
| SAFEX FTSE/JSE Top 40 Index Futures | | 1,204 | | | March 2025 | | | | 50,964,058 | | | | 48,696,564 | | | | (2,267,494 | ) |
| SFE S&P ASX Share Price Index 200 Futures | | 638 | | | March 2025 | | | | 82,122,051 | | | | 80,439,133 | | | | (1,682,918 | ) |
| SGX FTSE China A50 Futures Contract | | 91 | | | January 2025 | | | | 1,244,844 | | | | 1,225,315 | | | | (19,529 | ) |
| SGX FTSE Taiwan Index Futures | | 1,210 | | | January 2025 | | | | 93,421,417 | | | | 92,637,600 | | | | (783,817 | ) |
| SGX MSCI Singapore Index Futures | | 2,243 | | | January 2025 | | | | 61,360,933 | | | | 61,336,971 | | | | (23,962 | ) |
| SGX Nikkei 225 Stock Index Futures | | 814 | | | March 2025 | | | | 102,170,297 | | | | 101,617,433 | | | | (552,864 | ) |
| TSE TOPIX Futures | | 345 | | | March 2025 | | | | 60,426,747 | | | | 61,097,747 | | | | 671,000 | |
| | | | | | | | | | | | | | | | | | |
| | | $ | 1,147,622,357 | | | $ | 1,125,820,209 | | | $ | (21,802,148 | ) |
| | | | | | | | | | | | | | | | | | |
| | | | | | | | | | | | | | | | | | |
See accompanying notes
4
American Beacon AHL Managed Futures Strategy FundSM
Consolidated Schedule of Investments
December 31, 2024
| | | | | | | | | | | | | | | | |
| Interest Rate Futures Contracts | |
| Description | | Number of Contracts | | Expiration Date | | Notional Amount | | | Contract Value | | | Unrealized Appreciation (Depreciation) | |
| 3 Month Euro Euribor Futures | | 4,589 | | September 2025 | | $ | 1,165,875,997 | | | $ | 1,165,383,469 | | | $ | (492,528 | ) |
| 3 Month Euro Euribor Futures | | 173 | | December 2025 | | | 44,023,834 | | | | 43,947,051 | | | | (76,783 | ) |
| 3 Month Euro Euribor Futures | | 4,799 | | March 2026 | | | 1,219,391,868 | | | | 1,218,837,562 | | | | (554,306 | ) |
| 3 Month Euro Euribor Futures | | 292 | | June 2026 | | | 74,285,871 | | | | 74,123,593 | | | | (162,278 | ) |
| 3 Month Euro Euribor Futures | | 4,137 | | September 2026 | | | 1,050,556,277 | | | | 1,049,633,193 | | | | (923,084 | ) |
| Eurex 30 Year Euro BUXL Futures | | 223 | | March 2025 | | | 32,463,022 | | | | 30,648,349 | | | | (1,814,673 | ) |
| Eurex Euro-BTP Italian Bond Futures | | 578 | | March 2025 | | | 64,583,823 | | | | 64,314,625 | | | | (269,198 | ) |
| Eurex Euro-BTP Italian Bond Futures | | 345 | | March 2025 | | | 43,944,462 | | | | 42,877,031 | | | | (1,067,431 | ) |
| | | | | | | | | | | | | | | | |
| | | | | | $ | 3,695,125,154 | | | $ | 3,689,764,873 | | | $ | (5,360,281 | ) |
| | | | | | | | | | | | | | | | |
| | | | | | | | | | | | | | | | |
| Short Futures Contracts Open on December 31, 2024: | | | | | | | | | |
| | | |
| Commodity Futures Contracts | | | | | | | | | |
| Description | | Number of Contracts | | Expiration Date | | Notional Amount | | | Contract Value | | | Unrealized Appreciation (Depreciation) | |
| CBOT Soybean FuturesA | | 2,305 | | March 2025 | | $ | (113,857,203 | ) | | $ | (116,460,125 | ) | | $ | (2,602,922 | ) |
| CBOT Soybean Meal FuturesA | | 2,317 | | March 2025 | | | (68,491,909 | ) | | | (73,425,730 | ) | | | (4,933,821 | ) |
| CBOT Soybean Oil FuturesA | | 2,964 | | March 2025 | | | (72,436,341 | ) | | | (71,776,224 | ) | | | 660,117 | |
| COMEX Copper FuturesA | | 866 | | March 2025 | | | (89,553,945 | ) | | | (87,173,725 | ) | | | 2,380,220 | |
| Euronext Milling Wheat FuturesA | | 1,956 | | March 2025 | | | (23,000,547 | ) | | | (24,034,873 | ) | | | (1,034,326 | ) |
| ICE Brent Crude Oil FuturesA | | 535 | | January 2025 | | | (39,399,616 | ) | | | (39,932,400 | ) | | | (532,784 | ) |
| ICE Gas Oil FuturesA | | 237 | | January 2025 | | | (15,625,857 | ) | | | (16,477,425 | ) | | | (851,568 | ) |
| KCBT Hard Red Winter Wheat FuturesA | | 1,046 | | March 2025 | | | (29,357,986 | ) | | | (29,248,775 | ) | | | 109,211 | |
| LME Copper FuturesA | | 68 | | January 2025 | | | (15,518,761 | ) | | | (14,744,491 | ) | | | 774,270 | |
| LME Copper FuturesA | | 667 | | February 2025 | | | (150,228,232 | ) | | | (145,387,991 | ) | | | 4,840,241 | |
| LME Lead FuturesA | | 509 | | January 2025 | | | (25,952,084 | ) | | | (24,593,480 | ) | | | 1,358,604 | |
| LME Lead FuturesA | | 1,025 | | February 2025 | | | (51,304,683 | ) | | | (49,726,081 | ) | | | 1,578,602 | |
| LME Nickel FuturesA | | 107 | | January 2025 | | | (10,664,866 | ) | | | (9,719,925 | ) | | | 944,941 | |
| LME Nickel FuturesA | | 230 | | February 2025 | | | (21,978,491 | ) | | | (21,019,070 | ) | | | 959,421 | |
| LME Primary Aluminum FuturesA | | 250 | | January 2025 | | | (15,908,109 | ) | | | (15,853,000 | ) | | | 55,109 | |
| LME Primary Aluminum FuturesA | | 783 | | February 2025 | | | (49,355,190 | ) | | | (49,854,002 | ) | | | (498,812 | ) |
| LME Zinc FuturesA | | 138 | | January 2025 | | | (10,368,354 | ) | | | (10,213,518 | ) | | | 154,836 | |
| LME Zinc FuturesA | | 57 | | February 2025 | | | (4,231,551 | ) | | | (4,238,506 | ) | | | (6,955 | ) |
| MGE Red Wheat FuturesA | | 1,107 | | March 2025 | | | (33,089,851 | ) | | | (32,974,763 | ) | | | 115,088 | |
| NYBOT CSC Number 11 World Sugar FuturesA | | 441 | | February 2025 | | | (9,564,292 | ) | | | (9,512,899 | ) | | | 51,393 | |
| NYBOT CTN Number 2 Cotton FuturesA | | 629 | | March 2025 | | | (22,307,818 | ) | | | (21,511,800 | ) | | | 796,018 | |
| NYMEX NY Harbor ULSD FuturesA | | 348 | | January 2025 | | | (33,005,659 | ) | | | (33,856,502 | ) | | | (850,843 | ) |
| NYMEX Palladium FuturesA | | 147 | | March 2025 | | | (14,135,281 | ) | | | (13,374,060 | ) | | | 761,221 | |
| NYMEX Platinum FuturesA | | 1,090 | | April 2025 | | | (51,458,209 | ) | | | (49,622,250 | ) | | | 1,835,959 | |
| NYMEX Reformulated Gasoline Blendstock for Oxygen Blending RBOB FuturesA | | 115 | | January 2025 | | | (9,350,878 | ) | | | (9,704,436 | ) | | | (353,558 | ) |
| WCE Canola FuturesA | | 833 | | March 2025 | | | (7,027,456 | ) | | | (7,138,262 | ) | | | (110,806 | ) |
| WCE Canola FuturesA | | 299 | | May 2025 | | | (2,576,928 | ) | | | (2,595,514 | ) | | | (18,586 | ) |
| | | | | | | | | | | | | | | | |
| | | | | | $ | (989,750,097 | ) | | $ | (984,169,827 | ) | | $ | 5,580,270 | |
| | | | | | | | | | | | | | | | |
| | | |
| Equity Futures Contracts | | | | | | | | | |
| Description | | Number of Contracts | | Expiration Date | | Notional Amount | | | Contract Value | | | Unrealized Appreciation (Depreciation) | |
| Euronext CAC 40 Index Futures | | 487 | | January 2025 | | $ | (37,426,511 | ) | | $ | (37,251,761 | ) | | $ | 174,750 | |
| ICE FTSE 100 Index Futures | | 720 | | March 2025 | | | (73,426,729 | ) | | | (73,736,395 | ) | | | (309,666 | ) |
| ICE U.S. mini MSCI EAFE Index Futures | | 450 | | March 2025 | | | (51,711,128 | ) | | | (51,018,750 | ) | | | 692,378 | |
| ICE U.S. MSCI Emerging Markets Index Futures | | 142 | | March 2025 | | | (7,639,467 | ) | | | (7,623,980 | ) | | | 15,487 | |
| OML Stockholm OMXS30 Index Futures | | 558 | | January 2025 | | | (12,536,051 | ) | | | (12,522,892 | ) | | | 13,159 | |
| | | | | | | | | | | | | | | | |
| | | | | | $ | (182,739,886 | ) | | $ | (182,153,778 | ) | | $ | 586,108 | |
| | | | | | | | | | | | | | | | |
See accompanying notes
5
American Beacon AHL Managed Futures Strategy FundSM
Consolidated Schedule of Investments
December 31, 2024
| | | | | | | | | | | | | | | | |
| Interest Rate Futures Contracts | |
| Description | | Number of
Contracts | | Expiration Date | | Notional Amount | | | Contract Value | | | Unrealized Appreciation (Depreciation) | |
| CBOT 2 Year U.S. Treasury Notes Futures | | 3,670 | | March 2025 | | $ | (754,628,364 | ) | | $ | (754,586,410 | ) | | $ | 41,954 | |
| CBOT 5 Year U.S. Treasury Notes Futures | | 4,530 | | March 2025 | | | (483,208,284 | ) | | | (481,560,237 | ) | | | 1,648,047 | |
| CBOT 10 Year U.S. Treasury Notes Futures | | 2,213 | | March 2025 | | | (241,510,563 | ) | | | (240,663,750 | ) | | | 846,813 | |
| CBOT U.S. Long Bond Futures | | 1,069 | | March 2025 | | | (123,875,196 | ) | | | (121,698,969 | ) | | | 2,176,227 | |
| CBOT Ultra Long-Term U.S. Treasury Bond Futures | | 724 | | March 2025 | | | (88,900,884 | ) | | | (86,088,125 | ) | | | 2,812,759 | |
| Eurex 2 Year Euro SCHATZ Futures | | 2,228 | | March 2025 | | | (247,061,350 | ) | | | (246,907,812 | ) | | | 153,538 | |
| Eurex 5 Year Euro BOBL Futures | | 306 | | March 2025 | | | (37,314,164 | ) | | | (37,358,086 | ) | | | (43,922 | ) |
| Eurex 10 Year Euro BUND Futures | | 744 | | March 2025 | | | (102,553,572 | ) | | | (102,838,498 | ) | | | (284,926 | ) |
| French Government Bond Futures | | 769 | | March 2025 | | | (98,468,245 | ) | | | (98,296,545 | ) | | | 171,700 | |
| ICE Long Gilt Futures | | 1,202 | | March 2025 | | | (141,119,559 | ) | | | (139,057,044 | ) | | | 2,062,515 | |
| Montreal Exchange 10 Year Canadian Bond Futures | | 234 | | March 2025 | | | (19,842,106 | ) | | | (19,959,470 | ) | | | (117,364 | ) |
| SFE 3 Year Australian Bond Futures | | 8,160 | | March 2025 | | | (535,797,340 | ) | | | (536,141,282 | ) | | | (343,942 | ) |
| SFE 10 Year Australian Bond Futures | | 2,052 | | March 2025 | | | (142,903,288 | ) | | | (143,361,343 | ) | | | (458,055 | ) |
| Three-Month SOFR Futures | | 1,581 | | September 2025 | | | (380,807,342 | ) | | | (379,262,138 | ) | | | 1,545,204 | |
| Three-Month SOFR Futures | | 3,763 | | December 2025 | | | (904,570,969 | ) | | | (903,308,150 | ) | | | 1,262,819 | |
| Three-Month SOFR Futures | | 3,034 | | September 2026 | | | (729,505,992 | ) | | | (728,615,100 | ) | | | 890,892 | |
| Three-Month SOFR Futures | | 1,977 | | March 2027 | | | (475,179,368 | ) | | | (474,652,988 | ) | | | 526,380 | |
| Three Month SONIA Index Futures | | 4,658 | | December 2025 | | | (1,398,648,151 | ) | | | (1,396,826,778 | ) | | | 1,821,373 | |
| Three Month SONIA Index Futures | | 2,210 | | June 2026 | | | (663,720,167 | ) | | | (663,800,129 | ) | | | (79,962 | ) |
| TSE Japanese 10 Year Bond Futures | | 50 | | March 2025 | | | (45,054,759 | ) | | | (45,091,995 | ) | | | (37,236 | ) |
| | | | | | | | | | | | | | | | |
| | | | | | $ | (7,614,669,663 | ) | | $ | (7,600,074,849 | ) | | $ | 14,594,814 | |
| | | | | | | | | | | | | | | | |
A All or a portion represents positions held by the American Beacon Cayman Managed Futures Strategy Fund, Ltd.
| | | | | | | | | | | | | | | | | | | | | | | | | | | | |
| Forward Foreign Currency Contracts Open on December 31, 2024: | |
| | | | | | |
| Currency Purchased* | | | Currency Sold* | | | Settlement
Date | | Counterparty | | | Unrealized
Appreciation | | | Unrealized
(Depreciation) | | | Net Unrealized
Appreciation
(Depreciation) | |
| PHP | | | 43,101 | | | USD | | | 42,889 | | | 2/13/2025 | | | BNP | | | $ | 212 | | | $ | - | | | $ | 212 | |
| PHP | | | 301,706 | | | USD | | | 300,501 | | | 2/13/2025 | | | BNP | | | | 1,205 | | | | - | | | | 1,205 | |
| PHP | | | 301,706 | | | USD | | | 301,490 | | | 2/13/2025 | | | BNP | | | | 216 | | | | - | | | | 216 | |
| PHP | | | 431,009 | | | USD | | | 428,665 | | | 2/13/2025 | | | BNP | | | | 2,344 | | | | - | | | | 2,344 | |
| PHP | | | 474,110 | | | USD | | | 470,896 | | | 2/13/2025 | | | BNP | | | | 3,214 | | | | - | | | | 3,214 | |
| PHP | | | 517,211 | | | USD | | | 513,699 | | | 2/13/2025 | | | BNP | | | | 3,512 | | | | - | | | | 3,512 | |
| PHP | | | 560,312 | | | USD | | | 557,008 | | | 2/13/2025 | | | BNP | | | | 3,304 | | | | - | | | | 3,304 | |
| PHP | | | 560,312 | | | USD | | | 559,303 | | | 2/13/2025 | | | BNP | | | | 1,009 | | | | - | | | | 1,009 | |
| PHP | | | 560,312 | | | USD | | | 559,718 | | | 2/13/2025 | | | BNP | | | | 594 | | | | - | | | | 594 | |
| PHP | | | 603,413 | | | USD | | | 599,082 | | | 2/13/2025 | | | BNP | | | | 4,331 | | | | - | | | | 4,331 | |
| PHP | | | 603,413 | | | USD | | | 599,130 | | | 2/13/2025 | | | BNP | | | | 4,283 | | | | - | | | | 4,283 | |
| PHP | | | 603,413 | | | USD | | | 602,638 | | | 2/13/2025 | | | BNP | | | | 775 | | | | - | | | | 775 | |
| PHP | | | 646,514 | | | USD | | | 638,302 | | | 2/13/2025 | | | BNP | | | | 8,212 | | | | - | | | | 8,212 | |
| PHP | | | 646,514 | | | USD | | | 645,450 | | | 2/13/2025 | | | BNP | | | | 1,064 | | | | - | | | | 1,064 | |
| PHP | | | 646,514 | | | USD | | | 645,895 | | | 2/13/2025 | | | BNP | | | | 619 | | | | - | | | | 619 | |
| PHP | | | 689,615 | | | USD | | | 680,735 | | | 2/13/2025 | | | BNP | | | | 8,880 | | | | - | | | | 8,880 | |
| PHP | | | 689,615 | | | USD | | | 684,760 | | | 2/13/2025 | | | BNP | | | | 4,855 | | | | - | | | | 4,855 | |
| PHP | | | 862,019 | | | USD | | | 851,107 | | | 2/13/2025 | | | BNP | | | | 10,912 | | | | - | | | | 10,912 | |
| PHP | | | 905,119 | | | USD | | | 893,587 | | | 2/13/2025 | | | BNP | | | | 11,532 | | | | - | | | | 11,532 | |
| PHP | | | 948,220 | | | USD | | | 941,878 | | | 2/13/2025 | | | BNP | | | | 6,342 | | | | - | | | | 6,342 | |
| PHP | | | 1,077,523 | | | USD | | | 1,073,256 | | | 2/13/2025 | | | BNP | | | | 4,267 | | | | - | | | | 4,267 | |
| PHP | | | 1,163,725 | | | USD | | | 1,155,822 | | | 2/13/2025 | | | BNP | | | | 7,903 | | | | - | | | | 7,903 | |
| PHP | | | 1,206,826 | | | USD | | | 1,201,655 | | | 2/13/2025 | | | BNP | | | | 5,171 | | | | - | | | | 5,171 | |
| PHP | | | 1,508,532 | | | USD | | | 1,497,929 | | | 2/13/2025 | | | BNP | | | | 10,603 | | | | - | | | | 10,603 | |
| PHP | | | 1,508,532 | | | USD | | | 1,498,801 | | | 2/13/2025 | | | BNP | | | | 9,731 | | | | - | | | | 9,731 | |
| PHP | | | 1,594,734 | | | USD | | | 1,584,094 | | | 2/13/2025 | | | BNP | | | | 10,640 | | | | - | | | | 10,640 | |
| PHP | | | 2,068,844 | | | USD | | | 2,054,520 | | | 2/13/2025 | | | BNP | | | | 14,324 | | | | - | | | | 14,324 | |
| USD | | | 21,773,617 | | | PHP | | | 21,722,867 | | | 2/13/2025 | | | BNP | | | | 50,750 | | | | - | | | | 50,750 | |
See accompanying notes
6
American Beacon AHL Managed Futures Strategy FundSM
Consolidated Schedule of Investments
December 31, 2024
| | | | | | | | | | | | | | | | | | | | | | | | | | | | |
| | | | | | |
| Currency Purchased* | | | Currency Sold* | | | Settlement
Date | | Counterparty | | | Unrealized
Appreciation | | | Unrealized
(Depreciation) | | | Net Unrealized
Appreciation
(Depreciation) | |
| PHP | | | 517,116 | | | USD | | | 514,227 | | | 2/21/2025 | | | BNP | | | $ | 2,889 | | | $ | - | | | $ | 2,889 | |
| PHP | | | 689,487 | | | USD | | | 685,495 | | | 2/21/2025 | | | BNP | | | | 3,992 | | | | - | | | | 3,992 | |
| PHP | | | 861,859 | | | USD | | | 855,989 | | | 2/21/2025 | | | BNP | | | | 5,870 | | | | - | | | | 5,870 | |
| PHP | | | 948,045 | | | USD | | | 941,120 | | | 2/21/2025 | | | BNP | | | | 6,925 | | | | - | | | | 6,925 | |
| PHP | | | 948,045 | | | USD | | | 942,426 | | | 2/21/2025 | | | BNP | | | | 5,619 | | | | - | | | | 5,619 | |
| PHP | | | 1,034,231 | | | USD | | | 1,028,128 | | | 2/21/2025 | | | BNP | | | | 6,103 | | | | - | | | | 6,103 | |
| PHP | | | 1,249,696 | | | USD | | | 1,241,056 | | | 2/21/2025 | | | BNP | | | | 8,640 | | | | - | | | | 8,640 | |
| PHP | | | 1,249,696 | | | USD | | | 1,243,781 | | | 2/21/2025 | | | BNP | | | | 5,915 | | | | - | | | | 5,915 | |
| PHP | | | 1,378,975 | | | USD | | | 1,371,272 | | | 2/21/2025 | | | BNP | | | | 7,703 | | | | - | | | | 7,703 | |
| PHP | | | 1,422,068 | | | USD | | | 1,411,728 | | | 2/21/2025 | | | BNP | | | | 10,340 | | | | - | | | | 10,340 | |
| PHP | | | 1,465,161 | | | USD | | | 1,456,118 | | | 2/21/2025 | | | BNP | | | | 9,043 | | | | - | | | | 9,043 | |
| PHP | | | 1,551,347 | | | USD | | | 1,541,650 | | | 2/21/2025 | | | BNP | | | | 9,697 | | | | - | | | | 9,697 | |
| PHP | | | 1,551,347 | | | USD | | | 1,544,142 | | | 2/21/2025 | | | BNP | | | | 7,205 | | | | - | | | | 7,205 | |
| PHP | | | 1,594,440 | | | USD | | | 1,584,827 | | | 2/21/2025 | | | BNP | | | | 9,613 | | | | - | | | | 9,613 | |
| PHP | | | 1,680,626 | | | USD | | | 1,670,951 | | | 2/21/2025 | | | BNP | | | | 9,675 | | | | - | | | | 9,675 | |
| PHP | | | 1,766,812 | | | USD | | | 1,754,236 | | | 2/21/2025 | | | BNP | | | | 12,576 | | | | - | | | | 12,576 | |
| PHP | | | 1,766,812 | | | USD | | | 1,754,263 | | | 2/21/2025 | | | BNP | | | | 12,549 | | | | - | | | | 12,549 | |
| PHP | | | 1,852,998 | | | USD | | | 1,841,700 | | | 2/21/2025 | | | BNP | | | | 11,298 | | | | - | | | | 11,298 | |
| PHP | | | 2,025,369 | | | USD | | | 2,013,124 | | | 2/21/2025 | | | BNP | | | | 12,245 | | | | - | | | | 12,245 | |
| USD | | | 41,647,808 | | | PHP | | | 41,713,992 | | | 2/21/2025 | | | BNP | | | | - | | | | (66,184 | ) | | | (66,184 | ) |
| USD | | | 45,276 | | | SEK | | | 45,192 | | | 1/2/2025 | | | CBK | | | | 84 | | | | - | | | | 84 | |
| USD | | | 73,653 | | | SGD | | | 73,225 | | | 1/2/2025 | | | CBK | | | | 428 | | | | - | | | | 428 | |
| USD | | | 73,671 | | | SGD | | | 73,225 | | | 1/2/2025 | | | CBK | | | | 446 | | | | - | | | | 446 | |
| USD | | | 73,677 | | | SGD | | | 73,225 | | | 1/2/2025 | | | CBK | | | | 452 | | | | - | | | | 452 | |
| USD | | | 73,700 | | | SGD | | | 73,225 | | | 1/2/2025 | | | CBK | | | | 475 | | | | - | | | | 475 | |
| USD | | | 73,720 | | | SGD | | | 73,225 | | | 1/2/2025 | | | CBK | | | | 495 | | | | - | | | | 495 | |
| USD | | | 90,417 | | | SEK | | | 90,384 | | | 1/2/2025 | | | CBK | | | | 33 | | | | - | | | | 33 | |
| USD | | | 90,445 | | | SEK | | | 90,384 | | | 1/2/2025 | | | CBK | | | | 61 | | | | - | | | | 61 | |
| USD | | | 90,501 | | | SEK | | | 90,384 | | | 1/2/2025 | | | CBK | | | | 117 | | | | - | | | | 117 | |
| EUR | | | 103,585 | | | CAD | | | 103,945 | | | 1/2/2025 | | | CBK | | | | - | | | | (360 | ) | | | (360 | ) |
| EUR | | | 103,585 | | | CAD | | | 104,132 | | | 1/2/2025 | | | CBK | | | | - | | | | (547 | ) | | | (547 | ) |
| EUR | | | 103,585 | | | CAD | | | 104,399 | | | 1/2/2025 | | | CBK | | | | - | | | | (814 | ) | | | (814 | ) |
| EUR | | | 103,585 | | | CAD | | | 104,414 | | | 1/2/2025 | | | CBK | | | | - | | | | (829 | ) | | | (829 | ) |
| EUR | | | 103,585 | | | CAD | | | 104,422 | | | 1/2/2025 | | | CBK | | | | - | | | | (837 | ) | | | (837 | ) |
| EUR | | | 103,585 | | | CAD | | | 104,429 | | | 1/2/2025 | | | CBK | | | | - | | | | (844 | ) | | | (844 | ) |
| USD | | | 135,615 | | | SEK | | | 135,577 | | | 1/2/2025 | | | CBK | | | | 38 | | | | - | | | | 38 | |
| USD | | | 135,636 | | | SEK | | | 135,577 | | | 1/2/2025 | | | CBK | | | | 59 | | | | - | | | | 59 | |
| USD | | | 135,647 | | | SEK | | | 135,577 | | | 1/2/2025 | | | CBK | | | | 70 | | | | - | | | | 70 | |
| USD | | | 135,651 | | | SEK | | | 135,577 | | | 1/2/2025 | | | CBK | | | | 74 | | | | - | | | | 74 | |
| USD | | | 135,652 | | | SEK | | | 135,577 | | | 1/2/2025 | | | CBK | | | | 75 | | | | - | | | | 75 | |
| USD | | | 135,742 | | | SEK | | | 135,577 | | | 1/2/2025 | | | CBK | | | | 165 | | | | - | | | | 165 | |
| USD | | | 135,805 | | | SEK | | | 135,577 | | | 1/2/2025 | | | CBK | | | | 228 | | | | - | | | | 228 | |
| USD | | | 136,023 | | | SEK | | | 135,577 | | | 1/2/2025 | | | CBK | | | | 446 | | | | - | | | | 446 | |
| USD | | | 147,362 | | | SGD | | | 146,450 | | | 1/2/2025 | | | CBK | | | | 912 | | | | - | | | | 912 | |
| USD | | | 180,937 | | | SEK | | | 180,769 | | | 1/2/2025 | | | CBK | | | | 168 | | | | - | | | | 168 | |
| USD | | | 180,996 | | | SEK | | | 180,769 | | | 1/2/2025 | | | CBK | | | | 227 | | | | - | | | | 227 | |
| USD | | | 181,198 | | | SEK | | | 180,769 | | | 1/2/2025 | | | CBK | | | | 429 | | | | - | | | | 429 | |
| EUR | | | 207,169 | | | CAD | | | 208,452 | | | 1/2/2025 | | | CBK | | | | - | | | | (1,283 | ) | | | (1,283 | ) |
| EUR | | | 207,170 | | | CAD | | | 208,489 | | | 1/2/2025 | | | CBK | | | | - | | | | (1,319 | ) | | | (1,319 | ) |
| EUR | | | 207,170 | | | CAD | | | 208,606 | | | 1/2/2025 | | | CBK | | | | - | | | | (1,436 | ) | | | (1,436 | ) |
| EUR | | | 207,170 | | | CAD | | | 208,713 | | | 1/2/2025 | | | CBK | | | | - | | | | (1,543 | ) | | | (1,543 | ) |
| EUR | | | 207,170 | | | CAD | | | 208,896 | | | 1/2/2025 | | | CBK | | | | - | | | | (1,726 | ) | | | (1,726 | ) |
| EUR | | | 207,170 | | | CAD | | | 208,951 | | | 1/2/2025 | | | CBK | | | | - | | | | (1,781 | ) | | | (1,781 | ) |
| EUR | | | 207,170 | | | CAD | | | 208,959 | | | 1/2/2025 | | | CBK | | | | - | | | | (1,789 | ) | | | (1,789 | ) |
| EUR | | | 207,170 | | | CAD | | | 209,015 | | | 1/2/2025 | | | CBK | | | | - | | | | (1,845 | ) | | | (1,845 | ) |
| EUR | | | 207,170 | | | CAD | | | 209,065 | | | 1/2/2025 | | | CBK | | | | - | | | | (1,895 | ) | | | (1,895 | ) |
| EUR | | | 207,170 | | | CAD | | | 209,161 | | | 1/2/2025 | | | CBK | | | | - | | | | (1,991 | ) | | | (1,991 | ) |
| USD | | | 219,867 | | | NOK | | | 219,618 | | | 1/2/2025 | | | CBK | | | | 249 | | | | - | | | | 249 | |
| USD | | | 220,934 | | | SGD | | | 219,676 | | | 1/2/2025 | | | CBK | | | | 1,258 | | | | - | | | | 1,258 | |
See accompanying notes
7
American Beacon AHL Managed Futures Strategy FundSM
Consolidated Schedule of Investments
December 31, 2024
| | | | | | | | | | | | | | | | | | | | | | | | | | | | |
| | | | | | |
| Currency Purchased* | | | Currency Sold* | | | Settlement
Date | | Counterparty | | | Unrealized
Appreciation | | | Unrealized
(Depreciation) | | | Net Unrealized
Appreciation
(Depreciation) | |
| USD | | | 221,021 | | | SGD | | | 219,676 | | | 1/2/2025 | | | CBK | | | $ | 1,345 | | | $ | - | | | $ | 1,345 | |
| USD | | | 221,166 | | | SGD | | | 219,676 | | | 1/2/2025 | | | CBK | | | | 1,490 | | | | - | | | | 1,490 | |
| USD | | | 226,072 | | | SEK | | | 225,961 | | | 1/2/2025 | | | CBK | | | | 111 | | | | - | | | | 111 | |
| USD | | | 226,130 | | | SEK | | | 225,961 | | | 1/2/2025 | | | CBK | | | | 169 | | | | - | | | | 169 | |
| USD | | | 226,144 | | | SEK | | | 225,961 | | | 1/2/2025 | | | CBK | | | | 183 | | | | - | | | | 183 | |
| USD | | | 226,169 | | | SEK | | | 225,961 | | | 1/2/2025 | | | CBK | | | | 208 | | | | - | | | | 208 | |
| USD | | | 226,179 | | | SEK | | | 225,961 | | | 1/2/2025 | | | CBK | | | | 218 | | | | - | | | | 218 | |
| USD | | | 226,190 | | | SEK | | | 225,961 | | | 1/2/2025 | | | CBK | | | | 229 | | | | - | | | | 229 | |
| USD | | | 226,231 | | | SEK | | | 225,961 | | | 1/2/2025 | | | CBK | | | | 270 | | | | - | | | | 270 | |
| USD | | | 226,388 | | | SEK | | | 225,961 | | | 1/2/2025 | | | CBK | | | | 427 | | | | - | | | | 427 | |
| USD | | | 226,421 | | | SEK | | | 225,961 | | | 1/2/2025 | | | CBK | | | | 460 | | | | - | | | | 460 | |
| USD | | | 226,646 | | | SEK | | | 225,961 | | | 1/2/2025 | | | CBK | | | | 685 | | | | - | | | | 685 | |
| USD | | | 264,110 | | | NOK | | | 263,542 | | | 1/2/2025 | | | CBK | | | | 568 | | | | - | | | | 568 | |
| USD | | | 271,311 | | | SEK | | | 271,153 | | | 1/2/2025 | | | CBK | | | | 158 | | | | - | | | | 158 | |
| USD | | | 271,348 | | | SEK | | | 271,153 | | | 1/2/2025 | | | CBK | | | | 195 | | | | - | | | | 195 | |
| USD | | | 294,531 | | | SGD | | | 292,901 | | | 1/2/2025 | | | CBK | | | | 1,630 | | | | - | | | | 1,630 | |
| USD | | | 294,551 | | | SGD | | | 292,901 | | | 1/2/2025 | | | CBK | | | | 1,650 | | | | - | | | | 1,650 | |
| USD | | | 294,620 | | | SGD | | | 292,901 | | | 1/2/2025 | | | CBK | | | | 1,719 | | | | - | | | | 1,719 | |
| USD | | | 294,961 | | | SGD | | | 292,901 | | | 1/2/2025 | | | CBK | | | | 2,060 | | | | - | | | | 2,060 | |
| USD | | | 308,159 | | | NOK | | | 307,465 | | | 1/2/2025 | | | CBK | | | | 694 | | | | - | | | | 694 | |
| EUR | | | 310,754 | | | CAD | | | 313,344 | | | 1/2/2025 | | | CBK | | | | - | | | | (2,590 | ) | | | (2,590 | ) |
| EUR | | | 310,755 | | | CAD | | | 313,098 | | | 1/2/2025 | | | CBK | | | | - | | | | (2,343 | ) | | | (2,343 | ) |
| EUR | | | 310,755 | | | CAD | | | 313,503 | | | 1/2/2025 | | | CBK | | | | - | | | | (2,748 | ) | | | (2,748 | ) |
| EUR | | | 310,755 | | | CAD | | | 313,595 | | | 1/2/2025 | | | CBK | | | | - | | | | (2,840 | ) | | | (2,840 | ) |
| USD | | | 317,120 | | | SEK | | | 316,346 | | | 1/2/2025 | | | CBK | | | | 774 | | | | - | | | | 774 | |
| USD | | | 351,343 | | | NOK | | | 351,389 | | | 1/2/2025 | | | CBK | | | | - | | | | (46 | ) | | | (46 | ) |
| USD | | | 368,194 | | | SGD | | | 366,126 | | | 1/2/2025 | | | CBK | | | | 2,068 | | | | - | | | | 2,068 | |
| USD | | | 395,897 | | | NOK | | | 395,312 | | | 1/2/2025 | | | CBK | | | | 585 | | | | - | | | | 585 | |
| USD | | | 439,455 | | | NOK | | | 439,236 | | | 1/2/2025 | | | CBK | | | | 219 | | | | - | | | | 219 | |
| USD | | | 440,102 | | | NOK | | | 439,236 | | | 1/2/2025 | | | CBK | | | | 866 | | | | - | | | | 866 | |
| USD | | | 440,450 | | | NOK | | | 439,236 | | | 1/2/2025 | | | CBK | | | | 1,214 | | | | - | | | | 1,214 | |
| USD | | | 484,878 | | | NOK | | | 483,160 | | | 1/2/2025 | | | CBK | | | | 1,718 | | | | - | | | | 1,718 | |
| USD | | | 527,384 | | | NOK | | | 527,083 | | | 1/2/2025 | | | CBK | | | | 301 | | | | - | | | | 301 | |
| USD | | | 571,447 | | | NOK | | | 571,007 | | | 1/2/2025 | | | CBK | | | | 440 | | | | - | | | | 440 | |
| USD | | | 572,904 | | | NOK | | | 571,007 | | | 1/2/2025 | | | CBK | | | | 1,897 | | | | - | | | | 1,897 | |
| USD | | | 616,230 | | | NOK | | | 614,931 | | | 1/2/2025 | | | CBK | | | | 1,299 | | | | - | | | | 1,299 | |
| USD | | | 616,384 | | | NOK | | | 614,931 | | | 1/2/2025 | | | CBK | | | | 1,453 | | | | - | | | | 1,453 | |
| USD | | | 616,431 | | | NOK | | | 614,931 | | | 1/2/2025 | | | CBK | | | | 1,500 | | | | - | | | | 1,500 | |
| USD | | | 616,606 | | | NOK | | | 614,931 | | | 1/2/2025 | | | CBK | | | | 1,675 | | | | - | | | | 1,675 | |
| SGD | | | 2,709,333 | | | USD | | | 2,723,860 | | | 1/2/2025 | | | CBK | | | | - | | | | (14,527 | ) | | | (14,527 | ) |
| CAD | | | 3,949,082 | | | EUR | | | 3,936,229 | | | 1/2/2025 | | | CBK | | | | 12,853 | | | | - | | | | 12,853 | |
| SEK | | | 5,061,529 | | | USD | | | 5,085,961 | | | 1/2/2025 | | | CBK | | | | - | | | | (24,432 | ) | | | (24,432 | ) |
| NOK | | | 7,467,013 | | | USD | | | 7,499,523 | | | 1/2/2025 | | | CBK | | | | - | | | | (32,510 | ) | | | (32,510 | ) |
| USD | | | 71,988 | | | MXN | | | 71,939 | | | 1/3/2025 | | | CBK | | | | 49 | | | | - | | | | 49 | |
| USD | | | 73,542 | | | SGD | | | 73,225 | | | 1/3/2025 | | | CBK | | | | 317 | | | | - | | | | 317 | |
| USD | | | 95,895 | | | MXN | | | 95,919 | | | 1/3/2025 | | | CBK | | | | - | | | | (24 | ) | | | (24 | ) |
| USD | | | 95,897 | | | MXN | | | 95,919 | | | 1/3/2025 | | | CBK | | | | - | | | | (22 | ) | | | (22 | ) |
| USD | | | 119,629 | | | MXN | | | 119,898 | | | 1/3/2025 | | | CBK | | | | - | | | | (269 | ) | | | (269 | ) |
| USD | | | 119,710 | | | MXN | | | 119,898 | | | 1/3/2025 | | | CBK | | | | - | | | | (188 | ) | | | (188 | ) |
| USD | | | 119,715 | | | MXN | | | 119,898 | | | 1/3/2025 | | | CBK | | | | - | | | | (183 | ) | | | (183 | ) |
| USD | | | 119,724 | | | MXN | | | 119,898 | | | 1/3/2025 | | | CBK | | | | - | | | | (174 | ) | | | (174 | ) |
| USD | | | 119,746 | | | MXN | | | 119,898 | | | 1/3/2025 | | | CBK | | | | - | | | | (152 | ) | | | (152 | ) |
| USD | | | 119,767 | | | MXN | | | 119,898 | | | 1/3/2025 | | | CBK | | | | - | | | | (131 | ) | | | (131 | ) |
| USD | | | 119,810 | | | MXN | | | 119,898 | | | 1/3/2025 | | | CBK | | | | - | | | | (88 | ) | | | (88 | ) |
| USD | | | 119,836 | | | MXN | | | 119,898 | | | 1/3/2025 | | | CBK | | | | - | | | | (62 | ) | | | (62 | ) |
| USD | | | 119,909 | | | MXN | | | 119,898 | | | 1/3/2025 | | | CBK | | | | 11 | | | | - | | | | 11 | |
| USD | | | 119,979 | | | MXN | | | 119,898 | | | 1/3/2025 | | | CBK | | | | 81 | | | | - | | | | 81 | |
| USD | | | 119,993 | | | MXN | | | 119,898 | | | 1/3/2025 | | | CBK | | | | 95 | | | | - | | | | 95 | |
| USD | | | 120,177 | | | MXN | | | 119,898 | | | 1/3/2025 | | | CBK | | | | 279 | | | | - | | | | 279 | |
See accompanying notes
8
American Beacon AHL Managed Futures Strategy FundSM
Consolidated Schedule of Investments
December 31, 2024
| | | | | | | | | | | | | | | | | | | | | | | | | | | | |
| | | | | | |
| Currency Purchased* | | | Currency Sold* | | | Settlement
Date | | Counterparty | | | Unrealized
Appreciation | | | Unrealized
(Depreciation) | | | Net Unrealized
Appreciation
(Depreciation) | |
| USD | | | 132,545 | | | NOK | | | 131,771 | | | 1/3/2025 | | | CBK | | | $ | 774 | | | $ | - | | | $ | 774 | |
| USD | | | 143,643 | | | MXN | | | 143,878 | | | 1/3/2025 | | | CBK | | | | - | | | | (235 | ) | | | (235 | ) |
| USD | | | 143,679 | | | MXN | | | 143,878 | | | 1/3/2025 | | | CBK | | | | - | | | | (199 | ) | | | (199 | ) |
| USD | | | 143,682 | | | MXN | | | 143,878 | | | 1/3/2025 | | | CBK | | | | - | | | | (196 | ) | | | (196 | ) |
| USD | | | 143,779 | | | MXN | | | 143,878 | | | 1/3/2025 | | | CBK | | | | - | | | | (99 | ) | | | (99 | ) |
| USD | | | 143,790 | | | MXN | | | 143,878 | | | 1/3/2025 | | | CBK | | | | - | | | | (88 | ) | | | (88 | ) |
| USD | | | 143,826 | | | MXN | | | 143,878 | | | 1/3/2025 | | | CBK | | | | - | | | | (52 | ) | | | (52 | ) |
| USD | | | 143,858 | | | MXN | | | 143,878 | | | 1/3/2025 | | | CBK | | | | - | | | | (20 | ) | | | (20 | ) |
| USD | | | 143,927 | | | MXN | | | 143,878 | | | 1/3/2025 | | | CBK | | | | 49 | | | | - | | | | 49 | |
| USD | | | 143,936 | | | MXN | | | 143,878 | | | 1/3/2025 | | | CBK | | | | 58 | | | | - | | | | 58 | |
| USD | | | 143,945 | | | MXN | | | 143,878 | | | 1/3/2025 | | | CBK | | | | 67 | | | | - | | | | 67 | |
| USD | | | 143,964 | | | MXN | | | 143,878 | | | 1/3/2025 | | | CBK | | | | 86 | | | | - | | | | 86 | |
| USD | | | 144,276 | | | MXN | | | 143,878 | | | 1/3/2025 | | | CBK | | | | 398 | | | | - | | | | 398 | |
| USD | | | 144,629 | | | MXN | | | 143,878 | | | 1/3/2025 | | | CBK | | | | 751 | | | | - | | | | 751 | |
| USD | | | 147,057 | | | SGD | | | 146,450 | | | 1/3/2025 | | | CBK | | | | 607 | | | | - | | | | 607 | |
| USD | | | 147,065 | | | SGD | | | 146,450 | | | 1/3/2025 | | | CBK | | | | 615 | | | | - | | | | 615 | |
| USD | | | 147,078 | | | SGD | | | 146,450 | | | 1/3/2025 | | | CBK | | | | 628 | | | | - | | | | 628 | |
| USD | | | 147,079 | | | SGD | | | 146,450 | | | 1/3/2025 | | | CBK | | | | 629 | | | | - | | | | 629 | |
| USD | | | 147,084 | | | SGD | | | 146,450 | | | 1/3/2025 | | | CBK | | | | 634 | | | | - | | | | 634 | |
| USD | | | 147,087 | | | SGD | | | 146,450 | | | 1/3/2025 | | | CBK | | | | 637 | | | | - | | | | 637 | |
| USD | | | 147,093 | | | SGD | | | 146,450 | | | 1/3/2025 | | | CBK | | | | 643 | | | | - | | | | 643 | |
| USD | | | 147,101 | | | SGD | | | 146,450 | | | 1/3/2025 | | | CBK | | | | 651 | | | | - | | | | 651 | |
| USD | | | 147,112 | | | SGD | | | 146,450 | | | 1/3/2025 | | | CBK | | | | 662 | | | | - | | | | 662 | |
| USD | | | 147,120 | | | SGD | | | 146,450 | | | 1/3/2025 | | | CBK | | | | 670 | | | | - | | | | 670 | |
| USD | | | 147,128 | | | SGD | | | 146,450 | | | 1/3/2025 | | | CBK | | | | 678 | | | | - | | | | 678 | |
| USD | | | 147,165 | | | SGD | | | 146,450 | | | 1/3/2025 | | | CBK | | | | 715 | | | | - | | | | 715 | |
| USD | | | 167,436 | | | MXN | | | 167,858 | | | 1/3/2025 | | | CBK | | | | - | | | | (422 | ) | | | (422 | ) |
| USD | | | 167,471 | | | MXN | | | 167,858 | | | 1/3/2025 | | | CBK | | | | - | | | | (387 | ) | | | (387 | ) |
| USD | | | 167,629 | | | MXN | | | 167,858 | | | 1/3/2025 | | | CBK | | | | - | | | | (229 | ) | | | (229 | ) |
| USD | | | 167,633 | | | MXN | | | 167,858 | | | 1/3/2025 | | | CBK | | | | - | | | | (225 | ) | | | (225 | ) |
| USD | | | 167,653 | | | MXN | | | 167,858 | | | 1/3/2025 | | | CBK | | | | - | | | | (205 | ) | | | (205 | ) |
| USD | | | 167,676 | | | MXN | | | 167,858 | | | 1/3/2025 | | | CBK | | | | - | | | | (182 | ) | | | (182 | ) |
| USD | | | 167,733 | | | MXN | | | 167,858 | | | 1/3/2025 | | | CBK | | | | - | | | | (125 | ) | | | (125 | ) |
| USD | | | 167,739 | | | MXN | | | 167,858 | | | 1/3/2025 | | | CBK | | | | - | | | | (119 | ) | | | (119 | ) |
| USD | | | 167,760 | | | MXN | | | 167,858 | | | 1/3/2025 | | | CBK | | | | - | | | | (98 | ) | | | (98 | ) |
| USD | | | 167,765 | | | MXN | | | 167,858 | | | 1/3/2025 | | | CBK | | | | - | | | | (93 | ) | | | (93 | ) |
| USD | | | 167,796 | | | MXN | | | 167,858 | | | 1/3/2025 | | | CBK | | | | - | | | | (62 | ) | | | (62 | ) |
| USD | | | 167,800 | | | MXN | | | 167,858 | | | 1/3/2025 | | | CBK | | | | - | | | | (58 | ) | | | (58 | ) |
| USD | | | 167,829 | | | MXN | | | 167,858 | | | 1/3/2025 | | | CBK | | | | - | | | | (29 | ) | | | (29 | ) |
| USD | | | 167,922 | | | MXN | | | 167,858 | | | 1/3/2025 | | | CBK | | | | 64 | | | | - | | | | 64 | |
| USD | | | 167,993 | | | MXN | | | 167,858 | | | 1/3/2025 | | | CBK | | | | 135 | | | | - | | | | 135 | |
| USD | | | 168,024 | | | MXN | | | 167,858 | | | 1/3/2025 | | | CBK | | | | 166 | | | | - | | | | 166 | |
| USD | | | 168,111 | | | MXN | | | 167,858 | | | 1/3/2025 | | | CBK | | | | 253 | | | | - | | | | 253 | |
| USD | | | 168,283 | | | MXN | | | 167,858 | | | 1/3/2025 | | | CBK | | | | 425 | | | | - | | | | 425 | |
| USD | | | 168,391 | | | MXN | | | 167,858 | | | 1/3/2025 | | | CBK | | | | 533 | | | | - | | | | 533 | |
| USD | | | 168,398 | | | MXN | | | 167,858 | | | 1/3/2025 | | | CBK | | | | 540 | | | | - | | | | 540 | |
| USD | | | 168,770 | | | MXN | | | 167,858 | | | 1/3/2025 | | | CBK | | | | 912 | | | | - | | | | 912 | |
| USD | | | 176,702 | | | NOK | | | 175,694 | | | 1/3/2025 | | | CBK | | | | 1,008 | | | | - | | | | 1,008 | |
| USD | | | 191,317 | | | MXN | | | 191,837 | | | 1/3/2025 | | | CBK | | | | - | | | | (520 | ) | | | (520 | ) |
| USD | | | 191,527 | | | MXN | | | 191,837 | | | 1/3/2025 | | | CBK | | | | - | | | | (310 | ) | | | (310 | ) |
| USD | | | 191,547 | | | MXN | | | 191,837 | | | 1/3/2025 | | | CBK | | | | - | | | | (290 | ) | | | (290 | ) |
| USD | | | 191,569 | | | MXN | | | 191,837 | | | 1/3/2025 | | | CBK | | | | - | | | | (268 | ) | | | (268 | ) |
| USD | | | 191,583 | | | MXN | | | 191,837 | | | 1/3/2025 | | | CBK | | | | - | | | | (254 | ) | | | (254 | ) |
| USD | | | 191,679 | | | MXN | | | 191,837 | | | 1/3/2025 | | | CBK | | | | - | | | | (158 | ) | | | (158 | ) |
| USD | | | 191,693 | | | MXN | | | 191,837 | | | 1/3/2025 | | | CBK | | | | - | | | | (144 | ) | | | (144 | ) |
| USD | | | 191,700 | | | MXN | | | 191,837 | | | 1/3/2025 | | | CBK | | | | - | | | | (137 | ) | | | (137 | ) |
| USD | | | 191,801 | | | MXN | | | 191,837 | | | 1/3/2025 | | | CBK | | | | - | | | | (36 | ) | | | (36 | ) |
| USD | | | 191,986 | | | MXN | | | 191,837 | | | 1/3/2025 | | | CBK | | | | 149 | | | | - | | | | 149 | |
| USD | | | 192,032 | | | MXN | | | 191,837 | | | 1/3/2025 | | | CBK | | | | 195 | | | | - | | | | 195 | |
See accompanying notes
9
American Beacon AHL Managed Futures Strategy FundSM
Consolidated Schedule of Investments
December 31, 2024
| | | | | | | | | | | | | | | | | | | | | | | | | | | | |
| | | | | | |
| Currency Purchased* | | | Currency Sold* | | | Settlement
Date | | Counterparty | | | Unrealized
Appreciation | | | Unrealized
(Depreciation) | | | Net Unrealized
Appreciation
(Depreciation) | |
| USD | | | 192,361 | | | MXN | | | 191,837 | | | 1/3/2025 | | | CBK | | | $ | 524 | | | $ | - | | | $ | 524 | |
| USD | | | 215,266 | | | MXN | | | 215,817 | | | 1/3/2025 | | | CBK | | | | - | | | | (551 | ) | | | (551 | ) |
| USD | | | 215,286 | | | MXN | | | 215,817 | | | 1/3/2025 | | | CBK | | | | - | | | | (531 | ) | | | (531 | ) |
| USD | | | 215,455 | | | MXN | | | 215,817 | | | 1/3/2025 | | | CBK | | | | - | | | | (362 | ) | | | (362 | ) |
| USD | | | 215,462 | | | MXN | | | 215,817 | | | 1/3/2025 | | | CBK | | | | - | | | | (355 | ) | | | (355 | ) |
| USD | | | 215,554 | | | MXN | | | 215,817 | | | 1/3/2025 | | | CBK | | | | - | | | | (263 | ) | | | (263 | ) |
| USD | | | 215,625 | | | MXN | | | 215,817 | | | 1/3/2025 | | | CBK | | | | - | | | | (192 | ) | | | (192 | ) |
| USD | | | 215,667 | | | MXN | | | 215,817 | | | 1/3/2025 | | | CBK | | | | - | | | | (150 | ) | | | (150 | ) |
| USD | | | 215,673 | | | MXN | | | 215,817 | | | 1/3/2025 | | | CBK | | | | - | | | | (144 | ) | | | (144 | ) |
| USD | | | 215,693 | | | MXN | | | 215,817 | | | 1/3/2025 | | | CBK | | | | - | | | | (124 | ) | | | (124 | ) |
| USD | | | 215,707 | | | MXN | | | 215,817 | | | 1/3/2025 | | | CBK | | | | - | | | | (110 | ) | | | (110 | ) |
| USD | | | 215,711 | | | MXN | | | 215,817 | | | 1/3/2025 | | | CBK | | | | - | | | | (106 | ) | | | (106 | ) |
| USD | | | 215,992 | | | MXN | | | 215,817 | | | 1/3/2025 | | | CBK | | | | 175 | | | | - | | | | 175 | |
| USD | | | 216,237 | | | MXN | | | 215,817 | | | 1/3/2025 | | | CBK | | | | 420 | | | | - | | | | 420 | |
| USD | | | 216,321 | | | MXN | | | 215,817 | | | 1/3/2025 | | | CBK | | | | 504 | | | | - | | | | 504 | |
| USD | | | 216,335 | | | MXN | | | 215,817 | | | 1/3/2025 | | | CBK | | | | 518 | | | | - | | | | 518 | |
| USD | | | 216,591 | | | MXN | | | 215,817 | | | 1/3/2025 | | | CBK | | | | 774 | | | | - | | | | 774 | |
| USD | | | 216,711 | | | MXN | | | 215,817 | | | 1/3/2025 | | | CBK | | | | 894 | | | | - | | | | 894 | |
| USD | | | 216,799 | | | MXN | | | 215,817 | | | 1/3/2025 | | | CBK | | | | 982 | | | | - | | | | 982 | |
| USD | | | 216,858 | | | MXN | | | 215,817 | | | 1/3/2025 | | | CBK | | | | 1,041 | | | | - | | | | 1,041 | |
| USD | | | 220,215 | | | NOK | | | 219,618 | | | 1/3/2025 | | | CBK | | | | 597 | | | | - | | | | 597 | |
| USD | | | 220,567 | | | SGD | | | 219,676 | | | 1/3/2025 | | | CBK | | | | 891 | | | | - | | | | 891 | |
| USD | | | 220,577 | | | NOK | | | 219,618 | | | 1/3/2025 | | | CBK | | | | 959 | | | | - | | | | 959 | |
| USD | | | 220,681 | | | SGD | | | 219,676 | | | 1/3/2025 | | | CBK | | | | 1,005 | | | | - | | | | 1,005 | |
| USD | | | 239,197 | | | MXN | | | 239,797 | | | 1/3/2025 | | | CBK | | | | - | | | | (600 | ) | | | (600 | ) |
| USD | | | 239,469 | | | MXN | | | 239,797 | | | 1/3/2025 | | | CBK | | | | - | | | | (328 | ) | | | (328 | ) |
| USD | | | 239,508 | | | MXN | | | 239,797 | | | 1/3/2025 | | | CBK | | | | - | | | | (289 | ) | | | (289 | ) |
| USD | | | 239,596 | | | MXN | | | 239,797 | | | 1/3/2025 | | | CBK | | | | - | | | | (201 | ) | | | (201 | ) |
| USD | | | 239,614 | | | MXN | | | 239,797 | | | 1/3/2025 | | | CBK | | | | - | | | | (183 | ) | | | (183 | ) |
| USD | | | 239,691 | | | MXN | | | 239,797 | | | 1/3/2025 | | | CBK | | | | - | | | | (106 | ) | | | (106 | ) |
| USD | | | 239,694 | | | MXN | | | 239,797 | | | 1/3/2025 | | | CBK | | | | - | | | | (103 | ) | | | (103 | ) |
| USD | | | 239,919 | | | MXN | | | 239,797 | | | 1/3/2025 | | | CBK | | | | 122 | | | | - | | | | 122 | |
| USD | | | 239,922 | | | MXN | | | 239,797 | | | 1/3/2025 | | | CBK | | | | 125 | | | | - | | | | 125 | |
| USD | | | 240,662 | | | MXN | | | 239,797 | | | 1/3/2025 | | | CBK | | | | 865 | | | | - | | | | 865 | |
| USD | | | 263,101 | | | MXN | | | 263,776 | | | 1/3/2025 | | | CBK | | | | - | | | | (675 | ) | | | (675 | ) |
| USD | | | 263,479 | | | MXN | | | 263,776 | | | 1/3/2025 | | | CBK | | | | - | | | | (297 | ) | | | (297 | ) |
| USD | | | 263,482 | | | MXN | | | 263,776 | | | 1/3/2025 | | | CBK | | | | - | | | | (294 | ) | | | (294 | ) |
| USD | | | 263,527 | | | MXN | | | 263,776 | | | 1/3/2025 | | | CBK | | | | - | | | | (249 | ) | | | (249 | ) |
| USD | | | 263,706 | | | MXN | | | 263,776 | | | 1/3/2025 | | | CBK | | | | - | | | | (70 | ) | | | (70 | ) |
| USD | | | 263,719 | | | MXN | | | 263,776 | | | 1/3/2025 | | | CBK | | | | - | | | | (57 | ) | | | (57 | ) |
| USD | | | 264,097 | | | MXN | | | 263,776 | | | 1/3/2025 | | | CBK | | | | 321 | | | | - | | | | 321 | |
| USD | | | 264,481 | | | MXN | | | 263,776 | | | 1/3/2025 | | | CBK | | | | 705 | | | | - | | | | 705 | |
| USD | | | 264,503 | | | NOK | | | 263,542 | | | 1/3/2025 | | | CBK | | | | 961 | | | | - | | | | 961 | |
| USD | | | 264,910 | | | NOK | | | 263,542 | | | 1/3/2025 | | | CBK | | | | 1,368 | | | | - | | | | 1,368 | |
| USD | | | 287,570 | | | MXN | | | 287,756 | | | 1/3/2025 | | | CBK | | | | - | | | | (186 | ) | | | (186 | ) |
| USD | | | 287,600 | | | MXN | | | 287,756 | | | 1/3/2025 | | | CBK | | | | - | | | | (156 | ) | | | (156 | ) |
| USD | | | 287,606 | | | MXN | | | 287,756 | | | 1/3/2025 | | | CBK | | | | - | | | | (150 | ) | | | (150 | ) |
| USD | | | 287,622 | | | MXN | | | 287,756 | | | 1/3/2025 | | | CBK | | | | - | | | | (134 | ) | | | (134 | ) |
| USD | | | 287,668 | | | MXN | | | 287,756 | | | 1/3/2025 | | | CBK | | | | - | | | | (88 | ) | | | (88 | ) |
| USD | | | 287,738 | | | MXN | | | 287,756 | | | 1/3/2025 | | | CBK | | | | - | | | | (18 | ) | | | (18 | ) |
| USD | | | 288,071 | | | MXN | | | 287,756 | | | 1/3/2025 | | | CBK | | | | 315 | | | | - | | | | 315 | |
| USD | | | 288,223 | | | MXN | | | 287,756 | | | 1/3/2025 | | | CBK | | | | 467 | | | | - | | | | 467 | |
| USD | | | 289,328 | | | MXN | | | 287,756 | | | 1/3/2025 | | | CBK | | | | 1,572 | | | | - | | | | 1,572 | |
| USD | | | 289,900 | | | MXN | | | 287,756 | | | 1/3/2025 | | | CBK | | | | 2,144 | | | | - | | | | 2,144 | |
| USD | | | 294,165 | | | SGD | | | 292,901 | | | 1/3/2025 | | | CBK | | | | 1,264 | | | | - | | | | 1,264 | |
| USD | | | 147,095 | | | SGD | | | 146,450 | | | 1/3/2025 | | | CBK | | | | 645 | | | | - | | | | 645 | |
| USD | | | 147,095 | | | SGD | | | 146,450 | | | 1/3/2025 | | | CBK | | | | 645 | | | | - | | | | 645 | |
| USD | | | 294,209 | | | SGD | | | 292,901 | | | 1/3/2025 | | | CBK | | | | 1,308 | | | | - | | | | 1,308 | |
| USD | | | 294,284 | | | SGD | | | 292,901 | | | 1/3/2025 | | | CBK | | | | 1,383 | | | | - | | | | 1,383 | |
See accompanying notes
10
American Beacon AHL Managed Futures Strategy FundSM
Consolidated Schedule of Investments
December 31, 2024
| | | | | | | | | | | | | | | | | | | | | | | | | | | | |
| | | | | | |
| Currency Purchased* | | | Currency Sold* | | | Settlement
Date | | Counterparty | | | Unrealized
Appreciation | | | Unrealized
(Depreciation) | | | Net Unrealized
Appreciation
(Depreciation) | |
| USD | | | 308,736 | | | NOK | | | 307,465 | | | 1/3/2025 | | | CBK | | | $ | 1,271 | | | $ | - | | | $ | 1,271 | |
| USD | | | 311,560 | | | MXN | | | 311,736 | | | 1/3/2025 | | | CBK | | | | - | | | | (176 | ) | | | (176 | ) |
| USD | | | 311,668 | | | MXN | | | 311,736 | | | 1/3/2025 | | | CBK | | | | - | | | | (68 | ) | | | (68 | ) |
| USD | | | 312,034 | | | MXN | | | 311,736 | | | 1/3/2025 | | | CBK | | | | 298 | | | | - | | | | 298 | |
| USD | | | 312,252 | | | MXN | | | 311,736 | | | 1/3/2025 | | | CBK | | | | 516 | | | | - | | | | 516 | |
| USD | | | 312,312 | | | MXN | | | 311,736 | | | 1/3/2025 | | | CBK | | | | 576 | | | | - | | | | 576 | |
| USD | | | 312,634 | | | MXN | | | 311,736 | | | 1/3/2025 | | | CBK | | | | 898 | | | | - | | | | 898 | |
| USD | | | 313,872 | | | MXN | | | 311,736 | | | 1/3/2025 | | | CBK | | | | 2,136 | | | | - | | | | 2,136 | |
| USD | | | 314,063 | | | MXN | | | 311,736 | | | 1/3/2025 | | | CBK | | | | 2,327 | | | | - | | | | 2,327 | |
| USD | | | 335,207 | | | MXN | | | 335,715 | | | 1/3/2025 | | | CBK | | | | - | | | | (508 | ) | | | (508 | ) |
| USD | | | 167,840 | | | MXN | | | 167,858 | | | 1/3/2025 | | | CBK | | | | - | | | | (18 | ) | | | (18 | ) |
| USD | | | 167,840 | | | MXN | | | 167,858 | | | 1/3/2025 | | | CBK | | | | - | | | | (18 | ) | | | (18 | ) |
| USD | | | 336,444 | | | MXN | | | 335,715 | | | 1/3/2025 | | | CBK | | | | 729 | | | | - | | | | 729 | |
| USD | | | 352,840 | | | NOK | | | 351,389 | | | 1/3/2025 | | | CBK | | | | 1,451 | | | | - | | | | 1,451 | |
| USD | | | 359,493 | | | MXN | | | 359,695 | | | 1/3/2025 | | | CBK | | | | - | | | | (202 | ) | | | (202 | ) |
| USD | | | 359,949 | | | MXN | | | 359,695 | | | 1/3/2025 | | | CBK | | | | 254 | | | | - | | | | 254 | |
| USD | | | 361,859 | | | MXN | | | 359,695 | | | 1/3/2025 | | | CBK | | | | 2,164 | | | | - | | | | 2,164 | |
| USD | | | 362,143 | | | MXN | | | 359,695 | | | 1/3/2025 | | | CBK | | | | 2,448 | | | | - | | | | 2,448 | |
| USD | | | 362,272 | | | MXN | | | 359,695 | | | 1/3/2025 | | | CBK | | | | 2,577 | | | | - | | | | 2,577 | |
| USD | | | 386,576 | | | MXN | | | 383,675 | | | 1/3/2025 | | | CBK | | | | 2,901 | | | | - | | | | 2,901 | |
| USD | | | 396,847 | | | NOK | | | 395,312 | | | 1/3/2025 | | | CBK | | | | 1,535 | | | | - | | | | 1,535 | |
| USD | | | 396,952 | | | NOK | | | 395,312 | | | 1/3/2025 | | | CBK | | | | 1,640 | | | | - | | | | 1,640 | |
| USD | | | 410,519 | | | MXN | | | 407,654 | | | 1/3/2025 | | | CBK | | | | 2,865 | | | | - | | | | 2,865 | |
| USD | | | 410,920 | | | MXN | | | 407,654 | | | 1/3/2025 | | | CBK | | | | 3,266 | | | | - | | | | 3,266 | |
| USD | | | 434,343 | | | MXN | | | 431,634 | | | 1/3/2025 | | | CBK | | | | 2,709 | | | | - | | | | 2,709 | |
| USD | | | 434,824 | | | MXN | | | 431,634 | | | 1/3/2025 | | | CBK | | | | 3,190 | | | | - | | | | 3,190 | |
| USD | | | 440,544 | | | NOK | | | 439,236 | | | 1/3/2025 | | | CBK | | | | 1,308 | | | | - | | | | 1,308 | |
| USD | | | 458,164 | | | MXN | | | 455,614 | | | 1/3/2025 | | | CBK | | | | 2,550 | | | | - | | | | 2,550 | |
| USD | | | 458,587 | | | MXN | | | 455,614 | | | 1/3/2025 | | | CBK | | | | 2,973 | | | | - | | | | 2,973 | |
| USD | | | 458,687 | | | MXN | | | 455,614 | | | 1/3/2025 | | | CBK | | | | 3,073 | | | | - | | | | 3,073 | |
| USD | | | 482,251 | | | MXN | | | 479,593 | | | 1/3/2025 | | | CBK | | | | 2,658 | | | | - | | | | 2,658 | |
| USD | | | 484,995 | | | NOK | | | 483,160 | | | 1/3/2025 | | | CBK | | | | 1,835 | | | | - | | | | 1,835 | |
| USD | | | 485,631 | | | NOK | | | 483,160 | | | 1/3/2025 | | | CBK | | | | 2,471 | | | | - | | | | 2,471 | |
| USD | | | 506,266 | | | MXN | | | 503,573 | | | 1/3/2025 | | | CBK | | | | 2,693 | | | | - | | | | 2,693 | |
| USD | | | 529,324 | | | NOK | | | 527,083 | | | 1/3/2025 | | | CBK | | | | 2,241 | | | | - | | | | 2,241 | |
| USD | | | 554,597 | | | MXN | | | 551,532 | | | 1/3/2025 | | | CBK | | | | 3,065 | | | | - | | | | 3,065 | |
| USD | | | 573,521 | | | NOK | | | 571,007 | | | 1/3/2025 | | | CBK | | | | 2,514 | | | | - | | | | 2,514 | |
| USD | | | 617,485 | | | NOK | | | 614,931 | | | 1/3/2025 | | | CBK | | | | 2,554 | | | | - | | | | 2,554 | |
| USD | | | 626,890 | | | MXN | | | 623,471 | | | 1/3/2025 | | | CBK | | | | 3,419 | | | | - | | | | 3,419 | |
| USD | | | 627,796 | | | MXN | | | 623,471 | | | 1/3/2025 | | | CBK | | | | 4,325 | | | | - | | | | 4,325 | |
| USD | | | 674,949 | | | MXN | | | 671,431 | | | 1/3/2025 | | | CBK | | | | 3,518 | | | | - | | | | 3,518 | |
| USD | | | 770,676 | | | MXN | | | 767,349 | | | 1/3/2025 | | | CBK | | | | 3,327 | | | | - | | | | 3,327 | |
| USD | | | 892,879 | | | MXN | | | 887,248 | | | 1/3/2025 | | | CBK | | | | 5,631 | | | | - | | | | 5,631 | |
| USD | | | 1,108,578 | | | MXN | | | 1,103,065 | | | 1/3/2025 | | | CBK | | | | 5,513 | | | | - | | | | 5,513 | |
| GBP | | | 62,593 | | | JPY | | | 62,826 | | | 1/6/2025 | | | CBK | | | | - | | | | (233 | ) | | | (233 | ) |
| GBP | | | 62,593 | | | JPY | | | 62,849 | | | 1/6/2025 | | | CBK | | | | - | | | | (256 | ) | | | (256 | ) |
| GBP | | | 62,593 | | | JPY | | | 62,940 | | | 1/6/2025 | | | CBK | | | | - | | | | (347 | ) | | | (347 | ) |
| GBP | | | 125,186 | | | JPY | | | 126,075 | | | 1/6/2025 | | | CBK | | | | - | | | | (889 | ) | | | (889 | ) |
| GBP | | | 125,187 | | | JPY | | | 125,492 | | | 1/6/2025 | | | CBK | | | | - | | | | (305 | ) | | | (305 | ) |
| GBP | | | 125,187 | | | JPY | | | 125,498 | | | 1/6/2025 | | | CBK | | | | - | | | | (311 | ) | | | (311 | ) |
| GBP | | | 125,187 | | | JPY | | | 125,645 | | | 1/6/2025 | | | CBK | | | | - | | | | (458 | ) | | | (458 | ) |
| GBP | | | 125,187 | | | JPY | | | 125,954 | | | 1/6/2025 | | | CBK | | | | - | | | | (767 | ) | | | (767 | ) |
| GBP | | | 125,187 | | | JPY | | | 126,008 | | | 1/6/2025 | | | CBK | | | | - | | | | (821 | ) | | | (821 | ) |
| GBP | | | 187,780 | | | JPY | | | 188,325 | | | 1/6/2025 | | | CBK | | | | - | | | | (545 | ) | | | (545 | ) |
| GBP | | | 187,780 | | | JPY | | | 188,991 | | | 1/6/2025 | | | CBK | | | | - | | | | (1,211 | ) | | | (1,211 | ) |
| GBP | | | 250,373 | | | JPY | | | 251,264 | | | 1/6/2025 | | | CBK | | | | - | | | | (891 | ) | | | (891 | ) |
| GBP | | | 312,966 | | | JPY | | | 313,918 | | | 1/6/2025 | | | CBK | | | | - | | | | (952 | ) | | | (952 | ) |
| GBP | | | 312,967 | | | JPY | | | 313,917 | | | 1/6/2025 | | | CBK | | | | - | | | | (950 | ) | | | (950 | ) |
| GBP | | | 312,967 | | | JPY | | | 314,090 | | | 1/6/2025 | | | CBK | | | | - | | | | (1,123 | ) | | | (1,123 | ) |
See accompanying notes
11
American Beacon AHL Managed Futures Strategy FundSM
Consolidated Schedule of Investments
December 31, 2024
| | | | | | | | | | | | | | | | | | | | | | | | | | | | |
| | | | | | |
| Currency Purchased* | | | Currency Sold* | | | Settlement
Date | | Counterparty | | | Unrealized
Appreciation | | | Unrealized
(Depreciation) | | | Net Unrealized
Appreciation
(Depreciation) | |
| JPY | | | 2,522,928 | | | GBP | | | 2,503,733 | | | 1/6/2025 | | | CBK | | | $ | 19,195 | | | $ | - | | | $ | 19,195 | |
| GBP | | | 62,593 | | | JPY | | | 63,108 | | | 1/7/2025 | | | CBK | | | | - | | | | (515 | ) | | | (515 | ) |
| GBP | | | 62,593 | | | JPY | | | 63,109 | | | 1/7/2025 | | | CBK | | | | - | | | | (516 | ) | | | (516 | ) |
| GBP | | | 125,185 | | | JPY | | | 125,684 | | | 1/7/2025 | | | CBK | | | | - | | | | (499 | ) | | | (499 | ) |
| GBP | | | 125,186 | | | JPY | | | 126,082 | | | 1/7/2025 | | | CBK | | | | - | | | | (896 | ) | | | (896 | ) |
| GBP | | | 125,186 | | | JPY | | | 126,141 | | | 1/7/2025 | | | CBK | | | | - | | | | (955 | ) | | | (955 | ) |
| GBP | | | 125,186 | | | JPY | | | 126,210 | | | 1/7/2025 | | | CBK | | | | - | | | | (1,024 | ) | | | (1,024 | ) |
| GBP | | | 250,371 | | | JPY | | | 251,242 | | | 1/7/2025 | | | CBK | | | | - | | | | (871 | ) | | | (871 | ) |
| GBP | | | 250,371 | | | JPY | | | 252,197 | | | 1/7/2025 | | | CBK | | | | - | | | | (1,826 | ) | | | (1,826 | ) |
| GBP | | | 250,371 | | | JPY | | | 252,289 | | | 1/7/2025 | | | CBK | | | | - | | | | (1,918 | ) | | | (1,918 | ) |
| GBP | | | 250,371 | | | JPY | | | 252,366 | | | 1/7/2025 | | | CBK | | | | - | | | | (1,995 | ) | | | (1,995 | ) |
| USD | | | 29,439 | | | lNR | | | 29,184 | | | 1/8/2025 | | | CBK | | | | 255 | | | | - | | | | 255 | |
| USD | | | 29,440 | | | lNR | | | 29,184 | | | 1/8/2025 | | | CBK | | | | 256 | | | | - | | | | 256 | |
| USD | | | 29,442 | | | lNR | | | 29,184 | | | 1/8/2025 | | | CBK | | | | 258 | | | | - | | | | 258 | |
| USD | | | 29,447 | | | lNR | | | 29,184 | | | 1/8/2025 | | | CBK | | | | 263 | | | | - | | | | 263 | |
| USD | | | 29,448 | | | INR | | | 29,184 | | | 1/8/2025 | | | CBK | | | | 264 | | | | - | | | | 264 | |
| USD | | | 29,457 | | | INR | | | 29,184 | | | 1/8/2025 | | | CBK | | | | 273 | | | | - | | | | 273 | |
| USD | | | 29,458 | | | INR | | | 29,184 | | | 1/8/2025 | | | CBK | | | | 274 | | | | - | | | | 274 | |
| USD | | | 29,459 | | | INR | | | 29,184 | | | 1/8/2025 | | | CBK | | | | 275 | | | | - | | | | 275 | |
| USD | | | 29,472 | | | INR | | | 29,184 | | | 1/8/2025 | | | CBK | | | | 288 | | | | - | | | | 288 | |
| USD | | | 29,474 | | | INR | | | 29,184 | | | 1/8/2025 | | | CBK | | | | 290 | | | | - | | | | 290 | |
| USD | | | 29,478 | | | INR | | | 29,184 | | | 1/8/2025 | | | CBK | | | | 294 | | | | - | | | | 294 | |
| USD | | | 29,480 | | | INR | | | 29,184 | | | 1/8/2025 | | | CBK | | | | 296 | | | | - | | | | 296 | |
| USD | | | 29,482 | | | INR | | | 29,184 | | | 1/8/2025 | | | CBK | | | | 298 | | | | - | | | | 298 | |
| USD | | | 29,484 | | | INR | | | 29,184 | | | 1/8/2025 | | | CBK | | | | 300 | | | | - | | | | 300 | |
| USD | | | 29,525 | | | INR | | | 29,184 | | | 1/8/2025 | | | CBK | | | | 341 | | | | - | | | | 341 | |
| USD | | | 29,526 | | | INR | | | 29,184 | | | 1/8/2025 | | | CBK | | | | 342 | | | | - | | | | 342 | |
| USD | | | 29,527 | | | INR | | | 29,184 | | | 1/8/2025 | | | CBK | | | | 343 | | | | - | | | | 343 | |
| USD | | | 29,574 | | | INR | | | 29,184 | | | 1/8/2025 | | | CBK | | | | 390 | | | | - | | | | 390 | |
| USD | | | 29,576 | | | INR | | | 29,184 | | | 1/8/2025 | | | CBK | | | | 392 | | | | - | | | | 392 | |
| USD | | | 29,577 | | | INR | | | 29,184 | | | 1/8/2025 | | | CBK | | | | 393 | | | | - | | | | 393 | |
| USD | | | 29,581 | | | INR | | | 29,184 | | | 1/8/2025 | | | CBK | | | | 397 | | | | - | | | | 397 | |
| USD | | | 29,582 | | | INR | | | 29,184 | | | 1/8/2025 | | | CBK | | | | 398 | | | | - | | | | 398 | |
| USD | | | 29,583 | | | INR | | | 29,184 | | | 1/8/2025 | | | CBK | | | | 399 | | | | - | | | | 399 | |
| USD | | | 58,876 | | | INR | | | 58,368 | | | 1/8/2025 | | | CBK | | | | 508 | | | | - | | | | 508 | |
| USD | | | 58,878 | | | INR | | | 58,368 | | | 1/8/2025 | | | CBK | | | | 510 | | | | - | | | | 510 | |
| USD | | | 58,879 | | | INR | | | 58,368 | | | 1/8/2025 | | | CBK | | | | 511 | | | | - | | | | 511 | |
| USD | | | 58,883 | | | INR | | | 58,368 | | | 1/8/2025 | | | CBK | | | | 515 | | | | - | | | | 515 | |
| USD | | | 58,885 | | | INR | | | 58,368 | | | 1/8/2025 | | | CBK | | | | 517 | | | | - | | | | 517 | |
| USD | | | 58,886 | | | INR | | | 58,368 | | | 1/8/2025 | | | CBK | | | | 518 | | | | - | | | | 518 | |
| USD | | | 29,446 | | | INR | | | 29,184 | | | 1/8/2025 | | | CBK | | | | 262 | | | | - | | | | 262 | |
| USD | | | 29,446 | | | INR | | | 29,184 | | | 1/8/2025 | | | CBK | | | | 262 | | | | - | | | | 262 | |
| USD | | | 58,893 | | | INR | | | 58,368 | | | 1/8/2025 | | | CBK | | | | 525 | | | | - | | | | 525 | |
| USD | | | 58,912 | | | INR | | | 58,368 | | | 1/8/2025 | | | CBK | | | | 544 | | | | - | | | | 544 | |
| USD | | | 29,456 | | | INR | | | 29,184 | | | 1/8/2025 | | | CBK | | | | 272 | | | | - | | | | 272 | |
| USD | | | 29,456 | | | INR | | | 29,184 | | | 1/8/2025 | | | CBK | | | | 272 | | | | - | | | | 272 | |
| USD | | | 58,915 | | | INR | | | 58,368 | | | 1/8/2025 | | | CBK | | | | 547 | | | | - | | | | 547 | |
| USD | | | 58,918 | | | INR | | | 58,368 | | | 1/8/2025 | | | CBK | | | | 550 | | | | - | | | | 550 | |
| USD | | | 29,460 | | | INR | | | 29,184 | | | 1/8/2025 | | | CBK | | | | 276 | | | | - | | | | 276 | |
| USD | | | 29,460 | | | INR | | | 29,184 | | | 1/8/2025 | | | CBK | | | | 276 | | | | - | | | | 276 | |
| USD | | | 58,921 | | | INR | | | 58,368 | | | 1/8/2025 | | | CBK | | | | 553 | | | | - | | | | 553 | |
| USD | | | 29,461 | | | INR | | | 29,184 | | | 1/8/2025 | | | CBK | | | | 277 | | | | - | | | | 277 | |
| USD | | | 29,461 | | | INR | | | 29,184 | | | 1/8/2025 | | | CBK | | | | 277 | | | | - | | | | 277 | |
| USD | | | 58,923 | | | INR | | | 58,368 | | | 1/8/2025 | | | CBK | | | | 555 | | | | - | | | | 555 | |
| USD | | | 58,929 | | | INR | | | 58,368 | | | 1/8/2025 | | | CBK | | | | 561 | | | | - | | | | 561 | |
| USD | | | 58,930 | | | INR | | | 58,368 | | | 1/8/2025 | | | CBK | | | | 562 | | | | - | | | | 562 | |
| USD | | | 58,934 | | | INR | | | 58,368 | | | 1/8/2025 | | | CBK | | | | 566 | | | | - | | | | 566 | |
| USD | | | 58,935 | | | INR | | | 58,368 | | | 1/8/2025 | | | CBK | | | | 567 | | | | - | | | | 567 | |
| USD | | | 58,938 | | | INR | | | 58,368 | | | 1/8/2025 | | | CBK | | | | 570 | | | | - | | | | 570 | |
See accompanying notes
12
American Beacon AHL Managed Futures Strategy FundSM
Consolidated Schedule of Investments
December 31, 2024
| | | | | | | | | | | | | | | | | | | | | | | | | | | | |
| | | | | | |
| Currency Purchased* | | | Currency Sold* | | | Settlement
Date | | Counterparty | | | Unrealized
Appreciation | | | Unrealized
(Depreciation) | | | Net Unrealized
Appreciation
(Depreciation) | |
| USD | | | 29,469 | | | INR | | | 29,184 | | | 1/8/2025 | | | CBK | | | $ | 285 | | | $ | - | | | $ | 285 | |
| USD | | | 29,469 | | | INR | | | 29,184 | | | 1/8/2025 | | | CBK | | | | 285 | | | | - | | | | 285 | |
| USD | | | 29,470 | | | INR | | | 29,184 | | | 1/8/2025 | | | CBK | | | | 286 | | | | - | | | | 286 | |
| USD | | | 29,470 | | | INR | | | 29,184 | | | 1/8/2025 | | | CBK | | | | 286 | | | | - | | | | 286 | |
| USD | | | 58,941 | | | INR | | | 58,368 | | | 1/8/2025 | | | CBK | | | | 573 | | | | - | | | | 573 | |
| USD | | | 29,471 | | | INR | | | 29,184 | | | 1/8/2025 | | | CBK | | | | 287 | | | | - | | | | 287 | |
| USD | | | 29,471 | | | INR | | | 29,184 | | | 1/8/2025 | | | CBK | | | | 287 | | | | - | | | | 287 | |
| USD | | | 29,475 | | | INR | | | 29,184 | | | 1/8/2025 | | | CBK | | | | 291 | | | | - | | | | 291 | |
| USD | | | 29,475 | | | INR | | | 29,184 | | | 1/8/2025 | | | CBK | | | | 291 | | | | - | | | | 291 | |
| USD | | | 58,958 | | | INR | | | 58,368 | | | 1/8/2025 | | | CBK | | | | 590 | | | | - | | | | 590 | |
| USD | | | 29,479 | | | INR | | | 29,184 | | | 1/8/2025 | | | CBK | | | | 295 | | | | - | | | | 295 | |
| USD | | | 29,479 | | | INR | | | 29,184 | | | 1/8/2025 | | | CBK | | | | 295 | | | | - | | | | 295 | |
| USD | | | 29,528 | | | INR | | | 29,184 | | | 1/8/2025 | | | CBK | | | | 344 | | | | - | | | | 344 | |
| USD | | | 29,528 | | | INR | | | 29,184 | | | 1/8/2025 | | | CBK | | | | 344 | | | | - | | | | 344 | |
| USD | | | 29,573 | | | INR | | | 29,184 | | | 1/8/2025 | | | CBK | | | | 389 | | | | - | | | | 389 | |
| USD | | | 29,573 | | | INR | | | 29,184 | | | 1/8/2025 | | | CBK | | | | 389 | | | | - | | | | 389 | |
| USD | | | 88,309 | | | INR | | | 87,552 | | | 1/8/2025 | | | CBK | | | | 757 | | | | - | | | | 757 | |
| USD | | | 88,311 | | | INR | | | 87,552 | | | 1/8/2025 | | | CBK | | | | 759 | | | | - | | | | 759 | |
| USD | | | 88,312 | | | INR | | | 87,552 | | | 1/8/2025 | | | CBK | | | | 760 | | | | - | | | | 760 | |
| USD | | | 88,315 | | | INR | | | 87,552 | | | 1/8/2025 | | | CBK | | | | 763 | | | | - | | | | 763 | |
| USD | | | 88,318 | | | INR | | | 87,552 | | | 1/8/2025 | | | CBK | | | | 766 | | | | - | | | | 766 | |
| USD | | | 88,323 | | | INR | | | 87,552 | | | 1/8/2025 | | | CBK | | | | 771 | | | | - | | | | 771 | |
| USD | | | 29,443 | | | INR | | | 29,184 | | | 1/8/2025 | | | CBK | | | | 259 | | | | - | | | | 259 | |
| USD | | | 29,443 | | | INR | | | 29,184 | | | 1/8/2025 | | | CBK | | | | 259 | | | | - | | | | 259 | |
| USD | | | 29,443 | | | INR | | | 29,184 | | | 1/8/2025 | | | CBK | | | | 259 | | | | - | | | | 259 | |
| USD | | | 88,329 | | | INR | | | 87,552 | | | 1/8/2025 | | | CBK | | | | 777 | | | | - | | | | 777 | |
| USD | | | 88,362 | | | INR | | | 87,552 | | | 1/8/2025 | | | CBK | | | | 810 | | | | - | | | | 810 | |
| USD | | | 88,365 | | | INR | | | 87,552 | | | 1/8/2025 | | | CBK | | | | 813 | | | | - | | | | 813 | |
| USD | | | 88,367 | | | INR | | | 87,552 | | | 1/8/2025 | | | CBK | | | | 815 | | | | - | | | | 815 | |
| USD | | | 88,371 | | | INR | | | 87,552 | | | 1/8/2025 | | | CBK | | | | 819 | | | | - | | | | 819 | |
| USD | | | 88,372 | | | INR | | | 87,552 | | | 1/8/2025 | | | CBK | | | | 820 | | | | - | | | | 820 | |
| USD | | | 88,373 | | | INR | | | 87,552 | | | 1/8/2025 | | | CBK | | | | 821 | | | | - | | | | 821 | |
| USD | | | 88,374 | | | INR | | | 87,552 | | | 1/8/2025 | | | CBK | | | | 822 | | | | - | | | | 822 | |
| USD | | | 88,376 | | | INR | | | 87,552 | | | 1/8/2025 | | | CBK | | | | 824 | | | | - | | | | 824 | |
| USD | | | 88,377 | | | INR | | | 87,552 | | | 1/8/2025 | | | CBK | | | | 825 | | | | - | | | | 825 | |
| USD | | | 88,380 | | | INR | | | 87,552 | | | 1/8/2025 | | | CBK | | | | 828 | | | | - | | | | 828 | |
| USD | | | 88,382 | | | INR | | | 87,552 | | | 1/8/2025 | | | CBK | | | | 830 | | | | - | | | | 830 | |
| USD | | | 88,383 | | | INR | | | 87,552 | | | 1/8/2025 | | | CBK | | | | 831 | | | | - | | | | 831 | |
| USD | | | 88,384 | | | INR | | | 87,552 | | | 1/8/2025 | | | CBK | | | | 832 | | | | - | | | | 832 | |
| USD | | | 29,462 | | | INR | | | 29,184 | | | 1/8/2025 | | | CBK | | | | 278 | | | | - | | | | 278 | |
| USD | | | 29,462 | | | INR | | | 29,184 | | | 1/8/2025 | | | CBK | | | | 278 | | | | - | | | | 278 | |
| USD | | | 29,462 | | | INR | | | 29,184 | | | 1/8/2025 | | | CBK | | | | 278 | | | | - | | | | 278 | |
| USD | | | 117,738 | | | INR | | | 116,735 | | | 1/8/2025 | | | CBK | | | | 1,003 | | | | - | | | | 1,003 | |
| USD | | | 117,747 | | | INR | | | 116,735 | | | 1/8/2025 | | | CBK | | | | 1,012 | | | | - | | | | 1,012 | |
| USD | | | 117,755 | | | INR | | | 116,735 | | | 1/8/2025 | | | CBK | | | | 1,020 | | | | - | | | | 1,020 | |
| USD | | | 117,763 | | | INR | | | 116,735 | | | 1/8/2025 | | | CBK | | | | 1,028 | | | | - | | | | 1,028 | |
| USD | | | 117,764 | | | INR | | | 116,735 | | | 1/8/2025 | | | CBK | | | | 1,029 | | | | - | | | | 1,029 | |
| USD | | | 117,769 | | | INR | | | 116,735 | | | 1/8/2025 | | | CBK | | | | 1,034 | | | | - | | | | 1,034 | |
| USD | | | 117,770 | | | INR | | | 116,735 | | | 1/8/2025 | | | CBK | | | | 1,035 | | | | - | | | | 1,035 | |
| USD | | | 29,449 | | | INR | | | 29,184 | | | 1/8/2025 | | | CBK | | | | 265 | | | | - | | | | 265 | |
| USD | | | 29,449 | | | INR | | | 29,184 | | | 1/8/2025 | | | CBK | | | | 265 | | | | - | | | | 265 | |
| USD | | | 29,449 | | | INR | | | 29,184 | | | 1/8/2025 | | | CBK | | | | 265 | | | | - | | | | 265 | |
| USD | | | 29,449 | | | INR | | | 29,184 | | | 1/8/2025 | | | CBK | | | | 265 | | | | - | | | | 265 | |
| USD | | | 58,901 | | | INR | | | 58,368 | | | 1/8/2025 | | | CBK | | | | 533 | | | | - | | | | 533 | |
| USD | | | 58,901 | | | INR | | | 58,368 | | | 1/8/2025 | | | CBK | | | | 533 | | | | - | | | | 533 | |
| USD | | | 58,904 | | | INR | | | 58,368 | | | 1/8/2025 | | | CBK | | | | 536 | | | | - | | | | 536 | |
| USD | | | 58,904 | | | INR | | | 58,368 | | | 1/8/2025 | | | CBK | | | | 536 | | | | - | | | | 536 | |
| USD | | | 58,909 | | | INR | | | 58,368 | | | 1/8/2025 | | | CBK | | | | 541 | | | | - | | | | 541 | |
| USD | | | 58,909 | | | INR | | | 58,368 | | | 1/8/2025 | | | CBK | | | | 541 | | | | - | | | | 541 | |
See accompanying notes
13
American Beacon AHL Managed Futures Strategy FundSM
Consolidated Schedule of Investments
December 31, 2024
| | | | | | | | | | | | | | | | | | | | | | | | | | | | |
| | | | | | |
| Currency Purchased* | | | Currency Sold* | | | Settlement
Date | | Counterparty | | | Unrealized
Appreciation | | | Unrealized
(Depreciation) | | | Net Unrealized
Appreciation
(Depreciation) | |
| USD | | | 117,820 | | | INR | | | 116,735 | | | 1/8/2025 | | | CBK | | | $ | 1,085 | | | $ | - | | | $ | 1,085 | |
| USD | | | 117,822 | | | INR | | | 116,735 | | | 1/8/2025 | | | CBK | | | | 1,087 | | | | - | | | | 1,087 | |
| USD | | | 117,823 | | | INR | | | 116,735 | | | 1/8/2025 | | | CBK | | | | 1,088 | | | | - | | | | 1,088 | |
| USD | | | 58,914 | | | INR | | | 58,368 | | | 1/8/2025 | | | CBK | | | | 546 | | | | - | | | | 546 | |
| USD | | | 58,914 | | | INR | | | 58,368 | | | 1/8/2025 | | | CBK | | | | 546 | | | | - | | | | 546 | |
| USD | | | 117,843 | | | INR | | | 116,735 | | | 1/8/2025 | | | CBK | | | | 1,108 | | | | - | | | | 1,108 | |
| USD | | | 58,922 | | | INR | | | 58,368 | | | 1/8/2025 | | | CBK | | | | 554 | | | | - | | | | 554 | |
| USD | | | 58,922 | | | INR | | | 58,368 | | | 1/8/2025 | | | CBK | | | | 554 | | | | - | | | | 554 | |
| USD | | | 29,464 | | | INR | | | 29,184 | | | 1/8/2025 | | | CBK | | | | 280 | | | | - | | | | 280 | |
| USD | | | 29,464 | | | INR | | | 29,184 | | | 1/8/2025 | | | CBK | | | | 280 | | | | - | | | | 280 | |
| USD | | | 29,464 | | | INR | | | 29,184 | | | 1/8/2025 | | | CBK | | | | 280 | | | | - | | | | 280 | |
| USD | | | 29,464 | | | INR | | | 29,184 | | | 1/8/2025 | | | CBK | | | | 280 | | | | - | | | | 280 | |
| USD | | | 58,939 | | | INR | | | 58,368 | | | 1/8/2025 | | | CBK | | | | 571 | | | | - | | | | 571 | |
| USD | | | 58,939 | | | INR | | | 58,368 | | | 1/8/2025 | | | CBK | | | | 571 | | | | - | | | | 571 | |
| USD | | | 29,477 | | | INR | | | 29,184 | | | 1/8/2025 | | | CBK | | | | 293 | | | | - | | | | 293 | |
| USD | | | 29,477 | | | INR | | | 29,184 | | | 1/8/2025 | | | CBK | | | | 293 | | | | - | | | | 293 | |
| USD | | | 29,477 | | | INR | | | 29,184 | | | 1/8/2025 | | | CBK | | | | 293 | | | | - | | | | 293 | |
| USD | | | 29,477 | | | INR | | | 29,184 | | | 1/8/2025 | | | CBK | | | | 293 | | | | - | | | | 293 | |
| USD | | | 58,955 | | | INR | | | 58,368 | | | 1/8/2025 | | | CBK | | | | 587 | | | | - | | | | 587 | |
| USD | | | 58,955 | | | INR | | | 58,368 | | | 1/8/2025 | | | CBK | | | | 587 | | | | - | | | | 587 | |
| USD | | | 147,184 | | | INR | | | 145,919 | | | 1/8/2025 | | | CBK | | | | 1,265 | | | | - | | | | 1,265 | |
| USD | | | 147,190 | | | INR | | | 145,919 | | | 1/8/2025 | | | CBK | | | | 1,271 | | | | - | | | | 1,271 | |
| USD | | | 147,198 | | | INR | | | 145,919 | | | 1/8/2025 | | | CBK | | | | 1,279 | | | | - | | | | 1,279 | |
| USD | | | 147,201 | | | INR | | | 145,919 | | | 1/8/2025 | | | CBK | | | | 1,282 | | | | - | | | | 1,282 | |
| USD | | | 147,203 | | | INR | | | 145,919 | | | 1/8/2025 | | | CBK | | | | 1,284 | | | | - | | | | 1,284 | |
| USD | | | 147,210 | | | INR | | | 145,919 | | | 1/8/2025 | | | CBK | | | | 1,291 | | | | - | | | | 1,291 | |
| USD | | | 29,444 | | | INR | | | 29,184 | | | 1/8/2025 | | | CBK | | | | 260 | | | | - | | | | 260 | |
| USD | | | 29,444 | | | INR | | | 29,184 | | | 1/8/2025 | | | CBK | | | | 260 | | | | - | | | | 260 | |
| USD | | | 29,444 | | | INR | | | 29,184 | | | 1/8/2025 | | | CBK | | | | 260 | | | | - | | | | 260 | |
| USD | | | 29,444 | | | INR | | | 29,184 | | | 1/8/2025 | | | CBK | | | | 260 | | | | - | | | | 260 | |
| USD | | | 29,444 | | | INR | | | 29,184 | | | 1/8/2025 | | | CBK | | | | 260 | | | | - | | | | 260 | |
| USD | | | 88,314 | | | INR | | | 87,552 | | | 1/8/2025 | | | CBK | | | | 762 | | | | - | | | | 762 | |
| USD | | | 88,314 | | | INR | | | 87,552 | | | 1/8/2025 | | | CBK | | | | 762 | | | | - | | | | 762 | |
| USD | | | 176,632 | | | INR | | | 175,103 | | | 1/8/2025 | | | CBK | | | | 1,529 | | | | - | | | | 1,529 | |
| USD | | | 176,635 | | | INR | | | 175,103 | | | 1/8/2025 | | | CBK | | | | 1,532 | | | | - | | | | 1,532 | |
| USD | | | 88,319 | | | INR | | | 87,552 | | | 1/8/2025 | | | CBK | | | | 767 | | | | - | | | | 767 | |
| USD | | | 88,319 | | | INR | | | 87,552 | | | 1/8/2025 | | | CBK | | | | 767 | | | | - | | | | 767 | |
| USD | | | 176,640 | | | INR | | | 175,103 | | | 1/8/2025 | | | CBK | | | | 1,537 | | | | - | | | | 1,537 | |
| USD | | | 88,320 | | | INR | | | 87,552 | | | 1/8/2025 | | | CBK | | | | 768 | | | | - | | | | 768 | |
| USD | | | 88,320 | | | INR | | | 87,552 | | | 1/8/2025 | | | CBK | | | | 768 | | | | - | | | | 768 | |
| USD | | | 88,321 | | | INR | | | 87,552 | | | 1/8/2025 | | | CBK | | | | 769 | | | | - | | | | 769 | |
| USD | | | 88,321 | | | INR | | | 87,552 | | | 1/8/2025 | | | CBK | | | | 769 | | | | - | | | | 769 | |
| USD | | | 58,887 | | | INR | | | 58,368 | | | 1/8/2025 | | | CBK | | | | 519 | | | | - | | | | 519 | |
| USD | | | 58,887 | | | INR | | | 58,368 | | | 1/8/2025 | | | CBK | | | | 519 | | | | - | | | | 519 | |
| USD | | | 58,887 | | | INR | | | 58,368 | | | 1/8/2025 | | | CBK | | | | 519 | | | | - | | | | 519 | |
| USD | | | 58,888 | | | INR | | | 58,368 | | | 1/8/2025 | | | CBK | | | | 520 | | | | - | | | | 520 | |
| USD | | | 58,888 | | | INR | | | 58,368 | | | 1/8/2025 | | | CBK | | | | 520 | | | | - | | | | 520 | |
| USD | | | 58,888 | | | INR | | | 58,368 | | | 1/8/2025 | | | CBK | | | | 520 | | | | - | | | | 520 | |
| USD | | | 176,772 | | | INR | | | 175,103 | | | 1/8/2025 | | | CBK | | | | 1,669 | | | | - | | | | 1,669 | |
| USD | | | 58,926 | | | INR | | | 58,368 | | | 1/8/2025 | | | CBK | | | | 558 | | | | - | | | | 558 | |
| USD | | | 58,926 | | | INR | | | 58,368 | | | 1/8/2025 | | | CBK | | | | 558 | | | | - | | | | 558 | |
| USD | | | 58,926 | | | INR | | | 58,368 | | | 1/8/2025 | | | CBK | | | | 558 | | | | - | | | | 558 | |
| USD | | | 29,463 | | | INR | | | 29,184 | | | 1/8/2025 | | | CBK | | | | 279 | | | | - | | | | 279 | |
| USD | | | 29,463 | | | INR | | | 29,184 | | | 1/8/2025 | | | CBK | | | | 279 | | | | - | | | | 279 | |
| USD | | | 29,463 | | | INR | | | 29,184 | | | 1/8/2025 | | | CBK | | | | 279 | | | | - | | | | 279 | |
| USD | | | 29,463 | | | INR | | | 29,184 | | | 1/8/2025 | | | CBK | | | | 279 | | | | - | | | | 279 | |
| USD | | | 29,463 | | | INR | | | 29,184 | | | 1/8/2025 | | | CBK | | | | 279 | | | | - | | | | 279 | |
| USD | | | 29,463 | | | INR | | | 29,184 | | | 1/8/2025 | | | CBK | | | | 279 | | | | - | | | | 279 | |
| USD | | | 29,465 | | | INR | | | 29,184 | | | 1/8/2025 | | | CBK | | | | 281 | | | | - | | | | 281 | |
See accompanying notes
14
American Beacon AHL Managed Futures Strategy FundSM
Consolidated Schedule of Investments
December 31, 2024
| | | | | | | | | | | | | | | | | | | | | | | | | | | | |
| | | | | | |
| Currency Purchased* | | | Currency Sold* | | | Settlement
Date | | Counterparty | | | Unrealized
Appreciation | | | Unrealized
(Depreciation) | | | Net Unrealized
Appreciation
(Depreciation) | |
| USD | | | 29,465 | | | INR | | | 29,184 | | | 1/8/2025 | | | CBK | | | $ | 281 | | | $ | - | | | $ | 281 | |
| USD | | | 29,465 | | | INR | | | 29,184 | | | 1/8/2025 | | | CBK | | | | 281 | | | | - | | | | 281 | |
| USD | | | 29,465 | | | INR | | | 29,184 | | | 1/8/2025 | | | CBK | | | | 281 | | | | - | | | | 281 | |
| USD | | | 29,465 | | | INR | | | 29,184 | | | 1/8/2025 | | | CBK | | | | 281 | | | | - | | | | 281 | |
| USD | | | 29,465 | | | INR | | | 29,184 | | | 1/8/2025 | | | CBK | | | | 281 | | | | - | | | | 281 | |
| USD | | | 58,936 | | | INR | | | 58,368 | | | 1/8/2025 | | | CBK | | | | 568 | | | | - | | | | 568 | |
| USD | | | 58,936 | | | INR | | | 58,368 | | | 1/8/2025 | | | CBK | | | | 568 | | | | - | | | | 568 | |
| USD | | | 58,936 | | | INR | | | 58,368 | | | 1/8/2025 | | | CBK | | | | 568 | | | | - | | | | 568 | |
| USD | | | 88,404 | | | INR | | | 87,552 | | | 1/8/2025 | | | CBK | | | | 852 | | | | - | | | | 852 | |
| USD | | | 88,404 | | | INR | | | 87,552 | | | 1/8/2025 | | | CBK | | | | 852 | | | | - | | | | 852 | |
| USD | | | 29,467 | | | INR | | | 29,184 | | | 1/8/2025 | | | CBK | | | | 283 | | | | - | | | | 283 | |
| USD | | | 29,467 | | | INR | | | 29,184 | | | 1/8/2025 | | | CBK | | | | 283 | | | | - | | | | 283 | |
| USD | | | 29,467 | | | INR | | | 29,184 | | | 1/8/2025 | | | CBK | | | | 283 | | | | - | | | | 283 | |
| USD | | | 29,467 | | | INR | | | 29,184 | | | 1/8/2025 | | | CBK | | | | 283 | | | | - | | | | 283 | |
| USD | | | 29,467 | | | INR | | | 29,184 | | | 1/8/2025 | | | CBK | | | | 283 | | | | - | | | | 283 | |
| USD | | | 29,467 | | | INR | | | 29,184 | | | 1/8/2025 | | | CBK | | | | 283 | | | | - | | | | 283 | |
| USD | | | 29,467 | | | INR | | | 29,184 | | | 1/8/2025 | | | CBK | | | | 283 | | | | - | | | | 283 | |
| USD | | | 29,468 | | | INR | | | 29,184 | | | 1/8/2025 | | | CBK | | | | 284 | | | | - | | | | 284 | |
| USD | | | 29,468 | | | INR | | | 29,184 | | | 1/8/2025 | | | CBK | | | | 284 | | | | - | | | | 284 | |
| USD | | | 29,468 | | | INR | | | 29,184 | | | 1/8/2025 | | | CBK | | | | 284 | | | | - | | | | 284 | |
| USD | | | 29,468 | | | INR | | | 29,184 | | | 1/8/2025 | | | CBK | | | | 284 | | | | - | | | | 284 | |
| USD | | | 29,468 | | | INR | | | 29,184 | | | 1/8/2025 | | | CBK | | | | 284 | | | | - | | | | 284 | |
| USD | | | 29,468 | | | INR | | | 29,184 | | | 1/8/2025 | | | CBK | | | | 284 | | | | - | | | | 284 | |
| USD | | | 29,468 | | | INR | | | 29,184 | | | 1/8/2025 | | | CBK | | | | 284 | | | | - | | | | 284 | |
| USD | | | 117,752 | | | INR | | | 116,735 | | | 1/8/2025 | | | CBK | | | | 1,017 | | | | - | | | | 1,017 | |
| USD | | | 117,752 | | | INR | | | 116,735 | | | 1/8/2025 | | | CBK | | | | 1,017 | | | | - | | | | 1,017 | |
| USD | | | 117,753 | | | INR | | | 116,735 | | | 1/8/2025 | | | CBK | | | | 1,018 | | | | - | | | | 1,018 | |
| USD | | | 117,753 | | | INR | | | 116,735 | | | 1/8/2025 | | | CBK | | | | 1,018 | | | | - | | | | 1,018 | |
| USD | | | 117,756 | | | INR | | | 116,735 | | | 1/8/2025 | | | CBK | | | | 1,021 | | | | - | | | | 1,021 | |
| USD | | | 117,756 | | | INR | | | 116,735 | | | 1/8/2025 | | | CBK | | | | 1,021 | | | | - | | | | 1,021 | |
| USD | | | 117,760 | | | INR | | | 116,735 | | | 1/8/2025 | | | CBK | | | | 1,025 | | | | - | | | | 1,025 | |
| USD | | | 117,760 | | | INR | | | 116,735 | | | 1/8/2025 | | | CBK | | | | 1,025 | | | | - | | | | 1,025 | |
| USD | | | 58,908 | | | INR | | | 58,368 | | | 1/8/2025 | | | CBK | | | | 540 | | | | - | | | | 540 | |
| USD | | | 58,908 | | | INR | | | 58,368 | | | 1/8/2025 | | | CBK | | | | 540 | | | | - | | | | 540 | |
| USD | | | 58,908 | | | INR | | | 58,368 | | | 1/8/2025 | | | CBK | | | | 540 | | | | - | | | | 540 | |
| USD | | | 58,908 | | | INR | | | 58,368 | | | 1/8/2025 | | | CBK | | | | 540 | | | | - | | | | 540 | |
| USD | | | 58,911 | | | INR | | | 58,368 | | | 1/8/2025 | | | CBK | | | | 543 | | | | - | | | | 543 | |
| USD | | | 58,911 | | | INR | | | 58,368 | | | 1/8/2025 | | | CBK | | | | 543 | | | | - | | | | 543 | |
| USD | | | 58,911 | | | INR | | | 58,368 | | | 1/8/2025 | | | CBK | | | | 543 | | | | - | | | | 543 | |
| USD | | | 58,911 | | | INR | | | 58,368 | | | 1/8/2025 | | | CBK | | | | 543 | | | | - | | | | 543 | |
| USD | | | 235,695 | | | INR | | | 233,471 | | | 1/8/2025 | | | CBK | | | | 2,224 | | | | - | | | | 2,224 | |
| USD | | | 88,322 | | | INR | | | 87,552 | | | 1/8/2025 | | | CBK | | | | 770 | | | | - | | | | 770 | |
| USD | | | 88,322 | | | INR | | | 87,552 | | | 1/8/2025 | | | CBK | | | | 770 | | | | - | | | | 770 | |
| USD | | | 88,322 | | | INR | | | 87,552 | | | 1/8/2025 | | | CBK | | | | 770 | | | | - | | | | 770 | |
| USD | | | 88,366 | | | INR | | | 87,552 | | | 1/8/2025 | | | CBK | | | | 814 | | | | - | | | | 814 | |
| USD | | | 88,366 | | | INR | | | 87,552 | | | 1/8/2025 | | | CBK | | | | 814 | | | | - | | | | 814 | |
| USD | | | 88,366 | | | INR | | | 87,552 | | | 1/8/2025 | | | CBK | | | | 814 | | | | - | | | | 814 | |
| USD | | | 265,155 | | | INR | | | 262,655 | | | 1/8/2025 | | | CBK | | | | 2,500 | | | | - | | | | 2,500 | |
| USD | | | 147,195 | | | INR | | | 145,919 | | | 1/8/2025 | | | CBK | | | | 1,276 | | | | - | | | | 1,276 | |
| USD | | | 147,195 | | | INR | | | 145,919 | | | 1/8/2025 | | | CBK | | | | 1,276 | | | | - | | | | 1,276 | |
| USD | | | 29,455 | | | INR | | | 29,184 | | | 1/8/2025 | | | CBK | | | | 271 | | | | - | | | | 271 | |
| USD | | | 29,455 | | | INR | | | 29,184 | | | 1/8/2025 | | | CBK | | | | 271 | | | | - | | | | 271 | |
| USD | | | 29,455 | | | INR | | | 29,184 | | | 1/8/2025 | | | CBK | | | | 271 | | | | - | | | | 271 | |
| USD | | | 29,455 | | | INR | | | 29,184 | | | 1/8/2025 | | | CBK | | | | 271 | | | | - | | | | 271 | |
| USD | | | 29,455 | | | INR | | | 29,184 | | | 1/8/2025 | | | CBK | | | | 271 | | | | - | | | | 271 | |
| USD | | | 29,455 | | | INR | | | 29,184 | | | 1/8/2025 | | | CBK | | | | 271 | | | | - | | | | 271 | |
| USD | | | 29,455 | | | INR | | | 29,184 | | | 1/8/2025 | | | CBK | | | | 271 | | | | - | | | | 271 | |
| USD | | | 29,455 | | | INR | | | 29,184 | | | 1/8/2025 | | | CBK | | | | 271 | | | | - | | | | 271 | |
| USD | | | 29,455 | | | INR | | | 29,184 | | | 1/8/2025 | | | CBK | | | | 271 | | | | - | | | | 271 | |
See accompanying notes
15
American Beacon AHL Managed Futures Strategy FundSM
Consolidated Schedule of Investments
December 31, 2024
| | | | | | | | | | | | | | | | | | | | | | | | | | | | |
| | | | | | |
| Currency Purchased* | | | Currency Sold* | | | Settlement
Date | | Counterparty | | | Unrealized
Appreciation | | | Unrealized
(Depreciation) | | | Net Unrealized
Appreciation
(Depreciation) | |
| USD | | | 29,455 | | | INR | | | 29,184 | | | 1/8/2025 | | | CBK | | | $ | 271 | | | $ | - | | | $ | 271 | |
| USD | | | 294,592 | | | INR | | | 291,839 | | | 1/8/2025 | | | CBK | | | | 2,753 | | | | - | | | | 2,753 | |
| USD | | | 88,317 | | | INR | | | 87,552 | | | 1/8/2025 | | | CBK | | | | 765 | | | | - | | | | 765 | |
| USD | | | 88,317 | | | INR | | | 87,552 | | | 1/8/2025 | | | CBK | | | | 765 | | | | - | | | | 765 | |
| USD | | | 88,317 | | | INR | | | 87,552 | | | 1/8/2025 | | | CBK | | | | 765 | | | | - | | | | 765 | |
| USD | | | 88,317 | | | INR | | | 87,552 | | | 1/8/2025 | | | CBK | | | | 765 | | | | - | | | | 765 | |
| USD | | | 29,452 | | | INR | | | 29,184 | | | 1/8/2025 | | | CBK | | | | 268 | | | | - | | | | 268 | |
| USD | | | 29,452 | | | INR | | | 29,184 | | | 1/8/2025 | | | CBK | | | | 268 | | | | - | | | | 268 | |
| USD | | | 29,452 | | | INR | | | 29,184 | | | 1/8/2025 | | | CBK | | | | 268 | | | | - | | | | 268 | |
| USD | | | 29,452 | | | INR | | | 29,184 | | | 1/8/2025 | | | CBK | | | | 268 | | | | - | | | | 268 | |
| USD | | | 29,452 | | | INR | | | 29,184 | | | 1/8/2025 | | | CBK | | | | 268 | | | | - | | | | 268 | |
| USD | | | 29,452 | | | INR | | | 29,184 | | | 1/8/2025 | | | CBK | | | | 268 | | | | - | | | | 268 | |
| USD | | | 29,452 | | | INR | | | 29,184 | | | 1/8/2025 | | | CBK | | | | 268 | | | | - | | | | 268 | |
| USD | | | 29,452 | | | INR | | | 29,184 | | | 1/8/2025 | | | CBK | | | | 268 | | | | - | | | | 268 | |
| USD | | | 29,452 | | | INR | | | 29,184 | | | 1/8/2025 | | | CBK | | | | 268 | | | | - | | | | 268 | |
| USD | | | 29,452 | | | INR | | | 29,184 | | | 1/8/2025 | | | CBK | | | | 268 | | | | - | | | | 268 | |
| USD | | | 29,452 | | | INR | | | 29,184 | | | 1/8/2025 | | | CBK | | | | 268 | | | | - | | | | 268 | |
| USD | | | 29,452 | | | INR | | | 29,184 | | | 1/8/2025 | | | CBK | | | | 268 | | | | - | | | | 268 | |
| USD | | | 29,453 | | | INR | | | 29,184 | | | 1/8/2025 | | | CBK | | | | 269 | | | | - | | | | 269 | |
| USD | | | 29,453 | | | INR | | | 29,184 | | | 1/8/2025 | | | CBK | | | | 269 | | | | - | | | | 269 | |
| USD | | | 29,453 | | | INR | | | 29,184 | | | 1/8/2025 | | | CBK | | | | 269 | | | | - | | | | 269 | |
| USD | | | 29,453 | | | INR | | | 29,184 | | | 1/8/2025 | | | CBK | | | | 269 | | | | - | | | | 269 | |
| USD | | | 29,453 | | | INR | | | 29,184 | | | 1/8/2025 | | | CBK | | | | 269 | | | | - | | | | 269 | |
| USD | | | 29,453 | | | INR | | | 29,184 | | | 1/8/2025 | | | CBK | | | | 269 | | | | - | | | | 269 | |
| USD | | | 29,453 | | | INR | | | 29,184 | | | 1/8/2025 | | | CBK | | | | 269 | | | | - | | | | 269 | |
| USD | | | 29,453 | | | INR | | | 29,184 | | | 1/8/2025 | | | CBK | | | | 269 | | | | - | | | | 269 | |
| USD | | | 29,453 | | | INR | | | 29,184 | | | 1/8/2025 | | | CBK | | | | 269 | | | | - | | | | 269 | |
| USD | | | 29,453 | | | INR | | | 29,184 | | | 1/8/2025 | | | CBK | | | | 269 | | | | - | | | | 269 | |
| USD | | | 29,453 | | | INR | | | 29,184 | | | 1/8/2025 | | | CBK | | | | 269 | | | | - | | | | 269 | |
| USD | | | 29,453 | | | INR | | | 29,184 | | | 1/8/2025 | | | CBK | | | | 269 | | | | - | | | | 269 | |
| USD | | | 412,376 | | | INR | | | 408,574 | | | 1/8/2025 | | | CBK | | | | 3,802 | | | | - | | | | 3,802 | |
| USD | | | 29,450 | | | INR | | | 29,184 | | | 1/8/2025 | | | CBK | | | | 266 | | | | - | | | | 266 | |
| USD | | | 29,450 | | | INR | | | 29,184 | | | 1/8/2025 | | | CBK | | | | 266 | | | | - | | | | 266 | |
| USD | | | 29,450 | | | INR | | | 29,184 | | | 1/8/2025 | | | CBK | | | | 266 | | | | - | | | | 266 | |
| USD | | | 29,450 | | | INR | | | 29,184 | | | 1/8/2025 | | | CBK | | | | 266 | | | | - | | | | 266 | |
| USD | | | 29,450 | | | INR | | | 29,184 | | | 1/8/2025 | | | CBK | | | | 266 | | | | - | | | | 266 | |
| USD | | | 29,450 | | | INR | | | 29,184 | | | 1/8/2025 | | | CBK | | | | 266 | | | | - | | | | 266 | |
| USD | | | 29,450 | | | INR | | | 29,184 | | | 1/8/2025 | | | CBK | | | | 266 | | | | - | | | | 266 | |
| USD | | | 29,450 | | | INR | | | 29,184 | | | 1/8/2025 | | | CBK | | | | 266 | | | | - | | | | 266 | |
| USD | | | 29,450 | | | INR | | | 29,184 | | | 1/8/2025 | | | CBK | | | | 266 | | | | - | | | | 266 | |
| USD | | | 29,450 | | | INR | | | 29,184 | | | 1/8/2025 | | | CBK | | | | 266 | | | | - | | | | 266 | |
| USD | | | 29,450 | | | INR | | | 29,184 | | | 1/8/2025 | | | CBK | | | | 266 | | | | - | | | | 266 | |
| USD | | | 29,450 | | | INR | | | 29,184 | | | 1/8/2025 | | | CBK | | | | 266 | | | | - | | | | 266 | |
| USD | | | 29,450 | | | INR | | | 29,184 | | | 1/8/2025 | | | CBK | | | | 266 | | | | - | | | | 266 | |
| USD | | | 29,450 | | | INR | | | 29,184 | | | 1/8/2025 | | | CBK | | | | 266 | | | | - | | | | 266 | |
| USD | | | 29,450 | | | INR | | | 29,184 | | | 1/8/2025 | | | CBK | | | | 266 | | | | - | | | | 266 | |
| USD | | | 117,761 | | | INR | | | 116,735 | | | 1/8/2025 | | | CBK | | | | 1,026 | | | | - | | | | 1,026 | |
| USD | | | 117,761 | | | INR | | | 116,735 | | | 1/8/2025 | | | CBK | | | | 1,026 | | | | - | | | | 1,026 | |
| USD | | | 117,761 | | | INR | | | 116,735 | | | 1/8/2025 | | | CBK | | | | 1,026 | | | | - | | | | 1,026 | |
| USD | | | 117,761 | | | INR | | | 116,735 | | | 1/8/2025 | | | CBK | | | | 1,026 | | | | - | | | | 1,026 | |
| USD | | | 58,937 | | | INR | | | 58,368 | | | 1/8/2025 | | | CBK | | | | 569 | | | | - | | | | 569 | |
| USD | | | 58,937 | | | INR | | | 58,368 | | | 1/8/2025 | | | CBK | | | | 569 | | | | - | | | | 569 | |
| USD | | | 58,937 | | | INR | | | 58,368 | | | 1/8/2025 | | | CBK | | | | 569 | | | | - | | | | 569 | |
| USD | | | 58,937 | | | INR | | | 58,368 | | | 1/8/2025 | | | CBK | | | | 569 | | | | - | | | | 569 | |
| USD | | | 58,937 | | | INR | | | 58,368 | | | 1/8/2025 | | | CBK | | | | 569 | | | | - | | | | 569 | |
| USD | | | 58,937 | | | INR | | | 58,368 | | | 1/8/2025 | | | CBK | | | | 569 | | | | - | | | | 569 | |
| USD | | | 58,937 | | | INR | | | 58,368 | | | 1/8/2025 | | | CBK | | | | 569 | | | | - | | | | 569 | |
| USD | | | 58,937 | | | INR | | | 58,368 | | | 1/8/2025 | | | CBK | | | | 569 | | | | - | | | | 569 | |
| USD | | | 29,451 | | | INR | | | 29,184 | | | 1/8/2025 | | | CBK | | | | 267 | | | | - | | | | 267 | |
See accompanying notes
16
American Beacon AHL Managed Futures Strategy FundSM
Consolidated Schedule of Investments
December 31, 2024
| | | | | | | | | | | | | | | | | | | | | | | | | | | | |
| | | | | | |
| Currency Purchased* | | | Currency Sold* | | | Settlement
Date | | Counterparty | | | Unrealized
Appreciation | | | Unrealized
(Depreciation) | | | Net Unrealized
Appreciation
(Depreciation) | |
| USD | | | 29,451 | | | INR | | | 29,184 | | | 1/8/2025 | | | CBK | | | $ | 267 | | | $ | - | | | $ | 267 | |
| USD | | | 29,451 | | | INR | | | 29,184 | | | 1/8/2025 | | | CBK | | | | 267 | | | | - | | | | 267 | |
| USD | | | 29,451 | | | INR | | | 29,184 | | | 1/8/2025 | | | CBK | | | | 267 | | | | - | | | | 267 | |
| USD | | | 29,451 | | | INR | | | 29,184 | | | 1/8/2025 | | | CBK | | | | 267 | | | | - | | | | 267 | |
| USD | | | 29,451 | | | INR | | | 29,184 | | | 1/8/2025 | | | CBK | | | | 267 | | | | - | | | | 267 | |
| USD | | | 29,451 | | | INR | | | 29,184 | | | 1/8/2025 | | | CBK | | | | 267 | | | | - | | | | 267 | |
| USD | | | 29,451 | | | INR | | | 29,184 | | | 1/8/2025 | | | CBK | | | | 267 | | | | - | | | | 267 | |
| USD | | | 29,451 | | | INR | | | 29,184 | | | 1/8/2025 | | | CBK | | | | 267 | | | | - | | | | 267 | |
| USD | | | 29,451 | | | INR | | | 29,184 | | | 1/8/2025 | | | CBK | | | | 267 | | | | - | | | | 267 | |
| USD | | | 29,451 | | | INR | | | 29,184 | | | 1/8/2025 | | | CBK | | | | 267 | | | | - | | | | 267 | |
| USD | | | 29,451 | | | INR | | | 29,184 | | | 1/8/2025 | | | CBK | | | | 267 | | | | - | | | | 267 | |
| USD | | | 29,451 | | | INR | | | 29,184 | | | 1/8/2025 | | | CBK | | | | 267 | | | | - | | | | 267 | |
| USD | | | 29,451 | | | INR | | | 29,184 | | | 1/8/2025 | | | CBK | | | | 267 | | | | - | | | | 267 | |
| USD | | | 29,451 | | | INR | | | 29,184 | | | 1/8/2025 | | | CBK | | | | 267 | | | | - | | | | 267 | |
| USD | | | 29,451 | | | INR | | | 29,184 | | | 1/8/2025 | | | CBK | | | | 267 | | | | - | | | | 267 | |
| USD | | | 29,451 | | | INR | | | 29,184 | | | 1/8/2025 | | | CBK | | | | 267 | | | | - | | | | 267 | |
| USD | | | 29,451 | | | INR | | | 29,184 | | | 1/8/2025 | | | CBK | | | | 267 | | | | - | | | | 267 | |
| USD | | | 29,451 | | | INR | | | 29,184 | | | 1/8/2025 | | | CBK | | | | 267 | | | | - | | | | 267 | |
| USD | | | 29,454 | | | INR | | | 29,184 | | | 1/8/2025 | | | CBK | | | | 270 | | | | - | | | | 270 | |
| USD | | | 29,454 | | | INR | | | 29,184 | | | 1/8/2025 | | | CBK | | | | 270 | | | | - | | | | 270 | |
| USD | | | 29,454 | | | INR | | | 29,184 | | | 1/8/2025 | | | CBK | | | | 270 | | | | - | | | | 270 | |
| USD | | | 29,454 | | | INR | | | 29,184 | | | 1/8/2025 | | | CBK | | | | 270 | | | | - | | | | 270 | |
| USD | | | 29,454 | | | INR | | | 29,184 | | | 1/8/2025 | | | CBK | | | | 270 | | | | - | | | | 270 | |
| USD | | | 29,454 | | | INR | | | 29,184 | | | 1/8/2025 | | | CBK | | | | 270 | | | | - | | | | 270 | |
| USD | | | 29,454 | | | INR | | | 29,184 | | | 1/8/2025 | | | CBK | | | | 270 | | | | - | | | | 270 | |
| USD | | | 29,454 | | | INR | | | 29,184 | | | 1/8/2025 | | | CBK | | | | 270 | | | | - | | | | 270 | |
| USD | | | 29,454 | | | INR | | | 29,184 | | | 1/8/2025 | | | CBK | | | | 270 | | | | - | | | | 270 | |
| USD | | | 29,454 | | | INR | | | 29,184 | | | 1/8/2025 | | | CBK | | | | 270 | | | | - | | | | 270 | |
| USD | | | 29,454 | | | INR | | | 29,184 | | | 1/8/2025 | | | CBK | | | | 270 | | | | - | | | | 270 | |
| USD | | | 29,454 | | | INR | | | 29,184 | | | 1/8/2025 | | | CBK | | | | 270 | | | | - | | | | 270 | |
| USD | | | 29,454 | | | INR | | | 29,184 | | | 1/8/2025 | | | CBK | | | | 270 | | | | - | | | | 270 | |
| USD | | | 29,454 | | | INR | | | 29,184 | | | 1/8/2025 | | | CBK | | | | 270 | | | | - | | | | 270 | |
| USD | | | 29,454 | | | INR | | | 29,184 | | | 1/8/2025 | | | CBK | | | | 270 | | | | - | | | | 270 | |
| USD | | | 29,454 | | | INR | | | 29,184 | | | 1/8/2025 | | | CBK | | | | 270 | | | | - | | | | 270 | |
| USD | | | 29,454 | | | INR | | | 29,184 | | | 1/8/2025 | | | CBK | | | | 270 | | | | - | | | | 270 | |
| USD | | | 29,454 | | | INR | | | 29,184 | | | 1/8/2025 | | | CBK | | | | 270 | | | | - | | | | 270 | |
| USD | | | 29,454 | | | INR | | | 29,184 | | | 1/8/2025 | | | CBK | | | | 270 | | | | - | | | | 270 | |
| USD | | | 353,482 | | | INR | | | 350,206 | | | 1/8/2025 | | | CBK | | | | 3,276 | | | | - | | | | 3,276 | |
| USD | | | 353,482 | | | INR | | | 350,206 | | | 1/8/2025 | | | CBK | | | | 3,276 | | | | - | | | | 3,276 | |
| USD | | | 1,053,698 | | | INR | | | 1,042,840 | | | 1/8/2025 | | | CBK | | | | 10,858 | | | | - | | | | 10,858 | |
| USD | | | 1,237,192 | | | INR | | | 1,225,723 | | | 1/8/2025 | | | CBK | | | | 11,469 | | | | - | | | | 11,469 | |
| USD | | | 1,265,659 | | | INR | | | 1,254,907 | | | 1/8/2025 | | | CBK | | | | 10,752 | | | | - | | | | 10,752 | |
| USD | | | 1,296,106 | | | INR | | | 1,284,090 | | | 1/8/2025 | | | CBK | | | | 12,016 | | | | - | | | | 12,016 | |
| USD | | | 1,324,846 | | | INR | | | 1,313,274 | | | 1/8/2025 | | | CBK | | | | 11,572 | | | | - | | | | 11,572 | |
| USD | | | 1,384,565 | | | INR | | | 1,371,642 | | | 1/8/2025 | | | CBK | | | | 12,923 | | | | - | | | | 12,923 | |
| USD | | | 1,601,746 | | | INR | | | 1,585,291 | | | 1/8/2025 | | | CBK | | | | 16,455 | | | | - | | | | 16,455 | |
| USD | | | 2,209,653 | | | INR | | | 2,187,208 | | | 1/8/2025 | | | CBK | | | | 22,445 | | | | - | | | | 22,445 | |
| INR | | | 30,059,389 | | | USD | | | 30,123,230 | | | 1/8/2025 | | | CBK | | | | - | | | | (63,841 | ) | | | (63,841 | ) |
| TWD | | | 76,297 | | | USD | | | 76,546 | | | 1/9/2025 | | | CBK | | | | - | | | | (249 | ) | | | (249 | ) |
| TWD | | | 76,297 | | | USD | | | 77,041 | | | 1/9/2025 | | | CBK | | | | - | | | | (744 | ) | | | (744 | ) |
| TWD | | | 76,297 | | | USD | | | 77,084 | | | 1/9/2025 | | | CBK | | | | - | | | | (787 | ) | | | (787 | ) |
| TWD | | | 152,595 | | | USD | | | 154,103 | | | 1/9/2025 | | | CBK | | | | - | | | | (1,508 | ) | | | (1,508 | ) |
| TWD | | | 152,595 | | | USD | | | 154,183 | | | 1/9/2025 | | | CBK | | | | - | | | | (1,588 | ) | | | (1,588 | ) |
| TWD | | | 152,595 | | | USD | | | 154,232 | | | 1/9/2025 | | | CBK | | | | - | | | | (1,637 | ) | | | (1,637 | ) |
| TWD | | | 152,595 | | | USD | | | 154,251 | | | 1/9/2025 | | | CBK | | | | - | | | | (1,656 | ) | | | (1,656 | ) |
| TWD | | | 228,892 | | | USD | | | 231,144 | | | 1/9/2025 | | | CBK | | | | - | | | | (2,252 | ) | | | (2,252 | ) |
| TWD | | | 228,892 | | | USD | | | 231,253 | | | 1/9/2025 | | | CBK | | | | - | | | | (2,361 | ) | | | (2,361 | ) |
| TWD | | | 228,892 | | | USD | | | 231,259 | | | 1/9/2025 | | | CBK | | | | - | | | | (2,367 | ) | | | (2,367 | ) |
| TWD | | | 305,190 | | | USD | | | 308,356 | | | 1/9/2025 | | | CBK | | | | - | | | | (3,166 | ) | | | (3,166 | ) |
See accompanying notes
17
American Beacon AHL Managed Futures Strategy FundSM
Consolidated Schedule of Investments
December 31, 2024
| | | | | | | | | | | | | | | | | | | | | | | | | | | | |
| | | | | | |
| Currency Purchased* | | | Currency Sold* | | | Settlement
Date | | Counterparty | | | Unrealized
Appreciation | | | Unrealized
(Depreciation) | | | Net Unrealized
Appreciation
(Depreciation) | |
| TWD | | | 915,569 | | | USD | | | 919,630 | | | 1/9/2025 | | | CBK | | | $ | - | | | $ | (4,061 | ) | | $ | (4,061 | ) |
| TWD | | | 1,068,164 | | | USD | | | 1,078,193 | | | 1/9/2025 | | | CBK | | | | - | | | | (10,029 | ) | | | (10,029 | ) |
| TWD | | | 1,449,651 | | | USD | | | 1,458,487 | | | 1/9/2025 | | | CBK | | | | - | | | | (8,836 | ) | | | (8,836 | ) |
| TWD | | | 1,525,949 | | | USD | | | 1,542,591 | | | 1/9/2025 | | | CBK | | | | - | | | | (16,642 | ) | | | (16,642 | ) |
| TWD | | | 2,136,328 | | | USD | | | 2,144,017 | | | 1/9/2025 | | | CBK | | | | - | | | | (7,689 | ) | | | (7,689 | ) |
| TWD | | | 2,441,518 | | | USD | | | 2,450,230 | | | 1/9/2025 | | | CBK | | | | - | | | | (8,712 | ) | | | (8,712 | ) |
| TWD | | | 3,280,790 | | | USD | | | 3,298,426 | | | 1/9/2025 | | | CBK | | | | - | | | | (17,636 | ) | | | (17,636 | ) |
| TWD | | | 3,280,790 | | | USD | | | 3,302,408 | | | 1/9/2025 | | | CBK | | | | - | | | | (21,618 | ) | | | (21,618 | ) |
| TWD | | | 3,738,574 | | | USD | | | 3,752,259 | | | 1/9/2025 | | | CBK | | | | - | | | | (13,685 | ) | | | (13,685 | ) |
| TWD | | | 18,235,088 | | | USD | | | 18,257,885 | | | 1/9/2025 | | | CBK | | | | - | | | | (22,797 | ) | | | (22,797 | ) |
| USD | | | 40,963,961 | | | TWD | | | 39,903,560 | | | 1/9/2025 | | | CBK | | | | 1,060,401 | | | | - | | | | 1,060,401 | |
| USD | | | 77,030 | | | TWD | | | 76,329 | | | 1/14/2025 | | | CBK | | | | 701 | | | | - | | | | 701 | |
| USD | | | 77,195 | | | TWD | | | 76,329 | | | 1/14/2025 | | | CBK | | | | 866 | | | | - | | | | 866 | |
| USD | | | 77,299 | | | TWD | | | 76,329 | | | 1/14/2025 | | | CBK | | | | 970 | | | | - | | | | 970 | |
| USD | | | 77,387 | | | TWD | | | 76,329 | | | 1/14/2025 | | | CBK | | | | 1,058 | | | | - | | | | 1,058 | |
| USD | | | 153,998 | | | TWD | | | 152,659 | | | 1/14/2025 | | | CBK | | | | 1,339 | | | | - | | | | 1,339 | |
| USD | | | 154,078 | | | TWD | | | 152,659 | | | 1/14/2025 | | | CBK | | | | 1,419 | | | | - | | | | 1,419 | |
| USD | | | 154,340 | | | TWD | | | 152,659 | | | 1/14/2025 | | | CBK | | | | 1,681 | | | | - | | | | 1,681 | |
| USD | | | 154,465 | | | TWD | | | 152,659 | | | 1/14/2025 | | | CBK | | | | 1,806 | | | | - | | | | 1,806 | |
| USD | | | 154,600 | | | TWD | | | 152,659 | | | 1/14/2025 | | | CBK | | | | 1,941 | | | | - | | | | 1,941 | |
| USD | | | 154,639 | | | TWD | | | 152,659 | | | 1/14/2025 | | | CBK | | | | 1,980 | | | | - | | | | 1,980 | |
| USD | | | 154,762 | | | TWD | | | 152,659 | | | 1/14/2025 | | | CBK | | | | 2,103 | | | | - | | | | 2,103 | |
| USD | | | 154,852 | | | TWD | | | 152,659 | | | 1/14/2025 | | | CBK | | | | 2,193 | | | | - | | | | 2,193 | |
| USD | | | 231,035 | | | TWD | | | 228,988 | | | 1/14/2025 | | | CBK | | | | 2,047 | | | | - | | | | 2,047 | |
| USD | | | 231,186 | | | TWD | | | 228,988 | | | 1/14/2025 | | | CBK | | | | 2,198 | | | | - | | | | 2,198 | |
| USD | | | 231,763 | | | TWD | | | 228,988 | | | 1/14/2025 | | | CBK | | | | 2,775 | | | | - | | | | 2,775 | |
| USD | | | 231,789 | | | TWD | | | 228,988 | | | 1/14/2025 | | | CBK | | | | 2,801 | | | | - | | | | 2,801 | |
| USD | | | 231,834 | | | TWD | | | 228,988 | | | 1/14/2025 | | | CBK | | | | 2,846 | | | | - | | | | 2,846 | |
| USD | | | 232,284 | | | TWD | | | 228,988 | | | 1/14/2025 | | | CBK | | | | 3,296 | | | | - | | | | 3,296 | |
| USD | | | 232,318 | | | TWD | | | 228,988 | | | 1/14/2025 | | | CBK | | | | 3,330 | | | | - | | | | 3,330 | |
| USD | | | 154,076 | | | TWD | | | 152,659 | | | 1/14/2025 | | | CBK | | | | 1,417 | | | | - | | | | 1,417 | |
| USD | | | 154,076 | | | TWD | | | 152,659 | | | 1/14/2025 | | | CBK | | | | 1,417 | | | | - | | | | 1,417 | |
| USD | | | 308,977 | | | TWD | | | 305,317 | | | 1/14/2025 | | | CBK | | | | 3,660 | | | | - | | | | 3,660 | |
| USD | | | 309,665 | | | TWD | | | 305,317 | | | 1/14/2025 | | | CBK | | | | 4,348 | | | | - | | | | 4,348 | |
| USD | | | 309,858 | | | TWD | | | 305,317 | | | 1/14/2025 | | | CBK | | | | 4,541 | | | | - | | | | 4,541 | |
| USD | | | 386,184 | | | TWD | | | 381,646 | | | 1/14/2025 | | | CBK | | | | 4,538 | | | | - | | | | 4,538 | |
| USD | | | 386,328 | | | TWD | | | 381,646 | | | 1/14/2025 | | | CBK | | | | 4,682 | | | | - | | | | 4,682 | |
| USD | | | 386,470 | | | TWD | | | 381,646 | | | 1/14/2025 | | | CBK | | | | 4,824 | | | | - | | | | 4,824 | |
| USD | | | 464,339 | | | TWD | | | 457,976 | | | 1/14/2025 | | | CBK | | | | 6,363 | | | | - | | | | 6,363 | |
| GBP | | | 500,712 | | | JPY | | | 497,483 | | | 1/14/2025 | | | CBK | | | | 3,229 | | | | - | | | | 3,229 | |
| USD | | | 540,557 | | | TWD | | | 534,305 | | | 1/14/2025 | | | CBK | | | | 6,252 | | | | - | | | | 6,252 | |
| USD | | | 617,932 | | | TWD | | | 610,634 | | | 1/14/2025 | | | CBK | | | | 7,298 | | | | - | | | | 7,298 | |
| JPY | | | 661,067 | | | GBP | | | 688,479 | | | 1/14/2025 | | | CBK | | | | - | | | | (27,412 | ) | | | (27,412 | ) |
| JPY | | | 664,010 | | | GBP | | | 688,479 | | | 1/14/2025 | | | CBK | | | | - | | | | (24,469 | ) | | | (24,469 | ) |
| USD | | | 766,850 | | | TWD | | | 763,293 | | | 1/14/2025 | | | CBK | | | | 3,557 | | | | - | | | | 3,557 | |
| TWD | | | 839,622 | | | USD | | | 837,853 | | | 1/14/2025 | | | CBK | | | | 1,769 | | | | - | | | | 1,769 | |
| JPY | | | 917,068 | | | GBP | | | 938,835 | | | 1/14/2025 | | | CBK | | | | - | | | | (21,767 | ) | | | (21,767 | ) |
| GBP | | | 938,835 | | | JPY | | | 933,852 | | | 1/14/2025 | | | CBK | | | | 4,983 | | | | - | | | | 4,983 | |
| USD | | | 996,912 | | | TWD | | | 992,281 | | | 1/14/2025 | | | CBK | | | | 4,631 | | | | - | | | | 4,631 | |
| GBP | | | 1,064,013 | | | JPY | | | 1,038,195 | | | 1/14/2025 | | | CBK | | | | 25,818 | | | | - | | | | 25,818 | |
| USD | | | 1,150,824 | | | TWD | | | 1,144,939 | | | 1/14/2025 | | | CBK | | | | 5,885 | | | | - | | | | 5,885 | |
| GBP | | | 1,251,780 | | | JPY | | | 1,239,638 | | | 1/14/2025 | | | CBK | | | | 12,142 | | | | - | | | | 12,142 | |
| JPY | | | 1,374,262 | | | GBP | | | 1,376,958 | | | 1/14/2025 | | | CBK | | | | - | | | | (2,696 | ) | | | (2,696 | ) |
| GBP | | | 1,376,958 | | | JPY | | | 1,372,035 | | | 1/14/2025 | | | CBK | | | | 4,923 | | | | - | | | | 4,923 | |
| JPY | | | 1,386,707 | | | GBP | | | 1,439,547 | | | 1/14/2025 | | | CBK | | | | - | | | | (52,840 | ) | | | (52,840 | ) |
| JPY | | | 1,632,424 | | | GBP | | | 1,689,903 | | | 1/14/2025 | | | CBK | | | | - | | | | (57,479 | ) | | | (57,479 | ) |
| GBP | | | 1,689,903 | | | JPY | | | 1,666,197 | | | 1/14/2025 | | | CBK | | | | 23,706 | | | | - | | | | 23,706 | |
| GBP | | | 1,752,492 | | | JPY | | | 1,746,004 | | | 1/14/2025 | | | CBK | | | | 6,488 | | | | - | | | | 6,488 | |
| GBP | | | 2,253,203 | | | JPY | | | 2,253,158 | | | 1/14/2025 | | | CBK | | | | 45 | | | | - | | | | 45 | |
See accompanying notes
18
American Beacon AHL Managed Futures Strategy FundSM
Consolidated Schedule of Investments
December 31, 2024
| | | | | | | | | | | | | | | | | | | | | | | | | | | | |
| | | | | | |
| Currency Purchased* | | | Currency Sold* | | | Settlement
Date | | Counterparty | | | Unrealized
Appreciation | | | Unrealized
(Depreciation) | | | Net Unrealized
Appreciation
(Depreciation) | |
| USD | | | 2,464,572 | | | TWD | | | 2,442,537 | | | 1/14/2025 | | | CBK | | | $ | 22,035 | | | $ | - | | | $ | 22,035 | |
| GBP | | | 2,503,560 | | | JPY | | | 2,522,468 | | | 1/14/2025 | | | CBK | | | | - | | | | (18,908 | ) | | | (18,908 | ) |
| JPY | | | 2,581,810 | | | GBP | | | 2,628,738 | | | 1/14/2025 | | | CBK | | | | - | | | | (46,928 | ) | | | (46,928 | ) |
| JPY | | | 3,072,823 | | | GBP | | | 3,192,039 | | | 1/14/2025 | | | CBK | | | | - | | | | (119,216 | ) | | | (119,216 | ) |
| JPY | | | 3,091,020 | | | GBP | | | 3,129,449 | | | 1/14/2025 | | | CBK | | | | - | | | | (38,429 | ) | | | (38,429 | ) |
| GBP | | | 3,129,450 | | | JPY | | | 3,073,955 | | | 1/14/2025 | | | CBK | | | | 55,495 | | | | - | | | | 55,495 | |
| GBP | | | 3,817,928 | | | JPY | | | 3,830,775 | | | 1/14/2025 | | | CBK | | | | - | | | | (12,847 | ) | | | (12,847 | ) |
| JPY | | | 4,169,973 | | | GBP | | | 4,256,052 | | | 1/14/2025 | | | CBK | | | | - | | | | (86,079 | ) | | | (86,079 | ) |
| JPY | | | 4,182,500 | | | GBP | | | 4,193,463 | | | 1/14/2025 | | | CBK | | | | - | | | | (10,963 | ) | | | (10,963 | ) |
| GBP | | | 4,443,819 | | | JPY | | | 4,341,229 | | | 1/14/2025 | | | CBK | | | | 102,590 | | | | - | | | | 102,590 | |
| JPY | | | 4,698,113 | | | GBP | | | 4,756,763 | | | 1/14/2025 | | | CBK | | | | - | | | | (58,650 | ) | | | (58,650 | ) |
| GBP | | | 5,445,243 | | | JPY | | | 5,366,760 | | | 1/14/2025 | | | CBK | | | | 78,483 | | | | - | | | | 78,483 | |
| GBP | | | 5,570,420 | | | JPY | | | 5,442,558 | | | 1/14/2025 | | | CBK | | | | 127,862 | | | | - | | | | 127,862 | |
| JPY | | | 6,550,770 | | | GBP | | | 6,571,844 | | | 1/14/2025 | | | CBK | | | | - | | | | (21,074 | ) | | | (21,074 | ) |
| GBP | | | 7,911,555 | | | JPY | | | 7,886,526 | | | 1/14/2025 | | | CBK | | | | 25,029 | | | | - | | | | 25,029 | |
| JPY | | | 8,080,250 | | | GBP | | | 8,386,925 | | | 1/14/2025 | | | CBK | | | | - | | | | (306,675 | ) | | | (306,675 | ) |
| GBP | | | 27,800,800 | | | JPY | | | 27,761,308 | | | 1/14/2025 | | | CBK | | | | 39,492 | | | | - | | | | 39,492 | |
| GBP | | | 29,818,324 | | | JPY | | | 29,769,955 | | | 1/14/2025 | | | CBK | | | | 48,369 | | | | - | | | | 48,369 | |
| THB | | | 586,984 | | | USD | | | 593,962 | | | 1/15/2025 | | | CBK | | | | - | | | | (6,978 | ) | | | (6,978 | ) |
| USD | | | 590,790 | | | THB | | | 586,984 | | | 1/15/2025 | | | CBK | | | | 3,806 | | | | - | | | | 3,806 | |
| USD | | | 267 | | | SEK | | | 264 | | | 1/16/2025 | | | CBK | | | | 3 | | | | - | | | | 3 | |
| USD | | | 277 | | | SEK | | | 276 | | | 1/16/2025 | | | CBK | | | | 1 | | | | - | | | | 1 | |
| USD | | | 583 | | | SEK | | | 578 | | | 1/16/2025 | | | CBK | | | | 5 | | | | - | | | | 5 | |
| USD | | | 1,052 | | | SEK | | | 1,048 | | | 1/16/2025 | | | CBK | | | | 4 | | | | - | | | | 4 | |
| SEK | | | 1,808 | | | USD | | | 1,832 | | | 1/16/2025 | | | CBK | | | | - | | | | (24 | ) | | | (24 | ) |
| USD | | | 2,338 | | | SEK | | | 2,304 | | | 1/16/2025 | | | CBK | | | | 34 | | | | - | | | | 34 | |
| USD | | | 5,404 | | | SEK | | | 5,343 | | | 1/16/2025 | | | CBK | | | | 61 | | | | - | | | | 61 | |
| USD | | | 6,379 | | | SEK | | | 6,392 | | | 1/16/2025 | | | CBK | | | | - | | | | (13 | ) | | | (13 | ) |
| USD | | | 115,558 | | | SEK | | | 115,285 | | | 1/16/2025 | | | CBK | | | | 273 | | | | - | | | | 273 | |
| USD | | | 75,439,314 | | | TWD | | | 74,399,230 | | | 1/23/2025 | | | CBK | | | | 1,040,084 | | | | - | | | | 1,040,084 | |
| THB | | | 146,812 | | | USD | | | 148,497 | | | 1/24/2025 | | | CBK | | | | - | | | | (1,685 | ) | | | (1,685 | ) |
| THB | | | 220,219 | | | USD | | | 221,671 | | | 1/24/2025 | | | CBK | | | | - | | | | (1,452 | ) | | | (1,452 | ) |
| THB | | | 220,219 | | | USD | | | 221,734 | | | 1/24/2025 | | | CBK | | | | - | | | | (1,515 | ) | | | (1,515 | ) |
| THB | | | 220,219 | | | USD | | | 221,906 | | | 1/24/2025 | | | CBK | | | | - | | | | (1,687 | ) | | | (1,687 | ) |
| THB | | | 220,219 | | | USD | | | 222,840 | | | 1/24/2025 | | | CBK | | | | - | | | | (2,621 | ) | | | (2,621 | ) |
| THB | | | 293,625 | | | USD | | | 296,210 | | | 1/24/2025 | | | CBK | | | | - | | | | (2,585 | ) | | | (2,585 | ) |
| THB | | | 440,437 | | | USD | | | 445,821 | | | 1/24/2025 | | | CBK | | | | - | | | | (5,384 | ) | | | (5,384 | ) |
| USD | | | 508,473 | | | THB | | | 513,843 | | | 1/24/2025 | | | CBK | | | | - | | | | (5,370 | ) | | | (5,370 | ) |
| THB | | | 513,843 | | | USD | | | 519,877 | | | 1/24/2025 | | | CBK | | | | - | | | | (6,034 | ) | | | (6,034 | ) |
| THB | | | 587,249 | | | USD | | | 591,293 | | | 1/24/2025 | | | CBK | | | | - | | | | (4,044 | ) | | | (4,044 | ) |
| THB | | | 587,249 | | | USD | | | 592,679 | | | 1/24/2025 | | | CBK | | | | - | | | | (5,430 | ) | | | (5,430 | ) |
| THB | | | 587,249 | | | USD | | | 593,045 | | | 1/24/2025 | | | CBK | | | | - | | | | (5,796 | ) | | | (5,796 | ) |
| THB | | | 734,062 | | | USD | | | 740,438 | | | 1/24/2025 | | | CBK | | | | - | | | | (6,376 | ) | | | (6,376 | ) |
| USD | | | 944,611 | | | THB | | | 954,280 | | | 1/24/2025 | | | CBK | | | | - | | | | (9,669 | ) | | | (9,669 | ) |
| THB | | | 954,280 | | | USD | | | 964,017 | | | 1/24/2025 | | | CBK | | | | - | | | | (9,737 | ) | | | (9,737 | ) |
| THB | | | 1,101,093 | | | USD | | | 1,110,796 | | | 1/24/2025 | | | CBK | | | | - | | | | (9,703 | ) | | | (9,703 | ) |
| THB | | | 1,321,311 | | | USD | | | 1,333,432 | | | 1/24/2025 | | | CBK | | | | - | | | | (12,121 | ) | | | (12,121 | ) |
| USD | | | 1,389,682 | | | THB | | | 1,394,717 | | | 1/24/2025 | | | CBK | | | | - | | | | (5,035 | ) | | | (5,035 | ) |
| USD | | | 1,443,863 | | | THB | | | 1,468,123 | | | 1/24/2025 | | | CBK | | | | - | | | | (24,260 | ) | | | (24,260 | ) |
| USD | | | 1,589,558 | | | THB | | | 1,614,936 | | | 1/24/2025 | | | CBK | | | | - | | | | (25,378 | ) | | | (25,378 | ) |
| THB | | | 1,688,342 | | | USD | | | 1,703,015 | | | 1/24/2025 | | | CBK | | | | - | | | | (14,673 | ) | | | (14,673 | ) |
| USD | | | 27,625,511 | | | INR | | | 27,389,144 | | | 1/24/2025 | | | CBK | | | | 236,367 | | | | - | | | | 236,367 | |
| USD | | | 50,754,748 | | | INR | | | 50,211,996 | | | 1/24/2025 | | | CBK | | | | 542,752 | | | | - | | | | 542,752 | |
| USD | | | 53,668,223 | | | INR | | | 53,050,905 | | | 1/24/2025 | | | CBK | | | | 617,318 | | | | - | | | | 617,318 | |
| USD | | | 492,407 | | | NOK | | | 483,121 | | | 2/7/2025 | | | CBK | | | | 9,286 | | | | - | | | | 9,286 | |
| USD | | | 988,862 | | | NOK | | | 966,243 | | | 2/7/2025 | | | CBK | | | | 22,619 | | | | - | | | | 22,619 | |
| USD | | | 1,363,827 | | | SEK | | | 1,350,147 | | | 2/7/2025 | | | CBK | | | | 13,680 | | | | - | | | | 13,680 | |
| USD | | | 1,733,168 | | | SEK | | | 1,720,509 | | | 2/7/2025 | | | CBK | | | | 12,659 | | | | - | | | | 12,659 | |
| USD | | | 3,364,716 | | | NOK | | | 3,294,009 | | | 2/7/2025 | | | CBK | | | | 70,707 | | | | - | | | | 70,707 | |
See accompanying notes
19
American Beacon AHL Managed Futures Strategy FundSM
Consolidated Schedule of Investments
December 31, 2024
| | | | | | | | | | | | | | | | | | | | | | | | | | | | |
| | | | | | |
| Currency Purchased* | | | Currency Sold* | | | Settlement
Date | | Counterparty | | | Unrealized
Appreciation | | | Unrealized
(Depreciation) | | | Net Unrealized
Appreciation
(Depreciation) | |
| NOK | | | 3,407,032 | | | USD | | | 3,404,129 | | | 2/7/2025 | | | CBK | | | $ | 2,903 | | | $ | - | | | $ | 2,903 | |
| USD | | | 4,771,107 | | | NOK | | | 4,699,453 | | | 2/7/2025 | | | CBK | | | | 71,654 | | | | - | | | | 71,654 | |
| USD | | | 4,833,689 | | | NOK | | | 4,720,400 | | | 2/7/2025 | | | CBK | | | | 113,289 | | | | - | | | | 113,289 | |
| USD | | | 5,058,340 | | | SEK | | | 5,025,698 | | | 2/7/2025 | | | CBK | | | | 32,642 | | | | - | | | | 32,642 | |
| USD | | | 5,095,601 | | | SEK | | | 5,070,975 | | | 2/7/2025 | | | CBK | | | | 24,626 | | | | - | | | | 24,626 | |
| USD | | | 5,462,907 | | | SEK | | | 5,404,540 | | | 2/7/2025 | | | CBK | | | | 58,367 | | | | - | | | | 58,367 | |
| USD | | | 5,464,700 | | | SEK | | | 5,387,910 | | | 2/7/2025 | | | CBK | | | | 76,790 | | | | - | | | | 76,790 | |
| NOK | | | 5,709,616 | | | USD | | | 5,742,923 | | | 2/7/2025 | | | CBK | | | | - | | | | (33,307 | ) | | | (33,307 | ) |
| USD | | | 5,836,285 | | | NOK | | | 5,665,696 | | | 2/7/2025 | | | CBK | | | | 170,589 | | | | - | | | | 170,589 | |
| USD | | | 5,908,583 | | | SEK | | | 5,850,637 | | | 2/7/2025 | | | CBK | | | | 57,946 | | | | - | | | | 57,946 | |
| USD | | | 5,909,470 | | | SEK | | | 5,850,637 | | | 2/7/2025 | | | CBK | | | | 58,833 | | | | - | | | | 58,833 | |
| USD | | | 5,982,716 | | | SEK | | | 5,976,506 | | | 2/7/2025 | | | CBK | | | | 6,210 | | | | - | | | | 6,210 | |
| USD | | | 6,452,802 | | | NOK | | | 6,303,550 | | | 2/7/2025 | | | CBK | | | | 149,252 | | | | - | | | | 149,252 | |
| NOK | | | 6,814,064 | | | USD | | | 6,810,044 | | | 2/7/2025 | | | CBK | | | | 4,020 | | | | - | | | | 4,020 | |
| USD | | | 7,439,718 | | | NOK | | | 7,422,501 | | | 2/7/2025 | | | CBK | | | | 17,217 | | | | - | | | | 17,217 | |
| USD | | | 7,498,845 | | | NOK | | | 7,466,421 | | | 2/7/2025 | | | CBK | | | | 32,424 | | | | - | | | | 32,424 | |
| USD | | | 7,634,304 | | | NOK | | | 7,434,427 | | | 2/7/2025 | | | CBK | | | | 199,877 | | | | - | | | | 199,877 | |
| USD | | | 8,187,311 | | | SEK | | | 8,106,810 | | | 2/7/2025 | | | CBK | | | | 80,501 | | | | - | | | | 80,501 | |
| USD | | | 9,547,430 | | | SEK | | | 9,457,945 | | | 2/7/2025 | | | CBK | | | | 89,485 | | | | - | | | | 89,485 | |
| USD | | | 10,060,555 | | | NOK | | | 10,013,788 | | | 2/7/2025 | | | CBK | | | | 46,767 | | | | - | | | | 46,767 | |
| USD | | | 10,541,914 | | | NOK | | | 10,365,149 | | | 2/7/2025 | | | CBK | | | | 176,765 | | | | - | | | | 176,765 | |
| NOK | | | 12,749,128 | | | USD | | | 12,738,510 | | | 2/7/2025 | | | CBK | | | | 10,618 | | | | - | | | | 10,618 | |
| USD | | | 13,291,634 | | | SEK | | | 13,163,933 | | | 2/7/2025 | | | CBK | | | | 127,701 | | | | - | | | | 127,701 | |
| USD | | | 13,300,455 | | | SEK | | | 13,163,933 | | | 2/7/2025 | | | CBK | | | | 136,522 | | | | - | | | | 136,522 | |
| USD | | | 13,430,101 | | | NOK | | | 13,092,939 | | | 2/7/2025 | | | CBK | | | | 337,162 | | | | - | | | | 337,162 | |
| USD | | | 14,765,178 | | | SEK | | | 14,626,592 | | | 2/7/2025 | | | CBK | | | | 138,586 | | | | - | | | | 138,586 | |
| USD | | | 15,136,310 | | | NOK | | | 14,729,556 | | | 2/7/2025 | | | CBK | | | | 406,754 | | | | - | | | | 406,754 | |
| USD | | | 15,546,053 | | | NOK | | | 15,107,237 | | | 2/7/2025 | | | CBK | | | | 438,816 | | | | - | | | | 438,816 | |
| USD | | | 16,821,306 | | | NOK | | | 16,366,173 | | | 2/7/2025 | | | CBK | | | | 455,133 | | | | - | | | | 455,133 | |
| USD | | | 17,713,207 | | | SEK | | | 17,551,911 | | | 2/7/2025 | | | CBK | | | | 161,296 | | | | - | | | | 161,296 | |
| USD | | | 18,198,059 | | | SEK | | | 18,032,577 | | | 2/7/2025 | | | CBK | | | | 165,482 | | | | - | | | | 165,482 | |
| USD | | | 19,104,033 | | | SEK | | | 18,915,889 | | | 2/7/2025 | | | CBK | | | | 188,144 | | | | - | | | | 188,144 | |
| USD | | | 19,211,616 | | | SEK | | | 19,014,570 | | | 2/7/2025 | | | CBK | | | | 197,046 | | | | - | | | | 197,046 | |
| USD | | | 20,149,316 | | | NOK | | | 19,639,408 | | | 2/7/2025 | | | CBK | | | | 509,908 | | | | - | | | | 509,908 | |
| USD | | | 20,469,804 | | | SEK | | | 20,267,024 | | | 2/7/2025 | | | CBK | | | | 202,780 | | | | - | | | | 202,780 | |
| USD | | | 22,128,556 | | | SEK | | | 21,939,888 | | | 2/7/2025 | | | CBK | | | | 188,668 | | | | - | | | | 188,668 | |
| USD | | | 25,887,758 | | | NOK | | | 25,178,728 | | | 2/7/2025 | | | CBK | | | | 709,030 | | | | - | | | | 709,030 | |
| USD | | | 36,261,374 | | | NOK | | | 35,250,219 | | | 2/7/2025 | | | CBK | | | | 1,011,155 | | | | - | | | | 1,011,155 | |
| USD | | | 36,282,154 | | | NOK | | | 35,250,219 | | | 2/7/2025 | | | CBK | | | | 1,031,935 | | | | - | | | | 1,031,935 | |
| MXN | | | 47,632 | | | USD | | | 48,722 | | | 2/12/2025 | | | CBK | | | | - | | | | (1,090 | ) | | | (1,090 | ) |
| MXN | | | 65,104 | | | USD | | | 66,920 | | | 2/12/2025 | | | CBK | | | | - | | | | (1,816 | ) | | | (1,816 | ) |
| MXN | | | 595,395 | | | USD | | | 617,174 | | | 2/12/2025 | | | CBK | | | | - | | | | (21,779 | ) | | | (21,779 | ) |
| MXN | | | 881,185 | | | USD | | | 906,258 | | | 2/12/2025 | | | CBK | | | | - | | | | (25,073 | ) | | | (25,073 | ) |
| MXN | | | 1,414,317 | | | USD | | | 1,456,644 | | | 2/12/2025 | | | CBK | | | | - | | | | (42,327 | ) | | | (42,327 | ) |
| MXN | | | 2,238,686 | | | USD | | | 2,312,207 | | | 2/12/2025 | | | CBK | | | | - | | | | (73,521 | ) | | | (73,521 | ) |
| MXN | | | 2,262,501 | | | USD | | | 2,336,553 | | | 2/12/2025 | | | CBK | | | | - | | | | (74,052 | ) | | | (74,052 | ) |
| MXN | | | 2,595,923 | | | USD | | | 2,674,135 | | | 2/12/2025 | | | CBK | | | | - | | | | (78,212 | ) | | | (78,212 | ) |
| MXN | | | 2,881,712 | | | USD | | | 2,952,117 | | | 2/12/2025 | | | CBK | | | | - | | | | (70,405 | ) | | | (70,405 | ) |
| MXN | | | 3,143,686 | | | USD | | | 3,238,260 | | | 2/12/2025 | | | CBK | | | | - | | | | (94,574 | ) | | | (94,574 | ) |
| MXN | | | 3,381,844 | | | USD | | | 3,480,407 | | | 2/12/2025 | | | CBK | | | | - | | | | (98,563 | ) | | | (98,563 | ) |
| MXN | | | 3,669,520 | | | USD | | | 3,767,955 | | | 2/12/2025 | | | CBK | | | | - | | | | (98,435 | ) | | | (98,435 | ) |
| MXN | | | 3,691,450 | | | USD | | | 3,757,458 | | | 2/12/2025 | | | CBK | | | | - | | | | (66,008 | ) | | | (66,008 | ) |
| MXN | | | 4,001,055 | | | USD | | | 4,125,349 | | | 2/12/2025 | | | CBK | | | | - | | | | (124,294 | ) | | | (124,294 | ) |
| MXN | | | 6,096,846 | | | USD | | | 6,276,250 | | | 2/12/2025 | | | CBK | | | | - | | | | (179,404 | ) | | | (179,404 | ) |
| MXN | | | 6,349,634 | | | USD | | | 6,530,630 | | | 2/12/2025 | | | CBK | | | | - | | | | (180,996 | ) | | | (180,996 | ) |
| USD | | | 6,805,493 | | | MXN | | | 6,676,286 | | | 2/12/2025 | | | CBK | | | | 129,207 | | | | - | | | | 129,207 | |
| USD | | | 7,779,945 | | | MXN | | | 7,630,041 | | | 2/12/2025 | | | CBK | | | | 149,904 | | | | - | | | | 149,904 | |
| MXN | | | 8,220,909 | | | USD | | | 8,448,289 | | | 2/12/2025 | | | CBK | | | | - | | | | (227,380 | ) | | | (227,380 | ) |
| MXN | | | 8,621,321 | | | USD | | | 8,861,408 | | | 2/12/2025 | | | CBK | | | | - | | | | (240,087 | ) | | | (240,087 | ) |
See accompanying notes
20
American Beacon AHL Managed Futures Strategy FundSM
Consolidated Schedule of Investments
December 31, 2024
| | | | | | | | | | | | | | | | | | | | | | | | | | | | |
| | | | | | |
| Currency Purchased* | | | Currency Sold* | | | Settlement
Date | | Counterparty | | | Unrealized
Appreciation | | | Unrealized
(Depreciation) | | | Net Unrealized
Appreciation
(Depreciation) | |
| USD | | | 9,547,319 | | | MXN | | | 9,366,581 | | | 2/12/2025 | | | CBK | | | $ | 180,738 | | | $ | - | | | $ | 180,738 | |
| EUR | | | 968,423 | | | CAD | | | 974,251 | | | 2/13/2025 | | | CBK | | | | - | | | | (5,828 | ) | | | (5,828 | ) |
| EUR | | | 1,763,914 | | | CAD | | | 1,776,188 | | | 2/13/2025 | | | CBK | | | | - | | | | (12,274 | ) | | | (12,274 | ) |
| EUR | | | 2,075,192 | | | CAD | | | 2,073,668 | | | 2/13/2025 | | | CBK | | | | 1,524 | | | | - | | | | 1,524 | |
| EUR | | | 2,593,990 | | | CAD | | | 2,601,622 | | | 2/13/2025 | | | CBK | | | | - | | | | (7,632 | ) | | | (7,632 | ) |
| EUR | | | 3,320,308 | | | CAD | | | 3,335,149 | | | 2/13/2025 | | | CBK | | | | - | | | | (14,841 | ) | | | (14,841 | ) |
| EUR | | | 3,942,866 | | | CAD | | | 3,955,867 | | | 2/13/2025 | | | CBK | | | | - | | | | (13,001 | ) | | | (13,001 | ) |
| EUR | | | 3,942,866 | | | CAD | | | 3,969,785 | | | 2/13/2025 | | | CBK | | | | - | | | | (26,919 | ) | | | (26,919 | ) |
| EUR | | | 4,461,664 | | | CAD | | | 4,496,526 | | | 2/13/2025 | | | CBK | | | | - | | | | (34,862 | ) | | | (34,862 | ) |
| EUR | | | 5,603,019 | | | CAD | | | 5,621,936 | | | 2/13/2025 | | | CBK | | | | - | | | | (18,917 | ) | | | (18,917 | ) |
| EUR | | | 6,813,548 | | | CAD | | | 6,855,178 | | | 2/13/2025 | | | CBK | | | | - | | | | (41,630 | ) | | | (41,630 | ) |
| EUR | | | 9,130,848 | | | CAD | | | 9,196,645 | | | 2/13/2025 | | | CBK | | | | - | | | | (65,797 | ) | | | (65,797 | ) |
| EUR | | | 9,338,366 | | | CAD | | | 9,438,975 | | | 2/13/2025 | | | CBK | | | | - | | | | (100,609 | ) | | | (100,609 | ) |
| CAD | | | 15,336,450 | | | EUR | | | 15,328,675 | | | 2/13/2025 | | | CBK | | | | 7,775 | | | | - | | | | 7,775 | |
| CAD | | | 24,622,999 | | | EUR | | | 24,628,930 | | | 2/13/2025 | | | CBK | | | | - | | | | (5,931 | ) | | | (5,931 | ) |
| CAD | | | 35,373,010 | | | EUR | | | 35,371,884 | | | 2/13/2025 | | | CBK | | | | 1,126 | | | | - | | | | 1,126 | |
| USD | | | 669,668 | | | SGD | | | 660,298 | | | 2/19/2025 | | | CBK | | | | 9,370 | | | | - | | | | 9,370 | |
| SGD | | | 2,494,460 | | | USD | | | 2,506,647 | | | 2/19/2025 | | | CBK | | | | - | | | | (12,187 | ) | | | (12,187 | ) |
| USD | | | 2,729,333 | | | SGD | | | 2,714,560 | | | 2/19/2025 | | | CBK | | | | 14,773 | | | | - | | | | 14,773 | |
| USD | | | 2,767,431 | | | SGD | | | 2,714,560 | | | 2/19/2025 | | | CBK | | | | 52,871 | | | | - | | | | 52,871 | |
| USD | | | 8,180,476 | | | SGD | | | 8,070,313 | | | 2/19/2025 | | | CBK | | | | 110,163 | | | | - | | | | 110,163 | |
| SGD | | | 23,330,541 | | | USD | | | 23,526,209 | | | 2/19/2025 | | | CBK | | | | - | | | | (195,668 | ) | | | (195,668 | ) |
| SGD | | | 23,917,472 | | | USD | | | 24,063,816 | | | 2/19/2025 | | | CBK | | | | - | | | | (146,344 | ) | | | (146,344 | ) |
| USD | | | 319,065,891 | | | SGD | | | 312,467,837 | | | 2/19/2025 | | | CBK | | | | 6,598,054 | | | | - | | | | 6,598,054 | |
| USD | | | 18,286,747 | | | TWD | | | 18,303,887 | | | 2/20/2025 | | | CBK | | | | - | | | | (17,140 | ) | | | (17,140 | ) |
| USD | | | 30,001,794 | | | lNR | | | 29,941,114 | | | 2/20/2025 | | | CBK | | | | 60,680 | | | | - | | | | 60,680 | |
| THB | | | 294,370 | | | USD | | | 293,652 | | | 2/28/2025 | | | CBK | | | | 718 | | | | - | | | | 718 | |
| THB | | | 1,177,482 | | | USD | | | 1,175,430 | | | 2/28/2025 | | | CBK | | | | 2,052 | | | | - | | | | 2,052 | |
| USD | | | 48,831 | | | PLN | | | 48,424 | | | 1/2/2025 | | | HUB | | | | 407 | | | | - | | | | 407 | |
| USD | | | 62,415 | | | AUD | | | 61,895 | | | 1/2/2025 | | | HUB | | | | 520 | | | | - | | | | 520 | |
| USD | | | 62,448 | | | AUD | | | 61,895 | | | 1/2/2025 | | | HUB | | | | 553 | | | | - | | | | 553 | |
| GBP | | | 62,595 | | | AUD | | | 62,504 | | | 1/2/2025 | | | HUB | | | | 91 | | | | - | | | | 91 | |
| GBP | | | 62,595 | | | AUD | | | 62,536 | | | 1/2/2025 | | | HUB | | | | 59 | | | | - | | | | 59 | |
| GBP | | | 62,595 | | | AUD | | | 62,543 | | | 1/2/2025 | | | HUB | | | | 52 | | | | - | | | | 52 | |
| EUR | | | 103,584 | | | AUD | | | 103,717 | | | 1/2/2025 | | | HUB | | | | - | | | | (133 | ) | | | (133 | ) |
| EUR | | | 103,585 | | | AUD | | | 103,361 | | | 1/2/2025 | | | HUB | | | | 224 | | | | - | | | | 224 | |
| EUR | | | 103,585 | | | AUD | | | 103,378 | | | 1/2/2025 | | | HUB | | | | 207 | | | | - | | | | 207 | |
| EUR | | | 103,585 | | | AUD | | | 103,449 | | | 1/2/2025 | | | HUB | | | | 136 | | | | - | | | | 136 | |
| EUR | | | 103,585 | | | AUD | | | 103,586 | | | 1/2/2025 | | | HUB | | | | - | | | | (1 | ) | | | (1 | ) |
| USD | | | 124,550 | | | AUD | | | 123,790 | | | 1/2/2025 | | | HUB | | | | 760 | | | | - | | | | 760 | |
| USD | | | 124,598 | | | AUD | | | 123,790 | | | 1/2/2025 | | | HUB | | | | 808 | | | | - | | | | 808 | |
| USD | | | 124,652 | | | AUD | | | 123,790 | | | 1/2/2025 | | | HUB | | | | 862 | | | | - | | | | 862 | |
| USD | | | 124,772 | | | AUD | | | 123,790 | | | 1/2/2025 | | | HUB | | | | 982 | | | | - | | | | 982 | |
| USD | | | 124,780 | | | AUD | | | 123,790 | | | 1/2/2025 | | | HUB | | | | 990 | | | | - | | | | 990 | |
| USD | | | 124,842 | | | AUD | | | 123,790 | | | 1/2/2025 | | | HUB | | | | 1,052 | | | | - | | | | 1,052 | |
| GBP | | | 125,190 | | | AUD | | | 124,843 | | | 1/2/2025 | | | HUB | | | | 347 | | | | - | | | | 347 | |
| GBP | | | 125,190 | | | AUD | | | 125,007 | | | 1/2/2025 | | | HUB | | | | 183 | | | | - | | | | 183 | |
| USD | | | 125,197 | | | GBP | | | 125,190 | | | 1/2/2025 | | | HUB | | | | 7 | | | | - | | | | 7 | |
| USD | | | 125,660 | | | GBP | | | 125,190 | | | 1/2/2025 | | | HUB | | | | 470 | | | | - | | | | 470 | |
| USD | | | 125,675 | | | GBP | | | 125,190 | | | 1/2/2025 | | | HUB | | | | 485 | | | | - | | | | 485 | |
| USD | | | 139,188 | | | CAD | | | 139,135 | | | 1/2/2025 | | | HUB | | | | 53 | | | | - | | | | 53 | |
| USD | | | 186,219 | | | AUD | | | 185,685 | | | 1/2/2025 | | | HUB | | | | 534 | | | | - | | | | 534 | |
| USD | | | 186,393 | | | AUD | | | 185,685 | | | 1/2/2025 | | | HUB | | | | 708 | | | | - | | | | 708 | |
| USD | | | 186,738 | | | AUD | | | 185,685 | | | 1/2/2025 | | | HUB | | | | 1,053 | | | | - | | | | 1,053 | |
| USD | | | 186,939 | | | AUD | | | 185,685 | | | 1/2/2025 | | | HUB | | | | 1,254 | | | | - | | | | 1,254 | |
| USD | | | 186,972 | | | AUD | | | 185,685 | | | 1/2/2025 | | | HUB | | | | 1,287 | | | | - | | | | 1,287 | |
| USD | | | 186,987 | | | AUD | | | 185,685 | | | 1/2/2025 | | | HUB | | | | 1,302 | | | | - | | | | 1,302 | |
| USD | | | 187,089 | | | AUD | | | 185,685 | | | 1/2/2025 | | | HUB | | | | 1,404 | | | | - | | | | 1,404 | |
| USD | | | 187,161 | | | AUD | | | 185,685 | | | 1/2/2025 | | | HUB | | | | 1,476 | | | | - | | | | 1,476 | |
See accompanying notes
21
American Beacon AHL Managed Futures Strategy FundSM
Consolidated Schedule of Investments
December 31, 2024
| | | | | | | | | | | | | | | | | | | | | | | | | | | | |
| | | | | | |
| Currency Purchased* | | | Currency Sold* | | | Settlement
Date | | Counterparty | | | Unrealized
Appreciation | | | Unrealized
(Depreciation) | | | Net Unrealized
Appreciation
(Depreciation) | |
| USD | | | 187,266 | | | AUD | | | 185,685 | | | 1/2/2025 | | | HUB | | | $ | 1,581 | | | $ | - | | | $ | 1,581 | |
| USD | | | 187,269 | | | AUD | | | 185,685 | | | 1/2/2025 | | | HUB | | | | 1,584 | | | | - | | | | 1,584 | |
| GBP | | | 187,785 | | | AUD | | | 187,484 | | | 1/2/2025 | | | HUB | | | | 301 | | | | - | | | | 301 | |
| GBP | | | 187,785 | | | AUD | | | 187,537 | | | 1/2/2025 | | | HUB | | | | 248 | | | | - | | | | 248 | |
| EUR | | | 207,170 | | | AUD | | | 206,841 | | | 1/2/2025 | | | HUB | | | | 329 | | | | - | | | | 329 | |
| EUR | | | 207,170 | | | AUD | | | 206,858 | | | 1/2/2025 | | | HUB | | | | 312 | | | | - | | | | 312 | |
| EUR | | | 207,170 | | | AUD | | | 207,137 | | | 1/2/2025 | | | HUB | | | | 33 | | | | - | | | | 33 | |
| EUR | | | 207,170 | | | AUD | | | 207,150 | | | 1/2/2025 | | | HUB | | | | 20 | | | | - | | | | 20 | |
| EUR | | | 207,170 | | | AUD | | | 207,168 | | | 1/2/2025 | | | HUB | | | | 2 | | | | - | | | | 2 | |
| EUR | | | 207,170 | | | AUD | | | 207,192 | | | 1/2/2025 | | | HUB | | | | - | | | | (22 | ) | | | (22 | ) |
| EUR | | | 207,170 | | | AUD | | | 207,409 | | | 1/2/2025 | | | HUB | | | | - | | | | (239 | ) | | | (239 | ) |
| USD | | | 207,750 | | | EUR | | | 207,170 | | | 1/2/2025 | | | HUB | | | | 580 | | | | - | | | | 580 | |
| USD | | | 207,898 | | | EUR | | | 207,170 | | | 1/2/2025 | | | HUB | | | | 728 | | | | - | | | | 728 | |
| USD | | | 208,506 | | | EUR | | | 207,170 | | | 1/2/2025 | | | HUB | | | | 1,336 | | | | - | | | | 1,336 | |
| USD | | | 208,594 | | | EUR | | | 207,170 | | | 1/2/2025 | | | HUB | | | | 1,424 | | | | - | | | | 1,424 | |
| USD | | | 208,728 | | | EUR | | | 207,170 | | | 1/2/2025 | | | HUB | | | | 1,558 | | | | - | | | | 1,558 | |
| USD | | | 248,772 | | | AUD | | | 247,580 | | | 1/2/2025 | | | HUB | | | | 1,192 | | | | - | | | | 1,192 | |
| USD | | | 248,880 | | | AUD | | | 247,580 | | | 1/2/2025 | | | HUB | | | | 1,300 | | | | - | | | | 1,300 | |
| USD | | | 248,996 | | | AUD | | | 247,580 | | | 1/2/2025 | | | HUB | | | | 1,416 | | | | - | | | | 1,416 | |
| USD | | | 249,044 | | | AUD | | | 247,580 | | | 1/2/2025 | | | HUB | | | | 1,464 | | | | - | | | | 1,464 | |
| USD | | | 249,048 | | | AUD | | | 247,580 | | | 1/2/2025 | | | HUB | | | | 1,468 | | | | - | | | | 1,468 | |
| USD | | | 249,084 | | | AUD | | | 247,580 | | | 1/2/2025 | | | HUB | | | | 1,504 | | | | - | | | | 1,504 | |
| USD | | | 249,140 | | | AUD | | | 247,580 | | | 1/2/2025 | | | HUB | | | | 1,560 | | | | - | | | | 1,560 | |
| USD | | | 249,234 | | | AUD | | | 247,580 | | | 1/2/2025 | | | HUB | | | | 1,654 | | | | - | | | | 1,654 | |
| GBP | | | 250,380 | | | AUD | | | 249,553 | | | 1/2/2025 | | | HUB | | | | 827 | | | | - | | | | 827 | |
| GBP | | | 250,380 | | | AUD | | | 249,917 | | | 1/2/2025 | | | HUB | | | | 463 | | | | - | | | | 463 | |
| USD | | | 278,400 | | | CAD | | | 278,271 | | | 1/2/2025 | | | HUB | | | | 129 | | | | - | | | | 129 | |
| EUR | | | 310,755 | | | AUD | | | 310,636 | | | 1/2/2025 | | | HUB | | | | 119 | | | | - | | | | 119 | |
| USD | | | 311,895 | | | AUD | | | 309,475 | | | 1/2/2025 | | | HUB | | | | 2,420 | | | | - | | | | 2,420 | |
| USD | | | 312,750 | | | EUR | | | 310,755 | | | 1/2/2025 | | | HUB | | | | 1,995 | | | | - | | | | 1,995 | |
| USD | | | 312,807 | | | EUR | | | 310,755 | | | 1/2/2025 | | | HUB | | | | 2,052 | | | | - | | | | 2,052 | |
| USD | | | 373,832 | | | AUD | | | 371,370 | | | 1/2/2025 | | | HUB | | | | 2,462 | | | | - | | | | 2,462 | |
| USD | | | 414,432 | | | PLN | | | 411,602 | | | 1/2/2025 | | | HUB | | | | 2,830 | | | | - | | | | 2,830 | |
| USD | | | 416,056 | | | EUR | | | 414,340 | | | 1/2/2025 | | | HUB | | | | 1,716 | | | | - | | | | 1,716 | |
| USD | | | 416,780 | | | EUR | | | 414,340 | | | 1/2/2025 | | | HUB | | | | 2,440 | | | | - | | | | 2,440 | |
| USD | | | 416,824 | | | EUR | | | 414,340 | | | 1/2/2025 | | | HUB | | | | 2,484 | | | | - | | | | 2,484 | |
| USD | | | 416,880 | | | EUR | | | 414,340 | | | 1/2/2025 | | | HUB | | | | 2,540 | | | | - | | | | 2,540 | |
| USD | | | 417,036 | | | EUR | | | 414,340 | | | 1/2/2025 | | | HUB | | | | 2,696 | | | | - | | | | 2,696 | |
| USD | | | 417,048 | | | EUR | | | 414,340 | | | 1/2/2025 | | | HUB | | | | 2,708 | | | | - | | | | 2,708 | |
| USD | | | 417,088 | | | EUR | | | 414,340 | | | 1/2/2025 | | | HUB | | | | 2,748 | | | | - | | | | 2,748 | |
| USD | | | 417,600 | | | CAD | | | 417,406 | | | 1/2/2025 | | | HUB | | | | 194 | | | | - | | | | 194 | |
| USD | | | 417,648 | | | EUR | | | 414,340 | | | 1/2/2025 | | | HUB | | | | 3,308 | | | | - | | | | 3,308 | |
| USD | | | 418,044 | | | EUR | | | 414,340 | | | 1/2/2025 | | | HUB | | | | 3,704 | | | | - | | | | 3,704 | |
| USD | | | 463,460 | | | PLN | | | 460,026 | | | 1/2/2025 | | | HUB | | | | 3,434 | | | | - | | | | 3,434 | |
| USD | | | 521,060 | | | EUR | | | 517,925 | | | 1/2/2025 | | | HUB | | | | 3,135 | | | | - | | | | 3,135 | |
| USD | | | 556,607 | | | CAD | | | 556,541 | | | 1/2/2025 | | | HUB | | | | 66 | | | | - | | | | 66 | |
| USD | | | 556,956 | | | CAD | | | 556,541 | | | 1/2/2025 | | | HUB | | | | 415 | | | | - | | | | 415 | |
| USD | | | 566,127 | | | GBP | | | 563,355 | | | 1/2/2025 | | | HUB | | | | 2,772 | | | | - | | | | 2,772 | |
| USD | | | 312,771 | | | EUR | | | 310,755 | | | 1/2/2025 | | | HUB | | | | 2,016 | | | | - | | | | 2,016 | |
| USD | | | 312,771 | | | EUR | | | 310,755 | | | 1/2/2025 | | | HUB | | | | 2,016 | | | | - | | | | 2,016 | |
| USD | | | 765,164 | | | CAD | | | 765,244 | | | 1/2/2025 | | | HUB | | | | - | | | | (80 | ) | | | (80 | ) |
| USD | | | 904,763 | | | CAD | | | 904,379 | | | 1/2/2025 | | | HUB | | | | 384 | | | | - | | | | 384 | |
| PLN | | | 920,052 | | | USD | | | 924,980 | | | 1/2/2025 | | | HUB | | | | - | | | | (4,928 | ) | | | (4,928 | ) |
| GBP | | | 938,925 | | | USD | | | 941,559 | | | 1/2/2025 | | | HUB | | | | - | | | | (2,634 | ) | | | (2,634 | ) |
| USD | | | 974,815 | | | CAD | | | 973,947 | | | 1/2/2025 | | | HUB | | | | 868 | | | | - | | | | 868 | |
| EUR | | | 1,035,850 | | | AUD | | | 1,036,383 | | | 1/2/2025 | | | HUB | | | | - | | | | (533 | ) | | | (533 | ) |
| AUD | | | 1,312,665 | | | GBP | | | 1,314,495 | | | 1/2/2025 | | | HUB | | | | - | | | | (1,830 | ) | | | (1,830 | ) |
| AUD | | | 3,316,284 | | | EUR | | | 3,314,719 | | | 1/2/2025 | | | HUB | | | | 1,565 | | | | - | | | | 1,565 | |
| AUD | | | 5,384,866 | | | USD | | | 5,405,949 | | | 1/2/2025 | | | HUB | | | | - | | | | (21,083 | ) | | | (21,083 | ) |
See accompanying notes
22
American Beacon AHL Managed Futures Strategy FundSM
Consolidated Schedule of Investments
December 31, 2024
| | | | | | | | | | | | | | | | | | | | | | | | | | | | |
| | | | | | |
| Currency Purchased* | | | Currency Sold* | | | Settlement
Date | | Counterparty | | | Unrealized
Appreciation | | | Unrealized
(Depreciation) | | | Net Unrealized
Appreciation
(Depreciation) | |
| EUR | | | 6,525,853 | | | USD | | | 6,554,438 | | | 1/2/2025 | | | HUB | | | $ | - | | | $ | (28,585 | ) | | $ | (28,585 | ) |
| USD | | | 16,404 | | | BRL | | | 16,187 | | | 1/3/2025 | | | HUB | | | | 217 | | | | - | | | | 217 | |
| USD | | | 16,423 | | | BRL | | | 16,187 | | | 1/3/2025 | | | HUB | | | | 236 | | | | - | | | | 236 | |
| USD | | | 16,427 | | | BRL | | | 16,187 | | | 1/3/2025 | | | HUB | | | | 240 | | | | - | | | | 240 | |
| USD | | | 16,453 | | | BRL | | | 16,187 | | | 1/3/2025 | | | HUB | | | | 266 | | | | - | | | | 266 | |
| USD | | | 16,461 | | | BRL | | | 16,187 | | | 1/3/2025 | | | HUB | | | | 274 | | | | - | | | | 274 | |
| USD | | | 16,470 | | | BRL | | | 16,187 | | | 1/3/2025 | | | HUB | | | | 283 | | | | - | | | | 283 | |
| USD | | | 16,484 | | | BRL | | | 16,187 | | | 1/3/2025 | | | HUB | | | | 297 | | | | - | | | | 297 | |
| USD | | | 16,499 | | | BRL | | | 16,187 | | | 1/3/2025 | | | HUB | | | | 312 | | | | - | | | | 312 | |
| USD | | | 16,500 | | | BRL | | | 16,187 | | | 1/3/2025 | | | HUB | | | | 313 | | | | - | | | | 313 | |
| USD | | | 32,805 | | | BRL | | | 32,374 | | | 1/3/2025 | | | HUB | | | | 431 | | | | - | | | | 431 | |
| USD | | | 32,808 | | | BRL | | | 32,374 | | | 1/3/2025 | | | HUB | | | | 434 | | | | - | | | | 434 | |
| USD | | | 32,814 | | | BRL | | | 32,374 | | | 1/3/2025 | | | HUB | | | | 440 | | | | - | | | | 440 | |
| USD | | | 32,815 | | | BRL | | | 32,374 | | | 1/3/2025 | | | HUB | | | | 441 | | | | - | | | | 441 | |
| USD | | | 32,819 | | | BRL | | | 32,374 | | | 1/3/2025 | | | HUB | | | | 445 | | | | - | | | | 445 | |
| USD | | | 32,822 | | | BRL | | | 32,374 | | | 1/3/2025 | | | HUB | | | | 448 | | �� | | - | | | | 448 | |
| USD | | | 32,827 | | | BRL | | | 32,374 | | | 1/3/2025 | | | HUB | | | | 453 | | | | - | | | | 453 | |
| USD | | | 32,833 | | | BRL | | | 32,374 | | | 1/3/2025 | | | HUB | | | | 459 | | | | - | | | | 459 | |
| USD | | | 32,838 | | | BRL | | | 32,374 | | | 1/3/2025 | | | HUB | | | | 464 | | | | - | | | | 464 | |
| USD | | | 32,918 | | | BRL | | | 32,374 | | | 1/3/2025 | | | HUB | | | | 544 | | | | - | | | | 544 | |
| USD | | | 32,991 | | | BRL | | | 32,374 | | | 1/3/2025 | | | HUB | | | | 617 | | | | - | | | | 617 | |
| USD | | | 33,017 | | | BRL | | | 32,374 | | | 1/3/2025 | | | HUB | | | | 643 | | | | - | | | | 643 | |
| USD | | | 33,202 | | | BRL | | | 32,374 | | | 1/3/2025 | | | HUB | | | | 828 | | | | - | | | | 828 | |
| USD | | | 33,249 | | | BRL | | | 32,374 | | | 1/3/2025 | | | HUB | | | | 875 | | | | - | | | | 875 | |
| USD | | | 33,378 | | | BRL | | | 32,374 | | | 1/3/2025 | | | HUB | | | | 1,004 | | | | - | | | | 1,004 | |
| USD | | | 33,419 | | | BRL | | | 32,374 | | | 1/3/2025 | | | HUB | | | | 1,045 | | | | - | | | | 1,045 | |
| BRL | | | 48,561 | | | USD | | | 49,953 | | | 1/3/2025 | | | HUB | | | | - | | | | (1,392 | ) | | | (1,392 | ) |
| USD | | | 48,607 | | | PLN | | | 48,424 | | | 1/3/2025 | | | HUB | | | | 183 | | | | - | | | | 183 | |
| USD | | | 49,193 | | | BRL | | | 48,561 | | | 1/3/2025 | | | HUB | | | | 632 | | | | - | | | | 632 | |
| USD | | | 49,197 | | | BRL | | | 48,561 | | | 1/3/2025 | | | HUB | | | | 636 | | | | - | | | | 636 | |
| USD | | | 49,221 | | | BRL | | | 48,561 | | | 1/3/2025 | | | HUB | | | | 660 | | | | - | | | | 660 | |
| USD | | | 49,227 | | | BRL | | | 48,561 | | | 1/3/2025 | | | HUB | | | | 666 | | | | - | | | | 666 | |
| USD | | | 49,233 | | | BRL | | | 48,561 | | | 1/3/2025 | | | HUB | | | | 672 | | | | - | | | | 672 | |
| USD | | | 49,267 | | | BRL | | | 48,561 | | | 1/3/2025 | | | HUB | | | | 706 | | | | - | | | | 706 | |
| USD | | | 49,268 | | | BRL | | | 48,561 | | | 1/3/2025 | | | HUB | | | | 707 | | | | - | | | | 707 | |
| USD | | | 49,287 | | | BRL | | | 48,561 | | | 1/3/2025 | | | HUB | | | | 726 | | | | - | | | | 726 | |
| USD | | | 49,300 | | | BRL | | | 48,561 | | | 1/3/2025 | | | HUB | | | | 739 | | | | - | | | | 739 | |
| USD | | | 49,310 | | | BRL | | | 48,561 | | | 1/3/2025 | | | HUB | | | | 749 | | | | - | | | | 749 | |
| USD | | | 49,317 | | | BRL | | | 48,561 | | | 1/3/2025 | | | HUB | | | | 756 | | | | - | | | | 756 | |
| USD | | | 49,368 | | | BRL | | | 48,561 | | | 1/3/2025 | | | HUB | | | | 807 | | | | - | | | | 807 | |
| USD | | | 49,404 | | | BRL | | | 48,561 | | | 1/3/2025 | | | HUB | | | | 843 | | | | - | | | | 843 | |
| USD | | | 49,581 | | | BRL | | | 48,561 | | | 1/3/2025 | | | HUB | | | | 1,020 | | | | - | | | | 1,020 | |
| USD | | | 49,590 | | | BRL | | | 48,561 | | | 1/3/2025 | | | HUB | | | | 1,029 | | | | - | | | | 1,029 | |
| USD | | | 49,610 | | | BRL | | | 48,561 | | | 1/3/2025 | | | HUB | | | | 1,049 | | | | - | | | | 1,049 | |
| USD | | | 49,622 | | | BRL | | | 48,561 | | | 1/3/2025 | | | HUB | | | | 1,061 | | | | - | | | | 1,061 | |
| USD | | | 49,644 | | | BRL | | | 48,561 | | | 1/3/2025 | | | HUB | | | | 1,083 | | | | - | | | | 1,083 | |
| USD | | | 49,671 | | | BRL | | | 48,561 | | | 1/3/2025 | | | HUB | | | | 1,110 | | | | - | | | | 1,110 | |
| USD | | | 49,869 | | | BRL | | | 48,561 | | | 1/3/2025 | | | HUB | | | | 1,308 | | | | - | | | | 1,308 | |
| USD | | | 49,887 | | | BRL | | | 48,561 | | | 1/3/2025 | | | HUB | | | | 1,326 | | | | - | | | | 1,326 | |
| USD | | | 49,921 | | | BRL | | | 48,561 | | | 1/3/2025 | | | HUB | | | | 1,360 | | | | - | | | | 1,360 | |
| USD | | | 49,934 | | | BRL | | | 48,561 | | | 1/3/2025 | | | HUB | | | | 1,373 | | | | - | | | | 1,373 | |
| USD | | | 49,957 | | | BRL | | | 48,561 | | | 1/3/2025 | | | HUB | | | | 1,396 | | | | - | | | | 1,396 | |
| USD | | | 49,981 | | | BRL | | | 48,561 | | | 1/3/2025 | | | HUB | | | | 1,420 | | | | - | | | | 1,420 | |
| USD | | | 50,066 | | | BRL | | | 48,561 | | | 1/3/2025 | | | HUB | | | | 1,505 | | | | - | | | | 1,505 | |
| USD | | | 51,667 | | | BRL | | | 48,561 | | | 1/3/2025 | | | HUB | | | | 3,106 | | | | - | | | | 3,106 | |
| USD | | | 56,422 | | | NZD | | | 55,950 | | | 1/3/2025 | | | HUB | | | | 472 | | | | - | | | | 472 | |
| USD | | | 56,548 | | | NZD | | | 55,950 | | | 1/3/2025 | | | HUB | | | | 598 | | | | - | | | | 598 | |
| USD | | | 56,572 | | | NZD | | | 55,950 | | | 1/3/2025 | | | HUB | | | | 622 | | | | - | | | | 622 | |
| USD | | | 56,576 | | | NZD | | | 55,950 | | | 1/3/2025 | | | HUB | | | | 626 | | | | - | | | | 626 | |
See accompanying notes
23
American Beacon AHL Managed Futures Strategy FundSM
Consolidated Schedule of Investments
December 31, 2024
| | | | | | | | | | | | | | | | | | | | | | | | | | | | |
| | | | | | |
| Currency Purchased* | | | Currency Sold* | | | Settlement
Date | | Counterparty | | | Unrealized
Appreciation | | | Unrealized
(Depreciation) | | | Net Unrealized
Appreciation
(Depreciation) | |
| USD | | | 56,588 | | | NZD | | | 55,950 | | | 1/3/2025 | | | HUB | | | $ | 638 | | | $ | - | | | $ | 638 | |
| USD | | | 56,606 | | | NZD | | | 55,950 | | | 1/3/2025 | | | HUB | | | | 656 | | | | - | | | | 656 | |
| USD | | | 61,808 | | | AUD | | | 61,895 | | | 1/3/2025 | | | HUB | | | | - | | | | (87 | ) | | | (87 | ) |
| USD | | | 62,118 | | | AUD | | | 61,895 | | | 1/3/2025 | | | HUB | | | | 223 | | | | - | | | | 223 | |
| USD | | | 62,139 | | | AUD | | | 61,895 | | | 1/3/2025 | | | HUB | | | | 244 | | | | - | | | | 244 | |
| GBP | | | 62,595 | | | AUD | | | 62,445 | | | 1/3/2025 | | | HUB | | | | 150 | | | | - | | | | 150 | |
| BRL | | | 64,747 | | | USD | | | 66,652 | | | 1/3/2025 | | | HUB | | | | - | | | | (1,905 | ) | | | (1,905 | ) |
| USD | | | 65,481 | | | BRL | | | 64,747 | | | 1/3/2025 | | | HUB | | | | 734 | | | | - | | | | 734 | |
| USD | | | 65,588 | | | BRL | | | 64,747 | | | 1/3/2025 | | | HUB | | | | 841 | | | | - | | | | 841 | |
| USD | | | 65,643 | | | BRL | | | 64,747 | | | 1/3/2025 | | | HUB | | | | 896 | | | | - | | | | 896 | |
| USD | | | 65,658 | | | BRL | | | 64,747 | | | 1/3/2025 | | | HUB | | | | 911 | | | | - | | | | 911 | |
| USD | | | 65,683 | | | BRL | | | 64,747 | | | 1/3/2025 | | | HUB | | | | 936 | | | | - | | | | 936 | |
| USD | | | 65,689 | | | BRL | | | 64,747 | | | 1/3/2025 | | | HUB | | | | 942 | | | | - | | | | 942 | |
| USD | | | 65,724 | | | BRL | | | 64,747 | | | 1/3/2025 | | | HUB | | | | 977 | | | | - | | | | 977 | |
| USD | | | 65,742 | | | BRL | | | 64,747 | | | 1/3/2025 | | | HUB | | | | 995 | | | | - | | | | 995 | |
| USD | | | 65,757 | | | BRL | | | 64,747 | | | 1/3/2025 | | | HUB | | | | 1,010 | | | | - | | | | 1,010 | |
| USD | | | 65,769 | | | BRL | | | 64,747 | | | 1/3/2025 | | | HUB | | | | 1,022 | | | | - | | | | 1,022 | |
| USD | | | 65,825 | | | BRL | | | 64,747 | | | 1/3/2025 | | | HUB | | | | 1,078 | | | | - | | | | 1,078 | |
| USD | | | 65,841 | | | BRL | | | 64,747 | | | 1/3/2025 | | | HUB | | | | 1,094 | | | | - | | | | 1,094 | |
| USD | | | 65,869 | | | BRL | | | 64,747 | | | 1/3/2025 | | | HUB | | | | 1,122 | | | | - | | | | 1,122 | |
| USD | | | 65,888 | | | BRL | | | 64,747 | | | 1/3/2025 | | | HUB | | | | 1,141 | | | | - | | | | 1,141 | |
| USD | | | 65,993 | | | BRL | | | 64,747 | | | 1/3/2025 | | | HUB | | | | 1,246 | | | | - | | | | 1,246 | |
| USD | | | 66,003 | | | BRL | | | 64,747 | | | 1/3/2025 | | | HUB | | | | 1,256 | | | | - | | | | 1,256 | |
| USD | | | 66,084 | | | BRL | | | 64,747 | | | 1/3/2025 | | | HUB | | | | 1,337 | | | | - | | | | 1,337 | |
| USD | | | 66,095 | | | BRL | | | 64,747 | | | 1/3/2025 | | | HUB | | | | 1,348 | | | | - | | | | 1,348 | |
| USD | | | 66,108 | | | BRL | | | 64,747 | | | 1/3/2025 | | | HUB | | | | 1,361 | | | | - | | | | 1,361 | |
| USD | | | 66,115 | | | BRL | | | 64,747 | | | 1/3/2025 | | | HUB | | | | 1,368 | | | | - | | | | 1,368 | |
| USD | | | 66,118 | | | BRL | | | 64,747 | | | 1/3/2025 | | | HUB | | | | 1,371 | | | | - | | | | 1,371 | |
| USD | | | 66,119 | | | BRL | | | 64,747 | | | 1/3/2025 | | | HUB | | | | 1,372 | | | | - | | | | 1,372 | |
| USD | | | 66,159 | | | BRL | | | 64,747 | | | 1/3/2025 | | | HUB | | | | 1,412 | | | | - | | | | 1,412 | |
| USD | | | 66,214 | | | BRL | | | 64,747 | | | 1/3/2025 | | | HUB | | | | 1,467 | | | | - | | | | 1,467 | |
| USD | | | 66,472 | | | BRL | | | 64,747 | | | 1/3/2025 | | | HUB | | | | 1,725 | | | | - | | | | 1,725 | |
| USD | | | 66,500 | | | BRL | | | 64,747 | | | 1/3/2025 | | | HUB | | | | 1,753 | | | | - | | | | 1,753 | |
| USD | | | 66,518 | | | BRL | | | 64,747 | | | 1/3/2025 | | | HUB | | | | 1,771 | | | | - | | | | 1,771 | |
| USD | | | 66,561 | | | BRL | | | 64,747 | | | 1/3/2025 | | | HUB | | | | 1,814 | | | | - | | | | 1,814 | |
| USD | | | 66,571 | | | BRL | | | 64,747 | | | 1/3/2025 | | | HUB | | | | 1,824 | | | | - | | | | 1,824 | |
| USD | | | 66,799 | | | BRL | | | 64,747 | | | 1/3/2025 | | | HUB | | | | 2,052 | | | | - | | | | 2,052 | |
| USD | | | 66,879 | | | BRL | | | 64,747 | | | 1/3/2025 | | | HUB | | | | 2,132 | | | | - | | | | 2,132 | |
| USD | | | 69,094 | | | BRL | | | 64,747 | | | 1/3/2025 | | | HUB | | | | 4,347 | | | | - | | | | 4,347 | |
| BRL | | | 80,934 | | | USD | | | 82,894 | | | 1/3/2025 | | | HUB | | | | - | | | | (1,960 | ) | | | (1,960 | ) |
| BRL | | | 80,934 | | | USD | | | 83,079 | | | 1/3/2025 | | | HUB | | | | - | | | | (2,145 | ) | | | (2,145 | ) |
| BRL | | | 80,934 | | | USD | | | 83,307 | | | 1/3/2025 | | | HUB | | | | - | | | | (2,373 | ) | | | (2,373 | ) |
| USD | | | 81,904 | | | BRL | | | 80,934 | | | 1/3/2025 | | | HUB | | | | 970 | | | | - | | | | 970 | |
| USD | | | 82,072 | | | BRL | | | 80,934 | | | 1/3/2025 | | | HUB | | | | 1,138 | | | | - | | | | 1,138 | |
| USD | | | 82,133 | | | BRL | | | 80,934 | | | 1/3/2025 | | | HUB | | | | 1,199 | | | | - | | | | 1,199 | |
| USD | | | 82,200 | | | BRL | | | 80,934 | | | 1/3/2025 | | | HUB | | | | 1,266 | | | | - | | | | 1,266 | |
| USD | | | 82,207 | | | BRL | | | 80,934 | | | 1/3/2025 | | | HUB | | | | 1,273 | | | | - | | | | 1,273 | |
| USD | | | 82,250 | | | BRL | | | 80,934 | | | 1/3/2025 | | | HUB | | | | 1,316 | | | | - | | | | 1,316 | |
| USD | | | 82,271 | | | BRL | | | 80,934 | | | 1/3/2025 | | | HUB | | | | 1,337 | | | | - | | | | 1,337 | |
| USD | | | 82,292 | | | BRL | | | 80,934 | | | 1/3/2025 | | | HUB | | | | 1,358 | | | | - | | | | 1,358 | |
| USD | | | 82,315 | | | BRL | | | 80,934 | | | 1/3/2025 | | | HUB | | | | 1,381 | | | | - | | | | 1,381 | |
| USD | | | 82,376 | | | BRL | | | 80,934 | | | 1/3/2025 | | | HUB | | | | 1,442 | | | | - | | | | 1,442 | |
| USD | | | 82,721 | | | BRL | | | 80,934 | | | 1/3/2025 | | | HUB | | | | 1,787 | | | | - | | | | 1,787 | |
| USD | | | 82,735 | | | BRL | | | 80,934 | | | 1/3/2025 | | | HUB | | | | 1,801 | | | | - | | | | 1,801 | |
| USD | | | 82,998 | | | BRL | | | 80,934 | | | 1/3/2025 | | | HUB | | | | 2,064 | | | | - | | | | 2,064 | |
| USD | | | 83,016 | | | BRL | | | 80,934 | | | 1/3/2025 | | | HUB | | | | 2,082 | | | | - | | | | 2,082 | |
| USD | | | 83,072 | | | BRL | | | 80,934 | | | 1/3/2025 | | | HUB | | | | 2,138 | | | | - | | | | 2,138 | |
| USD | | | 83,145 | | | BRL | | | 80,934 | | | 1/3/2025 | | | HUB | | | | 2,211 | | | | - | | | | 2,211 | |
| USD | | | 83,156 | | | BRL | | | 80,934 | | | 1/3/2025 | | | HUB | | | | 2,222 | | | | - | | | | 2,222 | |
See accompanying notes
24
American Beacon AHL Managed Futures Strategy FundSM
Consolidated Schedule of Investments
December 31, 2024
| | | | | | | | | | | | | | | | | | | | | | | | | | | | |
| | | | | | |
| Currency Purchased* | | | Currency Sold* | | | Settlement
Date | | Counterparty | | | Unrealized
Appreciation | | | Unrealized
(Depreciation) | | | Net Unrealized
Appreciation
(Depreciation) | |
| USD | | | 83,401 | | | BRL | | | 80,934 | | | 1/3/2025 | | | HUB | | | $ | 2,467 | | | $ | - | | | $ | 2,467 | |
| USD | | | 83,610 | | | BRL | | | 80,934 | | | 1/3/2025 | | | HUB | | | | 2,676 | | | | - | | | | 2,676 | |
| USD | | | 85,994 | | | BRL | | | 80,934 | | | 1/3/2025 | | | HUB | | | | 5,060 | | | | - | | | | 5,060 | |
| USD | | | 86,016 | | | BRL | | | 80,934 | | | 1/3/2025 | | | HUB | | | | 5,082 | | | | - | | | | 5,082 | |
| USD | | | 86,084 | | | BRL | | | 80,934 | | | 1/3/2025 | | | HUB | | | | 5,150 | | | | - | | | | 5,150 | |
| BRL | | | 97,121 | | | USD | | | 99,208 | | | 1/3/2025 | | | HUB | | | | - | | | | (2,087 | ) | | | (2,087 | ) |
| BRL | | | 97,121 | | | USD | | | 99,950 | | | 1/3/2025 | | | HUB | | | | - | | | | (2,829 | ) | | | (2,829 | ) |
| USD | | | 97,212 | | | PLN | | | 96,848 | | | 1/3/2025 | | | HUB | | | | 364 | | | | - | | | | 364 | |
| USD | | | 97,532 | | | PLN | | | 96,848 | | | 1/3/2025 | | | HUB | | | | 684 | | | | - | | | | 684 | |
| USD | | | 98,320 | | | BRL | | | 97,121 | | | 1/3/2025 | | | HUB | | | | 1,199 | | | | - | | | | 1,199 | |
| USD | | | 98,477 | | | BRL | | | 97,121 | | | 1/3/2025 | | | HUB | | | | 1,356 | | | | - | | | | 1,356 | |
| USD | | | 98,483 | | | BRL | | | 97,121 | | | 1/3/2025 | | | HUB | | | | 1,362 | | | | - | | | | 1,362 | |
| USD | | | 98,522 | | | BRL | | | 97,121 | | | 1/3/2025 | | | HUB | | | | 1,401 | | | | - | | | | 1,401 | |
| USD | | | 98,597 | | | BRL | | | 97,121 | | | 1/3/2025 | | | HUB | | | | 1,476 | | | | - | | | | 1,476 | |
| USD | | | 98,600 | | | BRL | | | 97,121 | | | 1/3/2025 | | | HUB | | | | 1,479 | | | | - | | | | 1,479 | |
| USD | | | 98,611 | | | BRL | | | 97,121 | | | 1/3/2025 | | | HUB | | | | 1,490 | | | | - | | | | 1,490 | |
| USD | | | 98,639 | | | BRL | | | 97,121 | | | 1/3/2025 | | | HUB | | | | 1,518 | | | | - | | | | 1,518 | |
| USD | | | 98,671 | | | BRL | | | 97,121 | | | 1/3/2025 | | | HUB | | | | 1,550 | | | | - | | | | 1,550 | |
| USD | | | 98,692 | | | BRL | | | 97,121 | | | 1/3/2025 | | | HUB | | | | 1,571 | | | | - | | | | 1,571 | |
| USD | | | 98,699 | | | BRL | | | 97,121 | | | 1/3/2025 | | | HUB | | | | 1,578 | | | | - | | | | 1,578 | |
| USD | | | 98,716 | | | BRL | | | 97,121 | | | 1/3/2025 | | | HUB | | | | 1,595 | | | | - | | | | 1,595 | |
| USD | | | 98,759 | | | BRL | | | 97,121 | | | 1/3/2025 | | | HUB | | | | 1,638 | | | | - | | | | 1,638 | |
| USD | | | 98,764 | | | BRL | | | 97,121 | | | 1/3/2025 | | | HUB | | | | 1,643 | | | | - | | | | 1,643 | |
| USD | | | 98,785 | | | BRL | | | 97,121 | | | 1/3/2025 | | | HUB | | | | 1,664 | | | | - | | | | 1,664 | |
| USD | | | 98,934 | | | BRL | | | 97,121 | | | 1/3/2025 | | | HUB | | | | 1,813 | | | | - | | | | 1,813 | |
| USD | | | 99,121 | | | BRL | | | 97,121 | | | 1/3/2025 | | | HUB | | | | 2,000 | | | | - | | | | 2,000 | |
| USD | | | 99,567 | | | BRL | | | 97,121 | | | 1/3/2025 | | | HUB | | | | 2,446 | | | | - | | | | 2,446 | |
| USD | | | 99,752 | | | BRL | | | 97,121 | | | 1/3/2025 | | | HUB | | | | 2,631 | | | | - | | | | 2,631 | |
| USD | | | 99,762 | | | BRL | | | 97,121 | | | 1/3/2025 | | | HUB | | | | 2,641 | | | | - | | | | 2,641 | |
| USD | | | 99,767 | | | BRL | | | 97,121 | | | 1/3/2025 | | | HUB | | | | 2,646 | | | | - | | | | 2,646 | |
| USD | | | 99,776 | | | BRL | | | 97,121 | | | 1/3/2025 | | | HUB | | | | 2,655 | | | | - | | | | 2,655 | |
| USD | | | 99,791 | | | BRL | | | 97,121 | | | 1/3/2025 | | | HUB | | | | 2,670 | | | | - | | | | 2,670 | |
| USD | | | 99,996 | | | BRL | | | 97,121 | | | 1/3/2025 | | | HUB | | | | 2,875 | | | | - | | | | 2,875 | |
| USD | | | 102,896 | | | BRL | | | 97,121 | | | 1/3/2025 | | | HUB | | | | 5,775 | | | | - | | | | 5,775 | |
| USD | | | 103,043 | | | BRL | | | 97,121 | | | 1/3/2025 | | | HUB | | | | 5,922 | | | | - | | | | 5,922 | |
| USD | | | 103,068 | | | BRL | | | 97,121 | | | 1/3/2025 | | | HUB | | | | 5,947 | | | | - | | | | 5,947 | |
| USD | | | 103,135 | | | BRL | | | 97,121 | | | 1/3/2025 | | | HUB | | | | 6,014 | | | | - | | | | 6,014 | |
| USD | | | 103,464 | | | BRL | | | 97,121 | | | 1/3/2025 | | | HUB | | | | 6,343 | | | | - | | | | 6,343 | |
| USD | | | 103,523 | | | EUR | | | 103,585 | | | 1/3/2025 | | | HUB | | | | - | | | | (62 | ) | | | (62 | ) |
| EUR | | | 103,585 | | | AUD | | | 103,470 | | | 1/3/2025 | | | HUB | | | | 115 | | | | - | | | | 115 | |
| EUR | | | 103,585 | | | AUD | | | 103,520 | | | 1/3/2025 | | | HUB | | | | 65 | | | | - | | | | 65 | |
| EUR | | | 103,585 | | | AUD | | | 103,651 | | | 1/3/2025 | | | HUB | | | | - | | | | (66 | ) | | | (66 | ) |
| EUR | | | 103,585 | | | AUD | | | 103,726 | | | 1/3/2025 | | | HUB | | | | - | | | | (141 | ) | | | (141 | ) |
| USD | | | 103,913 | | | EUR | | | 103,585 | | | 1/3/2025 | | | HUB | | | | 328 | | | | - | | | | 328 | |
| USD | | | 112,836 | | | NZD | | | 111,900 | | | 1/3/2025 | | | HUB | | | | 936 | | | | - | | | | 936 | |
| USD | | | 112,868 | | | NZD | | | 111,900 | | | 1/3/2025 | | | HUB | | | | 968 | | | | - | | | | 968 | |
| USD | | | 112,890 | | | NZD | | | 111,900 | | | 1/3/2025 | | | HUB | | | | 990 | | | | - | | | | 990 | |
| USD | | | 112,944 | | | NZD | | | 111,900 | | | 1/3/2025 | | | HUB | | | | 1,044 | | | | - | | | | 1,044 | |
| USD | | | 113,042 | | | NZD | | | 111,900 | | | 1/3/2025 | | | HUB | | | | 1,142 | | | | - | | | | 1,142 | |
| USD | | | 113,072 | | | NZD | | | 111,900 | | | 1/3/2025 | | | HUB | | | | 1,172 | | | | - | | | | 1,172 | |
| USD | | | 113,154 | | | NZD | | | 111,900 | | | 1/3/2025 | | | HUB | | | | 1,254 | | | | - | | | | 1,254 | |
| USD | | | 113,190 | | | NZD | | | 111,900 | | | 1/3/2025 | | | HUB | | | | 1,290 | | | | - | | | | 1,290 | |
| USD | | | 113,210 | | | NZD | | | 111,900 | | | 1/3/2025 | | | HUB | | | | 1,310 | | | | - | | | | 1,310 | |
| USD | | | 113,242 | | | NZD | | | 111,900 | | | 1/3/2025 | | | HUB | | | | 1,342 | | | | - | | | | 1,342 | |
| BRL | | | 113,308 | | | USD | | | 115,788 | | | 1/3/2025 | | | HUB | | | | - | | | | (2,480 | ) | | | (2,480 | ) |
| BRL | | | 113,308 | | | USD | | | 116,095 | | | 1/3/2025 | | | HUB | | | | - | | | | (2,787 | ) | | | (2,787 | ) |
| BRL | | | 113,308 | | | USD | | | 116,473 | | | 1/3/2025 | | | HUB | | | | - | | | | (3,165 | ) | | | (3,165 | ) |
| BRL | | | 113,308 | | | USD | | | 116,514 | | | 1/3/2025 | | | HUB | | | | - | | | | (3,206 | ) | | | (3,206 | ) |
| USD | | | 114,764 | | | BRL | | | 113,308 | | | 1/3/2025 | | | HUB | | | | 1,456 | | | | - | | | | 1,456 | |
See accompanying notes
25
American Beacon AHL Managed Futures Strategy FundSM
Consolidated Schedule of Investments
December 31, 2024
| | | | | | | | | | | | | | | | | | | | | | | | | | | | |
| | | | | | |
| Currency Purchased* | | | Currency Sold* | | | Settlement
Date | | Counterparty | | | Unrealized
Appreciation | | | Unrealized
(Depreciation) | | | Net Unrealized
Appreciation
(Depreciation) | |
| USD | | | 114,765 | | | BRL | | | 113,308 | | | 1/3/2025 | | | HUB | | | $ | 1,457 | | | $ | - | | | $ | 1,457 | |
| USD | | | 114,862 | | | BRL | | | 113,308 | | | 1/3/2025 | | | HUB | | | | 1,554 | | | | - | | | | 1,554 | |
| USD | | | 114,888 | | | BRL | | | 113,308 | | | 1/3/2025 | | | HUB | | | | 1,580 | | | | - | | | | 1,580 | |
| USD | | | 114,890 | | | BRL | | | 113,308 | | | 1/3/2025 | | | HUB | | | | 1,582 | | | | - | | | | 1,582 | |
| USD | | | 114,956 | | | BRL | | | 113,308 | | | 1/3/2025 | | | HUB | | | | 1,648 | | | | - | | | | 1,648 | |
| USD | | | 114,979 | | | BRL | | | 113,308 | | | 1/3/2025 | | | HUB | | | | 1,671 | | | | - | | | | 1,671 | |
| USD | | | 115,007 | | | BRL | | | 113,308 | | | 1/3/2025 | | | HUB | | | | 1,699 | | | | - | | | | 1,699 | |
| USD | | | 115,022 | | | BRL | | | 113,308 | | | 1/3/2025 | | | HUB | | | | 1,714 | | | | - | | | | 1,714 | |
| USD | | | 115,045 | | | BRL | | | 113,308 | | | 1/3/2025 | | | HUB | | | | 1,737 | | | | - | | | | 1,737 | |
| USD | | | 115,077 | | | BRL | | | 113,308 | | | 1/3/2025 | | | HUB | | | | 1,769 | | | | - | | | | 1,769 | |
| USD | | | 115,079 | | | BRL | | | 113,308 | | | 1/3/2025 | | | HUB | | | | 1,771 | | | | - | | | | 1,771 | |
| USD | | | 115,108 | | | BRL | | | 113,308 | | | 1/3/2025 | | | HUB | | | | 1,800 | | | | - | | | | 1,800 | |
| USD | | | 115,128 | | | BRL | | | 113,308 | | | 1/3/2025 | | | HUB | | | | 1,820 | | | | - | | | | 1,820 | |
| USD | | | 115,147 | | | BRL | | | 113,308 | | | 1/3/2025 | | | HUB | | | | 1,839 | | | | - | | | | 1,839 | |
| USD | | | 115,169 | | | BRL | | | 113,308 | | | 1/3/2025 | | | HUB | | | | 1,861 | | | | - | | | | 1,861 | |
| USD | | | 115,203 | | | BRL | | | 113,308 | | | 1/3/2025 | | | HUB | | | | 1,895 | | | | - | | | | 1,895 | |
| USD | | | 115,242 | | | BRL | | | 113,308 | | | 1/3/2025 | | | HUB | | | | 1,934 | | | | - | | | | 1,934 | |
| USD | | | 115,624 | | | BRL | | | 113,308 | | | 1/3/2025 | | | HUB | | | | 2,316 | | | | - | | | | 2,316 | |
| USD | | | 115,634 | | | BRL | | | 113,308 | | | 1/3/2025 | | | HUB | | | | 2,326 | | | | - | | | | 2,326 | |
| USD | | | 115,699 | | | BRL | | | 113,308 | | | 1/3/2025 | | | HUB | | | | 2,391 | | | | - | | | | 2,391 | |
| USD | | | 115,708 | | | BRL | | | 113,308 | | | 1/3/2025 | | | HUB | | | | 2,400 | | | | - | | | | 2,400 | |
| USD | | | 115,879 | | | BRL | | | 113,308 | | | 1/3/2025 | | | HUB | | | | 2,571 | | | | - | | | | 2,571 | |
| USD | | | 116,074 | | | BRL | | | 113,308 | | | 1/3/2025 | | | HUB | | | | 2,766 | | | | - | | | | 2,766 | |
| USD | | | 116,302 | | | BRL | | | 113,308 | | | 1/3/2025 | | | HUB | | | | 2,994 | | | | - | | | | 2,994 | |
| USD | | | 116,409 | | | BRL | | | 113,308 | | | 1/3/2025 | | | HUB | | | | 3,101 | | | | - | | | | 3,101 | |
| USD | | | 116,577 | | | BRL | | | 113,308 | | | 1/3/2025 | | | HUB | | | | 3,269 | | | | - | | | | 3,269 | |
| USD | | | 116,682 | | | BRL | | | 113,308 | | | 1/3/2025 | | | HUB | | | | 3,374 | | | | - | | | | 3,374 | |
| USD | | | 120,157 | | | BRL | | | 113,308 | | | 1/3/2025 | | | HUB | | | | 6,849 | | | | - | | | | 6,849 | |
| USD | | | 120,277 | | | BRL | | | 113,308 | | | 1/3/2025 | | | HUB | | | | 6,969 | | | | - | | | | 6,969 | |
| USD | | | 120,729 | | | BRL | | | 113,308 | | | 1/3/2025 | | | HUB | | | | 7,421 | | | | - | | | | 7,421 | |
| USD | | | 121,539 | | | PLN | | | 121,060 | | | 1/3/2025 | | | HUB | | | | 479 | | | | - | | | | 479 | |
| USD | | | 124,288 | | | AUD | | | 123,790 | | | 1/3/2025 | | | HUB | | | | 498 | | | | - | | | | 498 | |
| USD | | | 124,316 | | | AUD | | | 123,790 | | | 1/3/2025 | | | HUB | | | | 526 | | | | - | | | | 526 | |
| USD | | | 124,326 | | | AUD | | | 123,790 | | | 1/3/2025 | | | HUB | | | | 536 | | | | - | | | | 536 | |
| USD | | | 124,368 | | | AUD | | | 123,790 | | | 1/3/2025 | | | HUB | | | | 578 | | | | - | | | | 578 | |
| USD | | | 124,470 | | | AUD | | | 123,790 | | | 1/3/2025 | | | HUB | | | | 680 | | | | - | | | | 680 | |
| USD | | | 124,490 | | | AUD | | | 123,790 | | | 1/3/2025 | | | HUB | | | | 700 | | | | - | | | | 700 | |
| BRL | | | 129,495 | | | USD | | | 132,400 | | | 1/3/2025 | | | HUB | | | | - | | | | (2,905 | ) | | | (2,905 | ) |
| BRL | | | 129,495 | | | USD | | | 132,465 | | | 1/3/2025 | | | HUB | | | | - | | | | (2,970 | ) | | | (2,970 | ) |
| BRL | | | 129,495 | | | USD | | | 132,853 | | | 1/3/2025 | | | HUB | | | | - | | | | (3,358 | ) | | | (3,358 | ) |
| USD | | | 130,971 | | | BRL | | | 129,495 | | | 1/3/2025 | | | HUB | | | | 1,476 | | | | - | | | | 1,476 | |
| USD | | | 131,074 | | | BRL | | | 129,495 | | | 1/3/2025 | | | HUB | | | | 1,579 | | | | - | | | | 1,579 | |
| USD | | | 131,113 | | | BRL | | | 129,495 | | | 1/3/2025 | | | HUB | | | | 1,618 | | | | - | | | | 1,618 | |
| USD | | | 131,178 | | | BRL | | | 129,495 | | | 1/3/2025 | | | HUB | | | | 1,683 | | | | - | | | | 1,683 | |
| USD | | | 131,236 | | | BRL | | | 129,495 | | | 1/3/2025 | | | HUB | | | | 1,741 | | | | - | | | | 1,741 | |
| USD | | | 131,277 | | | BRL | | | 129,495 | | | 1/3/2025 | | | HUB | | | | 1,782 | | | | - | | | | 1,782 | |
| USD | | | 131,303 | | | BRL | | | 129,495 | | | 1/3/2025 | | | HUB | | | | 1,808 | | | | - | | | | 1,808 | |
| USD | | | 131,346 | | | BRL | | | 129,495 | | | 1/3/2025 | | | HUB | | | | 1,851 | | | | - | | | | 1,851 | |
| USD | | | 131,397 | | | BRL | | | 129,495 | | | 1/3/2025 | | | HUB | | | | 1,902 | | | | - | | | | 1,902 | |
| USD | | | 131,406 | | | BRL | | | 129,495 | | | 1/3/2025 | | | HUB | | | | 1,911 | | | | - | | | | 1,911 | |
| USD | | | 131,464 | | | BRL | | | 129,495 | | | 1/3/2025 | | | HUB | | | | 1,969 | | | | - | | | | 1,969 | |
| USD | | | 131,473 | | | BRL | | | 129,495 | | | 1/3/2025 | | | HUB | | | | 1,978 | | | | - | | | | 1,978 | |
| USD | | | 131,601 | | | BRL | | | 129,495 | | | 1/3/2025 | | | HUB | | | | 2,106 | | | | - | | | | 2,106 | |
| USD | | | 131,623 | | | BRL | | | 129,495 | | | 1/3/2025 | | | HUB | | | | 2,128 | | | | - | | | | 2,128 | |
| USD | | | 131,668 | | | BRL | | | 129,495 | | | 1/3/2025 | | | HUB | | | | 2,173 | | | | - | | | | 2,173 | |
| USD | | | 131,754 | | | BRL | | | 129,495 | | | 1/3/2025 | | | HUB | | | | 2,259 | | | | - | | | | 2,259 | |
| USD | | | 131,770 | | | BRL | | | 129,495 | | | 1/3/2025 | | | HUB | | | | 2,275 | | | | - | | | | 2,275 | |
| USD | | | 131,812 | | | BRL | | | 129,495 | | | 1/3/2025 | | | HUB | | | | 2,317 | | | | - | | | | 2,317 | |
| USD | | | 131,824 | | | BRL | | | 129,495 | | | 1/3/2025 | | | HUB | | | | 2,329 | | | | - | | | | 2,329 | |
See accompanying notes
26
American Beacon AHL Managed Futures Strategy FundSM
Consolidated Schedule of Investments
December 31, 2024
| | | | | | | | | | | | | | | | | | | | | | | | | | | | |
| | | | | | |
| Currency Purchased* | | | Currency Sold* | | | Settlement
Date | | Counterparty | | | Unrealized
Appreciation | | | Unrealized
(Depreciation) | | | Net Unrealized
Appreciation
(Depreciation) | |
| USD | | | 131,833 | | | BRL | | | 129,495 | | | 1/3/2025 | | | HUB | | | $ | 2,338 | | | $ | - | | | $ | 2,338 | |
| USD | | | 132,074 | | | BRL | | | 129,495 | | | 1/3/2025 | | | HUB | | | | 2,579 | | | | - | | | | 2,579 | |
| USD | | | 132,140 | | | BRL | | | 129,495 | | | 1/3/2025 | | | HUB | | | | 2,645 | | | | - | | | | 2,645 | |
| USD | | | 132,190 | | | BRL | | | 129,495 | | | 1/3/2025 | | | HUB | | | | 2,695 | | | | - | | | | 2,695 | |
| USD | | | 132,212 | | | BRL | | | 129,495 | | | 1/3/2025 | | | HUB | | | | 2,717 | | | | - | | | | 2,717 | |
| USD | | | 132,299 | | | BRL | | | 129,495 | | | 1/3/2025 | | | HUB | | | | 2,804 | | | | - | | | | 2,804 | |
| USD | | | 137,367 | | | BRL | | | 129,495 | | | 1/3/2025 | | | HUB | | | | 7,872 | | | | - | | | | 7,872 | |
| USD | | | 137,976 | | | BRL | | | 129,495 | | | 1/3/2025 | | | HUB | | | | 8,481 | | | | - | | | | 8,481 | |
| USD | | | 137,984 | | | BRL | | | 129,495 | | | 1/3/2025 | | | HUB | | | | 8,489 | | | | - | | | | 8,489 | |
| USD | | | 138,191 | | | BRL | | | 129,495 | | | 1/3/2025 | | | HUB | | | | 8,696 | | | | - | | | | 8,696 | |
| BRL | | | 145,682 | | | USD | | | 149,250 | | | 1/3/2025 | | | HUB | | | | - | | | | (3,568 | ) | | | (3,568 | ) |
| BRL | | | 145,682 | | | USD | | | 149,681 | | | 1/3/2025 | | | HUB | | | | - | | | | (3,999 | ) | | | (3,999 | ) |
| BRL | | | 145,682 | | | USD | | | 149,716 | | | 1/3/2025 | | | HUB | | | | - | | | | (4,034 | ) | | | (4,034 | ) |
| BRL | | | 145,682 | | | USD | | | 149,888 | | | 1/3/2025 | | | HUB | | | | - | | | | (4,206 | ) | | | (4,206 | ) |
| BRL | | | 145,682 | | | USD | | | 149,995 | | | 1/3/2025 | | | HUB | | | | - | | | | (4,313 | ) | | | (4,313 | ) |
| USD | | | 146,268 | | | PLN | | | 145,271 | | | 1/3/2025 | | | HUB | | | | 997 | | | | - | | | | 997 | |
| USD | | | 147,309 | | | BRL | | | 145,682 | | | 1/3/2025 | | | HUB | | | | 1,627 | | | | - | | | | 1,627 | |
| USD | | | 147,518 | | | BRL | | | 145,682 | | | 1/3/2025 | | | HUB | | | | 1,836 | | | | - | | | | 1,836 | |
| USD | | | 147,599 | | | BRL | | | 145,682 | | | 1/3/2025 | | | HUB | | | | 1,917 | | | | - | | | | 1,917 | |
| USD | | | 147,689 | | | BRL | | | 145,682 | | | 1/3/2025 | | | HUB | | | | 2,007 | | | | - | | | | 2,007 | |
| USD | | | 147,761 | | | BRL | | | 145,682 | | | 1/3/2025 | | | HUB | | | | 2,079 | | | | - | | | | 2,079 | |
| USD | | | 147,880 | | | BRL | | | 145,682 | | | 1/3/2025 | | | HUB | | | | 2,198 | | | | - | | | | 2,198 | |
| USD | | | 147,968 | | | BRL | | | 145,682 | | | 1/3/2025 | | | HUB | | | | 2,286 | | | | - | | | | 2,286 | |
| USD | | | 147,985 | | | BRL | | | 145,682 | | | 1/3/2025 | | | HUB | | | | 2,303 | | | | - | | | | 2,303 | |
| USD | | | 148,020 | | | BRL | | | 145,682 | | | 1/3/2025 | | | HUB | | | | 2,338 | | | | - | | | | 2,338 | |
| USD | | | 148,080 | | | BRL | | | 145,682 | | | 1/3/2025 | | | HUB | | | | 2,398 | | | | - | | | | 2,398 | |
| USD | | | 148,109 | | | BRL | | | 145,682 | | | 1/3/2025 | | | HUB | | | | 2,427 | | | | - | | | | 2,427 | |
| USD | | | 148,119 | | | BRL | | | 145,682 | | | 1/3/2025 | | | HUB | | | | 2,437 | | | | - | | | | 2,437 | |
| USD | | | 148,155 | | | BRL | | | 145,682 | | | 1/3/2025 | | | HUB | | | | 2,473 | | | | - | | | | 2,473 | |
| USD | | | 148,180 | | | BRL | | | 145,682 | | | 1/3/2025 | | | HUB | | | | 2,498 | | | | - | | | | 2,498 | |
| USD | | | 148,207 | | | BRL | | | 145,682 | | | 1/3/2025 | | | HUB | | | | 2,525 | | | | - | | | | 2,525 | |
| USD | | | 148,503 | | | BRL | | | 145,682 | | | 1/3/2025 | | | HUB | | | | 2,821 | | | | - | | | | 2,821 | |
| USD | | | 148,725 | | | BRL | | | 145,682 | | | 1/3/2025 | | | HUB | | | | 3,043 | | | | - | | | | 3,043 | |
| USD | | | 154,493 | | | BRL | | | 145,682 | | | 1/3/2025 | | | HUB | | | | 8,811 | | | | - | | | | 8,811 | |
| USD | | | 154,536 | | | BRL | | | 145,682 | | | 1/3/2025 | | | HUB | | | | 8,854 | | | | - | | | | 8,854 | |
| USD | | | 154,708 | | | BRL | | | 145,682 | | | 1/3/2025 | | | HUB | | | | 9,026 | | | | - | | | | 9,026 | |
| USD | | | 154,772 | | | BRL | | | 145,682 | | | 1/3/2025 | | | HUB | | | | 9,090 | | | | - | | | | 9,090 | |
| USD | | | 154,884 | | | BRL | | | 145,682 | | | 1/3/2025 | | | HUB | | | | 9,202 | | | | - | | | | 9,202 | |
| USD | | | 154,948 | | | BRL | | | 145,682 | | | 1/3/2025 | | | HUB | | | | 9,266 | | | | - | | | | 9,266 | |
| USD | | | 155,371 | | | BRL | | | 145,682 | | | 1/3/2025 | | | HUB | | | | 9,689 | | | | - | | | | 9,689 | |
| BRL | | | 161,869 | | | USD | | | 166,271 | | | 1/3/2025 | | | HUB | | | | - | | | | (4,402 | ) | | | (4,402 | ) |
| BRL | | | 161,869 | | | USD | | | 166,387 | | | 1/3/2025 | | | HUB | | | | - | | | | (4,518 | ) | | | (4,518 | ) |
| BRL | | | 161,869 | | | USD | | | 166,617 | | | 1/3/2025 | | | HUB | | | | - | | | | (4,748 | ) | | | (4,748 | ) |
| USD | | | 163,800 | | | BRL | | | 161,869 | | | 1/3/2025 | | | HUB | | | | 1,931 | | | | - | | | | 1,931 | |
| USD | | | 164,110 | | | BRL | | | 161,869 | | | 1/3/2025 | | | HUB | | | | 2,241 | | | | - | | | | 2,241 | |
| USD | | | 164,136 | | | BRL | | | 161,869 | | | 1/3/2025 | | | HUB | | | | 2,267 | | | | - | | | | 2,267 | |
| USD | | | 164,249 | | | BRL | | | 161,869 | | | 1/3/2025 | | | HUB | | | | 2,380 | | | | - | | | | 2,380 | |
| USD | | | 164,287 | | | BRL | | | 161,869 | | | 1/3/2025 | | | HUB | | | | 2,418 | | | | - | | | | 2,418 | |
| USD | | | 82,156 | | | BRL | | | 80,934 | | | 1/3/2025 | | | HUB | | | | 1,222 | | | | - | | | | 1,222 | |
| USD | | | 82,156 | | | BRL | | | 80,934 | | | 1/3/2025 | | | HUB | | | | 1,222 | | | | - | | | | 1,222 | |
| USD | | | 164,338 | | | BRL | | | 161,869 | | | 1/3/2025 | | | HUB | | | | 2,469 | | | | - | | | | 2,469 | |
| USD | | | 164,406 | | | BRL | | | 161,869 | | | 1/3/2025 | | | HUB | | | | 2,537 | | | | - | | | | 2,537 | |
| USD | | | 164,469 | | | BRL | | | 161,869 | | | 1/3/2025 | | | HUB | | | | 2,600 | | | | - | | | | 2,600 | |
| USD | | | 164,496 | | | BRL | | | 161,869 | | | 1/3/2025 | | | HUB | | | | 2,627 | | | | - | | | | 2,627 | |
| USD | | | 164,498 | | | BRL | | | 161,869 | | | 1/3/2025 | | | HUB | | | | 2,629 | | | | - | | | | 2,629 | |
| USD | | | 164,558 | | | BRL | | | 161,869 | | | 1/3/2025 | | | HUB | | | | 2,689 | | | | - | | | | 2,689 | |
| USD | | | 164,655 | | | BRL | | | 161,869 | | | 1/3/2025 | | | HUB | | | | 2,786 | | | | - | | | | 2,786 | |
| USD | | | 164,685 | | | BRL | | | 161,869 | | | 1/3/2025 | | | HUB | | | | 2,816 | | | | - | | | | 2,816 | |
| USD | | | 164,712 | | | BRL | | | 161,869 | | | 1/3/2025 | | | HUB | | | | 2,843 | | | | - | | | | 2,843 | |
See accompanying notes
27
American Beacon AHL Managed Futures Strategy FundSM
Consolidated Schedule of Investments
December 31, 2024
| | | | | | | | | | | | | | | | | | | | | | | | | | | | |
| | | | | | |
| Currency Purchased* | | | Currency Sold* | | | Settlement
Date | | Counterparty | | | Unrealized
Appreciation | | | Unrealized
(Depreciation) | | | Net Unrealized
Appreciation
(Depreciation) | |
| USD | | | 164,753 | | | BRL | | | 161,869 | | | 1/3/2025 | | | HUB | | | $ | 2,884 | | | $ | - | | | $ | 2,884 | |
| USD | | | 164,758 | | | BRL | | | 161,869 | | | 1/3/2025 | | | HUB | | | | 2,889 | | | | - | | | | 2,889 | |
| USD | | | 164,815 | | | BRL | | | 161,869 | | | 1/3/2025 | | | HUB | | | | 2,946 | | | | - | | | | 2,946 | |
| USD | | | 165,071 | | | BRL | | | 161,869 | | | 1/3/2025 | | | HUB | | | | 3,202 | | | | - | | | | 3,202 | |
| USD | | | 165,177 | | | BRL | | | 161,869 | | | 1/3/2025 | | | HUB | | | | 3,308 | | | | - | | | | 3,308 | |
| USD | | | 165,180 | | | BRL | | | 161,869 | | | 1/3/2025 | | | HUB | | | | 3,311 | | | | - | | | | 3,311 | |
| USD | | | 165,205 | | | BRL | | | 161,869 | | | 1/3/2025 | | | HUB | | | | 3,336 | | | | - | | | | 3,336 | |
| USD | | | 165,213 | | | BRL | | | 161,869 | | | 1/3/2025 | | | HUB | | | | 3,344 | | | | - | | | | 3,344 | |
| USD | | | 165,251 | | | BRL | | | 161,869 | | | 1/3/2025 | | | HUB | | | | 3,382 | | | | - | | | | 3,382 | |
| USD | | | 165,324 | | | BRL | | | 161,869 | | | 1/3/2025 | | | HUB | | | | 3,455 | | | | - | | | | 3,455 | |
| USD | | | 168,993 | | | NZD | | | 167,850 | | | 1/3/2025 | | | HUB | | | | 1,143 | | | | - | | | | 1,143 | |
| USD | | | 169,047 | | | NZD | | | 167,850 | | | 1/3/2025 | | | HUB | | | | 1,197 | | | | - | | | | 1,197 | |
| USD | | | 169,080 | | | NZD | | | 167,850 | | | 1/3/2025 | | | HUB | | | | 1,230 | | | | - | | | | 1,230 | |
| USD | | | 169,212 | | | NZD | | | 167,850 | | | 1/3/2025 | | | HUB | | | | 1,362 | | | | - | | | | 1,362 | |
| USD | | | 169,284 | | | NZD | | | 167,850 | | | 1/3/2025 | | | HUB | | | | 1,434 | | | | - | | | | 1,434 | |
| USD | | | 169,302 | | | NZD | | | 167,850 | | | 1/3/2025 | | | HUB | | | | 1,452 | | | | - | | | | 1,452 | |
| USD | | | 169,350 | | | NZD | | | 167,850 | | | 1/3/2025 | | | HUB | | | | 1,500 | | | | - | | | | 1,500 | |
| USD | | | 169,353 | | | NZD | | | 167,850 | | | 1/3/2025 | | | HUB | | | | 1,503 | | | | - | | | | 1,503 | |
| USD | | | 169,386 | | | NZD | | | 167,850 | | | 1/3/2025 | | | HUB | | | | 1,536 | | | | - | | | | 1,536 | |
| USD | | | 169,539 | | | NZD | | | 167,850 | | | 1/3/2025 | | | HUB | | | | 1,689 | | | | - | | | | 1,689 | |
| USD | | | 170,006 | | | PLN | | | 169,483 | | | 1/3/2025 | | | HUB | | | | 523 | | | | - | | | | 523 | |
| USD | | | 171,541 | | | BRL | | | 161,869 | | | 1/3/2025 | | | HUB | | | | 9,672 | | | | - | | | | 9,672 | |
| USD | | | 172,108 | | | BRL | | | 161,869 | | | 1/3/2025 | | | HUB | | | | 10,239 | | | | - | | | | 10,239 | |
| USD | | | 172,316 | | | BRL | | | 161,869 | | | 1/3/2025 | | | HUB | | | | 10,447 | | | | - | | | | 10,447 | |
| BRL | | | 178,055 | | | USD | | | 183,232 | | | 1/3/2025 | | | HUB | | | | - | | | | (5,177 | ) | | | (5,177 | ) |
| USD | | | 180,547 | | | BRL | | | 178,055 | | | 1/3/2025 | | | HUB | | | | 2,492 | | | | - | | | | 2,492 | |
| USD | | | 180,805 | | | BRL | | | 178,055 | | | 1/3/2025 | | | HUB | | | | 2,750 | | | | - | | | | 2,750 | |
| USD | | | 180,817 | | | BRL | | | 178,055 | | | 1/3/2025 | | | HUB | | | | 2,762 | | | | - | | | | 2,762 | |
| USD | | | 180,870 | | | BRL | | | 178,055 | | | 1/3/2025 | | | HUB | | | | 2,815 | | | | - | | | | 2,815 | |
| USD | | | 180,927 | | | BRL | | | 178,055 | | | 1/3/2025 | | | HUB | | | | 2,872 | | | | - | | | | 2,872 | |
| USD | | | 180,948 | | | BRL | | | 178,055 | | | 1/3/2025 | | | HUB | | | | 2,893 | | | | - | | | | 2,893 | |
| USD | | | 180,954 | | | BRL | | | 178,055 | | | 1/3/2025 | | | HUB | | | | 2,899 | | | | - | | | | 2,899 | |
| USD | | | 180,990 | | | BRL | | | 178,055 | | | 1/3/2025 | | | HUB | | | | 2,935 | | | | - | | | | 2,935 | |
| USD | | | 181,034 | | | BRL | | | 178,055 | | | 1/3/2025 | | | HUB | | | | 2,979 | | | | - | | | | 2,979 | |
| USD | | | 181,037 | | | BRL | | | 178,055 | | | 1/3/2025 | | | HUB | | | | 2,982 | | | | - | | | | 2,982 | |
| USD | | | 181,119 | | | BRL | | | 178,055 | | | 1/3/2025 | | | HUB | | | | 3,064 | | | | - | | | | 3,064 | |
| USD | | | 181,635 | | | BRL | | | 178,055 | | | 1/3/2025 | | | HUB | | | | 3,580 | | | | - | | | | 3,580 | |
| USD | | | 181,981 | | | BRL | | | 178,055 | | | 1/3/2025 | | | HUB | | | | 3,926 | | | | - | | | | 3,926 | |
| USD | | | 186,444 | | | AUD | | | 185,685 | | | 1/3/2025 | | | HUB | | | | 759 | | | | - | | | | 759 | |
| USD | | | 186,564 | | | AUD | | | 185,685 | | | 1/3/2025 | | | HUB | | | | 879 | | | | - | | | | 879 | |
| USD | | | 186,771 | | | AUD | | | 185,685 | | | 1/3/2025 | | | HUB | | | | 1,086 | | | | - | | | | 1,086 | |
| USD | | | 186,780 | | | AUD | | | 185,685 | | | 1/3/2025 | | | HUB | | | | 1,095 | | | | - | | | | 1,095 | |
| USD | | | 186,891 | | | AUD | | | 185,685 | | | 1/3/2025 | | | HUB | | | | 1,206 | | | | - | | | | 1,206 | |
| USD | | | 186,894 | | | AUD | | | 185,685 | | | 1/3/2025 | | | HUB | | | | 1,209 | | | | - | | | | 1,209 | |
| GBP | | | 187,785 | | | AUD | | | 187,393 | | | 1/3/2025 | | | HUB | | | | 392 | | | | - | | | | 392 | |
| GBP | | | 187,785 | | | AUD | | | 187,408 | | | 1/3/2025 | | | HUB | | | | 377 | | | | - | | | | 377 | |
| GBP | | | 187,785 | | | AUD | | | 187,499 | | | 1/3/2025 | | | HUB | | | | 286 | | | | - | | | | 286 | |
| GBP | | | 187,785 | | | AUD | | | 187,650 | | | 1/3/2025 | | | HUB | | | | 135 | | | | - | | | | 135 | |
| USD | | | 188,088 | | | GBP | | | 187,785 | | | 1/3/2025 | | | HUB | | | | 303 | | | | - | | | | 303 | |
| USD | | | 188,190 | | | GBP | | | 187,785 | | | 1/3/2025 | | | HUB | | | | 405 | | | | - | | | | 405 | |
| BRL | | | 194,242 | | | USD | | | 200,020 | | | 1/3/2025 | | | HUB | | | | - | | | | (5,778 | ) | | | (5,778 | ) |
| USD | | | 197,310 | | | BRL | | | 194,242 | | | 1/3/2025 | | | HUB | | | | 3,068 | | | | - | | | | 3,068 | |
| USD | | | 197,433 | | | BRL | | | 194,242 | | | 1/3/2025 | | | HUB | | | | 3,191 | | | | - | | | | 3,191 | |
| USD | | | 98,726 | | | BRL | | | 97,121 | | | 1/3/2025 | | | HUB | | | | 1,605 | | | | - | | | | 1,605 | |
| USD | | | 98,726 | | | BRL | | | 97,121 | | | 1/3/2025 | | | HUB | | | | 1,605 | | | | - | | | | 1,605 | |
| USD | | | 197,534 | | | BRL | | | 194,242 | | | 1/3/2025 | | | HUB | | | | 3,292 | | | | - | | | | 3,292 | |
| USD | | | 197,547 | | | BRL | | | 194,242 | | | 1/3/2025 | | | HUB | | | | 3,305 | | | | - | | | | 3,305 | |
| USD | | | 197,576 | | | BRL | | | 194,242 | | | 1/3/2025 | | | HUB | | | | 3,334 | | | | - | | | | 3,334 | |
| USD | | | 197,661 | | | BRL | | | 194,242 | | | 1/3/2025 | | | HUB | | | | 3,419 | | | | - | | | | 3,419 | |
See accompanying notes
28
American Beacon AHL Managed Futures Strategy FundSM
Consolidated Schedule of Investments
December 31, 2024
| | | | | | | | | | | | | | | | | | | | | | | | | | | | |
| | | | | | |
| Currency Purchased* | | | Currency Sold* | | | Settlement
Date | | Counterparty | | | Unrealized
Appreciation | | | Unrealized
(Depreciation) | | | Net Unrealized
Appreciation
(Depreciation) | |
| USD | | | 197,674 | | | BRL | | | 194,242 | | | 1/3/2025 | | | HUB | | | $ | 3,432 | | | $ | - | | | $ | 3,432 | |
| USD | | | 205,991 | | | BRL | | | 194,242 | | | 1/3/2025 | | | HUB | | | | 11,749 | | | | - | | | | 11,749 | |
| USD | | | 206,352 | | | BRL | | | 194,242 | | | 1/3/2025 | | | HUB | | | | 12,110 | | | | - | | | | 12,110 | |
| USD | | | 206,879 | | | BRL | | | 194,242 | | | 1/3/2025 | | | HUB | | | | 12,637 | | | | - | | | | 12,637 | |
| USD | | | 207,070 | | | EUR | | | 207,170 | | | 1/3/2025 | | | HUB | | | | - | | | | (100 | ) | | | (100 | ) |
| EUR | | | 207,169 | | | AUD | | | 207,203 | | | 1/3/2025 | | | HUB | | | | - | | | | (34 | ) | | | (34 | ) |
| EUR | | | 207,170 | | | AUD | | | 206,991 | | | 1/3/2025 | | | HUB | | | | 179 | | | | - | | | | 179 | |
| EUR | | | 207,170 | | | AUD | | | 207,061 | | | 1/3/2025 | | | HUB | | | | 109 | | | | - | | | | 109 | |
| EUR | | | 207,170 | | | AUD | | | 207,161 | | | 1/3/2025 | | | HUB | | | | 9 | | | | - | | | | 9 | |
| EUR | | | 207,170 | | | AUD | | | 207,222 | | | 1/3/2025 | | | HUB | | | | - | | | | (52 | ) | | | (52 | ) |
| EUR | | | 207,170 | | | AUD | | | 207,301 | | | 1/3/2025 | | | HUB | | | | - | | | | (131 | ) | | | (131 | ) |
| EUR | | | 207,170 | | | AUD | | | 207,393 | | | 1/3/2025 | | | HUB | | | | - | | | | (223 | ) | | | (223 | ) |
| EUR | | | 207,170 | | | AUD | | | 207,413 | | | 1/3/2025 | | | HUB | | | | - | | | | (243 | ) | | | (243 | ) |
| EUR | | | 207,170 | | | CHF | | | 207,418 | | | 1/3/2025 | | | HUB | | | | - | | | | (248 | ) | | | (248 | ) |
| EUR | | | 207,170 | | | CHF | | | 207,493 | | | 1/3/2025 | | | HUB | | | | - | | | | (323 | ) | | | (323 | ) |
| EUR | | | 207,170 | | | AUD | | | 207,506 | | | 1/3/2025 | | | HUB | | | | - | | | | (336 | ) | | | (336 | ) |
| EUR | | | 207,170 | | | AUD | | | 207,586 | | | 1/3/2025 | | | HUB | | | | - | | | | (416 | ) | | | (416 | ) |
| USD | | | 208,198 | | | EUR | | | 207,170 | | | 1/3/2025 | | | HUB | | | | 1,028 | | | | - | | | | 1,028 | |
| BRL | | | 210,429 | | | USD | | | 216,478 | | | 1/3/2025 | | | HUB | | | | - | | | | (6,049 | ) | | | (6,049 | ) |
| BRL | | | 210,429 | | | USD | | | 216,580 | | | 1/3/2025 | | | HUB | | | | - | | | | (6,151 | ) | | | (6,151 | ) |
| BRL | | | 210,429 | | | USD | | | 222,969 | | | 1/3/2025 | | | HUB | | | | - | | | | (12,540 | ) | | | (12,540 | ) |
| USD | | | 213,619 | | | BRL | | | 210,429 | | | 1/3/2025 | | | HUB | | | | 3,190 | | | | - | | | | 3,190 | |
| USD | | | 213,728 | | | BRL | | | 210,429 | | | 1/3/2025 | | | HUB | | | | 3,299 | | | | - | | | | 3,299 | |
| USD | | | 213,803 | | | BRL | | | 210,429 | | | 1/3/2025 | | | HUB | | | | 3,374 | | | | - | | | | 3,374 | |
| USD | | | 213,974 | | | BRL | | | 210,429 | | | 1/3/2025 | | | HUB | | | | 3,545 | | | | - | | | | 3,545 | |
| USD | | | 214,179 | | | BRL | | | 210,429 | | | 1/3/2025 | | | HUB | | | | 3,750 | | | | - | | | | 3,750 | |
| USD | | | 214,182 | | | BRL | | | 210,429 | | | 1/3/2025 | | | HUB | | | | 3,753 | | | | - | | | | 3,753 | |
| USD | | | 214,451 | | | BRL | | | 210,429 | | | 1/3/2025 | | | HUB | | | | 4,022 | | | | - | | | | 4,022 | |
| USD | | | 219,501 | | | PLN | | | 217,907 | | | 1/3/2025 | | | HUB | | | | 1,594 | | | | - | | | | 1,594 | |
| USD | | | 223,372 | | | BRL | | | 210,429 | | | 1/3/2025 | | | HUB | | | | 12,943 | | | | - | | | | 12,943 | |
| USD | | | 223,594 | | | BRL | | | 210,429 | | | 1/3/2025 | | | HUB | | | | 13,165 | | | | - | | | | 13,165 | |
| BRL | | | 226,616 | | | USD | | | 232,863 | | | 1/3/2025 | | | HUB | | | | - | | | | (6,247 | ) | | | (6,247 | ) |
| USD | | | 230,395 | | | BRL | | | 226,616 | | | 1/3/2025 | | | HUB | | | | 3,779 | | | | - | | | | 3,779 | |
| USD | | | 230,426 | | | BRL | | | 226,616 | | | 1/3/2025 | | | HUB | | | | 3,810 | | | | - | | | | 3,810 | |
| USD | | | 230,829 | | | BRL | | | 226,616 | | | 1/3/2025 | | | HUB | | | | 4,213 | | | | - | | | | 4,213 | |
| BRL | | | 242,803 | | | USD | | | 249,526 | | | 1/3/2025 | | | HUB | | | | - | | | | (6,723 | ) | | | (6,723 | ) |
| BRL | | | 242,803 | | | USD | | | 249,846 | | | 1/3/2025 | | | HUB | | | | - | | | | (7,043 | ) | | | (7,043 | ) |
| BRL | | | 242,803 | | | USD | | | 249,921 | | | 1/3/2025 | | | HUB | | | | - | | | | (7,118 | ) | | | (7,118 | ) |
| BRL | | | 242,803 | | | USD | | | 250,054 | | | 1/3/2025 | | | HUB | | | | - | | | | (7,251 | ) | | | (7,251 | ) |
| USD | | | 243,013 | | | PLN | | | 242,119 | | | 1/3/2025 | | | HUB | | | | 894 | | | | - | | | | 894 | |
| USD | | | 246,051 | | | BRL | | | 242,803 | | | 1/3/2025 | | | HUB | | | | 3,248 | | | | - | | | | 3,248 | |
| USD | | | 246,346 | | | BRL | | | 242,803 | | | 1/3/2025 | | | HUB | | | | 3,543 | | | | - | | | | 3,543 | |
| USD | | | 246,785 | | | BRL | | | 242,803 | | | 1/3/2025 | | | HUB | | | | 3,982 | | | | - | | | | 3,982 | |
| USD | | | 247,003 | | | BRL | | | 242,803 | | | 1/3/2025 | | | HUB | | | | 4,200 | | | | - | | | | 4,200 | |
| USD | | | 248,548 | | | AUD | | | 247,580 | | | 1/3/2025 | | | HUB | | | | 968 | | | | - | | | | 968 | |
| USD | | | 248,592 | | | AUD | | | 247,580 | | | 1/3/2025 | | | HUB | | | | 1,012 | | | | - | | | | 1,012 | |
| USD | | | 248,608 | | | AUD | | | 247,580 | | | 1/3/2025 | | | HUB | | | | 1,028 | | | | - | | | | 1,028 | |
| USD | | | 248,772 | | | AUD | | | 247,580 | | | 1/3/2025 | | | HUB | | | | 1,192 | | | | - | | | | 1,192 | |
| USD | | | 249,072 | | | AUD | | | 247,580 | | | 1/3/2025 | | | HUB | | | | 1,492 | | | | - | | | | 1,492 | |
| USD | | | 249,116 | | | AUD | | | 247,580 | | | 1/3/2025 | | | HUB | | | | 1,536 | | | | -- | | | | 1,536 | |
| USD | | | 249,136 | | | AUD | | | 247,580 | | | 1/3/2025 | | | HUB | | | | 1,556 | | | | - | | | | 1,556 | |
| USD | | | 250,378 | | | GBP | | | 250,380 | | | 1/3/2025 | | | HUB | | | | - | | | | (2 | ) | | | (2 | ) |
| GBP | | | 250,380 | | | AUD | | | 249,982 | | | 1/3/2025 | | | HUB | | | | 398 | | | | - | | | | 398 | |
| GBP | | | 250,380 | | | AUD | | | 250,013 | | | 1/3/2025 | | | HUB | | | | 367 | | | | - | | | | 367 | |
| GBP | | | 250,380 | | | AUD | | | 250,053 | | | 1/3/2025 | | | HUB | | | | 327 | | | | - | | | | 327 | |
| GBP | | | 250,380 | | | AUD | | | 250,136 | | | 1/3/2025 | | | HUB | | | | 244 | | | | - | | | | 244 | |
| GBP | | | 250,380 | | | AUD | | | 250,218 | | | 1/3/2025 | | | HUB | | | | 162 | | | | - | | | | 162 | |
| GBP | | | 250,380 | | | AUD | | | 250,615 | | | 1/3/2025 | | | HUB | | | | - | | | | (235 | ) | | | (235 | ) |
| USD | | | 250,580 | | | GBP | | | 250,380 | | | 1/3/2025 | | | HUB | | | | 200 | | | | - | | | | 200 | |
See accompanying notes
29
American Beacon AHL Managed Futures Strategy FundSM
Consolidated Schedule of Investments
December 31, 2024
| | | | | | | | | | | | | | | | | | | | | | | | | | | | | | |
| | | | | | |
| Currency Purchased* | | | Currency Sold* | | | Settlement
Date | | | Counterparty | | | Unrealized
Appreciation | | | Unrealized
(Depreciation) | | | Net Unrealized
Appreciation
(Depreciation) | |
| USD | | | 250,944 | | | GBP | | | 250,380 | | | | 1/3/2025 | | | | HUB | | | $ | 564 | | | $ | - | | | $ | 564 | |
| USD | | | 250,964 | | | GBP | | | 250,380 | | | | 1/3/2025 | | | | HUB | | | | 584 | | | | - | | | | 584 | |
| USD | | | 262,631 | | | BRL | | | 258,990 | | | | 1/3/2025 | | | | HUB | | | | 3,641 | | | | - | | | | 3,641 | |
| USD | | | 263,050 | | | BRL | | | 258,990 | | | | 1/3/2025 | | | | HUB | | | | 4,060 | | | | - | | | | 4,060 | |
| USD | | | 263,222 | | | BRL | | | 258,990 | | | | 1/3/2025 | | | | HUB | | | | 4,232 | | | | - | | | | 4,232 | |
| USD | | | 131,624 | | | BRL | | | 129,495 | | | | 1/3/2025 | | | | HUB | | | | 2,129 | | | | - | | | | 2,129 | |
| USD | | | 131,624 | | | BRL | | | 129,495 | | | | 1/3/2025 | | | | HUB | | | | 2,129 | | | | - | | | | 2,129 | |
| USD | | | 267,788 | | | PLN | | | 266,331 | | | | 1/3/2025 | | | | HUB | | | | 1,457 | | | | - | | | | 1,457 | |
| BRL | | | 275,177 | | | USD | | | 282,669 | | | | 1/3/2025 | | | | HUB | | | | - | | | | (7,492 | ) | | | (7,492 | ) |
| BRL | | | 275,177 | | | USD | | | 282,961 | | | | 1/3/2025 | | | | HUB | | | | - | | | | (7,784 | ) | | | (7,784 | ) |
| BRL | | | 275,177 | | | USD | | | 292,277 | | | | 1/3/2025 | | | | HUB | | | | - | | | | (17,100 | ) | | | (17,100 | ) |
| USD | | | 279,201 | | | BRL | | | 275,177 | | | | 1/3/2025 | | | | HUB | | | | 4,024 | | | | - | | | | 4,024 | |
| USD | | | 279,550 | | | BRL | | | 275,177 | | | | 1/3/2025 | | | | HUB | | | | 4,373 | | | | - | | | | 4,373 | |
| USD | | | 282,150 | | | NZD | | | 279,750 | | | | 1/3/2025 | | | | HUB | | | | 2,400 | | | | - | | | | 2,400 | |
| BRL | | | 291,364 | | | USD | | | 298,905 | | | | 1/3/2025 | | | | HUB | | | | - | | | | (7,541 | ) | | | (7,541 | ) |
| BRL | | | 291,364 | | | USD | | | 299,381 | | | | 1/3/2025 | | | | HUB | | | | - | | | | (8,017 | ) | | | (8,017 | ) |
| BRL | | | 291,364 | | | USD | | | 299,911 | | | | 1/3/2025 | | | | HUB | | | | - | | | | (8,547 | ) | | | (8,547 | ) |
| BRL | | | 291,364 | | | USD | | | 300,130 | | | | 1/3/2025 | | | | HUB | | | | - | | | | (8,766 | ) | | | (8,766 | ) |
| BRL | | | 291,364 | | | USD | | | 302,006 | | | | 1/3/2025 | | | | HUB | | | | - | | | | (10,642 | ) | | | (10,642 | ) |
| USD | | | 147,820 | | | BRL | | | 145,682 | | | | 1/3/2025 | | | | HUB | | | | 2,138 | | | | - | | | | 2,138 | |
| USD | | | 147,820 | | | BRL | | | 145,682 | | | | 1/3/2025 | | | | HUB | | | | 2,138 | | | | - | | | | 2,138 | |
| USD | | | 295,863 | | | BRL | | | 291,364 | | | | 1/3/2025 | | | | HUB | | | | 4,499 | | | | - | | | | 4,499 | |
| EUR | | | 310,754 | | | CHF | | | 311,351 | | | | 1/3/2025 | | | | HUB | | | | - | | | | (597 | ) | | | (597 | ) |
| EUR | | | 310,755 | | | AUD | | | 310,681 | | | | 1/3/2025 | | | | HUB | | | | 74 | | | | - | | | | 74 | |
| EUR | | | 310,755 | | | AUD | | | 310,926 | | | | 1/3/2025 | | | | HUB | | | | - | | | | (171 | ) | | | (171 | ) |
| EUR | | | 310,755 | | | AUD | | | 310,928 | | | | 1/3/2025 | | | | HUB | | | | - | | | | (173 | ) | | | (173 | ) |
| EUR | | | 310,755 | | | AUD | | | 311,015 | | | | 1/3/2025 | | | | HUB | | | | - | | | | (260 | ) | | | (260 | ) |
| EUR | | | 310,755 | | | CHF | | | 311,156 | | | | 1/3/2025 | | | | HUB | | | | - | | | | (401 | ) | | | (401 | ) |
| EUR | | | 310,755 | | | CHF | | | 311,332 | | | | 1/3/2025 | | | | HUB | | | | - | | | | (577 | ) | | | (577 | ) |
| EUR | | | 310,755 | | | CHF | | | 311,348 | | | | 1/3/2025 | | | | HUB | | | | - | | | | (593 | ) | | | (593 | ) |
| EUR | | | 310,755 | | | AUD | | | 311,466 | | | | 1/3/2025 | | | | HUB | | | | - | | | | (711 | ) | | | (711 | ) |
| EUR | | | 310,755 | | | CHF | | | 312,006 | | | | 1/3/2025 | | | | HUB | | | | - | | | | (1,251 | ) | | | (1,251 | ) |
| USD | | | 311,214 | | | EUR | | | 310,755 | | | | 1/3/2025 | | | | HUB | | | | 459 | | | | - | | | | 459 | |
| USD | | | 312,136 | | | EUR | | | 310,755 | | | | 1/3/2025 | | | | HUB | | | | 1,381 | | | | - | | | | 1,381 | |
| USD | | | 312,153 | | | EUR | | | 310,755 | | | | 1/3/2025 | | | | HUB | | | | 1,398 | | | | - | | | | 1,398 | |
| USD | | | 312,393 | | | EUR | | | 310,755 | | | | 1/3/2025 | | | | HUB | | | | 1,638 | | | | - | | | | 1,638 | |
| USD | | | 312,399 | | | EUR | | | 310,755 | | | | 1/3/2025 | | | | HUB | | | | 1,644 | | | | - | | | | 1,644 | |
| USD | | | 312,579 | | | EUR | | | 310,755 | | | | 1/3/2025 | | | | HUB | | | | 1,824 | | | | - | | | | 1,824 | |
| USD | | | 312,582 | | | BRL | | | 307,550 | | | | 1/3/2025 | | | | HUB | | | | 5,032 | | | | - | | | | 5,032 | |
| USD | | | 312,612 | | | EUR | | | 310,755 | | | | 1/3/2025 | | | | HUB | | | | 1,857 | | | | - | | | | 1,857 | |
| USD | | | 312,680 | | | BRL | | | 307,550 | | | | 1/3/2025 | | | | HUB | | | | 5,130 | | | | - | | | | 5,130 | |
| USD | | | 312,850 | | | BRL | | | 307,550 | | | | 1/3/2025 | | | | HUB | | | | 5,300 | | | | - | | | | 5,300 | |
| USD | | | 312,963 | | | GBP | | | 312,975 | | | | 1/3/2025 | | | | HUB | | | | - | | | | (12 | ) | | | (12 | ) |
| USD | | | 364,162 | | | PLN | | | 363,179 | | | | 1/3/2025 | | | | HUB | | | | 983 | | | | - | | | | 983 | |
| USD | | | 365,346 | | | PLN | | | 363,179 | | | | 1/3/2025 | | | | HUB | | | | 2,167 | | | | - | | | | 2,167 | |
| USD | | | 365,627 | | | PLN | | | 363,179 | | | | 1/3/2025 | | | | HUB | | | | 2,448 | | | | - | | | | 2,448 | |
| BRL | | | 372,298 | | | USD | | | 384,273 | | | | 1/3/2025 | | | | HUB | | | | - | | | | (11,975 | ) | | | (11,975 | ) |
| USD | | | 373,794 | | | AUD | | | 371,370 | | | | 1/3/2025 | | | | HUB | | | | 2,424 | | | | - | | | | 2,424 | |
| GBP | | | 375,570 | | | AUD | | | 374,941 | | | | 1/3/2025 | | | | HUB | | | | 629 | | | | - | | | | 629 | |
| GBP | | | 375,570 | | | AUD | | | 375,188 | | | | 1/3/2025 | | | | HUB | | | | 382 | | | | - | | | | 382 | |
| USD | | | 375,728 | | | BRL | | | 356,111 | | | | 1/3/2025 | | | | HUB | | | | 19,617 | | | | - | | | | 19,617 | |
| USD | | | 375,771 | | | GBP | | | 375,570 | | | | 1/3/2025 | | | | HUB | | | | 201 | | | | - | | | | 201 | |
| BRL | | | 388,485 | | | USD | | | 411,621 | | | | 1/3/2025 | | | | HUB | | | | - | | | | (23,136 | ) | | | (23,136 | ) |
| USD | | | 388,561 | | | PLN | | | 387,390 | | | | 1/3/2025 | | | | HUB | | | | 1,171 | | | | - | | | | 1,171 | |
| EUR | | | 414,339 | | | CHF | | | 414,769 | | | | 1/3/2025 | | | | HUB | | | | - | | | | (430 | ) | | | (430 | ) |
| EUR | | | 414,340 | | | AUD | | | 414,491 | | | | 1/3/2025 | | | | HUB | | | | - | | | | (151 | ) | | | (151 | ) |
| EUR | | | 414,340 | | | CHF | | | 414,505 | | | | 1/3/2025 | | | | HUB | | | | - | | | | (165 | ) | | | (165 | ) |
| EUR | | | 414,340 | | | CHF | | | 414,536 | | | | 1/3/2025 | | | | HUB | | | | - | | | | (196 | ) | | | (196 | ) |
| EUR | | | 414,340 | | | CHF | | | 414,880 | | | | 1/3/2025 | | | | HUB | | | | - | | | | (540 | ) | | | (540 | ) |
See accompanying notes
30
American Beacon AHL Managed Futures Strategy FundSM
Consolidated Schedule of Investments
December 31, 2024
| | | | | | | | | | | | | | | | | | | | | | | | | | | | |
| | | | | | |
| Currency Purchased* | | | Currency Sold* | | | Settlement
Date | | Counterparty | | | Unrealized
Appreciation | | | Unrealized
(Depreciation) | | | Net Unrealized
Appreciation
(Depreciation) | |
| EUR | | | 414,340 | | | CHF | | | 415,043 | | | 1/3/2025 | | | HUB | | | $ | - | | | $ | (703 | ) | | $ | (703 | ) |
| EUR | | | 414,340 | | | CHF | | | 415,140 | | | 1/3/2025 | | | HUB | | | | - | | | | (800 | ) | | | (800 | ) |
| EUR | | | 414,340 | | | CHF | | | 415,153 | | | 1/3/2025 | | | HUB | | | | - | | | | (813 | ) | | | (813 | ) |
| EUR | | | 414,340 | | | CHF | | | 415,272 | | | 1/3/2025 | | | HUB | | | | - | | | | (932 | ) | | | (932 | ) |
| USD | | | 415,120 | | | EUR | | | 414,340 | | | 1/3/2025 | | | HUB | | | | 780 | | | | - | | | | 780 | |
| USD | | | 416,388 | | | EUR | | | 414,340 | | | 1/3/2025 | | | HUB | | | | 2,048 | | | | - | | | | 2,048 | |
| USD | | | 439,600 | | | GBP | | | 438,165 | | | 1/3/2025 | | | HUB | | | | 1,435 | | | | - | | | | 1,435 | |
| USD | | | 501,184 | | | GBP | | | 500,760 | | | 1/3/2025 | | | HUB | | | | 424 | | | | - | | | | 424 | |
| USD | | | 501,348 | | | GBP | | | 500,760 | | | 1/3/2025 | | | HUB | | | | 588 | | | | - | | | | 588 | |
| BRL | | | 501,793 | | | USD | | | 515,066 | | | 1/3/2025 | | | HUB | | | | - | | | | (13,273 | ) | | | (13,273 | ) |
| BRL | | | 501,793 | | | USD | | | 515,547 | | | 1/3/2025 | | | HUB | | | | - | | | | (13,754 | ) | | | (13,754 | ) |
| USD | | | 508,561 | | | PLN | | | 508,450 | | | 1/3/2025 | | | HUB | | | | 111 | | | | | | | | 111 | |
| EUR | | | 517,925 | | | CHF | | | 518,831 | | | 1/3/2025 | | | HUB | | | | - | | | | (906 | ) | | | (906 | ) |
| EUR | | | 517,925 | | | CHF | | | 518,974 | | | 1/3/2025 | | | HUB | | | | - | | | | (1,049 | ) | | | (1,049 | ) |
| USD | | | 520,690 | | | EUR | | | 517,925 | | | 1/3/2025 | | | HUB | | | | 2,765 | | | | - | | | | 2,765 | |
| USD | | | 520,700 | | | EUR | | | 517,925 | | | 1/3/2025 | | | HUB | | | | 2,775 | | | | - | | | | 2,775 | |
| BRL | | | 534,166 | | | USD | | | 567,017 | | | 1/3/2025 | | | HUB | | | | - | | | | (32,851 | ) | | | (32,851 | ) |
| BRL | | | 550,353 | | | USD | | | 563,203 | | | 1/3/2025 | | | HUB | | | | - | | | | (12,850 | ) | | | (12,850 | ) |
| BRL | | | 550,353 | | | USD | | | 571,306 | | | 1/3/2025 | | | HUB | | | | - | | | | (20,953 | ) | | | (20,953 | ) |
| BRL | | | 550,353 | | | USD | | | 585,831 | | | 1/3/2025 | | | HUB | | | | - | | | | (35,478 | ) | | | (35,478 | ) |
| EUR | | | 621,509 | | | CHF | | | 621,810 | | | 1/3/2025 | | | HUB | | | | - | | | | (301 | ) | | | (301 | ) |
| EUR | | | 621,509 | | | CHF | | | 622,286 | | | 1/3/2025 | | | HUB | | | | - | | | | (777 | ) | | | (777 | ) |
| EUR | | | 621,509 | | | CHF | | | 622,524 | | | 1/3/2025 | | | HUB | | | | - | | | | (1,015 | ) | | | (1,015 | ) |
| EUR | | | 621,509 | | | CHF | | | 623,714 | | | 1/3/2025 | | | HUB | | | | - | | | | (2,205 | ) | | | (2,205 | ) |
| EUR | | | 621,510 | | | CHF | | | 621,916 | | | 1/3/2025 | | | HUB | | | | - | | | | (406 | ) | | | (406 | ) |
| EUR | | | 621,510 | | | CHF | | | 622,068 | | | 1/3/2025 | | | HUB | | | | - | | | | (558 | ) | | | (558 | ) |
| EUR | | | 621,510 | | | CHF | | | 622,214 | | | 1/3/2025 | | | HUB | | | | - | | | | (704 | ) | | | (704 | ) |
| EUR | | | 621,510 | | | CHF | | | 622,346 | | | 1/3/2025 | | | HUB | | | | - | | | | (836 | ) | | | (836 | ) |
| EUR | | | 621,510 | | | CHF | | | 622,425 | | | 1/3/2025 | | | HUB | | | | - | | | | (915 | ) | | | (915 | ) |
| USD | | | 624,593 | | | EUR | | | 621,510 | | | 1/3/2025 | | | HUB | | | | 3,083 | | | | - | | | | 3,083 | |
| USD | | | 624,642 | | | EUR | | | 621,510 | | | 1/3/2025 | | | HUB | | | | 3,132 | | | | - | | | | 3,132 | |
| BRL | | | 663,661 | | | USD | | | 686,215 | | | 1/3/2025 | | | HUB | | | | - | | | | (22,554 | ) | | | (22,554 | ) |
| BRL | | | 679,848 | | | USD | | | 726,946 | | | 1/3/2025 | | | HUB | | | | - | | | | (47,098 | ) | | | (47,098 | ) |
| BRL | | | 712,222 | | | USD | | | 756,872 | | | 1/3/2025 | | | HUB | | | | - | | | | (44,650 | ) | | | (44,650 | ) |
| EUR | | | 725,094 | | | CHF | | | 725,175 | | | 1/3/2025 | | | HUB | | | | - | | | | (81 | ) | | | (81 | ) |
| EUR | | | 725,094 | | | CHF | | | 725,499 | | | 1/3/2025 | | | HUB | | | | - | | | | (405 | ) | | | (405 | ) |
| EUR | | | 725,094 | | | CHF | | | 727,998 | | | 1/3/2025 | | | HUB | | | | - | | | | (2,904 | ) | | | (2,904 | ) |
| EUR | | | 725,095 | | | AUD | | | 724,974 | | | 1/3/2025 | | | HUB | | | | 121 | | | | - | | | | 121 | |
| EUR | | | 725,095 | | | CHF | | | 726,433 | | | 1/3/2025 | | | HUB | | | | - | | | | (1,338 | ) | | | (1,338 | ) |
| EUR | | | 725,095 | | | CHF | | | 726,556 | | | 1/3/2025 | | | HUB | | | | - | | | | (1,461 | ) | | | (1,461 | ) |
| EUR | | | 725,095 | | | CHF | | | 727,628 | | | 1/3/2025 | | | HUB | | | | - | | | | (2,533 | ) | | | (2,533 | ) |
| BRL | | | 728,409 | | | USD | | | 745,880 | | | 1/3/2025 | | | HUB | | | | - | | | | (17,471 | ) | | | (17,471 | ) |
| BRL | | | 728,409 | | | USD | | | 778,736 | | | 1/3/2025 | | | HUB | | | | - | | | | (50,327 | ) | | | (50,327 | ) |
| USD | | | 728,588 | | | EUR | | | 725,095 | | | 1/3/2025 | | | HUB | | | | 3,493 | | | | - | | | | 3,493 | |
| BRL | | | 744,596 | | | USD | | | 764,539 | | | 1/3/2025 | | | HUB | | | | - | | | | (19,943 | ) | | | (19,943 | ) |
| EUR | | | 828,679 | | | CHF | | | 830,041 | | | 1/3/2025 | | | HUB | | | | - | | | | (1,362 | ) | | | (1,362 | ) |
| EUR | | | 828,680 | | | CHF | | | 828,948 | | | 1/3/2025 | | | HUB | | | | - | | | | (268 | ) | | | (268 | ) |
| EUR | | | 828,680 | | | CHF | | | 830,782 | | | 1/3/2025 | | | HUB | | | | - | | | | (2,102 | ) | | | (2,102 | ) |
| EUR | | | 828,680 | | | CHF | | | 832,095 | | | 1/3/2025 | | | HUB | | | | - | | | | (3,415 | ) | | | (3,415 | ) |
| BRL | | | 841,717 | | | USD | | | 894,716 | | | 1/3/2025 | | | HUB | | | | - | | | | (52,999 | ) | | | (52,999 | ) |
| USD | | | 869,167 | | | BRL | | | 825,530 | | | 1/3/2025 | | | HUB | | | | 43,637 | | | | - | | | | 43,637 | |
| BRL | | | 874,091 | | | USD | | | 932,143 | | | 1/3/2025 | | | HUB | | | | - | | | | (58,052 | ) | | | (58,052 | ) |
| USD | | | 878,710 | | | GBP | | | 876,330 | | | 1/3/2025 | | | HUB | | | | 2,380 | | | | - | | | | 2,380 | |
| EUR | | | 932,265 | | | CHF | | | 935,086 | | | 1/3/2025 | | | HUB | | | | - | | | | (2,821 | ) | | | (2,821 | ) |
| BRL | | | 938,838 | | | USD | | | 1,000,086 | | | 1/3/2025 | | | HUB | | | | - | | | | (61,248 | ) | | | (61,248 | ) |
| BRL | | | 1,035,959 | | | USD | | | 1,107,619 | | | 1/3/2025 | | | HUB | | | | - | | | | (71,660 | ) | | | (71,660 | ) |
| USD | | | 1,071,741 | | | BRL | | | 1,052,146 | | | 1/3/2025 | | | HUB | | | | 19,595 | | | | - | | | | 19,595 | |
| USD | | | 1,161,391 | | | BRL | | | 1,100,707 | | | 1/3/2025 | | | HUB | | | | 60,684 | | | | - | | | | 60,684 | |
| BRL | | | 1,165,454 | | | USD | | | 1,246,473 | | | 1/3/2025 | | | HUB | | | | - | | | | (81,019 | ) | | | (81,019 | ) |
See accompanying notes
31
American Beacon AHL Managed Futures Strategy FundSM
Consolidated Schedule of Investments
December 31, 2024
| | | | | | | | | | | | | | | | | | | | | | | | | | | | |
| | | | | | |
| Currency Purchased* | | | Currency Sold* | | | Settlement
Date | | Counterparty | | | Unrealized
Appreciation | | | Unrealized
(Depreciation) | | | Net Unrealized
Appreciation
(Depreciation) | |
| BRL | | | 1,181,641 | | | USD | | | 1,252,977 | | | 1/3/2025 | | | HUB | | | $ | - | | | $ | (71,336 | ) | | $ | (71,336 | ) |
| BRL | | | 1,262,575 | | | USD | | | 1,341,211 | | | 1/3/2025 | | | HUB | | | | - | | | | (78,636 | ) | | | (78,636 | ) |
| BRL | | | 1,262,575 | | | USD | | | 1,350,065 | | | 1/3/2025 | | | HUB | | | | - | | | | (87,490 | ) | | | (87,490 | ) |
| USD | | | 1,716,780 | | | BRL | | | 1,699,620 | | | 1/3/2025 | | | HUB | | | | 17,160 | | | | - | | | | 17,160 | |
| NZD | | | 3,412,950 | | | USD | | | 3,433,312 | | | 1/3/2025 | | | HUB | | | | - | | | | (20,362 | ) | | | (20,362 | ) |
| CHF | | | 5,671,687 | | | EUR | | | 5,668,545 | | | 1/3/2025 | | | HUB | | | | 3,142 | | | | - | | | | 3,142 | |
| USD | | | 5,838,519 | | | BRL | | | 5,477,634 | | | 1/3/2025 | | | HUB | | | | 360,885 | | | | - | | | | 360,885 | |
| BRL | | | 8,463,203 | | | USD | | | 8,589,293 | | | 1/3/2025 | | | HUB | | | | - | | | | (126,090 | ) | | | (126,090 | ) |
| BRL | | | 8,517,907 | | | USD | | | 8,721,117 | | | 1/3/2025 | | | HUB | | | | - | | | | (203,210 | ) | | | (203,210 | ) |
| USD | | | 12,142,583 | | | BRL | | | 11,455,875 | | | 1/3/2025 | | | HUB | | | | 686,708 | | | | - | | | | 686,708 | |
| BRL | | | 13,007,436 | | | USD | | | 13,306,131 | | | 1/3/2025 | | | HUB | | | | - | | | | (298,695 | ) | | | (298,695 | ) |
| BRL | | | 13,007,436 | | | USD | | | 13,323,825 | | | 1/3/2025 | | | HUB | | | | - | | | | (316,389 | ) | | | (316,389 | ) |
| USD | | | 13,589,496 | | | BRL | | | 12,781,146 | | | 1/3/2025 | | | HUB | | | | 808,350 | | | | - | | | | 808,350 | |
| CHF | | | 14,850,998 | | | EUR | | | 14,841,280 | | | 1/3/2025 | | | HUB | | | | 9,718 | | | | - | | | | 9,718 | |
| BRL | | | 19,870,828 | | | USD | | | 20,343,367 | | | 1/3/2025 | | | HUB | | | | - | | | | (472,539 | ) | | | (472,539 | ) |
| BRL | | | 19,870,828 | | | USD | | | 20,360,102 | | | 1/3/2025 | | | HUB | | | | - | | | | (489,274 | ) | | | (489,274 | ) |
| BRL | | | 24,513,978 | | | USD | | | 25,019,689 | | | 1/3/2025 | | | HUB | | | | - | | | | (505,711 | ) | | | (505,711 | ) |
| USD | | | 34,198,503 | | | BRL | | | 32,179,425 | | | 1/3/2025 | | | HUB | | | | 2,019,078 | | | | - | | | | 2,019,078 | |
| BRL | | | 39,806,017 | | | USD | | | 40,404,114 | | | 1/3/2025 | | | HUB | | | | - | | | | (598,097 | ) | | | (598,097 | ) |
| USD | | | 73,294,578 | | | BRL | | | 68,960,506 | | | 1/3/2025 | | | HUB | | | | 4,334,072 | | | | - | | | | 4,334,072 | |
| USD | | | 56,264 | | | NZD | | | 55,950 | | | 1/6/2025 | | | HUB | | | | 314 | | | | - | | | | 314 | |
| USD | | | 56,301 | | | NZD | | | 55,950 | | | 1/6/2025 | | | HUB | | | | 351 | | | | - | | | | 351 | |
| USD | | | 56,303 | | | NZD | | | 55,950 | | | 1/6/2025 | | | HUB | | | | 353 | | | | - | | | | 353 | |
| USD | | | 56,336 | | | NZD | | | 55,950 | | | 1/6/2025 | | | HUB | | | | 386 | | | | - | | | | 386 | |
| USD | | | 56,406 | | | NZD | | | 55,950 | | | 1/6/2025 | | | HUB | | | | 456 | | | | - | | | | 456 | |
| USD | | | 56,427 | | | NZD | | | 55,950 | | | 1/6/2025 | | | HUB | | | | 477 | | | | - | | | | 477 | |
| USD | | | 56,461 | | | NZD | | | 55,950 | | | 1/6/2025 | | | HUB | | | | 511 | | | | - | | | | 511 | |
| AUD | | | 61,895 | | | JPY | | | 62,194 | | | 1/6/2025 | | | HUB | | | | - | | | | (299 | ) | | | (299 | ) |
| AUD | | | 61,895 | | | JPY | | | 62,206 | | | 1/6/2025 | | | HUB | | | | - | | | | (311 | ) | | | (311 | ) |
| AUD | | | 61,895 | | | JPY | | | 62,255 | | | 1/6/2025 | | | HUB | | | | - | | | | (360 | ) | | | (360 | ) |
| AUD | | | 61,895 | | | JPY | | | 62,268 | | | 1/6/2025 | | | HUB | | | | - | | | | (373 | ) | | | (373 | ) |
| AUD | | | 61,895 | | | JPY | | | 62,269 | | | 1/6/2025 | | | HUB | | | | - | | | | (374 | ) | | | (374 | ) |
| AUD | | | 61,895 | | | JPY | | | 62,279 | | | 1/6/2025 | | | HUB | | | | - | | | | (384 | ) | | | (384 | ) |
| AUD | | | 61,895 | | | JPY | | | 62,302 | | | 1/6/2025 | | | HUB | | | | - | | | | (407 | ) | | | (407 | ) |
| AUD | | | 61,895 | | | JPY | | | 62,303 | | | 1/6/2025 | | | HUB | | | | - | | | | (408 | ) | | | (408 | ) |
| AUD | | | 61,895 | | | JPY | | | 62,380 | | | 1/6/2025 | | | HUB | | | | - | | | | (485 | ) | | | (485 | ) |
| AUD | | | 61,896 | | | JPY | | | 62,252 | | | 1/6/2025 | | | HUB | | | | - | | | | (356 | ) | | | (356 | ) |
| AUD | | | 61,896 | | | JPY | | | 62,343 | | | 1/6/2025 | | | HUB | | | | - | | | | (447 | ) | | | (447 | ) |
| AUD | | | 61,896 | | | JPY | | | 62,348 | | | 1/6/2025 | | | HUB | | | | - | | | | (452 | ) | | | (452 | ) |
| USD | | | 63,448 | | | JPY | | | 63,555 | | | 1/6/2025 | | | HUB | | | | - | | | | (107 | ) | | | (107 | ) |
| USD | | | 63,461 | | | JPY | | | 63,555 | | | 1/6/2025 | | | HUB | | | | - | | | | (94 | ) | | | (94 | ) |
| USD | | | 63,479 | | | JPY | | | 63,555 | | | 1/6/2025 | | | HUB | | | | - | | | | (76 | ) | | | (76 | ) |
| USD | | | 112,590 | | | NZD | | | 111,900 | | | 1/6/2025 | | | HUB | | | | 690 | | | | - | | | | 690 | |
| USD | | | 112,610 | | | NZD | | | 111,900 | | | 1/6/2025 | | | HUB | | | | 710 | | | | - | | | | 710 | |
| USD | | | 112,838 | | | NZD | | | 111,900 | | | 1/6/2025 | | | HUB | | | | 938 | | | | - | | | | 938 | |
| USD | | | 112,862 | | | NZD | | | 111,900 | | | 1/6/2025 | | | HUB | | | | 962 | | | | - | | | | 962 | |
| USD | | | 112,864 | | | NZD | | | 111,900 | | | 1/6/2025 | | | HUB | | | | 964 | | | | - | | | | 964 | |
| USD | | | 112,866 | | | NZD | | | 111,900 | | | 1/6/2025 | | | HUB | | | | 966 | | | | - | | | | 966 | |
| USD | | | 112,874 | | | NZD | | | 111,900 | | | 1/6/2025 | | | HUB | | | | 974 | | | | - | | | | 974 | |
| USD | | | 112,878 | | | NZD | | | 111,900 | | | 1/6/2025 | | | HUB | | | | 978 | | | | - | | | | 978 | |
| AUD | | | 123,790 | | | JPY | | | 124,662 | | | 1/6/2025 | | | HUB | | | | - | | | | (872 | ) | | | (872 | ) |
| AUD | | | 123,791 | | | JPY | | | 124,505 | | | 1/6/2025 | | | HUB | | | | - | | | | (714 | ) | | | (714 | ) |
| AUD | | | 123,791 | | | JPY | | | 124,722 | | | 1/6/2025 | | | HUB | | | | - | | | | (931 | ) | | | (931 | ) |
| USD | | | 126,863 | | | JPY | | | 127,109 | | | 1/6/2025 | | | HUB | | | | - | | | | (246 | ) | | | (246 | ) |
| USD | | | 169,089 | | | NZD | | | 167,850 | | | 1/6/2025 | | | HUB | | | | 1,239 | | | | - | | | | 1,239 | |
| USD | | | 169,161 | | | NZD | | | 167,850 | | | 1/6/2025 | | | HUB | | | | 1,311 | | | | - | | | | 1,311 | |
| USD | | | 169,281 | | | NZD | | | 167,850 | | | 1/6/2025 | | | HUB | | | | 1,431 | | | | - | | | | 1,431 | |
| USD | | | 169,305 | | | NZD | | | 167,850 | | | 1/6/2025 | | | HUB | | | | 1,455 | | | | - | | | | 1,455 | |
| USD | | | 169,314 | | | NZD | | | 167,850 | | | 1/6/2025 | | | HUB | | | | 1,464 | | | | - | | | | 1,464 | |
See accompanying notes
32
American Beacon AHL Managed Futures Strategy FundSM
Consolidated Schedule of Investments
December 31, 2024
| | | | | | | | | | | | | | | | | | | | | | | | | | | | |
| | | | | | |
| Currency Purchased* | | | Currency Sold* | | | Settlement
Date | | Counterparty | | | Unrealized
Appreciation | | | Unrealized
(Depreciation) | | | Net Unrealized
Appreciation
(Depreciation) | |
| USD | | | 169,353 | | | NZD | | | 167,850 | | | 1/6/2025 | | | HUB | | | $ | 1,503 | | | $ | - | | | $ | 1,503 | |
| AUD | | | 185,686 | | | JPY | | | 187,097 | | | 1/6/2025 | | | HUB | | | | - | | | | (1,411 | ) | | | (1,411 | ) |
| AUD | | | 185,686 | | | JPY | | | 187,253 | | | 1/6/2025 | | | HUB | | | | - | | | | (1,567 | ) | | | (1,567 | ) |
| USD | | | 190,112 | | | JPY | | | 190,664 | | | 1/6/2025 | | | HUB | | | | - | | | | (552 | ) | | | (552 | ) |
| USD | | | 190,301 | | | JPY | | | 190,664 | | | 1/6/2025 | | | HUB | | | | - | | | | (363 | ) | | | (363 | ) |
| EUR | | | 207,195 | | | CHF | | | 207,061 | | | 1/6/2025 | | | HUB | | | | 134 | | | | - | | | | 134 | |
| EUR | | | 207,195 | | | CHF | | | 207,429 | | | 1/6/2025 | | | HUB | | | | - | | | | (234 | ) | | | (234 | ) |
| USD | | | 225,640 | | | NZD | | | 223,800 | | | 1/6/2025 | | | HUB | | | | 1,840 | | | | - | | | | 1,840 | |
| USD | | | 225,832 | | | NZD | | | 223,800 | | | 1/6/2025 | | | HUB | | | | 2,032 | | | | - | | | | 2,032 | |
| USD | | | 253,375 | | | JPY | | | 254,218 | | | 1/6/2025 | | | HUB | | | | - | | | | (843 | ) | | | (843 | ) |
| USD | | | 253,457 | | | JPY | | | 254,218 | | | 1/6/2025 | | | HUB | | | | - | | | | (761 | ) | | | (761 | ) |
| USD | | | 253,783 | | | JPY | | | 254,218 | | | 1/6/2025 | | | HUB | | | | - | | | | (435 | ) | | | (435 | ) |
| EUR | | | 310,792 | | | CHF | | | 310,842 | | | 1/6/2025 | | | HUB | | | | - | | | | (50 | ) | | | (50 | ) |
| EUR | | | 310,792 | | | CHF | | | 311,348 | | | 1/6/2025 | | | HUB | | | | - | | | | (556 | ) | | | (556 | ) |
| EUR | | | 310,793 | | | CHF | | | 310,628 | | | 1/6/2025 | | | HUB | | | | 165 | | | | - | | | | 165 | |
| USD | | | 316,823 | | | JPY | | | 317,773 | | | 1/6/2025 | | | HUB | | | | - | | | | (950 | ) | | | (950 | ) |
| USD | | | 316,835 | | | JPY | | | 317,773 | | | 1/6/2025 | | | HUB | | | | - | | | | (938 | ) | | | (938 | ) |
| USD | | | 316,951 | | | JPY | | | 317,773 | | | 1/6/2025 | | | HUB | | | | - | | | | (822 | ) | | | (822 | ) |
| USD | | | 317,152 | | | JPY | | | 317,773 | | | 1/6/2025 | | | HUB | | | | - | | | | (621 | ) | | | (621 | ) |
| USD | | | 380,312 | | | JPY | | | 381,328 | | | 1/6/2025 | | | HUB | | | | - | | | | (1,016 | ) | | | (1,016 | ) |
| USD | | | 380,809 | | | JPY | | | 381,328 | | | 1/6/2025 | | | HUB | | | | - | | | | (519 | ) | | | (519 | ) |
| EUR | | | 414,390 | | | CHF | | | 413,989 | | | 1/6/2025 | | | HUB | | | | 401 | | | | - | | | | 401 | |
| EUR | | | 414,390 | | | CHF | | | 414,183 | | | 1/6/2025 | | | HUB | | | | 207 | | | | - | | | | 207 | |
| EUR | | | 414,390 | | | CHF | | | 414,408 | | | 1/6/2025 | | | HUB | | | | - | | | | (18 | ) | | | (18 | ) |
| EUR | | | 414,390 | | | CHF | | | 414,545 | | | 1/6/2025 | | | HUB | | | | - | | | | (155 | ) | | | (155 | ) |
| EUR | | | 414,390 | | | CHF | | | 414,571 | | | 1/6/2025 | | | HUB | | | | - | | | | (181 | ) | | | (181 | ) |
| EUR | | | 414,390 | | | CHF | | | 414,584 | | | 1/6/2025 | | | HUB | | | | - | | | | (194 | ) | | | (194 | ) |
| EUR | | | 414,390 | | | CHF | | | 414,650 | | | 1/6/2025 | | | HUB | | | | - | | | | (260 | ) | | | (260 | ) |
| EUR | | | 414,390 | | | CHF | | | 414,774 | | | 1/6/2025 | | | HUB | | | | - | | | | (384 | ) | | | (384 | ) |
| EUR | | | 414,390 | | | CHF | | | 414,915 | | | 1/6/2025 | | | HUB | | | | - | | | | (525 | ) | | | (525 | ) |
| EUR | | | 414,390 | | | CHF | | | 414,999 | | | 1/6/2025 | | | HUB | | | | - | | | | (609 | ) | | | (609 | ) |
| EUR | | | 414,390 | | | CHF | | | 415,188 | | | 1/6/2025 | | | HUB | | | | - | | | | (798 | ) | | | (798 | ) |
| USD | | | 443,406 | | | JPY | | | 444,882 | | | 1/6/2025 | | | HUB | | | | - | | | | (1,476 | ) | | | (1,476 | ) |
| USD | | | 443,555 | | | JPY | | | 444,882 | | | 1/6/2025 | | | HUB | | | | - | | | | (1,327 | ) | | | (1,327 | ) |
| USD | | | 443,684 | | | JPY | | | 444,882 | | | 1/6/2025 | | | HUB | | | | - | | | | (1,198 | ) | | | (1,198 | ) |
| USD | | | 443,734 | | | JPY | | | 444,882 | | | 1/6/2025 | | | HUB | | | | - | | | | (1,148 | ) | | | (1,148 | ) |
| USD | | | 443,802 | | | JPY | | | 444,882 | | | 1/6/2025 | | | HUB | | | | - | | | | (1,080 | ) | | | (1,080 | ) |
| USD | | | 443,943 | | | JPY | | | 444,882 | | | 1/6/2025 | | | HUB | | | | - | | | | (939 | ) | | | (939 | ) |
| USD | | | 444,775 | | | JPY | | | 444,882 | | | 1/6/2025 | | | HUB | | | | - | | | | (107 | ) | | | (107 | ) |
| USD | | | 506,691 | | | JPY | | | 508,437 | | | 1/6/2025 | | | HUB | | | | - | | | | (1,746 | ) | | | (1,746 | ) |
| USD | | | 506,839 | | | JPY | | | 508,437 | | | 1/6/2025 | | | HUB | | | | - | | | | (1,598 | ) | | | (1,598 | ) |
| USD | | | 506,865 | | | JPY | | | 508,437 | | | 1/6/2025 | | | HUB | | | | - | | | | (1,572 | ) | | | (1,572 | ) |
| USD | | | 506,987 | | | JPY | | | 508,437 | | | 1/6/2025 | | | HUB | | | | - | | | | (1,450 | ) | | | (1,450 | ) |
| USD | | | 507,096 | | | JPY | | | 508,437 | | | 1/6/2025 | | | HUB | | | | - | | | | (1,341 | ) | | | (1,341 | ) |
| EUR | | | 517,987 | | | CHF | | | 518,197 | | | 1/6/2025 | | | HUB | | | | - | | | | (210 | ) | | | (210 | ) |
| EUR | | | 517,988 | | | CHF | | | 518,710 | | | 1/6/2025 | | | HUB | | | | - | | | | (722 | ) | | | (722 | ) |
| EUR | | | 517,988 | | | CHF | | | 518,875 | | | 1/6/2025 | | | HUB | | | | - | | | | (887 | ) | | | (887 | ) |
| EUR | | | 517,988 | | | CHF | | | 518,892 | | | 1/6/2025 | | | HUB | | | | - | | | | (904 | ) | | | (904 | ) |
| USD | | | 570,418 | | | JPY | | | 571,991 | | | 1/6/2025 | | | HUB | | | | - | | | | (1,573 | ) | | | (1,573 | ) |
| USD | | | 571,091 | | | JPY | | | 571,991 | | | 1/6/2025 | | | HUB | | | | - | | | | (900 | ) | | | (900 | ) |
| AUD | | | 618,953 | | | JPY | | | 623,865 | | | 1/6/2025 | | | HUB | | | | - | | | | (4,912 | ) | | | (4,912 | ) |
| EUR | | | 621,585 | | | CHF | | | 621,817 | | | 1/6/2025 | | | HUB | | | | - | | | | (232 | ) | | | (232 | ) |
| EUR | | | 621,585 | | | CHF | | | 622,114 | | | 1/6/2025 | | | HUB | | | | - | | | | (529 | ) | | | (529 | ) |
| EUR | | | 621,585 | | | CHF | | | 622,630 | | | 1/6/2025 | | | HUB | | | | - | | | | (1,045 | ) | | | (1,045 | ) |
| EUR | | | 621,585 | | | CHF | | | 622,795 | | | 1/6/2025 | | | HUB | | | | - | | | | (1,210 | ) | | | (1,210 | ) |
| EUR | | | 621,585 | | | CHF | | | 622,835 | | | 1/6/2025 | | | HUB | | | | - | | | | (1,250 | ) | | | (1,250 | ) |
| EUR | | | 621,585 | | | CHF | | | 622,842 | | | 1/6/2025 | | | HUB | | | | - | | | | (1,257 | ) | | | (1,257 | ) |
| USD | | | 633,573 | | | JPY | | | 635,546 | | | 1/6/2025 | | | HUB | | | | - | | | | (1,973 | ) | | | (1,973 | ) |
| USD | | | 634,059 | | | JPY | | | 635,546 | | | 1/6/2025 | | | HUB | | | | - | | | | (1,487 | ) | | | (1,487 | ) |
See accompanying notes
33
American Beacon AHL Managed Futures Strategy FundSM
Consolidated Schedule of Investments
December 31, 2024
| | | | | | | | | | | | | | | | | | | | | | | | | | | | |
| | | | | | |
| Currency Purchased* | | | Currency Sold* | | | Settlement
Date | | Counterparty | | | Unrealized
Appreciation | | | Unrealized
(Depreciation) | | | Net Unrealized
Appreciation
(Depreciation) | |
| USD | | | 697,138 | | | JPY | | | 699,101 | | | 1/6/2025 | | | HUB | | | $ | - | | | $ | (1,963 | ) | | $ | (1,963 | ) |
| USD | | | 697,164 | | | JPY | | | 699,101 | | | 1/6/2025 | | | HUB | | | | - | | | | (1,937 | ) | | | (1,937 | ) |
| USD | | | 697,182 | | | JPY | | | 699,101 | | | 1/6/2025 | | | HUB | | | | - | | | | (1,919 | ) | | | (1,919 | ) |
| EUR | | | 725,182 | | | CHF | | | 725,769 | | | 1/6/2025 | | | HUB | | | | - | | | | (587 | ) | | | (587 | ) |
| EUR | | | 725,183 | | | CHF | | | 724,019 | | | 1/6/2025 | | | HUB | | | | 1,164 | | | | - | | | | 1,164 | |
| EUR | | | 725,183 | | | CHF | | | 724,219 | | | 1/6/2025 | | | HUB | | | | 964 | | | | - | | | | 964 | |
| EUR | | | 725,183 | | | CHF | | | 726,124 | | | 1/6/2025 | | | HUB | | | | - | | | | (941 | ) | | | (941 | ) |
| EUR | | | 725,183 | | | CHF | | | 726,587 | | | 1/6/2025 | | | HUB | | | | - | | | | (1,404 | ) | | | (1,404 | ) |
| USD | | | 760,427 | | | JPY | | | 762,655 | | | 1/6/2025 | | | HUB | | | | - | | | | (2,228 | ) | | | (2,228 | ) |
| USD | | | 760,678 | | | JPY | | | 762,655 | | | 1/6/2025 | | | HUB | | | | - | | | | (1,977 | ) | | | (1,977 | ) |
| USD | | | 760,692 | | | JPY | | | 762,655 | | | 1/6/2025 | | | HUB | | | | - | | | | (1,963 | ) | | | (1,963 | ) |
| USD | | | 760,847 | | | JPY | | | 762,655 | | | 1/6/2025 | | | HUB | | | | - | | | | (1,808 | ) | | | (1,808 | ) |
| EUR | | | 932,377 | | | CHF | | | 934,758 | | | 1/6/2025 | | | HUB | | | | - | | | | (2,381 | ) | | | (2,381 | ) |
| JPY | | | 1,181,859 | | | USD | | | 1,178,144 | | | 1/6/2025 | | | HUB | | | | 3,715 | | | | - | | | | 3,715 | |
| JPY | | | 2,128,245 | | | AUD | | | 2,104,441 | | | 1/6/2025 | | | HUB | | | | 23,804 | | | | - | | | | 23,804 | |
| JPY | | | 15,533,003 | | | USD | | | 15,482,898 | | | 1/6/2025 | | | HUB | | | | 50,105 | | | | - | | | | 50,105 | |
| AUD | | | 61,895 | | | JPY | | | 62,177 | | | 1/7/2025 | | | HUB | | | | - | | | | (282 | ) | | | (282 | ) |
| AUD | | | 61,895 | | | JPY | | | 62,377 | | | 1/7/2025 | | �� | HUB | | | | - | | | | (482 | ) | | | (482 | ) |
| AUD | | | 61,895 | | | JPY | | | 62,505 | | | 1/7/2025 | | | HUB | | | | - | | | | (610 | ) | | | (610 | ) |
| AUD | | | 61,895 | | | JPY | | | 62,524 | | | 1/7/2025 | | | HUB | | | | - | | | | (629 | ) | | | (629 | ) |
| AUD | | | 61,895 | | | JPY | | | 62,542 | | | 1/7/2025 | | | HUB | | | | - | | | | (647 | ) | | | (647 | ) |
| AUD | | | 61,895 | | | JPY | | | 62,581 | | | 1/7/2025 | | | HUB | | | | - | | | | (686 | ) | | | (686 | ) |
| AUD | | | 61,895 | | | JPY | | | 62,585 | | | 1/7/2025 | | | HUB | | | | - | | | | (690 | ) | | | (690 | ) |
| AUD | | | 61,895 | | | JPY | | | 62,602 | | | 1/7/2025 | | | HUB | | | | - | | | | (707 | ) | | | (707 | ) |
| AUD | | | 61,895 | | | JPY | | | 62,610 | | | 1/7/2025 | | | HUB | | | | - | | | | (715 | ) | | | (715 | ) |
| AUD | | | 61,896 | | | JPY | | | 62,339 | | | 1/7/2025 | | | HUB | | | | - | | | | (443 | ) | | | (443 | ) |
| USD | | | 63,356 | | | JPY | | | 63,555 | | | 1/7/2025 | | | HUB | | | | - | | | | (199 | ) | | | (199 | ) |
| AUD | | | 123,790 | | | JPY | | | 124,953 | | | 1/7/2025 | | | HUB | | | | - | | | | (1,163 | ) | | | (1,163 | ) |
| AUD | | | 123,791 | | | JPY | | | 124,932 | | | 1/7/2025 | | | HUB | | | | - | | | | (1,141 | ) | | | (1,141 | ) |
| AUD | | | 123,791 | | | JPY | | | 125,006 | | | 1/7/2025 | | | HUB | | | | - | | | | (1,215 | ) | | | (1,215 | ) |
| AUD | | | 123,791 | | | JPY | | | 125,306 | | | 1/7/2025 | | | HUB | | | | - | | | | (1,515 | ) | | | (1,515 | ) |
| USD | | | 126,695 | | | JPY | | | 127,109 | | | 1/7/2025 | | | HUB | | | | - | | | | (414 | ) | | | (414 | ) |
| USD | | | 126,781 | | | JPY | | | 127,109 | | | 1/7/2025 | | | HUB | | | | - | | | | (328 | ) | | | (328 | ) |
| USD | | | 127,380 | | | JPY | | | 127,109 | | | 1/7/2025 | | | HUB | | | | 271 | | | | - | | | | 271 | |
| AUD | | | 185,686 | | | JPY | | | 185,943 | | | 1/7/2025 | | | HUB | | | | - | | | | (257 | ) | | | (257 | ) |
| USD | | | 190,095 | | | JPY | | | 190,664 | | | 1/7/2025 | | | HUB | | | | - | | | | (569 | ) | | | (569 | ) |
| USD | | | 190,109 | | | JPY | | | 190,664 | | | 1/7/2025 | | | HUB | | | | - | | | | (555 | ) | | | (555 | ) |
| USD | | | 190,132 | | | JPY | | | 190,664 | | | 1/7/2025 | | | HUB | | | | - | | | | (532 | ) | | | (532 | ) |
| USD | | | 190,150 | | | JPY | | | 190,664 | | | 1/7/2025 | | | HUB | | | | - | | | | (514 | ) | | | (514 | ) |
| USD | | | 191,800 | | | JPY | | | 190,664 | | | 1/7/2025 | | | HUB | | | | 1,136 | | | | - | | | | 1,136 | |
| USD | | | 253,267 | | | JPY | | | 254,218 | | | 1/7/2025 | | | HUB | | | | - | | | | (951 | ) | | | (951 | ) |
| USD | | | 253,448 | | | JPY | | | 254,218 | | | 1/7/2025 | | | HUB | | | | - | | | | (770 | ) | | | (770 | ) |
| USD | | | 253,452 | | | JPY | | | 254,218 | | | 1/7/2025 | | | HUB | | | | - | | | | (766 | ) | | | (766 | ) |
| USD | | | 253,497 | | | JPY | | | 254,218 | | | 1/7/2025 | | | HUB | | | | - | | | | (721 | ) | | | (721 | ) |
| USD | | | 253,527 | | | JPY | | | 254,218 | | | 1/7/2025 | | | HUB | | | | - | | | | (691 | ) | | | (691 | ) |
| USD | | | 255,218 | | | JPY | | | 254,218 | | | 1/7/2025 | | | HUB | | | | 1,000 | | | | - | | | | 1,000 | |
| USD | | | 255,255 | | | JPY | | | 254,218 | | | 1/7/2025 | | | HUB | | | | 1,037 | | | | - | | | | 1,037 | |
| KRW | | | 271,743 | | | USD | | | 275,410 | | | 1/7/2025 | | | HUB | | | | - | | | | (3,667 | ) | | | (3,667 | ) |
| AUD | | | 309,478 | | | JPY | | | 312,311 | | | 1/7/2025 | | | HUB | | | | - | | | | (2,833 | ) | | | (2,833 | ) |
| USD | | | 316,869 | | | JPY | | | 317,773 | | | 1/7/2025 | | | HUB | | | | - | | | | (904 | ) | | | (904 | ) |
| USD | | | 319,603 | | | JPY | | | 317,773 | | | 1/7/2025 | | | HUB | | | | 1,830 | | | | - | | | | 1,830 | |
| USD | | | 380,125 | | | JPY | | | 381,328 | | | 1/7/2025 | | | HUB | | | | - | | | | (1,203 | ) | | | (1,203 | ) |
| USD | | | 380,173 | | | JPY | | | 381,328 | | | 1/7/2025 | | | HUB | | | | - | | | | (1,155 | ) | | | (1,155 | ) |
| USD | | | 380,341 | | | JPY | | | 381,328 | | | 1/7/2025 | | | HUB | | | | - | | | | (987 | ) | | | (987 | ) |
| USD | | | 382,875 | | | JPY | | | 381,328 | | | 1/7/2025 | | | HUB | | | | 1,547 | | | | - | | | | 1,547 | |
| USD | | | 382,956 | | | JPY | | | 381,328 | | | 1/7/2025 | | | HUB | | | | 1,628 | | | | - | | | | 1,628 | |
| USD | | | 383,068 | | | JPY | | | 381,328 | | | 1/7/2025 | | | HUB | | | | 1,740 | | | | - | | | | 1,740 | |
| USD | | | 383,573 | | | JPY | | | 381,328 | | | 1/7/2025 | | | HUB | | | | 2,245 | | | | - | | | | 2,245 | |
| USD | | | 383,583 | | | JPY | | | 381,328 | | | 1/7/2025 | | | HUB | | | | 2,255 | | | | - | | | | 2,255 | |
See accompanying notes
34
American Beacon AHL Managed Futures Strategy FundSM
Consolidated Schedule of Investments
December 31, 2024
| | | | | | | | | | | | | | | | | | | | | | | | | | | | |
| | | | | | |
| Currency Purchased* | | | Currency Sold* | | | Settlement
Date | | Counterparty | | | Unrealized
Appreciation | | | Unrealized
(Depreciation) | | | Net Unrealized
Appreciation
(Depreciation) | |
| USD | | | 443,248 | | | JPY | | | 444,882 | | | 1/7/2025 | | | HUB | | | $ | - | | | $ | (1,634 | ) | | $ | (1,634 | ) |
| USD | | | 447,333 | | | JPY | | | 444,882 | | | 1/7/2025 | | | HUB | | | | 2,451 | | | | - | | | | 2,451 | |
| USD | | | 447,379 | | | JPY | | | 444,882 | | | 1/7/2025 | | | HUB | | | | 2,497 | | | | - | | | | 2,497 | |
| USD | | | 447,479 | | | JPY | | | 444,882 | | | 1/7/2025 | | | HUB | | | | 2,597 | | | | - | | | | 2,597 | |
| USD | | | 506,926 | | | JPY | | | 508,437 | | | 1/7/2025 | | | HUB | | | | - | | | | (1,511 | ) | | | (1,511 | ) |
| USD | | | 508,854 | | | JPY | | | 508,437 | | | 1/7/2025 | | | HUB | | | | 417 | | | | - | | | | 417 | |
| USD | | | 508,954 | | | JPY | | | 508,437 | | | 1/7/2025 | | | HUB | | | | 517 | | | | - | | | | 517 | |
| USD | | | 509,256 | | | JPY | | | 508,437 | | | 1/7/2025 | | | HUB | | | | 819 | | | | - | | | | 819 | |
| USD | | | 510,461 | | | JPY | | | 508,437 | | | 1/7/2025 | | | HUB | | | | 2,024 | | | | - | | | | 2,024 | |
| USD | | | 510,608 | | | JPY | | | 508,437 | | | 1/7/2025 | | | HUB | | | | 2,171 | | | | - | | | | 2,171 | |
| USD | | | 570,035 | | | JPY | | | 571,991 | | | 1/7/2025 | | | HUB | | | | - | | | | (1,956 | ) | | | (1,956 | ) |
| USD | | | 570,248 | | | JPY | | | 571,991 | | | 1/7/2025 | | | HUB | | | | - | | | | (1,743 | ) | | | (1,743 | ) |
| USD | | | 570,259 | | | JPY | | | 571,991 | | | 1/7/2025 | | | HUB | | | | - | | | | (1,732 | ) | | | (1,732 | ) |
| USD | | | 570,386 | | | JPY | | | 571,991 | | | 1/7/2025 | | | HUB | | | | - | | | | (1,605 | ) | | | (1,605 | ) |
| USD | | | 570,512 | | | JPY | | | 571,991 | | | 1/7/2025 | | | HUB | | | | - | | | | (1,479 | ) | | | (1,479 | ) |
| USD | | | 571,585 | | | JPY | | | 571,991 | | | 1/7/2025 | | | HUB | | | | - | | | | (406 | ) | | | (406 | ) |
| USD | | | 575,315 | | | JPY | | | 571,991 | | | 1/7/2025 | | | HUB | | | | 3,324 | | | | - | | | | 3,324 | |
| USD | | | 633,332 | | | JPY | | | 635,546 | | | 1/7/2025 | | | HUB | | | | - | | | | (2,214 | ) | | | (2,214 | ) |
| USD | | | 633,453 | | | JPY | | | 635,546 | | | 1/7/2025 | | | HUB | | | | - | | | | (2,093 | ) | | | (2,093 | ) |
| USD | | | 633,794 | | | JPY | | | 635,546 | | | 1/7/2025 | | | HUB | | | | - | | | | (1,752 | ) | | | (1,752 | ) |
| USD | | | 634,490 | | | JPY | | | 635,546 | | | 1/7/2025 | | | HUB | | | | - | | | | (1,056 | ) | | | (1,056 | ) |
| USD | | | 634,614 | | | JPY | | | 635,546 | | | 1/7/2025 | | | HUB | | | | - | | | | (932 | ) | | | (932 | ) |
| KRW | | | 679,358 | | | USD | | | 690,959 | | | 1/7/2025 | | | HUB | | | | - | | | | (11,601 | ) | | | (11,601 | ) |
| KRW | | | 679,358 | | | USD | | | 691,079 | | | 1/7/2025 | | | HUB | | | | - | | | | (11,721 | ) | | | (11,721 | ) |
| KRW | | | 679,358 | | | USD | | | 691,147 | | | 1/7/2025 | | | HUB | | | | - | | | | (11,789 | ) | | | (11,789 | ) |
| USD | | | 696,516 | | | JPY | | | 699,101 | | | 1/7/2025 | | | HUB | | | | - | | | | (2,585 | ) | | | (2,585 | ) |
| USD | | | 696,939 | | | JPY | | | 699,101 | | | 1/7/2025 | | | HUB | | | | - | | | | (2,162 | ) | | | (2,162 | ) |
| KRW | | | 747,293 | | | USD | | | 760,014 | | | 1/7/2025 | | | HUB | | | | - | | | | (12,721 | ) | | | (12,721 | ) |
| KRW | | | 747,293 | | | USD | | | 760,110 | | | 1/7/2025 | | | HUB | | | | - | | | | (12,817 | ) | | | (12,817 | ) |
| KRW | | | 815,229 | | | USD | | | 829,216 | | | 1/7/2025 | | | HUB | | | | - | | | | (13,987 | ) | | | (13,987 | ) |
| KRW | | | 815,229 | | | USD | | | 829,217 | | | 1/7/2025 | | | HUB | | | | - | | | | (13,988 | ) | | | (13,988 | ) |
| USD | | | 823,337 | | | JPY | | | 826,210 | | | 1/7/2025 | | | HUB | | | | - | | | | (2,873 | ) | | | (2,873 | ) |
| USD | | | 1,077,511 | | | JPY | | | 1,080,428 | | | 1/7/2025 | | | HUB | | | | - | | | | (2,917 | ) | | | (2,917 | ) |
| KRW | | | 1,086,972 | | | USD | | | 1,105,909 | | | 1/7/2025 | | | HUB | | | | - | | | | (18,937 | ) | | | (18,937 | ) |
| KRW | | | 1,086,972 | | | USD | | | 1,106,210 | | | 1/7/2025 | | | HUB | | | | - | | | | (19,238 | ) | | | (19,238 | ) |
| KRW | | | 1,154,908 | | | USD | | | 1,174,853 | | | 1/7/2025 | | | HUB | | | | - | | | | (19,945 | ) | | | (19,945 | ) |
| KRW | | | 1,154,908 | | | USD | | | 1,174,869 | | | 1/7/2025 | | | HUB | | | | - | | | | (19,961 | ) | | | (19,961 | ) |
| KRW | | | 1,154,908 | | | USD | | | 1,175,242 | | | 1/7/2025 | | | HUB | | | | - | | | | (20,334 | ) | | | (20,334 | ) |
| KRW | | | 1,222,844 | | | USD | | | 1,243,362 | | | 1/7/2025 | | | HUB | | | | - | | | | (20,518 | ) | | | (20,518 | ) |
| KRW | | | 1,222,844 | | | USD | | | 1,243,918 | | | 1/7/2025 | | | HUB | | | | - | | | | (21,074 | ) | | | (21,074 | ) |
| KRW | | | 1,222,844 | | | USD | | | 1,244,101 | | | 1/7/2025 | | | HUB | | | | - | | | | (21,257 | ) | | | (21,257 | ) |
| KRW | | | 1,358,715 | | | USD | | | 1,381,976 | | | 1/7/2025 | | | HUB | | | | - | | | | (23,261 | ) | | | (23,261 | ) |
| KRW | | | 2,445,688 | | | USD | | | 2,511,556 | | | 1/7/2025 | | | HUB | | | | - | | | | (65,868 | ) | | | (65,868 | ) |
| KRW | | | 18,478,530 | | | USD | | | 18,781,936 | | | 1/7/2025 | | | HUB | | | | - | | | | (303,406 | ) | | | (303,406 | ) |
| KRW | | | 173,440,025 | | | USD | | | 175,710,274 | | | 1/7/2025 | | | HUB | | | | - | | | | (2,270,249 | ) | | | (2,270,249 | ) |
| USD | | | 220,564,154 | | | KRW | | | 210,465,020 | | | 1/7/2025 | | | HUB | | | | 10,099,134 | | | | - | | | | 10,099,134 | |
| USD | | | 1,929,374 | | | CNY | | | 1,907,843 | | | 1/10/2025 | | | HUB | | | | 21,531 | | | | - | | | | 21,531 | |
| USD | | | 2,683,303 | | | CNY | | | 2,657,353 | | | 1/10/2025 | | | HUB | | | | 25,950 | | | | - | | | | 25,950 | |
| USD | | | 2,836,252 | | | CNY | | | 2,793,628 | | | 1/10/2025 | | | HUB | | | | 42,624 | | | | - | | | | 42,624 | |
| CNY | | | 3,202,451 | | | USD | | | 3,226,329 | | | 1/10/2025 | | | HUB | | | | - | | | | (23,878 | ) | | | (23,878 | ) |
| USD | | | 3,313,150 | | | CNY | | | 3,270,588 | | | 1/10/2025 | | | HUB | | | | 42,562 | | | | - | | | | 42,562 | |
| CNY | | | 4,088,236 | | | USD | | | 4,109,234 | | | 1/10/2025 | | | HUB | | | | - | | | | (20,998 | ) | | | (20,998 | ) |
| USD | | | 4,405,633 | | | CNY | | | 4,360,785 | | | 1/10/2025 | | | HUB | | | | 44,848 | | | | - | | | | 44,848 | |
| USD | | | 4,617,562 | | | CNY | | | 4,565,196 | | | 1/10/2025 | | | HUB | | | | 52,366 | | | | - | | | | 52,366 | |
| CNY | | | 5,178,432 | | | USD | | | 5,216,621 | | | 1/10/2025 | | | HUB | | | | - | | | | (38,189 | ) | | | (38,189 | ) |
| CNY | | | 5,723,530 | | | USD | | | 5,749,014 | | | 1/10/2025 | | | HUB | | | | - | | | | (25,484 | ) | | | (25,484 | ) |
| USD | | | 5,725,812 | | | CNY | | | 5,655,393 | | | 1/10/2025 | | | HUB | | | | 70,419 | | | | - | | | | 70,419 | |
| USD | | | 6,137,152 | | | CNY | | | 6,064,216 | | | 1/10/2025 | | | HUB | | | | 72,936 | | | | - | | | | 72,936 | |
| CNY | | | 6,881,863 | | | USD | | | 6,984,577 | | | 1/10/2025 | | | HUB | | | | - | | | | (102,714 | ) | | | (102,714 | ) |
See accompanying notes
35
American Beacon AHL Managed Futures Strategy FundSM
Consolidated Schedule of Investments
December 31, 2024
| | | | | | | | | | | | | | | | | | | | | | | | | | | | |
| | | | | | |
| Currency Purchased* | | | Currency Sold* | | | Settlement
Date | | Counterparty | | | Unrealized
Appreciation | | | Unrealized
(Depreciation) | | | Net Unrealized
Appreciation
(Depreciation) | |
| CNY | | | 7,222,550 | | | USD | | | 7,255,213 | | | 1/10/2025 | | | HUB | | | $ | - | | | $ | (32,663 | ) | | $ | (32,663 | ) |
| CNY | | | 10,356,863 | | | USD | | | 10,432,915 | | | 1/10/2025 | | | HUB | | | | - | | | | (76,052 | ) | | | (76,052 | ) |
| USD | | | 10,573,433 | | | CNY | | | 10,493,138 | | | 1/10/2025 | | | HUB | | | | 80,295 | | | | - | | | | 80,295 | |
| USD | | | 15,460,305 | | | CNY | | | 15,330,883 | | | 1/10/2025 | | | HUB | | | | 129,422 | | | | - | | | | 129,422 | |
| CNY | | | 19,827,943 | | | USD | | | 19,938,278 | | | 1/10/2025 | | | HUB | | | | - | | | | (110,335 | ) | | | (110,335 | ) |
| CNY | | | 20,100,492 | | | USD | | | 20,195,539 | | | 1/10/2025 | | | HUB | | | | - | | | | (95,047 | ) | | | (95,047 | ) |
| USD | | | 231,043,884 | | | CNY | | | 227,510,310 | | | 1/10/2025 | | | HUB | | | | 3,533,574 | | | | - | | | | 3,533,574 | |
| AUD | | | 123,792 | | | JPY | | | 121,886 | | | 1/14/2025 | | | HUB | | | | 1,906 | | | | - | | | | 1,906 | |
| AUD | | | 185,687 | | | JPY | | | 189,193 | | | 1/14/2025 | | | HUB | | | | - | | | | (3,506 | ) | | | (3,506 | ) |
| AUD | | | 247,583 | | | JPY | | | 248,179 | | | 1/14/2025 | | | HUB | | | | - | | | | (596 | ) | | | (596 | ) |
| AUD | | | 247,583 | | | JPY | | | 248,765 | | | 1/14/2025 | | | HUB | | | | - | | | | (1,182 | ) | | | (1,182 | ) |
| AUD | | | 309,480 | | | JPY | | | 318,250 | | | 1/14/2025 | | | HUB | | | | - | | | | (8,770 | ) | | | (8,770 | ) |
| JPY | | | 311,654 | | | AUD | | | 309,479 | | | 1/14/2025 | | | HUB | | | | 2,175 | | | | - | | | | 2,175 | |
| JPY | | | 318,381 | | | AUD | | | 309,478 | | | 1/14/2025 | | | HUB | | | | 8,903 | | | | - | | | | 8,903 | |
| AUD | | | 433,271 | | | JPY | | | 435,687 | | | 1/14/2025 | | | HUB | | | | - | | | | (2,416 | ) | | | (2,416 | ) |
| AUD | | | 495,167 | | | JPY | | | 510,686 | | | 1/14/2025 | | | HUB | | | | - | | | | (15,519 | ) | | | (15,519 | ) |
| JPY | | | 1,225,457 | | | AUD | | | 1,237,917 | | | 1/14/2025 | | | HUB | | | | - | | | | (12,460 | ) | | | (12,460 | ) |
| JPY | | | 1,588,460 | | | AUD | | | 1,609,292 | | | 1/14/2025 | | | HUB | | | | - | | | | (20,832 | ) | | | (20,832 | ) |
| AUD | | | 1,733,084 | | | JPY | | | 1,736,070 | | | 1/14/2025 | | | HUB | | | | - | | | | (2,986 | ) | | | (2,986 | ) |
| JPY | | | 1,826,534 | | | AUD | | | 1,856,875 | | | 1/14/2025 | | | HUB | | | | - | | | | (30,341 | ) | | | (30,341 | ) |
| AUD | | | 2,104,459 | | | JPY | | | 2,128,011 | | | 1/14/2025 | | | HUB | | | | - | | | | (23,552 | ) | | | (23,552 | ) |
| AUD | | | 2,228,250 | | | JPY | | | 2,212,441 | | | 1/14/2025 | | | HUB | | | | 15,809 | | | | - | | | | 15,809 | |
| JPY | | | 2,568,524 | | | AUD | | | 2,599,626 | | | 1/14/2025 | | | HUB | | | | - | | | | (31,102 | ) | | | (31,102 | ) |
| JPY | | | 2,573,155 | | | AUD | | | 2,599,626 | | | 1/14/2025 | | | HUB | | | | - | | | | (26,471 | ) | | | (26,471 | ) |
| AUD | | | 2,732,865 | | | JPY | | | 2,832,607 | | | 1/14/2025 | | | HUB | | | | - | | | | (99,742 | ) | | | (99,742 | ) |
| JPY | | | 2,756,792 | | | AUD | | | 2,661,520 | | | 1/14/2025 | | | HUB | | | | 95,272 | | | | - | | | | 95,272 | |
| JPY | | | 2,768,966 | | | AUD | | | 2,785,313 | | | 1/14/2025 | | | HUB | | | | - | | | | (16,347 | ) | | | (16,347 | ) |
| AUD | | | 3,713,751 | | | JPY | | | 3,720,893 | | | 1/14/2025 | | | HUB | | | | - | | | | (7,142 | ) | | | (7,142 | ) |
| JPY | | | 3,751,119 | | | AUD | | | 3,651,854 | | | 1/14/2025 | | | HUB | | | | 99,265 | | | | - | | | | 99,265 | |
| AUD | | | 4,456,501 | | | JPY | | | 4,488,450 | | | 1/14/2025 | | | HUB | | | | - | | | | (31,949 | ) | | | (31,949 | ) |
| JPY | | | 4,754,707 | | | AUD | | | 4,765,980 | | | 1/14/2025 | | | HUB | | | | - | | | | (11,273 | ) | | | (11,273 | ) |
| AUD | | | 5,465,731 | | | JPY | | | 5,640,262 | | | 1/14/2025 | | | HUB | | | | - | | | | (174,531 | ) | | | (174,531 | ) |
| JPY | | | 5,742,697 | | | AUD | | | 5,752,021 | | | 1/14/2025 | | | HUB | | | | - | | | | (9,324 | ) | | | (9,324 | ) |
| JPY | | | 6,491,952 | | | AUD | | | 6,503,357 | | | 1/14/2025 | | | HUB | | | | - | | | | (11,405 | ) | | | (11,405 | ) |
| AUD | | | 8,198,597 | | | JPY | | | 8,489,460 | | | 1/14/2025 | | | HUB | | | | - | | | | (290,863 | ) | | | (290,863 | ) |
| AUD | | | 9,213,996 | | | JPY | | | 9,544,253 | | | 1/14/2025 | | | HUB | | | | - | | | | (330,257 | ) | | | (330,257 | ) |
| AUD | | | 10,931,463 | | | JPY | | | 11,277,319 | | | 1/14/2025 | | | HUB | | | | - | | | | (345,856 | ) | | | (345,856 | ) |
| AUD | | | 10,931,464 | | | JPY | | | 11,315,138 | | | 1/14/2025 | | | HUB | | | | - | | | | (383,674 | ) | | | (383,674 | ) |
| GBP | | | 35 | | | USD | | | 36 | | | 1/16/2025 | | | HUB | | | | - | | | | (1 | ) | | | (1 | ) |
| USD | | | 62 | | | PLN | | | 62 | | | 1/16/2025 | | | HUB | | | | - | | | | - | | | | | |
| JPY | | | 144 | | | USD | | | 150 | | | 1/16/2025 | | | HUB | | | | - | | | | (6 | ) | | | (6 | ) |
| PLN | | | 346 | | | USD | | | 352 | | | 1/16/2025 | | | HUB | | | | - | | | | (6 | ) | | | (6 | ) |
| JPY | | | 389 | | | USD | | | 399 | | | 1/16/2025 | | | HUB | | | | - | | | | (10 | ) | | | (10 | ) |
| JPY | | | 555 | | | USD | | | 556 | | | 1/16/2025 | | | HUB | | | | - | | | | (1 | ) | | | (1 | ) |
| GBP | | | 663 | | | USD | | | 676 | | | 1/16/2025 | | | HUB | | | | - | | | | (13 | ) | | | (13 | ) |
| USD | | | 698 | | | PLN | | | 689 | | | 1/16/2025 | | | HUB | | | | 9 | | | | - | | | | 9 | |
| JPY | | | 767 | | | USD | | | 806 | | | 1/16/2025 | | | HUB | | | | - | | | | (39 | ) | | | (39 | ) |
| JPY | | | 804 | | | USD | | | 805 | | | 1/16/2025 | | | HUB | | | | - | | | | (1 | ) | | | (1 | ) |
| JPY | | | 832 | | | USD | | | 837 | | | 1/16/2025 | | | HUB | | | | - | | | | (5 | ) | | | (5 | ) |
| JPY | | | 1,392 | | | USD | | | 1,428 | | | 1/16/2025 | | | HUB | | | | - | | | | (36 | ) | | | (36 | ) |
| USD | | | 1,617 | | | PLN | | | 1,606 | | | 1/16/2025 | | | HUB | | | | 11 | | | | - | | | | 11 | |
| JPY | | | 1,666 | | | USD | | | 1,710 | | | 1/16/2025 | | | HUB | | | | - | | | | (44 | ) | | | (44 | ) |
| USD | | | 1,731 | | | PLN | | | 1,716 | | | 1/16/2025 | | | HUB | | | | 15 | | | | - | | | | 15 | |
| USD | | | 1,900 | | | JPY | | | 1,889 | | | 1/16/2025 | | | HUB | | | | 11 | | | | - | | | | 11 | |
| USD | | | 1,990 | | | JPY | | | 1,897 | | | 1/16/2025 | | | HUB | | | | 93 | | | | - | | | | 93 | |
| USD | | | 2,074 | | | CAD | | | 2,038 | | | 1/16/2025 | | | HUB | | | | 36 | | | | - | | | | 36 | |
| CAD | | | 2,262 | | | USD | | | 2,257 | | | 1/16/2025 | | | HUB | | | | 5 | | | | - | | | | 5 | |
| JPY | | | 2,269 | | | USD | | | 2,284 | | | 1/16/2025 | | | HUB | | | | - | | | | (15 | ) | | | (15 | ) |
| JPY | | | 2,310 | | | USD | | | 2,312 | | | 1/16/2025 | | | HUB | | | | - | | | | (2 | ) | | | (2 | ) |
See accompanying notes
36
American Beacon AHL Managed Futures Strategy FundSM
Consolidated Schedule of Investments
December 31, 2024
| | | | | | | | | | | | | | | | | | | | | | | | | | | | |
| | | | | | |
| Currency Purchased* | | | Currency Sold* | | | Settlement
Date | | Counterparty | | | Unrealized
Appreciation | | | Unrealized
(Depreciation) | | | Net Unrealized
Appreciation
(Depreciation) | |
| GBP | | | 2,321 | | | USD | | | 2,367 | | | 1/16/2025 | | | HUB | | | $ | - | | | $ | (46 | ) | | $ | (46 | ) |
| AUD | | | 2,758 | | | USD | | | 2,764 | | | 1/16/2025 | | | HUB | | | | - | | | | (6 | ) | | | (6 | ) |
| AUD | | | 2,928 | | | USD | | | 3,013 | | | 1/16/2025 | | | HUB | | | | - | | | | (85 | ) | | | (85 | ) |
| JPY | | | 3,159 | | | USD | | | 3,239 | | | 1/16/2025 | | | HUB | | | | - | | | | (80 | ) | | | (80 | ) |
| JPY | | | 3,446 | | | USD | | | 3,437 | | | 1/16/2025 | | | HUB | | | | 9 | | | | - | | | | 9 | |
| CAD | | | 3,491 | | | USD | | | 3,531 | | | 1/16/2025 | | | HUB | | | | - | | | | (40 | ) | | | (40 | ) |
| JPY | | | 3,491 | | | USD | | | 3,662 | | | 1/16/2025 | | | HUB | | | | - | | | | (171 | ) | | | (171 | ) |
| AUD | | | 3,504 | | | USD | | | 3,529 | | | 1/16/2025 | | | HUB | | | | - | | | | (25 | ) | | | (25 | ) |
| USD | | | 3,793 | | | PLN | | | 3,727 | | | 1/16/2025 | | | HUB | | | | 66 | | | | - | | | | 66 | |
| USD | | | 4,066 | | | JPY | | | 3,958 | | | 1/16/2025 | | | HUB | | | | 108 | | | | - | | | | 108 | |
| GBP | | | 4,178 | | | USD | | | 4,176 | | | 1/16/2025 | | | HUB | | | | 2 | | | | - | | | | 2 | |
| USD | | | 4,213 | | | JPY | | | 4,096 | | | 1/16/2025 | | | HUB | | | | 117 | | | | - | | | | 117 | |
| USD | | | 4,283 | | | JPY | | | 4,256 | | | 1/16/2025 | | | HUB | | | | 27 | | | | - | | | | 27 | |
| USD | | | 4,913 | | | JPY | | | 4,790 | | | 1/16/2025 | | | HUB | | | | 123 | | | | - | | | | 123 | |
| USD | | | 5,375 | | | CAD | | | 5,384 | | | 1/16/2025 | | | HUB | | | | - | | | | (9 | ) | | | (9 | ) |
| USD | | | 5,402 | | | GBP | | | 5,300 | | | 1/16/2025 | | | HUB | | | | 102 | | | | - | | | | 102 | |
| USD | | | 5,890 | | | JPY | | | 5,855 | | | 1/16/2025 | | | HUB | | | | 35 | | | | - | | | | 35 | |
| USD | | | 6,114 | | | GBP | | | 6,055 | | | 1/16/2025 | | | HUB | | | | 59 | | | | - | | | | 59 | |
| USD | | | 7,128 | | | PLN | | | 7,084 | | | 1/16/2025 | | | HUB | | | | 44 | | | | - | | | | 44 | |
| AUD | | | 7,361 | | | USD | | | 7,539 | | | 1/16/2025 | | | HUB | | | | - | | | | (178 | ) | | | (178 | ) |
| USD | | | 8,458 | | | CAD | | | 8,461 | | | 1/16/2025 | | | HUB | | | | - | | | | (3 | ) | | | (3 | ) |
| JPY | | | 8,850 | | | USD | | | 8,827 | | | 1/16/2025 | | | HUB | | | | 23 | | | | - | | | | 23 | |
| JPY | | | 9,521 | | | USD | | | 9,850 | | | 1/16/2025 | | | HUB | | | | - | | | | (329 | ) | | | (329 | ) |
| USD | | | 10,996 | | | JPY | | | 10,556 | | | 1/16/2025 | | | HUB | | | | 440 | | | | - | | | | 440 | |
| CAD | | | 11,745 | | | USD | | | 11,752 | | | 1/16/2025 | | | HUB | | | | - | | | | (7 | ) | | | (7 | ) |
| JPY | | | 12,761 | | | USD | | | 12,831 | | | 1/16/2025 | | | HUB | | | | - | | | | (70 | ) | | | (70 | ) |
| USD | | | 13,028 | | | JPY | | | 12,685 | | | 1/16/2025 | | | HUB | | | | 343 | | | | - | | | | 343 | |
| CAD | | | 13,272 | | | USD | | | 13,473 | | | 1/16/2025 | | | HUB | | | | - | | | | (201 | ) | | | (201 | ) |
| USD | | | 13,660 | | | AUD | | | 13,587 | | | 1/16/2025 | | | HUB | | | | 73 | | | | - | | | | 73 | |
| USD | | | 13,777 | | | AUD | | | 13,683 | | | 1/16/2025 | | | HUB | | | | 94 | | | | - | | | | 94 | |
| CAD | | | 14,508 | | | USD | | | 14,611 | | | 1/16/2025 | | | HUB | | | | - | | | | (103 | ) | | | (103 | ) |
| PLN | | | 16,173 | | | USD | | | 16,285 | | | 1/16/2025 | | | HUB | | | | - | | | | (112 | ) | | | (112 | ) |
| USD | | | 16,205 | | | CAD | | | 16,211 | | | 1/16/2025 | | | HUB | | | | - | | | | (6 | ) | | | (6 | ) |
| AUD | | | 16,422 | | | USD | | | 16,468 | | | 1/16/2025 | | | HUB | | | | - | | | | (46 | ) | | | (46 | ) |
| USD | | | 17,244 | | | GBP | | | 17,166 | | | 1/16/2025 | | | HUB | | | | 78 | | | | - | | | | 78 | |
| USD | | | 17,999 | | | AUD | | | 17,785 | | | 1/16/2025 | | | HUB | | | | 214 | | | | - | | | | 214 | |
| USD | | | 18,509 | | | CAD | | | 18,516 | | | 1/16/2025 | | | HUB | | | | - | | | | (7 | ) | | | (7 | ) |
| USD | | | 19,731 | | | CAD | | | 19,748 | | | 1/16/2025 | | | HUB | | | | - | | | | (17 | ) | | | (17 | ) |
| USD | | | 20,228 | | | JPY | | | 19,696 | | | 1/16/2025 | | | HUB | | | | 532 | | | | - | | | | 532 | |
| JPY | | | 20,888 | | | USD | | | 21,607 | | | 1/16/2025 | | | HUB | | | | - | | | | (719 | ) | | | (719 | ) |
| JPY | | | 21,115 | | | USD | | | 21,061 | | | 1/16/2025 | | | HUB | | | | 54 | | | | - | | | | 54 | |
| USD | | | 21,793 | | | AUD | | | 21,162 | | | 1/16/2025 | | | HUB | | | | 631 | | | | - | | | | 631 | |
| AUD | | | 22,419 | | | USD | | | 22,596 | | | 1/16/2025 | | | HUB | | | | - | | | | (177 | ) | | | (177 | ) |
| JPY | | | 23,622 | | | USD | | | 24,250 | | | 1/16/2025 | | | HUB | | | | - | | | | (628 | ) | | | (628 | ) |
| CAD | | | 24,378 | | | USD | | | 24,808 | | | 1/16/2025 | | | HUB | | | | - | | | | (430 | ) | | | (430 | ) |
| JPY | | | 24,625 | | | USD | | | 24,756 | | | 1/16/2025 | | | HUB | | | | - | | | | (131 | ) | | | (131 | ) |
| USD | | | 25,633 | | | GBP | | | 25,617 | | | 1/16/2025 | | | HUB | | | | 16 | | | | - | | | | 16 | |
| CAD | | | 28,329 | | | USD | | | 28,449 | | | 1/16/2025 | | | HUB | | | | - | | | | (120 | ) | | | (120 | ) |
| USD | | | 30,082 | | | JPY | | | 29,243 | | | 1/16/2025 | | | HUB | | | | 839 | | | | - | | | | 839 | |
| USD | | | 37,352 | | | AUD | | | 35,918 | | | 1/16/2025 | | | HUB | | | | 1,434 | | | | - | | | | 1,434 | |
| AUD | | | 120,349 | | | USD | | | 124,994 | | | 1/16/2025 | | | HUB | | | | - | | | | (4,645 | ) | | | (4,645 | ) |
| AUD | | | 196,201 | | | USD | | | 202,780 | | | 1/16/2025 | | | HUB | | | | - | | | | (6,579 | ) | | | (6,579 | ) |
| USD | | | 296,175 | | | AUD | | | 285,835 | | | 1/16/2025 | | | HUB | | | | 10,340 | | | | - | | | | 10,340 | |
| PLN | | | 431,577 | | | USD | | | 437,229 | | | 1/16/2025 | | | HUB | | | | - | | | | (5,652 | ) | | | (5,652 | ) |
| GBP | | | 2,320,414 | | | USD | | | 2,344,082 | | | 1/16/2025 | | | HUB | | | | - | | | | (23,668 | ) | | | (23,668 | ) |
| USD | | | 3,554,433 | | | AUD | | | 3,485,437 | | | 1/16/2025 | | | HUB | | | | 68,996 | | | | - | | | | 68,996 | |
| USD | | | 23,739,433 | | | EUR | | | 23,407,849 | | | 1/16/2025 | | | HUB | | | | 331,584 | | | | - | | | | 331,584 | |
| USD | | | 27,603,464 | | | EUR | | | 27,223,827 | | | 1/16/2025 | | | HUB | | | | 379,637 | | | | - | | | | 379,637 | |
| USD | | | 27,934,038 | | | AUD | | | 27,241,883 | | | 1/16/2025 | | | HUB | | | | 692,155 | | | | - | | | | 692,155 | |
See accompanying notes
37
American Beacon AHL Managed Futures Strategy FundSM
Consolidated Schedule of Investments
December 31, 2024
| | | | | | | | | | | | | | | | | | | | | | | | | | | | |
| | | | | | |
| Currency Purchased* | | | Currency Sold* | | | Settlement
Date | | Counterparty | | | Unrealized
Appreciation | | | Unrealized
(Depreciation) | | | Net Unrealized
Appreciation
(Depreciation) | |
| KRW | | | 67,968 | | | USD | | | 68,014 | | | 1/23/2025 | | | HUB | | | $ | - | | | $ | (46 | ) | | $ | (46 | ) |
| USD | | | 69,714 | | | KRW | | | 67,968 | | | 1/23/2025 | | | HUB | | | | 1,746 | | | | - | | | | 1,746 | |
| USD | | | 69,888 | | | KRW | | | 67,968 | | | 1/23/2025 | | | HUB | | | | 1,920 | | | | - | | | | 1,920 | |
| USD | | | 70,548 | | | KRW | | | 67,968 | | | 1/23/2025 | | | HUB | | | | 2,580 | | | | - | | | | 2,580 | |
| USD | | | 70,702 | | | KRW | | | 67,968 | | | 1/23/2025 | | | HUB | | | | 2,734 | | | | - | | | | 2,734 | |
| USD | | | 70,723 | | | KRW | | | 67,968 | | | 1/23/2025 | | | HUB | | | | 2,755 | | | | - | | | | 2,755 | |
| USD | | | 70,763 | | | KRW | | | 67,968 | | | 1/23/2025 | | | HUB | | | | 2,795 | | | | - | | | | 2,795 | |
| USD | | | 71,360 | | | KRW | | | 67,968 | | | 1/23/2025 | | | HUB | | | | 3,392 | | | | - | | | | 3,392 | |
| USD | | | 71,405 | | | KRW | | | 67,968 | | | 1/23/2025 | | | HUB | | | | 3,437 | | | | - | | | | 3,437 | |
| KRW | | | 135,936 | | | USD | | | 136,253 | | | 1/23/2025 | | | HUB | | | | - | | | | (317 | ) | | | (317 | ) |
| USD | | | 141,392 | | | KRW | | | 135,936 | | | 1/23/2025 | | | HUB | | | | 5,456 | | | | - | | | | 5,456 | |
| USD | | | 141,395 | | | KRW | | | 135,936 | | | 1/23/2025 | | | HUB | | | | 5,459 | | | | - | | | | 5,459 | |
| USD | | | 141,418 | | | KRW | | | 135,936 | | | 1/23/2025 | | | HUB | | | | 5,482 | | | | - | | | | 5,482 | |
| USD | | | 141,432 | | | KRW | | | 135,936 | | | 1/23/2025 | | | HUB | | | | 5,496 | | | | - | | | | 5,496 | |
| USD | | | 141,447 | | | KRW | | | 135,936 | | | 1/23/2025 | | | HUB | | | | 5,511 | | | | - | | | | 5,511 | |
| USD | | | 141,469 | | | KRW | | | 135,936 | | | 1/23/2025 | | | HUB | | | | 5,533 | | | | - | | | | 5,533 | |
| USD | | | 141,477 | | | KRW | | | 135,936 | | | 1/23/2025 | | | HUB | | | | 5,541 | | | | - | | | | 5,541 | |
| USD | | | 141,478 | | | KRW | | | 135,936 | | | 1/23/2025 | | | HUB | | | | 5,542 | | | | - | | | | 5,542 | |
| USD | | | 142,082 | | | KRW | | | 135,936 | | | 1/23/2025 | | | HUB | | | | 6,146 | | | | - | | | | 6,146 | |
| USD | | | 142,775 | | | KRW | | | 135,936 | | | 1/23/2025 | | | HUB | | | | 6,839 | | | | - | | | | 6,839 | |
| USD | | | 142,781 | | | KRW | | | 135,936 | | | 1/23/2025 | | | HUB | | | | 6,845 | | | | - | | | | 6,845 | |
| USD | | | 142,784 | | | KRW | | | 135,936 | | | 1/23/2025 | | | HUB | | | | 6,848 | | | | - | | | | 6,848 | |
| USD | | | 142,815 | | | KRW | | | 135,936 | | | 1/23/2025 | | | HUB | | | | 6,879 | | | | - | | | | 6,879 | |
| USD | | | 142,881 | | | KRW | | | 135,936 | | | 1/23/2025 | | | HUB | | | | 6,945 | | | | - | | | | 6,945 | |
| KRW | | | 203,904 | | | USD | | | 203,209 | | | 1/23/2025 | | | HUB | | | | 695 | | | | - | | | | 695 | |
| KRW | | | 203,904 | | | USD | | | 203,857 | | | 1/23/2025 | | | HUB | | | | 47 | | | | - | | | | 47 | |
| KRW | | | 203,904 | | | USD | | | 204,115 | | | 1/23/2025 | | | HUB | | | | - | | | | (211 | ) | | | (211 | ) |
| USD | | | 209,106 | | | KRW | | | 203,904 | | | 1/23/2025 | | | HUB | | | | 5,202 | | | | - | | | | 5,202 | |
| USD | | | 211,666 | | | KRW | | | 203,904 | | | 1/23/2025 | | | HUB | | | | 7,762 | | | | - | | | | 7,762 | |
| USD | | | 211,689 | | | KRW | | | 203,904 | | | 1/23/2025 | | | HUB | | | | 7,785 | | | | - | | | | 7,785 | |
| USD | | | 211,800 | | | KRW | | | 203,904 | | | 1/23/2025 | | | HUB | | | | 7,896 | | | | - | | | | 7,896 | |
| USD | | | 212,121 | | | KRW | | | 203,904 | | | 1/23/2025 | | | HUB | | | | 8,217 | | | | - | | | | 8,217 | |
| USD | | | 212,139 | | | KRW | | | 203,904 | | | 1/23/2025 | | | HUB | | | | 8,235 | | | | - | | | | 8,235 | |
| USD | | | 212,163 | | | KRW | | | 203,904 | | | 1/23/2025 | | | HUB | | | | 8,259 | | | | - | | | | 8,259 | |
| USD | | | 212,165 | | | KRW | | | 203,904 | | | 1/23/2025 | | | HUB | | | | 8,261 | | | | - | | | | 8,261 | |
| USD | | | 212,218 | | | KRW | | | 203,904 | | | 1/23/2025 | | | HUB | | | | 8,314 | | | | - | | | | 8,314 | |
| USD | | | 212,291 | | | KRW | | | 203,904 | | | 1/23/2025 | | | HUB | | | | 8,387 | | | | - | | | | 8,387 | |
| USD | | | 213,011 | | | KRW | | | 203,904 | | | 1/23/2025 | | | HUB | | | | 9,107 | | | | - | | | | 9,107 | |
| USD | | | 214,099 | | | KRW | | | 203,904 | | | 1/23/2025 | | | HUB | | | | 10,195 | | | | - | | | | 10,195 | |
| USD | | | 214,125 | | | KRW | | | 203,904 | | | 1/23/2025 | | | HUB | | | | 10,221 | | | | - | | | | 10,221 | |
| USD | | | 214,130 | | | KRW | | | 203,904 | | | 1/23/2025 | | | HUB | | | | 10,226 | | | | - | | | | 10,226 | |
| USD | | | 214,186 | | | KRW | | | 203,904 | | | 1/23/2025 | | | HUB | | | | 10,282 | | | | - | | | | 10,282 | |
| USD | | | 214,212 | | | KRW | | | 203,904 | | | 1/23/2025 | | | HUB | | | | 10,308 | | | | - | | | | 10,308 | |
| USD | | | 214,301 | | | KRW | | | 203,904 | | | 1/23/2025 | | | HUB | | | | 10,397 | | | | - | | | | 10,397 | |
| USD | | | 214,477 | | | KRW | | | 203,904 | | | 1/23/2025 | | | HUB | | | | 10,573 | | | | - | | | | 10,573 | |
| KRW | | | 271,872 | | | USD | | | 269,756 | | | 1/23/2025 | | | HUB | | | | 2,116 | | | | - | | | | 2,116 | |
| KRW | | | 271,872 | | | USD | | | 270,549 | | | 1/23/2025 | | | HUB | | | | 1,323 | | | | - | | | | 1,323 | |
| KRW | | | 271,872 | | | USD | | | 270,865 | | | 1/23/2025 | | | HUB | | | | 1,007 | | | | - | | | | 1,007 | |
| KRW | | | 271,872 | | | USD | | | 271,210 | | | 1/23/2025 | | | HUB | | | | 662 | | | | - | | | | 662 | |
| USD | | | 282,229 | | | KRW | | | 271,872 | | | 1/23/2025 | | | HUB | | | | 10,357 | | | | - | | | | 10,357 | |
| USD | | | 282,378 | | | KRW | | | 271,872 | | | 1/23/2025 | | | HUB | | | | 10,506 | | | | - | | | | 10,506 | |
| USD | | | 282,418 | | | KRW | | | 271,872 | | | 1/23/2025 | | | HUB | | | | 10,546 | | | | - | | | | 10,546 | |
| USD | | | 282,802 | | | KRW | | | 271,872 | | | 1/23/2025 | | | HUB | | | | 10,930 | | | | - | | | | 10,930 | |
| USD | | | 284,469 | | | KRW | | | 271,872 | | | 1/23/2025 | | | HUB | | | | 12,597 | | | | - | | | | 12,597 | |
| USD | | | 285,258 | | | KRW | | | 271,872 | | | 1/23/2025 | | | HUB | | | | 13,386 | | | | - | | | | 13,386 | |
| USD | | | 285,309 | | | KRW | | | 271,872 | | | 1/23/2025 | | | HUB | | | | 13,437 | | | | - | | | | 13,437 | |
| USD | | | 285,435 | | | KRW | | | 271,872 | | | 1/23/2025 | | | HUB | | | | 13,563 | | | | - | | | | 13,563 | |
| USD | | | 285,472 | | | KRW | | | 271,872 | | | 1/23/2025 | | | HUB | | | | 13,600 | | | | - | | | | 13,600 | |
| USD | | | 285,492 | | | KRW | | | 271,872 | | | 1/23/2025 | | | HUB | | | | 13,620 | | | | - | | | | 13,620 | |
See accompanying notes
38
American Beacon AHL Managed Futures Strategy FundSM
Consolidated Schedule of Investments
December 31, 2024
| | | | | | | | | | | | | | | | | | | | | | | | | | | | |
| | | | | | |
| Currency Purchased* | | | Currency Sold* | | | Settlement
Date | | Counterparty | | | Unrealized
Appreciation | | | Unrealized
(Depreciation) | | | Net Unrealized
Appreciation
(Depreciation) | |
| USD | | | 285,529 | | | KRW | | | 271,872 | | | 1/23/2025 | | | HUB | | | $ | 13,657 | | | $ | - | | | $ | 13,657 | |
| USD | | | 285,555 | | | KRW | | | 271,872 | | | 1/23/2025 | | | HUB | | | | 13,683 | | | | - | | | | 13,683 | |
| USD | | | 285,611 | | | KRW | | | 271,872 | | | 1/23/2025 | | | HUB | | | | 13,739 | | | | - | | | | 13,739 | |
| USD | | | 285,616 | | | KRW | | | 271,872 | | | 1/23/2025 | | | HUB | | | | 13,744 | | | | - | | | | 13,744 | |
| USD | | | 285,701 | | | KRW | | | 271,872 | | | 1/23/2025 | | | HUB | | | | 13,829 | | | | - | | | | 13,829 | |
| USD | | | 285,702 | | | KRW | | | 271,872 | | | 1/23/2025 | | | HUB | | | | 13,830 | | | | - | | | | 13,830 | |
| USD | | | 285,923 | | | KRW | | | 271,872 | | | 1/23/2025 | | | HUB | | | | 14,051 | | | | - | | | | 14,051 | |
| KRW | | | 339,840 | | | USD | | | 337,211 | | | 1/23/2025 | | | HUB | | | | 2,629 | | | | - | | | | 2,629 | |
| KRW | | | 339,840 | | | USD | | | 337,414 | | | 1/23/2025 | | | HUB | | | | 2,426 | | | | - | | | | 2,426 | |
| KRW | | | 339,840 | | | USD | | | 338,208 | | | 1/23/2025 | | | HUB | | | | 1,632 | | | | - | | | | 1,632 | |
| KRW | | | 339,840 | | | USD | | | 338,284 | | | 1/23/2025 | | | HUB | | | | 1,556 | | | | - | | | | 1,556 | |
| USD | | | 348,770 | | | KRW | | | 339,840 | | | 1/23/2025 | | | HUB | | | | 8,930 | | | | - | | | | 8,930 | |
| USD | | | 352,766 | | | KRW | | | 339,840 | | | 1/23/2025 | | | HUB | | | | 12,926 | | | | - | | | | 12,926 | |
| USD | | | 352,798 | | | KRW | | | 339,840 | | | 1/23/2025 | | | HUB | | | | 12,958 | | | | - | | | | 12,958 | |
| USD | | | 352,851 | | | KRW | | | 339,840 | | | 1/23/2025 | | | HUB | | | | 13,011 | | | | - | | | | 13,011 | |
| USD | | | 356,371 | | | KRW | | | 339,840 | | | 1/23/2025 | | | HUB | | | | 16,531 | | | | - | | | | 16,531 | |
| USD | | | 356,572 | | | KRW | | | 339,840 | | | 1/23/2025 | | | HUB | | | | 16,732 | | | | - | | | | 16,732 | |
| USD | | | 356,762 | | | KRW | | | 339,840 | | | 1/23/2025 | | | HUB | | | | 16,922 | | | | - | | | | 16,922 | |
| USD | | | 356,836 | | | KRW | | | 339,840 | | | 1/23/2025 | | | HUB | | | | 16,996 | | | | - | | | | 16,996 | |
| USD | | | 356,902 | | | KRW | | | 339,840 | | | 1/23/2025 | | | HUB | | | | 17,062 | | | | - | | | | 17,062 | |
| USD | | | 357,112 | | | KRW | | | 339,840 | | | 1/23/2025 | | | HUB | | | | 17,272 | | | | - | | | | 17,272 | |
| USD | | | 357,122 | | | KRW | | | 339,840 | | | 1/23/2025 | | | HUB | | | | 17,282 | | | | - | | | | 17,282 | |
| USD | | | 357,225 | | | KRW | | | 339,840 | | | 1/23/2025 | | | HUB | | | | 17,385 | | | | - | | | | 17,385 | |
| USD | | | 357,475 | | | KRW | | | 339,840 | | | 1/23/2025 | | | HUB | | | | 17,635 | | | | - | | | | 17,635 | |
| KRW | | | 407,808 | | | USD | | | 405,814 | | | 1/23/2025 | | | HUB | | | | 1,994 | | | | - | | | | 1,994 | |
| KRW | | | 407,808 | | | USD | | | 405,843 | | | 1/23/2025 | | | HUB | | | | 1,965 | | | | - | | | | 1,965 | |
| KRW | | | 407,808 | | | USD | | | 406,161 | | | 1/23/2025 | | | HUB | | | | 1,647 | | | | - | | | | 1,647 | |
| KRW | | | 407,808 | | | USD | | | 406,163 | | | 1/23/2025 | | | HUB | | | | 1,645 | | | | - | | | | 1,645 | |
| KRW | | | 407,808 | | | USD | | | 406,970 | | | 1/23/2025 | | | HUB | | | | 838 | | | | - | | | | 838 | |
| USD | | | 418,449 | | | KRW | | | 407,808 | | | 1/23/2025 | | | HUB | | | | 10,641 | | | | - | | | | 10,641 | |
| USD | | | 423,549 | | | KRW | | | 407,808 | | | 1/23/2025 | | | HUB | | | | 15,741 | | | | - | | | | 15,741 | |
| USD | | | 423,561 | | | KRW | | | 407,808 | | | 1/23/2025 | | | HUB | | | | 15,753 | | | | - | | | | 15,753 | |
| USD | | | 427,340 | | | KRW | | | 407,808 | | | 1/23/2025 | | | HUB | | | | 19,532 | | | | - | | | | 19,532 | |
| USD | | | 427,711 | | | KRW | | | 407,808 | | | 1/23/2025 | | | HUB | | | | 19,903 | | | | - | | | | 19,903 | |
| USD | | | 427,930 | | | KRW | | | 407,808 | | | 1/23/2025 | | | HUB | | | | 20,122 | | | | - | | | | 20,122 | |
| USD | | | 428,195 | | | KRW | | | 407,808 | | | 1/23/2025 | | | HUB | | | | 20,387 | | | | - | | | | 20,387 | |
| USD | | | 428,477 | | | KRW | | | 407,808 | | | 1/23/2025 | | | HUB | | | | 20,669 | | | | - | | | | 20,669 | |
| USD | | | 428,967 | | | KRW | | | 407,808 | | | 1/23/2025 | | | HUB | | | | 21,159 | | | | - | | | | 21,159 | |
| KRW | | | 475,776 | | | USD | | | 471,037 | | | 1/23/2025 | | | HUB | | | | 4,739 | | | | - | | | | 4,739 | |
| KRW | | | 475,776 | | | USD | | | 471,360 | | | 1/23/2025 | | | HUB | | | | 4,416 | | | | - | | | | 4,416 | |
| KRW | | | 475,776 | | | USD | | | 473,474 | | | 1/23/2025 | | | HUB | | | | 2,302 | | | | - | | | | 2,302 | |
| KRW | | | 475,776 | | | USD | | | 473,506 | | | 1/23/2025 | | | HUB | | | | 2,270 | | | | - | | | | 2,270 | |
| USD | | | 488,155 | | | KRW | | | 475,776 | | | 1/23/2025 | | | HUB | | | | 12,379 | | | | - | | | | 12,379 | |
| USD | | | 488,247 | | | KRW | | | 475,776 | | | 1/23/2025 | | | HUB | | | | 12,471 | | | | - | | | | 12,471 | |
| USD | | | 489,151 | | | KRW | | | 475,776 | | | 1/23/2025 | | | HUB | | | | 13,375 | | | | - | | | | 13,375 | |
| USD | | | 498,893 | | | KRW | | | 475,776 | | | 1/23/2025 | | | HUB | | | | 23,117 | | | | - | | | | 23,117 | |
| USD | | | 498,895 | | | KRW | | | 475,776 | | | 1/23/2025 | | | HUB | | | | 23,119 | | | | - | | | | 23,119 | |
| USD | | | 499,287 | | | KRW | | | 475,776 | | | 1/23/2025 | | | HUB | | | | 23,511 | | | | - | | | | 23,511 | |
| USD | | | 499,301 | | | KRW | | | 475,776 | | | 1/23/2025 | | | HUB | | | | 23,525 | | | | - | | | | 23,525 | |
| USD | | | 499,433 | | | KRW | | | 475,776 | | | 1/23/2025 | | | HUB | | | | 23,657 | | | | - | | | | 23,657 | |
| USD | | | 500,189 | | | KRW | | | 475,776 | | | 1/23/2025 | | | HUB | | | | 24,413 | | | | - | | | | 24,413 | |
| KRW | | | 543,744 | | | USD | | | 541,206 | | | 1/23/2025 | | | HUB | | | | 2,538 | | | | - | | | | 2,538 | |
| KRW | | | 543,744 | | | USD | | | 541,255 | | | 1/23/2025 | | | HUB | | | | 2,489 | | | | - | | | | 2,489 | |
| KRW | | | 543,744 | | | USD | | | 541,546 | | | 1/23/2025 | | | HUB | | | | 2,198 | | | | - | | | | 2,198 | |
| KRW | | | 543,744 | | | USD | | | 544,477 | | | 1/23/2025 | | | HUB | | | | - | | | | (733 | ) | | | (733 | ) |
| USD | | | 557,957 | | | KRW | | | 543,744 | | | 1/23/2025 | | | HUB | | | | 14,213 | | | | - | | | | 14,213 | |
| USD | | | 564,868 | | | KRW | | | 543,744 | | | 1/23/2025 | | | HUB | | | | 21,124 | | | | - | | | | 21,124 | |
| USD | | | 570,047 | | | KRW | | | 543,744 | | | 1/23/2025 | | | HUB | | | | 26,303 | | | | - | | | | 26,303 | |
| USD | | | 570,105 | | | KRW | | | 543,744 | | | 1/23/2025 | | | HUB | | | | 26,361 | | | | - | | | | 26,361 | |
See accompanying notes
39
American Beacon AHL Managed Futures Strategy FundSM
Consolidated Schedule of Investments
December 31, 2024
| | | | | | | | | | | | | | | | | | | | | | | | | | | | |
| | | | | | |
| Currency Purchased* | | | Currency Sold* | | | Settlement
Date | | Counterparty | | | Unrealized
Appreciation | | | Unrealized
(Depreciation) | | | Net Unrealized
Appreciation
(Depreciation) | |
| USD | | | 570,349 | | | KRW | | | 543,744 | | | 1/23/2025 | | | HUB | | | $ | 26,605 | | | $ | - | | | $ | 26,605 | |
| USD | | | 570,960 | | | KRW | | | 543,744 | | | 1/23/2025 | | | HUB | | | | 27,216 | | | | - | | | | 27,216 | |
| USD | | | 571,486 | | | KRW | | | 543,744 | | | 1/23/2025 | | | HUB | | | | 27,742 | | | | - | | | | 27,742 | |
| USD | | | 573,070 | | | KRW | | | 543,744 | | | 1/23/2025 | | | HUB | | | | 29,326 | | | | - | | | | 29,326 | |
| USD | | | 573,629 | | | KRW | | | 543,744 | | | 1/23/2025 | | | HUB | | | | 29,885 | | | | - | | | | 29,885 | |
| USD | | | 574,231 | | | KRW | | | 543,744 | | | 1/23/2025 | | | HUB | | | | 30,487 | | | | - | | | | 30,487 | |
| KRW | | | 611,712 | | | USD | | | 606,477 | | | 1/23/2025 | | | HUB | | | | 5,235 | | | | - | | | | 5,235 | |
| KRW | | | 611,712 | | | USD | | | 610,490 | | | 1/23/2025 | | | HUB | | | | 1,222 | | | | - | | | | 1,222 | |
| KRW | | | 611,712 | | | USD | | | 612,499 | | | 1/23/2025 | | | HUB | | | | - | | | | (787 | ) | | | (787 | ) |
| USD | | | 627,317 | | | KRW | | | 611,712 | | | 1/23/2025 | | | HUB | | | | 15,605 | | | | - | | | | 15,605 | |
| USD | | | 627,572 | | | KRW | | | 611,712 | | | 1/23/2025 | | | HUB | | | | 15,860 | | | | - | | | | 15,860 | |
| USD | | | 629,516 | | | KRW | | | 611,712 | | | 1/23/2025 | | | HUB | | | | 17,804 | | | | - | | | | 17,804 | |
| USD | | | 641,423 | | | KRW | | | 611,712 | | | 1/23/2025 | | | HUB | | | | 29,711 | | | | - | | | | 29,711 | |
| USD | | | 643,146 | | | KRW | | | 611,712 | | | 1/23/2025 | | | HUB | | | | 31,434 | | | | - | | | | 31,434 | |
| USD | | | 644,329 | | | KRW | | | 611,712 | | | 1/23/2025 | | | HUB | | | | 32,617 | | | | - | | | | 32,617 | |
| USD | | | 645,715 | | | KRW | | | 611,712 | | | 1/23/2025 | | | HUB | | | | 34,003 | | | | - | | | | 34,003 | |
| KRW | | | 679,680 | | | USD | | | 673,759 | | | 1/23/2025 | | | HUB | | | | 5,921 | | | | - | | | | 5,921 | |
| KRW | | | 679,680 | | | USD | | | 675,785 | | | 1/23/2025 | | | HUB | | | | 3,895 | | | | - | | | | 3,895 | |
| KRW | | | 679,680 | | | USD | | | 676,293 | | | 1/23/2025 | | | HUB | | | | 3,387 | | | | - | | | | 3,387 | |
| KRW | | | 679,680 | | | USD | | | 677,328 | | | 1/23/2025 | | | HUB | | | | 2,352 | | | | - | | | | 2,352 | |
| USD | | | 713,804 | | | KRW | | | 679,680 | | | 1/23/2025 | | | HUB | | | | 34,124 | | | | - | | | | 34,124 | |
| USD | | | 715,787 | | | KRW | | | 679,680 | | | 1/23/2025 | | | HUB | | | | 36,107 | | | | - | | | | 36,107 | |
| USD | | | 716,441 | | | KRW | | | 679,680 | | | 1/23/2025 | | | HUB | | | | 36,761 | | | | - | | | | 36,761 | |
| KRW | | | 747,648 | | | USD | | | 743,022 | | | 1/23/2025 | | | HUB | | | | 4,626 | | | | - | | | | 4,626 | |
| USD | | | 767,202 | | | KRW | | | 747,648 | | | 1/23/2025 | | | HUB | | | | 19,554 | | | | - | | | | 19,554 | |
| USD | | | 772,884 | | | KRW | | | 747,648 | | | 1/23/2025 | | | HUB | | | | 25,236 | | | | - | | | | 25,236 | |
| USD | | | 777,012 | | | KRW | | | 747,648 | | | 1/23/2025 | | | HUB | | | | 29,364 | | | | - | | | | 29,364 | |
| USD | | | 783,253 | | | KRW | | | 747,648 | | | 1/23/2025 | | | HUB | | | | 35,605 | | | | - | | | | 35,605 | |
| USD | | | 783,883 | | | KRW | | | 747,648 | | | 1/23/2025 | | | HUB | | | | 36,235 | | | | - | | | | 36,235 | |
| USD | | | 838,873 | | | KRW | | | 815,616 | | | 1/23/2025 | | | HUB | | | | 23,257 | | | | - | | | | 23,257 | |
| USD | | | 859,531 | | | KRW | | | 815,616 | | | 1/23/2025 | | | HUB | | | | 43,915 | | | | - | | | | 43,915 | |
| KRW | | | 1,155,455 | | | USD | | | 1,158,254 | | | 1/23/2025 | | | HUB | | | | - | | | | (2,799 | ) | | | (2,799 | ) |
| KRW | | | 1,155,455 | | | USD | | | 1,158,758 | | | 1/23/2025 | | | HUB | | | | - | | | | (3,303 | ) | | | (3,303 | ) |
| USD | | | 1,414,882 | | | KRW | | | 1,359,359 | | | 1/23/2025 | | | HUB | | | | 55,523 | | | | - | | | | 55,523 | |
| USD | | | 2,520,602 | | | KRW | | | 2,446,847 | | | 1/23/2025 | | | HUB | | | | 73,755 | | | | - | | | | 73,755 | |
| USD | | | 4,013,219 | | | KRW | | | 3,806,206 | | | 1/23/2025 | | | HUB | | | | 207,013 | | | | - | | | | 207,013 | |
| PLN | | | 24,192 | | | USD | | | 24,607 | | | 1/27/2025 | | | HUB | | | | - | | | | (415 | ) | | | (415 | ) |
| USD | | | 122,920 | | | PLN | | | 120,960 | | | 1/27/2025 | | | HUB | | | | 1,960 | | | | - | | | | 1,960 | |
| USD | | | 251,163 | | | PLN | | | 241,921 | | | 1/27/2025 | | | HUB | | | | 9,242 | | | | - | | | | 9,242 | |
| USD | | | 273,689 | | | PLN | | | 266,113 | | | 1/27/2025 | | | HUB | | | | 7,576 | | | | - | | | | 7,576 | |
| PLN | | | 362,881 | | | USD | | | 365,508 | | | 1/27/2025 | | | HUB | | | | - | | | | (2,627 | ) | | | (2,627 | ) |
| PLN | | | 362,881 | | | USD | | | 368,213 | | | 1/27/2025 | | | HUB | | | | - | | | | (5,332 | ) | | | (5,332 | ) |
| EUR | | | 414,735 | | | USD | | | 421,322 | | | 1/27/2025 | | | HUB | | | | - | | | | (6,587 | ) | | | (6,587 | ) |
| PLN | | | 459,649 | | | USD | | | 462,183 | | | 1/27/2025 | | | HUB | | | | - | | | | (2,534 | ) | | | (2,534 | ) |
| USD | | | 583,937 | | | PLN | | | 556,418 | | | 1/27/2025 | | | HUB | | | | 27,519 | | | | - | | | | 27,519 | |
| USD | | | 819,260 | | | PLN | | | 798,338 | | | 1/27/2025 | | | HUB | | | | 20,922 | | | | - | | | | 20,922 | |
| USD | | | 826,397 | | | EUR | | | 821,175 | | | 1/27/2025 | | | HUB | | | | 5,222 | | | | - | | | | 5,222 | |
| PLN | | | 846,723 | | | USD | | | 854,939 | | | 1/27/2025 | | | HUB | | | | - | | | | (8,216 | ) | | | (8,216 | ) |
| PLN | | | 846,723 | | | USD | | | 887,250 | | | 1/27/2025 | | | HUB | | | | - | | | | (40,527 | ) | | | (40,527 | ) |
| USD | | | 924,276 | | | PLN | | | 919,299 | | | 1/27/2025 | | | HUB | | | | 4,977 | | | | - | | | | 4,977 | |
| USD | | | 965,572 | | | PLN | | | 943,491 | | | 1/27/2025 | | | HUB | | | | 22,081 | | | | - | | | | 22,081 | |
| USD | | | 973,165 | | | PLN | | | 967,683 | | | 1/27/2025 | | | HUB | | | | 5,482 | | | | - | | | | 5,482 | |
| PLN | | | 1,064,451 | | | USD | | | 1,119,617 | | | 1/27/2025 | | | HUB | | | | - | | | | (55,166 | ) | | | (55,166 | ) |
| USD | | | 1,296,681 | | | PLN | | | 1,282,180 | | | 1/27/2025 | | | HUB | | | | 14,501 | | | | - | | | | 14,501 | |
| USD | | | 1,546,737 | | | PLN | | | 1,478,037 | | | 1/27/2025 | | | HUB | | | | 68,700 | | | | - | | | | 68,700 | |
| USD | | | 1,548,666 | | | PLN | | | 1,548,293 | | | 1/27/2025 | | | HUB | | | | 373 | | | | - | | | | 373 | |
| USD | | | 1,733,896 | | | PLN | | | 1,693,445 | | | 1/27/2025 | | | HUB | | | | 40,451 | | | | - | | | | 40,451 | |
| USD | | | 1,773,239 | | | PLN | | | 1,693,445 | | | 1/27/2025 | | | HUB | | | | 79,794 | | | | - | | | | 79,794 | |
| USD | | | 1,800,384 | | | PLN | | | 1,741,829 | | | 1/27/2025 | | | HUB | | | | 58,555 | | | | - | | | | 58,555 | |
See accompanying notes
40
American Beacon AHL Managed Futures Strategy FundSM
Consolidated Schedule of Investments
December 31, 2024
| | | | | | | | | | | | | | | | | | | | | | | | | | | | |
| | | | | | |
| Currency Purchased* | | | Currency Sold* | | | Settlement
Date | | Counterparty | | | Unrealized
Appreciation | | | Unrealized
(Depreciation) | | | Net Unrealized
Appreciation
(Depreciation) | |
| USD | | | 1,876,019 | | | EUR | | | 1,866,306 | | | 1/27/2025 | | | HUB | | | $ | 9,713 | | | $ | - | | | $ | 9,713 | |
| PLN | | | 1,886,982 | | | USD | | | 1,919,037 | | | 1/27/2025 | | | HUB | | | | - | | | | (32,055 | ) | | | (32,055 | ) |
| PLN | | | 1,886,982 | | | USD | | | 1,969,222 | | | 1/27/2025 | | | HUB | | | | - | | | | (82,240 | ) | | | (82,240 | ) |
| USD | | | 2,105,276 | | | EUR | | | 2,073,673 | | | 1/27/2025 | | | HUB | | | | 31,603 | | | | | | | | 31,603 | |
| PLN | | | 2,249,863 | | | USD | | | 2,274,123 | | | 1/27/2025 | | | HUB | | | | - | | | | (24,260 | ) | | | (24,260 | ) |
| USD | | | 2,412,379 | | | PLN | | | 2,346,631 | | | 1/27/2025 | | | HUB | | | | 65,748 | | | | - | | | | 65,748 | |
| USD | | | 2,562,105 | | | PLN | | | 2,540,168 | | | 1/27/2025 | | | HUB | | | | 21,937 | | | | - | | | | 21,937 | |
| USD | | | 2,722,913 | | | PLN | | | 2,733,704 | | | 1/27/2025 | | | HUB | | | | - | | | | (10,791 | ) | | | (10,791 | ) |
| USD | | | 2,760,736 | | | PLN | | | 2,685,320 | | | 1/27/2025 | | | HUB | | | | 75,416 | | | | - | | | | 75,416 | |
| USD | | | 3,018,981 | | | PLN | | | 2,878,857 | | | 1/27/2025 | | | HUB | | | | 140,124 | | | | - | | | | 140,124 | |
| PLN | | | 3,048,201 | | | USD | | | 3,169,146 | | | 1/27/2025 | | | HUB | | | | - | | | | (120,945 | ) | | | (120,945 | ) |
| USD | | | 3,102,692 | | | PLN | | | 2,989,065 | | | 1/27/2025 | | | HUB | | | | 113,627 | | | | - | | | | 113,627 | |
| USD | | | 3,877,566 | | | PLN | | | 3,736,331 | | | 1/27/2025 | | | HUB | | | | 141,235 | | | | - | | | | 141,235 | |
| PLN | | | 4,040,076 | | | USD | | | 4,131,942 | | | 1/27/2025 | | | HUB | | | | - | | | | (91,866 | ) | | | (91,866 | ) |
| USD | | | 4,124,564 | | | PLN | | | 4,004,867 | | | 1/27/2025 | | | HUB | | | | 119,697 | | | | - | | | | 119,697 | |
| USD | | | 4,194,226 | | | PLN | | | 4,185,229 | | | 1/27/2025 | | | HUB | | | | 8,997 | | | | - | | | | 8,997 | |
| USD | | | 4,314,061 | | | EUR | | | 4,251,030 | | | 1/27/2025 | | | HUB | | | | 63,031 | | | | - | | | | 63,031 | |
| USD | | | 4,385,749 | | | PLN | | | 4,402,957 | | | 1/27/2025 | | | HUB | | | | - | | | | (17,208 | ) | | | (17,208 | ) |
| PLN | | | 4,617,089 | | | USD | | | 4,968,773 | | | 1/27/2025 | | | HUB | | | | - | | | | (351,684 | ) | | | (351,684 | ) |
| USD | | | 4,927,507 | | | PLN | | | 4,886,799 | | | 1/27/2025 | | | HUB | | | | 40,708 | | | | - | | | | 40,708 | |
| PLN | | | 5,370,640 | | | USD | | | 5,415,041 | | | 1/27/2025 | | | HUB | | | | - | | | | (44,401 | ) | | | (44,401 | ) |
| USD | | | 5,531,631 | | | PLN | | | 5,284,202 | | | 1/27/2025 | | | HUB | | | | 247,429 | | | | - | | | | 247,429 | |
| USD | | | 5,685,864 | | | PLN | | | 5,636,753 | | | 1/27/2025 | | | HUB | | | | 49,111 | | | | - | | | | 49,111 | |
| USD | | | 5,771,161 | | | PLN | | | 5,636,753 | | | 1/27/2025 | | | HUB | | | | 134,408 | | | | - | | | | 134,408 | |
| USD | | | 6,138,463 | | | PLN | | | 5,962,268 | | | 1/27/2025 | | | HUB | | | | 176,195 | | | | - | | | | 176,195 | |
| USD | | | 6,143,046 | | | EUR | | | 6,117,337 | | | 1/27/2025 | | | HUB | | | | 25,709 | | | | - | | | | 25,709 | |
| USD | | | 6,150,840 | | | PLN | | | 6,120,594 | | | 1/27/2025 | | | HUB | | | | 30,246 | | | | - | | | | 30,246 | |
| PLN | | | 6,483,476 | | | USD | | | 6,618,255 | | | 1/27/2025 | | | HUB | | | | - | | | | (134,779 | ) | | | (134,779 | ) |
| USD | | | 6,560,915 | | | EUR | | | 6,532,071 | | | 1/27/2025 | | | HUB | | | | 28,844 | | | | - | | | | 28,844 | |
| USD | | | 7,230,129 | | | EUR | | | 7,154,173 | | | 1/27/2025 | | | HUB | | | | 75,956 | | | | - | | | | 75,956 | |
| USD | | | 7,478,235 | | | PLN | | | 7,088,277 | | | 1/27/2025 | | | HUB | | | | 389,958 | | | | - | | | | 389,958 | |
| EUR | | | 7,672,592 | | | USD | | | 7,689,515 | | | 1/27/2025 | | | HUB | | | | - | | | | (16,923 | ) | | | (16,923 | ) |
| USD | | | 8,453,549 | | | PLN | | | 8,410,145 | | | 1/27/2025 | | | HUB | | | | 43,404 | | | | - | | | | 43,404 | |
| PLN | | | 8,588,186 | | | USD | | | 8,773,185 | | | 1/27/2025 | | | HUB | | | | - | | | | (184,999 | ) | | | (184,999 | ) |
| USD | | | 8,924,524 | | | PLN | | | 8,736,679 | | | 1/27/2025 | | | HUB | | | | 187,845 | | | | - | | | | 187,845 | |
| USD | | | 9,504,554 | | | EUR | | | 9,443,509 | | | 1/27/2025 | | | HUB | | | | 61,045 | | | | - | | | | 61,045 | |
| USD | | | 10,215,904 | | | EUR | | | 10,057,316 | | | 1/27/2025 | | | HUB | | | | 158,588 | | | | - | | | | 158,588 | |
| USD | | | 10,538,900 | | | EUR | | | 10,368,367 | | | 1/27/2025 | | | HUB | | | | 170,533 | | | | - | | | | 170,533 | |
| PLN | | | 10,857,374 | | | USD | | | 11,686,188 | | | 1/27/2025 | | | HUB | | | | - | | | | (828,814 | ) | | | (828,814 | ) |
| USD | | | 11,576,549 | | | PLN | | | 11,524,123 | | | 1/27/2025 | | | HUB | | | | 52,426 | | | | - | | | | 52,426 | |
| USD | | | 12,207,734 | | | PLN | | | 11,947,544 | | | 1/27/2025 | | | HUB | | | | 260,190 | | | | - | | | | 260,190 | |
| USD | | | 16,333,840 | | | EUR | | | 16,088,845 | | | 1/27/2025 | | | HUB | | | | 244,995 | | | | - | | | | 244,995 | |
| USD | | | 16,334,368 | | | EUR | | | 16,088,846 | | | 1/27/2025 | | | HUB | | | | 245,522 | | | | - | | | | 245,522 | |
| USD | | | 16,776,238 | | | PLN | | | 16,029,014 | | | 1/27/2025 | | | HUB | | | | 747,224 | | | | - | | | | 747,224 | |
| EUR | | | 17,211,489 | | | USD | | | 17,275,592 | | | 1/27/2025 | | | HUB | | | | - | | | | (64,103 | ) | | | (64,103 | ) |
| USD | | | 17,590,820 | | | PLN | | | 16,811,170 | | | 1/27/2025 | | | HUB | | | | 779,650 | | | | - | | | | 779,650 | |
| EUR | | | 18,974,112 | | | USD | | | 19,112,187 | | | 1/27/2025 | | | HUB | | | | - | | | | (138,075 | ) | | | (138,075 | ) |
| PLN | | | 19,000,405 | | | USD | | | 20,429,785 | | | 1/27/2025 | | | HUB | | | | - | | | | (1,429,380 | ) | | | (1,429,380 | ) |
| USD | | | 19,622,557 | | | EUR | | | 19,306,614 | | | 1/27/2025 | | | HUB | | | | 315,943 | | | | - | | | | 315,943 | |
| PLN | | | 21,486,298 | | | USD | | | 23,119,511 | | | 1/27/2025 | | | HUB | | | | - | | | | (1,633,213 | ) | | | (1,633,213 | ) |
| PLN | | | 24,429,092 | | | USD | | | 26,292,753 | | | 1/27/2025 | | | HUB | | | | - | | | | (1,863,661 | ) | | | (1,863,661 | ) |
| USD | | | 26,347,950 | | | EUR | | | 25,920,917 | | | 1/27/2025 | | | HUB | | | | 427,033 | | | | - | | | | 427,033 | |
| USD | | | 28,550,770 | | | EUR | | | 28,063,714 | | | 1/27/2025 | | | HUB | | | | 487,056 | | | | - | | | | 487,056 | |
| USD | | | 35,271,253 | | | EUR | | | 34,692,556 | | | 1/27/2025 | | | HUB | | | | 578,697 | | | | - | | | | 578,697 | |
| USD | | | 41,424,400 | | | EUR | | | 40,720,033 | | | 1/27/2025 | | | HUB | | | | 704,367 | | | | - | | | | 704,367 | |
| USD | | | 42,516,372 | | | EUR | | | 41,830,998 | | | 1/27/2025 | | | HUB | | | | 685,374 | | | | - | | | | 685,374 | |
| JPY | | | 637,359 | | | USD | | | 637,682 | | | 1/31/2025 | | | HUB | | | | - | | | | (323 | ) | | | (323 | ) |
| USD | | | 717,731 | | | JPY | | | 701,094 | | | 1/31/2025 | | | HUB | | | | 16,637 | | | | - | | | | 16,637 | |
| USD | | | 810,574 | | | JPY | | | 782,044 | | | 1/31/2025 | | | HUB | | | | 28,530 | | | | - | | | | 28,530 | |
See accompanying notes
41
American Beacon AHL Managed Futures Strategy FundSM
Consolidated Schedule of Investments
December 31, 2024
| | | | | | | | | | | | | | | | | | | | | | | | | | | | |
| | | | | | |
| Currency Purchased* | | | Currency Sold* | | | Settlement
Date | | Counterparty | | | Unrealized
Appreciation | | | Unrealized
(Depreciation) | | | Net Unrealized
Appreciation
(Depreciation) | |
| USD | | | 1,181,644 | | | JPY | | | 1,185,229 | | | 1/31/2025 | | | HUB | | | $ | - | | | $ | (3,585 | ) | | $ | (3,585 | ) |
| USD | | | 1,687,281 | | | JPY | | | 1,646,509 | | | 1/31/2025 | | | HUB | | | | 40,772 | | | | - | | | | 40,772 | |
| USD | | | 2,114,888 | | | JPY | | | 2,039,547 | | | 1/31/2025 | | | HUB | | | | 75,341 | | | | - | | | | 75,341 | |
| USD | | | 2,162,087 | | | JPY | | | 2,075,098 | | | 1/31/2025 | | | HUB | | | | 86,989 | | | | - | | | | 86,989 | |
| USD | | | 3,276,383 | | | JPY | | | 3,285,445 | | | 1/31/2025 | | | HUB | | | | - | | | | (9,062 | ) | | | (9,062 | ) |
| USD | | | 3,291,413 | | | JPY | | | 3,160,236 | | | 1/31/2025 | | | HUB | | | | 131,177 | | | | - | | | | 131,177 | |
| USD | | | 3,741,855 | | | JPY | | | 3,613,989 | | | 1/31/2025 | | | HUB | | | | 127,866 | | | | - | | | | 127,866 | |
| JPY | | | 4,180,759 | | | USD | | | 4,200,158 | | | 1/31/2025 | | | HUB | | | | - | | | | (19,399 | ) | | | (19,399 | ) |
| USD | | | 4,269,809 | | | JPY | | | 4,142,830 | | | 1/31/2025 | | | HUB | | | | 126,979 | | | | - | | | | 126,979 | |
| USD | | | 4,326,842 | | | JPY | | | 4,142,830 | | | 1/31/2025 | | | HUB | | | | 184,012 | | | | - | | | | 184,012 | |
| USD | | | 4,651,181 | | | JPY | | | 4,461,509 | | | 1/31/2025 | | | HUB | | | | 189,672 | | | | - | | | | 189,672 | |
| USD | | | 5,036,765 | | | JPY | | | 4,910,021 | | | 1/31/2025 | | | HUB | | | | 126,744 | | | | - | | | | 126,744 | |
| USD | | | 5,126,912 | | | JPY | | | 5,084,853 | | | 1/31/2025 | | | HUB | | | | 42,059 | | | | - | | | | 42,059 | |
| USD | | | 5,986,341 | | | JPY | | | 5,685,971 | | | 1/31/2025 | | | HUB | | | | 300,370 | | | | - | | | | 300,370 | |
| USD | | | 6,451,950 | | | JPY | | | 6,309,849 | | | 1/31/2025 | | | HUB | | | | 142,101 | | | | - | | | | 142,101 | |
| JPY | | | 6,501,057 | | | USD | | | 6,852,467 | | | 1/31/2025 | | | HUB | | | | - | | | | (351,410 | ) | | | (351,410 | ) |
| USD | | | 7,070,177 | | | JPY | | | 7,024,959 | | | 1/31/2025 | | | HUB | | | | 45,218 | | | | - | | | | 45,218 | |
| USD | | | 7,788,077 | | | JPY | | | 7,457,094 | | | 1/31/2025 | | | HUB | | | | 330,983 | | | | - | | | | 330,983 | |
| USD | | | 8,311,663 | | | JPY | | | 7,839,510 | | | 1/31/2025 | | | HUB | | | | 472,153 | | | | - | | | | 472,153 | |
| USD | | | 8,330,612 | | | JPY | | | 8,107,359 | | | 1/31/2025 | | | HUB | | | | 223,253 | | | | - | | | | 223,253 | |
| USD | | | 8,369,644 | | | JPY | | | 7,873,798 | | | 1/31/2025 | | | HUB | | | | 495,846 | | | | - | | | | 495,846 | |
| USD | | | 8,383,450 | | | JPY | | | 7,954,133 | | | 1/31/2025 | | | HUB | | | | 429,317 | | | | - | | | | 429,317 | |
| USD | | | 8,435,271 | | | JPY | | | 8,232,547 | | | 1/31/2025 | | | HUB | | | | 202,724 | | | | - | | | | 202,724 | |
| JPY | | | 8,653,820 | | | USD | | | 8,685,959 | | | 1/31/2025 | | | HUB | | | | - | | | | (32,139 | ) | | | (32,139 | ) |
| USD | | | 9,092,942 | | | JPY | | | 8,731,811 | | | 1/31/2025 | | | HUB | | | | 361,131 | | | | - | | | | 361,131 | |
| JPY | | | 9,114,227 | | | USD | | | 9,602,064 | | | 1/31/2025 | | | HUB | | | | - | | | | (487,837 | ) | | | (487,837 | ) |
| JPY | | | 9,624,113 | | | USD | | | 10,118,965 | | | 1/31/2025 | | | HUB | | | | - | | | | (494,852 | ) | | | (494,852 | ) |
| USD | | | 10,586,138 | | | JPY | | | 9,956,783 | | | 1/31/2025 | | | HUB | | | | 629,355 | | | | - | | | | 629,355 | |
| USD | | | 11,213,872 | | | JPY | | | 11,246,329 | | | 1/31/2025 | | | HUB | | | | - | | | | (32,457 | ) | | | (32,457 | ) |
| USD | | | 11,968,348 | | | JPY | | | 11,661,300 | | | 1/31/2025 | | | HUB | | | | 307,048 | | | | - | | | | 307,048 | |
| USD | | | 12,011,257 | | | JPY | | | 11,582,711 | | | 1/31/2025 | | | HUB | | | | 428,546 | | | | - | | | | 428,546 | |
| USD | | | 12,160,372 | | | JPY | | | 11,791,132 | | | 1/31/2025 | | | HUB | | | | 369,240 | | | | - | | | | 369,240 | |
| USD | | | 12,340,519 | | | JPY | | | 11,950,454 | | | 1/31/2025 | | | HUB | | | | 390,065 | | | | - | | | | 390,065 | |
| USD | | | 12,511,269 | | | JPY | | | 12,008,896 | | | 1/31/2025 | | | HUB | | | | 502,373 | | | | - | | | | 502,373 | |
| USD | | | 12,564,619 | | | JPY | | | 11,931,199 | | | 1/31/2025 | | | HUB | | | | 633,420 | | | | - | | | | 633,420 | |
| USD | | | 12,703,710 | | | JPY | | | 11,948,140 | | | 1/31/2025 | | | HUB | | | | 755,570 | | | | - | | | | 755,570 | |
| USD | | | 13,734,826 | | | JPY | | | 13,037,545 | | | 1/31/2025 | | | HUB | | | | 697,281 | | | | - | | | | 697,281 | |
| USD | | | 14,454,680 | | | JPY | | | 13,703,208 | | | 1/31/2025 | | | HUB | | | | 751,472 | | | | - | | | | 751,472 | |
| USD | | | 14,547,491 | | | JPY | | | 13,719,142 | | | 1/31/2025 | | | HUB | | | | 828,349 | | | | - | | | | 828,349 | |
| USD | | | 14,674,787 | | | JPY | | | 13,919,733 | | | 1/31/2025 | | | HUB | | | | 755,054 | | | | - | | | | 755,054 | |
| USD | | | 15,528,908 | | | JPY | | | 15,577,299 | | | 1/31/2025 | | | HUB | | | | - | | | | (48,391 | ) | | | (48,391 | ) |
| USD | | | 16,123,904 | | | JPY | | | 15,487,811 | | | 1/31/2025 | | | HUB | | | | 636,093 | | | | - | | | | 636,093 | |
| USD | | | 16,292,724 | | | JPY | | | 15,328,571 | | | 1/31/2025 | | | HUB | | | | 964,153 | | | | - | | | | 964,153 | |
| USD | | | 16,597,664 | | | JPY | | | 16,077,412 | | | 1/31/2025 | | | HUB | | | | 520,252 | | | | - | | | | 520,252 | |
| USD | | | 16,932,911 | | | JPY | | | 15,930,853 | | | 1/31/2025 | | | HUB | | | | 1,002,058 | | | | - | | | | 1,002,058 | |
| USD | | | 17,702,852 | | | JPY | | | 16,981,921 | | | 1/31/2025 | | | HUB | | | | 720,931 | | | | - | | | | 720,931 | |
| JPY | | | 18,167,078 | | | USD | | | 18,271,818 | | | 1/31/2025 | | | HUB | | | | - | | | | (104,740 | ) | | | (104,740 | ) |
| USD | | | 18,240,008 | | | JPY | | | 17,319,287 | | | 1/31/2025 | | | HUB | | | | 920,721 | | | | - | | | | 920,721 | |
| USD | | | 18,506,836 | | | JPY | | | 17,925,681 | | | 1/31/2025 | | | HUB | | | | 581,155 | | | | - | | | | 581,155 | |
| USD | | | 18,676,388 | | | JPY | | | 18,164,717 | | | 1/31/2025 | | | HUB | | | | 511,671 | | | | - | | | | 511,671 | |
| USD | | | 18,707,783 | | | JPY | | | 17,638,896 | | | 1/31/2025 | | | HUB | | | | 1,068,887 | | | | - | | | | 1,068,887 | |
| USD | | | 18,822,847 | | | JPY | | | 17,716,047 | | | 1/31/2025 | | | HUB | | | | 1,106,800 | | | | - | | | | 1,106,800 | |
| USD | | | 19,039,544 | | | JPY | | | 18,102,809 | | | 1/31/2025 | | | HUB | | | | 936,735 | | | | - | | | | 936,735 | |
| USD | | | 19,144,983 | | | JPY | | | 18,187,893 | | | 1/31/2025 | | | HUB | | | | 957,090 | | | | - | | | | 957,090 | |
| JPY | | | 20,437,962 | | | USD | | | 20,544,864 | | | 1/31/2025 | | | HUB | | | | - | | | | (106,902 | ) | | | (106,902 | ) |
| USD | | | 21,169,833 | | | JPY | | | 19,913,567 | | | 1/31/2025 | | | HUB | | | | 1,256,266 | | | | - | | | | 1,256,266 | |
| JPY | | | 22,708,847 | | | USD | | | 22,837,105 | | | 1/31/2025 | | | HUB | | | | - | | | | (128,258 | ) | | | (128,258 | ) |
| USD | | | 24,319,151 | | | JPY | | | 23,109,994 | | | 1/31/2025 | | | HUB | | | | 1,209,157 | | | | - | | | | 1,209,157 | |
| USD | | | 25,132,372 | | | JPY | | | 23,862,399 | | | 1/31/2025 | | | HUB | | | | 1,269,973 | | | | - | | | | 1,269,973 | |
See accompanying notes
42
American Beacon AHL Managed Futures Strategy FundSM
Consolidated Schedule of Investments
December 31, 2024
| | | | | | | | | | | | | | | | | | | | | | | | | | |
| | | | | | |
| Currency Purchased* | | | Currency Sold* | | | Settlement
Date | | Counterparty | | Unrealized
Appreciation | | | Unrealized
(Depreciation) | | | Net Unrealized
Appreciation
(Depreciation) | |
| USD | | | 25,408,525 | | | JPY | | | 23,896,280 | | | 1/31/2025 | | HUB | | $ | 1,512,245 | | | $ | - | | | $ | 1,512,245 | |
| JPY | | | 26,794,864 | | | USD | | | 26,939,081 | | | 1/31/2025 | | HUB | | | - | | | | (144,217 | ) | | | (144,217 | ) |
| JPY | | | 30,225,049 | | | USD | | | 30,325,494 | | | 1/31/2025 | | HUB | | | - | | | | (100,445 | ) | | | (100,445 | ) |
| USD | | | 33,454,335 | | | JPY | | | 32,556,113 | | | 1/31/2025 | | HUB | | | 898,222 | | | | - | | | | 898,222 | |
| USD | | | 34,006,203 | | | JPY | | | 32,842,917 | | | 1/31/2025 | | HUB | | | 1,163,286 | | | | - | | | | 1,163,286 | |
| USD | | | 38,072,837 | | | JPY | | | 36,205,618 | | | 1/31/2025 | | HUB | | | 1,867,219 | | | | - | | | | 1,867,219 | |
| USD | | | 45,707,835 | | | JPY | | | 43,446,742 | | | 1/31/2025 | | HUB | | | 2,261,093 | | | | - | | | | 2,261,093 | |
| USD | | | 16,407 | | | BRL | | | 16,091 | | | 2/4/2025 | | HUB | | | 316 | | | | - | | | | 316 | |
| USD | | | 16,409 | | | BRL | | | 16,091 | | | 2/4/2025 | | HUB | | | 318 | | | | - | | | | 318 | |
| USD | | | 16,418 | | | BRL | | | 16,091 | | | 2/4/2025 | | HUB | | | 327 | | | | - | | | | 327 | |
| USD | | | 16,420 | | | BRL | | | 16,091 | | | 2/4/2025 | | HUB | | | 329 | | | | - | | | | 329 | |
| USD | | | 16,434 | | | BRL | | | 16,091 | | | 2/4/2025 | | HUB | | | 343 | | | | - | | | | 343 | |
| USD | | | 16,437 | | | BRL | | | 16,091 | | | 2/4/2025 | | HUB | | | 346 | | | | - | | | | 346 | |
| USD | | | 16,445 | | | BRL | | | 16,091 | | | 2/4/2025 | | HUB | | | 354 | | | | - | | | | 354 | |
| USD | | | 16,453 | | | BRL | | | 16,091 | | | 2/4/2025 | | HUB | | | 362 | | | | - | | | | 362 | |
| USD | | | 16,457 | | | BRL | | | 16,091 | | | 2/4/2025 | | HUB | | | 366 | | | | - | | | | 366 | |
| BRL | | | 32,181 | | | USD | | | 32,223 | | | 2/4/2025 | | HUB | | | - | | | | (42 | ) | | | (42 | ) |
| USD | | | 32,735 | | | BRL | | | 32,181 | | | 2/4/2025 | | HUB | | | 554 | | | | - | | | | 554 | |
| USD | | | 32,737 | | | BRL | | | 32,181 | | | 2/4/2025 | | HUB | | | 556 | | | | - | | | | 556 | |
| USD | | | 32,745 | | | BRL | | | 32,181 | | | 2/4/2025 | | HUB | | | 564 | | | | - | | | | 564 | |
| USD | | | 32,772 | | | BRL | | | 32,181 | | | 2/4/2025 | | HUB | | | 591 | | | | - | | | | 591 | |
| USD | | | 32,776 | | | BRL | | | 32,181 | | | 2/4/2025 | | HUB | | | 595 | | | | - | | | | 595 | |
| USD | | | 32,787 | | | BRL | | | 32,181 | | | 2/4/2025 | | HUB | | | 606 | | | | - | | | | 606 | |
| USD | | | 32,802 | | | BRL | | | 32,181 | | | 2/4/2025 | | HUB | | | 621 | | | | - | | | | 621 | |
| USD | | | 32,806 | | | BRL | | | 32,181 | | | 2/4/2025 | | HUB | | | 625 | | | | - | | | | 625 | |
| USD | | | 32,812 | | | BRL | | | 32,181 | | | 2/4/2025 | | HUB | | | 631 | | | | - | | | | 631 | |
| USD | | | 32,820 | | | BRL | | | 32,181 | | | 2/4/2025 | | HUB | | | 639 | | | | - | | | | 639 | |
| USD | | | 32,826 | | | BRL | | | 32,181 | | | 2/4/2025 | | HUB | | | 645 | | | | - | | | | 645 | |
| USD | | | 32,828 | | | BRL | | | 32,181 | | | 2/4/2025 | | HUB | | | 647 | | | | - | | | | 647 | |
| USD | | | 16,414 | | | BRL | | | 16,091 | | | 2/4/2025 | | HUB | | | 323 | | | | - | | | | 323 | |
| USD | | | 16,414 | | | BRL | | | 16,091 | | | 2/4/2025 | | HUB | | | 323 | | | | - | | | | 323 | |
| USD | | | 32,832 | | | BRL | | | 32,181 | | | 2/4/2025 | | HUB | | | 651 | | | | - | | | | 651 | |
| USD | | | 32,833 | | | BRL | | | 32,181 | | | 2/4/2025 | | HUB | | | 652 | | | | - | | | | 652 | |
| USD | | | 32,836 | | | BRL | | | 32,181 | | | 2/4/2025 | | HUB | | | 655 | | | | - | | | | 655 | |
| USD | | | 32,837 | | | BRL | | | 32,181 | | | 2/4/2025 | | HUB | | | 656 | | | | - | | | | 656 | |
| USD | | | 16,419 | | | BRL | | | 16,091 | | | 2/4/2025 | | HUB | | | 328 | | | | - | | | | 328 | |
| USD | | | 16,419 | | | BRL | | | 16,091 | | | 2/4/2025 | | HUB | | | 328 | | | | - | | | | 328 | |
| USD | | | 32,839 | | | BRL | | | 32,181 | | | 2/4/2025 | | HUB | | | 658 | | | | - | | | | 658 | |
| USD | | | 32,842 | | | BRL | | | 32,181 | | | 2/4/2025 | | HUB | | | 661 | | | | - | | | | 661 | |
| USD | | | 32,844 | | | BRL | | | 32,181 | | | 2/4/2025 | | HUB | | | 663 | | | | - | | | | 663 | |
| USD | | | 32,847 | | | BRL | | | 32,181 | | | 2/4/2025 | | HUB | | | 666 | | | | - | | | | 666 | |
| USD | | | 32,849 | | | BRL | | | 32,181 | | | 2/4/2025 | | HUB | | | 668 | | | | - | | | | 668 | |
| USD | | | 32,850 | | | BRL | | | 32,181 | | | 2/4/2025 | | HUB | | | 669 | | | | - | | | | 669 | |
| USD | | | 32,855 | | | BRL | | | 32,181 | | | 2/4/2025 | | HUB | | | 674 | | | | - | | | | 674 | |
| USD | | | 32,857 | | | BRL | | | 32,181 | | | 2/4/2025 | | HUB | | | 676 | | | | - | | | | 676 | |
| USD | | | 32,859 | | | BRL | | | 32,181 | | | 2/4/2025 | | HUB | | | 678 | | | | - | | | | 678 | |
| USD | | | 32,861 | | | BRL | | | 32,181 | | | 2/4/2025 | | HUB | | | 680 | | | | - | | | | 680 | |
| USD | | | 16,431 | | | BRL | | | 16,091 | | | 2/4/2025 | | HUB | | | 340 | | | | - | | | | 340 | |
| USD | | | 16,431 | | | BRL | | | 16,091 | | | 2/4/2025 | | HUB | | | 340 | | | | - | | | | 340 | |
| USD | | | 32,863 | | | BRL | | | 32,181 | | | 2/4/2025 | | HUB | | | 682 | | | | - | | | | 682 | |
| USD | | | 32,865 | | | BRL | | | 32,181 | | | 2/4/2025 | | HUB | | | 684 | | | | - | | | | 684 | |
| USD | | | 32,868 | | | BRL | | | 32,181 | | | 2/4/2025 | | HUB | | | 687 | | | | - | | | | 687 | |
| USD | | | 32,869 | | | BRL | | | 32,181 | | | 2/4/2025 | | HUB | | | 688 | | | | - | | | | 688 | |
| USD | | | 32,875 | | | BRL | | | 32,181 | | | 2/4/2025 | | HUB | | | 694 | | | | - | | | | 694 | |
| USD | | | 16,440 | | | BRL | | | 16,091 | | | 2/4/2025 | | HUB | | | 349 | | | | - | | | | 349 | |
| USD | | | 16,440 | | | BRL | | | 16,091 | | | 2/4/2025 | | HUB | | | 349 | | | | - | | | | 349 | |
| USD | | | 32,882 | | | BRL | | | 32,181 | | | 2/4/2025 | | HUB | | | 701 | | | | - | | | | 701 | |
| USD | | | 32,896 | | | BRL | | | 32,181 | | | 2/4/2025 | | HUB | | | 715 | | | | - | | | | 715 | |
| USD | | | 16,449 | | | BRL | | | 16,091 | | | 2/4/2025 | | HUB | | | 358 | | | | - | | | | 358 | |
See accompanying notes
43
American Beacon AHL Managed Futures Strategy FundSM
Consolidated Schedule of Investments
December 31, 2024
| | | | | | | | | | | | | | | | | | | | | | | | | | |
| | | | | | |
| Currency Purchased* | | | Currency Sold* | | | Settlement
Date | | Counterparty | | Unrealized
Appreciation | | | Unrealized
(Depreciation) | | | Net Unrealized
Appreciation
(Depreciation) | |
| USD | | | 16,449 | | | BRL | | | 16,091 | | | 2/4/2025 | | HUB | | $ | 358 | | | $ | - | | | $ | 358 | |
| USD | | | 32,899 | | | BRL | | | 32,181 | | | 2/4/2025 | | HUB | | | 718 | | | | - | | | | 718 | |
| USD | | | 32,906 | | | BRL | | | 32,181 | | | 2/4/2025 | | HUB | | | 725 | | | | - | | | | 725 | |
| USD | | | 32,913 | | | BRL | | | 32,181 | | | 2/4/2025 | | HUB | | | 732 | | | | - | | | | 732 | |
| USD | | | 32,916 | | | BRL | | | 32,181 | | | 2/4/2025 | | HUB | | | 735 | | | | - | | | | 735 | |
| USD | | | 32,927 | | | BRL | | | 32,181 | | | 2/4/2025 | | HUB | | | 746 | | | | - | | | | 746 | |
| USD | | | 16,467 | | | BRL | | | 16,091 | | | 2/4/2025 | | HUB | | | 376 | | | | - | | | | 376 | |
| USD | | | 16,467 | | | BRL | | | 16,091 | | | 2/4/2025 | | HUB | | | 376 | | | | - | | | | 376 | |
| USD | | | 32,939 | | | BRL | | | 32,181 | | | 2/4/2025 | | HUB | | | 758 | | | | - | | | | 758 | |
| AUD | | | 41,031 | | | USD | | | 41,404 | | | 2/4/2025 | | HUB | | | - | | | | (373 | ) | | | (373 | ) |
| BRL | | | 48,272 | | | USD | | | 48,811 | | | 2/4/2025 | | HUB | | | - | | | | (539 | ) | | | (539 | ) |
| BRL | | | 48,272 | | | USD | | | 48,887 | | | 2/4/2025 | | HUB | | | - | | | | (615 | ) | | | (615 | ) |
| BRL | | | 48,272 | | | USD | | | 48,949 | | | 2/4/2025 | | HUB | | | - | | | | (677 | ) | | | (677 | ) |
| USD | | | 49,090 | | | BRL | | | 48,272 | | | 2/4/2025 | | HUB | | | 818 | | | | - | | | | 818 | |
| USD | | | 49,114 | | | BRL | | | 48,272 | | | 2/4/2025 | | HUB | | | 842 | | | | - | | | | 842 | |
| USD | | | 49,118 | | | BRL | | | 48,272 | | | 2/4/2025 | | HUB | | | 846 | | | | - | | | | 846 | |
| USD | | | 49,147 | | | BRL | | | 48,272 | | | 2/4/2025 | | HUB | | | 875 | | | | - | | | | 875 | |
| USD | | | 49,154 | | | BRL | | | 48,272 | | | 2/4/2025 | | HUB | | | 882 | | | | - | | | | 882 | |
| USD | | | 49,158 | | | BRL | | | 48,272 | | | 2/4/2025 | | HUB | | | 886 | | | | - | | | | 886 | |
| USD | | | 49,192 | | | BRL | | | 48,272 | | | 2/4/2025 | | HUB | | | 920 | | | | - | | | | 920 | |
| USD | | | 49,206 | | | BRL | | | 48,272 | | | 2/4/2025 | | HUB | | | 934 | | | | - | | | | 934 | |
| USD | | | 49,209 | | | BRL | | | 48,272 | | | 2/4/2025 | | HUB | | | 937 | | | | - | | | | 937 | |
| USD | | | 49,215 | | | BRL | | | 48,272 | | | 2/4/2025 | | HUB | | | 943 | | | | - | | | | 943 | |
| USD | | | 49,220 | | | BRL | | | 48,272 | | | 2/4/2025 | | HUB | | | 948 | | | | - | | | | 948 | |
| USD | | | 49,221 | | | BRL | | | 48,272 | | | 2/4/2025 | | HUB | | | 949 | | | | - | | | | 949 | |
| USD | | | 49,222 | | | BRL | | | 48,272 | | | 2/4/2025 | | HUB | | | 950 | | | | - | | | | 950 | |
| USD | | | 49,225 | | | BRL | | | 48,272 | | | 2/4/2025 | | HUB | | | 953 | | | | - | | | | 953 | |
| USD | | | 49,233 | | | BRL | | | 48,272 | | | 2/4/2025 | | HUB | | | 961 | | | | - | | | | 961 | |
| USD | | | 49,234 | | | BRL | | | 48,272 | | | 2/4/2025 | | HUB | | | 962 | | | | - | | | | 962 | |
| USD | | | 49,238 | | | BRL | | | 48,272 | | | 2/4/2025 | | HUB | | | 966 | | | | - | | | | 966 | |
| USD | | | 49,255 | | | BRL | | | 48,272 | | | 2/4/2025 | | HUB | | | 983 | | | | - | | | | 983 | |
| USD | | | 16,422 | | | BRL | | | 16,091 | | | 2/4/2025 | | HUB | | | 331 | | | | - | | | | 331 | |
| USD | | | 16,422 | | | BRL | | | 16,091 | | | 2/4/2025 | | HUB | | | 331 | | | | - | | | | 331 | |
| USD | | | 16,422 | | | BRL | | | 16,091 | | | 2/4/2025 | | HUB | | | 331 | | | | - | | | | 331 | |
| USD | | | 49,274 | | | BRL | | | 48,272 | | | 2/4/2025 | | HUB | | | 1,002 | | | | - | | | | 1,002 | |
| USD | | | 49,280 | | | BRL | | | 48,272 | | | 2/4/2025 | | HUB | | | 1,008 | | | | - | | | | 1,008 | |
| USD | | | 49,284 | | | BRL | | | 48,272 | | | 2/4/2025 | | HUB | | | 1,012 | | | | - | | | | 1,012 | |
| USD | | | 16,430 | | | BRL | | | 16,091 | | | 2/4/2025 | | HUB | | | 339 | | | | - | | | | 339 | |
| USD | | | 16,430 | | | BRL | | | 16,091 | | | 2/4/2025 | | HUB | | | 339 | | | | - | | | | 339 | |
| USD | | | 16,430 | | | BRL | | | 16,091 | | | 2/4/2025 | | HUB | | | 339 | | | | - | | | | 339 | |
| USD | | | 49,309 | | | BRL | | | 48,272 | | | 2/4/2025 | | HUB | | | 1,037 | | | | - | | | | 1,037 | |
| USD | | | 49,310 | | | BRL | | | 48,272 | | | 2/4/2025 | | HUB | | | 1,038 | | | | - | | | | 1,038 | |
| USD | | | 16,438 | | | BRL | | | 16,091 | | | 2/4/2025 | | HUB | | | 347 | | | | - | | | | 347 | |
| USD | | | 16,438 | | | BRL | | | 16,091 | | | 2/4/2025 | | HUB | | | 347 | | | | - | | | | 347 | |
| USD | | | 16,438 | | | BRL | | | 16,091 | | | 2/4/2025 | | HUB | | | 347 | | | | - | | | | 347 | |
| USD | | | 49,320 | | | BRL | | | 48,272 | | | 2/4/2025 | | HUB | | | 1,048 | | | | - | | | | 1,048 | |
| USD | | | 49,327 | | | BRL | | | 48,272 | | | 2/4/2025 | | HUB | | | 1,055 | | | | - | | | | 1,055 | |
| USD | | | 49,345 | | | BRL | | | 48,272 | | | 2/4/2025 | | HUB | | | 1,073 | | | | - | | | | 1,073 | |
| USD | | | 49,346 | | | BRL | | | 48,272 | | | 2/4/2025 | | HUB | | | 1,074 | | | | - | | | | 1,074 | |
| USD | | | 49,351 | | | BRL | | | 48,272 | | | 2/4/2025 | | HUB | | | 1,079 | | | | - | | | | 1,079 | |
| USD | | | 16,455 | | | BRL | | | 16,091 | | | 2/4/2025 | | HUB | | | 364 | | | | - | | | | 364 | |
| USD | | | 16,455 | | | BRL | | | 16,091 | | | 2/4/2025 | | HUB | | | 364 | | | | - | | | | 364 | |
| USD | | | 16,455 | | | BRL | | | 16,091 | | | 2/4/2025 | | HUB | | | 364 | | | | - | | | | 364 | |
| USD | | | 49,368 | | | BRL | | | 48,272 | | | 2/4/2025 | | HUB | | | 1,096 | | | | - | | | | 1,096 | |
| USD | | | 16,456 | | | BRL | | | 16,091 | | | 2/4/2025 | | HUB | | | 365 | | | | - | | | | 365 | |
| USD | | | 16,456 | | | BRL | | | 16,091 | | | 2/4/2025 | | HUB | | | 365 | | | | - | | | | 365 | |
| USD | | | 16,456 | | | BRL | | | 16,091 | | | 2/4/2025 | | HUB | | | 365 | | | | - | | | | 365 | |
| USD | | | 49,499 | | | BRL | | | 48,272 | | | 2/4/2025 | | HUB | | | 1,227 | | | | - | | | | 1,227 | |
| USD | | | 49,532 | | | BRL | | | 48,272 | | | 2/4/2025 | | HUB | | | 1,260 | | | | - | | | | 1,260 | |
See accompanying notes
44
American Beacon AHL Managed Futures Strategy FundSM
Consolidated Schedule of Investments
December 31, 2024
| | | | | | | | | | | | | | | | | | | | | | | | | | |
| | | | | | |
| Currency Purchased* | | | Currency Sold* | | | Settlement
Date | | Counterparty | | Unrealized
Appreciation | | | Unrealized
(Depreciation) | | | Net Unrealized
Appreciation
(Depreciation) | |
| USD | | | 63,780 | | | BRL | | | 64,362 | | | 2/4/2025 | | HUB | | $ | - | | | $ | (582 | ) | | $ | (582 | ) |
| BRL | | | 64,362 | | | USD | | | 65,165 | | | 2/4/2025 | | HUB | | | - | | | | (803 | ) | | | (803 | ) |
| BRL | | | 64,362 | | | USD | | | 65,178 | | | 2/4/2025 | | HUB | | | - | | | | (816 | ) | | | (816 | ) |
| BRL | | | 64,362 | | | USD | | | 65,194 | | | 2/4/2025 | | HUB | | | - | | | | (832 | ) | | | (832 | ) |
| BRL | | | 64,362 | | | USD | | | 65,228 | | | 2/4/2025 | | HUB | | | - | | | | (866 | ) | | | (866 | ) |
| BRL | | | 64,362 | | | USD | | | 65,241 | | | 2/4/2025 | | HUB | | | - | | | | (879 | ) | | | (879 | ) |
| BRL | | | 64,362 | | | USD | | | 65,271 | | | 2/4/2025 | | HUB | | | - | | | | (909 | ) | | | (909 | ) |
| BRL | | | 64,362 | | | USD | | | 65,333 | | | 2/4/2025 | | HUB | | | - | | | | (971 | ) | | | (971 | ) |
| USD | | | 65,471 | | | BRL | | | 64,362 | | | 2/4/2025 | | HUB | | | 1,109 | | | | - | | | | 1,109 | |
| USD | | | 65,487 | | | BRL | | | 64,362 | | | 2/4/2025 | | HUB | | | 1,125 | | | | - | | | | 1,125 | |
| USD | | | 65,522 | | | BRL | | | 64,362 | | | 2/4/2025 | | HUB | | | 1,160 | | | | - | | | | 1,160 | |
| USD | | | 65,523 | | | BRL | | | 64,362 | | | 2/4/2025 | | HUB | | | 1,161 | | | | - | | | | 1,161 | |
| USD | | | 65,539 | | | BRL | | | 64,362 | | | 2/4/2025 | | HUB | | | 1,177 | | | | - | | | | 1,177 | |
| USD | | | 65,552 | | | BRL | | | 64,362 | | | 2/4/2025 | | HUB | | | 1,190 | | | | - | | | | 1,190 | |
| USD | | | 65,561 | | | BRL | | | 64,362 | | | 2/4/2025 | | HUB | | | 1,199 | | | | - | | | | 1,199 | |
| USD | | | 65,629 | | | BRL | | | 64,362 | | | 2/4/2025 | | HUB | | | 1,267 | | | | - | | | | 1,267 | |
| USD | | | 65,655 | | | BRL | | | 64,362 | | | 2/4/2025 | | HUB | | | 1,293 | | | | - | | | | 1,293 | |
| USD | | | 65,661 | | | BRL | | | 64,362 | | | 2/4/2025 | | HUB | | | 1,299 | | | | - | | | | 1,299 | |
| USD | | | 65,674 | | | BRL | | | 64,362 | | | 2/4/2025 | | HUB | | | 1,312 | | | | - | | | | 1,312 | |
| USD | | | 65,677 | | | BRL | | | 64,362 | | | 2/4/2025 | | HUB | | | 1,315 | | | | - | | | | 1,315 | |
| USD | | | 65,684 | | | BRL | | | 64,362 | | | 2/4/2025 | | HUB | | | 1,322 | | | | - | | | | 1,322 | |
| USD | | | 65,701 | | | BRL | | | 64,362 | | | 2/4/2025 | | HUB | | | 1,339 | | | | - | | | | 1,339 | |
| USD | | | 65,707 | | | BRL | | | 64,362 | | | 2/4/2025 | | HUB | | | 1,345 | | | | - | | | | 1,345 | |
| USD | | | 32,858 | | | BRL | | | 32,181 | | | 2/4/2025 | | HUB | | | 677 | | | | - | | | | 677 | |
| USD | | | 32,858 | | | BRL | | | 32,181 | | | 2/4/2025 | | HUB | | | 677 | | | | - | | | | 677 | |
| USD | | | 32,864 | | | BRL | | | 32,181 | | | 2/4/2025 | | HUB | | | 683 | | | | - | | | | 683 | |
| USD | | | 32,864 | | | BRL | | | 32,181 | | | 2/4/2025 | | HUB | | | 683 | | | | - | | | | 683 | |
| USD | | | 65,742 | | | BRL | | | 64,362 | | | 2/4/2025 | | HUB | | | 1,380 | | | | - | | | | 1,380 | |
| USD | | | 65,766 | | | BRL | | | 64,362 | | | 2/4/2025 | | HUB | | | 1,404 | | | | - | | | | 1,404 | |
| USD | | | 32,884 | | | BRL | | | 32,181 | | | 2/4/2025 | | HUB | | | 703 | | | | - | | | | 703 | |
| USD | | | 32,884 | | | BRL | | | 32,181 | | | 2/4/2025 | | HUB | | | 703 | | | | - | | | | 703 | |
| USD | | | 65,815 | | | BRL | | | 64,362 | | | 2/4/2025 | | HUB | | | 1,453 | | | | - | | | | 1,453 | |
| USD | | | 65,818 | | | BRL | | | 64,362 | | | 2/4/2025 | | HUB | | | 1,456 | | | | - | | | | 1,456 | |
| USD | | | 65,820 | | | BRL | | | 64,362 | | | 2/4/2025 | | HUB | | | 1,458 | | | | - | | | | 1,458 | |
| USD | | | 32,912 | | | BRL | | | 32,181 | | | 2/4/2025 | | HUB | | | 731 | | | | - | | | | 731 | |
| USD | | | 32,912 | | | BRL | | | 32,181 | | | 2/4/2025 | | HUB | | | 731 | | | | - | | | | 731 | |
| USD | | | 65,910 | | | BRL | | | 64,362 | | | 2/4/2025 | | HUB | | | 1,548 | | | | - | | | | 1,548 | |
| BRL | | | 80,453 | | | USD | | | 80,210 | | | 2/4/2025 | | HUB | | | 243 | | | | - | | | | 243 | |
| BRL | | | 80,453 | | | USD | | | 81,360 | | | 2/4/2025 | | HUB | | | - | | | | (907 | ) | | | (907 | ) |
| BRL | | | 80,453 | | | USD | | | 81,365 | | | 2/4/2025 | | HUB | | | - | | | | (912 | ) | | | (912 | ) |
| BRL | | | 80,453 | | | USD | | | 81,394 | | | 2/4/2025 | | HUB | | | - | | | | (941 | ) | | | (941 | ) |
| BRL | | | 80,453 | | | USD | | | 81,432 | | | 2/4/2025 | | HUB | | | - | | | | (979 | ) | | | (979 | ) |
| BRL | | | 80,453 | | | USD | | | 81,441 | | | 2/4/2025 | | HUB | | | - | | | | (988 | ) | | | (988 | ) |
| BRL | | | 80,453 | | | USD | | | 81,547 | | | 2/4/2025 | | HUB | | | - | | | | (1,094 | ) | | | (1,094 | ) |
| BRL | | | 80,453 | | | USD | | | 81,677 | | | 2/4/2025 | | HUB | | | - | | | | (1,224 | ) | | | (1,224 | ) |
| USD | | | 81,776 | | | BRL | | | 80,453 | | | 2/4/2025 | | HUB | | | 1,323 | | | | - | | | | 1,323 | |
| USD | | | 81,856 | | | BRL | | | 80,453 | | | 2/4/2025 | | HUB | | | 1,403 | | | | - | | | | 1,403 | |
| USD | | | 81,857 | | | BRL | | | 80,453 | | | 2/4/2025 | | HUB | | | 1,404 | | | | - | | | | 1,404 | |
| USD | | | 81,893 | | | BRL | | | 80,453 | | | 2/4/2025 | | HUB | | | 1,440 | | | | - | | | | 1,440 | |
| USD | | | 82,020 | | | BRL | | | 80,453 | | | 2/4/2025 | | HUB | | | 1,567 | | | | - | | | | 1,567 | |
| USD | | | 82,022 | | | BRL | | | 80,453 | | | 2/4/2025 | | HUB | | | 1,569 | | | | - | | | | 1,569 | |
| USD | | | 82,053 | | | BRL | | | 80,453 | | | 2/4/2025 | | HUB | | | 1,600 | | | | - | | | | 1,600 | |
| USD | | | 82,063 | | | BRL | | | 80,453 | | | 2/4/2025 | | HUB | | | 1,610 | | | | - | | | | 1,610 | |
| USD | | | 82,075 | | | BRL | | | 80,453 | | | 2/4/2025 | | HUB | | | 1,622 | | | | - | | | | 1,622 | |
| USD | | | 82,098 | | | BRL | | | 80,453 | | | 2/4/2025 | | HUB | | | 1,645 | | | | - | | | | 1,645 | |
| USD | | | 82,103 | | | BRL | | | 80,453 | | | 2/4/2025 | | HUB | | | 1,650 | | | | - | | | | 1,650 | |
| USD | | | 82,107 | | | BRL | | | 80,453 | | | 2/4/2025 | | HUB | | | 1,654 | | | | - | | | | 1,654 | |
| USD | | | 82,123 | | | BRL | | | 80,453 | | | 2/4/2025 | | HUB | | | 1,670 | | | | - | | | | 1,670 | |
| USD | | | 82,177 | | | BRL | | | 80,453 | | | 2/4/2025 | | HUB | | | 1,724 | | | | - | | | | 1,724 | |
See accompanying notes
45
American Beacon AHL Managed Futures Strategy FundSM
Consolidated Schedule of Investments
December 31, 2024
| | | | | | | | | | | | | | | | | | | | | | | | | | |
| | | | | | |
| Currency Purchased* | | | Currency Sold* | | | Settlement
Date | | Counterparty | | Unrealized
Appreciation | | | Unrealized
(Depreciation) | | | Net Unrealized
Appreciation
(Depreciation) | |
| USD | | | 82,198 | | | BRL | | | 80,453 | | | 2/4/2025 | | HUB | | $ | 1,745 | | | $ | - | | | $ | 1,745 | |
| USD | | | 82,218 | | | BRL | | | 80,453 | | | 2/4/2025 | | HUB | | | 1,765 | | | | - | | | | 1,765 | |
| USD | | | 82,274 | | | BRL | | | 80,453 | | | 2/4/2025 | | HUB | | | 1,821 | | | | - | | | | 1,821 | |
| USD | | | 96,142 | | | BRL | | | 96,543 | | | 2/4/2025 | | HUB | | | - | | | | (401 | ) | | | (401 | ) |
| USD | | | 96,280 | | | BRL | | | 96,543 | | | 2/4/2025 | | HUB | | | - | | | | (263 | ) | | | (263 | ) |
| BRL | | | 96,543 | | | USD | | | 96,308 | | | 2/4/2025 | | HUB | | | 235 | | | | - | | | | 235 | |
| BRL | | | 96,543 | | | USD | | | 96,711 | | | 2/4/2025 | | HUB | | | - | | | | (168 | ) | | | (168 | ) |
| BRL | | | 96,543 | | | USD | | | 97,632 | | | 2/4/2025 | | HUB | | | - | | | | (1,089 | ) | | | (1,089 | ) |
| BRL | | | 96,543 | | | USD | | | 97,846 | | | 2/4/2025 | | HUB | | | - | | | | (1,303 | ) | | | (1,303 | ) |
| BRL | | | 96,543 | | | USD | | | 97,921 | | | 2/4/2025 | | HUB | | | - | | | | (1,378 | ) | | | (1,378 | ) |
| BRL | | | 96,543 | | | USD | | | 97,945 | | | 2/4/2025 | | HUB | | | - | | | | (1,402 | ) | | | (1,402 | ) |
| USD | | | 98,148 | | | BRL | | | 96,543 | | | 2/4/2025 | | HUB | | | 1,605 | | | | - | | | | 1,605 | |
| USD | | | 98,169 | | | BRL | | | 96,543 | | | 2/4/2025 | | HUB | | | 1,626 | | | | - | | | | 1,626 | |
| USD | | | 98,206 | | | BRL | | | 96,543 | | | 2/4/2025 | | HUB | | | 1,663 | | | | - | | | | 1,663 | |
| USD | | | 98,219 | | | BRL | | | 96,543 | | | 2/4/2025 | | HUB | | | 1,676 | | | | - | | | | 1,676 | |
| USD | | | 98,243 | | | BRL | | | 96,543 | | | 2/4/2025 | | HUB | | | 1,700 | | | | - | | | | 1,700 | |
| USD | | | 98,253 | | | BRL | | | 96,543 | | | 2/4/2025 | | HUB | | | 1,710 | | | | - | | | | 1,710 | |
| USD | | | 49,175 | | | BRL | | | 48,272 | | | 2/4/2025 | | HUB | | | 903 | | | | - | | | | 903 | |
| USD | | | 49,175 | | | BRL | | | 48,272 | | | 2/4/2025 | | HUB | | | 903 | | | | - | | | | 903 | |
| USD | | | 98,440 | | | BRL | | | 96,543 | | | 2/4/2025 | | HUB | | | 1,897 | | | | - | | | | 1,897 | |
| USD | | | 98,456 | | | BRL | | | 96,543 | | | 2/4/2025 | | HUB | | | 1,913 | | | | - | | | | 1,913 | |
| USD | | | 49,230 | | | BRL | | | 48,272 | | | 2/4/2025 | | HUB | | | 958 | | | | - | | | | 958 | |
| USD | | | 49,230 | | | BRL | | | 48,272 | | | 2/4/2025 | | HUB | | | 958 | | | | - | | | | 958 | |
| USD | | | 98,467 | | | BRL | | | 96,543 | | | 2/4/2025 | | HUB | | | 1,924 | | | | - | | | | 1,924 | |
| USD | | | 49,242 | | | BRL | | | 48,272 | | | 2/4/2025 | | HUB | | | 970 | | | | - | | | | 970 | |
| USD | | | 49,242 | | | BRL | | | 48,272 | | | 2/4/2025 | | HUB | | | 970 | | | | - | | | | 970 | |
| USD | | | 98,500 | | | BRL | | | 96,543 | | | 2/4/2025 | | HUB | | | 1,957 | | | | - | | | | 1,957 | |
| USD | | | 98,530 | | | BRL | | | 96,543 | | | 2/4/2025 | | HUB | | | 1,987 | | | | - | | | | 1,987 | |
| USD | | | 98,580 | | | BRL | | | 96,543 | | | 2/4/2025 | | HUB | | | 2,037 | | | | - | | | | 2,037 | |
| USD | | | 98,601 | | | BRL | | | 96,543 | | | 2/4/2025 | | HUB | | | 2,058 | | | | - | | | | 2,058 | |
| USD | | | 98,645 | | | BRL | | | 96,543 | | | 2/4/2025 | | HUB | | | 2,102 | | | | - | | | | 2,102 | |
| USD | | | 98,686 | | | BRL | | | 96,543 | | | 2/4/2025 | | HUB | | | 2,143 | | | | - | | | | 2,143 | |
| USD | | | 111,840 | | | BRL | | | 112,634 | | | 2/4/2025 | | HUB | | | - | | | | (794 | ) | | | (794 | ) |
| BRL | | | 112,634 | | | USD | | | 112,411 | | | 2/4/2025 | | HUB | | | 223 | | | | - | | | | 223 | |
| BRL | | | 112,634 | | | USD | | | 112,856 | | | 2/4/2025 | | HUB | | | - | | | | (222 | ) | | | (222 | ) |
| BRL | | | 112,634 | | | USD | | | 114,005 | | | 2/4/2025 | | HUB | | | - | | | | (1,371 | ) | | | (1,371 | ) |
| BRL | | | 112,634 | | | USD | | | 114,107 | | | 2/4/2025 | | HUB | | | - | | | | (1,473 | ) | | | (1,473 | ) |
| BRL | | | 112,634 | | | USD | | | 114,114 | | | 2/4/2025 | | HUB | | | - | | | | (1,480 | ) | | | (1,480 | ) |
| BRL | | | 112,634 | | | USD | | | 114,131 | | | 2/4/2025 | | HUB | | | - | | | | (1,497 | ) | | | (1,497 | ) |
| BRL | | | 112,634 | | | USD | | | 114,299 | | | 2/4/2025 | | HUB | | | - | | | | (1,665 | ) | | | (1,665 | ) |
| BRL | | | 112,634 | | | USD | | | 114,342 | | | 2/4/2025 | | HUB | | | - | | | | (1,708 | ) | | | (1,708 | ) |
| USD | | | 115,043 | | | BRL | | | 112,634 | | | 2/4/2025 | | HUB | | | 2,409 | | | | - | | | | 2,409 | |
| USD | | | 115,215 | | | BRL | | | 112,634 | | | 2/4/2025 | | HUB | | | 2,581 | | | | - | | | | 2,581 | |
| USD | | | 115,379 | | | BRL | | | 112,634 | | | 2/4/2025 | | HUB | | | 2,745 | | | | - | | | | 2,745 | |
| USD | | | 127,574 | | | BRL | | | 128,724 | | | 2/4/2025 | | HUB | | | - | | | | (1,150 | ) | | | (1,150 | ) |
| USD | | | 127,581 | | | BRL | | | 128,724 | | | 2/4/2025 | | HUB | | | - | | | | (1,143 | ) | | | (1,143 | ) |
| USD | | | 127,585 | | | BRL | | | 128,724 | | | 2/4/2025 | | HUB | | | - | | | | (1,139 | ) | | | (1,139 | ) |
| BRL | | | 128,724 | | | USD | | | 128,471 | | | 2/4/2025 | | HUB | | | 253 | | | | - | | | | 253 | |
| BRL | | | 128,724 | | | USD | | | 128,473 | | | 2/4/2025 | | HUB | | | 251 | | | | - | | | | 251 | |
| BRL | | | 128,724 | | | USD | | | 128,640 | | | 2/4/2025 | | HUB | | | 84 | | | | - | | | | 84 | |
| BRL | | | 128,724 | | | USD | | | 129,072 | | | 2/4/2025 | | HUB | | | - | | | | (348 | ) | | | (348 | ) |
| BRL | | | 128,724 | | | USD | | | 130,861 | | | 2/4/2025 | | HUB | | | - | | | | (2,137 | ) | | | (2,137 | ) |
| USD | | | 130,931 | | | BRL | | | 128,724 | | | 2/4/2025 | | HUB | | | 2,207 | | | | - | | | | 2,207 | |
| USD | | | 130,950 | | | BRL | | | 128,724 | | | 2/4/2025 | | HUB | | | 2,226 | | | | - | | | | 2,226 | |
| USD | | | 130,960 | | | BRL | | | 128,724 | | | 2/4/2025 | | HUB | | | 2,236 | | | | - | | | | 2,236 | |
| USD | | | 130,971 | | | BRL | | | 128,724 | | | 2/4/2025 | | HUB | | | 2,247 | | | | - | | | | 2,247 | |
| USD | | | 131,017 | | | BRL | | | 128,724 | | | 2/4/2025 | | HUB | | | 2,293 | | | | - | | | | 2,293 | |
| USD | | | 131,585 | | | BRL | | | 128,724 | | | 2/4/2025 | | HUB | | | 2,861 | | | | - | | | | 2,861 | |
| USD | | | 131,588 | | | BRL | | | 128,724 | | | 2/4/2025 | | HUB | | | 2,864 | | | | - | | | | 2,864 | |
See accompanying notes
46
American Beacon AHL Managed Futures Strategy FundSM
Consolidated Schedule of Investments
December 31, 2024
| | | | | | | | | | | | | | | | | | | | | | | | | | |
| | | | | | |
| Currency Purchased* | | | Currency Sold* | | | Settlement
Date | | Counterparty | | Unrealized
Appreciation | | | Unrealized
(Depreciation) | | | Net Unrealized
Appreciation
(Depreciation) | |
| BRL | | | 144,815 | | | USD | | | 144,804 | | | 2/4/2025 | | HUB | | $ | 11 | | | $ | - | | | $ | 11 | |
| BRL | | | 144,815 | | | USD | | | 145,197 | | | 2/4/2025 | | HUB | | | - | | | | (382 | ) | | | (382 | ) |
| BRL | | | 144,815 | | | USD | | | 145,244 | | | 2/4/2025 | | HUB | | | - | | | | (429 | ) | | | (429 | ) |
| BRL | | | 144,815 | | | USD | | | 145,405 | | | 2/4/2025 | | HUB | | | - | | | | (590 | ) | | | (590 | ) |
| BRL | | | 144,815 | | | USD | | | 145,466 | | | 2/4/2025 | | HUB | | | - | | | | (651 | ) | | | (651 | ) |
| BRL | | | 144,815 | | | USD | | | 145,492 | | | 2/4/2025 | | HUB | | | - | | | | (677 | ) | | | (677 | ) |
| BRL | | | 144,815 | | | USD | | | 146,914 | | | 2/4/2025 | | HUB | | | - | | | | (2,099 | ) | | | (2,099 | ) |
| BRL | | | 144,815 | | | USD | | | 146,929 | | | 2/4/2025 | | HUB | | | - | | | | (2,114 | ) | | | (2,114 | ) |
| BRL | | | 144,815 | | | USD | | | 147,149 | | | 2/4/2025 | | HUB | | | - | | | | (2,334 | ) | | | (2,334 | ) |
| BRL | | | 144,815 | | | USD | | | 147,479 | | | 2/4/2025 | | HUB | | | - | | | | (2,664 | ) | | | (2,664 | ) |
| USD | | | 147,270 | | | BRL | | | 144,815 | | | 2/4/2025 | | HUB | | | 2,455 | | | | - | | | | 2,455 | |
| USD | | | 147,300 | | | BRL | | | 144,815 | | | 2/4/2025 | | HUB | | | 2,485 | | | | - | | | | 2,485 | |
| USD | | | 147,324 | | | BRL | | | 144,815 | | | 2/4/2025 | | HUB | | | 2,509 | | | | - | | | | 2,509 | |
| USD | | | 148,312 | | | BRL | | | 144,815 | | | 2/4/2025 | | HUB | | | 3,497 | | | | - | | | | 3,497 | |
| USD | | | 148,552 | | | BRL | | | 144,815 | | | 2/4/2025 | | HUB | | | 3,737 | | | | - | | | | 3,737 | |
| USD | | | 159,664 | | | BRL | | | 160,905 | | | 2/4/2025 | | HUB | | | - | | | | (1,241 | ) | | | (1,241 | ) |
| USD | | | 160,754 | | | BRL | | | 160,905 | | | 2/4/2025 | | HUB | | | - | | | | (151 | ) | | | (151 | ) |
| BRL | | | 160,905 | | | USD | | | 160,615 | | | 2/4/2025 | | HUB | | | 290 | | | | - | | | | 290 | |
| BRL | | | 160,905 | | | USD | | | 160,823 | | | 2/4/2025 | | HUB | | | 82 | | | | - | | | | 82 | |
| BRL | | | 160,905 | | | USD | | | 162,896 | | | 2/4/2025 | | HUB | | | - | | | | (1,991 | ) | | | (1,991 | ) |
| BRL | | | 160,905 | | | USD | | | 163,188 | | | 2/4/2025 | | HUB | | | - | | | | (2,283 | ) | | | (2,283 | ) |
| USD | | | 81,864 | | | BRL | | | 80,453 | | | 2/4/2025 | | HUB | | | 1,411 | | | | - | | | | 1,411 | |
| USD | | | 81,864 | | | BRL | | | 80,453 | | | 2/4/2025 | | HUB | | | 1,411 | | | | - | | | | 1,411 | |
| USD | | | 81,958 | | | BRL | | | 80,453 | | | 2/4/2025 | | HUB | | | 1,505 | | | | - | | | | 1,505 | |
| USD | | | 81,958 | | | BRL | | | 80,453 | | | 2/4/2025 | | HUB | | | 1,505 | | | | - | | | | 1,505 | |
| USD | | | 164,512 | | | BRL | | | 160,905 | | | 2/4/2025 | | HUB | | | 3,607 | | | | - | | | | 3,607 | |
| USD | | | 165,210 | | | BRL | | | 160,905 | | | 2/4/2025 | | HUB | | | 4,305 | | | | - | | | | 4,305 | |
| USD | | | 176,748 | | | BRL | | | 176,996 | | | 2/4/2025 | | HUB | | | - | | | | (248 | ) | | | (248 | ) |
| BRL | | | 176,996 | | | USD | | | 176,639 | | | 2/4/2025 | | HUB | | | 357 | | | | - | | | | 357 | |
| BRL | | | 176,996 | | | USD | | | 176,732 | | | 2/4/2025 | | HUB | | | 264 | | | | - | | | | 264 | |
| BRL | | | 176,996 | | | USD | | | 176,815 | | | 2/4/2025 | | HUB | | | 181 | | | | - | | | | 181 | |
| BRL | | | 176,996 | | | USD | | | 176,897 | | | 2/4/2025 | | HUB | | | 99 | | | | - | | | | 99 | |
| BRL | | | 176,996 | | | USD | | | 177,454 | | | 2/4/2025 | | HUB | | | - | | | | (458 | ) | | | (458 | ) |
| BRL | | | 176,996 | | | USD | | | 177,601 | | | 2/4/2025 | | HUB | | | - | | | | (605 | ) | | | (605 | ) |
| BRL | | | 176,996 | | | USD | | | 177,766 | | | 2/4/2025 | | HUB | | | - | | | | (770 | ) | | | (770 | ) |
| BRL | | | 176,996 | | | USD | | | 177,768 | | | 2/4/2025 | | HUB | | | - | | | | (772 | ) | | | (772 | ) |
| BRL | | | 176,996 | | | USD | | | 177,780 | | | 2/4/2025 | | HUB | | | - | | | | (784 | ) | | | (784 | ) |
| BRL | | | 176,996 | | | USD | | | 177,805 | | | 2/4/2025 | | HUB | | | - | | | | (809 | ) | | | (809 | ) |
| BRL | | | 176,996 | | | USD | | | 177,807 | | | 2/4/2025 | | HUB | | | - | | | | (811 | ) | | | (811 | ) |
| BRL | | | 176,996 | | | USD | | | 177,831 | | | 2/4/2025 | | HUB | | | - | | | | (835 | ) | | | (835 | ) |
| BRL | | | 176,996 | | | USD | | | 178,000 | | | 2/4/2025 | | HUB | | | - | | | | (1,004 | ) | | | (1,004 | ) |
| BRL | | | 176,996 | | | USD | | | 179,448 | | | 2/4/2025 | | HUB | | | - | | | | (2,452 | ) | | | (2,452 | ) |
| BRL | | | 176,996 | | | USD | | | 179,998 | | | 2/4/2025 | | HUB | | | - | | | | (3,002 | ) | | | (3,002 | ) |
| BRL | | | 176,996 | | | USD | | | 180,292 | | | 2/4/2025 | | HUB | | | - | | | | (3,296 | ) | | | (3,296 | ) |
| BRL | | | 176,996 | | | USD | | | 180,389 | | | 2/4/2025 | | HUB | | | - | | | | (3,393 | ) | | | (3,393 | ) |
| USD | | | 180,969 | | | BRL | | | 176,996 | | | 2/4/2025 | | HUB | | | 3,973 | | | | - | | | | 3,973 | |
| AUD | | | 185,690 | | | USD | | | 186,504 | | | 2/4/2025 | | HUB | | | - | | | | (814 | ) | | | (814 | ) |
| BRL | | | 193,086 | | | USD | | | 192,691 | | | 2/4/2025 | | HUB | | | 395 | | | | - | | | | 395 | |
| BRL | | | 193,086 | | | USD | | | 193,923 | | | 2/4/2025 | | HUB | | | - | | | | (837 | ) | | | (837 | ) |
| BRL | | | 193,086 | | | USD | | | 194,107 | | | 2/4/2025 | | HUB | | | - | | | | (1,021 | ) | | | (1,021 | ) |
| BRL | | | 193,086 | | | USD | | | 195,578 | | | 2/4/2025 | | HUB | | | - | | | | (2,492 | ) | | | (2,492 | ) |
| BRL | | | 193,086 | | | USD | | | 196,433 | | | 2/4/2025 | | HUB | | | - | | | | (3,347 | ) | | | (3,347 | ) |
| BRL | | | 193,086 | | | USD | | | 196,727 | | | 2/4/2025 | | HUB | | | - | | | | (3,641 | ) | | | (3,641 | ) |
| USD | | | 208,180 | | | BRL | | | 209,177 | | | 2/4/2025 | | HUB | | | - | | | | (997 | ) | | | (997 | ) |
| BRL | | | 209,177 | | | USD | | | 208,990 | | | 2/4/2025 | | HUB | | | 187 | | | | - | | | | 187 | |
| BRL | | | 209,177 | | | USD | | | 209,003 | | | 2/4/2025 | | HUB | | | 174 | | | | - | | | | 174 | |
| BRL | | | 209,177 | | | USD | | | 210,128 | | | 2/4/2025 | | HUB | | | - | | | | (951 | ) | | | (951 | ) |
| BRL | | | 209,177 | | | USD | | | 210,169 | | | 2/4/2025 | | HUB | | | - | | | | (992 | ) | | | (992 | ) |
| BRL | | | 209,177 | | | USD | | | 211,406 | | | 2/4/2025 | | HUB | | | - | | | | (2,229 | ) | | | (2,229 | ) |
See accompanying notes
47
American Beacon AHL Managed Futures Strategy FundSM
Consolidated Schedule of Investments
December 31, 2024
| | | | | | | | | | | | | | | | | | | | | | | | | | | | |
| | | | | | |
| Currency Purchased* | | | Currency Sold* | | | Settlement
Date | | Counterparty | | | Unrealized
Appreciation | | | Unrealized
(Depreciation) | | | Net Unrealized
Appreciation
(Depreciation) | |
| BRL | | | 209,177 | | | USD | | | 211,960 | | | 2/4/2025 | | | HUB | | | $ | - | | | $ | (2,783 | ) | | $ | (2,783 | ) |
| BRL | | | 209,177 | | | USD | | | 212,913 | | | 2/4/2025 | | | HUB | | | | - | | | | (3,736 | ) | | | (3,736 | ) |
| USD | | | 213,774 | | | BRL | | | 209,177 | | | 2/4/2025 | | | HUB | | | | 4,597 | | | | - | | | | 4,597 | |
| USD | | | 225,149 | | | BRL | | | 225,267 | | | 2/4/2025 | | | HUB | | | | - | | | | (118 | ) | | | (118 | ) |
| BRL | | | 225,267 | | | USD | | | 225,432 | | | 2/4/2025 | | | HUB | | | | - | | | | (165 | ) | | | (165 | ) |
| BRL | | | 225,267 | | | USD | | | 226,210 | | | 2/4/2025 | | | HUB | | | | - | | | | (943 | ) | | | (943 | ) |
| BRL | | | 225,267 | | | USD | | | 226,261 | | | 2/4/2025 | | | HUB | | | | - | | | | (994 | ) | | | (994 | ) |
| BRL | | | 225,267 | | | USD | | | 226,415 | | | 2/4/2025 | | | HUB | | | | - | | | | (1,148 | ) | | | (1,148 | ) |
| BRL | | | 225,267 | | | USD | | | 228,244 | | | 2/4/2025 | | | HUB | | | | - | | | | (2,977 | ) | | | (2,977 | ) |
| BRL | | | 225,267 | | | USD | | | 228,440 | | | 2/4/2025 | | | HUB | | | | - | | | | (3,173 | ) | | | (3,173 | ) |
| BRL | | | 241,358 | | | USD | | | 240,646 | | | 2/4/2025 | | | HUB | | | | 712 | | | | - | | | | 712 | |
| BRL | | | 241,358 | | | USD | | | 242,318 | | | 2/4/2025 | | | HUB | | | | - | | | | (960 | ) | | | (960 | ) |
| BRL | | | 241,358 | | | USD | | | 242,368 | | | 2/4/2025 | | | HUB | | | | - | | | | (1,010 | ) | | | (1,010 | ) |
| BRL | | | 241,358 | | | USD | | | 244,186 | | | 2/4/2025 | | | HUB | | | | - | | | | (2,828 | ) | | | (2,828 | ) |
| BRL | | | 241,358 | | | USD | | | 244,644 | | | 2/4/2025 | | | HUB | | | | - | | | | (3,286 | ) | | | (3,286 | ) |
| USD | | | 246,950 | | | BRL | | | 241,358 | | | 2/4/2025 | | | HUB | | | | 5,592 | | | | - | | | | 5,592 | |
| BRL | | | 257,448 | | | USD | | | 258,296 | | | 2/4/2025 | | | HUB | | | | - | | | | (848 | ) | | | (848 | ) |
| BRL | | | 257,448 | | | USD | | | 258,489 | | | 2/4/2025 | | | HUB | | | | - | | | | (1,041 | ) | | | (1,041 | ) |
| BRL | | | 257,448 | | | USD | | | 258,644 | | | 2/4/2025 | | | HUB | | | | - | | | | (1,196 | ) | | | (1,196 | ) |
| BRL | | | 257,448 | | | USD | | | 260,814 | | | 2/4/2025 | | | HUB | | | | - | | | | (3,366 | ) | | | (3,366 | ) |
| BRL | | | 257,448 | | | USD | | | 261,123 | | | 2/4/2025 | | | HUB | | | | - | | | | (3,675 | ) | | | (3,675 | ) |
| BRL | | | 257,448 | | | USD | | | 261,635 | | | 2/4/2025 | | | HUB | | | | - | | | | (4,187 | ) | | | (4,187 | ) |
| USD | | | 261,951 | | | BRL | | | 257,448 | | | 2/4/2025 | | | HUB | | | | 4,503 | | | | - | | | | 4,503 | |
| BRL | | | 273,539 | | | USD | | | 274,795 | | | 2/4/2025 | | | HUB | | | | - | | | | (1,256 | ) | | | (1,256 | ) |
| BRL | | | 273,539 | | | USD | | | 274,810 | | | 2/4/2025 | | | HUB | | | | - | | | | (1,271 | ) | | | (1,271 | ) |
| BRL | | | 273,539 | | | USD | | | 277,659 | | | 2/4/2025 | | | HUB | | | | - | | | | (4,120 | ) | | | (4,120 | ) |
| BRL | | | 273,539 | | | USD | | | 278,535 | | | 2/4/2025 | | | HUB | | | | - | | | | (4,996 | ) | | | (4,996 | ) |
| BRL | | | 273,539 | | | USD | | | 278,608 | | | 2/4/2025 | | | HUB | | | | - | | | | (5,069 | ) | | | (5,069 | ) |
| BRL | | | 273,539 | | | USD | | | 278,661 | | | 2/4/2025 | | | HUB | | | | - | | | | (5,122 | ) | | | (5,122 | ) |
| BRL | | | 273,539 | | | USD | | | 278,881 | | | 2/4/2025 | | | HUB | | | | - | | | | (5,342 | ) | | | (5,342 | ) |
| BRL | | | 289,629 | | | USD | | | 290,558 | | | 2/4/2025 | | | HUB | | | | - | | | | (929 | ) | | | (929 | ) |
| BRL | | | 289,629 | | | USD | | | 290,979 | | | 2/4/2025 | | | HUB | | | | - | | | | (1,350 | ) | | | (1,350 | ) |
| BRL | | | 289,629 | | | USD | | | 292,512 | | | 2/4/2025 | | | HUB | | | | - | | | | (2,883 | ) | | | (2,883 | ) |
| BRL | | | 289,629 | | | USD | | | 293,341 | | | 2/4/2025 | | | HUB | | | | - | | | | (3,712 | ) | | | (3,712 | ) |
| BRL | | | 289,629 | | | USD | | | 293,508 | | | 2/4/2025 | | | HUB | | | | - | | | | (3,879 | ) | | | (3,879 | ) |
| BRL | | | 289,629 | | | USD | | | 294,036 | | | 2/4/2025 | | | HUB | | | | - | | | | (4,407 | ) | | | (4,407 | ) |
| BRL | | | 305,720 | | | USD | | | 307,210 | | | 2/4/2025 | | | HUB | | | | - | | | | (1,490 | ) | | | (1,490 | ) |
| BRL | | | 305,720 | | | USD | | | 309,351 | | | 2/4/2025 | | | HUB | | | | - | | | | (3,631 | ) | | | (3,631 | ) |
| BRL | | | 305,720 | | | USD | | | 309,510 | | | 2/4/2025 | | | HUB | | | | - | | | | (3,790 | ) | | | (3,790 | ) |
| BRL | | | 305,720 | | | USD | | | 309,523 | | | 2/4/2025 | | | HUB | | | | - | | | | (3,803 | ) | | | (3,803 | ) |
| BRL | | | 305,720 | | | USD | | | 310,285 | | | 2/4/2025 | | | HUB | | | | - | | | | (4,565 | ) | | | (4,565 | ) |
| BRL | | | 305,720 | | | USD | | | 311,058 | | | 2/4/2025 | | | HUB | | | | - | | | | (5,338 | ) | | | (5,338 | ) |
| BRL | | | 305,720 | | | USD | | | 311,734 | | | 2/4/2025 | | | HUB | | | | - | | | | (6,014 | ) | | | (6,014 | ) |
| BRL | | | 321,810 | | | USD | | | 323,053 | | | 2/4/2025 | | | HUB | | | | - | | | | (1,243 | ) | | | (1,243 | ) |
| BRL | | | 321,810 | | | USD | | | 323,332 | | | 2/4/2025 | | | HUB | | | | - | | | | (1,522 | ) | | | (1,522 | ) |
| BRL | | | 321,810 | | | USD | | | 323,339 | | | 2/4/2025 | | | HUB | | | | - | | | | (1,529 | ) | | | (1,529 | ) |
| BRL | | | 321,810 | | | USD | | | 323,358 | | | 2/4/2025 | | | HUB | | | | - | | | | (1,548 | ) | | | (1,548 | ) |
| BRL | | | 321,810 | | | USD | | | 326,275 | | | 2/4/2025 | | | HUB | | | | - | | | | (4,465 | ) | | | (4,465 | ) |
| USD | | | 336,357 | | | BRL | | | 337,901 | | | 2/4/2025 | | | HUB | | | | - | | | | (1,544 | ) | | | (1,544 | ) |
| BRL | | | 337,901 | | | USD | | | 339,270 | | | 2/4/2025 | | | HUB | | | | - | | | | (1,369 | ) | | | (1,369 | ) |
| BRL | | | 337,901 | | | USD | | | 342,152 | | | 2/4/2025 | | | HUB | | | | - | | | | (4,251 | ) | | | (4,251 | ) |
| BRL | | | 337,901 | | | USD | | | 342,393 | | | 2/4/2025 | | | HUB | | | | - | | | | (4,492 | ) | | | (4,492 | ) |
| BRL | | | 337,901 | | | USD | | | 344,147 | | | 2/4/2025 | | | HUB | | | | - | | | | (6,246 | ) | | | (6,246 | ) |
| BRL | | | 353,991 | | | USD | | | 353,129 | | | 2/4/2025 | | | HUB | | | | 862 | | | | - | | | | 862 | |
| BRL | | | 353,991 | | | USD | | | 355,740 | | | 2/4/2025 | | | HUB | | | | - | | | | (1,749 | ) | | | (1,749 | ) |
| BRL | | | 353,991 | | | USD | | | 358,541 | | | 2/4/2025 | | | HUB | | | | - | | | | (4,550 | ) | | | (4,550 | ) |
| BRL | | | 353,991 | | | USD | | | 358,557 | | | 2/4/2025 | | | HUB | | | | - | | | | (4,566 | ) | | | (4,566 | ) |
| BRL | | | 370,082 | | | USD | | | 370,115 | | | 2/4/2025 | | | HUB | | | | - | | | | (33 | ) | | | (33 | ) |
| BRL | | | 370,082 | | | USD | | | 371,511 | | | 2/4/2025 | | | HUB | | | | - | | | | (1,429 | ) | | | (1,429 | ) |
See accompanying notes
48
American Beacon AHL Managed Futures Strategy FundSM
Consolidated Schedule of Investments
December 31, 2024
| | | | | | | | | | | | | | | | | | | | | | | | | | |
| | | | | | |
| Currency Purchased* | | | Currency Sold* | | Settlement
Date | | Counterparty | | | Unrealized
Appreciation | | | Unrealized
(Depreciation) | | | Net Unrealized
Appreciation
(Depreciation) | |
| BRL | | | 370,082 | | | USD | | 371,578 | | 2/4/2025 | | | HUB | | | $ | - | | | $ | (1,496 | ) | | $ | (1,496 | ) |
| BRL | | | 370,082 | | | USD | | 371,595 | | 2/4/2025 | | | HUB | | | | - | | | | (1,513 | ) | | | (1,513 | ) |
| BRL | | | 370,082 | | | USD | | 371,645 | | 2/4/2025 | | | HUB | | | | - | | | | (1,563 | ) | | | (1,563 | ) |
| BRL | | | 370,082 | | | USD | | 371,672 | | 2/4/2025 | | | HUB | | | | - | | | | (1,590 | ) | | | (1,590 | ) |
| BRL | | | 370,082 | | | USD | | 375,848 | | 2/4/2025 | | | HUB | | | | - | | | | (5,766 | ) | | | (5,766 | ) |
| BRL | | | 386,172 | | | USD | | 387,851 | | 2/4/2025 | | | HUB | | | | - | | | | (1,679 | ) | | | (1,679 | ) |
| BRL | | | 386,172 | | | USD | | 387,934 | | 2/4/2025 | | | HUB | | | | - | | | | (1,762 | ) | | | (1,762 | ) |
| BRL | | | 402,263 | | | USD | | 402,538 | | 2/4/2025 | | | HUB | | | | - | | | | (275 | ) | | | (275 | ) |
| BRL | | | 466,625 | | | USD | | 478,114 | | 2/4/2025 | | | HUB | | | | - | | | | (11,489 | ) | | | (11,489 | ) |
| BRL | | | 466,625 | | | USD | | 478,889 | | 2/4/2025 | | | HUB | | | | - | | | | (12,264 | ) | | | (12,264 | ) |
| BRL | | | 482,716 | | | USD | | 489,506 | | 2/4/2025 | | | HUB | | | | - | | | | (6,790 | ) | | | (6,790 | ) |
| BRL | | | 482,716 | | | USD | | 495,083 | | 2/4/2025 | | | HUB | | | | - | | | | (12,367 | ) | | | (12,367 | ) |
| AUD | | | 490,588 | | | USD | | 495,499 | | 2/4/2025 | | | HUB | | | | - | | | | (4,911 | ) | | | (4,911 | ) |
| BRL | | | 498,806 | | | USD | | 498,737 | | 2/4/2025 | | | HUB | | | | 69 | | | | - | | | | 69 | |
| BRL | | | 514,897 | | | USD | | 522,387 | | 2/4/2025 | | | HUB | | | | - | | | | (7,490 | ) | | | (7,490 | ) |
| BRL | | | 514,897 | | | USD | | 522,594 | | 2/4/2025 | | | HUB | | | | - | | | | (7,697 | ) | | | (7,697 | ) |
| BRL | | | 530,987 | | | USD | | 537,881 | | 2/4/2025 | | | HUB | | | | - | | | | (6,894 | ) | | | (6,894 | ) |
| BRL | | | 547,078 | | | USD | | 555,407 | | 2/4/2025 | | | HUB | | | | - | | | | (8,329 | ) | | | (8,329 | ) |
| BRL | | | 579,259 | | | USD | | 578,735 | | 2/4/2025 | | | HUB | | | | 524 | | | | - | | | | 524 | |
| BRL | | | 595,349 | | | USD | | 604,914 | | 2/4/2025 | | | HUB | | | | - | | | | (9,565 | ) | | | (9,565 | ) |
| BRL | | | 595,349 | | | USD | | 609,538 | | 2/4/2025 | | | HUB | | | | - | | | | (14,189 | ) | | | (14,189 | ) |
| BRL | | | 643,621 | | | USD | | 651,869 | | 2/4/2025 | | | HUB | | | | - | | | | (8,248 | ) | | | (8,248 | ) |
| BRL | | | 675,802 | | | USD | | 692,326 | | 2/4/2025 | | | HUB | | | | - | | | | (16,524 | ) | | | (16,524 | ) |
| BRL | | | 724,073 | | | USD | | 734,018 | | 2/4/2025 | | | HUB | | | | - | | | | (9,945 | ) | | | (9,945 | ) |
| BRL | | | 724,073 | | | USD | | 734,119 | | 2/4/2025 | | | HUB | | | | - | | | | (10,046 | ) | | | (10,046 | ) |
| BRL | | | 820,616 | | | USD | | 835,603 | | 2/4/2025 | | | HUB | | | | - | | | | (14,987 | ) | | | (14,987 | ) |
| BRL | | | 949,341 | | | USD | | 974,578 | | 2/4/2025 | | | HUB | | | | - | | | | (25,237 | ) | | | (25,237 | ) |
| BRL | | | 965,431 | | | USD | | 987,302 | | 2/4/2025 | | | HUB | | | | - | | | | (21,871 | ) | | | (21,871 | ) |
| USD | | | 1,044,169 | | | AUD | | 990,346 | | 2/4/2025 | | | HUB | | | | 53,823 | | | | - | | | | 53,823 | |
| BRL | | | 1,045,884 | | | USD | | 1,074,753 | | 2/4/2025 | | | HUB | | | | - | | | | (28,869 | ) | | | (28,869 | ) |
| AUD | | | 1,052,242 | | | USD | | 1,109,451 | | 2/4/2025 | | | HUB | | | | - | | | | (57,209 | ) | | | (57,209 | ) |
| BRL | | | 1,094,155 | | | USD | | 1,121,187 | | 2/4/2025 | | | HUB | | | | - | | | | (27,032 | ) | | | (27,032 | ) |
| BRL | | | 1,190,698 | | | USD | | 1,218,231 | | 2/4/2025 | | | HUB | | | | - | | | | (27,533 | ) | | | (27,533 | ) |
| BRL | | | 1,206,789 | | | USD | | 1,234,777 | | 2/4/2025 | | | HUB | | | | - | | | | (27,988 | ) | | | (27,988 | ) |
| BRL | | | 1,238,970 | | | USD | | 1,257,741 | | 2/4/2025 | | | HUB | | | | - | | | | (18,771 | ) | | | (18,771 | ) |
| BRL | | | 1,271,151 | | | USD | | 1,291,941 | | 2/4/2025 | | | HUB | | | | - | | | | (20,790 | ) | | | (20,790 | ) |
| USD | | | 1,285,694 | | | AUD | | 1,237,932 | | 2/4/2025 | | | HUB | | | | 47,762 | | | | - | | | | 47,762 | |
| USD | | | 1,365,735 | | | AUD | | 1,299,829 | | 2/4/2025 | | | HUB | | | | 65,906 | | | | - | | | | 65,906 | |
| USD | | | 1,778,922 | | | AUD | | 1,733,105 | | 2/4/2025 | | | HUB | | | | 45,817 | | | | - | | | | 45,817 | |
| USD | | | 1,986,126 | | | AUD | | 1,918,795 | | 2/4/2025 | | | HUB | | | | 67,331 | | | | - | | | | 67,331 | |
| USD | | | 2,341,651 | | | AUD | | 2,228,278 | | 2/4/2025 | | | HUB | | | | 113,373 | | | | - | | | | 113,373 | |
| USD | | | 2,752,745 | | | AUD | | 2,634,539 | | 2/4/2025 | | | HUB | | | | 118,206 | | | | - | | | | 118,206 | |
| USD | | | 3,372,724 | | | AUD | | 3,218,624 | | 2/4/2025 | | | HUB | | | | 154,100 | | | | - | | | | 154,100 | |
| USD | | | 3,414,888 | | | AUD | | 3,280,521 | | 2/4/2025 | | | HUB | | | | 134,367 | | | | - | | | | 134,367 | |
| USD | | | 3,647,722 | | | AUD | | 3,466,210 | | 2/4/2025 | | | HUB | | | | 181,512 | | | | - | | | | 181,512 | |
| AUD | | | 3,775,694 | | | USD | | 3,875,658 | | 2/4/2025 | | | HUB | | | | - | | | | (99,964 | ) | | | (99,964 | ) |
| USD | | | 3,948,918 | | | AUD | | 3,749,615 | | 2/4/2025 | | | HUB | | | | 199,303 | | | | - | | | | 199,303 | |
| USD | | | 5,179,144 | | | AUD | | 5,137,419 | | 2/4/2025 | | | HUB | | | | 41,725 | | | | - | | | | 41,725 | |
| USD | | | 5,318,414 | | | AUD | | 5,075,522 | | 2/4/2025 | | | HUB | | | | 242,892 | | | | - | | | | 242,892 | |
| USD | | | 5,405,976 | | | AUD | | 5,385,006 | | 2/4/2025 | | | HUB | | | | 20,970 | | | | - | | | | 20,970 | |
| USD | | | 6,100,155 | | | AUD | | 5,846,768 | | 2/4/2025 | | | HUB | | | | 253,387 | | | | - | | | | 253,387 | |
| USD | | | 6,653,768 | | | AUD | | 6,437,248 | | 2/4/2025 | | | HUB | | | | 216,520 | | | | - | | | | 216,520 | |
| USD | | | 6,850,584 | | | AUD | | 6,499,145 | | 2/4/2025 | | | HUB | | | | 351,439 | | | | - | | | | 351,439 | |
| USD | | | 7,408,970 | | | AUD | | 7,118,111 | | 2/4/2025 | | | HUB | | | | 290,859 | | | | - | | | | 290,859 | |
| USD | | | 7,462,755 | | | AUD | | 7,118,111 | | 2/4/2025 | | | HUB | | | | 344,644 | | | | - | | | | 344,644 | |
| USD | | | 7,502,791 | | | AUD | | 7,188,448 | | 2/4/2025 | | | HUB | | | | 314,343 | | | | - | | | | 314,343 | |
| USD | | | 8,550,412 | | | BRL | | 8,412,831 | | 2/4/2025 | | | HUB | | | | 137,581 | | | | - | | | | 137,581 | |
| USD | | | 8,680,305 | | | BRL | | 8,467,209 | | 2/4/2025 | | | HUB | | | | 213,096 | | | | - | | | | 213,096 | |
| USD | | | 8,758,701 | | | AUD | | 8,320,225 | | 2/4/2025 | | | HUB | | | | 438,476 | | | | - | | | | 438,476 | |
See accompanying notes
49
American Beacon AHL Managed Futures Strategy FundSM
Consolidated Schedule of Investments
December 31, 2024
| | | | | | | | | | | | | | | | | | | | | | | | | | |
| | | | | | |
| Currency Purchased* | | | Currency Sold* | | | Settlement
Date | | Counterparty | | Unrealized
Appreciation | | | Unrealized
(Depreciation) | | | Net Unrealized
Appreciation
(Depreciation) | |
| USD | | | 9,005,775 | | | AUD | | | 8,628,599 | | | 2/4/2025 | | HUB | | $ | 377,176 | | | $ | - | | | $ | 377,176 | |
| USD | | | 9,452,590 | | | AUD | | | 9,036,906 | | | 2/4/2025 | | HUB | | | 415,684 | | | | - | | | | 415,684 | |
| AUD | | | 10,852,773 | | | USD | | | 10,949,769 | | | 2/4/2025 | | HUB | | | - | | | | (96,996 | ) | | | (96,996 | ) |
| USD | | | 11,777,020 | | | AUD | | | 11,131,548 | | | 2/4/2025 | | HUB | | | 645,472 | | | | - | | | | 645,472 | |
| AUD | | | 12,755,287 | | | USD | | | 12,889,356 | | | 2/4/2025 | | HUB | | | - | | | | (134,069 | ) | | | (134,069 | ) |
| USD | | | 13,243,938 | | | BRL | | | 12,930,017 | | | 2/4/2025 | | HUB | | | 313,921 | | | | - | | | | 313,921 | |
| USD | | | 13,261,510 | | | BRL | | | 12,930,017 | | | 2/4/2025 | | HUB | | | 331,493 | | | | - | | | | 331,493 | |
| USD | | | 14,714,788 | | | AUD | | | 13,914,434 | | | 2/4/2025 | | HUB | | | 800,354 | | | | - | | | | 800,354 | |
| USD | | | 17,659,362 | | | AUD | | | 16,697,321 | | | 2/4/2025 | | HUB | | | 962,041 | | | | - | | | | 962,041 | |
| AUD | | | 17,950,018 | | | USD | | | 18,088,199 | | | 2/4/2025 | | HUB | | | - | | | | (138,181 | ) | | | (138,181 | ) |
| USD | | | 20,248,339 | | | BRL | | | 19,752,559 | | | 2/4/2025 | | HUB | | | 495,780 | | | | - | | | | 495,780 | |
| USD | | | 20,264,851 | | | BRL | | | 19,752,559 | | | 2/4/2025 | | HUB | | | 512,292 | | | | - | | | | 512,292 | |
| USD | | | 20,415,006 | | | AUD | | | 19,306,445 | | | 2/4/2025 | | HUB | | | 1,108,561 | | | | - | | | | 1,108,561 | |
| USD | | | 20,545,386 | | | AUD | | | 19,648,242 | | | 2/4/2025 | | HUB | | | 897,144 | | | | - | | | | 897,144 | |
| USD | | | 23,552,647 | | | AUD | | | 22,263,096 | | | 2/4/2025 | | HUB | | | 1,289,551 | | | | - | | | | 1,289,551 | |
| USD | | | 24,902,848 | | | BRL | | | 24,368,074 | | | 2/4/2025 | | HUB | | | 534,774 | | | | - | | | | 534,774 | |
| USD | | | 40,222,181 | | | BRL | | | 39,569,096 | | | 2/4/2025 | | HUB | | | 653,085 | | | | - | | | | 653,085 | |
| PLN | | | 621,983 | | | EUR | | | 622,330 | | | 2/5/2025 | | HUB | | | - | | | | (347 | ) | | | (347 | ) |
| EUR | | | 622,331 | | | PLN | | | 621,173 | | | 2/5/2025 | | HUB | | | 1,158 | | | | - | | | | 1,158 | |
| EUR | | | 726,052 | | | PLN | | | 724,853 | | | 2/5/2025 | | HUB | | | 1,199 | | | | - | | | | 1,199 | |
| EUR | | | 829,774 | | | PLN | | | 825,628 | | | 2/5/2025 | | HUB | | | 4,146 | | | | - | | | | 4,146 | |
| EUR | | | 1,659,548 | | | PLN | | | 1,653,062 | | | 2/5/2025 | | HUB | | | 6,486 | | | | - | | | | 6,486 | |
| EUR | | | 2,593,044 | | | PLN | | | 2,584,110 | | | 2/5/2025 | | HUB | | | 8,934 | | | | - | | | | 8,934 | |
| PLN | | | 3,208,964 | | | EUR | | | 3,215,374 | | | 2/5/2025 | | HUB | | | - | | | | (6,410 | ) | | | (6,410 | ) |
| PLN | | | 5,328,278 | | | EUR | | | 5,327,332 | | | 2/5/2025 | | HUB | | | 946 | | | | - | | | | 946 | |
| EUR | | | 7,882,852 | | | PLN | | | 7,851,597 | | | 2/5/2025 | | HUB | | | 31,255 | | | | - | | | | 31,255 | |
| PLN | | | 7,997,680 | | | EUR | | | 7,990,999 | | | 2/5/2025 | | HUB | | | 6,681 | | | | - | | | | 6,681 | |
| PLN | | | 8,580,676 | | | EUR | | | 8,573,508 | | | 2/5/2025 | | HUB | | | 7,168 | | | | - | | | | 7,168 | |
| EUR | | | 8,920,070 | | | PLN | | | 8,901,424 | | | 2/5/2025 | | HUB | | | 18,646 | | | | - | | | | 18,646 | |
| PLN | | | 9,317,983 | | | EUR | | | 9,322,831 | | | 2/5/2025 | | HUB | | | - | | | | (4,848 | ) | | | (4,848 | ) |
| PLN | | | 10,655,307 | | | EUR | | | 10,654,664 | | | 2/5/2025 | | HUB | | | 643 | | | | - | | | | 643 | |
| PLN | | | 14,661,466 | | | EUR | | | 14,650,165 | | | 2/5/2025 | | HUB | | | 11,301 | | | | - | | | | 11,301 | |
| PLN | | | 15,989,500 | | | EUR | | | 15,981,996 | | | 2/5/2025 | | HUB | | | 7,504 | | | | - | | | | 7,504 | |
| PLN | | | 18,842,857 | | | EUR | | | 18,877,357 | | | 2/5/2025 | | HUB | | | - | | | | (34,500 | ) | | | (34,500 | ) |
| PLN | | | 20,635,080 | | | EUR | | | 20,640,626 | | | 2/5/2025 | | HUB | | | - | | | | (5,546 | ) | | | (5,546 | ) |
| GBP | | | 250,309 | | | USD | | | 252,459 | | | 2/6/2025 | | HUB | | | - | | | | (2,150 | ) | | | (2,150 | ) |
| GBP | | | 438,041 | | | USD | | | 447,153 | | | 2/6/2025 | | HUB | | | - | | | | (9,112 | ) | | | (9,112 | ) |
| USD | | | 941,258 | | | GBP | | | 938,659 | | | 2/6/2025 | | HUB | | | 2,599 | | | | - | | | | 2,599 | |
| GBP | | | 2,690,823 | | | USD | | | 2,740,308 | | | 2/6/2025 | | HUB | | | - | | | | (49,485 | ) | | | (49,485 | ) |
| USD | | | 3,646,034 | | | GBP | | | 3,629,482 | | | 2/6/2025 | | HUB | | | 16,552 | | | | - | | | | 16,552 | |
| USD | | | 3,848,942 | | | GBP | | | 3,817,213 | | | 2/6/2025 | | HUB | | | 31,729 | | | | - | | | | 31,729 | |
| USD | | | 4,026,589 | | | GBP | | | 4,025,253 | | | 2/6/2025 | | HUB | | | 1,336 | | | | - | | | | 1,336 | |
| USD | | | 4,134,830 | | | GBP | | | 4,130,100 | | | 2/6/2025 | | HUB | | | 4,730 | | | | - | | | | 4,730 | |
| USD | | | 4,583,263 | | | GBP | | | 4,505,563 | | | 2/6/2025 | | HUB | | | 77,700 | | | | - | | | | 77,700 | |
| USD | | | 4,739,426 | | | GBP | | | 4,693,295 | | | 2/6/2025 | | HUB | | | 46,131 | | | | - | | | | 46,131 | |
| GBP | | | 4,818,450 | | | USD | | | 4,908,763 | | | 2/6/2025 | | HUB | | | - | | | | (90,313 | ) | | | (90,313 | ) |
| USD | | | 5,004,475 | | | GBP | | | 4,943,604 | | | 2/6/2025 | | HUB | | | 60,871 | | | | - | | | | 60,871 | |
| USD | | | 5,207,147 | | | GBP | | | 5,193,913 | | | 2/6/2025 | | HUB | | | 13,234 | | | | - | | | | 13,234 | |
| USD | | | 5,214,040 | | | GBP | | | 5,193,913 | | | 2/6/2025 | | HUB | | | 20,127 | | | | - | | | | 20,127 | |
| USD | | | 5,398,023 | | | GBP | | | 5,319,068 | | | 2/6/2025 | | HUB | | | 78,955 | | | | - | | | | 78,955 | |
| USD | | | 5,412,483 | | | GBP | | | 5,381,645 | | | 2/6/2025 | | HUB | | | 30,838 | | | | - | | | | 30,838 | |
| USD | | | 6,479,866 | | | GBP | | | 6,445,459 | | | 2/6/2025 | | HUB | | | 34,407 | | | | - | | | | 34,407 | |
| USD | | | 7,743,634 | | | GBP | | | 7,739,274 | | | 2/6/2025 | | HUB | | | 4,360 | | | | - | | | | 4,360 | |
| GBP | | | 7,805,561 | | | USD | | | 7,994,284 | | | 2/6/2025 | | HUB | | | - | | | | (188,723 | ) | | | (188,723 | ) |
| GBP | | | 8,260,199 | | | USD | | | 8,414,319 | | | 2/6/2025 | | HUB | | | - | | | | (154,120 | ) | | | (154,120 | ) |
| USD | | | 9,061,927 | | | GBP | | | 9,073,704 | | | 2/6/2025 | | HUB | | | - | | | | (11,777 | ) | | | (11,777 | ) |
| USD | | | 9,571,241 | | | GBP | | | 9,449,167 | | | 2/6/2025 | | HUB | | | 122,074 | | | | - | | | | 122,074 | |
| USD | | | 10,097,500 | | | GBP | | | 9,949,786 | | | 2/6/2025 | | HUB | | | 147,714 | | | | - | | | | 147,714 | |
| GBP | | | 11,827,104 | | | USD | | | 12,041,376 | | | 2/6/2025 | | HUB | | | - | | | | (214,272 | ) | | | (214,272 | ) |
See accompanying notes
50
American Beacon AHL Managed Futures Strategy FundSM
Consolidated Schedule of Investments
December 31, 2024
| | | | | | | | | | | | | | | | | | | | | | | | | | | | |
| | | | | | |
| Currency Purchased* | | | Currency Sold* | | | Settlement
Date | | Counterparty | | | Unrealized
Appreciation | | | Unrealized
(Depreciation) | | | Net Unrealized
Appreciation
(Depreciation) | |
| GBP | | | 12,299,199 | | | USD | | | 12,599,495 | | | 2/6/2025 | | | HUB | | | $ | - | | | $ | (300,296 | ) | | $ | (300,296 | ) |
| GBP | | | 12,397,677 | | | USD | | | 12,705,826 | | | 2/6/2025 | | | HUB | | | | - | | | | (308,149 | ) | | | (308,149 | ) |
| USD | | | 16,423,138 | | | GBP | | | 16,144,935 | | | 2/6/2025 | | | HUB | | | | 278,203 | | | | - | | | | 278,203 | |
| USD | | | 17,063,761 | | | GBP | | | 16,833,285 | | | 2/6/2025 | | | HUB | | | | 230,476 | | | | - | | | | 230,476 | |
| USD | | | 19,469,961 | | | GBP | | | 19,398,953 | | | 2/6/2025 | | | HUB | | | | 71,008 | | | | - | | | | 71,008 | |
| GBP | | | 28,698,132 | | | USD | | | 29,388,991 | | | 2/6/2025 | | | HUB | | | | - | | | | (690,859 | ) | | | (690,859 | ) |
| USD | | | 25,649,819 | | | KRW | | | 24,412,377 | | | 2/7/2025 | | | HUB | | | | 1,237,442 | | | | - | | | | 1,237,442 | |
| USD | | | 1,972,052 | | | CAD | | | 1,950,793 | | | 2/12/2025 | | | HUB | | | | 21,259 | | | | - | | | | 21,259 | |
| USD | | | 2,497,882 | | | CAD | | | 2,438,492 | | | 2/12/2025 | | | HUB | | | | 59,390 | | | | - | | | | 59,390 | |
| CAD | | | 2,508,163 | | | USD | | | 2,503,282 | | | 2/12/2025 | | | HUB | | | | 4,881 | | | | - | | | | 4,881 | |
| USD | | | 4,394,228 | | | CAD | | | 4,389,285 | | | 2/12/2025 | | | HUB | | | | 4,943 | | | | - | | | | 4,943 | |
| CAD | | | 4,993,316 | | | USD | | | 4,993,749 | | | 2/12/2025 | | | HUB | | | | - | | | | (433 | ) | | | (433 | ) |
| USD | | | 5,533,505 | | | CAD | | | 5,364,682 | | | 2/12/2025 | | | HUB | | | | 168,823 | | | | - | | | | 168,823 | |
| USD | | | 5,711,970 | | | CAD | | | 5,573,696 | | | 2/12/2025 | | | HUB | | | | 138,274 | | | | - | | | | 138,274 | |
| USD | | | 6,413,596 | | | CAD | | | 6,270,408 | | | 2/12/2025 | | | HUB | | | | 143,188 | | | | - | | | | 143,188 | |
| CAD | | | 8,081,859 | | | USD | | | 8,074,970 | | | 2/12/2025 | | | HUB | | | | 6,889 | | | | - | | | | 6,889 | |
| USD | | | 10,757,120 | | | CAD | | | 10,633,523 | | | 2/12/2025 | | | HUB | | | | 123,597 | | | | - | | | | 123,597 | |
| USD | | | 10,958,167 | | | CAD | | | 10,799,035 | | | 2/12/2025 | | | HUB | | | | 159,132 | | | | - | | | | 159,132 | |
| USD | | | 11,004,532 | | | CAD | | | 10,880,829 | | | 2/12/2025 | | | HUB | | | | 123,703 | | | | - | | | | 123,703 | |
| USD | | | 11,553,180 | | | CAD | | | 11,356,405 | | | 2/12/2025 | | | HUB | | | | 196,775 | | | | - | | | | 196,775 | |
| USD | | | 12,580,682 | | | CAD | | | 12,192,459 | | | 2/12/2025 | | | HUB | | | | 388,223 | | | | - | | | | 388,223 | |
| CAD | | | 13,363,194 | | | USD | | | 13,368,978 | | | 2/12/2025 | | | HUB | | | | - | | | | (5,784 | ) | | | (5,784 | ) |
| USD | | | 13,828,730 | | | CAD | | | 13,671,672 | | | 2/12/2025 | | | HUB | | | | 157,058 | | | | - | | | | 157,058 | |
| USD | | | 15,090,938 | | | CAD | | | 14,630,951 | | | 2/12/2025 | | | HUB | | | | 459,987 | | | | - | | | | 459,987 | |
| USD | | | 15,098,485 | | | CAD | | | 14,630,951 | | | 2/12/2025 | | | HUB | | | | 467,534 | | | | - | | | | 467,534 | |
| USD | | | 16,010,744 | | | CAD | | | 15,739,356 | | | 2/12/2025 | | | HUB | | | | 271,388 | | | | - | | | | 271,388 | |
| USD | | | 16,161,564 | | | CAD | | | 15,739,357 | | | 2/12/2025 | | | HUB | | | | 422,207 | | | | - | | | | 422,207 | |
| USD | | | 16,904,547 | | | CAD | | | 16,709,822 | | | 2/12/2025 | | | HUB | | | | 194,725 | | | | - | | | | 194,725 | |
| USD | | | 17,607,695 | | | CAD | | | 17,069,443 | | | 2/12/2025 | | | HUB | | | | 538,252 | | | | - | | | | 538,252 | |
| USD | | | 19,112,560 | | | CAD | | | 18,890,088 | | | 2/12/2025 | | | HUB | | | | 222,472 | | | | - | | | | 222,472 | |
| USD | | | 19,207,224 | | | CAD | | | 18,887,227 | | | 2/12/2025 | | | HUB | | | | 319,997 | | | | - | | | | 319,997 | |
| USD | | | 19,381,015 | | | CAD | | | 18,887,227 | | | 2/12/2025 | | | HUB | | | | 493,788 | | | | - | | | | 493,788 | |
| CAD | | | 20,148,651 | | | USD | | | 20,149,664 | | | 2/12/2025 | | | HUB | | | | - | | | | (1,013 | ) | | | (1,013 | ) |
| USD | | | 22,640,051 | | | CAD | | | 21,946,427 | | | 2/12/2025 | | | HUB | | | | 693,624 | | | | - | | | | 693,624 | |
| CAD | | | 25,104,641 | | | USD | | | 25,108,127 | | | 2/12/2025 | | | HUB | | | | - | | | | (3,486 | ) | | | (3,486 | ) |
| USD | | | 25,159,150 | | | CAD | | | 24,384,918 | | | 2/12/2025 | | | HUB | | | | 774,232 | | | | - | | | | 774,232 | |
| USD | | | 25,163,319 | | | CAD | | | 24,384,918 | | | 2/12/2025 | | | HUB | | | | 778,401 | | | | - | | | | 778,401 | |
| USD | | | 29,070,069 | | | CAD | | | 28,330,842 | | | 2/12/2025 | | | HUB | | | | 739,227 | | | | - | | | | 739,227 | |
| USD | | | 35,219,889 | | | CAD | | | 34,626,585 | | | 2/12/2025 | | | HUB | | | | 593,304 | | | | - | | | | 593,304 | |
| USD | | | 35,553,427 | | | CAD | | | 34,626,584 | | | 2/12/2025 | | | HUB | | | | 926,843 | | | | - | | | | 926,843 | |
| USD | | | 42,020,674 | | | CAD | | | 40,922,326 | | | 2/12/2025 | | | HUB | | | | 1,098,348 | | | | - | | | | 1,098,348 | |
| CHF | | | 1,348,593 | | | EUR | | | 1,349,122 | | | 2/17/2025 | | | HUB | | | | - | | | | (529 | ) | | | (529 | ) |
| EUR | | | 1,376,375 | | | CHF | | | 1,365,665 | | | 2/17/2025 | | | HUB | | | | 10,710 | | | | - | | | | 10,710 | |
| CHF | | | 2,688,921 | | | EUR | | | 2,698,243 | | | 2/17/2025 | | | HUB | | | | - | | | | (9,322 | ) | | | (9,322 | ) |
| EUR | | | 4,770,246 | | | CHF | | | 4,720,654 | | | 2/17/2025 | | | HUB | | | | 49,592 | | | | - | | | | 49,592 | |
| EUR | | | 5,679,139 | | | CHF | | | 5,680,482 | | | 2/17/2025 | | | HUB | | | | - | | | | (1,343 | ) | | | (1,343 | ) |
| CHF | | | 7,506,475 | | | EUR | | | 7,575,836 | | | 2/17/2025 | | | HUB | | | | - | | | | (69,361 | ) | | | (69,361 | ) |
| EUR | | | 8,202,076 | | | CHF | | | 8,115,549 | | | 2/17/2025 | | | HUB | | | | 86,527 | | | | - | | | | 86,527 | |
| EUR | | | 9,755,187 | | | CHF | | | 9,756,718 | | | 2/17/2025 | | | HUB | | | | - | | | | (1,531 | ) | | | (1,531 | ) |
| EUR | | | 14,869,019 | | | CHF | | | 14,874,080 | | | 2/17/2025 | | | HUB | | | | - | | | | (5,061 | ) | | | (5,061 | ) |
| CHF | | | 17,331,534 | | | EUR | | | 17,434,801 | | | 2/17/2025 | | | HUB | | | | - | | | | (103,267 | ) | | | (103,267 | ) |
| EUR | | | 20,415,161 | | | CHF | | | 20,338,645 | | | 2/17/2025 | | | HUB | | | | 76,516 | | | | - | | | | 76,516 | |
| EUR | | | 37,540,593 | | | CHF | | | 37,263,002 | | | 2/17/2025 | | | HUB | | | | 277,591 | | | | - | | | | 277,591 | |
| EUR | | | 43,304,886 | | | CHF | | | 43,149,758 | | | 2/17/2025 | | | HUB | | | | 155,128 | | | | - | | | | 155,128 | |
| GBP | | | 1,314,016 | | | AUD | | | 1,312,253 | | | 2/18/2025 | | | HUB | | | | 1,763 | | | | - | | | | 1,763 | |
| GBP | | | 3,253,754 | | | AUD | | | 3,242,060 | | | 2/18/2025 | | | HUB | | | | 11,694 | | | | - | | | | 11,694 | |
| GBP | | | 3,629,187 | | | AUD | | | 3,614,736 | | | 2/18/2025 | | | HUB | | | | 14,451 | | | | - | | | | 14,451 | |
| AUD | | | 6,520,118 | | | GBP | | | 6,570,080 | | | 2/18/2025 | | | HUB | | | | - | | | | (49,962 | ) | | | (49,962 | ) |
| AUD | | | 8,390,048 | | | GBP | | | 8,447,246 | | | 2/18/2025 | | | HUB | | | | - | | | | (57,198 | ) | | | (57,198 | ) |
See accompanying notes
51
American Beacon AHL Managed Futures Strategy FundSM
Consolidated Schedule of Investments
December 31, 2024
| | | | | | | | | | | | | | | | | | | | | | | | | | | | |
| | | | | | |
| Currency Purchased* | | | Currency Sold* | | | Settlement
Date | | Counterparty | | | Unrealized
Appreciation | | | Unrealized
(Depreciation) | | | Net Unrealized
Appreciation
(Depreciation) | |
| GBP | | | 15,776,682 | | | AUD | | | 15,468,117 | | | 2/18/2025 | | | HUB | | | $ | 308,565 | | | $ | - | | | $ | 308,565 | |
| GBP | | | 29,741,907 | | | AUD | | | 29,169,098 | | | 2/18/2025 | | | HUB | | | | 572,809 | | | | - | | | | 572,809 | |
| GBP | | | 31,553,365 | | | AUD | | | 30,923,841 | | | 2/18/2025 | | | HUB | | | | 629,524 | | | | - | | | | 629,524 | |
| GBP | | | 31,553,366 | | | AUD | | | 30,928,157 | | | 2/18/2025 | | | HUB | | | | 625,209 | | | | - | | | | 625,209 | |
| USD | | | 44,886 | | | COP | | | 45,100 | | | 2/20/2025 | | | HUB | | | | - | | | | (214 | ) | | | (214 | ) |
| USD | | | 44,897 | | | COP | | | 45,100 | | | 2/20/2025 | | | HUB | | | | - | | | | (203 | ) | | | (203 | ) |
| USD | | | 44,913 | | | COP | | | 45,100 | | | 2/20/2025 | | | HUB | | | | - | | | | (187 | ) | | | (187 | ) |
| USD | | | 44,926 | | | COP | | | 45,100 | | | 2/20/2025 | | | HUB | | | | - | | | | (174 | ) | | | (174 | ) |
| USD | | | 44,932 | | | COP | | | 45,100 | | | 2/20/2025 | | | HUB | | | | - | | | | (168 | ) | | | (168 | ) |
| USD | | | 44,936 | | | COP | | | 45,100 | | | 2/20/2025 | | | HUB | | | | - | | | | (164 | ) | | | (164 | ) |
| USD | | | 44,946 | | | COP | | | 45,100 | | | 2/20/2025 | | | HUB | | | | - | | | | (154 | ) | | | (154 | ) |
| USD | | | 44,953 | | | COP | | | 45,100 | | | 2/20/2025 | | | HUB | | | | - | | | | (147 | ) | | | (147 | ) |
| COP | | | 45,100 | | | USD | | | 45,290 | | | 2/20/2025 | | | HUB | | | | - | | | | (190 | ) | | | (190 | ) |
| COP | | | 45,100 | | | USD | | | 45,302 | | | 2/20/2025 | | | HUB | | | | - | | | | (202 | ) | | | (202 | ) |
| COP | | | 45,100 | | | USD | | | 45,304 | | | 2/20/2025 | | | HUB | | | | - | | | | (204 | ) | | | (204 | ) |
| COP | | | 45,100 | | | USD | | | 45,316 | | | 2/20/2025 | | | HUB | | | | - | | | | (216 | ) | | | (216 | ) |
| COP | | | 45,100 | | | USD | | | 45,820 | | | 2/20/2025 | | | HUB | | | | - | | | | (720 | ) | | | (720 | ) |
| USD | | | 88,861 | | | COP | | | 90,199 | | | 2/20/2025 | | | HUB | | | | - | | | | (1,338 | ) | | | (1,338 | ) |
| USD | | | 89,794 | | | COP | | | 90,199 | | | 2/20/2025 | | | HUB | | | | - | | | | (405 | ) | | | (405 | ) |
| USD | | | 89,823 | | | COP | | | 90,199 | | | 2/20/2025 | | | HUB | | | | - | | | | (376 | ) | | | (376 | ) |
| USD | | | 89,841 | | | COP | | | 90,199 | | | 2/20/2025 | | | HUB | | | | - | | | | (358 | ) | | | (358 | ) |
| USD | | | 89,847 | | | COP | | | 90,199 | | | 2/20/2025 | | | HUB | | | | - | | | | (352 | ) | | | (352 | ) |
| USD | | | 89,866 | | | COP | | | 90,199 | | | 2/20/2025 | | | HUB | | | | - | | | | (333 | ) | | | (333 | ) |
| USD | | | 89,870 | | | COP | | | 90,199 | | | 2/20/2025 | | | HUB | | | | - | | | | (329 | ) | | | (329 | ) |
| USD | | | 89,890 | | | COP | | | 90,199 | | | 2/20/2025 | | | HUB | | | | - | | | | (309 | ) | | | (309 | ) |
| USD | | | 89,906 | | | COP | | | 90,199 | | | 2/20/2025 | | | HUB | | | | - | | | | (293 | ) | | | (293 | ) |
| COP | | | 90,199 | | | USD | | | 90,524 | | | 2/20/2025 | | | HUB | | | | - | | | | (325 | ) | | | (325 | ) |
| COP | | | 90,199 | | | USD | | | 90,557 | | | 2/20/2025 | | | HUB | | | | - | | | | (358 | ) | | | (358 | ) |
| COP | | | 90,199 | | | USD | | | 90,566 | | | 2/20/2025 | | | HUB | | | | - | | | | (367 | ) | | | (367 | ) |
| COP | | | 90,199 | | | USD | | | 91,586 | | | 2/20/2025 | | | HUB | | | | - | | | | (1,387 | ) | | | (1,387 | ) |
| COP | | | 90,199 | | | USD | | | 91,608 | | | 2/20/2025 | | | HUB | | | | - | | | | (1,409 | ) | | | (1,409 | ) |
| COP | | | 90,199 | | | USD | | | 91,638 | | | 2/20/2025 | | | HUB | | | | - | | | | (1,439 | ) | | | (1,439 | ) |
| COP | | | 45,100 | | | USD | | | 45,795 | | | 2/20/2025 | | | HUB | | | | - | | | | (695 | ) | | | (695 | ) |
| COP | | | 45,100 | | | USD | | | 45,795 | | | 2/20/2025 | | | HUB | | | | - | | | | (695 | ) | | | (695 | ) |
| USD | | | 133,119 | | | COP | | | 135,299 | | | 2/20/2025 | | | HUB | | | | - | | | | (2,180 | ) | | | (2,180 | ) |
| USD | | | 134,940 | | | COP | | | 135,299 | | | 2/20/2025 | | | HUB | | | | - | | | | (359 | ) | | | (359 | ) |
| COP | | | 135,299 | | | USD | | | 135,761 | | | 2/20/2025 | | | HUB | | | | - | | | | (462 | ) | | | (462 | ) |
| COP | | | 135,299 | | | USD | | | 135,850 | | | 2/20/2025 | | | HUB | | | | - | | | | (551 | ) | | | (551 | ) |
| COP | | | 135,299 | | | USD | | | 135,851 | | | 2/20/2025 | | | HUB | | | | - | | | | (552 | ) | | | (552 | ) |
| COP | | | 135,299 | | | USD | | | 135,910 | | | 2/20/2025 | | | HUB | | | | - | | | | (611 | ) | | | (611 | ) |
| COP | | | 135,299 | | | USD | | | 135,912 | | | 2/20/2025 | | | HUB | | | | - | | | | (613 | ) | | | (613 | ) |
| COP | | | 135,299 | | | USD | | | 137,359 | | | 2/20/2025 | | | HUB | | | | - | | | | (2,060 | ) | | | (2,060 | ) |
| COP | | | 135,299 | | | USD | | | 137,479 | | | 2/20/2025 | | | HUB | | | | - | | | | (2,180 | ) | | | (2,180 | ) |
| USD | | | 177,640 | | | COP | | | 180,399 | | | 2/20/2025 | | | HUB | | | | - | | | | (2,759 | ) | | | (2,759 | ) |
| COP | | | 180,399 | | | USD | | | 181,031 | | | 2/20/2025 | | | HUB | | | | - | | | | (632 | ) | | | (632 | ) |
| COP | | | 180,399 | | | USD | | | 181,134 | | | 2/20/2025 | | | HUB | | | | - | | | | (735 | ) | | | (735 | ) |
| COP | | | 180,399 | | | USD | | | 181,255 | | | 2/20/2025 | | | HUB | | | | - | | | | (856 | ) | | | (856 | ) |
| COP | | | 180,399 | | | USD | | | 183,097 | | | 2/20/2025 | | | HUB | | | | - | | | | (2,698 | ) | | | (2,698 | ) |
| COP | | | 180,399 | | | USD | | | 183,108 | | | 2/20/2025 | | | HUB | | | | - | | | | (2,709 | ) | | | (2,709 | ) |
| COP | | | 180,399 | | | USD | | | 183,220 | | | 2/20/2025 | | | HUB | | | | - | | | | (2,821 | ) | | | (2,821 | ) |
| COP | | | 180,399 | | | USD | | | 183,290 | | | 2/20/2025 | | | HUB | | | | - | | | | (2,891 | ) | | | (2,891 | ) |
| COP | | | 225,499 | | | USD | | | 226,468 | | | 2/20/2025 | | | HUB | | | | - | | | | (969 | ) | | | (969 | ) |
| COP | | | 225,499 | | | USD | | | 226,519 | | | 2/20/2025 | | | HUB | | | | - | | | | (1,020 | ) | | | (1,020 | ) |
| COP | | | 225,499 | | | USD | | | 228,784 | | | 2/20/2025 | | | HUB | | | | - | | | | (3,285 | ) | | | (3,285 | ) |
| COP | | | 225,499 | | | USD | | | 228,888 | | | 2/20/2025 | | | HUB | | | | - | | | | (3,389 | ) | | | (3,389 | ) |
| COP | | | 225,499 | | | USD | | | 228,976 | | | 2/20/2025 | | | HUB | | | | - | | | | (3,477 | ) | | | (3,477 | ) |
| USD | | | 354,503 | | | COP | | | 360,798 | | | 2/20/2025 | | | HUB | | | | - | | | | (6,295 | ) | | | (6,295 | ) |
| USD | | | 355,575 | | | COP | | | 360,798 | | | 2/20/2025 | | | HUB | | | | - | | | | (5,223 | ) | | | (5,223 | ) |
| USD | | | 445,387 | | | COP | | | 450,997 | | | 2/20/2025 | | | HUB | | | | - | | | | (5,610 | ) | | | (5,610 | ) |
See accompanying notes
52
American Beacon AHL Managed Futures Strategy FundSM
Consolidated Schedule of Investments
December 31, 2024
| | | | | | | | | | | | | | | | | | | | | | | | | | | | |
| | | | | | |
| Currency Purchased* | | | Currency Sold* | | | Settlement
Date | | Counterparty | | | Unrealized
Appreciation | | | Unrealized
(Depreciation) | | | Net Unrealized
Appreciation
(Depreciation) | |
| USD | | | 489,775 | | | COP | | | 496,097 | | | 2/20/2025 | | | HUB | | | $ | - | | | $ | (6,322 | ) | | $ | (6,322 | ) |
| EUR | | | 1,897,032 | | | AUD | | | 1,890,344 | | | 2/20/2025 | | | HUB | | | | 6,688 | | | | - | | | | 6,688 | |
| EUR | | | 3,009,991 | | | AUD | | | 3,012,313 | | | 2/20/2025 | | | HUB | | | | - | | | | (2,322 | ) | | | (2,322 | ) |
| EUR | | | 3,321,370 | | | AUD | | | 3,323,301 | | | 2/20/2025 | | | HUB | | | | - | | | | (1,931 | ) | | | (1,931 | ) |
| EUR | | | 3,840,334 | | | AUD | | | 3,834,218 | | | 2/20/2025 | | | HUB | | | | 6,116 | | | | - | | | | 6,116 | |
| EUR | | | 6,613,978 | | | AUD | | | 6,591,482 | | | 2/20/2025 | | | HUB | | | | 22,496 | | | | - | | | | 22,496 | |
| EUR | | | 7,888,253 | | | AUD | | | 7,843,233 | | | 2/20/2025 | | | HUB | | | | 45,020 | | | | - | | | | 45,020 | |
| EUR | | | 10,283,652 | | | AUD | | | 10,219,285 | | | 2/20/2025 | | | HUB | | | | 64,367 | | | | - | | | | 64,367 | |
| EUR | | | 13,396,261 | | | AUD | | | 13,311,176 | | | 2/20/2025 | | | HUB | | | | 85,085 | | | | - | | | | 85,085 | |
| EUR | | | 46,276,433 | | | AUD | | | 45,990,570 | | | 2/20/2025 | | | HUB | | | | 285,863 | | | | - | | | | 285,863 | |
| USD | | | 176,037,400 | | | KRW | | | 173,724,409 | | | 2/24/2025 | | | HUB | | | | 2,312,991 | | | | - | | | | 2,312,991 | |
| USD | | | 50,428 | | | CLP | | | 50,245 | | | 2/25/2025 | | | HUB | | | | 183 | | | | - | | | | 183 | |
| USD | | | 51,361 | | | CLP | | | 50,245 | | | 2/25/2025 | | | HUB | | | | 1,116 | | | | - | | | | 1,116 | |
| USD | | | 52,081 | | | CLP | | | 50,245 | | | 2/25/2025 | | | HUB | | | | 1,836 | | | | - | | | | 1,836 | |
| USD | | | 52,089 | | | CLP | | | 50,245 | | | 2/25/2025 | | | HUB | | | | 1,844 | | | | - | | | | 1,844 | |
| USD | | | 52,168 | | | CLP | | | 50,245 | | | 2/25/2025 | | | HUB | | | | 1,923 | | | | - | | | | 1,923 | |
| USD | | | 52,170 | | | CLP | | | 50,245 | | | 2/25/2025 | | | HUB | | | | 1,925 | | | | - | | | | 1,925 | |
| USD | | | 52,334 | | | CLP | | | 50,245 | | | 2/25/2025 | | | HUB | | | | 2,089 | | | | - | | | | 2,089 | |
| USD | | | 52,336 | | | CLP | | | 50,245 | | | 2/25/2025 | | | HUB | | | | 2,091 | | | | - | | | | 2,091 | |
| USD | | | 52,337 | | | CLP | | | 50,245 | | | 2/25/2025 | | | HUB | | | | 2,092 | | | | - | | | | 2,092 | |
| USD | | | 52,349 | | | CLP | | | 50,245 | | | 2/25/2025 | | | HUB | | | | 2,104 | | | | - | | | | 2,104 | |
| USD | | | 52,352 | | | CLP | | | 50,245 | | | 2/25/2025 | | | HUB | | | | 2,107 | | | | - | | | | 2,107 | |
| USD | | | 52,355 | | | CLP | | | 50,245 | | | 2/25/2025 | | | HUB | | | | 2,110 | | | | - | | | | 2,110 | |
| USD | | | 52,365 | | | CLP | | | 50,245 | | | 2/25/2025 | | | HUB | | | | 2,120 | | | | - | | | | 2,120 | |
| USD | | | 52,371 | | | CLP | | | 50,245 | | | 2/25/2025 | | | HUB | | | | 2,126 | | | | - | | | | 2,126 | |
| USD | | | 52,377 | | | CLP | | | 50,245 | | | 2/25/2025 | | | HUB | | | | 2,132 | | | | - | | | | 2,132 | |
| USD | | | 52,393 | | | CLP | | | 50,245 | | | 2/25/2025 | | | HUB | | | | 2,148 | | | | - | | | | 2,148 | |
| USD | | | 52,421 | | | CLP | | | 50,245 | | | 2/25/2025 | | | HUB | | | | 2,176 | | | | - | | | | 2,176 | |
| USD | | | 52,458 | | | CLP | | | 50,245 | | | 2/25/2025 | | | HUB | | | | 2,213 | | | | - | | | | 2,213 | |
| USD | | | 52,461 | | | CLP | | | 50,245 | | | 2/25/2025 | | | HUB | | | | 2,216 | | | | - | | | | 2,216 | |
| USD | | | 52,462 | | | CLP | | | 50,245 | | | 2/25/2025 | | | HUB | | | | 2,217 | | | | - | | | | 2,217 | |
| USD | | | 52,471 | | | CLP | | | 50,245 | | | 2/25/2025 | | | HUB | | | | 2,226 | | | | - | | | | 2,226 | |
| USD | | | 52,475 | | | CLP | | | 50,245 | | | 2/25/2025 | | | HUB | | | | 2,230 | | | | - | | | | 2,230 | |
| USD | | | 52,481 | | | CLP | | | 50,245 | | | 2/25/2025 | | | HUB | | | | 2,236 | | | | - | | | | 2,236 | |
| USD | | | 52,504 | | | CLP | | | 50,245 | | | 2/25/2025 | | | HUB | | | | 2,259 | | | | - | | | | 2,259 | |
| USD | | | 52,552 | | | CLP | | | 50,245 | | | 2/25/2025 | | | HUB | | | | 2,307 | | | | - | | | | 2,307 | |
| USD | | | 52,557 | | | CLP | | | 50,245 | | | 2/25/2025 | | | HUB | | | | 2,312 | | | | - | | | | 2,312 | |
| USD | | | 52,560 | | | CLP | | | 50,245 | | | 2/25/2025 | | | HUB | | | | 2,315 | | | | - | | | | 2,315 | |
| USD | | | 52,563 | | | CLP | | | 50,245 | | | 2/25/2025 | | | HUB | | | | 2,318 | | | | - | | | | 2,318 | |
| USD | | | 52,565 | | | CLP | | | 50,245 | | | 2/25/2025 | | | HUB | | | | 2,320 | | | | - | | | | 2,320 | |
| USD | | | 52,571 | | | CLP | | | 50,245 | | | 2/25/2025 | | | HUB | | | | 2,326 | | | | - | | | | 2,326 | |
| USD | | | 52,573 | | | CLP | | | 50,245 | | | 2/25/2025 | | | HUB | | | | 2,328 | | | | - | | | | 2,328 | |
| USD | | | 52,575 | | | CLP | | | 50,245 | | | 2/25/2025 | | | HUB | | | | 2,330 | | | | - | | | | 2,330 | |
| USD | | | 52,577 | | | CLP | | | 50,245 | | | 2/25/2025 | | | HUB | | | | 2,332 | | | | - | | | | 2,332 | |
| USD | | | 52,586 | | | CLP | | | 50,245 | | | 2/25/2025 | | | HUB | | | | 2,341 | | | | - | | | | 2,341 | |
| USD | | | 52,588 | | | CLP | | | 50,245 | | | 2/25/2025 | | | HUB | | | | 2,343 | | | | - | | | | 2,343 | |
| USD | | | 52,610 | | | CLP | | | 50,245 | | | 2/25/2025 | | | HUB | | | | 2,365 | | | | - | | | | 2,365 | |
| USD | | | 52,611 | | | CLP | | | 50,245 | | | 2/25/2025 | | | HUB | | | | 2,366 | | | | - | | | | 2,366 | |
| USD | | | 52,613 | | | CLP | | | 50,245 | | | 2/25/2025 | | | HUB | | | | 2,368 | | | | - | | | | 2,368 | |
| USD | | | 52,639 | | | CLP | | | 50,245 | | | 2/25/2025 | | | HUB | | | | 2,394 | | | | - | | | | 2,394 | |
| USD | | | 52,648 | | | CLP | | | 50,245 | | | 2/25/2025 | | | HUB | | | | 2,403 | | | | - | | | | 2,403 | |
| USD | | | 52,662 | | | CLP | | | 50,245 | | | 2/25/2025 | | | HUB | | | | 2,417 | | | | - | | | | 2,417 | |
| USD | | | 52,664 | | | CLP | | | 50,245 | | | 2/25/2025 | | | HUB | | | | 2,419 | | | | - | | | | 2,419 | |
| USD | | | 52,683 | | | CLP | | | 50,245 | | | 2/25/2025 | | | HUB | | | | 2,438 | | | | - | | | | 2,438 | |
| USD | | | 52,723 | | | CLP | | | 50,245 | | | 2/25/2025 | | | HUB | | | | 2,478 | | | | - | | | | 2,478 | |
| USD | | | 52,742 | | | CLP | | | 50,245 | | | 2/25/2025 | | | HUB | | | | 2,497 | | | | - | | | | 2,497 | |
| USD | | | 52,743 | | | CLP | | | 50,245 | | | 2/25/2025 | | | HUB | | | | 2,498 | | | | - | | | | 2,498 | |
| USD | | | 52,770 | | | CLP | | | 50,245 | | | 2/25/2025 | | | HUB | | | | 2,525 | | | | - | | | | 2,525 | |
| USD | | | 52,780 | | | CLP | | | 50,245 | | | 2/25/2025 | | | HUB | | | | 2,535 | | | | - | | | | 2,535 | |
See accompanying notes
53
American Beacon AHL Managed Futures Strategy FundSM
Consolidated Schedule of Investments
December 31, 2024
| | | | | | | | | | | | | | | | | | | | | | | | | | | | |
| | | | | | |
| Currency Purchased* | | | Currency Sold* | | | Settlement
Date | | Counterparty | | | Unrealized
Appreciation | | | Unrealized
(Depreciation) | | | Net Unrealized
Appreciation
(Depreciation) | |
| USD | | | 52,806 | | | CLP | | | 50,245 | | | 2/25/2025 | | | HUB | | | $ | 2,561 | | | $ | - | | | $ | 2,561 | |
| USD | | | 52,832 | | | CLP | | | 50,245 | | | 2/25/2025 | | | HUB | | | | 2,587 | | | | - | | | | 2,587 | |
| USD | | | 52,838 | | | CLP | | | 50,245 | | | 2/25/2025 | | | HUB | | | | 2,593 | | | | - | | | | 2,593 | |
| USD | | | 52,860 | | | CLP | | | 50,245 | | | 2/25/2025 | | | HUB | | | | 2,615 | | | | - | | | | 2,615 | |
| USD | | | 52,864 | | | CLP | | | 50,245 | | | 2/25/2025 | | | HUB | | | | 2,619 | | | | - | | | | 2,619 | |
| USD | | | 52,865 | | | CLP | | | 50,245 | | | 2/25/2025 | | | HUB | | | | 2,620 | | | | - | | | | 2,620 | |
| USD | | | 52,866 | | | CLP | | | 50,245 | | | 2/25/2025 | | | HUB | | | | 2,621 | | | | - | | | | 2,621 | |
| USD | | | 52,874 | | | CLP | | | 50,245 | | | 2/25/2025 | | | HUB | | | | 2,629 | | | | - | | | | 2,629 | |
| USD | | | 52,875 | | | CLP | | | 50,245 | | | 2/25/2025 | | | HUB | | | | 2,630 | | | | - | | | | 2,630 | |
| USD | | | 52,880 | | | CLP | | | 50,245 | | | 2/25/2025 | | | HUB | | | | 2,635 | | | | - | | | | 2,635 | |
| USD | | | 52,897 | | | CLP | | | 50,245 | | | 2/25/2025 | | | HUB | | | | 2,652 | | | | - | | | | 2,652 | |
| USD | | | 52,916 | | | CLP | | | 50,245 | | | 2/25/2025 | | | HUB | | | | 2,671 | | | | - | | | | 2,671 | |
| USD | | | 52,921 | | | CLP | | | 50,245 | | | 2/25/2025 | | | HUB | | | | 2,676 | | | | - | | | | 2,676 | |
| USD | | | 52,930 | | | CLP | | | 50,245 | | | 2/25/2025 | | | HUB | | | | 2,685 | | | | - | | | | 2,685 | |
| USD | | | 52,951 | | | CLP | | | 50,245 | | | 2/25/2025 | | | HUB | | | | 2,706 | | | | - | | | | 2,706 | |
| USD | | | 52,963 | | | CLP | | | 50,245 | | | 2/25/2025 | | | HUB | | | | 2,718 | | | | - | | | | 2,718 | |
| USD | | | 52,969 | | | CLP | | | 50,245 | | | 2/25/2025 | | | HUB | | | | 2,724 | | | | - | | | | 2,724 | |
| USD | | | 52,971 | | | CLP | | | 50,245 | | | 2/25/2025 | | | HUB | | | | 2,726 | | | | - | | | | 2,726 | |
| USD | | | 52,985 | | | CLP | | | 50,245 | | | 2/25/2025 | | | HUB | | | | 2,740 | | | | - | | | | 2,740 | |
| USD | | | 53,003 | | | CLP | | | 50,245 | | | 2/25/2025 | | | HUB | | | | 2,758 | | | | - | | | | 2,758 | |
| USD | | | 53,044 | | | CLP | | | 50,245 | | | 2/25/2025 | | | HUB | | | | 2,799 | | | | - | | | | 2,799 | |
| USD | | | 53,054 | | | CLP | | | 50,245 | | | 2/25/2025 | | | HUB | | | | 2,809 | | | | - | | | | 2,809 | |
| USD | | | 53,062 | | | CLP | | | 50,245 | | | 2/25/2025 | | | HUB | | | | 2,817 | | | | - | | | | 2,817 | |
| USD | | | 53,070 | | | CLP | | | 50,245 | | | 2/25/2025 | | | HUB | | | | 2,825 | | | | - | | | | 2,825 | |
| USD | | | 102,291 | | | CLP | | | 100,490 | | | 2/25/2025 | | | HUB | | | | 1,801 | | | | - | | | | 1,801 | |
| USD | | | 102,702 | | | CLP | | | 100,490 | | | 2/25/2025 | | | HUB | | | | 2,212 | | | | - | | | | 2,212 | |
| USD | | | 102,756 | | | CLP | | | 100,490 | | | 2/25/2025 | | | HUB | | | | 2,266 | | | | - | | | | 2,266 | |
| USD | | | 102,763 | | | CLP | | | 100,490 | | | 2/25/2025 | | | HUB | | | | 2,273 | | | | - | | | | 2,273 | |
| USD | | | 102,846 | | | CLP | | | 100,490 | | | 2/25/2025 | | | HUB | | | | 2,356 | | | | - | | | | 2,356 | |
| USD | | | 104,142 | | | CLP | | | 100,490 | | | 2/25/2025 | | | HUB | | | | 3,652 | | | | - | | | | 3,652 | |
| USD | | | 104,172 | | | CLP | | | 100,490 | | | 2/25/2025 | | | HUB | | | | 3,682 | | | | - | | | | 3,682 | |
| USD | | | 104,187 | | | CLP | | | 100,490 | | | 2/25/2025 | | | HUB | | | | 3,697 | | | | - | | | | 3,697 | |
| USD | | | 104,245 | | | CLP | | | 100,490 | | | 2/25/2025 | | | HUB | | | | 3,755 | | | | - | | | | 3,755 | |
| USD | | | 104,280 | | | CLP | | | 100,490 | | | 2/25/2025 | | | HUB | | | | 3,790 | | | | - | | | | 3,790 | |
| USD | | | 104,287 | | | CLP | | | 100,490 | | | 2/25/2025 | | | HUB | | | | 3,797 | | | | - | | | | 3,797 | |
| USD | | | 104,336 | | | CLP | | | 100,490 | | | 2/25/2025 | | | HUB | | | | 3,846 | | | | - | | | | 3,846 | |
| USD | | | 104,362 | | | CLP | | | 100,490 | | | 2/25/2025 | | | HUB | | | | 3,872 | | | | - | | | | 3,872 | |
| USD | | | 104,458 | | | CLP | | | 100,490 | | | 2/25/2025 | | | HUB | | | | 3,968 | | | | - | | | | 3,968 | |
| USD | | | 104,692 | | | CLP | | | 100,490 | | | 2/25/2025 | | | HUB | | | | 4,202 | | | | - | | | | 4,202 | |
| USD | | | 104,697 | | | CLP | | | 100,490 | | | 2/25/2025 | | | HUB | | | | 4,207 | | | | - | | | | 4,207 | |
| USD | | | 104,704 | | | CLP | | | 100,490 | | | 2/25/2025 | | | HUB | | | | 4,214 | | | | - | | | | 4,214 | |
| USD | | | 104,712 | | | CLP | | | 100,490 | | | 2/25/2025 | | | HUB | | | | 4,222 | | | | - | | | | 4,222 | |
| USD | | | 104,714 | | | CLP | | | 100,490 | | | 2/25/2025 | | | HUB | | | | 4,224 | | | | - | | | | 4,224 | |
| USD | | | 104,715 | | | CLP | | | 100,490 | | | 2/25/2025 | | | HUB | | | | 4,225 | | | | - | | | | 4,225 | |
| USD | | | 104,735 | | | CLP | | | 100,490 | | | 2/25/2025 | | | HUB | | | | 4,245 | | | | - | | | | 4,245 | |
| USD | | | 104,767 | | | CLP | | | 100,490 | | | 2/25/2025 | | | HUB | | | | 4,277 | | | | - | | | | 4,277 | |
| USD | | | 104,771 | | | CLP | | | 100,490 | | | 2/25/2025 | | | HUB | | | | 4,281 | | | | - | | | | 4,281 | |
| USD | | | 104,772 | | | CLP | | | 100,490 | | | 2/25/2025 | | | HUB | | | | 4,282 | | | | - | | | | 4,282 | |
| USD | | | 104,858 | | | CLP | | | 100,490 | | | 2/25/2025 | | | HUB | | | | 4,368 | | | | - | | | | 4,368 | |
| USD | | | 104,915 | | | CLP | | | 100,490 | | | 2/25/2025 | | | HUB | | | | 4,425 | | | | - | | | | 4,425 | |
| USD | | | 104,946 | | | CLP | | | 100,490 | | | 2/25/2025 | | | HUB | | | | 4,456 | | | | - | | | | 4,456 | |
| USD | | | 104,948 | | | CLP | | | 100,490 | | | 2/25/2025 | | | HUB | | | | 4,458 | | | | - | | | | 4,458 | |
| USD | | | 104,949 | | | CLP | | | 100,490 | | | 2/25/2025 | | | HUB | | | | 4,459 | | | | - | | | | 4,459 | |
| USD | | | 104,952 | | | CLP | | | 100,490 | | | 2/25/2025 | | | HUB | | | | 4,462 | | | | - | | | | 4,462 | |
| USD | | | 104,970 | | | CLP | | | 100,490 | | | 2/25/2025 | | | HUB | | | | 4,480 | | | | - | | | | 4,480 | |
| USD | | | 104,987 | | | CLP | | | 100,490 | | | 2/25/2025 | | | HUB | | | | 4,497 | | | | - | | | | 4,497 | |
| USD | | | 105,066 | | | CLP | | | 100,490 | | | 2/25/2025 | | | HUB | | | | 4,576 | | | | - | | | | 4,576 | |
| USD | | | 105,067 | | | CLP | | | 100,490 | | | 2/25/2025 | | | HUB | | | | 4,577 | | | | - | | | | 4,577 | |
| USD | | | 105,069 | | | CLP | | | 100,490 | | | 2/25/2025 | | | HUB | | | | 4,579 | | | | - | | | | 4,579 | |
See accompanying notes
54
American Beacon AHL Managed Futures Strategy FundSM
Consolidated Schedule of Investments
December 31, 2024
| | | | | | | | | | | | | | | | | | | | | | | | | | | | |
| | | | | | |
| Currency Purchased* | | | Currency Sold* | | | Settlement
Date | | Counterparty | | | Unrealized
Appreciation | | | Unrealized
(Depreciation) | | | Net Unrealized
Appreciation
(Depreciation) | |
| USD | | | 105,082 | | | CLP | | | 100,490 | | | 2/25/2025 | | | HUB | | | $ | 4,592 | | | $ | - | | | $ | 4,592 | |
| USD | | | 105,128 | | | CLP | | | 100,490 | | | 2/25/2025 | | | HUB | | | | 4,638 | | | | - | | | | 4,638 | |
| USD | | | 105,139 | | | CLP | | | 100,490 | | | 2/25/2025 | | | HUB | | | | 4,649 | | | | - | | | | 4,649 | |
| USD | | | 105,143 | | | CLP | | | 100,490 | | | 2/25/2025 | | | HUB | | | | 4,653 | | | | - | | | | 4,653 | |
| USD | | | 105,144 | | | CLP | | | 100,490 | | | 2/25/2025 | | | HUB | | | | 4,654 | | | | - | | | | 4,654 | |
| USD | | | 105,145 | | | CLP | | | 100,490 | | | 2/25/2025 | | | HUB | | | | 4,655 | | | | - | | | | 4,655 | |
| USD | | | 105,149 | | | CLP | | | 100,490 | | | 2/25/2025 | | | HUB | | | | 4,659 | | | | - | | | | 4,659 | |
| USD | | | 105,187 | | | CLP | | | 100,490 | | | 2/25/2025 | | | HUB | | | | 4,697 | | | | - | | | | 4,697 | |
| USD | | | 105,206 | | | CLP | | | 100,490 | | | 2/25/2025 | | | HUB | | | | 4,716 | | | | - | | | | 4,716 | |
| USD | | | 105,207 | | | CLP | | | 100,490 | | | 2/25/2025 | | | HUB | | | | 4,717 | | | | - | | | | 4,717 | |
| USD | | | 105,218 | | | CLP | | | 100,490 | | | 2/25/2025 | | | HUB | | | | 4,728 | | | | - | | | | 4,728 | |
| USD | | | 105,228 | | | CLP | | | 100,490 | | | 2/25/2025 | | | HUB | | | | 4,738 | | | | - | | | | 4,738 | |
| USD | | | 105,234 | | | CLP | | | 100,490 | | | 2/25/2025 | | | HUB | | | | 4,744 | | | | - | | | | 4,744 | |
| USD | | | 105,242 | | | CLP | | | 100,490 | | | 2/25/2025 | | | HUB | | | | 4,752 | | | | - | | | | 4,752 | |
| USD | | | 105,248 | | | CLP | | | 100,490 | | | 2/25/2025 | | | HUB | | | | 4,758 | | | | - | | | | 4,758 | |
| USD | | | 52,627 | | | CLP | | | 50,245 | | | 2/25/2025 | | | HUB | | | | 2,382 | | | | - | | | | 2,382 | |
| USD | | | 52,627 | | | CLP | | | 50,245 | | | 2/25/2025 | | | HUB | | | | 2,382 | | | | - | | | | 2,382 | |
| USD | | | 105,254 | | | CLP | | | 100,490 | | | 2/25/2025 | | | HUB | | | | 4,764 | | | | - | | | | 4,764 | |
| USD | | | 105,257 | | | CLP | | | 100,490 | | | 2/25/2025 | | | HUB | | | | 4,767 | | | | - | | | | 4,767 | |
| USD | | | 105,259 | | | CLP | | | 100,490 | | | 2/25/2025 | | | HUB | | | | 4,769 | | | | - | | | | 4,769 | |
| USD | | | 105,280 | | | CLP | | | 100,490 | | | 2/25/2025 | | | HUB | | | | 4,790 | | | | - | | | | 4,790 | |
| USD | | | 52,650 | | | CLP | | | 50,245 | | | 2/25/2025 | | | HUB | | | | 2,405 | | | | - | | | | 2,405 | |
| USD | | | 52,650 | | | CLP | | | 50,245 | | | 2/25/2025 | | | HUB | | | | 2,405 | | | | - | | | | 2,405 | |
| USD | | | 105,334 | | | CLP | | | 100,490 | | | 2/25/2025 | | | HUB | | | | 4,844 | | | | - | | | | 4,844 | |
| USD | | | 105,345 | | | CLP | | | 100,490 | | | 2/25/2025 | | | HUB | | | | 4,855 | | | | - | | | | 4,855 | |
| USD | | | 105,448 | | | CLP | | | 100,490 | | | 2/25/2025 | | | HUB | | | | 4,958 | | | | - | | | | 4,958 | |
| USD | | | 105,465 | | | CLP | | | 100,490 | | | 2/25/2025 | | | HUB | | | | 4,975 | | | | - | | | | 4,975 | |
| USD | | | 52,739 | | | CLP | | | 50,245 | | | 2/25/2025 | | | HUB | | | | 2,494 | | | | - | | | | 2,494 | |
| USD | | | 52,739 | | | CLP | | | 50,245 | | | 2/25/2025 | | | HUB | | | | 2,494 | | | | - | | | | 2,494 | |
| USD | | | 105,485 | | | CLP | | | 100,490 | | | 2/25/2025 | | | HUB | | | | 4,995 | | | | - | | | | 4,995 | |
| USD | | | 105,490 | | | CLP | | | 100,490 | | | 2/25/2025 | | | HUB | | | | 5,000 | | | | - | | | | 5,000 | |
| USD | | | 105,500 | | | CLP | | | 100,490 | | | 2/25/2025 | | | HUB | | | | 5,010 | | | | - | | | | 5,010 | |
| USD | | | 105,503 | | | CLP | | | 100,490 | | | 2/25/2025 | | | HUB | | | | 5,013 | | | | - | | | | 5,013 | |
| USD | | | 105,514 | | | CLP | | | 100,490 | | | 2/25/2025 | | | HUB | | | | 5,024 | | | | - | | | | 5,024 | |
| USD | | | 105,515 | | | CLP | | | 100,490 | | | 2/25/2025 | | | HUB | | | | 5,025 | | | | - | | | | 5,025 | |
| USD | | | 105,523 | | | CLP | | | 100,490 | | | 2/25/2025 | | | HUB | | | | 5,033 | | | | - | | | | 5,033 | |
| USD | | | 105,524 | | | CLP | | | 100,490 | | | 2/25/2025 | | | HUB | | | | 5,034 | | | | - | | | | 5,034 | |
| USD | | | 105,534 | | | CLP | | | 100,490 | | | 2/25/2025 | | | HUB | | | | 5,044 | | | | - | | | | 5,044 | |
| USD | | | 105,538 | | | CLP | | | 100,490 | | | 2/25/2025 | | | HUB | | | | 5,048 | | | | - | | | | 5,048 | |
| USD | | | 105,543 | | | CLP | | | 100,490 | | | 2/25/2025 | | | HUB | | | | 5,053 | | | | - | | | | 5,053 | |
| USD | | | 105,584 | | | CLP | | | 100,490 | | | 2/25/2025 | | | HUB | | | | 5,094 | | | | - | | | | 5,094 | |
| USD | | | 105,608 | | | CLP | | | 100,490 | | | 2/25/2025 | | | HUB | | | | 5,118 | | | | - | | | | 5,118 | |
| USD | | | 105,626 | | | CLP | | | 100,490 | | | 2/25/2025 | | | HUB | | | | 5,136 | | | | - | | | | 5,136 | |
| USD | | | 105,654 | | | CLP | | | 100,490 | | | 2/25/2025 | | | HUB | | | | 5,164 | | | | - | | | | 5,164 | |
| USD | | | 105,660 | | | CLP | | | 100,490 | | | 2/25/2025 | | | HUB | | | | 5,170 | | | | - | | | | 5,170 | |
| USD | | | 105,690 | | | CLP | | | 100,490 | | | 2/25/2025 | | | HUB | | | | 5,200 | | | | - | | | | 5,200 | |
| USD | | | 105,696 | | | CLP | | | 100,490 | | | 2/25/2025 | | | HUB | | | | 5,206 | | | | - | | | | 5,206 | |
| USD | | | 105,717 | | | CLP | | | 100,490 | | | 2/25/2025 | | | HUB | | | | 5,227 | | | | - | | | | 5,227 | |
| USD | | | 105,729 | | | CLP | | | 100,490 | | | 2/25/2025 | | | HUB | | | | 5,239 | | | | - | | | | 5,239 | |
| USD | | | 105,741 | | | CLP | | | 100,490 | | | 2/25/2025 | | | HUB | | | | 5,251 | | | | - | | | | 5,251 | |
| USD | | | 105,744 | | | CLP | | | 100,490 | | | 2/25/2025 | | | HUB | | | | 5,254 | | | | - | | | | 5,254 | |
| USD | | | 105,750 | | | CLP | | | 100,490 | | | 2/25/2025 | | | HUB | | | | 5,260 | | | | - | | | | 5,260 | |
| USD | | | 105,752 | | | CLP | | | 100,490 | | | 2/25/2025 | | | HUB | | | | 5,262 | | | | - | | | | 5,262 | |
| USD | | | 105,756 | | | CLP | | | 100,490 | | | 2/25/2025 | | | HUB | | | | 5,266 | | | | - | | | | 5,266 | |
| USD | | | 105,768 | | | CLP | | | 100,490 | | | 2/25/2025 | | | HUB | | | | 5,278 | | | | - | | | | 5,278 | |
| USD | | | 105,770 | | | CLP | | | 100,490 | | | 2/25/2025 | | | HUB | | | | 5,280 | | | | - | | | | 5,280 | |
| USD | | | 105,773 | | | CLP | | | 100,490 | | | 2/25/2025 | | | HUB | | | | 5,283 | | | | - | | | | 5,283 | |
| USD | | | 105,778 | | | CLP | | | 100,490 | | | 2/25/2025 | | | HUB | | | | 5,288 | | | | - | | | | 5,288 | |
| USD | | | 105,779 | | | CLP | | | 100,490 | | | 2/25/2025 | | | HUB | | | | 5,289 | | | | - | | | | 5,289 | |
See accompanying notes
55
American Beacon AHL Managed Futures Strategy FundSM
Consolidated Schedule of Investments
December 31, 2024
| | | | | | | | | | | | | | | | | | | | | | | | | | | | |
| | | | | | |
| Currency Purchased* | | | Currency Sold* | | | Settlement
Date | | Counterparty | | | Unrealized
Appreciation | | | Unrealized
(Depreciation) | | | Net Unrealized
Appreciation
(Depreciation) | |
| USD | | | 105,837 | | | CLP | | | 100,490 | | | 2/25/2025 | | | HUB | | | $ | 5,347 | | | $ | - | | | $ | 5,347 | |
| USD | | | 105,846 | | | CLP | | | 100,490 | | | 2/25/2025 | | | HUB | | | | 5,356 | | | | - | | | | 5,356 | |
| USD | | | 105,875 | | | CLP | | | 100,490 | | | 2/25/2025 | | | HUB | | | | 5,385 | | | | - | | | | 5,385 | |
| USD | | | 105,891 | | | CLP | | | 100,490 | | | 2/25/2025 | | | HUB | | | | 5,401 | | | | - | | | | 5,401 | |
| USD | | | 105,920 | | | CLP | | | 100,490 | | | 2/25/2025 | | | HUB | | | | 5,430 | | | | - | | | | 5,430 | |
| USD | | | 105,960 | | | CLP | | | 100,490 | | | 2/25/2025 | | | HUB | | | | 5,470 | | | | - | | | | 5,470 | |
| USD | | | 106,052 | | | CLP | | | 100,490 | | | 2/25/2025 | | | HUB | | | | 5,562 | | | | - | | | | 5,562 | |
| USD | | | 106,068 | | | CLP | | | 100,490 | | | 2/25/2025 | | | HUB | | | | 5,578 | | | | - | | | | 5,578 | |
| USD | | | 106,072 | | | CLP | | | 100,490 | | | 2/25/2025 | | | HUB | | | | 5,582 | | | | - | | | | 5,582 | |
| USD | | | 106,097 | | | CLP | | | 100,490 | | | 2/25/2025 | | | HUB | | | | 5,607 | | | | - | | | | 5,607 | |
| USD | | | 106,142 | | | CLP | | | 100,490 | | | 2/25/2025 | | | HUB | | | | 5,652 | | | | - | | | | 5,652 | |
| USD | | | 153,250 | | | CLP | | | 150,735 | | | 2/25/2025 | | | HUB | | | | 2,515 | | | | - | | | | 2,515 | |
| USD | | | 153,272 | | | CLP | | | 150,735 | | | 2/25/2025 | | | HUB | | | | 2,537 | | | | - | | | | 2,537 | |
| USD | | | 153,413 | | | CLP | | | 150,735 | | | 2/25/2025 | | | HUB | | | | 2,678 | | | | - | | | | 2,678 | |
| USD | | | 153,435 | | | CLP | | | 150,735 | | | 2/25/2025 | | | HUB | | | | 2,700 | | | | - | | | | 2,700 | |
| USD | | | 153,618 | | | CLP | | | 150,735 | | | 2/25/2025 | | | HUB | | | | 2,883 | | | | - | | | | 2,883 | |
| USD | | | 153,711 | | | CLP | | | 150,735 | | | 2/25/2025 | | | HUB | | | | 2,976 | | | | - | | | | 2,976 | |
| USD | | | 153,728 | | | CLP | | | 150,735 | | | 2/25/2025 | | | HUB | | | | 2,993 | | | | - | | | | 2,993 | |
| USD | | | 153,972 | | | CLP | | | 150,735 | | | 2/25/2025 | | | HUB | | | | 3,237 | | | | - | | | | 3,237 | |
| USD | | | 154,208 | | | CLP | | | 150,735 | | | 2/25/2025 | | | HUB | | | | 3,473 | | | | - | | | | 3,473 | |
| USD | | | 156,289 | | | CLP | | | 150,735 | | | 2/25/2025 | | | HUB | | | | 5,554 | | | | - | | | | 5,554 | |
| USD | | | 156,304 | | | CLP | | | 150,735 | | | 2/25/2025 | | | HUB | | | | 5,569 | | | | - | | | | 5,569 | |
| USD | | | 156,307 | | | CLP | | | 150,735 | | | 2/25/2025 | | | HUB | | | | 5,572 | | | | - | | | | 5,572 | |
| USD | | | 156,371 | | | CLP | | | 150,735 | | | 2/25/2025 | | | HUB | | | | 5,636 | | | | - | | | | 5,636 | |
| USD | | | 52,137 | | | CLP | | | 50,245 | | | 2/25/2025 | | | HUB | | | | 1,892 | | | | - | | | | 1,892 | |
| USD | | | 52,137 | | | CLP | | | 50,245 | | | 2/25/2025 | | | HUB | | | | 1,892 | | | | - | | | | 1,892 | |
| USD | | | 52,137 | | | CLP | | | 50,245 | | | 2/25/2025 | | | HUB | | | | 1,892 | | | | - | | | | 1,892 | |
| USD | | | 156,447 | | | CLP | | | 150,735 | | | 2/25/2025 | | | HUB | | | | 5,712 | | | | - | | | | 5,712 | |
| USD | | | 156,450 | | | CLP | | | 150,735 | | | 2/25/2025 | | | HUB | | | | 5,715 | | | | - | | | | 5,715 | |
| USD | | | 156,495 | | | CLP | | | 150,735 | | | 2/25/2025 | | | HUB | | | | 5,760 | | | | - | | | | 5,760 | |
| USD | | | 156,550 | | | CLP | | | 150,735 | | | 2/25/2025 | | | HUB | | | | 5,815 | | | | - | | | | 5,815 | |
| USD | | | 156,666 | | | CLP | | | 150,735 | | | 2/25/2025 | | | HUB | | | | 5,931 | | | | - | | | | 5,931 | |
| USD | | | 156,719 | | | CLP | | | 150,735 | | | 2/25/2025 | | | HUB | | | | 5,984 | | | | - | | | | 5,984 | |
| USD | | | 156,769 | | | CLP | | | 150,735 | | | 2/25/2025 | | | HUB | | | | 6,034 | | | | - | | | | 6,034 | |
| USD | | | 156,976 | | | CLP | | | 150,735 | | | 2/25/2025 | | | HUB | | | | 6,241 | | | | - | | | | 6,241 | |
| USD | | | 157,022 | | | CLP | | | 150,735 | | | 2/25/2025 | | | HUB | | | | 6,287 | | | | - | | | | 6,287 | |
| USD | | | 157,052 | | | CLP | | | 150,735 | | | 2/25/2025 | | | HUB | | | | 6,317 | | | | - | | | | 6,317 | |
| USD | | | 157,071 | | | CLP | | | 150,735 | | | 2/25/2025 | | | HUB | | | | 6,336 | | | | - | | | | 6,336 | |
| USD | | | 157,134 | | | CLP | | | 150,735 | | | 2/25/2025 | | | HUB | | | | 6,399 | | | | - | | | | 6,399 | |
| USD | | | 157,149 | | | CLP | | | 150,735 | | | 2/25/2025 | | | HUB | | | | 6,414 | | | | - | | | | 6,414 | |
| USD | | | 157,371 | | | CLP | | | 150,735 | | | 2/25/2025 | | | HUB | | | | 6,636 | | | | - | | | | 6,636 | |
| USD | | | 157,404 | | | CLP | | | 150,735 | | | 2/25/2025 | | | HUB | | | | 6,669 | | | | - | | | | 6,669 | |
| USD | | | 157,419 | | | CLP | | | 150,735 | | | 2/25/2025 | | | HUB | | | | 6,684 | | | | - | | | | 6,684 | |
| USD | | | 157,424 | | | CLP | | | 150,735 | | | 2/25/2025 | | | HUB | | | | 6,689 | | | | - | | | | 6,689 | |
| USD | | | 157,426 | | | CLP | | | 150,735 | | | 2/25/2025 | | | HUB | | | | 6,691 | | | | - | | | | 6,691 | |
| USD | | | 157,451 | | | CLP | | | 150,735 | | | 2/25/2025 | | | HUB | | | | 6,716 | | | | - | | | | 6,716 | |
| USD | | | 157,454 | | | CLP | | | 150,735 | | | 2/25/2025 | | | HUB | | | | 6,719 | | | | - | | | | 6,719 | |
| USD | | | 157,456 | | | CLP | | | 150,735 | | | 2/25/2025 | | | HUB | | | | 6,721 | | | | - | | | | 6,721 | |
| USD | | | 157,459 | | | CLP | | | 150,735 | | | 2/25/2025 | | | HUB | | | | 6,724 | | | | - | | | | 6,724 | |
| USD | | | 157,472 | | | CLP | | | 150,735 | | | 2/25/2025 | | | HUB | | | | 6,737 | | | | - | | | | 6,737 | |
| USD | | | 157,532 | | | CLP | | | 150,735 | | | 2/25/2025 | | | HUB | | | | 6,797 | | | | - | | | | 6,797 | |
| USD | | | 157,542 | | | CLP | | | 150,735 | | | 2/25/2025 | | | HUB | | | | 6,807 | | | | - | | | | 6,807 | |
| USD | | | 157,580 | | | CLP | | | 150,735 | | | 2/25/2025 | | | HUB | | | | 6,845 | | | | - | | | | 6,845 | |
| USD | | | 157,591 | | | CLP | | | 150,735 | | | 2/25/2025 | | | HUB | | | | 6,856 | | | | - | | | | 6,856 | |
| USD | | | 157,601 | | | CLP | | | 150,735 | | | 2/25/2025 | | | HUB | | | | 6,866 | | | | - | | | | 6,866 | |
| USD | | | 157,634 | | | CLP | | | 150,735 | | | 2/25/2025 | | | HUB | | | | 6,899 | | | | - | | | | 6,899 | |
| USD | | | 157,638 | | | CLP | | | 150,735 | | | 2/25/2025 | | | HUB | | | | 6,903 | | | | - | | | | 6,903 | |
| USD | | | 157,671 | | | CLP | | | 150,735 | | | 2/25/2025 | | | HUB | | | | 6,936 | | | | - | | | | 6,936 | |
| USD | | | 157,712 | | | CLP | | | 150,735 | | | 2/25/2025 | | | HUB | | | | 6,977 | | | | - | | | | 6,977 | |
See accompanying notes
56
American Beacon AHL Managed Futures Strategy FundSM
Consolidated Schedule of Investments
December 31, 2024
| | | | | | | | | | | | | | | | | | | | | | | | | | |
| | | | | | |
| Currency Purchased* | | Currency Sold* | | Settlement
Date | | | Counterparty | | | Unrealized
Appreciation | | | Unrealized
(Depreciation) | | | Net Unrealized
Appreciation
(Depreciation) | |
| USD | | 157,719 | | CLP | | 150,735 | | | 2/25/2025 | | | | HUB | | | $ | 6,984 | | | $ | - | | | $ | 6,984 | |
| USD | | 157,778 | | CLP | | 150,735 | | | 2/25/2025 | | | | HUB | | | | 7,043 | | | | - | | | | 7,043 | |
| USD | | 157,822 | | CLP | | 150,735 | | | 2/25/2025 | | | | HUB | | | | 7,087 | | | | - | | | | 7,087 | |
| USD | | 157,823 | | CLP | | 150,735 | | | 2/25/2025 | | | | HUB | | | | 7,088 | | | | - | | | | 7,088 | |
| USD | | 157,860 | | CLP | | 150,735 | | | 2/25/2025 | | | | HUB | | | | 7,125 | | | | - | | | | 7,125 | |
| USD | | 157,869 | | CLP | | 150,735 | | | 2/25/2025 | | | | HUB | | | | 7,134 | | | | - | | | | 7,134 | |
| USD | | 157,881 | | CLP | | 150,735 | | | 2/25/2025 | | | | HUB | | | | 7,146 | | | | - | | | | 7,146 | |
| USD | | 157,883 | | CLP | | 150,735 | | | 2/25/2025 | | | | HUB | | | | 7,148 | | | | - | | | | 7,148 | |
| USD | | 157,891 | | CLP | | 150,735 | | | 2/25/2025 | | | | HUB | | | | 7,156 | | | | - | | | | 7,156 | |
| USD | | 157,910 | | CLP | | 150,735 | | | 2/25/2025 | | | | HUB | | | | 7,175 | | | | - | | | | 7,175 | |
| USD | | 157,936 | | CLP | | 150,735 | | | 2/25/2025 | | | | HUB | | | | 7,201 | | | | - | | | | 7,201 | |
| USD | | 157,946 | | CLP | | 150,735 | | | 2/25/2025 | | | | HUB | | | | 7,211 | | | | - | | | | 7,211 | |
| USD | | 157,956 | | CLP | | 150,735 | | | 2/25/2025 | | | | HUB | | | | 7,221 | | | | - | | | | 7,221 | |
| USD | | 158,063 | | CLP | | 150,735 | | | 2/25/2025 | | | | HUB | | | | 7,328 | | | | - | | | | 7,328 | |
| USD | | 158,068 | | CLP | | 150,735 | | | 2/25/2025 | | | | HUB | | | | 7,333 | | | | - | | | | 7,333 | |
| USD | | 158,146 | | CLP | | 150,735 | | | 2/25/2025 | | | | HUB | | | | 7,411 | | | | - | | | | 7,411 | |
| USD | | 158,173 | | CLP | | 150,735 | | | 2/25/2025 | | | | HUB | | | | 7,438 | | | | - | | | | 7,438 | |
| USD | | 158,217 | | CLP | | 150,735 | | | 2/25/2025 | | | | HUB | | | | 7,482 | | | | - | | | | 7,482 | |
| USD | | 158,218 | | CLP | | 150,735 | | | 2/25/2025 | | | | HUB | | | | 7,483 | | | | - | | | | 7,483 | |
| USD | | 158,226 | | CLP | | 150,735 | | | 2/25/2025 | | | | HUB | | | | 7,491 | | | | - | | | | 7,491 | |
| USD | | 158,230 | | CLP | | 150,735 | | | 2/25/2025 | | | | HUB | | | | 7,495 | | | | - | | | | 7,495 | |
| USD | | 158,253 | | CLP | | 150,735 | | | 2/25/2025 | | | | HUB | | | | 7,518 | | | | - | | | | 7,518 | |
| USD | | 158,258 | | CLP | | 150,735 | | | 2/25/2025 | | | | HUB | | | | 7,523 | | | | - | | | | 7,523 | |
| USD | | 158,269 | | CLP | | 150,735 | | | 2/25/2025 | | | | HUB | | | | 7,534 | | | | - | | | | 7,534 | |
| USD | | 158,300 | | CLP | | 150,735 | | | 2/25/2025 | | | | HUB | | | | 7,565 | | | | - | | | | 7,565 | |
| USD | | 158,303 | | CLP | | 150,735 | | | 2/25/2025 | | | | HUB | | | | 7,568 | | | | - | | | | 7,568 | |
| USD | | 158,353 | | CLP | | 150,735 | | | 2/25/2025 | | | | HUB | | | | 7,618 | | | | - | | | | 7,618 | |
| USD | | 158,355 | | CLP | | 150,735 | | | 2/25/2025 | | | | HUB | | | | 7,620 | | | | - | | | | 7,620 | |
| USD | | 158,410 | | CLP | | 150,735 | | | 2/25/2025 | | | | HUB | | | | 7,675 | | | | - | | | | 7,675 | |
| USD | | 158,490 | | CLP | | 150,735 | | | 2/25/2025 | | | | HUB | | | | 7,755 | | | | - | | | | 7,755 | |
| USD | | 158,522 | | CLP | | 150,735 | | | 2/25/2025 | | | | HUB | | | | 7,787 | | | | - | | | | 7,787 | |
| USD | | 158,533 | | CLP | | 150,735 | | | 2/25/2025 | | | | HUB | | | | 7,798 | | | | - | | | | 7,798 | |
| USD | | 158,549 | | CLP | | 150,735 | | | 2/25/2025 | | | | HUB | | | | 7,814 | | | | - | | | | 7,814 | |
| USD | | 158,564 | | CLP | | 150,735 | | | 2/25/2025 | | | | HUB | | | | 7,829 | | | | - | | | | 7,829 | |
| USD | | 158,586 | | CLP | | 150,735 | | | 2/25/2025 | | | | HUB | | | | 7,851 | | | | - | | | | 7,851 | |
| USD | | 158,598 | | CLP | | 150,735 | | | 2/25/2025 | | | | HUB | | | | 7,863 | | | | - | | | | 7,863 | |
| USD | | 158,626 | | CLP | | 150,735 | | | 2/25/2025 | | | | HUB | | | | 7,891 | | | | - | | | | 7,891 | |
| USD | | 158,646 | | CLP | | 150,735 | | | 2/25/2025 | | | | HUB | | | | 7,911 | | | | - | | | | 7,911 | |
| USD | | 158,712 | | CLP | | 150,735 | | | 2/25/2025 | | | | HUB | | | | 7,977 | | | | - | | | | 7,977 | |
| USD | | 158,757 | | CLP | | 150,735 | | | 2/25/2025 | | | | HUB | | | | 8,022 | | | | - | | | | 8,022 | |
| USD | | 158,772 | | CLP | | 150,735 | | | 2/25/2025 | | | | HUB | | | | 8,037 | | | | - | | | | 8,037 | |
| USD | | 158,794 | | CLP | | 150,735 | | | 2/25/2025 | | | | HUB | | | | 8,059 | | | | - | | | | 8,059 | |
| USD | | 158,902 | | CLP | | 150,735 | | | 2/25/2025 | | | | HUB | | | | 8,167 | | | | - | | | | 8,167 | |
| USD | | 158,919 | | CLP | | 150,735 | | | 2/25/2025 | | | | HUB | | | | 8,184 | | | | - | | | | 8,184 | |
| USD | | 158,922 | | CLP | | 150,735 | | | 2/25/2025 | | | | HUB | | | | 8,187 | | | | - | | | | 8,187 | |
| USD | | 158,925 | | CLP | | 150,735 | | | 2/25/2025 | | | | HUB | | | | 8,190 | | | | - | | | | 8,190 | |
| USD | | 158,954 | | CLP | | 150,735 | | | 2/25/2025 | | | | HUB | | | | 8,219 | | | | - | | | | 8,219 | |
| USD | | 159,003 | | CLP | | 150,735 | | | 2/25/2025 | | | | HUB | | | | 8,268 | | | | - | | | | 8,268 | |
| USD | | 159,070 | | CLP | | 150,735 | | | 2/25/2025 | | | | HUB | | | | 8,335 | | | | - | | | | 8,335 | |
| USD | | 159,141 | | CLP | | 150,735 | | | 2/25/2025 | | | | HUB | | | | 8,406 | | | | - | | | | 8,406 | |
| USD | | 159,150 | | CLP | | 150,735 | | | 2/25/2025 | | | | HUB | | | | 8,415 | | | | - | | | | 8,415 | |
| USD | | 159,158 | | CLP | | 150,735 | | | 2/25/2025 | | | | HUB | | | | 8,423 | | | | - | | | | 8,423 | |
| USD | | 159,215 | | CLP | | 150,735 | | | 2/25/2025 | | | | HUB | | | | 8,480 | | | | - | | | | 8,480 | |
| USD | | 204,809 | | CLP | | 200,981 | | | 2/25/2025 | | | | HUB | | | | 3,828 | | | | - | | | | 3,828 | |
| USD | | 204,899 | | CLP | | 200,981 | | | 2/25/2025 | | | | HUB | | | | 3,918 | | | | - | | | | 3,918 | |
| USD | | 205,295 | | CLP | | 200,981 | | | 2/25/2025 | | | | HUB | | | | 4,314 | | | | - | | | | 4,314 | |
| USD | | 205,368 | | CLP | | 200,981 | | | 2/25/2025 | | | | HUB | | | | 4,387 | | | | - | | | | 4,387 | |
| USD | | 205,436 | | CLP | | 200,981 | | | 2/25/2025 | | | | HUB | | | | 4,455 | | | | - | | | | 4,455 | |
| USD | | 205,615 | | CLP | | 200,981 | | | 2/25/2025 | | | | HUB | | | | 4,634 | | | | - | | | | 4,634 | |
See accompanying notes
57
American Beacon AHL Managed Futures Strategy FundSM
Consolidated Schedule of Investments
December 31, 2024
| | | | | | | | | | | | | | | | | | | | | | | | | | |
| | | | | | |
| Currency Purchased* | | | Currency Sold* | | Settlement
Date | | Counterparty | | | Unrealized
Appreciation | | | Unrealized
(Depreciation) | | | Net Unrealized
Appreciation
(Depreciation) | |
| USD | | | 205,624 | | | CLP | | 200,981 | | 2/25/2025 | | | HUB | | | $ | 4,643 | | | $ | - | | | $ | 4,643 | |
| USD | | | 104,930 | | | CLP | | 100,490 | | 2/25/2025 | | | HUB | | | | 4,440 | | | | - | | | | 4,440 | |
| USD | | | 104,930 | | | CLP | | 100,490 | | 2/25/2025 | | | HUB | | | | 4,440 | | | | - | | | | 4,440 | |
| USD | | | 209,923 | | | CLP | | 200,981 | | 2/25/2025 | | | HUB | | | | 8,942 | | | | - | | | | 8,942 | |
| USD | | | 209,965 | | | CLP | | 200,981 | | 2/25/2025 | | | HUB | | | | 8,984 | | | | - | | | | 8,984 | |
| USD | | | 209,974 | | | CLP | | 200,981 | | 2/25/2025 | | | HUB | | | | 8,993 | | | | - | | | | 8,993 | |
| USD | | | 210,024 | | | CLP | | 200,981 | | 2/25/2025 | | | HUB | | | | 9,043 | | | | - | | | | 9,043 | |
| USD | | | 210,047 | | | CLP | | 200,981 | | 2/25/2025 | | | HUB | | | | 9,066 | | | | - | | | | 9,066 | |
| USD | | | 210,243 | | | CLP | | 200,981 | | 2/25/2025 | | | HUB | | | | 9,262 | | | | - | | | | 9,262 | |
| USD | | | 210,305 | | | CLP | | 200,981 | | 2/25/2025 | | | HUB | | | | 9,324 | | | | - | | | | 9,324 | |
| USD | | | 210,374 | | | CLP | | 200,981 | | 2/25/2025 | | | HUB | | | | 9,393 | | | | - | | | | 9,393 | |
| USD | | | 210,451 | | | CLP | | 200,981 | | 2/25/2025 | | | HUB | | | | 9,470 | | | | - | | | | 9,470 | |
| USD | | | 210,469 | | | CLP | | 200,981 | | 2/25/2025 | | | HUB | | | | 9,488 | | | | - | | | | 9,488 | |
| USD | | | 105,263 | | | CLP | | 100,490 | | 2/25/2025 | | | HUB | | | | 4,773 | | | | - | | | | 4,773 | |
| USD | | | 105,263 | | | CLP | | 100,490 | | 2/25/2025 | | | HUB | | | | 4,773 | | | | - | | | | 4,773 | |
| USD | | | 210,553 | | | CLP | | 200,981 | | 2/25/2025 | | | HUB | | | | 9,572 | | | | - | | | | 9,572 | |
| USD | | | 105,299 | | | CLP | | 100,490 | | 2/25/2025 | | | HUB | | | | 4,809 | | | | - | | | | 4,809 | |
| USD | | | 105,299 | | | CLP | | 100,490 | | 2/25/2025 | | | HUB | | | | 4,809 | | | | - | | | | 4,809 | |
| USD | | | 211,126 | | | CLP | | 200,981 | | 2/25/2025 | | | HUB | | | | 10,145 | | | | - | | | | 10,145 | |
| USD | | | 211,191 | | | CLP | | 200,981 | | 2/25/2025 | | | HUB | | | | 10,210 | | | | - | | | | 10,210 | |
| USD | | | 211,481 | | | CLP | | 200,981 | | 2/25/2025 | | | HUB | | | | 10,500 | | | | - | | | | 10,500 | |
| USD | | | 211,542 | | | CLP | | 200,981 | | 2/25/2025 | | | HUB | | | | 10,561 | | | | - | | | | 10,561 | |
| USD | | | 211,591 | | | CLP | | 200,981 | | 2/25/2025 | | | HUB | | | | 10,610 | | | | - | | | | 10,610 | |
| USD | | | 105,799 | | | CLP | | 100,490 | | 2/25/2025 | | | HUB | | | | 5,309 | | | | - | | | | 5,309 | |
| USD | | | 105,799 | | | CLP | | 100,490 | | 2/25/2025 | | | HUB | | | | 5,309 | | | | - | | | | 5,309 | |
| USD | | | 211,604 | | | CLP | | 200,981 | | 2/25/2025 | | | HUB | | | | 10,623 | | | | - | | | | 10,623 | |
| USD | | | 211,633 | | | CLP | | 200,981 | | 2/25/2025 | | | HUB | | | | 10,652 | | | | - | | | | 10,652 | |
| USD | | | 211,645 | | | CLP | | 200,981 | | 2/25/2025 | | | HUB | | | | 10,664 | | | | - | | | | 10,664 | |
| USD | | | 211,837 | | | CLP | | 200,981 | | 2/25/2025 | | | HUB | | | | 10,856 | | | | - | | | | 10,856 | |
| USD | | | 211,912 | | | CLP | | 200,981 | | 2/25/2025 | | | HUB | | | | 10,931 | | | | - | | | | 10,931 | |
| USD | | | 212,008 | | | CLP | | 200,981 | | 2/25/2025 | | | HUB | | | | 11,027 | | | | - | | | | 11,027 | |
| USD | | | 252,108 | | | CLP | | 251,226 | | 2/25/2025 | | | HUB | | | | 882 | | | | - | | | | 882 | |
| USD | | | 255,575 | | | CLP | | 251,226 | | 2/25/2025 | | | HUB | | | | 4,349 | | | | - | | | | 4,349 | |
| USD | | | 256,323 | | | CLP | | 251,226 | | 2/25/2025 | | | HUB | | | | 5,097 | | | | - | | | | 5,097 | |
| USD | | | 256,521 | | | CLP | | 251,226 | | 2/25/2025 | | | HUB | | | | 5,295 | | | | - | | | | 5,295 | |
| USD | | | 256,829 | | | CLP | | 251,226 | | 2/25/2025 | | | HUB | | | | 5,603 | | | | - | | | | 5,603 | |
| USD | | | 257,006 | | | CLP | | 251,226 | | 2/25/2025 | | | HUB | | | | 5,780 | | | | - | | | | 5,780 | |
| USD | | | 257,083 | | | CLP | | 251,226 | | 2/25/2025 | | | HUB | | | | 5,857 | | | | - | | | | 5,857 | |
| USD | | | 263,916 | | | CLP | | 251,226 | | 2/25/2025 | | | HUB | | | | 12,690 | | | | - | | | | 12,690 | |
| USD | | | 264,067 | | | CLP | | 251,226 | | 2/25/2025 | | | HUB | | | | 12,841 | | | | - | | | | 12,841 | |
| USD | | | 264,086 | | | CLP | | 251,226 | | 2/25/2025 | | | HUB | | | | 12,860 | | | | - | | | | 12,860 | |
| USD | | | 264,307 | | | CLP | | 251,226 | | 2/25/2025 | | | HUB | | | | 13,081 | | | | - | | | | 13,081 | |
| USD | | | 264,324 | | | CLP | | 251,226 | | 2/25/2025 | | | HUB | | | | 13,098 | | | | - | | | | 13,098 | |
| USD | | | 264,335 | | | CLP | | 251,226 | | 2/25/2025 | | | HUB | | | | 13,109 | | | | - | | | | 13,109 | |
| USD | | | 264,478 | | | CLP | | 251,226 | | 2/25/2025 | | | HUB | | | | 13,252 | | | | - | | | | 13,252 | |
| USD | | | 264,500 | | | CLP | | 251,226 | | 2/25/2025 | | | HUB | | | | 13,274 | | | | - | | | | 13,274 | |
| USD | | | 264,542 | | | CLP | | 251,226 | | 2/25/2025 | | | HUB | | | | 13,316 | | | | - | | | | 13,316 | |
| USD | | | 302,124 | | | CLP | | 301,471 | | 2/25/2025 | | | HUB | | | | 653 | | | | - | | | | 653 | |
| USD | | | 302,185 | | | CLP | | 301,471 | | 2/25/2025 | | | HUB | | | | 714 | | | | - | | | | 714 | |
| USD | | | 306,535 | | | CLP | | 301,471 | | 2/25/2025 | | | HUB | | | | 5,064 | | | | - | | | | 5,064 | |
| USD | | | 306,796 | | | CLP | | 301,471 | | 2/25/2025 | | | HUB | | | | 5,325 | | | | - | | | | 5,325 | |
| USD | | | 307,017 | | | CLP | | 301,471 | | 2/25/2025 | | | HUB | | | | 5,546 | | | | - | | | | 5,546 | |
| USD | | | 307,554 | | | CLP | | 301,471 | | 2/25/2025 | | | HUB | | | | 6,083 | | | | - | | | | 6,083 | |
| USD | | | 307,803 | | | CLP | | 301,471 | | 2/25/2025 | | | HUB | | | | 6,332 | | | | - | | | | 6,332 | |
| USD | | | 308,277 | | | CLP | | 301,471 | | 2/25/2025 | | | HUB | | | | 6,806 | | | | - | | | | 6,806 | |
| USD | | | 157,871 | | | CLP | | 150,735 | | 2/25/2025 | | | HUB | | | | 7,136 | | | | - | | | | 7,136 | |
| USD | | | 157,871 | | | CLP | | 150,735 | | 2/25/2025 | | | HUB | | | | 7,136 | | | | - | | | | 7,136 | |
| USD | | | 158,747 | | | CLP | | 150,735 | | 2/25/2025 | | | HUB | | | | 8,012 | | | | - | | | | 8,012 | |
| USD | | | 158,747 | | | CLP | | 150,735 | | 2/25/2025 | | | HUB | | | | 8,012 | | | | - | | | | 8,012 | |
See accompanying notes
58
American Beacon AHL Managed Futures Strategy FundSM
Consolidated Schedule of Investments
December 31, 2024
| | | | | | | | | | | | | | | | | | | | | | | | | | | | |
| | | | | | |
| Currency Purchased* | | | Currency Sold* | | | Settlement
Date | | Counterparty | | | Unrealized
Appreciation | | | Unrealized
(Depreciation) | | | Net Unrealized
Appreciation
(Depreciation) | |
| USD | | | 353,125 | | | CLP | | | 351,716 | | | 2/25/2025 | | | HUB | | | $ | 1,409 | | | $ | - | | | $ | 1,409 | |
| USD | | | 357,458 | | | CLP | | | 351,716 | | | 2/25/2025 | | | HUB | | | | 5,742 | | | | - | | | | 5,742 | |
| USD | | | 357,822 | | | CLP | | | 351,716 | | | 2/25/2025 | | | HUB | | | | 6,106 | | | | - | | | | 6,106 | |
| USD | | | 358,144 | | | CLP | | | 351,716 | | | 2/25/2025 | | | HUB | | | | 6,428 | | | | - | | | | 6,428 | |
| USD | | | 358,313 | | | CLP | | | 351,716 | | | 2/25/2025 | | | HUB | | | | 6,597 | | | | - | | | | 6,597 | |
| USD | | | 403,275 | | | CLP | | | 401,961 | | | 2/25/2025 | | | HUB | | | | 1,314 | | | | - | | | | 1,314 | |
| USD | | | 409,507 | | | CLP | | | 401,961 | | | 2/25/2025 | | | HUB | | | | 7,546 | | | | - | | | | 7,546 | |
| USD | | | 409,710 | | | CLP | | | 401,961 | | | 2/25/2025 | | | HUB | | | | 7,749 | | | | - | | | | 7,749 | |
| USD | | | 409,786 | | | CLP | | | 401,961 | | | 2/25/2025 | | | HUB | | | | 7,825 | | | | - | | | | 7,825 | |
| USD | | | 454,110 | | | CLP | | | 452,206 | | | 2/25/2025 | | | HUB | | | | 1,904 | | | | - | | | | 1,904 | |
| USD | | | 460,207 | | | CLP | | | 452,206 | | | 2/25/2025 | | | HUB | | | | 8,001 | | | | - | | | | 8,001 | |
| USD | | | 461,340 | | | CLP | | | 452,206 | | | 2/25/2025 | | | HUB | | | | 9,134 | | | | - | | | | 9,134 | |
| USD | | | 503,489 | | | CLP | | | 502,452 | | | 2/25/2025 | | | HUB | | | | 1,037 | | | | - | | | | 1,037 | |
| USD | | | 504,301 | | | CLP | | | 502,452 | | | 2/25/2025 | | | HUB | | | | 1,849 | | | | - | | | | 1,849 | |
| USD | | | 512,132 | | | CLP | | | 502,452 | | | 2/25/2025 | | | HUB | | | | 9,680 | | | | - | | | | 9,680 | |
| USD | | | 512,773 | | | CLP | | | 502,452 | | | 2/25/2025 | | | HUB | | | | 10,321 | | | | - | | | | 10,321 | |
| USD | | | 514,922 | | | CLP | | | 502,452 | | | 2/25/2025 | | | HUB | | | | 12,470 | | | | - | | | | 12,470 | |
| USD | | | 560,361 | | | CLP | | | 552,697 | | | 2/25/2025 | | | HUB | | | | 7,664 | | | | - | | | | 7,664 | |
| USD | | | 565,082 | | | CLP | | | 552,697 | | | 2/25/2025 | | | HUB | | | | 12,385 | | | | - | | | | 12,385 | |
| USD | | | 565,354 | | | CLP | | | 552,697 | | | 2/25/2025 | | | HUB | | | | 12,657 | | | | - | | | | 12,657 | |
| USD | | | 655,388 | | | CLP | | | 653,187 | | | 2/25/2025 | | | HUB | | | | 2,201 | | | | - | | | | 2,201 | |
| USD | | | 705,624 | | | CLP | | | 703,432 | | | 2/25/2025 | | | HUB | | | | 2,192 | | | | - | | | | 2,192 | |
| USD | | | 718,094 | | | CLP | | | 703,432 | | | 2/25/2025 | | | HUB | | | | 14,662 | | | | - | | | | 14,662 | |
| USD | | | 719,876 | | | CLP | | | 703,432 | | | 2/25/2025 | | | HUB | | | | 16,444 | | | | - | | | | 16,444 | |
| USD | | | 759,732 | | | CLP | | | 753,677 | | | 2/25/2025 | | | HUB | | | | 6,055 | | | | - | | | | 6,055 | |
| USD | | | 765,728 | | | CLP | | | 753,677 | | | 2/25/2025 | | | HUB | | | | 12,051 | | | | - | | | | 12,051 | |
| USD | | | 771,026 | | | CLP | | | 753,677 | | | 2/25/2025 | | | HUB | | | | 17,349 | | | | - | | | | 17,349 | |
| USD | | | 913,659 | | | CLP | | | 904,413 | | | 2/25/2025 | | | HUB | | | | 9,246 | | | | - | | | | 9,246 | |
| USD | | | 1,014,858 | | | CLP | | | 1,004,903 | | | 2/25/2025 | | | HUB | | | | 9,955 | | | | - | | | | 9,955 | |
| USD | | | 1,027,781 | | | CLP | | | 1,004,903 | | | 2/25/2025 | | | HUB | | | | 22,878 | | | | - | | | | 22,878 | |
| USD | | | 1,069,040 | | | CLP | | | 1,055,148 | | | 2/25/2025 | | | HUB | | | | 13,892 | | | | - | | | | 13,892 | |
| USD | | | 1,078,505 | | | CLP | | | 1,055,148 | | | 2/25/2025 | | | HUB | | | | 23,357 | | | | - | | | | 23,357 | |
| USD | | | 1,227,211 | | | CLP | | | 1,205,884 | | | 2/25/2025 | | | HUB | | | | 21,327 | | | | - | | | | 21,327 | |
| USD | | | 1,266,272 | | | CLP | | | 1,256,129 | | | 2/25/2025 | | | HUB | | | | 10,143 | | | | - | | | | 10,143 | |
| USD | | | 1,308,225 | | | CLP | | | 1,306,374 | | | 2/25/2025 | | | HUB | | | | 1,851 | | | | - | | | | 1,851 | |
| USD | | | 1,324,287 | | | CLP | | | 1,306,374 | | | 2/25/2025 | | | HUB | | | | 17,913 | | | | - | | | | 17,913 | |
| USD | | | 1,325,800 | | | CLP | | | 1,306,374 | | | 2/25/2025 | | | HUB | | | | 19,426 | | | | - | | | | 19,426 | |
| USD | | | 1,336,871 | | | CLP | | | 1,306,374 | | | 2/25/2025 | | | HUB | | | | 30,497 | | | | - | | | | 30,497 | |
| USD | | | 1,388,018 | | | CLP | | | 1,356,619 | | | 2/25/2025 | | | HUB | | | | 31,399 | | | | - | | | | 31,399 | |
| USD | | | 1,459,164 | | | CLP | | | 1,457,110 | | | 2/25/2025 | | | HUB | | | | 2,054 | | | | - | | | | 2,054 | |
| USD | | | 5,455,065 | | | CLP | | | 5,376,232 | | | 2/25/2025 | | | HUB | | | | 78,833 | | | | - | | | | 78,833 | |
| USD | | | 15,121,377 | | | CLP | | | 14,973,058 | | | 2/25/2025 | | | HUB | | | | 148,319 | | | | - | | | | 148,319 | |
| USD | | | 25,597,796 | | | CLP | | | 25,022,090 | | | 2/25/2025 | | | HUB | | | | 575,706 | | | | - | | | | 575,706 | |
| USD | | | 758,607 | | | NZD | | | 727,657 | | | 2/26/2025 | | | HUB | | | | 30,950 | | | | - | | | | 30,950 | |
| USD | | | 862,029 | | | NZD | | | 839,605 | | | 2/26/2025 | | | HUB | | | | 22,424 | | | | - | | | | 22,424 | |
| NZD | | | 1,063,499 | | | USD | | | 1,069,877 | | | 2/26/2025 | | | HUB | | | | - | | | | (6,378 | ) | | | (6,378 | ) |
| USD | | | 1,758,638 | | | NZD | | | 1,679,209 | | | 2/26/2025 | | | HUB | | | | 79,429 | | | | - | | | | 79,429 | |
| USD | | | 1,850,918 | | | NZD | | | 1,791,156 | | | 2/26/2025 | | | HUB | | | | 59,762 | | | | - | | | | 59,762 | |
| NZD | | | 2,971,442 | | | USD | | | 3,000,463 | | | 2/26/2025 | | | HUB | | | | - | | | | (29,021 | ) | | | (29,021 | ) |
| USD | | | 3,105,114 | | | NZD | | | 2,980,596 | | | 2/26/2025 | | | HUB | | | | 124,518 | | | | - | | | | 124,518 | |
| USD | | | 3,342,026 | | | NZD | | | 3,302,445 | | | 2/26/2025 | | | HUB | | | | 39,581 | | | | - | | | | 39,581 | |
| USD | | | 3,434,532 | | | NZD | | | 3,414,392 | | | 2/26/2025 | | | HUB | | | | 20,140 | | | | - | | | | 20,140 | |
| USD | | | 3,460,518 | | | NZD | | | 3,358,418 | | | 2/26/2025 | | | HUB | | | | 102,100 | | | | - | | | | 102,100 | |
| USD | | | 3,730,082 | | | NZD | | | 3,610,426 | | | 2/26/2025 | | | HUB | | | | 119,656 | | | | - | | | | 119,656 | |
| USD | | | 3,805,248 | | | NZD | | | 3,682,264 | | | 2/26/2025 | | | HUB | | | | 122,984 | | | | - | | | | 122,984 | |
| USD | | | 4,238,146 | | | NZD | | | 4,072,082 | | | 2/26/2025 | | | HUB | | | | 166,064 | | | | - | | | | 166,064 | |
| NZD | | | 4,367,167 | | | USD | | | 4,413,717 | | | 2/26/2025 | | | HUB | | | | - | | | | (46,550 | ) | | | (46,550 | ) |
| NZD | | | 5,369,028 | | | USD | | | 5,406,060 | | | 2/26/2025 | | | HUB | | | | - | | | | (37,032 | ) | | | (37,032 | ) |
| USD | | | 5,706,821 | | | NZD | | | 5,523,396 | | | 2/26/2025 | | | HUB | | | | 183,425 | | | | - | | | | 183,425 | |
See accompanying notes
59
American Beacon AHL Managed Futures Strategy FundSM
Consolidated Schedule of Investments
December 31, 2024
| | | | | | | | | | | | | | | | | | | | | | | | | | | | |
| | | | | | |
| Currency Purchased* | | | Currency Sold* | | | Settlement
Date | | Counterparty | | | Unrealized
Appreciation | | | Unrealized
(Depreciation) | | | Net Unrealized
Appreciation
(Depreciation) | |
| NZD | | | 6,207,012 | | | USD | | | 6,262,648 | | | 2/26/2025 | | | HUB | | | $ | - | | | $ | (55,636 | ) | | $ | (55,636 | ) |
| USD | | | 6,782,455 | | | NZD | | | 6,562,356 | | | 2/26/2025 | | | HUB | | | | 220,099 | | | | - | | | | 220,099 | |
| USD | | | 8,450,293 | | | NZD | | | 8,177,333 | | | 2/26/2025 | | | HUB | | | | 272,960 | | | | - | | | | 272,960 | |
| NZD | | | 10,202,744 | | | USD | | | 10,277,161 | | | 2/26/2025 | | | HUB | | | | - | | | | (74,417 | ) | | | (74,417 | ) |
| USD | | | 11,782,901 | | | NZD | | | 11,178,736 | | | 2/26/2025 | | | HUB | | | | 604,165 | | | | - | | | | 604,165 | |
| NZD | | | 13,422,572 | | | USD | | | 13,513,280 | | | 2/26/2025 | | | HUB | | | | - | | | | (90,708 | ) | | | (90,708 | ) |
| NZD | | | 13,545,621 | | | USD | | | 13,670,762 | | | 2/26/2025 | | | HUB | | | | - | | | | (125,141 | ) | | | (125,141 | ) |
| USD | | | 15,721,082 | | | NZD | | | 14,904,980 | | | 2/26/2025 | | | HUB | | | | 816,102 | | | | - | | | | 816,102 | |
| USD | | | 21,572,551 | | | NZD | | | 20,869,686 | | | 2/26/2025 | | | HUB | | | | 702,865 | | | | - | | | | 702,865 | |
| USD | | | 58,033,905 | | | NZD | | | 55,637,797 | | | 2/26/2025 | | | HUB | | | | 2,396,108 | | | | - | | | | 2,396,108 | |
| USD | | | 65,768,239 | | | NZD | | | 63,633,763 | | | 2/26/2025 | | | HUB | | | | 2,134,476 | | | | - | | | | 2,134,476 | |
| USD | | | 26,690 | | | ZAR | | | 26,495 | | | 1/2/2025 | | | NWM | | | | 195 | | | | - | | | | 195 | |
| USD | | | 26,771 | | | ZAR | | | 26,495 | | | 1/2/2025 | | | NWM | | | | 276 | | | | - | | | | 276 | |
| USD | | | 53,141 | | | ZAR | | | 52,991 | | | 1/2/2025 | | | NWM | | | | 150 | | | | - | | | | 150 | |
| USD | | | 53,253 | | | ZAR | | | 52,991 | | | 1/2/2025 | | | NWM | | | | 262 | | | | - | | | | 262 | |
| USD | | | 53,331 | | | ZAR | | | 52,991 | | | 1/2/2025 | | | NWM | | | | 340 | | | | - | | | | 340 | |
| USD | | | 53,357 | | | ZAR | | | 52,991 | | | 1/2/2025 | | | NWM | | | | 366 | | | | - | | | | 366 | |
| USD | | | 53,410 | | | ZAR | | | 52,991 | | | 1/2/2025 | | | NWM | | | | 419 | | | | - | | | | 419 | |
| USD | | | 53,464 | | | ZAR | | | 52,991 | | | 1/2/2025 | | | NWM | | | | 473 | | | | - | | | | 473 | |
| USD | | | 53,550 | | | ZAR | | | 52,991 | | | 1/2/2025 | | | NWM | | | | 559 | | | | - | | | | 559 | |
| USD | | | 79,710 | | | ZAR | | | 79,486 | | | 1/2/2025 | | | NWM | | | | 224 | | | | - | | | | 224 | |
| USD | | | 79,723 | | | ZAR | | | 79,486 | | | 1/2/2025 | | | NWM | | | | 237 | | | | - | | | | 237 | |
| USD | | | 79,725 | | | ZAR | | | 79,486 | | | 1/2/2025 | | | NWM | | | | 239 | | | | - | | | | 239 | |
| USD | | | 79,738 | | | ZAR | | | 79,486 | | | 1/2/2025 | | | NWM | | | | 252 | | | | - | | | | 252 | |
| USD | | | 79,755 | | | ZAR | | | 79,486 | | | 1/2/2025 | | | NWM | | | | 269 | | | | - | | | | 269 | |
| USD | | | 79,771 | | | ZAR | | | 79,486 | | | 1/2/2025 | | | NWM | | | | 285 | | | | - | | | | 285 | |
| USD | | | 79,772 | | | ZAR | | | 79,486 | | | 1/2/2025 | | | NWM | | | | 286 | | | | - | | | | 286 | |
| USD | | | 79,776 | | | ZAR | | | 79,486 | | | 1/2/2025 | | | NWM | | | | 290 | | | | - | | | | 290 | |
| USD | | | 79,795 | | | ZAR | | | 79,486 | | | 1/2/2025 | | | NWM | | | | 309 | | | | - | | | | 309 | |
| USD | | | 79,799 | | | ZAR | | | 79,486 | | | 1/2/2025 | | | NWM | | | | 313 | | | | - | | | | 313 | |
| USD | | | 79,933 | | | ZAR | | | 79,486 | | | 1/2/2025 | | | NWM | | | | 447 | | | | - | | | | 447 | |
| USD | | | 79,947 | | | ZAR | | | 79,486 | | | 1/2/2025 | | | NWM | | | | 461 | | | | - | | | | 461 | |
| USD | | | 79,952 | | | ZAR | | | 79,486 | | | 1/2/2025 | | | NWM | | | | 466 | | | | - | | | | 466 | |
| USD | | | 79,956 | | | ZAR | | | 79,486 | | | 1/2/2025 | | | NWM | | | | 470 | | | | - | | | | 470 | |
| USD | | | 80,014 | | | ZAR | | | 79,486 | | | 1/2/2025 | | | NWM | | | | 528 | | | | - | | | | 528 | |
| USD | | | 80,067 | | | ZAR | | | 79,486 | | | 1/2/2025 | | | NWM | | | | 581 | | | | - | | | | 581 | |
| USD | | | 80,080 | | | ZAR | | | 79,486 | | | 1/2/2025 | | | NWM | | | | 594 | | | | - | | | | 594 | |
| USD | | | 80,084 | | | ZAR | | | 79,486 | | | 1/2/2025 | | | NWM | | | | 598 | | | | - | | | | 598 | |
| USD | | | 80,087 | | | ZAR | | | 79,486 | | | 1/2/2025 | | | NWM | | | | 601 | | | | - | | | | 601 | |
| USD | | | 80,089 | | | ZAR | | | 79,486 | | | 1/2/2025 | | | NWM | | | | 603 | | | | - | | | | 603 | |
| USD | | | 80,098 | | | ZAR | | | 79,486 | | | 1/2/2025 | | | NWM | | | | 612 | | | | - | | | | 612 | |
| USD | | | 80,102 | | | ZAR | | | 79,486 | | | 1/2/2025 | | | NWM | | | | 616 | | | | - | | | | 616 | |
| USD | | | 80,117 | | | ZAR | | | 79,486 | | | 1/2/2025 | | | NWM | | | | 631 | | | | - | | | | 631 | |
| USD | | | 80,140 | | | ZAR | | | 79,486 | | | 1/2/2025 | | | NWM | | | | 654 | | | | - | | | | 654 | |
| USD | | | 80,171 | | | ZAR | | | 79,486 | | | 1/2/2025 | | | NWM | | | | 685 | | | | - | | | | 685 | |
| USD | | | 80,188 | | | ZAR | | | 79,486 | | | 1/2/2025 | | | NWM | | | | 702 | | | | - | | | | 702 | |
| USD | | | 80,195 | | | ZAR | | | 79,486 | | | 1/2/2025 | | | NWM | | | | 709 | | | | - | | | | 709 | |
| USD | | | 80,196 | | | ZAR | | | 79,486 | | | 1/2/2025 | | | NWM | | | | 710 | | | | - | | | | 710 | |
| USD | | | 80,202 | | | ZAR | | | 79,486 | | | 1/2/2025 | | | NWM | | | | 716 | | | | - | | | | 716 | |
| USD | | | 80,225 | | | ZAR | | | 79,486 | | | 1/2/2025 | | | NWM | | | | 739 | | | | - | | | | 739 | |
| USD | | | 80,329 | | | ZAR | | | 79,486 | | | 1/2/2025 | | | NWM | | | | 843 | | | | - | | | | 843 | |
| USD | | | 80,352 | | | ZAR | | | 79,486 | | | 1/2/2025 | | | NWM | | | | 866 | | | | - | | | | 866 | |
| USD | | | 80,405 | | | ZAR | | | 79,486 | | | 1/2/2025 | | | NWM | | | | 919 | | | | - | | | | 919 | |
| HUF | | | 103,516 | | | EUR | | | 103,585 | | | 1/2/2025 | | | NWM | | | | - | | | | (69 | ) | | | (69 | ) |
| HUF | | | 103,543 | | | EUR | | | 103,585 | | | 1/2/2025 | | | NWM | | | | - | | | | (42 | ) | | | (42 | ) |
| USD | | | 106,255 | | | ZAR | | | 105,981 | | | 1/2/2025 | | | NWM | | | | 274 | | | | - | | | | 274 | |
| USD | | | 106,317 | | | ZAR | | | 105,981 | | | 1/2/2025 | | | NWM | | | | 336 | | | | - | | | | 336 | |
| USD | | | 106,383 | | | ZAR | | | 105,981 | | | 1/2/2025 | | | NWM | | | | 402 | | | | - | | | | 402 | |
| USD | | | 106,386 | | | ZAR | | | 105,981 | | | 1/2/2025 | | | NWM | | | | 405 | | | | - | | | | 405 | |
See accompanying notes
60
American Beacon AHL Managed Futures Strategy FundSM
Consolidated Schedule of Investments
December 31, 2024
| | | | | | | | | | | | | | | | | | | | | | | | | | | | |
| | | | | | |
| Currency Purchased* | | | Currency Sold* | | | Settlement
Date | | Counterparty | | | Unrealized
Appreciation | | | Unrealized
(Depreciation) | | | Net Unrealized
Appreciation
(Depreciation) | |
| USD | | | 106,397 | | | ZAR | | | 105,981 | | | 1/2/2025 | | | NWM | | | $ | 416 | | | $ | - | | | $ | 416 | |
| USD | | | 106,430 | | | ZAR | | | 105,981 | | | 1/2/2025 | | | NWM | | | | 449 | | | | - | | | | 449 | |
| USD | | | 106,487 | | | ZAR | | | 105,981 | | | 1/2/2025 | | | NWM | | | | 506 | | | | - | | | | 506 | |
| USD | | | 106,490 | | | ZAR | | | 105,981 | | | 1/2/2025 | | | NWM | | | | 509 | | | | - | | | | 509 | |
| USD | | | 106,562 | | | ZAR | | | 105,981 | | | 1/2/2025 | | | NWM | | | | 581 | | | | - | | | | 581 | |
| USD | | | 106,621 | | | ZAR | | | 105,981 | | | 1/2/2025 | | | NWM | | | | 640 | | | | - | | | | 640 | |
| USD | | | 106,650 | | | ZAR | | | 105,981 | | | 1/2/2025 | | | NWM | | | | 669 | | | | - | | | | 669 | |
| USD | | | 106,656 | | | ZAR | | | 105,981 | | | 1/2/2025 | | | NWM | | | | 675 | | | | - | | | | 675 | |
| USD | | | 106,660 | | | ZAR | | | 105,981 | | | 1/2/2025 | | | NWM | | | | 679 | | | | - | | | | 679 | |
| USD | | | 106,664 | | | ZAR | | | 105,981 | | | 1/2/2025 | | | NWM | | | | 683 | | | | - | | | | 683 | |
| USD | | | 106,684 | | | ZAR | | | 105,981 | | | 1/2/2025 | | | NWM | | | | 703 | | | | - | | | | 703 | |
| USD | | | 106,711 | | | ZAR | | | 105,981 | | | 1/2/2025 | | | NWM | | | | 730 | | | | - | | | | 730 | |
| USD | | | 106,715 | | | ZAR | | | 105,981 | | | 1/2/2025 | | | NWM | | | | 734 | | | | - | | | | 734 | |
| USD | | | 106,719 | | | ZAR | | | 105,981 | | | 1/2/2025 | | | NWM | | | | 738 | | | | - | | | | 738 | |
| USD | | | 106,731 | | | ZAR | | | 105,981 | | | 1/2/2025 | | | NWM | | | | 750 | | | | - | | | | 750 | |
| USD | | | 106,764 | | | ZAR | | | 105,981 | | | 1/2/2025 | | | NWM | | | | 783 | | | | - | | | | 783 | |
| USD | | | 106,766 | | | ZAR | | | 105,981 | | | 1/2/2025 | | | NWM | | | | 785 | | | | - | | | | 785 | |
| USD | | | 106,773 | | | ZAR | | | 105,981 | | | 1/2/2025 | | | NWM | | | | 792 | | | | - | | | | 792 | |
| USD | | | 106,776 | | | ZAR | | | 105,981 | | | 1/2/2025 | | | NWM | | | | 795 | | | | - | | | | 795 | |
| USD | | | 106,779 | | | ZAR | | | 105,981 | | | 1/2/2025 | | | NWM | | | | 798 | | | | - | | | | 798 | |
| USD | | | 106,781 | | | ZAR | | | 105,981 | | | 1/2/2025 | | | NWM | | | | 800 | | | | - | | | | 800 | |
| USD | | | 106,787 | | | ZAR | | | 105,981 | | | 1/2/2025 | | | NWM | | | | 806 | | | | - | | | | 806 | |
| USD | | | 106,813 | | | ZAR | | | 105,981 | | | 1/2/2025 | | | NWM | | | | 832 | | | | - | | | | 832 | |
| USD | | | 106,815 | | | ZAR | | | 105,981 | | | 1/2/2025 | | | NWM | | | | 834 | | | | - | | | | 834 | |
| USD | | | 106,816 | | | ZAR | | | 105,981 | | | 1/2/2025 | | | NWM | | | | 835 | | | | - | | | | 835 | |
| USD | | | 106,817 | | | ZAR | | | 105,981 | | | 1/2/2025 | | | NWM | | | | 836 | | | | - | | | | 836 | |
| USD | | | 106,820 | | | ZAR | | | 105,981 | | | 1/2/2025 | | | NWM | | | | 839 | | | | - | | | | 839 | |
| USD | | | 106,822 | | | ZAR | | | 105,981 | | | 1/2/2025 | | | NWM | | | | 841 | | | | - | | | | 841 | |
| USD | | | 106,830 | | | ZAR | | | 105,981 | | | 1/2/2025 | | | NWM | | | | 849 | | | | - | | | | 849 | |
| USD | | | 106,862 | | | ZAR | | | 105,981 | | | 1/2/2025 | | | NWM | | | | 881 | | | | - | | | | 881 | |
| USD | | | 106,873 | | | ZAR | | | 105,981 | | | 1/2/2025 | | | NWM | | | | 892 | | | | - | | | | 892 | |
| USD | | | 106,931 | | | ZAR | | | 105,981 | | | 1/2/2025 | | | NWM | | | | 950 | | | | - | | | | 950 | |
| USD | | | 106,938 | | | ZAR | | | 105,981 | | | 1/2/2025 | | | NWM | | | | 957 | | | | - | | | | 957 | |
| USD | | | 106,978 | | | ZAR | | | 105,981 | | | 1/2/2025 | | | NWM | | | | 997 | | | | - | | | | 997 | |
| USD | | | 107,002 | | | ZAR | | | 105,981 | | | 1/2/2025 | | | NWM | | | | 1,021 | | | | - | | | | 1,021 | |
| USD | | | 107,021 | | | ZAR | | | 105,981 | | | 1/2/2025 | | | NWM | | | | 1,040 | | | | - | | | | 1,040 | |
| USD | | | 132,821 | | | ZAR | | | 132,477 | | | 1/2/2025 | | | NWM | | | | 344 | | | | - | | | | 344 | |
| USD | | | 132,843 | | | ZAR | | | 132,477 | | | 1/2/2025 | | | NWM | | | | 366 | | | | - | | | | 366 | |
| USD | | | 132,849 | | | ZAR | | | 132,477 | | | 1/2/2025 | | | NWM | | | | 372 | | | | - | | | | 372 | |
| USD | | | 132,851 | | | ZAR | | | 132,477 | | | 1/2/2025 | | | NWM | | | | 374 | | | | - | | | | 374 | |
| USD | | | 132,854 | | | ZAR | | | 132,477 | | | 1/2/2025 | | | NWM | | | | 377 | | | | - | | | | 377 | |
| USD | | | 132,875 | | | ZAR | | | 132,477 | | | 1/2/2025 | | | NWM | | | | 398 | | | | - | | | | 398 | |
| USD | | | 132,951 | | | ZAR | | | 132,477 | | | 1/2/2025 | | | NWM | | | | 474 | | | | - | | | | 474 | |
| USD | | | 132,958 | | | ZAR | | | 132,477 | | | 1/2/2025 | | | NWM | | | | 481 | | | | - | | | | 481 | |
| USD | | | 132,961 | | | ZAR | | | 132,477 | | | 1/2/2025 | | | NWM | | | | 484 | | | | - | | | | 484 | |
| USD | | | 132,975 | | | ZAR | | | 132,477 | | | 1/2/2025 | | | NWM | | | | 498 | | | | - | | | | 498 | |
| USD | | | 133,093 | | | ZAR | | | 132,477 | | | 1/2/2025 | | | NWM | | | | 616 | | | | - | | | | 616 | |
| USD | | | 133,151 | | | ZAR | | | 132,477 | | | 1/2/2025 | | | NWM | | | | 674 | | | | - | | | | 674 | |
| USD | | | 133,194 | | | ZAR | | | 132,477 | | | 1/2/2025 | | | NWM | | | | 717 | | | | - | | | | 717 | |
| USD | | | 133,237 | | | ZAR | | | 132,477 | | | 1/2/2025 | | | NWM | | | | 760 | | | | - | | | | 760 | |
| USD | | | 133,254 | | | ZAR | | | 132,477 | | | 1/2/2025 | | | NWM | | | | 777 | | | | - | | | | 777 | |
| USD | | | 133,266 | | | ZAR | | | 132,477 | | | 1/2/2025 | | | NWM | | | | 789 | | | | - | | | | 789 | |
| USD | | | 133,295 | | | ZAR | | | 132,477 | | | 1/2/2025 | | | NWM | | | | 818 | | | | - | | | | 818 | |
| USD | | | 133,311 | | | ZAR | | | 132,477 | | | 1/2/2025 | | | NWM | | | | 834 | | | | - | | | | 834 | |
| USD | | | 133,321 | | | ZAR | | | 132,477 | | | 1/2/2025 | | | NWM | | | | 844 | | | | - | | | | 844 | |
| USD | | | 133,324 | | | ZAR | | | 132,477 | | | 1/2/2025 | | | NWM | | | | 847 | | | | - | | | | 847 | |
| USD | | | 133,325 | | | ZAR | | | 132,477 | | | 1/2/2025 | | | NWM | | | | 848 | | | | - | | | | 848 | |
| USD | | | 133,332 | | | ZAR | | | 132,477 | | | 1/2/2025 | | | NWM | | | | 855 | | | | - | | | | 855 | |
| USD | | | 133,335 | | | ZAR | | | 132,477 | | | 1/2/2025 | | | NWM | | | | 858 | | | | - | | | | 858 | |
See accompanying notes
61
American Beacon AHL Managed Futures Strategy FundSM
Consolidated Schedule of Investments
December 31, 2024
| | | | | | | | | | | | | | | | | | | | | | | | | | | | |
| | | | | | |
| Currency Purchased* | | | Currency Sold* | | | Settlement
Date | | Counterparty | | | Unrealized
Appreciation | | | Unrealized
(Depreciation) | | | Net Unrealized
Appreciation
(Depreciation) | |
| USD | | | 133,387 | | | ZAR | | | 132,477 | | | 1/2/2025 | | | NWM | | | $ | 910 | | | $ | - | | | $ | 910 | |
| USD | | | 133,402 | | | ZAR | | | 132,477 | | | 1/2/2025 | | | NWM | | | | 925 | | | | - | | | | 925 | |
| USD | | | 133,407 | | | ZAR | | | 132,477 | | | 1/2/2025 | | | NWM | | | | 930 | | | | - | | | | 930 | |
| USD | | | 133,416 | | | ZAR | | | 132,477 | | | 1/2/2025 | | | NWM | | | | 939 | | | | - | | | | 939 | |
| USD | | | 133,446 | | | ZAR | | | 132,477 | | | 1/2/2025 | | | NWM | | | | 969 | | | | - | | | | 969 | |
| USD | | | 133,447 | | | ZAR | | | 132,477 | | | 1/2/2025 | | | NWM | | | | 970 | | | | - | | | | 970 | |
| USD | | | 133,456 | | | ZAR | | | 132,477 | | | 1/2/2025 | | | NWM | | | | 979 | | | | - | | | | 979 | |
| USD | | | 133,501 | | | ZAR | | | 132,477 | | | 1/2/2025 | | | NWM | | | | 1,024 | | | | - | | | | 1,024 | |
| USD | | | 133,508 | | | ZAR | | | 132,477 | | | 1/2/2025 | | | NWM | | | | 1,031 | | | | - | | | | 1,031 | |
| USD | | | 133,509 | | | ZAR | | | 132,477 | | | 1/2/2025 | | | NWM | | | | 1,032 | | | | - | | | | 1,032 | |
| USD | | | 133,513 | | | ZAR | | | 132,477 | | | 1/2/2025 | | | NWM | | | | 1,036 | | | | - | | | | 1,036 | |
| USD | | | 133,519 | | | ZAR | | | 132,477 | | | 1/2/2025 | | | NWM | | | | 1,042 | | | | - | | | | 1,042 | |
| USD | | | 133,522 | | | ZAR | | | 132,477 | | | 1/2/2025 | | | NWM | | | | 1,045 | | | | - | | | | 1,045 | |
| USD | | | 133,558 | | | ZAR | | | 132,477 | | | 1/2/2025 | | | NWM | | | | 1,081 | | | | - | | | | 1,081 | |
| USD | | | 133,572 | | | ZAR | | | 132,477 | | | 1/2/2025 | | | NWM | | | | 1,095 | | | | - | | | | 1,095 | |
| USD | | | 133,587 | | | ZAR | | | 132,477 | | | 1/2/2025 | | | NWM | | | | 1,110 | | | | - | | | | 1,110 | |
| USD | | | 133,616 | | | ZAR | | | 132,477 | | | 1/2/2025 | | | NWM | | | | 1,139 | | | | - | | | | 1,139 | |
| USD | | | 133,650 | | | ZAR | | | 132,477 | | | 1/2/2025 | | | NWM | | | | 1,173 | | | | - | | | | 1,173 | |
| USD | | | 133,664 | | | ZAR | | | 132,477 | | | 1/2/2025 | | | NWM | | | | 1,187 | | | | - | | | | 1,187 | |
| USD | | | 133,678 | | | ZAR | | | 132,477 | | | 1/2/2025 | | | NWM | | | | 1,201 | | | | - | | | | 1,201 | |
| USD | | | 133,743 | | | ZAR | | | 132,477 | | | 1/2/2025 | | | NWM | | | | 1,266 | | | | - | | | | 1,266 | |
| USD | | | 133,846 | | | ZAR | | | 132,477 | | | 1/2/2025 | | | NWM | | | | 1,369 | | | | - | | | | 1,369 | |
| USD | | | 133,855 | | | ZAR | | | 132,477 | | | 1/2/2025 | | | NWM | | | | 1,378 | | | | - | | | | 1,378 | |
| USD | | | 133,868 | | | ZAR | | | 132,477 | | | 1/2/2025 | | | NWM | | | | 1,391 | | | | - | | | | 1,391 | |
| USD | | | 133,875 | | | ZAR | | | 132,477 | | | 1/2/2025 | | | NWM | | | | 1,398 | | | | - | | | | 1,398 | |
| USD | | | 133,937 | | | ZAR | | | 132,477 | | | 1/2/2025 | | | NWM | | | | 1,460 | | | | - | | | | 1,460 | |
| USD | | | 135,940 | | | ILS | | | 137,533 | | | 1/2/2025 | | | NWM | | | | - | | | | (1,593 | ) | | | (1,593 | ) |
| USD | | | 135,995 | | | ILS | | | 137,533 | | | 1/2/2025 | | | NWM | | | | - | | | | (1,538 | ) | | | (1,538 | ) |
| USD | | | 136,241 | | | ILS | | | 137,533 | | | 1/2/2025 | | | NWM | | | | - | | | | (1,292 | ) | | | (1,292 | ) |
| USD | | | 136,429 | | | ILS | | | 137,533 | | | 1/2/2025 | | | NWM | | | | - | | | | (1,104 | ) | | | (1,104 | ) |
| USD | | | 136,451 | | | ILS | | | 137,533 | | | 1/2/2025 | | | NWM | | | | - | | | | (1,082 | ) | | | (1,082 | ) |
| USD | | | 136,462 | | | ILS | | | 137,533 | | | 1/2/2025 | | | NWM | | | | - | | | | (1,071 | ) | | | (1,071 | ) |
| USD | | | 136,517 | | | ILS | | | 137,533 | | | 1/2/2025 | | | NWM | | | | - | | | | (1,016 | ) | | | (1,016 | ) |
| USD | | | 136,543 | | | ILS | | | 137,533 | | | 1/2/2025 | | | NWM | | | | - | | | | (990 | ) | | | (990 | ) |
| USD | | | 136,569 | | | ILS | | | 137,533 | | | 1/2/2025 | | | NWM | | | | - | | | | (964 | ) | | | (964 | ) |
| USD | | | 136,578 | | | ILS | | | 137,533 | | | 1/2/2025 | | | NWM | | | | - | | | | (955 | ) | | | (955 | ) |
| USD | | | 136,702 | | | ILS | | | 137,533 | | | 1/2/2025 | | | NWM | | | | - | | | | (831 | ) | | | (831 | ) |
| USD | | | 136,720 | | | ILS | | | 137,533 | | | 1/2/2025 | | | NWM | | | | - | | | | (813 | ) | | | (813 | ) |
| USD | | | 136,767 | | | ILS | | | 137,533 | | | 1/2/2025 | | | NWM | | | | - | | | | (766 | ) | | | (766 | ) |
| USD | | | 136,818 | | | ILS | | | 137,533 | | | 1/2/2025 | | | NWM | | | | - | | | | (715 | ) | | | (715 | ) |
| USD | | | 137,058 | | | ILS | | | 137,533 | | | 1/2/2025 | | | NWM | | | | - | | | | (475 | ) | | | (475 | ) |
| USD | | | 159,544 | | | ZAR | | | 158,972 | | | 1/2/2025 | | | NWM | | | | 572 | | | | - | | | | 572 | |
| USD | | | 159,592 | | | ZAR | | | 158,972 | | | 1/2/2025 | | | NWM | | | | 620 | | | | - | | | | 620 | |
| USD | | | 159,604 | | | ZAR | | | 158,972 | | | 1/2/2025 | | | NWM | | | | 632 | | | | - | | | | 632 | |
| USD | | | 159,609 | | | ZAR | | | 158,972 | | | 1/2/2025 | | | NWM | | | | 637 | | | | - | | | | 637 | |
| USD | | | 159,613 | | | ZAR | | | 158,972 | | | 1/2/2025 | | | NWM | | | | 641 | | | | - | | | | 641 | |
| USD | | | 79,868 | | | ZAR | | | 79,486 | | | 1/2/2025 | | | NWM | | | | 382 | | | | - | | | | 382 | |
| USD | | | 79,868 | | | ZAR | | | 79,486 | | | 1/2/2025 | | | NWM | | | | 382 | | | | - | | | | 382 | |
| USD | | | 159,813 | | | ZAR | | | 158,972 | | | 1/2/2025 | | | NWM | | | | 841 | | | | - | | | | 841 | |
| USD | | | 159,877 | | | ZAR | | | 158,972 | | | 1/2/2025 | | | NWM | | | | 905 | | | | - | | | | 905 | |
| USD | | | 159,917 | | | ZAR | | | 158,972 | | | 1/2/2025 | | | NWM | | | | 945 | | | | - | | | | 945 | |
| USD | | | 159,984 | | | ZAR | | | 158,972 | | | 1/2/2025 | | | NWM | | | | 1,012 | | | | - | | | | 1,012 | |
| USD | | | 159,994 | | | ZAR | | | 158,972 | | | 1/2/2025 | | | NWM | | | | 1,022 | | | | - | | | | 1,022 | |
| USD | | | 79,999 | | | ZAR | | | 79,486 | | | 1/2/2025 | | | NWM | | | | 513 | | | | - | | | | 513 | |
| USD | | | 79,999 | | | ZAR | | | 79,486 | | | 1/2/2025 | | | NWM | | | | 513 | | | | - | | | | 513 | |
| USD | | | 160,001 | | | ZAR | | | 158,972 | | | 1/2/2025 | | | NWM | | | | 1,029 | | | | - | | | | 1,029 | |
| USD | | | 160,014 | | | ZAR | | | 158,972 | | | 1/2/2025 | | | NWM | | | | 1,042 | | | | - | | | | 1,042 | |
| USD | | | 160,021 | | | ZAR | | | 158,972 | | | 1/2/2025 | | | NWM | | | | 1,049 | | | | - | | | | 1,049 | |
| USD | | | 160,051 | | | ZAR | | | 158,972 | | | 1/2/2025 | | | NWM | | | | 1,079 | | | | - | | | | 1,079 | |
See accompanying notes
62
American Beacon AHL Managed Futures Strategy FundSM
Consolidated Schedule of Investments
December 31, 2024
| | | | | | | | | | | | | | | | | | | | | | | | | | | | |
| | | | | | |
| Currency Purchased* | | | Currency Sold* | | | Settlement
Date | | Counterparty | | | Unrealized
Appreciation | | | Unrealized
(Depreciation) | | | Net Unrealized
Appreciation
(Depreciation) | |
| USD | | | 160,056 | | | ZAR | | | 158,972 | | | 1/2/2025 | | | NWM | | | $ | 1,084 | | | $ | - | | | $ | 1,084 | |
| USD | | | 160,069 | | | ZAR | | | 158,972 | | | 1/2/2025 | | | NWM | | | | 1,097 | | | | - | | | | 1,097 | |
| USD | | | 160,078 | | | ZAR | | | 158,972 | | | 1/2/2025 | | | NWM | | | | 1,106 | | | | - | | | | 1,106 | |
| USD | | | 160,093 | | | ZAR | | | 158,972 | | | 1/2/2025 | | | NWM | | | | 1,121 | | | | - | | | | 1,121 | |
| USD | | | 160,126 | | | ZAR | | | 158,972 | | | 1/2/2025 | | | NWM | | | | 1,154 | | | | - | | | | 1,154 | |
| USD | | | 160,157 | | | ZAR | | | 158,972 | | | 1/2/2025 | | | NWM | | | | 1,185 | | | | - | | | | 1,185 | |
| USD | | | 160,159 | | | ZAR | | | 158,972 | | | 1/2/2025 | | | NWM | | | | 1,187 | | | | - | | | | 1,187 | |
| USD | | | 160,177 | | | ZAR | | | 158,972 | | | 1/2/2025 | | | NWM | | | | 1,205 | | | | - | | | | 1,205 | |
| USD | | | 160,186 | | | ZAR | | | 158,972 | | | 1/2/2025 | | | NWM | | | | 1,214 | | | | - | | | | 1,214 | |
| USD | | | 160,213 | | | ZAR | | | 158,972 | | | 1/2/2025 | | | NWM | | | | 1,241 | | | | - | | | | 1,241 | |
| USD | | | 160,214 | | | ZAR | | | 158,972 | | | 1/2/2025 | | | NWM | | | | 1,242 | | | | - | | | | 1,242 | |
| USD | | | 160,223 | | | ZAR | | | 158,972 | | | 1/2/2025 | | | NWM | | | | 1,251 | | | | - | | | | 1,251 | |
| USD | | | 160,281 | | | ZAR | | | 158,972 | | | 1/2/2025 | | | NWM | | | | 1,309 | | | | - | | | | 1,309 | |
| USD | | | 160,287 | | | ZAR | | | 158,972 | | | 1/2/2025 | | | NWM | | | | 1,315 | | | | - | | | | 1,315 | |
| USD | | | 160,296 | | | ZAR | | | 158,972 | | | 1/2/2025 | | | NWM | | | | 1,324 | | | | - | | | | 1,324 | |
| USD | | | 160,300 | | | ZAR | | | 158,972 | | | 1/2/2025 | | | NWM | | | | 1,328 | | | | - | | | | 1,328 | |
| USD | | | 160,307 | | | ZAR | | | 158,972 | | | 1/2/2025 | | | NWM | | | | 1,335 | | | | - | | | | 1,335 | |
| USD | | | 160,394 | | | ZAR | | | 158,972 | | | 1/2/2025 | | | NWM | | | | 1,422 | | | | - | | | | 1,422 | |
| USD | | | 160,395 | | | ZAR | | | 158,972 | | | 1/2/2025 | | | NWM | | | | 1,423 | | | | - | | | | 1,423 | |
| USD | | | 160,577 | | | ZAR | | | 158,972 | | | 1/2/2025 | | | NWM | | | | 1,605 | | | | - | | | | 1,605 | |
| USD | | | 160,583 | | | ZAR | | | 158,972 | | | 1/2/2025 | | | NWM | | | | 1,611 | | | | - | | | | 1,611 | |
| USD | | | 160,642 | | | ZAR | | | 158,972 | | | 1/2/2025 | | | NWM | | | | 1,670 | | | | - | | | | 1,670 | |
| USD | | | 160,678 | | | ZAR | | | 158,972 | | | 1/2/2025 | | | NWM | | | | 1,706 | | | | - | | | | 1,706 | |
| USD | | | 186,383 | | | ZAR | | | 185,467 | | | 1/2/2025 | | | NWM | | | | 916 | | | | - | | | | 916 | |
| USD | | | 186,540 | | | ZAR | | | 185,467 | | | 1/2/2025 | | | NWM | | | | 1,073 | | | | - | | | | 1,073 | |
| USD | | | 186,549 | | | ZAR | | | 185,467 | | | 1/2/2025 | | | NWM | | | | 1,082 | | | | - | | | | 1,082 | |
| USD | | | 186,571 | | | ZAR | | | 185,467 | | | 1/2/2025 | | | NWM | | | | 1,104 | | | | - | | | | 1,104 | |
| USD | | | 186,589 | | | ZAR | | | 185,467 | | | 1/2/2025 | | | NWM | | | | 1,122 | | | | - | | | | 1,122 | |
| USD | | | 186,613 | | | ZAR | | | 185,467 | | | 1/2/2025 | | | NWM | | | | 1,146 | | | | - | | | | 1,146 | |
| USD | | | 186,621 | | | ZAR | | | 185,467 | | | 1/2/2025 | | | NWM | | | | 1,154 | | | | - | | | | 1,154 | |
| USD | | | 186,640 | | | ZAR | | | 185,467 | | | 1/2/2025 | | | NWM | | | | 1,173 | | | | - | | | | 1,173 | |
| USD | | | 186,659 | | | ZAR | | | 185,467 | | | 1/2/2025 | | | NWM | | | | 1,192 | | | | - | | | | 1,192 | |
| USD | | | 186,670 | | | ZAR | | | 185,467 | | | 1/2/2025 | | | NWM | | | | 1,203 | | | | - | | | | 1,203 | |
| USD | | | 186,694 | | | ZAR | | | 185,467 | | | 1/2/2025 | | | NWM | | | | 1,227 | | | | - | | | | 1,227 | |
| USD | | | 186,711 | | | ZAR | | | 185,467 | | | 1/2/2025 | | | NWM | | | | 1,244 | | | | - | | | | 1,244 | |
| USD | | | 186,716 | | | ZAR | | | 185,467 | | | 1/2/2025 | | | NWM | | | | 1,249 | | | | - | | | | 1,249 | |
| USD | | | 186,719 | | | ZAR | | | 185,467 | | | 1/2/2025 | | | NWM | | | | 1,252 | | | | - | | | | 1,252 | |
| USD | | | 186,753 | | | ZAR | | | 185,467 | | | 1/2/2025 | | | NWM | | | | 1,286 | | | | - | | | | 1,286 | |
| USD | | | 186,837 | | | ZAR | | | 185,467 | | | 1/2/2025 | | | NWM | | | | 1,370 | | | | - | | | | 1,370 | |
| USD | | | 186,843 | | | ZAR | | | 185,467 | | | 1/2/2025 | | | NWM | | | | 1,376 | | | | - | | | | 1,376 | |
| USD | | | 186,846 | | | ZAR | | | 185,467 | | | 1/2/2025 | | | NWM | | | | 1,379 | | | | - | | | | 1,379 | |
| USD | | | 186,854 | | | ZAR | | | 185,467 | | | 1/2/2025 | | | NWM | | | | 1,387 | | | | - | | | | 1,387 | |
| USD | | | 186,859 | | | ZAR | | | 185,467 | | | 1/2/2025 | | | NWM | | | | 1,392 | | | | - | | | | 1,392 | |
| USD | | | 186,864 | | | ZAR | | | 185,467 | | | 1/2/2025 | | | NWM | | | | 1,397 | | | | - | | | | 1,397 | |
| USD | | | 186,867 | | | ZAR | | | 185,467 | | | 1/2/2025 | | | NWM | | | | 1,400 | | | | - | | | | 1,400 | |
| USD | | | 186,878 | | | ZAR | | | 185,467 | | | 1/2/2025 | | | NWM | | | | 1,411 | | | | - | | | | 1,411 | |
| USD | | | 186,938 | | | ZAR | | | 185,467 | | | 1/2/2025 | | | NWM | | | | 1,471 | | | | - | | | | 1,471 | |
| USD | | | 186,987 | | | ZAR | | | 185,467 | | | 1/2/2025 | | | NWM | | | | 1,520 | | | | - | | | | 1,520 | |
| USD | | | 187,003 | | | ZAR | | | 185,467 | | | 1/2/2025 | | | NWM | | | | 1,536 | | | | - | | | | 1,536 | |
| USD | | | 187,064 | | | ZAR | | | 185,467 | | | 1/2/2025 | | | NWM | | | | 1,597 | | | | - | | | | 1,597 | |
| USD | | | 187,088 | | | ZAR | | | 185,467 | | | 1/2/2025 | | | NWM | | | | 1,621 | | | | - | | | | 1,621 | |
| USD | | | 187,286 | | | ZAR | | | 185,467 | | | 1/2/2025 | | | NWM | | | | 1,819 | | | | - | | | | 1,819 | |
| EUR | | | 207,170 | | | HUF | | | 207,221 | | | 1/2/2025 | | | NWM | | | | - | | | | (51 | ) | | | (51 | ) |
| USD | | | 213,262 | | | ZAR | | | 211,963 | | | 1/2/2025 | | | NWM | | | | 1,299 | | | | - | | | | 1,299 | |
| USD | | | 213,290 | | | ZAR | | | 211,963 | | | 1/2/2025 | | | NWM | | | | 1,327 | | | | - | | | | 1,327 | |
| USD | | | 106,646 | | | ZAR | | | 105,981 | | | 1/2/2025 | | | NWM | | | | 665 | | | | - | | | | 665 | |
| USD | | | 106,646 | | | ZAR | | | 105,981 | | | 1/2/2025 | | | NWM | | | | 665 | | | | - | | | | 665 | |
| USD | | | 106,658 | | | ZAR | | | 105,981 | | | 1/2/2025 | | | NWM | | | | 677 | | | | - | | | | 677 | |
| USD | | | 106,658 | | | ZAR | | | 105,981 | | | 1/2/2025 | | | NWM | | | | 677 | | | | - | | | | 677 | |
See accompanying notes
63
American Beacon AHL Managed Futures Strategy FundSM
Consolidated Schedule of Investments
December 31, 2024
| | | | | | | | | | | | | | | | | | | | | | | | | | | | |
| | | | | | |
| Currency Purchased* | | | Currency Sold* | | | Settlement
Date | | Counterparty | | | Unrealized
Appreciation | | | Unrealized
(Depreciation) | | | Net Unrealized
Appreciation
(Depreciation) | |
| USD | | | 213,336 | | | ZAR | | | 211,963 | | | 1/2/2025 | | | NWM | | | $ | 1,373 | | | $ | - | | | $ | 1,373 | |
| USD | | | 213,397 | | | ZAR | | | 211,963 | | | 1/2/2025 | | | NWM | | | | 1,434 | | | | - | | | | 1,434 | |
| USD | | | 213,398 | | | ZAR | | | 211,963 | | | 1/2/2025 | | | NWM | | | | 1,435 | | | | - | | | | 1,435 | |
| USD | | | 213,400 | | | ZAR | | | 211,963 | | | 1/2/2025 | | | NWM | | | | 1,437 | | | | - | | | | 1,437 | |
| USD | | | 213,404 | | | ZAR | | | 211,963 | | | 1/2/2025 | | | NWM | | | | 1,441 | | | | - | | | | 1,441 | |
| USD | | | 213,508 | | | ZAR | | | 211,963 | | | 1/2/2025 | | | NWM | | | | 1,545 | | | | - | | | | 1,545 | |
| USD | | | 213,531 | | | ZAR | | | 211,963 | | | 1/2/2025 | | | NWM | | | | 1,568 | | | | - | | | | 1,568 | |
| USD | | | 213,546 | | | ZAR | | | 211,963 | | | 1/2/2025 | | | NWM | | | | 1,583 | | | | - | | | | 1,583 | |
| USD | | | 213,588 | | | ZAR | | | 211,963 | | | 1/2/2025 | | | NWM | | | | 1,625 | | | | - | | | | 1,625 | |
| USD | | | 213,600 | | | ZAR | | | 211,963 | | | 1/2/2025 | | | NWM | | | | 1,637 | | | | - | | | | 1,637 | |
| USD | | | 213,615 | | | ZAR | | | 211,963 | | | 1/2/2025 | | | NWM | | | | 1,652 | | | | - | | | | 1,652 | |
| USD | | | 213,649 | | | ZAR | | | 211,963 | | | 1/2/2025 | | | NWM | | | | 1,686 | | | | - | | | | 1,686 | |
| USD | | | 213,718 | | | ZAR | | | 211,963 | | | 1/2/2025 | | | NWM | | | | 1,755 | | | | - | | | | 1,755 | |
| USD | | | 133,457 | | | ZAR | | | 132,477 | | | 1/2/2025 | | | NWM | | | | 980 | | | | - | | | | 980 | |
| USD | | | 133,457 | | | ZAR | | | 132,477 | | | 1/2/2025 | | | NWM | | | | 980 | | | | - | | | | 980 | |
| USD | | | 272,524 | | | ILS | | | 275,065 | | | 1/2/2025 | | | NWM | | | | - | | | | (2,541 | ) | | | (2,541 | ) |
| USD | | | 273,647 | | | ILS | | | 275,065 | | | 1/2/2025 | | | NWM | | | | - | | | | (1,418 | ) | | | (1,418 | ) |
| USD | | | 273,774 | | | ILS | | | 275,065 | | | 1/2/2025 | | | NWM | | | | - | | | | (1,291 | ) | | | (1,291 | ) |
| USD | | | 159,934 | | | ZAR | | | 158,972 | | | 1/2/2025 | | | NWM | | | | 962 | | | | - | | | | 962 | |
| USD | | | 159,934 | | | ZAR | | | 158,972 | | | 1/2/2025 | | | NWM | | | | 962 | | | | - | | | | 962 | |
| USD | | | 159,962 | | | ZAR | | | 158,972 | | | 1/2/2025 | | | NWM | | | | 990 | | | | - | | | | 990 | |
| USD | | | 159,962 | | | ZAR | | | 158,972 | | | 1/2/2025 | | | NWM | | | | 990 | | | | - | | | | 990 | |
| USD | | | 159,969 | | | ZAR | | | 158,972 | | | 1/2/2025 | | | NWM | | | | 997 | | | | - | | | | 997 | |
| USD | | | 159,969 | | | ZAR | | | 158,972 | | | 1/2/2025 | | | NWM | | | | 997 | | | | - | | | | 997 | |
| USD | | | 160,245 | | | ZAR | | | 158,972 | | | 1/2/2025 | | | NWM | | | | 1,273 | | | | - | | | | 1,273 | |
| USD | | | 160,245 | | | ZAR | | | 158,972 | | | 1/2/2025 | | | NWM | | | | 1,273 | | | | - | | | | 1,273 | |
| USD | | | 556,411 | | | ZAR | | | 554,642 | | | 1/2/2025 | | | NWM | | | | 1,769 | | | | - | | | | 1,769 | |
| USD | | | 687,254 | | | ZAR | | | 685,454 | | | 1/2/2025 | | | NWM | | | | 1,800 | | | | - | | | | 1,800 | |
| USD | | | 792,023 | | | ZAR | | | 790,103 | | | 1/2/2025 | | | NWM | | | | 1,920 | | | | - | | | | 1,920 | |
| USD | | | 886,237 | | | ZAR | | | 884,288 | | | 1/2/2025 | | | NWM | | | | 1,949 | | | | - | | | | 1,949 | |
| ILS | | | 2,888,186 | | | USD | | | 2,877,106 | | | 1/2/2025 | | | NWM | | | | 11,080 | | | | - | | | | 11,080 | |
| ZAR | | | 2,946,562 | | | USD | | | 2,977,641 | | | 1/2/2025 | | | NWM | | | | - | | | | (31,079 | ) | | | (31,079 | ) |
| ZAR | | | 3,748,753 | | | USD | | | 3,791,945 | | | 1/2/2025 | | | NWM | | | | - | | | | (43,192 | ) | | | (43,192 | ) |
| ZAR | | | 4,084,105 | | | USD | | | 4,134,435 | | | 1/2/2025 | | | NWM | | | | - | | | | (50,330 | ) | | | (50,330 | ) |
| ZAR | | | 4,498,504 | | | USD | | | 4,552,303 | | | 1/2/2025 | | | NWM | | | | - | | | | (53,799 | ) | | | (53,799 | ) |
| ZAR | | | 18,132,688 | | | USD | | | 18,314,511 | | | 1/2/2025 | | | NWM | | | | - | | | | (181,823 | ) | | | (181,823 | ) |
| USD | | | 26,493 | | | ZAR | | | 26,495 | | | 1/3/2025 | | | NWM | | | | - | | | | (2 | ) | | | (2 | ) |
| USD | | | 26,604 | | | ZAR | | | 26,495 | | | 1/3/2025 | | | NWM | | | | 109 | | | | - | | | | 109 | |
| USD | | | 26,616 | | | ZAR | | | 26,495 | | | 1/3/2025 | | | NWM | | | | 121 | | | | - | | | | 121 | |
| USD | | | 26,625 | | | ZAR | | | 26,495 | | | 1/3/2025 | | | NWM | | | | 130 | | | | - | | | | 130 | |
| USD | | | 26,639 | | | ZAR | | | 26,495 | | | 1/3/2025 | | | NWM | | | | 144 | | | | - | | | | 144 | |
| USD | | | 26,651 | | | ZAR | | | 26,495 | | | 1/3/2025 | | | NWM | | | | 156 | | | | - | | | | 156 | |
| USD | | | 26,653 | | | ZAR | | | 26,495 | | | 1/3/2025 | | | NWM | | | | 158 | | | | - | | | | 158 | |
| USD | | | 26,668 | | | ZAR | | | 26,495 | | | 1/3/2025 | | | NWM | | | | 173 | | | | - | | | | 173 | |
| USD | | | 26,671 | | | ZAR | | | 26,495 | | | 1/3/2025 | | | NWM | | | | 176 | | | | - | | | | 176 | |
| USD | | | 26,672 | | | ZAR | | | 26,495 | | | 1/3/2025 | | | NWM | | | | 177 | | | | - | | | | 177 | |
| USD | | | 26,678 | | | ZAR | | | 26,495 | | | 1/3/2025 | | | NWM | | | | 183 | | | | - | | | | 183 | |
| USD | | | 26,688 | | | ZAR | | | 26,495 | | | 1/3/2025 | | | NWM | | | | 193 | | | | - | | | | 193 | |
| USD | | | 26,702 | | | ZAR | | | 26,495 | | | 1/3/2025 | | | NWM | | | | 207 | | | | - | | | | 207 | |
| USD | | | 52,952 | | | ZAR | | | 52,991 | | | 1/3/2025 | | | NWM | | | | - | | | | (39 | ) | | | (39 | ) |
| USD | | | 52,969 | | | ZAR | | | 52,991 | | | 1/3/2025 | | | NWM | | | | - | | | | (22 | ) | | | (22 | ) |
| USD | | | 53,010 | | | ZAR | | | 52,991 | | | 1/3/2025 | | | NWM | | | | 19 | | | | - | | | | 19 | |
| USD | | | 53,015 | | | ZAR | | | 52,991 | | | 1/3/2025 | | | NWM | | | | 24 | | | | - | | | | 24 | |
| USD | | | 53,035 | | | ZAR | | | 52,991 | | | 1/3/2025 | | | NWM | | | | 44 | | | | - | | | | 44 | |
| USD | | | 53,038 | | | ZAR | | | 52,991 | | | 1/3/2025 | | | NWM | | | | 47 | | | | - | | | | 47 | |
| USD | | | 53,076 | | | ZAR | | | 52,991 | | | 1/3/2025 | | | NWM | | | | 85 | | | | - | | | | 85 | |
| USD | | | 53,080 | | | ZAR | | | 52,991 | | | 1/3/2025 | | | NWM | | | | 89 | | | | - | | | | 89 | |
| USD | | | 53,151 | | | ZAR | | | 52,991 | | | 1/3/2025 | | | NWM | | | | 160 | | | | - | | | | 160 | |
| USD | | | 53,159 | | | ZAR | | | 52,991 | | | 1/3/2025 | | | NWM | | | | 168 | | | | - | | | | 168 | |
See accompanying notes
64
American Beacon AHL Managed Futures Strategy FundSM
Consolidated Schedule of Investments
December 31, 2024
| | | | | | | | | | | | | | | | | | | | | | | | | | | | |
| | | | | | |
| Currency Purchased* | | | Currency Sold* | | | Settlement
Date | | Counterparty | | | Unrealized
Appreciation | | | Unrealized
(Depreciation) | | | Net Unrealized
Appreciation
(Depreciation) | |
| USD | | | 53,175 | | | ZAR | | | 52,991 | | | 1/3/2025 | | | NWM | | | $ | 184 | | | $ | - | | | $ | 184 | |
| USD | | | 53,216 | | | ZAR | | | 52,991 | | | 1/3/2025 | | | NWM | | | | 225 | | | | - | | | | 225 | |
| USD | | | 53,233 | | | ZAR | | | 52,991 | | | 1/3/2025 | | | NWM | | | | 242 | | | | - | | | | 242 | |
| USD | | | 53,237 | | | ZAR | | | 52,991 | | | 1/3/2025 | | | NWM | | | | 246 | | | | - | | | | 246 | |
| USD | | | 53,251 | | | ZAR | | | 52,991 | | | 1/3/2025 | | | NWM | | | | 260 | | | | - | | | | 260 | |
| USD | | | 53,252 | | | ZAR | | | 52,991 | | | 1/3/2025 | | | NWM | | | | 261 | | | | - | | | | 261 | |
| USD | | | 53,253 | | | ZAR | | | 52,991 | | | 1/3/2025 | | | NWM | | | | 262 | | | | - | | | | 262 | |
| USD | | | 53,259 | | | ZAR | | | 52,991 | | | 1/3/2025 | | | NWM | | | | 268 | | | | - | | | | 268 | |
| USD | | | 53,262 | | | ZAR | | | 52,991 | | | 1/3/2025 | | | NWM | | | | 271 | | | | - | | | | 271 | |
| USD | | | 53,264 | | | ZAR | | | 52,991 | | | 1/3/2025 | | | NWM | | | | 273 | | | | - | | | | 273 | |
| USD | | | 53,267 | | | ZAR | | | 52,991 | | | 1/3/2025 | | | NWM | | | | 276 | | | | - | | | | 276 | |
| USD | | | 53,272 | | | ZAR | | | 52,991 | | | 1/3/2025 | | | NWM | | | | 281 | | | | - | | | | 281 | |
| USD | | | 53,274 | | | ZAR | | | 52,991 | | | 1/3/2025 | | | NWM | | | | 283 | | | | - | | | | 283 | |
| USD | | | 53,305 | | | ZAR | | | 52,991 | | | 1/3/2025 | | | NWM | | | | 314 | | | | - | | | | 314 | |
| USD | | | 53,308 | | | ZAR | | | 52,991 | | | 1/3/2025 | | | NWM | | | | 317 | | | | - | | | | 317 | |
| USD | | | 53,312 | | | ZAR | | | 52,991 | | | 1/3/2025 | | | NWM | | | | 321 | | | | - | | | | 321 | |
| USD | | | 53,319 | | | ZAR | | | 52,991 | | | 1/3/2025 | | | NWM | | | | 328 | | | | - | | | | 328 | |
| USD | | | 53,321 | | | ZAR | | | 52,991 | | | 1/3/2025 | | | NWM | | | | 330 | | | | - | | | | 330 | |
| USD | | | 53,336 | | | ZAR | | | 52,991 | | | 1/3/2025 | | | NWM | | | | 345 | | | | - | | | | 345 | |
| USD | | | 53,358 | | | ZAR | | | 52,991 | | | 1/3/2025 | | | NWM | | | | 367 | | | | - | | | | 367 | |
| USD | | | 53,388 | | | ZAR | | | 52,991 | | | 1/3/2025 | | | NWM | | | | 397 | | | | - | | | | 397 | |
| USD | | | 53,394 | | | ZAR | | | 52,991 | | | 1/3/2025 | | | NWM | | | | 403 | | | | - | | | | 403 | |
| USD | | | 53,401 | | | ZAR | | | 52,991 | | | 1/3/2025 | | | NWM | | | | 410 | | | | - | | | | 410 | |
| USD | | | 53,402 | | | ZAR | | | 52,991 | | | 1/3/2025 | | | NWM | | | | 411 | | | | - | | | | 411 | |
| USD | | | 79,381 | | | ZAR | | | 79,486 | | | 1/3/2025 | | | NWM | | | | - | | | | (105 | ) | | | (105 | ) |
| USD | | | 79,412 | | | ZAR | | | 79,486 | | | 1/3/2025 | | | NWM | | | | - | | | | (74 | ) | | | (74 | ) |
| USD | | | 79,416 | | | ZAR | | | 79,486 | | | 1/3/2025 | | | NWM | | | | - | | | | (70 | ) | | | (70 | ) |
| USD | | | 79,425 | | | ZAR | | | 79,486 | | | 1/3/2025 | | | NWM | | | | - | | | | (61 | ) | | | (61 | ) |
| USD | | | 79,439 | | | ZAR | | | 79,486 | | | 1/3/2025 | | | NWM | | | | - | | | | (47 | ) | | | (47 | ) |
| USD | | | 79,453 | | | ZAR | | | 79,486 | | | 1/3/2025 | | | NWM | | | | - | | | | (33 | ) | | | (33 | ) |
| USD | | | 79,461 | | | ZAR | | | 79,486 | | | 1/3/2025 | | | NWM | | | | - | | | | (25 | ) | | | (25 | ) |
| USD | | | 79,471 | | | ZAR | | | 79,486 | | | 1/3/2025 | | | NWM | | | | - | | | | (15 | ) | | | (15 | ) |
| USD | | | 79,479 | | | ZAR | | | 79,486 | | | 1/3/2025 | | | NWM | | | | - | | | | (7 | ) | | | (7 | ) |
| USD | | | 79,491 | | | ZAR | | | 79,486 | | | 1/3/2025 | | | NWM | | | | 5 | | | | - | | | | 5 | |
| USD | | | 79,508 | | | ZAR | | | 79,486 | | | 1/3/2025 | | | NWM | | | | 22 | | | | - | | | | 22 | |
| USD | | | 79,509 | | | ZAR | | | 79,486 | | | 1/3/2025 | | | NWM | | | | 23 | | | | - | | | | 23 | |
| USD | | | 79,516 | | | ZAR | | | 79,486 | | | 1/3/2025 | | | NWM | | | | 30 | | | | - | | | | 30 | |
| USD | | | 79,528 | | | ZAR | | | 79,486 | | | 1/3/2025 | | | NWM | | | | 42 | | | | - | | | | 42 | |
| USD | | | 79,529 | | | ZAR | | | 79,486 | | | 1/3/2025 | | | NWM | | | | 43 | | | | - | | | | 43 | |
| USD | | | 79,556 | | | ZAR | | | 79,486 | | | 1/3/2025 | | | NWM | | | | 70 | | | | - | | | | 70 | |
| USD | | | 79,574 | | | ZAR | | | 79,486 | | | 1/3/2025 | | | NWM | | | | 88 | | | | - | | | | 88 | |
| USD | | | 79,617 | | | ZAR | | | 79,486 | | | 1/3/2025 | | | NWM | | | | 131 | | | | - | | | | 131 | |
| USD | | | 79,737 | | | ZAR | | | 79,486 | | | 1/3/2025 | | | NWM | | | | 251 | | | | - | | | | 251 | |
| USD | | | 79,744 | | | ZAR | | | 79,486 | | | 1/3/2025 | | | NWM | | | | 258 | | | | - | | | | 258 | |
| USD | | | 79,747 | | | ZAR | | | 79,486 | | | 1/3/2025 | | | NWM | | | | 261 | | | | - | | | | 261 | |
| USD | | | 79,784 | | | ZAR | | | 79,486 | | | 1/3/2025 | | | NWM | | | | 298 | | | | - | | | | 298 | |
| USD | | | 79,794 | | | ZAR | | | 79,486 | | | 1/3/2025 | | | NWM | | | | 308 | | | | - | | | | 308 | |
| USD | | | 79,807 | | | ZAR | | | 79,486 | | | 1/3/2025 | | | NWM | | | | 321 | | | | - | | | | 321 | |
| USD | | | 79,817 | | | ZAR | | | 79,486 | | | 1/3/2025 | | | NWM | | | | 331 | | | | - | | | | 331 | |
| USD | | | 79,829 | | | ZAR | | | 79,486 | | | 1/3/2025 | | | NWM | | | | 343 | | | | - | | | | 343 | |
| USD | | | 79,831 | | | ZAR | | | 79,486 | | | 1/3/2025 | | | NWM | | | | 345 | | | | - | | | | 345 | |
| USD | | | 79,842 | | | ZAR | | | 79,486 | | | 1/3/2025 | | | NWM | | | | 356 | | | | - | | | | 356 | |
| USD | | | 79,846 | | | ZAR | | | 79,486 | | | 1/3/2025 | | | NWM | | | | 360 | | | | - | | | | 360 | |
| USD | | | 79,847 | | | ZAR | | | 79,486 | | | 1/3/2025 | | | NWM | | | | 361 | | | | - | | | | 361 | |
| USD | | | 79,855 | | | ZAR | | | 79,486 | | | 1/3/2025 | | | NWM | | | | 369 | | | | - | | | | 369 | |
| USD | | | 79,861 | | | ZAR | | | 79,486 | | | 1/3/2025 | | | NWM | | | | 375 | | | | - | | | | 375 | |
| USD | | | 79,864 | | | ZAR | | | 79,486 | | | 1/3/2025 | | | NWM | | | | 378 | | | | - | | | | 378 | |
| USD | | | 79,867 | | | ZAR | | | 79,486 | | | 1/3/2025 | | | NWM | | | | 381 | | | | - | | | | 381 | |
| USD | | | 79,875 | | | ZAR | | | 79,486 | | | 1/3/2025 | | | NWM | | | | 389 | | | | - | | | | 389 | |
See accompanying notes
65
American Beacon AHL Managed Futures Strategy FundSM
Consolidated Schedule of Investments
December 31, 2024
| | | | | | | | | | | | | | | | | | | | | | | | | | | | |
| | | | | | |
| Currency Purchased* | | | Currency Sold* | | | Settlement
Date | | Counterparty | | | Unrealized
Appreciation | | | Unrealized
(Depreciation) | | | Net Unrealized
Appreciation
(Depreciation) | |
| USD | | | 79,879 | | | ZAR | | | 79,486 | | | 1/3/2025 | | | NWM | | | $ | 393 | | | $ | - | | | $ | 393 | |
| USD | | | 79,886 | | | ZAR | | | 79,486 | | | 1/3/2025 | | | NWM | | | | 400 | | | | - | | | | 400 | |
| USD | | | 79,902 | | | ZAR | | | 79,486 | | | 1/3/2025 | | | NWM | | | | 416 | | | | - | | | | 416 | |
| USD | | | 79,904 | | | ZAR | | | 79,486 | | | 1/3/2025 | | | NWM | | | | 418 | | | | - | | | | 418 | |
| USD | | | 79,907 | | | ZAR | | | 79,486 | | | 1/3/2025 | | | NWM | | | | 421 | | | | - | | | | 421 | |
| USD | | | 79,911 | | | ZAR | | | 79,486 | | | 1/3/2025 | | | NWM | | | | 425 | | | | - | | | | 425 | |
| USD | | | 79,912 | | | ZAR | | | 79,486 | | | 1/3/2025 | | | NWM | | | | 426 | | | | - | | | | 426 | |
| USD | | | 79,913 | | | ZAR | | | 79,486 | | | 1/3/2025 | | | NWM | | | | 427 | | | | - | | | | 427 | |
| USD | | | 79,914 | | | ZAR | | | 79,486 | | | 1/3/2025 | | | NWM | | | | 428 | | | | - | | | | 428 | |
| USD | | | 79,960 | | | ZAR | | | 79,486 | | | 1/3/2025 | | | NWM | | | | 474 | | | | - | | | | 474 | |
| USD | | | 79,965 | | | ZAR | | | 79,486 | | | 1/3/2025 | | | NWM | | | | 479 | | | | - | | | | 479 | |
| USD | | | 79,966 | | | ZAR | | | 79,486 | | | 1/3/2025 | | | NWM | | | | 480 | | | | - | | | | 480 | |
| USD | | | 79,967 | | | ZAR | | | 79,486 | | | 1/3/2025 | | | NWM | | | | 481 | | | | - | | | | 481 | |
| USD | | | 79,972 | | | ZAR | | | 79,486 | | | 1/3/2025 | | | NWM | | | | 486 | | | | - | | | | 486 | |
| USD | | | 79,979 | | | ZAR | | | 79,486 | | | 1/3/2025 | | | NWM | | | | 493 | | | | - | | | | 493 | |
| USD | | | 79,982 | | | ZAR | | | 79,486 | | | 1/3/2025 | | | NWM | | | | 496 | | | | - | | | | 496 | |
| USD | | | 79,985 | | | ZAR | | | 79,486 | | | 1/3/2025 | | | NWM | | | | 499 | | | | - | | | | 499 | |
| USD | | | 79,986 | | | ZAR | | | 79,486 | | | 1/3/2025 | | | NWM | | | | 500 | | | | - | | | | 500 | |
| USD | | | 79,988 | | | ZAR | | | 79,486 | | | 1/3/2025 | | | NWM | | | | 502 | | | | - | | | | 502 | |
| USD | | | 80,003 | | | ZAR | | | 79,486 | | | 1/3/2025 | | | NWM | | | | 517 | | | | - | | | | 517 | |
| USD | | | 80,007 | | | ZAR | | | 79,486 | | | 1/3/2025 | | | NWM | | | | 521 | | | | - | | | | 521 | |
| USD | | | 80,012 | | | ZAR | | | 79,486 | | | 1/3/2025 | | | NWM | | | | 526 | | | | - | | | | 526 | |
| USD | | | 80,031 | | | ZAR | | | 79,486 | | | 1/3/2025 | | | NWM | | | | 545 | | | | - | | | | 545 | |
| USD | | | 80,040 | | | ZAR | | | 79,486 | | | 1/3/2025 | | | NWM | | | | 554 | | | | - | | | | 554 | |
| USD | | | 80,049 | | | ZAR | | | 79,486 | | | 1/3/2025 | | | NWM | | | | 563 | | | | - | | | | 563 | |
| USD | | | 80,063 | | | ZAR | | | 79,486 | | | 1/3/2025 | | | NWM | | | | 577 | | | | - | | | | 577 | |
| USD | | | 80,077 | | | ZAR | | | 79,486 | | | 1/3/2025 | | | NWM | | | | 591 | | | | - | | | | 591 | |
| USD | | | 80,086 | | | ZAR | | | 79,486 | | | 1/3/2025 | | | NWM | | | | 600 | | | | - | | | | 600 | |
| USD | | | 80,090 | | | ZAR | | | 79,486 | | | 1/3/2025 | | | NWM | | | | 604 | | | | - | | | | 604 | |
| USD | | | 80,095 | | | ZAR | | | 79,486 | | | 1/3/2025 | | | NWM | | | | 609 | | | | - | | | | 609 | |
| USD | | | 80,119 | | | ZAR | | | 79,486 | | | 1/3/2025 | | | NWM | | | | 633 | | | | - | | | | 633 | |
| USD | | | 80,121 | | | ZAR | | | 79,486 | | | 1/3/2025 | | | NWM | | | | 635 | | | | - | | | | 635 | |
| USD | | | 80,156 | | | ZAR | | | 79,486 | | | 1/3/2025 | | | NWM | | | | 670 | | | | - | | | | 670 | |
| USD | | | 80,177 | | | ZAR | | | 79,486 | | | 1/3/2025 | | | NWM | | | | 691 | | | | - | | | | 691 | |
| HUF | | | 103,380 | | | EUR | | | 103,585 | | | 1/3/2025 | | | NWM | | | | - | | | | (205 | ) | | | (205 | ) |
| USD | | | 105,871 | | | ZAR | | | 105,981 | | | 1/3/2025 | | | NWM | | | | - | | | | (110 | ) | | | (110 | ) |
| USD | | | 105,913 | | | ZAR | | | 105,981 | | | 1/3/2025 | | | NWM | | | | - | | | | (68 | ) | | | (68 | ) |
| USD | | | 105,917 | | | ZAR | | | 105,981 | | | 1/3/2025 | | | NWM | | | | - | | | | (64 | ) | | | (64 | ) |
| USD | | | 105,919 | | | ZAR | | | 105,981 | | | 1/3/2025 | | | NWM | | | | - | | | | (62 | ) | | | (62 | ) |
| USD | | | 105,982 | | | ZAR | | | 105,981 | | | 1/3/2025 | | | NWM | | | | 1 | | | | - | | | | 1 | |
| USD | | | 106,005 | | | ZAR | | | 105,981 | | | 1/3/2025 | | | NWM | | | | 24 | | | | - | | | | 24 | |
| USD | | | 106,010 | | | ZAR | | | 105,981 | | | 1/3/2025 | | | NWM | | | | 29 | | | | - | | | | 29 | |
| USD | | | 106,027 | | | ZAR | | | 105,981 | | | 1/3/2025 | | | NWM | | | | 46 | | | | - | | | | 46 | |
| USD | | | 106,031 | | | ZAR | | | 105,981 | | | 1/3/2025 | | | NWM | | | | 50 | | | | - | | | | 50 | |
| USD | | | 106,075 | | | ZAR | | | 105,981 | | | 1/3/2025 | | | NWM | | | | 94 | | | | - | | | | 94 | |
| USD | | | 106,092 | | | ZAR | | | 105,981 | | | 1/3/2025 | | | NWM | | | | 111 | | | | - | | | | 111 | |
| USD | | | 106,154 | | | ZAR | | | 105,981 | | | 1/3/2025 | | | NWM | | | | 173 | | | | - | | | | 173 | |
| USD | | | 106,313 | | | ZAR | | | 105,981 | | | 1/3/2025 | | | NWM | | | | 332 | | | | - | | | | 332 | |
| USD | | | 106,329 | | | ZAR | | | 105,981 | | | 1/3/2025 | | | NWM | | | | 348 | | | | - | | | | 348 | |
| USD | | | 106,380 | | | ZAR | | | 105,981 | | | 1/3/2025 | | | NWM | | | | 399 | | | | - | | | | 399 | |
| USD | | | 106,427 | | | ZAR | | | 105,981 | | | 1/3/2025 | | | NWM | | | | 446 | | | | - | | | | 446 | |
| USD | | | 106,437 | | | ZAR | | | 105,981 | | | 1/3/2025 | | | NWM | | | | 456 | | | | - | | | | 456 | |
| USD | | | 106,439 | | | ZAR | | | 105,981 | | | 1/3/2025 | | | NWM | | | | 458 | | | | - | | | | 458 | |
| USD | | | 53,228 | | | ZAR | | | 52,991 | | | 1/3/2025 | | | NWM | | | | 237 | | | | - | | | | 237 | |
| USD | | | 53,228 | | | ZAR | | | 52,991 | | | 1/3/2025 | | | NWM | | | | 237 | | | | - | | | | 237 | |
| USD | | | 106,464 | | | ZAR | | | 105,981 | | | 1/3/2025 | | | NWM | | | | 483 | | | | - | | | | 483 | |
| USD | | | 106,466 | | | ZAR | | | 105,981 | | | 1/3/2025 | | | NWM | | | | 485 | | | | - | | | | 485 | |
| USD | | | 106,494 | | | ZAR | | | 105,981 | | | 1/3/2025 | | | NWM | | | | 513 | | | | - | | | | 513 | |
| USD | | | 106,500 | | | ZAR | | | 105,981 | | | 1/3/2025 | | | NWM | | | | 519 | | | | - | | | | 519 | |
See accompanying notes
66
American Beacon AHL Managed Futures Strategy FundSM
Consolidated Schedule of Investments
December 31, 2024
| | | | | | | | | | | | | | | | | | | | | | | | | | | | |
| | | | | | |
| Currency Purchased* | | | Currency Sold* | | | Settlement
Date | | Counterparty | | | Unrealized
Appreciation | | | Unrealized
(Depreciation) | | | Net Unrealized
Appreciation
(Depreciation) | |
| USD | | | 106,509 | | | ZAR | | | 105,981 | | | 1/3/2025 | | | NWM | | | $ | 528 | | | $ | - | | | $ | 528 | |
| USD | | | 106,522 | | | ZAR | | | 105,981 | | | 1/3/2025 | | | NWM | | | | 541 | | | | - | | | | 541 | |
| USD | | | 106,549 | | | ZAR | | | 105,981 | | | 1/3/2025 | | | NWM | | | | 568 | | | | - | | | | 568 | |
| USD | | | 106,554 | | | ZAR | | | 105,981 | | | 1/3/2025 | | | NWM | | | | 573 | | | | - | | | | 573 | |
| USD | | | 106,575 | | | ZAR | | | 105,981 | | | 1/3/2025 | | | NWM | | | | 594 | | | | - | | | | 594 | |
| USD | | | 106,580 | | | ZAR | | | 105,981 | | | 1/3/2025 | | | NWM | | | | 599 | | | | - | | | | 599 | |
| USD | | | 106,600 | | | ZAR | | | 105,981 | | | 1/3/2025 | | | NWM | | | | 619 | | | | - | | | | 619 | |
| USD | | | 106,613 | | | ZAR | | | 105,981 | | | 1/3/2025 | | | NWM | | | | 632 | | | | - | | | | 632 | |
| USD | | | 106,620 | | | ZAR | | | 105,981 | | | 1/3/2025 | | | NWM | | | | 639 | | | | - | | | | 639 | |
| USD | | | 106,621 | | | ZAR | | | 105,981 | | | 1/3/2025 | | | NWM | | | | 640 | | | | - | | | | 640 | |
| USD | | | 106,624 | | | ZAR | | | 105,981 | | | 1/3/2025 | | | NWM | | | | 643 | | | | - | | | | 643 | |
| USD | | | 106,628 | | | ZAR | | | 105,981 | | | 1/3/2025 | | | NWM | | | | 647 | | | | - | | | | 647 | |
| USD | | | 106,634 | | | ZAR | | | 105,981 | | | 1/3/2025 | | | NWM | | | | 653 | | | | - | | | | 653 | |
| USD | | | 106,637 | | | ZAR | | | 105,981 | | | 1/3/2025 | | | NWM | | | | 656 | | | | - | | | | 656 | |
| USD | | | 106,639 | | | ZAR | | | 105,981 | | | 1/3/2025 | | | NWM | | | | 658 | | | | - | | | | 658 | |
| USD | | | 106,659 | | | ZAR | | | 105,981 | | | 1/3/2025 | | | NWM | | | | 678 | | | | - | | | | 678 | |
| USD | | | 106,668 | | | ZAR | | | 105,981 | | | 1/3/2025 | | | NWM | | | | 687 | | | | - | | | | 687 | |
| USD | | | 106,678 | | | ZAR | | | 105,981 | | | 1/3/2025 | | | NWM | | | | 697 | | | | - | | | | 697 | |
| USD | | | 106,685 | | | ZAR | | | 105,981 | | | 1/3/2025 | | | NWM | | | | 704 | | | | - | | | | 704 | |
| USD | | | 106,699 | | | ZAR | | | 105,981 | | | 1/3/2025 | | | NWM | | | | 718 | | | | - | | | | 718 | |
| USD | | | 106,708 | | | ZAR | | | 105,981 | | | 1/3/2025 | | | NWM | | | | 727 | | | | - | | | | 727 | |
| USD | | | 106,729 | | | ZAR | | | 105,981 | | | 1/3/2025 | | | NWM | | | | 748 | | | | - | | | | 748 | |
| USD | | | 106,730 | | | ZAR | | | 105,981 | | | 1/3/2025 | | | NWM | | | | 749 | | | | - | | | | 749 | |
| USD | | | 106,734 | | | ZAR | | | 105,981 | | | 1/3/2025 | | | NWM | | | | 753 | | | | - | | | | 753 | |
| USD | | | 106,759 | | | ZAR | | | 105,981 | | | 1/3/2025 | | | NWM | | | | 778 | | | | - | | | | 778 | |
| USD | | | 53,387 | | | ZAR | | | 52,991 | | | 1/3/2025 | | | NWM | | | | 396 | | | | - | | | | 396 | |
| USD | | | 53,387 | | | ZAR | | | 52,991 | | | 1/3/2025 | | | NWM | | | | 396 | | | | - | | | | 396 | |
| USD | | | 106,784 | | | ZAR | | | 105,981 | | | 1/3/2025 | | | NWM | | | | 803 | | | | - | | | | 803 | |
| USD | | | 106,819 | | | ZAR | | | 105,981 | | | 1/3/2025 | | | NWM | | | | 838 | | | | - | | | | 838 | |
| USD | | | 106,837 | | | ZAR | | | 105,981 | | | 1/3/2025 | | | NWM | | | | 856 | | | | - | | | | 856 | |
| USD | | | 110,640 | | | CHF | | | 110,187 | | | 1/3/2025 | | | NWM | | | | 453 | | | | - | | | | 453 | |
| USD | | | 132,235 | | | ZAR | | | 132,477 | | | 1/3/2025 | | | NWM | | | | - | | | | (242 | ) | | | (242 | ) |
| USD | | | 132,326 | | | ZAR | | | 132,477 | | | 1/3/2025 | | | NWM | | | | - | | | | (151 | ) | | | (151 | ) |
| USD | | | 132,339 | | | ZAR | | | 132,477 | | | 1/3/2025 | | | NWM | | | | - | | | | (138 | ) | | | (138 | ) |
| USD | | | 132,379 | | | ZAR | | | 132,477 | | | 1/3/2025 | | | NWM | | | | - | | | | (98 | ) | | | (98 | ) |
| USD | | | 132,401 | | | ZAR | | | 132,477 | | | 1/3/2025 | | | NWM | | | | - | | | | (76 | ) | | | (76 | ) |
| USD | | | 132,422 | | | ZAR | | | 132,477 | | | 1/3/2025 | | | NWM | | | | - | | | | (55 | ) | | | (55 | ) |
| USD | | | 132,429 | | | ZAR | | | 132,477 | | | 1/3/2025 | | | NWM | | | | - | | | | (48 | ) | | | (48 | ) |
| USD | | | 132,436 | | | ZAR | | | 132,477 | | | 1/3/2025 | | | NWM | | | | - | | | | (41 | ) | | | (41 | ) |
| USD | | | 132,443 | | | ZAR | | | 132,477 | | | 1/3/2025 | | | NWM | | | | - | | | | (34 | ) | | | (34 | ) |
| USD | | | 132,451 | | | ZAR | | | 132,477 | | | 1/3/2025 | | | NWM | | | | - | | | | (26 | ) | | | (26 | ) |
| USD | | | 132,671 | | | ZAR | | | 132,477 | | | 1/3/2025 | | | NWM | | | | 194 | | | | - | | | | 194 | |
| USD | | | 132,761 | | | ZAR | | | 132,477 | | | 1/3/2025 | | | NWM | | | | 284 | | | | - | | | | 284 | |
| USD | | | 132,930 | | | ZAR | | | 132,477 | | | 1/3/2025 | | | NWM | | | | 453 | | | | - | | | | 453 | |
| USD | | | 132,964 | | | ZAR | | | 132,477 | | | 1/3/2025 | | | NWM | | | | 487 | | | | - | | | | 487 | |
| USD | | | 133,033 | | | ZAR | | | 132,477 | | | 1/3/2025 | | | NWM | | | | 556 | | | | - | | | | 556 | |
| USD | | | 133,034 | | | ZAR | | | 132,477 | | | 1/3/2025 | | | NWM | | | | 557 | | | | - | | | | 557 | |
| USD | | | 133,052 | | | ZAR | | | 132,477 | | | 1/3/2025 | | | NWM | | | | 575 | | | | - | | | | 575 | |
| USD | | | 133,058 | | | ZAR | | | 132,477 | | | 1/3/2025 | | | NWM | | | | 581 | | | | - | | | | 581 | |
| USD | | | 133,104 | | | ZAR | | | 132,477 | | | 1/3/2025 | | | NWM | | | | 627 | | | | - | | | | 627 | |
| USD | | | 133,106 | | | ZAR | | | 132,477 | | | 1/3/2025 | | | NWM | | | | 629 | | | | - | | | | 629 | |
| USD | | | 133,111 | | | ZAR | | | 132,477 | | | 1/3/2025 | | | NWM | | | | 634 | | | | - | | | | 634 | |
| USD | | | 133,126 | | | ZAR | | | 132,477 | | | 1/3/2025 | | | NWM | | | | 649 | | | | - | | | | 649 | |
| USD | | | 133,145 | | | ZAR | | | 132,477 | | | 1/3/2025 | | | NWM | | | | 668 | | | | - | | | | 668 | |
| USD | | | 133,146 | | | ZAR | | | 132,477 | | | 1/3/2025 | | | NWM | | | | 669 | | | | - | | | | 669 | |
| USD | | | 133,149 | | | ZAR | | | 132,477 | | | 1/3/2025 | | | NWM | | | | 672 | | | | - | | | | 672 | |
| USD | | | 133,156 | | | ZAR | | | 132,477 | | | 1/3/2025 | | | NWM | | | | 679 | | | | - | | | | 679 | |
| USD | | | 133,159 | | | ZAR | | | 132,477 | | | 1/3/2025 | | | NWM | | | | 682 | | | | - | | | | 682 | |
| USD | | | 133,162 | | | ZAR | | | 132,477 | | | 1/3/2025 | | | NWM | | | | 685 | | | | - | | | | 685 | |
See accompanying notes
67
American Beacon AHL Managed Futures Strategy FundSM
Consolidated Schedule of Investments
December 31, 2024
| | | | | | | | | | | | | | | | | | | | | | | | | | | | |
| | | | | | |
| Currency Purchased* | | | Currency Sold* | | | Settlement
Date | | Counterparty | | | Unrealized
Appreciation | | | Unrealized
(Depreciation) | | | Net Unrealized
Appreciation
(Depreciation) | |
| USD | | | 133,167 | | | ZAR | | | 132,477 | | | 1/3/2025 | | | NWM | | | $ | 690 | | | $ | - | | | $ | 690 | |
| USD | | | 133,187 | | | ZAR | | | 132,477 | | | 1/3/2025 | | | NWM | | | | 710 | | | | - | | | | 710 | |
| USD | | | 133,202 | | | ZAR | | | 132,477 | | | 1/3/2025 | | | NWM | | | | 725 | | | | - | | | | 725 | |
| USD | | | 133,228 | | | ZAR | | | 132,477 | | | 1/3/2025 | | | NWM | | | | 751 | | | | - | | | | 751 | |
| USD | | | 133,231 | | | ZAR | | | 132,477 | | | 1/3/2025 | | | NWM | | | | 754 | | | | - | | | | 754 | |
| USD | | | 133,257 | | | ZAR | | | 132,477 | | | 1/3/2025 | | | NWM | | | | 780 | | | | - | | | | 780 | |
| USD | | | 133,258 | | | ZAR | | | 132,477 | | | 1/3/2025 | | | NWM | | | | 781 | | | | - | | | | 781 | |
| USD | | | 133,259 | | | ZAR | | | 132,477 | | | 1/3/2025 | | | NWM | | | | 782 | | | | - | | | | 782 | |
| USD | | | 133,268 | | | ZAR | | | 132,477 | | | 1/3/2025 | | | NWM | | | | 791 | | | | - | | | | 791 | |
| USD | | | 133,275 | | | ZAR | | | 132,477 | | | 1/3/2025 | | | NWM | | | | 798 | | | | - | | | | 798 | |
| USD | | | 133,278 | | | ZAR | | | 132,477 | | | 1/3/2025 | | | NWM | | | | 801 | | | | - | | | | 801 | |
| USD | | | 133,285 | | | ZAR | | | 132,477 | | | 1/3/2025 | | | NWM | | | | 808 | | | | - | | | | 808 | |
| USD | | | 133,287 | | | ZAR | | | 132,477 | | | 1/3/2025 | | | NWM | | | | 810 | | | | - | | | | 810 | |
| USD | | | 133,293 | | | ZAR | | | 132,477 | | | 1/3/2025 | | | NWM | | | | 816 | | | | - | | | | 816 | |
| USD | | | 133,298 | | | ZAR | | | 132,477 | | | 1/3/2025 | | | NWM | | | | 821 | | | | - | | | | 821 | |
| USD | | | 133,299 | | | ZAR | | | 132,477 | | | 1/3/2025 | | | NWM | | | | 822 | | | | - | | | | 822 | |
| USD | | | 133,301 | | | ZAR | | | 132,477 | | | 1/3/2025 | | | NWM | | | | 824 | | | | - | | | | 824 | |
| USD | | | 133,312 | | | ZAR | | | 132,477 | | | 1/3/2025 | | | NWM | | | | 835 | | | | - | | | | 835 | |
| USD | | | 133,321 | | | ZAR | | | 132,477 | | | 1/3/2025 | | | NWM | | | | 844 | | | | - | | | | 844 | |
| USD | | | 133,327 | | | ZAR | | | 132,477 | | | 1/3/2025 | | | NWM | | | | 850 | | | | - | | | | 850 | |
| USD | | | 133,417 | | | ZAR | | | 132,477 | | | 1/3/2025 | | | NWM | | | | 940 | | | | - | | | | 940 | |
| USD | | | 133,474 | | | ZAR | | | 132,477 | | | 1/3/2025 | | | NWM | | | | 997 | | | | - | | | | 997 | |
| USD | | | 133,483 | | | ZAR | | | 132,477 | | | 1/3/2025 | | | NWM | | | | 1,006 | | | | - | | | | 1,006 | |
| USD | | | 133,486 | | | ZAR | | | 132,477 | | | 1/3/2025 | | | NWM | | | | 1,009 | | | | - | | | | 1,009 | |
| USD | | | 133,518 | | | ZAR | | | 132,477 | | | 1/3/2025 | | | NWM | | | | 1,041 | | | | - | | | | 1,041 | |
| USD | | | 133,553 | | | ZAR | | | 132,477 | | | 1/3/2025 | | | NWM | | | | 1,076 | | | | - | | | | 1,076 | |
| USD | | | 133,563 | | | ZAR | | | 132,477 | | | 1/3/2025 | | | NWM | | | | 1,086 | | | | - | | | | 1,086 | |
| USD | | | 133,593 | | | ZAR | | | 132,477 | | | 1/3/2025 | | | NWM | | | | 1,116 | | | | - | | | | 1,116 | |
| USD | | | 136,701 | | | ILS | | | 137,533 | | | 1/3/2025 | | | NWM | | | | - | | | | (832 | ) | | | (832 | ) |
| USD | | | 136,890 | | | ILS | | | 137,533 | | | 1/3/2025 | | | NWM | | | | - | | | | (643 | ) | | | (643 | ) |
| USD | | | 136,966 | | | ILS | | | 137,533 | | | 1/3/2025 | | | NWM | | | | - | | | | (567 | ) | | | (567 | ) |
| USD | | | 158,841 | | | ZAR | | | 158,972 | | | 1/3/2025 | | | NWM | | | | - | | | | (131 | ) | | | (131 | ) |
| USD | | | 158,891 | | | ZAR | | | 158,972 | | | 1/3/2025 | | | NWM | | | | - | | | | (81 | ) | | | (81 | ) |
| USD | | | 158,897 | | | ZAR | | | 158,972 | | | 1/3/2025 | | | NWM | | | | - | | | | (75 | ) | | | (75 | ) |
| USD | | | 158,907 | | | ZAR | | | 158,972 | | | 1/3/2025 | | | NWM | | | | - | | | | (65 | ) | | | (65 | ) |
| USD | | | 159,237 | | | ZAR | | | 158,972 | | | 1/3/2025 | | | NWM | | | | 265 | | | | - | | | | 265 | |
| USD | | | 159,514 | | | ZAR | | | 158,972 | | | 1/3/2025 | | | NWM | | | | 542 | | | | - | | | | 542 | |
| USD | | | 159,529 | | | ZAR | | | 158,972 | | | 1/3/2025 | | | NWM | | | | 557 | | | | - | | | | 557 | |
| USD | | | 159,567 | | | ZAR | | | 158,972 | | | 1/3/2025 | | | NWM | | | | 595 | | | | - | | | | 595 | |
| USD | | | 159,632 | | | ZAR | | | 158,972 | | | 1/3/2025 | | | NWM | | | | 660 | | | | - | | | | 660 | |
| USD | | | 159,683 | | | ZAR | | | 158,972 | | | 1/3/2025 | | | NWM | | | | 711 | | | | - | | | | 711 | |
| USD | | | 159,687 | | | ZAR | | | 158,972 | | | 1/3/2025 | | | NWM | | | | 715 | | | | - | | | | 715 | |
| USD | | | 159,689 | | | ZAR | | | 158,972 | | | 1/3/2025 | | | NWM | | | | 717 | | | | - | | | | 717 | |
| USD | | | 159,696 | | | ZAR | | | 158,972 | | | 1/3/2025 | | | NWM | | | | 724 | | | | - | | | | 724 | |
| USD | | | 159,707 | | | ZAR | | | 158,972 | | | 1/3/2025 | | | NWM | | | | 735 | | | | - | | | | 735 | |
| USD | | | 79,854 | | | ZAR | | | 79,486 | | | 1/3/2025 | | | NWM | | | | 368 | | | | - | | | | 368 | |
| USD | | | 79,854 | | | ZAR | | | 79,486 | | | 1/3/2025 | | | NWM | | | | 368 | | | | - | | | | 368 | |
| USD | | | 159,725 | | | ZAR | | | 158,972 | | | 1/3/2025 | | | NWM | | | | 753 | | | | - | | | | 753 | |
| USD | | | 159,734 | | | ZAR | | | 158,972 | | | 1/3/2025 | | | NWM | | | | 762 | | | | - | | | | 762 | |
| USD | | | 159,735 | | | ZAR | | | 158,972 | | | 1/3/2025 | | | NWM | | | | 763 | | | | - | | | | 763 | |
| USD | | | 79,871 | | | ZAR | | | 79,486 | | | 1/3/2025 | | | NWM | | | | 385 | | | | - | | | | 385 | |
| USD | | | 79,871 | | | ZAR | | | 79,486 | | | 1/3/2025 | | | NWM | | | | 385 | | | | - | | | | 385 | |
| USD | | | 159,754 | | | ZAR | | | 158,972 | | | 1/3/2025 | | | NWM | | | | 782 | | | | - | | | | 782 | |
| USD | | | 159,771 | | | ZAR | | | 158,972 | | | 1/3/2025 | | | NWM | | | | 799 | | | | - | | | | 799 | |
| USD | | | 159,775 | | | ZAR | | | 158,972 | | | 1/3/2025 | | | NWM | | | | 803 | | | | - | | | | 803 | |
| USD | | | 159,782 | | | ZAR | | | 158,972 | | | 1/3/2025 | | | NWM | | | | 810 | | | | - | | | | 810 | |
| USD | | | 79,895 | | | ZAR | | | 79,486 | | | 1/3/2025 | | | NWM | | | | 409 | | | | - | | | | 409 | |
| USD | | | 79,895 | | | ZAR | | | 79,486 | | | 1/3/2025 | | | NWM | | | | 409 | | | | - | | | | 409 | |
| USD | | | 79,897 | | | ZAR | | | 79,486 | | | 1/3/2025 | | | NWM | | | | 411 | | | | - | | | | 411 | |
See accompanying notes
68
American Beacon AHL Managed Futures Strategy FundSM
Consolidated Schedule of Investments
December 31, 2024
| | | | | | | | | | | | | | | | | | | | | | | | | | | | |
| | | | | | |
| Currency Purchased* | | | Currency Sold* | | | Settlement
Date | | Counterparty | | | Unrealized
Appreciation | | | Unrealized
(Depreciation) | | | Net Unrealized
Appreciation
(Depreciation) | |
| USD | | | 79,897 | | | ZAR | | | 79,486 | | | 1/3/2025 | | | NWM | | | $ | 411 | | | $ | - | | | $ | 411 | |
| USD | | | 159,802 | | | ZAR | | | 158,972 | | | 1/3/2025 | | | NWM | | | | 830 | | | | - | | | | 830 | |
| USD | | | 159,821 | | | ZAR | | | 158,972 | | | 1/3/2025 | | | NWM | | | | 849 | | | | - | | | | 849 | |
| USD | | | 159,850 | | | ZAR | | | 158,972 | | | 1/3/2025 | | | NWM | | | | 878 | | | | - | | | | 878 | |
| USD | | | 159,852 | | | ZAR | | | 158,972 | | | 1/3/2025 | | | NWM | | | | 880 | | | | - | | | | 880 | |
| USD | | | 159,864 | | | ZAR | | | 158,972 | | | 1/3/2025 | | | NWM | | | | 892 | | | | - | | | | 892 | |
| USD | | | 159,872 | | | ZAR | | | 158,972 | | | 1/3/2025 | | | NWM | | | | 900 | | | | - | | | | 900 | |
| USD | | | 159,910 | | | ZAR | | | 158,972 | | | 1/3/2025 | | | NWM | | | | 938 | | | | - | | | | 938 | |
| USD | | | 159,914 | | | ZAR | | | 158,972 | | | 1/3/2025 | | | NWM | | | | 942 | | | | - | | | | 942 | |
| USD | | | 159,926 | | | ZAR | | | 158,972 | | | 1/3/2025 | | | NWM | | | | 954 | | | | - | | | | 954 | |
| USD | | | 79,963 | | | ZAR | | | 79,486 | | | 1/3/2025 | | | NWM | | | | 477 | | | | - | | | | 477 | |
| USD | | | 79,963 | | | ZAR | | | 79,486 | | | 1/3/2025 | | | NWM | | | | 477 | | | | - | | | | 477 | |
| USD | | | 159,931 | | | ZAR | | | 158,972 | | | 1/3/2025 | | | NWM | | | | 959 | | | | - | | | | 959 | |
| USD | | | 159,936 | | | ZAR | | | 158,972 | | | 1/3/2025 | | | NWM | | | | 964 | | | | - | | | | 964 | |
| USD | | | 159,972 | | | ZAR | | | 158,972 | | | 1/3/2025 | | | NWM | | | | 1,000 | | | | - | | | | 1,000 | |
| USD | | | 159,976 | | | ZAR | | | 158,972 | | | 1/3/2025 | | | NWM | | | | 1,004 | | | | - | | | | 1,004 | |
| USD | | | 159,991 | | | ZAR | | | 158,972 | | | 1/3/2025 | | | NWM | | | | 1,019 | | | | - | | | | 1,019 | |
| USD | | | 159,993 | | | ZAR | | | 158,972 | | | 1/3/2025 | | | NWM | | | | 1,021 | | | | - | | | | 1,021 | |
| USD | | | 159,996 | | | ZAR | | | 158,972 | | | 1/3/2025 | | | NWM | | | | 1,024 | | | | - | | | | 1,024 | |
| USD | | | 160,001 | | | ZAR | | | 158,972 | | | 1/3/2025 | | | NWM | | | | 1,029 | | | | - | | | | 1,029 | |
| USD | | | 160,010 | | | ZAR | | | 158,972 | | | 1/3/2025 | | | NWM | | | | 1,038 | | | | - | | | | 1,038 | |
| USD | | | 160,029 | | | ZAR | | | 158,972 | | | 1/3/2025 | | | NWM | | | | 1,057 | | | | - | | | | 1,057 | |
| USD | | | 160,062 | | | ZAR | | | 158,972 | | | 1/3/2025 | | | NWM | | | | 1,090 | | | | - | | | | 1,090 | |
| USD | | | 160,067 | | | ZAR | | | 158,972 | | | 1/3/2025 | | | NWM | | | | 1,095 | | | | - | | | | 1,095 | |
| USD | | | 160,073 | | | ZAR | | | 158,972 | | | 1/3/2025 | | | NWM | | | | 1,101 | | | | - | | | | 1,101 | |
| USD | | | 160,110 | | | ZAR | | | 158,972 | | | 1/3/2025 | | | NWM | | | | 1,138 | | | | - | | | | 1,138 | |
| USD | | | 160,141 | | | ZAR | | | 158,972 | | | 1/3/2025 | | | NWM | | | | 1,169 | | | | - | | | | 1,169 | |
| USD | | | 160,160 | | | ZAR | | | 158,972 | | | 1/3/2025 | | | NWM | | | | 1,188 | | | | - | | | | 1,188 | |
| USD | | | 160,165 | | | ZAR | | | 158,972 | | | 1/3/2025 | | | NWM | | | | 1,193 | | | | - | | | | 1,193 | |
| USD | | | 160,181 | | | ZAR | | | 158,972 | | | 1/3/2025 | | | NWM | | | | 1,209 | | | | - | | | | 1,209 | |
| USD | | | 160,302 | | | ZAR | | | 158,972 | | | 1/3/2025 | | | NWM | | | | 1,330 | | | | - | | | | 1,330 | |
| USD | | | 160,313 | | | ZAR | | | 158,972 | | | 1/3/2025 | | | NWM | | | | 1,341 | | | | - | | | | 1,341 | |
| USD | | | 160,344 | | | ZAR | | | 158,972 | | | 1/3/2025 | | | NWM | | | | 1,372 | | | | - | | | | 1,372 | |
| USD | | | 185,553 | | | ZAR | | | 185,467 | | | 1/3/2025 | | | NWM | | | | 86 | | | | - | | | | 86 | |
| USD | | | 186,083 | | | ZAR | | | 185,467 | | | 1/3/2025 | | | NWM | | | | 616 | | | | - | | | | 616 | |
| USD | | | 186,104 | | | ZAR | | | 185,467 | | | 1/3/2025 | | | NWM | | | | 637 | | | | - | | | | 637 | |
| USD | | | 186,111 | | | ZAR | | | 185,467 | | | 1/3/2025 | | | NWM | | | | 644 | | | | - | | | | 644 | |
| USD | | | 186,241 | | | ZAR | | | 185,467 | | | 1/3/2025 | | | NWM | | | | 774 | | | | - | | | | 774 | |
| USD | | | 186,249 | | | ZAR | | | 185,467 | | | 1/3/2025 | | | NWM | | | | 782 | | | | - | | | | 782 | |
| USD | | | 186,266 | | | ZAR | | | 185,467 | | | 1/3/2025 | | | NWM | | | | 799 | | | | - | | | | 799 | |
| USD | | | 186,301 | | | ZAR | | | 185,467 | | | 1/3/2025 | | | NWM | | | | 834 | | | | - | | | | 834 | |
| USD | | | 186,304 | | | ZAR | | | 185,467 | | | 1/3/2025 | | | NWM | | | | 837 | | | | - | | | | 837 | |
| USD | | | 186,307 | | | ZAR | | | 185,467 | | | 1/3/2025 | | | NWM | | | | 840 | | | | - | | | | 840 | |
| USD | | | 186,313 | | | ZAR | | | 185,467 | | | 1/3/2025 | | | NWM | | | | 846 | | | | - | | | | 846 | |
| USD | | | 186,318 | | | ZAR | | | 185,467 | | | 1/3/2025 | | | NWM | | | | 851 | | | | - | | | | 851 | |
| USD | | | 186,332 | | | ZAR | | | 185,467 | | | 1/3/2025 | | | NWM | | | | 865 | | | | - | | | | 865 | |
| USD | | | 186,349 | | | ZAR | | | 185,467 | | | 1/3/2025 | | | NWM | | | | 882 | | | | - | | | | 882 | |
| USD | | | 186,414 | | | ZAR | | | 185,467 | | | 1/3/2025 | | | NWM | | | | 947 | | | | - | | | | 947 | |
| USD | | | 186,415 | | | ZAR | | | 185,467 | | | 1/3/2025 | | | NWM | | | | 948 | | | | - | | | | 948 | |
| USD | | | 186,426 | | | ZAR | | | 185,467 | | | 1/3/2025 | | | NWM | | | | 959 | | | | - | | | | 959 | |
| USD | | | 186,428 | | | ZAR | | | 185,467 | | | 1/3/2025 | | | NWM | | | | 961 | | | | - | | | | 961 | |
| USD | | | 186,443 | | | ZAR | | | 185,467 | | | 1/3/2025 | | | NWM | | | | 976 | | | | - | | | | 976 | |
| USD | | | 186,445 | | | ZAR | | | 185,467 | | | 1/3/2025 | | | NWM | | | | 978 | | | | - | | | | 978 | |
| USD | | | 186,465 | | | ZAR | | | 185,467 | | | 1/3/2025 | | | NWM | | | | 998 | | | | - | | | | 998 | |
| USD | | | 186,487 | | | ZAR | | | 185,467 | | | 1/3/2025 | | | NWM | | | | 1,020 | | | | - | | | | 1,020 | |
| USD | | | 186,497 | | | ZAR | | | 185,467 | | | 1/3/2025 | | | NWM | | | | 1,030 | | | | - | | | | 1,030 | |
| USD | | | 186,498 | | | ZAR | | | 185,467 | | | 1/3/2025 | | | NWM | | | | 1,031 | | | | - | | | | 1,031 | |
| USD | | | 186,501 | | | ZAR | | | 185,467 | | | 1/3/2025 | | | NWM | | | | 1,034 | | | | - | | | | 1,034 | |
| USD | | | 186,526 | | | ZAR | | | 185,467 | | | 1/3/2025 | | | NWM | | | | 1,059 | | | | - | | | | 1,059 | |
See accompanying notes
69
American Beacon AHL Managed Futures Strategy FundSM
Consolidated Schedule of Investments
December 31, 2024
| | | | | | | | | | | | | | | | | | | | | | | | | | | | |
| | | | | | |
| Currency Purchased* | | | Currency Sold* | | | Settlement
Date | | Counterparty | | | Unrealized
Appreciation | | | Unrealized
(Depreciation) | | | Net Unrealized
Appreciation
(Depreciation) | |
| USD | | | 186,553 | | | ZAR | | | 185,467 | | | 1/3/2025 | | | NWM | | | $ | 1,086 | | | $ | - | | | $ | 1,086 | |
| USD | | | 186,568 | | | ZAR | | | 185,467 | | | 1/3/2025 | | | NWM | | | | 1,101 | | | | - | | | | 1,101 | |
| USD | | | 186,604 | | | ZAR | | | 185,467 | | | 1/3/2025 | | | NWM | | | | 1,137 | | | | - | | | | 1,137 | |
| USD | | | 186,607 | | | ZAR | | | 185,467 | | | 1/3/2025 | | | NWM | | | | 1,140 | | | | - | | | | 1,140 | |
| USD | | | 186,610 | | | ZAR | | | 185,467 | | | 1/3/2025 | | | NWM | | | | 1,143 | | | | - | | | | 1,143 | |
| USD | | | 186,624 | | | ZAR | | | 185,467 | | | 1/3/2025 | | | NWM | | | | 1,157 | | | | - | | | | 1,157 | |
| USD | | | 186,626 | | | ZAR | | | 185,467 | | | 1/3/2025 | | | NWM | | | | 1,159 | | | | - | | | | 1,159 | |
| USD | | | 186,641 | | | ZAR | | | 185,467 | | | 1/3/2025 | | | NWM | | | | 1,174 | | | | - | | | | 1,174 | |
| USD | | | 186,646 | | | ZAR | | | 185,467 | | | 1/3/2025 | | | NWM | | | | 1,179 | | | | - | | | | 1,179 | |
| USD | | | 186,673 | | | ZAR | | | 185,467 | | | 1/3/2025 | | | NWM | | | | 1,206 | | | | - | | | | 1,206 | |
| USD | | | 186,674 | | | ZAR | | | 185,467 | | | 1/3/2025 | | | NWM | | | | 1,207 | | | | - | | | | 1,207 | |
| USD | | | 186,675 | | | ZAR | | | 185,467 | | | 1/3/2025 | | | NWM | | | | 1,208 | | | | - | | | | 1,208 | |
| USD | | | 186,683 | | | ZAR | | | 185,467 | | | 1/3/2025 | | | NWM | | | | 1,216 | | | | - | | | | 1,216 | |
| USD | | | 186,701 | | | ZAR | | | 185,467 | | | 1/3/2025 | | | NWM | | | | 1,234 | | | | - | | | | 1,234 | |
| USD | | | 186,705 | | | ZAR | | | 185,467 | | | 1/3/2025 | | | NWM | | | | 1,238 | | | | - | | | | 1,238 | |
| USD | | | 186,746 | | | ZAR | | | 185,467 | | | 1/3/2025 | | | NWM | | | | 1,279 | | | | - | | | | 1,279 | |
| USD | | | 186,753 | | | ZAR | | | 185,467 | | | 1/3/2025 | | | NWM | | | | 1,286 | | | | - | | | | 1,286 | |
| USD | | | 186,854 | | | ZAR | | | 185,467 | | | 1/3/2025 | | | NWM | | | | 1,387 | | | | - | | | | 1,387 | |
| USD | | | 186,977 | | | ZAR | | | 185,467 | | | 1/3/2025 | | | NWM | | | | 1,510 | | | | - | | | | 1,510 | |
| USD | | | 187,063 | | | ZAR | | | 185,467 | | | 1/3/2025 | | | NWM | | | | 1,596 | | | | - | | | | 1,596 | |
| USD | | | 187,066 | | | ZAR | | | 185,467 | | | 1/3/2025 | | | NWM | | | | 1,599 | | | | - | | | | 1,599 | |
| SEK | | | 206,790 | | | EUR | | | 207,170 | | | 1/3/2025 | | | NWM | | | | - | | | | (380 | ) | | | (380 | ) |
| USD | | | 212,139 | | | ZAR | | | 211,963 | | | 1/3/2025 | | | NWM | | | | 176 | | | | - | | | | 176 | |
| USD | | | 212,251 | | | ZAR | | | 211,963 | | | 1/3/2025 | | | NWM | | | | 288 | | | | - | | | | 288 | |
| USD | | | 212,611 | | | ZAR | | | 211,963 | | | 1/3/2025 | | | NWM | | | | 648 | | | | - | | | | 648 | |
| USD | | | 213,006 | | | ZAR | | | 211,963 | | | 1/3/2025 | | | NWM | | | | 1,043 | | | | - | | | | 1,043 | |
| USD | | | 213,014 | | | ZAR | | | 211,963 | | | 1/3/2025 | | | NWM | | | | 1,051 | | | | - | | | | 1,051 | |
| USD | | | 213,124 | | | ZAR | | | 211,963 | | | 1/3/2025 | | | NWM | | | | 1,161 | | | | - | | | | 1,161 | |
| USD | | | 213,130 | | | ZAR | | | 211,963 | | | 1/3/2025 | | | NWM | | | | 1,167 | | | | - | | | | 1,167 | |
| USD | | | 213,173 | | | ZAR | | | 211,963 | | | 1/3/2025 | | | NWM | | | | 1,210 | | | | - | | | | 1,210 | |
| USD | | | 213,271 | | | ZAR | | | 211,963 | | | 1/3/2025 | | | NWM | | | | 1,308 | | | | - | | | | 1,308 | |
| USD | | | 213,298 | | | ZAR | | | 211,963 | | | 1/3/2025 | | | NWM | | | | 1,335 | | | | - | | | | 1,335 | |
| USD | | | 213,315 | | | ZAR | | | 211,963 | | | 1/3/2025 | | | NWM | | | | 1,352 | | | | - | | | | 1,352 | |
| USD | | | 213,659 | | | ZAR | | | 211,963 | | | 1/3/2025 | | | NWM | | | | 1,696 | | | | - | | | | 1,696 | |
| USD | | | 213,696 | | | ZAR | | | 211,963 | | | 1/3/2025 | | | NWM | | | | 1,733 | | | | - | | | | 1,733 | |
| USD | | | 221,455 | | | CHF | | | 220,374 | | | 1/3/2025 | | | NWM | | | | 1,081 | | | | - | | | | 1,081 | |
| USD | | | 221,769 | | | CHF | | | 220,374 | | | 1/3/2025 | | | NWM | | | | 1,395 | | | | - | | | | 1,395 | |
| USD | | | 221,823 | | | CHF | | | 220,374 | | | 1/3/2025 | | | NWM | | | | 1,449 | | | | - | | | | 1,449 | |
| USD | | | 221,828 | | | CHF | | | 220,374 | | | 1/3/2025 | | | NWM | | | | 1,454 | | | | - | | | | 1,454 | |
| USD | | | 239,236 | | | ZAR | | | 238,458 | | | 1/3/2025 | | | NWM | | | | 778 | | | | - | | | | 778 | |
| USD | | | 265,508 | | | ZAR | | | 264,953 | | | 1/3/2025 | | | NWM | | | | 555 | | | | - | | | | 555 | |
| USD | | | 265,676 | | | ZAR | | | 264,953 | | | 1/3/2025 | | | NWM | | | | 723 | | | | - | | | | 723 | |
| USD | | | 133,171 | | | ZAR | | | 132,477 | | | 1/3/2025 | | | NWM | | | | 694 | | | | - | | | | 694 | |
| USD | | | 133,171 | | | ZAR | | | 132,477 | | | 1/3/2025 | | | NWM | | | | 694 | | | | - | | | | 694 | |
| USD | | | 133,276 | | | ZAR | | | 132,477 | | | 1/3/2025 | | | NWM | | | | 799 | | | | - | | | | 799 | |
| USD | | | 133,276 | | | ZAR | | | 132,477 | | | 1/3/2025 | | | NWM | | | | 799 | | | | - | | | | 799 | |
| USD | | | 133,279 | | | ZAR | | | 132,477 | | | 1/3/2025 | | | NWM | | | | 802 | | | | - | | | | 802 | |
| USD | | | 133,279 | | | ZAR | | | 132,477 | | | 1/3/2025 | | | NWM | | | | 802 | | | | - | | | | 802 | |
| USD | | | 291,936 | | | ZAR | | | 291,449 | | | 1/3/2025 | | | NWM | | | | 487 | | | | - | | | | 487 | |
| USD | | | 292,421 | | | ZAR | | | 291,449 | | | 1/3/2025 | | | NWM | | | | 972 | | | | - | | | | 972 | |
| USD | | | 318,488 | | | ZAR | | | 317,944 | | | 1/3/2025 | | | NWM | | | | 544 | | | | - | | | | 544 | |
| USD | | | 332,576 | | | CHF | | | 330,560 | | | 1/3/2025 | | | NWM | | | | 2,016 | | | | - | | | | 2,016 | |
| USD | | | 332,602 | | | CHF | | | 330,560 | | | 1/3/2025 | | | NWM | | | | 2,042 | | | | - | | | | 2,042 | |
| USD | | | 186,642 | | | ZAR | | | 185,467 | | | 1/3/2025 | | | NWM | | | | 1,175 | | | | - | | | | 1,175 | |
| USD | | | 186,642 | | | ZAR | | | 185,467 | | | 1/3/2025 | | | NWM | | | | 1,175 | | | | - | | | | 1,175 | |
| USD | | | 443,444 | | | CHF | | | 440,747 | | | 1/3/2025 | | | NWM | | | | 2,697 | | | | - | | | | 2,697 | |
| USD | | | 554,103 | | | CHF | | | 550,934 | | | 1/3/2025 | | | NWM | | | | 3,169 | | | | - | | | | 3,169 | |
| USD | | | 554,293 | | | CHF | | | 550,934 | | | 1/3/2025 | | | NWM | | | | 3,359 | | | | - | | | | 3,359 | |
| USD | | | 554,336 | | | CHF | | | 550,934 | | | 1/3/2025 | | | NWM | | | | 3,402 | | | | - | | | | 3,402 | |
See accompanying notes
70
American Beacon AHL Managed Futures Strategy FundSM
Consolidated Schedule of Investments
December 31, 2024
| | | | | | | | | | | | | | | | | | | | | | | | | | | | |
| | | | | | |
| Currency Purchased* | | | Currency Sold* | | | Settlement
Date | | Counterparty | | | Unrealized
Appreciation | | | Unrealized
(Depreciation) | | | Net Unrealized
Appreciation
(Depreciation) | |
| USD | | | 664,901 | | | CHF | | | 661,121 | | | 1/3/2025 | | | NWM | | | $ | 3,780 | | | $ | - | | | $ | 3,780 | |
| CHF | | | 4,407,471 | | | USD | | | 4,423,554 | | | 1/3/2025 | | | NWM | | | | - | | | | (16,083 | ) | | | (16,083 | ) |
| EUR | | | 103,597 | | | JPY | | | 104,288 | | | 1/6/2025 | | | NWM | | | | - | | | | (691 | ) | | | (691 | ) |
| EUR | | | 103,597 | | | JPY | | | 104,353 | | | 1/6/2025 | | | NWM | | | | - | | | | (756 | ) | | | (756 | ) |
| EUR | | | 103,597 | | | JPY | | | 104,368 | | | 1/6/2025 | | | NWM | | | | - | | | | (771 | ) | | | (771 | ) |
| EUR | | | 103,597 | | | JPY | | | 104,470 | | | 1/6/2025 | | | NWM | | | | - | | | | (873 | ) | | | (873 | ) |
| EUR | | | 103,597 | | | JPY | | | 104,477 | | | 1/6/2025 | | | NWM | | | | - | | | | (880 | ) | | | (880 | ) |
| EUR | | | 103,597 | | | JPY | | | 104,503 | | | 1/6/2025 | | | NWM | | | | - | | | | (906 | ) | | | (906 | ) |
| USD | | | 110,327 | | | CHF | | | 110,187 | | | 1/6/2025 | | | NWM | | | | 140 | | | | - | | | | 140 | |
| USD | | | 110,452 | | | CHF | | | 110,187 | | | 1/6/2025 | | | NWM | | | | 265 | | | | - | | | | 265 | |
| USD | | | 110,473 | | | CHF | | | 110,187 | | | 1/6/2025 | | | NWM | | | | 286 | | | | - | | | | 286 | |
| USD | | | 110,505 | | | CHF | | | 110,187 | | | 1/6/2025 | | | NWM | | | | 318 | | | | - | | | | 318 | |
| USD | | | 110,583 | | | CHF | | | 110,187 | | | 1/6/2025 | | | NWM | | | | 396 | | | | - | | | | 396 | |
| USD | | | 110,645 | | | CHF | | | 110,187 | | | 1/6/2025 | | | NWM | | | | 458 | | | | - | | | | 458 | |
| USD | | | 110,657 | | | CHF | | | 110,187 | | | 1/6/2025 | | | NWM | | | | 470 | | | | - | | | | 470 | |
| USD | | | 110,683 | | | CHF | | | 110,187 | | | 1/6/2025 | | | NWM | | | | 496 | | | | - | | | | 496 | |
| USD | | | 110,695 | | | CHF | | | 110,187 | | | 1/6/2025 | | | NWM | | | | 508 | | | | - | | | | 508 | |
| USD | | | 110,724 | | | CHF | | | 110,187 | | | 1/6/2025 | | | NWM | | | | 537 | | | | - | | | | 537 | |
| EUR | | | 207,195 | | | JPY | | | 208,645 | | | 1/6/2025 | | | NWM | | | | - | | | | (1,450 | ) | | | (1,450 | ) |
| EUR | | | 207,195 | | | JPY | | | 209,022 | | | 1/6/2025 | | | NWM | | | | - | | | | (1,827 | ) | | | (1,827 | ) |
| USD | | | 220,361 | | | CHF | | | 220,374 | | | 1/6/2025 | | | NWM | | | | - | | | | (13 | ) | | | (13 | ) |
| USD | | | 220,505 | | | CHF | | | 220,374 | | | 1/6/2025 | | | NWM | | | | 131 | | | | - | | | | 131 | |
| USD | | | 220,707 | | | CHF | | | 220,374 | | | 1/6/2025 | | | NWM | | | | 333 | | | | - | | | | 333 | |
| USD | | | 220,853 | | | CHF | | | 220,374 | | | 1/6/2025 | | | NWM | | | | 479 | | | | - | | | | 479 | |
| USD | | | 220,958 | | | CHF | | | 220,374 | | | 1/6/2025 | | | NWM | | | | 584 | | | | - | | | | 584 | |
| USD | | | 221,078 | | | CHF | | | 220,374 | | | 1/6/2025 | | | NWM | | | | 704 | | | | - | | | | 704 | |
| USD | | | 221,239 | | | CHF | | | 220,374 | | | 1/6/2025 | | | NWM | | | | 865 | | | | - | | | | 865 | |
| EUR | | | 310,792 | | | JPY | | | 313,087 | | | 1/6/2025 | | | NWM | | | | - | | | | (2,295 | ) | | | (2,295 | ) |
| EUR | | | 310,792 | | | JPY | | | 313,186 | | | 1/6/2025 | | | NWM | | | | - | | | | (2,394 | ) | | | (2,394 | ) |
| EUR | | | 310,793 | | | JPY | | | 313,234 | | | 1/6/2025 | | | NWM | | | | - | | | | (2,441 | ) | | | (2,441 | ) |
| EUR | | | 310,793 | | | JPY | | | 313,314 | | | 1/6/2025 | | | NWM | | | | - | | | | (2,521 | ) | | | (2,521 | ) |
| USD | | | 331,407 | | | CHF | | | 330,560 | | | 1/6/2025 | | | NWM | | | | 847 | | | | - | | | | 847 | |
| USD | | | 331,602 | | | CHF | | | 330,560 | | | 1/6/2025 | | | NWM | | | | 1,042 | | | | - | | | | 1,042 | |
| USD | | | 331,609 | | | CHF | | | 330,560 | | | 1/6/2025 | | | NWM | | | | 1,049 | | | | - | | | | 1,049 | |
| USD | | | 331,682 | | | CHF | | | 330,560 | | | 1/6/2025 | | | NWM | | | | 1,122 | | | | - | | | | 1,122 | |
| USD | | | 332,134 | | | CHF | | | 330,560 | | | 1/6/2025 | | | NWM | | | | 1,574 | | | | - | | | | 1,574 | |
| EUR | | | 414,390 | | | JPY | | | 417,920 | | | 1/6/2025 | | | NWM | | | | - | | | | (3,530 | ) | | | (3,530 | ) |
| EUR | | | 414,390 | | | JPY | | | 418,052 | | | 1/6/2025 | | | NWM | | | | - | | | | (3,662 | ) | | | (3,662 | ) |
| USD | | | 441,847 | | | CHF | | | 440,747 | | | 1/6/2025 | | | NWM | | | | 1,100 | | | | - | | | | 1,100 | |
| USD | | | 442,914 | | | CHF | | | 440,747 | | | 1/6/2025 | | | NWM | | | | 2,167 | | | | - | | | | 2,167 | |
| EUR | | | 517,987 | | | JPY | | | 522,409 | | | 1/6/2025 | | | NWM | | | | - | | | | (4,422 | ) | | | (4,422 | ) |
| EUR | | | 517,987 | | | JPY | | | 523,496 | | | 1/6/2025 | | | NWM | | | | - | | | | (5,509 | ) | | | (5,509 | ) |
| USD | | | 554,053 | | | CHF | | | 550,934 | | | 1/6/2025 | | | NWM | | | | 3,119 | | | | - | | | | 3,119 | |
| JPY | | | 4,183,441 | | | EUR | | | 4,143,901 | | | 1/6/2025 | | | NWM | | | | 39,540 | | | | - | | | | 39,540 | |
| EUR | | | 103,602 | | | JPY | | | 104,558 | | | 1/7/2025 | | | NWM | | | | - | | | | (956 | ) | | | (956 | ) |
| EUR | | | 103,602 | | | JPY | | | 104,588 | | | 1/7/2025 | | | NWM | | | | - | | | | (986 | ) | | | (986 | ) |
| EUR | | | 103,602 | | | JPY | | | 104,597 | | | 1/7/2025 | | | NWM | | | | - | | | | (995 | ) | | | (995 | ) |
| EUR | | | 103,602 | | | JPY | | | 104,598 | | | 1/7/2025 | | | NWM | | | | - | | | | (996 | ) | | | (996 | ) |
| EUR | | | 103,602 | | | JPY | | | 104,683 | | | 1/7/2025 | | | NWM | | | | - | | | | (1,081 | ) | | | (1,081 | ) |
| EUR | | | 207,203 | | | JPY | | | 207,793 | | | 1/7/2025 | | | NWM | | | | - | | | | (590 | ) | | | (590 | ) |
| EUR | | | 207,203 | | | JPY | | | 209,495 | | | 1/7/2025 | | | NWM | | | | - | | | | (2,292 | ) | | | (2,292 | ) |
| EUR | | | 207,204 | | | JPY | | | 209,114 | | | 1/7/2025 | | | NWM | | | | - | | | | (1,910 | ) | | | (1,910 | ) |
| EUR | | | 103,602 | | | JPY | | | 104,714 | | | 1/7/2025 | | | NWM | | | | - | | | | (1,112 | ) | | | (1,112 | ) |
| EUR | | | 103,602 | | | JPY | | | 104,714 | | | 1/7/2025 | | | NWM | | | | - | | | | (1,112 | ) | | | (1,112 | ) |
| EUR | | | 310,806 | | | JPY | | | 313,795 | | | 1/7/2025 | | | NWM | | | | - | | | | (2,989 | ) | | | (2,989 | ) |
| EUR | | | 414,407 | | | JPY | | | 418,236 | | | 1/7/2025 | | | NWM | | | | - | | | | (3,829 | ) | | | (3,829 | ) |
| EUR | | | 414,407 | | | JPY | | | 418,370 | | | 1/7/2025 | | | NWM | | | | - | | | | (3,963 | ) | | | (3,963 | ) |
| EUR | | | 518,008 | | | JPY | | | 522,765 | | | 1/7/2025 | | | NWM | | | | - | | | | (4,757 | ) | | | (4,757 | ) |
| EUR | | | 518,009 | | | JPY | | | 517,443 | | | 1/7/2025 | | | NWM | | | | 566 | | | | - | | | | 566 | |
See accompanying notes
71
American Beacon AHL Managed Futures Strategy FundSM
Consolidated Schedule of Investments
December 31, 2024
| | | | | | | | | | | | | | | | | | | | | | | | | | | | |
| | | | | | |
| Currency Purchased* | | | Currency Sold* | | | Settlement
Date | | Counterparty | | | Unrealized
Appreciation | | | Unrealized
(Depreciation) | | | Net Unrealized
Appreciation
(Depreciation) | |
| EUR | | | 518,009 | | | JPY | | | 523,029 | | | 1/7/2025 | | | NWM | | | $ | - | | | $ | (5,020 | ) | | $ | (5,020 | ) |
| EUR | | | 518,009 | | | JPY | | | 523,379 | | | 1/7/2025 | | | NWM | | | | - | | | | (5,370 | ) | | | (5,370 | ) |
| USD | | | 161 | | | HUF | | | 162 | | | 1/16/2025 | | | NWM | | | | - | | | | (1 | ) | | | (1 | ) |
| USD | | | 361 | | | CHF | | | 348 | | | 1/16/2025 | | | NWM | | | | 13 | | | | - | | | | 13 | |
| USD | | | 759 | | | HUF | | | 753 | | | 1/16/2025 | | | NWM | | | | 6 | | | | - | | | | 6 | |
| HUF | | | 1,351 | | | USD | | | 1,375 | | | 1/16/2025 | | | NWM | | | | - | | | | (24 | ) | | | (24 | ) |
| USD | | | 2,122 | | | HUF | | | 2,129 | | | 1/16/2025 | | | NWM | | | | - | | | | (7 | ) | | | (7 | ) |
| USD | | | 2,383 | | | HUF | | | 2,342 | | | 1/16/2025 | | | NWM | | | | 41 | | | | - | | | | 41 | |
| HUF | | | 2,594 | | | USD | | | 2,654 | | | 1/16/2025 | | | NWM | | | | - | | | | (60 | ) | | | (60 | ) |
| USD | | | 2,766 | | | HUF | | | 2,726 | | | 1/16/2025 | | | NWM | | | | 40 | | | | - | | | | 40 | |
| USD | | | 4,799 | | | CHF | | | 4,756 | | | 1/16/2025 | | | NWM | | | | 43 | | | | - | | | | 43 | |
| USD | | | 8,507 | | | HUF | | | 8,370 | | | 1/16/2025 | | | NWM | | | | 137 | | | | - | | | | 137 | |
| CHF | | | 9,616 | | | USD | | | 9,661 | | | 1/16/2025 | | | NWM | | | | - | | | | (45 | ) | | | (45 | ) |
| CHF | | | 12,258 | | | USD | | | 12,477 | | | 1/16/2025 | | | NWM | | | | - | | | | (219 | ) | | | (219 | ) |
| USD | | | 23,127 | | | CHF | | | 22,774 | | | 1/16/2025 | | | NWM | | | | 353 | | | | - | | | | 353 | |
| USD | | | 29,846 | | | CHF | | | 29,197 | | | 1/16/2025 | | | NWM | | | | 649 | | | | - | | | | 649 | |
| USD | | | 30,079 | | | CHF | | | 29,602 | | | 1/16/2025 | | | NWM | | | | 477 | | | | - | | | | 477 | |
| USD | | | 54,965 | | | CHF | | | 54,419 | | | 1/16/2025 | | | NWM | | | | 546 | | | | - | | | | 546 | |
| HUF | | | 66,462 | | | USD | | | 67,558 | | | 1/16/2025 | | | NWM | | | | - | | | | (1,096 | ) | | | (1,096 | ) |
| USD | | | 137,024 | | | CHF | | | 135,093 | | | 1/16/2025 | | | NWM | | | | 1,931 | | | | - | | | | 1,931 | |
| USD | | | 169,356 | | | CHF | | | 166,391 | | | 1/16/2025 | | | NWM | | | | 2,965 | | | | - | | | | 2,965 | |
| USD | | | 1,614,367 | | | CHF | | | 1,591,351 | | | 1/16/2025 | | | NWM | | | | 23,016 | | | | - | | | | 23,016 | |
| JPY | | | 503,316 | | | EUR | | | 518,296 | | | 1/21/2025 | | | NWM | | | | - | | | | (14,980 | ) | | | (14,980 | ) |
| EUR | | | 518,296 | | | JPY | | | 504,688 | | | 1/21/2025 | | | NWM | | | | 13,608 | | | | - | | | | 13,608 | |
| EUR | | | 518,296 | | | JPY | | | 516,645 | | | 1/21/2025 | | | NWM | | | | 1,651 | | | | - | | | | 1,651 | |
| JPY | | | 929,166 | | | EUR | | | 932,931 | | | 1/21/2025 | | | NWM | | | | - | | | | (3,765 | ) | | | (3,765 | ) |
| JPY | | | 1,140,722 | | | EUR | | | 1,140,251 | | | 1/21/2025 | | | NWM | | | | 471 | | | | - | | | | 471 | |
| EUR | | | 1,347,569 | | | JPY | | | 1,343,964 | | | 1/21/2025 | | | NWM | | | | 3,605 | | | | - | | | | 3,605 | |
| JPY | | | 1,602,056 | | | EUR | | | 1,658,547 | | | 1/21/2025 | | | NWM | | | | - | | | | (56,491 | ) | | | (56,491 | ) |
| JPY | | | 2,021,580 | | | EUR | | | 2,073,183 | | | 1/21/2025 | | | NWM | | | | - | | | | (51,603 | ) | | | (51,603 | ) |
| JPY | | | 2;2.97,727 | | | EUR | | | 2,384,161 | | | 1/21/2025 | | | NWM | | | | - | | | | (86,434 | ) | | | (86,434 | ) |
| JPY | | | 2,558,412 | | | EUR | | | 2,591,479 | | | 1/21/2025 | | | NWM | | | | - | | | | (33,067 | ) | | | (33,067 | ) |
| JPY | | | 2,904,916 | | | EUR | | | 3,006,116 | | | 1/21/2025 | | | NWM | | | | - | | | | (101,200 | ) | | | (101,200 | ) |
| EUR | | | 3,109,775 | | | JPY | | | 3,052,506 | | | 1/21/2025 | | | NWM | | | | 57,269 | | | | - | | | | 57,269 | |
| EUR | | | 3,524,412 | | | JPY | | | 3,449,379 | | | 1/21/2025 | | | NWM | | | | 75,033 | | | | - | | | | 75,033 | |
| EUR | | | 3,628,071 | | | JPY | | | 3,592,468 | | | 1/21/2025 | | | NWM | | | | 35,603 | | | | - | | | | 35,603 | |
| JPY | | | 3,804,904 | | | EUR | | | 3,835,388 | | | 1/21/2025 | | | NWM | | | | - | | | | (30,484 | ) | | | (30,484 | ) |
| JPY | | | 4,001,079 | | | EUR | | | 4,146,367 | | | 1/21/2025 | | | NWM | | | | - | | | | (145,288 | ) | | | (145,288 | ) |
| EUR | | | 4,146,366 | | | JPY | | | 4,092,109 | | | 1/21/2025 | | | NWM | | | | 54,257 | | | | - | | | | 54,257 | |
| EUR | | | 4,146,367 | | | JPY | | | 4,185,475 | | | 1/21/2025 | | | NWM | | | | - | | | | (39,108 | ) | | | (39,108 | ) |
| EUR | | | 4;2.50,026 | | | JPY | | | 4;2.01,079 | | | 1/21/2025 | | | NWM | | | | 48,947 | | | | - | | | | 48,947 | |
| EUR | | | 5,079,299 | | | JPY | | | 5,119,983 | | | 1/21/2025 | | | NWM | | | | - | | | | (40,684 | ) | | | (40,684 | ) |
| JPY | | | 5,383,607 | | | EUR | | | 5,390,276 | | | 1/21/2025 | | | NWM | | | | - | | | | (6,669 | ) | | | (6,669 | ) |
| JPY | | | 6,461,752 | | | EUR | | | 6,426,867 | | | 1/21/2025 | | | NWM | | | | 34,885 | | | | - | | | | 34,885 | |
| JPY | | | 9,642,858 | | | EUR | | | 9,951,280 | | | 1/21/2025 | | | NWM | | | | - | | | | (308,422 | ) | | | (308,422 | ) |
| JPY | | | 10,123,147 | | | EUR | | | 10;2.62,257 | | | 1/21/2025 | | | NWM | | | | - | | | | (139,110 | ) | | | (139,110 | ) |
| EUR | | | 36,046,176 | | | JPY | | | 36;2.28,214 | | | 1/21/2025 | | | NWM | | | | - | | | | (182,038 | ) | | | (182,038 | ) |
| EUR | | | 38,692,083 | | | JPY | | | 38,896,750 | | | 1/21/2025 | | | NWM | | | | - | | | | (204,667 | ) | | | (204,667 | ) |
| ZAR | | | 1,829,624 | | | USD | | | 1,933,523 | | | 1/29/2025 | | | NWM | | | | - | | | | (103,899 | ) | | | (103,899 | ) |
| USD | | | 2,315,107 | | | ZAR | | | 2;2.92,709 | | | 1/29/2025 | | | NWM | | | | 22,398 | | | | - | | | | 22,398 | |
| ZAR | | | 2,767,558 | | | USD | | | 2,953,390 | | | 1/29/2025 | | | NWM | | | | - | | | | (185,832 | ) | | | (185,832 | ) |
| USD | | | 2,970,003 | | | ZAR | | | 2,939,366 | | | 1/29/2025 | | | NWM | | | | 30,637 | | | | - | | | | 30,637 | |
| USD | | | 2,973,014 | | | ZAR | | | 2,852,347 | | | 1/29/2025 | | | NWM | | | | 120,667 | | | | - | | | | 120,667 | |
| ZAR | | | 3;2.28,818 | | | USD | | | 3,445,554 | | | 1/29/2025 | | | NWM | | | | - | | | | (216,736 | ) | | | (216,736 | ) |
| USD | | | 3,782,217 | | | ZAR | | | 3,739,598 | | | 1/29/2025 | | | NWM | | | | 42,619 | | | | - | | | | 42,619 | |
| ZAR | | | 3,900,816 | | | USD | | | 4,106,449 | | | 1/29/2025 | | | NWM | | | | - | | | | (205,633 | ) | | | (205,633 | ) |
| ZAR | | | 3,980,613 | | | USD | | | 4,138,557 | | | 1/29/2025 | | | NWM | | | | - | | | | (157,944 | ) | | | (157,944 | ) |
| USD | | | 4,056,721 | | | ZAR | | | 3,935,572 | | | 1/29/2025 | | | NWM | | | | 121,149 | | | | - | | | | 121,149 | |
| USD | | | 4,123,855 | | | ZAR | | | 4,074,131 | | | 1/29/2025 | | | NWM | | | | 49,724 | | | | - | | | | 49,724 | |
See accompanying notes
72
American Beacon AHL Managed Futures Strategy FundSM
Consolidated Schedule of Investments
December 31, 2024
| | | | | | | | | | | | | | | | | | | | | | | | | | | | |
| | | | | | |
| Currency Purchased* | | | Currency Sold* | | | Settlement
Date | | Counterparty | | | Unrealized
Appreciation | | | Unrealized
(Depreciation) | | | Net Unrealized
Appreciation
(Depreciation) | |
| USD | | | 4,352,506 | | | ZAR | | | 4,338,665 | | | 1/29/2025 | | | NWM | | | $ | 13,841 | | | $ | - | | | $ | 13,841 | |
| ZAR | | | 4,505,978 | | | USD | | | 4,757,025 | | | 1/29/2025 | | | NWM | | | | - | | | | (251,047 | ) | | | (251,047 | ) |
| USD | | | 4,540,671 | | | ZAR | | | 4,487,518 | | | 1/29/2025 | | | NWM | | | | 53,153 | | | | - | | | | 53,153 | |
| USD | | | 4,553,960 | | | ZAR | | | 4,428,504 | | | 1/29/2025 | | | NWM | | | | 125,456 | | | | - | | | | 125,456 | |
| ZAR | | | 4,916,097 | | | USD | | | 5,110,194 | | | 1/29/2025 | | | NWM | | | | - | | | | (194,097 | ) | | | (194,097 | ) |
| USD | | | 4,948,753 | | | ZAR | | | 4,927,636 | | | 1/29/2025 | | | NWM | | | | 21,117 | | | | - | | | | 21,117 | |
| USD | | | 4,977,610 | | | ZAR | | | 4,958,475 | | | 1/29/2025 | | | NWM | | | | 19,135 | | | | - | | | | 19,135 | |
| ZAR | | | 5,114,631 | | | USD | | | 5,406,436 | | | 1/29/2025 | | | NWM | | | | - | | | | (291,805 | ) | | | (291,805 | ) |
| ZAR | | | 5,151,381 | | | USD | | | 5,350,839 | | | 1/29/2025 | | | NWM | | | | - | | | | (199,458 | ) | | | (199,458 | ) |
| USD | | | 5;2.04,871 | | | ZAR | | | 5,051,615 | | | 1/29/2025 | | | NWM | | | | 153,256 | | | | - | | | | 153,256 | |
| USD | | | 5,348,954 | | | ZAR | | | 5,197,907 | | | 1/29/2025 | | | NWM | | | | 151,047 | | | | - | | | | 151,047 | |
| USD | | | 5,660,089 | | | ZAR | | | 5,631,584 | | | 1/29/2025 | | | NWM | | | | 28,505 | | | | - | | | | 28,505 | |
| ZAR | | | 5,946,891 | | | USD | | | 6;2.09,940 | | | 1/29/2025 | | | NWM | | | | - | | | | (263,049 | ) | | | (263,049 | ) |
| USD | | | 5,994,266 | | | ZAR | | | 5,934,027 | | | 1/29/2025 | | | NWM | | | | 60,239 | | | | - | | | | 60,239 | |
| ZAR | | | 6,078,459 | | | USD | | | 6,375,569 | | | 1/29/2025 | | | NWM | | | | - | | | | (297,110 | ) | | | (297,110 | ) |
| USD | | | 6,099,859 | | | ZAR | | | 5,942,529 | | | 1/29/2025 | | | NWM | | | | 157,330 | | | | - | | | | 157,330 | |
| ZAR | | | 6,181,657 | | | USD | | | 6,430,160 | | | 1/29/2025 | | | NWM | | | | - | | | | (248,503 | ) | | | (248,503 | ) |
| USD | | | 6,210,707 | | | ZAR | | | 6,198,093 | | | 1/29/2025 | | | NWM | | | | 12,614 | | | | - | | | | 12,614 | |
| USD | | | 6,238,580 | | | ZAR | | | 6,064,225 | | | 1/29/2025 | | | NWM | | | | 174,355 | | | | - | | | | 174,355 | |
| ZAR | | | 6,241,305 | | | USD | | | 6,572,524 | | | 1/29/2025 | | | NWM | | | | - | | | | (331,219 | ) | | | (331,219 | ) |
| USD | | | 6,246,598 | | | ZAR | | | 6,064,225 | | | 1/29/2025 | | | NWM | | | | 182,373 | | | | - | | | | 182,373 | |
| ZAR | | | 6,368,980 | | | USD | | | 6,621,464 | | | 1/29/2025 | | | NWM | | | | - | | | | (252,484 | ) | | | (252,484 | ) |
| ZAR | | | 6,794,841 | | | USD | | | 7,164,611 | | | 1/29/2025 | | | NWM | | | | - | | | | (369,770 | ) | | | (369,770 | ) |
| USD | | | 6,836,015 | | | ZAR | | | 6,642,756 | | | 1/29/2025 | | | NWM | | | | 193,259 | | | | - | | | | 193,259 | |
| USD | | | 6,970,661 | | | ZAR | | | 6,779,225 | | | 1/29/2025 | | | NWM | | | | 191,436 | | | | - | | | | 191,436 | |
| USD | | | 6,997,792 | | | ZAR | | | 6,800,354 | | | 1/29/2025 | | | NWM | | | | 197,438 | | | | - | | | | 197,438 | |
| ZAR | | | 7,060,354 | | | USD | | | 7,530,386 | | | 1/29/2025 | | | NWM | | | | - | | | | (470,032 | ) | | | (470,032 | ) |
| USD | | | 7,084,778 | | | ZAR | | | 7,039,480 | | | 1/29/2025 | | | NWM | | | | 45,298 | | | | - | | | | 45,298 | |
| USD | | | 7,105,438 | | | ZAR | | | 7,039,480 | | | 1/29/2025 | | | NWM | | | | 65,958 | | | | - | | | | 65,958 | |
| USD | | | 7,156,008 | | | ZAR | | | 6,945,971 | | | 1/29/2025 | | | NWM | | | | 210,037 | | | | - | | | | 210,037 | |
| USD | | | 7,262,328 | | | ZAR | | | 6,953,416 | | | 1/29/2025 | | | NWM | | | | 308,912 | | | | - | | | | 308,912 | |
| ZAR | | | 7,374,730 | | | USD | | | 7,742,444 | | | 1/29/2025 | | | NWM | | | | - | | | | (367,714 | ) | | | (367,714 | ) |
| USD | | | 7,598,255 | | | ZAR | | | 7,347,714 | | | 1/29/2025 | | | NWM | | | | 250,541 | | | | - | | | | 250,541 | |
| ZAR | | | 7,644,196 | | | USD | | | 8,045,354 | | | 1/29/2025 | | | NWM | | | | - | | | | (401,158 | ) | | | (401,158 | ) |
| ZAR | | | 7,644,196 | | | USD | | | 8,057,127 | | | 1/29/2025 | | | NWM | | | | - | | | | (412,931 | ) | | | (412,931 | ) |
| ZAR | | | 7,657,626 | | | USD | | | 8,080,267 | | | 1/29/2025 | | | NWM | | | | - | | | | (422,641 | ) | | | (422,641 | ) |
| ZAR | | | 7,698,553 | | | USD | | | 8,112,756 | | | 1/29/2025 | | | NWM | | | | - | | | | (414,203 | ) | | | (414,203 | ) |
| USD | | | 7,804,658 | | | ZAR | | | 7,743,428 | | | 1/29/2025 | | | NWM | | | | 61,230 | | | | - | | | | 61,230 | |
| USD | | | 7,949,677 | | | ZAR | | | 7,747,686 | | | 1/29/2025 | | | NWM | | | | 201,991 | | | | - | | | | 201,991 | |
| ZAR | | | 7,961,225 | | | USD | | | 8,286,888 | | | 1/29/2025 | | | NWM | | | | - | | | | (325,663 | ) | | | (325,663 | ) |
| ZAR | | | 7,961,225 | | | USD | | | 8,288,086 | | | 1/29/2025 | | | NWM | | | | - | | | | (326,861 | ) | | | (326,861 | ) |
| ZAR | | | 8,121,459 | | | USD | | | 8,567,124 | | | 1/29/2025 | | | NWM | | | | - | | | | (445,665 | ) | | | (445,665 | ) |
| ZAR | | | 8,616,385 | | | USD | | | 8,947,760 | | | 1/29/2025 | | | NWM | | | | - | | | | (331,375 | ) | | | (331,375 | ) |
| ZAR | | | 9,272,486 | | | USD | | | 9,634,285 | | | 1/29/2025 | | | NWM | | | | - | | | | (361,799 | ) | | | (361,799 | ) |
| ZAR | | | 9,574,887 | | | USD | | | 10,119,917 | | | 1/29/2025 | | | NWM | | | | - | | | | (545,030 | ) | | | (545,030 | ) |
| ZAR | | | 10,302,762 | | | USD | | | 10,690,485 | | | 1/29/2025 | | | NWM | | | | - | | | | (387,723 | ) | | | (387,723 | ) |
| ZAR | | | 10,302,762 | | | USD | | | 10,700,951 | | | 1/29/2025 | | | NWM | | | | - | | | | (398,189 | ) | | | (398,189 | ) |
| ZAR | | | 11,333,038 | | | USD | | | 11,782,395 | | | 1/29/2025 | | | NWM | | | | - | | | | (449,357 | ) | | | (449,357 | ) |
| USD | | | 18,267,235 | | | ZAR | | | 18,088,407 | | | 1/29/2025 | | | NWM | | | | 178,828 | | | | - | | | | 178,828 | |
| USD | | | 28,693,529 | | | ZAR | | | 28,606,584 | | | 1/29/2025 | | | NWM | | | | 86,945 | | | | - | | | | 86,945 | |
| USD | | | 1,629,310 | | | CHF | | | 1,618,826 | | | 2/13/2025 | | | NWM | | | | 10,484 | | | | - | | | | 10,484 | |
| USD | | | 2,619,823 | | | CHF | | | 2,545,133 | | | 2/13/2025 | | | NWM | | | | 74,690 | | | | - | | | | 74,690 | |
| USD | | | 3,501,282 | | | CHF | | | 3,430,397 | | | 2/13/2025 | | | NWM | | | | 70,885 | | | | - | | | | 70,885 | |
| USD | | | 3,781,282 | | | CHF | | | 3,651,713 | | | 2/13/2025 | | | NWM | | | | 129,569 | | | | - | | | | 129,569 | |
| CHF | | | 4,094,345 | | | USD | | | 4,129,515 | | | 2/13/2025 | | | NWM | | | | - | | | | (35,170 | ) | | | (35,170 | ) |
| USD | | | 4,443,958 | | | CHF | | | 4,426,319 | | | 2/13/2025 | | | NWM | | | | 17,639 | | | | - | | | | 17,639 | |
| CHF | | | 5,612,376 | | | USD | | | 5,665,311 | | | 2/13/2025 | | | NWM | | | | - | | | | (52,935 | ) | | | (52,935 | ) |
| CHF | | | 6,086,188 | | | USD | | | 6,187,178 | | | 2/13/2025 | | | NWM | | | | - | | | | (100,990 | ) | | | (100,990 | ) |
| USD | | | 9,654,996 | | | CHF | | | 9,520,957 | | | 2/13/2025 | | | NWM | | | | 134,039 | | | | - | | | | 134,039 | |
See accompanying notes
73
American Beacon AHL Managed Futures Strategy FundSM
Consolidated Schedule of Investments
December 31, 2024
| | | | | | | | | | | | | | | | | | | | | | | | | | | | |
| | | | | | |
| Currency Purchased* | | | Currency Sold* | | | Settlement
Date | | Counterparty | | | Unrealized
Appreciation | | | Unrealized
(Depreciation) | | | Net Unrealized
Appreciation
(Depreciation) | |
| USD | | | 9,657,546 | | | CHF | | | 9,520,957 | | | 2/13/2025 | | | NWM | | | $ | 136,589 | | | $ | - | | | $ | 136,589 | |
| USD | | | 9,696,554 | | | CHF | | | 9,441,153 | | | 2/13/2025 | | | NWM | | | | 255,401 | | | | - | | | | 255,401 | |
| USD | | | 10,372,841 | | | CHF | | | 10,069,875 | | | 2/13/2025 | | | NWM | | | | 302,966 | | | | - | | | | 302,966 | |
| USD | | | 11,585,501 | | | CHF | | | 11,272,859 | | | 2/13/2025 | | | NWM | | | | 312,642 | | | | - | | | | 312,642 | |
| USD | | | 11,594,570 | | | CHF | | | 11,272,860 | | | 2/13/2025 | | | NWM | | | | 321,710 | | | | - | | | | 321,710 | |
| USD | | | 11,597,160 | | | CHF | | | 11,272,859 | | | 2/13/2025 | | | NWM | | | | 324,301 | | | | - | | | | 324,301 | |
| USD | | | 11,609,777 | | | CHF | | | 11,272,860 | | | 2/13/2025 | | | NWM | | | | 336,917 | | | | - | | | | 336,917 | |
| USD | | | 11,845,140 | | | CHF | | | 11,770,788 | | | 2/13/2025 | | | NWM | | | | 74,352 | | | | - | | | | 74,352 | |
| USD | | | 11,938,745 | | | CHF | | | 11,619,087 | | | 2/13/2025 | | | NWM | | | | 319,658 | | | | - | | | | 319,658 | |
| USD | | | 12,706,275 | | | CHF | | | 12,343,392 | | | 2/13/2025 | | | NWM | | | | 362,883 | | | | - | | | | 362,883 | |
| CHF | | | 14,306,058 | | | USD | | | 14,443,890 | | | 2/13/2025 | | | NWM | | | | - | | | | (137,832 | ) | | | (137,832 | ) |
| USD | | | 19,308,881 | | | CHF | | | 19,041,916 | | | 2/13/2025 | | | NWM | | | | 266,965 | | | | - | | | | 266,965 | |
| USD | | | 19,316,269 | | | CHF | | | 19,041,914 | | | 2/13/2025 | | | NWM | | | | 274,355 | | | | - | | | | 274,355 | |
| USD | | | 21,172,377 | | | CHF | | | 20,572,320 | | | 2/13/2025 | | | NWM | | | | 600,057 | | | | - | | | | 600,057 | |
| USD | | | 23,204,529 | | | CHF | | | 22,545,718 | | | 2/13/2025 | | | NWM | | | | 658,811 | | | | - | | | | 658,811 | |
| USD | | | 33,809,217 | | | CHF | | | 33,323,351 | | | 2/13/2025 | | | NWM | | | | 485,866 | | | | - | | | | 485,866 | |
| USD | | | 35,879,760 | | | CHF | | | 35,349,337 | | | 2/13/2025 | | | NWM | | | | 530,423 | | | | - | | | | 530,423 | |
| USD | | | 43,488,783 | | | CHF | | | 42,844,309 | | | 2/13/2025 | | | NWM | | | | 644,474 | | | | - | | | | 644,474 | |
| GBP | | | 723,558 | | | EUR | | | 726,483 | | | 2/18/2025 | | | NWM | | | | - | | | | (2,925 | ) | | | (2,925 | ) |
| GBP | | | 1,039,722 | | | EUR | | | 1,037,833 | | | 2/18/2025 | | | NWM | | | | 1,889 | | | | - | | | | 1,889 | |
| GBP | | | 1,734,420 | | | EUR | | | 1,727,811 | | | 2/18/2025 | | | NWM | | | | 6,609 | | | | - | | | | 6,609 | |
| GBP | | | 1,767,692 | | | EUR | | | 1,764,316 | | | 2/18/2025 | | | NWM | | | | 3,376 | | | | - | | | | 3,376 | |
| GBP | | | 1,775,177 | | | EUR | | | 1,764,316 | | | 2/18/2025 | | | NWM | | | | 10,861 | | | | - | | | | 10,861 | |
| EUR | | | 2,387,017 | | | GBP | | | 2,398,009 | | | 2/18/2025 | | | NWM | | | | - | | | | (10,992 | ) | | | (10,992 | ) |
| GBP | | | 3,534,255 | | | EUR | | | 3,528,633 | | | 2/18/2025 | | | NWM | | | | 5,622 | | | | - | | | | 5,622 | |
| GBP | | | 4,677,032 | | | EUR | | | 4,670,249 | | | 2/18/2025 | | | NWM | | | | 6,783 | | | | - | | | | 6,783 | |
| GBP | | | 4,995,975 | | | EUR | | | 4,981,599 | | | 2/18/2025 | | | NWM | | | | 14,376 | | | | - | | | | 14,376 | |
| GBP | | | 6,207,036 | | | EUR | | | 6,226,999 | | | 2/18/2025 | | | NWM | | | | - | | | | (19,963 | ) | | | (19,963 | ) |
| GBP | | | 9,201,285 | | | EUR | | | 9,172,740 | | | 2/18/2025 | | | NWM | | | | 28,545 | | | | - | | | | 28,545 | |
| GBP | | | 10,314,100 | | | EUR | | | 10,274,549 | | | 2/18/2025 | | | NWM | | | | 39,551 | | | | - | | | | 39,551 | |
| GBP | | | 10,411,296 | | | EUR | | | 10,378,332 | | | 2/18/2025 | | | NWM | | | | 32,964 | | | | - | | | | 32,964 | |
| GBP | | | 13,815,107 | | | EUR | | | 13,759,109 | | | 2/18/2025 | | | NWM | | | | 55,998 | | | | - | | | | 55,998 | |
| EUR | | | 18,784,781 | | | GBP | | | 18,832,614 | | | 2/18/2025 | | | NWM | | | | - | | | | (47,833 | ) | | | (47,833 | ) |
| GBP | | | 20,372,126 | | | EUR | | | 20,306,366 | | | 2/18/2025 | | | NWM | | | | 65,760 | | | | - | | | | 65,760 | |
| GBP | | | 20,665,439 | | | EUR | | | 20,632,124 | | | 2/18/2025 | | | NWM | | | | 33,315 | | | | - | | | | 33,315 | |
| GBP | | | 26,566,005 | | | EUR | | | 26,527,016 | | | 2/18/2025 | | | NWM | | | | 38,989 | | | | - | | | | 38,989 | |
| GBP | | | 26,568,977 | | | EUR | | | 26,527,016 | | | 2/18/2025 | | | NWM | | | | 41,961 | | | | - | | | | 41,961 | |
| GBP | | | 29,530,928 | | | EUR | | | 29,474,463 | | | 2/18/2025 | | | NWM | | | | 56,465 | | | | - | | | | 56,465 | |
| EUR | | | 32,172,829 | | | GBP | | | 32,288,682 | | | 2/18/2025 | | | NWM | | | | - | | | | (115,853 | ) | | | (115,853 | ) |
| GBP | | | 40,091,164 | | | EUR | | | 39,928,730 | | | 2/18/2025 | | | NWM | | | | 162,434 | | | | - | | | | 162,434 | |
| HUF | | | 207,637 | | | EUR | | | 207,576 | | | 2/19/2025 | | | NWM | | | | 61 | | | | - | | | | 61 | |
| HUF | | | 312,773 | | | EUR | | | 311,364 | | | 2/19/2025 | | | NWM | | | | 1,409 | | | | - | | | | 1,409 | |
| HUF | | | 1,034,910 | | | EUR | | | 1,037,881 | | | 2/19/2025 | | | NWM | | | | - | | | | (2,971 | ) | | | (2,971 | ) |
| HUF | | | 3,005,902 | | | EUR | | | 3,009,854 | | | 2/19/2025 | | | NWM | | | | - | | | | (3,952 | ) | | | (3,952 | ) |
| EUR | | | 6,227,283 | | | HUF | | | 6,196,218 | | | 2/19/2025 | | | NWM | | | | 31,065 | | | | - | | | | 31,065 | |
| EUR | | | 18,681,851 | | | HUF | | | 18,588,637 | | | 2/19/2025 | | | NWM | | | | 93,214 | | | | - | | | | 93,214 | |
| USD | | | 1,422,137 | | | ILS | | | 1,425,354 | | | 2/24/2025 | | | NWM | | | | - | | | | (3,217 | ) | | | (3,217 | ) |
| USD | | | 1,422,254 | | | ILS | | | 1,425,354 | | | 2/24/2025 | | | NWM | | | | - | | | | (3,100 | ) | | | (3,100 | ) |
| ILS | | | 1,514,870 | | | USD | | | 1,524,842 | | | 2/24/2025 | | | NWM | | | | - | | | | (9,972 | ) | | | (9,972 | ) |
| USD | | | 2,879,655 | | | ILS | | | 2,892,024 | | | 2/24/2025 | | | NWM | | | | - | | | | (12,369 | ) | | | (12,369 | ) |
| USD | | | 2,905,010 | | | ILS | | | 2,930,584 | | | 2/24/2025 | | | NWM | | | | - | | | | (25,574 | ) | | | (25,574 | ) |
| USD | | | 3,544,648 | | | ILS | | | 3,580,601 | | | 2/24/2025 | | | NWM | | | | - | | | | (35,953 | ) | | | (35,953 | ) |
| USD | | | 4,357,598 | | | ILS | | | 4,395,876 | | | 2/24/2025 | | | NWM | | | | - | | | | (38,278 | ) | | | (38,278 | ) |
| USD | | | 6,387,995 | | | ILS | | | 6,445,081 | | | 2/24/2025 | | | NWM | | | | - | | | | (57,086 | ) | | | (57,086 | ) |
| USD | | | 6,636,637 | | | ILS | | | 6,651,654 | | | 2/24/2025 | | | NWM | | | | - | | | | (15,017 | ) | | | (15,017 | ) |
| ILS | | | 8,215,640 | | | USD | | | 8,278,669 | | | 2/24/2025 | | | NWM | | | | - | | | | (63,029 | ) | | | (63,029 | ) |
| USD | | | 8,935,896 | | | ILS | | | 8,945,993 | | | 2/24/2025 | | | NWM | | | | - | | | | (10,097 | ) | | | (10,097 | ) |
| ILS | | | 11,159,578 | | | USD | | | 11,232,330 | | | 2/24/2025 | | | NWM | | | | - | | | | (72,752 | ) | | | (72,752 | ) |
| ILS | | | 13,113,946 | | | USD | | | 13,214,459 | | | 2/24/2025 | | | NWM | | | | - | | | | (100,513 | ) | | | (100,513 | ) |
See accompanying notes
74
American Beacon AHL Managed Futures Strategy FundSM
Consolidated Schedule of Investments
December 31, 2024
| | | | | | | | | | | | | | | | | | | | | | | | | | | | |
| | | | | | |
| Currency Purchased* | | | Currency Sold* | | | Settlement
Date | | Counterparty | | | Unrealized
Appreciation | | | Unrealized
(Depreciation) | | | Net Unrealized
Appreciation
(Depreciation) | |
| ILS | | | 14,571,051 | | | USD | | | 14,671,061 | | | 2/24/2025 | | | NWM | | | $ | - | | | $ | (100,010 | ) | | $ | (100,010 | ) |
| USD | | | 14,981,912 | | | ILS | | | 15,016,489 | | | 2/24/2025 | | | NWM | | | | - | | | | (34,577 | ) | | | (34,577 | ) |
| ILS | | | 15,348,173 | | | USD | | | 15,474,755 | | | 2/24/2025 | | | NWM | | | | - | | | | (126,582 | ) | | | (126,582 | ) |
| ILS | | | 16,028,156 | | | USD | | | 16,166,527 | | | 2/24/2025 | | | NWM | | | | - | | | | (138,371 | ) | | | (138,371 | ) |
| ILS | | | 17,275,666 | | | USD | | | 17,361,245 | | | 2/24/2025 | | | NWM | | | | - | | | | (85,579 | ) | | | (85,579 | ) |
| USD | | | 154,082 | | | HUF | | | 150,638 | | | 2/26/2025 | | | NWM | | | | 3,444 | | | | - | | | | 3,444 | |
| USD | | | 317,397 | | | HUF | | | 311,946 | | | 2/26/2025 | | | NWM | | | | 5,451 | | | | - | | | | 5,451 | |
| USD | | | 326,426 | | | HUF | | | 326,383 | | | 2/26/2025 | | | NWM | | | | 43 | | | | - | | | | 43 | |
| HUF | | | 602,552 | | | USD | | | 607,176 | | | 2/26/2025 | | | NWM | | | | - | | | | (4,624 | ) | | | (4,624 | ) |
| HUF | | | 677,871 | | | USD | | | 677,903 | | | 2/26/2025 | | | NWM | | | | - | | | | (32 | ) | | | (32 | ) |
| USD | | | 3,008,694 | | | HUF | | | 2,943,089 | | | 2/26/2025 | | | NWM | | | | 65,605 | | | | - | | | | 65,605 | |
| USD | | | 3,807,258 | | | HUF | | | 3,743,356 | | | 2/26/2025 | | | NWM | | | | 63,902 | | | | - | | | | 63,902 | |
| USD | | | 3,872,026 | | | HUF | | | 3,783,972 | | | 2/26/2025 | | | NWM | | | | 88,054 | | | | - | | | | 88,054 | |
| USD | | | 8,336,831 | | | HUF | | | 8,161,003 | | | 2/26/2025 | | | NWM | | | | 175,828 | | | | - | | | | 175,828 | |
| USD | | | 8,566,010 | | | HUF | | | 8,422,552 | | | 2/26/2025 | | | NWM | | | | 143,458 | | | | - | | | | 143,458 | |
| SEK | | | 1,042,725 | | | EUR | | | 1,038,260 | | | 2/27/2025 | | | NWM | | | | 4,465 | | | | - | | | | 4,465 | |
| SEK | | | 1,459,391 | | | EUR | | | 1,453,564 | | | 2/27/2025 | | | NWM | | | | 5,827 | | | | - | | | | 5,827 | |
| EUR | | | 12,043,816 | | | SEK | | | 12,023,027 | | | 2/27/2025 | | | NWM | | | | 20,789 | | | | - | | | | 20,789 | |
| USD | | | 65,636 | | | PEN | | | 66,413 | | | 2/28/2025 | | | NWM | | | | - | | | | (777 | ) | | | (777 | ) |
| USD | | | 65,638 | | | PEN | | | 66,413 | | | 2/28/2025 | | | NWM | | | | - | | | | (775 | ) | | | (775 | ) |
| PEN | | | 132,826 | | | USD | | | 132,740 | | | 2/28/2025 | | | NWM | | | | 86 | | | | - | | | | 86 | |
| PEN | | | 132,826 | | | USD | | | 132,788 | | | 2/28/2025 | | | NWM | | | | 38 | | | | - | | | | 38 | |
| PEN | | | 132,826 | | | USD | | | 133,534 | | | 2/28/2025 | | | NWM | | | | - | | | | (708 | ) | | | (708 | ) |
| PEN | | | 132,826 | | | USD | | | 133,536 | | | 2/28/2025 | | | NWM | | | | - | | | | (710 | ) | | | (710 | ) |
| PEN | | | 132,826 | | | USD | | | 134,221 | | | 2/28/2025 | | | NWM | | | | - | | | | (1,395 | ) | | | (1,395 | ) |
| PEN | | | 199,240 | | | USD | | | 199,123 | | | 2/28/2025 | | | NWM | | | | 117 | | | | - | | | | 117 | |
| PEN | | | 265,653 | | | USD | | | 265,614 | | | 2/28/2025 | | | NWM | | | | 39 | | | | - | | | | 39 | |
| PEN | | | 265,653 | | | USD | | | 268,261 | | | 2/28/2025 | | | NWM | | | | - | | | | (2,608 | ) | | | (2,608 | ) |
| PEN | | | 265,653 | | | USD | | | 268,379 | | | 2/28/2025 | | | NWM | | | | - | | | | (2,726 | ) | | | (2,726 | ) |
| PEN | | | 265,653 | | | USD | | | 268,608 | | | 2/28/2025 | | | NWM | | | | - | | | | (2,955 | ) | | | (2,955 | ) |
| PEN | | | 332,066 | | | USD | | | 331,896 | | | 2/28/2025 | | | NWM | | | | 170 | | | | - | | | | 170 | |
| PEN | | | 332,066 | | | USD | | | 335,534 | | | 2/28/2025 | | | NWM | | | | - | | | | (3,468 | ) | | | (3,468 | ) |
| PEN | | | 398,479 | | | USD | | | 398,851 | | | 2/28/2025 | | | NWM | | | | - | | | | (372 | ) | | | (372 | ) |
| PEN | | | 398,479 | | | USD | | | 402,739 | | | 2/28/2025 | | | NWM | | | | - | | | | (4,260 | ) | | | (4,260 | ) |
| PEN | | | 398,479 | | | USD | | | 403,104 | | | 2/28/2025 | | | NWM | | | | - | | | | (4,625 | ) | | | (4,625 | ) |
| PEN | | | 464,893 | | | USD | | | 464,573 | | | 2/28/2025 | | | NWM | | | | 320 | | | | - | | | | 320 | |
| USD | | | 526,425 | | | PEN | | | 531,306 | | | 2/28/2025 | | | NWM | | | | - | | | | (4,881 | ) | | | (4,881 | ) |
| USD | | | 526,499 | | | PEN | | | 531,306 | | | 2/28/2025 | | | NWM | | | | - | | | | (4,807 | ) | | | (4,807 | ) |
| PEN | | | 265,653 | | | USD | | | 268,377 | | | 2/28/2025 | | | NWM | | | | - | | | | (2,724 | ) | | | (2,724 | ) |
| PEN | | | 265,653 | | | USD | | | 268,377 | | | 2/28/2025 | | | NWM | | | | - | | | | (2,724 | ) | | | (2,724 | ) |
| PEN | | | 597,719 | | | USD | | | 597,790 | | | 2/28/2025 | | | NWM | | | | - | | | | (71 | ) | | | (71 | ) |
| PEN | | | 664,132 | | | USD | | | 667,503 | | | 2/28/2025 | | | NWM | | | | - | | | | (3,371 | ) | | | (3,371 | ) |
| PEN | | | 796,959 | | | USD | | | 801,047 | | | 2/28/2025 | | | NWM | | | | - | | | | (4,088 | ) | | | (4,088 | ) |
| PEN | | | 863,372 | | | USD | | | 868,134 | | | 2/28/2025 | | | NWM | | | | - | | | | (4,762 | ) | | | (4,762 | ) |
| USD | | | 1,777,120 | | | PEN | | | 1,793,157 | | | 2/28/2025 | | | NWM | | | | - | | | | (16,037 | ) | | | (16,037 | ) |
| USD | | | 1,843,095 | | | PEN | | | 1,859,570 | | | 2/28/2025 | | | NWM | | | | - | | | | (16,475 | ) | | | (16,475 | ) |
| USD | | | 4,878,006 | | | GBP | | | 4,797,992 | | | 1/16/2025 | | | SSB | | | | 80,014 | | | | - | | | | 80,014 | |
| USD | | | 26,741,403 | | | MYR | | | 26,446,941 | | | 1/16/2025 | | | SSB | | | | 294,462 | | | | - | | | | 294,462 | |
| | | | | | | | | | | | | | | | | | | | | | | | | | | | |
| | | $ | 145,678,496 | | | $ | (40,163,121 | ) | | $ | 105,515,375 | |
| | | | | | | | | | | | | | | | | | | | | | | | | | | | |
| * | All values denominated in USD. |
| | |
| Glossary: |
| | |
| Counterparty Abbreviations: |
| BNP | | BNP Paribas NA |
| CBK | | Citibank, N.A. |
| HUB | | HSBC Bank PLC |
| NWM | | NatWest Markets PLC |
| SSB | | State Street Bank & Trust Co. |
See accompanying notes
75
American Beacon AHL Managed Futures Strategy FundSM
Consolidated Schedule of Investments
December 31, 2024
| | |
|
| Currency Abbreviations: |
| AUD | | Australian Dollar |
| BRL | | Brazilian Real |
| CAD | | Canadian Dollar |
| CHF | | Swiss Franc |
| CLP | | Chilean Peso |
| CNY | | Chinese Yuan |
| COP | | Colombian Peso |
| EUR | | Euro |
| GBP | | British Pound |
| HUF | | Hungarian Forint |
| lLS | | Israeli New Shekel |
| INR | | Indian Rupee |
| JPY | | Japanese Yen |
| KRW | | South Korean Won |
| MXN | | Mexican Peso |
| MYR | | Malaysian Ringgit |
| NOK | | Norwegian Krone |
| NZD | | New Zealand Dollar |
| PEN | | Peruvian Nuevo Sol |
| PHP | | Philippine Peso |
| PLN | | Polish Zloty |
| SEK | | Swedish Krona |
| SGD | | Singapore Dollar |
| THB | | Thai Baht |
| TWD | | New Taiwan Dollar |
| USD | | United States Dollar |
| ZAR | | South African Rand |
| Index Abbreviations: |
| CAC 40 | | Euronet Paris - French Stock Market Index. |
| DAX | | Deutsche Boerse AG German Stock Index. |
| Euro Stoxx 50 | | Eurozone Blue-chip Index. |
| FTSE 100 | | Financial Times Stock Exchange 100 Index. |
| FTSE China A50 | | Financial Times Stock Exchange China A50 Index. |
| FTSE/JSE Top 40 | | Largest 40 companies ranked by full market value in the FTSE/JSE All-Share Index. |
| FTSE/MIB | | Borsa Italiana-Italian Stock Market Index. |
| Hang Seng | | Hong Kong Stock Market Index. |
| MSCI EAFE | | Morgan Stanley Capital International - Europe, Australasia, and Far East. |
| NASDAQ | | National Association of Securities Dealers Automated Quotations. |
| Nifty 50 | | National Stock Exchange FIFTY |
| NIKKEI 225 | | Nikkei Stock Average. |
| OMXS30 | | Stockholm Stock Exchange’s leading share index. |
| Russell 2000 | | U.S. Small-Cap Stock Market Index. |
| S&P 500 | | Standard & Poor’s 500 Index - U.S. Equity Large-Cap Index. |
| S&P/TSX | | Canadian Equity Market Index. |
| TOPIX | | Tokyo Stock Exchange Tokyo Price Index. |
| Exchange Abbreviations: |
| ASX | | Australian Securities Exchange. |
| CBOT | | Chicago Board of Trade. |
| CME | | Chicago Mercantile Exchange. |
| EUREX | | European derivatives exchange. |
| Euronext | | European New Exchange Technology. |
| FinEx | | Financial Instruments Exchange. |
| HKG | | Hong Kong Exchange. |
| ICE | | Intercontinental Exchange. |
| JSE | | Johannesburg Stock Exchange. |
| LME | | London Metal Exchange. |
| MDE | | Malaysian Derivative Exchange. |
| MGE | | Minneapolis Grain Exchange/ |
| NSE | | National Stock Exchange |
| NYMEX | | New York Mercantile Exchange. |
| OML | | OMLX: London Securities & Derivatives Exchange. |
| SAFEX | | South African Futures Exchange. |
| SFE | | Sydney Futures Exchange. |
| SGX | | Singapore Stock Exchange. |
| TSE | | Tokyo Stock Exchange. |
| WCE | | Winnipeg Commodity Exchange. |
See accompanying notes
76
American Beacon AHL Managed Futures Strategy FundSM
Consolidated Schedule of Investments
December 31, 2024
| | |
| Other Abbreviations: |
| Bobl | | Medium term debt that is issued by the Federal Republic of Germany. |
| BTP | | Buoni del Tesoro Poliennali. |
| Bund | | German Federal Government Bond. |
| Buxl | | Long term debt that is issued by the Federal Republic of Germany. |
| COMEX | | The Commodity Exchange Inc. |
| CSC | | CEI: Coffee, Sugar and Cocoa. |
| CTN | | Cotton. |
| EURIBOR | | Euro Interbank Offered Rate. |
| GILT | | Bank of England Bonds. |
| IFSC | | International Financial Services Centre. |
| KCBT | | The Kansas City Board of Trade. |
| NYBOT | | New York Board of Trade. |
| RBOB | | Reformulated Gasoline Blendstock for Oxygen Blending. |
| Schatz | | Short-dated equivalent of the Bobl and Bund futures. |
| SOFR | | Secured Overnight Financing Rate. |
| SONIA | | Sterling Overnight Index Average. |
| ULSD | | Ultra-low-sulfur diesel. |
The Fund’s investments are summarized by level based on the inputs used to determine their values. As of December 31, 2024, the investments were classified as described below:
| | | | | | | | | | | | | | | | | | | | | | | | | | | | |
AHL Managed Futures Strategy Fund | | Level 1 | | | | | | Level 2 | | | | | | Level 3 | | | | | | Total | |
Assets | | | | | | | | | | | | | | | | | | | | | | | | | | | | |
Short-Term Investments | | $ | - | | | | | | | $ | 2,652,440,182 | | | | | | | $ | - | | | | | | | $ | 2,652,440,182 | |
| | | | | | | | | | | | | | | | | | | | | | | | | | | | |
Total Investments in Securities - Assets | | $ | - | | | | | | | $ | 2,652,440,182 | | | | | | | $ | - | | | | | | | $ | 2,652,440,182 | |
| | | | | | | | | | | | | | | | | | | | | | | | | | | | |
| | | | | | | |
Financial Derivative Instruments - Assets | | | | | | | | | | | | | | | | | | | | | | | | | | | | |
Futures Contracts | | $ | 72,468,042 | | | | | | | $ | - | | | | | | | $ | - | | | | | | | $ | 72,468,042 | |
Forward Foreign Currency Contracts | | | - | | | | | | | | 145,678,496 | | | | | | | | - | | | | | | | | 145,678,496 | |
| | | | | | | | | | | | | | | | | | | | | | | | | | | | |
Total Financial Derivative Instruments - Assets | | $ | 72,468,042 | | | | | | | $ | 145,678,496 | | | | | | | $ | - | | | | | | | $ | 218,146,538 | |
| | | | | | | | | | | | | | | | | | | | | | | | | | | | |
| | | | | | | |
Financial Derivative Instruments - Liabilities | | | | | | | | | | | | | | | | | | | | | | | | | | | | |
Futures Contracts | | $ | (58,083,936 | ) | | | | | | $ | - | | | | | | | $ | - | | | | | | | $ | (58,083,936 | ) |
Forward Foreign Currency Contracts | | | - | | | | | | | | (40,163,121 | ) | | | | | | $ | - | | | | | | | | (40,163,121 | ) |
| | | | | | | | | | | | | | | | | | | | | | | | | | | | |
Total Financial Derivative Instruments - Liabilities | | | (58,083,936 | ) | | | | | | $ | (40,163,121 | ) | | | | | | $ | - | | | | | | | $ | (98,247,057 | ) |
| | | | | | | | | | | | | | | | | | | | | | | | | | | | |
U.S. GAAP requires transfers between all levels to/from level 3 be disclosed. During the year ended December 31, 2024, there were no transfers into or out of Level 3.
See accompanying notes
77
American Beacon AHL Multi-Alternatives FundSM
Consolidated Schedule of Investments
December 31, 2024
| | | | | | | | | | | | | | | |
| | | |
| | | Principal Amount | | | | Fair Value |
| | | | | | | |
| | | |
| FOREIGN SOVEREIGN OBLIGATIONS - 6.02% | | | | | | |
| French Republic Government Bonds OAT, | | | | | | | | | | | | | | | |
0.100%, Due 7/25/2031A B | | | EUR | 602,425 | | | | | | | | | $ | 590,659 | |
0.600%, Due 7/25/2034A B C | | | | 547,380 | | | | | | | | | | 536,602 | |
| U.K. Inflation-Linked Gilts, 1.250%, Due 11/22/2032A B | | | GBP | 899,680 | | | | | | | | | | 1,157,995 | |
| | | | | | | | | | | | | | | |
| | | | | | | | | | | | | | | |
Total Foreign Sovereign Obligations (Cost $2,399,793) | | | | | | | | | | | | | | 2,285,256 | |
| | | | | | | | | | | | | | | |
| | | | | | | | | | | | | | | |
| | | |
| U.S. TREASURY OBLIGATIONS - 7.89% | | | | | | |
| U.S. Treasury Inflation-Indexed Notes, | | | | | | | | | | | | | | | |
2.125%, Due 4/15/2029A | | | $ | 1,530,825 | | | | | | | | | | 1,532,651 | |
1.875%, Due 7/15/2034A | | | | 1,508,985 | | | | | | | | | | 1,462,551 | |
| | | | | | | | | | | | | | | |
| | | | | | | | | | | | | | | |
Total U.S. Treasury Obligations (Cost $3,064,164) | | | | | | | | | | | | | | 2,995,202 | |
| | | | | | | | | | | | | | | |
| | | | | | | | | | | | | | | |
| | | |
| SHORT-TERM INVESTMENTS - 72.62% | | | | | | |
| | | |
| U.S. Treasury Obligations - 72.62% | | | | | | |
| U.S. Treasury Bills, | | | | | | | | | | | | | | | |
5.266%, Due 1/9/2025D | | | | 700,000 | | | | | | | | | | 699,427 | |
4.957%, Due 1/23/2025 | | | | 6,500,000 | | | | | | | | | | 6,483,915 | |
5.104%, Due 2/20/2025D | | | | 1,000,000 | | | | | | | | | | 994,316 | |
4.480%, Due 3/20/2025 | | | | 6,000,000 | | | | | | | | | | 5,946,398 | |
4.468%, Due 3/27/2025D | | | | 1,550,000 | | | | | | | | | | 1,534,846 | |
4.458%, Due 4/10/2025D | | | | 1,700,000 | | | | | | | | | | 1,680,759 | |
4.348%, Due 4/24/2025D | | | | 400,000 | | | | | | | | | | 394,826 | |
4.463%, Due 5/22/2025D | | | | 1,500,000 | | | | | | | | | | 1,475,885 | |
4.322%, Due 5/29/2025 | | | | 7,500,000 | | | | | | | | | | 7,373,029 | |
4.293%, Due 6/12/2025 | | | | 1,000,000 | | | | | | | | | | 981,492 | |
| | | | | | | | | | | | | | | |
| | | | | | | | | | | | | | | |
Total Short-Term Investments (Cost $27,556,315) | | | | | | | | | | | | | | 27,564,893 | |
| | | | | | | | | | | | | | | |
| | | | | | | | | | | | | | | |
TOTAL INVESTMENTS - 86.53% (Cost $33,020,272) | | | | | | | | | | | | | | 32,845,351 | |
OTHER ASSETS, NET OF LIABILITIES - 13.47% | | | | | | | | | | | | | | 5,113,886 | |
| | | | | | | | | | | | | | | |
TOTAL NET ASSETS - 100.00% | | | | | | | | | | | | | $ | 37,959,237 | |
| | | | | | | | | | | | | | | |
| | | | | | | |
| Percentages are stated as a percent of net assets. | | | | | | | | | | | | | | | |
A Inflation-Indexed Note.
B Reg S - Security purchased under the Securities Act of 1933, which exempts from registration securities offered and sold outside of the United States. Such a security cannot be sold in the United States without either an effective registration statement filed pursuant to the Securities Act of 1933, or pursuant to an exemption from registration.
C Security exempt from registration under the Securities Act of 1933. These securities may be resold to qualified institutional buyers pursuant to Rule 144A. At the period end, the value of these securities amounted to $536,602 or 1.41% of net assets. The Fund has no right to demand registration of these securities.
D All or a portion represents positions held by the American Beacon Cayman Multi-Alternatives Company, Ltd.
| | | | | | | | | | | | | | | | |
| Long Futures Contracts Open on December 31, 2024: | |
| | | | | |
| Commodity Futures Contracts | | | | | | | | | | | | | |
| Description | | Number of
Contracts | | Expiration Date | | Notional Amount | | | Contract Value | | | Unrealized
Appreciation
(Depreciation) | |
| CBOT Corn FuturesA | | 2 | | March 2025 | | $ | 45,755 | | | $ | 45,850 | | | $ | 95 | |
| CBOT Corn FuturesA | | 5 | | May 2025 | | | 114,824 | | | | 116,438 | | | | 1,614 | |
| CME Lean Hogs FuturesA | | 1 | | February 2025 | | | 34,892 | | | | 32,520 | | | | (2,372 | ) |
| COMEX Gold 100 Troy Ounces FuturesA | | 2 | | February 2025 | | | 541,094 | | | | 528,200 | | | | (12,894 | ) |
| Euronext Rapeseed FuturesA | | 3 | | January 2025 | | | 81,862 | | | | 79,437 | | | | (2,425 | ) |
| ICE Cocoa FuturesA | | 1 | | March 2025 | | | 65,513 | | | | 114,461 | | | | 48,948 | |
| ICE Robusta Coffee Futures 10-TonneA | | 2 | | March 2025 | | | 103,812 | | | | 97,500 | | | | (6,312 | ) |
| LME Lead FuturesA | | 3 | | January 2025 | | | 153,777 | | | | 144,952 | | | | (8,825 | ) |
| LME Lead FuturesA | | 1 | | February 2025 | | | 52,377 | | | | 48,513 | | | | (3,864 | ) |
| LME Nickel FuturesA | | 1 | | January 2025 | | | 95,199 | | | | 90,840 | | | | (4,359 | ) |
See accompanying notes
78
American Beacon AHL Multi-Alternatives FundSM
Consolidated Schedule of Investments
December 31, 2024
| | | | | | | | | | | | | | | | |
| Commodity Futures Contracts (continued) | | | | | | | | | | | | | |
| Description | | Number of
Contracts | | Expiration Date | | Notional Amount | | | Contract Value | | | Unrealized
Appreciation
(Depreciation) | |
| LME Primary Aluminum FuturesA | | 1 | | January 2025 | | $ | 65,534 | | | $ | 63,412 | | | $ | (2,122 | ) |
| LME Primary Aluminum FuturesA | | 1 | | February 2025 | | | 66,838 | | | | 63,671 | | | | (3,167 | ) |
| LME Zinc FuturesA | | 3 | | January 2025 | | | 232,859 | | | | 222,033 | | | | (10,826 | ) |
| LME Zinc FuturesA | | 2 | | February 2025 | | | 155,904 | | | | 148,719 | | | | (7,185 | ) |
| MDE Crude Palm Oil FuturesA | | 10 | | March 2025 | | | 267,497 | | | | 248,686 | | | | (18,811 | ) |
| NYBOT CSC C Coffee FuturesA | | 3 | | March 2025 | | | 297,363 | | | | 359,719 | | | | 62,356 | |
| NYBOT CSC Cocoa FuturesA | | 2 | | March 2025 | | | 151,204 | | | | 233,500 | | | | 82,296 | |
| NYMEX Henry Hub Natural Gas FuturesA | | 9 | | February 2025 | | | 264,426 | | | | 278,820 | | | | 14,394 | |
| NYMEX Light Sweet Crude Oil FuturesA | | 3 | | February 2025 | | | 213,515 | | | | 213,750 | | | | 235 | |
| | | | | | | | | | | | | | | | |
| | $ | 3,004,245 | | | $ | 3,131,021 | | | $ | 126,776 | |
| | | | | | | | | | | | | | | | |
| | | | | |
| Currency Futures Contracts | | | | | | | | | | | | | |
| Description | | Number of
Contracts | | Expiration Date | | Notional Amount | | | Contract Value | | | Unrealized
Appreciation
(Depreciation) | |
| NYBOT FINEX U.S. Dollar Index Futures | | 12 | | March 2025 | | $ | 1,275,177 | | | $ | 1,299,552 | | | $ | 24,375 | |
| | | | | | | | | | | | | | | | |
| | $ | 1,275,177 | | | $ | 1,299,552 | | | $ | 24,375 | |
| | | | | | | | | | | | | | | | |
| | | | | |
| Equity Futures Contracts | | | | | | | | | | | | | |
| Description | | Number of
Contracts | | Expiration Date | | Notional Amount | | | Contract Value | | | Unrealized
Appreciation
(Depreciation) | |
| Borsa Italiana FTSE/MIB Index Futures | | 4 | | March 2025 | | $ | 725,980 | | | $ | 710,593 | | | $ | (15,387 | ) |
| CME E-Mini NASDAQ 100 Index Futures | | 2 | | March 2025 | | | 883,612 | | | | 849,060 | | | | (34,552 | ) |
| CME E-Mini Russell 2000 Index Futures | | 2 | | March 2025 | | | 237,746 | | | | 224,980 | | | | (12,766 | ) |
| CME E-Mini S&P 500 Index Futures | | 6 | | March 2025 | | | 1,838,669 | | | | 1,780,725 | | | | (57,944 | ) |
| Eurex DAX Index Futures | | 2 | | March 2025 | | | 1,070,955 | | | | 1,038,543 | | | | (32,412 | ) |
| Eurex EURO STOXX 50 Futures | | 18 | | March 2025 | | | 931,734 | | | | 910,077 | | | | (21,657 | ) |
| Eurex STOXX Europe 600 ESG-X Futures | | 1 | | March 2025 | | | 19,806 | | | | 19,443 | | | | (363 | ) |
| HKG Hang Seng China Enterprises Index Futures | | 7 | | January 2025 | | | 324,865 | | | | 327,979 | | | | 3,114 | |
| HKG Hang Seng Index Futures | | 3 | | January 2025 | | | 387,052 | | | | 387,947 | | | | 895 | |
| ICE FTSE 100 Index Futures | | 2 | | March 2025 | | | 208,803 | | | | 204,823 | | | | (3,980 | ) |
| Montreal Exchange S&P/TSX 60 Index Futures | | 6 | | March 2025 | | | 1,269,781 | | | | 1,239,779 | | | | (30,002 | ) |
| NSE IFSC NIFTY 50 Index Futures | | 2 | | January 2025 | | | 95,728 | | | | 95,078 | | | | (650 | ) |
| OML Stockholm OMXS30 Index Futures | | 10 | | January 2025 | | | 231,509 | | | | 224,425 | | | | (7,084 | ) |
| SAFEX FTSE/JSE Top 40 Index Futures | | 9 | | March 2025 | | | 380,961 | | | | 364,011 | | | | (16,950 | ) |
| SFE S&P ASX Share Price Index 200 Futures | | 8 | | March 2025 | | | 1,028,477 | | | | 1,008,641 | | | | (19,836 | ) |
| SGX FTSE China A50 Futures Contract | | 12 | | January 2025 | | | 161,915 | | | | 161,580 | | | | (335 | ) |
| SGX FTSE Taiwan Index Futures | | 8 | | January 2025 | | | 618,335 | | | | 612,480 | | | | (5,855 | ) |
| SGX MSCI Singapore Index Futures | | 18 | | January 2025 | | | 492,142 | | | | 492,227 | | | | 85 | |
| SGX Nikkei 225 Stock Index Futures | | 8 | | March 2025 | | | 1,002,799 | | | | 998,697 | | | | (4,102 | ) |
| TSE TOPIX Futures | | 5 | | March 2025 | | | 871,573 | | | | 885,475 | | | | 13,902 | |
| | | | | | | | | | | | | | | | |
| | $ | 12,782,442 | | | $ | 12,536,563 | | | $ | (245,879 | ) |
| | | | | | | | | | | | | | | | |
| | | | | |
| Interest Rate Futures Contracts | | | | | | | | | | | | | |
| Description | | Number of
Contracts | | Expiration Date | | Notional Amount | | | Contract Value | | | Unrealized
Appreciation
(Depreciation) | |
| 3 Month Euro Euribor Futures | | 28 | | September 2025 | | $ | 7,114,035 | | | $ | 7,110,642 | | | $ | (3,393 | ) |
| 3 Month Euro Euribor Futures | | 1 | | December 2025 | | | 254,496 | | | | 254,029 | | | | (467 | ) |
| 3 Month Euro Euribor Futures | | 29 | | March 2026 | | | 7,368,842 | | | | 7,365,345 | | | | (3,497 | ) |
| 3 Month Euro Euribor Futures | | 2 | | June 2026 | | | 508,836 | | | | 507,696 | | | | (1,140 | ) |
| 3 Month Euro Euribor Futures | | 25 | | September 2026 | | | 6,348,978 | | | | 6,342,961 | | | | (6,017 | ) |
| Eurex 5 Year Euro BOBL Futures | | 2 | | March 2025 | | | 246,201 | | | | 244,170 | | | | (2,031 | ) |
| Eurex 30 Year Euro BUXL Futures | | 2 | | March 2025 | | | 291,592 | | | | 274,873 | | | | (16,719 | ) |
| Eurex Euro-BTP Italian Bond Futures | | 4 | | March 2025 | | | 446,981 | | | | 445,084 | | | | (1,897 | ) |
| Eurex Euro-BTP Italian Bond Futures | | 6 | | March 2025 | | | 762,802 | | | | 745,687 | | | | (17,115 | ) |
| KFE 3 Year Treasury Bond Futures | | 3 | | March 2025 | | | 218,276 | | | | 217,335 | | | | (941 | ) |
See accompanying notes
79
American Beacon AHL Multi-Alternatives FundSM
Consolidated Schedule of Investments
December 31, 2024
| | | | | | | | | | | | | | | | | | |
| Interest Rate Futures Contracts (continued) | | | | | | | | | | | | | | |
| Description | | Number of
Contracts | | Expiration Date | | | Notional Amount | | | Contract Value | | | Unrealized
Appreciation
(Depreciation) | |
| KFE 10 Year Treasury Bond Futures | | 2 | | | March 2025 | | | $ | 161,903 | | | $ | 158,843 | | | $ | (3,060 | ) |
| Montreal Exchange 10 Year Canadian Bond Futures | | 2 | | | March 2025 | | | | 172,801 | | | | 170,594 | | | | (2,207 | ) |
| TSE Japanese 10 Year Bond Futures | | 1 | | | March 2025 | | | | 904,574 | | | | 901,840 | | | | (2,734 | ) |
| | | | | | | | | | | | | | | | | | |
| | | $ | 24,800,317 | | | $ | 24,739,099 | | | | (61,218 | ) |
| | | | | | | | | | | | | | | | | | |
| | | | | | | | | | | | | | | | | | |
| Short Futures Contracts Open on December 31, 2024: | |
|
| Commodity Futures Contracts | |
| Description | | Number of
Contracts | | Expiration Date | | | Notional Amount | | | Contract Value | | | Unrealized
Appreciation
(Depreciation) | |
| CBOT Soybean FuturesA | | 14 | | | March 2025 | | | $ | (691,406 | ) | | $ | (707,350 | ) | | $ | (15,944 | ) |
| CBOT Soybean Meal FuturesA | | 14 | | | March 2025 | | | | (413,863 | ) | | | (443,660 | ) | | | (29,797 | ) |
| CBOT Soybean Oil FuturesA | | 18 | | | March 2025 | | | | (440,029 | ) | | | (435,888 | ) | | | 4,141 | |
| COMEX Copper FuturesA | | 5 | | | March 2025 | | | | (516,491 | ) | | | (503,312 | ) | | | 13,179 | |
| Euronext Milling Wheat FuturesA | | 12 | | | March 2025 | | | | (140,730 | ) | | | (147,453 | ) | | | (6,723 | ) |
| ICE Brent Crude Oil FuturesA | | 3 | | | January 2025 | | | | (221,396 | ) | | | (223,920 | ) | | | (2,524 | ) |
| ICE Gas Oil FuturesA | | 1 | | | January 2025 | | | | (66,048 | ) | | | (69,525 | ) | | | (3,477 | ) |
| KCBT Hard Red Winter Wheat FuturesA | | 6 | | | March 2025 | | | | (168,074 | ) | | | (167,775 | ) | | | 299 | |
| LME Copper FuturesA | | 4 | | | February 2025 | | | | (902,113 | ) | | | (871,892 | ) | | | 30,221 | |
| LME Lead FuturesA | | 3 | | | January 2025 | | | | (153,705 | ) | | | (144,952 | ) | | | 8,753 | |
| LME Lead FuturesA | | 7 | | | February 2025 | | | | (352,196 | ) | | | (339,593 | ) | | | 12,603 | |
| LME Nickel FuturesA | | 1 | | | January 2025 | | | | (99,513 | ) | | | (90,840 | ) | | | 8,673 | |
| LME Nickel FuturesA | | 1 | | | February 2025 | | | | (95,711 | ) | | | (91,387 | ) | | | 4,324 | |
| LME Primary Aluminum FuturesA | | 1 | | | January 2025 | | | | (63,439 | ) | | | (63,412 | ) | | | 27 | |
| LME Primary Aluminum FuturesA | | 4 | | | February 2025 | | | | (251,502 | ) | | | (254,682 | ) | | | (3,180 | ) |
| LME Zinc FuturesA | | 3 | | | January 2025 | | | | (226,513 | ) | | | (222,033 | ) | | | 4,480 | |
| LME Zinc FuturesA | | 1 | | | February 2025 | | | | (74,546 | ) | | | (74,360 | ) | | | 186 | |
| MGE Red Wheat FuturesA | | 7 | | | March 2025 | | | | (208,836 | ) | | | (208,513 | ) | | | 323 | |
| NYBOT CSC Number 11 World Sugar FuturesA | | 3 | | | February 2025 | | | | (64,651 | ) | | | (64,714 | ) | | | (63 | ) |
| NYBOT CTN Number 2 Cotton FuturesA | | 3 | | | March 2025 | | | | (105,738 | ) | | | (102,600 | ) | | | 3,138 | |
| NYMEX NY Harbor ULSD FuturesA | | 2 | | | January 2025 | | | | (190,102 | ) | | | (194,578 | ) | | | (4,476 | ) |
| NYMEX Palladium FuturesA | | 1 | | | March 2025 | | | | (92,898 | ) | | | (90,980 | ) | | | 1,918 | |
| NYMEX Platinum FuturesA | | 7 | | | April 2025 | | | | (330,123 | ) | | | (318,675 | ) | | | 11,448 | |
| NYMEX Reformulated Gasoline Blendstock for Oxygen Blending RBOB FuturesA | | 1 | | | January 2025 | | | | (81,978 | ) | | | (84,386 | ) | | | (2,408 | ) |
| WCE Canola FuturesA | | 6 | | | March 2025 | | | | (50,645 | ) | | | (51,416 | ) | | | (771 | ) |
| WCE Canola FuturesA | | 1 | | | May 2025 | | | | (8,672 | ) | | | (8,681 | ) | | | (9 | ) |
| | | | | | | | | | | | | | | | | | |
| | | | | | | | $ | (6,010,918 | ) | | $ | (5,976,577 | ) | | $ | 34,341 | |
| | | | | | | | | | | | | | | | | | |
| | | | | |
| Equity Futures Contracts | | | | | | | | | | | | | | |
| Description | | Number of
Contracts | | Expiration Date | | | Notional Amount | | | Contract Value | | | Unrealized
Appreciation
(Depreciation) | |
| ICE U.S. mini MSCI EAFE Index Futures | | 3 | | | March 2025 | | | $ | (344,356 | ) | | $ | (340,125 | ) | | $ | 4,231 | |
| ICE U.S. MSCI Emerging Markets Index Futures | | 1 | | | March 2025 | | | | (53,739 | ) | | | (53,690 | ) | | | 49 | |
| | | | | | | | | | | | | | | | | | |
| | | | | | | | $ | (398,095 | ) | | $ | (393,815 | ) | | $ | 4,280 | |
| | | | | | | | | | | | | | | | | | |
| | | | | |
| Interest Rate Futures Contracts | | | | | | | | | | | | | | |
| Description | | Number of
Contracts | | Expiration Date | | | Notional Amount | | | Contract Value | | | Unrealized
Appreciation
(Depreciation) | |
| CBOT 2 Year U.S. Treasury Notes Futures | | 21 | | | March 2025 | | | $ | (4,317,842 | ) | | $ | (4,317,797 | ) | | $ | 45 | |
| CBOT 5 Year U.S. Treasury Notes Futures | | 24 | | | March 2025 | | | | (2,557,152 | ) | | | (2,551,312 | ) | | | 5,840 | |
| CBOT 10 Year U.S. Treasury Notes Futures | | 10 | | | March 2025 | | | | (1,086,928 | ) | | | (1,087,500 | ) | | | (572 | ) |
| CBOT U.S. Long Bond Futures | | 4 | | | March 2025 | | | | (456,746 | ) | | | (455,375 | ) | | | 1,371 | |
| Eurex 2 Year Euro SCHATZ Futures | | 14 | | | March 2025 | | | | (1,552,323 | ) | | | (1,551,485 | ) | | | 838 | |
| Eurex 10 Year Euro BUND Futures | | 1 | | | March 2025 | | | | (138,255 | ) | | | (138,224 | ) | | | 31 | |
See accompanying notes
80
American Beacon AHL Multi-Alternatives FundSM
Consolidated Schedule of Investments
December 31, 2024
| | | | | | | | | | | | | | | | |
| Interest Rate Futures Contracts (continued) | | | | | | | | | | | | | |
| Description | | Number of
Contracts | | Expiration Date | | Notional Amount | | | Contract Value | | | Unrealized
Appreciation
(Depreciation) | |
| French Government Bond Futures | | 2 | | March 2025 | | $ | (255,368 | ) | | $ | (255,648 | ) | | $ | (280 | ) |
| ICE Long Gilt Futures | | 5 | | March 2025 | | | (577,786 | ) | | | (578,440 | ) | | | (654 | ) |
| SFE 3 Year Australian Bond Futures | | 47 | | March 2025 | | | (3,084,744 | ) | | | (3,088,069 | ) | | | (3,325 | ) |
| SFE 10 Year Australian Bond Futures | | 9 | | March 2025 | | | (625,179 | ) | | | (628,778 | ) | | | (3,599 | ) |
| Three-Month SOFR Futures | | 11 | | September 2025 | | | (2,649,459 | ) | | | (2,638,762 | ) | | | 10,697 | |
| Three-Month SOFR Futures | | 22 | | December 2025 | | | (5,288,906 | ) | | | (5,281,100 | ) | | | 7,806 | |
| Three-Month SOFR Futures | | 19 | | September 2026 | | | (4,568,498 | ) | | | (4,562,850 | ) | | | 5,648 | |
| Three-Month SOFR Futures | | 12 | | March 2027 | | | (2,884,108 | ) | | | (2,881 ,050 | ) | | | 3,058 | |
| Three Month SONIA Index Futures | | 29 | | December 2025 | | | (8,707,750 | ) | | | (8,696,431 | ) | | | 11,319 | |
| Three Month SONIA Index Futures | | 14 | | June 2026 | | | (4,204,884 | ) | | | (4,205,069 | ) | | | (185 | ) |
| | | | | | | | | | | | | | | | |
| | | | | | $ | (42,955,928 | ) | | $ | (42,917,890 | ) | | $ | 38,038 | |
| | | | | | | | | | | | | | | | |
A All or a portion represents positions held by the American Beacon Cayman Multi-Alternatives Company, Ltd.
| | | | | | | | | | | | | | | | | | | | | | | | | | | | |
| Centrally Cleared Swap Agreements Outstanding on December 31, 2024: | |
|
| Credit Default Swaps on Credit Indices - Sell Protection(1) | |
| Index/Tranches | | Fixed
Rate (%) | | Payment
Frequency | | Expiration
Date | | Implied Credit
Spread at
12/31/2024(2)
(%) | | | Curr | | Notional
Amount(3)
(000s) | | | Premiums
Paid
(Received) | | | Fair Value(4) | | | Unrealized
Appreciation
(Depreciation) | |
| CDX.NA.IG.S43 | | 1.00 | | Quarterly | | 12/20/2029 | | | 0.4956 | | | USD | | | 10,000 | | | $ | 215,675 | | | $ | 226,818 | | | $ | 11,143 | |
| | | | | | | | | | | | | | | | | | | | | | | | | | | | |
| | | $ | 215,675 | | | $ | 226,818 | | | $ | 11,143 | |
| | | | | | | | | | | | | | | | | | | | | | | | | | | | |
| | | | | | | | | | | | | | | | | | | | | | | | | | | | | | | | |
| OTC Swap Agreements Outstanding on December 31, 2024: | |
|
| Total Return Swaps Agreements | |
Pay/Receive Floating
Rate | | Description | | Reference
Entity | | Counter-
party | | Floating
Rate | | | Payment
Frequency | | Expiration
Date | | | Reference
Quantity | | | Notional
Amount | | | Premiums
Paid
(Received) | | | Unrealized
Appreciation
(Depreciation) | |
| Pay | | 1-Month
USD-LIBOR | | BBUXALC
INDEX | | JPM | | | 0.000 | % | | Maturity | | | 1/6/2025 | | | | 16,000 | | | $ | 2,005,295 | | | $ | (425 | ) | | $ | 40,049 | |
| | | | | | | | | | | | | | | | | | | | | | | | | | | | | | | | |
| | | | | | | | | | | | | | | | | | | | | | | | $ | (425 | ) | | $ | 40,049 | |
| | | | | | | | | | | | | | | | | | | | | | | | | | | | | | | | |
(1) If the Fund is a seller of protection and a credit event occurs, as defined under the terms of that particular swap agreement, the Fund will either (i) pay to the buyer of protection an amount equal to the notional amount of the swap and take delivery of the referenced obligation or underlying securities comprising the referenced index or (ii) pay a net settlement amount in the form of cash or securities equal to the notional amount of the swap less the recovery value of the referenced obligation or underlying securities comprising the referenced index.
(2) Implied credit spreads, represented in absolute terms, utilized in determining the fair value of credit default swaps agreements on corporate issues and sovereign issues of an emerging country as of period end serve as an indicator of the current status of the payment/performance risk and represent the likelihood or risk of default for the credit derivative. The implied credit spread of a particular referenced entity reflects the cost of buying/selling protection and may include upfront payments required to be made to enter into the agreement. Wider credit spreads represent a deterioration of the referenced entity’s credit soundness and a greater likelihood or risk of default or other credit event occurring as defined under the terms of the agreement.
(3) The maximum potential amount the Fund could be required to pay as a seller of credit protection or receive as a buyer of credit protection if a credit event occurs as defined under the terms of that particular swap agreement.
(4) The quoted market prices and resulting values for credit default swaps on asset-backed securities and credit indices serve as an indicator of the current status of the payment/performance risk and represent the likelihood of an expected liability (or profit) for the credit derivative should the notional amount of the swap agreement be closed/ sold as of the period end. Increasing fair values, in absolute terms when compared to the notional amount of the swap, represent a deterioration of the referenced entity’s credit soundness and greater likelihood or risk of default or other credit event occurring as defined under the terms of the agreement.
See accompanying notes
81
American Beacon AHL Multi-Alternatives FundSM
Consolidated Schedule of Investments
December 31, 2024
| | | | | | | | | | | | | | | | | | | | | | | | | | | | |
| Forward Foreign Currency Contracts Open on December 31, 2024: | |
| Currency Purchased* | | | Currency Sold* | | | Settlement
Date | | Counterparty | | | Unrealized
Appreciation | | | Unrealized
(Depreciation) | | | Net Unrealized
Appreciation
(Depreciation) | |
| PHP | | | 43,101 | | | USD | | | 42,546 | | | 2/13/2025 | | | BNP | | | $ | 555 | | | $ | - | | | $ | 555 | |
| PHP | | | 43,101 | | | USD | | | 42,813 | | | 2/13/2025 | | | BNP | | | | 288 | | | | - | | | | 288 | |
| PHP | | | 43,101 | | | USD | | | 43,046 | | | 2/13/2025 | | | BNP | | | | 55 | | | | - | | | | 55 | |
| USD | | | 129,605 | | | PHP | | | 129,303 | | | 2/13/2025 | | | BNP | | | | 302 | | | | - | | | | 302 | |
| PHP | | | 43,093 | | | USD | | | 42,787 | | | 2/21/2025 | | | BNP | | | | 306 | | | | - | | | | 306 | |
| PHP | | | 43,093 | | | USD | | | 42,830 | | | 2/21/2025 | | | BNP | | | | 263 | | | | - | | | | 263 | |
| PHP | | | 43,093 | | | USD | | | 42,845 | | | 2/21/2025 | | | BNP | | | | 248 | | | | - | | | | 248 | |
| PHP | | | 43,093 | | | USD | | | 42,893 | | | 2/21/2025 | | | BNP | | | | 200 | | | | - | | | | 200 | |
| USD | | | 258,148 | | | PHP | | | 258,558 | | | 2/21/2025 | | | BNP | | | | - | | | | (410 | ) | | | (410 | ) |
| NOK | | | 43,924 | | | USD | | | 44,115 | | | 1/2/2025 | | | CBK | | | | - | | | | (191 | ) | | | (191 | ) |
| USD | | | 44,031 | | | NOK | | | 43,924 | | | 1/2/2025 | | | CBK | | | | 107 | | | | - | | | | 107 | |
| SEK | | | 45,192 | | | USD | | | 45,410 | | | 1/2/2025 | | | CBK | | | | - | | | | (218 | ) | | | (218 | ) |
| USD | | | 45,219 | | | SEK | | | 45,192 | | | 1/2/2025 | | | CBK | | | | 27 | | | | - | | | | 27 | |
| USD | | | 23,924 | | | MXN | | | 23,980 | | | 1/3/2025 | | | CBK | | | | - | | | | (56 | ) | | | (56 | ) |
| USD | | | 23,963 | | | MXN | | | 23,980 | | | 1/3/2025 | | | CBK | | | | - | | | | (17 | ) | | | (17 | ) |
| USD | | | 23,966 | | | MXN | | | 23,980 | | | 1/3/2025 | | | CBK | | | | - | | | | (14 | ) | | | (14 | ) |
| USD | | | 23,974 | | | MXN | | | 23,980 | | | 1/3/2025 | | | CBK | | | | - | | | | (6 | ) | | | (6 | ) |
| USD | | | 23,976 | | | MXN | | | 23,980 | | | 1/3/2025 | | | CBK | | | | - | | | | (4 | ) | | | (4 | ) |
| USD | | | 24,009 | | | MXN | | | 23,980 | | | 1/3/2025 | | | CBK | | | | 29 | | | | - | | | | 29 | |
| USD | | | 24,108 | | | MXN | | | 23,980 | | | 1/3/2025 | | | CBK | | | | 128 | | | | - | | | | 128 | |
| USD | | | 24,136 | | | MXN | | | 23,980 | | | 1/3/2025 | | | CBK | | | | 156 | | | | - | | | | 156 | |
| USD | | | 24,146 | | | MXN | | | 23,980 | | | 1/3/2025 | | | CBK | | | | 166 | | | | - | | | | 166 | |
| USD | | | 44,148 | | | NOK | | | 43,924 | | | 1/3/2025 | | | CBK | | | | 224 | | | | - | | | | 224 | |
| GBP | | | 62,593 | | | JPY | | | 62,749 | | | 1/6/2025 | | | CBK | | | | - | | | | (156 | ) | | | (156 | ) |
| JPY | | | 63,073 | | | GBP | | | 62,593 | | | 1/6/2025 | | | CBK | | | | 480 | | | | - | | | | 480 | |
| USD | | | 6,386 | | | INR | | | 6,320 | | | 1/8/2025 | | | CBK | | | | 66 | | | | - | | | | 66 | |
| USD | | | 9,708 | | | INR | | | 9,608 | | | 1/8/2025 | | | CBK | | | | 100 | | | | - | | | | 100 | |
| USD | | | 13,392 | | | INR | | | 13,256 | | | 1/8/2025 | | | CBK | | | | 136 | | | | - | | | | 136 | |
| USD | | | 29,434 | | | INR | | | 29,184 | | | 1/8/2025 | | | CBK | | | | 250 | | | | - | | | | 250 | |
| USD | | | 29,439 | | | INR | | | 29,184 | | | 118/2025 | | | CBK | | | | 255 | | | | - | | | | 255 | |
| USD | | | 29,456 | | | INR | | | 29,184 | | | 118/2025 | | | CBK | | | | 272 | | | | - | | | | 272 | |
| USD | | | 29,457 | | | INR | | | 29,184 | | | 1/8/2025 | | | CBK | | | | 273 | | | | - | | | | 273 | |
| USD | | | 29,467 | | | INR | | | 29,184 | | | 1/8/2025 | | | CBK | | | | 283 | | | | - | | | | 283 | |
| INR | | | 175,103 | | | USD | | | 175,475 | | | 118/2025 | | | CBK | | | | - | | | | (372 | ) | | | (372 | ) |
| TWD | | | 76,297 | | | USD | | | 76,393 | | | 1/9/2025 | | | CBK | | | | - | | | | (96 | ) | | | (96 | ) |
| TWD | | | 76,297 | | | USD | | | 76,546 | | | 1/9/2025 | | | CBK | | | | - | | | | (249 | ) | | | (249 | ) |
| TWD | | | 76,297 | | | USD | | | 76,570 | | | 1/9/2025 | | | CBK | | | | - | | | | (273 | ) | | | (273 | ) |
| USD | | | 234,975 | | | TWD | | | 228,892 | | | 1/9/2025 | | | CBK | | | | 6,083 | | | | - | | | | 6,083 | |
| GBP | | | 52,895 | | | JPY | | | 52,728 | | | 1/14/2025 | | | CBK | | | | 167 | | | | - | | | | 167 | |
| JPY | | | 60,251 | | | GBP | | | 62,589 | | | 1/14/2025 | | | CBK | | | | - | | | | (2,338 | ) | | | (2,338 | ) |
| JPY | | | 60,460 | | | GBP | | | 62,589 | | | 1/14/2025 | | | CBK | | | | - | | | | (2,129 | ) | | | (2,129 | ) |
| JPY | | | 61,817 | | | GBP | | | 62,589 | | | 1/14/2025 | | | CBK | | | | - | | | | (772 | ) | | | (772 | ) |
| JPY | | | 61,820 | | | GBP | | | 62,589 | | | 1/14/2025 | | | CBK | | | | - | | | | (769 | ) | | | (769 | ) |
| JPY | | | 62,273 | | | GBP | | | 62,589 | | | 1/14/2025 | | | CBK | | | | - | | | | (316 | ) | | | (316 | ) |
| JPY | | | 62,466 | | | GBP | | | 62,589 | | | 1/14/2025 | | | CBK | | | | - | | | | (123 | ) | | | (123 | ) |
| GBP | | | 62,589 | | | JPY | | | 61,144 | | | 1/14/2025 | | | CBK | | | | 1,445 | | | | - | | | | 1,445 | |
| GBP | | | 62,589 | | | JPY | | | 61,152 | | | 1/14/2025 | | | CBK | | | | 1,437 | | | | - | | | | 1,437 | |
| GBP | | | 62,589 | | | JPY | | | 62,365 | | | 1/14/2025 | | | CBK | | | | 224 | | | | - | | | | 224 | |
| GBP | | | 62,589 | | | JPY | | | 62,588 | | | 1/14/2025 | | | CBK | | | | 1 | | | | - | | | | 1 | |
| GBP | | | 62,589 | | | JPY | | | 63,062 | | | 1/14/2025 | | | CBK | | | | - | | | | (473 | ) | | | (473 | ) |
| USD | | | 77,222 | | | TWD | | | 76,329 | | | 1/14/2025 | | | CBK | | | | 893 | | | | - | | | | 893 | |
| GBP | | | 185,869 | | | JPY | | | 185,605 | | | 1/14/2025 | | | CBK | | | | 264 | | | | - | | | | 264 | |
| GBP | | | 199,358 | | | JPY | | | 199,035 | | | 1/14/2025 | | | CBK | | | | 323 | | | | - | | | | 323 | |
| USD | | | 527 | | | SEK | | | 525 | | | 11/16/2025 | | | CBK | | | | 2 | | | | - | | | | 2 | |
| USD | | | 464,719 | | | TWD | | | 458,311 | | | 1/23/2025 | | | CBK | | | | 6,408 | | | | - | | | | 6,408 | |
| USD | | | 73,141 | | | THB | | | 73,406 | | | 1/24/2025 | | | CBK | | | | - | | | | (265 | ) | | | (265 | ) |
| THB | | | 73,406 | | | USD | | | 74,268 | | | 1/24/2025 | | | CBK | | | | - | | | | (862 | ) | | | (862 | ) |
| USD | | | 176,333 | | | INR | | | 174,824 | | | 1/24/2025 | | | CBK | | | | 1,509 | | | | - | | | | 1,509 | |
See accompanying notes
82
American Beacon AHL Multi-Alternatives FundSM
Consolidated Schedule of Investments
December 31, 2024
| | | | | | | | | | | | | | | | | | | | | | | | | | | | |
| Currency Purchased* | | | Currency Sold* | | | Settlement
Date | | Counterparty | | | Unrealized
Appreciation | | | Unrealized
(Depreciation) | | | Net Unrealized
Appreciation
(Depreciation) | |
| USD | | | 315,069 | | | INR | | | 311,700 | | | 1/24/2025 | | | CBK | | | $ | 3,369 | | | $ | - | | | $ | 3,369 | |
| USD | | | 333,155 | | | INR | | | 329,323 | | | 1/24/2025 | | | CBK | | | | 3,832 | | | | - | | | | 3,832 | |
| USD | | | 8,232 | | | SEK | | | 8,150 | | | 2/7/2025 | | | CBK | | | | 82 | | | | - | | | | 82 | |
| NOK | | | 26,058 | | | USD | | | 26,035 | | | 2/7/2025 | | | CBK | | | | 23 | | | | - | | | | 23 | |
| USD | | | 33,931 | | | SEK | | | 33,569 | | | 2/7/2025 | | | CBK | | | | 362 | | | | - | | | | 362 | |
| USD | | | 35,665 | | | SEK | | | 35,316 | | | 2/7/2025 | | | CBK | | | | 349 | | | | - | | | | 349 | |
| USD | | | 35,671 | | | SEK | | | 35,316 | | | 2/7/2025 | | | CBK | | | | 355 | | | | - | | | | 355 | |
| USD | | | 38,515 | | | NOK | | | 37,613 | | | 2/7/2025 | | | CBK | | | | 902 | | | | - | | | | 902 | |
| USD | | | 44,022 | | | NOK | | | 43,920 | | | 2/7/2025 | | | CBK | | | | 102 | | | | - | | | | 102 | |
| USD | | | 44,111 | | | NOK | | | 43,920 | | | 2/7/2025 | | | CBK | | | | 191 | | | | - | | | | 191 | |
| USD | | | 44,125 | | | NOK | | | 43,920 | | | 2/7/2025 | | | CBK | | | | 205 | | | | - | | | | 205 | |
| USD | | | 44,590 | | | NOK | | | 43,920 | | | 2/7/2025 | | | CBK | | | | 670 | | | | - | | | | 670 | |
| USD | | | 44,669 | | | NOK | | | 43,920 | | | 2/7/2025 | | | CBK | | | | 749 | | | | - | | | | 749 | |
| USD | | | 44,948 | | | NOK | | | 43,920 | | | 2/7/2025 | | | CBK | | | | 1,028 | | | | - | | | | 1,028 | |
| USD | | | 45,496 | | | SEK | | | 45,277 | | | 2/7/2025 | | | CBK | | | | 219 | | | | - | | | | 219 | |
| USD | | | 45,571 | | | SEK | | | 45,277 | | | 2/7/2025 | | | CBK | | | | 294 | | | | - | | | | 294 | |
| USD | | | 45,922 | | | SEK | | | 45,277 | | | 2/7/2025 | | | CBK | | | | 645 | | | | - | | | | 645 | |
| USD | | | 47,887 | | | NOK | | | 46,633 | | | 2/7/2025 | | | CBK | | | | 1,254 | | | | - | | | | 1,254 | |
| USD | | | 50,853 | | | SEK | | | 50,353 | | | 2/7/2025 | | | CBK | | | | 500 | | | | - | | | | 500 | |
| USD | | | 51,417 | | | NOK | | | 50,227 | | | 2/7/2025 | | | CBK | | | | 1,190 | | | | - | | | | 1,190 | |
| NOK | | | 52,115 | | | USD | | | 52,085 | | | 2/7/2025 | | | CBK | | | | 30 | | | | - | | | | 30 | |
| USD | | | 59,301 | | | SEK | | | 58,745 | | | 2/7/2025 | | | CBK | | | | 556 | | | | - | | | | 556 | |
| USD | | | 80,231 | | | SEK | | | 79,460 | | | 2/7/2025 | | | CBK | | | | 771 | | | | - | | | | 771 | |
| USD | | | 80,284 | | | SEK | | | 79,460 | | | 2/7/2025 | | | CBK | | | | 824 | | | | - | | | | 824 | |
| USD | | | 84,242 | | | NOK | | | 82,127 | | | 2/7/2025 | | | CBK | | | | 2,115 | | | | - | | | | 2,115 | |
| USD | | | 89,126 | | | SEK | | | 88,289 | | | 2/7/2025 | | | CBK | | | | 837 | | | | - | | | | 837 | |
| USD | | | 94,944 | | | NOK | | | 92,393 | | | 2/7/2025 | | | CBK | | | | 2,551 | | | | - | | | | 2,551 | |
| NOK | | | 97,508 | | | USD | | | 97,426 | | | 2/7/2025 | | | CBK | | | | 82 | | | | - | | | | 82 | |
| USD | | | 97,514 | | | NOK | | | 94,762 | | | 2/7/2025 | | | CBK | | | | 2,752 | | | | - | | | | 2,752 | |
| USD | | | 105,514 | | | NOK | | | 102,659 | | | 2/7/2025 | | | CBK | | | | 2,855 | | | | - | | | | 2,855 | |
| USD | | | 106,921 | | | SEK | | | 105,947 | | | 2/7/2025 | | | CBK | | | | 974 | | | | - | | | | 974 | |
| USD | | | 113,031 | | | SEK | | | 112,004 | | | 2/7/2025 | | | CBK | | | | 1,027 | | | | - | | | | 1,027 | |
| USD | | | 115,965 | | | SEK | | | 114,776 | | | 2/7/2025 | | | CBK | | | | 1,189 | | | | - | | | | 1,189 | |
| USD | | | 118,659 | | | SEK | | | 117,490 | | | 2/7/2025 | | | CBK | | | | 1,169 | | | | - | | | | 1,169 | |
| USD | | | 126,389 | | | NOK | | | 123,190 | | | 2/7/2025 | | | CBK | | | | 3,199 | | | | - | | | | 3,199 | |
| USD | | | 127,142 | | | SEK | | | 125,882 | | | 2/7/2025 | | | CBK | | | | 1,260 | | | | - | | | | 1,260 | |
| USD | | | 133,573 | | | SEK | | | 132,434 | | | 2/7/2025 | | | CBK | | | | 1,139 | | | | - | | | | 1,139 | |
| USD | | | 162,384 | | | NOK | | | 157,937 | | | 2/7/2025 | | | CBK | | | | 4,447 | | | | - | | | | 4,447 | |
| USD | | | 227,454 | | | NOK | | | 221,111 | | | 2/7/2025 | | | CBK | | | | 6,343 | | | | - | | | | 6,343 | |
| USD | | | 227,584 | | | NOK | | | 221,111 | | | 2/7/2025 | | | CBK | | | | 6,473 | | | | - | | | | 6,473 | |
| MXN | | | 389 | | | USD | | | 400 | | | 2/12/2025 | | | CBK | | | | - | | | | (11 | ) | | | (11 | ) |
| MXN | | | 8,677 | | | USD | | | 8,936 | | | 2/12/2025 | | | CBK | | | | - | | | | (259 | ) | | | (259 | ) |
| MXN | | | 21,929 | | | USD | | | 22,518 | | | 2/12/2025 | | | CBK | | | | - | | | | (589 | ) | | | (589 | ) |
| MXN | | | 23,815 | | | USD | | | 24,242 | | | 2/12/2025 | | | CBK | | | | - | | | | (427 | ) | | | (427 | ) |
| MXN | | | 23,816 | | | USD | | | 24,510 | | | 2/12/2025 | | | CBK | | | | - | | | | (694 | ) | | | (694 | ) |
| MXN | | | 23,816 | | | USD | | | 24,532 | | | 2/12/2025 | | | CBK | | | | - | | | | (716 | ) | | | (716 | ) |
| MXN | | | 23,816 | | | USD | | | 24,533 | | | 2/12/2025 | | | CBK | | | | - | | | | (717 | ) | | | (717 | ) |
| MXN | | | 23,816 | | | USD | | | 24,556 | | | 2/12/2025 | | | CBK | | | | - | | | | (740 | ) | | | (740 | ) |
| MXN | | | 23,816 | | | USD | | | 24,595 | | | 2/12/2025 | | | CBK | | | | - | | | | (779 | ) | | | (779 | ) |
| MXN | | | 38,955 | | | USD | | | 40,065 | | | 2/12/2025 | | | CBK | | | | - | | | | (1,110 | ) | | | (1,110 | ) |
| USD | | | 41,079 | | | MXN | | | 40,300 | | | 2/12/2025 | | | CBK | | | | 779 | | | | - | | | | 779 | |
| USD | | | 46,961 | | | MXN | | | 46,057 | | | 2/12/2025 | | | CBK | | | | 904 | | | | - | | | | 904 | |
| MXN | | | 47,632 | | | USD | | | 48,958 | | | 2/12/2025 | | | CBK | | | | - | | | | (1,326 | ) | | | (1,326 | ) |
| MXN | | | 47,632 | | | USD | | | 49,033 | | | 2/12/2025 | | | CBK | | | | - | | | | (1,401 | ) | | | (1,401 | ) |
| MXN | | | 49,129 | | | USD | | | 50,488 | | | 2/12/2025 | | | CBK | | | | - | | | | (1,359 | ) | | | (1,359 | ) |
| USD | | | 57,630 | | | MXN | | | 56,539 | | | 2/12/2025 | | | CBK | | | | 1,091 | | | | - | | | | 1,091 | |
| EUR | | | 103,758 | | | CAD | | | 104,570 | | | 2/13/2025 | | | CBK | | | | - | | | | (812 | ) | | | (812 | ) |
| EUR | | | 103,759 | | | CAD | | | 103,683 | | | 2/13/2025 | | | CBK | | | | 76 | | | | - | | | | 76 | |
| EUR | | | 103,760 | | | CAD | | | 104,065 | | | 2/13/2025 | | | CBK | | | | - | | | | (305 | ) | | | (305 | ) |
See accompanying notes
83
American Beacon AHL Multi-Alternatives FundSM
Consolidated Schedule of Investments
December 31, 2024
| | | | | | | | | | | | | | | | | | | | | | | | | | | | |
| Currency Purchased* | | | Currency Sold* | | | Settlement
Date | | Counterparty | | | Unrealized
Appreciation | | | Unrealized
(Depreciation) | | | Net Unrealized
Appreciation
(Depreciation) | |
| EUR | | | 103,760 | | | CAD | | | 104,878 | | | 2/13/2025 | | | CBK | | | $ | - | | | $ | (1,118 | ) | | $ | (1,118 | ) |
| CAD | | | 105,623 | | | EUR | | | 105,569 | | | 2/13/2025 | | | CBK | | | | 54 | | | | - | | | | 54 | |
| CAD | | | 169,580 | | | EUR | | | 169,621 | | | 2/13/2025 | | | CBK | | | | - | | | | (41 | ) | | | (41 | ) |
| CAD | | | 243,616 | | | EUR | | | 243,608 | | | 2/13/2025 | | | CBK | | | | 8 | | | | - | | | | 8 | |
| USD | | | 74,795 | | | SGD | | | 73,366 | | | 2/19/2025 | | | CBK | | | | 1,429 | | | | - | | | | 1,429 | |
| SGD | | | 146,733 | | | USD | | | 147,631 | | | 2/19/2025 | | | CBK | | | | - | | | | (898 | ) | | | (898 | ) |
| SGD | | | 146,733 | | | USD | | | 147,964 | | | 2/19/2025 | | | CBK | | | | - | | | | (1,231 | ) | | | (1,231 | ) |
| USD | | | 1,947,808 | | | SGD | | | 1,907,528 | | | 2/19/2025 | | | CBK | | | | 40,280 | | | | - | | | | 40,280 | |
| USD | | | 76,514 | | | TWD | | | 76,585 | | | 2/20/2025 | | | CBK | | | | - | | | | (71 | ) | | | (71 | ) |
| USD | | | 174,768 | | | INR | | | 174,414 | | | 2/20/2025 | | | CBK | | | | 354 | | | | - | | | | 354 | |
| EUR | | | 103,585 | | | AUD | | | 103,638 | | | 1/2/2025 | | | HUB | | | | - | | | | (53 | ) | | | (53 | ) |
| AUD | | | 103,634 | | | EUR | | | 103,585 | | | 1/2/2025 | | | HUB | | | | 49 | | | | - | | | | 49 | |
| BRL | | | 16,187 | | | USD | | | 16,620 | | | 1/3/2025 | | | HUB | | | | - | | | | (433 | ) | | | (433 | ) |
| BRL | | | 16,187 | | | USD | | | 16,645 | | | 1/3/2025 | | | HUB | | | | - | | | | (458 | ) | | | (458 | ) |
| BRL | | | 16,187 | | | USD | | | 16,657 | | | 113/2025 | | | HUB | | | | - | | | | (470 | ) | | | (470 | ) |
| BRL | | | 16,187 | | | USD | | | 16,778 | | | 1/3/2025 | | | HUB | | | | - | | | | (591 | ) | | | (591 | ) |
| BRL | | | 16,187 | | | USD | | | 17,164 | | | 1/3/2025 | | | HUB | | | | - | | | | (977 | ) | | | (977 | ) |
| BRL | | | 16,187 | | | USD | | | 17,182 | | | 1/3/2025 | | | HUB | | | | - | | | | (995 | ) | | | (995 | ) |
| BRL | | | 16,187 | | | USD | | | 17,243 | | | 1/3/2025 | | | HUB | | | | - | | | | (1,056 | ) | | | (1,056 | ) |
| BRL | | | 16,187 | | | USD | | | 17,305 | | | 1/3/2025 | | | HUB | | | | - | | | | (1,118 | ) | | | (1,118 | ) |
| BRL | | | 16,187 | | | USD | | | 17,312 | | | 1/3/2025 | | | HUB | | | | - | | | | (1,125 | ) | | | (1,125 | ) |
| USD | | | 16,350 | | | BRL | | | 16,187 | | | 1/3/2025 | | | HUB | | | | 163 | | | | - | | | | 163 | |
| USD | | | 16,395 | | | BRL | | | 16,187 | | | 1/3/2025 | | | HUB | | | | 208 | | | | - | | | | 208 | |
| USD | | | 16,414 | | | BRL | | | 16,187 | | | 113/2025 | | | HUB | | | | 227 | | | | - | | | | 227 | |
| USD | | | 16,431 | | | BRL | | | 16,187 | | | 1/3/2025 | | | HUB | | | | 244 | | | | - | | | | 244 | |
| USD | | | 16,432 | | | BRL | | | 16,187 | | | 1/3/2025 | | | HUB | | | | 245 | | | | - | | | | 245 | |
| USD | | | 16,457 | | | BRL | | | 16,187 | | | 1/3/2025 | | | HUB | | | | 270 | | | | - | | | | 270 | |
| USD | | | 16,461 | | | BRL | | | 16,187 | | | 113/2025 | | | HUB | | | | 274 | | | | - | | | | 274 | |
| USD | | | 16,467 | | | BRL | | | 16,187 | | | 1/3/2025 | | | HUB | | | | 280 | | | | - | | | | 280 | |
| USD | | | 16,496 | | | BRL | | | 16,187 | | | 1/3/2025 | | | HUB | | | | 309 | | | | - | | | | 309 | |
| USD | | | 16,521 | | | BRL | | | 16,187 | | | 1/3/2025 | | | HUB | | | | 334 | | | | - | | | | 334 | |
| USD | | | 16,720 | | | BRL | | | 16,187 | | | 113/2025 | | | HUB | | | | 533 | | | | - | | | | 533 | |
| USD | | | 17,182 | | | BRL | | | 16,187 | | | 1/3/2025 | | | HUB | | | | 995 | | | | - | | | | 995 | |
| USD | | | 17,200 | | | BRL | | | 16,187 | | | 1/3/2025 | | | HUB | | | | 1,013 | | | | - | | | | 1,013 | |
| USD | | | 17,232 | | | BRL | | | 16,187 | | | 1/3/2025 | | | HUB | | | | 1,045 | | | | - | | | | 1,045 | |
| USD | | | 24,277 | | | PLN | | | 24,212 | | | 113/2025 | | | HUB | | | | 65 | | | | - | | | | 65 | |
| CHF | | | 28,645 | | | EUR | | | 28,629 | | | 1/3/2025 | | | HUB | | | | 16 | | | | - | | | | 16 | |
| USD | | | 16,452 | | | BRL | | | 16,187 | | | 1/3/2025 | | | HUB | | | | 265 | | | | - | | | | 265 | |
| USD | | | 16,452 | | | BRL | | | 16,187 | | | 1/3/2025 | | | HUB | | | | 265 | | | | - | | | | 265 | |
| USD | | | 36,232 | | | BRL | | | 33,992 | | | 113/2025 | | | HUB | | | | 2,240 | | | | - | | | | 2,240 | |
| BRL | | | 51,086 | | | USD | | | 51,847 | | | 1/3/2025 | | | HUB | | | | - | | | | (761 | ) | | | (761 | ) |
| BRL | | | 53,036 | | | USD | | | 54,302 | | | 113/2025 | | | HUB | | | | - | | | | (1,266 | ) | | | (1,266 | ) |
| USD | | | 62,152 | | | AUD | | | 61,895 | | | 1/3/2025 | | | HUB | | | | 257 | | | | - | | | | 257 | |
| USD | | | 73,316 | | | BRL | | | 69,170 | | | 1/3/2025 | | | HUB | | | | 4,146 | | | | - | | | | 4,146 | |
| CHF | | | 75,005 | | | EUR | | | 74,956 | | | 1/3/2025 | | | HUB | | | | 49 | | | | - | | | | 49 | |
| BRL | | | 80,990 | | | USD | | | 82,850 | | | 113/2025 | | | HUB | | | | - | | | | (1,860 | ) | | | (1,860 | ) |
| BRL | | | 80,990 | | | USD | | | 82,960 | | | 1/3/2025 | | | HUB | | | | - | | | | (1,970 | ) | | | (1,970 | ) |
| USD | | | 84,332 | | | BRL | | | 79,316 | | | 1/3/2025 | | | HUB | | | | 5,016 | | | | - | | | | 5,016 | |
| EUR | | | 103,585 | | | CHF | | | 103,898 | | | 1/3/2025 | | | HUB | | | | - | | | | (313 | ) | | | (313 | ) |
| BRL | | | 123,725 | | | USD | | | 126,667 | | | 1/3/2025 | | | HUB | | | | - | | | | (2,942 | ) | | | (2,942 | ) |
| BRL | | | 123,725 | | | USD | | | 126,771 | | | 1/3/2025 | | | HUB | | | | - | | | | (3,046 | ) | | | (3,046 | ) |
| BRL | | | 152,635 | | | USD | | | 155,784 | | | 1/3/2025 | | | HUB | | | | - | | | | (3,149 | ) | | | (3,149 | ) |
| USD | | | 206,489 | | | BRL | | | 194,298 | | | 1/3/2025 | | | HUB | | | | 12,191 | | | | - | | | | 12,191 | |
| BRL | | | 240,278 | | | USD | | | 243,888 | | | 1/3/2025 | | | HUB | | | | - | | | | (3,610 | ) | | | (3,610 | ) |
| USD | | | 442,549 | | | BRL | | | 416,380 | | | 1/3/2025 | | | HUB | | | | 26,169 | | | | - | | | | 26,169 | |
| JPY | | | 4,494 | | | USD | | | 4,480 | | | 1/6/2025 | | | HUB | | | | 14 | | | | - | | | | 14 | |
| USD | | | 56,458 | | | NZD | | | 55,950 | | | 1/6/2025 | | | HUB | | | | 508 | | | | - | | | | 508 | |
| JPY | | | 59,061 | | | USD | | | 58,870 | | | 1/6/2025 | | | HUB | | | | 191 | | | | - | | | | 191 | |
| AUD | | | 61,895 | | | JPY | | | 62,386 | | | 1/6/2025 | | | HUB | | | | - | | | | (491 | ) | | | (491 | ) |
See accompanying notes
84
American Beacon AHL Multi-Alternatives FundSM
Consolidated Schedule of Investments
December 31, 2024
| | | | | | | | | | | | | | | | | | | | | | | | | | | | |
| Currency Purchased* | | | Currency Sold* | | | Settlement
Date | | Counterparty | | | Unrealized
Appreciation | | | Unrealized
(Depreciation) | | | Net Unrealized
Appreciation
(Depreciation) | |
| JPY | | | 62,595 | | | AUD | | | 61,895 | | | 1/6/2025 | | | HUB | | | $ | 700 | | | $ | - | | | $ | 700 | |
| USD | | | 63,358 | | | JPY | | | 63,555 | | | 1/6/2025 | | | HUB | | | | - | | | | (197 | ) | | | (197 | ) |
| EUR | | | 103,597 | | | CHF | | | 103,799 | | | 1/6/2025 | | | HUB | | | | - | | | | (202 | ) | | | (202 | ) |
| USD | | | 63,390 | | | JPY | | | 63,555 | | | 1/7/2025 | | | HUB | | | | - | | | | (165 | ) | | | (165 | ) |
| USD | | | 63,509 | | | JPY | | | 63,555 | | | 1/7/2025 | | | HUB | | | | - | | | | (46 | ) | | | (46 | ) |
| KRW | | | 67,936 | | | USD | | | 69,101 | | | 1/7/2025 | | | HUB | | | | - | | | | (1,165 | ) | | | (1,165 | ) |
| KRW | | | 67,936 | | | USD | | | 69,110 | | | 1/7/2025 | | | HUB | | | | - | | | | (1,174 | ) | | | (1,174 | ) |
| KRW | | | 135,872 | | | USD | | | 138,102 | | | 1/7/2025 | | | HUB | | | | - | | | | (2,230 | ) | | | (2,230 | ) |
| KRW | | | 1,086,972 | | | USD | | | 1,101,200 | | | 1/7/2025 | | | HUB | | | | - | | | | (14,228 | ) | | | (14,228 | ) |
| USD | | | 1,423,913 | | | KRW | | | 1,358,715 | | | 1/7/2025 | | | HUB | | | | 65,198 | | | | - | | | | 65,198 | |
| CNY | | | 68,137 | | | USD | | | 68,441 | | | 1/10/2025 | | | HUB | | | | - | | | | (304 | ) | | | (304 | ) |
| CNY | | | 68,137 | | | USD | | | 68,445 | | | 1/10/2025 | | | HUB | | | | - | | | | (308 | ) | | | (308 | ) |
| CNY | | | 68,137 | | | USD | | | 68,487 | | | 1/10/2025 | | | HUB | | | | - | | | | (350 | ) | | | (350 | ) |
| CNY | | | 68,137 | | | USD | | | 68,516 | | | 1/10/2025 | | | HUB | | | | - | | | | (379 | ) | | | (379 | ) |
| CNY | | | 68,137 | | | USD | | | 68,638 | | | 1/10/2025 | | | HUB | | | | - | | | | (501 | ) | | | (501 | ) |
| USD | | | 68,659 | | | CNY | | | 68,137 | | | 1/10/2025 | | | HUB | | | | 522 | | | | - | | | | 522 | |
| USD | | | 68,919 | | | CNY | | | 68,137 | | | 1/10/2025 | | | HUB | | | | 782 | | | | - | | | | 782 | |
| USD | | | 69,177 | | | CNY | | | 68,137 | | | 1/10/2025 | | | HUB | | | | 1,040 | | | | - | | | | 1,040 | |
| CNY | | | 136,275 | | | USD | | | 136,919 | | | 1/10/2025 | | | HUB | | | | - | | | | (644 | ) | | | (644 | ) |
| USD | | | 137,425 | | | CNY | | | 136,275 | | | 1/10/2025 | | | HUB | | | | 1,150 | | | | - | | | | 1,150 | |
| USD | | | 1,383,911 | | | CNY | | | 1,362,745 | | | 1/10/2025 | | | HUB | | | | 21,166 | | | | - | | | | 21,166 | |
| AUD | | | 17,815 | | | JPY | | | 18,465 | | | 1/14/2025 | | | HUB | | | | - | | | | (650 | ) | | | (650 | ) |
| JPY | | | 29,004 | | | AUD | | | 29,051 | | | 1/14/2025 | | | HUB | | | | - | | | | (47 | ) | | | (47 | ) |
| JPY | | | 32,787 | | | AUD | | | 32,845 | | | 1/14/2025 | | | HUB | | | | - | | | | (58 | ) | | | (58 | ) |
| AUD | | | 35,630 | | | JPY | | | 36,768 | | | 1/14/2025 | | | HUB | | | | - | | | | (1,138 | ) | | | (1,138 | ) |
| AUD | | | 53,446 | | | JPY | | | 55,342 | | | 1/14/2025 | | | HUB | | | | - | | | | (1,896 | ) | | | (1,896 | ) |
| AUD | | | 60,065 | | | JPY | | | 62,218 | | | 1/14/2025 | | | HUB | | | | - | | | | (2,153 | ) | | | (2,153 | ) |
| JPY | | | 61,095 | | | AUD | | | 61,896 | | | 1/14/2025 | | | HUB | | | | - | | | | (801 | ) | | | (801 | ) |
| JPY | | | 61,750 | | | AUD | | | 61,896 | | | 1/14/2025 | | | HUB | | | | - | | | | (146 | ) | | | (146 | ) |
| AUD | | | 61,896 | | | JPY | | | 62,015 | | | 1/14/2025 | | | HUB | | | | - | | | | (119 | ) | | | (119 | ) |
| AUD | | | 61,896 | | | JPY | | | 62,589 | | | 1/14/2025 | | | HUB | | | | - | | | | (693 | ) | | | (693 | ) |
| JPY | | | 63,578 | | | AUD | | | 61,896 | | | 1/14/2025 | | | HUB | | | | 1,682 | | | | | | | | 1,682 | |
| AUD | | | 71,261 | | | JPY | | | 73,516 | | | 1/14/2025 | | | HUB | | | | - | | | | (2,255 | ) | | | (2,255 | ) |
| AUD | | | 71,261 | | | JPY | | | 73,762 | | | 1/14/2025 | | | HUB | | | | - | | | | (2,501 | ) | | | (2,501 | ) |
| USD | | | 22 | | | PLN | | | 21 | | | 1/16/2025 | | | HUB | | | | 1 | | | | - | | | | 1 | |
| AUD | | | 22 | | | USD | | | 23 | | | 1/16/2025 | | | HUB | | | | - | | | | (1 | ) | | | (1 | ) |
| USD | | | 38 | | | PLN | | | 38 | | | 1/16/2025 | | | HUB | | | | - | | | | - | | | | - | |
| USD | | | 43 | | | JPY | | | 42 | | | 1/16/2025 | | | HUB | | | | 1 | | | | - | | | | 1 | |
| USD | | | 44 | | | CAD | | | 43 | | | 1/16/2025 | | | HUB | | | | 1 | | | | - | | | | 1 | |
| JPY | | | 73 | | | USD | | | 73 | | | 1/16/2025 | | | HUB | | | | - | | | | - | | | | - | |
| AUD | | | 82 | | | USD | | | 82 | | | 1/16/2025 | | | HUB | | | | - | | | | - | | | | - | |
| JPY | | | 86 | | | USD | | | 90 | | | 1/16/2025 | | | HUB | | | | - | | | | (4 | ) | | | (4 | ) |
| USD | | | 120 | | | GBP | | | 119 | | | 1/16/2025 | | | HUB | | | | 1 | | | | - | | | | 1 | |
| USD | | | 154 | | | GBP | | | 154 | | | 1/16/2025 | | | HUB | | | | - | | | | - | | | | - | |
| USD | | | 159 | | | AUD | | | 157 | | | 1/16/2025 | | | HUB | | | | 2 | | | | - | | | | 2 | |
| AUD | | | 171 | | | USD | | | 176 | | | 1/16/2025 | | | HUB | | | | - | | | | (5 | ) | | | (5 | ) |
| JPY | | | 271 | | | USD | | | 281 | | | 1/16/2025 | | | HUB | | | | - | | | | (10 | ) | | | (10 | ) |
| AUD | | | 274 | | | USD | | | 281 | | | 1/16/2025 | | | HUB | | | | - | | | | (7 | ) | | | (7 | ) |
| AUD | | | 283 | | | USD | | | 286 | | | 1/16/2025 | | | HUB | | | | - | | | | (3 | ) | | | (3 | ) |
| USD | | | 284 | | | CAD | | | 284 | | | 1/16/2025 | | | HUB | | | | - | | | | - | | | | - | |
| USD | | | 290 | | | CAD | | | 290 | | | 1/16/2025 | | | HUB | | | | - | | | | - | | | | - | |
| USD | | | 320 | | | PLN | | | 318 | | | 1/16/2025 | | | HUB | | | | 2 | | | | - | | | | 2 | |
| USD | | | 356 | | | JPY | | | 354 | | | 1/16/2025 | | | HUB | | | | 2 | | | | - | | | | 2 | |
| CAD | | | 459 | | | USD | | | 461 | | | 1/16/2025 | | | HUB | | | | - | | | | (2 | ) | | | (2 | ) |
| AUD | | | 529 | | | USD | | | 550 | | | 1/16/2025 | | | HUB | | | | - | | | | (21 | ) | | | (21 | ) |
| USD | | | 532 | | | AUD | | | 512 | | | 1/16/2025 | | | HUB | | | | 20 | | | | - | | | | 20 | |
| USD | | | 555 | | | JPY | | | 539 | | | 1/16/2025 | | | HUB | | | | 16 | | | | - | | | | 16 | |
| JPY | | | 704 | | | USD | | | 708 | | | 1/16/2025 | | | HUB | | | | - | | | | (4 | ) | | | (4 | ) |
| JPY | | | 724 | | | USD | | | 722 | | | 1/16/2025 | | | HUB | | | | 2 | | | | - | | | | 2 | |
See accompanying notes
85
American Beacon AHL Multi-Alternatives FundSM
Consolidated Schedule of Investments
December 31, 2024
| | | | | | | | | | | | | | | | | | | | | | | | | | | | |
| Currency Purchased* | | | Currency Sold* | | | Settlement
Date | | Counterparty | | | Unrealized
Appreciation | | | Unrealized
(Depreciation) | | | Net Unrealized
Appreciation
(Depreciation) | |
| JPY | | | 923 | | | USD | | | 929 | | | 1/16/2025 | | | HUB | | | $ | - | | | $ | (6 | ) | | $ | (6 | ) |
| AUD | | | 1,223 | | | USD | | | 1,264 | | | 1/16/2025 | | | HUB | | | | - | | | | (41 | ) | | | (41 | ) |
| USD | | | 1,635 | | | CAD | | | 1,607 | | | 1/16/2025 | | | HUB | | | | 28 | | | | - | | | | 28 | |
| USD | | | 2,142 | | | AUD | | | 2,067 | | | 1/16/2025 | | | HUB | | | | 75 | | | | - | | | | 75 | |
| PLN | | | 2,696 | | | USD | | | 2,732 | | | 1/16/2025 | | | HUB | | | | - | | | | (36 | ) | | | (36 | ) |
| GBP | | | 13,691 | | | USD | | | 13,831 | | | 1/16/2025 | | | HUB | | | | - | | | | (140 | ) | | | (140 | ) |
| USD | | | 21,235 | | | AUD | | | 20,823 | | | 1/16/2025 | | | HUB | | | | 412 | | | | - | | | | 412 | |
| USD | | | 515,962 | | | EUR | | | 508,866 | | | 1/16/2025 | | | HUB | | | | 7,096 | | | | - | | | | 7,096 | |
| KRW | | | 67,968 | | | USD | | | 67,637 | | | 1/23/2025 | | | HUB | | | | 331 | | | | - | | | | 331 | |
| USD | | | 69,750 | | | KRW | | | 67,968 | | | 1/16/2025 | | | HUB | | | | 1,782 | | | | - | | | | 1,782 | |
| USD | | | 70,637 | | | KRW | | | 67,968 | | | 1/16/2025 | | | HUB | | | | 2,669 | | | | - | | | | 2,669 | |
| USD | | | 71,269 | | | KRW | | | 67,968 | | | 1/16/2025 | | | HUB | | | | 3,301 | | | | - | | | | 3,301 | |
| USD | | | 71,352 | | | KRW | | | 67,968 | | | 1/16/2025 | | | HUB | | | | 3,384 | | | | - | | | | 3,384 | |
| USD | | | 71,665 | | | KRW | | | 67,968 | | | 1/16/2025 | | | HUB | | | | 3,697 | | | | - | | | | 3,697 | |
| USD | | | 8,347 | | | EUR | | | 8,295 | | | 1/27/2025 | | | HUB | | | | 52 | | | | - | | | | 52 | |
| USD | | | 10,230 | | | PLN | | | 9,775 | | | 1/27/2025 | | | HUB | | | | 455 | | | | - | | | | 455 | |
| USD | | | 22,321 | | | PLN | | | 21,504 | | | 1/27/2025 | | | HUB | | | | 817 | | | | - | | | | 817 | |
| USD | | | 24,097 | | | PLN | | | 24,192 | | | 1/27/2025 | | | HUB | | | | - | | | | (95 | ) | | | (95 | ) |
| USD | | | 24,098 | | | PLN | | | 24,192 | | | 1/27/2025 | | | HUB | | | | - | | | | (94 | ) | | | (94 | ) |
| PLN | | | 24,192 | | | USD | | | 24,548 | | | 1/27/2025 | | | HUB | | | | - | | | | (356 | ) | | | (356 | ) |
| PLN | | | 24,192 | | | USD | | | 24,603 | | | 1/27/2025 | | | HUB | | | | - | | | | (411 | ) | | | (411 | ) |
| PLN | | | 24,192 | | | USD | | | 24,695 | | | 1/27/2025 | | | HUB | | | | - | | | | (503 | ) | | | (503 | ) |
| PLN | | | 24,192 | | | USD | | | 24,742 | | | 1/27/2025 | | | HUB | | | | - | | | | (550 | ) | | | (550 | ) |
| PLN | | | 24,192 | | | USD | | | 25,152 | | | 1/27/2025 | | | HUB | | | | - | | | | (960 | ) | | | (960 | ) |
| PLN | | | 24,192 | | | USD | | | 25,350 | | | 1/27/2025 | | | HUB | | | | - | | | | (1,158 | ) | | | (1,158 | ) |
| USD | | | 24,198 | | | PLN | | | 24,192 | | | 1/27/2025 | | | HUB | | | | 6 | | | | - | | | | 6 | |
| USD | | | 24,244 | | | PLN | | | 24,192 | | | 1/27/2025 | | | HUB | | | | 52 | | | | - | | | | 52 | |
| USD | | | 24,312 | | | PLN | | | 24,192 | | | 1/27/2025 | | | HUB | | | | 120 | | | | - | | | | 120 | |
| USD | | | 24,329 | | | PLN | | | 24,192 | | | 1/27/2025 | | | HUB | | | | 137 | | | | - | | | | 137 | |
| USD | | | 24,394 | | | PLN | | | 24,192 | | | 1/27/2025 | | | HUB | | | | 202 | | | | - | | | | 202 | |
| USD | | | 24,401 | | | PLN | | | 24,192 | | | 1/27/2025 | | | HUB | | | | 209 | | | | - | | | | 209 | |
| USD | | | 24,403 | | | PLN | | | 24,192 | | | 1/27/2025 | | | HUB | | | | 211 | | | | - | | | | 211 | |
| USD | | | 24,769 | | | PLN | | | 24,192 | | | 1/27/2025 | | | HUB | | | | 577 | | | | - | | | | 577 | |
| USD | | | 24,826 | | | PLN | | | 24,192 | | | 1/27/2025 | | | HUB | | | | 634 | | | | - | | | | 634 | |
| USD | | | 24,870 | | | PLN | | | 24,192 | | | 1/27/2025 | | | HUB | | | | 678 | | | | - | | | | 678 | |
| USD | | | 24,872 | | | PLN | | | 24,192 | | | 1/27/2025 | | | HUB | | | | 680 | | | | - | | | | 680 | |
| USD | | | 25,332 | | | PLN | | | 24,192 | | | 1/27/2025 | | | HUB | | | | 1,140 | | | | - | | | | 1,140 | |
| USD | | | 25,370 | | | PLN | | | 24,192 | | | 1/27/2025 | | | HUB | | | | 1,178 | | | | - | | | | 1,178 | |
| USD | | | 25,523 | | | PLN | | | 24,192 | | | 1/27/2025 | | | HUB | | | | 1,331 | | | | - | | | | 1,331 | |
| PLN | | | 27,789 | | | USD | | | 29,905 | | | 1/27/2025 | | | HUB | | | | - | | | | (2,116 | ) | | | (2,116 | ) |
| USD | | | 27,896 | | | PLN | | | 26,880 | | | 1/27/2025 | | | HUB | | | | 1,016 | | | | - | | | | 1,016 | |
| USD | | | 30,033 | | | PLN | | | 29,162 | | | 1/27/2025 | | | HUB | | | | 871 | | | | - | | | | 871 | |
| USD | | | 31,394 | | | PLN | | | 29,990 | | | 1/27/2025 | | | HUB | | | | 1,404 | | | | - | | | | 1,404 | |
| USD | | | 44,698 | | | PLN | | | 43,415 | | | 1/27/2025 | | | HUB | | | | 1,283 | | | | - | | | | 1,283 | |
| PLN | | | 48,384 | | | USD | | | 48,784 | | | 1/27/2025 | | | HUB | | | | - | | | | (400 | ) | | | (400 | ) |
| PLN | | | 48,384 | | | USD | | | 49,426 | | | 1/27/2025 | | | HUB | | | | - | | | | (1,042 | ) | | | (1,042 | ) |
| USD | | | 51,296 | | | PLN | | | 51,032 | | | 1/27/2025 | | | HUB | | | | 264 | | | | - | | | | 264 | |
| USD | | | 52,190 | | | PLN | | | 51,092 | | | 1/27/2025 | | | HUB | | | | 1,098 | | | | - | | | | 1,098 | |
| PLN | | | 65,347 | | | USD | | | 70,335 | | | 1/27/2025 | | | HUB | | | | - | | | | (4,988 | ) | | | (4,988 | ) |
| USD | | | 70,246 | | | PLN | | | 69,928 | | | 1/27/2025 | | | HUB | | | | 318 | | | | - | | | | 318 | |
| USD | | | 71,390 | | | PLN | | | 69,869 | | | 1/27/2025 | | | HUB | | | | 1,521 | | | | - | | | | 1,521 | |
| USD | | | 95,211 | | | PLN | | | 90,971 | | | 1/27/2025 | | | HUB | | | | 4,240 | | | | - | | | | 4,240 | |
| USD | | | 96,006 | | | EUR | | | 95,389 | | | 1/27/2025 | | | HUB | | | | 617 | | | | - | | | | 617 | |
| EUR | | | 103,684 | | | USD | | | 103,912 | | | 1/27/2025 | | | HUB | | | | - | | | | (228 | ) | | | (228 | ) |
| EUR | | | 103,684 | | | USD | | | 104,070 | | | 1/27/2025 | | | HUB | | | | - | | | | (386 | ) | | | (386 | ) |
| EUR | | | 103,684 | | | USD | | | 104,438 | | | 1/27/2025 | | | HUB | | | | - | | | | (754 | ) | | | (754 | ) |
| USD | | | 104,119 | | | EUR | | | 103,684 | | | 1/27/2025 | | | HUB | | | | 435 | | | | - | | | | 435 | |
| USD | | | 105,319 | | | EUR | | | 103,684 | | | 1/27/2025 | | | HUB | | | | 1,635 | | | | - | | | | 1,635 | |
| USD | | | 105,815 | | | EUR | | | 103,684 | | | 1/27/2025 | | | HUB | | | | 2,131 | | | | - | | | | 2,131 | |
See accompanying notes
86
American Beacon AHL Multi-Alternatives FundSM
Consolidated Schedule of Investments
December 31, 2024
| | | | | | | | | | | | | | | | | | | | | | | | | | | | |
| Currency Purchased* | | | Currency Sold* | | | Settlement
Date | | Counterparty | | | Unrealized
Appreciation | | | Unrealized
(Depreciation) | | | Net Unrealized
Appreciation
(Depreciation) | |
| USD | | | 108,427 | | | EUR | | | 103,684 | | | 1/27/2025 | | | HUB | | | $ | 4,743 | | | $ | - | | | $ | 4,743 | |
| USD | | | 108,905 | | | EUR | | | 103,684 | | | 1/27/2025 | | | HUB | | | | 5,221 | | | | - | | | | 5,221 | |
| USD | | | 109,013 | | | EUR | | | 103,684 | | | 1/27/2025 | | | HUB | | | | 5,329 | | | | - | | | | 5,329 | |
| USD | | | 109,261 | | | EUR | | | 103,684 | | | 1/27/2025 | | | HUB | | | | 5,577 | | | | - | | | | 5,577 | |
| USD | | | 109,432 | | | EUR | | | 103,684 | | | 1/27/2025 | | | HUB | | | | 5,748 | | | | - | | | | 5,748 | |
| USD | | | 110,158 | | | EUR | | | 103,684 | | | 1/27/2025 | | | HUB | | | | 6,474 | | | | - | | | | 6,474 | |
| USD | | | 110,367 | | | EUR | | | 103,684 | | | 1/27/2025 | | | HUB | | | | 6,683 | | | | - | | | | 6,683 | |
| PLN | | | 114,357 | | | USD | | | 122,960 | | | 1/27/2025 | | | HUB | | | | - | | | | (8,603 | ) | | | (8,603 | ) |
| USD | | | 116,342 | | | PLN | | | 111,185 | | | 1/27/2025 | | | HUB | | | | 5,157 | | | | - | | | | 5,157 | |
| PLN | | | 129,319 | | | USD | | | 139,148 | | | 1/27/2025 | | | HUB | | | | - | | | | (9,829 | ) | | | (9,829 | ) |
| PLN | | | 147,030 | | | USD | | | 158,247 | | | 1/27/2025 | | | HUB | | | | - | | | | (11,217 | ) | | | (11,217 | ) |
| USD | | | 216,643 | | | EUR | | | 207,367 | | | 1/27/2025 | | | HUB | | | | 9,276 | | | | - | | | | 9,276 | |
| USD | | | 216,890 | | | EUR | | | 207,367 | | | 1/27/2025 | | | HUB | | | | 9,523 | | | | - | | | | 9,523 | |
| USD | | | 325,666 | | | EUR | | | 311,051 | | | 1/27/2025 | | | HUB | | | | 14,615 | | | | - | | | | 14,615 | |
| USD | | | 325,831 | | | EUR | | | 311,051 | | | 1/27/2025 | | | HUB | | | | 14,780 | | | | - | | | | 14,780 | |
| EUR | | | 414,735 | | | USD | | | 437,240 | | | 1/27/2025 | | | HUB | | | | - | | | | (22,505 | ) | | | (22,505 | ) |
| USD | | | 4,178 | | | JPY | | | 4,031 | | | 1/31/2025 | | | HUB | | | | 147 | | | | - | | | | 147 | |
| USD | | | 4,492 | | | JPY | | | 4,507 | | | 1/31/2025 | | | HUB | | | | - | | | | (15 | ) | | | (15 | ) |
| USD | | | 7,231 | | | JPY | | | 6,940 | | | 1/31/2025 | | | HUB | | | | 291 | | | | - | | | | 291 | |
| USD | | | 10,886 | | | JPY | | | 10,623 | | | 1/31/2025 | | | HUB | | | | 263 | | | | - | | | | 263 | |
| USD | | | 19,372 | | | JPY | | | 18,885 | | | 1/31/2025 | | | HUB | | | | 487 | | | | - | | | | 487 | |
| USD | | | 19,625 | | | JPY | | | 18,954 | | | 1/31/2025 | | | HUB | | | | 671 | | | | - | | | | 671 | |
| JPY | | | 25,807 | | | USD | | | 25,927 | | | 1/31/2025 | | | HUB | | | | - | | | | (120 | ) | | | (120 | ) |
| USD | | | 26,983 | | | JPY | | | 26,762 | | | 1/31/2025 | | | HUB | | | | 221 | | | | - | | | | 221 | |
| USD | | | 27,659 | | | JPY | | | 26,557 | | | 1/31/2025 | | | HUB | | | | 1,102 | | | | - | | | | 1,102 | |
| USD | | | 28,740 | | | JPY | | | 28,820 | | | 1/31/2025 | | | HUB | | | | - | | | | (80 | ) | | | (80 | ) |
| USD | | | 36,135 | | | JPY | | | 34,322 | | | 1/31/2025 | | | HUB | | | | 1,813 | | | | - | | | | 1,813 | |
| USD | | | 37,211 | | | JPY | | | 36,973 | | | 1/31/2025 | | | HUB | | | | 238 | | | | - | | | | 238 | |
| USD | | | 46,032 | | | JPY | | | 44,851 | | | 1/31/2025 | | | HUB | | | | 1,181 | | | | - | | | | 1,181 | |
| USD | | | 50,604 | | | JPY | | | 48,013 | | | 1/31/2025 | | | HUB | | | | 2,591 | | | | - | | | | 2,591 | |
| USD | | | 52,147 | | | JPY | | | 49,058 | | | 1/31/2025 | | | HUB | | | | 3,089 | | | | - | | | | 3,089 | |
| USD | | | 52,230 | | | JPY | | | 50,830 | | | 1/31/2025 | | | HUB | | | | 1,400 | | | | - | | | | 1,400 | |
| USD | | | 54,060 | | | JPY | | | 50,989 | | | 1/31/2025 | | | HUB | | | | 3,071 | | | | - | | | | 3,071 | |
| USD | | | 54,421 | | | JPY | | | 53,113 | | | 1/31/2025 | | | HUB | | | | 1,308 | | | | - | | | | 1,308 | |
| JPY | | | 56,746 | | | USD | | | 56,957 | | | 1/31/2025 | | | HUB | | | | - | | | | (211 | ) | | | (211 | ) |
| USD | | | 59,045 | | | JPY | | | 59,229 | | | 1/31/2025 | | | HUB | | | | - | | | | (184 | ) | | | (184 | ) |
| USD | | | 59,207 | | | JPY | | | 56,796 | | | 1/31/2025 | | | HUB | | | | 2,411 | | | | - | | | | 2,411 | |
| USD | | | 61,914 | | | JPY | | | 59,705 | | | 1/31/2025 | | | HUB | | | | 2,209 | | | | - | | | | 2,209 | |
| JPY | | | 63,736 | | | USD | | | 63,768 | | | 1/31/2025 | | | HUB | | | | - | | | | (32 | ) | | | (32 | ) |
| JPY | | | 63,736 | | | USD | | | 67,013 | | | 1/31/2025 | | | HUB | | | | - | | | | (3,277 | ) | | | (3,277 | ) |
| JPY | | | 63,736 | | | USD | | | 67,147 | | | 1/31/2025 | | | HUB | | | | - | | | | (3,411 | ) | | | (3,411 | ) |
| USD | | | 65,689 | | | JPY | | | 63,736 | | | 1/31/2025 | | | HUB | | | | 1,953 | | | | - | | | | 1,953 | |
| USD | | | 65,732 | | | JPY | | | 63,736 | | | 1/31/2025 | | | HUB | | | | 1,996 | | | | - | | | | 1,996 | |
| USD | | | 66,013 | | | JPY | | | 63,736 | | | 1/31/2025 | | | HUB | | | | 2,277 | | | | - | | | | 2,277 | |
| USD | | | 66,112 | | | JPY | | | 62,181 | | | 1/31/2025 | | | HUB | | | | 3,931 | | | | - | | | | 3,931 | |
| USD | | | 66,372 | | | JPY | | | 63,736 | | | 1/31/2025 | | | HUB | | | | 2,636 | | | | - | | | | 2,636 | |
| USD | | | 66,445 | | | JPY | | | 63,736 | | | 1/31/2025 | | | HUB | | | | 2,709 | | | | - | | | | 2,709 | |
| USD | | | 66,565 | | | JPY | | | 63,736 | | | 1/31/2025 | | | HUB | | | | 2,829 | | | | - | | | | 2,829 | |
| USD | | | 66,567 | | | JPY | | | 63,736 | | | 1/31/2025 | | | HUB | | | | 2,831 | | | | - | | | | 2,831 | |
| USD | | | 67,231 | | | JPY | | | 63,736 | | | 1/31/2025 | | | HUB | | | | 3,495 | | | | - | | | | 3,495 | |
| USD | | | 72,343 | | | JPY | | | 68,670 | | | 1/31/2025 | | | HUB | | | | 3,673 | | | | - | | | | 3,673 | |
| USD | | | 75,843 | | | JPY | | | 72,019 | | | 1/31/2025 | | | HUB | | | | 3,824 | | | | - | | | | 3,824 | |
| USD | | | 79,336 | | | JPY | | | 74,618 | | | 1/31/2025 | | | HUB | | | | 4,718 | | | | - | | | | 4,718 | |
| USD | | | 85,579 | | | JPY | | | 82,874 | | | 1/31/2025 | | | HUB | | | | 2,705 | | | | - | | | | 2,705 | |
| USD | | | 88,580 | | | JPY | | | 84,023 | | | 1/31/2025 | | | HUB | | | | 4,557 | | | | - | | | | 4,557 | |
| USD | | | 94,618 | | | JPY | | | 89,230 | | | 1/31/2025 | | | HUB | | | | 5,388 | | | | - | | | | 5,388 | |
| USD | | | 96,072 | | | JPY | | | 91,223 | | | 1/31/2025 | | | HUB | | | | 4,849 | | | | - | | | | 4,849 | |
| USD | | | 98,367 | | | JPY | | | 98,652 | | | 1/31/2025 | | | HUB | | | | - | | | | (285 | ) | | | (285 | ) |
| USD | | | 100,284 | | | JPY | | | 95,350 | | | 1/31/2025 | | | HUB | | | | 4,934 | | | | - | | | | 4,934 | |
See accompanying notes
87
American Beacon AHL Multi-Alternatives FundSM
Consolidated Schedule of Investments
December 31, 2024
| | | | | | | | | | | | | | | | | | | | | | | | | | | | |
| Currency Purchased* | | | Currency Sold* | | | Settlement
Date | | Counterparty | | | Unrealized
Appreciation | | | Unrealized
(Depreciation) | | | Net Unrealized
Appreciation
(Depreciation) | |
| USD | | | 100,839 | | | JPY | | | 95,798 | | | 1/31/2025 | | | HUB | | | $ | 5,041 | | | $ | - | | | $ | 5,041 | |
| USD | | | 101,512 | | | JPY | | | 95,505 | | | 1/31/2025 | | | HUB | | | | 6,007 | | | | - | | | | 6,007 | |
| USD | | | 105,137 | | | JPY | | | 100,915 | | | 1/31/2025 | | | HUB | | | | 4,222 | | | | - | | | | 4,222 | |
| USD | | | 105,748 | | | JPY | | | 99,490 | | | 1/31/2025 | | | HUB | | | | 6,258 | | | | - | | | | 6,258 | |
| JPY | | | 113,308 | | | USD | | | 113,961 | | | 1/31/2025 | | | HUB | | | | - | | | | (653 | ) | | | (653 | ) |
| USD | | | 115,102 | | | JPY | | | 111,494 | | | 1/31/2025 | | | HUB | | | | 3,608 | | | | - | | | | 3,608 | |
| USD | | | 117,276 | | | JPY | | | 110,380 | | | 1/31/2025 | | | HUB | | | | 6,896 | | | | - | | | | 6,896 | |
| USD | | | 121,677 | | | JPY | | | 114,725 | | | 1/31/2025 | | | HUB | | | | 6,952 | | | | - | | | | 6,952 | |
| JPY | | | 127,472 | | | USD | | | 128,138 | | | 1/31/2025 | | | HUB | | | | - | | | | (666 | ) | | | (666 | ) |
| USD | | | 128,092 | | | JPY | | | 121,723 | | | 1/31/2025 | | | HUB | | | | 6,369 | | | | - | | | | 6,369 | |
| USD | | | 128,341 | | | JPY | | | 124,311 | | | 1/31/2025 | | | HUB | | | | 4,030 | | | | - | | | | 4,030 | |
| USD | | | 131,062 | | | JPY | | | 127,472 | | | 1/31/2025 | | | HUB | | | | 3,590 | | | | - | | | | 3,590 | |
| USD | | | 132,208 | | | JPY | | | 124,363 | | | 1/31/2025 | | | HUB | | | | 7,845 | | | | - | | | | 7,845 | |
| JPY | | | 141,635 | | | USD | | | 142,435 | | | 1/31/2025 | | | HUB | | | | - | | | | (800 | ) | | | (800 | ) |
| USD | | | 151,704 | | | JPY | | | 144,039 | | | 1/31/2025 | | | HUB | | | | 7,665 | | | | - | | | | 7,665 | |
| USD | | | 158,679 | | | JPY | | | 149,235 | | | 1/31/2025 | | | HUB | | | | 9,444 | | | | - | | | | 9,444 | |
| JPY | | | 165,400 | | | USD | | | 166,291 | | | 1/31/2025 | | | HUB | | | | - | | | | (891 | ) | | | (891 | ) |
| USD | | | 178,354 | | | JPY | | | 172,253 | | | 1/31/2025 | | | HUB | | | | 6,101 | | | | - | | | | 6,101 | |
| JPY | | | 198,197 | | | USD | | | 198,856 | | | 1/31/2025 | | | HUB | | | | - | | | | (659 | ) | | | (659 | ) |
| USD | | | 199,061 | | | JPY | | | 191,208 | | | 1/31/2025 | | | HUB | | | | 7,853 | | | | - | | | | 7,853 | |
| USD | | | 200,534 | | | JPY | | | 190,699 | | | 1/31/2025 | | | HUB | | | | 9,835 | | | | - | | | | 9,835 | |
| USD | | | 209,745 | | | JPY | | | 204,114 | | | 1/31/2025 | | | HUB | | | | 5,631 | | | | - | | | | 5,631 | |
| USD | | | 240,749 | | | JPY | | | 228,839 | | | 1/31/2025 | | | HUB | | | | 11,910 | | | | - | | | | 11,910 | |
| AUD | | | 233 | | | USD | | | 235 | | | 2/4/2025 | | | HUB | | | | - | | | | (2 | ) | | | (2 | ) |
| AUD | | | 4,585 | | | USD | | | 4,631 | | | 2/4/2025 | | | HUB | | | | - | | | | (46 | ) | | | (46 | ) |
| USD | | | 15,293 | | | AUD | | | 14,636 | | | 2/4/2025 | | | HUB | | | | 657 | | | | - | | | | 657 | |
| USD | | | 15,947 | | | BRL | | | 16,091 | | | 2/4/2025 | | | HUB | | | | - | | | | (144 | ) | | | (144 | ) |
| BRL | | | 16,091 | | | USD | | | 16,051 | | | 2/4/2025 | | | HUB | | | | 40 | | | | - | | | | 40 | |
| BRL | | | 16,091 | | | USD | | | 16,062 | | | 2/4/2025 | | | HUB | | | | 29 | | | | - | | | | 29 | |
| BRL | | | 16,091 | | | USD | | | 16,156 | | | 2/4/2025 | | | HUB | | | | - | | | | (65 | ) | | | (65 | ) |
| BRL | | | 16,091 | | | USD | | | 16,160 | | | 2/4/2025 | | | HUB | | | | - | | | | (69 | ) | | | (69 | ) |
| BRL | | | 16,091 | | | USD | | | 16,170 | | | 2/4/2025 | | | HUB | | | | - | | | | (79 | ) | | | (79 | ) |
| BRL | | | 16,091 | | | USD | | | 16,173 | | | 2/4/2025 | | | HUB | | | | - | | | | (82 | ) | | | (82 | ) |
| BRL | | | 16,091 | | | USD | | | 16,298 | | | 2/4/2025 | | | HUB | | | | - | | | | (207 | ) | | | (207 | ) |
| BRL | | | 16,091 | | | USD | | | 16,314 | | | 2/4/2025 | | | HUB | | | | - | | | | (223 | ) | | | (223 | ) |
| BRL | | | 16,091 | | | USD | | | 16,319 | | | 2/4/2025 | | | HUB | | | | - | | | | (228 | ) | | | (228 | ) |
| BRL | | | 16,091 | | | USD | | | 16,331 | | | 2/4/2025 | | | HUB | | | | - | | | | (240 | ) | | | (240 | ) |
| BRL | | | 16,091 | | | USD | | | 16,333 | | | 2/4/2025 | | | HUB | | | | - | | | | (242 | ) | | | (242 | ) |
| BRL | | | 16,091 | | | USD | | | 16,335 | | | 2/4/2025 | | | HUB | | | | - | | | | (244 | ) | | | (244 | ) |
| BRL | | | 16,091 | | | USD | | | 16,341 | | | 2/4/2025 | | | HUB | | | | - | | | | (250 | ) | | | (250 | ) |
| BRL | | | 16,091 | | | USD | | | 16,354 | | | 2/4/2025 | | | HUB | | | | - | | | | (263 | ) | | | (263 | ) |
| BRL | | | 16,091 | | | USD | | | 16,384 | | | 2/4/2025 | | | HUB | | | | - | | | | (293 | ) | | | (293 | ) |
| BRL | | | 16,091 | | | USD | | | 16,394 | | | 2/4/2025 | | | HUB | | | | - | | | | (303 | ) | | | (303 | ) |
| BRL | | | 16,091 | | | USD | | | 16,464 | | | 2/4/2025 | | | HUB | | | | - | | | | (373 | ) | | | (373 | ) |
| BRL | | | 16,091 | | | USD | | | 16,488 | | | 2/4/2025 | | | HUB | | | | - | | | | (397 | ) | | | (397 | ) |
| BRL | | | 16,091 | | | USD | | | 16,518 | | | 2/4/2025 | | | HUB | | | | - | | | | (427 | ) | | | (427 | ) |
| USD | | | 16,370 | | | BRL | | | 16,091 | | | 2/4/2025 | | | HUB | | | | 279 | | | | - | | | | 279 | |
| USD | | | 16,409 | | | BRL | | | 16,091 | | | 2/4/2025 | | | HUB | | | | 318 | | | | - | | | | 318 | |
| USD | | | 16,419 | | | BRL | | | 16,091 | | | 2/4/2025 | | | HUB | | | | 328 | | | | - | | | | 328 | |
| USD | | | 16,420 | | | BRL | | | 16,091 | | | 2/4/2025 | | | HUB | | | | 329 | | | | - | | | | 329 | |
| USD | | | 16,483 | | | BRL | | | 16,091 | | | 2/4/2025 | | | HUB | | | | 392 | | | | - | | | | 392 | |
| USD | | | 34,858 | | | AUD | | | 33,410 | | | 2/4/2025 | | | HUB | | | | 1,448 | | | | - | | | | 1,448 | |
| USD | | | 40,502 | | | AUD | | | 38,458 | | | 2/4/2025 | | | HUB | | | | 2,044 | | | | - | | | | 2,044 | |
| USD | | | 42,873 | | | AUD | | | 41,077 | | | 2/4/2025 | | | HUB | | | | 1,796 | | | | - | | | | 1,796 | |
| USD | | | 51,462 | | | AUD | | | 49,306 | | | 2/4/2025 | | | HUB | | | | 2,156 | | | | - | | | | 2,156 | |
| USD | | | 51,612 | | | BRL | | | 50,782 | | | 2/4/2025 | | | HUB | | | | 830 | | | | - | | | | 830 | |
| USD | | | 54,047 | | | BRL | | | 52,721 | | | 2/4/2025 | | | HUB | | | | 1,326 | | | | - | | | | 1,326 | |
| AUD | | | 61,663 | | | USD | | | 62,214 | | | 2/4/2025 | | | HUB | | | | - | | | | (551 | ) | | | (551 | ) |
| AUD | | | 61,897 | | | USD | | | 65,259 | | | 2/4/2025 | | | HUB | | | | - | | | | (3,362 | ) | | | (3,362 | ) |
See accompanying notes
88
American Beacon AHL Multi-Alternatives FundSM
Consolidated Schedule of Investments
December 31, 2024
| | | | | | | | | | | | | | | | | | | | | | | | | | | | |
| Currency Purchased* | | | Currency Sold* | | | Settlement
Date | | Counterparty | | | Unrealized
Appreciation | | | Unrealized
(Depreciation) | | | Net Unrealized
Appreciation
(Depreciation) | |
| USD | | | 62,399 | | | AUD | | | 61,897 | | | 2/4/2025 | | | HUB | | | $ | 502 | | | $ | - | | | $ | 502 | |
| USD | | | 63,979 | | | AUD | | | 61,897 | | | 2/4/2025 | | | HUB | | | | 2,082 | | | | - | | | | 2,082 | |
| USD | | | 64,432 | | | AUD | | | 61,897 | | | 2/4/2025 | | | HUB | | | | 2,535 | | | | - | | | | 2,535 | |
| USD | | | 64,744 | | | AUD | | | 61,897 | | | 2/4/2025 | | | HUB | | | | 2,847 | | | | - | | | | 2,847 | |
| USD | | | 64,859 | | | AUD | | | 61,897 | | | 2/4/2025 | | | HUB | | | | 2,962 | | | | - | | | | 2,962 | |
| USD | | | 64,860 | | | AUD | | | 61,897 | | | 2/4/2025 | | | HUB | | | | 2,963 | | | | - | | | | 2,963 | |
| USD | | | 64,894 | | | AUD | | | 61,897 | | | 2/4/2025 | | | HUB | | | | 2,997 | | | | - | | | | 2,997 | |
| USD | | | 78,747 | | | AUD | | | 74,431 | | | 2/4/2025 | | | HUB | | | | 4,316 | | | | - | | | | 4,316 | |
| USD | | | 82,463 | | | BRL | | | 80,508 | | | 2/4/2025 | | | HUB | | | | 1,955 | | | | - | | | | 1,955 | |
| USD | | | 82,572 | | | BRL | | | 80,508 | | | 2/4/2025 | | | HUB | | | | 2,064 | | | | - | | | | 2,064 | |
| USD | | | 89,833 | | | AUD | | | 85,336 | | | 2/4/2025 | | | HUB | | | | 4,497 | | | | - | | | | 4,497 | |
| USD | | | 98,390 | | | AUD | | | 93,038 | | | 2/4/2025 | | | HUB | | | | 5,352 | | | | - | | | | 5,352 | |
| USD | | | 114,141 | | | AUD | | | 109,157 | | | 2/4/2025 | | | HUB | | | | 4,984 | | | | - | | | | 4,984 | |
| USD | | | 118,079 | | | AUD | | | 111,646 | | | 2/4/2025 | | | HUB | | | | 6,433 | | | | - | | | | 6,433 | |
| AUD | | | 119,209 | | | USD | | | 120,462 | | | 2/4/2025 | | | HUB | | | | - | | | | (1,253 | ) | | | (1,253 | ) |
| AUD | | | 123,793 | | | USD | | | 124,746 | | | 2/4/2025 | | | HUB | | | | - | | | | (953 | ) | | | (953 | ) |
| USD | | | 126,075 | | | BRL | | | 122,988 | | | 2/4/2025 | | | HUB | | | | 3,087 | | | | - | | | | 3,087 | |
| USD | | | 126,178 | | | BRL | | | 122,988 | | | 2/4/2025 | | | HUB | | | | 3,190 | | | | - | | | | 3,190 | |
| USD | | | 136,505 | | | AUD | | | 129,092 | | | 2/4/2025 | | | HUB | | | | 7,413 | | | | - | | | | 7,413 | |
| USD | | | 155,056 | | | BRL | | | 151,727 | | | 2/4/2025 | | | HUB | | | | 3,329 | | | | - | | | | 3,329 | |
| USD | | | 157,485 | | | AUD | | | 148,862 | | | 2/4/2025 | | | HUB | | | | 8,623 | | | | - | | | | 8,623 | |
| USD | | | 242,790 | | | BRL | | | 238,848 | | | 2/4/2025 | | | HUB | | | | 3,942 | | | | - | | | | 3,942 | |
| PLN | | | 38,113 | | | EUR | | | 38,106 | | | 2/5/2025 | | | HUB | | | | 7 | | | | - | | | | 7 | |
| PLN | | | 57,209 | | | EUR | | | 57,161 | | | 2/5/2025 | | | HUB | | | | 48 | | | | - | | | | 48 | |
| PLN | | | 61,378 | | | EUR | | | 61,327 | | | 2/5/2025 | | | HUB | | | | 51 | | | | - | | | | 51 | |
| PLN | | | 66,652 | | | EUR | | | 66,687 | | | 2/5/2025 | | | HUB | | | | - | | | | (35 | ) | | | (35 | ) |
| PLN | | | 76,219 | | | EUR | | | 76,214 | | | 2/5/2025 | | | HUB | | | | 5 | | | | - | | | | 5 | |
| PLN | | | 103,532 | | | EUR | | | 103,722 | | | 2/5/2025 | | | HUB | | | | - | | | | (190 | ) | | | (190 | ) |
| PLN | | | 103,694 | | | EUR | | | 103,722 | | | 2/5/2025 | | | HUB | | | | - | | | | (28 | ) | | | (28 | ) |
| EUR | | | 103,721 | | | PLN | | | 103,310 | | | 2/5/2025 | | | HUB | | | | 411 | | | | - | | | | 411 | |
| EUR | | | 103,721 | | | PLN | | | 103,364 | | | 2/5/2025 | | | HUB | | | | 357 | | | | - | | | | 357 | |
| PLN | | | 104,875 | | | EUR | | | 104,794 | | | 2/5/2025 | | | HUB | | | | 81 | | | | - | | | | 81 | |
| PLN | | | 114,374 | | | EUR | | | 114,320 | | | 2/5/2025 | | | HUB | | | | 54 | | | | - | | | | 54 | |
| USD | | | 21,419 | | | GBP | | | 21,411 | | | 2/6/2025 | | | HUB | | | | 8 | | | | - | | | | 8 | |
| USD | | | 41,189 | | | GBP | | | 41,166 | | | 2/6/2025 | | | HUB | | | | 23 | | | | - | | | | 23 | |
| GBP | | | 47,887 | | | USD | | | 49,044 | | | 2/6/2025 | | | HUB | | | | - | | | | (1,157 | ) | | | (1,157 | ) |
| USD | | | 62,496 | | | GBP | | | 62,577 | | | 2/6/2025 | | | HUB | | | | - | | | | (81 | ) | | | (81 | ) |
| GBP | | | 62,577 | | | USD | | | 63,711 | | | 2/6/2025 | | | HUB | | | | - | | | | (1,134 | ) | | | (1,134 | ) |
| GBP | | | 62,577 | | | USD | | | 63,745 | | | 2/6/2025 | | | HUB | | | | - | | | | (1,168 | ) | | | (1,168 | ) |
| GBP | | | 62,577 | | | USD | | | 63,750 | | | 2/6/2025 | | | HUB | | | | - | | | | (1,173 | ) | | | (1,173 | ) |
| USD | | | 62,737 | | | GBP | | | 62,577 | | | 2/6/2025 | | | HUB | | | | 160 | | | | - | | | | 160 | |
| USD | | | 62,820 | | | GBP | | | 62,577 | | | 2/6/2025 | | | HUB | | | | 243 | | | | - | | | | 243 | |
| USD | | | 62,863 | | | GBP | | | 62,577 | | | 2/6/2025 | | | HUB | | | | 286 | | | | - | | | | 286 | |
| USD | | | 63,097 | | | GBP | | | 62,577 | | | 2/6/2025 | | | HUB | | | | 520 | | | | - | | | | 520 | |
| USD | | | 63,386 | | | GBP | | | 62,577 | | | 2/6/2025 | | | HUB | | | | 809 | | | | - | | | | 809 | |
| USD | | | 63,434 | | | GBP | | | 62,577 | | | 2/6/2025 | | | HUB | | | | 857 | | | | - | | | | 857 | |
| USD | | | 63,656 | | | GBP | | | 62,577 | | | 2/6/2025 | | | HUB | | | | 1,079 | | | | - | | | | 1,079 | |
| GBP | | | 75,454 | | | USD | | | 77,297 | | | 2/6/2025 | | | HUB | | | | - | | | | (1,843 | ) | | | (1,843 | ) |
| GBP | | | 76,059 | | | USD | | | 77,949 | | | 2/6/2025 | | | HUB | | | | - | | | | (1,890 | ) | | | (1,890 | ) |
| USD | | | 125,613 | | | GBP | | | 125,155 | | | 2/6/2025 | | | HUB | | | | 458 | | | | - | | | | 458 | |
| USD | | | 63,506 | | | GBP | | | 62,577 | | | 2/6/2025 | | | HUB | | | | 929 | | | | - | | | | 929 | |
| USD | | | 63,506 | | | GBP | | | 62,577 | | | 2/6/2025 | | | HUB | | | | 929 | | | | - | | | | 929 | |
| USD | | | 127,311 | | | GBP | | | 125,155 | | | 2/6/2025 | | | HUB | | | | 2,156 | | | | - | | | | 2,156 | |
| GBP | | | 176,064 | | | USD | | | 180,302 | | | 2/6/2025 | | | HUB | | | | - | | | | (4,238 | ) | | | (4,238 | ) |
| USD | | | 71,448 | | | KRW | | | 68,001 | | | 2/7/2025 | | | HUB | | | | 3,447 | | | | - | | | | 3,447 | |
| CAD | | | 46,235 | | | USD | | | 46,239 | | | 2/12/2025 | | | HUB | | | | - | | | | (4 | ) | | | (4 | ) |
| USD | | | 69,750 | | | CAD | | | 69,671 | | | 2/12/2025 | | | HUB | | | | 79 | | | | - | | | | 79 | |
| USD | | | 70,698 | | | CAD | | | 69,671 | | | 2/12/2025 | | | HUB | | | | 1,027 | | | | - | | | | 1,027 | |
| USD | | | 70,878 | | | CAD | | | 69,671 | | | 2/12/2025 | | | HUB | | | | 1,207 | | | | - | | | | 1,207 | |
See accompanying notes
89
American Beacon AHL Multi-Alternatives FundSM
Consolidated Schedule of Investments
December 31, 2024
| | | | | | | | | | | | | | | | | | | | | | | | | | | | |
| Currency Purchased* | | | Currency Sold* | | | Settlement
Date | | Counterparty | | | Unrealized
Appreciation | | | Unrealized
(Depreciation) | | | Net Unrealized
Appreciation
(Depreciation) | |
| USD | | | 71,262 | | | CAD | | | 69,671 | | | 2/12/2025 | | | HUB | | | $ | 1,591 | | | $ | - | | | $ | 1,591 | |
| USD | | | 74,114 | | | CAD | | | 73,262 | | | 2/12/2025 | | | HUB | | | | 852 | | | | - | | | | 852 | |
| USD | | | 75,818 | | | CAD | | | 74,966 | | | 2/12/2025 | | | HUB | | | | 852 | | | | - | | | | 852 | |
| USD | | | 81,385 | | | CAD | | | 78,873 | | | 2/12/2025 | | | HUB | | | | 2,512 | | | | - | | | | 2,512 | |
| CAD | | | 83,346 | | | USD | | | 83,382 | | | 2/12/2025 | | | HUB | | | | - | | | | (36 | ) | | | (36 | ) |
| USD | | | 95,277 | | | CAD | | | 94,195 | | | 2/12/2025 | | | HUB | | | | 1,082 | | | | - | | | | 1,082 | |
| USD | | | 96,644 | | | CAD | | | 95,006 | | | 2/12/2025 | | | HUB | | | | 1,638 | | | | - | | | | 1,638 | |
| USD | | | 97,555 | | | CAD | | | 95,006 | | | 2/12/2025 | | | HUB | | | | 2,549 | | | | - | | | | 2,549 | |
| USD | | | 97,623 | | | CAD | | | 94,648 | | | 2/12/2025 | | | HUB | | | | 2,975 | | | | - | | | | 2,975 | |
| USD | | | 97,672 | | | CAD | | | 94,648 | | | 2/12/2025 | | | HUB | | | | 3,024 | | | | - | | | | 3,024 | |
| USD | | | 113,904 | | | CAD | | | 110,422 | | | 2/12/2025 | | | HUB | | | | 3,482 | | | | - | | | | 3,482 | |
| USD | | | 115,939 | | | CAD | | | 114,007 | | | 2/12/2025 | | | HUB | | | | 1,932 | | | | - | | | | 1,932 | |
| USD | | | 116,468 | | | CAD | | | 115,127 | | | 2/12/2025 | | | HUB | | | | 1,341 | | | | - | | | | 1,341 | |
| USD | | | 116,988 | | | CAD | | | 114,007 | | | 2/12/2025 | | | HUB | | | | 2,981 | | | | - | | | | 2,981 | |
| CAD | | | 125,667 | | | USD | | | 125,674 | | | 2/12/2025 | | | HUB | | | | - | | | | (7 | ) | | | (7 | ) |
| USD | | | 131,681 | | | CAD | | | 130,149 | | | 2/12/2025 | | | HUB | | | | 1,532 | | | | - | | | | 1,532 | |
| USD | | | 146,459 | | | CAD | | | 141,972 | | | 2/12/2025 | | | HUB | | | | 4,487 | | | | - | | | | 4,487 | |
| USD | | | 162,755 | | | CAD | | | 157,746 | | | 2/12/2025 | | | HUB | | | | 5,009 | | | | - | | | | 5,009 | |
| USD | | | 162,782 | | | CAD | | | 157,746 | | | 2/12/2025 | | | HUB | | | | 5,036 | | | | - | | | | 5,036 | |
| USD | | | 175,474 | | | CAD | | | 171,011 | | | 2/12/2025 | | | HUB | | | | 4,463 | | | | - | | | | 4,463 | |
| USD | | | 212,596 | | | CAD | | | 209,014 | | | 2/12/2025 | | | HUB | | | | 3,582 | | | | - | | | | 3,582 | |
| USD | | | 214,608 | | | CAD | | | 209,014 | | | 2/12/2025 | | | HUB | | | | 5,594 | | | | - | | | | 5,594 | |
| CAD | | | 232,450 | | | USD | | | 232,483 | | | 2/12/2025 | | | HUB | | | | - | | | | (33 | ) | | | (33 | ) |
| USD | | | 253,646 | | | CAD | | | 247,016 | | | 2/12/2025 | | | HUB | | | | 6,630 | | | | - | | | | 6,630 | |
| EUR | | | 7,340 | | | CHF | | | 7,283 | | | 2/17/2025 | | | HUB | | | | 57 | | | | - | | | | 57 | |
| EUR | | | 28,682 | | | CHF | | | 28,689 | | | 2/17/2025 | | | HUB | | | | - | | | | (7 | ) | | | (7 | ) |
| EUR | | | 38,162 | | | CHF | | | 37,765 | | | 2/17/2025 | | | HUB | | | | 397 | | | | - | | | | 397 | |
| EUR | | | 65,617 | | | CHF | | | 64,925 | | | 2/17/2025 | | | HUB | | | | 692 | | | | - | | | | 692 | |
| EUR | | | 75,096 | | | CHF | | | 75,122 | | | 2/17/2025 | | | HUB | | | | - | | | | (26 | ) | | | (26 | ) |
| CHF | | | 102,829 | | | EUR | | | 103,779 | | | 2/17/2025 | | | HUB | | | | - | | | | (950 | ) | | | (950 | ) |
| CHF | | | 103,164 | | | EUR | | | 103,779 | | | 2/17/2025 | | | HUB | | | | - | | | | (615 | ) | | | (615 | ) |
| EUR | | | 103,778 | | | CHF | | | 103,795 | | | 2/17/2025 | | | HUB | | | | - | | | | (17 | ) | | | (17 | ) |
| EUR | | | 132,997 | | | CHF | | | 132,499 | | | 2/17/2025 | | | HUB | | | | 498 | | | | - | | | | 498 | |
| EUR | | | 200,216 | | | CHF | | | 198,736 | | | 2/17/2025 | | | HUB | | | | 1,480 | | | | - | | | | 1,480 | |
| EUR | | | 282,117 | | | CHF | | | 281,106 | | | 2/17/2025 | | | HUB | | | | 1,011 | | | | - | | | | 1,011 | |
| AUD | | | 62,096 | | | GBP | | | 62,572 | | | 2/18/2025 | | | HUB | | | | - | | | | (476 | ) | | | (476 | ) |
| AUD | | | 62,148 | | | GBP | | | 62,572 | | | 2/18/2025 | | | HUB | | | | - | | | | (424 | ) | | | (424 | ) |
| GBP | | | 62,572 | | | AUD | | | 62,323 | | | 2/18/2025 | | | HUB | | | | 249 | | | | - | | | | 249 | |
| GBP | | | 99,966 | | | AUD | | | 98,011 | | | 2/18/2025 | | | HUB | | | | 1,955 | | | | - | | | | 1,955 | |
| GBP | | | 188,456 | | | AUD | | | 184,826 | | | 2/18/2025 | | | HUB | | | | 3,630 | | | | - | | | | 3,630 | |
| GBP | | | 199,936 | | | AUD | | | 195,947 | | | 2/18/2025 | | | HUB | | | | 3,989 | | | | - | | | | 3,989 | |
| GBP | | | 199,936 | | | AUD | | | 195,974 | | | 2/18/2025 | | | HUB | | | | 3,962 | | | | - | | | | 3,962 | |
| EUR | | | 23,135 | | | AUD | | | 23,053 | | | 2/20/2025 | | | HUB | | | | 82 | | | | - | | | | 82 | |
| EUR | | | 61,030 | | | AUD | | | 60,648 | | | 2/20/2025 | | | HUB | | | | 382 | | | | - | | | | 382 | |
| EUR | | | 79,503 | | | AUD | | | 78,998 | | | 2/20/2025 | | | HUB | | | | 505 | | | | - | | | | 505 | |
| EUR | | | 80,658 | | | AUD | | | 80,384 | | | 2/20/2025 | | | HUB | | | | 274 | | | | - | | | | 274 | |
| EUR | | | 103,793 | | | AUD | | | 103,853 | | | 2/20/2025 | | | HUB | | | | - | | | | (60 | ) | | | (60 | ) |
| EUR | | | 274,638 | | | AUD | | | 272,941 | | | 2/20/2025 | | | HUB | | | | 1,697 | | | | - | | | | 1,697 | |
| USD | | | 1,103,250 | | | KRW | | | 1,088,755 | | | 2/24/2025 | | | HUB | | | | 14,495 | | | | - | | | | 14,495 | |
| USD | | | 50,651 | | | CLP | | | 50,245 | | | 2/25/2025 | | | HUB | | | | 406 | | | | - | | | | 406 | |
| USD | | | 50,982 | | | CLP | | | 50,245 | | | 2/25/2025 | | | HUB | | | | 737 | | | | - | | | | 737 | |
| USD | | | 51,049 | | | CLP | | | 50,245 | | | 2/25/2025 | | | HUB | | | | 804 | | | | - | | | | 804 | |
| USD | | | 51,163 | | | CLP | | | 50,245 | | | 2/25/2025 | | | HUB | | | | 918 | | | | - | | | | 918 | |
| USD | | | 51,371 | | | CLP | | | 50,245 | | | 2/25/2025 | | | HUB | | | | 1,126 | | | | - | | | | 1,126 | |
| USD | | | 52,137 | | | CLP | | | 50,245 | | | 2/25/2025 | | | HUB | | | | 1,892 | | | | - | | | | 1,892 | |
| USD | | | 52,506 | | | CLP | | | 50,245 | | | 2/25/2025 | | | HUB | | | | 2,261 | | | | - | | | | 2,261 | |
| USD | | | 52,561 | | | CLP | | | 50,245 | | | 2/25/2025 | | | HUB | | | | 2,316 | | | | - | | | | 2,316 | |
| USD | | | 52,572 | | | CLP | | | 50,245 | | | 2/25/2025 | | | HUB | | | | 2,327 | | | | - | | | | 2,327 | |
| USD | | | 52,975 | | | CLP | | | 50,245 | | | 2/25/2025 | | | HUB | | | | 2,730 | | | | - | | | | 2,730 | |
See accompanying notes
90
American Beacon AHL Multi-Alternatives FundSM
Consolidated Schedule of Investments
December 31, 2024
| | | | | | | | | | | | | | | | | | | | | | | | | | | | |
| Currency Purchased* | | | Currency Sold* | | | Settlement
Date | | Counterparty | | | Unrealized
Appreciation | | | Unrealized
(Depreciation) | | | Net Unrealized
Appreciation
(Depreciation) | |
| USD | | | 101,486 | | | CLP | | | 100,490 | | | 2/25/2025 | | | HUB | | | $ | 996 | | | $ | - | | | $ | 996 | |
| USD | | | 102,802 | | | CLP | | | 100,490 | | | 2/25/2025 | | | HUB | | | | 2,312 | | | | - | | | | 2,312 | |
| USD | | | 22,358 | | | NZD | | | 21,641 | | | 2/26/2025 | | | HUB | | | | 717 | | | | - | | | | 717 | |
| USD | | | 22,809 | | | NZD | | | 22,072 | | | 2/26/2025 | | | HUB | | | | 737 | | | | - | | | | 737 | |
| NZD | | | 24,557 | | | USD | | | 24,797 | | | 2/26/2025 | | | HUB | | | | - | | | | (240 | ) | | | (240 | ) |
| NZD | | | 31,094 | | | USD | | | 31,309 | | | 2/26/2025 | | | HUB | | | | - | | | | (215 | ) | | | (215 | ) |
| USD | | | 34,207 | | | NZD | | | 33,107 | | | 2/26/2025 | | | HUB | | | | 1,100 | | | | - | | | | 1,100 | |
| NZD | | | 36,092 | | | USD | | | 36,477 | | | 2/26/2025 | | | HUB | | | | - | | | | (385 | ) | | | (385 | ) |
| USD | | | 40,654 | | | NZD | | | 39,335 | | | 2/26/2025 | | | HUB | | | | 1,319 | | | | - | | | | 1,319 | |
| USD | | | 50,651 | | | NZD | | | 49,015 | | | 2/26/2025 | | | HUB | | | | 1,636 | | | | - | | | | 1,636 | |
| NZD | | | 51,298 | | | USD | | | 51,757 | | | 2/26/2025 | | | HUB | | | | - | | | | (459 | ) | | | (459 | ) |
| NZD | | | 55,974 | | | USD | | | 56,491 | | | 2/26/2025 | | | HUB | | | | - | | | | (517 | ) | | | (517 | ) |
| USD | | | 57,841 | | | NZD | | | 55,974 | | | 2/26/2025 | | | HUB | | | | 1,867 | | | | - | | | | 1,867 | |
| USD | | | 58,621 | | | NZD | | | 55,974 | | | 2/26/2025 | | | HUB | | | | 2,647 | | | | - | | | | 2,647 | |
| NZD | | | 59,089 | | | USD | | | 59,520 | | | 2/26/2025 | | | HUB | | | | - | | | | (431 | ) | | | (431 | ) |
| USD | | | 75,856 | | | NZD | | | 71,966 | | | 2/26/2025 | | | HUB | | | | 3,890 | | | | - | | | | 3,890 | |
| NZD | | | 77,737 | | | USD | | | 78,263 | | | 2/26/2025 | | | HUB | | | | - | | | | (526 | ) | | | (526 | ) |
| USD | | | 101,208 | | | NZD | | | 95,954 | | | 2/26/2025 | | | HUB | | | | 5,254 | | | | - | | | | 5,254 | |
| USD | | | 129,306 | | | NZD | | | 125,093 | | | 2/26/2025 | | | HUB | | | | 4,213 | | | | - | | | | 4,213 | |
| USD | | | 350,305 | | | NZD | | | 335,842 | | | 2/26/2025 | | | HUB | | | | 14,463 | | | | - | | | | 14,463 | |
| USD | | | 394,215 | | | NZD | | | 381,421 | | | 2/26/2025 | | | HUB | | | | 12,794 | | | | - | | | | 12,794 | |
| ZAR | | | 16,357 | | | USD | | | 16,529 | | | 1/2/2025 | | | NWM | | | | - | | | | (172 | ) | | | (172 | ) |
| ZAR | | | 20,810 | | | USD | | | 21,050 | | | 1/2/2025 | | | NWM | | | | - | | | | (240 | ) | | | (240 | ) |
| ZAR | | | 22,671 | | | USD | | | 22,951 | | | 1/2/2025 | | | NWM | | | | - | | | | (280 | ) | | | (280 | ) |
| ZAR | | | 24,972 | | | USD | | | 25,271 | | | 1/2/2025 | | | NWM | | | | - | | | | (299 | ) | | | (299 | ) |
| USD | | | 26,602 | | | ZAR | | | 26,495 | | | 1/2/2025 | | | NWM | | | | 107 | | | | - | | | | 107 | |
| USD | | | 26,661 | | | ZAR | | | 26,495 | | | 1/2/2025 | | | NWM | | | | 166 | | | | - | | | | 166 | |
| USD | | | 26,692 | | | ZAR | | | 26,495 | | | 1/2/2025 | | | NWM | | | | 197 | | | | - | | | | 197 | |
| USD | | | 26,702 | | | ZAR | | | 26,495 | | | 1/2/2025 | | | NWM | | | | 207 | | | | - | | | | 207 | |
| USD | | | 26,704 | | | ZAR | | | 26,495 | | | 1/2/2025 | | | NWM | | | | 209 | | | | - | | | | 209 | |
| USD | | | 26,706 | | | ZAR | | | 26,495 | | | 1/2/2025 | | | NWM | | | | 211 | | | | - | | | | 211 | |
| USD | | | 26,715 | | | ZAR | | | 26,495 | | | 1/2/2025 | | | NWM | | | | 220 | | | | - | | | | 220 | |
| ZAR | | | 100,657 | | | USD | | | 101,667 | | | 1/2/2025 | | | NWM | | | | - | | | | (1,010 | ) | | | (1,010 | ) |
| USD | | | 26,484 | | | ZAR | | | 26,495 | | | 1/3/2025 | | | NWM | | | | - | | | | (11 | ) | | | (11 | ) |
| USD | | | 26,576 | | | ZAR | | | 26,495 | | | 1/3/2025 | | | NWM | | | | 81 | | | | - | | | | 81 | |
| USD | | | 26,615 | | | ZAR | | | 26,495 | | | 1/3/2025 | | | NWM | | | | 120 | | | | - | | | | 120 | |
| USD | | | 26,627 | | | ZAR | | | 26,495 | | | 1/3/2025 | | | NWM | | | | 132 | | | | - | | | | 132 | |
| USD | | | 26,629 | | | ZAR | | | 26,495 | | | 1/3/2025 | | | NWM | | | | 134 | | | | - | | | | 134 | |
| USD | | | 26,655 | | | ZAR | | | 26,495 | | | 1/3/2025 | | | NWM | | | | 160 | | | | - | | | | 160 | |
| USD | | | 26,660 | | | ZAR | | | 26,495 | | | 1/3/2025 | | | NWM | | | | 165 | | | | - | | | | 165 | |
| USD | | | 26,668 | | | ZAR | | | 26,495 | | | 1/3/2025 | | | NWM | | | | 173 | | | | - | | | | 173 | |
| USD | | | 26,672 | | | ZAR | | | 26,495 | | | 1/3/2025 | | | NWM | | | | 177 | | | | - | | | | 177 | |
| USD | | | 26,724 | | | ZAR | | | 26,495 | | | 1/3/2025 | | | NWM | | | | 229 | | | | - | | | | 229 | |
| USD | | | 110,728 | | | CHF | | | 110,187 | | | 1/6/2025 | | | NWM | | | | 541 | | | | - | | | | 541 | |
| CHF | | | 70 | | | USD | | | 71 | | | 1/16/2025 | | | NWM | | | | - | | | | (1 | ) | | | (1 | ) |
| USD | | | 133 | | | CHF | | | 131 | | | 1/16/2025 | | | NWM | | | | 2 | | | | - | | | | 2 | |
| CHF | | | 133 | | | USD | | | 135 | | | 1/16/2025 | | | NWM | | | | - | | | | (2 | ) | | | (2 | ) |
| USD | | | 189 | | | CHF | | | 186 | | | 1/16/2025 | | | NWM | | | | 3 | | | | - | | | | 3 | |
| USD | | | 199 | | | CHF | | | 197 | | | 1/16/2025 | | | NWM | | | | 2 | | | | - | | | | 2 | |
| USD | | | 245 | | | HUF | | | 241 | | | 1/16/2025 | | | NWM | | | | 4 | | | | - | | | | 4 | |
| USD | | | 264 | | | CHF | | | 260 | | | 1/16/2025 | | | NWM | | | | 4 | | | | - | | | | 4 | |
| USD | | | 748 | | | CHF | | | 738 | | | 1/16/2025 | | | NWM | | | | 10 | | | | - | | | | 10 | |
| USD | | | 1,010 | | | CHF | | | 992 | | | 1/16/2025 | | | NWM | | | | 18 | | | | - | | | | 18 | |
| USD | | | 11,617 | | | CHF | | | 11,451 | | | 1/16/2025 | | | NWM | | | | 166 | | | | - | | | | 166 | |
| JPY | | | 100,169 | | | EUR | | | 103,659 | | | 1/21/2025 | | | NWM | | | | - | | | | (3,490 | ) | | | (3,490 | ) |
| JPY | | | 100,446 | | | EUR | | | 103,659 | | | 1/21/2025 | | | NWM | | | | - | | | | (3,213 | ) | | | (3,213 | ) |
| JPY | | | 102,835 | | | EUR | | | 103,659 | | | 1/21/2025 | | | NWM | | | | - | | | | (824 | ) | | | (824 | ) |
| EUR | | | 103,659 | | | JPY | | | 101,750 | | | 1/21/2025 | | | NWM | | | | 1,909 | | | | - | | | | 1,909 | |
| EUR | | | 103,659 | | | JPY | | | 103,382 | | | 1/21/2025 | | | NWM | | | | 277 | | | | - | | | | 277 | |
See accompanying notes
91
American Beacon AHL Multi-Alternatives FundSM
Consolidated Schedule of Investments
December 31, 2024
| | | | | | | | | | | | | | | | | | | | | | | | | | | | |
| Currency Purchased* | | | Currency Sold* | | | Settlement
Date | | Counterparty | | | Unrealized
Appreciation | | | Unrealized
(Depreciation) | | | Net Unrealized
Appreciation
(Depreciation) | |
| EUR | | | 103,659 | | | JPY | | | 104,489 | | | 1/21/2025 | | | NWM | | | $ | - | | | $ | (830 | ) | | $ | (830 | ) |
| JPY | | | 103,702 | | | EUR | | | 103,659 | | | 1/21/2025 | | | NWM | | | | 43 | | | | - | | | | 43 | |
| EUR | | | 199,979 | | | JPY | | | 200,989 | | | 1/21/2025 | | | NWM | | | | - | | | | (1,010 | ) | | | (1,010 | ) |
| EUR | | | 214,658 | | | JPY | | | 215,793 | | | 1/21/2025 | | | NWM | | | | - | | | | (1,135 | ) | | | (1,135 | ) |
| ZAR | | | 11,710 | | | USD | | | 12,375 | | | 1/29/2025 | | | NWM | | | | - | | | | (665 | ) | | | (665 | ) |
| USD | | | 14,447 | | | ZAR | | | 14,307 | | | 1/29/2025 | | | NWM | | | | 140 | | | | - | | | | 140 | |
| USD | | | 16,027 | | | ZAR | | | 15,377 | | | 1/29/2025 | | | NWM | | | | 650 | | | | - | | | | 650 | |
| USD | | | 16,487 | | | ZAR | | | 16,317 | | | 1/29/2025 | | | NWM | | | | 170 | | | | - | | | | 170 | |
| ZAR | | | 16,807 | | | USD | | | 17,936 | | | 1/29/2025 | | | NWM | | | | - | | | | (1,129 | ) | | | (1,129 | ) |
| ZAR | | | 19,608 | | | USD | | | 20,924 | | | 1/29/2025 | | | NWM | | | | - | | | | (1,316 | ) | | | (1,316 | ) |
| USD | | | 20,996 | | | ZAR | | | 20,759 | | | 1/29/2025 | | | NWM | | | | 237 | | | | - | | | | 237 | |
| USD | | | 22,892 | | | ZAR | | | 22,616 | | | 1/29/2025 | | | NWM | | | | 276 | | | | - | | | | 276 | |
| ZAR | | | 23,116 | | | USD | | | 24,334 | | | 1/29/2025 | | | NWM | | | | - | | | | (1,218 | ) | | | (1,218 | ) |
| ZAR | | | 24,028 | | | USD | | | 24,981 | | | 1/29/2025 | | | NWM | | | | - | | | | (953 | ) | | | (953 | ) |
| USD | | | 25,206 | | | ZAR | | | 24,911 | | | 1/29/2025 | | | NWM | | | | 295 | | | | - | | | | 295 | |
| USD | | | 25,374 | | | ZAR | | | 24,617 | | | 1/29/2025 | | | NWM | | | | 757 | | | | - | | | | 757 | |
| ZAR | | | 26,431 | | | USD | | | 27,474 | | | 1/29/2025 | | | NWM | | | | - | | | | (1,043 | ) | | | (1,043 | ) |
| ZAR | | | 26,875 | | | USD | | | 28,372 | | | 1/29/2025 | | | NWM | | | | - | | | | (1,497 | ) | | | (1,497 | ) |
| USD | | | 27,161 | | | ZAR | | | 27,074 | | | 1/29/2025 | | | NWM | | | | 87 | | | | - | | | | 87 | |
| USD | | | 28,484 | | | ZAR | | | 27,700 | | | 1/29/2025 | | | NWM | | | | 784 | | | | - | | | | 784 | |
| USD | | | 30,881 | | | ZAR | | | 30,750 | | | 1/29/2025 | | | NWM | | | | 131 | | | | - | | | | 131 | |
| USD | | | 31,062 | | | ZAR | | | 30,942 | | | 1/29/2025 | | | NWM | | | | 120 | | | | - | | | | 120 | |
| ZAR | | | 31,095 | | | USD | | | 32,299 | | | 1/29/2025 | | | NWM | | | | - | | | | (1,204 | ) | | | (1,204 | ) |
| USD | | | 32,556 | | | ZAR | | | 31,597 | | | 112912025 | | | NWM | | | | 959 | | | | - | | | | 959 | |
| ZAR | | | 32,734 | | | USD | | | 34,601 | | | 1/29/2025 | | | NWM | | | | - | | | | (1,867 | ) | | | (1,867 | ) |
| USD | | | 33,665 | | | ZAR | | | 32,714 | | | 1/29/2025 | | | NWM | | | | 951 | | | | - | | | | 951 | |
| USD | | | 35,320 | | | ZAR | | | 35,143 | | | 1/29/2025 | | | NWM | | | | 177 | | | | - | | | | 177 | |
| ZAR | | | 35,826 | | | USD | | | 37,577 | | | 1/29/2025 | | | NWM | | | | - | | | | (1,751 | ) | | | (1,751 | ) |
| ZAR | | | 36,986 | | | USD | | | 38,948 | | | 1/29/2025 | | | NWM | | | | - | | | | (1,962 | ) | | | (1,962 | ) |
| ZAR | | | 37,314 | | | USD | | | 38,814 | | | 1/29/2025 | | | NWM | | | | - | | | | (1,500 | ) | | | (1,500 | ) |
| USD | | | 37,406 | | | ZAR | | | 37,030 | | | 1/29/2025 | | | NWM | | | | 376 | | | | - | | | | 376 | |
| USD | | | 38,391 | | | ZAR | | | 37,401 | | | 1/29/2025 | | | NWM | | | | 990 | | | | - | | | | 990 | |
| ZAR | | | 38,445 | | | USD | | | 39,969 | | | 1/29/2025 | | | NWM | | | | - | | | | (1,524 | ) | | | (1,524 | ) |
| USD | | | 38,756 | | | ZAR | | | 38,678 | | | 1/29/2025 | | | NWM | | | | 78 | | | | - | | | | 78 | |
| USD | | | 39,150 | | | ZAR | | | 37,485 | | | 1/29/2025 | | | NWM | | | | 1,665 | | | | - | | | | 1,665 | |
| USD | | | 39,264 | | | ZAR | | | 38,166 | | | 1/29/2025 | | | NWM | | | | 1,098 | | | | - | | | | 1,098 | |
| USD | | | 39,314 | | | ZAR | | | 38,166 | | | 1/29/2025 | | | NWM | | | | 1,148 | | | | - | | | | 1,148 | |
| ZAR | | | 40,526 | | | USD | | | 42,731 | | | 1/29/2025 | | | NWM | | | | - | | | | (2,205 | ) | | | (2,205 | ) |
| USD | | | 42,759 | | | ZAR | | | 41,550 | | | 1/29/2025 | | | NWM | | | | 1,209 | | | | - | | | | 1,209 | |
| ZAR | | | 42,877 | | | USD | | | 45,731 | | | 1/29/2025 | | | NWM | | | | - | | | | (2,854 | ) | | | (2,854 | ) |
| ZAR | | | 43,466 | | | USD | | | 45,633 | | | 1/29/2025 | | | NWM | | | | - | | | | (2,167 | ) | | | (2,167 | ) |
| USD | | | 43,770 | | | ZAR | | | 42,535 | | | 1/29/2025 | | | NWM | | | | 1,235 | | | | - | | | | 1,235 | |
| USD | | | 43,871 | | | ZAR | | | 42,666 | | | 1/29/2025 | | | NWM | | | | 1,205 | | | | - | | | | 1,205 | |
| USD | | | 44,211 | | | ZAR | | | 43,928 | | | 1/29/2025 | | | NWM | | | | 283 | | | | - | | | | 283 | |
| USD | | | 44,340 | | | ZAR | | | 43,928 | | | 1/29/2025 | | | NWM | | | | 412 | | | | - | | | | 412 | |
| USD | | | 44,760 | | | ZAR | | | 43,446 | | | 1/29/2025 | | | NWM | | | | 1,314 | | | | - | | | | 1,314 | |
| ZAR | | | 45,592 | | | USD | | | 47,984 | | | 1/29/2025 | | | NWM | | | | - | | | | (2,392 | ) | | | (2,392 | ) |
| ZAR | | | 45,592 | | | USD | | | 48,054 | | | 1/29/2025 | | | NWM | | | | - | | | | (2,462 | ) | | | (2,462 | ) |
| ZAR | | | 45,621 | | | USD | | | 48,076 | | | 1/29/2025 | | | NWM | | | | - | | | | (2,455 | ) | | | (2,455 | ) |
| ZAR | | | 48,056 | | | USD | | | 50,021 | | | 1/29/2025 | | | NWM | | | | - | | | | (1,965 | ) | | | (1,965 | ) |
| ZAR | | | 48,056 | | | USD | | | 50,029 | | | 1/29/2025 | | | NWM | | | | - | | | | (1,973 | ) | | | (1,973 | ) |
| USD | | | 48,703 | | | ZAR | | | 48,321 | | | 1/29/2025 | | | NWM | | | | 382 | | | | - | | | | 382 | |
| USD | | | 50,033 | | | ZAR | | | 48,762 | | | 1/29/2025 | | | NWM | | | | 1,271 | | | | - | | | | 1,271 | |
| ZAR | | | 51,307 | | | USD | | | 54,139 | | | 1/29/2025 | | | NWM | | | | - | | | | (2,832 | ) | | | (2,832 | ) |
| ZAR | | | 52,861 | | | USD | | | 54,894 | | | 112912025 | | | NWM | | | | - | | | | (2,033 | ) | | | (2,033 | ) |
| ZAR | | | 52,861 | | | USD | | | 55,199 | | | 1/29/2025 | | | NWM | | | | - | | | | (2,338 | ) | | | (2,338 | ) |
| ZAR | | | 54,415 | | | USD | | | 57,401 | | | 1/29/2025 | | | NWM | | | | - | | | | (2,986 | ) | | | (2,986 | ) |
| USD | | | 54,664 | | | ZAR | | | 52,861 | | | 1/29/2025 | | | NWM | | | | 1,803 | | | | - | | | | 1,803 | |
| ZAR | | | 55,971 | | | USD | | | 58,155 | | | 1/29/2025 | | | NWM | | | | - | | | | (2,184 | ) | | | (2,184 | ) |
See accompanying notes
92
American Beacon AHL Multi-Alternatives FundSM
Consolidated Schedule of Investments
December 31, 2024
| | | | | | | | | | | | | | | | | | | | | | | | | | | | |
| Currency Purchased* | | | Currency Sold* | | | Settlement
Date | | Counterparty | | | Unrealized
Appreciation | | | Unrealized
(Depreciation) | | | Net Unrealized
Appreciation
(Depreciation) | |
| ZAR | | | 61,279 | | | USD | | | 64,767 | | | 1/29/2025 | | | NWM | | | $ | - | | | $ | (3,488 | ) | | $ | (3,488 | ) |
| ZAR | | | 62,190 | | | USD | | | 64,530 | | | 1/29/2025 | | | NWM | | | | - | | | | (2,340 | ) | | | (2,340 | ) |
| ZAR | | | 62,190 | | | USD | | | 64,593 | | | 1/29/2025 | | | NWM | | | | - | | | | (2,403 | ) | | | (2,403 | ) |
| ZAR | | | 68,409 | | | USD | | | 71,121 | | | 112912025 | | | NWM | | | | - | | | | (2,712 | ) | | | (2,712 | ) |
| USD | | | 101,404 | | | ZAR | | | 100,411 | | | 1/29/2025 | | | NWM | | | | 993 | | | | - | | | | 993 | |
| USD | | | 179,055 | | | ZAR | | | 178,512 | | | 1/29/2025 | | | NWM | | | | 543 | | | | - | | | | 543 | |
| USD | | | 13,465 | | | CHF | | | 13,379 | | | 2/13/2025 | | | NWM | | | | 86 | | | | - | | | | 86 | |
| CHF | | | 31,180 | | | USD | | | 31,474 | | | 2/13/2025 | | | NWM | | | | - | | | | (294 | ) | | | (294 | ) |
| USD | | | 57,018 | | | CHF | | | 56,226 | | | 2/13/2025 | | | NWM | | | | 792 | | | | - | | | | 792 | |
| USD | | | 57,032 | | | CHF | | | 56,225 | | | 2/13/2025 | | | NWM | | | | 807 | | | | - | | | | 807 | |
| USD | | | 58,531 | | | CHF | | | 56,989 | | | 2/13/2025 | | | NWM | | | | 1,542 | | | | - | | | | 1,542 | |
| USD | | | 69,932 | | | CHF | | | 68,045 | | | 2/13/2025 | | | NWM | | | | 1,887 | | | | - | | | | 1,887 | |
| USD | | | 69,988 | | | CHF | | | 68,046 | | | 2/13/2025 | | | NWM | | | | 1,942 | | | | - | | | | 1,942 | |
| USD | | | 70,002 | | | CHF | | | 68,045 | | | 2/13/2025 | | | NWM | | | | 1,957 | | | | - | | | | 1,957 | |
| USD | | | 70,080 | | | CHF | | | 68,046 | | | 2/13/2025 | | | NWM | | | | 2,034 | | | | - | | | | 2,034 | |
| USD | | | 76,698 | | | CHF | | | 74,507 | | | 2/13/2025 | | | NWM | | | | 2,191 | | | | - | | | | 2,191 | |
| CHF | | | 79,478 | | | USD | | | 80,244 | | | 2/13/2025 | | | NWM | | | | - | | | | (766 | ) | | | (766 | ) |
| USD | | | 97,894 | | | CHF | | | 97,279 | | | 2/13/2025 | | | NWM | | | | 615 | | | | - | | | | 615 | |
| CHF | | | 110,658 | | | USD | | | 111,609 | | | 2/13/2025 | | | NWM | | | | - | | | | (951 | ) | | | (951 | ) |
| USD | | | 113,702 | | | CHF | | | 110,658 | | | 2/13/2025 | | | NWM | | | | 3,044 | | | | - | | | | 3,044 | |
| USD | | | 114,029 | | | CHF | | | 112,453 | | | 2/13/2025 | | | NWM | | | | 1,576 | | | | - | | | | 1,576 | |
| USD | | | 114,072 | | | CHF | | | 112,452 | | | 2/13/2025 | | | NWM | | | | 1,620 | | | | - | | | | 1,620 | |
| USD | | | 114,584 | | | CHF | | | 110,658 | | | 2/13/2025 | | | NWM | | | | 3,926 | | | | - | | | | 3,926 | |
| USD | | | 127,801 | | | CHF | | | 124,179 | | | 2/13/2025 | | | NWM | | | | 3,622 | | | | - | | | | 3,622 | |
| USD | | | 140,068 | | | CHF | | | 136,092 | | | 2/13/2025 | | | NWM | | | | 3,976 | | | | - | | | | 3,976 | |
| USD | | | 199,660 | | | CHF | | | 196,791 | | | 2/13/2025 | | | NWM | | | | 2,869 | | | | - | | | | 2,869 | |
| USD | | | 211,889 | | | CHF | | | 208,756 | | | 2/13/2025 | | | NWM | | | | 3,133 | | | | - | | | | 3,133 | |
| USD | | | 256,824 | | | CHF | | | 253,018 | | | 2/13/2025 | | | NWM | | | | 3,806 | | | | - | | | | 3,806 | |
| GBP | | | 10,601 | | | EUR | | | 10,561 | | | 2/18/2025 | | | NWM | | | | 40 | | | | - | | | | 40 | |
| GBP | | | 56,243 | | | EUR | | | 56,069 | | | 2/18/2025 | | | NWM | | | | 174 | | | | - | | | | 174 | |
| GBP | | | 84,444 | | | EUR | | | 84,102 | | | 2/18/2025 | | | NWM | | | | 342 | | | | - | | | | 342 | |
| GBP | | | 103,450 | | | EUR | | | 103,783 | | | 2/18/2025 | | | NWM | | | | - | | | | (333 | ) | | | (333 | ) |
| EUR | | | 103,784 | | | GBP | | | 104,048 | | | 2/18/2025 | | | NWM | | | | - | | | | (264 | ) | | | (264 | ) |
| GBP | | | 103,934 | | | EUR | | | 103,783 | | | 2/18/2025 | | | NWM | | | | 151 | | | | - | | | | 151 | |
| GBP | | | 104,183 | | | EUR | | | 103,783 | | | 2/18/2025 | | | NWM | | | | 400 | | | | - | | | | 400 | |
| GBP | | | 124,524 | | | EUR | | | 124,122 | | | 2/18/2025 | | | NWM | | | | 402 | | | | - | | | | 402 | |
| GBP | | | 124,741 | | | EUR | | | 124,540 | | | 2/18/2025 | | | NWM | | | | 201 | | | | - | | | | 201 | |
| GBP | | | 160,358 | | | EUR | | | 160,123 | | | 2/18/2025 | | | NWM | | | | 235 | | | | - | | | | 235 | |
| GBP | | | 160,375 | | | EUR | | | 160,122 | | | 2/18/2025 | | | NWM | | | | 253 | | | | - | | | | 253 | |
| GBP | | | 178,256 | | | EUR | | | 177,915 | | | 2/18/2025 | | | NWM | | | | 341 | | | | - | | | | 341 | |
| EUR | | | 207,567 | | | GBP | | | 208,314 | | | 2/18/2025 | | | NWM | | | | - | | | | (747 | ) | | | (747 | ) |
| GBP | | | 245,056 | | | EUR | | | 244,063 | | | 2/18/2025 | | | NWM | | | | 993 | | | | - | | | | 993 | |
| EUR | | | 25,947 | | | HUF | | | 25,818 | | | 2/19/2025 | | | NWM | | | | 129 | | | | - | | | | 129 | |
| EUR | | | 77,841 | | | HUF | | | 77,453 | | | 2/19/2025 | | | NWM | | | | 388 | | | | - | | | | 388 | |
| USD | | | 20,611 | | | ILS | | | 20,657 | | | 2/24/2025 | | | NWM | | | | - | | | | (46 | ) | | | (46 | ) |
| USD | | | 20,612 | | | ILS | | | 20,657 | | | 2/24/2025 | | | NWM | | | | - | | | | (45 | ) | | | (45 | ) |
| ILS | | | 47,284 | | | USD | | | 47,647 | | | 2/24/2025 | | | NWM | | | | - | | | | (363 | ) | | | (363 | ) |
| USD | | | 51,356 | | | ILS | | | 51,414 | | | 2/24/2025 | | | NWM | | | | - | | | | (58 | ) | | | (58 | ) |
| ILS | | | 64,228 | | | USD | | | 64,646 | | | 2/24/2025 | | | NWM | | | | - | | | | (418 | ) | | | (418 | ) |
| ILS | | | 75,476 | | | USD | | | 76,055 | | | 2/24/2025 | | | NWM | | | | - | | | | (579 | ) | | | (579 | ) |
| ILS | | | 83,862 | | | USD | | | 84,438 | | | 2/24/2025 | | | NWM | | | | - | | | | (576 | ) | | | (576 | ) |
| USD | | | 86,103 | | | ILS | | | 86,302 | | | 2/24/2025 | | | NWM | | | | - | | | | (199 | ) | | | (199 | ) |
| ILS | | | 88,335 | | | USD | | | 89,063 | | | 2/24/2025 | | | NWM | | | | - | | | | (728 | ) | | | (728 | ) |
| ILS | | | 92,248 | | | USD | | | 93,044 | | | 2/24/2025 | | | NWM | | | | - | | | | (796 | ) | | | (796 | ) |
| USD | | | 96,183 | | | ILS | | | 96,401 | | | 2/24/2025 | | | NWM | | | | - | | | | (218 | ) | | | (218 | ) |
| ILS | | | 99,428 | | | USD | | | 99,921 | | | 2/24/2025 | | | NWM | | | | - | | | | (493 | ) | | | (493 | ) |
| USD | | | 1,916 | | | HUF | | | 1,883 | | | 2/26/2025 | | | NWM | | | | 33 | | | | - | | | | 33 | |
| USD | | | 20,295 | | | HUF | | | 19,852 | | | 2/26/2025 | | | NWM | | | | 443 | | | | - | | | | 443 | |
| USD | | | 22,981 | | | HUF | | | 22,596 | | | 2/26/2025 | | | NWM | | | | 385 | | | | - | | | | 385 | |
See accompanying notes
93
American Beacon AHL Multi-Alternatives FundSM
Consolidated Schedule of Investments
December 31, 2024
| | | | | | | | | | | | | | | | | | | | | | | | | | | | |
| Currency Purchased* | | | Currency Sold* | | | Settlement
Date | | Counterparty | | | Unrealized
Appreciation | | | Unrealized
(Depreciation) | | | Net Unrealized
Appreciation
(Depreciation) | |
| HUF | | | 25,105 | | | USD | | | 25,299 | | | 2/26/2025 | | | NWM | | | $ | - | | | $ | (194 | ) | | $ | (194 | ) |
| USD | | | 26,118 | | | HUF | | | 25,524 | | | 2/26/2025 | | | NWM | | | | 594 | | | | - | | | | 594 | |
| USD | | | 51,706 | | | HUF | | | 50,840 | | | 2/26/2025 | | | NWM | | | | 866 | | | | - | | | | 866 | |
| USD | | | 56,235 | | | HUF | | | 55,049 | | | 2/26/2025 | | | NWM | | | | 1,186 | | | | - | | | | 1,186 | |
| EUR | | | 103,826 | | | SEK | | | 103,647 | | | 2/27/2025 | | | NWM | | | | 179 | | | | - | | | | 179 | |
| USD | | | 133,032 | | | MYR | | | 131,567 | | | 1/16/2025 | | | SSB | | | | 1,465 | | | | - | | | | 1,465 | |
| USD | | | 1,239,022 | | | EUR | | | 1,217,001 | | | 1/16/2025 | | | SSB | | | | 22,021 | | | | - | | | | 22,021 | |
| USD | | | 1,288,337 | | | GBP | | | 1,263,887 | | | 1/16/2025 | | | SSB | | | | 24,450 | | | | - | | | | 24,450 | |
| | | | | | | | | | | | | | | | | | | | | | | | | | | | |
| | | $ | 1,013,690 | | | $ | (272,170 | ) | | $ | 741,520 | |
| | | | | | | | | | | | | | | | | | | | | | | | | | | | |
| * | All values denominated in USD. |
| | |
| Glossary: |
| | |
| Counterparty Abbreviations: |
| BNP | | BNP Paribas NA |
| CBK | | Citibank, N.A. |
| HUB | | HSBC Bank PLC |
| JPM | | JPMorgan Chase Bank, N.A. |
| NWM | | NatWest Markets PLC |
| SSB | | State Street Bank & Trust Co. |
|
| Currency Abbreviations: |
| AUD | | Australian Dollar |
| BRL | | Brazilian Real |
| CAD | | Canadian Dollar |
| CHF | | Swiss Franc |
| CLP | | Chilean Peso |
| CNY | | Chinese Yuan |
| EUR | | Euro |
| GBP | | British Pound |
| HUF | | Hungarian Forint |
| ILS | | Israeli New Shekel |
| INR | | Indian Rupee |
| JPY | | Japanese Yen |
| KRW | | South Korean Won |
| MXN | | Mexican Peso |
| MYR | | Malaysian Ringgit |
| NOK | | Norwegian Krone |
| NZD | | New Zealand Dollar |
| PHP | | Philippine Peso |
| PLN | | Polish Zloty |
| SEK | | Swedish Krona |
| SGD | | Singapore Dollar |
| THB | | Thai Baht |
| TWD | | New Taiwan Dollar |
| USD | | United States Dollar |
| ZAR | | South African Rand |
See accompanying notes
94
American Beacon AHL Multi-Alternatives FundSM
Consolidated Schedule of Investments
December 31, 2024
| | |
|
| Index Abbreviations: |
| BBUXALC | | Bloomberg Commodity ex-Agriculture and Livestock Capped Index. |
| DAX | | Deutsche Boerse AG German Stock Index. |
| Euro Stoxx 50 | | Eurozone Blue-chip Index. |
| FTSE 100 | | Financial Times Stock Exchange 100 Index. |
| FTSE China A50 | | Financial Times Stock Exchange China A50 Index. |
| FTSF/JSE Top 40 | | Largest 40 companies ranked by full market value in the FTSF/JSE All-Share Index. |
| FTSE/MIB | | Borsa Italiana-Italian Stock Market Index. |
| Hang Seng | | Hong Kong Stock Market Index. |
| MSCI EAFE | | Morgan Stanley Capital International - Europe, Australasia, and Far East. |
| NASDAQ | | National Association of Securities Dealers Automated Quotations. |
| Nifty 50 | | National Stock Exchange FIFTY. |
| NIKKEI 225 | | Nikkei Stock Average. |
| OMXS30 | | Stockholm Stock Exchange’s leading share index. |
| Russell 2000 | | U.S. Small-Cap Stock Market Index. |
| S&P500 | | Standard & Poor’s 500 Index - U.S. Equity Large-Cap Index. |
| S&P/TSX | | Canadian Equity Market Index. |
| Stoxx Europe 600 | | Europe Total Market Index. |
| TOPIX | | Tokyo Stock Exchange Tokyo Price Index. |
|
| Exchange Abbreviations: |
| ASX | | Australian Securities Exchange. |
| CBOT | | Chicago Board of Trade. |
| CME | | Chicago Mercantile Exchange. |
| EUREX | | European derivatives exchange. |
| Euronext | | European New Exchange Technology. |
| FinEx | | Financial Instruments Exchange. |
| HKG | | Hong Kong Exchange. |
| ICE | | Intercontinental Exchange. |
| JSE | | Johannesburg Stock Exchange. |
| KFE | | Korea Exchange - KOFEX. |
| LME | | London Metal Exchange. |
| MDE | | Malaysian Derivative Exchange. |
| MGE | | Minneapolis Grain Exchange/ |
| NSE | | National Stock Exchange |
| NYMEX | | New York Mercantile Exchange. |
| OML | | OMLX: London Securities & Derivatives Exchange. |
| SAFEX | | South African Futures Exchange. |
| SFE | | Sydney Futures Exchange. |
| SGX | | Singapore Stock Exchange. |
| TSE | | Tokyo Stock Exchange. |
| WCE | | Winnipeg Commodity Exchange. |
See accompanying notes
95
American Beacon AHL Multi-Alternatives FundSM
Consolidated Schedule of Investments
December 31, 2024
| | |
|
| Other Abbreviations: |
| Bobl | | Medium term debt that is issued by the Federal Republic of Germany. |
| BTP | | Buoni del Tesoro Poliennali. |
| Bund | | German Federal Government Bond. |
| Buxl | | Long term debt that is issued by the Federal Republic of Germany. |
| CDX | | Credit Default Swap Index. |
| COMEX | | The Commodity Exchange Inc. |
| CSC | | CEI: Coffee, Sugar and Cocoa. |
| CTN | | Cotton. |
| ESG | | Environmental, Social, Governance. |
| EURIBOR | | Euro Interbank Offered Rate. |
| GILT | | Bank of England Bonds. |
| IFSC | | International Financial Services Centre. |
| KCBT | | The Kansas City Board of Trade. |
| LIBOR | | London International Offered Rate. |
| NYBOT | | New York Board of Trade. |
| OAT | | Obligations Assimilables du Tresor. |
| OTC | | Over-the-Counter. |
| RBOB | | Reformulated Gasoline Blendstock for Oxygen Blending. |
| Schatz | | Short-dated equivalent of the Bobl and Bund futures. |
| SOFR | | Secured Overnight Financing Rate. |
| SONIA | | Sterling Overnight Index Average. |
| ULSD | | Ultra-low-sulfur diesel. |
The Fund’s investments are summarized by level based on the inputs used to determine their values. As of December 31, 2024, the investments were classified as described below:
| | | | | | | | | | | | | | | | | | | | | | | | | | | | |
AHL Multi-Alternatives Fund | | Level 1 | | | | | | Level 2 | | | | | | Level 3 | | | | | | Total | |
Assets | | | | | | | | | | | | | | | | | | | | | | | | | | | | |
Foreign Sovereign Obligations | | $ | - | | | | | | | $ | 2,285,256 | | | | | | | $ | - | | | | | | | $ | 2,285,256 | |
U.S. Treasury Obligations | | | - | | | | | | | | 2,995,202 | | | | | | | | - | | | | | | | | 2,995,202 | |
Short-Term Investments | | | - | | | | | | | | 27,564,893 | | | | | | | | - | | | | | | | | 27,564,893 | |
| | | | | | | | | | | | | | | | | | | | | | | | | | | | |
Total Investments in Securities - Assets | | $ | - | | | | | | | $ | 32,845,351 | | | | | | | $ | - | | | | | | | $ | 32,845,351 | |
| | | | | | | | | | | | | | | | | | | | | | | | | | | | |
|
Financial Derivative Instruments - Assets | |
Futures Contracts | | $ | 406,955 | | | | | | | $ | - | | | | | | | $ | - | | | | | | | $ | 406,955 | |
Swap Contract Agreements | | | - | | | | | | | | 51,192 | | | | | | | | - | | | | | | | | 51,192 | |
Forward Foreign Currency Contracts | | | - | | | | | | | | 1,013,690 | | | | | | | | - | | | | | | | | 1,013,690 | |
| | | | | | | | | | | | | | | | | | | | | | | | | | | | |
Total Financial Derivative Instruments - Assets | | $ | 406,955 | | | | | | | $ | 1,064,882 | | | | | | | $ | - | | | | | | | $ | 1,471,837 | |
| | | | | | | | | | | | | | | | | | | | | | | | | | | | |
|
Financial Derivative Instruments - Liabilities | |
Futures Contracts | | $ | (486,242 | ) | | | | | | $ | - | | | | | | | $ | - | | | | | | | $ | (486,242 | ) |
Forward Foreign Currency Contracts | | | - | | | | | | | | (272,170 | ) | | | | | | | - | | | | | | | | (272,170 | ) |
| | | | | | | | | | | | | | | | | | | | | | | | | | | | |
Total Financial Derivative Instruments - Liabilities | | $ | (486,242 | ) | | | | | | $ | (272,170 | ) | | | | | | $ | - | | | | | | | $ | (758,412 | ) |
| | | | | | | | | | | | | | | | | | | | | | | | | | | | |
U.S. GAAP requires transfers between all levels to/from level 3 be disclosed. During the year ended December 31, 2024, there were no transfers into or out of Level 3.
See accompanying notes
96
American Beacon AHL TargetRisk FundSM
Consolidated Schedule of Investments
December 31, 2024
| | | | | | | | | | | | | | | |
| | | |
| | | Principal Amount | | | | Fair Value |
| | | | | | | |
| | | |
| FOREIGN SOVEREIGN OBLIGATIONS - 9.89% | | | | | | |
| French Republic Government Bonds OAT, | | | | | | | | | | | | | | | |
0.100%, Due 7/25/2031A B | | | EUR | 4,819,400 | | | | | | | | | $ | 4,725,273 | |
0.600%, Due 7/25/2034A B C | | | | 2,736,900 | | | | | | | | | | 2,683,009 | |
| Italy Buoni Poliennali Del Tesoro, 1.800%, Due 5/15/2036A B D | | | | 4,084,720 | | | | | | | | | | 4,192,568 | |
| U.K. Inflation-Linked Gilts, | | | | | | | | | | | | | | | |
1.250%, Due 11/22/2032A B | | | GBP | 8,097,120 | | | | | | | | | | 10,421,951 | |
0.750%, Due 11/22/2033A B | | | | 3,148,770 | | | | | | | | | | 3,862,636 | |
0.125%, Due 3/22/2051A B | | | | 1,992,615 | | | | | | | | | | 1,590,959 | |
| | | | | | | | | | | | | | | |
| | | | | | | | | | | | | | | |
Total Foreign Sovereign Obligations (Cost $29,174,941) | | | | | | | | | | | | | | 27,476,396 | |
| | | | | | | | | | | | | | | |
| | | | | | | | | | | | | | | |
| | | |
| U.S. TREASURY OBLIGATIONS - 13.54% | | | | | | |
| U.S. Treasury Inflation-Indexed Bonds, | | | | | | | | | | | | | | | |
1.500%, Due 2/15/2053A | | | $ | 530,965 | | | | | | | | | | 425,394 | |
2.125%, Due 2/15/2054A | | | | 2,057,080 | | | | | | | | | | 1,905,047 | |
| U.S. Treasury Inflation-Indexed Notes, | | | | | | | | | | | | | | | |
2.125%, Due 4/15/2029A | | | | 12,756,875 | | | | | | | | | | 12,772,097 | |
1.625%, Due 10/15/2029A | | | | 5,517,600 | | | | | | | | | | 5,424,973 | |
1.875%, Due 7/15/2034A | | | | 17,604,825 | | | | | | | | | | 17,063,092 | |
| | | | | | | | | | | | | | | |
| | | | | | | | | | | | | | | |
Total U.S. Treasury Obligations (Cost $38,641,916) | | | | | | | | | | | | | | 37,590,603 | |
| | | | | | | | | | | | | | | |
| | | | | | | | | | | | | | | |
| | | |
| SHORT-TERM INVESTMENTS - 66.37% | | | | | | |
| | | |
| U.S. Treasury Obligations - 66.37% | | | | | | |
| U.S. Treasury Bills, | | | | | | | | | | | | | | | |
5.109%, Due 1/16/2025 | | | | 30,000,000 | | | | | | | | | | 29,950,615 | |
4.778%, Due 2/20/2025D | | | | 12,000,000 | | | | | | | | | | 11,931,796 | |
4.453%, Due 3/27/2025D | | | | 62,000,000 | | | | | | | | | | 61,393,846 | |
4.408%, Due 4/3/2025 | | | | 50,000,000 | | | | | | | | | | 49,466,007 | |
4.469%, Due 4/10/2025D | | | | 6,000,000 | | | | | | | | | | 5,932,090 | |
4.459%, Due 4/17/2025D | | | | 13,000,000 | | | | | | | | | | 12,842,235 | |
4.402%, Due 5/8/2025D | | | | 13,000,000 | | | | | | | | | | 12,811,459 | |
| | | | | | | | | | | | | | | |
| | | | | | | | | | | | | | | |
Total Short-Term Investments (Cost $184,274,523) | | | | | | | | | | | | | | 184,328,048 | |
| | | | | | | | | | | | | | | |
| | | | | | | | | | | | | | | |
TOTAL INVESTMENTS - 89.80% (Cost $252,091,380) | | | | | | | | | | | | | | 249,395,047 | |
OTHER ASSETS, NET OF LIABILITIES - 10.20% | | | | | | | | | | | | | | 28,323,389 | |
| | | | | | | | | | | | | | | |
TOTAL NET ASSETS - 100.00% | | | | | | | | | | | | | $ | 277,718,436 | |
| | | | | | | | | | | | | | | |
| | | | | | | |
| Percentages are stated as a percent of net assets. | | | | | | | | | | | | | | | |
A Inflation-Indexed Note.
B Reg S - Security purchased under the Securities Act of 1933, which exempts from registration securities offered and sold outside of the United States. Such a security cannot be sold in the United States without either an effective registration statement filed pursuant to the Securities Act of 1933, or pursuant to an exemption from registration.
C Security exempt from registration under the Securities Act of 1933. These securities may be resold to qualified institutional buyers pursuant to Rule 144A. At the period end, the value of these securities amounted to $2,683,009 or 0.97% of net assets. The Fund has no right to demand registration of these securities.
D All or a portion represents positions held by the American Beacon Cayman TargetRisk Company, Ltd.
| | | | | | | | | | | | | | | | |
| Long Futures Contracts Open on December 31, 2024: | |
| | | | | |
| Equity Futures Contracts | | | | | | | | | | | | | |
| Description | | Number of
Contracts | | Expiration Date | | Notional Amount | | | Contract Value | | | Unrealized
Appreciation
(Depreciation) | |
| Borsa Italiana FTSE/MIB Index Futures | | 20 | | March 2025 | | $ | 3,637,339 | | | $ | 3,552,965 | | | $ | (84,374 | ) |
| CME E-Mini NASDAQ 100 Index Futures | | 15 | | March 2025 | | | 6,594,645 | | | | 6,367,950 | | | | (226,695 | ) |
| CME E-Mini S&P 500 ESG Index Futures | | 1 | | March 2025 | | | 269,327 | | | | 260,730 | | | | (8,597 | ) |
| CME E-Mini S&P 500 Index Futures | | 49 | | March 2025 | | | 15,016,605 | | | | 14,542,588 | | | | (474,017 | ) |
| Eurex DAX Index Futures | | 9 | | March 2025 | | | 4,826,386 | | | | 4,673,443 | | | | (152,943 | ) |
See accompanying notes
97
American Beacon AHL TargetRisk FundSM
Consolidated Schedule of Investments
December 31, 2024
| | | | | | | | | | | | | | | | |
| | | | | |
| Equity Futures Contracts (continued) | | | | | | | | | | | | | |
| Description | | Number of
Contracts | | Expiration Date | | Notional Amount | | | Contract Value | | | Unrealized
Appreciation
(Depreciation) | |
| Eurex EURO STOXX 50 Futures | | 141 | | March 2025 | | $ | 7,308,432 | | | $ | 7,128,935 | | | $ | (179,497 | ) |
| Eurex STOXX Europe 600 ESG-X Futures | | 10 | | March 2025 | | | 198,060 | | | | 194,429 | | | | (3,631 | ) |
| Euronext CAC 40 Index Futures | | 49 | | January 2025 | | | 3,788,715 | | | | 3,748,124 | | | | (40,591 | ) |
| HKG Hang Seng China Enterprises Index Futures | | 36 | | January 2025 | | | 1,672,737 | | | | 1,686,750 | | | | 14,013 | |
| HKG Hang Seng Index Futures | | 15 | | January 2025 | | | 1,927,489 | | | | 1,939,736 | | | | 12,247 | |
| ICE FTSE 100 Index Futures | | 80 | | March 2025 | | | 8,361,169 | | | | 8,192,933 | | | | (168,236 | ) |
| KFE KOSPI 200 Index Futures | | 56 | | March 2025 | | | 3,071,833 | | | | 3,032,707 | | | | (39,126 | ) |
| Montreal Exchange S&P/TSX 60 Index Futures | | 42 | | March 2025 | | | 8,905,228 | | | | 8,678,451 | | | | (226,777 | ) |
| NSE IFSC NIFTY 50 Index Futures | | 10 | | January 2025 | | | 477,938 | | | | 475,390 | | | | (2,548 | ) |
| OML Stockholm OMXS30 Index Futures | | 185 | | January 2025 | | | 4,310,526 | | | | 4,151,855 | | | | (158,671 | ) |
| SAFEX FTSE/JSE Top 40 Index Futures | | 22 | | March 2025 | | | 931,237 | | | | 889,804 | | | | (41,433 | ) |
| SFE S&P ASX Share Price Index 200 Futures | | 52 | | March 2025 | | | 6,679,425 | | | | 6,556,168 | | | | (123,257 | ) |
| SGX FTSE China A50 Futures Contract | | 162 | | January 2025 | | | 2,181,641 | | | | 2,181,330 | | | | (311 | ) |
| SGX FTSE Taiwan Index Futures | | 21 | | January 2025 | | | 1,619,300 | | | | 1,607,760 | | | | (11,540 | ) |
| SGX MSCI Singapore Index Futures | | 51 | | January 2025 | | | 1,394,457 | | | | 1,394,644 | | | | 187 | |
| SGX Nikkei 225 Stock Index Futures | | 41 | | March 2025 | | | 5,122,863 | | | | 5,118,323 | | | | (4,540 | ) |
| TSE TOPIX Futures | | 47 | | March 2025 | | | 8,199,633 | | | | 8,323,461 | | | | 123,828 | |
| | | | | | | | | | | | | | | | |
| | | | | | $ | 96,494,985 | | | $ | 94,698,476 | | | $ | (1,796,509 | ) |
| | | | | | | | | | | | | | | | |
| | | | | |
| Interest Rate Futures Contracts | | | | | | | | | | | | | |
| Description | | Number of
Contracts | | Expiration Date | | Notional Amount | | | Contract Value | | | Unrealized
Appreciation
(Depreciation) | |
| CBOT 2 Year U.S. Treasury Notes Futures | | 18 | | March 2025 | | $ | 3,704,672 | | | $ | 3,700,969 | | | $ | (3,703 | ) |
| CBOT 5 Year U.S. Treasury Notes Futures | | 52 | | March 2025 | | | 5,578,066 | | | | 5,527,844 | | | | (50,222 | ) |
| CBOT 10 Year U.S. Treasury Notes Futures | | 55 | | March 2025 | | | 6,093,414 | | | | 5,981,250 | | | | (112,164 | ) |
| CBOT U.S. Long Bond Futures | | 40 | | March 2025 | | | 4,740,560 | | | | 4,553,750 | | | | (186,810 | ) |
| CBOT Ultra Long-Term U.S. Treasury Bond Futures | | 50 | | March 2025 | | | 6,277,861 | | | | 5,945,312 | | | | (332,549 | ) |
| Eurex 5 Year Euro BOBL Futures | | 53 | | March 2025 | | | 6,549,253 | | | | 6,470,518 | | | | (78,735 | ) |
| Eurex 10 Year Euro BUND Futures | | 54 | | March 2025 | | | 7,651,007 | | | | 7,464,085 | | | | (186,922 | ) |
| Eurex 30 Year Euro BUXL Futures | | 9 | | March 2025 | | | 1,313,814 | | | | 1,236,929 | | | | (76,885 | ) |
| Eurex Euro-BTP Italian Bond Futures | | 55 | | March 2025 | | | 6,991,420 | | | | 6,835,469 | | | | (155,951 | ) |
| French Government Bond Futures | | 50 | | March 2025 | | | 6,537,483 | | | | 6,391,193 | | | | (146,290 | ) |
| ICE Long Gilt Futures | | 35 | | March 2025 | | | 4,172,715 | | | | 4,049,082 | | | | (123,633 | ) |
| KFE 3 Year Treasury Bond Futures | | 42 | | March 2025 | | | 3,055,720 | | | | 3,042,693 | | | | (13,027 | ) |
| KFE 10 Year Treasury Bond Futures | | 24 | | March 2025 | | | 1,943,624 | | | | 1,906,110 | | | | (37,514 | ) |
| Montreal Exchange 10 Year Canadian Bond Futures | | 42 | | March 2025 | | | 3,561,122 | | | | 3,582,469 | | | | 21,347 | |
| SFE 3 Year Australian Bond Futures | | 45 | | March 2025 | | | 2,957,082 | | | | 2,956,661 | | | | (421 | ) |
| SFE 10 Year Australian Bond Futures | | 63 | | March 2025 | | | 4,437,862 | | | | 4,401,445 | | | | (36,417 | ) |
| TSE Japanese 10 Year Bond Futures | | 16 | | March 2025 | | | 14,473,051 | | | | 14,429,438 | | | | (43,613 | ) |
| | | | | | | | | | | | | | | | |
| | | | | | $ | 90,038,726 | | | $ | 88,475,217 | | | $ | (1,563,509 | ) |
| | | | | | | | | | | | | | | | |
| | | | | | | | | | | | | | | | | | | | | | | | | | | | |
| Centrally Cleared Swap Agreements Outstanding on December 31, 2024: | |
|
| Credit Default Swaps on Credit Indices - Buy Protection(1) | |
| Index/Tranches | | Fixed
Rate (%) | | Payment
Frequency | | Expiration
Date | | Implied Credit
Spread at
12/31/2024(2)
(%) | | | Curr | | Notional
Amount(3)
(000s) | | | Premiums
Paid
(Received) | | | Fair Value(4) | | | Unrealized
Appreciation
(Depreciation) | |
| iTraxx Europe S42 | | 1.00 | | Quarterly | | 12/20/2029 | | | 0.5755 | | | EUR | | | 5,000 | | | $ | (102,185 | ) | | $ | (104,542 | ) | | $ | (2,357 | ) |
| iTraxx Europe S42 | | 1.00 | | Quarterly | | 12/20/2029 | | | 0.5755 | | | EUR | | | 10,000 | | | | (214,221 | ) | | | (209,085 | ) | | | 5,136 | |
| iTraxx Europe S42 | | 1.00 | | Quarterly | | 12/20/2029 | | | 0.5755 | | | EUR | | | 5,000 | | | | (108,017 | ) | | | (104,542 | ) | | | 3,475 | |
| iTraxx Europe Crossover S42 | | 5.00 | | Quarterly | | 12/20/2029 | | | 3.1379 | | | EUR | | | 5,000 | | | | (404,951 | ) | | | (415,758 | ) | | | (10,807 | ) |
| CDX.NA.IG.S43 | | 1.00 | | Quarterly | | 12/20/2029 | | | 0.4991 | | | USD | | | 5,000 | | | | (107,057 | ) | | | (113,410 | ) | | | (6,353 | ) |
| CDX.NA.HY.S43 | | 5.00 | | Quarterly | | 12/20/2029 | | | 3.1181 | | | USD | | | 5,000 | | | | (394,220 | ) | | | (393,820 | ) | | | 400 | |
See accompanying notes
98
American Beacon AHL TargetRisk FundSM
Consolidated Schedule of Investments
December 31, 2024
| | | | | | | | | | | | | | | | | | | | | | | | | | | | |
| Credit Default Swaps on Credit Indices - Buy Protection(1) (continued) | |
| Index/Tranches | | Fixed
Rate (%) | | Payment
Frequency | | Expiration
Date | | Implied Credit
Spread at
12/31/2024(2)
(%) | | | Curr | | Notional
Amount(3)
(000s) | | | Premiums
Paid
(Received) | | | Fair Value(4) | | | Unrealized
Appreciation
(Depreciation) | |
| CDX.NA.HY.S43 | | 5.00 | | Quarterly | | 12/20/2029 | | | 3.1181 | | | USD | | | 5,000 | | | $ | (370,705 | ) | | $ | (393,820 | ) | | $ | (23,115 | ) |
| CDX.NA.IG.S43 | | 1.00 | | Quarterly | | 12/20/2029 | | | 0.4991 | | | USD | | | 5,000 | | | | (111,648 | ) | | | (113,410 | ) | | | (1,762 | ) |
| CDX.NA.IG.S43 | | 1.00 | | Quarterly | | 12/20/2029 | | | 0.4991 | | | USD | | | 5,000 | | | | (110,255 | ) | | | (113,410 | ) | | | (3,155 | ) |
| CDX.NA.IG.S43 | | 1.00 | | Quarterly | | 12/20/2029 | | | 0.4991 | | | USD | | | 5,000 | | | | (112,659 | ) | | | (113,410 | ) | | | (751 | ) |
| | | | | | | | | | | | | | | | | | | | | | | | | | | | |
| | | $ | (2,035,918 | ) | | $ | (2,075,207 | ) | | $ | (39,289 | ) |
| | | | | | | | | | | | | | | | | | | | | | | | | | | | |
|
| Credit Default Swaps on Credit Indices - Sell Protection(5) | |
| Index/Tranches | | Fixed
Rate (%) | | Payment
Frequency | | Expiration
Date | | Implied Credit
Spread at
12/31/2024(2)
(%) | | | Curr | | Notional
Amount(3)
(000s) | | | Premiums
Paid
(Received) | | | Fair Value(4) | | | Unrealized
Appreciation
(Depreciation) | |
| iTraxx Europe S42 | | 1.00 | | Quarterly | | 12/20/2029 | | | 0.5755 | | | EUR | | | 60,000 | | | $ | 1,246,184 | | | $ | 1,254,507 | | | $ | 8,323 | |
| iTraxx Europe Crossover S42 | | 5.00 | | Quarterly | | 12/20/2029 | | | 3.1379 | | | EUR | | | 20,000 | | | | 1,643,571 | | | | 1,663,034 | | | | 19,463 | |
| CDX.NA.HY.S43 | | 5.00 | | Quarterly | | 12/20/2029 | | | 3.1181 | | | USD | | | 30,000 | | | | 2,213,866 | | | | 2,362,919 | | | | 149,053 | |
| CDX.NA.IG.S43 | | 1.00 | | Quarterly | | 12/20/2029 | | | 0.4991 | | | USD | | | 60,000 | | | | 1,294,052 | | | | 1,360,910 | | | | 66,858 | |
| | | | | | | | | | | | | | | | | | | | | | | | | | | | |
| | | $ | 6,397,673 | | | $ | 6,641,370 | | | $ | 243,697 | |
| | | | | | | | | | | | | | | | | | | | | | | | | | | | |
| | | | | | | | | | | | | | | | | | | | | | | | | | | | | | | | |
| OTC Swap Agreements Outstanding on December 31, 2024: | |
|
| Total Return Swaps Agreements | |
Pay/Receive Floating
Rate | | Description | | Reference
Entity | | Counter-
party | | Floating
Rate | | | Payment
Frequency | | Expiration
Date | | | Reference
Quantity | | | Notional
Amount | | | Premiums
Paid
(Received) | | | Unrealized
Appreciation
(Depreciation) | |
| Pay | | 1-Month
USD-LIBOR | | BBUXALC
INDEX | | JPM | | | 0.000 | % | | Maturity | | | 1/6/2025 | | | | 242,000 | | | $ | 30,333,944 | | | $ | (2,944 | ) | | $ | 598,390 | |
| | | | | | | | | | | | | | | | | | | | | | | | | | | | | | | | |
| | | | | | | | | | | | | | | | | | | | | | | | $ | (2,944 | ) | | $ | 598,390 | |
| | | | | | | | | | | | | | | | | | | | | | | | | | | | | | | | |
(1) If the Fund is a buyer of protection and a credit event occurs, as defined under the terms of that particular swap agreement, the Fund will either (i) receive from the seller of protection an amount equal to the notional amount of the swap and deliver the referenced obligation or underlying securities comprising the referenced index or (ii) receive a net settlement amount in the form of cash or securities equal to the notional amount of the swap less the recovery value of the referenced obligation or underlying securities comprising the referenced index.
(2) Implied credit spreads, represented in absolute terms, utilized in determining the fair value of credit default swaps agreements on corporate issues and sovereign issues of an emerging country as of period end serve as an indicator of the current status of the payment/performance risk and represent the likelihood or risk of default for the credit derivative. The implied credit spread of a particular referenced entity reflects the cost of buying/selling protection and may include upfront payments required to be made to enter into the agreement. Wider credit spreads represent a deterioration of the referenced entity’s credit soundness and a greater likelihood or risk of default or other credit event occurring as defined under the terms of the agreement.
(3) The maximum potential amount the Fund could be required to pay as a seller of credit protection or receive as a buyer of credit protection if a credit event occurs as defined under the terms of that particular swap agreement.
(4) The quoted market prices and resulting values for credit default swaps on asset-backed securities and credit indices serve as an indicator of the current status of the payment/performance risk and represent the likelihood of an expected liability (or profit) for the credit derivative should the notional amount of the swap agreement be closed/ sold as of the period end. Increasing fair values, in absolute terms when compared to the notional amount of the swap, represent a deterioration of the referenced entity’s credit soundness and greater likelihood or risk of default or other credit event occurring as defined under the terms of the agreement.
(5) If the Fund is a seller of protection and a credit event occurs, as defined under the terms of that particular swap agreement, the Fund will either (i) pay to the buyer of protection an amount equal to the notional amount of the swap and take delivery of the referenced obligation or underlying securities comprising the referenced index or (ii) pay a net settlement amount in the form of cash or securities equal to the notional amount of the swap less the recovery value of the referenced obligation or underlying securities comprising the referenced index.
See accompanying notes
99
American Beacon AHL TargetRisk FundSM
Consolidated Schedule of Investments
December 31, 2024
| | | | | | | | | | | | | | | | | | | | | | | | | | | | |
| Forward Foreign Currency Contracts Open on December 31, 2024: | |
| Currency Purchased* | | | Currency Sold* | | | Settlement
Date | | Counterparty | | | Unrealized
Appreciation | | | Unrealized
(Depreciation) | | | Net Unrealized
Appreciation
(Depreciation) | |
| USD | | | 62,598 | | | SEK | | | 62,035 | | | 1/16/2025 | | | SSB | | | $ | 563 | | | $ | - | | | $ | 563 | |
| USD | | | 65,524 | | | SEK | | | 64,652 | | | 1/16/2025 | | | SSB | | | | 872 | | | | - | | | | 872 | |
| USD | | | 93,009 | | | CAD | | | 91,684 | | | 1/16/2025 | | | SSB | | | | 1,325 | | | | - | | | | 1,325 | |
| EUR | | | 103,639 | | | USD | | | 105,099 | | | 1/16/2025 | | | SSB | | | | - | | | | (1,460 | ) | | | (1,460 | ) |
| USD | | | 108,437 | | | AUD | | | 105,382 | | | 1/16/2025 | | | SSB | | | | 3,055 | | | | - | | | | 3,055 | |
| USD | | | 126,855 | | | AUD | | | 123,345 | | | 1/16/2025 | | | SSB | | | | 3,510 | | | | - | | | | 3,510 | |
| USD | | | 131,471 | | | AUD | | | 126,876 | | | 1/16/2025 | | | SSB | | | | 4,595 | | | | - | | | | 4,595 | |
| USD | | | 132,191 | | | CAD | | | 130,720 | | | 1/16/2025 | | | SSB | | | | 1,471 | | | | - | | | | 1,471 | |
| USD | | | 136,268 | | | GBP | | | 133,945 | | | 1/16/2025 | | | SSB | | | | 2,323 | | | | - | | | | 2,323 | |
| USD | | | 146,017 | | | CAD | | | 144,401 | | | 1/16/2025 | | | SSB | | | | 1,616 | | | | - | | | | 1,616 | |
| USD | | | 169,311 | | | EUR | | | 167,012 | | | 1/16/2025 | | | SSB | | | | 2,299 | | | | - | | | | 2,299 | |
| USD | | | 176,178 | | | EUR | | | 173,628 | | | 1/16/2025 | | | SSB | | | | 2,550 | | | | - | | | | 2,550 | |
| GBP | | | 187,764 | | | USD | | | 190,754 | | | 1/16/2025 | | | SSB | | | | - | | | | (2,990 | ) | | | (2,990 | ) |
| USD | | | 230,656 | | | GBP | | | 226,724 | | | 1/16/2025 | | | SSB | | | | 3,932 | | | | - | | | | 3,932 | |
| USD | | | 249,600 | | | CAD | | | 249,973 | | | 1/16/2025 | | | SSB | | | | - | | | | (373 | ) | | | (373 | ) |
| GBP | | | 250,352 | | | USD | | | 250,501 | | | 1/16/2025 | | | SSB | | | | - | | | | (149 | ) | | | (149 | ) |
| EUR | | | 310,916 | | | USD | | | 312,400 | | | 1/16/2025 | | | SSB | | | | - | | | | (1,484 | ) | | | (1,484 | ) |
| EUR | | | 414,555 | | | USD | | | 423,833 | | | 1/16/2025 | | | SSB | | | | - | | | | (9,278 | ) | | | (9,278 | ) |
| USD | | | 442,262 | | | EUR | | | 436,142 | | | 1/16/2025 | | | SSB | | | | 6,120 | | | | - | | | | 6,120 | |
| EUR | | | 518,194 | | | USD | | | 526,256 | | | 1/16/2025 | | | SSB | | | | - | | | | (8,062 | ) | | | (8,062 | ) |
| USD | | | 548,574 | | | GBP | | | 538,514 | | | 1/16/2025 | | | SSB | | | | 10,060 | | | | - | | | | 10,060 | |
| USD | | | 557,838 | | | EUR | | | 549,272 | | | 1/16/2025 | | | SSB | | | | 8,566 | | | | - | | | | 8,566 | |
| GBP | | | 625,880 | | | USD | | | 629,363 | | | 1/16/2025 | | | SSB | | | | - | | | | (3,483 | ) | | | (3,483 | ) |
| EUR | | | 725,471 | | | USD | | | 728,135 | | | 1/16/2025 | | | SSB | | | | - | | | | (2,664 | ) | | | (2,664 | ) |
| EUR | | | 829,110 | | | USD | | | 831,958 | | | 1/16/2025 | | | SSB | | | | - | | | | (2,848 | ) | | | (2,848 | ) |
| GBP | | | 1,001,407 | | | USD | | | 1,016,182 | | | 1/16/2025 | | | SSB | | | | - | | | | (14,775 | ) | | | (14,775 | ) |
| EUR | | | 1,036,388 | | | USD | | | 1,050,987 | | | 1/16/2025 | | | SSB | | | | - | | | | (14,599 | ) | | | (14,599 | ) |
| EUR | | | 1,554,581 | | | USD | | | 1,559,922 | | | 1/16/2025 | | | SSB | | | | - | | | | (5,341 | ) | | | (5,341 | ) |
| EUR | | | 2,072,775 | | | USD | | | 2,085,146 | | | 1/16/2025 | | | SSB | | | | - | | | | (12,371 | ) | | | (12,371 | ) |
| USD | | | 2,537,066 | | | KRW | | | 2,438,715 | | | 1/16/2025 | | | SSB | | | | 98,351 | | | | - | | | | 98,351 | |
| USD | | | 5,384,876 | | | EUR | | | 5,289,173 | | | 1/16/2025 | | | SSB | | | | 95,703 | | | | - | | | | 95,703 | |
| USD | | | 16,314,139 | | | EUR | | | 16,024,196 | | | 1/16/2025 | | | SSB | | | | 289,943 | | | | - | | | | 289,943 | |
| USD | | | 19,701,422 | | | GBP | | | 19,327,520 | | | 1/16/2025 | | | SSB | | | | 373,902 | | | | - | | | | 373,902 | |
| | | | | | | | | | | | | | | | | | | | | | | | | | | | |
| | | $ | 910,756 | | | $ | (79,877 | ) | | $ | 830,879 | |
| | | | | | | | | | | | | | | | | | | | | | | | | | | | |
| * | All values denominated in USD. |
| | |
| Glossary: |
| | |
| Counterparty Abbreviations: |
| JPM | | JPMorgan Chase Bank, N.A. |
| SSB | | State Street Bank & Trust Co. |
|
| Currency Abbreviations: |
| AUD | | Australian Dollar |
| CAD | | Canadian Dollar |
| EUR | | Euro |
| GBP | | British Pound |
| KRW | | South Korean Won |
| SEK | | Swedish Krona |
| USD | | United States Dollar |
See accompanying notes
100
American Beacon AHL TargetRisk FundSM
Consolidated Schedule of Investments
December 31, 2024
| | |
| Index Abbreviations: |
| BBUXALC | | Bloomberg Commodity ex-Agriculture and Livestock Capped Index. |
| CAC 40 | | Euronet Paris - French Stock Market Index. |
| DAX | | Deutsche Boerse AG German Stock Index. |
| Euro Stoxx 50 | | Eurozone Blue-chip Index. |
| FTSE 100 | | Financial Times Stock Exchange 100 Index. |
| FTSE China A50 | | Financial Times Stock Exchange China A50 Index. |
| FTSE/JSE Top 40 | | Largest 40 companies ranked by full market value in the FTSE/JSE All-Share Index. |
| FTSE/MIB | | Borsa Italiana-Italian Stock Market Index. |
| Hang Seng | | Hong Kong Stock Market Index. |
| KOSPI | | South Korean Stock Market Index. |
| NASDAQ | | National Association of Securities Dealers Automated Quotations. |
| Nifty 50 | | National Stock Exchange FIFTY. |
| NIKKEI 225 | | Nikkei Stock Average. |
| OMXS30 | | Stockholm Stock Exchange’s leading share index. |
| S&P 500 | | Standard & Poor’s 500 Index - U.S. Equity Large-Cap Index. |
| S&P/TSX | | Canadian Equity Market Index. |
| Stoxx Europe 600 | | Europe Total Market Index. |
| TOPIX | | Tokyo Stock Exchange Tokyo Price Index. |
|
| Exchange Abbreviations: |
| ASX | | Australian Securities Exchange. |
| CBOT | | Chicago Board of Trade. |
| CME | | Chicago Mercantile Exchange. |
| EUREX | | European derivatives exchange. |
| Euronext | | European New Exchange Technology. |
| HKG | | Hong Kong Exchange. |
| ICE | | Intercontinental Exchange. |
| JSE | | Johannesburg Stock Exchange. |
| KFE | | Korea Exchange - KOFEX. |
| NSE | | National Stock Exchange |
| OML | | OMLX: London Securities & Derivatives Exchange. |
| SAFEX | | South African Futures Exchange. |
| SFE | | Sydney Futures Exchange. |
| SGX | | Singapore Stock Exchange. |
| TSE | | Tokyo Stock Exchange. |
|
| Other Abbreviations: |
| Bobl | | Medium term debt that is issued by the Federal Republic of Germany. |
| BTP | | Buoni del Tesoro Poliennali. |
| Bund | | German Federal Government Bond. |
| Buxl | | Long term debt that is issued by the Federal Republic of Germany. |
| CDX | | Credit Default Swap Index. |
| ESG | | Environmental, Social, Governance. |
| GILT | | Bank of England Bonds. |
| IFSC | | International Financial Services Centre. |
| iTraxx | | Credit Default Swap Index. |
| LIBOR | | London International Offered Rate. |
| OAT | | Obligations Assimilables du Tresor. |
| OTC | | Over-the-Counter. |
See accompanying notes
101
American Beacon AHL TargetRisk FundSM
Consolidated Schedule of Investments
December 31, 2024
The Fund’s investments are summarized by level based on the inputs used to determine their values. As of December 31, 2024, the investments were classified as described below:
| | | | | | | | | | | | | | | | | | | | | | | | | | | | |
AHL TargetRisk Fund | | Level 1 | | | | | | Level 2 | | | | | | Level 3 | | | | | | Total | |
Assets | | | | | | | | | | | | | | | | | | | | | | | | | | | | |
Foreign Sovereign Obligations | | $ | - | | | | | | | $ | 27,476,396 | | | | | | | $ | - | | | | | | | $ | 27,476,396 | |
U.S. Treasury Obligations | | | - | | | | | | | | 37,590,603 | | | | | | | | - | | | | | | | | 37,590,603 | |
Short-Term Investments | | | - | | | | | | | | 184,328,048 | | | | | | | | - | | | | | | | | 184,328,048 | |
| | | | | | | | | | | | | | | | | | | | | | | | | | | | |
Total Investments in Securities - Assets | | $ | - | | | | | | | $ | 249,395,047 | | | | | | | $ | - | | | | | | | $ | 249,395,047 | |
| | | | | | | | | | | | | | | | | | | | | | | | | | | | |
|
Financial Derivative Instruments - Assets | |
Futures Contracts | | $ | 171,622 | | | | | | | $ | - | | | | | | | $ | - | | | | | | | $ | 171,622 | |
Swap Contract Agreements | | | - | | | | | | | | 851,098 | | | | | | | | - | | | | | | | | 851,098 | |
Forward Foreign Currency Contracts | | | - | | | | | | | | 910,756 | | | | | | | | - | | | | | | | | 910,756 | |
| | | | | | | | | | | | | | | | | | | | | | | | | | | | |
Total Financial Derivative Instruments - Assets
| | $ | 171,622 | | | | | | | $ | 1,761,854 | | | | | | | $ | - | | | | | | | $ | 1,933,476 | |
| | | | | | | | | | | | | | | | | | | | | | | | | | | | |
|
Financial Derivative Instruments - Liabilities | |
Futures Contracts | | $ | (3,531,640 | ) | | | | | | $ | - | | | | | | | $ | - | | | | | | | $ | (3,531,640 | ) |
Swap Contract Agreements | | | - | | | | | | | | (48,300 | ) | | | | | | | - | | | | | | | | (48,300 | ) |
Forward Foreign Currency Contracts | | | - | | | | | | | | (79,877 | ) | | | | | | | - | | | | | | | | (79,877 | ) |
| | | | | | | | | | | | | | | | | | | | | | | | | | | | |
Total Financial Derivative Instruments - Liabilities | | $ | (3,531,640 | ) | | | | | | $ | (128,177 | ) | | | | | | $ | - | | | | | | | $ | (3,659,817 | ) |
| | | | | | | | | | | | | | | | | | | | | | | | | | | | |
U.S. GAAP requires transfers between all levels to/from level 3 be disclosed. During the year ended December 31, 2024, there were no transfers into or out of Level 3.
See accompanying notes
102
American Beacon FundsSM
Consolidated Statements of Assets and LiabilitiesA
December 31, 2024
| | | | | | | | | | | | | | | | | | | | |
| | | AHL Managed
Futures Strategy
Fund | | | | | | AHL Multi-
Alternatives
Fund | | | | | | AHL TargetRisk
Fund | |
Assets: | | | | | | | | | | | | | | | | | | | | |
Investments in unaffiliated securities, at fair value† | | $ | 2,652,440,182 | | | | | | | $ | 32,845,351 | | | | | | | $ | 249,395,047 | |
Foreign currency, at fair value^ | | | - | | | | | | | | 228,775 | | | | | | | | 1,842,890 | |
Foreign currency deposits with brokers for futures contracts, and swap agreements at fair value¤ | | | 137,241,763 | | | | | | | | 1,492,536 | | | | | | | | 7,200,835 | |
Cash | | | 30,211,287 | | | | | | | | 1,097,654 | | | | | | | | 4,291,381 | |
Cash collateral held at broker | | | - | | | | | | | | - | | | | | | | | 1,958,045 | |
Cash collateral held at custodian for the benefit of the broker | | | 57,330,000 | | | | | | | | 1,070,000 | | | | | | | | 3,210,000 | |
Dividends and interest receivable | | | - | | | | | | | | 23,577 | | | | | | | | 289,496 | |
Deposits with broker for futures contracts | | | 77,832,585 | | | | | | | | 260,351 | | | | | | | | 3,756,504 | |
Receivable for investments sold | | | - | | | | | | | | 1,885,180 | | | | | | | | 64,257 | |
Receivable for fund shares sold | | | 7,737,571 | | | | | | | | 17,986 | | | | | | | | 3,570,699 | |
Receivable for expense reimbursement (Note 2) | | | - | | | | | | | | 141,972 | | | | | | | | 41,628 | |
Unrealized appreciation from forward foreign currency contracts | | | 145,678,496 | | | | | | | | 1,013,690 | | | | | | | | 910,756 | |
Receivable for variation margin on open futures contracts (Note 5) | | | 14,562,253 | | | | | | | | - | | | | | | | | - | |
Receivable for variation margin on open centrally cleared swap agreements (Note 5) | | | - | | | | | | | | 226,818 | | | | | | | | 4,566,163 | |
OTC swap agreements, at fair value | | | - | | | | | | | | 39,624 | | | | | | | | 595,446 | |
Prepaid expenses | | | 71,045 | | | | | | | | 24,287 | | | | | | | | 43,030 | |
| | | | | | | | | | | | | | | | | | | | |
Total assets | | | 3,123,105,182 | | | | | | | | 40,367,801 | | | | | | | | 281,736,177 | |
| | | | | | | | | | | | | | | | | | | | |
Liabilities: | | | | | | | | | | | | | | | | | | | | |
Payable for investments purchased | | | - | | | | | | | | 1,879,964 | | | | | | | | - | |
Payable for fund shares redeemed | | | 5,459,691 | | | | | | | | 18,913 | | | | | | | | 200,298 | |
Payable for expense recoupment (Note 2) | | | 163,397 | | | | | | | | - | | | | | | | | - | |
Management and sub-advisory fees payable (Note 2) | | | 3,620,438 | | | | | | | | 36,845 | | | | | | | | 228,203 | |
Service fees payable (Note 2) | | | 74,655 | | | | | | | | 113 | | | | | | | | 8,651 | |
Transfer agent fees payable (Note 2) | | | 236,699 | | | | | | | | 7,676 | | | | | | | | 23,394 | |
Custody and fund accounting fees payable | | | 179,842 | | | | | | | | 20,639 | | | | | | | | 21,991 | |
Professional fees payable | | | 97,476 | | | | | | | | 89,683 | | | | | | | | 56,809 | |
Trustee fees payable (Note 2) | | | 834 | | | | | | | | 15 | | | | | | | | 154 | |
Payable for prospectus and shareholder reports | | | 164,760 | | | | | | | | 1,434 | | | | | | | | 49,749 | |
Unrealized depreciation from forward foreign currency contracts | | | 40,163,121 | | | | | | | | 272,170 | | | | | | | | 79,877 | |
Payable for variation margin from open futures contracts (Note 5) | | | - | | | | | | | | 78,836 | | | | | | | | 3,342,866 | |
Other liabilities | | | 16,017 | | | | | | | | 2,276 | | | | | | | | 5,749 | |
| | | | | | | | | | | | | | | | | | | | |
Total liabilities | | | 50,176,930 | | | | | | | | 2,408,564 | | | | | | | | 4,017,741 | |
| | | | | | | | | | | | | | | | | | | | |
Commitments and contingent liabilities (Note 2) | | | | | | | | | | | | | | | | | | | | |
| | | | | | | | | | | | | | | | | | | | |
Net assets | | $ | 3,072,928,252 | | | | | | | $ | 37,959,237 | | | | | | | $ | 277,718,436 | |
| | | | | | | | | | | | | | | | | | | | |
Analysis of net assets: | | | | | | | | | | | | | | | | | | | | |
Paid-in-capital | | $ | 3,226,388,666 | | | | | | | $ | 37,180,192 | | | | | | | $ | 382,303,023 | |
Total distributable earnings (deficits) | | | (153,460,414 | ) | | | | | | | 779,045 | | | | | | | | (104,584,587 | ) |
| | | | | | | | | | | | | | | | | | | | |
Net assets | | $ | 3,072,928,252 | | | | | | | $ | 37,959,237 | | | | | | | $ | 277,718,436 | |
| | | | | | | | | | | | | | | | | | | | |
See accompanying notes
103
American Beacon FundsSM
Consolidated Statements of Assets and LiabilitiesA
December 31, 2024
| | | | | | | | | | | | | | | | | | | | |
| | | AHL Managed
Futures Strategy
Fund | | | | | | AHL Multi-
Alternatives
Fund | | | | | | AHL TargetRisk
Fund | |
Shares outstanding at no par value (unlimited shares authorized): | | | | | | | | | | | | | | | | | | | | |
R5 Class | | | 56,936,384 | | | | | | | | N/A | | | | | | | | 2,208,001 | |
| | | | | | | | | | | | | | | | | | | | |
Y Class | | | 231,734,198 | | | | | | | | 920,385 | | | | | | | | 22,427,770 | |
| | | | | | | | | | | | | | | | | | | | |
Investor Class | | | 6,928,940 | | | | | | | | N/A | | | | | | | | 378,299 | |
| | | | | | | | | | | | | | | | | | | | |
A Class | | | 8,934,592 | | | | | | | | 10,593 | | | | | | | | 241,149 | |
| | | | | | | | | | | | | | | | | | | | |
C Class | | | 2,779,072 | | | | | | | | 10,593 | | | | | | | | 633,049 | |
| | | | | | | | | | | | | | | | | | | | |
R6 Class | | | N/A | | | | | | | | 2,789,118 | | | | | | | | N/A | |
| | | | | | | | | | | | | | | | | | | | |
Net assets: | | | | | | | | | | | | | | | | | | | | |
R5 Class | | $ | 572,740,617 | | | | | | | | N/A | | | | | | | $ | 23,702,057 | |
| | | | | | | | | | | | | | | | | | | | |
Y Class | | $ | 2,317,399,884 | | | | | | | $ | 9,357,645 | | | | | | | $ | 240,697,355 | |
| | | | | | | | | | | | | | | | | | | | |
Investor Class | | $ | 68,313,579 | | | | | | | | N/A | | | | | | | $ | 4,050,432 | |
| | | | | | | | | | | | | | | | | | | | |
A Class | | $ | 88,263,305 | | | | | | | $ | 107,328 | | | | | | | $ | 2,568,834 | |
| | | | | | | | | | | | | | | | | | | | |
C Class | | $ | 26,210,867 | | | | | | | $ | 106,227 | | | | | | | $ | 6,699,758 | |
| | | | | | | | | | | | | | | | | | | | |
R6 Class | | | N/A | | | | | | | $ | 28,388,037 | | | | | | | | N/A | |
| | | | | | | | | | | | | | | | | | | | |
Net asset value, offering and redemption price per share: | | | | | | | | | | | | | | | | | | | | |
R5 Class | | $ | 10.06 | | | | | | | | N/A | | | | | | | $ | 10.73 | |
| | | | | | | | | | | | | | | | | | | | |
Y Class | | $ | 10.00 | | | | | | | $ | 10.17 | | | | | | | $ | 10.73 | |
| | | | | | | | | | | | | | | | | | | | |
Investor Class | | $ | 9.86 | | | | | | | | N/A | | | | | | | $ | 10.71 | |
| | | | | | | | | | | | | | | | | | | | |
A Class | | $ | 9.88 | | | | | | | $ | 10.13 | | | | | | | $ | 10.65 | |
| | | | | | | | | | | | | | | | | | | | |
A Class (offering price) | | $ | 10.48 | | | | | | | $ | 10.75 | | | | | | | $ | 11.30 | |
| | | | | | | | | | | | | | | | | | | | |
C Class | | $ | 9.43 | | | | | | | $ | 10.03 | | | | | | | $ | 10.58 | |
| | | | | | | | | | | | | | | | | | | | |
R6 Class | | | N/A | | | | | | | $ | 10.18 | | | | | | | | N/A | |
| | | | | | | | | | | | | | | | | | | | |
† Cost of investments in unaffiliated securities | | $ | 2,651,532,323 | | | | | | | $ | 33,020,272 | | | | | | | $ | 252,091,380 | |
¤ Cost of foreign currency deposits with broker for futures contracts | | $ | 140,967,758 | | | | | | | $ | 1,542,939 | | | | | | | $ | 9,453,039 | |
^ Cost of foreign currency | | $ | - | | | | | | | $ | 229,739 | | | | | | | $ | 1,869,716 | |
|
A See Note 1 in the Consolidated Notes to Financial Statements for additional information. | |
See accompanying notes
104
American Beacon FundsSM
Consolidated Statements of OperationsA
For the year ended December 31, 2024
| | | | | | | | | | | | | | | | | | | | |
| | | AHL Managed
Futures Strategy
Fund | | | | | | AHL Multi-
Alternatives
Fund | | | | | | AHL TargetRisk
Fund | |
Investment income: | | | | | | | | | | | | | | | | | | | | |
Interest income | | $ | 159,858,702 | | | | | | | $ | 1,685,594 | | | | | | | $ | 13,051,855 | |
Other income | | | - | | | | | | | | 5 | | | | | | | | 7 | |
| | | | | | | | | | | | | | | | | | | | |
Total investment income | | | 159,858,702 | | | | | | | | 1,685,599 | | | | | | | | 13,051,862 | |
| | | | | | | | | | | | | | | | | | | | |
Expenses: | | | | | | | | | | | | | | | | | | | | |
Management and sub-advisory fees (Note 2) | | | 44,861,883 | | | | | | | | 414,753 | | | | | | | | 2,616,202 | |
Transfer agent fees (Note 2): | | | | | | | | | | | | | | | | | | | | |
R5 Class | | | 55,057 | | | | | | | | - | | | | | | | | 7,222 | |
Y Class | | | 2,530,265 | | | | | | | | 9,503 | | | | | | | | 228,283 | |
Investor Class | | | 3,408 | | | | | | | | - | | | | | | | | 1,532 | |
A Class | | | 3,997 | | | | | | | | 1,042 | | | | | | | | 143 | |
C Class | | | 1,486 | | | | | | | | 1,042 | | | | | | | | 350 | |
R6 Class | | | - | | | | | | | | 2,309 | | | | | | | | - | |
Custody and fund accounting fees | | | 4,310,826 | | | | | | | | 303,387 | | | | | | | | 177,839 | |
Professional fees | | | 346,245 | | | | | | | | 154,488 | | | | | | | | 86,908 | |
Registration fees and expenses | | | 170,484 | | | | | | | | 54,890 | | | | | | | | 92,164 | |
Service fees (Note 2): | | | | | | | | | | | | | | | | | | | | |
Investor Class | | | 188,148 | | | | | | | | - | | | | | | | | 16,226 | |
A Class | | | 123,193 | | | | | | | | - | | | | | | | | 6,277 | |
C Class | | | 19,700 | | | | | | | | - | | | | | | | | 6,123 | |
Distribution fees (Note 2): | | | | | | | | | | | | | | | | | | | | |
A Class | | | 233,194 | | | | | | | | 270 | | | | | | | | 6,221 | |
C Class | | | 314,668 | | | | | | | | 1,076 | | | | | | | | 79,834 | |
Prospectus and shareholder report expenses | | | 344,723 | | | | | | | | 7,685 | | | | | | | | 38,322 | |
Trustee fees (Note 2) | | | 329,776 | | | | | | | | 3,603 | | | | | | | | 28,616 | |
Prime broker fees | | | 176,826 | | | | | | | | 727 | | | | | | | | - | |
Line of credit interest expense (Note 9) | | | 43,899 | | | | | | | | 451 | | | | | | | | 3,802 | |
Other expenses | | | 227,302 | | | | | | | | 14,867 | | | | | | | | 174,952 | |
| | | | | | | | | | | | | | | | | | | | |
Total expenses | | | 54,285,080 | | | | | | | | 970,093 | | | | | | | | 3,571,016 | |
| | | | | | | | | | | | | | | | | | | | |
Net fees waived and expenses (reimbursed/recouped) (Note 2) | | | - | | | | | | | | (505,953 | )B | | | | | | | (18,758 | ) |
| | | | | | | | | | | | | | | | | | | | |
Net expenses | | | 54,285,080 | | | | | | | | 464,140 | | | | | | | | 3,552,258 | |
| | | | | | | | | | | | | | | | | | | | |
Net investment income | | | 105,573,622 | | | | | | | | 1,221,459 | | | | | | | | 9,499,604 | |
| | | | | | | | | | | | | | | | | | | | |
| | | | | |
Realized and unrealized gain (loss) from investments: | | | | | | | | | | | | | | | | | | | | |
Net realized gain (loss) from: | | | | | | | | | | | | | | | | | | | | |
Investments in unaffiliated securitiesC | | | 495,529 | | | | | | | | 54,157 | | | | | | | | 473,236 | |
Foreign currency transactions | | | (7,002,469 | ) | | | | | | | 49,654 | | | | | | | | 819,485 | |
Forward foreign currency contracts | | | (73,567,963 | ) | | | | | | | (515,510 | ) | | | | | | | (146,593 | ) |
Futures contracts | | | (30,482,591 | ) | | | | | | | 681,403 | | | | | | | | 18,855,462 | |
Swap agreements | | | - | | | | | | | | 159,443 | | | | | | | | 4,425,028 | |
Change in net unrealized appreciation (depreciation) of: | | | | | | | | | | | | | | | | | | | | |
Investments in unaffiliated securitiesD | | | (19,641 | ) | | | | | | | (346,836 | ) | | | | | | | (4,892,330 | ) |
Foreign currency transactions | | | (6,648,606 | ) | | | | | | | (91,460 | ) | | | | | | | (434,397 | ) |
Forward foreign currency contracts | | | 108,352,939 | | | | | | | | 799,084 | | | | | | | | 1,451,464 | |
Futures contracts | | | (33,158,723 | ) | | | | | | | (775,824 | ) | | | | | | | (11,890,743 | ) |
Swap agreements | | | - | | | | | | | | 2,147 | | | | | | | | (122,068 | ) |
| | | | | | | | | | | | | | | | | | | | |
Net gain (loss) from investments | | | (42,031,525 | ) | | | | | | | 16,258 | | | | | | | | 8,538,544 | |
| | | | | | | | | | | | | | | | | | | | |
Net increase in net assets resulting from operations | | $ | 63,542,097 | | | | | | | $ | 1,237,717 | | | | | | | $ | 18,038,148 | |
| | | | | | | | | | | | | | | | | | | | |
|
A See Note 1 in the Consolidated Notes to Financial Statements for additional information. | |
B The Manager voluntarily reimbursed service fees in the amount of $127. | |
C The Fund did not recognize net realized gains (losses) from the sale of investments in affiliated securities. | |
D The Fund’s investments in affiliated securities did not have a change in unrealized appreciation (depreciation) at year end. | |
See accompanying notes
105
American Beacon FundsSM
Consolidated Statements of Changes in Net AssetsA
| | | | | | | | | | | | | | | | | | | | | | | | | | | | |
| | | AHL Managed Futures Strategy Fund | | | | | | AHL Multi-Alternatives Fund | |
| | | Year Ended
December 31, 2024 | | | | | | Year Ended
December 31, 2023 | | | | | | Year Ended
December 31, 2024 | | | | | | August 17, 2023B to
December 31, 2023 | |
Increase (decrease) in net assets: | | | | | | | | | |
Operations: | | | | | | | | | |
Net investment income | | $ | 105,573,622 | | | | | | | $ | 108,781,513 | | | | | | | $ | 1,221,459 | | | | | | | $ | 375,951 | |
Net realized gain (loss) from investments in unaffiliated securities, foreign currency transactions, forward foreign currency contracts, futures contracts, and swap agreements | | | (110,557,494 | ) | | | | | | | (283,479,734 | ) | | | | | | | 429,147 | | | | | | | | (168,430 | ) |
Change in net unrealized appreciation (depreciation) of investments in unaffiliated securities, foreign currency transactions, forward foreign currency contracts, futures contracts, and swap agreements | | | 68,525,969 | | | | | | | | 28,233,827 | | | | | | | | (412,889 | ) | | | | | | | 892,341 | |
| | | | | | | | | | | | | | | | | | | | | | | | | | | | |
Net increase (decrease) in net assets resulting from operations | | | 63,542,097 | | | | | | | | (146,464,394 | ) | | | | | | | 1,237,717 | | | | | | | | 1,099,862 | |
| | | | | | | | | | | | | | | | | | | | | | | | | | | | |
Distributions to shareholders: | | | | | | | | | |
Total retained earnings: | | | | | | | | | | | | | | | | | | | | | | | | | | | | |
R5 Class | | | (3,156,272 | ) | | | | | | | (8,081,982 | ) | | | | | | | - | | | | | | | | - | |
Y Class | | | (10,622,659 | ) | | | | | | | (22,062,769 | ) | | | | | | | (390,558 | ) | | | | | | | (100,429 | ) |
Investor Class | | | (201,961 | ) | | | | | | | (277,804 | ) | | | | | | | - | | | | | | | | - | |
A Class | | | (143,482 | ) | | | | | | | (287,075 | ) | | | | | | | (4,495 | ) | | | | | | | (1,505 | ) |
C Class | | | - | | | | | | | | - | | | | | | | | (4,442 | ) | | | | | | | (1,505 | ) |
R6 Class | | | - | | | | | | | | - | | | | | | | | (1,191,336 | ) | | | | | | | (371,735 | ) |
| | | | | | | | | | | | | | | | | | | | | | | | | | | | |
Net distributions to shareholders | | | (14,124,374 | ) | | | | | | | (30,709,630 | ) | | | | | | | (1,590,831 | ) | | | | | | | (475,174 | ) |
| | | | | | | | | | | | | | | | | | | | | | | | | | | | |
| | |
Capital share transactions (Note 10): | | | | | | | | | |
Proceeds from sales of shares | | | 1,423,958,304 | | | | | | | | 1,806,501,124 | | | | | | | | 11,206,724 | | | | | | | | 9,208,811 | |
Reinvestment of dividends and distributions | | | 12,503,770 | | | | | | | | 26,956,881 | | | | | | | | 1,590,831 | | | | | | | | 475,174 | |
Cost of shares redeemed | | | (1,553,452,340 | ) | | | | | | | (2,156,933,583 | ) | | | | | | | (2,199,485 | ) | | | | | | | (5,094,392 | ) |
| | | | | | | | | | | | | | | | | | | | | | | | | | | | |
Net increase (decrease) in net assets from capital share transactions | | | (116,990,266 | ) | | | | | | | (323,475,578 | ) | | | | | | | 10,598,070 | | | | | | | | 4,589,593 | |
| | | | | | | | | | | | | | | | | | | | | | | | | | | | |
Net increase (decrease) in net assets | | | (67,572,543 | ) | | | | | | | (500,649,602 | ) | | | | | | | 10,244,956 | | | | | | | | 5,214,281 | |
| | | | | | | | | | | | | | | | | | | | | | | | | | | | |
Net assets: | | | | | | | | | |
Beginning of year | | | 3,140,500,795 | | | | | | | | 3,641,150,397 | | | | | | | | 27,714,281 | | | | | | | | 22,500,000 | c |
| | | | | | | | | | | | | | | | | | | | | | | | | | | | |
End of year | | $ | 3,072,928,252 | | | | | | | $ | 3,140,500,795 | | | | | | | $ | 37,959,237 | | | | | | | $ | 27,714,281 | |
| | | | | | | | | | | | | | | | | | | | | | | | | | | | |
| | |
A Consolidated financial statement. See Note 1 in the Notes to Financial Statements for additional information. | | | | | | | | | |
B Commencement of operations. | | | | | | | | | |
C Seed capital. | | | | | | | | | |
See accompanying notes
106
American Beacon FundsSM
Consolidated Statements of Changes in Net AssetsA
| | | | | | | | | | | | |
| | | AHL TargetRisk Fund | |
| | | Year Ended
December 31, 2024 | | | | | | Year Ended
December 31, 2023 | |
Increase (decrease) in net assets: | | | | | | | | | | | | |
Operations: | |
Net investment income | | $ | 9,499,604 | | | | | | | $ | 11,671,048 | |
Net realized gain from investments in unaffiliated securities, foreign currency transactions, forward foreign currency contracts, futures contracts, and swap agreements | | | 24,426,618 | | | | | | | | 4,689,743 | |
Change in net unrealized appreciation (depreciation) of investments in unaffiliated securities, foreign currency transactions, forward foreign currency contracts, futures contracts, and swap agreements | | | (15,888,074 | ) | | | | | | | 27,647,250 | |
| | | | | | | | | | | | |
Net increase in net assets resulting from operations | | | 18,038,148 | | | | | | | | 44,008,041 | |
| | | | | | | | | | | | |
Distributions to shareholders: | |
Total retained earnings: | |
R5 Class | | | (1,257,168 | ) | | | | | | | (1,016,000 | ) |
Y Class | | | (12,561,368 | ) | | | | | | | (8,797,885 | ) |
Investor Class | | | (186,775 | ) | | | | | | | (253,764 | ) |
A Class | | | (116,032 | ) | | | | | | | (102,669 | ) |
C Class | | | (255,290 | ) | | | | | | | (248,384 | ) |
| | | | | | | | | | | | |
Net distributions to shareholders | | | (14,376,633 | ) | | | | | | | (10,418,702 | ) |
| | | | | | | | | | | | |
|
Capital share transactions (Note 10): | |
Proceeds from sales of shares | | | 103,238,112 | | | | | | | | 84,633,468 | |
Reinvestment of dividends and distributions | | | 14,081,085 | | | | | | | | 10,013,293 | |
Cost of shares redeemed | | | (117,236,170 | ) | | | | | | | (290,191,816 | ) |
| | | | | | | | | | | | |
Net increase (decrease) in net assets from capital share transactions | | | 83,027 | | | | | | | | (195,545,055 | ) |
| | | | | | | | | | | | |
Net increase (decrease) in net assets | | | 3,744,542 | | | | | | | | (161,955,716 | ) |
| | | | | | | | | | | | |
Net assets: | |
Beginning of year | | | 273,973,894 | | | | | | | | 435,929,610 | |
| | | | | | | | | | | | |
End of year | | $ | 277,718,436 | | | | | | | $ | 273,973,894 | |
| | | | | | | | | | | | |
|
| A Consolidated financial statement. See Note 1 in the Consolidated Notes to Financial Statements for additional information. | |
See accompanying notes
107
American Beacon FundsSM
Consolidated Notes to Financial Statements
December 31, 2024
1. Organization and Significant Accounting Policies
American Beacon Funds (the “Trust”) is organized as a Massachusetts business trust. The Funds, each a series within the Trust, are registered under the Investment Company Act of 1940, as amended (the “Act”), as non-diversified, open-end management investment companies. As of December 31, 2024, the Trust consists of twenty-six active series, three of which are presented in this filing: American Beacon AHL Managed Futures Strategy Fund, American Beacon AHL Multi-Alternatives Fund and American Beacon AHL TargetRisk Fund (collectively, the “Funds” and each individually a “Fund”). The remaining twenty-three active series are reported in separate filings.
American Beacon Advisors, Inc. (the “Manager”) is a Delaware corporation and a wholly-owned subsidiary of Resolute Investment Managers, Inc. (“RIM”) organized in 1986 to provide business management, advisory, administrative, and asset management consulting services to the Trust and other investors. The Manager is registered as an investment advisor under the Investment Advisers Act of 1940, as amended (the “Advisers Act”). The Manager is an indirect wholly-owned subsidiary of Resolute Topco, Inc. (“Topco”), which is owned primarily by various institutional investment funds that are managed by financial institutions and other investment advisory firms. No owner of Topco owns 25% or more of the outstanding equity or voting interests of Topco.
Recently Adopted Accounting Pronouncements
In March 2020, the Financial Accounting Standards Board (“FASB”) issued Accounting Standards Update (“ASU”) No. 2020-04, Reference Rate Reform (Topic 848); Facilitation of the Effects of Reference Rate Reform on Financial Reporting, which provides optional guidance for a limited period of time to ease the potential burden in accounting for (or recognizing the effects of) reference rate reform. The guidance is applicable to contracts referencing London Inter-bank Offered Rate (“LIBOR”) or another reference rate that is expected to be discontinued due to reference rate reform. The ASU is effective as of March 12, 2020 and generally can be applied through December 31, 2022. In December 2022, the FASB issued ASU No. 2022-06 Reference Rate Reform (Topic 848): Deferral of the Sunset Date of Topic 848 which updates and clarifies ASU No. 2020-04. The amendments in this ASU defer the sunset date of Topic 848 from December 31, 2022, to December 31, 2024. Management has concluded that these ASUs will not have a material impact on the Funds’ financial statements.
In June 2022, the FASB issued ASU No. 2022-03, Fair Value Measurement (Topic 820); Fair Value Measurement of Equity Securities Subject to Contractual Sale Restrictions, which provides clarifying guidance that a contractual restriction on the sale of an equity security is not considered part of the unit of account of the equity security and, therefore, is not considered in measuring fair value. The ASU is effective for fiscal years beginning after December 15, 2023, and interim periods within those fiscal years. Management has concluded that the ASU will not have a material impact on the Funds’ financial statements.
In this reporting period, the Funds adopted FASB ASU No., Segment Reporting (Topic 280); Improvements to Reportable Segment Disclosures. Adoption of the new standard impacted financial statement disclosures only and did not affect the Funds’ financial position or the results of its operations. An operating segment is defined in Topic 280 as a component of a public entity that engages in business activities from which it may recognize revenues and incur expenses, has operating results that are regularly reviewed by the public entity’s chief operating decision maker (“CODM”) to make decisions about resources to be allocated to the segment and assess its performance, and has discrete financial information available. The President of the American Beacon Funds acts as the Funds’ CODM. The Funds represent a single operating segment, as the CODM monitors the operating results of the Funds as a whole and the Funds’ long-term strategic asset allocation is pre-determined in accordance with the terms of its prospectus, based on a defined investment strategy which is executed by the Funds’ portfolio managers as a team. The financial information in the form of the Funds’ portfolio composition, total returns, expense ratios and changes in net assets (i.e., changes in net assets resulting from operations, subscriptions and redemptions), which are used by the CODM to assess the segment’s performance versus the Funds’ comparative benchmarks and to make resource allocation decisions for the Funds’ single segment, is consistent with that presented within the Funds’
108
American Beacon FundsSM
Consolidated Notes to Financial Statements
December 31, 2024
financial statements. Segment assets are reflected on the accompanying statements of assets and liabilities as “total assets” and significant segment expenses are listed on the accompanying statements of operations.
Class Disclosure
Each Fund has multiple classes of shares designed to meet the needs of different groups of investors; however, not all of the Funds offer all classes. The following table sets forth the differences amongst the classes:
| | | | | | |
Class | | Eligible Investors | | Minimum Initial
Investments | |
| R5 Class | | Large institutional investors - sold directly or through intermediary channels. | | $ | 250,000 | |
| | |
| Y Class | | Large institutional retirement plan investors - sold directly or through intermediary channels. | | $ | 100,000 | |
| | |
| Investor Class | | All investors using intermediary organizations, such as broker-dealers or retirement plan sponsors. | | $ | 2,500 | |
| | |
| A Class | | All investors who invest through intermediary organizations, such as broker-dealers or third party administrator. Retail investors who invest directly through a financial intermediary such as a broker, bank, or registered investment advisor which may include a front-end sales charge and a contingent deferred sales charge (“CDSC”). | | $ | 2,500 | |
| | |
| C Class | | Retail investors who invest directly through a financial intermediary, such as a broker or through employee directed benefit plans with applicable sales charges which may include CDSC. | | $ | 1,000 | |
| | |
| R6 Class | | Large institutional retirement plan investors - sold through retirement plan sponsors. | | | None | |
Each class offered by the Trust has equal rights as to assets and voting privileges. Income and non-class specific expenses are allocated daily to each class based on the relative net assets. Realized and unrealized capital gains and losses of each class are allocated daily based on the relative net assets of each class of the respective Fund. Class specific expenses, where applicable, currently include service, distribution, transfer agent fees, and sub-transfer agent fees that vary amongst the classes as described more fully in Note 2.
Consolidation of Subsidiaries
The Consolidated Schedules of Investments of AHL Managed Futures Strategy Fund, AHL Multi-Alternatives Fund and AHL TargetRisk Fund are consolidated to include the accounts of American Beacon Cayman Managed Futures Strategy Fund, Ltd., American Beacon Cayman Multi-Alternatives Company, Ltd. and American Beacon Cayman TargetRisk Company, Ltd., respectively, each of which are wholly-owned and controlled subsidiaries (the “Subsidiaries”) of the applicable Fund. All intercompany accounts and transactions have been eliminated in consolidation for AHL Managed Futures Strategy Fund, AHL Multi-Alternatives Fund and AHL TargetRisk Fund.
For Federal tax purposes, taxable income for each Fund and its Subsidiary are calculated separately. The Subsidiaries are classified as controlled foreign corporations under the Internal Revenue Code of 1986 (the “Code”) and each Subsidiary’s taxable income is included in the calculation of the applicable Fund’s taxable income. Net losses of the Subsidiaries are not deductible by AHL Managed Futures Strategy Fund, AHL Multi-Alternatives Fund and AHL TargetRisk Fund either in the current period or future periods. The Subsidiaries have a fiscal year end of December 31st for financial statement consolidation purposes and a nonconforming tax year end of November 30th.
Each Fund may invest up to 25% of its total assets in its Subsidiary, which acts as an investment vehicle in order to effect certain investments consistent with the Fund’s investment objectives and policies. AHL Managed Futures Strategy Fund, AHL Multi-Alternatives Fund and AHL TargetRisk Fund expect to achieve a significant portion of their exposure to commodities and commodities-related investments through investment in the Subsidiaries.
109
American Beacon FundsSM
Consolidated Notes to Financial Statements
December 31, 2024
Unlike AHL Managed Futures Strategy Fund, AHL Multi-Alternatives Fund and AHL TargetRisk Fund, the Subsidiaries may invest without limitation in commodities and commodities-related investments.
| | | | | | | | | | |
Fund | | Inception Date of
Subsidiary | | Subsidiary Net Assets at
December 31, 2024 | | | % of Total Assets of the
Fund at
December 31, 2024 | |
American Beacon Cayman Managed Futures Strategy Fund, Ltd. | | August 19, 2014 | | $ | 734,049,340 | | | | 23.50 | % |
American Beacon Cayman Multi-Alternatives Company, Ltd. | | August 17, 2023 | | | 8,329,024 | | | | 20.63 | % |
American Beacon Cayman TargetRisk Company, Ltd. | | December 31, 2018 | | | 60,336,371 | | | | 21.42 | % |
CFTC Regulation
On August 13, 2013, the Commodity Futures Trading Commission (“CFTC”) adopted rules to harmonize conflicting SEC and CFTC disclosure, reporting and recordkeeping requirements for registered investment companies that do not meet an exemption from the definition of commodity pool. The harmonization rules provide that the CFTC will accept the SEC’s disclosure, reporting, and recordkeeping regime as substituted compliance for substantially all of the otherwise applicable CFTC regulations as long as such investment companies meet the applicable SEC requirements.
The Funds are commodity pools, as defined in the regulation of the CFTC and operated by the Manager, a commodity pool operator regulated by the CFTC.
Significant Accounting Policies
The following is a summary of significant accounting policies, consistently followed by the Funds in preparation of the financial statements. The Funds are considered investment companies and accordingly, follow the investment company accounting and reporting guidance of the FASB Accounting Standards Codification Topic 946, Financial Services – Investment Companies, a part of Generally Accepted Accounting Principles (“U.S. GAAP”).
Security Transactions and Investment Income
Security transactions are recorded as of the trade date for financial reporting purposes. Securities purchased or sold on a when-issued or delayed-delivery basis may be settled beyond a standard settlement period for the security after the trade date.
Dividend income, net of foreign taxes, is recorded on the ex-dividend date, except certain dividends from foreign securities which are recorded as soon as the information is available to the Funds. Interest income, net of foreign taxes, is earned from settlement date, recorded on the accrual basis, and adjusted, if necessary, for accretion of discounts and amortization of premiums. Realized gains (losses) from securities sold are determined based on specific lot identification.
Distributions to Shareholders
The Funds distribute most or all of their net earnings and realized gains, if any, each taxable year in the form of dividends from net investment income and distributions of realized net capital gains and net gains from foreign currency transactions on an annual basis. The Funds do not have a fixed dividend rate and do not guarantee that they will pay any distributions in any particular period. Dividends to shareholders are determined in accordance with federal income tax regulations, which may differ in amount and character from net investment income and realized gains recognized for purposes of U.S. GAAP. To the extent necessary to fully distribute capital gains, the Funds may designate earnings and profits distributed to shareholders on the redemption of shares.
110
American Beacon FundsSM
Consolidated Notes to Financial Statements
December 31, 2024
Allocation of Income, Trust Expenses, Gains, and Losses
Investment income and realized and unrealized gains and losses from investments of the Funds are allocated daily to each class of shares based upon the relative proportion of net assets of each class to the total net assets of the Funds. Expenses directly charged or attributable to a Fund will be paid from the assets of a Fund. Generally, expenses of the Trust will be allocated among and charged to the assets of the Funds on a basis that the Trust’s Board of Trustees (the “Board”) deems fair and equitable, which may be based on the relative net assets of the Funds or nature of the services performed and relative applicability to the Funds.
Use of Estimates
The preparation of financial statements in conformity with U.S. GAAP requires management to make estimates and assumptions that affect the amounts reported in the financial statements and accompanying notes. Actual results may differ from those estimated.
Organization and Offering Costs
Organizational costs consist of the costs of forming AHL Multi-Alternatives Fund, drafting the bylaws, administration, custody and transfer agency agreements, and legal services in connection with the initial meeting of trustees, and were expensed immediately as incurred. Offering costs consist of the costs of preparation, review and filing with the SEC the Fund’s registration statement (including the Prospectus and the Statement of Additional Information (“SAI”)), the costs of preparation, the costs associated with the printing, mailing or other distribution of the Prospectus, SAI and the amounts of associated filing fees and legal fees associated with the offering. Organizational costs and offering costs are subject to the Fund’s expense limitation agreement discussed in Note 2 and offering costs require amortization over twelve months on a straight-line basis from the commencement of operations. For the year ended December 31, 2024, the Fund recorded $53,360 of amortized offering costs.
Other
Under the Trust’s organizational documents, its officers and trustees are indemnified against certain liabilities arising out of the performance of their duties to the Trust. In the normal course of business, the Trust enters into contracts that provide indemnification to the other party or parties against potential costs or liabilities. The Trust’s maximum exposure under these arrangements is dependent on claims that may be made in the future and, therefore, cannot be estimated. The Trust has had no prior claims or losses pursuant to any such agreement.
2. Transactions with Affiliates
Management and Investment Sub-Advisory Agreements
The Funds and the Manager are parties to a Management Agreement that obligates the Manager to provide the Funds with investment advisory and administrative services. As compensation for performing the duties under the Management Agreement, the Manager will receive an annualized management fee based on a percentage of each Fund’s average daily net assets that is calculated and accrued daily, according to the following schedules:
AHL Managed Futures Strategy Fund
AHL Multi-Alternatives Fund and AHL TargetRisk Fund
| | | | |
First $ 5 billion | | | 0.35 | % |
Next $5 billion | | | 0.325 | % |
Next $10 billion | | | 0.30 | % |
Over $20 billion | | | 0.275 | % |
111
American Beacon FundsSM
Consolidated Notes to Financial Statements
December 31, 2024
The Trust, on behalf of the Funds, and the Manager have entered into an Investment Advisory Agreement with AHL Partners LLP (the “Sub-Advisor”), pursuant to which each Fund has agreed to pay an annualized sub-advisory fee that is calculated and accrued daily based on the Funds’ average daily net assets according to the following schedules:
AHL Managed Futures Strategy Fund
AHL Multi-Alternatives Fund
| | | | |
First $ 500 million | | | 0.775 | % |
Next $500 million | | | 0.745 | % |
Next $500 million | | | 0.725 | % |
Over $1.5 billion | | | 0.70 | % |
AHL TargetRisk Fund
| | | | |
First $ 500 million | | | 0.55 | % |
Next $500 million | | | 0.50 | % |
Next $500 million | | | 0.45 | % |
Over $1.5 billion | | | 0.40 | % |
The Management and Sub-Advisory Fees paid by the Funds for the year ended December 31, 2024 were as follows:
AHL Managed Futures Strategy Fund
| | | | | | | | | | | | |
| | | Effective Fee Rate | | | | | | Amount of Fees Paid | |
Management Fees | | | 0.35 | % | | | | | | $ | 11,630,858 | |
Sub-Advisory Fees | | | 1.00 | % | | | | | | | 33,231,025 | |
| | | | | | | | | | | | |
Total | | | 1.35 | % | | | | | | $ | 44,861,883 | |
| | | | | | | | | | | | |
AHL Multi-Alternatives Fund
| | | | | | | | | | | | |
| | | Effective Fee Rate | | | | | | Amount of Fees Paid | |
Management Fees | | | 0.35 | % | | | | | | $ | 129,034 | |
Sub-Advisory Fees | | | 0.78 | % | | | | | | | 285,719 | |
| | | | | | | | | | | | |
Total | | | 1.13 | % | | | | | | $ | 414,753 | |
| | | | | | | | | | | | |
AHL TargetRisk Fund
| | | | | | | | | | | | |
| | | Effective Fee Rate | | | | | | Amount of Fees Paid | |
Management Fees | | | 0.35 | % | | | | | | $ | 1,026,520 | |
Sub-Advisory Fees | | | 0.55 | % | | | | | | | 1,589,682 | |
| | | | | | | | | | | | |
Total | | | 0.90 | % | | | | | | $ | 2,616,202 | |
| | | | | | | | | | | | |
Distribution Plans
Separate Distribution Plans (the “Distribution Plans”) have been adopted pursuant to Rule 12b-1 under the Act for the A and C Classes of the Funds. Under the Distribution Plans, as compensation for distribution and shareholder servicing assistance, the Manager receives an annual fee of 0.25% of the average daily net assets of the A Class and 1.00% of the average daily net assets of the C Class. The fee will be payable without regard to whether the amount of the fee is more or less than the actual expenses incurred in a particular month by the Manager for distribution assistance.
112
American Beacon FundsSM
Consolidated Notes to Financial Statements
December 31, 2024
Service Plans
The Manager and the Trust entered into Service Plans that obligate the Manager to oversee additional shareholder servicing of the Investor, A, and C Classes of the Funds. As compensation for performing the duties required under the Service Plans, the Manager receives an annualized fee up to 0.25% of the average daily net assets of the A and C Classes and up to 0.375% of the average daily net assets of the Investor Class of the Funds.
Sub-Transfer Agent Fees
The Manager has entered into agreements, which include servicing agreements, with financial intermediaries that provide recordkeeping, processing, shareholder communications and other services to customers of the intermediaries that hold positions in the R5 and Y Classes of the Funds and has agreed to compensate the intermediaries for providing these services. Intermediaries transact with the Funds primarily through the use of omnibus accounts on behalf of their customers who hold positions in the Funds. Certain services would have been provided by the Funds’ transfer agent and other service providers if the shareholders’ accounts were maintained directly by the Funds’ transfer agent. Accordingly, the Funds, pursuant to Board approval, have agreed to reimburse the Manager for certain non-distribution shareholder services provided by financial intermediaries for the R5 and Y Classes. The reimbursement amounts (sub-transfer agent fees) paid to the Manager are subject to a fee limit of up to 0.10% of an intermediary’s average net assets in the R5 and Y Classes on an annual basis. During the year ended December 31, 2024, the sub-transfer agent fees, as reflected in “Transfer agent fees” on the Statements of Operations, were as follows:
| | | | |
Fund | | Sub-Transfer Agent Fees | |
AHL Managed Futures Strategy | | $ | 2,447,458 | |
AHL Multi-Alternatives | | | 8,462 | |
AHL TargetRisk | | | 221,625 | |
As of December 31, 2024, the Funds owed the Manager the following reimbursement of sub-transfer agent fees, as reflected in “Transfer agent fees payable” on the Statements of Assets and Liabilities:
| | | | |
Fund | | Reimbursement
Sub-Transfer Agent Fees | |
AHL Managed Futures Strategy | | $ | 200,489 | |
AHL Multi-Alternatives | | | 794 | |
AHL TargetRisk | | | 19,235 | |
Interfund Credit Facility
Pursuant to an exemptive order issued by the U.S. Securities and Exchange Commission (“SEC”), the Funds, along with other registered investment companies having management contracts with the Manager, may participate in a credit facility whereby each fund, under certain conditions, is permitted to lend money directly to and borrow directly from other participating funds for temporary purposes. The interfund credit facility is advantageous to the funds because it provides added liquidity and eliminates the need to maintain higher cash balances to meet redemptions. This situation could arise when shareholder redemptions exceed anticipated volumes and certain funds have insufficient cash on hand to satisfy such redemptions or when sales of securities do not settle as expected, resulting in a cash shortfall for a fund. The credit facility provides a source of immediate, short-term liquidity pending settlement of the sale of portfolio securities. The credit facility is administered by a credit facility team consisting of professionals from the Manager’s asset management, compliance, and accounting areas who report the activities of the credit facility to the Board. During the year ended December 31, 2024, the Funds did not utilize the credit facility.
Expense Reimbursement Plan
The Manager contractually agreed to reduce fees and/or reimburse expenses for the classes of the Funds, through December 31, 2025, to the extent that total operating expenses (excluding taxes, interest, brokerage
113
American Beacon FundsSM
Consolidated Notes to Financial Statements
December 31, 2024
commissions, acquired fund fees and expenses, securities lending fees, expenses associated with securities sold short, litigation, and other extraordinary expenses) exceed the Funds’ expense cap. During the year ended December 31, 2024, the Manager waived and/or reimbursed expenses as follows:
| | | | | | | | | | | | | | | | | | | | | | |
| | | | | Expense Cap | | | | | | | | | Expiration of
Reimbursed
Expenses | |
Fund | | Class | | 1/1/2024 –
4/30/2024 | | | 5/1/2024 –
12/31/2024 | | | Reimbursed
Expenses | | | (Recouped)
Expenses | |
AHL Multi-Alternatives | | Y | | | 1.33 | % | | | 1.33 | % | | $ | 116,777 | | | $ | – | | | | 2027 | |
AHL Multi-Alternatives | | A | | | 1.56 | % | | | 1.56 | % | | | 2,482 | | | | – | | | | 2027 | |
AHL Multi-Alternatives | | C | | | 2.31 | % | | | 2.31 | % | | | 2,471 | | | | – | | | | 2027 | |
AHL Multi-Alternatives | | R6 | | | 1.23 | % | | | 1.23 | % | | | 384,350 | | | | – | | | | 2027 | |
AHL TargetRisk | | R5 | | | 1.04 | % | | | 1.04 | % | | | 16,429 | | | | (1,167 | )* | | | 2027 | |
AHL TargetRisk | | Y | | | N/A | | | | N/A | | | | – | | | | (67,624 | )* | | | 2027 | |
AHL TargetRisk | | Investor | | | N/A | | | | N/A | | | | – | | | | (3,106 | )* | | | 2027 | |
AHL TargetRisk | | A | | | N/A | | | | 1.44 | % | | | 2,329 | | | | (681 | )* | | | 2027 | |
AHL TargetRisk | | C | | | N/A | | | | N/A | | | | – | | | | (2,766 | )* | | | 2027 | |
| | * | These amounts represent Recouped Expenses from prior fiscal years and is reflected in Total Expenses on the Statements of Operations. |
Of the above amounts, $141,972 and $41,628 was disclosed as a Receivable for expense reimbursement on the Statements of Assets and Liabilities at December 31, 2024 for AHL Multi-Alternatives Fund and AHL TargetRisk Fund and $163,397 was disclosed as a Payable for expense recoupment on the Statements of Assets and Liabilities at December 31, 2024 for AHL Managed Futures Strategy Fund.
The Funds have adopted an Expense Reimbursement Plan whereby the Manager may seek repayment of contractual or voluntary fee reductions and expense reimbursements. Under the policy, the Manager can be reimbursed by the Funds for any contractual or voluntary fee reductions or expense reimbursements if reimbursement to the Manager (a) occurs within three years from the date of the Manager’s waiver/reimbursement and (b) does not cause the Funds’ annual operating expenses to exceed the lesser of the contractual percentage limit in effect at the time of the waiver/reimbursement or time of recoupment. The reimbursed expenses listed above will expire in 2027. The Funds did not record a liability for potential contingent reimbursements due to the current assessment that reimbursements are uncertain. The carryover of excess expenses potentially reimbursable to the Manager, but not recorded as a liability are as follows:
| | | | | | | | | | | | | | | | |
Fund | | Recouped
Expenses | | | Excess Expense
Carryover | | | Expired Expense
Carryover | | | Expiration of
Reimbursed
Expenses | |
AHL Managed Futures Strategy | | $ | – | | | $ | 15,728 | | | $ | – | | | | 2026 | |
AHL Multi-Alternatives | | | – | | | | 386,298 | | | | – | | | | 2026 | |
AHL TargetRisk | | | 20,344 | | | | - | | | | 17,214 | | | | 2023 | |
AHL TargetRisk | | | 30,012 | | | | – | | | | 10,993 | | | | 2024 | |
AHL TargetRisk | | | 16,915 | | | | 40,259 | | | | – | | | | 2025 | |
AHL TargetRisk | | | 925 | | | | 47,203 | | | | – | | | | 2026 | |
Concentration of Ownership
From time to time, the Funds may have a concentration of one or more accounts constituting a significant percentage of shares outstanding. Investment activities by holders of accounts that represent a significant ownership of more than 5% of the Funds’ outstanding shares could have a material impact on the Funds. As of December 31, 2024, based on management’s evaluation of the shareholder account base, one account in AHL Multi-Alternatives Fund has been identified as representing an affiliated significant ownership of approximately 14% of the Fund’s outstanding shares.
Sales Commissions
The Funds’ Distributor, Resolute Investment Distributors, Inc. (“RID” or “Distributor”), may receive a portion of A Class sales charges from broker dealers which may be used to offset distribution related expenses. During the
114
American Beacon FundsSM
Consolidated Notes to Financial Statements
December 31, 2024
year ended December 31, 2024, RID collected $4,594 and $998 for AHL Managed Futures Strategy Fund and AHL TargetRisk Fund, respectively, from the sale of A Class Shares.
A CDSC of 0.50% will be deducted with respect to A Class Shares on certain purchases of $1,000,000 or more that are redeemed in whole or part within 18 months of purchase, unless waived as discussed in the Funds’ Prospectus. Any applicable CDSC will be 0.50% of the lesser of the original purchase price or the value of the redemption of the A Class Shares redeemed. During the year ended December 31, 2024, there were no CDSC fees collected for the A Class Shares of the Funds.
A CDSC of 1.00% will be deducted with respect to C Class Shares redeemed within 12 months of purchase, unless waived as discussed in the Funds’ Prospectus. Any applicable CDSC will be 1.00% of the lesser of the original purchase price or the value of the redemption of the C Class Shares redeemed. During the year ended December 31, 2024, CDSC fees of $3,697 and $249 were collected for the C Class Shares of AHL Managed Futures Strategy Fund and AHL TargetRisk Fund, respectively.
Trustee Fees and Expenses
As compensation for their service to the American Beacon Funds Complex, including the Trust (collectively, the “Trusts”), each Trustee is compensated from the Trusts as follows: (1) an annual retainer of $140,000; (2) meeting attendance fee (for attendance in-person or via teleconference) of (a) $12,000 for in person attendance, or $5,000 for telephonic attendance, by Board members for each regularly scheduled or special Board meeting, (b) $2,500 for attendance by Committee members at meetings of the Audit and Compliance Committee and the Investment Committee, (c) $1,000 for attendance by Committee members at meetings of the Nominating and Governance Committee; and (d) $2,500 for attendance by Board members for each special telephonic Board meeting; and (3) reimbursement of reasonable expenses incurred in attending Board meetings, Committee meetings, and relevant educational seminars. For this purpose, the Board considers attendance at regular meetings held by video conference to constitute in-person attendance at a Board meeting. The Trustees also may be compensated for attendance at special Board and/or Committee meetings from time to time. For her service as Board Chair, Ms. Cline receives an additional annual retainer of $50,000. Although she attends several committee meetings at each quarterly Board meeting, she receives only a single $2,500 fee each quarter for her attendance at the Audit and Compliance Committee and Investment Committee meetings. The chairpersons of the Audit and Compliance Committee and the Investment Committee each receive an additional annual retainer of $25,000 and the Chair of the Nominating and Governance Committee receives an additional annual retainer of $10,000.
3. Security Valuation and Fair Value Measurements
The price of each Fund’s shares is based on its net asset value (“NAV”) per share. Each Fund’s NAV is computed by adding total assets, subtracting all the Fund’s liabilities, and dividing the result by the total number of shares outstanding.
The NAV of each class of a Fund’s shares is determined based on a pro rata allocation of a Fund’s investment income, expenses and total capital gains and losses. A Fund’s NAV per share is determined each business day as of the regular close of trading on the New York Stock Exchange (“NYSE” or “Exchange”), which is typically 4:00 p.m. Eastern Time (“ET”). However, if trading on the NYSE closes at a time other than 4:00 p.m. ET, a Fund’s NAV per share typically would still be determined as of the regular close of trading on the NYSE. The Funds do not price their shares on days that the NYSE is closed. Foreign exchanges may permit trading in foreign securities on days when a Fund is not open for business, which may result in the value of a Fund’s portfolio investments being affected at a time when you are unable to buy or sell shares.
Equity securities, including shares of closed-end funds and exchange-traded funds (“ETFs”), are valued at the last sale price or official closing price taken from the primary exchange in which each security trades. Investments in other mutual funds are valued at the closing NAV per share on the day of valuation. Debt securities are valued at bid quotes from broker/dealers or evaluated bid prices from pricing services, who may consider a
115
American Beacon FundsSM
Consolidated Notes to Financial Statements
December 31, 2024
number of inputs and factors, such as prices of comparable securities, yield curves, spreads, credit ratings, coupon rates, maturity, default rates, and underlying collateral. Futures are valued based on their daily settlement prices. Exchange-traded and over-the-counter (“OTC”) options are valued at the last sale price. Options with no last sale for the day are priced at mid quote. Swaps are valued at evaluated mid prices from pricing services.
The valuation of securities traded on foreign markets and certain fixed-income securities will generally be based on prices determined as of the earlier closing time of the markets on which they primarily trade unless a significant event has occurred. When a Fund holds securities or other assets that are denominated in a foreign currency, a Fund will normally use the currency exchange rates as of 4:00 p.m. ET.
Rule 2a-5 under the Investment Company Act (the “Valuation Rule”) establishes requirements for determining fair value in good faith for purposes of the Investment Company Act, including related oversight and reporting requirements. The Valuation Rule also defines when market quotations are “readily available,” which is the threshold for determining whether a Fund must fair value a security. Among other things, the Valuation Rule permits the Board to designate the Manager as Valuation Designee to perform the Fund’s fair value determinations subject to board oversight and certain reporting and other requirements intended to ensure that the Board receives the information it needs to oversee the Manager’s fair value determinations.
Securities may be valued at fair value, as determined in good faith and pursuant to the Manager’s procedures, under certain limited circumstances. For example, fair value pricing will be used for fixed-income securities and when market quotations are not readily available or reliable, as determined by the Manager, such as when (i) trading for a security is restricted or stopped; (ii) a security’s trading market is closed (other than customary closings); or (iii) a security has been de-listed from a national exchange. A security with limited market liquidity may require fair value pricing if the Manager determines that the available price does not reflect the security’s true market value. In addition, if a significant event that the Manager determines to affect the value of one or more securities held by a Fund occurs after the close of a related exchange but before the determination of a Fund’s NAV, fair value pricing may be used on the affected security or securities. Securities of small-capitalization companies are also more likely to require a fair value determination using these procedures because they are more thinly traded and less liquid than the securities of larger-capitalization companies. The Funds may fair value securities as a result of significant events occurring after the close of the foreign markets in which a Fund invests as described below. In addition, the Funds may invest in illiquid securities requiring these procedures.
A Fund may use fair value pricing for securities primarily traded in non-U.S. markets because most foreign markets close well before a Fund’s pricing time of 4:00 p.m. ET. The earlier close of these foreign markets gives rise to the possibility that significant events, including broad market moves, may have occurred in the interim and may materially affect the value of those securities. If the Manager determines that the last quoted prices of non-U.S. securities will, in its judgment, materially affect the value of some or all a Fund’s portfolio securities, the Manager can adjust the previous closing prices to reflect what it believes to be the fair value of the securities as of the close of the Exchange. In deciding whether it is necessary to adjust closing prices to reflect fair value, the Manager reviews a variety of factors, including developments in foreign markets, the performance of U.S. securities markets, and the performance of instruments trading in U.S. markets that represent foreign securities and baskets of foreign securities. These securities are fair valued using a pricing service, using methods approved by the Manager, that considers the correlation of the trading patterns of the foreign security to intraday trading in the U.S. markets, based on indices of domestic securities and other appropriate indicators such as prices of relevant American Depositary Receipts (“ADRs”) and futures contracts. The Manager’s Valuation Committee may also fair value securities in other situations, such as when a particular foreign market is closed but a Fund is open. A Fund uses outside pricing services to provide closing prices and information to evaluate and/or adjust those prices. As a means of evaluating its security valuation process, the Valuation Committee routinely compares closing prices, the next day’s opening prices in the same markets and adjusted prices.
Attempts to determine the fair value of securities introduce an element of subjectivity to the pricing of securities. As a result, the price of a security determined through fair valuation techniques may differ from the price quoted or published by other sources and may not accurately reflect the market value of the security when
116
American Beacon FundsSM
Consolidated Notes to Financial Statements
December 31, 2024
trading resumes. If a reliable market quotation becomes available for a security formerly valued through fair valuation techniques, the Manager compares the new market quotation to the fair value price to evaluate the effectiveness of a Fund’s fair valuation procedures. If any significant discrepancies are found, the Manager may adjust Manager’s fair valuation procedures for a Fund.
Valuation Inputs
Various inputs may be used to determine the fair value of the Funds’ investments. These inputs are summarized in three broad levels for financial statement purposes. The inputs or methodologies used to value securities are not necessarily an indication of the risk associated with investing in those securities.
| | | | |
| Level 1 | | - | | Quoted prices in active markets for identical securities. |
| | |
| Level 2 | | - | | Prices determined using other significant observable inputs. These may include quoted prices for similar securities, interest rates, prepayment speeds, credit risk, and others. |
| | |
| Level 3 | | - | | Prices determined using other significant unobservable inputs. Unobservable inputs reflect a Fund’s own assumptions about the factors market participants would use in pricing an investment. |
Level 1 and Level 2 trading assets and trading liabilities, at fair value
Common stocks, ETFs, preferred securities, and financial derivative instruments, such as futures contracts or options that are traded on a national securities exchange, are stated at the last reported sale or settlement price on the day of valuation. To the extent these securities are actively traded and valuation adjustments are not applied, they are categorized as Level 1 of the fair value hierarchy. Valuation adjustments may be applied to certain securities that are solely traded on a foreign exchange to account for the market movement between the close of the foreign market and the close of the Exchange. These securities are valued using pricing service providers that consider the correlation of the trading patterns of the foreign security to the intraday trading in the U.S. markets for investments. Securities using these valuation adjustments are categorized as Level 2 of the fair value hierarchy. Preferred securities and other equities traded on inactive markets or valued by reference to similar instruments are generally categorized as Level 2 of the fair value hierarchy.
Fixed-income securities including corporate, convertible and municipal bonds and notes, U.S. government agencies, U.S. Treasury obligations, sovereign issues, bank loans, convertible preferred securities, and non-U.S. bonds are normally valued by pricing service providers that use broker dealer quotations, reported trades or valuation estimates from their internal pricing models. The service providers’ internal models use inputs that are observable such as issuer details, interest rates, yield curves, prepayment speeds, credit risks/spreads, default rates, and quoted prices for similar assets. Securities that use similar valuation techniques and inputs as described above are categorized as Level 2 of the fair value hierarchy. Fixed-income securities purchased on a delayed-delivery basis are marked-to-market daily until settlement at the forward settlement date and are categorized as Level 2 of the fair value hierarchy.
Mortgage-related and asset-backed securities (“ABS”) are usually issued as separate tranches, or classes, of securities within each deal. These securities are also normally valued by pricing service providers that use broker-dealer quotations or valuation estimates from their internal pricing models. The pricing models for these securities usually consider tranche-level attributes, current market data, estimated cash flows, and market-based yield spreads for each tranche, and incorporates deal collateral performance, as available. Mortgage-related and ABS that use similar valuation techniques and inputs as described above are categorized as Level 2 of the fair value hierarchy.
With respect to a Fund’s investments that do not have readily available market quotations, the Board has designated the Adviser as its valuation designee to perform fair valuations pursuant to Rule 2a-5 under the Act (the “Valuation Designee”). If market prices are not readily available or are deemed unreliable, the Valuation Designee will use the fair value of the security or other instrument as determined in good faith under policies and procedures established by and under the supervision of the Board (“Valuation Procedures”). Market prices are considered not readily available where there is an absence of current or reliable market-based data (e.g., trade
117
American Beacon FundsSM
Consolidated Notes to Financial Statements
December 31, 2024
information or broker quotes), including where events occur after the close of the relevant market, but prior to the NYSE Close, that materially affect the values of a Fund’s portfolio holdings or assets. In addition, market prices are considered not readily available when, due to extraordinary circumstances, the exchanges or markets on which the securities or other instruments trade do not open for trading for the entire day and no other market prices are available. Fair value pricing is subjective in nature and the use of fair value pricing by the Valuation Designee may cause the NAV of a Fund’s shares to differ significantly from the NAV that would have been calculated using market prices at the close of the exchange on which a portfolio holding is primarily traded. There can be no assurance that a Fund could obtain the fair value assigned to an investment if a Fund were to sell the investment at approximately the time at which a Fund determines its NAV.
Investments in registered open-end investment management companies will be valued based upon the NAVs of such investments and are categorized as Level 1 of the fair value hierarchy.
OTC financial derivative instruments, such as forward foreign currency contracts derive their value from underlying asset prices, indices, reference rates, and other inputs or a combination of these factors. These contracts are normally valued on the basis of broker dealer quotations or pricing service providers. Depending on the product and the terms of the transaction, the fair value of the financial derivative contracts can be estimated by a pricing service provider using a series of techniques, including simulation pricing models. The pricing models use inputs that are observed from actively quoted markets such as issuer details, indices, spreads, interest rates, curves, dividends, and exchange rates. Financial derivatives that use similar valuation techniques and inputs as described above are categorized as Level 2 of the fair value hierarchy.
4. Securities and Other Investments
Commodity Instruments
Exposure to physical commodities may subject the Funds to greater volatility than investments in traditional securities. The value of such investments may be affected by overall market movements, commodity index volatility, changes in interest rates, or factors affecting a particular industry or commodity, such as supply and demand, drought, floods, weather, embargoes, tariffs and international economic, political and regulatory developments. Their value may also respond to investor perception of instability in the national or international economy, whether or not justified by the facts. However, these investments may help to moderate fluctuations in the value of a Fund’s other holdings, because these investments may not correlate with investments in traditional securities. Economic and other events (whether real or perceived) can reduce the demand for commodities, which may reduce market prices and cause the value of a Fund’s shares to fall. No active trading market may exist for certain commodities investments, which may impair the ability of the Fund to sell or realize the full value of such investments in the event of the need to liquidate such investments. Certain commodities are subject to limited pricing flexibility because of supply and demand factors. Others are subject to broad price fluctuations as a result of the volatility of the prices for certain raw materials and the instability of supplies of other materials. These additional variables may create additional investment risks and result in greater volatility than investments in traditional securities. Because physical commodities do not generate investment income, the return on such investments will be derived solely from the appreciation or depreciation on such investments. Certain types of commodities instruments (such as commodity-linked swaps and commodity-linked structured notes) are subject to the risk that the counterparty to the instrument will not perform or will be unable to perform in accordance with the terms of the instrument.
Fixed Income Investments
The Funds exposure to fixed-income instruments may include:
| | • | | Emerging Markets Debt. The Funds may invest a significant portion of their assets in a particular geographic region or country, including emerging markets. The Funds may consider a country to be an emerging market country based on a number of factors including, but not limited to, if the country is classified as an emerging or developing economy by any supranational organization such as the World |
118
American Beacon FundsSM
Consolidated Notes to Financial Statements
December 31, 2024
| | Bank, International Finance Corporation or the United Nations, or related entities, or if the country is considered an emerging market country for purposes of constructing emerging market indices. |
| | • | | High-Yield Bonds. High-yield, non-investment grade bonds (also known as “junk bonds”) are low-quality, high-risk corporate bonds that generally offer a high level of current income. These bonds are considered speculative by rating organizations. For example, Moody’s, S&P Global Ratings and Fitch, Inc. rate them below Baa 3 and BBB-, respectively. High-yield bonds are often issued as a result of corporate restructurings, such as leveraged buyouts, mergers, acquisitions, or other similar events. They may also be issued by smaller, less creditworthy companies or by highly leveraged firms, which are generally less able to make scheduled payments of interest and principal than more financially stable firms. Because of their low credit quality, high-yield bonds must pay higher interest to compensate investors for the substantial credit risk they assume. Lower-rated securities are subject to certain risks that may not be present with investments in higher-grade securities. Investors should consider carefully their ability to assume the risks associated with lower-rated securities before investing in the Fund. The lower rating of certain high yielding corporate income securities reflects a greater possibility that the financial condition of the issuer or adverse changes in general economic conditions may impair the ability of the issuer to pay income and principal. Changes by rating agencies in their ratings of a fixed income security also may affect the value of these investments. However, allocating investments in the Fund among securities of different issuers should reduce the risks of owning any such securities separately. The prices of these high yielding securities tend to be less sensitive to interest rate changes than higher-rated investments, but more sensitive to adverse economic changes or individual corporate developments. During economic downturns, highly leveraged issuers may experience financial stress that adversely affects their ability to service principal and interest payment obligations, to meet projected business goals or to obtain additional financing, and the markets for their securities may be more volatile. If an issuer defaults, a Fund may incur additional expenses to seek recovery. Additionally, accruals of interest income for a Fund may have to be adjusted in the event of default. In the event of an issuer’s default, a Fund may write off prior income accruals for that issuer, resulting in a reduction in the Fund’s current dividend payment. Frequently, the higher yields of high-yielding securities may not reflect the value of the income stream that holders of such securities may expect, but rather the risk that such securities may lose a substantial portion of their value as a result of their issuer’s financial restructuring or default. Additionally, an economic downturn or an increase in interest rates could have a negative effect on the high-yield securities market and on the market value of the high-yield securities held by a Fund, as well as on the ability of the issuers of such securities to repay principal and interest on their borrowings. |
| | • | | Inflation Index Linked Securities. Inflation-indexed securities, also known as inflation-protected securities, are fixed income instruments structured such that their interest and principal payments are adjusted to keep up with inflation. In periods of deflation when the inflation rate is declining, the principal value of an inflation-indexed security will be adjusted downward. This will result in a decrease in the interest payments. |
| | • | | Investment Grade Securities. Investment grade securities that the Funds may purchase, either as part of its principal investment strategy or to implement a temporary defensive policy, include securities issued or guaranteed by the U.S. Government, its agencies and instrumentalities, as well as securities rated in one of the four highest rating categories by a rating organization rating that security (such as S&P Global Ratings, Moody’s Investors Service, Inc., or Fitch, Inc.) or comparably rated by the sub-advisor if unrated by a rating organization. The Funds, at the discretion of the sub-advisor, may retain a security that has been downgraded below the initial investment criteria. |
| | • | | Sovereign Debt. Sovereign debt securities are typically issued or guaranteed by national governments in order to finance the issuing country’s growth and/or budget. Investing in foreign sovereign debt securities will expose funds investing in such securities to the direct or indirect consequences of political, social or economic changes in the countries that issue the debt securities. |
| | • | | U.S. Government Securities. U.S. Government securities may include U.S. Treasury securities or debt obligations of U.S. Government-sponsored enterprises. |
119
American Beacon FundsSM
Consolidated Notes to Financial Statements
December 31, 2024
Illiquid and Restricted Securities
Generally, an illiquid asset is an asset that the Funds reasonably expect cannot be sold or disposed of in current market conditions in seven calendar days or less without the sale or disposition significantly changing the market value of the investment, as determined pursuant to Rule 22e-4 under the Act or as otherwise permitted or required by SEC rules and interpretations. Historically, illiquid securities have included securities that have not been registered under the Securities Act, securities that are otherwise not readily marketable, and repurchase agreements having a remaining maturity of longer than seven calendar days. Securities that have not been registered under the Securities Act are referred to as private placements or restricted securities and are purchased directly from the issuer or in the secondary market. These securities may be sold only in a privately negotiated transaction or pursuant to an exemption from registration. A large institutional market exists for certain securities that are not registered under the Securities Act, including repurchase agreements, commercial paper, foreign securities, municipal securities and corporate bonds and notes. Institutional investors depend on an efficient institutional market in which the unregistered security can be readily resold or on an issuer’s ability to honor a demand for repayment. However, the fact that there are contractual or legal restrictions on resale of such investments to the general public or to certain institutions may not be indicative of their liquidity.
Limitations on resale may have an adverse effect on the marketability of portfolio securities, and a Fund might be unable to dispose of restricted or other illiquid securities promptly or at reasonable prices and might thereby experience difficulty satisfying redemptions within seven calendar days. In addition, a Fund may get only limited information about an issuer, so it may be less able to predict a loss. A Fund also might have to register such restricted securities in order to dispose of them resulting in additional expense and delay. Adverse market conditions could impede such a public offering of securities.
In recognition of the increased size and liquidity of the institutional market for unregistered securities and the importance of institutional investors in the formation of capital, the SEC adopted Rule 144A under the Securities Act. Rule 144A is designed to facilitate efficient trading among institutional investors by permitting the sale of certain unregistered securities to qualified institutional buyers. To the extent privately placed securities held by a Fund qualify under Rule 144A and an institutional market develops for those securities, a Fund likely will be able to dispose of the securities without registering them under the Securities Act. To the extent that institutional buyers become, for a time, uninterested in purchasing these securities, investing in Rule 144A securities could increase the level of a Fund’s illiquidity. The Manager or the Sub-Advisor, as applicable, may determine that certain securities qualified for trading under Rule 144A are liquid. Regulation S under the Securities Act permits the sale abroad of securities that are not registered for sale in the United States and includes a provision for U.S. investors, such as a Fund, to purchase such unregistered securities if certain conditions are met.
Securities sold in private placement offerings made in reliance on the “private placement” exemption from registration afforded by Section 4(a)(2) of the Securities Act and resold to qualified institutional buyers under Rule 144A under the Securities Act (“Section 4(a)(2) securities”) are restricted as to disposition under the federal securities laws, and generally are sold to institutional investors, such as a Fund, that agree they are purchasing the securities for investment and not with an intention to distribute to the public. Any resale by the purchaser must be pursuant to an exempt transaction and may be accomplished in accordance with Rule 144A. Section 4(a)(2) securities normally are resold to other institutional investors through or with the assistance of the issuer or dealers that make a market in the Section 4(a)(2) securities, thus providing liquidity. The Manager and the sub-advisor will carefully monitor the Fund’s investments in Section 4(a)(2) securities offered and sold under Rule 144A, focusing on such important factors, among others, as valuation, liquidity, and availability of information. Investments in Section 4(a)(2) securities could have the effect of reducing the Fund’s liquidity to the extent that qualified institutional buyers no longer wish to purchase these restricted securities.
Restricted securities outstanding during the year ended December 31, 2024 are disclosed in the Notes to the Schedules of Investments.
120
American Beacon FundsSM
Consolidated Notes to Financial Statements
December 31, 2024
Other Investment Company Securities and Other Exchange-Traded Products
The Funds at times may invest in shares of other investment companies, including open-end funds, closed-end funds, ETFs, unit investment trusts, and other investment companies of the Trust. The Funds may invest in securities of an investment company advised by the Manager or the Sub-Advisor. Investments in the securities of other investment companies may involve duplication of advisory fees and certain other expenses. By investing in another investment company, the Funds become a shareholder of that investment company. As a result, the Funds’ shareholders indirectly will bear the Funds’ proportionate share of the fees and expenses paid by shareholders of the other investment company, in addition to the fees and expenses the Funds’ shareholders directly bear in connection with the Funds’ own operations. These other fees and expenses are reflected as Acquired Fund Fees and Expenses and are included in the Fees and Expenses Table for the Funds in their Prospectus, if applicable. Investments in other investment companies may involve the payment of substantial premiums above the value of such issuer’s portfolio securities.
The Funds can invest free cash balances in registered open-end investment companies regulated as government money market funds under the Act, to provide liquidity or for defensive purposes. The Funds could invest in government money market funds rather than purchasing individual short-term investments. If the Funds invest in government money market funds, shareholders will bear their proportionate share of the expenses, including for example, advisory and administrative fees, of the government money market funds in which the Funds invest, including advisory fees charged by the Manager to any applicable money market funds advised by the Manager.
U.S. Treasury Obligations
U.S. Treasury obligations include bills (initial maturities of one year or less), notes (initial maturities between two and ten years), and bonds (initial maturities over ten years) issued by the U.S. Treasury, Separately Traded Registered Interest and Principal component parts of such obligations (known as “STRIPS”) and inflation-indexed securities. The prices of these securities (like all debt securities) change between issuance and maturity in response to fluctuating market interest rates. U.S. Treasury obligations are subject to credit risk and interest rate risk.
5. Financial Derivative Instruments
The Funds may utilize derivative instruments to enhance return, hedge risk, gain efficient exposure to an asset class or to manage liquidity.
Forward Foreign Currency Contracts
The Funds may have exposure to foreign currencies for investment or hedging purposes by purchasing or selling forward currency exchange contracts in non-U.S. currencies and by purchasing securities denominated in non-U.S. currencies. Foreign currencies may decline in value relative to the U.S. dollar and affect the Funds’ investments in securities that trade in, and receive revenues in, or in derivatives that provide exposure to, foreign (non-U.S.) currencies. Not all forward contracts require a counterparty to post collateral, which may expose the Funds to greater losses in the event of a default by a counterparty.
Forward contracts are two-party contracts pursuant to which one party agrees to pay the counterparty a fixed price for an agreed upon amount of commodities or securities, or the cash value of commodities, securities or a securities index, at an agreed upon future date. A forward currency contract is an obligation to buy or sell a specific currency at a future date, which may be any fixed number of days from the date of the contract agreed upon by the parties, at a price set at the time of the contract. An NDF is a forward contract where there is no physical settlement of the two currencies at maturity. Rather, on the contract settlement date, a net cash settlement will be made by one party to the other based on the difference between the contracted forward rate
121
American Beacon FundsSM
Consolidated Notes to Financial Statements
December 31, 2024
and the prevailing spot rate, on an agreed notional amount. Not all forward contracts require a counterparty to post collateral, which may expose the Fund to greater losses in the event of a default by a counterparty.
During the year ended December 31, 2024, the Funds entered into forward foreign currency contracts primarily for hedging foreign currency fluctuations.
The Funds’ forward foreign currency contract notional dollar values outstanding fluctuate throughout the operating year as required to meet strategic requirements. The following table illustrates the average monthly volume of forward foreign currency contracts. For the purpose of this disclosure, volume is measured by the amounts bought and sold in USD at each month end.
| | | | | | | | | | | | |
Average Forward Foreign Currency Notional Amounts Outstanding
Year Ended December 31, 2024 | |
Fund | | Purchased Contracts | | | | | | Sold Contracts | |
AHL Managed Futures Strategy | | $ | 6,335,626,224 | | | | | | | $ | 7,545,541,968 | |
AHL Multi-Alternatives | | | 26,685,413 | | | | | | | | 36,140,196 | |
AHL TargetRisk | | | 7,551,384 | | | | | | | | 47,600,545 | |
Futures Contracts
A futures contract is a contract to purchase or sell a particular security, or the cash value of an asset, such as securities, indices, or currencies, at a specified future date at a price agreed upon when the contract is made. Under many such contracts, no delivery of the actual underlying asset is required. Rather, upon the expiration of the contract, settlement is made by exchanging cash in an amount equal to the difference between the contract price and the closing price of the asset (e.g., a security or an index) at expiration, net of the initial and variation margin that was previously paid. A Treasury futures contract is a contract for the future delivery of a U.S. Treasury security. An equity index futures contract is based on the value of an underlying index. A Fund may, from time to time, use futures positions to equitize cash and expose its portfolio to changes in securities prices or index prices. This can magnify gains and losses in a Fund. A Fund also may have to sell assets at inopportune times to satisfy its settlement or collateral obligations. The risks associated with the use of futures contracts also include that there may be an imperfect correlation between the changes in market value of the futures contracts and the assets underlying such contracts and that there may not be a liquid secondary market for a futures contract.
During the year ended December 31, 2024, the Funds entered into futures contracts primarily for investing and/ or hedging purposes.
The Funds’ average futures contracts outstanding fluctuate throughout the operating year as required to meet strategic requirements. The following table illustrates the average monthly volume of futures contracts. For the purpose of this disclosure, volume is measured by contracts outstanding at each month end.
| | | | |
Average Futures Contracts Outstanding | |
Fund | | Year Ended December 31, 2024 | |
AHL Managed Futures Strategy | | | 124,164 | |
AHL Multi-Alternatives | | | 807 | |
AHL TargetRisk | | | 3,476 | |
Swap Agreements
A swap is a transaction in which a Fund and a counterparty agree to pay or receive payments at specified dates based upon or calculated by reference to changes in specified prices or rates (e.g., interest rates in the case of interest rate swaps) or the performance of specified securities or indices based on a specified amount (the “notional” amount). Nearly any type of derivative, including forward contracts, can be structured as a swap.
Swap agreements can be structured to provide exposure to a variety of different types of investments or market factors. For example, in an interest rate swap, fixed-rate payments may be exchanged for floating rate
122
American Beacon FundsSM
Consolidated Notes to Financial Statements
December 31, 2024
payments; in a currency swap, U.S. dollar-denominated payments may be exchanged for payments denominated in a foreign currency; and in a total return swap, payments tied to the investment return on a particular asset, group of assets or index may be exchanged for payments that are effectively equivalent to interest payments or for payments tied to the return on another asset, group of assets, or index. Swaps may have a leverage component, and adverse changes in the value or level of the underlying asset, reference rate or index can result in gains or losses that are substantially greater than the amount invested in the swap itself.
Some swaps currently are, and more in the future will be, centrally cleared. Swaps that are centrally-cleared are exposed to the creditworthiness of the clearing organizations (and, consequently, that of their members — generally, banks and broker-dealers) involved in the transaction. For example, an investor could lose margin payments it has deposited with the clearing organization as well as the net amount of gains not yet paid by the clearing organization if it breaches its agreement with the investor or becomes insolvent or goes into bankruptcy. In the event of bankruptcy of the clearing organization, the investor may be able to recover only a portion of the net amount of gains on its transactions and of the margin owed to it, potentially resulting in losses to the investor.
Swaps that are not centrally cleared, involve the risk that a loss may be sustained as a result of the insolvency or bankruptcy of the counterparty or the failure of the counterparty to make required payments or otherwise comply with the terms of the agreement. To mitigate this risk, a Fund will only enter into swap agreements with counterparties considered by a sub-advisor to present minimum risk of default and a Fund normally obtains collateral to secure its exposure. Changing conditions in a particular market area, whether or not directly related to the referenced assets that underlie the swap agreement, may have an adverse impact on the creditworthiness of a counterparty.
The centrally cleared and OTC swap agreements into which a Fund enters normally provide for the obligations of a Fund and its counterparty in the event of a default or other early termination to be determined on a net basis. Similarly, periodic payments on a swap transaction that are due by each party on the same day normally are netted. To the extent that a swap agreement is subject to netting, a Fund’s cover and asset segregation responsibilities will normally be with respect to the net amount owed by a Fund. However, a Fund may be required to segregate liquid assets equal to the full notional amount of certain swaps, such as written credit default swaps on physically settled forwards or written options. The amount that a Fund must segregate may be reduced by the value of any collateral that it has pledged to secure its own obligations under the swap.
Credit Default Swap Agreements
Credit default swap agreements involve one party making a stream of payments (referred to as the buyer of protection) to another party (the seller of protection) in exchange for the right to receive a specified return in the event of a default or other credit event for the referenced entity, obligation or index. As a seller of protection on credit default swap agreements, a Fund will generally receive from the buyer of protection a fixed rate of periodic premiums throughout the term of the swap provided that there is no credit event. As the seller, a Fund would effectively add leverage to its portfolio because, in addition to its total net assets, a Fund would be subject to investment exposure up to the notional amount of the swap.
If a Fund is a seller of protection and a credit event occurs, as defined under the terms of that particular swap agreement, a Fund will either (i) pay to the buyer of protection an amount equal to the notional amount of the swap and take delivery of the referenced obligation, other deliverable obligations or underlying securities comprising the referenced index or (ii) pay a net settlement amount in the form of cash or securities equal to the notional amount of the swap less the recovery value of the referenced obligation or underlying securities comprising the referenced index. If a Fund is a buyer of protection and a credit event occurs, as defined under the terms of that particular swap agreement, a Fund will either (i) receive from the seller of protection an amount equal to the notional amount of the swap and deliver the referenced obligation, other deliverable obligations or underlying securities comprising the referenced index or (ii) receive a net settlement amount in the form of cash or securities equal to the notional amount of the swap less the recovery value of the referenced obligation or
123
American Beacon FundsSM
Consolidated Notes to Financial Statements
December 31, 2024
underlying securities comprising the referenced index. Recovery values are estimated by market makers considering either industry standard recovery rates or entity specific factors and considerations until a credit event occurs. If a credit event has occurred, the recovery value is determined by a facilitated auction whereby a minimum number of allowable broker bids, together with a specified valuation method, are used to calculate the settlement value.
Credit default swap agreements on corporate issues, sovereign issues of an emerging country or U.S. municipal issues involve one party making a stream of payments to another party in exchange for the right to receive a specified return in the event of a default or other credit event. If a credit event occurs and cash settlement is not elected, a variety of other deliverable obligations may be delivered in lieu of the specific referenced obligation. The ability to deliver other obligations may result in a cheapest-to-deliver option (the buyer of protection’s right to choose the deliverable obligation with the lowest value following a credit event). A Fund may use credit default swaps on corporate issues, sovereign issues of an emerging country or U.S. municipal issues to provide a measure of protection against defaults of the issuers (i.e., to reduce risk where a Fund owns or has exposure to the referenced obligation) or to take an active long or short position with respect to the likelihood of a particular issuer’s default.
Credit default swap agreements on asset-backed securities involve one party making a stream of payments to another party in exchange for the right to receive a specified return in the event of a default or other credit event. Unlike credit default swaps on corporate issues, sovereign issues of an emerging country or U.S. municipal issues, deliverable obligations in most instances would be limited to the specific referenced obligation as performance for asset-backed securities can vary across deals. Prepayments, principal paydowns, and other writedown or loss events on the underlying mortgage loans will reduce the outstanding principal balance of the referenced obligation. These reductions may be temporary or permanent as defined under the terms of the swap agreement and the notional amount for the swap agreement will be adjusted by corresponding amounts. A Fund may use credit default swaps on asset-backed securities to provide a measure of protection against defaults of the referenced obligation that a Fund owns or to take an active long or short position with respect to the likelihood of a particular referenced obligation’s default that a Fund does not own.
Credit default swap agreements on credit indices involve one party making a stream of payments to another party in exchange for the right to receive a specified return in the event of a write-down, principal shortfall, interest shortfall or default of all or part of the referenced entities comprising the credit index. A credit index is a basket of credit instruments or exposures designed to be representative of some part of the credit market as a whole. These indices are made up of reference credits that are judged by a poll of dealers to be the most liquid entities in the credit default swap market based on the sector of the index. Components of the indices may include, but are not limited to, investment grade securities, high yield securities, asset-backed securities, emerging markets, and/or various credit ratings within each sector. Credit indices are traded using credit default swaps with standardized terms including a fixed spread and standard maturity dates. An index credit default swap references all the names in the index, and if there is a default, the credit event is settled based on that name’s weight in the index. The composition of the indices changes periodically, usually every six months, and for most indices, each name has an equal weight in the index. A Fund may use credit default swaps on credit indices to hedge a portfolio of credit default swaps or bonds, which is less expensive than it would be to buy many credit default swaps to achieve a similar effect. Credit default swaps on indices are benchmarks for protecting investors owning bonds against default, and traders use them to speculate on changes in credit quality.
Implied credit spreads, represented in absolute terms, utilized in determining the market value of credit default swap agreements on corporate issues, sovereign issues of an emerging country or U.S. municipal issues as of period end are disclosed in the Notes to the Schedule of Investments and serve as an indicator of the current status of the payment/performance risk and represent a market participant view of the likelihood or risk of default for the underlying referenced security to credit derivative. The implied credit spread of a particular referenced entity reflects the cost of buying/selling protection and may include upfront payments required to be made to enter into the agreement. For credit default swap agreements on asset-backed securities and credit indices, the quoted
124
American Beacon FundsSM
Consolidated Notes to Financial Statements
December 31, 2024
market prices and resulting values serve as the indicator of the current status of the payment/performance risk. Wider credit spreads represent a deterioration of the referenced entity’s credit soundness and a greater likelihood or risk of default or other credit event occurring as defined under the terms of the agreement.
The maximum potential amount of future payments (undiscounted) that a Fund as a seller of protection could be required to make under a credit default swap agreement would be an amount equal to the notional amount of the agreement. Notional amounts of each individual credit default swap agreement outstanding as of December 31, 2024, for which a Fund is the seller of protection is disclosed in the Notes to the Schedule of Investments. These potential amounts would be partially offset by any recovery values of the respective referenced obligations, upfront payments received upon entering into the agreement, or net amounts received from the settlement of buy protection credit default swap agreements entered into by a Fund for the same referenced entity or entities.
During the year ended December 31, 2024, AHL Multi-Alternatives Fund and AHL TargetRisk Fund entered into credit default swaps primarily for return enhancement and hedging.
The Fund’s credit default swap contract notional amounts outstanding fluctuate throughout the operating year as required to meet the strategic requirements. The following table illustrates the average monthly volume of credit default swap contracts. For the purpose of this disclosure, the volume is measure by the notional amounts outstanding at each month end.
| | | | |
Average Credit Default Swap Notional Amounts Outstanding | |
Fund | | Year Ended December 31, 2024 | |
AHL Multi-Alternatives | | | 13,846,154 | |
AHL TargetRisk | | | 236,800,000 | |
Total Return Swap Agreements
A Fund may enter into total return swaps in order to take a “long” or “short” position with respect to an underlying referenced asset, which will subject the Fund to the Fund to market price volatility of the underlying referenced asset. A total return swap involves commitments to pay interest in exchange for a market linked return based on a notional amount. To the extent that the total return of the security, group of securities or index underlying the transaction exceeds or falls short of the offsetting interest obligation, the Fund will receive a payment from or make a payment to the counterparty.
A Fund’s total return swap contracts outstanding fluctuate throughout the operating year as required to meet strategic requirements. The following table illustrates the average monthly volume of total return swap contracts. For the purpose of this disclosure, volume is measured by notional amounts outstanding at each month end:
| | | | |
Average Total Return Swap Notional Amounts Outstanding | |
Fund | | Year Ended December 31, 2024 | |
AHL Multi-Alternatives | | | 3,713,594 | |
AHL TargetRisk | | | 58,394,000 | |
125
American Beacon FundsSM
Consolidated Notes to Financial Statements
December 31, 2024
The following is a summary of the fair valuations of the Funds’ derivative instruments categorized by risk exposure(1):
AHL Managed Futures Strategy Fund
| | | | | | | | | | | | | | | | | | | | | | | | | | | | | | | | | | | | | | | | | | | | | | | | | | | | | | | |
| Fair values of financial instruments on the Consolidated Statements of Assets and Liabilities as of December 31, 2024: | |
| |
| | | Derivatives not accounted for as hedging instruments |
| | | | | | | | | | | |
Assets: | | Credit contracts | | | | Foreign exchange
contracts | | | | Commodity
contracts | | | | Interest rate
contracts | | | | Equity contracts | | | | Total |
| Unrealized appreciation of forward foreign currency contracts | | | $ | - | | | | | | | | | $ | 145,678,496 | | | | | | | | | $ | - | | | | | | | | | $ | - | | | | | | | | | $ | - | | | | | | | | | $ | 145,678,496 | |
| Receivable for variation margin from open futures contracts(2) | | | | - | | | | | | | | | | 3,978,586 | | | | | | | | | | 50,464,701 | | | | | | | | | | 15,960,221 | | | | | | | | | | 2,064,534 | | | | | | | | | | 72,468,042 | |
| | | | | | | | | | | |
Liabilities: | | Credit contracts | | | | Foreign exchange
contracts | | | | Commodity
contracts | | | | Interest rate
contracts | | | | Equity contracts | | | | Total |
| Unrealized depreciation of forward foreign currency contracts | | | $ | - | | | | | | | | | $ | (40,163,121 | ) | | | | | | | | $ | - | | | | | | | | | $ | - | | | | | | | | | $ | - | | | | | | | | | $ | (40,163,121 | ) |
| Payable for variation margin from open futures contracts(2) | | | | - | | | | | | | | | | - | | | | | | | | | | (28,074,353 | ) | | | | | | | | | (6,729,009 | ) | | | | | | | | | (23,280,574 | ) | | | | | | | | | (58,083,936 | ) |
| | | | | | | | | | | | | | | | | | | | | | | | | | | | | | | | | | | | | | | | | | | | | | | | | | | | | | | |
| The effect of financial derivative instruments on the Consolidated Statements of Operations as of December 31, 2024: | |
| |
| | | Derivatives not accounted for as hedging instruments |
| | | | | | | | | | | |
Realized gain (loss) from derivatives
recognized as a result of operations | | Credit contracts | | | | Foreign exchange
contracts | | | | Commodity
contracts | | | | Interest rate
contracts | | | | Equity contracts | | | | Total |
| Forward foreign currency contracts | | | $ | - | | | | | | | | | $ | (73,567,963 | ) | | | | | | | | $ | - | | | | | | | | | $ | - | | | | | | | | | $ | - | | | | | | | | | $ | (73,567,963 | ) |
| Futures contracts | | | | - | | | | | | | | | | 34,855,427 | | | | | | | | | | (16,874,097 | ) | | | | | | | | | (115,410,445 | ) | | | | | | | | | 66,946,524 | | | | | | | | | | (30,482,591 | ) |
| | | | | | | | | | | |
Net change in unrealized appreciation
(depreciation) of derivatives
recognized as a result from
operations: | | Credit contracts | | | | Foreign exchange
contracts | | | | Commodity
contracts | | | | Interest rate
contracts | | | | Equity contracts | | | | Total |
| Forward foreign currency contracts | | | $ | - | | | | | | | | | $ | 108,352,939 | | | | | | | | | $ | - | | | | | | | | | $ | - | | | | | | | | | $ | - | | | | | | | | | $ | 108,352,939 | |
| Futures contracts | | | | - | | | | | | | | | | (1,122,404 | ) | | | | | | | | | 31,571,106 | | | | | | | | | | (3,529,112 | ) | | | | | | | | | (60,078,313 | ) | | | | | | | | | (33,158,723 | ) |
AHL Multi-Alternatives Fund
| | | | | | | | | | | | | | | | | | | | | | | | | | | | | | | | | | | | | | | | | | | | | | | | | | | | | | | |
| Fair values of financial instruments on the Consolidated Statements of Assets and Liabilities as of December 31, 2024: | |
| |
| | | Derivatives not accounted for as hedging instruments |
| | | | | | | | | | | |
Assets: | | Credit contracts | | | | Foreign exchange
contracts | | | | Commodity
contracts | | | | Interest rate
contracts | | | | Equity contracts | | | | Total |
| Unrealized appreciation of forward foreign currency contracts | | | $ | - | | | | | | | | | $ | 1,013,690 | | | | | | | | | $ | - | | | | | | | | | $ | - | | | | | | | | | $ | - | | | | | | | | | $ | 1,013,690 | |
| Receivable for variation margin from open futures contracts(2) | | | | - | | | | | | | | | | 24,375 | | | | | | | | | | 313,651 | | | | | | | | | | 46,653 | | | | | | | | | | 22,276 | | | | | | | | | | 406,955 | |
| Unrealized appreciation from swap agreements | | | | 11,143 | | | | | | | | | | - | | | | | | | | | | - | | | | | | | | | | - | | | | | | | | | | 40,049 | | | | | | | | | | 51,192 | |
| | | | | | | | | | | |
Liabilities: | | Credit contracts | | | | Foreign exchange
contracts | | | | Commodity
contracts | | | | Interest rate
contracts | | | | Equity contracts | | | | Total |
| Unrealized depreciation of forward foreign currency contracts | | | $ | - | | | | | | | | | $ | (272,170 | ) | | | | | | | | $ | - | | | | | | | | | $ | - | | | | | | | | | $ | - | | | | | | | | | $ | (272,170 | ) |
| Payable for variation margin from open futures contracts(2) | | | | - | | | | | | | | | | - | | | | | | | | | | (152,511 | ) | | | | | | | | | (69,856 | ) | | | | | | | | | (263,875 | ) | | | | | | | | | (486,242 | ) |
| | | | | | | | | | | | | | | | | | | | | | | | | | | | | | | | | | | | | | | | | | | | | | | | | | | | | | | |
126
American Beacon FundsSM
Consolidated Notes to Financial Statements
December 31, 2024
| | | | | | | | | | | | | | | | | | | | | | | | | | | | | | | | | | | | | | | | | | | | | | | | | | | | | | | |
| The effect of financial derivative instruments on the Consolidated Statements of Operations as of December 31, 2024: | |
| |
| | | Derivatives not accounted for as hedging instruments |
| | | | | | | | | | | |
Realized gain (loss) from derivatives recognized
as a result of operations | | Credit contracts | | | | Foreign exchange
contracts | | | | Commodity
contracts | | | | Interest rate
contracts | | | | Equity
contracts | | | | Total |
| Forward foreign currency contracts | | | $ | - | | | | | | | | | $ | (515,510 | ) | | | | | | | | $ | - | | | | | | | | | $ | - | | | | | | | | | $ | - | | | | | | | | | $ | (515,510 | ) |
| Futures contracts | | | | - | | | | | | | | | | 206,003 | | | | | | | | | | (231,922 | ) | | | | | | | | | (919,309 | ) | | | | | | | | | 1,626,631 | | | | | | | | | | 681,403 | |
| Swap agreements | | | | 165,810 | | | | | | | | | | - | | | | | | | | | | - | | | | | | | | | | - | | | | | | | | | | (6,367 | ) | | | | | | | | | 159,443 | |
| | | | | | | | | | | |
Net change in unrealized appreciation
(depreciation) of derivatives recognized as a
result from operations: | | Credit contracts | | | | Foreign exchange
contracts | | | | Commodity
contracts | | | | Interest rate
contracts | | | | Equity
contracts | | | | Total |
| Forward foreign currency contracts | | | $ | - | | | | | | | | | $ | 799,084 | | | | | | | | | $ | - | | | | | | | | | $ | - | | | | | | | | | $ | - | | | | | | | | | $ | 799,084 | |
| Futures contracts | | | | - | | | | | | | | | | 2,610 | | | | | | | | | | 217,213 | | | | | | | | | | (340,485 | ) | | | | | | | | | (655,162 | ) | | | | | | | | | (775,824 | ) |
| Swap agreements | | | | (32,206 | ) | | | | | | | | | - | | | | | | | | | | - | | | | | | | | | | - | | | | | | | | | | 34,353 | | | | | | | | | | 2,147 | |
AHL TargetRisk Fund
| | | | | | | | | | | | | | | | | | | | | | | | | | | | | | | | | | | | | | | | | | | | | | | | | | | | | | | |
| Fair values of financial instruments on the Consolidated Statements of Assets and Liabilities as of December 31, 2024: | |
| |
| | | Derivatives not accounted for as hedging instruments |
| | | | | | | | | | | |
Assets: | | Credit contracts | | | | Foreign exchange
contracts | | | | Commodity
contracts | | | | Interest rate
contracts | | | | Equity contracts | | | | Total |
| Unrealized appreciation of forward foreign currency contracts | | | $ | - | | | | | | | | | $ | 910,756 | | | | | | | | | $ | - | | | | | | | | | $ | - | | | | | | | | | $ | - | | | | | | | | | $ | 910,756 | |
| Receivable for variation margin from open futures contracts(2) | | | | - | | | | | | | | | | - | | | | | | | | | | - | | | | | | | | | | 21,347 | | | | | | | | | | 150,275 | | | | | | | | | | 171,622 | |
| Unrealized appreciation from swap agreements | | | | 252,708 | | | | | | | | | | - | | | | | | | | | | - | | | | | | | | | | - | | | | | | | | | | 598,390 | | | | | | | | | | 851,098 | |
| | | | | | | | | | | |
Liabilities: | | Credit contracts | | | | Foreign exchange
contracts | | | | Commodity
contracts | | | | Interest rate
contracts | | | | Equity contracts | | | | Total |
| Unrealized depreciation of forward foreign currency contracts | | | $ | - | | | | | | | | | $ | (79,877 | ) | | | | | | | | $ | - | | | | | | | | | $ | - | | | | | | | | | $ | - | | | | | | | | | $ | (79,877 | ) |
| Payable for variation margin from open futures contracts(2) | | | | - | | | | | | | | | | - | | | | | | | | | | - | | | | | | | | | | (1,584,856 | ) | | | | | | | | | (1,946,784 | ) | | | | | | | | | (3,531,640 | ) |
| Unrealized depreciation from swap agreements | | | | (48,300 | ) | | | | | | | | | - | | | | | | | | | | - | | | | | | | | | | - | | | | | | | | | | - | | | | | | | | | | (48,300 | ) |
| | | | | | | | | | | | | | | | | | | | | | | | | | | | | | | | | | | | | | | | | | | | | | | | | | | | | | | |
| The effect of financial derivative instruments on the Consolidated Statements of Operations as of December 31, 2024: | |
| |
| | | Derivatives not accounted for as hedging instruments |
| | | | | | | | | | | |
Realized gain (loss) from derivatives
recognized as a result of operations | | Credit contracts | | | | Foreign exchange
contracts | | | | Commodity
contracts | | | | Interest rate
contracts | | | | Equity contracts | | | | Total |
| Forward foreign currency contracts | | | $ | - | | | | | | | | | $ | (146,593 | ) | | | | | | | | $ | - | | | | | | | | | $ | - | | | | | | | | | $ | - | | | | | | | | | $ | (146,593 | ) |
| Futures contracts | | | | - | | | | | | | | | | - | | | | | | | | | | - | | | | | | | | | | (734,687 | ) | | | | | | | | | 19,590,149 | | | | | | | | | | 18,855,462 | |
| Swap agreements | | | | 4,609,637 | | | | | | | | | | - | | | | | | | | | | - | | | | | | | | | | - | | | | | | | | | | (184,609 | ) | | | | | | | | | 4,425,028 | |
| | | | | | | | | | | |
Net change in unrealized
appreciation (depreciation) of
derivatives recognized as a result
from operations: | | Credit contracts | | | | Foreign exchange
contracts | | | | Commodity
contracts | | | | Interest rate
contracts | | | | Equity contracts | | | | Total |
| Forward foreign currency contracts | | | $ | - | | | | | | | | | $ | 1,451,464 | | | | | | | | | $ | - | | | | | | | | | $ | - | | | | | | | | | $ | - | | | | | | | | | $ | 1,451,464 | |
| Futures contracts | | | | - | | | | | | | | | | - | | | | | | | | | | - | | | | | | | | | | (6,497,790 | ) | | | | | | | | | (5,392,953 | ) | | | | | | | | | (11,890,743 | ) |
| Swap agreements | | | | (605,825 | ) | | | | | | | | | - | | | | | | | | | | - | | | | | | | | | | - | | | | | | | | | | 483,757 | | | | | | | | | | (122,068 | ) |
(1) See Note 3 in the Consolidated Notes to Financial Statements for additional information.
(2) Includes cumulative appreciation (depreciation) of futures contracts as reported in the Fund’s Consolidated Schedule of Investments footnotes. Only current day’s variation margin is reported within the Consolidated Statements of Assets and Liabilities.
127
American Beacon FundsSM
Consolidated Notes to Financial Statements
December 31, 2024
Master Agreements
International Swaps and Derivatives Association, Inc. Master Agreements (“ISDA Master Agreements”) with counterparties govern transactions in OTC derivative and foreign exchange contracts entered into by the Funds and those counterparties. The ISDA Master Agreements contain provisions for general obligations, representations, agreements, collateral and events of default or termination. Events of termination include conditions that may entitle counterparties to elect to terminate early and cause settlement of all outstanding transactions under the applicable ISDA Master Agreement. Any election to terminate early could be material to the financial statements. Since different types of forward and OTC financial derivative transactions have different mechanics and are sometimes traded out of different legal entities of a particular counterparty organization, each type of transaction may be covered by a different Master Agreement, resulting in the need for multiple agreements with a single counterparty.
As the ISDA Master Agreements are specific to unique operations of different asset types, they allow a Fund to net its total exposure to a counterparty in the event of a default with respect to all the transactions governed under a single agreement with a counterparty.
Master Securities Forward Transaction Agreements (“Master Forward Agreements”) govern the considerations and factors surrounding the settlement of certain forward settling transactions, such as delayed delivery or sale-buyback financing transactions by and between a Fund and select counterparties. The Master Forward Agreements maintain provisions for, among other things, initiation and confirmation, payment and transfer, events of default, termination, and maintenance of collateral.
Offsetting Assets and Liabilities
The Funds are parties to enforceable master netting agreements between brokers and counterparties which provide for the right to offset under certain circumstances. The Funds employ multiple money managers and counterparties and have elected not to offset qualifying financial and derivative instruments on the Statements of Assets and Liabilities, as such all financial and derivative instruments are presented on a gross basis. The impacts of netting arrangements that provide the right to offset are detailed below, if applicable. The net amount represents the net receivable or payable that would be due from or to the counterparty in the event of default. Exposure from borrowings and other financing agreements such as repurchase agreements can only be netted across transactions governed by the same Master Agreement with the same legal entity. All amounts reported below represent the balance as of the report date, December 31, 2024.
AHL Managed Futures Strategy Fund
| | | | | | | | | | | | |
| Offsetting of Financial and Derivative Assets as of December 31, 2024: | |
| | Assets | | | | | | Liabilities | |
| Futures Contracts(1)(2) | | $ | 72,468,042 | | | | | | | $ | 58,083,936 | |
| Forward Foreign Currency Contracts | | | 145,678,496 | | | | | | | | 40,163,121 | |
| | | | | | | | | | | | |
| Total derivative assets and liabilities in the Statement of Assets and Liabilities | | $ | 218,146,538 | | | | | | | $ | 98,247,057 | |
| | | | | | | | | | | | |
| Derivatives not subject to a Master Netting Agreement or similar agreement (“MNA”) | | $ | (72,468,042 | ) | | | | | | $ | (58,083,936 | ) |
| | | | | | | | | | | | |
| Total derivative assets and liabilities subject to an MNA | | $ | 145,678,496 | | | | | | | $ | 40,163,121 | |
| | | | | | | | | | | | |
| | | | | | | | | | | | | | | | | | | | | | | | | | | | | | | | | | | | |
| Financial Assets, Derivatives, and Collateral Received/(Pledged) by Counterparty as of December 31, 2024: | |
| | | Gross Amounts of
Assets Presented in
the Statements of
Assets and Liabilities | | | | | | Derivatives
Available for
Offset | | | | | | Gross Amounts Not Offset in the
Statements of Assets and Liabilities | | | | | | | |
Counterparty | | | | | | | | Non-Cash Collateral
Pledged(2) | | | | | | Cash Collateral
Pledged(2) | | | | | | Net Amount | |
BNP Paribas, N.A. | | $ | 348,701 | | | | | | | $ | (66,184 | ) | | | | | | $ | - | | | | | | | $ | - | | | | | | | $ | 282,517 | |
Citibank, N.A. | | | 20,001,222 | | | | | | | | (3,877,310 | ) | | | | | | | - | | | | | | | | - | | | | | | | | 16,123,912 | |
HSBC Bank (USA) | | | 112,583,835 | | | | | | | | (23,117,257 | ) | | | | | | | - | | | | | | | | - | | | | | | | | 89,466,578 | |
128
American Beacon FundsSM
Consolidated Notes to Financial Statements
December 31, 2024
| | | | | | | | | | | | | | | | | | | | | | | | | | | | | | | | | | | | |
| | | Gross Amounts of
Assets Presented in
the Statements of
Assets and Liabilities | | | | | | Derivatives
Available for
Offset | | | | | | Gross Amounts Not Offset in the
Statements of Assets and Liabilities | | | | | | | |
Counterparty | | | | | | | | Non-Cash Collateral
Pledged(2) | | | | | | Cash Collateral
Pledged(2) | | | | | | Net Amount | |
NatWest Markets PLC | | $ | 12,370,262 | | | | | | | $ | (12,370,262 | ) | | | | | | $ | - | | | | | | | $ | - | | | | | | | $ | - | |
State Street Bank & Trust Co. | | | 374,476 | | | | | | | | - | | | | | | | | - | | | | | | | | - | | | | | | | | 374,476 | |
| | | | | | | | | | | | | | | | | | | | | | | | | | | | | | | | | | | | |
Total | | $ | 145,678,496 | | | | | | | $ | (39,431,013 | ) | | | | | | $ | - | | | | | | | $ | - | | | | | | | $ | 106,247,483 | |
| | | | | | | | | | | | | | | | | | | | | | | | | | | | | | | | | | | | |
| | | | | | | |
| | | Gross Amounts of
Liabilities Presented in
the Statements of
Assets and Liabilities | | | | | | Derivatives
Available for
Offset | | | | | | Gross Amounts Not Offset in the
Statements of Assets and Liabilities | | | | | | | |
Counterparty | | | | | | | | Non-Cash Collateral
Received(2) | | | | | | Cash Collateral
Received(2) | | | | | | Net Amount | |
BNP Paribas, N.A. | | $ | 66,184 | | | | | | | $ | (66,184 | ) | | | | | | $ | - | | | | | | | $ | - | | | | | | | $ | - | |
Citibank, N.A. | | | 3,877,310 | | | | | | | | (3,877,310 | ) | | | | | | | - | | | | | | | | - | | | | | | | | | |
HSBC Bank (USA) | | | 23,117,257 | | | | | | | | (23,117,257 | ) | | | | | | | - | | | | | | | | - | | | | | | | | - | |
NatWest Markets PLC | | | 13,102,370 | | | | | | | | (12,370,262 | ) | | | | | | | - | | | | | | | | (732,108 | ) | | | | | | | - | |
| | | | | | | | | | | | | | | | | | | | | | | | | | | | | | | | | | | | |
Total | | $ | 40,163,121 | | | | | | | $ | (39,431,013 | ) | | | | | | $ | - | | | | | | | $ | (732,108 | ) | | | | | | $ | - | |
| | | | | | | | | | | | | | | | | | | | | | | | | | | | | | | | | | | | |
AHL Multi-Alternatives Fund
| | | | | | | | | | | | |
| Offsetting of Financial and Derivative Assets as of December 31, 2024: | |
| | Assets | | | | | | Liabilities | |
| Futures Contracts(1)(2) | | $ | 406,955 | | | | | | | $ | 486,242 | |
| Swap Contract Agreements - Centrally cleared(2) | | | 11,143 | | | | | | | | - | |
| Swap Agreement - OTC | | | 40,049 | | | | | | | | - | |
| Forward Foreign Currency Contracts | | | 1,013,690 | | | | | | | | 272,170 | |
| | | | | | | | | | | | |
| Total derivative assets and liabilities in the Statement of Assets and Liabilities | | $ | 1,471,837 | | | | | | | $ | 758,412 | |
| | | | | | | | | | | | |
| Derivatives not subject to a Master Netting Agreement or similar agreement (“MNA”) | | $ | (418,098 | ) | | | | | | $ | (486,242 | ) |
| | | | | | | | | | | | |
| Total derivative assets and liabilities subject to an MNA | | $ | 1,053,739 | | | | | | | $ | 272,170 | |
| | | | | | | | | | | | |
| | | | | | | | | | | | | | | | | | | | | | | | | | | | | | | | | | | | |
| Financial Assets, Derivatives, and Collateral Received/(Pledged) by Counterparty as of December 31, 2024: | |
| | | Gross Amounts of
Assets Presented in
the Statements of
Assets and Liabilities | | | | | | Derivatives
Available for
Offset | | | | | | Gross Amounts Not Offset in the
Statements of Assets and Liabilities | | | | | | | |
Counterparty | | | | | | | | Non-Cash Collateral
Pledged(2) | | | | | | Cash Collateral
Pledged(2) | | | | | | Net Amount | |
BNP Paribas, N.A. | | $ | 2,217 | | | | | | | $ | (410 | ) | | | | | | $ | - | | | | | | | $ | - | | | | | | | $ | 1,807 | |
Citibank, N.A. | | | 123,597 | | | | | | | | (24,303 | ) | | | | | | | - | | | | | | | | - | | | | | | | | 99,294 | |
HSBC Bank (USA) | | | 763,374 | | | | | | | | (167,454 | ) | | | | | | | - | | | | | | | | - | | | | | | | | 595,920 | |
JPMorgan Securities LLC | | | 40,049 | | | | | | | | - | | | | | | | | - | | | | | | | | - | | | | | | | | 40,049 | |
NatWest Markets PLC | | | 76,566 | | | | | | | | (76,566 | ) | | | | | | | - | | | | | | | | - | | | | | | | | - | |
State Street Bank & Trust Co. | | | 47,936 | | | | | | | | - | | | | | | | | - | | | | | | | | - | | | | | | | | 47,936 | |
| | | | | | | | | | | | | | | | | | | | | | | | | | | | | | | | | | | | |
Total | | $ | 1,053,739 | | | | | | | $ | (268,733 | ) | | | | | | $ | - | | | | | | | $ | - | | | | | | | $ | 785,006 | |
| | | | | | | | | | | | | | | | | | | | | | | | | | | | | | | | | | | | |
| | | | | | | |
| | | Gross Amounts of
Liabilities Presented
in the Statements of
Assets and Liabilities | | | | | | Derivatives
Available for
Offset | | | | | | Gross Amounts Not Offset in the
Statements of Assets and Liabilities | | | | | | | |
Counterparty | | | | | | | | Non-Cash Collateral
Received(2) | | | | | | Cash Collateral
Received(2) | | | | | | Net Amount | |
BNP Paribas, N.A. | | $ | 410 | | | | | | | $ | (410 | ) | | | | | | $ | - | | | | | | | $ | - | | | | | | | $ | - | |
Citibank, N.A. | | | 24,303 | | | | | | | | (24,303 | ) | | | | | | | - | | | | | | | | - | | | | | | | | - | |
HSBC Bank (USA) | | | 167,454 | | | | | | | | (167,454 | ) | | | | | | | - | | | | | | | | - | | | | | | | | - | |
NatWest Markets PLC | | | 80,003 | | | | | | | | (76,566 | ) | | | | | | | - | | | | | | | | (3,437 | ) | | | | | | | - | |
| | | | | | | | | | | | | | | | | | | | | | | | | | | | | | | | | | | | |
Total | | $ | 272,170 | | | | | | | $ | (268,733 | ) | | | | | | $ | - | | | | | | | $ | (3,437 | ) | | | | | | $ | - | |
| | | | | | | | | | | | | | | | | | | | | | | | | | | | | | | | | | | | |
129
American Beacon FundsSM
Consolidated Notes to Financial Statements
December 31, 2024
AHL TargetRisk Fund
| | | | | | | | | | | | |
| Offsetting of Financial and Derivative Assets as of December 31, 2024: | |
| | Assets | | | | | | Liabilities | |
| Futures Contracts(1)(2) | | $ | 171,622 | | | | | | | $ | 3,531,640 | |
| Swap Agreement - Centrally cleared(2) | | | 252,708 | | | | | | | | 48,300 | |
| Swap Agreement - OTC | | | 598,390 | | | | | | | | - | |
| Forward Foreign Currency Contracts | | | 910,756 | | | | | | | | 79,877 | |
| | | | | | | | | | | | |
| Total derivative assets and liabilities in the Statement of Assets and Liabilities | | $ | 1,933,476 | | | | | | | $ | 3,659,817 | |
| | | | | | | | | | | | |
| Derivatives not subject to a Master Netting Agreement or similar agreement (“MNA”) | | $ | (424,330 | ) | | | | | | $ | (3,579,940 | ) |
| | | | | | | | | | | | |
| Total derivative assets and liabilities subject to an MNA | | $ | 1,509,146 | | | | | | | $ | 79,877 | |
| | | | | | | | | | | | |
| | | | | | | | | | | | | | | | | | | | | | | | | | | | | | | | | | | | |
| Financial Assets, Derivatives, and Collateral Received/(Pledged) by Counterparty as of December 31, 2024: | |
| | | Gross Amounts of
Assets Presented
in the Statements of
Assets and Liabilities | | | | | | Derivatives
Available for
Offset | | | | | | Gross Amounts Not Offset in the
Statements of Assets and Liabilities | | | | | | | |
Counterparty | | | | | | | | Non-Cash Collateral
Pledged(2) | | | | | | Cash Collateral
Pledged(2) | | | | | | Net Amount | |
JPMorgan Securities LLC | | $ | 598,390 | | | | | | | $ | | | | | | | | $ | - | | | | | | | $ | - | | | | | | | $ | 598,390 | |
State Street Bank & Trust Co. | | | 910,756 | | | | | | | | (79,877 | ) | | | | | | | - | | | | | | | | - | | | | | | | | 830,879 | |
| | | | | | | | | | | | | | | | | | | | | | | | | | | | | | | | | | | | |
Total | | $ | 1,509,146 | | | | | | | $ | (79,877 | ) | | | | | | $ | - | | | | | | | $ | - | | | | | | | $ | 1,429,269 | |
| | | | | | | | | | | | | | | | | | | | | | | | | | | | | | | | | | | | |
| | | Gross Amounts of
Liabilities Presented
in the Statements of
Assets and Liabilities | | | | | | Derivatives
Available for
Offset | | | | | | Gross Amounts Not Offset in the
Statements of Assets and Liabilities | | | | | | | |
Counterparty | | | | | | | | Non-Cash Collateral
Received(2) | | | | | | Cash Collateral
Received(2) | | | | | | Net Amount | |
State Street Bank & Trust Co. | | $ | 79,877 | | | | | | | $ | (79,877 | ) | | | | | | $ | - | | | | | | | $ | - | | | | | | | $ | - | |
| | | | | | | | | | | | | | | | | | | | | | | | | | | | | | | | | | | | |
Total | | $ | 79,877 | | | | | | | $ | (79,877 | ) | | | | | | $ | - | | | | | | | $ | - | | | | | | | $ | - | |
| | | | | | | | | | | | | | | | | | | | | | | | | | | | | | | | | | | | |
(1) Includes cumulative appreciation or (depreciation) of futures contracts as reported in the Schedule of Investments footnotes. Only current day’s variation margin is reported within the Statements of Assets and Liabilities.
(2) The securities presented here within are not subject to master netting agreements. As such, this is disclosed for informational purposes only.
6. Principal Risks
Investing in the Funds may involve certain risks including, but not limited to, those described below.
Commodities Risk
The Funds’ investments in commodity-linked derivative instruments may subject the Funds to greater volatility than investments in traditional securities. The value of commodity-linked derivative instruments may be affected by changes in overall market movements, commodity index volatility, changes in interest rates, or factors affecting a particular industry or commodity, such as changes in supply and demand, drought, floods, weather, livestock disease, embargoes, tariffs, war, acts of terrorism and international economic, political and regulatory developments. The Funds and the Subsidiaries each may concentrate its assets in a particular sector of the commodities market (such as oil, metal or agricultural products). As a result, the Funds and the Subsidiaries may be more susceptible to risks associated with those sectors. The Funds’ investments in commodity-related instruments may lead to losses in excess of the Funds’ investment in such products. Such losses can significantly and adversely affect the NAV of the Funds and, consequently, a shareholder’s interest in the Funds.
Counterparty Risk
There are two separate categories of counterparty risk that arise out of a Fund’s investments in derivatives. The first relates to the risk that its swap counterparty defaults, and the second category relates to the risk that a
130
American Beacon FundsSM
Consolidated Notes to Financial Statements
December 31, 2024
futures commission merchant (“FCM”) would default on an obligation set forth in an agreement between a Fund and the FCM. As for the first category of risk, entering into derivatives in the OTC market involves counterparty risk, which is the risk that the dealer providing the derivative or other product will fail to timely perform its payment and other obligations or experience financial difficulties, which may include filing for bankruptcy. Therefore, to the extent that a Fund engages in trading in OTC markets, a Fund could be exposed to greater risk of loss through default than if it confined its trading to transactions that are centrally cleared. The second category of risk exists at and from the time that a Fund enters into derivatives transactions that are centrally cleared. In such cases, a clearing organization becomes a Fund’s counterparty and the principal counterparty risk is that the clearing organization itself will default. In addition, the FCM may hold margin posted in connection with those contracts and that margin may be rehypothecated (or re-pledged) by the FCM and lost or its return delayed due to a default by the FCM or other customer of the FCM. The FCM may itself file for bankruptcy, which would either delay the return of, or jeopardize altogether the assets posted by the FCM as margin in response to margin calls relating to cleared positions. If a counterparty fails to meet its contractual obligations, goes bankrupt, or otherwise experiences a business interruptions, a Fund could miss investment opportunities or otherwise hold investments it would prefer to sell, resulting in losses for a Fund.
Credit Risk
The Funds are subject to the risk that the issuer or guarantor of a debt security, or the counterparty to a derivatives contract or a loan will fail to make timely payment of interest or principal or otherwise honor its obligations or default completely. A decline in the credit rating of an individual security held by the Funds may have an adverse impact on its price and make it difficult for the Funds to sell it. Ratings represent a rating agency’s opinion regarding the quality of the security and are not a guarantee of quality. Rating agencies might not always change their credit rating on an issuer or security in a timely manner to reflect events that could affect the issuer’s ability to make timely payments on its obligations. Credit risk is typically greater for securities with ratings that are below investment grade. Since the Funds can invest significantly in high-yield investments considered speculative in nature, this risk may be substantial.
Currency Risk
The Funds may have exposure to foreign currencies by making direct investments in non-U.S. currencies or in securities denominated in non-U.S. currencies, or by purchasing or selling forward currency exchange contracts in non-U.S. currencies. Foreign currencies may decline in value relative to the U.S. dollar, or, in the case of hedging positions, the U.S. dollar may decline in value relative to the currency being hedged, and thereby affect a Fund’s investments in foreign (non-U.S.) currencies or in securities that trade in, and receive revenues in, or in derivatives that provide exposure to, foreign (non-U.S.) currencies. Currency exchange rates may fluctuate significantly over short periods of time for a number of reasons, including changes in interest rates, intervention (or the failure to intervene) by U.S. or foreign governments, central banks or supranational entities such as the International Monetary Fund, or by the imposition of currency controls or other political developments in the United States or abroad. As a result, the Funds’ investments in foreign currency denominated securities may reduce the returns of the Funds. Currency futures, forwards, options or swaps may not always work as intended, and in specific cases, the Funds may be worse off than if it had not used such instrument(s). There may not always be suitable hedging instruments available. Even where suitable hedging instruments are available, the Funds may choose to not hedge its currency risks.
Derivatives Risk
Derivatives may involve significant risk. The use of derivative instruments may expose the Funds to additional risks that it would not be subject to if it invested directly in the securities or other instruments underlying those derivatives, including the high degree of leverage often embedded in such instruments, and potential material and prolonged deviations between the theoretical value and realizable value of a derivative. Some derivatives have the potential for unlimited loss, regardless of the size of the initial investment. Derivatives
131
American Beacon FundsSM
Consolidated Notes to Financial Statements
December 31, 2024
may at times be illiquid, and the Funds may not be able to close out or sell a derivative at a particular time or at an anticipated price. Certain derivatives may be difficult to value, and valuation may be more difficult in times of market turmoil.
Derivatives may also be more volatile than other types of investments. The Funds may buy or sell derivatives not traded on an exchange, which may be subject to heightened liquidity and valuation risk. Derivative investments can increase portfolio turnover and transaction costs. Derivatives also are subject to counterparty risk and credit risk. As a result, the Funds may not recover their investment or may only obtain a limited recovery, and any recovery may be delayed. Not all derivative transactions require a counterparty to post collateral, which may expose the Funds to greater losses in the event of a default by a counterparty. Ongoing changes to the regulation of the derivatives markets and potential changes in the regulation of funds using derivative instruments could limit a Fund’s ability to pursue its investment strategies. New regulation of derivatives may make them more costly, or may otherwise adversely affect their liquidity, value or performance.
Foreign Investing and Emerging Markets Risk
Non-U.S. investments carry potential risks not associated with U.S. investments. Such risks include, but are not limited to: (1) currency exchange rate fluctuations, (2) political and financial instability, (3) less liquidity, (4) lack of uniform accounting, auditing and financial reporting standards, (5) increased price volatility, (6) less government regulation and supervision of foreign stock exchanges, brokers and listed companies, and (7) delays in transaction settlement in some foreign markets. To the extent the Funds invest a significant portion of its assets in securities of a single country or region, it is more likely to be affected by events or conditions of that country or region. In addition, the economies and political environments of emerging market countries tend to be more unstable than those of developed countries, resulting in more volatile rates of return than the developed markets and substantially greater risk to investors. There may be very limited oversight of certain foreign banks or securities depositories that hold foreign securities and currency and the laws of certain countries may limit the ability to recover such assets if a foreign bank or depository or their agents goes bankrupt. When investing in emerging markets, the risks of investing in foreign securities are heightened. Emerging markets have unique risks that are greater than, or in addition to, investing in developed markets because emerging markets are generally smaller, less developed, less liquid and more volatile than the securities markets of the U.S. and other developed markets. There are also risks of: greater political uncertainties; an economy’s dependence on revenues from particular commodities or on international aid or development assistance; currency transfer restrictions; a limited number of potential buyers for such securities, resulting in increased volatility and limited liquidity for emerging market securities; trading suspensions; and delays and disruptions in securities settlement procedures. In addition, there may be less information available to make investment decisions and more volatile rates of return.
Forward Foreign Currency Contracts Risk
Forward foreign currency contracts, including non-deliverable forwards, are derivative instruments pursuant to a contract with a counterparty to pay a fixed price for an agreed amount of securities or other underlying assets at an agreed date or to buy or sell a specific currency at a future date at a price set at the time of the contract. The use of forward foreign currency contracts may expose the Funds to additional risks that it would not be subject to if it invested directly in the securities or currencies underlying the forward foreign currency contract.
Futures Contracts Risk
Futures contracts are derivative instruments where one party pays a fixed price for an agreed amount of securities or other underlying assets at an agreed date. The use of such derivative instruments may expose the Funds to additional risks that they would not be subject to if they invested directly in the securities underlying those derivatives. There may at times be an imperfect correlation between the movement in the prices of futures contracts and the value of their underlying instruments or indexes. There can be no assurance that any strategy used will succeed. There also can be no assurance that, at all times, a liquid market will exist for offsetting a
132
American Beacon FundsSM
Consolidated Notes to Financial Statements
December 31, 2024
futures contract that a Fund has previously bought or sold and this may result in the inability to close a futures contract when desired. Futures contracts may experience potentially dramatic price changes, which will increase the volatility of a Fund and may involve a small investment of cash (the amount of initial and variation margin) relative to the magnitude of the risk assumed (the potential increase or decrease in the price of the futures contract).
Hedging Risk
If the Funds use a hedging instrument at the wrong time or judges the market conditions incorrectly, or the hedged instrument does not correlate to the risk sought to be hedged, the hedge might be unsuccessful, reduce the Funds’ return, or create a loss.
High Portfolio Turnover Risk
Portfolio turnover is a measure of a Fund’s trading activity over a one-year period. A portfolio turnover rate of 100% would indicate that a Fund sold and replaced the entire value of its securities holdings during the period. High portfolio turnover could increase a Fund’s transaction costs because of increased broker commissions resulting from such transactions. These costs are not reflected in the Funds’ annual operating expenses or in the expense example, but they can have a negative impact on performance. Frequent trading by the Funds could also result in increased realized net capital gains, distributions of which are taxable to the Funds’ shareholders (including net short-term capital gain distributions, which are taxable to them as ordinary income).
High-Yield Securities Risk
Exposure to high-yield, below investment-grade securities (commonly referred to as “junk bonds”) generally involves significantly greater risks than an investment in investment grade securities. High-yield debt securities may fluctuate more widely in price and yield and may fall in price when the economy is weak or expected to become weak. These securities also may be difficult to sell at the time and price a Fund desires. High-yield securities are considered to be speculative with respect to an issuer’s ability to pay interest and principal and carry a greater risk that the issuers of lower-rated securities will default on the timely payment of principal and interest. High-yield securities may experience greater price volatility and less liquidity than investment grade securities. Issuers of securities that are in default or have defaulted may fail to resume principal or interest payments, in which case the Funds may lose its entire investment.
Interest Rate Risk
Generally, the value of investments with interest rate risk, such as fixed income securities or derivatives, will move in the opposite direction to movements in interest rates. The prices of fixed income securities or derivatives are also affected by their durations. Fixed income securities or derivatives with longer durations generally have greater sensitivity to changes in interest rates. For example, if a bond has a duration of eight years, a 1% increase in interest rates could be expected to result in an 8% decrease in the value of the bond. An increase in interest rates can impact markets broadly as well. Extremely low or negative interest rates may become more prevalent among U.S. and foreign issuers. To the extent a Fund holds an investment with a negative interest rate to maturity, a Fund may generate a negative return on that investment. Conversely, in the future, interest rates may rise, perhaps significantly and/or rapidly, potentially resulting in substantial losses to a Fund.
Leverage Risk
Financial leverage magnifies the exposure to the movement in prices of an asset or class of assets underlying a derivative instrument and results in increased volatility, which means that a Fund will have the potential for greater losses than if a Fund does not use the derivative instruments that have a leveraging effect. Leverage tends to magnify, sometimes significantly, the effect of any increase or decrease in a Fund’s exposure to an asset or class of assets and may cause a Fund’s NAV to be volatile.
133
American Beacon FundsSM
Consolidated Notes to Financial Statements
December 31, 2024
A Fund may experience leveraging risk in connection with investments in derivatives because its investments in derivatives may be purchased with a fraction of the assets that would be needed to purchase the securities directly, so that the remainder of the assets may be invested in other investments. Such investments may have the effect of leveraging a Fund because a Fund may experience gains or losses not only on its investments in derivatives, but also on the investments purchased with the remainder of the assets. If the value of a Fund’s investments in derivatives is increasing, this could be offset by declining values of a Fund’s other investments. Conversely, it is possible that the rise in the value of a Fund’s non-derivative investments could be offset by a decline in the value of a Fund’s investments in derivatives. In either scenario, a Fund may experience losses. In a market where the value of a Fund’s investments in derivatives is declining and the value of its other investments is declining, a Fund may experience substantial losses. The use of leverage may cause a Fund to liquidate portfolio positions when it may not be advantageous to do so to satisfy its obligations or to meet any required asset segregation requirements. In addition, the costs that a Fund pays to engage in these practices are additional costs borne by a Fund and could reduce or eliminate any net investment profits.
LIBOR Risk
Certain of the instruments identified in a Fund’s principal investment strategies have coupon rates or may provide exposure to underlying investments with coupon rates, that are based on the ICE LIBOR (“LIBOR”), the Secured Overnight Financing Rate (“SOFR”), Euro Interbank Offered Rate and other similar types of reference rates (each, a “Reference Rate”). These Reference Rates are generally intended to represent the rate at which contributing banks may obtain short-term borrowings within certain financial markets.
Most maturities and currencies of LIBOR were phased out at the end of 2021, with the remaining ones phased out on June 30, 2023. These events and any additional regulatory or market changes may have an adverse impact on a Fund or its investments, including increased volatility or illiquidity in markets for instruments that rely on LIBOR. SOFR has been selected by a committee established by the Board of Governors of the Federal Reserve System and the Federal Reserve Bank of New York to replace LIBOR as a Reference Rate in the United States and U.S. law required that contracts without a practicable LIBOR alternative default to SOFR plus a set spread beginning in mid-2023. Other countries have undertaken similar initiatives to identify replacement Reference Rates for LIBOR in their respective markets. However, there are obstacles to converting certain existing investments and transactions to a new Reference Rate, as well as risks associated with using a new Reference Rate with respect to new investments and transactions. The transition process, or the failure of an industry to transition, could lead to increased volatility and illiquidity in markets for instruments that relied on LIBOR to determine interest rates and a reduction in the values of some LIBOR-based investments, all of which would impact a Fund. In addition, any substitute Reference Rate and any pricing adjustments imposed by a regulator or by counterparties or otherwise may adversely affect a Fund’s performance and/or NAV.
Liquidity Risk
When there is little or no active trading market for a specific type of security, it can become more difficult to purchase or sell the securities at or near their perceived value. During such periods, certain investments held by a Fund may be difficult to sell or other investments may be difficult to purchase at favorable times or prices. As a result, a Fund may have to lower the price on certain securities that it is trying to sell, sell other securities instead or forgo an investment opportunity, any of which could have a negative effect on Fund management or performance. Additionally, the market for certain investments may become illiquid under adverse market or economic conditions independent of any specific adverse changes in the conditions of a particular issuer.
Market Direction Risk
Since the Funds will typically hold both long and short positions, an investment in the Funds will involve market risks associated with different types of investment decisions than those made for a typical “long only” fund. The Funds’ results could suffer both when there is a general market advance and the Funds hold significant
134
American Beacon FundsSM
Consolidated Notes to Financial Statements
December 31, 2024
“short” positions, and when there is a general market decline and the Funds hold significant “long” positions. In recent years, the markets have shown considerable volatility from day to day and even in intra-day trading.
Market Timing Risk
The Funds are subject to the risk of market timing activities by investors due to the Funds’ investments in high yield, and foreign securities, or its exposure to foreign securities through the derivatives it holds. If the Funds trade foreign securities, it generally prices these foreign securities using their closing prices from the foreign markets in which they trade, which typically is prior to the Funds’ calculation of its net asset value (“NAV”). These prices may be affected by events that occur after the close of a foreign market but before the Fund prices its shares. In such instances, the Funds may fair value high yield and foreign securities. However, some investors may engage in frequent short-term trading in the Funds to take advantage of any price differentials that may be reflected in the NAV of the Funds’ shares. Frequent trading by Funds shareholders poses risks to other shareholders in the Funds, including (i) the dilution of the Funds’ NAV, (ii) an increase in the Funds’ expenses, and (iii) interference with the portfolio manager’s ability to execute efficient investment strategies. While the Manager monitors trading in the Funds, there is no guarantee that it can detect all market timing activities.
Market Risk
The Funds are subject to the risk that the securities markets will move down, sometimes rapidly and unpredictably, based on overall economic conditions and other factors, which may negatively affect a Fund’s performance. Equity securities generally have greater price volatility than fixed-income securities, although under certain market conditions fixed-income securities may have comparable or greater price volatility. During a general downturn in the securities markets, multiple assets may decline in value simultaneously. In some cases, traditional market participants have been less willing to make a market in some types of debt instruments, which has affected the liquidity of those instruments. During times of market turmoil, investors tend to look to the safety of securities issued or backed by the U.S. Treasury, causing the prices of these securities to rise and the yields to decline. Reduced liquidity in fixed-income and credit markets may negatively affect many issuers worldwide. Prices in many financial markets have increased significantly over the last decade, but there have also been periods of adverse market and financial developments and cyclical change during that timeframe, which have resulted in unusually high levels of volatility in domestic and foreign financial markets that has caused losses for investors and may occur again in the future, particularly if markets enter a period of uncertainty or economic weakness. The value of a security may decline due to adverse issuer-specific conditions, general market conditions unrelated to a particular issuer, or factors that affect a particular industry or industries. Changes in the financial condition of a single issuer or market segment also can impact the market as a whole.
Geopolitical and other events, including war, terrorism, economic uncertainty, trade disputes, pandemics, public health crises, natural disasters and related events have led, and in the future may continue to lead, to instability in world economies and markets generally and reduced liquidity in equity, credit and fixed-income markets, which may disrupt economies and markets and adversely affect the value of your investment. Changes in value may be temporary or may last for extended periods.
Policy changes by the U.S. government and/or Federal Reserve and political events within the U.S. and abroad, including the U.S. presidential election, the U.S. government’s inability at times to agree on a long-term budget and deficit reduction plan, the threat of a federal government shutdown and threats not to increase the federal government’s debt limit, may affect investor and consumer confidence and may adversely impact financial markets and the broader economy, perhaps suddenly and to a significant degree.
Markets and market participants are increasingly reliant upon both publicly available and proprietary information data systems. Data imprecision, software or other technology malfunctions, programming inaccuracies, unauthorized use or access, and similar circumstances may impair the performance of these systems and may have
an adverse impact upon a single issuer, a group of issuers, or the market at large. The financial markets generally
135
American Beacon FundsSM
Consolidated Notes to Financial Statements
December 31, 2024
move in cycles, with periods of rising prices followed by periods of declining prices. The value of your investment may reflect these fluctuations.
Non-Diversification Risk
The Funds are non-diversified, which means the Funds may focus their investments in the securities of a comparatively small number of issuers. Investments in securities of a limited number of issuers exposes the Funds to greater market risk and potential losses than if assets were diversified among the securities of a greater number of issuers.
Obsolescence Risk
The Funds are unlikely to be successful in its quantitative trading strategies unless the assumptions underlying the models are realistic and either remain realistic and relevant in the future or are adjusted to account for changes in the overall market environment. If such assumptions are inaccurate or become inaccurate and are not promptly adjusted, it is likely that profitable trading signals will not be generated. If and to the extent that the models do not reflect certain factors, and the sub-advisor does not successfully address such omission through its testing and evaluation and modify the models accordingly, major losses may result – all of which will be borne by the Funds. The sub-advisor will continue to test, evaluate and add new Models, which may lead to the Models being modified from time to time. Any modification of the Models or strategies will not be subject to any requirement that shareholders receive notice of the change or that they consent to it. There can be no assurance as to the effects (positive or negative) of any modification to the Models or strategies on a Fund’s performance.
Other Investment Companies Risk
The Funds may invest in shares of other registered investment companies, including money market funds and ETFs. To the extent that the Funds invest in shares of other registered investment companies, the Funds will indirectly bear the fees and expenses, including for example, advisory and administrative fees, charged by those investment companies in addition to the Funds’ direct fees and expenses and will be subject to the risks associated with investments in those companies. For example, the Funds’ investments in money market funds are subject to interest rate risk, credit risk, and market risk. The Funds must rely on the investment company in which it invests to achieve its investment objective. If the investment company fails to achieve its investment objective, the value of the Funds’ investment may decline, adversely affecting the Funds’ performance. ETFs are subject to the following risks that do not apply to conventional funds: (1) the market price of an ETF’s shares may trade at a discount or premium to its NAV; (2) an active trading market for an ETF’s shares may not develop or be maintained; or (3) trading of an ETF’s shares may be halted if the listing exchange’s officials deem such action appropriate, the shares are delisted from the exchange, or the activation of market-wide “circuit breakers” (which are tied to large decreases in stock prices) halts stock trading generally. An ETF that tracks an index may not precisely replicate the returns of its benchmark index. To the extent the Funds invest in other investment companies that invest in equity securities, fixed-income securities and/or foreign securities, or that track an index, the Funds are subject to the risks associated with the underlying investments held by the investment company or the index fluctuations to which the investment company is subject. ETFs have expenses associated with their operation, typically including advisory fees.
Recent Market Events Risk
Both U.S. and international markets have experienced significant volatility in recent months and years. As a result of such volatility, investment returns may fluctuate significantly. Moreover, the risks discussed herein associated with an investment in a Fund may be increased.
Although interest rates were unusually low in recent years in the U.S. and abroad, in 2022, the Federal Reserve and certain foreign central banks began to raise interest rates as part of their efforts to address rising
136
American Beacon FundsSM
Consolidated Notes to Financial Statements
December 31, 2024
inflation. It is difficult to accurately predict the pace at which interest rates may continue to increase, the timing, frequency or magnitude of any such increases, or when such increases might stop. Additionally, various economic and political factors could cause the Federal Reserve or another foreign central bank to change their approach in the future and such actions may result in an economic slowdown in the U.S. and abroad. Unexpected increases in interest rates could lead to market volatility or reduce liquidity in certain sectors of the market. Deteriorating economic fundamentals may, in turn, increase the risk of default or insolvency of particular issuers, negatively impact market value, cause credit spreads to widen, and reduce bank balance sheets. Any of these could cause an increase in market volatility, reduce liquidity across various markets or decrease confidence in the markets. Additionally, high public debt in the U.S. and other countries creates ongoing systemic and market risks and policymaking uncertainty.
In March 2023, the shutdown of certain financial institutions in the U.S. and questions regarding the viability of other financial institutions raised economic concerns over disruption in the U.S. and global banking systems. There can be no certainty that the actions taken by the U.S. or foreign governments will be effective in mitigating the effects of financial institution failures on the economy and restoring public confidence in the U.S. and global banking systems.
Some countries, including the U.S., have in recent years adopted more protectionist trade policies. Slowing global economic growth; imposition of tariffs and resulting impacts on global prices and supply chains; risks associated with a trade agreement between the United Kingdom and the European Union; the risks associated with ongoing trade negotiations with China; the possibility of changes to some international trade agreements; political or economic dysfunction within some nations, including major producers of oil; and dramatic changes in commodity and currency prices could have adverse effects that cannot be foreseen at the present time.
Tensions, war, or open conflict between nations, such as between Russia and Ukraine, in the Middle East or in eastern Asia could affect the economies of many nations, including the United States. The duration of ongoing hostilities in the Middle East and between Russia and Ukraine, and any sanctions and related events cannot be predicted. Those events present material uncertainty and risk with respect to markets globally and the performance of the Fund and its investments or operations could be negatively impacted.
Regulators in the U.S. have proposed and recently adopted a number of changes to regulations involving the markets and issuers, some of which apply to the Fund. The full effect of various newly-adopted regulations is not currently known. Additionally, it is not clear whether the proposed regulations will be adopted. However, due to the broad scope of the new and proposed regulations, certain changes could limit the Fund’s ability to pursue its investment strategies or make certain investments, or may make it more costly for the Fund to operate, which may impact performance.
Economists and others have expressed increasing concern about the potential effects of global climate change on property and security values. Certain issuers, industries and regions may be adversely affected by the impacts of climate change, including on the demand for and the development of goods and services and related production costs, and the impacts of legislation, regulation and international accords related to climate change, as well as any indirect consequences of regulation or business trends driven by climate change.
Short Position Risk
The Funds’ losses are potentially unlimited in a short position transaction because there is potentially no limit on the amount that the security that the Funds are required to purchase may have appreciated. Because the Funds may invest the proceeds of a short sale, another effect of short selling on the Funds is similar to the effect of leverage, in that it amplifies changes in the Funds’ net asset value since it increases the exposure of the Funds to the market.
137
American Beacon FundsSM
Consolidated Notes to Financial Statements
December 31, 2024
Sovereign and Quasi Sovereign Debt Risk
An investment in sovereign and quasi-sovereign debt obligations involves special risks not present in corporate debt obligations. Sovereign and quasi-sovereign debt securities. These investments are issued or guaranteed by a sovereign government or entity affiliated with or backed by a sovereign government. The issuer of the sovereign or quasi-sovereign debt that controls the repayment of the debt may be unable or unwilling to repay principal or interest when due, and the Funds may have limited recourse in the event of a default. In addition, these investments are subject to risk of payment delays or defaults due to (1) country cash flow problems, (2) insufficient foreign currency reserves, (3) political considerations, (4) large debt positions relative to the country’s economy, (5) policies toward foreign lenders or investors, (6) the failure to implement economic reforms required by the International Monetary Fund or other multilateral agencies, or (7) an inability or unwillingness to repay debts. It may be particularly difficult to enforce the rights of debt holders in frontier and emerging markets. A governmental entity that defaults on an obligation may request additional time in which to pay or receive further loans or may seek to restructure its obligations to reduce interest rates or outstanding principal. There is no legal process for collecting sovereign and quasi-sovereign debt that a government does not pay nor are there bankruptcy proceedings through which all or part of the sovereign debt that a governmental entity has not repaid may be collected. Sovereign and quasi-sovereign debt risk is increased for emerging and frontier markets issuers, which are among the largest debtors to commercial banks and foreign governments. At times, certain emerging market countries have declared moratoria on the payment of principal and interest on external debt. Certain emerging market countries have experienced difficulty in servicing their sovereign debt on a timely basis, which has led to defaults and the restructuring of certain indebtedness.
Subsidiaries Risk
There can be no assurance that the investment objective of a Subsidiary will be achieved. The Subsidiaries are not registered under the Act, and are not subject to all the investor protections of the Act. However, each Fund wholly owns and controls its respective Subsidiary, and each Fund and its respective Subsidiary are both managed by the Manager and the sub-advisor pursuant to separate agreements, making it unlikely that a Subsidiary will take action contrary to the interests of its respective Fund and its shareholders. The Board has oversight responsibility for the investment activities of the Funds, including its investment in the Subsidiaries, and each Fund’s role as sole shareholder of its respective Subsidiary. Changes in the laws of the United States and/or the Cayman Islands, under which the Funds and Subsidiaries, respectively, are organized, could result in the inability of the Funds and/or Subsidiaries to operate as described in the Prospectus and could negatively affect the Funds and their respective shareholders. For example, the Cayman Islands government has undertaken not to impose any income, corporate or capital gains tax, estate duty, inheritance tax, gift tax or withholding tax on the Subsidiaries. If Cayman Islands law changes such that the Subsidiaries must pay Cayman Islands taxes, Fund shareholders would likely suffer decreased investment returns. Rulemaking by the CFTC or other regulatory initiatives may affect the Funds’ ability to use its respective Subsidiary to pursue its investment strategies.
Swap Agreement Risk
Swaps can involve greater risks than a direct investment in an underlying asset, because swaps typically include a certain amount of embedded leverage and as such are subject to leveraging risk. If swaps are used as a hedging strategy, the Funds are subject to the risk that the hedging strategy may not eliminate the risk that is intended to offset, due to, among other reasons, the occurrence of unexpected price movements or the non-occurrence of expected price movements. Swaps also may be difficult to value. Interest rate swaps, total return swaps, currency swaps, credit default swaps and commodities swaps are subject to counterparty risk, credit risk and liquidity risk. In addition, interest rate swaps are subject to interest rate risk, total return swaps are subject to market risk, and interest rate risk if the underlying securities are bonds or other debt obligations, currency swaps are subject to currency risk, and commodities swaps are subject to commodities risk.
138
American Beacon FundsSM
Consolidated Notes to Financial Statements
December 31, 2024
Tax Risk
To qualify as a “regulated investment company” under Subchapter M of the Internal Revenue Code of 1986, as amended (the “Internal Revenue Code”) (“RIC”), the Funds must, among other requirements, derive at least 90% of their gross income for each taxable year from “qualifying income.” Income from certain commodity-linked derivative instruments in which AHL Managed Futures Strategy and AHL TargetRisk Funds invest is not considered qualifying income. These Funds will therefore restrict their income from direct investments in those instruments, such as commodity-linked swaps, to a maximum of 10% of their gross income for each taxable year. Each of these Fund’s investment in its Subsidiary is expected to provide the Funds with exposure to the commodities markets within the limitations of the federal tax requirements of Subchapter M. The Internal Revenue Service (“IRS”) issued a large number of private letter rulings (“PLRs”) (which the Funds may not cite as precedent) from 2006 to 2011 that income a RIC derives from a wholly owned foreign subsidiary (a “controlled foreign corporation” or “CFC”) (such as the Subsidiary) that earns income derived from commodity-linked derivative instruments is qualifying income. Treasury regulations published on March 19, 2019, provide that income inclusions of a RIC from a CFC are qualifying income for the RIC whether or not the CFC makes distributions to the RIC out of its associated earnings and profits for the applicable taxable year. The federal income tax treatment of a Fund’s commodity-linked investments and income from its Subsidiary may be materially adversely affected by future legislation, other Treasury regulations, and/or guidance issued by the IRS that could affect whether income from such investments is qualifying income under Subchapter M or otherwise materially affect the character, timing or recognition, and/or amount of a Fund’s taxable income and/or net capital gains and, therefore, the distributions the Funds make.
Valuation Risk
This is the risk that a Fund has valued a security at a price different from the price at which it can be sold. This risk may be especially pronounced for investments, such as derivatives, which may be illiquid or which may become illiquid and for securities that trade in relatively thin markets and/or markets that experience extreme volatility. If market conditions make it difficult to value certain investments, a Fund may value these investments using more subjective methods, such as fair-value methodologies. Investors who purchase or redeem Fund shares on days when a Fund is holding fair-valued securities may receive fewer or more shares, or lower or higher redemption proceeds, than they would have received if the Fund had not fair-valued the securities or had used a different valuation methodology. The value of foreign securities, certain fixed-income securities and currencies, as applicable, may be materially affected by events after the close of the markets on which they are traded, but before a Fund determines its NAV. A Fund’s ability to value its investments in an accurate and timely manner may be impacted by technological issues and/or errors by third-party service providers, such as pricing services or accounting agents.
Volatility Risk
The Funds may have investments that appreciate or decrease significantly in value over short periods of time. This may cause the Funds’ NAV per share to experience significant increases or declines in value over short periods of time. Market interest rate changes may also cause the Funds’ NAV per share to experience volatility. This is because the value of an obligation asset in the Funds is partially a function of whether it is paying what the market perceives to be a market rate of interest for the particular obligation given its individual credit and other characteristics. If market interest rates change, an obligation’s value could be affected to the extent the interest rate paid on that obligation does not reset at the same time.
7. Federal Income and Excise Taxes
It is the policy of each Fund to qualify as a regulated investment company (“RIC”), by complying with all applicable provisions of Subchapter M of the Internal Revenue Code, as amended, and to make distributions of taxable income sufficient to relieve it from substantially all federal income and excise taxes. For federal income tax purposes, each Fund is treated as a single entity for the purpose of determining such qualification.
139
American Beacon FundsSM
Consolidated Notes to Financial Statements
December 31, 2024
The Funds do not have any unrecorded tax liabilities in the accompanying financial statements. Each of the tax years in the four year period ended December 31, 2024 for AHL Managed Futures Strategy Fund and AHL TargetRisk Fund and two year period ended December 31, 2024 for AHL Multi-Alternatives Fund remain subject to examination by the Internal Revenue Service. If applicable, the Funds recognize interest accrued related to unrecognized tax benefits in interest expense and penalties in “Other expenses” on the Statements of Operations.
The Funds may be subject to taxes imposed by countries in which it invests. Such taxes are generally based on returns of income earned or gains realized or repatriated. Taxes are accrued and applied to net investment income, net realized capital gains and net unrealized appreciation (depreciation), as applicable, as the income is earned or capital gains are recorded.
Dividends are categorized in accordance with income tax regulations which may treat certain transactions differently than U.S. GAAP. Accordingly, the character of distributions and composition of net assets for tax purposes may differ from those reflected in the accompanying financial statements. The Funds also utilize earnings and profits distributed to shareholders on redemptions of shares as part of the dividends paid deduction.
The tax character of distributions paid were as follows:
| | | | | | | | | | | | | | | | | | | | | | | | | | | | | | | | | | | | | | | | | | | | |
| | | AHL Managed Futures
Strategy Fund | | | | | | AHL Multi-Alternatives Fund | | | | | | AHL TargetRisk Fund | |
| | | Year Ended
December 31,
2024 | | | | | | Year Ended
December 31,
2023 | | | | | | Year Ended
December 31,
2024 | | | | | | From August 17,
2023A to
December 31,
2023 | | | | | | Year Ended
December 31,
2024 | | | | | | Year Ended
December 31,
2023 | |
Distributions paid from: | | | | | | | | | | | | | | | | | | | | | | | | | | | | | | | | | | | | | | | | | | | | |
Ordinary income* | | | | | | | | | | | | | | | | | | | | | | | | | | | | | | | | | | | | | | | | | | | | |
R5 Class | | $ | 3,156,272 | | | | | | | $ | 8,081,982 | | | | | | | $ | - | | | | | | | | - | | | | | | | $ | 1,257,168 | | | | | | | $ | 1,016,000 | |
Y Class | | | 10,622,659 | | | | | | | | 22,062,769 | | | | | | | | 367,663 | | | | | | | | 58,990 | | | | | | | | 12,561,368 | | | | | | | | 8,797,885 | |
Investor Class | | | 201,961 | | | | | | | | 277,804 | | | | | | | | - | | | | | | | | - | | | | | | | | 186,775 | | | | | | | | 253,764 | |
A Class | | | 143,482 | | | | | | | | 287,075 | | | | | | | | 4,231 | | | | | | | | 884 | | | | | | | | 116,032 | | | | | | | | 102,669 | |
C Class | | | - | | | | | | | | - | | | | | | | | 4,178 | | | | | | | | 884 | | | | | | | | 255,290 | | | | | | | | 248,384 | |
R6 Class | | | - | | | | | | | | - | | | | | | | | 1,121,500 | | | | | | | | 218,348 | | | | | | | | - | | | | | | | | - | |
Long-term capital gains | | | | | | | | | | | | | | | | | | | | | | | | | | | | | | | | | | | | | | | | | | | | |
R5 Class | | | - | | | | | | | | - | | | | | | | | - | | | | | | | | - | | | | | | | | - | | | | | | | | - | |
Y Class | | | - | | | | | | | | - | | | | | | | | 22,895 | | | | | | | | 41,439 | | | | | | | | - | | | | | | | | - | |
Investor Class | | | - | | | | | | | | - | | | | | | | | - | | | | | | | | - | | | | | | | | - | | | | | | | | - | |
A Class | | | - | | | | | | | | - | | | | | | | | 264 | | | | | | | | 621 | | | | | | | | - | | | | | | | | - | |
C Class | | | - | | | | | | | | - | | | | | | | | 264 | | | | | | | | 621 | | | | | | | | - | | | | | | | | - | |
R6 Class | | | - | | | | | | | | - | | | | | | | | 69,836 | | | | | | | | 153,387 | | | | | | | | - | | | | | | | | - | |
| | | | | | | | | | | | | | | | | | | | | | | | | | | | | | | | | | | | | | | | | | | | |
Total distributions paid | | | 14,124,374 | | | | | | | | 30,709,630 | | | | | | | | 1,590,831 | | | | | | | | 475,174 | | | | | | | | 14,376,633 | | | | | | | | 10,418,702 | |
| | | | | | | | | | | | | | | | | | | | | | | | | | | | | | | | | | | | | | | | | | | | |
A Commencement of operations.
* For tax purposes, short-term capital gains are considered ordinary income distributions.
As of December 31, 2024, the components of distributable earnings (deficits) on a tax basis were as follows:
| | | | | | | | | | | | | | | | | | | | | | | | | | | | |
Fund | | Tax Cost | | | | | | Unrealized
Appreciation | | | | | | Unrealized
(Depreciation) | | | | | | Net Unrealized
Appreciation
(Depreciation) | |
AHL Managed Futures Strategy | | $ | 2,877,516,669 | | | | | | | $ | 211,568,888 | | | | | | | $ | (318,403,941 | ) | | | | | | $ | (106,835,053 | ) |
AHL Multi-Alternatives | | | 34,334,313 | | | | | | | | 1,171,849 | | | | | | | | (1,833,418 | ) | | | | | | | (661,569 | ) |
AHL TargetRisk | | | 253,050,419 | | | | | | | | 30,092 | | | | | | | | (6,072,255 | ) | | | | | | | (6,042,163 | ) |
| | | | | | | | | | | | | | | | | | | | | | | | | | | | | | | | | | | | | | | | | | | | |
Fund | | Net Unrealized
Appreciation
(Depreciation) | | | | | | Undistributed
Ordinary
Income | | | | | | Undistributed
Long-Term
Capital Gains | | | | | | Accumulated
Capital and
Other (Losses) | | | | | | Other Temporary
Differences | | | | | | Distributable
Earnings | |
AHL Managed Futures Strategy | | $ | (106,835,053 | ) | | | | | | $ | 121,643,692 | | | | | | | $ | - | | | | | | | $ | (296,397,935 | ) | | | | | | $ | 128,128,882 | | | | | | | $ | (153,460,414) | |
AHL Multi-Alternatives | | | (661,569 | ) | | | | | | | 820,622 | | | | | | | | - | | | | | | | | – | | | | | | | | 619,992 | | | | | | | | 779,045 | |
AHL TargetRisk | | | (6,042,163 | ) | | | | | | | 8,588,733 | | | | | | | | - | | | | | | | | (109,543,594 | ) | | | | | | | 2,412,437 | | | | | | | | (104,584,587 | ) |
140
American Beacon FundsSM
Consolidated Notes to Financial Statements
December 31, 2024
Financial reporting records are adjusted for permanent book/tax differences to reflect tax character. Financial records are not adjusted for temporary differences. The temporary differences between financial reporting and tax-basis reporting of unrealized appreciation (depreciation) are attributable primarily to the tax deferral of losses from wash sales, capital loss carryforwards, the tax deferral of losses related to straddles and the realization for tax purposes of unrealized gains (losses) on certain derivative instruments.
Due to inherent differences in the recognition of income, expenses, and realized gains (losses) under U.S. GAAP and federal income tax regulations, permanent differences between book and tax reporting have been identified and appropriately reclassified on the Statements of Assets and Liabilities. Accordingly, the following amounts represent current year permanent differences derived from non-deductible excise tax and the reclassification of income from investment subsidiary as of December 31, 2024:
| | | | | | | | | | | | |
Fund | | Paid-In-Capital | | | | | | Distributable
Earnings/(Deficits) | |
| AHL Managed Futures Strategy | | $ | (60,861,471 | ) | | | | | | $ | 60,861,471 | |
| AHL Multi-Alternatives | | | (354,071 | ) | | | | | | | 354,071 | |
| AHL TargetRisk | | | 1,239,837 | | | | | | | | (1,239,837 | ) |
Under the Regulated Investment Company Modernization Act of 2010 (“RIC MOD”), net capital losses recognized by the Funds in taxable years beginning after December 22, 2010 are carried forward indefinitely and retain their character as short-term and/or long-term losses.
As of December 31, 2024, the Funds had the following capital loss carryforwards.
| | | | | | | | | | | | |
Fund | | Short-Term Capital Loss
Carryforwards | | | | | | Long-Term Capital Loss
Carryforwards | |
| AHL Managed Futures Strategy | | $ | (155,012,825 | ) | | | | | | $ | (141,385,110 | ) |
| AHL Multi-Alternatives Fund | | | – | | | | | | | | – | |
| AHL TargetRisk | | | (55,835,644 | ) | | | | | | | (53,707,950 | ) |
The AHL TargetRisk Fund utilized $11,119,746 short-term capital loss carryforwards.
8. Investment Transactions
The aggregate cost of purchases and proceeds from sales and maturities of investments, other than short-term obligations, for the year ended December 31, 2024 were as follows:
| | | | | | | | | | | | | | | | | | | | | | | | | | | | |
Fund | | Purchases
(non-U.S.
Government
Securities) | | | | | | Purchases of
U.S.
Government
Securities | | | | | | Sales
(non-U.S.
Government
Securities) | | | | | | Sales of U.S.
Government
Securities | |
AHL Managed Futures Strategy | | $ | – | | | | | | | $ | – | | | | | | | $ | – | | | | | | | $ | – | |
AHL Multi-Alternatives | | | 3,095,819 | | | | | | | | 5,557,110 | | | | | | | | 2,461,951 | | | | | | | | 4,054,754 | |
AHL TargetRisk | | | 42,130,372 | | | | | | | | 63,424,035 | | | | | | | | 34,093,872 | | | | | | | | 51,901,979 | |
9. Borrowing Arrangements
Effective November 8, 2024 (the “Effective Date”), the Funds, along with certain other funds managed by the Manager (“Participating Funds”), renewed a committed revolving line of credit (the “Committed Line”) agreement with State Street Bank and Trust Company (the “Bank”) to be used to facilitate portfolio liquidity. The maximum borrowing amount under the Committed Line is $100 million with interest at a rate equal to the higher of (a) Overnight Bank Funding Rate (“OBFR”) daily fluctuating rate per annum equal to 1.25% plus the sum of 0.10% or (b) the Federal Funds daily fluctuating rate per annum on amounts borrowed. Each of the Participating Funds paid a proportional amount of a quarterly commitment fee at a rate of 0.25% per annum on the unused portion of the
141
American Beacon FundsSM
Consolidated Notes to Financial Statements
December 31, 2024
Committed Line amount. The Committed Line expires November 7, 2025, unless extended by the Bank or terminated by the Participating Funds in accordance with the agreement. Prior to the Effective Date, the maximum borrowing amount under the Committed Line was $100 million with an expiration date November 7, 2024.
On the Effective Date, the Funds, along with certain other Participating Funds managed by the Manager, also renewed an uncommitted discretionary demand revolving line of credit (the “Uncommitted Line”) agreement with the Bank to be used to facilitate portfolio liquidity. The maximum borrowing amount under the Uncommitted Line is $100 million with interest at a rate equal to the higher of (a) OBFR daily fluctuating rate per annum equal to 1.25% plus the sum of 0.10% or (b) the Federal Funds daily fluctuating rate per annum on amounts borrowed on each outstanding loan. Each of the Participating Funds paid a proportional amount of a closing fee of $35,000 on the Effective Date. The Uncommitted Line expires November 7, 2025, unless extended by the Bank or terminated by the Participating Funds in accordance with the agreement. Prior to the Effective Date, the maximum borrowing amount under the Uncommitted Line was $100 million with an expiration date November 7, 2024.
The Participating Funds paid administration, legal and arrangement fees, which are recognized as a component of “Line of credit interest expense” on the Statements of Operations, along with commitment fees, that have been allocated among the Participating Funds based on average daily net assets.
During the year ended December 31, 2024, the Funds did not utilize these facilities.
10. Capital Share Transactions
The tables below summarize the activity in capital shares for each Class of the Funds:
| | | | | | | | | | | | | | | | | | | | | | | | | | | | |
| | | R5 Class | |
| | | Year Ended
December 31, 2024 | | | | | | Year Ended
December 31, 2023 | |
AHL Managed Futures Strategy Fund | | Shares | | | | | | Amount | | | | | | Shares | | | | | | Amount | |
| Shares sold | | | 30,956,164 | | | | | | | $ | 315,983,783 | | | | | | | | 50,593,874 | | | | | | | $ | 512,372,686 | |
| Reinvestment of dividends | | | 191,442 | | | | | | | | 1,918,256 | | | | | | | | 534,514 | | | | | | | | 5,280,994 | |
| Shares redeemed | | | (48,402,121 | ) | | | | | | | (490,116,505 | ) | | | | | | | (43,539,506 | ) | | | | | | | (443,006,379 | ) |
| | | | | | | | | | | | | | | | | | | | | | | | | | | | |
| Net increase (decrease) in shares outstanding | | | (17,254,515 | ) | | | | | | $ | (172,214,466 | ) | | | | | | | 7,588,882 | | | | | | | $ | 74,647,301 | |
| | | | | | | | | | | | | | | | | | | | | | | | | | | | |
| | | | | | | | | | | | | | | | | | | | | | | | | | | | |
| | | Y Class | |
| | | Year Ended
December 31, 2024 | | | | | | Year Ended
December 31, 2023 | |
AHL Managed Futures Strategy Fund | | Shares | | | | | | Amount | | | | | | Shares | | | | | | Amount | |
| Shares sold | | | 101,908,099 | | | | | | | $ | 1,030,105,840 | | | | | | | | 114,825,737 | | | | | | | $ | 1,164,198,999 | |
| Reinvestment of dividends | | | 1,028,452 | | | | | | | | 10,243,379 | | | | | | | | 2,148,446 | | | | | | | | 21,119,221 | |
| Shares redeemed | | | (98,532,899 | ) | | | | | | | (1,000,140,053 | ) | | | | | | | (145,587,565 | ) | | | | | | | (1,463,885,329 | ) |
| | | | | | | | | | | | | | | | | | | | | | | | | | | | |
| Net increase (decrease) in shares outstanding | | | 4,403,652 | | | | | | | $ | 40,209,166 | | | | | | | | (28,613,382 | ) | | | | | | $ | (278,567,109 | ) |
| | | | | | | | | | | | | | | | | | | | | | | | | | | | |
| | | | | | | | | | | | | | | | | | | | | | | | | | | | |
| | | Investor Class | |
| | | Year Ended
December 31, 2024 | | | | | | Year Ended
December 31, 2023 | |
AHL Managed Futures Strategy Fund | | Shares | | | | | | Amount | | | | | | Shares | | | | | | Amount | |
| Shares sold | | | 4,479,467 | | | | | | | $ | 44,266,550 | | | | | | | | 2,441,426 | | | | | | | $ | 24,487,587 | |
| Reinvestment of dividends | | | 20,426 | | | | | | | | 200,580 | | | | | | | | 28,164 | | | | | | | | 273,189 | |
| Shares redeemed | | | (2,167,916 | ) | | | | | | | (21,728,899 | ) | | | | | | | (4,337,236 | ) | | | | | | | (43,605,644 | ) |
| | | | | | | | | | | | | | | | | | | | | | | | | | | | |
| Net increase (decrease) in shares outstanding | | | 2,331,977 | | | | | | | $ | 22,738,231 | | | | | | | | (1,867,646 | ) | | | | | | $ | (18,844,868 | ) |
| | | | | | | | | | | | | | | | | | | | | | | | | | | | |
| | | | | | | | | | | | | | | | | | | | | | | | | | | | |
142
American Beacon FundsSM
Consolidated Notes to Financial Statements
December 31, 2024
| | | | | | | | | | | | | | | | | | | | | | | | | | | | |
| | | A Class | |
| | | Year Ended
December 31, 2024 | | | | | | Year Ended
December 31, 2023 | |
AHL Managed Futures Strategy Fund | | Shares | | | | | | Amount | | | | | | Shares | | | | | | Amount | |
| Shares sold | | | 2,834,748 | | | | | | | $ | 28,451,645 | | | | | | | | 9,847,242 | | | | | | | $ | 98,095,203 | |
| Reinvestment of dividends | | | 14,385 | | | | | | | | 141,555 | | | | | | | | 29,194 | | | | | | | | 283,477 | |
| Shares redeemed | | | (3,088,156 | ) | | | | | | | (30,864,245 | ) | | | | | | | (19,934,544 | ) | | | | | | | (197,233,014 | ) |
| | | | | | | | | | | | | | | | | | | | | | | | | | | | |
| Net (decrease) in shares outstanding | | | (239,023 | ) | | | | | | $ | (2,271,045 | ) | | | | | | | (10,058,108 | ) | | | | | | $ | (98,854,334 | ) |
| | | | | | | | | | | | | | | | | | | | | | | | | | | | |
| | | | | | | | | | | | | | | | | | | | | | | | | | | | |
| | | C Class | |
| | | Year Ended
December 31, 2024 | | | | | | Year Ended
December 31, 2023 | |
AHL Managed Futures Strategy Fund | | Shares | | | | | | Amount | | | | | | Shares | | | | | | Amount | |
| Shares sold | | | 536,833 | | | | | | | $ | 5,150,486 | | | | | | | | 769,490 | | | | | | | $ | 7,346,649 | |
| Reinvestment of dividends | | | - | | | | | | | | - | | | | | | | | - | | | | | | | | - | |
| Shares redeemed | | | (1,113,186 | ) | | | | | | | (10,602,638 | ) | | | | | | | (970,673 | ) | | | | | | | (9,203,217 | ) |
| | | | | | | | | | | | | | | | | | | | | | | | | | | | |
| Net (decrease) in shares outstanding | | | (576,353 | ) | | | | | | $ | (5,452,152 | ) | | | | | | | (201,183 | ) | | | | | | $ | (1,856,568 | ) |
| | | | | | | | | | | | | | | | | | | | | | | | | | | | |
| | | | | | | | | | | | | | | | | | | | | | | | | | | | |
| | | Y Class | |
| | | Year Ended
December 31, 2024 | | | | | | August 17, 2023A to
December 31, 2023 | |
AHL Multi-Alternatives Fund | | Shares | | | | | | Amount | | | | | | Shares | | | | | | Amount | |
| Shares sold | | | 320,921 | | | | | | | $ | 3,443,159 | | | | | | | | 668,826 | B | | | | | | $ | 6,708,801 | B |
| Reinvestment of dividends | | | 38,517 | | | | | | | | 390,558 | | | | | | | | 9,885 | | | | | | | | 100,429 | |
| Shares redeemed | | | (105,609 | ) | | | | | | | (1,126,162 | ) | | | | | | | (22,155 | ) | | | | | | | (224,599 | ) |
| | | | | | | | | | | | | | | | | | | | | | | | | | | | |
| Net increase in shares outstanding | | | 253,829 | | | | | | | $ | 2,707,555 | | | | | | | | 656,556 | | | | | | | $ | 6,584,631 | |
| | | | | | | | | | | | | | | | | | | | | | | | | | | | |
| | | | |
| | | A Class | |
| | | Year Ended
December 31, 2024 | | | | | | August 17, 2023A to
December 31, 2023 | |
AHL Multi-Alternatives Fund | | Shares | | | | | | Amount | | | | | | Shares | | | | | | Amount | |
| Shares sold | | | - | | | | | | | $ | - | | | | | | | | - | B | | | | | | $ | - | B |
| Reinvestment of dividends | | | 445 | | | | | | | | 4,495 | | | | | | | | 148 | | | | | | | | 1,505 | |
| Shares redeemed | | | - | | | | | | | | - | | | | | | | | - | | | | | | | | - | |
| | | | | | | | | | | | | | | | | | | | | | | | | | | | |
| Net increase in shares outstanding | | | 445 | | | | | | | $ | 4,495 | | | | | | | | 148 | | | | | | | $ | 1,505 | |
| | | | | | | | | | | | | | | | | | | | | | | | | | | | |
| | | | |
| | | C Class | |
| | | Year Ended
December 31, 2024 | | | | | | August 17, 2023A to
December 31, 2023 | |
AHL Multi-Alternatives Fund | | Shares | | | | | | Amount | | | | | | Shares | | | | | | Amount | |
| Shares sold | | | - | | | | | | | $ | - | | | | | | | | - | B | | | | | | $ | - | B |
| Reinvestment of dividends | | | 444 | | | | | | | | 4,442 | | | | | | | | 149 | | | | | | | | 1,505 | |
| Shares redeemed | | | - | | | | | | | | - | | | | | | | | - | | | | | | | | - | |
| | | | | | | | | | | | | | | | | | | | | | | | | | | | |
| Net increase in shares outstanding | | | 444 | | | | | | | $ | 4,442 | | | | | | | | 149 | | | | | | | $ | 1,505 | |
| | | | | | | | | | | | | | | | | | | | | | | | | | | | |
| | | | |
| | | R6 Class | |
| | | Year Ended
December 31, 2024 | | | | | | August 17, 2023A to
December 31, 2023 | |
AHL Multi-Alternatives Fund | | Shares | | | | | | Amount | | | | | | Shares | | | | | | Amount | |
| Shares sold | | | 742,561 | | | | | | | $ | 7,763,565 | | | | | | | | 250,001 | B | | | | | | $ | 2,500,010 | B |
| Reinvestment of dividends | | | 117,373 | | | | | | | | 1,191,336 | | | | | | | | 36,588 | | | | | | | | 371,735 | |
| Shares redeemed | | | (100,442 | ) | | | | | | | (1,073,323 | ) | | | | | | | (476,963 | ) | | | | | | | (4,869,793 | ) |
| | | | | | | | | | | | | | | | | | | | | | | | | | | | |
| Net increase (decrease) in shares outstanding | | | 759,492 | | | | | | | $ | 7,881,578 | | | | | | | | (190,374 | ) | | | | | | $ | (1,998,048 | ) |
| | | | | | | | | | | | | | | | | | | | | | | | | | | | |
| | | | |
| | | R5 Class | |
| | | Year Ended
December 31, 2024 | | | | | | Year Ended
December 31, 2023 | |
AHL TargetRisk Fund | | Shares | | | | | | Amount | | | | | | Shares | | | | | | Amount | |
| Shares sold | | | 571,619 | | | | | | | $ | 6,429,044 | | | | | | | | 805,106 | | | | | | | $ | 8,146,521 | |
| Reinvestment of dividends | | | 95,172 | | | | | | | | 1,019,297 | | | | | | | | 77,394 | | | | | | | | 810,314 | |
| Shares redeemed | | | (814,051 | ) | | | | | | | (9,031,766 | ) | | | | | | | (5,707,271 | ) | | | | | | | (58,467,743 | ) |
| | | | | | | | | | | | | | | | | | | | | | | | | | | | |
| Net (decrease) in shares outstanding | | | (147,260 | ) | | | | | | $ | (1,583,425 | ) | | | | | | | (4,824,771 | ) | | | | | | $ | (49,510,908 | ) |
| | | | | | | | | | | | | | | | | | | | | | | | | | | | |
| | | | |
143
American Beacon FundsSM
Consolidated Notes to Financial Statements
December 31, 2024
| | | | | | | | | | | | | | | | | | | | | | | | | | | | |
| | | Y Class | |
| | | Year Ended
December 31, 2024 | | | | | | Year Ended
December 31, 2023 | |
AHL TargetRisk Fund | | Shares | | | | | | Amount | | | | | | Shares | | | | | | Amount | |
| Shares sold | | | 8,116,151 | | | | | | | $ | 91,393,875 | | | | | | | | 7,224,904 | | | | | | | $ | 73,079,633 | |
| Reinvestment of dividends | | | 1,167,689 | | | | | | | | 12,505,945 | | | | | | | | 822,035 | | | | | | | | 8,606,708 | |
| Shares redeemed | | | (8,682,913 | ) | | | | | | | (96,236,786 | ) | | | | | | | (21,491,044 | ) | | | | | | | (218,043,679 | ) |
| | | | | | | | | | | | | | | | | | | | | | | | | | | | |
| Net increase (decrease) in shares outstanding | | | 600,927 | | | | | | | $ | 7,663,034 | | | | | | | | (13,444,105 | ) | | | | | | $ | (136,357,338 | ) |
| | | | | | | | | | | | | | | | | | | | | | | | | | | | |
| | | | |
| | | Investor Class | |
| | | Year Ended
December 31, 2024 | | | | | | Year Ended
December 31, 2023 | |
AHL TargetRisk Fund | | Shares | | | | | | Amount | | | | | | Shares | | | | | | Amount | |
| Shares sold | | | 348,648 | | | | | | | $ | 3,906,249 | | | | | | | | 110,005 | | | | | | | $ | 1,121,346 | |
| Reinvestment of dividends | | | 17,356 | | | | | | | | 185,540 | | | | | | | | 24,213 | | | | | | | | 252,780 | |
| Shares redeemed | | | (674,841 | ) | | | | | | | (7,359,776 | ) | | | | | | | (619,817 | ) | | | | | | | (6,202,663 | ) |
| | | | | | | | | | | | | | | | | | | | | | | | | | | | |
| Net (decrease) in shares outstanding | | | (308,837 | ) | | | | | | $ | (3,267,987 | ) | | | | | | | (485,599 | ) | | | | | | $ | (4,828,537 | ) |
| | | | | | | | | | | | | | | | | | | | | | | | | | | | |
| | | | |
| | | A Class | |
| | | Year Ended
December 31, 2024 | | | | | | Year Ended
December 31, 2023 | |
AHL TargetRisk Fund | | Shares | | | | | | Amount | | | | | | Shares | | | | | | Amount | |
| Shares sold | | | 94,543 | | | | | | | $ | 1,047,128 | | | | | | | | 176,241 | | | | | | | $ | 1,783,437 | |
| Reinvestment of dividends | | | 10,825 | | | | | | | | 115,178 | | | | | | | | 9,819 | | | | | | | | 102,125 | |
| Shares redeemed | | | (126,312 | ) | | | | | | | (1,377,686 | ) | | | | | | | (305,755 | ) | | | | | | | (3,093,481 | ) |
| | | | | | | | | | | | | | | | | | | | | | | | | | | | |
| Net (decrease) in shares outstanding | | | (20,944 | ) | | | | | | $ | (215,380 | ) | | | | | | | (119,695 | ) | | | | | | $ | (1,207,919 | ) |
| | | | | | | | | | | | | | | | | | | | | | | | | | | | |
| | | | | | | | | | | | | | | | | | | | | | | | | | | | |
| | | C Class | |
| | | Year Ended
December 31, 2024 | | | | | | Year Ended
December 31, 2023 | |
AHL TargetRisk Fund | | Shares | | | | | | Amount | | | | | | Shares | | | | | | Amount | |
| Shares sold | | | 44,067 | | | | | | | $ | 461,816 | | | | | | | | 50,393 | | | | | | | $ | 502,531 | |
| Reinvestment of dividends | | | 24,137 | | | | | | | | 255,125 | | | | | | | | 23,411 | | | | | | | | 241,366 | |
| Shares redeemed | | | (296,272 | ) | | | | | | | (3,230,156 | ) | | | | | | | (440,857 | ) | | | | | | | (4,384,250 | ) |
| | | | | | | | | | | | | | | | | | | | | | | | | | | | |
| Net (decrease) in shares outstanding | | | (228,068 | ) | | | | | | $ | (2,513,215 | ) | | | | | | | (367,053 | ) | | | | | | $ | (3,640,353 | ) |
| | | | | | | | | | | | | | | | | | | | | | | | | | | | |
A Commencement of operations.
B Seed capital was received on August 17, 2023 in the amount of $100,000 for the Y Class, $100,000 for the A Class, $100,000 for the C Class and $22,200,000 for the R6 Class. As a result, shares were issued in the amount of 10,000 for the Y Class, 10,000 for the A Class, 10,000 for the C Class and 2,220,000 for the R6 Class.
11. Subsequent Events
Management has evaluated subsequent events for possible recognition or disclosure in the financial statements through the date the financial statements are issued. Management has determined that there are no material events that would require disclosure in the Funds’ financial statements through this date.
144
American Beacon AHL Managed Futures Strategy FundSM
Consolidated Financial Highlights
(For a share outstanding throughout the period)
| | | | | | | | | | | | | | | | | | | | | | | | | | | | | | | | | | | | |
| | | R5 ClassA | |
| | | Year Ended December 31, | |
| | | 2024 | | | | | | 2023 | | | | | | 2022 | | | | | | 2021 | | | | | | 2020 | |
| | | | |
Net asset value, beginning of period | | $ | 9.91 | | | | | | | $ | 10.42 | | | | | | | $ | 10.49 | | | | | | | $ | 10.72 | | | | | | | $ | 10.22 | |
| | | | | | | | | | | | | | | | | | | | | | | | | | | | | | | | | | | | |
Income (loss) from investment operations: | | | | | | | | | | | | | | | | | | | | | | | | | | | | | | | | | | | | |
Net investment income (loss) | | | 0.12 | | | | | | | | 0.43 | | | | | | | | 0.41 | | | | | | | | (0.18 | )B | | | | | | | (1.03 | ) |
Net gains (losses) on investments (both realized and unrealized) | | | 0.09 | | | | | | | | (0.83 | ) | | | | | | | 1.36 | | | | | | | | 0.74 | | | | | | | | 2.10 | |
| | | | | | | | | | | | | | | | | | | | | | | | | | | | | | | | | | | | |
Total income (loss) from investment operations | | | 0.21 | | | | | | | | (0.40 | ) | | | | | | | 1.77 | | | | | | | | 0.56 | | | | | | | | 1.07 | |
| | | | | | | | | | | | | | | | | | | | | | | | | | | | | | | | | | | | |
Less distributions: | | | | | | | | | | | | | | | | | | | | | | | | | | | | | | | | | | | | |
Dividends from net investment income | | | (0.06 | ) | | | | | | | (0.11 | ) | | | | | | | (0.52 | ) | | | | | | | (0.47 | ) | | | | | | | (0.34 | ) |
Distributions from net realized gains | | | - | | | | | | | | - | | | | | | | | (1.32 | ) | | | | | | | (0.32 | ) | | | | | | | (0.23 | ) |
| | | | | | | | | | | | | | | | | | | | | | | | | | | | | | | | | | | | |
Total distributions | | | (0.06 | ) | | | | | | | (0.11 | ) | | | | | | | (1.84 | ) | | | | | | | (0.79 | ) | | | | | | | (0.57 | ) |
| | | | | | | | | | | | | | | | | | | | | | | | | | | | | | | | | | | | |
Net asset value, end of period | | $ | 10.06 | | | | | | | $ | 9.91 | | | | | | | $ | 10.42 | | | | | | | $ | 10.49 | | | | | | | $ | 10.72 | |
| | | | | | | | | | | | | | | | | | | | | | | | | | | | | | | | | | | | |
Total returnC | | | 2.07 | % | | | | | | | (3.85 | )% | | | | | | | 16.93 | % | | | | | | | 5.12 | % | | | | | | | 10.67 | % |
| | | | | | | | | | | | | | | | | | | | | | | | | | | | | | | | | | | | |
| | | | | | | | | |
Ratios and supplemental data: | | | | | | | | | | | | | | | | | | | | | | | | | | | | | | | | | | | | |
Net assets, end of period | | $ | 572,740,617 | | | | | | | $ | 735,326,328 | | | | | | | $ | 693,916,735 | | | | | | | $ | 473,334,156 | | | | | | | $ | 195,920,482 | |
Ratios to average net assets: | | | | | | | | | | | | | | | | | | | | | | | | | | | | | | | | | | | | |
Expenses, before reimbursements and/or recoupmentsD | | | 1.53 | % | | | | | | | 1.51 | % | | | | | | | 1.49 | % | | | | | | | 1.55 | % | | | | | | | 1.59 | % |
Expenses, net of reimbursements and/or recoupmentsD | | | 1.53 | % | | | | | | | 1.51 | % | | | | | | | 1.48 | % | | | | | | | 1.54 | % | | | | | | | 1.54 | % |
Net investment income (loss), before expense reimbursements and/or recoupments | | | 3.30 | % | | | | | | | 3.15 | % | | | | | | | 0.08 | % | | | | | | | (1.58 | )% | | | | | | | (3.19 | )% |
Net investment income (loss), net of reimbursements and/or recoupments . | | | 3.30 | % | | | | | | | 3.15 | % | | | | | | | 0.09 | % | | | | | | | (1.57 | )% | | | | | | | (3.14 | )% |
Portfolio turnover rateE | | | - | % | | | | | | | - | % | | | | | | | - | % | | | | | | | - | % | | | | | | | - | % |
| A | Prior to February 28, 2020, the R5 Class was known as Institutional Class. |
| B | Per share amounts have been calculated using the average shares method. |
| C | Based on net asset value, which does not reflect the sales charge, redemption fee, or contingent deferred sales charge, if applicable. May include adjustments in accordance with U.S. GAAP and as such, the net asset value for reporting purposes and the returns based upon those net asset values may differ from the net asset value and returns for shareholder transactions. |
| D | Please refer to the Expense Reimbursement Plan in Note 2 of the Notes to the Consolidated Financial Statements for information related to the voluntary fees waived and expenses reimbursed at the American Beacon Cayman Managed Futures Strategy Fund, Ltd. |
| E | Portfolio turnover is based on the lesser of long-term purchases or sales divided by the average long-term fair value during the period. The Fund did not invest in any long-term securities during the reporting period. |
See accompanying notes
145
American Beacon AHL Managed Futures Strategy FundSM
Consolidated Financial Highlights
(For a share outstanding throughout the period)
| | | | | | | | | | | | | | | | | | | | | | | | | | | | | | | | | | | | |
| | | Y Class | |
| | | Year Ended December 31, | |
| | | 2024 | | | | | | 2023 | | | | | | 2022 | | | | | | 2021 | | | | | | 2020 | |
| | | | |
Net asset value, beginning of period | | $ | 9.85 | | | | | | | $ | 10.36 | | | | | | | $ | 10.43 | | | | | | | $ | 10.67 | | | | | | | $ | 10.17 | |
| | | | | | | | | | | | | | | | | | | | | | | | | | | | | | | | | | | | |
Income (loss) from investment operations: | | | | | | | | | | | | | | | | | | | | | | | | | | | | | | | | | | | | |
Net investment income (loss) | | | 0.35 | | | | | | | | 0.23 | | | | | | | | 0.40 | | | | | | | | (0.17 | )A | | | | | | | 0.08 | |
Net gains (losses) on investments (both realized and unrealized) | | | (0.15 | ) | | | | | | | (0.64 | ) | | | | | | | 1.36 | | | | | | | | 0.72 | | | | | | | | 0.99 | |
| | | | | | | | | | | | | | | | | | | | | | | | | | | | | | | | | | | | |
Total income (loss) from investment operations | | | 0.20 | | | | | | | | (0.41 | ) | | | | | | | 1.76 | | | | | | | | 0.55 | | | | | | | | 1.07 | |
| | | | | | | | | | | | | | | | | | | | | | | | | | | | | | | | | | | | |
Less distributions: | | | | | | | | | | | | | | | | | | | | | | | | | | | | | | | | | | | | |
Dividends from net investment income | | | (0.05 | ) | | | | | | | (0.10 | ) | | | | | | | (0.51 | ) | | | | | | | (0.47 | ) | | | | | | | (0.34 | ) |
Distributions from net realized gains | | | - | | | | | | | | - | | | | | | | | (1.32 | ) | | | | | | | (0.32 | ) | | | | | | | (0.23 | ) |
| | | | | | | | | | | | | | | | | | | | | | | | | | | | | | | | | | | | |
Total distributions | | | (0.05 | ) | | | | | | | (0.10 | ) | | | | | | | (1.83 | ) | | | | | | | (0.79 | ) | | | | | | | (0.57 | ) |
| | | | | | | | | | | | | | | | | | | | | | | | | | | | | | | | | | | | |
Net asset value, end of period | | $ | 10.00 | | | | | | | $ | 9.85 | | | | | | | $ | 10.36 | | | | | | | $ | 10.43 | | | | | | | $ | 10.67 | |
| | | | | | | | | | | | | | | | | | | | | | | | | | | | | | | | | | | | |
Total returnB | | | 1.99 | % | | | | | | | (3.99 | )% | | | | | | | 16.95 | % | | | | | | | 5.04 | % | | | | | | | 10.71 | % |
| | | | | | | | | | | | | | | | | | | | | | | | | | | | | | | | | | | | |
| | | | | | | | | |
Ratios and supplemental data: | | | | | | | | | | | | | | | | | | | | | | | | | | | | | | | | | | | | |
Net assets, end of period | | $ | 2,317,399,884 | | | | | | | $ | 2,239,856,084 | | | | | | | $ | 2,650,349,111 | | | | | | | $ | 1,608,801,856 | | | | | | | $ | 888,669,539 | |
Ratios to average net assets: | | | | | | | | | | | | | | | | | | | | | | | | | | | | | | | | | | | | |
Expenses, before reimbursements and/or recoupmentsC | | | 1.63 | % | | | | | | | 1.60 | % | | | | | | | 1.56 | % | | | | | | | 1.54 | % | | | | | | | 1.64 | % |
Expenses, net of reimbursements and/or recoupmentsC | | | 1.63 | % | | | | | | | 1.60 | % | | | | | | | 1.55 | % | | | | | | | 1.53 | % | | | | | | | 1.62 | % |
Net investment income (loss), before expense reimbursements and/or recoupments | | | 3.17 | % | | | | | | | 3.03 | % | | | | | | | 0.00 | %D | | | | | | | (1.48 | )% | | | | | | | 0.02 | % |
Net investment income (loss), net of reimbursements and/or recoupments . | | | 3.17 | % | | | | | | | 3.03 | % | | | | | | | 0.01 | % | | | | | | | (1.47 | )% | | | | | | | 0.04 | % |
Portfolio turnover rateE | | | - | % | | | | | | | - | % | | | | | | | - | % | | | | | | | - | % | | | | | | | - | % |
| A | Per share amounts have been calculated using the average shares method. |
| B | Based on net asset value, which does not reflect the sales charge, redemption fee, or contingent deferred sales charge, if applicable. May include adjustments in accordance with U.S. GAAP and as such, the net asset value for reporting purposes and the returns based upon those net asset values may differ from the net asset value and returns for shareholder transactions. |
| C | Please refer to the Expense Reimbursement Plan in Note 2 of the Notes to the Consolidated Financial Statements for information related to the voluntary fees waived and expenses reimbursed at the American Beacon Cayman Managed Futures Strategy Fund, Ltd. |
| D | Amount rounds to less than 0.005%. |
| E | Portfolio turnover is based on the lesser of long-term purchases or sales divided by the average long-term fair value during the period. The Fund did not invest in any long-term securities during the reporting period. |
See accompanying notes
146
American Beacon AHL Managed Futures Strategy FundSM
Consolidated Financial Highlights
(For a share outstanding throughout the period)
| | | | | | | | | | | | | | | | | | | | | | | | | | | | | | | | | | | | |
| | | Investor Class | |
| | | Year Ended December 31, | |
| | | 2024 | | | | | | 2023 | | | | | | 2022 | | | | | | 2021 | | | | | | 2020 | |
| | | | |
Net asset value, beginning of period | | $ | 9.72 | | | | | | | $ | 10.21 | | | | | | | $ | 10.32 | | | | | | | $ | 10.56 | | | | | | | $ | 10.07 | |
| | | | | | | | | | | | | | | | | | | | | | | | | | | | | | | | | | | | |
Income (loss) from investment operations: | | | | | | | | | | | | | | | | | | | | | | | | | | | | | | | | | | | | |
Net investment income (loss) | | | 0.65 | | | | | | | | 0.27 | A | | | | | | | (0.02 | )A | | | | | | | (0.17 | ) | | | | | | | (0.04 | )A |
Net gains (losses) on investments (both realized and unrealized) | | | (0.48 | ) | | | | | | | (0.70 | ) | | | | | | | 1.72 | | | | | | | | 0.67 | | | | | | | | 1.07 | |
| | | | | | | | | | | | | | | | | | | | | | | | | | | | | | | | | | | | |
Total income (loss) from investment operations | | | 0.17 | | | | | | | | (0.43 | ) | | | | | | | 1.70 | | | | | | | | 0.50 | | | | | | | | 1.03 | |
| | | | | | | | | | | | | | | | | | | | | | | | | | | | | | | | | | | | |
Less distributions: | | | | | | | | | | | | | | | | | | | | | | | | | | | | | | | | | | | | |
Dividends from net investment income | | | (0.03 | ) | | | | | | | (0.06 | ) | | | | | | | (0.49 | ) | | | | | | | (0.42 | ) | | | | | | | (0.31 | ) |
Distributions from net realized gains | | | - | | | | | | | | - | | | | | | | | (1.32 | ) | | | | | | | (0.32 | ) | | | | | | | (0.23 | ) |
| | | | | | | | | | | | | | | | | | | | | | | | | | | | | | | | | | | | |
Total distributions | | | (0.03 | ) | | | | | | | (0.06 | ) | | | | | | | (1.81 | ) | | | | | | | (0.74 | ) | | | | | | | (0.54 | ) |
| | | | | | | | | | | | | | | | | | | | | | | | | | | | | | | | | | | | |
Net asset value, end of period | | $ | 9.86 | | | | | | | $ | 9.72 | | | | | | | $ | 10.21 | | | | | | | $ | 10.32 | | | | | | | $ | 10.56 | |
| | | | | | | | | | | | | | | | | | | | | | | | | | | | | | | | | | | | |
Total returnB | | | 1.74 | % | | | | | | | (4.20 | )% | | | | | | | 16.47 | % | | | | | | | 4.69 | % | | | | | | | 10.42 | % |
| | | | | | | | | | | | | | | | | | | | | | | | | | | | | | | | | | | | |
| | | | | | | | | |
Ratios and supplemental data: | | | | | | | | | | | | | | | | | | | | | | | | | | | | | | | | | | | | |
Net assets, end of period | | $ | 68,313,579 | | | | | | | $ | 44,699,687 | | | | | | | $ | 66,007,099 | | | | | | | $ | 37,408,089 | | | | | | | $ | 31,217,881 | |
Ratios to average net assets: | | | | | | | | | | | | | | | | | | | | | | | | | | | | | | | | | | | | |
Expenses, before reimbursements and/or recoupmentsC | | | 1.91 | % | | | | | | | 1.86 | % | | | | | | | 1.84 | % | | | | | | | 1.93 | % | | | | | | | 1.97 | % |
Expenses, net of reimbursements and/or recoupmentsC | | | 1.91 | % | | | | | | | 1.86 | % | | | | | | | 1.83 | % | | | | | | | 1.92 | % | | | | | | | 1.92 | % |
Net investment income (loss), before expense reimbursements and/or recoupments | | | 2.87 | % | | | | | | | 2.74 | % | | | | | | | (0.20 | )% | | | | | | | (2.84 | )% | | | | | | | (0.44 | )% |
Net investment income (loss), net of reimbursements and/or recoupments . | | | 2.87 | % | | | | | | | 2.74 | % | | | | | | | (0.19 | )% | | | | | | | (2.83 | )% | | | | | | | (0.39 | )% |
Portfolio turnover rateD | | | - | % | | | | | | | - | % | | | | | | | - | % | | | | | | | - | % | | | | | | | - | % |
| A | Per share amounts have been calculated using the average shares method. |
| B | Based on net asset value, which does not reflect the sales charge, redemption fee, or contingent deferred sales charge, if applicable. May include adjustments in accordance with U.S. GAAP and as such, the net asset value for reporting purposes and the returns based upon those net asset values may differ from the net asset value and returns for shareholder transactions. |
| C | Please refer to the Expense Reimbursement Plan in Note 2 of the Notes to the Consolidated Financial Statements for information related to the voluntary fees waived and expenses reimbursed at the American Beacon Cayman Managed Futures Strategy Fund, Ltd. |
| D | Portfolio turnover is based on the lesser of long-term purchases or sales divided by the average long-term fair value during the period. The Fund did not invest in any long-term securities during the reporting period. |
See accompanying notes
147
American Beacon AHL Managed Futures Strategy FundSM
Consolidated Financial Highlights
(For a share outstanding throughout the period)
| | | | | | | | | | | | | | | | | | | | | | | | | | | | | | | | | | | | |
| | | A Class | |
| | | Year Ended December 31, | |
| | | 2024 | | | | | | 2023 | | | | | | 2022 | | | | | | 2021 | | | | | | 2020 | |
| | | | |
Net asset value, beginning of period | | $ | 9.73 | | | | | | | $ | 10.19 | | | | | | | $ | 10.32 | | | | | | | $ | 10.56 | | | | | | | $ | 10.08 | |
| | | | | | | | | | | | | | | | | | | | | | | | | | | | | | | | | | | | |
Income (loss) from investment operations: | | | | | | | | | | | | | | | | | | | | | | | | | | | | | | | | | | | | |
Net investment income (loss) | | | 0.29 | | | | | | | | 0.27 | A | | | | | | | 1.04 | | | | | | | | (0.16 | )A | | | | | | | (0.01 | ) |
Net gains (losses) on investments (both realized and unrealized) | | | (0.12 | ) | | | | | | | (0.70 | ) | | | | | | | 0.66 | | | | | | | | 0.68 | | | | | | | | 1.03 | |
| | | | | | | | | | | | | | | | | | | | | | | | | | | | | | | | | | | | |
Total income (loss) from investment operations | | | 0.17 | | | | | | | | (0.43 | ) | | | | | | | 1.70 | | | | | | | | 0.52 | | | | | | | | 1.02 | |
| | | | | | | | | | | | | | | | | | | | | | | | | | | | | | | | | | | | |
Less distributions: | | | | | | | | | | | | | | | | | | | | | | | | | | | | | | | | | | | | |
Dividends from net investment income | | | (0.02 | ) | | | | | | | (0.03 | ) | | | | | | | (0.51 | ) | | | | | | | (0.44 | ) | | | | | | | (0.31 | ) |
Distributions from net realized gains | | | - | | | | | | | | - | | | | | | | | (1.32 | ) | | | | | | | (0.32 | ) | | | | | | | (0.23 | ) |
| | | | | | | | | | | | | | | | | | | | | | | | | | | | | | | | | | | | |
Total distributions | | | (0.02 | ) | | | | | | | (0.03 | ) | | | | | | | (1.83 | ) | | | | | | | (0.76 | ) | | | | | | | (0.54 | ) |
| | | | | | | | | | | | | | | | | | | | | | | | | | | | | | | | | | | | |
Net asset value, end of period | | $ | 9.88 | | | | | | | $ | 9.73 | | | | | | | $ | 10.19 | | | | | | | $ | 10.32 | | | | | | | $ | 10.56 | |
| | | | | | | | | | | | | | | | | | | | | | | | | | | | | | | | | | | | |
Total returnB | | | 1.71 | % | | | | | | | (4.21 | )% | | | | | | | 16.53 | % | | | | | | | 4.88 | % | | | | | | | 10.31 | % |
| | | | | | | | | | | | | | | | | | | | | | | | | | | | | | | | | | | | |
| | | | | | | | | |
Ratios and supplemental data: | | | | | | | | | | | | | | | | | | | | | | | | | | | | | | | | | | | | |
Net assets, end of period | | $ | 88,263,305 | | | | | | | $ | 89,278,134 | | | | | | | $ | 195,971,375 | | | | | | | $ | 9,680,124 | | | | | | | $ | 4,653,583 | |
Ratios to average net assets: | | | | | | | | | | | | | | | | | | | | | | | | | | | | | | | | | | | | |
Expenses, before reimbursements and/or recoupmentsC | | | 1.92 | % | | | | | | | 1.89 | % | | | | | | | 1.80 | % | | | | | | | 1.82 | % | | | | | | | 1.91 | % |
Expenses, net of reimbursements and/or recoupmentsC | | | 1.92 | % | | | | | | | 1.89 | % | | | | | | | 1.79 | % | | | | | | | 1.81 | % | | | | | | | 1.90 | % |
Net investment income (loss), before expense reimbursements and/or recoupments | | | 2.89 | % | | | | | | | 2.70 | % | | | | | | | 0.45 | % | | | | | | | (1.44 | )% | | | | | | | (0.69 | )% |
Net investment income (loss), net of reimbursements and/or recoupments . | | | 2.89 | % | | | | | | | 2.70 | % | | | | | | | 0.46 | % | | | | | | | (1.43 | )% | | | | | | | (0.68 | )% |
Portfolio turnover rateD | | | - | % | | | | | | | - | % | | | | | | | - | % | | | | | | | - | % | | | | | | | - | % |
| A | Per share amounts have been calculated using the average shares method. |
| B | Based on net asset value, which does not reflect the sales charge, redemption fee, or contingent deferred sales charge, if applicable. May include adjustments in accordance with U.S. GAAP and as such, the net asset value for reporting purposes and the returns based upon those net asset values may differ from the net asset value and returns for shareholder transactions. |
| C | Please refer to the Expense Reimbursement Plan in Note 2 of the Notes to the Consolidated Financial Statements for information related to the voluntary fees waived and expenses reimbursed at the American Beacon Cayman Managed Futures Strategy Fund, Ltd. |
| D | Portfolio turnover is based on the lesser of long-term purchases or sales divided by the average long-term fair value during the period. The Fund did not invest in any long-term securities during the reporting period. |
See accompanying notes
148
American Beacon AHL Managed Futures Strategy FundSM
Consolidated Financial Highlights
(For a share outstanding throughout the period)
| | | | | | | | | | | | | | | | | | | | | | | | | | | | | | | | | | | | |
| | | C Class | |
| | | Year Ended December 31, | |
| | | 2024 | | | | | | 2023 | | | | | | 2022 | | | | | | 2021 | | | | | | 2020 | |
| | | | |
Net asset value, beginning of period | | $ | 9.34 | | | | | | | $ | 9.81 | | | | | | | $ | 10.00 | | | | | | | $ | 10.27 | | | | | | | $ | 9.82 | |
| | | | | | | | | | | | | | | | | | | | | | | | | | | | | | | | | | | | |
Income (loss) from investment operations: | | | | | | | | | | | | | | | | | | | | | | | | | | | | | | | | | | | | |
Net investment income (loss) | | | 0.10 | | | | | | | | 0.16 | | | | | | | | (0.09 | )A | | | | | | | (0.33 | )A | | | | | | | (0.11 | )A |
Net gains (losses) on investments (both realized and unrealized) | | | (0.01 | ) | | | | | | | (0.63 | ) | | | | | | | 1.66 | | | | | | | | 0.75 | | | | | | | | 1.04 | |
| | | | | | | | | | | | | | | | | | | | | | | | | | | | | | | | | | | | |
Total income (loss) from investment operations | | | 0.09 | | | | | | | | (0.47 | ) | | | | | | | 1.57 | | | | | | | | 0.42 | | | | | | | | 0.93 | |
| | | | | | | | | | | | | | | | | | | | | | | | | | | | | | | | | | | | |
Less distributions: | | | | | | | | | | | | | | | | | | | | | | | | | | | | | | | | | | | | |
Dividends from net investment income | | | - | | | | | | | | - | | | | | | | | (0.44 | ) | | | | | | | (0.37 | ) | | | | | | | (0.25 | ) |
Distributions from net realized gains | | | - | | | | | | | | - | | | | | | | | (1.32 | ) | | | | | | | (0.32 | ) | | | | | | | (0.23 | ) |
| | | | | | | | | | | | | | | | | | | | | | | | | | | | | | | | | | | | |
Total distributions | | | - | | | | | | | | - | | | | | | | | (1.76 | ) | | | | | | | (0.69 | ) | | | | | | | (0.48 | ) |
| | | | | | | | | | | | | | | | | | | | | | | | | | | | | | | | | | | | |
Net asset value, end of period | | $ | 9.43 | | | | | | | $ | 9.34 | | | | | | | $ | 9.81 | | | | | | | $ | 10.00 | | | | | | | $ | 10.27 | |
| | | | | | | | | | | | | | | | | | | | | | | | | | | | | | | | | | | | |
Total returnB | | | 0.96 | % | | | | | | | (4.79 | )% | | | | | | | 15.71 | % | | | | | | | 4.01 | % | | | | | | | 9.62 | % |
| | | | | | | | | | | | | | | | | | | | | | | | | | | | | | | | | | | | |
| | | | | | | | | |
Ratios and supplemental data: | | | | | | | | | | | | | | | | | | | | | | | | | | | | | | | | | | | | |
Net assets, end of period | | $ | 26,210,867 | | | | | | | $ | 31,340,562 | | | | | | | $ | 34,906,077 | | | | | | | $ | 15,052,491 | | | | | | | $ | 9,482,185 | |
Ratios to average net assets: | | | | | | | | | | | | | | | | | | | | | | | | | | | | | | | | | | | | |
Expenses, before reimbursements and/or recoupmentsC | | | 2.59 | % | | | | | | | 2.55 | % | | | | | | | 2.53 | % | | | | | | | 2.55 | % | | | | | | | 2.65 | % |
Expenses, net of reimbursements and/or recoupmentsC | | | 2.59 | % | | | | | | | 2.55 | % | | | | | | | 2.52 | % | | | | | | | 2.54 | % | | | | | | | 2.64 | % |
Net investment income (loss), before expense reimbursements and/or recoupments | | | 2.22 | % | | | | | | | 2.09 | % | | | | | | | (0.82 | )% | | | | | | | (3.06 | )% | | | | | | | (1.07 | )% |
Net investment income (loss), net of reimbursements and/or recoupments . | | | 2.22 | % | | | | | | | 2.09 | % | | | | | | | (0.81 | )% | | | | | | | (3.05 | )% | | | | | | | (1.06 | )% |
Portfolio turnover rateD | | | - | % | | | | | | | - | % | | | | | | | - | % | | | | | | | - | % | | | | | | | - | % |
| A | Per share amounts have been calculated using the average shares method. |
| B | Based on net asset value, which does not reflect the sales charge, redemption fee, or contingent deferred sales charge, if applicable. May include adjustments in accordance with U.S. GAAP and as such, the net asset value for reporting purposes and the returns based upon those net asset values may differ from the net asset value and returns for shareholder transactions. |
| C | Please refer to the Expense Reimbursement Plan in Note 2 of the Notes to the Consolidated Financial Statements for information related to the voluntary fees waived and expenses reimbursed at the American Beacon Cayman Managed Futures Strategy Fund, Ltd. |
| D | Portfolio turnover is based on the lesser of long-term purchases or sales divided by the average long-term fair value during the period. The Fund did not invest in any long-term securities during the reporting period. |
See accompanying notes
149
American Beacon AHL Multi-Alternatives Fund
Consolidated Financial Highlights
(For a share outstanding throughout the period)
| | | | | | | | | | | | |
| | | Y Class | |
| | | Year Ended December 31, | | | | | | August 17, 2023A to December 31, | |
| | | 2024 | | | | | | 2023 | |
| | | | | | | | | | | | |
Net asset value, beginning of period | | $ | 10.20 | | | | | | | $ | 10.00 | |
| | | | | | | | | | | | |
Income from investment operations: | | | | | | | | | | | | |
Net investment income | | | 0.30 | | | | | | | | 0.08 | |
Net gains on investments (both realized and unrealized) | | | 0.12 | | | | | | | | 0.27 | |
| | | | | | | | | | | | |
Total income from investment operations | | | 0.42 | | | | | | | | 0.35 | |
| | | | | | | | | | | | |
Less distributions: | | | | | | | | | | | | |
Dividends from net investment income | | | (0.20 | ) | | | | | | | (0.08 | ) |
Distributions from net realized gains | | | (0.25 | ) | | | | | | | (0.07 | ) |
| | | | | | | | | | | | |
Total distributions | | | (0.45 | ) | | | | | | | (0.15 | ) |
| | | | | | | | | | | | |
Net asset value, end of period | | $ | 10.17 | | | | | | | $ | 10.20 | |
| | | | | | | | | | | | |
Total returnB | | | 4.06 | % | | | | | | | 3.51 | %C |
| | | | | | | | | | | | |
| | | |
Ratios and supplemental data: | | | | | | | | | | | | |
Net assets, end of period | | $ | 9,357,645 | | | | | | | $ | 6,800,010 | |
Ratios to average net assets: | | | | | | | | | | | | |
Expenses, before reimbursements and/or recoupmentsD | | | 2.72 | %E | | | | | | | 3.99 | %EF |
Expenses, net of reimbursements and/or recoupmentsD | | | 1.33 | % | | | | | | | 1.33 | %F |
Net investment income, before expense reimbursements and/or recoupments | | | 1.84 | %E | | | | | | | 0.81 | %EF |
Net investment income, net of reimbursements and/or recoupments | | | 3.23 | % | | | | | | | 3.47 | %F |
Portfolio turnover rateE | | | 141 | % | | | | | | | 83 | %C |
| A | Commencement of operations. |
| B | Based on net asset value, which does not reflect the sales charge, redemption fee, or contingent deferred sales charge, if applicable. May include adjustments in accordance with U.S. GAAP and as such, the net asset value for reporting purposes and the returns based upon those net asset values may differ from the net asset value and returns for shareholder transactions. |
| D | Please refer to the Expense Reimbursement Plan in Note 2 of the Notes to the Consolidated Financial Statements for information related to the voluntary fees waived and expenses reimbursed at the American Beacon Cayman Multi-Alternatives Company, Ltd. |
| E | Includes non-recurring organization and offering costs. |
See accompanying notes
150
American Beacon AHL Multi-Alternatives Fund
Consolidated Financial Highlights
(For a share outstanding throughout the period)
| | | | | | | | | | | | |
| | | A Class | |
| | | Year Ended
December 31,
2024 | | | | | | August 17,
2023A to
December 31,
2023 | |
| | | | |
Net asset value, beginning of period | | $ | 10.19 | | | | | | | $ | 10.00 | |
| | | | | | | | | | | | |
Income from investment operations: | | | | | | | | | | | | |
Net investment income | | | 0.31 | | | | | | | | 0.12 | |
Net gains on investments (both realized and unrealized) | | | 0.08 | | | | | | | | 0.22 | |
| | | | | | | | | | | | |
Total income from investment operations | | | 0.39 | | | | | | | | 0.34 | |
| | | | | | | | | | | | |
Less distributions: | | | | | | | | | | | | |
Dividends from net investment income | | | (0.20 | ) | | | | | | | (0.08 | ) |
Distributions from net realized gains | | | (0.25 | ) | | | | | | | (0.07 | ) |
| | | | | | | | | | | | |
Total distributions | | | (0.45 | ) | | | | | | | (0.15 | ) |
| | | | | | | | | | | | |
Net asset value, end of period | | $ | 10.13 | | | | | | | $ | 10.19 | |
| | | | | | | | | | | | |
Total returnB | | | 3.77 | % | | | | | | | 3.41 | %C |
| | | | | | | | | | | | |
| | | |
Ratios and supplemental data: | | | | | | | | | | | | |
Net assets, end of period | | $ | 107,328 | | | | | | | $ | 103,423 | |
Ratios to average net assets: | | | | | | | | | | | | |
Expenses, before reimbursements and/or recoupmentsD | | | 3.79 | %E | | | | | | | 8.22 | %EF |
Expenses, net of reimbursements and/or recoupmentsD | | | 1.56 | % | | | | | | | 1.56 | %F |
Net investment income (loss), before expense reimbursements and/or recoupments | | | 0.79 | %E | | | | | | | (3.53 | )%EF |
Net investment income, net of reimbursements and/or recoupments | | | 3.02 | % | | | | | | | 3.13 | %F |
Portfolio turnover rateE | | | 141 | % | | | | | | | 83 | %C |
| A | Commencement of operations. |
| B | Based on net asset value, which does not reflect the sales charge, redemption fee, or contingent deferred sales charge, if applicable. May include adjustments in accordance with U.S. GAAP and as such, the net asset value for reporting purposes and the returns based upon those net asset values may differ from the net asset value and returns for shareholder transactions. |
| D | Please refer to the Expense Reimbursement Plan in Note 2 of the Notes to the Consolidated Financial Statements for information related to the voluntary fees waived and expenses reimbursed at the American Beacon Cayman Multi-Alternatives Company, Ltd. |
| E | Includes non-recurring organization and offering costs. |
See accompanying notes
151
American Beacon AHL Multi-Alternatives Fund
Consolidated Financial Highlights
(For a share outstanding throughout the period)
| | | | | | | | | | | | |
| | | C Class | |
| | | Year Ended
December 31,
2024 | | | | | | August 17, 2023A
to December 31,
2023 | |
| | | | |
Net asset value, beginning of period | | $ | 10.16 | | | | | | | $ | 10.00 | |
| | | | | | | | | | | | |
Income from investment operations: | | | | | | | | | | | | |
Net investment income | | | 0.24 | | | | | | | | 0.09 | |
Net gains on investments (both realized and unrealized) | | | 0.07 | | | | | | | | 0.22 | |
| | | | | | | | | | | | |
Total income from investment operations | | | 0.31 | | | | | | | | 0.31 | |
| | | | | | | | | | | | |
Less distributions: | | | | | | | | | | | | |
Dividends from net investment income | | | (0.19 | ) | | | | | | | (0.08 | ) |
Distributions from net realized gains | | | (0.25 | ) | | | | | | | (0.07 | ) |
| | | | | | | | | | | | |
Total distributions | | | (0.44 | ) | | | | | | | (0.15 | ) |
| | | | | | | | | | | | |
Net asset value, end of period | | $ | 10.03 | | | | | | | $ | 10.16 | |
| | | | | | | | | | | | |
Total returnB | | | 3.04 | % | | | | | | | 3.11 | %C |
| | | | | | | | | | | | |
| | | |
Ratios and supplemental data: | | | | | | | | | | | | |
Net assets, end of period | | $ | 106,227 | | | | | | | $ | 103,135 | |
Ratios to average net assets: | | | | | | | | | | | | |
Expenses, before reimbursements and/or recoupmentsD | | | 4.55 | %E | | | | | | | 8.97 | %EF |
Expenses, net of reimbursements and/or recoupmentsD | | | 2.31 | % | | | | | | | 2.31 | %F |
Net investment income (loss), before expense reimbursements and/or recoupments | | | 0.03 | %E | | | | | | | (4.28 | )%EF |
Net investment income, net of reimbursements and/or recoupments | | | 2.27 | % | | | | | | | 2.38 | %F |
Portfolio turnover rateE | | | 141 | % | | | | | | | 83 | %C |
| A | Commencement of operations. |
| B | Based on net asset value, which does not reflect the sales charge, redemption fee, or contingent deferred sales charge, if applicable. May include adjustments in accordance with U.S. GAAP and as such, the net asset value for reporting purposes and the returns based upon those net asset values may differ from the net asset value and returns for shareholder transactions. |
| D | Please refer to the Expense Reimbursement Plan in Note 2 of the Notes to the Consolidated Financial Statements for information related to the voluntary fees waived and expenses reimbursed at the American Beacon Cayman Multi-Alternatives Company, Ltd. |
| E | Includes non-recurring organization and offering costs. |
See accompanying notes
152
American Beacon AHL Multi-Alternatives Fund
Consolidated Financial Highlights
(For a share outstanding throughout the period)
| | | | | | | | | | | | |
| | | R6 Class | |
| | | Year Ended
December 31, | | | | | | August 17, 2023A
to December 31, | |
| | | 2024 | | | | | | 2023 | |
| | | | |
Net asset value, beginning of period | | $ | 10.20 | | | | | | | $ | 10.00 | |
| | | | | | | | | | | | |
Income from investment operations: | | | | | | | | | | | | |
Net investment income | | | 0.33 | | | | | | | | 0.14 | |
Net gains on investments (both realized and unrealized) | | | 0.10 | | | | | | | | 0.21 | |
| | | | | | | | | | | | |
Total income from investment operations | | | 0.43 | | | | | | | | 0.35 | |
| | | | | | | | | | | | |
Less distributions: | | | | | | | | | | | | |
Dividends from net investment income | | | (0.20 | ) | | | | | | | (0.08 | ) |
Distributions from net realized gains | | | (0.25 | ) | | | | | | | (0.07 | ) |
| | | | | | | | | | | | |
Total distributions | | | (0.45 | ) | | | | | | | (0.15 | ) |
| | | | | | | | | | | | |
Net asset value, end of period | | $ | 10.18 | | | | | | | $ | 10.20 | |
| | | | | | | | | | | | |
Total returnB | | | 4.16 | % | | | | | | | 3.51 | %C |
| | | | | | | | | | | | |
| | | |
Ratios and supplemental data: | | | | | | | | | | | | |
Net assets, end of period | | $ | 28,388,037 | | | | | | | $ | 20,707,713 | |
Ratios to average net assets: | | | | | | | | | | | | |
Expenses, before reimbursements and/or recoupmentsD | | | 2.59 | %E | | | | | | | 3.83 | %EF |
Expenses, net of reimbursements and/or recoupmentsD | | | 1.23 | % | | | | | | | 1.23 | %F |
Net investment income, before expense reimbursements and/or recoupments | | | 1.98 | %E | | | | | | | 0.86 | %EF |
Net investment income, net of reimbursements and/or recoupments | | | 3.34 | % | | | | | | | 3.46 | %F |
Portfolio turnover rateE | | | 141 | % | | | | | | | 83 | %C |
| A | Commencement of operations. |
| B | Based on net asset value, which does not reflect the sales charge, redemption fee, or contingent deferred sales charge, if applicable. May include adjustments in accordance with U.S. GAAP and as such, the net asset value for reporting purposes and the returns based upon those net asset values may differ from the net asset value and returns for shareholder transactions. |
| D | Please refer to the Expense Reimbursement Plan in Note 2 of the Notes to the Consolidated Financial Statements for information related to the voluntary fees waived and expenses reimbursed at the American Beacon Cayman Multi-Alternatives Company, Ltd. |
| E | Includes non-recurring organization and offering costs. |
See accompanying notes
153
American Beacon AHL TargetRisk FundSM
Consolidated Financial Highlights
(For a share outstanding throughout the period)
| | | | | | | | | | | | | | | | | | | | | | | | | | | | | | | | | | | | |
| | | R5 ClassA | |
| | | Year Ended December 31, | |
| | | 2024 | | | | | | 2023 | | | | | | 2022 | | | | | | 2021 | | | | | | 2020 | |
| | | | |
Net asset value, beginning of period | | $ | 10.55 | | | | | | | $ | 9.64 | | | | | | | $ | 12.17 | | | | | | | $ | 12.75 | | | | | | | $ | 12.16 | |
| | | | | | | | | | | | | | | | | | | | | | | | | | | | | | | | | | | | |
Income (loss) from investment operations: | | | | | | | | | | | | | | | | | | | | | | | | | | | | | | | | | | | | |
Net investment income (loss) | | | 0.12 | | | | | | | | 0.33 | B | | | | | | | 0.13 | B | | | | | | | 0.21 | | | | | | | | (0.05 | ) |
Net gains (losses) on investments (both realized and unrealized) | | | 0.63 | | | | | | | | 1.01 | | | | | | | | (2.12 | ) | | | | | | | 1.53 | | | | | | | | 0.74 | |
| | | | | | | | | | | | | | | | | | | | | | | | | | | | | | | | | | | | |
Total income (loss) from investment operations | | | 0.75 | | | | | | | | 1.34 | | | | | | | | (1.99 | ) | | | | | | | 1.74 | | | | | | | | 0.69 | |
| | | | | | | | | | | | | | | | | | | | | | | | | | | | | | | | | | | | |
Less distributions: | | | | | | | | | | | | | | | | | | | | | | | | | | | | | | | | | | | | |
Dividends from net investment income | | | (0.57 | ) | | | | | | | (0.43 | ) | | | | | | | (0.36 | ) | | | | | | | (0.97 | ) | | | | | | | (0.03 | ) |
Distributions from net realized gains | | | - | | | | | | | | - | | | | | | | | (0.18 | ) | | | | | | | (1.35 | ) | | | | | | | (0.07 | ) |
| | | | | | | | | | | | | | | | | | | | | | | | | | | | | | | | | | | | |
Total distributions | | | (0.57 | ) | | | | | | | (0.43 | ) | | | | | | | (0.54 | ) | | | | | | | (2.32 | ) | | | | | | | (0.10 | ) |
| | | | | | | | | | | | | | | | | | | | | | | | | | | | | | | | | | | | |
Net asset value, end of period | | $ | 10.73 | | | | | | | $ | 10.55 | | | | | | | $ | 9.64 | | | | | | | $ | 12.17 | | | | | | | $ | 12.75 | |
| | | | | | | | | | | | | | | | | | | | | | | | | | | | | | | | | | | | |
Total returnC | | | 7.13 | % | | | | | | | 13.92 | % | | | | | | | (16.42 | )% | | | | | | | 13.69 | % | | | | | | | 5.68 | % |
| | | | | | | | | | | | | | | | | | | | | | | | | | | | | | | | | | | | |
| | | | | | | | | |
Ratios and supplemental data: | | | | | | | | | | | | | | | | | | | | | | | | | | | | | | | | | | | | |
Net assets, end of period | | $ | 23,702,057 | | | | | | | $ | 24,839,297 | | | | | | | $ | 69,246,839 | | | | | | | $ | 116,339,052 | | | | | | | $ | 95,337,373 | |
Ratios to average net assets: | | | | | | | | | | | | | | | | | | | | | | | | | | | | | | | | | | | | |
Expenses, before reimbursements and/or recoupmentsD | | | 1.11 | % | | | | | | | 1.12 | % | | | | | | | 1.08 | % | | | | | | | 1.05 | % | | | | | | | 1.08 | % |
Expenses, net of reimbursements and/or recoupmentsD | | | 1.04 | % | | | | | | | 1.05 | %E | | | | | | | 1.05 | %E | | | | | | | 1.04 | % | | | | | | | 1.04 | % |
Net investment income (loss), before expense reimbursements and/or recoupments | | | 3.33 | % | | | | | | | 3.21 | % | | | | | | | 1.14 | % | | | | | | | 0.62 | % | | | | | | | (0.97 | )% |
Net investment income (loss), net of reimbursements and/or recoupments . | | | 3.40 | % | | | | | | | 3.28 | % | | | | | | | 1.17 | % | | | | | | | 0.63 | % | | | | | | | (0.93 | )% |
Portfolio turnover rate | | | 138 | % | | | | | | | 135 | % | | | | | | | 277 | % | | | | | | | 195 | % | | | | | | | 197 | % |
| A | Prior to February 28, 2020, the R5 Class was known as Institutional Class. |
| B | Per share amounts have been calculated using the average shares method. |
| C | Based on net asset value, which does not reflect the sales charge, redemption fee, or contingent deferred sales charge, if applicable. May include adjustments in accordance with U.S. GAAP and as such, the net asset value for reporting purposes and the returns based upon those net asset values may differ from the net asset value and returns for shareholder transactions. |
| D | Please refer to the Expense Reimbursement Plan in Note 2 of the Notes to the Consolidated Financial Statements for information related to the voluntary fees waived and expenses reimbursed at the American Beacon Cayman TargetRisk Company, Ltd. |
| E | Includes non-operating expenses consisting of prime broker fees, dividends and interest expense from securities sold short. The Expenses, net of reimbursements, excluding non-operating expenses is 1.04% and 1.04% for the year ended December 31, 2023 and year ended December 31, 2022, respectively. |
See accompanying notes
154
American Beacon AHL TargetRisk FundSM
Consolidated Financial Highlights
(For a share outstanding throughout the period)
| | | | | | | | | | | | | | | | | | | | | | | | | | | | | | | | | | | | |
| | | Y Class | |
| | | Year Ended December 31, | |
| | | 2024 | | | | | | 2023 | | | | | | 2022 | | | | | | 2021 | | | | | | 2020 | |
| | | | |
Net asset value, beginning of period | | $ | 10.55 | | | | | | | $ | 9.64 | | | | | | | $ | 12.16 | | | | | | | $ | 12.74 | | | | | | | $ | 12.16 | |
| | | | | | | | | | | | | | | | | | | | | | | | | | | | | | | | | | | | |
Income (loss) from investment operations: | | | | | | | | | | | | | | | | | | | | | | | | | | | | | | | | | | | | |
Net investment income (loss) | | | 0.43 | | | | | | | | 0.33 | A | | | | | | | 0.11 | A | | | | | | | 0.28 | | | | | | | | (0.05 | ) |
Net gains (losses) on investments (both realized and unrealized) | | | 0.31 | | | | | | | | 0.99 | | | | | | | | (2.11 | ) | | | | | | | 1.46 | | | | | | | | 0.73 | |
| | | | | | | | | | | | | | | | | | | | | | | | | | | | | | | | | | | | |
Total income (loss) from investment operations | | | 0.74 | | | | | | | | 1.32 | | | | | | | | (2.00 | ) | | | | | | | 1.74 | | | | | | | | 0.68 | |
| | | | | | | | | | | | | | | | | | | | | | | | | | | | | | | | | | | | |
Less distributions: | | | | | | | | | | | | | | | | | | | | | | | | | | | | | | | | | | | | |
Dividends from net investment income | | | (0.56 | ) | | | | | | | (0.41 | ) | | | | | | | (0.34 | ) | | | | | | | (0.97 | ) | | | | | | | (0.03 | ) |
Distributions from net realized gains | | | - | | | | | | | | - | | | | | | | | (0.18 | ) | | | | | | | (1.35 | ) | | | | | | | (0.07 | ) |
| | | | | | | | | | | | | | | | | | | | | | | | | | | | | | | | | | | | |
Total distributions | | | (0.56 | ) | | | | | | | (0.41 | ) | | | | | | | (0.52 | ) | | | | | | | (2.32 | ) | | | | | | | (0.10 | ) |
| | | | | | | | | | | | | | | | | | | | | | | | | | | | | | | | | | | | |
Net asset value, end of period | | $ | 10.73 | | | | | | | $ | 10.55 | | | | | | | $ | 9.64 | | | | | | | $ | 12.16 | | | | | | | $ | 12.74 | |
| | | | | | | | | | | | | | | | | | | | | | | | | | | | | | | | | | | | |
Total returnB | | | 7.00 | % | | | | | | | 13.77 | % | | | | | | | (16.45 | )% | | | | | | | 13.66 | % | | | | | | | 5.55 | % |
| | | | | | | | | | | | | | | | | | | | | | | | | | | | | | | | | | | | |
| | | | | | | | | |
Ratios and supplemental data: | | | | | | | | | | | | | | | | | | | | | | | | | | | | | | | | | | | | |
Net assets, end of period | | $ | 240,697,355 | | | | | | | $ | 230,217,307 | | | | | | | $ | 340,103,816 | | | | | | | $ | 756,225,072 | | | | | | | $ | 665,119,502 | |
Ratios to average net assets: | | | | | | | | | | | | | | | | | | | | | | | | | | | | | | | | | | | | |
Expenses, before reimbursements and/or recoupmentsC | | | 1.19 | % | | | | | | | 1.17 | % | | | | | | | 1.11 | % | | | | | | | 1.07 | % | | | | | | | 1.13 | % |
Expenses, net of reimbursements and/or recoupmentsC | | | 1.19 | % | | | | | | | 1.16 | % | | | | | | | 1.10 | % | | | | | | | 1.07 | % | | | | | | | 1.11 | % |
Net investment income (loss), before expense reimbursements and/or recoupments | | | 3.26 | % | | | | | | | 3.25 | % | | | | | | | 1.03 | % | | | | | | | 0.58 | % | | | | | | | (1.18 | )% |
Net investment income (loss), net of reimbursements and/or recoupments . | | | 3.26 | % | | | | | | | 3.26 | % | | | | | | | 1.04 | % | | | | | | | 0.58 | % | | | | | | | (1.16 | )% |
Portfolio turnover rate | | | 138 | % | | | | | | | 135 | % | | | | | | | 277 | % | | | | | | | 195 | % | | | | | | | 197 | % |
| A | Per share amounts have been calculated using the average shares method. |
| B | Based on net asset value, which does not reflect the sales charge, redemption fee, or contingent deferred sales charge, if applicable. May include adjustments in accordance with U.S. GAAP and as such, the net asset value for reporting purposes and the returns based upon those net asset values may differ from the net asset value and returns for shareholder transactions. |
| C | Please refer to the Expense Reimbursement Plan in Note 2 of the Notes to the Consolidated Financial Statements for information related to the voluntary fees waived and expenses reimbursed at the American Beacon Cayman TargetRisk Company, Ltd. |
See accompanying notes
155
American Beacon AHL TargetRisk FundSM
Consolidated Financial Highlights
(For a share outstanding throughout the period)
| | | | | | | | | | | | | | | | | | | | | | | | | | | | | | | | | | | | |
| | | Investor Class | |
| | | Year Ended December 31, | |
| | | 2024 | | | | | | 2023 | | | | | | 2022 | | | | | | 2021 | | | | | | 2020 | |
| | | | |
Net asset value, beginning of period | | $ | 10.52 | | | | | | | $ | 9.61 | | | | | | | $ | 12.11 | | | | | | | $ | 12.70 | | | | | | | $ | 12.14 | |
| | | | | | | | | | | | | | | | | | | | | | | | | | | | | | | | | | | | |
Income (loss) from investment operations: | | | | | | | | | | | | | | | | | | | | | | | | | | | | | | | | | | | | |
Net investment income (loss) | | | 0.32 | A | | | | | | | 0.30 | A | | | | | | | 0.09 | A | | | | | | | 0.21 | | | | | | | | (0.13 | ) |
Net gains (losses) on investments (both realized and unrealized) | | | 0.38 | | | | | | | | 0.99 | | | | | | | | (2.10 | ) | | | | | | | 1.47 | | | | | | | | 0.76 | |
| | | | | | | | | | | | | | | | | | | | | | | | | | | | | | | | | | | | |
Total income (loss) from investment operations | | | 0.70 | | | | | | | | 1.29 | | | | | | | | (2.01 | ) | | | | | | | 1.68 | | | | | | | | 0.63 | |
| | | | | | | | | | | | | | | | | | | | | | | | | | | | | | | | | | | | |
Less distributions: | | | | | | | | | | | | | | | | | | | | | | | | | | | | | | | | | | | | |
Dividends from net investment income | | | (0.51 | ) | | | | | | | (0.38 | ) | | | | | | | (0.31 | ) | | | | | | | (0.92 | ) | | | | | | | - | |
Distributions from net realized gains | | | - | | | | | | | | - | | | | | | | | (0.18 | ) | | | | | | | (1.35 | ) | | | | | | | (0.07 | ) |
| | | | | | | | | | | | | | | | | | | | | | | | | | | | | | | | | | | | |
Total distributions | | | (0.51 | ) | | | | | | | (0.38 | ) | | | | | | | (0.49 | ) | | | | | | | (2.27 | ) | | | | | | | (0.07 | ) |
| | | | | | | | | | | | | | | | | | | | | | | | | | | | | | | | | | | | |
Net asset value, end of period | | $ | 10.71 | | | | | | | $ | 10.52 | | | | | | | $ | 9.61 | | | | | | | $ | 12.11 | | | | | | | $ | 12.70 | |
| | | | | | | | | | | | | | | | | | | | | | | | | | | | | | | | | | | | |
Total returnB | | | 6.71 | % | | | | | | | 13.48 | % | | | | | | | (16.65 | )% | | | | | | | 13.24 | % | | | | | | | 5.18 | % |
| | | | | | | | | | | | | | | | | | | | | | | | | | | | | | | | | | | | |
| | | | | | | | | |
Ratios and supplemental data: | | | | | | | | | | | | | | | | | | | | | | | | | | | | | | | | | | | | |
Net assets, end of period | | $ | 4,050,432 | | | | | | | $ | 7,227,795 | | | | | | | $ | 11,271,945 | | | | | | | $ | 18,344,072 | | | | | | | $ | 16,012,197 | |
Ratios to average net assets: | | | | | | | | | | | | | | | | | | | | | | | | | | | | | | | | | | | | |
Expenses, before reimbursements and/or recoupmentsC | | | 1.53 | % | | | | | | | 1.41 | % | | | | | | | 1.41 | % | | | | | | | 1.42 | % | | | | | | | 1.45 | % |
Expenses, net of reimbursements and/or recoupmentsC | | | 1.53 | % | | | | | | | 1.41 | % | | | | | | | 1.41 | % | | | | | | | 1.42 | % | | | | | | | 1.42 | % |
Net investment income (loss), before expense reimbursements and/or recoupments | | | 2.88 | % | | | | | | | 2.96 | % | | | | | | | 0.80 | % | | | | | | | 0.29 | % | | | | | | | (1.70 | )% |
Net investment income (loss), net of reimbursements and/or recoupments | | | 2.88 | % | | | | | | | 2.96 | % | | | | | | | 0.80 | % | | | | | | | 0.29 | % | | | | | | | (1.67 | )% |
Portfolio turnover rate | | | 138 | % | | | | | | | 135 | % | | | | | | | 277 | % | | | | | | | 195 | % | | | | | | | 197 | % |
| A | Per share amounts have been calculated using the average shares method. |
| B | Based on net asset value, which does not reflect the sales charge, redemption fee, or contingent deferred sales charge, if applicable. May include adjustments in accordance with U.S. GAAP and as such, the net asset value for reporting purposes and the returns based upon those net asset values may differ from the net asset value and returns for shareholder transactions. |
| C | Please refer to the Expense Reimbursement Plan in Note 2 of the Notes to the Consolidated Financial Statements for information related to the voluntary fees waived and expenses reimbursed at the American Beacon Cayman TargetRisk Company, Ltd. |
See accompanying notes
156
American Beacon AHL TargetRisk FundSM
Consolidated Financial Highlights
(For a share outstanding throughout the period)
| | | | | | | | | | | | | | | | | | | | | | | | | | | | | | | | | | | | |
| | | A Class | |
| | | Year Ended December 31, | |
| | | 2024 | | | | | | 2023 | | | | | | 2022 | | | | | | 2021 | | | | | | 2020 | |
| | | | |
Net asset value, beginning of period | | $ | 10.48 | | | | | | | $ | 9.58 | | | | | | | $ | 12.08 | | | | | | | $ | 12.68 | | | | | | | $ | 12.12 | |
| | | | | | | | | | | | | | | | | | | | | | | | | | | | | | | | | | | | |
Income (loss) from investment operations: | | | | | | | | | | | | | | | | | | | | | | | | | | | | | | | | | | | | |
Net investment income (loss) | | | 0.19 | | | | | | | | 0.29 | A | | | | | | | 0.10 | A | | | | | | | 0.25 | | | | | | | | (0.10 | ) |
Net gains (losses) on investments (both realized and unrealized) | | | 0.50 | | | | | | | | 0.98 | | | | | | | | (2.10 | ) | | | | | | | 1.45 | | | | | | | | 0.73 | |
| | | | | | | | | | | | | | | | | | | | | | | | | | | | | | | | | | | | |
Total income (loss) from investment operations | | | 0.69 | | | | | | | | 1.27 | | | | | | | | (2.00 | ) | | | | | | | 1.70 | | | | | | | | 0.63 | |
| | | | | | | | | | | | | | | | | | | | | | | | | | | | | | | | | | | | |
Less distributions: | | | | | | | | | | | | | | | | | | | | | | | | | | | | | | | | | | | | |
Dividends from net investment income | | | (0.52 | ) | | | | | | | (0.37 | ) | | | | | | | (0.32 | ) | | | | | | | (0.95 | ) | | | | | | | 0.00 | B |
Distributions from net realized gains | | | - | | | | | | | | - | | | | | | | | (0.18 | ) | | | | | | | (1.35 | ) | | | | | | | (0.07 | ) |
| | | | | | | | | | | | | | | | | | | | | | | | | | | | | | | | | | | | |
Total distributions | | | (0.52 | ) | | | | | | | (0.37 | ) | | | | | | | (0.50 | ) | | | | | | | (2.30 | ) | | | | | | | (0.07 | ) |
| | | | | | | | | | | | | | | | | | | | | | | | | | | | | | | | | | | | |
Net asset value, end of period | | $ | 10.65 | | | | | | | $ | 10.48 | | | | | | | $ | 9.58 | | | | | | | $ | 12.08 | | | | | | | $ | 12.68 | |
| | | | | | | | | | | | | | | | | | | | | | | | | | | | | | | | | | | | |
Total returnC | | | 6.63 | % | | | | | | | 13.25 | % | | | | | | | (16.56 | )% | | | | | | | 13.38 | % | | | | | | | 5.19 | % |
| | | | | | | | | | | | | | | | | | | | | | | | | | | | | | | | | | | | |
| | | | | | | | | |
Ratios and supplemental data: | | | | | | | | | | | | | | | | | | | | | | | | | | | | | | | | | | | | |
Net assets, end of period | | $ | 2,568,834 | | | | | | | $ | 2,745,472 | | | | | | | $ | 3,656,374 | | | | | | | $ | 5,381,597 | | | | | | | $ | 4,007,021 | |
Ratios to average net assets: | | | | | | | | | | | | | | | | | | | | | | | | | | | | | | | | | | | | |
Expenses, before reimbursements and/or recoupmentsD | | | 1.61 | % | | | | | | | 1.58 | % | | | | | | | 1.33 | % | | | | | | | 1.30 | % | | | | | | | 1.45 | % |
Expenses, net of reimbursements and/or recoupmentsD | | | 1.51 | %E | | | | | | | 1.57 | % | | | | | | | 1.32 | % | | | | | | | 1.30 | % | | | | | | | 1.44 | % |
Net investment income (loss), before expense reimbursements and/or recoupments | | | 2.82 | % | | | | | | | 2.84 | % | | | | | | | 0.89 | % | | | | | | | 1.06 | % | | | | | | | (1.57 | )% |
Net investment income (loss), net of reimbursements and/or recoupments . | | | 2.92 | % | | | | | | | 2.85 | % | | | | | | | 0.90 | % | | | | | | | 1.06 | % | | | | | | | (1.56 | )% |
Portfolio turnover rate | | | 138 | % | | | | | | | 135 | % | | | | | | | 277 | % | | | | | | | 195 | % | | | | | | | 197 | % |
| A | Per share amounts have been calculated using the average shares method. |
| B | Amount represents less than $0.01 per share. |
| C | Based on net asset value, which does not reflect the sales charge, redemption fee, or contingent deferred sales charge, if applicable. May include adjustments in accordance with U.S. GAAP and as such, the net asset value for reporting purposes and the returns based upon those net asset values may differ from the net asset value and returns for shareholder transactions. |
| D | Please refer to the Expense Reimbursement Plan in Note 2 of the Notes to the Consolidated Financial Statements for information related to the voluntary fees waived and expenses reimbursed at the American Beacon Cayman TargetRisk Company, Ltd. |
| E | Expense ratios may exceed stated expense caps in Note 2 due to the change in the contractual expense caps on May 1, 2024. |
See accompanying notes
157
American Beacon AHL TargetRisk FundSM
Consolidated Financial Highlights
(For a share outstanding throughout the period)
| | | | | | | | | | | | | | | | | | | | | | | | | | | | | | | | | | | | |
| | | C Class | |
| | | Year Ended December 31, | |
| | | 2024 | | | | | | 2023 | | | | | | 2022 | | | | | | 2021 | | | | | | 2020 | |
| | | | |
Net asset value, beginning of period | | $ | 10.39 | | | | | | | $ | 9.49 | | | | | | | $ | 11.92 | | | | | | | $ | 12.55 | | | | | | | $ | 12.09 | |
| | | | | | | | | | | | | | | | | | | | | | | | | | | | | | | | | | | | |
Income (loss) from investment operations: | | | | | | | | | | | | | | | | | | | | | | | | | | | | | | | | | | | | |
Net investment income (loss) | | | 0.25 | A | | | | | | | 0.23 | A | | | | | | | 0.01 | A | | | | | | | (0.02 | ) | | | | | | | (0.17 | ) |
Net gains (losses) on investments (both realized and unrealized) | | | 0.36 | | | | | | | | 0.96 | | | | | | | | (2.06 | ) | | | | | | | 1.59 | | | | | | | | 0.70 | |
| | | | | | | | | | | | | | | | | | | | | | | | | | | | | | | | | | | | |
Total income (loss) from investment operations | | | 0.61 | | | | | | | | 1.19 | | | | | | | | (2.05 | ) | | | | | | | 1.57 | | | | | | | | 0.53 | |
| | | | | | | | | | | | | | | | | | | | | | | | | | | | | | | | | | | | |
Less distributions: | | | | | | | | | | | | | | | | | | | | | | | | | | | | | | | | | | | | |
Dividends from net investment income | | | (0.42 | ) | | | | | | | (0.29 | ) | | | | | | | (0.20 | ) | | | | | | | (0.85 | ) | | | | | | | - | |
Distributions from net realized gains | | | - | | | | | | | | - | | | | | | | | (0.18 | ) | | | | | | | (1.35 | ) | | | | | | | (0.07 | ) |
| | | | | | | | | | | | | | | | | | | | | | | | | | | | | | | | | | | | |
Total distributions | | | (0.42 | ) | | | | | | | (0.29 | ) | | | | | | | (0.38 | ) | | | | | | | (2.20 | ) | | | | | | | (0.07 | ) |
| | | | | | | | | | | | | | | | | | | | | | | | | | | | | | | | | | | | |
Net asset value, end of period | | $ | 10.58 | | | | | | | $ | 10.39 | | | | | | | $ | 9.49 | | | | | | | $ | 11.92 | | | | | | | $ | 12.55 | |
| | | | | | | | | | | | | | | | | | | | | | | | | | | | | | | | | | | | |
Total returnB | | | 5.91 | % | | | | | | | 12.59 | % | | | | | | | (17.19 | )% | | | | | | | 12.51 | % | | | | | | | 4.37 | % |
| | | | | | | | | | | | | | | | | | | | | | | | | | | | | | | | | | | | |
| | | | | | | | | |
Ratios and supplemental data: | | | | | | | | | | | | | | | | | | | | | | | | | | | | | | | | | | | | |
Net assets, end of period | | $ | 6,699,758 | | | | | | | $ | 8,944,023 | | | | | | | $ | 11,650,636 | | | | | | | $ | 20,623,659 | | | | | | | $ | 14,969,947 | |
Ratios to average net assets: | | | | | | | | | | | | | | | | | | | | | | | | | | | | | | | | | | | | |
Expenses, before reimbursements and/or recoupmentsC | | | 2.19 | % | | | | | | | 2.15 | % | | | | | | | 2.10 | % | | | | | | | 2.06 | % | | | | | | | 2.20 | % |
Expenses, net of reimbursements and/or recoupmentsC | | | 2.19 | % | | | | | | | 2.14 | % | | | | | | | 2.09 | % | | | | | | | 2.06 | % | | | | | | | 2.19 | % |
Net investment income (loss), before expense reimbursements and/or recoupments | | | 2.28 | % | | | | | | | 2.26 | % | | | | | | | 0.09 | % | | | | | | | (0.15 | )% | | | | | | | (2.34 | )% |
Net investment income (loss), net of reimbursements and/or recoupments . | | | 2.28 | % | | | | | | | 2.27 | % | | | | | | | 0.10 | % | | | | | | | (0.15 | )% | | | | | | | (2.33 | )% |
Portfolio turnover rate | | | 138 | % | | | | | | | 135 | % | | | | | | | 277 | % | | | | | | | 195 | % | | | | | | | 197 | % |
| A | Per share amounts have been calculated using the average shares method. |
| B | Based on net asset value, which does not reflect the sales charge, redemption fee, or contingent deferred sales charge, if applicable. May include adjustments in accordance with U.S. GAAP and as such, the net asset value for reporting purposes and the returns based upon those net asset values may differ from the net asset value and returns for shareholder transactions. |
| C | Please refer to the Expense Reimbursement Plan in Note 2 of the Notes to the Consolidated Financial Statements for information related to the voluntary fees waived and expenses reimbursed at the American Beacon Cayman TargetRisk Company, Ltd. |
See accompanying notes
158
American Beacon FundsSM
Affirmation of the Commodity Pool Operator
December 31, 2024 (Unaudited)
To the best of my knowledge and belief, the information contained in the attached financial statements for the American Beacon AHL Managed Futures Strategy Fund, American Beacon AHL Multi-Alternatives Fund and American Beacon AHL TargetRisk Fund for the period from January 1, 2024 to December 31, 2024, is accurate and complete.

Sonia L. Bates, Assistant Treasurer
American Beacon Advisors, Inc.
Commodity Pool Operator for the
American Beacon AHL Managed Futures Strategy Fund,
American Beacon AHL Multi-Alternatives Fund, and
American Beacon AHL TargetRisk Fund
159
American Beacon FundsSM
Federal Tax Information
Certain tax information regarding the Funds is required to be provided to shareholders based upon the Funds’ income and distributions for the taxable year ended December 31, 2024. The information and distributions reported herein may differ from information and distributions taxable to the shareholders for the calendar year ended December 31, 2024.
The Funds designated the following items with regard to distributions paid during the fiscal year ended December 31, 2024. All designations are based on financial information available as of this annual report and, accordingly, are subject to change. For each item, it is the intention of the Funds to designate the maximum amount permitted under the Internal Revenue Code of 1986, as amended, and the regulations there under.
Corporate Dividends-Received Deduction:
| | | | |
AHL Managed Futures Strategy | | | 0.00 | % |
AHL Multi-Alternatives | | | 0.00 | % |
AHL TargetRisk | | | 0.00 | % |
Qualified Dividend Income:
| | | | |
AHL Managed Futures Strategy | | | 0.00 | % |
AHL Multi-Alternatives | | | 0.00 | % |
AHL TargetRisk | | | 0.00 | % |
Long-Term Capital Gain Distributions:
| | | | |
AHL Managed Futures Strategy | | $ | 0 | |
AHL Multi-Alternatives | | $ | 93,259 | |
AHL TargetRisk | | $ | 0 | |
Short-Term Capital Gain Distributions:
| | | | |
AHL Managed Futures Strategy | | $ | 0 | |
AHL Multi-Alternatives | | $ | 793,107 | |
AHL TargetRisk | | $ | 0 | |
Shareholders received notification in January 2025 of the applicable tax information necessary to prepare their 2024 income tax returns.
160

Delivery of Documents
If you invest in the Fund through a financial institution, you may be able to receive the Fund’s regulatory mailings, such as the Prospectus, Annual Report, Semi-Annual Report and Financial Statement Reports, by e-mail. If you are interested in this option, please go to www.icsdelivery.com and search for your financial institution’s name or contact your financial institution directly.
You may request a paper copy of this document at no charge by contacting your financial institution. This document is also available for download at www.americanbeaconfunds.com or you can request an electronic copy by contacting your financial institution.
To obtain more information about the Fund:
| | |
 | |  |
| | |
| By E-mail: | | On the Internet: |
| american_beacon.funds@ambeacon.com | | Visit our website at www.americanbeaconfunds.com |
| | | |
| | | |
| | |

By Telephone: Call (800) 658-5811 | | 
By Mail: American Beacon Funds P.O. Box 219643 Kansas City, MO 64121-9643 |
|
|
|
| | | |
Fund Service Providers:
| | | | | | | | | | | | |
CUSTODIAN State Street Bank and Trust Company Boston, Massachusetts | | | | TRANSFER AGENT SS&C GIDS, Inc. Quincy, Massachusetts | | | | INDEPENDENT REGISTERED PUBLIC ACCOUNTING FIRM PricewaterhouseCoopers LLP Boston, Massachusetts | | | | DISTRIBUTOR Resolute Investment Distributors, Inc. Irving, Texas |
This report is prepared for shareholders of the American Beacon Funds and may be distributed to others only if preceded or accompanied by a current Prospectus or Summary Prospectus.
American Beacon Funds, American Beacon AHL Managed Futures Strategy Fund, American Beacon AHL Multi-Alternatives Fund and American Beacon AHL TargetRisk Fund are service marks of American Beacon Advisors, Inc.
AR 12/24

American Beacon Funds
Although information has been compiled from reliable sources, American Beacon Advisors, Inc. makes no representation as to the completeness or accuracy of the statements contained herein. All information is as of the end of the reporting period, unless noted otherwise, and is subject to change. Each Fund’s portfolio composition will change depending on economic and market conditions.
American Beacon Funds | December 31, 2024 |
Contents
American Beacon FundsSM
Report of Independent Registered Public Accounting Firm
To the Board of Trustees of American Beacon Funds and Shareholders of American Beacon Man Large Cap Growth Fund and American Beacon Man Large Cap Value Fund
Opinions on the Financial Statements
We have audited the accompanying statements of assets and liabilities, including the schedules of investments, of American Beacon Man Large Cap Growth Fund and American Beacon Man Large Cap Value Fund (two of the funds constituting American Beacon Funds, hereafter collectively referred to as the “Funds”) as of December 31, 2024, the related statements of operations for the year ended December 31, 2024, the statements of changes in net assets for each of the two years in the period ended December 31, 2024, including the related notes, and the financial highlights for each of the three years in the period ended December 31, 2024 (collectively referred to as the “financial statements”). In our opinion, the financial statements present fairly, in all material respects, the financial position of each of the Funds as of December 31, 2024, the results of each of their operations for the year then ended, the changes in each of their net assets for each of the two years in the period ended December 31, 2024 and each of the financial highlights for the three years in the period ended December 31, 2024 in conformity with accounting principles generally accepted in the United States of America.
The financial statements of the Funds as of and for the year ended December 31, 2021 and the financial highlights for each of the periods ended on or prior to December 31, 2021 (not presented herein, other than the financial highlights) were audited by other auditors whose report dated February 28, 2022 expressed an unqualified opinion on those financial statements and financial highlights.
Basis for Opinions
These financial statements are the responsibility of the Funds’ management. Our responsibility is to express an opinion on the Funds’ financial statements based on our audits. We are a public accounting firm registered with the Public Company Accounting Oversight Board (United States) (PCAOB) and are required to be independent with respect to the Funds in accordance with the U.S. federal securities laws and the applicable rules and regulations of the Securities and Exchange Commission and the PCAOB.
We conducted our audits of these financial statements in accordance with the standards of the PCAOB. Those standards require that we plan and perform the audit to obtain reasonable assurance about whether the financial statements are free of material misstatement, whether due to error or fraud.
Our audits included performing procedures to assess the risks of material misstatement of the financial statements, whether due to error or fraud, and performing procedures that respond to those risks. Such procedures included examining, on a test basis, evidence regarding the amounts and disclosures in the financial statements. Our audits also included evaluating the accounting principles used and significant estimates made by management, as well as evaluating the overall presentation of the financial statements. Our procedures included confirmation of securities owned as of December 31, 2024 by correspondence with the custodian and brokers; when replies were not received from brokers, we performed other auditing procedures. We believe that our audits provide a reasonable basis for our opinions.
/s/PricewaterhouseCoopers LLP
Boston, Massachusetts
February 27, 2025
We have served as the auditor of one or more investment companies in the American Beacon family of funds since 2016.
1
American Beacon Man Large Cap Growth FundSM
Schedule of Investments
December 31, 2024
| | | | | | | | | | | | | | | |
| | | |
| | | Shares | | | | Fair Value |
| | | | | | | |
| | | |
| COMMON STOCKS - 97.02% | | | | | | |
| | | |
| Communication Services - 12.40% | | | | | | |
| | | |
| Entertainment - 0.67% | | | | | | |
| Netflix, Inc.A | | | | 1,510 | | | | | | | | | $ | 1,345,893 | |
| | | | | | | | | | | | | | | |
| | | | | | | | | | | | | | | |
| | | |
| Interactive Media & Services - 11.73% | | | | | | |
| Alphabet, Inc., Class A | | | | 70,200 | | | | | | | | | | 13,288,860 | |
| Meta Platforms, Inc., Class A | | | | 14,320 | | | | | | | | | | 8,384,503 | |
| Pinterest, Inc., Class AA | | | | 67,400 | | | | | | | | | | 1,954,600 | |
| | | | | | | | | | | | | | | |
| | | | | | | | | | | | | | 23,627,963 | |
| | | | | | | | | | | | | | | |
| | | | | | | | | | | | | | | |
Total Communication Services | | | | | | | | | | | | | | 24,973,856 | |
| | | | | | | | | | | | | | | |
| | | | | | | | | | | | | | | |
| | | |
| Consumer Discretionary - 11.81% | | | | | | |
| | | |
| Broadline Retail - 6.49% | | | | | | |
| Amazon.com, Inc.A | | | | 56,400 | | | | | | | | | | 12,373,596 | |
| Etsy, Inc.A | | | | 13,500 | | | | | | | | | | 714,015 | |
| | | | | | | | | | | | | | | |
| | | | | | | | | | | | | | 13,087,611 | |
| | | | | | | | | | | | | | | |
| | | | | | | | | | | | | | | |
| | | |
| Hotels, Restaurants & Leisure - 3.12% | | | | | | |
| Booking Holdings, Inc. | | | | 1,265 | | | | | | | | | | 6,285,051 | |
| | | | | | | | | | | | | | | |
| | | | | | | | | | | | | | | |
| | | |
| Household Durables - 0.25% | | | | | | |
| TopBuild Corp.A | | | | 1,610 | | | | | | | | | | 501,257 | |
| | | | | | | | | | | | | | | |
| | | | | | | | | | | | | | | |
| | | |
| Textiles, Apparel & Luxury Goods - 1.95% | | | | | | |
| Lululemon Athletica, Inc.A | | | | 4,360 | | | | | | | | | | 1,667,308 | |
| NIKE, Inc., Class B | | | | 29,700 | | | | | | | | | | 2,247,399 | |
| | | | | | | | | | | | | | | |
| | | | | | | | | | | | | | 3,914,707 | |
| | | | | | | | | | | | | | | |
| | | | | | | | | | | | | | | |
Total Consumer Discretionary | | | | | | | | | | | | | | 23,788,626 | |
| | | | | | | | | | | | | | | |
| | | | | | | | | | | | | | | |
| | | |
| Consumer Staples - 1.91% | | | | | | |
| | | |
| Consumer Staples Distribution & Retail - 1.91% | | | | | | |
| Costco Wholesale Corp. | | | | 2,510 | | | | | | | | | | 2,299,838 | |
| Target Corp. | | | | 11,400 | | | | | | | | | | 1,541,052 | |
| | | | | | | | | | | | | | | |
| | | | | | | | | | | | | | 3,840,890 | |
| | | | | | | | | | | | | | | |
| | | | | | | | | | | | | | | |
Total Consumer Staples | | | | | | | | | | | | | | 3,840,890 | |
| | | | | | | | | | | | | | | |
| | | | | | | | | | | | | | | |
| | | |
| Financials - 6.53% | | | | | | |
| | | |
| Financial Services - 5.63% | | | | | | |
| Mastercard, Inc., Class A | | | | 16,600 | | | | | | | | | | 8,741,062 | |
| Visa, Inc., Class A | | | | 8,200 | | | | | | | | | | 2,591,528 | |
| | | | | | | | | | | | | | | |
| | | | | | | | | | | | | | 11,332,590 | |
| | | | | | | | | | | | | | | |
| | | | | | | | | | | | | | | |
| | | |
| Insurance - 0.90% | | | | | | |
| Arch Capital Group Ltd. | | | | 19,600 | | | | | | | | | | 1,810,060 | |
| | | | | | | | | | | | | | | |
| | | | | | | | | | | | | | | |
Total Financials | | | | | | | | | | | | | | 13,142,650 | |
| | | | | | | | | | | | | | | |
| | | | | | | | | | | | | | | |
| | | |
| Health Care - 13.13% | | | | | | |
| | | |
| Biotechnology - 3.61% | | | | | | |
| AbbVie, Inc. | | | | 17,900 | | | | | | | | | | 3,180,830 | |
| Exelixis, Inc.A | | | | 26,700 | | | | | | | | | | 889,110 | |
| Incyte Corp.A | | | | 21,300 | | | | | | | | | | 1,471,191 | |
| Regeneron Pharmaceuticals, Inc.A | | | | 2,430 | | | | | | | | | | 1,730,962 | |
| | | | | | | | | | | | | | | |
| | | | | | | | | | | | | | 7,272,093 | |
| | | | | | | | | | | | | | | |
See accompanying notes
2
American Beacon Man Large Cap Growth FundSM
Schedule of Investments
December 31, 2024
| | | | | | | | | | | | | | | |
| | | |
| | | Shares | | | | Fair Value |
| | | | | | | |
| | | |
| COMMON STOCKS - 97.02% (continued) | | | | | | |
| | | |
| Health Care - 13.13% (continued) | | | | | | |
| | | |
| Health Care Equipment & Supplies - 2.45% | | | | | | |
| Abbott Laboratories | | | | 4,300 | | | | | | | | | $ | 486,373 | |
| Dexcom, Inc.A | | | | 11,300 | | | | | | | | | | 878,801 | |
| Edwards Lifesciences Corp.A | | | | 30,100 | | | | | | | | | | 2,228,303 | |
| IDEXX Laboratories, Inc.A | | | | 3,200 | | | | | | | | | | 1,323,008 | |
| | | | | | | | | | | | | | | |
| | | | | | | | | | | | | | 4,916,485 | |
| | | | | | | | | | | | | | | |
| | | | | | | | | | | | | | | |
| | | |
| Health Care Providers & Services - 2.38% | | | | | | |
| McKesson Corp. | | | | 8,400 | | | | | | | | | | 4,787,244 | |
| | | | | | | | | | | | | | | |
| | | | | | | | | | | | | | | |
| | | |
| Health Care Technology - 1.43% | | | | | | |
| Veeva Systems, Inc., Class AA | | | | 13,700 | | | | | | | | | | 2,880,425 | |
| | | | | | | | | | | | | | | |
| | | | | | | | | | | | | | | |
| | | |
| Life Sciences Tools & Services - 0.41% | | | | | | |
| West Pharmaceutical Services, Inc. | | | | 2,550 | | | | | | | | | | 835,278 | |
| | | | | | | | | | | | | | | |
| | | | | | | | | | | | | | | |
| | | |
| Pharmaceuticals - 2.85% | | | | | | |
| Intra-Cellular Therapies, Inc.A | | | | 3,800 | | | | | | | | | | 317,376 | |
| Merck & Co., Inc. | | | | 25,200 | | | | | | | | | | 2,506,896 | |
| Zoetis, Inc. | | | | 17,900 | | | | | | | | | | 2,916,447 | |
| | | | | | | | | | | | | | | |
| | | | | | | | | | | | | | 5,740,719 | |
| | | | | | | | | | | | | | | |
| | | | | | | | | | | | | | | |
Total Health Care | | | | | | | | | | | | | | 26,432,244 | |
| | | | | | | | | | | | | | | |
| | | | | | | | | | | | | | | |
| | | |
| Industrials - 3.24% | | | | | | |
| | | |
| Building Products - 1.03% | | | | | | |
| Trane Technologies PLC | | | | 5,590 | | | | | | | | | | 2,064,666 | |
| | | | | | | | | | | | | | | |
| | | | | | | | | | | | | | | |
| | | |
| Electrical Equipment - 0.39% | | | | | | |
| Generac Holdings, Inc.A | | | | 5,100 | | | | | | | | | | 790,755 | |
| | | | | | | | | | | | | | | |
| | | | | | | | | | | | | | | |
| | | |
| Ground Transportation - 0.60% | | | | | | |
| Uber Technologies, Inc.A | | | | 20,100 | | | | | | | | | | 1,212,432 | |
| | | | | | | | | | | | | | | |
| | | | | | | | | | | | | | | |
| | | |
| Machinery - 1.22% | | | | | | |
| Caterpillar, Inc. | | | | 6,760 | | | | | | | | | | 2,452,258 | |
| | | | | | | | | | | | | | | |
| | | | | | | | | | | | | | | |
Total Industrials | | | | | | | | | | | | | | 6,520,111 | |
| | | | | | | | | | | | | | | |
| | | | | | | | | | | | | | | |
| | | |
| Information Technology - 48.00% | | | | | | |
| | | |
| Communications Equipment - 0.28% | | | | | | |
| Arista Networks, Inc.A | | | | 5,040 | | | | | | | | | | 557,071 | |
| | | | | | | | | | | | | | | |
| | | | | | | | | | | | | | | |
| | | |
| Electronic Equipment, Instruments & Components - 1.61% | | | | | | |
| Amphenol Corp., Class A | | | | 29,600 | | | | | | | | | | 2,055,720 | |
| Jabil, Inc. | | | | 5,200 | | | | | | | | | | 748,280 | |
| Keysight Technologies, Inc.A | | | | 2,800 | | | | | | | | | | 449,764 | |
| | | | | | | | | | | | | | | |
| | | | | | | | | | | | | | 3,253,764 | |
| | | | | | | | | | | | | | | |
| | | | | | | | | | | | | | | |
| | | |
| IT Services - 1.84% | | | | | | |
| EPAM Systems, Inc.A | | | | 2,600 | | | | | | | | | | 607,932 | |
| Okta, Inc.A | | | | 16,200 | | | | | | | | | | 1,276,560 | |
| Twilio, Inc., Class AA | | | | 16,800 | | | | | | | | | | 1,815,744 | |
| | | | | | | | | | | | | | | |
| | | | | | | | | | | | | | 3,700,236 | |
| | | | | | | | | | | | | | | |
| | | | | | | | | | | | | | | |
| | | |
| Semiconductors & Semiconductor Equipment - 17.94% | | | | | | |
| Advanced Micro Devices, Inc.A | | | | 21,700 | | | | | | | | | | 2,621,143 | |
| Applied Materials, Inc. | | | | 19,100 | | | | | | | | | | 3,106,233 | |
See accompanying notes
3
American Beacon Man Large Cap Growth FundSM
Schedule of Investments
December 31, 2024
| | | | | | | | | | | | | | | |
| | | |
| | | Shares | | | | Fair Value |
| | | | | | | |
| | | |
| COMMON STOCKS - 97.02% (continued) | | | | | | |
| | | |
| Information Technology - 48.00% (continued) | | | | | | |
| | | |
| Semiconductors & Semiconductor Equipment - 17.94% (continued) | | | | | | |
| Broadcom, Inc. | | | | 20,300 | | | | | | | | | $ | 4,706,352 | |
| KLA Corp. | | | | 7,500 | | | | | | | | | | 4,725,900 | |
| Lam Research Corp. | | | | 27,600 | | | | | | | | | | 1,993,548 | |
| NVIDIA Corp. | | | | 90,200 | | | | | | | | | | 12,112,958 | |
| Onto Innovation, Inc.A | | | | 7,500 | | | | | | | | | | 1,250,025 | |
| QUALCOMM, Inc. | | | | 18,600 | | | | | | | | | | 2,857,332 | |
| Teradyne, Inc. | | | | 17,800 | | | | | | | | | | 2,241,376 | |
| Universal Display Corp. | | | | 3,400 | | | | | | | | | | 497,080 | |
| | | | | | | | | | | | | | | |
| | | | | | | | | | | | | | 36,111,947 | |
| | | | | | | | | | | | | | | |
| | | | | | | | | | | | | | | |
| | | |
| Software - 20.95% | | | | | | |
| Adobe, Inc.A | | | | 9,200 | | | | | | | | | | 4,091,056 | |
| ANSYS, Inc.A | | | | 4,310 | | | | | | | | | | 1,453,892 | |
| Atlassian Corp., Class AA | | | | 11,500 | | | | | | | | | | 2,798,870 | |
| Autodesk, Inc.A | | | | 4,600 | | | | | | | | | | 1,359,622 | |
| Cadence Design Systems, Inc.A | | | | 7,380 | | | | | | | | | | 2,217,395 | |
| Crowdstrike Holdings, Inc., Class AA | | | | 8,690 | | | | | | | | | | 2,973,371 | |
| DocuSign, Inc.A | | | | 10,200 | | | | | | | | | | 917,388 | |
| Dropbox, Inc., Class AA | | | | 9,300 | | | | | | | | | | 279,372 | |
| Fortinet, Inc.A | | | | 55,600 | | | | | | | | | | 5,253,088 | |
| Intuit, Inc. | | | | 4,670 | | | | | | | | | | 2,935,095 | |
| Microsoft Corp. | | | | 24,600 | | | | | | | | | | 10,368,900 | |
| Nutanix, Inc., Class AA | | | | 3,700 | | | | | | | | | | 226,366 | |
| Palo Alto Networks, Inc.A | | | | 3,240 | | | | | | | | | | 589,550 | |
| Salesforce, Inc. | | | | 11,490 | | | | | | | | | | 3,841,452 | |
| ServiceNow, Inc.A | | | | 520 | | | | | | | | | | 551,262 | |
| Workday, Inc., Class AA | | | | 9,000 | | | | | | | | | | 2,322,270 | |
| | | | | | | | | | | | | | | |
| | | | | | | | | | | | | | 42,178,949 | |
| | | | | | | | | | | | | | | |
| | | | | | | | | | | | | | | |
| | | |
| Technology Hardware, Storage & Peripherals - 5.38% | | | | | | |
| Apple, Inc. | | | | 38,570 | | | | | | | | | | 9,658,700 | |
| HP, Inc. | | | | 21,700 | | | | | | | | | | 708,071 | |
| NetApp, Inc. | | | | 4,000 | | | | | | | | | | 464,320 | |
| | | | | | | | | | | | | | | |
| | | | | | | | | | | | | | 10,831,091 | |
| | | | | | | | | | | | | | | |
| | | | | | | | | | | | | | | |
Total Information Technology | | | | | | | | | | | | | | 96,633,058 | |
| | | | | | | | | | | | | | | |
| | | | | | | | | | | | | | | |
Total Common Stocks (Cost $134,828,468) | | | | | | | | | | | | | | 195,331,435 | |
| | | | | | | | | | | | | | | |
| | | | | | | | | | | | | | | |
| | | |
| RIGHTS - 0.00% (Cost $4,590) | | | | | | |
| | | |
| Consumer Staples - 0.00% | | | | | | |
| ABIOMED, Inc.A B C | | | | 4,500 | | | | | | | | | | 0 | |
| | | | | | | | | | | | | | | |
| | | | | | | | | | | | | | | |
| | | |
| SHORT-TERM INVESTMENTS - 2.88% (Cost $5,792,568) | | | | | | |
| | | |
| Investment Companies - 2.88% | | | | | | |
| American Beacon U.S. Government Money Market Select Fund, 4.33%D E | | | | 5,792,568 | | | | | | | | | | 5,792,568 | |
| | | | | | | | | | | | | | | |
| | | | | | | | | | | | | | | |
TOTAL INVESTMENTS - 99.90% (Cost $140,625,626) | | | | | | | | | | | | | | 201,124,003 | |
OTHER ASSETS, NET OF LIABILITIES - 0.10% | | | | | | | | | | | | | | 201,895 | |
| | | | | | | | | | | | | | | |
TOTAL NET ASSETS - 100.00% | | | | | | | | | | | | | $ | 201,325,898 | |
| | | | | | | | | | | | | | | |
| | | | | | | |
| Percentages are stated as a percent of net assets. | | | | | | | | | | | | | | | |
A Non-income producing security.
B Security has been fair valued pursuant to the Manager’s procedures related to pricing that is not available after the close of exchange or the available price does not reflect the security’s true market value. At period end, the value of these securities amounted to $0 or 0.00% of net assets.
See accompanying notes
4
American Beacon Man Large Cap Growth FundSM
Schedule of Investments
December 31, 2024
C Value was determined using significant unobservable inputs.
D The Fund is affiliated by having the same investment advisor.
E 7-day yield.
PLC - Public Limited Company.
| | | | | | | | | | | | | | | | |
| Long Futures Contracts Open on December 31, 2024: | | | | | | | | | | | | |
| | | |
| Equity Futures Contracts | | | | | | | | | |
| Description | | Number of Contracts | | Expiration Date | | Notional Amount | | | Contract Value | | | Unrealized Appreciation (Depreciation) | |
| CME E-Mini S&P 500 Index Futures | | 20 | | March 2025 | | $ | 6,044,306 | | | $ | 5,935,750 | | | $ | (108,556 | ) |
| | | | | | | | | | | | | | | | |
| | | | | | $ | 6,044,306 | | | $ | 5,935,750 | | | $ | (108,556 | ) |
| | | | | | | | | | | | | | | | |
| | |
| Glossary: |
| | |
| Index Abbreviations: |
| S&P 500 | | Standard & Poor’s 500 Index - U.S. Equity Large-Cap Index. |
|
| Exchange Abbreviations: |
| CME | | Chicago Mercantile Exchange. |
The Fund’s investments are summarized by level based on the inputs used to determine their values. As of December 31, 2024, the investments were classified as described below:
| | | | | | | | | | | | | | | | | | | | | | | | | | | | |
Man Large Cap Growth Fund | | Level 1 | | | | | | Level 2 | | | | | | Level 3 | | | | | | Total | |
Assets | | | | | | | | | | | | | | | | | | | | | | | | | | | | |
Common Stocks | | $ | 195,331,435 | | | | | | | $ | - | | | | | | | $ | - | | | | | | | $ | 195,331,435 | |
Rights | | | - | | | | | | | | - | | | | | | | | 0 | (1) | | | | | | | 0 | (1) |
Short-Term Investments | | | 5,792,568 | | | | | | | | - | | | | | | | | - | | | | | | | | 5,792,568 | |
| | | | | | | | | | | | | | | | | | | | | | | | | | | | |
Total Investments in Securities - Assets | | $ | 201,124,003 | | | | | | | $ | - | | | | | | | $ | 0 | (1) | | | | | | $ | 201,124,003 | |
| | | | | | | | | | | | | | | | | | | | | | | | | | | | |
| | | | | | | |
Financial Derivative Instruments - Liabilities | | | | | | | | | | | | | | | | | | | | | | | | | | | | |
Futures Contracts | | $ | (108,556 | ) | | | | | | $ | - | | | | | | | $ | - | | | | | | | $ | (108,556 | ) |
| | | | | | | | | | | | | | | | | | | | | | | | | | | | |
Total Financial Derivative Instruments - Liabilities | | $ | (108,556 | ) | | | | | | $ | - | | | | | | | $ | - | | | | | | | $ | (108,556 | ) |
| | | | | | | | | | | | | | | | | | | | | | | | | | | | |
| (1) | Includes investments held in the Fund’s portfolio with $0 fair value. |
U.S. GAAP requires transfers between all levels to/from level 3 be disclosed. During the year ended December 31, 2024, there were no material transfers into or out of Level 3.
See accompanying notes
5
American Beacon Man Large Cap Value FundSM
Schedule of Investments
December 31, 2024
| | | | | | | | | | | | | | | |
| | | |
| | | Shares | | | | Fair Value |
| | | | | | | |
| | | |
| COMMON STOCKS - 97.37% | | | | | | |
| | | |
| Communication Services - 2.31% | | | | | | |
| | | |
| Entertainment - 0.99% | | | | | | |
| Electronic Arts, Inc. | | | | 16,200 | | | | | | | | | $ | 2,370,060 | |
| | | | | | | | | | | | | | | |
| | | | | | | | | | | | | | | |
| | | |
| Media - 1.32% | | | | | | |
| Comcast Corp., Class A | | | | 70,700 | | | | | | | | | | 2,653,371 | |
| New York Times Co., Class A | | | | 9,700 | | | | | | | | | | 504,885 | |
| | | | | | | | | | | | | | | |
| | | | | | | | | | | | | | 3,158,256 | |
| | | | | | | | | | | | | | | |
| | | | | | | | | | | | | | | |
Total Communication Services | | | | | | | | | | | | | | 5,528,316 | |
| | | | | | | | | | | | | | | |
| | | | | | | | | | | | | | | |
| | | |
| Consumer Discretionary - 4.50% | | | | | | |
| | | |
| Automobile Components - 0.68% | | | | | | |
| BorgWarner, Inc. | | | | 51,100 | | | | | | | | | | 1,624,469 | |
| | | | | | | | | | | | | | | |
| | | | | | | | | | | | | | | |
| | | |
| Broadline Retail - 2.11% | | | | | | |
| eBay, Inc. | | | | 81,500 | | | | | | | | | | 5,048,925 | |
| | | | | | | | | | | | | | | |
| | | | | | | | | | | | | | | |
| | | |
| Hotels, Restaurants & Leisure - 0.27% | | | | | | |
| Expedia Group, Inc.A | | | | 3,500 | | | | | | | | | | 652,155 | |
| | | | | | | | | | | | | | | |
| | | | | | | | | | | | | | | |
| | | |
| Household Durables - 1.13% | | | | | | |
| Toll Brothers, Inc. | | | | 21,600 | | | | | | | | | | 2,720,520 | |
| | | | | | | | | | | | | | | |
| | | | | | | | | | | | | | | |
| | | |
| Textiles, Apparel & Luxury Goods - 0.31% | | | | | | |
| NIKE, Inc., Class B | | | | 9,700 | | | | | | | | | | 733,999 | |
| | | | | | | | | | | | | | | |
| | | | | | | | | | | | | | | |
Total Consumer Discretionary | | | | | | | | | | | | | | 10,780,068 | |
| | | | | | | | | | | | | | | |
| | | | | | | | | | | | | | | |
| | | |
| Consumer Staples - 4.32% | | | | | | |
| | | |
| Beverages - 0.17% | | | | | | |
| Coca-Cola Consolidated, Inc. | | | | 330 | | | | | | | | | | 415,797 | |
| | | | | | | | | | | | | | | |
| | | | | | | | | | | | | | | |
| | | |
| Consumer Staples Distribution & Retail - 1.65% | | | | | | |
| Walmart, Inc. | | | | 43,700 | | | | | | | | | | 3,948,295 | |
| | | | | | | | | | | | | | | |
| | | | | | | | | | | | | | | |
| | | |
| Food Products - 2.50% | | | | | | |
| Archer-Daniels-Midland Co. | | | | 46,200 | | | | | | | | | | 2,334,024 | |
| Bunge Global SA | | | | 4,300 | | | | | | | | | | 334,368 | |
| Ingredion, Inc. | | | | 14,800 | | | | | | | | | | 2,035,888 | |
| Tyson Foods, Inc., Class A | | | | 22,500 | | | | | | | | | | 1,292,400 | |
| | | | | | | | | | | | | | | |
| | | | | | | | | | | | | | 5,996,680 | |
| | | | | | | | | | | | | | | |
| | | | | | | | | | | | | | | |
Total Consumer Staples | | | | | | | | | | | | | | 10,360,772 | |
| | | | | | | | | | | | | | | |
| | | | | | | | | | | | | | | |
| | | |
| Energy - 4.17% | | | | | | |
| | | |
| Energy Equipment & Services - 0.56% | | | | | | |
| Baker Hughes Co. | | | | 32,600 | | | | | | | | | | 1,337,252 | |
| | | | | | | | | | | | | | | |
| | | | | | | | | | | | | | | |
| | | |
| Oil, Gas & Consumable Fuels - 3.61% | | | | | | |
| Coterra Energy, Inc. | | | | 68,900 | | | | | | | | | | 1,759,706 | |
| Expand Energy Corp.B | | | | 34,300 | | | | | | | | | | 3,414,565 | |
| HF Sinclair Corp. | | | | 35,000 | | | | | | | | | | 1,226,750 | |
| Valero Energy Corp. | | | | 18,500 | | | | | | | | | | 2,267,915 | |
| | | | | | | | | | | | | | | |
| | | | | | | | | | | | | | 8,668,936 | |
| | | | | | | | | | | | | | | |
| | | | | | | | | | | | | | | |
Total Energy | | | | | | | | | | | | | | 10,006,188 | |
| | | | | | | | | | | | | | | |
See accompanying notes
6
American Beacon Man Large Cap Value FundSM
Schedule of Investments
December 31, 2024
| | | | | | | | | | | | | | | |
| | | |
| | | Shares | | | | Fair Value |
| | | | | | | |
| | | |
| COMMON STOCKS - 97.37% (continued) | | | | | | |
| | | |
| Financials - 26.39% | | | | | | |
| | | |
| Banks - 5.19% | | | | | | |
| Citigroup, Inc. | | | | 23,700 | | | | | | | | | $ | 1,668,243 | |
| Citizens Financial Group, Inc. | | | | 84,100 | | | | | | | | | | 3,680,216 | |
| JPMorgan Chase & Co. | | | | 29,500 | | | | | | | | | | 7,071,445 | |
| | | | | | | | | | | | | | | |
| | | | | | | | | | | | | | 12,419,904 | |
| | | | | | | | | | | | | | | |
| | | | | | | | | | | | | | | |
| | | |
| Capital Markets - 2.61% | | | | | | |
| Affiliated Managers Group, Inc. | | | | 3,700 | | | | | | | | | | 684,204 | |
| Cboe Global Markets, Inc. | | | | 9,100 | | | | | | | | | | 1,778,140 | |
| State Street Corp. | | | | 38,600 | | | | | | | | | | 3,788,590 | |
| | | | | | | | | | | | | | | |
| | | | | | | | | | | | | | 6,250,934 | |
| | | | | | | | | | | | | | | |
| | | |
| Consumer Finance - 7.32% | | | | | | |
| Ally Financial, Inc. | | | | 110,700 | | | | | | | | | | 3,986,307 | |
| Capital One Financial Corp. | | | | 29,200 | | | | | | | | | | 5,206,944 | |
| Synchrony Financial | | | | 128,800 | | | | | | | | | | 8,372,000 | |
| | | | | | | | | | | | | | | |
| | | | | | | | | | | | | | 17,565,251 | |
| | | | | | | | | | | | | | | |
| | | | | | | | | | | | | | | |
| | | |
| Financial Services - 2.42% | | | | | | |
| Berkshire Hathaway, Inc., Class BA | | | | 6,370 | | | | | | | | | | 2,887,394 | |
| PayPal Holdings, Inc.A | | | | 34,100 | | | | | | | | | | 2,910,435 | |
| | | | | | | | | | | | | | | |
| | | | | | | | | | | | | | 5,797,829 | |
| | | | | | | | | | | | | | | |
| | | | | | | | | | | | | | | |
| | | |
| Insurance - 8.85% | | | | | | |
| Allstate Corp. | | | | 15,790 | | | | | | | | | | 3,044,154 | |
| Arch Capital Group Ltd. | | | | 31,700 | | | | | | | | | | 2,927,495 | |
| Cincinnati Financial Corp. | | | | 8,500 | | | | | | | | | | 1,221,450 | |
| Everest Group Ltd. | | | | 5,640 | | | | | | | | | | 2,044,274 | |
| Hartford Financial Services Group, Inc. | | | | 22,300 | | | | | | | | | | 2,439,620 | |
| Markel Group, Inc.A | | | | 391 | | | | | | | | | | 674,956 | |
| MetLife, Inc. | | | | 62,100 | | | | | | | | | | 5,084,748 | |
| Principal Financial Group, Inc. | | | | 26,300 | | | | | | | | | | 2,035,883 | |
| Progressive Corp. | | | | 7,300 | | | | | | | | | | 1,749,153 | |
| | | | | | | | | | | | | | | |
| | | | | | | | | | | | | | 21,221,733 | |
| | | | | | | | | | | | | | | |
| | | | | | | | | | | | | | | |
Total Financials | | | | | | | | | | | | | | 63,255,651 | |
| | | | | | | | | | | | | | | |
| | | | | | | | | | | | | | | |
| | | |
| Health Care - 23.66% | | | | | | |
| | | |
| Biotechnology - 8.59% | | | | | | |
| AbbVie, Inc. | | | | 23,400 | | | | | | | | | | 4,158,180 | |
| Biogen, Inc.A | | | | 15,500 | | | | | | | | | | 2,370,260 | |
| Exelixis, Inc.A | | | | 79,100 | | | | | | | | | | 2,634,030 | |
| Gilead Sciences, Inc. | | | | 47,700 | | | | | | | | | | 4,406,049 | |
| Incyte Corp.A | | | | 33,100 | | | | | | | | | | 2,286,217 | |
| Regeneron Pharmaceuticals, Inc.A | | | | 3,330 | | | | | | | | | | 2,372,059 | |
| United Therapeutics Corp.A | | | | 3,790 | | | | | | | | | | 1,337,264 | |
| Vertex Pharmaceuticals, Inc.A | | | | 2,550 | | | | | | | | | | 1,026,885 | |
| | | | | | | | | | | | | | | |
| | | | | | | | | | | | | | 20,590,944 | |
| | | | | | | | | | | | | | | |
| | | | | | | | | | | | | | | |
| | | |
| Health Care Equipment & Supplies - 5.15% | | | | | | |
| Abbott Laboratories | | | | 28,100 | | | | | | | | | | 3,178,391 | |
| Edwards Lifesciences Corp.A | | | | 39,300 | | | | | | | | | | 2,909,379 | |
| Hologic, Inc.A | | | | 33,600 | | | | | | | | | | 2,422,224 | |
| Medtronic PLC | | | | 42,600 | | | | | | | | | | 3,402,888 | |
| Teleflex, Inc. | | | | 2,500 | | | | | | | | | | 444,950 | |
| | | | | | | | | | | | | | | |
| | | | | | | | | | | | | | 12,357,832 | |
| | | | | | | | | | | | | | | |
| | | | | | | | | | | | | | | |
See accompanying notes
7
American Beacon Man Large Cap Value FundSM
Schedule of Investments
December 31, 2024
| | | | | | | | | | | | | | | |
| | | |
| | | Shares | | | | Fair Value |
| | | | | | | |
| | | |
| COMMON STOCKS - 97.37% (continued) | | | | | | |
| | | |
| Health Care - 23.66% (continued) | | | | | | |
| | | |
| Health Care Providers & Services - 3.80% | | | | | | |
| Cardinal Health, Inc. | | | | 26,500 | | | | | | | | | $ | 3,134,155 | |
| Cigna Group | | | | 2,510 | | | | | | | | | | 693,111 | |
| Elevance Health, Inc. | | | | 6,140 | | | | | | | | | | 2,265,046 | |
| McKesson Corp. | | | | 5,310 | | | | | | | | | | 3,026,222 | |
| | | | | | | | | | | | | | | |
| | | | | | | | | | | | | | 9,118,534 | |
| | | | | | | | | | | | | | | |
| | | | | | | | | | | | | | | |
| | | |
| Life Sciences Tools & Services - 1.22% | | | | | | |
| Agilent Technologies, Inc. | | | | 19,400 | | | | | | | | | | 2,606,196 | |
| Qiagen NVA | | | | 7,100 | | | | | | | | | | 316,163 | |
| | | | | | | | | | | | | | | |
| | | | | | | | | | | | | | 2,922,359 | |
| | | | | | | | | | | | | | | |
| | | | | | | | | | | | | | | |
| | | |
| Pharmaceuticals - 4.90% | | | | | | |
| Bristol-Myers Squibb Co. | | | | 77,200 | | | | | | | | | | 4,366,432 | |
| Jazz Pharmaceuticals PLCA | | | | 8,900 | | | | | | | | | | 1,096,035 | |
| Johnson & Johnson | | | | 32,000 | | | | | | | | | | 4,627,840 | |
| Merck & Co., Inc. | | | | 10,600 | | | | | | | | | | 1,054,488 | |
| Pfizer, Inc. | | | | 22,300 | | | | | | | | | | 591,619 | |
| | | | | | | | | | | | | | | |
| | | | | | | | | | | | | | 11,736,414 | |
| | | | | | | | | | | | | | | |
| | | | | | | | | | | | | | | |
Total Health Care | | | | | | | | | | | | | | 56,726,083 | |
| | | | | | | | | | | | | | | |
| | | | | | | | | | | | | | | |
| | | |
| Industrials - 11.94% | | | | | | |
| | | |
| Aerospace & Defense - 2.83% | | | | | | |
| RTX Corp. | | | | 58,700 | | | | | | | | | | 6,792,764 | |
| | | | | | | | | | | | | | | |
| | | | | | | | | | | | | | | |
| | | |
| Building Products - 4.02% | | | | | | |
| A.O. Smith Corp. | | | | 17,400 | | | | | | | | | | 1,186,854 | |
| Builders FirstSource, Inc.A | | | | 33,500 | | | | | | | | | | 4,788,155 | |
| Masco Corp. | | | | 11,600 | | | | | | | | | | 841,812 | |
| Owens Corning | | | | 10,400 | | | | | | | | | | 1,771,328 | |
| Trane Technologies PLC | | | | 2,780 | | | | | | | | | | 1,026,793 | |
| | | | | | | | | | | | | | | |
| | | | | | | | | | | | | | 9,614,942 | |
| | | | | | | | | | | | | | | |
| | | | | | | | | | | | | | | |
| | | |
| Construction & Engineering - 1.09% | | | | | | |
| AECOM | | | | 9,000 | | | | | | | | | | 961,380 | |
| EMCOR Group, Inc. | | | | 3,650 | | | | | | | | | | 1,656,735 | |
| | | | | | | | | | | | | | | |
| | | | | | | | | | | | | | 2,618,115 | |
| | | | | | | | | | | | | | | |
| | | | | | | | | | | | | | | |
| | | |
| Machinery - 3.14% | | | | | | |
| Cummins, Inc. | | | | 9,370 | | | | | | | | | | 3,266,382 | |
| Donaldson Co., Inc. | | | | 6,200 | | | | | | | | | | 417,570 | |
| Graco, Inc. | | | | 21,100 | | | | | | | | | | 1,778,519 | |
| IDEX Corp. | | | | 6,600 | | | | | | | | | | 1,381,314 | |
| ITT, Inc. | | | | 4,800 | | | | | | | | | | 685,824 | |
| | | | | | | | | | | | | | | |
| | | | | | | | | | | | | | 7,529,609 | |
| | | | | | | | | | | | | | | |
| | | | | | | | | | | | | | | |
| | | |
| Professional Services - 0.86% | | | | | | |
| FTI Consulting, Inc.A | | | | 3,400 | | | | | | | | | | 649,842 | |
| Jacobs Solutions, Inc. | | | | 5,500 | | | | | | | | | | 734,910 | |
| Leidos Holdings, Inc. | | | | 4,700 | | | | | | | | | | 677,082 | |
| | | | | | | | | | | | | | | |
| | | | | | | | | | | | | | 2,061,834 | |
| | | | | | | | | | | | | | | |
| | | | | | | | | | | | | | | |
Total Industrials | | | | | | | | | | | | | | 28,617,264 | |
| | | | | | | | | | | | | | | |
| | | | | | | | | | | | | | | |
| | | |
| Information Technology - 15.48% | | | | | | |
| | | |
| Communications Equipment - 3.02% | | | | | | |
| Cisco Systems, Inc. | | | | 111,300 | | | | | | | | | | 6,588,960 | |
| Motorola Solutions, Inc. | | | | 1,410 | | | | | | | | | | 651,744 | |
| | | | | | | | | | | | | | | |
| | | | | | | | | | | | | | 7,240,704 | |
| | | | | | | | | | | | | | | |
| | | | | | | | | | | | | | | |
See accompanying notes
8
American Beacon Man Large Cap Value FundSM
Schedule of Investments
December 31, 2024
| | | | | | | | | | | | | | | |
| | | |
| | | Shares | | | | Fair Value |
| | | | | | | |
| | | |
| COMMON STOCKS - 97.37% (continued) | | | | | | |
| | | |
| Information Technology - 15.48% (continued) | | | | | | |
| | | |
| Electronic Equipment, Instruments & Components - 1.92% | | | | | | |
| Amphenol Corp., Class A | | | | 3,700 | | | | | | | | | $ | 256,965 | |
| Keysight Technologies, Inc.A | | | | 14,800 | | | | | | | | | | 2,377,324 | |
| TD SYNNEX Corp. | | | | 16,800 | | | | | | | | | | 1,970,304 | |
| | | | | | | | | | | | | | | |
| | | | | | | | | | | | | | 4,604,593 | |
| | | | | | | | | | | | | | | |
| | | | | | | | | | | | | | | |
| | | |
| IT Services - 1.02% | | | | | | |
| Amdocs Ltd. | | | | 21,100 | | | | | | | | | | 1,796,454 | |
| Twilio, Inc., Class AA | | | | 6,000 | | | | | | | | | | 648,480 | |
| | | | | | | | | | | | | | | |
| | | | | | | | | | | | | | 2,444,934 | |
| | | | | | | | | | | | | | | |
| | | | | | | | | | | | | | | |
| | | |
| Semiconductors & Semiconductor Equipment - 2.96% | | | | | | |
| Applied Materials, Inc. | | | | 20,600 | | | | | | | | | | 3,350,178 | |
| Intel Corp. | | | | 39,300 | | | | | | | | | | 787,965 | |
| Qorvo, Inc.A | | | | 5,800 | | | | | | | | | | 405,594 | |
| QUALCOMM, Inc. | | | | 6,200 | | | | | | | | | | 952,444 | |
| Skyworks Solutions, Inc. | | | | 17,900 | | | | | | | | | | 1,587,372 | |
| | | | | | | | | | | | | | | |
| | | | | | | | | | | | | | 7,083,553 | |
| | | | | | | | | | | | | | | |
| | | | | | | | | | | | | | | |
| | | |
| Software - 5.20% | | | | | | |
| ANSYS, Inc.A | | | | 7,150 | | | | | | | | | | 2,411,910 | |
| Dolby Laboratories, Inc., Class A | | | | 18,700 | | | | | | | | | | 1,460,470 | |
| Dropbox, Inc., Class AA | | | | 58,500 | | | | | | | | | | 1,757,340 | |
| Salesforce, Inc. | | | | 20,500 | | | | | | | | | | 6,853,765 | |
| | | | | | | | | | | | | | | |
| | | | | | | | | | | | | | 12,483,485 | |
| | | | | | | | | | | | | | | |
| | | | | | | | | | | | | | | |
| | | |
| Technology Hardware, Storage & Peripherals - 1.36% | | | | | | |
| HP, Inc. | | | | 93,400 | | | | | | | | | | 3,047,642 | |
| NetApp, Inc. | | | | 1,800 | | | | | | | | | | 208,944 | |
| | | | | | | | | | | | | | | |
| | | | | | | | | | | | | | 3,256,586 | |
| | | | | | | | | | | | | | | |
| | | | | | | | | | | | | | | |
Total Information Technology | | | | | | | | | | | | | | 37,113,855 | |
| | | | | | | | | | | | | | | |
| | | | | | | | | | | | | | | |
| | | |
| Materials - 3.89% | | | | | | |
| | | |
| Metals & Mining - 3.89% | | | | | | |
| Newmont Corp. | | | | 55,800 | | | | | | | | | | 2,076,876 | |
| Nucor Corp. | | | | 25,200 | | | | | | | | | | 2,941,092 | |
| Royal Gold, Inc. | | | | 4,600 | | | | | | | | | | 606,510 | |
| Steel Dynamics, Inc. | | | | 32,400 | | | | | | | | | | 3,695,868 | |
| | | | | | | | | | | | | | | |
| | | | | | | | | | | | | | 9,320,346 | |
| | | | | | | | | | | | | | | |
| | | | | | | | | | | | | | | |
Total Materials | | | | | | | | | | | | | | 9,320,346 | |
| | | | | | | | | | | | | | | |
| | | | | | | | | | | | | | | |
| | | |
| Utilities - 0.71% | | | | | | |
| | | |
| Electric Utilities - 0.71% | | | | | | |
| Xcel Energy, Inc. | | | | 25,241 | | | | | | | | | | 1,704,272 | |
| | | | | | | | | | | | | | | |
| | | | | | | | | | | | | | | |
Total Common Stocks (Cost $197,490,540) | | | | | | | | | | | | | | 233,412,815 | |
| | | | | | | | | | | | | | | |
| | | | | | | | | | | | | | | |
| | | |
| FOREIGN COMMON STOCKS - 0.43% (Cost $799,214) | | | | | | |
| | | |
| Financials - 0.43% | | | | | | |
| | | |
| Insurance - 0.43% | | | | | | |
| RenaissanceRe Holdings Ltd. | | | | 4,100 | | | | | | | | | | 1,020,121 | |
| | | | | | | | | | | | | | | |
| | | | | | | | | | | | | | | |
See accompanying notes
9
American Beacon Man Large Cap Value FundSM
Schedule of Investments
December 31, 2024
| | | | | | | | | | | | | | | |
| | | |
| | | Shares | | | | Fair Value |
| | | | | | | |
| | | |
| SHORT-TERM INVESTMENTS - 2.25% (Cost $5,395,636) | | | | | | |
| | | |
| Investment Companies - 2.25% | | | | | | |
| American Beacon U.S. Government Money Market Select Fund, 4.33%C D | | | | 5,395,636 | | | | | | | | | $ | 5,395,636 | |
| | | | | | | | | | | | | | | |
| | | | | | | | | | | | | | | |
| | | | | | | | | | | | | | | |
TOTAL INVESTMENTS - 100.05% (Cost $203,685,390) | | | | | | | | | | | | | | 239,828,572 | |
LIABILITIES, NET OF OTHER ASSETS - (0.05)% | | | | | | | | | | | | | | (117,205 | ) |
| | | | | | | | | | | | | | | |
TOTAL NET ASSETS - 100.00% | | | | | | | | | | | | | $ | 239,711,367 | |
| | | | | | | | | | | | | | | |
| | | | | | | | | | | | | | | |
| Percentages are stated as a percent of net assets. | | | | | | | | | | | | | | | |
A Non-income producing security.
B All or a portion of this security is on loan, collateralized by either cash and/or U.S. Treasuries at December 31, 2024 (Note 9).
C The Fund is affiliated by having the same investment advisor.
D 7-day yield.
PLC - Public Limited Company.
| | | | | | | | | | | | | | | | |
| Long Futures Contracts Open on December 31, 2024: | | | | | | | | | | | | |
| | | |
| Equity Futures Contracts | | | | | | | | | |
| Description | | Number of
Contracts | | Expiration Date | | Notional Amount | | | Contract Value | | | Unrealized Appreciation (Depreciation) | |
| CME E-Mini S&P 500 Index Futures | | 19 | | March 2025 | | $ | 5,703,602 | | | $ | 5,638,963 | | | $ | (64,639 | ) |
| | | | | | | | | | | | | | | | |
| | | | | | $ | 5,703,602 | | | $ | 5,638,963 | | | $ | (64,639 | ) |
| | | | | | | | | | | | | | | | |
| | |
| Glossary: |
| | |
| Index Abbreviations: |
| S&P 500 | | Standard & Poor’s 500 Index - U.S. Equity Large-Cap Index. |
|
| Exchange Abbreviations: |
| CME | | Chicago Mercantile Exchange. |
The Fund’s investments are summarized by level based on the inputs used to determine their values. As of December 31, 2024, the investments were classified as described below:
| | | | | | | | | | | | | | | | | | | | | | | | | | | | |
Man Large Cap Value Fund | | Level 1 | | | | | | Level 2 | | | | | | Level 3 | | | | | | Total | |
Assets | | | | | | | | | | | | | | | | | | | | | | | | | | | | |
Common Stocks | | $ | 233,412,815 | | | | | | | $ | - | | | | | | | $ | - | | | | | | | $ | 233,412,815 | |
Foreign Common Stocks | | | 1,020,121 | | | | | | | | - | | | | | | | | - | | | | | | | | 1,020,121 | |
Short-Term Investments | | | 5,395,636 | | | | | | | | - | | | | | | | | - | | | | | | | | 5,395,636 | |
| | | | | | | | | | | | | | | | | | | | | | | | | | | | |
Total Investments in Securities - Assets | | $ | 239,828,572 | | | | | | | $ | - | | | | | | | $ | - | | | | | | | $ | 239,828,572 | |
| | | | | | | | | | | | | | | | | | | | | | | | | | | | |
| | | | | | | |
Financial Derivative Instruments - Liabilities | | | | | | | | | | | | | | | | | | | | | | | | | | | | |
Futures Contracts | | $ | (64,639 | ) | | | | | | $ | - | | | | | | | $ | - | | | | | | | $ | (64,639 | ) |
| | | | | | | | | | | | | | | | | | | | | | | | | | | | |
Total Financial Derivative Instruments - Liabilities | | $ | (64,639 | ) | | | | | | $ | - | | | | | | | $ | - | | | | | | | $ | (64,639 | ) |
| | | | | | | | | | | | | | | | | | | | | | | | | | | | |
U.S. GAAP requires transfers between all levels to/from level 3 be disclosed. During the year ended December 31, 2024, there were no transfers into or out of Level 3.
See accompanying notes
10
American Beacon FundsSM
Statements of Assets and Liabilities
December 31, 2024
| | | | | | | | | | | | |
| | | Man Large Cap
Growth Fund | | | | | | Man Large Cap
Value Fund | |
Assets: | | | | | | | | | | | | |
Investments in unaffiliated securities, at fair value† § | | $ | 195,331,435 | | | | | | | $ | 234,432,936 | |
Investments in affiliated securities, at fair value‡ | | | 5,792,568 | | | | | | | | 5,395,636 | |
Cash | | | 4,696 | | | | | | | | 2,335 | |
Cash collateral held at broker for futures contracts | | | 353,000 | | | | | | | | 370,000 | |
Dividends and interest receivable | | | 81,340 | | | | | | | | 193,309 | |
Deposits with broker for futures contracts | | | 84,130 | | | | | | | | 41,314 | |
Receivable for fund shares sold | | | 17,542 | | | | | | | | 32,457 | |
Receivable for expense reimbursement (Note 2) | | | 10,355 | | | | | | | | - | |
Prepaid expenses | | | 24,653 | | | | | | | | 14,901 | |
| | | | | | | | | | | | |
Total assets | | | 201,699,719 | | | | | | | | 240,482,888 | |
| | | | | | | | | | | | |
Liabilities: | | | | | | | | | | | | |
Payable for fund shares redeemed | | | 25,405 | | | | | | | | 361,656 | |
Management and sub-advisory fees payable (Note 2) | | | 95,107 | | | | | | | | 121,662 | |
Service fees payable (Note 2) | | | 29,281 | | | | | | | | 29,917 | |
Transfer agent fees payable (Note 2) | | | 10,041 | | | | | | | | 15,287 | |
Custody and fund accounting fees payable | | | 12,843 | | | | | | | | 16,174 | |
Professional fees payable | | | 65,712 | | | | | | | | 69,430 | |
Registration fees payable | | | - | | | | | | | | 25,859 | |
Trustee fees payable (Note 2) | | | 82 | | | | | | | | 77 | |
Payable for prospectus and shareholder reports | | | 20,542 | | | | | | | | 41,049 | |
Payable for variation margin from open futures contracts (Note 5) | | | 108,501 | | | | | | | | 64,636 | |
Other liabilities | | | 6,307 | | | | | | | | 25,774 | |
| | | | | | | | | | | | |
Total liabilities | | | 373,821 | | | | | | | | 771,521 | |
| | | | | | | | | | | | |
Commitments and contingent liabilities (Note 2) | | | | | | | | | | | | |
| | | | | | | | | | | | |
Net assets | | $ | 201,325,898 | | | | | | | $ | 239,711,367 | |
| | | | | | | | | | | | |
See accompanying notes
11
American Beacon FundsSM
Statements of Assets and Liabilities
December 31, 2024
| | | | | | | | | | | | |
| | | Man Large Cap
Growth Fund | | | | | | Man Large Cap
Value Fund | |
Analysis of net assets: | | | | | | | | | | | | |
Paid-in-capital | | $ | 139,601,466 | | | | | | | $ | 202,700,081 | |
Total distributable earnings (deficits)A | | | 61,724,432 | | | | | | | | 37,011,286 | |
| | | | | | | | | | | | |
Net assets | | $ | 201,325,898 | | | | | | | $ | 239,711,367 | |
| | | | | | | | | | | | |
Shares outstanding at no par value (unlimited shares authorized): | | | | | | | | | | | | |
R5 Class | | | 2,669,069 | | | | | | | | 3,483,759 | |
| | | | | | | | | | | | |
Y Class | | | 193,589 | | | | | | | | 3,495,630 | |
| | | | | | | | | | | | |
Investor Class | | | 2,860,443 | | | | | | | | 2,110,143 | |
| | | | | | | | | | | | |
A Class | | | 71,246 | | | | | | | | 1,063,768 | |
| | | | | | | | | | | | |
C Class | | | 28,061 | | | | | | | | 338,335 | |
| | | | | | | | | | | | |
R6 Class | | | 373,149 | | | | | | | | 88,226 | |
| | | | | | | | | | | | |
Net assets: | | | | | | | | | | | | |
R5 Class | | $ | 88,492,829 | | | | | | | $ | 79,563,790 | |
| | | | | | | | | | | | |
Y Class | | $ | 6,357,762 | | | | | | | $ | 79,350,343 | |
| | | | | | | | | | | | |
Investor Class | | $ | 90,941,583 | | | | | | | $ | 47,734,675 | |
| | | | | | | | | | | | |
A Class | | $ | 2,281,303 | | | | | | | $ | 23,827,119 | |
| | | | | | | | | | | | |
C Class | | $ | 801,704 | | | | | | | $ | 7,218,739 | |
| | | | | | | | | | | | |
R6 Class | | $ | 12,450,717 | | | | | | | $ | 2,016,701 | |
| | | | | | | | | | | | |
Net asset value, offering and redemption price per share: | | | | | | | | | | | | |
R5 Class | | $ | 33.15 | | | | | | | $ | 22.84 | |
| | | | | | | | | | | | |
Y Class | | $ | 32.84 | | | | | | | $ | 22.70 | |
| | | | | | | | | | | | |
Investor Class | | $ | 31.79 | | | | | | | $ | 22.62 | |
| | | | | | | | | | | | |
A Class | | $ | 32.02 | | | | | | | $ | 22.40 | |
| | | | | | | | | | | | |
A Class (offering price) | | $ | 33.97 | | | | | | | $ | 23.77 | |
| | | | | | | | | | | | |
C Class | | $ | 28.57 | | | | | | | $ | 21.34 | |
| | | | | | | | | | | | |
R6 Class | | $ | 33.37 | | | | | | | $ | 22.86 | |
| | | | | | | | | | | | |
† Cost of investments in unaffiliated securities | | $ | 134,833,058 | | | | | | | $ | 198,289,754 | |
‡ Cost of investments in affiliated securities | | $ | 5,792,568 | | | | | | | $ | 5,395,636 | |
§ Fair value of securities on loan | | $ | - | | | | | | | $ | 3,243,837 | |
|
A The Fund’s investments in affiliated securities did not have unrealized appreciation (depreciation) at year end. | |
See accompanying notes
12
American Beacon FundsSM
Statements of Operations
For the year ended December 31, 2024
| | | | | | | | | | | | |
| | | Man Large Cap
Growth Fund | | | | | | Man Large Cap
Value Fund | |
Investment income: | | | | | | | | | | | | |
Dividend income from unaffiliated securities | | $ | 1,332,253 | | | | | | | $ | 4,833,689 | |
Dividend income from affiliated securities (Note 2) | | | 202,715 | | | | | | | | 293,174 | |
Interest income | | | 9,019 | | | | | | | | 13,050 | |
Income derived from securities lending (Note 9) | | | 8 | | | | | | | | 2,935 | |
| | | | | | | | | | | | |
Total investment income | | | 1,543,995 | | | | | | | | 5,142,848 | |
| | | | | | | | | | | | |
Expenses: | | | | | | | | | | | | |
Management and sub-advisory fees (Note 2) | | | 1,222,218 | | | | | | | | 1,736,726 | |
Transfer agent fees (Note 2): | | | | | | | | | | | | |
R5 Class | | | 48,079 | | | | | | | | 17,717 | |
Y Class | | | 5,833 | | | | | | | | 94,861 | |
Investor Class | | | 10,390 | | | | | | | | 5,222 | |
A Class | | | 267 | | | | | | | | 1,931 | |
C Class | | | 217 | | | | | | | | 1,149 | |
R6 Class | | | 952 | | | | | | | | 1,454 | |
Custody and fund accounting fees | | | 60,618 | | | | | | | | 66,738 | |
Professional fees | | | 143,869 | | | | | | | | 156,686 | |
Registration fees and expenses | | | 92,406 | | | | | | | | 93,124 | |
Service fees (Note 2): | | | | | | | | | | | | |
Investor Class | | | 316,856 | | | | | | | | 206,048 | |
A Class | | | 1,615 | | | | | | | | 31,576 | |
C Class | | | 989 | | | | | | | | 11,874 | |
Distribution fees (Note 2): | | | | | | | | | | | | |
A Class | | | 5,441 | | | | | | | | 56,321 | |
C Class | | | 10,620 | | | | | | | | 117,941 | |
Prospectus and shareholder report expenses | | | 37,353 | | | | | | | | 58,198 | |
Trustee fees (Note 2) | | | 19,455 | | | | | | | | 27,423 | |
Line of credit interest expense (Note 10) | | | 2,423 | | | | | | | | 3,641 | |
Other expenses | | | 41,080 | | | | | | | | 40,310 | |
| | | | | | | | | | | | |
Total expenses | | | 2,020,681 | | | | | | | | 2,728,940 | |
| | | | | | | | | | | | |
Net fees waived and expenses (reimbursed) (Note 2) | | | (126,361 | ) | | | | | | | - | |
| | | | | | | | | | | | |
Net expenses | | | 1,894,320 | | | | | | | | 2,728,940 | |
| | | | | | | | | | | | |
Net investment income (loss) | | | (350,325 | ) | | | | | | | 2,413,908 | |
| | | | | | | | | | | | |
| | | |
Realized and unrealized gain (loss) from investments: | | | | | | | | | | | | |
Net realized gain from: | | | | | | | | | | | | |
Investments in unaffiliated securitiesA | | | 28,852,664 | | | | | | | | 38,972,221 | |
Futures contracts | | | 638,763 | | | | | | | | 1,048,222 | |
Change in net unrealized appreciation (depreciation) of: | | | | | | | | | | | | |
Investments in unaffiliated securitiesB | | | 12,953,066 | | | | | | | | (598,828 | ) |
Futures contracts | | | (232,925 | ) | | | | | | | (58,570 | ) |
| | | | | | | | | | | | |
Net gain from investments | | | 42,211,568 | | | | | | | | 39,363,045 | |
| | | | | | | | | | | | |
Net increase in net assets resulting from operations | | $ | 41,861,243 | | | | | | | $ | 41,776,953 | |
| | | | | | | | | | | | |
A The Fund did not recognize net realized gains (losses) from the sale of investments in affiliated securities. | |
B The Fund’s investments in affiliated securities did not have a change in unrealized appreciation (depreciation) at year end. | |
See accompanying notes
13
American Beacon FundsSM
Statements of Changes in Net Assets
| | | | | | | | | | | | | | | | | | | | | | | | | | | | |
| | | Man Large Cap Growth Fund | | | | | | Man Large Cap Value Fund | |
| | | Year Ended
December 31, 2024 | | | | | | Year Ended
December 31, 2023 | | | | | | Year Ended
December 31, 2024 | | | | | | Year Ended
December 31, 2023 | |
Increase (decrease) in net assets: | | | | | | | | | | | | | | | | | | | | | | | | | | | | |
Operations: | | | | | | | | | | | | | | | | | | | | | | | | | | | | |
Net investment income (loss) | | $ | (350,325 | ) | | | | | | $ | 4,645 | | | | | | | $ | 2,413,908 | | | | | | | $ | 5,813,582 | |
Net realized gain from investments in unaffiliated securities and futures contracts | | | 29,491,427 | | | | | | | | 832,726 | | | | | | | | 40,020,443 | | | | | | | | 12,857,546 | |
Change in net unrealized appreciation (depreciation) of investments in unaffiliated securities and futures contracts | | | 12,720,141 | | | | | | | | 44,492,545 | | | | | | | | (657,398 | ) | | | | | | | 18,142,808 | |
| | | | | | | | | | | | | | | | | | | | | | | | | | | | |
Net increase in net assets resulting from operations | | | 41,861,243 | | | | | | | | 45,329,916 | | | | | | | | 41,776,953 | | | | | | | | 36,813,936 | |
| | | | | | | | | | | | | | | | | | | | | | | | | | | | |
Distributions to shareholders: | |
Total retained earnings: | | | | | | | | | | | | | | | | | | | | | | | | | | | | |
R5 Class | | | (11,698,459 | ) | | | | | | | (632,467 | ) | | | | | | | (12,355,548 | ) | | | | | | | (9,688,208 | ) |
Y Class | | | (825,395 | ) | | | | | | | (27,715 | ) | | | | | | | (12,570,382 | ) | | | | | | | (10,182,440 | ) |
Investor Class | | | (12,140,088 | ) | | | | | | | (479,218 | ) | | | | | | | (7,339,841 | ) | | | | | | | (5,917,631 | ) |
A Class | | | (324,044 | ) | | | | | | | (10,717 | ) | | | | | | | (3,689,160 | ) | | | | | | | (1,966,189 | ) |
C Class | | | (118,688 | ) | | | | | | | (5,332 | ) | | | | | | | (1,099,467 | ) | | | | | | | (1,741,090 | ) |
R6 Class | | | (1,593,816 | ) | | | | | | | (85,097 | ) | | | | | | | (305,029 | ) | | | | | | | (2,527,979 | ) |
| | | | | | | | | | | | | | | | | | | | | | | | | | | | |
Net distributions to shareholders | | | (26,700,490 | ) | | | | | | | (1,240,546 | ) | | | | | | | (37,359,427 | ) | | | | | | | (32,023,537 | ) |
| | | | | | | | | | | | | | | | | | | | | | | | | | | | |
| | | | | | | |
Capital share transactions (Note 11): | | | | | | | | | | | | | | | | | | | | | | | | | | | | |
Proceeds from sales of shares | | | 7,674,494 | | | | | | | | 9,593,850 | | | | | | | | 24,047,441 | | | | | | | | 25,220,292 | |
Reinvestment of dividends and distributions | | | 26,577,671 | | | | | | | | 1,233,759 | | | | | | | | 36,346,436 | | | | | | | | 31,199,112 | |
Cost of shares redeemed | | | (32,392,525 | ) | | | | | | | (19,304,434 | ) | | | | | | | (119,318,770 | ) | | | | | | | (244,327,427 | ) |
| | | | | | | | | | | | | | | | | | | | | | | | | | | | |
Net increase (decrease) in net assets from capital share transactions | | | 1,859,640 | | | | | | | | (8,476,825 | ) | | | | | | | (58,924,893 | ) | | | | | | | (187,908,023 | ) |
| | | | | | | | | | | | | | | | | | | | | | | | | | | | |
Net increase (decrease) in net assets | | | 17,020,393 | | | | | | | | 35,612,545 | | | | | | | | (54,507,367 | ) | | | | | | | (183,117,624 | ) |
| | | | | | | | | | | | | | | | | | | | | | | | | | | | |
Net assets: | | | | | | | | | | | | | | | | | | | | | | | | | | | | |
Beginning of year | | | 184,305,505 | | | | | | | | 148,692,960 | | | | | | | | 294,218,734 | | | | | | | | 477,336,358 | |
| | | | | | | | | | | | | | | | | | | | | | | | | | | | |
End of year | | $ | 201,325,898 | | | | | | | $ | 184,305,505 | | | | | | | $ | 239,711,367 | | | | | | | $ | 294,218,734 | |
| | | | | | | | | | | | | | | | | | | | | | | | | | | | |
See accompanying notes
14
American Beacon FundsSM
Notes to Financial Statements
December 31, 2024
1. Organization and Significant Accounting Policies
American Beacon Funds (the “Trust”) is organized as a Massachusetts business trust. The Funds, each a series within the Trust, are registered under the Investment Company Act of 1940, as amended (the “Act”), as diversified, open-end management investment companies. As of December 31, 2024, the Trust consists of twenty-six active series, two of which are presented in this filing: American Beacon Man Large Cap Growth Fund and American Beacon Man Large Cap Value Fund (collectively, the “Funds” and each individually a “Fund”). The remaining twenty-four active series are reported in separate filings. Prior to May 1, 2024, the American Beacon Man Large Cap Growth Fund and American Beacon Man Large Cap Value Fund were known as American Beacon Bridgeway Large Cap Growth Fund and American Beacon Bridgeway Large Cap Value Fund, respectively.
American Beacon Advisors, Inc. (the “Manager”) is a Delaware corporation and a wholly-owned subsidiary of Resolute Investment Managers, Inc. (“RIM”) organized in 1986 to provide business management, advisory, administrative, and asset management consulting services to the Trust and other investors. The Manager is registered as an investment advisor under the Investment Advisers Act of 1940, as amended (the “Advisers Act”). The Manager is an indirect wholly-owned subsidiary of Resolute Topco, Inc. (“Topco”), which is owned primarily by various institutional investment funds that are managed by financial institutions and other investment advisory firms. No owner of Topco owns 25% or more of the outstanding equity or voting interests of Topco.
Recently Adopted Accounting Pronouncements
In March 2020, the Financial Accounting Standards Board (“FASB”) issued Accounting Standards Update (“ASU”) No. 2020-04, Reference Rate Reform (Topic 848); Facilitation of the Effects of Reference Rate Reform on Financial Reporting, which provides optional guidance for a limited period of time to ease the potential burden in accounting for (or recognizing the effects of) reference rate reform. The guidance is applicable to contracts referencing London Inter-bank Offered Rate (“LIBOR”) or another reference rate that is expected to be discontinued due to reference rate reform. The ASU is effective as of March 12, 2020 and generally can be applied through December 31, 2022. In December 2022, the FASB issued ASU No. 2022-06 Reference Rate Reform (Topic 848): Deferral of the Sunset Date of Topic 848 which updates and clarifies ASU No. 2020-04. The amendments in this ASU defer the sunset date of Topic 848 from December 31, 2022, to December 31, 2024. Management expects these ASUs will not have a material impact on the Funds’ financial statements.
In June 2022, the FASB issued ASU No. 2022-03, Fair Value Measurement (Topic 820); Fair Value Measurement of Equity Securities Subject to Contractual Sale Restrictions, which provides clarifying guidance that a contractual restriction on the sale of an equity security is not considered part of the unit of account of the equity security and, therefore, is not considered in measuring fair value. The ASU is effective for fiscal years beginning after December 15, 2023, and interim periods within those fiscal years. Management has concluded that the ASU will not have a material impact on the Funds’ financial statements.
In this reporting period, the Funds adopted FASB ASU No. 2023-07, Segment Reporting (Topic 280); – Improvements to Reportable Segment Disclosures. Adoption of the new standard impacted financial statement disclosures only and did not affect the Funds’ financial position or the results of its operations. An operating segment is defined in Topic 280 as a component of a public entity that engages in business activities from which it may recognize revenues and incur expenses, has operating results that are regularly reviewed by the public entity’s chief operating decision maker (“CODM”) to make decisions about resources to be allocated to the segment and assess its performance, and has discrete financial information available. The President of the American Beacon Funds acts as the Funds’ CODM. The Funds represent a single operating segment, as the CODM monitors the operating results of the Funds as a whole and the Funds’ long-term strategic asset allocation is pre-determined in accordance with the terms of its prospectus, based on a defined investment strategy which is executed by the Funds’ portfolio managers as a team. The financial information in the form of the Funds’ portfolio composition, total returns, expense ratios and changes in net assets (i.e., changes in net assets resulting from operations, subscriptions and redemptions), which are used by the CODM to assess the segment’s performance versus the
15
American Beacon FundsSM
Notes to Financial Statements
December 31, 2024
Funds’ comparative benchmarks and to make resource allocation decisions for the Funds’ single segment, is consistent with that presented within the Funds’ financial statements. Segment assets are reflected on the accompanying statements of assets and liabilities as “total assets” and significant segment expenses are listed on the accompanying statements of operations.
Class Disclosure
Each Fund has multiple classes of shares designed to meet the needs of different groups of investors; however, not all of the Funds offer all classes. The following table sets forth the differences amongst the classes:
| | | | | | |
Class | | Eligible Investors | | Minimum Initial
Investments | |
| R5 Class | | Large institutional investors - sold directly or through intermediary channels. | | $ | 250,000 | |
| | |
| Y Class | | Large institutional retirement plan investors - sold directly or through intermediary channels. | | $ | 100,000 | |
| | |
| Investor Class | | All investors using intermediary organizations, such as broker-dealers or retirement plan sponsors. | | $ | 2,500 | |
| | |
| A Class | | All investors who invest through intermediary organizations, such as broker-dealers or third party administrator. Retail investors who invest directly through a financial intermediary such as a broker, bank, or registered investment advisor which may include a front-end sales charge and a contingent deferred sales charge (“CDSC”). | | $ | 2,500 | |
| | |
| C Class | | Retail investors who invest directly through a financial intermediary, such as a broker or through employee directed benefit plans with applicable sales charges which may include CDSC. | | $ | 1,000 | |
| | |
| R6 Class | | Large institutional retirement plan investors - sold through retirement plan sponsors. | | | None | |
Each class offered by the Trust has equal rights as to assets and voting privileges. Income and non-class specific expenses are allocated daily to each class based on the relative net assets. Realized and unrealized capital gains and losses of each class are allocated daily based on the relative net assets of each class of the respective Fund. Class specific expenses, where applicable, currently include service, distribution, transfer agent fees, and sub-transfer agent fees that vary amongst the classes as described more fully in Note 2.
Significant Accounting Policies
The following is a summary of significant accounting policies, consistently followed by the Funds in preparation of the financial statements. The Funds are considered investment companies and accordingly, follow the investment company accounting and reporting guidance of the FASB Accounting Standards Codification Topic 946, Financial Services – Investment Companies, a part of Generally Accepted Accounting Principles (“U.S. GAAP”).
Security Transactions and Investment Income
Security transactions are recorded as of the trade date for financial reporting purposes. Securities purchased or sold on a when-issued or delayed-delivery basis may be settled beyond a standard settlement period for the security after the trade date.
Dividend income, net of foreign taxes, is recorded on the ex-dividend date, except certain dividends from foreign securities which are recorded as soon as the information is available to the Funds. Interest income, net of foreign taxes, is earned from settlement date, recorded on the accrual basis, and adjusted, if necessary, for accretion of discounts and amortization of premiums. Realized gains (losses) from securities sold are determined based on specific lot identification.
Distributions to Shareholders
The Funds distribute most or all of their net earnings and realized gains, if any, each taxable year in the form of dividends from net investment income and distributions of realized net capital gains and net gains from
16
American Beacon FundsSM
Notes to Financial Statements
December 31, 2024
foreign currency transactions on an annual basis. The Funds do not have a fixed dividend rate and do not guarantee that they will pay any distributions in any particular period. Dividends to shareholders are determined in accordance with federal income tax regulations, which may differ in amount and character from net investment income and realized gains recognized for purposes of U.S. GAAP. To the extent necessary to fully distribute capital gains, the Funds may designate earnings and profits distributed to shareholders on the redemption of shares.
Commission Recapture
The Funds have established brokerage commission recapture arrangements with certain brokers or dealers. If the Funds’ investment advisor chooses to execute a transaction through a participating broker, the broker rebates a portion of the commission back to the Funds. Any collateral benefit received through participation in the commission recapture program is directed exclusively to the Funds. This amount is reported with the net realized gain (loss) in the Funds’ Statements of Operations, if applicable.
Allocation of Income, Trust Expenses, Gains, and Losses
Investment income and realized and unrealized gains and losses from investments of the Funds are allocated daily to each class of shares based upon the relative proportion of net assets of each class to the total net assets of the Funds. Expenses directly charged or attributable to a Fund will be paid from the assets of a Fund. Generally, expenses of the Trust will be allocated among and charged to the assets of the Funds on a basis that the Trust’s Board deems fair and equitable, which may be based on the relative net assets of the Funds or nature of the services performed and relative applicability to the Funds.
Use of Estimates
The preparation of financial statements in conformity with U.S. GAAP requires management to make estimates and assumptions that affect the amounts reported in the financial statements and accompanying notes. Actual results may differ from those estimated.
Other
Under the Trust’s organizational documents, its officers and trustees are indemnified against certain liabilities arising out of the performance of their duties to the Trust. In the normal course of business, the Trust enters into contracts that provide indemnification to the other party or parties against potential costs or liabilities. The Trust’s maximum exposure under these arrangements is dependent on claims that may be made in the future and, therefore, cannot be estimated. The Trust has had no prior claims or losses pursuant to any such agreement.
2. Transactions with Affiliates
Management and Investment Sub-Advisory Agreements
The Funds and the Manager are parties to a Management Agreement that obligates the Manager to provide the Funds with investment advisory and administrative services. As compensation for performing the duties under the Management Agreement, the Manager will receive an annualized management fee based on a percentage of each Fund’s average daily net assets that is calculated and accrued daily according to the following schedule:
| | | | |
First $ 5 billion | | | 0.35 | % |
Next $5 billion | | | 0.325 | % |
Next $10 billion | | | 0.30 | % |
Over $20 billion | | | 0.275 | % |
The Board of the Trust, at the recommendation of the Manager, approved; (i) the termination of the investment advisory agreement among the Manager, Bridgeway Capital Management, LLC and the Trust, on behalf
17
American Beacon FundsSM
Notes to Financial Statements
December 31, 2024
of the American Beacon Man Large Cap Growth Fund (formerly known as American Beacon Bridgeway Large Cap Growth Fund) and the American Beacon Man Large Cap Value Fund (formerly known as American Beacon Bridgeway Large Cap Value Fund), effective April 30, 2024, and (ii) a new investment advisory agreement among the Manager, Numeric Investors LLC (an indirect wholly-owned subsidiary of Man Group plc), and the Trust on behalf of the Funds effective May 1, 2024.
The Trust, on behalf of the Funds, and the Manager have entered into an Investment Advisory Agreement with Numeric Investors LLC (the “Sub-Advisor”) pursuant to which each Fund has agreed to pay an annualized sub-advisory fee that is calculated and accrued daily based on each Fund’s average daily net assets according to the following schedule:
Bridgeway Capital Management, LLC
| | | | |
First $250 million | | | 0.40 | % |
Next $250 million | | | 0.35 | % |
Over $500 million | | | 0.30 | % |
Numeric Investors LLC
| | | | |
First $600 million | | | 0.20 | % |
Next $600 million to $1 billion | | | 0.18 | % |
Over $1 billion | | | 0.15 | % |
The Management and Sub-Advisory Fees paid by the Funds for the year ended December 31, 2024 were as follows:
Man Large Cap Growth Fund
| | | | | | | | | | | | |
| | | Effective
Fee Rate | | | | | | Amount of
Fees Paid | |
Management Fees | | | 0.35 | % | | | | | | $ | 697,916 | |
Sub-Advisory Fees | | | 0.26 | % | | | | | | | 524,302 | |
| | | | | | | | | | | | |
Total | | | 0.61 | % | | | | | | $ | 1,222,218 | |
| | | | | | | | | | | | |
Man Large Cap Value Fund
| | | | | | | | | | | | |
| | | Effective
Fee Rate | | | | | | Amount of
Fees Paid | |
Management Fees | | | 0.35 | % | | | | | | $ | 962,132 | |
Sub-Advisory Fees | | | 0.28 | % | | | | | | | 774,594 | |
| | | | | | | | | | | | |
Total | | | 0.63 | % | | | | | | $ | 1,736,726 | |
| | | | | | | | | | | | |
As compensation for services provided by the Manager in connection with securities lending activities conducted by a Fund, the lending Fund pays to the Manager, with respect to cash collateral posted by borrowers, a fee of 10% of the net monthly investment income (the income earned in the form of interest, dividends and realized capital gains from the investment of cash collateral, plus any negative rebate fees paid by borrowers, less the rebate amount paid to borrowers as well as related expenses) and, with respect to collateral other than cash, a fee up to 10% of loan fees and demand premiums paid by borrowers. These fees are included in “Income derived from securities lending” and “Management and sub-advisory fees” on the Statements of Operations. During the year ended December 31, 2024, the Manager received securities lending fees of $1 and $152 for the securities lending activities of the Man Large Cap Growth Fund and Man Large Cap Value Fund, respectively.
18
American Beacon FundsSM
Notes to Financial Statements
December 31, 2024
Distribution Plans
Separate Distribution Plans (the “Distribution Plans”) have been adopted pursuant to Rule 12b-1 under the Act for the A and C Classes of the Funds. Under the Distribution Plans, as compensation for distribution and shareholder servicing assistance, the Manager receives an annual fee of 0.25% of the average daily net assets of the A Class and 1.00% of the average daily net assets of the C Class. The fee will be payable without regard to whether the amount of the fee is more or less than the actual expenses incurred in a particular month by the Manager for distribution assistance.
Service Plans
The Manager and the Trust entered into Service Plans that obligate the Manager to oversee additional shareholder servicing of the Investor, A, and C Classes of the Funds. As compensation for performing the duties required under the Service Plans, the Manager receives an annualized fee up to 0.25% of the average daily net assets of the A and C Classes and up to 0.375% of the average daily net assets of the Investor Class of the Funds.
Sub-Transfer Agent Fees
The Manager has entered into agreements, which include servicing agreements, with financial intermediaries that provide recordkeeping, processing, shareholder communications and other services to customers of the intermediaries that hold positions in the R5 and Y Classes of the Funds and has agreed to compensate the intermediaries for providing these services. Intermediaries transact with the Funds primarily through the use of omnibus accounts on behalf of their customers who hold positions in the Funds. Certain services would have been provided by the Funds’ transfer agent and other service providers if the shareholders’ accounts were maintained directly by the Funds’ transfer agent. Accordingly, the Funds, pursuant to Board approval, have agreed to reimburse the Manager for certain non-distribution shareholder services provided by financial intermediaries for the R5 and Y Classes. The reimbursement amounts (sub-transfer agent fees) paid to the Manager are subject to a fee limit of up to 0.10% of an intermediary’s average net assets in the R5 and Y Classes on an annual basis. During the year ended December 31, 2024, the sub-transfer agent fees, as reflected in “Transfer agent fees” on the Statements of Operations, were as follows:
| | | | |
Fund | | Sub-Transfer Agent Fees | |
Man Large Cap Growth | | $ | 37,496 | |
Man Large Cap Value | | | 95,288 | |
As of December 31, 2024, the Funds owed the Manager the following reimbursement of sub-transfer agent fees, as reflected in “Transfer agent fees payable” on the Statements of Assets and Liabilities:
| | | | |
Fund | | Reimbursement
Sub-Transfer Agent Fees | |
Man Large Cap Growth | | $ | 3,309 | |
Man Large Cap Value | | | 8,565 | |
19
American Beacon FundsSM
Notes to Financial Statements
December 31, 2024
Investments in Affiliated Funds
The Funds may invest in the American Beacon U.S. Government Money Market Select Fund (the “USG Select Fund”). Cash collateral received by the Funds in connection with securities lending may also be invested in the USG Select Fund. The Funds listed below held the following shares with a December 31, 2024 fair value and dividend income earned from the investment in the USG Select Fund.
| | | | | | | | | | | | | | | | | | | | | | | | | | | | | | | | | | | | | | | | | | | | | | | | | | |
Affiliated Security | | Type of
Transaction | | | | | Fund | | | | | | December 31,
2024
Shares/Principal | | | | | | Change in
Unrealized
Gain (Loss) | | | | | | Realized
Gain
(Loss) | | | | | | Dividend
Income | | | | | | December 31,
2024
Fair Value | |
| U.S. Government Money Market Select | | Direct | | | | | |
| Man Large
Cap Growth |
| | | | | | $ | 5,792,568 | | | | | | | $ | - | | | | | | | $ | - | | | | | | | $ | 202,715 | | | | | | | $ | 5,792,568 | |
| U.S. Government Money Market Select | | Direct | | | | | |
| Man Large
Cap Value |
| | | | | | | 5,395,636 | | | | | | | | - | | | | | | | | - | | | | | | | | 293,174 | | | | | | | | 5,395,636 | |
The Funds and the USG Select Fund have the same investment advisor and therefore, are considered to be affiliated. The Manager serves as investment advisor to the USG Select Fund and receives management fees and administrative fees totaling 0.10% of the average daily net assets of the USG Select Fund. During the year ended December 31, 2024, the Manager earned fees on the Funds’ direct investments and securities lending collateral investments in the USG Select Fund as shown below:
| | | | |
Fund | | Direct Investments in
USG Select Fund | |
Man Large Cap Growth | | $ | 4,009 | |
Man Large Cap Value | | | 5,779 | |
Interfund Credit Facility
Pursuant to an exemptive order issued by the U.S. Securities and Exchange Commission (“SEC”), the Funds, along with other registered investment companies having management contracts with the Manager, may participate in a credit facility whereby each fund, under certain conditions, is permitted to lend money directly to and borrow directly from other participating funds for temporary purposes. The interfund credit facility is advantageous to the funds because it provides added liquidity and eliminates the need to maintain higher cash balances to meet redemptions. This situation could arise when shareholder redemptions exceed anticipated volumes and certain funds have insufficient cash on hand to satisfy such redemptions or when sales of securities do not settle as expected, resulting in a cash shortfall for a fund. The credit facility provides a source of immediate, short-term liquidity pending settlement of the sale of portfolio securities. The credit facility is administered by a credit facility team consisting of professionals from the Manager’s asset management, compliance, and accounting areas who report the activities of the credit facility to the Board. During the year ended December 31, 2024, the Funds did not utilize the credit facility.
20
American Beacon FundsSM
Notes to Financial Statements
December 31, 2024
Expense Reimbursement Plan
The Manager contractually agreed to reduce fees and/or reimburse expenses for the classes of the Funds, through December 31, 2025, to the extent that total operating expenses (excluding taxes, interest, brokerage commissions, acquired fund fees and expenses, securities lending fees, expenses associated with securities sold short, litigation, and other extraordinary expenses) exceed the Funds’ expense cap. During the year ended December 31, 2024, the Manager waived and/or reimbursed expenses as follows:
| | | | | | | | | | | | | | | | | | | | | | |
| | | | | Expense Cap | | | | | | | | | Expiration of
Reimbursed
Expenses | |
Fund | | Class | | 1/1/2024 -
4/30/2024 | | | 5/1/2024 -
12/31/2024 | | | Reimbursed
Expenses | | | (Recouped)
Expenses | |
Man Large Cap Growth | | R5 | | | 0.80 | % | | | 0.80 | % | | $ | 58,606 | | | $ | (4,890 | )* | | | 2027 | |
Man Large Cap Growth | | Y | | | 0.83 | % | | | 0.83 | % | | | 4,497 | | | | (49 | )* | | | 2027 | |
Man Large Cap Growth | | Investor | | | 1.12 | % | | | 1.12 | % | | | 54,615 | | | | (5,979 | )* | | | 2027 | |
Man Large Cap Growth | | A | | | 1.09 | % | | | 1.09 | % | | | 1,277 | | | | (160 | )* | | | 2027 | |
Man Large Cap Growth | | C | | | 1.83 | % | | | 1.83 | % | | | 992 | | | | - | | | | 2027 | |
Man Large Cap Growth | | R6 | | | 0.77 | % | | | 0.77 | % | | | 6,374 | | | | (1,043 | )* | | | 2027 | |
*These amounts represent Recouped Expenses from prior fiscal years and are reflected in Other expenses on the Statements of Operations.
Of the above amounts, $10,355, was disclosed as a Receivable for expense reimbursement on the Statements of Assets and Liabilities at December 31, 2024 for the Man Large Cap Growth Fund.
The Funds have adopted an Expense Reimbursement Plan whereby the Manager may seek repayment of contractual or voluntary fee reductions and expense reimbursements. Under the policy, the Manager can be reimbursed by the Funds for any contractual or voluntary fee reductions or expense reimbursements if reimbursement to the Manager (a) occurs within three years from the date of the Manager’s waiver/reimbursement and (b) does not cause the Funds’ annual operating expenses to exceed the lesser of the contractual percentage limit in effect at the time of the waiver/reimbursement or time of recoupment. The reimbursed expenses listed above will expire in 2027. The Funds did not record a liability for potential contingent reimbursements due to the current assessment that reimbursements are uncertain. The carryover of excess expenses potentially reimbursable to the Manager, but not recorded as a liability are as follows:
| | | | | | | | | | | | | | | | |
Fund | | Recouped
Expenses | | | Excess Expense
Carryover | | | Expired Expense
Carryover | | | Expiration of
Reimbursed
Expenses | |
Man Large Cap Growth | | $ | 12,121 | | | $ | - | | | $ | 254,401 | | | | 2024 | |
Man Large Cap Growth | | | - | | | | 239,600 | | | | - | | | | 2025 | |
Man Large Cap Growth | | | - | | | | 277,452 | | | | - | | | | 2026 | |
Sales Commissions
The Funds’ Distributor, Resolute Investment Distributors, Inc. (“RID” or “Distributor”), may receive a portion of A Class sales charges from broker dealers which may be used to offset distribution related expenses. During the year ended December 31, 2024, RID collected $130 and $453 for Man Large Cap Growth Fund and Man Large Cap Value Fund, respectively, from the sale of A Class Shares.
A CDSC of 0.50% will be deducted with respect to A Class Shares on certain purchases of $1,000,000 or more that are redeemed in whole or part within 18 months of purchase, unless waived as discussed in the Funds’ Prospectus. Any applicable CDSC will be 0.50% of the lesser of the original purchase price or the value of the redemption of the A Class Shares redeemed. During the year ended December 31, 2024, there were no CDSC fees collected for the A Class Shares of the Funds.
21
American Beacon FundsSM
Notes to Financial Statements
December 31, 2024
A CDSC of 1.00% will be deducted with respect to C Class Shares redeemed within 12 months of purchase, unless waived as discussed in the Funds’ Prospectus. Any applicable CDSC will be 1.00% of the lesser of the original purchase price or the value of the redemption of the C Class Shares redeemed. During the year ended December 31, 2024, CDSC fees of $119 were collected for the C Class Shares of Man Large Cap Value Fund. There were no CDSC fees collected for the C Class Shares of the Man Large Cap Growth Fund.
Trustee Fees and Expenses
As compensation for their service to the American Beacon Funds Complex, including the Trust (collectively, the “Trusts”), each Trustee is compensated from the Trusts as follows: (1) an annual retainer of $140,000; (2) meeting attendance fee (for attendance in-person or via teleconference) of (a) $12,000 for in person attendance, or $5,000 for telephonic attendance, by Board members for each regularly scheduled or special Board meeting, (b) $2,500 for attendance by Committee members at meetings of the Audit and Compliance Committee and the Investment Committee, (c) $1,000 for attendance by Committee members at meetings of the Nominating and Governance Committee; and (d) $2,500 for attendance by Board members for each special telephonic Board meeting; and (3) reimbursement of reasonable expenses incurred in attending Board meetings, Committee meetings, and relevant educational seminars. For this purpose, the Board considers attendance at regular meetings held by video conference to constitute in-person attendance at a Board meeting. The Trustees also may be compensated for attendance at special Board and/or Committee meetings from time to time. For her service as Board Chair, Ms. Cline receives an additional annual retainer of $50,000. Although she attends several committee meetings at each quarterly Board meeting, she receives only a single $2,500 fee each quarter for her attendance at the Audit and Compliance Committee and Investment Committee meetings. The chairpersons of the Audit and Compliance Committee and the Investment Committee each receive an additional annual retainer of $25,000 and the Chair of the Nominating and Governance Committee receives an additional annual retainer of $10,000.
3. Security Valuation and Fair Value Measurements
The price of each Fund’s shares is based on its net asset value (“NAV”) per share. Each Fund’s NAV is computed by adding total assets, subtracting all the Fund’s liabilities, and dividing the result by the total number of shares outstanding.
The NAV of each class of a Fund’s shares is determined based on a pro rata allocation of a Fund’s investment income, expenses and total capital gains and losses. A Fund’s NAV per share is determined each business day as of the regular close of trading on the New York Stock Exchange (“NYSE” or “Exchange”), which is typically 4:00 p.m. Eastern Time (“ET”). However, if trading on the NYSE closes at a time other than 4:00 p.m. ET, a Fund’s NAV per share typically would still be determined as of the regular close of trading on the NYSE. The Funds do not price their shares on days that the NYSE is closed. Foreign exchanges may permit trading in foreign securities on days when a Fund is not open for business, which may result in the value of a Fund’s portfolio investments being affected at a time when you are unable to buy or sell shares.
Equity securities, including shares of closed-end funds and exchange-traded funds (“ETFs”), are valued at the last sale price or official closing price taken from the primary exchange in which each security trades. Investments in other mutual funds are valued at the closing NAV per share on the day of valuation. Debt securities are valued at bid quotes from broker/dealers or evaluated bid prices from pricing services, who may consider a number of inputs and factors, such as prices of comparable securities, yield curves, spreads, credit ratings, coupon rates, maturity, default rates, and underlying collateral. Futures are valued based on their daily settlement prices. Exchange-traded and over-the-counter (“OTC”) options are valued at the last sale price. Options with no last sale for the day are priced at mid quote. Swaps are valued at evaluated mid prices from pricing services.
22
American Beacon FundsSM
Notes to Financial Statements
December 31, 2024
The valuation of securities traded on foreign markets and certain fixed-income securities will generally be based on prices determined as of the earlier closing time of the markets on which they primarily trade unless a significant event has occurred. When a Fund holds securities or other assets that are denominated in a foreign currency, a Fund will normally use the currency exchange rates as of 4:00 p.m. ET.
Rule 2a-5 under the Investment Company Act (the “Valuation Rule”) establishes requirements for determining fair value in good faith for purposes of the Investment Company Act, including related oversight and reporting requirements. The Valuation Rule also defines when market quotations are “readily available,” which is the threshold for determining whether a Fund must fair value a security. Among other things, the Valuation Rule permits the Board to designate the Manager as Valuation Designee to perform the Fund’s fair value determinations subject to board oversight and certain reporting and other requirements intended to ensure that the Board receives the information it needs to oversee the Manager’s fair value determinations. Effective September 8, 2022, the Board has designated the Manager as valuation designee to perform fair value functions in accordance with the requirements of the Valuation Rule.
Securities may be valued at fair value, as determined in good faith and pursuant to the Manager’s procedures, under certain limited circumstances. For example, fair value pricing will be used for fixed-income securities and when market quotations are not readily available or reliable, as determined by the Manager, such as when (i) trading for a security is restricted or stopped; (ii) a security’s trading market is closed (other than customary closings); or (iii) a security has been de-listed from a national exchange. A security with limited market liquidity may require fair value pricing if the Manager determines that the available price does not reflect the security’s true market value. In addition, if a significant event that the Manager determines to affect the value of one or more securities held by a Fund occurs after the close of a related exchange but before the determination of a Fund’s NAV, fair value pricing may be used on the affected security or securities. Securities of small-capitalization companies are also more likely to require a fair value determination using these procedures because they are more thinly traded and less liquid than the securities of larger-capitalization companies. The Funds may fair value securities as a result of significant events occurring after the close of the foreign markets in which a Fund invests as described below. In addition, the Funds may invest in illiquid securities requiring these procedures.
A Fund may use fair value pricing for securities primarily traded in non-U.S. markets because most foreign markets close well before a Fund’s pricing time of 4:00 p.m. ET. The earlier close of these foreign markets gives rise to the possibility that significant events, including broad market moves, may have occurred in the interim and may materially affect the value of those securities. If the Manager determines that the last quoted prices of non-U.S. securities will, in its judgment, materially affect the value of some or all a Fund’s portfolio securities, the Manager can adjust the previous closing prices to reflect what it believes to be the fair value of the securities as of the close of the Exchange. In deciding whether it is necessary to adjust closing prices to reflect fair value, the Manager reviews a variety of factors, including developments in foreign markets, the performance of U.S. securities markets, and the performance of instruments trading in U.S. markets that represent foreign securities and baskets of foreign securities. These securities are fair valued using a pricing service, using methods approved by the Manager, that considers the correlation of the trading patterns of the foreign security to intraday trading in the U.S. markets, based on indices of domestic securities and other appropriate indicators such as prices of relevant American Depositary Receipts (“ADRs”) and futures contracts. The Manager’s Valuation Committee may also fair value securities in other situations, such as when a particular foreign market is closed but a Fund is open. A Fund uses outside pricing services to provide closing prices and information to evaluate and/or adjust those prices. As a means of evaluating its security valuation process, the Valuation Committee routinely compares closing prices, the next day’s opening prices in the same markets and adjusted prices.
23
American Beacon FundsSM
Notes to Financial Statements
December 31, 2024
Attempts to determine the fair value of securities introduce an element of subjectivity to the pricing of securities. As a result, the price of a security determined through fair valuation techniques may differ from the price quoted or published by other sources and may not accurately reflect the market value of the security when trading resumes. If a reliable market quotation becomes available for a security formerly valued through fair valuation techniques, the Manager compares the new market quotation to the fair value price to evaluate the effectiveness of a Fund’s fair valuation procedures. If any significant discrepancies are found, the Manager may adjust Manager’s fair valuation procedures for a Fund.
Valuation Inputs
Various inputs may be used to determine the fair value of the Funds’ investments. These inputs are summarized in three broad levels for financial statement purposes. The inputs or methodologies used to value securities are not necessarily an indication of the risk associated with investing in those securities.
| | | | |
| Level 1 | | - | | Quoted prices in active markets for identical securities. |
| | |
| Level 2 | | - | | Prices determined using other significant observable inputs. These may include quoted prices for similar securities, interest rates, prepayment speeds, credit risk, and others. |
| | |
| Level 3 | | - | | Prices determined using other significant unobservable inputs. Unobservable inputs reflect a Fund’s own assumptions about the factors market participants would use in pricing an investment. |
Level 1 and Level 2 trading assets and trading liabilities, at fair value
Common stocks, preferred securities, ETFs, and financial derivative instruments, such as futures contracts that are traded on a national securities exchange, are stated at the last reported sale or settlement price on the day of valuation. To the extent these securities are actively traded and valuation adjustments are not applied, they are categorized as Level 1 of the fair value hierarchy. Preferred securities and other equities traded on inactive markets or valued by reference to similar instruments are generally categorized as Level 2 of the fair value hierarchy.
Investments in registered open-end investment management companies will be valued based upon the NAVs of such investments and are categorized as Level 1 of the fair value hierarchy.
4. Securities and Other Investments
Common Stock
Common stock generally takes the form of shares in a corporation which represent an ownership interest. It ranks below preferred stock and debt securities in claims for dividends and for assets of the company in a liquidation or bankruptcy. The value of a company’s common stock may fall as a result of factors directly relating to that company, such as decisions made by its management or decreased demand for the company’s products or services. A stock’s value may also decline because of factors affecting not just the company, but also companies in the same industry or sector. The price of a company’s stock may also be affected by changes in financial markets that are relatively unrelated to the company, such as changes in interest rates, currency exchange rates or industry regulation. Companies that elect to pay dividends on their common stock generally only do so after they invest in their own business and make required payments to bondholders and on other debt and preferred stock. Therefore, the value of a company’s common stock will usually be more volatile than its bonds, other debt and preferred stock. Common stock may be exchange-traded or OTC. OTC stock may be less liquid than exchange-traded stock.
24
American Beacon FundsSM
Notes to Financial Statements
December 31, 2024
Other Investment Company Securities and Other Exchange-Traded Products
The Funds at times may invest in shares of other investment companies, including open-end funds, closed-end funds, business development companies (“BDCs”), ETFs, unit investment trusts, and other investment companies of the Trust. The Funds may invest in securities of an investment company advised by the Manager or the Sub-Advisor. Investments in the securities of other investment companies may involve duplication of advisory fees and certain other expenses. By investing in another investment company, the Funds become a shareholder of that investment company. As a result, the Funds’ shareholders indirectly will bear the Funds’ proportionate share of the fees and expenses paid by shareholders of the other investment company, in addition to the fees and expenses the Funds’ shareholders directly bear in connection with the Funds’ own operations. These other fees and expenses are reflected as Acquired Fund Fees and Expenses and are included in the Fees and Expenses Table for the Funds in their Prospectus, if applicable. Investments in other investment companies may involve the payment of substantial premiums above the value of such issuer’s portfolio securities.
Real Estate Investment Trusts (“REITs”)
The Funds may own shares of REITs which report information on the source of their distributions annually. The Funds re-characterize distributions received from REIT investments based on information provided by the REITs into the following categories: ordinary income, long-term capital gains, and return of capital. If information is not available on a timely basis from the REITs, the re-characterization will be estimated based on available information, which may include the previous year allocation. If new or additional information becomes available from the REITs at a later date, a re-characterization will be made the following year.
5. Financial Derivative Instruments
The Funds may utilize derivative instruments to gain market exposure on cash balances. When considering the Funds’ use of derivatives, it is important to note that the Funds do not use derivatives for the purpose of creating financial leverage.
Futures Contracts
A futures contract is a contract to purchase or sell a particular security, or the cash value of an asset, such as securities, indices, or currencies, at a specified future date at a price agreed upon when the contract is made. Under many such contracts, no delivery of the actual underlying asset is required. Rather, upon the expiration of the contract, settlement is made by exchanging cash in an amount equal to the difference between the contract price and the closing price of the asset (e.g., a security or an index) at expiration, net of the initial and variation margin that was previously paid. A Treasury futures contract is a contract for the future delivery of a U.S. Treasury security. An equity index futures contract is based on the value of an underlying index. A Fund may, from time to time, use futures positions to equitize cash and expose its portfolio to changes in securities prices or index prices. This can magnify gains and losses in a Fund. A Fund also may have to sell assets at inopportune times to satisfy its settlement or collateral obligations. The risks associated with the use of futures contracts also include that there may be an imperfect correlation between the changes in market value of the futures contracts and the assets underlying such contracts and that there may not be a liquid secondary market for a futures contract.
During the year ended December 31, 2024, the Funds entered into futures contracts primarily for exposing cash to markets.
25
American Beacon FundsSM
Notes to Financial Statements
December 31, 2024
The Funds’ average futures contracts outstanding fluctuate throughout the operating year as required to meet strategic requirements. The following table illustrates the average monthly volume of futures contracts. For the purpose of this disclosure, volume is measured by contracts outstanding at each month end.
| | | | |
Average Futures Contracts Outstanding | |
Fund | | Year Ended December 31, 2024 | |
Man Large Cap Growth | | | 14 | |
Man Large Cap Value | | | 19 | |
The following is a summary of the fair valuations of the Funds’ derivative instruments categorized by risk exposure(1):
Man Large Cap Growth Fund
| | | | | | | | | | | | | | | | | | | | | | | | | | | | | | | | | | | | | | | | | | | | | | | | | | | | | | | |
| Fair values of financial instruments on the Statements of Assets and Liabilities as of December 31, 2024: | |
| |
| | | Derivatives not accounted for as hedging instruments |
| | | | | | | | | | | |
Liabilities: | | Credit contracts | | | | Foreign exchange
contracts | | | | Commodity
contracts | | | | Interest rate
contracts | | | | Equity contracts | | | | Total |
| Payable for variation margin from open futures contracts(2) | | | $ | - | | | | | | | | | $ | - | | | | | | | | | $ | - | | | | | | | | | $ | - | | | | | | | | | $ | (108,556 | ) | | | | | | | | $ | (108,556 | ) |
| | | | | | | | | | | | | | | | | | | | | | | | | | | | | | | | | | | | | | | | | | | | | | | | | | | | | | | |
| The effect of financial derivative instruments on the Statements of Operations as of December 31, 2024: | |
| |
| | | Derivatives not accounted for as hedging instruments |
| | | | | | | | | | | |
Realized gain (loss) from derivatives
recognized as a result of operations | | Credit contracts | | | | Foreign exchange
contracts | | | | Commodity
contracts | | | | Interest rate
contracts | | | | Equity contracts | | | | Total |
| Futures contracts | | | $ | - | | | | | | | | | $ | - | | | | | | | | | $ | - | | | | | | | | | $ | - | | | | | | | | | $ | 638,763 | | | | | | | | | $ | 638,763 | |
| | | | | | | | | | | |
Net change in unrealized appreciation
(depreciation) of derivatives recognized
as a result from operations: | | Credit contracts | | | | Foreign exchange
contracts | | | | Commodity
contracts | | | | Interest rate
contracts | | | | Equity contracts | | | | Total |
| Futures contracts | | | $ | - | | | | | | | | | $ | - | | | | | | | | | $ | - | | | | | | | | | $ | - | | | | | | | | | $ | (232,925 | ) | | | | | | | | $ | (232,925 | ) |
Man Large Cap Value Fund
| | | | | | | | | | | | | | | | | | | | | | | | | | | | | | | | | | | | | | | | | | | | | | | | | | | | | | | |
| Fair values of financial instruments on the Statements of Assets and Liabilities as of December 31, 2024: | |
| |
| | | Derivatives not accounted for as hedging instruments |
| | | | | | | | | | | |
Liabilities: | | Credit contracts | | | | Foreign exchange
contracts | | | | Commodity
contracts | | | | Interest rate
contracts | | | | Equity contracts | | | | Total |
| Payable for variation margin from open futures contracts(2) | | | $ | - | | | | | | | | | $ | - | | | | | | | | | $ | - | | | | | | | | | $ | - | | | | | | | | | $ | (64,639 | ) | | | | | | | | $ | (64,639 | ) |
| | | | | | | | | | | | | | | | | | | | | | | | | | | | | | | | | | | | | | | | | | | | | | | | | | | | | | | |
| The effect of financial derivative instruments on the Statements of Operations as of December 31, 2024: | |
| |
| | | Derivatives not accounted for as hedging instruments |
| | | | | | | | | | | |
Realized gain (loss) from derivatives
recognized as a result of operations | | Credit contracts | | | | Foreign exchange
contracts | | | | Commodity
contracts | | | | Interest rate
contracts | | | | Equity contracts | | | | Total |
| Futures contracts | | | $ | - | | | | | | | | | $ | - | | | | | | | | | $ | - | | | | | | | | | $ | - | | | | | | | | | $ | 1,048,222 | | | | | | | | | $ | 1,048,222 | |
| | | | | | | | | | | |
Net change in unrealized appreciation
(depreciation) of derivatives recognized
as a result from operations: | | Credit contracts | | | | Foreign exchange
contracts | | | | Commodity
contracts | | | | Interest rate
contracts | | | | Equity contracts | | | | Total |
| Futures contracts | | | $ | - | | | | | | | | | $ | - | | | | | | | | | $ | - | | | | | | | | | $ | - | | | | | | | | | $ | (58,570 | ) | | | | | | | | $ | (58,570 | ) |
(1) See Note 3 in the Notes to Financial Statements for additional information.
26
American Beacon FundsSM
Notes to Financial Statements
December 31, 2024
(2) Includes cumulative appreciation (depreciation) of futures contracts as reported in the Fund’s Schedule of Investments footnotes. Only current day’s variation margin is reported within the Statements of Assets and Liabilities.
Offsetting Assets and Liabilities
The Funds are parties to enforceable master netting agreements between brokers and counterparties which provide for the right to offset under certain circumstances. The Funds employ multiple money managers and counterparties and have elected not to offset qualifying financial and derivative instruments on the Statements of Assets and Liabilities, as such all financial and derivative instruments are presented on a gross basis. The impacts of netting arrangements that provide the right to offset are detailed below, if applicable. The net amount represents the net receivable or payable that would be due from or to the counterparty in the event of default. Exposure from borrowings and other financing agreements such as repurchase agreements can only be netted across transactions governed by the same Master Agreement with the same legal entity. All amounts reported below represent the balance as of the report date, December 31, 2024.
Man Large Cap Growth Fund
| | | | | | | | | | | | |
| Offsetting of Financial and Derivative Assets as of December 31, 2024: | | | | | | | | | | | | |
| | Assets | | | | | | Liabilities | |
| | | | | | | | | | |
| Futures Contracts(1) | | $ | - | | | | | | | $ | 108,556 | |
| | | | | | | | | | | | |
| Total derivative assets and liabilities in the Statement of Assets and Liabilities | | $ | - | | | | | | | $ | 108,556 | |
| | | | | | | | | | | | |
| Derivatives not subject to a Master Netting Agreement or similar agreement (“MNA”) | | $ | - | | | | | | | $ | (108,556 | ) |
| | | | | | | | | | | | |
Man Large Cap Value Fund
| | | | | | | | | | | | |
| Offsetting of Financial and Derivative Assets as of December 31, 2024: | | | | | | | | | | | | |
| | Assets | | | | | | Liabilities | |
| | | | | | | | | | |
| Futures Contracts(1) | | $ | - | | | | | | | $ | 64,639 | |
| | | | | | | | | | | | |
| Total derivative assets and liabilities in the Statement of Assets and Liabilities | | $ | - | | | | | | | $ | 64,639 | |
| | | | | | | | | | | | |
| Derivatives not subject to a Master Netting Agreement or similar agreement (“MNA”) | | $ | - | | | | | | | $ | (64,639 | ) |
| | | | | | | | | | | | |
(1) Includes cumulative appreciation or (depreciation) of futures contracts as reported in the Schedule of Investments footnotes. Only current day’s variation margin is reported within the Statements of Assets and Liabilities.
6. Principal Risks
Investing in the Funds may involve certain risks including, but not limited to, those described below.
Equity Investments Risk
Equity securities are subject to investment risk and market risk. The Funds’ investments in equity securities may include common stocks, preferred stocks, securities convertible into or exchangeable for common stocks, REITs, depositary receipts, and U.S. dollar-denominated foreign stocks traded on U.S. exchanges. Such investments may expose the Funds to additional risk. The value of a company’s common stock may fall as a result of factors affecting the company, companies in the same industry or sector, or the financial markets overall. Common stock generally is subordinate to preferred stock upon the liquidation or bankruptcy of the issuing company. Preferred stocks and convertible securities are sensitive to movements in interest rates. Preferred stocks may be less liquid than common stocks and, unlike common stocks, participation in the growth of an issuer may be limited. Distributions on preferred stocks generally are payable at the discretion of an issuer and after required payments to bond holders. Convertible securities are subject to the risk that the credit standing of the issuer may have an effect on the convertible securities’ investment value. Investments in REITs are subject to the risks associated with investing in the real estate industry such as adverse developments affecting the real estate industry and real property values. Depositary receipts and U.S. dollar-denominated foreign stocks traded on U.S. exchanges are subject to certain of the risks associated with investing directly in foreign securities, including, but not limited to, currency fluctuations and political and financial instability in the home country of a particular depositary receipt or foreign stock.
27
American Beacon FundsSM
Notes to Financial Statements
December 31, 2024
Futures Contracts Risk
Futures contracts are derivative instruments where one party pays a fixed price for an agreed amount of securities or other underlying assets at an agreed date. The use of such derivative instruments may expose the Funds to additional risks that they would not be subject to if they invested directly in the securities underlying those derivatives. There may at times be an imperfect correlation between the movement in the prices of futures contracts and the value of their underlying instruments or indexes. There can be no assurance that any strategy used will succeed. There also can be no assurance that, at all times, a liquid market will exist for offsetting a futures contract that a Fund has previously bought or sold and this may result in the inability to close a futures contract when desired. Futures contracts may experience potentially dramatic price changes, which will increase the volatility of a Fund and may involve a small investment of cash (the amount of initial and variation margin) relative to the magnitude of the risk assumed (the potential increase or decrease in the price of the futures contract).
Investment Risk
An investment in the Funds is not a deposit with a bank and is not insured or guaranteed by the Federal Deposit Insurance Corporation or any other government agency. When you sell your shares of the Funds, they could be worth less than what you paid for them. Therefore, you may lose money by investing in the Funds.
Market Risk
The Funds are subject to the risk that the securities markets will move down, sometimes rapidly and unpredictably, based on overall economic conditions and other factors, which may negatively affect a Fund’s performance. Equity securities generally have greater price volatility than fixed-income securities, although under certain market conditions fixed-income securities may have comparable or greater price volatility. During a general downturn in the securities markets, multiple assets may decline in value simultaneously. In some cases, traditional market participants have been less willing to make a market in some types of debt instruments, which has affected the liquidity of those instruments. During times of market turmoil, investors tend to look to the safety of securities issued or backed by the U.S. Treasury, causing the prices of these securities to rise and the yields to decline. Reduced liquidity in fixed-income and credit markets may negatively affect many issuers worldwide. Prices in many financial markets have increased significantly over the last decade, but there have also been periods of adverse market and financial developments and cyclical change during that timeframe, which have resulted in unusually high levels of volatility in domestic and foreign financial markets that has caused losses for investors and may occur again in the future, particularly if markets enter a period of uncertainty or economic weakness. The value of a security may decline due to adverse issuer-specific conditions, general market conditions unrelated to a particular issuer, or factors that affect a particular industry or industries. Changes in the financial condition of a single issuer or market segment also can impact the market as a whole.
Geopolitical and other events, including war, terrorism, economic uncertainty, trade disputes, pandemics, public health crises, natural disasters and related events have led, and in the future may continue to lead, to instability in world economies and markets generally and reduced liquidity in equity, credit and fixed-income markets, which may disrupt economies and markets and adversely affect the value of your investment. Changes in value may be temporary or may last for extended periods.
Policy changes by the U.S. government and/or Federal Reserve and political events within the U.S. and abroad, including the U.S. presidential election, the U.S. government’s inability at times to agree on a long-term budget and deficit reduction plan, the threat of a federal government shutdown and threats not to increase the federal government’s debt limit, may affect investor and consumer confidence and may adversely impact financial markets and the broader economy, perhaps suddenly and to a significant degree.
28
American Beacon FundsSM
Notes to Financial Statements
December 31, 2024
Markets and market participants are increasingly reliant upon both publicly available and proprietary information data systems. Data imprecision, software or other technology malfunctions, programming inaccuracies, unauthorized use or access, and similar circumstances may impair the performance of these systems and may have an adverse impact upon a single issuer, a group of issuers, or the market at large. The financial markets generally move in cycles, with periods of rising prices followed by periods of declining prices. The value of your investment may reflect these fluctuations.
Other Investment Companies Risk
The Funds may invest in shares of other registered investment companies, including money market funds that are advised by the Manager. To the extent that the Funds invest in shares of other registered investment companies, the Funds will indirectly bear the fees and expenses, including for example advisory and administrative fees, charged by those investment companies in addition to the Funds’ direct fees and expenses and will be subject to the risks associated with investments in those companies. For example, the Funds’ investments in money market funds are subject to interest rate risk, credit risk, and market risk. The Funds must rely on the investment company in which it invests to achieve its investment objective. If the investment company fails to achieve its investment objective, the value of the Funds’ investment will decline, adversely affecting the Funds’ performance. To the extent the Funds invest in other investment companies that invest in equity securities, fixed-income securities and/or foreign securities, or that track an index, the Funds are subject to the risks associated with the underlying investments held by the investment company or the index fluctuations to which the investment company is subject.
Recent Market Events Risk
Both U.S. and international markets have experienced significant volatility in recent months and years. As a result of such volatility, investment returns may fluctuate significantly. Moreover, the risks discussed herein associated with an investment in a Fund may be increased.
Although interest rates were unusually low in recent years in the U.S. and abroad, in 2022, the Federal Reserve and certain foreign central banks began to raise interest rates as part of their efforts to address rising inflation. It is difficult to accurately predict the pace at which interest rates may continue to increase, the timing, frequency or magnitude of any such increases, or when such increases might stop. Additionally, various economic and political factors could cause the Federal Reserve or another foreign central bank to change their approach in the future and such actions may result in an economic slowdown in the U.S. and abroad. Unexpected increases in interest rates could lead to market volatility or reduce liquidity in certain sectors of the market. Deteriorating economic fundamentals may, in turn, increase the risk of default or insolvency of particular issuers, negatively impact market value, cause credit spreads to widen, and reduce bank balance sheets. Any of these could cause an increase in market volatility, reduce liquidity across various markets or decrease confidence in the markets. Additionally, high public debt in the U.S. and other countries creates ongoing systemic and market risks and policymaking uncertainty.
In March 2023, the shutdown of certain financial institutions in the U.S. and questions regarding the viability of other financial institutions raised economic concerns over disruption in the U.S. and global banking systems. There can be no certainty that the actions taken by the U.S. or foreign governments will be effective in mitigating the effects of financial institution failures on the economy and restoring public confidence in the U.S. and global banking systems.
Some countries, including the U.S., have in recent years adopted more protectionist trade policies. Slowing global economic growth; imposition of tariffs and resulting impacts on global prices and supply chains; risks associated with a trade agreement between the United Kingdom and the European Union; the risks associated with ongoing trade negotiations with China; the possibility of changes to some international trade agreements; political or economic dysfunction within some nations, including major producers of oil; and dramatic changes in commodity and currency prices could have adverse effects that cannot be foreseen at the present time.
29
American Beacon FundsSM
Notes to Financial Statements
December 31, 2024
Tensions, war, or open conflict between nations, such as between Russia and Ukraine, in the Middle East or in eastern Asia could affect the economies of many nations, including the United States. The duration of ongoing hostilities in the Middle East and between Russia and Ukraine, and any sanctions and related events cannot be predicted. Those events present material uncertainty and risk with respect to markets globally and the performance of a Fund and its investments or operations could be negatively impacted.
Regulators in the U.S. have proposed and recently adopted a number of changes to regulations involving the markets and issuers, some of which apply to the Fund. The full effect of various newly-adopted regulations is not currently known. Additionally, it is not clear whether the proposed regulations will be adopted. However, due to the broad scope of the new and proposed regulations, certain changes could limit a Fund’s ability to pursue its investment strategies or make certain investments, or may make it more costly for a Fund to operate, which may impact performance.
Economists and others have expressed increasing concern about the potential effects of global climate change on property and security values. Certain issuers, industries and regions may be adversely affected by the impacts of climate change, including on the demand for and the development of goods and services and related production costs, and the impacts of legislation, regulation and international accords related to climate change, as well as any indirect consequences of regulation or business trends driven by climate change.
Environmental, Social, and/or Governance Investing Risk
The use of environmental, social, and/or governance (“ESG”) considerations by a sub-advisor may cause a Fund to make different investments than funds that have a similar investment style but do not incorporate such considerations in their strategy. As with the use of any investment considerations involved in investment decisions, there is no guarantee that the use of any ESG investment considerations will result in the selection of issuers that will outperform other issuers or help reduce risk in a Fund. A Fund may underperform funds that do not incorporate these considerations.
Securities Lending Risk
A Fund may lend its portfolio securities to brokers, dealers and financial institutions in order to obtain additional income. Borrowers of a Fund’s securities provide collateral either in the form of cash, which a Fund reinvests in securities or in the form of non-cash collateral consisting of securities issued or guaranteed by the U.S. government or one of its agencies or instrumentalities. A Fund will be responsible for the risks associated with the investment of cash collateral, including any collateral invested in an affiliated money market fund. A Fund may lose money on its investment of cash collateral or may fail to earn sufficient income on its investment to cover its payment to the borrower of a pre-negotiated fee or “rebate” for the use of that cash collateral in connection with the loan. A Fund could also lose money due to a decline in the value of non-cash collateral. In addition, delays may occur in the recovery of securities from borrowers, which could interfere with a Fund’s ability to vote proxies or to settle transactions or could result in increased costs. Moreover, if the borrower becomes subject to insolvency or similar proceedings, a Fund could incur delays in its ability to enforce its rights in its collateral. There also is a risk that a borrower may default on its obligation to return loaned securities at a time when the value of a Fund’s collateral is inadequate. Although a Fund’s securities lending agent may indemnify a Fund against that risk, it is also possible that the securities lending agent will be unable to satisfy its indemnification obligations. In any case in which the loaned securities are not returned to a Fund before an ex-dividend date, whether or not due to a default by the borrower, the payment in lieu of the dividend that a Fund receives from the securities’ borrower would not be treated as a dividend for federal income tax purposes and thus would not qualify for treatment as “qualified dividend income.”
30
American Beacon FundsSM
Notes to Financial Statements
December 31, 2024
7. Federal Income and Excise Taxes
It is the policy of each Fund to qualify as a regulated investment company (“RIC”), by complying with all applicable provisions of Subchapter M of the Internal Revenue Code, as amended, and to make distributions of taxable income sufficient to relieve it from substantially all federal income and excise taxes. For federal income tax purposes, each Fund is treated as a single entity for the purpose of determining such qualification.
The Funds do not have any unrecorded tax liabilities in the accompanying financial statements. Each of the tax years in the four year period ended December 31, 2024 remain subject to examination by the Internal Revenue Service. If applicable, the Funds recognize interest accrued related to unrecognized tax benefits in interest expense and penalties in “Other expenses” on the Statements of Operations.
The Funds may be subject to taxes imposed by countries in which it invests. Such taxes are generally based on returns of income earned or gains realized or repatriated. Taxes are accrued and applied to net investment income, net realized capital gains and net unrealized appreciation (depreciation), as applicable, as the income is earned or capital gains are recorded.
Dividends are categorized in accordance with income tax regulations which may treat certain transactions differently than U.S. GAAP. Accordingly, the character of distributions and composition of net assets for tax purposes may differ from those reflected in the accompanying financial statements.
The tax character of distributions paid were as follows:
| | | | | | | | | | | | | | | | | | | | | | | | | | | | |
| | | Man Large Cap Growth Fund | | | | | | Man Large Cap Value Fund | |
| | | Year Ended
December 31, 2024 | | | | | | Year Ended
December 31, 2023 | | | | | | Year Ended
December 31, 2024 | | | | | | Year Ended
December 31, 2023 | |
Distributions paid from: | | | | | | | | | | | | | | | | | | | | | | | | | | | | |
Ordinary income* | | | | | | | | | | | | | | | | | | | | | | | | | | | | |
R5 Class | | $ | 2,584,145 | | | | | | | $ | 275,104 | | | | | | | $ | 5,745,041 | | | | | | | $ | 3,101,199 | |
Y Class | | | 182,103 | | | | | | | | 12,055 | | | | | | | | 5,804,151 | | | | | | | | 3,218,446 | |
Investor Class | | | 2,678,406 | | | | | | | | 113,675 | | | | | | | | 3,306,089 | | | | | | | | 1,765,127 | |
A Class | | | 71,492 | | | | | | | | 3,266 | | | | | | | | 1,669,927 | | | | | | | | 581,097 | |
C Class | | | 26,186 | | | | | | | | - | | | | | | | | 458,526 | | | | | | | | 416,319 | |
R6 Class | | | 352,068 | | | | | | | | 37,015 | | | | | | | | 141,295 | | | | | | | | 818,952 | |
Long-term capital gains | | | | | | | | | | | | | | | | | | | | | | | | | | | | |
R5 Class | | | 9,114,314 | | | | | | | | 357,363 | | | | | | | | 6,610,507 | | | | | | | | 6,587,009 | |
Y Class | | | 643,292 | | | | | | | | 15,660 | | | | | | | | 6,766,231 | | | | | | | | 6,963,994 | |
Investor Class | | | 9,461,682 | | | | | | | | 365,543 | | | | | | | | 4,033,752 | | | | | | | | 4,152,504 | |
A Class | | | 252,552 | | | | | | | | 7,451 | | | | | | | | 2,019,233 | | | | | | | | 1,385,092 | |
C Class | | | 92,502 | | | | | | | | 5,332 | | | | | | | | 640,941 | | | | | | | | 1,324,771 | |
R6 Class | | | 1,241,748 | | | | | | | | 48,082 | | | | | | | | 163,734 | | | | | | | | 1,709,027 | |
| | | | | | | | | | | | | | | | | | | | | | | | | | | | |
Total distributions paid | | $ | 26,700,490 | | | | | | | $ | 1,240,546 | | | | | | | $ | 37,359,427 | | | | | | | $ | 32,023,537 | |
| | | | | | | | | | | | | | | | | | | | | | | | | | | | |
* For tax purposes, short-term capital gains are considered ordinary income distributions.
As of December 31, 2024, the components of distributable earnings (deficits) on a tax basis were as follows:
| | | | | | | | | | | | | | | | | | | | | | | | | | | | |
Fund | | Tax Cost | | | | | | Unrealized
Appreciation | | | | | | Unrealized
(Depreciation) | | | | | | Net Unrealized
Appreciation
(Depreciation) | |
Man Large Cap Growth | | $ | 140,625,640 | | | | | | | $ | 64,334,717 | | | | | | | $ | (3,836,354 | ) | | | | | | $ | 60,498,363 | |
Man Large Cap Value | | | 203,708,455 | | | | | | | | 43,248,531 | | | | | | | | (7,128,414 | ) | | | | | | | 36,120,117 | |
31
American Beacon FundsSM
Notes to Financial Statements
December 31, 2024
| | | | | | | | | | | | | | | | | | | | | | | | | | | | | | | | | | | | | | | | | | | | |
Fund | | Net Unrealized
Appreciation
(Depreciation) | | | | | | Undistributed
Ordinary
Income | | | | | | Undistributed
Long-Term
Capital Gains | | | | | | Accumulated
Capital and
Other (Losses) | | | | | | Other Temporary
Differences | | | | | | Distributable
Earnings | |
Man Large Cap Growth | | $ | 60,498,363 | | | | | | | $ | 1,226,069 | | | | | | | $ | - | | | | | | | $ | - | | | | | | | $ | - | | | | | | | $ | 61,724,432 | |
Man Large Cap Value | | | 36,120,117 | | | | | | | | 202,862 | | | | | | | | 1,391,126 | | | | | | | | - | | | | | | | | (702,819 | ) | | | | | | | 37,011,286 | |
Financial reporting records are adjusted for permanent book/tax differences to reflect tax character. Financial records are not adjusted for temporary differences. The temporary differences between financial reporting and tax-basis reporting of unrealized appreciation (depreciation) are attributable primarily to the tax deferral of losses from wash sales and the realization for tax purposes of unrealized gains (losses) on certain derivative instruments.
Due to inherent differences in the recognition of income, expenses, and realized gains (losses) under U.S. GAAP and federal income tax regulations, permanent differences between book and tax reporting have been identified and appropriately reclassified on the Statements of Assets and Liabilities.
Accordingly, the following amounts represent current year permanent differences derived from equalization as of December 31, 2024:
| | | | | | | | | | | | |
Fund | | Paid-In-Capital | | | | | | Distributable
Earnings/(Deficits) | |
| Man Large Cap Growth | | $ | 1,939,293 | | | | | | | $ | (1,939,293 | ) |
| Man Large Cap Value | | | 6,841,898 | | | | | | | | (6,841,898 | ) |
For federal income tax purposes, the Funds measure their capital loss carryforwards annually at December 31, their fiscal year end. Capital loss carryforwards retain their character as short-term and/or long-term and may be carried forward and applied against future realized capital gains with no expiration date.
As of December 31, 2024, the Funds did not have any capital loss carryforwards.
The Funds are permitted for tax purposes to defer into the next fiscal year qualified late year losses. Qualified late year capital losses are net losses incurred after October 31 through the Fund’s fiscal year end, December 31, 2024. Qualified late year ordinary losses are specified losses generally incurred after October 31 through the end of the Fund’s fiscal year end, December 31, 2024. Man Large Cap Value deferred $702,819 ordinary loss to January 1, 2025.
8. Investment Transactions
The aggregate cost of purchases and proceeds from sales and maturities of investments, other than short-term obligations, for the year ended December 31, 2024 were as follows:
| | | | | | | | | | | | |
Fund | | Purchases (non-U.S. Government
Securities) | | | | | | Sales (non-U.S. Government
Securities) | |
| Man Large Cap Growth | | $ | 100,830,362 | | | | | | | $ | 126,970,417 | |
| Man Large Cap Value | | | 171,213,112 | | | | | | | | 264,273,588 | |
32
American Beacon FundsSM
Notes to Financial Statements
December 31, 2024
A summary of the Funds’ transactions in the USG Select Fund for the year ended December 31, 2024 were as follows:
| | | | | | | | | | | | | | | | | | | | | | | | | | | | | | | | | | |
Fund | | Type of
Transaction | | | | | December 31,
2023
Shares/Fair
Value | | | | | | Purchases | | | | | | Sales | | | | | | December 31,
2024
Shares/Fair
Value | |
| Man Large Cap Growth | | Direct | | | | | | $ | 4,562,560 | | | | | | | $ | 61,452,543 | | | | | | | $ | 60,222,535 | | | | | | | $ | 5,792,568 | |
| Man Large Cap Value | | Direct | | | | | | | 4,315,835 | | | | | | | | 136,970,419 | | | | | | | | 135,890,618 | | | | | | | | 5,395,636 | |
9. Securities Lending
The Funds may lend their securities to qualified financial institutions, such as certain broker-dealers, to earn additional income. The borrowers are required to secure their loans continuously with collateral in an amount at least equal to the fair value of the securities loaned, initially in an amount at least equal to 102% of the fair value of domestic securities loaned and 105% of the fair value of international securities loaned. Collateral is monitored and marked-to-market daily. Daily mark-to-market amounts are required to be paid to the borrower or received from the borrower by the end of the following business day. This one day settlement for mark-to-market amounts may result in the collateral being temporarily less than the value of the securities on loan or temporarily more than the required minimum collateral.
To the extent that a loan is collateralized by cash, such cash collateral shall be invested by the securities lending agent (the “Agent”) in money market mutual funds and other short-term investments, provided the investments meet certain quality and diversification requirements. Securities purchased with cash collateral proceeds are listed in the Funds’ Schedule of Investments and the collateral is shown on the Statements of Assets and Liabilities as a payable.
Securities lending income is generated from the demand premium (if any) paid by the borrower to borrow a specific security and from the return on investment of cash collateral, reduced by negotiated rebate fees paid to the borrower and transaction costs. To the extent that a loan is secured by non-cash collateral, securities lending income is generated as a demand premium reduced by transaction costs. The Funds, the Agent, and the Manager retained 80%, 10%, and 10%, respectively, of the income generated from securities lending.
While securities are on loan, the Funds continue to receive certain income associated with that security and any gain or loss in the market price that may occur during the term of the loan. In the case of domestic equities, the value of any dividend is received in the form of a substitute payment approximately equal to the dividend. In the case of foreign securities, a negotiated amount is received that is less than the actual dividend, but higher than the dividend amount minus the foreign tax that the Funds would be subject to on the dividend.
Securities lending transactions pose certain risks to the Funds, including that the borrower may not provide additional collateral when required or return the securities when due, that the value of the short-term investments will be less than the amount of cash collateral required to be returned to the borrower, that non-cash collateral may be subject to legal constraints in the event of a borrower bankruptcy, and that the cash collateral investments could become illiquid and unable to be used to return collateral to the borrower. The Funds could also experience delays and costs in gaining access to the collateral. The Funds bear the risk of any deficiency in the amount of the cash collateral available for return to the borrower and any action which impairs its ability to liquidate non-cash collateral to satisfy a borrower default.
33
American Beacon FundsSM
Notes to Financial Statements
December 31, 2024
As of December 31, 2024, the value of outstanding securities on loan and the value of collateral were as follows:
| | | | | | | | | | | | | | | | | | | | | | | | | | | | |
Fund | | Fair Value of
Securities on Loan | | | | | | Cash Collateral
Received | | | | | | Non-Cash Collateral
Received | | | | | | Total Collateral
Received | |
Man Large Cap Value | | $ | 3,243,837 | | | | | | | $ | - | | | | | | | $ | 3,323,670 | | | | | | | $ | 3,323,670 | |
Cash collateral is listed on the Funds’ Schedules of Investments and is shown on the Statements of Assets and Liabilities. Income earned on these investments is included in “Income derived from securities lending” on the Statements of Operations.
Non-cash collateral received by the Funds may not be sold or re-pledged except to satisfy a borrower default. Therefore, non-cash collateral is not included on the Funds’ Schedules of Investments or Statements of Assets and Liabilities.
10. Borrowing Arrangements
Effective November 8, 2024 (the “Effective Date”), the Funds, along with certain other funds managed by the Manager (“Participating Funds”), renewed a committed revolving line of credit (the “Committed Line”) agreement with State Street Bank and Trust Company (the “Bank”) to be used to facilitate portfolio liquidity. The maximum borrowing amount under the Committed Line is $100 million with interest at a rate equal to the higher of (a) Overnight Bank Funding Rate (“OBFR”) daily fluctuating rate per annum equal to 1.25% plus the sum of 0.10% or (b) the Federal Funds daily fluctuating rate per annum on amounts borrowed. Each of the Participating Funds paid a proportional amount of a quarterly commitment fee at a rate of 0.25% per annum on the unused portion of the Committed Line amount. The Committed Line expires November 7, 2025, unless extended by the Bank or terminated by the Participating Funds in accordance with the agreement. Prior to the Effective Date, the maximum borrowing amount under the Committed Line was $100 million with an expiration date November 7, 2024.
On the Effective Date, the Funds, along with certain other Participating Funds managed by the Manager, also renewed an uncommitted discretionary demand revolving line of credit (the “Uncommitted Line”) agreement with the Bank to be used to facilitate portfolio liquidity. The maximum borrowing amount under the Uncommitted Line is $100 million with interest at a rate equal to the higher of (a) OBFR daily fluctuating rate per annum equal to 1.25% plus the sum of 0.10% or (b) the Federal Funds daily fluctuating rate per annum on amounts borrowed on each outstanding loan. Each of the Participating Funds paid a proportional amount of a closing fee of $35,000 on the Effective Date. The Uncommitted Line expires November 7, 2025, unless extended by the Bank or terminated by the Participating Funds in accordance with the agreement. Prior to the Effective Date, the maximum borrowing amount under the Uncommitted Line was $100 million with an expiration date November 7, 2024.
The Participating Funds paid administration, legal and arrangement fees, which are recognized as a component of “Line of credit interest expense” on the Statements of Operations, along with commitment fees, that have been allocated among the Participating Funds based on average daily net assets.
During the year ended December 31, 2024, the Funds did not utilize these facilities.
34
American Beacon FundsSM
Notes to Financial Statements
December 31, 2024
11. Capital Share Transactions
The tables below summarize the activity in capital shares for each Class of the Funds:
| | | | | | | | | | | | | | | | | | | | | | | | | | | | |
| | | R5 Class | |
| | | Year Ended
December 31, 2024 | | | | | | Year Ended
December 31, 2023 | |
Man Large Cap Growth Fund | | Shares | | | | | | Amount | | | | | | Shares | | | | | | Amount | |
| | | | | | | | | | | | | | | | | | | | | | |
| Shares sold | | | 26,939 | | | | | | | $ | 890,053 | | | | | | | | 50,364 | | | | | | | $ | 1,352,315 | |
| Reinvestment of dividends | | | 344,857 | | | | | | | | 11,580,300 | | | | | | | | 20,412 | | | | | | | | 625,838 | |
| Shares redeemed | | | (433,622 | ) | | | | | | | (14,972,358 | ) | | | | | | | (308,595 | ) | | | | | | | (8,352,884 | ) |
| | | | | | | | | | | | | | | | | | | | | | | | | | | | |
| Net (decrease) in shares outstanding | | | (61,826 | ) | | | | | | $ | (2,502,005 | ) | | | | | | | (237,819 | ) | | | | | | $ | (6,374,731 | ) |
| | | | | | | | | | | | | | | | | | | | | | | | | | | | |
| | | | |
| | | Y Class | |
| | | Year Ended
December 31, 2024 | | | | | | Year Ended
December 31, 2023 | |
Man Large Cap Growth Fund | | Shares | | | | | | Amount | | | | | | Shares | | | | | | Amount | |
| Shares sold | | | 73,918 | | | | | | | $ | 2,535,348 | | | | | | | | 111,875 | | | | | | | $ | 3,031,961 | |
| Reinvestment of dividends | | | 24,809 | | | | | | | | 825,395 | | | | | | | | 912 | | | | | | | | 27,715 | |
| Shares redeemed | | | (26,651 | ) | | | | | | | (934,649 | ) | | | | | | | (17,385 | ) | | | | | | | (449,286 | ) |
| | | | | | | | | | | | | | | | | | | | | | | | | | | | |
| Net increase in shares outstanding | | | 72,076 | | | | | | | $ | 2,426,094 | | | | | | | | 95,402 | | | | | | | $ | 2,610,390 | |
| | | | | | | | | | | | | | | | | | | | | | | | | | | | |
| | | | |
| | | Investor Class | |
| | | Year Ended
December 31, 2024 | | | | | | Year Ended
December 31, 2023 | |
Man Large Cap Growth Fund | | Shares | | | | | | Amount | | | | | | Shares | | | | | | Amount | |
| | | | | | | | | | | | | | | | | | | | | | |
| Shares sold | | | 98,518 | | | | | | | $ | 3,373,006 | | | | | | | | 170,281 | | | | | | | $ | 4,153,111 | |
| Reinvestment of dividends | | | 376,760 | | | | | | | | 12,135,428 | | | | | | | | 16,168 | | | | | | | | 479,060 | |
| Shares redeemed | | | (409,510 | ) | | | | | | | (13,718,463 | ) | | | | | | | (317,956 | ) | | | | | | | (8,386,384 | ) |
| | | | | | | | | | | | | | | | | | | | | | | | | | | | |
| Net increase (decrease) in shares outstanding | | | 65,768 | | | | | | | $ | 1,789,971 | | | | | | | | (131,507 | ) | | | | | | $ | (3,754,213 | ) |
| | | | | | | | | | | | | | | | | | | | | | | | | | | | |
| | | | |
| | | A Class | |
| | | Year Ended
December 31, 2024 | | | | | | Year Ended
December 31, 2023 | |
Man Large Cap Growth Fund | | Shares | | | | | | Amount | | | | | | Shares | | | | | | Amount | |
| Shares sold | | | 16,566 | | | | | | | $ | 562,735 | | | | | | | | 17,670 | | | | | | | $ | 480,179 | |
| Reinvestment of dividends | | | 9,989 | | | | | | | | 324,044 | | | | | | | | 359 | | | | | | | | 10,717 | |
| Shares redeemed | | | (12,433 | ) | | | | | | | (422,167 | ) | | | | | | | (9,076 | ) | | | | | | | (234,650 | ) |
| | | | | | | | | | | | | | | | | | | | | | | | | | | | |
| Net increase in shares outstanding | | | 14,122 | | | | | | | $ | 464,612 | | | | | | | | 8,953 | | | | | | | $ | 256,246 | |
| | | | | | | | | | | | | | | | | | | | | | | | | | | | |
| | | | |
| | | C Class | |
| | | Year Ended
December 31, 2024 | | | | | | Year Ended
December 31, 2023 | |
Man Large Cap Growth Fund | | Shares | | | | | | Amount | | | | | | Shares | | | | | | Amount | |
| | | | | | | | | | | | | | | | | | | | | | |
| Shares sold | | | 4,397 | | | | | | | $ | 131,968 | | | | | | | | 19,200 | | | | | | | $ | 466,327 | |
| Reinvestment of dividends | | | 4,100 | | | | | | | | 118,688 | | | | | | | | 196 | | | | | | | | 5,332 | |
| Shares redeemed | | | (21,274 | ) | | | | | | | (668,399 | ) | | | | | | | (11,121 | ) | | | | | | | (268,647 | ) |
| | | | | | | | | | | | | | | | | | | | | | | | | | | | |
| Net increase (decrease) in shares outstanding | | | (12,777 | ) | | | | | | $ | (417,743 | ) | | | | | | | 8,275 | | | | | | | $ | 203,012 | |
| | | | | | | | | | | | | | | | | | | | | | | | | | | | |
| | | | |
| | | R6 Class | |
| | | Year Ended
December 31, 2024 | | | | | | Year Ended
December 31, 2023 | |
Man Large Cap Growth Fund | | Shares | | | | | | Amount | | | | | | Shares | | | | | | Amount | |
| | | | | | | | | | | | | | | | | | | | | | |
| Shares sold | | | 5,151 | | | | | | | $ | 181,384 | | | | | | | | 4,033 | | | | | | | $ | 109,957 | |
| Reinvestment of dividends | | | 47,154 | | | | | | | | 1,593,816 | | | | | | | | 2,764 | | | | | | | | 85,097 | |
| Shares redeemed | | | (48,295 | ) | | | | | | | (1,676,489 | ) | | | | | | | (61,189 | ) | | | | | | | (1,612,583 | ) |
| | | | | | | | | | | | | | | | | | | | | | | | | | | | |
| Net increase (decrease) in shares outstanding | | | 4,010 | | | | | | | $ | 98,711 | | | | | | | | (54,392 | ) | | | | | | $ | (1,417,529 | ) |
| | | | | | | | | | | | | | | | | | | | | | | | | | | | |
35
American Beacon FundsSM
Notes to Financial Statements
December 31, 2024
| | | | | | | | | | | | | | | | | | | | | | | | | | | | |
| | | R5 Class | |
| | | Year Ended
December 31, 2024 | | | | | | Year Ended
December 31, 2023 | |
Man Large Cap Value Fund | | Shares | | | | | | Amount | | | | | | Shares | | | | | | Amount | |
| | | | | | | | | | | | | | | | | | | | | | |
| Shares sold | | | 238,378 | | | | | | | $ | 6,064,246 | | | | | | | | 475,016 | | | | | | | $ | 11,405,282 | |
| Reinvestment of dividends | | | 529,947 | | | | | | | | 12,130,486 | | | | | | | | 411,696 | | | | | | | | 9,514,304 | |
| Shares redeemed | | | (1,117,186 | ) | | | | | | | (28,463,754 | ) | | | | | | | (6,498,178 | ) | | | | | | | (157,162,878 | ) |
| | | | | | | | | | | | | | | | | | | | | | | | | | | | |
| Net (decrease) in shares outstanding | | | (348,861 | ) | | | | | | $ | (10,269,022 | ) | | | | | | | (5,611,466 | ) | | | | | | $ | (136,243,292 | ) |
| | | | | | | | | | | | | | | | | | | | | | | | | | | | |
| | | | |
| | | Y Class | |
| | | Year Ended
December 31, 2024 | | | | | | Year Ended
December 31, 2023 | |
Man Large Cap Value Fund | | Shares | | | | | | Amount | | | | | | Shares | | | | | | Amount | |
| | | | | | | | | | | | | | | | | | | | | | |
| Shares sold | | | 211,986 | | | | | | | $ | 5,287,207 | | | | | | | | 270,068 | | | | | | | $ | 6,430,142 | |
| Reinvestment of dividends | | | 531,147 | | | | | | | | 12,083,590 | | | | | | | | 426,054 | | | | | | | | 9,794,984 | |
| Shares redeemed | | | (1,201,546 | ) | | | | | | | (29,941,151 | ) | | | | | | | (1,974,265 | ) | | | | | | | (47,327,369 | ) |
| | | | | | | | | | | | | | | | | | | | | | | | | | | | |
| Net (decrease) in shares outstanding | | | (458,413 | ) | | | | | | $ | (12,570,354 | ) | | | | | | | (1,278,143 | ) | | | | | | $ | (31,102,243 | ) |
| | | | | | | | | | | | | | | | | | | | | | | | | | | | |
| | | | |
| | | Investor Class | |
| | | Year Ended
December 31, 2024 | | | | | | Year Ended
December 31, 2023 | |
Man Large Cap Value Fund | | Shares | | | | | | Amount | | | | | | Shares | | | | | | Amount | |
| | | | | | | | | | | | | | | | | | | | | | |
| Shares sold | | | 49,420 | | | | | | | $ | 1,234,789 | | | | | | | | 62,676 | | | | | | | $ | 1,496,254 | |
| Reinvestment of dividends | | | 322,227 | | | | | | | | 7,304,895 | | | | | | | | 256,908 | | | | | | | | 5,888,329 | |
| Shares redeemed | | | (661,996 | ) | | | | | | | (16,555,784 | ) | | | | | | | (888,129 | ) | | | | | | | (20,973,725 | ) |
| | | | | | | | | | | | | | | | | | | | | | | | | | | | |
| Net (decrease) in shares outstanding | | | (290,349 | ) | | | | | | $ | (8,016,100 | ) | | | | | | | (568,545 | ) | | | | | | $ | (13,589,142 | ) |
| | | | | | | | | | | | | | | | | | | | | | | | | | | | |
| | | | |
| | | A Class | |
| | | Year Ended
December 31, 2024 | | | | | | Year Ended
December 31, 2023 | |
Man Large Cap Value Fund | | Shares | | | | | | Amount | | | | | | Shares | | | | | | Amount | |
| | | | | | | | | | | | | | | | | | | | | | |
| Shares sold | | | 402,635 | | | | | | | $ | 10,017,737 | | | | | | | | 137,760 | | | | | | | $ | 3,241,835 | |
| Reinvestment of dividends | | | 153,066 | | | | | | | | 3,436,324 | | | | | | | | 77,185 | | | | | | | | 1,755,182 | |
| Shares redeemed | | | (310,728 | ) | | | | | | | (7,737,701 | ) | | | | | | | (258,770 | ) | | | | | | | (6,209,757 | ) |
| | | | | | | | | | | | | | | | | | | | | | | | | | | | |
| Net increase (decrease) in shares outstanding | | | 244,973 | | | | | | | $ | 5,716,360 | | | | | | | | (43,825 | ) | | | | | | $ | (1,212,740 | ) |
| | | | | | | | | | | | | | | | | | | | | | | | | | | | |
| | | | |
| | | C Class | |
| | | Year Ended
December 31, 2024 | | | | | | Year Ended
December 31, 2023 | |
Man Large Cap Value Fund | | Shares | | | | | | Amount | | | | | | Shares | | | | | | Amount | |
| | | | | | | | | | | | | | | | | | | | | | |
| Shares sold | | | 12,641 | | | | | | | $ | 297,319 | | | | | | | | 9,708 | | | | | | | $ | 221,086 | |
| Reinvestment of dividends | | | 50,777 | | | | | | | | 1,086,112 | | | | | | | | 78,895 | | | | | | | | 1,718,333 | |
| Shares redeemed | | | (493,104 | ) | | | | | | | (11,719,944 | ) | | | | | | | (257,463 | ) | | | | | | | (5,812,519 | ) |
| | | | | | | | | | | | | | | | | | | | | | | | | | | | |
| Net (decrease) in shares outstanding | | | (429,686 | ) | | | | | | $ | (10,336,513 | ) | | | | | | | (168,860 | ) | | | | | | $ | (3,873,100 | ) |
| | | | | | | | | | | | | | | | | | | | | | | | | | | | |
| | | | |
| | | R6 Class | |
| | | Year Ended
December 31, 2024 | | | | | | Year Ended
December 31, 2023 | |
Man Large Cap Value Fund | | Shares | | | | | | Amount | | | | | | Shares | | | | | | Amount | |
| | | | | | | | | | | | | | | | | | | | | | |
| Shares sold | | | 46,190 | | | | | | | $ | 1,146,143 | | | | | | | | 99,623 | | | | | | | $ | 2,425,693 | |
| Reinvestment of dividends | | | 13,326 | | | | | | | | 305,029 | | | | | | | | 109,579 | | | | | | | | 2,527,980 | |
| Shares redeemed | | | (990,718 | ) | | | | | | | (24,900,436 | ) | | | | | | | (295,870 | ) | | | | | | | (6,841,179 | ) |
| | | | | | | | | | | | | | | | | | | | | | | | | | | | |
| Net (decrease) in shares outstanding | | | (931,202 | ) | | | | | | $ | (23,449,264 | ) | | | | | | | (86,668 | ) | | | | | | $ | (1,887,506 | ) |
| | | | | | | | | | | | | | | | | | | | | | | | | | | | |
12. Subsequent Events
Management has evaluated subsequent events for possible recognition or disclosure in the financial statements through the date the financial statements are issued. Management has determined that there are no material events that would require disclosure in the Funds’ financial statements through this date.
36
American Beacon Man Large Cap Growth FundSM
Financial Highlights
(For a share outstanding throughout the period)
| | | | | | | | | | | | | | | | | | | | | | | | | | | | | | | | | | | | |
| | | R5 ClassA | |
| | | Year Ended December 31, | |
| | | 2024B | | | | | | 2023 | | | | | | 2022 | | | | | | 2021 | | | | | | 2020 | |
| | | | |
Net asset value, beginning of period | | $ | 30.64 | | | | | | | $ | 23.50 | | | | | | | $ | 36.78 | | | | | | | $ | 36.24 | | | | | | | $ | 29.84 | |
| | | | | | | | | | | | | | | | | | | | | | | | | | | | | | | | | | | | |
Income (loss) from investment operations: | | | | | | | | | | | | | | | | | | | | | | | | | | | | | | | | | | | | |
Net investment income | | | (0.00 | )C | | | | | | | 0.07 | | | | | | | | 0.12 | | | | | | | | 0.01 | | | | | | | | 0.07 | |
Net gains (losses) on investments (both realized and unrealized) | | | 7.39 | | | | | | | | 7.30 | | | | | | | | (9.37 | ) | | | | | | | 7.82 | | | | | | | | 10.21 | |
| | | | | | | | | | | | | | | | | | | | | | | | | | | | | | | | | | | | |
Total income (loss) from investment operations | | | 7.39 | | | | | | | | 7.37 | | | | | | | | (9.25 | ) | | | | | | | 7.83 | | | | | | | | 10.28 | |
| | | | | | | | | | | | | | | | | | | | | | | | | | | | | | | | | | | | |
Less distributions: | | | | | | | | | | | | | | | | | | | | | | | | | | | | | | | | | | | | |
Dividends from net investment income | | | (0.00 | )C | | | | | | | (0.10 | ) | | | | | | | - | | | | | | | | - | | | | | | | | (0.07 | ) |
Distributions from net realized gains | | | (4.88 | ) | | | | | | | (0.13 | ) | | | | | | | (4.03 | ) | | | | | | | (7.29 | ) | | | | | | | (3.81 | ) |
| | | | | | | | | | | | | | | | | | | | | | | | | | | | | | | | | | | | |
Total distributions | | | (4.88 | ) | | | | | | | (0.23 | ) | | | | | | | (4.03 | ) | | | | | | | (7.29 | ) | | | | | | | (3.88 | ) |
| | | | | | | | | | | | | | | | | | | | | | | | | | | | | | | | | | | | |
Net asset value, end of period | | $ | 33.15 | | | | | | | $ | 30.64 | | | | | | | $ | 23.50 | | | | | | | $ | 36.78 | | | | | | | $ | 36.24 | |
| | | | | | | | | | | | | | | | | | | | | | | | | | | | | | | | | | | | |
Total returnD | | | 23.93 | % | | | | | | | 31.37 | % | | | | | | | (25.17 | )% | | | | | | | 21.82 | % | | | | | | | 34.44 | % |
| | | | | | | | | | | | | | | | | | | | | | | | | | | | | | | | | | | | |
| | | | | | | | | |
Ratios and supplemental data: | | | | | | | | | | | | | | | | | | | | | | | | | | | | | | | | | | | | |
Net assets, end of period | | $ | 88,492,829 | | | | | | | $ | 83,676,439 | | | | | | | $ | 69,755,325 | | | | | | | $ | 112,640,010 | | | | | | | $ | 114,246,613 | |
Ratios to average net assets: | | | | | | | | | | | | | | | | | | | | | | | | | | | | | | | | | | | | |
Expenses, before reimbursements and/or recoupments | | | 0.87 | % | | | | | | | 0.97 | % | | | | | | | 0.94 | % | | | | | | | 0.92 | % | | | | | | | 0.97 | % |
Expenses, net of reimbursements and/or recoupments | | | 0.80 | % | | | | | | | 0.80 | % | | | | | | | 0.80 | % | | | | | | | 0.81 | % | | | | | | | 0.82 | %E |
Net investment income (loss), before expense reimbursements and/or recoupments | | | (0.10 | )% | | | | | | | (0.02 | )% | | | | | | | 0.25 | % | | | | | | | (0.10 | )% | | | | | | | (0.08 | )% |
Net investment income (loss), net of reimbursements and/or recoupments | | | (0.03 | )% | | | | | | | 0.15 | % | | | | | | | 0.39 | % | | | | | | | 0.01 | % | | | | | | | 0.07 | % |
Portfolio turnover rate | | | 52 | % | | | | | | | 78 | % | | | | | | | 72 | % | | | | | | | 57 | % | | | | | | | 58 | % |
| A | Prior to February 28, 2020, the R5 Class was known as Institutional Class. |
| B | On April 30, 2024 Bridgeway Capital Management, LLC was terminated and ceased managing assets of the Fund. On May 1, 2024, Numeric Investors LLC, began managing assets of the Fund. |
| C | Amount represents less than $0.01 per share. |
| D | Based on net asset value, which does not reflect the sales charge, redemption fee, or contingent deferred sales charge, if applicable. May include adjustments in accordance with U.S. GAAP and as such, the net asset value for reporting purposes and the returns based upon those net asset values may differ from the net asset value and returns for shareholder transactions. |
| E | Expense ratios may exceed stated expense caps in Note 2 due to security lending expenses, which are not reimbursable under the agreement with the Manager. |
See accompanying notes
37
American Beacon Man Large Cap Growth FundSM
Financial Highlights
(For a share outstanding throughout the period)
| | | | | | | | | | | | | | | | | | | | | | | | | | | | | | | | | | | | |
| | | Y Class | |
| | | Year Ended December 31, | |
| | | 2024A | | | | | | 2023 | | | | | | 2022 | | | | | | 2021 | | | | | | 2020 | |
| | | | |
Net asset value, beginning of period | | $ | 30.37 | | | | | | | $ | 23.30 | | | | | | | $ | 36.53 | | | | | | | $ | 36.05 | | | | | | | $ | 29.72 | |
| | | | | | | | | | | | | | | | | | | | | | | | | | | | | | | | | | | | |
Income (loss) from investment operations: | | | | | | | | | | | | | | | | | | | | | | | | | | | | | | | | | | | | |
Net investment income (loss) | | | (0.02 | )B | | | | | | | 0.05 | | | | | | | | 0.03 | | | | | | | | (0.04 | ) | | | | | | | 0.00 | C |
Net gains (losses) on investments (both realized and unrealized) | | | 7.37 | | | | | | | | 7.25 | | | | | | | | (9.23 | ) | | | | | | | 7.81 | | | | | | | | 10.21 | |
| | | | | | | | | | | | | | | | | | | | | | | | | | | | | | | | | | | | |
Total income (loss) from investment operations | | | 7.35 | | | | | | | | 7.30 | | | | | | | | (9.20 | ) | | | | | | | 7.77 | | | | | | | | 10.21 | |
| | | | | | | | | | | | | | | | | | | | | | | | | | | | | | | | | | | | |
Less distributions: | | | | | | | | | | | | | | | | | | | | | | | | | | | | | | | | | | | | |
Dividends from net investment income | | | - | | | | | | | | (0.10 | ) | | | | | | | - | | | | | | | | - | | | | | | | | (0.07 | ) |
Distributions from net realized gains | | | (4.88 | ) | | | | | | | (0.13 | ) | | | | | | | (4.03 | ) | | | | | | | (7.29 | ) | | | | | | | (3.81 | ) |
| | | | | | | | | | | | | | | | | | | | | | | | | | | | | | | | | | | | |
Total distributions | | | (4.88 | ) | | | | | | | (0.23 | ) | | | | | | | (4.03 | ) | | | | | | | (7.29 | ) | | | | | | | (3.88 | ) |
| | | | | | | | | | | | | | | | | | | | | | | | | | | | | | | | | | | | |
Net asset value, end of period | | $ | 32.84 | | | | | | | $ | 30.37 | | | | | | | $ | 23.30 | | | | | | | $ | 36.53 | | | | | | | $ | 36.05 | |
| | | | | | | | | | | | | | | | | | | | | | | | | | | | | | | | | | | | |
Total returnD | | | 24.00 | % | | | | | | | 31.34 | % | | | | | | | (25.21 | )% | | | | | | | 21.77 | % | | | | | | | 34.34 | % |
| | | | | | | | | | | | | | | | | | | | | | | | | | | | | | | | | | | | |
| | | | | | | | | |
Ratios and supplemental data: | | | | | | | | | | | | | | | | | | | | | | | | | | | | | | | | | | | | |
Net assets, end of period | | $ | 6,357,762 | | | | | | | $ | 3,690,269 | | | | | | | $ | 608,328 | | | | | | | $ | 2,237,130 | | | | | | | $ | 3,168,012 | |
Ratios to average net assets: | | | | | | | | | | | | | | | | | | | | | | | | | | | | | | | | | | | | |
Expenses, before reimbursements and/or recoupments | | | 0.91 | % | | | | | | | 1.03 | % | | | | | | | 1.17 | % | | | | | | | 0.95 | % | | | | | | | 1.02 | % |
Expenses, net of reimbursements and/or recoupments | | | 0.83 | % | | | | | | | 0.83 | % | | | | | | | 0.84 | %E | | | | | | | 0.86 | % | | | | | | | 0.89 | %F |
Net investment (loss), before expense reimbursements and/or recoupments | | | (0.13 | )% | | | | | | | (0.12 | )% | | | | | | | 0.00 | %G | | | | | | | (0.15 | )% | | | | | | | (0.14 | )% |
Net investment income (loss), net of reimbursements and/or recoupments | | | (0.05 | )% | | | | | | | 0.08 | % | | | | | | | 0.33 | % | | | | | | | (0.06 | )% | | | | | | | (0.01 | )% |
Portfolio turnover rate | | | 52 | % | | | | | | | 78 | % | | | | | | | 72 | % | | | | | | | 57 | % | | | | | | | 58 | % |
| A | On April 30, 2024 Bridgeway Capital Management, LLC was terminated and ceased managing assets of the Fund. On May 1, 2024, Numeric Investors LLC, began managing assets of the Fund. |
| B | Per share amounts have been calculated using the average shares method. |
| C | Amount represents less than $0.01 per share. |
| D | Based on net asset value, which does not reflect the sales charge, redemption fee, or contingent deferred sales charge, if applicable. May include adjustments in accordance with U.S. GAAP and as such, the net asset value for reporting purposes and the returns based upon those net asset values may differ from the net asset value and returns for shareholder transactions. |
| E | Expense ratios may exceed stated expense caps in Note 2 due to the change in the contractual expense caps on May 31, 2022. |
| F | Expense ratios may exceed stated expense caps in Note 2 due to security lending expenses, which are not reimbursable under the agreement with the Manager. |
| G | Amount rounds to less than 0.005%. |
See accompanying notes
38
American Beacon Man Large Cap Growth FundSM
Financial Highlights
(For a share outstanding throughout the period)
| | | | | | | | | | | | | | | | | | | | | | | | | | | | | | | | | | | | |
| | | Investor Class | |
| | | Year Ended December 31, | |
| | | 2024A | | | | | | 2023 | | | | | | 2022 | | | | | | 2021 | | | | | | 2020 | |
| | | | |
Net asset value, beginning of period | | $ | 29.62 | | | | | | | $ | 22.74 | | | | | | | $ | 35.89 | | | | | | | $ | 35.61 | | | | | | | $ | 29.42 | |
| | | | | | | | | | | | | | | | | | | | | | | | | | | | | | | | | | | | |
Income (loss) from investment operations: | | | | | | | | | | | | | | | | | | | | | | | | | | | | | | | | | | | | |
Net investment income (loss) | | | (0.10 | ) | | | | | | | (0.06 | ) | | | | | | | 0.05 | | | | | | | | (0.08 | ) | | | | | | | (0.08 | ) |
Net gains (losses) on investments (both realized and unrealized) | | | 7.15 | | | | | | | | 7.11 | | | | | | | | (9.17 | ) | | | | | | | 7.65 | | | | | | | | 10.08 | |
| | | | | | | | | | | | | | | | | | | | | | | | | | | | | | | | | | | | |
Total income (loss) from investment operations | | | 7.05 | | | | | | | | 7.05 | | | | | | | | (9.12 | ) | | | | | | | 7.57 | | | | | | | | 10.00 | |
| | | | | | | | | | | | | | | | | | | | | | | | | | | | | | | | | | | | |
Less distributions: | | | | | | | | | | | | | | | | | | | | | | | | | | | | | | | | | | | | |
Dividends from net investment income | | | - | | | | | | | | (0.04 | ) | | | | | | | - | | | | | | | | - | | | | | | | | - | |
Distributions from net realized gains | | | (4.88 | ) | | | | | | | (0.13 | ) | | | | | | | (4.03 | ) | | | | | | | (7.29 | ) | | | | | | | (3.81 | ) |
| | | | | | | | | | | | | | | | | | | | | | | | | | | | | | | | | | | | |
Total distributions | | | (4.88 | ) | | | | | | | (0.17 | ) | | | | | | | (4.03 | ) | | | | | | | (7.29 | ) | | | | | | | (3.81 | ) |
| | | | | | | | | | | | | | | | | | | | | | | | | | | | | | | | | | | | |
Net asset value, end of period | | $ | 31.79 | | | | | | | $ | 29.62 | | | | | | | $ | 22.74 | | | | | | | $ | 35.89 | | | | | | | $ | 35.61 | |
| | | | | | | | | | | | | | | | | | | | | | | | | | | | | | | | | | | | |
Total returnB | | | 23.60 | % | | | | | | | 31.01 | % | | | | | | | (25.44 | )% | | | | | | | 21.48 | % | | | | | | | 33.98 | % |
| | | | | | | | | | | | | | | | | | | | | | | | | | | | | | | | | | | | |
| | | | | | | | | |
Ratios and supplemental data: | | | | | | | | | | | | | | | | | | | | | | | | | | | | | | | | | | | | |
Net assets, end of period | | $ | 90,941,583 | | | | | | | $ | 82,767,017 | | | | | | | $ | 66,552,222 | | | | | | | $ | 95,710,995 | | | | | | | $ | 84,109,027 | |
Ratios to average net assets: | | | | | | | | | | | | | | | | | | | | | | | | | | | | | | | | | | | | |
Expenses, before reimbursements and/or recoupments | | | 1.18 | % | | | | | | | 1.28 | % | | | | | | | 1.25 | % | | | | | | | 1.24 | % | | | | | | | 1.31 | % |
Expenses, net of reimbursements and/or recoupments | | | 1.12 | % | | | | | | | 1.12 | % | | | | | | | 1.12 | % | | | | | | | 1.12 | % | | | | | | | 1.15 | %C |
Net investment (loss), before expense reimbursements and/or recoupments | | | (0.41 | )% | | | | | | | (0.32 | )% | | | | | | | (0.06 | )% | | | | | | | (0.42 | )% | | | | | | | (0.43 | )% |
Net investment income (loss), net of reimbursements and/or recoupments | | | (0.35 | )% | | | | | | | (0.16 | )% | | | | | | | 0.07 | % | | | | | | | (0.30 | )% | | | | | | | (0.27 | )% |
Portfolio turnover rate | | | 52 | % | | | | | | | 78 | % | | | | | | | 72 | % | | | | | | | 57 | % | | | | | | | 58 | % |
| A | On April 30, 2024 Bridgeway Capital Management, LLC was terminated and ceased managing assets of the Fund. On May 1, 2024, Numeric Investors LLC, began managing assets of the Fund. |
| B | Based on net asset value, which does not reflect the sales charge, redemption fee, or contingent deferred sales charge, if applicable. May include adjustments in accordance with U.S. GAAP and as such, the net asset value for reporting purposes and the returns based upon those net asset values may differ from the net asset value and returns for shareholder transactions. |
| C | Expense ratios may exceed stated expense caps in Note 2 due to security lending expenses, which are not reimbursable under the agreement with the Manager. |
See accompanying notes
39
American Beacon Man Large Cap Growth FundSM
Financial Highlights
(For a share outstanding throughout the period)
| | | | | | | | | | | | | | | | | | | | | | | | | | | | | | | | | | | | |
| | | A Class | |
| | | Year Ended December 31, | |
| | | 2024A | | | | | | 2023 | | | | | | 2022 | | | | | | 2021 | | | | | | 2020 | |
| | | | |
Net asset value, beginning of period | | $ | 29.81 | | | | | | | $ | 22.90 | | | | | | | $ | 36.08 | | | | | | | $ | 35.77 | | | | | | | $ | 29.51 | |
| | | | | | | | | | | | | | | | | | | | | | | | | | | | | | | | | | | | |
Income (loss) from investment operations: | | | | | | | | | | | | | | | | | | | | | | | | | | | | | | | | | | | | |
Net investment income (loss) | | | (0.11 | )B | | | | | | | (0.04 | )B | | | | | | | 0.03B | | | | | | | | (0.16 | ) | | | | | | | (0.10 | ) |
Net gains (losses) on investments (both realized and unrealized) | | | 7.20 | | | | | | | | 7.14 | | | | | | | | (9.18 | ) | | | | | | | 7.76 | | | | | | | | 10.17 | |
| | | | | | | | | | | | | | | | | | | | | | | | | | | | | | | | | | | | |
Total income (loss) from investment operations | | | 7.09 | | | | | | | | 7.10 | | | | | | | | (9.15 | ) | | | | | | | 7.60 | | | | | | | | 10.07 | |
| | | | | | | | | | | | | | | | | | | | | | | | | | | | | | | | | | | | |
Less distributions: | | | | | | | | | | | | | | | | | | | | | | | | | | | | | | | | | | | | |
Dividends from net investment income | | | - | | | | | | | | (0.06 | ) | | | | | | | - | | | | | | | | - | | | | | | | | - | |
Distributions from net realized gains | | | (4.88 | ) | | | | | | | (0.13 | ) | | | | | | | (4.03 | ) | | | | | | | (7.29 | ) | | | | | | | (3.81 | ) |
| | | | | | | | | | | | | | | | | | | | | | | | | | | | | | | | | | | | |
Total distributions | | | (4.88 | ) | | | | | | | (0.19 | ) | | | | | | | (4.03 | ) | | | | | | | (7.29 | ) | | | | | | | (3.81 | ) |
| | | | | | | | | | | | | | | | | | | | | | | | | | | | | | | | | | | | |
Net asset value, end of period | | $ | 32.02 | | | | | | | $ | 29.81 | | | | | | | $ | 22.90 | | | | | | | $ | 36.08 | | | | | | | $ | 35.77 | |
| | | | | | | | | | | | | | | | | | | | | | | | | | | | | | | | | | | | |
Total returnC | | | 23.58 | % | | | | | | | 31.00 | % | | | | | | | (25.38 | )% | | | | | | | 21.47 | % | | | | | | | 34.11 | % |
| | | | | | | | | | | | | | | | | | | | | | | | | | | | | | | | | | | | |
| | | | | | | | | |
Ratios and supplemental data: | | | | | | | | | | | | | | | | | | | | | | | | | | | | | | | | | | | | |
Net assets, end of period | | $ | 2,281,303 | | | | | | | $ | 1,702,761 | | | | | | | $ | 1,102,933 | | | | | | | $ | 1,955,909 | | | | | | | $ | 2,212,193 | |
Ratios to average net assets: | | | | | | | | | | | | | | | | | | | | | | | | | | | | | | | | | | | | |
Expenses, before reimbursements and/or recoupments | | | 1.15 | % | | | | | | | 1.26 | % | | | | | | | 1.36 | % | | | | | | | 1.21 | % | | | | | | | 1.27 | % |
Expenses, net of reimbursements and/or recoupments | | | 1.09 | % | | | | | | | 1.09 | % | | | | | | | 1.09 | % | | | | | | | 1.10 | % | | | | | | | 1.14 | % |
Net investment (loss), before expense reimbursements and/or recoupments | | | (0.37 | )% | | | | | | | (0.32 | )% | | | | | | | (0.18 | )% | | | | | | | (0.40 | )% | | | | | | | (0.39 | )% |
Net investment income (loss), net of reimbursements and/or recoupments | | | (0.31 | )% | | | | | | | (0.15 | )% | | | | | | | 0.09 | % | | | | | | | (0.29 | )% | | | | | | | (0.26 | )% |
Portfolio turnover rate | | | 52 | % | | | | | | | 78 | % | | | | | | | 72 | % | | | | | | | 57 | % | | | | | | | 58 | % |
| A | On April 30, 2024 Bridgeway Capital Management, LLC was terminated and ceased managing assets of the Fund. On May 1, 2024, Numeric Investors LLC, began managing assets of the Fund. |
| B | Per share amounts have been calculated using the average shares method. |
| C | Based on net asset value, which does not reflect the sales charge, redemption fee, or contingent deferred sales charge, if applicable. May include adjustments in accordance with U.S. GAAP and as such, the net asset value for reporting purposes and the returns based upon those net asset values may differ from the net asset value and returns for shareholder transactions. |
See accompanying notes
40
American Beacon Man Large Cap Growth FundSM
Financial Highlights
(For a share outstanding throughout the period)
| | | | | | | | | | | | | | | | | | | | | | | | | | | | | | | | | | | | |
| | | C Class | |
| | | Year Ended December 31, | |
| | | 2024A | | | | | | 2023 | | | | | | 2022 | | | | | | 2021 | | | | | | 2020 | |
| | | | |
Net asset value, beginning of period | | $ | 27.20 | | | | | | | $ | 21.01 | | | | | | | $ | 33.81 | | | | | | | $ | 34.15 | | | | | | | $ | 28.53 | |
| | | | | | | | | | | | | | | | | | | | | | | | | | | | | | | | | | | | |
Income (loss) from investment operations: | | | | | | | | | | | | | | | | | | | | | | | | | | | | | | | | | | | | |
Net investment (loss) | | | (1.23 | ) | | | | | | | (0.22 | )B | | | | | | | (1.11 | ) | | | | | | | (0.46 | ) | | | | | | | (0.01 | ) |
Net gains (losses) on investments (both realized and unrealized) | | | 7.48 | | | | | | | | 6.54 | | | | | | | | (7.66 | ) | | | | | | | 7.41 | | | | | | | | 9.44 | |
| | | | | | | | | | | | | | | | | | | | | | | | | | | | | | | | | | | | |
Total income (loss) from investment operations | | | 6.25 | | | | | | | | 6.32 | | | | | | | | (8.77 | ) | | | | | | | 6.95 | | | | | | | | 9.43 | |
| | | | | | | | | | | | | | | | | | | | | | | | | | | | | | | | | | | | |
Less distributions: | | | | | | | | | | | | | | | | | | | | | | | | | | | | | | | | | | | | |
Distributions from net realized gains | | | (4.88 | ) | | | | | | | (0.13 | ) | | | | | | | (4.03 | ) | | | | | | | (7.29 | ) | | | | | | | (3.81 | ) |
| | | | | | | | | | | | | | | | | | | | | | | | | | | | | | | | | | | | |
Total distributions | | | (4.88 | ) | | | | | | | (0.13 | ) | | | | | | | (4.03 | ) | | | | | | | (7.29 | ) | | | | | | | (3.81 | ) |
| | | | | | | | | | | | | | | | | | | | | | | | | | | | | | | | | | | | |
Net asset value, end of period | | $ | 28.57 | | | | | | | $ | 27.20 | | | | | | | $ | 21.01 | | | | | | | $ | 33.81 | | | | | | | $ | 34.15 | |
| | | | | | | | | | | | | | | | | | | | | | | | | | | | | | | | | | | | |
Total returnC | | | 22.75 | % | | | | | | | 30.09 | % | | | | | | | (25.97 | )% | | | | | | | 20.58 | % | | | | | | | 33.04 | % |
| | | | | | | | | | | | | | | | | | | | | | | | | | | | | | | | | | | | |
| | | | | | | | | |
Ratios and supplemental data: | | | | | | | | | | | | | | | | | | | | | | | | | | | | | | | | | | | | |
Net assets, end of period | | $ | 801,704 | | | | | | | $ | 1,110,747 | | | | | | | $ | 684,305 | | | | | | | $ | 2,109,687 | | | | | | | $ | 2,575,041 | |
Ratios to average net assets: | | | | | | | | | | | | | | | | | | | | | | | | | | | | | | | | | | | | |
Expenses, before reimbursements and/or recoupments | | | 1.92 | % | | | | | | | 2.01 | % | | | | | | | 2.20 | % | | | | | | | 1.95 | % | | | | | | | 2.01 | % |
Expenses, net of reimbursements and/or recoupments | | | 1.83 | % | | | | | | | 1.83 | % | | | | | | | 1.83 | % | | | | | | | 1.84 | % | | | | | | | 1.87 | %D |
Net investment (loss), before expense reimbursements and/or recoupments | | | (1.16 | )% | | | | | | | (1.08 | )% | | | | | | | (1.04 | )% | | | | | | | (1.14 | )% | | | | | | | (1.14 | )% |
Net investment (loss), net of reimbursements and/or recoupments | | | (1.07 | )% | | | | | | | (0.90 | )% | | | | | | | (0.67 | )% | | | | | | | (1.03 | )% | | | | | | | (1.00 | )% |
Portfolio turnover rate | | | 52 | % | | | | | | | 78 | % | | | | | | | 72 | % | | | | | | | 57 | % | | | | | | | 58 | % |
| A | On April 30, 2024 Bridgeway Capital Management, LLC was terminated and ceased managing assets of the Fund. On May 1, 2024, Numeric Investors LLC, began managing assets of the Fund. |
| B | Per share amounts have been calculated using the average shares method. |
| C | Based on net asset value, which does not reflect the sales charge, redemption fee, or contingent deferred sales charge, if applicable. May include adjustments in accordance with U.S. GAAP and as such, the net asset value for reporting purposes and the returns based upon those net asset values may differ from the net asset value and returns for shareholder transactions. |
| D | Expense ratios may exceed stated expense caps in Note 2 due to security lending expenses, which are not reimbursable under the agreement with the Manager. |
See accompanying notes
41
American Beacon Man Large Cap Growth FundSM
Financial Highlights
(For a share outstanding throughout the period)
| | | | | | | | | | | | | | | | | | | | | | | | | | | | | | | | | | | | |
| | | R6 Class | |
| | | Year Ended December 31, | |
| | | 2024A | | | | | | 2023 | | | | | | 2022 | | | | | | 2021 | | | | | | 2020 | |
| | | | |
Net asset value, beginning of period | | $ | 30.77 | | | | | | | $ | 23.59 | | | | | | | $ | 36.89 | | | | | | | $ | 36.31 | | | | | | | $ | 29.86 | |
| | | | | | | | | | | | | | | | | | | | | | | | | | | | | | | | | | | | |
Income (loss) from investment operations: | | | | | | | | | | | | | | | | | | | | | | | | | | | | | | | | | | | | |
Net investment income | | | 0.00 | B | | | | | | | 0.07 | | | | | | | | 0.12 | | | | | | | | 0.03 | | | | | | | | 0.04 | C |
Net gains (losses) on investments (both realized and unrealized) | | | 7.48 | | | | | | | | 7.34 | | | | | | | | (9.39 | ) | | | | | | | 7.84 | | | | | | | | 10.29 | |
| | | | | | | | | | | | | | | | | | | | | | | | | | | | | | | | | | | | |
Total income (loss) from investment operations | | | 7.48 | | | | | | | | 7.41 | | | | | | | | (9.27 | ) | | | | | | | 7.87 | | | | | | | | 10.33 | |
| | | | | | | | | | | | | | | | | | | | | | | | | | | | | | | | | | | | |
Less distributions: | | | | | | | | | | | | | | | | | | | | | | | | | | | | | | | | | | | | |
Dividends from net investment income | | | (0.00 | )B | | | | | | | (0.10 | ) | | | | | | | - | | | | | | | | - | | | | | | | | (0.07 | ) |
Distributions from net realized gains | | | (4.88 | ) | | | | | | | (0.13 | ) | | | | | | | (4.03 | ) | | | | | | | (7.29 | ) | | | | | | | (3.81 | ) |
| | | | | | | | | | | | | | | | | | | | | | | | | | | | | | | | | | | | |
Total distributions | | | (4.88 | ) | | | | | | | (0.23 | ) | | | | | | | (4.03 | ) | | | | | | | (7.29 | ) | | | | | | | (3.88 | ) |
| | | | | | | | | | | | | | | | | | | | | | | | | | | | | | | | | | | | |
Net asset value, end of period | | $ | 33.37 | | | | | | | $ | 30.77 | | | | | | | $ | 23.59 | | | | | | | $ | 36.89 | | | | | | | $ | 36.31 | |
| | | | | | | | | | | | | | | | | | | | | | | | | | | | | | | | | | | | |
Total returnD | | | 24.12 | % | | | | | | | 31.42 | % | | | | | | | (25.15 | )% | | | | | | | 21.90 | % | | | | | | | 34.58 | % |
| | | | | | | | | | | | | | | | | | | | | | | | | | | | | | | | | | | | |
| | | | | | | | | |
Ratios and supplemental data: | | | | | | | | | | | | | | | | | | | | | | | | | | | | | | | | | | | | |
Net assets, end of period | | $ | 12,450,717 | | | | | | | $ | 11,358,272 | | | | | | | $ | 9,989,847 | | | | | | | $ | 18,361,929 | | | | | | | $ | 16,307,767 | |
Ratios to average net assets: | | | | | | | | | | | | | | | | | | | | | | | | | | | | | | | | | | | | |
Expenses, before reimbursements and/or recoupments | | | 0.82 | % | | | | | | | 0.92 | % | | | | | | | 0.90 | % | | | | | | | 0.88 | % | | | | | | | 0.91 | % |
Expenses, net of reimbursements and/or recoupments | | | 0.77 | % | | | | | | | 0.77 | % | | | | | | | 0.76 | % | | | | | | | 0.76 | % | | | | | | | 0.76 | % |
Net investment income (loss), before expense reimbursements and/or recoupments | | | (0.05 | )% | | | | | | | 0.04 | % | | | | | | | 0.29 | % | | | | | | | (0.06 | )% | | | | | | | (0.05 | )% |
Net investment income, net of reimbursements and/or recoupments | | | 0.00 | %E | | | | | | | 0.19 | % | | | | | | | 0.43 | % | | | | | | | 0.06 | % | | | | | | | 0.10 | % |
Portfolio turnover rate | | | 52 | % | | | | | | | 78 | % | | | | | | | 72 | % | | | | | | | 57 | % | | | | | | | 58 | % |
| A | On April 30, 2024 Bridgeway Capital Management, LLC was terminated and ceased managing assets of the Fund. On May 1, 2024, Numeric Investors LLC, began managing assets of the Fund. |
| B | Amount represents less than $0.01 per share. |
| C | Per share amounts have been calculated using the average shares method. |
| D | Based on net asset value, which does not reflect the sales charge, redemption fee, or contingent deferred sales charge, if applicable. May include adjustments in accordance with U.S. GAAP and as such, the net asset value for reporting purposes and the returns based upon those net asset values may differ from the net asset value and returns for shareholder transactions. |
| E | Amount rounds to less than 0.005%. |
See accompanying notes
42
American Beacon Man Large Cap Value FundSM
Financial Highlights
(For a share outstanding throughout the period)
| | | | | | | | | | | | | | | | | | | | | | | | | | | | | | | | | | | | |
| | | R5 ClassA | |
| | | Year Ended December 31, | |
| | | 2024B | | | | | | 2023 | | | | | | 2022 | | | | | | 2021 | | | | | | 2020 | |
| | | | |
Net asset value, beginning of period | | $ | 23.18 | | | | | | | $ | 23.35 | | | | | | | $ | 26.55 | | | | | | | $ | 23.73 | | | | | | | $ | 27.14 | |
| | | | | | | | | | | | | | | | | | | | | | | | | | | | | | | | | | | | |
Income (loss) from investment operations: | | | | | | | | | | | | | | | | | | | | | | | | | | | | | | | | | | | | |
Net investment income | | | 0.23 | | | | | | | | 0.12 | | | | | | | | 0.49 | | | | | | | | 0.69 | | | | | | | | 0.59 | |
Net gains (losses) on investments (both realized and unrealized) | | | 3.55 | | | | | | | | 2.49 | | | | | | | | (2.55 | ) | | | | | | | 4.71 | | | | | | | | (1.48 | ) |
| | | | | | | | | | | | | | | | | | | | | | | | | | | | | | | | | | | | |
Total income (loss) from investment operations | | | 3.78 | | | | | | | | 2.61 | | | | | | | | (2.06 | ) | | | | | | | 5.40 | | | | | | | | (0.89 | ) |
| | | | | | | | | | | | | | | | | | | | | | | | | | | | | | | | | | | | |
Less distributions: | | | | | | | | | | | | | | | | | | | | | | | | | | | | | | | | | | | | |
Dividends from net investment income | | | (0.34 | ) | | | | | | | (0.53 | ) | | | | | | | (0.56 | ) | | | | | | | (1.59 | ) | | | | | | | (0.00 | )C |
Distributions from net realized gains | | | (3.78 | ) | | | | | | | (2.25 | ) | | | | | | | (0.58 | ) | | | | | | | (0.99 | ) | | | | | | | (2.52 | ) |
| | | | | | | | | | | | | | | | | | | | | | | | | | | | | | | | | | | | |
Total distributions | | | (4.12 | ) | | | | | | | (2.78 | ) | | | | | | | (1.14 | ) | | | | | | | (2.58 | ) | | | | | | | (2.52 | ) |
| | | | | | | | | | | | | | | | | | | | | | | | | | | | | | | | | | | | |
Net asset value, end of period | | $ | 22.84 | | | | | | | $ | 23.18 | | | | | | | $ | 23.35 | | | | | | | $ | 26.55 | | | | | | | $ | 23.73 | |
| | | | | | | | | | | | | | | | | | | | | | | | | | | | | | | | | | | | |
Total returnD | | | 16.24 | % | | | | | | | 11.25 | % | | | | | | | (7.74 | )% | | | | | | | 22.93 | % | | | | | | | (3.05 | )% |
| | | | | | | | | | | | | | | | | | | | | | | | | | | | | | | | | | | | |
| | | | | | | | | |
Ratios and supplemental data: | | | | | | | | | | | | | | | | | | | | | | | | | | | | | | | | | | | | |
Net assets, end of period | | $ | 79,563,790 | | | | | | | $ | 88,833,933 | | | | | | | $ | 220,554,216 | | | | | | | $ | 364,332,529 | | | | | | | $ | 445,009,590 | |
Ratios to average net assets: | | | | | | | | | | | | | | | | | | | | | | | | | | | | | | | | | | | | |
Expenses, before reimbursements and/or recoupments | | | 0.81 | % | | | | | | | 0.87 | % | | | | | | | 0.81 | % | | | | | | | 0.75 | % | | | | | | | 0.75 | % |
Expenses, net of reimbursements and/or recoupments | | | 0.81 | % | | | | | | | 0.87 | % | | | | | | | 0.81 | % | | | | | | | 0.74 | % | | | | | | | 0.75 | % |
Net investment income, before expense reimbursements and/or recoupments | | | 1.06 | % | | | | | | | 1.68 | % | | | | | | | 1.81 | % | | | | | | | 1.37 | % | | | | | | | 1.76 | % |
Net investment income, net of reimbursements and/or recoupments | | | 1.06 | % | | | | | | | 1.68 | % | | | | | | | 1.81 | % | | | | | | | 1.38 | % | | | | | | | 1.76 | % |
Portfolio turnover rate | | | 64 | % | | | | | | | 54 | % | | | | | | | 54 | % | | | | | | | 51 | % | | | | | | | 43 | % |
| A | Prior to February 28, 2020, the R5 Class was known as Institutional Class. |
| B | On April 30, 2024 Bridgeway Capital Management, LLC was terminated and ceased managing assets of the Fund. On May 1, 2024, Numeric Investors LLC, began managing assets of the Fund. |
| C | Amount represents less than $0.01 per share. |
| D | Based on net asset value, which does not reflect the sales charge, redemption fee, or contingent deferred sales charge, if applicable. May include adjustments in accordance with U.S. GAAP and as such, the net asset value for reporting purposes and the returns based upon those net asset values may differ from the net asset value and returns for shareholder transactions. |
See accompanying notes
43
American Beacon Man Large Cap Value FundSM
Financial Highlights
(For a share outstanding throughout the period)
| | | | | | | | | | | | | | | | | | | | | | | | | | | | | | | | | | | | |
| | | Y Class | |
| | | Year Ended December 31, | |
| | | 2024A | | | | | | 2023 | | | | | | 2022 | | | | | | 2021 | | | | | | 2020 | |
| | | | |
Net asset value, beginning of period | | $ | 23.06 | | | | | | | $ | 23.24 | | | | | | | $ | 26.43 | | | | | | | $ | 23.63 | | | | | | | $ | 27.06 | |
| | | | | | | | | | | | | | | | | | | | | | | | | | | | | | | | | | | | |
Income (loss) from investment operations: | | | | | | | | | | | | | | | | | | | | | | | | | | | | | | | | | | | | |
Net investment income | | | 0.25 | | | | | | | | 0.42 | | | | | | | | 0.48 | | | | | | | | 0.89 | | | | | | | | 0.67 | |
Net gains (losses) on investments (both realized and unrealized) | | | 3.48 | | | | | | | | 2.17 | | | | | | | | (2.54 | ) | | | | | | | 4.46 | | | | | | | | (1.58 | ) |
| | | | | | | | | | | | | | | | | | | | | | | | | | | | | | | | | | | | |
Total income (loss) from investment operations | | | 3.73 | | | | | | | | 2.59 | | | | | | | | (2.06 | ) | | | | | | | 5.35 | | | | | | | | (0.91 | ) |
| | | | | | | | | | | | | | | | | | | | | | | | | | | | | | | | | | | | |
Less distributions: | | | | | | | | | | | | | | | | | | | | | | | | | | | | | | | | | | | | |
Dividends from net investment income | | | (0.31 | ) | | | | | | | (0.52 | ) | | | | | | | (0.55 | ) | | | | | | | (1.56 | ) | | | | | | | (0.00 | )B |
Distributions from net realized gains | | | (3.78 | ) | | | | | | | (2.25 | ) | | | | | | | (0.58 | ) | | | | | | | (0.99 | ) | | | | | | | (2.52 | ) |
| | | | | | | | | | | | | | | | | | | | | | | | | | | | | | | | | | | | |
Total distributions | | | (4.09 | ) | | | | | | | (2.77 | ) | | | | | | | (1.13 | ) | | | | | | | (2.55 | ) | | | | | | | (2.52 | ) |
| | | | | | | | | | | | | | | | | | | | | | | | | | | | | | | | | | | | |
Net asset value, end of period | | $ | 22.70 | | | | | | | $ | 23.06 | | | | | | | $ | 23.24 | | | | | | | $ | 26.43 | | | | | | | $ | 23.63 | |
| | | | | | | | | | | | | | | | | | | | | | | | | | | | | | | | | | | | |
Total returnC | | | 16.13 | % | | | | | | | 11.19 | % | | | | | | | (7.81 | )% | | | | | | | 22.84 | % | | | | | | | (3.14 | )% |
| | | | | | | | | | | | | | | | | | | | | | | | | | | | | | | | | | | | |
| | | | | | | | | |
Ratios and supplemental data: | | | | | | | | | | | | | | | | | | | | | | | | | | | | | | | | | | | | |
Net assets, end of period | | $ | 79,350,343 | | | | | | | $ | 91,172,593 | | | | | | | $ | 121,618,005 | | | | | | | $ | 191,459,312 | | | | | | | $ | 284,218,555 | |
Ratios to average net assets: | | | | | | | | | | | | | | | | | | | | | | | | | | | | | | | | | | | | |
Expenses, before reimbursements and/or recoupments | | | 0.90 | % | | | | | | | 0.94 | % | | | | | | | 0.88 | % | | | | | | | 0.82 | % | | | | | | | 0.83 | % |
Expenses, net of reimbursements and/or recoupments | | | 0.90 | % | | | | | | | 0.94 | % | | | | | | | 0.87 | % | | | | | | | 0.82 | % | | | | | | | 0.83 | % |
Net investment income, before expense reimbursements and/or recoupments | | | 0.97 | % | | | | | | | 1.59 | % | | | | | | | 1.71 | % | | | | | | | 1.29 | % | | | | | | | 1.66 | % |
Net investment income, net of reimbursements and/or recoupments | | | 0.97 | % | | | | | | | 1.59 | % | | | | | | | 1.72 | % | | | | | | | 1.29 | % | | | | | | | 1.66 | % |
Portfolio turnover rate | | | 64 | % | | | | | | | 54 | % | | | | | | | 54 | % | | | | | | | 51 | % | | | | | | | 43 | % |
| A | On April 30, 2024 Bridgeway Capital Management, LLC was terminated and ceased managing assets of the Fund. On May 1, 2024, Numeric Investors LLC, began managing assets of the Fund. |
| B | Amount represents less than $0.01 per share. |
| C | Based on net asset value, which does not reflect the sales charge, redemption fee, or contingent deferred sales charge, if applicable. May include adjustments in accordance with U.S. GAAP and as such, the net asset value for reporting purposes and the returns based upon those net asset values may differ from the net asset value and returns for shareholder transactions. |
See accompanying notes
44
American Beacon Man Large Cap Value FundSM
Financial Highlights
(For a share outstanding throughout the period)
| | | | | | | | | | | | | | | | | | | | | | | | | | | | | | | | | | | | |
| | | Investor Class | |
| | | Year Ended December 31, | |
| | | 2024A | | | | | | 2023 | | | | | | 2022 | | | | | | 2021 | | | | | | 2020 | |
| | | | |
Net asset value, beginning of period | | $ | 22.99 | | | | | | | $ | 23.17 | | | | | | | $ | 26.35 | | | | | | | $ | 23.56 | | | | | | | $ | 27.05 | |
| | | | | | | | | | | | | | | | | | | | | | | | | | | | | | | | | | | | |
Income (loss) from investment operations: | | | | | | | | | | | | | | | | | | | | | | | | | | | | | | | | | | | | |
Net investment income | | | 0.67 | | | | | | | | 1.05 | | | | | | | | 0.95 | | | | | | | | 1.39 | | | | | | | | 2.12 | |
Net gains (losses) on investments (both realized and unrealized) | | | 2.97 | | | | | | | | 1.47 | | | | | | | | (3.07 | ) | | | | | | | 3.87 | | | | | | | | (3.09 | ) |
| | | | | | | | | | | | | | | | | | | | | | | | | | | | | | | | | | | | |
Total income (loss) from investment operations | | | 3.64 | | | | | | | | 2.52 | | | | | | | | (2.12 | ) | | | | | | | 5.26 | | | | | | | | (0.97 | ) |
| | | | | | | | | | | | | | | | | | | | | | | | | | | | | | | | | | | | |
Less distributions: | | | | | | | | | | | | | | | | | | | | | | | | | | | | | | | | | | | | |
Dividends from net investment income | | | (0.23 | ) | | | | | | | (0.45 | ) | | | | | | | (0.48 | ) | | | | | | | (1.48 | ) | | | | | | | - | |
Distributions from net realized gains | | | (3.78 | ) | | | | | | | (2.25 | ) | | | | | | | (0.58 | ) | | | | | | | (0.99 | ) | | | | | | | (2.52 | ) |
| | | | | | | | | | | | | | | | | | | | | | | | | | | | | | | | | | | | |
Total distributions | | | (4.01 | ) | | | | | | | (2.70 | ) | | | | | | | (1.06 | ) | | | | | | | (2.47 | ) | | | | | | | (2.52 | ) |
| | | | | | | | | | | | | | | | | | | | | | | | | | | | | | | | | | | | |
Net asset value, end of period | | $ | 22.62 | | | | | | | $ | 22.99 | | | | | | | $ | 23.17 | | | | | | | $ | 26.35 | | | | | | | $ | 23.56 | |
| | | | | | | | | | | | | | | | | | | | | | | | | | | | | | | | | | | | |
Total returnB | | | 15.78 | % | | | | | | | 10.92 | % | | | | | | | (8.04 | )% | | | | | | | 22.51 | % | | | | | | | (3.36 | )% |
| | | | | | | | | | | | | | | | | | | | | | | | | | | | | | | | | | | | |
| | | | | | | | | |
Ratios and supplemental data: | | | | | | | | | | | | | | | | | | | | | | | | | | | | | | | | | | | | |
Net assets, end of period | | $ | 47,734,675 | | | | | | | $ | 55,177,185 | | | | | | | $ | 68,797,588 | | | | | | | $ | 96,839,009 | | | | | | | $ | 121,683,174 | |
Ratios to average net assets: | | | | | | | | | | | | | | | | | | | | | | | | | | | | | | | | | | | | |
Expenses, before reimbursements and/or recoupments | | | 1.19 | % | | | | | | | 1.18 | % | | | | | | | 1.13 | % | | | | | | | 1.08 | % | | | | | | | 1.10 | % |
Expenses, net of reimbursements and/or recoupments | | | 1.19 | % | | | | | | | 1.18 | % | | | | | | | 1.13 | % | | | | | | | 1.08 | % | | | | | | | 1.10 | % |
Net investment income, before expense reimbursements and/or recoupments | | | 0.68 | % | | | | | | | 1.36 | % | | | | | | | 1.46 | % | | | | | | | 1.04 | % | | | | | | | 1.44 | % |
Net investment income, net of reimbursements and/or recoupments | | | 0.68 | % | | | | | | | 1.36 | % | | | | | | | 1.46 | % | | | | | | | 1.04 | % | | | | | | | 1.44 | % |
Portfolio turnover rate | | | 64 | % | | | | | | | 54 | % | | | | | | | 54 | % | | | | | | | 51 | % | | | | | | | 43 | % |
| A | On April 30, 2024 Bridgeway Capital Management, LLC was terminated and ceased managing assets of the Fund. On May 1, 2024, Numeric Investors LLC, began managing assets of the Fund. |
| B | Based on net asset value, which does not reflect the sales charge, redemption fee, or contingent deferred sales charge, if applicable. May include adjustments in accordance with U.S. GAAP and as such, the net asset value for reporting purposes and the returns based upon those net asset values may differ from the net asset value and returns for shareholder transactions. |
See accompanying notes
45
American Beacon Man Large Cap Value FundSM
Financial Highlights
(For a share outstanding throughout the period)
| | | | | | | | | | | | | | | | | | | | | | | | | | | | | | | | | | | | |
| | | A Class | |
| | | Year Ended December 31, | |
| | | 2024A | | | | | | 2023 | | | | | | 2022 | | | | | | 2021 | | | | | | 2020 | |
| | | | |
Net asset value, beginning of period | | $ | 22.81 | | | | | | | $ | 23.02 | | | | | | | $ | 26.18 | | | | | | | $ | 23.43 | | | | | | | $ | 26.92 | |
| | | | | | | | | | | | | | | | | | | | | | | | | | | | | | | | | | | | |
Income (loss) from investment operations: | | | | | | | | | | | | | | | | | | | | | | | | | | | | | | | | | | | | |
Net investment income | | | 0.17 | | | | | | | | 0.36 | | | | | | | | 0.41 | | | | | | | | 0.45 | | | | | | | | 0.84 | |
Net gains (losses) on investments (both realized and unrealized) | | | 3.45 | | | | | | | | 2.12 | | | | | | | | (2.50 | ) | | | | | | | 4.78 | | | | | | | | (1.81 | ) |
| | | | | | | | | | | | | | | | | | | | | | | | | | | | | | | | | | | | |
Total income (loss) from investment operations | | | 3.62 | | | | | | | | 2.48 | | | | | | | | (2.09 | ) | | | | | | | 5.23 | | | | | | | | (0.97 | ) |
| | | | | | | | | | | | | | | | | | | | | | | | | | | | | | | | | | | | |
Less distributions: | | | | | | | | | | | | | | | | | | | | | | | | | | | | | | | | | | | | |
Dividends from net investment income | | | (0.25 | ) | | | | | | | (0.44 | ) | | | | | | | (0.49 | ) | | | | | | | (1.49 | ) | | | | | | | - | |
Distributions from net realized gains | | | (3.78 | ) | | | | | | | (2.25 | ) | | | | | | | (0.58 | ) | | | | | | | (0.99 | ) | | | | | | | (2.52 | ) |
| | | | | | | | | | | | | | | | | | | | | | | | | | | | | | | | | | | | |
Total distributions | | | (4.03 | ) | | | | | | | (2.69 | ) | | | | | | | (1.07 | ) | | | | | | | (2.48 | ) | | | | | | | (2.52 | ) |
| | | | | | | | | | | | | | | | | | | | | | | | | | | | | | | | | | | | |
Net asset value, end of period | | $ | 22.40 | | | | | | | $ | 22.81 | | | | | | | $ | 23.02 | | | | | | | $ | 26.18 | | | | | | | $ | 23.43 | |
| | | | | | | | | | | | | | | | | | | | | | | | | | | | | | | | | | | | |
Total returnB | | | 15.80 | % | | | | | | | 10.81 | % | | | | | | | (8.00 | )% | | | | | | | 22.51 | % | | | | | | | (3.38 | )% |
| | | | | | | | | | | | | | | | | | | | | | | | | | | | | | | | | | | | |
| | | | | | | | | |
Ratios and supplemental data: | | | | | | | | | | | | | | | | | | | | | | | | | | | | | | | | | | | | |
Net assets, end of period | | $ | 23,827,119 | | | | | | | $ | 18,676,222 | | | | | | | $ | 19,853,284 | | | | | | | $ | 26,438,159 | | | | | | | $ | 24,734,491 | |
Ratios to average net assets: | | | | | | | | | | | | | | | | | | | | | | | | | | | | | | | | | | | | |
Expenses, before reimbursements and/or recoupments | | | 1.20 | % | | | | | | | 1.23 | % | | | | | | | 1.12 | % | | | | | | | 1.08 | % | | | | | | | 1.10 | % |
Expenses, net of reimbursements and/or recoupments | | | 1.20 | % | | | | | | | 1.23 | % | | | | | | | 1.12 | % | | | | | | | 1.07 | % | | | | | | | 1.10 | % |
Net investment income, before expense reimbursements and/or recoupments | | | 0.68 | % | | | | | | | 1.30 | % | | | | | | | 1.47 | % | | | | | | | 1.05 | % | | | | | | | 1.40 | % |
Net investment income, net of reimbursements and/or recoupments | | | 0.68 | % | | | | | | | 1.30 | % | | | | | | | 1.47 | % | | | | | | | 1.06 | % | | | | | | | 1.40 | % |
Portfolio turnover rate | | | 64 | % | | | | | | | 54 | % | | | | | | | 54 | % | | | | | | | 51 | % | | | | | | | 43 | % |
| A | On April 30, 2024 Bridgeway Capital Management, LLC was terminated and ceased managing assets of the Fund. On May 1, 2024, Numeric Investors LLC, began managing assets of the Fund. |
| B | Based on net asset value, which does not reflect the sales charge, redemption fee, or contingent deferred sales charge, if applicable. May include adjustments in accordance with U.S. GAAP and as such, the net asset value for reporting purposes and the returns based upon those net asset values may differ from the net asset value and returns for shareholder transactions. |
See accompanying notes
46
American Beacon Man Large Cap Value FundSM
Financial Highlights
(For a share outstanding throughout the period)
| | | | | | | | | | | | | | | | | | | | | | | | | | | | | | | | | | | | |
| | | C Class | |
| | | Year Ended December 31, | |
| | | 2024A | | | | | | 2023 | | | | | | 2022 | | | | | | 2021 | | | | | | 2020 | |
| | | | |
Net asset value, beginning of period | | $ | 21.84 | | | | | | | $ | 22.11 | | | | | | | $ | 25.17 | | | | | | | $ | 22.60 | | | | | | | $ | 26.25 | |
| | | | | | | | | | | | | | | | | | | | | | | | | | | | | | | | | | | | |
Income (loss) from investment operations: | | | | | | | | | | | | | | | | | | | | | | | | | | | | | | | | | | | | |
Net investment income (loss) | | | (1.84 | ) | | | | | | | 0.13 | B | | | | | | | 0.17 | B | | | | | | | 0.21 | | | | | | | | 0.22 | |
Net gains (losses) on investments (both realized and unrealized) | | | 5.12 | | | | | | | | 2.09 | | | | | | | | (2.37 | ) | | | | | | | 4.63 | | | | | | | | (1.35 | ) |
| | | | | | | | | | | | | | | | | | | | | | | | | | | | | | | | | | | | |
Total income (loss) from investment operations | | | 3.28 | | | | | | | | 2.22 | | | | | | | | (2.20 | ) | | | | | | | 4.84 | | | | | | | | (1.13 | ) |
| | | | | | | | | | | | | | | | | | | | | | | | | | | | | | | | | | | | |
Less distributions: | | | | | | | | | | | | | | | | | | | | | | | | | | | | | | | | | | | | |
Dividends from net investment income | | | - | | | | | | | | (0.24 | ) | | | | | | | (0.28 | ) | | | | | | | (1.28 | ) | | | | | | | - | |
Distributions from net realized gains | | | (3.78 | ) | | | | | | | (2.25 | ) | | | | | | | (0.58 | ) | | | | | | | (0.99 | ) | | | | | | | (2.52 | ) |
| | | | | | | | | | | | | | | | | | | | | | | | | | | | | | | | | | | | |
Total distributions | | | (3.78 | ) | | | | | | | (2.49 | ) | | | | | | | (0.86 | ) | | | | | | | (2.27 | ) | | | | | | | (2.52 | ) |
| | | | | | | | | | | | | | | | | | | | | | | | | | | | | | | | | | | | |
Net asset value, end of period | | $ | 21.34 | | | | | | | $ | 21.84 | | | | | | | $ | 22.11 | | | | | | | $ | 25.17 | | | | | | | $ | 22.60 | |
| | | | | | | | | | | | | | | | | | | | | | | | | | | | | | | | | | | | |
Total returnC | | | 14.96 | % | | | | | | | 10.08 | % | | | | | | | (8.73 | )% | | | | | | | 21.58 | % | | | | | | | (4.08 | )% |
| | | | | | | | | | | | | | | | | | | | | | | | | | | | | | | | | | | | |
| | | | | | | | | |
Ratios and supplemental data: | | | | | | | | | | | | | | | | | | | | | | | | | | | | | | | | | | | | |
Net assets, end of period | | $ | 7,218,739 | | | | | | | $ | 16,771,478 | | | | | | | $ | 20,717,120 | | | | | | | $ | 29,384,166 | | | | | | | $ | 30,186,523 | |
Ratios to average net assets: | | | | | | | | | | | | | | | | | | | | | | | | | | | | | | | | | | | | |
Expenses, before reimbursements and/or recoupments | | | 1.93 | % | | | | | | | 1.94 | % | | | | | | | 1.88 | % | | | | | | | 1.84 | % | | | | | | | 1.83 | % |
Expenses, net of reimbursements and/or recoupments | | | 1.93 | % | | | | | | | 1.94 | % | | | | | | | 1.88 | % | | | | | | | 1.83 | % | | | | | | | 1.83 | % |
Net investment income (loss), before expense reimbursements and/or recoupments | | | (0.07 | )% | | | | | | | 0.59 | % | | | | | | | 0.72 | % | | | | | | | 0.28 | % | | | | | | | 0.69 | % |
Net investment income (loss), net of reimbursements and/or recoupments | | | (0.07 | )% | | | | | | | 0.59 | % | | | | | | | 0.72 | % | | | | | | | 0.29 | % | | | | | | | 0.69 | % |
Portfolio turnover rate | | | 64 | % | | | | | | | 54 | % | | | | | | | 54 | % | | | | | | | 51 | % | | | | | | | 43 | % |
| A | On April 30, 2024 Bridgeway Capital Management, LLC was terminated and ceased managing assets of the Fund. On May 1, 2024, Numeric Investors LLC, began managing assets of the Fund. |
| B | Per share amounts have been calculated using the average shares method. |
| C | Based on net asset value, which does not reflect the sales charge, redemption fee, or contingent deferred sales charge, if applicable. May include adjustments in accordance with U.S. GAAP and as such, the net asset value for reporting purposes and the returns based upon those net asset values may differ from the net asset value and returns for shareholder transactions. |
See accompanying notes
47
American Beacon Man Large Cap Value FundSM
Financial Highlights
(For a share outstanding throughout the period)
| | | | | | | | | | | | | | | | | | | | | | | | | | | | | | | | | | | | |
| | | R6 Class | |
| | | Year Ended December 31, | |
| | | 2024A | | | | | | 2023 | | | | | | 2022 | | | | | | 2021 | | | | | | 2020 | |
| | | | |
Net asset value, beginning of period | | $ | 23.14 | | | | | | | $ | 23.32 | | | | | | | $ | 26.53 | | | | | | | $ | 23.71 | | | | | | | $ | 27.12 | |
| | | | | | | | | | | | | | | | | | | | | | | | | | | | | | | | | | | | |
Income (loss) from investment operations: | | | | | | | | | | | | | | | | | | | | | | | | | | | | | | | | | | | | |
Net investment income | | | 0.26 | B | | | | | | | 0.23 | | | | | | | | 0.45 | B | | | | | | | 0.53 | | | | | | | | 0.24 | |
Net gains (losses) on investments (both realized and unrealized) | | | 3.56 | | | | | | | | 2.39 | | | | | | | | (2.50 | ) | | | | | | | 4.87 | | | | | | | | (1.12 | ) |
| | | | | | | | | | | | | | | | | | | | | | | | | | | | | | | | | | | | |
Total income (loss) from investment operations | | | 3.82 | | | | | | | | 2.62 | | | | | | | | (2.05 | ) | | | | | | | 5.40 | | | | | | | | (0.88 | ) |
| | | | | | | | | | | | | | | | | | | | | | | | | | | | | | | | | | | | |
Less distributions: | | | | | | | | | | | | | | | | | | | | | | | | | | | | | | | | | | | | |
Dividends from net investment income | | | (0.32 | ) | | | | | | | (0.55 | ) | | | | | | | (0.58 | ) | | | | | | | (1.59 | ) | | | | | | | (0.01 | ) |
Distributions from net realized gains | | | (3.78 | ) | | | | | | | (2.25 | ) | | | | | | | (0.58 | ) | | | | | | | (0.99 | ) | | | | | | | (2.52 | ) |
| | | | | | | | | | | | | | | | | | | | | | | | | | | | | | | | | | | | |
Total distributions | | | (4.10 | ) | | | | | | | (2.80 | ) | | | | | | | (1.16 | ) | | | | | | | (2.58 | ) | | | | | | | (2.53 | ) |
| | | | | | | | | | | | | | | | | | | | | | | | | | | | | | | | | | | | |
Net asset value, end of period | | $ | 22.86 | | | | | | | $ | 23.14 | | | | | | | $ | 23.32 | | | | | | | $ | 26.53 | | | | | | | $ | 23.71 | |
| | | | | | | | | | | | | | | | | | | | | | | | | | | | | | | | | | | | |
Total returnC | | | 16.49 | % | | | | | | | 11.29 | % | | | | | | | (7.74 | )% | | | | | | | 22.99 | % | | | | | | | (3.03 | )% |
| | | | | | | | | | | | | | | | | | | | | | | | | | | | | | | | | | | | |
| | | | | | | | | |
Ratios and supplemental data: | | | | | | | | | | | | | | | | | | | | | | | | | | | | | | | | | | | | |
Net assets, end of period | | $ | 2,016,701 | | | | | | | $ | 23,587,323 | | | | | | | $ | 25,796,145 | | | | | | | $ | 71,972,572 | | | | | | | $ | 97,789,536 | |
Ratios to average net assets: | | | | | | | | | | | | | | | | | | | | | | | | | | | | | | | | | | | | |
Expenses, before reimbursements and/or recoupments | | | 0.81 | % | | | | | | | 0.84 | % | | | | | | | 0.77 | % | | | | | | | 0.72 | % | | | | | | | 0.73 | % |
Expenses, net of reimbursements and/or recoupments | | | 0.81 | % | | | | | | | 0.84 | % | | | | | | | 0.77 | % | | | | | | | 0.72 | % | | | | | | | 0.73 | % |
Net investment income, before expense reimbursements and/or recoupments | | | 1.05 | % | | | | | | | 1.71 | % | | | | | | | 1.81 | % | | | | | | | 1.39 | % | | | | | | | 1.77 | % |
Net investment income, net of reimbursements and/or recoupments | | | 1.05 | % | | | | | | | 1.71 | % | | | | | | | 1.81 | % | | | | | | | 1.39 | % | | | | | | | 1.77 | % |
Portfolio turnover rate | | | 64 | % | | | | | | | 54 | % | | | | | | | 54 | % | | | | | | | 51 | % | | | | | | | 43 | % |
| A | On April 30, 2024 Bridgeway Capital Management, LLC was terminated and ceased managing assets of the Fund. On May 1, 2024, Numeric Investors LLC, began managing assets of the Fund. |
| B | Per share amounts have been calculated using the average shares method. |
| C | Based on net asset value, which does not reflect the sales charge, redemption fee, or contingent deferred sales charge, if applicable. May include adjustments in accordance with U.S. GAAP and as such, the net asset value for reporting purposes and the returns based upon those net asset values may differ from the net asset value and returns for shareholder transactions. |
See accompanying notes
48
American Beacon FundsSM
Federal Tax Information
December 31, 2024 (Unaudited)
Certain tax information regarding the Funds is required to be provided to shareholders based upon the Funds’ income and distributions for the taxable year ended December 31, 2024. The information and distributions reported herein may differ from information and distributions taxable to the shareholders for the calendar year ended December 31, 2024.
The Funds designated the following items with regard to distributions paid during the fiscal year ended December 31, 2024. All designations are based on financial information available as of this annual report and, accordingly, are subject to change. For each item, it is the intention of the Funds to designate the maximum amount permitted under the Internal Revenue Code of 1986, as amended, and the regulations there under.
Corporate Dividends-Received Deduction:
| | | | |
Man Large Cap Growth | | | 20.04 | % |
Man Large Cap Value | | | 28.21 | % |
Qualified Dividend Income:
| | | | |
Man Large Cap Growth | | | 22.16 | % |
Man Large Cap Value | | | 30.05 | % |
Long-Term Capital Gain Distributions:
| | | | |
Man Large Cap Growth | | $ | 22,663,796 | |
Man Large Cap Value | | $ | 27,076,297 | |
Short-Term Capital Gain Distributions:
| | | | |
Man Large Cap Growth | | $ | 5,971,380 | |
Man Large Cap Value | | $ | 14,475,024 | |
Shareholders received notification in January 2025 of the applicable tax information necessary to prepare their 2024 income tax returns.
49

Delivery of Documents
If you invest in the Fund through a financial institution, you may be able to receive the Fund’s regulatory mailings, such as the Prospectus, Annual Report, Semi-Annual Report and Financial Statement Reports, by e-mail. If you are interested in this option, please go to www.icsdelivery.com and search for your financial institution’s name or contact your financial institution directly.
You may request a paper copy of this document at no charge by contacting your financial institution. This document is also available for download at www.americanbeaconfunds.com or you can request an electronic copy by contacting your financial institution.
To obtain more information about the Fund:
| | |
 | |  |
| | |
| By E-mail: | | On the Internet: |
| american_beacon.funds@ambeacon.com | | Visit our website at www.americanbeaconfunds.com |
| | | |
| | | |
| | |

By Telephone: Call (800) 658-5811 | | 
By Mail: American Beacon Funds P.O. Box 219643 Kansas City, MO 64121-9643 |
|
|
|
| | | |
Fund Service Providers:
| | | | | | | | | | | | |
CUSTODIAN State Street Bank and Trust Company Boston, Massachusetts | | | | TRANSFER AGENT SS&C GIDS, Inc. Quincy, Massachusetts | | | | INDEPENDENT REGISTERED PUBLIC ACCOUNTING FIRM PricewaterhouseCoopers LLP Boston, Massachusetts | | | | DISTRIBUTOR Resolute Investment Distributors, Inc. Irving, Texas |
This report is prepared for shareholders of the American Beacon Funds and may be distributed to others only if preceded or accompanied by a current Prospectus or Summary Prospectus.
American Beacon Funds, American Beacon Man Large Cap Growth Fund, and American Beacon Man Large Cap Value Fund are service marks of American Beacon Advisors, Inc.
AR 12/24

American Beacon Funds
Although information has been compiled from reliable sources, American Beacon Advisors, Inc. makes no representation as to the completeness or accuracy of the statements contained herein. All information is as of the end of the reporting period, unless noted otherwise, and is subject to change. Each Fund’s portfolio composition will change depending on economic and market conditions.
American Beacon Funds | December 31, 2024 |
Contents
American Beacon FundsSM
Report of Independent Registered Public Accounting Firm
To the Board of Trustees of American Beacon Funds and Shareholders of American Beacon Stephens Mid-Cap Growth Fund and American Beacon Stephens Small Cap Growth Fund
Opinions on the Financial Statements
We have audited the accompanying statements of assets and liabilities, including the schedules of investments, of American Beacon Stephens Mid-Cap Growth Fund and American Beacon Stephens Small Cap Growth Fund (two of the funds constituting American Beacon Funds, hereafter collectively referred to as the “Funds”) as of December 31, 2024, the related statements of operations for the year ended December 31, 2024, the statements of changes in net assets for each of the two years in the period ended December 31, 2024, including the related notes, and the financial highlights for each of the three years in the period ended December 31, 2024 (collectively referred to as the “financial statements”). In our opinion, the financial statements present fairly, in all material respects, the financial position of each of the Funds as of December 31, 2024, the results of each of their operations for the year then ended, the changes in each of their net assets for each of the two years in the period ended December 31, 2024 and each of the financial highlights for the three years in the period ended December 31, 2024 in conformity with accounting principles generally accepted in the United States of America.
The financial statements of the Funds as of and for the year ended December 31, 2021 and the financial highlights for each of the periods ended on or prior to December 31, 2021 (not presented herein, other than the financial highlights) were audited by other auditors whose report dated February 28, 2022 expressed an unqualified opinion on those financial statements and financial highlights.
Basis for Opinions
These financial statements are the responsibility of the Funds’ management. Our responsibility is to express an opinion on the Funds’ financial statements based on our audits. We are a public accounting firm registered with the Public Company Accounting Oversight Board (United States) (PCAOB) and are required to be independent with respect to the Funds in accordance with the U.S. federal securities laws and the applicable rules and regulations of the Securities and Exchange Commission and the PCAOB.
We conducted our audits of these financial statements in accordance with the standards of the PCAOB. Those standards require that we plan and perform the audit to obtain reasonable assurance about whether the financial statements are free of material misstatement, whether due to error or fraud.
Our audits included performing procedures to assess the risks of material misstatement of the financial statements, whether due to error or fraud, and performing procedures that respond to those risks. Such procedures included examining, on a test basis, evidence regarding the amounts and disclosures in the financial statements. Our audits also included evaluating the accounting principles used and significant estimates made by management, as well as evaluating the overall presentation of the financial statements. Our procedures included confirmation of securities owned as of December 31, 2024 by correspondence with the custodian and brokers; when replies were not received from brokers, we performed other auditing procedures. We believe that our audits provide a reasonable basis for our opinions.
/s/PricewaterhouseCoopers LLP
Boston, Massachusetts
February 27, 2025
We have served as the auditor of one or more investment companies in the American Beacon family of funds since 2016.
1
American Beacon Stephens Mid-Cap Growth FundSM
Schedule of Investments
December 31, 2024
| | | | | | | | | | | | | | | |
| | | |
| | | Shares | | | | Fair Value |
| | | | | | | |
| | | |
| COMMON STOCKS - 96.75% | | | | | | |
| | | |
| Communication Services - 8.68% | | | | | | |
| | | |
| Entertainment - 7.00% | | | | | | |
| Electronic Arts, Inc. | | | | 81,214 | | | | | | | | | $ | 11,881,608 | |
| Live Nation Entertainment, Inc.A | | | | 101,834 | | | | | | | | | | 13,187,503 | |
| Spotify Technology SAA | | | | 37,195 | | | | | | | | | | 16,640,299 | |
| Take-Two Interactive Software, Inc.A | | | | 77,770 | | | | | | | | | | 14,315,902 | |
| | | | | | | | | | | | | | | |
| | | | | | | | | | | | | | 56,025,312 | |
| | | | | | | | | | | | | | | |
| | | | | | | | | | | | | | | |
| | | |
| Interactive Media & Services - 0.36% | | | | | | |
| Reddit, Inc., Class AA | | | | 17,523 | | | | | | | | | | 2,863,959 | |
| | | | | | | | | | | | | | | |
| | | | | | | | | | | | | | | |
| | | |
| Media - 1.32% | | | | | | |
| Trade Desk, Inc., Class AA | | | | 89,691 | | | | | | | | | | 10,541,383 | |
| | | | | | | | | | | | | | | |
| | | | | | | | | | | | | | | |
Total Communication Services | | | | | | | | | | | | | | 69,430,654 | |
| | | | | | | | | | | | | | | |
| | | | | | | | | | | | | | | |
| | | |
| Consumer Discretionary - 9.95% | | | | | | |
| | | |
| Distributors - 0.68% | | | | | | |
| Pool Corp. | | | | 15,920 | | | | | | | | | | 5,427,765 | |
| | | | | | | | | | | | | | | |
| | | | | | | | | | | | | | | |
| | | |
| Diversified Consumer Services - 0.90% | | | | | | |
| Bright Horizons Family Solutions, Inc.A | | | | 64,896 | | | | | | | | | | 7,193,722 | |
| | | | | | | | | | | | | | | |
| | | | | | | | | | | | | | | |
| | | |
| Hotels, Restaurants & Leisure - 2.34% | | | | | | |
| Domino’s Pizza, Inc. | | | | 24,478 | | | | | | | | | | 10,274,885 | |
| Wingstop, Inc. | | | | 30,018 | | | | | | | | | | 8,531,116 | |
| | | | | | | | | | | | | | | |
| | | | | | | | | | | | | | 18,806,001 | |
| | | | | | | | | | | | | | | |
| | | | | | | | | | | | | | | |
| | | |
| Specialty Retail - 4.84% | | | | | | |
| Burlington Stores, Inc.A | | | | 53,843 | | | | | | | | | | 15,348,485 | |
| Five Below, Inc.A | | | | 62,345 | | | | | | | | | | 6,543,731 | |
| Ross Stores, Inc. | | | | 73,418 | | | | | | | | | | 11,105,941 | |
| Tractor Supply Co. | | | | 106,625 | | | | | | | | | | 5,657,522 | |
| | | | | | | | | | | | | | | |
| | | | | | | | | | | | | | 38,655,679 | |
| | | | | | | | | | | | | | | |
| | | | | | | | | | | | | | | |
| | | |
| Textiles, Apparel & Luxury Goods - 1.19% | | | | | | |
| Deckers Outdoor Corp.A | | | | 47,055 | | | | | | | | | | 9,556,400 | |
| | | | | | | | | | | | | | | |
| | | | | | | | | | | | | | | |
Total Consumer Discretionary | | | | | | | | | | | | | | 79,639,567 | |
| | | | | | | | | | | | | | | |
| | | | | | | | | | | | | | | |
| | | |
| Consumer Staples - 0.20% | | | | | | |
| | | |
| Beverages - 0.20% | | | | | | |
| Celsius Holdings, Inc.A | | | | 60,201 | | | | | | | | | | 1,585,694 | |
| | | | | | | | | | | | | | | |
| | | | | | | | | | | | | | | |
| | | |
| Energy - 4.38% | | | | | | |
| | | |
| Energy Equipment & Services - 1.08% | | | | | | |
| Baker Hughes Co. | | | | 210,693 | | | | | | | | | | 8,642,627 | |
| | | | | | | | | | | | | | | |
| | | | | | | | | | | | | | | |
| | | |
| Oil, Gas & Consumable Fuels - 3.30% | | | | | | |
| Coterra Energy, Inc. | | | | 236,583 | | | | | | | | | | 6,042,330 | |
| Diamondback Energy, Inc. | | | | 50,487 | | | | | | | | | | 8,271,285 | |
| Expand Energy Corp. | | | | 121,545 | | | | | | | | | | 12,099,805 | |
| | | | | | | | | | | | | | | |
| | | | | | | | | | | | | | 26,413,420 | |
| | | | | | | | | | | | | | | |
| | | | | | | | | | | | | | | |
Total Energy | | | | | | | | | | | | | | 35,056,047 | |
| | | | | | | | | | | | | | | |
| | | | | | | | | | | | | | | |
| | | |
| Financials - 8.86% | | | | | | |
| | | |
| Capital Markets - 4.23% | | | | | | |
| Evercore, Inc., Class A | | | | 27,371 | | | | | | | | | | 7,586,968 | |
| MarketAxess Holdings, Inc. | | | | 18,038 | | | | | | | | | | 4,077,310 | |
| Robinhood Markets, Inc., Class AA | | | | 149,705 | | | | | | | | | | 5,578,008 | |
| Tradeweb Markets, Inc., Class A | | | | 126,559 | | | | | | | | | | 16,569,104 | |
| | | | | | | | | | | | | | | |
| | | | | | | | | | | | | | 33,811,390 | |
| | | | | | | | | | | | | | | |
| | | | | | | | | | | | | | | |
See accompanying notes
2
American Beacon Stephens Mid-Cap Growth FundSM
Schedule of Investments
December 31, 2024
| | | | | | | | | | | | | | | |
| | | |
| | | Shares | | | | Fair Value |
| | | | | | | |
| | | |
| COMMON STOCKS - 96.75% (continued) | | | | | | |
| | | |
| Financials - 8.86% (continued) | | | | | | |
| | | |
| Consumer Finance - 0.97% | | | | | | |
| FirstCash Holdings, Inc. | | | | 74,603 | | | | | | | | | $ | 7,728,871 | |
| | | | | | | | | | | | | | | |
| | | | | | | | | | | | | | | |
| | | |
| Financial Services - 1.25% | | | | | | |
| Toast, Inc., Class AA | | | | 275,007 | | | | | | | | | | 10,024,005 | |
| | | | | | | | | | | | | | | |
| | | | | | | | | | | | | | | |
| | | |
| Insurance - 2.41% | | | | | | |
| Kinsale Capital Group, Inc. | | | | 17,977 | | | | | | | | | | 8,361,642 | |
| Ryan Specialty Holdings, Inc. | | | | 171,434 | | | | | | | | | | 10,999,205 | |
| | | | | | | | | | | | | | | |
| | | | | | | | | | | | | | 19,360,847 | |
| | | | | | | | | | | | | | | |
| | | | | | | | | | | | | | | |
Total Financials | | | | | | | | | | | | | | 70,925,113 | |
| | | | | | | | | | | | | | | |
| | | | | | | | | | | | | | | |
| | | |
| Health Care - 14.80% | | | | | | |
| | | |
| Biotechnology - 1.38% | | | | | | |
| Exelixis, Inc.A | | | | 332,187 | | | | | | | | | | 11,061,827 | |
| | | | | | | | | | | | | | | |
| | | | | | | | | | | | | | | |
| | | |
| Health Care Equipment & Supplies - 5.73% | | | | | | |
| Dexcom, Inc.A | | | | 105,580 | | | | | | | | | | 8,210,957 | |
| Hologic, Inc.A | | | | 99,116 | | | | | | | | | | 7,145,272 | |
| IDEXX Laboratories, Inc.A | | | | 17,634 | | | | | | | | | | 7,290,601 | |
| Insulet Corp.A | | | | 32,478 | | | | | | | | | | 8,479,032 | |
| ResMed, Inc. | | | | 49,666 | | | | | | | | | | 11,358,118 | |
| Tandem Diabetes Care, Inc.A | | | | 91,907 | | | | | | | | | | 3,310,490 | |
| | | | | | | | | | | | | | | |
| | | | | | | | | | | | | | 45,794,470 | |
| | | | | | | | | | | | | | | |
| | | | | | | | | | | | | | | |
| | | |
| Health Care Providers & Services - 2.35% | | | | | | |
| Acadia Healthcare Co., Inc.A | | | | 110,828 | | | | | | | | | | 4,394,330 | |
| HealthEquity, Inc.A | | | | 83,571 | | | | | | | | | | 8,018,637 | |
| Henry Schein, Inc.A | | | | 92,609 | | | | | | | | | | 6,408,543 | |
| | | | | | | | | | | | | | | |
| | | | | | | | | | | | | | 18,821,510 | |
| | | | | | | | | | | | | | | |
| | | | | | | | | | | | | | | |
| | | |
| Health Care Technology - 0.88% | | | | | | |
| Veeva Systems, Inc., Class AA | | | | 33,600 | | | | | | | | | | 7,064,400 | |
| | | | | | | | | | | | | | | |
| | | | | | | | | | | | | | | |
| | | |
| Life Sciences Tools & Services - 4.46% | | | | | | |
| Bio-Techne Corp. | | | | 105,337 | | | | | | | | | | 7,587,424 | |
| ICON PLCA | | | | 55,414 | | | | | | | | | | 11,620,870 | |
| Illumina, Inc.A | | | | 35,501 | | | | | | | | | | 4,743,999 | |
| Medpace Holdings, Inc.A | | | | 14,422 | | | | | | | | | | 4,791,421 | |
| Repligen Corp.A | | | | 48,184 | | | | | | | | | | 6,935,605 | |
| | | | | | | | | | | | | | | |
| | | | | | | | | | | | | | 35,679,319 | |
| | | | | | | | | | | | | | | |
| | | | | | | | | | | | | | | |
Total Health Care | | | | | | | | | | | | | | 118,421,526 | |
| | | | | | | | | | | | | | | |
| | | | | | | | | | | | | | | |
| | | |
| Industrials - 18.93% | | | | | | |
| | | |
| Aerospace & Defense - 5.13% | | | | | | |
| Axon Enterprise, Inc.A | | | | 31,202 | | | | | | | | | | 18,543,973 | |
| BWX Technologies, Inc. | | | | 39,745 | | | | | | | | | | 4,427,196 | |
| HEICO Corp., Class A | | | | 54,426 | | | | | | | | | | 10,127,590 | |
| L3Harris Technologies, Inc. | | | | 37,696 | | | | | | | | | | 7,926,715 | |
| | | | | | | | | | | | | | | |
| | | | | | | | | | | | | | 41,025,474 | |
| | | | | | | | | | | | | | | |
| | | |
| Building Products - 0.50% | | | | | | |
| Trex Co., Inc.A | | | | 58,129 | | | | | | | | | | 4,012,645 | |
| | | | | | | | | | | | | | | |
| | | | | | | | | | | | | | | |
| | | |
| Commercial Services & Supplies - 1.99% | | | | | | |
| Copart, Inc.A | | | | 277,297 | | | | | | | | | | 15,914,075 | |
| | | | | | | | | | | | | | | |
| | | | | | | | | | | | | | | |
See accompanying notes
3
American Beacon Stephens Mid-Cap Growth FundSM
Schedule of Investments
December 31, 2024
| | | | | | | | | | | | | | | |
| | | |
| | | Shares | | | | Fair Value |
| | | | | | | |
| | | |
| COMMON STOCKS - 96.75% (continued) | | | | | | |
| | | |
| Industrials - 18.93% (continued) | | | | | | |
| | | |
| Electrical Equipment - 4.26% | | | | | | |
| Generac Holdings, Inc.A | | | | 35,089 | | | | | | | | | $ | 5,440,549 | |
| Hubbell, Inc. | | | | 18,703 | | | | | | | | | | 7,834,500 | |
| Rockwell Automation, Inc. | | | | 33,446 | | | | | | | | | | 9,558,532 | |
| Vertiv Holdings Co., Class A | | | | 99,481 | | | | | | | | | | 11,302,036 | |
| | | | | | | | | | | | | | | |
| | | | | | | | | | | | | | 34,135,617 | |
| | | | | | | | | | | | | | | |
| | | | | | | | | | | | | | | |
| | | |
| Ground Transportation - 1.62% | | | | | | |
| JB Hunt Transport Services, Inc. | | | | 37,305 | | | | | | | | | | 6,366,471 | |
| Saia, Inc.A | | | | 14,420 | | | | | | | | | | 6,571,627 | |
| | | | | | | | | | | | | | | |
| | | | | | | | | | | | | | 12,938,098 | |
| | | | | | | | | | | | | | | |
| | | | | | | | | | | | | | | |
| | | |
| Machinery - 1.15% | | | | | | |
| RBC Bearings, Inc.A | | | | 30,628 | | | | | | | | | | 9,162,060 | |
| | | | | | | | | | | | | | | |
| | | | | | | | | | | | | | | |
| | | |
| Professional Services - 2.87% | | | | | | |
| FTI Consulting, Inc.A | | | | 50,854 | | | | | | | | | | 9,719,725 | |
| Verisk Analytics, Inc. | | | | 48,254 | | | | | | | | | | 13,290,599 | |
| | | | | | | | | | | | | | | |
| | | | | | | | | | | | | | 23,010,324 | |
| | | | | | | | | | | | | | | |
| | | | | | | | | | | | | | | |
| | | |
| Trading Companies & Distributors - 1.41% | | | | | | |
| Fastenal Co. | | | | 115,913 | | | | | | | | | | 8,335,304 | |
| SiteOne Landscape Supply, Inc.A | | | | 22,339 | | | | | | | | | | 2,943,610 | |
| | | | | | | | | | | | | | | |
| | | | | | | | | | | | | | 11,278,914 | |
| | | | | | | | | | | | | | | |
| | | | | | | | | | | | | | | |
Total Industrials | | | | | | | | | | | | | | 151,477,207 | |
| | | | | | | | | | | | | | | |
| | | | | | | | | | | | | | | |
| | | |
| Information Technology - 29.28% | | | | | | |
| | | |
| Electronic Equipment, Instruments & Components - 1.83% | | | | | | |
| Cognex Corp. | | | | 112,819 | | | | | | | | | | 4,045,689 | |
| Coherent Corp.A | | | | 49,596 | | | | | | | | | | 4,698,229 | |
| Keysight Technologies, Inc.A | | | | 36,787 | | | | | | | | | | 5,909,096 | |
| | | | | | | | | | | | | | | |
| | | | | | | | | | | | | | 14,653,014 | |
| | | | | | | | | | | | | | | |
| | | | | | | | | | | | | | | |
| | | |
| IT Services - 2.23% | | | | | | |
| Globant SAA | | | | 30,706 | | | | | | | | | | 6,583,981 | |
| MongoDB, Inc.A | | | | 21,787 | | | | | | | | | | 5,072,231 | |
| Okta, Inc.A | | | | 79,080 | | | | | | | | | | 6,231,504 | |
| | | | | | | | | | | | | | | |
| | | | | | | | | | | | | | 17,887,716 | |
| | | | | | | | | | | | | | | |
| | | | | | | | | | | | | | | |
| | | |
| Semiconductors & Semiconductor Equipment - 4.44% | | | | | | |
| Lattice Semiconductor Corp.A | | | | 92,053 | | | | | | | | | | 5,214,802 | |
| Marvell Technology, Inc. | | | | 133,434 | | | | | | | | | | 14,737,785 | |
| Microchip Technology, Inc. | | | | 129,459 | | | | | | | | | | 7,424,474 | |
| Teradyne, Inc. | | | | 64,991 | | | | | | | | | | 8,183,667 | |
| | | | | | | | | | | | | | | |
| | | | | | | | | | | | | | 35,560,728 | |
| | | | | | | | | | | | | | | |
| | | | | | | | | | | | | | | |
| | | |
| Software - 19.79% | | | | | | |
| ANSYS, Inc.A | | | | 16,509 | | | | | | | | | | 5,568,981 | |
| Aspen Technology, Inc.A | | | | 35,779 | | | | | | | | | | 8,931,512 | |
| Autodesk, Inc.A | | | | 20,710 | | | | | | | | | | 6,121,255 | |
| Cadence Design Systems, Inc.A | | | | 44,283 | | | | | | | | | | 13,305,270 | |
| Crowdstrike Holdings, Inc., Class AA | | | | 18,912 | | | | | | | | | | 6,470,930 | |
| CyberArk Software Ltd.A | | | | 21,147 | | | | | | | | | | 7,045,123 | |
| Fortinet, Inc.A | | | | 69,931 | | | | | | | | | | 6,607,081 | |
| Gitlab, Inc., Class AA | | | | 97,204 | | | | | | | | | | 5,477,445 | |
| Guidewire Software, Inc.A | | | | 93,101 | | | | | | | | | | 15,694,967 | |
| Manhattan Associates, Inc.A | | | | 52,016 | | | | | | | | | | 14,056,804 | |
| Monday.com Ltd.A | | | | 17,602 | | | | | | | | | | 4,144,215 | |
| Nutanix, Inc., Class AA | | | | 103,012 | | | | | | | | | | 6,302,274 | |
See accompanying notes
4
American Beacon Stephens Mid-Cap Growth FundSM
Schedule of Investments
December 31, 2024
| | | | | | | | | | | | | | | |
| | | |
| | | Shares | | | | Fair Value |
| | | | | | | |
| | | |
| COMMON STOCKS - 96.75% (continued) | | | | | | |
| | | |
| Information Technology - 29.28% (continued) | | | | | | |
| | | |
| Software - 19.79% (continued) | | | | | | |
| Palantir Technologies, Inc., Class AA | | | | 290,044 | | | | | | | | | $ | 21,936,028 | |
| Palo Alto Networks, Inc.A | | | | 35,350 | | | | | | | | | | 6,432,286 | |
| PTC, Inc.A | | | | 51,595 | | | | | | | | | | 9,486,773 | |
| Roper Technologies, Inc. | | | | 14,111 | | | | | | | | | | 7,335,603 | |
| Tyler Technologies, Inc.A | | | | 23,146 | | | | | | | | | | 13,346,909 | |
| | | | | | | | | | | | | | | |
| | | | | | | | | | | | | | 158,263,456 | |
| | | | | | | | | | | | | | | |
| | | | | | | | | | | | | | | |
| | | |
| Technology Hardware, Storage & Peripherals - 0.99% | | | | | | |
| Pure Storage, Inc., Class AA | | | | 129,451 | | | | | | | | | | 7,952,175 | |
| | | | | | | | | | | | | | | |
| | | | | | | | | | | | | | | |
Total Information Technology | | | | | | | | | | | | | | 234,317,089 | |
| | | | | | | | | | | | | | | |
| | | | | | | | | | | | | | | |
| | | |
| Real Estate - 0.84% | | | | | | |
| | | |
| Real Estate Management & Development - 0.84% | | | | | | |
| CoStar Group, Inc.A | | | | 93,892 | | | | | | | | | | 6,721,728 | |
| | | | | | | | | | | | | | | |
| | | | | | | | | | | | | | | |
| | | |
| Utilities - 0.83% | | | | | | |
| | | |
| Independent Power & Renewable Electricity Producers - 0.83% | | | | | | |
| Vistra Corp. | | | | 48,060 | | | | | | | | | | 6,626,032 | |
| | | | | | | | | | | | | | | |
| | | | | | | | | | | | | | | |
Total Common Stocks (Cost $561,182,614) | | | | | | | | | | | | | | 774,200,657 | |
| | | | | | | | | | | | | | | |
| | | | | | | | | | | | | | | |
| | | |
| FOREIGN COMMON STOCKS - 1.32% (Cost $5,182,919) | | | | | | |
| | | |
| Energy - 1.32% | | | | | | |
| | | |
| Energy Equipment & Services - 1.32% | | | | | | |
| TechnipFMC PLC | | | | 364,173 | | | | | | | | | | 10,539,166 | |
| | | | | | | | | | | | | | | |
| | | | | | | | | | | | | | | |
| | | |
| SHORT-TERM INVESTMENTS - 2.03% (Cost $16,210,936) | | | | | | |
| | | |
| Investment Companies - 2.03% | | | | | | |
| American Beacon U.S. Government Money Market Select Fund, 4.33%B C | | | | 16,210,936 | | | | | | | | | | 16,210,936 | |
| | | | | | | | | | | | | | | |
| | | | | | | | | | | | | | | |
TOTAL INVESTMENTS - 100.10% (Cost $582,576,469) | | | | | | | | | | | | | | 800,950,759 | |
LIABILITIES, NET OF OTHER ASSETS - (0.10)% | | | | | | | | | | | | | | (795,304 | ) |
| | | | | | | | | | | | | | | |
TOTAL NET ASSETS - 100.00% | | | | | | | | | | | | | $ | 800,155,455 | |
| | | | | | | | | | | | | | | |
| | | | | | | |
| Percentages are stated as a percent of net assets. | | | | | | | | | | | |
A Non-income producing security.
B The Fund is affiliated by having the same investment advisor.
C 7-day yield.
PLC - Public Limited Company.
The Fund’s investments are summarized by level based on the inputs used to determine their values. As of December 31, 2024, the investments were classified as described below:
| | | | | | | | | | | | | | | | | | | | | | | | | | | | |
Stephens Mid-Cap Growth Fund | | Level 1 | | | | | | Level 2 | | | | | | Level 3 | | | | | | Total | |
Assets | | | | | | | | | | | | | | | | | | | | | | | | | | | | |
Common Stocks | | $ | 774,200,657 | | | | | | | $ | - | | | | | | | $ | - | | | | | | | $ | 774,200,657 | |
Foreign Common Stocks | | | 10,539,166 | | | | | | | | - | | | | | | | | - | | | | | | | | 10,539,166 | |
Short-Term Investments | | | 16,210,936 | | | | | | | | - | | | | | | | | - | | | | | | | | 16,210,936 | |
| | | | | | | | | | | | | | | | | | | | | | | | | | | | |
Total Investments in Securities - Assets | | $ | 800,950,759 | | | | | | | $ | - | | | | | | | $ | - | | | | | | | $ | 800,950,759 | |
| | | | | | | | | | | | | | | | | | | | | | | | | | | | |
U.S. GAAP requires transfers between all levels to/from level 3 be disclosed. During the year ended December 31, 2024, there were no transfers into or out of Level 3.
See accompanying notes
5
American Beacon Stephens Small Cap Growth FundSM
Schedule of Investments
December 31, 2024
| | | | | | | | | | | | | | | |
| | | |
| | | Shares | | | | Fair Value |
| | | | | | | |
| | | |
| COMMON STOCKS - 93.75% | | | | | | |
| | | |
| Communication Services - 1.01% | | | | | | |
| | | |
| Media - 1.01% | | | | | | |
| Magnite, Inc.A B | | | | 232,196 | | | | | | | | | $ | 3,696,560 | |
| | | | | | | | | | | | | | | |
| | | | | | | | | | | | | | | |
| | | |
| Consumer Discretionary - 10.72% | | | | | | |
| | | |
| Broadline Retail - 1.34% | | | | | | |
| Ollie’s Bargain Outlet Holdings, Inc.A | | | | 44,409 | | | | | | | | | | 4,873,000 | |
| | | | | | | | | | | | | | | |
| | | | | | | | | | | | | | | |
| | | |
| Diversified Consumer Services - 0.99% | | | | | | |
| Bright Horizons Family Solutions, Inc.A | | | | 32,523 | | | | | | | | | | 3,605,174 | |
| | | | | | | | | | | | | | | |
| | | | | | | | | | | | | | | |
| | | |
| Hotels, Restaurants & Leisure - 3.66% | | | | | | |
| First Watch Restaurant Group, Inc.A B | | | | 164,249 | | | | | | | | | | 3,056,674 | |
| Papa John’s International, Inc.B | | | | 82,470 | | | | | | | | | | 3,387,043 | |
| Sweetgreen, Inc., Class AA | | | | 92,286 | | | | | | | | | | 2,958,689 | |
| Wingstop, Inc. | | | | 13,844 | | | | | | | | | | 3,934,465 | |
| | | | | | | | | | | | | | | |
| | | | | | | | | | | | | | 13,336,871 | |
| | | | | | | | | | | | | | | |
| | | | | | | | | | | | | | | |
| | | |
| Household Durables - 0.55% | | | | | | |
| Installed Building Products, Inc. | | | | 11,421 | | | | | | | | | | 2,001,530 | |
| | | | | | | | | | | | | | | |
| | | | | | | | | | | | | | | |
| | | |
| Specialty Retail - 4.18% | | | | | | |
| Academy Sports & Outdoors, Inc.B | | | | 77,260 | | | | | | | | | | 4,444,768 | |
| Boot Barn Holdings, Inc.A | | | | 19,031 | | | | | | | | | | 2,889,286 | |
| Five Below, Inc.A | | | | 31,703 | | | | | | | | | | 3,327,547 | |
| Revolve Group, Inc.A | | | | 136,647 | | | | | | | | | | 4,576,308 | |
| | | | | | | | | | | | | | | |
| | | | | | | | | | | | | | 15,237,909 | |
| | | | | | | | | | | | | | | |
| | | | | | | | | | | | | | | |
Total Consumer Discretionary | | | | | | | | | | | | | | 39,054,484 | |
| | | | | | | | | | | | | | | |
| | | | | | | | | | | | | | | |
| | | |
| Consumer Staples - 2.91% | | | | | | |
| | | |
| Beverages - 0.21% | | | | | | |
| Celsius Holdings, Inc.A | | | | 28,798 | | | | | | | | | | 758,540 | |
| | | | | | | | | | | | | | | |
| | | | | | | | | | | | | | | |
| | | |
| Consumer Staples Distribution & Retail - 0.64% | | | | | | |
| Chefs’ Warehouse, Inc.A | | | | 47,572 | | | | | | | | | | 2,346,251 | |
| | | | | | | | | | | | | | | |
| | | | | | | | | | | | | | | |
| | | |
| Personal Products - 2.06% | | | | | | |
| BellRing Brands, Inc.A | | | | 99,556 | | | | | | | | | | 7,500,549 | |
| | | | | | | | | | | | | | | |
| | | | | | | | | | | | | | | |
Total Consumer Staples | | | | | | | | | | | | | | 10,605,340 | |
| | | | | | | | | | | | | | | |
| | | | | | | | | | | | | | | |
| | | |
| Energy - 4.67% | | | | | | |
| | | |
| Energy Equipment & Services - 0.40% | | | | | | |
| Solaris Energy Infrastructure, Inc. | | | | 50,572 | | | | | | | | | | 1,455,462 | |
| | | | | | | | | | | | | | | |
| | | | | | | | | | | | | | | |
| | | |
| Oil, Gas & Consumable Fuels - 4.27% | | | | | | |
| Expand Energy Corp. | | | | 46,139 | | | | | | | | | | 4,593,137 | |
| Magnolia Oil & Gas Corp., Class A | | | | 172,137 | | | | | | | | | | 4,024,563 | |
| Viper Energy, Inc. | | | | 141,435 | | | | | | | | | | 6,940,216 | |
| | | | | | | | | | | | | | | |
| | | | | | | | | | | | | | 15,557,916 | |
| | | | | | | | | | | | | | | |
| | | | | | | | | | | | | | | |
Total Energy | | | | | | | | | | | | | | 17,013,378 | |
| | | | | | | | | | | | | | | |
| | | | | | | | | | | | | | | |
| | | |
| Financials - 11.33% | | | | | | |
| | | |
| Capital Markets - 2.67% | | | | | | |
| MarketAxess Holdings, Inc. | | | | 5,763 | | | | | | | | | | 1,302,668 | |
| Piper Sandler Cos. | | | | 15,305 | | | | | | | | | | 4,590,735 | |
| Virtu Financial, Inc., Class A | | | | 107,052 | | | | | | | | | | 3,819,615 | |
| | | | | | | | | | | | | | | |
| | | | | | | | | | | | | | 9,713,018 | |
| | | | | | | | | | | | | | | |
| | | | | | | | | | | | | | | |
See accompanying notes
6
American Beacon Stephens Small Cap Growth FundSM
Schedule of Investments
December 31, 2024
| | | | | | | | | | | | | | | |
| | | |
| | | Shares | | | | Fair Value |
| | | | | | | |
| | | |
| COMMON STOCKS - 93.75% (continued) | | | | | | |
| | | |
| Financials - 11.33% (continued) | | | | | | |
| | | |
| Consumer Finance - 3.87% | | | | | | |
| Encore Capital Group, Inc.A | | | | 88,896 | | | | | | | | | $ | 4,246,562 | |
| EZCORP, Inc., Class AA | | | | 399,593 | | | | | | | | | | 4,883,026 | |
| FirstCash Holdings, Inc. | | | | 48,126 | | | | | | | | | | 4,985,854 | |
| | | | | | | | | | | | | | | |
| | | | | | | | | | | | | | 14,115,442 | |
| | | | | | | | | | | | | | | |
| | | | | | | | | | | | | | | |
| | | |
| Financial Services - 0.74% | | | | | | |
| Toast, Inc., Class AA | | | | 73,796 | | | | | | | | | | 2,689,864 | |
| | | | | | | | | | | | | | | |
| | | | | | | | | | | | | | | |
| | | |
| Insurance - 4.05% | | | | | | |
| Kinsale Capital Group, Inc. | | | | 8,205 | | | | | | | | | | 3,816,392 | |
| Palomar Holdings, Inc.A | | | | 50,964 | | | | | | | | | | 5,381,289 | |
| Ryan Specialty Holdings, Inc. | | | | 86,618 | | | | | | | | | | 5,557,411 | |
| | | | | | | | | | | | | | | |
| | | | | | | | | | | | | | 14,755,092 | |
| | | | | | | | | | | | | | | |
| | | | | | | | | | | | | | | |
Total Financials | | | | | | | | | | | | | | 41,273,416 | |
| | | | | | | | | | | | | | | |
| | | | | | | | | | | | | | | |
| | | |
| Health Care - 17.28% | | | | | | |
| | | |
| Biotechnology - 2.61% | | | | | | |
| Exelixis, Inc.A | | | | 157,125 | | | | | | | | | | 5,232,263 | |
| Halozyme Therapeutics, Inc.A | | | | 89,272 | | | | | | | | | | 4,268,094 | |
| | | | | | | | | | | | | | | |
| | | | | | | | | | | | | | 9,500,357 | |
| | | | | | | | | | | | | | | |
| | | | | | | | | | | | | | | |
| | | |
| Health Care Equipment & Supplies - 3.42% | | | | | | |
| Globus Medical, Inc., Class AA | | | | 36,287 | | | | | | | | | | 3,001,298 | |
| Insulet Corp.A | | | | 3,569 | | | | | | | | | | 931,759 | |
| iRhythm Technologies, Inc.A | | | | 34,972 | | | | | | | | | | 3,153,425 | |
| Neogen Corp.A B | | | | 182,636 | | | | | | | | | | 2,217,201 | |
| Tandem Diabetes Care, Inc.A | | | | 86,885 | | | | | | | | | | 3,129,598 | |
| | | | | | | | | | | | | | | |
| | | | | | | | | | | | | | 12,433,281 | |
| | | | | | | | | | | | | | | |
| | | | | | | | | | | | | | | |
| | | |
| Health Care Providers & Services - 2.52% | | | | | | |
| Acadia Healthcare Co., Inc.A | | | | 78,476 | | | | | | | | | | 3,111,573 | |
| HealthEquity, Inc.A | | | | 63,401 | | | | | | | | | | 6,083,326 | |
| | | | | | | | | | | | | | | |
| | | | | | | | | | | | | | 9,194,899 | |
| | | | | | | | | | | | | | | |
| | | | | | | | | | | | | | | |
| | | |
| Health Care Technology - 1.34% | | | | | | |
| HealthStream, Inc. | | | | 78,342 | | | | | | | | | | 2,491,276 | |
| Schrodinger, Inc.A B | | | | 124,031 | | | | | | | | | | 2,392,558 | |
| | | | | | | | | | | | | | | |
| | | | | | | | | | | | | | 4,883,834 | |
| | | | | | | | | | | | | | | |
| | | | | | | | | | | | | | | |
| | | |
| Life Sciences Tools & Services - 4.86% | | | | | | |
| Azenta, Inc.A | | | | 60,161 | | | | | | | | | | 3,008,050 | |
| Bio-Techne Corp. | | | | 40,741 | | | | | | | | | | 2,934,574 | |
| BioLife Solutions, Inc.A | | | | 117,597 | | | | | | | | | | 3,052,818 | |
| ICON PLCA | | | | 7,344 | | | | | | | | | | 1,540,110 | |
| Medpace Holdings, Inc.A | | | | 10,136 | | | | | | | | | | 3,367,483 | |
| OmniAb, Inc.A C D | | | | 25,374 | | | | | | | | | | 0 | |
| Repligen Corp.A | | | | 26,384 | | | | | | | | | | 3,797,713 | |
| | | | | | | | | | | | | | | |
| | | | | | | | | | | | | | 17,700,748 | |
| | | | | | | | | | | | | | | |
| | | | | | | | | | | | | | | |
| | | |
| Pharmaceuticals - 2.53% | | | | | | |
| Ligand Pharmaceuticals, Inc.A | | | | 46,013 | | | | | | | | | | 4,930,293 | |
| Supernus Pharmaceuticals, Inc.A | | | | 119,298 | | | | | | | | | | 4,313,816 | |
| | | | | | | | | | | | | | | |
| | | | | | | | | | | | | | 9,244,109 | |
| | | | | | | | | | | | | | | |
| | | | | | | | | | | | | | | |
Total Health Care | | | | | | | | | | | | | | 62,957,228 | |
| | | | | | | | | | | | | | | |
| | | | | | | | | | | | | | | |
See accompanying notes
7
American Beacon Stephens Small Cap Growth FundSM
Schedule of Investments
December 31, 2024
| | | | | | | | | | | | | | | |
| | | |
| | | Shares | | | | Fair Value |
| | | | | | | |
| | | |
| COMMON STOCKS - 93.75% (continued) | | | | | | |
| | | |
| Industrials - 20.67% | | | | | | |
| | | |
| Aerospace & Defense - 7.03% | | | | | | |
| AeroVironment, Inc.A B | | | | 33,172 | | | | | | | | | $ | 5,104,839 | |
| BWX Technologies, Inc. | | | | 23,041 | | | | | | | | | | 2,566,537 | |
| HEICO Corp., Class A | | | | 24,819 | | | | | | | | | | 4,618,320 | |
| Kratos Defense & Security Solutions, Inc.A | | | | 278,549 | | | | | | | | | | 7,348,123 | |
| Leonardo DRS, Inc.A | | | | 184,960 | | | | | | | | | | 5,976,058 | |
| | | | | | | | | | | | | | | |
| | | | | | | | | | | | | | 25,613,877 | |
| | | | | | | | | | | | | | | |
| | | | | | | | | | | | | | | |
| | | |
| Air Freight & Logistics - 0.95% | | | | | | |
| Hub Group, Inc., Class A | | | | 77,361 | | | | | | | | | | 3,447,206 | |
| | | | | | | | | | | | | | | |
| | | | | | | | | | | | | | | |
| | | |
| Building Products - 3.06% | | | | | | |
| AAON, Inc. | | | | 37,919 | | | | | | | | | | 4,462,308 | |
| AZEK Co., Inc.A | | | | 71,984 | | | | | | | | | | 3,417,080 | |
| Trex Co., Inc.A | | | | 47,688 | | | | | | | | | | 3,291,903 | |
| | | | | | | | | | | | | | | |
| | | | | | | | | | | | | | 11,171,291 | |
| | | | | | | | | | | | | | | |
| | | | | | | | | | | | | | | |
| | | |
| Commercial Services & Supplies - 1.70% | | | | | | |
| Montrose Environmental Group, Inc.A | | | | 112,108 | | | | | | | | | | 2,079,603 | |
| VSE Corp. | | | | 43,345 | | | | | | | | | | 4,122,109 | |
| | | | | | | | | | | | | | | |
| | | | | | | | | | | | | | 6,201,712 | |
| | | | | | | | | | | | | | | |
| | | | | | | | | | | | | | | |
| | | |
| Construction & Engineering - 0.48% | | | | | | |
| Ameresco, Inc., Class AA B | | | | 74,290 | | | | | | | | | | 1,744,329 | |
| | | | | | | | | | | | | | | |
| | | | | | | | | | | | | | | |
| | | |
| Electrical Equipment - 1.45% | | | | | | |
| Generac Holdings, Inc.A | | | | 10,872 | | | | | | | | | | 1,685,704 | |
| Powell Industries, Inc.B | | | | 16,302 | | | | | | | | | | 3,613,338 | |
| | | | | | | | | | | | | | | |
| | | | | | | | | | | | | | 5,299,042 | |
| | | | | | | | | | | | | | | |
| | | | | | | | | | | | | | | |
| | | |
| Machinery - 2.27% | | | | | | |
| Lindsay Corp. | | | | 21,194 | | | | | | | | | | 2,507,462 | |
| RBC Bearings, Inc.A | | | | 19,273 | | | | | | | | | | 5,765,325 | |
| | | | | | | | | | | | | | | |
| | | | | | | | | | | | | | 8,272,787 | |
| | | | | | | | | | | | | | | |
| | | | | | | | | | | | | | | |
| | | |
| Professional Services - 2.75% | | | | | | |
| FTI Consulting, Inc.A | | | | 23,226 | | | | | | | | | | 4,439,185 | |
| ICF International, Inc. | | | | 21,323 | | | | | | | | | | 2,541,915 | |
| Maximus, Inc. | | | | 40,575 | | | | | | | | | | 3,028,924 | |
| | | | | | | | | | | | | | | |
| | | | | | | | | | | | | | 10,010,024 | |
| | | | | | | | | | | | | | | |
| | | | | | | | | | | | | | | |
| | | |
| Trading Companies & Distributors - 0.98% | | | | | | |
| SiteOne Landscape Supply, Inc.A | | | | 27,070 | | | | | | | | | | 3,567,014 | |
| | | | | | | | | | | | | | | |
| | | | | | | | | | | | | | | |
Total Industrials | | | | | | | | | | | | | | 75,327,282 | |
| | | | | | | | | | | | | | | |
| | | | | | | | | | | | | | | |
| | | | | | | | | | | | | | | |
| | | |
| Information Technology - 24.06% | | | | | | |
| | | |
| Communications Equipment - 0.96% | | | | | | |
| Ciena Corp.A | | | | 41,365 | | | | | | | | | | 3,508,166 | |
| | | | | | | | | | | | | | | |
| | | | | | | | | | | | | | | |
| | | |
| Electronic Equipment, Instruments & Components - 1.13% | | | | | | |
| Cognex Corp. | | | | 49,252 | | | | | | | | | | 1,766,177 | |
| nLight, Inc.A | | | | 224,602 | | | | | | | | | | 2,356,075 | |
| | | | | | | | | | | | | | | |
| | | | | | | | | | | | | | 4,122,252 | |
| | | | | | | | | | | | | | | |
| | | | | | | | | | | | | | | |
| | | |
| IT Services - 0.82% | | | | | | |
| Globant SAA | | | | 13,947 | | | | | | | | | | 2,990,516 | |
| | | | | | | | | | | | | | | |
| | | | | | | | | | | | | | | |
See accompanying notes
8
American Beacon Stephens Small Cap Growth FundSM
Schedule of Investments
December 31, 2024
| | | | | | | | | | | | | | | |
| | | |
| | | Shares | | | | Fair Value |
| | | | | | | |
| | | |
| COMMON STOCKS - 93.75% (continued) | | | | | | |
| | | |
| Information Technology - 24.06% (continued) | | | | | | |
| | | |
| Semiconductors & Semiconductor Equipment - 5.11% | | | | | | |
| Ambarella, Inc.A | | | | 33,219 | | | | | | | | | $ | 2,416,350 | |
| Lattice Semiconductor Corp.A | | | | 43,454 | | | | | | | | | | 2,461,669 | |
| MACOM Technology Solutions Holdings, Inc.A | | | | 31,297 | | | | | | | | | | 4,065,793 | |
| Onto Innovation, Inc.A | | | | 17,965 | | | | | | | | | | 2,994,227 | |
| Power Integrations, Inc. | | | | 34,317 | | | | | | | | | | 2,117,359 | |
| Rambus, Inc.A | | | | 45,078 | | | | | | | | | | 2,382,823 | |
| Silicon Laboratories, Inc.A | | | | 17,460 | | | | | | | | | | 2,168,881 | |
| | | | | | | | | | | | | | | |
| | | | | | | | | | | | | | 18,607,102 | |
| | | | | | | | | | | | | | | |
| | | | | | | | | | | | | | | |
| | | |
| Software - 15.27% | | | | | | |
| Agilysys, Inc.A | | | | 12,382 | | | | | | | | | | 1,630,833 | |
| Altair Engineering, Inc., Class AA | | | | 18,200 | | | | | | | | | | 1,985,802 | |
| Aspen Technology, Inc.A | | | | 6,589 | | | | | | | | | | 1,644,812 | |
| Braze, Inc., Class AA | | | | 48,228 | | | | | | | | | | 2,019,789 | |
| Clearwater Analytics Holdings, Inc., Class AA | | | | 105,736 | | | | | | | | | | 2,909,855 | |
| CyberArk Software Ltd.A | | | | 24,289 | | | | | | | | | | 8,091,880 | |
| Guidewire Software, Inc.A | | | | 29,099 | | | | | | | | | | 4,905,509 | |
| Intapp, Inc.A | | | | 50,721 | | | | | | | | | | 3,250,709 | |
| Manhattan Associates, Inc.A | | | | 23,422 | | | | | | | | | | 6,329,561 | |
| PROS Holdings, Inc.A | | | | 116,495 | | | | | | | | | | 2,558,230 | |
| Rubrik, Inc., Class AA | | | | 63,623 | | | | | | | | | | 4,158,399 | |
| SentinelOne, Inc., Class AA | | | | 113,506 | | | | | | | | | | 2,519,833 | |
| SPS Commerce, Inc.A | | | | 27,235 | | | | | | | | | | 5,010,968 | |
| Tenable Holdings, Inc.A | | | | 68,415 | | | | | | | | | | 2,694,183 | |
| Varonis Systems, Inc.A | | | | 95,183 | | | | | | | | | | 4,228,981 | |
| Zeta Global Holdings Corp., Class AA | | | | 94,979 | | | | | | | | | | 1,708,672 | |
| | | | | | | | | | | | | | | |
| | | | | | | | | | | | | | 55,648,016 | |
| | | | | | | | | | | | | | | |
| | | | | | | | | | | | | | | |
| | | |
| Technology Hardware, Storage & Peripherals - 0.77% | | | | | | |
| Pure Storage, Inc., Class AA | | | | 45,472 | | | | | | | | | | 2,793,345 | |
| | | | | | | | | | | | | | | |
| | | | | | | | | | | | | | | |
Total Information Technology | | | | | | | | | | | | | | 87,669,397 | |
| | | | | | | | | | | | | | | |
| | | | | | | | | | | | | | | |
| | | |
| Materials - 1.10% | | | | | | |
| | | |
| Chemicals - 1.10% | | | | | | |
| Balchem Corp. | | | | 24,489 | | | | | | | | | | 3,991,585 | |
| | | | | | | | | | | | | | | |
| | | | | | | | | | | | | | | |
Total Common Stocks (Cost $219,761,028) | | | | | | | | | | | | | | 341,588,670 | |
| | | | | | | | | | | | | | | |
| | | | | | | | | | | | | | | |
| | | |
| FOREIGN COMMON STOCKS - 4.73% | | | | | | |
| | | |
| Consumer Discretionary - 0.39% | | | | | | |
| | | |
| Broadline Retail - 0.39% | | | | | | |
| Global-e Online Ltd.A | | | | 25,767 | | | | | | | | | | 1,405,074 | |
| | | | | | | | | | | | | | | |
| | | | | | | | | | | | | | | |
| | | |
| Energy - 1.32% | | | | | | |
| | | |
| Energy Equipment & Services - 1.32% | | | | | | |
| TechnipFMC PLC | | | | 165,500 | | | | | | | | | | 4,789,570 | |
| | | | | | | | | | | | | | | |
| | | | | | | | | | | | | | | |
| | | |
| Industrials - 0.97% | | | | | | |
| | | |
| Machinery - 0.97% | | | | | | |
| Kornit Digital Ltd.A | | | | 114,586 | | | | | | | | | | 3,546,437 | |
| | | | | | | | | | | | | | | |
| | | | | | | | | | | | | | | |
| | | |
| Information Technology - 2.05% | | | | | | |
| | | |
| Electronic Equipment, Instruments & Components - 0.55% | | | | | | |
| FabrinetA | | | | 9,156 | | | | | | | | | | 2,013,221 | |
| | | | | | | | | | | | | | | |
| | | | | | | | | | | | | | | |
See accompanying notes
9
American Beacon Stephens Small Cap Growth FundSM
Schedule of Investments
December 31, 2024
| | | | | | | | | | | | | | | |
| | | |
| | | Shares | | | | Fair Value |
| | | | | | | |
| | | |
| FOREIGN COMMON STOCKS - 4.73% (continued) | | | | | | |
| | | |
| Information Technology - 2.05% (continued) | | | | | | |
| | | |
| Software - 1.50% | | | | | | |
| Descartes Systems Group, Inc.A | | | | 48,163 | | | | | | | | | $ | 5,471,317 | |
| | | | | | | | | | | | | | | |
| | | | | | | | | | | | | | | |
Total Information Technology | | | | | | | | | | | | | | 7,484,538 | |
| | | | | | | | | | | | | | | |
| | | | | | | | | | | | | | | |
Total Foreign Common Stocks (Cost $11,623,569) | | | | | | | | | | | | | | 17,225,619 | |
| | | | | | | | | | | | | | | |
| | | | | | | | | | | | | | | |
| | | |
| SHORT-TERM INVESTMENTS - 1.66% (Cost $6,060,205) | | | | | | |
| | | |
| Investment Companies - 1.66% | | | | | | |
| American Beacon U.S. Government Money Market Select Fund, 4.33%E F | | | | 6,060,205 | | | | | | | | | | 6,060,205 | |
| | | | | | | | | | | | | | | |
| | | | | | | | | | | | | | | |
TOTAL INVESTMENTS - 100.14% (Cost $237,444,802) | | | | | | | | | | | | | | 364,874,494 | |
LIABILITIES, NET OF OTHER ASSETS - (0.14)% | | | | | | | | | | | | | | (492,315 | ) |
| | | | | | | | | | | | | | | |
TOTAL NET ASSETS - 100.00% | | | | | | | | | | | | | $ | 364,382,179 | |
| | | | | | | | | | | | | | | |
| | | | | | | |
| Percentages are stated as a percent of net assets. | | | | | | | | | | | | | | | |
A Non-income producing security.
B All or a portion of this security is on loan, collateralized by either cash and/or U.S. Treasuries at December 31, 2024 (Note 8).
C Value was determined using significant unobservable inputs.
D Security has been fair valued pursuant to the Manager’s procedures related to pricing that is not available after the close of exchange or the available price does not reflect the security’s true market value. At period end, the value of these securities amounted to $0 or 0.00% of net assets.
E The Fund is affiliated by having the same investment advisor.
F 7-day yield.
PLC - Public Limited Company.
The Fund’s investments are summarized by level based on the inputs used to determine their values. As of December 31, 2024, the investments were classified as described below:
| | | | | | | | | | | | | | | | | | | | | | | | | | | | |
Stephens Small Cap Growth Fund | | Level 1 | | | | | | Level 2 | | | | | | Level 3 | | | | | | Total | |
Assets | | | | | | | | | | | | | | | | | | | | | | | | | | | | |
Common Stocks | | $ | 341,588,670 | | | | | | | $ | - | | | | | | | $ | 0 | (1) | | | | | | $ | 341,588,670 | |
Foreign Common Stocks | | | 17,225,619 | | | | | | | | - | | | | | | | | - | | | | | | | | 17,225,619 | |
Short-Term Investments | | | 6,060,205 | | | | | | | | - | | | | | | | | - | | | | | | | | 6,060,205 | |
| | | | | | | | | | | | | | | | | | | | | | | | | | | | |
Total Investments in Securities - Assets | | $ | 364,874,494 | | | | | | | $ | - | | | | | | | $ | 0 | (1) | | | | | | $ | 364,874,494 | |
| | | | | | | | | | | | | | | | | | | | | | | | | | | | |
| (1) | Includes investments held in the Fund’s portfolio with $0 fair value. |
U.S. GAAP requires transfers between all levels to/from level 3 be disclosed. During the year ended December 31, 2024, there were no material transfers into or out of Level 3.
See accompanying notes
10
American Beacon FundsSM
Statements of Assets and Liabilities
December 31, 2024
| | | | | | | | | | | | |
| | | Stephens Mid-Cap
Growth Fund | | | | | | Stephens Small Cap
Growth Fund | |
Assets: | | | | | | | | | | | | |
Investments in unaffiliated securities, at fair value† § | | $ | 784,739,823 | | | | | | | $ | 358,814,289 | |
Investments in affiliated securities, at fair value‡ | | | 16,210,936 | | | | | | | | 6,060,205 | |
Dividends and interest receivable | | | 76,486 | | | | | | | | 60,643 | |
Receivable for fund shares sold | | | 1,286,201 | | | | | | | | 473,129 | |
Receivable for expense reimbursement (Note 2) | | | 9,102 | | | | | | | | 33,539 | |
Prepaid expenses | | | 39,679 | | | | | | | | 35,424 | |
| | | | | | | | | | | | |
Total assets | | | 802,362,227 | | | | | | | | 365,477,229 | |
| | | | | | | | | | | | |
Liabilities: | | | | | | | | | | | | |
Payable for investments purchased | | | 1,084,137 | | | | | | | | 473,889 | |
Payable for fund shares redeemed | | | 401,249 | | | | | | | | 203,661 | |
Management and sub-advisory fees payable (Note 2) | | | 568,861 | | | | | | | | 299,158 | |
Service fees payable (Note 2) | | | 12,894 | | | | | | | | 13,127 | |
Transfer agent fees payable (Note 2) | | | 20,096 | | | | | | | | 15,758 | |
Custody and fund accounting fees payable | | | 24,330 | | | | | | | | 17,014 | |
Professional fees payable | | | 52,217 | | | | | | | | 46,718 | |
Trustee fees payable (Note 2) | | | 365 | | | | | | | | 197 | |
Payable for prospectus and shareholder reports | | | 36,610 | | | | | | | | 22,181 | |
Other liabilities | | | 6,013 | | | | | | | | 3,347 | |
| | | | | | | | | | | | |
Total liabilities | | | 2,206,772 | | | | | | | | 1,095,050 | |
| | | | | | | | | | | | |
Commitments and contingent liabilities (Note 2) | | | | | | | | | | | | |
| | | | | | | | | | | | |
Net assets | | $ | 800,155,455 | | | | | | | $ | 364,382,179 | |
| | | | | | | | | | | | |
Analysis of net assets: | | | | | | | | | | | | |
Paid-in-capital | | $ | 570,888,792 | | | | | | | $ | 226,966,044 | |
Total distributable earnings (deficits)A | | | 229,266,663 | | | | | | | | 137,416,135 | |
| | | | | | | | | | | | |
Net assets | | $ | 800,155,455 | | | | | | | $ | 364,382,179 | |
| | | | | | | | | | | | |
See accompanying notes
11
American Beacon FundsSM
Statements of Assets and Liabilities
December 31, 2024
| | | | | | | | | | | | |
| | | Stephens Mid-Cap
Growth Fund | | | | | | Stephens Small Cap
Growth Fund | |
Shares outstanding at no par value (unlimited shares authorized): | | | | | | | | | | | | |
R5 Class | | | 17,400,759 | | | | | | | | 14,801,740 | |
| | | | | | | | | | | | |
Y Class | | | 1,580,932 | | | | | | | | 3,054,686 | |
| | | | | | | | | | | | |
Investor Class | | | 961,593 | | | | | | | | 3,008,114 | |
| | | | | | | | | | | | |
A Class | | | 198,970 | | | | | | | | 407,338 | |
| | | | | | | | | | | | |
C Class | | | 78,725 | | | | | | | | 90,079 | |
| | | | | | | | | | | | |
R6 Class | | | 941,798 | | | | | | | | 3,834,973 | |
| | | | | | | | | | | | |
Net assets: | | | | | | | | | | | | |
R5 Class | | $ | 666,887,131 | | | | | | | $ | 220,665,620 | |
| | | | | | | | | | | | |
Y Class | | $ | 59,837,617 | | | | | | | $ | 44,637,961 | |
| | | | | | | | | | | | |
Investor Class | | $ | 29,208,326 | | | | | | | $ | 36,158,013 | |
| | | | | | | | | | | | |
A Class | | $ | 5,999,749 | | | | | | | $ | 4,771,737 | |
| | | | | | | | | | | | |
C Class | | $ | 2,081,631 | | | | | | | $ | 817,857 | |
| | | | | | | | | | | | |
R6 Class | | $ | 36,141,001 | | | | | | | $ | 57,330,991 | |
| | | | | | | | | | | | |
Net asset value, offering and redemption price per share: | | | | | | | | | | | | |
R5 Class | | $ | 38.33 | | | | | | | $ | 14.91 | |
| | | | | | | | | | | | |
Y Class | | $ | 37.85 | | | | | | | $ | 14.61 | |
| | | | | | | | | | | | |
Investor Class | | $ | 30.37 | | | | | | | $ | 12.02 | |
| | | | | | | | | | | | |
A Class | | $ | 30.15 | | | | | | | $ | 11.71 | |
| | | | | | | | | | | | |
A Class (offering price) | | $ | 31.99 | | | | | | | $ | 12.42 | |
| | | | | | | | | | | | |
C Class | | $ | 26.44 | | | | | | | $ | 9.08 | |
| | | | | | | | | | | | |
R6 Class | | $ | 38.37 | | | | | | | $ | 14.95 | |
| | | | | | | | | | | | |
† Cost of investments in unaffiliated securities | | $ | 566,365,533 | | | | | | | $ | 231,384,597 | |
‡ Cost of investments in affiliated securities | | $ | 16,210,936 | | | | | | | $ | 6,060,205 | |
§ Fair value of securities on loan | | $ | - | | | | | | | $ | 19,707,313 | |
|
A The Fund’s investments in affiliated securities did not have unrealized appreciation (depreciation) at year end. | |
See accompanying notes
12
American Beacon FundsSM
Statements of Operations
For the year ended December 31, 2024
| | | | | | | | | | | | |
| | | Stephens Mid-Cap
Growth FundA | | | | | | Stephens Small Cap
Growth FundA | |
Investment income: | | | | | | | | | | | | |
Dividend income from unaffiliated securities | | $ | 3,428,886 | | | | | | | $ | 1,343,898 | |
Dividend income from affiliated securities (Note 2) | | | 1,261,781 | | | | | | | | 513,257 | |
Interest income | | | 8,833 | | | | | | | | 10,074 | |
Income derived from securities lending (Note 8) | | | 9,936 | | | | | | | | 11,329 | |
| | | | | | | | | | | | |
Total investment income | | | 4,709,436 | | | | | | | | 1,878,558 | |
| | | | | | | | | | | | |
Expenses: | | | | | | | | | | | | |
Management and sub-advisory fees (Note 2) | | | 6,054,942 | | | | | | | | 3,177,862 | |
Transfer agent fees (Note 2): | | | | | | | | | | | | |
R5 Class (Note 2) | | | 95,433 | | | | | | | | 88,919 | |
Y Class (Note 2) | | | 56,221 | | | | | | | | 28,251 | |
Investor Class | | | 2,781 | | | | | | | | 3,207 | |
A Class | | | 421 | | | | | | | | 494 | |
C Class | | | 121 | | | | | | | | 67 | |
R6 Class | | | 2,304 | | | | | | | | 2,846 | |
Custody and fund accounting fees | | | 112,192 | | | | | | | | 70,225 | |
Professional fees | | | 109,620 | | | | | | | | 74,377 | |
Registration fees and expenses | | | 117,314 | | | | | | | | 101,758 | |
Service fees (Note 2): | | | | | | | | | | | | |
Investor Class | | | 94,530 | | | | | | | | 125,463 | |
A Class | | | 15,519 | | | | | | | | 13,619 | |
C Class | | | 1,466 | | | | | | | | 613 | |
Distribution fees (Note 2): | | | | | | | | | | | | |
A Class | | | 15,641 | | | | | | | | 13,361 | |
C Class | | | 21,220 | | | | | | | | 7,574 | |
Prospectus and shareholder report expenses | | | 54,348 | | | | | | | | 30,349 | |
Trustee fees (Note 2) | | | 73,206 | | | | | | | | 33,245 | |
Loan interest expense (Note 2) | | | - | | | | | | | | 12,692 | |
Line of credit interest expense (Note 9) | | | 8,978 | | | | | | | | 4,117 | |
Other expenses | | | 107,246 | | | | | | | | 57,559 | |
| | | | | | | | | | | | |
Total expenses | | | 6,943,503 | | | | | | | | 3,846,598 | |
| | | | | | | | | | | | |
Net fees waived and expenses (reimbursed) (Note 2)A | | | (61,148 | ) | | | | | | | (323,604 | ) |
| | | | | | | | | | | | |
Net expenses | | | 6,882,355 | | | | | | | | 3,522,994 | |
| | | | | | | | | | | | |
Net investment (loss) | | | (2,172,919 | ) | | | | | | | (1,644,436 | ) |
| | | | | | | | | | | | |
| | | |
Realized and unrealized gain from investments: | | | | | | | | | | | | |
Net realized gain from: | | | | | | | | | | | | |
Investments in unaffiliated securitiesB | | | 43,767,524 | | | | | | | | 45,759,565 | |
Change in net unrealized appreciation of: | | | | | | | | | | | | |
Investments in unaffiliated securitiesC | | | 51,931,722 | | | | | | | | 5,349,793 | |
| | | | | | | | | | | | |
Net gain from investments | | | 95,699,246 | | | | | | | | 51,109,358 | |
| | | | | | | | | | | | |
Net increase in net assets resulting from operations | | $ | 93,526,327 | | | | | | | $ | 49,464,922 | |
| | | | | | | | | | | | |
|
A The Manager voluntarily reimbursed service fees in the amount of $1,155 and $11,273, for Stephens Mid-Cap Growth Fund and Stephens Small Cap Growth Fund, respectively. | |
B The Fund did not recognize net realized gains (losses) from the sale of investments in affiliated securities. | |
C The Fund’s investments in affiliated securities did not have a change in unrealized appreciation (depreciation) at year end. | |
See accompanying notes
13
American Beacon FundsSM
Statements of Changes in Net Assets
| | | | | | | | | | | | | | | | | | | | | | | | | | | | |
| | | Stephens Mid-Cap Growth Fund | | | | | | Stephens Small Cap Growth Fund | |
| | | Year Ended
December 31, 2024 | | | | | | Year Ended
December 31, 2023 | | | | | | Year Ended
December 31, 2024 | | | | | | Year Ended
December 31, 2023 | |
Increase (decrease) in net assets: | | | | | | | | | | | | | | | | | | | | | | | | | | | | |
Operations: | | | | | | | | | | | | | | | | | | | | | | | | | | | | |
Net investment (loss) | | $ | (2,172,919 | ) | | | | | | $ | (1,566,663 | ) | | | | | | $ | (1,644,436 | ) | | | | | | $ | (1,620,423 | ) |
Net realized gain (loss) from investments in unaffiliated securities | | | 43,767,524 | | | | | | | | 12,193,915 | | | | | | | | 45,759,565 | | | | | | | | (5,047,922 | ) |
Change in net unrealized appreciation of investments in unaffiliated securities | | | 51,931,722 | | | | | | | | 118,214,377 | | | | | | | | 5,349,793 | | | | | | | | 59,263,396 | |
| | | | | | | | | | | | | | | | | | | | | | | | | | | | |
Net increase in net assets resulting from operations | | | 93,526,327 | | | | | | | | 128,841,629 | | | | | | | | 49,464,922 | | | | | | | | 52,595,051 | |
| | | | | | | | | | | | | | | | | | | | | | | | | | | | |
Distributions to shareholders: | |
Total retained earnings: | | | | | | | | | | | | | | | | | | | | | | | | | | | | |
R5 Class | | | (25,125,555 | ) | | | | | | | - | | | | | | | | (13,995,053 | ) | | | | | | | (2,423,132 | ) |
Y Class | | | (2,272,657 | ) | | | | | | | - | | | | | | | | (2,896,475 | ) | | | | | | | (361,055 | ) |
Investor Class | | | (1,362,282 | ) | | | | | | | - | | | | | | | | (2,780,546 | ) | | | | | | | (519,271 | ) |
A Class | | | (285,019 | ) | | | | | | | - | | | | | | | | (380,537 | ) | | | | | | | (86,911 | ) |
C Class | | | (106,525 | ) | | | | | | | - | | | | | | | | (80,873 | ) | | | | | | | (12,895 | ) |
R6 Class | | | (1,335,784 | ) | | | | | | | - | | | | | | | | (3,583,475 | ) | | | | | | | (634,849 | ) |
| | | | | | | | | | | | | | | | | | | | | | | | | | | | |
Net distributions to shareholders | | | (30,487,822 | ) | | | | | | | - | | | | | | | | (23,716,959 | ) | | | | | | | (4,038,113 | ) |
| | | | | | | | | | | | | | | | | | | | | | | | | | | | |
| | | | | | | |
Capital share transactions (Note 10): | | | | | | | | | | | | | | | | | | | | | | | | | | | | |
Proceeds from sales of shares | | | 168,368,231 | | | | | | | | 174,444,318 | | | | | | | | 116,661,438 | | | | | | | | 79,962,187 | |
Reinvestment of dividends and distributions | | | 17,173,362 | | | | | | | | - | | | | | | | | 22,675,703 | | | | | | | | 3,912,008 | |
Cost of shares redeemed | | | (127,846,633 | ) | | | | | | | (103,654,150 | ) | | | | | | | (117,679,450 | ) | | | | | | | (84,328,338 | ) |
| | | | | | | | | | | | | | | | | | | | | | | | | | | | |
Net increase (decrease) in net assets from capital share transactions | | | 57,694,960 | | | | | | | | 70,790,168 | | | | | | | | 21,657,691 | | | | | | | | (454,143 | ) |
| | | | | | | | | | | | | | | | | | | | | | | | | | | | |
Net increase in net assets | | | 120,733,465 | | | | | | | | 199,631,797 | | | | | | | | 47,405,654 | | | | | | | | 48,102,795 | |
| | | | | | | | | | | | | | | | | | | | | | | | | | | | |
Net assets: | | | | | | | | | | | | | | | | | | | | | | | | | | | | |
Beginning of year | | | 679,421,990 | | | | | | | | 479,790,193 | | | | | | | | 316,976,525 | | | | | | | | 268,873,730 | |
| | | | | | | | | | | | | | | | | | | | | | | | | | | | |
End of year | | $ | 800,155,455 | | | | | | | $ | 679,421,990 | | | | | | | $ | 364,382,179 | | | | | | | $ | 316,976,525 | |
| | | | | | | | | | | | | | | | | | | | | | | | | | | | |
See accompanying notes
14
American Beacon FundsSM
Notes to Financial Statements
December 31, 2024
1. Organization and Significant Accounting Policies
American Beacon Funds (the “Trust”) is organized as a Massachusetts business trust. The Funds, each a series within the Trust, are registered under the Investment Company Act of 1940, as amended (the “Act”), as diversified, open-end management investment companies. As of December 31, 2024, the Trust consists of twenty-six active series, two of which are presented in this filing: American Beacon Stephens Mid-Cap Growth Fund and American Beacon Stephens Small Cap Growth Fund (collectively, the “Funds” and each individually a “Fund”). The remaining twenty-four active series are reported in separate filings.
American Beacon Advisors, Inc. (the “Manager”) is a Delaware corporation and a wholly-owned subsidiary of Resolute Investment Managers, Inc. (“RIM”) organized in 1986 to provide business management, advisory, administrative, and asset management consulting services to the Trust and other investors. The Manager is registered as an investment advisor under the Investment Advisers Act of 1940, as amended (the “Advisers Act”). The Manager is an indirect wholly-owned subsidiary of Resolute Topco, Inc. (“Topco”), which is owned primarily by various institutional investment funds that are managed by financial institutions and other investment advisory firms. No owner of Topco owns 25% or more of the outstanding equity or voting interests of Topco.
Recently Adopted Accounting Pronouncements
In March 2020, the Financial Accounting Standards Board (“FASB”) issued Accounting Standards Update (“ASU”) No. 2020-04, Reference Rate Reform (Topic 848); Facilitation of the Effects of Reference Rate Reform on Financial Reporting, which provides optional guidance for a limited period of time to ease the potential burden in accounting for (or recognizing the effects of) reference rate reform. The guidance is applicable to contracts referencing London Inter- bank Offered Rate (“LIBOR”) or another reference rate that is expected to be discontinued due to reference rate reform. The ASU is effective as of March 12, 2020 and generally can be applied through December 31, 2022. In December 2022, the FASB issued ASU No. 2022-06 Reference Rate Reform (Topic 848): Deferral of the Sunset Date of Topic 848 which updates and clarifies ASU No. 2020-04. The amendments in this ASU defer the sunset date of Topic 848 from December 31, 2022, to December 31, 2024. Management expects these ASUs will not have a material impact on the Funds’ financial statements.
In June 2022, the FASB issued ASU No. 2022-03, Fair Value Measurement (Topic 820); Fair Value Measurement of Equity Securities Subject to Contractual Sale Restrictions, which provides clarifying guidance that a contractual restriction on the sale of an equity security is not considered part of the unit of account of the equity security and, therefore, is not considered in measuring fair value. The ASU is effective for fiscal years beginning after December 15, 2023, and interim periods within those fiscal years. Management has concluded that the ASU will not have a material impact on the Funds’ financial statements.
In this reporting period, the Funds adopted FASB ASU No. 2023-07, Segment Reporting (Topic 280); Improvements to Reportable Segment Disclosures. Adoption of the new standard impacted financial statement disclosures only and did not affect the Funds’ financial position or the results of its operations. An operating segment is defined in Topic 280 as a component of a public entity that engages in business activities from which it may recognize revenues and incur expenses, has operating results that are regularly reviewed by the public entity’s chief operating decision maker (“CODM”) to make decisions about resources to be allocated to the segment and assess its performance, and has discrete financial information available. The President of the American Beacon Funds acts as the Funds’ CODM. The Funds represent a single operating segment, as the CODM monitors the operating results of the Funds as a whole and the Funds’ long-term strategic asset allocation is pre-determined in accordance with the terms of its prospectus, based on a defined investment strategy which is executed by the Funds’ portfolio managers as a team. The financial information in the form of the Funds’ portfolio composition, total returns, expense ratios and changes in net assets (i.e., changes in net assets resulting from operations, subscriptions and redemptions), which are used by the CODM to assess the segment’s performance versus the Funds’ comparative benchmarks and to make resource allocation decisions for the Funds’ single segment, is consistent with that presented within the Funds’ financial statements. Segment assets are reflected on the accompanying statements of assets and liabilities as “total assets” and significant segment expenses are listed on the accompanying statements of operations.
15
American Beacon FundsSM
Notes to Financial Statements
December 31, 2024
Class Disclosure
Each Fund has multiple classes of shares designed to meet the needs of different groups of investors. The following table sets forth the differences amongst the classes:
| | | | | | |
Class | | Eligible Investors | | Minimum Initial
Investments | |
| R5 Class | | Large institutional investors - sold directly or through intermediary channels. | | $ | 250,000 | |
| | |
| Y Class | | Large institutional retirement plan investors - sold directly or through intermediary channels. | | $ | 100,000 | |
| | |
| Investor Class | | All investors using intermediary organizations, such as broker-dealers or retirement plan sponsors. | | $ | 2,500 | |
| | |
| A Class | | All investors who invest through intermediary organizations, such as broker-dealers or third party administrator. Retail investors who invest directly through a financial intermediary such as a broker, bank, or registered investment advisor which may include a front-end sales charge and a contingent deferred sales charge (“CDSC”). | | $ | 2,500 | |
| | |
| C Class | | Retail investors who invest directly through a financial intermediary, such as a broker or through employee directed benefit plans with applicable sales charges which may include CDSC. | | $ | 1,000 | |
| | |
| R6 Class | | Large institutional retirement plan investors - sold through retirement plan sponsors. | | | None | |
Each class offered by the Trust has equal rights as to assets and voting privileges. Income and non-class specific expenses are allocated daily to each class based on the relative net assets. Realized and unrealized capital gains and losses of each class are allocated daily based on the relative net assets of each class of the respective Fund. Class specific expenses, where applicable, currently include service, distribution, transfer agent fees, and sub-transfer agent fees that vary amongst the classes as described more fully in Note 2.
Significant Accounting Policies
The following is a summary of significant accounting policies, consistently followed by the Funds in preparation of the financial statements. The Funds are considered investment companies and accordingly, follow the investment company accounting and reporting guidance of the FASB Accounting Standards Codification Topic 946, Financial Services – Investment Companies, a part of Generally Accepted Accounting Principles (“U.S. GAAP”).
Security Transactions and Investment Income
Security transactions are recorded as of the trade date for financial reporting purposes. Securities purchased or sold on a when-issued or delayed-delivery basis may be settled beyond a standard settlement period for the security after the trade date.
Dividend income, net of foreign taxes, is recorded on the ex-dividend date, except certain dividends from foreign securities which are recorded as soon as the information is available to the Funds. Interest income, net of foreign taxes, is earned from settlement date, recorded on the accrual basis, and adjusted, if necessary, for accretion of discounts and amortization of premiums. Realized gains (losses) from securities sold are determined based on specific lot identification.
Distributions to Shareholders
The Funds distribute most or all of their net earnings and realized gains, if any, each taxable year in the form of dividends from net investment income and distributions of realized net capital gains and net gains from foreign currency transactions on an annual basis. The Funds do not have a fixed dividend rate and do not guarantee that they will pay any distributions in any particular period. Dividends to shareholders are determined
16
American Beacon FundsSM
Notes to Financial Statements
December 31, 2024
in accordance with federal income tax regulations, which may differ in amount and character from net investment income and realized gains recognized for purposes of U.S. GAAP. To the extent necessary to fully distribute capital gains, the Funds may designate earnings and profits distributed to shareholders on the redemption of shares.
Allocation of Income, Trust Expenses, Gains, and Losses
Investment income and realized and unrealized gains and losses from investments of the Funds are allocated daily to each class of shares based upon the relative proportion of net assets of each class to the total net assets of the Funds. Expenses directly charged or attributable to a Fund will be paid from the assets of a Fund. Generally, expenses of the Trust will be allocated among and charged to the assets of the Funds on a basis that the Trust’s Board deems fair and equitable, which may be based on the relative net assets of the Funds or nature of the services performed and relative applicability to the Funds.
Use of Estimates
The preparation of financial statements in conformity with U.S. GAAP requires management to make estimates and assumptions that affect the amounts reported in the financial statements and accompanying notes. Actual results may differ from those estimated.
Other
Under the Trust’s organizational documents, its officers and trustees are indemnified against certain liabilities arising out of the performance of their duties to the Trust. In the normal course of business, the Trust enters into contracts that provide indemnification to the other party or parties against potential costs or liabilities. The Trust’s maximum exposure under these arrangements is dependent on claims that may be made in the future and, therefore, cannot be estimated. The Trust has had no prior claims or losses pursuant to any such agreement.
2. Transactions with Affiliates
Management and Investment Sub-Advisory Agreements
The Funds and the Manager are parties to a Management Agreement that obligates the Manager to provide the Funds with investment advisory and administrative services. As compensation for performing the duties under the Management Agreement, the Manager will receive an annualized management fee based on a percentage of each Fund’s average daily net assets that is calculated and accrued daily according to the following schedule:
| | | | |
First $5 billion | | | 0.35 | % |
Next $5 billion | | | 0.325 | % |
Next $10 billion | | | 0.30 | % |
Over $20 billion | | | 0.275 | % |
The Trust, on behalf of the Funds, and the Manager have entered into Investment Advisory Agreement with Stephens Investment Management Group LLC (the “Sub-Advisor”) pursuant to which each Fund has agreed to pay an annualized sub-advisory fee that is calculated and accrued daily based on each Fund’s average daily net assets according to the following schedule:
Stephens Mid-Cap Growth
Stephens Small Cap Growth
| | | | |
First $200 million | | | 0.65 | % |
Over $200 million | | | 0.55 | % |
17
American Beacon FundsSM
Notes to Financial Statements
December 31, 2024
The Management and Sub-Advisory Fees paid by the Funds for the year ended December 31, 2024 were as follows:
Stephens Mid-Cap Growth Fund
| | | | | | | | | | | | |
| | | Effective Fee Rate | | | | | | Amount of Fees Paid | |
Management Fees | | | 0.35 | % | | | | | | $ | 2,649,658 | |
Sub-Advisory Fees | | | 0.45 | % | | | | | | | 3,405,284 | |
| | | | | | | | | | | | |
Total | | | 0.80 | % | | | | | | $ | 6,054,942 | |
| | | | | | | | | | | | |
Stephens Small Cap Growth Fund
| | | | | | | | | | | | |
| | | Effective Fee Rate | | | | | | Amount of Fees Paid | |
Management Fees | | | 0.35 | % | | | | | | $ | 1,197,607 | |
Sub-Advisory Fees | | | 0.58 | % | | | | | | | 1,980,255 | |
| | | | | | | | | | | | |
Total | | | 0.93 | % | | | | | | $ | 3,177,862 | |
| | | | | | | | | | | | |
As compensation for services provided by the Manager in connection with securities lending activities conducted by a Fund, the lending Fund pays to the Manager, with respect to cash collateral posted by borrowers, a fee of 10% of the net monthly investment income (the income earned in the form of interest, dividends and realized capital gains from the investment of cash collateral, plus any negative rebate fees paid by borrowers, less the rebate amount paid to borrowers as well as related expenses) and, with respect to collateral other than cash, a fee up to 10% of loan fees and demand premiums paid by borrowers. These fees are included in “Income derived from securities lending” and “Management and sub-advisory fees” on the Statements of Operations. During the year ended December 31, 2024, the Manager received securities lending fees of $990 and $1,300 for the securities lending activities of the Stephens Mid-Cap Growth Fund and Stephens Small Cap Growth Fund, respectively.
Distribution Plans
Separate Distribution Plans (the “Distribution Plans”) have been adopted pursuant to Rule 12b-1 under the Act for the A and C Classes of the Funds. Under the Distribution Plans, as compensation for distribution and shareholder servicing assistance, the Manager receives an annual fee of 0.25% of the average daily net assets of the A Class and 1.00% of the average daily net assets of the C Class. The fee will be payable without regard to whether the amount of the fee is more or less than the actual expenses incurred in a particular month by the Manager for distribution assistance.
Service Plans
The Manager and the Trust entered into Service Plans that obligate the Manager to oversee additional shareholder servicing of the Investor, A, and C Classes of the Funds. As compensation for performing the duties required under the Service Plans, the Manager receives an annualized fee up to 0.25% of the average daily net assets of the A and C Classes and up to 0.375% of the average daily net assets of the Investor Class of the Funds.
Sub-Transfer Agent Fees
The Manager has entered into agreements, which include servicing agreements, with financial intermediaries that provide recordkeeping, processing, shareholder communications and other services to customers of the intermediaries that hold positions in the R5 and Y Classes of the Funds and has agreed to compensate the intermediaries for providing these services. Intermediaries transact with the Funds primarily through the use of omnibus accounts on behalf of their customers who hold positions in the Funds. Certain services would have been provided by the Funds’ transfer agent and other service providers if the shareholders’ accounts were maintained directly by the Funds’ transfer agent. Accordingly, the Funds, pursuant to Board approval, have
18
American Beacon FundsSM
Notes to Financial Statements
December 31, 2024
agreed to reimburse the Manager for certain non-distribution shareholder services provided by financial intermediaries for the R5 and Y Classes. The reimbursement amounts (sub-transfer agent fees) paid to the Manager are subject to a fee limit of up to 0.10% of an intermediary’s average net assets in the R5 and Y Classes on an annual basis. During the year ended December 31, 2024, the sub-transfer agent fees, as reflected in “Transfer agent fees” on the Statements of Operations, were as follows:
| | | | |
Fund | | Sub-Transfer Agent Fees | |
Stephens Mid-Cap Growth | | $ | 122,036 | |
Stephens Small Cap Growth | | | 107,261 | |
As of December 31, 2024, the Funds owed the Manager the following reimbursement of sub-transfer agent fees, as reflected in “Transfer agent fees payable” on the Statements of Assets and Liabilities:
| | | | |
Fund | | Reimbursement
Sub-Transfer Agent Fees | |
Stephens Mid-Cap Growth | | $ | 11,360 | |
Stephens Small Cap Growth | | | 11,599 | |
Investments in Affiliated Funds
The Funds may invest in the American Beacon U.S. Government Money Market Select Fund (the “USG Select Fund”). Cash collateral received by the Funds in connection with securities lending may also be invested in the USG Select Fund. The Funds listed below held the following shares with a December 31, 2024 fair value and dividend income earned from the investment in the USG Select Fund.
| | | | | | | | | | | | | | | | | | | | | | | | | | | | | | | | | | | | | | | | | | | | | | | | | | |
Affiliated Security | | Type of
Transaction | | | | | Fund | | | | | | December 31,
2024
Shares/Principal | | | | | | Change in
Unrealized
Gain (Loss) | | | | | | Realized
Gain
(Loss) | | | | | | Dividend
Income | | | | | | December 31,
2024
Fair Value | |
| U.S. Government Money Market Select | | Direct | | | | | |
| Stephens Mid-
Cap Growth |
| | | | | | $ | 16,210,936 | | | | | | | $ | - | | | | | | | $ | - | | | | | | | $ | 1,261,781 | | | | | | | $ | 16,210,936 | |
| U.S. Government Money Market Select | | Direct | | | | | |
| Stephens Small
Cap Growth |
| | | | | | | 6,060,205 | | | | | | | | - | | | | | | | | - | | | | | | | | 513,257 | | | | | | | | 6,060,205 | |
The Funds and the USG Select Fund have the same investment advisor and therefore, are considered to be affiliated. The Manager serves as investment advisor to the USG Select Fund and receives management fees and administrative fees totaling 0.10% of the average daily net assets of the USG Select Fund. During the year ended December 31, 2024, the Manager earned fees on the Funds’ direct investments and securities lending collateral investments in the USG Select Fund as shown below:
| | | | | | | | | | | | |
Fund | | Direct Investments in
USG Select Fund | | | Securities Lending
Collateral
Investments in USG
Select Fund | | | Total | |
Stephens Mid-Cap Growth | | $ | 24,679 | | | $ | 170 | | | $ | 24,849 | |
Stephens Small Cap Growth | | | 10,091 | | | | 809 | | | | 10,900 | |
Interfund Credit Facility
Pursuant to an exemptive order issued by the U.S. Securities and Exchange Commission (“SEC”), the Funds, along with other registered investment companies having management contracts with the Manager, may participate in a credit facility whereby each fund, under certain conditions, is permitted to lend money directly to and borrow directly from other participating funds for temporary purposes. The interfund credit facility is advantageous to the funds because it provides added liquidity and eliminates the need to maintain higher cash balances to meet redemptions. This situation could arise when shareholder redemptions exceed anticipated volumes and certain funds have insufficient cash on hand to satisfy such redemptions or when sales of securities do
19
American Beacon FundsSM
Notes to Financial Statements
December 31, 2024
not settle as expected, resulting in a cash shortfall for a fund. The credit facility provides a source of immediate, short-term liquidity pending settlement of the sale of portfolio securities. The credit facility is administered by a credit facility team consisting of professionals from the Manager’s asset management, compliance, and accounting areas who report the activities of the credit facility to the Board. During the year ended December 31, 2024, the Stephens Small Cap Growth Fund borrowed on average $20,514,395 for 2 days at an average interest rate of 6.14% with interest charges of $12,692. These amounts are recorded as “Loan interest expense” in the Statements of Operations. During the year ended December 31, 2024, the Stephens Mid-Cap Growth Fund did not utilize the credit facility.
Expense Reimbursement Plan
The Manager contractually agreed to reduce fees and/or reimburse expenses for the classes of the Funds, through December 31, 2025, to the extent that total operating expenses (excluding taxes, interest, brokerage commissions, acquired fund fees and expenses, securities lending fees, expenses associated with securities sold short, litigation, and other extraordinary expenses) exceed the Funds’ expense cap. During the year ended December 31, 2024, the Manager waived and/or reimbursed expenses as follows:
| | | | | | | | | | | | | | | | | | | | | | |
| | | | | Expense Cap | | | | | | | | | Expiration of
Reimbursed
Expenses | |
Fund | | Class | | 1/1/2024 -
4/30/2024 | | | 5/1/2024 -
12/31/2024 | | | Reimbursed
Expenses | | | (Recouped)
Expenses | |
Stephens Mid-Cap Growth | | R5 | | | 0.89 | % | | | 0.89 | % | | $ | 15,442 | | | $ | (16,643 | )* | | | 2027 | |
Stephens Mid-Cap Growth | | Y | | | 0.95 | % | | | 0.95 | % | | | 16,116 | | | | - | | | | 2027 | |
Stephens Mid-Cap Growth | | Investor | | | 1.15 | % | | | 1.15 | % | | | 15,489 | | | | - | | | | 2027 | |
Stephens Mid-Cap Growth | | A | | | 1.20 | % | | | 1.20 | % | | | 11,413 | | | | - | | | | 2027 | |
Stephens Mid-Cap Growth | | C | | | 1.94 | % | | | 1.94 | % | | | 287 | | | | (52 | )* | | | 2027 | |
Stephens Mid-Cap Growth | | R6 | | | 0.88 | % | | | 0.88 | % | | | 1,246 | | | | (649 | )* | | | 2027 | |
Stephens Small Cap Growth | | R5 | | | 0.99 | % | | | 0.99 | % | | | 180,158 | | | | - | | | | 2027 | |
Stephens Small Cap Growth | | Y | | | 1.05 | % | | | 1.05 | % | | | 24,748 | | | | - | | | | 2027 | |
Stephens Small Cap Growth | | Investor | | | 1.27 | % | | | 1.27 | % | | | 39,171 | | | | (7,777 | )* | | | 2027 | |
Stephens Small Cap Growth | | A | | | 1.28 | % | | | 1.28 | % | | | 14,456 | | | | - | | | | 2027 | |
Stephens Small Cap Growth | | C | | | 2.06 | % | | | 2.06 | % | | | 577 | | | | (57 | )* | | | 2027 | |
Stephens Small Cap Growth | | R6 | | | 0.96 | % | | | 0.96 | % | | | 53,221 | | | | - | | | | 2027 | |
* These amounts represent Recouped Expenses from prior fiscal years and are reflected in Other expenses on the Statements of Operations.
Of the above amounts, $9,102 and $33,539 were disclosed as a Receivable for expense reimbursement on the Statements of Assets and Liabilities at December 31, 2024 for the Stephens Mid-Cap Growth Fund and Stephens Small Cap Growth Fund, respectively.
The Funds have adopted an Expense Reimbursement Plan whereby the Manager may seek repayment of contractual or voluntary fee reductions and expense reimbursements. Under the policy, the Manager can be reimbursed by the Funds for any contractual or voluntary fee reductions or expense reimbursements if reimbursement to the Manager (a) occurs within three years from the date of the Manager’s waiver/reimbursement and (b) does not cause the Funds’ annual operating expenses to exceed the lesser of the contractual percentage limit in effect at the time of the waiver/reimbursement or time of recoupment. The reimbursed expenses listed above will expire in 2027. The Funds did not record a liability for potential contingent reimbursements due to the current assessment that reimbursements are uncertain. The carryover of excess expenses potentially reimbursable to the Manager, but not recorded as a liability are as follows:
| | | | | | | | | | | | | | | | |
Fund | | Recouped
Expenses | | | Excess Expense
Carryover | | | Expired Expense
Carryover | | | Expiration of
Reimbursed
Expenses | |
Stephens Mid-Cap Growth | | $ | 17,344 | | | $ | - | | | $ | 41,439 | | | | 2024 | |
Stephens Mid-Cap Growth | | | - | | | | 66,561 | | | | - | | | | 2025 | |
Stephens Mid-Cap Growth | | | - | | | | 62,485 | | | | - | | | | 2026 | |
Stephens Small Cap Growth | | | 7,834 | | | | - | | | | 197,237 | | | | 2024 | |
Stephens Small Cap Growth | | | - | | | | 291,681 | | | | - | | | | 2025 | |
Stephens Small Cap Growth | | | - | | | | 288,569 | | | | - | | | | 2026 | |
20
American Beacon FundsSM
Notes to Financial Statements
December 31, 2024
Concentration of Ownership
From time to time, the Funds may have a concentration of one or more accounts constituting a significant percentage of shares outstanding. Investment activities by holders of accounts that represent a significant ownership of more than 5% of the Funds’ outstanding shares could have a material impact on the Funds. As of January 31, 2025, based on management’s evaluation of the shareholder account base, one account has been identified as representing an unaffiliated significant ownership of approximately 60% for the Stephens Mid-Cap Growth Fund.
Sales Commissions
The Funds’ Distributor, Resolute Investment Distributors, Inc. (“RID” or “Distributor”), may receive a portion of A Class sales charges from broker dealers which may be used to offset distribution related expenses. During the year ended December 31, 2024, RID collected $315 and $150 for Stephens Mid-Cap Growth Fund and Stephens Small Cap Growth Fund, respectively, from the sale of A Class Shares.
A CDSC of 0.50% will be deducted with respect to A Class Shares on certain purchases of $1,000,000 or more that are redeemed in whole or part within 18 months of purchase, unless waived as discussed in the Funds’ Prospectus. Any applicable CDSC will be 0.50% of the lesser of the original purchase price or the value of the redemption of the A Class Shares redeemed. During the year ended December 31, 2024, there were no CDSC fees collected for the A Class Shares of the Funds.
A CDSC of 1.00% will be deducted with respect to C Class Shares redeemed within 12 months of purchase, unless waived as discussed in the Funds’ Prospectus. Any applicable CDSC will be 1.00% of the lesser of the original purchase price or the value of the redemption of the C Class Shares redeemed. During the year ended December 31, 2024, CDSC fees of $29 were collected for the C Class Shares of the Stephens Small Cap Growth Fund. There were no CDSC fees collected for the C Class Shares of the Stephens Mid-Cap Growth Fund.
Trustee Fees and Expenses
As compensation for their service to the American Beacon Funds Complex, including the Trust (collectively, the “Trusts”), each Trustee is compensated from the Trusts as follows: (1) an annual retainer of $140,000; (2) meeting attendance fee (for attendance in-person or via teleconference) of (a) $12,000 for in person attendance, or $5,000 for telephonic attendance, by Board members for each regularly scheduled or special Board meeting, (b) $2,500 for attendance by Committee members at meetings of the Audit and Compliance Committee and the Investment Committee, (c) $1,000 for attendance by Committee members at meetings of the Nominating and Governance Committee; and (d) $2,500 for attendance by Board members for each special telephonic Board meeting; and (3) reimbursement of reasonable expenses incurred in attending Board meetings, Committee meetings, and relevant educational seminars. For this purpose, the Board considers attendance at regular meetings held by video conference to constitute in-person attendance at a Board meeting. The Trustees also may be compensated for attendance at special Board and/or Committee meetings from time to time. For her service as Board Chair, Ms. Cline receives an additional annual retainer of $50,000. Although she attends several committee meetings at each quarterly Board meeting, she receives only a single $2,500 fee each quarter for her attendance at the Audit and Compliance Committee and Investment Committee meetings. The chairpersons of the Audit and Compliance Committee and the Investment Committee each receive an additional annual retainer of $25,000 and the Chair of the Nominating and Governance Committee receives an additional annual retainer of $10,000.
21
American Beacon FundsSM
Notes to Financial Statements
December 31, 2024
3. Security Valuation and Fair Value Measurements
The price of each Fund’s shares is based on its net asset value (“NAV”) per share. Each Fund’s NAV is computed by adding total assets, subtracting all the Fund’s liabilities, and dividing the result by the total number of shares outstanding.
The NAV of each class of a Fund’s shares is determined based on a pro rata allocation of a Fund’s investment income, expenses and total capital gains and losses. A Fund’s NAV per share is determined each business day as of the regular close of trading on the New York Stock Exchange (“NYSE” or “Exchange”), which is typically 4:00 p.m. Eastern Time (“ET”). However, if trading on the NYSE closes at a time other than 4:00 p.m. ET, a Fund’s NAV per share typically would still be determined as of the regular close of trading on the NYSE. The Funds do not price their shares on days that the NYSE is closed. Foreign exchanges may permit trading in foreign securities on days when a Fund is not open for business, which may result in the value of a Fund’s portfolio investments being affected at a time when you are unable to buy or sell shares.
Equity securities, including shares of closed-end funds and exchange-traded funds (“ETFs”), are valued at the last sale price or official closing price taken from the primary exchange in which each security trades. Investments in other mutual funds are valued at the closing NAV per share on the day of valuation. Debt securities are valued at bid quotes from broker/dealers or evaluated bid prices from pricing services, who may consider a number of inputs and factors, such as prices of comparable securities, yield curves, spreads, credit ratings, coupon rates, maturity, default rates, and underlying collateral. Futures are valued based on their daily settlement prices. Exchange-traded and over- the-counter (“OTC”) options are valued at the last sale price. Options with no last sale for the day are priced at mid quote. Swaps are valued at evaluated mid prices from pricing services.
The valuation of securities traded on foreign markets and certain fixed-income securities will generally be based on prices determined as of the earlier closing time of the markets on which they primarily trade unless a significant event has occurred. When a Fund holds securities or other assets that are denominated in a foreign currency, a Fund will normally use the currency exchange rates as of 4:00 p.m. ET.
Rule 2a-5 under the Investment Company Act (the “Valuation Rule”) establishes requirements for determining fair value in good faith for purposes of the Investment Company Act, including related oversight and reporting requirements. The Valuation Rule also defines when market quotations are “readily available,” which is the threshold for determining whether a Fund must fair value a security. Among other things, the Valuation Rule permits the Board to designate the Manager as Valuation Designee to perform the Fund’s fair value determinations subject to board oversight and certain reporting and other requirements intended to ensure that the Board receives the information it needs to oversee the Manager’s fair value determinations. Effective September 8, 2022, the Board has designated the Manager as valuation designee to perform fair value functions in accordance with the requirements of the Valuation Rule.
Securities may be valued at fair value, as determined in good faith and pursuant to the Manager’s procedures, under certain limited circumstances. For example, fair value pricing will be used for fixed-income securities and when market quotations are not readily available or reliable, as determined by the Manager, such as when (i) trading for a security is restricted or stopped; (ii) a security’s trading market is closed (other than customary closings); or (iii) a security has been de-listed from a national exchange. A security with limited market liquidity may require fair value pricing if the Manager determines that the available price does not reflect the security’s true market value. In addition, if a significant event that the Manager determines to affect the value of one or more securities held by a Fund occurs after the close of a related exchange but before the determination of a Fund’s NAV, fair value pricing may be used on the affected security or securities. Securities of small-capitalization companies are also more likely to require a fair value determination using these procedures because they are more thinly traded and less liquid than the securities of larger-capitalization companies. The Funds may fair value securities as a result of significant events occurring after the close of the foreign markets in which a Fund invests as described below. In addition, the Funds may invest in illiquid securities requiring these procedures.
22
American Beacon FundsSM
Notes to Financial Statements
December 31, 2024
A Fund may use fair value pricing for securities primarily traded in non-U.S. markets because most foreign markets close well before a Fund’s pricing time of 4:00 p.m. ET. The earlier close of these foreign markets gives rise to the possibility that significant events, including broad market moves, may have occurred in the interim and may materially affect the value of those securities. If the Manager determines that the last quoted prices of non-U.S. securities will, in its judgment, materially affect the value of some or all a Fund’s portfolio securities, the Manager can adjust the previous closing prices to reflect what it believes to be the fair value of the securities as of the close of the Exchange. In deciding whether it is necessary to adjust closing prices to reflect fair value, the Manager reviews a variety of factors, including developments in foreign markets, the performance of U.S. securities markets, and the performance of instruments trading in U.S. markets that represent foreign securities and baskets of foreign securities. These securities are fair valued using a pricing service, using methods approved by the Manager, that considers the correlation of the trading patterns of the foreign security to intraday trading in the U.S. markets, based on indices of domestic securities and other appropriate indicators such as prices of relevant American Depositary Receipts (“ADRs”) and futures contracts. The Manager’s Valuation Committee may also fair value securities in other situations, such as when a particular foreign market is closed but a Fund is open. A Fund uses outside pricing services to provide closing prices and information to evaluate and/or adjust those prices. As a means of evaluating its security valuation process, the Valuation Committee routinely compares closing prices, the next day’s opening prices in the same markets and adjusted prices.
Attempts to determine the fair value of securities introduce an element of subjectivity to the pricing of securities. As a result, the price of a security determined through fair valuation techniques may differ from the price quoted or published by other sources and may not accurately reflect the market value of the security when trading resumes. If a reliable market quotation becomes available for a security formerly valued through fair valuation techniques, the Manager compares the new market quotation to the fair value price to evaluate the effectiveness of a Fund’s fair valuation procedures. If any significant discrepancies are found, the Manager may adjust Manager’s fair valuation procedures for a Fund.
Valuation Inputs
Various inputs may be used to determine the fair value of the Funds’ investments. These inputs are summarized in three broad levels for financial statement purposes. The inputs or methodologies used to value securities are not necessarily an indication of the risk associated with investing in those securities.
| | | | |
| Level 1 | | - | | Quoted prices in active markets for identical securities. |
| | |
| Level 2 | | - | | Prices determined using other significant observable inputs. These may include quoted prices for similar securities, interest rates, prepayment speeds, credit risk, and others. |
| | |
| Level 3 | | - | | Prices determined using other significant unobservable inputs. Unobservable inputs reflect a Fund’s own assumptions about the factors market participants would use in pricing an investment. |
Level 1 and Level 2 trading assets and trading liabilities, at fair value
Common stocks, preferred securities, ETFs and financial derivative instruments, such as futures contracts that are traded on a national securities exchange, are stated at the last reported sale or settlement price on the day of valuation. To the extent these securities are actively traded and valuation adjustments are not applied, they are categorized as Level 1 of the fair value hierarchy. Preferred securities and other equities traded on inactive markets or valued by reference to similar instruments are generally categorized as Level 2 of the fair value hierarchy.
Investments in registered open-end investment management companies will be valued based upon the NAVs of such investments and are categorized as Level 1 of the fair value hierarchy.
23
American Beacon FundsSM
Notes to Financial Statements
December 31, 2024
4. Securities and Other Investments
Common Stock
Common stock generally takes the form of shares in a corporation which represent an ownership interest. It ranks below preferred stock and debt securities in claims for dividends and for assets of the company in a liquidation or bankruptcy. The value of a company’s common stock may fall as a result of factors directly relating to that company, such as decisions made by its management or decreased demand for the company’s products or services. A stock’s value may also decline because of factors affecting not just the company, but also companies in the same industry or sector. The price of a company’s stock may also be affected by changes in financial markets that are relatively unrelated to the company, such as changes in interest rates, currency exchange rates or industry regulation. Companies that elect to pay dividends on their common stock generally only do so after they invest in their own business and make required payments to bondholders and on other debt and preferred stock. Therefore, the value of a company’s common stock will usually be more volatile than its bonds, other debt and preferred stock. Common stock may be exchange-traded or OTC. OTC stock may be less liquid than exchange-traded stock.
Depositary Receipts and U.S. Dollar-Denominated Foreign Stocks Traded on U.S. Exchanges
ADRs are U.S. dollar-denominated receipts issued generally by domestic banks and represent the deposit with the bank of a security of a foreign issuer. Depositary receipts may not be denominated in the same currency as the securities into which they may be converted. Investing in depositary receipts entails substantially the same risks as direct investment in foreign securities. There is generally less publicly available information about foreign companies and there may be less governmental regulation and supervision of foreign stock exchanges, brokers, and listed companies. In addition, such companies may use different accounting and financial standards (and certain currencies may become unavailable for transfer from a foreign currency), resulting in the Funds’ possible inability to convert immediately into U.S. currency proceeds realized upon the sale of portfolio securities of the affected foreign companies. In addition, the Funds may invest in unsponsored depositary receipts, the issuers of which are not obligated to disclose material information about the underlying securities to investors in the United States. Ownership of unsponsored depositary receipts may not entitle the Funds to the same benefits and rights as ownership of a sponsored depositary receipt or the underlying security.
Other Investment Company Securities and Other Exchange-Traded Products
The Funds at times may invest in shares of other investment companies, including open-end funds, closed-end funds, business development companies (“BDCs”), ETFs, unit investment trusts, and other investment companies of the Trust. The Funds may invest in securities of an investment company advised by the Manager or the Sub-Advisor. Investments in the securities of other investment companies may involve duplication of advisory fees and certain other expenses. By investing in another investment company, the Funds become a shareholder of that investment company. As a result, the Funds’ shareholders indirectly will bear the Funds’ proportionate share of the fees and expenses paid by shareholders of the other investment company, in addition to the fees and expenses the Funds’ shareholders directly bear in connection with the Funds’ own operations. These other fees and expenses are reflected as Acquired Fund Fees and Expenses and are included in the Fees and Expenses Table for the Funds in their Prospectus, if applicable. Investments in other investment companies may involve the payment of substantial premiums above the value of such issuer’s portfolio securities.
Publicly Traded Partnerships/Master Limited Partnerships (“MLPs”)
The Funds may invest in publicly traded partnerships such as MLPs. MLPs issue units that are registered with the SEC and are freely tradable on a securities exchange or in the OTC market. An MLP may have one or more general partners, who conduct the business, and one or more limited partners, who contribute capital. The general partner or partners are jointly and severally responsible for the liabilities of the MLP. (An MLP also may be an entity similar to a limited partnership, such as an LLC, which has one or more managers or managing members and
24
American Beacon FundsSM
Notes to Financial Statements
December 31, 2024
non-managing members (who are like limited partners)). The Funds invest in an MLP as a limited partner and normally would not be liable for the debts of an MLP beyond the amount a Fund has invested therein, but it would not be shielded to the same extent that a shareholder of a corporation would be. In certain instances, creditors of an MLP would have the right to seek a return of capital that had been distributed to a limited partner. The right of an MLP’s creditors would continue even after a Fund had sold its investment in the partnership. MLPs typically invest in real estate and oil and gas equipment leasing assets, but they also finance entertainment, research and development, and other projects.
5. Principal Risks
Investing in the Funds may involve certain risks including, but not limited to, those described below.
Equity Investments Risk
Equity securities are subject to investment risk and market risk. The Funds’ investments in equity securities may include common stocks, preferred stocks, securities convertible into or exchangeable for common stocks, real estate investment trusts (“REITs”), depositary receipts, and U.S. dollar-denominated foreign stocks traded on U.S. exchanges. Such investments may expose the Funds to additional risk. The value of a company’s common stock may fall as a result of factors affecting the company, companies in the same industry or sector, or the financial markets overall. Common stock generally is subordinate to preferred stock upon the liquidation or bankruptcy of the issuing company. Preferred stocks and convertible securities are sensitive to movements in interest rates. Preferred stocks may be less liquid than common stocks and, unlike common stocks, participation in the growth of an issuer may be limited. Distributions on preferred stocks generally are payable at the discretion of an issuer and after required payments to bond holders. Convertible securities are subject to the risk that the credit standing of the issuer may have an effect on the convertible securities’ investment value. Investments in REITs are subject to the risks associated with investing in the real estate industry such as adverse developments affecting the real estate industry and real property values. Depositary receipts and U.S. dollar-denominated foreign stocks traded on U.S. exchanges are subject to certain of the risks associated with investing directly in foreign securities, including, but not limited to, currency fluctuations and political and financial instability in the home country of a particular depositary receipt or foreign stock.
Foreign Investing Risk
Non-U.S. investments carry potential risks not associated with U.S. investments. Such risks include, but are not limited to: (1) currency exchange rate fluctuations, (2) political and financial instability, (3) less liquidity, (4) lack of uniform accounting, auditing and financial reporting standards, (5) increased price volatility, (6) less government regulation and supervision of foreign stock exchanges, brokers and listed companies, and (7) delays in transaction settlement in some foreign markets.
Investment Risk
An investment in the Funds is not a deposit with a bank and is not insured or guaranteed by the Federal Deposit Insurance Corporation or any other government agency. When you sell your shares of the Funds, they could be worth less than what you paid for them. Therefore, you may lose money by investing in the Funds.
Market Risk
The Funds are subject to the risk that the securities markets will move down, sometimes rapidly and unpredictably, based on overall economic conditions and other factors, which may negatively affect a Fund’s performance. Equity securities generally have greater price volatility than fixed-income securities, although under certain market conditions fixed-income securities may have comparable or greater price volatility. During a general downturn in the securities markets, multiple assets may decline in value simultaneously. In some cases, traditional
25
American Beacon FundsSM
Notes to Financial Statements
December 31, 2024
market participants have been less willing to make a market in some types of debt instruments, which has affected the liquidity of those instruments. During times of market turmoil, investors tend to look to the safety of securities issued or backed by the U.S. Treasury, causing the prices of these securities to rise and the yields to decline. Reduced liquidity in fixed-income and credit markets may negatively affect many issuers worldwide. Prices in many financial markets have increased significantly over the last decade, but there have also been periods of adverse market and financial developments and cyclical change during that timeframe, which have resulted in unusually high levels of volatility in domestic and foreign financial markets that has caused losses for investors and may occur again in the future, particularly if markets enter a period of uncertainty or economic weakness. The value of a security may decline due to adverse issuer-specific conditions, general market conditions unrelated to a particular issuer, or factors that affect a particular industry or industries. Changes in the financial condition of a single issuer or market segment also can impact the market as a whole.
Geopolitical and other events, including war, terrorism, economic uncertainty, trade disputes, pandemics, public health crises, natural disasters and related events have led, and in the future may continue to lead, to instability in world economies and markets generally and reduced liquidity in equity, credit and fixed-income markets, which may disrupt economies and markets and adversely affect the value of your investment. Changes in value may be temporary or may last for extended periods.
Policy changes by the U.S. government and/or Federal Reserve and political events within the U.S. and abroad, including the U.S. presidential election, the U.S. government’s inability at times to agree on a long-term budget and deficit reduction plan, the threat of a federal government shutdown and threats not to increase the federal government’s debt limit, may affect investor and consumer confidence and may adversely impact financial markets and the broader economy, perhaps suddenly and to a significant degree.
Markets and market participants are increasingly reliant upon both publicly available and proprietary information data systems. Data imprecision, software or other technology malfunctions, programming inaccuracies, unauthorized use or access, and similar circumstances may impair the performance of these systems and may have an adverse impact upon a single issuer, a group of issuers, or the market at large. The financial markets generally move in cycles, with periods of rising prices followed by periods of declining prices. The value of your investment may reflect these fluctuations.
Other Investment Companies Risk
The Funds may invest in shares of other registered investment companies, including money market funds and ETFs. To the extent that the Funds invest in shares of other registered investment companies, the Funds will indirectly bear the fees and expenses, including for example, advisory and administrative fees, charged by those investment companies in addition to the Funds’ direct fees and expenses and will be subject to the risks associated with investments in those companies. For example, the Funds’ investments in money market funds are subject to interest rate risk, credit risk, and market risk. The Funds must rely on the investment company in which it invests to achieve its investment objective. If the investment company fails to achieve its investment objective, the value of the Funds’ investment may decline, adversely affecting the Funds’ performance. ETFs are subject to the following risks that do not apply to conventional funds: (1) the market price of an ETF’s shares may trade at a discount or premium to its NAV; (2) an active trading market for an ETF’s shares may not develop or be maintained; or (3) trading of an ETF’s shares may be halted if the listing exchange’s officials deem such action appropriate, the shares are delisted from the exchange, or the activation of market-wide “circuit breakers” (which are tied to large decreases in stock prices) halts stock trading generally. An ETF that tracks an index may not precisely replicate the returns of its benchmark index. To the extent the Funds invest in other investment companies that invest in equity securities, fixed-income securities and/or foreign securities, or that track an index, the Funds are subject to the risks associated with the underlying investments held by the investment company or the index fluctuations to which the investment company is subject. ETFs have expenses associated with their operation, typically including advisory fees.
26
American Beacon FundsSM
Notes to Financial Statements
December 31, 2024
Recent Market Events Risk
Both U.S. and international markets have experienced significant volatility in recent months and years. As a result of such volatility, investment returns may fluctuate significantly. Moreover, the risks discussed herein associated with an investment in a Fund may be increased.
Although interest rates were unusually low in recent years in the U.S. and abroad, in 2022, the Federal Reserve and certain foreign central banks began to raise interest rates as part of their efforts to address rising inflation. It is difficult to accurately predict the pace at which interest rates may continue to increase, the timing, frequency or magnitude of any such increases, or when such increases might stop. Additionally, various economic and political factors could cause the Federal Reserve or another foreign central bank to change their approach in the future and such actions may result in an economic slowdown in the U.S. and abroad. Unexpected increases in interest rates could lead to market volatility or reduce liquidity in certain sectors of the market. Deteriorating economic fundamentals may, in turn, increase the risk of default or insolvency of particular issuers, negatively impact market value, cause credit spreads to widen, and reduce bank balance sheets. Any of these could cause an increase in market volatility, reduce liquidity across various markets or decrease confidence in the markets. Additionally, high public debt in the U.S. and other countries creates ongoing systemic and market risks and policymaking uncertainty.
In March 2023, the shutdown of certain financial institutions in the U.S. and questions regarding the viability of other financial institutions raised economic concerns over disruption in the U.S. and global banking systems. There can be no certainty that the actions taken by the U.S. or foreign governments will be effective in mitigating the effects of financial institution failures on the economy and restoring public confidence in the U.S. and global banking systems.
Some countries, including the U.S., have in recent years adopted more protectionist trade policies. Slowing global economic growth; imposition of tariffs and resulting impacts on global prices and supply chains; risks associated with a trade agreement between the United Kingdom and the European Union; the risks associated with ongoing trade negotiations with China; the possibility of changes to some international trade agreements; political or economic dysfunction within some nations, including major producers of oil; and dramatic changes in commodity and currency prices could have adverse effects that cannot be foreseen at the present time.
Tensions, war, or open conflict between nations, such as between Russia and Ukraine, in the Middle East or in eastern Asia could affect the economies of many nations, including the United States. The duration of ongoing hostilities in the Middle East and between Russia and Ukraine, and any sanctions and related events cannot be predicted. Those events present material uncertainty and risk with respect to markets globally and the performance of a Fund and its investments or operations could be negatively impacted.
Regulators in the U.S. have proposed and recently adopted a number of changes to regulations involving the markets and issuers, some of which apply to the Fund. The full effect of various newly-adopted regulations is not currently known. Additionally, it is not clear whether the proposed regulations will be adopted. However, due to the broad scope of the new and proposed regulations, certain changes could limit a Fund’s ability to pursue its investment strategies or make certain investments, or may make it more costly for a Fund to operate, which may impact performance.
Economists and others have expressed increasing concern about the potential effects of global climate change on property and security values. Certain issuers, industries and regions may be adversely affected by the impacts of climate change, including on the demand for and the development of goods and services and related production costs, and the impacts of legislation, regulation and international accords related to climate change, as well as any indirect consequences of regulation or business trends driven by climate change.
27
American Beacon FundsSM
Notes to Financial Statements
December 31, 2024
Sector Risk
Sector risk is the risk associated with a Fund holding a significant amount of investments in similar businesses, which would be similarly affected by particular economic or market events, which may, in certain circumstances, cause the value of the equity and debt securities of companies in a particular sector of the market to change. To the extent a Fund has substantial holdings within a particular sector, the risks to a Fund associated with that sector increase.
To the extent a Fund invests significantly in the information technology sector, the value of the Fund’s shares may be particularly vulnerable to factors affecting that sector, such as a greater degree of market risk and sharp price fluctuations than other types of securities. These securities may fall in and out of favor with investors rapidly, which may cause sudden selling and dramatically lower market prices. The value of a Fund’s shares could experience significantly greater volatility than investment companies investing more broadly.
Securities Lending Risk
A Fund may lend its portfolio securities to brokers, dealers and financial institutions in order to obtain additional income. Borrowers of a Fund’s securities provide collateral either in the form of cash, which a Fund reinvests in securities or in the form of non-cash collateral consisting of securities issued or guaranteed by the U.S. government or one of its agencies or instrumentalities. A Fund will be responsible for the risks associated with the investment of cash collateral, including any collateral invested in an affiliated money market fund. A Fund may lose money on its investment of cash collateral or may fail to earn sufficient income on its investment to cover its payment to the borrower of a pre-negotiated fee or “rebate” for the use of that cash collateral in connection with the loan. A Fund could also lose money due to a decline in the value of non-cash collateral. In addition, delays may occur in the recovery of securities from borrowers, which could interfere with a Fund’s ability to vote proxies or to settle transactions or could result in increased costs. Moreover, if the borrower becomes subject to insolvency or similar proceedings, a Fund could incur delays in its ability to enforce its rights in its collateral. There also is a risk that a borrower may default on its obligation to return loaned securities at a time when the value of a Fund’s collateral is inadequate. Although a Fund’s securities lending agent may indemnify a Fund against that risk, it is also possible that the securities lending agent will be unable to satisfy its indemnification obligations. In any case in which the loaned securities are not returned to a Fund before an ex-dividend date, whether or not due to a default by the borrower, the payment in lieu of the dividend that a Fund receives from the securities’ borrower would not be treated as a dividend for federal income tax purposes and thus would not qualify for treatment as “qualified dividend income.”
Offsetting Assets and Liabilities
The Funds are parties to enforceable master netting agreements between brokers and counterparties which provide for the right to offset under certain circumstances. The Funds employ multiple money managers and counterparties and have elected not to offset qualifying financial and derivative instruments on the Statements of Assets and Liabilities, as such all financial and derivative instruments are presented on a gross basis. The impacts of netting arrangements that provide the right to offset are detailed below, if applicable. The net amount represents the net receivable or payable that would be due from or to the counterparty in the event of default. Exposure from borrowings and other financing agreements such as repurchase agreements can only be netted across transactions governed by the same Master Agreement with the same legal entity.
6. Federal Income and Excise Taxes
It is the policy of each Fund to qualify as a regulated investment company (“RIC”), by complying with all applicable provisions of Subchapter M of the Internal Revenue Code, as amended, and to make distributions of taxable income sufficient to relieve it from substantially all federal income and excise taxes. For federal income tax purposes, each Fund is treated as a single entity for the purpose of determining such qualification.
28
American Beacon FundsSM
Notes to Financial Statements
December 31, 2024
The Funds do not have any unrecorded tax liabilities in the accompanying financial statements. Each of the tax years in the four year period ended December 31, 2024 remain subject to examination by the Internal Revenue Service. If applicable, the Funds recognize interest accrued related to unrecognized tax benefits in interest expense and penalties in “Other expenses” on the Statements of Operations.
The Funds may be subject to taxes imposed by countries in which it invests. Such taxes are generally based on returns of income earned or gains realized or repatriated. Taxes are accrued and applied to net investment income, net realized capital gains and net unrealized appreciation (depreciation), as applicable, as the income is earned or capital gains are recorded.
The tax character of distributions paid were as follows:
| | | | | | | | | | | | | | | | | | | | | | | | | | | | |
| | | Stephens Mid-Cap Growth Fund | | | | | | Stephens Small Cap Growth Fund | |
| | | Year Ended
December 31, 2024 | | | | | | Year Ended
December 31, 2023 | | | | | | Year Ended
December 31, 2024 | | | | | | Year Ended
December 31, 2023 | |
Distributions paid from: | | | | | | | | | | | | | | | | | | | | | | | | | | | | |
Ordinary income* | | | | | | | | | | | | | | | | | | | | | | | | | | | | |
R5 Class | | $ | - | | | | | | | $ | - | | | | | | | $ | - | | | | | | | $ | - | |
Y Class | | | - | | | | | | | | - | | | | | | | | - | | | | | | | | - | |
Investor Class | | | - | | | | | | | | - | | | | | | | | - | | | | | | | | - | |
A Class | | | - | | | | | | | | - | | | | | | | | - | | | | | | | | - | |
C Class | | | - | | | | | | | | - | | | | | | | | - | | | | | | | | - | |
R6 Class | | | - | | | | | | | | - | | | | | | | | - | | | | | | | | - | |
Long-term capital gains | | | | | | | | | | | | | | | | | | | | | | | | | | | | |
R5 Class | | | 25,125,555 | | | | | | | | - | | | | | | | | 13,995,053 | | | | | | | | 2,423,132 | |
Y Class | | | 2,272,657 | | | | | | | | - | | | | | | | | 2,896,475 | | | | | | | | 361,055 | |
Investor Class | | | 1,362,282 | | | | | | | | - | | | | | | | | 2,780,546 | | | | | | | | 519,271 | |
A Class | | | 285,019 | | | | | | | | - | | | | | | | | 380,537 | | | | | | | | 86,911 | |
C Class | | | 106,525 | | | | | | | | - | | | | | | | | 80,873 | | | | | | | | 12,895 | |
R6 Class | | | 1,335,784 | | | | | | | | - | | | | | | | | 3,583,475 | | | | | | | | 634,849 | |
| | | | | | | | | | | | | | | | | | | | | | | | | | | | |
Total distributions paid | | $ | 30,487,822 | | | | | | | $ | - | | | | | | | $ | 23,716,959 | | | | | | | $ | 4,038,113 | |
| | | | | | | | | | | | | | | | | | | | | | | | | | | | |
* For tax purposes, short-term capital gains are considered ordinary income distributions.
As of December 31, 2024, the components of distributable earnings (deficits) on a tax basis were as follows:
| | | | | | | | | | | | | | | | | | | | | | | | | | | | |
Fund | | Tax Cost | | | | | | Unrealized
Appreciation | | | | | | Unrealized
(Depreciation) | | | | | | Net Unrealized
Appreciation
(Depreciation) | |
Stephens Mid-Cap Growth | | $ | 584,710,823 | | | | | | | $ | 239,061,265 | | | | | | | $ | (22,821,329 | ) | | | | | | $ | 216,239,936 | |
Stephens Small Cap Growth | | | 241,559,723 | | | | | | | | 133,794,363 | | | | | | | | (10,479,592 | ) | | | | | | | 123,314,771 | |
| | | | | | | | | | | | | | | | | | | | | | | | | | | | | | | | | | | | | | | | | | | | |
Fund | | Net Unrealized
Appreciation
(Depreciation) | | | | | | Undistributed
Ordinary
Income | | | | | | Undistributed
Long-Term
Capital Gains | | | | | | Accumulated
Capital and
Other (Losses) | | | | | | Other Temporary
Differences | | | | | | Distributable
Earnings | |
Stephens Mid-Cap Growth | | $ | 216,239,936 | | | | | | | $ | - | | | | | | | $ | 13,026,727 | | | | | | | $ | - | | | | | | | $ | - | | | | | | | $ | 229,266,663 | |
Stephens Small Cap Growth | | | 123,314,771 | | | | | | | | - | | | | | | | | 14,101,364 | | | | | | | | - | | | | | | | | - | | | | | | | | 137,416,135 | |
Financial reporting records are adjusted for permanent book/tax differences to reflect tax character. Financial records are not adjusted for temporary differences. The temporary differences between financial reporting and tax- basis reporting of unrealized appreciation (depreciation) are attributable primarily to the tax deferral of losses from wash sales.
Due to inherent differences in the recognition of income, expenses, and realized gains (losses) under U.S. GAAP and federal income tax regulations, permanent differences between book and tax reporting have been identified and appropriately reclassified on the Statements of Assets and Liabilities.
29
American Beacon FundsSM
Notes to Financial Statements
December 31, 2024
Accordingly, the following amounts represent current year permanent differences derived from non-utilization of net-operating losses and equalization as of December 31, 2024:
| | | | | | | | | | | | |
Fund | | Paid-In-Capital | | | | | | Distributable
Earnings/(Deficits) | |
| Stephens Mid-Cap Growth | | $ | 188,093 | | | | | | | $ | (188,093 | ) |
| Stephens Small Cap Growth | | | 2,092,822 | | | | | | | | (2,092,822 | ) |
For federal income tax purposes, the Funds measure their capital loss carryforwards annually at December 31, their fiscal year end. Capital loss carryforwards retain their character as short-term and/or long-term and may be carried forward and applied against future realized capital gains with no expiration date.
As of December 31, 2024, the Funds did not have any capital loss carryforwards.
The Stephens Small Cap Growth Fund utilized $1,330,589 short-term and $3,708,707 long-term capital loss carryforwards.
7. Investment Transactions
The aggregate cost of purchases and proceeds from sales and maturities of investments, other than short-term obligations, for the year ended December 31, 2024 were as follows:
| | | | | | | | | | | | |
Fund | | Purchases (non-U.S.
Government
Securities) | | | | | | Sales (non-U.S.
Government
Securities) | |
| Stephens Mid-Cap Growth | | $ | 210,034,272 | | | | | | | $ | 172,611,245 | |
| Stephens Small Cap Growth | | | 122,139,975 | | | | | | | | 129,034,031 | |
A summary of the Funds’ transactions in the USG Select Fund for the year ended December 31, 2024 were as follows:
| | | | | | | | | | | | | | | | | | | | | | | | | | | | | | | | | | |
Fund | | Type of
Transaction | | | | | December 31,
2023
Shares/Fair
Value | | | | | | Purchases | | | | | | Sales | | | | | | December 31,
2024
Shares/Fair
Value | |
| Stephens Mid-Cap Growth | | Direct | | | | | | $ | 27,591,191 | | | | | | | $ | 148,132,659 | | | | | | | $ | 159,512,914 | | | | | | | $ | 16,210,936 | |
| Stephens Mid-Cap Growth | | Securities Lending | | | | | | | - | | | | | | | | 12,769,704 | | | | | | | | 12,769,704 | | | | | | | | - | |
| Stephens Small Cap Growth | | Direct | | | | | | | 2,637,978 | | | | | | | | 108,864,438 | | | | | | | | 105,442,211 | | | | | | | | 6,060,205 | |
| Stephens Small Cap Growth | | Securities Lending | | | | | | | 1,236,944 | | | | | | | | 10,324,860 | | | | | | | | 11,561,804 | | | | | | | | - | |
8. Securities Lending
The Funds may lend their securities to qualified financial institutions, such as certain broker-dealers, to earn additional income. The borrowers are required to secure their loans continuously with collateral in an amount at least equal to the fair value of the securities loaned, initially in an amount at least equal to 102% of the fair value of domestic securities loaned and 105% of the fair value of international securities loaned. Collateral is monitored and marked-to-market daily. Daily mark-to-market amounts are required to be paid to the borrower or received from the borrower by the end of the following business day. This one day settlement for mark-to-market amounts may result in the collateral being temporarily less than the value of the securities on loan or temporarily more than the required minimum collateral.
To the extent that a loan is collateralized by cash, such cash collateral shall be invested by the securities lending agent (the “Agent”) in money market mutual funds and other short-term investments, provided the investments meet certain quality and diversification requirements. Securities purchased with cash collateral proceeds are listed in the Funds’ Schedule of Investments and the collateral is shown on the Statements of Assets and Liabilities as a payable.
30
American Beacon FundsSM
Notes to Financial Statements
December 31, 2024
Securities lending income is generated from the demand premium (if any) paid by the borrower to borrow a specific security and from the return on investment of cash collateral, reduced by negotiated rebate fees paid to the borrower and transaction costs. To the extent that a loan is secured by non-cash collateral, securities lending income is generated as a demand premium reduced by transaction costs. The Funds, the Agent, and the Manager retained 80%, 10%, and 10%, respectively, of the income generated from securities lending.
While securities are on loan, the Funds continue to receive certain income associated with that security and any gain or loss in the market price that may occur during the term of the loan. In the case of domestic equities, the value of any dividend is received in the form of a substitute payment approximately equal to the dividend. In the case of foreign securities, a negotiated amount is received that is less than the actual dividend, but higher than the dividend amount minus the foreign tax that the Funds would be subject to on the dividend.
Securities lending transactions pose certain risks to the Funds, including that the borrower may not provide additional collateral when required or return the securities when due, that the value of the short-term investments will be less than the amount of cash collateral required to be returned to the borrower, that non-cash collateral may be subject to legal constraints in the event of a borrower bankruptcy, and that the cash collateral investments could become illiquid and unable to be used to return collateral to the borrower. The Funds could also experience delays and costs in gaining access to the collateral. The Funds bear the risk of any deficiency in the amount of the cash collateral available for return to the borrower and any action which impairs its ability to liquidate non-cash collateral to satisfy a borrower default.
As of December 31, 2024, the value of outstanding securities on loan and the value of collateral were as follows:
| | | | | | | | | | | | | | | | | | | | | | | | | | | | |
Fund | | Fair Value of
Securities on Loan | | | | | | Cash Collateral
Received | | | | | | Non-Cash Collateral
Received | | | | | | Total Collateral
Received | |
Stephens Small Cap Growth | | $ | 19,707,313 | | | | | | | $ | - | | | | | | | $ | 20,262,989 | | | | | | | $ | 20,262,989 | |
Cash collateral is listed on the Funds’ Schedules of Investments and is shown on the Statements of Assets and Liabilities. Income earned on these investments is included in “Income derived from securities lending” on the Statements of Operations.
Non-cash collateral received by the Funds may not be sold or re-pledged except to satisfy a borrower default. Therefore, non-cash collateral is not included on the Funds’ Schedules of Investments or Statements of Assets and Liabilities.
9. Borrowing Arrangements
Effective November 8, 2024 (the “Effective Date”), the Funds, along with certain other funds managed by the Manager (“Participating Funds”), renewed a committed revolving line of credit (the “Committed Line”) agreement with State Street Bank and Trust Company (the “Bank”) to be used to facilitate portfolio liquidity. The maximum borrowing amount under the Committed Line is $100 million with interest at a rate equal to the higher of (a) Overnight Bank Funding Rate (“OBFR”) daily fluctuating rate per annum equal to 1.25% plus the sum of 0.10% or (b) the Federal Funds daily fluctuating rate per annum on amounts borrowed. Each of the Participating Funds paid a proportional amount of a quarterly commitment fee at a rate of 0.25% per annum on the unused portion of the Committed Line amount. The Committed Line expires November 7, 2025, unless extended by the Bank or terminated by the Participating Funds in accordance with the agreement. Prior to the Effective Date, the maximum borrowing amount under the Committed Line was $100 million with an expiration date November 7, 2024.
31
American Beacon FundsSM
Notes to Financial Statements
December 31, 2024
On the Effective Date, the Funds, along with certain other Participating Funds managed by the Manager, also renewed an uncommitted discretionary demand revolving line of credit (the “Uncommitted Line”) agreement with the Bank to be used to facilitate portfolio liquidity. The maximum borrowing amount under the Uncommitted Line is $100 million with interest at a rate equal to the higher of (a) OBFR daily fluctuating rate per annum equal to 1.25% plus the sum of 0.10% or (b) the Federal Funds daily fluctuating rate per annum on amounts borrowed on each outstanding loan. Each of the Participating Funds paid a proportional amount of a closing fee of $35,000 on the Effective Date. The Uncommitted Line expires November 7, 2025, unless extended by the Bank or terminated by the Participating Funds in accordance with the agreement. Prior to the Effective Date, the maximum borrowing amount under the Uncommitted Line was $100 million with an expiration date November 7, 2024.
The Participating Funds paid administration, legal and arrangement fees, which are recognized as a component of “Line of credit interest expense” on the Statements of Operations, along with commitment fees, that have been allocated among the Participating Funds based on average daily net assets.
During the year ended December 31, 2024, the Funds did not utilize these facilities.
10. Capital Share Transactions
The tables below summarize the activity in capital shares for each Class of the Funds:
| | | | | | | | | | | | | | | | | | | | | | | | | | | | |
| | | R5 Class | |
| | | Year Ended
December 31, 2024 | | | | | | Year Ended
December 31, 2023 | |
Stephens Mid-Cap Growth Fund | | Shares | | | | | | Amount | | | | | | Shares | | | | | | Amount | |
| Shares sold | | | 3,831,638 | | | | | | | $ | 143,684,617 | | | | | | | | 5,085,968 | | | | | | | $ | 160,539,617 | |
| Reinvestment of dividends | | | 309,838 | | | | | | | | 12,071,309 | | | | | | | | - | | | | | | | | - | |
| Shares redeemed | | | (2,952,921 | ) | | | | | | | (110,852,386 | ) | | | | | | | (2,640,855 | ) | | | | | | | (82,078,549 | ) |
| | | | | | | | | | | | | | | | | | | | | | | | | | | | |
| Net increase in shares outstanding | | | 1,188,555 | | | | | | | $ | 44,903,540 | | | | | | | | 2,445,113 | | | | | | | $ | 78,461,068 | |
| | | | | | | | | | | | | | | | | | | | | | | | | | | | |
| | | | |
| | | Y Class | |
| | | Year Ended
December 31, 2024 | | | | | | Year Ended
December 31, 2023 | |
Stephens Mid-Cap Growth Fund | | Shares | | | | | | Amount | | | | | | Shares | | | | | | Amount | |
| Shares sold | | | 362,374 | | | | | | | $ | 13,399,668 | | | | | | | | 175,605 | | | | | | | $ | 5,442,861 | |
| Reinvestment of dividends | | | 55,399 | | | | | | | | 2,131,195 | | | | | | | | - | | | | | | | | - | |
| Shares redeemed | | | (125,706 | ) | | | | | | | (4,673,152 | ) | | | | | | | (297,273 | ) | | | | | | | (9,173,104 | ) |
| | | | | | | | | | | | | | | | | | | | | | | | | | | | |
| Net increase (decrease) in shares outstanding | | | 292,067 | | | | | | | $ | 10,857,711 | | | | | | | | (121,668 | ) | | | | | | $ | (3,730,243 | ) |
| | | | | | | | | | | | | | | | | | | | | | | | | | | | |
| | | | |
| | | Investor Class | |
| | | Year Ended
December 31, 2024 | | | | | | Year Ended
December 31, 2023 | |
Stephens Mid-Cap Growth Fund | | Shares | | | | | | Amount | | | | | | Shares | | | | | | Amount | |
| Shares sold | | | 71,951 | | | | | | | $ | 2,148,376 | | | | | | | | 103,349 | | | | | | | $ | 2,589,893 | |
| Reinvestment of dividends | | | 40,300 | | | | | | | | 1,244,451 | | | | | | | | - | | | | | | | | - | |
| Shares redeemed | | | (151,249 | ) | | | | | | | (4,570,912 | ) | | | | | | | (213,660 | ) | | | | | | | (5,259,257 | ) |
| | | | | | | | | | | | | | | | | | | | | | | | | | | | |
| Net (decrease) in shares outstanding | | | (38,998 | ) | | | | | | $ | (1,178,085 | ) | | | | | | | (110,311 | ) | | | | | | $ | (2,669,364 | ) |
| | | | | | | | | | | | | | | | | | | | | | | | | | | | |
| | | | |
| | | A Class | |
| | | Year Ended
December 31, 2024 | | | | | | Year Ended
December 31, 2023 | |
Stephens Mid-Cap Growth Fund | | Shares | | | | | | Amount | | | | | | Shares | | | | | | Amount | |
| Shares sold | | | 19,161 | | | | | | | $ | 574,122 | | | | | | | | 23,470 | | | | | | | $ | 592,355 | |
| Reinvestment of dividends | | | 9,269 | | | | | | | | 284,098 | | | | | | | | - | | | | | | | | - | |
| Shares redeemed | | | (50,747 | ) | | | | | | | (1,530,239 | ) | | | | | | | (36,933 | ) | | | | | | | (945,858 | ) |
| | | | | | | | | | | | | | | | | | | | | | | | | | | | |
| Net (decrease) in shares outstanding | | | (22,317 | ) | | | | | | $ | (672,019 | ) | | | | | | | (13,463 | ) | | | | | | $ | (353,503 | ) |
| | | | | | | | | | | | | | | | | | | | | | | | | | | | |
32
American Beacon FundsSM
Notes to Financial Statements
December 31, 2024
| | | | | | | | | | | | | | | | | | | | | | | | | | | | |
| | | C Class | |
| | | Year Ended
December 31, 2024 | | | | | | Year Ended
December 31, 2023 | |
Stephens Mid-Cap Growth Fund | | Shares | | | | | | Amount | | | | | | Shares | | | | | | Amount | |
| Shares sold | | | 10,713 | | | | | | | $ | 285,910 | | | | | | | | 19,889 | | | | | | | $ | 440,657 | |
| Reinvestment of dividends | | | 3,963 | | | | | | | | 106,525 | | | | | | | | - | | | | | | | | - | |
| Shares redeemed | | | (23,281 | ) | | | | | | | (614,601 | ) | | | | | | | (19,560 | ) | | | | | | | (429,821 | ) |
| | | | | | | | | | | | | | | | | | | | | | | | | | | | |
| Net increase (decrease) in shares outstanding | | | (8,605 | ) | | | | | | $ | (222,166 | ) | | | | | | | 329 | | | | | | | $ | 10,836 | |
| | | | | | | | | | | | | | | | | | | | | | | | | | | | |
| | | | |
| | | R6 Class | |
| | | Year Ended
December 31, 2024 | | | | | | Year Ended
December 31, 2023 | |
Stephens Mid-Cap Growth Fund | | Shares | | | | | | Amount | | | | | | Shares | | | | | | Amount | |
| Shares sold | | | 220,583 | | | | | | | $ | 8,275,538 | | | | | | | | 153,839 | | | | | | | $ | 4,838,935 | |
| Reinvestment of dividends | | | 34,242 | | | | | | | | 1,335,784 | | | | | | | | - | | | | | | | | - | |
| Shares redeemed | | | (149,808 | ) | | | | | | | (5,605,343 | ) | | | | | | | (183,016 | ) | | | | | | | (5,767,561 | ) |
| | | | | | | | | | | | | | | | | | | | | | | | | | | | |
| Net increase (decrease) in shares outstanding | | | 105,017 | | | | | | | $ | 4,005,979 | | | | | | | | (29,177 | ) | | | | | | $ | (928,626 | ) |
| | | | | | | | | | | | | | | | | | | | | | | | | | | | |
| | | | |
| | | R5 Class | |
| | | Year Ended
December 31, 2024 | | | | | | Year Ended
December 31, 2023 | |
Stephens Small Cap Growth Fund | | Shares | | | | | | Amount | | | | | | Shares | | | | | | Amount | |
| Shares sold | | | 3,818,279 | | | | | | | $ | 56,370,620 | | | | | | | | 3,221,806 | | | | | | | $ | 39,999,073 | |
| Reinvestment of dividends | | | 862,831 | | | | | | | | 12,976,977 | | | | | | | | 168,018 | | | | | | | | 2,301,844 | |
| Shares redeemed | | | (4,098,862 | ) | | | | | | | (58,582,990 | ) | | | | | | | (3,584,363 | ) | | | | | | | (45,008,284 | ) |
| | | | | | | | | | | | | | | | | | | | | | | | | | | | |
| Net increase (decrease) in shares outstanding | | | 582,248 | | | | | | | $ | 10,764,607 | | | | | | | | (194,539 | ) | | | | | | $ | (2,707,367 | ) |
| | | | | | | | | | | | | | | | | | | | | | | | | | | | |
| | | | |
| | | Y Class | |
| | | Year Ended
December 31, 2024 | | | | | | Year Ended
December 31, 2023 | |
Stephens Small Cap Growth Fund | | Shares | | | | | | Amount | | | | | | Shares | | | | | | Amount | |
| Shares sold | | | 1,399,723 | | | | | | | $ | 21,168,252 | | | | | | | | 535,042 | | | | | | | $ | 6,639,773 | |
| Reinvestment of dividends | | | 195,359 | | | | | | | | 2,879,601 | | | | | | | | 26,674 | | | | | | | | 358,767 | |
| Shares redeemed | | | (667,259 | ) | | | | | | | (9,744,610 | ) | | | | | | | (674,550 | ) | | | | | | | (8,395,724 | ) |
| | | | | | | | | | | | | | | | | | | | | | | | | | | | |
| Net increase (decrease) in shares outstanding | | | 927,823 | | | | | | | $ | 14,303,243 | | | | | | | | (112,834 | ) | | | | | | $ | (1,397,184 | ) |
| | | | | | | | | | | | | | | | | | | | | | | | | | | | |
| | | | |
| | | Investor Class | |
| | | Year Ended
December 31, 2024 | | | | | | Year Ended
December 31, 2023 | |
Stephens Small Cap Growth Fund | | Shares | | | | | | Amount | | | | | | Shares | | | | | | Amount | |
| Shares sold | | | 298,839 | | | | | | | $ | 3,586,746 | | | | | | | | 1,904,018 | | | | | | | $ | 20,135,236 | |
| Reinvestment of dividends | | | 228,740 | | | | | | | | 2,774,610 | | | | | | | | 46,078 | | | | | | | | 517,918 | |
| Shares redeemed | | | (597,243 | ) | | | | | | | (7,376,103 | ) | | | | | | | (407,802 | ) | | | | | | | (4,272,082 | ) |
| | | | | | | | | | | | | | | | | | | | | | | | | | | | |
| Net increase (decrease) in shares outstanding | | | (69,664 | ) | | | | | | $ | (1,014,747 | ) | | | | | | | 1,542,294 | | | | | | | $ | 16,381,072 | |
| | | | | | | | | | | | | | | | | | | | | | | | | | | | |
| | | | |
| | | A Class | |
| | | Year Ended
December 31, 2024 | | | | | | Year Ended
December 31, 2023 | |
Stephens Small Cap Growth Fund | | Shares | | | | | | Amount | | | | | | Shares | | | | | | Amount | |
| Shares sold | | | 4,188 | | | | | | | $ | 50,020 | | | | | | | | 176,810 | | | | | | | $ | 1,777,688 | |
| Reinvestment of dividends | | | 32,163 | | | | | | | | 380,167 | | | | | | | | 7,809 | | | | | | | | 85,736 | |
| Shares redeemed | | | (146,431 | ) | | | | | | | (1,741,212 | ) | | | | | | | (2,029,703 | ) | | | | | | | (20,883,445 | ) |
| | | | | | | | | | | | | | | | | | | | | | | | | | | | |
| Net (decrease) in shares outstanding | | | (110,080 | ) | | | | | | $ | (1,311,025 | ) | | | | | | | (1,845,084 | ) | | | | | | $ | (19,020,021 | ) |
| | | | | | | | | | | | | | | | | | | | | | | | | | | | |
| | | | |
| | | C Class | |
| | | Year Ended
December 31, 2024 | | | | | | Year Ended
December 31, 2023 | |
Stephens Small Cap Growth Fund | | Shares | | | | | | Amount | | | | | | Shares | | | | | | Amount | |
| Shares sold | | | 14,069 | | | | | | | $ | 139,110 | | | | | | | | 69,159 | | | | | | | $ | 580,245 | |
| Reinvestment of dividends | | | 8,829 | | | | | | | | 80,873 | | | | | | | | 1,470 | | | | | | | | 12,894 | |
| Shares redeemed | | | (9,783 | ) | | | | | | | (93,489 | ) | | | | | | | (28,252 | ) | | | | | | | (223,250 | ) |
| | | | | | | | | | | | | | | | | | | | | | | | | | | | |
| Net increase in shares outstanding | | | 13,115 | | | | | | | $ | 126,494 | | | | | | | | 42,377 | | | | | | | $ | 369,889 | |
| | | | | | | | | | | | | | | | | | | | | | | | | | | | |
33
American Beacon FundsSM
Notes to Financial Statements
December 31, 2024
| | | | | | | | | | | | | | | | | | | | | | | | | | | | |
| | | R6 Class | |
| | | Year Ended
December 31, 2024 | | | | | | Year Ended
December 31, 2023 | |
Stephens Small Cap Growth Fund | | Shares | | | | | | Amount | | | | | | Shares | | | | | | Amount | |
| Shares sold | | | 2,548,037 | | | | | | | $ | 35,346,690 | | | | | | | | 878,164 | | | | | | | $ | 10,830,172 | |
| Reinvestment of dividends | | | 237,631 | | | | | | | | 3,583,475 | | | | | | | | 46,238 | | | | | | | | 634,849 | |
| Shares redeemed | | | (2,715,221 | ) | | | | | | | (40,141,046 | ) | | | | | | | (443,527 | ) | | | | | | | (5,545,553 | ) |
| | | | | | | | | | | | | | | | | | | | | | | | | | | | |
| Net increase (decrease) in shares outstanding | | | 70,447 | | | | | | | $ | (1,210,881 | ) | | | | | | | 480,875 | | | | | | | $ | 5,919,468 | |
| | | | | | | | | | | | | | | | | | | | | | | | | | | | |
11. Subsequent Events
Management has evaluated subsequent events for possible recognition or disclosure in the financial statements through the date the financial statements are issued. Management has determined that there are no material events that would require disclosure in the Funds’ financial statements through this date.
34
American Beacon Stephens Mid-Cap Growth FundSM
Financial Highlights
(For a share outstanding throughout the period)
| | | | | | | | | | | | | | | | | | | | | | | | | | | | | | | | | | | | |
| | | R5 ClassA | |
| | | Year Ended December 31, | |
| | | 2024 | | | | | | 2023 | | | | | | 2022 | | | | | | 2021 | | | | | | 2020 | |
| | | | |
Net asset value, beginning of period | | $ | 35.08 | | | | | | | $ | 27.94 | | | | | | | $ | 39.90 | | | | | | | $ | 37.67 | | | | | | | $ | 27.17 | |
| | | | | | | | | | | | | | | | | | | | | | | | | | | | | | | | | | | | |
Income (loss) from investment operations: | | | | | | | | | | | | | | | | | | | | | | | | | | | | | | | | | | | | |
Net investment (loss) | | | (0.06 | ) | | | | | | | (0.08 | )B | | | | | | | (0.13 | ) | | | | | | | (0.14 | ) | | | | | | | (0.07 | ) |
Net gains (losses) on investments (both realized and unrealized) | | | 4.79 | | | | | | | | 7.22 | | | | | | | | (11.06 | ) | | | | | | | 4.80 | | | | | | | | 11.02 | |
| | | | | | | | | | | | | | | | | | | | | | | | | | | | | | | | | | | | |
Total income (loss) from investment operations | | | 4.73 | | | | | | | | 7.14 | | | | | | | | (11.19 | ) | | | | | | | 4.66 | | | | | | | | 10.95 | |
| | | | | | | | | | | | | | | | | | | | | | | | | | | | | | | | | | | | |
Less distributions: | | | | | | | | | | | | | | | | | | | | | | | | | | | | | | | | | | | | |
Distributions from net realized gains | | | (1.48 | ) | | | | | | | - | | | | | | | | (0.77 | ) | | | | | | | (2.43 | ) | | | | | | | (0.45 | ) |
| | | | | | | | | | | | | | | | | | | | | | | | | | | | | | | | | | | | |
Total distributions | | | (1.48 | ) | | | | | | | - | | | | | | | | (0.77 | ) | | | | | | | (2.43 | ) | | | | | | | (0.45 | ) |
| | | | | | | | | | | | | | | | | | | | | | | | | | | | | | | | | | | | |
Net asset value, end of period | | $ | 38.33 | | | | | | | $ | 35.08 | | | | | | | $ | 27.94 | | | | | | | $ | 39.90 | | | | | | | $ | 37.67 | |
| | | | | | | | | | | | | | | | | | | | | | | | | | | | | | | | | | | | |
Total returnC | | | 13.41 | % | | | | | | | 25.55 | % | | | | | | | (28.04 | )% | | | | | | | 12.46 | % | | | | | | | 40.30 | % |
| | | | | | | | | | | | | | | | | | | | | | | | | | | | | | | | | | | | |
| | | | | | | | | |
Ratios and supplemental data: | | | | | | | | | | | | | | | | | | | | | | | | | | | | | | | | | | | | |
Net assets, end of period | | $ | 666,887,131 | | | | | | | $ | 568,803,340 | | | | | | | $ | 384,632,608 | | | | | | | $ | 611,720,453 | | | | | | | $ | 476,150,642 | |
Ratios to average net assets: | | | | | | | | | | | | | | | | | | | | | | | | | | | | | | | | | | | | |
Expenses, before reimbursements and/or recoupments | | | 0.89 | % | | | | | | | 0.90 | % | | | | | | | 0.90 | % | | | | | | | 0.90 | % | | | | | | | 0.91 | % |
Expenses, net of reimbursements and/or recoupments | | | 0.89 | % | | | | | | | 0.89 | % | | | | | | | 0.89 | % | | | | | | | 0.89 | % | | | | | | | 0.89 | %D |
Net investment (loss), before expense reimbursements and/or recoupments | | | (0.27 | )% | | | | | | | (0.26 | )% | | | | | | | (0.24 | )% | | | | | | | (0.54 | )% | | | | | | | (0.52 | )% |
Net investment (loss), net of reimbursements and/or recoupments | | | (0.27 | )% | | | | | | | (0.25 | )% | | | | | | | (0.23 | )% | | | | | | | (0.53 | )% | | | | | | | (0.50 | )% |
Portfolio turnover rate | | | 24 | % | | | | | | | 16 | % | | | | | | | 20 | % | | | | | | | 28 | % | | | | | | | 22 | % |
| A | Prior to February 28, 2020, the R5 Class was known as Institutional Class. |
| B | Per share amounts have been calculated using the average shares method. |
| C | Based on net asset value, which does not reflect the sales charge, redemption fee, or contingent deferred sales charge, if applicable. May include adjustments in accordance with U.S. GAAP and as such, the net asset value for reporting purposes and the returns based upon those net asset values may differ from the net asset value and returns for shareholder transactions. |
| D | Expense ratios may exceed stated expense caps in Note 2 due to security lending expenses, which are not reimbursable under the agreement with the Manager. |
See accompanying notes
35
American Beacon Stephens Mid-Cap Growth FundSM
Financial Highlights
(For a share outstanding throughout the period)
| | | | | | | | | | | | | | | | | | | | | | | | | | | | | | | | | | | | |
| | | Y Class | |
| | | Year Ended December 31, | |
| | | 2024 | | | | | | 2023 | | | | | | 2022 | | | | | | 2021 | | | | | | 2020 | |
| | | | |
Net asset value, beginning of period | | $ | 34.69 | | | | | | | $ | 27.64 | | | | | | | $ | 39.51 | | | | | | | $ | 37.34 | | | | | | | $ | 26.95 | |
| | | | | | | | | | | | | | | | | | | | | | | | | | | | | | | | | | | | |
Income (loss) from investment operations: | | | | | | | | | | | | | | | | | | | | | | | | | | | | | | | | | | | | |
Net investment (loss) | | | (0.12 | )A | | | | | | | (0.18 | ) | | | | | | | (0.34 | ) | | | | | | | (0.20 | ) | | | | | | | (0.04 | ) |
Net gains (losses) on investments (both realized and unrealized) | | | 4.76 | | | | | | | | 7.23 | | | | | | | | (10.76 | ) | | | | | | | 4.80 | | | | | | | | 10.88 | |
| | | | | | | | | | | | | | | | | | | | | | | | | | | | | | | | | | | | |
Total income (loss) from investment operations | | | 4.64 | | | | | | | | 7.05 | | | | | | | | (11.10 | ) | | | | | | | 4.60 | | | | | | | | 10.84 | |
| | | | | | | | | | | | | | | | | | | | | | | | | | | | | | | | | | | | |
Less distributions: | | | | | | | | | | | | | | | | | | | | | | | | | | | | | | | | | | | | |
Distributions from net realized gains | | | (1.48 | ) | | | | | | | - | | | | | | | | (0.77 | ) | | | | | | | (2.43 | ) | | | | | | | (0.45 | ) |
| | | | | | | | | | | | | | | | | | | | | | | | | | | | | | | | | | | | |
Total distributions | | | (1.48 | ) | | | | | | | - | | | | | | | | (0.77 | ) | | | | | | | (2.43 | ) | | | | | | | (0.45 | ) |
| | | | | | | | | | | | | | | | | | | | | | | | | | | | | | | | | | | | |
Net asset value, end of period | | $ | 37.85 | | | | | | | $ | 34.69 | | | | | | | $ | 27.64 | | | | | | | $ | 39.51 | | | | | | | $ | 37.34 | |
| | | | | | | | | | | | | | | | | | | | | | | | | | | | | | | | | | | | |
Total returnB | | | 13.30 | % | | | | | | | 25.51 | % | | | | | | | (28.09 | )% | | | | | | | 12.41 | % | | | | | | | 40.22 | % |
| | | | | | | | | | | | | | | | | | | | | | | | | | | | | | | | | | | | |
| | | | | | | | | |
Ratios and supplemental data: | | | | | | | | | | | | | | | | | | | | | | | | | | | | | | | | | | | | |
Net assets, end of period | | $ | 59,837,617 | | | | | | | $ | 44,706,237 | | | | | | | $ | 38,984,552 | | | | | | | $ | 82,970,930 | | | | | | | $ | 69,132,838 | |
Ratios to average net assets: | | | | | | | | | | | | | | | | | | | | | | | | | | | | | | | | | | | | |
Expenses, before reimbursements and/or recoupments | | | 0.98 | % | | | | | | | 0.99 | % | | | | | | | 0.98 | % | | | | | | | 0.97 | % | | | | | | | 1.00 | % |
Expenses, net of reimbursements and/or recoupments | | | 0.95 | % | | | | | | | 0.95 | % | | | | | | | 0.95 | % | | | | | | | 0.95 | % | | | | | | | 0.96 | %C |
Net investment (loss), before expense reimbursements and/or recoupments | | | (0.36 | )% | | | | | | | (0.36 | )% | | | | | | | (0.32 | )% | | | | | | | (0.64 | )% | | | | | | | (0.61 | )% |
Net investment (loss), net of reimbursements and/or recoupments | | | (0.33 | )% | | | | | | | (0.32 | )% | | | | | | | (0.29 | )% | | | | | | | (0.62 | )% | | | | | | | (0.57 | )% |
Portfolio turnover rate | | | 24 | % | | | | | | | 16 | % | | | | | | | 20 | % | | | | | | | 28 | % | | | | | | | 22 | % |
| A | Per share amounts have been calculated using the average shares method. |
| B | Based on net asset value, which does not reflect the sales charge, redemption fee, or contingent deferred sales charge, if applicable. May include adjustments in accordance with U.S. GAAP and as such, the net asset value for reporting purposes and the returns based upon those net asset values may differ from the net asset value and returns for shareholder transactions. |
| C | Expense ratios may exceed stated expense caps in Note 2 due to security lending expenses, which are not reimbursable under the agreement with the Manager. |
See accompanying notes
36
American Beacon Stephens Mid-Cap Growth FundSM
Financial Highlights
(For a share outstanding throughout the period)
| | | | | | | | | | | | | | | | | | | | | | | | | | | | | | | | | | | | |
| | | Investor Class | |
| | | Year Ended December 31, | |
| | | 2024 | | | | | | 2023 | | | | | | 2022 | | | | | | 2021 | | | | | | 2020 | |
| | | | |
Net asset value, beginning of period | | $ | 28.15 | | | | | | | $ | 22.48 | | | | | | | $ | 32.42 | | | | | | | $ | 31.09 | | | | | | | $ | 22.56 | |
| | | | | | | | | | | | | | | | | | | | | | | | | | | | | | | | | | | | |
Income (loss) from investment operations: | | | | | | | | | | | | | | | | | | | | | | | | | | | | | | | | | | | | |
Net investment (loss) | | | (0.24 | ) | | | | | | | (0.32 | ) | | | | | | | (0.13 | )A | | | | | | | (0.41 | ) | | | | | | | (0.61 | ) |
Net gains (losses) on investments (both realized and unrealized) | | | 3.94 | | | | | | | | 5.99 | | | | | | | | (9.04 | ) | | | | | | | 4.17 | | | | | | | | 9.59 | |
| | | | | | | | | | | | | | | | | | | | | | | | | | | | | | | | | | | | |
Total income (loss) from investment operations | | | 3.70 | | | | | | | | 5.67 | | | | | | | | (9.17 | ) | | | | | | | 3.76 | | | | | | | | 8.98 | |
| | | | | | | | | | | | | | | | | | | | | | | | | | | | | | | | | | | | |
Less distributions: | | | | | | | | | | | | | | | | | | | | | | | | | | | | | | | | | | | | |
Distributions from net realized gains | | | (1.48 | ) | | | | | | | - | | | | | | | | (0.77 | ) | | | | | | | (2.43 | ) | | | | | | | (0.45 | ) |
| | | | | | | | | | | | | | | | | | | | | | | | | | | | | | | | | | | | |
Total distributions | | | (1.48 | ) | | | | | | | - | | | | | | | | (0.77 | ) | | | | | | | (2.43 | ) | | | | | | | (0.45 | ) |
| | | | | | | | | | | | | | | | | | | | | | | | | | | | | | | | | | | | |
Net asset value, end of period | | $ | 30.37 | | | | | | | $ | 28.15 | | | | | | | $ | 22.48 | | | | | | | $ | 32.42 | | | | | | | $ | 31.09 | |
| | | | | | | | | | | | | | | | | | | | | | | | | | | | | | | | | | | | |
Total returnB | | | 13.05 | % | | | | | | | 25.22 | % | | | | | | | (28.28 | )% | | | | | | | 12.20 | % | | | | | | | 39.80 | % |
| | | | | | | | | | | | | | | | | | | | | | | | | | | | | | | | | | | | |
| | | | | | | | | |
Ratios and supplemental data: | | | | | | | | | | | | | | | | | | | | | | | | | | | | | | | | | | | | |
Net assets, end of period | | $ | 29,208,326 | | | | | | | $ | 28,162,111 | | | | | | | $ | 24,969,273 | | | | | | | $ | 16,964,278 | | | | | | | $ | 17,203,402 | |
Ratios to average net assets: | | | | | | | | | | | | | | | | | | | | | | | | | | | | | | | | | | | | |
Expenses, before reimbursements and/or recoupments | | | 1.21 | % | | | | | | | 1.22 | % | | | | | | | 1.23 | % | | | | | | | 1.14 | % | | | | | | | 1.23 | % |
Expenses, net of reimbursements and/or recoupments | | | 1.15 | % | | | | | | | 1.18 | %C | | | | | | | 1.23 | % | | | | | | | 1.14 | % | | | | | | | 1.23 | %D |
Net investment (loss), before expense reimbursements and/or recoupments | | | (0.59 | )% | | | | | | | (0.58 | )% | | | | | | | (0.54 | )% | | | | | | | (0.79 | )% | | | | | | | (0.85 | )% |
Net investment (loss), net of reimbursements and/or recoupments | | | (0.53 | )% | | | | | | | (0.54 | )% | | | | | | | (0.54 | )% | | | | | | | (0.79 | )% | | | | | | | (0.85 | )% |
Portfolio turnover rate | | | 24 | % | | | | | | | 16 | % | | | | | | | 20 | % | | | | | | | 28 | % | | | | | | | 22 | % |
| A | Per share amounts have been calculated using the average shares method. |
| B | Based on net asset value, which does not reflect the sales charge, redemption fee, or contingent deferred sales charge, if applicable. May include adjustments in accordance with U.S. GAAP and as such, the net asset value for reporting purposes and the returns based upon those net asset values may differ from the net asset value and returns for shareholder transactions. |
| C | Expense ratios may exceed stated expense caps in Note 2 due to the change in the contractual expense caps on May 1, 2023. |
| D | Expense ratios may exceed stated expense caps in Note 2 due to security lending expenses, which are not reimbursable under the agreement with the Manager. |
See accompanying notes
37
American Beacon Stephens Mid-Cap Growth FundSM
Financial Highlights
(For a share outstanding throughout the period)
| | | | | | | | | | | | | | | | | | | | | | | | | | | | | | | | | | | | |
| | | A Class | |
| | | Year Ended December 31, | |
| | | 2024 | | | | | | 2023 | | | | | | 2022 | | | | | | 2021 | | | | | | 2020 | |
| | | | |
Net asset value, beginning of period | | $ | 27.96 | | | | | | | $ | 22.34 | | | | | | | $ | 32.22 | | | | | | | $ | 30.92 | | | | | | | $ | 22.43 | |
| | | | | | | | | | | | | | | | | | | | | | | | | | | | | | | | | | | | |
Income (loss) from investment operations: | | | | | | | | | | | | | | | | | | | | | | | | | | | | | | | | | | | | |
Net investment (loss) | | | (0.73 | ) | | | | | | | (0.42 | ) | | | | | | | (0.04 | ) | | | | | | | (0.80 | ) | | | | | | | (0.49 | ) |
Net gains (losses) on investments (both realized and unrealized) | | | 4.40 | | | | | | | | 6.04 | | | | | | | | (9.07 | ) | | | | | | | 4.53 | | | | | | | | 9.43 | |
| | | | | | | | | | | | | | | | | | | | | | | | | | | | | | | | | | | | |
Total income (loss) from investment operations | | | 3.67 | | | | | | | | 5.62 | | | | | | | | (9.11 | ) | | | | | | | 3.73 | | | | | | | | 8.94 | |
| | | | | | | | | | | | | | | | | | | | | | | | | | | | | | | | | | | | |
Less distributions: | | | | | | | | | | | | | | | | | | | | | | | | | | | | | | | | | | | | |
Distributions from net realized gains | | | (1.48 | ) | | | | | | | - | | | | | | | | (0.77 | ) | | | | | | | (2.43 | ) | | | | | | | (0.45 | ) |
| | | | | | | | | | | | | | | | | | | | | | | | | | | | | | | | | | | | |
Total distributions | | | (1.48 | ) | | | | | | | - | | | | | | | | (0.77 | ) | | | | | | | (2.43 | ) | | | | | | | (0.45 | ) |
| | | | | | | | | | | | | | | | | | | | | | | | | | | | | | | | | | | | |
Net asset value, end of period | | $ | 30.15 | | | | | | | $ | 27.96 | | | | | | | $ | 22.34 | | | | | | | $ | 32.22 | | | | | | | $ | 30.92 | |
| | | | | | | | | | | | | | | | | | | | | | | | | | | | | | | | | | | | |
Total returnA | | | 13.03 | % | | | | | | | 25.16 | % | | | | | | | (28.27 | )% | | | | | | | 12.17 | % | | | | | | | 39.85 | % |
| | | | | | | | | | | | | | | | | | | | | | | | | | | | | | | | | | | | |
| | | | | | | | | |
Ratios and supplemental data: | | | | | | | | | | | | | | | | | | | | | | | | | | | | | | | | | | | | |
Net assets, end of period | | $ | 5,999,749 | | | | | | | $ | 6,187,739 | | | | | | | $ | 5,243,837 | | | | | | | $ | 7,400,729 | | | | | | | $ | 8,166,847 | |
Ratios to average net assets: | | | | | | | | | | | | | | | | | | | | | | | | | | | | | | | | | | | | |
Expenses, before reimbursements and/or recoupments | | | 1.38 | % | | | | | | | 1.40 | % | | | | | | | 1.22 | % | | | | | | | 1.14 | % | | | | | | | 1.24 | % |
Expenses, net of reimbursements and/or recoupments | | | 1.20 | % | | | | | | | 1.21 | %B | | | | | | | 1.22 | % | | | | | | | 1.13 | % | | | | | | | 1.23 | %C |
Net investment (loss), before expense reimbursements and/or recoupments | | | (0.76 | )% | | | | | | | (0.76 | )% | | | | | | | (0.55 | )% | | | | | | | (0.75 | )% | | | | | | | (0.86 | )% |
Net investment (loss), net of reimbursements and/or recoupments | | | (0.58 | )% | | | | | | | (0.57 | )% | | | | | | | (0.55 | )% | | | | | | | (0.74 | )% | | | | | | | (0.85 | )% |
Portfolio turnover rate | | | 24 | % | | | | | | | 16 | % | | | | | | | 20 | % | | | | | | | 28 | % | | | | | | | 22 | % |
| A | Based on net asset value, which does not reflect the sales charge, redemption fee, or contingent deferred sales charge, if applicable. May include adjustments in accordance with U.S. GAAP and as such, the net asset value for reporting purposes and the returns based upon those net asset values may differ from the net asset value and returns for shareholder transactions. |
| B | Expense ratios may exceed stated expense caps in Note 2 due to the change in the contractual expense caps on May 1, 2023. |
| C | Expense ratios may exceed stated expense caps in Note 2 due to security lending expenses, which are not reimbursable under the agreement with the Manager. |
See accompanying notes
38
American Beacon Stephens Mid-Cap Growth FundSM
Financial Highlights
(For a share outstanding throughout the period)
| | | | | | | | | | | | | | | | | | | | | | | | | | | | | | | | | | | | |
| | | C Class | |
| | | Year Ended December 31, | |
| | | 2024 | | | | | | 2023 | | | | | | 2022 | | | | | | 2021 | | | | | | 2020 | |
| | | | |
Net asset value, beginning of period | | $ | 24.86 | | | | | | | $ | 20.01 | | | | | | | $ | 29.19 | | | | | | | $ | 28.44 | | | | | | | $ | 20.81 | |
| | | | | | | | | | | | | | | | | | | | | | | | | | | | | | | | | | | | |
Income (loss) from investment operations: | | | | | | | | | | | | | | | | | | | | | | | | | | | | | | | | | | | | |
Net investment (loss) | | | (0.80 | ) | | | | | | | (0.28 | ) | | | | | | | (0.83 | ) | | | | | | | (0.63 | ) | | | | | | | (0.94 | ) |
Net gains (losses) on investments (both realized and unrealized) | | | 3.86 | | | | | | | | 5.13 | | | | | | | | (7.58 | ) | | | | | | | 3.81 | | | | | | | | 9.02 | |
| | | | | | | | | | | | | | | | | | | | | | | | | | | | | | | | | | | | |
Total income (loss) from investment operations | | | 3.06 | | | | | | | | 4.85 | | | | | | | | (8.41 | ) | | | | | | | 3.18 | | | | | | | | 8.08 | |
| | | | | | | | | | | | | | | | | | | | | | | | | | | | | | | | | | | | |
Less distributions: | | | | | | | | | | | | | | | | | | | | | | | | | | | | | | | | | | | | |
Distributions from net realized gains | | | (1.48 | ) | | | | | | | - | | | | | | | | (0.77 | ) | | | | | | | (2.43 | ) | | | | | | | (0.45 | ) |
| | | | | | | | | | | | | | | | | | | | | | | | | | | | | | | | | | | | |
Total distributions | | | (1.48 | ) | | | | | | | - | | | | | | | | (0.77 | ) | | | | | | | (2.43 | ) | | | | | | | (0.45 | ) |
| | | | | | | | | | | | | | | | | | | | | | | | | | | | | | | | | | | | |
Net asset value, end of period | | $ | 26.44 | | | | | | | $ | 24.86 | | | | | | | $ | 20.01 | | | | | | | $ | 29.19 | | | | | | | $ | 28.44 | |
| | | | | | | | | | | | | | | | | | | | | | | | | | | | | | | | | | | | |
Total returnA | | | 12.20 | % | | | | | | | 24.24 | % | | | | | | | (28.80 | )% | | | | | | | 11.29 | % | | | | | | | 38.82 | % |
| | | | | | | | | | | | | | | | | | | | | | | | | | | | | | | | | | | | |
| | | | | | | | | |
Ratios and supplemental data: | | | | | | | | | | | | | | | | | | | | | | | | | | | | | | | | | | | | |
Net assets, end of period | | $ | 2,081,631 | | | | | | | $ | 2,171,329 | | | | | | | $ | 1,740,775 | | | | | | | $ | 2,977,572 | | | | | | | $ | 3,107,948 | |
Ratios to average net assets: | | | | | | | | | | | | | | | | | | | | | | | | | | | | | | | | | | | | |
Expenses, before reimbursements and/or recoupments | | | 1.95 | % | | | | | | | 1.97 | % | | | | | | | 1.97 | % | | | | | | | 1.98 | % | | | | | | | 1.96 | % |
Expenses, net of reimbursements and/or recoupments | | | 1.94 | % | | | | | | | 1.94 | % | | | | | | | 1.94 | % | | | | | | | 1.94 | % | | | | | | | 1.94 | %B |
Net investment (loss), before expense reimbursements and/or recoupments | | | (1.33 | )% | | | | | | | (1.34 | )% | | | | | | | (1.31 | )% | | | | | | | (1.65 | )% | | | | | | | (1.57 | )% |
Net investment (loss), net of reimbursements and/or recoupments | | | (1.32 | )% | | | | | | | (1.31 | )% | | | | | | | (1.28 | )% | | | | | | | (1.61 | )% | | | | | | | (1.55 | )% |
Portfolio turnover rate | | | 24 | % | | | | | | | 16 | % | | | | | | | 20 | % | | | | | | | 28 | % | | | | | | | 22 | % |
| A | Based on net asset value, which does not reflect the sales charge, redemption fee, or contingent deferred sales charge, if applicable. May include adjustments in accordance with U.S. GAAP and as such, the net asset value for reporting purposes and the returns based upon those net asset values may differ from the net asset value and returns for shareholder transactions. |
| B | Expense ratios may exceed stated expense caps in Note 2 due to security lending expenses, which are not reimbursable under the agreement with the Manager. |
See accompanying notes
39
American Beacon Stephens Mid-Cap Growth FundSM
Financial Highlights
(For a share outstanding throughout the period)
| | | | | | | | | | | | | | | | | | | | | | | | | | | | | | | | | | | | |
| | | R6 Class | |
| | | Year Ended December 31, | |
| | | 2024 | | | | | | 2023 | | | | | | 2022 | | | | | | 2021 | | | | | | 2020 | |
| | | | |
Net asset value, beginning of period | | $ | 35.12 | | | | | | | $ | 27.97 | | | | | | | $ | 39.94 | | | | | | | $ | 37.70 | | | | | | | $ | 27.18 | |
| | | | | | | | | | | | | | | | | | | | | | | | | | | | | | | | | | | | |
Income (loss) from investment operations: | | | | | | | | | | | | | | | | | | | | | | | | | | | | | | | | | | | | |
Net investment (loss) | | | (0.03 | ) | | | | | | | (0.10 | )A | | | | | | | (0.23 | ) | | | | | | | (0.14 | ) | | | | | | | (0.06 | ) |
Net gains (losses) on investments (both realized and unrealized) | | | 4.76 | | | | | | | | 7.25 | | | | | | | | (10.97 | ) | | | | | | | 4.81 | | | | | | | | 11.03 | |
| | | | | | | | | | | | | | | | | | | | | | | | | | | | | | | | | | | | |
Total income (loss) from investment operations | | | 4.73 | | | | | | | | 7.15 | | | | | | | | (11.20 | ) | | | | | | | 4.67 | | | | | | | | 10.97 | |
| | | | | | | | | | | | | | | | | | | | | | | | | | | | | | | | | | | | |
Less distributions: | | | | | | | | | | | | | | | | | | | | | | | | | | | | | | | | | | | | |
Distributions from net realized gains | | | (1.48 | ) | | | | | | | - | | | | | | | | (0.77 | ) | | | | | | | (2.43 | ) | | | | | | | (0.45 | ) |
| | | | | | | | | | | | | | | | | | | | | | | | | | | | | | | | | | | | |
Total distributions | | | (1.48 | ) | | | | | | | - | | | | | | | | (0.77 | ) | | | | | | | (2.43 | ) | | | | | | | (0.45 | ) |
| | | | | | | | | | | | | | | | | | | | | | | | | | | | | | | | | | | | |
Net asset value, end of period | | $ | 38.37 | | | | | | | $ | 35.12 | | | | | | | $ | 27.97 | | | | | | | $ | 39.94 | | | | | | | $ | 37.70 | |
| | | | | | | | | | | | | | | | | | | | | | | | | | | | | | | | | | | | |
Total returnA | | | 13.39 | % | | | | | | | 25.56 | % | | | | | | | (28.04 | )% | | | | | | | 12.47 | % | | | | | | | 40.36 | % |
| | | | | | | | | | | | | | | | | | | | | | | | | | | | | | | | | | | | |
| | | | | | | | | |
Ratios and supplemental data: | | | | | | | | | | | | | | | | | | | | | | | | | | | | | | | | | | | | |
Net assets, end of period | | $ | 36,141,001 | | | | | | | $ | 29,391,234 | | | | | | | $ | 24,219,148 | | | | | | | $ | 55,701,734 | | | | | | | $ | 37,373,802 | |
Ratios to average net assets: | | | | | | | | | | | | | | | | | | | | | | | | | | | | | | | | | | | | |
Expenses, before reimbursements and/or recoupments | | | 0.88 | % | | | | | | | 0.89 | % | | | | | | | 0.89 | % | | | | | | | 0.88 | % | | | | | | | 0.90 | % |
Expenses, net of reimbursements and/or recoupments | | | 0.88 | % | | | | | | | 0.88 | % | | | | | | | 0.89 | % | | | | | | | 0.87 | % | | | | | | | 0.84 | %B |
Net investment (loss), before expense reimbursements and/or recoupments | | | (0.26 | )% | | | | | | | (0.26 | )% | | | | | | | (0.26 | )% | | | | | | | (0.50 | )% | | | | | | | (0.49 | )% |
Net investment (loss), net of reimbursements and/or recoupments | | | (0.26 | )% | | | | | | | (0.25 | )% | | | | | | | (0.26 | )% | | | | | | | (0.49 | )% | | | | | | | (0.43 | )% |
Portfolio turnover rate | | | 24 | % | | | | | | | 16 | % | | | | | | | 20 | % | | | | | | | 28 | % | | | | | | | 22 | % |
| A | Based on net asset value, which does not reflect the sales charge, redemption fee, or contingent deferred sales charge, if applicable. May include adjustments in accordance with U.S. GAAP and as such, the net asset value for reporting purposes and the returns based upon those net asset values may differ from the net asset value and returns for shareholder transactions. |
| B | Expense ratios may exceed stated expense caps in Note 2 due to security lending expenses, which are not reimbursable under the agreement with the Manager. |
See accompanying notes
40
American Beacon Stephens Small Cap Growth FundSM
Financial Highlights
(For a share outstanding throughout the period)
| | | | | | | | | | | | | | | | | | | | | | | | | | | | | | | | | | | | |
| | | R5 ClassA | |
| | | Year Ended December 31, | |
| | | 2024 | | | | | | 2023 | | | | | | 2022 | | | | | | 2021 | | | | | | 2020 | |
| | | | |
Net asset value, beginning of period | | $ | 13.74 | | | | | | | $ | 11.64 | | | | | | | $ | 18.31 | | | | | | | $ | 19.27 | | | | | | | $ | 15.40 | |
| | | | | | | | | | | | | | | | | | | | | | | | | | | | | | | | | | | | |
Income (loss) from investment operations: | | | | | | | | | | | | | | | | | | | | | | | | | | | | | | | | | | | | |
Net investment (loss) | | | (0.07 | )B | | | | | | | (0.09 | ) | | | | | | | (0.17 | )C | | | | | | | (0.17 | )B | | | | | | | (0.31 | )D |
Net gains (losses) on investments (both realized and unrealized) | | | 2.23 | | | | | | | | 2.36 | | | | | | | | (5.06 | ) | | | | | | | 2.89 | | | | | | | | 6.11 | |
| | | | | | | | | | | | | | | | | | | | | | | | | | | | | | | | | | | | |
Total income (loss) from investment operations | | | 2.16 | | | | | | | | 2.27 | | | | | | | | (5.23 | ) | | | | | | | 2.72 | | | | | | | | 5.80 | |
| | | | | | | | | | | | | | | | | | | | | | | | | | | | | | | | | | | | |
Less distributions: | | | | | | | | | | | | | | | | | | | | | | | | | | | | | | | | | | | | |
Distributions from net realized gains | | | (0.99 | ) | | | | | | | (0.17 | ) | | | | | | | (1.44 | ) | | | | | | | (3.68 | ) | | | | | | | (1.93 | ) |
| | | | | | | | | | | | | | | | | | | | | | | | | | | | | | | | | | | | |
Total distributions | | | (0.99 | ) | | | | | | | (0.17 | ) | | | | | | | (1.44 | ) | | | | | | | (3.68 | ) | | | | | | | (1.93 | ) |
| | | | | | | | | | | | | | | | | | | | | | | | | | | | | | | | | | | | |
Net asset value, end of period | | $ | 14.91 | | | | | | | $ | 13.74 | | | | | | | $ | 11.64 | | | | | | | $ | 18.31 | | | | | | | $ | 19.27 | |
| | | | | | | | | | | | | | | | | | | | | | | | | | | | | | | | | | | | |
Total returnE | | | 15.69 | % | | | | | | | 19.51 | % | | | | | | | (28.50 | )% | | | | | | | 14.34 | % | | | | | | | 37.56 | % |
| | | | | | | | | | | | | | | | | | | | | | | | | | | | | | | | | | | | |
| | | | | | | | | |
Ratios and supplemental data: | | | | | | | | | | | | | | | | | | | | | | | | | | | | | | | | | | | | |
Net assets, end of period | | $ | 220,665,620 | | | | | | | $ | 195,356,581 | | | | | | | $ | 167,776,189 | | | | | | | $ | 280,613,603 | | | | | | | $ | 261,976,294 | |
Ratios to average net assets: | | | | | | | | | | | | | | | | | | | | | | | | | | | | | | | | | | | | |
Expenses, before reimbursements and/or recoupments | | | 1.08 | % | | | | | | | 1.09 | % | | | | | | | 1.08 | % | | | | | | | 1.04 | % | | | | | | | 1.05 | % |
Expenses, net of reimbursements and/or recoupments | | | 0.99 | % | | | | | | | 0.99 | % | | | | | | | 0.99 | % | | | | | | | 0.99 | % | | | | | | | 0.99 | %F |
Net investment (loss), before expense reimbursements and/or recoupments | | | (0.54 | )% | | | | | | | (0.61 | )% | | | | | | | (0.70 | )%C | | | | | | | (0.86 | )% | | | | | | | (0.82 | )%D |
Net investment (loss), net of reimbursements and/or recoupments | | | (0.45 | )% | | | | | | | (0.51 | )% | | | | | | | (0.61 | )%C | | | | | | | (0.81 | )% | | | | | | | (0.76 | )%D |
Portfolio turnover rate | | | 37 | % | | | | | | | 15 | % | | | | | | | 27 | % | | | | | | | 28 | % | | | | | | | 18 | % |
| A | Prior to February 28, 2020, the R5 Class was known as Institutional Class. |
| B | Per share amounts have been calculated using the average shares method. |
| C | Net investment income includes a significant dividend payment from Viper Energy Partners LP and Wingstop, Inc. amounting to $0.0132. |
| D | Net investment income includes a significant dividend payment from Wingstop, Inc. amounting to $0.0083. |
| E | Based on net asset value, which does not reflect the sales charge, redemption fee, or contingent deferred sales charge, if applicable. May include adjustments in accordance with U.S. GAAP and as such, the net asset value for reporting purposes and the returns based upon those net asset values may differ from the net asset value and returns for shareholder transactions. |
| F | Expense ratios may exceed stated expense caps in Note 2 due to security lending expenses, which are not reimbursable under the agreement with the Manager. |
See accompanying notes
41
American Beacon Stephens Small Cap Growth FundSM
Financial Highlights
(For a share outstanding throughout the period)
| | | | | | | | | | | | | | | | | | | | | | | | | | | | | | | | | | | | |
| | | Y Class | |
| | | Year Ended December 31, | |
| | | 2024 | | | | | | 2023 | | | | | | 2022 | | | | | | 2021 | | | | | | 2020 | |
| | | | |
Net asset value, beginning of period | | $ | 13.49 | | | | | | | $ | 11.44 | | | | | | | $ | 18.04 | | | | | | | $ | 19.05 | | | | | | | $ | 15.24 | |
| | | | | | | | | | | | | | | | | | | | | | | | | | | | | | | | | | | | |
Income (loss) from investment operations: | | | | | | | | | | | | | | | | | | | | | | | | | | | | | | | | | | | | |
Net investment (loss) | | | (0.07 | )A | | | | | | | (0.24 | ) | | | | | | | (0.96 | )B | | | | | | | (0.13 | ) | | | | | | | (0.56 | )C |
Net gains (losses) on investments (both realized and unrealized) | | | 2.18 | | | | | | | | 2.46 | | | | | | | | (4.20 | ) | | | | | | | 2.80 | | | | | | | | 6.30 | |
| | | | | | | | | | | | | | | | | | | | | | | | | | | | | | | | | | | | |
Total income (loss) from investment operations | | | 2.11 | | | | | | | | 2.22 | | | | | | | | (5.16 | ) | | | | | | | 2.67 | | | | | | | | 5.74 | |
| | | | | | | | | | | | | | | | | | | | | | | | | | | | | | | | | | | | |
Less distributions: | | | | | | | | | | | | | | | | | | | | | | | | | | | | | | | | | | | | |
Distributions from net realized gains | | | (0.99 | ) | | | | | | | (0.17 | ) | | | | | | | (1.44 | ) | | | | | | | (3.68 | ) | | | | | | | (1.93 | ) |
| | | | | | | | | | | | | | | | | | | | | | | | | | | | | | | | | | | | |
Total distributions | | | (0.99 | ) | | | | | | | (0.17 | ) | | | | | | | (1.44 | ) | | | | | | | (3.68 | ) | | | | | | | (1.93 | ) |
| | | | | | | | | | | | | | | | | | | | | | | | | | | | | | | | | | | | |
Net asset value, end of period | | $ | 14.61 | | | | | | | $ | 13.49 | | | | | | | $ | 11.44 | | | | | | | $ | 18.04 | | | | | | | $ | 19.05 | |
| | | | | | | | | | | | | | | | | | | | | | | | | | | | | | | | | | | | |
Total returnD | | | 15.61 | % | | | | | | | 19.42 | % | | | | | | | (28.54 | )% | | | | | | | 14.23 | % | | | | | | | 37.56 | % |
| | | | | | | | | | | | | | | | | | | | | | | | | | | | | | | | | | | | |
| | | | | | | | | |
Ratios and supplemental data: | | | | | | | | | | | | | | | | | | | | | | | | | | | | | | | | | | | | |
Net assets, end of period | | $ | 44,637,961 | | | | | | | $ | 28,695,634 | | | | | | | $ | 25,622,348 | | | | | | | $ | 55,841,696 | | | | | | | $ | 58,341,053 | |
Ratios to average net assets: | | | | | | | | | | | | | | | | | | | | | | | | | | | | | | | | | | | | |
Expenses, before reimbursements and/or recoupments | | | 1.13 | % | | | | | | | 1.13 | % | | | | | | | 1.13 | % | | | | | | | 1.10 | % | | | | | | | 1.12 | % |
Expenses, net of reimbursements and/or recoupments | | | 1.05 | % | | | | | | | 1.05 | % | | | | | | | 1.05 | % | | | | | | | 1.05 | % | | | | | | | 1.06 | %E |
Net investment (loss), before expense reimbursements and/or recoupments | | | (0.59 | )% | | | | | | | (0.65 | )% | | | | | | | (0.75 | )%B | | | | | | | (0.88 | )% | | | | | | | (0.89 | )%C |
Net investment (loss), net of reimbursements and/or recoupments | | | (0.51 | )% | | | | | | | (0.57 | )% | | | | | | | (0.67 | )%B | | | | | | | (0.83 | )% | | | | | | | (0.83 | )%C |
Portfolio turnover rate | | | 37 | % | | | | | | | 15 | % | | | | | | | 27 | % | | | | | | | 28 | % | | | | | | | 18 | % |
| A | Per share amounts have been calculated using the average shares method. |
| B | Net investment income includes a significant dividend payment from Viper Energy Partners LP and Wingstop, Inc. amounting to $0.0152. |
| C | Net investment income includes a significant dividend payment from Wingstop, Inc. amounting to $0.0081. |
| D | Based on net asset value, which does not reflect the sales charge, redemption fee, or contingent deferred sales charge, if applicable. May include adjustments in accordance with U.S. GAAP and as such, the net asset value for reporting purposes and the returns based upon those net asset values may differ from the net asset value and returns for shareholder transactions. |
| E | Expense ratios may exceed stated expense caps in Note 2 due to security lending expenses, which are not reimbursable under the agreement with the Manager. |
See accompanying notes
42
American Beacon Stephens Small Cap Growth FundSM
Financial Highlights
(For a share outstanding throughout the period)
| | | | | | | | | | | | | | | | | | | | | | | | | | | | | | | | | | | | |
| | | Investor Class | |
| | | Year Ended December 31, | |
| | | 2024 | | | | | | 2023 | | | | | | 2022 | | | | | | 2021 | | | | | | 2020 | |
| | | | |
Net asset value, beginning of period | | $ | 11.27 | | | | | | | $ | 9.60 | | | | | | | $ | 15.51 | | | | | | | $ | 16.88 | | | | | | | $ | 13.70 | |
| | | | | | | | | | | | | | | | | | | | | | | | | | | | | | | | | | | | |
Income (loss) from investment operations: | | | | | | | | | | | | | | | | | | | | | | | | | | | | | | | | | | | | |
Net investment (loss) | | | (0.16 | ) | | | | | | | (0.09 | )A | | | | | | | (4.03 | )B | | | | | | | (0.04 | ) | | | | | | | (0.14 | )C |
Net gains (losses) on investments (both realized and unrealized) | | | 1.90 | | | | | | | | 1.93 | | | | | | | | (0.44 | ) | | | | | | | 2.35 | | | | | | | | 5.25 | |
| | | | | | | | | | | | | | | | | | | | | | | | | | | | | | | | | | | | |
Total income (loss) from investment operations | | | 1.74 | | | | | | | | 1.84 | | | | | | | | (4.47 | ) | | | | | | | 2.31 | | | | | | | | 5.11 | |
| | | | | | | | | | | | | | | | | | | | | | | | | | | | | | | | | | | | |
Less distributions: | | | | | | | | | | | | | | | | | | | | | | | | | | | | | | | | | | | | |
Distributions from net realized gains | | | (0.99 | ) | | | | | | | (0.17 | ) | | | | | | | (1.44 | ) | | | | | | | (3.68 | ) | | | | | | | (1.93 | ) |
| | | | | | | | | | | | | | | | | | | | | | | | | | | | | | | | | | | | |
Total distributions | | | (0.99 | ) | | | | | | | (0.17 | ) | | | | | | | (1.44 | ) | | | | | | | (3.68 | ) | | | | | | | (1.93 | ) |
| | | | | | | | | | | | | | | | | | | | | | | | | | | | | | | | | | | | |
Net asset value, end of period | | $ | 12.02 | | | | | | | $ | 11.27 | | | | | | | $ | 9.60 | | | | | | | $ | 15.51 | | | | | | | $ | 16.88 | |
| | | | | | | | | | | | | | | | | | | | | | | | | | | | | | | | | | | | |
Total returnD | | | 15.40 | % | | | | | | | 19.18 | % | | | | | | | (28.74 | )% | | | | | | | 13.93 | % | | | | | | | 37.18 | % |
| | | | | | | | | | | | | | | | | | | | | | | | | | | | | | | | | | | | |
| | | | | | | | | |
Ratios and supplemental data: | | | | | | | | | | | | | | | | | | | | | | | | | | | | | | | | | | | | |
Net assets, end of period | | $ | 36,158,013 | | | | | | | $ | 34,697,255 | | | | | | | $ | 14,745,379 | | | | | | | $ | 78,747,464 | | | | | | | $ | 78,610,201 | |
Ratios to average net assets: | | | | | | | | | | | | | | | | | | | | | | | | | | | | | | | | | | | | |
Expenses, before reimbursements and/or recoupments | | | 1.41 | % | | | | | | | 1.32 | % | | | | | | | 1.35 | % | | | | | | | 1.35 | % | | | | | | | 1.39 | % |
Expenses, net of reimbursements and/or recoupments | | | 1.27 | % | | | | | | | 1.28 | %E | | | | | | | 1.30 | % | | | | | | | 1.30 | % | | | | | | | 1.31 | %F |
Net investment (loss), before expense reimbursements and/or recoupments | | | (0.87 | )% | | | | | | | (0.87 | )% | | | | | | | (1.00 | )%B | | | | | | | (1.13 | )% | | | | | | | (1.15 | )%C |
Net investment (loss), net of reimbursements and/or recoupments | | | (0.73 | )% | | | | | | | (0.83 | )% | | | | | | | (0.95 | )%B | | | | | | | (1.08 | )% | | | | | | | (1.07 | )% |
Portfolio turnover rate | | | 37 | % | | | | | | | 15 | % | | | | | | | 27 | % | | | | | | | 28 | % | | | | | | | 18 | % |
| A | Per share amounts have been calculated using the average shares method. |
| B | Net investment income includes a significant dividend payment from Viper Energy Partners LP and Wingstop, Inc. amounting to $0.0146. |
| C | Net investment income includes a significant dividend payment from Wingstop, Inc. amounting to $0.0074. |
| D | Based on net asset value, which does not reflect the sales charge, redemption fee, or contingent deferred sales charge, if applicable. May include adjustments in accordance with U.S. GAAP and as such, the net asset value for reporting purposes and the returns based upon those net asset values may differ from the net asset value and returns for shareholder transactions. |
| E | Expense ratios may exceed stated expense caps in Note 2 due to the change in the contractual expense caps on May 1, 2023. |
| F | Expense ratios may exceed stated expense caps in Note 2 due to security lending expenses, which are not reimbursable under the agreement with the Manager. |
See accompanying notes
43
American Beacon Stephens Small Cap Growth FundSM
Financial Highlights
(For a share outstanding throughout the period)
| | | | | | | | | | | | | | | | | | | | | | | | | | | | | | | | | | | | |
| | | A Class | |
| | | Year Ended December 31, | |
| | | 2024 | | | | | | 2023 | | | | | | 2022 | | | | | | 2021 | | | | | | 2020 | |
| | | | |
Net asset value, beginning of period | | $ | 11.01 | | | | | | | $ | 9.38 | | | | | | | $ | 15.20 | | | | | | | $ | 16.60 | | | | | | | $ | 13.49 | |
| | | | | | | | | | | | | | | | | | | | | | | | | | | | | | | | | | | | |
Income (loss) from investment operations: | | | | | | | | | | | | | | | | | | | | | | | | | | | | | | | | | | | | |
Net investment (loss) | | | (0.67 | ) | | | | | | | (1.72 | ) | | | | | | | (0.10 | )A B | | | | | | | (0.19 | )A | | | | | | | (0.15 | )A C |
Net gains (losses) on investments (both realized and unrealized) | | | 2.36 | | | | | | | | 3.52 | | | | | | | | (4.28 | ) | | | | | | | 2.47 | | | | | | | | 5.19 | |
| | | | | | | | | | | | | | | | | | | | | | | | | | | | | | | | | | | | |
Total income (loss) from investment operations | | | 1.69 | | | | | | | | 1.80 | | | | | | | | (4.38 | ) | | | | | | | 2.28 | | | | | | | | 5.04 | |
| | | | | | | | | | | | | | | | | | | | | | | | | | | | | | | | | | | | |
Less distributions: | | | | | | | | | | | | | | | | | | | | | | | | | | | | | | | | | | | | |
Distributions from net realized gains | | | (0.99 | ) | | | | | | | (0.17 | ) | | | | | | | (1.44 | ) | | | | | | | (3.68 | ) | | | | | | | (1.93 | ) |
| | | | | | | | | | | | | | | | | | | | | | | | | | | | | | | | | | | | |
Total distributions | | | (0.99 | ) | | | | | | | (0.17 | ) | | | | | | | (1.44 | ) | | | | | | | (3.68 | ) | | | | | | | (1.93 | ) |
| | | | | | | | | | | | | | | | | | | | | | | | | | | | | | | | | | | | |
Net asset value, end of period | | $ | 11.71 | | | | | | | $ | 11.01 | | | | | | | $ | 9.38 | | | | | | | $ | 15.20 | | | | | | | $ | 16.60 | |
| | | | | | | | | | | | | | | | | | | | | | | | | | | | | | | | | | | | |
Total returnD | | | 15.31 | % | | | | | | | 19.20 | % | | | | | | | (28.74 | )% | | | | | | | 13.99 | % | | | | | | | 37.25 | % |
| | | | | | | | | | | | | | | | | | | | | | | | | | | | | | | | | | | | |
| | | | | | | | | |
Ratios and supplemental data: | | | | | | | | | | | | | | | | | | | | | | | | | | | | | | | | | | | | |
Net assets, end of period | | $ | 4,771,737 | | | | | | | $ | 5,696,802 | | | | | | | $ | 22,160,000 | | | | | | | $ | 7,203,359 | | | | | | | $ | 6,575,393 | |
Ratios to average net assets: | | | | | | | | | | | | | | | | | | | | | | | | | | | | | | | | | | | | |
Expenses, before reimbursements and/or recoupments | | | 1.56 | % | | | | | | | 1.48 | % | | | | | | | 1.43 | % | | | | | | | 1.38 | % | | | | | | | 1.35 | % |
Expenses, net of reimbursements and/or recoupments | | | 1.28 | % | | | | | | | 1.28 | % | | | | | | | 1.28 | % | | | | | | | 1.28 | % | | | | | | | 1.28 | %E |
Net investment (loss), before expense reimbursements and/or recoupments | | | (1.02 | )% | | | | | | | (0.98 | )% | | | | | | | (1.03 | )%B | | | | | | | (1.18 | )% | | | | | | | (1.11 | )%C |
Net investment (loss), net of reimbursements and/or recoupments | | | (0.74 | )% | | | | | | | (0.78 | )% | | | | | | | (0.88 | )%B | | | | | | | (1.08 | )% | | | | | | | (1.04 | )%C |
Portfolio turnover rate | | | 37 | % | | | | | | | 15 | % | | | | | | | 27 | % | | | | | | | 28 | % | | | | | | | 18 | % |
| A | Per share amounts have been calculated using the average shares method. |
| B | Net investment income includes a significant dividend payment from Viper Energy Partners LP and Wingstop, Inc. amounting to $0.0115. |
| C | Net investment income includes a significant dividend payment from Wingstop, Inc. amounting to $0.0078. |
| D | Based on net asset value, which does not reflect the sales charge, redemption fee, or contingent deferred sales charge, if applicable. May include adjustments in accordance with U.S. GAAP and as such, the net asset value for reporting purposes and the returns based upon those net asset values may differ from the net asset value and returns for shareholder transactions. |
| E | Expense ratios may exceed stated expense caps in Note 2 due to security lending expenses, which are not reimbursable under the agreement with the Manager. |
See accompanying notes
44
American Beacon Stephens Small Cap Growth FundSM
Financial Highlights
(For a share outstanding throughout the period)
| | | | | | | | | | | | | | | | | | | | | | | | | | | | | | | | | | | | |
| | | C Class | |
| | | Year Ended December 31, | |
| | | 2024 | | | | | | 2023 | | | | | | 2022 | | | | | | 2021 | | | | | | 2020 | |
| | | | |
Net asset value, beginning of period | | $ | 8.79 | | | | | | | $ | 7.58 | | | | | | | $ | 12.91 | | | | | | | $ | 14.63 | | | | | | | $ | 12.15 | |
| | | | | | | | | | | | | | | | | | | | | | | | | | | | | | | | | | | | |
Income (loss) from investment operations: | | | | | | | | | | | | | | | | | | | | | | | | | | | | | | | | | | | | |
Net investment (loss) | | | (0.14 | )A | | | | | | | (0.13 | )A | | | | | | | (1.65 | )B | | | | | | | (0.53 | ) | | | | | | | (1.69 | )C |
Net gains (losses) on investments (both realized and unrealized) | | | 1.42 | | | | | | | | 1.51 | | | | | | | | (2.24 | ) | | | | | | | 2.49 | | | | | | | | 6.10 | |
| | | | | | | | | | | | | | | | | | | | | | | | | | | | | | | | | | | | |
Total income (loss) from investment operations | | | 1.28 | | | | | | | | 1.38 | | | | | | | | (3.89 | ) | | | | | | | 1.96 | | | | | | | | 4.41 | |
| | | | | | | | | | | | | | | | | | | | | | | | | | | | | | | | | | | | |
Less distributions: | | | | | | | | | | | | | | | | | | | | | | | | | | | | | | | | | | | | |
Distributions from net realized gains | | | (0.99 | ) | | | | | | | (0.17 | ) | | | | | | | (1.44 | ) | | | | | | | (3.68 | ) | | | | | | | (1.93 | ) |
| | | | | | | | | | | | | | | | | | | | | | | | | | | | | | | | | | | | |
Total distributions | | | (0.99 | ) | | | | | | | (0.17 | ) | | | | | | | (1.44 | ) | | | | | | | (3.68 | ) | | | | | | | (1.93 | ) |
| | | | | | | | | | | | | | | | | | | | | | | | | | | | | | | | | | | | |
Net asset value, end of period | | $ | 9.08 | | | | | | | $ | 8.79 | | | | | | | $ | 7.58 | | | | | | | $ | 12.91 | | | | | | | $ | 14.63 | |
| | | | | | | | | | | | | | | | | | | | | | | | | | | | | | | | | | | | |
Total returnD | | | 14.51 | % | | | | | | | 18.22 | % | | | | | | | (30.04 | )% | | | | | | | 12.91 | % | | | | | | | 36.16 | % |
| | | | | | | | | | | | | | | | | | | | | | | | | | | | | | | | | | | | |
| | | | | | | | | |
Ratios and supplemental data: | | | | | | | | | | | | | | | | | | | | | | | | | | | | | | | | | | | | |
Net assets, end of period | | $ | 817,857 | | | | | | | $ | 676,861 | | | | | | | $ | 262,215 | | | | | | | $ | 566,124 | | | | | | | $ | 675,112 | |
Ratios to average net assets: | | | | | | | | | | | | | | | | | | | | | | | | | | | | | | | | | | | | |
Expenses, before reimbursements and/or recoupments | | | 2.14 | % | | | | | | | 2.16 | % | | | | | | | 2.17 | % | | | | | | | 2.24 | % | | | | | | | 2.15 | % |
Expenses, net of reimbursements and/or recoupments | | | 2.06 | % | | | | | | | 2.06 | % | | | | | | | 2.06 | % | | | | | | | 2.06 | % | | | | | | | 2.06 | %E |
Net investment (loss), before expense reimbursements and/or recoupments | | | (1.60 | )% | | | | | | | (1.68 | )% | | | | | | | (1.79 | )%B | | | | | | | (2.04 | )% | | | | | | | (1.93 | )%C |
Net investment (loss), net of reimbursements and/or recoupments | | | (1.52 | )% | | | | | | | (1.58 | )% | | | | | | | (1.68 | )%B | | | | | | | (1.86 | )% | | | | | | | (1.84 | )%C |
Portfolio turnover rate | | | 37 | % | | | | | | | 15 | % | | | | | | | 27 | % | | | | | | | 28 | % | | | | | | | 18 | % |
| A | Per share amounts have been calculated using the average shares method. |
| B | Net investment income includes a significant dividend payment from Viper Energy Partners LP and Wingstop, Inc. amounting to $0.0104. |
| C | Net investment income includes a significant dividend payment from Wingstop, Inc. amounting to $0.0063. |
| D | Based on net asset value, which does not reflect the sales charge, redemption fee, or contingent deferred sales charge, if applicable. May include adjustments in accordance with U.S. GAAP and as such, the net asset value for reporting purposes and the returns based upon those net asset values may differ from the net asset value and returns for shareholder transactions. |
| E | Expense ratios may exceed stated expense caps in Note 2 due to security lending expenses, which are not reimbursable under the agreement with the Manager. |
See accompanying notes
45
American Beacon Stephens Small Cap Growth FundSM
Financial Highlights
(For a share outstanding throughout the period)
| | | | | | | | | | | | | | | | | | | | | | | | | | | | | | | | | | | | |
| | | R6 Class | |
| | | Year Ended December 31, | |
| | | 2024 | | | | | | 2023 | | | | | | 2022 | | | | | | 2021 | | | | | | 2020 | |
| | | | |
Net asset value, beginning of period | | $ | 13.77 | | | | | | | $ | 11.67 | | | | | | | $ | 18.34 | | | | | | | $ | 19.30 | | | | | | | $ | 15.40 | |
| | | | | | | | | | | | | | | | | | | | | | | | | | | | | | | | | | | | |
Income (loss) from investment operations: | | | | | | | | | | | | | | | | | | | | | | | | | | | | | | | | | | | | |
Net investment (loss) | | | (0.07 | ) | | | | | | | (0.04 | ) | | | | | | | (0.08 | )A B | | | | | | | (0.11 | ) | | | | | | | (0.08 | )C |
Net gains (losses) on investments (both realized and unrealized) | | | 2.24 | | | | | | | | 2.31 | | | | | | | | (5.15 | ) | | | | | | | 2.83 | | | | | | | | 5.91 | |
| | | | | | | | | | | | | | | | | | | | | | | | | | | | | | | | | | | | |
Total income (loss) from investment operations | | | 2.17 | | | | | | | | 2.27 | | | | | | | | (5.23 | ) | | | | | | | 2.72 | | | | | | | | 5.83 | |
| | | | | | | | | | | | | | | | | | | | | | | | | | | | | | | | | | | | |
Less distributions: | | | | | | | | | | | | | | | | | | | | | | | | | | | | | | | | | | | | |
Distributions from net realized gains | | | (0.99 | ) | | | | | | | (0.17 | ) | | | | | | | (1.44 | ) | | | | | | | (3.68 | ) | | | | | | | (1.93 | ) |
| | | | | | | | | | | | | | | | | | | | | | | | | | | | | | | | | | | | |
Total distributions | | | (0.99 | ) | | | | | | | (0.17 | ) | | | | | | | (1.44 | ) | | | | | | | (3.68 | ) | | | | | | | (1.93 | ) |
| | | | | | | | | | | | | | | | | | | | | | | | | | | | | | | | | | | | |
Net asset value, end of period | | $ | 14.95 | | | | | | | $ | 13.77 | | | | | | | $ | 11.67 | | | | | | | $ | 18.34 | | | | | | | $ | 19.30 | |
| | | | | | | | | | | | | | | | | | | | | | | | | | | | | | | | | | | | |
Total returnD | | | 15.73 | % | | | | | | | 19.46 | % | | | | | | | (28.45 | )% | | | | | | | 14.30 | % | | | | | | | 37.76 | % |
| | | | | | | | | | | | | | | | | | | | | | | | | | | | | | | | | | | | |
| | | | | | | | | |
Ratios and supplemental data: | | | | | | | | | | | | | | | | | | | | | | | | | | | | | | | | | | | | |
Net assets, end of period | | $ | 57,330,991 | | | | | | | $ | 51,853,392 | | | | | | | $ | 38,307,599 | | | | | | | $ | 21,521,147 | | | | | | | $ | 17,036,408 | |
Ratios to average net assets: | | | | | | | | | | | | | | | | | | | | | | | | | | | | | | | | | | | | |
Expenses, before reimbursements and/or recoupments | | | 1.04 | % | | | | | | | 1.05 | % | | | | | | | 1.04 | % | | | | | | | 1.01 | % | | | | | | | 1.02 | % |
Expenses, net of reimbursements and/or recoupments | | | 0.96 | % | | | | | | | 0.96 | % | | | | | | | 0.96 | % | | | | | | | 0.96 | % | | | | | | | 0.95 | %E |
Net investment (loss), before expense reimbursements and/or recoupments | | | (0.48 | )% | | | | | | | (0.57 | )% | | | | | | | (0.63 | )%B | | | | | | | (0.80 | )% | | | | | | | (0.76 | )%C |
Net investment (loss), net of reimbursements and/or recoupments | | | (0.40 | )% | | | | | | | (0.48 | )% | | | | | | | (0.55 | )%B | | | | | | | (0.75 | )% | | | | | | | (0.69 | )%C |
Portfolio turnover rate | | | 37 | % | | | | | | | 15 | % | | | | | | | 27 | % | | | | | | | 28 | % | | | | | | | 18 | % |
| A | Per share amounts have been calculated using the average shares method. |
| B | Net investment income includes a significant dividend payment from Viper Energy Partners LP and Wingstop, Inc. amounting to $0.0141. |
| C | Net investment income includes a significant dividend payment from Wingstop, Inc. amounting to $0.0084. |
| D | Based on net asset value, which does not reflect the sales charge, redemption fee, or contingent deferred sales charge, if applicable. May include adjustments in accordance with U.S. GAAP and as such, the net asset value for reporting purposes and the returns based upon those net asset values may differ from the net asset value and returns for shareholder transactions. |
| E | Expense ratios may exceed stated expense caps in Note 2 due to security lending expenses, which are not reimbursable under the agreement with the Manager. |
See accompanying notes
46
American Beacon FundsSM
Federal Tax Information
December 31, 2024 (Unaudited)
Certain tax information regarding the Funds is required to be provided to shareholders based upon the Funds’ income and distributions for the taxable year ended December 31, 2024. The information and distributions reported herein may differ from information and distributions taxable to the shareholders for the calendar year ended December 31, 2024.
The Funds designated the following items with regard to distributions paid during the fiscal year ended December 31, 2024. All designations are based on financial information available as of this annual report and, accordingly, are subject to change. For each item, it is the intention of the Funds to designate the maximum amount permitted under the Internal Revenue Code of 1986, as amended, and the regulations there under.
Corporate Dividends-Received Deduction:
| | | | |
Stephens Mid-Cap Growth | | | 0.00 | % |
Stephens Small Cap Growth | | | 0.00 | % |
Qualified Dividend Income:
| | | | |
Stephens Mid-Cap Growth | | | 0.00 | % |
Stephens Small Cap Growth | | | 0.00 | % |
Long-Term Capital Gain Distributions:
| | | | |
Stephens Mid-Cap Growth | | $ | 32,848,834 | |
Stephens Small Cap Growth | | $ | 26,092,222 | |
Short-Term Capital Gain Distributions:
| | | | |
Stephens Mid-Cap Growth | | $ | 0 | |
Stephens Small Cap Growth | | $ | 0 | |
Shareholders received notification in January 2025 of the applicable tax information necessary to prepare their 2024 income tax returns.
47

Delivery of Documents
If you invest in the Fund through a financial institution, you may be able to receive the Fund’s regulatory mailings, such as the Prospectus, Annual Report, Semi-Annual Report and Financial Statement Reports, by e-mail. If you are interested in this option, please go to www.icsdelivery.com and search for your financial institution’s name or contact your financial institution directly.
You may request a paper copy of this document at no charge by contacting your financial institution. This document is also available for download at www.americanbeaconfunds.com or you can request an electronic copy by contacting your financial institution.
To obtain more information about the Fund:
| | |
 | |  |
| | |
| By E-mail: | | On the Internet: |
| american_beacon.funds@ambeacon.com | | Visit our website at www.americanbeaconfunds.com |
| | | |
| | | |
| | |

By Telephone: Call (800) 658-5811 | | 
By Mail: American Beacon Funds P.O. Box 219643 Kansas City, MO 64121-9643 |
|
|
|
| | | |
Fund Service Providers:
| | | | | | | | | | | | |
CUSTODIAN State Street Bank and Trust Company Boston, Massachusetts | | | | TRANSFER AGENT SS&C GIDS, Inc. Quincy, Massachusetts | | | | INDEPENDENT REGISTERED PUBLIC ACCOUNTING FIRM PricewaterhouseCoopers LLP Boston, Massachusetts | | | | DISTRIBUTOR Resolute Investment Distributors, Inc. Irving, Texas |
This report is prepared for shareholders of the American Beacon Funds and may be distributed to others only if preceded or accompanied by a current Prospectus or Summary Prospectus.
American Beacon Funds, American Beacon Stephens Mid-Cap Growth Fund and American Beacon Stephens Small Cap Growth Fund are service marks of American Beacon Advisors, Inc.
AR 12/24
Item 8. Changes in and Disagreements with Accountants for Open-End Management Investment Companies
Not applicable.
Item 9. Proxy Disclosures for Open-End Management Investment Companies
Not applicable.
Item 10. Renumeration Paid to Directors, Officers, and Others of Open-End Management Investment Companies
The remuneration paid to directors, officers and others is included as part of the report to stockholders filed under Item 7 of this Form.
Item 11. Statement Regarding Basis for Approval of Investment Advisory Contract
Not applicable.
Item 12. Disclosure of Proxy Voting Policies and Procedures for Closed-End Management Investment Companies
Not applicable.
Item 13. Portfolio Managers of Closed-End Management Investment Companies
Not applicable.
Item 14. Purchase of Equity Securities by Closed-End Management Investment Company and Affiliated Purchasers
Not applicable.
Item 15. Submission of Matters to a Vote of Security Holders
The registrant has made no material changes to the procedures by which shareholders may recommend nominees to the Trust’s Board of Trustees.
Item 16. Controls and Procedures
(a) The registrant’s principal executive officer and principal financial officer have reviewed the registrant’s disclosure controls and procedures (as defined in Rule 30a-3(c) under the Investment Company Act of 1940, as amended) as of a date within 90 days of the filing of this report as required by Rule 30a-3(b) under the Act and Rules 13a-15(b) or 15d-15(b) under the Securities Exchange Act of 1934. Based upon their review, such officers have concluded that the registrant’s disclosure controls and procedures are effective in ensuring that information required to be disclosed in the report is appropriately recorded, processed, summarized and reported and made know to them by others within the registrant and by the registrant’s service provider.
(b) The registrant’s principal executive officer and principal financial officer are aware of no changes in the registrant’s internal control over financial reporting (as defined in Rule 30a-3(d) under the Act) that occurred during the period covered by this report that has materially affected, or is reasonably likely to materially affect, the registrant’s internal control over financial reporting.
Item 17. Disclosure of Securities Lending Activities for Closed-End Management Investment Companies
Not Applicable.
Item 18. Recovery of Erroneously Awarded Compensation
Not Applicable.
Item 19. Exhibits
(a)(1) Filed herewith as EX-99.CODE ETH.
(a)(2) A separate certification for each principal executive officer and principal financial officer of the registrant as required by Rule 30a-2(a) under the Investment Company Act of 1940 (17 CFR 270.30a-2(a)) is attached hereto as EX-99.CERT.
(a)(3) Not applicable.
(a)(4) Not applicable.
(b) The certifications of each principal executive officer and principal financial officer pursuant to Rule 30a-2(b) under the Investment Company Act of 1940, as amended, (17 CFR 270.30a-2(b), Rule 13a-14(b) or Rule 15d-14(b)) are attached hereto as EX-99.906CERT.
SIGNATURES
Pursuant to the requirements of the Securities Exchange Act of 1934 and the Investment Company Act of 1940, the registrant has duly caused this report to be signed on its behalf by the undersigned, thereunto duly authorized.
(Registrant): American Beacon Funds
| | |
| By | | /s/ Gregory J. Stumm |
|
| Gregory J. Stumm |
| President |
| American Beacon Funds |
| Date: March 6, 2025 |
Pursuant to the requirements of the Securities Exchange Act of 1934 and the Investment Company Act of 1940, this report has been signed below by the following persons on behalf of the registrant and in the capacities and on the dates indicated.
| | |
| By | | /s/ Gregory J. Stumm |
|
| Gregory J. Stumm |
| President |
| American Beacon Funds |
| Date: March 6, 2025 |
| | |
| By | | /s/ Sonia L. Bates |
|
| Sonia L. Bates |
| Chief Accounting Officer and Treasurer |
| American Beacon Funds |
| Date: March 6, 2025 |