UNITED STATES
SECURITIES AND EXCHANGE COMMISSION
Washington, DC 20549
FORMN-CSR
CERTIFIED SHAREHOLDER REPORT OF REGISTERED
MANAGEMENT INVESTMENT COMPANIES
Investment Company Act file number811-04985
Templeton Emerging Markets Fund
(Exact name of registrant as specified in charter)
300 S.E. 2nd Street, Fort Lauderdale, FL 33301-1923
(Address of principal executive offices) (Zip code)
Craig S. Tyle, One Franklin Parkway, San Mateo, CA 94403-1906
(Name and address of agent for service)
Registrant’s telephone number, including area code: (954)527-7500
Date of fiscal year end: 8/31
Date of reporting period: 8/31/19
Item 1. Reports to Stockholders.
Internet Delivery of Fund Reports Unless You Request Paper Copies: Effective January 1, 2021, as permitted by the SEC, paper copies of the Fund’s shareholder reports will no longer be sent by mail, unless you specifically request them from the Fund or your financial intermediary. Instead, the reports will be made available on a website, and you will be notified by mail each time a report is posted and provided with a website link to access the report.
If you already elected to receive shareholder reports electronically, you will not be affected by this change and you need not take any action. If you have not signed up for electronic delivery, we would encourage you to join fellow shareholders who have. You may elect to receive shareholder reports and other communications electronically from the Fund by calling (800)416-5585 or by contacting your financial intermediary.
You may elect to continue to receive paper copies of all your future shareholder reports free of charge by contacting your financial intermediary or, if you invest directly with a Fund, calling (800)416-5585 to let the Fund know of your request. Your election to receive reports in paper will apply to all funds held in your account.
FRANKLIN TEMPLETON
Successful investing begins with ambition. And achievement only comes when you reach for it. That’s why we continually strive to deliver better outcomes for investors. No matter what your goals are, our deep, global investment expertise allows us to offer solutions that can help.
During our more than 70 years of experience, we’ve managed through all kinds of markets—up, down and those in between. We’re always preparing for what may come next. It’s because of this, combined with our strength as one of the world’s largest asset managers that we’ve earned the trust of millions of investors around the world.
| Visitfranklintempleton.com/investor/ products/products/closed-end-fundsfor fund updates, to access your account, | ||
| or to find helpful financial planning tools. | |
Not FDIC Insured
| | May Lose Value
| | No Bank Guarantee
| ||
| franklintempleton.com | Not part of the annual report | 1 | ||
Templeton Emerging Markets Fund
Dear Shareholder:
This annual report for Templeton Emerging Markets Fund covers the fiscal year ended August 31, 2019.
Your Fund’s Goal and Main Investments
The Fund seeks long-term capital appreciation by investing, under normal market conditions, at least 80% of its net assets in emerging country equity securities.
Performance Overview
The Fund posted cumulative total returns of +2.80% based on market price and +0.29% based on net asset value for the 12 months under review. You can find the Fund’s long-term performance data in the Performance Summary on page 6.
Performance data represent past performance, which does not guarantee future results. Investment return and principal value will fluctuate, and you may have a gain or loss when you sell your shares. Current performance may differ from figures shown.
Economic and Market Overview
Emerging market economies in general continued to grow faster than their developed market counterparts during the 12 months ended August 31, 2019. However, several countries’ growth rates dipped to multi-year lows. China’s economy slowed during the period, with growth in 2019’s second quarter reaching the lowest annual rate since 1992. Trade tensions with the U.S., soft global demand and weak investment levels weighed on the economy, while increased industrial production provided some support. Taiwan’s annual growth rate moderated to a multi-year low in 2018’s fourth quarter as a sluggish global economy and the U.S.-China trade dispute hurt the country’s exports. After holding steady in 2019’s first quarter, growth rebounded in the second quarter as exports recovered. South Korea’s economic growth accelerated in 2018’s fourth quarter before falling to a10-year low in 2019’s first quarter, mainly due to weak manufacturing activity and a decline in construction. Growth accelerated again in the second quarter, driven by utilities and services. India’s economy slowed throughout the period, with the annual growth rate hitting asix-year low in 2019’s second quarter due to slower growth in manufacturing, construction and consumer spending. Turning to
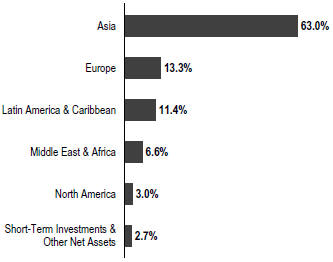
Geographic Composition
Based on Total Net Assets as of 8/31/19
Europe, Russia’s annual growth rate accelerated in 2018’s fourth quarter before slowing in 2019’s first quarter, due to weakness in the information, communication, and financial and insurance sectors, as well as contractions in other sectors, significantly real estate. Growth accelerated in the second quarter as several sectors, including real estate, rebounded. In Latin America, Brazil’s annual growth rate moderated in 2018’s third quarter and 2019’s first quarter before accelerating in 2019’s second quarter. Exports were an area of strength throughout the period.
The People’s Bank of China (PBOC) implemented an interest-rate reform in August, designating the loan prime rate as the new benchmark for household and business loans, effectively lowering interest rates. The PBOC also lowered its cash reserve requirement ratio for some banks in an effort to improve market liquidity. Taiwan’s central bank left its benchmark interest rate unchanged during the period, while South Korea’s central bank hiked its benchmark rate in the period’s first half and lowered it towardperiod-end. India’s central bank cut its benchmark rate four times to boost a slowing economy. Russia’s central bank raised its key rate twice, citing increased inflationary risks, and then cut it twice in response to slowing inflation growth and weaker-than-expected economic growth. In Latin America, Brazil’s central bank cut its benchmark interest rate once in response to inflation approaching its target range.
The dollar value, number of shares or principal amount, and names of all portfolio holdings are listed in the Fund’s Statement of Investments (SOI). The SOI begins on page 10.
2 | Annual Report | franklintempleton.com | ||
TEMPLETON EMERGING MARKETS FUND
Emerging market equities declined during the12-month period, lagging both developed and frontier market stocks. U.S.-China trade tensions, concerns about the global economy and the U.S. Federal Reserve’s (Fed’s) rate hikes in 2018 weighed on emerging markets, while the Fed’s more accommodative policy stance and rate cut in 2019 supported equities. Regionally, Asia posted negative returns, while Latin America and the Europe, Middle East and Africa (EMEA) region posted gains. Chinese equities fell largely due to the U.S.-China trade conflict, which escalated nearperiod-end with new tariffs. Concerns about China’s economic growth, perceived inadequate stimulus measures and the Hong Kong protests also hurt investor confidence. Equities in South Korea, India and Taiwan also declined. In EMEA, Russia posted large gains, boosted by periods of higher oil prices and an appreciation of the ruble. South African stocks declined, despite an increase in metal prices, due to investor concerns about government debt and anemic economic growth. Brazil led Latin America, aided by investors’ positive reaction to the election of President Jair Bolsonaro, who is viewed as market friendly. However, Argentina, Chile and Mexico posted double-digit percentage losses. In this environment, global emerging market stocks, as measured by the MSCI Emerging Markets Index, posted a-3.99% total return for the12-month period.1
Investment Strategy
Our investment strategy employs a fundamental, value-oriented, long-term approach. We focus on the market price of a company’s securities relative to our evaluation of the company’s long-term earnings, asset value and cash flow potential. As we look for investments, we focus on specific companies and undertakein-depth research to construct an action list from which we make our buy decisions. Before we make a purchase, we look at the company’s potential for earnings and growth over a five-year horizon. During our analysis, we also consider the company’s position in its sector, the economic framework and political environment.
Manager’s Discussion
During the 12 months under review, key contributors to the Fund’s absolute performance included Banco Bradesco, ICICI Bank and Compania de Minas Buenaventura.
Banco Bradesco is a leading Brazilian financial conglomerate. It operates across a wide range of segments,
Top 10 Countries
8/31/19
% of Total Net Assets | ||||
China | 24.5% | |||
South Korea | 15.8% | |||
Taiwan | 9.7% | |||
Russia | 8.7% | |||
Brazil | 8.6% | |||
India | 7.4% | |||
South Africa | 6.3% | |||
U.K. | 3.4% | |||
Thailand | 3.1% | |||
U.S. | 3.0% | |||
including asset management, insurance, wholesale banking, full retail operations, credit card, general corporate and personal lending. Banco Bradesco consistently delivered solid quarterly corporate results over the reporting period, benefiting from positive loan growth trends and decliningnon-performing loan ratios. Strong management guidance for 2019 further drove sentiment in the stock. Progress on a landmark pension reform bill that could substantially shore up Brazil’s fiscal situation and the victory of a more market-friendly candidate in the 2018 presidential elections also drove investor confidence in Brazilian equities, including Banco Bradesco.
ICICI Bank is one of the largest private-sector banks in India, which has one of the fastest growing banking systems in the world. The resolution of senior management transition issues and improvement in asset quality drove returns. The bank also reported decent first- and second-quarter 2019 operating results, including healthy growth in net interest income and loans. The bank also continued to strengthen its balance sheet and improve asset quality. Hopes for India’s central bank to improve liquidity and ease lending rules in the banking system also played a role. The bank’s strong retail franchise and extensive network continued to support investor confidence in the stock.
Buenaventura is Peru’s biggest publicly traded precious metals company and is engaged in the exploration, development, mining, processing and trading of gold, silver and base metals. Shares rose during the reporting period on the back of higher gold and silver prices. The company, however, continued to report weak quarterly results due to
1. Source: Morningstar.
The index is unmanaged and includes reinvestment of any income or distributions. It does not reflect any fees, expenses or sales charges. One cannot invest directly in an index, and an index is not representative of the Fund’s portfolio.
| franklintempleton.com | Annual Report | 3 | ||
TEMPLETON EMERGING MARKETS FUND
lower production volumes and higher costs. The rebound in share prices provided the Fund with an opportunity to sell out of this stock.
Conversely, major detractors included Brilliance China Automotive, Samsung Electronics and Massmart.
Brilliance China manufactures and sells automobiles for China’s domestic market, predominantly through its joint venture (JV) with German luxury car maker BMW (not a Fund holding). Brilliance China’s shares fell sharply in the second half of 2018 after investors reacted negatively to BMW’s plans to increase its JV to a majority share. However, shares partially recovered in 2019, as investors saw value emerge following the price drop. The sale of part of the company’s stake to BMW was approved by shareholders in early 2019, and the company is expected to distribute a special dividend to shareholders from sale proceeds. However, completion of the deal is pending approval from Chinese regulators in 2022, when a change in regulations on foreign ownership comes into effect. Government measures to support car sales also boosted sentiment in the stock. Although the company reported disappointing results for the first half of 2019, the announcement of a special dividend provided investors with some comfort.
Samsung is a South Korea-based consumer electronics and semiconductor manufacturer. It is one of the world’s largest smartphone and memory chip producers as well as a key supplier of organic light-emitting diode (LED) displays. Share price performance was volatile during the period as investors remained conflicted by disappointing first- and second-quarter 2019 corporate results and expectations of price stabilization and a recovery in the demand for memory chips. Management’s decision to delay disclosure of a detailed shareholder return policy due to increased economic uncertainties resulting from recent geopolitical issues also weighed on investor sentiment.
Massmart is a leading South African distributor, wholesaler and retailer of food products, general merchandise, alcohol, home improvement equipment and supplies. U.S.-based Walmart (not a Fund holding), the world’s largest retailer, owns a controlling stake in Massmart. Disappointing 2018 corporate results resulted in a correction in the share price. The resignation of the chief executive officer (CEO) and chief financial officer further impacted sentiment. Following the release of a profit decline warning, the company reported a loss for the first-half of 2019 and did not pay out
Top 10 Holdings
8/31/19
Company Sector/Industry, Country | % of Total Net Assets | |||
Taiwan Semiconductor Manufacturing Co. Ltd. | 7.0% | |||
Semiconductors & Semiconductor Equipment, Taiwan | ||||
| ||||
Samsung Electronics Co. Ltd. | 6.9% | |||
Technology Hardware, Storage & Peripherals, South Korea | ||||
| ||||
Alibaba Group Holding Ltd. | 5.8% | |||
Internet & Direct Marketing Retail, China | ||||
| ||||
Naspers Ltd. | 5.7% | |||
Internet & Direct Marketing Retail, South Africa | ||||
| ||||
ICICI Bank Ltd. | 3.7% | |||
Banks, India | ||||
| ||||
Unilever PLC | 3.3% | |||
Personal Products, U.K. | ||||
| ||||
Brilliance China Automotive Holdings Ltd. | 3.3% | |||
Automobiles, China | ||||
| ||||
Tencent Holdings Ltd. | 3.2% | |||
Interactive Media & Services, China | ||||
| ||||
Naver Corp. | 2.8% | |||
Interactive Media & Services, South Korea | ||||
| ||||
LUKOIL PJSC | 2.6% | |||
Oil, Gas & Consumable Fuels, Russia | ||||
| ||||
any dividends. The new CEO has been brought in from Walmart to turn around the business.
In the past 12 months, we increased the Fund’s holdings in South Korea, India and Brazil due to the availability of what we believe are attractive investment opportunities. Some purchases were also made in U.S.-listed companies that have significant exposure to emerging markets. Exposure to Argentina was initiated via the addition of financial institution Banco BBVA Argentina. In terms of sectors, additions were made in the information technology (IT), financials and industrials sectors.2 Among key purchases were new positions in Cognizant Technology Solutions, a major U.S.-listed global IT services company; Vale, a Brazilian mining company; and Sunny Optical Technology, a prominent manufacturer of optical-related products in China. We also added to investments in LG, a major South Korean conglomerate; China Resources Cement, a leading cement and concrete producer in Southern China; and Sberbank of Russia, a dominant Russian bank.
2. The IT sector comprises electronic equipment, instruments and components; IT services; semiconductors and semiconductor equipment; software; and technology hardware, storage and peripherals in the SOI. The financials sector comprises banks, capital markets, diversified financial services and insurance in the SOI. The industrials sector comprises construction and engineering, industrial conglomerates and transportation infrastructure in the SOI.
4 | Annual Report | franklintempleton.com | ||
TEMPLETON EMERGING MARKETS FUND
Meanwhile, we decreased the Fund’s investments in Peru, Russia and Taiwan in favor of opportunities that we found more compelling, and to raise funds for dividend and capital gains distribution during the reporting period. Reductions were also undertaken in the energy, consumer discretionary and materials sectors.3 In terms of key sales, we reduced holdings in LUKOIL, a Russian oil company; and Naspers, a South African diversified media group. We also closed positions in Buenaventura, a Peruvian precious metals company; Hering, a Brazilian apparel manufacturer; and Saudi Basic Industries, a petrochemical producer in Saudi Arabia, the sale of which eliminated the Fund’s exposure to that market.
It is important to recognize the effect of currency movements on the Fund’s performance. In general, if the value of the U.S. dollar goes up compared with a foreign currency, an investment traded in that foreign currency will go down in value because it will be worth fewer U.S. dollars. This can have a negative effect on Fund performance. Conversely, when the U.S. dollar weakens in relation to a foreign currency, an investment traded in that foreign currency will increase in value, which can contribute to Fund performance. For the 12 months ended August 31, 2019, the U.S. dollar rose in value relative to most currencies. As a result, the Fund’s performance negatively affected by the portfolio’s investment predominantly in securities withnon-U.S. currency exposure. However, one cannot expect the same result in future periods.
Thank you for your continued participation in Templeton Emerging Markets Fund. We look forward to serving your future investment needs.
Sincerely,
 |
Chetan Sehgal, CFA Portfolio Manager |

The foregoing information reflects our analysis, opinions and portfolio holdings as of August 31, 2019, the end of the reporting period. The way we implement our main investment strategies and the resulting portfolio holdings may change depending on factors such as market and economic conditions. These opinions may not be relied upon as investment advice or an offer for a particular security. The information is not a complete analysis of every aspect of any market, country, industry, security or the Fund. Statements of fact are from sources considered reliable, but the investment manager makes no representation or warranty as to their completeness or accuracy. Although historical performance is no guarantee of future results, these insights may help you understand our investment management philosophy.
CFA® is a trademark owned by CFA Institute.
3. The energy sector comprises oil, gas and consumable fuels in the SOI. The consumer discretionary sector comprises auto components; automobiles; hotels, restaurants and leisure; internet and direct marketing retail; multiline retail; and textiles, apparel and luxury goods in the SOI. The materials sector comprises chemicals, construction materials, and metals and mining in the SOI.
See www.franklintempletondatasources.com for additional data provider information.
| franklintempleton.com | Annual Report | 5 | ||
TEMPLETON EMERGING MARKETS FUND
Performance Summary as of August 31, 2019
Total return reflects reinvestment of the Fund’s dividends and capital gain distributions, if any, and any unrealized gains or losses. Total returns do not reflect any sales charges paid at inception or brokerage commissions paid on secondary market purchases. The performance table does not reflect any taxes that a shareholder would pay on Fund dividends, capital gain distributions, if any, or any realized gains on the sale of Fund shares. Your dividend income will vary depending on dividends or interest paid by securities in the Fund’s portfolio, adjusted for operating expenses. Capital gain distributions are net profits realized from the sale of portfolio securities.
Performance as of 8/31/191
| Cumulative Total Return2 | Average Annual Total Return2 | |||||||||||||||||||
|
|
|
| |||||||||||||||||
| | Based on NAV | 3 | | Based on market price | 4 | | Based on NAV | 3 | | Based on market price | 4 | |||||||||
1-Year | +0.29% | +2.80% | +0.29% | +2.80% | ||||||||||||||||
| ||||||||||||||||||||
5-Year | +4.01% | +3.51% | +0.79% | +0.69% | ||||||||||||||||
| ||||||||||||||||||||
10-Year | +59.71% | +52.69% | +4.79% | +4.32% | ||||||||||||||||
| ||||||||||||||||||||
Performance data represent past performance, which does not guarantee future results. Investment return and principal value will fluctuate, and you may have a gain or loss when you sell your shares. Current performance may differ from figures shown.
Distributions(9/1/18–8/31/19)
Net Investment Income | Short-Term Capital Gain | Long-Term Capital Gain | Total | |||||||||
$0.2034 | $0.0660 | $0.5114 | $0.7808 | |||||||||
See page 7 for Performance Summary footnotes.
6 | Annual Report | franklintempleton.com | ||
TEMPLETON EMERGING MARKETS FUND
PERFORMANCE SUMMARY
All investments involve risks, including possible loss of principal. Special risks are associated with foreign investing, including currency volatility, economic instability, and social and political developments of countries where the Fund invests. Emerging markets are subject to all of the risks of foreign investing generally and involve heightened risks due to these markets’ smaller size and lesser liquidity, and lack of established legal, political, business and social frameworks to support securities markets. Some of these heightened risks may include political and social uncertainty (for example, regional conflicts and risk of war); pervasiveness of corruption and crime in these countries’ economic systems; delays in settling portfolio securities transactions; risk of loss arising out of the system of share registration and custody used in these countries; greater sensitivity to interest rate changes; currency and capital controls; currency exchange rate volatility; and inflation, deflation or currency devaluation. The Fund is actively managed but there is no guarantee that the manager’s investment decisions will produce the desired results.
The Fund may invest in eligible China A shares (“Stock Connect Securities”) listed and traded on the Shanghai Stock Exchange through the Shanghai-Hong Kong Stock Connect program, as well as eligible China A shares listed and traded on the Shenzhen Stock Exchange through theShenzhen-Hong Kong Stock Connect program (collectively, “Stock Connect”) and may invest in China Interbank bonds traded on the China Interbank Bond Market (“CIBM”) through the China-Hong Kong Bond Connect program (“Bond Connect”).
Trading through Stock Connect is subject to a number of restrictions that may affect the Fund’s investments and returns. For example, investors in Stock Connect Securities are generally subject to Chinese securities regulations and the listing rules of the respective Exchange, among other restrictions. In addition, Stock Connect Securities generally may not be sold, purchased or otherwise transferred other than through Stock Connect in accordance with applicable rules. While Stock Connect is not subject to individual investment quotas, daily and aggregate investment quotas apply to all Stock Connect participants, which may restrict or preclude the Fund’s ability to invest in Stock Connect Securities. Trading in the Stock Connect program is subject to trading, clearance and settlement procedures that are untested in China, which could pose risks to the Fund. Finally, the withholding tax treatment of dividends and capital gains payable to overseas investors currently is unsettled. In China, the Hong Kong Monetary Authority Central Money Markets Unit holds Bond Connect securities on behalf of ultimate investors (such as the Fund) in accounts maintained with a China-based custodian (either the China Central Depository & Clearing Co. or the Shanghai Clearing House). This recordkeeping system subjects the Fund to various risks, including the risk that the Fund may have a limited ability to enforce rights as a bondholder and the risks of settlement delays and counterparty default of the Hong Kongsub-custodian. In addition, enforcing the ownership rights of a beneficial holder of Bond Connect securities is untested and courts in China have limited experience in applying the concept of beneficial ownership. Bond Connect uses the trading infrastructure of both Hong Kong and China and is not available on trading holidays in Hong Kong. As a result, prices of securities purchased through Bond Connect may fluctuate at times when a Fund is unable to add to or exit its position. Securities offered through Bond Connect may lose their eligibility for trading through the program at any time. If Bond Connect securities lose their eligibility for trading through the program, they may be sold but can no longer be purchased through Bond Connect.
The application and interpretation of the laws and regulations of Hong Kong and China, and the rules, policies or guidelines published or applied by relevant regulators and exchanges in respect of the Stock Connect and Bond Connect programs, are uncertain, and they may have a detrimental effect on the Fund’s investments and returns.
The Fund may also invest a portion of its assets in Russian securities. The U.S. and other nations have imposed and could impose additional sanctions on certain issuers in Russia due to regional conflicts. These sanctions could result in the devaluation of Russia’s currency, a downgrade in Russian issuers’ credit ratings, or a decline in the value and liquidity of Russian stocks or other securities. The Fund may be prohibited from investing in securities issued by companies subject to such sanctions. In addition, if the Fund holds the securities of an issuer that is subject to such sanctions, an immediate freeze of that issuer’s securities could result, impairing the ability of the Fund to buy, sell, receive or deliver those securities. There is also the risk that countermeasures could be taken by Russia’s government, which could involve the seizure of the Fund’s assets. Such sanctions could adversely affect Russia’s economy, possibly forcing the economy into a recession. These risks could affect the value of the Fund’s portfolio.
1. The Fund has a fee waiver associated with any investment it makes in a Franklin Templeton money fund and/or other Franklin Templeton fund, contractually guaranteed through 10/31/19. Fund investment results reflect the fee waiver; without this waiver, the results would have been lower.
2. Total return calculations represent the cumulative and average annual changes in value of an investment over the periods indicated. Return for less than one year, if any, has not been annualized.
3. Assumes reinvestment of distributions based on net asset value.
4. Assumes reinvestment of distributions based on the dividend reinvestment and cash purchase plan.
| franklintempleton.com | Annual Report | 7 | ||
TEMPLETON EMERGING MARKETS FUND
Important Notice to Shareholders
Share Repurchase Program
The Fund’s Board has approved a modification to its existing open-market share repurchase program to authorize the Fund to repurchase an additional 10% of its outstanding shares in open-market transactions, at the discretion of management.
The Board’s action provides greater flexibility by enabling the Fund to continue to engage in open-market repurchases under a continuing authorization for up to an additional 10% of its outstanding shares, above and in addition to the initial 10% previously authorized, at the discretion of Fund management. The timing and amount of repurchases would continue to be at the discretion of the investment manager, taking into account various factors, including, but not limited to, the level of the discount, the Fund’s performance, portfolio holdings, dividend history, market conditions, cash on hand, the availability of other attractive investments and whether the sale of certain portfolio securities would be undesirable because of liquidity concerns or because the sale might subject the Fund to adverse tax consequences. Any repurchases would be made on a national securities exchange at the prevailing market price, subject to exchange requirements, Federal securities laws and rules that restrict repurchases, and the terms of any outstanding leverage or borrowing of the Fund. If and when the Fund’s new 10% threshold is reached, no further repurchases could be completed until authorized by the Board. Until the additional 10% threshold is reached, Fund management will have the flexibility to commence share repurchases if and when it is determined to be appropriate in light of prevailing circumstances. The share repurchase program is intended to benefit shareholders by enabling the Fund to repurchase shares at a discount to net asset value, thereby increasing the proportionate interest of each remaining shareholder in the Fund.
In the Notes to Financial Statements section, please see note 2 (Shares of Beneficial Interest) for additional information regarding shares repurchased.
Approval of Borrowing Arrangements
On November 28, 2018, the Fund entered into a senior secured revolving credit facility agreement with The Bank of Nova Scotia pursuant to which the Fund may borrow up to a maximum commitment amount of $30 million, which matures on November 27, 2019. For additional information, please see note 8 on page 22.
8 | Annual Report | franklintempleton.com | ||
TEMPLETON EMERGING MARKETS FUND
| Year Ended August 31, | ||||||||||||||||||||
| 2019 | 2018 | 2017 | 2016 | 2015 | ||||||||||||||||
Per share operating performance | ||||||||||||||||||||
(for a share outstanding throughout the year) | ||||||||||||||||||||
Net asset value, beginning of year | $16.90 | $18.32 | $13.92 | $13.34 | $20.91 | |||||||||||||||
Income from investment operations: | ||||||||||||||||||||
Net investment incomea | 0.21 | b | 0.14 | 0.16 | 0.19 | 0.21 | ||||||||||||||
Net realized and unrealized gains (losses) | (0.27 | ) | (0.51 | ) | 4.39 | 1.67 | (6.60 | ) | ||||||||||||
Total from investment operations | (0.06 | ) | (0.37 | ) | 4.55 | 1.86 | (6.39 | ) | ||||||||||||
Less distributions from: | ||||||||||||||||||||
Net investment income | (0.20 | ) | (0.25 | ) | (0.20 | ) | (0.31 | ) | (0.31 | ) | ||||||||||
Net realized gains | (0.58 | ) | (0.87 | ) | — | (0.97 | ) | (0.87 | ) | |||||||||||
Total distributions | (0.78 | ) | (1.12 | ) | (0.20 | ) | (1.28 | ) | (1.18 | ) | ||||||||||
Repurchase of shares | 0.03 | 0.07 | 0.05 | — | — | |||||||||||||||
Net asset value, end of year | $16.09 | $16.90 | $18.32 | $13.92 | $13.34 | |||||||||||||||
Market value, end of yearc | $14.18 | $14.61 | $16.45 | $12.56 | $11.56 | |||||||||||||||
Total return (based on market value per share)
| 2.80% | (5.14)% | 33.10% | 22.57% | (34.94)% | |||||||||||||||
Ratios to average net assets | ||||||||||||||||||||
Expenses before waiver and payments by affiliates | 1.60% | 1.38% | 1.37% | 1.39% | 1.37% | |||||||||||||||
Expenses net of waiver and payments by affiliates | 1.58% | 1.38%d | 1.37% | d,e | 1.38% | 1.37% | d | |||||||||||||
Net investment income | 1.30% | b | 0.79% | 1.03% | 1.49% | 1.19% | ||||||||||||||
Supplemental data | ||||||||||||||||||||
Net assets, end of year (000’s) | $268,845 | $287,115 | $321,004 | $250,642 | $240,289 | |||||||||||||||
Portfolio turnover rate | 21.56% | 11.69% | 20.38% | 42.16% | 18.92% | |||||||||||||||
Total outstanding borrowings on credit facility at end of year (000’s) | $10,000 | $ — | $ — | $ — | $ — | |||||||||||||||
Asset coverage per $1,000 of debt | $27,885 | $ — | $ — | $ — | $ — | |||||||||||||||
aBased on average daily shares outstanding.
bNet investment income per share includes approximately $0.06 per share related to income received in the form of special dividends in connection with certain Fund holdings. Excluding this amount, the ratio of net investment income to average net assets would have been 0.95%.
cBased on the last sale on the New York Stock Exchange.
dBenefit of waiver and payments by affiliates rounds to less than 0.01%.
eBenefit of expense reduction rounds to less than 0.01%.
| franklintempleton.com | The accompanying notes are an integral part of these financial statements. | Annual Report | 9 | ||
TEMPLETON EMERGING MARKETS FUND
Statement of Investments, August 31, 2019
| Industry | Shares | Value | ||||||||
Common Stocks 92.3% | ||||||||||
Argentina 0.1% | ||||||||||
Banco BBVA Argentina SA, ADR | Banks | 50,300 | $ | 212,266 | ||||||
|
| |||||||||
Brazil 3.6% | ||||||||||
aB2W Cia Digital | Internet & Direct Marketing Retail | 104,800 | 1,189,974 | |||||||
B3 SA - Brasil Bolsa Balcao | Capital Markets | 150,400 | 1,627,812 | |||||||
Lojas Americanas SA | Multiline Retail | 395,760 | 1,377,762 | |||||||
M. Dias Branco SA | Food Products | 109,200 | 955,014 | |||||||
Mahle-Metal Leve SA | Auto Components | 104,000 | 594,968 | |||||||
Totvs SA | Software | 87,300 | 1,136,371 | |||||||
aVale SA | Metals & Mining | 262,700 | 2,892,127 | |||||||
|
| |||||||||
| 9,774,028 | ||||||||||
|
| |||||||||
Cambodia 0.4% | ||||||||||
NagaCorp Ltd. | Hotels, Restaurants & Leisure | 730,000 | 1,022,152 | |||||||
|
| |||||||||
China 24.5% | ||||||||||
aAlibaba Group Holding Ltd., ADR | Internet & Direct Marketing Retail | 89,281 | 15,626,853 | |||||||
BAIC Motor Corp. Ltd., H | Automobiles | 360,000 | 202,358 | |||||||
aBaidu Inc., ADR | Interactive Media & Services | 13,012 | 1,359,364 | |||||||
Brilliance China Automotive Holdings Ltd. | Automobiles | 8,289,500 | 8,771,240 | |||||||
China Construction Bank Corp., H | Banks | 5,658,400 | 4,204,785 | |||||||
China Merchants Bank Co. Ltd., A | Banks | 289,000 | 1,384,267 | |||||||
China Mobile Ltd. | Wireless Telecommunication Services | 360,500 | 2,982,948 | |||||||
China Petroleum & Chemical Corp., H | Oil, Gas & Consumable Fuels | 2,153,100 | 1,255,963 | |||||||
China Resources Cement Holdings Ltd. | Construction Materials | 3,015,100 | 2,664,053 | |||||||
CNOOC Ltd. | Oil, Gas & Consumable Fuels | 1,885,000 | 2,792,434 | |||||||
COSCO SHIPPING Ports Ltd. | Transportation Infrastructure | 345,560 | 302,322 | |||||||
Dairy Farm International Holdings Ltd. | Food & Staples Retailing | 56,900 | 407,404 | |||||||
Health & Happiness H&H International Holdings Ltd. | Food Products | 382,600 | 1,590,392 | |||||||
MGM China Holdings Ltd. | Hotels, Restaurants & Leisure | 426,000 | 636,189 | |||||||
NetEase Inc., ADR | Entertainment | 4,709 | 1,200,795 | |||||||
Ping An Bank Co. Ltd., A | Banks | 1,666,800 | 3,297,827 | |||||||
Ping An Insurance (Group) Co. of China Ltd., A | Insurance | 208,349 | 2,542,063 | |||||||
Sands China Ltd. | Hotels, Restaurants & Leisure | 237,600 | 1,075,657 | |||||||
Sunny Optical Technology Group Co. Ltd. | Electronic Equipment, Instruments & Components | 246,400 | 3,392,043 | |||||||
Tencent Holdings Ltd. | Interactive Media & Services | 208,200 | 8,595,537 | |||||||
Uni-President China Holdings Ltd. | Food Products | 976,000 | 1,082,154 | |||||||
Weifu High-Technology Co. Ltd., B | Auto Components | 294,712 | 481,132 | |||||||
|
| |||||||||
| 65,847,780 | ||||||||||
|
| |||||||||
Czech Republic 0.3% | ||||||||||
Moneta Money Bank AS | Banks | 243,000 | 786,030 | |||||||
|
| |||||||||
Hungary 0.9% | ||||||||||
Richter Gedeon Nyrt | Pharmaceuticals | 137,430 | 2,291,792 | |||||||
|
| |||||||||
India 7.4% | ||||||||||
Bajaj Holdings & Investment Ltd. | Diversified Financial Services | 44,578 | 2,028,885 | |||||||
Coal India Ltd. | Oil, Gas & Consumable Fuels | 276,220 | 714,199 | |||||||
Glenmark Pharmaceuticals Ltd. | Pharmaceuticals | 264,190 | 1,420,909 | |||||||
ICICI Bank Ltd. | Banks | 1,757,254 | 10,074,582 | |||||||
Infosys Ltd. | IT Services | 268,602 | 3,063,325 | |||||||
10 | Annual Report | franklintempleton.com | ||
TEMPLETON EMERGING MARKETS FUND
STATEMENT OF INVESTMENTS
| Industry | Shares | Value | ||||||||
Common Stocks(continued) | ||||||||||
India(continued) | ||||||||||
Tata Chemicals Ltd. | Chemicals | 167,100 | $ | 1,366,444 | ||||||
Tata Investment Corp. Ltd. | Capital Markets | 122,221 | 1,318,973 | |||||||
|
| |||||||||
| 19,987,317 | ||||||||||
|
| |||||||||
Indonesia 1.3% | ||||||||||
Astra International Tbk PT | Automobiles | 7,340,500 | 3,454,201 | |||||||
|
| |||||||||
Kenya 0.3% | ||||||||||
Equity Group Holdings PLC | Banks | 1,946,807 | 751,449 | |||||||
|
| |||||||||
Mexico 2.2% | ||||||||||
Banco Santander Mexico SA Institucion de Banca Multiple | ||||||||||
Grupo Financiero Santander, ADR | Banks | 791,217 | 4,968,842 | |||||||
Nemak SAB de CV | Auto Components | 1,917,631 | 893,684 | |||||||
|
| |||||||||
| 5,862,526 | ||||||||||
|
| |||||||||
Nigeria 0.0%† | ||||||||||
Nigerian Breweries PLC | Beverages | 132,031 | 18,572 | |||||||
|
| |||||||||
Pakistan 0.5% | ||||||||||
MCB Bank Ltd. | Banks | 1,343,910 | 1,441,058 | |||||||
|
| |||||||||
Peru 0.5% | ||||||||||
Intercorp Financial Services Inc. | Banks | 34,920 | 1,363,296 | |||||||
|
| |||||||||
Philippines 0.3% | ||||||||||
BDO Unibank Inc. | Banks | 260,750 | 745,000 | |||||||
|
| |||||||||
Russia 8.7% | ||||||||||
Gazprom PJSC, ADR | Oil, Gas & Consumable Fuels | 507,744 | 3,503,434 | |||||||
LUKOIL PJSC, ADR | Oil, Gas & Consumable Fuels | 85,666 | 6,882,406 | |||||||
a,bMail.Ru Group Ltd., GDR, Reg S | Interactive Media & Services | 99,578 | 2,218,598 | |||||||
MMC Norilsk Nickel PJSC, ADR | Metals & Mining | 33,900 | 822,075 | |||||||
Sberbank of Russia PJSC, ADR | Banks | 437,637 | 5,997,815 | |||||||
aYandex NV, A | Interactive Media & Services | 109,621 | 4,066,939 | |||||||
|
| |||||||||
| 23,491,267 | ||||||||||
|
| |||||||||
South Africa 6.3% | ||||||||||
Massmart Holdings Ltd. | Food & Staples Retailing | 557,740 | 1,653,186 | |||||||
Naspers Ltd., N | Internet & Direct Marketing Retail | 67,244 | 15,301,173 | |||||||
|
| |||||||||
| 16,954,359 | ||||||||||
|
| |||||||||
South Korea 15.8% | ||||||||||
Fila Korea Ltd. | Textiles, Apparel & Luxury Goods | 40,950 | 1,935,035 | |||||||
Hankook Tire & Technology Co. Ltd. | Auto Components | 17,600 | 423,828 | |||||||
Hanon Systems | Auto Components | 84,734 | 811,997 | |||||||
HDC Hyundai DevelopmentCo-Engineering & Construction | Construction & Engineering | 51,154 | 1,514,982 | |||||||
Interpark Holdings Corp. | Internet & Direct Marketing Retail | 98,712 | 172,880 | |||||||
KT Skylife Co. Ltd. | Media | 59,360 | 456,544 | |||||||
LG Corp. | Industrial Conglomerates | 94,283 | 5,545,647 | |||||||
Naver Corp. | Interactive Media & Services | 61,138 | 7,399,249 | |||||||
POSCO | Metals & Mining | 14,133 | 2,463,517 | |||||||
Samsung Electronics Co. Ltd. | Technology Hardware, Storage & Peripherals | 512,281 | 18,620,859 | |||||||
SK Hynix Inc. | Semiconductors & Semiconductor Equipment | 34,540 | 2,208,524 | |||||||
SK Innovation Co. Ltd. | Oil, Gas & Consumable Fuels | 6,530 | 890,094 | |||||||
|
| |||||||||
| 42,443,156 | ||||||||||
|
| |||||||||
| franklintempleton.com | Annual Report | 11 | ||
TEMPLETON EMERGING MARKETS FUND
STATEMENT OF INVESTMENTS
| Industry | Shares | Value | ||||||||
Common Stocks(continued) | ||||||||||
Taiwan 9.7% | ||||||||||
Catcher Technology Co. Ltd. | Technology Hardware, Storage & Peripherals | 212,000 | $ | 1,492,243 | ||||||
CTBC Financial Holding Co. Ltd. | Banks | 2,387,000 | 1,550,643 | |||||||
FIT Hon Teng Ltd. | Electronic Equipment, Instruments & Components | 1,173,700 | 486,932 | |||||||
Hon Hai Precision Industry Co. Ltd. | Electronic Equipment, Instruments & Components | 782,112 | 1,852,541 | |||||||
Largan Precision Co. Ltd. | Electronic Equipment, Instruments & Components | 6,400 | 794,739 | |||||||
aPChome Online Inc. | Internet & Direct Marketing Retail | 237,482 | 1,015,852 | |||||||
Taiwan Semiconductor Manufacturing Co. Ltd. | Semiconductors & Semiconductor Equipment | 2,291,400 | 18,945,049 | |||||||
|
| |||||||||
| 26,137,999 | ||||||||||
|
| |||||||||
Thailand 3.1% | ||||||||||
Kasikornbank PCL, fgn | Banks | 644,900 | 3,370,374 | |||||||
Kiatnakin Bank PCL, fgn | Banks | 893,200 | 2,115,205 | |||||||
Siam Commercial Bank PCL, fgn | Banks | 283,000 | 1,141,614 | |||||||
Thai Beverage PCL, fgn | Beverages | 2,278,600 | 1,477,691 | |||||||
Univanich Palm Oil PCL, fgn | Food Products | 1,120,500 | 195,808 | |||||||
|
| |||||||||
| 8,300,692 | ||||||||||
|
| |||||||||
United Kingdom 3.4% | ||||||||||
Unilever PLC | Personal Products | 142,280 | 8,994,165 | |||||||
|
| |||||||||
United States 3.0% | ||||||||||
Cognizant Technology Solutions Corp., A | IT Services | 96,171 | 5,903,938 | |||||||
aIMAX Corp. | Entertainment | 108,700 | 2,274,004 | |||||||
|
| |||||||||
| 8,177,942 | ||||||||||
|
| |||||||||
Total Common Stocks (Cost $184,666,053) | 248,057,047 | |||||||||
|
| |||||||||
Preferred Stocks 5.0% | ||||||||||
Brazil 5.0% | ||||||||||
cBanco Bradesco SA, 3.74%, ADR, pfd | Banks | 718,640 | 5,741,934 | |||||||
cItau Unibanco Holding SA, 9.053%, ADR, pfd | Banks | 695,797 | 5,733,367 | |||||||
cPetroleo Brasileiro SA, 1.339%, ADR, pfd | Oil, Gas & Consumable Fuels | 167,100 | 2,043,633 | |||||||
|
| |||||||||
Total Preferred Stocks (Cost $6,698,398) | 13,518,934 | |||||||||
|
| |||||||||
Total Investments before Short Term Investments (Cost $191,364,451) | 261,575,981 | |||||||||
|
| |||||||||
Short Term Investments (Cost $16,797,137) 6.2% | ||||||||||
Money Market Funds 6.2% | ||||||||||
United States 6.2% | ||||||||||
d,eInstitutional Fiduciary Trust Money Market Portfolio, 1.85% | 16,797,137 | 16,797,137 | ||||||||
|
| |||||||||
Total Investments (Cost $208,161,588) 103.5% | 278,373,118 | |||||||||
fCredit Facility (3.7)% | (10,000,000 | ) | ||||||||
Other Assets, less Liabilities 0.2% | 472,338 | |||||||||
|
| |||||||||
Net Assets 100.0% | $ | 268,845,456 | ||||||||
|
| |||||||||
12 | Annual Report | franklintempleton.com | ||
TEMPLETON EMERGING MARKETS FUND
STATEMENT OF INVESTMENTS
See Abbreviations on page 23.
†Rounds to less than 0.1% of net assets.
aNon-income producing.
bSecurity was purchased pursuant to Regulation S under the Securities Act of 1933, which exempts from registration securities offered and sold outside of the United States. Such a security cannot be sold in the United States without either an effective registration statement filed pursuant to the Securities Act of 1933, or pursuant to an exemption from registration. This security has been deemed liquid under guidelines approved by the Fund’s Board of Trustees. At August 31, 2019, the value of this security was $2,218,598, representing 0.8% of net assets.
cVariable rate security. The rate shown represents the yield at period end.
dSee Note 3(c) regarding investments in affiliated management investment companies.
eThe rate shown is the annualizedseven-day effective yield at period end.
fSee Note 8 regarding Credit Facility.
| franklintempleton.com | The accompanying notes are an integral part of these financial statements. | Annual Report | 13 | ||
TEMPLETON EMERGING MARKETS FUND
Statement of Assets and Liabilities
August 31, 2019
Assets: | ||||
Investments in securities: | ||||
Cost - Unaffiliated issuers | $191,364,451 | |||
Cost -Non-controlled affiliates (Note 3c) | 16,797,137 | |||
|
| |||
Value - Unaffiliated issuers | $261,575,981 | |||
Value -Non-controlled affiliates (Note 3c) | 16,797,137 | |||
Cash | 6,663 | |||
Foreign currency, at value (cost $193,677) | 193,677 | |||
Receivables: | ||||
Investment securities sold | 1,119,263 | |||
Dividends | 469,376 | |||
Foreign tax refund | 8,081 | |||
|
| |||
Total assets | 280,170,178 | |||
|
| |||
Liabilities: | ||||
Payables: | ||||
Investment securities purchased | 535,984 | |||
Credit facility (Note 8) | 10,000,000 | |||
Management fees | 279,088 | |||
Accrued interest expense (Note 8) | 90,438 | |||
Deferred tax | 304,484 | |||
Accrued expenses and other liabilities | 114,728 | |||
|
| |||
Total liabilities | 11,324,722 | |||
|
| |||
Net assets, at value | $268,845,456 | |||
|
| |||
Net assets consist of: | ||||
Paid-in capital | $192,208,586 | |||
Total distributable earnings (loss) | 76,636,870 | |||
|
| |||
Net assets, at value | $268,845,456 | |||
|
| |||
Shares outstanding | 16,704,613 | |||
|
| |||
Net asset value per share | $16.09 | |||
|
| |||
14 | Annual Report | The accompanying notes are an integral part of these financial statements. | franklintempleton.com | ||
TEMPLETON EMERGING MARKETS FUND
FINANCIAL STATEMENTS
Statement of Operations
for the year ended August 31, 2019
Investment income: | ||||
Dividends: (net of foreign taxes)* | ||||
Unaffiliated issuers | $ | 7,559,887 | ||
Non-controlled affiliates (Note 3c) | 283,189 | |||
|
| |||
Total investment income | 7,843,076 | |||
|
| |||
Expenses: | ||||
Management fees (Note 3a) | 3,410,625 | |||
Interest expense (Note 8) | 307,493 | |||
Transfer agent fees | 112,317 | |||
Custodian fees (Note 4) | 79,082 | |||
Reports to shareholders | 28,959 | |||
Registration and filing fees | 24,765 | |||
Professional fees | 327,388 | |||
Trustees’ fees and expenses | 38,274 | |||
Other | 30,862 | |||
|
| |||
Total expenses | 4,359,765 | |||
Expenses waived/paid by affiliates (Note 3c) | (50,030 | ) | ||
|
| |||
Net expenses | 4,309,735 | |||
|
| |||
Net investment income | 3,533,341 | |||
|
| |||
Realized and unrealized gains (losses): | ||||
Net realized gain (loss) from: | ||||
Investments:# | ||||
Unaffiliated issuers | 7,615,144 | |||
Foreign currency transactions | (148,615 | ) | ||
|
| |||
Net realized gain (loss) | 7,466,529 | |||
|
| |||
Net change in unrealized appreciation (depreciation) on: | ||||
Investments: | ||||
Unaffiliated issuers | (12,000,295 | ) | ||
Translation of other assets and liabilities denominated in foreign currencies | 2,166 | |||
Change in deferred taxes on unrealized appreciation | (167,511 | ) | ||
|
| |||
Net change in unrealized appreciation (depreciation) | (12,165,640 | ) | ||
|
| |||
Net realized and unrealized gain (loss) | (4,699,111 | ) | ||
|
| |||
Net increase (decrease) in net assets resulting from operations | $ | (1,165,770 | ) | |
|
| |||
*Foreign taxes withheld on dividends | $ | 897,219 | ||
#Net of foreign taxes | $ | 41,167 | ||
| franklintempleton.com | The accompanying notes are an integral part of these financial statements. | Annual Report | 15 | ||
TEMPLETON EMERGING MARKETS FUND
FINANCIAL STATEMENTS
Statements of Changes in Net Assets
| Year Ended August 31, | ||||||||
|
| |||||||
| 2019 | 2018 | |||||||
| ||||||||
Increase (decrease) in net assets: | ||||||||
Operations: | ||||||||
Net investment income | $ | 3,533,341 | $ | 2,494,346 | ||||
Net realized gain (loss) | 7,466,529 | 16,493,612 | ||||||
Net change in unrealized appreciation (depreciation) | (12,165,640 | ) | (24,818,968 | ) | ||||
|
| |||||||
Net increase (decrease) in net assets resulting from operations | (1,165,770 | ) | (5,831,010 | ) | ||||
|
| |||||||
Distributions to shareholders (Note 1d) | (13,130,776 | ) | (19,499,553 | ) | ||||
|
| |||||||
Capital share transactions from - repurchase of shares (Note 2) | (3,972,632 | ) | (8,558,881 | ) | ||||
|
| |||||||
Net increase (decrease) in net assets | (18,269,178 | ) | (33,889,444 | ) | ||||
Net assets: | ||||||||
Beginning of year | 287,114,634 | 321,004,078 | ||||||
|
| |||||||
End of year (Note 1d) | $ | 268,845,456 | $ | 287,114,634 | ||||
|
| |||||||
16 | Annual Report | The accompanying notes are an integral part of these financial statements. | franklintempleton.com | ||
TEMPLETON EMERGING MARKETS FUND
1. Organization and Significant Accounting Policies
Templeton Emerging Markets Fund (Fund) is registered under the Investment Company Act of 1940 (1940 Act) as aclosed-end management investment company and applies the specialized accounting and reporting guidance in U.S. Generally Accepted Accounting Principles (U.S. GAAP).
The following summarizes the Fund’s significant accounting policies.
a. Financial Instrument Valuation
The Fund’s investments in financial instruments are carried at fair value daily. Fair value is the price that would be received to sell an asset or paid to transfer a liability in an orderly transaction between market participants on the measurement date. The Fund calculates the net asset value (NAV) per share each business day as of 4 p.m. Eastern time or the regularly scheduled close of the New York Stock Exchange (NYSE), whichever is earlier. Under compliance policies and procedures approved by the Fund’s Board of Trustees (the Board), the Fund’s administrator has responsibility for oversight of valuation, including leading the cross-functional Valuation Committee (VC). The Fund may utilize independent pricing services, quotations from securities and financial instrument dealers, and other market sources to determine fair value.
Equity securities listed on an exchange or on the NASDAQ National Market System are valued at the last quoted sale price or the official closing price of the day, respectively. Foreign equity securities are valued as of the close of trading on the foreign stock exchange on which the security is primarily traded, or as of 4 p.m. Eastern time. The value is then converted into its U.S. dollar equivalent at the foreign exchange rate in effect at 4 p.m. Eastern time on the day that the value of the security is determined.Over-the-counter (OTC) securities are valued within the range of the most recent quoted bid and ask prices. Securities that trade in multiple markets or on multiple exchanges are valued according to the broadest and most representative market. Certain equity securities are valued based upon fundamental characteristics or relationships to similar securities.
Investments inopen-end mutual funds are valued at the closing NAV.
The Fund has procedures to determine the fair value of financial instruments for which market prices are not reliable or readily available. Under these procedures, the Fund
primarily employs a market-based approach which may use related or comparable assets or liabilities, recent transactions, market multiples, book values, and other relevant information for the investment to determine the fair value of the investment. An income-based valuation approach may also be used in which the anticipated future cash flows of the investment are discounted to calculate fair value. Discounts may also be applied due to the nature or duration of any restrictions on the disposition of the investments. Due to the inherent uncertainty of valuations of such investments, the fair values may differ significantly from the values that would have been used had an active market existed.
Trading in securities on foreign securities stock exchanges and OTC markets may be completed before 4 p.m. Eastern time. In addition, trading in certain foreign markets may not take place on every Fund’s business day. Occasionally, events occur between the time at which trading in a foreign security is completed and
4 p.m. Eastern time that might call into question the reliability of the value of a portfolio security held by the Fund. As a result, differences may arise between the value of the Fund’s portfolio securities as determined at the foreign market close and the latest indications of value at 4 p.m. Eastern time. In order to minimize the potential for these differences, the VC monitors price movements following the close of trading in foreign stock markets through a series of country specific market proxies (such as baskets of American Depositary Receipts, futures contracts and exchange traded funds). These price movements are measured against established trigger thresholds for each specific market proxy to assist in determining if an event has occurred that may call into question the reliability of the values of the foreign securities held by the Fund. If such an event occurs, the securities may be valued using fair value procedures, which may include the use of independent pricing services. At August 31, 2019, a market event occurred resulting in a portion of the securities held by the Fund being valued using fair value procedures.
When the last day of the reporting period is anon-business day, certain foreign markets may be open on those days that the Fund’s NAV is not calculated, which could result in differences between the value of the Fund’s portfolio securities on the last business day and the last calendar day of the reporting period. Any significant security valuation changes due to an open foreign market are adjusted and reflected by the Fund for financial reporting purposes.
| franklintempleton.com | Annual Report | 17 | ||
TEMPLETON EMERGING MARKETS FUND
NOTES TO FINANCIAL STATEMENTS
1. Organization and Significant Accounting Policies (continued)
b. Foreign Currency Translation
Portfolio securities and other assets and liabilities denominated in foreign currencies are translated into U.S. dollars based on the exchange rate of such currencies against U.S. dollars on the date of valuation. The Fund may enter into foreign currency exchange contracts to facilitate transactions denominated in a foreign currency. Purchases and sales of securities, income and expense items denominated in foreign currencies are translated into U.S. dollars at the exchange rate in effect on the transaction date. Portfolio securities and assets and liabilities denominated in foreign currencies contain risks that those currencies will decline in value relative to the U.S. dollar. Occasionally, events may impact the availability or reliability of foreign exchange rates used to convert the U.S. dollar equivalent value. If such an event occurs, the foreign exchange rate will be valued at fair value using procedures established and approved by the Board.
The Fund does not separately report the effect of changes in foreign exchange rates from changes in market prices on securities held. Such changes are included in net realized and unrealized gain or loss from investments in the Statement of Operations.
Realized foreign exchange gains or losses arise from sales of foreign currencies, currency gains or losses realized between the trade and settlement dates on securities transactions and the difference between the recorded amounts of dividends, interest, and foreign withholding taxes and the U.S. dollar equivalent of the amounts actually received or paid. Net unrealized foreign exchange gains and losses arise from changes in foreign exchange rates on foreign denominated assets and liabilities other than investments in securities held at the end of the reporting period.
c. Income and Deferred Taxes
It is the Fund’s policy to qualify as a regulated investment company under the Internal Revenue Code. The Fund intends to distribute to shareholders substantially all of its taxable income and net realized gains to relieve it from federal income and excise taxes. As a result, no provision for U.S. federal income taxes is required.
The Fund may be subject to foreign taxation related to income received, capital gains on the sale of securities and certain foreign currency transactions in the foreign jurisdictions in which it invests. Foreign taxes, if any, are recorded based on the tax regulations and rates that exist in the foreign markets in which the Fund invests. When a capital gain tax is determined to apply, the Fund records an estimated deferred tax liability in an amount that would be payable if the securities were disposed of on the valuation date.
The Fund may recognize an income tax liability related to its uncertain tax positions under U.S. GAAP when the uncertain tax position has a less than 50% probability that it will be sustained upon examination by the tax authorities based on its technical merits. As of August 31, 2019, the Fund has determined that no tax liability is required in its financial statements related to uncertain tax positions for any open tax years (or expected to be taken in future tax years). Open tax years are those that remain subject to examination and are based on the statute of limitations in each jurisdiction in which the Fund invests.
d. Security Transactions, Investment Income, Expenses and Distributions
Security transactions are accounted for on trade date. Realized gains and losses on security transactions are determined on a specific identification basis. Estimated expenses are accrued daily. Dividend income is recorded on theex-dividend date except for certain dividends from securities where the dividend rate is not available. In such cases, the dividend is recorded as soon as the information is received by the Fund. Distributions to shareholders are recorded on theex-dividend date. Distributable earnings are determined according to income tax regulations (tax basis) and may differ from earnings recorded in accordance with U.S. GAAP. These differences may be permanent or temporary. Permanent differences are reclassified among capital accounts to reflect their tax character. These reclassifications have no impact on net assets or the results of operations. Temporary differences are not reclassified, as they may reverse in subsequent periods.*
e. Accounting Estimates
The preparation of financial statements in accordance with U.S. GAAP requires management to make estimates and assumptions that affect the reported amounts of assets and
18 | Annual Report | franklintempleton.com | ||
TEMPLETON EMERGING MARKETS FUND
NOTES TO FINANCIAL STATEMENTS
liabilities at the date of the financial statements and the amounts of income and expenses during the reporting period. Actual results could differ from those estimates.
f. Guarantees and Indemnifications
Under the Fund’s organizational documents, its officers and trustees are indemnified by the Fund against certain liabilities arising out of the performance of their duties to the Fund.
Additionally, in the normal course of business, the Fund enters into contracts with service providers that contain general indemnification clauses. The Fund’s maximum exposure under these arrangements is unknown as this would involve future claims that may be made against the Fund that have not yet occurred. Currently, the Fund expects the risk of loss to be remote.
*Effective during the current reporting period, it is no longer required to present certain line items in the Statements of Changes in Net Assets. The below prior period amounts affected by this change are shown as they were in the prior year Statements of Changes in Net Assets.
For the year ended August 31, 2018, distributions to shareholders were as follows:
Net investment income | $ | (4,345,445 | ) | |
Net realized gains | (15,154,108 | ) |
For the year ended August 31, 2018, distributions in excess of net investment income included in net assets was $(293,826).
2. Shares of Beneficial Interest
At August 31, 2019, there were an unlimited number of shares authorized (without par value). During the years ended August 31, 2019 and 2018 there were no shares issued; all reinvested distributions were satisfied with previously issued shares purchased in the open market.
Under the Board approved open-market share repurchase program, the Fund may purchase, from time to time, Fund shares in open-market transactions, at the discretion of management. Since the inception of the program, the Fund has repurchased a total of 1,380,494 shares. Transactions in the Fund’s shares were as follows:
| Year Ended August 31, | ||||||||||||||||
|
| |||||||||||||||
| 2019 | 2018 | |||||||||||||||
|
| |||||||||||||||
| Shares | Amount | Shares | Amount | |||||||||||||
| ||||||||||||||||
Shares repurchased | 283,161 | $3,972,632 | 538,586 | $8,558,881 | ||||||||||||
|
| |||||||||||||||
Weighted average discount of market price to net asset value of shares repurchased | 12.06% | 12.11% | ||||||||||||||
3. Transactions with Affiliates
Franklin Resources, Inc. is the holding company for various subsidiaries that together are referred to as Franklin Templeton. Certain officers and trustees of the Fund are also officers and/or directors of the following subsidiaries:
| Subsidiary | Affiliation | |
| Templeton Asset Management Ltd. (Asset Management) | Investment manager | |
| Franklin Templeton Services, LLC (FT Services) | Administrative manager |
| franklintempleton.com | Annual Report | 19 | ||
TEMPLETON EMERGING MARKETS FUND
NOTES TO FINANCIAL STATEMENTS
3. Transactions with Affiliates(continued)
a. Management Fees
The Fund pays an investment management fee to Asset Management based on the average daily net assets of the Fund as follows:
| Annualized Fee Rate | Net Assets | |
| 1.250% | Up to and including $1 billion | |
| 1.200% | Over $1 billion, up to and including $5 billion | |
| 1.150% | Over $5 billion, up to and including $10 billion | |
| 1.100% | Over $10 billion, up to and including $15 billion | |
| 1.050% | Over $15 billion, up to and including $20 billion | |
| 1.000% | In excess of $20 billion | |
b. Administrative Fees
Under an agreement with Asset Management, FT Services provides administrative services to the Fund. The fee is paid by Asset Management based on the Fund’s average daily net assets, and is not an additional expense of the Fund.
c. Investments in Affiliated Management Investment Companies
The Fund invests in one or more affiliated management investment companies for purposes other than exercising a controlling influence over the management or policies. Management fees paid by the Fund are waived on assets invested in the affiliated management investment companies, as noted in the Statement of Operations, in an amount not to exceed the management and administrative fees paid directly or indirectly by each affiliate. During the year ended August 31, 2019, the Fund held investments in affiliated management investment companies as follows:
Value at Beginning of Year | Purchases | Sales | Realized Gain (Loss) | Net Change in Unrealized Appreciation (Depreciation) | Value at End of Year | Number of Shares Held at End of Year | Dividend Income | |||||||||||||||||||
| ||||||||||||||||||||||||||
Non-Controlled Affiliates | ||||||||||||||||||||||||||
Institutional Fiduciary Trust Money Market Portfolio, 1.85% | $ | 8,367,054 | $ | 62,392,974 | $ | (53,962,891 | ) | $ — | $ — | $16,797,137 | 16,797,137 | $283,189 | ||||||||||||||
|
|
| ||||||||||||||||||||||||
4. Expense Offset Arrangement
The Fund has entered into an arrangement with its custodian whereby credits realized as a result of uninvested cash balances are used to reduce a portion of the Fund’s custodian expenses. During the year ended August 31, 2019, there were no credits earned.
20 | Annual Report | franklintempleton.com | ||
TEMPLETON EMERGING MARKETS FUND
NOTES TO FINANCIAL STATEMENTS
5. Income Taxes
The tax character of distributions paid during the years ended August 31, 2019 and 2018, was as follows:
| 2019 | 2018 | |||||||
Distributions paid from: | ||||||||
Ordinary income | $ | 4,530,521 | $ | 4,345,445 | ||||
Long term capital gain | 8,600,255 | 15,154,108 | ||||||
| $ | 13,130,776 | $ | 19,499,553 | |||||
At August 31, 2019, the cost of investments, net unrealized appreciation (depreciation), undistributed ordinary income and undistributed long term capital gains for income tax purposes were as follows:
Cost of investments | $ | 211,421,243 | ||
|
|
| ||
Unrealized appreciation | $ | 87,214,572 | ||
Unrealized depreciation | (20,262,697 | ) | ||
|
|
| ||
Net unrealized appreciation (depreciation) |
$ |
66,951,875 |
| |
|
|
| ||
Distributable earnings: | ||||
Undistributed ordinary income | $ | 3,985,716 | ||
Undistributed long term capital gains | 6,022,161 | |||
|
|
| ||
Total distributable earnings |
$ |
10,007,877 |
| |
|
|
| ||
Differences between income and/or capital gains as determined on a book basis and a tax basis are primarily due to differing treatment of corporate actions.
6. Investment Transactions
Purchases and sales of investments (excluding short term securities) for the year ended August 31, 2019, aggregated $57,866,439 and $66,874,993, respectively.
7. Concentration of Risk
Investing in foreign securities may include certain risks and considerations not typically associated with investing in U.S. securities, such as fluctuating currency values and changing local, regional and global economic, political and social conditions, which may result in greater market volatility. Current political and financial uncertainty surrounding the European Union may increase market volatility and the economic risk of investing in securities in Europe. In addition, certain foreign securities may not be as liquid as U.S. securities.
The United States and other nations have imposed and could impose additional sanctions on certain issuers in Russia due to regional conflicts. These sanctions could result in the devaluation of Russia’s currency, a downgrade in Russian issuers’ credit ratings, or a decline in the value and liquidity of Russian stocks or other securities. Such sanctions could also adversely affect Russia’s economy. The Fund may be prohibited from investing in securities issued by companies subject to such sanctions. In addition, if the Fund holds the securities of an issuer that is subject to such sanctions, an immediate freeze of that issuer’s securities could result, impairing the ability of the Fund to buy, sell, receive or deliver those securities. There is also the risk that countermeasures could be taken by Russia’s government, which could involve the seizure of the Fund’s assets. These
| franklintempleton.com | Annual Report | 21 | ||
TEMPLETON EMERGING MARKETS FUND
NOTES TO FINANCIAL STATEMENTS
7. Concentration of Risk(continued)
risks could affect the value of the Fund’s portfolio. While the Fund holds securities of certain issuers impacted by the sanctions, existing investments do not presently violate the applicable terms and conditions of the sanctions. The sanctions currently do not affect the Fund’s ability to sell these securities. At August 31, 2019, the Fund had 8.7% of its net assets invested in Russia.
8. Credit Facility
On November 28, 2018, the Fund entered into a senior secured revolving credit facility agreement (Credit Facility) with The Bank of Nova Scotia (BNS) pursuant to which the Fund may borrow up to a maximum commitment amount of $30 million, which matures on November 27, 2019. The Credit Facility provides a source of funds to the Fund to purchase additional investments as part of its investment strategy.
Under the terms of the Credit Facility, the Fund shall, in addition to interest charged on any borrowings made by the Fund at the applicable rate, pay an annual commitment fee of 0.25% based on the unused portion of the Credit Facility or 0.15% whenever the outstanding borrowings exceed 75% of the commitment amount. As security for the obligations of the Fund under the Credit Facility, the Fund has granted to BNS a security interest in the assets of the Fund.
At August 31, 2019, the Fund had outstanding borrowings of $10,000,000, which approximates fair value, and incurred interest expenses at a rate equal to the6-month U.S. Dollar London Interbank Offered Rate plus 0.80%. The borrowings are categorized as Level 2 within the fair value hierarchy. The average borrowings and the average interest rate for the days with outstanding borrowings during the year ended August 31, 2019, were $10,000,000 and 3.58%, respectively.
9. Fair Value Measurements
The Fund follows a fair value hierarchy that distinguishes between market data obtained from independent sources (observable inputs) and the Fund’s own market assumptions (unobservable inputs). These inputs are used in determining the value of the Fund’s financial instruments and are summarized in the following fair value hierarchy:
| • | Level 1 – quoted prices in active markets for identical financial instruments |
| • | Level 2 – other significant observable inputs (including quoted prices for similar financial instruments, interest rates, prepayment speed, credit risk, etc.) |
| • | Level 3 – significant unobservable inputs (including the Fund’s own assumptions in determining the fair value of financial instruments) |
The input levels are not necessarily an indication of the risk or liquidity associated with financial instruments at that level.
22 | Annual Report | franklintempleton.com | ||
TEMPLETON EMERGING MARKETS FUND
NOTES TO FINANCIAL STATEMENTS
A summary of inputs used as of August 31, 2019, in valuing the Fund’s assets carried at fair value, is as follows:
| Level 1 | Level 2 | Level 3 | Total | |||||||||||||
Assets: | ||||||||||||||||
Investments in Securities:a | ||||||||||||||||
Equity Investments:b | ||||||||||||||||
Cambodia | $ | — | $ | 1,022,152 | $ | — | $ | 1,022,152 | ||||||||
China | 26,299,705 | 39,548,075 | — | 65,847,780 | ||||||||||||
Peru | — | 1,363,296 | — | 1,363,296 | ||||||||||||
Russia | 19,165,758 | 4,325,509 | — | 23,491,267 | ||||||||||||
Taiwan | 25,651,067 | 486,932 | — | 26,137,999 | ||||||||||||
All Other Equity Investments | 143,713,487 | — | — | 143,713,487 | ||||||||||||
Short Term Investments | 16,797,137 | — | — | 16,797,137 | ||||||||||||
|
| |||||||||||||||
Total Investments in Securities | $ | 231,627,154 | $ | 46,745,964 | $ | — | $ | 278,373,118 | ||||||||
|
| |||||||||||||||
aFor detailed categories, see the accompanying Statement of Investments.
bIncludes common and preferred stocks.
10. Subsequent Events
The Fund has evaluated subsequent events through the issuance of the financial statements and determined that no events have occurred that require disclosure.
| Abbreviations | ||
Selected Portfolio
| ||
ADR | American Depositary Receipt | |
GDR | Global Depositary Receipt | |
| franklintempleton.com | Annual Report | 23 | ||
TEMPLETON EMERGING MARKETS FUND
Report of Independent Registered Public Accounting Firm
To the Board of Trustees and Shareholders of Templeton Emerging Markets Fund
Opinion on the Financial Statements
We have audited the accompanying statement of assets and liabilities, including the statement of investments, of Templeton Emerging Markets Fund (the “Fund”) as of August 31, 2019, the related statement of operations for the year ended August 31, 2019, the statement of changes in net assets for each of the two years in the period ended August 31, 2019, including the related notes, and the financial highlights for each of the five years in the period ended August 31, 2019 (collectively referred to as the “financial statements”). In our opinion, the financial statements present fairly, in all material respects, the financial position of the Fund as of August 31, 2019, the results of its operations for the year then ended, the changes in its net assets for each of the two years in the period ended August 31, 2019 and the financial highlights for each of the five years in the period ended August 31, 2019 in conformity with accounting principles generally accepted in the United States of America.
Basis for Opinion
These financial statements are the responsibility of the Fund’s management. Our responsibility is to express an opinion on the Fund’s financial statements based on our audits. We are a public accounting firm registered with the Public Company Accounting Oversight Board (United States) (PCAOB) and are required to be independent with respect to the Fund in accordance with the U.S. federal securities laws and the applicable rules and regulations of the Securities and Exchange Commission and the PCAOB.
We conducted our audits of these financial statements in accordance with the standards of the PCAOB. Those standards require that we plan and perform the audit to obtain reasonable assurance about whether the financial statements are free of material misstatement, whether due to error or fraud.
Our audits included performing procedures to assess the risks of material misstatement of the financial statements, whether due to error or fraud, and performing procedures that respond to those risks. Such procedures included examining, on a test basis, evidence regarding the amounts and disclosures in the financial statements. Our audits also included evaluating the accounting principles used and significant estimates made by management, as well as evaluating the overall presentation of the financial statements. Our procedures included confirmation of securities owned as of August 31, 2019 by correspondence with the custodian, transfer agent and brokers; when replies were not received from brokers, we performed other auditing procedures. We believe that our audits provide a reasonable basis for our opinion.
PricewaterhouseCoopers LLP
San Francisco, California
October 17, 2019
We have served as the auditor of one or more investment companies in the Franklin Templeton funds since 1948.
24 | Annual Report | franklintempleton.com | ||
TEMPLETON EMERGING MARKETS FUND
Under Section 852(b)(3)(C) of the Internal Revenue Code, the Fund hereby reports the maximum amount allowable but no less than $8,600,255 as a long term capital gain dividend for the fiscal year ended August 31, 2019.
Under Section 871(k)(2)(C) of the Internal Revenue Code, the Fund hereby reports the maximum amount allowable but no less than $1,109,927 as a short term capital gain dividend for purposes of the tax imposed under Section 871(a)(1)(A) of the Internal Revenue Code for the fiscal year ended August 31, 2019.
Under Section 854(b)(1)(B) of the Internal Revenue Code, the Fund hereby reports the maximum amount allowable but no less than $3,736,630 as qualified dividends for purposes of the maximum rate under Section 1(h)(11) of the Internal Revenue Code for the fiscal year ended August 31, 2019. Distributions, including qualified dividend income, paid during calendar year 2019 will be reported to shareholders on Form1099-DIV bymid-February 2020. Shareholders are advised to check with their tax advisors for information on the treatment of these amounts on their individual income tax returns.
At August 31, 2019, more than 50% of the Fund’s total assets were invested in securities of foreign issuers. In most instances, foreign taxes were withheld from income paid to the Fund on these investments. The Fund elects to treat foreign taxes paid as allowed under Section 853 of the Internal Revenue Code. This election will allow shareholders of record as of the 2019 distribution date, to treat their proportionate share of foreign taxes paid by the Fund as having been paid directly by them. The shareholder shall consider these amounts as foreign taxes paid in the tax year in which they receive the Fund distribution.
| franklintempleton.com | Annual Report | 25 | ||
TEMPLETON EMERGING MARKETS FUND
Annual Meeting of Shareholders: March 4, 2019 (unaudited)
The Annual Meeting of Shareholders of Templeton Emerging Markets Fund (the “Fund”) was held at the Fund’s offices, 300 S.E. 2nd Street, Fort Lauderdale, Florida, on March 4, 2019. The purpose of the meeting was to elect three Trustees of the Fund and to ratify the selection of PricewaterhouseCoopers LLP as the independent registered public accounting firm for the Fund for the fiscal year ending August 31, 2019. At the meeting, the following persons were elected by the shareholders to serve as Trustees of the Fund: Constantine D. Tseretopoulos, Rupert H. Johnson, Jr., and Gregory E. Johnson. *Shareholders also ratified the selection of PricewaterhouseCoopers LLP as the independent registered public accounting firm for the Fund for the fiscal year ending August 31, 2019. No other business was transacted at the meeting with respect to the Fund.
The results of the voting at the Annual Meeting are as follows:
1. Election of three Trustees:
Term Expiring 2022 | For | % of Outstanding Shares | % of Shares Present | Withheld | % of Outstanding Shares | % of Shares Present | ||||||||||||||||||
Constantine D. Tseretopoulos | 13,049,284 | 77.60% | 86.70% | 2,002,237 | 11.91% | 13.30% | ||||||||||||||||||
Rupert H. Johnson, Jr | 13,039,821 | 77.54% | 86.63% | 2,011,700 | 11.96% | 13.37% | ||||||||||||||||||
Gregory E. Johnson | 13,074,391 | 77.74% | 86.86% | 1,977,130 | 11.76% | 13.14% | ||||||||||||||||||
There were no brokernon-votes received with respect to this item.
2. Ratification of the selection of PricewaterhouseCoopers LLP as the independent registered public accounting firm for the Fund for the fiscal year ending August 31, 2019:
Shares Voted | % of Outstanding Shares | % of Shares Present | ||||||||||
For | 14,676,351 | 87.27% | 97.51% | |||||||||
Against | 263,448 | 1.57% | 1.75% | |||||||||
Abstain | 111,723 | 0.66% | 0.74% | |||||||||
*Harris J. Ashton, Ann Torre Bates, Mary C. Choksi, Edith E. Holiday, J. Michael Luttig, David W. Niemiec, Larry D. Thompson, and Robert E. Wade are Trustees of the Fund who are currently serving and whose terms of office continued after the Annual Meeting of Shareholders.
26 | Annual Report | franklintempleton.com | ||
TEMPLETON EMERGING MARKETS FUND
Dividend Reinvestment and Cash Purchase Plan
The Fund offers a Dividend Reinvestment and Cash Purchase Plan (the “Plan”) with the following features:
Shareholders must affirmatively elect to participate in the Plan. If you decide to use this service, share dividends and capital gains distributions will be reinvested automatically in shares of the Fund for your account.
Whenever the Fund declares dividends in either cash or shares of the Fund, if the market price is equal to or exceeds net asset value at the valuation date, the participant will receive the dividends entirely in new shares at a price equal to the net asset value, but not less than 95% of the then current market price of the Fund’s shares. If the market price is lower than net asset value or if dividends and/or capital gains distributions are payable only in cash, the participant will receive shares purchased on the New York Stock Exchange or otherwise on the open market.
A participant has the option of submitting additional cash payments to the Plan Administrator, in any amounts of at least $100, up to a maximum of $5,000 per month, for the purchase of Fund shares for his or her account. These payments can be made by check payable to American Stock Transfer and Trust Company, LLC (the “Plan Administrator”) and sent to American Stock Transfer and Trust Company, LLC, P.O. Box 922, Wall Street Station, New York, NY 10269-0560 Attention: Templeton Emerging Markets Fund. The Plan Administrator will apply such payments (less a $5.00 service charge and less a pro rata share of trading fees) to purchases of Fund shares on the open market.
The automatic reinvestment of dividends and/or capital gains does not relieve the participant of any income tax that may be payable on dividends or distributions.
Whenever shares are purchased on the New York Stock Exchange or otherwise on the open market, each participant will pay a pro rata portion of trading fees. Trading fees will be deducted from amounts to be invested. The Plan Administrator’s fee for a sale of shares through the Plan is $15.00 per transaction plus a $0.12 per share trading fee.
A participant may withdraw from the Plan without penalty at any time by written notice to the Plan Administrator sent to American Stock Transfer and Trust Company, LLC, P.O. Box 922, Wall Street Station, New York, NY 10269-0560. Upon withdrawal, the participant will receive, without charge, share certificates issued in the participant’s name for all full shares held by the Plan Administrator; or, if the participant wishes, the Plan Administrator will sell the participant’s shares and send the proceeds to the participant, less a service charge of $15.00 and less trading fees of $0.12 per share. The Plan Administrator will convert any fractional shares held at the time of withdrawal to cash at the current market price and send a check to the participant for the net proceeds.
For more information, please see the Plan’s Terms & Conditions located at the back of this report.
| franklintempleton.com | Annual Report | 27 | ||
TEMPLETON EMERGING MARKETS FUND
Transfer Agent
American Stock Transfer and Trust Company, LLC
P.O. Box 922, Wall Street Station
New York, NY10269-560
(800)416-5585
www.astfinancial.com
Direct Deposit Service for Registered Shareholders
Cash distributions can now be electronically credited to a checking or saving account at any financial institution that participates in the Automated Clearing House (“ACH”) system. The Direct Deposit service is provided for registered shareholders at no charge. To enroll in the service, access your account online by going to www.astfinancial.com or dial (800)416-5585 (toll free) and follow the instructions. Direct Deposit will begin with the next scheduled distribution payment date following enrollment in the service.
Direct Registration
If you are a registered shareholder of the Fund, purchases of shares of the Fund can be electronically credited to your Fund account at American Stock Transfer and Trust Company, LLC through Direct Registration. This service provides shareholders with a convenient way to keep track of shares through book entry transactions, electronically move book-entry shares between broker-dealers, transfer agents and DRS eligible issuers, and eliminate the possibility of lost certificates. For additional information, please contact American Stock Transfer and Trust Company, LLC at (800)416-5585.
Shareholder Information
Shares of Templeton Emerging Markets Fund are traded on the New York Stock Exchange under the symbol “EMF.” Information about the net asset value and the market price is available at franklintempleton.com.
For current information about dividends and shareholder accounts, call (800)416-5585. Registered shareholders can access their Fund accounton-line. For information go to American Stock Transfer and Trust Company, LLC’s web site at www.astfinancial.com and follow the instructions.
The daily closing net asset value as of the previous business day may be obtained when available by calling Franklin Templeton Fund Information after 7 a.m. Pacific time any business day at (800) DIALBEN/342-5236. The Fund’s net asset value and dividends are also listed on the NASDAQ Stock Market, Inc.’s Mutual Fund Quotation Service (“NASDAQ MFQS”).
Shareholders not receiving copies of reports to shareholders because their shares are registered in the name of a broker or a custodian can request that they be added to the Fund’s mailing list, by writing Templeton Emerging Markets Fund, 100 Fountain Parkway, P.O. Box 33030, St. Petersburg, FL 33733-8030.
28 | Annual Report | franklintempleton.com | ||
TEMPLETON EMERGING MARKETS FUND
The name, year of birth and address of the officers and board members, as well as their affiliations, positions held with the Fund, principal occupations during at least the past five years and number of U.S. registered portfolios overseen in the Franklin Templeton fund complex are shown below. Generally, each board member serves a three-year term that continues until that person’s successor is elected and qualified.
Independent Board Members
Name, Year of Birth and Address | Position | Length of Time Served | Number of Portfolios in Fund Complex Overseen by Board Member* | Other Directorships Held During at Least the Past 5 Years | ||||
Harris J. Ashton (1932) 300 S.E. 2nd Street Fort Lauderdale, FL 33301-1923 | Trustee | Since 1992 | 138 | Bar-S Foods (meat packing company) (1981-2010). | ||||
Principal Occupation During at Least the Past 5 Years: | ||||||||
Director of various companies; andformerly, Director, RBC Holdings, Inc. (bank holding company) (until 2002); and President, Chief Executive Officer and Chairman of the Board, General Host Corporation (nursery and craft centers) (until 1998).
| ||||||||
Ann Torre Bates (1958) 300 S.E. 2nd Street Fort Lauderdale, FL 33301-1923 | Trustee | Since 2008 | 35 | Ares Capital Corporation (specialty finance company) (2010-present), United Natural Foods, Inc. (distributor of natural, organic and specialty foods) (2013-present), Allied Capital Corporation (financial services) (2003-2010), SLM Corporation (Sallie Mae) (1997-2014) and Navient Corporation (loan management, servicing and asset recovery) (2014-2016). | ||||
Principal Occupation During at Least the Past 5 Years: | ||||||||
Director of various companies; andformerly, Executive Vice President and Chief Financial Officer, NHP Incorporated (manager of multifamily housing) (1995-1997); and Vice President and Treasurer, US Airways, Inc. (until 1995).
| ||||||||
Mary C. Choksi (1950) 300 S.E. 2nd Street Fort Lauderdale, FL 33301-1923 | Trustee | Since 2016 | 138 | Avis Budget Group Inc. (car rental) (2007-present), Omnicom Group Inc. (advertising and marketing communications services) (2011-present) and White Mountains Insurance Group, Ltd. (holding company) (2017-present). | ||||
Principal Occupation During at Least the Past 5 Years: | ||||||||
Director of various companies; andformerly, Founder and Senior Advisor, Strategic Investment Group (investment management group) (2015-2017); Founding Partner and Senior Managing Director, Strategic Investment Group (1987-2015); Founding Partner and Managing Director, Emerging Markets Management LLC (investment management firm) (1987-2011); and Loan Officer/Senior Loan Officer/Senior Pension Investment Officer, World Bank Group (international financial institution) (1977-1987).
| ||||||||
| franklintempleton.com | Annual Report | 29 | ||
TEMPLETON EMERGING MARKETS FUND
Independent Board Members(continued)
Name, Year of Birth and Address | Position | Length of Time Served | Number of Portfolios in Fund Complex Overseen by Board Member* | Other Directorships Held During at Least the Past 5 Years | ||||
Edith E. Holiday (1952) 300 S.E. 2nd Street Fort Lauderdale, FL 33301-1923 | Lead Independent Trustee | Trustee since 1996 and Lead Independent Trustee since 2007 | 138 | Hess Corporation (exploration of oil and gas) (1993-present), Canadian National Railway (railroad) (2001-present), White Mountains Insurance Group, Ltd. (holding company) (2004-present), Santander Consumer USA Holdings, Inc. (consumer finance) (2016-present), RTI International Metals, Inc. (manufacture and distribution of titanium) (1999-2015) and H.J. Heinz Company (processed foods and allied products) (1994-2013). | ||||
Principal Occupation During at Least the Past 5 Years: | ||||||||
Director or Trustee of various companies and trusts; andformerly, Assistant to the President of the United States and Secretary of the Cabinet (1990-1993); General Counsel to the United States Treasury Department (1989-1990); and Counselor to the Secretary and Assistant Secretary for Public Affairs and Public Liaison–United States Treasury Department (1988-1989).
| ||||||||
J. Michael Luttig (1954) 300 S.E. 2nd Street Fort Lauderdale, FL 33301-1923 | Trustee | Since 2009 | 138 | Boeing Capital Corporation (aircraft financing) (2006-2013). | ||||
Principal Occupation During at Least the Past 5 Years: | ||||||||
Executive Vice President, Counselor and Senior Advisor to Boeing Chairman and Board of Directors, The Boeing Company (aerospace company) (May 2019); andformerly, General Counsel and member of the Executive Council, The Boeing Company (2006-2019) and Federal Appeals Court Judge, U.S. Court of Appeals for the Fourth Circuit (1991-2006).
| ||||||||
David W. Niemiec (1949) 300 S.E. 2nd Street Fort Lauderdale, FL 33301-1923 | Trustee | Since 2005 | 35 | Hess Midstream Partners LP (oil and gas midstream infrastructure) (2017-present). | ||||
Principal Occupation During at Least the Past 5 Years: | ||||||||
Advisor, Saratoga Partners (private equity fund); andformerly, Managing Director, Saratoga Partners (1998-2001) and SBC Warburg Dillon Read (investment banking) (1997-1998); Vice Chairman, Dillon, Read & Co. Inc. (investment banking) (1991-1997); and Chief Financial Officer, Dillon, Read & Co. Inc. (1982-1997).
| ||||||||
Larry D. Thompson (1945) 300 S.E. 2nd Street Fort Lauderdale, FL 33301-1923 | Trustee | Since 2005 | 138 | The Southern Company (energy company) (2014-present; previously 2010-2012), Graham Holdings Company (education and media organization) (2011-present) and Cbeyond, Inc. (business communications provider) (2010-2012). | ||||
Principal Occupation During at Least the Past 5 Years: | ||||||||
Director of various companies; Counsel, Finch McCranie, LLP (law firm) (2015-present); Independent Compliance Monitor and Auditor, Volkswagen AG (manufacturer of automobiles and commercial vehicles) (2017-present); John A. Sibley Professor of Corporate and Business Law, University of Georgia School of Law (2015-present; previously 2011-2012); andformerly, Executive Vice President – Government Affairs, General Counsel and Corporate Secretary, PepsiCo, Inc. (consumer products) (2012-2014); Senior Vice President – Government Affairs, General Counsel and Secretary, PepsiCo, Inc. (2004-2011); Senior Fellow of The Brookings Institution (2003-2004); Visiting Professor, University of Georgia School of Law (2004); and Deputy Attorney General, U.S. Department of Justice (2001-2003).
| ||||||||
30 | Annual Report | franklintempleton.com | ||
TEMPLETON EMERGING MARKETS FUND
IndependentBoardMembers(continued)
Name, Year of Birth and Address | Position | Length of Time Served | Number of Portfolios in Fund Complex Overseen by Board Member* | Other Directorships Held During at Least the Past 5 Years | ||||
Constantine D. Tseretopoulos (1954) 300 S.E. 2nd Street Fort Lauderdale, FL 33301-1923 | Trustee | Since 1999 | 22 | None | ||||
Principal Occupation During at Least the Past 5 Years: | ||||||||
Physician, Chief of Staff, owner and operator of the Lyford Cay Hospital (1987-present); director of various nonprofit organizations; andformerly, Cardiology Fellow, University of Maryland (1985-1987); and Internal Medicine Resident, Greater Baltimore Medical Center (1982-1985).
| ||||||||
Robert E. Wade (1946) 300 S.E. 2nd Street Fort Lauderdale, FL 33301-1923 | Trustee | Since 2006 | 35 | El Oro Ltd (investments) (2003-June 2019). | ||||
Principal Occupation During at Least the Past 5 Years: | ||||||||
Attorney at law engaged in private practice as a sole practitioner (1972-2008) and member of various boards.
| ||||||||
| Interested Board Members and Officers | ||||||||
Name, Year of Birth and Address | Position | Length of Time Served | Number of Portfolios in by Board Member* | Other Directorships Held During at Least the Past 5 Years | ||||
**Gregory E. Johnson (1961) One Franklin Parkway San Mateo, CA 94403-1906 | Trustee | Since 2007 | 150 | None | ||||
Principal Occupation During at Least the Past 5 Years: | ||||||||
Chairman of the Board, Member – Office of the Chairman, Director and Chief Executive Officer, Franklin Resources, Inc.; officer and/or director or trustee, as the case may be, of some of the other subsidiaries of Franklin Resources, Inc. and of 42 of the investment companies in Franklin Templeton; Vice Chairman, Investment Company Institute; andformerly, President, Franklin Resources, Inc. (1994-2015).
| ||||||||
**Rupert H. Johnson, Jr. (1940) One Franklin Parkway San Mateo, CA 94403-1906 | Chairman of the Board, Trustee and Vice President | Chairman of the Board and Trustee since 2013 and Vice President since 1996 | 138 | None | ||||
Principal Occupation During at Least the Past 5 Years: | ||||||||
Vice Chairman, Member – Office of the Chairman and Director, Franklin Resources, Inc.; Director, Franklin Advisers, Inc.; and officer and/or director or trustee, as the case may be, of some of the other subsidiaries of Franklin Resources, Inc. and of 40 of the investment companies in Franklin Templeton.
| ||||||||
Alison E. Baur (1964) One Franklin Parkway San Mateo, CA 94403-1906 | Vice President | Since 2012 | Not Applicable | Not Applicable | ||||
Principal Occupation During at Least the Past 5 Years: | ||||||||
Deputy General Counsel, Franklin Templeton; and officer of some of the other subsidiaries of Franklin Resources, Inc. and of 44 of the investment companies in Franklin Templeton.
| ||||||||
Aliya S. Gordon (1973) One Franklin Parkway San Mateo, CA 94403-1906 | Vice President | Since 2009 | Not Applicable | Not Applicable | ||||
Principal Occupation During at Least the Past 5 Years: | ||||||||
Senior Associate General Counsel, Franklin Templeton; Vice President and Secretary, Franklin Resources, Inc.; and officer of 44 of the investment companies in Franklin Templeton.
| ||||||||
| franklintempleton.com | Annual Report | 31 | ||
TEMPLETON EMERGING MARKETS FUND
Interested Board Members and Officers(continued)
Name, Year of Birth and Address | Position | Length of Time Served | Number of Portfolios in Fund Complex Overseen by Board Member* | Other Directorships Held During at Least the Past 5 Years | ||||
Steven J. Gray (1955) One Franklin Parkway San Mateo, CA 94403-1906 | Vice President | Since 2009 | Not Applicable | Not Applicable | ||||
Principal Occupation During at Least the Past 5 Years: | ||||||||
Senior Associate General Counsel, Franklin Templeton; Vice President, Franklin Templeton Distributors, Inc. and FASA, LLC; and officer of 44 of the investment companies in Franklin Templeton.
| ||||||||
Matthew T. Hinkle (1971) One Franklin Parkway San Mateo, CA 94403-1906 | Chief Executive Officer – Finance and Administration | Since 2017 | Not Applicable | Not Applicable | ||||
Principal Occupation During at Least the Past 5 Years: | ||||||||
Senior Vice President, Franklin Templeton Services, LLC; officer of 44 of the investment companies in Franklin Templeton; andformerly,Vice President, Global Tax (2012-April 2017) and Treasurer/Assistant Treasurer, Franklin Templeton (2009-2017).
| ||||||||
Robert G. Kubilis (1973) 300 S.E. 2nd Street Fort Lauderdale, FL 33301-1923 | Chief Financial Officer, Chief Accounting Officer and Treasurer | Since 2017 | Not Applicable | Not Applicable | ||||
Principal Occupation During at Least the Past 5 Years: | ||||||||
Treasurer, U.S. Fund Administration & Reporting and officer of 16 of the investment companies in Franklin Templeton.
| ||||||||
Robert Lim (1948) One Franklin Parkway San Mateo, CA 94403-1906 | Vice President – AML Compliance | Since 2016 | Not Applicable | Not Applicable | ||||
Principal Occupation During at Least the Past 5 Years: | ||||||||
Vice President, Franklin Templeton Companies, LLC; Chief Compliance Officer, Franklin Templeton Distributors, Inc. and Franklin Templeton Investor Services, LLC; and officer of 44 of the investment companies in Franklin Templeton.
| ||||||||
Kimberly H. Novotny (1972) 300 S.E. 2nd Street Fort Lauderdale, FL 33301-1923 | Vice President | Since 2013 | Not Applicable | Not Applicable | ||||
Principal Occupation During at Least the Past 5 Years: | ||||||||
Senior Associate General Counsel, Franklin Templeton; Vice President and Corporate Secretary, Fiduciary Trust International of the South; Vice President, Templeton Investment Counsel, LLC; Assistant Secretary, Franklin Resources, Inc.; and officer of 44 of the investment companies in Franklin Templeton.
| ||||||||
Robert C. Rosselot (1960) 300 S.E. 2nd Street Fort Lauderdale, FL 33301-1923 | Chief Compliance Officer | Since 2013 | Not Applicable | Not Applicable | ||||
Principal Occupation During at Least the Past 5 Years: | ||||||||
Director, Global Compliance, Franklin Templeton; Vice President, Franklin Templeton Companies, LLC; officer of 44 of the investment companies in Franklin Templeton; andformerly, Senior Associate General Counsel, Franklin Templeton (2007-2013); and Secretary and Vice President, Templeton Group of Funds (2004-2013).
| ||||||||
Manraj S. Sekhon (1969) 7 Temasek Blvd., Suntec Tower 1,#38-03 Singapore 038987 | President and Chief Executive Officer - Investment Management | Since 2018 | Not Applicable | Not Applicable | ||||
Principal Occupation During at Least the Past 5 Years: | ||||||||
Chief Investment Officer, Franklin Templeton Emerging Markets Equity; officer of four of the investment companies in Franklin Templeton; andformerly, Chief Executive and Chief Investment Officer, Fullerton Fund Management Company Ltd. (2011-2016).
| ||||||||
32 | Annual Report | franklintempleton.com | ||
TEMPLETON EMERGING MARKETS FUND
Interested Board Members and Officers(continued)
Name, Year of Birth and Address | Position | Length of Time Served | Number of Portfolios in by Board Member* | Other Directorships Held During at Least the Past 5 Years | ||||
Navid J. Tofigh (1972) One Franklin Parkway San Mateo, CA 94403-1906 | Vice President | Since 2015 | Not Applicable | Not Applicable | ||||
Principal Occupation During at Least the Past 5 Years: | ||||||||
Associate General Counsel and officer of 44 of the investment companies in Franklin Templeton.
| ||||||||
Craig S. Tyle (1960) One Franklin Parkway San Mateo, CA 94403-1906 | Vice President | Since 2005 | Not Applicable | Not Applicable | ||||
Principal Occupation During at Least the Past 5 Years: | ||||||||
General Counsel and Executive Vice President, Franklin Resources, Inc.; and officer of some of the other subsidiaries of Franklin Resources, Inc. and of 44 of the investment companies in Franklin Templeton.
| ||||||||
Lori A. Weber (1964) 300 S.E. 2nd Street Fort Lauderdale, FL 33301-1923 | Vice President and Secretary | Vice President since 2011 and Secretary since 2013 | Not Applicable | Not Applicable | ||||
Principal Occupation During at Least the Past 5 Years: | ||||||||
Senior Associate General Counsel, Franklin Templeton; Assistant Secretary, Franklin Resources, Inc.; Vice President and Secretary, Templeton Investment Counsel, LLC; and officer of 44 of the investment companies in Franklin Templeton.
| ||||||||
*We base the number of portfolios on each separate series of the U.S. registered investment companies within the Franklin Templeton fund complex. These portfolios have a common investment manager or affiliated investment managers.
**Gregory E. Johnson is considered to be an interested person of the Fund under the federal securities laws due to his position as an officer and director of Franklin Resources, Inc. (Resources), which is the parent company of the Fund’s investment manager and distributor. Rupert H. Johnson, Jr. is considered to be an interested person of the Fund under the federal securities laws due to his position as an officer and director and major shareholder of Resources.
Note 1: Rupert H. Johnson, Jr. is the uncle of Gregory E. Johnson.
Note 2: Officer information is current as of the date of this report. It is possible that after this date, information about officers may change.
The Sarbanes-Oxley Act of 2002 and Rules adopted by the U.S. Securities and Exchange Commission require the Fund to disclose whether the Fund’s Audit Committee includes at least one member who is an audit committee financial expert within the meaning of such Act and Rules. The Fund’s Board has determined that there is at least one such financial expert on the Audit Committee and has designated each of Ann Torre Bates and David W. Niemiec as an audit committee financial expert. The Board believes that Ms. Bates and Mr. Niemiec qualify as such an expert in view of their extensive business background and experience. Ms. Bates has served as a member of the Fund Audit Committee since 2008. She currently serves as a director of Ares Capital Corporation (2010-present) and United Natural Foods, Inc. (2013-present) and was formerly a director of Navient Corporation from 2014 to 2016, SLM Corporation from 1997 to 2014 and Allied Capital Corporation from 2003 to 2010, Executive Vice President and Chief Financial Officer of NHP Incorporated from 1995 to 1997 and Vice President and Treasurer of US Airways, Inc. until 1995. Mr. Niemiec has served as a member of the Fund Audit Committee since 2005, currently serves as an Advisor to Saratoga Partners and was formerly its Managing Director from 1998 to 2001 and serves as a director of Hess Midstream Partners LP (2017-present). Mr. Niemiec was formerly a director of Emeritus Corporation from 1999 to 2010 and OSI Pharmaceuticals, Inc. from 2006 to 2010, Managing Director of SBC Warburg Dillon Read from 1997 to 1998, and was Vice Chairman from 1991 to 1997 and Chief Financial Officer from 1982 to 1997 of Dillon, Read & Co. Inc. As a result of such background and experience, the Board believes that Ms. Bates and Mr. Niemiec have each acquired an understanding of generally accepted accounting principles and financial statements, the general application of such principles in connection with the accounting estimates, accruals and reserves, and analyzing and evaluating financial statements that present a breadth and level of complexity of accounting issues generally comparable to those of the Fund, as well as an understanding of internal controls and procedures for financial reporting and an understanding of audit committee functions. Ms. Bates and Mr. Niemiec are independent Board members as that term is defined under the applicable U.S. Securities and Exchange Commission Rules and Releases or the listing standards applicable to the Fund.
| franklintempleton.com | Annual Report | 33 | ||
TEMPLETON EMERGING MARKETS FUND
Board Approval of Investment Management Agreements
TEMPLETON EMERGING MARKETS FUND
(Fund)
At anin-person meeting held on May 21, 2019 (Meeting), the Board of Trustees (Board) of the Fund, including a majority of the trustees who are not “interested persons” as defined in the Investment Company Act of 1940 (Independent Trustees), reviewed and approved the continuance of the investment management agreement between Templeton Asset Management Ltd. (Manager) and the Fund (Management Agreement) for an additionalone-year period. The Independent Trustees received advice from and met separately with Independent Trustee counsel in considering whether to approve the continuation of the Management Agreement.
In considering the continuation of the Management Agreement, the Board reviewed and considered information provided by the Manager at the Meeting and throughout the year at meetings of the Board and its committees. The Board also reviewed and considered information provided in response to a detailed set of requests for information submitted to the Manager by Independent Trustee counsel on behalf of the Independent Trustees in connection with the annual contract renewal process. In addition, prior to the Meeting, the Independent Trustees held a telephonic contract renewal meeting at which the Independent Trustees conferred amongst themselves and Independent Trustee counsel about contract renewal matters. The Board reviewed and considered all of the factors it deemed relevant in approving the continuance of the Management Agreement, including, but not limited to: (i) the nature, extent and quality of the services provided by the Manager; (ii) the investment performance of the Fund; (iii) the costs of the services provided and profits realized by the Manager and its affiliates from the relationship with the Fund; (iv) the extent to which economies of scale are realized as the Fund grows; and (v) whether fee levels reflect these economies of scale for the benefit of Fund investors.
In approving the continuance of the Management Agreement, the Board, including a majority of the Independent Trustees, determined that the terms of the Management Agreement are fair and reasonable and that the continuance of such Management Agreement is in the interests of the Fund and its shareholders. While attention was given to all information furnished, the following
discusses some primary factors relevant to the Board’s determination.
Nature, Extent and Quality of Services
The Board reviewed and considered information regarding the nature, extent and quality of investment management services provided by the Manager and its affiliates to the Fund and its shareholders. This information included, among other things, the qualifications, background and experience of the senior management and investment personnel of the Manager; the structure of investment personnel compensation; oversight of third-party service providers; investment performance reports and related financial information for the Fund (including its share price discount to net asset value); reports on expenses and shareholder services; legal and compliance matters; risk controls; pricing and other services provided by the Manager and its affiliates; and management fees charged by the Manager and its affiliates to US funds and other accounts, including management’s explanation of differences among accounts where relevant. The Board noted management’s continuing efforts and expenditures in establishing effective business continuity plans and developing strategies to address areas of heightened concern in the mutual fund industry, such as cybersecurity and liquidity risk management.
The Board also reviewed and considered the benefits provided to Fund shareholders of investing in a fund that is part of the Franklin Templeton family of funds. The Board noted the financial position of Franklin Resources, Inc. (FRI), the Manager’s parent, and its commitment to the mutual fund business as evidenced by its continued introduction of new funds, reassessment of the fund offerings in response to the market environment and project initiatives and capital investments relating to the services provided to the Fund by the Franklin Templeton (FT) organization.
Following consideration of such information, the Board was satisfied with the nature, extent and quality of services provided by the Manager and its affiliates to the Fund and its shareholders.
Fund Performance
The Board reviewed and considered the performance results of the Fund over various time periods ended February 28, 2019. The Board considered the performance returns for the Fund in comparison to the performance returns of mutual funds deemed comparable to the Fund included in a universe (Performance Universe) selected by Broadridge Financial Solutions, Inc. (Broadridge), an independent provider of investment company data. The Board received a
34 | Annual Report | franklintempleton.com | ||
TEMPLETON EMERGING MARKETS FUND
SHAREHOLDER INFORMATION
description of the methodology used by Broadridge to select the mutual funds included in a Performance Universe. The Board also reviewed and considered Fund performance reports provided and discussions that occurred with portfolio managers at Board meetings throughout the year. A summary of the Fund’s performance results is below. Such results are based on net asset value without regard to market discounts or premiums.
The Performance Universe for the Fund included the Fund and allclosed-endnon-leveraged emerging markets funds. The Board noted that the Fund’s annualized income return and annualized total return for theone-, three-, five- and10-year periods was above the median of its Performance Universe. The Broadridge report also contained a performance supplement, provided at the request of the Manager, with a Performance Universe which included the Fund and all retail and institutional emerging markets funds. The Board noted management’s explanation that the standard Performance Universe was very small and consisted of approximately 15closed-end funds, many with highly variable investment scope such as funds focused on China, Russia, Taiwan, Mexico or funds with specific capitalization focus such as small capitalization. The Board noted management’s further explanation that the supplemental Performance Universe included approximately 800 funds and offered a more comprehensive comparison in terms of like funds. The Fund’s annualized total return for theone-, three-, five- and10-year periods was above the median of its supplemental Performance Universe. The Board concluded that the Fund’s performance was satisfactory.
Comparative Fees and Expenses
The Board reviewed and considered information regarding the Fund’s actual total expense ratio and its various components, including, as applicable, management fees; underlying fund expenses; investment-related expenses; and othernon-management fees. The Board considered the actual total expense ratio and, separately, the contractual management fee rate, without the effect of fee waivers, if any (Management Rate) of the Fund in comparison to the median expense ratio and median Management Rate, respectively, of other mutual funds deemed comparable to and with a similar expense structure to the Fund selected by Broadridge (Expense Group). Broadridge fee and expense data is based upon information taken from each fund’s most recent annual report, which reflects historical asset levels. While recognizing such inherent limitation and the fact that expense ratios and Management Rates generally increase
as assets decline and decrease as assets grow, the Board believed the independent analysis conducted by Broadridge to be an appropriate measure of comparative fees and expenses. The Broadridge Management Rate includes administrative charges. The Board received a description of the methodology used by Broadridge to select the mutual funds included in the Expense Group.
The Expense Group for the Fund included the Fund and seven otherclosed-endnon-leveraged emerging markets funds. The Board noted that while the Management Rate for the Fund was above the median and in the fifth quintile (most expensive) of its Expense Group, its actual total expense ratio was below the median of its Expense Group. The Board concluded that the Management Rate charged to the Fund is reasonable. In doing so, the Board noted management’s explanation that the above median Management Rate is due to cost factors relating to the Fund’s operations, such as the quality and experience of its portfolio manager and research staff, and the depth of the Manager’s physical presence and coverage in the geographical area in which the Fund invests.
Profitability
The Board reviewed and considered information regarding the profits realized by the Manager and its affiliates in connection with the operation of the Fund. In this respect, the Board considered the Fund profitability analysis provided by the Manager that addresses the overall profitability of FT’s US fund business, as well as its profits in providing investment management and other services to each of the individual funds during the12-month period ended September 30, 2018, being the most recent fiscalyear-end for FRI. The Board noted that although management continually makes refinements to its methodologies used in calculating profitability in response to organizational and product-related changes, the overall methodology has remained consistent with that used in the Fund’s profitability report presentations from prior years. Additionally, PricewaterhouseCoopers LLP, auditor to FRI and certain Franklin Templeton funds, has been engaged by the Manager to periodically review and assess the allocation methodologies to be used solely by the Fund’s Board with respect to the profitability analysis.
The Board noted management’s belief that costs incurred in establishing the infrastructure necessary for the type of mutual fund operations conducted by the Manager and its affiliates may not be fully reflected in the expenses allocated to the Fund in determining its profitability, as well as the fact that the level of profits, to a certain extent, reflected
| franklintempleton.com | Annual Report | 35 | ||
TEMPLETON EMERGING MARKETS FUND
SHAREHOLDER INFORMATION
operational cost savings and efficiencies initiated by management. The Board also noted management’s expenditures in improving shareholder services provided to the Fund, as well as the need to implement systems and meet additional regulatory and compliance requirements resulting from recent SEC and other regulatory requirements.
The Board also considered the extent to which the Manager and its affiliates might derive ancillary benefits from fund operations, potential benefits resulting from personnel and systems enhancements necessitated by fund growth, as well as increased leverage with service providers and counterparties. Based upon its consideration of all these factors, the Board concluded that the level of profits realized by the Manager and its affiliates from providing services to the Fund was not excessive in view of the nature, extent and quality of services provided to the Fund.
Economies of Scale
The Board reviewed and considered the extent to which the Manager may realize economies of scale, if any, as the Fund grows larger and whether the Fund’s management fee structure reflects any economies of scale for the benefit of shareholders. The Board believes that the Manager’s ability to realize economies of scale and the sharing of such benefit is a more relevant consideration in the case of anopen-end fund whose size increases as a result of the continuous sale of its shares. Aclosed-end fund such as the Fund does not continuously offer shares, and growth following its initial public offering will primarily result from market appreciation, which benefits its shareholders. While believing economies of scale to be less of a factor in the context of aclosed-end fund, the Board believes at some point an increase in size may lead to economies of scale that would be shared with the Fund and its shareholders. The Board noted the existence of management fee breakpoints, which operate generally to share any economies of scale with the Fund’s shareholders by reducing the Fund’s effective management fees as the Fund grows in size. The Board considered the Manager’s view that any analyses of potential economies of scale in managing a particular fund are inherently limited in light of the joint and
common costs and investments the Manager incurs across the Franklin Templeton family of funds as a whole. The Board concluded that to the extent economies of scale may be realized by the Manager and its affiliates, the Fund’s management fee structure provided a sharing of benefits with the Fund and its shareholders as the Fund grows.
Conclusion
Based on its review, consideration and evaluation of all factors it believed relevant, including the above-described factors and conclusions, the Board unanimously approved the continuation of the Management Agreement for an additionalone-year period.
Proxy Voting Policies and Procedures
The Fund’s investment manager has established Proxy Voting Policies and Procedures (Policies) that the Fund uses to determine how to vote proxies relating to portfolio securities. Shareholders may view the Fund’s complete Policies online at franklintempleton.com. Alternatively, shareholders may request copies of the Policies free of charge by calling the Proxy Group collect at (954)527-7678 or by sending a written request to: Franklin Templeton Companies, LLC, 300 S.E. 2nd Street, Fort Lauderdale, FL 33301, Attention: Proxy Group. Copies of the Fund’s proxy voting records are also made available online at franklintempleton.com and posted on the U.S. Securities and Exchange Commission’s website at sec.gov and reflect the most recent12-month period ended June 30.
Quarterly Statement of Investments
The Fund files a complete statement of investments with the U.S. Securities and Exchange Commission for the first and third quarters for each fiscal year as an exhibit to its report on FormN-PORT. Shareholders may view the filed FormN-PORT by visiting the Commission’s website at sec.gov. The filed form may also be viewed and copied at the Commission’s Public Reference Room in Washington, DC. Information regarding the operations of the Public Reference Room may be obtained by calling(800) SEC-0330.
36 | Annual Report | franklintempleton.com | ||
TERMS AND CONDITIONS OF DIVIDEND REINVESTMENT AND CASH PURCHASE PLAN
1. American Stock Transfer and Trust Company, LLC (“AST”), will act as Plan Administrator and will open an account for participating shareholders (“participant”) under the Dividend Reinvestment and Cash Purchase Plan (the “Plan”) in the same name as that in which the participant’s present shares are registered, and put the Plan into effect as of the first record date for a dividend or capital gains distribution after AST receives the authorization duly executed by such participant.
2. Whenever Templeton Emerging Markets Fund (the “Fund”) declares a distribution from capital gains or an income dividend payable in either cash or shares of the Fund (“Fund shares”), if the market price per share on the valuation date equals or exceeds the net asset value per share, participants will receive such dividend or distribution entirely in Fund shares, and AST shall automatically receive such Fund shares for participant accounts including aggregate fractions. The number of additional Fund shares to be credited to participant accounts shall be determined by dividing the equivalent dollar amount of the capital gains distribution or dividend payable to participating holders by the net asset value per share of the Fund shares on the valuation date, provided that the Fund shall not issue such shares at a price lower than 95% of the current market price per share. The valuation date will be the payable date for such distribution or dividend.
3. Whenever the Fund declares a distribution from capital gains or an income dividend payable only in cash, or if the Fund’s net asset value per share exceeds the market price per share on the valuation date, AST shall apply the amount of such dividend or distribution payable to participants to the purchase of Fund shares on the open market (less their pro rata share of trading fees incurred with respect to open market purchases in connection with the reinvestment of such dividend or distribution). If, before AST has completed its purchases, the market price exceeds the net asset value per share, the average per share purchase price paid by AST may exceed the net asset value of the Fund’s shares, resulting in the acquisition of fewer shares than if the dividend or capital gains distribution had been paid in shares issued by the Fund at net asset value per share. Such purchases will be made promptly after the payable date for such dividend or distribution, and in no event more than 30 days after such date except where temporary curtailment or suspension of purchase is necessary to comply with applicable provisions of the Federal securities laws.
4. A participant has the option of submitting additional payments to AST, in any amounts of at least $100, up to a maximum of $5,000 per month, for the purchase of Fund shares for his or her account. These payments may be made electronically through AST at www.astfinancial.com or by check payable to “American Stock Transfer and Trust Company, LLC” and sent to American Stock Transfer and Trust Company, LLC, P.O. Box 922, Wall Street Station, New York, NY 10269-0560, Attention: Templeton Emerging Markets Fund. AST shall apply such payments (less a $5.00 service charge and less a pro rata share of trading fees) to purchases of Fund shares on the open market, as discussed below in paragraph 6. AST shall make such purchases promptly on approximately the 15th of each month or, during a month in which a dividend or distribution is paid, beginning on the dividend payment date, and in no event more than 30 days after receipt, except where necessary to comply with provisions of the Federal securities laws. Any voluntary payment received less than two business days before an investment date shall be invested during the following month unless there are more than 30 days until the next investment date, in which case such
payment will be returned to the participant. AST shall return to the participant his or her entire voluntary cash payment upon written notice of withdrawal received by AST not less than 48 hours before such payment is to be invested. Such written notice shall be sent to AST by the participant, as discussed below in paragraph 14.
5. For all purposes of the Plan: (a) the market price of the Fund’s shares on a particular date shall be the last sale price on the New York Stock Exchange on that date if a business day and if not, on the preceding business day, or if there is no sale on such Exchange on such date, then the mean between the closing bid and asked quotations for such shares on such Exchange on such date, and (b) net asset value per share of the Fund’s shares on a particular date shall be as determined by or on behalf of the Fund.
6. Open market purchases provided for above may be made on any securities exchange where Fund shares are traded, in theover-the-counter market or in negotiated transactions and may be on such terms as to price, delivery and otherwise as AST shall determine. Participant funds held by AST uninvested will not bear interest, and it is understood that, in any event, AST shall have no liability in connection with any inability to purchase Fund shares within 30 days after the payable date for any dividend or distribution as herein provided, or with the timing of any purchases effected. AST shall have no responsibility as to the value of the Fund shares acquired for participant accounts. For the purposes of purchases in the open market, AST may aggregate purchases with those of other participants, and the average price (including trading fees) of all shares purchased by AST shall be the price per share allocable to all participants.
7. AST will hold shares acquired pursuant to this Plan, together with the shares of other participants acquired pursuant to this Plan, in its name or that of its nominee. AST will forward to participants any proxy solicitation material and will vote any shares so held for participants only in accordance with the proxies returned by participants to the Fund. Upon written request, AST will deliver to participants, without charge, a certificate or certificates for all or a portion of the full shares held by AST.
8. AST will confirm to participants each acquisition made for an account as soon as practicable but not later than ten business days after the date thereof. AST will send to participants a detailed account statement showing total dividends and distributions, date of investment, shares acquired and price per share, and total shares of record for the account. Although participants may from time to time have an undivided fractional interest (computed to three decimal places) in a share of the Fund, no certificates for a fractional share will be issued. However, dividends and distributions on fractional shares will be credited to participant accounts. In the event of termination of an account under the Plan, AST will adjust for any such undivided fractional interest in cash at the market price of the Fund’s shares on the date of termination.
9. Any share dividends or split shares distributed by the Fund on shares held by AST for participants will be credited to participant accounts. In the event that the Fund makes available to its shareholders transferable rights to purchase additional Fund shares or other securities, AST will sell such rights and apply the proceeds of the sale to the purchase of additional Fund shares for the participant accounts. The shares held for participants under the Plan will be added to underlying shares held by participants in calculating the number of rights to be issued.
| franklintempleton.com | Not part of the annual report | 37 | ||
TERMS AND CONDITIONS OF DIVIDEND REINVESTMENT AND CASH PURCHASE PLAN(continued)
10. AST’s service charge for capital gains or income dividend purchases will be paid by the Fund when shares are issued by the Fund or purchased on the open market. AST will deduct a $5.00 service charge from each voluntary cash payment. Participants will be charged a pro rata share of trading fees on all open market purchases.
11. Participants may withdraw shares from such participant’s account or terminate their participation under the Plan by notifying AST in writing. Such withdrawal or termination will be effective immediately if notice is received by AST not less than two days prior to any dividend or distribution record date; otherwise such withdrawal or termination will be effective after the investment of any current dividend or distribution or voluntary cash payment. The Plan may be terminated by AST or the Fund upon 90 days’ notice in writing mailed to participants. Upon any withdrawal or termination, AST will cause a certificate or certificates for the full shares held by AST for participants and cash adjustment for any fractional shares (valued at the market value of the shares at the time of withdrawal or termination) to be delivered to participants, less any trading fees. Alternatively, a participant may elect by written notice to AST to have AST sell part or all of the shares held for him and to remit the proceeds to him. AST is authorized to deduct a $15.00 service charge and a $0.12 per share trading fee for this transaction from the proceeds. If a participant disposes of all shares registered in his name on the books of the Fund, AST may, at its option, terminate the participant’s account or determine from the participant whether he wishes to continue his participation in the Plan.
12. These terms and conditions may be amended or supplemented by AST or the Fund at any time or times, except when necessary or appropriate to comply with applicable law or the rules or policies of the U.S. Securities and Exchange Commission or any other regulatory authority, only by mailing to participants appropriate written notice at least 90 days prior to the effective date thereof. The amendment or supplement shall be deemed to be accepted by participants unless, prior to the effective date thereof, AST receives written notice of the termination of a participant account under the Plan. Any such amendment may include an appointment by AST in its place and stead of a successor Plan Administrator under these terms and conditions, with full power and authority to perform all or any of the acts to be performed by AST under these terms and conditions. Upon any such appointment of a Plan Administrator for the purpose of receiving dividends and distributions, the Fund will be authorized to pay to such successor Plan Administrator, for a participant’s account, all dividends and distributions payable on Fund shares held in a participant’s name or under the Plan for retention or application by such successor Plan Administrator as provided in these terms and conditions.
13. AST shall at all times act in good faith and agree to use its best efforts within reasonable limits to ensure the accuracy of all services performed under this Agreement and to comply with applicable law, but shall assume no responsibility and shall not be liable for loss or damage due to errors unless such error is caused by AST’s negligence, bad faith or willful misconduct or that of its employees.
14. Any notice, instruction, request or election which by any provision of the Plan is required or permitted to be given or made by the participant to AST shall be in writing addressed to American Stock Transfer and Trust Company, LLC, P.O. Box 922, Wall Street Station, New York, NY
10269-0560, Attention: Templeton Emerging Markets Fund, or www.astfinancial.com or such other address as AST shall furnish to the participant, and shall have been deemed to be given or made when received by AST.
15. Any notice or other communication which by any provision of the Plan is required to be given by AST to the participant shall be in writing and shall be deemed to have been sufficiently given for all purposes by being deposited postage prepaid in a post office letter box addressed to the participant at his or her address as it shall last appear on AST’s records. The participant agrees to notify AST promptly of any change of address.
16. These terms and conditions shall be governed by and construed in accordance with the laws of the State of New York and the rules and regulations of the U.S. Securities and Exchange Commission, as they may be amended from time to time.
38 | Not part of the annual report | franklintempleton.com | ||
This page intentionally left blank.
This page intentionally left blank.
Investors should be aware that the value of investments made for the Fund may go down as well as up. Like any investment in securities, the value of the Fund’s portfolio will be subject to the risk of loss from market, currency, economic, political and other factors. The Fund and its investors are not protected from such losses by the investment manager. Therefore, investors who cannot accept this risk should not invest in shares of the Fund.
To help ensure we provide you with quality service, all calls to and from our service areas are monitored and/or recorded.
 | Annual Report Templeton Emerging Markets Fund | |||||
| Investment Manager | Transfer Agent | Fund Information | ||||
| Templeton Asset | American Stock Transfer & Trust Co., LLC | (800) DIAL BEN® / 342-5236 | ||||
| Management Ltd. | 6201 15th Avenue | |||||
| Brooklyn, NY 11219 | ||||||
| Toll Free Number: (800)416-5585 | ||||||
| Hearing Impaired Number: (866)703-9077 | ||||||
| International Phone Number: (718) 921-8124 | ||||||
| www.astfinancial.com | ||||||
| © 2019 Franklin Templeton Investments. All rights reserved. | TLEMF A 10/19 |
Item 2. Code of Ethics.
| (a) | The Registrant has adopted a code of ethics that applies to its principal executive officers and principal financial and accounting officer. |
| (c) | N/A |
| (d) | N/A |
| (f) | Pursuant to Item 13(a)(1), the Registrant is attaching as an exhibit a copy of its code of ethics that applies to its principal executive officers and principal financial and accounting officer. |
Item 3. Audit Committee Financial Expert.
(a) (1) The Registrant has an audit committee financial expert serving on its audit committee.
| (2) | The audit committee financial experts are Ann Torre Bates and David W. Niemiec and they are “independent” as defined under the relevant Securities and Exchange Commission Rules and Releases. |
Item 4. Principal Accountant Fees and Services.
| (a) | Audit Fees |
The aggregate fees paid to the principal accountant for professional services rendered by the principal accountant for the audit of the registrant’s annual financial statements or for services that are normally provided by the principal accountant in connection with statutory and regulatory filings or engagements were $46,194 for the fiscal year ended August 31, 2019 and $53,526 for the fiscal year ended August 31, 2018.
| (b) | Audit-Related Fees |
There were no fees paid to the principal accountant for assurance and related services rendered by the principal accountant to the registrant that are reasonably related to the performance of the audit of the registrant’s financial statements and are not reported under paragraph (a) of Item 4.
There were no fees paid to the principal accountant for assurance and related services rendered by the principal accountant to the registrant’s investment adviser and any entity controlling, controlled by or under common control with the investment adviser that provides ongoing services to the registrant that are reasonably related to the performance of the audit of their financial statements.
| (c) | Tax Fees |
There were no fees paid to the principal accountant for professional services rendered by the principal accountant to the registrant for tax compliance, tax advice and tax planning.
The aggregate fees paid to the principal accountant for professional services rendered by the principal accountant to the registrant’s investment adviser and any entity controlling, controlled by or under common control with the investment adviser that provides ongoing services to the registrant for tax compliance, tax advice and tax planning were $20,000 for the fiscal year ended August 31, 2019 and $0 for the fiscal year ended August 31, 2018. The services for which these fees were paid included professional fees in connection with tax treatment of equipment lease transactions and professional fees in connection with an Indonesia withholding tax refund claim.
| (d) | All Other Fees |
The aggregate fees paid to the principal accountant for products and services rendered by the principal accountant to the registrant not reported in paragraphs (a)-(c) of Item 4 were $0 for the fiscal year ended August 31, 2019 and $113 for the fiscal year ended August 31, 2018. The services for which these fees were paid included review of materials provided to the fund Board in connection with the investment management contract renewal process.
The aggregate fees paid to the principal accountant for products and services rendered by the principal accountant to the registrant’s investment adviser and any entity controlling, controlled by or under common control with the investment adviser that provides ongoing services to the registrant not reported in paragraphs (a)-(c) of Item 4 were $7,700 for the fiscal year ended August 31, 2019 and $7,500 for the fiscal year ended August 31, 2018. The services for which these fees were paid included the issuance of an Auditors’ Certificate for South Korean regulatory shareholder disclosures.
(e) (1) The registrant’s audit committee is directly responsible for approving the services to be provided by the auditors, including:
(i)pre-approval of all audit and audit related services;
(ii)pre-approval of allnon-audit related services to be provided to the Fund by the auditors;
(iii)pre-approval of allnon-audit related services to be provided to the registrant by the auditors to the registrant’s investment adviser or to any entity that controls, is controlled by or is under common control with the registrant’s investment adviser and that provides ongoing services to the registrant where thenon-audit services relate directly to the operations or financial reporting of the registrant; and
(iv) establishment by the audit committee, if deemed necessary or appropriate, as an alternative to committeepre-approval of services to be provided by the auditors, as required by paragraphs (ii) and (iii) above, of policies and procedures to permit such services to bepre-approved by other means, such as through establishment of guidelines or by action of a designated member or members of the committee; provided the policies and procedures are detailed as to the particular service and the committee is informed of each service and such policies and procedures do not include delegation of audit committee responsibilities, as contemplated under the Securities Exchange Act of 1934, to management; subject, in the case of (ii) through (iv), to any waivers, exceptions or exemptions that may be available under applicable law or rules.
(e) (2) None of the services provided to the registrant described in paragraphs (b)-(d) of Item 4 were approved by the audit committee pursuant to paragraph (c)(7)(i)(C) of Rule2-01 of regulationS-X.
(f) No disclosures are required by this Item 4(f).
(g) The aggregatenon-audit fees paid to the principal accountant for services rendered by the principal accountant to the registrant and the registrant’s investment adviser and any entity controlling, controlled by or under common control with the investment adviser that provides ongoing services to the registrant were $27,700 for the fiscal year ended August 31, 2019 and $7,613 for the fiscal year ended August 31, 2018.
(h) The registrant’s audit committee of the board has considered whether the provision ofnon-audit services that were rendered to the registrant’s investment adviser (not including anysub-adviser whose role is primarily portfolio management and is subcontracted with or overseen by another investment adviser), and any entity controlling, controlled by, or under common control with the investment adviser that provides ongoing services to the registrant that were notpre-approved pursuant to paragraph (c)(7)(ii) of Rule2-01 of RegulationS-X is compatible with maintaining the principal accountant’s independence.
Item 5. Audit Committee of Listed Registrants.
Members of the Audit Committee are: Ann Torre Bates, David W. Niemiec and Constantine D. Tseretopoulos.
Item 6. Schedule of Investments. N/A
Item 7.Disclosure of Proxy Voting Policies and Procedures forClosed-End Management Investment Companies.
The board of trustees of the Fund has delegated the authority to vote proxies related to the portfolio securities held by the Fund to the Fund’s investment manager Templeton Asset Management Ltd. (Asset Management) in accordance with the Proxy Voting Policies and Procedures (Policies) adopted by the investment manager.
The investment manager has delegated its administrative duties with respect to the voting of proxies for securities to the Proxy Group within Franklin Templeton Companies, LLC (Proxy Group), an affiliate and wholly owned subsidiary of Franklin Resources, Inc. All proxies received by the Proxy Group will be voted based upon the investment manager’s instructions and/or policies. The investment manager votes proxies solely in the best interests of the Fund and its shareholders.
To assist it in analyzing proxies of equity securities, the investment manager subscribes to Institutional Shareholder Services, Inc. (ISS), an unaffiliated third-party corporate governance research service that providesin-depth analyses of shareholder meeting agendas, vote recommendations, vote execution services, ballot reconciliation services, recordkeeping and vote disclosure services. In addition, the investment manager subscribes to Glass, Lewis & Co., LLC (Glass Lewis), an unaffiliated third-party analytical research firm, to receive analyses and vote recommendations on the shareholder meetings of publicly held U.S. companies, as well as a limited subscription to its international research. Also, the investment manager has a supplemental subscription to Egan-Jones Proxy Services (Egan-Jones), an unaffiliated third party proxy advisory firm, to receive analyses and vote recommendations. Although analyses provided by ISS, Glass Lewis, Egan-Jones, and/or another independent third party proxy service provider (each a “Proxy Service”) are thoroughly reviewed and considered in making a final voting decision, the investment manager does not consider recommendations from a Proxy Service or any third party to be determinative of the investment manager’s ultimate decision. Rather, the investment manager exercises its independent judgment in making voting decisions. For most proxy proposals, the investment manager’s evaluation should result in the same position being taken for all Funds. In some cases, however, the evaluation may result in a Fund voting differently, depending upon the nature and objective of the Fund, the composition of its portfolio and other factors. As a matter of policy, the officers, directors/trustees and employees of the investment manager and the Proxy Group will not be influenced by outside sources whose interests conflict with the interests of the Fund and its shareholders. Efforts are made to resolve all conflicts in the best interests of the investment manager’s clients. Material conflicts of interest are identified by the Proxy Group based upon analyses of client, distributor, broker-dealer and vendor lists, information periodically gathered from directors and officers, and information derived from other sources, including public filings. In situations where a material conflict of interest is identified, the Proxy Group may vote consistent with the voting recommendation of a Proxy Service; or send the proxy directly to the Fund’s board or a committee of the board with the investment manager’s recommendation regarding the vote for approval.
Where a material conflict of interest has been identified, but the items on which the investment manager’s vote recommendations differ from a Proxy Service and relate specifically to (1) shareholder proposals regarding social or environmental issues, (2) “Other Business” without describing the matters that might be considered, or (3) items the investment manager wishes to vote in opposition to the recommendations of an issuer’s management, the Proxy Group may defer to the vote recommendations of the investment manager rather than sending the proxy directly to the Fund’s board or a board committee for approval.
To avoid certain potential conflicts of interest, the investment manager will employ echo voting or pass-through voting, if possible, in the following instances: (1) when the Fund invests in an underlying fund in reliance on any one of Sections 12(d) (1) (F), or (G) of the 1940 Act, the rules thereunder, or pursuant to a SEC exemptive order thereunder; (2) when the Fund invests uninvested cash in affiliated money market funds pursuant to the rules under the 1940 Act or any exemptive orders thereunder (“cash sweep arrangement”); or (3) when required pursuant to the Fund’s governing documents or applicable law. Echo voting means that the investment manager will vote the shares in the same proportion as the vote of all of the other holders of the underlying fund’s shares. With respect to instances when a Franklin Templeton U.S. registered investment company invests in an underlying fund in reliance on any one of Sections 12(d)(1)(F) or (G) of the 1940 Act, the rules thereunder, or pursuant to an SEC exemptive order thereunder, and there are no other unaffiliated shareholders also invested in the underlying fund, the Investment Manager will vote in accordance with the recommendation of such investment company’s board of trustees or directors. In addition, to avoid certain potential conflicts of interest, and where required under a fund’s governing documents or applicable law, the Investment Manager will employ pass-through voting when a Franklin Templeton U.S. registered investment company invests in an underlying fund in reliance on Section 12(d)(1)(E) of the 1940 Act, the rules thereunder, or pursuant to an SEC exemptive order thereunder. In “pass-through voting,” a feeder fund will solicit voting instructions from its shareholders as to how to vote on the master fund’s proposals.
The recommendation of management on any issue is a factor that the investment manager considers in determining how proxies should be voted. However, the investment manager does not consider recommendations from management to be determinative of the investment manager’s ultimate decision. As a matter of practice, the votes with respect to most issues are cast in accordance with the position of the company’s management. Each issue, however, is considered on its own merits, and the investment manager will not support the position of the company’s management in any situation where it deems that the ratification of management’s position would adversely affect the investment merits of owning that company’s shares.
Engagement with issuers. The investment manager believes that engagement with issuers is important to good corporate governance and to assist in making proxy voting decisions. The investment manager may engage with issuers to discuss specific ballot items to be voted on in advance of an annual or special meeting to obtain further information or clarification on the proposals. The investment manager may also engage with management on a range of environmental, social or corporate governance issues throughout the year.
Investment manager’s proxy voting policies and principles The investment manager has adopted general proxy voting guidelines, which are summarized below. These guidelines are not an exhaustive list of all the issues that may
arise and the investment manager cannot anticipate all future situations. In all cases, each proxy and proposal (including both management and shareholder proposals) will be considered based on the relevant facts and circumstances on acase-by-case basis.
Board of directors. The investment manager supports an independent, diverse board of directors, and prefers that key committees such as audit, nominating, and compensation committees be comprised of independent directors. The investment manager supports boards with strong risk management oversight. The investment manager will generally vote against management efforts to classify a board and will generally support proposals to declassify the board of directors. The investment manager will consider withholding votes from directors who have attended less than 75% of meetings without a valid reason. While generally in favor of separating Chairman and CEO positions, the investment manager will review this issue as well as proposals to restore or provide for cumulative voting on acase-by-case basis, taking into consideration factors such as the company’s corporate governance guidelines or provisions and performance. The investment manager generally will supportnon-binding shareholder proposals to require a majority vote standard for the election of directors; however, if these proposals are binding, the investment manager will give careful review on acase-by-case basis of the potential ramifications of such implementation.
In the event of a contested election, the investment manager will review a number of factors in making a decision including management’s track record, the company’s financial performance, qualifications of candidates on both slates, and the strategic plan of the dissidents and/or shareholder nominees.
Ratification of auditors of portfolio companies. The investment manager will closely scrutinize the independence, role and performance of auditors. On acase-by-case basis, the investment manager will examine proposals relating tonon-audit relationships andnon-audit fees. The investment manager will also consider, on acase-by-case basis, proposals to rotate auditors, and will vote against the ratification of auditors when there is clear and compelling evidence of a lack of independence, accounting irregularities or negligence. The investment manager may also consider whether the ratification of auditors has been approved by an appropriate audit committee that meets applicable composition and independence requirements.
Management and director compensation. A company’s equity-based compensation plan should be in alignment with the shareholders’ long-term interests. The investment manager believes that executive compensation should be directly linked to the performance of the company. The investment manager evaluates plans on acase-by-case basis by considering several factors to determine whether the plan is fair and reasonable, including the ISS quantitative model utilized to assess such plans and/or the Glass Lewis evaluation of the plans. The investment manager will generally oppose plans that have the potential to be excessively dilutive, and will almost always oppose plans that are structured to allow the repricing of underwater options, or plans that have an automatic share replenishment “evergreen” feature. The investment manager will generally support employee stock option plans in which the purchase price is at least 85% of fair market value, and when potential dilution is 10% or less.
Severance compensation arrangements will be reviewed on acase-by-case basis, although the investment manager will generally oppose “golden parachutes” that are considered to be excessive. The investment manager will normally support
proposals that require a percentage of directors’ compensation to be in the form of common stock, as it aligns their interests with those of shareholders.
The investment manager will reviewnon-bindingsay-on-pay proposals on acase-by-case basis, and will generally vote in favor of such proposals unless compensation is misaligned with performance and/or shareholders’ interests, the company has not provided reasonably clear disclosure regarding its compensation practices, or there are concerns with the company’s remuneration practices.
Anti-takeover mechanisms and related issues. The investment manager generally opposes anti-takeover measures since they tend to reduce shareholder rights. However, as with all proxy issues, the investment manager conducts an independent review of each anti-takeover proposal. On occasion, the investment manager may vote with management when the research analyst has concluded that the proposal is not onerous and would not harm the Fund or its shareholders’ interests. The investment manager generally supports proposals that require shareholder rights’ plans (“poison pills”) to be subject to a shareholder vote and will closely evaluate such plans on acase-by-case basis to determine whether or not they warrant support. In addition, the investment manager will generally vote against any proposal to issue stock that has unequal or subordinate voting rights. The investment manager generally opposes any supermajority voting requirements as well as the payment of “greenmail.” The investment manager generally supports “fair price” provisions and confidential voting. The investment manager will review a company’s proposal to reincorporate to a different state or country on acase-by-case basis taking into consideration financial benefits such as tax treatment as well as comparing corporate governance provisions and general business laws that may result from the change in domicile.
Changes to capital structure. The investment manager realizes that a company’s financing decisions have a significant impact on its shareholders, particularly when they involve the issuance of additional shares of common or preferred stock or the assumption of additional debt. The investment manager will review, on acase-by-case basis, proposals by companies to increase authorized shares and the purpose for the increase. The investment manager will generally not vote in favor of dual-class capital structures to increase the number of authorized shares where that class of stock would have superior voting rights. The investment manager will generally vote in favor of the issuance of preferred stock in cases where the company specifies the voting, dividend, conversion and other rights of such stock and the terms of the preferred stock issuance are deemed reasonable. The investment manager will review proposals seeking preemptive rights on acase-by-case basis.
Mergers and corporate restructuring. Mergers and acquisitions will be subject to careful review by the research analyst to determine whether they would be beneficial to shareholders. The investment manager will analyze various economic and strategic factors in making the final decision on a merger or acquisition. Corporate restructuring proposals are also subject to a thorough examination on acase-by-case basis.
Environmental and social issues. The investment manager considers environmental and social issues alongside traditional financial measures to provide a more comprehensive view of the value, risk and return potential of an investment. Companies may face significant financial, legal and reputational risks resulting from poor environmental and social practices, or negligent oversight of environmental or social issues. Franklin Templeton’s “Responsible Investment Principles and Policies” describes the investment manager’s approach
to consideration of environmental, social and governance issues within the investment manager’s processes and ownership practices.
In the investment manager’s experience, those companies that are managed well are often effective in dealing with the relevant environmental and social issues that pertain to their business. As such, the investment manager will generally give management discretion with regard to environmental and social issues. However, in cases where management and the board have not demonstrated adequate efforts to mitigate material environmental or social risks, have engaged in inappropriate or illegal conduct, or have failed to adequately address current or emergent risks that threaten shareholder value, the investment manager may choose to support well-crafted shareholder proposals that serve to promote or protect shareholder value. This may include seeking appropriate disclosure regarding material environmental and social issues. The investment manager will review shareholder proposals on acase-by-case basis and may support those that serve to enhance value or mitigate risk, are drafted appropriately, and do not disrupt the course of business or require a disproportionate or inappropriate use of company resources.
The investment manager will consider supporting a shareholder proposal seeking disclosure and greater board oversight of lobbying and corporate political contributions if the investment manager believes that there is evidence of inadequate oversight by the company’s board, if the company’s current disclosure is significantly deficient, or if the disclosure is notably lacking in comparison to the company’s peers.
Governance matters. The investment manager generally supports the right of shareholders to call special meetings and act by written consent. However, the investment manager will review such shareholder proposals on acase-by-case basis in an effort to ensure that such proposals do not disrupt the course of business or require a disproportionate or inappropriate use of company resources.
Proxy access. In cases where the investment manager is satisfied with company performance and the responsiveness of management, it will generally vote against shareholder proxy access proposals not supported by management. In other instances, the investment manager will consider such proposals on acase-by-case basis, taking into account factors such as the size of the company, ownership thresholds and holding periods, nomination limits (e.g., number of candidates that can be nominated), the intentions of the shareholder proponent, and shareholder base.
Global corporate governance. Many of the tenets discussed above are applied to the investment manager’s proxy voting decisions for international investments. However, the investment manager must be flexible in these worldwide markets. Principles of good corporate governance may vary by country, given the constraints of a country’s laws and acceptable practices in the markets. As a result, it is on occasion difficult to apply a consistent set of governance practices to all issuers. As experienced money managers, the investment manager’s analysts are skilled in understanding the complexities of the regions in which they specialize and are trained to analyze proxy issues germane to their regions.
The investment manager will generally attempt to process every proxy it receives for all domestic and foreign securities. However, there may be situations in which the investment manager may be unable to successfully vote a proxy, or may choose not to vote a proxy, such as where: (i) a proxy ballot was
not received from the custodian bank; (ii) a meeting notice was received too late; (iii) there are fees imposed upon the exercise of a vote and it is determined that such fees outweigh the benefit of voting; (iv) there are legal encumbrances to voting, including blocking restrictions in certain markets that preclude the ability to dispose of a security if the investment manager votes a proxy or where the investment manager is prohibited from voting by applicable law, economic or other sanctions, or other regulatory or market requirements, including but not limited to, effective Powers of Attorney; (v) additional documentation or the disclosure of beneficial owner details is required; (vi) the investment manager held shares on the record date but has sold them prior to the meeting date; (vii) a proxy voting service is not offered by the custodian in the market; (viii) due to either system error or human error, the investment manager’s intended vote is not correctly submitted; (ix) the investment manager believes it is not in the best interest of the Fund or its shareholders to vote the proxy for any other reason not enumerated herein; or (x) a security is subject to a securities lending or similar program that has transferred legal title to the security to another person.
In somenon-U.S. jurisdictions, even if the investment manager uses reasonable efforts to vote a proxy on behalf of the Fund, such vote or proxy may be rejected because of (a) operational or procedural issues experienced by one or more third parties involved in voting proxies in such jurisdictions; (b) changes in the process or agenda for the meeting by the issuer for which the investment manager does not have sufficient notice; or (c) the exercise by the issuer of its discretion to reject the vote of the investment manager. In addition, despite the best efforts of the Proxy Group and its agents, there may be situations where the investment manager’s votes are not received, or properly tabulated, by an issuer or the issuer’s agent.
The investment manager or its affiliates may, on behalf of one or more of the proprietary registered investment companies advised by the investment manager or its affiliates, determine to use its best efforts to recall any security on loan where the investment manager or its affiliates (a) learn of a vote on a material event that may affect a security on loan and (b) determine that it is in the best interests of such proprietary registered investment companies to recall the security for voting purposes.
Procedures for meetings involving fixed income securities. From time to time, certain custodians may process events for fixed income securities through their proxy voting channels rather than corporate action channels for administrative convenience. In such cases, the Proxy Group will receive ballots for such events on the ISS voting platform. The Proxy Group will solicit voting instructions from the investment manager for each Fund involved. If the Proxy Group does not receive voting instructions from the investment manager, the Proxy Group will take no action on the event. The investment manager may be unable to vote a proxy for a fixed income security, or may choose not to vote a proxy, for the reasons described under the section entitled “Proxy Procedures.”
The Proxy Group will monitor such meetings involving fixed income securities for conflicts of interest in accordance with these procedures for fixed income securities. If a fixed income issuer is flagged as a potential conflict of interest, the investment manager may nonetheless vote as it deems in the best interests of the Fund. The investment manager will report such decisions on an annual basis to the Fund board as may be required.
Shareholders may view the complete Policies online at franklintempleton.com. Alternatively, shareholders may request copies of the Policies free of charge by calling the Proxy Group collect at (954)527-7678 or by sending a written
request to: Franklin Templeton Companies, LLC, 300 S.E. 2nd Street, Fort Lauderdale, FL 33301-1923, Attention: Proxy Group. Copies of the Fund’s proxy voting records are available online at franklintempleton.com and posted on the SEC website at www.sec.gov. The proxy voting records are updated each year by August 31 to reflect the most recent12-month period ended June 30.
Item 8. Portfolio Managers ofClosed-End Management Investment Companies.
(a) (1) As of October 31, 2019, the portfolio manager of the Fund is as follows:
Chetan Sehgal CFA,Director of Global Emerging Markets/Small Cap Strategies of the Templeton Emerging Markets Group and portfolio manager of Asset Management Mr. Sehgal has been a portfolio manager of the emerging markets equity portion of the Fund since March 2017. He has primary responsibility for the investments of the Fund. He has final authority over all aspects of the Fund’s investment portfolio, including but not limited to, purchases and sales of individual securities, portfolio risk assessment, and the management of daily cash balances in accordance with anticipated investment management requirements. The degree to which he may perform these functions, and the nature of these functions, may change from time to time. He joined Franklin Templeton Investments in 1995.
CFA and Chartered Financial Analyst are trademarks owned by CFA Institute.
(a) (2) This section reflects information about the portfolio manager as of the fiscal year ended August 31, 2019.
The following table shows the number of other accounts managed by each portfolio manager and the total assets in the accounts managed within each category:
Name | Number of Other Registered Investment Companies Managed1 | Assets of Other Registered Investment Companies Managed (x $1 million)1 | Number of Other Pooled Investment Vehicles Managed1 | Assets of Other Pooled Investment Vehicles Managed (x $1 million)1 | Number of Other Accounts Managed1 | Assets of Other Accounts Managed (x $1 million)1 | ||||||||||||||||||
Chetan Sehgal | 4 | 2,390.4 | 11 | 4,246.4 | 2 | 2,659.0 | ||||||||||||||||||
| 1. | The various pooled investment vehicles and accounts listed are managed by a team of investment professionals. Accordingly, the individual manager listed would not be solely responsible for managing such listed amounts. |
Portfolio managers that provide investment services to the Fund may also provide services to a variety of other investment products, including other funds, institutional accounts and private accounts. The advisory fees for some of such other products and accounts may be different than that charged to the Fund and may include performance based compensation (as noted, in the chart above, if any). This may result in fees that are higher (or lower) than the advisory fees paid by the Fund. As a matter of policy, each fund or account is managed solely for the benefit of the beneficial owners thereof. As discussed
below, the separation of the trading execution function from the portfolio management function and the application of objectively based trade allocation procedures help to mitigate potential conflicts of interest that may arise as a result of the portfolio managers managing accounts with different advisory fees.
Conflicts. The management of multiple funds, including the Fund, and accounts may also give rise to potential conflicts of interest if the funds and other accounts have different objectives, benchmarks, time horizons, and fees as the portfolio manager must allocate his or her time and investment ideas across multiple funds and accounts. The investment manager seeks to manage such competing interests for the time and attention of portfolio managers by having portfolio managers focus on a particular investment discipline. Most other accounts managed by a portfolio manager are managed using the same investment strategies that are used in connection with the management of the Fund. Accordingly, portfolio holdings, position sizes, and industry and sector exposures tend to be similar across similar portfolios, which may minimize the potential for conflicts of interest. As noted above, the separate management of the trade execution and valuation functions from the portfolio management process also helps to reduce potential conflicts of interest. However, securities selected for funds or accounts other than the Fund may outperform the securities selected for the Fund. Moreover, if a portfolio manager identifies a limited investment opportunity that may be suitable for more than one fund or other account, the Fund may not be able to take full advantage of that opportunity due to an allocation of that opportunity across all eligible funds and other accounts. The investment manager seeks to manage such potential conflicts by using procedures intended to provide a fair allocation of buy and sell opportunities among funds and other accounts.
The structure of a portfolio manager’s compensation may give rise to potential conflicts of interest. A portfolio manager’s base pay and bonus tend to increase with additional and more complex responsibilities that include increased assets under management. As such, there may be a relationship between a portfolio manager’s marketing or sales efforts and his or her bonus.
Finally, the management of personal accounts by a portfolio manager may give rise to potential conflicts of interest. While the funds and the manager have adopted a code of ethics which they believe contains provisions reasonably necessary to prevent a wide range of prohibited activities by portfolio managers and others with respect to their personal trading activities, there can be no assurance that the code of ethics addresses all individual conduct that could result in conflicts of interest.
The manager and the Fund have adopted certain compliance procedures that are designed to address these, and other, types of conflicts. However, there is no guarantee that such procedures will detect each and every situation where a conflict arises.
Compensation. The investment manager seeks to maintain a compensation program that is competitively positioned to attract, retain and motivatetop-quality investment professionals. Portfolio managers receive a base salary, a cash incentive bonus opportunity, an equity compensation opportunity, and a benefits package. Portfolio manager compensation is reviewed annually and the level of compensation is based on individual performance, the salary range for a portfolio manager’s level of responsibility and Franklin Templeton guidelines. Portfolio managers are provided no financial incentive to favor one fund or
account over another. Each portfolio manager’s compensation consists of the following three elements:
Base salary Each portfolio manager is paid a base salary.
Annual bonus Annual bonuses are structured to align the interests of the portfolio manager with those of the Fund’s shareholders. Each portfolio manager is eligible to receive an annual bonus. Bonuses generally are split between cash and equity which vest over a three-year period. The deferred equity-based compensation is intended to build a vested interest of the portfolio manager in the mutual funds they advise. The bonus plan seeks to provide a competitive level of annual bonus compensation, commensurate with the portfolio manager’s consistently strong investment performance. In accordance with Franklin Templeton guidelines, the Chief Investment Officer and/or other officers of the portfolio manager who also bear responsibility for the account, have discretion in the granting of annual bonuses. The following factors are generally considered when determining bonuses:
| • | Stock selection. The quality and success of a portfolio manager’s purchase and sale recommendations are considered when granting bonus awards. |
| • | Investment performance.Primary consideration is given to the performance of their portfolios relative to those portfolios with similar objectives and restrictions. |
| • | Non-investment performance. The more qualitative contributions of a portfolio manager to the company’s business and the investment management team, such as superior client service, are evaluated in determining the amount of any bonus award. |
| • | Responsibilities. The characteristics and complexity of accounts managed by the portfolio manager are factored in the manager’s appraisal. |
| • | Research. Where the portfolio management team also has research responsibilities, each portfolio manager is evaluated on productivity and quality of recommendations over time. |
Additional long-term equity-based compensationPortfolio managers may also be awarded restricted shares or units of Resources stock or restricted shares or units of one or more mutual funds. Awards of such deferred equity-based compensation typically vest over time, so as to create incentives to retain key talent.
Benefits Portfolio managers also participate in benefit plans and programs available generally to all employees of the investment manager.
Ownership of Fund shares.The investment manager has a policy of encouraging portfolio managers to invest in the funds they manage. Exceptions arise when, for example, a fund is closed to new investors or when tax considerations or jurisdictional constraints cause such an investment to be inappropriate for the portfolio manager. The following is the dollar range of Fund shares beneficially owned by each portfolio manager (such amounts may change from time to time):
Portfolio Manager | Dollar Range of Fund Shares Beneficially Owned | |
| Chetan Sehgal | None |
Note: Because the portfolio managers are all foreign nationals, they do not hold shares in this U.S. registered Fund; however they own shares in other similar Franklin Templeton funds managed by them, registered offshore and appropriate for foreign nationals.
Item 9. Purchases of Equity Securities byClosed-End Management Investment Company and Affiliated Purchasers.
Period | (a) Total Number of Shares Purchased | (b) Average Price Paid per Share | (c) Total Number of Shares Purchased as Part of Publicly Announced Plans or Program | (d) Maximum Number (or Approximate Dollar Value) of Shares that May Yet Be Purchased Under the Plans or Programs | ||||||||||||
Month #1 (3/1/19 - 3/31/19) | 9,451.000 | 14.69 | 9,451.000 | 2,198,969.00 | ||||||||||||
Month #2 (4/1/19 - 4/30/19) | 6,788.000 | 15.39 | 6,788.000 | 2,192,181.00 | ||||||||||||
Month #3 (5/1/19 - 5/31/19) | 17,162.000 | 14.82 | 17,162.000 | 2,175,019.00 | ||||||||||||
Month #4 (6/1/19 - 6/30/19) | 2,819.000 | 14.48 | 2,819.000 | 2,172,200.00 | ||||||||||||
Month #5 (7/1/19 - 7/31/19) | 8,938.000 | 15.23 | 8,938.000 | 2,163,262.00 | ||||||||||||
Month #6 (8/1/19 - 8/31/19) | 22,944.000 | 14.11 | 22,944.000 | 2,140,318.00 | ||||||||||||
|
|
|
| |||||||||||||
Total | 68,102.000 | 68,102.000 | ||||||||||||||
|
|
|
| |||||||||||||
The Board previously authorized an open-market share repurchase program pursuant to which the Fund may purchase, from time to time, Fund shares in open-market transactions, at the discretion of management. Effective December 13, 2018, the Board approved a modification to its existing open-market share repurchase program to authorize the Fund to repurchase an additional 10% of the Fund’s shares outstanding in open market transactions, at the discretion of management. Since the inception of the program, the Fund had repurchased a total of 1,380,494 shares.
Item 10. Submission of Matters to a Vote of Security Holders.
There have been no changes to the procedures by which shareholders may recommend nominees to the Registrant’s Board of Trustees that would require disclosure herein.
Item 11. Controls and Procedures.
(a) Evaluation of Disclosure Controls and Procedures. The Registrant maintains disclosure controls and procedures that are designed to provide reasonable assurance that information required to be disclosed in the Registrant’s filings under the Securities Exchange Act of 1934, as amended, and the Investment Company Act of 1940 is recorded, processed, summarized and reported within the periods specified in the rules and forms of the Securities and Exchange Commission. Such information is accumulated and communicated to the Registrant’s management, including its principal executive officer and principal financial officer, as appropriate, to allow timely decisions regarding required disclosure. The Registrant’s management, including the principal executive officer and the principal financial officer, recognizes that any set of controls and procedures, no matter how well designed and operated, can provide only reasonable assurance of achieving the desired control objectives.
Within 90 days prior to the filing date of this Shareholder Report on FormN-CSR, the Registrant had carried out an evaluation, under the supervision and with the participation of the Registrant’s management, including the Registrant’s principal executive officer and the Registrant’s principal financial officer, of the effectiveness of the design and operation of the Registrant’s disclosure controls and procedures. Based on such evaluation, the Registrant’s principal executive officer and principal financial officer concluded that the Registrant’s disclosure controls and procedures are effective.
(b) Changes in Internal Controls: Effective November 1, 2018, the Registrant’s controls were enhanced through the implementation of a daily secondary review of market events following the close of trading on foreign stock markets to ensure the appropriate application of market level fair value.
Item 12. Disclosure of Securities Lending Activities forClosed-End Management Investment Company. N/A
Item 13. Exhibits.
(a)(1)Code of Ethics
(a)(2) Certifications pursuant to Section 302 of the Sarbanes-Oxley Act of 2002 of Matthew T. Hinkle, Chief Executive Officer - Finance and Administration, and Robert G. Kubilis, Chief Financial Officer and Chief Accounting Officer
(b) Certifications pursuant to Section 906 of the Sarbanes-Oxley Act of 2002 of Matthew T. Hinkle, Chief Executive Officer - Finance and Administration, and Robert G. Kubilis, Chief Financial Officer and Chief Accounting Officer
SIGNATURES
Pursuant to the requirements of the Securities Exchange Act of 1934 and the Investment Company Act of 1940, the registrant has duly caused this report to be signed on its behalf by the undersigned, thereunto duly authorized.
TEMPLETON EMERGING MARKETS FUND
| By | S\MATTHEW T. HINKLE | |
| Matthew T. Hinkle | ||
| Chief Executive Officer - | ||
| Finance and Administration | ||
| Date: October 31, 2019 | ||
Pursuant to the requirements of the Securities Exchange Act of 1934 and the Investment Company Act of 1940, this report has been signed below by the following persons on behalf of the registrant and in the capacities and on the dates indicated.
| By | S\MATTHEW T. HINKLE | |
| Matthew T. Hinkle | ||
| Chief Executive Officer - | ||
| Finance and Administration | ||
| Date: October 31, 2019 | ||
| By | S\ROBERT G. KUBILIS | |
| Robert G. Kubilis | ||
| Chief Financial Officer and | ||
| Chief Accounting Officer | ||
| Date: October 31, 2019 | ||