UNITED STATES
SECURITIES AND EXCHANGE COMMISSION
Washington, D.C. 20549
FORM N-CSR
CERTIFIED SHAREHOLDER REPORT OF REGISTERED MANAGEMENT INVESTMENT
COMPANIES
Investment Company Act file number 811-04993
| Nicholas Limited Edition, Inc. | |
| (Exact Name of Registrant as specified in charter) | |
| 411 East Wisconsin Avenue, Milwaukee, Wisconsin 53202 | |
| (Address of Principal Executive Offices) | (Zip Code) |
| Jennifer R. Kloehn, Senior Vice President and Treasurer | |
| 411 East Wisconsin Avenue | |
| Milwaukee, Wisconsin 53202 | |
| (Name and Address of Agent for Service) | |
Registrant's telephone number, including area code: 414-272-4650
Date of fiscal year end: 12/31/2020
Date of reporting period: 12/31/2020
Item 1. Report to Stockholders.
ANNUAL REPORT
December 31, 2020

Beginning on January 1, 2021, as permitted by regulations adopted by the Securities and Exchange Commission, paper copies of the Fund’s shareholder reports will no longer be sent by mail, unless you specifically request paper copies of the reports from the Fund or from your financial intermediary, such as a broker-dealer or bank. Instead, the reports will be made available on the Fund’s website, www.nicholasfunds.com, and you will be notified by mail each time a report is posted and provided with a website link to access the report.
If you already elected to receive shareholder reports electronically, you will not be affected by this change and you need not take any action. You may elect to receive shareholder reports and other communications from the Fund or your financial intermediary electronically by contacting your financial intermediary (such as a broker-dealer or bank); direct shareholders may call the Fund at 1-800-544-6547.
You may elect to receive all future reports in paper free of charge. You can inform the Fund or your financial intermediary that you wish to continue receiving paper copies of your shareholder reports by contacting your financial intermediary (such as a broker-dealer or bank); direct shareholders may call the Fund at 1-800-544-6547. Your election to receive reports in paper will apply to all funds held with the Fund complex or your financial intermediary.
WWW.NICHOLASFUNDS.COM
NICHOLAS LIMITED EDITION, INC.
February 2021
Dear Fellow Shareholders:
Nicholas Limited Edition – Class I returned 22.73% in 2020 compared to 19.96% for the Russell 2000 Index, 34.63% for the Russell 2000 Growth Index and 18.40% for the S&P 500. Small company stocks performed extremely well during the second half of the year after the Federal Reserve instituted a strong response to the coronavirus pandemic. The year was one of the most volatile years in stock market history with the closing of the world’s economy to control the virus, subsequent governmental reaction, and the hope of a vaccine. The quickest bear market during March and April 2020 was followed by the quickest recovery during the second half of the year.
Growth stocks outperformed value stocks significantly for the year as the pandemic changed consumer behavior and corporate actions, driving demand for technology development. Other sectors that benefited from the pandemic were the biotech sector and supporting health care industries.
For the year ended December 31, 2020, returns for the Fund and selected indices are provided in the chart below for the periods ended December 31, 2020.
| Average Annual Total Return | |||||||||
| 1 | Year | 3 | Year | 5 | Year | 10 | Year | ||
| Nicholas Limited Edition, Inc. – Class I | 22.73 | % | 15.67 | % | 15.84 | % | 12.54 | % | |
| Nicholas Limited Edition, Inc. – Class N | 22.48 | % | 15.38 | % | 15.51 | % | 12.18 | % | |
| Russell 2000 Growth Index | 34.63 | % | 16.20 | % | 16.36 | % | 13.48 | % | |
| Russell 2000 Index | 19.96 | % | 10.25 | % | 13.26 | % | 11.20 | % | |
| Morningstar Small-Cap Growth Fund Category | 38.68 | % | 18.75 | % | 17.76 | % | 13.69 | % | |
| Standard & Poor’s 500 Index | 18.40 | % | 14.18 | % | 15.22 | % | 13.88 | % | |
| Ending value of $10,000 invested in | |||||||||
| Nicholas Limited Edition, Inc. – Class I | $ | 12,273 | $ | 15,476 | $ | 20,855 | $ | 32,584 | |
| Ending value of $10,000 invested in | |||||||||
| Nicholas Limited Edition, Inc. – Class N | $ | 12,248 | $ | 15,359 | $ | 20,567 | $ | 31,565 | |
| Fund’s Class I Expense Ratio (from 04/29/20 Prospectus): 0.86% | |||||||||
| Fund’s Class N Expense Ratio (from 01/29/21 Prospectus): 1.07% | |||||||||
The Fund’s expense ratios for the period ended December 31, 2020 can be found in the financial highlights included within this report.
Performance data quoted represents past performance and is no guarantee of future results. The investment return and principal value of an investment will fluctuate so that an investor’s shares, when redeemed, may be worth more or less than their original cost. Current performance of the Fund may be lower or higher than the performance quoted. Performance data current to the most recent month-end may be obtained by visiting www.nicholasfunds.com/returns.html.
The Fund’s returns are reduced by expenses, while the market indices are not. The ending values above illustrate the performance of a hypothetical $10,000 investment made in the Fund over the timeframes listed. Assumes reinvestment of dividends and capital gains. Returns shown do not reflect the deduction of taxes that a shareholder
would pay on Fund distributions or the redemption of Fund shares. These figures do not imply any future performance.
Class N of the Fund commenced operations on February 28, 2005. Class I shares and Class N shares are invested in the same portfolio of securities. Annual returns will generally differ only to the extent that the classes do not have the same expenses. Please see the respective prospectus for details.
The Fund’s relative underperformance versus the Russell 2000 Growth Index for the year ended December 31, 2020 was primarily the result of unfavorable stock selection due largely to Nicholas’ philosophical valuation discipline. Investors gravitated to more speculative areas of the market during the year, including non-earning companies which were among the top performing group of stocks.
The combined result of the excess liquidity and increased speculative behavior was a market whose valuation was pushed to excessive levels. As of December 31, 2020, the Fund’s holdings consisted of 65 stocks and approximately 4% cash. We believe the Fund is well diversified with sector weightings of approximately 33% information technology, 18% health care, 16% industrials, 15% consumer related, 7% financial, 3% materials, 2% real estate and 2% other. For the year, stocks of defensively positioned companies, such as technology, health care, and work-from-home beneficiaries outperformed. The Fund lagged the benchmark due to underperformance within health care and industrials, while its information technology positions offered positive contribution to overall performance. Lattice Semiconductor, BlackLine and Repay Holdings contributed positively to the Fund’s return, while EVO Payments, SP Plus and Interface detracted from performance.
2020 was a very tumultuous year in many ways. The pandemic changed the way everyone lived. This change in behavior has had a significant impact on so many different businesses. During the initial phase of the pandemic, the market collapsed; however, fiscal and monetary stimulus had the effect of activating a strong market, sending most indices to record highs. Growth (technology) stocks led the market as well as a slew of new companies positioned to take advantage of the changing economy. Looking forward, we are cautious as valuations have reached very high levels and there is a great deal of speculation in the market due to the Federal Reserve’s very easy monetary policy. We believe future returns might be more limited from these high levels.
Management will be cautious going forward and will stay consistent with our efforts to hold what we believe are quality growth companies that produce profits, good returns on investment and sell at reasonable valuations.
Thank you for your continued support.

David O. Nicholas Ryan P. Bushman
Lead Portfolio Manager Co-Portfolio Manager
The information above represents the opinions of the Fund manager, is subject to change, and any forecasts made cannot be guaranteed.
Mutual fund investing involves risk. Principal loss is possible. The Fund may invest in small- and mid-cap companies, which involve additional risks such as limited liquidity and greater volatility.
Diversification does not assure a profit nor protect against loss in a declining market.
Return on investment (ROI) is a performance measure used to evaluate the amount of return on a particular investment relative to the investment’s cost.
Earnings growth is not representative of the Fund’s future performance.
Please refer to the schedule of investments in the report for complete Fund holdings information. Fund holdings and sector allocations are subject to change and should not be considered a recommendation to buy or sell any security.
The Russell 2000 Index measures the performance of the 2000 smallest companies in the Russell 3000 Index, which represents approximately 10% of the total market capitalization of the Russell 3000 Index. The Russell 2000 Growth Index measures the performance of those Russell 2000 companies with higher price-to-book ratios and higher forecasted growth values. The S&P 500 Index is a broad-based unmanaged index of 500 stocks, which is widely recognized as representative of the equity market in general. One cannot invest directly in an index. Each Morningstar Category average represents a universe of funds with similar investment objectives.
Must be preceded or accompanied by a prospectus.
The Nicholas Funds are distributed by Quasar Distributors, LLC.
COMPARISON OF CHANGE IN VALUE OF $100,000 INVESTMENT IN
NICHOLAS LIMITED EDITION, INC. – CLASS I,
RUSSELL 2000 INDEX AND RUSSELL 2000 GROWTH INDEX
The line graph, which follows, compares the initial account value and subsequent account values at the end of each of the most recently completed ten fiscal years of the Fund’s Class I, to the same investment over the same period in two peer group indices. The graph assumes a $100,000 investment in the Fund’s Class I and the indices at the beginning of the first fiscal year. The peer group in the graph includes the Russell 2000 Index and the Russell 2000 Growth Index. The Adviser believes the Russell 2000 Index and the Russell 2000 Growth Index are representative of the performance of small- and medium-capitalization growth companies in which the Fund primarily invests and provide a meaningful and representative basis of comparison for Fund investors.
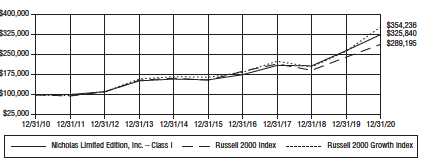
The Fund’s Class I average annual total returns for the one-, five- and ten-year periods ended on the last day of the most recent fiscal year are as follows:
| One Year Ended | Five Years Ended | Ten Years Ended | ||||
| December 31, | December 31, | December 31, | ||||
| 2020 | 2020 | 2020 | ||||
| Average Annual Total Return | 22.73 | % | 15.84 | % | 12.54 | % |
Past performance is not predictive of future performance, and the above graph and table do not reflect deduction of taxes that a shareholder would pay on Fund distributions or the redemption of Fund shares.
– 4–
Financial Highlights Class I (NCLEX)
For a share outstanding throughout each period
| Years Ended December 31, | |||||||||||||||
| 2020 | 2019 | 2018 | 2017 | 2016 | |||||||||||
| NET ASSET VALUE, BEGINNING OF PERIOD | $ | 28.33 | $ | 23.50 | $ | 26.32 | $ | 23.69 | $ | 23.31 | |||||
| INCOME (LOSS) FROM | |||||||||||||||
| INVESTMENT OPERATIONS | |||||||||||||||
| Net investment income (loss)(1) | (.08 | ) | .06 | .01 | (.04 | ) | .01 | ||||||||
| Net gain (loss) on securities | |||||||||||||||
| (realized and unrealized) | 6.51 | 6.37 | (.31 | ) | 4.77 | 2.90 | |||||||||
| Total from investment operations | 6.43 | 6.43 | (.30 | ) | 4.73 | 2.91 | |||||||||
| LESS DISTRIBUTIONS | |||||||||||||||
| From net investment income | — | (.06 | ) | (.01 | ) | — | (.00 | )(2) | |||||||
| From net capital gain | (1.69 | ) | (1.54 | ) | (2.51 | ) | (2.10 | ) | (2.53 | ) | |||||
| Total distributions | (1.69 | ) | (1.60 | ) | (2.52 | ) | (2.10 | ) | (2.53 | ) | |||||
| NET ASSET VALUE, END OF PERIOD | $ | 33.07 | $ | 28.33 | $ | 23.50 | $ | 26.32 | $ | 23.69 | |||||
| TOTAL RETURN | 22.73 | % | 27.37 | % | (1.00 | )% | 19.92 | % | 12.37 | % | |||||
| SUPPLEMENTAL DATA: | |||||||||||||||
| Net assets, end of period (millions) | $ | 507.9 | $ | 433.4 | $ | 341.4 | $ | 358.0 | $ | 298.0 | |||||
| Ratio of expenses to average net assets | .86 | % | .86 | % | .86 | % | .86 | % | .86 | % | |||||
| Ratio of net investment income (loss) | |||||||||||||||
| to average net assets | (.28 | )% | .22 | % | .05 | % | (.14 | )% | .04 | % | |||||
| Portfolio turnover rate. | 28.16 | % | 21.56 | % | 23.38 | % | 29.67 | % | 42.07 | % | |||||
| (1) | Computed based on average shares outstanding. |
| (2) | The amount rounds to $0.00. |
The accompanying notes to financial statements are an integral part of these highlights.
– 5–
Financial Highlights Class N (NNLEX)
For a share outstanding throughout each period
| Years Ended December 31, | |||||||||||||||
| 2020 | 2019 | 2018 | 2017 | 2016 | |||||||||||
| NET ASSET VALUE, BEGINNING OF PERIOD | $ | 26.24 | $ | 21.86 | $ | 24.74 | $ | 22.44 | $ | 22.27 | |||||
| INCOME (LOSS) FROM | |||||||||||||||
| INVESTMENT OPERATIONS | |||||||||||||||
| Net investment loss(1) | (.12 | ) | (.01 | ) | (.07 | ) | (.11 | ) | (.07 | ) | |||||
| Net gain (loss) on securities | |||||||||||||||
| (realized and unrealized) | 6.01 | 5.93 | (.30 | ) | 4.51 | 2.77 | |||||||||
| Total from investment operations | 5.89 | 5.92 | (.37 | ) | 4.40 | 2.70 | |||||||||
| LESS DISTRIBUTIONS | |||||||||||||||
| From net investment income | — | — | — | — | — | ||||||||||
| From net capital gain | (1.69 | ) | (1.54 | ) | (2.51 | ) | (2.10 | ) | (2.53 | ) | |||||
| Total distributions | (1.69 | ) | (1.54 | ) | (2.51 | ) | (2.10 | ) | (2.53 | ) | |||||
| NET ASSET VALUE, END OF PERIOD | $ | 30.44 | $ | 26.24 | $ | 21.86 | $ | 24.74 | $ | 22.44 | |||||
| TOTAL RETURN | 22.48 | % | 27.09 | % | (1.33 | )% | 19.57 | % | 12.00 | % | |||||
| SUPPLEMENTAL DATA: | |||||||||||||||
| Net assets, end of period (millions) | $ | 28.0 | $ | 30.0 | $ | 28.6 | $ | 33.0 | $ | 33.3 | |||||
| Ratio of expenses to average net assets | 1.07 | % | 1.11 | % | 1.17 | % | 1.19 | % | 1.21 | % | |||||
| Ratio of net investment loss | |||||||||||||||
| to average net assets | (.48 | )% | (.03 | )% | (.27 | )% | (.46 | )% | (.30 | )% | |||||
| Portfolio turnover rate. | 28.16 | % | 21.56 | % | 23.38 | % | 29.67 | % | 42.07 | % | |||||
| (1) Computed based on average shares outstanding. | |||||||||||||||
The accompanying notes to financial statements are an integral part of these highlights.
– 6–
Top Ten Equity Portfolio Holdings
December 31, 2020 (unaudited)
| Percentage | ||
| Name | of Net Assets | |
| Power Integrations, Inc. | 2.45 | % |
| Vocera Communications, Inc. | 2.34 | % |
| Morningstar, Inc. | 2.26 | % |
| CyberArk Software Ltd. | 2.24 | % |
| Rapid7, Inc. | 2.19 | % |
| Ritchie Bros. Auctioneers Incorporated | 2.08 | % |
| Bio-Techne Corporation | 1.98 | % |
| Descartes Systems Group Inc. (The) | 1.95 | % |
| IAA, Inc. | 1.94 | % |
| Lattice Semiconductor Corporation | 1.92 | % |
| Total of top ten | 21.35 | % |
Sector Diversification (As a Percentage of Portfolio)
December 31, 2020 (unaudited)
– 7–
Fund Expenses
For the six month period ended December 31, 2020 (unaudited)
As a shareholder of the Fund, you incur two types of costs: (1) transaction costs and (2) ongoing costs, including management fees and other operating expenses. The following table is intended to help you understand your ongoing costs (in dollars) of investing in the Fund and to compare these costs with those of other mutual funds.
The example is based on an investment of $1,000 made at the beginning of the period and held for the entire period.
The first line of the table below for each share class of the Fund provides information about the actual account values and actual expenses. You may use the information in this line, together with the amount you invested, to estimate the expenses that you paid over the period. Simply divide your account value by $1,000 (for example, an $8,600 account value divided by $1,000 = 8.6), then multiply the result by the number in the first line under the heading entitled “Expenses Paid During Period” to estimate the expenses you paid on your account during this period.
The second line of the table below provides information about hypothetical account values and hypothetical expenses based on the Fund’s actual expense ratios for each class of the Fund and an assumed rate of return of 5% per year before expenses, which are not the Fund’s actual returns. The hypothetical account values and expenses may not be used to estimate the actual ending account balance or expenses you paid for the period. You may use this information to compare the ongoing costs of investing in the Fund with other funds. To do so, compare this 5% hypothetical example with the 5% hypothetical examples that appear in the shareholder reports of other funds.
Please note that the expenses shown in the table are meant to highlight your ongoing costs only and do not reflect any transactional costs, such as wire fees. Therefore, the second line of the table is useful in comparing ongoing costs only, and will not help you determine the relative total costs of owning different funds. In addition, if these transactional costs were included, your costs would have been higher.
| Class I | ||||||
| Beginning | Ending | Expenses | ||||
| Account | Account | Paid During | ||||
| Value | Value | Period* | ||||
| 06/30/20 | 12/31/20 | 07/01/20 – 12/31/20 | ||||
| Actual | $ | 1,000.00 | $ | 1,280.70 | $ | 4.87 |
| Hypothetical | 1,000.00 | 1,020.73 | 4.32 | |||
| (5% return before expenses) |
| * | Expenses are equal to the Fund’s Class I six-month annualized expense ratio of 0.85%, multiplied by the average account value over the period, multiplied by 184 then divided by 366 to reflect the one-half year period. |
– 8–
Fund Expenses (continued)
For the six month period ended December 31, 2020 (unaudited)
| Class N | ||||||
| Beginning | Ending | Expenses | ||||
| Account | Account | Paid During | ||||
| Value | Value | Period** | ||||
| 06/30/20 | 12/31/20 | 07/01/20 – 12/31/20 | ||||
| Actual | $ | 1,000.00 | $ | 1,279.40 | $ | 6.02 |
| Hypothetical | 1,000.00 | 1,019.72 | 5.33 | |||
| (5% return before expenses) |
| ** | Expenses are equal to the Fund’s Class N six-month annualized expense ratio of 1.05%, multiplied by the average account value over the period, multiplied by 184 then divided by 366 to reflect the one-half year period. |
– 9–
Schedule of Investments
December 31, 2020
| Shares or | |||
| Principal | |||
| Amount | Value | ||
| COMMON STOCKS — 96.39% | |||
| Consumer Discretionary – Automobiles & Components — 2.41% | |||
| 82,000 | Dorman Products, Inc.* | $ | 7,119,240 |
| 85,000 | Patrick Industries, Inc. | 5,809,750 | |
| 12,928,990 | |||
| Consumer Discretionary – Durables & Apparel — 2.64% | |||
| 170,000 | La-Z-Boy Incorporated | 6,772,800 | |
| 171,500 | Lovesac Company (The)* | 7,389,935 | |
| 14,162,735 | |||
| Consumer Discretionary – Retailing — 3.31% | |||
| 68,500 | Murphy USA Inc. | 8,964,595 | |
| 107,500 | Ollie’s Bargain Outlet Holdings, Inc.* | 8,790,275 | |
| 17,754,870 | |||
| Consumer Discretionary – Services — 2.99% | |||
| 265,000 | Carriage Services, Inc. | 8,299,800 | |
| 352,500 | Wendy’s Company (The) | 7,726,800 | |
| 16,026,600 | |||
| Consumer Staples – Food & Staples Retailing — 2.74% | |||
| 170,000 | Grocery Outlet Holding Corp.* | 6,672,500 | |
| 88,000 | PriceSmart, Inc. | 8,015,920 | |
| 14,688,420 | |||
| Consumer Staples – Food, Beverage & Tobacco — 1.42% | |||
| 300,000 | Nomad Foods Limited* | 7,626,000 | |
| Financials – Banks — 1.17% | |||
| 136,000 | Glacier Bancorp, Inc. | 6,257,360 | |
| Financials – Diversified — 3.87% | |||
| 116,500 | Cohen & Steers, Inc. | 8,655,950 | |
| 52,300 | Morningstar, Inc. | 12,111,111 | |
| 20,767,061 | |||
| Financials – Insurance — 1.78% | |||
| 170,000 | Brown & Brown, Inc. | 8,059,700 | |
| 12,000 | Goosehead Insurance, Inc. – Class A | 1,497,120 | |
| 9,556,820 | |||
| Health Care – Equipment & Services — 10.35% | |||
| 120,000 | BioTelemetry, Inc.* | 8,649,600 | |
| 245,000 | Covetrus, Inc.* | 7,041,300 | |
| 92,500 | NuVasive, Inc.* | 5,210,525 | |
| 75,000 | Omnicell, Inc.* | 9,001,500 | |
| 147,000 | Tabula Rasa HealthCare, Inc.* | 6,297,480 | |
The accompanying notes to financial statements are an integral part of this schedule.
– 10 –
Schedule of Investments (continued)
December 31, 2020
| Shares or | |||
| Principal | |||
| Amount | Value | ||
| COMMON STOCKS — 96.39% (continued) | |||
| Health Care – Equipment & Services — 10.35% (continued) | |||
| 150,000 | Tactile Systems Technology, Inc.* | $ | 6,741,000 |
| 302,246 | Vocera Communications, Inc.* | 12,552,276 | |
| 55,493,681 | |||
| Health Care – Pharmaceuticals, Biotechnology & | |||
| Life Sciences — 7.35% | |||
| 33,500 | Bio-Techne Corporation | 10,637,925 | |
| 49,000 | ICON plc* | 9,554,020 | |
| 105,000 | Pacira BioSciences, Inc.* | 6,283,200 | |
| 160,000 | Prestige Consumer Healthcare Inc.* | 5,579,200 | |
| 107,500 | Syneos Health, Inc.* | 7,323,975 | |
| 39,378,320 | |||
| Industrials – Capital Goods — 4.45% | |||
| 137,500 | A.O. Smith Corporation | 7,537,750 | |
| 185,000 | Beacon Roofing Supply, Inc.* | 7,435,150 | |
| 165,210 | BMC Stock Holdings, Inc.* | 8,868,473 | |
| 23,841,373 | |||
| Industrials – Commercial & Professional Services — 8.22% | |||
| 100,000 | Exponent, Inc. | 9,003,000 | |
| 160,000 | IAA, Inc.* | 10,396,800 | |
| 88,000 | ICF International, Inc. | 6,541,040 | |
| 375,000 | KAR Auction Services, Inc. | 6,978,750 | |
| 160,000 | Ritchie Bros. Auctioneers Incorporated | 11,128,000 | |
| 44,047,590 | |||
| Industrials – Transportation — 3.20% | |||
| 164,000 | Knight-Swift Transportation Holdings Inc. | 6,858,480 | |
| 440,649 | Marten Transport, Ltd. | 7,592,382 | |
| 68,500 | Werner Enterprises, Inc. | 2,686,570 | |
| 17,137,432 | |||
| Information Technology – Hardware & Equipment — 1.48% | |||
| 90,000 | ePlus inc.* | 7,915,500 | |
| Information Technology – Semiconductors & | |||
| Semiconductor Equipment — 5.72% | |||
| 225,000 | Lattice Semiconductor Corporation* | 10,309,500 | |
| 160,280 | Power Integrations, Inc. | 13,120,521 | |
| 100,100 | Semtech Corporation* | 7,216,209 | |
| 30,646,230 | |||
The accompanying notes to financial statements are an integral part of this schedule.
– 11 –
Schedule of Investments (continued)
December 31, 2020
| Shares or | |||
| Principal | |||
| Amount | Value | ||
| COMMON STOCKS — 96.39% (continued) | |||
| Information Technology – Software & Services — 25.45% | |||
| 58,500 | BlackLine, Inc.* | $ | 7,802,730 |
| 74,250 | CyberArk Software Ltd.* | 11,998,058 | |
| 179,000 | Descartes Systems Group Inc. (The)* | 10,467,920 | |
| 192,500 | EVERTEC, Inc. | 7,569,100 | |
| 102,500 | ExlService Holdings, Inc.* | 8,725,825 | |
| 305,000 | i3 Verticals, Inc. – Class A* | 10,126,000 | |
| 149,800 | Mimecast Limited* | 8,514,632 | |
| 160,000 | Model N, Inc.* | 5,708,800 | |
| 35,500 | Paylocity Holding Corporation* | 7,309,805 | |
| 78,000 | Q2 Holdings, Inc.* | 9,869,340 | |
| 79,500 | Qualys, Inc.* | 9,688,665 | |
| 130,000 | Rapid7, Inc.* | 11,720,800 | |
| 325,000 | Repay Holdings Corporation* | 8,856,250 | |
| 155,000 | SailPoint Technologies Holdings, Inc.* | 8,252,200 | |
| 135,900 | WNS (Holdings) Limited* | 9,791,595 | |
| 136,401,720 | |||
| Materials — 3.59% | |||
| 59,500 | AptarGroup, Inc. | 8,144,955 | |
| 281,000 | GCP Applied Technologies Inc.* | 6,645,650 | |
| 95,292 | UFP Technologies, Inc.* | 4,440,607 | |
| 19,231,212 | |||
| Other — 1.67% | |||
| 22,000 | Invesco KBW Regional Banking ETF | 1,040,556 | |
| 60,000 | iShares Russell 2000 Value ETF | 7,905,000 | |
| 8,945,556 | |||
| Real Estate — 2.58% | |||
| 154,933 | Community Healthcare Trust Incorporated | 7,298,894 | |
| 154,200 | NexPoint Residential Trust, Inc. | 6,524,202 | |
| 13,823,096 | |||
| TOTAL COMMON STOCKS | |||
| (cost $278,590,703) | 516,630,566 | ||
The accompanying notes to financial statements are an integral part of this schedule.
– 12 –
Schedule of Investments (continued)
December 31, 2020
| Shares or | |||||
| Principal | |||||
| Amount | Value | ||||
| SHORT-TERM INVESTMENTS — 3.73% | |||||
| U.S. Government Securities — 2.24% | |||||
| $ | 6,000,000 | U.S. Treasury Bill 01/12/2021, 0.041% | $ | 5,999,927 | |
| 6,000,000 | U.S. Treasury Bill 02/04/2021, 0.031% | 5,999,830 | |||
| 11,999,757 | |||||
| Variable Rate Security — 1.49% | |||||
| 8,004,695 | Morgan Stanley Liquidity Funds Government Portfolio | ||||
| (Institutional Class), 7-day net yield 0.030% | 8,004,695 | ||||
| TOTAL SHORT-TERM INVESTMENTS | |||||
| (cost $20,004,452) | 20,004,452 | ||||
| TOTAL INVESTMENTS | |||||
| (cost $298,595,155) — 100.12% | 536,635,018 | ||||
| LIABILITIES, NET OF OTHER ASSETS — (0.12)% | (677,134 | ) | |||
| TOTAL NET ASSETS | |||||
| (basis of percentages above) — 100% | $ | 535,957,884 | |||
| * Non-income producing security. | |||||
The accompanying notes to financial statements are an integral part of this schedule.
– 13 –
Statement of Assets and Liabilities
December 31, 2020
| ASSETS | ||
| Investments in securities at value (cost $298,595,155) | $ | 536,635,018 |
| Receivables – | ||
| Dividend and interest | 35,100 | |
| Capital stock subscription | 94,918 | |
| Total receivables | 130,018 | |
| Other | 15,289 | |
| Total assets | 536,780,325 | |
| LIABILITIES | ||
| Payables – | ||
| Investment securities purchased | 356,393 | |
| Due to adviser – | ||
| Management fee | 328,553 | |
| Accounting and administrative fee | 10,952 | |
| Total due to adviser | 339,505 | |
| 12b-1 and servicing fee | 35,016 | |
| Capital stock redemption | 31,474 | |
| Other payables and accrued expense | 60,053 | |
| Total liabilities | 822,441 | |
| Total net assets | $ | 535,957,884 |
| NET ASSETS CONSIST OF | ||
| Paid in capital | $ | 297,939,219 |
| Accumulated distributable earnings | 238,018,665 | |
| Total net assets | $ | 535,957,884 |
| Class I | ||
| Net assets | $ | 507,929,040 |
| Shares outstanding | 15,359,153 | |
| NET ASSET VALUE PER SHARE ($.01 par value, | ||
| 39,000,000 shares authorized), offering price and redemption price | $ | 33.07 |
| Class N | ||
| Net assets | $ | 28,028,844 |
| Shares outstanding | 920,917 | |
| NET ASSET VALUE PER SHARE ($.01 par value, | ||
| 11,000,000 shares authorized), offering price and redemption price | $ | 30.44 |
The accompanying notes to financial statements are an integral part of this statement.
– 14 –
Statement of Operations
For the year ended December 31, 2020
| INCOME | |||
| Dividend (net of foreign taxes of $20,310) | $ | 2,537,307 | |
| Interest | 98,291 | ||
| Total income | 2,635,598 | ||
| EXPENSES | |||
| Management fee | 3,410,239 | ||
| Transfer agent fees | 129,082 | ||
| Accounting and administrative fees | 113,675 | ||
| Registration fees | 63,568 | ||
| 12b-1 fees – Class N | 40,319 | ||
| Audit and tax fees | 34,548 | ||
| Accounting system and pricing service fees | 31,164 | ||
| Custodian fees | 22,542 | ||
| Directors’ fees | 21,675 | ||
| Printing | 20,149 | ||
| Postage and mailing | 20,086 | ||
| Insurance | 15,173 | ||
| Legal fees | 14,039 | ||
| Servicing fees – Class N | 12,635 | ||
| Other operating expenses | 8,439 | ||
| Total expenses | 3,957,333 | ||
| Net investment loss | (1,321,735 | ) | |
| NET REALIZED GAIN ON INVESTMENTS | 26,144,410 | ||
| CHANGE IN NET UNREALIZED APPRECIATION/DEPRECIATION | |||
| ON INVESTMENTS | 75,291,321 | ||
| Net realized and unrealized gain on investments | 101,435,731 | ||
| Net increase in net assets resulting from operations | $ | 100,113,996 | |
The accompanying notes to financial statements are an integral part of this statement.
– 15 –
Statements of Changes in Net Assets
For the years ended December 31, 2020 and 2019
| 2020 | 2019 | |||||
| INCREASE (DECREASE) IN NET ASSETS FROM OPERATIONS | ||||||
| Net investment income (loss) | $ | (1,321,735 | ) | $ | 875,304 | |
| Net realized gain on investments | 26,144,410 | 24,167,321 | ||||
| Change in net unrealized appreciation/depreciation | ||||||
| on investments | 75,291,321 | 76,704,157 | ||||
| Net increase in net assets resulting from operations | 100,113,996 | 101,746,782 | ||||
| DISTRIBUTIONS TO SHAREHOLDERS FROM | ||||||
| Investment operations – Class I | (24,677,475 | ) | (23,348,594 | ) | ||
| Investment operations – Class N | (1,488,887 | ) | (1,694,307 | ) | ||
| Total distributions | (26,166,362 | ) | (25,042,901 | ) | ||
| CAPITAL SHARE TRANSACTIONS | ||||||
| Proceeds from shares issued – Class I | ||||||
| (2,064,914 and 2,039,218 shares, respectively) | 56,244,918 | 54,876,829 | ||||
| Reinvestment of distributions – Class I | ||||||
| (690,857 and 757,369 shares, respectively) | 22,667,001 | 21,478,973 | ||||
| Cost of shares redeemed – Class I | ||||||
| (2,694,700 and 2,025,702 shares, respectively) | (75,603,756 | ) | (55,513,893 | ) | ||
| Proceeds from shares issued – Class N | ||||||
| (174,298 and 183,462 shares, respectively) | 4,402,964 | 4,655,893 | ||||
| Reinvestment of distributions – Class N | ||||||
| (48,809 and 64,043 shares, respectively) | 1,474,032 | 1,682,397 | ||||
| Cost of shares redeemed – Class N | ||||||
| (445,267 and 412,399 shares, respectively) | (10,584,617 | ) | (10,418,697 | ) | ||
| Change in net assets derived from | ||||||
| capital share transactions | (1,399,458 | ) | 16,761,502 | |||
| Total increase in net assets | 72,548,176 | 93,465,383 | ||||
| NET ASSETS | ||||||
| Beginning of period | 463,409,708 | 369,944,325 | ||||
| End of period | $ | 535,957,884 | $ | 463,409,708 | ||
The accompanying notes to financial statements are an integral part of these statements.
– 16 –
Notes to Financial Statements
December 31, 2020
(1) Summary of Significant Accounting Policies —
Nicholas Limited Edition, Inc. (the “Fund”) is organized as a Maryland corporation and is registered as an open-end, diversified management investment company under the Investment Company Act of 1940, as amended. The primary objective of the Fund is long-term growth. The following is a summary of the significant accounting policies of the Fund:
| (a) | Equity securities traded on a stock exchange will ordinarily be valued on the basis of the last sale price on the date of valuation on the securities principal exchange, or if in the absence of any sale on that day, the closing bid price. For securities principally traded on the NASDAQ market, the Fund uses the NASDAQ Official Closing Price. Investments in shares of open-end mutual funds, including money market funds, are valued at their daily net asset value, which is calculated as of the close of regular trading on the New York Stock Exchange. Debt securities, excluding short-term investments, are valued at their current evaluated bid price as determined by an independent pricing service, which generates evaluations on the basis of dealer quotes for normal institutional-sized trading units, issuer analysis, bond market activity and various other factors. Securities for which market quotations may not be readily available are valued at their fair value as determined in good faith by procedures adopted by the Board of Directors. Short-term investments purchased at par are valued at cost, which approximates market value. Short-term investments purchased at a premium or discount are stated at amortized cost, which approximates market value. The Fund did not maintain any positions in derivative instruments or engage in hedging activities during the year. Investment transactions for financial statement purposes are recorded on trade date. |
In accordance with Accounting Standards Codification (“ASC”) 820-10, “Fair Value Measurements and Disclosures” (“ASC 820-10”), fair value is defined as the price that the Fund would receive upon selling an investment in a timely transaction to an independent buyer in the principal or most advantageous market of the investment. ASC 820-10 established a three-tier hierarchy to maximize the use of observable market data and minimize the use of unobservable inputs and to establish classification of fair value measurements for disclosure purposes. Inputs refer broadly to the assumptions that market participants would use in pricing the asset or liability, including assumptions about risk, for example, the risk inherent in a particular valuation technique used to measure fair value such as a pricing model and/or the risk inherent in the inputs to the valuation technique. Inputs may be observable or unobservable. Observable inputs are inputs that reflect the assumptions market participants would use in pricing the asset or liability based on market data obtained from sources independent of the reporting entity. Unobservable inputs are inputs that reflect the reporting entity’s own assumptions about the assumptions market participants would use in pricing the asset or liability based on the best information available in the circumstances. The three-tier hierarchy of inputs is summarized in the three broad levels listed below. | |
| Level 1 – quoted prices in active markets for identical investments |
– 17 –
Notes to Financial Statements (continued)
December 31, 2020
| Level 2 – | other significant observable inputs (including quoted prices for | |
| similar investments, interest rates, benchmark yields, bids, offers, | ||
| transactions, spreads and other relationships observed in the | ||
| markets among market securities, underlying equity of the issuer, | ||
| proprietary pricing models, credit risk, etc.) | ||
| Level 3 – | significant unobservable inputs (including the Fund’s own | |
| assumptions in determining the fair value of investments) |
The inputs or methodology used for valuing securities are not necessarily an indication of the risk associated with investing in those securities.
The following is a summary of the inputs used as of December 31, 2020 in valuing the Fund’s investments carried at value:
| Investments | ||
| Valuation Inputs | in Securities | |
| Level 1 – | ||
| Common Stocks(1) | $ | 516,630,566 |
| Money Market Fund | 8,004,695 | |
| Level 2 – | ||
| U.S. Government Securities | 11,999,757 | |
| Level 3 – | ||
| None | — | |
| Total | $ | 536,635,018 |
| (1) See Schedule of Investments for further detail by industry. | ||
The Fund did not hold any Level 3 investments during the year. | |
| (b) | Net realized gain (loss) on portfolio securities was computed on the basis of specific identification. |
| (c) | Dividend income is recorded on the ex-dividend date, and interest income is recognized on an accrual basis. Non-cash dividends, if any, are recorded at value on date of distribution. Generally, discounts and premiums on long-term debt security purchases, if any, are amortized over the expected lives of the respective securities using the effective yield method. |
| (d) | Provision has not been made for federal income taxes or excise taxes since the Fund has elected to be taxed as a “regulated investment company” and intends to distribute substantially all net investment income and net realized capital gains on sales of investments to its shareholders and otherwise comply with the provisions of Subchapter M of the Internal Revenue Code applicable to regulated investment companies. |
Investment income, net capital gains (losses) and all expenses incurred by the Fund are allocated based on the relative net assets of each class, except for 12b-1 and shareholder servicing fees and certain other fees and expenses related to one class of shares. |
– 18 –
Notes to Financial Statements (continued)
December 31, 2020
Class N shares are subject to a 0.25% 12b-1 fee and a 0.10% servicing fee, as described in its prospectus. Subsequent to April 30, 2017 through November 1, 2020, the servicing fee was voluntarily reduced to 0.06% and from November 2, 2020 through period-end was reduced to zero. The 12b-1 fee subsequent to April 30, 2019 through November 1, 2020, was voluntarily reduced to 0.15% and from November 2, 2020 through period-end was increased to 0.20%. Income, expenses (other than expenses attributable to a specific class), and realized and unrealized gains and losses are allocated daily to each class of shares based upon the relative net asset value of outstanding shares.
| (e) | Dividends and distributions paid to shareholders are recorded on the ex-dividend date. Distributions from net investment income are generally declared and paid at least annually. Distributions of net realized capital gain, if any, are declared and paid at least annually. |
The amount of distributions from net investment income and net realized capital gain are determined in accordance with federal income tax regulations, which may differ from U.S. generally accepted accounting principles (“U.S. GAAP”) for financial reporting purposes. Financial reporting records are adjusted for permanent book-to-tax differences to reflect tax character. At December 31, 2020, reclassifications were recorded to increase accumulated distributable earnings and decrease paid in capital by $1,322,489. | |
The tax character of distributions paid during the years ended December 31, 2020 and 2019 was as follows: |
| 12/31/2020 | 12/31/2019 | |||
| Distributions paid from: | ||||
| Ordinary income | $ | — | $ | 875,304 |
| Long-term capital gain | 26,166,362 | 24,167,597 | ||
| Total distributions paid | $ | 26,166,362 | $ | 25,042,901 |
As of December 31, 2020, investment cost for federal tax purposes was $298,616,353 and the tax basis components of net assets were as follows:
| Unrealized appreciation | $ | 240,683,264 | |
| Unrealized depreciation | (2,664,599 | ) | |
| Net unrealized appreciation | 238,018,665 | ||
| Undistributed ordinary income | — | ||
| Accumulated net realized capital gain | — | ||
| Paid in capital | 297,939,219 | ||
| Net assets | $ | 535,957,884 |
The difference between financial statement and tax-basis cost is attributable primarily to the tax deferral of wash sales losses.
– 19 –
Notes to Financial Statements (continued)
December 31, 2020
The Fund had no material uncertain tax positions and has not recorded a liability for unrecognized tax benefits as of December 31, 2020. Also, the Fund recognized no interest and penalties related to uncertain tax benefits during the year ended December 31, 2020. At December 31, 2020, the fiscal years 2017 through 2020 remain open to examination in the Fund’s major tax jurisdictions. | |
| (f) | The Fund is considered an investment company under U.S. GAAP and follows the accounting and reporting guidance applicable to investment companies in the Financial Accounting Standards Board (“FASB”) ASC 946, “Financial Services – Investment Companies.” U.S. GAAP guidance requires management to make estimates and assumptions that effect the amounts reported in the financial statements and accompanying notes. Actual results could differ from estimates. |
| (g) | In the normal course of business the Fund enters into contracts that contain general indemnification clauses. The Fund’s maximum exposure under these arrangements is unknown, as this would involve future claims against the Fund that have not yet occurred. Based on experience, the Fund expects the risk of loss to be remote. |
| (h) | In connection with the preparation of the Fund’s financial statements, management evaluated subsequent events after the date of the Statement of Assets and Liabilities of December 31, 2020. There have been no material subsequent events since December 31, 2020 that would require adjustment to or additional disclosure in these financial statements. |
| (2) Related Parties — | ||
| (a) | Investment Adviser and Management Agreement — | |
The Fund has an agreement with Nicholas Company, Inc. (with whom certain officers and directors of the Fund are affiliated) (the “Adviser”) to serve as investment adviser and manager. Under the terms of the agreement, a monthly fee is paid to the Adviser based on an annualized fee of 0.75% of the average net asset value. | ||
The Adviser may be paid for accounting and administrative services rendered by its personnel, subject to the following guidelines: (i) up to five basis points, on an annual basis, of the average net asset value of the Fund up to and including $2 billion and up to three basis points, on an annual basis, of the average net asset value of the Fund greater than $2 billion, based on the average net asset value of the Fund as determined by valuations made at the close of each business day of each month, and (ii) where the preceding calculation results in an annual payment of less than $50,000, the Adviser, in its discretion, may charge the Fund up to $50,000 for such services. | ||
| (b) | Legal Counsel — | |
A director of the Adviser is affiliated with a law firm that provides services to the Fund. The Fund incurred expenses of $9,139 for the year ended December 31, 2020 for legal services rendered by this law firm. | ||
– 20 –
Notes to Financial Statements (continued)
December 31, 2020
(3) Investment Transactions —
For the year ended December 31, 2020, the cost of purchases and the proceeds from sales of investment securities, other than short-term obligations, aggregated $120,331,663 and $143,357,449, respectively.
– 21 –
Report of Independent Registered
Public Accounting Firm
To the shareholders and Board of Directors of Nicholas Limited Edition, Inc.
Opinion on the Financial Statements and Financial Highlights
We have audited the accompanying statement of assets and liabilities of Nicholas Limited Edition, Inc. (the “Fund”), including the schedule of investments, as of December 31, 2020, the related statements of operations for the year then ended, the statements of changes in net assets for each of the two years in the period then ended, the financial highlights for each of the five years in the period then ended, and the related notes. In our opinion, the financial statements and financial highlights present fairly, in all material respects, the financial position of the Fund as of December 31, 2020, and the results of its operations for the year then ended, the changes in its net assets for each of the two years in the period then ended, and the financial highlights for each of the five years in the period then ended, in conformity with accounting principles generally accepted in the United States of America.
Basis for Opinion
These financial statements and financial highlights are the responsibility of the Fund’s management. Our responsibility is to express an opinion on the Fund’s financial statements and financial highlights based on our audits. We are a public accounting firm registered with the Public Company Accounting Oversight Board (United States) (PCAOB) and are required to be independent with respect to the Fund in accordance with the U.S. federal securities laws and the applicable rules and regulations of the Securities and Exchange Commission and the PCAOB.
We conducted our audits in accordance with the standards of the PCAOB. Those standards require that we plan and perform the audit to obtain reasonable assurance about whether the financial statements and financial highlights are free of material misstatement, whether due to error or fraud. The Fund is not required to have, nor were we engaged to perform, an audit of its internal control over financial reporting. As part of our audits we are required to obtain an understanding of internal control over financial reporting but not for the purpose of expressing an opinion on the effectiveness of the Fund’s internal control over financial reporting. Accordingly, we express no such opinion.
Our audits included performing procedures to assess the risks of material misstatement of the financial statements and financial highlights, whether due to error or fraud, and performing procedures that respond to those risks. Such procedures included examining, on a test basis, evidence regarding the amounts and disclosures in the financial statements and financial highlights. Our audits also included evaluating the accounting principles used and significant estimates made by management, as well as evaluating the overall presentation of the financial statements and financial highlights. Our procedures included confirmation of securities owned as of December 31, 2020, by correspondence with the custodian and brokers; when replies were not received from brokers, we performed other auditing procedures. We believe that our audits provide a reasonable basis for our opinion.

We have served as the auditor of one or more Nicholas investment companies since 1977.
– 22 –
Historical Record
(unaudited)
| Net | |||||||||||
| Investment | Dollar | Growth of | |||||||||
| Net | Income | Capital Gain | Weighted | an Initial | |||||||
| Asset Value | Distributions | Distributions | Price/Earnings | $10,000 | |||||||
| Class I | Per Share | Per Share | Per Share | Ratio(2) | Investment(3) | ||||||
| May 18, 1987(1) | $ | 10.00 | $ | — | $ | — | — | $ | 10,000 | ||
| December 31, 1987 | 9.15 | .0900 | — | 13.9 times | 9,242 | ||||||
| December 31, 1988 | 11.29 | .0969 | .2527 | 14.1 | 11,762 | ||||||
| December 31, 1989 | 12.49 | .1453 | .6151 | 16.3 | 13,804 | ||||||
| December 31, 1990 | 12.03 | .1207 | .1213 | 14.2 | 13,566 | ||||||
| December 31, 1991 | 16.86 | .1228 | .2407 | 21.9 | 19,429 | ||||||
| December 31, 1992 | 18.77 | .0815 | .8275 | 18.8 | 22,690 | ||||||
| December 31, 1993 | 18.68 | .0867 | 1.6782 | 20.4 | 24,738 | ||||||
| December 31, 1994 | 17.09 | .1031 | .9065 | 18.3 | 23,985 | ||||||
| December 31, 1995 | 19.22 | .0761 | 2.9353 | 25.2 | 31,223 | ||||||
| December 31, 1996 | 20.74 | .0124 | 2.6151 | 30.7 | 38,031 | ||||||
| December 31, 1997 | 25.07 | .0029 | 2.4886 | 33.0 | 50,590 | ||||||
| December 31, 1998 | 24.20 | .0142 | 1.2490 | 30.3 | 51,436 | ||||||
| December 31, 1999 | 22.61 | .0538 | .5439 | 23.4 | 49,333 | ||||||
| December 31, 2000 | 15.16 | — | 5.5800 | 25.9 | 45,063 | ||||||
| December 31, 2001 | 16.37 | — | .0357 | 25.5 | 48,764 | ||||||
| December 31, 2002 | 12.49 | — | .0311 | 21.4 | 37,299 | ||||||
| December 31, 2003 | 17.43 | — | — | 24.2 | 52,051 | ||||||
| December 31, 2004 | 19.59 | — | .2679 | 25.3 | 59,309 | ||||||
| December 31, 2005 | 19.23 | — | 1.8896 | 25.2 | 63,925 | ||||||
| December 31, 2006 | 19.62 | — | .8425 | 23.6 | 68,002 | ||||||
| December 31, 2007 | 20.07 | .0008 | 1.7607 | 24.7 | 75,615 | ||||||
| December 31, 2008 | 13.93 | .0301 | .0327 | 14.9 | 52,733 | ||||||
| December 31, 2009 | 17.76 | .0005 | — | 23.5 | 67,234 | ||||||
| December 31, 2010 | 21.85 | — | 1.5377 | 24.8 | 88,494 | ||||||
| December 31, 2011 | 20.90 | — | 1.2484 | 22.9 | 89,672 | ||||||
| December 31, 2012 | 21.06 | .0043 | 2.0167 | 22.3 | 99,159 | ||||||
| December 31, 2013 | 27.05 | .0160 | 1.5957 | 23.9 | 134,984 | ||||||
| December 31, 2014 | 25.63 | .0002 | 2.6251 | 24.9 | 140,842 | ||||||
| December 31, 2015 | 23.31 | — | 1.8767 | 23.4 | 138,262 | ||||||
| December 31, 2016 | 23.69 | .0012 | 2.5295 | 25.3 | 155,364 | ||||||
| December 31, 2017 | 26.32 | — | 2.0989 | 27.7 | 186,320 | ||||||
| December 31, 2018 | 23.50 | .0063 | 2.5137 | 25.5 | 184,458 | ||||||
| December 31, 2019 | 28.33 | .0601 | 1.5436 | 29.2 | 234,944 | ||||||
| December 31, 2020 | 33.07 | — | 1.6863 | (a) | 35.1 | 288,349 |
(1) Date of Initial Public Offering.
(2) Based on latest 12 months accomplished earnings.
(3) Assuming reinvestment of all distributions.
(a) Paid on December 29, 2020 to shareholders of record on December 28, 2020.
– 23 –
Historical Record (continued)
(unaudited)
| Net | ||||||||||
| Investment | Dollar | Growth of | ||||||||
| Net | Income | Capital Gain | Weighted | an Initial | ||||||
| Asset Value | Distributions | Distributions | Price/Earnings | $10,000 | ||||||
| Class N | Per Share | Per Share | Per Share | Ratio(2) | Investment(3) | |||||
| February 28, 2005 (1) | $ | 19.30 | $ | — | $ | — | 25.5 times | $ | 10,000 | |
| December 31, 2005 | 19.19 | — | 1.8581 | 25.2 | 10,903 | |||||
| December 31, 2006 | 19.51 | — | .8425 | 23.6 | 11,560 | |||||
| December 31, 2007 | 19.86 | — | 1.7607 | 24.7 | 12,802 | |||||
| December 31, 2008 | 13.78 | .0062 | .0327 | 14.9 | 8,909 | |||||
| December 31, 2009 | 17.54 | .0005 | — | 23.5 | 11,341 | |||||
| December 31, 2010 | 21.50 | — | 1.5377 | 24.8 | 14,888 | |||||
| December 31, 2011 | 20.47 | — | 1.2484 | 22.9 | 15,034 | |||||
| December 31, 2012 | 20.51 | — | 2.0167 | 22.3 | 16,568 | |||||
| December 31, 2013 | 26.21 | — | 1.5957 | 23.9 | 22,466 | |||||
| December 31, 2014 | 24.66 | — | 2.6251 | 24.9 | 23,361 | |||||
| December 31, 2015 | 22.27 | — | 1.8767 | 23.4 | 22,849 | |||||
| December 31, 2016 | 22.44 | — | 2.5295 | 25.3 | 25,591 | |||||
| December 31, 2017 | 24.74 | — | 2.0989 | 27.7 | 30,597 | |||||
| December 31, 2018 | 21.86 | — | 2.5137 | 25.5 | 30,189 | |||||
| December 31, 2019 | 26.24 | — | 1.5436 | 29.2 | 38,367 | |||||
| December 31, 2020 | 30.44 | — | 1.6863 | (a) | 35.1 | 46,994 |
(1) Date of Initial Public Offering.
(2) Based on latest 12 months accomplished earnings.
(3) Assuming reinvestment of all distributions.
(a) Paid on December 29, 2020 to shareholders of record on December 28, 2020.
– 24 –
Approval of Investment Advisory Contract
(unaudited)
In October 2020, the Board of Directors of the Fund renewed the one-year term of the Investment Advisory Agreement by and between the Fund and the Adviser through October 2021. In connection with the renewal of the Investment Advisory Agreement, no changes to the amount or manner of calculation of the management fee or the terms of the agreement were proposed by the Adviser or adopted by the Board. In renewing the Investment Advisory Agreement, the Board carefully considered the following factors on an absolute basis and relative to the Fund’s peer group: (i) the Fund’s historical performance; (ii) the Fund’s performance relative to its benchmark; (iii) the expense ratios for peer group funds in the small-cap growth category and the Fund’s risk/return profile as measured by the standard deviation and the Sharpe Ratio; and (iv) the range and quality of the services offered by the Adviser. The peer group fund data included small-cap growth focused funds with similar asset sizes, number of holdings and market capitalizations and at least a 10-year history.
In terms of the peer group data used for performance comparisons, the Fund’s Class I total return ranked 31st, 24th, 22nd and 29th out of 43 funds for the one-, three-, five- and ten-year periods ending September 30, 2020. The Fund’s Class I had the ninth lowest expense ratio among its peer group.
The Board considered the range of services to be provided by the Adviser to the Fund under the Advisory Agreement. The Board concluded that the nature, extent and quality of the services to be provided were consistent with the terms of the Advisory Agreement and the needs of the Fund, and that the services provided were of a high quality.
The Board considered the investment performance of the Fund and the Adviser. Among other things, the Board noted its consideration of the Fund’s performance relative to peer funds and its benchmarks. The Board reviewed the actual and relative short-term and long-term performance of the Fund. The Board agreed that the Fund demonstrated satisfactory performance with respect to its benchmarks and peers. The Board also discussed the extent to which economies of scale would be realized, and whether such economies were reflected in the Fund’s fee levels and concluded that the Adviser had been instrumental in holding down Fund costs, citing consistently low fees.
The Board considered the cost of services provided and the profits to be realized by the Adviser from the relationship with the Fund. The Board concluded that given the Board’s focus on performance and maintaining a low fee structure that the Adviser’s profits were not relevant.
The Board determined that the Adviser had fully and adequately carried out the terms and conditions of its contract with the Fund. The Board expressed satisfaction with the Fund’s performance, strategies to improve performance, management’s control of expenses and the rate of the management fee for the Fund and the overall level of services provided by the Adviser.
– 25 –
Liquidity Risk Management Program
(unaudited)
The Fund has adopted and implemented a liquidity risk management program (the “Program”) in accordance with Rule 22e-4 under the 1940 Act. The Program seeks to assess and manage the Fund’s liquidity risk, i.e., the risk that the Fund is unable to satisfy redemption requests without significantly diluting remaining investors’ interests in the Fund. The Board of Directors of the Fund has designated Nicholas Company, Inc., the Fund’s investment adviser, to administer the Program. Certain aspects of the Program rely on third parties to perform certain functions, including the provision of market data and application of models.
The Program is comprised of various components designed to support the assessment and/or management of liquidity risk, including: (1) the periodic assessment (no less frequently than annually) of certain factors that influence the Fund’s liquidity risk; (2) the periodic classification (no less frequently than monthly) of the Fund’s investments into one of four liquidity categories that reflect an estimate of their liquidity under current market conditions; (3) a 15% limit on the acquisition of “illiquid investments” (as defined under Rule 22e-4); (4) for a Fund that does not invest primarily in “highly liquid investments” (as defined under Rule 22e-4), the determination of a minimum percentage of the Fund’s assets that will generally be invested in highly liquid investments (a “Highly Liquid Investment Minimum”); and (5) periodic reporting to the Board of Directors.
At a meeting of the Board of Directors on February 1, 2021, Nicholas Company, Inc. provided a written report to the Board addressing the operation, and the adequacy and effectiveness of the implementation, of the Program, including, as applicable, the operation of any Highly Liquid Investment Minimum and any material changes to the Program, for the period from January 1, 2020 through December 31, 2020 (the “Reporting Period”). Among other things, the annual report discussed: (1) the results of stress tests designed to assess liquidity under a hypothetical stressed scenario involving elevated redemptions; and (2) an assessment of the methodologies used to classify investments into one of four liquidity categories. The report concluded that the Program was reasonably designed to assess and manage liquidity risk and was adequately and effectively implemented during the Reporting Period.
There can be no assurance that the Program will achieve its objectives under all circumstances in the future. Please refer to the Fund’s prospectus for more information regarding the Fund’s exposure to liquidity risk and other risks to which it may be subject.
– 26 –
Information on Proxy Voting
(unaudited)
A description of the policies and procedures that the Fund uses to determine how to vote proxies relating to portfolio securities is available, without charge, upon request by calling 800-544-6547 or 414-276-0535. It also appears in the Fund’s Statement of Additional Information, which can be found on the SEC’s website, www.sec.gov. A record of how the Fund voted its proxies for the most recent twelve-month period ended June 30, also is available on the Fund’s website, www.nicholasfunds.com, and the SEC’s website, www.sec.gov.
Quarterly Portfolio Schedule
(unaudited)
The Fund files its complete schedule of investments with the SEC for the first and third quarters of each fiscal year as an exhibit to its reports on Form N-PORT. The Fund’s Form N-PORT reports are available on the SEC’s website at www.sec.gov and may be reviewed and copied at the SEC’s Public Reference Room in Washington, D.C. Information on the operation of the Public Reference Room may be obtained by calling 800-SEC-0330.
– 27 –
Directors and Officers of the Fund
(unaudited)
The following table sets forth the pertinent information about the Fund’s directors and officers as of December 31, 2020. Unless otherwise listed, the business address of each director and officer is 411 East Wisconsin Avenue, Milwaukee, WI 53202.
| Number of | ||||||
| Term of | Portfolios | |||||
| Positions | Office and | Principal | in Fund | Other | ||
| Held | Length of | Occupations | Complex | Directorships | ||
| With | Time | During Past | Overseen | Held | ||
| Name and Age | Fund | Served | 5 Years | by Director | by Director | |
| INTERESTED DIRECTOR | ||||||
| David O. Nicholas, CFA | President, | (3), 31 years | President, Chief Executive | 4 | None | |
| 59(1)(2) | Director | Officer, Chief Investment | ||||
| and | Officer and Director, | |||||
| Lead | Nicholas Company, Inc., | |||||
| Portfolio | the Adviser to the Fund. | |||||
| Manager | He has been the Lead | |||||
| Portfolio Manager of | ||||||
| Nicholas Fund, Inc. and | ||||||
| Nicholas II, Inc. and | ||||||
| Co-Portfolio Manager of | ||||||
| Nicholas Equity Income | ||||||
| Fund, Inc. | ||||||
| DISINTERESTED DIRECTORS | ||||||
| John A. Hauser | Director | (3), 4 years | Chaplain, Door County | 4 | None | |
| 62 | Medical Center, 2019 to | |||||
| present. Private Investor, | ||||||
| January 2018 to present. | ||||||
| Senior Vice President – | ||||||
| Trust and Community | ||||||
| Relations, Nicolet Bank, | ||||||
| October 2016 to December | ||||||
| 2016. Senior Vice President – | ||||||
| Director of Wealth Services, | ||||||
| April 2016 to October 2016. | ||||||
| Prior to its acquisition by | ||||||
| Nicolet Bank in April 2016, | ||||||
| Mr. Hauser served in various | ||||||
| senior management roles for | ||||||
| Baylake Bank from 1984 to | ||||||
| 2008 and from 2009 | ||||||
| to April 2016. | ||||||
– 28 –
Directors and Officers of the Fund (continued)
(unaudited)
| Number of | |||||
| Term of | Portfolios | ||||
| Positions | Office and | Principal | in Fund | Other | |
| Held | Length of | Occupations | Complex | Directorships | |
| With | Time | During Past | Overseen | Held | |
| Name and Age | Fund | Served | 5 Years | by Director | by Director |
| David P. Pelisek, CFA | Director | (3), 1 year | Private Investor, | 4 | None |
| 61 | September 2016 to | ||||
| present. Managing | |||||
| Director, Robert W. Baird | |||||
| & Co., Inc., and Partner, | |||||
| Baird Capital Partners | |||||
| Buyout Funds I–V, | |||||
| January 1994 to | |||||
| May 2016. | |||||
| Jay H. Robertson | Director | (3), 18 years | Private Investor, | 4 | None |
| 69 | April 2000 to present. | ||||
| Chairman of the Board | |||||
| of Robertson-Ryan and | |||||
| Associates, Inc., an | |||||
| insurance brokerage | |||||
| firm from 1993 to | |||||
| March 2000. | |||||
– 29 –
Directors and Officers of the Fund (continued)
(unaudited)
| Term of | ||||
| Positions | Office and | |||
| Held | Length of | |||
| With | Time | |||
| Name and Age | Fund | Served | Principal Occupations During Past 5 Years | |
| OFFICERS | ||||
| David L. Johnson, CFA | Executive | Annual, | Executive Vice President, Nicholas Company, Inc., | |
| 78(2) | Vice | 34 years | the Adviser to the Fund. | |
President
| ||||
| Lawrence J. Pavelec, CFA | Senior Vice | Annual, | Executive Vice President, Secretary and Chief | |
| 62 | President | 16 years | Operating Officer, Nicholas Company, Inc., the | |
| and | Adviser to the Fund, and employed by the Adviser | |||
Secretary
| since 2003.
| |||
| Jennifer R. Kloehn, CPA | Senior Vice | Annual, | Executive Vice President, Treasurer, Chief | |
| 47 | President, | 4 years | Financial Officer and Chief Compliance Officer, | |
| Treasurer | Nicholas Company, Inc., the Adviser to the Fund. | |||
| and Chief | Compliance Officer and Assistant Vice President | |||
| Compliance | of the Adviser from July 2004 to April 2016. | |||
Officer
| ||||
| Ryan P. Bushman, CFA | Senior Vice | Annual, | Vice President, Nicholas Company, Inc., the | |
| 42 | President | Effective | Adviser to the Fund. Co-Portfolio Manager | |
| and Co- | February 1, | (effective February 1, 2021) of the Fund and | ||
| Portfolio | 2021 | employed by Nicholas Company, Inc. since | ||
| Manager | October 2020. He was Co-Portfolio Manager at | |||
| Rice Hall James & Associates from March 2017 | ||||
| to September 2020. He was an Equity Analyst and | ||||
| Director for the BMO Small-Cap Growth and | ||||
| Mid-Cap Growth products from 2008 to October | ||||
2016 at BMO Asset Management Corp.
| ||||
| Candace L. Lesak, CFP | Vice | Annual, | Employee, Nicholas Company, Inc., the Adviser to | |
| 63 | President | 27 years | the Fund. |
| (1) | David O. Nicholas is the only director of the Fund who is an “interested person” of the Fund, as that term is defined in the 1940 Act. Mr. Nicholas is a Director of the Adviser and owns 60% of the outstanding voting securities of the Adviser. |
| (2) | David O. Nicholas is a nephew of David L. Johnson. |
| (3) | Until duly elected or re-elected at a subsequent annual meeting of the Fund. |
The Fund’s Statement of Additional Information includes additional information about the Fund directors and is available, without charge, upon request, by calling 800-544-6547 or 414-276-0535.
– 30 –
Privacy Policy
(unaudited)
Nicholas Limited Edition, Inc. respects each shareholder’s right to privacy. We are committed to safeguarding the information that you provide us to maintain and execute transactions on your behalf.
We collect the following non-public personal information about you:
| * | Information we receive from you on applications or other forms, whether we receive the form in writing or electronically. This includes, but is not limited to, your name, address, phone number, tax identification number, date of birth, beneficiary information and investment selection. |
| * | Information about your transactions with us and account history with us. This includes, but is not limited to, your account number, balances and cost basis information. This also includes transaction requests made through our transfer agent. |
| * | Other general information that we may obtain about you such as demographic information. |
WE DO NOT SELL ANY NON-PUBLIC PERSONAL INFORMATION ABOUT CURRENT OR FORMER SHAREHOLDERS.
INFORMATION SHARED WITH OUR TRANSFER AGENT, A THIRD PARTY COMPANY, ALSO IS NOT SOLD.
We may share, only as permitted by law, non-public personal information about you with third party companies. Listed below are some examples of third parties to whom we may disclose non-public personal information. While these examples do not cover every circumstance permitted by law, we hope they help you understand how your information may be shared.
We may share non-public personal information about you:
| * | With companies who work for us to service your accounts or to process transactions that you may request. This would include, but is not limited to, our transfer agent to process your transactions, mailing houses to send you required reports and correspondence regarding the Fund and its Adviser, the Nicholas Company, Inc., and our dividend disbursing agent to process fund dividend checks. |
| * | With a party representing you, with your consent, such as your broker or lawyer. |
| * | When required by law, such as in response to a subpoena or other legal process. |
The Fund and its Adviser maintain policies and procedures to safeguard your non-public personal information. Access is restricted to employees who the Adviser determines need the information in order to perform their job duties. To guard your non-public personal information we maintain physical, electronic, and procedural safeguards that comply with federal standards.
In the event that you hold shares of the Fund with a financial intermediary, including, but not limited to, a broker-dealer, bank, or trust company, the privacy policy of your financial intermediary would govern how your non-public personal information would be shared with non-affiliated third parties.
– 31 –
Nicholas Funds Services Offered
(unaudited)
| • | IRAs | |
| • Traditional | • SIMPLE | |
| • Roth | • SEP | |
| • | Coverdell Education Accounts | |
| • | Automatic Investment Plan | |
| • | Direct Deposit of Dividend and Capital Gain Distributions | |
| • | Systematic Withdrawal Plan | |
| • | Monthly Automatic Exchange between Funds | |
| • | Telephone Purchase and Redemption | |
| • | Telephone Exchange | |
| • | 24-hour Automated Account Information (800-544-6547) | |
| • | 24-hour Internet Account Access (www.nicholasfunds.com) | |
Please call a shareholder representative for further information on the above services or with any other questions you may have regarding the Nicholas Funds (800-544-6547).
– 32 –
Notes
Directors and Officers
DAVID O. NICHOLAS, President and Director
JOHN A. HAUSER, Director
DAVID P. PELISEK, Director
JAY H. ROBERTSON, Director
DAVID L. JOHNSON, Executive Vice President
RYAN P. BUSHMAN, Senior Vice President
JENNIFER R. KLOEHN, Senior Vice President,
Treasurer and Chief Compliance Officer
LAWRENCE J. PAVELEC, Senior Vice President and Secretary
CANDACE L. LESAK, Vice President
Investment Adviser
NICHOLAS COMPANY, INC.
Milwaukee, Wisconsin
www.nicholasfunds.com
414-276-0535 or 800-544-6547
Transfer Agent
U.S. BANCORP FUND SERVICES, LLC
Milwaukee, Wisconsin
414-276-0535 or 800-544-6547
Distributor
QUASAR DISTRIBUTORS, LLC
Milwaukee, Wisconsin
Custodian
U.S. BANK N.A.
Milwaukee, Wisconsin
Independent Registered Public Accounting Firm
DELOITTE & TOUCHE LLP
Milwaukee, Wisconsin
Counsel
MICHAEL BEST & FRIEDRICH LLP
Milwaukee, Wisconsin
This report is submitted for the information of shareholders of the Fund. It is not authorized for distribution to prospective investors unless preceded or accompanied by an effective prospectus.
Item 2. Code of Ethics.
(a) The registrant has adopted a Code of Ethics that applies to the registrant’s principal executive officer and principal financial officer.
(b) Not applicable.
(c) During the period covered by the report, there were no amendments to the provisions of the Code of Ethics adopted in Item 2(a) above.
(d) During the period covered by the report, no implicit or explicit waivers were made with respect to the provisions of the Code of Ethics adopted in Item 2(a) above.
(e) Not applicable.
(f) The registrant’s Code of Ethics is attached as Exhibit 13(a)(1) to this Form N-CSR.
Item 3. Audit Committee Financial Expert.
The Fund's Board of Directors has determined that Mr. David P. Pelisek, an independent director, qualifies as an audit committee financial expert as that term is defined for purposes of this item. He was selected as the Fund’s Audit Committee Financial Expert at the Fund’s Board of Directors Meeting held on February 3, 2020.
Item 4. Principal Accountant Fees and Services.
(a) Audit Fees. The aggregate fees billed for each of the last two fiscal years (the "Reporting Periods") for professional services rendered by the Fund's principal accountant (the "Auditor") for the audit of the Fund's annual financial statements, or services that are normally provided by the Auditor in connection with the statutory and regulatory filings or engagements for the Reporting Periods, were $29,100 in 2020 and $28,200 in 2019.
(b) Audit-Related Fees. There were no fees billed in each of the last two fiscal years for assurance and related services rendered by the Auditor to the Fund that are reasonably related to the performance of the audit of the Fund's financial statements and are not reported under paragraph (a) of this Item 4.
(c) Tax Fees. The aggregate fees billed in the Reporting Periods for professional services rendered by the Auditor for tax compliance, tax advice and tax planning ("Tax Services") were $6,650 in 2020 and $6,450 in 2019. These services consisted of (i) review or preparation of U.S. federal, state, local and excise tax returns; (ii) U.S. federal, state and local tax planning, advice and assistance regarding statutory, regulatory or administrative developments, (iii) tax advice regarding tax qualification matters and/or treatment of various financial instruments held or proposed to be acquired or held.
(d) All Other Fees. The aggregate fees billed for professional services rendered by the Auditor to the Fund's investment adviser were approximately $18,200 in 2019 and $18,200 in 2018. These services were for the audit of the investment adviser for the adviser's fiscal year ended 10/31/2019 and 10/31/2018, respectively.
(e) (1) Audit Committee Pre-Approval Policies and Procedures. The Fund's Board of Director's has not adopted any pre-approval policies and procedures as described in paragraph (c)(7) of Rule 2-01 of Regulation S-X. The Fund's Board of Directors meets with the Auditors and management to review and authorize the Auditor's engagements for audit and non-audit services to the Fund and its Adviser prior to each engagement.
(e) (2) The percentage of services described in each of paragraphs (b) through (d) of this Item that were approved by the audit committee pursuant to paragraph (c)(7)(i)(C) of Rule 2-01 of Regulation S-X are as follows:
| (b) | N/A |
| (c) | N/A |
| (d) | N/A |
(f) No disclosures are required by this Item 4(f).
(g) There were no non-audit fees billed in each of the last two fiscal years by the Auditor for services rendered to the Fund or the Fund's investment adviser that provides ongoing services.
(h) No disclosures are required by this Item 4(h).
Item 5. Audit Committee of Listed Registrants.
Not applicable to this filing.
Item 6. Schedule of Investments.
The schedule of investments in securities of unaffiliated issuers is included as part of the report to shareholders filed under Item 1 of this Form N-CSR.
Item 7. Disclosure of Proxy Voting Policies and Procedures for Closed-End Management Investment Companies.
Applicable only to annual reports filed by closed-end funds.
Item 8. Portfolio Managers of Closed-End Management Investment Companies.
Applicable only to annual reports filed by closed-end funds.
Item 9. Purchases of Equity Securities by Closed-End Management Investment Companies and Affiliated Purchasers.
Applicable only to closed-end funds.
Item 10. Submission of Matters to a Vote of Security Holders.
Not applicable to this filing.
Item 11. Controls and Procedures.
(a) The Fund’s principal executive officer and principal financial officer, or persons performing similar functions, have concluded that the registrant’s disclosure controls and procedures (as defined in Rule 30a-3(c) under the Investment Company Act of 1940, as amended (the “1940 Act”) are effective, based on their evaluation of these controls and procedures as of a date within 90 days of the filing date of the
report that includes the disclosure required by this paragraph, based on their evaluation of these controls and procedures required by Rule 30a-3(b) under the 1940 Act and Rules 13a-15(b) or 15d-15(b) under the Securities Exchange Act of 1934, as amended.
(b) There were no changes in the registrant’s internal controls over financial reporting (as defined in
Rule 30a-3(d) under the 1940 Act) that occurred during the period covered by this report that have materially affected, or are reasonably likely to materially affect, the registrant’s internal control over financial reporting.
Item 12. Disclosure of Securities Lending Activities for Closed-End Management Investment Companies.
Applicable only to closed-end funds.
Item 13. Exhibits.
(a)(1) Sarbanes-Oxley Code of Ethics for Principal Executive and Senior Financial Officers (that is the subject of the disclosure required by Item 2), attached hereto as EX-99.CODE ETH.
(a)(2) Certifications of Principal Executive Officer and Principal Financial Officer pursuant to Rule 30a-2(a) under the Investment Company Act of 1940, attached hereto as EX-99.CERT.
(a)(3) Any written solicitation to purchase securities under Rule 23c-1 under the Act sent or given during the period covered by the report by or on behalf of the registrant to 10 or more person.
Applicable only to closed-end funds.
(a)(4) Change in the registrant’s independent public accountant.
Not applicable to this filing.
(b) Certifications of Principal Executive Officer and Principal Financial Officer pursuant to Rule 30a-2(b) under the Investment Company Act of 1940, attached hereto as EX-99.906 CERT.
SIGNATURES
Pursuant to the requirements of the Securities Exchange Act of 1934 and the Investment Company Act of 1940, the registrant has duly caused this report to be signed on its behalf by the undersigned, thereunto duly authorized.
(Registrant) Nicholas Limited Edition, Inc.
By: /s/ David O. Nicholas
Name: David O. Nicholas
Title: Principal Executive Officer
Date: February 26, 2020
Pursuant to the requirements of the Securities Exchange Act of 1934 and the Investment Company Act of 1940, this report has been signed by the following persons on behalf of the registrant and in the capacities and on the dates indicated.
By: /s/ David O. Nicholas
Name: David O. Nicholas
Title: Principal Executive Officer
Date: February 26, 2020
By: /s/ Jennifer R. Kloehn
Name: Jennifer R. Kloehn
Title: Principal Financial Officer
Date: February 26, 2020