UNITED STATES SECURITIES AND EXCHANGE COMMISSION
Washington, D.C. 20549
FORM N-CSR
CERTIFIED SHAREHOLDER REPORT OF REGISTERED MANAGEMENT
INVESTMENT COMPANIES
| Investment Company Act file number: | 811-04997 |
| | |
| Exact name of registrant as specified in charter: | Delaware Group® Equity Funds V |
| | |
| Address of principal executive offices: | 610 Market Street |
| | Philadelphia, PA 19106 |
| | |
| Name and address of agent for service: | David F. Connor, Esq. |
| | 610 Market Street |
| | Philadelphia, PA 19106 |
| | |
| Registrant’s telephone number, including area code: | (800) 523-1918 |
| | |
| Date of fiscal year end: | November 30 |
| | |
| Date of reporting period: | November 30, 2023 |
Item 1. Reports to Stockholders
Annual report
US equity mutual fund
Delaware Small Cap Core Fund
November 30, 2023
Carefully consider the Fund's investment objectives, risk factors, charges, and expenses before investing. This and other information can be found in the Fund's prospectus and its summary prospectus, which may be obtained by visiting delawarefunds.com/literature or calling 800 523-1918. Investors should read the prospectus and the summary prospectus carefully before investing.
You can obtain shareholder reports and prospectuses online instead of in the mail. Visit delawarefunds.com/edelivery.
Experience Delaware Funds by Macquarie®
Macquarie Asset Management (MAM) is a global asset manager that aims to deliver positive impact for everyone. MAM's public markets businesses trace their roots to 1929 and partner with institutional and individual clients to deliver specialist active investment capabilities across global equities, fixed income, and multi-asset solutions using a conviction-based, long-term approach to investing. In the US, retail investors recognize our Delaware Funds by Macquarie family of funds as one of the oldest mutual fund families.
If you are interested in learning more about creating an investment plan, contact your financial advisor.
You can learn more about Delaware Funds or obtain a prospectus for Delaware Small Cap Core Fund at delawarefunds.com/literature.
Manage your account online
· Check your account balance and transactions
· View statements and tax forms
· Make purchases and redemptions
Visit delawarefunds.com/account-access.
Macquarie Asset Management (MAM) is the asset management division of Macquarie Group. MAM is an integrated asset manager across public and private markets offering a diverse range of capabilities, including real assets, real estate, credit, equities, and multi-asset solutions.
The Fund is advised by Delaware Management Company, a series of Macquarie Investment Management Business Trust (MIMBT), a US registered investment adviser, and distributed by Delaware Distributors, L.P. (DDLP), an affiliate of MIMBT and Macquarie Group Limited.
Other than Macquarie Bank Limited ABN 46 008 583 542 (“Macquarie Bank”), any Macquarie Group entity noted in this document is not an authorized deposit-taking institution for the purposes of the Banking Act 1959 (Commonwealth of Australia). The obligations of these other Macquarie Group entities do not represent deposits or other liabilities of Macquarie Bank. Macquarie Bank does not guarantee or otherwise provide assurance in respect of the obligations of these other Macquarie Group entities. In addition, if this document relates to an investment, (a) the investor is subject to investment risk including possible delays in repayment and loss of income and principal invested and (b) none of Macquarie Bank or any other Macquarie Group entity guarantees any particular rate of return on or the performance of the investment, nor do they guarantee repayment of capital in respect of the investment.
The Fund is governed by US laws and regulations.
Table of contents
This annual report is for the information of Delaware Small Cap Core Fund shareholders, but it may be used with prospective investors when preceded or accompanied by the Delaware Fund fact sheet for the most recently completed calendar quarter. These documents are available at delawarefunds.com/literature.
Unless otherwise noted, views expressed herein are current as of November 30, 2023, and subject to change for events occurring after such date. These views are not intended to be investment advice, to forecast future events, or to guarantee future results.
The Fund is not FDIC insured and is not guaranteed. It is possible to lose the principal amount invested.
All third-party marks cited are the property of their respective owners.
© 2024 Macquarie Management Holdings, Inc.
| Portfolio management review | |
| Delaware Small Cap Core Fund | November 30, 2023 (Unaudited) |
| Performance preview (for the year ended November 30, 2023) | | |
| Delaware Small Cap Core Fund (Institutional Class shares) | 1-year return | -3.59% |
| Delaware Small Cap Core Fund (Class A shares) | 1-year return | -3.86% |
| Russell 2000® Index (benchmark) | 1-year return | -2.57% |
Past performance does not guarantee future results.
For complete, annualized performance for Delaware Small Cap Core Fund, please see the table on page 5. Institutional Class shares are not subject to a sales charge and are offered for sale exclusively to certain eligible investors. In addition, Institutional Class shares pay no distribution and service fee.
The performance of Class A shares excludes the applicable sales charge. The performance of both Institutional Class shares and Class A shares reflects the reinvestment of all distributions.
Please see page 7 for a description of the index. Index performance returns do not reflect any management fees, transaction costs, or expenses. Indices are unmanaged and one cannot invest directly in an index.
Investment objective
The Fund seeks long-term capital appreciation.
Market review
For the Fund’s fiscal year ended November 30, 2023, small-cap stocks underperformed large-cap stocks, as the Russell 2000® Index, the Fund’s benchmark, declined 2.57% while the large-cap Russell 1000® Index advanced 13.57%. The smallest US companies posted the weakest performances for the period, with the Russell Microcap® Index declining 8.41%. Small-cap value stocks trailed small-cap growth stocks, with the Russell 2000® Value Index declining 4.73% and the Russell 2000® Growth Index declining 0.83%.
Sector-level performance within the Russell 2000 Index was mixed during the fiscal year, with 10 of 16 sectors advancing. The capital goods, transportation, and communications services sectors in the benchmark were the strongest-performing sectors. Companies in the media, utilities, healthcare, and finance sectors of the benchmark declined the most; each fell more than 10% during the fiscal year.
| Stock selection detracted from the Fund’s relative performance for the fiscal year. In the technology, energy, and transportation sectors, the Fund’s holdings declined while those sectors in the benchmark advanced. Stock selection contributed in the credit cyclicals, healthcare, and basic materials sectors. The Fund’s holdings in the credit cyclicals and basic materials sectors outperformed those in the benchmark while its holdings in the healthcare sector provided downside protection relative to those in the benchmark. |
Portfolio management review
Delaware Small Cap Core Fund
The third-quarter 2023 US gross domestic product (GDP) annualized growth rate of 5.2% was well above consensus and followed two consecutive quarters of 2%-plus GDP growth reports. Many economists have extended their expectations of a softer economy into 2024. With inflation no longer advancing, we think the US Federal Reserve is likely to cut rates in 2024. Valuations for small caps remain at historically low levels, and our preference is for companies with quality earnings. The combination of these factors creates periods of dislocation in the market, which we have used as an opportunity to buy mispriced securities.
Source: Bloomberg unless otherwise noted.
Within the Fund
For the fiscal year ended November 30, 2023, Delaware Small Cap Core Fund underperformed its benchmark, the Russell 2000 Index. The Fund’s Institutional Class shares declined 3.59%. The Fund’s Class A shares declined 3.86% at net asset value (NAV) and 9.39% at maximum offer price (both figures reflect all distributions reinvested). For the same period, the Fund’s benchmark declined 2.57%. For complete annualized performance of Delaware Small Cap Core Fund, please see the table on page 5.
Stock selection detracted from the Fund’s relative performance for the fiscal year. In the technology, energy, and transportation sectors, the Fund’s holdings declined while those sectors in the benchmark advanced. Stock selection contributed in the credit cyclicals, healthcare, and basic materials sectors. The Fund’s holdings in the credit cyclicals and basic materials sectors outperformed those in the benchmark while its holdings in the healthcare sector provided downside protection relative to those in the benchmark.
Patterson-UTI Energy Inc., a leading contract drilling and pressure pumping company, underperformed for the Fund’s fiscal year. As a provider of high-quality drilling and completion equipment to exploration and production (E&P) companies, Patterson’s stock is sensitive to changes in oil and natural gas prices; both commodities declined during the Fund’s fiscal year. During the period, Patterson acquired a competitor, NexTier Oilfield Solutions Inc., we owned in the Fund, bringing together two of the industry’s leading well completion services companies. We are optimistic about the synergies and cost savings that Patterson projects realizing in the first quarter of 2025 as well as the benefit from the size and scale of the transaction. We maintained the Fund’s position in Patterson as we believe the company has a sound plan to return capital to shareholders through dividends and share repurchases. We think it should continue to benefit from an extended demand cycle for oil service equipment companies based on both demand recovery and supply constraints.
The Fund’s position in commercial-stage biotechnology company Travere Therapeutics Inc. underperformed. Travere identifies, develops, commercializes, and distributes therapies to people living with rare diseases. Included among the company’s products the US Food and Drug Administration (FDA) have approved are Chenodal, Cholbam, Filspari (sparsentan), and Thiola. In February, the FDA granted accelerated approval for Filspari to reduce proteinuria in adults with primary IgA nephropathy (IgAN). IgAN is a leading cause of end-stage kidney disease. In September, the company released top-line results from its two-year study of Filspari in IgAN in which the drug missed achieving its statistical significance, resulting in a sharp stock selloff. Travere updated investors following a preliminary new drug application (NDA) meeting with the FDA for Filspari in
IgAN, stating that it will submit an NDA in the first quarter of 2024. We maintained the Fund’s position in Travere as the FDA continues to approve Filspari for treatment in the US and the company has implemented a strategic reorganization to focus its resources on Filspari.
In the technology sector, the Fund’s semiconductor positions detracted from performance, led lower by shares of MaxLinear Inc., a radio frequency (RF), analog, digital, and mixed-signal integrated circuits company. In 2022, MaxLinear entered into an agreement, subject to regulatory and conditional approvals, to acquire Silicon Motion Technology Corp. When the transaction was announced, we were focused on how the company would finance the transaction and manage financial leverage as we did see value in the combined company. During the Fund’s fiscal year, however, MaxLinear terminated the planned acquisition of Silicon Motion. We viewed this action favorably, but the market did not. We maintained the Fund’s position in MaxLinear as we think demand for its broadband and wireless infrastructure products should remain strong. Additionally, the company’s cost structure has improved.
Stock selection contributed to relative performance in the credit cyclicals sector as the Fund’s homebuilder companies outperformed. Arizona-based homebuilder Taylor Morrison Home Corp. contributed as the number of homes sold and average selling price grew above projections for the fiscal year. Taylor Morrison Home’s communities are catered toward favorable buyer groups such as entry level, move up, and adult resort lifestyle. We maintained the Fund’s position in Taylor Morrison Home since the company has a balanced capital allocation strategy aimed at delivering shareholder returns over the course of the housing cycle.
Boise Cascade Co. is one of the largest producers of engineered wood products and plywood in North America and a leading US wholesale distributor of building products. Boise Cascade outperformed for the Fund’s fiscal year, reporting multiple quarters of strong financial performance. Boise Cascade has benefited from continued demand in its wood products and building materials segments. Operating in these two segments gives the Fund’s portfolio exposure to residential construction and home remodeling activity. We maintained the Fund’s position in Boise Cascade as it has a strong balance sheet and management is returning capital to shareholders.
In the capital goods sector, shares of industrial parts manufacturer and distributor Applied Industrial Technologies Inc., outperformed. Applied Industrial Technologies has exceeded its organic sales and earnings growth projections as the company’s management has focused on operational execution and profit margins. Applied Industrial Technologies has benefited from secular growth tailwinds and end-market business diversification. This was part of our investment thesis for owning the company. We maintained the Fund’s position in Applied Industrial Technologies since it has a strong balance sheet, is returning capital to shareholders, and, in our view, is well positioned to react to its customer’s product needs.
The Fund ended the fiscal year overweight the benchmark in the healthcare, basic materials, and transportation sectors. The largest sector underweights were in business services, consumer discretionary, and energy. We believe the current market and economic environments should continue to support
Portfolio management review
Delaware Small Cap Core Fund
active management and our investment philosophy. We continue to maintain our strategy of investing in companies that we believe have strong balance sheets and cash flow, sustainable competitive advantages, and high-quality management teams with the potential to deliver value to shareholders. We appreciate your confidence and look forward to serving your investment needs in the next fiscal year.
| Performance summary | |
| Delaware Small Cap Core Fund | November 30, 2023 (Unaudited) |
The performance quoted represents past performance and does not guarantee future results. Investment return and principal value of an investment will fluctuate so that shares, when redeemed, may be worth more or less than their original cost. Current performance may be lower or higher than the performance quoted. Performance data current to the most recent month end may be obtained by calling 800 523-1918 or visiting delawarefunds.com/performance.
| Fund and benchmark performance1,2 | Average annual total returns through November 30, 2023 |
| | 1 year | 5 year | 10 year | Lifetime |
| Class A (Est. December 29, 1998) | | | | |
| Excluding sales charge | -3.86% | +5.84% | +7.08% | — |
| Including sales charge | -9.39% | +4.59% | +6.45% | — |
| Class C (Est. August 1, 2005) | | | | |
| Excluding sales charge | -4.57% | +5.05% | +6.28% | — |
| Including sales charge | -5.49% | +5.05% | +6.28% | — |
| Class R (Est. August 1, 2005) | | | | |
| Excluding sales charge | -4.09% | +5.58% | +6.82% | — |
| Including sales charge | -4.09% | +5.58% | +6.82% | — |
| Institutional Class (Est. December 29, 1998) | | | | |
| Excluding sales charge | -3.59% | +6.11% | +7.35% | — |
| Including sales charge | -3.59% | +6.11% | +7.35% | — |
| Class R6 (Est. May 2, 2016) | | | | |
| Excluding sales charge | -3.49% | +6.24% | — | +8.87% |
| Including sales charge | -3.49% | +6.24% | — | +8.87% |
| Russell 2000 Index | -2.57% | +4.78% | +6.13% | — |
1Returns reflect the reinvestment of all distributions and are presented both with and without the applicable sales charges described below. Returns do not reflect the deduction of taxes the shareholder would pay on Fund distributions or redemptions of Fund shares.
Expense limitations were in effect for certain classes during some or all of the periods shown in the “Fund and benchmark performance” table. Expenses for each class are listed in the “Fund expense ratios” table on page 6. Performance would have been lower had expense limitations not been in effect.
Class A shares are sold with a maximum front-end sales charge of 5.75%, and have an annual distribution and service (12b-1) fee of 0.25% of average daily net assets. Performance for Class A shares, excluding sales charges, assumes that no front-end sales charge applied.
Class C shares are sold with a contingent deferred sales charge (CDSC) of 1.00% if redeemed within one year of purchase. They are also subject to an annual 12b-1 fee of 1.00% of average daily net assets. Performance for Class C shares, excluding sales charges, assumes either that CDSCs did
Performance summary
Delaware Small Cap Core Fund
not apply or that the investment was not redeemed.
Class R shares are available only for certain retirement plan products. They are sold without a sales charge and have an annual 12b-1 fee of 0.50% of average daily net assets.
Institutional Class shares are not subject to a sales charge and are offered for sale exclusively to certain eligible investors. In addition, Institutional Class shares pay no 12b-1 fee.
Class R6 shares are available only to certain investors. In addition, Class R6 shares do not pay any service fees, sub-accounting fees, and/or sub-transfer agency fees to any brokers, dealers, or other financial intermediaries. Class R6 shares pay no 12b-1 fee.
Narrowly focused investments may exhibit higher volatility than investments in multiple industry sectors.
Investments in small and/or medium-sized companies typically exhibit greater risk and higher volatility than larger, more established companies.
REIT investments are subject to many of the risks associated with direct real estate ownership, including changes in economic conditions, credit risk, and interest rate fluctuations.
International investments entail risks including fluctuation in currency values, differences in accounting principles, or economic or political instability. Investing in emerging markets can be riskier than investing in established foreign markets due to increased volatility, lower trading volume, and higher risk of market closures. In many emerging markets, there is substantially less publicly available information and the available information may be incomplete or misleading. Legal claims are generally more difficult to pursue.
The disruptions caused by natural disasters, pandemics, or similar events could prevent the Fund from executing advantageous investment decisions in a timely manner and could negatively impact the Fund’s ability to achieve its investment objective and the value of the Fund’s investments.
2The Fund’s expense ratios, as described in the most recent prospectus, are disclosed in the following “Fund expense ratios” table. The expense ratios below may differ from the expense ratios in the "Financial highlights" since they are based on different time periods and the expense ratios in the prospectus include acquired fund fees and expenses, if any. See Note 2 in "Notes to financial statements" for additional details. Please see the “Financial highlights” section in this report for the most recent expense ratios.
| | | | | | | | | Institutional | | |
| Fund expense ratios | | Class A | | Class C | | Class R | | Class | | Class R6 |
| Total annual operating expenses (without fee waivers) | | 1.05% | | 1.80% | | 1.30% | | 0.80% | | 0.69% |
| Net expenses (including fee waivers, if any) | | 1.05% | | 1.80% | | 1.30% | | 0.80% | | 0.69% |
| Type of waiver | | n/a | | n/a | | n/a | | n/a | | n/a |
Performance of a $10,000 investment1
For the period November 30, 2013 through November 30, 2023

| | | | Starting value | | Ending value |
 | Delaware Small Cap Core Fund - Institutional Class shares | | $ | 10,000 | | | $ | 20,328 | |
 | Delaware Small Cap Core Fund - Class A shares | | $ | 9,425 | | | $ | 18,681 | |
 | Russell 2000 Index | | $ | 10,000 | | | $ | 18,136 | |
1The “Performance of a $10,000 investment” graph assumes $10,000 invested in Institutional Class and Class A shares of the Fund on November 30, 2013, and includes the effect of a 5.75% front-end sales charge (for Class A shares) and the reinvestment of all distributions. The graph does not reflect the deduction of taxes the shareholders would pay on Fund distributions or redemptions of Fund shares. Expense limitations were in effect for some or all of the periods shown. Performance would have been lower had expense limitations not been in effect. Expenses are listed in the “Fund expense ratios” table on page 6. Please note additional details on pages 5 through 8.
The graph also assumes $10,000 invested in the Russell 2000 Index as of November 30, 2013. The Russell 2000 Index measures the performance of the small-cap segment of the US equity universe.
The Russell 1000 Index, mentioned on page 1, measures the performance of the large-cap segment of the US equity universe.
The Russell 2000 Growth Index, mentioned on page 1, measures the performance of the small-cap growth segment of the US equity universe. It includes those Russell 2000 companies with higher price-to-book ratios and higher forecasted growth values.
The Russell 2000 Value Index, mentioned on page 1, measures the performance of the small-cap value segment of the US equity universe. It includes those Russell 2000 companies with lower price-to-book ratios and lower forecasted growth values.
The Russell Microcap Index, mentioned on page 1, measures almost 1,550 small-cap and Performance summary Delaware Small Cap Core Fund 6 micro-cap stocks, including the
Performance summary
Delaware Small Cap Core Fund
smallest 1,000 companies in the Russell 2000 Index, plus 1,000 smaller US-based listed stocks.
Gross domestic product, mentioned on page 2, is a measure of all goods and services produced by a nation in a year. It is a measure of economic activity.
Frank Russell Company is the source and owner of the trademarks, service marks, and copyrights related to the Russell Indexes.
Russell® is a trademark of Frank Russell Company.
Index performance returns do not reflect any management fees, transaction costs, or expenses. Indices are unmanaged and one cannot invest directly in an index. Past performance does not guarantee future results.
Performance of other Fund classes will vary due to different charges and expenses.
| | Nasdaq symbols | CUSIPs |
| Class A | DCCAX | 24610B883 |
| Class C | DCCCX | 24610B867 |
| Class R | DCCRX | 24610B834 |
| Institutional Class | DCCIX | 24610B859 |
| Class R6 | DCZRX | 24610B826 |
Disclosure of Fund expenses
For the six-month period from June 1, 2023 to November 30, 2023 (Unaudited)
As a shareholder of the Fund, you incur two types of costs: (1) transaction costs, including sales charges (loads) on purchase payments, reinvested dividends, or other distributions; redemption fees; and exchange fees; and (2) ongoing costs, including management fees; distribution and service (12b-1) fees; and other Fund expenses. This example is intended to help you understand your ongoing costs (in dollars) of investing in the Fund and to compare these costs with the ongoing costs of investing in other mutual funds.
The example is based on an investment of $1,000 invested at the beginning of the period and held for the entire six-month period from June 1, 2023 to November 30, 2023.
Actual expenses
The first section of the table shown, “Actual Fund return,” provides information about actual account values and actual expenses. You may use the information in this section of the table, together with the amount you invested, to estimate the expenses that you paid over the period. Simply divide your account value by $1,000 (for example, an $8,600 account value divided by $1,000 = 8.6), then multiply the result by the number in the first section under the heading entitled “Expenses Paid During Period” to estimate the expenses you paid on your account during this period.
Hypothetical example for comparison purposes
The second section of the table shown, “Hypothetical 5% return,” provides information about hypothetical account values and hypothetical expenses based on the Fund’s actual expense ratio and an assumed rate of return of 5% per year before expenses, which is not the Fund’s actual return. The hypothetical account values and expenses may not be used to estimate the actual ending account balance or expenses you paid for the period. You may use this information to compare the ongoing costs of investing in the Fund and other funds. To do so, compare this 5% hypothetical example with the 5% hypothetical examples that appear in the shareholder reports of the other funds.
Please note that the expenses shown in the table are meant to highlight your ongoing costs only and do not reflect any transactional costs, such as sales charges (loads), redemption fees, or exchange fees. Therefore, the second section of the table is useful in comparing ongoing costs only, and will not help you determine the relative total costs of owning different funds. In addition, if these transactional costs were included, your costs would have been higher. The Fund's expenses shown in the table assume reinvestment of all dividends and distributions.
Disclosure of Fund expenses
For the six-month period from June 1, 2023 to November 30, 2023 (Unaudited)
Delaware Small Cap Core Fund
Expense analysis of an investment of $1,000
| | Beginning | Ending | | Expenses |
| | Account Value | Account Value | Annualized | Paid During Period |
| | 6/1/23 | 11/30/23 | Expense Ratio | 6/1/23 to 11/30/23* |
| Actual Fund return† | | | | |
| Class A | $1,000.00 | $1,040.00 | 1.11% | $5.68 |
| Class C | 1,000.00 | 1,036.30 | 1.86% | 9.49 |
| Class R | 1,000.00 | 1,038.50 | 1.36% | 6.95 |
| Institutional Class | 1,000.00 | 1,041.60 | 0.86% | 4.40 |
| Class R6 | 1,000.00 | 1,042.00 | 0.75% | 3.84 |
| Hypothetical 5% return (5% return before expenses) | |
| Class A | $1,000.00 | $1,019.50 | 1.11% | $5.62 |
| Class C | 1,000.00 | 1,015.74 | 1.86% | 9.40 |
| Class R | 1,000.00 | 1,018.25 | 1.36% | 6.88 |
| Institutional Class | 1,000.00 | 1,020.76 | 0.86% | 4.36 |
| Class R6 | 1,000.00 | 1,021.31 | 0.75% | 3.80 |
*“Expenses Paid During Period” are equal to the Fund's annualized expense ratio, multiplied by the average account value over the period, multiplied by 183/365 (to reflect the one-half year period).
†Because actual returns reflect only the most recent six-month period, the returns shown may differ significantly from fiscal year returns.
In addition to the Fund's expenses reflected above, the Fund also indirectly bears its portion of the fees and expenses of any investment companies (Underlying Funds), in which it invests. The table above does not reflect the expenses of any Underlying Funds.
| Security type / sector allocations and top 10 equity holdings |
| Delaware Small Cap Core Fund | As of November 30, 2023 (Unaudited) |
Sector designations may be different from the sector designations presented in other Fund materials. The sector designations may represent the investment manager’s internal sector classifications, which may result in the sector designations for one fund being different from another fund's sector designations.
| Security type / sector | Percentage of net assets |
| Common Stocks | 98.18 | % |
| Basic Materials | 7.50 | % |
| Business Services | 3.83 | % |
| Capital Goods | 10.36 | % |
| Communications Services | 0.27 | % |
| Consumer Discretionary | 2.95 | % |
| Consumer Services | 1.96 | % |
| Consumer Staples | 3.65 | % |
| Credit Cyclicals | 3.87 | % |
| Energy | 5.84 | % |
| Financials | 14.58 | % |
| Healthcare | 15.71 | % |
| Media | 0.53 | % |
| Real Estate Investment Trusts | 6.58 | % |
| Technology | 14.84 | % |
| Transportation | 3.39 | % |
| Utilities | 2.32 | % |
| Short-Term Investments | 1.91 | % |
| Total Value of Securities | 100.09 | % |
| Liabilities Net of Receivables and Other Assets | (0.09 | )% |
| Total Net Assets | 100.00 | % |
Top 10 equity holdings are for informational purposes only and are subject to change at any time. They are not a recommendation to buy, sell, or hold any security.
| Top 10 equity holdings | Percentage of net assets |
| Permian Resources | 1.78 | % |
| Federal Signal | 1.77 | % |
| Patterson-UTI Energy | 1.65 | % |
| Applied Industrial Technologies | 1.64 | % |
| Boise Cascade | 1.51 | % |
| Taylor Morrison Home | 1.50 | % |
| Steven Madden | 1.44 | % |
| Prestige Consumer Healthcare | 1.41 | % |
| Summit Materials Class A | 1.38 | % |
| Minerals Technologies | 1.32 | % |
| Schedule of investments | |
| Delaware Small Cap Core Fund | November 30, 2023 |
| | | Number of | | | | |
| | | shares | | | Value (US $) | |
| Common Stocks — 98.18% | | | | | | | | |
| Basic Materials — 7.50% | | | | | | | | |
| Balchem | | | 64,610 | | | $ | 8,058,159 | |
| Boise Cascade | | | 950,213 | | | | 103,858,281 | |
| Huntsman | | | 1,159,775 | | | | 28,530,465 | |
| Kaiser Aluminum | | | 636,241 | | | | 37,207,374 | |
| Minerals Technologies | | | 1,449,208 | | | | 90,778,389 | |
| Quaker Chemical | | | 270,303 | | | | 48,327,473 | |
| Summit Materials Class A † | | | 2,722,567 | | | | 94,445,849 | |
| Tecnoglass | | | 714,561 | | | | 24,902,451 | |
| Worthington Enterprises | | | 1,103,980 | | | | 79,155,366 | |
| | | | | | | | 515,263,807 | |
| Business Services — 3.83% | | | | | | | | |
| ABM Industries | | | 1,431,555 | | | | 58,679,439 | |
| ASGN † | | | 972,861 | | | | 86,818,116 | |
| BrightView Holdings † | | | 2,687,290 | | | | 20,530,896 | |
| Casella Waste Systems Class A † | | | 871,048 | | | | 70,450,362 | |
| WillScot Mobile Mini Holdings † | | | 635,631 | | | | 26,518,525 | |
| | | | | | | | 262,997,338 | |
| Capital Goods — 10.36% | | | | | | | | |
| Ameresco Class A † | | | 1,309,594 | | | | 39,235,436 | |
| Applied Industrial Technologies | | | 702,906 | | | | 112,514,163 | |
| Chart Industries † | | | 416,941 | | | | 54,214,838 | |
| Coherent † | | | 555,206 | | | | 20,426,029 | |
| Columbus McKinnon | | | 1,324,194 | | | | 46,240,854 | |
| Construction Partners Class A † | | | 814,160 | | | | 34,162,154 | |
| ESCO Technologies | | | 422,530 | | | | 44,357,199 | |
| Federal Signal | | | 1,764,169 | | | | 121,621,811 | |
| H&E Equipment Services | | | 750,550 | | | | 33,256,870 | |
| Kadant | | | 303,156 | | | | 79,008,517 | |
| MYR Group † | | | 563,973 | | | | 70,169,521 | |
| Zurn Elkay Water Solutions | | | 1,912,808 | | | | 56,313,068 | |
| | | | | | | | 711,520,460 | |
| Communications Services — 0.27% | | | | | | | | |
| ATN International | | | 600,449 | | | | 18,277,668 | |
| | | | | | | | 18,277,668 | |
| Consumer Discretionary — 2.95% | | | | | | | | |
| Hibbett | | | 509,879 | | | | 31,892,931 | |
| Malibu Boats Class A † | | | 1,081,529 | | | | 47,846,843 | |
| Sonic Automotive Class A | | | 470,792 | | | | 24,137,506 | |
| | Number of | | | | |
| | | shares | | | Value (US $) | |
| Common Stocks (continued) | | | | | | |
| Consumer Discretionary (continued) | | | | | | | | |
| Steven Madden | | | 2,604,693 | | | $ | 98,769,959 | |
| | | | | | | | 202,647,239 | |
| Consumer Services — 1.96% | | | | | | | | |
| Brinker International † | | | 1,183,389 | | | | 42,613,838 | |
| Chuy's Holdings † | | | 875,906 | | | | 30,831,891 | |
| Jack in the Box | | | 457,653 | | | | 33,088,312 | |
| OneSpaWorld Holdings † | | | 572,764 | | | | 6,901,806 | |
| Texas Roadhouse | | | 188,192 | | | | 21,182,892 | |
| | | | | | | | 134,618,739 | |
| Consumer Staples — 3.65% | | | | | | | | |
| Helen of Troy † | | | 346,951 | | | | 36,440,264 | |
| J & J Snack Foods | | | 538,108 | | | | 88,545,671 | |
| Prestige Consumer Healthcare † | | | 1,692,423 | | | | 97,060,459 | |
| YETI Holdings † | | | 664,971 | | | | 28,354,363 | |
| | | | | | | | 250,400,757 | |
| Credit Cyclicals — 3.87% | | | | | | | | |
| Dana | | | 2,997,022 | | | | 39,590,661 | |
| KB Home | | | 1,393,858 | | | | 72,620,002 | |
| La-Z-Boy | | | 1,434,344 | | | | 50,474,565 | |
| Taylor Morrison Home † | | | 2,282,885 | | | | 102,958,113 | |
| | | | | | | | 265,643,341 | |
| Energy — 5.84% | | | | | | | | |
| Magnolia Oil & Gas Class A | | | 2,739,314 | | | | 58,895,251 | |
| Patterson-UTI Energy | | | 9,696,178 | | | | 113,542,240 | |
| Permian Resources | | | 9,315,248 | | | | 122,402,359 | |
| SM Energy | | | 1,534,735 | | | | 57,475,826 | |
| Southwestern Energy † | | | 7,423,158 | | | | 48,918,611 | |
| | | | | | | | 401,234,287 | |
| Financials — 14.58% | | | | | | | | |
| BRP Group Class A † | | | 2,367,613 | | | | 41,409,551 | |
| City Holding | | | 443,624 | | | | 42,707,683 | |
| CNO Financial Group | | | 1,759,730 | | | | 46,632,845 | |
| Enterprise Financial Services | | | 690,256 | | | | 27,064,938 | |
| Essent Group | | | 1,422,022 | | | | 68,740,544 | |
| First Bancorp | | | 1,015,127 | | | | 31,814,080 | |
| First Financial Bancorp | | | 1,812,730 | | | | 36,635,273 | |
| First Interstate BancSystem Class A | | | 1,662,775 | | | | 43,049,245 | |
| Hamilton Lane Class A | | | 873,231 | | | | 85,445,653 | |
| Independent Bank | | | 705,172 | | | | 40,208,907 | |
Schedule of investments
Delaware Small Cap Core Fund
| | | Number of | | | | |
| | | shares | | | Value (US $) | |
| Common Stocks (continued) | | | | | | |
| Financials (continued) | | | | | | | | |
| Independent Bank Group | | | 611,516 | | | $ | 23,653,439 | |
| NMI Holdings Class A † | | | 1,819,654 | | | | 50,040,485 | |
| Old National Bancorp | | | 4,217,667 | | | | 62,801,062 | |
| Pacific Premier Bancorp | | | 1,810,471 | | | | 40,771,807 | |
| PJT Partners Class A | | | 613,722 | | | | 55,271,803 | |
| Selective Insurance Group | | | 788,190 | | | | 80,151,041 | |
| SouthState | | | 680,210 | | | | 50,369,551 | |
| United Community Banks | | | 1,693,452 | | | | 41,743,592 | |
| Valley National Bancorp | | | 4,866,963 | | | | 44,289,363 | |
| WesBanco | | | 1,450,384 | | | | 38,609,222 | |
| WSFS Financial | | | 1,302,760 | | | | 50,247,453 | |
| | | | | | | | 1,001,657,537 | |
| Healthcare — 15.71% | | | | | | | | |
| Agios Pharmaceuticals † | | | 1,629,913 | | | | 36,232,966 | |
| Amicus Therapeutics † | | | 5,362,316 | | | | 59,092,722 | |
| Apellis Pharmaceuticals † | | | 753,839 | | | | 40,609,307 | |
| Artivion † | | | 2,359,339 | | | | 41,854,674 | |
| AtriCure † | | | 1,188,868 | | | | 42,181,037 | |
| Azenta † | | | 777,530 | | | | 43,829,366 | |
| Blueprint Medicines † | | | 1,168,609 | | | | 81,381,931 | |
| CONMED | | | 583,793 | | | | 62,623,475 | |
| Halozyme Therapeutics † | | | 1,816,982 | | | | 70,153,675 | |
| Insmed † | | | 2,634,311 | | | | 65,910,461 | |
| Intra-Cellular Therapies † | | | 985,300 | | | | 60,467,861 | |
| Lantheus Holdings † | | | 766,649 | | | | 54,907,401 | |
| Ligand Pharmaceuticals † | | | 740,914 | | | | 43,202,695 | |
| Merit Medical Systems † | | | 1,051,318 | | | | 75,232,316 | |
| NeoGenomics † | | | 2,468,392 | | | | 44,850,683 | |
| OmniAb † | | | 2,991,363 | | | | 13,132,084 | |
| OmniAb 12.5 =, † | | | 221,566 | | | | 0 | |
| OmniAb 15 =, † | | | 221,566 | | | | 0 | |
| Omnicell † | | | 696,865 | | | | 23,247,416 | |
| Pacific Biosciences of California † | | | 4,079,689 | | | | 34,595,763 | |
| Pacira BioSciences † | | | 1,113,792 | | | | 30,384,246 | |
| Shockwave Medical † | | | 78,158 | | | | 13,642,479 | |
| Supernus Pharmaceuticals † | | | 2,085,784 | | | | 56,837,614 | |
| TransMedics Group † | | | 822,240 | | | | 62,227,123 | |
| Travere Therapeutics † | | | 3,607,771 | | | | 22,656,802 | |
| | | | | | | | 1,079,254,097 | |
| | | Number of | | | | |
| | | shares | | | Value (US $) | |
| Common Stocks (continued) | | | | | | |
| Media — 0.53% | | | | | | | | |
| IMAX † | | | 2,271,371 | | | $ | 36,228,368 | |
| | | | | | | | 36,228,368 | |
| Real Estate Investment Trusts — 6.58% | | | | | | | | |
| Armada Hoffler Properties | | | 2,924,056 | | | | 32,106,135 | |
| Cushman & Wakefield † | | | 3,807,453 | | | | 31,259,189 | |
| DiamondRock Hospitality | | | 5,526,068 | | | | 45,976,886 | |
| Four Corners Property Trust | | | 2,213,113 | | | | 50,879,468 | |
| Independence Realty Trust | | | 4,113,108 | | | | 56,020,531 | |
| Kite Realty Group Trust | | | 3,488,932 | | | | 73,686,244 | |
| LXP Industrial Trust | | | 5,203,441 | | | | 45,686,212 | |
| Phillips Edison & Co. | | | 1,271,967 | | | | 44,824,117 | |
| Physicians Realty Trust | | | 4,237,194 | | | | 49,490,426 | |
| RPT Realty | | | 1,868,501 | | | | 21,711,981 | |
| | | | | | | | 451,641,189 | |
| Technology — 14.84% | | | | | | | | |
| Atkore † | | | 250,236 | | | | 32,505,656 | |
| Box Class A † | | | 1,980,948 | | | | 51,841,409 | |
| Clearwater Analytics Holdings Class A † | | | 331,726 | | | | 7,069,081 | |
| ExlService Holdings † | | | 2,463,982 | | | | 69,903,169 | |
| Ichor Holdings † | | | 1,069,008 | | | | 27,933,179 | |
| Instructure Holdings † | | | 1,523,736 | | | | 39,845,696 | |
| MACOM Technology Solutions Holdings † | | | 735,045 | | | | 61,729,079 | |
| MaxLinear † | | | 1,845,736 | | | | 34,570,635 | |
| Progress Software | | | 661,366 | | | | 35,621,173 | |
| Q2 Holdings † | | | 1,863,842 | | | | 66,203,668 | |
| Rapid7 † | | | 1,129,556 | | | | 61,165,458 | |
| Semtech † | | | 1,749,987 | | | | 28,647,287 | |
| Silicon Laboratories † | | | 600,555 | | | | 63,280,480 | |
| Sprout Social Class A † | | | 849,298 | | | | 48,325,056 | |
| SPS Commerce † | | | 401,841 | | | | 69,229,168 | |
| Varonis Systems † | | | 2,023,396 | | | | 84,760,059 | |
| Verint Systems † | | | 1,485,879 | | | | 36,508,047 | |
| WNS Holdings ADR † | | | 851,293 | | | | 50,634,908 | |
| Workiva † | | | 530,486 | | | | 51,016,839 | |
| Yelp † | | | 1,472,025 | | | | 64,342,213 | |
| Ziff Davis † | | | 540,093 | | | | 34,468,735 | |
| | | | | | | | 1,019,600,995 | |
| Transportation — 3.39% | | | | | | | | |
| Allegiant Travel | | | 383,902 | | | | 26,293,448 | |
| ArcBest | | | 292,532 | | | | 34,866,889 | |
Schedule of investments
Delaware Small Cap Core Fund
| | | Number of | | | | |
| | | shares | | | Value (US $) | |
| Common Stocks (continued) | | | | | | | | |
| Transportation (continued) | | | | | | | | |
| Hub Group Class A † | | | 694,928 | | | $ | 52,501,810 | |
| Sun Country Airlines Holdings † | | | 3,116,304 | | | | 47,305,495 | |
| Werner Enterprises | | | 1,792,220 | | | | 71,706,722 | |
| | | | | | | | 232,674,364 | |
| Utilities — 2.32% | | | | | | | | |
| Black Hills | | | 984,643 | | | | 50,797,732 | |
| Northwestern Energy Group | | | 1,094,261 | | | | 55,052,271 | |
| Spire | | | 881,901 | | | | 53,804,780 | |
| | | | | | | | 159,654,783 | |
| Total Common Stocks (cost $6,155,355,191) | | | | | | | 6,743,314,969 | |
| | | | | | | | | |
| Short-Term Investments — 1.91% | | | | | | | | |
| Money Market Mutual Funds — 1.91% | | | | | | | | |
| BlackRock Liquidity FedFund – Institutional Shares (seven-day effective yield 5.25%) | | | 32,804,503 | | | | 32,804,503 | |
Fidelity Investments Money Market Government Portfolio – Class I
(seven-day effective yield 5.24%) | | | 32,804,502 | | | | 32,804,502 | |
Goldman Sachs Financial Square Government Fund – Institutional Shares
(seven-day effective yield 5.39%) | | | 32,804,502 | | | | 32,804,502 | |
| Morgan Stanley Institutional Liquidity Funds Government Portfolio – Institutional Class (seven-day effective yield 5.26%) | | | 32,804,502 | | | | 32,804,502 | |
| Total Short-Term Investments (cost $131,218,009) | | | | | | | 131,218,009 | |
Total Value of Securities—100.09%
(cost $6,286,573,200) | | | | | | $ | 6,874,532,978 | |
| † | Non-income producing security. |
| = | The value of this security was determined using significant unobservable inputs and is reported as a Level 3 security in the disclosure table located in Note 3 in “Notes to financial statements.” |
Summary of abbreviations:
ADR – American Depositary Receipt
See accompanying notes, which are an integral part of the financial statements.
| Statement of assets and liabilities | |
| Delaware Small Cap Core Fund | November 30, 2023 |
| Assets: | | | |
| Investments, at value* | | $ | 6,874,532,978 | |
| Cash | | | 54,721 | |
| Receivable for fund shares sold | | | 12,037,108 | |
| Dividends receivable | | | 10,679,183 | |
| Prepaid expenses | | | 106,041 | |
| Other assets | | | 52,780 | |
| Total Assets | | | 6,897,462,811 | |
| Liabilities: | | | | |
| Payable for fund shares redeemed | | | 15,913,869 | |
| Payable for securities purchased | | | 6,823,127 | |
| Investment management fees payable to affiliates | | | 3,455,922 | |
| Other accrued expenses | | | 2,148,680 | |
| Administration expenses payable to affiliates | | | 576,452 | |
| Distribution fees payable to affiliates | | | 120,027 | |
| Total Liabilities | | | 29,038,077 | |
| Total Net Assets | | $ | 6,868,424,734 | |
| | | | | |
| Net Assets Consist of: | | | | |
| Paid-in capital | | $ | 6,105,910,614 | |
| Total distributable earnings (loss) | | | 762,514,120 | |
| Total Net Assets | | $ | 6,868,424,734 | |
Statement of assets and liabilities
Delaware Small Cap Core Fund
| Net Asset Value | | | | |
| | | | | |
| Class A: | | | | |
| Net assets | | $ | 254,989,799 | |
| Shares of beneficial interest outstanding, unlimited authorization, no par | | | 10,104,788 | |
| Net asset value per share | | $ | 25.23 | |
| Sales charge | | | 5.75 | % |
| Offering price per share, equal to net asset value per share / (1 - sales charge) | | $ | 26.77 | |
| | | | | |
| Class C: | | | | |
| Net assets | | $ | 72,866,916 | |
| Shares of beneficial interest outstanding, unlimited authorization, no par | | | 3,447,120 | |
| Net asset value per share | | $ | 21.14 | |
| | | | | |
| Class R: | | | | |
| Net assets | | $ | 25,702,735 | |
| Shares of beneficial interest outstanding, unlimited authorization, no par | | | 1,070,465 | |
| Net asset value per share | | $ | 24.01 | |
| | | | | |
| Institutional Class: | | | | |
| Net assets | | $ | 4,976,768,203 | |
| Shares of beneficial interest outstanding, unlimited authorization, no par | | | 191,296,801 | |
| Net asset value per share | | $ | 26.02 | |
| | | | | |
| Class R6: | | | | |
| Net assets | | $ | 1,538,097,081 | |
| Shares of beneficial interest outstanding, unlimited authorization, no par | | | 59,001,766 | |
| Net asset value per share | | $ | 26.07 | |
| | | | | |
| *Investments, at cost | | $ | 6,286,573,200 | |
See accompanying notes, which are an integral part of the financial statements.
| Statement of operations | |
| Delaware Small Cap Core Fund | Year ended November 30, 2023 |
| Investment Income: | | | | |
| Dividends | | $ | 97,942,758 | |
| | | | | |
| Expenses: | | | | |
| Management fees | | | 44,252,641 | |
| Distribution expenses — Class A | | | 676,780 | |
| Distribution expenses — Class C | | | 856,830 | |
| Distribution expenses — Class R | | | 138,080 | |
| Dividend disbursing and transfer agent fees and expenses | | | 10,118,342 | |
| Accounting and administration expenses | | | 1,009,072 | |
| Reports and statements to shareholders expenses | | | 639,791 | |
| Legal fees | | | 360,822 | |
| Trustees’ fees and expenses | | | 329,542 | |
| Registration fees | | | 210,944 | |
| Custodian fees | | | 32,333 | |
| Audit and tax fees | | | 31,730 | |
| Other | | | 368,505 | |
| | | | 59,025,412 | |
| Less expenses paid indirectly | | | (527 | ) |
| Total operating expenses | | | 59,024,885 | |
| Net Investment Income (Loss) | | | 38,917,873 | |
| | | | | |
| Net Realized and Unrealized Gain (Loss): | | | | |
| Net realized gain (loss) on: | | | | |
| Investments | | | 245,318,575 | |
| Net increase from payment by affiliates1 | | | 24,946 | |
| Net realized gain (loss) | | | 245,343,521 | |
| Net change in unrealized appreciation (depreciation) on investments | | | (572,820,302 | ) |
| Net Realized and Unrealized Gain (Loss) | | | (327,476,781 | ) |
| Net Increase (Decrease) in Net Assets Resulting from Operations | | $ | (288,558,908 | ) |
| 1 | See Note 2 in “Notes to financial statements.” |
See accompanying notes, which are an integral part of the financial statements.
Statements of changes in net assets
Delaware Small Cap Core Fund
| | | Year ended | |
| | | 11/30/23 | | | 11/30/22 | |
| Increase (Decrease) in Net Assets from Operations: | | | | | | | | |
| Net investment income (loss) | | $ | 38,917,873 | | | $ | 31,805,604 | |
| Net realized gain (loss) | | | 245,318,575 | | | | 183,425,714 | |
| Net increase from payment by affiliates1 | | | 24,946 | | | | — | |
| Net change in unrealized appreciation (depreciation) | | | (572,820,302 | ) | | | (785,793,771 | ) |
| Net increase (decrease) in net assets resulting from operations | | | (288,558,908 | ) | | | (570,562,453 | ) |
| | | | | | | | | |
| Dividends and Distributions to Shareholders from: | | | | | | | | |
| Distributable earnings: | | | | | | | | |
| Class A | | | (9,782,777 | ) | | | (19,265,935 | ) |
| Class C | | | (3,637,759 | ) | | | (9,463,365 | ) |
| Class R | | | (992,220 | ) | | | (2,863,111 | ) |
| Institutional Class | | | (187,750,406 | ) | | | (357,240,198 | ) |
| Class R6 | | | (49,448,818 | ) | | | (83,096,087 | ) |
| | | | (251,611,980 | ) | | | (471,928,696 | ) |
| | | | | | | | | |
| Capital Share Transactions (See Note 6): | | | | | | | | |
| Proceeds from shares sold: | | | | | | | | |
| Class A | | | 62,963,286 | | | | 84,786,905 | |
| Class C | | | 5,659,555 | | | | 9,612,206 | |
| Class R | | | 3,744,025 | | | | 7,797,361 | |
| Institutional Class | | | 1,413,408,919 | | | | 2,089,807,031 | |
| Class R6 | | | 610,374,577 | | | | 418,220,068 | |
| | | | | | | | | |
| Net asset value of shares issued upon reinvestment of dividends and distributions: | | | | | | | | |
| Class A | | | 9,074,862 | | | | 17,764,566 | |
| Class C | | | 3,581,775 | | | | 9,319,053 | |
| Class R | | | 992,190 | | | | 2,863,111 | |
| Institutional Class | | | 156,894,836 | | | | 264,151,848 | |
| Class R6 | | | 41,330,661 | | | | 74,281,941 | |
| | | | 2,308,024,686 | | | | 2,978,604,090 | |
| | | Year ended | |
| | | 11/30/23 | | | 11/30/22 | |
| Capital Share Transactions (continued): | | | | | | | | |
| Cost of shares redeemed: | | | | | | | | |
| Class A | | $ | (91,093,074 | ) | | $ | (79,054,946 | ) |
| Class C | | | (28,656,296 | ) | | | (31,092,812 | ) |
| Class R | | | (11,007,074 | ) | | | (14,542,161 | ) |
| Institutional Class | | | (1,637,326,416 | ) | | | (1,835,591,261 | ) |
| Class R6 | | | (402,929,386 | ) | | | (261,945,901 | ) |
| | | | (2,171,012,246 | ) | | | (2,222,227,081 | ) |
| Increase in net assets derived from capital share transactions | | | 137,012,440 | | | | 756,377,009 | |
| Net Decrease in Net Assets | | | (403,158,448 | ) | | | (286,114,140 | ) |
| | | | | | | | | |
| Net Assets: | | | | | | | | |
| Beginning of year | | | 7,271,583,182 | | | | 7,557,697,322 | |
| End of year | | $ | 6,868,424,734 | | | $ | 7,271,583,182 | |
| 1 | See Note 2 in “Notes to financial statements.” |
See accompanying notes, which are an integral part of the financial statements.
Financial highlights
Delaware Small Cap Core Fund Class A
Selected data for each share of the Fund outstanding throughout each period were as follows:
| Net asset value, beginning of period |
| |
| Income (loss) from investment operations: |
| Net investment income (loss)1 |
| Net realized and unrealized gain (loss) |
| Total from investment operations |
| |
| Less dividends and distributions from: |
| Net investment income |
| Net realized gain |
| Total dividends and distributions |
| |
| Payment by affiliates |
| |
| Net asset value, end of period |
| |
| Total return4 |
| |
| Ratios and supplemental data: |
| Net assets, end of period (000 omitted) |
| Ratio of expenses to average net assets5 |
| Ratio of net investment income (loss) to average net assets |
| Portfolio turnover |
| 1 | Calculated using average shares outstanding. |
| 2 | Amount is less than $0.005 per share. |
| 3 | See Note 2 in “Notes to financial statements.” |
| 4 | Total return is based on the change in net asset value of a share during the period and assumes reinvestment of dividends and distributions at net asset value and does not reflect the impact of a sales charge. |
| 5 | Expense ratios do not include expenses of any investment companies in which the Fund invests. |
See accompanying notes, which are an integral part of the financial statements.
| Year ended | |
| 11/30/23 | | | 11/30/22 | | | 11/30/21 | | | 11/30/20 | | | 11/30/19 | |
| $ | 27.21 | | | $ | 31.14 | | | $ | 24.79 | | | $ | 23.20 | | | $ | 23.91 | |
| | | | | | | | | | | | | | | | | | | |
| | | | | | | | | | | | | | | | | | | |
| | 0.08 | | | | 0.05 | | | | (0.02 | ) | | | 0.02 | | | | 0.03 | |
| | (1.16 | ) | | | (2.05 | ) | | | 6.56 | | | | 1.99 | | | | 1.25 | |
| | (1.08 | ) | | | (2.00 | ) | | | 6.54 | | | | 2.01 | | | | 1.28 | |
| | | | | | | | | | | | | | | | | | | |
| | | | | | | | | | | | | | | | | | | |
| | (0.06 | ) | | | — | | | | — | | | | (0.04 | ) | | | (0.02 | ) |
| | (0.84 | ) | | | (1.93 | ) | | | (0.19 | ) | | | (0.38 | ) | | | (1.97 | ) |
| | (0.90 | ) | | | (1.93 | ) | | | (0.19 | ) | | | (0.42 | ) | | | (1.99 | ) |
| | | | | | | | | | | | | | | | | | | |
| | — | 2,3 | | | — | | | | — | | | | — | | | | — | |
| | | | | | | | | | | | | | | | | | | |
| $ | 25.23 | | | $ | 27.21 | | | $ | 31.14 | | | $ | 24.79 | | | $ | 23.20 | |
| | | | | | | | | | | | | | | | | | | |
| | (3.86 | )% | | | (6.87 | )% | | | 26.50 | % | | | 8.81 | % | | | 7.79 | % |
| | | | | | | | | | | | | | | | | | | |
| | | | | | | | | | | | | | | | | | | |
| $ | 254,990 | | | $ | 295,128 | | | $ | 312,223 | | | $ | 264,888 | | | $ | 279,872 | |
| | 1.09 | % | | | 1.05 | % | | | 1.06 | % | | | 1.10 | % | | | 1.10 | % |
| | 0.30 | % | | | 0.20 | % | | | (0.06 | )% | | | 0.09 | % | | | 0.15 | % |
| | 26 | % | | | 23 | % | | | 24 | % | | | 37 | % | | | 34 | % |
Financial highlights
Delaware Small Cap Core Fund Class C
Selected data for each share of the Fund outstanding throughout each period were as follows:
| Net asset value, beginning of period |
| |
| Income (loss) from investment operations: |
| Net investment loss1 |
| Net realized and unrealized gain (loss) |
| Total from investment operations |
| |
| Less dividends and distributions from: |
| Net realized gain |
| Total dividends and distributions |
| |
| Payment by affiliates |
| |
| Net asset value, end of period |
| |
| Total return5 |
| |
| Ratios and supplemental data: |
| Net assets, end of period (000 omitted) |
| Ratio of expenses to average net assets6 |
| Ratio of net investment loss to average net assets |
| Portfolio turnover |
| 1 | Calculated using average shares outstanding. |
| 2 | The per share amount of net investment income (loss) does not directly correlate to the amounts reported in the Statement of operations due to class specific expenses. |
| 3 | Amount is less than $0.005 per share. |
| 4 | See Note 2 in “Notes to financial statements.” |
| 5 | Total return is based on the change in net asset value of a share during the period and assumes reinvestment of dividends and distributions at net asset value and does not reflect the impact of a sales charge. |
| 6 | Expense ratios do not include expenses of any investment companies in which the Fund invests. |
See accompanying notes, which are an integral part of the financial statements.
| Year ended | |
| 11/30/23 | | | 11/30/22 | | | 11/30/21 | | | 11/30/20 | | | 11/30/19 | |
| $ | 23.05 | | | $ | 26.86 | | | $ | 21.57 | | | $ | 20.35 | | | $ | 21.38 | |
| | | | | | | | | | | | | | | | | | | |
| | | | | | | | | | | | | | | | | | | |
| | (0.10 | )2 | | | (0.13 | ) | | | (0.21 | ) | | | (0.12 | ) | | | (0.11 | ) |
| | (0.97 | ) | | | (1.75 | ) | | | 5.69 | | | | 1.72 | | | | 1.05 | |
| | (1.07 | ) | | | (1.88 | ) | | | 5.48 | | | | 1.60 | | | | 0.94 | |
| | | | | | | | | | | | | | | | | | | |
| | | | | | | | | | | | | | | | | | | |
| | (0.84 | ) | | | (1.93 | ) | | | (0.19 | ) | | | (0.38 | ) | | | (1.97 | ) |
| | (0.84 | ) | | | (1.93 | ) | | | (0.19 | ) | | | (0.38 | ) | | | (1.97 | ) |
| | | | | | | | | | | | | | | | | | | |
| | — | 3,4 | | | — | | | | — | | | | — | | | | — | |
| | | | | | | | | | | | | | | | | | | |
| $ | 21.14 | | | $ | 23.05 | | | $ | 26.86 | | | $ | 21.57 | | | $ | 20.35 | |
| | | | | | | | | | | | | | | | | | | |
| | (4.57 | )% | | | (7.57 | )% | | | 25.54 | % | | | 8.00 | % | | | 6.99 | % |
| | | | | | | | | | | | | | | | | | | |
| | | | | | | | | | | | | | | | | | | |
| $ | 72,867 | | | $ | 100,445 | | | $ | 132,294 | | | $ | 117,251 | | | $ | 139,808 | |
| | 1.84 | % | | | 1.80 | % | | | 1.81 | % | | | 1.85 | % | | | 1.85 | % |
| | (0.45 | )% | | | (0.55 | )% | | | (0.81 | )% | | | (0.66 | )% | | | (0.60 | )% |
| | 26 | % | | | 23 | % | | | 24 | % | | | 37 | % | | | 34 | % |
Financial highlights
Delaware Small Cap Core Fund Class R
Selected data for each share of the Fund outstanding throughout each period were as follows:
| Net asset value, beginning of period |
| |
| Income (loss) from investment operations: |
| Net investment income (loss)1 |
| Net realized and unrealized gain (loss) |
| Total from investment operations |
| |
| Less dividends and distributions from: |
| Net realized gain |
| Total dividends and distributions |
| |
| Payment by affiliates |
| |
| Net asset value, end of period |
| |
| Total return4 |
| |
| Ratios and supplemental data: |
| Net assets, end of period (000 omitted) |
| Ratio of expenses to average net assets5 |
| Ratio of net investment income (loss) to average net assets |
| Portfolio turnover |
| 1 | Calculated using average shares outstanding. |
| 2 | Amount is less than $0.005 per share. |
| 3 | See Note 2 in “Notes to financial statements.” |
| 4 | Total return is based on the change in net asset value of a share during the period and assumes reinvestment of dividends and distributions at net asset value. |
| 5 | Expense ratios do not include expenses of any investment companies in which the Fund invests. |
See accompanying notes, which are an integral part of the financial statements.
| Year ended | |
| 11/30/23 | | | 11/30/22 | | | 11/30/21 | | | 11/30/20 | | | 11/30/19 | |
| $ | 25.93 | | | $ | 29.84 | | | $ | 23.82 | | | $ | 22.33 | | | $ | 23.12 | |
| | | | | | | | | | | | | | | | | | | |
| | | | | | | | | | | | | | | | | | | |
| | 0.01 | | | | (0.01 | ) | | | (0.09 | ) | | | (0.03 | ) | | | (0.02 | ) |
| | (1.09 | ) | | | (1.97 | ) | | | 6.30 | | | | 1.90 | | | | 1.20 | |
| | (1.08 | ) | | | (1.98 | ) | | | 6.21 | | | | 1.87 | | | | 1.18 | |
| | | | | | | | | | | | | | | | | | | |
| | | | | | | | | | | | | | | | | | | |
| | (0.84 | ) | | | (1.93 | ) | | | (0.19 | ) | | | (0.38 | ) | | | (1.97 | ) |
| | (0.84 | ) | | | (1.93 | ) | | | (0.19 | ) | | | (0.38 | ) | | | (1.97 | ) |
| | | | | | | | | | | | | | | | | | | |
| | — | 2,3 | | | — | | | | — | | | | — | | | | — | |
| | | | | | | | | | | | | | | | | | | |
| $ | 24.01 | | | $ | 25.93 | | | $ | 29.84 | | | $ | 23.82 | | | $ | 22.33 | |
| | | | | | | | | | | | | | | | | | | |
| | (4.09 | )% | | | (7.12 | )% | | | 26.19 | % | | | 8.51 | % | | | 7.55 | % |
| | | | | | | | | | | | | | | | | | | |
| | | | | | | | | | | | | | | | | | | |
| $ | 25,703 | | | $ | 34,289 | | | $ | 44,366 | | | $ | 36,065 | | | $ | 27,631 | |
| | 1.34 | % | | | 1.30 | % | | | 1.31 | % | | | 1.35 | % | | | 1.35 | % |
| | 0.05 | % | | | (0.05 | )% | | | (0.31 | )% | | | (0.16 | )% | | | (0.10 | )% |
| | 26 | % | | | 23 | % | | | 24 | % | | | 37 | % | | | 34 | % |
Financial highlights
Delaware Small Cap Core Fund Institutional Class
Selected data for each share of the Fund outstanding throughout each period were as follows:
| Net asset value, beginning of period |
| |
| Income (loss) from investment operations: |
| Net investment income1 |
| Net realized and unrealized gain (loss) |
| Total from investment operations |
| |
| Less dividends and distributions from: |
| Net investment income |
| Net realized gain |
| Total dividends and distributions |
| |
| Payment by affiliates |
| |
| Net asset value, end of period |
| |
| Total return4 |
| |
| Ratios and supplemental data: |
| Net assets, end of period (000 omitted) |
| Ratio of expenses to average net assets5 |
| Ratio of net investment income to average net assets |
| Portfolio turnover |
| 1 | Calculated using average shares outstanding. |
| 2 | Amount is less than $0.005 per share. |
| 3 | See Note 2 in “Notes to financial statements.” |
| 4 | Total return is based on the change in net asset value of a share during the period and assumes reinvestment of dividends and distributions at net asset value. |
| 5 | Expense ratios do not include expenses of any investment companies in which the Fund invests. |
See accompanying notes, which are an integral part of the financial statements.
| Year ended | |
| 11/30/23 | | | 11/30/22 | | | 11/30/21 | | | 11/30/20 | | | 11/30/19 | |
| $ | 28.02 | | | $ | 32.00 | | | $ | 25.46 | | | $ | 23.81 | | | $ | 24.50 | |
| | | | | | | | | | | | | | | | | | | |
| | | | | | | | | | | | | | | | | | | |
| | 0.14 | | | | 0.13 | | | | 0.06 | | | | 0.07 | | | | 0.09 | |
| | (1.17 | ) | | | (2.12 | ) | | | 6.72 | | | | 2.06 | | | | 1.28 | |
| | (1.03 | ) | | | (1.99 | ) | | | 6.78 | | | | 2.13 | | | | 1.37 | |
| | | | | | | | | | | | | | | | | | | |
| | | | | | | | | | | | | | | | | | | |
| | (0.13 | ) | | | (0.06 | ) | | | (0.05 | ) | | | (0.10 | ) | | | (0.09 | ) |
| | (0.84 | ) | | | (1.93 | ) | | | (0.19 | ) | | | (0.38 | ) | | | (1.97 | ) |
| | (0.97 | ) | | | (1.99 | ) | | | (0.24 | ) | | | (0.48 | ) | | | (2.06 | ) |
| | | | | | | | | | | | | | | | | | | |
| | — | 2,3 | | | — | | | | — | | | | — | | | | — | |
| | | | | | | | | | | | | | | | | | | |
| $ | 26.02 | | | $ | 28.02 | | | $ | 32.00 | | | $ | 25.46 | | | $ | 23.81 | |
| | | | | | | | | | | | | | | | | | | |
| | (3.59 | )% | | | (6.65 | )% | | | 26.80 | % | | | 9.09 | % | | | 8.06 | % |
| | | | | | | | | | | | | | | | | | | |
| | | | | | | | | | | | | | | | | | | |
| $ | 4,976,768 | | | $ | 5,455,486 | | | $ | 5,743,601 | | | $ | 4,632,204 | | | $ | 3,888,603 | |
| | 0.84 | % | | | 0.80 | % | | | 0.81 | % | | | 0.85 | % | | | 0.85 | % |
| | 0.55 | % | | | 0.45 | % | | | 0.19 | % | | | 0.34 | % | | | 0.40 | % |
| | 26 | % | | | 23 | % | | | 24 | % | | | 37 | % | | | 34 | % |
Financial highlights
Delaware Small Cap Core Fund Class R6
Selected data for each share of the Fund outstanding throughout each period were as follows:
| Net asset value, beginning of period |
| |
| Income (loss) from investment operations: |
| Net investment income1 |
| Net realized and unrealized gain (loss) |
| Total from investment operations |
| |
| Less dividends and distributions from: |
| Net investment income |
| Net realized gain |
| Total dividends and distributions |
| |
| Payment by affiliates |
| |
| Net asset value, end of period |
| |
| Total return4 |
| |
| Ratios and supplemental data: |
| Net assets, end of period (000 omitted) |
| Ratio of expenses to average net assets5 |
| Ratio of net investment income to average net assets |
| Portfolio turnover |
| 1 | Calculated using average shares outstanding. |
| 2 | Amount is less than $0.005 per share. |
| 3 | See Note 2 in “Notes to financial statements.” |
| 4 | Total return is based on the change in net asset value of a share during the period and assumes reinvestment of dividends and distributions at net asset value. |
| 5 | Expense ratios do not include expenses of any investment companies in which the Fund invests. |
See accompanying notes, which are an integral part of the financial statements.
| Year ended | |
| 11/30/23 | | | 11/30/22 | | | 11/30/21 | | | 11/30/20 | | | 11/30/19 | |
| $ | 28.08 | | | $ | 32.06 | | | $ | 25.51 | | | $ | 23.85 | | | $ | 24.54 | |
| | | | | | | | | | | | | | | | | | | |
| | | | | | | | | | | | | | | | | | | |
| | 0.17 | | | | 0.16 | | | | 0.10 | | | | 0.10 | | | | 0.12 | |
| | (1.18 | ) | | | (2.11 | ) | | | 6.72 | | | | 2.06 | | | | 1.28 | |
| | (1.01 | ) | | | (1.95 | ) | | | 6.82 | | | | 2.16 | | | | 1.40 | |
| | | | | | | | | | | | | | | | | | | |
| | | | | | | | | | | | | | | | | | | |
| | (0.16 | ) | | | (0.10 | ) | | | (0.08 | ) | | | (0.12 | ) | | | (0.12 | ) |
| | (0.84 | ) | | | (1.93 | ) | | | (0.19 | ) | | | (0.38 | ) | | | (1.97 | ) |
| | (1.00 | ) | | | (2.03 | ) | | | (0.27 | ) | | | (0.50 | ) | | | (2.09 | ) |
| | | | | | | | | | | | | | | | | | | |
| | — | 2,3 | | | — | | | | — | | | | — | | | | — | |
| | | | | | | | | | | | | | | | | | | |
| $ | 26.07 | | | $ | 28.08 | | | $ | 32.06 | | | $ | 25.51 | | | $ | 23.85 | |
| | | | | | | | | | | | | | | | | | | |
| | (3.49 | )% | | | (6.52 | )% | | | 26.92 | % | | | 9.24 | % | | | 8.20 | % |
| | | | | | | | | | | | | | | | | | | |
| | | | | | | | | | | | | | | | | | | |
| $ | 1,538,097 | | | $ | 1,386,235 | | | $ | 1,325,213 | | | $ | 894,120 | | | $ | 677,315 | |
| | 0.72 | % | | | 0.69 | % | | | 0.69 | % | | | 0.71 | % | | | 0.72 | % |
| | 0.67 | % | | | 0.57 | % | | | 0.31 | % | | | 0.48 | % | | | 0.53 | % |
| | 26 | % | | | 23 | % | | | 24 | % | | | 37 | % | | | 34 | % |
| Notes to financial statements | |
| Delaware Small Cap Core Fund | November 30, 2023 |
Delaware Group® Equity Funds V (Trust) is organized as a Delaware statutory trust and offers three series: Delaware Small Cap Core Fund, Delaware Small Cap Value Fund, and Delaware Wealth Builder Fund. These financial statements and the related notes pertain to Delaware Small Cap Core Fund (Fund). The Trust is an open-end investment company. The Fund is considered diversified under the Investment Company Act of 1940, as amended (1940 Act), and offers Class A, Class C, Class R, Institutional Class, and Class R6 shares. Class A shares are sold with a maximum front-end sales charge of 5.75%. There is no front-end sales charge when you purchase $1 million or more of Class A shares. However, if Delaware Distributors, L.P. (DDLP) paid your financial intermediary a commission on your purchase of $1 million or more of Class A shares, you will have to pay a limited contingent deferred sales charge (Limited CDSC) of 1.00% if you redeem these shares within the first 18 months after your purchase, unless a specific waiver of the Limited CDSC applies. Class C shares have no upfront sales charge, but are sold with a contingent deferred sales charge (CDSC) of 1.00%, which will be incurred if redeemed during the first 12 months. Class R, Institutional Class, and Class R6 shares are not subject to a sales charge and are offered for sale exclusively to certain eligible investors. In addition, Class R6 shares do not pay any service fees, sub-accounting fees, and/or sub-transfer agency fees to any brokers, dealers, or other financial intermediaries.
1. Significant Accounting Policies
The Fund follows accounting and reporting guidance under Financial Accounting Standards Board (FASB) Accounting Standards Codification Topic 946, Financial Services — Investment Companies. The following accounting policies are in accordance with US generally accepted accounting principles (US GAAP) and are consistently followed by the Fund.
Security Valuation — Equity securities and exchange-traded funds (ETFs), except those traded on the Nasdaq Stock Market LLC (Nasdaq), are valued at the last quoted sales price as of the time of the regular close of the New York Stock Exchange on the valuation date. Equity securities and ETFs traded on the Nasdaq are valued in accordance with the Nasdaq Official Closing Price, which may not be the last sales price. If, on a particular day, an equity security or ETF does not trade, the mean between the bid and the ask prices will be used, which approximates fair value. Open-end investment companies, other than ETFs, are valued at their published net asset value (NAV). Generally, other securities and assets for which market quotations are not readily available are valued at fair value as determined in good faith by Delaware Management Company (DMC). Subject to the oversight of the Trust's Board of Trustees (Board), DMC, as valuation designee, has adopted policies and procedures to fair value securities for which market quotations are not readily available consistent with the requirements of Rule 2a-5 under the 1940 Act. In determining whether market quotations are readily available or fair valuation will be used, various factors will be taken into consideration, such as market closures or suspension of trading in a security. Restricted securities and private placements are valued at fair value.
Federal Income Taxes — No provision for federal income taxes has been made as the Fund intends to continue to qualify for federal income tax purposes as a regulated investment
company under Subchapter M of the Internal Revenue Code of 1986, as amended, and make the requisite distributions to shareholders. The Fund evaluates tax positions taken or expected to be taken in the course of preparing the Fund’s tax returns to determine whether the tax positions are “more-likely-than-not” of being sustained by the applicable tax authority. Tax positions not deemed to meet the “more-likely-than-not” threshold are recorded as a tax benefit or expense in the current year. Management has analyzed the Fund’s tax positions taken or expected to be taken on the Fund’s federal income tax returns through the year ended November 30, 2023, and for all open tax years (years ended November 30, 2020–November 30, 2022), and has concluded that no provision for federal income tax is required in the Fund’s financial statements. If applicable, the Fund recognizes interest accrued on unrecognized tax benefits in interest expense and penalties in “Other” on the “Statement of operations.” During the year ended November 30, 2023, the Fund did not incur any interest or tax penalties.
Class Accounting — Investment income, common expenses, and realized and unrealized gain (loss) on investments are allocated to the various classes of the Fund on the basis of daily net assets of each class. Distribution expenses relating to a specific class are charged directly to that class. Class R6 shares will not be allocated any expenses related to service fees, sub-accounting fees, and/or sub-transfer agency fees paid to brokers, dealers, or other financial intermediaries.
Use of Estimates — The preparation of financial statements in conformity with US GAAP requires management to make estimates and assumptions that affect the fair value of investments, the reported amounts of assets and liabilities and disclosure of contingent assets and liabilities at the date of the financial statements, and the reported amounts of revenues and expenses during the reporting period. Actual results could differ from those estimates and the differences could be material.
Other — Expenses directly attributable to the Fund are charged directly to the Fund. Other expenses common to various funds within the Delaware Funds by Macquarie® (Delaware Funds) are generally allocated among such funds on the basis of average net assets. Management fees and certain other expenses are paid monthly. Security transactions are recorded on the date the securities are purchased or sold (trade date) for financial reporting purposes. Costs used in calculating realized gains and losses on the sale of investment securities are those of the specific securities sold. Dividend income is recorded on the ex-dividend date and interest income is recorded on an accrual basis. Income and capital gain distributions from any investment companies (Underlying Funds) in which the Fund invests are recorded on the ex-dividend date. Distributions received from investments in real estate investment trusts (REITs) are recorded as dividend income on the ex-dividend date, subject to reclassification upon notice of the character of such distributions by the issuer, which are estimated. The Fund declares and pays dividends from net investment income and distributions from net realized gain on investments, if any, at least annually. The Fund may distribute more frequently, if necessary for tax purposes. Dividends and distributions, if any, are recorded on the ex-dividend date.
Notes to financial statements
Delaware Small Cap Core Fund
1. Significant Accounting Policies (continued)
The Fund receives earnings credits from its transfer agent when positive cash balances are maintained, which may be used to offset transfer agent fees. If the amount earned is greater than $1, the expenses paid under this arrangement are included on the “Statement of operations” under “Dividend disbursing and transfer agent fees and expenses” with the corresponding expenses offset included under “Less expenses paid indirectly.”
2. Investment Management, Administration Agreements, and Other Transactions with Affiliates
In accordance with the terms of its investment management agreement, the Fund pays DMC, a series of Macquarie Investment Management Business Trust and the investment manager, an annual fee which is calculated daily and paid monthly at the rates of 0.75% on the first $500 million of average daily net assets of the Fund, 0.70% on the next $500 million, 0.65% on the next $1.5 billion, and 0.60% on average daily net assets in excess of $2.5 billion.
DMC entered into a Sub-Advisory Agreement on behalf of the Fund with Macquarie Investment Management Global Limited, which is an affiliate of DMC (“Affiliated Sub-Advisor”). Pursuant to the terms of the Sub-Advisory Agreement, the investment sub-advisory fee is paid by DMC to the Affiliated Sub-Advisor based on the extent to which the Affiliated Sub-Advisor provides services to the Fund.
Delaware Investments Fund Services Company (DIFSC), an affiliate of DMC, provides fund accounting and financial administrative oversight services to the Fund. For these services, effective October 1, 2023, DIFSC’s fees are calculated daily and paid monthly, based on the aggregate daily net assets of all funds within the Delaware Funds at the following annual rates: 0.0050% of the first $60 billion; 0.00475% of the next $30 billion; and 0.0015% of aggregate average daily net assets in excess of $90 billion (Total Fee). Prior to October 1, 2023, DIFSC's fees were payable by the fund at the following annual rates: 0.00475% of the first $35 billion; 0.0040% of the next $10 billion; 0.0025% of the next $45 billion; and 0.0015% of aggregate average daily net assets in excess of $90 billion. Each fund in the Delaware Funds pays a minimum of $4,000, which, in aggregate, is subtracted from the Total Fee. Each fund then pays its portion of the remainder of the Total Fee on a relative NAV basis. This amount is included on the “Statement of operations” under “Accounting and administration expenses.” For the year ended November 30, 2023, the Fund paid $222,246 for these services.
DIFSC is also the transfer agent and dividend disbursing agent of the Fund. For these services, DIFSC’s fees are calculated daily and paid monthly, based on the aggregate daily net assets of the retail funds within the Delaware Funds at the following annual rates: 0.014% of the first $20 billion; 0.011% of the next $5 billion; 0.007% of the next $5 billion; 0.004% of the next $20 billion; 0.002% of the next $25 billion; and 0.0015% of average daily net assets in excess of $75 billion. The fees payable to DIFSC under the shareholder services agreement described above are allocated among all retail funds in the Delaware Funds on a relative NAV basis. This amount is included on the “Statement of operations” under “Dividend disbursing and transfer
agent fees and expenses.” For the year ended November 30, 2023, the Fund paid $453,234 for these services. Pursuant to a sub-transfer agency agreement between DIFSC and BNY Mellon Investment Servicing (US) Inc. (BNYMIS), BNYMIS provides certain sub-transfer agency services to the Fund. Sub-transfer agency fees are paid by the Fund and are also included on the “Statement of operations” under “Dividend disbursing and transfer agent fees and expenses.” The fees that are calculated daily and paid as invoices are received on a monthly or quarterly basis.
Pursuant to a distribution agreement and distribution plan, the Fund pays DDLP, the distributor and an affiliate of DMC, an annual 12b-1 fee of 0.25%, 1.00%, and 0.50% of the average daily net assets of the Class A, Class C, and Class R shares, respectively. The fees are calculated daily and paid monthly. Institutional Class and Class R6 shares do not pay 12b-1 fees.
As provided in the investment management agreement, the Fund bears a portion of the cost of certain resources shared with DMC, including the cost of internal personnel of DMC and/or its affiliates that provide legal and regulatory reporting services to the Fund. For the year ended November 30, 2023, the Fund paid $207,721 for internal legal and regulatory reporting services provided by DMC and/or its affiliates’ employees. This amount is included on the “Statement of operations” under “Legal fees.”
For the year ended November 30, 2023, DDLP earned $14,633 for commissions on sales of the Fund’s Class A shares. For the year ended November 30, 2023, DDLP received gross CDSC commissions of $1,986 and $3,266 on redemptions of the Fund’s Class A and Class C shares, respectively, and these commissions were entirely used to offset upfront commissions previously paid by DDLP to broker/dealers on sales of those shares.
Trustees’ fees include expenses accrued by the Fund for each Trustee’s retainer and meeting fees. Certain officers of DMC, DIFSC, and DDLP are officers and/or Trustees of the Trust. These officers and Trustees are paid no compensation by the Fund.
In addition to the management fees and other expenses of the Fund, the Fund indirectly bears the investment management fees and other expenses of any Underlying Funds, including ETFs, in which it invests. The amount of these fees and expenses incurred indirectly by the Fund will vary based upon the expense and fee levels of any Underlying Funds and the number of shares that are owned of any Underlying Funds at different times.
During the year ended November 30, 2023, DMC reimbursed the Fund $24,946 for losses related to a trade error. These amounts are included in “Net increase from payment by affiliates” in the "Statement of operations." Payment by affiliates had no impact on total return.
Cross trades for the year ended November 30, 2023 were executed by the Fund pursuant to procedures adopted by the Board designed to ensure compliance with Rule 17a-7 under the 1940 Act. Cross trading is the buying or selling of portfolio securities between funds of investment companies, or between a fund of an investment company and another entity, that are or could be considered affiliates by virtue of having a common investment advisor (or affiliated investment advisors), common directors/trustees and/or common officers. At its regularly
Notes to financial statements
Delaware Small Cap Core Fund
2. Investment Management, Administration Agreements, and Other Transactions with Affiliates (continued)
scheduled meetings, the Board reviews such transactions for compliance with the procedures adopted by the Board. Pursuant to these procedures, for the year ended November 30, 2023, the Fund engaged in Rule 17a-7 securities purchases and sales of $16,478,073 and $12,342,312 respectively, resulting in losses of $587,021.
3. Investments
For the year ended November 30, 2023, the Fund made purchases and sales of investment securities other than short-term investments and US government securities as follows:
| Purchases | | $ | 1,787,805,502 | |
| Sales | | | 1,823,220,133 | |
The tax cost of investments includes adjustments to net unrealized appreciation (depreciation) which may not necessarily be the final tax cost basis adjustments but which approximate the tax basis unrealized gains and losses that may be realized and distributed to shareholders. At November 30, 2023, the cost and unrealized appreciation (depreciation) of investments for federal income tax purposes for the Fund were as follows:
| Cost of investments | | $ | 6,367,337,496 | |
| Aggregate unrealized appreciation of investments | | $ | 1,290,755,840 | |
| Aggregate unrealized depreciation of investments | | | (783,560,358 | ) |
| Net unrealized appreciation of investments | | $ | 507,195,482 | |
US GAAP defines fair value as the price that the Fund would receive to sell an asset or pay to transfer a liability in an orderly transaction between market participants at the measurement date under current market conditions. A three-level hierarchy for fair value measurements has been established based upon the transparency of inputs to the valuation of an asset or liability. Inputs may be observable or unobservable and refer broadly to the assumptions that market participants would use in pricing the asset or liability. Observable inputs reflect the assumptions market participants would use in pricing the asset or liability based on market data obtained from sources independent of the reporting entity. Unobservable inputs reflect the reporting entity’s own assumptions about the assumptions that market participants would use in pricing the asset or liability based on the best information available under the circumstances. The Fund's investment in its entirety is assigned a level based upon the observability of the inputs which are significant to the overall valuation. The three-level hierarchy of inputs is summarized as follows:
| Level 1 - | Inputs are quoted prices in active markets for identical investments. (Examples: equity securities, open-end investment companies, futures contracts, and exchange-traded options contracts) |
| | |
| Level 2 - | Other observable inputs, including, but not limited to: quoted prices for similar assets or liabilities in markets that are active, quoted prices for identical or similar assets or liabilities in markets that are not active, inputs other than quoted prices that are |
| | observable for the assets or liabilities (such as interest rates, yield curves, volatilities, prepayment speeds, loss severities, credit risks, and default rates) or other market-corroborated inputs. (Examples: debt securities, government securities, swap contracts, forward foreign currency exchange contracts, foreign securities utilizing international fair value pricing, broker-quoted securities, and fair valued securities) |
| | |
| Level 3 - | Significant unobservable inputs, including the Fund's own assumptions used to determine the fair value of investments. (Examples: broker-quoted securities and fair valued securities) |
Level 3 investments are valued using significant unobservable inputs. The Fund may also use an income-based valuation approach in which the anticipated future cash flows of the investment are discounted to calculate fair value. Discounts may also be applied due to the nature or duration of any restrictions on the disposition of the investments. Valuations may also be based upon current market prices of securities that are comparable in coupon, rating, maturity, and industry. The derived value of a Level 3 investment may not represent the value which is received upon disposition and this could impact the results of operations.
The following table summarizes the valuation of the Fund's investments by fair value hierarchy levels as of November 30, 2023:
| | | Level 1 | | | Level 3 | | | Total | |
| Securities | | | | | | | | | | | | |
| Assets: | | | | | | | | | | | | |
| Common Stocks | | | | | | | | | | | | |
| Basic Materials | | $ | 515,263,807 | | | $ | — | | | $ | 515,263,807 | |
| Business Services | | | 262,997,338 | | | | — | | | | 262,997,338 | |
| Capital Goods | | | 711,520,460 | | | | — | | | | 711,520,460 | |
| Communications Services | | | 18,277,668 | | | | — | | | | 18,277,668 | |
| Consumer Discretionary | | | 202,647,239 | | | | — | | | | 202,647,239 | |
| Consumer Services | | | 134,618,739 | | | | — | | | | 134,618,739 | |
| Consumer Staples | | | 250,400,757 | | | | — | | | | 250,400,757 | |
| Credit Cyclicals | | | 265,643,341 | | | | — | | | | 265,643,341 | |
| Energy | | | 401,234,287 | | | | — | | | | 401,234,287 | |
| Financials | | | 1,001,657,537 | | | | — | | | | 1,001,657,537 | |
| Healthcare | | | 1,079,254,097 | | | | — | 1 | | | 1,079,254,097 | |
| Media | | | 36,228,368 | | | | — | | | | 36,228,368 | |
| Real Estate Investment Trusts | | | 451,641,189 | | | | — | | | | 451,641,189 | |
| Technology | | | 1,019,600,995 | | | | — | | | | 1,019,600,995 | |
| Transportation | | | 232,674,364 | | | | — | | | | 232,674,364 | |
| Utilities | | | 159,654,783 | | | | — | | | | 159,654,783 | |
| Short-Term Investments | | | 131,218,009 | | | | — | | | | 131,218,009 | |
| Total Value of Securities | | $ | 6,874,532,978 | | | $ | — | | | $ | 6,874,532,978 | |
Notes to financial statements
Delaware Small Cap Core Fund
3. Investments (continued)
1The security that has been valued at zero on the “Schedule of investments” is considered to be Level 3 investment in this table.
During the year ended November 30, 2023, there were no transfers into or out of Level 3 investments. The Fund's policy is to recognize transfers into or out of Level 3 investments based on fair value at the beginning of the reporting year.
A reconciliation of Level 3 investments is presented when the Fund has a significant amount of Level 3 investments at the beginning or end of the year in relation to the Fund's net assets. Management has determined not to provide a reconciliation of Level 3 investments as the Level 3 investments were not considered significant to the Fund's net assets at the beginning or end of the year. Management has determined not to provide additional disclosure on Level 3 inputs since the Level 3 investments are not considered significant to the Fund's net assets at the end of the year.
4. Dividend and Distribution Information
Income and long-term capital gain distributions are determined in accordance with federal income tax regulations, which may differ from US GAAP. Additionally, distributions from net gains on foreign currency transactions and net short-term gains on sales of investment securities are treated as ordinary income for federal income tax purposes. The tax character of dividends and distributions paid during the years ended November 30, 2023 and 2022 were as follows:
| | | Year ended | |
| | | 11/30/23 | | | 11/30/22 | |
| Ordinary income | | $ | 56,004,891 | | | $ | 136,339,783 | |
| Long-term capital gains | | | 195,607,089 | | | | 335,588,913 | |
| Total | | $ | 251,611,980 | | | $ | 471,928,696 | |
5. Components of Net Assets on a Tax Basis
As of November 30, 2023, the components of net assets on a tax basis were as follows:
| Shares of beneficial interest | | $ | 6,105,910,614 | |
| Undistributed ordinary income | | | 37,039,197 | |
| Undistributed long-term capital gains | | | 218,279,441 | |
| Unrealized appreciation of investments | | | 507,195,482 | |
| Net assets | | $ | 6,868,424,734 | |
The differences between book basis and tax basis components of net assets are primarily attributable to tax deferral of losses on wash sales.
For financial reporting purposes, capital accounts are adjusted to reflect the tax character of permanent book/tax differences. Results of operations and net assets were not affected by these reclassifications. For the year ended November 30, 2023, the Fund had no reclassifications.
6. Capital Shares
Transactions in capital shares were as follows:
| | | Year ended | |
| | | 11/30/23 | | | 11/30/22 | |
| Shares sold: | | | | | | | | |
| Class A | | | 2,478,277 | | | | 3,137,218 | |
| Class C | | | 262,496 | | | | 411,294 | |
| Class R | | | 154,425 | | | | 298,520 | |
| Institutional Class | | | 53,501,717 | | | | 74,276,643 | |
| Class R6 | | | 23,584,622 | | | | 15,017,046 | |
| | | | | | | | | |
| Shares issued upon reinvestment of dividends and distributions: | | | | | | | | |
| Class A | | | 368,897 | | | | 606,921 | |
| Class C | | | 172,616 | | | | 373,209 | |
| Class R | | | 42,293 | | | | 102,400 | |
| Institutional Class | | | 6,201,377 | | | | 8,784,564 | |
| Class R6 | | | 1,632,332 | | | | 2,468,659 | |
| | | | 88,399,052 | | | | 105,476,474 | |
| | | | | | | | | |
| Shares redeemed: | | | | | | | | |
| Class A | | | (3,587,864 | ) | | | (2,923,940 | ) |
| Class C | | | (1,345,728 | ) | | | (1,351,858 | ) |
| Class R | | | (448,448 | ) | | | (565,527 | ) |
| Institutional Class | | | (63,075,263 | ) | | | (67,857,366 | ) |
| Class R6 | | | (15,581,652 | ) | | | (9,448,694 | ) |
| | | | (84,038,955 | ) | | | (82,147,385 | ) |
| Net increase | | | 4,360,097 | | | | 23,329,089 | |
Notes to financial statements
Delaware Small Cap Core Fund
6. Capital Shares (continued)
Certain shareholders may exchange shares of one class for shares of another class in the same Fund. These exchange transactions are included as subscriptions and redemptions in the table above and on the “Statements of changes in net assets.” For the years ended November 30, 2023 and 2022, the Fund had the following exchange transactions:
| | | Exchange Redemptions | | | Exchange Subscriptions | | | | |
| | | | | | | | | | | | Institutional | | | | | | | | | Institutional | | | | | | | |
| | | Class A | | | Class C | | | Class R | | | Class | | | Class R6 | | | Class A | | | Class | | | Class R6 | | | | |
| | | Shares | | | Shares | | | Shares | | | Shares | | | Shares | | | Shares | | | Shares | | | Shares | | | Value | |
| Year ended | | | | | | | | | | | | | | | | | | | | | | | | | | | | | | | | | | | | |
| 11/30/23 | | | 134,482 | | | | 14,190 | | | | 1,764 | | | | 8,283,030 | | | | 4,070 | | | | 58,829 | | | | 124,915 | | | | 8,239,034 | | | $ | 212,118,530 | |
| 11/30/22 | | | 17,490 | | | | 9,627 | | | | — | | | | 14,309 | | | | 7,216 | | | | 18,465 | | | | 23,670 | | | | 4,873 | | | | 1,304,639 | |
7. Line of Credit
The Fund, along with certain other funds in the Delaware Funds (Participants), was a participant in a $355,000,000 revolving line of credit (Agreement) intended to be used for temporary or emergency purposes as an additional source of liquidity to fund redemptions of investor shares. Under the Agreement, the Participants were charged an annual commitment fee of 0.15%, which was allocated across the Participants based on a weighted average of the respective net assets of each Participant. The Participants were permitted to borrow up to a maximum of one-third of their net assets under the Agreement. Each Participant was individually, and not jointly, liable for its particular advances, if any, under the line of credit. The line of credit available under the Agreement expired on October 30, 2023.
On October 30, 2023, the Fund, along with the other Participants, entered into an amendment to the Agreement for a $335,000,000 revolving line of credit. It operates in substantially the same manner as the original Agreement. Under the amendment to the Agreement, the Participants are charged an annual commitment fee of 0.15%, which is allocated across the Participants based on a weighted average of the respective net assets of each Participant. The line of credit available under the Agreement expires on October 28, 2024.
The Fund had no amounts outstanding as of November 30, 2023, or at any time during the year then ended.
8. Securities Lending
The Fund, along with other funds in the Delaware Funds, may lend its securities pursuant to a security lending agreement (Lending Agreement) with The Bank of New York Mellon (BNY Mellon). At the time a security is loaned, the borrower must post collateral equal to the required percentage of the market value of the loaned security, including any accrued interest. The required percentage is: (1) 102% with respect to US securities and foreign securities that are denominated and payable in US dollars; and (2) 105% with respect to foreign securities. With respect to each loan, if on any business day the aggregate market value of securities collateral plus cash collateral held is less than the aggregate market value of the securities which are the
subject of such loan, the borrower will be notified to provide additional collateral by the end of the following business day, which, together with the collateral already held, will be not less than the applicable initial collateral requirements for such security loan. If the aggregate market value of securities collateral and cash collateral held with respect to a security loan exceeds the applicable initial collateral requirement, upon the request of the borrower, BNY Mellon must return enough collateral to the borrower by the end of the following business day to reduce the value of the remaining collateral to the applicable initial collateral requirement for such security loan. As a result of the foregoing, the value of the collateral held with respect to a loaned security on any particular day, may be more or less than the value of the security on loan. The collateral percentage with respect to the market value of the loaned security is determined by the security lending agent.
Cash collateral received by the Fund is generally invested in an individual separate account. The investment guidelines permit each separate account to hold certain securities that would be considered eligible securities for a money market fund. Cash collateral received is generally invested in government securities; certain obligations issued by government sponsored enterprises; repurchase agreements collateralized by US Treasury securities; obligations issued by the central government of any Organization for Economic Cooperation and Development (OECD) country or its agencies, instrumentalities, or establishments; obligations of supranational organizations; commercial paper, notes, bonds, and other debt obligations; certificates of deposit, time deposits, and other bank obligations; certain money market funds; and asset-backed securities. The Fund can also accept US government securities and letters of credit (non-cash collateral) in connection with securities loans.
In the event of default or bankruptcy by the lending agent, realization and/or retention of the collateral may be subject to legal proceedings. In the event the borrower fails to return loaned securities and the collateral received is insufficient to cover the value of the loaned securities and provided such collateral shortfall is not the result of investment losses, the lending agent has agreed to pay the amount of the shortfall to the Fund or, at the discretion of the lending agent, replace the loaned securities. The Fund continues to record dividends or interest, as applicable, on the securities loaned and is subject to changes in value of the securities loaned that may occur during the term of the loan. The Fund has the right under the Lending Agreement to recover the securities from the borrower on demand. With respect to security loans collateralized by non-cash collateral, the Fund receives loan premiums paid by the borrower. With respect to security loans collateralized by cash collateral, the earnings from the collateral investments are shared among the Fund, the security lending agent, and the borrower. The Fund records security lending income net of allocations to the security lending agent and the borrower.
The Fund may incur investment losses as a result of investing securities lending collateral. This could occur if an investment in the collateral investment account defaulted or became impaired. Under those circumstances, the value of the Fund's cash collateral account may be less than the amount the Fund would be required to return to the borrowers of the securities and the Fund would be required to make up for this shortfall.
Notes to financial statements
Delaware Small Cap Core Fund
8. Securities Lending (continued)
At November 30, 2023, the Fund had no securities out on loan.
9. Credit and Market Risks
The impact of COVID-19, and other infectious illness outbreaks that may arise in the future, could adversely affect the economies of many nations or the entire global economy, individual issuers and capital markets in ways that cannot necessarily be foreseen.
Investments in equity securities in general are subject to market risks that may cause their prices to fluctuate over time. Fluctuations in the value of equity securities in which the Fund invests will cause the NAV of the Fund to fluctuate.
The Fund invests a significant portion of its assets in small companies and may be subject to certain risks associated with ownership of securities of such companies. Investments in small sized companies may be more volatile than investments in larger companies for a number of reasons, which include limited financial resources or a dependence on narrow product lines.
The Fund invests in REITs and is subject to the risks associated with that industry. If the Fund holds real estate directly or receives rental income directly from real estate holdings, its tax status as a regulated investment company may be jeopardized. There were no direct real estate holdings during the year ended November 30, 2023. The Fund’s REIT holdings are also affected by interest rate changes, particularly if the REITs it holds use floating rate debt to finance their ongoing operations.
The Fund may invest up to 15% of its net assets in illiquid securities, which may include securities with contractual restrictions on resale, securities exempt from registration under Rule 144A promulgated under the Securities Act of 1933, as amended, and other securities which may not be readily marketable. The relative illiquidity of these securities may impair the Fund from disposing of them in a timely manner and at a fair price when it is necessary or desirable to do so. While maintaining oversight, the Board has delegated to DMC the day-to-day functions of determining whether individual securities are liquid for purposes of the Fund’s limitation on investments in illiquid securities. Securities eligible for resale pursuant to Rule 144A, which are determined to be liquid, are not subject to the Fund’s 15% limit on investments in illiquid securities. As of November 30, 2023, there were no Rule 144A securities held by the Fund.
10. Contractual Obligations
The Fund enters into contracts in the normal course of business that contain a variety of indemnifications. The Fund's maximum exposure under these arrangements is unknown. However, the Fund has not had prior claims or losses pursuant to these contracts. Management has reviewed the Fund's existing contracts and expects the risk of loss to be remote.
11. Subsequent Events
Management has determined that no material events or transactions occurred subsequent to November 30, 2023, that would require recognition or disclosure in the Fund's financial statements.
Report of independent
registered public accounting firm
To the Board of Trustees of Delaware Group® Equity Funds V and Shareholders of Delaware Small Cap Core Fund
Opinion on the Financial Statements
We have audited the accompanying statement of assets and liabilities, including the schedule of investments, of Delaware Small Cap Core Fund (one of the funds constituting Delaware Group® Equity Funds V, referred to hereafter as the “Fund”) as of November 30, 2023, the related statement of operations for the year ended November 30, 2023, the statement of changes in net assets for each of the two years in the period ended November 30, 2023, including the related notes, and the financial highlights for each of the five years in the period ended November 30, 2023 (collectively referred to as the “financial statements”). In our opinion, the financial statements present fairly, in all material respects, the financial position of the Fund as of November 30, 2023, the results of its operations for the year then ended, the changes in its net assets for each of the two years in the period ended November 30, 2023 and the financial highlights for each of the five years in the period ended November 30, 2023 in conformity with accounting principles generally accepted in the United States of America.
Basis for Opinion
These financial statements are the responsibility of the Fund’s management. Our responsibility is to express an opinion on the Fund’s financial statements based on our audits. We are a public accounting firm registered with the Public Company Accounting Oversight Board (United States) (PCAOB) and are required to be independent with respect to the Fund in accordance with the U.S. federal securities laws and the applicable rules and regulations of the Securities and Exchange Commission and the PCAOB.
We conducted our audits of these financial statements in accordance with the standards of the PCAOB. Those standards require that we plan and perform the audit to obtain reasonable assurance about whether the financial statements are free of material misstatement, whether due to error or fraud.
Our audits included performing procedures to assess the risks of material misstatement of the financial statements, whether due to error or fraud, and performing procedures that respond to those risks. Such procedures included examining, on a test basis, evidence regarding the amounts and disclosures in the financial statements. Our audits also included evaluating the accounting principles used and significant estimates made by management, as well as evaluating the overall presentation of the financial statements. Our procedures included confirmation of securities owned as of November 30, 2023 by correspondence with the custodian, transfer agents and brokers; when replies were not received from brokers, we performed other auditing procedures. We believe that our audits provide a reasonable basis for our opinion.
/s/PricewaterhouseCoopers LLP
Philadelphia, Pennsylvania
January 23, 2024
We have served as the auditor of one or more Macquarie investment companies since 2010.
Other Fund information (Unaudited)
Delaware Small Cap Core Fund
Liquidity Risk Management Program
The Securities and Exchange Commission (the “SEC”) has adopted Rule 22e-4 under the Investment Company Act of 1940 (the “Liquidity Rule”), which requires all open-end funds (other than money market funds) to adopt and implement a program reasonably designed to assess and manage the fund’s “liquidity risk,” defined as the risk that the fund could not meet requests to redeem shares issued by the fund without significant dilution of remaining investors’ interests in the fund.
The Fund has adopted and implemented a liquidity risk management program in accordance with the Liquidity Rule (the “Program”). The Board has designated a member of the US Operational Risk Group of Macquarie Asset Management as the Program Administrator for each Fund in the Trust.
As required by the Liquidity Rule, the Program includes policies and procedures that provide for: (1) assessment, management, and review (no less frequently than annually) of the Fund’s liquidity risk; (2) classification of each of the Fund’s portfolio holdings into one of four liquidity categories (Highly Liquid, Moderately Liquid, Less Liquid, and Illiquid); (3) for funds that do not primarily hold assets that are Highly Liquid, establishing and maintaining a minimum percentage of the Fund’s net assets in Highly Liquid investments (called a “Highly Liquid Investment Minimum” or “HLIM”); and (4) prohibiting the Fund’s acquisition of Illiquid investments if, immediately after the acquisition, the Fund would hold more than 15% of its net assets in Illiquid assets. The Program also requires reporting to the SEC (on a non-public basis) and to the Board if the Fund’s holdings of Illiquid assets exceed 15% of the Fund’s net assets. Funds with HLIMs must have procedures for addressing HLIM shortfalls, including reporting to the Board and, with respect to HLIM shortfalls lasting more than seven consecutive calendar days, reporting to the SEC (on a non-public basis).
In assessing and managing the Fund’s liquidity risk, the Program Administrator considers, as relevant, a variety of factors, including: (1) the Fund’s investment strategy and liquidity of portfolio investments during both normal and reasonably foreseeable stressed conditions; (2) short-term and long-term cash flow projections for the Fund during both normal and reasonably foreseeable stressed conditions; and (3) the Fund’s holdings of cash and cash equivalents and any borrowing arrangements. Classification of the Fund’s portfolio holdings in the four liquidity categories is based on the number of days it is reasonably expected to take to convert the investment to cash (for Highly Liquid and Moderately Liquid holdings) or to sell or dispose of the investment (for Less Liquid and Illiquid investments), in current market conditions without significantly changing the investment’s market value. The Fund primarily holds assets that are classified as Highly Liquid, and therefore is not required to establish an HLIM.
At a meeting of the Board held on May 23-25, 2023, the Program Administrator provided a written report to the Board addressing the Program’s operation and assessing the adequacy and effectiveness of its implementation for the period from April 1, 2022 through March 31, 2023. The report concluded that the Program is appropriately designed and effectively implemented and that it meets the requirements of Rule 22e-4 and the Fund’s liquidity needs. The Fund’s HLIM is set at an appropriate level and the Fund complied with its HLIM at all times during the reporting period.
Other Fund information (Unaudited)
Delaware Small Cap Core Fund
Tax Information
The information set forth below is for the Fund’s fiscal year as required by federal income tax laws. Shareholders, however, must report distributions on a calendar year basis for income tax purposes, which may include distributions for portions of two fiscal years of the Fund. Accordingly, the information needed by shareholders for income tax purposes will be sent to them in January of each year. Please consult your tax advisor for proper treatment of this information.
All disclosures are based on financial information available as of the date of this annual report and, accordingly are subject to change. For any and all items requiring reporting, it is the intention of the Fund to report the maximum amount permitted under the Internal Revenue Code and the regulations thereunder.
For the fiscal year ended November 30, 2023, the Fund reports distributions paid during the year as follows:
| (A) Long-Term Capital Gain Distributions (Tax Basis) | 77.74% |
| (B) Ordinary Income Distributions (Tax Basis)* | 22.26% |
| Total Distributions (Tax Basis) | 100.00% |
| (C) Qualified Dividends1 | 100.00% |
(A) and (B) are based on a percentage of the Fund's total distributions.
(C) is based on the Fund's ordinary income distributions.
1Qualified dividends represent dividends which qualify for the corporate dividends received deduction.
*For the fiscal year ended November 30, 2023, certain dividends paid by the Fund may be subject to a maximum tax rate of 20%. The percentage of dividends paid by the Fund from ordinary income reported as qualified income is 100.00%. Complete information will be computed and reported in conjunction with your 2023 Form 1099-DIV, as applicable.
For the fiscal year ended November 30, 2023, certain dividends paid by the Fund, determined to be Qualified Short-Term Capital Gains, may be subject to relief from US withholding for foreign shareholders, as provided by the American Jobs Creation Act of 2004; the Tax Relief, Unemployment Insurance Reauthorization, and Job Creation Act of 2010; and as extended by the American Taxpayer Relief Act of 2012. For the fiscal year ended November 30, 2023, the Fund has reported maximum distributions of Qualified Short-Term Capital Gains of $5,735,996.
Board Consideration of Investment Management Agreement and Sub-Advisory Agreement at a Meeting Held on August 8-10, 2023
At a meeting held on August 8-10, 2023 (the “Annual Contract Renewal Meeting”), the Board of Trustees (the “Board”), including a majority of Trustees each of whom is not an “interested person” as defined under the Investment Company Act of 1940 (the “Independent Trustees”), approved the renewal of the Delaware Small Cap Core Fund (the “Fund”) Investment Management Agreement with Delaware Management Company (“DMC”) and the Sub-Advisory Agreement with Macquarie Investment Management Global Limited (“MIMGL” or the “Affiliated Sub-Adviser”).
Prior to the Annual Contract Renewal Meeting, including at a Board meeting held in May 2023, the Trustees conferred extensively among themselves and with representatives of DMC about these matters. Also, the Board was assisted by the Equity Investments Committee and the Fixed Income Multi-Asset Sub-Advised Funds Investments Committee (each an “Investment Committee” and together, the “Investment Committees”), with each Investment Committee assisting the full Board in reviewing investment performance and other matters throughout the year. The Independent Trustees were also assisted in their evaluation of the Investment Management Agreement and the Sub-Advisory Agreement by independent legal counsel, from whom they received separate legal advice and with whom they met separately.
In providing information to the Board, DMC was guided by a detailed set of requests for information submitted to them by independent legal counsel on behalf of the Independent Trustees at the start of the Board’s annual contract renewal process earlier in 2023. Prior to the Annual Contract Renewal Meeting, and in response to the requests, the Board received and reviewed materials specifically relating to the renewal of the Investment Management Agreement and the Sub-Advisory Agreement. In considering and approving the Investment Management Agreement and the Sub-Advisory Agreement, the Trustees considered the information they believed relevant, including but not limited to the information discussed below. The Board considered not only the specific information presented in connection with the Annual Contract Renewal Meeting and the review process for the Investment Management Agreement and the Sub-Advisory Agreement, but also the knowledge gained over time through interaction with DMC about various topics. In this regard, the Board reviewed reports of DMC at each of its quarterly meetings, which included information about, among other things, Fund performance, investment strategies, and expenses. In addition, the Investment Committees confer with portfolio managers at various times throughout the year. In considering information relating to the approval of the Fund’s Investment Management Agreement and the Sub-Advisory Agreement, the Independent Trustees also received information from an independent fund consultant, JDL Consultants, LLC (“JDL”).
The Board did not identify any particular information or consideration that was all-important or controlling, and each individual Trustee may have attributed different weights to various factors.
After its deliberations, the Board, including the Independent Trustees, unanimously approved the continuation of the Investment Management Agreement and the Sub-Advisory Agreement for a one-year term. The following summarizes a number of important, but not necessarily all, factors considered by the Board in support of its approval.
Nature, extent, and quality of services. The Board received and considered various information regarding the nature, extent, and quality of the advisory services provided to the Fund by DMC under its Investment Management Agreement and the experience of the officers and employees of DMC who provide these services, including the Fund’s portfolio managers. The Board’s review included consideration of DMC’s investment process and oversight and research and analysis capabilities, and its ability to attract and retain skilled investment professionals. The Board also considered information regarding DMC’s programs for risk management, including investment, operational, liquidity, derivatives (as applicable), valuation,
Other Fund information (Unaudited)
Delaware Small Cap Core Fund
Board Consideration of Investment Management Agreement and Sub-Advisory Agreement at a Meeting Held on August 8-10, 2023 (continued)
and compliance risks. The Board received information with respect to the cybersecurity program and business continuity plans of DMC and its affiliates.
In addition, the Board considered certain non-advisory services that DMC and its affiliates provide to the Delaware Funds by Macquarie complex (the “Delaware Funds”). Among other things, these services include third party service provider oversight, transfer agency, internal audit, valuation, portfolio trading, and legal and compliance functions. The Board noted DMC’s responsibility for overseeing the preparation of the Delaware Funds’ registration statement and supplements thereto and shareholder reports; responsibility for periodic filings with regulators; organizing Board meetings and preparing materials for such Board meetings; and furnishing analytical and other support to assist the Board. The Board took into account the benefits to shareholders of investing in a Fund that is part of a family of funds managed by an affiliate of Macquarie Group Ltd. (“Macquarie”), the parent company of DMC, and the resources available to DMC as part of Macquarie’s global asset management business.
The Board received and considered various information with respect to the services provided by the Affiliated Sub-Adviser under the Sub-Advisory Agreement and the credentials and experience of the officers and employees of the Affiliated Sub-Adviser who provide these services. The Board considered the division of responsibilities between DMC and the Affiliated Sub-Adviser and the oversight provided by DMC. The Board also considered the expertise of the Affiliated Sub-Adviser with respect to certain asset classes and/or investment styles. The Board noted that the Affiliated Sub-Adviser is part of Macquarie’s global investment platform that has offices and personnel that are located around the world. The Affiliated Sub-Adviser provides research, investment and trading analysis on the markets and economies of various countries in which the Fund may invest, makes recommendations regarding securities, provides portfolio management services and assists with security trades, as applicable. The Board took into account that the Sub-Advisory Agreement may benefit the Fund and its shareholders by permitting DMC to use the resources and talents of the Affiliated Sub-Adviser in managing the Fund.
The Board also received and considered information about the nature and extent of services offered and fee rates charged by DMC to other types of clients with investment strategies similar to those of the Fund. In this regard, the Board received information about the significantly greater scope of services, and compliance, reporting and other legal and regulatory obligations and risks of managing registered investment companies compared with those associated with managing assets of other types of clients, including third-party sub-advised fund clients, unregistered funds and separately managed accounts.
The Board concluded that, overall, it was satisfied with the nature, extent, and quality of services provided (and expected to be provided) to the Fund by DMC and the Affiliated Sub-Adviser.
Investment performance. The Board received and considered information with respect to the investment performance of the Fund, including performance reports and discussions with portfolio managers at meetings of the Board’s Investment Committees throughout the year as well as reports provided by Broadridge Financial Solutions, Inc., an independent investment
company data provider (“Broadridge”), furnished for the Annual Contract Renewal Meeting. The Broadridge reports prepared for the Fund’s institutional share class showed its investment performance in comparison to the institutional share class of a group of similar funds (the “Performance Universe”). The Board received a description of the methodology used by Broadridge to select the peer funds in the Performance Universe. Comparative annualized performance for the Fund was shown for the past 1-, 3-, 5-, and 10-year or since inception periods, as applicable, ended December 31, 2022.
The Performance Universe consists of the Fund and all retail and institutional small-cap core funds, regardless of asset size or primary channel of distribution. The Board noted that the Broadridge report comparison showed that the Fund’s total return for the 1-year period was in the third quartile of its Performance Universe, for the 3-year period was in the second quartile of its Performance Universe, and for the 5- and 10-year periods was in the first quartile of its Performance Universe. The Broadridge report comparison showed that the Fund’s total return for the 1-year period was below the median of its Performance Universe and for the 3-, 5- and 10-year periods was above the median of its Performance Universe. The Board also noted that the Fund outperformed its benchmark index for the 1-, 3-, 5-, and 10-year periods. The Board noted that the Fund was generally performing in line with its Performance Universe and outperforming its benchmark index during the periods under review.
Comparative expenses. The Board received and considered expense data for the Fund. DMC provided the Board with information on pricing levels and fee structures for the Fund as of its most recently completed fiscal year. The Broadridge total expenses, for comparative consistency, were shown by Broadridge for Institutional Class shares and comparative total expenses including 12b-1 and non-12b-1 service fees. The Board also considered the comparative analysis of contractual management fees and actual total expense ratios of the Fund versus contractual management fees and actual total expense ratios of a group of peer funds as selected by Broadridge (the “Expense Group”). In reviewing comparative costs, the Fund’s contractual management fee and the actual management fee incurred by the Fund were compared with the contractual management fees (assuming all funds in the Expense Group were similar in size to the Fund) and actual management fees, taking into account any applicable breakpoints and fee waivers, with the Fund’s expense universe, which is comprised of the Fund, its Expense Group and all other similar institutional funds, excluding outliers (the “Expense Universe”). The Fund’s total expenses were also compared with those of its Expense Universe. The Board also received and considered information regarding the Fund’s net operating expense ratios and their various components, including actual management fees, custodian and other non-management fees, and Rule 12b-1 and non-Rule 12b-1 shareholder service fees.
The expense comparisons for the Fund showed that its actual management fee was below the median of its Expense Universe and its actual total expenses were below its Expense Group average. It was noted that consistent with DMC’s waiver methodology, its advisory fee waivers, if any, were at the fund level and not class level.
The Board noted that DMC, and not the Fund, pays the sub-advisory fees to the Affiliated Sub-Adviser and, accordingly, that the retention of the Affiliated Sub-Adviser does not increase the fees and expenses incurred by the Fund.
Other Fund information (Unaudited)
Delaware Small Cap Core Fund
Board Consideration of Investment Management Agreement and Sub-Advisory Agreement at a Meeting Held on August 8-10, 2023 (continued)
Based on its consideration of the factors and information it deemed relevant, including those described here, the Board determined that the compensation payable to DMC under the Investment Management Agreement and to the Affiliated Sub-Adviser under the Sub-Advisory Agreement was reasonable.
Economies of scale. The Board received and considered information about the potential for DMC to realize economies of scale in the provision of management services to the Fund, the difficulties of calculating economies of scale at an individual Fund level, and the extent to which potential scale benefits are shared with shareholders, including the extent to which any economies of scale are reflected in the level of management fees charged. DMC discussed its advisory fee pricing and structure for the Delaware Funds, including the current breakpoints. The Board noted that, as of March 31, 2023, the Fund’s net assets exceeded its third breakpoint level and that breakpoints result in a lower advisory fee than would otherwise be the case in the absence of breakpoints, when the asset levels specified in the breakpoints schedule are exceeded. The Board noted that the Fund may also benefit from economies of scale through initial fee setting, fee waivers and expense reimbursements, as well as DMC’s investment in its business, including investments in business infrastructure, technology and cybersecurity.
Management profitability. The Board received and considered the Investment Management Profitability Analysis that addressed the overall profitability of DMC’s business in providing management and other services to the Fund and the Delaware Funds as a whole, including the methodology used by DMC in allocating costs for the purpose of determining profitability. The Board noted DMC’s changes to its cost allocation methodology for its profitability analysis and the explanations for such changes. The Board also reviewed a report prepared by JDL regarding DMC’s profitability as compared to certain peer fund complexes and the Independent Trustees discussed DMC’s profitability in such context with representatives from JDL. The Board recognized that calculating and comparing profitability at the individual fund level is difficult; that DMC’s profit, if any, can vary significantly depending on the particular fund; and that DMC’s support for, and commitment to, a fund is not solely dependent on the profits realized as to that fund.
The Board also received and considered information about the portion of the total management fee that was retained by DMC after payment of the fee to the Affiliated Sub-Adviser for sub-advisory services. In assessing the reasonableness of this amount, the Board received and evaluated information about the nature and extent of the responsibilities retained and risk assumed by DMC and not delegated to or assumed by the Affiliated Sub-Adviser. Given the affiliation between DMC and the Affiliated Sub-Adviser, the Board ascribed limited relevance to the allocation of fees between them.
Based on its review, the Board determined that DMC’s profitability was not excessive in light of the nature, extent, and quality of the services provided to the Fund.
Ancillary benefits. The Board received and considered information regarding the extent to which DMC and its affiliates might derive ancillary benefits from fund operations, including the
potential for procuring additional business as a result of the prestige and visibility associated with its role as investment manager to the Delaware Funds; the benefits from allocation of fund brokerage to improve trading efficiencies; the portfolio transactions executed through “soft dollar” arrangements; and the fees that various affiliates received for serving as transfer agent and for overseeing fund accounting and financial administration services to the Delaware Funds. The Board considered that it receives periodic reports from DMC that include a representation that any soft dollar arrangements are consistent with regulatory requirements. The Board received information from DMC regarding its view of the performance of its affiliates in providing transfer agent and fund accounting and financial administration oversight services and the organizational structure employed to provide these services pursuant to their contracts with the Fund.
Based on its consideration of the factors and information it deemed relevant, including the costs of providing investment management and other services to the Fund and the ongoing commitment of DMC and its affiliates to the Fund, the Board did not find that any ancillary benefits received by DMC and its affiliates, including the Affiliated Sub-Adviser, were unreasonable.
Conclusion. Based on its review, consideration and evaluation of all factors it believed relevant, including the above-described factors and conclusions, the Board, including all of the Independent Trustees, approved the continuation of DMC’s Investment Management Agreement and of the Affiliated Sub-Adviser’s Sub-Advisory Agreement for an additional one-year period.
Form N-PORT and proxy voting information
The Fund files its complete schedule of portfolio holdings with the Securities and Exchange Commission (SEC) for the first and third quarters of each fiscal year on Form N-PORT. The Fund’s Form N-PORT, as well as a description of the policies and procedures that the Fund uses to determine how to vote proxies (if any) relating to portfolio securities, is available without charge (i) upon request, by calling 800 523-1918; and (ii) on the SEC’s website at sec.gov. In addition, a description of the policies and procedures that the Fund uses to determine how to vote proxies (if any) relating to portfolio securities and the Schedule of Investments included in the Fund’s most recent Form N-PORT are available without charge on the Fund’s website at delawarefunds.com/literature.
Information (if any) regarding how the Fund voted proxies relating to portfolio securities during the most recently disclosed 12-month period ended June 30 is available without charge (i) through the Fund’s website at delawarefunds.com/proxy; and (ii) on the SEC’s website at sec.gov.
Board of trustees and officers addendum
Delaware Funds by Macquarie®
A mutual fund is governed by a Board of Trustees (“Trustees”), which has oversight responsibility for the management of a fund’s business affairs. Trustees establish procedures and oversee and review the performance of the investment manager, the distributor, and others who perform services for the fund. The independent fund trustees, in particular, are advocates for shareholder interests. Each trustee has served in that capacity since he or she was elected to or appointed to the Board of Trustees, and will continue to serve until his or her retirement or the election of a new trustee in his or her place. The following is a list of the Trustees and Officers with certain background and related information.
| | | | | | Other |
| | | | Number of | Principal | Directorships |
| Name, | Position(s) | | Funds in Fund | Occupation(s) | Held by Trustee |
| Address, | Held with | Length of Time | Complex Overseen | During the | During the |
| and Birth Year | the Trust | Served1 | by Trustee | Past Five Years | Past Five Years |
| Interested Trustee | | |
| | | | | | |
Shawn K. Lytle2 100 Independence 610 Market Street Philadelphia, PA 19106-2354 1970 | President, Chief Executive Officer, and Trustee | President and Chief Executive Officer since August 2015 Trustee since September 2015 | 105 | Macquarie Asset Management3 (2015–Present) -Head of Equities & Multi-Asset (2023–Present) -Head of Americas of Macquarie Group (2017–Present) -Global Head of Public Investments (2019–2023) | None |
| | | | | | Other |
| | | | Number of | Principal | Directorships |
| Name, | Position(s) | | Funds in Fund | Occupation(s) | Held by Trustee |
| Address, | Held with | Length of Time | Complex Overseen | During the | During the |
| and Birth Year | the Trust | Served1 | by Trustee | Past Five Years | Past Five Years |
| Independent Trustees | | |
| | | | | | |
Jerome D. Abernathy 100 Independence 610 Market Street Philadelphia, PA 19106-2354 1959 | Trustee | Since January 2019 | 105 | Stonebrook Capital Management, LLC (financial technology: macro factors and databases) -Managing Member (1993-Present) | None |
| | | | | | |
Ann D. Borowiec 100 Independence 610 Market Street Philadelphia, PA 19106-2354
1958 | Trustee | Since March 2015 | 105 | J.P. Morgan Chase & Co. (1987-2013) -Chief Executive Officer, Private Wealth Management (2011–2013) | Banco Santander International (2016–2019) Santander Bank, N.A. (2016-2019) |
Board of trustees and officers addendum
Delaware Funds by Macquarie®
| | | | | | Other |
| | | | Number of | Principal | Directorships |
| Name, | Position(s) | | Funds in Fund | Occupation(s) | Held by Trustee |
| Address, | Held with | Length of Time | Complex Overseen | During the | During the |
| and Birth Year | the Trust | Served1 | by Trustee | Past Five Years | Past Five Years |
| | | | | | |
Joseph W. Chow 100 Independence 610 Market Street Philadelphia, PA 19106-2354 1953 | Trustee | Since January 2013 | 105 | Private Investor (2011–Present) State Street Bank and Trust Company (1996-2011) -Executive Vice President of Enterprise Risk Management and Emerging Economies Strategy; and Chief Risk and Corporate Administration Officer | None |
| | | | | | |
H. Jeffrey Dobbs 100 Independence 610 Market Street Philadelphia, PA 19106-2354
1955 | Trustee | Since April 20194 | 105 | KPMG LLP (2002-2015) -Global Sector Chairman, Industrial Manufacturing (2010-2015) | TechAccel LLC (2015–Present) PatientsVoices, Inc. (2018–Present) Valparaiso University Board (2012-Present) Ivy Funds Complex (2019-2021) |
| | | | | | Other |
| | | | Number of | Principal | Directorships |
| Name, | Position(s) | | Funds in Fund | Occupation(s) | Held by Trustee |
| Address, | Held with | Length of Time | Complex Overseen | During the | During the |
| and Birth Year | the Trust | Served1 | by Trustee | Past Five Years | Past Five Years |
| | | | | | |
John A. Fry 100 Independence 610 Market Street Philadelphia, PA 19106-2354 1960 | Trustee | Since January 2001 | 105 | Drexel University -President (2010–Present) | Federal Reserve Bank of Philadelphia (2020–Present) Kresge Foundation (2018-Present) FS Credit Real Estate Income Trust, Inc. (2018–Present) vTv Therapeutics Inc. (2017–Present) Community Health Systems (2004–Present) Drexel Morgan & Co. (2015–2019) |
Board of trustees and officers addendum
Delaware Funds by Macquarie®
| | | | | | Other |
| | | | Number of | Principal | Directorships |
| Name, | Position(s) | | Funds in Fund | Occupation(s) | Held by Trustee |
| Address, | Held with | Length of Time | Complex Overseen | During the | During the |
| and Birth Year | the Trust | Served1 | by Trustee | Past Five Years | Past Five Years |
| | | | | | |
Joseph Harroz, Jr. 100 Independence 610 Market Street Philadelphia, PA 19106-2354 1967 | Trustee | Since November 19984 | 105 | University of Oklahoma -President (2020–Present) -Interim President (2019–2020) -Vice President and Dean, College of Law (2010–2019) Brookhaven Investments LLC (commercial enterprises) -Managing Member (2019–Present) St. Clair, LLC (commercial enterprises) -Managing Member (2019–Present) | OU Medicine, Inc. (2020–Present) Big 12 Athletic Conference (2019-Present) Valliance Bank (2007–Present) Ivy Funds Complex (1998-2021) |
| | | | | | Other |
| | | | Number of | Principal | Directorships |
| Name, | Position(s) | | Funds in Fund | Occupation(s) | Held by Trustee |
| Address, | Held with | Length of Time | Complex Overseen | During the | During the |
| and Birth Year | the Trust | Served1 | by Trustee | Past Five Years | Past Five Years |
| | | | | | |
Sandra A.J. Lawrence 100 Independence 610 Market Street Philadelphia, PA 19106-2354 1957 | Trustee | Since April 20194 | 105 | Children’s Mercy Hospitals and Clinics (2005–2019) -Chief Administrative Officer (2016–2019) | Brixmor Property Group Inc. (2021-Present) Sera Prognostics Inc. (biotechnology) (2021-Present) Recology (resource recovery) (2021-2023) Evergy, Inc., Kansas City Power & Light Company, KCP&L Greater Missouri Operations Company, Westar Energy, Inc. and Kansas Gas and Electric Company (related utility companies) (2018-Present) National Association of Corporate Directors (2017-Present) American Shared Hospital Services (medical device) (2017-2021) Ivy Funds Complex (2019-2021) |
Board of trustees and officers addendum
Delaware Funds by Macquarie®
| | | | | | Other |
| | | | Number of | Principal | Directorships |
| Name, | Position(s) | | Funds in Fund | Occupation(s) | Held by Trustee |
| Address, | Held with | Length of Time | Complex Overseen | During the | During the |
| and Birth Year | the Trust | Served1 | by Trustee | Past Five Years | Past Five Years |
| | | | | | |
Frances A.
Sevilla-Sacasa 100 Independence 610 Market Street Philadelphia, PA 19106-2354 1956 | Trustee | Since September 2011 | 105 | Banco Itaú International -Chief Executive Officer (2012–2016) US Trust Bank of America Private Wealth Management -President
(2007-2008) U.S. Trust Corp. -President & CEO (2005-2007) | Invitation Homes Inc. (2023-Present) Florida Chapter of National Association of Corporate Directors (2021-Present) Callon Petroleum Company (2019-Present) Camden Property Trust (2011-Present) New Senior Investment Group Inc. (REIT) (2021) Carrizo Oil & Gas, Inc. (2018-2019) |
| | | | | | |
Thomas K. Whitford 100 Independence 610 Market Street Philadelphia, PA 19106-2354 1956 | Chair and Trustee | Trustee since January 2013 Chair since January 2023 | 105 | PNC Financial Services Group (1983–2013) -Vice Chairman (2009-2013) | HSBC USA Inc. (2014–2022) HSBC North America Holdings Inc. (2013–2022) |
| | | | | | Other |
| | | | Number of | Principal | Directorships |
| Name, | Position(s) | | Funds in Fund | Occupation(s) | Held by Trustee |
| Address, | Held with | Length of Time | Complex Overseen | During the | During the |
| and Birth Year | the Trust | Served1 | by Trustee | Past Five Years | Past Five Years |
| | | | | | |
Christianna Wood 100 Independence 610 Market Street Philadelphia, PA 19106-2354 1959 | Trustee | Since January 2019 | 105 | Gore Creek Capital, Ltd. -Chief Executive Officer and President (2009–Present) Capital Z Asset Management -Chief Executive Officer (2008-2009) California Public Employees' Retirement System (CalPERS) -Senior Investment Officer of Global Equity (2002-2008) | The Merger Fund (2013–2021), The Merger Fund VL (2013–2021), WCM Alternatives: Event-Driven Fund (2013–2021), and WCM Alternatives: Credit Event Fund
(2017–2021) Grange Insurance (2013–Present) H&R Block Corporation (2008–2022) |
| Officers | | | | | |
David F. Connor 100 Independence 610 Market Street Philadelphia, PA 19106-2354
1963 | Senior Vice President, General Counsel, and Secretary | Senior Vice President,
since May 2013; General Counsel since May 2015;
Secretary since
October 2005 | 105 | David F. Connor has served in various capacities at different times at Macquarie Asset Management. | None5 |
Board of trustees and officers addendum
Delaware Funds by Macquarie®
| | | | | | Other |
| | | | Number of | Principal | Directorships |
| Name, | Position(s) | | Funds in Fund | Occupation(s) | Held by Trustee |
| Address, | Held with | Length of Time | Complex Overseen | During the | During the |
| and Birth Year | the Trust | Served1 | by Trustee | Past Five Years | Past Five Years |
| | | | | | |
Daniel V. Geatens 100 Independence 610 Market Street Philadelphia, PA 19106-2354 1972 | Senior Vice President and Treasurer | Senior Vice President and Treasurer since October 2007 | 105 | Daniel V. Geatens has served in various capacities at different times at Macquarie Asset Management. | None5 |
| | | | | | |
Richard Salus 100 Independence 610 Market Street Philadelphia, PA 19106-2354 1963 | Senior Vice President and Chief Financial Officer | Senior Vice President and Chief Financial Officer since November 2006 | 105 | Richard Salus has served in various capacities at different times at Macquarie Asset Management. | None5 |
1 “Length of Time Served” refers to the time since the Trustee or officer began serving one or more of the Trusts in the Delaware Funds complex.
2 Shawn K. Lytle is considered to be an “Interested Trustee” because he is an executive officer of the Funds' investment advisor.
3 Macquarie Asset Management is the marketing name for certain companies comprising the asset management division of Macquarie Group, including the Funds' investment advisor, principal underwriter, and transfer agent.
4 Includes time served on the Board of the Ivy Funds complex prior to the date when the Ivy Funds joined the Delaware Funds complex.
5 David F. Connor and Daniel V. Geatens serve in similar capacities for the six portfolios of the Optimum Fund Trust, which have the same investment manager, principal underwriter, and transfer agent as the Funds. Mr. Connor also serves as Senior Vice President and Assistant Secretary for the three portfolios of the Macquarie ETF Trust, which have the same investment manager as the Funds. Mr. Geatens also serves as the Chief Financial Officer of the Optimum Fund Trust and as Senior Vice President and Treasurer for the Macquarie ETF Trust. Mr. Salus serves in a similar capacity for the Macquarie ETF Trust.
The Statement of Additional Information for the Fund(s) includes additional information about the Trustees and Officers and is available, without charge, upon request by calling 800 523-1918.
Table of Contents
Annual report
US equity mutual fund
Delaware Small Cap Value Fund
November 30, 2023
Carefully consider the Fund’s investment objectives, risk factors, charges, and expenses before investing. This and other information can be found in the Fund’s prospectus and its summary prospectus, which may be obtained by visiting delawarefunds.com/literature or calling 800 523-1918. Investors should read the prospectus and the summary prospectus carefully before investing.
You can obtain shareholder reports and prospectuses online instead of in the mail. Visit delawarefunds.com/edelivery.
Experience Delaware Funds by Macquarie®
Macquarie Asset Management (MAM) is a global asset manager that aims to deliver positive impact for everyone. MAM’s public markets businesses trace their roots to 1929 and partner with institutional and individual clients to deliver specialist active investment capabilities across global equities, fixed income, and multi-asset solutions using a conviction-based, long-term approach to investing. In the US, retail investors recognize our Delaware Funds by Macquarie family of funds as one of the oldest mutual fund families.
If you are interested in learning more about creating an investment plan, contact your financial advisor.
You can learn more about Delaware Funds or obtain a prospectus for Delaware Small Cap Value Fund at delawarefunds.com/literature.
Manage your account online
| ● | Check your account balance and transactions |
| ● | View statements and tax forms |
| ● | Make purchases and redemptions |
Visit delawarefunds.com/account-access.
Macquarie Asset Management (MAM) is the asset management division of Macquarie Group. MAM is an integrated asset manager across public and private markets offering a diverse range of capabilities, including real assets, real estate, credit, equities, and multi-asset solutions.
The Fund is advised by Delaware Management Company, a series of Macquarie Investment Management Business Trust (MIMBT), a US registered investment adviser, and distributed by Delaware Distributors, L.P. (DDLP), an affiliate of MIMBT and Macquarie Group Limited.
Other than Macquarie Bank Limited ABN 46 008 583 542 (“Macquarie Bank”), any Macquarie Group entity noted in this document is not an authorized deposit-taking institution for the purposes of the Banking Act 1959 (Commonwealth of Australia). The obligations of these other Macquarie Group entities do not represent deposits or other liabilities of Macquarie Bank. Macquarie Bank does not guarantee or otherwise provide assurance in respect of the obligations of these other Macquarie Group entities. In addition, if this document relates to an investment, (a) the investor is subject to investment risk including possible delays in repayment and loss of income and principal invested and (b) none of Macquarie Bank or any other Macquarie Group entity guarantees any particular rate of return on or the performance of the investment, nor do they guarantee repayment of capital in respect of the investment.
The Fund is governed by US laws and regulations.
Table of contents
This annual report is for the information of Delaware Small Cap Value Fund shareholders, but it may be used with prospective investors when preceded or accompanied by the Delaware Fund fact sheet for the most recently completed calendar quarter. These documents are available at delawarefunds.com/literature.
Unless otherwise noted, views expressed herein are current as of November 30, 2023, and subject to change for events occurring after such date. These views are not intended to be investment advice, to forecast future events, or to guarantee future results.
The Fund is not FDIC insured and is not guaranteed. It is possible to lose the principal amount invested.
All third-party marks cited are the property of their respective owners.
© 2024 Macquarie Management Holdings, Inc.
| Portfolio management review | |
| Delaware Small Cap Value Fund | November 30, 2023 (Unaudited) |
| Performance preview (for the year ended November 30, 2023) | | | |
| Delaware Small Cap Value Fund (Institutional Class shares) | 1-year return | -6.50% | |
| Delaware Small Cap Value Fund (Class A shares) | 1-year return | -6.74% | |
| Russell 2000® Value Index (benchmark) | 1-year return | -4.73% | |
Past performance does not guarantee future results.
For complete, annualized performance for Delaware Small Cap Value Fund, please see the table on page 4. Institutional Class shares are not subject to a sales charge and are offered for sale exclusively to certain eligible investors. In addition, Institutional Class shares pay no distribution and service fee.
The performance of Class A shares excludes the applicable sales charge. The performance of both Institutional Class shares and Class A shares reflects the reinvestment of all distributions.
Please see page 6 for a description of the index. Index performance returns do not reflect any management fees, transaction costs, or expenses. Indices are unmanaged and one cannot invest directly in an index.
Investment objective
The Fund seeks capital appreciation.
Market review
For the fiscal year ended November 30, 2023, the performance of the small-cap value asset class was the weakest across the US equity market. The Fund’s benchmark, the Russell 2000 Value Index, declined 4.73% while the Russell 2000® Growth Index declined 0.83%. Large-cap stocks outperformed small-cap stocks. The Russell 1000® Value Index advanced 1.36%, while the Russell 1000® Growth Index’s return of 26.17% for the fiscal year was the most robust.
The equity market rotated between periods of preference for high- or low-quality stocks during the Fund’s fiscal year, resulting in mixed sector-level performance within the Russell 2000 Value Index. Six sectors declined and five sectors advanced. The healthcare, utilities, financial services, and consumer staples sectors were the weakest, as each declined by more than 10% for the fiscal year. The strongest sectors in the index were industrials, technology, and energy, with each advancing by more than 5% for the fiscal year.
The Fund’s underperformance for the fiscal year resulted from weak stock selection within the technology, energy, and financial services sectors. On a relative basis, stock selection contributed in the transportation and consumer sectors. The Fund’s underweight allocation to companies in the healthcare sector also benefited performance.
Portfolio management review
Delaware Small Cap Value Fund
The effects of the Federal Open Market Committee’s (FOMC’s) fierce pace of rate increases over the past 18 months began to influence US macroeconomic conditions and financial markets. With a target federal funds rate range of 5.25% to 5.50%, and an unemployment rate of just 3.7%, we anticipate borrowing costs will be higher for longer. In the survey reports we monitor from the US Federal Reserve, banks reported having tightened their standards for loans in the third quarter of 2023, with respondents frequently citing a more uncertain economic outlook and reduced tolerance for risk. These conditions may challenge companies with leveraged balance sheets that need access to capital. During the Fund’s fiscal year, we further improved its high-quality posture as we were cautious about the macroeconomic environment.
Source: Bloomberg unless otherwise noted.
Within the Fund
For the fiscal year ended November 30, 2023, Delaware Small Cap Value Fund underperformed its benchmark, the Russell 2000 Value Index. The Fund’s Institutional Class shares declined 6.50%. The Fund’s Class A shares fell 6.74% at net asset value (NAV) and declined 12.10% at maximum offer price. These figures reflect reinvestment of all distributions. During the same period, the Fund’s benchmark declined 4.73%. For complete annualized performance of Delaware Small Cap Value Fund, please see the table on page 4.
The Fund’s underperformance for the fiscal year resulted from weak stock selection within the technology, energy, and financial services sectors. On a relative basis, stock selection contributed in the transportation and consumer sectors. The Fund’s underweight allocation to companies in the healthcare sector also benefited performance.
In the financial services sector, the Fund’s holdings in the bank industry declined by more than those in the benchmark over the fiscal year. Western Alliance Bancorp is a regional bank with branches in Arizona, Nevada, and California. It also operates several national commercial lending businesses, a national residential mortgage business, and several national banking businesses, including providing bank services for companies backed by venture capital investors, the core business of Silicon Valley Bank. These venture capital investor customers made up about 14% of Western Alliance Bancorp’s deposits for the first quarter of 2023. After the failure of Silicon Valley Bank and Signature Bank, fears of a bank run at Western Alliance Bancorp caused the company’s stock to decline meaningfully in a short period of time. We exited the Fund’s position in Western Alliance Bancorp owing to what we considered the potential risk of a bank run.
Outfront Media Inc., one of the largest billboard owners in the US, is a leading owner of transit-related billboards in major cities. Outfront leases space on its billboards on a short-term basis to a diverse range of companies. Shares of Outfront underperformed when the company took a write-down related to its contract with the New York Metropolitan Transportation Authority (MTA). The write-down was a result of the impact work-from-home trends have had in decreasing transit ridership. We exited the Fund’s position in Outfront as the company’s fundamentals had deteriorated.
MasTec Inc., a specialty engineering and construction firm, operates in the traditional energy, renewable energy, communication, and utility end markets. Shares of MasTec
underperformed when the company reduced its guidance, noting slowing wireless spending and delays in project starts in its power delivery and energy segments. While we are disappointed with MasTec’s near term challenges, we view them as temporary, and we maintained the Fund’s position in the company as we believe management’s revised financial guidance is achievable.
ITT Inc. produces engineered industrial products and solutions for aerospace, auto, energy, transportation, and industrial clients. Shares of ITT performed well during the Fund’s fiscal year as the company continued its strong operational execution and progress toward achieving long-term financial targets. ITT’s orders increased, its operating margins expanded, and cash flow continued to grow. ITT announced a new $1 billion share repurchase program that it will implement at the completion of the company’s current $500 million plan. We are positive about ITT’s long-term prospects and have maintained the Fund’s position.
Strong stock selection in the consumer discretionary sector contributed to the Fund’s performance. Meritage Homes Corp., a large US homebuilder that focuses on entry-level homes for first-time buyers, outperformed. The lack of available homes for sale and higher borrowing costs during the Fund’s fiscal year created strong demand for new homes, which benefited Meritage Homes. The company’s average sales price increased, and home orders and closings grew during the fiscal year. In addition to generating strong financial results, Meritage Homes returned cash flow to shareholders by repurchasing its stock and paying a quarterly dividend. We maintained the Fund’s position in Meritage Homes since we believe the company is well positioned to weather a softer demand environment for housing as well as higher mortgage rates.
Assurant Inc. is a property and casualty insurance company that provides several specialized, niche products such as lender-placed home insurance, auto warranties, and electronic device warranties. We purchased Assurant early in the Fund’s fiscal year as we believed the company was trading at a discounted valuation and would potentially grow its earnings. Shares of Assurant outperformed for the fiscal year when its earnings growth exceeded analysts’ expectations. We maintained the Fund’s position in Assurant as we believe its fundamentals remain favorable and note that the company is returning cash to shareholders through dividend increases and share repurchases.
Relative to the benchmark, the Fund ended the fiscal year overweight the industrials, basic industry, and technology sectors and underweight the healthcare, real estate investment trust (REIT), consumer discretionary, financial services, and utilities sectors. Sector weightings were similar to benchmark weights in the transportation, consumer staples, and energy sectors at fiscal year end.
Our team’s investment philosophy remains unchanged. We continue to focus on bottom-up stock selection and specifically on identifying what we believe are quality companies that trade at attractive valuations. Additionally, we continue to focus on uncovering companies that have shareholder-friendly capital return policies – returning cash through share buybacks, dividends, and/or debt reduction.
| Performance summary | |
| Delaware Small Cap Value Fund | November 30, 2023 (Unaudited) |
The performance quoted represents past performance and does not guarantee future results. Investment return and principal value of an investment will fluctuate so that shares, when redeemed, may be worth more or less than their original cost. Current performance may be lower or higher than the performance quoted. Performance data current to the most recent month end may be obtained by calling 800 523-1918 or visiting delawarefunds.com/performance.
| Fund and benchmark performance1,2 | Average annual total returns through November 30, 2023 |
| | 1 year | 5 year | 10 year | Lifetime |
| Class A (Est. June 24, 1987) | | | | |
| Excluding sales charge | -6.74% | +5.24% | +5.99% | — |
| Including sales charge | -12.10% | +4.00% | +5.37% | — |
| Class C (Est. November 29, 1995) | | | | |
| Excluding sales charge | -7.43% | +4.45% | +5.20% | — |
| Including sales charge | -8.31% | +4.45% | +5.20% | — |
| Class R (Est. June 2, 2003) | | | | |
| Excluding sales charge | -6.98%* | +4.98% | +5.72% | — |
| Including sales charge | -6.96% | +4.98% | +5.72% | — |
| Institutional Class (Est. November 9, 1992) | | | | |
| Excluding sales charge | -6.50% | +5.50% | +6.26% | — |
| Including sales charge | -6.50% | +5.50% | +6.26% | — |
| Class R6 (Est. May 2, 2016) | | | | |
| Excluding sales charge | -6.35% | +5.68% | — | +7.39% |
| Including sales charge | -6.35% | +5.68% | — | +7.39% |
| Russell 2000 Value Index | -4.73% | +4.72% | +5.71% | — |
*Total return for the report period presented in the table differs from the return in “Financial highlights.” The total return presented in the above table is calculated based on the net asset value at which shareholder transactions were processed. The total return presented in “Financial highlights” is calculated in the same manner but also takes into account certain adjustments that are necessary under US generally accepted accounting principles.
1Returns reflect the reinvestment of all distributions and are presented both with and without the applicable sales charges described below. Returns do not reflect the deduction of taxes the shareholder would pay on Fund distributions or redemptions of Fund shares.
Expense limitations were in effect for certain classes during some or all of the periods shown in the “Fund and benchmark performance” table. Expenses for each class are listed in the “Fund expense ratios” table on page 5. Performance would have been lower had expense limitations not been in effect.
Class A shares are sold with a maximum front-end sales charge of 5.75%, and have an annual distribution and service (12b-1) fee of 0.25% of average daily net assets. Performance for Class A shares, excluding
sales charges, assumes that no front-end sales charge applied.
Class C shares are sold with a contingent deferred sales charge (CDSC) of 1.00% if redeemed within one year of purchase. They are also subject to an annual 12b-1 fee of 1.00% of average daily net assets. Performance for Class C shares, excluding sales charges, assumes either that CDSCs did not apply or that the investment was not redeemed.
Class R shares are available only for certain retirement plan products. They are sold without a sales charge and have an annual 12b-1 fee of 0.50% of average daily net assets.
Institutional Class shares are not subject to a sales charge and are offered for sale exclusively to certain eligible investors. In addition, Institutional Class shares pay no 12b-1 fee.
Class R6 shares are available only to certain investors. In addition, Class R6 shares do not pay any service fees, sub-accounting fees, and/or sub-transfer agency fees to any brokers, dealers, or other financial intermediaries. Class R6 shares pay no 12b-1 fee.
Narrowly focused investments may exhibit higher volatility than investments in multiple industry sectors.
Investments in small and/or medium-sized companies typically exhibit greater risk and higher volatility than larger, more established companies.
REIT investments are subject to many of the risks associated with direct real estate ownership, including changes in economic conditions, credit risk, and interest rate fluctuations.
The disruptions caused by natural disasters, pandemics, or similar events could prevent the Fund from executing advantageous investment decisions in a timely manner and could negatively impact the Fund’s ability to achieve its investment objective and the value of the Fund’s investments.
2The Fund’s expense ratios, as described in the most recent prospectus, are disclosed in the following “Fund expense ratios” table. The expense ratios below may differ from the expense ratios in the “Financial highlights” since they are based on different time periods and the expense ratios in the prospectus include acquired fund fees and expenses, if any. See Note 2 in “Notes to financial statements” for additional details. Please see the “Financial highlights” section in this report for the most recent expense ratios.
| Fund expense ratios | Class A | Class C | Class R | Institutional
Class | Class R6 |
| Total annual operating expenses (without fee waivers) | 1.11% | 1.86% | 1.36% | 0.86% | 0.70% |
| Net expenses (including fee waivers, if any) | 1.11% | 1.86% | 1.36% | 0.86% | 0.70% |
| | | | | | |
| Type of waiver | n/a | n/a | n/a | n/a | n/a |
Performance summary
Delaware Small Cap Value Fund
Performance of a $10,000 investment1
For the period November 30, 2013 through November 30, 2023
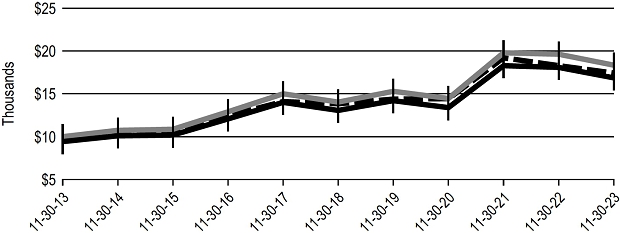
| | | | Starting value | | Ending value |
 | Delaware Small Cap Value Fund - Institutional Class shares | | $ | 10,000 | | | $ | 18,344 | |
 | Russell 2000 Value Index | | $ | 10,000 | | | $ | 17,420 | |
 | Delaware Small Cap Value Fund - Class A shares | | $ | 9,425 | | | $ | 16,863 | |
1The “Performance of a $10,000 investment” graph assumes $10,000 invested in Institutional Class and Class A shares of the Fund on November 30, 2013, and includes the effect of a 5.75% front-end sales charge (for Class A shares) and the reinvestment of all distributions. The graph does not reflect the deduction of taxes the shareholders would pay on Fund distributions or redemptions of Fund shares. Expense limitations were in effect for some or all of the periods shown. Performance would have been lower had expense limitations not been in effect. Expenses are listed in the “Fund expense ratios” table on page 5. Please note additional details on pages 4 through 7.
The graph also assumes $10,000 invested in the Russell 2000 Value Index as of November 30, 2013. The Russell 2000 Value Index measures the performance of the small-cap value segment of the US equity universe. It includes those Russell 2000 companies with lower price-to-book ratios and lower forecasted growth values.
The Russell 2000 Growth Index, mentioned on page 1, measures the performance of the small-cap growth segment of the US equity universe. It includes those Russell 2000 companies with higher price-to-book ratios and higher forecasted growth values.
The Russell 1000 Growth Index, mentioned on page 1, measures the performance of the large-cap growth segment of the US equity universe. It includes those Russell 1000 companies with higher price-to-book ratios and higher forecasted growth values.
The Russell 1000 Value Index, mentioned on page 1, measures the performance of the large-cap value segment of the US equity universe. It includes those Russell
1000 companies with lower price-to-book ratios and lower forecasted growth values.
Frank Russell Company is the source and owner of the trademarks, service marks and copyrights related to the Russell Indexes. Russell® is a trademark of Frank Russell Company.
Index performance returns do not reflect any management fees, transaction costs, or expenses. Indices are unmanaged and one cannot invest directly in an index. Past performance does not guarantee future results.
Performance of other Fund classes will vary due to different charges and expenses.
| | Nasdaq symbols | CUSIPs |
| Class A | DEVLX | 246097109 |
| Class C | DEVCX | 246097406 |
| Class R | DVLRX | 246097505 |
| Institutional Class | DEVIX | 246097208 |
| Class R6 | DVZRX | 24610B818 |
Disclosure of Fund expenses
For the six-month period from June 1, 2023 to November 30, 2023 (Unaudited)
As a shareholder of the Fund, you incur two types of costs: (1) transaction costs, including sales charges (loads) on purchase payments, reinvested dividends, or other distributions; redemption fees; and exchange fees; and (2) ongoing costs, including management fees; distribution and service (12b-1) fees; and other Fund expenses. This example is intended to help you understand your ongoing costs (in dollars) of investing in the Fund and to compare these costs with the ongoing costs of investing in other mutual funds.
The example is based on an investment of $1,000 invested at the beginning of the period and held for the entire six-month period from June 1, 2023 to November 30, 2023.
Actual expenses
The first section of the table shown, “Actual Fund return,” provides information about actual account values and actual expenses. You may use the information in this section of the table, together with the amount you invested, to estimate the expenses that you paid over the period. Simply divide your account value by $1,000 (for example, an $8,600 account value divided by $1,000 = 8.6), then multiply the result by the number in the first section under the heading entitled “Expenses Paid During Period” to estimate the expenses you paid on your account during this period.
Hypothetical example for comparison purposes
The second section of the table shown, “Hypothetical 5% return,” provides information about hypothetical account values and hypothetical expenses based on the Fund’s actual expense ratio and an assumed rate of return of 5% per year before expenses, which is not the Fund’s actual return. The hypothetical account values and expenses may not be used to estimate the actual ending account balance or expenses you paid for the period. You may use this information to compare the ongoing costs of investing in the Fund and other funds. To do so, compare this 5% hypothetical example with the 5% hypothetical examples that appear in the shareholder reports of the other funds.
Please note that the expenses shown in the table are meant to highlight your ongoing costs only and do not reflect any transactional costs, such as sales charges (loads), redemption fees, or exchange fees. Therefore, the second section of the table is useful in comparing ongoing costs only, and will not help you determine the relative total costs of owning different funds. In addition, if these transactional costs were included, your costs would have been higher. The Fund’s expenses shown in the table assume reinvestment of all dividends and distributions.
Delaware Small Cap Value Fund
Expense analysis of an investment of $1,000
| | | Beginning
Account Value
6/1/23 | | Ending
Account Value
11/30/23 | | Annualized
Expense Ratio | | Expenses
Paid During Period
6/1/23 to 11/30/23* |
| Actual Fund return† | | | | | | | | | | | | |
| Class A | | $ | 1,000.00 | | | $ | 1,068.40 | | | | 1.11 | % | | $ | 5.76 | |
| Class C | | | 1,000.00 | | | | 1,064.50 | | | | 1.86 | % | | | 9.63 | |
| Class R | | | 1,000.00 | | | | 1,067.00 | | | | 1.36 | % | | | 7.05 | |
| Institutional Class | | | 1,000.00 | | | | 1,069.80 | | | | 0.86 | % | | | 4.46 | |
| Class R6 | | | 1,000.00 | | | | 1,070.80 | | | | 0.71 | % | | | 3.69 | |
| Hypothetical 5% return (5% return before expenses) | | | | | | | | | | |
| Class A | | $ | 1,000.00 | | | $ | 1,019.50 | | | | 1.11 | % | | $ | 5.62 | |
| Class C | | | 1,000.00 | | | | 1,015.74 | | | | 1.86 | % | | | 9.40 | |
| Class R | | | 1,000.00 | | | | 1,018.25 | | | | 1.36 | % | | | 6.88 | |
| Institutional Class | | | 1,000.00 | | | | 1,020.76 | | | | 0.86 | % | | | 4.36 | |
| Class R6 | | | 1,000.00 | | | | 1,021.51 | | | | 0.71 | % | | | 3.60 | |
*“Expenses Paid During Period” are equal to the Fund’s annualized expense ratio, multiplied by the average account value over the period, multiplied by 183/365 (to reflect the one-half year period).
†Because actual returns reflect only the most recent six-month period, the returns shown may differ significantly from fiscal year returns.
In addition to the Fund’s expenses reflected above, the Fund also indirectly bears its portion of the fees and expenses of any investment companies (Underlying Funds), in which it invests. The table above does not reflect the expenses of any Underlying Funds.
Security type / sector allocations and top 10
equity holdings
| Delaware Small Cap Value Fund | As of November 30, 2023 (Unaudited) |
Sector designations may be different from the sector designations presented in other Fund materials. The sector designations may represent the investment manager’s internal sector classifications, which may result in the sector designations for one fund being different from another fund’s sector designations.
| Security type / sector | | Percentage of net assets |
| Common Stocks | | | 98.18 | % |
| Basic Industry | | | 8.21 | % |
| Consumer Discretionary | | | 11.29 | % |
| Consumer Staples | | | 2.87 | % |
| Energy | | | 9.97 | % |
| Financial Services | | | 24.82 | % |
| Healthcare | | | 3.67 | % |
| Industrials | | | 14.33 | % |
| Real Estate Investment Trusts | | | 6.89 | % |
| Technology | | | 10.42 | % |
| Transportation | | | 2.55 | % |
| Utilities | | | 3.16 | % |
| Short-Term Investments | | | 0.49 | % |
| Total Value of Securities | | | 98.67 | % |
| Receivables and Other Assets Net of Liabilities | | | 1.33 | % |
| Total Net Assets | | | 100.00 | % |
Top 10 equity holdings are for informational purposes only and are subject to change at any time. They are not a recommendation to buy, sell, or hold any security.
| Top 10 equity holdings | | Percentage of net assets |
| ITT | | | 1.91 | % |
| Webster Financial | | | 1.77 | % |
| Atkore | | | 1.76 | % |
| Hancock Whitney | | | 1.71 | % |
| Stifel Financial | | | 1.69 | % |
| Valley National Bancorp | | | 1.59 | % |
| East West Bancorp | | | 1.58 | % |
| Meritage Homes | | | 1.53 | % |
| Berry Global Group | | | 1.52 | % |
| FNB | | | 1.49 | % |
| | | | | |
| Schedule of investments | |
| Delaware Small Cap Value Fund | November 30, 2023 |
| | | Number of
shares | | | Value (US $) | |
| Common Stocks — 98.18% | | | | | | |
| Basic Industry — 8.21% | | | | | | | | |
| Ashland | | | 349,000 | | | $ | 27,892,080 | |
| Avient | | | 1,021,350 | | | | 35,083,373 | |
| Berry Global Group | | | 1,072,560 | | | | 70,917,667 | |
| HB Fuller | | | 783,750 | | | | 59,314,200 | |
| Huntsman | | | 1,550,100 | | | | 38,132,460 | |
| Knife River † | | | 480,500 | | | | 28,676,240 | |
| Louisiana-Pacific | | | 846,950 | | | | 51,655,480 | |
| Ryerson Holding | | | 863,750 | | | | 26,750,338 | |
| Summit Materials Class A † | | | 1,296,926 | | | | 44,990,363 | |
| | | | | | | | 383,412,201 | |
| Consumer Discretionary — 11.29% | | | | | | | | |
| Acushnet Holdings | | | 881,000 | | | | 49,776,500 | |
| Adient † | | | 1,437,700 | | | | 46,293,940 | |
| Barnes Group | | | 393,800 | | | | 10,388,444 | |
| Choice Hotels International | | | 278,900 | | | | 30,757,092 | |
| Columbia Sportswear | | | 557,300 | | | | 43,653,309 | |
| Group 1 Automotive | | | 211,010 | | | | 59,525,921 | |
| KB Home | | | 1,067,500 | | | | 55,616,750 | |
| Meritage Homes | | | 504,800 | | | | 71,328,240 | |
| Oxford Industries | | | 262,100 | | | | 23,701,703 | |
| Steven Madden | | | 1,162,925 | | | | 44,098,116 | |
| Texas Roadhouse | | | 372,550 | | | | 41,934,228 | |
| UniFirst | | | 291,170 | | | | 50,255,942 | |
| | | | | | | | 527,330,185 | |
| Consumer Staples — 2.87% | | | | | | | | |
| Flowers Foods | | | 1,127,000 | | | | 23,452,870 | |
| J & J Snack Foods | | | 392,400 | | | | 64,569,420 | |
| J M Smucker | | | 41,850 | | | | 4,592,239 | |
| Performance Food Group † | | | 634,922 | | | | 41,301,676 | |
| | | | | | | | 133,916,205 | |
| Energy — 9.97% | | | | | | | | |
| CNX Resources † | | | 988,300 | | | | 20,615,938 | |
| EnLink Midstream | | | 4,706,600 | | | | 64,339,222 | |
| International Seaways | | | 912,800 | | | | 41,660,192 | |
| Liberty Energy | | | 3,181,800 | | | | 63,158,730 | |
| Magnolia Oil & Gas Class A | | | 2,954,700 | | | | 63,526,050 | |
| Matador Resources | | | 1,016,050 | | | | 58,808,974 | |
| Murphy Oil | | | 1,558,700 | | | | 66,665,599 | |
| Patterson-UTI Energy | | | 3,845,700 | | | | 45,033,147 | |
Schedule of investments
Delaware Small Cap Value Fund
| | | Number of
shares | | | Value (US $) | |
| Common Stocks (continued) | | | | | | |
| Energy (continued) | | | | | | | | |
| PBF Energy Class A | | | 950,100 | | | $ | 42,184,440 | |
| | | | | | | | 465,992,292 | |
| Financial Services — 24.82% | | | | | | | | |
| Assurant | | | 371,900 | | | | 62,486,638 | |
| Axis Capital Holdings | | | 980,600 | | | | 55,247,004 | |
| Bank of NT Butterfield & Son | | | 1,100,800 | | | | 30,525,184 | |
| Bread Financial Holdings | | | 785,900 | | | | 22,083,790 | |
| Cadence Bank | | | 1,786,150 | | | | 44,743,058 | |
| Columbia Banking System | | | 2,601,361 | | | | 58,348,527 | |
| Comerica | | | 612,200 | | | | 27,683,684 | |
| East West Bancorp | | | 1,174,573 | | | | 73,904,133 | |
| Essent Group | | | 1,028,600 | | | | 49,722,524 | |
| First Financial Bancorp | | | 1,932,000 | | | | 39,045,720 | |
| First Interstate BancSystem Class A | | | 1,255,922 | | | | 32,515,821 | |
| FNB | | | 5,822,450 | | | | 69,811,175 | |
| Hancock Whitney | | | 1,934,350 | | | | 79,791,937 | |
| Hanover Insurance Group | | | 437,250 | | | | 54,350,175 | |
| Hope Bancorp | | | 3,538,440 | | | | 34,676,712 | |
| Sandy Spring Bancorp | | | 937,925 | | | | 20,653,109 | |
| Selective Insurance Group | | | 398,406 | | | | 40,513,906 | |
| Stewart Information Services | | | 811,200 | | | | 38,329,200 | |
| Stifel Financial | | | 1,292,400 | | | | 78,862,248 | |
| Synovus Financial | | | 1,817,450 | | | | 55,959,286 | |
| Valley National Bancorp | | | 8,140,100 | | | | 74,074,910 | |
| WaFd | | | 1,278,100 | | | | 34,163,613 | |
| Webster Financial | | | 1,839,310 | | | | 82,493,053 | |
| | | | | | | | 1,159,985,407 | |
| Healthcare — 3.67% | | | | | | | | |
| Globus Medical Class A † | | | 480,400 | | | | 21,579,568 | |
| Integer Holdings † | | | 622,800 | | | | 54,320,616 | |
| Integra LifeSciences Holdings † | | | 616,800 | | | | 24,172,392 | |
| Patterson Cos | | | 1,218,300 | | | | 30,957,003 | |
| Prestige Consumer Healthcare † | | | 708,600 | | | | 40,638,210 | |
| | | | | | | | 171,667,789 | |
| Industrials — 14.33% | | | | | | | | |
| Atkore † | | | 634,800 | | | | 82,460,520 | |
| CACI International Class A † | | | 178,400 | | | | 57,257,480 | |
| Concentrix | | | 358,400 | | | | 33,686,016 | |
| H&E Equipment Services | | | 991,600 | | | | 43,937,796 | |
| | | Number of
shares | | | Value (US $) | |
| Common Stocks (continued) | | | | | | |
| Industrials (continued) | | | | | | | | |
| ITT | | | 824,830 | | | $ | 89,304,344 | |
| KBR | | | 1,056,572 | | | | 54,593,075 | |
| MasTec † | | | 912,429 | | | | 55,329,695 | |
| Regal Rexnord | | | 366,739 | | | | 43,935,332 | |
| Terex | | | 1,069,550 | | | | 52,942,725 | |
| Timken | | | 637,250 | | | | 46,136,900 | |
| WESCO International | | | 297,600 | | | | 46,380,960 | |
| Zurn Elkay Water Solutions | | | 2,167,200 | | | | 63,802,368 | |
| | | | | | | | 669,767,211 | |
| Real Estate Investment Trusts — 6.89% | | | | | | | | |
| Agree Realty | | | 643,950 | | | | 38,128,279 | |
| Apple Hospitality REIT | | | 3,001,600 | | | | 50,036,672 | |
| Independence Realty Trust | | | 2,638,290 | | | | 35,933,510 | |
| Kite Realty Group Trust | | | 1,794,664 | | | | 37,903,304 | |
| LXP Industrial Trust | | | 4,781,300 | | | | 41,979,814 | |
| National Health Investors | | | 716,950 | | | | 38,901,707 | |
| Spirit Realty Capital | | | 1,008,250 | | | | 41,640,725 | |
| Tricon Residential | | | 4,735,300 | | | | 37,314,164 | |
| | | | | | | | 321,838,175 | |
| Technology — 10.42% | | | | | | | | |
| Belden | | | 613,200 | | | | 40,741,008 | |
| Cirrus Logic † | | | 612,400 | | | | 46,487,284 | |
| Diodes † | | | 640,300 | | | | 42,528,726 | |
| Flex † | | | 2,734,110 | | | | 69,583,100 | |
| Leonardo DRS † | | | 2,125,300 | | | | 39,169,279 | |
| NCR Voyix † | | | 677,628 | | | | 10,625,207 | |
| NetScout Systems † | | | 1,467,806 | | | | 29,473,544 | |
| Power Integrations | | | 632,100 | | | | 48,298,761 | |
| TD SYNNEX | | | 380,300 | | | | 37,512,792 | |
| TTM Technologies † | | | 3,542,802 | | | | 53,177,458 | |
| Viavi Solutions † | | | 3,112,700 | | | | 25,150,616 | |
| Vishay Intertechnology | | | 1,995,800 | | | | 44,366,634 | |
| | | | | | | | 487,114,409 | |
| Transportation — 2.55% | | | | | | | | |
| Kirby † | | | 525,700 | | | | 40,347,475 | |
| Saia † | | | 59,750 | | | | 23,325,802 | |
| Werner Enterprises | | | 1,390,100 | | | | 55,617,901 | |
| | | | | | | | 119,291,178 | |
Schedule of investments
Delaware Small Cap Value Fund
| | | Number of
shares | | | Value (US $) | |
| Common Stocks (continued) | | | | | | |
| Utilities — 3.16% | | | | | | | | |
| ALLETE | | | 438,900 | | | $ | 24,350,172 | |
| Black Hills | | | 624,790 | | | | 32,232,916 | |
| OGE Energy | | | 1,445,400 | | | | 50,661,270 | |
| Southwest Gas Holdings | | | 686,500 | | | | 40,579,015 | |
| | | | | | | | 147,823,373 | |
| Total Common Stocks (cost $3,318,219,974) | | | | | | | 4,588,138,425 | |
| | | | | | | | | |
| Short-Term Investments — 0.49% | | | | | | | | |
| Money Market Mutual Funds — 0.49% | | | | | | | | |
| BlackRock Liquidity FedFund – Institutional Shares (seven-day effective yield 5.25%) | | | 5,783,772 | | | | 5,783,772 | |
| Fidelity Investments Money Market Government Portfolio – Class I (seven-day effective yield 5.24%) | | | 5,783,771 | | | | 5,783,771 | |
| Goldman Sachs Financial Square Government Fund – Institutional Shares (seven-day effective yield 5.39%) | | | 5,783,771 | | | | 5,783,771 | |
| Morgan Stanley Institutional Liquidity Funds Government Portfolio – Institutional Class (seven-day effective yield 5.26%) | | | 5,783,771 | | | | 5,783,771 | |
| Total Short-Term Investments (cost $23,135,085) | | | | | | | 23,135,085 | |
Total Value of Securities—98.67%
(cost $3,341,355,059) | | | | | | $ | 4,611,273,510 | |
| † | Non-income producing security. |
Summary of abbreviations:
REIT – Real Estate Investment Trust
See accompanying notes, which are an integral part of the financial statements.
| Statement of assets and liabilities | |
| Delaware Small Cap Value Fund | November 30, 2023 |
| Assets: | | | |
| Investments, at value* | | $ | 4,611,273,510 | |
| Receivable for securities sold | | | 63,767,942 | |
| Receivable for fund shares sold | | | 10,284,665 | |
| Dividends receivable | | | 8,418,970 | |
| Prepaid expenses | | | 76,490 | |
| Foreign tax reclaims receivable | | | 30,312 | |
| Other assets | | | 47,973 | |
| Total Assets | | | 4,693,899,862 | |
| Liabilities: | | | | |
| Payable for fund shares redeemed | | | 15,282,933 | |
| Investment management fees payable to affiliates | | | 2,482,822 | |
| Other accrued expenses | | | 2,119,130 | |
| Administration expenses payable to affiliates | | | 442,372 | |
| Distribution fees payable to affiliates | | | 183,600 | |
| Total Liabilities | | | 20,510,857 | |
| Total Net Assets | | $ | 4,673,389,005 | |
| | | | | |
| Net Assets Consist of: | | | | |
| Paid-in capital | | $ | 3,095,085,881 | |
| Total distributable earnings (loss) | | | 1,578,303,124 | |
| Total Net Assets | | $ | 4,673,389,005 | |
Statement of assets and liabilities
Delaware Small Cap Value Fund
| Net Asset Value | | | |
| | | | |
| Class A: | | | | |
| Net assets | | $ | 726,869,674 | |
| Shares of beneficial interest outstanding, unlimited authorization, no par | | | 11,404,762 | |
| Net asset value per share | | $ | 63.73 | |
| Sales charge | | | 5.75 | % |
| Offering price per share, equal to net asset value per share / (1 - sales charge) | | $ | 67.62 | |
| | | | | |
| Class C: | | | | |
| Net assets | | $ | 26,959,054 | |
| Shares of beneficial interest outstanding, unlimited authorization, no par | | | 541,013 | |
| Net asset value per share | | $ | 49.83 | |
| | | | | |
| Class R: | | | | |
| Net assets | | $ | 37,410,866 | |
| Shares of beneficial interest outstanding, unlimited authorization, no par | | | 609,944 | |
| Net asset value per share | | $ | 61.33 | |
| | | | | |
| Institutional Class: | | | | |
| Net assets | | $ | 2,639,183,514 | |
| Shares of beneficial interest outstanding, unlimited authorization, no par | | | 38,697,202 | |
| Net asset value per share | | $ | 68.20 | |
| | | | | |
| Class R6: | | | | |
| Net assets | | $ | 1,242,965,897 | |
| Shares of beneficial interest outstanding, unlimited authorization, no par | | | 18,170,413 | |
| Net asset value per share | | $ | 68.41 | |
| _______________ | | | | |
| *Investments, at cost | | $ | 3,341,355,059 | |
See accompanying notes, which are an integral part of the financial statements.
| Statement of operations | |
| Delaware Small Cap Value Fund | Year ended November 30, 2023 |
| Investment Income: | | | | |
| Dividends | | $ | 110,647,522 | |
| Foreign tax withheld | | | (161,676 | ) |
| | | | 110,485,846 | |
| | | | | |
| Expenses: | | | | |
| Management fees | | | 34,442,244 | |
| Distribution expenses — Class A | | | 1,962,151 | |
| Distribution expenses — Class C | | | 318,616 | |
| Distribution expenses — Class R | | | 195,564 | |
| Dividend disbursing and transfer agent fees and expenses | | | 8,128,492 | |
| Reports and statements to shareholders expenses | | | 633,909 | |
| Accounting and administration expenses | | | 546,863 | |
| Trustees’ fees and expenses | | | 315,287 | |
| Legal fees | | | 191,893 | |
| Registration fees | | | 80,320 | |
| Custodian fees | | | 59,369 | |
| Audit and tax fees | | | 32,438 | |
| Other | | | 126,072 | |
| | | | 47,033,218 | |
| Less expenses paid indirectly | | | (931 | ) |
| Total operating expenses | | | 47,032,287 | |
| Net Investment Income (Loss) | | | 63,453,559 | |
| | | | | |
| Net Realized and Unrealized Gain (Loss): | | | | |
| Net realized gain (loss) on investments | | | 354,282,632 | |
| Net change in unrealized appreciation (depreciation) on investments | | | (842,788,765 | ) |
| Net Realized and Unrealized Gain (Loss) | | | (488,506,133 | ) |
| Net Increase (Decrease) in Net Assets Resulting from Operations | | $ | (425,052,574 | ) |
See accompanying notes, which are an integral part of the financial statements.
Statements of changes in net assets
Delaware Small Cap Value Fund
| | | Year ended | |
| | | 11/30/23 | | | 11/30/22 | |
| Increase (Decrease) in Net Assets from Operations: | | | | | | | | |
| Net investment income (loss) | | $ | 63,453,559 | | | $ | 57,565,767 | |
| Net realized gain (loss) | | | 354,282,632 | | | | 197,937,802 | |
| Net change in unrealized appreciation (depreciation) | | | (842,788,765 | ) | | | (312,047,509 | ) |
| Net increase (decrease) in net assets resulting from operations | | | (425,052,574 | ) | | | (56,543,940 | ) |
| | | | | | | | | |
| Dividends and Distributions to Shareholders from: | | | | | | | | |
| Distributable earnings: | | | | | | | | |
| Class A | | | (35,039,596 | ) | | | (45,458,396 | ) |
| Class C | | | (1,634,204 | ) | | | (2,658,184 | ) |
| Class R | | | (1,676,683 | ) | | | (2,387,422 | ) |
| Institutional Class | | | (149,773,304 | ) | | | (174,740,155 | ) |
| Class R6 | | | (62,711,912 | ) | | | (72,885,947 | ) |
| | | | (250,835,699 | ) | | | (298,130,104 | ) |
| | | | | | | | | |
| Capital Share Transactions (See Note 6): | | | | | | | | |
| Proceeds from shares sold: | | | | | | | | |
| Class A | | | 84,042,354 | | | | 115,735,281 | |
| Class C | | | 1,993,421 | | | | 5,387,882 | |
| Class R | | | 6,773,118 | | | | 8,181,846 | |
| Institutional Class | | | 489,116,148 | | | | 873,821,014 | |
| Class R6 | | | 301,884,026 | | | | 435,711,124 | |
| | | | | | | | | |
| Net asset value of shares issued upon reinvestment of dividends and distributions: | | | | | | | | |
| Class A | | | 34,729,377 | | | | 45,074,335 | |
| Class C | | | 1,628,375 | | | | 2,654,661 | |
| Class R | | | 1,676,683 | | | | 2,387,422 | |
| Institutional Class | | | 141,879,441 | | | | 165,309,317 | |
| Class R6 | | | 59,670,927 | | | | 71,157,932 | |
| | | | 1,123,393,870 | | | | 1,725,420,814 | |
| | | Year ended | |
| | | 11/30/23 | | | 11/30/22 | |
| Capital Share Transactions (continued): | | | | | | | | |
| Cost of shares redeemed: | | | | | | | | |
| Class A | | $ | (194,047,016 | ) | | $ | (224,410,436 | ) |
| Class C | | | (11,537,199 | ) | | | (15,832,017 | ) |
| Class R | | | (10,212,321 | ) | | | (17,922,778 | ) |
| Institutional Class | | | (1,418,502,968 | ) | | | (949,611,398 | ) |
| Class R6 | | | (500,931,258 | ) | | | (485,353,212 | ) |
| | | | (2,135,230,762 | ) | | | (1,693,129,841 | ) |
| Increase (decrease) in net assets derived from capital share transactions | | | (1,011,836,892 | ) | | | 32,290,973 | |
| Net Decrease in Net Assets | | | (1,687,725,165 | ) | | | (322,383,071 | ) |
| | | | | | | | | |
| Net Assets: | | | | | | | | |
| Beginning of year | | | 6,361,114,170 | | | | 6,683,497,241 | |
| End of year | | $ | 4,673,389,005 | | | $ | 6,361,114,170 | |
See accompanying notes, which are an integral part of the financial statements.
Financial highlights
Delaware Small Cap Value Fund Class A
Selected data for each share of the Fund outstanding throughout each period were as follows:
| Net asset value, beginning of period |
| |
| Income (loss) from investment operations: |
| Net investment income1 |
| Net realized and unrealized gain (loss) |
| Total from investment operations |
| |
| Less dividends and distributions from: |
| Net investment income |
| Net realized gain |
| Total dividends and distributions |
| |
| Net asset value, end of period |
| |
| Total return2 |
| |
| Ratios and supplemental data: |
| Net assets, end of period (000 omitted) |
| Ratio of expenses to average net assets3 |
| Ratio of net investment income to average net assets |
| Portfolio turnover |
| 1 | Calculated using average shares outstanding. |
| 2 | Total return is based on the change in net asset value of a share during the period and assumes reinvestment of dividends and distributions at net asset value and does not reflect the impact of a sales charge. |
| 3 | Expense ratios do not include expenses of any investment companies in which the Fund invests. |
See accompanying notes, which are an integral part of the financial statements.
| Year ended | |
| 11/30/23 | | | 11/30/22 | | | 11/30/21 | | | 11/30/20 | | | 11/30/19 | |
| $ | 71.35 | | | $ | 75.49 | | | $ | 55.68 | | | $ | 61.58 | | | $ | 61.81 | |
| | | | | | | | | | | | | | | | | | | |
| | 0.60 | | | | 0.47 | | | | 0.28 | | | | 0.39 | | | | 0.52 | |
| | (5.42 | ) | | | (1.23 | ) | | | 19.94 | | | | (3.67 | ) | | | 3.63 | |
| | (4.82 | ) | | | (0.76 | ) | | | 20.22 | | | | (3.28 | ) | | | 4.15 | |
| | | | | | | | | | | | | | | | | | | |
| | | | | | | | | | | | | | | | | | | |
| | (0.49 | ) | | | (0.28 | ) | | | (0.41 | ) | | | (0.58 | ) | | | (0.42 | ) |
| | (2.31 | ) | | | (3.10 | ) | | | — | | | | (2.04 | ) | | | (3.96 | ) |
| | (2.80 | ) | | | (3.38 | ) | | | (0.41 | ) | | | (2.62 | ) | | | (4.38 | ) |
| | | | | | | | | | | | | | | | | | | |
| $ | 63.73 | | | $ | 71.35 | | | $ | 75.49 | | | $ | 55.68 | | | $ | 61.58 | |
| | | | | | | | | | | | | | | | | | | |
| | (6.74 | %) | | | (1.10 | %) | | | 36.52 | % | | | (5.70 | %) | | | 8.69 | % |
| | | | | | | | | | | | | | | | | | | |
| $ | 726,870 | | | $ | 896,355 | | | $ | 1,016,518 | | | $ | 551,442 | | | $ | 637,146 | |
| | 1.11 | % | | | 1.11 | % | | | 1.11 | % | | | 1.14 | % | | | 1.15 | % |
| | 0.93 | % | | | 0.67 | % | | | 0.38 | % | | | 0.80 | % | | | 0.90 | % |
| | 27 | % | | | 19 | % | | | 14 | % | | | 23 | % | | | 18 | % |
Financial highlights
Delaware Small Cap Value Fund Class C
Selected data for each share of the Fund outstanding throughout each period were as follows:
| Net asset value, beginning of period |
| |
| Income (loss) from investment operations: |
| Net investment income (loss)1 |
| Net realized and unrealized gain (loss) |
| Total from investment operations |
| |
| Less dividends and distributions from: |
| Net investment income |
| Net realized gain |
| Total dividends and distributions |
| |
| Net asset value, end of period |
| |
| Total return2 |
| |
| Ratios and supplemental data: |
| Net assets, end of period (000 omitted) |
| Ratio of expenses to average net assets3 |
| Ratio of net investment income (loss) to average net assets |
| Portfolio turnover |
| 1 | Calculated using average shares outstanding. |
| 2 | Total return is based on the change in net asset value of a share during the period and assumes reinvestment of dividends and distributions at net asset value and does not reflect the impact of a sales charge. |
| 3 | Expense ratios do not include expenses of any investment companies in which the Fund invests. |
See accompanying notes, which are an integral part of the financial statements.
| Year ended | |
| 11/30/23 | | | 11/30/22 | | | 11/30/21 | | | 11/30/20 | | | 11/30/19 | |
| $ | 56.36 | | | $ | 60.49 | | | $ | 44.71 | | | $ | 49.95 | | | $ | 50.96 | |
| | | | | | | | | | | | | | | | | | | |
| | 0.09 | | | | (0.05 | ) | | | (0.21 | ) | | | 0.02 | | | | 0.07 | |
| | (4.27 | ) | | | (0.98 | ) | | | 16.06 | | | | (3.00 | ) | | | 2.88 | |
| | (4.18 | ) | | | (1.03 | ) | | | 15.85 | | | | (2.98 | ) | | | 2.95 | |
| | | | | | | | | | | | | | | | | | | |
| | | | | | | | | | | | | | | | | | | |
| | (0.04 | ) | | | — | | | | (0.07 | ) | | | (0.22 | ) | | | — | |
| | (2.31 | ) | | | (3.10 | ) | | | — | | | | (2.04 | ) | | | (3.96 | ) |
| | (2.35 | ) | | | (3.10 | ) | | | (0.07 | ) | | | (2.26 | ) | | | (3.96 | ) |
| | | | | | | | | | | | | | | | | | | |
| $ | 49.83 | | | $ | 56.36 | | | $ | 60.49 | | | $ | 44.71 | | | $ | 49.95 | |
| | | | | | | | | | | | | | | | | | | |
| | (7.43 | %) | | | (1.84 | %) | | | 35.48 | % | | | (6.38 | %) | | | 7.88 | % |
| | | | | | | | | | | | | | | | | | | |
| $ | 26,959 | | | $ | 39,409 | | | $ | 51,078 | | | $ | 46,463 | | | $ | 69,109 | |
| | 1.86 | % | | | 1.86 | % | | | 1.86 | % | | | 1.89 | % | | | 1.90 | % |
| | 0.18 | % | | | (0.08 | %) | | | (0.37 | %) | | | 0.05 | % | | | 0.15 | % |
| | 27 | % | | | 19 | % | | | 14 | % | | | 23 | % | | | 18 | % |
Financial highlights
Delaware Small Cap Value Fund Class R
Selected data for each share of the Fund outstanding throughout each period were as follows:
| Net asset value, beginning of period |
| |
| Income (loss) from investment operations: |
| Net investment income1 |
| Net realized and unrealized gain (loss) |
| Total from investment operations |
| |
| Less dividends and distributions from: |
| Net investment income |
| Net realized gain |
| Total dividends and distributions |
| |
| Net asset value, end of period |
| |
| Total return2 |
| |
| Ratios and supplemental data: |
| Net assets, end of period (000 omitted) |
| Ratio of expenses to average net assets3 |
| Ratio of net investment income to average net assets |
| Portfolio turnover |
| 1 | Calculated using average shares outstanding. |
| 2 | Total return is based on the change in net asset value of a share during the period and assumes reinvestment of dividends and distributions at net asset value. |
| 3 | Expense ratios do not include expenses of any investment companies in which the Fund invests. |
See accompanying notes, which are an integral part of the financial statements.
| Year ended |
| 11/30/23 | | | 11/30/22 | | | 11/30/21 | | | 11/30/20 | | | 11/30/19 | |
| $ | 68.74 | | | $ | 72.83 | | | $ | 53.74 | | | $ | 59.52 | | | $ | 59.86 | |
| | | | | | | | | | | | | | | | | | | |
| | 0.42 | | | | 0.28 | | | | 0.09 | | | | 0.26 | | | | 0.36 | |
| | (5.21 | ) | | | (1.20 | ) | | | 19.28 | | | | (3.56 | ) | | | 3.52 | |
| | (4.79 | ) | | | (0.92 | ) | | | 19.37 | | | | (3.30 | ) | | | 3.88 | |
| | | | | | | | | | | | | | | | | | | |
| | | | | | | | | | | | | | | | | | | |
| | (0.31 | ) | | | (0.07 | ) | | | (0.28 | ) | | | (0.44 | ) | | | (0.26 | ) |
| | (2.31 | ) | | | (3.10 | ) | | | — | | | | (2.04 | ) | | | (3.96 | ) |
| | (2.62 | ) | | | (3.17 | ) | | | (0.28 | ) | | | (2.48 | ) | | | (4.22 | ) |
| | | | | | | | | | | | | | | | | | | |
| $ | 61.33 | | | $ | 68.74 | | | $ | 72.83 | | | $ | 53.74 | | | $ | 59.52 | |
| | | | | | | | | | | | | | | | | | | |
| | (6.96 | %) | | | (1.34 | %) | | | 36.18 | % | | | (5.92 | %) | | | 8.42 | % |
| | | | | | | | | | | | | | | | | | | |
| $ | 37,411 | | | $ | 43,983 | | | $ | 54,481 | | | $ | 43,823 | | | $ | 55,697 | |
| | 1.36 | % | | | 1.36 | % | | | 1.36 | % | | | 1.39 | % | | | 1.40 | % |
| | 0.68 | % | | | 0.42 | % | | | 0.13 | % | | | 0.55 | % | | | 0.65 | % |
| | 27 | % | | | 19 | % | | | 14 | % | | | 23 | % | | | 18 | % |
Financial highlights
Delaware Small Cap Value Fund Institutional Class
Selected data for each share of the Fund outstanding throughout each period were as follows:
| Net asset value, beginning of period |
| |
| Income (loss) from investment operations: |
| Net investment income1 |
| Net realized and unrealized gain (loss) |
| Total from investment operations |
| |
| Less dividends and distributions from: |
| Net investment income |
| Net realized gain |
| Total dividends and distributions |
| |
| Net asset value, end of period |
| |
| Total return2 |
| |
| Ratios and supplemental data: |
| Net assets, end of period (000 omitted) |
| Ratio of expenses to average net assets3 |
| Ratio of net investment income to average net assets |
| Portfolio turnover |
| 1 | Calculated using average shares outstanding. |
| 2 | Total return is based on the change in net asset value of a share during the period and assumes reinvestment of dividends and distributions at net asset value. |
| 3 | Expense ratios do not include expenses of any investment companies in which the Fund invests. |
See accompanying notes, which are an integral part of the financial statements.
| Year ended |
| 11/30/23 | | | 11/30/22 | | | 11/30/21 | | | 11/30/20 | | | 11/30/19 | |
| $ | 76.15 | | | $ | 80.31 | | | $ | 59.19 | | | $ | 65.28 | | | $ | 65.29 | |
| | | | | | | | | | | | | | | | | | | |
| | 0.82 | | | | 0.68 | | | | 0.48 | | | | 0.55 | | | | 0.70 | |
| | (5.78 | ) | | | (1.30 | ) | | | 21.18 | | | | (3.86 | ) | | | 3.86 | |
| | (4.96 | ) | | | (0.62 | ) | | | 21.66 | | | | (3.31 | ) | | | 4.56 | |
| | | | | | | | | | | | | | | | | | | |
| | | | | | | | | | | | | | | | | | | |
| | (0.68 | ) | | | (0.44 | ) | | | (0.54 | ) | | | (0.74 | ) | | | (0.61 | ) |
| | (2.31 | ) | | | (3.10 | ) | | | — | | | | (2.04 | ) | | | (3.96 | ) |
| | (2.99 | ) | | | (3.54 | ) | | | (0.54 | ) | | | (2.78 | ) | | | (4.57 | ) |
| | | | | | | | | | | | | | | | | | | |
| $ | 68.20 | | | $ | 76.15 | | | $ | 80.31 | | | $ | 59.19 | | | $ | 65.28 | |
| | | | | | | | | | | | | | | | | | | |
| | (6.50 | %) | | | (0.85 | %) | | | 36.84 | % | | | (5.43 | %) | | | 8.95 | % |
| | | | | | | | | | | | | | | | | | | |
| $ | 2,639,183 | | | $ | 3,833,425 | | | $ | 3,958,855 | | | $ | 3,115,293 | | | $ | 2,955,897 | |
| | 0.86 | % | | | 0.86 | % | | | 0.86 | % | | | 0.89 | % | | | 0.90 | % |
| | 1.18 | % | | | 0.92 | % | | | 0.63 | % | | | 1.05 | % | | | 1.15 | % |
| | 27 | % | | | 19 | % | | | 14 | % | | | 23 | % | | | 18 | % |
Financial highlights
Delaware Small Cap Value Fund Class R6
Selected data for each share of the Fund outstanding throughout each period were as follows:
| Net asset value, beginning of period |
| |
| Income (loss) from investment operations: |
| Net investment income1 |
| Net realized and unrealized gain (loss) |
| Total from investment operations |
| |
| Less dividends and distributions from: |
| Net investment income |
| Net realized gain |
| Total dividends and distributions |
| |
| Net asset value, end of period |
| |
| Total return2 |
| |
| Ratios and supplemental data: |
| Net assets, end of period (000 omitted) |
| Ratio of expenses to average net assets3 |
| Ratio of net investment income to average net assets |
| Portfolio turnover |
| 1 | Calculated using average shares outstanding. |
| 2 | Total return is based on the change in net asset value of a share during the period and assumes reinvestment of dividends and distributions at net asset value. |
| 3 | Expense ratios do not include expenses of any investment companies in which the Fund invests. |
See accompanying notes, which are an integral part of the financial statements.
| Year ended |
| 11/30/23 | | | 11/30/22 | | | 11/30/21 | | | 11/30/20 | | | 11/30/19 | |
| $ | 76.38 | | | $ | 80.53 | | | $ | 59.32 | | | $ | 65.41 | | | $ | 65.41 | |
| | | | | | | | | | | | | | | | | | | |
| | 0.92 | | | | 0.81 | | | | 0.61 | | | | 0.64 | | | | 0.81 | |
| | (5.79 | ) | | | (1.31 | ) | | | 21.21 | | | | (3.85 | ) | | | 3.85 | |
| | (4.87 | ) | | | (0.50 | ) | | | 21.82 | | | | (3.21 | ) | | | 4.66 | |
| | | | | | | | | | | | | | | | | | | |
| | | | | | | | | | | | | | | | | | | |
| | (0.79 | ) | | | (0.55 | ) | | | (0.61 | ) | | | (0.84 | ) | | | (0.70 | ) |
| | (2.31 | ) | | | (3.10 | ) | | | — | | | | (2.04 | ) | | | (3.96 | ) |
| | (3.10 | ) | | | (3.65 | ) | | | (0.61 | ) | | | (2.88 | ) | | | (4.66 | ) |
| | | | | | | | | | | | | | | | | | | |
| $ | 68.41 | | | $ | 76.38 | | | $ | 80.53 | | | $ | 59.32 | | | $ | 65.41 | |
| | | | | | | | | | | | | | | | | | | |
| | (6.35 | %) | | | (0.69 | %) | | | 37.08 | % | | | (5.28 | %) | | | 9.14 | % |
| | | | | | | | | | | | | | | | | | | |
| $ | 1,242,966 | | | $ | 1,547,942 | | | $ | 1,602,565 | | | $ | 928,618 | | | $ | 605,623 | |
| | 0.71 | % | | | 0.70 | % | | | 0.69 | % | | | 0.72 | % | | | 0.72 | % |
| | 1.33 | % | | | 1.08 | % | | | 0.80 | % | | | 1.22 | % | | | 1.33 | % |
| | 27 | % | | | 19 | % | | | 14 | % | | | 23 | % | | | 18 | % |
| Notes to financial statements | |
| Delaware Small Cap Value Fund | November 30, 2023 |
Delaware Group® Equity Funds V (Trust) is organized as a Delaware statutory trust and offers three series: Delaware Small Cap Core Fund, Delaware Small Cap Value Fund, and Delaware Wealth Builder Fund. These financial statements and the related notes pertain to Delaware Small Cap Value Fund (Fund). The Trust is an open-end investment company. The Fund is considered diversified under the Investment Company Act of 1940, as amended (1940 Act), and offers Class A, Class C, Class R, Institutional Class, and Class R6 shares. Class A shares are sold with a maximum front-end sales charge of 5.75%. There is no front-end sales charge when you purchase $1 million or more of Class A shares. However, if Delaware Distributors, L.P. (DDLP) paid your financial intermediary a commission on your purchase of $1 million or more of Class A shares, you will have to pay a limited contingent deferred sales charge (Limited CDSC) of 1.00% if you redeem these shares within the first 18 months after your purchase, unless a specific waiver of the Limited CDSC applies. Class C shares have no upfront sales charge, but are sold with a contingent deferred sales charge (CDSC) of 1.00%, which will be incurred if redeemed during the first 12 months. Class R, Institutional Class, and Class R6 shares are not subject to a sales charge and are offered for sale exclusively to certain eligible investors. In addition, Class R6 shares do not pay any service fees, sub-accounting fees, and/or sub-transfer agency fees to any brokers, dealers, or other financial intermediaries.
1. Significant Accounting Policies
The Fund follows accounting and reporting guidance under Financial Accounting Standards Board (FASB) Accounting Standards Codification Topic 946, Financial Services — Investment Companies. The following accounting policies are in accordance with US generally accepted accounting principles (US GAAP) and are consistently followed by the Fund.
Security Valuation — Equity securities and exchange-traded funds (ETFs), except those traded on the Nasdaq Stock Market LLC (Nasdaq), are valued at the last quoted sales price as of the time of the regular close of the New York Stock Exchange on the valuation date. Equity securities and ETFs traded on the Nasdaq are valued in accordance with the Nasdaq Official Closing Price, which may not be the last sales price. If, on a particular day, an equity security or ETF does not trade, the mean between the bid and the ask prices will be used, which approximates fair value. Open-end investment companies, other than ETFs, are valued at their published net asset value (NAV). Generally, other securities and assets for which market quotations are not readily available are valued at fair value as determined in good faith by Delaware Management Company (DMC). Subject to the oversight of the Trust’s Board of Trustees (Board), DMC, as valuation designee, has adopted policies and procedures to fair value securities for which market quotations are not readily available consistent with the requirements of Rule 2a-5 under the 1940 Act. In determining whether market quotations are readily available or fair valuation will be used, various factors will be taken into consideration, such as market closures or suspension of trading in a security. Restricted securities and private placements are valued at fair value.
Federal Income Taxes — No provision for federal income taxes has been made as the Fund intends to continue to qualify for federal income tax purposes as a regulated investment
company under Subchapter M of the Internal Revenue Code of 1986, as amended, and make the requisite distributions to shareholders. The Fund evaluates tax positions taken or expected to be taken in the course of preparing the Fund’s tax returns to determine whether the tax positions are “more-likely-than-not” of being sustained by the applicable tax authority. Tax positions not deemed to meet the “more-likely-than-not” threshold are recorded as a tax benefit or expense in the current year. Management has analyzed the Fund’s tax positions taken or expected to be taken on the Fund’s federal income tax returns through the year ended November 30, 2023, and for all open tax years (years ended November 30, 2020–November 30, 2022), and has concluded that no provision for federal income tax is required in the Fund’s financial statements. If applicable, the Fund recognizes interest accrued on unrecognized tax benefits in interest expense and penalties in “Other” on the “Statement of operations.” During the year ended November 30, 2023, the Fund did not incur any interest or tax penalties.
Class Accounting — Investment income, common expenses, and realized and unrealized gain (loss) on investments are allocated to the various classes of the Fund on the basis of daily net assets of each class. Distribution expenses relating to a specific class are charged directly to that class. Class R6 shares will not be allocated any expenses related to service fees, sub-accounting fees, and/or sub-transfer agency fees paid to brokers, dealers, or other financial intermediaries.
Underlying Funds — The Fund may invest in other investment companies (Underlying Funds) to the extent permitted by the 1940 Act. The Underlying Funds in which the Fund may invest include ETFs. The Fund will indirectly bear the investment management fees and other expenses of the Underlying Funds.
Use of Estimates — The preparation of financial statements in conformity with US GAAP requires management to make estimates and assumptions that affect the fair value of investments, the reported amounts of assets and liabilities and disclosure of contingent assets and liabilities at the date of the financial statements, and the reported amounts of revenues and expenses during the reporting period. Actual results could differ from those estimates and the differences could be material.
Other — Expenses directly attributable to the Fund are charged directly to the Fund. Other expenses common to various funds within the Delaware Funds by Macquarie® (Delaware Funds) are generally allocated among such funds on the basis of average net assets. Management fees and certain other expenses are paid monthly. Security transactions are recorded on the date the securities are purchased or sold (trade date) for financial reporting purposes. Costs used in calculating realized gains and losses on the sale of investment securities are those of the specific securities sold. Dividend income is recorded on the ex-dividend date and interest income is recorded on an accrual basis. Income and capital gain distributions from any Underlying Funds in which the Fund invests are recorded on the ex-dividend date. Distributions received from investments in real estate investment trusts (REITs) are recorded as dividend income on the ex-dividend date, subject to reclassification upon notice of the character of such distributions by the issuer, which are estimated. The Fund declares and pays dividends from net investment
Notes to financial statements
Delaware Small Cap Value Fund
1. Significant Accounting Policies (continued)
income and distributions from net realized gain on investments, if any, at least annually. The Fund may distribute more frequently, if necessary for tax purposes. Dividends and distributions, if any, are recorded on the ex-dividend date.
The Fund receives earnings credits from its transfer agent when positive cash balances are maintained, which may be used to offset transfer agent fees. If the amount earned is greater than $1, the expenses paid under this arrangement are included on the “Statement of operations” under “Dividend disbursing and transfer agent fees and expenses” with the corresponding expenses offset included under “Less expenses paid indirectly.”
2. Investment Management, Administration Agreements, and Other Transactions with Affiliates
In accordance with the terms of its investment management agreement, the Fund pays DMC, a series of Macquarie Investment Management Business Trust and the investment manager, an annual fee which is calculated daily and paid monthly at the rates of 0.75% on the first $500 million of average daily net assets of the Fund, 0.70% on the next $500 million, 0.65% on the next $1.5 billion, and 0.60% on average daily net assets in excess of $2.5 billion.
DMC entered into a Sub-Advisory Agreement on behalf of the Fund with Macquarie Investment Management Global Limited, which is an affiliate of DMC (“Affiliated Sub-Advisor”). Pursuant to the terms of the Sub-Advisory Agreement, the investment sub-advisory fee is paid by DMC to the Affiliated Sub-Advisor based on the extent to which the Affiliated Sub-Advisor provides services to the Fund.
Delaware Investments Fund Services Company (DIFSC), an affiliate of DMC, provides fund accounting and financial administrative oversight services to the Fund. For these services, effective October 1, 2023, DIFSC’s fees are calculated daily and paid monthly, based on the aggregate daily net assets of all funds within the Delaware Funds at the following annual rates: 0.0050% of the first $60 billion; 0.00475% of the next $30 billion; and 0.0015% of aggregate average daily net assets in excess of $90 billion (Total Fee). Prior to October 1, 2023, DIFSC’s fees were payable by the fund at the following annual rates: 0.00475% of the first $35 billion; 0.0040% of the next $10 billion; 0.0025% of the next $45 billion; and 0.0015% of aggregate average daily net assets in excess of $90 billion. Each fund in the Delaware Funds pays a minimum of $4,000, which, in aggregate, is subtracted from the Total Fee. Each fund then pays its portion of the remainder of the Total Fee on a relative NAV basis. This amount is included on the “Statement of operations” under “Accounting and administration expenses.” For the year ended November 30, 2023, the Fund paid $170,768 for these services.
DIFSC is also the transfer agent and dividend disbursing agent of the Fund. For these services, DIFSC’s fees are calculated daily and paid monthly, based on the aggregate daily net assets of the retail funds within the Delaware Funds at the following annual rates: 0.014% of the first $20 billion; 0.011% of the next $5 billion; 0.007% of the next $5 billion; 0.004% of the next $20 billion; 0.002% of the next $25 billion; and 0.0015% of average daily net assets in excess of
$75 billion. The fees payable to DIFSC under the shareholder services agreement described above are allocated among all retail funds in the Delaware Funds on a relative NAV basis. This amount is included on the “Statement of operations” under “Dividend disbursing and transfer agent fees and expenses.” For the year ended November 30, 2023, the Fund paid $347,223 for these services. Pursuant to a sub-transfer agency agreement between DIFSC and BNY Mellon Investment Servicing (US) Inc. (BNYMIS), BNYMIS provides certain sub-transfer agency services to the Fund. Sub-transfer agency fees are paid by the Fund and are also included on the “Statement of operations” under “Dividend disbursing and transfer agent fees and expenses.” The fees that are calculated daily and paid as invoices are received on a monthly or quarterly basis.
Pursuant to a distribution agreement and distribution plan, the Fund pays DDLP, the distributor and an affiliate of DMC, an annual 12b-1 fee of 0.25%, 1.00%, and 0.50% of the average daily net assets of the Class A, Class C, and Class R shares, respectively. The fees are calculated daily and paid monthly. Institutional Class and Class R6 shares do not pay 12b-1 fees.
As provided in the investment management agreement, the Fund bears a portion of the cost of certain resources shared with DMC, including the cost of internal personnel of DMC and/or its affiliates that provide legal and regulatory reporting services to the Fund. For the year ended November 30, 2023, the Fund paid $154,700 for internal legal and regulatory reporting services provided by DMC and/or its affiliates’ employees. This amount is included on the “Statement of operations” under “Legal fees.”
For the year ended November 30, 2023, DDLP earned $35,202 for commissions on sales of the Fund’s Class A shares. For the year ended November 30, 2023, DDLP received gross CDSC commissions of $299 and $1,183 on redemptions of the Fund’s Class A and Class C shares, respectively, and these commissions were entirely used to offset upfront commissions previously paid by DDLP to broker/dealers on sales of those shares.
Trustees’ fees include expenses accrued by the Fund for each Trustee’s retainer and meeting fees. Certain officers of DMC, DIFSC, and DDLP are officers and/or Trustees of the Trust. These officers and Trustees are paid no compensation by the Fund.
In addition to the management fees and other expenses of the Fund, the Fund indirectly bears the investment management fees and other expenses of any Underlying Funds, including ETFs, in which it invests. The amount of these fees and expenses incurred indirectly by the Fund will vary based upon the expense and fee levels of any Underlying Funds and the number of shares that are owned of any Underlying Funds at different times.
Cross trades for the year ended November 30, 2023, were executed by the Fund pursuant to procedures adopted by the Board designed to ensure compliance with Rule 17a-7 under the 1940 Act. Cross trading is the buying or selling of portfolio securities between funds of investment companies, or between a fund of an investment company and another entity, that are or could be considered affiliates by virtue of having a common investment advisor (or affiliated investment advisors), common directors/trustees and/or common officers. At its regularly
Notes to financial statements
Delaware Small Cap Value Fund
2. Investment Management, Administration Agreements, and Other Transactions with Affiliates (continued)
scheduled meetings, the Board reviews such transactions for compliance with the procedures adopted by the Board. Pursuant to these procedures, for the year ended November 30, 2023, the Fund engaged in Rule 17a-7 securities sales of $20,110,761, resulting in losses of $191,415. There were no Rule 17a-7 securities purchases during the year ended November 30, 2023.
3. Investments
For the year ended November 30, 2023, the Fund made purchases and sales of investment securities other than short-term investments and US government securities as follows:
| Purchases | | $ | 1,427,745,953 | |
| Sales | | | 2,537,496,379 | |
The tax cost of investments includes adjustments to net unrealized appreciation (depreciation) which may not necessarily be the final tax cost basis adjustments but which approximate the tax basis unrealized gains and losses that may be realized and distributed to shareholders. At November 30, 2023, the cost and unrealized appreciation (depreciation) of investments for federal income tax purposes for the Fund were as follows:
| Cost of investments | | $ | 3,363,434,708 | |
| Aggregate unrealized appreciation of investments | | $ | 1,382,497,270 | |
| Aggregate unrealized depreciation of investments | | | (134,658,468 | ) |
| Net unrealized appreciation of investments | | $ | 1,247,838,802 | |
US GAAP defines fair value as the price that the Fund would receive to sell an asset or pay to transfer a liability in an orderly transaction between market participants at the measurement date under current market conditions. A three-level hierarchy for fair value measurements has been established based upon the transparency of inputs to the valuation of an asset or liability. Inputs may be observable or unobservable and refer broadly to the assumptions that market participants would use in pricing the asset or liability. Observable inputs reflect the assumptions market participants would use in pricing the asset or liability based on market data obtained from sources independent of the reporting entity. Unobservable inputs reflect the reporting entity’s own assumptions about the assumptions that market participants would use in pricing the asset or liability based on the best information available under the circumstances. The Fund’s investment in its entirety is assigned a level based upon the observability of the inputs which are significant to the overall valuation. The three-level hierarchy of inputs is summarized as follows:
| Level 1 – | Inputs are quoted prices in active markets for identical investments. (Examples: equity securities, open-end investment companies, futures contracts, and exchange-traded options contracts) |
| | |
| Level 2 – | Other observable inputs, including, but not limited to: quoted prices for similar assets or liabilities in markets that are active, quoted prices for identical or similar assets or liabilities in markets that are not active, inputs other than quoted prices that are |
| | observable for the assets or liabilities (such as interest rates, yield curves, volatilities, prepayment speeds, loss severities, credit risks, and default rates) or other market-corroborated inputs. (Examples: debt securities, government securities, swap contracts, forward foreign currency exchange contracts, foreign securities utilizing international fair value pricing, broker-quoted securities, and fair valued securities) |
| | |
| Level 3 – | Significant unobservable inputs, including the Fund’s own assumptions used to determine the fair value of investments. (Examples: broker-quoted securities and fair valued securities) |
Level 3 investments are valued using significant unobservable inputs. The Fund may also use an income-based valuation approach in which the anticipated future cash flows of the investment are discounted to calculate fair value. Discounts may also be applied due to the nature or duration of any restrictions on the disposition of the investments. Valuations may also be based upon current market prices of securities that are comparable in coupon, rating, maturity, and industry. The derived value of a Level 3 investment may not represent the value which is received upon disposition and this could impact the results of operations.
The following table summarizes the valuation of the Fund’s investments by fair value hierarchy levels as of November 30, 2023:
| | | Level 1 | |
| Securities | | | | |
| Assets: | | | | |
| Common Stocks | | $ | 4,588,138,425 | |
| Short-Term Investments | | | 23,135,085 | |
| Total Value of Securities | | $ | 4,611,273,510 | |
During the year ended November 30, 2023, there were no transfers into or out of Level 3 investments. The Fund’s policy is to recognize transfers into or out of Level 3 investments based on fair value at the beginning of the reporting year.
A reconciliation of Level 3 investments is presented when the Fund has a significant amount of Level 3 investments at the beginning or end of the year in relation to the Fund’s net assets. As of November 30, 2023, there were no Level 3 investments.
Notes to financial statements
Delaware Small Cap Value Fund
4. Dividend and Distribution Information
Income and long-term capital gain distributions are determined in accordance with federal income tax regulations, which may differ from US GAAP. Additionally, distributions from net gains on foreign currency transactions and net short-term gains on sales of investment securities are treated as ordinary income for federal income tax purposes. The tax character of dividends and distributions paid during the years ended November 30, 2023 and 2022 were as follows:
| | | Year ended | |
| | | 11/30/23 | | | 11/30/22 | |
| Ordinary income | | $ | 56,299,652 | | | $ | 40,636,940 | |
| Long-term capital gains | | | 194,536,047 | | | | 257,493,164 | |
| Total | | $ | 250,835,699 | | | $ | 298,130,104 | |
5. Components of Net Assets on a Tax Basis
As of November 30, 2023, the components of net assets on a tax basis were as follows:
| Shares of beneficial interest | | $ | 3,095,085,881 | |
| Undistributed ordinary income | | | 55,906,666 | |
| Undistributed long-term capital gains | | | 274,557,656 | |
| Unrealized appreciation of investments | | | 1,247,838,802 | |
| Net assets | | $ | 4,673,389,005 | |
The differences between book basis and tax basis components of net assets are primarily attributable to tax deferral of losses on wash sales.
For financial reporting purposes, capital accounts are adjusted to reflect the tax character of permanent book/tax differences. Reclassifications are primarily due to tax treatment of earnings and profits distributed to shareholders on redemption of shares. Results of operations and net assets were not affected by these reclassifications. For the year ended November 30, 2023, the adjustments were to decrease total distributable earnings (loss) and increase paid-in capital by $82,731,016.
6. Capital Shares
Transactions in capital shares were as follows:
| | | Year ended | |
| | | | 11/30/23 | | | | 11/30/22 | |
| Shares sold: | | | | | | | | |
| Class A | | | 1,302,787 | | | | 1,641,008 | |
| Class C | | | 38,944 | | | | 93,505 | |
| Class R | | | 110,039 | | | | 119,924 | |
| Institutional Class | | | 7,064,325 | | | | 11,590,777 | |
| Class R6 | | | 4,355,857 | | | | 5,858,329 | |
| Shares issued upon reinvestment of dividends and distributions: | | | | | | | | |
| Class A | | | 546,317 | | | | 618,304 | |
| Class C | | | 32,528 | | | | 45,770 | |
| Class R | | | 27,343 | | | | 33,912 | |
| Institutional Class | | | 2,090,767 | | | | 2,129,726 | |
| Class R6 | | | 877,901 | | | | 915,332 | |
| | | | 16,446,808 | | | | 23,046,587 | |
| Shares redeemed: | | | | | | | | |
| Class A | | | (3,007,733 | ) | | | (3,161,057 | ) |
| Class C | | | (229,692 | ) | | | (284,423 | ) |
| Class R | | | (167,252 | ) | | | (262,075 | ) |
| Institutional Class | | | (20,799,218 | ) | | | (12,672,743 | ) |
| Class R6 | | | (7,328,707 | ) | | | (6,407,440 | ) |
| | | | (31,532,602 | ) | | | (22,787,738 | ) |
| Net increase (decrease) | | | (15,085,794 | ) | | | 258,849 | |
Certain shareholders may exchange shares of one class for shares of another class in the same Fund. These exchange transactions are included as subscriptions and redemptions in the table above and on the “Statements of changes in net assets.” For the years ended November 30, 2023 and 2022, the Fund had the following exchange transactions:
| | | Exchange Redemptions | | | Exchange Subscriptions | | | | |
| | | Class A
Shares | | | Class C
Shares | | | Institutional
Class
Shares | | | Class A
Shares | | | Institutional
Class
Shares | | | Class R6
Shares | | | Value | |
| Year ended | | | | | | | | | | | | | | | | | | | | | |
| 11/30/23 | | | 232,370 | | | | 6,222 | | | | 68,910 | | | | 5,751 | | | | 181,768 | | | | 103,698 | | | $ | 20,710,519 | |
| 11/30/22 | | | 49,645 | | | | 2,376 | | | | 156,367 | | | | 2,071 | | | | 46,540 | | | | 155,881 | | | | 15,408,687 | |
Notes to financial statements
Delaware Small Cap Value Fund
7. Line of Credit
The Fund, along with certain other funds in the Delaware Funds (Participants), was a participant in a $355,000,000 revolving line of credit (Agreement) intended to be used for temporary or emergency purposes as an additional source of liquidity to fund redemptions of investor shares. Under the Agreement, the Participants were charged an annual commitment fee of 0.15%, which was allocated across the Participants based on a weighted average of the respective net assets of each Participant. The Participants were permitted to borrow up to a maximum of one-third of their net assets under the Agreement. Each Participant was individually, and not jointly, liable for its particular advances, if any, under the line of credit. The line of credit available under the Agreement expired on October 30, 2023.
On October 30, 2023, the Fund, along with the other Participants, entered into an amendment to the Agreement for a $335,000,000 revolving line of credit. It operates in substantially the same manner as the original Agreement. Under the amendment to the Agreement, the Participants are charged an annual commitment fee of 0.15%, which is allocated across the Participants based on a weighted average of the respective net assets of each Participant. The line of credit available under the Agreement expires on October 28, 2024.
The Fund had no amounts outstanding as of November 30, 2023, or at any time during the year then ended.
8. Securities Lending
The Fund, along with other funds in the Delaware Funds, may lend its securities pursuant to a security lending agreement (Lending Agreement) with The Bank of New York Mellon (BNY Mellon). At the time a security is loaned, the borrower must post collateral equal to the required percentage of the market value of the loaned security, including any accrued interest. The required percentage is: (1) 102% with respect to US securities and foreign securities that are denominated and payable in US dollars; and (2) 105% with respect to foreign securities. With respect to each loan, if on any business day the aggregate market value of securities collateral plus cash collateral held is less than the aggregate market value of the securities which are the subject of such loan, the borrower will be notified to provide additional collateral by the end of the following business day, which, together with the collateral already held, will be not less than the applicable initial collateral requirements for such security loan. If the aggregate market value of securities collateral and cash collateral held with respect to a security loan exceeds the applicable initial collateral requirement, upon the request of the borrower, BNY Mellon must return enough collateral to the borrower by the end of the following business day to reduce the value of the remaining collateral to the applicable initial collateral requirement for such security loan. As a result of the foregoing, the value of the collateral held with respect to a loaned security on any particular day, may be more or less than the value of the security on loan. The collateral percentage with respect to the market value of the loaned security is determined by the security lending agent.
Cash collateral received by the Fund is generally invested in an individual separate account. The investment guidelines permit each separate account to hold certain securities that would be considered eligible securities for a money market fund. Cash collateral received is generally invested in government securities; certain obligations issued by government sponsored enterprises; repurchase agreements collateralized by US Treasury securities; obligations issued by the central government of any Organization for Economic Cooperation and Development (OECD) country or its agencies, instrumentalities, or establishments; obligations of supranational organizations; commercial paper, notes, bonds, and other debt obligations; certificates of deposit, time deposits, and other bank obligations; certain money market funds; and asset-backed securities. The Fund can also accept US government securities and letters of credit (non-cash collateral) in connection with securities loans.
In the event of default or bankruptcy by the lending agent, realization and/or retention of the collateral may be subject to legal proceedings. In the event the borrower fails to return loaned securities and the collateral received is insufficient to cover the value of the loaned securities and provided such collateral shortfall is not the result of investment losses, the lending agent has agreed to pay the amount of the shortfall to the Fund or, at the discretion of the lending agent, replace the loaned securities. The Fund continues to record dividends or interest, as applicable, on the securities loaned and is subject to changes in value of the securities loaned that may occur during the term of the loan. The Fund has the right under the Lending Agreement to recover the securities from the borrower on demand. With respect to security loans collateralized by non-cash collateral, the Fund receives loan premiums paid by the borrower. With respect to security loans collateralized by cash collateral, the earnings from the collateral investments are shared among the Fund, the security lending agent, and the borrower. The Fund records security lending income net of allocations to the security lending agent and the borrower.
The Fund may incur investment losses as a result of investing securities lending collateral. This could occur if an investment in the collateral investment account defaulted or became impaired. Under those circumstances, the value of the Fund’s cash collateral account may be less than the amount the Fund would be required to return to the borrowers of the securities and the Fund would be required to make up for this shortfall.
At November 30, 2023, the Fund had no securities out on loan.
9. Credit and Market Risks
The impact of COVID-19, and other infectious illness outbreaks that may arise in the future, could adversely affect the economies of many nations or the entire global economy, individual issuers and capital markets in ways that cannot necessarily be foreseen.
The Fund invests in growth stocks (such as those in the financial services sector), which reflect projections of future earnings and revenue. These prices may rise or fall dramatically depending on whether those projections are met. These companies’ stock prices may be more volatile, particularly over the short term.
Notes to financial statements
Delaware Small Cap Value Fund
9. Credit and Market Risks (continued)
The Fund invests a significant portion of its assets in small companies and may be subject to certain risks associated with ownership of securities of such companies. Investments in small sized companies may be more volatile than investments in larger companies for a number of reasons, which include limited financial resources or a dependence on narrow product lines.
The Fund invests in REITs and is subject to the risks associated with that industry. If the Fund holds real estate directly or receives rental income directly from real estate holdings, its tax status as a regulated investment company may be jeopardized. There were no direct real estate holdings during the year ended November 30, 2023. The Fund’s REIT holdings are also affected by interest rate changes, particularly if the REITs it holds use floating rate debt to finance their ongoing operations.
The Fund may invest up to 15% of its net assets in illiquid securities, which may include securities with contractual restrictions on resale, securities exempt from registration under Rule 144A promulgated under the Securities Act of 1933, as amended, and other securities which may not be readily marketable. The relative illiquidity of these securities may impair the Fund from disposing of them in a timely manner and at a fair price when it is necessary or desirable to do so. While maintaining oversight, the Board has delegated to DMC the day-to-day functions of determining whether individual securities are liquid for purposes of the Fund’s limitation on investments in illiquid securities. Securities eligible for resale pursuant to Rule 144A, which are determined to be liquid, are not subject to the Fund’s 15% limit on investments in illiquid securities. As of November 30, 2023, there were no Rule 144A securities held by the Fund.
10. Contractual Obligations
The Fund enters into contracts in the normal course of business that contain a variety of indemnifications. The Fund’s maximum exposure under these arrangements is unknown. However, the Fund has not had prior claims or losses pursuant to these contracts. Management has reviewed the Fund’s existing contracts and expects the risk of loss to be remote.
11. Subsequent Events
Management has determined that no material events or transactions occurred subsequent to November 30, 2023, that would require recognition or disclosure in the Fund’s financial statements.
Report of independent
registered public accounting firm
To the Board of Trustees of Delaware Group® Equity Funds V and Shareholders of Delaware Small Cap Value Fund
Opinion on the Financial Statements
We have audited the accompanying statement of assets and liabilities, including the schedule of investments, of Delaware Small Cap Value Fund (one of the funds constituting Delaware Group® Equity Funds V, referred to hereafter as the “Fund”) as of November 30, 2023, the related statement of operations for the year ended November 30, 2023, the statement of changes in net assets for each of the two years in the period ended November 30, 2023, including the related notes, and the financial highlights for each of the five years in the period ended November 30, 2023 (collectively referred to as the “financial statements”). In our opinion, the financial statements present fairly, in all material respects, the financial position of the Fund as of November 30, 2023, the results of its operations for the year then ended, the changes in its net assets for each of the two years in the period ended November 30, 2023 and the financial highlights for each of the five years in the period ended November 30, 2023 in conformity with accounting principles generally accepted in the United States of America.
Basis for Opinion
These financial statements are the responsibility of the Fund’s management. Our responsibility is to express an opinion on the Fund’s financial statements based on our audits. We are a public accounting firm registered with the Public Company Accounting Oversight Board (United States) (PCAOB) and are required to be independent with respect to the Fund in accordance with the U.S. federal securities laws and the applicable rules and regulations of the Securities and Exchange Commission and the PCAOB.
We conducted our audits of these financial statements in accordance with the standards of the PCAOB. Those standards require that we plan and perform the audit to obtain reasonable assurance about whether the financial statements are free of material misstatement, whether due to error or fraud.
Our audits included performing procedures to assess the risks of material misstatement of the financial statements, whether due to error or fraud, and performing procedures that respond to those risks. Such procedures included examining, on a test basis, evidence regarding the amounts and disclosures in the financial statements. Our audits also included evaluating the accounting principles used and significant estimates made by management, as well as evaluating the overall presentation of the financial statements. Our procedures included confirmation of securities owned as of November 30, 2023 by correspondence with the custodian and transfer agents. We believe that our audits provide a reasonable basis for our opinion.
/s/PricewaterhouseCoopers LLP
Philadelphia, Pennsylvania
January 23, 2024
We have served as the auditor of one or more Macquarie investment companies since 2010.
Other Fund information (Unaudited)
Delaware Small Cap Value Fund
Liquidity Risk Management Program
The Securities and Exchange Commission (the “SEC”) has adopted Rule 22e-4 under the Investment Company Act of 1940 (the “Liquidity Rule”), which requires all open-end funds (other than money market funds) to adopt and implement a program reasonably designed to assess and manage the fund’s “liquidity risk,” defined as the risk that the fund could not meet requests to redeem shares issued by the fund without significant dilution of remaining investors’ interests in the fund.
The Fund has adopted and implemented a liquidity risk management program in accordance with the Liquidity Rule (the “Program”). The Board has designated a member of the US Operational Risk Group of Macquarie Asset Management as the Program Administrator for each Fund in the Trust.
As required by the Liquidity Rule, the Program includes policies and procedures that provide for: (1) assessment, management, and review (no less frequently than annually) of the Fund’s liquidity risk; (2) classification of each of the Fund’s portfolio holdings into one of four liquidity categories (Highly Liquid, Moderately Liquid, Less Liquid, and Illiquid); (3) for funds that do not primarily hold assets that are Highly Liquid, establishing and maintaining a minimum percentage of the Fund’s net assets in Highly Liquid investments (called a “Highly Liquid Investment Minimum” or “HLIM”); and (4) prohibiting the Fund’s acquisition of Illiquid investments if, immediately after the acquisition, the Fund would hold more than 15% of its net assets in Illiquid assets. The Program also requires reporting to the SEC (on a non-public basis) and to the Board if the Fund’s holdings of Illiquid assets exceed 15% of the Fund’s net assets. Funds with HLIMs must have procedures for addressing HLIM shortfalls, including reporting to the Board and, with respect to HLIM shortfalls lasting more than seven consecutive calendar days, reporting to the SEC (on a non-public basis).
In assessing and managing the Fund’s liquidity risk, the Program Administrator considers, as relevant, a variety of factors, including: (1) the Fund’s investment strategy and liquidity of portfolio investments during both normal and reasonably foreseeable stressed conditions; (2) short-term and long-term cash flow projections for the Fund during both normal and reasonably foreseeable stressed conditions; and (3) the Fund’s holdings of cash and cash equivalents and any borrowing arrangements. Classification of the Fund’s portfolio holdings in the four liquidity categories is based on the number of days it is reasonably expected to take to convert the investment to cash (for Highly Liquid and Moderately Liquid holdings) or to sell or dispose of the investment (for Less Liquid and Illiquid investments), in current market conditions without significantly changing the investment’s market value. The Fund primarily holds assets that are classified as Highly Liquid, and therefore is not required to establish an HLIM.
At a meeting of the Board held on May 23-25, 2023, the Program Administrator provided a written report to the Board addressing the Program’s operation and assessing the adequacy and effectiveness of its implementation for the period from April 1, 2022 through March 31, 2023. The report concluded that the Program is appropriately designed and effectively implemented and that it meets the requirements of Rule 22e-4 and the Fund’s liquidity needs. The Fund’s HLIM is set at an appropriate level and the Fund complied with its HLIM at all times during the reporting period.
Tax Information
The information set forth below is for the Fund’s fiscal year as required by federal income tax laws. Shareholders, however, must report distributions on a calendar year basis for income tax purposes, which may include distributions for portions of two fiscal years of the Fund. Accordingly, the information needed by shareholders for income tax purposes will be sent to them in January of each year. Please consult your tax advisor for proper treatment of this information.
All disclosures are based on financial information available as of the date of this annual report and, accordingly are subject to change. For any and all items requiring reporting, it is the intention of the Fund to report the maximum amount permitted under the Internal Revenue Code and the regulations thereunder.
For the fiscal year ended November 30, 2023, the Fund reports distributions paid during the year as follows:
| (A) Long-Term Capital Gain Distributions (Tax Basis) | | | 77.56 | % |
| (B) Ordinary Income Distributions (Tax Basis)* | | | 22.44 | % |
| Total Distributions (Tax Basis) | | | 100.00 | % |
| (C) Qualified Dividends1 | | | 100.00 | % |
(A) and (B) are based on a percentage of the Fund’s total distributions.
(C) is based on the Fund’s ordinary income distributions.
1Qualified dividends represent dividends which qualify for the corporate dividends received deduction.
*For the fiscal year ended November 30, 2023, certain dividends paid by the Fund may be subject to a maximum tax rate of 20%. The percentage of dividends paid by the Fund from ordinary income reported as qualified income is 100.00%. Complete information will be computed and reported in conjunction with your 2023 Form 1099-DIV, as applicable.
Board Consideration of Investment Management Agreement and Sub-Advisory Agreement at a Meeting Held on August 8-10, 2023
At a meeting held on August 8-10, 2023 (the “Annual Contract Renewal Meeting”), the Board of Trustees (the “Board”), including a majority of Trustees each of whom is not an “interested person” as defined under the Investment Company Act of 1940 (the “Independent Trustees”), approved the renewal of the Delaware Small Cap Value Fund (the “Fund”) Investment Management Agreement with Delaware Management Company (“DMC”) and the Sub-Advisory Agreement with Macquarie Investment Management Global Limited (“MIMGL” or the “Affiliated Sub-Adviser”).
Prior to the Annual Contract Renewal Meeting, including at a Board meeting held in May 2023, the Trustees conferred extensively among themselves and with representatives of DMC about these matters. Also, the Board was assisted by the Equity Investments Committee and the Fixed Income Multi-Asset Sub-Advised Funds Investments Committee (each an “Investment Committee” and together, the “Investment Committees”), with each Investment Committee assisting the full Board in reviewing investment performance and other matters throughout the year. The Independent Trustees were also assisted in their evaluation of the Investment
Other Fund information (Unaudited)
Delaware Small Cap Value Fund
Board Consideration of Investment Management Agreement and Sub-Advisory Agreement at a Meeting Held on August 8-10, 2023 (continued)
Management Agreement and the Sub-Advisory Agreement by independent legal counsel, from whom they received separate legal advice and with whom they met separately.
In providing information to the Board, DMC was guided by a detailed set of requests for information submitted to them by independent legal counsel on behalf of the Independent Trustees at the start of the Board’s annual contract renewal process earlier in 2023. Prior to the Annual Contract Renewal Meeting, and in response to the requests, the Board received and reviewed materials specifically relating to the renewal of the Investment Management Agreement and the Sub-Advisory Agreement. In considering and approving the Investment Management Agreement and the Sub-Advisory Agreement, the Trustees considered the information they believed relevant, including but not limited to the information discussed below. The Board considered not only the specific information presented in connection with the Annual Contract Renewal Meeting and the review process for the Investment Management Agreement and the Sub-Advisory Agreement, but also the knowledge gained over time through interaction with DMC about various topics. In this regard, the Board reviewed reports of DMC at each of its quarterly meetings, which included information about, among other things, Fund performance, investment strategies, and expenses. In addition, the Investment Committees confer with portfolio managers at various times throughout the year. In considering information relating to the approval of the Fund’s Investment Management Agreement and the Sub-Advisory Agreement, the Independent Trustees also received information from an independent fund consultant, JDL Consultants, LLC (“JDL”).
The Board did not identify any particular information or consideration that was all-important or controlling, and each individual Trustee may have attributed different weights to various factors.
After its deliberations, the Board, including the Independent Trustees, unanimously approved the continuation of the Investment Management Agreement and the Sub-Advisory Agreement for a one-year term. The following summarizes a number of important, but not necessarily all, factors considered by the Board in support of its approval.
Nature, extent, and quality of services. The Board received and considered various information regarding the nature, extent, and quality of the advisory services provided to the Fund by DMC under its Investment Management Agreement and the experience of the officers and employees of DMC who provide these services, including the Fund’s portfolio managers. The Board’s review included consideration of DMC’s investment process and oversight and research and analysis capabilities, and its ability to attract and retain skilled investment professionals. The Board also considered information regarding DMC’s programs for risk management, including investment, operational, liquidity, derivatives (as applicable), valuation, and compliance risks. The Board received information with respect to the cybersecurity program and business continuity plans of DMC and its affiliates.
In addition, the Board considered certain non-advisory services that DMC and its affiliates provide to the Delaware Funds by Macquarie complex (the “Delaware Funds”). Among other things, these services include third party service provider oversight, transfer agency, internal
audit, valuation, portfolio trading, and legal and compliance functions. The Board noted DMC’s responsibility for overseeing the preparation of the Delaware Funds’ registration statement and supplements thereto and shareholder reports; responsibility for periodic filings with regulators; organizing Board meetings and preparing materials for such Board meetings; and furnishing analytical and other support to assist the Board. The Board took into account the benefits to shareholders of investing in a Fund that is part of a family of funds managed by an affiliate of Macquarie Group Ltd. (“Macquarie”), the parent company of DMC, and the resources available to DMC as part of Macquarie’s global asset management business.
The Board received and considered various information with respect to the services provided by the Affiliated Sub-Adviser under the Sub-Advisory Agreement and the credentials and experience of the officers and employees of the Affiliated Sub-Adviser who provide these services. The Board considered the division of responsibilities between DMC and the Affiliated Sub-Adviser and the oversight provided by DMC. The Board also considered the expertise of the Affiliated Sub-Adviser with respect to certain asset classes and/or investment styles. The Board noted that the Affiliated Sub-Adviser is part of Macquarie’s global investment platform that has offices and personnel that are located around the world. The Affiliated Sub-Adviser provides research, investment and trading analysis on the markets and economies of various countries in which the Fund may invest, makes recommendations regarding securities, provides portfolio management services and assists with security trades, as applicable. The Board took into account that the Sub-Advisory Agreement may benefit the Fund and its shareholders by permitting DMC to use the resources and talents of the Affiliated Sub-Adviser in managing the Fund.
The Board also received and considered information about the nature and extent of services offered and fee rates charged by DMC to other types of clients with investment strategies similar to those of the Fund. In this regard, the Board received information about the significantly greater scope of services, and compliance, reporting and other legal and regulatory obligations and risks of managing registered investment companies compared with those associated with managing assets of other types of clients, including third-party sub-advised fund clients, unregistered funds and separately managed accounts.
The Board concluded that, overall, it was satisfied with the nature, extent and quality of services provided (and expected to be provided) to the Fund by DMC and the Affiliated Sub-Adviser.
Investment performance. The Board received and considered information with respect to the investment performance of the Fund, including performance reports and discussions with portfolio managers at meetings of the Board’s Investment Committees throughout the year as well as reports provided by Broadridge Financial Solutions, Inc., an independent investment company data provider (“Broadridge”), furnished for the Annual Contract Renewal Meeting. The Broadridge reports prepared for the Fund’s institutional share class showed its investment performance in comparison to the institutional share class of a group of similar funds (the “Performance Universe”). The Board received a description of the methodology used by Broadridge to select the peer funds in the Performance Universe. Comparative annualized performance for the Fund was shown for the past 1-, 3-, 5-, and 10-year or since inception periods, as applicable, ended December 31, 2022.
Other Fund information (Unaudited)
Delaware Small Cap Value Fund
Board Consideration of Investment Management Agreement and Sub-Advisory Agreement at a Meeting Held on August 8-10, 2023 (continued)
The Performance Universe consists of the Fund and all retail and institutional small-cap value funds, regardless of asset size or primary channel of distribution. The Board noted that the Broadridge report comparison showed that the Fund’s total return for the 1- and 5-year periods was in the third quartile of its Performance Universe, for the 3-year period was in the fourth quartile of its Performance Universe, and for the 10-year period was in the second quartile of its Performance Universe. The Broadridge report comparison showed that the Fund’s total return for the 1-, 3-, and 5-year periods was below the median of its Performance Universe and for the 10-year period was above the median of its Performance Universe. The Board also noted that the Fund outperformed its benchmark index for the 1-, 3-, 5-, and 10-year periods. The Board noted that the Fund was generally performing in line with its benchmark index during the periods under review. The Board noted the explanations from DMC and the Affiliated Sub-Adviser concerning the reasons for the Fund’s relative performance versus its Performance Universe for the various periods.
Comparative expenses. The Board received and considered expense data for the Fund. DMC provided the Board with information on pricing levels and fee structures for the Fund as of its most recently completed fiscal year. The Broadridge total expenses, for comparative consistency, were shown by Broadridge for Institutional Class shares and comparative total expenses including 12b-1 and non-12b-1 service fees. The Board also considered the comparative analysis of contractual management fees and actual total expense ratios of the Fund versus contractual management fees and actual total expense ratios of a group of peer funds as selected by Broadridge (the “Expense Group”). In reviewing comparative costs, the Fund’s contractual management fee and the actual management fee incurred by the Fund were compared with the contractual management fees (assuming all funds in the Expense Group were similar in size to the Fund) and actual management fees, taking into account any applicable breakpoints and fee waivers, with the Fund’s expense universe, which is comprised of the Fund, its Expense Group and all other similar institutional funds, excluding outliers (the “Expense Universe”). The Fund’s total expenses were also compared with those of its Expense Universe. The Board also received and considered information regarding the Fund’s net operating expense ratios and their various components, including actual management fees, custodian and other non-management fees, and Rule 12b-1 and non-Rule 12b-1 shareholder service fees.
The expense comparisons for the Fund showed that its actual management fee was below the median of its Expense Universe and its actual total expenses were above its Expense Group average. It was noted that consistent with DMC’s waiver methodology, its advisory fee waivers, if any, were at the fund level and not class level.
The Board noted that DMC, and not the Fund, pays the sub-advisory fees to the Affiliated Sub-Adviser and, accordingly, that the retention of the Affiliated Sub-Adviser does not increase the fees and expenses incurred by the Fund.
Based on its consideration of the factors and information it deemed relevant, including those described here, the Board determined that the compensation payable to DMC under the Investment Management Agreement and to the Affiliated Sub-Adviser under the Sub-Advisory Agreement was reasonable.
Economies of scale. The Board received and considered information about the potential for DMC to realize economies of scale in the provision of management services to the Fund, the difficulties of calculating economies of scale at an individual Fund level, and the extent to which potential scale benefits are shared with shareholders, including the extent to which any economies of scale are reflected in the level of management fees charged. DMC discussed its advisory fee pricing and structure for the Delaware Funds, including the current breakpoints. The Board noted that, as of March 31, 2023, the Fund’s net assets exceeded its third breakpoint level and that breakpoints result in a lower advisory fee than would otherwise be the case in the absence of breakpoints, when the asset levels specified in the breakpoints schedule are exceeded. The Board noted that the Fund may also benefit from economies of scale through initial fee setting, fee waivers and expense reimbursements, as well as DMC’s investment in its business, including investments in business infrastructure, technology and cybersecurity.
Management profitability. The Board received and considered the Investment Management Profitability Analysis that addressed the overall profitability of DMC’s business in providing management and other services to the Fund and the Delaware Funds as a whole, including the methodology used by DMC in allocating costs for the purpose of determining profitability. The Board noted DMC’s changes to its cost allocation methodology for its profitability analysis and the explanations for such changes. The Board also reviewed a report prepared by JDL regarding DMC’s profitability as compared to certain peer fund complexes and the Independent Trustees discussed DMC’s profitability in such context with representatives from JDL. The Board recognized that calculating and comparing profitability at the individual fund level is difficult; that DMC’s profit, if any, can vary significantly depending on the particular fund; and that DMC’s support for, and commitment to, a fund is not solely dependent on the profits realized as to that fund.
The Board also received and considered information about the portion of the total management fee that was retained by DMC after payment of the fee to the Affiliated Sub-Adviser for sub-advisory services. In assessing the reasonableness of this amount, the Board received and evaluated information about the nature and extent of the responsibilities retained and risk assumed by DMC and not delegated to or assumed by the Affiliated Sub-Adviser. Given the affiliation between DMC and the Affiliated Sub-Adviser, the Board ascribed limited relevance to the allocation of fees between them.
Based on its review, the Board determined that DMC’s profitability was not excessive in light of the nature, extent and quality of the services provided to the Fund.
Ancillary benefits. The Board received and considered information regarding the extent to which DMC and its affiliates might derive ancillary benefits from fund operations, including the potential for procuring additional business as a result of the prestige and visibility associated with its role as investment manager to the Delaware Funds; the benefits from allocation of fund brokerage to improve trading efficiencies; the portfolio transactions executed through “soft dollar”
Other Fund information (Unaudited)
Delaware Small Cap Value Fund
Board Consideration of Investment Management Agreement and Sub-Advisory Agreement at a Meeting Held on August 8-10, 2023 (continued)
arrangements; and the fees that various affiliates received for serving as transfer agent and for overseeing fund accounting and financial administration services to the Delaware Funds. The Board considered that it receives periodic reports from DMC that include a representation that any soft dollar arrangements are consistent with regulatory requirements. The Board received information from DMC regarding its view of the performance of its affiliates in providing transfer agent and fund accounting and financial administration oversight services and the organizational structure employed to provide these services pursuant to their contracts with the Fund.
Based on its consideration of the factors and information it deemed relevant, including the costs of providing investment management and other services to the Fund and the ongoing commitment of DMC and its affiliates to the Fund, the Board did not find that any ancillary benefits received by DMC and its affiliates, including the Affiliated Sub-Adviser, were unreasonable.
Conclusion. Based on its review, consideration and evaluation of all factors it believed relevant, including the above-described factors and conclusions, the Board, including all of the Independent Trustees, approved the continuation of DMC’s Investment Management Agreement and of the Affiliated Sub-Adviser’s Sub-Advisory Agreement for an additional one-year period.
Form N-PORT and proxy voting information
The Fund files its complete schedule of portfolio holdings with the Securities and Exchange Commission (SEC) for the first and third quarters of each fiscal year on Form N-PORT. The Fund’s Form N-PORT, as well as a description of the policies and procedures that the Fund uses to determine how to vote proxies (if any) relating to portfolio securities, is available without charge (i) upon request, by calling 800 523-1918; and (ii) on the SEC’s website at sec.gov. In addition, a description of the policies and procedures that the Fund uses to determine how to vote proxies (if any) relating to portfolio securities and the Schedule of Investments included in the Fund’s most recent Form N-PORT are available without charge on the Fund’s website at delawarefunds.com/literature.
Information (if any) regarding how the Fund voted proxies relating to portfolio securities during the most recently disclosed 12-month period ended June 30 is available without charge (i) through the Fund’s website at delawarefunds.com/proxy; and (ii) on the SEC’s website at sec.gov.
Board of trustees and officers addendum
Delaware Funds by Macquarie ®
A mutual fund is governed by a Board of Trustees (“Trustees”), which has oversight responsibility for the management of a fund’s business affairs. Trustees establish procedures and oversee and review the performance of the investment manager, the distributor, and others who perform services for the fund. The independent fund trustees, in particular, are advocates for shareholder interests. Each trustee has served in that capacity since he or she was elected to or appointed to the Board of Trustees, and will continue to serve until his or her retirement or the election of a new trustee in his or her place. The following is a list of the Trustees and Officers with certain background and related information.
Name,
Address,
and Birth Year | | Position(s)
Held with
the Trust | | Length of Time
Served1 | | Number of
Funds in Fund
Complex Overseen
by Trustee | | Principal
Occupation(s)
During the
Past Five Years | | Other
Directorships
Held by Trustee
During the
Past Five Years |
| Interested Trustee | | | | | | |
| | | | | | | |
Shawn K. Lytle2
100 Independence
610 Market Street
Philadelphia, PA
19106-2354
1970 | | President, Chief Executive
Officer,
and Trustee | | President and Chief Executive
Officer
since August 2015
Trustee since
September 2015 | | 105 | | Macquarie Asset
Management3
(2015–Present)
-Head of Equities &
Multi-Asset
(2023–Present)
-Head of Americas of
Macquarie Group
(2017–Present)
-Global Head of Public
Investments
(2019–2023) | | None |
Board of trustees and officers addendum
Delaware Funds by Macquarie®
Name,
Address,
and Birth Year | | Position(s)
Held with
the Trust | | Length of Time
Served1 | | Number of
Funds in Fund
Complex Overseen
by Trustee | | Principal
Occupation(s)
During the
Past Five Years | | Other
Directorships
Held by Trustee
During the
Past Five Years |
| Independent Trustees | | | | |
| | | | | |
Jerome D.
Abernathy
100 Independence
610 Market Street
Philadelphia, PA
19106-2354
1959 | | Trustee | | Since January 2019 | | 105 | | Stonebrook Capital
Management, LLC
(financial
technology: macro
factors and databases)
-Managing Member
(1993-Present) | | None |
| | | | | | | | | | | |
Ann D. Borowiec
100 Independence
610 Market Street
Philadelphia, PA
19106-2354
1958 | | Trustee | | Since March 2015 | | 105 | | J.P. Morgan Chase & Co.
(1987-2013)
-Chief Executive Officer,
Private Wealth
Management
(2011–2013) | | Banco Santander International
(2016–2019)
Santander Bank, N.A.
(2016-2019) |
Name,
Address,
and Birth Year | | Position(s)
Held with
the Trust | | Length of Time
Served1 | | Number of
Funds in Fund
Complex Overseen
by Trustee | | Principal
Occupation(s)
During the
Past Five Years | | Other
Directorships
Held by Trustee
During the
Past Five Years |
| | | | | | | | | | | |
Joseph W. Chow
100 Independence
610 Market Street
Philadelphia, PA
19106-2354
1953 | | Trustee | | Since January 2013 | | 105 | | Private Investor
(2011–Present)
State Street Bank and
Trust Company
(1996-2011)
-Executive Vice President
of Enterprise Risk
Management and
Emerging Economies
Strategy; and Chief Risk
and Corporate
Administration Officer | | None |
| | | | | | | | | | | |
H. Jeffrey Dobbs
100 Independence
610 Market Street
Philadelphia, PA
19106-2354
1955 | | Trustee | | Since April 20194 | | 105 | | KPMG LLP
(2002-2015)
-Global Sector Chairman,
Industrial Manufacturing
(2010-2015) | | TechAccel LLC
(2015–Present)
PatientsVoices, Inc.
(2018–Present)
Valparaiso University Board
(2012-Present)
Ivy Funds Complex (2019-2021) |
Board of trustees and officers addendum
Delaware Funds by Macquarie®
Name,
Address,
and Birth Year | | Position(s)
Held with
the Trust | | Length of Time
Served1 | | Number of
Funds in Fund
Complex Overseen
by Trustee | | Principal
Occupation(s)
During the
Past Five Years | | Other
Directorships
Held by Trustee
During the
Past Five Years |
| | | | | | | | | | | |
John A. Fry
100 Independence
610 Market Street
Philadelphia, PA
19106-2354
1960 | | Trustee | | Since January 2001 | | 105 | | Drexel University
-President
(2010–Present) | | Federal Reserve
Bank of Philadelphia
(2020–Present)
Kresge Foundation
(2018-Present)
FS Credit Real Estate Income
Trust, Inc. (2018–Present)
vTv Therapeutics Inc.
(2017–Present)
Community Health Systems
(2004–Present)
Drexel Morgan & Co.
(2015–2019) |
| | | | | | | | | | | |
Name,
Address,
and Birth Year | | Position(s)
Held with
the Trust | | Length of Time
Served1 | | Number of
Funds in Fund
Complex Overseen
by Trustee | | Principal
Occupation(s)
During the
Past Five Years | | Other
Directorships
Held by Trustee
During the
Past Five Years |
| | | | | | | | | | | |
Joseph Harroz, Jr.
100 Independence
610 Market Street
Philadelphia, PA
19106-2354
1967 | | Trustee | | Since November
19984 | | 105 | | University of Oklahoma
-President
(2020–Present)
-Interim President
(2019–2020)
-Vice President and
Dean, College of Law
(2010–2019)
Brookhaven Investments
LLC (commercial
enterprises)
-Managing Member
(2019–Present)
St. Clair, LLC
(commercial enterprises)
-Managing Member
(2019–Present) | | OU Medicine, Inc.
(2020–Present)
Big 12 Athletic Conference
(2019-Present)
Valliance Bank
(2007–Present)
Ivy Funds Complex
(1998-2021) |
Board of trustees and officers addendum
Delaware Funds by Macquarie®
Name,
Address,
and Birth Year | | Position(s)
Held with
the Trust | | Length of Time
Served1 | | Number of
Funds in Fund
Complex Overseen
by Trustee | | Principal
Occupation(s)
During the
Past Five Years | | Other
Directorships
Held by Trustee
During the
Past Five Years |
| | | | | | | | | | | |
Sandra A.J.
Lawrence
100 Independence
610 Market Street
Philadelphia, PA
19106-2354
1957 | | Trustee | | Since April 20194 | | 105 | | Children’s Mercy
Hospitals and Clinics
(2005–2019)
-Chief Administrative
Officer
(2016–2019) | | Brixmor Property Group Inc.
(2021-Present)
Sera Prognostics Inc.
(biotechnology) (2021-Present)
Recology (resource recovery)
(2021-2023)
Evergy, Inc., Kansas City Power
& Light Company, KCP&L
Greater Missouri Operations
Company, Westar Energy, Inc.
and Kansas Gas and Electric
Company (related utility
companies) (2018-Present)
National Association of Corporate
Directors (2017-Present)
American Shared Hospital
Services (medical device)
(2017-2021)
Ivy Funds Complex (2019-2021) |
Name,
Address,
and Birth Year | | Position(s)
Held with
the Trust | | Length of Time
Served1 | | Number of
Funds in Fund
Complex Overseen
by Trustee | | Principal
Occupation(s)
During the
Past Five Years | | Other
Directorships
Held by Trustee
During the
Past Five Years |
| | | | | | | | | | | |
Frances A.
Sevilla-Sacasa
100 Independence
610 Market Street
Philadelphia, PA
19106-2354
1956 | | Trustee | | Since September
2011 | | 105 | | Banco Itaú International
-Chief Executive Officer
(2012–2016)
US Trust Bank of
America Private Wealth
Management
-President (2007-2008)
U.S. Trust Corp.
-President & CEO
(2005-2007) | | Invitation Homes Inc.
(2023-Present)
Florida Chapter of National
Association of Corporate
Directors (2021-Present)
Callon Petroleum Company
(2019-Present)
Camden Property Trust
(2011-Present)
New Senior Investment
Group Inc. (REIT) (2021)
Carrizo Oil & Gas, Inc.
(2018-2019) |
| | | | | | | | | | | |
Thomas K. Whitford
100 Independence
610 Market Street
Philadelphia, PA
19106-2354
1956 | | Chair and Trustee | | Trustee since January
2013
Chair since January
2023 | | 105 | | PNC Financial Services
Group (1983–2013)
-Vice Chairman
(2009-2013) | | HSBC USA Inc.
(2014–2022)
HSBC North America
Holdings Inc.
(2013–2022) |
Board of trustees and officers addendum
Delaware Funds by Macquarie®
Name,
Address,
and Birth Year | | Position(s)
Held with
the Trust | | Length of Time
Served1 | | Number of
Funds in Fund
Complex Overseen
by Trustee | | Principal
Occupation(s)
During the
Past Five Years | | Other
Directorships
Held by Trustee
During the
Past Five Years |
| | | | | | | | | | | |
Christianna Wood
100 Independence
610 Market Street
Philadelphia, PA
19106-2354
1959 | | Trustee | | Since January 2019 | | 105 | | Gore Creek
Capital, Ltd.
-Chief Executive Officer
and President
(2009–Present)
Capital Z Asset
Management
-Chief Executive Officer
(2008-2009)
California Public
Employees’ Retirement
System (CalPERS)
-Senior Investment
Officer of Global Equity
(2002-2008) | | The Merger Fund
(2013–2021),
The Merger Fund VL
(2013–2021),
WCM Alternatives: Event-Driven
Fund (2013–2021),
and WCM Alternatives: Credit
Event Fund (2017–2021)
Grange Insurance
(2013–Present)
H&R Block Corporation
(2008–2022) |
| Officers | | | | | | |
David F. Connor
100 Independence
610 Market Street
Philadelphia, PA
19106-2354
1963 | | Senior Vice President,
General Counsel, and
Secretary | | Senior Vice President,
since May 2013;
General Counsel
since May 2015;
Secretary since
October 2005 | | 105 | | David F. Connor has
served in various
capacities at different
times at Macquarie Asset
Management. | | None5 |
| | | | | | | | | | | |
Name,
Address,
and Birth Year | | Position(s)
Held with
the Trust | | Length of Time
Served1 | | Number of
Funds in Fund
Complex Overseen
by Trustee | | Principal
Occupation(s)
During the
Past Five Years | | Other
Directorships
Held by Trustee
During the
Past Five Years |
| | | | | | | | | | | |
Daniel V. Geatens
100 Independence
610 Market Street
Philadelphia, PA
19106-2354
1972 | | Senior Vice President
and Treasurer | | Senior Vice President
and Treasurer since
October 2007 | | 105 | | Daniel V. Geatens has
served in various
capacities at different
times at Macquarie Asset
Management. | | None5 |
| | | | | | | | | | | |
Richard Salus
100 Independence
610 Market Street
Philadelphia, PA
19106-2354
1963 | | Senior Vice President
and Chief Financial
Officer | | Senior Vice President
and Chief Financial
Officer since
November 2006 | | 105 | | Richard Salus has
served in various
capacities at different
times at Macquarie Asset
Management. | | None5 |
| 1 | “Length of Time Served” refers to the time since the Trustee or officer began serving one or more of the Trusts in the Delaware Funds complex. |
| 2 | Shawn K. Lytle is considered to be an “Interested Trustee” because he is an executive officer of the Funds’ investment advisor. |
| 3 | Macquarie Asset Management is the marketing name for certain companies comprising the asset management division of Macquarie Group, including the Funds’ investment advisor, principal underwriter, and transfer agent. |
| 4 | Includes time served on the Board of the Ivy Funds complex prior to the date when the Ivy Funds joined the Delaware Funds complex. |
Board of trustees and officers addendum
Delaware Funds by Macquarie ®
| 5 | David F. Connor and Daniel V. Geatens serve in similar capacities for the six portfolios of the Optimum Fund Trust, which have the same investment manager, principal underwriter, and transfer agent as the Funds. Mr. Connor also serves as Senior Vice President and Assistant Secretary for the three portfolios of the Macquarie ETF Trust, which have the same investment manager as the Funds. Mr. Geatens also serves as the Chief Financial Officer of the Optimum Fund Trust and as Senior Vice President and Treasurer for the Macquarie ETF Trust. Mr. Salus serves in a similar capacity for the Macquarie ETF Trust. |
The Statement of Additional Information for the Fund(s) includes additional information about the Trustees and Officers and is available, without charge, upon request by calling 800 523-1918.
Table of Contents
| | |
 |  |
| | |
| | |
| | |
| | |
| | |
| | |
| | |
| | |
| | Annual report |
| | |
| | |
| | |
| | |
Multi-asset mutual fund
Delaware Wealth Builder Fund
November 30, 2023
Carefully consider the Fund’s investment objectives, risk factors, charges, and expenses before investing. This and other information can be found in the Fund’s prospectus and its summary prospectus, which may be obtained by visiting delawarefunds.com/literature or calling 800 523-1918. Investors should read the prospectus and the summary prospectus carefully before investing.
You can obtain shareholder reports and prospectuses online instead of in the mail.
Visit delawarefunds.com/edelivery.
Experience Delaware Funds by Macquarie®
Macquarie Asset Management (MAM) is a global asset manager that aims to deliver positive impact for everyone. MAM’s public markets businesses trace their roots to 1929 and partner with institutional and individual clients to deliver specialist active investment capabilities across global equities, fixed income, and multi-asset solutions using a conviction-based, long-term approach to investing. In the US, retail investors recognize our Delaware Funds by Macquarie family of funds as one of the oldest mutual fund families.
If you are interested in learning more about creating an investment plan, contact your financial advisor.
You can learn more about Delaware Funds or obtain a prospectus for Delaware Wealth Builder Fund at delawarefunds.com/literature.
Manage your account online
· Check your account balance and transactions
· View statements and tax forms
· Make purchases and redemptions
Visit delawarefunds.com/account-access.
Macquarie Asset Management (MAM) is the asset management division of Macquarie Group. MAM is an integrated asset manager across public and private markets offering a diverse range of capabilities, including real assets, real estate, credit, equities, and multi-asset solutions.
The Fund is advised by Delaware Management Company, a series of Macquarie Investment Management Business Trust (MIMBT), a US registered investment adviser, and distributed by Delaware Distributors, L.P. (DDLP), an affiliate of MIMBT and Macquarie Group Limited.
Other than Macquarie Bank Limited ABN 46 008 583 542 (“Macquarie Bank”), any Macquarie Group entity noted in this document is not an authorized deposit-taking institution for the purposes of the Banking Act 1959 (Commonwealth of Australia). The obligations of these other Macquarie Group entities do not represent deposits or other liabilities of Macquarie Bank. Macquarie Bank does not guarantee or otherwise provide assurance in respect of the obligations of these other Macquarie Group entities. In addition, if this document relates to an investment, (a) the investor is subject to investment risk including possible delays in repayment and loss of income and principal invested and (b) none of Macquarie Bank or any other Macquarie Group entity guarantees any particular rate of return on or the performance of the investment, nor do they guarantee repayment of capital in respect of the investment.
The Fund is governed by US laws and regulations.
Table of contents
This annual report is for the information of Delaware Wealth Builder Fund shareholders, but it may be used with prospective investors when preceded or accompanied by the Delaware Fund fact sheet for the most recently completed calendar quarter. These documents are available at delawarefunds.com/literature.
Unless otherwise noted, views expressed herein are current as of November 30, 2023, and subject to change for events occurring after such date. These views are not intended to be investment advice, to forecast future events, or to guarantee future results.
The Fund is not FDIC insured and is not guaranteed. It is possible to lose the principal amount invested.
All third-party marks cited are the property of their respective owners.
© 2024 Macquarie Management Holdings, Inc.
| Portfolio management review | |
| Delaware Wealth Builder Fund | November 30, 2023 (Unaudited) |
| Performance preview (for the year ended November 30, 2023) | | |
| Delaware Wealth Builder Fund (Institutional Class shares) | 1-year return | +4.13%* |
| Delaware Wealth Builder Fund (Class A shares) | 1-year return | +3.75%* |
| 60% S&P 500® Index / 40% Bloomberg US Aggregate Index (primary benchmark) | 1-year return | +8.76% |
| S&P 500 Index | 1-year return | +13.84% |
| Bloomberg US Aggregate Index | 1-year return | +1.18% |
*Total return for the report period presented in the table differs from the return in “Financial highlights.” The total return presented in the above table is calculated based on the net asset value at which shareholder transactions were processed. The total return presented in “Financial highlights” is calculated in the same manner but also takes into account certain adjustments that are necessary under US generally accepted accounting principles.
Past performance does not guarantee future results.
For complete, annualized performance for Delaware Wealth Builder Fund, please see the table on page 5.
Institutional Class shares are not subject to a sales charge and are offered for sale exclusively to certain eligible investors. In addition, Institutional Class shares pay no distribution and service fee.
The performance of Class A shares excludes the applicable sales charge. The performance of both Institutional Class shares and Class A shares reflects the reinvestment of all distributions.
Please see page 8 for a description of the indices. Index performance returns do not reflect any management fees, transaction costs, or expenses. Indices are unmanaged and one cannot invest directly in an index.
Investment objective
The Fund seeks to provide high current income and an investment that has the potential for capital appreciation.
Investment in the Fund does not in any way provide an indication of future performance or a guarantee of positive returns.
Economic backdrop
Equities and bonds sustained significant losses in December 2022, the opening month of the fiscal year ended November 30, 2023. The major central banks raised key interest rates, though by less than they had previously. The US Federal Reserve and the European Central Bank (ECB) each raised rates 0.50 percentage points. At the time, ECB president Christine Lagarde said that significantly higher interest rates were still needed, causing yields to rise sharply and prices to fall. In Europe, bonds lost much more than stocks, while the reverse occurred in the
The picture for markets is still mixed, in our opinion. A big challenge on the horizon is the combination of tightening lending standards and falling credit demand, which could increase the risk of a recession. At the same time, in an environment with at least temporary disinflationary headwinds, we believe it will be vital for companies to preserve margins.
Portfolio management review
Delaware Wealth Builder Fund
US, as tech stocks slipped again. China surprised many by ending its zero-COVID policy. Japan slightly tightened its monetary policy, which helped bolster the yen.
At the start of 2023, there was a positive reversal of trends from the challenges and large drawdowns that had characterized much of 2022. The equity and bond markets started the year strong on the heels of China’s reopening and hope for falling inflation. Although headline inflation rates did fall thanks to declining energy prices, core inflation continued to rise.
Three US regional banks collapsed in March, and Switzerland’s Credit Suisse experienced severe turbulence before UBS Group AG acquired it. Bank share prices plummeted, and stock markets in general fell sharply. Government bonds and gold rallied, risk premiums on corporate bonds widened, and the US dollar lost ground against the euro.
Stock markets in developed countries trended slightly positive as the second quarter of 2023 began, although North American equities were under water at times. Europe and the Pacific region were the strongest performers, whereas emerging markets, led by China, slipped into negative territory.
Equity markets were strong in June, particularly in Japan and the US, although overall equity performance was somewhat bumpy. After Congress agreed to raise the US debt ceiling and the Fiscal Responsibility Act of 2023 was signed into law in early June, equities rallied significantly. However, this positive phase was short lived. A large downturn followed the Fed and ECB central bank meetings. Strong performance returned only toward the end of June after the release of several surprisingly good US economic data points.
The third quarter of 2023 challenged markets. Most major asset classes declined largely because central banks around the world continued tightening monetary policy. In the US, the Fed continued raising rates, and the Federal Open Market Committee (FOMC) increased its interest rate outlook, with the latest dot plot calling for a median federal funds rate of 5.6% by the end of 2023. The ECB raised short-term policy rates to the highest level in more than 20 years. However, China continued to be the contrarian among major economies, easing both fiscal and monetary policy.
Higher rates make servicing debt more difficult, especially for governments running large budget deficits. None of this was lost on American credit rating agency Fitch Ratings; it downgraded the US credit rating in August from AAA to AA+, focusing attention on the US government, which carries a national debt of more than $33 trillion. Capital markets reacted by selling off bonds as interest rates soared globally. The 10-year Treasury yield peaked at a level not seen since 2007. Similar trends appeared around the world, with 10-year German and Japanese government bonds rising to levels not seen in a decade.
While global equities mostly suffered losses, energy stocks were an exception, as oil prices rose during the quarter. Crude oil had its biggest quarterly gain since the Russian invasion of Ukraine in early 2022. That followed news that Saudi Arabia and Russia were extending production cuts until the end of 2023, reducing the overall supply.
Within the Fund
For the fiscal year ended November 30, 2023, Delaware Wealth Builder Fund underperformed its primary benchmark, a blend of 60% S&P 500 Index and 40%
Bloomberg US Aggregate Index. The Fund’s Institutional Class shares gained 4.13%. The Fund’s Class A shares rose 3.75% at net asset value and declined 2.22% at maximum offer price. These figures reflect all distributions reinvested. During the same period, the blend of 60% S&P 500 Index and 40% Bloomberg US Aggregate Index rose 8.76%, the S&P 500 Index gained 13.84%, and the Bloomberg US Aggregate Index gained 1.18%. For complete, annualized performance of Delaware Wealth Builder Fund, please see the table on page 5.
The Fund’s underperformance for the fiscal year was largely driven by its equity exposure, which underperformed relative to the S&P 500 Index. Within equities, the largest detractors came from large-cap value and US real estate investment trusts (REITs), which continued to struggle relative to more growth-oriented stocks. Among equities, US quality and income detracted the least within the Fund.
On the fixed income side, most asset classes outperformed relative to the Bloomberg US Aggregate Index. The largest contributors came from high yield and emerging market fixed income as those credits tended to outperform longer-duration bonds that are more rate sensitive. Similarly, investment grade bonds slightly underperformed.
Portfolio positioning
The Fund’s strategic policy weights reflect a commitment to seeking diversification across geographies and asset classes. As part of the oversight process, we periodically analyze the sources of the Fund’s active performance.
During the fiscal year, the Fund’s active positioning with respect to the strategic policy weights of different asset classes detracted from performance.
We periodically examine derivatives’ contribution to the Fund’s performance. Based on the available information, the Fund’s combination of futures, options, swaps, and currency positions had only a limited effect on performance for the 12-month period.
As the Fund’s fiscal year ended, we sought to continue delivering the potential benefits of diversification while actively managing risk. The Fund seeks to deliver returns that are derived from tactical asset allocation decisions as well as from active management of individual asset classes and investment styles. We manage the Fund based on the assumption that investors should keep a global perspective when evaluating potential investment opportunities and, as a result, we continue to include global investment possibilities within the Fund.
The picture for markets is still mixed, in our opinion. A big challenge on the horizon is the combination of tightening lending standards and falling credit demand, which could increase the risk of a recession. At the same time, in an environment with at least temporary disinflationary headwinds, we believe it will be vital for companies to preserve margins. We expect central banks to take the increasing risk into account and believe that the combination of softening inflationary pressures and initial signs of a slowing labor market may indicate that the rate-hiking cycle is nearing its end.
Portfolio management review
Delaware Wealth Builder Fund
In our view, a thoughtful active management approach is needed given the increased uncertainty. We believe vigilant and continuous assessment of the current market environment offers opportunities to take advantage of market dislocations and may help us achieve what we consider to be attractive risk-adjusted returns through an active focus on portfolio risk and diversification.
| Performance summary | |
| Delaware Wealth Builder Fund | November 30, 2023 (Unaudited) |
The performance quoted represents past performance and does not guarantee future results. Investment return and principal value of an investment will fluctuate so that shares, when redeemed, may be worth more or less than their original cost. Current performance may be lower or higher than the performance quoted. Performance data current to the most recent month end may be obtained by calling 800 523-1918 or visiting delawarefunds.com/performance.
| Fund and benchmark performance1,2 | Average annual total returns through November 30, 2023 |
| | 1 year | 5 year | 10 year | Lifetime |
| Class A (Est. December 2, 1996) | | | | |
| Excluding sales charge | +3.75%* | +5.50% | +5.01% | — |
| Including sales charge | -2.22% | +4.26% | +4.39% | — |
| Class C (Est. October 1, 2003) | | | | |
| Excluding sales charge | +2.99%* | +4.70% | +4.22% | — |
| Including sales charge | +2.04% | +4.70% | +4.22% | — |
| Class R (Est. October 1, 2003) | | | | |
| Excluding sales charge | +3.56%* | +5.24% | +4.76% | — |
| Including sales charge | +3.56% | +5.24% | +4.76% | — |
| Institutional Class (Est. December 2, 1996) | | | | |
| Excluding sales charge | +4.13%* | +5.77% | +5.28% | — |
| Including sales charge | +4.13% | +5.77% | +5.28% | — |
| Class R6 (Est. February 28, 2023) | | | | |
| Excluding sales charge | — | — | — | +5.49% |
| Including sales charge | — | — | — | +5.49% |
| 60% S&P 500 Index / 40% Bloomberg US Aggregate Index | +8.76% | +8.03% | +7.78% | — |
| S&P 500 Index | +13.84% | +12.51% | +11.82% | — |
| Bloomberg US Aggregate Index | +1.18% | +0.71% | +1.37% | — |
*Total return for the report period presented in the table differs from the return in “Financial highlights.” The total return presented in the above table is calculated based on the net asset value at which shareholder transactions were processed. The total return presented in “Financial highlights” is calculated in the same manner but also takes into account certain adjustments that are necessary under US generally accepted accounting principles.
1Returns reflect the reinvestment of all distributions and are presented both with and without the applicable sales charges described below. Returns do not reflect the deduction of taxes the shareholder would pay on Fund distributions or redemptions of Fund shares.
Expense limitations were in effect for certain classes during some or all of the periods shown in the “Fund and benchmark performance” table. Expenses for each class are listed in the “Fund expense ratios” table on
Performance summary
Delaware Wealth Builder Fund
page 7. Performance would have been lower had expense limitations not been in effect.
Class A shares are sold with a maximum front-end sales charge of 5.75%, and have an annual distribution and service (12b-1) fee of 0.25% of average daily net assets. Performance for Class A shares, excluding sales charges, assumes that no front-end sales charge applied.
Class C shares are sold with a contingent deferred sales charge (CDSC) of 1.00% if redeemed within one year of purchase. They are also subject to an annual 12b-1 fee of 1.00% of average daily net assets. Performance for Class C shares, excluding sales charges, assumes either that CDSCs did not apply or that the investment was not redeemed.
Class R shares are available only for certain retirement plan products. They are sold without a sales charge and have an annual 12b-1 fee of 0.50% of average daily net assets.
Institutional Class shares are not subject to a sales charge and are offered for sale exclusively to certain eligible investors. In addition, Institutional Class shares pay no 12b-1 fee.
Class R6 shares are available only to certain investors. In addition, Class R6 shares do not pay any service fees, sub-accounting fees, and/or sub-transfer agency fees to any brokers, dealers, or other financial intermediaries. Class R6 shares pay no 12b-1 fee.
The Fund may invest up to 45% of its net assets in high yield, higher-risk corporate bonds.
Fixed income securities and bond funds can lose value, and investors can lose principal as interest rates rise. They also may be affected by economic conditions that hinder an issuer’s ability to make interest and principal payments on its debt. This includes prepayment risk, the risk that the principal of a bond that is held by a portfolio will be prepaid prior to maturity at the time when interest rates are lower than what the bond was paying. A portfolio may then have to reinvest that money at a lower interest rate.
High yielding, non-investment-grade bonds (junk bonds) involve higher risk than investment grade bonds. The high yield secondary market is particularly susceptible to liquidity problems when institutional investors, such as mutual funds and certain other financial institutions, temporarily stop buying bonds for regulatory, financial, or other reasons. In addition, a less liquid secondary market makes it more difficult to obtain precise valuations of the high yield securities.
International investments entail risks including fluctuation in currency values, differences in accounting principles, or economic or political instability. Investing in emerging markets can be riskier than investing in established foreign markets due to increased volatility, lower trading volume, and higher risk of market closures. In many emerging markets, there is substantially less publicly available information and the available information may be incomplete or misleading. Legal claims are generally more difficult to pursue.
IBOR risk is the risk that changes related to the use of the London interbank offered rate (LIBOR) or similar rates (such as EONIA) could have adverse impacts on financial instruments that reference these rates. The abandonment of these rates and transition to alternative rates could affect the value and liquidity of instruments that reference them and could affect investment strategy performance.
The disruptions caused by natural disasters, pandemics, or similar events could prevent the Fund from executing advantageous investment decisions in a timely manner and could negatively impact the Fund’s ability to achieve its investment objective and the value of the Fund’s investments.
2The Fund’s expense ratios, as described in the most recent prospectus, are disclosed in the following “Fund expense ratios” table. The expense ratios below may differ from the expense ratios in the “Financial highlights” since they are based on different time periods and the expense ratios in the prospectus include acquired fund fees and expenses, if any. See Note 2 in “Notes to financial statements” for additional details. Please see the “Financial highlights” section in this report for the most recent expense ratios.
| Fund expense ratios | Class A | Class C | Class R | Institutional
Class | Class R6 |
| Total annual operating expenses (without fee waivers) | 1.30% | 2.05% | 1.55% | 1.05% | 0.87% |
| Net expenses (including fee waivers, if any) | 1.04% | 1.79% | 1.29% | 0.79% | 0.72% |
| Type of waiver | Contractual | Contractual | Contractual | Contractual | Contractual |
Performance summary
Delaware Wealth Builder Fund
Performance of a $10,000 investment1
For the period November 30, 2013 through November 30, 2023
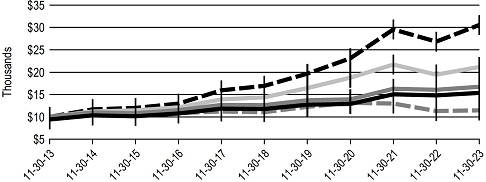
| | | Starting value | | Ending value |
 | S&P 500 Index | | $10,000 | | | $30,550 |
 | 60% S&P 500 Index / 40% Bloomberg US Aggregate Index | | $10,000 | | | $21,160 |
 | Delaware Wealth Builder Fund - Institutional Class shares | | $10,000 | | | $16,734 |
 | Delaware Wealth Builder Fund - Class A shares | | $9,425 | | | $15,374 |
 | Bloomberg US Aggregate Index | | $10,000 | | | $11,458 |
1The “Performance of a $10,000 investment” graph assumes $10,000 invested in Institutional Class and Class A shares of the Fund on November 30, 2013, and includes the effect of a 5.75% front-end sales charge (for Class A shares) and the reinvestment of all distributions. The graph does not reflect the deduction of taxes the shareholders would pay on Fund distributions or redemptions of Fund shares. Expense limitations were in effect for some or all of the periods shown. Performance would have been lower had expense limitations not been in effect. Expenses are listed in the “Fund expense ratios” table on page 7. Please note additional details on pages 5 through 8.
The graph also assumes $10,000 invested in the 60% S&P 500 Index / 40% Bloomberg US Aggregate Index, the S&P 500 Index, and the Bloomberg US Aggregate Index as of November 30, 2013.
The S&P 500 Index measures the performance of 500 mostly large-cap stocks weighted by market value and is often used to represent performance of the US stock market.
The Bloomberg US Aggregate Index is a broad-based benchmark that measures the investment grade, US dollar-denominated, fixed-rate taxable bond market.
Index performance returns do not reflect any management fees, transaction costs, or
expenses. Indices are unmanaged and one cannot invest directly in an index. Past performance does not guarantee future results.
Performance of other Fund classes will vary due to different charges and expenses.
| | Nasdaq symbols | CUSIPs |
| Class A | DDIAX | 24610B107 |
| Class C | DDICX | 24610B305 |
| Class R | DDDRX | 24610B842 |
| Institutional Class | DDIIX | 24610B404 |
| Class R6 | DDERX | 24610B776 |
Disclosure of Fund expenses
For the six-month period from June 1, 2023 to November 30, 2023 (Unaudited)
As a shareholder of the Fund, you incur two types of costs: (1) transaction costs, including sales charges (loads) on purchase payments, reinvested dividends, or other distributions; redemption fees; and exchange fees; and (2) ongoing costs, including management fees; distribution and service (12b-1) fees; and other Fund expenses. This example is intended to help you understand your ongoing costs (in dollars) of investing in the Fund and to compare these costs with the ongoing costs of investing in other mutual funds.
The example is based on an investment of $1,000 invested at the beginning of the period and held for the entire six-month period from June 1, 2023 to November 30, 2023.
Actual expenses
The first section of the table shown, “Actual Fund return,” provides information about actual account values and actual expenses. You may use the information in this section of the table, together with the amount you invested, to estimate the expenses that you paid over the period. Simply divide your account value by $1,000 (for example, an $8,600 account value divided by $1,000 = 8.6), then multiply the result by the number in the first section under the heading entitled “Expenses Paid During Period” to estimate the expenses you paid on your account during this period.
Hypothetical example for comparison purposes
The second section of the table shown, “Hypothetical 5% return,” provides information about hypothetical account values and hypothetical expenses based on the Fund’s actual expense ratio and an assumed rate of return of 5% per year before expenses, which is not the Fund’s actual return. The hypothetical account values and expenses may not be used to estimate the actual ending account balance or expenses you paid for the period. You may use this information to compare the ongoing costs of investing in the Fund and other funds. To do so, compare this 5% hypothetical example with the 5% hypothetical examples that appear in the shareholder reports of the other funds.
Please note that the expenses shown in the table are meant to highlight your ongoing costs only and do not reflect any transactional costs, such as sales charges (loads), redemption fees, or exchange fees. Therefore, the second section of the table is useful in comparing ongoing costs only, and will not help you determine the relative total costs of owning different funds. In addition, if these transactional costs were included, your costs would have been higher. The Fund’s expenses shown in the table reflect fee waivers in effect and assume reinvestment of all dividends and distributions.
Delaware Wealth Builder Fund
Expense analysis of an investment of $1,000
| | | Beginning
Account Value
6/1/23 | | Ending
Account Value
11/30/23 | | Annualized
Expense Ratio | | Expenses
Paid During Period
6/1/23 to 11/30/23* |
| Actual Fund return† | | | | | | | | | | | | |
| Class A | | $ | 1,000.00 | | | $ | 1,058.20 | | | | 1.04 | % | | $ | 5.37 | |
| Class C | | | 1,000.00 | | | | 1,054.00 | | | | 1.79 | % | | | 9.22 | |
| Class R | | | 1,000.00 | | | | 1,057.30 | | | | 1.29 | % | | | 6.65 | |
| Institutional Class | | | 1,000.00 | | | | 1,060.10 | | | | 0.79 | % | | | 4.08 | |
| Class R6 | | | 1,000.00 | | | | 1,059.80 | | | | 0.72 | % | | | 3.72 | |
| Hypothetical 5% return (5% return before expenses) | | |
| Class A | | $ | 1,000.00 | | | $ | 1,019.85 | | | | 1.04 | % | | $ | 5.27 | |
| Class C | | | 1,000.00 | | | | 1,016.09 | | | | 1.79 | % | | | 9.05 | |
| Class R | | | 1,000.00 | | | | 1,018.60 | | | | 1.29 | % | | | 6.53 | |
| Institutional Class | | | 1,000.00 | | | | 1,021.11 | | | | 0.79 | % | | | 4.00 | |
| Class R6 | | | 1,000.00 | | | | 1,021.46 | | | | 0.72 | % | | | 3.65 | |
*“Expenses Paid During Period” are equal to the Fund’s annualized expense ratio, multiplied by the average account value over the period, multiplied by 183/365 (to reflect the one-half year period).
†Because actual returns reflect only the most recent six-month period, the returns shown may differ significantly from fiscal year returns.
In addition to the Fund’s expenses reflected above, the Fund also indirectly bears its portion of the fees and expenses of any investment companies (Underlying Funds), including exchange-traded funds, in which it invests. The table above does not reflect the expenses of any Underlying Funds.
Security type / sector allocations and top 10 equity holdings
| Delaware Wealth Builder Fund | As of November 30, 2023 (Unaudited) |
Sector designations may be different from the sector designations presented in other Fund materials. The sector designations may represent the investment manager’s internal sector classifications, which may result in the sector designations for one fund being different from another fund’s sector designations.
| Security type / sector | | Percentage of net assets |
| Agency Collateralized Mortgage Obligations | | | 0.07 | % |
| Agency Commercial Mortgage-Backed Security | | | 0.01 | % |
| Agency Mortgage-Backed Securities | | | 5.69 | % |
| Collateralized Debt Obligations | | | 0.29 | % |
| Convertible Bonds | | | 7.38 | % |
| Corporate Bonds | | | 11.88 | % |
| Automotive | | | 0.31 | % |
| Banking | | | 1.20 | % |
| Basic Industry | | | 0.65 | % |
| Brokerage | | | 0.07 | % |
| Capital Goods | | | 0.58 | % |
| Communications | | | 0.68 | % |
| Consumer Cyclical | | | 0.12 | % |
| Consumer Goods | | | 0.13 | % |
| Consumer Non-Cyclical | | | 0.54 | % |
| Electric | | | 0.79 | % |
| Energy | | | 1.53 | % |
| Financials | | | 0.54 | % |
| Healthcare | | | 0.40 | % |
| Industrials | | | 0.02 | % |
| Insurance | | | 0.87 | % |
| Leisure | | | 0.42 | % |
| Local Authorities | | | 0.02 | % |
| Media | | | 0.63 | % |
| Natural Gas | | | 0.11 | % |
| Real Estate Investment Trusts | | | 0.09 | % |
| Retail | | | 0.30 | % |
| Services | | | 0.43 | % |
| Technology | | | 0.27 | % |
| Technology & Electronics | | | 0.28 | % |
| Telecommunications | | | 0.56 | % |
| Transportation | | | 0.34 | % |
| Government Agency Obligations | | | 0.35 | % |
| Municipal Bonds | | | 0.05 | % |
| Non-Agency Asset-Backed Securities | | | 0.28 | % |
| Non-Agency Collateralized Mortgage Obligations | | | 0.29 | % |
| Security type / sector | | Percentage of net assets |
| Non-Agency Commercial Mortgage-Backed Securities | | | 1.31 | % |
| Sovereign Bonds | | | 1.87 | % |
| Supranational Banks | | | 0.11 | % |
| US Treasury Obligations | | | 5.04 | % |
| Common Stocks | | | 56.32 | % |
| Communication Services | | | 2.40 | % |
| Consumer Discretionary | | | 6.09 | % |
| Consumer Staples | | | 4.96 | % |
| Energy | | | 3.98 | % |
| Financials | | | 8.75 | % |
| Healthcare | | | 6.89 | % |
| Industrials | | | 4.37 | % |
| Information Technology | | | 14.87 | % |
| Materials | | | 0.94 | % |
| Real Estate | | | 0.49 | % |
| REIT Diversified | | | 0.17 | % |
| REIT Healthcare | | | 0.06 | % |
| REIT Hotel | | | 0.19 | % |
| REIT Industrial | | | 0.39 | % |
| REIT Mall | | | 0.19 | % |
| REIT Manufactured Housing | | | 0.06 | % |
| REIT Multifamily | | | 0.26 | % |
| REIT Office | | | 0.04 | % |
| REIT Self-Storage | | | 0.20 | % |
| REIT Shopping Center | | | 0.26 | % |
| REIT Single Tenant | | | 0.09 | % |
| REIT Specialty | | | 0.18 | % |
| Utilities | | | 0.49 | % |
| Convertible Preferred Stock | | | 1.24 | % |
| Preferred Stock | | | 0.16 | % |
| Exchange-Traded Funds | | | 4.76 | % |
| Leveraged Non-Recourse Security | | | 0.00 | % |
| Limited Liability Corporation | | | 1.18 | % |
| Short-Term Investments | | | 1.45 | % |
| Total Value of Securities | | | 99.73 | % |
| Receivables and Other Assets Net of Liabilities | | | 0.27 | % |
| Total Net Assets | | | 100.00 | % |
Security type / sector allocations and top 10 equity holdings
Delaware Wealth Builder Fund
Top 10 equity holdings are for informational purposes only and are subject to change at any time. They are not a recommendation to buy, sell, or hold any security.
| Top 10 equity holdings | | Percentage of net assets |
| Apple | | | 2.94 | % |
| Microsoft | | | 2.68 | % |
| NVIDIA | | | 1.37 | % |
| Merck & Co. | | | 1.06 | % |
| Verizon Communications | | | 0.98 | % |
| TJX | | | 0.93 | % |
| ConocoPhillips | | | 0.91 | % |
| Lowe’s | | | 0.91 | % |
| Cisco Systems | | | 0.88 | % |
| Exxon Mobil | | | 0.75 | % |
| Schedule of investments | |
| Delaware Wealth Builder Fund | November 30, 2023 |
| | | Principal
amount° | | | Value (US $) | |
| Agency Collateralized Mortgage Obligations — 0.07% | | | | | | | | |
| Fannie Mae REMIC | | | | | | | | |
| Series 2013-44 DI 3.00% 5/25/33 Σ | | | 220,129 | | | $ | 18,124 | |
| Freddie Mac REMIC | | | | | | | | |
| Series 5092 WG 1.00% 4/25/31 | | | 193,864 | | | | 167,377 | |
| Freddie Mac Structured Agency Credit Risk REMIC Trust | | | | | | | | |
| Series 2021-HQA2 M1 144A 6.028% (SOFR + 0.70%) 12/25/33 #, • | | | 9,618 | | | | 9,598 | |
| GNMA | | | | | | | | |
| Series 2013-113 LY 3.00% 5/20/43 | | | 450,000 | | | | 397,614 | |
| Series 2017-10 KZ 3.00% 1/20/47 | | | 1,227 | | | | 1,035 | |
Total Agency Collateralized Mortgage Obligations
(cost $695,344) | | | | | | | 593,748 | |
| | | | | | | | | |
| Agency Commercial Mortgage-Backed Security — 0.01% | | | | | | | | |
| Freddie Mac Multifamily Structured Pass Through Certificates | | | | | | | | |
| Series K729 A2 3.136% 10/25/24 t | | | 100,000 | | | | 98,030 | |
Total Agency Commercial Mortgage-Backed Security
(cost $108,828) | | | | | | | 98,030 | |
| | | | | | | | | |
| Agency Mortgage-Backed Securities — 5.69% | | | | | | | | |
| Fannie Mae | | | | | | | | |
| 3.50% 10/1/42 | | | 326,225 | | | | 297,518 | |
| Fannie Mae S.F. 15 yr | | | | | | | | |
| 2.00% 2/1/36 | | | 253,332 | | | | 222,652 | |
| 2.00% 4/1/36 | | | 434,538 | | | | 383,232 | |
| 2.50% 8/1/36 | | | 604,885 | | | | 543,707 | |
| 4.50% 9/1/37 | | | 83,725 | | | | 81,640 | |
| Fannie Mae S.F. 20 yr | | | | | | | | |
| 2.00% 3/1/41 | | | 94,800 | | | | 78,582 | |
| 2.00% 5/1/41 | | | 796,406 | | | | 658,781 | |
| 2.50% 1/1/41 | | | 45,184 | | | | 38,744 | |
| 4.00% 8/1/42 | | | 484,489 | | | | 447,091 | |
| 4.00% 9/1/42 | | | 561,424 | | | | 517,185 | |
| Fannie Mae S.F. 30 yr | | | | | | | | |
| 2.00% 12/1/50 | | | 126,790 | | | | 99,530 | |
| 2.00% 1/1/51 | | | 34,477 | | | | 27,232 | |
| 2.00% 2/1/51 | | | 905,816 | | | | 716,676 | |
| 2.00% 3/1/51 | | | 479,340 | | | | 374,654 | |
| 2.00% 5/1/51 | | | 815,238 | | | | 633,414 | |
| 2.00% 1/1/52 | | | 72,369 | | | | 57,009 | |
Schedule of investments
Delaware Wealth Builder Fund
| | | Principal
amount° | | | Value (US $) | |
| Agency Mortgage-Backed Securities (continued) | | | | | | |
| Fannie Mae S.F. 30 yr | | | | | | | | |
| 2.50% 1/1/43 | | | 16,711 | | | $ | 14,039 | |
| 2.50% 8/1/50 | | | 577,764 | | | | 477,003 | |
| 2.50% 9/1/50 | | | 80,451 | | | | 65,653 | |
| 2.50% 11/1/50 | | | 372,059 | | | | 301,515 | |
| 2.50% 1/1/51 | | | 254,421 | | | | 210,119 | |
| 2.50% 5/1/51 | | | 20,307 | | | | 16,632 | |
| 2.50% 6/1/51 | | | 26,955 | | | | 22,128 | |
| 2.50% 7/1/51 | | | 49,334 | | | | 40,241 | |
| 2.50% 8/1/51 | | | 602,145 | | | | 493,013 | |
| 2.50% 11/1/51 | | | 352,065 | | | | 286,529 | |
| 2.50% 2/1/52 | | | 1,423,226 | | | | 1,160,601 | |
| 2.50% 4/1/52 | | | 732,842 | | | | 596,446 | |
| 3.00% 1/1/47 | | | 161,918 | | | | 142,452 | |
| 3.00% 11/1/48 | | | 8,922 | | | | 7,739 | |
| 3.00% 11/1/49 | | | 255,835 | | | | 220,742 | |
| 3.00% 3/1/50 | | | 365,911 | | | | 314,295 | |
| 3.00% 7/1/50 | | | 203,394 | | | | 174,283 | |
| 3.00% 7/1/51 | | | 142,057 | | | | 121,082 | |
| 3.00% 5/1/52 | | | 1,369,629 | | | | 1,162,143 | |
| 3.50% 1/1/46 | | | 116,327 | | | | 106,372 | |
| 3.50% 7/1/47 | | | 193,648 | | | | 176,590 | |
| 3.50% 2/1/48 | | | 46,190 | | | | 41,377 | |
| 3.50% 11/1/48 | | | 234,517 | | | | 210,100 | |
| 3.50% 12/1/49 | | | 138,682 | | | | 123,855 | |
| 3.50% 3/1/50 | | | 10,250 | | | | 9,181 | |
| 3.50% 7/1/50 | | | 1,905,226 | | | | 1,716,394 | |
| 3.50% 8/1/50 | | | 889,863 | | | | 798,138 | |
| 3.50% 9/1/50 | | | 572,042 | | | | 512,709 | |
| 3.50% 6/1/51 | | | 601,349 | | | | 530,560 | |
| 3.50% 1/1/52 | | | 373,105 | | | | 328,218 | |
| 3.50% 5/1/52 | | | 276,640 | | | | 245,961 | |
| 3.50% 9/1/52 | | | 199,252 | | | | 174,870 | |
| 4.00% 3/1/47 | | | 181,550 | | | | 168,697 | |
| 4.00% 4/1/47 | | | 7,061 | | | | 6,561 | |
| 4.00% 6/1/48 | | | 82,266 | | | | 76,391 | |
| 4.00% 9/1/48 | | | 3,453 | | | | 3,202 | |
| 4.00% 10/1/48 | | | 294,183 | | | | 274,035 | |
| 4.00% 6/1/49 | | | 6,380 | | | | 5,915 | |
| 4.00% 5/1/51 | | | 430,165 | | | | 396,532 | |
| 4.00% 6/1/52 | | | 469,618 | | | | 426,716 | |
| 4.00% 9/1/52 | | | 153,407 | | | | 139,333 | |
| | | Principal
amount° | | | Value (US $) | |
| Agency Mortgage-Backed Securities (continued) | | | | | | |
| Fannie Mae S.F. 30 yr | | | | | | | | |
| 4.50% 11/1/47 | | | 79,794 | | | $ | 76,411 | |
| 4.50% 9/1/48 | | | 344,392 | | | | 327,179 | |
| 4.50% 1/1/49 | | | 12,706 | | | | 12,105 | |
| 4.50% 5/1/49 | | | 134,791 | | | | 127,928 | |
| 4.50% 1/1/50 | | | 1,423,868 | | | | 1,375,491 | |
| 4.50% 4/1/50 | | | 198,283 | | | | 189,047 | |
| 4.50% 9/1/52 | | | 143,442 | | | | 134,397 | |
| 4.50% 10/1/52 | | | 1,906,457 | | | | 1,786,374 | |
| 4.50% 2/1/53 | | | 2,719,839 | | | | 2,548,520 | |
| 5.00% 7/1/47 | | | 729,464 | | | | 727,371 | |
| 5.00% 7/1/49 | | | 76,000 | | | | 74,324 | |
| 5.00% 8/1/49 | | | 581,127 | | | | 568,590 | |
| 5.00% 8/1/53 | | | 991,179 | | | | 954,391 | |
| 5.50% 5/1/44 | | | 1,262,603 | | | | 1,281,645 | |
| 5.50% 8/1/52 | | | 1,162,128 | | | | 1,146,402 | |
| 5.50% 10/1/52 | | | 265,808 | | | | 262,826 | |
| 5.50% 3/1/53 | | | 249,652 | | | | 246,023 | |
| 5.50% 7/1/53 | | | 898,627 | | | | 885,944 | |
| 6.00% 1/1/42 | | | 728,228 | | | | 751,864 | |
| 6.00% 6/1/53 | | | 610,254 | | | | 612,063 | |
| 6.00% 9/1/53 | | | 871,546 | | | | 874,130 | |
| 6.50% 11/1/33 | | | 59,637 | | | | 61,717 | |
| 6.50% 6/1/36 | | | 11,710 | | | | 12,066 | |
| 7.00% 3/1/32 | | | 83,586 | | | | 85,790 | |
| 7.00% 8/1/32 | | | 72,272 | | | | 74,177 | |
| Fannie Mae S.F. 30 yr TBA | | | | | | | | |
| 4.00% 12/1/53 | | | 150,000 | | | | 136,169 | |
| 6.00% 12/1/53 | | | 1,393,000 | | | | 1,396,868 | |
| Freddie Mac S.F. 15 yr | | | | | | | | |
| 3.00% 3/1/35 | | | 505,556 | | | | 468,871 | |
| 4.50% 9/1/37 | | | 437,789 | | | | 427,364 | |
| Freddie Mac S.F. 20 yr | | | | | | | | |
| 2.00% 3/1/41 | | | 108,893 | | | | 90,459 | |
| 2.50% 9/1/42 | | | 444,213 | | | | 376,187 | |
| 3.00% 9/1/40 | | | 172,265 | | | | 153,027 | |
| 3.00% 6/1/42 | | | 279,337 | | | | 244,242 | |
| Freddie Mac S.F. 30 yr | | | | | | | | |
| 2.00% 9/1/51 | | | 158,871 | | | | 124,142 | |
| 2.00% 2/1/52 | | | 659,668 | | | | 512,832 | |
| 2.00% 3/1/52 | | | 7,317 | | | | 5,693 | |
| 2.50% 11/1/50 | | | 394,718 | | | | 324,431 | |
Schedule of investments
Delaware Wealth Builder Fund
| | | Principal
amount° | | | Value (US $) | |
| Agency Mortgage-Backed Securities (continued) | | | | | | |
| Freddie Mac S.F. 30 yr | | | | | | | | |
| 2.50% 12/1/51 | | | 543,446 | | | $ | 445,301 | |
| 3.00% 11/1/46 | | | 908,464 | | | | 790,013 | |
| 3.00% 8/1/50 | | | 130,289 | | | | 111,986 | |
| 3.00% 12/1/50 | | | 368,506 | | | | 316,513 | |
| 3.00% 8/1/51 | | | 660,712 | | | | 561,754 | |
| 3.50% 8/1/49 | | | 448,835 | | | | 401,313 | |
| 3.50% 4/1/52 | | | 25,665 | | | | 22,634 | |
| 3.50% 6/1/52 | | | 21,837 | | | | 19,226 | |
| 4.00% 10/1/47 | | | 21,097 | | | | 19,437 | |
| 4.00% 9/1/49 | | | 1,023,715 | | | | 949,330 | |
| 4.00% 8/1/52 | | | 437,995 | | | | 399,286 | |
| 4.00% 9/1/52 | | | 590,474 | | | | 536,884 | |
| 4.50% 8/1/48 | | | 64,998 | | | | 62,085 | |
| 4.50% 1/1/49 | | | 80,890 | | | | 76,910 | |
| 4.50% 8/1/49 | | | 19,956 | | | | 19,018 | |
| 4.50% 10/1/52 | | | 675,531 | | | | 632,935 | |
| 5.00% 6/1/53 | | | 1,711,295 | | | | 1,647,557 | |
| 5.50% 9/1/41 | | | 18,960 | | | | 19,274 | |
| 5.50% 9/1/52 | | | 686,814 | | | | 686,667 | |
| 5.50% 10/1/52 | | | 619,485 | | | | 611,190 | |
| 5.50% 3/1/53 | | | 307,689 | | | | 305,504 | |
| 5.50% 6/1/53 | | | 357,703 | | | | 352,507 | |
| 6.00% 1/1/53 | | | 363,212 | | | | 368,409 | |
| GNMA I S.F. 30 yr | | | | | | | | |
| 3.00% 8/15/45 | | | 754,517 | | | | 654,948 | |
| GNMA II S.F. 30 yr | | | | | | | | |
| 3.00% 12/20/51 | | | 106,132 | | | | 91,894 | |
| 3.00% 1/20/52 | | | 155,493 | | | | 134,527 | |
| 5.50% 5/20/37 | | | 7,003 | | | | 7,124 | |
| 5.50% 5/20/53 | | | 1,819,581 | | | | 1,806,689 | |
| 6.50% 6/20/39 | | | 10,839 | | | | 11,368 | |
Total Agency Mortgage-Backed Securities
(cost $52,682,729) | | | | | | | 48,995,352 | |
| | | Principal
amount° | | | Value (US $) | |
| Collateralized Debt Obligations — 0.29% | | | | | | | | |
| Cedar Funding IX CLO | | | | | | | | |
| Series 2018-9A A1 144A 6.657% (TSFR03M + 1.24%, Floor 0.98%) 4/20/31 #, • | | | 491,814 | | | $ | 490,313 | |
| ICG US CLO 2014-1 | | | | | | | | |
| Series 2014-1A A1A2 144A 6.877% (TSFR03M + 1.46%, Floor 1.20%) 10/20/34 #, • | | | 250,000 | | | | 247,195 | |
| Park Avenue Institutional Advisers CLO | | | | | | | | |
| Series 2021-1A A1A 144A 7.067% (TSFR03M + 1.65%, Floor 1.39%) 1/20/34 #, • | | | 250,000 | | | | 249,885 | |
| Signal Peak CLO 5 | | | | | | | | |
| Series 2018-5A A 144A 6.75% (TSFR03M + 1.37%, Floor 1.11%) 4/25/31 #, • | | | 212,744 | | | | 212,641 | |
| Sound Point CLO XXI | | | | | | | | |
| Series 2018-3A A1A 144A 6.821% (TSFR03M + 1.44%, Floor 1.18%) 10/26/31 #, • | | | 500,000 | | | | 499,369 | |
| Venture 34 CLO | | | | | | | | |
| Series 2018-34A A 144A 6.885% (TSFR03M + 1.49%, Floor 1.23%) 10/15/31 #, • | | | 550,000 | | | | 546,343 | |
| Venture 42 CLO | | | | | | | | |
| Series 2021-42A A1A 144A 6.785% (TSFR03M + 1.39%, Floor 1.13%) 4/15/34 #, • | | | 250,000 | | | | 246,590 | |
Total Collateralized Debt Obligations
(cost $2,487,958) | | | | | | | 2,492,336 | |
| | | | | | | | | |
| Convertible Bonds — 7.38% | | | | | | | | |
| Basic Industry — 0.13% | | | | | | | | |
| Ivanhoe Mines 144A 2.50% exercise price $9.31, maturity date 4/15/26 # | | | 843,000 | | | | 1,108,025 | |
| | | | | | | | 1,108,025 | |
| Brokerage — 0.10% | | | | | | | | |
| WisdomTree 144A 5.75% exercise price $9.54, maturity date 8/15/28 # | | | 850,000 | | | | 847,450 | |
| | | | | | | | 847,450 | |
| Capital Goods — 0.40% | | | | | | | | |
| Chart Industries 1.00% exercise price $58.73, maturity date 11/15/24 | | | 725,000 | | | | 1,624,000 | |
| Kaman 3.25% exercise price $65.26, maturity date 5/1/24 | | | 1,839,000 | | | | 1,793,025 | |
| | | | | | | | 3,417,025 | |
Schedule of investments
Delaware Wealth Builder Fund
| | | Principal
amount° | | | Value (US $) | |
| Convertible Bonds (continued) | | | | | | | | |
| Communications — 0.82% | | | | | | | | |
| Cable One 1.125% exercise price $2,275.83, maturity date 3/15/28 | | | 2,700,000 | | | $ | 2,003,130 | |
| DISH Network 3.375% exercise price $65.18, maturity date 8/15/26 | | | 2,817,000 | | | | 1,288,777 | |
| Liberty Broadband 144A 3.125% exercise price $529.07, maturity date 3/31/53 # | | | 2,955,000 | | | | 2,968,002 | |
| Liberty Latin America 2.00% exercise price $20.65, maturity date 7/15/24 | | | 853,000 | | | | 818,880 | |
| | | | | | | | 7,078,789 | |
| Consumer Cyclical — 0.48% | | | | | | | | |
| Cheesecake Factory 0.375% exercise price $74.75, maturity date 6/15/26 | | | 3,009,000 | | | | 2,559,455 | |
| Ford Motor 0.885% exercise price $15.25, maturity date 3/15/26 ^ | | | 1,636,000 | | | | 1,533,750 | |
| | | | | | | | 4,093,205 | |
| Consumer Non-Cyclical — 2.16% | | | | | | | | |
| BioMarin Pharmaceutical 0.599% exercise price $124.67, maturity date 8/1/24 | | | 1,376,000 | | | | 1,339,949 | |
| Chefs’ Warehouse 1.875% exercise price $44.20, maturity date 12/1/24 | | | 2,587,000 | | | | 2,504,475 | |
| Chegg 4.581% exercise price $107.55, maturity date 9/1/26 ^ | | | 2,846,000 | | | | 2,291,030 | |
| Coherus Biosciences 1.50% exercise price $19.26, maturity date 4/15/26 | | | 2,828,000 | | | | 1,493,537 | |
| CONMED 2.25% exercise price $145.33, maturity date 6/15/27 | | | 2,212,000 | | | | 2,177,714 | |
| Integer Holdings 144A 2.125% exercise price $87.20, maturity date 2/15/28 # | | | 376,000 | | | | 438,792 | |
| Integra LifeSciences Holdings 0.50% exercise price $73.67, maturity date 8/15/25 | | | 2,277,000 | | | | 2,090,286 | |
| Ionis Pharmaceuticals 0.125% exercise price $83.28, maturity date 12/15/24 | | | 1,763,000 | | | | 1,702,397 | |
| Jazz Investments I 2.00% exercise price $155.81, maturity date 6/15/26 | | | 983,000 | | | | 973,170 | |
| Lantheus Holdings 144A 2.625% exercise price $79.81, maturity date 12/15/27 # | | | 377,000 | | | | 450,063 | |
| Pacira BioSciences 0.75% exercise price $71.78, maturity date 8/1/25 | | | 2,265,000 | | | | 2,056,903 | |
| Post Holdings 2.50% exercise price $106.10, maturity date 8/15/27 | | | 1,121,000 | | | | 1,117,076 | |
| | | | | | | | 18,635,392 | |
| | | Principal
amount° | | | Value (US $) | |
| Convertible Bonds (continued) | | | | | | |
| Electric — 0.92% | | | | | | | | |
| Duke Energy 144A 4.125% exercise price $118.86, maturity date 4/15/26 # | | | 1,610,000 | | | $ | 1,591,485 | |
| FirstEnergy 144A 4.00% exercise price $46.81, maturity date 5/1/26 # | | | 1,180,000 | | | | 1,167,610 | |
| NextEra Energy Partners 144A 1.002% exercise price $74.40, maturity date 11/15/25 #, ^ | | | 819,000 | | | | 705,978 | |
| NRG Energy 2.75% exercise price $42.17, maturity date 6/1/48 | | | 1,535,000 | | | | 1,878,072 | |
| Ormat Technologies 2.50% exercise price $90.27, maturity date 7/15/27 | | | 2,730,000 | | | | 2,590,770 | |
| | | | | | | | 7,933,915 | |
| Energy — 0.29% | | | | | | | | |
| Helix Energy Solutions Group 6.75% exercise price $6.97, maturity date 2/15/26 | | | 1,679,000 | | | | 2,515,982 | |
| | | | | | | | 2,515,982 | |
| Financials — 0.28% | | | | | | | | |
| Repay Holdings 144A 3.768% exercise price $33.60, maturity date 2/1/26 #, ^ | | | 2,936,000 | | | | 2,455,377 | |
| | | | | | | | 2,455,377 | |
| Industrials — 0.01% | | | | | | | | |
| Danimer Scientific 144A 3.25% exercise price $10.78, maturity date 12/15/26 # | | | 428,000 | | | | 101,039 | |
| | | | | | | | 101,039 | |
| Real Estate Investment Trusts — 0.20% | | | | | | | | |
| Summit Hotel Properties 1.50% exercise price $11.48, maturity date 2/15/26 | | | 2,030,000 | | | | 1,717,380 | |
| | | | | | | | 1,717,380 | |
| Technology — 1.59% | | | | | | | | |
| Akamai Technologies 0.125% exercise price $95.10, maturity date 5/1/25 | | | 2,279,000 | | | | 2,858,778 | |
| Block 0.125% exercise price $121.01, maturity date 3/1/25 | | | 927,000 | | | | 884,729 | |
| CSG Systems International 144A 3.875% exercise price $71.05, maturity date 9/15/28 # | | | 1,595,000 | | | | 1,541,248 | |
| InterDigital 3.50% exercise price $77.49, maturity date 6/1/27 | | | 2,662,000 | | | | 3,658,653 | |
| Semtech 1.625% exercise price $37.27, maturity date 11/1/27 | | | 2,097,000 | | | | 1,510,888 | |
| Verint Systems 0.25% exercise price $62.08, maturity date 4/15/26 | | | 2,050,000 | | | | 1,789,906 | |
Schedule of investments
Delaware Wealth Builder Fund
| | | Principal
amount° | | | Value (US $) | |
| Convertible Bonds (continued) | | | | | | | | |
| Technology (continued) | | | | | | | | |
| Wolfspeed 0.25% exercise price $127.22, maturity date 2/15/28 | | | 2,372,000 | | | $ | 1,478,942 | |
| | | | | | | | 13,723,144 | |
Total Convertible Bonds
(cost $65,539,881) | | | | | | | 63,626,723 | |
| | | | | | | | | |
| Corporate Bonds — 11.88% | | | | | | | | |
| Automotive — 0.31% | | | | | | | | |
| Allison Transmission | | | | | | | | |
| 144A 3.75% 1/30/31 # | | | 340,000 | | | | 284,189 | |
| 144A 5.875% 6/1/29 # | | | 1,000,000 | | | | 968,503 | |
| Ford Motor 4.75% 1/15/43 | | | 210,000 | | | | 162,374 | |
| Ford Motor Credit | | | | | | | | |
| 3.375% 11/13/25 | | | 240,000 | | | | 226,240 | |
| 4.542% 8/1/26 | | | 750,000 | | | | 713,657 | |
| Goodyear Tire & Rubber 5.25% 7/15/31 | | | 365,000 | | | | 316,866 | |
| | | | | | | | 2,671,829 | |
| Banking — 1.20% | | | | | | | | |
| Banco Continental 144A 2.75% 12/10/25 # | | | 400,000 | | | | 369,276 | |
| Bank of America | | | | | | | | |
| 1.922% 10/24/31 µ | | | 560,000 | | | | 438,004 | |
| 2.482% 9/21/36 µ | | | 340,000 | | | | 256,898 | |
| 2.884% 10/22/30 µ | | | 20,000 | | | | 17,188 | |
| 2.972% 2/4/33 µ | | | 240,000 | | | | 195,952 | |
| 3.194% 7/23/30 µ | | | 55,000 | | | | 48,375 | |
| 6.204% 11/10/28 µ | | | 280,000 | | | | 286,459 | |
| Bank of New York Mellon 4.70% 9/20/25 µ, Ψ | | | 305,000 | | | | 298,195 | |
| BBVA Bancomer 144A 1.875% 9/18/25 # | | | 400,000 | | | | 371,592 | |
| Citigroup 5.61% 9/29/26 µ | | | 265,000 | | | | 264,762 | |
| Citizens Bank 6.064% 10/24/25 µ | | | 790,000 | | | | 761,992 | |
| Citizens Financial Group 2.85% 7/27/26 | | | 345,000 | | | | 314,950 | |
| Deutsche Bank | | | | | | | | |
| 6.72% 1/18/29 µ | | | 150,000 | | | | 152,735 | |
| 6.819% 11/20/29 µ | | | 180,000 | | | | 183,433 | |
| Fifth Third Bancorp 6.361% 10/27/28 µ | | | 300,000 | | | | 301,984 | |
| Goldman Sachs Group | | | | | | | | |
| 1.542% 9/10/27 µ | | | 638,000 | | | | 568,507 | |
| 2.60% 2/7/30 | | | 70,000 | | | | 59,351 | |
| 6.484% 10/24/29 µ | | | 290,000 | | | | 300,320 | |
| | | Principal
amount° | | | Value (US $) | |
| Corporate Bonds (continued) | | | | | | |
| Banking (continued) | | | | | | | | |
| Huntington Bancshares 6.208% 8/21/29 µ | | | 300,000 | | | $ | 300,654 | |
| JPMorgan Chase & Co. | | | | | | | | |
| 1.764% 11/19/31 µ | | | 40,000 | | | | 31,334 | |
| 1.953% 2/4/32 µ | | | 140,000 | | | | 110,105 | |
| 2.58% 4/22/32 µ | | | 435,000 | | | | 355,686 | |
| 3.109% 4/22/51 µ | | | 30,000 | | | | 20,146 | |
| 4.08% 4/26/26 µ | | | 170,000 | | | | 166,331 | |
| KeyBank | | | | | | | | |
| 3.40% 5/20/26 | | | 500,000 | | | | 451,912 | |
| 5.85% 11/15/27 | | | 30,000 | | | | 29,028 | |
| KeyCorp 4.789% 6/1/33 µ | | | 2,000 | | | | 1,733 | |
| Morgan Stanley | | | | | | | | |
| 1.794% 2/13/32 µ | | | 315,000 | | | | 241,471 | |
| 1.928% 4/28/32 µ | | | 15,000 | | | | 11,533 | |
| 2.484% 9/16/36 µ | | | 256,000 | | | | 193,380 | |
| 2.511% 10/20/32 µ | | | 40,000 | | | | 31,739 | |
| 5.123% 2/1/29 µ | | | 15,000 | | | | 14,770 | |
| 5.25% 4/21/34 µ | | | 4,000 | | | | 3,834 | |
| 6.138% 10/16/26 µ | | | 155,000 | | | | 156,294 | |
| 6.296% 10/18/28 µ | | | 249,000 | | | | 256,011 | |
| NBK SPC 144A 1.625% 9/15/27 #, µ | | | 405,000 | | | | 362,002 | |
| PNC Financial Services Group | | | | | | | | |
| 2.60% 7/23/26 | | | 355,000 | | | | 331,239 | |
| 5.671% 10/28/25 µ | | | 345,000 | | | | 342,869 | |
| Popular 7.25% 3/13/28 | | | 10,000 | | | | 10,018 | |
| State Street | | | | | | | | |
| 5.751% 11/4/26 µ | | | 15,000 | | | | 15,052 | |
| 5.82% 11/4/28 µ | | | 10,000 | | | | 10,200 | |
| 6.123% 11/21/34 µ | | | 300,000 | | | | 303,498 | |
| SVB Financial Group | | | | | | | | |
| 1.80% 10/28/26 ‡ | | | 51,000 | | | | 31,638 | |
| 1.80% 2/2/31 ‡ | | | 60,000 | | | | 37,023 | |
| 4.00% 5/15/26 µ, ‡, Ψ | | | 680,000 | | | | 11,111 | |
| 4.57% 4/29/33 µ, ‡ | | | 22,000 | | | | 13,659 | |
| Truist Bank 2.636% 9/17/29 µ | | | 533,000 | | | | 488,793 | |
| Truist Financial | | | | | | | | |
| 1.887% 6/7/29 µ | | | 75,000 | | | | 62,879 | |
| 4.95% 9/1/25 µ, Ψ | | | 85,000 | | | | 80,604 | |
| 6.123% 10/28/33 µ | | | 10,000 | | | | 9,871 | |
| 7.161% 10/30/29 µ | | | 175,000 | | | | 183,023 | |
Schedule of investments
Delaware Wealth Builder Fund
| | | Principal
amount° | | | Value (US $) | |
| Corporate Bonds (continued) | | | | | | | | |
| Banking (continued) | | | | | | | | |
| US Bancorp | | | | | | | | |
| 2.491% 11/3/36 µ | | | 65,000 | | | $ | 48,010 | |
| 3.00% 7/30/29 | | | 150,000 | | | | 130,003 | |
| 3.10% 4/27/26 | | | 210,000 | | | | 198,762 | |
| 4.839% 2/1/34 µ | | | 10,000 | | | | 9,161 | |
| 5.727% 10/21/26 µ | | | 59,000 | | | | 58,803 | |
| | | | | | | | 10,304,152 | |
| Basic Industry — 0.65% | | | | | | | | |
| AngloGold Ashanti Holdings 3.75% 10/1/30 | | | 400,000 | | | | 337,138 | |
| Avient 144A 5.75% 5/15/25 # | | | 312,000 | | | | 311,157 | |
| BHP Billiton Finance USA 5.25% 9/8/30 | | | 420,000 | | | | 424,363 | |
| Chemours 144A 5.75% 11/15/28 # | | | 305,000 | | | | 276,387 | |
| CP Atlas Buyer 144A 7.00% 12/1/28 # | | | 190,000 | | | | 155,800 | |
| First Quantum Minerals | | | | | | | | |
| 144A 7.50% 4/1/25 # | | | 635,000 | | | | 588,061 | |
| 144A 8.625% 6/1/31 # | | | 425,000 | | | | 344,250 | |
| FMG Resources August 2006 144A 5.875% 4/15/30 # | | | 385,000 | | | | 370,493 | |
| Freeport-McMoRan 5.45% 3/15/43 | | | 310,000 | | | | 278,356 | |
| Metinvest 8.50% 4/23/26 | | | 400,000 | | | | 276,720 | |
| Newmont | | | | | | | | |
| 2.25% 10/1/30 | | | 150,000 | | | | 124,401 | |
| 2.60% 7/15/32 | | | 100,000 | | | | 81,684 | |
| NOVA Chemicals 144A 8.50% 11/15/28 # | | | 65,000 | | | | 67,226 | |
| Novelis 144A 4.75% 1/30/30 # | | | 560,000 | | | | 508,921 | |
| Olin 5.00% 2/1/30 | | | 135,000 | | | | 124,071 | |
| Roller Bearing Co. of America 144A 4.375% 10/15/29 # | | | 255,000 | | | | 229,321 | |
| Sherwin-Williams | | | | | | | | |
| 2.90% 3/15/52 | | | 235,000 | | | | 145,753 | |
| 3.30% 5/15/50 | | | 475,000 | | | | 315,913 | |
| Sociedad Quimica y Minera de Chile 144A 6.50% 11/7/33 # | | | 200,000 | | | | 200,915 | |
| Standard Industries 144A 3.375% 1/15/31 # | | | 525,000 | | | | 431,528 | |
| | | | | | | | 5,592,458 | |
| | | Principal
amount° | | | Value (US $) | |
| Corporate Bonds (continued) | | | | | | |
| Brokerage — 0.07% | | | | | | | | |
| Jefferies Financial Group | | | | | | | | |
| 2.625% 10/15/31 | | | 355,000 | | | $ | 278,956 | |
| 4.15% 1/23/30 | | | 170,000 | | | | 154,356 | |
| 6.45% 6/8/27 | | | 90,000 | | | | 91,944 | |
| 6.50% 1/20/43 | | | 70,000 | | | | 70,385 | |
| | | | | | | | 595,641 | |
| Capital Goods — 0.58% | | | | | | | | |
| ARD Finance 144A PIK 6.50% 6/30/27 #, > | | | 200,000 | | | | 103,178 | |
| Ardagh Metal Packaging Finance USA 144A 4.00% 9/1/29 # | | | 605,000 | | | | 481,417 | |
| Boeing 2.196% 2/4/26 | | | 645,000 | | | | 603,139 | |
| Bombardier | | | | | | | | |
| 144A 6.00% 2/15/28 # | | | 350,000 | | | | 330,204 | |
| 144A 7.50% 2/1/29 # | | | 211,000 | | | | 209,246 | |
| 144A 8.75% 11/15/30 # | | | 110,000 | | | | 112,755 | |
| Carrier Global 144A 5.90% 3/15/34 # | | | 595,000 | | | | 612,580 | |
| Clydesdale Acquisition Holdings 144A 8.75% 4/15/30 # | | | 190,000 | | | | 170,653 | |
| Eaton 4.15% 3/15/33 | | | 110,000 | | | | 102,731 | |
| Mauser Packaging Solutions Holding | | | | | | | | |
| 144A 7.875% 8/15/26 # | | | 410,000 | | | | 407,658 | |
| 144A 9.25% 4/15/27 # | | | 150,000 | | | | 136,659 | |
| Pactiv Evergreen Group Issuer 144A 4.00% 10/15/27 # | | | 135,000 | | | | 123,653 | |
| Sealed Air 144A 5.00% 4/15/29 # | | | 350,000 | | | | 326,562 | |
| Teledyne Technologies 2.75% 4/1/31 | | | 840,000 | | | | 701,643 | |
| TransDigm 144A 6.25% 3/15/26 # | | | 607,000 | | | | 603,316 | |
| | | | | | | | 5,025,394 | |
| Communications — 0.68% | | | | | | | | |
| American Tower 2.30% 9/15/31 | | | 770,000 | | | | 611,195 | |
| AT&T | | | | | | | | |
| 1.70% 3/25/26 | | | 215,000 | | | | 198,798 | |
| 3.50% 6/1/41 | | | 31,000 | | | | 23,056 | |
| 3.50% 9/15/53 | | | 735,000 | | | | 489,730 | |
| 4.35% 3/1/29 | | | 280,000 | | | | 269,130 | |
| Charter Communications Operating | | | | | | | | |
| 3.85% 4/1/61 | | | 440,000 | | | | 262,945 | |
| 4.40% 12/1/61 | | | 290,000 | | | | 190,631 | |
| 4.80% 3/1/50 | | | 240,000 | | | | 178,712 | |
| 5.05% 3/30/29 | | | 100,000 | | | | 96,428 | |
Schedule of investments
Delaware Wealth Builder Fund
| | | Principal
amount° | | | Value (US $) | |
| Corporate Bonds (continued) | | | | | | |
| Communications (continued) | | | | | | | | |
| Comcast | | | | | | | | |
| 2.80% 1/15/51 | | | 220,000 | | | $ | 137,916 | |
| 3.20% 7/15/36 | | | 552,000 | | | | 441,939 | |
| 3.375% 8/15/25 | | | 530,000 | | | | 514,314 | |
| Crown Castle | | | | | | | | |
| 1.05% 7/15/26 | | | 565,000 | | | | 502,427 | |
| 2.10% 4/1/31 | | | 465,000 | | | | 365,566 | |
| Discovery Communications 4.00% 9/15/55 | | | 745,000 | | | | 493,215 | |
| Time Warner Cable 7.30% 7/1/38 | | | 170,000 | | | | 170,191 | |
| T-Mobile USA | | | | | | | | |
| 3.00% 2/15/41 | | | 440,000 | | | | 310,596 | |
| 3.75% 4/15/27 | | | 130,000 | | | | 123,988 | |
| 5.75% 1/15/34 | | | 180,000 | | | | 183,383 | |
| Verizon Communications | | | | | | | | |
| 2.10% 3/22/28 | | | 200,000 | | | | 177,214 | |
| 2.875% 11/20/50 | | | 195,000 | | | | 123,538 | |
| Warnermedia Holdings 4.279% 3/15/32 | | | 20,000 | | | | 17,649 | |
| | | | | | | | 5,882,561 | |
| Consumer Cyclical — 0.12% | | | | | | | | |
| Amazon.com 2.50% 6/3/50 | | | 15,000 | | | | 9,386 | |
| Aptiv 3.10% 12/1/51 | | | 817,000 | | | | 492,532 | |
| Ford Motor Credit 6.95% 6/10/26 | | | 290,000 | | | | 293,327 | |
| VICI Properties 4.95% 2/15/30 | | | 230,000 | | | | 214,053 | |
| | | | | | | | 1,009,298 | |
| Consumer Goods — 0.13% | | | | | | | | |
| Acushnet 144A 7.375% 10/15/28 # | | | 173,000 | | | | 177,802 | |
| Pilgrim’s Pride 4.25% 4/15/31 | | | 320,000 | | | | 277,407 | |
| Post Holdings | | | | | | | | |
| 144A 5.50% 12/15/29 # | | | 568,000 | | | | 534,342 | |
| 144A 5.625% 1/15/28 # | | | 160,000 | | | | 155,827 | |
| | | | | | | | 1,145,378 | |
| Consumer Non-Cyclical — 0.54% | | | | | | | | |
| AbbVie 2.95% 11/21/26 | | | 190,000 | | | | 179,894 | |
| Amgen | | | | | | | | |
| 5.15% 3/2/28 | | | 475,000 | | | | 476,210 | |
| 5.25% 3/2/30 | | | 10,000 | | | | 10,054 | |
| 5.25% 3/2/33 | | | 113,000 | | | | 111,902 | |
| 5.65% 3/2/53 | | | 5,000 | | | | 4,935 | |
| | | Principal
amount° | | | Value (US $) | |
| Corporate Bonds (continued) | | | | | | |
| Consumer Non-Cyclical (continued) | | | | | | | | |
| Bunge Limited Finance | | | | | | | | |
| 1.63% 8/17/25 | | | 150,000 | | | $ | 140,492 | |
| 2.75% 5/14/31 | | | 565,000 | | | | 478,033 | |
| Central American Bottling 144A 5.25% 4/27/29 # | | | 400,000 | | | | 365,252 | |
| CVS Health | | | | | | | | |
| 1.875% 2/28/31 | | | 20,000 | | | | 15,820 | |
| 2.70% 8/21/40 | | | 1,280,000 | | | | 856,712 | |
| HCA 3.50% 7/15/51 | | | 55,000 | | | | 36,080 | |
| InRetail Consumer 144A 3.25% 3/22/28 # | | | 400,000 | | | | 350,512 | |
| JBS USA LUX 3.00% 2/2/29 | | | 300,000 | | | | 256,641 | |
| MHP Lux 6.95% 4/3/26 | | | 400,000 | | | | 302,083 | |
| Pfizer Investment Enterprises 4.45% 5/19/28 | | | 485,000 | | | | 476,337 | |
| Royalty Pharma | | | | | | | | |
| 1.20% 9/2/25 | | | 655,000 | | | | 604,833 | |
| 3.35% 9/2/51 | | | 15,000 | | | | 9,377 | |
| | | | | | | | 4,675,167 | |
| Electric — 0.79% | | | | | | | | |
| AEP Transmission 5.40% 3/15/53 | | | 5,000 | | | | 4,820 | |
| Appalachian Power 4.50% 8/1/32 | | | 285,000 | | | | 262,086 | |
| Atlantic City Electric 4.00% 10/15/28 | | | 75,000 | | | | 71,485 | |
| Berkshire Hathaway Energy 2.85% 5/15/51 | | | 210,000 | | | | 130,472 | |
| Calpine | | | | | | | | |
| 144A 5.00% 2/1/31 # | | | 550,000 | | | | 486,916 | |
| 144A 5.25% 6/1/26 # | | | 80,000 | | | | 78,600 | |
| Duke Energy 4.875% 9/16/24 µ, ψ | | | 570,000 | | | | 559,399 | |
| Duke Energy Carolinas | | | | | | | | |
| 3.95% 11/15/28 | | | 420,000 | | | | 400,873 | |
| 4.95% 1/15/33 | | | 25,000 | | | | 24,513 | |
| Entergy Arkansas 4.20% 4/1/49 | | | 190,000 | | | | 150,494 | |
| Entergy Louisiana | | | | | | | | |
| 4.00% 3/15/33 | | | 90,000 | | | | 80,445 | |
| 4.95% 1/15/45 | | | 20,000 | | | | 17,211 | |
| Entergy Mississippi 2.85% 6/1/28 | | | 150,000 | | | | 135,535 | |
| Entergy Texas 3.55% 9/30/49 | | | 300,000 | | | | 209,385 | |
| Exelon 5.30% 3/15/33 | | | 10,000 | | | | 9,866 | |
| Nevada Power 5.90% 5/1/53 | | | 165,000 | | | | 165,057 | |
| NextEra Energy Capital Holdings | | | | | | | | |
| 2.25% 6/1/30 | | | 85,000 | | | | 70,138 | |
| 3.00% 1/15/52 | | | 905,000 | | | | 557,932 | |
| 5.65% 5/1/79 µ | | | 55,000 | | | | 49,184 | |
Schedule of investments
Delaware Wealth Builder Fund
| | | Principal
amount° | | | Value (US $) | |
| Corporate Bonds (continued) | | | | | | |
| Electric (continued) | | | | | | | | |
| Oglethorpe Power 3.75% 8/1/50 | | | 520,000 | | | $ | 363,420 | |
| Pacific Gas and Electric | | | | | | | | |
| 2.10% 8/1/27 | | | 30,000 | | | | 26,481 | |
| 2.50% 2/1/31 | | | 45,000 | | | | 35,867 | |
| 3.25% 6/1/31 | | | 25,000 | | | | 20,784 | |
| 3.30% 8/1/40 | | | 355,000 | | | | 242,931 | |
| 4.95% 7/1/50 | | | 43,000 | | | | 34,267 | |
| PacifiCorp | | | | | | | | |
| 2.70% 9/15/30 | | | 20,000 | | | | 16,349 | |
| 2.90% 6/15/52 | | | 425,000 | | | | 242,043 | |
| 3.30% 3/15/51 | | | 30,000 | | | | 18,284 | |
| 3.50% 6/15/29 | | | 255,000 | | | | 230,221 | |
| 5.35% 12/1/53 | | | 5,000 | | | | 4,242 | |
| Southern 5.70% 10/15/32 | | | 170,000 | | | | 172,583 | |
| Southern California Edison | | | | | | | | |
| 4.00% 4/1/47 | | | 355,000 | | | | 271,288 | |
| 4.20% 3/1/29 | | | 150,000 | | | | 142,390 | |
| 4.875% 3/1/49 | | | 165,000 | | | | 141,324 | |
| Southwestern Electric Power 4.10% 9/15/28 | | | 165,000 | | | | 155,470 | |
| Vistra | | | | | | | | |
| 144A 7.00% 12/15/26 #, µ, ψ | | | 620,000 | | | | 589,471 | |
| 144A 8.00% 10/15/26 #, µ, ψ | | | 265,000 | | | | 259,454 | |
| Vistra Operations | | | | | | | | |
| 144A 4.30% 7/15/29 # | | | 215,000 | | | | 195,173 | |
| 144A 6.95% 10/15/33 # | | | 175,000 | | | | 178,785 | |
| | | | | | | | 6,805,238 | |
| Energy — 1.53% | | | | | | | | |
| Ascent Resources Utica Holdings | | | | | | | | |
| 144A 5.875% 6/30/29 # | | | 485,000 | | | | 446,086 | |
| 144A 7.00% 11/1/26 # | | | 235,000 | | | | 231,928 | |
| BP Capital Markets 4.875% 3/22/30 µ, ψ | | | 200,000 | | | | 180,378 | |
| BP Capital Markets America | | | | | | | | |
| 2.721% 1/12/32 | | | 80,000 | | | | 67,518 | |
| 2.939% 6/4/51 | | | 275,000 | | | | 178,173 | |
| 4.812% 2/13/33 | | | 10,000 | | | | 9,712 | |
| Callon Petroleum | | | | | | | | |
| 144A 7.50% 6/15/30 # | | | 135,000 | | | | 133,380 | |
| 144A 8.00% 8/1/28 # | | | 470,000 | | | | 476,964 | |
| Civitas Resources 144A 8.625% 11/1/30 # | | | 265,000 | | | | 274,716 | |
| CNX Midstream Partners 144A 4.75% 4/15/30 # | | | 190,000 | | | | 165,934 | |
| | | Principal
amount° | | | Value (US $) | |
| Corporate Bonds (continued) | | | | | | | | |
| Energy (continued) | | | | | | | | |
| Diamondback Energy | | | | | | | | |
| 3.125% 3/24/31 | | | 435,000 | | | $ | 374,833 | |
| 4.25% 3/15/52 | | | 69,000 | | | | 52,106 | |
| Enbridge 6.70% 11/15/53 | | | 225,000 | | | | 246,211 | |
| Energean Israel Finance 144A 4.875% 3/30/26 # | | | 200,000 | | | | 183,646 | |
| Energy Transfer | | | | | | | | |
| 5.25% 4/15/29 | | | 170,000 | | | | 167,064 | |
| 144A 5.625% 5/1/27 # | | | 41,000 | | | | 40,310 | |
| 5.75% 2/15/33 | | | 3,000 | | | | 2,989 | |
| 144A 6.00% 2/1/29 # | | | 299,000 | | | | 294,804 | |
| 6.25% 4/15/49 | | | 190,000 | | | | 187,128 | |
| 6.50% 11/15/26 µ, ψ | | | 445,000 | | | | 417,807 | |
| Enterprise Products Operating | | | | | | | | |
| 3.20% 2/15/52 | | | 695,000 | | | | 473,013 | |
| 3.30% 2/15/53 | | | 40,000 | | | | 27,948 | |
| 5.35% 1/31/33 | | | 5,000 | | | | 5,046 | |
| EQM Midstream Partners | | | | | | | | |
| 144A 4.75% 1/15/31 # | | | 620,000 | | | | 552,579 | |
| 6.50% 7/15/48 | | | 90,000 | | | | 82,863 | |
| Galaxy Pipeline Assets Bidco 144A 2.16% 3/31/34 # | | | 751,754 | | | | 637,112 | |
| Genesis Energy | | | | | | | | |
| 7.75% 2/1/28 | | | 275,000 | | | | 271,905 | |
| 8.00% 1/15/27 | | | 350,000 | | | | 350,605 | |
| 8.25% 1/15/29 | | | 95,000 | | | | 94,013 | |
| Hilcorp Energy I | | | | | | | | |
| 144A 6.00% 4/15/30 # | | | 400,000 | | | | 373,425 | |
| 144A 6.00% 2/1/31 # | | | 55,000 | | | | 50,979 | |
| 144A 6.25% 4/15/32 # | | | 213,000 | | | | 196,860 | |
| Kinder Morgan 5.20% 6/1/33 | | | 85,000 | | | | 81,436 | |
| Murphy Oil 6.375% 7/15/28 | | | 925,000 | | | | 919,522 | |
| NuStar Logistics | | | | | | | | |
| 5.625% 4/28/27 | | | 503,000 | | | | 495,556 | |
| 6.00% 6/1/26 | | | 157,000 | | | | 156,602 | |
| Occidental Petroleum 6.125% 1/1/31 | | | 470,000 | | | | 475,071 | |
| PDC Energy 5.75% 5/15/26 | | | 660,000 | | | | 657,740 | |
| Southwestern Energy | | | | | | | | |
| 5.375% 2/1/29 | | | 55,000 | | | | 52,377 | |
| 5.375% 3/15/30 | | | 255,000 | | | | 241,975 | |
| Targa Resources Partners 5.00% 1/15/28 | | | 740,000 | | | | 719,239 | |
Schedule of investments
Delaware Wealth Builder Fund
| | | Principal
amount° | | | Value (US $) | |
| Corporate Bonds (continued) | | | | | | |
| Energy (continued) | | | | | | | | |
| Tennessee Gas Pipeline 144A 2.90% 3/1/30 # | | | 365,000 | | | $ | 311,816 | |
| Transocean 144A 8.00% 2/1/27 # | | | 351,000 | | | | 336,337 | |
| USA Compression Partners | | | | | | | | |
| 6.875% 4/1/26 | | | 215,000 | | | | 213,974 | |
| 6.875% 9/1/27 | | | 398,000 | | | | 393,234 | |
| Vital Energy | | | | | | | | |
| 144A 7.75% 7/31/29 # | | | 325,000 | | | | 298,204 | |
| 9.75% 10/15/30 | | | 120,000 | | | | 120,356 | |
| Weatherford International 144A 8.625% 4/30/30 # | | | 422,000 | | | | 436,606 | |
| | | | | | | | 13,158,080 | |
| Financials — 0.54% | | | | | | | | |
| AerCap Holdings 5.875% 10/10/79 µ | | | 185,000 | | | | 178,948 | |
| AerCap Ireland Capital DAC | | | | | | | | |
| 3.00% 10/29/28 | | | 150,000 | | | | 132,293 | |
| 3.65% 7/21/27 | | | 200,000 | | | | 186,084 | |
| 4.45% 4/3/26 | | | 645,000 | | | | 627,224 | |
| Air Lease | | | | | | | | |
| 2.875% 1/15/26 | | | 560,000 | | | | 527,127 | |
| 2.875% 1/15/32 | | | 300,000 | | | | 243,404 | |
| 3.00% 2/1/30 | | | 175,000 | | | | 149,245 | |
| 4.65% 6/15/26 µ, ψ | | | 180,000 | | | | 154,370 | |
| Aviation Capital Group | | | | | | | | |
| 144A 1.95% 1/30/26 # | | | 830,000 | | | | 757,355 | |
| 144A 3.50% 11/1/27 # | | | 445,000 | | | | 399,491 | |
| 144A 6.25% 4/15/28 # | | | 15,000 | | | | 14,844 | |
| Castlelake Aviation Finance 144A 5.00% 4/15/27 # | | | 505,000 | | | | 465,203 | |
| MAF Global Securities 7.875% 6/30/27 µ, ψ | | | 400,000 | | | | 398,706 | |
| MSCI 144A 3.625% 11/1/31 # | | | 485,000 | | | | 413,187 | |
| | | | | | | | 4,647,481 | |
| Healthcare — 0.40% | | | | | | | | |
| AthenaHealth Group 144A 6.50% 2/15/30 # | | | 75,000 | | | | 65,060 | |
| Bausch Health 144A 11.00% 9/30/28 # | | | 256,000 | | | | 160,640 | |
| Catalent Pharma Solutions | | | | | | | | |
| 144A 3.125% 2/15/29 # | | | 140,000 | | | | 117,354 | |
| 144A 3.50% 4/1/30 # | | | 30,000 | | | | 25,108 | |
| Cheplapharm Arzneimittel 144A 5.50% 1/15/28 # | | | 605,000 | | | | 561,469 | |
| CHS 144A 4.75% 2/15/31 # | | | 325,000 | | | | 238,777 | |
| DaVita | | | | | | | | |
| 144A 3.75% 2/15/31 # | | | 190,000 | | | | 148,900 | |
| 144A 4.625% 6/1/30 # | | | 155,000 | | | | 131,128 | |
| | | Principal
amount° | | | Value (US $) | |
| Corporate Bonds (continued) | | | | | | |
| Healthcare (continued) | | | | | | | | |
| HCA | | | | | | | | |
| 5.375% 2/1/25 | | | 4,000 | | | $ | 3,978 | |
| 7.58% 9/15/25 | | | 214,000 | | | | 219,531 | |
| Heartland Dental 144A 8.50% 5/1/26 # | | | 495,000 | | | | 468,040 | |
| Medline Borrower 144A 5.25% 10/1/29 # | | | 458,000 | | | | 414,799 | |
| Tenet Healthcare | | | | | | | | |
| 4.25% 6/1/29 | | | 235,000 | | | | 210,765 | |
| 6.125% 10/1/28 | | | 675,000 | | | | 655,027 | |
| | | | | | | | 3,420,576 | |
| Industrials — 0.02% | | | | | | | | |
| CK Hutchison International 23 144A 4.875% 4/21/33 # | | | 200,000 | | | | 193,943 | |
| | | | | | | | 193,943 | |
| Insurance — 0.87% | | | | | | | | |
| American International Group 5.125% 3/27/33 | | | 440,000 | | | | 428,017 | |
| Aon | | | | | | | | |
| 2.90% 8/23/51 | | | 370,000 | | | | 227,199 | |
| 5.00% 9/12/32 | | | 755,000 | | | | 730,347 | |
| Athene Global Funding 144A 1.985% 8/19/28 # | | | 55,000 | | | | 46,047 | |
| Athene Holding 3.95% 5/25/51 | | | 705,000 | | | | 493,421 | |
| Berkshire Hathaway Finance 3.85% 3/15/52 | | | 945,000 | | | | 739,823 | |
| Brighthouse Financial 3.85% 12/22/51 | | | 221,000 | | | | 134,985 | |
| GA Global Funding Trust 144A 1.00% 4/8/24 # | | | 365,000 | | | | 357,567 | |
| HUB International 144A 5.625% 12/1/29 # | | | 470,000 | | | | 426,480 | |
| Jones Deslauriers Insurance Management | | | | | | | | |
| 144A 8.50% 3/15/30 # | | | 585,000 | | | | 604,431 | |
| 144A 10.50% 12/15/30 # | | | 620,000 | | | | 642,776 | |
| New York Life Global Funding 144A 5.45% 9/18/26 # | | | 575,000 | | | | 579,617 | |
| NFP | | | | | | | | |
| 144A 6.875% 8/15/28 # | | | 360,000 | | | | 320,919 | |
| 144A 7.50% 10/1/30 # | | | 150,000 | | | | 148,776 | |
| UnitedHealth Group | | | | | | | | |
| 4.50% 4/15/33 | | | 465,000 | | | | 446,092 | |
| 5.05% 4/15/53 | | | 440,000 | | | | 417,357 | |
| USI 144A 6.875% 5/1/25 # | | | 758,000 | | | | 752,868 | |
| | | | | | | | 7,496,722 | |
Schedule of investments
Delaware Wealth Builder Fund
| | | Principal
amount° | | | Value (US $) | |
| Corporate Bonds (continued) | | | | | | |
| Leisure — 0.42% | | | | | | | | |
| Boyd Gaming | | | | | | | | |
| 4.75% 12/1/27 | | | 505,000 | | | $ | 479,024 | |
| 144A 4.75% 6/15/31 # | | | 135,000 | | | | 119,575 | |
| Caesars Entertainment | | | | | | | | |
| 144A 7.00% 2/15/30 # | | | 235,000 | | | | 235,435 | |
| 144A 8.125% 7/1/27 # | | | 247,000 | | | | 251,843 | |
| Carnival | | | | | | | | |
| 144A 5.75% 3/1/27 # | | | 270,000 | | | | 256,881 | |
| 144A 6.00% 5/1/29 # | | | 595,000 | | | | 547,874 | |
| Light & Wonder International 144A 7.25% 11/15/29 # | | | 425,000 | | | | 426,373 | |
| Royal Caribbean Cruises | | | | | | | | |
| 144A 5.50% 4/1/28 # | | | 724,000 | | | | 692,266 | |
| 144A 7.25% 1/15/30 # | | | 135,000 | | | | 137,618 | |
| Scientific Games Holdings 144A 6.625% 3/1/30 # | | | 505,000 | | | | 452,361 | |
| | | | | | | | 3,599,250 | |
| Local Authorities — 0.02% | | | | | | | | |
| Grupo Energia Bogota ESP 144A 7.85% 11/9/33 # | | | 200,000 | | | | 208,236 | |
| | | | | | | | 208,236 | |
| Media — 0.63% | | | | | | | | |
| AMC Networks 4.25% 2/15/29 | | | 390,000 | | | | 273,390 | |
| CCO Holdings | | | | | | | | |
| 144A 4.50% 8/15/30 # | | | 445,000 | | | | 382,094 | |
| 4.50% 5/1/32 | | | 150,000 | | | | 123,656 | |
| 144A 5.375% 6/1/29 # | | | 645,000 | | | | 598,525 | |
| CMG Media 144A 8.875% 12/15/27 # | | | 550,000 | | | | 440,525 | |
| CSC Holdings | | | | | | | | |
| 144A 3.375% 2/15/31 # | | | 945,000 | | | | 645,220 | |
| 144A 5.00% 11/15/31 # | | | 700,000 | | | | 391,741 | |
| Cumulus Media New Holdings 144A 6.75% 7/1/26 # | | | 403,000 | | | | 268,394 | |
| Directv Financing 144A 5.875% 8/15/27 # | | | 340,000 | | | | 306,288 | |
| DISH DBS 144A 5.75% 12/1/28 # | | | 490,000 | | | | 363,854 | |
| Gray Escrow II 144A 5.375% 11/15/31 # | | | 405,000 | | | | 289,101 | |
| Gray Television 144A 4.75% 10/15/30 # | | | 543,000 | | | | 388,160 | |
| Sirius XM Radio 144A 4.00% 7/15/28 # | | | 1,065,000 | | | | 952,442 | |
| | | | | | | | 5,423,390 | |
| | | Principal
amount° | | | Value (US $) | |
| Corporate Bonds (continued) | | | | | | |
| Natural Gas — 0.11% | | | | | | | | |
| Atmos Energy | | | | | | | | |
| 2.85% 2/15/52 | | | 200,000 | | | $ | 125,564 | |
| 5.75% 10/15/52 | | | 170,000 | | | | 173,317 | |
| ENN Energy Holdings 144A 4.625% 5/17/27 # | | | 200,000 | | | | 195,895 | |
| Infraestructura Energetica Nova 144A 3.75% 1/14/28 # | | | 480,000 | | | | 443,119 | |
| | | | | | | | 937,895 | |
| Real Estate Investment Trusts — 0.09% | | | | | | | | |
| American Homes 4 Rent 3.625% 4/15/32 | | | 425,000 | | | | 364,551 | |
| VICI Properties | | | | | | | | |
| 144A 3.875% 2/15/29 # | | | 225,000 | | | | 200,521 | |
| 144A 5.75% 2/1/27 # | | | 210,000 | | | | 206,847 | |
| | | | | | | | 771,919 | |
| Retail — 0.30% | | | | | | | | |
| Asbury Automotive Group | | | | | | | | |
| 144A 4.625% 11/15/29 # | | | 85,000 | | | | 76,618 | |
| 4.75% 3/1/30 | | | 230,000 | | | | 206,335 | |
| Bath & Body Works | | | | | | | | |
| 6.875% 11/1/35 | | | 580,000 | | | | 549,155 | |
| 6.95% 3/1/33 | | | 151,000 | | | | 141,310 | |
| LSF9 Atlantis Holdings 144A 7.75% 2/15/26 # | | | 289,000 | | | | 271,042 | |
| Michaels 144A 5.25% 5/1/28 # | | | 210,000 | | | | 153,555 | |
| Murphy Oil USA 144A 3.75% 2/15/31 # | | | 530,000 | | | | 450,140 | |
| PetSmart 144A 7.75% 2/15/29 # | | | 755,000 | | | | 712,339 | |
| | | | | | | | 2,560,494 | |
| Services — 0.43% | | | | | | | | |
| CDW 3.569% 12/1/31 | | | 545,000 | | | | 469,820 | |
| Gartner 144A 4.50% 7/1/28 # | | | 170,000 | | | | 159,384 | |
| GFL Environmental 144A 6.75% 1/15/31 # | | | 200,000 | | | | 202,000 | |
| Iron Mountain | | | | | | | | |
| 144A 4.50% 2/15/31 # | | | 430,000 | | | | 372,627 | |
| 144A 5.25% 3/15/28 # | | | 510,000 | | | | 483,824 | |
| Prime Security Services Borrower 144A 5.75% 4/15/26 # | | | 713,000 | | | | 705,739 | |
| Staples 144A 7.50% 4/15/26 # | | | 321,000 | | | | 284,388 | |
| United Rentals North America 3.875% 2/15/31 | | | 411,000 | | | | 358,259 | |
| White Cap Buyer 144A 6.875% 10/15/28 # | | | 455,000 | | | | 415,541 | |
| White Cap Parent 144A PIK 8.25% 3/15/26 #, > | | | 234,000 | | | | 229,104 | |
| | | | | | | | 3,680,686 | |
Schedule of investments
Delaware Wealth Builder Fund
| | | Principal
amount° | | | Value (US $) | |
| Corporate Bonds (continued) | | | | | | |
| Technology — 0.27% | | | | | | | | |
| Autodesk 2.40% 12/15/31 | | | 515,000 | | | $ | 422,607 | |
| Broadcom | | | | | | | | |
| 144A 3.137% 11/15/35 # | | | 4,000 | | | | 3,116 | |
| 144A 3.419% 4/15/33 # | | | 11,000 | | | | 9,250 | |
| 144A 3.469% 4/15/34 # | | | 742,000 | | | | 617,245 | |
| CDW | | | | | | | | |
| 2.67% 12/1/26 | | | 30,000 | | | | 27,496 | |
| 3.276% 12/1/28 | | | 390,000 | | | | 345,288 | |
| Marvell Technology 2.45% 4/15/28 | | | 260,000 | | | | 229,422 | |
| Oracle | | | | | | | | |
| 3.60% 4/1/50 | | | 528,000 | | | | 369,020 | |
| 4.65% 5/6/30 | | | 5,000 | | | | 4,825 | |
| PayPal Holdings 2.65% 10/1/26 | | | 340,000 | | | | 318,914 | |
| | | | | | | | 2,347,183 | |
| Technology & Electronics — 0.28% | | | | | | | | |
| Clarios Global 144A 8.50% 5/15/27 # | | | 285,000 | | | | 287,242 | |
| CommScope Technologies 144A 6.00% 6/15/25 # | | | 300,000 | | | | 235,809 | |
| Entegris Escrow | | | | | | | | |
| 144A 4.75% 4/15/29 # | | | 256,000 | | | | 242,040 | |
| 144A 5.95% 6/15/30 # | | | 445,000 | | | | 430,167 | |
| Micron Technology 5.875% 9/15/33 | | | 285,000 | | | | 285,388 | |
| NCR Voyix 144A 5.25% 10/1/30 # | | | 170,000 | | | | 149,589 | |
| Seagate HDD Cayman | | | | | | | | |
| 5.75% 12/1/34 | | | 165,000 | | | | 151,463 | |
| 144A 8.25% 12/15/29 # | | | 150,000 | | | | 159,428 | |
| Sensata Technologies 144A 4.00% 4/15/29 # | | | 255,000 | | | | 229,041 | |
| SS&C Technologies 144A 5.50% 9/30/27 # | | | 265,000 | | | | 256,703 | |
| | | | | | | | 2,426,870 | |
| Telecommunications — 0.56% | | | | | | | | |
| Altice France 144A 5.50% 10/15/29 # | | | 600,000 | | | | 433,640 | |
| Altice France Holding 144A 6.00% 2/15/28 # | | | 800,000 | | | | 323,995 | |
| Connect Finco 144A 6.75% 10/1/26 # | | | 450,000 | | | | 432,435 | |
| Consolidated Communications | | | | | | | | |
| 144A 5.00% 10/1/28 # | | | 405,000 | | | | 317,297 | |
| 144A 6.50% 10/1/28 # | | | 390,000 | | | | 322,725 | |
| Digicel International Finance 144A 8.75% 5/25/24 # | | | 400,000 | | | | 368,660 | |
| | | Principal
amount° | | | Value (US $) | |
| Corporate Bonds (continued) | | | | | | |
| Telecommunications (continued) | | | | | | | | |
| Frontier Communications Holdings | | | | | | | | |
| 144A 5.00% 5/1/28 # | | | 35,000 | | | $ | 31,432 | |
| 144A 5.875% 10/15/27 # | | | 848,000 | | | | 797,507 | |
| 5.875% 11/1/29 | | | 110,000 | | | | 88,206 | |
| 144A 6.75% 5/1/29 # | | | 250,000 | | | | 212,085 | |
| Northwest Fiber 144A 4.75% 4/30/27 # | | | 685,000 | | | | 627,368 | |
| Sable International Finance 144A 5.75% 9/7/27 # | | | 200,000 | | | | 184,043 | |
| Vmed O2 UK Financing I 144A 4.75% 7/15/31 # | | | 605,000 | | | | 517,297 | |
| VZ Secured Financing 144A 5.00% 1/15/32 # | | | 200,000 | | | | 164,167 | |
| | | | | | | | 4,820,857 | |
| Transportation — 0.34% | | | | | | | | |
| American Airlines 144A 5.75% 4/20/29 # | | | 152,605 | | | | 146,302 | |
| Azul Secured Finance 144A 11.93% 8/28/28 # | | | 320,000 | | | | 324,389 | |
| Babcock International Group 1.375% 9/13/27 | | EUR | 200,000 | | | | 196,680 | |
| Burlington Northern Santa Fe 2.875% 6/15/52 | | | 15,000 | | | | 9,710 | |
| Delta Air Lines 7.375% 1/15/26 | | | 308,000 | | | | 315,623 | |
| Grupo Aeromexico 144A 8.50% 3/17/27 # | | | 400,000 | | | | 381,742 | |
| Mileage Plus Holdings 144A 6.50% 6/20/27 # | | | 461,250 | | | | 459,086 | |
| Rumo Luxembourg 144A 5.25% 1/10/28 # | | | 400,000 | | | | 377,973 | |
| TAV Havalimanlari Holding 144A 8.50% 12/7/28 # | | | 200,000 | | | | 200,000 | |
| United Airlines | | | | | | | | |
| 144A 4.375% 4/15/26 # | | | 195,000 | | | | 185,561 | |
| 144A 4.625% 4/15/29 # | | | 235,000 | | | | 209,939 | |
| United Airlines Pass Through Trust | | | | | | | | |
| Series 2014-1 A 4.00% 10/11/27 t | | | 37,454 | | | | 35,314 | |
| Series 2014-2 A 3.75% 3/3/28 t | | | 85,767 | | | | 80,540 | |
| | | | | | | | 2,922,859 | |
Total Corporate Bonds
(cost $111,879,795) | | | | | | | 102,323,557 | |
| | | | | | | | | |
| Government Agency Obligations — 0.35% | | | | | | | | |
| Development Bank of Kazakhstan JSC | | | | | | | | |
| 144A 10.95% 5/6/26 # | | KZT | 200,000,000 | | | | 382,009 | |
| Georgian Railway JSC | | | | | | | | |
| 4.00% 6/17/28 | | | 400,000 | | | | 349,550 | |
| Hutama Karya Persero | | | | | | | | |
| 144A 3.75% 5/11/30 # | | | 600,000 | | | | 545,468 | |
| OCP | | | | | | | | |
| 144A 3.75% 6/23/31 # | | | 400,000 | | | | 331,612 | |
Schedule of investments
Delaware Wealth Builder Fund
| | | Principal
amount° | | | Value (US $) | |
| Government Agency Obligations (continued) | | | | | | |
| Perusahaan Listrik Negara | | | | | | | | |
| 144A 4.125% 5/15/27 # | | | 200,000 | | | $ | 192,141 | |
| PTTEP Treasury Center | | | | | | | | |
| 144A 2.587% 6/10/27 # | | | 385,000 | | | | 352,669 | |
| QazaqGaz NC JSC | | | | | | | | |
| 144A 4.375% 9/26/27 # | | | 960,000 | | | | 900,211 | |
Total Government Agency Obligations
(cost $3,445,933) | | | | | | | 3,053,660 | |
| | | | | | | | | |
| Municipal Bonds — 0.05% | | | | | | | | |
| Bay Area, California Toll Authority Revenue | | | | | | | | |
| (Build America Bonds) | | | | | | | | |
| Series S-3 6.907% 10/1/50 | | | 185,000 | | | | 217,007 | |
| New Jersey Turnpike Authority Revenue | | | | | | | | |
| (Build America Bonds) Series A 7.102% 1/1/41 | | | 105,000 | | | | 121,341 | |
| South Carolina Public Service Authority Revenue | | | | | | | | |
| Series D 4.77% 12/1/45 | | | 60,000 | | | | 52,662 | |
Total Municipal Bonds
(cost $488,795) | | | | | | | 391,010 | |
| | | | | | | | | |
| Non-Agency Asset-Backed Securities — 0.28% | | | | | | | | |
| Diamond Infrastructure Funding | | | | | | | | |
| Series 2021-1A A 144A 1.76% 4/15/49 # | | | 250,000 | | | | 217,624 | |
| Domino's Pizza Master Issuer | | | | | | | | |
| Series 2021-1A A2I 144A 2.662% 4/25/51 # | | | 243,750 | | | | 209,395 | |
| Enterprise Fleet Financing | | | | | | | | |
| Series 2022-2 A2 144A 4.65% 5/21/29 # | | | 205,027 | | | | 202,548 | |
| Ford Credit Auto Owner Trust | | | | | | | | |
| Series 2021-A B 0.70% 10/15/26 | | | 140,000 | | | | 131,410 | |
| GMF Floorplan Owner Revolving Trust | | | | | | | | |
| Series 2023-1 A1 144A 5.34% 6/15/28 # | | | 150,000 | | | | 149,948 | |
| Taco Bell Funding | | | | | | | | |
| Series 2021-1A A2I 144A 1.946% 8/25/51 # | | | 461,775 | | | | 405,472 | |
| Towd Point Mortgage Trust | | | | | | | | |
| Series 2017-1 A1 144A 2.75% 10/25/56 #, • | | | 1,490 | | | | 1,478 | |
| Series 2017-2 A1 144A 2.75% 4/25/57 #, • | | | 427 | | | | 425 | |
| Series 2018-1 A1 144A 3.00% 1/25/58 #, • | | | 15,132 | | | | 14,590 | |
| Toyota Auto Loan Extended Note Trust | | | | | | | | |
| Series 2022-1A A 144A 3.82% 4/25/35 # | | | 100,000 | | | | 95,584 | |
| Trafigura Securitisation Finance | | | | | | | | |
| Series 2021-1A A2 144A 1.08% 1/15/25 # | | | 550,000 | | | | 525,864 | |
| | | Principal
amount° | | | Value (US $) | |
| Non-Agency Asset-Backed Securities (continued) | | | | | | |
| Volkswagen Auto Lease Trust | | | | | | | | |
| Series 2022-A A3 3.44% 7/21/25 | | | 470,000 | | | $ | 465,284 | |
Total Non-Agency Asset-Backed Securities
(cost $2,586,900) | | | | | | | 2,419,622 | |
| | | | | | | | | |
| Non-Agency Collateralized Mortgage Obligations — 0.29% | | | | | | | | |
| Connecticut Avenue Securities Trust | | | | | | | | |
| Series 2023-R08 1M1 144A 6.828% (SOFR + 1.50%) 10/25/43#,• | | | 1,176,367 | | | | 1,178,579 | |
| Freddie Mac Stacr Remic Trust | | | | | | | | |
| Series 2023-HQA3 A1 144A 7.172% (SOFR + 1.85%) 11/25/43#,• | | | 300,000 | | | | 301,637 | |
| JPMorgan Mortgage Trust | | | | | | | | |
| Series 2014-2 B1 144A 3.412% 6/25/29 #, • | | | 42,372 | | | | 37,401 | |
| Series 2014-2 B2 144A 3.412% 6/25/29 #, • | | | 42,373 | | | | 37,111 | |
| Series 2015-4 B1 144A 3.539% 6/25/45 #, • | | | 99,868 | | | | 88,035 | |
| Series 2015-4 B2 144A 3.539% 6/25/45 #, • | | | 99,868 | | | | 87,867 | |
| Series 2021-10 A3 144A 2.50% 12/25/51 #, • | | | 41,882 | | | | 32,377 | |
| JPMorgan Trust | | | | | | | | |
| Series 2015-5 B2 144A 6.757% 5/25/45 #, • | | | 66,562 | | | | 65,947 | |
| Series 2015-6 B1 144A 3.517% 10/25/45 #, • | | | 89,476 | | | | 82,268 | |
| Series 2015-6 B2 144A 3.517% 10/25/45 #, • | | | 89,476 | | | | 82,055 | |
| Morgan Stanley Residential Mortgage Loan Trust | | | | | | | | |
| Series 2021-4 A3 144A 2.50% 7/25/51 #, • | | | 81,891 | | | | 63,613 | |
| Sequoia Mortgage Trust | | | | | | | | |
| Series 2015-1 B2 144A 3.93% 1/25/45 #, • | | | 18,077 | | | | 16,944 | |
| WST Trust | | | | | | | | |
| Series 2019-1 A 5.369% (BBSW1M + 1.08%) 8/18/50 • | | AUD | 690,248 | | | | 457,078 | |
Total Non-Agency Collateralized Mortgage Obligations
(cost $2,599,931) | | | | | | | 2,530,912 | |
| | | | | | | | | |
| Non-Agency Commercial Mortgage-Backed Securities — 1.31% | | | | | | | | |
| BANK | | | | | | | | |
| Series 2017-BNK5 B 3.896% 6/15/60 • | | | 95,000 | | | | 82,486 | |
| Series 2019-BN20 A3 3.011% 9/15/62 | | | 250,000 | | | | 210,656 | |
| Series 2019-BN21 A5 2.851% 10/17/52 | | | 725,000 | | | | 618,527 | |
| Series 2020-BN25 A5 2.649% 1/15/63 | | | 850,000 | | | | 712,651 | |
| Series 2022-BNK40 A4 3.507% 3/15/64 • | | | 1,000,000 | | | | 854,864 | |
Schedule of investments
Delaware Wealth Builder Fund
| | | Principal
amount° | | | Value (US $) | |
| Non-Agency Commercial Mortgage-Backed Securities (continued) | | | | | | |
| Bank of America Merrill Lynch Commercial Mortgage Trust | | | | | | | | |
| Series 2017-BNK3 B 3.879% 2/15/50 • | | | 340,000 | | | $ | 283,467 | |
| Benchmark Mortgage Trust | | | | | | | | |
| Series 2020-B17 A5 2.289% 3/15/53 | | | 850,000 | | | | 682,631 | |
| Series 2020-B21 A5 1.978% 12/17/53 | | | 500,000 | | | | 386,619 | |
| Series 2021-B24 A5 2.584% 3/15/54 | | | 260,000 | | | | 203,547 | |
| Series 2021-B25 A5 2.577% 4/15/54 | | | 450,000 | | | | 347,638 | |
| Series 2022-B33 A5 3.458% 3/15/55 | | | 1,000,000 | | | | 853,779 | |
| Cantor Commercial Real Estate Lending | | | | | | | | |
| Series 2019-CF2 A5 2.874% 11/15/52 | | | 350,000 | | | | 296,580 | |
| CD Mortgage Trust | | | | | | | | |
| Series 2019-CD8 A4 2.912% 8/15/57 | | | 250,000 | | | | 210,513 | |
| CFCRE Commercial Mortgage Trust | | | | | | | | |
| Series 2016-C7 A3 3.839% 12/10/54 | | | 100,000 | | | | 93,549 | |
| COMM Mortgage Trust | | | | | | | | |
| Series 2014-CR20 AM 3.938% 11/10/47 | | | 345,000 | | | | 331,546 | |
| Series 2015-3BP A 144A 3.178% 2/10/35 # | | | 500,000 | | | | 474,799 | |
| Grace Trust | | | | | | | | |
| Series 2020-GRCE A 144A 2.347% 12/10/40 # | | | 100,000 | | | | 77,393 | |
| GS Mortgage Securities Trust | | | | | | | | |
| Series 2017-GS5 A4 3.674% 3/10/50 | | | 350,000 | | | | 320,367 | |
| Series 2017-GS6 A3 3.433% 5/10/50 | | | 515,000 | | | | 466,721 | |
| Series 2019-GC39 A4 3.567% 5/10/52 | | | 580,000 | | | | 516,082 | |
| Series 2019-GC42 A4 3.001% 9/10/52 | | | 1,280,000 | | | | 1,103,372 | |
| Series 2020-GC47 A5 2.377% 5/12/53 | | | 250,000 | | | | 203,467 | |
| JPM-BB Commercial Mortgage Securities Trust | | | | | | | | |
| Series 2015-C33 A4 3.77% 12/15/48 | | | 150,000 | | | | 143,032 | |
| JPM-DB Commercial Mortgage Securities Trust | | | | | | | | |
| Series 2017-C7 A5 3.409% 10/15/50 | | | 350,000 | | | | 316,889 | |
| JPMorgan Chase Commercial Mortgage Securities Trust | | | | | | | | |
| Series 2013-LC11 B 3.499% 4/15/46 | | | 125,000 | | | | 104,375 | |
| Morgan Stanley Bank of America Merrill Lynch Trust | | | | | | | | |
| Series 2016-C29 A4 3.325% 5/15/49 | | | 350,000 | | | | 327,673 | |
| Wells Fargo Commercial Mortgage Trust | | | | | | | | |
| Series 2016-BNK1 A3 2.652% 8/15/49 | | | 835,000 | | | | 761,135 | |
| Series 2019-C54 A4 3.146% 12/15/52 | | | 375,000 | | | | 324,777 | |
Total Non-Agency Commercial Mortgage-Backed Securities
(cost $13,581,888) | | | | | | | 11,309,135 | |
| | | Principal
amount° | | | Value (US $) | |
| Sovereign Bonds — 1.87%Δ | | | | | | |
| Albania — 0.03% | | | | | | | | |
Albania Government International Bond
3.50% 11/23/31 | | EUR | 320,000 | | | $ | 295,637 | |
| | | | | | | | 295,637 | |
| Angola — 0.02% | | | | | | | | |
Angolan Government International Bond
9.375% 5/8/48 | | | 200,000 | | | | 155,281 | |
| | | | | | | | 155,281 | |
| Argentina — 0.00% | | | | | | | | |
Argentine Republic Government International Bond
0.75% 7/9/30 ~ | | | 87,300 | | | | 32,702 | |
| | | | | | | | 32,702 | |
| Armenia — 0.04% | | | | | | | | |
| Republic of Armenia International Bond 144A 3.60% 2/2/31 # | | | 400,000 | | | | 312,792 | |
| | | | | | | | 312,792 | |
| Bermuda — 0.13% | | | | | | | | |
| Bermuda Government International Bonds | | | | | | | | |
| 144A 5.00% 7/15/32 # | | | 800,000 | | | | 758,800 | |
| 5.00% 7/15/32 | | | 400,000 | | | | 379,400 | |
| | | | | | | | 1,138,200 | |
| Brazil — 0.05% | | | | | | | | |
Brazil Notas do Tesouro Nacional Serie F
10.00% 1/1/33 | | BRL | 2,100,000 | | | | 406,146 | |
| | | | | | | | 406,146 | |
| Chile — 0.17% | | | | | | | | |
| Chile Government International Bonds | | | | | | | | |
| 2.55% 1/27/32 | | | 918,000 | | | | 764,035 | |
| 4.34% 3/7/42 | | | 865,000 | | | | 733,102 | |
| | | | | | | | 1,497,137 | |
| Colombia — 0.06% | | | | | | | | |
| Colombia Government International Bonds | | | | | | | | |
| 5.20% 5/15/49 | | | 400,000 | | | | 284,897 | |
| 8.75% 11/14/53 | | | 200,000 | | | | 213,088 | |
| | | | | | | | 497,985 | |
Schedule of investments
Delaware Wealth Builder Fund
| | | Principal
amount° | | | Value (US $) | |
| Sovereign BondsΔ (continued) | | | | | | |
| Dominican Republic — 0.18% | | | | | | | | |
| Dominican Republic International Bonds | | | | | | | | |
| 144A 4.50% 1/30/30 # | | | 1,309,000 | | | $ | 1,160,332 | |
| 144A 4.875% 9/23/32 # | | | 200,000 | | | | 173,024 | |
| 144A 5.50% 2/22/29 # | | | 200,000 | | | | 189,624 | |
| | | | | | | | 1,522,980 | |
| Gabon — 0.02% | | | | | | | | |
| Gabon Government International Bond 6.625% 2/6/31 | | | 200,000 | | | | 157,120 | |
| | | | | | | | 157,120 | |
| Indonesia — 0.18% | | | | | | | | |
| Indonesia Government International Bond 4.65% 9/20/32 | | | 400,000 | | | | 386,103 | |
| Perusahaan Penerbit SBSN Indonesia III 4.70% 6/6/32 | | | 1,163,000 | | | | 1,124,080 | |
| | | | | | | | 1,510,183 | |
| Ivory Coast — 0.11% | | | | | | | | |
| Ivory Coast Government International Bonds | | | | | | | | |
| 144A 4.875% 1/30/32 # | | EUR | 400,000 | | | | 354,398 | |
| 144A 6.125% 6/15/33 # | | | 449,000 | | | | 395,805 | |
| 144A 6.875% 10/17/40 # | | EUR | 200,000 | | | | 173,042 | |
| | | | | | | | 923,245 | |
| Morocco — 0.09% | | | | | | | | |
| Morocco Government International Bonds | | | | | | | | |
| 144A 1.375% 3/30/26 # | | EUR | 370,000 | | | | 376,314 | |
| 144A 2.375% 12/15/27 # | | | 500,000 | | | | 439,735 | |
| | | | | | | | 816,049 | |
| Nigeria — 0.04% | | | | | | | | |
| Nigeria Government International Bond 7.375% 9/28/33 | | | 411,000 | | | | 327,789 | |
| | | | | | | | 327,789 | |
| Paraguay — 0.20% | | | | | | | | |
| Paraguay Government International Bonds | | | | | | | | |
| 144A 4.95% 4/28/31 # | | | 1,142,000 | | | | 1,080,050 | |
| 5.60% 3/13/48 | | | 800,000 | | | | 672,727 | |
| | | | | | | | 1,752,777 | |
| Peru — 0.12% | | | | | | | | |
| Corp Financiera de Desarrollo 144A 2.40% 9/28/27 # | | | 400,000 | | | | 348,642 | |
| | | Principal
amount° | | | Value (US $) | |
| Sovereign BondsΔ (continued) | | | | | | |
| Peru (continued) | | | | | | | | |
| Peruvian Government International Bonds | | | | | | | | |
| 3.30% 3/11/41 | | | 455,000 | | | $ | 332,404 | |
| 3.60% 1/15/72 | | | 516,000 | | | | 334,971 | |
| | | | | | | | 1,016,017 | |
| Philippines — 0.07% | | | | | | | | |
| Philippine Government International Bond 5.50% 1/17/48 | | | 650,000 | | | | 643,705 | |
| | | | | | | | 643,705 | |
| Poland — 0.07% | | | | | | | | |
| Bank Gospodarstwa Krajowego 144A 5.375% 5/22/33 # | | | 300,000 | | | | 293,269 | |
| Republic of Poland Government International Bond 5.50% 4/4/53 | | | 330,000 | | | | 319,422 | |
| | | | | | | | 612,691 | |
| Republic of Korea — 0.04% | | | | | | | | |
| Export-Import Bank of Korea 5.125% 1/11/33 | | | 300,000 | | | | 301,739 | |
| | | | | | | | 301,739 | |
| Republic of North Macedonia — 0.02% | | | | | | | | |
North Macedonia Government International Bond
144A 3.675% 6/3/26 # | | EUR | 200,000 | | | | 208,324 | |
| | | | | | | | 208,324 | |
| Romania — 0.01% | | | | | | | | |
Romanian Government International Bond
144A 2.625% 12/2/40 # | | EUR | 173,000 | | | | 116,157 | |
| | | | | | | | 116,157 | |
| Serbia — 0.06% | | | | | | | | |
Serbia International Bond
1.00% 9/23/28 | | EUR | 576,000 | | | | 506,817 | |
| | | | | | | | 506,817 | |
| South Africa — 0.12% | | | | | | | | |
| Republic of South Africa Government International Bonds | | | | | | | | |
| 5.65% 9/27/47 | | | 1,000,000 | | | | 724,995 | |
| 5.75% 9/30/49 | | | 444,000 | | | | 322,673 | |
| | | | | | | | 1,047,668 | |
Schedule of investments
Delaware Wealth Builder Fund
| | | Principal
amount° | | | Value (US $) | |
| Sovereign Bonds Δ (continued) | | | | | | |
| Uruguay — 0.04% | | | | | | | | |
| Uruguay Government International Bond | | | | | | | | |
| 5.10% 6/18/50 | | | 323,000 | | | $ | 305,743 | |
| | | | | | | | 305,743 | |
Total Sovereign Bonds
(cost $17,415,223) | | | | | | | 16,104,884 | |
| |
| Supranational Banks — 0.11% | | | | | | | | |
Banco Latinoamericano de Comercio Exterior
144A 2.375% 9/14/25 # | | | 250,000 | | | | 232,998 | |
Banque Ouest Africaine de Developpement
144A 4.70% 10/22/31 # | | | 393,000 | | | | 321,788 | |
Corp Andina de Fomento
5.25% 11/21/25 | | | 400,000 | | | | 397,218 | |
Total Supranational Banks
(cost $1,051,102) | | | | | | | 952,004 | |
| |
| US Treasury Obligations — 5.04% | | | | | | | | |
| US Treasury Bonds | | | | | | | | |
| 2.25% 8/15/46 | | | 2,050,000 | | | | 1,344,952 | |
| 3.875% 2/15/43 | | | 2,835,000 | | | | 2,529,739 | |
| 3.875% 5/15/43 | | | 1,265,000 | | | | 1,127,826 | |
| 4.125% 8/15/53 | | | 745,000 | | | | 696,924 | |
| 4.75% 11/15/53 | | | 4,105,000 | | | | 4,267,917 | |
| US Treasury Notes | | | | | | | | |
| 3.375% 5/15/33 | | | 9,100,000 | | | | 8,410,391 | |
| 3.875% 8/15/33 | | | 5,000 | | | | 4,810 | |
| 4.50% 9/30/28 | | | 1,670,000 | | | | 1,692,180 | |
| 4.50% 11/15/33 | | | 9,800,000 | | | | 9,922,500 | |
| 4.625% 9/30/30 | | | 1,505,000 | | | | 1,527,810 | |
| 4.875% 10/31/28 | | | 11,585,000 | | | | 11,871,005 | |
| 5.125% 9/30/25 | | | 45,000 | | | | 45,170 | |
Total US Treasury Obligations
(cost $44,035,857) | | | | | | | 43,441,224 | |
| | | Number of
shares | | | Value (US $) | |
| Common Stocks — 56.32% | | | | | | |
| Communication Services — 2.40% | | | | | | | | |
| AT&T | | | 81,570 | | | $ | 1,351,615 | |
| Comcast Class A | | | 90,708 | | | | 3,799,758 | |
| Interpublic Group | | | 20,887 | | | | 642,066 | |
| KDDI | | | 19,700 | | | | 614,545 | |
| Orange | | | 82,869 | | | | 1,019,654 | |
| Publicis Groupe | | | 9,428 | | | | 796,155 | |
| Verizon Communications | | | 219,623 | | | | 8,418,150 | |
| Walt Disney † | | | 43,613 | | | | 4,042,489 | |
| | | | | | | | 20,684,432 | |
| Consumer Discretionary — 6.09% | | | | | | | | |
| adidas AG | | | 9,083 | | | | 1,899,659 | |
| Amadeus IT Group | | | 27,022 | | | | 1,847,753 | |
| Bath & Body Works | | | 77,977 | | | | 2,543,610 | |
| Best Buy | | | 43,799 | | | | 3,107,101 | |
| eBay | | | 33,537 | | | | 1,375,352 | |
| H & M Hennes & Mauritz Class B | | | 63,950 | | | | 1,022,211 | |
| Home Depot | | | 18,696 | | | | 5,861,009 | |
| Kering | | | 1,868 | | | | 800,517 | |
| Lowe's | | | 39,343 | | | | 7,822,569 | |
| LVMH Moet Hennessy Louis Vuitton | | | 280 | | | | 214,169 | |
| NIKE Class B | | | 27,199 | | | | 2,999,234 | |
| PulteGroup | | | 41,553 | | | | 3,674,116 | |
| Ross Stores | | | 25,792 | | | | 3,362,761 | |
| Sodexo | | | 17,314 | | | | 1,854,475 | |
| Starbucks | | | 21,056 | | | | 2,090,861 | |
| Swatch Group | | | 2,990 | | | | 783,607 | |
| TJX | | | 91,281 | | | | 8,042,769 | |
| Tractor Supply | | | 15,547 | | | | 3,156,196 | |
| | | | | | | | 52,457,969 | |
| Consumer Staples — 4.96% | | | | | | | | |
| Altria Group | | | 85,293 | | | | 3,585,718 | |
| Anheuser-Busch InBev | | | 11,530 | | | | 723,029 | |
| Archer-Daniels-Midland | | | 51,800 | | | | 3,819,214 | |
| Asahi Group Holdings | | | 12,200 | | | | 448,880 | |
| Conagra Brands | | | 122,498 | | | | 3,465,468 | |
| Danone | | | 37,815 | | | | 2,427,301 | |
| Diageo | | | 63,833 | | | | 2,226,993 | |
| Dollar General | | | 30,538 | | | | 4,004,143 | |
| Dollar Tree † | | | 30,300 | | | | 3,744,777 | |
| Essity Class B | | | 62,411 | | | | 1,559,696 | |
Schedule of investments
Delaware Wealth Builder Fund
| | | Number of
shares | | | Value (US $) | |
| Common Stocks (continued) | | | | | | |
| Consumer Staples (continued) | | | | | | | | |
| Kao | | | 35,900 | | | $ | 1,379,242 | |
| Koninklijke Ahold Delhaize | | | 85,424 | | | | 2,469,656 | |
| Medifast | | | 35,825 | | | | 2,378,064 | |
| Nestle | | | 19,753 | | | | 2,241,019 | |
| Philip Morris International | | | 47,393 | | | | 4,424,610 | |
| Seven & i Holdings | | | 12,700 | | | | 470,703 | |
| Unilever | | | 49,040 | | | | 2,333,718 | |
| Vector Group | | | 97,835 | | | | 1,047,813 | |
| | | | | | | | 42,750,044 | |
| Energy — 3.98% | | | | | | | | |
| APA | | | 69,440 | | | | 2,499,840 | |
| Cheniere Energy | | | 18,890 | | | | 3,440,814 | |
| Chevron | | | 18,342 | | | | 2,633,911 | |
| Civitas Resources | | | 19,429 | | | | 1,334,578 | |
| ConocoPhillips | | | 67,851 | | | | 7,841,540 | |
| Coterra Energy | | | 90,103 | | | | 2,365,204 | |
| EOG Resources | | | 15,563 | | | | 1,915,339 | |
| Exxon Mobil | | | 63,012 | | | | 6,473,853 | |
| Marathon Petroleum | | | 26,260 | | | | 3,917,729 | |
| Texas Pacific Land | | | 533 | | | | 891,149 | |
| Viper Energy | | | 31,210 | | | | 961,892 | |
| | | | | | | | 34,275,849 | |
| Financials — 8.75% | | | | | | | | |
| Allstate | | | 30,401 | | | | 4,191,386 | |
| Ally Financial | | | 54,034 | | | | 1,578,873 | |
| American Financial Group | | | 5,810 | | | | 664,606 | |
| American International Group | | | 63,500 | | | | 4,178,935 | |
| Ameriprise Financial | | | 10,976 | | | | 3,880,126 | |
| Bank of New York Mellon | | | 58,842 | | | | 2,843,245 | |
| BlackRock | | | 5,967 | | | | 4,482,589 | |
| Blackstone | | | 35,796 | | | | 4,022,396 | |
| Carlyle Group | | | 41,927 | | | | 1,437,258 | |
| Discover Financial Services | | | 13,935 | | | | 1,295,955 | |
| East West Bancorp | | | 39,156 | | | | 2,463,696 | |
| Evercore Class A | | | 6,108 | | | | 901,235 | |
| Fidelity National Financial | | | 49,461 | | | | 2,217,831 | |
| Fidelity National Information Services | | | 70,775 | | | | 4,150,246 | |
| Fifth Third Bancorp | | | 92,343 | | | | 2,673,330 | |
| Invesco | | | 84,187 | | | | 1,201,348 | |
| KeyCorp | | | 293,102 | | | | 3,631,534 | |
| | | Number of
shares | | | Value (US $) | |
| Common Stocks (continued) | | | | | | |
| Financials (continued) | | | | | | | | |
| MetLife | | | 61,001 | | | $ | 3,881,494 | |
| PNC Financial Services Group | | | 8,086 | | | | 1,083,201 | |
| Principal Financial Group | | | 49,970 | | | | 3,689,285 | |
| Prudential Financial | | | 40,143 | | | | 3,925,183 | |
| Sberbank of Russia PJSC = | | | 52,870 | | | | 0 | |
| SEI Investments | | | 31,969 | | | | 1,875,621 | |
| State Street | | | 29,819 | | | | 2,171,420 | |
| Synchrony Financial | | | 79,369 | | | | 2,568,381 | |
| Truist Financial | | | 120,800 | | | | 3,882,512 | |
| US Bancorp | | | 97,600 | | | | 3,720,512 | |
| Western Union | | | 236,250 | | | | 2,747,587 | |
| | | | | | | | 75,359,785 | |
| Healthcare — 6.89% | | | | | | | | |
| AbbVie | | | 35,501 | | | | 5,054,987 | |
| Amgen | | | 3,523 | | | | 949,942 | |
| Baxter International | | | 103,200 | | | | 3,723,456 | |
| Bristol-Myers Squibb | | | 49,446 | | | | 2,441,643 | |
| Cardinal Health | | | 30,081 | | | | 3,221,074 | |
| CareTrust REIT | | | 6,688 | | | | 154,359 | |
| Cencora | | | 19,237 | | | | 3,912,229 | |
| Cigna Group | | | 12,882 | | | | 3,386,420 | |
| CVS Health | | | 52,400 | | | | 3,560,580 | |
| Gilead Sciences | | | 44,741 | | | | 3,427,161 | |
| Healthpeak Properties | | | 4,167 | | | | 72,172 | |
| Hologic † | | | 52,031 | | | | 3,709,810 | |
| Johnson & Johnson | | | 23,800 | | | | 3,680,908 | |
| McKesson | | | 4,811 | | | | 2,263,864 | |
| Medical Properties Trust | | | 2,004 | | | | 9,719 | |
| Merck & Co. | | | 89,014 | | | | 9,122,155 | |
| Novo Nordisk Class B | | | 10,541 | | | | 1,070,469 | |
| OmniAb 12.5 =, † | | | 363 | | | | 0 | |
| OmniAb 15 =, † | | | 363 | | | | 0 | |
| Pfizer | | | 85,092 | | | | 2,592,753 | |
| Roche Holding | | | 6,151 | | | | 1,658,038 | |
| SIGA Technologies | | | 149,771 | | | | 813,257 | |
| Smith & Nephew | | | 146,580 | | | | 1,893,986 | |
| UnitedHealth Group | | | 2,518 | | | | 1,392,378 | |
| Ventas | | | 4,878 | | | | 223,608 | |
| Welltower | | | 11,274 | | | | 1,004,513 | |
| | | | | | | | 59,339,481 | |
Schedule of investments
Delaware Wealth Builder Fund
| | | Number of
shares | | | Value (US $) | |
| Common Stocks (continued) | | | | | | |
| Industrials — 4.37% | | | | | | | | |
| Dover | | | 28,927 | | | $ | 4,083,335 | |
| Expeditors International of Washington | | | 25,679 | | | | 3,090,211 | |
| Honeywell International | | | 20,835 | | | | 4,081,993 | |
| Intertek Group | | | 24,234 | | | | 1,219,179 | |
| Knorr-Bremse | | | 14,517 | | | | 908,601 | |
| Kone Class B | | | 8,753 | | | | 388,633 | |
| Lockheed Martin | | | 2,244 | | | | 1,004,796 | |
| Makita | | | 50,700 | | | | 1,341,878 | |
| Masco | | | 48,313 | | | | 2,925,352 | |
| Northrop Grumman | | | 8,250 | | | | 3,920,070 | |
| Otis Worldwide | | | 26,780 | | | | 2,297,456 | |
| Paychex | | | 31,066 | | | | 3,789,120 | |
| Robert Half | | | 37,480 | | | | 3,072,610 | |
| RTX | | | 44,149 | | | | 3,597,261 | |
| Securitas Class B | | | 214,357 | | | | 1,927,272 | |
| | | | | | | | 37,647,767 | |
| Information Technology — 14.87% | | | | | | | | |
| Accenture Class A | | | 7,767 | | | | 2,587,498 | |
| Apple | | | 133,264 | | | | 25,313,497 | |
| Applied Materials | | | 18,597 | | | | 2,785,459 | |
| Broadcom | | | 6,614 | | | | 6,122,778 | |
| Cisco Systems | | | 156,980 | | | | 7,594,692 | |
| Cognizant Technology Solutions Class A | | | 57,950 | | | | 4,078,521 | |
| Dell Technologies Class C | | | 49,030 | | | | 3,719,906 | |
| Digital Realty Trust | | | 4,134 | | | | 573,717 | |
| Equinix | | | 1,804 | | | | 1,470,278 | |
| HP | | | 121,038 | | | | 3,551,255 | |
| KLA | | | 6,047 | | | | 3,293,317 | |
| Lam Research | | | 6,005 | | | | 4,299,100 | |
| Microchip Technology | | | 9,563 | | | | 797,937 | |
| Microsoft | | | 61,018 | | | | 23,120,330 | |
| Monolithic Power Systems | | | 6,781 | | | | 3,720,870 | |
| Motorola Solutions | | | 12,933 | | | | 4,175,678 | |
| NetApp | | | 47,022 | | | | 4,297,341 | |
| NVIDIA | | | 25,169 | | | | 11,771,541 | |
| Oracle | | | 35,300 | | | | 4,102,213 | |
| QUALCOMM | | | 31,983 | | | | 4,127,406 | |
| SAP | | | 17,511 | | | | 2,772,954 | |
| Teledyne Technologies † | | | 9,622 | | | | 3,877,281 | |
| | | | | | | | 128,153,569 | |
| | | Number of
shares | | | Value (US $) | |
| Common Stocks (continued) | | | | | | |
| Materials — 0.94% | | | | | | | | |
| Air Liquide | | | 10,651 | | | $ | 2,014,970 | |
| Dow | | | 44,151 | | | | 2,284,814 | |
| DuPont de Nemours | | | 53,477 | | | | 3,825,745 | |
| | | | | | | | 8,125,529 | |
| Real Estate — 0.49% | | | | | | | | |
| Equity Residential | | | 74,591 | | | | 4,239,752 | |
| Etalon Group GDR 144A #, =, † | | | 20,100 | | | | 0 | |
| Spirit MTA REIT =, † | | | 677 | | | | 0 | |
| | | | | | | | 4,239,752 | |
| REIT Diversified — 0.17% | | | | | | | | |
| Gaming and Leisure Properties | | | 11,154 | | | | 521,227 | |
| VICI Properties | | | 30,934 | | | | 924,617 | |
| | | | | | | | 1,445,844 | |
| REIT Healthcare — 0.06% | | | | | | | | |
| Alexandria Real Estate Equities | | | 4,464 | | | | 488,362 | |
| | | | | | | | 488,362 | |
| REIT Hotel — 0.19% | | | | | | | | |
| Apple Hospitality REIT | | | 25,312 | | | | 421,951 | |
| Chatham Lodging Trust | | | 19,760 | | | | 195,821 | |
| Host Hotels & Resorts | | | 25,640 | | | | 447,931 | |
| Park Hotels & Resorts | | | 8,702 | | | | 129,051 | |
| Ryman Hospitality Properties | | | 4,354 | | | | 436,924 | |
| Sunstone Hotel Investors | | | 2,581 | | | | 25,500 | |
| | | | | | | | 1,657,178 | |
| REIT Industrial — 0.39% | | | | | | | | |
| Plymouth Industrial REIT | | | 1,172 | | | | 25,491 | |
| Prologis | | | 23,039 | | | | 2,647,872 | |
| Rexford Industrial Realty | | | 8,788 | | | | 432,546 | |
| Terreno Realty | | | 3,999 | | | | 228,383 | |
| | | | | | | | 3,334,292 | |
| REIT Mall — 0.19% | | | | | | | | |
| Simon Property Group | | | 13,322 | | | | 1,663,785 | |
| | | | | | | | 1,663,785 | |
| REIT Manufactured Housing — 0.06% | | | | | | | | |
| Equity LifeStyle Properties | | | 3,121 | | | | 221,903 | |
| Sun Communities | | | 2,220 | | | | 287,135 | |
| | | | | | | | 509,038 | |
Schedule of investments
Delaware Wealth Builder Fund
| | | Number of
shares | | | Value (US $) | |
| Common Stocks (continued) | | | | | | |
| REIT Multifamily — 0.26% | | | | | | | | |
| American Homes 4 Rent Class A | | | 8,080 | | | $ | 293,062 | |
| AvalonBay Communities | | | 3,100 | | | | 536,114 | |
| Camden Property Trust | | | 3,437 | | | | 310,224 | |
| Essex Property Trust | | | 2,596 | | | | 554,142 | |
| Independence Realty Trust | | | 12,459 | | | | 169,691 | |
| Mid-America Apartment Communities | | | 2,299 | | | | 286,179 | |
| UDR | | | 3,445 | | | | 115,063 | |
| | | | | | | | 2,264,475 | |
| REIT Office — 0.04% | | | | | | | | |
| Cousins Properties | | | 10,769 | | | | 220,980 | |
| Highwoods Properties | | | 2,129 | | | | 40,344 | |
| Piedmont Office Realty Trust Class A | | | 16,745 | | | | 104,154 | |
| | | | | | | | 365,478 | |
| REIT Self-Storage — 0.20% | | | | | | | | |
| CubeSmart | | | 9,071 | | | | 360,663 | |
| Extra Space Storage | | | 3,458 | | | | 450,128 | |
| Public Storage | | | 3,391 | | | | 877,455 | |
| | | | | | | | 1,688,246 | |
| REIT Shopping Center — 0.26% | | | | | | | | |
| Agree Realty | | | 6,313 | | | | 373,793 | |
| Brixmor Property Group | | | 22,342 | | | | 480,800 | |
| Kimco Realty | | | 18,424 | | | | 355,952 | |
| Kite Realty Group Trust | | | 6,383 | | | | 134,809 | |
| Phillips Edison & Co. | | | 1,525 | | | | 53,741 | |
| Regency Centers | | | 3,516 | | | | 220,735 | |
| Retail Opportunity Investments | | | 22,984 | | | | 295,804 | |
| SITE Centers | | | 14,207 | | | | 187,390 | |
| Tanger Factory Outlet Centers | | | 6,264 | | | | 156,349 | |
| | | | | | | | 2,259,373 | |
| REIT Single Tenant — 0.09% | | | | | | | | |
| Four Corners Property Trust | | | 4,282 | | | | 98,443 | |
| NET Lease Office Properties † | | | 73 | | | | 1,194 | |
| Realty Income | | | 10,411 | | | | 561,778 | |
| Spirit Realty Capital | | | 3,118 | | | | 128,773 | |
| | | | | | | | 790,188 | |
| REIT Specialty — 0.18% | | | | | | | | |
| EPR Properties | | | 2,740 | | | | 122,259 | |
| Essential Properties Realty Trust | | | 4,190 | | | | 99,512 | |
| Invitation Homes | | | 21,705 | | | | 724,079 | |
| | | Number of
shares | | | Value (US $) | |
| Common Stocks (continued) | | | | | | |
| REIT Specialty (continued) | | | | | | | | |
| Iron Mountain | | | 6,517 | | | $ | 418,066 | |
| Lamar Advertising Class A | | | 1,804 | | | | 182,727 | |
| Outfront Media | | | 4,080 | | | | 49,898 | |
| | | | | | | | 1,596,541 | |
| Utilities — 0.49% | | | | | | | | |
| Duke Energy | | | 4,400 | | | | 406,032 | |
| Edison International | | | 56,700 | | | | 3,798,333 | |
| | | | | | | | 4,204,365 | |
Total Common Stocks
(cost $439,272,229) | | | | | | | 485,301,342 | |
| | | | | | | | | |
| Convertible Preferred Stock — 1.24% | | | | | | | | |
| Algonquin Power & Utilities 7.75% exercise price $18.00, maturity date 6/15/24 | | | 17,549 | | | | 379,936 | |
| AMG Capital Trust II 5.15% exercise price $195.47, maturity date 10/15/37 | | | 15,856 | | | | 665,952 | |
| Apollo Global Management 6.75% exercise price $98.97, maturity date 7/31/26 | | | 14,066 | | | | 780,522 | |
| Bank of America 7.25% exercise price $50.00 ω | | | 1,091 | | | | 1,223,011 | |
| El Paso Energy Capital Trust I 4.75% exercise price $34.49, maturity date 3/31/28 | | | 47,703 | | | | 2,222,960 | |
| Lyondellbasell Advanced Polymers 6.00% exercise price $0.00 ω | | | 1,356 | | | | 1,152,600 | |
| RBC Bearings 5.00% exercise price $226.60, maturity date 10/15/24 | | | 13,442 | | | | 1,620,837 | |
| UGI 7.25% exercise price $52.57, maturity date 6/1/24 | | | 19,571 | | | | 1,024,346 | |
| Wells Fargo & Co. 7.50% exercise price $156.71 ω | | | 1,403 | | | | 1,568,554 | |
Total Convertible Preferred Stock
(cost $12,647,635) | | | | | | | 10,638,718 | |
| | | | | | | | | |
| Preferred Stock — 0.16% | | | | | | | | |
| Henkel AG & Co. 2.64% | | | 17,345 | | | | 1,363,138 | |
Total Preferred Stock
(cost $1,407,500) | | | | | | | 1,363,138 | |
| | | | | | | | | |
| Exchange-Traded Funds — 4.76% | | | | | | | | |
| iShares Latin America 40 ETF | | | 173,598 | | | | 4,859,008 | |
| iShares MSCI China ETF | | | 141,772 | | | | 6,050,829 | |
Schedule of investments
Delaware Wealth Builder Fund
| | | Number of
shares | | | Value (US $) | |
| Exchange-Traded Funds (continued) | | | | | | |
| iShares MSCI Emerging Markets Asia ETF | | | 108,754 | | | $ | 7,072,272 | |
| Vanguard Russell 2000 ETF | | | 317,662 | | | | 23,065,438 | |
Total Exchange-Traded Funds
(cost $43,212,564) | | | | | | | 41,047,547 | |
| | | | | | | | | |
| | | | Principal
amount° | | | | | |
| Leveraged Non-Recourse Security — 0.00% | | | | | | | | |
| JPMorgan Fixed Income Pass Through Trust Auction | | | | | | | | |
| Series 2007-B 144A 0.251% 1/15/87 #, =, | | | 1,300,000 | | | | 1,300 | |
Total Leveraged Non-Recourse Security
(cost $1,105,000) | | | | | | | 1,300 | |
| | | | | | | | | |
| | | | Number of
shares | | | | | |
| Limited Liability Corporation — 1.18% | | | | | | | | |
| Sc Hixson<<, = | | | 7,200,000 | | | | 10,163,520 | |
Total Limited Liability Corporation
(cost $5,481,000) | | | | | | | 10,163,520 | |
| | | | | | | | | |
| Short-Term Investments — 1.45% | | | | | | | | |
| Money Market Mutual Funds — 1.45% | | | | | | | | |
BlackRock Liquidity FedFund – Institutional Shares
(seven-day effective yield 5.25%) | | | 3,119,650 | | | | 3,119,650 | |
| Fidelity Investments Money Market Government Portfolio – Class I (seven-day effective yield 5.24%) | | | 3,119,650 | | | | 3,119,650 | |
| Goldman Sachs Financial Square Government Fund – Institutional Shares (seven-day effective yield 5.39%) | | | 3,119,650 | | | | 3,119,650 | |
Morgan Stanley Institutional Liquidity Funds Government Portfolio – Institutional Class
(seven-day effective yield 5.26%) | | | 3,119,650 | | | | 3,119,650 | |
Total Short-Term Investments
(cost $12,478,600) | | | | | | | 12,478,600 | |
Total Value of Securities—99.73%
(cost $834,204,692) | | | | | | $ | 859,326,362 | |
| ° | Principal amount shown is stated in USD unless noted that the security is denominated in another currency. |
∑ | Interest only security. An interest only security is the interest only portion of a fixed income security, which is separated and sold individually from the principal portion of the security. |
| # | Security exempt from registration under Rule 144A of the Securities Act of 1933, as amended. At November 30, 2023, the aggregate value of Rule 144A securities was $80,247,324, which represents 9.31% of the Fund's net assets. See Note 12 in “Notes to financial statements.” |
| • | Variable rate investment. Rates reset periodically. Rate shown reflects the rate in effect at November 30, 2023. For securities based on a published reference rate and spread, the reference rate and spread are indicated in their descriptions. The reference rate descriptions (i.e. SOFR01M, SOFR03M, etc.) used in this report are identical for different securities, but the underlying reference rates may differ due to the timing of the reset period. Certain variable rate securities are not based on a published reference rate and spread but are determined by the issuer or agent and are based on current market conditions, or for mortgage-backed securities, are impacted by the individual mortgages which are paying off over time. These securities do not indicate a reference rate and spread in their descriptions. |
| t | Pass Through Agreement. Security represents the contractual right to receive a proportionate amount of underlying payments due to the counterparty pursuant to various agreements related to the rescheduling of obligations and the exchange of certain notes. |
| ^ | Zero-coupon security. The rate shown is the effective yield at the time of purchase. |
| µ | Fixed to variable rate investment. The rate shown reflects the fixed rate in effect at November 30, 2023. Rate will reset at a future date. |
| ψ | Perpetual security. Maturity date represents next call date. |
| ‡ | Non-income producing security. Security is currently in default. |
| > | PIK. 100% of the income received was in the form of cash. |
| Δ | Securities have been classified by country of risk. |
| ~ | Step-up bond that pays an initial coupon rate for the first period and then a higher coupon rate for the following periods. Stated rate in effect at November 30, 2023. |
| † | Non-income producing security. |
| = | The value of this security was determined using significant unobservable inputs and is reported as a Level 3 security in the disclosure table located in Note 3 in “Notes to financial statements.” |
| ω | Perpetual security with no stated maturity date. |
| << | Affiliated company. See Note 2 in “Notes to financial statements.” |
Schedule of investments
Delaware Wealth Builder Fund
The following forward foreign currency exchange contracts, futures contracts, and swap contracts were outstanding at November 30, 2023:1
Forward Foreign Currency Exchange Contracts
| Counterparty | | Currency to
Receive (Deliver) | | | In Exchange For | | | Settlement
Date | | | Unrealized
Appreciation | | |
Unrealized
Depreciation | |
| JPMCB | | BRL | | | (1,987,000 | ) | | USD | | | 403,547 | | | | 2/2/24 | | | $ | 2,825 | | | $ | — | |
| JPMCB | | EUR | | | (1,257,526 | ) | | USD | | | 1,381,099 | | | | 2/2/24 | | | | 8,248 | | | | — | |
| JPMCB | | INR | | | 51,869,680 | | | USD | | | (621,626 | ) | | | 2/2/24 | | | | — | | | | (642 | ) |
| Total Forward Foreign Currency Exchange Contracts | | | $ | 11,073 | | | $ | (642 | ) |
Futures Contracts
Exchange-Traded
| Contracts to Buy (Sell) | | Notional
Amount | | | Notional
Cost
(Proceeds) | | | Expiration
Date | | Value/
Unrealized
Appreciation | | | Value/
Unrealized
Depreciation | | | Variation
Margin
Due from
(Due to)
Brokers | |
| 107 | | US Treasury 5 yr Notes | | $ | 11,433,117 | | | $ | 11,349,670 | | | 3/28/24 | | $ | 83,447 | | | $ | — | | | $ | (37,618 | ) |
| 68 | | US Treasury 10 yr Notes | | | 7,466,188 | | | | 7,397,296 | | | 3/19/24 | | | 68,892 | | | | — | | | | (35,062 | ) |
| (6) | | US Treasury Long Bonds | | | (698,625 | ) | | | (689,375 | ) | | 3/19/24 | | | — | | | | (9,250 | ) | | | 6,000 | |
| Total Futures Contracts | | | | | | $ | 18,057,591 | | | | | $ | 152,339 | | | $ | (9,250 | ) | | $ | (66,680 | ) |
Swap Contracts
CDS Contracts2
Counterparty/
Reference Obligation/
Termination Date/
Payment Frequency | | Notional
Amount3 | | | Annual
Protection
Payments | | | Value | | | Amortized
Upfront
Payments
Paid
(Received) | | | Unrealized
Depreciation4 | |
| Over-The-Counter: | | | | | | | | | | | | | | | | | | | | |
Protection Purchased/
Moody’s Ratings: | | | | | | | | | | | | | | | | | | | | |
| JPMCB Republic of Brazil | | | | | | | | | | | | | | | | | | | | |
| 1.00% 12/20/28 | | | | | | | | | | | | | | | | | | | | |
| Ba2 6/20/28- Quarterly | | | 705,000 | | | | 1.000 | % | | $ | 9,306 | | | $ | 27,300 | | | $ | (17,994 | ) |
| JPMCB Republic of | | | | | | | | | | | | | | | | | | | | |
| Indonesia 1.00% 12/20/28 | | | | | | | | | | | | | | | | | | | | |
| Baa2 6/20/28- Quarterly | | | 1,006,000 | | | | 1.000 | % | | | (12,797 | ) | | | (5,267 | ) | | | (7,530 | ) |
| JPMCB Republic of | | | | | | | | | | | | | | | | | | | | |
| Indonesia 1.00% 12/20/28 | | | | | | | | | | | | | | | | | | | | |
| Baa2 6/20/28- Quarterly | | | 941,000 | | | | 1.000 | % | | | (10,383 | ) | | | (5,599 | ) | | | (4,784 | ) |
| JPMCB Republic of South | | | | | | | | | | | | | | | | | | | | |
| Africa 1.00% 12/20/28 | | | | | | | | | | | | | | | | | | | | |
| Ba2 6/20/28- Quarterly | | | 1,438,000 | | | | 1.000 | % | | | 67,382 | | | | 75,866 | | | | (8,484 | ) |
| JPMCB Republic of South | | | | | | | | | | | | | | | | | | | | |
| Africa 1.00% 4/14/26 | | | | | | | | | | | | | | | | | | | | |
| Ba2 6/20/28- Quarterly | | | 700,000 | | | | 1.000 | % | | | 32,801 | | | | 39,032 | | | | (6,231 | ) |
| Total CDS Contracts | | | | | | | | | | $ | 86,309 | | | $ | 131,332 | | | $ | (45,023 | ) |
The use of forward foreign currency exchange contracts, futures contracts, and swap contracts involves elements of market risk and risks in excess of the amounts disclosed in the financial statements. The forward foreign currency exchange contracts and notional amounts presented above represent the Fund's total exposure in such contracts, whereas only the net unrealized appreciation (depreciation) and variation margin are reflected in the Fund's net assets.
Schedule of investments
Delaware Wealth Builder Fund
| 1 | See Note 9 in “Notes to financial statements.” |
| 2 | A CDS contract is a risk-transfer instrument through which one party (purchaser of protection) transfers to another party (seller of protection) the financial risk of a credit event (as defined in the CDS agreement), as it relates to a particular reference security or basket of securities (such as an index). Periodic payments (receipts) on such contracts are accrued daily and recorded as unrealized losses (gains) on swap contracts. Upon payment (receipt), such amounts are recorded as realized losses (gains) on swap contracts. Upfront payments made or received in connection with CDS contracts are amortized over the expected life of the CDS contracts as unrealized losses (gains) on swap contracts. The change in value of CDS contracts is recorded daily as unrealized appreciation or depreciation. A realized gain or loss is recorded upon a credit event (as defined in the CDS agreement) or the maturity or termination of the CDS agreement. |
| 3 | Notional amount shown is stated in USD unless noted that the swap is denominated in another currency. |
| 4 | Unrealized appreciation (depreciation) does not include periodic interest (payments) receipt on swap contracts accrued daily in the amount of $(9,580). |
Summary of abbreviations:
AG – Aktiengesellschaft
BBSW1M – Bank Bill Swap Rate 1 Month
CLO – Collateralized Loan Obligation
DAC – Designated Activity Company
DB – Deutsche Bank
ETF – Exchange-Traded Fund
GDR – Global Depositary Receipt
GNMA – Government National Mortgage Association
GS – Goldman Sachs
JPM – JPMorgan
JPMCB – JPMorgan Chase Bank
JSC – Joint Stock Company
MSCI – Morgan Stanley Capital International
PIK – Payment-in-kind
PJSC – Private Joint Stock Company
REIT – Real Estate Investment Trust
REMIC – Real Estate Mortgage Investment Conduit
S.F. – Single Family
SOFR – Secured Overnight Financing Rate
SOFR01M – Secured Overnight Financing Rate 1 Month
Summary of abbreviations: (continued)
SOFR03M – Secured Overnight Financing Rate 3 Month
TBA – To be announced
TSFR03M – 3 Month Term Secured Overnight Financing
Rate yr – Year
Summary of currencies:
AUD – Australian Dollar
BRL – Brazilian Real
EUR – European Monetary Unit
INR – Indian Rupee
KZT – Kazakhstani Tenge
USD – US Dollar
See accompanying notes, which are an integral part of the financial statements.
| Statement of assets and liabilities | |
| Delaware Wealth Builder Fund | November 30, 2023 |
| Assets: | | | |
| Investments, at value* | | $ | 849,162,842 | |
| Investments of affiliated issuers, at value** | | | 10,163,520 | |
| Foreign currencies, at valueΔ | | | 137,225 | |
| Cash | | | 123,401 | |
| Cash collateral due from brokers | | | 288,822 | |
| Receivable for securities sold | | | 5,397,934 | |
| Dividends and interest receivable | | | 3,573,186 | |
| Foreign tax reclaims receivable | | | 580,824 | |
| Receivable for fund shares sold | | | 393,631 | |
| Upfront payments paid on over-the-counter credit default swap contracts | | | 131,332 | |
| Prepaid expenses | | | 54,301 | |
| Unrealized appreciation on forward foreign currency exchange contracts | | | 11,073 | |
| Other assets | | | 7,919 | |
| Total Assets | | | 870,026,010 | |
| Liabilities: | | | | |
| Payable for securities purchased | | | 6,448,075 | |
| Payable for fund shares redeemed | | | 759,410 | |
| Investment management fees payable to affiliates | | | 423,201 | |
| Other accrued expenses | | | 342,054 | |
| Distribution fees payable to affiliates | | | 159,396 | |
| Cash collateral due to brokers | | | 80,000 | |
| Administration expenses payable to affiliates | | | 78,654 | |
| Variation margin due to broker on futures contracts | | | 66,680 | |
| Unrealized depreciation on over-the-counter credit default swap contracts | | | 45,023 | |
| Swap payments payable | | | 9,580 | |
| Unrealized depreciation on forward foreign currency exchange contracts | | | 642 | |
| Total Liabilities | | | 8,412,715 | |
| Total Net Assets | | $ | 861,613,295 | |
| |
| Net Assets Consist of: | | | | |
| Paid-in capital | | $ | 822,207,730 | |
| Total distributable earnings (loss) | | | 39,405,565 | |
| Total Net Assets | | $ | 861,613,295 | |
| Net Asset Value | | | |
| | | | |
| Class A: | | | | |
| Net assets | | $ | 720,746,115 | |
| Shares of beneficial interest outstanding, unlimited authorization, no par | | | 52,138,569 | |
| Net asset value per share | | $ | 13.82 | |
| Sales charge | | | 5.75 | % |
| Offering price per share, equal to net asset value per share / (1 - sales charge) | | $ | 14.66 | |
| | | | | |
| Class C: | | | | |
| Net assets | | $ | 16,303,635 | |
| Shares of beneficial interest outstanding, unlimited authorization, no par | | | 1,175,468 | |
| Net asset value per share | | $ | 13.87 | |
| | | | | |
| Class R: | | | | |
| Net assets | | $ | 1,826,548 | |
| Shares of beneficial interest outstanding, unlimited authorization, no par | | | 132,004 | |
| Net asset value per share | | $ | 13.84 | |
| | | | | |
| Institutional Class: | | | | |
| Net assets | | $ | 120,627,732 | |
| Shares of beneficial interest outstanding, unlimited authorization, no par | | | 8,724,640 | |
| Net asset value per share | | $ | 13.83 | |
| | | | | |
| Class R6: | | | | |
| Net assets | | $ | 2,109,265 | |
| Shares of beneficial interest outstanding, unlimited authorization, no par | | | 152,535 | |
| Net asset value per share | | $ | 13.83 | |
| |
| *Investments, at cost | | $ | 828,723,692 | |
| **Investments of affiliated issuers, at cost | | | 5,481,000 | |
| ΔForeign currencies, at cost | | | 134,503 | |
See accompanying notes, which are an integral part of the financial statements.
| Statement of operations | |
| Delaware Wealth Builder Fund | Year ended November 30, 2023 |
| Investment Income: | | | |
| Dividends | | $ | 12,465,798 | |
| Interest | | | 9,580,742 | |
| Dividends from affiliated investments | | | 522,000 | |
| Foreign tax withheld | | | (116,197 | ) |
| | | | 22,452,343 | |
| |
| Expenses: | | | | |
| Management fees | | | 4,316,833 | |
| Distribution expenses — Class A | | | 1,351,555 | |
| Distribution expenses — Class C | | | 189,507 | |
| Distribution expenses — Class R | | | 8,040 | |
| Dividend disbursing and transfer agent fees and expenses | | | 500,729 | |
| Reports and statements to shareholders expenses | | | 108,252 | |
| Accounting and administration expenses | | | 105,839 | |
| Registration fees | | | 87,039 | |
| Legal fees | | | 81,241 | |
| Audit and tax fees | | | 56,495 | |
| Custodian fees | | | 39,884 | |
| Trustees’ fees and expenses | | | 22,407 | |
| Other | | | 285,091 | |
| | | | 7,152,912 | |
| Less expenses waived | | | (14,854 | ) |
| Less expenses paid indirectly | | | (453 | ) |
| Total operating expenses | | | 7,137,605 | |
| Net Investment Income (Loss) | | | 15,314,738 | |
| Net Realized and Unrealized Gain (Loss): | | | |
| Net realized gain (loss) on: | | | |
| Investments* | | $ | 18,020,628 | |
| Foreign currencies | | | (20,419 | ) |
| Forward foreign currency exchange contracts | | | (24,391 | ) |
| Futures contracts | | | (728,692 | ) |
| Swap contracts | | | (17,658 | ) |
| Net realized gain (loss) | | | 17,229,468 | |
| |
| Net change in unrealized appreciation (depreciation) on: | | | | |
| Investments | | | 1,145,482 | |
| Affiliated investments | | | 4,682,520 | |
| Foreign currencies | | | 16,074 | |
| Forward foreign currency exchange contracts | | | 17,239 | |
| Futures contracts | | | 135,900 | |
| Swap contracts | | | (53,270 | ) |
| Net change in unrealized appreciation (depreciation) | | | 5,943,945 | |
| Net Realized and Unrealized Gain (Loss) | | | 23,173,413 | |
| Net Increase (Decrease) in Net Assets Resulting from Operations | | $ | 38,488,151 | |
| * | Includes $550,211 in proceeds received from the settlement of class action litigation. |
See accompanying notes, which are an integral part of the financial statements.
Statements of changes in net assets
Delaware Wealth Builder Fund
| | | Year ended | |
| | | 11/30/23 | | | 11/30/22 | |
| Increase (Decrease) in Net Assets from Operations: | | | | | | | | |
| Net investment income (loss) | | $ | 15,314,738 | | | $ | 5,776,655 | |
| Net realized gain (loss) | | | 17,229,468 | | | | 20,219,332 | |
| Net change in unrealized appreciation (depreciation) | | | 5,943,945 | | | | (33,020,182 | ) |
| Net increase (decrease) in net assets resulting from operations | | | 38,488,151 | | | | (7,024,195 | ) |
| |
| Dividends and Distributions to Shareholders from: | | | | | | | | |
| Distributable earnings: | | | | | | | | |
| Class A | | | (24,558,534 | ) | | | (17,814,302 | ) |
| Class C | | | (1,362,727 | ) | | | (1,877,254 | ) |
| Class R | | | (86,471 | ) | | | (75,857 | ) |
| Institutional Class | | | (8,665,489 | ) | | | (8,271,180 | ) |
| Class R6 | | | (22,903 | ) | | | — | |
| | | | (34,696,124 | ) | | | (28,038,593 | ) |
| |
| Capital Share Transactions (See Note 6): | | | | | | | | |
| Proceeds from shares sold: | | | | | | | | |
| Class A | | | 20,254,353 | | | | 18,399,239 | |
| Class C | | | 1,311,979 | | | | 1,319,163 | |
| Class R | | | 250,460 | | | | 232,702 | |
| Institutional Class | | | 15,222,119 | | | | 15,316,180 | |
| Class R6 | | | 2,052,465 | | | | — | |
| | | | | | | | | |
| Net assets from merger:1 | | | | | | | | |
| Class A | | | 524,606,211 | | | | — | |
| Class C | | | 4,120,753 | | | | — | |
| Class R | | | 694,137 | | | | — | |
| Institutional Class | | | 24,272,794 | | | | — | |
| Class R6 | | | 22,008 | | | | — | |
| | | | | | | | | |
| Net asset value of shares issued upon reinvestment of dividends and distributions: | | | | | | | | |
| Class A | | | 23,425,241 | | | | 16,904,917 | |
| Class C | | | 1,357,724 | | | | 1,866,313 | |
| Class R | | | 85,581 | | | | 74,032 | |
| Institutional Class | | | 8,114,698 | | | | 7,661,983 | |
| Class R6 | | | 22,903 | | | | — | |
| | | | 625,813,426 | | | | 61,774,529 | |
| | | Year ended | |
| | | 11/30/23 | | | 11/30/22 | |
| Capital Share Transactions (continued): | | | | | | | | |
| Cost of shares redeemed: | | | | | | | | |
| Class A | | $ | (90,609,262 | ) | | $ | (36,517,964 | ) |
| Class C | | | (10,912,196 | ) | | | (10,586,912 | ) |
| Class R | | | (234,742 | ) | | | (378,618 | ) |
| Institutional Class | | | (32,825,120 | ) | | | (20,717,412 | ) |
| Class R6 | | | (50,477 | ) | | | — | |
| | | | (134,631,797 | ) | | | (68,200,906 | ) |
| Increase (decrease) in net assets derived from capital share transactions | | | 491,181,629 | | | | (6,426,377 | ) |
| Net Increase (Decrease) in Net Assets | | | 494,973,656 | | | | (41,489,165 | ) |
| | | | | | | | | |
| Net Assets: | | | | | | | | |
| Beginning of year | | | 366,639,639 | | | | 408,128,804 | |
| End of year | | $ | 861,613,295 | | | $ | 366,639,639 | |
| 1 | See Note 7 in “Notes to financial statements.” |
See accompanying notes, which are an integral part of the financial statements.
Financial highlights
Delaware Wealth Builder Fund Class A
Selected data for each share of the Fund outstanding throughout each period were as follows:
| Net asset value, beginning of period |
| |
| Income (loss) from investment operations: |
| Net investment income1 |
| Net realized and unrealized gain (loss) |
| Total from investment operations |
| |
| Less dividends and distributions from: |
| Net investment income |
| Net realized gain |
| Total dividends and distributions |
| |
| Net asset value, end of period |
| |
| Total return3 |
| |
| Ratios and supplemental data: |
| Net assets, end of period (000 omitted) |
| Ratio of expenses to average net assets6 |
| Ratio of expenses to average net assets prior to fees waived6 |
| Ratio of net investment income to average net assets |
| Ratio of net investment income to average net assets prior to fees waived |
| Portfolio turnover |
| 1 | Calculated using average shares outstanding. |
| 2 | Amount includes non-recurring payment for litigation proceeds, which represents class action settlement received by the Fund. The litigation proceeds impact the realized and unrealized gain (loss) per share by $0.01 and total return by 0.07%. |
| 3 | Total return is based on the change in net asset value of a share during the period and assumes reinvestment of dividends and distributions at net asset value and does not reflect the impact of a sales charge. |
| 4 | Total return during the period reflects waivers by the manager and/or distributor (as applicable). Performance would have been lower had the waivers not been in effect. |
| 5 | General Motors term loan litigation were included in total return. If excluded, the impact on the total return would be 0.11% lower. |
| 6 | Expense ratios do not include expenses of any investment companies in which the Fund invests. |
| 7 | Includes tax expense ratio of 0.18% for the year ended November 30, 2022. |
See accompanying notes, which are an integral part of the financial statements.
| Year ended | |
| | 11/30/23 | | | | 11/30/22 | | | | 11/30/21 | | | | 11/30/20 | | | | 11/30/19 | |
| $ | 14.38 | | | $ | 15.71 | | | $ | 13.71 | | | $ | 14.01 | | | $ | 14.15 | |
|
|
| | 0.30 | | | | 0.22 | | | | 0.21 | | | | 0.25 | | | | 0.53 | |
| | 0.21 | 2 | | | (0.47 | ) | | | 2.06 | | | | (0.09 | ) | | | 0.50 | |
| | 0.51 | | | | (0.25 | ) | | | 2.27 | | | | 0.16 | | | | 1.03 | |
|
|
| | (0.31 | ) | | | (0.25 | ) | | | (0.27 | ) | | | (0.27 | ) | | | (0.35 | ) |
| | (0.76 | ) | | | (0.83 | ) | | | — | | | | (0.19 | ) | | | (0.82 | ) |
| | (1.07 | ) | | | (1.08 | ) | | | (0.27 | ) | | | (0.46 | ) | | | (1.17 | ) |
|
| $ | 13.82 | | | $ | 14.38 | | | $ | 15.71 | | | $ | 13.71 | | | $ | 14.01 | |
|
| | 3.97 | % | | | (1.78 | %)4 | | | 16.63 | %4 | | | 1.30 | %4 | | | 8.30 | %5 |
|
|
| $ | 720,746 | | | $ | 235,618 | | | $ | 259,143 | | | $ | 230,168 | | | $ | 259,283 | |
| | 1.05 | % | | | 1.26 | %7 | | | 1.08 | % | | | 1.09 | % | | | 1.09 | % |
| | 1.05 | % | | | 1.30 | %7 | | | 1.11 | % | | | 1.12 | % | | | 1.09 | % |
| | 2.22 | % | | | 1.51 | %7 | | | 1.37 | % | | | 1.91 | % | | | 3.91 | % |
| | 2.22 | % | | | 1.47 | %7 | | | 1.34 | % | | | 1.88 | % | | | 3.91 | % |
| | 51 | % | | | 65 | % | | | 89 | % | | | 68 | % | | | 91 | % |
Financial highlights
Delaware Wealth Builder Fund Class C
Selected data for each share of the Fund outstanding throughout each period were as follows:
| Net asset value, beginning of period |
| |
| Income (loss) from investment operations: |
| Net investment income1 |
| Net realized and unrealized gain (loss) |
| Total from investment operations |
| |
| Less dividends and distributions from: |
| Net investment income |
| Net realized gain |
| Total dividends and distributions |
| |
| Net asset value, end of period |
| |
| Total return3 |
| |
| Ratios and supplemental data: |
| Net assets, end of period (000 omitted) |
| Ratio of expenses to average net assets6 |
| Ratio of expenses to average net assets prior to fees waived6 |
| Ratio of net investment income to average net assets |
| Ratio of net investment income to average net assets prior to fees waived |
| Portfolio turnover |
| 1 | Calculated using average shares outstanding. |
| 2 | Amount includes non-recurring payment for litigation proceeds, which represents class action settlement received by the Fund. The litigation proceeds impact the realized and unrealized gain (loss) per share by $0.01 and total return by 0.07%. |
| 3 | Total return is based on the change in net asset value of a share during the period and assumes reinvestment of dividends and distributions at net asset value and does not reflect the impact of a sales charge. |
| 4 | Total return during the period reflects waivers by the manager and/or distributor (as applicable). Performance would have been lower had the waivers not been in effect. |
| 5 | General Motors term loan litigation were included in total return. If excluded, the impact on the total return would be 0.11% lower. |
| 6 | Expense ratios do not include expenses of any investment companies in which the Fund invests. |
| 7 | Includes tax expense ratio of 0.18% for the year ended November 30, 2022. |
See accompanying notes, which are an integral part of the financial statements.
| Year ended | |
| | 11/30/23 | | | | 11/30/22 | | | | 11/30/21 | | | | 11/30/20 | | | | 11/30/19 | |
| $ | 14.42 | | | $ | 15.75 | | | $ | 13.73 | | | $ | 14.04 | | | $ | 14.18 | |
|
|
| | 0.20 | | | | 0.11 | | | | 0.09 | | | | 0.15 | | | | 0.43 | |
| | 0.21 | 2 | | | (0.47 | ) | | | 2.08 | | | | (0.10 | ) | | | 0.49 | |
| | 0.41 | | | | (0.36 | ) | | | 2.17 | | | | 0.05 | | | | 0.92 | |
|
|
| | (0.20 | ) | | | (0.14 | ) | | | (0.15 | ) | | | (0.17 | ) | | | (0.24 | ) |
| | (0.76 | ) | | | (0.83 | ) | | | — | | | | (0.19 | ) | | | (0.82 | ) |
| | (0.96 | ) | | | (0.97 | ) | | | (0.15 | ) | | | (0.36 | ) | | | (1.06 | ) |
|
| $ | 13.87 | | | $ | 14.42 | | | $ | 15.75 | | | $ | 13.73 | | | $ | 14.04 | |
|
| | 3.21 | % | | | (2.53 | %)4 | | | 15.84 | %4 | | | 0.47 | %4 | | | 7.46 | %5 |
|
|
| $ | 16,304 | | | $ | 21,168 | | | $ | 31,157 | | | $ | 52,258 | | | $ | 95,672 | |
| | 1.80 | % | | | 2.01 | %7 | | | 1.83 | % | | | 1.84 | % | | | 1.84 | % |
| | 1.80 | % | | | 2.05 | %7 | | | 1.86 | % | | | 1.87 | % | | | 1.84 | % |
| | 1.47 | % | | | 0.76 | %7 | | | 0.62 | % | | | 1.16 | % | | | 3.17 | % |
| | 1.47 | % | | | 0.72 | %7 | | | 0.59 | % | | | 1.13 | % | | | 3.17 | % |
| | 51 | % | | | 65 | % | | | 89 | % | | | 68 | % | | | 91 | % |
Financial highlights
Delaware Wealth Builder Fund Class R
Selected data for each share of the Fund outstanding throughout each period were as follows:
| Net asset value, beginning of period |
| |
| Income (loss) from investment operations: |
| Net investment income1 |
| Net realized and unrealized gain (loss) |
| Total from investment operations |
| |
| Less dividends and distributions from: |
| Net investment income |
| Net realized gain |
| Total dividends and distributions |
| |
| Net asset value, end of period |
| |
| Total return3 |
| |
| Ratios and supplemental data: |
| Net assets, end of period (000 omitted) |
| Ratio of expenses to average net assets6 |
| Ratio of expenses to average net assets prior to fees waived6 |
| Ratio of net investment income to average net assets |
| Ratio of net investment income to average net assets prior to fees waived |
| Portfolio turnover |
| 1 | Calculated using average shares outstanding. |
| 2 | Amount includes non-recurring payment for litigation proceeds, which represents class action settlement received by the Fund. The litigation proceeds impact the realized and unrealized gain (loss) per share by $0.01 and total return by 0.07%. |
| 3 | Total return is based on the change in net asset value of a share during the period and assumes reinvestment of dividends and distributions at net asset value. |
| 4 | Total return during the period reflects waivers by the manager and/or distributor (as applicable). Performance would have been lower had the waivers not been in effect. |
| 5 | General Motors term loan litigation were included in total return. If excluded, the impact on the total return would be 0.11% lower. |
| 6 | Expense ratios do not include expenses of any investment companies in which the Fund invests. |
| 7 | Includes tax expense ratio of 0.18% for the year ended November 30, 2022. |
See accompanying notes, which are an integral part of the financial statements.
| Year ended | |
| | 11/30/23 | | | | 11/30/22 | | | | 11/30/21 | | | | 11/30/20 | | | | 11/30/19 | |
| $ | 14.39 | | | $ | 15.71 | | | $ | 13.71 | | | $ | 14.02 | | | $ | 14.16 | |
|
|
| | 0.27 | | | | 0.18 | | | | 0.17 | | | | 0.21 | | | | 0.49 | |
| | 0.21 | 2 | | | (0.46 | ) | | | 2.06 | | | | (0.09 | ) | | | 0.50 | |
| | 0.48 | | | | (0.28 | ) | | | 2.23 | | | | 0.12 | | | | 0.99 | |
|
|
| | (0.27 | ) | | | (0.21 | ) | | | (0.23 | ) | | | (0.24 | ) | | | (0.31 | ) |
| | (0.76 | ) | | | (0.83 | ) | | | — | | | | (0.19 | ) | | | (0.82 | ) |
| | (1.03 | ) | | | (1.04 | ) | | | (0.23 | ) | | | (0.43 | ) | | | (1.13 | ) |
|
| $ | 13.84 | | | $ | 14.39 | | | $ | 15.71 | | | $ | 13.71 | | | $ | 14.02 | |
|
| | 3.78 | % | | | (1.98 | %)4 | | | 16.32 | %4 | | | 0.99 | %4 | | | 8.02 | %5 |
|
|
| $ | 1,826 | | | $ | 1,028 | | | $ | 1,203 | | | $ | 1,069 | | | $ | 1,288 | |
| | 1.30 | % | | | 1.51 | %7 | | | 1.33 | % | | | 1.34 | % | | | 1.34 | % |
| | 1.30 | % | | | 1.55 | %7 | | | 1.36 | % | | | 1.37 | % | | | 1.34 | % |
| | 1.97 | % | | | 1.26 | %7 | | | 1.12 | % | | | 1.66 | % | | | 3.66 | % |
| | 1.97 | % | | | 1.22 | %7 | | | 1.09 | % | | | 1.63 | % | | | 3.66 | % |
| | 51 | % | | | 65 | % | | | 89 | % | | | 68 | % | | | 91 | % |
Financial highlights
Delaware Wealth Builder Fund Institutional Class
Selected data for each share of the Fund outstanding throughout each period were as follows:
| Net asset value, beginning of period |
| |
| Income (loss) from investment operations: |
| Net investment income1 |
| Net realized and unrealized gain (loss) |
| Total from investment operations |
| |
| Less dividends and distributions from: |
| Net investment income |
| Net realized gain |
| Total dividends and distributions |
| |
| Net asset value, end of period |
| |
| Total return3 |
| |
| Ratios and supplemental data: |
| Net assets, end of period (000 omitted) |
| Ratio of expenses to average net assets6 |
| Ratio of expenses to average net assets prior to fees waived6 |
| Ratio of net investment income to average net assets |
| Ratio of net investment income to average net assets prior to fees waived |
| Portfolio turnover |
| 1 | Calculated using average shares outstanding. |
| 2 | Amount includes non-recurring payment for litigation proceeds, which represents class action settlement received by the Fund. The litigation proceeds impact the realized and unrealized gain (loss) per share by $0.01 and total return by 0.07%. |
| 3 | Total return is based on the change in net asset value of a share during the period and assumes reinvestment of dividends and distributions at net asset value. |
| 4 | Total return during the period reflects waivers by the manager. Performance would have been lower had the waivers not been in effect. |
| 5 | General Motors term loan litigation were included in total return. If excluded, the impact on the total return would be 0.11% lower. |
| 6 | Expense ratios do not include expenses of any investment companies in which the Fund invests. |
| 7 | Includes tax expense ratio of 0.18% for the year ended November 30, 2022. |
See accompanying notes, which are an integral part of the financial statements.
| Year ended | |
| 11/30/23 | | | 11/30/22 | | | 11/30/21 | | | 11/30/20 | | | 11/30/19 | |
| $ | 14.38 | | | $ | 15.70 | | | $ | 13.70 | | | $ | 14.01 | | | $ | 14.15 | |
|
|
| | 0.34 | | | | 0.25 | | | | 0.25 | | | | 0.28 | | | | 0.56 | |
| | 0.21 | 2 | | | (0.45 | ) | | | 2.05 | | | | (0.10 | ) | | | 0.50 | |
| | 0.55 | | | | (0.20 | ) | | | 2.30 | | | | 0.18 | | | | 1.06 | |
|
|
| | (0.34 | ) | | | (0.29 | ) | | | (0.30 | ) | | | (0.30 | ) | | | (0.38 | ) |
| | (0.76 | ) | | | (0.83 | ) | | | — | | | | (0.19 | ) | | | (0.82 | ) |
| | (1.10 | ) | | | (1.12 | ) | | | (0.30 | ) | | | (0.49 | ) | | | (1.20 | ) |
|
| $ | 13.83 | | | $ | 14.38 | | | $ | 15.70 | | | $ | 13.70 | | | $ | 14.01 | |
|
| | 4.28 | % | | | (1.47 | %)4 | | | 16.93 | %4 | | | 1.50 | %4 | | | 8.59 | %5 |
|
|
| $ | 120,628 | | | $ | 108,827 | | | $ | 116,626 | | | $ | 116,589 | | | $ | 155,525 | |
| | 0.80 | % | | | 1.01 | %7 | | | 0.83 | % | | | 0.84 | % | | | 0.84 | % |
| | 0.80 | % | | | 1.05 | %7 | | | 0.86 | % | | | 0.87 | % | | | 0.84 | % |
| | 2.47 | % | | | 1.76 | %7 | | | 1.62 | % | | | 2.16 | % | | | 4.16 | % |
| | 2.47 | % | | | 1.72 | %7 | | | 1.59 | % | | | 2.13 | % | | | 4.16 | % |
| | 51 | % | | | 65 | % | | | 89 | % | | | 68 | % | | | 91 | % |
Financial highlights
Delaware Wealth Builder Fund Class R6
Selected data for each share of the Fund outstanding throughout each period were as follows:
| | | 2/28/231
to
11/30/23 | |
| Net asset value, beginning of period. | | $ | 13.35 | |
| |
| Income from investment operations: | | | | |
| Net investment income2 | | | 0.45 | |
| Net realized and unrealized gain | | | 0.27 | 3 |
| Total from investment operations | | | 0.72 | |
| |
| Less dividends and distributions from: | | | | |
| Net investment income | | | (0.24 | ) |
| Total dividends and distributions | | | (0.24 | ) |
| |
| Net asset value, end of period | | $ | 13.83 | |
| |
| Total return4 | | | 5.49 | % |
| |
| Ratios and supplemental data: | | | | |
| Net assets, end of period (000 omitted) | | $ | 2,109 | |
| Ratio of expenses to average net assets5 | | | 0.72 | % |
| Ratio of expenses to average net assets prior to fees waived5 | | | 0.75 | % |
| Ratio of net investment income to average net assets | | | 3.36 | % |
| Ratio of net investment income to average net assets prior to fees waived | | | 3.33 | % |
| Portfolio turnover | | | 51 | %6 |
| 1 | Date of commencement of operations; ratios have been annualized and total return has not been annualized. |
| 2 | Calculated using average shares outstanding. |
| 3 | Amount includes non-recurring payment for litigation proceeds, which represents class action settlement received by the Fund. The litigation proceeds impact the realized and unrealized gain (loss) per share by $0.01 and total return by 0.07%. |
| 4 | Total return is based on the change in net asset value of a share during the period and assumes reinvestment of dividends and distributions at net asset value. Total return during the period reflects waivers by the manager. Performance would have been lower had the waivers not been in effect. |
| 5 | Expense ratios do not include expenses of any investment companies in which the Fund invests. |
| 6 | Portfolio turnover is representative of the Fund for the period ended November 30, 2023. |
See accompanying notes, which are an integral part of the financial statements.
| Notes to financial statements | |
| Delaware Wealth Builder Fund | November 30, 2023 |
Delaware Group® Equity Funds V (Trust) is organized as a Delaware statutory trust and offers three series: Delaware Small Cap Core Fund, Delaware Small Cap Value Fund, and Delaware Wealth Builder Fund. These financial statements and the related notes pertain to Delaware Wealth Builder Fund (Fund). The Trust is an open-end investment company. The Fund is considered diversified under the Investment Company Act of 1940, as amended (1940 Act), and offers Class A, Class C, Class R, Institutional Class, and Class R6 shares. Class A shares are sold with a maximum front-end sales charge of 5.75%. There is no front-end sales charge when you purchase $1 million or more of Class A shares. However, if Delaware Distributors, L.P. (DDLP) paid your financial intermediary a commission on your purchase of $1 million or more of Class A shares, you will have to pay a limited contingent deferred sales charge (Limited CDSC) of 1.00% if you redeem these shares within the first 18 months after your purchase, unless a specific waiver of the Limited CDSC applies. Class C shares have no upfront sales charge, but are sold with a contingent deferred sales charge (CDSC) of 1.00%, which will be incurred if redeemed during the first 12 months. Class R, Institutional Class, and Class R6 shares are not subject to a sales charge and are offered for sale exclusively to certain eligible investors. In addition, Class R6 shares do not pay any service fees, sub-accounting fees, and/or sub-transfer agency fees to any brokers, dealers, or other financial intermediaries.
1. Significant Accounting Policies
The Fund follows accounting and reporting guidance under Financial Accounting Standards Board (FASB) Accounting Standards Codification Topic 946, Financial Services — Investment Companies. The following accounting policies are in accordance with US generally accepted accounting principles (US GAAP) and are consistently followed by the Fund.
Security Valuation — Equity securities and exchange-traded funds (ETFs), except those traded on the Nasdaq Stock Market LLC (Nasdaq), are valued at the last quoted sales price as of the time of the regular close of the New York Stock Exchange on the valuation date. Equity securities and ETFs traded on the Nasdaq are valued in accordance with the Nasdaq Official Closing Price, which may not be the last sales price. If, on a particular day, an equity security or ETF does not trade, the mean between the bid and the ask prices will be used, which approximates fair value. Open-end investment companies, other than ETFs, are valued at their published net asset value (NAV). Equity securities listed on a foreign exchange are normally valued at the last quoted sales price on the valuation date. Fixed income securities and credit default swap (CDS) contracts are generally priced based upon valuations provided by an independent pricing service or broker/counterparty in accordance with methodologies included within Delaware Management Company (DMC)'s Pricing Policy (the Policy). Fixed income security valuations and CDS contracts are then reviewed by DMC as part of its duties as the Fund’s valuation designee and, to the extent required by the Policy and applicable regulation, fair valued consistent with the Policy. To the extent current market prices are not available, the pricing service may take into account developments related to the specific security, as well as transactions in comparable securities. US government and agency securities are valued at the mean between the bid and the ask prices, which approximates fair value. Valuations for fixed
Notes to financial statements
Delaware Wealth Builder Fund
1. Significant Accounting Policies (continued)
income securities utilize matrix systems, which reflect such factors as security prices, yields, maturities, and ratings, and are supplemented by dealer and exchange quotations. For asset-backed securities, collateralized mortgage obligations (CMOs), commercial mortgage securities, and US government agency mortgage securities, pricing vendors utilize matrix pricing which considers prepayment speed, attributes of the collateral, yield or price of bonds of comparable quality, coupon, maturity, and type as well as broker/dealer-supplied prices. Swap prices are derived using daily swap curves and models that incorporate a number of market data factors, such as discounted cash flows, trades, and values of the underlying reference instruments. Forward foreign currency exchange contracts are valued at the mean between the bid and the ask prices, which approximates fair value. Interpolated values are derived when the settlement date of the contract is an interim date for which quotations are not available. Futures contracts and options on futures contracts are valued at the daily quoted settlement prices. Exchange-traded options are valued at the last reported sale price or, if no sales are reported, at the mean between the last reported bid and ask prices, which approximates fair value. Generally, other securities and assets for which market quotations are not readily available are valued at fair value as determined in good faith by DMC. Subject to the oversight of the Trust's Board of Trustees (Board), DMC, as valuation designee, has adopted policies and procedures to fair value securities for which market quotations are not readily available consistent with the requirements of Rule 2a-5 under the 1940 Act. In determining whether market quotations are readily available or fair valuation will be used, various factors will be taken into consideration, such as market closures or suspension of trading in a security. Restricted securities and private placements are valued at fair value.
Federal and Foreign Income Taxes — No provision for federal income taxes has been made as the Fund intends to continue to qualify for federal income tax purposes as a regulated investment company under Subchapter M of the Internal Revenue Code of 1986, as amended, and make the requisite distributions to shareholders. The Fund evaluates tax positions taken or expected to be taken in the course of preparing the Fund’s tax returns to determine whether the tax positions are “more-likely-than-not” of being sustained by the applicable tax authority. Tax positions not deemed to meet the “more-likely-than-not” threshold are recorded as a tax benefit or expense in the current year. Management has analyzed the Fund’s tax positions taken or expected to be taken on the Fund’s federal income tax returns through the year ended November 30, 2023 and for all open tax years (years ended November 30, 2020–November 30, 2022), and has concluded that no provision for federal income tax is required in the Fund’s financial statements. In regard to foreign taxes only, the Fund has open tax years in certain foreign countries in which it invests that may date back to the inception of the Fund. If applicable, the Fund recognizes interest accrued on unrecognized tax benefits in interest expense and penalties in “Other” on the “Statement of operations.” During the year ended November 30, 2023, the Fund did not incur any interest or tax penalties.
Class Accounting — Investment income, common expenses, and realized and unrealized gain (loss) on investments are allocated to the various classes of the Fund on the basis of daily net
assets of each class. Distribution expenses relating to a specific class are charged directly to that class. Class R6 shares will not be allocated any expenses related to service fees, sub-accounting fees, and/or sub-transfer agency fees paid to brokers, dealers, or other financial intermediaries.
Underlying Funds — The Fund may invest in other investment companies (Underlying Funds) to the extent permitted by the 1940 Act. The Underlying Funds in which the Fund may invest include ETFs. The Fund will indirectly bear the investment management fees and other expenses of the Underlying Funds.
To Be Announced Trades (TBA) — The Fund may contract to purchase or sell securities for a fixed price at a transaction date beyond the customary settlement period (examples: when issued, delayed delivery, forward commitment, or TBA transactions) consistent with the Fund’s ability to manage its investment portfolio and meet redemption requests. These transactions involve a commitment by the Fund to purchase or sell securities for a predetermined price or yield with payment and delivery taking place more than three days in the future, or after a period longer than the customary settlement period for that type of security. No interest will be earned by the Fund on such purchases until the securities are delivered or the transaction is completed; however, the market value may change prior to delivery.
Foreign Currency Transactions — Transactions denominated in foreign currencies are recorded at the prevailing exchange rates on the valuation date. The value of all assets and liabilities denominated in foreign currencies is translated daily into US dollars at the exchange rate of such currencies against the US dollar. Transaction gains or losses resulting from changes in exchange rates during the reporting period or upon settlement of the foreign currency transaction are reported in operations for the current period. The Fund generally bifurcates that portion of realized gains and losses on investments in debt securities which is due to changes in foreign exchange rates from that which is due to changes in market prices of debt securities. That portion of gains (losses), attributable to changes in foreign exchange rates, is included on the “Statement of operations” under “Net realized gain (loss) on foreign currencies.” For foreign equity securities, the realized gains and losses are included on the “Statement of operations” under “Net realized gain (loss) on investments.” The Fund reports certain foreign currency related transactions as components of realized gains (losses) for financial reporting purposes, whereas such components are treated as ordinary income (loss) for federal income tax purposes.
Derivative Financial Instruments — The Fund may invest in various derivative financial instruments. These instruments are used to obtain exposure to a security, commodity, index, market, and/or other assets without owning or taking physical custody of securities, commodities and/or other referenced assets or to manage market, equity, credit, interest rate, foreign currency exchange rate, commodity and/or other risks. Derivative financial instruments may give rise to a form of economic leverage and involve risks, including the imperfect correlation between the value of a derivative financial instrument and the underlying asset, possible default of the counterparty to the transaction or illiquidity of the instrument. Pursuant to Rule 18f-4 under the
Notes to financial statements
Delaware Wealth Builder Fund
1. Significant Accounting Policies (continued)
1940 Act, among other things, the Fund intends to use either derivative financial instruments with embedded leverage in a limited manner or comply with an outer limit on fund leverage risk based on value-at-risk.
Segregation and Collateralization — In certain cases, based on requirements and agreements with certain exchanges and third-party broker-dealers, the Fund may deliver or receive collateral in connection with certain investments (e.g., futures contracts, forward foreign currency exchange contracts, options written, securities with extended settlement periods, and swaps). Certain countries require that cash reserves be held while investing in companies incorporated in that country. Cash collateral that has been pledged/received to cover obligations of the Fund under derivative contracts, if any, will be reported separately on the “Statement of assets and liabilities” as cash collateral due to/from broker. Securities collateral pledged for the same purpose, if any, is noted on the “Schedule of investments.”
Use of Estimates — The preparation of financial statements in conformity with US GAAP requires management to make estimates and assumptions that affect the fair value of investments, the reported amounts of assets and liabilities and disclosure of contingent assets and liabilities at the date of the financial statements, and the reported amounts of revenues and expenses during the reporting period. Actual results could differ from those estimates and the differences could be material.
Other — Expenses directly attributable to the Fund are charged directly to the Fund. Other expenses common to various funds within the Delaware Funds by Macquarie® (Delaware Funds) are generally allocated among such funds on the basis of average net assets. Management fees and certain other expenses are paid monthly. Security transactions are recorded on the date the securities are purchased or sold (trade date) for financial reporting purposes. Costs used in calculating realized gains and losses on the sale of investment securities are those of the specific securities sold. Dividend income is recorded on the ex-dividend date and interest income is recorded on an accrual basis. Income and capital gain distributions from any Underlying Funds in which the Fund invests are recorded on the ex-dividend date. Discounts and premiums on debt securities are accreted or amortized to interest income, respectively, over the lives of the respective securities using the effective interest method. Premiums on callable debt securities are amortized to interest income to the earliest call date using the effective interest method. Realized gains (losses) on paydowns of asset- and mortgage-backed securities are classified as interest income. Distributions received from investments in real estate investment trusts (REITs) are recorded as dividend income on the ex-dividend date, subject to reclassification upon notice of the character of such distributions by the issuer, which are estimated. Foreign dividends are also recorded on the ex-dividend date or as soon after the ex-dividend date that the Fund is aware of such dividends, net of all tax withholdings, a portion of which may be reclaimable. Withholding taxes and reclaims on foreign dividends have been recorded in accordance with the Fund’s understanding of the applicable country’s tax rules and rates. The Fund declares and pays dividends from net investment income monthly and distributions from net realized gain on
investments, if any, at least annually. The Fund may distribute more frequently, if necessary for tax purposes. Dividends and distributions, if any, are recorded on the ex-dividend date.
The Fund receives earnings credits from its transfer agent when positive cash balances are maintained, which may be used to offset transfer agent fees. If the amount earned is greater than $1, the expenses paid under this arrangement are included on the “Statement of operations” under “Dividend disbursing and transfer agent fees and expenses” with the corresponding expenses offset included under “Less expenses paid indirectly.”
2. Investment Management, Administration Agreements, and Other Transactions with Affiliates
In accordance with the terms of its investment management agreement, the Fund pays DMC, a series of Macquarie Investment Management Business Trust and the investment manager, an annual fee which is calculated daily and paid monthly at the rates of 0.65% on the first $500 million of average daily net assets of the Fund, 0.60% on the next $500 million, 0.55% on the next $1.5 billion, and 0.50% on average daily net assets in excess of $2.5 billion.
DMC has contractually agreed to waive all or a portion of its management fees and/or pay/reimburse expenses (excluding any distribution and service (12b-1) fees, acquired fund fees and expenses, taxes, interest, short sale dividend and interest expenses, brokerage fees, certain insurance costs, and nonroutine expenses or costs, including, but not limited to, those relating to reorganizations, litigation, conducting shareholder meetings, and liquidations), in order to prevent total annual fund operating expenses from exceeding 0.79% of the Fund's Class A, Class C, Class R, and Institutional Class shares' average daily net assets and 0.72% of the Fund's Class R6 shares' average daily net assets from March 10, 2023 through March 29, 2024. Prior to March 10, 2023, DMC contractually agreed to waive all or a portion of its management fees and/or pay/reimburse expenses to 0.83% of the Fund’s Class A, Class C, Class R, and Institutional Class shares' and 0.72% of the Fund's Class R6 shares' average daily net assets. These waivers and reimbursements may only be terminated by agreement of DMC and the Fund. The waivers and reimbursements are accrued daily and received monthly.
After consideration of class specific expenses, including 12b-1 fees, the class level operating expense limitation as a percentage of average daily net assets for the period December 1, 2022 (except as noted) through March 29, 2024 is as follows:
| | | Operating expense limitation as a percentage of average daily net assets | |
| | Class A | | | Class C | | | Class R | | | Institutional Class | | | Class R6 | |
| | | 1.04% | * | | | 1.79% | * | | | 1.29% | * | | | 0.79% | * | | | 0.72% | ** |
| * | Effective March 10, 2023. Prior to March 10, 2023, the expense limitation were as follows for Class A, Class C, Class R, and Institutional Class shares, respectively: 1.08%, 1.83%, 1.33%, and 0.83%. |
| ** | Effective February 28, 2023. Date of commencement of operations. |
Notes to financial statements
Delaware Wealth Builder Fund
2. Investment Management, Administration Agreements, and Other Transactions with Affiliates (continued)
DMC may seek investment advice and recommendations from its affiliates: Macquarie Investment Management Europe Limited, Macquarie Investment Management Austria Kapitalanlage AG, and Macquarie Investment Management Global Limited (MIMGL) (together, the “Affiliated Sub-Advisors”). The Manager may also permit these Affiliated Sub-Advisors to execute Fund security trades on behalf of the Manager and exercise investment discretion for securities in certain markets where DMC believes it will be beneficial to utilize an Affiliated Sub-Advisor’s specialized market knowledge. DMC may also seek quantitative support from MIMGL. Although the Affiliated Sub-Advisors serve as sub-advisors, DMC has ultimate responsibility for all investment advisory services. For these services, DMC, not the Fund, may pay each Affiliated Sub-Advisor a portion of its investment management fee.
Delaware Investments Fund Services Company (DIFSC), an affiliate of DMC, provides fund accounting and financial administrative oversight services to the Fund. For these services, effective October 1, 2023, DIFSC’s fees are calculated daily and paid monthly, based on the aggregate daily net assets of all funds within the Delaware Funds at the following annual rates: 0.0050% of the first $60 billion; 0.00475% of the next $30 billion; and 0.0015% of aggregate average daily net assets in excess of $90 billion (Total Fee). Prior to October 1, 2023, DIFSC's fees were payable by the fund at the following annual rates: 0.00475% of the first $35 billion; 0.0040% of the next $10 billion; 0.0025% of the next $45 billion; and 0.0015% of aggregate average daily net assets in excess of $90 billion. Each fund in the Delaware Funds pays a minimum of $4,000, which, in aggregate, is subtracted from the Total Fee. Each fund then pays its portion of the remainder of the Total Fee on a relative NAV basis. This amount is included on the “Statement of operations” under “Accounting and administration expenses.” For the year ended November 30, 2023, the Fund paid $25,457 for these services.
DIFSC is also the transfer agent and dividend disbursing agent of the Fund. For these services, DIFSC’s fees are calculated daily and paid monthly, based on the aggregate daily net assets of the retail funds within the Delaware Funds at the following annual rates: 0.014% of the first $20 billion; 0.011% of the next $5 billion; 0.007% of the next $5 billion; 0.004% of the next $20 billion; 0.002% of the next $25 billion; and 0.0015% of average daily net assets in excess of $75 billion. The fees payable to DIFSC under the shareholder services agreement described above are allocated among all retail funds in the Delaware Funds on a relative NAV basis. This amount is included on the “Statement of operations” under “Dividend disbursing and transfer agent fees and expenses.” For the year ended November 30, 2023, the Fund paid $44,134 for these services. Pursuant to a sub-transfer agency agreement between DIFSC and BNY Mellon Investment Servicing (US) Inc. (BNYMIS), BNYMIS provides certain sub-transfer agency services to the Fund. Sub-transfer agency fees are paid by the Fund and are also included on the “Statement of operations” under “Dividend disbursing and transfer agent fees and expenses.” The fees that are calculated daily and paid as invoices are received on a monthly or quarterly basis.
Pursuant to a distribution agreement and distribution plan, the Fund pays DDLP, the distributor and an affiliate of DMC, an annual 12b-1 fee of 0.25%, 1.00%, and 0.50% of the average daily net assets of the Class A, Class C, and Class R shares, respectively. The fees are calculated daily and paid monthly. Institutional Class and Class R6 shares do not pay 12b-1 fees.
As provided in the investment management agreement, the Fund bears a portion of the cost of certain resources shared with DMC, including the cost of internal personnel of DMC and/or its affiliates that provide legal and regulatory reporting services to the Fund. For the year ended November 30, 2023, the Fund paid $23,830 for internal legal and regulatory reporting services provided by DMC and/or its affiliates’ employees. This amount is included on the “Statement of operations” under “Legal fees.”
For the year ended November 30, 2023, DDLP earned $32,484 for commissions on sales of the Fund’s Class A shares. For the year ended November 30, 2023, DDLP received gross CDSC commissions of $1,459 and $500 on redemptions of the Fund’s Class A and Class C shares, respectively, and these commissions were entirely used to offset upfront commissions previously paid by DDLP to broker/dealers on sales of those shares.
Trustees’ fees include expenses accrued by the Fund for each Trustee’s retainer and meeting fees. Certain officers of DMC, DIFSC, and DDLP are officers and/or Trustees of the Trust. These officers and Trustees are paid no compensation by the Fund.
In addition to the management fees and other expenses of the Fund, the Fund indirectly bears the investment management fees and other expenses of any Underlying Funds, including ETFs in which it invests. The amount of these fees and expenses incurred indirectly by the Fund will vary based upon the expense and fee levels of any Underlying Funds and the number of shares that are owned of any Underlying Funds at different times.
A summary of the transactions in affiliated companies during the year ended November 30, 2023 was as follows:
| | | Value,
beginning
of period | | | Gross
additions1 | | | Gross
reductions | | | Net
realized
gain (loss)
on
affiliated
investments | | | Net change in
unrealized
appreciation
(depreciation)
on affiliated
investments | |
| Limited Liability Corporation—1.18% | | | | | | | | | |
| Sc Hixson= | | | $— | | | | $10,098,000 | | | | $— | | | | $— | | | | $65,520 | |
| | | Value,
end of
period | | | Shares | | | Dividend
Income | | | Capital gain
distributions | |
| Limited Liability Corporation—1.18% | | |
| Sc Hixson= | | | $10,163,520 | | | | 7,200,000 | | | | $522,000 | | | | $— | |
| 1 | Includes value from reorganization (see Note 7). |
| = | The value of this security was determined using significant unobservable inputs and is reported as a Level 3 security in the disclosure table located in Note 3. |
Notes to financial statements
Delaware Wealth Builder Fund
3. Investments
For the year ended November 30, 2023, the Fund made purchases and sales of investment securities other than short-term investments as follows:
| Purchases other than US government securities | | $ | 186,773,711 | |
| Purchases of US government securities | | | 158,067,205 | |
| Sales other than US government securities | | | 261,343,892 | |
| Sales of US government securities | | | 141,434,331 | |
The tax cost of investments and derivatives includes adjustments to net unrealized appreciation (depreciation) which may not necessarily be the final tax cost basis adjustments but which approximate the tax basis unrealized gains and losses that may be realized and distributed to shareholders. At November 30, 2023, the cost and unrealized appreciation (depreciation) of investments and derivatives for federal income tax purposes for the Fund were as follows:
| Cost of investments and derivatives | | $ | 834,894,441 | |
| Aggregate unrealized appreciation of investments and derivatives | | $ | 90,237,671 | |
| Aggregate unrealized depreciation of investments and derivatives | | | (65,640,021 | ) |
| Net unrealized appreciation of investments and derivatives | | $ | 24,597,650 | |
US GAAP defines fair value as the price that the Fund would receive to sell an asset or pay to transfer a liability in an orderly transaction between market participants at the measurement date under current market conditions. A three-level hierarchy for fair value measurements has been established based upon the transparency of inputs to the valuation of an asset or liability. Inputs may be observable or unobservable and refer broadly to the assumptions that market participants would use in pricing the asset or liability. Observable inputs reflect the assumptions market participants would use in pricing the asset or liability based on market data obtained from sources independent of the reporting entity. Unobservable inputs reflect the reporting entity’s own assumptions about the assumptions that market participants would use in pricing the asset or liability based on the best information available under the circumstances. The Fund's investment in its entirety is assigned a level based upon the observability of the inputs which are significant to the overall valuation. The three-level hierarchy of inputs is summarized as follows:
| Level 1 – | Inputs are quoted prices in active markets for identical investments. (Examples: equity securities, open-end investment companies, futures contracts, and exchange-traded options contracts) |
| | |
| Level 2 – | Other observable inputs, including, but not limited to: quoted prices for similar assets or liabilities in markets that are active, quoted prices for identical or similar assets or liabilities in markets that are not active, inputs other than quoted prices that are observable for the assets or liabilities (such as interest rates, yield curves, volatilities, prepayment speeds, loss severities, credit risks, and default rates) or other market-corroborated inputs. (Examples: debt securities, government securities, swap contracts, forward foreign currency exchange contracts, foreign securities utilizing international fair value pricing, broker-quoted securities, and fair valued securities) |
| Level 3 – | Significant unobservable inputs, including the Fund's own assumptions used to determine the fair value of investments. (Examples: broker-quoted securities and fair valued securities) |
Level 3 investments are valued using significant unobservable inputs. The Fund may also use an income-based valuation approach in which the anticipated future cash flows of the investment are discounted to calculate fair value. Discounts may also be applied due to the nature or duration of any restrictions on the disposition of the investments. Valuations may also be based upon current market prices of securities that are comparable in coupon, rating, maturity, and industry. The derived value of a Level 3 investment may not represent the value which is received upon disposition and this could impact the results of operations.
The following table summarizes the valuation of the Fund's investments by fair value hierarchy levels as of November 30, 2023:
| | | Level 1 | | | Level 2 | | | Level 3 | | | Total | |
| Securities | | | | | | | | | | | | |
| Assets: | | | | | | | | | | | | |
| Agency Collateralized Mortgage Obligations | | $ | — | | | $ | 593,748 | | | $ | — | | | $ | 593,748 | |
| Agency Commercial Mortgage-Backed Security | | | — | | | | 98,030 | | | | — | | | | 98,030 | |
| Agency Mortgage-Backed Securities | | | — | | | | 48,995,352 | | | | — | | | | 48,995,352 | |
| Collateralized Debt Obligations | | | — | | | | 2,492,336 | | | | — | | | | 2,492,336 | |
| Common Stocks | | | | | | | | | | | | | | | | |
| Communication Services | | | 20,684,432 | | | | — | | | | — | | | | 20,684,432 | |
| Consumer Discretionary | | | 52,457,969 | | | | — | | | | — | | | | 52,457,969 | |
| Consumer Staples | | | 42,750,044 | | | | — | | | | — | | | | 42,750,044 | |
| Energy | | | 34,275,849 | | | | — | | | | — | | | | 34,275,849 | |
| Financials | | | 75,359,785 | | | | — | | | | — | 1 | | | 75,359,785 | |
| Healthcare | | | 59,339,481 | | | | — | | | | — | 1 | | | 59,339,481 | |
| Industrials | | | 37,647,767 | | | | — | | | | — | | | | 37,647,767 | |
| Information Technology | | | 128,153,569 | | | | — | | | | — | | | | 128,153,569 | |
| Materials | | | 8,125,529 | | | | — | | | | — | | | | 8,125,529 | |
| Real Estate | | | 4,239,752 | | | | — | | | | — | 1 | | | 4,239,752 | |
| REIT Diversified | | | 1,445,844 | | | | — | | | | — | | | | 1,445,844 | |
| REIT Healthcare | | | 488,362 | | | | — | | | | — | | | | 488,362 | |
| REIT Hotel | | | 1,657,178 | | | | — | | | | — | | | | 1,657,178 | |
| REIT Industrial | | | 3,334,292 | | | | — | | | | — | | | | 3,334,292 | |
| REIT Mall | | | 1,663,785 | | | | — | | | | — | | | | 1,663,785 | |
| REIT Manufactured Housing | | | 509,038 | | | | — | | | | — | | | | 509,038 | |
| REIT Multifamily | | | 2,264,475 | | | | — | | | | — | | | | 2,264,475 | |
| REIT Office | | | 365,478 | | | | — | | | | — | | | | 365,478 | |
Notes to financial statements
Delaware Wealth Builder Fund
3. Investments (continued)
| | | Level 1 | | | Level 2 | | | Level 3 | | | Total | |
| REIT Self-Storage | | $ | 1,688,246 | | | $ | — | | | $ | — | | | $ | 1,688,246 | |
| REIT Shopping Center | | | 2,259,373 | | | | — | | | | — | | | | 2,259,373 | |
| REIT Single Tenant | | | 790,188 | | | | — | | | | — | | | | 790,188 | |
| REIT Specialty | | | 1,596,541 | | | | — | | | | — | | | | 1,596,541 | |
| Utilities | | | 4,204,365 | | | | — | | | | — | | | | 4,204,365 | |
| Convertible Bonds | | | — | | | | 63,626,723 | | | | — | | | | 63,626,723 | |
| Convertible Preferred Stock | | | 10,638,718 | | | | — | | | | — | | | | 10,638,718 | |
| Corporate Bonds | | | — | | | | 102,323,557 | | | | — | | | | 102,323,557 | |
| Exchange-Traded Funds | | | 41,047,547 | | | | — | | | | — | | | | 41,047,547 | |
| Government Agency Obligations | | | — | | | | 3,053,660 | | | | — | | | | 3,053,660 | |
| Leveraged Non-Recourse Security | | | — | | | | — | | | | 1,300 | | | | 1,300 | |
| Limited Liability Corporation | | | — | | | | — | | | | 10,163,520 | | | | 10,163,520 | |
| Municipal Bonds | | | — | | | | 391,010 | | | | — | | | | 391,010 | |
| Non-Agency Asset-Backed Securities | | | — | | | | 2,419,622 | | | | — | | | | 2,419,622 | |
| Non-Agency Collateralized Mortgage Obligations | | | — | | | | 2,530,912 | | | | — | | | | 2,530,912 | |
| Non-Agency Commercial Mortgage-Backed Securities | | | — | | | | 11,309,135 | | | | — | | | | 11,309,135 | |
| Preferred Stock | | | 1,363,138 | | | | — | | | | — | | | | 1,363,138 | |
| Sovereign Bonds | | | — | | | | 16,104,884 | | | | — | | | | 16,104,884 | |
| Supranational Banks | | | — | | | | 952,004 | | | | — | | | | 952,004 | |
| US Treasury Obligations | | | — | | | | 43,441,224 | | | | — | | | | 43,441,224 | |
| Short-Term Investments | | | 12,478,600 | | | | — | | | | — | | | | 12,478,600 | |
| Total Value of Securities | | $ | 550,829,345 | | | $ | 298,332,197 | | | $ | 10,164,820 | | | $ | 859,326,362 | |
| | | | | | | | | | | | | | | | | |
| Derivatives2 | | | | | | | | | | | | | | | | |
| Assets: | | | | | | | | | | | | | | | | |
| Forward Foreign Currency Exchange Contracts | | $ | — | | | $ | 11,073 | | | $ | — | | | $ | 11,073 | |
| Futures Contracts | | | 152,339 | | | | — | | | | — | | | | 152,339 | |
| Liabilities: | | | | | | | | | | | | | | | | |
| Forward Foreign Currency Exchange Contracts | | $ | — | | | $ | (642 | ) | | $ | — | | | $ | (642 | ) |
| Futures Contracts | | | (9,250 | ) | | | — | | | | — | | | | (9,250 | ) |
| Over-The-Counter Credit Default | | | | | | | | | | | | | | | | |
| Swap Contracts | | | — | | | | (45,023 | ) | | | — | | | | (45,023 | ) |
1The security that has been valued at zero on the “Schedule of investments” is considered to be a Level 3 investment in this table.
2Forward foreign currency exchange contracts, futures contracts and swap contracts are valued at the unrealized appreciation (depreciation) on the instrument at the year end.
During the year ended November 30, 2023, there were no transfers into or out of Level 3 investments. The Fund’s policy is to recognize transfers into or out of Level 3 investments based on fair value at the beginning of the reporting year.
A reconciliation of Level 3 investments is presented when the Fund has a significant amount of Level 3 investments at the beginning or end of the year in relation to the Fund’s net assets.
The following is a reconciliation of investments in which significant unobservable inputs (Level 3) were used in determining fair value for the Fund:
| | | Common
Stocks | | | Limited
Liability
Corporation | | | Leveraged
Non-Recourse
Security | | | Total | |
| Balance as of 11/30/22 | | $ | — | | | $ | — | | | $ | 1,300 | | | $ | 1,300 | |
| Transfer in from reorganization (See Note 7) | | | — | | | | 10,098,000 | | | | — | | | | 10,098,000 | |
| Purchases | | | 182,496 | | | | — | | | | — | | | | 182,496 | |
| Sales | | | (26,214 | ) | | | — | | | | — | | | | (26,214 | ) |
| Net realized gain (loss) | | | (22,980 | ) | | | — | | | | — | | | | (22,980 | ) |
| Net change in unrealized appreciation (depreciation) | | | (133,302 | ) | | | 65,520 | | | | — | | | | (67,782 | ) |
| Balance as of 11/30/23 | | $ | — | 1 | | $ | 10,163,520 | | | $ | 1,300 | | | $ | 10,164,820 | |
| Net change in unrealized appreciation (depreciation) from Level 3 investments still held as of 11/30/23 | | $ | (182,496 | ) | | $ | 65,520 | | | $ | — | | | $ | (116,976 | ) |
1The security that has been valued at zero on the “Schedule of investments” is considered to be Level 3 investment in this table.
When market quotations are not readily available for one or more portfolio securities, the Fund’s NAV shall be calculated by using the “fair value” of the securities as determined by the Pricing Committee. Such “fair value” is the amount that the Fund might reasonably expect to receive for the security (or asset) upon its current sale. Each such determination should be based on a consideration of all relevant factors, which are likely to vary from one pricing context to another.
Notes to financial statements
Delaware Wealth Builder Fund
3. Investments (continued)
Examples of such factors may include, but are not limited to: (i) the type of security, (ii) the size of the holding, (iii) the initial cost of the security, (iv) the existence of any contractual restrictions of the security’s disposition, (v) the price and extent of public trading in similar securities of the issuer or of comparable companies, (vi) quotations or evaluated prices from broker/dealers and/ or pricing services, (vii) information obtained from the issuer, analysts, and/or appropriate stock exchange (for exchange-traded securities), (viii) an analysis of the company’s financial statements, and (ix) an evaluation of the forces that influence the issuer and the market(s) in which the security is purchased and sold.
The Pricing Committee, or its delegate, employs various methods for calibrating these valuation approaches, including due diligence of the Fund’s pricing vendors and periodic back-testing of the prices that are fair valued under these procedures and reviews of any market related activity. The pricing of all securities fair valued by the Pricing Committee is subsequently reported to and approved by the Board on a quarterly basis.
A significant change to the inputs may result in a significant change to the valuation. Quantitative information about Level 3 fair value measurements for the Fund is as follows:
| | | Assets | | Value | | Valuation
Techniques | | Unobservable
Inputs | | Input Value | |
| | | Limited Liability Corporation | | $10,163,520 | | Market Cap rate method (using trailing 12 month NOI adjusted for assets and liabilities) | | Liquidity discount Cap rate | | 5.00% 6.80% | |
Level 3 securities with a total value of $1,300 have been valued using third party pricing information without adjustment and are excluded from the table above.
4. Dividend and Distribution Information
Income and long-term capital gain distributions are determined in accordance with federal income tax regulations, which may differ from US GAAP. Additionally, distributions from net gains on foreign currency transactions and net short-term gains on sales of investment securities are treated as ordinary income for federal income tax purposes. The tax character of dividends and distributions paid during the years ended November 30, 2023 and 2022 were as follows:
| | | Year ended | |
| | | | 11/30/23 | | | | 11/30/22 | |
| Ordinary income | | $ | 15,481,306 | | | $ | 18,471,924 | |
| Long-term capital gains | | | 19,214,818 | | | | 9,566,669 | |
| Total | | $ | 34,696,124 | | | $ | 28,038,593 | |
5. Components of Net Assets on a Tax Basis
As of November 30, 2023, the components of net assets on a tax basis were as follows:
| Shares of beneficial interest | | $ | 822,207,730 | |
| Undistributed ordinary income | | | 332,917 | |
| Undistributed long-term capital gains | | | 14,474,998 | |
| Unrealized appreciation of investments, foreign currencies, and derivatives | | | 24,597,650 | |
| Net assets | | $ | 861,613,295 | |
The differences between book basis and tax basis components of net assets are primarily attributable to tax deferral of losses on wash sales and straddle losses, mark-to-market of forward foreign currency exchange contracts, futures contracts and CDS contracts, tax treatment of partnership income, REITs, swap contracts, trust preferred securities, and market discount and premium on debt instruments.
For financial reporting purposes, capital accounts are adjusted to reflect the tax character of permanent book/tax differences. Reclassifications are primarily due to reorganization-related adjustments, gain (loss) on foreign currency transactions, tax treatment of partnerships, swap contracts, trust preferred securities, amortization on fixed income securities, paydown gains (loss) of asset- and mortgage back securities, and tax treatment of REITs. Results of operations and net assets were not affected by these reclassifications. For the year ended November 30, 2023, the adjustments were to decrease total distributable earnings (loss) and increase paid-in capital by $992,238.
For federal income tax purposes, capital loss carryforwards may be carried forward and applied against future capital gains. At November 30, 2023, the Fund utilized $2,215,767 capital loss carryforwards.
Notes to financial statements
Delaware Wealth Builder Fund
6. Capital Shares
Transactions in capital shares were as follows:
| | | Year ended | |
| | | | 11/30/23 | | | | 11/30/22 | |
| Shares sold: | | | | | | | | |
| Class A | | | 1,514,024 | | | | 1,264,925 | |
| Class C | | | 97,010 | | | | 89,032 | |
| Class R | | | 18,425 | | | | 15,792 | |
| Institutional Class | | | 1,125,229 | | | | 1,066,489 | |
| Class R6 | | | 152,909 | | | | — | |
| | | | | | | | | |
| Shares from merger:1 | | | | | | | | |
| Class A | | | 39,183,567 | | | | — | |
| Class C | | | 314,783 | | | | — | |
| Class R | | | 53,145 | | | | — | |
| Institutional Class | | | 1,853,886 | | | | — | |
| Class R6 | | | 1,628 | | | | — | |
| | | | | | | | | |
| Shares issued upon reinvestment of dividends and distributions: | | | | | | | | |
| Class A | | | 1,756,099 | | | | 1,127,967 | |
| Class C | | | 102,163 | | | | 123,325 | |
| Class R | | | 6,434 | | | | 4,933 | |
| Institutional Class | | | 611,273 | | | | 512,004 | |
| Class R6 | | | 1,696 | | | | — | |
| | | | 46,792,271 | | | | 4,204,467 | |
| | | | | | | | | |
|
| Shares redeemed: | | | | | | | | |
| Class A | | | (6,696,220 | ) | | | (2,509,026 | ) |
| Class C | | | (805,903 | ) | | | (723,647 | ) |
| Class R | | | (17,449 | ) | | | (25,868 | ) |
| Institutional Class | | | (2,434,735 | ) | | | (1,436,615 | ) |
| Class R6 | | | (3,698 | ) | | | — | |
| | | | (9,958,005 | ) | | | (4,695,156 | ) |
| Net increase (decrease) | | | 36,834,266 | | | | (490,689 | ) |
1 See Note 7.
Certain shareholders may exchange shares of one class for shares of another class in the same Fund. These exchange transactions are included as subscriptions and redemptions in the table on the previous page and on the “Statements of changes in net assets.” For the years ended November 30, 2023 and 2022, the Fund had the following exchange transactions:
| | | Exchange Redemptions | | | Exchange Subscriptions | | | | |
| | | Class A
Shares | | | Class C
Shares | | | Institutional
Class
Shares | | | Class A
Shares | | | Institutional
Class
Shares | | | Class R6
Shares | | | Value | |
| Year ended | | | | | | | | | | | | | | | | | | | |
| 11/30/23 | | 171,811 | | | 54,837 | | | 130,499 | | | 67,820 | | | 171,852 | | | 125,738 | | | $4,868,904 | |
| 11/30/22 | | 10,651 | | | 21,748 | | | — | | | 21,368 | | | 11,080 | | | — | | | 467,390 | |
7. Reorganization
On November 10, 2022, the Board approved a proposal to reorganize Delaware Strategic Allocation Fund (the “Acquired Fund I”), a series of Delaware Group® Foundation Funds, and Delaware Total Return Fund (the “Acquired Fund II”), a series of Delaware Group Equity Funds IV (and together with Acquired Fund I, the “Acquired Funds”), with and into Delaware Wealth Builder Fund (the “Acquiring Fund”), a series of the Trust (the “Reorganizations”). Pursuant to an Agreement and Plan of Reorganization (the “Plan”): (i) all of the property, assets, and goodwill of Acquired Funds were acquired by the Acquiring Fund, and (ii) the Trust, on behalf of Acquiring Fund, assumed the liabilities of Acquired Funds, in exchange for shares of Acquiring Fund. In accordance with the Plan, the Acquired Funds liquidated and dissolved following the Reorganizations. In approving the Reorganizations, the Board considered various factors, including that the Acquiring Fund and the Acquired Funds share similar investment objectives, principal investment strategies and principal risks, and materially identical fundamental investment restrictions and that the Acquiring Fund's overall total expense ratio is expected to be equal to or lower than the corresponding Acquired Funds' total expense ratio following the Reorganizations taking into account applicable expense limitation arrangements. The Reorganizations were accomplished by a tax-free exchange of shares on March 10, 2023 for Acquired Fund I reorganization and April 28, 2023 for Acquired Fund II reoganization. For financial reporting purposes, assets received and shares issued by the Acquiring Funds were recorded at fair value; however, the cost basis of the investments received from the Acquired Funds was carried forward to align ongoing reporting of the Acquiring Fund’s realized and unrealized gains and losses with amounts distributable to shareholders for tax purposes.
Notes to financial statements
Delaware Wealth Builder Fund
7. Reorganization (continued)
The share transactions associated with the March 10, 2023 Acquired Fund I Reorganizations are as follows:
| | | Acquired
Fund I
Net Assets | | | Acquired
Fund I
Shares
Outstanding | | | Shares
Converted
to Acquiring
Fund | | | Acquiring
Fund
Net Assets | | | Conversion
Ratio | |
| | | | Delaware Strategic Allocation
Fund | | | Delaware Wealth Builder Fund | | | | | |
| Class A | | $ | 146,093,404 | | | | 16,492,544 | | | | 11,190,719 | | | $ | 217,450,659 | | | | 0.6785 | |
| Class C | | | 4,120,753 | | | | 465,638 | | | | 314,783 | | | | 17,542,300 | | | | 0.6760 | |
| Class R | | | 694,137 | | | | 78,828 | | | | 53,145 | | | | 1,005,249 | | | | 0.6742 | |
| Institutional Class | | | 21,988,717 | | | | 2,479,809 | | | | 1,684,946 | | | | 104,009,271 | | | | 0.6795 | |
The net assets of the Acquired Fund I before the Reorganizations were $172,897,011. The net assets of the Acquiring Fund immediately following the Reorganizations were $512,915,719.
The share transactions associated with the April 28, 2023 Acquired Fund II Reorganizations are as follows:
| | | Acquired
Fund II
Net Assets | | | Acquired
Fund II
Shares
Outstanding | | | Shares
Converted
to Acquiring
Fund | | | Acquiring
Fund
Net Assets | | | Conversion
Ratio | |
| | | | Delaware Total Return Fund | | | | Delaware Wealth Builder Fund | | | | | |
| Class A | | $ | 378,512,807 | | | | 26,887,085 | | | | 27,992,848 | | | $ | 373,001,835 | | | | 1.0411 | |
| Institutional Class | | | 2,284,077 | | | | 161,406 | | | | 168,940 | | | | 126,439,202 | | | | 1.0467 | |
| Class R6 | | | 22,008 | | | | 1,550 | | | | 1,628 | | | | 1,307,393 | | | | 1.0503 | |
The net assets of the Acquired Fund II before the Reorganizations were $380,818,892. The net assets of the Acquiring Fund immediately following the Reorganizations were $904,448,376.
Assuming the Reorganizations had been completed on December 1, 2022, the Acquiring Fund's pro forma results of operations for the year ended November 30, 2023, would have been as follows:
| Net investment income | | $ | 23,506,200 | |
| Net realized gain on investments | | | 32,965,766 | |
| Net change in unrealized appreciation (depreciation) | | | 3,881,681 | |
| Net increase in net assets resulting from operations | | $ | 60,353,647 | |
Because the combined investment portfolios have been managed as a single integrated portfolio since the acquisition was completed, it is not practical to separate the amounts of revenue and earnings of Acquired Funds that have been included in Acquiring Fund’s “Statement of
operations” since the Reorganizations were consummated on March 10, 2023 for Acquired Fund I and April 28, 2023 for Acquired Fund II.
8. Line of Credit
The Fund, along with certain other funds in the Delaware Funds (Participants), was a participant in a $355,000,000 revolving line of credit (Agreement) intended to be used for temporary or emergency purposes as an additional source of liquidity to fund redemptions of investor shares. Under the Agreement, the Participants were charged an annual commitment fee of 0.15%, which was allocated across the Participants based on a weighted average of the respective net assets of each Participant. The Participants were permitted to borrow up to a maximum of one-third of their net assets under the Agreement. Each Participant was individually, and not jointly, liable for its particular advances, if any, under the line of credit. The line of credit available under the Agreement expired on October 30, 2023.
On October 30, 2023, the Fund, along with the other Participants, entered into an amendment to the Agreement for a $335,000,000 revolving line of credit. It operates in substantially the same manner as the original Agreement. Under the amendment to the Agreement, the Participants are charged an annual commitment fee of 0.15%, which is allocated across the Participants based on a weighted average of the respective net assets of each Participant. The line of credit available under the Agreement expires on October 28, 2024.
The Fund had no amounts outstanding as of November 30, 2023, or at any time during the year then ended.
9. Derivatives
US GAAP requires disclosures that enable investors to understand: (1) how and why an entity uses derivatives; (2) how they are accounted for; and (3) how they affect an entity’s results of operations and financial position.
Forward Foreign Currency Exchange Contracts — The Fund may enter into forward foreign currency exchange contracts as a way of managing foreign exchange rate risk. The Fund may enter into these contracts to fix the US dollar value of a security that it has agreed to buy or sell for the period between the date the trade was entered into and the date the security is delivered and paid for. The Fund may also enter into these contracts to hedge the US dollar value of securities it already owns that are denominated in foreign currencies. In addition, the Fund may enter into these contracts to facilitate or expedite the settlement of portfolio transactions. The change in value is recorded as an unrealized gain or loss. When the contract is closed, a realized gain or loss is recorded equal to the difference between the value of the contract at the time it was opened and the value at the time it was closed.
The use of forward foreign currency exchange contracts does not eliminate fluctuations in the underlying prices of the securities, but does establish a rate of exchange that can be achieved in the future. Although forward foreign currency exchange contracts limit the risk of loss due to an unfavorable change in the value of the hedged currency, they also limit any potential gain that
Notes to financial statements
Delaware Wealth Builder Fund
9. Derivatives (continued)
might result should the value of the currency change favorably. In addition, the Fund could be exposed to risks if the counterparties to the contracts are unable to meet the terms of their contracts. The Fund's maximum risk of loss from counterparty credit risk is the value of its currency exchanged with the counterparty. The risk is generally mitigated by having a netting arrangement between the Fund and the counterparty and by the posting of collateral by the counterparty to the Fund to cover the Fund's exposure to the counterparty. Open forward foreign currency exchange contracts, if any, are disclosed on the “Schedule of investments.”
During the year ended November 30, 2023, the Fund entered into forward foreign currency exchange contracts to hedge the US dollar value of securities it already owns that are denominated in foreign currencies to decrease exposure to foreign currencies, and to facilitate or expedite the settlement of portfolio transactions.
Futures Contracts — A futures contract is an agreement in which the writer (or seller) of the contract agrees to deliver to the buyer an amount of cash or securities equal to a specific dollar amount times the difference between the value of a specific security or index at the close of the last trading day of the contract and the price at which the agreement is made. The Fund may use futures contracts in the normal course of pursuing its investment objective. The Fund may invest in futures contracts to hedge its existing portfolio securities against fluctuations in value caused by changes in interest rates or market conditions. Upon entering into a futures contract, the Fund deposits cash or pledges US government securities to a broker, equal to the minimum “initial margin” requirements of the exchange on which the contract is traded. Subsequent payments are received from the broker or paid to the broker each day, based on the daily fluctuation in the market value of the contract. These receipts or payments are known as “variation margin” and are recorded daily by the Fund as unrealized gains or losses until the contracts are closed. When the contracts are closed, the Fund records a realized gain or loss equal to the difference between the value of the contract at the time it was opened and the value at the time it was closed. Risks of entering into futures contracts include potential imperfect correlation between the futures contracts and the underlying securities and the possibility of an illiquid secondary market for these instruments. When investing in futures, there is reduced counterparty credit risk to the Fund because futures are exchange-traded and the exchange’s clearinghouse, as counterparty to all exchange-traded futures, guarantees against default. At November 30, 2023, the Fund posted $288,822 cash collateral as margin for open futures contracts, which is included in “Cash collateral due from brokers” on the “Statement of assets and liabilities.” Open futures contracts, if any, are disclosed on the “Schedule of investments.”
During the year ended November 30, 2023, the Fund entered into futures contracts to hedge the Fund’s existing portfolio securities against fluctuations in value caused by changes in interest rates or market conditions.
Swap Contracts — The Fund may enter into CDS contracts in the normal course of pursuing its investment objective. The Fund may enter into CDS contracts in order to hedge against a credit event, to enhance total return or to gain exposure to certain securities or markets. The Fund will
not be permitted to enter into any swap transactions unless, at the time of entering into such transactions, the unsecured long-term debt of the actual counterparty, combined with any credit enhancements, is rated at least BBB- by Standard & Poor’s Financial Services LLC (S&P) or Baa3 by Moody’s Investors Service, Inc. (Moody's) or is determined to be of equivalent credit quality by DMC.
Credit Default Swaps. A CDS contract is a risk-transfer instrument through which one party (purchaser of protection) transfers to another party (seller of protection) the financial risk of a credit event (as defined in the CDS agreement), as it relates to a particular reference security or basket of securities (such as an index). In exchange for the protection offered by the seller of protection, the purchaser of protection agrees to pay the seller of protection a periodic amount at a stated rate that is applied to the notional amount of the CDS contract. In addition, an upfront payment may be made or received by the Fund in connection with an unwinding or assignment of a CDS contract. Upon the occurrence of a credit event, the seller of protection would pay the par (or other agreed-upon) value of the reference security (or basket of securities) to the counterparty. Credit events generally include, among others, bankruptcy, failure to pay, and obligation default.
During the year ended November 30, 2023, the Fund entered into CDS contracts as a purchaser of protection as a hedge against credit events. Periodic payments (receipts) on such contracts are accrued daily and recorded as unrealized losses (gains) on swap contracts. Upon payment (receipt), such amounts are recorded as realized losses (gains) on swap contracts. Upfront payments made or received in connection with CDS contracts are amortized over the expected life of the CDS contracts as unrealized losses (gains) on swap contracts. The change in value of CDS contracts is recorded daily as unrealized appreciation or depreciation. A realized gain or loss is recorded upon a credit event (as defined in the CDS agreement) or the maturity or termination of the agreement. Initial margin and variation margin are posted to central counterparties for centrally cleared CDS basket trades, as determined by the applicable central counterparty.
CDS contracts may involve greater risks than if the Fund had invested in the reference obligation directly. CDS contracts are subject to general market risk, liquidity risk, counterparty risk, and credit risk. The Fund’s maximum risk of loss from counterparty credit risk, either as the seller of protection or the buyer of protection, is the fair value of the contract. This risk is mitigated by (1) for bilateral swap contracts, having a netting arrangement between the Fund and the counterparty and by the posting of collateral by the counterparty to the Fund to cover the Fund’s exposure to the counterparty, and (2) for cleared swaps, trading these instruments through a central counterparty.
During the year ended November 30, 2023, the Fund used CDS contracts to hedge against credit events, and to gain exposure to certain securities or markets.
At November 30, 2023, the Fund received $80,000 in cash collateral for open over-the-counter credit default swap contracts, which is included in “Cash collateral due to brokers” on the “Statement of assets and liabilities.”
Notes to financial statements
Delaware Wealth Builder Fund
9. Derivatives (continued)
Fair values of derivative instruments as of November 30, 2023 were as follows:
| | | Asset Derivatives Fair Value | |
Statement of Assets and
Liabilities Location | | Currency
Contracts | | | Interest
Rate
Contracts | | | Total | |
| Unrealized appreciation on forward foreign currency exchange contracts | | $ | 11,073 | | | $ | — | | | $ | 11,073 | |
| Variation margin due to broker on futures contracts* | | | — | | | | 152,339 | | | | 152,339 | |
| Total | | $ | 11,073 | | | $ | 152,339 | | | $ | 163,412 | |
| | | Liability Derivatives Fair Value | |
Statement of Assets and
Liabilities Location | | Currency
Contracts | | | Interest
Rate
Contracts | | | Credit
Contracts | | | Total | |
| Unrealized depreciation on forward foreign currency exchange contracts | | $ | (642 | ) | | $ | — | | | $ | — | | | $ | (642 | ) |
| Variation margin due to broker on futures contracts* | | | — | | | | (9,250 | ) | | | — | | | | (9,250 | ) |
| Unrealized depreciation on over-the-counter credit default swap contracts | | | — | | | | — | | | | (45,023 | ) | | | (45,023 | ) |
| Total | | $ | (642 | ) | | $ | (9,250 | ) | | $ | (45,023 | ) | | $ | (54,915 | ) |
*Includes cumulative appreciation (depreciation) of futures contracts from the date the contracts were opened through November 30, 2023. Only current day variation margin is reported on the Fund’s “Statement of assets and liabilities.”
The effect of derivative instruments on the “Statement of operations” for the year ended November 30, 2023 was as follows:
| | | Net Realized Gain (Loss) on: | |
| | | Forward
Foreign
Currency
Exchange
Contracts | | | Futures
Contracts | | | Swap
Contracts | | | Total | |
| Currency contracts | | $ | (24,391 | ) | | $ | — | | | $ | — | | | $ | (24,391 | ) |
| Interest rate contracts | | | — | | | | (728,692 | ) | | | — | | | | (728,692 | ) |
| Credit contracts | | | — | | | | — | | | | (17,658 | ) | | | (17,658 | ) |
| Total | | $ | (24,391 | ) | | $ | (728,692 | ) | | $ | (17,658 | ) | | $ | (770,741 | ) |
| | | Net Change in Unrealized Appreciation (Depreciation) on: | |
| | | Forward
Foreign
Currency
Exchange
Contracts | | | Futures
Contracts | | | Swap
Contracts | | | Total | |
| Currency contracts | | $ | 17,239 | | | $ | — | | | $ | — | | | $ | 17,239 | |
| Interest rate contracts | | | — | | | | 135,900 | | | | — | | | | 135,900 | |
| Credit contracts | | | — | | | | — | | | | (53,270 | ) | | | (53,270 | ) |
| Total | | $ | 17,239 | | | $ | 135,900 | | | $ | (53,270 | ) | | $ | 99,869 | |
The table below summarizes the average daily balance of derivative holdings by the Fund during the year ended November 30, 2023:
| | | Long Derivative
Volume | | | Short Derivative
Volume | |
| Forward foreign currency exchange contracts (average notional value) | | $ | 808,290 | | | $ | 1,198,757 | |
| Futures contracts (average notional value) | | | 10,258,793 | | | | 393,300 | |
| CDS contracts (average notional value)* | | | 1,583,068 | | | | — | |
*Long represents buying protection and short represents selling protection.
10. Offsetting
The Fund entered into an International Swaps and Derivatives Association, Inc. Master Agreement (ISDA Master Agreement) or a similar agreement with certain of its derivative contract counterparties in order to better define its contractual rights and to secure rights that will help the Fund mitigate its counterparty risk. An ISDA Master Agreement is a bilateral agreement between the Fund and a counterparty that governs over-the-counter derivatives and foreign exchange contracts and typically contains, among other things, collateral posting items and netting provisions in the event of a default and/or termination event. Under an ISDA Master Agreement, the Fund may, under certain circumstances, offset with the counterparty certain derivative financial instruments’ payables and/or receivables with collateral held and/or posted and create one single net payment. The provisions of the ISDA Master Agreement typically permit a single net payment in the event of default (close-out), including the bankruptcy or insolvency of the counterparty. However, bankruptcy or insolvency laws of a particular jurisdiction may impose restrictions on or prohibitions against the right of offset in bankruptcy, insolvency, or other events.
For financial reporting purposes, the Fund does not offset derivative assets and derivative liabilities that are subject to netting arrangements on the “Statement of assets and liabilities.”
Notes to financial statements
Delaware Wealth Builder Fund
10. Offsetting (continued)
At November 30, 2023, the Fund had the following assets and liabilities subject to offsetting provisions:
Offsetting of Financial Assets and Liabilities and Derivative Assets and Liabilities
| Counterparty | | Gross Value of
Derivative Asset | | | | | | Gross Value of
Derivative Liability | | | | | | Net Position | |
| JPMorgan Chase Bank | | $ | 11,073 | | | | | | | $ | (45,665 | ) | | | | | | $ | (34,592 | ) |
| Counterparty | | Net Position | | | Fair Value of
Non-Cash
Collateral
Received | | | Cash Collateral
Received | | | Fair Value of
Non-Cash
Collateral
Pledged | | | Cash Collateral
Pledged | | | Net Exposure(a) | |
| JPMorgan Chase Bank | | $ | (34,592 | ) | | $ | — | | | $ | — | | | $ | — | | | $ | — | | | $ | (34,592 | ) |
(a)Net exposure represents the receivable (payable) that would be due from (to) the counterparty in the event of default.
11. Securities Lending
The Fund, along with other funds in the Delaware Funds, may lend its securities pursuant to a security lending agreement (Lending Agreement) with The Bank of New York Mellon (BNY Mellon). At the time a security is loaned, the borrower must post collateral equal to the required percentage of the market value of the loaned security, including any accrued interest. The required percentage is: (1) 102% with respect to US securities and foreign securities that are denominated and payable in US dollars; and (2) 105% with respect to foreign securities. With respect to each loan, if on any business day the aggregate market value of securities collateral plus cash collateral held is less than the aggregate market value of the securities which are the subject of such loan, the borrower will be notified to provide additional collateral by the end of the following business day, which, together with the collateral already held, will be not less than the applicable initial collateral requirements for such security loan. If the aggregate market value of securities collateral and cash collateral held with respect to a security loan exceeds the applicable initial collateral requirement, upon the request of the borrower, BNY Mellon must return enough collateral to the borrower by the end of the following business day to reduce the value of the remaining collateral to the applicable initial collateral requirement for such security loan. As a result of the foregoing, the value of the collateral held with respect to a loaned security on any particular day, may be more or less than the value of the security on loan. The collateral percentage with respect to the market value of the loaned security is determined by the security lending agent.
Cash collateral received by the Fund is generally invested in an individual separate account. The investment guidelines permit each separate account to hold certain securities that would be considered eligible securities for a money market fund. Cash collateral received is generally invested in government securities; certain obligations issued by government sponsored enterprises; repurchase agreements collateralized by US Treasury securities; obligations issued
by the central government of any Organization for Economic Cooperation and Development (OECD) country or its agencies, instrumentalities, or establishments; obligations of supranational organizations; commercial paper, notes, bonds, and other debt obligations; certificates of deposit, time deposits, and other bank obligations; certain money market funds; and asset-backed securities. The Fund can also accept US government securities and letters of credit (non-cash collateral) in connection with securities loans.
In the event of default or bankruptcy by the lending agent, realization and/or retention of the collateral may be subject to legal proceedings. In the event the borrower fails to return loaned securities and the collateral received is insufficient to cover the value of the loaned securities and provided such collateral shortfall is not the result of investment losses, the lending agent has agreed to pay the amount of the shortfall to the Fund or, at the discretion of the lending agent, replace the loaned securities. The Fund continues to record dividends or interest, as applicable, on the securities loaned and is subject to changes in value of the securities loaned that may occur during the term of the loan. The Fund has the right under the Lending Agreement to recover the securities from the borrower on demand. With respect to security loans collateralized by non-cash collateral, the Fund receives loan premiums paid by the borrower. With respect to security loans collateralized by cash collateral, the earnings from the collateral investments are shared among the Fund, the security lending agent, and the borrower. The Fund records security lending income net of allocations to the security lending agent and the borrower.
The Fund may incur investment losses as a result of investing securities lending collateral. This could occur if an investment in the collateral investment account defaulted or became impaired. Under those circumstances, the value of the Fund's cash collateral account may be less than the amount the Fund would be required to return to the borrowers of the securities and the Fund would be required to make up for this shortfall.
At November 30, 2023, the Fund had no securities out on loan.
12. Credit and Market Risks
The impact of COVID-19, and other infectious illness outbreaks that may arise in the future, could adversely affect the economies of many nations or the entire global economy, individual issuers and capital markets in ways that cannot necessarily be foreseen.
Beginning in late February 2022, global financial markets have experienced and may continue to experience significant volatility related to military action by Russia in Ukraine. As a result of this military action, the US and many other countries have imposed sanctions on Russia and certain Russian individuals, banks and corporations. The ongoing hostilities and resulting sanctions are expected to have a severe adverse effect on the region’s economies and more globally, including significant negative impact on markets for certain securities and commodities, such as oil and natural gas. Any cessation of trading on the Russian securities markets will impact the value and liquidity of certain portfolio holdings. The extent and duration of military action, sanctions, and resulting market disruptions are impossible to predict, but could be substantial and prolonged and impact the Fund’s performance.
Notes to financial statements
Delaware Wealth Builder Fund
12. Credit and Market Risks (continued)
Investments in equity securities in general are subject to market risks that may cause their prices to fluctuate over time. Fluctuations in the value of equity securities in which the Fund invests will cause the NAV of the Fund to fluctuate.
When interest rates rise, fixed income securities (i.e. debt obligations) generally will decline in value. These declines in value are greater for fixed income securities with longer maturities or durations. Interest rate changes are influenced by a number of factors, such as government policy, monetary policy, inflation expectations, and the supply and demand of bonds. A fund may be subject to a greater risk of rising interest rates when interest rates are low or inflation rates are high or rising.
Some countries in which the Fund may invest require governmental approval for the repatriation of investment income, capital, or the proceeds of sales of securities by foreign investors. In addition, if there is deterioration in a country’s balance of payments or for other reasons, a country may impose temporary restrictions on foreign capital remittances abroad.
The securities exchanges of certain foreign markets are substantially smaller, less liquid, and more volatile than the major securities markets in the US. Consequently, acquisition and disposition of securities by the Fund may be inhibited. In addition, a significant portion of the aggregate market value of equity securities listed on the major securities exchanges in emerging markets is held by a smaller number of investors. This may limit the number of shares available for acquisition or disposition by the Fund.
The Fund invests a portion of its assets in high yield fixed income securities, which are securities rated lower than BBB- by S&P and Baa3 by Moody’s, or similarly rated by another nationally recognized statistical rating organization. Investments in these higher yielding securities are generally accompanied by a greater degree of credit risk than higher rated securities. Additionally, lower rated securities may be more susceptible to adverse economic and competitive industry conditions than investment grade securities.
The Fund invests in fixed income securities whose value is derived from an underlying pool of mortgages or consumer loans. The value of these securities is sensitive to changes in economic conditions, including delinquencies and/or defaults, and may be adversely affected by shifts in the market’s perception of the issuers and changes in interest rates. Investors receive principal and interest payments as the underlying mortgages and consumer loans are paid back. Some of these securities are CMOs. CMOs are debt securities issued by US government agencies or by financial institutions and other mortgage lenders, which are collateralized by a pool of mortgages held under an indenture. Prepayment of mortgages may shorten the stated maturity of the obligations and can result in a loss of premium, if any has been paid. Certain of these securities may be stripped (securities which provide only the principal or interest feature of the underlying security). The yield to maturity on an interest-only CMO is extremely sensitive not only to changes in prevailing interest rates, but also to the rate of principal payments (including prepayments) on the related underlying mortgage assets. A rapid rate of principal payments may have a material adverse effect on the Fund’s yield to maturity. If the underlying mortgage assets
experience greater than anticipated prepayments of principal, the Fund may fail to fully recoup its initial investment in these securities even if the securities are rated in the highest rating categories.
The Fund invests in REITs and is subject to the risks associated with that industry. If the Fund holds real estate directly or receives rental income directly from real estate holdings, its tax status as a regulated investment company may be jeopardized. There were no direct real estate holdings during the year ended November 30, 2023. The Fund’s REIT holdings are also affected by interest rate changes, particularly if the REITs it holds use floating rate debt to finance their ongoing operations. The Fund also invests in real estate acquired as a result of ownership of securities or other instruments, including issuers that invest, deal, or otherwise engage in transactions in real estate or interests therein. These instruments may include interests in private equity limited partnerships or limited liability companies that hold real estate investments (Real Estate Limited Partnerships).
The Fund invests in certain obligations that may have liquidity protection designed to ensure that the receipt of payments due on the underlying security is timely. Such protection may be provided through guarantees, insurance policies, or letters of credit obtained by the issuer or sponsor through third parties, through various means of structuring the transaction, or through a combination of such approaches. The Fund will not pay any additional fees for such credit support, although the existence of credit support may increase the price of the security.
The Fund invests in bank loans and other securities that may subject it to direct indebtedness risk, the risk that the Fund will not receive payment of principal, interest, and other amounts due in connection with these investments and will depend primarily on the financial condition of the borrower. Loans that are fully secured offer the Fund more protection than unsecured loans in the event of nonpayment of scheduled interest or principal, although there is no assurance that the liquidation of collateral from a secured loan would satisfy the corporate borrower’s obligation, or that the collateral can be liquidated. Some loans or claims may be in default at the time of purchase. Certain of the loans and the other direct indebtedness acquired by the Fund may involve revolving credit facilities or other standby financing commitments that obligate the Fund to pay additional cash on a certain date or on demand. These commitments may require the Fund to increase its investment in a company at a time when the Fund might not otherwise decide to do so (including at a time when the company’s financial condition makes it unlikely that such amounts will be repaid). To the extent that the Fund is committed to advance additional funds, it will at all times hold and maintain cash or other high grade debt obligations in an amount sufficient to meet such commitments. When a loan agreement is purchased, the Fund may pay an assignment fee. On an ongoing basis, the Fund may receive a commitment fee based on the undrawn portion of the underlying line of credit portion of a loan agreement. Prepayment penalty fees are received upon the prepayment of a loan agreement by the borrower. Prepayment penalty, facility, commitment, consent, and amendment fees are recorded to income as earned or paid.
Notes to financial statements
Delaware Wealth Builder Fund
12. Credit and Market Risks (continued)
As the Fund may be required to rely upon another lending institution to collect and pass on to the Fund amounts payable with respect to the loan and to enforce the Fund’s rights under the loan and other direct indebtedness, an insolvency, bankruptcy, or reorganization of the lending institution may delay or prevent the Fund from receiving such amounts. The highly leveraged nature of many loans may make them especially vulnerable to adverse changes in economic or market conditions. Investments in such loans and other direct indebtedness may involve additional risk to the Fund. There were no unfunded loan commitments at the year ended November 30, 2023.
The Fund may invest up to 15% of its net assets in illiquid securities, which may include securities with contractual restrictions on resale, securities exempt from registration under Rule 144A promulgated under the Securities Act of 1933, as amended, and other securities which may not be readily marketable. The relative illiquidity of these securities may impair the Fund from disposing of them in a timely manner and at a fair price when it is necessary or desirable to do so. While maintaining oversight, the Board has delegated to DMC the day-to-day functions of determining whether individual securities are liquid for purposes of the Fund’s limitation on investments in illiquid securities. Securities eligible for resale pursuant to Rule 144A, which are determined to be liquid, are not subject to the Fund’s 15% limit on investments in illiquid securities. Rule 144A securities have been identified on the “Schedule of investments.”
13. Contractual Obligations
The Fund enters into contracts in the normal course of business that contain a variety of indemnifications. The Fund's maximum exposure under these arrangements is unknown. However, the Fund has not had prior claims or losses pursuant to these contracts. Management has reviewed the Fund's existing contracts and expects the risk of loss to be remote.
14. Subsequent Events
Management has determined that no material events or transactions occurred subsequent to November 30, 2023, that would require recognition or disclosure in the Fund's financial statements.
Report of independent
registered public accounting firm
To the Board of Trustees of Delaware Group® Equity Funds V and Shareholders of Delaware Wealth Builder Fund
Opinion on the Financial Statements
We have audited the accompanying statement of assets and liabilities, including the schedule of investments, of Delaware Wealth Builder Fund (one of the funds constituting Delaware Group® Equity Funds V, referred to hereafter as the “Fund”) as of November 30, 2023, the related statement of operations for the year ended November 30, 2023, the statement of changes in net assets for each of the two years in the period ended November 30, 2023, including the related notes, and the financial highlights for each of the periods indicated therein (collectively referred to as the “financial statements”). In our opinion, the financial statements present fairly, in all material respects, the financial position of the Fund as of November 30, 2023, the results of its operations for the year then ended, the changes in its net assets for each of the two years in the period ended November 30, 2023 and the financial highlights for each of the periods indicated therein in conformity with accounting principles generally accepted in the United States of America.
Basis for Opinion
These financial statements are the responsibility of the Fund’s management. Our responsibility is to express an opinion on the Fund’s financial statements based on our audits. We are a public accounting firm registered with the Public Company Accounting Oversight Board (United States) (PCAOB) and are required to be independent with respect to the Fund in accordance with the U.S. federal securities laws and the applicable rules and regulations of the Securities and Exchange Commission and the PCAOB.
We conducted our audits of these financial statements in accordance with the standards of the PCAOB. Those standards require that we plan and perform the audit to obtain reasonable assurance about whether the financial statements are free of material misstatement, whether due to error or fraud.
Our audits included performing procedures to assess the risks of material misstatement of the financial statements, whether due to error or fraud, and performing procedures that respond to those risks. Such procedures included examining, on a test basis, evidence regarding the amounts and disclosures in the financial statements. Our audits also included evaluating the accounting principles used and significant estimates made by management, as well as evaluating the overall presentation of the financial statements. Our procedures included confirmation of securities owned as of November 30, 2023 by correspondence with the custodian, transfer agents, brokers and managing member of the investee company; when replies were not received from brokers, we performed other auditing procedures. We believe that our audits provide a reasonable basis for our opinion.
/s/PricewaterhouseCoopers LLP
Philadelphia, Pennsylvania
January 23, 2024
We have served as the auditor of one or more Macquarie investment companies since 2010.
Other Fund information (Unaudited)
Delaware Wealth Builder Fund
Liquidity Risk Management Program
The Securities and Exchange Commission (the “SEC”) has adopted Rule 22e-4 under the Investment Company Act of 1940 (the “Liquidity Rule”), which requires all open-end funds (other than money market funds) to adopt and implement a program reasonably designed to assess and manage the fund’s “liquidity risk,” defined as the risk that the fund could not meet requests to redeem shares issued by the fund without significant dilution of remaining investors’ interests in the fund.
The Fund has adopted and implemented a liquidity risk management program in accordance with the Liquidity Rule (the “Program”). The Board has designated a member of the US Operational Risk Group of Macquarie Asset Management as the Program Administrator for each Fund in the Trust.
As required by the Liquidity Rule, the Program includes policies and procedures that provide for: (1) assessment, management, and review (no less frequently than annually) of the Fund’s liquidity risk; (2) classification of each of the Fund’s portfolio holdings into one of four liquidity categories (Highly Liquid, Moderately Liquid, Less Liquid, and Illiquid); (3) for funds that do not primarily hold assets that are Highly Liquid, establishing and maintaining a minimum percentage of the Fund’s net assets in Highly Liquid investments (called a “Highly Liquid Investment Minimum” or “HLIM”); and (4) prohibiting the Fund’s acquisition of Illiquid investments if, immediately after the acquisition, the Fund would hold more than 15% of its net assets in Illiquid assets. The Program also requires reporting to the SEC (on a non-public basis) and to the Board if the Fund’s holdings of Illiquid assets exceed 15% of the Fund’s net assets. Funds with HLIMs must have procedures for addressing HLIM shortfalls, including reporting to the Board and, with respect to HLIM shortfalls lasting more than seven consecutive calendar days, reporting to the SEC (on a non-public basis).
In assessing and managing the Fund’s liquidity risk, the Program Administrator considers, as relevant, a variety of factors, including: (1) the Fund’s investment strategy and liquidity of portfolio investments during both normal and reasonably foreseeable stressed conditions; (2) short-term and long-term cash flow projections for the Fund during both normal and reasonably foreseeable stressed conditions; and (3) the Fund’s holdings of cash and cash equivalents and any borrowing arrangements. Classification of the Fund’s portfolio holdings in the four liquidity categories is based on the number of days it is reasonably expected to take to convert the investment to cash (for Highly Liquid and Moderately Liquid holdings) or to sell or dispose of the investment (for Less Liquid and Illiquid investments), in current market conditions without significantly changing the investment’s market value. The Fund primarily holds assets that are classified as Highly Liquid, and therefore is not required to establish an HLIM.
At a meeting of the Board held on May 23-25, 2023, the Program Administrator provided a written report to the Board addressing the Program’s operation and assessing the adequacy and effectiveness of its implementation for the period from April 1, 2022 through March 31, 2023. The report concluded that the Program is appropriately designed and effectively implemented and that it meets the requirements of Rule 22e-4 and the Fund’s liquidity needs. The Fund’s HLIM is set at an appropriate level and the Fund complied with its HLIM at all times during the reporting period.
Tax Information
The information set forth below is for the Fund’s fiscal year as required by federal income tax laws. Shareholders, however, must report distributions on a calendar year basis for income tax purposes, which may include distributions for portions of two fiscal years of the Fund. Accordingly, the information needed by shareholders for income tax purposes will be sent to them in January of each year. Please consult your tax advisor for proper treatment of this information.
All disclosures are based on financial information available as of the date of this annual report and, accordingly are subject to change. For any and all items requiring reporting, it is the intention of the Fund to report the maximum amount permitted under the Internal Revenue Code and the regulations thereunder.
For the fiscal year ended November 30, 2023, the Fund reports distributions paid during the year as follows:
| (A) Long-Term Capital Gains Distributions (Tax Basis) | | | 55.38 | % |
| (B) Ordinary Income Distributions (Tax Basis)* | | | 44.62 | % |
| Total Distributions (Tax Basis) | | | 100.00 | % |
| (C) Qualified Dividends1 | | | 65.43 | % |
(A) and (B) are based on a percentage of the Fund's total distributions.
(C) is based on the Fund's ordinary income distributions.
1Qualified dividends represent dividends which qualify for the corporate dividends received deduction.
*For the fiscal year ended November 30, 2023, certain dividends paid by the Fund may be subject to a maximum tax rate of 20%. The percentage of dividends paid by the Fund from ordinary income reported as qualified income is 78.84%. Complete information will be computed and reported in conjunction with your 2023 Form 1099-DIV, as applicable.
Other Fund information (Unaudited)
Delaware Wealth Builder Fund
Board Consideration of Investment Management Agreement and Sub-Advisory Agreements at a Meeting Held on August 8-10, 2023
At a meeting held on August 8-10, 2023 (the “Annual Contract Renewal Meeting”), the Board of Trustees (the “Board”), including a majority of Trustees each of whom is not an “interested person” as defined under the Investment Company Act of 1940 (the “Independent Trustees”), approved the renewal of the Delaware Wealth Builder Fund (the “Fund”) Investment Management Agreement with Delaware Management Company (“DMC”) and the Sub-Advisory Agreements with Macquarie Investment Management Global Limited (“MIMGL”), Macquarie Investment Management Austria Kapitalanlage AG (“MIMAK”) and Macquarie Investment Management Europe Limited (“MIMEL”) (together, the “Affiliated Sub-Advisers”).
Prior to the Annual Contract Renewal Meeting, including at a Board meeting held in May 2023, the Trustees conferred extensively among themselves and with representatives of DMC about these matters. Also, the Board was assisted by the Equity Investments Committee and the Fixed Income Multi-Asset Sub-Advised Funds Investments Committee (each an “Investment Committee” and together, the “Investment Committees”), with each Investment Committee assisting the full Board in reviewing investment performance and other matters throughout the year. The Independent Trustees were also assisted in their evaluation of the Investment Management Agreement and the Sub-Advisory Agreements by independent legal counsel, from whom they received separate legal advice and with whom they met separately.
In providing information to the Board, DMC was guided by a detailed set of requests for information submitted to them by independent legal counsel on behalf of the Independent Trustees at the start of the Board’s annual contract renewal process earlier in 2023. Prior to the Annual Contract Renewal Meeting, and in response to the requests, the Board received and reviewed materials specifically relating to the renewal of the Investment Management Agreement and the Sub-Advisory Agreements. In considering and approving the Investment Management Agreement and the Sub-Advisory Agreements, the Trustees considered the information they believed relevant, including but not limited to the information discussed below. The Board considered not only the specific information presented in connection with the Annual Contract Renewal Meeting and the review process for the Investment Management Agreement and the Sub-Advisory Agreements, but also the knowledge gained over time through interaction with DMC about various topics. In this regard, the Board reviewed reports of DMC at each of its quarterly meetings, which included information about, among other things, Fund performance, investment strategies, and expenses. In addition, the Investment Committees confer with portfolio managers at various times throughout the year. In considering information relating to the approval of the Fund’s Investment Management Agreement and the Sub-Advisory Agreements, the Independent Trustees also received information from an independent fund consultant, JDL Consultants, LLC (“JDL”).
The Board did not identify any particular information or consideration that was all-important or controlling, and each individual Trustee may have attributed different weights to various factors.
After its deliberations, the Board, including the Independent Trustees, unanimously approved the continuation of the Investment Management Agreement and the Sub-Advisory Agreements for a
one-year term. The following summarizes a number of important, but not necessarily all, factors considered by the Board in support of its approval.
Nature, extent, and quality of services. The Board received and considered various information regarding the nature, extent, and quality of the advisory services provided to the Fund by DMC under its Investment Management Agreement and the experience of the officers and employees of DMC who provide these services, including the Fund’s portfolio manager. The Board’s review included consideration of DMC’s investment process and oversight and research and analysis capabilities, and its ability to attract and retain skilled investment professionals. The Board also considered information regarding DMC’s programs for risk management, including investment, operational, liquidity, derivatives (as applicable), valuation, and compliance risks. The Board received information with respect to the cybersecurity program and business continuity plans of DMC and its affiliates.
In addition, the Board considered certain non-advisory services that DMC and its affiliates provide to the Delaware Funds by Macquarie complex (the “Delaware Funds”). Among other things, these services include third party service provider oversight, transfer agency, internal audit, valuation, portfolio trading, and legal and compliance functions. The Board noted DMC’s responsibility for overseeing the preparation of the Delaware Funds’ registration statement and supplements thereto and shareholder reports; responsibility for periodic filings with regulators; organizing Board meetings and preparing materials for such Board meetings; and furnishing analytical and other support to assist the Board. The Board took into account the benefits to shareholders of investing in a Fund that is part of a family of funds managed by an affiliate of Macquarie Group Ltd. (“Macquarie”), the parent company of DMC, and the resources available to DMC as part of Macquarie’s global asset management business.
The Board received and considered various information with respect to the services provided by the Affiliated Sub-Advisers under the Sub-Advisory Agreements and the credentials and experience of the officers and employees of the Affiliated Sub-Advisers who provide these services, including the Fund’s portfolio managers. The Board considered the division of responsibilities between DMC and the Affiliated Sub-Advisers and the oversight provided by DMC. The Board also considered the expertise of the Affiliated Sub-Advisers with respect to certain asset classes and/or investment styles. The Board noted that the Affiliated Sub-Advisers are part of Macquarie’s global investment platform that has offices and personnel that are located around the world. These Affiliated Sub-Advisers provide research, investment and trading analysis on the markets and economies of various countries in which the Fund may invest, make recommendations regarding securities, provide portfolio management services and assist with security trades, as applicable. The Board took into account that the Sub-Advisory Agreements may benefit the Fund and its shareholders by permitting DMC to use the resources and talents of the Affiliated Sub-Advisers in managing the Fund.
The Board also received and considered information about the nature and extent of services offered and fee rates charged by DMC to other types of clients with investment strategies similar to those of the Fund. In this regard, the Board received information about the significantly greater scope of services, and compliance, reporting and other legal and regulatory obligations and risks of managing registered investment companies compared with those associated with managing
Other Fund information (Unaudited)
Delaware Wealth Builder Fund
Board Consideration of Investment Management Agreement and Sub-Advisory Agreements at a Meeting Held on August 8-10, 2023 (continued)
assets of other types of clients, including third-party sub-advised fund clients, unregistered funds and separately managed accounts.
The Board concluded that, overall, it was satisfied with the nature, extent and quality of services provided (and expected to be provided) to the Fund by DMC and the Affiliated Sub-Advisers.
Investment performance. The Board received and considered information with respect to the investment performance of the Fund, including performance reports and discussions with portfolio managers at meetings of the Board’s Investment Committees throughout the year as well as reports provided by Broadridge Financial Solutions, Inc., an independent investment company data provider (“Broadridge”), furnished for the Annual Contract Renewal Meeting. The Broadridge reports prepared for the Fund’s institutional share class showed its investment performance in comparison to the institutional share class of a group of similar funds (the “Performance Universe”). The Board received a description of the methodology used by Broadridge to select the peer funds in the Performance Universe. Comparative annualized performance for the Fund was shown for the past 1-, 3-, 5-, and 10-year or since inception periods, as applicable, ended December 31, 2022.
The Performance Universe for the Fund consisted of the Fund and all retail and institutional flexible portfolio funds, regardless of asset size or primary channel of distribution. The Board noted that the Broadridge report comparison showed that the Fund’s total return for the 1- and 10-year periods was in the first quartile of its Performance Universe and for the 3- and 5-year periods was in the second quartile of its Performance Universe. The Broadridge report comparison showed that the Fund’s total return for the 1-, 3-, 5-, and 10-year periods was above the median of its Performance Universe. The Board also noted that the Fund outperformed its benchmark index for the 1-year period and underperformed its benchmark index for the 3-, 5-, and 10-year periods. The Board noted that the Fund was generally outperforming its Performance Universe during the periods under review. The Board, however, noted that the investment performance of the current portfolio management team only began March 2022. The Board noted the limited period of performance data available since it changed its portfolio management team and would continue to evaluate the Fund’s performance. The Board noted the explanations from DMC and from the Affiliated Sub-Advisers concerning the reasons for the Fund’s relative performance versus its benchmark for the various periods. The Board also noted that the Fund’s performance was ahead of its benchmark for the 1-year period.
Comparative expenses. The Board received and considered expense data for the Fund. DMC provided the Board with information on pricing levels and fee structures for the Fund as of its most recently completed fiscal year. The Broadridge total expenses, for comparative consistency, were shown by Broadridge for Institutional Class shares and comparative total expenses including 12b-1 and non-12b-1 service fees. The Board also considered the comparative analysis of contractual management fees and actual total expense ratios of the Fund versus contractual management fees and actual total expense ratios of a group of peer funds as selected by Broadridge (the “Expense Group”). In reviewing comparative costs, the Fund’s contractual
management fee and the actual management fee incurred by the Fund were compared with the contractual management fees (assuming all funds in the Expense Group were similar in size to the Fund) and actual management fees, taking into account any applicable breakpoints and fee waivers, with the Fund’s expense universe, which is comprised of the Fund, its Expense Group and all other similar institutional funds, excluding outliers (the “Expense Universe”). The Fund’s total expenses were also compared with those of its Expense Universe. The Board also received and considered information regarding the Fund’s net operating expense ratios and their various components, including actual management fees, custodian and other non-management fees, and Rule 12b-1 and non-Rule 12b-1 shareholder service fees.
The expense comparisons for the Fund showed that its actual management fee was below the median of its Expense Universe and its actual total expenses were slightly above its Expense Group average. It was noted that consistent with DMC’s waiver methodology, its advisory fee waivers, if any, were at the fund level and not class level.
The Board noted that DMC, and not the Fund, pays the sub-advisory fees to the Affiliated Sub-Advisers and, accordingly, that the retention of the Affiliated Sub-Advisers does not increase the fees and expenses incurred by the Fund.
Based on its consideration of the factors and information it deemed relevant, including those described here, the Board determined that the compensation payable to DMC under the Investment Management Agreement and to the Affiliated Sub-Advisers under the Sub-Advisory Agreements was reasonable.
Economies of scale. The Board received and considered information about the potential for DMC to realize economies of scale in the provision of management services to the Fund, the difficulties of calculating economies of scale at an individual Fund level, and the extent to which potential scale benefits are shared with shareholders, including the extent to which any economies of scale are reflected in the level of management fees charged. DMC discussed its advisory fee pricing and structure for the Delaware Funds, including the current breakpoints. The Board noted that the Fund may also benefit from economies of scale through initial fee setting, fee waivers and expense reimbursements, as well as DMC’s investment in its business, including investments in business infrastructure, technology and cybersecurity.
Management profitability. The Board received and considered the Investment Management Profitability Analysis that addressed the overall profitability of DMC’s business in providing management and other services to the Fund and the Delaware Funds as a whole, including the methodology used by DMC in allocating costs for the purpose of determining profitability. The Board noted DMC’s changes to its cost allocation methodology for its profitability analysis and the explanations for such changes. The Board also reviewed a report prepared by JDL regarding DMC’s profitability as compared to certain peer fund complexes and the Independent Trustees discussed DMC’s profitability in such context with representatives from JDL. The Board recognized that calculating and comparing profitability at the individual fund level is difficult; that DMC’s profit, if any, can vary significantly depending on the particular fund; and that DMC’s support for, and commitment to, a fund is not solely dependent on the profits realized as to that fund.
Other Fund information (Unaudited)
Delaware Wealth Builder Fund
Board Consideration of Investment Management Agreement and Sub-Advisory Agreements at a Meeting Held on August 8-10, 2023 (continued)
The Board also received and considered information about the portion of the total management fee that was retained by DMC after payment of the fee to the Affiliated Sub-Advisers for sub-advisory services. In assessing the reasonableness of this amount, the Board received and evaluated information about the nature and extent of the responsibilities retained and risk assumed by DMC and not delegated to or assumed by the Affiliated Sub-Advisers. Given the affiliation between DMC and the Affiliated Sub-Advisers, the Board ascribed limited relevance to the allocation of fees between them.
Based on its review, the Board determined that DMC’s profitability was not excessive in light of the nature, extent and quality of the services provided to the Fund.
Ancillary benefits. The Board received and considered information regarding the extent to which DMC and its affiliates might derive ancillary benefits from fund operations, including the potential for procuring additional business as a result of the prestige and visibility associated with its role as investment manager to the Delaware Funds; the benefits from allocation of fund brokerage to improve trading efficiencies; the portfolio transactions executed through “soft dollar” arrangements; and the fees that various affiliates received for serving as transfer agent and for overseeing fund accounting and financial administration services to the Delaware Funds. The Board considered that it receives periodic reports from DMC that include a representation that any soft dollar arrangements are consistent with regulatory requirements. The Board received information from DMC regarding its view of the performance of its affiliates in providing transfer agent and fund accounting and financial administration oversight services and the organizational structure employed to provide these services pursuant to their contracts with the Fund.
Based on its consideration of the factors and information it deemed relevant, including the costs of providing investment management and other services to the Fund and the ongoing commitment of DMC and its affiliates to the Fund, the Board did not find that any ancillary benefits received by DMC and its affiliates, including the Affiliated Sub-Advisers, were unreasonable.
Conclusion. Based on its review, consideration and evaluation of all factors it believed relevant, including the above-described factors and conclusions, the Board, including all of the Independent Trustees, approved the continuation of DMC’s Investment Management Agreement and of the Affiliated Sub-Advisers’ Sub-Advisory Agreements for an additional one-year period.
Form N-PORT and proxy voting information
The Fund files its complete schedule of portfolio holdings with the Securities and Exchange Commission (SEC) for the first and third quarters of each fiscal year on Form N-PORT. The Fund’s Form N-PORT, as well as a description of the policies and procedures that the Fund uses to determine how to vote proxies (if any) relating to portfolio securities, is available without charge (i) upon request, by calling 800 523-1918; and (ii) on the SEC’s website at sec.gov. In addition, a description of the policies and procedures that the Fund uses to determine how to vote proxies (if any) relating to portfolio securities and the Schedule of Investments included in
the Fund’s most recent Form N-PORT are available without charge on the Fund’s website at delawarefunds.com/literature.
Information (if any) regarding how the Fund voted proxies relating to portfolio securities during the most recently disclosed 12-month period ended June 30 is available without charge (i) through the Fund’s website at delawarefunds.com/proxy; and (ii) on the SEC’s website at sec.gov.
Board of trustees and officers addendum
Delaware Funds by Macquarie®
A mutual fund is governed by a Board of Trustees (“Trustees”), which has oversight responsibility for the management of a fund’s business affairs. Trustees establish procedures and oversee and review the performance of the investment manager, the distributor, and others who perform services for the fund. The independent fund trustees, in particular, are advocates for shareholder interests. Each trustee has served in that capacity since he or she was elected to or appointed to the Board of Trustees, and will continue to serve until his or her retirement or the election of a new trustee in his or her place. The following is a list of the Trustees and Officers with certain background and related information.
Name,
Address,
and Birth Year | Position(s)
Held with
the Trust | Length of Time
Served1 | Number of
Funds in Fund
Complex Overseen
by Trustee | Principal
Occupation(s)
During the
Past Five Years | Other
Directorships
Held by Trustee
During the
Past Five Years |
| Interested Trustee | | |
| | | | | | |
Shawn K. Lytle2
100 Independence
610 Market Street
Philadelphia, PA
19106-2354
1970 | President,
Chief Executive
Officer,
and Trustee | President and
Chief Executive
Officer
since August 2015
Trustee since
September 2015 | 105 | Macquarie Asset
Management3
(2015–Present)
-Head of Equities &
Multi-Asset
(2023–Present)
-Head of Americas of
Macquarie Group
(2017–Present)
-Global Head of Public
Investments
(2019–2023) | None |
Name,
Address,
and Birth Year | Position(s)
Held with
the Trust | Length of Time
Served1 | Number of
Funds in Fund
Complex Overseen
by Trustee | Principal
Occupation(s)
During the
Past Five Years | Other
Directorships
Held by Trustee
During the
Past Five Years |
| Independent Trustees |
| | | | | | |
Jerome D.
Abernathy
100 Independence
610 Market Street
Philadelphia, PA
19106-2354
1959 | Trustee | Since January 2019 | 105 | Stonebrook Capital
Management, LLC
(financial
technology: macro
factors and databases)
-Managing Member
(1993-Present) | None |
| | | | | | |
Ann D. Borowiec
100 Independence
610 Market Street
Philadelphia, PA
19106-2354
1958 | Trustee | Since March 2015 | 105 | J.P. Morgan Chase & Co.
(1987-2013)
-Chief Executive Officer,
Private Wealth
Management
(2011–2013) | Banco Santander International
(2016–2019)
Santander Bank, N.A.
(2016-2019)
|
Board of trustees and officers addendum
Delaware Funds by Macquarie®
Name,
Address,
and Birth Year | Position(s)
Held with
the Trust | Length of Time
Served1 | Number of
Funds in Fund
Complex Overseen
by Trustee | Principal
Occupation(s)
During the
Past Five Years | Other
Directorships
Held by Trustee
During the
Past Five Years |
| | | | | | |
Joseph W. Chow
100 Independence
610 Market Street
Philadelphia, PA
19106-2354
1953 | Trustee | Since January 2013 | 105 | Private Investor
(2011–Present)
State Street Bank and
Trust Company
(1996-2011)
-Executive Vice President
of Enterprise Risk
Management and
Emerging Economies
Strategy; and Chief Risk
and Corporate
Administration Officer | None |
| | | | | | |
H. Jeffrey Dobbs
100 Independence
610 Market Street
Philadelphia, PA
19106-2354
1955
| Trustee | Since April 20194 | 105 | KPMG LLP
(2002-2015)
-Global Sector Chairman,
Industrial Manufacturing
(2010-2015) | TechAccel LLC
(2015–Present)
PatientsVoices, Inc.
(2018–Present)
Valparaiso University Board
(2012-Present)
Ivy Funds Complex (2019-2021) |
Name,
Address,
and Birth Year | Position(s)
Held with
the Trust | Length of Time
Served1 | Number of
Funds in Fund
Complex Overseen
by Trustee | Principal
Occupation(s)
During the
Past Five Years | Other
Directorships
Held by Trustee
During the
Past Five Years |
| | | | | | |
John A. Fry
100 Independence
610 Market Street
Philadelphia, PA
19106-2354
1960 | Trustee | Since January 2001 | 105 | Drexel University
-President
(2010–Present) | Federal Reserve
Bank of Philadelphia
(2020–Present)
Kresge Foundation
(2018-Present)
FS Credit Real Estate Income
Trust, Inc. (2018–Present)
vTv Therapeutics Inc.
(2017–Present)
Community Health Systems
(2004–Present)
Drexel Morgan & Co.
(2015–2019) |
Board of trustees and officers addendum
Delaware Funds by Macquarie®
Name,
Address,
and Birth Year | Position(s)
Held with
the Trust | Length of Time
Served1 | Number of
Funds in Fund
Complex Overseen
by Trustee | Principal
Occupation(s)
During the
Past Five Years | Other
Directorships
Held by Trustee
During the
Past Five Years |
| | | | | | |
Joseph Harroz, Jr.
100 Independence
610 Market Street
Philadelphia, PA
19106-2354
1967 | Trustee | Since November
19984 | 105 | University of Oklahoma
-President
(2020–Present)
-Interim President
(2019–2020)
-Vice President and
Dean, College of Law
(2010–2019)
Brookhaven Investments
LLC (commercial
enterprises)
-Managing Member
(2019–Present)
St. Clair, LLC
(commercial enterprises)
-Managing Member
(2019–Present) | OU Medicine, Inc.
(2020–Present)
Big 12 Athletic Conference
(2019-Present)
Valliance Bank
(2007–Present)
Ivy Funds Complex
(1998-2021) |
Name,
Address,
and Birth Year | Position(s)
Held with
the Trust | Length of Time
Served1 | Number of
Funds in Fund
Complex Overseen
by Trustee | Principal
Occupation(s)
During the
Past Five Years | Other
Directorships
Held by Trustee
During the
Past Five Years |
| | | | | | |
Sandra A.J.
Lawrence
100 Independence
610 Market Street
Philadelphia, PA
19106-2354
1957 | Trustee | Since April 20194 | 105 | Children’s Mercy
Hospitals and Clinics
(2005–2019)
-Chief Administrative
Officer
(2016–2019) | Brixmor Property Group Inc.
(2021-Present)
Sera Prognostics Inc.
(biotechnology) (2021-Present)
Recology (resource recovery)
(2021-2023)
Evergy, Inc., Kansas City Power
& Light Company, KCP&L
Greater Missouri Operations
Company, Westar Energy, Inc.
and Kansas Gas and Electric
Company (related utility
companies) (2018-Present)
National Association of Corporate
Directors (2017-Present)
American Shared Hospital
Services (medical device)
(2017-2021)
Ivy Funds Complex (2019-2021) |
Board of trustees and officers addendum
Delaware Funds by Macquarie®
Name,
Address,
and Birth Year | Position(s)
Held with
the Trust | Length of Time
Served1 | Number of
Funds in Fund
Complex Overseen
by Trustee | Principal
Occupation(s)
During the
Past Five Years | Other
Directorships
Held by Trustee
During the
Past Five Years |
| | | | | | |
Frances A.
Sevilla-Sacasa
100 Independence
610 Market Street
Philadelphia, PA
19106-2354
1956 | Trustee | Since September
2011 | 105 | Banco Itaú International
-Chief Executive Officer
(2012–2016)
US Trust Bank of
America Private Wealth
Management
-President (2007-2008)
U.S. Trust Corp.
-President & CEO
(2005-2007) | Invitation Homes Inc.
(2023-Present)
Florida Chapter of National
Association of Corporate
Directors (2021-Present)
Callon Petroleum Company
(2019-Present)
Camden Property Trust
(2011-Present)
New Senior Investment
Group Inc. (REIT) (2021)
Carrizo Oil & Gas, Inc.
(2018-2019) |
| | | | | | |
Thomas K. Whitford
100 Independence
610 Market Street
Philadelphia, PA
19106-2354
1956 | Chair and Trustee | Trustee since January
2013
Chair since January
2023 | 105 | PNC Financial Services
Group (1983–2013)
-Vice Chairman
(2009-2013) | HSBC USA Inc.
(2014–2022)
HSBC North America
Holdings Inc.
(2013–2022) |
Name,
Address,
and Birth Year | Position(s)
Held with
the Trust | Length of Time
Served1 | Number of
Funds in Fund
Complex Overseen
by Trustee | Principal
Occupation(s)
During the
Past Five Years | Other
Directorships
Held by Trustee
During the
Past Five Years |
| |
Christianna Wood
100 Independence
610 Market Street
Philadelphia, PA
19106-2354
1959 | Trustee | Since January 2019 | 105 | Gore Creek
Capital, Ltd.
-Chief Executive Officer
and President
(2009–Present)
Capital Z Asset
Management
-Chief Executive Officer
(2008-2009)
California Public
Employees' Retirement
System (CalPERS)
-Senior Investment
Officer of Global Equity
(2002-2008) | The Merger Fund
(2013–2021),
The Merger Fund VL
(2013–2021),
WCM Alternatives: Event-Driven
Fund (2013–2021),
and WCM Alternatives: Credit
Event Fund (2017–2021)
Grange Insurance
(2013–Present)
H&R Block Corporation
(2008–2022) |
| |
| Officers |
| |
David F. Connor
100 Independence
610 Market Street
Philadelphia, PA
19106-2354
1963 | Senior Vice President,
General Counsel, and
Secretary | Senior Vice President,
since May 2013;
General Counsel
since May 2015;
Secretary since
October 2005 | 105 | David F. Connor has
served in various
capacities at different
times at Macquarie Asset
Management. | None5 |
Board of trustees and officers addendum
Delaware Funds by Macquarie®
Name,
Address,
and Birth Year | Position(s)
Held with
the Trust | Length of Time
Served1 | Number of
Funds in Fund
Complex Overseen
by Trustee | Principal
Occupation(s)
During the
Past Five Years | Other
Directorships
Held by Trustee
During the
Past Five Years |
| |
Daniel V. Geatens
100 Independence
610 Market Street
Philadelphia, PA
19106-2354
1972 | Senior Vice President
and Treasurer | Senior Vice President
and Treasurer since
October 2007 | 105 | Daniel V. Geatens has
served in various
capacities at different
times at Macquarie Asset
Management. | None5 |
| |
Richard Salus
100 Independence
610 Market Street
Philadelphia, PA
19106-2354
1963 | Senior Vice President
and Chief Financial
Officer
| Senior Vice President
and Chief Financial
Officer since
November 2006
| 105
| Richard Salus has
served in various
capacities at different
times at Macquarie Asset
Management.
| None5
|
| 1 | “Length of Time Served” refers to the time since the Trustee or officer began serving one or more of the Trusts in the Delaware Funds complex. |
| 2 | Shawn K. Lytle is considered to be an “Interested Trustee” because he is an executive officer of the Funds' investment advisor. |
| 3 | Macquarie Asset Management is the marketing name for certain companies comprising the asset management division of Macquarie Group, including the Funds' investment advisor, principal underwriter, and transfer agent. |
| 4 | Includes time served on the Board of the Ivy Funds complex prior to the date when the Ivy Funds joined the Delaware Funds complex. |
| 5 | David F. Connor and Daniel V. Geatens serve in similar capacities for the six portfolios of the Optimum Fund Trust, which have the same investment manager, principal underwriter, and transfer agent as the Funds. Mr. Connor also serves as Senior Vice President and Assistant Secretary for the three portfolios of the Macquarie ETF Trust, which have the same investment manager as the Funds. Mr. Geatens also serves as the Chief Financial Officer of the Optimum Fund Trust and as Senior Vice President and Treasurer for the Macquarie ETF Trust. Mr. Salus serves in a similar capacity for the Macquarie ETF Trust. |
The Statement of Additional Information for the Fund(s) includes additional information about the Trustees and Officers and is available, without charge, upon request by calling 800 523-1918.
Item 2. Code of Ethics
The registrant has adopted a code of ethics that applies to the registrant’s principal executive officer, principal financial officer, principal accounting officer or controller, or persons performing similar functions, regardless of whether these individuals are employed by the registrant or a third party. A copy of the registrant’s Code of Business Ethics has been posted on the Delaware Funds by Macquarie® Internet Web site at www.delawarefunds.com. Any amendments to the Code of Business Ethics, and information on any waiver from its provisions granted by the registrant, will also be posted on this Web site within five business days of such amendment or waiver and will remain on the Web site for at least 12 months.
Item 3. Audit Committee Financial Expert
The registrant’s Board of Trustees has determined that certain members of the registrant’s Audit Committee are audit committee financial experts, as defined below. For purposes of this item, an “audit committee financial expert” is a person who has the following attributes:
a. An understanding of generally accepted accounting principles and financial statements;
b. The ability to assess the general application of such principles in connection with the accounting for estimates, accruals, and reserves;
c. Experience preparing, auditing, analyzing, or evaluating financial statements that present a breadth and level of complexity of accounting issues that are generally comparable to the breadth and complexity of issues that can reasonably be expected to be raised by the registrant’s financial statements, or experience actively supervising one or more persons engaged in such activities;
d. An understanding of internal controls and procedures for financial reporting; and
e. An understanding of audit committee functions.
An “audit committee financial expert” shall have acquired such attributes through:
a. Education and experience as a principal financial officer, principal accounting officer, controller, public accountant, or auditor or experience in one or more positions that involve the performance of similar functions;
b. Experience actively supervising a principal financial officer, principal accounting officer, controller, public accountant, auditor, or person performing similar functions;
c. Experience overseeing or assessing the performance of companies or public accountants with respect to the preparation, auditing, or evaluation of financial statements; or
d. Other relevant experience.
The registrant’s Board of Trustees has also determined that each member of the registrant’s Audit Committee is independent. In order to be “independent” for purposes of this item, the Audit Committee member may not: (i) other than in his or her capacity as a member of the Board of Trustees or any committee thereof, accept directly or indirectly any consulting,
advisory or other compensatory fee from the issuer; or (ii) be an “interested person” of the registrant as defined in Section 2(a)(19) of the Investment Company Act of 1940.
The names of the audit committee financial experts on the registrant’s Audit Committee are set forth below:
H. Jeffrey Dobbs
Frances Sevilla-Sacasa, Chair
Item 4. Principal Accountant Fees and Services
(a) Audit fees.
The aggregate fees billed for services provided to the registrant by its independent auditors for the audit of the registrant’s annual financial statements and for services normally provided by the independent auditors in connection with statutory and regulatory filings or engagements were $99,728 for the fiscal year ended November 30, 2023.
The aggregate fees billed for services provided to the registrant by its independent auditors for the audit of the registrant’s annual financial statements and for services normally provided by the independent auditors in connection with statutory and regulatory filings or engagements were $99,728 for the fiscal year ended November 30, 2022.
(b) Audit-related fees.
The aggregate fees billed by the registrant’s independent auditors for services relating to the performance of the audit of the registrant’s financial statements and not reported under paragraph (a) of this Item were $0 for the fiscal year ended November 30, 2023.
The aggregate fees billed by the registrant’s independent auditors for services relating to the performance of the audit of the financial statements of the registrant’s investment adviser and other service providers under common control with the adviser and that relate directly to the operations or financial reporting of the registrant were $1,362,878 for the registrant’s fiscal year ended November 30, 2023. The percentage of these fees relating to services approved by the registrant’s Audit Committee pursuant to the de minimis exception from the pre-approval requirement in Rule 2-01(c)(7)(i)(C) of Regulation S-X was 0%. These audit-related services were as follows: year-end audit procedures; group reporting and subsidiary statutory audits.
The aggregate fees billed by the registrant’s independent auditors for services relating to the performance of the audit of the registrant’s financial statements and not reported under paragraph (a) of this Item were $0 for the fiscal year ended November 30, 2022.
The aggregate fees billed by the registrant’s independent auditors for services relating to the performance of the audit of the financial statements of the registrant’s investment adviser and other service providers under common control with the adviser and that relate directly to the operations or financial reporting of the registrant were $2,050,189 for the registrant’s fiscal year ended November 30, 2022. The percentage of these fees relating to services approved by the registrant’s Audit Committee pursuant to the de minimis exception from the pre-approval requirement in Rule 2-01(c)(7)(i)(C) of Regulation S-X was 0%. These audit-related services were as follows: year-end audit procedures; group reporting and subsidiary statutory audits.
(c) Tax fees.
The aggregate fees billed by the registrant’s independent auditors for tax-related services provided to the registrant were $16,670 for the fiscal year ended November 30, 2023. The percentage of these fees relating to services approved by the registrant’s Audit Committee pursuant to the de minimis exception from the pre-approval requirement in Rule 2-01(c)(7)(i)(C) of Regulation S-X was 0%. These tax-related services were as follows: review of income tax returns and review of annual excise distribution calculations.
The aggregate fees billed by the registrant’s independent auditors for tax-related services provided to the registrant’s investment adviser and other service providers under common control with the adviser and that relate directly to the operations or financial reporting of the registrant were $0 for the registrant’s fiscal year ended November 30, 2023.
The aggregate fees billed by the registrant’s independent auditors for tax-related services provided to the registrant were $16,670 for the fiscal year ended November 30, 2022. The percentage of these fees relating to services approved by the registrant’s Audit Committee pursuant to the de minimis exception from the pre-approval requirement in Rule 2-01(c)(7)(i)(C) of Regulation S-X was 0%. These tax-related services were as follows: review of income tax returns and review of annual excise distribution calculations.
The aggregate fees billed by the registrant’s independent auditors for tax-related services provided to the registrant’s investment adviser and other service providers under common control with the adviser and that relate directly to the operations or financial reporting of the registrant were $0 for the registrant’s fiscal year ended November 30, 2022.
(d) All other fees.
The aggregate fees billed for all services provided by the independent auditors to the registrant other than those set forth in paragraphs (a), (b) and (c) of this Item were $0 for the fiscal year ended November 30, 2023.
The aggregate fees billed for all services other than those set forth in paragraphs (b) and (c) of this Item provided by the registrant’s independent auditors to the registrant’s adviser and other service providers under common control with the adviser and that relate directly to the operations or financial reporting of the registrant were $0 for the registrant’s fiscal year ended November 30, 2023. The percentage of these fees relating to services approved by the registrant’s Audit Committee pursuant to the de minimis exception from the pre-approval requirement in Rule 2-01(c)(7)(i)(C) of Regulation S-X was 0%.
The aggregate fees billed for all services provided by the independent auditors to the registrant other than those set forth in paragraphs (a), (b) and (c) of this Item were $0 for the fiscal year ended November 30, 2022.
The aggregate fees billed for all services other than those set forth in paragraphs (b) and (c) of this Item provided by the registrant’s independent auditors to the registrant’s adviser and other service providers under common control with the adviser and that relate directly to the operations or financial reporting of the registrant were $0 for the registrant’s fiscal year ended November 30, 2022. The percentage of these fees relating to services approved by the registrant’s Audit Committee pursuant to the de minimis exception from the pre-approval requirement in Rule 2-01(c)(7)(i)(C) of Regulation S-X was 0%.
(e) The registrant’s Audit Committee has established pre-approval policies and procedures as permitted by Rule 2-01(c)(7)(i)(B) of Regulation S-X (the “Pre-Approval Policy”) with respect to services provided by the registrant’s independent auditors. Pursuant to the Pre-Approval Policy, the Audit Committee has pre-approved the services set forth in the table below with respect to the registrant up to the specified fee limits. Certain fee limits are based on aggregate fees to the registrant and other registrants within the Delaware Funds by Macquarie®.
| Service | Range of Fees |
| Audit Services | |
| Statutory audits or financial audits for new Funds | up to $50,000 per Fund |
| Services associated with SEC registration statements (e.g., Form N-1A, Form N-14, etc.), periodic reports and other documents filed with the SEC or other documents issued in connection with securities offerings (e.g., comfort letters for closed-end Fund offerings, consents), and assistance in responding to SEC comment letters | up to $10,000 per Fund |
| Consultations by Fund management as to the accounting or disclosure treatment of transactions or events and/or the actual or potential impact of final or proposed rules, standards or interpretations by the SEC, FASB, or other regulatory or standard-setting bodies (Note: Under SEC rules, some consultations may be considered “audit-related services” rather than “audit services”) | up to $25,000 in the aggregate |
| Audit-Related Services | |
| Consultations by Fund management as to the accounting or disclosure treatment of transactions or events and /or the actual or potential impact of final or proposed rules, standards or interpretations by the SEC, FASB, or other regulatory or standard-setting bodies (Note: Under SEC rules, some consultations may be considered “audit services” rather than “audit-related services”) | up to $25,000 in the aggregate |
| Tax Services | |
| U.S. federal, state and local and international tax planning and advice (e.g., consulting on statutory, regulatory or administrative developments, evaluation of Funds’ tax compliance function, etc.) | up to $25,000 in the aggregate |
| U.S. federal, state and local tax compliance (e.g., excise distribution reviews, etc.) | up to $5,000 per Fund |
| Review of federal, state, local and international income, franchise and other tax returns | up to $5,000 per Fund |
Under the Pre-Approval Policy, the Audit Committee has also pre-approved the services set forth in the table below with respect to the registrant’s investment adviser and other entities controlling, controlled by or under common control with the investment adviser that provide ongoing services to the registrant (the “Control Affiliates”) up to the specified fee limit. This fee limit is based on aggregate fees to the investment adviser and its Control Affiliates.
| Service | Range of Fees |
| Non-Audit Services | |
| Services associated with periodic reports and other documents filed with the SEC and assistance in responding to SEC comment letters | up to $10,000 in the aggregate |
The Pre-Approval Policy requires the registrant’s independent auditors to report to the Audit Committee at each of its regular meetings regarding all services initiated since the last such report was rendered, including those services authorized by the Pre-Approval Policy.
(f) Not applicable.
(g) The aggregate non-audit fees billed by the registrant’s independent auditors for services rendered to the registrant and to its investment adviser and other service providers under common control with the adviser were $24,428,000 and $9,044,000 for the registrant’s fiscal years ended November 30, 2023 and November 30, 2022, respectively.
(h) In connection with its selection of the independent auditors, the registrant’s Audit Committee has considered the independent auditors’ provision of non-audit services to the registrant’s investment adviser and other service providers under common control with the adviser that were not required to be pre-approved pursuant to Rule 2-01(c)(7)(ii) of Regulation S-X. The Audit Committee has determined that the independent auditors’ provision of these services is compatible with maintaining the auditors’ independence.
(i) Not applicable.
(j) Not applicable.
Item 5. Audit Committee of Listed Registrants
Not applicable.
Item 6. Investments
(a) Included as part of report to shareholders filed under Item 1 of this Form N-CSR.
(b) Divestment of securities in accordance with Section 13(c) of the Investment Company Act of 1940.
Not applicable.
Item 7. Disclosure of Proxy Voting Policies and Procedures for Closed-End Management Investment Companies
Not applicable.
Item 8. Portfolio Managers of Closed-End Management Investment Companies
Not applicable.
Item 9. Purchases of Equity Securities by Closed-End Management Investment Companies and Affiliated Purchasers
Not applicable.
Item 10. Submission of Matters to a Vote of Security Holders
Not applicable.
Item 11. Controls and Procedures
The registrant’s principal executive officer and principal financial officers, or persons performing similar functions, have concluded that the registrant’s disclosure controls and procedures (as defined in Rule 30a-3(c) under the Investment Company Act of 1940, as amended (17 CFR 270.30a-3(c))) are effective, as of a date within 90 days of the filing of this report, based on their evaluation of these controls and procedures required by Rule 30a-3(b) under the Investment Company Act of 1940 (17 CFR 270.30a-3(b)) and Rules 13a-15(b) or 15d-15(b) under the Securities Exchange Act of 1934, as amended (17 CFR 240.13a-15(b) or 240.15d-15(b)) and provide reasonable assurance that the information required to be disclosed by the registrant in its reports or statements filed under the Securities Exchange Act of 1934 is recorded, processed, summarized and reported within the time periods specified in the rules and forms of the Securities and Exchange Commission.
There were no significant changes in the registrant’s internal control over financial reporting (as defined in Rule 30a-3(d) under the Investment Company Act of 1940 (17 CFR 270.30a-3(d)) that occurred during the period covered by the report to stockholders included herein that have materially affected, or are reasonably likely to materially affect, the registrant’s internal control over financial reporting.
Item 12. Disclosure of Securities Lending Activities for Closed-End Management Investment Companies
Not applicable.
Item 13. Recovery of Erroneously Awarded Compensation
Not Applicable
Item 14. Exhibits
Not applicable.
(2) Certifications of Principal Executive Officer and Principal Financial Officer pursuant to Rule 30a-2 under the Investment Company Act of 1940 are attached hereto as Exhibit 99.CERT.
(3) Written solicitations to purchase securities pursuant to Rule 23c-1 under the Securities Exchange Act of 1934.
Not applicable.
SIGNATURES
Pursuant to the requirements of the Securities Exchange Act of 1934 and the Investment Company Act of 1940, the registrant has duly caused this report to be signed on its behalf, by the undersigned, thereunto duly authorized.
| DELAWARE GROUP® EQUITY FUNDS V |
| | |
| /s/ SHAWN K. LYTLE | |
| By: | Shawn K. Lytle | |
| Title: | President and Chief Executive Officer |
| Date: | February 2, 2024 | |
Pursuant to the requirements of the Securities Exchange Act of 1934 and the Investment Company Act of 1940, this report has been signed below by the following persons on behalf of the registrant and in the capacities and on the dates indicated.
| /s/ SHAWN K. LYTLE | |
| By: | Shawn K. Lytle | |
| Title: | President and Chief Executive Officer |
| Date: | February 2, 2024 | |
| | | |
| /s/ RICHARD SALUS | |
| By: | Richard Salus | |
| Title: | Chief Financial Officer | |
| Date: | February 2, 2024 | |