The 12-month period included one of the most difficult economic and investment climates the portfolio management team has ever seen, followed by a considerable recovery within the municipal bond market and across fixed income markets more broadly.
The financial markets’ troubles date back to 2007 and turmoil continued into the start of the reporting period in September 2008:
Several weeks into the period, the financial markets received a jolt with the bankruptcy of storied Wall Street investment bank Lehman Brothers. This event, followed soon after by the near bankruptcy (and ultimate federal bailout) of insurance giant American International Group (AIG), sent the markets into a near panic. Stock and bond prices virtually collapsed, while credit became even less available. On the whole, businesses began to cut their capital spending, and large-scale job losses ensued.
By early 2009, both stock and bond valuations had fallen extremely from their highs, reflecting investors’ fears of an economic depression. Though the “worst-case scenarios” that many may have envisioned did not materialize, the U.S. economy did experience its most severe downturn in decades. Gross domestic product (GDP) — a widely used measure of economic activity — fell by 5.4% and 6.4% in the fourth quarter of 2008 and the first quarter of 2009, respectively. It was the country’s worst two-quarter economic performance in more than 50 years.
Within this environment, the Federal Reserve and federal government took a series of steps to loosen tight credit markets and avert a worst-case scenario for the economy. The Fed significantly expanded its balance sheet during the fiscal year. Notably, it employed one of the lesser-used tools that it has at its disposal, in purchasing hundreds of billions of dollars’ worth of longer-term U.S. Treasury debt as well as agency mortgage-backed securities. In December 2008, the Federal Open Market Committee (FOMC) cut the target federal funds rate to a range of zero to 0.25% — an all-time low. For its part,
Portfolio management review
Delaware multi-state funds
the federal government passed the Troubled Asset Relief Program (TARP), a $700 billion package designed to shore up financial institutions, in October 2008. Several months later, the Obama administration followed up with the American Recovery and Reinvestment Act of 2009, a nearly $800 billion economic stimulus package. (Source: Bloomberg.)
As the period came to a close, the economy was, if not improving, declining at a far slower pace, and many were anticipating an end to the long recession. During the second quarter of 2009, GDP fell by an estimated 1% (source: Bloomberg). This figure was still weak, but it was the best economic performance seen in a year.
Economic environment by state
As of the end of the fiscal period, Arizona had a budget approved for $8.3 billion of state spending, but a $3.2 billion revenue shortfall meant that the budget wasn’t constitutionally balanced. The Arizona Legislature adjourned its special session on Aug. 25. The governor had until Sept. 5 to sign or veto a budget package (budget negotiations remained at a stalemate as of this writing). The Republican package includes more than $600 million in spending cuts, $250 million in transfers, $735 million from refinancing prisons, $160 million in funding delays, and $1.1 billion in federal stimulus money, while the Democrats’ proposal included the governor’s three-year sales-tax proposal and erased spending cuts for education, healthcare, and social services. (Sources: KTAR.com, Office of the Governor.)
In California, lawmakers passed $23.2 billion of budget balancing measures, closing most of the state’s estimated $24.2 billion deficit for this year. Two important components of the package failed in the Assembly, one that would have allowed oil drilling off the coast of Santa Barbara and another that authorized taking about $1 billion in gas tax revenues from local governments. To eliminate the $156 million deficit and create a $500 million reserve, the governor made $489 million in extra cuts, borrowed $50 million from one of the state’s special funds and found about $117 million in savings from money not spent in the last fiscal year. It has been reported that California will need to borrow approximately $10.5 billion to meet its cash flow needs for the rest of the fiscal year. Officials should begin with a $1.5 billion interim revenue anticipation note (RAN). The interim RANs are to be taken out by mid-September, when the treasurer’s office plans to issue $10.5 billion of RANs in a deal designed to meet the state’s cash flow needs through fiscal 2010. (Sources: Sacramento Bee, State Controller, State Treasurer, Office of the Governor, and The Bond Buyer.)
Colorado Governor Bill Ritter presented the Joint Budget Committee with a budget balancing plan that closes a nearly $320 million shortfall in the current 2010 fiscal year. Most cuts took effect Sept. 1, and come on top of the $1.45 billion the Legislature already has cut from the state budget in the last two years. The plan reflects a 9% reduction in spending from last fiscal year. It includes $265 million in targeted service cuts, the elimination of 270 state jobs, and $48 million in cash-funded program reductions. (Source: Office of the Governor.)
Idaho General Fund revenue finished fiscal 2009 $94.8 million lower than expected
4
based on the February 2009 forecast and $443.8 million lower than 2008 figures. More than half of the fiscal year revenue shortfall was due to weakness in individual income tax. Overall general fund revenues on a budgetary basis are forecasted to decline to $2.5 billion in fiscal 2010, down from $2.6 billion in 2009. It has been reported that spending holdbacks or draws on reserves outside the general fund are likely. However, Idaho has external reserves that are expected to total $280 million at the end of 2010. (Sources: Idaho Division of Financial Management and Standard & Poor’s.)
In New York, total tax revenues of $11.5 billion were $52.6 million below projections and $3.6 billion lower than last year from April through July. Personal income tax collections were $3.3 billion below last year, primarily due to collections in April 2009. While total personal income tax collections are down for the year, personal income tax withholding collections grew by $16 million in July for the second consecutive month this year. Business tax collections were $181 million higher than collections for the same period last year. (Source: New York State Comptroller.)
The municipal bond market
In our view, the most notable trend within the municipal bond market during the period was the widening performance gap between higher-rated and lower-rated bonds. Demand remained strong for securities with high (AA or better) credit ratings, for example, but was weak for those in all other rating categories, particularly securities rated BBB or below. As a result, lower-rated bonds dramatically underperformed their higher-grade counterparts — especially in the first few months of the period when investor confidence was lowest.
This bifurcation, or divergence of performance, within the municipal market largely resulted from the continued financial troubles for monoline municipal bond insurers. For many years, these companies — which insure municipal bond principal and interest payments — received AAA ratings from the major credit rating agencies. As a result, many investors were willing to buy lower-quality bonds as long as they carried this AAA-rated insurance guarantee. Beginning in 2007, however, as credit conditions worsened, many of these monoline insurance companies saw their credit ratings cut dramatically.
Severe capitalization constraints within the investment banking community compounded the municipal markets’ problems during approximately the first half of the fiscal period. Once investment banks’ capital positions were compromised, most were less willing to provide liquidity to help bolster the municipal market.
With municipal bond yields high and their prices at historic lows (bond yields and prices move in opposite directions), investors slowly began to return to the tax-exempt bond market beginning in mid-December 2008. At first, they favored highly rated bonds generally associated with minimal credit risk. By the year’s second calendar quarter, as optimism about the economy grew, municipal bond issuance began to grow, and for the first time in months we began to see increased new supply that stemmed from lower-rated, higher-yielding deals.
In this environment, lower-rated bonds generally enjoyed more-favorable performance, and even rallied in the summer months. Credit spreads — which can be interpreted as the additional income paid to
5
Portfolio management review
Delaware multi-state funds
investors in exchange for investing in riskier bonds — narrowed sharply from their peak in early January, indicating some initial easing of the general risk aversion that characterized fixed income markets for so long.
Besides generally avoiding credit risk, many municipal bond investors sought to minimize interest rate risk as well during the period. This was indicated by the fact that the yield curve, or the difference in yield offered by shorter-dated AAA-rated general obligation bonds relative to comparable longer-dated issues, rose steadily during the fiscal period. In fact, it reached a high of nearly four percentage points in August 2009 — almost double the historical average. (Source: Barclays Capital.)
Tactical portfolio shifts
Entering the reporting period, we sought to take advantage of market conditions by positioning the Funds more conservatively. We were emphasizing higher-rated securities as well as those with intermediate maturities. As the credit crisis deepened, this conservative stance generally contributed to the Funds’ performance versus our peers, especially in the fourth quarter of 2008 and first quarter of 2009.
Beginning early in 2009 and continuing through the end of the fiscal period, we became somewhat more confident, as we perceived a positive shift in the outlook for municipal bonds. Believing that municipal bond investors were being unusually well compensated for taking on credit risk, we began to selectively invest more of the Funds’ assets in lower-rated, higher-yielding bonds. We also sold some of our intermediate-dated holdings and increasingly focused on longer-dated issues — an approach that enabled us to lock higher interest rates into the portfolios for an extended time.
Our approach during approximately the second half of the fiscal year (selectively investing across the credit spectrum) is more representative of how we manage the Funds during more-normalized market conditions. We are bottom-up investors, meaning that we evaluate securities one by one, based on thorough fundamental research to help ensure our comfort with the credit quality of each issuer. We believe that this approach may enable us to uncover value potential that investors with less experience or a less rigorous dedication to research might not be able to identify.
We believe this shift in Fund positioning was well timed. Early on, when the Funds emphasized higher-quality, intermediate-maturity debt, the securities we owned were often less affected by the worst of the market turmoil. As we gradually positioned the Funds more aggressively in a more favorable investment environment, we generally benefited from having security selection to the types of fundamentally solid, yet higher-than-average yielding bonds that we have historically favored.
Of final note, large states with plentiful supplies of tax-free bonds to choose from — such as California and New York — provided us with multiple investment opportunities, while in smaller states with reduced supply, such as Idaho, we attempted to take advantage of opportunities as they surfaced. In the latter category, we made increased use of bonds issued by U.S. territories such as Puerto Rico, which generally are fully exempt from income taxes at all levels of government.
6
Notable sectors and securities
Many of the best-performing sectors in all Funds (regardless of state) were those with a large proportion of high-quality bonds. For example, all Funds benefited greatly from exposure to pre-refunded issues. These securities are found on the short end of the yield curve and have historically faced little if any credit risk. This is because they are backed by the invested debt proceeds of a second bond issue, which typically consists of U.S. Treasury securities. Given investors’ tremendous risk aversion during the period, Treasurys performed extremely well, boosting the performance of our pre-refunded holdings.
Other sectors with predominantly higher-quality issuance added to performance as well. In Delaware Tax-Free Colorado Fund, for example, local general obligation (GO) bonds, and especially an investment in Adams and Arapahoe Counties GO bonds, were particularly helpful. Water/sewer bonds were among the best performers for Delaware Tax-Free California Fund. These bonds benefited from their essential function, which helped them during the challenging economic environment.
Special-tax bonds generally contributed to the Funds’ performances as well, especially in the New York and Arizona Funds. Special-tax bonds are backed by dedicated tax revenue streams, potentially making them less vulnerable to the financial weakness of state and local governments. For example, Delaware Tax-Free New York Fund benefited from its position in Metropolitan Transportation Authority bonds, which were purchased near the market’s bottom and which recovered substantially off of their lows. Similarly, Delaware Tax-Free Arizona Fund benefited from two particularly strong-performing special-tax bonds — Scottsdale Water/Sewer as well as Mesa, Ariz. Street and Highway revenue bonds.
The Funds’ performances in the healthcare sector were mixed overall. We saw strong results from individual healthcare bonds we bought near the market’s bottom and that subsequently recovered off their lows. Within Delaware Tax-Free Idaho Fund, for example, a position in Idaho Health Facilities Authority revenue bonds issued for Trinity Health performed well, while Delaware Tax-Free Colorado Fund was helped by Colorado Health Facilities Authority revenue bonds issued for Catholic Health Initiatives. In Delaware Tax-Free New York Fund, our investment in New York State Dormitory Authority revenue bonds issued for Memorial Sloan-Kettering performed quite well. We were able to purchase these bonds near the bottom of the market, and the holdings rebounded nicely in the second half of the period. Despite the success of our Sloan-Kettering holdings, the healthcare sector was an overall source of underperformance for this Fund.
On the negative side, the industrial development revenue (IDR) bond category, which consists of corporate-backed bonds, many of which were lower rated, was generally a source of underperformance across the state Funds. This was particularly true for Delaware Tax-Free New York Fund and Delaware Tax-Free Idaho Fund. Bonds issued for the Brooklyn Navy Yard were a noteworthy drag on the New York Fund’s returns. The proceeds from this bond issue went to fund electricity generation plants — a cyclical business that lagged as the economy weakened. In the Idaho Fund, Nez Perce County pollution bonds issued for Potlatch Corporation were significant detractors.
7
Portfolio management review
Delaware multi-state funds
Because of their more-limited municipal issuance, both Delaware Tax-Free Arizona Fund and Delaware Tax-Free Idaho Fund had elevated exposure to bonds issued by U.S. territories. In both cases, the Funds were hurt by their exposure to Puerto Rico general obligation bonds, which underperformed because of the territory’s lower credit rating. The Arizona Fund was also hurt by its allocation to U.S. Virgin Islands gross receipt tax bonds.
Lower-rated education bonds had a noteworthy negative impact on both Delaware Tax-Free Colorado Fund and Delaware Tax-Free California Fund. The education bond sector in Colorado includes an unusually large proportion of charter school bonds, many of which carry mid-investment-grade credit ratings at best. These lower-rated bonds underperformed, as did our holdings in bonds issued for the University of Puerto Rico. Although lower-rated education bonds were also a negative within the California Fund, we did benefit from several highly rated university issues that were helped by their strong credit quality.
Several funds, including Delaware Tax-Free Colorado Fund and Delaware Tax-Free California Fund, also were weighed down by their allocation to land-transaction bonds, sometimes called “dirt bonds.” These issues, which help finance property developments, were particularly challenged in the regions that experienced the biggest housing boom and subsequent bust. For example, the Colorado Fund was hurt by the performance of Park Meadows Business Improvement and North Range Metropolitan District bonds, while a handful of California issues, including those of Roseville WestPark Community and Culver City Redevelopment Agency, lagged as well.
8
| Performance summaries | |
| Delaware Tax-Free Arizona Fund | Aug. 31, 2009 |
The performance data quoted represent past performance; past performance does not guarantee future results. Investment return and principal value will fluctuate so your shares, when redeemed, may be worth more or less than their original cost. Please obtain the performance data for the most recent month end by calling 800 523-1918 or visiting our Web site at www.delawareinvestments.com/performance. Current performance may be lower or higher than the performance data quoted.
You should consider the investment objectives, risks, charges, and expenses of the investment company carefully before investing. The Delaware Tax-Free Arizona Fund prospectus contains this and other important information about the investment company. Please request a prospectus through your financial advisor or by calling 800 523-1918 or visiting our Web site at www.delawareinvestments.com. Read the prospectus carefully before you invest or send money.
A rise or fall in interest rates can have a significant impact on bond prices and the net asset value (NAV) of the Fund. Funds that invest in bonds can lose their value as interest rates rise, and an investor can lose principal.
| Fund performance | Average annual total returns through Aug. 31, 2009 |
| | 1 year | | 5 years | | 10 years | | Lifetime |
| Class A (Est. April 1, 1991) | | | | | | | | |
| Excluding sales charge | | +5.64% | | +3.60% | | +4.72% | | +5.73% |
| Including sales charge | | +0.84% | | +2.65% | | +4.24% | | +5.47% |
| Class B (Est. March 10, 1995) | | | | | | | | |
| Excluding sales charge | | +4.85% | | +2.83% | | +4.09% | | +4.71% |
| Including sales charge | | +0.85% | | +2.57% | | +4.09% | | +4.71% |
| Class C (Est. May 26, 1994) | | | | | | | | |
| Excluding sales charge | | +4.84% | | +2.84% | | +3.96% | | +4.39% |
| Including sales charge | | +3.84% | | +2.84% | | +3.96% | | +4.39% |
Returns reflect the reinvestment of all distributions and any applicable sales charges as noted in the following paragraphs.
Performance for Class B and C shares, excluding sales charges, assumes either that contingent deferred sales charges did not apply or that the investment was not redeemed.
Expense limitations were in effect for all classes during the periods shown in the Fund performance chart and in the “Performance of a $10,000 investment” chart. The current expenses for each class are listed on the “Fund expenses” chart. (Note that all charts and graphs referred to in the “Performance summaries” section of this report are found on pages 9 through 11.) Performance would have been lower had the expense limitations not been in effect.
9
Performance summaries
Delaware Tax-Free Arizona Fund
The Fund offers Class A, B, and C shares. Class A shares are sold with a maximum front-end sales charge of up to 4.50%, and have an annual distribution and service fee of up to 0.25% of average daily net assets.
Class B shares may only be purchased through dividend reinvestment and certain permitted exchanges as described in the prospectus. Please see the prospectus for additional information on Class B purchase and sales charges. Class B shares have a contingent deferred sales charge that declines from 4.00% to zero depending on the period of time the shares are held.
Class B shares will automatically convert to Class A shares on a quarterly basis approximately eight years after purchase. They are also subject to an annual distribution and service fee of up to 1.00% of average daily net assets.
Ten-year and lifetime performance figures for Class B shares reflect conversion to Class A shares after approximately eight years.
Class C shares are sold with a contingent deferred sales charge of 1.00% if redeemed during the first 12 months. They are also subject to an annual distribution and service fee of 1.00% of average daily net assets.
The “Fund performance” table and the “Performance of a $10,000 investment” graph do not reflect the deduction of taxes the shareholder would pay on Fund distributions or redemptions of Fund shares.
Fixed income securities and bond funds can lose value, and investors can lose principal, as interest rates rise. They also may be affected by economic conditions that hinder an issuer’s ability to make interest and principal payments on its debt. High yielding, noninvestment grade bonds (junk bonds) involve higher risk than investment grade bonds.
The Fund may also be subject to prepayment risk, the risk that the principal of a fixed income security that is held by the Fund may be prepaid prior to maturity, potentially forcing the Fund to reinvest that money at a lower interest rate.
Substantially all dividend income derived from tax-free funds is exempt from federal income tax. Some income may be subject to the federal alternative minimum tax that applies to certain investors. Capital gains, if any, are taxable.
Funds that invest primarily in a specific state may be more susceptible to the economic, regulatory, and other factors of that state than funds that invest more broadly.
The Fund’s expense ratios, as described in the most recent prospectus, are disclosed in the following “Fund expense ratios” table. Delaware Investments has agreed to reimburse certain expenses and/or waive certain fees from Jan. 1, 2009, through Dec. 31, 2009. Please see the most recent prospectus for additional information on these fee waivers and/or reimbursements.
| Fund expense ratios | Class A | | Class B | | Class C |
| Total annual operating expenses | 0.91% | | 1.66% | | 1.66% |
| (without fee waivers) | | | | | |
| Net expenses | 0.75% | | 1.50% | | 1.50% |
| (including fee waivers, if any) | | | | | |
| Type of waiver | Contractual | | Contractual | | Contractual |
10
Performance of a $10,000 investment
Average annual total returns from Aug. 31, 1999, through Aug. 31, 2009
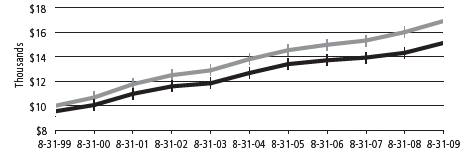
| For period beginning Aug. 31, 1999, through Aug. 31, 2009 | Starting value | Ending value |
| | Barclays Capital Municipal Bond Index | $10,000 | $16,924 |
| | Delaware Tax-Free Arizona Fund — Class A Shares | $9,550 | $15,134 |
The chart assumes $10,000 invested in the Fund on Aug. 31, 1999, and includes the effect of a 4.50% front-end sales charge and the reinvestment of all distributions. Please note additional details on these fees in the “Performance summaries” section of this report, which includes pages 9 through 11.
The chart also assumes $10,000 invested in the Barclays Capital Municipal Bond Index as of Aug. 31, 1999. The Barclays Capital Municipal Bond Index, formerly the Lehman Brothers Municipal Bond Index, measures the total return performance of the long-term, investment grade, tax-exempt bond market.
An index is unmanaged and does not reflect the costs of operating a mutual fund, such as the costs of buying, selling, and holding securities. You cannot invest directly in an index.
Performance of other Fund classes will vary due to different charges and expenses.
The “Fund performance” table and the “Performance of a $10,000 investment” graph do not reflect the deduction of taxes the shareholder would pay on Fund distributions or redemptions of Fund shares.
Past performance is not a guarantee of future results.
| Stock symbols and CUSIP numbers |
| | | Nasdaq symbols | | CUSIPs | |
| Class A | | | VAZIX | | | 928916204 | |
| Class B | | | DVABX | | | 928928639 | |
| Class C | | | DVACX | | | 928916501 | |
11
| Performance summaries | |
| Delaware Tax-Free California Fund | Aug. 31, 2009 |
The performance data quoted represent past performance; past performance does not guarantee future results. Investment return and principal value will fluctuate so your shares, when redeemed, may be worth more or less than their original cost. Please obtain the performance data for the most recent month end by calling 800 523-1918 or visiting our Web site at www.delawareinvestments.com/performance. Current performance may be lower or higher than the performance data quoted.
You should consider the investment objectives, risks, charges, and expenses of the investment company carefully before investing. The Delaware Tax-Free California Fund prospectus contains this and other important information about the investment company. Please request a prospectus through your financial advisor or by calling 800 523-1918 or visiting our Web site at www.delawareinvestments.com. Read the prospectus carefully before you invest or send money.
A rise or fall in interest rates can have a significant impact on bond prices and the net asset value (NAV) of the Fund. Funds that invest in bonds can lose their value as interest rates rise, and an investor can lose principal.
| Fund performance | Average annual total returns through Aug. 31, 2009 |
| 1 year | | 5 years | | 10 years | | Lifetime |
| Class A (Est. March 2, 1995) | | | | | | | |
| Excluding sales charge | +2.74% | | +3.26% | | +4.80% | | +5.49% |
| Including sales charge | -1.89% | | +2.32% | | +4.32% | | +5.15% |
| Class B (Est. Aug. 23, 1995) | | | | | | | |
| Excluding sales charge | +2.07% | | +2.48% | | +4.18% | | +5.13% |
| Including sales charge | -1.86% | | +2.22% | | +4.18% | | +5.13% |
| Class C (Est. April 9, 1996) | | | | | | | |
| Excluding sales charge | +2.07% | | +2.48% | | +4.02% | | +4.59% |
| Including sales charge | +1.09% | | +2.48% | | +4.02% | | +4.59% |
Returns reflect the reinvestment of all distributions and any applicable sales charges as noted in the following paragraphs.
Performance for Class B and C shares, excluding sales charges, assumes either that contingent deferred sales charges did not apply or that the investment was not redeemed.
Expense limitations were in effect for all classes during the periods shown in the Fund performance chart and in the “Performance of a $10,000 investment” chart. The current expenses for each class are listed on the “Fund expenses” chart. (Note that all charts and graphs referred to in the “Performance summaries” section of this report are found on pages 12 through 14.) Performance would have been lower had the expense limitations not been in effect.
12
The Fund offers Class A, B, and C shares. Class A shares are sold with a maximum front-end sales charge of up to 4.50%, and have an annual distribution and service fee of up to 0.25% of average daily net assets.
Class B shares may only be purchased through dividend reinvestment and certain permitted exchanges as described in the prospectus. Please see the prospectus for additional information on Class B purchase and sales charges. Class B shares have a contingent deferred sales charge that declines from 4.00% to zero depending on the period of time the shares are held.
Class B shares will automatically convert to Class A shares on a quarterly basis approximately eight years after purchase. They are also subject to an annual distribution and service fee of up to 1.00% of average daily net assets.
Ten-year and lifetime performance figures for Class B shares reflect conversion to Class A shares after approximately eight years.
Class C shares are sold with a contingent deferred sales charge of 1.00% if redeemed during the first 12 months. They are also subject to an annual distribution and service fee of 1.00% of average daily net assets.
The “Fund performance” table and the “Performance of a $10,000 investment” graph do not reflect the deduction of taxes the shareholder would pay on Fund distributions or redemptions of Fund shares.
Fixed income securities and bond funds can lose value, and investors can lose principal, as interest rates rise. They also may be affected by economic conditions that hinder an issuer’s ability to make interest and principal payments on its debt. High yielding, noninvestment grade bonds (junk bonds) involve higher risk than investment grade bonds.
The Fund may also be subject to prepayment risk, the risk that the principal of a fixed income security that is held by the Fund may be prepaid prior to maturity, potentially forcing the Fund to reinvest that money at a lower interest rate.
Substantially all dividend income derived from tax-free funds is exempt from federal income tax. Some income may be subject to the federal alternative minimum tax that applies to certain investors. Capital gains, if any, are taxable.
Funds that invest primarily in a specific state may be more susceptible to the economic, regulatory, and other factors of that state than funds that invest more broadly.
The Fund’s expense ratios, as described in the most recent prospectus, are disclosed in the following “Fund expense ratios” table. Delaware Investments has agreed to reimburse certain expenses and/or waive certain fees from Jan. 1, 2009, through Dec. 31, 2009. Please see the most recent prospectus for additional information on these fee waivers and/or reimbursements.
| Fund expense ratios | Class A | | Class B | | Class C |
| Total annual operating expenses | 0.97% | | 1.72% | | 1.72% |
| (without fee waivers) | | | | | |
| Net expenses | 0.88% | | 1.63% | | 1.63% |
| (including fee waivers, if any) | | | | | |
| Type of waiver | Contractual | | Contractual | | Contractual |
13
Performance summaries
Delaware Tax-Free California Fund
Performance of a $10,000 investment
Average annual total returns from Aug. 31, 1999, through Aug. 31, 2009
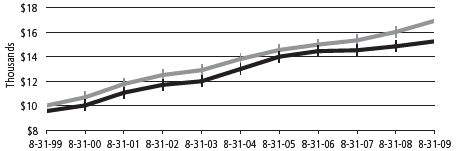
| For period beginning Aug. 31, 1999, through Aug. 31, 2009 | Starting value | Ending value |
| | Barclays Capital Municipal Bond Index | $10,000 | $16,924 |
| | Delaware Tax-Free California Fund — Class A Shares | $9,550 | $15,248 |
The chart assumes $10,000 invested in the Fund on Aug. 31, 1999, and includes the effect of a 4.50% front-end sales charge and the reinvestment of all distributions. Please note additional details on these fees in the “Performance summaries” section of this report, which includes pages 12 through 14.
The chart also assumes $10,000 invested in the Barclays Capital Municipal Bond Index as of Aug. 31, 1999. The Barclays Capital Municipal Bond Index, formerly the Lehman Brothers Municipal Bond Index, measures the total return performance of the long-term, investment grade, tax-exempt bond market.
An index is unmanaged and does not reflect the costs of operating a mutual fund, such as the costs of buying, selling, and holding securities. You cannot invest directly in an index.
Performance of other Fund classes will vary due to different charges and expenses.
The “Fund performance” table and the “Performance of a $10,000 investment” graph do not reflect the deduction of taxes the shareholder would pay on Fund distributions or redemptions of Fund shares.
Past performance is not a guarantee of future results.
| Stock symbols and CUSIP numbers |
| | | Nasdaq symbols | | CUSIPs | |
| Class A | | | DVTAX | | | 928928829 | |
| Class B | | | DVTFX | | | 928928811 | |
| Class C | | | DVFTX | | | 928928795 | |
14
| Delaware Tax-Free Colorado Fund | Aug. 31, 2009 |
The performance data quoted represent past performance; past performance does not guarantee future results. Investment return and principal value will fluctuate so your shares, when redeemed, may be worth more or less than their original cost. Please obtain the performance data for the most recent month end by calling 800 523-1918 or visiting our Web site at www.delawareinvestments.com/performance. Current performance may be lower or higher than the performance data quoted.
You should consider the investment objectives, risks, charges, and expenses of the investment company carefully before investing. The Delaware Tax-Free Colorado Fund prospectus contains this and other important information about the investment company. Please request a prospectus through your financial advisor or by calling 800 523-1918 or visiting our Web site at www.delawareinvestments.com. Read the prospectus carefully before you invest or send money.
A rise or fall in interest rates can have a significant impact on bond prices and the net asset value (NAV) of the Fund. Funds that invest in bonds can lose their value as interest rates rise, and an investor can lose principal.
| Fund performance | | Average annual total returns through Aug. 31, 2009 |
| | 1 year | | 5 years | | 10 years | | Lifetime |
| Class A (Est. April 23, 1987) | | | | | | | | | | | | | | | | | | | | |
| Excluding sales charge | | | +4.11 | % | | | | +3.52 | % | | | | +4.55 | % | | | | +6.18 | % | |
| Including sales charge | | | -0.56 | % | | | | +2.58 | % | | | | +4.07 | % | | | | +5.96 | % | |
| Class B (Est. March 22, 1995) | | | | | | | | | | | | | | | | | | | | |
| Excluding sales charge | | | +3.43 | % | | | | +2.75 | % | | | | +3.91 | % | | | | +4.66 | % | |
| Including sales charge | | | -0.56 | % | | | | +2.49 | % | | | | +3.91 | % | | | | +4.66 | % | |
| Class C (Est. May 6, 1994) | | | | | | | | | | | | | | | | | | | | |
| Excluding sales charge | | | +3.43 | % | | | | +2.77 | % | | | | +3.78 | % | | | | +4.38 | % | |
| Including sales charge | | | +2.43 | % | | | | +2.77 | % | | | | +3.78 | % | | | | +4.38 | % | |
Returns reflect the reinvestment of all distributions and any applicable sales charges as noted in the following paragraphs.
Performance for Class B and C shares, excluding sales charges, assumes either that contingent deferred sales charges did not apply or that the investment was not redeemed.
Expense limitations were in effect for all classes during the periods shown in the Fund performance chart and in the “Performance of a $10,000 investment” chart. The current expenses for each class are listed on the “Fund expenses” chart. (Note that all charts and graphs referred to in the “Performance summaries” section of this report are found on pages 15 through 17.) Performance would have been lower had the expense limitations not been in effect.
15
Performance summaries
Delaware Tax-Free Colorado Fund
The Fund offers Class A, B, and C shares. Class A shares are sold with a maximum front-end sales charge of up to 4.50%, and have an annual distribution and service fee of up to 0.25% of average daily net assets.
Class B shares may only be purchased through dividend reinvestment and certain permitted exchanges as described in the prospectus. Please see the prospectus for additional information on Class B purchase and sales charges. Class B shares have a contingent deferred sales charge that declines from 4.00% to zero depending on the period of time the shares are held.
Class B shares will automatically convert to Class A shares on a quarterly basis approximately eight years after purchase. They are also subject to an annual distribution and service fee of up to 1.00% of average daily net assets.
Ten-year and lifetime performance figures for Class B shares reflect conversion to Class A shares after approximately eight years.
Class C shares are sold with a contingent deferred sales charge of 1.00% if redeemed during the first 12 months. They are also subject to an annual distribution and service fee of 1.00% of average daily net assets.
The “Fund performance” table and the “Performance of a $10,000 investment” graph do not reflect the deduction of taxes the shareholder would pay on Fund distributions or redemptions of Fund shares.
Fixed income securities and bond funds can lose value, and investors can lose principal, as interest rates rise. They also may be affected by economic conditions that hinder an issuer’s ability to make interest and principal payments on its debt. High yielding, noninvestment grade bonds (junk bonds) involve higher risk than investment grade bonds.
The Fund may also be subject to prepayment risk, the risk that the principal of a fixed income security that is held by the Fund may be prepaid prior to maturity, potentially forcing the Fund to reinvest that money at a lower interest rate.
Substantially all dividend income derived from tax-free funds is exempt from federal income tax. Some income may be subject to the federal alternative minimum tax that applies to certain investors. Capital gains, if any, are taxable.
Funds that invest primarily in a specific state may be more susceptible to the economic, regulatory, and other factors of that state than funds that invest more broadly.
The Fund’s expense ratios, as described in the most recent prospectus, are disclosed in the following “Fund expense ratios” table. Delaware Investments has agreed to reimburse certain expenses and/or waive certain fees from Jan. 1, 2009, through Dec. 31, 2009. Please see the most recent prospectus for additional information on these fee waivers and/or reimbursements.
| Fund expense ratios | Class A | | Class B | | Class C |
| Total annual operating expenses | 0.95% | | 1.70% | | 1.70% |
| (without fee waivers) | | | | | |
| Net expenses | 0.89% | | 1.64% | | 1.64% |
| (including fee waivers, if any) | | | | | |
| Type of waiver | Contractual | | Contractual | | Contractual |
16
Performance of a $10,000 investment
Average annual total returns from Aug. 31, 1999, through Aug. 31, 2009
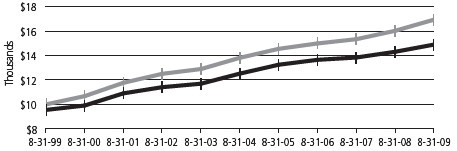
| For period beginning Aug. 31, 1999, through Aug. 31, 2009 | Starting value | Ending value |
| Barclays Capital Municipal Bond Index | $10,000 | $16,924 |
| Delaware Tax-Free Colorado Fund — Class A Shares | $9,550 | $14,888 |
The chart assumes $10,000 invested in the Fund on Aug. 31, 1999, and includes the effect of a 4.50% front-end sales charge and the reinvestment of all distributions. Please note additional details on these fees in the “Performance summaries” section of this report, which includes pages 15 through 17.
The chart also assumes $10,000 invested in the Barclays Capital Municipal Bond Index as of Aug. 31, 1999. The Barclays Capital Municipal Bond Index, formerly the Lehman Brothers Municipal Bond Index, measures the total return performance of the long-term, investment grade, tax-exempt bond market.
An index is unmanaged and does not reflect the costs of operating a mutual fund, such as the costs of buying, selling, and holding securities. You cannot invest directly in an index.
Performance of other Fund classes will vary due to different charges and expenses.
The “Fund performance” table and the “Performance of a $10,000 investment” graph do not reflect the deduction of taxes the shareholder would pay on Fund distributions or redemptions of Fund shares.
Past performance is not a guarantee of future results.
| Stock symbols and CUSIP numbers |
| | | Nasdaq symbols | | CUSIPs | |
| Class A | | | VCTFX | | | 928920107 | |
| Class B | | | DVBTX | | | 928928787 | |
| Class C | | | DVCTX | | | 92907R101 | |
17
| Performance summaries | |
| Delaware Tax-Free Idaho Fund | Aug. 31, 2009 |
The performance data quoted represent past performance; past performance does not guarantee future results. Investment return and principal value will fluctuate so your shares, when redeemed, may be worth more or less than their original cost. Please obtain the performance data for the most recent month end by calling 800 523-1918 or visiting our Web site at www.delawareinvestments.com/performance. Current performance may be lower or higher than the performance data quoted.
You should consider the investment objectives, risks, charges, and expenses of the investment company carefully before investing. The Delaware Tax-Free Idaho Fund prospectus contains this and other important information about the investment company. Please request a prospectus through your financial advisor or by calling 800 523-1918 or visiting our Web site at www.delawareinvestments.com. Read the prospectus carefully before you invest or send money.
A rise or fall in interest rates can have a significant impact on bond prices and the net asset value (NAV) of the Fund. Funds that invest in bonds can lose their value as interest rates rise, and an investor can lose principal.
| Fund performance | | Average annual total returns through Aug. 31, 2009 |
| | 1 year | | 5 years | | 10 years | | Lifetime |
| Class A (Est. Jan. 4, 1995) | | | | | | | | | | | | | | | | | | | | |
| Excluding sales charge | | | +6.12 | % | | | | +3.98 | % | | | | +4.89 | % | | | | +5.69 | % | |
| Including sales charge | | | +1.35 | % | | | | +3.03 | % | | | | +4.41 | % | | | | +5.36 | % | |
| Class B (Est. March 16, 1995) | | | | | | | | | | | | | | | | | | | | |
| Excluding sales charge | | | +5.34 | % | | | | +3.20 | % | | | | +4.27 | % | | | | +4.92 | % | |
| Including sales charge | | | +1.34 | % | | | | +2.93 | % | | | | +4.27 | % | | | | +4.92 | % | |
| Class C (Est. Jan. 11, 1995) | | | | | | | | | | | | | | | | | | | | |
| Excluding sales charge | | | +5.34 | % | | | | +3.19 | % | | | | +4.13 | % | | | | +4.86 | % | |
| Including sales charge | | | +4.34 | % | | | | +3.19 | % | | | | +4.13 | % | | | | +4.86 | % | |
Returns reflect the reinvestment of all distributions and any applicable sales charges as noted in the following paragraphs.
Performance for Class B and C shares, excluding sales charges, assumes either that contingent deferred sales charges did not apply or that the investment was not redeemed.
Expense limitations were in effect for all classes during the periods shown in the Fund performance chart and in the “Performance of a $10,000 investment” chart. The current expenses for each class are listed on the “Fund expenses” chart. (Note that all charts and graphs referred to in the “Performance summaries” section of this report are found on pages 18 through 20.) Performance would have been lower had the expense limitations not been in effect.
18
The Fund offers Class A, B, and C shares. Class A shares are sold with a maximum front-end sales charge of up to 4.50%, and have an annual distribution and service fee of up to 0.25% of average daily net assets.
Class B shares may only be purchased through dividend reinvestment and certain permitted exchanges as described in the prospectus. Please see the prospectus for additional information on Class B purchase and sales charges. Class B shares have a contingent deferred sales charge that declines from 4.00% to zero depending on the period of time the shares are held.
Class B shares will automatically convert to Class A shares on a quarterly basis approximately eight years after purchase. They are also subject to an annual distribution and service fee of up to 1.00% of average daily net assets.
Ten-year and lifetime performance figures for Class B shares reflect conversion to Class A shares after approximately eight years.
Class C shares are sold with a contingent deferred sales charge of 1.00% if redeemed during the first 12 months. They are also subject to an annual distribution and service fee of 1.00% of average daily net assets.
The “Fund performance” table and the “Performance of a $10,000 investment” graph do not reflect the deduction of taxes the shareholder would pay on Fund distributions or redemptions of Fund shares.
Fixed income securities and bond funds can lose value, and investors can lose principal, as interest rates rise. They also may be affected by economic conditions that hinder an issuer’s ability to make interest and principal payments on its debt. High yielding, noninvestment grade bonds (junk bonds) involve higher risk than investment grade bonds.
The Fund may also be subject to prepayment risk, the risk that the principal of a fixed income security that is held by the Fund may be prepaid prior to maturity, potentially forcing the Fund to reinvest that money at a lower interest rate.
Substantially all dividend income derived from tax-free funds is exempt from federal income tax. Some income may be subject to the federal alternative minimum tax that applies to certain investors. Capital gains, if any, are taxable.
Funds that invest primarily in a specific state may be more susceptible to the economic, regulatory, and other factors of that state than funds that invest more broadly.
The Fund’s expense ratios, as described in the most recent prospectus, are disclosed in the following “Fund expense ratios” table. Delaware Investments has agreed to reimburse certain expenses and/or waive certain fees from Jan. 1, 2009, through Dec. 31, 2009. Please see the most recent prospectus for additional information on these fee waivers and/or reimbursements.
| Fund expense ratios | Class A | | Class B | | Class C |
| Total annual operating expenses | 0.96% | | 1.71% | | 1.71% |
| (without fee waivers) | | | | | |
| Net expenses | 0.90% | | 1.65% | | 1.65% |
| (including fee waivers, if any) | | | | | |
| Type of waiver | Contractual | | Contractual | | Contractual |
19
Performance summaries
Delaware Tax-Free Idaho Fund
Performance of a $10,000 investment
Average annual total returns from Aug. 31, 1999, through Aug. 31, 2009

| For period beginning Aug. 31, 1999, through Aug. 31, 2009 | Starting value | Ending value |
| Barclays Capital Municipal Bond Index | $10,000 | $16,924 |
| Delaware Tax-Free Idaho Fund — Class A Shares | $9,550 | $15,384 |
The chart assumes $10,000 invested in the Fund on Aug. 31, 1999, and includes the effect of a 4.50% front-end sales charge and the reinvestment of all distributions. Please note additional details on these fees in the “Performance summaries” section of this report, which includes pages 18 through 20.
The chart also assumes $10,000 invested in the Barclays Capital Municipal Bond Index as of Aug. 31, 1999. The Barclays Capital Municipal Bond Index, formerly the Lehman Brothers Municipal Bond Index, measures the total return performance of the long-term, investment grade, tax-exempt bond market.
An index is unmanaged and does not reflect the costs of operating a mutual fund, such as the costs of buying, selling, and holding securities. You cannot invest directly in an index.
Performance of other Fund classes will vary due to different charges and expenses.
The “Fund performance” table and the “Performance of a $10,000 investment” graph do not reflect the deduction of taxes the shareholder would pay on Fund distributions or redemptions of Fund shares.
Past performance is not a guarantee of future results.
| Stock symbols and CUSIP numbers |
| | | Nasdaq symbols | | CUSIPs | |
| Class A | | | VIDAX | | | 928928704 | |
| Class B | | | DVTIX | | | 928928746 | |
| Class C | | | DVICX | | | 928928803 | |
20
| Delaware Tax-Free New York Fund | Aug. 31, 2009 |
The performance data quoted represent past performance; past performance does not guarantee future results. Investment return and principal value will fluctuate so your shares, when redeemed, may be worth more or less than their original cost. Please obtain the performance data for the most recent month end by calling 800 523-1918 or visiting our Web site at www.delawareinvestments.com/performance. Current performance may be lower or higher than the performance data quoted.
You should consider the investment objectives, risks, charges, and expenses of the investment company carefully before investing. The Delaware Tax-Free New York Fund prospectus contains this and other important information about the investment company. Please request a prospectus through your financial advisor or by calling 800 523-1918 or visiting our Web site at www.delawareinvestments.com. Read the prospectus carefully before you invest or send money.
A rise or fall in interest rates can have a significant impact on bond prices and the net asset value (NAV) of the Fund. Funds that invest in bonds can lose their value as interest rates rise, and an investor can lose principal.
| Fund performance | | Average annual total returns through Aug. 31, 2009 |
| | 1 year | | 5 years | | 10 years | | Lifetime |
| Class A (Est. Nov. 6, 1987) | | | | | | | | | | | | | | | | | | | | |
| Excluding sales charge | | | +5.65 | % | | | | +4.18 | % | | | | +5.26 | % | | | | +5.95 | % | |
| Including sales charge | | | +0.86 | % | | | | +3.24 | % | | | | +4.77 | % | | | | +5.73 | % | |
| Class B (Est. Nov. 14, 1994) | | | | | | | | | | | | | | | | | | | | |
| Excluding sales charge | | | +4.88 | % | | | | +3.40 | % | | | | +4.63 | % | | | | +4.72 | % | |
| Including sales charge | | | +0.88 | % | | | | +3.13 | % | | | | +4.63 | % | | | | +4.72 | % | |
| Class C (Est. April 26, 1995) | | | | | | | | | | | | | | | | | | | | |
| Excluding sales charge | | | +4.88 | % | | | | +3.40 | % | | | | +4.48 | % | | | | +4.03 | % | |
| Including sales charge | | | +3.88 | % | | | | +3.40 | % | | | | +4.48 | % | | | | +4.03 | % | |
Returns reflect the reinvestment of all distributions and any applicable sales charges as noted in the following paragraphs.
Performance for Class B and C shares, excluding sales charges, assumes either that contingent deferred sales charges did not apply or that the investment was not redeemed.
Expense limitations were in effect for all classes during the periods shown in the Fund performance chart and in the “Performance of a $10,000 investment” chart. The current expenses for each class are listed on the “Fund expenses” chart. (Note that all charts and graphs referred to in the “Performance summaries” section of this report are found on pages 21 through 23.) Performance would have been lower had the expense limitations not been in effect.
21
Performance summaries
Delaware Tax-Free New York Fund
The Fund offers Class A, B, and C shares. Class A shares are sold with a maximum front-end sales charge of up to 4.50%, and have an annual distribution and service fee of up to 0.25% of average daily net assets.
Class B shares may only be purchased through dividend reinvestment and certain permitted exchanges as described in the prospectus. Please see the prospectus for additional information on Class B purchase and sales charges. Class B shares have a contingent deferred sales charge that declines from 4.00% to zero depending on the period of time the shares are held.
Class B shares will automatically convert to Class A shares on a quarterly basis approximately eight years after purchase. They are also subject to an annual distribution and service fee of up to 1.00% of average daily net assets.
Ten-year and lifetime performance figures for Class B shares reflect conversion to Class A shares after approximately eight years.
Class C shares are sold with a contingent deferred sales charge of 1.00% if redeemed during the first 12 months. They are also subject to an annual distribution and service fee of 1.00% of average daily net assets.
The “Fund performance” table and the “Performance of a $10,000 investment” graph do not reflect the deduction of taxes the shareholder would pay on Fund distributions or redemptions of Fund shares.
Fixed income securities and bond funds can lose value, and investors can lose principal, as interest rates rise. They also may be affected by economic conditions that hinder an issuer’s ability to make interest and principal payments on its debt. High yielding, noninvestment grade bonds (junk bonds) involve higher risk than investment grade bonds.
The Fund may also be subject to prepayment risk, the risk that the principal of a fixed income security that is held by the Fund may be prepaid prior to maturity, potentially forcing the Fund to reinvest that money at a lower interest rate.
Substantially all dividend income derived from tax-free funds is exempt from federal income tax. Some income may be subject to the federal alternative minimum tax that applies to certain investors. Capital gains, if any, are taxable.
Funds that invest primarily in a specific state may be more susceptible to the economic, regulatory, and other factors of that state than funds that invest more broadly.
The Fund’s expense ratios, as described in the most recent prospectus, are disclosed in the following “Fund expense ratios” table. Delaware Investments has agreed to reimburse certain expenses and/or waive certain fees from Jan. 1, 2009, through Dec. 31, 2009. Please see the most recent prospectus for additional information on these fee waivers and/or reimbursements.
| Fund expense ratios | Class A | | Class B | | Class C |
| Total annual operating expenses | 1.09% | | 1.84% | | 1.84% |
| (without fee waivers) | | | | | |
| Net expenses | 0.85% | | 1.60% | | 1.60% |
| (including fee waivers, if any) | | | | | |
| Type of waiver | Contractual | | Contractual | | Contractual |
22
Performance of a $10,000 investment
Average annual total returns from Aug. 31, 1999, through Aug. 31, 2009

| For period beginning Aug. 31, 1999, through Aug. 31, 2009 | Starting value | | Ending value |
| | Barclays Capital Municipal Bond Index | | $10,000 | | | | $16,924 | |
| | Delaware Tax-Free New York Fund — Class A Shares | | $9,550 | | | | $15,931 | |
The chart assumes $10,000 invested in the Fund on Aug. 31, 1999, and includes the effect of a 4.50% front-end sales charge and the reinvestment of all distributions. Please note additional details on these fees in the “Performance summaries” section of this report, which includes pages 21 through 23.
The chart also assumes $10,000 invested in the Barclays Capital Municipal Bond Index as of Aug. 31, 1999. The Barclays Capital Municipal Bond Index, formerly the Lehman Brothers Municipal Bond Index, measures the total return performance of the long-term, investment grade, tax-exempt bond market.
An index is unmanaged and does not reflect the costs of operating a mutual fund, such as the costs of buying, selling, and holding securities. You cannot invest directly in an index.
Performance of other Fund classes will vary due to different charges and expenses.
The “Fund performance” table and the “Performance of a $10,000 investment” graph do not reflect the deduction of taxes the shareholder would pay on Fund distributions or redemptions of Fund shares.
Past performance is not a guarantee of future results.
| Stock symbols and CUSIP numbers |
| | | Nasdaq symbols | | CUSIPs | |
| Class A | | | FTNYX | | | 928928274 | |
| Class B | | | DVTNX | | | 928928266 | |
| Class C | | | DVFNX | | | 928928258 | |
23
Disclosure of Fund expenses
For the period March 1, 2009 to August 31, 2009
As a shareholder of a Fund, you incur two types of costs: (1) transaction costs, including sales charges (loads) on purchase payments, reinvested dividends, or other distributions; redemption fees; and exchange fees; and (2) ongoing costs, including management fees; distribution and/or service (12b-1) fees; and other Fund expenses. These following examples are intended to help you understand your ongoing costs (in dollars) of investing in a Fund and to compare these costs with the ongoing costs of investing in other mutual funds.
The examples are based on an investment of $1,000 invested at the beginning of the period and held for the entire period March 1, 2009 to August 31, 2009.
Actual expenses
The first section of the tables shown, “Actual Fund Return,” provides information about actual account values and actual expenses. You may use the information in this section of the table, together with the amount you invested, to estimate the expenses that you paid over the period. Simply divide your account value by $1,000 (for example, an $8,600 account value divided by $1,000 = 8.6), then multiply the result by the number in the first section under the heading entitled “Expenses Paid During Period” to estimate the expenses you paid on your account during this period.
Hypothetical example for comparison purposes
The second section of the tables shown, “Hypothetical 5% Return,” provides information about hypothetical account values and hypothetical expenses based on the Funds’ actual expense ratios and an assumed rate of return of 5% per year before expenses, which is not the Funds’ actual return. The hypothetical account values and expenses may not be used to estimate the actual ending account balance or expenses you paid for the period. You may use this information to compare the ongoing costs of investing in the Funds and other funds. To do so, compare this 5% hypothetical example with the 5% hypothetical examples that appear in the shareholder reports of the other funds.
Please note that the expenses shown in the tables are meant to highlight your ongoing costs only and do not reflect any transactional costs, such as sales charges (loads), redemption fees, or exchange fees. Therefore, the second section of each table is useful in comparing ongoing costs only, and will not help you determine the relative total costs of owning different funds. In addition, if these transactional costs were included, your costs would have been higher. The Funds’ expenses shown in the tables reflect fee waivers in effect. The expenses shown in each table assume reinvestment of all dividends and distributions.
24
Delaware Tax-Free Arizona Fund
Expense analysis of an investment of $1,000
| | Beginning
Account Value
3/1/09 | | Ending
Account Value
8/31/09 | | Annualized
Expense Ratio | | Expenses
Paid During Period
3/1/09 to 8/31/09* |
| Actual Fund return | | | | | | | | | | | | | | | | |
| Class A | | | $1,000.00 | | | | $1,064.20 | | | | 0.75% | | | | $3.90 | |
| Class B | | | 1,000.00 | | | | 1,061.20 | | | | 1.50% | | | | 7.79 | |
| Class C | | | 1,000.00 | | | | 1,061.10 | | | | 1.50% | | | | 7.79 | |
| Hypothetical 5% return (5% return before expenses) | | | | | | | | | | | | | | | | |
| Class A | | | $1,000.00 | | | | $1,021.42 | | | | 0.75% | | | | $3.82 | |
| Class B | | | 1,000.00 | | | | 1,017.64 | | | | 1.50% | | | | 7.63 | |
| Class C | | | 1,000.00 | | | | 1,017.64 | | | | 1.50% | | | | 7.63 | |
Delaware Tax-Free California Fund
Expense analysis of an investment of $1,000
| | Beginning
Account Value
3/1/09 | | Ending
Account Value
8/31/09 | | Annualized
Expense Ratio | | Expenses
Paid During Period
3/1/09 to 8/31/09* |
| Actual Fund return | | | | | | | | | | | | | | | | |
| Class A | | | $1,000.00 | | | | $1,076.30 | | | | 0.88% | | | | $4.61 | |
| Class B | | | 1,000.00 | | | | 1,072.00 | | | | 1.63% | | | | 8.51 | |
| Class C | | | 1,000.00 | | | | 1,072.20 | | | | 1.63% | | | | 8.51 | |
| Hypothetical 5% return (5% return before expenses) | | | | | | | | | | | | | | | | |
| Class A | | | $1,000.00 | | | | $1,020.77 | | | | 0.88% | | | | $4.48 | |
| Class B | | | 1,000.00 | | | | 1,016.99 | | | | 1.63% | | | | 8.29 | |
| Class C | | | 1,000.00 | | | | 1,016.99 | | | | 1.63% | | | | 8.29 | |
Delaware Tax-Free Colorado Fund
Expense analysis of an investment of $1,000
| | Beginning
Account Value
3/1/09 | | Ending
Account Value
8/31/09 | | Annualized
Expense Ratio | �� | Expenses
Paid During Period
3/1/09 to 8/31/09* |
| Actual Fund return | | | | | | | | | | | | | | | | |
| Class A | | | $1,000.00 | | | | $1,070.70 | | | | 0.89% | | | | $4.65 | |
| Class B | | | 1,000.00 | | | | 1,066.60 | | | | 1.64% | | | | 8.54 | |
| Class C | | | 1,000.00 | | | | 1,067.60 | | | | 1.64% | | | | 8.55 | |
| Hypothetical 5% return (5% return before expenses) | | | | | | | | | | | | | | | | |
| Class A | | | $1,000.00 | | | | $1,020.72 | | | | 0.89% | | | | $4.53 | |
| Class B | | | 1,000.00 | | | | 1,016.94 | | | | 1.64% | | | | 8.34 | |
| Class C | | | 1,000.00 | | | | 1,016.94 | | | | 1.64% | | | | 8.34 | |
25
Disclosure of Fund expenses
Delaware Tax-Free Idaho Fund
Expense analysis of an investment of $1,000
| | Beginning
Account Value
3/1/09 | | Ending
Account Value
8/31/09 | | Annualized
Expense Ratio | | Expenses
Paid During Period
3/1/09 to 8/31/09* |
| Actual Fund return | | | | | | | | | | | | | | | | |
| Class A | | | $1,000.00 | | | | $1,056.20 | | | | 0.90% | | | | $4.66 | |
| Class B | | | 1,000.00 | | | | 1,052.30 | | | | 1.65% | | | | 8.54 | |
| Class C | | | 1,000.00 | | | | 1,052.30 | | | | 1.65% | | | | 8.54 | |
| Hypothetical 5% return (5% return before expenses) | | | | | | | | | | | | | | | | |
| Class A | | | $1,000.00 | | | | $1,020.67 | | | | 0.90% | | | | $4.58 | |
| Class B | | | 1,000.00 | | | | 1,016.89 | | | | 1.65% | | | | 8.39 | |
| Class C | | | 1,000.00 | | | | 1,016.89 | | | | 1.65% | | | | 8.39 | |
Delaware Tax-Free New York Fund
Expense analysis of an investment of $1,000
| | Beginning
Account Value
3/1/09 | | Ending
Account Value
8/31/09 | | Annualized
Expense Ratio | | Expenses
Paid During Period
3/1/09 to 8/31/09* |
| Actual Fund return | | | | | | | | | | | | | | | | |
| Class A | | | $1,000.00 | | | | $1,066.30 | | | | 0.85% | | | | $4.43 | |
| Class B | | | 1,000.00 | | | | 1,061.40 | | | | 1.60% | | | | 8.31 | |
| Class C | | | 1,000.00 | | | | 1,061.30 | | | | 1.60% | | | | 8.31 | |
| Hypothetical 5% return (5% return before expenses) | | | | | | | | | | | | | | | | |
| Class A | | | $1,000.00 | | | | $1,020.92 | | | | 0.85% | | | | $4.33 | |
| Class B | | | 1,000.00 | | | | 1,017.14 | | | | 1.60% | | | | 8.13 | |
| Class C | | | 1,000.00 | | | | 1,017.14 | | | | 1.60% | | | | 8.13 | |
*“Expenses Paid During Period” are equal to a Fund’s annualized expense ratios, multiplied by the average account value over the period, multiplied by 184/365 (to reflect the one-half year period).
26
| Sector allocations and credit quality breakdowns |
| Delaware Tax-Fee Arizona Fund | As of August 31, 2009 |
Sector designations may be different than the sector designations presented in other Fund materials.
| Sector | | Percentage of net assets |
| Municipal Bonds | | | 98.73% | | |
| Corporate Revenue Bonds | | | 4.49% | | |
| Education Revenue Bonds | | | 8.32% | | |
| Electric Revenue Bonds | | | 5.25% | | |
| Health Care Revenue Bonds | | | 10.80% | | |
| Housing Revenue Bonds | | | 1.96% | | |
| Lease Revenue Bonds | | | 11.61% | | |
| Local General Obligation Bonds | | | 7.79% | | |
| Pre-Refunded Bonds | | | 13.22% | | |
| Special Tax Revenue Bonds | | | 15.92% | | |
| State General Obligation Bonds | | | 6.05% | | |
| Transportation Revenue Bonds | | | 5.20% | | |
| Water & Sewer Revenue Bonds | | | 8.12% | | |
| Short-Term Investment | | | 2.73% | | |
| Total Value of Securities | | | 101.46% | | |
| Liabilities Net of Receivables and Other Assets | | | (1.46% | ) | |
| Total Net Assets | | | 100.00% | | |
| | | | | | |
| Credit quality breakdown (as a % of fixed income investments)* | | | | | |
| AAA | | | 17.79% | | |
| AA | | | 30.15% | | |
| A | | | 25.90% | | |
| BBB | | | 24.27% | | |
| B | | | 1.10% | | |
| Not Rated | | | 0.79% | | |
| Total | | | 100.00% | | |
*Bond ratings are determined by independent, nationally recognized statistical rating organizations.
27
| Sector allocations and credit quality breakdowns |
| Delaware Tax-Free California Fund | As of August 31, 2009 |
Sector designations may be different than the sector designations presented in other Fund materials.
| Sector | | Percentage of net assets |
| Municipal Bonds | | | 100.07% | | |
| Corporate Revenue Bond | | | 7.52% | | |
| Education Revenue Bonds | | | 10.13% | | |
| Electric Revenue Bonds | | | 5.82% | | |
| Health Care Revenue Bonds | | | 15.63% | | |
| Housing Revenue Bonds | | | 8.11% | | |
| Lease Revenue Bonds | | | 10.31% | | |
| Local General Obligation Bonds | | | 6.53% | | |
| Pre-Refunded Bonds | | | 2.94% | | |
| Resource Recovery Revenue Bond | | | 1.27% | | |
| Special Tax Revenue Bonds | | | 15.11% | | |
| State General Obligation Bonds | | | 6.42% | | |
| Transportation Revenue Bonds | | | 6.25% | | |
| Water & Sewer Revenue Bonds | | | 4.03% | | |
| Short-Term Investment | | | 2.90% | | |
| Total Value of Securities | | | 102.97% | | |
| Liabilities Net of Receivables and Other Assets | | | (2.97% | ) | |
| Total Net Assets | | | 100.00% | | |
| | | | | | |
| Credit quality breakdown (as a % of fixed income investments)* | | | | | |
| AAA | | | 13.55% | | |
| AA | | | 14.17% | | |
| A | | | 43.84% | | |
| BBB | | | 15.55% | | |
| BB | | | 1.69% | | |
| B | | | 2.23% | | |
| Not Rated | | | 8.97% | | |
| Total | | | 100.00% | | |
*Bond ratings are determined by independent, nationally recognized statistical rating organizations.
28
| Delaware Tax-Free Colorado Fund | As of August 31, 2009 |
Sector designations may be different than the sector designations presented in other Fund materials.
| Sector | | Percentage of net assets |
| Municipal Bonds | | | 97.81% | | |
| Corporate Revenue Bond | | | 1.32% | | |
| Education Revenue Bonds | | | 11.82% | | |
| Electric Revenue Bonds | | | 5.98% | | |
| Escrowed to Maturity Bonds | | | 2.33% | | |
| Health Care Revenue Bonds | | | 20.24% | | |
| Housing Revenue Bonds | | | 2.18% | | |
| Lease Revenue Bonds | | | 2.66% | | |
| Local General Obligation Bonds | | | 14.88% | | |
| Pre-Refunded Bonds | | | 14.85% | | |
| Special Tax Revenue Bonds | | | 10.14% | | |
| State General Obligation Bonds | | | 5.34% | | |
| Transportation Revenue Bonds | | | 2.52% | | |
| Water & Sewer Revenue Bonds | | | 3.55% | | |
| Short-Term Investments | | | 1.00% | | |
| Money Market Instrument | | | 0.46% | | |
| Variable Rate Demand Note | | | 0.54% | | |
| Total Value of Securities | | | 98.81% | | |
| Receivables and Other Assets Net of Liabilities | | | 1.19% | | |
| Total Net Assets | | | 100.00% | | |
| | | | | | |
| Credit quality breakdown (as a % of fixed income investments)* | | | | | |
| AAA | | | 16.15% | | |
| AA | | | 25.20% | | |
| A | | | 29.27% | | |
| BBB | | | 18.69% | | |
| B | | | 1.06% | | |
| Not Rated | | | 9.63% | | |
| Total | | | 100.00% | | |
*Bond ratings are determined by independent, nationally recognized statistical rating organizations.
29
| Sector allocations and credit quality breakdowns |
| Delaware Tax-Free Idaho Fund | As of August 31, 2009 |
Sector designations may be different than the sector designations presented in other Fund materials.
| Sector | | Percentage of net assets |
| Municipal Bonds | | | 95.18% | | |
| Corporate Revenue Bonds | | | 4.84% | | |
| Education Revenue Bonds | | | 10.48% | | |
| Electric Revenue Bonds | | | 1.52% | | |
| Escrowed to Maturity Bond | | | 1.71% | | |
| Health Care Revenue Bonds | | | 4.30% | | |
| Housing Revenue Bonds | | | 5.61% | | |
| Lease Revenue Bonds | | | 4.01% | | |
| Local General Obligation Bonds | | | 23.95% | | |
| Pre-Refunded Bonds | | | 11.32% | | |
| Special Tax Revenue Bonds | | | 13.70% | | |
| State General Obligation Bonds | | | 3.87% | | |
| Transportation Revenue Bonds | | | 6.86% | | |
| Water & Sewer Revenue Bonds | | | 3.01% | | |
| Short-Term Investment | | | 2.22% | | |
| Total Value of Securities | | | 97.40% | | |
| Receivables and Other Assets Net of Liabilities | | | 2.60% | | |
| Total Net Assets | | | 100.00% | | |
| | | | | | |
| Credit quality breakdown (as a % of fixed income investments)* | | | | | |
| AAA | | | 20.30% | | |
| AA | | | 31.87% | | |
| A | | | 27.87% | | |
| BBB | | | 15.07% | | |
| BB | | | 3.12% | | |
| B | | | 1.52% | | |
| Not Rated | | | 0.25% | | |
| Total | | | 100.00% | | |
*Bond ratings are determined by independent, nationally recognized statistical rating organizations.
30
| Delaware Tax-Free New York Fund | As of August 31, 2009 |
Sector designations may be different than the sector designations presented in other Fund materials.
| Sector | | Percentage of net assets |
| Municipal Bonds | | | 97.71% | | |
| Corporate Revenue Bonds | | | 7.41% | | |
| Education Revenue Bonds | | | 19.31% | | |
| Electric Revenue Bonds | | | 3.80% | | |
| Health Care Revenue Bonds | | | 9.38% | | |
| Housing Revenue Bonds | | | 2.47% | | |
| Lease Revenue Bonds | | | 4.62% | | |
| Local General Obligation Bonds | | | 4.08% | | |
| Pre-Refunded Bonds | | | 8.24% | | |
| Special Tax Revenue Bonds | | | 21.84% | | |
| State General Obligation Bonds | | | 4.27% | | |
| Transportation Revenue Bonds | | | 10.64% | | |
| Water & Sewer Revenue Bonds | | | 1.65% | | |
| Short-Term Investment | | | 0.68% | | |
| Total Value of Securities | | | 98.39% | | |
| Receivables and Other Assets Net of Liabilities | | | 1.61% | | |
| Total Net Assets | | | 100.00% | | |
| | | | | | |
| Credit quality breakdown (as a % of fixed income investments)* | | | | | |
| AAA | | | 16.50% | | |
| AA | | | 28.94% | | |
| A | | | 29.80% | | |
| BBB | | | 17.86% | | |
| BB | | | 3.60% | | |
| B | | | 1.37% | | |
| Not Rated | | | 1.93% | | |
| Total | | | 100.00% | | |
*Bond ratings are determined by independent, nationally recognized statistical rating organizations.
31
| Statements of net assets | |
| Delaware Tax-Free Arizona Fund | August 31, 2009 |
| | | Principal amount | | Value |
| Municipal Bonds – 98.73% | | | | | | | |
| Corporate Revenue Bonds – 4.49% | | | | | | | |
| Maricopa County Pollution Control (Palo Verde Project) | | | | | | | |
| Series A 5.05% 5/1/29 (AMBAC) | | $ | 2,000,000 | | | $ | 1,771,620 |
| · | Navajo County Pollution Control Revenue | | | | | | | |
| Series D 5.75% 6/1/34 | | | 1,500,000 | | | | 1,527,360 |
| Salt Verde Financial Corporation Gas Revenue Senior | | | | | | | |
| 5.00% 12/1/37 | | | 2,895,000 | | | | 2,427,515 |
| | | | | | | | 5,726,495 |
| Education Revenue Bonds – 8.32% | | | | | | | |
| Arizona State Board of Regents | | | | | | | |
| (University of Arizona System Revenue) | | | | | | | |
| Series A 5.00% 6/1/39 | | | 1,500,000 | | | | 1,520,700 |
| Series 2008A 5.00% 6/1/21 | | | 1,255,000 | | | | 1,382,935 |
| Arizona State University Certificates of Participation | | | | | | | |
| (Research Infrastructure Project) | | | | | | | |
| 5.00% 9/1/30 (AMBAC) | | | 2,000,000 | | | | 2,023,799 |
| Arizona State University Energy Management Revenue | | | | | | | |
| (Arizona State University-Tempe Campus II Project) | | | | | | | |
| 4.50% 7/1/24 | | | 1,385,000 | | | | 1,367,217 |
| Energy Management Services Energy Conservation Revenue | | | | | | | |
| (Arizona State University-Main Campus Project) | | | | | | | |
| �� 5.25% 7/1/17 (NATL-RE) | | | 1,500,000 | | | | 1,632,075 |
| Pima County Industrial Development Authority Educational | | | | | | | |
| Revenue Refunding (Tucson Country Day School Project) | | | | | | | |
| 5.00% 6/1/37 | | | 1,000,000 | | | | 624,970 |
| | South Campus Group Student Housing Revenue | | | | | | | |
| (Arizona State University-South Campus Project) | | | | | | | |
| 5.625% 9/1/35 (NATL-RE) | | | 1,000,000 | | | | 974,030 |
| Tucson Industrial Development Authority Lease Revenue | | | | | | | |
| (University of Arizona-Marshall Foundation) Series A | | | | | | | |
| 5.00% 7/15/27 (AMBAC) | | | 1,000,000 | | | | 992,940 |
| University of Arizona Certificates of Participation | | | | | | | |
| (University of Arizona Project) | | | | | | | |
| Series A 5.125% 6/1/21 (AMBAC) | | | 85,000 | | | | 89,712 |
| | | | | | | | 10,608,378 |
32
| | | Principal amount | | Value |
| Municipal Bonds (continued) | | | | | | | |
| Electric Revenue Bonds – 5.25% | | | | | | | |
| Mesa Utilities System Revenue Refunding | | | | | | | |
| 5.00% 7/1/18 (NATL-RE) (FGIC) | | $ | 2,150,000 | | | $ | 2,352,939 |
| Puerto Rico Electric Power Authority Revenue | | | | | | | |
| | Series TT 5.00% 7/1/37 | | | 315,000 | | | | 294,790 |
| Series WW 5.00% 7/1/28 | | | 1,430,000 | | | | 1,404,231 |
| Series WW 5.50% 7/1/38 | | | 600,000 | | | | 601,200 |
| Salt River Project Agricultural Improvement & | | | | | | | |
| Power District Electric System Revenue | | | | | | | |
| Series B 5.00% 1/1/31 (NATL-RE) (IBC) | | | 2,000,000 | | | | 2,041,680 |
| | | | | | | | 6,694,840 |
| Health Care Revenue Bonds – 10.80% | | | | | | | |
| Glendale Industrial Development Authority Hospital | | | | | | | |
| Revenue (John C. Lincoln Health) 5.00% 12/1/42 | | | 2,500,000 | | | | 2,067,375 |
| Maricopa County Industrial Development Authority | | | | | | | |
| Health Facilities Revenue (Catholic Healthcare West) | | | | | | | |
| Series A 5.50% 7/1/26 | | | 1,000,000 | | | | 992,330 |
| Series A 6.00% 7/1/39 | | | 2,500,000 | | | | 2,516,350 |
| Scottsdale Industrial Development Authority | | | | | | | |
| Hospital Revenue (Scottsdale Healthcare) | | | | | | | |
| Series A 5.25% 9/1/30 | | | 1,250,000 | | | | 1,186,025 |
| University Medical Center Hospital Revenue | | | | | | | |
| 5.00% 7/1/24 | | | 800,000 | | | | 745,136 |
| 5.00% 7/1/35 | | | 2,000,000 | | | | 1,750,720 |
| 6.50% 7/1/39 | | | 2,500,000 | | | | 2,585,950 |
| Yavapai County Industrial Development Authority | | | | | | | |
| Revenue (Yavapai Regional Medical Center) | | | | | | | |
| Series A 5.25% 8/1/21 (RADIAN) | | | 2,000,000 | | | | 1,917,820 |
| | | | | | | | 13,761,706 |
| Housing Revenue Bonds – 1.96% | | | | | | | |
| Pima County Industrial Development Authority | | | | | | | |
| Single Family Housing Revenue | | | | | | | |
| Series A-1 6.125% 11/1/33 | | | | | | | |
| (GNMA) (FNMA) (FHLMC) (AMT) | | | 15,000 | | | | 15,028 |
| Yuma Industrial Development Authority | | | | | | | |
| Multifamily Housing Revenue | | | | | | | |
| Series A 6.10% 9/20/19 (GNMA) (AMT) | | | 2,340,000 | | | | 2,481,804 |
| | | | | | | | 2,496,832 |
33
Statements of net assets
Delaware Tax-Free Arizona Fund
| | | Principal amount | | Value |
| Municipal Bonds (continued) | | | | | | | |
| Lease Revenue Bonds – 11.61% | | | | | | | |
| Arizona Game & Fish Department & | | | | | | | |
| Community Beneficial Interest Certificates | | | | | | | |
| (Administration Building Project) 5.00% 7/1/32 | | $ | 1,300,000 | | | $ | 1,291,160 |
| Marana Municipal Property Facilities Revenue | | | | | | | |
| 5.00% 7/1/28 (AMBAC) | | | 575,000 | | | | 588,237 |
| Maricopa County Industrial Development Authority | | | | | | | |
| Correctional Contract Revenue (Phoenix West Prison) | | | | | | | |
| Series B 5.375% 7/1/22 (ACA) | | | 1,000,000 | | | | 930,970 |
| Phoenix Industrial Development Authority Lease | | | | | | | |
| Revenue (Capitol Mall II, LLC Project) | | | | | | | |
| 5.00% 9/15/28 (AMBAC) | | | 2,000,000 | | | | 2,005,620 |
| Pima County Industrial Development Authority Lease | | | | | | | |
| Revenue Metro Police Facility (Nevada Project) Series A | | | | | | | |
| 5.25% 7/1/31 | | | 1,500,000 | | | | 1,506,750 |
| 5.375% 7/1/39 | | | 1,500,000 | | | | 1,494,360 |
| Pinal County Certificates of Participation | | | | | | | |
| 5.00% 12/1/29 | | | 1,300,000 | | | | 1,240,954 |
| 5.125% 6/1/21 (AMBAC) | | | 4,000,000 | | | | 4,071,080 |
| Puerto Rico Public Buildings Authority Revenue | | | | | | | |
| (Guaranteed Government Facilities) Series D | | | | | | | |
| 5.25% 7/1/27 | | | 470,000 | | | | 431,681 |
| 5.25% 7/1/36 | | | 270,000 | | | | 236,960 |
| University of Arizona Certificates of Participation | | | | | | | |
| Prerefunded (University of Arizona Project) | | | | | | | |
| Series B 5.00% 6/1/31 (AMBAC) | | | 1,000,000 | | | | 1,005,690 |
| | | | | | | | 14,803,462 |
| Local General Obligation Bonds – 7.79% | | | | | | | |
| | Chandler 5.00% 7/1/17 | | | 1,935,000 | | | | 2,247,270 |
| Cochise County Unified School District #68 | | | | | | | |
| (Sierra Vista) 7.50% 7/1/10 (NATL-RE) (FGIC) | | | 1,000,000 | | | | 1,050,850 |
| Coconino & Yavapai Counties Joint Unified School | | | | | | | |
| District #9 (Sedona Oak Creek Project of 2007) | | | | | | | |
| Series A 4.50% 7/1/18 (FSA) | | | 1,520,000 | | | | 1,705,744 |
| Series B 5.375% 7/1/28 | | | 1,350,000 | | | | 1,422,090 |
| DC Ranch Community Facilities | | | | | | | |
| 5.00% 7/15/27 (AMBAC) | | | 1,000,000 | | | | 920,000 |
34
| | | Principal amount | | Value |
| Municipal Bonds (continued) | | | | | | | |
| Local General Obligation Bonds (continued) | | | | | | | |
| · | Gila County Unified School District #10 | | | | | | | |
| (Payson School Improvement-Project of 2006) | | | | | | | |
| Series A 5.25% 7/1/27 (AMBAC) | | $ | 1,000,000 | | | $ | 1,012,740 |
| Maricopa County Unified School District #41 | | | | | | | |
| (Gilbert School Improvement-Projects of | | | | | | | |
| 2005 & 2007) 3.25% 7/1/15 | | | 1,500,000 | | | | 1,564,830 |
| | | | | | | | 9,923,524 |
| §Pre-Refunded Bonds – 13.22% | | | | | | | |
| Phoenix Variable Purpose Series B 5.00% 7/1/27-12 | | | 2,435,000 | | | | 2,505,396 |
| Pima County Industrial Development Authority | | | | | | | |
| Single Family Housing Revenue | | | | | | | |
| Series B-1 6.10% 5/1/31-09 (GNMA) (AMT) | | | 45,000 | | | | 45,547 |
| Puerto Rico Commonwealth Highway & | | | | | | | |
| Transportation Authority Revenue Series K | | | | | | | |
| 5.00% 7/1/35-15 | | | 750,000 | | | | 877,560 |
| 5.00% 7/1/40-15 | | | 590,000 | | | | 690,347 |
| Puerto Rico Electric Power Authority Revenue | | | | | | | |
| Series NN 5.00% 7/1/32-13 (NATL-RE) | | | 1,750,000 | | | | 1,988,158 |
| Series RR 5.00% 7/1/35-15 (FGIC) | | | 1,545,000 | | | | 1,807,774 |
| Puerto Rico Public Buildings Authority Revenue | | | | | | | |
| (Guaranteed Government Facilities) | | | | | | | |
| Series D 5.25% 7/1/27-12 | | | 1,280,000 | | | | 1,413,581 |
| Series I 5.25% 7/1/33-14 | | | 5,000 | | | | 5,692 |
| Scottsdale Municipal Property Corporation Excise Tax | | | | | | | |
| | Revenue 5.00% 7/1/21-16 | | | 1,505,000 | | | | 1,762,099 |
| Southern Arizona Capital Facilities Finance | | | | | | | |
| Revenue (University of Arizona Project) | | | | | | | |
| 5.10% 9/1/33-12 (NATL-RE) | | | 3,250,000 | | | | 3,629,339 |
| University of Arizona Certificates of Participation | | | | | | | |
| (University of Arizona Project) | | | | | | | |
| Series A 5.125% 6/1/21-12 (AMBAC) | | | 915,000 | | | | 1,012,246 |
| Series B 5.125% 6/1/22-12 (AMBAC) | | | 1,000,000 | | | | 1,108,570 |
| | | | | | | | 16,846,309 |
35
Statements of net assets
Delaware Tax-Free Arizona Fund
| | | Principal amount | | Value |
| Municipal Bonds (continued) | | | | | | | |
| Special Tax Revenue Bonds – 15.92% | | | | | | | |
| Arizona State Transportation Board Excise Tax Revenue | | | | | | | |
| (Maricopa County Regional Area Road Foundation) | | | | | | | |
| 5.00% 7/1/19 | | $ | 1,500,000 | | | $ | 1,661,595 |
| Arizona Tourism & Sports Authority Tax Revenue | | | | | | | |
| (Multipurpose Stadium Facilities) | | | | | | | |
| Series A 5.00% 7/1/28 (NATL-RE) | | | 2,500,000 | | | | 2,469,799 |
| Flagstaff Aspen Place Sawmill Improvement District | | | | | | | |
| Revenue 5.00% 1/1/32 | | | 1,350,000 | | | | 1,349,906 |
| Gilbert Public Facilities Municipal Property | | | | | | | |
| Revenue 5.00% 7/1/25 | | | 1,250,000 | | | | 1,298,138 |
| Marana Tangerine Farm Road Improvement District | | | | | | | |
| Revenue 4.60% 1/1/26 | | | 963,000 | | | | 801,043 |
| Mesa Street & Highway Revenue 5.00% 7/1/20 (FSA) | | | 1,000,000 | | | | 1,127,500 |
| Peoria Municipal Development Authority Transition | | | | | | | |
| Sales Tax, Excise Tax & State Shared Revenue | | | | | | | |
| (Senior Lien & Subordinated Lien) 4.50% 1/1/16 | | | 1,000,000 | | | | 1,105,340 |
| Phoenix Civic Improvement Transition Excise Tax Revenue | | | | | | | |
| (Light Rail Project) 5.00% 7/1/20 (AMBAC) | | | 2,270,000 | | | | 2,429,785 |
| Puerto Rico Commonwealth Infrastructure Financing | | | | | | | |
| Authority Special Tax Revenue Refunding | | | | | | | |
| Series C 5.50% 7/1/25 (AMBAC) | | | 1,955,000 | | | | 1,914,414 |
| Puerto Rico Sales Tax Financing Revenue | | | | | | | |
| WCapital Appreciation-First Subordinate | | | 3,045,000 | | | | 2,131,500 |
| Series A 0.00% 8/1/32 | | | | | | | |
| First Subordinate Series A | | | | | | | |
| | 5.00% 8/1/39 | | | 1,500,000 | | | | 1,535,430 |
| 5.75% 8/1/37 | | | 2,405,000 | | | | 2,472,580 |
| | | | | | | | 20,297,030 |
| State General Obligation Bonds – 6.05% | | | | | | | |
| Guam Government Series A | | | | | | | |
| 6.75% 11/15/29 | | | 115,000 | | | | 116,191 |
| 7.00% 11/15/39 | | | 1,250,000 | | | | 1,260,238 |
| Puerto Rico Commonwealth Public Improvement | | | | | | | |
| Refunding Series A | | | | | | | |
| 5.50% 7/1/17 | | | 1,765,000 | | | | 1,819,751 |
| 5.50% 7/1/19 | | | 1,300,000 | | | | 1,330,628 |
36
| | | Principal amount | | Value |
| Municipal Bonds (continued) | | | | | | | |
| State General Obligation Bonds (continued) | | | | | | | |
| Puerto Rico Commonwealth Public Improvement Refunding | | | | | | | |
| Un-Refunded Balance Series A | | | | | | | |
| 5.125% 7/1/30 (FSA) | | $ | 480,000 | | | $ | 481,430 |
| 5.125% 7/1/31 | | | 2,000,000 | | | | 1,815,500 |
| Virgin Islands Public Finance Authority | | | | | | | |
| (Gross Receipts Taxes Loan Note) | | | | | | | |
| 5.00% 10/1/31 (ACA) | | | 1,000,000 | | | | 886,270 |
| | | | | | | | 7,710,008 |
| Transportation Revenue Bonds – 5.20% | | | | | | | |
| Arizona State Transportation Board Grant Anticipation | | | | | | | |
| Notes Series A 5.00% 7/1/14 | | | 1,500,000 | | | | 1,676,925 |
| Arizona State Transportation Broad Highway | | | | | | | |
| Revenue Subordinated Series A 5.00% 7/1/23 | | | 1,000,000 | | | | 1,057,680 |
| Phoenix Civic Improvement Airport | | | | | | | |
| Revenue (Senior Lien) Series B | | | | | | | |
| 5.25% 7/1/27 (NATL-RE) (FGIC) (AMT) | | | 1,000,000 | | | | 995,340 |
| 5.25% 7/1/32 (NATL-RE) (FGIC) (AMT) | | | 3,000,000 | | | | 2,891,580 |
| | | | | | | | 6,621,525 |
| Water & Sewer Revenue Bonds – 8.12% | | | | | | | |
| Phoenix Civic Improvement Corporation | | | | | | | |
| Water System Revenue (Junior Lien) | | | | | | | |
| 5.00% 7/1/26 (NATL-RE) (FGIC) | | | 3,750,000 | | | | 3,789,187 |
| Phoenix Civic Improvement Wastewater Corporation | | | | | | | |
| Systems Revenue (Junior Lien) | | | | | | | |
| 5.00% 7/1/19 (NATL-RE) | | | 2,750,000 | | | | 3,038,283 |
| Refunding 5.00% 7/1/24 (NATL-RE) (FGIC) | | | 1,000,000 | | | | 1,010,220 |
| Scottsdale Water & Sewer Revenue | | | | | | | |
| | 4.00% 7/1/14 | | | 175,000 | | | | 192,316 |
| �� 4.00% 7/1/15 | | | 500,000 | | | | 551,890 |
| 4.00% 7/1/16 | | | 375,000 | | | | 413,344 |
| 5.25% 7/1/22 | | | 1,150,000 | | | | 1,353,967 |
| | | | | | | | 10,349,207 |
| Total Municipal Bonds (cost $123,880,458) | | | | | | | 125,839,316 |
37
Statements of net assets
Delaware Tax-Free Arizona Fund
| | | Number of shares | | Value | |
| Short-Term Investment – 2.73% | | | | | | | |
| Money Market Instrument – 2.73% | | | | | | | |
| Federated Arizona Municipal Cash Trust | | 3,479,300 | | | $ | 3,479,300 | |
| Total Short-Term Investment (cost $3,479,300) | | | | | | 3,479,300 | |
| | | | | | | | |
| Total Value of Securities – 101.46% | | | | | | | |
| (cost $127,359,758) | | | | | | 129,318,616 | |
| Liabilities Net of Receivables and | | | | | | | |
| Other Assets – (1.46%) | | | | | | (1,863,669 | ) |
| Net Assets Applicable to 11,489,715 | | | | | | | |
| Shares Outstanding – 100.00% | | | | | $ | 127,454,947 | |
| | | | | | | | |
| Net Asset Value – Delaware Tax-Free Arizona Fund | | | | | | | |
| Class A ($113,689,280 / 10,250,736 Shares) | | | | | | | $11.09 | |
| Net Asset Value – Delaware Tax-Free Arizona Fund | | | | | | | |
| Class B ($6,509,074 / 586,448 Shares) | | | | | | | $11.10 | |
| Net Asset Value – Delaware Tax-Free Arizona Fund | | | | | | | |
| Class C ($7,256,593 / 652,531 Shares) | | | | | | | $11.12 | |
| | | | | | | | |
| Components of Net Assets at August 31, 2009: | | | | | | | |
| Shares of beneficial interest (unlimited authorization – no par) | | | | | $ | 126,874,334 | |
| Undistributed net investment income | | | | | | 26,196 | |
| Accumulated net realized loss on investments | | | | | | (1,404,441 | ) |
| Net unrealized appreciation of investments | | | | | | 1,958,858 | |
| Total net assets | | | | | $ | 127,454,947 | |
| § | Pre-Refunded bonds. Municipals that are generally backed or secured by U.S. Treasury bonds. For Pre-Refunded Bonds, the stated maturity is followed by the year in which the bond is pre-refunded. See Note 8 in “Notes to financial statements.” |
| W | Step coupon bond. Indicates security that has a zero coupon that remains in effect until a predetermined date at which time the stated interest rate becomes effective. |
| · | Variable rate security. The rate shown is the rate as of August 31, 2009. |
38
| |
Summary of abbreviations:
ACA — Insured by American Capital Access
AMBAC — Insured by the AMBAC Assurance Corporation
AMT — Subject to Alternative Minimum Tax
FGIC — Insured by the Financial Guaranty Insurance Company
FHLMC — Insured by the Federal Home Loan Mortgage Corporation
FNMA — Federal National Mortgage Association collateral
FSA — Insured by Financial Security Assurance
GNMA — Government National Mortgage Association collateral
IBC — Integrity Building Corporation
NATL-RE — Insured by the National Public Finance Guarantee Corporation
RADIAN — Insured by Radian Asset Assurance |
| Net Asset Value and Offering Price Per Share – | | |
| Delaware Tax-Free Arizona Fund | | |
| Net asset value Class A (A) | $ | 11.09 |
| Sales charge (4.50% of offering price) (B) | | 0.52 |
| Offering price | $ | 11.61 |
| (A) | Net asset value per share, as illustrated, is the amount which would be paid upon redemption or repurchase of shares. |
| (B) | See the current prospectus for purchases of $100,000 or more. |
See accompanying notes
39
| Statements of net assets | |
| Delaware Tax-Free California Fund | August 31, 2009 |
| | | Principal amount | | Value |
| Municipal Bonds – 100.07% | | | | | | | |
| Corporate Revenue Bonds – 7.52% | | | | | | | |
| Chula Vista Industrial Development Revenue | | | | | | | |
| (San Diego Gas & Electric) | | | | | | | |
| Series D 5.875% 1/1/34 | | $ | 1,000,000 | | | $ | 1,028,670 |
| Golden State Tobacco Securitization Corporation | | | | | | | |
| Settlement Revenue (Asset-Backed Senior Notes) | | | | | | | |
| Series A-1 | | | | | | | |
| 5.125% 6/1/47 | | | 3,075,000 | | | | 2,158,426 |
| 5.75% 6/1/47 | | | 1,000,000 | | | | 780,010 |
| M-S-R Energy Authority Gas Revenue | | | | | | | |
| Series A 6.50% 11/1/39 | | | 2,000,000 | | | | 2,016,040 |
| | | | | | | | 5,983,146 |
| Education Revenue Bonds – 10.13% | | | | | | | |
| California Educational Facilities Authority Revenue | | | | | | | |
| (University of the Pacific) | | | | | | | |
| 5.50% 11/1/39 | | | 1,000,000 | | | | 1,016,510 |
| Un-Refunded Balance 5.75% 11/1/30 (NATL-RE) | | | 310,000 | | | | 311,531 |
| (Woodbury University) 5.00% 1/1/36 | | | 1,000,000 | | | | 723,880 |
| California Municipal Finance Authority Educational Revenue | | | | | | | |
| (American Heritage Foundation Project) | | | | | | | |
| Series A 5.25% 6/1/36 | | | 1,000,000 | | | | 746,770 |
| | California Statewide Communities Development | | | | | | | |
| Authority Revenue | | | | | | | |
| (California Baptist University Project) | | | | | | | |
| Series A 5.50% 11/1/38 | | | 1,000,000 | | | | 669,180 |
| (Viewpoint School Project) 5.75% 10/1/33 (ACA) | | | 1,000,000 | | | | 824,880 |
| (Windrush School Project) 5.50% 7/1/37 | | | 1,000,000 | | | | 709,500 |
| California Statewide Communities Development | | | | | | | |
| Authority Student Housing Revenue | | | | | | | |
| (East Campus Apartments, LLC) | | | | | | | |
| Series A 5.625% 8/1/34 (ACA) | | | 1,000,000 | | | | 890,420 |
| San Diego County Certificates of Participation | | | | | | | |
| (University of San Diego) 5.375% 10/1/41 | | | 1,000,000 | | | | 979,880 |
| University of California Revenue | | | | | | | |
| (Multiple Purpose Projects) Series L | | | | | | | |
| 5.00% 5/15/16 | | | 225,000 | | | | 255,769 |
| 5.00% 5/15/19 | | | 850,000 | | | | 936,386 |
| | | | | | | | 8,064,706 |
40
| | Principal amount | | Value |
| Municipal Bonds (continued) | | | | | | | |
| Electric Revenue Bonds – 5.82% | | | | | | | |
| | California Department of Water Resources | | | | | | | |
| Power Supply Revenue Series H 5.00% 5/1/17 | | $ | 1,000,000 | | | $ | 1,103,380 |
| Chino Basin Regional Financing Authority Revenue | | | | | | | |
| Series A 5.00% 11/1/24 (AMBAC) | | | 845,000 | | | | 877,068 |
| Puerto Rico Electric Power Authority Revenue | | | | | | | |
| Series TT 5.00% 7/1/37 | | | 210,000 | | | | 196,526 |
| Series WW 5.50% 7/1/38 | | | 400,000 | | | | 400,800 |
| Southern California Public Power Authority Revenue | | | | | | | |
| (Transmission Project) Series A 5.00% 7/1/22 | | | 1,000,000 | | | | 1,055,080 |
| Vernon Electric System Revenue Series A 5.125% 8/1/21 | | | 1,000,000 | | | | 1,000,260 |
| | | | | | | | 4,633,114 |
| Health Care Revenue Bonds – 15.63% | | | | | | | |
| Association Bay Area Governments Finance Authority | | | | | | | |
| for California Nonprofit Corporations | | | | | | | |
| (San Diego Hospital Association) Series A 6.125% 8/15/20 | | | 1,250,000 | | | | 1,274,275 |
| | (Sharp Health Care) Series B 6.25% 8/1/39 | | | 1,000,000 | | | | 1,015,430 |
| California Health Facilities Financing Authority Revenue | | | | | | | |
| (Adventist Health System West) Series A 5.75% 9/1/39 | | | 1,000,000 | | | | 984,550 |
| (Catholic Health Care West) | | | | | | | |
| Series A 6.00% 7/1/39 | | | 1,000,000 | | | | 1,003,580 |
| Series G 5.25% 7/1/23 | | | 1,000,000 | | | | 992,160 |
| (Children’s Hospital Orange County) | | | | | | | |
| Series A 6.50% 11/1/38 | | | 1,000,000 | | | | 1,021,510 |
| (St. Joseph Health System) Series A 5.75% 7/1/39 | | | 1,000,000 | | | | 1,011,140 |
| (The Episcopal Home) Series A 5.30% 2/1/32 (RADIAN) | | | 1,000,000 | | | | 933,400 |
| California Infrastructure & Economic Development Bank | | | | | | | |
| Revenue (Kaiser Hospital Associates I, LLC) | | | | | | | |
| Series A 5.55% 8/1/31 | | | 1,000,000 | | | | 1,005,880 |
| California Statewide Communities Development | | | | | | | |
| Authority Revenue | | | | | | | |
| (Kaiser Permanente) Series A 5.00% 4/1/19 | | | 1,245,000 | | | | 1,299,382 |
| (Presbyterian Homes Senior Living) | | | | | | | |
| Series A 4.875% 11/15/36 | | | 1,000,000 | | | | 732,530 |
| (Southern California Senior Living) 7.25% 11/15/41 | | | 500,000 | | | | 510,760 |
| (Valleycare Health Systems) Series A 5.125% 7/15/31 | | | 1,000,000 | | | | 659,530 |
| | | | | | | | 12,444,127 |
41
Statements of net assets
Delaware Tax-Free California Fund
| | | Principal amount | | Value |
| Municipal Bonds (continued) | | | | | | | |
| Housing Revenue Bonds – 8.11% | | | | | | | |
| California Housing Finance Agency Revenue (Home Mortgage) | | | | | | | |
| Series K 5.30% 8/1/23 (AMT) | | $ | 1,000,000 | | | $ | 927,400 |
| Series M 5.95% 8/1/25 (AMT) | | | 1,000,000 | | | | 964,110 |
| California Statewide Communities Development Multifamily | | | | | | | |
| Housing Authority Revenue | | | | | | | |
| (Citrus Gardens Apartments) Series D-1 5.375% 7/1/32 | | | 1,800,000 | | | | 1,743,516 |
| | (Silver Ridge Apartments) Series H 5.80% 8/1/33 | | | | | | | |
| (FNMA) (AMT) | | | 1,000,000 | | | | 1,033,170 |
| Palm Springs Mobile Home Park Revenue (Sahara | | | | | | | |
| Mobile Home Park) Series A 5.75% 5/15/37 | | | 1,000,000 | | | | 879,800 |
| Santa Clara County Multifamily Housing Authority | | | | | | | |
| Revenue (Rivertown Apartments Project) | | | | | | | |
| Series A 5.85% 8/1/31 (AMT) | | | 1,000,000 | | | | 911,530 |
| | | | | | | | 6,459,526 |
| Lease Revenue Bonds – 10.31% | | | | | | | |
| California State Public Works Board Lease Revenue | | | | | | | |
| (Department of Corrections) | | | | | | | |
| Series A 5.00% 3/1/27 (AMBAC) | | | 1,000,000 | | | | 934,670 |
| (General Services) Series A 6.25% 4/1/34 | | | 1,000,000 | | | | 1,038,780 |
| Elsinore Valley Municipal Water District Certificates | | | | | | | |
| of Participation Series A 5.00% 7/1/24 (BHAC) | | | 1,000,000 | | | | 1,080,700 |
| Franklin-McKinley School District Certificates | | | | | | | |
| of Participation (Financing Project) | | | | | | | |
| Series B 5.00% 9/1/27 (AMBAC) | | | 1,060,000 | | | | 1,058,749 |
| Golden State Tobacco Securitization Corporation | | | | | | | |
| Settlement Revenue (Asset-Backed Senior Notes) | | | | | | | |
| Series A 5.00% 6/1/45 | | | 1,000,000 | | | | 862,490 |
| Puerto Rico Public Buildings Authority Revenue (Guaranteed | | | | | | | |
| Government Facilities) Series M-2 5.50% 7/1/35 (AMBAC) | | | 700,000 | | | | 718,753 |
| San Diego County Certificates of Participation | | | | | | | |
| 5.75% 7/1/31 (NATL-RE) | | | 1,000,000 | | | | 1,013,450 |
| San Diego County Regional Building Authority Lease | | | | | | | |
| Revenue (County Operations & Annexation Center) | | | | | | | |
| Series A 5.375% 2/1/36 | | | 1,000,000 | | | | 1,027,090 |
| ^ | San Mateo Unified High School District Certificates of | | | | | | | |
| Participation Capital Appreciation (Partnership Phase I | | | | | | | |
| Projects) Series B 5.00% 12/15/43 (AMBAC) | | | 1,000,000 | | | | 468,910 |
| | | | | | | | 8,203,592 |
42
| | | Principal amount | | Value |
| Municipal Bonds (continued) | | | | | | | |
| Local General Obligation Bonds – 6.53% | | | | | | | |
| ^ | Anaheim School District Election 2002 | | | | | | | |
| 4.58% 8/1/25 (NATL-RE) | | $ | 1,250,000 | | | $ | 465,588 |
| Central Unified School District Election 2008 | | | | | | | |
| Series A 5.625% 8/1/33 (ASSURED GTY) | | | 1,000,000 | | | | 1,038,840 |
| Fairfield-Suisun Unified School District Election 2002 | | | | | | | |
| 5.50% 8/1/28 (NATL-RE) | | | 500,000 | | | | 522,040 |
| | Grossmont Union High School District Election 2004 | | | | | | | |
| 5.00% 8/1/23 (NATL-RE) | | | 1,000,000 | | | | 1,044,850 |
| Santa Barbara Community College District Election 2008 | | | | | | | |
| Series A 5.25% 8/1/33 | | | 1,000,000 | | | | 1,028,640 |
| Sierra Joint Community College Improvement | | | | | | | |
| District #2 (Western Nevada) | | | | | | | |
| Series A 5.25% 8/1/21 (BHAC) (FGIC) | | | 1,000,000 | | | | 1,097,080 |
| | | | | | | | 5,197,038 |
| §Pre-Refunded Bonds – 2.94% | | | | | | | |
| California Department of Water Resources | | | | | | | |
| (Central Valley Project) Series X | | | | | | | |
| 5.00% 12/1/29-12 (NATL-RE) (FGIC) | | | 5,000 | | | | 5,615 |
| Commerce Joint Powers Financing Authority Revenue | | | | | | | |
| (Redevelopment Projects) Series A | | | | | | | |
| 5.00% 8/1/28-13 (RADIAN) | | | 60,000 | | | | 68,265 |
| Golden State Tobacco Securitization Corporation Settlement | | | | | | | |
| Revenue (Asset-Backed Senior Notes) Series B | | | | | | | |
| 5.50% 6/1/43-13 (RADIAN) | | | 1,000,000 | | | | 1,129,370 |
| 5.625% 6/1/33-13 | | | 1,000,000 | | | | 1,133,870 |
| | | | | | | | 2,337,120 |
| Resource Recovery Revenue Bond – 1.27% | | | | | | | |
| South Bayside Solid Waste Management Authority | | | | | | | |
| Revenue (Shoreway Environmental Center) | | | | | | | |
| Series A 6.00% 9/1/36 | | | 1,000,000 | | | | 1,011,240 |
| | | | | | | | 1,011,240 |
| Special Tax Revenue Bonds – 15.11% | | | | | | | |
| | Commerce Joint Powers Financing Authority Revenue | | | | | | | |
| | (Redevelopment Projects) Un-Refunded Balance | | | | | | | |
| | Series A 5.00% 8/1/28 (RADIAN) | | | 940,000 | | | | 763,938 |
| Fremont Community Facilities District #1 | | | | | | | |
| (Special Tax Pacific Commons) 5.375% 9/1/36 | | | 1,000,000 | | | | 725,440 |
43
Statements of net assets
Delaware Tax-Free California Fund
| | | Principal amount | | Value |
| Municipal Bonds (continued) | | | | | | | |
| Special Tax Revenue Bonds (continued) | | | | | | | |
| Lake Elsinore Public Financing Authority Tax Allocation | | | | | | | |
| Series A 5.50% 9/1/30 | | $ | 1,000,000 | | | $ | 922,820 |
| Lammersville School District Community Facilities District | | | | | | | |
| #2002 (Mountain House) | | | | | | | |
| 5.125% 9/1/35 | | | 500,000 | | | | 336,295 |
| Lancaster Redevelopment Agency Tax Allocation | | | | | | | |
| Combined Revenue (Combined Redevelopment | | | | | | | |
| Project Areas) 6.875% 8/1/39 | | | 500,000 | | | | 503,100 |
| @ | Modesto Special Tax Community Facilities District #04-1 | | | | | | | |
| (Village 2) 5.15% 9/1/36 | | | 1,000,000 | | | | 664,650 |
| @ | Palm Drive Health Care District Parcel Tax Revenue | | | | | | | |
| 5.25% 4/1/30 | | | 2,000,000 | | | | 1,341,340 |
| Poway Redevelopment Agency Tax Allocation Revenue | | | | | | | |
| 5.75% 6/15/33 (NATL-RE) | | | 270,000 | | | | 257,213 |
| Poway Unified School District Community Facilities | | | | | | | |
| District #1 Special Tax Refunding | | | | | | | |
| 5.00% 10/1/17 (FSA) | | | 1,000,000 | | | | 1,068,810 |
| Puerto Rico Sales Tax Financing Corporation Revenue | | | | | | | |
| WCapital Appreciation-First Subordinate | | | | | | | |
| | Series A 0.00% 8/1/32 | | | 2,040,000 | | | | 1,428,000 |
| First Subordinate Series A | | | | | | | |
| 5.00% 8/1/39 | | | 1,000,000 | | | | 1,023,620 |
| 5.75% 8/1/37 | | | 930,000 | | | | 956,133 |
| Roseville Westpark Special Tax Public Community | | | | | | | |
| Facilities District #1 5.25% 9/1/37 | | | 500,000 | | | | 302,790 |
| San Bernardino County Special Tax Community | | | | | | | |
| Facilities District #2002-1 5.90% 9/1/33 | | | 2,000,000 | | | | 1,732,520 |
| | | | | | | | 12,026,669 |
| State General Obligation Bonds – 6.42% | | | | | | | |
| California State Various Purposes 6.00% 4/1/38 | | | 515,000 | | | | 544,963 |
| Guam Government Series A 6.75% 11/15/29 | | | 1,755,000 | | | | 1,773,182 |
| Puerto Rico Commonwealth Government Development | | | | | | | |
| Bank Senior Notes Series B | | | | | | | |
| 5.00% 12/1/15 | | | 1,000,000 | | | | 1,007,290 |
| Puerto Rico Commonwealth Public Improvement | | | | | | | |
| Series A 5.25% 7/1/15 | | | 1,750,000 | | | | 1,787,747 |
| | | | | | | | 5,113,182 |
44
| | | Principal amount | | Value | |
| Municipal Bonds (continued) | | | | | | | | |
| Transportation Revenue Bonds – 6.25% | | | | | | | | |
| Bay Area Toll Bridge Authority Revenue | | | | | | | | |
| (San Francisco Bay Area) | | | | | | | | |
| Series F-1 5.625% 4/1/44 | | $ | 2,000,000 | | | $ | 2,127,360 | |
| Port of Oakland Revenue Series L 5.375% 11/1/27 | | | | | | | | |
| (NATL-RE) (FGIC) (AMT) | | | 1,000,000 | | | | 962,340 | |
| Sacramento County Airport Services Revenue (PFC/Grant) | | | | | | | | |
| Series C 6.00% 7/1/41 | | | 1,000,000 | | | | 1,013,100 | |
| San Diego Redevelopment Agency (Centre City | | | | | | | | |
| Redevelopment Project) Series A | | | | | | | | |
| 6.40% 9/1/25 | | | 1,000,000 | | | | 877,000 | |
| | | | | | | | 4,979,800 | |
| Water & Sewer Revenue Bonds – 4.03% | | | | | | | | |
| California Department of Water Resources Systems Revenue | | | | | | | | |
| (Central Valley Project) | | | | | | | | |
| Series A 5.00% 12/1/22 | | | 1,000,000 | | | | 1,099,890 | |
| Series A 5.00% 12/1/24 | | | 1,000,000 | | | | 1,086,390 | |
| Un-Refunded Balance Series X | | | | | | | | |
| 5.00% 12/1/29 (NATL-RE) (FGIC) | | | 995,000 | | | | 1,019,795 | |
| | | | | | | | 3,206,075 | |
| Total Municipal Bonds (cost $82,805,282) | | | | | | | 79,659,335 | |
| | | | | | |
| | | Number of shares | | | | |
| Short-Term Investment – 2.90% | | | | | | | | |
| Money Market Instrument – 2.90% | | | | | | | | |
| Federated California Municipal Cash Trust | | | 2,304,287 | | | | 2,304,287 | |
| Total Short-Term Investment (cost $2,304,287) | | | | | | | 2,304,287 | |
| | | | | | | | | |
| Total Value of Securities – 102.97% | | | | | | | | |
| (cost $85,109,569) | | | | | | | 81,963,622 | |
| Liabilities Net of Receivables | | | | | | | | |
| and Other Assets – (2.97%) | | | | | | | (2,363,724 | ) |
| Net Assets Applicable to 7,489,772 | | | | | | | | |
| Shares Outstanding – 100.00% | | | | | | $ | 79,599,898 | |
45
Statements of net assets
Delaware Tax-Free California Fund
| | | |
| Net Asset Value – Delaware Tax-Free California Fund | | | |
| Class A ($61,131,524 / 5,755,082 Shares) | | | $10.62 | |
| Net Asset Value – Delaware Tax-Free California Fund | | | |
| Class B ($4,938,136 / 463,001 Shares) | | | $10.67 | |
| Net Asset Value – Delaware Tax-Free California Fund | | | |
| Class C ($13,530,238 / 1,271,689 Shares) | | | $10.64 | |
| | | | |
| Components of Net Assets at August 31, 2009: | | | |
| Shares of beneficial interest (unlimited authorization – no par) | $ | 82,942,740 | |
| Undistributed net investment income | | 18,763 | |
| Accumulated net realized loss on investments | | (215,658 | ) |
| Net unrealized depreciation of investments | | (3,145,947 | ) |
| Total net assets | $ | 79,599,898 | |
| ^ | Zero coupon security. The rate shown is the yield at the time of purchase. |
| § | Pre-Refunded Bonds. Municipals that are generally backed or secured by U.S. Treasury bonds. For Pre-Refunded Bonds, the stated maturity is followed by the year in which the bond is pre-refunded. See Note 8 in “Notes to financial statements.” |
| @ | Illiquid security. At August 31, 2009, the aggregate amount of illiquid securities was $2,005,990, which represented 2.52% of the Fund’s net assets. See Note 8 in “Notes to financial statements.” |
| W | Step coupon bond. Indicates security that has a zero coupon that remains in effect until a predetermined date at which time the stated interest rate becomes effective. |
Summary of abbreviations:
ACA — Insured by American Capital Access
AMBAC — Insured by the AMBAC Assurance Corporation
AMT — Subject to Alternative Minimum Tax
ASSURED GTY — Insured by the Assured Guaranty Corporation
BHAC — Insured by the Berkshire Hathaway Assurance Company
FGIC — Insured by the Financial Guaranty Insurance Company
FNMA — Federal National Mortgage Association collateral
FSA — Insured by Financial Security Assurance
NATL-RE — Insured by the National Public Finance Guarantee Corporation
RADIAN — Insured by Radian Asset Assurance
46
| | | |
| Net Asset Value and Offering Price Per Share – | | |
| Delaware Tax-Free California Fund | | |
| Net asset value Class A (A) | $ | 10.62 |
| Sales charge (4.50% of offering price) (B) | | 0.50 |
| Offering price | $ | 11.12 |
| (A) | Net asset value per share, as illustrated, is the amount which would be paid upon redemption or repurchase of shares. |
| (B) | See the current prospectus for purchases of $100,000 or more. |
See accompanying notes
47
| Statements of net assets | |
| Delaware Tax-Free Colorado Fund | August 31, 2009 |
| | | Principal amount | | Value |
| Municipal Bonds – 97.81% | | | | | | | |
| Corporate Revenue Bond – 1.32% | | | | | | | |
| Public Authority Energy National Gas Purpose | | | | | | | |
| | Revenue Series 2008 6.50% 11/15/38 | | $ | 3,015,000 | | | $ | 3,173,891 |
| | | | | | | | 3,173,891 |
| Education Revenue Bonds – 11.82% | | | | | | | |
| Boulder County Development Revenue | | | | | | | |
| (University Corporation for Atmospheric Research) | | | | | | | |
| 5.00% 9/1/33 (NATL-RE) | | | 1,000,000 | | | | 970,090 |
| 5.00% 9/1/35 (AMBAC) | | | 1,000,000 | | | | 989,950 |
| Colorado Educational & Cultural Facilities | | | | | | | |
| Authority Revenue | | | | | | | |
| (Charter School Project) 5.50% 5/1/36 (XLCA) | | | 2,280,000 | | | | 2,172,703 |
| (Johnson & Wales University Project) Series A | | | | | | | |
| 5.00% 4/1/28 (XLCA) | | | 1,000,000 | | | | 905,460 |
| (Liberty Common Charter School Project) | | | | | | | |
| 5.125% 12/1/33 (XLCA) | | | 2,740,000 | | | | 2,513,895 |
| (Montessori Districts Charter School Projects) | | | | | | | |
| 6.125% 7/15/32 | | | 5,590,000 | | | | 4,822,718 |
| (Pinnacle Charter School Project) 5.00% 6/1/33 (XLCA) | | | 2,170,000 | | | | 1,957,817 |
| (University of Northern Colorado Student Housing Project) | | | | | | | |
| 5.125% 7/1/37 (NATL-RE) | | | 4,705,000 | | | | 4,168,160 |
| (Woodrow Wilson Charter School Project) | | | | | | | |
| 5.25% 12/1/34 (XLCA) | | | 1,960,000 | | | | 1,808,080 |
| Colorado School Mines Auxiliary Facilities Revenue | | | | | | | |
| 5.00% 12/1/37 (AMBAC) | | | 425,000 | | | | 404,604 |
| Colorado State Board Governors University | | | | | | | |
| Enterprise System Revenue Series A | | | | | | | |
| 5.00% 3/1/39 | | | 2,300,000 | | | | 2,331,257 |
| University of Colorado Enterprise System Revenue Series A | | | | | | | |
| 5.00% 6/1/30 (AMBAC) | | | 2,000,000 | | | | 2,057,520 |
| 5.375% 6/1/26 | | | 1,000,000 | | | | 1,020,400 |
| University of Puerto Rico Revenue Series Q | | | | | | | |
| 5.00% 6/1/36 | | | 2,750,000 | | | | 2,324,575 |
| | | | | | | | 28,447,229 |
| Electric Revenue Bonds – 5.98% | | | | | | | |
| Colorado Springs Utilities Revenue Series A | | | | | | | |
| 5.00% 11/15/29 | | | 5,000,000 | | | | 5,062,100 |
48
| | | Principal amount | | Value |
| Municipal Bonds (continued) | | | | | | | |
| Electric Revenue Bonds (continued) | | | | | | | |
| Platte River Power Authority Revenue Series HH | | | | | | | |
| 5.00% 6/1/27 | | $ | 2,795,000 | | | $ | 2,999,985 |
| 5.00% 6/1/29 | | | 2,355,000 | | | | 2,481,181 |
| Puerto Rico Electric Power Authority Revenue | | | | | | | |
| Series TT 5.00% 7/1/37 | | | 525,000 | | | | 491,316 |
| Series WW 5.00% 7/1/28 | | | 2,400,000 | | | | 2,356,752 |
| Series WW 5.50% 7/1/38 | | | 1,000,000 | | | | 1,002,000 |
| | | | | | | | 14,393,334 |
| Escrowed to Maturity Bonds – 2.33% | | | | | | | |
| Colorado Health Facilities Authority Revenue | | | | | | | |
| (Catholic Health Initiatives) Series A 5.50% 3/1/32 | | | 5,000,000 | | | | 5,375,800 |
| Galleria Metropolitan District 7.25% 12/1/09 | | | 230,000 | | | | 233,873 |
| | | | | | | | 5,609,673 |
| Health Care Revenue Bonds – 20.24% | | | | | | | |
| Aurora Hospital Revenue (Childrens Hospital) | | | | | | | |
| Series D 5.00% 12/1/23 (FSA) | | | 2,775,000 | | | | 2,860,193 |
| | Colorado Health Facilities Authority Revenue | | | | | | | |
| (Adventist Health/Sunbelt) 5.125% 11/15/24 | | | 1,375,000 | | | | 1,381,064 |
| (Catholic Health Initiatives) | | | | | | | |
| Series A 4.75% 9/1/40 | | | 1,000,000 | | | | 886,300 |
| Series D 6.25% 10/1/33 | | | 2,000,000 | | | | 2,177,580 |
| (Christian Living Community Project) | | | | | | | |
| Series A 5.75% 1/1/37 | | | 1,500,000 | | | | 1,113,645 |
| (Covenant Retirement Communities) | | | | | | | |
| Series A 5.50% 12/1/33 (RADIAN) | | | 5,000,000 | | | | 4,145,100 |
| (Evangelical Lutheran) | | | | | | | |
| 5.00% 6/1/35 | | | 2,000,000 | | | | 1,765,400 |
| 6.125% 6/1/38 | | | 5,250,000 | | | | 5,304,241 |
| Series A 5.25% 6/1/34 | | | 2,750,000 | | | | 2,508,633 |
| (Parkview Medical Center) 5.00% 9/1/25 | | | 1,000,000 | | | | 943,190 |
| (Porter Place) Series A 6.00% 1/20/36 (GNMA) | | | 5,000,000 | | | | 5,064,049 |
| (Vail Valley Medical Center Project) 5.80% 1/15/27 | | | 3,475,000 | | | | 3,433,543 |
| (Valley View Hospital Association) 5.50% 5/15/28 | | | 1,000,000 | | | | 915,790 |
| Colorado Springs Hospital Revenue 6.25% 12/15/33 | | | 2,500,000 | | | | 2,537,600 |
| Delta County Memorial Hospital District Enterprise Revenue | | | | | | | |
| 5.35% 9/1/17 | | | 4,000,000 | | | | 3,881,120 |
49
Statements of net assets
Delaware Tax-Free Colorado Fund
| | Principal amount | | Value |
| Municipal Bonds (continued) | | | | | | | |
| Health Care Revenue Bonds (continued) | | | | | | | |
| Denver Health & Hospital Authority Health Care Revenue | | | | | | | |
| Series A 4.75% 12/1/36 | | $ | 1,500,000 | | | $ | 1,117,785 |
| | Mesa County Residential Care Facilities Mortgage Revenue | | | | | | | |
| (Hilltop Community Resources) | | | | | | | |
| Series A 5.375% 12/1/28 (RADIAN) | | | 475,000 | | | | 404,239 |
| University of Colorado Hospital Authority Revenue Series A | | | | | | | |
| | 5.00% 11/15/37 | | | 2,690,000 | | | | 2,451,639 |
| 5.25% 11/15/39 | | | 3,500,000 | | | | 3,293,115 |
| 6.00% 11/15/29 | | | 2,460,000 | | | | 2,510,528 |
| | | | | | | | 48,694,754 |
| Housing Revenue Bonds – 2.18% | | | | | | | |
| Colorado Housing & Finance Authority | | | | | | | |
| (Multifamily Housing Insured Mortgage) | | | | | | | |
| Series C3 6.15% 10/1/41 | | | 1,590,000 | | | | 1,597,235 |
| (Single Family Mortgage) Series A 5.50% 11/1/29 (FHA) | | | 1,500,000 | | | | 1,574,430 |
| Puerto Rico Housing Finance Authority | | | | | | | |
| Subordinate-Capital Foundation Modernization | | | | | | | |
| 5.125% 12/1/27 | | | 2,040,000 | | | | 2,078,209 |
| | | | | | | | 5,249,874 |
| Lease Revenue Bonds – 2.66% | | | | | | | |
| Colorado Educational & Cultural National | | | | | | | |
| Conference of State Legislatures Office Building | | | | | | | |
| Facilities Authority Revenue 5.25% 6/1/21 | | | 2,000,000 | | | | 2,023,480 |
| @ | Conejos & Alamosa Counties School #11J | | | | | | | |
| Certificates of Participation 6.50% 4/1/11 | | | 520,000 | | | | 520,161 |
| El Paso County Certificates of Participation | | | | | | | |
| (Detention Facilities Project) Series B | | | | | | | |
| 5.00% 12/1/27 (AMBAC) | | | 1,500,000 | | | | 1,521,435 |
| Puerto Rico Public Buildings Authority Revenue | | | | | | | |
| (Guaranteed Government Facilities) | | | | | | | |
| Series I 5.25% 7/1/33 | | | 1,475,000 | | | | 1,304,933 |
| Series M-2 5.50% 7/1/35 (AMBAC) | | | 1,000,000 | | | | 1,026,790 |
| | | | | | | | 6,396,799 |
| Local General Obligation Bonds – 14.88% | | | | | | | |
| Adams & Arapahoe Counties Joint School | | | | | | | |
| District #28J (Aurora) 6.00% 12/1/28 | | | 2,500,000 | | | | 2,845,900 |
50
| | Principal amount | | Value |
| Municipal Bonds (continued) | | | | | | | |
| Local General Obligation Bonds (continued) | | | | | | | |
| | Arapahoe County Water & Wastewater Public | | | | | | | |
| Improvement District Refunding Series A | | | | | | | |
| 5.125% 12/1/32 (NATL-RE) | | $ | 2,555,000 | | | $ | 2,498,764 |
| Boulder Larimer & Weld Counties | | | | | | | |
| (St. Vrain Valley School) District #1J | | | | | | | |
| 5.00% 12/15/33 | | | 2,500,000 | | | | 2,576,650 |
| Denver City & County Justice System | | | | | | | |
| 5.50% 8/1/16 | | | 5,000,000 | | | | 5,932,549 |
| (Facilities & Zoo) 5.00% 8/1/19 | | | 1,020,000 | | | | 1,150,856 |
| Denver City & County School District #1 Series A | | | | | | | |
| 5.00% 12/1/29 | | | 960,000 | | | | 1,016,131 |
| | Denver West Metropolitan District | | | | | | | |
| 5.00% 12/1/33 (RADIAN) | | | 1,400,000 | | | | 1,035,636 |
| Douglas County School District #1 | | | | | | | |
| (Douglas & Elbert Counties) Series B | | | | | | | |
| 5.00% 12/15/24 | | | 2,355,000 | | | | 2,508,758 |
| 5.125% 12/15/25 (FSA) | | | 2,000,000 | | | | 2,074,640 |
| El Paso County School District #2 (Harrison) | | | | | | | |
| 5.00% 12/1/27 (NATL-RE) | | | 2,115,000 | | | | 2,162,672 |
| Garfield County School District #2 | | | | | | | |
| 5.00% 12/1/25 (FSA) | | | 3,280,000 | | | | 3,497,372 |
| (East Grand) 5.25% 12/1/25 (FSA) | | | 2,485,000 | | | | 2,686,956 |
| Gunnison Watershed Colorado School District #1J | | | | | | | |
| (East Grand) Series 2009 5.25% 12/1/33 | | | 1,400,000 | | | | 1,471,064 |
| La Plata County School District #9-R (Durango) | | | | | | | |
| 5.125% 11/1/24 (NATL-RE) | | | 1,000,000 | | | | 1,072,070 |
| @ | North Range Metropolitan | | | | | | | |
| District #1 4.50% 12/15/31 (ACA) | | | 1,500,000 | | | | 958,365 |
| District #2 5.50% 12/15/37 | | | 1,200,000 | | | | 658,344 |
| Sand Creek Metropolitan District Refunding & Improvement | | | | | | | |
| 5.00% 12/1/31 (XLCA) | | | 500,000 | | | | 411,350 |
| Weld County School District #4 5.00% 12/1/19 (FSA) | | | 1,085,000 | | | | 1,235,533 |
| | | | | | | | 35,793,610 |
| §Pre-Refunded Bonds – 14.85% | | | | | | | |
| Boulder County Hospital Revenue | | | | | | | |
| (Development Longmont United Hospital Project) | | | | | | | |
| 6.00% 12/1/30-10 (RADIAN) | | | 2,500,000 | | | | 2,669,600 |
51
Statements of net assets
Delaware Tax-Free Colorado Fund
| | Principal amount | | Value |
| Municipal Bonds (continued) | | | | | | | |
| §Pre-Refunded Bonds (continued) | | | | | | | |
| | Colorado Educational & Cultural Facilities | | | | | | | |
| Authority Revenue | | | | | | | |
| (Littleton Academy Charter School Project) | | | | | | | |
| 6.125% 1/15/31-12 | | $ | 2,000,000 | | | $ | 2,227,660 |
| (Stargate Charter School Project) 6.125% 5/1/33-13 | | | 2,000,000 | | | | 2,315,180 |
| (University of Denver Project) Series A | | | | | | | |
| 5.00% 3/1/27-12 (NATL-RE) | | | 5,000,000 | | | | 5,475,000 |
| Colorado Health Facilities Authority Revenue | | | | | | | |
| (Adventist Health/Sunbelt) 5.125% 11/15/24-16 | | | 75,000 | | | | 88,872 |
| El Paso County Certificates of Participation | | | | | | | |
| (Judicial Building Project) Series A | | | | | | | |
| 5.00% 12/1/27 (AMBAC) | | | 2,000,000 | | | | 2,208,780 |
| Fremont County School District #1 (Canon City) | | | | | | | |
| 5.00% 12/1/24-13 (NATL-RE) | | | 1,735,000 | | | | 1,980,850 |
| Garfield Pitkin & Eagle County School District #1 | | | | | | | |
| (Roaring Fork County) Series A 5.00% 12/15/27-14 (FSA) | | | 1,500,000 | | | | 1,736,235 |
| Lincoln Park Metropolitan District 7.75% 12/1/26-11 | | | 2,500,000 | | | | 2,863,675 |
| North Range Metropolitan District #1 7.25% 12/15/31-11 | | | 3,390,000 | | | | 3,826,429 |
| | Northwest Parkway Public Highway Authority Series A | | | | | | | |
| 5.25% 6/15/41-11 (FSA) | | | 8,100,000 | | | | 8,847,062 |
| Puerto Rico Commonwealth Series A 5.25% 7/1/30-16 | | | 1,235,000 | | | | 1,473,170 |
| Puerto Rico Public Buildings Authority Revenue | | | | | | | |
| (Guaranteed Government Facilities) Series I | | | | | | | |
| 5.25% 7/1/33-14 | | | 25,000 | | | | 28,459 |
| | | | | | | | 35,740,972 |
| Special Tax Revenue Bonds – 10.14% | | | | | | | |
| Aspen Sales Tax Revenue (Parks & Open Spaces) | | | | | | | |
| Series B 5.25% 11/1/23 (FSA) | | | 2,040,000 | | | | 2,199,406 |
| @ | Baptist Road Rural Transportation Authority Sales & | | | | | | | |
| Use Tax Revenue 5.00% 12/1/26 | | | 2,000,000 | | | | 1,186,020 |
| Loveland Special Improvements District #1 7.50% 7/1/29 | | | 4,980,000 | | | | 5,354,794 |
| Park Meadows Business Improvement District | | | | | | | |
| Shared Sales Tax Revenue | | | | | | | |
| 5.30% 12/1/27 | | | 950,000 | | | | 628,539 |
| 5.35% 12/1/31 | | | 720,000 | | | | 449,626 |
| Puerto Rico Commonwealth Highway & Transportation | | | | | | | |
| Authority Revenue Series K 5.00% 7/1/30 | | | 2,200,000 | | | | 1,966,580 |
52
| | Principal amount | | Value |
| Municipal Bonds (continued) | | | | | | | |
| Special Tax Revenue Bonds (continued) | | | | | | | |
| | Puerto Rico Commonwealth Infrastructure Financing | | | | | | | |
| Authority Special Tax Revenue Series B | | | | | | | |
| 5.00% 7/1/46 | | $ | 1,200,000 | | | $ | 997,056 |
| Puerto Rico Sales Tax Financing Corporation Revenue | | | | | | | |
| WCapital Appreciation-First Subordinate Series A | | | | | | | |
| 0.00% 8/1/32 | | | 5,075,000 | | | | 3,552,500 |
| First Subordinate Series A | | | | | | | |
| 5.00% 8/1/39 | | | 2,500,000 | | | | 2,559,050 |
| 5.75% 8/1/37 | | | 3,095,000 | | | | 3,181,970 |
| Regional Transportation District Sales Tax Revenue | | | | | | | |
| Series A 5.25% 11/1/18 | | | 2,000,000 | | | | 2,316,520 |
| | | | | | | | 24,392,061 |
| State General Obligation Bonds – 5.34% | | | | | | | |
| Guam Government Series A 7.00% 11/15/39 | | | 2,500,000 | | | | 2,520,475 |
| | Puerto Rico Commonwealth Government Development | | | | | | | |
| Bank Senior Notes Series B | | | | | | | |
| 5.00% 12/1/14 | | | 1,000,000 | | | | 1,014,580 |
| 5.00% 12/1/15 | | | 1,000,000 | | | | 1,007,290 |
| Puerto Rico Commonwealth Public Improvement | | | | | | | |
| Series A 5.25% 7/1/15 | | | 1,650,000 | | | | 1,685,591 |
| Series A 5.25% 7/1/21 | | | 4,000,000 | | | | 3,978,799 |
| Series B 5.00% 7/1/35 | | | 190,000 | | | | 166,999 |
| Puerto Rico Commonwealth Series A 5.25% 7/1/30 | | | 765,000 | | | | 706,615 |
| Virgin Islands Public Finance Authority | | | | | | | |
| (Gross Receipts Taxes) 5.00% 10/1/31 (ACA) | | | 2,000,000 | | | | 1,772,540 |
| | | | | | | | 12,852,889 |
| Transportation Revenue Bonds – 2.52% | | | | | | | |
| Denver City & County Airport Revenue | | | | | | | |
| Series A 5.00% 11/15/25 (NATL-RE) (FGIC) | | | 2,000,000 | | | | 2,068,300 |
| Series B 5.00% 11/15/33 (XLCA) | | | 4,000,000 | | | | 3,983,000 |
| | | | | | | | 6,051,300 |
| Water & Sewer Revenue Bonds – 3.55% | | | | | | | |
| Colorado Springs Utilities Systems Improvement Revenue | | | | | | | |
| Series C 5.50% 11/15/48 | | | 3,250,000 | | | | 3,388,677 |
53
Statements of net assets
Delaware Tax-Free Colorado Fund
| | Principal amount | | Value |
| Municipal Bonds (continued) | | | | | | | |
| Water & Sewer Revenue Bonds (continued) | | | | | | | |
| | Eagle River Water & Sanitation District Enterprise Revenue | | | | | | | |
| 5.00% 12/1/29 (ASSURED GTY) | | $ | 250,000 | | | $ | 261,203 |
| 5.125% 12/1/39 (ASSURED GTY) | | | 850,000 | | | | 867,400 |
| Pueblo Board Waterworks Revenue 5.00% 11/1/21 (FSA) | | | 1,000,000 | | | | 1,061,580 |
| | Ute Water Conservancy District Revenue | | | | | | | |
| 5.75% 6/15/20 (NATL-RE) | | | 2,900,000 | | | | 2,970,441 |
| | | | | | | | 8,549,301 |
| Total Municipal Bonds (cost $234,676,691) | | | | | | | 235,345,687 |
| |
| | Number of shares | | | |
| Short-Term Investments – 1.00% | | | | | | | |
| Money Market Instrument – 0.46% | | | | | | | |
| Dreyfus Cash Management Fund 0.16% 9/1/09 | | | 1,109,864 | | | | 1,109,864 |
| | | | | | | | 1,109,864 |
| |
| | Principal amount | | | |
| ·Variable Rate Demand Note – 0.54% | | | | | | | |
| Colorado Educational & Cultural Facilities Authority | | | | | | | |
| Revenue (National Jewish Federal Building) | | | | | | | |
| 0.16% 2/1/25 | | $ | 300,000 | | | | 300,000 |
| 0.16% 2/1/35 | | | 1,000,000 | | | | 1,000,000 |
| | | | | | | | 1,300,000 |
| Total Short-Term Investments (cost $2,409,864) | | | | | | | 2,409,864 |
| |
| Total Value of Securities – 98.81% | | | | | | | |
| (cost $237,086,555) | | | | | | | 237,755,551 |
| Receivables and Other Assets | | | | | | | |
| Net of Liabilities – 1.19% | | | | | | | 2,872,705 |
| Net Assets Applicable to 22,701,316 | | | | | | | |
| Shares Outstanding – 100.00% | | | | | | $ | 240,628,256 |
| |
| Net Asset Value – Delaware Tax-Free Colorado Fund | | | | | | | |
| Class A ($226,392,436 / 21,361,253 Shares) | | | | | | | | $10.60 |
| Net Asset Value – Delaware Tax-Free Colorado Fund | | | | | | | |
| Class B ($2,693,432 / 253,944 Shares) | | | | | | | | $10.61 |
| Net Asset Value – Delaware Tax-Free Colorado Fund | | | | | | | |
| Class C ($11,542,388 / 1,086,119 Shares) | | | | | | | | $10.63 |
54
| | | | |
| Components of Net Assets at August 31, 2009: | | | |
| Shares of beneficial interest (unlimited authorization – no par) | $ | 245,028,207 | |
| Undistributed net investment income | | 43,501 | |
| Accumulated net realized loss on investments | | (5,112,448 | ) |
| Net unrealized appreciation of investments | | 668,996 | |
| Total net assets | $ | 240,628,256 | |
| @ | Illiquid security. At August 31, 2009, the aggregate amount of illiquid securities was $3,322,890, which represented 1.38% of the Fund’s net assets. See Note 8 in “Notes to financial statements.” |
| § | Pre-Refunded Bonds. Municipals that are generally backed or secured by U.S. Treasury bonds. For Pre-Refunded Bonds, the stated maturity is followed by the year in which the bond is pre-refunded. See Note 8 in “Notes to financial statements.” |
| W | Step coupon bond. Indicates security that has a zero coupon that remains in effect until a predetermined date at which time the stated interest rate becomes effective. |
| · | Variable rate security. The rate shown is the rate as of August 31, 2009. |
Summary of abbreviations:
ACA — Insured by American Capital Access
AMBAC — Insured by the AMBAC Assurance Corporation
ASSURED GTY — Insured by the Assured Guaranty Corporation
FGIC — Insured by the Financial Guaranty Insurance Company
FHA — Insured by the Federal Housing Administration
FSA — Insured by Financial Security Assurance
GNMA — Government National Mortgage Association collateral
NATL-RE — Insured by the National Public Finance Guarantee Corporation
RADIAN — Insured by Radian Asset Assurance
XLCA — Insured by XL Capital Assurance
55
Statements of net assets
Delaware Tax-Free Colorado Fund
| | | |
| Net Asset Value and Offering Price Per Share – | | |
| Delaware Tax-Free Colorado Fund | | |
| Net asset value Class A (A) | $ | 10.60 |
| Sales charge (4.50% of offering price) (B) | | 0.50 |
| Offering price | $ | 11.10 |
(A) | Net asset value per share, as illustrated, is the amount which would be paid upon redemption or repurchase of shares. |
(B) | See the current prospectus for purchases of $100,000 or more. |
See accompanying notes
56
| Delaware Tax-Free Idaho Fund | August 31, 2009 |
| | Principal amount | | Value |
| Municipal Bonds – 95.18% | | | | | | | |
| Corporate Revenue Bonds – 4.84% | | | | | | | |
| Meridian Economic Industrial Development Revenue | | | | | | | |
| | (Hi-Micro Project) 5.85% 8/15/11 | | $ | 660,000 | | | $ | 661,729 |
| Nez Perce County Pollution Control Revenue | | | | | | | |
| (Potlatch Project) 6.00% 10/1/24 | | | 2,535,000 | | | | 2,187,629 |
| Power County Pollution Control Revenue | | | | | | | |
| (FMC Project) 5.625% 10/1/14 | | | 2,475,000 | | | | 2,429,930 |
| | | | | | | | 5,279,288 |
| Education Revenue Bonds – 10.48% | | | | | | | |
| Boise State University Revenue | | | | | | | |
| 5.00% 4/1/17 (AMBAC) | | | 500,000 | | | | 532,320 |
| Series A 4.25% 4/1/32 (NATL-RE) | | | 1,500,000 | | | | 1,374,945 |
| Series A 5.00% 4/1/18 (NATL-RE) (FGIC) | | | 1,500,000 | | | | 1,595,325 |
| Series A 5.00% 4/1/39 | | | 1,000,000 | | | | 1,022,510 |
| Un-Refunded Balance Series 07 5.375% 4/1/22 (FGIC) | | | 15,000 | | | | 15,554 |
| Idaho Housing & Financing Association Nonprofit | | | | | | | |
| Facilities Revenue (North Star Charter School Project) | | | | | | | |
| Series A 9.50% 7/1/39 | | | 1,000,000 | | | | 1,046,890 |
| Idaho State University Revenue Refunding & Improvement | | | | | | | |
| 5.00% 4/1/20 (FSA) | | | 1,130,000 | | | | 1,207,755 |
| 5.00% 4/1/23 (FSA) | | | 2,115,000 | | | | 2,186,529 |
| University of Idaho (General Refunding) | | | | | | | |
| Series A 5.00% 4/1/21 (AMBAC) | | | 1,150,000 | | | | 1,207,765 |
| Series B 4.50% 4/1/41 (FSA) | | | 1,000,000 | | | | 1,021,760 |
| University of Puerto Rico-Revenue | | | | | | | |
| Series Q 5.00% 6/1/36 | | | 250,000 | | | | 211,325 |
| | | | | | | | 11,422,678 |
| Electric Revenue Bonds – 1.52% | | | | | | | |
| Boise-Kuna Idaho Irrigation District Revenue | | | | | | | |
| (Arrowrock Hydroelectric Project) 6.30% 6/1/31 | | | 1,000,000 | | | | 1,056,290 |
| Puerto Rico Electric Power Authority Revenue | | | | | | | |
| Series TT 5.00% 7/1/37 | | | 210,000 | | | | 196,526 |
| Series WW 5.50% 7/1/38 | | | 400,000 | | | | 400,800 |
| | | | | | | | 1,653,616 |
| Escrowed to Maturity Bond – 1.71% | | | | | | | |
| Puerto Rico Commonwealth Infrastructure Financing | | | | | | | |
| Authority Revenue Series A 5.375% 10/1/24 | | | 1,750,000 | | | | 1,860,355 |
| | | | | | | | 1,860,355 |
57
Statements of net assets
Delaware Tax-Free Idaho Fund
| | Principal amount | | Value |
| Municipal Bonds (continued) | | | | | | | |
| Health Care Revenue Bonds – 4.30% | | | | | | | |
| Idaho Health Facilities Authority Hospital Revenue | | | | | | | |
| | (Idaho Elks Rehabilitation Hospital Project) | | | | | | | |
| 5.30% 7/15/18 | | $ | 625,000 | | | $ | 622,338 |
| 5.45% 7/15/23 | | | 2,000,000 | | | | 1,909,920 |
| Idaho Health Facilities Authority Revenue | | | | | | | |
| (St. Luke’s Medical Center Project) 6.75% 11/1/37 | | | 1,000,000 | | | | 1,074,060 |
| (Trinity Health Credit Group) Series B 6.125% 12/1/28 | | | 1,000,000 | | | | 1,085,500 |
| | | | | | | | 4,691,818 |
| Housing Revenue Bonds – 5.61% | | | | | | | |
| Idaho Housing Agency Single Family Mortgage Revenue | | | | | | | |
| Series A 6.05% 7/1/13 (AMBAC) (FHA) (VA) (AMT) | | | 20,000 | | | | 20,021 |
| Series A 6.10% 7/1/16 (FHA) (VA) (AMT) | | | 30,000 | | | | 30,039 |
| Series A-1 6.85% 7/1/12 (AMT) | | | 5,000 | | | | 5,015 |
| Series B 6.45% 7/1/15 (AMT) | | | 10,000 | | | | 10,013 |
| Series C-2 6.35% 7/1/15 (AMT) | | | 15,000 | | | | 15,019 |
| Series E 6.35% 7/1/15 (FHA) (AMT) | | | 20,000 | | | | 20,025 |
| Series G-2 6.15% 7/1/15 (FHA) (VA) (AMT) | | | 85,000 | | | | 85,099 |
| | Idaho Housing & Finance Association | | | | | | | |
| Single Family Mortgage Revenue | | | | | | | |
| Series B Class I 5.00% 7/1/37 (AMT) | | | 815,000 | | | | 780,705 |
| Series B Class I 5.50% 7/1/38 (AMT) | | | 1,000,000 | | | | 1,017,400 |
| Series C Class III 5.35% 1/1/25 (AMT) | | | 250,000 | | | | 251,215 |
| Series D Class III 5.45% 7/1/23 (AMT) | | | 840,000 | | | | 854,146 |
| Series E Class III 4.875% 1/1/26 (AMT) | | | 145,000 | | | | 138,769 |
| Series E Class III 5.00% 1/1/28 (AMT) | | | 895,000 | | | | 857,312 |
| Series I Class I 5.45% 1/1/39 (AMT) | | | 1,000,000 | | | | 1,005,770 |
| Puerto Rico Housing Finance Authority Subordinate- | | | | | | | |
| Capital Foundation Modernization | | | | | | | |
| 5.125% 12/1/27 | | | 1,000,000 | | | | 1,018,729 |
| | | | | | | | 6,109,277 |
| Lease Revenue Bonds – 4.01% | | | | | | | |
| Boise City Certificate of Participation | | | | | | | |
| 5.375% 9/1/20 (NATL-RE) (FGIC) (AMT) | | | 2,100,000 | | | | 2,100,294 |
| Boise City Revenue Series A 5.375% 12/1/31 (NATL-RE) | | | 500,000 | | | | 503,690 |
| Idaho State Building Authority Revenue | | | | | | | |
| Series A 5.00% 9/1/43 (XLCA) | | | 1,000,000 | | | | 985,840 |
| Series B 5.00% 9/1/21 (NATL-RE) | | | 750,000 | | | | 785,100 |
| | | | | | | | 4,374,924 |
58
| | Principal amount | | Value |
| Municipal Bonds (continued) | | | | | | | |
| Local General Obligation Bonds – 23.95% | | | | | | | |
| | Ada & Canyon Counties Joint School District #2 Meridian | | | | | | | |
| | (School Board Guaranteed Program) | | | | | | | |
| 4.75% 2/15/20 | | $ | 1,000,000 | | | $ | 1,080,650 |
| 5.125% 7/30/19 | | | 1,005,000 | | | | 1,079,682 |
| 5.50% 7/30/16 | | | 1,305,000 | | | | 1,546,673 |
| Un-Refunded Balance 5.00% 7/30/20 | | | 600,000 | | | | 642,486 |
| Bannock County School District #025 | | | | | | | |
| (Pocatello Idaho School Board Guaranteed Program) | | | | | | | |
| 5.00% 8/15/15 | | | 1,040,000 | | | | 1,181,918 |
| 5.00% 8/15/16 | | | 1,100,000 | | | | 1,235,762 |
| Boise City Independent School District | | | | | | | |
| 5.00% 8/1/24 (FSA) | | | 1,500,000 | | | | 1,640,040 |
| Canyon County Idaho School District #132 Caldwell | | | | | | | |
| 5.00% 7/30/15 (NATL-RE) (FGIC) | | | 2,000,000 | | | | 2,229,220 |
| Series A 5.00% 9/15/22 (FSA) | | | 1,725,000 | | | | 1,925,066 |
| Series A 5.00% 9/15/23 (FSA) | | | 1,810,000 | | | | 2,007,326 |
| Idaho Bond Bank Authority Revenue Series A | | | | | | | |
| 5.00% 9/15/28 | | | 1,000,000 | | | | 1,055,890 |
| 5.25% 9/15/26 | | | 2,000,000 | | | | 2,185,000 |
| Lemhi County 5.20% 8/1/27 (FSA) | | | 2,145,000 | | | | 2,209,093 |
| Nampa, Idaho 5.00% 8/1/21 (NATL-RE) (FGIC) | | | 2,475,000 | | | | 2,602,709 |
| Power & Cassia Counties Joint School District #381 | | | | | | | |
| American Falls 5.00% 8/1/17 | | | 1,155,000 | | | | 1,230,156 |
| Twin Falls County Idaho School District #413 Filer | | | | | | | |
| 5.25% 9/15/25 | | | 2,000,000 | | | | 2,244,960 |
| | | | | | | | 26,096,631 |
| §Pre-Refunded Bonds – 11.32% | | | | | | | |
| Ada & Canyon Counties Joint School District #2 Meridan | | | | | | | |
| (School Board Guaranteed Program) | | | | | | | |
| 5.00% 7/30/20-12 | | | 1,555,000 | | | | 1,726,501 |
| Boise State University Revenue Refunding & Improvement | | | | | | | |
| 5.125% 4/1/31-12 (FGIC) | | | 1,000,000 | | | | 1,102,900 |
| 5.375% 4/1/22-12 (FGIC) | | | 985,000 | | | | 1,092,621 |
| Puerto Rico Commonwealth Highway & Transportation | | | | | | | |
| Authority Revenue | | | | | | | |
| Series D 5.25% 7/1/38-12 | | | 1,000,000 | | | | 1,107,300 |
| Series Y 5.00% 7/1/36-16 | | | 1,250,000 | | | | 1,471,325 |
59
Statements of net assets
Delaware Tax-Free Idaho Fund
| | Principal amount | | Value |
| Municipal Bonds (continued) | | | | | | | |
| §Pre-Refunded Bonds (continued) | | | | | | | |
| | Puerto Rico Commonwealth Public Improvement Revenue | | | | | | | |
| Series A 5.125% 7/1/31-11 | | $ | 1,010,000 | | | $ | 1,091,164 |
| Puerto Rico Electric Power Authority Revenue | | | | | | | |
| | Series II 5.25% 7/1/31-12 | | | 1,000,000 | | | | 1,127,690 |
| Series NN 5.125% 7/1/29-13 | | | 105,000 | | | | 119,652 |
| Puerto Rico Public Buildings Authority Revenue | | | | | | | |
| (Guaranteed Government Facilities) | | | | | | | |
| Series I 5.50% 7/1/23-14 | | | 1,000,000 | | | | 1,149,750 |
| University of Idaho Revenue | | | | | | | |
| (Student Fee Housing Improvements Project) | | | | | | | |
| 5.25% 4/1/31-11 (FGIC) | | | 2,195,000 | | | | 2,348,188 |
| | | | | | | | 12,337,091 |
| Special Tax Revenue Bonds – 13.70% | | | | | | | |
| Boise Urban Renewal Agency Parking Revenue | | | | | | | |
| (Tax Increment) | | | | | | | |
| Series A 6.125% 9/1/15 | | | 1,160,000 | | | | 1,166,647 |
| Series B 6.125% 9/1/15 | | | 950,000 | | | | 955,444 |
| Bonner County Local Improvement District #93-1 | | | | | | | |
| 6.50% 4/30/10 | | | 60,000 | | | | 60,130 |
| Coeur D’Alene Local Improvement District #6 | | | | | | | |
| Series 1996 6.05% 7/1/10 | | | 90,000 | | | | 91,007 |
| Series 1997 6.10% 7/1/12 | | | 40,000 | | | | 40,386 |
| Series 1998 6.10% 7/1/14 | | | 45,000 | | | | 45,346 |
| Idaho Board Bank Authority Revenue Series B | | | | | | | |
| 4.125% 9/15/36 (NATL-RE) | | | 755,000 | | | | 644,581 |
| 5.00% 9/15/30 (NATL-RE) | | | 725,000 | | | | 746,649 |
| Puerto Rico Commonwealth Highway & Transportation | | | | | | | |
| Authority Revenue | | | | | | | |
| Series K 5.00% 7/1/30 | | | 890,000 | | | | 795,571 |
| Series W 5.50% 7/1/15 | | | 175,000 | | | | 180,976 |
| Puerto Rico Sales Tax Financing Corporation Revenue | | | | | | | |
| Series A 5.25% 8/1/57 | | | 1,000,000 | | | | 1,005,740 |
| WCapital Appreciation-First Subordinate | | | | | | | |
| Series A 0.00% 8/1/32 | | | 2,040,000 | | | | 1,428,000 |
| First Subordinate Series A | | | | | | | |
| 5.00% 8/1/39 | | | 1,000,000 | | | | 1,023,620 |
| 5.25% 8/1/27 | | | 1,500,000 | | | | 1,534,860 |
| 5.75% 8/1/37 | | | 3,350,000 | | | | 3,444,134 |
60
| | Principal amount | | Value |
| Municipal Bonds (continued) | | | | | | | |
| Special Tax Revenue Bonds (continued) | | | | | | | |
| | Virgin Islands Public Finance Authority Revenue | | | | | | | |
| (Senior Lien-Matching Fund Loan Note) Series A | | | | | | | |
| 5.25% 10/1/20 | | $ | 500,000 | | | $ | 497,075 |
| 5.25% 10/1/21 | | | 500,000 | | | | 495,130 |
| 5.25% 10/1/24 | | | 800,000 | | | | 772,488 |
| | | | | | | | 14,927,784 |
| State General Obligation Bonds – 3.87% | | | | | | | |
| Guam Government Series A 6.75% 11/15/29 | | | 1,565,000 | | | | 1,581,213 |
| Puerto Rico Commonwealth Public Improvement Series A | | | | | | | |
| 5.25% 7/1/22 | | | 1,000,000 | | | | 990,720 |
| Un-Refunded Balance 5.125% 7/1/31 | | | 1,815,000 | | | | 1,647,567 |
| | | | | | | | 4,219,500 |
| Transportation Revenue Bonds – 6.86% | | | | | | | |
| Idaho Housing & Finance Association Grant Revenue | | | | | | | |
| (Anticipated Federal Highway Trust) | | | | | | | |
| 5.00% 7/15/24 (NATL-RE) | | | 2,000,000 | | | | 2,123,860 |
| 5.25% 7/15/20 (ASSURED GTY) | | | 2,750,000 | | | | 3,106,813 |
| 5.25% 7/15/25 (ASSURED GTY) | | | 1,500,000 | | | | 1,633,545 |
| Puerto Rico Commonwealth Highway & Transportation | | | | | | | |
| Authority Revenue Un-Refunded Balance Series G | | | | | | | |
| 5.00% 7/1/33 | | | 690,000 | | | | 610,215 |
| | | | | | | | 7,474,433 |
| Water & Sewer Revenue Bonds – 3.01% | | | | | | | |
| Idaho Bond Bank Authority Revenue | | | | | | | |
| Series C 5.375% 9/15/38 | | | 1,000,000 | | | | 1,047,720 |
| Moscow Sewer Revenue 5.00% 11/1/22 (FSA) | | | 2,175,000 | | | | 2,227,461 |
| | | | | | | | 3,275,181 |
| Total Municipal Bonds (cost $100,688,015) | | | | | | | 103,722,576 |
61
Statements of net assets
Delaware Tax-Free Idaho Fund
| | Number of shares | | Value | |
| Short-Term Investment – 2.22% | | | | | | | | |
| Money Market Instrument – 2.22% | | | | | | | | |
| | Dreyfus Cash Management Fund 0.16% 9/1/09 | | | 2,423,123 | | | $ | 2,423,123 | |
| Total Short-Term Investment (cost $2,423,123) | | | | | | | 2,423,123 | |
| | | | | | | | | |
| Total Value of Securities – 97.40% | | | | | | | | |
| (cost $103,111,138) | | | | | | | 106,145,699 | |
| Receivables and Other Assets | | | | | | | | |
| Net of Liabilities – 2.60% | | | | | | | 2,834,736 | |
| Net Assets Applicable to 9,485,095 | | | | | | | | |
| Shares Outstanding – 100.00% | | | | | | $ | 108,980,435 | |
| | | | | | | | | |
| Net Asset Value – Delaware Tax-Free Idaho Fund | | | | | | | | |
| Class A ($86,445,574 / 7,522,375 Shares) | | | | | | | $11.49 | |
| Net Asset Value – Delaware Tax-Free Idaho Fund | | | | | | | | |
| Class B ($3,358,878 / 292,846 Shares) | | | | | | | $11.47 | |
| Net Asset Value – Delaware Tax-Free Idaho Fund | | | | | | | | |
| Class C ($19,175,983 / 1,669,874 Shares) | | | | | | | $11.48 | |
| | | | | | | | | |
| Components of Net Assets at August 31, 2009: | | | | | | | | |
| Shares of beneficial interest (unlimited authorization – no par) | | | | | | $ | 106,006,595 | |
| Undistributed net investment income | | | | | | | 5,851 | |
| Accumulated net realized loss on investments | | | | | | | (66,572 | ) |
| Net unrealized appreciation of investments | | | | | | | 3,034,561 | |
| Total net assets | | | | | | $ | 108,980,435 | |
| § | Pre-Refunded Bonds. Municipals that are generally backed or secured by U.S. Treasury bonds. For Pre-Refunded Bonds, the stated maturity is followed by the year in which the bond is pre-refunded. See Note 8 in “Notes to financial statements.” |
| W | Step coupon bond. Indicates security that has a zero coupon that remains in effect until a predetermined date at which time the stated interest rate becomes effective. |
62
Summary of abbreviations:
AMBAC — Insured by the AMBAC Assurance Corporation
AMT — Subject to the Alternative Minimum Tax
ASSURED GTY — Insured by the Assured Guaranty Corporation
FGIC — Insured by the Financial Guaranty Insurance Company
FHA — Insured by the Federal Housing Administration
FSA — Insured by Financial Security Assurance
NATL-RE — Insured by the National Public Finance Guarantee Corporation
VA — Insured by the Veterans Administration
XLCA — Insured by XL Capital Assurance
| Net Asset Value and Offering Price Per Share – | | | |
| Delaware Tax-Free Idaho Fund | | | |
| Net asset value Class A (A) | | $ | 11.49 |
| Sales charge (4.50% of offering price) (B) | | | 0.54 |
| Offering price | | $ | 12.03 |
(A) | Net asset value per share, as illustrated, is the amount which would be paid upon redemption or repurchase of shares. |
(B) | See the current prospectus for purchases of $100,000 or more. |
See accompanying notes
63
| Statements of net assets |
| Delaware Tax-Free New York Fund | August 31, 2009 |
| | Principal amount | | Value |
| Municipal Bonds – 97.71% | | | | | | | |
| Corporate Revenue Bonds – 7.41% | | | | | | | |
| | Liberty Development Corporation Revenue | | | | | | | |
| (Goldman Sachs Headquarters) 5.25% 10/1/35 | | $ | 400,000 | | | $ | 391,636 |
| Nassau County Tobacco Settlement Refunding | | | | | | | |
| (Asset-Backed) Series A-3 5.125% 6/1/46 | | | 750,000 | | | | 550,574 |
| New York City Industrial Development Agency Revenue | | | | | | | |
| (Brooklyn Navy Yard Cogen Partners) | | | | | | | |
| 5.75% 10/1/36 (AMT) | | | 450,000 | | | | 318,393 |
| New York Energy Research & Development Authority | | | | | | | |
| Pollution Control Revenue Refunding | | | | | | | |
| (Central Hudson Gas) | | | | | | | |
| Series A 5.45% 8/1/27 (AMBAC) | | | 500,000 | | | | 505,510 |
| Suffolk County Industrial Development Agency Revenue | | | | | | | |
| (Keyspan-Port Jefferson Energy Center) | | | | | | | |
| 5.25% 6/1/27 (AMT) | | | 250,000 | | | | 230,438 |
| TSASC Tobacco Settlement Refunding (Asset-Backed) | | | | | | | |
| Series 1 5.125% 6/1/42 | | | 250,000 | | | | 185,273 |
| | | | | | | | 2,181,824 |
| Education Revenue Bonds – 19.31% | | | | | | | |
| Albany Industrial Development Agency Civic Facilities | | | | | | | |
| Revenue (Brighter Choice Charter School) | | | | | | | |
| Series A 5.00% 4/1/37 | | | 250,000 | | | | 182,698 |
| Amherst Industrial Development Agency Civic Facilities | | | | | | | |
| Revenue (UBF Faculty Student Housing) | | | | | | | |
| Series A 5.75% 8/1/30 (AMBAC) | | | 200,000 | | | | 203,960 |
| Dutchess County Industrial Development Agency | | | | | | | |
| (Marist College) 5.00% 7/1/20 | | | 500,000 | | | | 509,565 |
| Madison County Industrial Development Agency Civic | | | | | | | |
| Facility Revenue (Colgate University Project) | | | | | | | |
| Series A 5.00% 7/1/39 (NATL-RE) | | | 400,000 | | | | 404,248 |
| New York State Dormitory Authority Revenue | | | | | | | |
| (Columbia University) Series A 5.00% 7/1/23 | | | 500,000 | | | | 527,304 |
| (Pratt Institute) Series C 5.125% 7/1/39 (ASSURED GTY) | | | 300,000 | | | | 305,430 |
| ·Series B 5.25% 11/15/23 | | | 250,000 | | | | 270,195 |
| Un-Refunded Series B 7.50% 5/15/11 | | | 125,000 | | | | 137,718 |
64
| | Principal amount | | Value |
| Municipal Bonds (continued) | | | | | | | |
| Education Revenue Bonds (continued) | | | | | | | |
| | New York State Dormitory Authority Revenue | | | | | | | |
| Non-State Supported Debt | | | | | | | |
| (Brooklyn Law School) 5.75% 7/1/33 | | $ | 340,000 | | | $ | 344,556 |
| (Cornell University) Series A | | | | | | | |
| 4.75% 7/1/29 | | | 100,000 | | | | 104,061 |
| 5.00% 7/1/34 | | | 170,000 | | | | 178,616 |
| 5.00% 7/1/39 | | | 500,000 | | | | 521,274 |
| (New York University) Series A 5.25% 7/1/48 | | | 400,000 | | | | 406,812 |
| (Rockefeller University) Series A 5.00% 7/1/27 | | | 250,000 | | | | 275,490 |
| (Teachers College) 5.50% 3/1/39 | | | 250,000 | | | | 258,160 |
| (University of Rochester) | | | | | | | |
| Series A 5.125% 7/1/39 | | | 250,000 | | | | 254,723 |
| WSeries A-2 4.375% 7/1/20 | | | 250,000 | | | | 238,748 |
| St. Lawrence County Industrial Development Agency | | | | | | | |
| Civic Faculty Revenue (St. Lawrence University) | | | | | | | |
| Series A 5.00% 10/1/16 | | | 500,000 | | | | 562,014 |
| | | | | | | | 5,685,572 |
| Electric Revenue Bonds – 3.80% | | | | | | | |
| Long Island Power Authority New York Electric System Revenue | | | | | | | |
| Series A 5.75% 4/1/39 | | | 350,000 | | | | 372,106 |
| Series B 5.75% 4/1/33 | | | 250,000 | | | | 267,468 |
| Puerto Rico Electric Power Authority Revenue | | | | | | | |
| Series WW 5.00% 7/1/28 | | | 190,000 | | | | 186,576 |
| Series WW 5.50% 7/1/38 | | | 200,000 | | | | 200,400 |
| Series TT 5.00% 7/1/37 | | | 100,000 | | | | 93,584 |
| | | | | | | | 1,120,134 |
| Health Care Revenue Bonds – 9.38% | | | | | | | |
| Albany Industrial Development Agency Civic Facility | | | | | | | |
| Revenue (St. Peter’s Hospital Project) | | | | | | | |
| Series A 5.25% 11/15/32 | | | 500,000 | | | | 430,930 |
| East Rochester Housing Authority Revenue Refunding | | | | | | | |
| (Senior Living-Woodland Village Project) 5.50% 8/1/33 | | | 200,000 | | | | 151,782 |
65
| Statements of net assets |
| Delaware Tax-Free New York Fund | |
| | Principal amount | | Value |
| Municipal Bonds (continued) | | | | | | | |
| Health Care Revenue Bonds (continued) | | | | | | | |
| | New York Dormitory Authority Revenue | | | | | | | |
| (Chapel Oaks) 5.45% 7/1/26 (LOC, Allied Irish Bank) | | $ | 450,000 | | | $ | 453,722 |
| (Millard Fillmore Hospital) 5.375% 2/1/32 (AMBAC) (FHA) | | | 225,000 | | | | 225,117 |
| (Winthrop South Nassau Hospital) | | | | | | | |
| Series B 5.50% 7/1/23 | | | 500,000 | | | | 471,745 |
| New York Dormitory Authority Revenue | | | | | | | |
| Non-State Supported Debt | | | | | | | |
| (Memorial Sloan-Kettering) Series 1 5.00% 7/1/35 | | | 225,000 | | | | 226,539 |
| (North Shore Long Island Jewish Group) | | | | | | | |
| Series A 5.50% 5/1/37 | | | 500,000 | | | | 495,049 |
| (Orange Regional Medical Center) 6.125% 12/1/29 | | | 365,000 | | | | 305,965 |
| | | | | | | | 2,760,849 |
| Housing Revenue Bonds – 2.47% | | | | | | | |
| New York City Housing Development Multifamily Housing | | | | | | | |
| Revenue Series G-1 4.875% 11/1/39 (AMT) | | | 250,000 | | | | 229,853 |
| New York State Housing Finance Agency Revenue | | | | | | | |
| (Affordable Housing) Series A 5.25% 11/1/41 | | | 500,000 | | | | 497,805 |
| | | | | | | | 727,658 |
| Lease Revenue Bonds – 4.62% | | | | | | | |
| Battery Park City Authority Revenue | | | | | | | |
| Series A 5.00% 11/1/26 | | | 250,000 | | | | 259,785 |
| Hudson Yards Infrastructure Revenue | | | | | | | |
| Series A 5.00% 2/15/47 | | | 400,000 | | | | 359,168 |
| Tobacco Settlement Financing Authority | | | | | | | |
| Revenue (Asset-Backed) Series B-1C | | | | | | | |
| 5.50% 6/1/20 | | | 200,000 | | | | 212,104 |
| 5.50% 6/1/21 | | | 500,000 | | | | 527,825 |
| | | | | | | | 1,358,882 |
| Local General Obligation Bonds – 4.08% | | | | | | | |
| New York City | | | | | | | |
| Series D 5.00% 11/1/34 | | | 125,000 | | | | 126,540 |
| Subordinated Series C-1 5.00% 10/1/19 | | | 500,000 | | | | 547,675 |
| Subordinated Series I-1 5.375% 4/1/36 | | | 500,000 | | | | 527,360 |
| | | | | | | | 1,201,575 |
66
| | Principal amount | | Value |
| Municipal Bonds (continued) | | | | | | | |
| §Pre-Refunded Bonds – 8.24% | | | | | | | |
| | Albany Parking Authority Revenue | | | | | | | |
| Series A 5.625% 7/15/25-11 | | $ | 280,000 | | | $ | 308,126 |
| New York Dormitory Authority Revenue | | | | | | | |
| (North Shore Long Island Jewish Group Project) | | | | | | | |
| 5.50% 5/1/33-13 | | | 500,000 | | | | 574,735 |
| Pre-Refunding Series B 7.50% 5/15/11-10 | | | 75,000 | | | | 78,482 |
| Puerto Rico Commonwealth Highway & Transportation | | | | | | | |
| Authority Revenue Series Y 5.50% 7/1/36-16 | | | 475,000 | | | | 574,099 |
| Puerto Rico Commonwealth Series B 5.25% 7/1/32-16 | | | 155,000 | | | | 184,892 |
| Puerto Rico Electric Power Authority Revenue | | | | | | | |
| Series II 5.25% 7/1/31-12 | | | 500,000 | | | | 563,845 |
| Series NN 5.125% 7/1/29-13 | | | 125,000 | | | | 142,443 |
| | | | | | | | 2,426,622 |
| Special Tax Revenue Bonds – 21.84% | | | | | | | |
| Metropolitan Transportation Authority Revenue | | | | | | | |
| (Dedicated Tax Fund) Series B 5.00% 11/15/34 | | | 500,000 | | | | 506,345 |
| New York City Transitional Finance Authority Revenue | | | | | | | |
| (Subordinated Future Tax Secured) | | | | | | | |
| Series B 5.00% 11/1/18 | | | 500,000 | | | | 564,724 |
| New York City Trust for Cultural Resources Revenue | | | | | | | |
| Refunding (American Museum of National History) | | | | | | | |
| Series A 5.00% 7/1/44 (NATL-RE) | | | 250,000 | | | | 251,475 |
| (Museum of Modern Art) Series 1A 5.00% 4/1/31 | | | 250,000 | | | | 260,743 |
| New York Dormitory Authority State | | | | | | | |
| Personal Income Tax Revenue | | | | | | | |
| Series A 5.00% 3/15/38 | | | 500,000 | | | | 511,800 |
| Series C 5.00% 3/15/15 | | | 250,000 | | | | 285,053 |
| New York Dormitory Authority State Supported Debt | | | | | | | |
| Revenue (Consolidated Services Contract) | | | | | | | |
| 5.00% 7/1/17 (FSA) | | | 500,000 | | | | 561,899 |
| New York Sales Tax Asset Receivables | | | | | | | |
| Series A 5.25% 10/15/27 (AMBAC) | | | 500,000 | | | | 543,594 |
| New York State Urban Development Revenue Personal | | | | | | | |
| Income Tax Series A-1 5.00% 12/15/22 | | | 250,000 | | | | 272,298 |
| Puerto Rico Commonwealth Highway & Transportation | | | | | | | |
| Authority Revenue Series K 5.00% 7/1/30 | | | 235,000 | | | | 210,067 |
| Puerto Rico Commonwealth Infrastructure Financing | | | | | | | |
| Authority Revenue Series B 5.00% 7/1/15 | | | 250,000 | | | | 253,390 |
67
Statements of net assets
Delaware Tax-Free New York Fund
| | | Principal amount | | Value |
| Municipal Bonds (continued) | | | | | | | |
| Special Tax Revenue Bonds (continued) | | | | | | | |
| Puerto Rico Sales Tax Financing Corporation Revenue | | | | | | | |
| Series A 5.25% 8/1/57 | | $ | 325,000 | | | $ | 326,866 |
| WCapital Appreciation-First Subordinate | | | | | | | |
| Series A 0.00% 8/1/32 | | | 510,000 | | | | 357,000 |
| First Subordinate Series A | | | | | | | |
| | 5.00% 8/1/39 | | | 500,000 | | | | 511,810 |
| 5.75% 8/1/37 | | | 485,000 | | | | 498,629 |
| Schenectady Metroplex Development Authority Revenue | | | | | | | |
| Series A 5.375% 12/15/21 | | | 500,000 | | | | 516,799 |
| | | | | | | | 6,432,492 |
| State General Obligation Bonds – 4.27% | | | | | | | |
| Guam Government Series A 7.00% 11/15/39 | | | 395,000 | | | | 398,235 |
| New York State Series A | | | | | | | |
| 5.00% 3/1/38 | | | 500,000 | | | | 514,650 |
| 5.00% 2/15/39 | | | 250,000 | | | | 257,785 |
| Puerto Rico Commonwealth Series B 5.25% 7/1/32 | | | 95,000 | | | | 87,524 |
| | | | | | | | 1,258,194 |
| Transportation Revenue Bonds – 10.64% | | | | | | | |
| Albany Parking Authority Revenue Series A 5.625% 7/15/25 | | | 220,000 | | | | 221,982 |
| Metropolitan Transportation Authority Revenue | | | | | | | |
| Series 2008C 6.50% 11/15/28 | | | 200,000 | | | | 226,156 |
| ·Series B 5.00% 11/15/27 | | | 200,000 | | | | 219,164 |
| Series F 5.00% 11/15/15 | | | 150,000 | | | | 165,302 |
| New York City Industrial Development Agency Special | | | | | | | |
| Airport Facilities (JFK Airis Project) | | | | | | | |
| Series A 5.50% 7/1/28 (AMT) | | | 500,000 | | | | 349,645 |
| New York State Thruway Authority General Revenue Series H | | | | | | | |
| 5.00% 1/1/14 (NATL-RE) | | | 500,000 | | | | 556,889 |
| 5.00% 1/1/15 (NATL-RE) | | | 250,000 | | | | 279,693 |
| Onondaga County Industrial Development Authority | | | | | | | |
| Revenue (Subordinated Air Cargo Project) | | | | | | | |
| 7.25% 1/1/32 (AMT) | | | 500,000 | | | | 417,545 |
| Port Auth New York & New Jersey | | | | | | | |
| (Consolidated-One Hundred Fifty-Third) 5.00% 7/15/35 | | | 250,000 | | | | 259,790 |
| Triborough Bridge & Tunnel Authority Revenue | | | | | | | |
| Series C 5.00% 11/15/24 | | | 200,000 | | | | 216,112 |
| ·Subordinate Series B-1 5.00% 11/15/25 | | | 200,000 | | | | 221,860 |
| | | | | | | | 3,134,138 |
68
| | | Principal amount | | Value | |
| Municipal Bonds (continued) | | | | | | | | |
| Water & Sewer Revenue Bonds – 1.65% | | | | | | | | |
| New York City Municipal Finance Authority | | | | | | | | |
| Water & Sewer System Revenue | | | | | | | | |
| (Fiscal 2009) Series A 5/75% 6/15/40 | | $ | 200,000 | | | $ | 218,650 | |
| (Second General Resolution) Series FF-2 5.50% 6/15/40 | | | 250,000 | | | | 268,268 | |
| | | | | | | | 486,918 | |
| Total Municipal Bonds (cost $27,843,074) | | | | | | | 28,774,858 | |
| | | | | | | | | |
| Short-Term Investment – 0.68% | | | | | | | | |
| ·Variable Rate Demand Note – 0.68% | | | | | | | | |
| New York City Industrial Development Agency | | | | | | | | |
| Civic Facility Revenue (New York Law School Project) | | | | | | | | |
| Series B-2 1.40% 7/1/36 | | | 200,000 | | | | 200,000 | |
| Total Short-Term Investment (cost $200,000) | | | | | | | 200,000 | |
| | | | | | | | | |
| Total Value of Securities – 98.39% | | | | | | | | |
| (cost $28,043,074) | | | | | | | 28,974,858 | |
| Receivables and Other Assets | | | | | | | | |
| Net of Liabilities – 1.61% | | | | | | | 474,139 | |
| Net Assets Applicable to 2,820,274 | | | | | | | | |
| Shares Outstanding – 100.00% | | | | | | $ | 29,448,997 | |
| | | | | | | | | |
| Net Asset Value – Delaware Tax-Free New York Fund | | | | | | | | |
| Class A ($22,779,828 / 2,180,382 Shares) | | | | | | | | $10.45 | |
| Net Asset Value – Delaware Tax-Free New York Fund | | | | | | | | |
| Class B ($1,018,421 / 97,699 Shares) | | | | | | | | $10.42 | |
| Net Asset Value – Delaware Tax-Free New York Fund | | | | | | | | |
| Class C ($5,650,748 / 542,193 Shares) | | | | | | | | $10.42 | |
| | | | | | | | | |
| Components of Net Assets at August 31, 2009: | | | | | | | | |
| Shares of beneficial interest (unlimited authorization – no par) | | | | | | $ | 28,530,345 | |
| Undistributed net investment income | | | | | | | 3,746 | |
| Accumulated net realized loss on investments | | | | | | | (16,878 | ) |
| Net unrealized appreciation of investments | | | | | | | 931,784 | |
| Total net assets | | | | | | $ | 29,448,997 | |
69
Statements of net assets
Delaware Tax-Free New York Fund
| |
| W | Step coupon bond. Indicates security that has a zero coupon that remains in effect until a predetermined date at which time the stated interest rate becomes effective. |
| § | Pre-Refunded Bonds. Municipals that are generally backed or secured by U.S. Treasury bonds. For Pre-Refunded Bonds, the stated maturity is followed by the year in which the bond is pre-refunded. See Note 8 in “Notes to financial statements.” |
| · | Variable rate security. The rate shown is the rate as of August 31, 2009. |
Summary of abbreviations:
AMBAC — Insured by the AMBAC Assurance Corporation
AMT — Subject to Alternative Minimum Tax
ASSURED GTY — Insured by the Assured Guaranty Corporation
FHA — Insured by the Federal Housing Administration
FSA — Insured by Financial Security Assurance
LOC — Letter of Credit
NATL-RE — Insured by the National Public Finance Guarantee Corporation
| Net Asset Value and Offering Price Per Share – | |
| Delaware Tax-Free New York Fund | |
| Net asset value Class A (A) | $10.45 |
| Sales charge (4.50% of offering price) (B) | 0.49 |
| Offering price | $10.94 |
| (A) | Net asset value per share, as illustrated, is the amount which would be paid upon redemption or repurchase of shares. |
| (B) | See the current prospectus for purchases of $100,000 or more. |
See accompanying notes
70
Statements of operations |
Year Ended August 31, 2009 |
| Delaware Tax-Free | | Delaware Tax-Free | | Delaware Tax-Free |
| Arizona Fund | | California Fund | | Colorado Fund |
| Investment Income: | | | | | | | | | | | | | | |
| Interest | | $ | 6,028,844 | | | | $ | 4,248,739 | | | | $ | 12,393,884 | |
| | | | | | | | | | | | | | | |
| Expenses: | | | | | | | | | | | | | | |
| Management fees | | | 624,943 | | | | | 440,661 | | | | | 1,276,704 | |
| Distribution expenses – Class A | | | 276,245 | | | | | 153,655 | | | | | 548,320 | |
| Distribution expenses – Class B | | | 75,220 | | | | | 53,650 | | | | | 31,742 | |
| Distribution expenses – Class C | | | 71,518 | | | | | 133,863 | | | | | 97,866 | |
| Dividend disbursing and transfer agent | | | | | | | | | | | | | | |
| fees and expenses | | | 54,929 | | | | | 41,751 | | | | | 118,538 | |
| Accounting and administration expenses | | | 49,995 | | | | | 32,048 | | | | | 92,851 | |
| Legal fees | | | 22,049 | | | | | 15,099 | | | | | 39,431 | |
| Audit and tax | | | 18,678 | | | | | 15,929 | | | | | 25,448 | |
| Reports and statements to shareholders | | | 16,014 | | | | | 9,315 | | | | | 26,926 | |
| Registration fees | | | 14,623 | | | | | 5,461 | | | | | 7,480 | |
| Trustees’ fees | | | 9,099 | | | | | 5,831 | | | | | 16,865 | |
| Pricing fees | | | 8,268 | | | | | 8,105 | | | | | 10,265 | |
| Insurance fees | | | 4,007 | | | | | 2,606 | | | | | 7,298 | |
| Custodian fees | | | 2,557 | | | | | 1,785 | | | | | 5,713 | |
| Consulting fees | | | 1,732 | | | | | 1,111 | | | | | 3,209 | |
| Trustees’ expenses | | | 757 | | | | | 487 | | | | | 1,326 | |
| Dues and services | | | 572 | | | | | 413 | | | | | 1,305 | |
| | | 1,251,206 | | | | | 921,770 | | | | | 2,311,287 | |
| Less fees waived | | | (201,387 | ) | | | | (74,551 | ) | | | | (113,721 | ) |
| Less expense paid indirectly | | | (58 | ) | | | | — | | | | | — | |
| Total operating expenses | | | 1,049,761 | | | | | 847,219 | | | | | 2,197,566 | |
| Net Investment Income | | | 4,979,083 | | | | | 3,401,520 | | | | | 10,196,318 | |
| | | | | | | | | | | | | | | |
| Net Realized and Unrealized Gain (Loss) | | | | | | | | | | | | | | |
| on Investments: | | | | | | | | | | | | | | |
| Net realized gain on investments | | | 676,245 | | | | | 709,018 | | | | | 3,397,919 | |
| Net change in unrealized appreciation/ | | | | | | | | | | | | | | |
| depreciation of investments | | | 283,443 | | | | | (2,723,629 | ) | | | | (4,848,204 | ) |
| Net Realized and Unrealized Gain (Loss) | | | | | | | | | | | | | | |
| on Investments | | | 959,688 | | | | | (2,014,611 | ) | | | | (1,450,285 | ) |
| | | | | | | | | | | | | | | |
| Net Increase in Net Assets | | | | | | | | | | | | | | |
| Resulting from Operations | | $ | 5,938,771 | | | | $ | 1,386,909 | | | | $ | 8,746,033 | |
See accompanying notes
72
| Delaware Tax-Free | | Delaware Tax-Free |
| Idaho Fund | | New York Fund |
| Investment Income: | | | | | | | | | |
| Interest | | $ | 4,443,611 | | | | $ | 1,129,762 | |
| | | | | | | | | | |
| Expenses: | | | | | | | | | |
| Management fees | | | 506,038 | | | | | 125,458 | |
| Distribution expenses – Class A | | | 187,156 | | | | | 45,078 | |
| Distribution expenses – Class B | | | 42,576 | | | | | 11,859 | |
| Distribution expenses – Class C | | | 127,184 | | | | | 35,392 | |
| Dividend disbursing and transfer agent | | | | | | | | | |
| fees and expenses | | | 42,373 | | | | | 18,373 | |
| Accounting and administration expenses | | | 36,803 | | | | | 9,124 | |
| Legal fees | | | 17,574 | | | | | 4,230 | |
| Audit and tax | | | 17,184 | | | | | 12,520 | |
| Reports and statements to shareholders | | | 11,104 | | | | | 2,889 | |
| Pricing fees | | | 8,260 | | | | | 6,566 | |
| Trustees’ fees | | | 6,640 | | | | | 120 | |
| Registration fees | | | 5,896 | | | | | 10,969 | |
| Insurance fees | | | 2,799 | | | | | 665 | |
| Consulting fees | | | 1,243 | | | | | 304 | |
| Custodian fees | | | 1,223 | | | | | 226 | |
| Trustees’ expenses | | | 508 | | | | | 1,637 | |
| Dues and services | | | 466 | | | | | 99 | |
| | | 1,015,027 | | | | | 285,509 | |
| Less fees waived | | | (73,531 | ) | | | | (56,173 | ) |
| Less expense paid indirectly | | | (11 | ) | | | | (82 | ) |
| Total operating expenses | | | 941,485 | | | | | 229,254 | |
| Net Investment Income | | | 3,502,126 | | | | | 900,508 | |
| | | | | | | | | | |
| Net Realized and Unrealized Gain | | | | | | | | | |
| on Investments: | | | | | | | | | |
| Net realized gain on investments | | | 242,232 | | | | | 190,585 | |
| Net change in unrealized appreciation/ | | | | | | | | | |
| depreciation of investments | | | 2,073,940 | | | | | 482,416 | |
| Net Realized and Unrealized Gain | | | | | | | | | |
| on Investments | | | 2,316,172 | | | | | 673,001 | |
| | | | | | | | | | |
| Net Increase in Net Assets | | | | | | | | | |
| Resulting from Operations | | $ | 5,818,298 | | | | $ | 1,573,509 | |
See accompanying notes
73
Statements of changes in net assets
Delaware Tax-Free Arizona Fund
| Year Ended |
| 8/31/09 | | 8/31/08 |
| Increase (Decrease) in Net Assets from Operations: | | | | | | | |
| Net investment income | $ | 4,979,083 | | | $ | 5,547,803 | |
| Net realized gain (loss) on investments | | 676,245 | | | | (122,728 | ) |
| Net change in unrealized | | | | | | | |
| appreciation/depreciation of investments | | 283,443 | | | | (1,640,599 | ) |
| Net increase in net assets resulting from operations | | 5,938,771 | | | | 3,784,476 | |
| | | | | | | | |
| Dividends and Distributions to Shareholders from: | | | | | | | |
| Net investment income: | | | | | | | |
| Class A | | (4,473,743 | ) | | | (4,918,990 | ) |
| Class B | | (247,800 | ) | | | (359,177 | ) |
| Class C | | (235,244 | ) | | | (269,611 | ) |
| | (4,956,787 | ) | | | (5,547,778 | ) |
| | | | | | | | |
| Capital Share Transactions: | | | | | | | |
| Proceeds from shares sold: | | | | | | | |
| Class A | | 8,072,718 | | | | 14,751,087 | |
| Class B | | 20,443 | | | | 343 | |
| Class C | | 1,098,183 | | | | 2,945,439 | |
| | | | | | | | |
| Net asset value of shares issued upon reinvestment | | | | | | | |
| of dividends and distributions: | | | | | | | |
| Class A | | 2,209,302 | | | | 2,407,736 | |
| Class B | | 128,925 | | | | 184,069 | |
| Class C | | 146,249 | | | | 174,113 | |
| | 11,675,820 | | | | 20,462,787 | |
74
| Year Ended |
| 8/31/09 | | 8/31/08 |
| Capital Share Transactions (continued): | | | | | | | |
| Cost of shares repurchased: | | | | | | | |
| Class A | $ | (19,633,059 | ) | | $ | (19,237,873 | ) |
| Class B | | (3,235,890 | ) | | | (2,845,303 | ) |
| Class C | | (2,787,126 | ) | | | (1,815,293 | ) |
| | (25,656,075 | ) | | | (23,898,469 | ) |
| Decrease in net assets derived from | | | | | | | |
| capital share transactions | | (13,980,255 | ) | | | (3,435,682 | ) |
| Net Decrease in Net Assets | | (12,998,271 | ) | | | (5,198,984 | ) |
| | | | | | | | |
| Net Assets: | | | | | | | |
| Beginning of year | | 140,453,218 | | | | 145,652,202 | |
| End of year1 | $ | 127,454,947 | | | $ | 140,453,218 | |
| | | | | | | | |
| 1Including undistributed net investment income | $ | 26,196 | | | $ | — | |
See accompanying notes
75
Statements of changes in net assets
Delaware Tax-Free California Fund
| Year Ended |
| 8/31/09 | | 8/31/08 |
| Increase (Decrease) in Net Assets from Operations: | | | | | | | |
| Net investment income | $ | 3,401,520 | | | $ | 3,715,410 | |
| Net realized gain (loss) on investments | | 709,018 | | | | (461,721 | ) |
| Net change in unrealized | | | | | | | |
| appreciation/depreciation of investments | | (2,723,629 | ) | | | (1,438,134 | ) |
| Net increase in net assets resulting from operations | | 1,386,909 | | | | 1,815,555 | |
| | | | | | | | |
| Dividends and Distributions to Shareholders from: | | | | | | | |
| Net investment income: | | | | | | | |
| Class A | | (2,701,738 | ) | | | (2,975,104 | ) |
| Class B | | (195,352 | ) | | | (272,986 | ) |
| Class C | | (487,982 | ) | | | (467,320 | ) |
| | (3,385,072 | ) | | | (3,715,410 | ) |
| | | | | | | | |
| Capital Share Transactions: | | | | | | | |
| Proceeds from shares sold: | | | | | | | |
| Class A | | 8,313,126 | | | | 13,897,604 | |
| Class B | | 90,914 | | | | 141,422 | |
| Class C | | 2,115,521 | | | | 4,752,482 | |
| | | | | | | | |
| Net asset value of shares issued upon reinvestment | | | | | | | |
| of dividends and distributions: | | | | | | | |
| Class A | | 1,547,832 | | | | 1,795,621 | |
| Class B | | 137,850 | | | | 191,370 | |
| Class C | | 358,106 | | | | 353,985 | |
| | 12,563,349 | | | | 21,132,484 | |
76
| Year Ended |
| 8/31/09 | | 8/31/08 |
| Capital Share Transactions (continued): | | | | | | | |
| Cost of shares repurchased: | | | | | | | |
| Class A | $ | (14,448,671 | ) | | $ | (23,597,793 | ) |
| Class B | | (1,676,431 | ) | | | (2,976,125 | ) |
| Class C | | (3,594,180 | ) | | | (3,278,508 | ) |
| | (19,719,282 | ) | | | (29,852,426 | ) |
| Decrease in net assets derived from | | | | | | | |
| capital share transactions | | (7,155,933 | ) | | | (8,719,942 | ) |
| Net Decrease in Net Assets | | (9,154,096 | ) | | | (10,619,797 | ) |
| | | | | | | | |
| Net Assets: | | | | | | | |
| Beginning of year | | 88,753,994 | | | | 99,373,791 | |
| End of year1 | $ | 79,599,898 | | | $ | 88,753,994 | |
| | | | | | | | |
| 1Including undistributed net investment income | $ | 18,763 | | | $ | 1,300 | |
See accompanying notes
77
Statements of changes in net assets
Delaware Tax-Free Colorado Fund
| Year Ended |
| 8/31/09 | | 8/31/08 |
| Increase (Decrease) in Net Assets from Operations: | | | | | | | |
| Net investment income | $ | 10,196,318 | | | $ | 10,555,283 | |
| Net realized gain (loss) on investments | | 3,397,919 | | | | (620,603 | ) |
| Net change in unrealized | | | | | | | |
| appreciation/depreciation of investments | | (4,848,204 | ) | | | (1,307,241 | ) |
| Net increase in net assets resulting from operations | | 8,746,033 | | | | 8,627,439 | |
| |
| Dividends and Distributions to Shareholders from: | | | | | | | |
| Net investment income: | | | | | | | |
| Class A | | (9,697,369 | ) | | | (10,088,211 | ) |
| Class B | | (116,434 | ) | | | (155,100 | ) |
| Class C | | (355,221 | ) | | | (340,507 | ) |
| | | (10,169,024 | ) | | | (10,583,818 | ) |
| |
| Capital Share Transactions: | | | | | | | |
| Proceeds from shares sold: | | | | | | | |
| Class A | | 14,183,751 | | | | 10,216,326 | |
| Class B | | 10,613 | | | | 19 | |
| Class C | | 2,881,769 | | | | 1,027,663 | |
| |
| Net asset value of shares issued upon reinvestment | | | | | | | |
| of dividends and distributions: | | | | | | | |
| Class A | | 6,074,319 | | | | 6,399,592 | |
| Class B | | 50,248 | | | | 72,523 | |
| Class C | | 248,362 | | | | 231,599 | |
| | 23,449,062 | | | | 17,947,722 | |
78
| Year Ended |
| 8/31/09 | | 8/31/08 |
| Capital Share Transactions (continued): | | | | | | | |
| Cost of shares repurchased: | | | | | | | |
| Class A | $ | (27,122,635 | ) | | $ | (26,823,353 | ) |
| Class B | | (1,264,891 | ) | | | (1,411,740 | ) |
| Class C | | (1,437,234 | ) | | | (1,502,110 | ) |
| | | (29,824,760 | ) | | | (29,737,203 | ) |
| Decrease in net assets derived from | | | | | | | |
| capital share transactions | | (6,375,698 | ) | | | (11,789,481 | ) |
| Net Decrease in Net Assets | | (7,798,689 | ) | | | (13,745,860 | ) |
| |
| Net Assets: | | | | | | | |
| Beginning of year | | 248,426,945 | | | | 262,172,805 | |
| End of year1 | $ | 240,628,256 | | | $ | 248,426,945 | |
| |
| 1Including undistributed net investment income | $ | 43,501 | | | $ | — | |
See accompanying notes
79
Statements of changes in net assets
Delaware Tax-Free Idaho Fund
| | Year Ended |
| | 8/31/09 | | 8/31/08 |
| Increase (Decrease) in Net Assets from Operations: | | | | | | | |
| Net investment income | $ | 3,502,126 | | | $ | 3,256,157 | |
| Net realized gain on investments | | 242,232 | | | | 75,661 | |
| Net change in unrealized | | | | | | | |
| appreciation/depreciation of investments | | 2,073,940 | | | | (89,235 | ) |
| Net increase in net assets resulting from operations | | 5,818,298 | | | | 3,242,583 | |
| |
| Dividends and Distributions to Shareholders from: | | | | | | | |
| Net investment income: | | | | | | | |
| Class A | | (2,944,277 | ) | | | (2,732,459 | ) |
| Class B | | (136,217 | ) | | | (170,938 | ) |
| Class C | | (403,213 | ) | | | (349,960 | ) |
| | | (3,483,707 | ) | | | (3,253,357 | ) |
| |
| Capital Share Transactions: | | | | | | | |
| Proceeds from shares sold: | | | | | | | |
| Class A | | 17,915,127 | | | | 8,896,373 | |
| Class B | | 63,569 | | | | 12 | |
| Class C | | 8,501,134 | | | | 1,462,472 | |
| |
| Net asset value of shares issued upon reinvestment | | | | | | | |
| of dividends and distributions: | | | | | | | |
| Class A | | 1,894,609 | | | | 1,765,961 | |
| Class B | | 98,426 | | | | 115,322 | |
| Class C | | 249,454 | | | | 215,873 | |
| | | 28,722,319 | | | | 12,456,013 | |
80
| Year Ended |
| 8/31/09 | | 8/31/08 |
| Capital Share Transactions (continued): | | | | | | | |
| Cost of shares repurchased: | | | | | | | |
| Class A | $ | (7,521,138 | ) | | $ | (8,346,549 | ) |
| Class B | | (1,954,363 | ) | | | (1,000,259 | ) |
| Class C | | (1,450,880 | ) | | | (1,717,154 | ) |
| | | (10,926,381 | ) | | | (11,063,962 | ) |
| Increase in net assets derived from | | | | | | | |
| capital share transactions | | 17,795,938 | | | | 1,392,051 | |
| Net Increase in Net Assets | | 20,130,529 | | | | 1,381,277 | |
| |
| Net Assets: | | | | | | | |
| Beginning of year | | 88,849,906 | | | | 87,468,629 | |
| End of year1 | $ | 108,980,435 | | | $ | 88,849,906 | |
| |
| 1Including undistributed (distributions in excess of) | | | | | | | |
| net investment income | $ | 5,851 | | | $ | (11,301 | ) |
See accompanying notes
81
Statements of changes in net assets
Delaware Tax-Free New York Fund
| Year Ended |
| 8/31/09 | | 8/31/08 |
| Increase (Decrease) in Net Assets from Operations: | | | | | | | |
| Net investment income | $ | 900,508 | | | $ | 718,580 | |
| Net realized gain (loss) on investments | | 190,585 | | | | (59,331 | ) |
| Net change in unrealized | | | | | | | |
| appreciation/depreciation of investments | | 482,416 | | | | 64,192 | |
| Net increase in net assets resulting from operations | | 1,573,509 | | | | 723,441 | |
| |
| Dividends and Distributions to Shareholders from: | | | | | | | |
| Net investment income: | | | | | | | |
| Class A | | (738,485 | ) | | | (591,360 | ) |
| Class B | | (39,735 | ) | | | (58,984 | ) |
| Class C | | (116,762 | ) | | | (68,233 | ) |
| | | (894,982 | ) | | | (718,577 | ) |
| |
| Capital Share Transactions: | | | | | | | |
| Proceeds from shares sold: | | | | | | | |
| Class A | | 10,366,325 | | | | 1,725,009 | |
| Class B | | 47,828 | | | | 15,697 | |
| Class C | | 3,939,824 | | | | 773,501 | |
| |
| Net asset value of shares issued upon reinvestment | | | | | | | |
| of dividends and distributions: | | | | | | | |
| Class A | | 403,783 | | | | 340,675 | |
| Class B | | 22,930 | | | | 34,201 | |
| Class C | | 62,861 | | | | 26,265 | |
| | 14,843,551 | | | | 2,915,348 | |
82
| Year Ended |
| 8/31/09 | | 8/31/08 |
| Capital Share Transactions (continued): | | | | | | | |
| Cost of shares repurchased: | | | | | | | |
| Class A | $ | (3,831,875 | ) | | $ | (1,537,264 | ) |
| Class B | | (593,493 | ) | | | (674,159 | ) |
| Class C | | (585,220 | ) | | | (883,325 | ) |
| | | (5,010,588 | ) | | | (3,094,748 | ) |
| Increase (decrease) in net assets derived from | | | | | | | |
| capital share transactions | | 9,832,963 | | | | (179,400 | ) |
| Net Increase (Decrease) in Net Assets | | 10,511,490 | | | | (174,536 | ) |
| |
| Net Assets: | | | | | | | |
| Beginning of year | | 18,937,507 | | | | 19,112,043 | |
| End of year1 | $ | 29,448,997 | | | $ | 18,937,507 | |
| |
| 1Including undistributed (distributions in excess of) | | | | | | | |
| net investment income | $ | 3,746 | | | $ | (652 | ) |
See accompanying notes
83
Financial highlights
Delaware Tax-Free Arizona Fund Class A
Selected data for each share of the Fund outstanding throughout each period were as follows:
| Net asset value, beginning of period |
| |
| Income (loss) from investment operations: |
| Net investment income |
| Net realized and unrealized gain (loss) on investments |
| Total from investment operations |
| |
| Less dividends and distributions from: |
| Net investment income |
| Net realized gain on investments |
| Total dividends and distributions |
| |
| Net asset value, end of period |
| |
| Total return1 |
| |
| Ratios and supplemental data: |
| Net assets, end of period (000 omitted) |
| Ratio of expenses to average net assets |
| Ratio of expenses to average net assets |
| prior to fees waived and expense paid indirectly |
| Ratio of net investment income to average net assets |
| Ratio of net investment income to average net assets |
| prior to fees waived and expense paid indirectly |
| Portfolio turnover |
1 Total investment return is based on the change in net asset value of a share during the period and assumes reinvestment of dividends and distributions at net asset value and does not reflect the impact of a sales charge. Total investment return reflects a waiver by the manager. Performance would have been lower had the waiver not been in effect. |
See accompanying notes
84
| | Year Ended | |
| 8/31/09 | | 8/31/08 | | 8/31/07 | | 8/31/06 | | 8/31/05 | |
| | $10.930 | | | $11.070 | | | $11.350 | | | $11.560 | | | $11.410 | | |
| | |
| | |
| 0.431 | | | 0.444 | | | 0.465 | | | 0.467 | | | 0.468 | | |
| 0.158 | | | (0.140 | ) | | (0.280 | ) | | (0.210 | ) | | 0.174 | | |
| 0.589 | | | 0.304 | | | 0.185 | | | 0.257 | | | 0.642 | | |
| | |
| | |
| (0.429 | ) | | (0.444 | ) | | (0.465 | ) | | (0.467 | ) | | (0.468 | ) | |
| — | | | — | | | — | | | — | | | (0.024 | ) | |
| (0.429 | ) | | (0.444 | ) | | (0.465 | ) | | (0.467 | ) | | (0.492 | ) | |
| | |
| | $11.090 | | | $10.930 | | | $11.070 | | | $11.350 | | | $11.560 | | |
| | |
| | 5.64% | | | 2.78% | | | 1.63% | | | 2.31% | | | 5.74% | | |
| | |
| | |
| | $113,689 | | | $122,027 | | | $125,636 | | | $131,468 | | | $134,874 | | |
| | 0.75% | | | 0.75% | | | 0.76% | | | 0.76% | | | 0.80% | | |
| | |
| | 0.91% | | | 0.91% | | | 0.91% | | | 0.91% | | | 0.91% | | |
| | 4.07% | | | 4.02% | | | 4.11% | | | 4.12% | | | 4.07% | | |
| | |
| | 3.91% | | | 3.86% | | | 3.96% | | | 3.97% | | | 3.96% | | |
| | 27% | | | 29% | | | 9% | | | 8% | | | 3% | | |
85
Financial highlights
Delaware Tax-Free Arizona Fund Class B
Selected data for each share of the Fund outstanding throughout each period were as follows:
| Net asset value, beginning of period |
| |
| Income (loss) from investment operations: |
| Net investment income |
| Net realized and unrealized gain (loss) on investments |
| Total from investment operations |
| |
| Less dividends and distributions from: |
| Net investment income |
| Net realized gain on investments |
| Total dividends and distributions |
| |
| Net asset value, end of period |
| |
| Total return1 |
| |
| Ratios and supplemental data: |
| Net assets, end of period (000 omitted) |
| Ratio of expenses to average net assets |
| Ratio of expenses to average net assets |
| prior to fees waived and expense paid indirectly |
| Ratio of net investment income to average net assets |
| Ratio of net investment income to average net assets |
| prior to fees waived and expense paid indirectly |
| Portfolio turnover |
1 Total investment return is based on the change in net asset value of a share during the period and assumes reinvestment of dividends and distributions at net asset value and does not reflect the impact of a sales charge. Total investment return reflects a waiver by the manager. Performance would have been lower had the waiver not been in effect. |
See accompanying notes
86
| | Year Ended | |
| | 8/31/09 | | 8/31/08 | | 8/31/07 | | 8/31/06 | | 8/31/05 | |
| $10.940 | | | $11.070 | | | $11.360 | | | $11.570 | | | $11.420 | | |
| | | |
| | | |
| 0.352 | | | 0.361 | | | 0.380 | | | 0.382 | | | 0.382 | | |
| 0.158 | | | (0.130 | ) | | (0.290 | ) | | (0.210 | ) | | 0.174 | | |
| 0.510 | | | 0.231 | | | 0.090 | | | 0.172 | | | 0.556 | | |
| | | |
| | | |
| (0.350 | ) | | (0.361 | ) | | (0.380 | ) | | (0.382 | ) | | (0.382 | ) | |
| — | | | — | | | — | | | — | | | (0.024 | ) | |
| (0.350 | ) | | (0.361 | ) | | (0.380 | ) | | (0.382 | ) | | (0.406 | ) | |
| | | |
| $11.100 | | | $10.940 | | | $11.070 | | | $11.360 | | | $11.570 | | |
| | | |
| 4.85% | | | 2.10% | | | 0.78% | | | 1.54% | | | 4.95% | | |
| | | |
| | | |
| $6,509 | | | $9,620 | | | $12,407 | | | $16,413 | | | $19,005 | | |
| 1.50% | | | 1.50% | | | 1.51% | | | 1.51% | | | 1.55% | | |
| | | |
| 1.66% | | | 1.66% | | | 1.66% | | | 1.66% | | | 1.66% | | |
| | 3.32% | | | 3.27% | | | 3.36% | | | 3.37% | | | 3.32% | | |
| | | |
| 3.16% | | | 3.11% | | | 3.21% | | | 3.22% | | | 3.21% | | |
| 27% | | | 29% | | | 9% | | | 8% | | | 3% | | |
87
Financial highlights
Delaware Tax-Free Arizona Fund Class C
Selected data for each share of the Fund outstanding throughout each period were as follows:
| Net asset value, beginning of period |
| |
| Income (loss) from investment operations: |
| Net investment income |
| Net realized and unrealized gain (loss) on investments |
| Total from investment operations |
| |
| Less dividends and distributions from: |
| Net investment income |
| Net realized gain on investments |
| Total dividends and distributions |
| |
| Net asset value, end of period |
| |
| Total return1 |
| |
| Ratios and supplemental data: |
| Net assets, end of period (000 omitted) |
| Ratio of expenses to average net assets |
| Ratio of expenses to average net assets |
| prior to fees waived and expense paid indirectly |
| Ratio of net investment income to average net assets |
| Ratio of net investment income to average net assets |
| prior to fees waived and expense paid indirectly |
| Portfolio turnover |
1 Total investment return is based on the change in net asset value of a share during the period and assumes reinvestment of dividends and distributions at net asset value and does not reflect the impact of a sales charge. Total investment return reflects a waiver by the manager. Performance would have been lower had the waiver not been in effect. |
See accompanying notes
88
| | Year Ended | |
| | 8/31/09 | | 8/31/08 | | 8/31/07 | | 8/31/06 | | 8/31/05 | |
| $10.960 | | | $11.090 | | | $11.380 | | | $11.580 | | | $11.430 | | |
| | | |
| | | |
| 0.352 | | | 0.361 | | | 0.380 | | | 0.381 | | | 0.382 | | |
| 0.158 | | | (0.130 | ) | | (0.290 | ) | | (0.200 | ) | | 0.174 | | |
| 0.510 | | | 0.231 | | | 0.090 | | | 0.181 | | | 0.556 | | |
| | | |
| | | |
| (0.350 | ) | | (0.361 | ) | | (0.380 | ) | | (0.381 | ) | | (0.382 | ) | |
| — | | | — | | | — | | | — | | | (0.024 | ) | |
| (0.350 | ) | | (0.361 | ) | | (0.380 | ) | | (0.381 | ) | | (0.406 | ) | |
| | | |
| $11.120 | | | $10.960 | | | $11.090 | | | $11.380 | | | $11.580 | | |
| | | |
| 4.84% | | | 2.09% | | | 0.77% | | | 1.63% | | | 4.94% | | |
| | | |
| | | |
| $7,257 | | | $8,806 | | | $7,609 | | | $8,117 | | | $8,591 | | |
| 1.50% | | | 1.50% | | | 1.51% | | | 1.51% | | | 1.55% | | |
| | | |
| 1.66% | | | 1.66% | | | 1.66% | | | 1.66% | | | 1.66% | | |
| 3.32% | | | 3.27% | | | 3.36% | | | 3.37% | | | 3.32% | | |
| | | |
| 3.16% | | | 3.11% | | | 3.21% | | | 3.22% | | | 3.21% | | |
| 27% | | | 29% | | | 9% | | | 8% | | | 3% | | |
89
Financial highlights
Delaware Tax-Free California Fund Class A
Selected data for each share of the Fund outstanding throughout each period were as follows:
| Net asset value, beginning of period |
| |
| Income (loss) from investment operations: |
| Net investment income |
| Net realized and unrealized gain (loss) on investments |
| Total from investment operations |
| |
| Less dividends and distributions from: |
| Net investment income |
| Total dividends and distributions |
| |
| Net asset value, end of period |
| |
| Total return1 |
| |
| Ratios and supplemental data: |
| Net assets, end of period (000 omitted) |
| Ratio of expenses to average net assets |
| Ratio of expenses to average net assets |
| prior to fees waived and expense paid indirectly |
| Ratio of net investment income to average net assets |
| Ratio of net investment income to average net assets |
| prior to fees waived and expense paid indirectly |
| Portfolio turnover |
1 Total investment return is based on the change in net asset value of a share during the period and assumes reinvestment of dividends and distributions at net asset value and does not reflect the impact of a sales charge. Total investment return reflects a waiver by the manager. Performance would have been lower had the waiver not been in effect. |
See accompanying notes
90
| | Year Ended | |
| | 8/31/09 | | 8/31/08 | | 8/31/07 | | 8/31/06 | | 8/31/05 | |
| $10.800 | | | $11.010 | | | $11.400 | | | $11.490 | | | $11.110 | | |
| | | |
| | | | | | | | | | | | | | | |
| 0.448 | | | 0.449 | | | 0.454 | | | 0.450 | | | 0.462 | | |
| (0.182 | ) | | (0.210 | ) | | (0.390 | ) | | (0.090 | ) | | 0.380 | | |
| 0.266 | | | 0.239 | | | 0.064 | | | 0.360 | | | 0.842 | | |
| | | |
| | | | | | | | | | | | | | | |
| (0.446 | ) | | (0.449 | ) | | (0.454 | ) | | (0.450 | ) | | (0.462 | ) | |
| (0.446 | ) | | (0.449 | ) | | (0.454 | ) | | (0.450 | ) | | (0.462 | ) | |
| | | |
| $10.620 | | | $10.800 | | | $11.010 | | | $11.400 | | | $11.490 | | |
| | | |
| 2.74% | | | 2.21% | | | 0.51% | | | 3.24% | | | 7.72% | | |
| | | |
| | | | | | | | | | | | | | | |
| $61,132 | | | $67,174 | | | $76,537 | | | $75,995 | | | $60,744 | | |
| 0.88% | | | 0.88% | | | 0.89% | | | 0.88% | | | 0.84% | | |
| | | | | | | | | | | | | | | |
| 0.97% | | | 0.97% | | | 0.97% | | | 0.97% | | | 1.06% | | |
| 4.42% | | | 4.11% | | | 3.98% | | | 3.97% | | | 4.03% | | |
| | | | | | | | | | | | | | | |
| 4.33% | | | 4.02% | | | 3.90% | | | 3.88% | | | 3.81% | | |
| 59% | | | 34% | | | 21% | | | 14% | | | 11% | | |
91
Financial highlights
Delaware Tax-Free California Fund Class B
Selected data for each share of the Fund outstanding throughout each period were as follows:
| Net asset value, beginning of period |
| |
| Income (loss) from investment operations: |
| Net investment income |
| Net realized and unrealized gain (loss) on investments |
| Total from investment operations |
| |
| Less dividends and distributions from: |
| Net investment income |
| Total dividends and distributions |
| |
| Net asset value, end of period |
| |
| Total return1 |
| |
| Ratios and supplemental data: |
| Net assets, end of period (000 omitted) |
| Ratio of expenses to average net assets |
| Ratio of expenses to average net assets |
| prior to fees waived and expense paid indirectly |
| Ratio of net investment income to average net assets |
| Ratio of net investment income to average net assets |
| prior to fees waived and expense paid indirectly |
| Portfolio turnover |
1 Total investment return is based on the change in net asset value of a share during the period and assumes reinvestment of dividends and distributions at net asset value and does not reflect the impact of a sales charge. Total investment return reflects a waiver by the manager. Performance would have been lower had the waiver not been in effect. |
See accompanying notes
92
| | Year Ended | |
| | 8/31/09 | | 8/31/08 | | 8/31/07 | | 8/31/06 | | 8/31/05 | |
| $10.840 | | | $11.060 | | | $11.440 | | | $11.530 | | | $11.160 | | |
| | | |
| | | | | | | | | | | | | | | |
| 0.373 | | | 0.367 | | | 0.368 | | | 0.365 | | | 0.377 | | |
| (0.172 | ) | | (0.220 | ) | | (0.380 | ) | | (0.090 | ) | | 0.370 | | |
| 0.201 | | | 0.147 | | | (0.012 | ) | | 0.275 | | | 0.747 | | |
| | | |
| | | | | | | | | | | | | | | |
| (0.371 | ) | | (0.367 | ) | | (0.368 | ) | | (0.365 | ) | | (0.377 | ) | |
| (0.371 | ) | | (0.367 | ) | | (0.368 | ) | | (0.365 | ) | | (0.377 | ) | |
| | | |
| $10.670 | | | $10.840 | | | $11.060 | | | $11.440 | | | $11.530 | | |
| | | |
| 2.07% | | | 1.34% | | | (0.15% | ) | | 2.46% | | | 6.80% | | |
| | | |
| | | | | | | | | | | | | | | |
| $4,938 | | | $6,589 | | | $9,384 | | | $14,918 | | | $18,254 | | |
| 1.63% | | | 1.63% | | | 1.64% | | | 1.63% | | | 1.59% | | |
| | | | | | | | | | | | | | | |
| 1.72% | | | 1.72% | | | 1.72% | | | 1.72% | | | 1.81% | | |
| 3.67% | | | 3.36% | | | 3.23% | | | 3.22% | | | 3.28% | | |
| | | | | | | | | | | | | | | |
| 3.58% | | | 3.27% | | | 3.15% | | | 3.13% | | | 3.06% | | |
| 59% | | | 34% | | | 21% | | | 14% | | | 11% | | |
93
Financial highlights
Delaware Tax-Free California Fund Class C
Selected data for each share of the Fund outstanding throughout each period were as follows:
| Net asset value, beginning of period |
| |
| Income (loss) from investment operations: |
| Net investment income |
| Net realized and unrealized gain (loss) on investments |
| Total from investment operations |
| |
| Less dividends and distributions from: |
| Net investment income |
| Total dividends and distributions |
| |
| Net asset value, end of period |
| |
| Total return1 |
| |
| Ratios and supplemental data: |
| Net assets, end of period (000 omitted) |
| Ratio of expenses to average net assets |
| Ratio of expenses to average net assets |
| prior to fees waived and expense paid indirectly |
| Ratio of net investment income to average net assets |
| Ratio of net investment income to average net assets |
| prior to fees waived and expense paid indirectly |
| Portfolio turnover |
1 Total investment return is based on the change in net asset value of a share during the period and assumes reinvestment of dividends and distributions at net asset value and does not reflect the impact of a sales charge. Total investment return reflects a waiver by the manager. Performance would have been lower had the waiver not been in effect. |
See accompanying notes
94
| | Year Ended | |
| | 8/31/09 | | 8/31/08 | | 8/31/07 | | 8/31/06 | | 8/31/05 | |
| $10.810 | | | $11.030 | | | $11.420 | | | $11.500 | | | $11.130 | | |
| | | |
| | | | | | | | | | | | | | | |
| 0.373 | | | 0.367 | | | 0.368 | | | 0.365 | | | 0.377 | | |
| (0.172 | ) | | (0.220 | ) | | (0.390 | ) | | (0.080 | ) | | 0.370 | | |
| 0.201 | | | 0.147 | | | (0.022 | ) | | 0.285 | | | 0.747 | | |
| | | |
| | | | | | | | | | | | | | | |
| (0.371 | ) | | (0.367 | ) | | (0.368 | ) | | (0.365 | ) | | (0.377 | ) | |
| (0.371 | ) | | (0.367 | ) | | (0.368 | ) | | (0.365 | ) | | (0.377 | ) | |
| | | |
| $10.640 | | | $10.810 | | | $11.030 | | | $11.420 | | | $11.500 | | |
| | | |
| 2.07% | | | 1.35% | | | (0.24% | ) | | 2.56% | | | 6.81% | | |
| | | |
| | | | | | | | | | | | | | | |
| $13,530 | | | $14,991 | | | $13,453 | | | $12,768 | | | $9,756 | | |
| 1.63% | | | 1.63% | | | 1.64% | | | 1.63% | | | 1.59% | | |
| | | | | | | | | | | | | | | |
| 1.72% | | | 1.72% | | | 1.72% | | | 1.72% | | | 1.81% | | |
| 3.67% | | | 3.36% | | | 3.23% | | | 3.22% | | | 3.28% | | |
| | | | | | | | | | | | | | | |
| 3.58% | | | 3.27% | | | 3.15% | | | 3.13% | | | 3.06% | | |
| 59% | | | 34% | | | 21% | | | 14% | | | 11% | | |
95
Financial highlights
Delaware Tax-Free Colorado Fund Class A
Selected data for each share of the Fund outstanding throughout each period were as follows:
| Net asset value, beginning of period |
| |
| Income (loss) from investment operations: |
| Net investment income |
| Net realized and unrealized gain (loss) on investments |
| Total from investment operations |
| |
| Less dividends and distributions from: |
| Net investment income |
| Total dividends and distributions |
| |
| Net asset value, end of period |
| |
| Total return1 |
| |
| Ratios and supplemental data: |
| Net assets, end of period (000 omitted) |
| Ratio of expenses to average net assets |
Ratio of expenses to average net assets
prior to fees waived and expense paid indirectly |
| Ratio of net investment income to average net assets |
Ratio of net investment income to average net assets
prior to fees waived and expense paid indirectly |
| Portfolio turnover |
1 Total investment return is based on the change in net asset value of a share during the period and assumes reinvestment of dividends and distributions at net asset value and does not reflect the impact of a sales charge. Total investment return reflects a waiver by the manager, as applicable. Performance would have been lower had the waiver not been in effect. |
See accompanying notes
96
| | Year Ended | |
| | 8/31/09 | | 8/31/08 | | 8/31/07 | | 8/31/06 | | 8/31/05 | |
| | $10.640 | | | $10.730 | | | $11.040 | | | $11.200 | | | $11.070 | | |
| | | | | | | | | | | | | | | | |
| | | | | | | | | | | | | | | | |
| | 0.452 | | | 0.448 | | | 0.464 | | | 0.488 | | | 0.495 | | |
| | (0.041 | ) | | (0.089 | ) | | (0.310 | ) | | (0.160 | ) | | 0.130 | | |
| | 0.411 | | | 0.359 | | | 0.154 | | | 0.328 | | | 0.625 | | |
| | | | | | | | | | | | | | | | |
| | | | | | | | | | | | | | | | |
| | (0.451 | ) | | (0.449 | ) | | (0.464 | ) | | (0.488 | ) | | (0.495 | ) | |
| | (0.451 | ) | | (0.449 | ) | | (0.464 | ) | | (0.488 | ) | | (0.495 | ) | |
| | | | | | | | | | | | | | | | |
| | $10.600 | | | $10.640 | | | $10.730 | | | $11.040 | | | $11.200 | | |
| | | | | | | | | | | | | | | | |
| | 4.11% | | | 3.38% | | | 1.38% | | | 3.03% | | | 5.78% | | |
| | | | | | | | | | | | | | | | |
| | | | | | | | | | | | | | | | |
| | $226,393 | | | $234,630 | | | $246,695 | | | $258,773 | | | $270,149 | | |
| | 0.90% | | | 0.93% | | | 0.94% | | | 0.93% | | | 0.94% | | |
| | | | | | | | | | | | | | | | |
| | 0.95% | | | 0.95% | | | 0.96% | | | 0.94% | | | 0.94% | | |
| | 4.43% | | | 4.16% | | | 4.22% | | | 4.43% | | | 4.46% | | |
| | | | | | | | | | | | | | | | |
| | 4.38% | | | 4.14% | | | 4.20% | | | 4.42% | | | 4.46% | | |
| | 27% | | | 15% | | | 12% | | | 8% | | | 8% | | |
97
Financial highlights
Delaware Tax-Free Colorado Fund Class B
Selected data for each share of the Fund outstanding throughout each period were as follows:
| Net asset value, beginning of period |
| |
| Income (loss) from investment operations: |
| Net investment income |
| Net realized and unrealized gain (loss) on investments |
| Total from investment operations |
| |
| Less dividends and distributions from: |
| Net investment income |
| Total dividends and distributions |
| |
| Net asset value, end of period |
| |
| Total return1 |
| |
| Ratios and supplemental data: |
| Net assets, end of period (000 omitted) |
| Ratio of expenses to average net assets |
Ratio of expenses to average net assets
prior to fees waived and expense paid indirectly |
| Ratio of net investment income to average net assets |
Ratio of net investment income to average net assets
prior to fees waived and expense paid indirectly |
| Portfolio turnover |
1 Total investment return is based on the change in net asset value of a share during the period and assumes reinvestment of dividends and distributions at net asset value and does not reflect the impact of a sales charge. Total investment return reflects a waiver by the manager, as applicable. Performance would have been lower had the waiver not been in effect. |
See accompanying notes
98
| | Year Ended | |
| | 8/31/09 | | 8/31/08 | | 8/31/07 | | 8/31/06 | | 8/31/05 | |
| | $10.640 | | | $10.730 | | | $11.050 | | | $11.200 | | | $11.080 | | |
| | | | | | | | | | | | | | | | |
| | | | | | | | | | | | | | | | |
| | 0.375 | | | 0.367 | | | 0.382 | | | 0.405 | | | 0.412 | | |
| | (0.031 | ) | | (0.089 | ) | | (0.320 | ) | | (0.150 | ) | | 0.120 | | |
| | 0.344 | | | 0.278 | | | 0.062 | | | 0.255 | | | 0.532 | | |
| | | | | | | | | | | | | | | | |
| | | | | | | | | | | | | | | | |
| | (0.374 | ) | | (0.368 | ) | | (0.382 | ) | | (0.405 | ) | | (0.412 | ) | |
| | (0.374 | ) | | (0.368 | ) | | (0.382 | ) | | (0.405 | ) | | (0.412 | ) | |
| | | | | | | | | | | | | | | | |
| | $10.610 | | | $10.640 | | | $10.730 | | | $11.050 | | | $11.200 | | |
| | | | | | | | | | | | | | | | |
| | 3.43% | | | 2.60% | | | 0.53% | | | 2.35% | | | 4.89% | | |
| | | | | | | | | | | | | | | | |
| | | | | | | | | | | | | | | | |
| | $2,693 | | | $3,961 | | | $5,326 | | | $8,221 | | | $10,370 | | |
| | 1.65% | | | 1.68% | | | 1.69% | | | 1.68% | | | 1.69% | | |
| | | | | | | | | | | | | | | | |
| | 1.70% | | | 1.70% | | | 1.71% | | | 1.69% | | | 1.69% | | |
| | 3.68% | | | 3.41% | | | 3.47% | | | 3.68% | | | 3.71% | | |
| | | | | | | | | | | | | | | | |
| | 3.63% | | | 3.39% | | | 3.45% | | | 3.67% | | | 3.71% | | |
| | 27% | | | 15% | | | 12% | | | 8% | | | 8% | | |
99
Financial highlights
Delaware Tax-Free Colorado Fund Class C
Selected data for each share of the Fund outstanding throughout each period were as follows:
| Net asset value, beginning of period |
| |
| Income (loss) from investment operations: |
| Net investment income |
| Net realized and unrealized gain (loss) on investments |
| Total from investment operations |
| |
| Less dividends and distributions from: |
| Net investment income |
| Total dividends and distributions |
| |
| Net asset value, end of period |
| |
| Total return1 |
| |
| Ratios and supplemental data: |
| Net assets, end of period (000 omitted) |
| Ratio of expenses to average net assets |
Ratio of expenses to average net assets
prior to fees waived and expense paid indirectly |
| Ratio of net investment income to average net assets |
Ratio of net investment income to average net assets
prior to fees waived and expense paid indirectly |
| Portfolio turnover |
1 Total investment return is based on the change in net asset value of a share during the period and assumes reinvestment of dividends and distributions at net asset value and does not reflect the impact of a sales charge. Total investment return reflects a waiver by the manager, as applicable. Performance would have been lower had the waiver not been in effect. |
See accompanying notes
100
| Year Ended | |
| 8/31/09 | | 8/31/08 | | 8/31/07 | | 8/31/06 | | 8/31/05 | |
| $10.660 | | | $10.750 | | | $11.070 | | | $11.220 | | | $11.090 | | |
| | | | | | | | | | | | | | | | |
| | | | | | | | | | | | | | | | |
| 0.375 | | | 0.367 | | | 0.382 | | | 0.405 | | | 0.413 | | |
| (0.031 | ) | | (0.089 | ) | | (0.320 | ) | | (0.150 | ) | | 0.130 | | |
| 0.344 | | | 0.278 | | | 0.062 | | | 0.255 | | | 0.543 | | |
| | | | | | | | | | | | | | | | |
| | | | | | | | | | | | | | | | |
| (0.374 | ) | | (0.368 | ) | | (0.382 | ) | | (0.405 | ) | | (0.413 | ) | |
| (0.374 | ) | | (0.368 | ) | | (0.382 | ) | | (0.405 | ) | | (0.413 | ) | |
| | | | | | | | | | | | | | | | |
| $10.630 | | | $10.660 | | | $10.750 | | | $11.070 | | | $11.220 | | |
| | | | | | | | | | | | | | | | |
| 3.43% | | | 2.60% | | | 0.53% | | | 2.34% | | | 4.99% | | |
| | | | | | | | | | | | | | | | |
| | | | | | | | | | | | | | | | |
| $11,542 | | | $9,836 | | | $10,152 | | | $9,971 | | | $9,170 | | |
| 1.65% | | | 1.68% | | | 1.69% | | | 1.68% | | | 1.69% | | |
| | | | | | | | | | | | | | | | |
| 1.70% | | | 1.70% | | | 1.71% | | | 1.69% | | | 1.69% | | |
| 3.68% | | | 3.41% | | | 3.47% | | | 3.68% | | | 3.71% | | |
| | | | | | | | | | | | | | | | |
| 3.63% | | | 3.39% | | | 3.45% | | | 3.67% | | | 3.71% | | |
| 27% | | | 15% | | | 12% | | | 8% | | | 8% | | |
101
Financial highlights
Delaware Tax-Free Idaho Fund Class A
Selected data for each share of the Fund outstanding throughout each period were as follows:
| Net asset value, beginning of period |
| |
| Income (loss) from investment operations: |
| Net investment income |
| Net realized and unrealized gain (loss) on investments |
| Total from investment operations |
| |
| Less dividends and distributions from: |
| Net investment income |
| Total dividends and distributions |
| |
| Net asset value, end of period |
| |
| Total return1 |
| |
| Ratios and supplemental data: |
| Net assets, end of period (000 omitted) |
| Ratio of expenses to average net assets |
| Ratio of expenses to average net assets |
| prior to fees waived and expense paid indirectly |
| Ratio of net investment income to average net assets |
| Ratio of net investment income to average net assets |
| prior to fees waived and expense paid indirectly |
| Portfolio turnover |
1 Total investment return is based on the change in net asset value of a share during the period and assumes reinvestment of dividends and distributions at net asset value and does not reflect the impact of a sales charge. Total investment return reflects a waiver by the manager. Performance would have been lower had the waiver not been in effect.
See accompanying notes
102
| Year Ended | |
| 8/31/09 | | 8/31/08 | | 8/31/07 | | 8/31/06 | | 8/31/05 | |
| $11.260 | | | $11.260 | | | $11.450 | | | $11.630 | | | $11.490 | | |
| | | | | | | | | | | | | | | | |
| | | | | | | | | | | | | | | | |
| 0.436 | | | 0.437 | | | 0.448 | | | 0.449 | | | 0.452 | | |
| 0.228 | | | — | | | (0.190 | ) | | (0.180 | ) | | 0.140 | | |
| 0.664 | | | 0.437 | | | 0.258 | | | 0.269 | | | 0.592 | | |
| | | | | | | | | | | | | | | | |
| | | | | | | | | | | | | | | | |
| (0.434 | ) | | (0.437 | ) | | (0.448 | ) | | (0.449 | ) | | (0.452 | ) | |
| (0.434 | ) | | (0.437 | ) | | (0.448 | ) | | (0.449 | ) | | (0.452 | ) | |
| | | | | | | | | | | | | | | | |
| $11.490 | | | $11.260 | | | $11.260 | | | $11.450 | | | $11.630 | | |
| | | | | | | | | | | | | | | | |
| 6.12% | | | 3.93% | | | 2.27% | | | 2.40% | | | 5.25% | | |
| | | | | | | | | | | | | | | | |
| | | | | | | | | | | | | | | | |
| $86,445 | | | $72,237 | | | $69,931 | | | $62,808 | | | $60,554 | | |
| 0.88% | | | 0.85% | | | 0.86% | | | 0.85% | | | 0.87% | | |
| | | | | | | | | | | | | | | | |
| 0.96% | | | 0.96% | | | 0.98% | | | 0.98% | | | 0.98% | | |
| 3.94% | | | 3.87% | | | 3.92% | | | 3.95% | | | 3.92% | | |
| | | | | | | | | | | | | | | | |
| 3.86% | | | 3.76% | | | 3.80% | | | 3.82% | | | 3.81% | | |
| 10% | | | 11% | | | 8% | | | 15% | | | 27% | | |
103
Financial highlights
Delaware Tax-Free Idaho Fund Class B
Selected data for each share of the Fund outstanding throughout each period were as follows:
| Net asset value, beginning of period |
| |
| Income (loss) from investment operations: |
| Net investment income |
| Net realized and unrealized gain (loss) on investments |
| Total from investment operations |
| |
| Less dividends and distributions from: |
| Net investment income |
| Total dividends and distributions |
| |
| Net asset value, end of period |
| |
| Total return1 |
| |
| Ratios and supplemental data: |
| Net assets, end of period (000 omitted) |
| Ratio of expenses to average net assets |
| Ratio of expenses to average net assets |
| prior to fees waived and expense paid indirectly |
| Ratio of net investment income to average net assets |
| Ratio of net investment income to average net assets |
| prior to fees waived and expense paid indirectly |
| Portfolio turnover |
1 Total investment return is based on the change in net asset value of a share during the period and assumes reinvestment of dividends and distributions at net asset value and does not reflect the impact of a sales charge. Total investment return reflects a waiver by the manager. Performance would have been lower had the waiver not been in effect.
See accompanying notes
104
| Year Ended | |
| 8/31/09 | | 8/31/08 | | 8/31/07 | | 8/31/06 | | 8/31/05 | |
| | $11.240 | | | $11.240 | | | $11.430 | | | $11.610 | | | $11.480 | | |
| | |
| | |
| 0.353 | | | 0.353 | | | 0.363 | | | 0.364 | | | 0.366 | | |
| 0.228 | | | — | | | (0.190 | ) | | (0.180 | ) | | 0.130 | | |
| 0.581 | | | 0.353 | | | 0.173 | | | 0.184 | | | 0.496 | | |
| | |
| | |
| (0.351 | ) | | (0.353 | ) | | (0.363 | ) | | (0.364 | ) | | (0.366 | ) | |
| (0.351 | ) | | (0.353 | ) | | (0.363 | ) | | (0.364 | ) | | (0.366 | ) | |
| | |
| $11.470 | | | $11.240 | | | $11.240 | | | $11.430 | | | $11.610 | | |
| | |
| 5.34% | | | 3.17% | | | 1.51% | | | 1.64% | | | 4.39% | | |
| | |
| | | | | | | | | | | | | | | |
| $3,359 | | | $5,123 | | | $6,003 | | | $7,892 | | | $10,911 | | |
| 1.63% | | | 1.60% | | | 1.61% | | | 1.60% | | | 1.62% | | |
| | | | | | | | | | | | | | | |
| 1.71% | | | 1.71% | | | 1.73% | | | 1.73% | | | 1.73% | | |
| 3.19% | | | 3.12% | | | 3.17% | | | 3.20% | | | 3.17% | | |
| | | | | | | | | | | | | | | |
| 3.11% | | | 3.01% | | | 3.05% | | | 3.07% | | | 3.06% | | |
| 10% | | | 11% | | | 8% | | | 15% | | | 27% | | |
105
Financial highlights
Delaware Tax-Free Idaho Fund Class C
Selected data for each share of the Fund outstanding throughout each period were as follows:
| Net asset value, beginning of period |
| |
| Income (loss) from investment operations: |
| Net investment income |
| Net realized and unrealized gain (loss) on investments |
| Total from investment operations |
| |
| Less dividends and distributions from: |
| Net investment income |
| Total dividends and distributions |
| |
| Net asset value, end of period |
| |
| Total return1 |
| |
| Ratios and supplemental data: |
| Net assets, end of period (000 omitted) |
| Ratio of expenses to average net assets |
| Ratio of expenses to average net assets |
| prior to fees waived and expense paid indirectly |
| Ratio of net investment income to average net assets |
| Ratio of net investment income to average net assets |
| prior to fees waived and expense paid indirectly |
| Portfolio turnover |
| 1 Total investment return is based on the change in net asset value of a share during the period and assumes reinvestment of dividends and distributions at net asset value and does not reflect the impact of a sales charge. Total investment return reflects a waiver by the manager. Performance would have been lower had the waiver not been in effect. |
See accompanying notes
106
| Year Ended | |
| 8/31/09 | | 8/31/08 | | 8/31/07 | | 8/31/06 | | 8/31/05 | |
| $11.250 | | | $11.250 | | | $11.440 | | | $11.630 | | | $11.490 | | |
| | | | | | | | | | | | | | | |
| | |
| 0.353 | | | 0.352 | | | 0.363 | | | 0.364 | | | 0.366 | | |
| 0.228 | | | — | | | (0.190 | ) | | (0.190 | ) | | 0.140 | | |
| 0.581 | | | 0.352 | | | 0.173 | | | 0.174 | | | 0.506 | | |
| | | | | | | | | | | | | | | |
| | |
| (0.351 | ) | | (0.352 | ) | | (0.363 | ) | | (0.364 | ) | | (0.366 | ) | |
| (0.351 | ) | | (0.352 | ) | | (0.363 | ) | | (0.364 | ) | | (0.366 | ) | |
| | |
| $11.480 | | | $11.250 | | | $11.250 | | | $11.440 | | | $11.630 | | |
| | |
| 5.34% | | | 3.16% | | | 1.51% | | | 1.56% | | | 4.47% | | |
| | |
| | | | | | | | | | | | | | | |
| $19,176 | | | $11,490 | | | $11,535 | | | $13,430 | | | $15,678 | | |
| 1.63% | | | 1.60% | | | 1.61% | | | 1.60% | | | 1.62% | | |
| | | | | | | | | | | | | | | |
| 1.71% | | | 1.71% | | | 1.73% | | | 1.73% | | | 1.73% | | |
| 3.19% | | | 3.12% | | | 3.17% | | | 3.20% | | | 3.17% | | |
| | | | | | | | | | | | | | | |
| 3.11% | | | 3.01% | | | 3.05% | | | 3.07% | | | 3.06% | | |
| 10% | | | 11% | | | 8% | | | 15% | | | 27% | | |
107
Financial highlights
Delaware Tax-Free New York Fund Class A
Selected data for each share of the Fund outstanding throughout each period were as follows:
| Net asset value, beginning of period |
| |
| Income (loss) from investment operations: |
| Net investment income |
| Net realized and unrealized gain (loss) on investments |
| Total from investment operations |
| |
| Less dividends and distributions from: |
| Net investment income |
| Total dividends and distributions |
| |
| Net asset value, end of period |
| |
| Total return1 |
| |
| Ratios and supplemental data: |
| Net assets, end of period (000 omitted) |
| Ratio of expenses to average net assets |
| Ratio of expenses to average net assets |
| prior to fees waived and expense paid indirectly |
| Ratio of net investment income to average net assets |
| Ratio of net investment income to average net assets |
| prior to fees waived and expense paid indirectly |
| Portfolio turnover |
| 1 Total investment return is based on the change in net asset value of a share during the period and assumes reinvestment of dividends and distributions at net asset value and does not reflect the impact of a sales charge. Total investment return reflects a waiver by the manager. Performance would have been lower had the waiver not been in effect. |
See accompanying notes
108
| Year Ended | |
| 8/31/09 | | 8/31/08 | | 8/31/07 | | 8/31/06 | | 8/31/05 | |
| $10.300 | | | $10.300 | | | $10.550 | | | $10.700 | | | $10.470 | | |
| | |
| | |
| 0.409 | | | 0.411 | | | 0.435 | | | 0.449 | | | 0.453 | | |
| 0.148 | | | — | | | (0.250 | ) | | (0.150 | ) | | 0.230 | | |
| 0.557 | | | 0.411 | | | 0.185 | | | 0.299 | | | 0.683 | | |
| | |
| | |
| (0.407 | ) | | (0.411 | ) | | (0.435 | ) | | (0.449 | ) | | (0.453 | ) | |
| (0.407 | ) | | (0.411 | ) | | (0.435 | ) | | (0.449 | ) | | (0.453 | ) | |
| | |
| $10.450 | | | $10.300 | | | $10.300 | | | $10.550 | | | $10.700 | | |
| | |
| 5.65% | | | 4.04% | | | 1.75% | | | 2.90% | | | 6.65% | | |
| | |
| | |
| $22,780 | | | $15,340 | | | $14,817 | | | $13,519 | | | $13,153 | | |
| 0.85% | | | 0.85% | | | 0.79% | | | 0.65% | | | 0.66% | | |
| | | | | | | | | | | | | | | |
| 1.10% | | | 1.09% | | | 1.10% | | | 1.09% | | | 1.12% | | |
| 4.10% | | | 3.97% | | | 4.13% | | | 4.28% | | | 4.29% | | |
| | | | | | | | | | | | | | | |
| 3.85% | | | 3.73% | | | 3.82% | | | 3.84% | | | 3.83% | | |
| 36% | | | 28% | | | 14% | | | 20% | | | 13% | | |
109
Financial highlights
Delaware Tax-Free New York Fund Class B
Selected data for each share of the Fund outstanding throughout each period were as follows:
| Net asset value, beginning of period |
| |
| Income (loss) from investment operations: |
| Net investment income |
| Net realized and unrealized gain (loss) on investments |
| Total from investment operations |
| |
| Less dividends and distributions from: |
| Net investment income |
| Total dividends and distributions |
| |
| Net asset value, end of period |
| |
| Total return1 |
| |
| Ratios and supplemental data: |
| Net assets, end of period (000 omitted) |
| Ratio of expenses to average net assets |
| Ratio of expenses to average net assets |
| prior to fees waived and expense paid indirectly |
| Ratio of net investment income to average net assets |
| Ratio of net investment income to average net assets |
| prior to fees waived and expense paid indirectly |
| Portfolio turnover |
| 1 Total investment return is based on the change in net asset value of a share during the period and assumes reinvestment of dividends and distributions at net asset value and does not reflect the impact of a sales charge. Total investment return reflects a waiver by the manager. Performance would have been lower had the waiver not been in effect. |
See accompanying notes
110
| Year Ended | |
| 8/31/09 | | 8/31/08 | | 8/31/07 | | 8/31/06 | | 8/31/05 | |
| | $10.270 | | | $10.280 | | | $10.530 | | | $10.670 | | | $10.450 | | |
| | |
| | |
| 0.334 | | | 0.333 | | | 0.357 | | | 0.370 | | | 0.374 | | |
| 0.148 | | | (0.010 | ) | | (0.250 | ) | | (0.140 | ) | | 0.220 | | |
| 0.482 | | | 0.323 | | | 0.107 | | | 0.230 | | | 0.594 | | |
| | |
| | |
| (0.332 | ) | | (0.333 | ) | | (0.357 | ) | | (0.370 | ) | | (0.374 | ) | |
| (0.332 | ) | | (0.333 | ) | | (0.357 | ) | | (0.370 | ) | | (0.374 | ) | |
| | |
| $10.420 | | | $10.270 | | | $10.280 | | | $10.530 | | | $10.670 | | |
| | |
| 4.88% | | | 3.17% | | | 0.99% | | | 2.23% | | | 5.77% | | |
| | |
| | |
| $1,018 | | | $1,549 | | | $2,164 | | | $2,858 | | | $3,023 | | |
| 1.60% | | | 1.60% | | | 1.54% | | | 1.40% | | | 1.41% | | |
| | | | | | | | | | | | | | | |
| 1.85% | | | 1.84% | | | 1.85% | | | 1.84% | | | 1.87% | | |
| 3.35% | | | 3.22% | | | 3.38% | | | 3.53% | | | 3.54% | | |
| | | | | | | | | | | | | | | |
| 3.10% | | | 2.98% | | | 3.07% | | | 3.09% | | | 3.08% | | |
| 36% | | | 28% | | | 14% | | | 20% | | | 13% | | |
111
Financial highlights
Delaware Tax-Free New York Fund Class C
Selected data for each share of the Fund outstanding throughout each period were as follows:
| Net asset value, beginning of period |
| |
| Income (loss) from investment operations: |
| Net investment income |
| Net realized and unrealized gain (loss) on investments |
| Total from investment operations |
| |
| Less dividends and distributions from: |
| Net investment income |
| Total dividends and distributions |
| |
| Net asset value, end of period |
| |
| Total return1 |
| |
| Ratios and supplemental data: |
| Net assets, end of period (000 omitted) |
| Ratio of expenses to average net assets |
| Ratio of expenses to average net assets |
| prior to fees waived and expense paid indirectly |
| Ratio of net investment income to average net assets |
| Ratio of net investment income to average net assets |
| prior to fees waived and expense paid indirectly |
| Portfolio turnover |
| 1 Total investment return is based on the change in net asset value of a share during the period and assumes reinvestment of dividends and distributions at net asset value and does not reflect the impact of a sales charge. Total investment return reflects a waiver by the manager. Performance would have been lower had the waiver not been in effect. |
See accompanying notes
112
| Year Ended | |
| 8/31/09 | | 8/31/08 | | 8/31/07 | | 8/31/06 | | 8/31/05 | |
| | $10.270 | | | $10.280 | | | $10.530 | | | $10.670 | | | $10.450 | | |
| | | | | | | | | | | | | | | |
| | |
| 0.333 | | | 0.333 | | | 0.357 | | | 0.370 | | | 0.376 | | |
| 0.148 | | | (0.010 | ) | | (0.250 | ) | | (0.140 | ) | | 0.220 | | |
| 0.481 | | | 0.323 | | | 0.107 | | | 0.230 | | | 0.596 | | |
| | | | | | | | | | | | | | | |
| | |
| (0.331 | ) | | (0.333 | ) | | (0.357 | ) | | (0.370 | ) | | (0.376 | ) | |
| (0.331 | ) | | (0.333 | ) | | (0.357 | ) | | (0.370 | ) | | (0.376 | ) | |
| | |
| $10.420 | | | $10.270 | | | $10.280 | | | $10.530 | | | $10.670 | | |
| | |
| 4.88% | | | 3.17% | | | 0.99% | | | 2.23% | | | 5.80% | | |
| | | | | | | | | | | | | | | |
| | |
| $5,651 | | | $2,049 | | | $2,131 | | | $2,068 | | | $886 | | |
| 1.60% | | | 1.60% | | | 1.54% | | | 1.40% | | | 1.41% | | |
| | | | | | | | | | | | | | | |
| 1.85% | | | 1.84% | | | 1.85% | | | 1.84% | | | 1.87% | | |
| 3.35% | | | 3.22% | | | 3.38% | | | 3.53% | | | 3.54% | | |
| | | | | | | | | | | | | | | |
| 3.10% | | | 2.98% | | | 3.07% | | | 3.09% | | | 3.08% | | |
| 36% | | | 28% | | | 14% | | | 20% | | | 13% | | |
113
| Notes to financial statements | |
| Delaware multi-state funds | August 31, 2009 |
Voyageur Mutual Funds is organized as a Delaware statutory trust and offers five series: Delaware Minnesota High-Yield Municipal Bond Fund, Delaware National High-Yield Municipal Bond Fund, Delaware Tax-Free California Fund, Delaware Tax-Free Idaho Fund, and Delaware Tax-Free New York Fund. Voyageur Mutual Funds II is organized as a Delaware statutory trust and offers one series: Delaware Tax-Free Colorado Fund. Voyageur Insured Funds is organized as a Delaware statutory trust and offers one series: Delaware Tax-Free Arizona Fund. Voyageur Mutual Funds, Voyageur Mutual Funds II, and Voyageur Insured Funds are individually referred to as a Trust and collectively as the Trusts. These financial statements and related notes pertain to Delaware Tax-Free Arizona Fund, Delaware Tax-Free California Fund, Delaware Tax-Free Colorado Fund, Delaware Tax-Free Idaho Fund, and Delaware Tax-Free New York Fund (each, a Fund or, collectively, the Funds). The above Trusts are open-end investment companies. The Funds are considered non-diversified under the Investment Company Act of 1940, as amended, and offer Class A, Class B, and Class C shares. Class A shares are sold with a maximum front-end sales charge of up to 4.50%. Class A share purchases of $1,000,000 or more will incur a contingent deferred sales charge (CDSC) of 1% if redeemed during the first year and 0.50% during the second year, provided that Delaware Distributors, L.P. (DDLP) paid a financial advisor a commission on the purchase of those shares. Class B shares may only be purchased through dividend reinvestment and certain permitted exchanges. Prior to June 1, 2007, Class B shares were sold with a CDSC that declined from 4% to zero depending upon the period of time the shares were held. Class B shares will automatically convert to Class A shares on a quarterly basis approximately eight years after purchase. Class C shares are sold with a CDSC of 1%, if redeemed during the first twelve months.
The investment objective of each Fund is to seek as high a level of current income exempt from federal income tax and personal income tax in its respective state, as is consistent with preservation of capital.
1. Significant Accounting Policies
The following accounting policies are in accordance with U.S. generally accepted accounting principles and are consistently followed by the Funds.
Security Valuation — Debt securities are valued by an independent pricing service or broker. To the extent current market prices are not available, the pricing service may take into account developments related to the specific security, as well as transactions in comparable securities. Open-end investment companies are valued at their published net asset value. Generally, other securities and assets for which market quotations are not readily available are valued at fair value as determined in good faith under the direction of each Fund’s Board of Trustees (each a Board, and collectively, the Boards). In determining whether market quotations are readily available or fair valuation will be used, various factors will be taken into consideration, such as market closures or suspension of trading in a security.
114
Federal Income Taxes — No provision for federal income taxes has been made as each Fund intends to continue to qualify for federal income tax purposes as a regulated investment company under Subchapter M of the Internal Revenue Code of 1986, as amended, and make the requisite distributions to shareholders. The Funds evaluate tax positions taken or expected to be taken in the course of preparing the Funds’ tax returns to determine whether the tax positions are “more-likely-than-not” of being sustained by the applicable tax authority. Tax positions not deemed to meet the more-likely-than-not threshold are recorded as a tax benefit or expense in the current year. Management has analyzed the Funds’ tax positions taken on federal income tax returns for all open tax years (tax years ended August 31, 2006-August 31, 2009), and has concluded that no provision for federal income tax is required in the Funds’ financial statements.
Class Accounting — Investment income and common expenses are allocated to the various classes of each Fund on the basis of “settled shares” of each class in relation to the net assets of each Fund. Realized and unrealized gain (loss) on investments are allocated to the various classes of each Fund on the basis of daily net assets of each class. Distribution expenses relating to a specific class are charged directly to that class.
Use of Estimates — The preparation of financial statements in conformity with U.S. generally accepted accounting principles requires management to make estimates and assumptions that affect the reported amounts of assets and liabilities at the date of the financial statements and the reported amounts of revenues and expenses during the reporting period. Actual results could differ from those estimates.
Other — Expenses directly attributable to a Fund are charged directly to that Fund. Other expenses common to various funds within the Delaware Investments® Family of Funds are generally allocated amongst such funds on the basis of average net assets. Management fees and some other expenses are paid monthly. Security transactions are recorded on the date the securities are purchased or sold (trade date) for financial reporting purposes. Costs used in calculating realized gains and losses on the sale of investment securities are those of the specific securities sold. Interest income is recorded on the accrual basis. Discounts and premiums are amortized to interest income over the lives of the respective securities. Each Fund declares dividends daily from net investment income and pays such dividends monthly and declares and pays distributions from net realized gain on investments, if any, annually.
The Funds receive earnings credits from their custodian when positive cash balances are maintained, which are used to offset custody fees. The expense paid under this arrangement is included in custodian fees on the statements of operations with the corresponding expense offset shown as “expense paid indirectly.”
115
Notes to financial statements
Delaware multi-state funds
2. Investment Management, Administration Agreements and Other Transactions with Affiliates
In accordance with the terms of its respective investment management agreement, each Fund pays Delaware Management Company (DMC), a series of Delaware Management Business Trust and the investment manager, an annual fee, which is calculated based on each Fund’s average daily net assets as follows:
| | Delaware | | Delaware | | Delaware | | Delaware | | Delaware |
| | Tax-Free | | Tax-Free | | Tax-Free | | Tax-Free | | Tax-Free |
| | Arizona Fund | | California Fund | | Colorado Fund | | Idaho Fund | | New York Fund |
| On the first $500 million | 0.500% | | 0.550% | | 0.550% | | 0.550% | | 0.550% |
| On the next $500 million | 0.475% | | 0.500% | | 0.500% | | 0.500% | | 0.500% |
| On the next $1.5 billion | 0.450% | | 0.450% | | 0.450% | | 0.450% | | 0.450% |
| In excess of $2.5 billion | 0.425% | | 0.425% | | 0.425% | | 0.425% | | 0.425% |
DMC has contractually agreed to waive that portion, if any, of its management fee and reimburse each Fund to the extent necessary to ensure that total annual operating expenses, (excluding any 12b-1 plan expenses, taxes, interest, inverse floater program expenses, brokerage fees, certain insurance costs, and nonroutine expenses or costs, including, but not limited to, those relating to reorganizations, litigation, conducting shareholder meetings, and liquidations (collectively, “nonroutine expenses”)), do not exceed specified percentages of average daily net assets as shown below. For purposes of these waivers and reimbursements, nonroutine expenses may also include such additional costs and expenses, as may be agreed upon from time to time by each Fund’s Board and DMC. These expense waivers and reimbursements apply only to expenses paid directly by the Funds.
| | Delaware | | Delaware | | Delaware | | Delaware | | Delaware |
| | Tax-Free | | Tax-Free | | Tax-Free | | Tax-Free | | Tax-Free |
| | Arizona Fund | | California Fund | | Colorado Fund | | Idaho Fund | | New York Fund |
| Effective January 1, 2009, | | | | | | | | | | | | | |
| operating expense | | | | | | | | | | | | | |
| limitation as a percentage | | | | | | | | | | | | | |
| of average daily net assets | | | | | | | | | | | | | |
| (per annum) | 0.50% | | | 0.63% | | | 0.64% | | | 0.65% | | 0.60% | |
| Expiration date | 12/31/09 | | | 12/31/09 | | | 12/31/09 | | | 12/31/09 | | 12/31/09 | |
| |
| Through December 31, 2008, | | | | | | | | | | | | | |
| operating expense | | | | | | | | | | | | | |
| limitation as a percentage | | | | | | | | | | | | | |
| of average daily net assets | | | | | | | | | | | | | |
| (per annum) | 0.50% | | | 0.63% | | | 0.68% | | | 0.60% | | 0.60% | |
| Expiration date | 12/31/08 | | | 12/31/08 | | | 12/31/08 | | | 12/31/08 | | 12/31/08 | |
116
Delaware Service Company, Inc. (DSC), an affiliate of DMC, provides fund accounting and financial administration oversight services to each Fund. For these services, the Funds pay DSC fees based on the aggregate daily net assets of the Delaware Investments® Family of Funds at the following annual rate: 0.0050% of the first $30 billion; 0.0045% of the next $10 billion; 0.0040% of the next $10 billion; and 0.0025% of aggregate average daily net assets in excess of $50 billion. The fees payable to DSC under the service agreement described above are allocated among all Funds in the Delaware Investments Family of Funds on a relative net asset value basis. For the year ended August 31, 2009, each Fund was charged for these services as follows:
| Delaware | | Delaware | | Delaware | | Delaware | | Delaware |
| Tax-Free | | Tax-Free | | Tax-Free | | Tax-Free | | Tax-Free |
| Arizona Fund | | California Fund | | Colorado Fund | | Idaho Fund | | New York Fund |
| $6,249 | | $4,006 | | $11,606 | | $4,600 | | $1,141 |
DSC also provides dividend disbursing and transfer agency services. Each Fund pays DSC a monthly fee based on the number of shareholder accounts for dividend disbursing and transfer agent services.
Pursuant to a distribution agreement and distribution plan, each Fund pays DDLP, the distributor and an affiliate of DMC, an annual distribution and service fee not to exceed 0.25% of the average daily net assets of the Class A shares and 1.00% of the average daily net assets of the Class B and C shares.
At August 31, 2009, each Fund had liabilities payable to affiliates as follows:
| | Delaware | | Delaware | | Delaware | | Delaware | | Delaware |
| | Tax-Free | | Tax-Free | | Tax-Free | | Tax-Free | | Tax-Free |
| | Arizona Fund | | California Fund | | Colorado Fund | | Idaho Fund | | New York Fund |
| Investment management | | | | | | | | | | | | | | | | | | | |
| fee payable to DMC | $ | 40,824 | | | $ | 30,586 | | | $ | 98,081 | | | $ | 40,166 | | | $ | 4,056 | |
| Dividend disbursing, | | | | | | | | | | | | | | | | | | | |
| transfer agent, fund | | | | | | | | | | | | | | | | | | | |
| accounting oversight | | | | | | | | | | | | | | | | | | | |
| fees and other expenses | | | | | | | | | | | | | | | | | | | |
| payable to DSC | | 3,932 | | | | 2,966 | | | | 7,964 | | | | 3,241 | | | | 1,783 | |
| Distribution fees | | | | | | | | | | | | | | | | | | | |
| payable to DDLP | | 35,396 | | | | 28,226 | | | | 59,178 | | | | 35,777 | | | | 10,226 | |
| Other expenses payable to | | | | | | | | | | | | | | | | | | | |
| DMC and affiliates* | | 3,806 | | | | 1,325 | | | | 4,053 | | | | 1,763 | | | | 494 | |
*DMC, as part of its administrative services, pays operating expenses on behalf of each Fund and is reimbursed on a periodic basis. Such expenses include items such as printing of shareholder reports, fees for audit, legal and tax services, registration fees and trustees’ fees.
117
Notes to financial statements
Delaware multi-state funds
2. Investment Management, Administration Agreements and Other Transactions with Affiliates (continued)
As provided in the investment management agreement, each Fund bears the cost of certain legal and tax services, including internal legal and tax services provided to each Fund by DMC and/or its affiliates’ employees. For the year ended August 31, 2009, each Fund was charged for internal legal and tax services provided by DMC and/or its affiliates’ employees as follows:
| Delaware | | Delaware | | Delaware | | Delaware | | Delaware |
| Tax-Free | | Tax-Free | | Tax-Free | | Tax-Free | | Tax-Free |
| Arizona Fund | | California Fund | | Colorado Fund | | Idaho Fund | | New York Fund |
| | $10,722 | | $6,875 | | $20,031 | | $8,049 | | $2,029 |
For the year ended August 31, 2009, DDLP earned commissions on sales of Class A shares for each Fund as follows:
| Delaware | | Delaware | | Delaware | | Delaware | | Delaware |
| Tax-Free | | Tax-Free | | Tax-Free | | Tax-Free | | Tax-Free |
| Arizona Fund | | California Fund | | Colorado Fund | | Idaho Fund | | New York Fund |
| $17,118 | | $8,263 | | $18,525 | | $43,606 | | $15,274 |
For the year ended August 31, 2009, DDLP received gross CDSC commissions on redemptions of each Fund’s Class A, Class B and Class C shares, and these commissions were entirely used to offset up-front commissions previously paid by DDLP to broker-dealers on sales of those shares. The amounts received were as follows:
| | | Delaware | | Delaware | | Delaware | | Delaware | | Delaware |
| | | Tax-Free | | Tax-Free | | Tax-Free | | Tax-Free | | Tax-Free |
| | | Arizona Fund | | California Fund | | Colorado Fund | | Idaho Fund | | New York Fund |
| Class A | | $ | — | | | $ | — | | | $ | — | | | $ | — | | | $ | — | |
| Class B | | | 1,283 | | | | 2,450 | | | | 3,906 | | | | 1,103 | | | | 518 | |
| Class C | | | 9,537 | | | | 5,957 | | | | 28 | | | | 803 | | | | 109 | |
Trustees’ fees include expenses accrued by the Funds for each Trustee’s retainer and meeting fees. Certain officers of DMC, DSC and DDLP are officers and/or Trustees of the Trusts. These officers and Trustees are paid no compensation by the Funds.
3. Investments
For the year ended August 31, 2009, the Funds made purchases and sales of investment securities other than short-term investments as follows:
| | | Delaware | | Delaware | | Delaware | | Delaware | | Delaware |
| | | Tax-Free | | Tax-Free | | Tax-Free | | Tax-Free | | Tax-Free |
| | | Arizona Fund | | California Fund | | Colorado Fund | | Idaho Fund | | New York Fund |
| Purchases | | $33,942,299 | | $46,843,843 | | $62,145,496 | | $25,167,660 | | $17,757,244 |
| Sales | | 47,258,395 | | 52,880,911 | | 70,503,570 | | 8,639,449 | | 8,022,948 |
118
At August 31, 2009, the cost of investments and unrealized appreciation (depreciation) for federal income tax purposes for each Fund were as follows:
| | Delaware | | Delaware | | Delaware | | Delaware | | Delaware |
| | Tax-Free | | Tax-Free | | Tax-Free | | Tax-Free | | Tax-Free |
| | Arizona Fund | | California Fund | | Colorado Fund | | Idaho Fund | | New York Fund |
| Cost of | | | | | | | | | | | | | | | | | | | |
| investments | $ | 127,315,728 | | | $ | 85,097,533 | | | $ | 237,097,050 | | | $ | 103,088,087 | | | $ | 28,045,023 | |
| Aggregate | | | | | | | | | | | | | | | | | | | |
| unrealized | | | | | | | | | | | | | | | | | | | |
| appreciation | | 4,395,525 | | | | 2,227,240 | | | | 9,598,102 | | | | 4,247,710 | | | | 1,481,610 | |
| Aggregate | | | | | | | | | | | | | | | | | | | |
| unrealized | | | | | | | | | | | | | | | | | | | |
| depreciation | | (2,392,637 | ) | | | (5,361,151 | ) | | | (8,939,601 | ) | | | (1,190,098 | ) | | | (551,775 | ) |
| Net unrealized | | | | | | | | | | | | | | | | | | | |
| appreciation | | | | | | | | | | | | | | | | | | | |
| (depreciation) | $ | 2,002,888 | | | $ | (3,133,911 | ) | | $ | 658,501 | | | $ | 3,057,612 | | | $ | 929,835 | |
Effective September 1, 2008, the Funds adopted Financial Accounting Standards No. 157, Fair Value Measurements (FAS 157). FAS 157 defines fair value as the price that each Fund would receive to sell an asset or pay to transfer a liability in an orderly transaction between market participants at the measurement date under current market conditions. FAS 157 also establishes a framework for measuring fair value and a three level hierarchy for fair value measurements based upon the transparency of inputs to the valuation of an asset or liability. Inputs may be observable or unobservable and refer broadly to the assumptions that market participants would use in pricing the asset or liability. Observable inputs reflect the assumptions market participants would use in pricing the asset or liability based on market data obtained from sources independent of the reporting entity. Unobservable inputs reflect the reporting entity’s own assumptions about the assumptions that market participants would use in pricing the asset or liability developed based on the best information available under the circumstances. Each Fund’s investment in its entirety is assigned a level based upon the observability of the inputs which are significant to the overall valuation. The three-tier hierarchy of inputs is summarized below.
Level 1 – inputs are quoted prices in active markets
Level 2 – inputs are observable, directly or indirectly
Level 3 – inputs are unobservable and reflect assumptions on the part of the reporting entity
119
Notes to financial statements
Delaware multi-state funds
3. Investments (continued)
The following table summarizes the valuation of the Funds’ investments by the FAS 157 fair value hierarchy levels as of August 31, 2009:
| | Delaware Tax-Free Arizona Fund |
| | Level 1 | | Level 2 | | Total |
| Municipal Bonds | $ | — | | $ | 125,839,316 | | $ | 125,839,316 |
| Short-Term | | 3,479,300 | | | — | | | 3,479,300 |
| Total | $ | 3,479,300 | | $ | 125,839,316 | | $ | 129,318,616 |
| |
| | Delaware Tax-Free California Fund |
| | Level 1 | | Level 2 | | Total |
| Municipal Bonds | $ | — | | $ | 79,659,335 | | $ | 79,659,335 |
| Short-Term | | 2,304,287 | | | — | | | 2,304,287 |
| Total | $ | 2,304,287 | | $ | 79,659,335 | | $ | 81,963,622 |
| |
| | Delaware Tax-Free Colorado Fund |
| | Level 1 | | Level 2 | | Total |
| Municipal Bonds | $ | — | | $ | 235,345,687 | | $ | 235,345,687 |
| Short-Term | | 1,109,864 | | | 1,300,000 | | | 2,409,864 |
| Total | $ | 1,109,864 | | $ | 236,645,687 | | $ | 237,755,551 |
| |
| | Delaware Tax-Free Idaho Fund |
| | Level 1 | | Level 2 | | Total |
| Municipal Bonds | $ | — | | $ | 103,722,576 | | $ | 103,722,576 |
| Short-Term | | 2,423,123 | | | — | | | 2,423,123 |
| Total | $ | 2,423,123 | | $ | 103,722,576 | | $ | 106,145,699 |
| |
| | Delaware Tax-Free New York Fund |
| | Level 1 | | Level 2 | | Total |
| Municipal Bonds | $ | — | | $ | 28,774,858 | | $ | 28,774,858 |
| Short-Term | | — | | | 200,000 | | | 200,000 |
| Total | $ | — | | $ | 28,974,858 | | $ | 28,974,858 |
There were no Level 3 securities at the beginning or end of the year.
120
4. Dividend and Distribution Information
Income and long-term capital gain distributions are determined in accordance with federal income tax regulations, which may differ from U.S. generally accepted accounting principles. Additionally, distributions from net short-term gains on sales of investment securities are treated as ordinary income for federal income tax purposes. The tax character of dividends and distributions paid during the years ended August 31, 2009 and 2008 was as follows:
| | Delaware | | Delaware | | Delaware | | Delaware | | Delaware |
| | Tax-Free | | Tax-Free | | Tax-Free | | Tax-Free | | Tax-Free |
| | Arizona Fund | | California Fund | | Colorado Fund | | Idaho Fund | | New York Fund |
| Year Ended 8/31/09 | | | | | | | | | | | | | | | | |
| Tax-exempt income | $ | 4,956,787 | | | $3,385,072 | | | $ | 10,156,494 | | $ | 3,483,707 | | | $894,982 | |
| Ordinary income | | — | | | — | | | | 12,530 | | | — | | | — | |
| Total | $ | 4,956,787 | | | $3,385,072 | | | $ | 10,169,024 | | $ | 3,483,707 | | | $894,982 | |
| | |
| Year Ended 8/31/08 | | | | | | | | | | | | | | | | |
| Tax-exempt income | $ | 5,547,778 | | | $3,715,410 | | | $ | 10,556,654 | | $ | 3,253,357 | | | $718,577 | |
| Ordinary income | | — | | | — | | | | 27,164 | | | — | | | — | |
| Total | $ | 5,547,778 | | | $3,715,410 | | | $ | 10,583,818 | | $ | 3,253,357 | | | $718,577 | |
5. Components of Net Assets on a Tax Basis
As of August 31, 2009, the components of net assets on a tax basis were as follows:
| | Delaware | | Delaware | | Delaware | | Delaware | | Delaware |
| | Tax-Free | | Tax-Free | | Tax-Free | | Tax-Free | | Tax-Free |
| | Arizona Fund | | California Fund | | Colorado Fund | | Idaho Fund | | New York Fund |
| Shares of beneficial | | | | | | | | | | | | | | | | | | | |
| interest | $ | 126,874,334 | | | $ | 82,942,740 | | | $ | 245,028,207 | | | $ | 106,006,595 | | | $ | 28,530,345 | |
| Distributions | | | | | | | | | | | | | | | | | | | |
| payable | | (119,108 | ) | | | (83,509 | ) | | | (247,386 | ) | | | (91,309 | ) | | | (31,770 | ) |
| Undistributed | | | | | | | | | | | | | | | | | | | |
| tax-exempt | | | | | | | | | | | | | | | | | | | |
| income | | 145,304 | | | | 102,272 | | | | 290,887 | | | | 97,160 | | | | 35,516 | |
| Capital loss | | | | | | | | | | | | | | | | | | | |
| carryforwards | | (1,448,471 | ) | | | (227,694 | ) | | | (5,101,953 | ) | | | (89,623 | ) | | | (14,929 | ) |
| Unrealized | | | | | | | | | | | | | | | | | | | |
| appreciation | | | | | | | | | | | | | | | | | | | |
| (depreciation) of | | | | | | | | | | | | | | | | | | | |
| investments | | 2,002,888 | | | | (3,133,911 | ) | | | 658,501 | | | | 3,057,612 | | | | 929,835 | |
| Net assets | $ | 127,454,947 | | | $ | 79,599,898 | | | $ | 240,628,256 | | | $ | 108,980,435 | | | $ | 29,448,997 | |
The differences between book basis and tax basis components of net assets are primarily attributable to tax deferral of losses on wash sales and tax treatment of market discount on debt instruments.
121
Notes to financial statements
Delaware multi-state funds
5. Components of Net Assets on a Tax Basis (continued)
For financial reporting purposes, capital accounts are adjusted to reflect the tax character of permanent book/tax differences. Reclassifications are primarily due to tax treatment of market discount on certain debt instruments and expiration of capital loss carryforwards. Results of operations and net assets were not affected by these reclassifications. For the year ended August 31, 2009, the Funds recorded the following reclassifications:
| Delaware | | Delaware | | Delaware | | Delaware | | Delaware |
| Tax-Free | | Tax-Free | | Tax-Free | | Tax-Free | | Tax-Free |
| Arizona Fund | | California Fund | | Colorado Fund | | Idaho Fund | | New York Fund |
| Undistributed | | | | | | | | | | | | | | | | | | | |
| (distributions in excess of) | | | | | | | | | | | | | | | | | | | |
| net investment income | $ | 3,900 | | | $ | 1,015 | | | $ | 16,207 | | | $ | (1,267 | ) | | $ | (1,128 | ) |
| Accumulated net realized | | | | | | | | | | | | | | | | | | | |
| gain (loss) | | (3,900 | ) | | | 404,319 | | | | (16,207 | ) | | | 1,267 | | | | 17,296 | |
| Paid-in capital | | — | | | | (405,334 | ) | | | — | | | | — | | | | (16,168 | ) |
For federal income tax purposes, capital loss carryforwards may be carried forward and applied against future capital gains. In 2009, the Funds utilized capital loss carryforwards as follows:
| | Delaware | | Delaware | | Delaware | | Delaware | | Delaware |
| | Tax-Free | | Tax-Free | | Tax-Free | | Tax-Free | | Tax-Free |
| | Arizona Fund | | California Fund | | Colorado Fund | | Idaho Fund | | New York Fund |
| Capital loss | | | | | | | | | | |
| carryforward utilized | | $311,673 | | $256,907 | | $2,819,378 | | $235,475 | | $149,260 |
In 2009, the Funds had capital loss carryforwards that expired as follows:
| | Delaware | | Delaware |
| | Tax-Free | | Tax-Free |
| | California Fund | | New York Fund |
| Capital loss carryforward expired | | $405,334 | | $16,168 |
Capital loss carryforwards remaining at August 31, 2009 will expire as follows:
| | Delaware | | Delaware | | Delaware | | Delaware | | Delaware |
| Year of | | Tax-Free | | Tax-Free | | Tax-Free | | Tax-Free | | Tax-Free |
| Expiration | | Arizona Fund | | California Fund | | Colorado Fund | | Idaho Fund | | New York Fund |
| 2010 | | $ | — | | | $ — | | | $ | — | | | $ 9,312 | | | | $ — | |
| 2011 | | | — | | | 6,039 | | | | — | | | — | | | | — | |
| 2012 | | | 1,448,471 | | | — | | | | 2,796,560 | | | — | | | | — | |
| 2013 | | | — | | | — | | | | 57,695 | | | — | | | | — | |
| 2014 | | | — | | | — | | | | 2,203,520 | | | 23,435 | | | | — | |
| 2015 | | | — | | | — | | | | — | | | 56,876 | | | | — | |
| 2016 | | | — | | | 221,655 | | | | 44,178 | | | — | | | | 14,929 | |
| Total | | $ | 1,448,471 | | | $227,694 | | | $ | 5,101,953 | | | $89,623 | | | | 14,929 | |
122
6. Capital shares
Transactions in capital shares were as follows:
| | Delaware Tax-Free | | Delaware Tax-Free | | Delaware Tax-Free |
| | Arizona Fund | | California Fund | | Colorado Fund |
| | Year Ended | | Year Ended | | Year Ended |
| | 8/31/09 | | 8/31/08 | | 8/31/09 | | 8/31/08 | | 8/31/09 | | 8/31/08 |
| Shares sold: |
| Class A | | 756,808 | | | 1,334,775 | | | 825,013 | | | 1,269,777 | | | 1,387,638 | | | 948,236 | |
| Class B | | 1,968 | | | 31 | | | 9,030 | | | 12,972 | | | 1,049 | | | 1 | |
| Class C | | 102,547 | | | 266,518 | | | 208,816 | | | 433,780 | | | 281,038 | | | 95,653 | |
| |
| Shares issued upon reinvestment of dividends and distributions: |
| Class A | | 207,965 | | | 217,919 | | | 152,565 | | | 164,369 | | | 595,084 | | | 594,257 | |
| Class B | | 12,138 | | | 16,633 | | | 13,524 | | | 17,433 | | | 4,925 | | | 6,724 | |
| Class C | | 13,735 | | | 15,736 | | | 35,227 | | | 32,379 | | | 24,239 | | | 21,454 | |
| | 1,095,161 | | | 1,851,612 | | | 1,244,175 | | | 1,930,710 | | | 2,293,973 | | | 1,666,325 | |
| |
| Shares repurchased: |
| Class A | | (1,879,717 | ) | | (1,740,104 | ) | | (1,444,076 | ) | | (2,161,501 | ) | | (2,677,810 | ) | | (2,487,354 | ) |
| Class B | | (307,293 | ) | | (257,420 | ) | | (167,397 | ) | | (271,127 | ) | | (124,079 | ) | | (130,940 | ) |
| Class C | | (267,390 | ) | | (164,512 | ) | | (358,482 | ) | | (299,668 | ) | | (141,654 | ) | | (139,008 | ) |
| | (2,454,400 | ) | | (2,162,036 | ) | | (1,969,955 | ) | | (2,732,296 | ) | | (2,943,543 | ) | | (2,757,302 | ) |
| Net decrease | | (1,359,239 | ) | | (310,424 | ) | | (725,780 | ) | | (801,586 | ) | | (649,570 | ) | | (1,090,977 | ) |
| |
| | Delaware Tax-Free | | Delaware Tax-Free | | | | | | |
| | Idaho Fund | | New York Fund | | | | | | |
| | Year Ended | | Year Ended | | | | | | |
| | 8/31/09 | | 8/31/08 | | 8/31/09 | | 8/31/08 | | | | | | |
| Shares sold: | | | | | | |
| Class A | | 1,615,020 | | | 787,130 | | | 1,035,723 | | | 166,604 | | | | | | | |
| Class B | | 5,765 | | | 1 | | | 4,787 | | | 1,496 | | | | | | | |
| Class C | | 758,087 | | | 128,677 | | | 396,933 | | | 74,906 | | | | | | | |
| | | | | | | |
| Shares issued upon reinvestment of dividends and distributions: | | | | | | |
| Class A | | 171,510 | | | 155,988 | | | 40,258 | | | 32,892 | | | | | | | |
| Class B | | 8,957 | | | 10,201 | | | 2,303 | | | 3,309 | | | | | | | |
| Class C | | 22,570 | | | 19,082 | | | 6,249 | | | 2,539 | | | | | | | |
| | 2,581,909 | | | 1,101,079 | | | 1,486,253 | | | 281,746 | | | | | | | |
| | | | | | | |
| Shares repurchased: | | | | | | |
| Class A | | (679,777 | ) | | (736,838 | ) | | (385,163 | ) | | (148,374 | ) | | | | | | |
| Class B | | (177,717 | ) | | (88,298 | ) | | (60,185 | ) | | (64,544 | ) | | | | | | |
| Class C | | (131,937 | ) | | (151,455 | ) | | (60,407 | ) | | (85,398 | ) | | | | | | |
| | (989,431 | ) | | (976,591 | ) | | (505,755 | ) | | (298,316 | ) | | | | | | |
| Net increase (decrease) | | 1,592,478 | | | 124,488 | | | 980,498 | | | (16,570 | ) | | | | | | |
123
Notes to financial statements
Delaware multi-state funds
6. Capital shares (continued)
For the years ended August 31, 2009 and 2008, the following shares and values were converted from Class B to Class A shares. The respective amounts are included in Class B redemptions and Class A subscriptions in the tables on page 123 and the statements of changes in net assets.
| | Year Ended | | Year Ended |
| | 8/31/09 | | 8/31/08 |
| | Class B | | Class A | | | | | Class B | | Class A | | |
| | Shares | | Shares | | Value | | Shares | | Shares | | Value |
| Delaware Tax-Free | | | | | | | | | | | | | | |
| Arizona Fund | | 126,754 | | 126,825 | | $ | 1,338,820 | | 29,536 | | 29,541 | | $ | 328,168 |
| Delaware Tax-Free | | | | | | | | | | | | | | |
| California Fund | | 92,283 | | 92,659 | | | 913,283 | | 79,561 | | 79,848 | | | 881,603 |
| Delaware Tax-Free | | | | | | | | | | | | | | |
| Colorado Fund | | 28,997 | | 29,016 | | | 288,928 | | 88,870 | | 88,933 | | | 958,664 |
| Delaware Tax-Free | | | | | | | | | | | | | | |
| Idaho Fund | | 58,929 | | 58,820 | | | 644,988 | | 43,828 | | 43,749 | | | 496,288 |
| Delaware Tax-Free | | | | | | | | | | | | | | |
| New York Fund | | 33,488 | | 33,413 | | | 327,019 | | 14,375 | | 14,339 | | | 148,612 |
7. Line of Credit
Each Fund, along with certain other funds in the Delaware Investments® Family of Funds (Participants), was a participant in a $225,000,000 revolving line of credit with The Bank of New York Mellon (BNY Mellon) to be used for temporary or emergency purposes as an additional source of liquidity to fund redemptions of investor shares. Under the agreement, the Participants were charged an annual commitment fee, which was allocated across the Participants on the basis of each Participant’s allocation of the entire facility. Participants were permitted to borrow up to a maximum of one third of their net assets under the agreement. The agreement expired on November 18, 2008.
Effective November 18, 2008, the Funds, along with the other Participants, entered into an amendment to the agreement with BNY Mellon for a $35,000,000 revolving line of credit. The agreement, as amended, is to be used as described above and operates in substantially the same manner as the original agreement. The agreement, as amended, expires on November 17, 2009. The Funds had no amounts outstanding as of August 31, 2009, or at any time during the year then ended.
8. Credit and Market Risk
The Funds concentrate their investments in securities issued by municipalities. The value of these investments may be adversely affected by new legislation within the states, regional or local economic conditions, as applicable, and differing levels of supply and demand for municipal bonds. Many municipalities insure repayment for their obligations. Although bond insurance reduces the risk of loss due to default by an issuer, such bonds remain subject to the risk that value may fluctuate for other reasons and there is no assurance that the insurance company will meet its obligations. A
124
real or perceived decline in creditworthiness of a bond insurer can have an adverse impact on the value of insured bonds held in the Funds. At August 31, 2009, the percentages of each Fund’s net assets insured by bond insurers are listed below and these securities have been identified in the statements of net assets.
| Delaware | | Delaware | | Delaware | | Delaware | | Delaware |
| Tax-Free | | Tax-Free | | Tax-Free | | Tax-Free | | Tax-Free |
| Arizona Fund | | California Fund | | Colorado Fund | | Idaho Fund | | New York Fund |
| 47% | | 23% | | 35% | | 38% | | 13% |
The Funds may invest in advanced refunded bonds, escrow secured bonds or defeased bonds. Under current federal tax laws and regulations, state and local government borrowers are permitted to refinance outstanding bonds by issuing new bonds. The issuer refinances the outstanding debt to either reduce interest costs or to remove or alter restrictive covenants imposed by the bonds being refinanced. A refunding transaction where the municipal securities are being refunded within 90 days from the issuance of the refunding issue is known as a “current refunding.” Advance refunded bonds are bonds in which the refunded bond issue remains outstanding for more than 90 days following the issuance of the refunding issue. In an advance refunding, the issuer will use the proceeds of a new bond issue to purchase high grade interest bearing debt securities which are then deposited in an irrevocable escrow account held by an escrow agent to secure all future payments of principal and interest and bond premium of the advance refunded bond. Bonds are “escrowed to maturity” when the proceeds of the refunding issue are deposited in an escrow account for investment sufficient to pay all of the principal and interest on the original interest payment and maturity dates.
Bonds are considered “pre-refunded” when the refunding issue’s proceeds are escrowed only until a permitted call date or dates on the refunded issue with the refunded issue being redeemed at the time, including any required premium. Bonds become “defeased” when the rights and interests of the bondholders and of their lien on the pledged revenues or other security under the terms of the bond contract are substituted with an alternative source of revenues (the escrow securities) sufficient to meet payments of principal and interest to maturity or to the first call dates. Escrowed secured bonds will often receive a rating of AAA from Moody’s Investors Service Inc., Standard & Poor’s Rating Group, and/or Fitch Ratings due to the strong credit quality of the escrow securities and the irrevocable nature of the escrow deposit agreement.
Each Fund may invest up to 15% of its net assets in illiquid securities, which may include securities with contractual restrictions on resale, securities exempt from registration under Rule 144A of the Securities Act of 1933, as amended, and other securities which may not be readily marketable. The relative illiquidity of these securities may impair each Fund from disposing of them in a timely manner and at a fair price when it is necessary or desirable to do so. While maintaining oversight, each Fund’s Board has delegated to DMC the day-to-day functions of determining whether individual securities are liquid for purposes of each Fund’s limitation on investments in illiquid assets. Securities eligible for resale pursuant to Rule 144A, which are determined to be liquid, are not subject to each Fund’s 15% limit on investments in illiquid securities. As of August 31, 2009, there were no Rule 144A securities. Illiquid securities have been identified on the statements of net assets.
125
Notes to financial statements
Delaware multi-state funds
9. Contractual Obligations
The Funds enter into contracts in the normal course of business that contain a variety of indemnifications. The Funds’ maximum exposure under these arrangements is unknown. However, the Funds have not had prior claims or losses pursuant to these contracts. Management has reviewed the Funds’ existing contracts and expects the risk of loss to be remote.
10. Sale of Delaware Investments to Macquarie Group
On August 18, 2009, Lincoln National Corporation (parent company of Delaware Investments) and Macquarie Group (Macquarie) entered into an agreement pursuant to which Delaware Investments, including DMC, DDLP and DSC, will be acquired by Macquarie, an Australia-based global provider of banking, financial, advisory, investment and funds management services ( Transaction). Upon completion of the Transaction, DMC, DDLP and DSC will be wholly owned subsidiaries of Macquarie.
The Transaction will result in a change of control of DMC which, in turn, will cause the termination of the investment advisory agreement between DMC and the Funds. As a result, a Special Meeting of Shareholders (Meeting) of the Funds will be scheduled for the purpose of asking shareholders to approve a new investment advisory agreement between DMC and the Funds (New Agreement). If approved by shareholders, the New Agreement will take effect upon the closing of the Transaction, which is currently anticipated to occur in the fourth quarter of 2009. Shareholders of the Funds will receive proxy materials including more detailed information about the Meeting, the Transaction and the proposed New Agreement.
11. Subsequent Events
Effective August 31, 2009, the Funds adopted Financial Accounting Standards Board Statement of Financial Accounting Standards No. 165, Subsequent Events (FAS 165). In accordance with FAS 165, management has evaluated whether any events or transactions occurred subsequent to August 31, 2009 through October 19, 2009, the date of issuance of the Funds’ financial statements, and determined that there were no material events or transactions other than those already disclosed that would require recognition or disclosure in the Funds’ financial statements.
Amendment to Investment Advisory Fee — In addition to the expense cap described in footnote 2, effective September 11, 2009, DMC has agreed to voluntarily waive all or a portion of its investment advisory fees and/or pay/reimburse expenses (excluding any 12b-1 plan expenses, taxes, interest, inverse floater program expenses, brokerage fees, certain insurance costs, and nonroutine expenses) in order to prevent total annual fund operating expenses from exceeding, in an aggregate amount, 0.57% and 0.55%, respectively, of the Delaware Tax-Free California Fund and Delaware Tax-Free New York Fund’s average daily net assets until such time as the voluntary expense cap is discontinued. These fee waivers and expense reimbursements apply only to expenses paid directly by the Funds, and may be discontinued at any time because they are voluntary.
126
12. Tax Information (Unaudited)
The information set forth below is for each Fund’s fiscal year as required by federal income tax laws. Shareholders, however, must report distributions on a calendar year basis for income tax purposes, which may include distributions for portions of two fiscal years of a Fund. Accordingly, the information needed by shareholders for income tax purposes will be sent to them in January of each year. Please consult your tax advisor for proper treatment of this information.
For the fiscal year ended August 31, 2009, each Fund designates distributions paid during the year as follows:
| | (A) | | | | |
| | Ordinary | | (B) | | |
| | Income | | Tax-Exempt | | Total |
| | Distributions | | Distributions | | Distributions |
| | (Tax Basis) | | (Tax Basis) | | (Tax Basis) |
| Delaware Tax-Free Arizona Fund | | — | | 100.00% | | 100.00% |
| Delaware Tax-Free California Fund | | — | | 100.00% | | 100.00% |
| Delaware Tax-Free Colorado Fund | | 0.12% | | 99.88% | | 100.00% |
| Delaware Tax-Free Idaho Fund | | — | | 100.00% | | 100.00% |
| Delaware Tax-Free New York Fund | | — | | 100.00% | | 100.00% |
(A) and (B) are based on a percentage of each Fund’s total distributions.
127
Report of independent
registered public accounting firm
To the Shareholders and Board of Trustees
Voyageur Insured Funds — Delaware Tax-Free Arizona Fund
Voyageur Mutual Funds — Delaware Tax-Free California Fund, Delaware Tax-Free Idaho Fund, and Delaware Tax-Free New York Fund
Voyageur Mutual Funds II — Delaware Tax-Free Colorado Fund
We have audited the accompanying statements of net assets of Delaware Tax-Free Arizona Fund (the sole series of Voyageur Insured Funds), Delaware Tax-Free California Fund, Delaware Tax- Free Idaho Fund, and Delaware Tax-Free New York Fund (three of the series constituting Voyageur Mutual Funds) and Delaware Tax-Free Colorado Fund (the sole series of Voyageur Mutual Funds II) (the “Funds”) as of August 31, 2009, and the related statements of operations for the year then ended, the statements of changes in net assets for each of the two years in the period then ended, and the financial highlights for each of the five years in the period then ended. These financial statements and financial highlights are the responsibility of the Funds’ management. Our responsibility is to express an opinion on these financial statements and financial highlights based on our audits.
We conducted our audits in accordance with the standards of the Public Company Accounting Oversight Board (United States). Those standards require that we plan and perform the audit to obtain reasonable assurance about whether the financial statements and financial highlights are free of material misstatement. We were not engaged to perform an audit of the Funds’ internal control over financial reporting. Our audits included consideration of internal control over financial reporting as a basis for designing audit procedures that are appropriate in the circumstances, but not for the purpose of expressing an opinion on the effectiveness of the Funds’ internal control over financial reporting. Accordingly, we express no such opinion. An audit also includes examining, on a test basis, evidence supporting the amounts and disclosures in the financial statements and financial highlights, assessing the accounting principles used and significant estimates made by management, and evaluating the overall financial statement presentation. Our procedures included confirmation of securities owned as of August 31, 2009 by correspondence with the custodian and brokers or by other appropriate auditing procedures where replies from brokers were not received. We believe that our audits provide a reasonable basis for our opinion.
In our opinion, the financial statements and financial highlights referred to above present fairly, in all material respects, the financial position of the Delaware Tax Free Arizona Fund of Voyageur Insured Funds, the Delaware Tax-Free California Fund, the Delaware Tax-Free Idaho Fund, and the Delaware Tax-Free New York Fund of Voyageur Mutual Funds, and the Delaware Tax-Free Colorado Fund of Voyageur Mutual Funds II at August 31, 2009, the results of their operations for the year then ended, the changes in their net assets for each of the two years in the period then ended, and their financial highlights for each of the five years in the period then ended, in conformity with U.S. generally accepted accounting principles.

Philadelphia, Pennsylvania
October 19, 2009
128
Other Fund information
(Unaudited)
Delaware multi-state funds
Board Consideration of Delaware Tax-Free Arizona Fund, Delaware Tax-Free California Fund, Delaware Tax-Free Colorado Fund, Delaware Tax-Free Idaho Fund and Delaware Tax-Free New York Fund Investment Advisory Agreements
At a meeting held on May 19–21, 2009 (the “Annual Meeting”), the Board of Trustees (the “Board”), including a majority of disinterested or independent Trustees, approved the renewal of the Investment Advisory Agreements for the Delaware Tax-Free Arizona Fund, Delaware Tax-Free California Fund, Delaware Tax-Free Colorado Fund, Delaware Tax-Free Idaho Fund and Delaware Tax-Free New York Fund (each, a “Fund” and together, the “Funds”). In making its decision, the Board considered information furnished specifically in connection with the renewal of the Investment Advisory Agreements with Delaware Management Company (“DMC”), which included materials provided by DMC and its affiliates (“Delaware Investments”) concerning, among other things, the nature, extent and quality of services provided to the Funds, the costs of such services to the Funds, economies of scale and the financial condition and profitability of Delaware Investments. Reference was made to information furnished at regular quarterly Board meetings, including reports detailing Fund performance, investment strategies and expenses, as well as information prepared specifically in connection with the renewal of the investment advisory and sub-advisory contracts. In addition, in connection with the Annual Meeting, reports were provided in February 2009 and included independent historical and comparative reports prepared by Lipper Inc. (“Lipper”), an independent statistical compilation organization. The Lipper reports compared each Fund’s investment performance and expenses with those of other comparable mutual funds. The independent Trustees reviewed and discussed the Lipper reports with counsel to the independent Trustees. The Board requested and received information regarding DMC’s policy with respect to advisory fee levels and its breakpoint philosophy; the structure of portfolio manager compensation; the investment manager’s profitability; and any constraints or limitations on the availability of securities in certain investment styles, which had in the past year inhibited, or which were likely in the future to inhibit, DMC’s ability to invest fully in accordance with Fund policies.
In considering information relating to the approval of each Fund’s advisory agreement, the independent Trustees received assistance and advice from and met separately with counsel to the independent Trustees. Although the Board gave attention to all information furnished, the following discussion identifies, under separate headings, the primary factors taken into account by the Board during its contract renewal considerations.
Nature, Extent and Quality of Service. The Board considered the services provided by Delaware Investments to the Funds and their shareholders. In reviewing the nature, extent and quality of services, the Board considered reports furnished to it throughout the year, which covered matters such as the relative performance of the Funds, compliance of portfolio managers with the investment policies, strategies and restrictions for the Funds, compliance by DMC and Delaware Distributors, L.P. (together, “Management”) personnel with the Code of Ethics adopted throughout the Delaware Investments® Family of Funds complex and adherence to fair value pricing procedures as established by the Board. The Board was pleased with the current staffing of the Funds’ investment advisor and the emphasis placed on research in the investment process. The Board gave favorable consideration to DMC’s efforts to control expenditures while maintaining service levels committed to fund matters. The Board also considered the transfer agent and shareholder services
129
Other Fund information
(Unaudited)
Delaware multi-state funds
Board Consideration of Delaware Tax-Free Arizona Fund, Delaware Tax-Free California Fund, Delaware Tax-Free Colorado Fund, Delaware Tax-Free Idaho Fund and Delaware Tax-Free New York Fund Investment Advisory Agreements (continued)
provided to Fund shareholders by DMC’s affiliate, Delaware Service Company, Inc. (“DSC”), noting DSC’s high level of service. The Board noted that Management finished upgrading investment accounting functions through outsourcing to improve the quality and lower the cost of delivering investment accounting services to the Funds. The Board once again noted the benefits provided to Fund shareholders through each shareholder’s ability to exchange an investment in one Delaware Investments® fund for the same class of shares in another Delaware Investments fund without a sales charge, to reinvest Fund dividends into additional shares of the same Fund or into additional shares of other Delaware Investments funds and the privilege to combine holdings in other Delaware Investments funds to obtain a reduced sales charge. The Board was satisfied with the nature, extent and quality of the overall services provided by Delaware Investments.
Investment Performance. The Board placed significant emphasis on the investment performance of the Funds in view of its importance to shareholders. Although the Board gave appropriate consideration to performance reports and discussions with portfolio managers at Board meetings throughout the year, the Board gave particular weight to the Lipper reports furnished for the Annual Meeting. The Lipper reports prepared for each Fund showed the investment performance of its Class A shares in comparison to a group of similar funds as selected by Lipper (the “Performance Universe”). A fund with the best performance ranked first, and a fund with the poorest performance ranked last. The highest/best performing 25% of funds in the Performance Universe make up the first quartile; the next 25%, the second quartile; the next 25%, the third quartile; and the poorest/worst performing 25% of funds in the Performance Universe make up the fourth quartile. Comparative annualized performance for each Fund was shown for the past one-, three-, five- and ten-year periods ended December 31, 2008. The Board’s objective is that each Fund’s performance for the periods considered be at or above the median of its Performance Universe. The following paragraphs summarize the performance results for the Funds and the Board’s view of such performance.
Delaware Tax-Free Arizona Fund – The Performance Universe for the Fund consisted of the Fund and all retail and institutional Arizona municipal debt funds as selected by Lipper. The Lipper report comparison showed that the Fund’s total return for the one-, three-, five- and ten-year periods was in the first quartile of its Performance Universe. The Board was very satisfied with performance.
Delaware Tax-Free California Fund – The Performance Universe for the Fund consisted of the Fund and all retail and institutional California municipal debt funds as selected by Lipper. The Lipper report comparison showed that the Fund’s total return for the one- and three-year periods was in the second quartile of its Performance Universe. The report further showed that the Fund’s total return for the five- and ten-year periods was in the first quartile. The Board was satisfied with performance.
130
Delaware Tax-Free Colorado Fund – The Performance Universe for the Fund consisted of the Fund and all retail and institutional Colorado municipal debt funds as selected by Lipper. The Lipper report comparison showed that the Fund’s total return for the one-, three- and five-year periods was in the first quartile of its Performance Universe. The report further showed that the Fund’s total return for the ten-year period was in the second quartile. The Board was satisfied with performance.
Delaware Tax-Free Idaho Fund – The Performance Universe for the Fund consisted of the Fund and all retail and institutional other state municipal debt funds as selected by Lipper. The Lipper report comparison showed that the Fund’s total return for the one-, three-, five- and ten-year periods was in the first quartile of its Performance Universe. The Board was satisfied with performance.
Delaware Tax-Free New York Fund – The Performance Universe for the Fund consisted of the Fund and all retail and institutional New York municipal debt funds as selected by Lipper. The Lipper report comparison showed that the Fund’s total return for the one-, three-, five- and ten-year periods was in the first quartile of its Performance Universe. The Board was very satisfied with performance.
Comparative Expenses. The Board considered expense comparison data for the Delaware Investments® Family of Funds. Management provided the Board with information on pricing levels and fee structures for each Fund as of October 31, 2008 and, for comparative funds, information as of their respective fiscal year end occurring on or before August 31, 2008. The Board also focused on the comparative analysis of effective management fees and total expense ratios of each Fund versus effective management fees and expense ratios of a group of similar funds as selected by Lipper (the “Expense Group”). In reviewing comparative costs, each Fund’s contractual management fee and the actual management fee incurred by the Fund were compared with the contractual management fees (assuming all funds in the Expense Group were similar in size to the Fund) and actual management fees (as reported by each fund) within the Expense Group, taking into account any applicable breakpoints and fee waivers. Each Fund’s total expenses were also compared with those of its Expense Group. The Lipper total expenses, for comparative consistency, were shown by Lipper for Class A shares and comparative total expenses including 12b-1 and non 12b-1 service fees. The Board considered fees paid to Delaware Investments for nonmanagement services. The Board’s objective is to limit each Fund’s total expense ratio to be competitive with that of the Expense Group. The following paragraphs summarize the expense results for the Funds and the Board’s view of such expenses.
Delaware Tax-Free Arizona Fund – The expense comparisons for the Fund showed that its actual management fee and total expenses were in the quartile with the second lowest expenses of its Expense Group. The Board was satisfied with the management fee and total expenses of the Fund in comparison to those of its Expense Group as shown in the Lipper report.
Delaware Tax-Free California Fund – The expense comparisons for the Fund showed that its actual management fee was in the quartile with the lowest expenses of its Expense Group and its total
131
Other Fund information
(Unaudited)
Delaware multi-state funds
Board Consideration of Delaware Tax-Free Arizona Fund, Delaware Tax-Free California Fund, Delaware Tax-Free Colorado Fund, Delaware Tax-Free Idaho Fund and Delaware Tax-Free New York Fund Investment Advisory Agreements (continued)
expenses were in the quartile with the highest expenses of its Expense Group. The Board gave favorable consideration to the Fund’s management fee, but noted that the Fund’s total expenses were not in line with the Board’s objective. In evaluating the total expenses, the Board considered fee waivers in place through December 2009 and various initiatives implemented by Management, such as the outsourcing of certain transfer agency and investment accounting services, creating an opportunity for a reduction in expenses. The Board was satisfied with Management’s efforts to improve the Fund’s total expense ratio and bring it in line with the Board’s objective.
Delaware Tax-Free Colorado Fund – The expense comparisons for the Fund showed that its actual management fee was in the quartile with the second highest expenses of its Expense Group and its total expenses were in the quartile with the highest expenses of its Expense Group. The Board noted that the Fund’s total expenses were not in line with the Board’s objective. In evaluating the total expenses, the Board considered fee waivers in place through December 2009 and various initiatives implemented by Management, such as the outsourcing of certain transfer agency and investment accounting services, creating an opportunity for a reduction in expenses. Consequently, the Board was satisfied with Management’s efforts to improve the Fund’s total expense ratio and bring it in line with the Board’s objective.
Delaware Tax-Free Idaho Fund – The expense comparisons for the Fund showed that its actual management fee was in the quartile with the second highest expenses of its Expense Group but its total expenses were in the quartile with the second lowest expenses of its Expense Group. The Board was satisfied with the total expenses of the Fund in comparison to those of its Expense Group as shown in the Lipper report.
Delaware Tax-Free New York Fund – The expense comparisons for the Fund showed that its actual management fee was in the quartile with the second lowest expenses of its Expense Group and its total expenses were in the quartile with the second highest expenses of its Expense Group. The Board gave favorable consideration to the Fund’s management fee, but noted that the Fund’s total expenses were not in line with the Board’s objective. In evaluating the total expenses, the Board considered waivers in place through December 2009 and various initiatives implemented by Management, such as the outsourcing of certain transfer agency and investment accounting services, creating an opportunity for a reduction in expenses. The Board was satisfied with Management’s efforts to improve the Fund’s total expense ratio and bring it in line with the Board’s objective.
Management Profitability. The Board considered the level of profits realized by Delaware Investments in connection with the operation of the Funds. In this respect, the Board reviewed the Investment Management Profitability Analysis that addressed the overall profitability of Delaware Investments’ business in providing management and other services to each of the individual funds and the Delaware Investments® Family of Funds as a whole. Specific attention was given to the methodology followed in allocating costs for the purpose of determining profitability. Management stated that the level of profits of Delaware Investments, to a certain extent, reflect
132
recent operational cost savings and efficiencies initiated by Delaware Investments. The Board considered Delaware Investments’ efforts to improve services provided to fund shareholders and to meet additional regulatory and compliance requirements resulting from recent industry-wide Securities and Exchange Commission initiatives. The Board also considered the extent to which Delaware Investments might derive ancillary benefits from fund operations, including the potential for procuring additional business as a result of the prestige and visibility associated with its role as service provider to the Delaware Investments® Family of Funds and the benefits from allocation of fund brokerage to improve trading efficiencies. The Board found that the management fees were reasonable in light of the services rendered and the level of profitability of Delaware Investments.
Economies of Scale. The Trustees considered whether economies of scale are realized by Delaware Investments as each Fund’s assets increase and the extent to which any economies of scale are reflected in the level of management fees charged. The Trustees reviewed the standardized advisory fee pricing and structure, approved by the Board and shareholders, which includes breakpoints. Breakpoints in the advisory fee occur when the advisory fee rate is reduced on assets in excess of specified levels. Breakpoints result in a lower advisory fee than would otherwise be the case on all assets when the asset levels specified are exceeded. The Board noted that the fee under each Fund’s management contract fell within the standard structure. Although the Funds have not reached a size at which they can take advantage of breakpoints, the Board recognized that the fees were structured so that when the Funds grow, economies of scale may be shared.
Fund management
Joseph R. Baxter
Senior Vice President, Head of Municipal Bond Department, Senior Portfolio Manager
Joseph R. Baxter is the head of the municipal bond department and is responsible for setting the department’s investment strategy. He is also a co-portfolio manager of the firm’s municipal bond funds and several client accounts. Before joining Delaware Investments in 1999 as head municipal bond trader, he held investment positions with First Union, most recently as a municipal portfolio manager with the Evergreen Funds. Baxter received a bachelor’s degree in finance and marketing from La Salle University.
Stephen J. Czepiel
Senior Vice President, Senior Portfolio Manager
Stephen J. Czepiel is a member of the firm’s municipal fixed income portfolio management team with primary responsibility for portfolio construction and strategic asset allocation. He is a co-portfolio manager of the firm’s municipal bond funds and client accounts. He joined Delaware Investments in July 2004 as a senior bond trader. Previously, he was vice president at both Mesirow Financial and Loop Capital Markets. He began his career in the securities industry in 1982 as a municipal bond trader at Kidder Peabody and now has more than 20 years of experience in the municipal securities industry. Czepiel earned his bachelor’s degree in finance and economics from Duquesne University.
133
Board of trustees/directors and officers addendum
Delaware Investments® Family of Funds
A mutual fund is governed by a Board of Trustees/Directors (“Trustees”), which has oversight responsibility for the management of a fund’s business affairs. Trustees establish procedures and oversee and review the performance of the investment manager, the distributor, and others who perform services for the fund. The independent fund trustees, in particular, are advocates
| Name, Address, | | Position(s) | | Length of |
| and Birth Date | | Held with Fund(s) | | Time Served |
| Interested Trustees |
| |
| Patrick P. Coyne1 | | Chairman, President, | | Chairman and Trustee |
| 2005 Market Street | | Chief Executive Officer, | | since August 16, 2006 |
| Philadelphia, PA 19103 | | and Trustee | | |
| April 1963 | | | | President and |
| | | | Chief Executive Officer |
| | | | since August 1, 2006 |
| | | | | |
| Independent Trustees |
| |
| Thomas L. Bennett | | Trustee | | Since March 2005 |
| 2005 Market Street | | | | |
| Philadelphia, PA 19103 | | | | |
| October 1947 | | | | |
| |
| |
| |
| John A. Fry | | Trustee | | Since January 2001 |
| 2005 Market Street | | | | |
| Philadelphia, PA 19103 | | | | |
| May 1960 | | | | |
| |
| |
| |
| |
| Anthony D. Knerr | | Trustee | | Since April 1990 |
| 2005 Market Street | | | | |
| Philadelphia, PA 19103 | | | | |
| December 1938 | | | | |
| |
| |
| Lucinda S. Landreth | | Trustee | | Since March 2005 |
| 2005 Market Street | | | | |
| Philadelphia, PA 19103 | | | | |
| June 1947 | | | | |
| | | | | |
1 Patrick P. Coyne is considered to be an “Interested Trustee” because he is an executive officer of the Fund’s(s’) investment advisor.
134
for shareholder interests. Each trustee has served in that capacity since he or she was elected to or appointed to the Board of Trustees, and will continue to serve until his or her retirement or the election of a new trustee in his or her place. The following is a list of the Trustees and Officers with certain background and related information.
| | Number of Portfolios in | | |
| Principal Occupation(s) | | Fund Complex Overseen | | Other Directorships |
| During Past 5 Years | | by Trustee or Officer | | Held by Trustee or Officer |
| |
| |
| Patrick P. Coyne has served in | | 81 | | Director |
| various executive capacities | | | | Kaydon Corp. |
| at different times at | | | | |
| Delaware Investments.2 | | | | |
| |
| |
| |
| |
| |
| Private Investor | | 81 | | Director |
| (March 2004–Present) | | | | Bryn Mawr Bank Corp. (BMTC) |
| | | | (April 2007–Present) |
| Investment Manager | | | | |
| Morgan Stanley & Co. | | | | |
| (January 1984–March 2004) | | | | |
| |
| President | | 81 | | Director |
| Franklin & Marshall College | | | | Community Health Systems |
| (June 2002–Present) | | | | |
| |
| Executive Vice President | | | | |
| University of Pennsylvania | | | | |
| (April 1995–June 2002) | | | | |
| |
| Founder and | | 81 | | None |
| Managing Director | | | | |
| Anthony Knerr & Associates | | | | |
| (Strategic Consulting) | | | | |
| (1990–Present) | | | | |
| |
| Chief Investment Officer | | 81 | | None |
| Assurant, Inc. (Insurance) | | | | |
| (2002–2004) | | | | |
| | | | | |
| | | | | |
2 Delaware Investments is the marketing name for Delaware Management Holdings, Inc. and its subsidiaries, including the Fund’s(s’) investment advisor, principal underwriter, and its transfer agent.
135
Board of trustees/directors and officers addendum
Delaware Investments® Family of Funds
| Name, Address, | | Position(s) | | Length of |
| and Birth Date | | Held with Fund(s) | | Time Served |
| Independent Trustees (continued) |
| |
| Ann R. Leven | | Trustee | | Since October 1989 |
| 2005 Market Street | | | | |
| Philadelphia, PA 19103 | | | | |
| November 1940 | | | | |
| |
| Thomas F. Madison | | Trustee | | Since May 19973 |
| 2005 Market Street | | | | |
| Philadelphia, PA 19103 | | | | |
| February 1936 | | | | |
| | | | | |
| | | | | |
| | | | | |
| | | | | |
| | | | | |
| | | | | |
| | | | | |
| | | | | |
| | | | | |
| | | | | |
| | | | | |
| | | | | |
| | | | | |
| | | | | |
| | | | | |
| | | | | |
| | | | | |
| | | | | |
| | | | | |
| | | | | |
| | | | | |
| | | | | |
| | | | | |
3 In 1997, several funds managed by Voyageur Fund Managers, Inc. (the “Voyageur Funds”) were incorporated into the Delaware Investments Family of Funds. Mr. Madison served as a director of the Voyageur Funds from 1993 until 1997.
136
| | Number of Portfolios in | | |
| Principal Occupation(s) | | Fund Complex Overseen | | Other Directorships |
| During Past 5 Years | | by Trustee or Officer | | Held by Trustee or Officer |
| |
| |
| Consultant | | 81 | | None |
| ARL Associates | | | | |
| (Financial Planning) | | | | |
| (1983–Present) | | | | |
| |
| President and | | 81 | | Director and Chair of |
| Chief Executive Officer | | | | Compensation Committee, |
| MLM Partners, Inc. | | | | Governance Committee |
| (Small Business Investing | | | | Member |
| and Consulting) | | | | CenterPoint Energy |
| (January 1993–Present) | | | | |
| | | | Lead Director and Chair of |
| | | | Audit and Governance |
| | | | Committees, Member of |
| | | | Compensation Committee |
| | | | Digital River, Inc. |
| |
| | | | Director and Chair of |
| | | | Governance Committee, |
| | | | Audit Committee |
| | | | Member |
| | | | Rimage Corporation |
| |
| | | | Director and Chair of |
| | | | Compensation Committee |
| | | | Spanlink Communications |
| |
| | | | Lead Director and Member of |
| | | | Compensation and |
| | | | Governance Committees |
| | | | Valmont Industries, Inc. |
| | | | | |
137
Board of trustees/directors and officers addendum
Delaware Investments® Family of Funds
| Name, Address, | | Position(s) | | Length of |
| and Birth Date | | Held with Fund(s) | | Time Served |
| Independent Trustees (continued) |
| |
| Janet L. Yeomans | | Trustee | | Since April 1999 |
| 2005 Market Street | | | | |
| Philadelphia, PA 19103 | | | | |
| July 1948 | | | | |
| |
| |
| |
| |
| J. Richard Zecher | | Trustee | | Since March 2005 |
| 2005 Market Street | | | | |
| Philadelphia, PA 19103 | | | | |
| July 1940 | | | | |
| |
| |
| |
| |
| |
| |
| Officers |
| |
| David F. Connor | | Vice President, | | Vice President since |
| 2005 Market Street | | Deputy General | | September 2000 |
| Philadelphia, PA 19103 | | Counsel, and Secretary | | and Secretary since |
| December 1963 | | | | October 2005 |
| |
| |
| Daniel V. Geatens | | Vice President | | Treasurer |
| 2005 Market Street | | and Treasurer | | since October 25, 2007 |
| Philadelphia, PA 19103 | | | | |
| October 1972 | | | | |
| |
| David P. O’Connor | | Senior Vice President, | | Senior Vice President, |
| 2005 Market Street | | General Counsel, | | General Counsel, and |
| Philadelphia, PA 19103 | | and Chief Legal Officer | | Chief Legal Officer |
| February 1966 | | | | since October 2005 |
| |
| Richard Salus | | Senior Vice President | | Chief Financial Officer |
| 2005 Market Street | | and Chief Financial Officer | | since November 2006 |
| Philadelphia, PA 19103 | | | | |
| October 1963 | | | | |
| | | | | |
4 David F. Connor, Daniel V. Geatens, David P. O’Connor, and Richard Salus serve in similar capacities for the six portfolios of the Optimum Fund Trust, which have the same investment advisor, principal underwriter, and transfer agent as the registrant.
138
| | Number of Portfolios in | | |
| Principal Occupation(s) | | Fund Complex Overseen | | Other Directorships |
| During Past 5 Years | | by Trustee or Officer | | Held by Trustee or Officer |
| |
| |
| Vice President and Treasurer | | 81 | | None |
| (January 2006–Present) | | | | |
| Vice President — Mergers & Acquisitions | | | | |
| (January 2003–January 2006), and | | | | |
| Vice President | | | | |
| (July 1995–January 2003) | | | | |
| 3M Corporation | | | | |
| |
| Founder | | 81 | | Director and Audit |
| Investor Analytics | | | | Committee Member |
| (Risk Management) | | | | Investor Analytics |
| (May 1999–Present) | | | | |
| |
| Founder | | | | |
| Sutton Asset Management | | | | |
| (Hedge Fund) | | | | |
| (September 1996–Present) | | | | |
| |
| |
| |
| David F. Connor has served as | | 81 | | None4 |
| Vice President and Deputy | | | | |
| General Counsel of | | | | |
| Delaware Investments | | | | |
| since 2000. | | | | |
| |
| Daniel V. Geatens has served | | 81 | | None4 |
| in various capacities at | | | | |
| different times at | | | | |
| Delaware Investments. | | | | |
| |
| David P. O’Connor has served in | | 81 | | None4 |
| various executive and legal | | | | |
| capacities at different times | | | | |
| at Delaware Investments. | | | | |
| |
| Richard Salus has served in | | 81 | | None4 |
| various executive capacities | | | | |
| at different times at | | | | |
| Delaware Investments. | | | | |
| | | | | |
The Statement of Additional Information for the Fund(s) includes additional information about the Trustees and Officers and is available, without charge, upon request by calling 800 523-1918.
139
About the organization
Board of trustees |
| | | | |
Patrick P. Coyne
Chairman, President, and
Chief Executive Officer
Delaware Investments®
Family of Funds
Philadelphia, PA Thomas L. Bennett
Private Investor
Rosemont, PA John A. Fry
President
Franklin & Marshall
College
Lancaster, PA | Anthony D. Knerr
Founder and Managing
Director
Anthony Knerr &
Associates
New York, NY Lucinda S. Landreth
Former Chief Investment
Officer
Assurant, Inc.
Philadelphia, PA | Ann R. Leven
Consultant
ARL Associates
New York, NY Thomas F. Madison
President and
Chief Executive Officer
MLM Partners, Inc.
Minneapolis, MN | Janet L. Yeomans
Vice President and
Treasurer
3M Corporation
St. Paul, MN J. Richard Zecher
Founder
Investor Analytics
Scottsdale, AZ |
| | | | |
Affiliated officers |
| | | | |
David F. Connor
Vice President, Deputy
General Counsel, and
Secretary
Delaware Investments
Family of Funds
Philadelphia, PA | Daniel V. Geatens
Vice President and
Treasurer
Delaware Investments
Family of Funds
Philadelphia, PA | David P. O’Connor
Senior Vice President,
General Counsel,
and Chief Legal Officer
Delaware Investments
Family of Funds
Philadelphia, PA | Richard Salus
Senior Vice President and
Chief Financial Officer
Delaware Investments
Family of Funds
Philadelphia, PA |
This annual report is for the information of Delaware Tax-Free Arizona Fund, Delaware Tax-Free California Fund, Delaware Tax-Free Colorado Fund, Delaware Tax-Free Idaho Fund, and Delaware Tax-Free New York Fund shareholders, but it may be used with prospective investors when preceded or accompanied by a current prospectus for Delaware Tax-Free Arizona Fund, Delaware Tax-Free California Fund, Delaware Tax-Free Colorado Fund, Delaware Tax-Free Idaho Fund, and Delaware Tax-Free New York Fund and the Delaware Investments Fund profile for the most recently completed calendar quarter. These documents are available at www.delawareinvestments.com. The prospectus sets forth details about charges, expenses, investment objectives, and operating policies of the investment company. You should read the prospectus carefully before you invest. The figures in this report represent past results that are not a guarantee of future results. The return and principal value of an investment in the investment company will fluctuate so that shares, when redeemed, may be worth more or less than their original cost. |
Delaware Investments is the marketing name of Delaware Management Holdings, Inc. and its subsidiaries. Each Fund files its complete schedule of portfolio holdings with the Securities and Exchange Commission for the first and third quarters of each fiscal year on Form N-Q. Each Fund’s Forms N-Q, as well as a description of the policies and procedures that each Fund uses to determine how to vote proxies (if any) relating to portfolio securities are available without charge (i) upon request, by calling 800 523-1918; and (ii) on the Commission’s Web site at www.sec.gov. In addition, a description of the policies and procedures that each Fund uses to determine how to vote proxies (if any) relating to portfolio securities and each Fund’s Schedule of Investments are available without charge on each Fund’s Web site at www.delawareinvestments.com. Each Fund’s Forms N-Q may be reviewed and copied at the Commission’s Public Reference Room in Washington, D.C.; information on the operation of the Public Reference Room may be obtained by calling 800 SEC-0330. Information (if any) regarding how each Fund voted proxies relating to portfolio securities during the most recently disclosed 12-month period ended June 30 is available without charge (i) through each Fund’s Web site at www.delawareinvestments.com; and (ii) on the Commission’s Web site at www.sec.gov. |
140
Item 2. Code of Ethics
The registrant has adopted a code of ethics that applies to the registrant’s principal executive officer, principal financial officer, principal accounting officer or controller, or persons performing similar functions, regardless of whether these individuals are employed by the registrant or a third party. A copy of the registrant’s Code of Business Ethics has been posted on Delaware Investments’ internet website at www.delawareinvestments.com. Any amendments to the Code of Business Ethics, and information on any waiver from its provisions granted by the registrant, will also be posted on this website within five business days of such amendment or waiver and will remain on the website for at least 12 months.
Item 3. Audit Committee Financial Expert
The registrant’s Board of Trustees/Directors has determined that each member of the registrant’s Audit Committee is an audit committee financial expert, as defined below. For purposes of this item, an “audit committee financial expert” is a person who has the following attributes:
a. An understanding of generally accepted accounting principles and financial statements;
b. The ability to assess the general application of such principles in connection with the accounting for estimates, accruals, and reserves;
c. Experience preparing, auditing, analyzing, or evaluating financial statements that present a breadth and level of complexity of accounting issues that are generally comparable to the breadth and complexity of issues that can reasonably be expected to be raised by the registrant’s financial statements, or experience actively supervising one or more persons engaged in such activities;
d. An understanding of internal controls and procedures for financial reporting; and
e. An understanding of audit committee functions.
An “audit committee financial expert” shall have acquired such attributes through:
a. Education and experience as a principal financial officer, principal accounting officer, controller, public accountant, or auditor or experience in one or more positions that involve the performance of similar functions;
b. Experience actively supervising a principal financial officer, principal accounting officer, controller, public accountant, auditor, or person performing similar functions;
c. Experience overseeing or assessing the performance of companies or public accountants with respect to the preparation, auditing, or evaluation of financial statements; or
d. Other relevant experience.
The registrant’s Board of Trustees/Directors has also determined that each member of the registrant’s Audit Committee is independent. In order to be “independent” for purposes of this item, the Audit Committee member may not: (i) other than in his or her capacity as a member of the Board of Trustees/Directors or any committee thereof, accept directly or indirectly any consulting, advisory or other compensatory fee from the issuer; or (ii) be an “interested person” of the registrant as defined in Section 2(a)(19) of the Investment Company Act of 1940.
The names of the audit committee financial experts on the registrant’s Audit Committee are set forth below:
Thomas L. Bennett 1
John A. Fry
Thomas F. Madison
J. Richard Zecher
Item 4. Principal Accountant Fees and Services
(a) Audit fees.
The aggregate fees billed for services provided to the registrant by its independent auditors for the audit of the registrant’s annual financial statements and for services normally provided by the independent auditors in connection with statutory and regulatory filings or engagements were $19,600 for the fiscal year ended August 31, 2009.
____________________
1 The instructions to Form N-CSR require disclosure on the relevant experience of persons who qualify as audit committee financial experts based on “other relevant experience.” The Board of Trustees/Directors has determined that Mr. Bennett qualifies as an audit committee financial expert by virtue of his education, Chartered Financial Analyst designation, and his experience as a credit analyst, portfolio manager and the manager of other credit analysts and portfolio managers.
The aggregate fees billed for services provided to the registrant by its independent auditors for the audit of the registrant’s annual financial statements and for services normally provided by the independent auditors in connection with statutory and regulatory filings or engagements were $18,200 for the fiscal year ended August 31, 2008.
(b) Audit-related fees.
The aggregate fees billed by the registrant’s independent auditors for services relating to the performance of the audit of the registrant’s financial statements and not reported under paragraph (a) of this Item were $0 for the fiscal year ended August 31, 2009.
The aggregate fees billed by the registrant’s independent auditors for services relating to the performance of the audit of the financial statements of the registrant’s investment adviser and other service providers under common control with the adviser and that relate directly to the operations or financial reporting of the registrant were $19,074 for the registrant’s fiscal year ended August 31, 2009. The percentage of these fees relating to services approved by the registrant’s Audit Committee pursuant to the de minimis exception from the pre-approval requirement in Rule 2-01(c)(7)(i)(C) of Regulation S-X was 0%. These audit-related services were as follows: issuance of report concerning transfer agent's system of internal accounting control pursuant to Rule 17Ad-13 of the Securities Exchange Act.
The aggregate fees billed by the registrant’s independent auditors for services relating to the performance of the audit of the registrant’s financial statements and not reported under paragraph (a) of this Item were $0 for the fiscal year ended August 31, 2008.
The aggregate fees billed by the registrant’s independent auditors for services relating to the performance of the audit of the financial statements of the registrant’s investment adviser and other service providers under common control with the adviser and that relate directly to the operations or financial reporting of the registrant were $19,074 for the registrant’s fiscal year ended August 31, 2008. The percentage of these fees relating to services approved by the registrant’s Audit Committee pursuant to the de minimis exception from the pre-approval requirement in Rule 2-01(c)(7)(i)(C) of Regulation S-X was 0%. These audit-related services were as follows: issuance of report concerning transfer agent's system of internal accounting control pursuant to Rule 17Ad-13 of the Securities Exchange Act.
(c) Tax fees.
The aggregate fees billed by the registrant’s independent auditors for tax-related services provided to the registrant were $6,450 for the fiscal year ended August 31, 2009. The percentage of these fees relating to services approved by the registrant’s Audit Committee pursuant to the de minimis exception from the pre-approval requirement in Rule 2-01(c)(7)(i)(C) of Regulation S-X was 0%. These tax-related services were as follows: review of income tax returns and review of annual excise distribution calculations.
The aggregate fees billed by the registrant’s independent auditors for tax-related services provided to the registrant’s investment adviser and other service providers under common control with the adviser and that relate directly to the operations or financial reporting of the registrant were $0 for the registrant’s fiscal year ended August 31, 2009.
The aggregate fees billed by the registrant’s independent auditors for tax-related services provided to the registrant were $5,450 for the fiscal year ended August 31, 2008. The percentage of these fees relating to services approved by the registrant’s Audit Committee pursuant to the de minimis exception from the pre-approval requirement in Rule 2-01(c)(7)(i)(C) of Regulation S-X was 0%. These tax-related services were as follows: review of income tax returns and review of annual excise distribution calculations.
The aggregate fees billed by the registrant’s independent auditors for tax-related services provided to the registrant’s investment adviser and other service providers under common control with the adviser and that relate directly to the operations or financial reporting of the registrant were $0 for the registrant’s fiscal year ended August 31, 2008.
(d) All other fees.
The aggregate fees billed for all services provided by the independent auditors to the registrant other than those set forth in paragraphs (a), (b) and (c) of this Item were $0 for the fiscal year ended August 31, 2009.
The aggregate fees billed for all services other than those set forth in paragraphs (b) and (c) of this Item provided by the registrant’s independent auditors to the registrant’s adviser and other service providers under common control with the adviser and that relate directly to the operations or financial reporting of the registrant were $0 for the registrant’s fiscal year ended August 31, 2009.
The aggregate fees billed for all services provided by the independent auditors to the registrant other than those set forth in paragraphs (a), (b) and (c) of this Item were $0 for the fiscal year ended August 31, 2008.
The aggregate fees billed for all services other than those set forth in paragraphs (b) and (c) of this Item provided by the registrant’s independent auditors to the registrant’s adviser and other service providers under common control with the adviser and that relate directly to the operations or financial reporting of the registrant were $0 for the registrant’s fiscal year ended August 31, 2008.
(e) The registrant’s Audit Committee has established pre-approval policies and procedures as permitted by Rule 2-01(c)(7)(i)(B) of Regulation S-X (the “Pre-Approval Policy”) with respect to services provided by the registrant’s independent auditors. Pursuant to the Pre-Approval Policy, the Audit Committee has pre-approved the services set forth in the table below with respect to the registrant up to the specified fee limits. Certain fee limits are based on aggregate fees to the registrant and other registrants within the Delaware Investments Family of Funds.
Service | Range of Fees |
| Audit Services | |
| Statutory audits or financial audits for new Funds | up to $25,000 per Fund |
| Services associated with SEC registration statements (e.g., Form N-1A, Form N-14, etc.), periodic reports and other documents filed with the SEC or other documents issued in connection with securities offerings (e.g., comfort letters for closed-end Fund offerings, consents), and assistance in responding to SEC comment letters | up to $10,000 per Fund |
| Consultations by Fund management as to the accounting or disclosure treatment of transactions or events and/or the actual or potential impact of final or proposed rules, standards or interpretations by the SEC, FASB, or other regulatory or standard-setting bodies (Note: Under SEC rules, some consultations may be considered “audit-related services” rather than “audit services”) | up to $25,000 in the aggregate |
| Audit-Related Services | |
| Consultations by Fund management as to the accounting or disclosure treatment of transactions or events and /or the actual or potential impact of final or proposed rules, standards or interpretations by the SEC, FASB, or other regulatory or standard-setting bodies (Note: Under SEC rules, some consultations may be considered “audit services” rather than “audit-related services”) | up to $25,000 in the aggregate |
| Tax Services | |
| U.S. federal, state and local and international tax planning and advice (e.g., consulting on statutory, regulatory or administrative developments, evaluation of Funds’ tax compliance function, etc.) | up to $25,000 in the aggregate |
| U.S. federal, state and local tax compliance (e.g., excise distribution reviews, etc.) | up to $5,000 per Fund |
| Review of federal, state, local and international income, franchise and other tax returns | up to $5,000 per Fund |
Under the Pre-Approval Policy, the Audit Committee has also pre-approved the services set forth in the table below with respect to the registrant’s investment adviser and other entities controlling, controlled by or under common control with the investment adviser that provide ongoing services to the registrant (the “Control Affiliates”) up to the specified fee limit. This fee limit is based on aggregate fees to the investment adviser and its Control Affiliates.
| Service | Range of Fees |
| Non-Audit Services | |
| Services associated with periodic reports and other documents filed with the SEC and assistance in responding to SEC comment letters | up to $10,000 in the aggregate |
The Pre-Approval Policy requires the registrant’s independent auditors to report to the Audit Committee at each of its regular meetings regarding all services initiated since the last such report was rendered, including those services authorized by the Pre-Approval Policy.
(f) Not applicable.
(g) The aggregate non-audit fees billed by the registrant’s independent auditors for services rendered to the registrant and to its investment adviser and other service providers under common control with the adviser were $206,164 and $259,452 for the registrant’s fiscal years ended August 31, 2009 and August 31, 2008, respectively.
(h) In connection with its selection of the independent auditors, the registrant’s Audit Committee has considered the independent auditors’ provision of non-audit services to the registrant’s investment adviser and other service providers under common control with the adviser that were not required to be pre-approved pursuant to Rule 2-01(c)(7)(ii) of Regulation S-X. The Audit Committee has determined that the independent auditors’ provision of these services is compatible with maintaining the auditors’ independence.
Item 5. Audit Committee of Listed Registrants
Not applicable.
Item 6. Investments
(a) Included as part of report to shareholders filed under Item 1 of this Form N-CSR.
(b) Divestment of securities in accordance with Section 13(c) of the Investment Company Act of 1940.
Not applicable.
Item 7. Disclosure of Proxy Voting Policies and Procedures for Closed-End Management Investment Companies
Not applicable.
Item 8. Portfolio Managers of Closed-End Management Investment Companies
Not applicable.
Item 9. Purchases of Equity Securities by Closed-End Management Investment Company and Affiliated Purchasers
Not applicable.
Item 10. Submission of Matters to a Vote of Security Holders
Not applicable.
Item 11. Controls and Procedures
The registrant’s principal executive officer and principal financial officer have evaluated the registrant’s disclosure controls and procedures within 90 days of the filing of this report and have concluded that they are effective in providing reasonable assurance that the information required to be disclosed by the registrant in its reports or statements filed under the Securities Exchange Act of 1934 is recorded, processed, summarized and reported within the time periods specified in the rules and forms of the Securities and Exchange Commission.
There were no significant changes in the registrant’s internal control over financial reporting that occurred during the second fiscal quarter of the period covered by the report to stockholders included herein (i.e., the registrant’s fourth fiscal quarter) that have materially affected, or are reasonably likely to materially affect, the registrant’s internal control over financial reporting.
Item 12. Exhibits
| (a) | | (1) Code of Ethics |
| | |
| | Not applicable. |
| | |
| | (2) Certifications of Principal Executive Officer and Principal Financial Officer pursuant to Rule 30a-2 under the Investment Company Act of 1940 are attached hereto as Exhibit 99.CERT. |
| | |
| | (3) Written solicitations to purchase securities pursuant to Rule 23c-1 under the Securities Exchange Act of 1934. |
| | |
| | Not applicable. |
| | |
| (b) | | Certifications pursuant to Section 906 of the Sarbanes-Oxley Act of 2002 are furnished herewith as Exhibit 99.906CERT. |
SIGNATURES
Pursuant to the requirements of the Securities Exchange Act of 1934 and the Investment Company Act of 1940, the registrant has duly caused this report to be signed on its behalf, by the undersigned, thereunto duly authorized.
Name of Registrant: VOYAGEUR MUTUAL FUNDS II
| PATRICK P. COYNE |
| By: | Patrick P. Coyne |
| Title: | Chief Executive Officer |
| Date: | November 4, 2009 |
Pursuant to the requirements of the Securities Exchange Act of 1934 and the Investment Company Act of 1940, this report has been signed below by the following persons on behalf of the registrant and in the capacities and on the dates indicated.
| PATRICK P. COYNE |
| By: | Patrick P. Coyne |
| Title: | Chief Executive Officer |
| Date: | November 4, 2009 |
| RICHARD SALUS |
| By: | Richard Salus |
| Title: | Chief Financial Officer |
| Date: | November 4, 2009 |