UNITED STATES SECURITIES AND EXCHANGE COMMISSION
Washington, D.C. 20549
FORM N-CSR
CERTIFIED SHAREHOLDER REPORT OF REGISTERED
MANAGEMENT INVESTMENT COMPANIES
Investment Company Act file number: 811-04995
Sit U.S. Government Securities Fund, Inc.
(Exact name of registrant as specified in charter)
3300 IDS Center
80 South Eighth Street
Minneapolis, MN 55402
(Address of principal executive offices)
Paul E. Rasmussen, VP Treasurer
Sit Mutual Funds, Inc.
3300 IDS Center
80 South Eighth Street
Minneapolis, MN 55402
(Name and address of agent for service)
Copy to:
Mike Radmer, Esq.
Dorsey & Whitney
Suite 1500
50 South Sixth Street
Minneapolis, MN 55402-1498
Registrant’s telephone number, including area code:
(612) 332-3223
Date of fiscal year end: March 31, 2014
Date of reporting period: September 30, 2013
Item 1: Reports to Stockholders

Semi-Annual Report
September 30, 2013
U.S. Government Securities Fund Quality Income Fund Tax-Free Income Fund Minnesota Tax-Free Income Fund
Sit Mutual Funds
|
| Sit Mutual Funds |
| BOND FUNDS SEMI-ANNUAL REPORT |
TABLE OF CONTENTS |
This document must be preceded or accompanied by a Prospectus.
CHAIRMAN’S LETTER
November 6, 2013
Dear fellow shareholders:
During the 6-month period ended September 30, 2013, the U.S. fixed-income markets experienced weak performance as yields on most bonds increased. In August, the 30-year U.S. Treasury bond traded at its highest yield in over two years. Even though intermediate and long bond yields rose, short Treasury bills actually traded at slightly lower yields over much of the period, resulting in the Treasury yield curve steepening significantly between the 1-year and 10-year maturities, while 10-year to 30-year maturities experienced a nearly parallel increase in yields. The significant movements of the yield curve largely occurred after Federal Reserve Chairman Ben Bernanke made comments before Congress on May 22. Mr. Bernanke’s comments were generally understood to signal that the Federal Reserve would begin tapering its bond purchase program in the near future. In the months that followed, taxable bond fund flows have exceeded a negative $75 billion and tax-exempt bond fund flows have topped a negative $45 billion. On September 18th, the Federal Open Market Committee indicated that no tapering would be forthcoming at this time, subsequently causing yields to decline from their six-month period highs.
The 30-year Treasury bond ended September yielding 3.69%, 59 basis points higher than at the beginning of the period. The historically low Treasury yields that had persisted for some time have now started rising towards more normalized levels. Even so, a low interest rate environment continues to persist as indicated by Treasury yields remaining below their long-term historical averages across all maturities. It appears that near-term economic worries and political gridlock are still weighing heavily on investors, while concerns about longer-term inflationary risk remain on the back burner.
The performance of corporate bonds was also weaker during the six-month period ended September 30, 2013. Rising Treasury yields, in addition to widening credit spreads, caused corporate yields to increase. Nonetheless, corporate yields remain below their long-term historical averages.
The tax-exempt yield curve steepened in a similar fashion to the Treasury yield curve, but with even larger yield increases overall. Because the negative municipal bond fund flows were more concentrated in high yield and long-term funds, credit spreads widened and long-term bond yields rose much more than short-term bond yields. The AAA-rated, 30-year general obligation bonds yielded 4.12% at the end of September, 103 basis points higher than six months ago.
Global
Economic conditions in Europe may be starting to improve slightly, but negative economic growth is still forecasted for 2013. The sovereign debt crisis concerns that have made headlines for the past few years have calmed down recently. The most problematic countries have made strides towards reducing their budget deficits. However, a return to more volatility after the German elections would
not be a surprise. Further impacting Eurozone growth and recovery prospects are the high levels of unemployment that persist in many countries; youth unemployment remains over 50% in some of the hardest hit countries. So, despite being somewhat better situated to avoid crisis conditions, it seems that most Eurozone countries still remain poorly positioned for broad based economic expansion in the near future.
Outside of Europe, China appears to be stabilizing around a +7 1⁄2% GDP growth rate, a decline from better than +9% in 2011. Further expansion of growth is not expected to take place in China over the next two years. Japan is also forecasted to have stable year-over-year growth of around +2% in 2013. Brazil, meanwhile, is projected to see its GDP rate of economic growth rebound to +2.5% in 2013, improving from the recent low growth levels of around +1%.
In all, the measurable gains in some parts of the global economy could motivate some investors to once again start looking outside of the U.S. bond markets for investment opportunities. However, we do not expect a flood of additional outflows on account of a tepid, albeit improving, global economy.
Domestic
The U.S. continues to experience generally sub-par economic growth with GDP growth of less than +2.0% now expected for the 2013 calendar year. First quarter growth was revised downward to +1.1% from the initial consensus estimate of +2.5%. Second quarter growth improved to +2.5%, while third quarter growth is estimated to slow to approximately +1.5%. Unemployment remains stubbornly above 7.0%, while the labor participation rate has fallen to 63.2%, a 35-year low. Core inflation continues to be below targeted levels and has been holding steady at around +1.8% over the 2013 summer months.
Weighing on many investors’ minds is the constant political brinkmanship, most recently resulting in a Federal government “shutdown.” In addition to the annual budget debate, the debt limit ceiling was once again reached and the Patient Protection and Affordable Care Act (PPACA) continues to be front and center in terms of political rancor. The effects of sequestration enforced beginning early this year appear to have been relatively minimal in terms of impacting second quarter GDP growth. However, the associated tax increases, and to a lesser extent the enacted spending cuts, have helped bring the 2013 budget deficit to its lowest level in five years. Also of note, following the tax increase on high income earners at the federal level, some states (among them California and Minnesota) also followed suit by raising their tax rates before their legislative sessions wrapped up at mid-year.
| | |
2 | | SIT MUTUAL FUNDS SEMI-ANNUAL REPORT |
Because entitlement spending, budget deficits, debt limit debates and the implementation of the PPACA are likely to continue to dominate the headlines and create overall economic uncertainty for businesses in the U.S., the recovery will likely remain sluggish across most sectors of the domestic economy through 2014.
Federal Reserve
With the generally weak economic growth abroad and ongoing political uncertainty at home, the Federal Reserve and Chairman Ben Bernanke were unquestionably the biggest drivers of interest rate fluctuations during the six-month period ended September 30, 2013. Mr. Bernanke’s comments before Congress in May sparked a sell off in the U.S. Treasury market which drove yields higher. The sizeable and sustained increase in interest rates that followed was only partially reversed after the Federal Open Market Committee’s meeting in September. In the September meeting minutes, it was disclosed that the Federal Reserve would, in fact, wait for more evidence that economic progress could be sustained before adjusting the pace of its asset purchases.
These statements from Mr. Bernanke and the Federal Reserve have impacted Treasury rates in competing ways over the past few months. After hovering around 3.0% through mid-May, the yield of the 30-year maturity U.S. Treasury bond rose to as high as 3.90%. Meanwhile, the 10-year Treasury maturity, which had opened the period and had been hovering around 1.86%, rose to just below 3.0%. However, after the Federal Reserve’s September meeting, yields on 10-year and 30-year Treasury maturities fell by 35 basis points and 25 basis points, respectively.
Strategy Summary
The taxable fixed-income strategy employed to manage the U.S. Government Securities Fund will remain focused on seasoned, high coupon agency-backed securities. We believe, that despite recent performance, long-term income stability and principal preservation will return in conjunction with mortgage rates rising from recent all-time lows. Enhanced stability of principal, while also generating steady income, has been the fundamental focus of the Sit Quality Income Fund since its inception. The Fund uses of a mix of short duration taxable securities in order to achieve its investment goals.
The tax-exempt fixed-income strategy employed in managing both the Tax-Free Income Fund and the Minnesota Tax-Free Income Fund will continue to focus heavily on the use of high coupon bonds and bonds structured with put, call, sinking fund and prepayment provisions that provide regular cash flow. We believe that the recent rise in yields has created opportunities to find bonds that provide attractive absolute levels of tax-exempt income, particularly in longer duration bonds. We have also continued with sector migration from healthcare into housing. Our expectations for subpar economic growth and controlled inflation support our belief that tax-exempt rates could stabilize around these higher yield levels, particularly if refunding issuance volume remains low. Our investment strategy remains focused on income, which we believe is the primary source of return over longer periods of time. We continue to focus on sectors and security structures that provide incremental yield, while using diversification to help manage credit risk.
We appreciate your continued interest in the Sit family of funds.
With best wishes,

Roger J. Sit
Chairman and President
Sit Mutual Funds
|
Sit U.S. Government Securities Fund |
OBJECTIVE & STRATEGY
The objective of the U.S. Government Securities Fund is to provide high current income and safety of principal, which it seeks to attain by investing solely in debt obligations issued, guaranteed or insured by the U.S. government or its agencies or its instrumentalities. Agency mortgage securities and U.S. Treasury securities are the principal holdings in the Fund. The mortgage securities that the Fund purchases consist of pass-through securities including those issued by Government National Mortgage Association (GNMA), Federal National Mortgage Asociation (FNMA), and Federal Home Loan Mortgage Corporation (FHLMC).
The Sit U.S. Government Securities Fund provided a return of -1.83% during the 6-month period ended September 30, 2013, compared to the Barclays Intermediate Government Bond Index return of -0.98%. The Fund’s 30-day SEC yield was 1.49% and its 12-month distribution rate was 0.99%.
During the 6-month period, the Fund benefitted from its holdings in collateralized mortgage obligations. The income generated by these securities and structural features were able to offset price declines. Speculation surrounding the reduction in the pace of the Federal Reserve’s asset purchases drove interest rates higher and reduced demand for mortgage-backed securities. These factors, in addition to elevated prepayment levels, caused the Fund’s holdings of mortgage pass-through securities to underperform during the period. However, the rise in mortgage rates and traditional impediments to refinancing is beginning to bring prepayment activity closer to historical levels.
In response to guidance from the Federal Reserve regarding the timing of reducing asset purchases, we positioned the portfolio to be defensive against a rise in interest rates. Unfortunately, the surprise announcement in September to not begin a reduction in the bond buying program caused interest rates to partially reverse the upward movement and our defensive positioning led to underperformance.
Looking forward, we do believe the current domestic fiscal uncertainties will cause only temporary disruption in economic growth and that we will continue to see sub-par growth overall. We continue to be defensively positioned, albeit at a smaller magnitude. The Federal Reserve’s delay in decreasing its monthly bond purchases portends that we are further away from the end of bond purchases as well as the timing of the first increase in the Fed funds rate. However, once the market senses a shift in the Fed’s sentiment of the economy, we expect another significant increase in interest rates, validating our cautious interest rate stance. We continue to focus on old, high coupon agency mortgage securities that should provide relatively
HYPOTHETICAL GROWTH OF $10,000
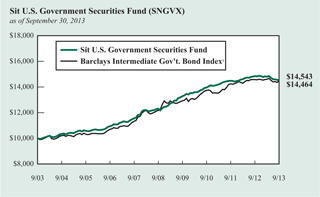
The chart above illustrates the total value of a hypothetical $10,000 investment in the Fund over the past 10 years (or for the life of the Fund if shorter) as compared to the performance of the Barclays Intermediate Government Bond Index. Past performance does not guarantee future results. Returns include the reinvestment of distributions. The chart does not reflect the deduction of taxes that a shareholder would pay on Fund distributions or the redemption of Fund shares.
1 The Barclays Intermediate Government Bond Index is a sub-index of the Barclays Government Bond Index covering issues with remaining maturities of between three and five years. The Barclays Government Bond Index is an index that measures the performance of all public U.S. government obligations with remaining maturities of one year or more. The returns include the reinvestment of income and do not include any transaction costs, management fees or other costs. It is not possible to invest directly in an index. This is the Fund’s primary index.
stable income and price levels. This high level of income and stability of principal has been a core fundamental focus of the Fund since its inception.
Michael C. Brilley Bryce A. Doty, CFA
Senior Portfolio Managers
Mark H. Book, CFA
Portfolio Manager
| | |
4 | | SIT MUTUAL FUNDS SEMI-ANNUAL REPORT |
COMPARATIVE RATES OF RETURNS
| | | | | | | | | | | | |
as of September 30, 2013 | |
| | | |
| | | Sit U.S. | | | | | | Lipper | |
| | | Government | | | Barclays | | | U.S. | |
| | | Securities | | | Inter. Gov’t | | | Gov’t Fund | |
| | | Fund | | | Bond Index1 | | | Index2 | |
Six Months | | | -1.83% | | | | -0.98% | | | | n/a | |
One Year | | | -2.02 | | | | -0.80 | | | | -3.20% | |
Five Years | | | 3.39 | | | | 3.52 | | | | 4.51 | |
Ten Years | | | 3.82 | | | | 3.76 | | | | 3.94 | |
Since Inception(6/2/87) | | | 5.97 | | | | 6.17 | | | | 5.88 | |
Performance figures are historical and do not guarantee future results. Investment returns and principal value will vary, and you may have a gain or loss when you sell shares. Current performance may be lower or higher than the performance data quoted. Contact the Fund for performance data current to the most recent month-end. Returns include changes in share price as well as reinvestment of all dividends and capital gains and all fee waivers. Without the fee waivers total return and yield figures would have been lower. Returns do not reflect the deduction of taxes that a shareholder would pay on Fund distributions or the redemption of Fund shares. Management fees and administrative expenses are included in the Fund’s performance. Returns for periods greater than one year are compounded average annual rates of return.
1 The Barclays Intermediate Government Bond Index is a sub-index of the Barclays Government Bond Index covering issues with remaining maturities of between three and five years. The Barclays Government Bond Index is an index that measures the performance of all public U.S. government obligations with remaining maturities of one year or more. The returns include the reinvestment of income and do not include any transaction costs, management fees or other costs. It is not possible to invest directly in an index.
2 The Lipper returns are obtained from Lipper Analytical Services, Inc., a large independent evaluator of mutual funds.
FUND DIVERSIFICATION
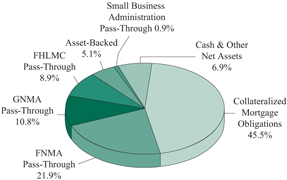
Based on total net assets as of September 30, 2013. Subject to change.
PORTFOLIO SUMMARY
| | |
Net Asset Value 9/30/13: | | $11.05 Per Share |
Net Asset Value 3/31/13: | | $11.30 Per Share |
Total Net Assets: | | $940.2 Million |
30-day SEC Yield 3: | | 1.49% |
12-month Distribution Rate 3: | | 0.99% |
Effective Duration 4: | | 1.4 Years |
3 The SEC Yield reflects the rate at which the Fund is earning income on its current portfolio of securities, while the distribution rate reflects the Fund’s past dividends paid to shareholders based on the net investment income distributed and the average NAV during the past 12 months. Accordingly, the Fund’s SEC yield and distribution rate may differ.
4 Duration is a measure of estimated price sensitivity relative to changes in interest rates. Portfolios with longer durations are typically more sensitive to changes in interest rates. For example, if interest rates rise by 1%, the fair value of a security with an effective duration of 5 years would decrease by 5%, with all other factors being constant. The correlation between duration and price sensitivity is greater for securities rated investment-grade than it is for securities rated below investment-grade. Duration estimates are based on assumptions by the Adviser and are subject to a number of limitations. Effective duration is calculated based on historical price changes of securities held by the Fund, and therefore is a more accurate estimate of price sensitivity provided interest rates remain within their historical range.
ESTIMATED AVERAGE LIFE
| | | | |
0-1 Year | | | 8.2% | |
1-5 Years | | | 86.9% | |
5-10 Years | | | 4.9% | |
10-20 Years | | | 0.0% | |
20+ Years | | | 0.0% | |
The table represents the Adviser’s estimates of the dollar weighted average life of the portfolio’s securities, which differ from their stated maturities. The Fund’s average stated maturity was 19.7 years as of September 30, 2013.
SCHEDULE OF INVESTMENTS (Unaudited)
September 30, 2013
Sit U.S. Government Securities Fund
| | | | | | | | | | | | | | |
| | |
| | | |
Principal Amount ($) | | | Coupon Rate
(%) | | | Maturity Date | | | Fair Value ($) | |
| | |
|
| Mortgage Pass-Through Securities - 42.5% | |
| Federal Home Loan Mortgage Corporation - 8.9% | |
| | 880,180 | | | | 4.00 | | | | 7/1/25 | | | | 931,769 | |
| | 550,525 | | | | 5.82 | | | | 10/1/37 | | | | 600,020 | |
| | 142,986 | | | | 6.38 | | | | 12/1/26-12/1/27 | | | | 159,984 | |
| | 16,918,535 | | | | 6.50 | | | | 11/1/27-9/1/39 | | | | 18,799,465 | |
| | 641,629 | | | | 6.88 | | | | 2/17/31 | | | | 734,506 | |
| | 40,071,465 | | | | 7.00 | | | | 8/1/27-1/1/39 | | | | 44,352,873 | |
| | 85,754 | | | | 7.38 | | | | 12/17/24 | | | | 96,174 | |
| | 5,181,734 | | | | 7.50 | | | | 1/1/31-10/1/38 | | | | 5,919,615 | |
| | 137,440 | | | | 7.95 | | | | 10/1/25-11/1/25 | | | | 153,519 | |
| | 1,049,539 | | | | 8.00 | | | | 5/1/31-1/1/37 | | | | 1,216,794 | |
| | 21,687 | | | | 8.25 | | | | 12/1/17 | | | | 22,358 | |
| | 2,849,308 | | | | 8.50 | | | | 5/1/16-8/1/36 | | | | 3,381,946 | |
| | 3,672,224 | | | | 9.00 | | | | 11/1/15-11/1/36 | | | | 4,272,469 | |
| | 49,851 | | | | 9.25 | | | | 2/1/18-3/1/19 | | | | 50,967 | |
| | 363,611 | | | | 9.50 | | | | 4/1/18-12/17/21 | | | | 421,308 | |
| | 15,900 | | | | 9.75 | | | | 12/1/16-12/1/17 | | | | 16,342 | |
| | 1,464,636 | | | | 10.00 | | | | 9/1/20-7/1/30 | | | | 1,685,705 | |
| | 78,843 | | | | 10.50 | | | | 6/1/19 | | | | 90,002 | |
| | 97,306 | | | | 11.00 | | | | 8/25/20 | | | | 103,819 | |
| | | | | | | | | | | | | | |
| | | |
| | | | | | | | | | | | | 83,009,635 | |
| | | | | | | | | | | | | | |
| Federal National Mortgage Association - 21.9% | |
| | 5,285 | | | | 4.24 | | | | 3/1/19 | 1 | | | 5,358 | |
| | 1,513,643 | | | | 5.50 | | | | 12/1/32 | | | | 1,654,350 | |
| | 3,385,114 | | | | 5.61 | | | | 11/1/22 | | | | 3,786,047 | |
| | 67,131 | | | | 5.76 | | | | 3/1/33 | | | | 73,956 | |
| | 2,871,630 | | | | 5.81 | | | | 12/1/19 | | | | 3,334,701 | |
| | 1,188,440 | | | | 5.92 | | | | 1/1/35 | | | | 1,295,328 | |
| | 3,701,817 | | | | 5.94 | | | | 7/1/27 | | | | 4,145,787 | |
| | 5,160,187 | | | | 5.96 | | | | 11/1/27-6/1/28 | | | | 5,565,222 | |
| | 5,485,686 | | | | 6.00 | | | | 9/1/28-10/1/39 | | | | 6,017,170 | |
| | 482,290 | | | | 6.15 | | | | 6/1/33 | 1 | | | 524,695 | |
| | 141,960 | | | | 6.20 | | | | 11/1/27 | | | | 159,574 | |
| | 109,886 | | | | 6.35 | | | | 10/1/30 | | | | 124,382 | |
| | 3,457,485 | | | | 6.48 | | | | 10/15/28 | | | | 3,940,206 | |
| | 43,748,855 | | | | 6.50 | | | | 1/1/22-6/1/40 | | | | 48,728,349 | |
| | 138,258 | | | | 6.91 | | | | 11/1/26-8/1/27 | | | | 154,234 | |
| | 3,199,694 | | | | 6.94 | | | | 7/1/29 | | | | 3,694,717 | |
| | 153,018 | | | | 6.95 | | | | 8/1/21 | 1 | | | 160,144 | |
| | 70,777,459 | | | | 7.00 | | | | 6/1/17-5/1/39 | | | | 81,370,866 | |
| | 2,763,484 | | | | 7.19 | | | | 2/1/31 | | | | 3,296,516 | |
| | 14,661,362 | | | | 7.50 | | | | 6/1/22-2/1/38 | | | | 16,788,707 | |
| | 81,009 | | | | 7.62 | | | | 12/1/16 | | | | 80,910 | |
| | 240,382 | | | | 7.95 | | | | 9/15/20 | | | | 273,636 | |
| | 4,058,822 | | | | 8.00 | | | | 4/1/16-3/1/38 | | | | 4,763,926 | |
| | 341,158 | | | | 8.11 | | | | 11/15/31 | | | | 414,033 | |
| | 142,141 | | | | 8.33 | | | | 7/15/20 | | | | 162,371 | |
| | 123,082 | | | | 8.37 | | | | 7/20/30 | | | | 132,103 | |
| | 809,244 | | | | 8.46 | | | | 3/15/32 | | | | 992,051 | |
| | 156,422 | | | | 8.48 | | | | 7/20/28-9/15/30 | | | | 172,567 | |
| | 4,238,006 | | | | 8.50 | | | | 2/1/16-1/1/37 | | | | 5,014,301 | |
| | | | | | | | | | | | | | |
| | |
| | | |
Principal Amount ($) | | | Coupon Rate
(%) | | | Maturity Date | | | Fair Value ($) | |
| | |
| | | |
| | 4,238,643 | | | | 9.00 | | | | 10/1/19-2/1/38 | | | | 5,056,893 | |
| | 56,539 | | | | 9.25 | | | | 10/1/16-2/1/17 | | | | 59,577 | |
| | 83,568 | | | | 9.32 | | | | 5/15/28 | | | | 88,513 | |
| | 2,225,867 | | | | 9.50 | | | | 5/1/19-8/1/31 | | | | 2,530,953 | |
| | 270,133 | | | | 9.74 | | | | 7/15/20-8/20/25 | | | | 308,961 | |
| | 90,803 | | | | 9.75 | | | | 10/1/21-4/1/25 | | | | 103,151 | |
| | 499,751 | | | | 10.00 | | | | 2/1/15-6/1/30 | | | | 586,913 | |
| | 33,125 | | | | 10.18 | | | | 7/1/20 | | | | 34,016 | |
| | 104,300 | | | | 10.50 | | | | 6/1/28 | | | | 122,692 | |
| | 25,717 | | | | 10.51 | | | | 8/15/20 | | | | 25,855 | |
| | | | | | | | | | | | | | |
| | | |
| | | | | | | | | | | | | 205,743,731 | |
| | | | | | | | | | | | | | |
| Government National Mortgage Association - 10.8% | |
| | 23,106,200 | | | | 4.00 | | | | 12/15/24-12/20/31 | | | | 24,952,264 | |
| | 2,675,993 | | | | 4.25 | | | | 10/20/31-3/20/37 | | | | 2,865,598 | |
| | 6,621,269 | | | | 4.50 | | | | 6/15/40 | | | | 7,208,188 | |
| | 4,267,520 | | | | 4.75 | | | | 9/20/31 | | | | 4,604,030 | |
| | 188,800 | | | | 5.50 | | | | 9/15/25 | | | | 207,069 | |
| | 1,543,310 | | | | 5.75 | | | | 10/20/31 | | | | 1,697,544 | |
| | 173,315 | | | | 5.76 | | | | 3/20/33-5/20/33 | | | | 192,227 | |
| | 2,055,844 | | | | 5.95 | | | | 3/15/37 | | | | 2,189,496 | |
| | 2,463,827 | | | | 6.00 | | | | 9/15/18-11/20/34 | | | | 2,723,188 | |
| | 504,926 | | | | 6.20 | | | | 3/15/32 | | | | 564,655 | |
| | 2,701,813 | | | | 6.25 | | | | 12/15/23-4/15/29 | | | | 3,046,152 | |
| | 1,386,487 | | | | 6.35 | | | | 4/20/30-11/20/31 | | | | 1,540,976 | |
| | 434,415 | | | | 6.38 | | | | 8/15/26-4/15/28 | | | | 480,856 | |
| | 189,854 | | | | 6.49 | | | | 11/20/31-6/20/32 | | | | 209,939 | |
| | 28,054,336 | | | | 6.50 | | | | 11/15/23-7/20/42 | | | | 31,554,522 | |
| | 104,587 | | | | 6.57 | | | | 9/20/32-3/20/33 | | | | 107,653 | |
| | 76,133 | | | | 6.58 | | | | 2/20/28 | | | | 87,728 | |
| | 674,392 | | | | 6.75 | | | | 9/15/15-6/15/29 | | | | 726,386 | |
| | 592,726 | | | | 6.91 | | | | 7/20/26-2/20/27 | | | | 664,265 | |
| | 8,520,832 | | | | 7.00 | | | | 5/15/24-1/20/39 | | | | 9,821,643 | |
| | 144,325 | | | | 7.02 | | | | 4/20/26 | | | | 156,074 | |
| | 141,406 | | | | 7.05 | | | | 9/20/26-4/20/27 | | | | 146,169 | |
| | 455,417 | | | | 7.10 | | | | 5/20/25 | | | | 511,868 | |
| | 259,758 | | | | 7.15 | | | | 3/20/27-4/20/27 | | | | 303,673 | |
| | 141,191 | | | | 7.25 | | | | 5/15/29-6/15/29 | | | | 155,963 | |
| | 42,479 | | | | 7.27 | | | | 7/20/22 | | | | 43,566 | |
| | 661,872 | | | | 7.50 | | | | 8/20/29-3/15/39 | | | | 757,870 | |
| | 31,353 | | | | 7.63 | | | | 12/15/29 | | | | 31,825 | |
| | 49,143 | | | | 7.65 | | | | 7/20/22 | | | | 55,010 | |
| | 231,257 | | | | 7.75 | | | | 6/15/20-11/15/20 | | | | 252,227 | |
| | 498,226 | | | | 7.95 | | | | 2/15/20-3/20/27 | | | | 531,505 | |
| | 300,753 | | | | 7.99 | | | | 4/20/21-6/20/22 | | | | 329,692 | |
| | 1,560,815 | | | | 8.00 | | | | 10/15/14-8/20/33 | | | | 1,827,018 | |
| | 171,518 | | | | 8.10 | | | | 5/20/19-1/20/20 | | | | 177,428 | |
| | 154,373 | | | | 8.25 | | | | 4/15/19-2/15/20 | | | | 170,722 | |
| | 100,062 | | | | 8.40 | | | | 2/15/19-2/15/20 | | | | 101,674 | |
| | 187,684 | | | | 8.50 | | | | 9/15/16-12/20/26 | | | | 214,745 | |
| | 23,478 | | | | 8.60 | | | | 6/15/18 | | | | 23,588 | |
| | 15,424 | | | | 8.63 | | | | 10/15/18 | | | | 16,945 | |
See accompanying notes to financial statements.
| | |
6 | | SIT MUTUAL FUNDS SEMI-ANNUAL REPORT |
| | | | | | | | | | | | | | |
| | |
| | | |
Principal Amount ($) | | | Coupon Rate
(%) | | | Maturity Date | | | Fair Value ($) | |
| | |
| | | |
| | 73,576 | | | | 9.00 | | | | 12/15/20 | | | | 81,039 | |
| | 79,697 | | | | 9.50 | | | | 11/20/16-9/20/18 | | | | 87,970 | |
| | 137,627 | | | | 10.00 | | | | 2/15/19-6/15/21 | | | | 153,743 | |
| | 188,643 | | | | 10.50 | | | | 2/15/20-8/15/21 | | | | 213,040 | |
| | | | | | | | | | | | | | |
| | | |
| | | | | | | | | | | | | 101,787,733 | |
| | | | | | | | | | | | | | |
| Small Business Administration - 0.9% | |
| | 7,868,735 | | | | 5.33 | | | | 8/25/36-9/25/36 | | | | 8,705,051 | |
| | | | | | | | | | | | | | |
|
| Total Mortgage Pass-Through Securities | |
| (cost: $398,464,199) | | | | 399,246,150 | |
| | | | | | | | | | | | | | |
|
| Collateralized Mortgage Obligations - 45.5% | |
| Federal Home Loan Mortgage Corporation - 12.7% | |
| | 43,666 | | | | 4.86 | | | | 3/25/44 | 1 | | | 44,062 | |
| | 2,898,555 | | | | 6.00 | | | | 9/15/21-5/15/36 | | | | 3,218,382 | |
| | 21,701,484 | | | | 6.50 | | | | 9/15/23-10/25/43 | | | | 25,325,268 | |
| | 1,091,568 | | | | 6.50 | | | | 9/25/43 | 1 | | | 1,259,937 | |
| | 93,022 | | | | 6.70 | | | | 9/15/23 | | | | 107,570 | |
| | 205,307 | | | | 6.95 | | | | 3/15/28 | | | | 236,734 | |
| | 55,493,655 | | | | 7.00 | | | | 12/15/20-7/25/43 | | | | 61,714,631 | |
| | 16,596,446 | | | | 7.50 | | | | 10/15/21-9/25/43 | | | | 19,724,023 | |
| | 3,686,377 | | | | 8.00 | | | | 3/15/21-1/15/30 | | | | 4,292,395 | |
| | 54,134 | | | | 8.25 | | | | 6/15/22 | | | | 62,009 | |
| | 308,378 | | | | 8.30 | | | | 11/15/20 | | | | 350,751 | |
| | 627,030 | | | | 8.50 | | | | 10/15/22-3/15/32 | | | | 736,421 | |
| | 312,500 | | | | 9.00 | | | | 12/15/19 | | | | 347,813 | |
| | 7,672 | | | | 9.15 | | | | 10/15/20 | | | | 8,421 | |
| | 1,641,993 | | | | 9.50 | | | | 2/15/20-2/25/42 | | | | 1,943,800 | |
| | | | | | | | | | | | | | |
| | | |
| | | | | | | | | | | | | 119,372,217 | |
| | | | | | | | | | | | | | |
| Federal National Mortgage Association - 25.3% | |
| | 13,017,100 | | | | 4.50 | | | | 6/25/21 | | | | 13,836,409 | |
| | 2,979,443 | | | | 6.43 | | | | 9/25/37 | 1 | | | 3,423,630 | |
| | 30,258,911 | | | | 6.50 | | | | 8/20/28-11/25/42 | | | | 33,439,363 | |
| | 1,187,701 | | | | 6.53 | | | | 6/25/42 | 1 | | | 1,338,865 | |
| | 187,838 | | | | 6.63 | | | | 3/25/29 | 1 | | | 212,880 | |
| | 4,731,345 | | | | 6.73 | | | | 2/25/42 | 1 | | | 5,608,991 | |
| | 18,901,838 | | | | 6.75 | | | | 6/25/32-4/25/37 | | | | 21,198,249 | |
| | 4,624,184 | | | | 6.77 | | | | 10/25/42 | 1 | | | 5,401,584 | |
| | 663,995 | | | | 6.80 | | | | 12/25/42 | 1 | | | 763,212 | |
| | 25,186 | | | | 6.85 | | | | 12/18/27 | | | | 28,832 | |
| | 39,786,960 | | | | 7.00 | | | | 1/25/21-3/25/45 | | | | 46,261,078 | |
| | 2,729,156 | | | | 7.04 | | | | 8/25/37 | 1 | | | 3,117,526 | |
| | 55,044,367 | | | | 7.50 | | | | 8/20/27-1/25/48 | | | | 64,198,125 | |
| | 1,299,810 | | | | 7.50 | | | | 6/19/30 | 1 | | | 1,537,649 | |
| | 1,559,183 | | | | 8.00 | | | | 7/25/22-7/25/44 | | | | 1,813,067 | |
| | 1,062,378 | | | | 8.37 | | | | 11/25/37 | 1 | | | 1,267,928 | |
| | 996,668 | | | | 8.48 | | | | 11/25/37 | 1 | | | 1,145,062 | |
| | 11,442,417 | | | | 8.50 | | | | 1/25/21-10/25/30 | | | | 13,609,059 | |
| | 11,605 | | | | 8.70 | | | | 12/25/19 | | | | 13,183 | |
| | 18,290 | | | | 8.75 | | | | 9/25/20 | | | | 19,931 | |
| | 79,242 | | | | 8.95 | | | | 10/25/20 | | | | 90,089 | |
| | | | | | | | | | | | | | |
| | |
| | | |
Principal Amount ($) | | | Coupon Rate
(%) | | | Maturity Date | | | Fair Value ($) | |
| | |
| | | |
| | 2,427,468 | | | | 9.00 | | | | 7/25/19-10/25/30 | | | | 2,897,825 | |
| | 65,132 | | | | 9.04 | | | | 10/25/42 | 1 | | | 76,386 | |
| | 29,944 | | | | 9.05 | | | | 12/25/18 | | | | 32,771 | |
| | 41,717 | | | | 9.25 | | | | 1/25/20 | | | | 47,324 | |
| | 908,527 | | | | 9.39 | | | | 6/25/32 | 1 | | | 1,044,092 | |
| | 3,238,040 | | | | 9.50 | | | | 12/25/18-12/25/41 | | | | 4,019,321 | |
| | 105,076 | | | | 9.60 | | | | 3/25/20 | | | | 120,670 | |
| | 5,019,682 | | | | 9.79 | | | | 7/25/37 | 1 | | | 5,622,195 | |
| | 2,802,935 | | | | 10.21 | | | | 9/25/42 | 1 | | | 3,567,657 | |
| | 1,392,747 | | | | 11.38 | | | | 6/25/44 | 1 | | | 1,696,758 | |
| | 169,251 | | | | 12.34 | | | | 3/25/39 | 1 | | | 195,394 | |
| | | | | | | | | | | | | | |
| | | |
| | | | | | | | | | | | | 237,645,105 | |
| | | | | | | | | | | | | | |
| Government National Mortgage Association - 4.2% | |
| | 14,264,808 | | | | 4.79 | | | | 1/20/42 | 1 | | | 15,803,552 | |
| | 4,462,077 | | | | 5.52 | | | | 7/20/40 | 1 | | | 4,909,762 | |
| | 600,392 | | | | 6.50 | | | | 9/20/28 | | | | 686,767 | |
| | 971,480 | | | | 6.95 | | | | 3/16/41 | 1 | | | 1,034,301 | |
| | 15,296,544 | | | | 7.00 | | | | 9/16/23-2/16/40 | | | | 16,938,546 | |
| | 158,676 | | | | 7.50 | | | | 5/16/27 | | | | 184,408 | |
| | 44,833 | | | | 8.50 | | | | 2/20/32 | | | | 55,934 | |
| | | | | | | | | | | | | | |
| | | |
| | | | | | | | | | | | | 39,613,270 | |
| | | | | | | | | | | | | | |
| Vendee Mortgage Trust - 3.3% | |
| | 8,301,422 | | | | 3.75 | | | | 12/15/33 | | | | 8,698,611 | |
| | 355,900 | | | | 6.00 | | | | 2/15/30 | | | | 365,887 | |
| | 5,915,973 | | | | 6.50 | | | | 8/15/31 | | | | 6,858,441 | |
| | 2,613,098 | | | | 7.00 | | | | 3/15/28 | | | | 3,015,436 | |
| | 325,846 | | | | 7.00 | | | | 7/15/30 | 1 | | | 372,213 | |
| | 1,611,996 | | | | 7.25 | | | | 9/15/22-9/15/25 | | | | 1,823,673 | |
| | 2,766,853 | | | | 7.75 | | | | 5/15/22-9/15/24 | | | | 3,195,961 | |
| | 4,923,578 | | | | 7.91 | | | | 3/15/25 | 1 | | | 5,735,043 | |
| | 469,804 | | | | 8.00 | | | | 2/15/25 | | | | 563,290 | |
| | 192,058 | | | | 8.29 | | | | 12/15/26 | | | | 220,956 | |
| | | | | | | | | | | | | | |
| | | |
| | | | | | | | | | | | | 30,849,511 | |
| | | | | | | | | | | | | | |
| Total Collateralized Mortgage Obligations | |
| (cost: $424,630,161) | | | | 427,480,103 | |
| | | | | | | | | | | | | | |
| Asset-Backed Securities - 5.1% | |
| Federal Home Loan Mortgage Corporation - 0.7% | |
| | 11,004 | | | | 6.09 | | | | 9/25/29 | 1 | | | 11,017 | |
| | 250,000 | | | | 6.28 | | | | 10/27/31 | 14 | | | 279,807 | |
| | 231,924 | | | | 7.00 | | | | 11/25/30 | 14 | | | 234,021 | |
| | 3,379,129 | | | | 7.15 | | | | 9/25/28 | 14 | | | 3,625,321 | |
| | 2,509,745 | | | | 7.16 | | | | 7/25/29 | | | | 2,750,969 | |
| | | | | | | | | | | | | | |
| | | |
| | | | | | | | | | | | | 6,901,135 | |
| | | | | | | | | | | | | | |
| Federal National Mortgage Association - 0.3% | |
| | 59,482 | | | | 0.52 | | | | 11/25/32 | 1 | | | 54,159 | |
| | 475,311 | | | | 4.70 | | | | 10/25/33 | 14 | | | 462,485 | |
| | 422,275 | | | | 5.41 | | | | 9/26/33 | 14 | | | 432,699 | |
| | 153,973 | | | | 5.70 | | | | 2/25/33 | 14 | | | 155,450 | |
| | 207,974 | | | | 6.47 | | | | 10/25/31 | 14 | | | 220,275 | |
See accompanying notes to financial statements.
SCHEDULE OF INVESTMENTS (Unaudited)
September 30, 2013
Sit U.S. Government Securities Fund (Continued)
| | | | | | | | | | | | | | |
| | |
Principal Amount($)/ Contracts | | | Coupon Rate
(%) | | | Maturity Date | | | Fair Value ($) | |
| | |
| | | |
| | 1,174,588 | | | | 6.59 | | | | 10/25/31 | 14 | | | 1,309,296 | |
| | 394,934 | | | | 6.63 | | | | 5/25/32 | 1 | | | 398,672 | |
| | 93,587 | | | | 6.83 | | | | 7/25/31 | 14 | | | 97,693 | |
| | 43,616 | | | | 7.80 | | | | 6/25/26 | 1 | | | 43,124 | |
| | | | | | | | | | | | | | |
| | | |
| | | | | | | | | | | | | 3,173,853 | |
| | | | | | | | | | | | | | |
| Small Business Administration - 4.1% | |
| | 3,550,933 | | | | 5.49 | | | | 5/1/28 | | | | 3,910,738 | |
| | 3,583,082 | | | | 5.57 | | | | 10/1/27 | | | | 3,973,319 | |
| | 12,898,536 | | | | 5.87 | | | | 7/1/28 | | | | 14,524,392 | |
| | 509,688 | | | | 6.02 | | | | 8/1/28 | | | | 578,188 | |
| | 2,855,659 | | | | 6.77 | | | | 11/1/28 | | | | 3,262,667 | |
| | 3,583,920 | | | | 7.13 | | | | 10/1/20 | | | | 3,948,948 | |
| | 4,133,894 | | | | 7.33 | | | | 8/1/20 | | | | 4,592,598 | |
| | 3,246,644 | | | | 8.03 | | | | 5/1/20 | | | | 3,633,804 | |
| | | | | | | | | | | | | | |
| | | |
| | | | | | | | | | | | | 38,424,654 | |
| | | | | | | | | | | | | | |
Total Asset-Backed Securities
(cost: $49,230,527) | | | 48,499,642 | |
| | | | | | | | | | | | | | |
|
| Put Options Purchased 10 - 0.0% | |
| | 1,600 | | |
| U.S. Treasury 5 Year Future
Put Options: $118.00 strike
October 2013 expiration |
| | | 37,501 | |
| | 500 | | |
| U.S. Treasury 5 Year Future
Put Options: $119.75 Strike
October 2013 expiration |
| | | 58,594 | |
| | | | | | | | | | | | | | |
Total Put Options Purchased
(cost: $854,671) | | | 96,095 | |
| | | | | | | | | | | | | | |
| Total Investments in Securities - 93.1%
(cost: $873,179,558) |
| | | 875,321,990 | |
| | | | | | | | | | | | | | |
| | | | | | | | |
| | |
Contracts | | Fair Value ($) | |
| | |
| Call Options Written 10 - (1.3%) | |
| | (800 | ) | | U.S. Treasury 2 Year Future | | | | |
| | | | Call Options: $109.63 strike | | | | |
| | | | October 2013 expiration | | | (825,000 | ) |
| | (650 | ) | | U.S. Treasury 2 Year Future | | | | |
| | | | Call Options: $109.75 strike | | | | |
| | | | November 2013 expiration | | | (528,125 | ) |
| | (1,600 | ) | | U.S. Treasury 5 Year Future | | | | |
| | | | Call Options: $117.50 strike | | | | |
| | | | November 2013 expiration | | | (5,787,501 | ) |
| | (2,000 | ) | | U.S. Treasury 5 Year Future | | | | |
| | | | Call Options: $118.75 strike | | | | |
| | | | October 2013 expiration | | | (4,687,500 | ) |
| | (155 | ) | | U.S. Treasury 5 Year Future | | | | |
| | | | Call Options: $119.00 strike | | | | |
| | | | November 2013 expiration | | | (343,906 | ) |
| | | | | | | | |
Total Call Options Written
(premiums received: $5,163,656) | | (12,172,032) | |
| | | | | | | | |
| |
| | Other Assets and Liabilities, net - 8.2% | | | 77,097,475 | |
| | | | | | | | |
| |
| Total Net Assets - 100.0% | | $940,247,433 | |
| | | | | | | | |
| 1 | Variable rate security. Rate disclosed is as of September 30, 2013. |
| 10 | The amount of $18,000,000 in cash was segregated with the broker to cover margin requirements for derivative transactions as of September 30, 2013. |
| 14 | Step Coupon: A bond that pays an initial coupon rate for the first period and then a higher coupon rate for the following periods. Rate disclosed is as of September 30, 2013. |
Numeric footnotes not disclosed are not applicable to this Schedule of Investments.
See accompanying notes to financial statements.
| | |
8 | | SIT MUTUAL FUNDS SEMI-ANNUAL REPORT |
For a detailed list of security holdings, refer to our company website at www.sitfunds.com.
A summary of the levels for the Fund’s investments as of September 30, 2013 is as follows (See Note 2 -significant accounting policies in the notes to the financial statements):
| | | | | | | | | | | | | | |
| | | Investment in Securities | |
| | | Level 1 | | | Level 2 | | | Level 3 | | | |
| | | Quoted Price
($) | | | Other significant
observable inputs ($) | | | Significant
unobservable inputs ($) | | Total ($) | |
Assets | | | | | | | | | | | | | | |
Mortgage Pass-Through Securities | | | — | | | | 399,246,150 | | | — | | | 399,246,150 | |
Collateralized Mortgage Obligations | | | — | | | | 427,480,103 | | | — | | | 427,480,103 | |
Asset-Backed Securities | | | — | | | | 48,499,642 | | | — | | | 48,499,642 | |
Put Options Purchased | | | 96,095 | | | | — | | | — | | | 96,095 | |
| | | 96,095 | | | | 875,225,895 | | | — | | | 875,321,990 | |
Liabilities | | | | | | | | | | | | | | |
Call Options Written | | | (12,172,032) | | | | — | | | — | | | (12,172,032) | |
For the reporting period, there were no transfers between levels 1, 2 and 3.
See accompanying notes to financial statements.
OBJECTIVE & STRATEGY
The objective of the Quality Income Fund is to provide high current income and safety of principal, which it seeks to attain by investing at least 80% of its assets in debt securities issued by the U.S. government and its agencies, debt securities issued by corporations, mortgage and other asset-backed securities. The Fund invests at least 50% of its assets in U.S. government debt securities, which are securities issued, guaranteed or insured by the U.S. government, its agencies or instrumentalities.
The Sit Quality Income Fund provided a return of -0.03% during the 6-month period ended September 30, 2013, compared to the return of the Barclays 1-3 year Government/Credit Bond Index of +0.27%. The Fund’s 30-day SEC yield was 1.10%
During the 6-month period, the Fund benefitted from the income advantage primarily produced by its holdings in non-agency residential mortgage and corporate securities. Speculation surrounding the reduction in the pace of the Federal Reserve’s asset purchases drove interest rates higher and reduced demand for mortgage-backed securities. These factors caused the Fund’s holdings of mortgage pass-through securities to underperform during the period. Although U.S. Treasuries provided positive returns on an absolute basis, the sector underperformed relative to the benchmark. Thus, the Fund’s underweight position in U.S. Treasury securities benefitted performance.
In response to guidance from the Federal Reserve regarding the timing of reducing asset purchases, we positioned the portfolio to be defensive against a rise in interest rates. Unfortunately, the surprise announcement in September to not begin a reduction in the bond buying program caused interest rates to partially reverse the upward movement and our defensive positioning led to underperformance.
Looking forward, we believe the current domestic fiscal uncertainties will cause only a temporary disruption in economic growth and that we will continue to see sub-par growth overall. The Fund is defensively positioned with a duration of only 0.3 years. The Federal Reserve’s delay in decreasing its monthly bond purchases portends that we are further away from the end of bond purchases as well as the timing of the first increase in the Fed funds rate. However, once the market senses a shift in the Fed’s sentiment of the economy, we expect another significant increase in interest rates, validating our cautious interest rate stance. We focus on a mix of
HYPOTHETICAL GROWTH OF $10,000
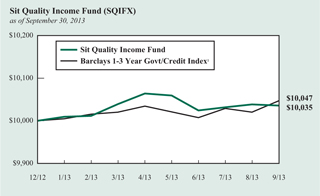
The chart above illustrates the total value of a hypothetical $10,000 investment in the Fund over the past 10 years (or for the life of the Fund if shorter) as compared to the performance of the Barclays 1-3 Year Government/Credit Index. Past performance does not guarantee future results. Returns include the reinvestment of distributions. The chart does not reflect the deduction of taxes that a shareholder would pay on Fund distributions or the redemption of Fund shares.
1 The Barclays 1-3 Year Government/Credit Index is an unmanaged index of Treasury or government agency securities and investment grade corporate debt securities with maturities of one to three years. The returns include the reinvestment of income and do not include any transaction costs, management fees or other costs. It is not possible to invest directly in an index.
Treasury, agency and credit sectors that provide relatively high levels of income and stable prices. The dual goals of principal stability and income are the primary objectives the Fund.
Michael C. Brilley
Bryce A. Doty, CFA
Senior Portfolio Managers
Mark H. Book, CFA
Chris M. Rasmussen, CFA
Portfolio Managers
| | |
10 | | SIT MUTUAL FUNDS SEMI-ANNUAL REPORT |
COMPARATIVE RATES OF RETURNS
as of September 30, 2013
| | | | | | |
| | | | | | | Lipper |
| | | | | Barclays | | Short |
| | | Sit | | 1-3 Year | | Investment |
| | | Quality | | Government/Credit | | Grade Bond |
| | | Income Fund | | Index1 | | Index2 |
|
Six Months | | -0.03% | | 0.27% | | n/a |
Since Inception
(12/31/12) | | 0.35 | | 0.47 | | 0.24% |
|
Performance figures are historical and do not guarantee future results. Investment returns and principal value will vary, and you may have a gain or loss when you sell shares. Current performance may be lower or higher than the performance data quoted. Contact the Fund for performance data current to the most recent month-end. Returns include changes in share price as well as reinvestment of all dividends and capital gains and all fee waivers. Without the fee waivers total return and yield figures would have been lower. Returns do not reflect the deduction of taxes that a shareholder would pay on Fund distributions or the redemption of Fund shares. Management fees and administrative expenses are included in the Fund’s performance.
1 The Barclays 1-3 Year Government/Credit Index is an unmanaged index of Treasury or government agency securities and investment grade corporate debt securities with maturities of one to three years. The returns include the reinvestment of income and do not include any transaction costs, management fees or other costs. It is not possible to invest directly in an index.
2 The Lipper returns are obtained from Lipper Analytical Services, Inc., a large independent evaluator of mutual funds.
FUND DIVERSIFICATION
| | |
| |
U.S. Treasury/Federal Agency Securities | | 43.5% |
Corporate Bonds | | 26.0% |
Asset Backed (Non-Agency) | | 11.9% |
Mortgage Pass-Through (Agency) | | 7.7% |
Taxable Municipal | | 5.6% |
Collateralized Mortgage Obligations (Non-Agency) | | 3.0% |
Cash & Other Net Assets | | 2.3% |
|
Based on total net assets as of September 30, 2013. Subject to change.
PORTFOLIO SUMMARY
| | |
| |
Net Asset Value 9/30/13: | | $9.96 Per Share |
Net Asset Value 3/31/13: | | $10.01 Per Share |
Total Net Assets: | | $75.4 Million |
30-day SEC Yield 3: | | 1.10% |
Average Maturity: | | 6.4 Years |
Effective Duration 4: | | 0.3 Years |
3 The SEC Yield reflects the rate at which the Fund is earning income on its current portfolio of securities, while the distribution rate reflects the Fund’s past dividends paid to shareholders based on the net investment income distributed and the average NAV during the past 12 months. Accordingly, the Fund’s SEC yield and distribution rate may differ.
4 Duration is a measure of estimated price sensitivity relative to changes in interest rates. Portfolios with longer durations are typically more sensitive to changes in interest rates. For example, if interest rates rise by 1%, the fair value of a security with an effective duration of 5 years would decrease by 5%, with all other factors being constant. The correlation between duration and price sensitivity is greater for securities rated investment-grade than it is for securities rated below investment-grade. Duration estimates are based on assumptions by the Adviser and are subject to a number of limitations. Effective duration is calculated based on historical price changes of securities held by the Fund, and therefore is a more accurate estimate of price sensitivity provided interest rates remain within their historical range.
QUALITY RATINGS (% of Total Net Assets)
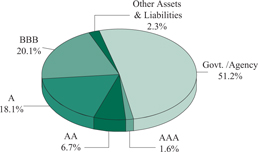
Lower of Moody’s, S&P, Fitch or Duff & Phelps ratings used.
SCHEDULE OF INVESTMENTS (Unaudited)
September 30, 2013
Sit Quality Income Fund
| | | | | | | | | | | | | | | | | |
| Principal | | | | Coupon | | Maturity | | Fair |
| Amount ($) | | Name of Issuer | | Rate (%) | | Date | | Value ($) |
Asset-Backed Securities - 12.3% | | | | | | | | | | | |
Agency - 0.4% | | | | | | | | | | | |
| 257,582 | | FNMA REMICS, Series 2001-W2, Class AS5 14 | | | | 6.47 | | | | | 10/25/31 | | | | | 272,818 | |
| | | | | | | | | | | | | | | | | |
| | | |
Non-Agency - 11.9% | | | | | | | | | | | | | | | |
| 209,474 | | Ace Securities Corp. Home Equity Loan Trust Series 2004-SD1 1 | | | | 0.67 | | | | | 11/25/33 | | | | | 205,261 | |
| 400,596 | | Aegis Asset Backed Securities Trust, Series 2005-2, Class M1 1 | | | | 0.60 | | | | | 6/25/35 | | | | | 394,284 | |
| 337,746 | | Bayview Financial Mortgage Pass-Through Trust, Series 2005-B, Class 1A5 14 | | | | 5.66 | | | | | 4/28/39 | | | | | 338,949 | |
| 85,015 | | Bayview Financial Mortgage Pass-Through Trust, Series 2005-D, Class AF3 1 | | | | 5.50 | | | | | 12/28/35 | | | | | 85,698 | |
| 85,704 | | Bear Stearns Asset Backed Securities Trust, Series 2005-SD2, Class 1A3 1 | | | | 0.58 | | | | | 3/25/35 | | | | | 83,855 | |
| 41,083 | | Centex Home Equity Loan Trust, Series 2004-A, Class AF4 14 | | | | 5.01 | | | | | 8/25/32 | | | | | 41,325 | |
| 310,000 | | Centex Home Equity Loan Trust, Series 2004-A, Class AF5 14 | | | | 5.43 | | | | | 1/25/34 | | | | | 315,803 | |
| 332,354 | | Centex Home Equity Loan Trust, Series 2004-D, Class AF4 14 | | | | 4.68 | | | | | 6/25/32 | | | | | 345,326 | |
| 180,280 | | Citifinancial Mortgage Securities, Inc., Series 2003-4, Class AF4 14 | | | | 4.43 | | | | | 10/25/33 | | | | | 181,939 | |
| 465,394 | | Citifinancial Mortgage Securities, Inc., Series 2004-1, Class AF3 14 | | | | 3.77 | | | | | 4/25/34 | | | | | 474,832 | |
| 59,839 | | Conseco Financial Corp., Series 1996-4, Class A6 | | | | 7.40 | | | | | 6/15/27 | | | | | 61,153 | |
| 126,941 | | Conseco Financial Corp., Series 1997-3, Class A6 | | | | 7.32 | | | | | 3/15/28 | | | | | 137,126 | |
| 148,845 | | Conseco Financial Corp., Series 1997-4, Class A7 1 | | | | 7.36 | | | | | 2/15/29 | | | | | 157,360 | |
| 219,692 | | Conseco Financial Corp., Series 1997-6, Class A7 | | | | 7.14 | | | | | 1/15/29 | | | | | 232,418 | |
| 368,558 | | Conseco Financial Corp., Series 1998-1, Class A6 1 | | | | 6.33 | | | | | 11/1/29 | | | | | 385,168 | |
| 348,319 | | Countrywide Asset-Backed Certificates, Series 2002-S2, Class A5 14 | | | | 5.98 | | | | | 1/25/17 | | | | | 349,891 | |
| 161,317 | | Countrywide Asset-Backed Certificates, Series 2004-S1, Class A3 14 | | | | 5.12 | | | | | 2/25/35 | | | | | 164,821 | |
| 36,915 | | Deutsche Financial Capital Securitization LLC, Series 1998-I, Class A4 | | | | 6.38 | | | | | 4/15/28 | | | | | 37,642 | |
| 155,715 | | Deutsche Financial Capital Securitization, LLC, Series 1998-I, Class A3 | | | | 6.10 | | | | | 4/15/28 | | | | | 158,416 | |
| 500,000 | | HSBC Home Equity Loan Trust USA, Series 2007-2, Class A4 1 | | | | 0.48 | | | | | 7/20/36 | | | | | 464,968 | |
| 348,351 | | Irwin Whole Loan Home Equity Trust, Series 2003-D, Class M1 1 | | | | 1.27 | | | | | 11/25/28 | | | | | 346,695 | |
| 202,656 | | Irwin Whole Loan Home Equity Trust, Series 2005-C, Class 1M1 1 | | | | 0.75 | | | | | 4/25/30 | | | | | 200,785 | |
| 802,071 | | Irwin Whole Loan Home Equity Trust, Series 2005-C, Class 1M2 14 | | | | 5.75 | | | | | 4/25/30 | | | | | 837,177 | |
| 119,155 | | JP Morgan Mortgage Acquisition Corp., Series 2005-OPT2, Class A3 1 | | | | 0.42 | | | | | 12/25/35 | | | | | 118,822 | |
| 405,954 | | Morgan Stanley Home Equity Loan Trust, Series 2005-3, Class M1 1 | | | | 0.63 | | | | | 8/25/35 | | | | | 397,767 | |
| 91,556 | | New Century Home Equity Loan Trust, Series 2003-5, Class AI7 1 | | | | 5.15 | | | | | 11/25/33 | | | | | 94,239 | |
| 102,120 | | Origen Manufactured Housing Contract Trust, Series 2002-A, Class A3 1 | | | | 6.17 | | | | | 5/15/32 | | | | | 103,039 | |
| 65,073 | | Park Place Securities, Inc., Series 2005-WCW1, Class A3D 1 | | | | 0.52 | | | | | 9/25/35 | | | | | 64,725 | |
| 300,000 | | Popular ABS Mortgage Pass-Through Trust Series 2005-1, Class AF5 14 | | | | 5.23 | | | | | 5/25/35 | | | | | 304,327 | |
| 154,304 | | Popular ABS Mortgage Pass-Through Trust, Series 2004-4, Class AF4 1 | | | | 4.63 | | | | | 9/25/34 | | | | | 156,778 | |
| 334,159 | | Popular ABS Mortgage Pass-Through Trust, Series 2004-5, Class AF4 1 | | | | 4.66 | | | | | 12/25/34 | | | | | 339,927 | |
| 59,566 | | Quest Trust, Series 2005-X1, Class M1 1, 4 | | | | 0.68 | | | | | 3/25/35 | | | | | 59,401 | |
| 124,755 | | Residential Asset Mortgage Products Trust, Series 2003-RZ5, Class A7 14 | | | | 4.97 | | | | | 9/25/33 | | | | | 129,414 | |
| 17,827 | | Residential Asset Mortgage Products Trust, Series 2003-RZ3, Class A6 14 | | | | 3.90 | | | | | 3/25/33 | | | | | 17,766 | |
| 146,668 | | Residential Asset Mortgage Products Trust, Series 2004-RS12, Class A16 | | | | 4.55 | | | | | 12/25/34 | | | | | 148,883 | |
| 456,838 | | Residential Asset Securities Corp., Series 2004-KS2, Class AI4 1 | | | | 4.18 | | | | | 12/25/31 | | | | | 464,736 | |
| 55,158 | | Residential Funding Mortgage Securities II Home Loan Trust, Series 1999-HI1, Class A6 14 | | | | 7.58 | | | | | 9/25/29 | | | | | 56,086 | |
| 67,439 | | Residential Funding Mortgage Securities II Home Loan Trust, Series 1999-HI8, Class AI7 14 | | | | 8.47 | | | | | 11/25/29 | | | | | 69,434 | |
| 87,054 | | Saxon Asset Securities Trust, Series 2003-1, Class AF7 14 | | | | 4.03 | | | | | 6/25/33 | | | | | 88,297 | |
| 95,423 | | Structured Asset Investment Loan Trust, Series 2005-4, Class M1 1 | | | | 0.78 | | | | | 5/25/35 | | | | | 94,979 | |
| 191,421 | | Vanderbilt Mortgage Finance, Series 2002-B, Class A4 | | | | 5.84 | | | | | 2/7/26 | | | | | 195,509 | |
| 89,086 | | Wells Fargo Home Equity Asset-Backed Securities Trust, Series 2004-2, Class AI6 1 | | | | 5.00 | | | | | 10/25/34 | | | | | 90,630 | |
| | | | | | | | | | | | | | | | | |
| | | | | | | | | | | | | | | | 8,995,651 | |
| | | | | | | | | | | | | | | | | |
Total Asset-Backed Securities
(cost: $9,267,396) | | | | 9,268,469 |
| | | | | | | | | | | | | | | | | |
See accompanying notes to financial statements.
| | |
12 | | SIT MUTUAL FUNDS SEMI-ANNUAL REPORT |
| | | | | | | | | | | | | | | | | |
| | | | |
| Principal | | | | Coupon | | Maturity | | Fair |
| Amount ($) | | Name of Issuer | | Rate (%) | | Date | | Value ($) |
Collateralized Mortgage Obligations - 9.0% | | | | | | | | | | | |
Agency - 6.0% | | | | | | | | | | | |
| 349,720 | | FHLMC REMICS, Series 2631, Class LC | | | | 4.50 | | | | | 6/15/18 | | | | | 368,381 | |
| 115,757 | | FHLMC REMICS, Series 3634, Class EA | | | | 4.00 | | | | | 11/15/23 | | | | | 119,054 | |
| 208,975 | | FHLMC REMICS, Series 3711, Class AG | | | | 3.00 | | | | | 8/15/23 | | | | | 213,245 | |
| 187,504 | | FNMA REMICS, Series 2001-53, Class GB | | | | 5.00 | | | | | 9/25/16 | | | | | 192,809 | |
| 242,053 | | FNMA REMICS, Series 2002-94, Class HQ | | | | 4.50 | | | | | 1/25/18 | | | | | 254,194 | |
| 290,945 | | FNMA REMICS, Series 2003-52, Class NA | | | | 4.00 | | | | | 6/25/23 | | | | | 309,913 | |
| 306,868 | | FNMA REMICS, Series 2004-101, Class BH | | | | 5.00 | | | | | 1/25/20 | | | | | 325,365 | |
| 316,959 | | FNMA REMICS, Series 2005-24, Class A | | | | 4.50 | | | | | 7/25/32 | | | | | 324,781 | |
| 60,961 | | FNMA REMICS, Series 2007-100, Class ND | | | | 5.75 | | | | | 10/25/35 | | | | | 63,220 | |
| 71,646 | | FNMA REMICS, Series 2007-79, Class PD | | | | 5.00 | | | | | 1/25/34 | | | | | 72,278 | |
| 328,903 | | FNMA REMICS, Series 2009-70, Class A1 | | | | 4.00 | | | | | 8/25/19 | | | | | 343,503 | |
| 229,133 | | FNMA REMICS, Series 2009-76, Class MA | | | | 4.00 | | | | | 9/25/24 | | | | | 238,451 | |
| 362,122 | | FNMA REMICS, Series 2009-88, Class DA | | | | 4.50 | | | | | 10/25/20 | | | | | 382,479 | |
| 130,536 | | FNMA REMICS, Series 2012-19, Class GH | | | | 3.00 | | | | | 11/25/30 | | | | | 136,128 | |
| 359,864 | | GNMA, Series 2007-48, Class FM 1 | | | | 0.43 | | | | | 4/20/37 | | | | | 359,931 | |
| 273,639 | | GNMA, Series 2009-10, Class PA | | | | 4.50 | | | | | 12/20/38 | | | | | 291,213 | |
| 111,326 | | GNMA, Series 2010-108, Class BH | | | | 2.25 | | | | | 12/20/36 | | | | | 113,207 | |
| 331,947 | | Vendee Mortgage Trust, Series 1993-1, Class ZB | | | | 7.25 | | | | | 2/15/23 | | | | | 387,852 | |
| | | | | | | | | | | | | | | | | |
| | | | | | | | | | | | | | | | 4,496,004 | |
| | | | | | | | | | | | | | | | | |
Non-Agency - 3.0% | | | | | | | | | | | | | | | |
| 69,966 | | Alternative Loan Trust, Series 2003-20CB, Class 1A2 | | | | 5.50 | | | | | 10/25/33 | | | | | 71,753 | |
| 138,675 | | American Home Mortgage Investment Trust, Series 2004-3, Class 6A4 14 | | | | 5.01 | | | | | 10/25/34 | | | | | 142,823 | |
| 79,273 | | Banc of America Mortgage Trust, Series 2004-3, Class 1A26 | | | | 5.50 | | | | | 4/25/34 | | | | | 80,596 | |
| 562,387 | | Citicorp Mortgage Securities, Inc., Series 2004-5, Class 1A27 | | | | 5.50 | | | | | 8/25/34 | | | | | 564,936 | |
| 117,152 | | Master Asset Securitization Trust, Series 2003-4, Class CA1 | | | | 8.00 | | | | | 5/25/18 | | | | | 123,365 | |
| 102,855 | | MASTR Alternative Loan Trust, Series 2003-4, Class 2A1 | | | | 6.25 | | | | | 6/25/33 | | | | | 107,417 | |
| 102,207 | | RAAC Trust, Series 2004-SP3, Class AI5 1 | | | | 4.89 | | | | | 12/25/32 | | | | | 103,375 | |
| 182,152 | | Residential Asset Securitization Trust, Series 2003-A14, Class A1 | | | | 4.75 | | | | | 2/25/19 | | | | | 186,742 | |
| 90,279 | | Residential Funding Mortgage Securities I Trust, Series 2003-S13, Class A3 | | | | 5.50 | | | | | 6/25/33 | | | | | 90,515 | |
| 372,336 | | Sequoia Mortgage Trust, Series 2012-1, Class 2A1 1 | | | | 3.47 | | | | | 1/25/42 | | | | | 372,333 | |
| 97,092 | | Structured Asset Sec Corp. Mortgage Pass Through Certificates, Series 2003-16, Class A2 | | | | 4.75 | | | | | 6/25/33 | | | | | 97,730 | |
| 196,394 | | WaMu Mortgage Pass Through Certificates, Series 2004-CB2, Class 7A | | | | 5.50 | | | | | 8/25/19 | | | | | 203,861 | |
| 130,494 | | Wells Fargo Mortgage Backed Securities Trust, Series 2004-C, Class A1 1 | | | | 4.97 | | | | | 4/25/34 | | | | | 132,576 | |
| | | | | | | | | | | | | | | | | |
| | | | | | | | | | | | | | | | 2,278,022 | |
| | | | | | | | | | | | | | | | | |
Total Collateralized Mortgage Obligations
(cost: $6,774,705) | | | | | | | | | | | | | | 6,774,026 | |
| | | | | | | | | | | | | | | | | |
| | | |
| Corporate Bonds - 26.0% | | | | | | |
| 90,000 | | Alterra USA Holdings, Ltd. 4 | | | | 7.20 | | | | | 4/14/17 | | | | | 92,986 | |
| 100,000 | | Apple, Inc. 1 | | | | 0.52 | | | | | 5/3/18 | | | | | 99,595 | |
| 500,000 | | Bank of Montreal 1 | | | | 0.79 | | | | | 7/15/16 | | | | | 501,934 | |
| 500,000 | | Bank of Nova Scotia 1 | | | | 0.79 | | | | | 7/15/16 | | | | | 501,796 | |
| 600,000 | | Bank of Oklahoma 1 | | | | 0.95 | | | | | 5/15/17 | | | | | 586,500 | |
| 50,000 | | Chittenden Corp. 1 | | | | 0.95 | | | | | 2/14/17 | | | | | 48,993 | |
| 400,000 | | Citigroup, Inc. 14 | | | | 4.00 | | | | | 10/26/22 | | | | | 408,485 | |
| 300,000 | | Comerica Bank | | | | 8.38 | | | | | 7/15/24 | | | | | 316,905 | |
| 400,000 | | Commonwealth Edison Co. | | | | 1.95 | | | | | 9/1/16 | | | | | 409,090 | |
| 642,249 | | Continental Airlines 2009-1 Pass Through Trust | | | | 9.00 | | | | | 7/8/16 | | | | | 733,770 | |
| 300,000 | | Copano Energy LLC | | | | 7.13 | | | | | 4/1/21 | | | | | 343,499 | |
See accompanying notes to financial statements.
SCHEDULE OF INVESTMENTS (Unaudited)
September 30, 2013
Sit Quality Income Fund (Continued)
| | | | | | | | | | | | | | |
| | |
| | | | |
Principal
Amount ($) | | | Name of Issuer | | Coupon
Rate (%) | | Maturity
Date | | | Fair Value ($) | |
| | |
| 800,000 | | | Duke Energy Corp. 1 | | 0.95 | | | 6/15/20 | | | | 789,233 | |
| | 500,000 | | | Duke Energy Indiana, Inc. 1 | | 0.62 | | | 7/11/16 | | | | 501,102 | |
| | 100,000 | | | Entergy Arkansas, Inc. | | 5.90 | | | 6/1/33 | | | | 100,322 | |
| | 250,000 | | | Fidelity National Information Services, Inc. | | 7.88 | | | 7/15/20 | | | | 276,269 | |
| | 650,000 | | | Fifth Third Bancorp 1 | | 0.67 | | | 12/20/16 | | | | 638,428 | |
| | 500,000 | | | General Electric Capital Corp. 1 | | 0.92 | | | 7/12/16 | | | | 501,786 | |
| | 357,105 | | | Great River Energy 4 | | 5.83 | | | 7/1/17 | | | | 381,866 | |
| | 300,000 | | | Home Depot, Inc. | | 5.40 | | | 3/1/16 | | | | 332,782 | |
| | 1,500,000 | | | HSBC USA Capital Trust III | | 7.75 | | | 11/15/26 | | | | 1,524,600 | |
| | 600,000 | | | Macy’s Retail Holdings, Inc. | | 8.13 | | | 8/15/35 | | | | 664,358 | |
| | 880,000 | | | Manufacturers & Traders Trust Co. 1 | | 5.59 | | | 12/28/20 | | | | 888,592 | |
| | 974,342 | | | Northwest Airlines 1999-2 Class A Pass Through Trust | | 7.58 | | | 3/1/19 | | | | 1,096,135 | |
| | 1,000,000 | | | Pacific Life Global Funding 1, 4 | | 3.93 | | | 2/6/16 | | | | 1,037,050 | |
| | 25,000 | | | PartnerRe Finance A LLC | | 6.88 | | | 6/1/18 | | | | 29,166 | |
| | 500,000 | | | Principal Life Income Funding Trusts 1 | | 3.63 | | | 4/1/16 | | | | 525,290 | |
| | 465,000 | | | Prudential Financial, Inc. 1 | | 4.50 | | | 8/10/18 | | | | 486,483 | |
| | 50,000 | | | Prudential Financial, Inc. | | 4.75 | | | 9/17/15 | | | | 53,648 | |
| | 500,000 | | | Royal Bank of Canada 1 | | 0.71 | | | 9/9/16 | | | | 501,755 | |
| | 850,000 | | | Security Benefit Life Insurance Co. 4 | | 8.75 | | | 5/15/16 | | | | 962,029 | |
| | 400,000 | | | Toronto-Dominion Bank | | 1.50 | | | 9/9/16 | | | | 405,141 | |
| | 519,055 | | | Union Pacific Railroad Co. 1999 Pass Through Trust | | 7.60 | | | 1/2/20 | | | | 610,910 | |
| | 164,350 | | | United Airlines 2009-1 Pass Through Trust | | 10.40 | | | 11/1/16 | | | | 184,171 | |
| | 655,364 | | | United Airlines 2009-2A Pass Through Trust | | 9.75 | | | 1/15/17 | | | | 745,476 | |
| | 700,000 | | | Wachovia Bank NA 1 | | 0.58 | | | 3/15/16 | | | | 695,979 | |
| | 600,000 | | | Whitney National Bank | | 5.88 | | | 4/1/17 | | | | 632,953 | |
| | 300,000 | | | Zions Bancorporation | | 2.75 | | | 5/16/16 | | | | 301,913 | |
| | 750,000 | | | Zions Bancorporation | | 3.05 | | | 2/15/17 | | | | 751,556 | |
| | | | | | | | | | | | | | |
| | | |
| Total Corporate Bonds
(cost: $19,644,042) | | | | | | | | | 19,662,546 | |
| | | | | | | | | | | | | | |
| Mortgage Pass-Through Securities - 7.7% | | | | | | | | | | |
| Federal Home Loan Mortgage Corporation - 4.6% | | | | | | | | | | |
| | 124,083 | | | Freddie Mac | | 3.50 | | | 7/1/26 | | | | 130,773 | |
| | 205,755 | | | Freddie Mac | | 4.50 | | | 1/1/18 | | | | 217,509 | |
| | 210,358 | | | Freddie Mac | | 4.50 | | | 12/1/18 | | | | 222,304 | |
| | 116,747 | | | Freddie Mac | | 4.50 | | | 5/1/19 | | | | 123,419 | |
| | 245,036 | | | Freddie Mac | | 4.50 | | | 6/1/19 | | | | 259,100 | |
| | 195,464 | | | Freddie Mac | | 4.50 | | | 6/1/19 | | | | 206,620 | |
| | 244,508 | | | Freddie Mac | | 4.50 | | | 1/1/21 | | | | 259,031 | |
| | 156,391 | | | Freddie Mac | | 4.50 | | | 12/1/21 | | | | 165,669 | |
| | 214,581 | | | Freddie Mac | | 4.50 | | | 10/1/23 | | | | 228,944 | |
| | 278,188 | | | Freddie Mac | | 4.50 | | | 7/1/26 | | | | 294,547 | |
| | 186,913 | | | Freddie Mac | | 5.00 | | | 3/1/18 | | | | 197,919 | |
| | 159,718 | | | Freddie Mac | | 5.00 | | | 10/1/18 | | | | 169,386 | |
| | 65,419 | | | Freddie Mac | | 5.00 | | | 10/1/25 | | | | 71,355 | |
| | 246,400 | | | Freddie Mac | | 5.50 | | | 9/1/17 | | | | 259,402 | |
| | 254,063 | | | Freddie Mac | | 5.50 | | | 4/1/19 | | | | 268,378 | |
| | 106,011 | | | Freddie Mac | | 5.50 | | | 10/1/19 | | | | 111,767 | |
| | 128,347 | | | Freddie Mac | | 5.50 | | | 10/1/21 | | | | 135,578 | |
| | 126,596 | | | Freddie Mac | | 6.00 | | | 9/1/23 | | | | 138,388 | |
| | | | | | | | | | | | | | |
| | | | |
| | | | | | | | | | | | | 3,460,089 | |
| | | | | | | | | | | | | | |
See accompanying notes to financial statements.
| | |
14 | | SIT MUTUAL FUNDS SEMI-ANNUAL REPORT |
| | | | | | | | | | | | | | |
| | |
Principal Amount ($)/ Contracts | | | Name of Issuer | | Coupon
Rate (%) | | Maturity
Date | | | Fair
Value
($) | |
| | |
| Federal National Mortgage Association - 2.1% | | | | | | | | | | |
| | 318,566 | | | Fannie Mae | | 3.00 | | | 8/1/21 | | | | 333,358 | |
| | 319,188 | | | Fannie Mae | | 3.00 | | | 1/1/22 | | | | 334,025 | |
| | 208,191 | | | Fannie Mae | | 3.50 | | | 5/1/21 | | | | 221,319 | |
| | 186,888 | | | Fannie Mae | | 3.50 | | | 10/1/21 | | | | 198,246 | |
| | 110,064 | | | Fannie Mae | | 4.00 | | | 3/1/26 | | | | 116,764 | |
| | 63,954 | | | Fannie Mae | | 4.00 | | | 10/1/31 | | | | 68,467 | |
| | 206,579 | | | Fannie Mae | | 6.00 | | | 5/1/23 | | | | 225,602 | |
| | 69,678 | | | Fannie Mae | | 6.50 | | | 2/1/19 | | | | 77,082 | |
| | | | | | | | | | | | | | |
| | | | |
| | | | | | | | | | | | | 1,574,863 | |
| | | | | | | | | | | | | | |
| | | |
| Government National Mortgage Association - 1.0% | | | | | | | | | | |
| | 138,812 | | | Ginnie Mae 1 | | 1.63 | | | 4/20/33 | | | | 144,634 | |
| | 95,105 | | | Ginnie Mae 1 | | 1.63 | | | 10/20/34 | | | | 98,844 | |
| | 78,973 | | | Ginnie Mae 1 | | 3.50 | | | 4/20/42 | | | | 82,622 | |
| | 293,817 | | | Ginnie Mae | | 5.00 | | | 9/15/24 | | | | 312,335 | |
| | 104,228 | | | Ginnie Mae | | 5.00 | | | 12/15/25 | | | | 110,797 | |
| | | | | | | | | | | | | | |
| | | | |
| | | | | | | | | | | | | 749,232 | |
| | | | | | | | | | | | | | |
| | | |
| Total Mortgage Pass-Through Securities
(cost: $5,780,781) | | | | | | | | | 5,784,184 | |
| | | | | | | | | | | | | | |
| Taxable Municipal Bonds - 5.6% | | | | | | | | | | |
| | 1,000,000 | | | Academica Charter Schools 4 | | 7.93 | | | 8/15/19 | | | | 1,005,600 | |
| | 100,000 | | | Brewer High School District | | 1.58 | | | 11/1/16 | | | | 100,402 | |
| | 530,000 | | | City of Cleveland OH Airport System Revenue | | 5.24 | | | 1/1/17 | | | | 542,651 | |
| | 400,000 | | | Memphis Health Educational & Housing Facility Board | | 4.45 | | | 2/1/18 | | | | 425,116 | |
| | 250,000 | | | New Jersey Economic Development Authority | | 7.55 | | | 12/20/36 | | | | 253,380 | |
| | 295,000 | | | Skagit County Public Hospital District No 1 | | 2.00 | | | 12/1/14 | | | | 292,717 | |
| | 1,200,000 | | | Skyway Concession Co. LLC 1, 4 | | 0.56 | | | 6/30/17 | | | | 1,077,000 | |
| | 305,000 | | | South Bend Redevelopment District | | 4.65 | | | 7/15/16 | | | | 316,950 | |
| | 200,000 | | | Texas Department of Housing & Community Affairs | | 4.80 | | | 7/1/19 | | | | 206,500 | |
| | | | | | | | | | | | | | |
| | | |
| Total Taxable Municipal Bonds
(cost: $4,237,921) | | | | | | | | | 4,220,316 | |
| | | | | | | | | | | | | | |
| U.S. Treasury / Federal Agency Securities - 37.1% | | | | | | | | | | |
| Federal Farm Credit Banks - 0.3% | | | | | | | | | | |
| | 100,000 | | | Federal Farm Credit Banks 1 | | 0.14 | | | 5/12/14 | | | | 100,034 | |
| | 100,000 | | | Federal Farm Credit Banks 1 | | 0.20 | | | 11/3/14 | | | | 100,083 | |
| | | | | | | | | | | | | | |
| | | | |
| | | | | | | | | | | | | 200,117 | |
| | | | | | | | | | | | | | |
| | | |
| Other Federal Agency Securities - 2.6% | | | | | | | | | | |
| | 250,000 | | | Ally Bank 12 | | 0.60 | | | 6/29/15 | | | | 248,762 | |
| | 150,000 | | | Bank of China, Ltd. 12 | | 0.50 | | | 7/17/14 | | | | 149,863 | |
| | 100,000 | | | Bank of China, Ltd. 12 | | 0.60 | | | 4/17/15 | | | | 99,683 | |
| | 250,000 | | | Bank of India 12 | | 0.50 | | | 6/25/14 | | | | 249,828 | |
| | 250,000 | | | Beal Bank USA 12 | | 0.45 | | | 7/9/14 | | | | 249,698 | |
| | 150,000 | | | Discover Bank 12 | | 0.50 | | | 5/22/15 | | | | 149,401 | |
| | 100,000 | | | Discover Bank 12 | | 0.55 | | | 2/27/15 | | | | 99,830 | |
| | 150,000 | | | Fifth Third Bank 12 | | 0.40 | | | 5/22/14 | | | | 149,844 | |
| | 250,000 | | | Firstbank Puerto Rico 12 | | 0.80 | | | 9/21/15 | | | | 249,126 | |
See accompanying notes to financial statements.
SCHEDULE OF INVESTMENTS (Unaudited)
September 30, 2013
Sit Quality Income Fund (Continued)
| | | | | | | | | | | | | | |
| | |
Principal
Amount ($)/
Contracts | | | Name of Issuer | | Coupon
Rate (%) | | Maturity
Date | | | Fair Value ($) | |
| | |
| | | | |
| | 100,000 | | | Goldman Sachs Bank 12 | | 0.70 | | | 2/6/15 | | | | 99,906 | |
| | 100,000 | | | Peoples Bank of The Ozarks | | 4.85 | | | 1/23/14 | | | | 101,331 | |
| | 125,000 | | | State Bank of India 12 | | 0.45 | | | 6/24/14 | | | | 124,870 | |
| | | | | | | | | | | | | | |
| | | | | | | | | | | | | 1,972,142 | |
| | | | | | | | | | | | | | |
| | | |
| U.S. Treasury Note - 34.2% | | | | | | | | | | |
| | 5,025,000 | | | U.S. Treasury Note | | 0.13 | | | 12/31/13 | | | | 5,025,980 | |
| | 2,250,000 | | | U.S. Treasury Note | | 0.25 | | | 9/15/14 | | | | 2,252,988 | |
| | 5,435,000 | | | U.S. Treasury Note | | 0.25 | | | 3/31/15 | | | | 5,437,549 | |
| | 1,000,000 | | | U.S. Treasury Note | | 0.25 | | | 9/15/15 | | | | 998,594 | |
| | 3,920,000 | | | U.S. Treasury Note | | 0.25 | | | 12/15/15 | | | | 3,908,667 | |
| | 8,150,000 | | | U.S. Treasury Note | | 0.63 | | | 7/15/14 | | | | 8,183,749 | |
| | | | | | | | | | | | | | |
| | | | | | | | | | | | | 25,807,527 | |
| | | | | | | | | | | | | | |
| | | |
| Total U.S. Treasury / Federal Agency Securities
(cost: $27,965,624) | | | | | | | | | 27,979,786 | |
| | | | | | | | | | | | | | |
| Total Investments in Securities - 97.7%
(cost: $73,670,469) | | | | | | | | | 73,689,327 | |
| | | | | | | | | | | | | | |
| Call Options Written 10 - (0.1%) | | | | | | | | | | |
| (75) U.S. Treasury 2 Year Future | | | | | | | | | | |
| | | | Call Options: $109.75 strike | | | | | | | | | | |
| | | | December 2013 expiration | | | | | | | | | (60,938 | ) |
| | | | | | | | | | | | | | |
| Total Call Options Written
(premiums received: $11,345) | | | | | | | (60,938 | ) |
| | | | | | | | | | | | | | |
| | Other Assets and Liabilities, net - 2.4% | | | | | | | 1,810,921 | |
| | | | | | | | | | | | | | |
| Total Net Assets - 100.0% | | | | | | $ | 75,439,310 | |
| | | | | | | | | | | | | | |
| 1 | Variable rate security. Rate disclosed is as of September 30, 2013. |
| 4 | 144A Restricted Security. The total value of such securities as of September 30, 2013 was $4,615,932 and represented 6.1% of net assets. These securities been determined to be liquid by the Adviser in accordance with guidelines established by the Board of Directors. |
| 12 | Certificate of Deposit. Investments up to $250,000 are insured by the Federal Deposit Insurance Corporation. |
| 10 | The amount of $500,000 in cash was segregated with the broker to cover margin requirements for derivative transactions as of September 30, 2013. |
| 14 | Step Coupon: A bond that pays an initial coupon rate for the first period and then a higher coupon rate for the following periods. Rate disclosed is as of September 30, 2013. |
Numeric footnotes not disclosed are not applicable to this Schedule of Investments.
Short futures contracts outstanding as of September 30, 2013 were as follows:
| | | | | | | | |
| | | | | Expiration | | Notional | | Unrealized |
Contracts | | Type | | Date | | Amount | | (Depreciation) |
195 | | U.S. Treasury 2 Year Futures 10 | | December 2013 | | $42,951,797 | | $(124,375) |
See accompanying notes to financial statements.
| | |
16 | | SIT MUTUAL FUNDS SEMI-ANNUAL REPORT |
A summary of the levels for the Fund’s investments as of September 30, 2013 is as follows (See Note 2 -significant accounting policies in the notes to the financial statements):
| | | | | | | | | | | | | | |
| | | Investment in Securities | |
| | | | |
| | | Level 1 Quoted Price ($) | | | Level 2 Other Significant
Observable Inputs ($) | | | Level 3 Other Significant
Observable Inputs ($) | | Total ($) | |
| | | | |
Assets | | | | | | | | | | | | | | |
Asset-Backed Securities | | | — | | | | 9,268,469 | | | — | | | 9,268,469 | |
Collateralized Mortgage Obligations | | | — | | | | 6,774,026 | | | — | | | 6,774,026 | |
Corporate Bonds | | | — | | | | 19,662,546 | | | — | | | 19,662,546 | |
Mortgage Pass-Through Securities | | | — | | | | 5,784,184 | | | — | | | 5,784,184 | |
Taxable Municipal Bonds | | | — | | | | 4,220,316 | | | — | | | 4,220,316 | |
U.S. Treasury / Federal Agency Securities | | | — | | | | 27,979,786 | | | — | | | 27,979,786 | |
| | | | |
| | | — | | | | 73,689,327 �� | | | — | | | 73,689,327 | |
| | | | |
Liabilities | | | | | | | | | | | | | | |
Call Options Written | | | (60,938) | | | | — | | | — | | | (60,938) | |
Futures | | | (124,375) | | | | — | | | — | | | (124,375) | |
| | | | |
| | | (185,313) | | | | — | | | — | | | (185,313) | |
| | | | |
For the reporting period, there were no transfers between levels 1, 2 and 3.
See accompanying notes to financial statements.
OBJECTIVE & STRATEGY
The objective of the Tax-Free Income Fund is to provide a high level of current income that is exempt from federal income tax, consistent with preservation of capital, by investing primarily in investment-grade municipal securities.
Such municipal securities generate interest income that is exempt from both federal regular income tax and federal alternative minimum tax. During normal market conditions, the Fund invests 100% of its net assets in such tax-exempt municipal securities.
The Sit Tax-Free Income Fund provided a total return of -6.01% for the 6-month period ended September 30, 2013, compared with a total return of -0.86% for the Barclays Capital 5-Year Municipal Bond Index. As of September 30, 2013, the Fund’s 30-day SEC yield was 4.64% and its 12-month distribution rate was 4.14%.
Tax-exempt municipal bond yields increased markedly during the 6-month period, resulting in poor returns for the asset class. The tax-exempt yield curve steepened as long-term and intermediate-term bond yields increased markedly, while shorter-term yields had little or no increase. Credit spreads generally widened during the period, particularly for healthcare revenue bonds and high yield credits. There were several higher profile credit events during the period that negatively impacted the municipal market and credit spreads in general. These events include the attempted bankruptcy filing and later payment default by Detroit, a multi-notch downgrade for the City of Chicago due to the State of Illinois’ continued inability to resolve pension problems, and credit concerns regarding Puerto Rico government and utility credits. In addition or as a result, mutual fund flows were negative for much of the period before at least temporarily stabilizing in late September. Combined, these factors made the weakness in the tax-exempt market very broad-based.
The Fund’s underperformance during this period was due to duration and industry positioning. The Fund suffered from its longer duration versus the benchmark. The shortest portions of the portfolio outperformed the benchmark return; however, the nearly 85 percent of the portfolio invested in bonds with durations of 5-years or longer underperformed the benchmark return. Most of the industry sectors in the portfolio underperformed the benchmark return during the period. The only industry to outperform the benchmark in absolute terms during the period was public facilities revenue bonds. In addition, both lease rental and other revenue bonds outperformed the comparable industries within the benchmark in relative terms. Alternatively, the largest four industries in the portfolio – single family mortgage revenue, multi-family mortgage revenue, other revenue, and education/student loan revenue – had returns that ranged from -2.9% to -8.6% during the period. The Funds’ average credit quality was stable at A- during the period.
HYPOTHETICAL GROWTH OF $10,000
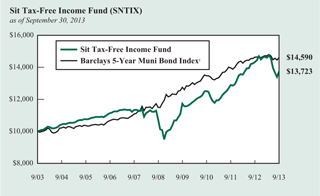
The chart above illustrates the total value of a hypothetical $10,000 investment in the Fund over the past 10 years (or for the life of the Fund if shorter) as compared to the performance of the Barclays 5-Year Municipal Bond Index. Past performance does not guarantee future results. Returns include the reinvestment of distributions. The chart does not reflect the deduction of taxes that a shareholder would pay on Fund distributions or the redemption of Fund shares.
1 The Barclays 5-Year Municipal Bond Index is the 5 year (4-6) component of the Municipal Bond Index, an unmanaged, rules-based, market-value-weighted index for the long-term tax-exempt bond market. The index includes bonds with a minimum credit rating of BBB. The returns include the reinvestment of income and do not include any transaction costs, management fees or other costs. It is not possible to invest directly in an index. This is the Fund’s primary index.
The Fund maintains its duration longer than its benchmark, with significant weightings in intermediate and longer-term bonds. However, the Fund may modestly shorten its duration over the next six months to a year. The Fund continues to possess a substantial income advantage over the benchmark. Furthermore, tax-exempt municipals remain cheap when compared to comparable maturity U.S. Treasury bonds. Given the steep tax-exempt yield curve and modestly widened credit spreads, we believe the Fund is attractively positioned for the current environment. As always, our strategy continues to emphasize income, which we believe is the primary driver of return over the long run. Diversification remains a key factor in managing risk.
Michael C. Brilley
Debra A. Sit, CFA
Paul J. Jungquist, CFA
Senior Portfolio Managers
| | |
18 | | SIT MUTUAL FUNDS SEMI-ANNUAL REPORT |
COMPARATIVE RATES OF RETURNS
as of September 30, 2013
| | | | | | |
| | | Sit | | | | Lipper |
| | | Tax-Free | | Barclays | | General |
| | | Income | | 5-Year Muni | | Muni. Bond |
| | | Fund | | Bond Index1 | | Fund Index2 |
|
Six Months | | -6.01% | | -0.86% | | n/a |
One Year | | -4.25% | | -0.24% | | -3.12% |
Five Years | | 5.03 | | 4.90 | | 6.03 |
Ten Years | | 3.22 | | 3.85 | | 4.04 |
Since Inception (9/29/88) | | 5.10 | | 5.49 | | 5.72 |
|
Performance figures are historical and do not guarantee future results. Investment returns and principal value will vary, and you may have a gain or loss when you sell shares. Current performance may be lower or higher than the performance data quoted. Contact the Fund for performance data current to the most recent month-end. Returns include changes in share price as well as reinvestment of all dividends and capital gains and all fee waivers. Without the fee waivers total return and yield figures would have been lower. Returns do not reflect the deduction of taxes that a shareholder would pay on Fund distributions or the redemption of Fund shares. Management fees and administrative expenses are included in the Fund’s performance. Returns for periods greater than one year are compounded average annual rates of return.
1 The Barclays 5-Year Municipal Bond Index is the 5 year (4-6) component of the Municipal Bond Index, an unmanaged, rules-based, market-value-weighted index for the long-term tax-exempt bond market. The index includes bonds with a minimum credit rating of BBB. The returns include the reinvestment of income and do not include any transaction costs, management fees or other costs. It is not possible to invest directly in an index.
2 The Lipper returns are obtained from Lipper Analytical Services, Inc., a large independent evaluator of mutual funds.
FUND DIVERSIFICATION
| | | | |
| |
Single Family Mortgage | | | 20.5 | % |
Multifamily Mortgage | | | 15.8 | % |
Other Revenue | | | 14.1 | % |
Education/Student Loan | | | 11.1 | % |
General Obligation | | | 6.6 | % |
Closed-End Mutual Funds | | | 6.3 | % |
Hospital/Health Care | | | 6.1 | % |
Insured | | | 5.9 | % |
Sectors less than 5% | | | 10.2 | % |
Cash & Other Net Assets | | | 3.4 | % |
Based on total net assets as of September 30, 2013. Subject to change.
PORTFOLIO SUMMARY
| | |
| |
Net Asset Value 9/30/13: | | $8.80 Per Share |
Net Asset Value 3/31/13: | | $9.57 Per Share |
Total Net Assets: | | $146.8 Million |
30-day SEC Yield 3: | | 4.64% |
Tax Equivalent Yield 4: | | 8.20% |
12-month Distribution Rate 3: | | 4.14% |
Average Maturity: | | 17.8 Years |
Effective Duration 5: | | 7.3 Years |
3 The SEC Yield reflects the rate at which the Fund is earning income on its current portfolio of securities, while the distribution rate reflects the Fund’s past dividends paid to shareholders based on the net investment income distributed and the average NAV during the past 12 months. Accordingly, the Fund’s SEC yield and distribution rate may differ.
4 The tax-equivalent yield is based on an assumed tax rate of 43.4%.
5 Duration is a measure of estimated price sensitivity relative to changes in interest rates. Portfolios with longer durations are typically more sensitive to changes in interest rates. For example, if interest rates rise by 1%, the fair value of a security with an effective duration of 5 years would decrease by 5%, with all other factors being constant. The correlation between duration and price sensitivity is greater for securities rated investment-grade than it is for securities rated below investment-grade. Duration estimates are based on assumptions by the Adviser and are subject to a number of limitations. Effective duration is calculated based on historical price changes of securities held by the Fund, and therefore is a more accurate estimate of price sensitivity provided interest rates remain within their historical range.
QUALITY RATINGS (% of Total Net Assets)
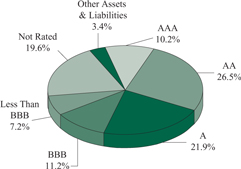
Lower of Moody’s, S&P, Fitch or Duff & Phelps ratings used.
Adviser’s Assessment of Non-Rated Securities:
| | | | |
AAA | | | 0.0% | |
AA | | | 1.6 | |
A | | | 0.2 | |
BBB | | | 3.2 | |
BB | | | 9.0 | |
<BB | | | 5.6 | |
| | | | |
Total | | | 19.6% | |
SCHEDULE OF INVESTMENTS (Unaudited)
September 30, 2013
Sit Tax-Free Income Fund
| | | | | | | | | | | | | | |
Principal Amount ($) | | | Name of Issuer | | Coupon
Rate (%) | | Maturity
Date | | | Fair Value ($) | |
| | |
| Municipal Bonds - 90.3% | | | | | | | | | | |
| | | |
| | Alabama - 0.5% | | | | | | | | | | |
| | 785,000 | | | Pell City Special Care Facs. Finance Rev. | | 5.00 | | | 12/1/39 | | | | 748,607 | |
| | | | | | | | | | | | | | |
| | | |
| | Alaska - 1.0% | | | | | | | | | | |
| | 415,000 | | | AK Hsg. Finance Corp. Mtg. Rev. | | 4.25 | | | 12/1/40 | | | | 378,185 | |
| | 500,000 | | | AK Hsg. Finance Corp. Mtg. Rev. (GO of Corp. Insured) | | 4.50 | | | 12/1/35 | | | | 477,010 | |
| | 250,000 | | | AK Industrial Dev. & Export Auth. Rev. (Boys & Girls Home) 2, 5, 10 | | 5.50 | | | N/A | | | | 120,450 | |
| | 500,000 | | | Koyukuk Health Facility Rev. (Tanana Chief’s Conf. Health Care) | | 7.00 | | | 10/1/23 | | | | 530,830 | |
| | | | | | | | | | | | | | |
| | | | |
| | | | | | | | | | | | | 1,506,475 | |
| | | | | | | | | | | | | | |
| | | |
| | Arizona - 2.1% | | | | | | | | | | |
| | 941,313 | | | AZ Health Facs. Auth. Rev. (New Arizona Family Proj.) | | 5.25 | | | 7/1/27 | | | | 929,443 | |
| | 250,000 | | | Festival Ranch Community Facs. District G.O. | | 6.25 | | | 7/15/24 | | | | 262,275 | |
| | 175,000 | | | Flagstaff Industrial Dev. Auth. Rev. (Sr. Living Community Proj.) | | 5.50 | | | 7/1/22 | | | | 167,256 | |
| | 5,000 | | | Pima Co. Industrial Dev. Auth. Education Rev. (AZ Charter Schools Proj.) | | 6.70 | | | 7/1/21 | | | | 5,006 | |
| | 270,000 | | | Pima Co. Industrial Dev. Auth. Education Rev. (Choice Education & Dev. Corp. Proj.) | | 6.00 | | | 6/1/16 | | | | 274,960 | |
| | 500,000 | | | Pima Co. Industrial Dev. Auth. Education Rev. (Coral Academy Science Proj.) | | 6.38 | | | 12/1/18 | | | | 518,045 | |
| | 400,000 | | | Pima Co. Industrial Dev. Auth. Education Rev. (Tucson Country Day School Proj.) | | 5.00 | | | 6/1/22 | | | | 385,792 | |
| | 500,000 | | | Quechan Indian Tribe of Fort Yuma Rev. (Tribal Economic Dev.) | | 9.75 | | | 5/1/25 | | | | 530,295 | |
| | | | | | | | | | | | | | |
| | | | |
| | | | | | | | | | | | | 3,073,072 | |
| | | | | | | | | | | | | | |
| | | |
| | Arkansas - 0.3% | | | | | | | | | | |
| | 460,000 | | | Rogers Rev. (Sales & Use Tax) | | 4.13 | | | 11/1/31 | | | | 457,953 | |
| | | | | | | | | | | | | | |
| | | |
| | California - 11.6% | | | | | | | | | | |
| | 500,000 | | | Agua Caliente Band of Cahuilla Indians Rev. 4 | | 6.00 | | | 7/1/18 | | | | 485,100 | |
| | 250,000 | | | CA Finance Auth. Rev. (Kern Regional Center Proj.) 9 | | 6.88 | | | 5/1/25 | | | | 280,382 | |
| | 495,000 | | | CA Govt. Finance Auth. Lease Rev. (Placer Co. Transportation Proj.) | | 6.00 | | | 12/1/28 | | | | 495,802 | |
| | 240,000 | | | CA Hsg. Finance Agy. Home Mtg. Rev. | | 5.20 | | | 8/1/28 | | | | 234,646 | |
| | 110,000 | | | CA Hsg. Finance Agy. Home Mtg. Rev. | | 5.50 | | | 8/1/38 | | | | 111,678 | |
| | 500,000 | | | CA Infrastructure & Economic Dev. Bank Rev. | | 6.00 | | | 2/1/30 | | | | 522,790 | |
| | 500,000 | | | CA School Facs. Finance Auth. Rev. (Azusa Unified School District) (AGM Insured) 6 | | 6.00 | | | 8/1/29 | | | | 457,065 | |
| | 250,000 | | | CA Statewide Communities Dev Auth. Rev. (Lancer Plaza Proj.) | | 5.13 | | | 11/1/23 | | | | 234,150 | |
| | 500,000 | | | CA Statewide Communities Dev Auth. Rev. (Provident Group - Pomona Property) | | 5.60 | | | 1/15/36 | | | | 428,525 | |
| | 200,000 | | | CA Statewide Communities Dev. Auth. Rev. (Sunedison Huntington Beach Solar Proj.) | | 6.00 | | | 1/1/21 | | | | 202,002 | |
| | 400,000 | | | CA Statewide Communities Dev. Auth. Rev. C.O.P. (Internext Group) | | 5.38 | | | 4/1/30 | | | | 400,116 | |
| | 400,000 | | | Carlsbad Unified School District G.O. Capital Appreciation 6 | | 6.13 | | | 8/1/31 | | | | 287,136 | |
| | 500,000 | | | Clovis Unified School District G.O. 6 | | 6.12 | | | 8/1/30 | | | | 191,175 | |
| | 1,000,000 | | | Colton Joint Unified School District G.O. (AGM Insured) 6 | | 5.80 | | | 8/1/35 | | | | 645,770 | |
| | 250,000 | | | Eden Township Hospital District C.O.P. | | 6.00 | | | 6/1/25 | | | | 263,745 | |
| | 500,000 | | | Encinitas Union School District G.O. Capital Appreciation 6 | | 6.75 | | | 8/1/35 | | | | 343,940 | |
| | 1,000,000 | | | Glendale Unified School District G.O. Capital Appreciation 6 | | 6.22 | | | 9/1/27 | | | | 480,040 | |
| | 500,000 | | | Hartnell Community College G.O. 6 | | 7.00 | | | 8/1/34 | | | | 336,895 | |
| | 1,045,000 | | | Hayward Unified School District G.O. Capital Appreciation (AGM Insured) 6 | | 5.48 | | | 8/1/33 | | | | 340,743 | |
| | 1,250,000 | | | Healdsburg Unified School District G.O. 6 | | 4.60 | | | 8/1/37 | | | | 671,712 | |
| | 250,000 | | | Imperial Community College District G.O. Capital Appreciation (AGM Insured) 6 | | 6.75 | | | 8/1/40 | | | | 239,828 | |
| | 1,100,000 | | | Los Alamitos Unified School District Capital Appreciation C.O.P. 6 | | 5.95 | | | 8/1/34 | | | | 599,786 | |
| | 500,000 | | | Los Alamitos Unified School District G.O. 6 | | 2.87 | | | 8/1/40 | | | | 247,095 | |
| | 250,000 | | | Marina Coast Water District Rev. | | 5.00 | | | 6/1/20 | | | | 273,782 | |
| | 250,000 | | | Martinez Unified School District G.O. 6 | | 6.13 | | | 8/1/35 | | | | 258,968 | |
| | 250,000 | | | Northern Inyo Co. Local Hospital District Rev. | | 5.00 | | | 12/1/29 | | | | 235,940 | |
| | 1,000,000 | | | Oak Grove School District G.O. 6 | | 6.96 | | | 6/1/41 | | | | 164,670 | |
| | 2,100,000 | | | Pittsburg CA Unified School District Rev. Capital Appreciation (AGM GO of District Insured) 6 | | 7.12 | | | 9/1/29 | | | | 824,145 | |
| | 500,000 | | | Placentia-Yorba Linda Unified School District C.O.P. Capital Appreciation (AGM Insured) 6 | | 6.25 | | | 10/1/28 | | | | 461,280 | |
See accompanying notes to financial statements.
| | |
20 | | SIT MUTUAL FUNDS SEMI-ANNUAL REPORT |
| | | | | | | | | | | | | | |
Principal Amount ($) | | | Name of Issuer | | Coupon
Rate (%) | | Maturity
Date | | | Fair Value ($) | |
| | |
| 600,000 | | | Redondo Beach School District G.O. 6 | | 6.38 | | | 8/1/34 | | | | 555,450 | |
| | 750,000 | | | Reef-Sunset Unified School District 6 | | 4.85 | | | 8/1/38 | | | | 443,775 | |
| | 350,000 | | | Ripon Unified School District G.O. 6 | | 4.50 | | | 8/1/30 | | | | 259,752 | |
| | 1,000,000 | | | Robla School District G.O. (AGM Insured) 6 | | 6.51 | | | 8/1/36 | | | | 270,390 | |
| | 500,000 | | | Sacramento Co. Water Financing Auth. Rev. (NATL-RE FGIC Insured) 1 | | 0.75 | | | 6/1/39 | | | | 371,120 | |
| | 1,000,000 | | | San Bernardino City Unified School District G.O. Capital Appreciation (NATL-RE Insured) 6 | | 4.72 | | | 8/1/29 | | | | 423,330 | |
| | 170,000 | | | San Bernardino Joint Powers Financing Auth. Rev. (City Hall Proj.) (NATL-RE Insured) | | 5.60 | | | 1/1/15 | | | | 165,485 | |
| | 400,000 | | | San Jose Financing Auth. Rev. (Civic Center Garage Proj.) 9 | | 5.00 | | | 6/1/39 | | | | 409,212 | |
| | 250,000 | | | South Bayside Waste Management Auth. Rev. (Shoreway Environmental) | | 6.25 | | | 9/1/29 | | | | 272,775 | |
| | 350,000 | | | Southwest Community Finance Auth. Rev. (Riverside Co. Proj.) 9 | | 6.00 | | | 5/1/24 | | | | 398,083 | |
| | 515,000 | | | Sulphur Springs Union School District C.O.P. Capital Appreciation (AGM Insured) 6 | | 6.50 | | | 12/1/37 | | | | 492,670 | |
| | 500,000 | | | Sutter Butte Flood Agency | | 4.00 | | | 10/1/38 | | | | 428,350 | |
| | 600,000 | | | Tracy Joint Unified School District G.O. Capital Appreciation 6 | | 7.30 | | | 8/1/41 | | | | 291,042 | |
| | 500,000 | | | Tustin Unified School District G.O. Capital Appreciation 6 | | 6.00 | | | 8/1/28 | | | | 373,290 | |
| | 1,000,000 | | | Upland Unified School District G.O. Capital Appreciation 6 | | 2.16 | | | 8/1/41 | | | | 766,680 | |
| | 500,000 | | | Val Verde Unified School District G.O. Capital Appreciation (AGM Insured) 6 | | 6.13 | | | 8/1/34 | | | | 317,085 | |
| | | | | | | | | | | | | | |
| | | | |
| | | | | | | | | | | | | 16,957,395 | |
| | | | | | | | | | | | | | |
| | | |
| | Colorado - 1.8% | | | | | | | | | | |
| | 250,000 | | | CO Education & Cultural Facs. Auth. Rev. (CO Springs Charter Academy Proj.) | | 5.60 | | | 7/1/34 | | | | 245,615 | |
| | 500,000 | | | CO Education & Cultural Facs. Auth. Rev. Ref. (Vail Mountain School Proj.) | | 6.00 | | | 5/1/30 | | | | 506,195 | |
| | 575,000 | | | CO Hsg. Finance Auth. Multifamily Rev. | | 3.90 | | | 10/1/42 | | | | 462,513 | |
| | 345,000 | | | CO Hsg. Finance Auth. Single Family Mtg. Rev. | | 5.50 | | | 11/1/29 | | | | 357,489 | |
| | 625,000 | | | CO Hsg. Finance Auth. Single Family Mtg. Rev. (FHA Insured) | | 5.00 | | | 11/1/34 | | | | 631,344 | |
| | 456,305 | | | Lyons Rev. (Longmont Humane Society Proj.) | | 4.75 | | | 11/30/16 | | | | 438,888 | |
| | | | | | | | | | | | | | |
| | | | |
| | | | | | | | | | | | | 2,642,044 | |
| | | | | | | | | | | | | | |
| | | |
| | Connecticut - 2.5% | | | | | | | | | | |
| | 1,000,000 | | | CT Hsg. Finance Auth. Rev. | | 4.00 | | | 11/15/34 | | | | 896,930 | |
| | 210,000 | | | CT Hsg. Finance Auth. Rev. | | 5.15 | | | 11/15/34 | | | | 214,297 | |
| | 500,000 | | | CT Hsg. Finance Auth. Rev. | | 3.40 | | | 11/15/42 | | | | 379,210 | |
| | 1,000,000 | | | CT Hsg. Finance Auth. Rev. | | 3.65 | | | 11/15/47 | | | | 786,370 | |
| | 500,000 | | | CT Hsg. Finance Auth. Rev. (GO of Auth.) | | 3.75 | | | 11/15/35 | | | | 435,700 | |
| | 500,000 | | | CT Hsg. Finance Auth. Rev. (GO of Auth.) | | 4.75 | | | 11/15/35 | | | | 501,820 | |
| | 425,000 | | | CT Hsg. Finance Auth. Rev. (GO of Auth.) | | 4.90 | | | 11/15/36 | | | | 429,828 | |
| | 37,850 | | | Hamden Facs. Rev. (Whitney Center Proj.) | | 6.13 | | | 1/1/14 | | | | 37,856 | |
| | | | | | | | | | | | | | |
| | | | |
| | | | | | | | | | | | | 3,682,011 | |
| | | | | | | | | | | | | | |
| | | |
| | Delaware - 0.1% | | | | | | | | | | |
| | 310,000 | | | Millsboro Special Obligation Rev. (Plantation Lakes Dev. District) | | 5.45 | | | 7/1/36 | | | | 217,592 | |
| | | | | | | | | | | | | | |
| | | |
| | Florida - 7.8% | | | | | | | | | | |
| | 385,000 | | | Alachua County Health Facs. Auth. Rev. (Oak Hammock University) | | 8.00 | | | 10/1/32 | | | | 429,063 | |
| | 500,000 | | | Alachua County Health Facs. Auth. Rev. (Terraces Bonita Springs District) | | 7.13 | | | 11/15/16 | | | | 503,350 | |
| | 400,000 | | | Bay Co. Educational Facs. Rev. (Bay Haven Charter Academy, Inc.) | | 5.00 | | | 9/1/33 | | | | 351,316 | |
| | 500,000 | | | Bay Co. Educational Facs. Rev. (Bay Haven Charter) | | 5.25 | | | 9/1/30 | | | | 460,460 | |
| | 410,000 | | | Boynton Beach Rev. (Charter Schools Boynton Beach, Inc.) | | 6.25 | | | 6/1/27 | | | | 369,504 | |
| | 335,000 | | | Capital Trust Agy. Rev. (Golf Villas, Rivermill, and Village Square Apartments Proj.) 2, 5, 10 | | 4.75 | | | N/A | | | | 190,843 | |
| | 1,000,000 | | | Capital Trust Agy. Rev. (Golf Villas, Rivermill, and Village Square Apartments Proj.) 2, 5 | | 5.88 | | | 6/1/38 | | | | 569,680 | |
| | 415,000 | | | Collier Co. Industrial Dev. Auth. Rev. (NCH Healthcare System Proj.) | | 6.25 | | | 10/1/39 | | | | 445,781 | |
| | 100,000 | | | Fiddlers Creek Community Dev. District No. 2 Special Assessment Rev. 2, 5, 10 | | 5.75 | | | N/A | | | | 51,943 | |
| | 245,000 | | | FL Hsg. Finance Corp. (GNMA/FNMA Collateralized) | | 5.00 | | | 7/1/26 | | | | 246,828 | |
| | 285,000 | | | FL Hsg. Finance Corp. (GNMA/FNMA/FHLMC Collateralized) | | 5.00 | | | 7/1/39 | | | | 304,591 | |
See accompanying notes to financial statements.
SCHEDULE OF INVESTMENTS (Unaudited)
September 30, 2013
Sit Tax-Free Income Fund (Continued)
| | | | | | | | | | | | | | |
| | | | |
Principal Amount ($) | | | Name of Issuer | | Coupon
Rate (%) | | Maturity
Date | | | Fair Value ($) | |
| | |
| | | | |
| | 5,000 | | | Forest Creek Community Dev. District Capital Improvement Special Assessment Rev. 2, 5 | | 7.00 | | | 11/1/13 | | | | 4,991 | |
| | 135,000 | | | Gramercy Farms Community Dev. District Special Assessment 2, 5 | | 5.10 | | | 5/1/14 | | | | 1 | |
| | 535,000 | | | Gramercy Farms Community Dev. District Special Assessment 6 | | 3.24 | | | 5/1/39 | | | | 68,416 | |
| | 500,000 | | | Lake Ashton Community Dev. District Cap. Improvement Special Assessment Rev. 2, 5, 10 | | 5.00 | | | N/A | | | | 165,000 | |
| | 250,000 | | | Lakewood Ranch Stewardship District Cap. Improvement Special Assesment Rev. (Country Club East Proj.) | | 6.70 | | | 5/1/33 | | | | 249,170 | |
| | 500,000 | | | Lakewood Ranch Stewardship District Cap. Improvement Special Assesment Rev. (Lakewood Center) | | 7.40 | | | 5/1/30 | | | | 566,190 | |
| | 250,000 | | | Lee Co. Tourist Development Tax Rev. | | 4.00 | | | 10/1/38 | | | | 217,120 | |
| | 250,000 | | | Lexington Oaks Community Dev. District Special Assessment Rev. | | 5.65 | | | 5/1/33 | | | | 248,230 | |
| | 250,000 | | | Magnolia Creek Community Dev. District Rev. 2, 5 | | 5.60 | | | 5/1/14 | | | | 86,032 | |
| | 500,000 | | | Miami-Dade Co. Rev. (AGM Insured) | | 5.00 | | | 10/1/35 | | | | 506,875 | |
| | 230,000 | | | New River Community Dev. District Cap. Improvement Special Assessment Rev. 2, 5, 10 | | 5.00 | | | N/A | | | | 2 | |
| | 130,000 | | | New River Community Dev. District Cap. Improvement Special Assessment Rev. | | 5.00 | | | 5/1/15 | | | | 125,420 | |
| | 275,000 | | | New River Community Dev. District Cap. Improvement Special Assessment Rev. 6 | | 1.85 | | | 5/1/18 | | | | 130,031 | |
| | 350,000 | | | New River Community Dev. District Cap. Improvement Special Assessment Rev. 6 | | 5.75 | | | 5/1/38 | | | | 148,645 | |
| | 135,000 | | | New River Community Dev. District Cap. Improvement Special Assessment Rev. | | 5.75 | | | 5/1/38 | | | | 106,755 | |
| | 350,000 | | | North Sumter Co. Utility Dependent District Rev. | | 5.00 | | | 10/1/32 | | | | 335,500 | |
| | 270,000 | | | Palma Sola Trace Community Dev. District Cap. Special Assessment Rev. | | 4.00 | | | 5/1/29 | | | | 238,054 | |
| | 750,000 | | | Sarasota Co. Health Facs. Auth. Retirement Rev. Ref. (Village on the Isle) | | 5.50 | | | 1/1/27 | | | | 766,448 | |
| | 500,000 | | | Seminole Tribe Special Obligation Rev. 4 | | 5.50 | | | 10/1/24 | | | | 523,720 | |
| | 250,000 | | | Seven Oaks Community Dev. District Special Assessment Rev. | | 5.50 | | | 5/1/33 | | | | 240,428 | |
| | 1,000,000 | | | St. Petersburg Public Utility Rev. | | 4.00 | | | 10/1/42 | | | | 869,800 | |
| | 615,000 | | | Tallahassee Health Facs. Rev. (Memorial Health Care Proj.) | | 6.38 | | | 12/1/30 | | | | 615,258 | |
| | 295,000 | | | Tolomato Community Dev. District Special Assessment 2, 5 | | 6.38 | | | 5/1/17 | | | | 144,756 | |
| | 105,000 | | | Tolomato Community Dev. District Special Assessment 2, 5 | | 6.38 | | | 5/1/17 | | | | 1 | |
| | 95,000 | | | Tolomato Community Dev. District Special Assessment | | 6.38 | | | 5/1/17 | | | | 90,886 | |
| | 5,000 | | | Tolomato Community Dev. District Special Assessment 2, 5 | | 6.38 | | | 5/1/17 | | | | 4,903 | |
| | 40,000 | | | Tolomato Community Dev. District Special Assessment 6 | | 6.61 | | | 5/1/39 | | | | 29,401 | |
| | 85,000 | | | Tolomato Community Dev. District Special Assessment 6 | | 6.61 | | | 5/1/40 | | | | 50,925 | |
| | 45,000 | | | Tolomato Community Dev. District Special Assessment 6 | | 6.61 | | | 5/1/40 | | | | 19,956 | |
| | 500,000 | | | Viera East Community Dev. District Special Assessment Rev. Ref. | | 5.00 | | | 5/1/26 | | | | 466,430 | |
| | 10,000 | | | Waters Edge Community Dev. District Cap. Improvement Rev. | | 5.35 | | | 5/1/39 | | | | 8,998 | |
| | 650,000 | | | Waters Edge Community Dev. District Cap. Improvement Rev. 6 | | 6.60 | | | 5/1/39 | | | | 296,550 | |
| | 450,000 | | | Zephyr Ridge Community Dev. District Special Assessment Rev. 2, 5, 10 | | 5.25 | | | N/A | | | | 176,584 | |
| | | | | | | | | | | | | | |
| | | | | | | | | | | | | 11,424,835 | |
| | | | | | | | | | | | | | |
| | | |
| | Georgia - 2.4% | | | | | | | | | | |
| | 1,240,000 | | | East Point Tax Allocation | | 8.00 | | | 2/1/26 | | | | 1,241,314 | |
| | 1,280,000 | | | GA Housing & Finance Authority Rev. | | 3.80 | | | 12/1/37 | | | | 1,048,717 | |
| | 1,000,000 | | | GA Housing & Finance Authority Rev. | | 4.00 | | | 12/1/37 | | | | 869,440 | |
| | 300,000 | | | GA State Environmental Loan Acquisition Corp. Rev. | | 5.13 | | | 2/15/31 | | | | 317,625 | |
| | | | | | | | | | | | | | |
| | | | | | | | | | | | | 3,477,096 | |
| | | | | | | | | | | | | | |
| | | |
| | Idaho - 0.7% | | | | | | | | | | |
| | 570,000 | | | ID Hsg. & Fin. Assoc. Nonprofit Facs. Rev. (Compass Public Charter School Proj.) | | 5.50 | | | 7/1/30 | | | | 534,364 | |
| | 500,000 | | | ID Hsg. & Fin. Assoc. Nonprofit Facs. Rev. (Idaho Arts Charter School Proj.) | | 5.75 | | | 12/1/32 | | | | 467,485 | |
| | | | | | | | | | | | | | |
| | | | | | | | | | | | | 1,001,849 | |
| | | | | | | | | | | | | | |
| | | |
| | Illinois - 5.9% | | | | | | | | | | |
| | 500,000 | | | Bellwood G.O. | | 5.88 | | | 12/1/27 | | | | 444,550 | |
| | 500,000 | | | Bureau Co. Township High School Dist. No. 502 G.O. | | 6.25 | | | 12/1/33 | | | | 538,890 | |
| | 375,000 | | | Chicago Board of Education G.O. | | 5.50 | | | 12/1/39 | | | | 361,380 | |
| | 1,000,000 | | | Dekalb, Kane & Lasalle Counties Comm. College Dist. No. 523 G.O. Capital Appreciation 6 | | 6.58 | | | 2/1/30 | | | | 406,060 | |
| | 265,000 | | | IL C.O.P. (NATL-RE Insured) | | 5.80 | | | 7/1/17 | | | | 265,339 | |
See accompanying notes to financial statements.
| | |
22 | | SIT MUTUAL FUNDS SEMI-ANNUAL REPORT |
| | | | | | | | | | | | | | |
| | | | |
Principal Amount ($) | | | Name of Issuer | | Coupon
Rate (%) | | Maturity
Date | | | Fair Value ($) | |
| | |
| | 300,000 | | | IL Fin. Auth. Rev. (Lutheran Home & Services) | | 5.50 | | | 5/15/27 | | | | 294,624 | |
| | 750,000 | | | IL Fin. Auth. Rev. (Noble Network Charter Schools) (ACA Insured) | | 5.00 | | | 9/1/27 | | | | 688,485 | |
| | 95,000 | | | IL Fin. Auth. Rev. (TEMPS-50-The Admiral at the Lake Proj.) | | 6.00 | | | 5/15/17 | | | | 95,028 | |
| | 375,000 | | | IL Fin. Auth. Rev. (UNO Charter School Network) | | 6.88 | | | 10/1/31 | | | | 409,222 | |
| | 1,000,000 | | | IL Fin. Auth. Sports Facs. Rev. (North Shore Ice Arena Proj.) | | 6.25 | | | 12/1/38 | | | | 483,840 | |
| | 500,000 | | | IL Fin. Auth. Sports Facs. Rev. (United Sports Organizations of Barrington Proj.) 2, 4, 5 | | 6.13 | | | 10/1/27 | | | | 29,709 | |
| | 500,000 | | | IL Fin. Auth. Sports Facs. Rev. (United Sports Organizations of Barrington Proj.) 2, 4, 5 | | 6.25 | | | 10/1/37 | | | | 29,709 | |
| | 250,000 | | | IL G.O. | | 5.50 | | | 7/1/33 | | | | 253,558 | |
| | 380,000 | | | IL Housing Dev. Auth. (AMBAC GO of Authority Insured) | | 4.50 | | | 7/1/47 | | | | 344,641 | |
| | 500,000 | | | IL Sports Facs. Auth. (AMBAC Insured) | | 5.00 | | | 6/15/32 | | | | 500,065 | |
| | 250,000 | | | Lake Co. Community Consolidated School District No. 50 Woodland G.O. | | 5.63 | | | 1/1/26 | | | | 280,015 | |
| | 80,000 | | | Lombard Public Facs. Corp. Rev. First Tier (Conference Center & Hotel Proj.) | | 6.38 | | | 1/1/15 | | | | 56,931 | |
| | 1,000,000 | | | Lombard Public Facs. Corp. Rev. First Tier (Conference Center & Hotel Proj.) | | 5.25 | | | 1/1/36 | | | | 441,560 | |
| | 550,000 | | | Lombard Public Facs. Corp. Rev. First Tier (Conference Center & Hotel Proj.) (ACA Insured) | | 5.50 | | | 1/1/25 | | | | 419,353 | |
| | 250,000 | | | Macon County School District No. 61 Decatur G.O. (AGM Insured) | | 5.25 | | | 1/1/37 | | | | 258,350 | |
| | 1,921,000 | | | Malta Tax Allocation Rev. 2, 5 | | 5.75 | | | 12/30/25 | | | | 913,704 | |
| | 818,000 | | | Manhattan Special Service Area Special Tax No. 07-6 (Groebe Farm-Stonegate) 2, 5 | | 5.75 | | | 3/1/22 | | | | 162,798 | |
| | 395,000 | | | Southwestern IL Dev. Auth. Rev. (Village of Sauget Proj.) | | 5.63 | | | 11/1/26 | | | | 309,644 | |
| | 575,000 | | | Southwestern IL Dev. Auth. Tax Allocation Ref. (Local Govt. Program) | | 7.00 | | | 10/1/22 | | | | 458,131 | |
| | 250,000 | | | West Chicago Park District G.O (AGM Insured) | | 5.25 | | | 12/1/29 | | | | 267,368 | |
| | | | | | | | | | | | | | |
| | | | | | | | | | | | | 8,712,954 | |
| | | | | | | | | | | | | | |
| | | |
| | Indiana - 3.5% | | | | | | | | | | |
| | 700,000 | | | Carmel Multifamily Hsg. Rev. (Barrington Carmel Proj.) | | 6.00 | | | 11/15/22 | | | | 684,586 | |
| | 300,000 | | | Damon Run Conservancy Dist. G.O. (St Intercept Insured) | | 6.10 | | | 7/1/25 | | | | 317,679 | |
| | 400,000 | | | Hammond Local Public Improvement Bond Bank | | 6.50 | | | 8/15/25 | | | | 407,824 | |
| | 250,000 | | | Hammond Local Public Improvement Bond Bank | | 6.50 | | | 8/15/30 | | | | 252,870 | |
| | 300,000 | | | IN Finance Auth. Rev. (BHI Senior Living) | | 5.50 | | | 11/15/26 | | | | 313,230 | |
| | 400,000 | | | IN Finance Auth. Rev. (BHI Senior Living) | | 6.00 | | | 11/15/41 | | | | 389,380 | |
| | 500,000 | | | IN Finance Auth. Rev. (Community Foundation of Northwest Indiana) | | 5.00 | | | 3/1/41 | | | | 475,650 | |
| | 350,000 | | | IN Finance Auth. Rev. (Educational Facility Indianapolis) | | 4.00 | | | 2/1/31 | | | | 320,747 | |
| | 300,000 | | | IN Health & Educational Fac. Fin. Auth. Rev. (Clarian Health Obligation) | | 5.00 | | | 2/15/39 | | | | 300,249 | |
| | 350,000 | | | IN Health & Educational Fac. Fin. Auth. Rev. (Schneck Memorial Hospital Proj.) | | 5.25 | | | 2/15/30 | | | | 351,138 | |
| | 1,000,000 | | | Mt. Vernon School Building Corp. Rev. (State Aid Withholding) | | 5.00 | | | 1/15/37 | | | | 1,027,940 | |
| | 250,000 | | | St. Joseph Co. Health Facs. Rev. (Holy Cross Village) 1 | | 6.25 | | | 5/15/39 | | | | 250,098 | |
| | 340,555 | | | St. Joseph Co. Hospital Auth. Health Facs. Rev. (Madison Center) 2, 5 | | 5.25 | | | 2/15/28 | | | | 36,770 | |
| | | | | | | | | | | | | | |
| | | | | | | | | | | | | 5,128,161 | |
| | | | | | | | | | | | | | |
| | | |
| | Iowa - 0.7% | | | | | | | | | | |
| | 250,000 | | | IA Fin. Auth. Midwestern District Rev. (Iowa Fertilizer Co. Proj.) | | 5.00 | | | 12/1/19 | | | | 242,880 | |
| | 500,000 | | | IA Fin. Auth. Midwestern District Rev. (Iowa Fertilizer Co. Proj.) | | 5.50 | | | 12/1/22 | | | | 481,835 | |
| | 250,000 | | | IA Student Loan Liquidity Corp. Rev. | | 5.80 | | | 12/1/31 | | | | 254,380 | |
| | | | | | | | | | | | | | |
| | | | | | | | | | | | | 979,095 | |
| | | | | | | | | | | | | | |
| | | |
| | Kansas - 0.7% | | | | | | | | | | |
| | 500,000 | | | Wichita Health Care Facs. Rev. (Presbyterian Manors, Inc.) | | 6.25 | | | 5/15/34 | | | | 497,945 | |
| | 500,000 | | | Wyandotte Co./Kansas City Board of Public Utility Rev. (Office Building Complex) (NATL-RE Insured) | | 5.00 | | | 5/1/21 | | | | 501,780 | |
| | | | | | | | | | | | | | |
| | | | | | | | | | | | | 999,725 | |
| | | | | | | | | | | | | | |
| | | |
| | Kentucky - 0.3% | | | | | | | | | | |
| | 425,000 | | | Pikeville Hospital Rev. Ref. (Pikeville Medical Center) | | 6.50 | | | 3/1/41 | | | | 462,170 | |
| | | | | | | | | | | | | | |
See accompanying notes to financial statements.
SCHEDULE OF INVESTMENTS (Unaudited)
September 30, 2013
Sit Tax-Free Income Fund (Continued)
| | | | | | | | | | | | | | |
| | |
| | | | |
| Principal | | | | | Coupon | | Maturity | | | Fair | |
| Amount ($) | | | Name of Issuer | | Rate (%) | | Date | | | Value ($) | |
| | |
| Louisiana - 2.4% | | | | | | | | | | |
| | 126,576 | | | Denham Springs/Livingston Hsg. & Mtg. Finance Auth. Rev. | | 5.00 | | | 11/1/40 | | | | 127,414 | |
| | 620,000 | | | Jefferson Parish Finance Auth. Single Family Mtg. Rev. | | 5.00 | | | 6/1/38 | | | | 648,235 | |
| | 170,000 | | | LA Hsg. Fin. Agy. Single Family Mtg. Rev. (Home Ownership Program) | | 6.00 | | | 12/1/28 | | | | 179,173 | |
| | 950,000 | | | LA Hsg. Fin. Agy. Single Family Mtg. Rev. (Home Ownership Program) | | 5.70 | | | 12/1/38 | | | | 1,009,916 | |
| | 380,000 | | | LA Hsg. Fin. Agy. Single Family Mtg. Rev. (Mtg. Backed Securities Program) | | 4.60 | | | 6/1/29 | | | | 389,857 | |
| | 250,000 | | | LA Public Facs. Auth. Rev. (Belle-Chase Educational Foundation Proj.) (NATL-RE Insured) | | 6.50 | | | 5/1/31 | | | | 266,278 | |
| | 725,000 | | | LA Public Facs. Auth. Rev. (Tulane Univ. Proj.) (NATL-RE Insured) 1 | | 0.88 | | | 2/15/36 | | | | 622,296 | |
| | 250,000 | | | LA Tobacco Settlement Financing Corp. Rev. | | 5.50 | | | 5/15/30 | | | | 255,475 | |
| | 70,000 | | | Lafayette Public Finance Auth. Single Family Mortgage-Backed Rev. | | 5.35 | | | 1/1/41 | | | | 73,102 | |
| | | | | | | | | | | | | | |
| | | | |
| | | | | | | | | | | | | 3,571,746 | |
| | | | | | | | | | | | | | |
| | | |
| Maine - 0.8% | | | | | | | | | | |
| | 500,000 | | | ME Health & Higher Educational Facs. Auth. Rev. (ME General Medical Center) | | 7.50 | | | 7/1/32 | | | | 560,695 | |
| | 500,000 | | | ME Hsg. Auth. Rev. | | 3.60 | | | 11/15/36 | | | | 400,555 | |
| | 250,000 | | | ME Hsg. Auth. Rev. | | 4.50 | | | 11/15/37 | | | | 233,578 | |
| | | | | | | | | | | | | | |
| | | | |
| | | | | | | | | | | | | 1,194,828 | |
| | | | | | | | | | | | | | |
| | | |
| Maryland - 0.7% | | | | | | | | | | |
| | 235,000 | | | MD Community Dev. Administration Rev. | | 5.13 | | | 9/1/30 | | | | 244,170 | |
| | 900,000 | | | Montgomery Co. Housing Opportunites Commission Rev. | | 4.00 | | | 7/1/38 | | | | 768,402 | |
| | | | | | | | | | | | | | |
| | | | |
| | | | | | | | | | | | | 1,012,572 | |
| | | | | | | | | | | | | | |
| | | |
| Massachusetts - 2.3% | | | | | | | | | | |
| | 365,000 | | | MA Education Finance Auth. Education Rev. | | 5.15 | | | 1/1/26 | | | | 377,111 | |
| | 250,000 | | | MA Housing Finance Agy. Rev. | | 3.50 | | | 12/1/31 | | | | 220,038 | |
| | 250,000 | | | MA Housing Finance Agy. Rev. | | 4.75 | | | 6/1/35 | | | | 246,325 | |
| | 1,250,000 | | | MA Housing Finance Agy. Rev. | | 3.45 | | | 12/1/37 | | | | 981,388 | |
| | 500,000 | | | MA Housing Finance Agy. Rev. (FHA Insured) | | 5.30 | | | 12/1/38 | | | | 505,445 | |
| | 1,250,000 | | | MA Housing Finance Agy. Rev. (GNMA/FNMA/FHLMC Collateralized) | | 3.90 | | | 12/1/38 | | | | 1,041,412 | |
| | | | | | | | | | | | | | |
| | | | |
| | | | | | | | | | | | | 3,371,719 | |
| | | | | | | | | | | | | | |
| | | |
| Michigan - 2.0% | | | | | | | | | | |
| | 240,000 | | | Allen Academy Rev. | | 5.25 | | | 6/1/17 | | | | 243,497 | |
| | 975,000 | | | MI Hospital Finance Auth. Rev. Ref. (Presbyterian Village) | | 5.25 | | | 11/15/25 | | | | 896,786 | |
| | 250,000 | | | MI Hsg. Dev. Auth. (GO of Authority Insured) | | 4.63 | | | 10/1/41 | | | | 229,958 | |
| | 500,000 | | | MI Public Education Facs. Auth. Ltd. Rev. Ref. (Nataki Talibah Proj.) (Q-SBLF Insured) | | 6.25 | | | 10/1/23 | | | | 469,930 | |
| | 465,000 | | | MI Public Education Facs. Auth. Rev. Ref. (Bradford Proj.) 4 | | 6.00 | | | 9/1/16 | | | | 244,888 | |
| | 285,000 | | | MI Tobacco Settlement Finance Auth. Sr. Rev. | | 5.13 | | | 6/1/22 | | | | 240,771 | |
| | 300,000 | | | Oakland County Economic Development Corp. Rev. (Roman Catholic Archdiocese Proj.) | | 6.50 | | | 12/1/20 | | | | 308,253 | |
| | 250,000 | | | Saline Economic Dev. Corp. Rev. (Evangelical Homes Proj.) | | 5.25 | | | 6/1/32 | | | | 230,145 | |
| | | | | | | | | | | | | | |
| | | | |
| | | | | | | | | | | | | 2,864,228 | |
| | | | | | | | | | | | | | |
| | | |
| Minnesota - 1.9% | | | | | | | | | | |
| | 1,920,226 | | | Intermediate School District 287 Lease Rev. | | 5.30 | | | 11/1/32 | | | | 1,938,890 | |
| | 280,000 | | | MN Hsg. Fin. Agy. Mtg. Rev. (Mtg. Backed Securities Program) (GNMA/FNMA Collateralized) | | 4.40 | | | 7/1/32 | | | | 299,354 | |
| | 485,000 | | | MN Hsg. Fin. Agy. Residential Hsg. Rev. | | 5.10 | | | 1/1/40 | | | | 490,015 | |
| | | | | | | | | | | | | | |
| | | | |
| | | | | | | | | | | | | 2,728,259 | |
| | | | | | | | | | | | | | |
| | | |
| Mississippi - 0.5% | | | | | | | | | | |
| | 500,000 | | | D’Iberville Tax Increment Rev. (Gult Coast Promenade Proj.) | | 4.75 | | | 4/1/33 | | | | 454,230 | |
| | 110,000 | | | MS Home Corp. Single Family Mtg. Rev. (GNMA/FNMA/FHLMC Collateralized) | | 5.60 | | | 6/1/38 | | | | 111,547 | |
| | 140,000 | | | MS Home Corp. Single Family Mtg. Rev. (GNMA/FNMA/FHLMC Collateralized) | | 6.75 | | | 6/1/39 | | | | 141,897 | |
| | | | | | | | | | | | | | |
| | | | |
| | | | | | | | | | | | | 707,674 | |
| | | | | | | | | | | | | | |
See accompanying notes to financial statements.
| | |
24 | | SIT MUTUAL FUNDS SEMI-ANNUAL REPORT |
| | | | | | | | | | | | | | |
| Principal | | | | | Coupon | | Maturity | | | Fair | |
| Amount ($) | | | Name of Issuer | | Rate (%) | | Date | | | Value ($) | |
| | |
| | | |
| Missouri - 1.5% | | | | | | | | | | |
| | 500,000 | | | Chillicothe Tax Increment Rev. (South U.S. 65 Proj.) | | 5.63 | | | 4/1/27 | | | | 430,385 | |
| | 250,000 | | | Independence 39th St. Transportation District Rev. Ref. & Improvement | | 6.88 | | | 9/1/32 | | | | 246,472 | |
| | 400,000 | | | Kansas City Industrial Dev. Auth. Rev. (Kansas City Pkg. LLC) | | 5.45 | | | 9/1/23 | | | | 410,712 | |
| | 320,000 | | | Kirkwood Industrial Dev. Auth. Rev. (Aberdeen Heights) | | 8.00 | | | 5/15/21 | | | | 339,558 | |
| | 320,000 | | | MO Health & Educational Facilities Auth. Rev. (Stephens College) | | 5.75 | | | 3/1/33 | | | | 288,506 | |
| | 473,793 | | | Moberly Industrial Dev. Auth. (Annual Appropriation Proj.) 2, 5 | | 6.00 | | | 9/1/24 | | | | 33,132 | |
| | 250,000 | | | St. Louis Co. Industrial Dev. Auth. Rev. (Nazareth Living Center) | | 5.88 | | | 8/15/32 | | | | 229,948 | |
| | 250,000 | | | St. Louis Co. Industrial Dev. Auth. Rev. Ref. (Friendship Village Sunset Hills) | | 5.00 | | | 9/1/32 | | | | 248,178 | |
| | | | | | | | | | | | | | |
| | | | |
| | | | | | | | | | | | | 2,226,891 | |
| | | | | | | | | | | | | | |
| | | |
| Montana - 0.8% | | | | | | | | | | |
| | 500,000 | | | MT Board of Housing Single Family Rev. | | 3.75 | | | 12/1/38 | | | | 427,005 | |
| | 170,000 | | | MT Board of Housing Single Family Rev. (GO of BRD Insured) | | 4.70 | | | 12/1/26 | | | | 170,656 | |
| | 625,121 | | | MT Facs. Finance Auth. Rev. (Great Falls Pre-Release Services Proj.) | | 5.08 | | | 4/1/21 | | | | 648,594 | |
| | | | | | | | | | | | | | |
| | | | |
| | | | | | | | | | | | | 1,246,255 | |
| | | | | | | | | | | | | | |
| | | |
| Nebraska - 0.1% | | | | | | | | | | |
| | 410,000 | | | Mead Village Tax Allocation Rev. (E3 Biofuels - Mead LLC Proj.) 2, 5, 10 | | 5.13 | | | N/A | | | | 192,491 | |
| | | | | | | | | | | | | | |
| | | |
| Nevada - 1.2% | | | | | | | | | | |
| | 250,000 | | | Clark Co. Economic Dev. Rev. (Alexander Dawson School Proj.) | | 5.38 | | | 5/15/33 | | | | 250,698 | |
| | 750,000 | | | Las Vegas Redev. Agy. Tax Allocation Rev. | | 7.50 | | | 6/15/23 | | | | 823,312 | |
| | 315,000 | | | NV Hsg. Dev. Single Family Mtg. Program Mezzanine (GNMA/FNMA/FHLMC Collateralized) | | 5.10 | | | 10/1/40 | | | | 319,523 | |
| | 380,000 | | | Sparks Redev. Agy. Tax Increment Rev. (Redev. Area No. 2 Proj.) | | 6.40 | | | 6/1/20 | | | | 401,071 | |
| | | | | | | | | | | | | | |
| | | | |
| | | | | | | | | | | | | 1,794,604 | |
| | | | | | | | | | | | | | |
| | | |
| New Hampshire - 0.9% | | | | | | | | | | |
| | 890,000 | | | Manchester Hsg. & Redev. Auth. Rev. (ACA Insured) | | 6.75 | | | 1/1/15 | | | | 886,618 | |
| | 400,000 | | | NH Health & Educ. Facs. Auth. Rev. (Wentworth Douglas Hospital) | | 6.00 | | | 1/1/34 | | | | 420,324 | |
| | | | | | | | | | | | | | |
| | | | |
| | | | | | | | | | | | | 1,306,942 | |
| | | | | | | | | | | | | | |
| | | |
| New Jersey - 1.5% | | | | | | | | | | |
| | 450,000 | | | NJ Economic Dev. Auth. Rev. Ref. (United Methodist Home Obligation) | | 5.00 | | | 7/1/34 | | | | 427,122 | |
| | 210,000 | | | NJ Higher Education Assistance Auth. Student Loan Rev. | | 5.00 | | | 12/1/28 | | | | 218,186 | |
| | 615,000 | | | NJ Hsg. & Mtg. Finance Agy. Rev. | | 5.05 | | | 10/1/39 | | | | 621,765 | |
| | 550,000 | | | NJ Hsg. & Mtg. Finance Agy. Rev. (Mciver Homes Hsg. Proj.) (FHLMC Collateralized) | | 3.60 | | | 1/1/30 | | | | 473,830 | |
| | 400,000 | | | NJ Hsg. & Mtg. Finance Agy. Single Family Mtg. Rev. | | 4.50 | | | 10/1/30 | | | | 400,800 | |
| | | | | | | | | | | | | | |
| | | | |
| | | | | | | | | | | | | 2,141,703 | |
| | | | | | | | | | | | | | |
| | | |
| New Mexico - 1.5% | | | | | | | | | | |
| | 325,000 | | | NM Mtg. Fin. Auth. Single Family Mtg. Rev. (GNMA/FNMA/FHLMC Collateralized) | | 4.80 | | | 9/1/29 | | | | 332,040 | |
| | 275,000 | | | NM Mtg. Fin. Auth. Single Family Mtg. Rev. (GNMA/FNMA/FHLMC Collateralized) | | 5.35 | | | 9/1/30 | | | | 290,942 | |
| | 600,000 | | | NM Mtg. Fin. Auth. Single Family Mtg. Rev. (GNMA/FNMA/FHLMC Collateralized) | | 5.25 | | | 9/1/34 | | | | 633,378 | |
| | 485,000 | | | NM Mtg. Fin. Auth. Single Family Mtg. Rev. (GNMA/FNMA/FHLMC Collateralized) | | 3.90 | | | 9/1/42 | | | | 402,831 | |
| | 530,000 | | | NM Mtg. Fin. Auth. Single Family Mtg. Rev. (GNMA/FNMA/FHLMC Collateralized) | | 4.13 | | | 9/1/42 | | | | 473,597 | |
| | | | | | | | | | | | | | |
| | | | |
| | | | | | | | | | | | | 2,132,788 | |
| | | | | | | | | | | | | | |
| | | |
| New York - 4.1% | | | | | | | | | | |
| | 250,000 | | | Albany Capital Resource Corp. Rev. (The College of Saint Rose) | | 5.63 | | | 7/1/31 | | | | 260,245 | |
| | 350,000 | | | Hempstead Town Local Development Corp. Rev. (Hofstra University Proj.) | | 4.00 | | | 7/1/33 | | | | 329,900 | |
| | 250,000 | | | New York City Housing Development Corp. Multifamily Mtg. Rev. | | 4.60 | | | 11/1/36 | | | | 241,702 | |
| | 500,000 | | | New York City Housing Development Corp. Rev. | | 3.80 | | | 11/1/37 | | | | 406,235 | |
| | 750,000 | | | New York City Municipal Water Finance Authority | | 5.00 | | | 6/15/38 | | | | 787,612 | |
See accompanying notes to financial statements.
SCHEDULE OF INVESTMENTS (Unaudited)
September 30, 2013
Sit Tax-Free Income Fund (Continued)
| | | | | | | | | | | | | | |
| | | | |
Principal Amount ($) | | | Name of Issuer | | Coupon
Rate (%) | | Maturity
Date | | | Fair Value ($) | |
| | |
| 500,000 | | | NY Mortgage Agency Rev. | | 3.70 | | | 10/1/38 | | | | 396,320 | |
| | 455,000 | | | NY Mortgage Agency Rev. | | 4.13 | | | 10/1/40 | | | | 401,733 | |
| | 200,000 | | | NY Mortgage Agency Rev. | | 3.75 | | | 10/1/42 | | | | 160,894 | |
| | 480,000 | | | NY Mortgage Agency Rev. | | 4.75 | | | 10/1/42 | | | | 463,152 | |
| | 200,000 | | | NY State Dormitory Auth. Rev. Ref. (Miriam Osborne Memorial Home) | | 5.00 | | | 7/1/42 | | | | 201,276 | |
| | 590,000 | | | NY State Housing Finance Agency Rev. (Affordable Hsg. Proj.) | | 3.75 | | | 11/1/37 | | | | 489,547 | |
| | 400,000 | | | NY State Housing Finance Agency Rev. (Affordable Hsg. Proj.) | | 4.88 | | | 11/1/42 | | | | 394,172 | |
| | 880,000 | | | NY State Housing Finance Agency Rev. (Affordable Hsg. Proj.) | | 3.85 | | | 11/1/44 | | | | 711,462 | |
| | 1,000,000 | | | NY State Housing Finance Agency Rev. (Affordable Hsg. Proj.) | | 4.10 | | | 5/1/48 | | | | 815,480 | |
| | | | | | | | | | | | | | |
| | | | |
| | | | | | | | | | | | | 6,059,730 | |
| | | | | | | | | | | | | | |
| | | |
| North Carolina - 0.2% | | | | | | | | | | |
| | 250,000 | | | NC Medical Care Commission Rev. (Village of Brookwood) | | 5.25 | | | 1/1/32 | | | | 241,578 | |
| | | | | | | | | | | | | | |
| | | |
| North Dakota - 0.3% | | | | | | | | | | |
| | | | |
| | 500,000 | | | ND Housing Finance Agency Rev. | | 5.00 | | | 7/1/33 | | | | 499,340 | |
| | | | | | | | | | | | | | |
| | | |
| Ohio - 1.7% | | | | | | | | | | |
| | 815,000 | | | Cleveland-Cuyahoga Co. Port Auth. Dev. Rev. (St. Clarence Proj.) | | 6.00 | | | 5/1/21 | | | | 771,031 | |
| | 680,900 | | | Cuyahoga Co. Hsg. Mtg. Sr. Rev. (R H Myers Apts. Proj.) (GNMA Collateralized) | | 5.70 | | | 3/20/42 | | | | 715,401 | |
| | 300,000 | | | Fairfield Co. Hospital Rev. (Fairfield Medical Center Proj.) | | 5.13 | | | 6/15/33 | | | | 298,320 | |
| | 550,000 | | | Lucas Co. Hospital Rev. (Promedica Health Care Proj.) | | 6.50 | | | 11/15/37 | | | | 630,988 | |
| | 60,000 | | | OH Hsg. Finance Agy. Residential Mtg. Rev. (GNMA/FNMA/FHLMC Collateralized) | | 5.45 | | | 9/1/33 | | | | 62,060 | |
| | | | | | | | | | | | | | |
| | | | |
| | | | | | | | | | | | | 2,477,800 | |
| | | | | | | | | | | | | | |
| | | |
| Oklahoma - 0.7% | | | | | | | | | | |
| | 300,000 | | | Citizen Potawatomi Nation Sr. Obligation Tax Rev. | | 6.50 | | | 9/1/16 | | | | 289,905 | |
| | 525,000 | | | Fort Sill Apache Tribe Economic Dev. Auth. 4 | | 8.50 | | | 8/25/26 | | | | 563,897 | |
| | 250,000 | | | Oklahoma Co. Finance Auth. Rev. (Epworth Villa Proj.) | | 5.13 | | | 4/1/42 | | | | 230,785 | |
| | | | | | | | | | | | | | |
| | | | |
| | | | | | | | | | | | | 1,084,587 | |
| | | | | | | | | | | | | | |
| | | |
| Oregon - 1.1% | | | | | | | | | | |
| | 350,000 | | | Clackamas Co. Hsg. Auth. Rev. (Easton Ridge Apts. Proj.) | | 3.50 | | | 9/1/33 | | | | 287,336 | |
| | 500,000 | | | OR Hsg. & Community Services Dept. Rev. (Single Family Mtg. Program) | | 4.00 | | | 7/1/38 | | | | 431,335 | |
| | 350,000 | | | Port of Morrow G.O. | | 4.00 | | | 6/1/32 | | | | 297,199 | |
| | 315,000 | | | Western Generation Agy. Rev. (Wauna Cogeneration Proj.) | | 5.00 | | | 1/1/21 | | | | 304,744 | |
| | 300,000 | | | Western Generation Agy. Rev. (Wauna Cogeneration) | | 5.00 | | | 1/1/21 | | | | 290,232 | |
| | | | | | | | | | | | | | |
| | | | |
| | | | | | | | | | | | | 1,610,846 | |
| | | | | | | | | | | | | | |
| | | |
| Pennsylvania - 3.5% | | | | | | | | | | |
| | 225,000 | | | Allegheny Co. Industrial Dev. Auth. Charter School Rev. (Propel Charter-McKeesport) | | 5.90 | | | 8/15/26 | | | | 227,005 | |
| | 480,000 | | | Butler Co. General Authority Rev. (School District Proj.) (AGM GO of District) 1 | | 0.87 | | | 10/1/34 | | | | 369,504 | |
| | 250,000 | | | Central Bradford Progress Auth. Rev. (Guthrie Healthcare System) | | 5.50 | | | 12/1/31 | | | | 264,290 | |
| | 250,000 | | | Erie Co. Hospital Auth. Rev. (St. Vincent Health Center Proj.) | | 7.00 | | | 7/1/27 | | | | 256,435 | |
| | 600,000 | | | Geisinger Auth. Health System Rev. (Geisinger Health System Proj.) 1 | | 0.95 | | | 5/1/37 | | | | 422,868 | |
| | 245,000 | | | Lehigh Co. General Purpose Auth. Rev. (Saint Luke’s Bethlehem) 1 | | 1.20 | | | 8/15/42 | | | | 177,471 | |
| | 500,000 | | | Luzerne Co. G.O. (FSA Insured) | | 7.00 | | | 11/1/26 | | | | 566,585 | |
| | 500,000 | | | PA Housing Finance Agy. Single Family Mtg. Rev. | | 4.85 | | | 10/1/37 | | | | 483,880 | |
| | 40,000 | | | PA Hsg. Finance Agy. Rev. | | 5.00 | | | 10/1/25 | | | | 41,027 | |
| | 370,000 | | | PA Hsg. Finance Agy. Rev. | | 3.65 | | | 10/1/37 | | | | 299,741 | |
| | 500,000 | | | PA Hsg. Finance Agy. Rev. (GO of Agency Insured) | | 4.63 | | | 10/1/29 | | | | 501,685 | |
| | 185,000 | | | PA Hsg. Finance Agy. Single Family Mtg. Rev. | | 4.75 | | | 10/1/39 | | | | 189,978 | |
| | 500,000 | | | PA Turnpike Commission Rev. Capital Appreciation 6 | | 5.13 | | | 12/1/35 | | | | 445,830 | |
| | 1,250,000 | | | PA Turnpike Commission Rev. Captial Appreciation 6 | | 3.45 | | | 12/1/38 | | | | 913,038 | |
| | | | | | | | | | | | | | |
| | | | |
| | | | | | | | | | | | | 5,159,337 | |
| | | | | | | | | | | | | | |
| | |
| See accompanying notes to financial statements. |
26 | | SIT MUTUAL FUNDS SEMI-ANNUAL REPORT |
| | | | | | | | | | | | | | |
| | | | |
Principal Amount ($) | | | Name of Issuer | | Coupon
Rate (%) | | Maturity Date | | | Fair Value ($) | |
| | |
| Puerto Rico - 1.3% | | | | | | | | |
| | 500,000 | | | Puerto Rico Electric Power Auth. Rev. 1 | | 0.85 | | | 7/1/25 | | | | 351,120 | |
| | 335,000 | | | Puerto Rico Ind. Medical & Enviromental Pollution Control Facs. Fing. Auth. Rev. (American Home Proj.)1 | | 5.10 | | | 12/1/18 | | | | 335,094 | |
| | 250,000 | | | Puerto Rico Public Improvement G.O. (AGM Insured) | | 5.50 | | | 7/1/27 | | | | 231,648 | |
| | 350,000 | | | Puerto Rico Public Improvement G.O. (AGM Insured) | | 5.00 | | | 7/1/35 | | | | 283,364 | |
| | 300,000 | | | Puerto Rico Sales Tax Financing Corp. Rev. | | 6.00 | | | 8/1/39 | | | | 246,000 | |
| | 250,000 | | | Puerto Rico Sales Tax Financing Corp. Rev. | | 5.25 | | | 8/1/40 | | | | 216,198 | |
| | 500,000 | | | Puerto Rico Sales Tax Financing Corp. Rev. 1 | | 1.11 | | | 8/1/57 | | | | 291,190 | |
| | | | | | | | | | | | | | |
| | | | |
| | | | | | | | | | | | | 1,954,614 | |
| | | | | | | | | | | | | | |
| | |
| Rhode Island - 0.3% | | | | | | | | |
| | 250,000 | | | RI Hsg. & Mortgage Finance Corp. Rev. | | 3.45 | | | 4/1/35 | | | | 199,580 | |
| | 250,000 | | | RI Hsg. & Mortgage Finance Corp. Rev. | | 3.90 | | | 10/1/37 | | | | 207,830 | |
| | | | | | | | | | | | | | |
| | | | |
| | | | | | | | | | | | | 407,410 | |
| | | | | | | | | | | | | | |
| | |
| South Carolina - 0.9% | | | | | | | | |
| | 250,000 | | | Coastal Carolina University Rev. | | 3.50 | | | 6/1/40 | | | | 197,995 | |
| | 395,000 | | | SC Education Assistance Auth. Student Loan Rev. | | 5.10 | | | 10/1/29 | | | | 409,236 | |
| | 76,190 | | | SC Jobs Economic Dev. Auth. Health Care Facs. Rev. (Woodlands at Furman Proj.) 6 | | 0.40 | | | 11/15/47 | | | | 76 | |
| | 177,778 | | | SC Jobs Economic Dev. Auth. Health Care Facs. Rev. (Woodlands at Furman Proj.) | | 6.00 | | | 11/15/47 | | | | 103,901 | |
| | 500,000 | | | SC Public Service Auth. Rev. (Santee Cooper) | | 5.75 | | | 12/1/43 | | | | 544,975 | |
| | | | | | | | | | | | | | |
| | | | |
| | | | | | | | | | | | | 1,256,183 | |
| | | | | | | | | | | | | | |
| | |
| South Dakota - 0.2% | | | | | | | | |
| | | | |
| | 350,000 | | | Huron School District No. 2-2 G.O. | | 5.00 | | | 6/15/39 | | | | 347,970 | |
| | | | | | | | | | | | | | |
| | |
| Tennessee - 1.2% | | | | | | | | |
| | 250,000 | | | Johnson City Health & Educational Facs. Board Rev. (Appalachian Christian Village) | | 5.00 | | | 2/15/34 | | | | 232,178 | |
| | 495,000 | | | Metro Govt. Nashville & Davidson Co. Health & Education Facs. Rev. (Prestige Proj.) 2, 5 | | 7.50 | | | 12/20/40 | | | | 247,480 | |
| | 1,850,000 | | | Shelby Co. Health, Education & Hsg. Facs. Rev. (CME Memphis Apts. Proj.) 2, 5 | | 5.35 | | | 1/1/19 | | | | 138,806 | |
| | 7,875,000 | | | Shelby Co. Health, Education & Hsg. Facs. Rev. (CME Memphis Apts. Proj.) 2, 5 | | 5.55 | | | 1/1/29 | | | | 590,861 | |
| | 1,630,000 | | | Shelby Co. Health, Education & Hsg. Facs. Rev. (CME Memphis Apts. Proj.) 2, 5 | | 6.00 | | | 1/1/29 | | | | 16 | |
| | 645,000 | | | Tennessee Housing Dev. Agy. Rev. | | 3.80 | | | 7/1/43 | | | | 522,018 | |
| | | | | | | | | | | | | | |
| | | | |
| | | | | | | | | | | | | 1,731,359 | |
| | | | | | | | | | | | | | |
| | |
| Texas - 6.4% | | | | | | | | |
| | 1,000,000 | | | Arlington Higher Education Finance Corp., Education Rev. (Arlington Classics Academy) | | 7.00 | | | 8/15/28 | | | | 1,020,610 | |
| | 250,000 | | | Bexar Co. Hsg. Fin. Corp. Rev. (Dymaxion & Marbach Park Apts. Proj.) (NATL-RE Insured) | | 6.10 | | | 8/1/30 | | | | 252,425 | |
| | 1,000,000 | | | Bexar Co. Rev. (Venue Proj.) | | 5.00 | | | 8/15/39 | | | | 1,020,780 | |
| | 1,553,521 | | | Galveston Co. Municipal Utility | | 5.54 | | | N/A | | | | 1,235,205 | |
| | 600,000 | | | Harris Co. Cultural Education Facs. Finance Corp. Rev. (Space Center Houston Proj.) 4 | | 6.75 | | | 8/15/21 | | | | 642,102 | |
| | 480,000 | | | Harris Co. Housing Finance Corp. Rev. (FHA/VA/VEREX Mtgs.) 6 | | 10.34 | | | 10/15/15 | | | | 381,662 | |
| | 240,000 | | | Houston Hotel Occupancy Rev. Ref. | | 5.25 | | | 9/1/29 | | | | 250,409 | |
| | 250,000 | | | Matagorda Co. Navigation District No. 1 Rev. (AEP Texas Central Co.) | | 4.00 | | | 6/1/30 | | | | 222,458 | |
| | 500,000 | | | Newark Cultural Education Facs. Finance Corp. Rev. (A.W. Brown-Fellowship Leadership) | | 6.00 | | | 8/15/32 | | | | 494,950 | |
| | 300,000 | | | Red River Health Facs. Dev. Corp. Rev. (Wichita Falls Retirement Foundation) | | 5.50 | | | 1/1/32 | | | | 277,518 | |
| | 250,000 | | | Tarrant Co. Cultural Education Facs. Fin. Rev. (Mirador Proj.) | | 7.75 | | | 11/15/19 | | | | 273,260 | |
| | 250,000 | | | Texas State Turnpike Auth. Rev. Capital Appreciation (AMBAC Insured) 6 | | 6.02 | | | 8/15/37 | | | | 59,772 | |
| | 250,000 | | | Travis Co. Health Facs. Dev. Corp. Rev. (First Mortgage - Longhorn Village Proj.) | | 5.50 | | | 1/1/17 | | | | 249,610 | |
| | 500,000 | | | Travis Co. Health Facs. Dev. Corp. Rev. (First Mortgage - Longhorn Village Proj.) | | 6.00 | | | 1/1/22 | | | | 488,520 | |
| | 250,000 | | | Travis Co. Health Facs. Dev. Corp. Rev. (Westminster Manor) | | 6.25 | | | 11/1/16 | | | | 250,362 | |
| | 500,000 | | | TX Grand Parkway Transportation Corp. Rev. 6 | | 2.50 | | | 10/1/35 | | | | 291,400 | |
| | 500,000 | | | TX Municipal Gas Acquisition & Supply Corp. I Sr. Lien Rev. 1 | | 1.62 | | | 12/15/26 | | | | 432,505 | |
| | 300,000 | | | TX Municipal Gas Acquisition & Supply Corp. II Rev. 1 | | 1.04 | | | 9/15/27 | | | | 258,990 | |
See accompanying notes to financial statements.
SCHEDULE OF INVESTMENTS (Unaudited)
September 30, 2013
Sit Tax-Free Income Fund (Continued)
| | | | | | | | | | | | | | |
| Principal | | | | | Coupon | | Maturity | | | Fair | |
| Amount ($) | | | Name of Issuer | | Rate (%) | | Date | | | Value ($) | |
| | |
| | | | |
| | 750,000 | | | TX Private Activity Surface Transportation Corp. Rev. (LBJ Infrastructure) | | 7.50 | | | 6/30/33 | | | | 858,068 | |
| | 500,000 | | | TX Seminole Hospital District G.O. | | 5.00 | | | 2/15/34 | | | | 500,500 | |
| | | | | | | | | | | | | | |
| | | | |
| | | | | | | | | | | | | 9,461,106 | |
| | | | | | | | | | | | | | |
| | | |
| Utah - 0.8% | | | | | | | | | | |
| | 280,000 | | | UT Hsg. Corp. Single Family Mtg. Rev. | | 5.75 | | | 1/1/33 | | | | 294,182 | |
| | 470,000 | | | UT Hsg. Corp. Single Family Mtg. Rev. | | 4.60 | | | 7/1/34 | | | | 458,908 | |
| | 400,000 | | | Utah Charter School Finance Auth. Rev. (Entheos Academy) | | 6.50 | | | 10/15/33 | | | | 408,056 | |
| | | | | | | | | | | | | | |
| | | | |
| | | | | | | | | | | | | 1,161,146 | |
| | | | | | | | | | | | | | |
| | | |
| Virginia - 2.6% | | | | | | | | | | |
| | 500,000 | | | Farms New Kent Community Dev. Auth. Special Assessment 2, 5 | | 5.13 | | | 3/1/36 | | | | 255,730 | |
| | 1,000,000 | | | VA Hsg. Dev. Auth. Rev. (Commonwealth Mtg.) | | 3.88 | | | 1/1/38 | | | | 866,290 | |
| | 550,000 | | | VA Hsg. Dev. Auth. Rev. (Commonwealth Mtg.) | | 4.80 | | | 7/1/38 | | | | 549,802 | |
| | 500,000 | | | VA Hsg. Dev. Auth. Rev. (Commonwealth Mtg.) | | 5.10 | | | 10/1/38 | | | | 510,495 | |
| | 215,000 | | | VA Hsg. Dev. Auth. Rev. (GO of Authority Insured) | | 6.25 | | | 7/1/31 | | | | 233,911 | |
| | 375,000 | | | VA Hsg. Dev. Auth. Rev. (GO of Authority Insured) | | 3.75 | | | 3/1/34 | | | | 320,599 | |
| | 400,000 | | | VA Hsg. Dev. Auth. Rev. (Rental Hsg. Proj.) | | 4.13 | | | 7/1/33 | | | | 361,732 | |
| | 250,000 | | | VA Hsg. Dev. Auth. Rev. (Rental Hsg. Proj.) | | 4.60 | | | 12/1/38 | | | | 242,370 | |
| | 500,000 | | | VA Hsg. Dev. Auth. Rev. (Rental Hsg. Proj.) | | 5.00 | | | 12/1/39 | | | | 507,110 | |
| | | | | | | | | | | | | | |
| | | | |
| | | | | | | | | | | | | 3,848,039 | |
| | | | | | | | | | | | | | |
| | | |
| Washington - 1.7% | | | | | | | | | | |
| | 390,000 | | | Kalispel Tribe Indians Priority District Rev. | | 6.20 | | | 1/1/16 | | | | 379,138 | |
| | 200,000 | | | WA Hsg. Fin. Commission Multi Family Mtg. Rev. (Emerald Heights Proj.) | | 5.00 | | | 7/1/33 | | | | 190,106 | |
| | 500,000 | | | WA Hsg. Fin. Commission Multi Family Mtg. Rev. (GNMA/FNMA/FHLMC Collateralized) | | 3.50 | | | 12/1/33 | | | | 410,930 | |
| | 400,000 | | | WA Hsg. Fin. Commission Multi Family Mtg. Rev. (Non-profit Hsg.) | | 6.00 | | | 10/1/22 | | | | 387,584 | |
| | 855,000 | | | WA Hsg. Fin. Commission Multi Family Mtg. Rev. (Skyline at First Hill Proj.) | | 5.25 | | | 1/1/17 | | | | 840,910 | |
| | 280,000 | | | WA Hsg. Fin. Commission Single Family Mtg. Rev. (GNMA/FNMA Collateralized) | | 4.60 | | | 10/1/33 | | | | 281,058 | |
| | | | | | | | | | | | | | |
| | | | |
| | | | | | | | | | | | | 2,489,726 | |
| | | | | | | | | | | | | | |
| | | |
| West Virginia - 0.2% | | | | | | | | | | |
| | 250,000 | | | WV Hsg. Dev. Fund Rev. | | 4.50 | | | 11/1/31 | | | | 250,000 | |
| | | | | | | | | | | | | | |
| | | |
| Wisconsin - 1.8% | | | | | | | | | | |
| | 250,000 | | | WI General Fund Rev. Appropriation Rev. | | 6.00 | | | 5/1/27 | | | | 286,505 | |
| | 500,000 | | | WI Health & Education Facs. Auth. Rev. (Three Pillars Senior Living) | | 5.00 | | | 8/15/43 | | | | 472,590 | |
| | 250,000 | | | WI Public Finance Auth. Rev. (Glenridge Palmer Ranch Proj.) | | 7.00 | | | 6/1/20 | | | | 271,460 | |
| | 500,000 | | | WI Public Finance Auth. Rev. (Glenridge Palmer Ranch Proj.) | | 8.25 | | | 6/1/46 | | | | 551,180 | |
| | 340,000 | | | WI Public Finance Auth. Rev. (Horizon Academy West Charter School) | | 5.25 | | | 9/1/22 | | | | 324,146 | |
| | 250,000 | | | WI Public Finance Auth. Rev. (Roseman University Health Sciences) | | 5.00 | | | 4/1/22 | | | | 246,262 | |
| | 500,000 | | | WI Public Finance Auth. Rev. (Roseman University Health Sciences) | | 5.50 | | | 4/1/32 | | | | 464,905 | |
| | | | | | | | | | | | | | |
| | | | |
| | | | | | | | | | | | | 2,617,048 | |
| | | | | | | | | | | | | | |
| | | |
| Wyoming - 1.3% | | | | | | | | | | |
| | 650,000 | | | WY Community Dev. Auth. Rev. | | 3.75 | | | 12/1/32 | | | | 568,770 | |
| | 1,000,000 | | | WY Community Dev. Auth. Rev. | | 4.25 | | | 12/1/37 | | | | 911,100 | |
| | 480,000 | | | WY Community Dev. Auth. Rev. | | 4.05 | | | 12/1/38 | | | | 411,643 | |
| | | | | | | | | | | | | | |
| | | | |
| | | | | | | | | | | | | 1,891,513 | |
| | | | | | | | | | | | | | |
| Total Municipal Bonds | | | | | | | | | | |
| (cost: $157,233,106) | | | | | | | | | 132,513,066 | |
| | | | | | | | | | | | | | |
See accompanying notes to financial statements.
| | |
28 | | SIT MUTUAL FUNDS SEMI-ANNUAL REPORT |
| | | | | | | | | | | | |
| | |
| | | | |
| | | | | | | | | | Fair | |
| Quantity | | | Name of Issuer | | | | | | Value($) | |
| | |
|
| Closed-End Mutual Funds - 6.3% | |
| | 49,700 | | | BlackRock Long-Term Municipal Advantage Trust (BTA) | | | | | | | 526,820 | |
| | 25,000 | | | BlackRock MuniHoldings Florida Insured Fund (MFL) | | | | | | | 328,000 | |
| | 47,500 | | | BlackRock MuniYield Florida Fund (MYF) | | | | | | | 655,975 | |
| | 70,100 | | | BlackRock MuniYield Insured Fund (MYI) | | | | | | | 917,609 | |
| | 8,491 | | | BlackRock MuniYield Michigan Insured Fund (MIY) | | | | | | | 108,345 | |
| | 23,000 | | | BlackRock MuniYield Michigan Insured Fund II (MYM) | | | | | | | 270,480 | |
| | 14,100 | | | Dreyfus Strategic Municipal Bond Fund (DSM) | | | | | | | 108,711 | |
| | 208,600 | | | DWS Municipal Income Trust (KTF) | | | | | | | 2,578,296 | |
| | 18,400 | | | Invesco Municipal Opportunity Trust (VMO) | | | | | | | 216,752 | |
| | 31,200 | | | Invesco PA Value Muni Income Trust (VPV) | | | | | | | 393,744 | |
| | 8,250 | | | Invesco Quality Municipal Income Trust (IQI) | | | | | | | 95,364 | |
| | 35,700 | | | Invesco Van Kampen Advantage Muni Income Trust (VKI) | | | | | | | 382,347 | |
| | 32,389 | | | Invesco Van Kampen Trust for Investment Grade Municipals (VGM) | | | | | | | 403,891 | |
| | 36,123 | | | Managed Duration Investment Grade (MZF) | | | | | | | 460,568 | |
| | 21,500 | | | Nuveen Premier Municipal Income Fund (NPF) | | | | | | | 277,350 | |
| | 114,332 | | | Nuveen Premium Income Fund (NPM) | | | | | | | 1,492,033 | |
| | | | | | | | | | | | |
| | | |
| Total Closed-End Mutual Funds | | | | | | | | |
| (cost: $9,248,357) | | | | | | | 9,216,285 | |
| | | | | | | | | | | | |
|
| Short-Term Securities - 3.0% | |
| | 4,501,483 | | | Dreyfus Tax-Exempt Cash Management Fund, 0.004% | | | | | | | | |
| Total Short-Term Securities | | | | | | | | |
| (cost: $4,501,483) | | | | | | | 4,501,483 | |
| | | | | | | | | | | | |
| | | |
| Total Investments in Securities - 99.6% | | | | | | | | |
| (cost: $170,982,946) | | | | | | | 146,230,834 | |
| Other Assets and Liabilities, net - 0.4% | | | | | | | 553,609 | |
| | | | | | | | | | | | |
| | | |
| Total Net Assets - 100.0% | | | | | | | $146,784,443 | |
| | | | | | | | | | | | |
| |
| | | | | | |
| 1 | Variable rate security. Rate disclosed is as of September 30, 2013. |
| 2 | Securities considered illiquid by the Investment Adviser. The total value of such securities as of September 30, 2013 was $4,146,392 and represented 2.8% of net assets. |
| 4 | 144A Restricted Security. The total value of such securities as of September 30, 2013 was $2,519,125 and represented 1.7% of net assets. These securities been determined to be liquid by the Adviser in accordance with guidelines established by the Board of Directors. |
| 5 | The issuer is in default of certain debt covenants. Income is not being accrued. The total value of such securities as of September 30, 2013 was $4,146,392 and represented 2.8% of net assets. |
| 6 | Zero coupon or convertible capital appreciation bond, for which the rate disclosed is either the effective yield on purchase date or the coupon rate to be paid upon conversion to coupon paying, respectively. |
| 9 | Municipal Lease Security. The total value of such securities as of September 30, 2013 was $1,087,677 and represented 0.7% of net assets. These securities have been determined to be liquid by the Adviser in accordance with guidelines established by the Board of Directors. |
| 10 | Securities with a “N/A” maturity date have passed their stated maturity date and have pending restructuring arrangements. |
| Numeric | footnotes not disclosed are not applicable to this Schedule of Investments. |
See accompanying notes to financial statements.
SCHEDULE OF INVESTMENTS (Unaudited)
September 30, 2013
Sit Tax-Free Income Fund (Continued)
A summary of the levels for the Fund’s investments as of September 30, 2013 is as follows (See Note 2 - significant accounting policies in the notes to financial statements):
| | | | | | | | | | | | | | |
| | | Investment in Securities | |
| | | Level 1 | | | Level 2 | | | Level 3 | | | |
| | | Quoted | | | Other significant | | | Significant | | | |
| | | Price ($) | | | observable inputs ($) | | | unobservable inputs ($) | | Total ($) | |
Municipal Bonds | | | — | | | | 132,513,066 | | | — | | | 132,513,066 | |
Closed-End Mutual Funds | | | 9,216,285 | | | | — | | | — | | | 9,216,285 | |
Short-Term Securities | | | 4,501,483 | | | | — | | | — | | | 4,501,483 | |
Total: | | | 13,717,768 | | | | 132,513,066 | | | — | | | 146,230,834 | |
For the reporting period, there were no transfers between levels 1, 2 and 3.
See accompanying notes to financial statements.
| | |
30 | | SIT MUTUAL FUNDS SEMI-ANNUAL REPORT |
[This page intentionally left blank.]
|
Sit Minnesota Tax-Free Income Fund |
OBJECTIVE & STRATEGY
The investment objective of the Minnesota Tax-Free Income Fund is to provide a high level of current income exempt from federal regular income tax and Minnesota regular personal income tax as is consistent with the preservation of capital.
During normal market conditions, the Fund invests 100% of its net assets in municipal securities that generate interest income that is exempt from federal regular income tax and Minnesota regular personal income tax. The Fund anticipates that substantially all of its distributions to its shareholders will be exempt as such. For investors subject to the alternative minimum tax (“AMT”), up to 20% of the Fund’s income may be alternative minimum taxable income.
The Sit Minnesota Tax-Free Income Fund provided a total return of -4.50% for the 6-month period ended September 30, 2013 compared with a total return of -0.86% for the Barclays Capital 5-Year Municipal Bond Index. As of September 30, 2013, the Fund’s 30-day SEC yield was 4.34% and its 12-month distribution rate was 3.36%.
Tax-exempt municipal bond yields increased markedly during the 6-month period, resulting in poor returns for the asset class. The tax-exempt yield curve steepened as long-term and intermediate-term bond yields increased markedly, while shorter-term yields had little or no increase. Credit spreads generally widened during the period, particularly for healthcare revenue bonds and high yield credits. Lastly, mutual fund flows were negative for much of the period before at least temporarily stabilizing in late September. Combined, these factors made the weakness in the tax-exempt market very broad based. The State of Minnesota’s revenues in fiscal 2013 exceeded its budget forecast, improving the state’s fiscal position. Moreover, the state continues to have a lower unemployment rate and a higher level of economic growth than the nation, which benefits both general obligation and revenue bonds. Supply of new issue Minnesota bonds with more attractive relative yields tapered significantly as yields increased during the summer months. Although attractive new issue supply in Minnesota remains limited, the secondary market has provided sufficient investment opportunities.
The Fund’s underperformance during this period was due predominantly to duration and to a lesser extent industry positioning. The Fund suffered from its longer duration versus the benchmark, as longer bonds underperformed shorter bonds. In terms of industry positioning, only transportation revenue and escrowed to maturity/pre-refunded bonds, together just under five percent of the portfolio, outperformed the benchmark return. In addition, the largest four industries in the portfolio - multi-family mortgage revenue, single family mortgage revenue, hospital/healthcare revenue, and education/ student loan revenue - had returns that ranged from -1.8% to -5.4% during the period. The Fund’s average credit quality also fell one notch to A- from A during the period, largely due to a significant reduction in cash held during the period.
HYPOTHETICAL GROWTH OF $10,000
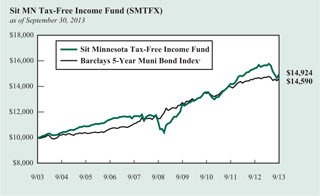
The chart above illustrates the total value of a hypothetical $10,000 investment in the Fund over the past 10 years (or for the life of the Fund if shorter) as compared to the performance of the Barclays 5-Year Municipal Bond Index. Past performance does not guarantee future results. Returns include the reinvestment of distributions. The chart does not reflect the deduction of taxes that a shareholder would pay on Fund distributions or the redemption of Fund shares.
1 The Barclays 5-Year Municipal Bond Index is the 5 year (4-6) component of the Municipal Bond Index, an unmanaged, rules-based, market-value-weighted index for the long-term tax-exempt bond market. The index includes bonds with a minimum credit rating of BBB. The returns include the reinvestment of income and do not include any transaction costs, management fees or other costs. It is not possible to invest directly in an index. This is the Fund’s primary index.
The Fund maintains its duration longer than its benchmark, with significant weightings in intermediate and longer-term bonds. However, the Fund may modestly shorten its duration over the next six months to a year. The Fund continues to possess a substantial income advantage over the benchmark. Furthermore, tax-exempt municipals remain cheap when compared to comparable maturity U.S. Treasury bonds. Given the steep tax-exempt yield curve and modestly widened credit spreads, we believe the Fund is attractively positioned for the current environment. As always, our strategy continues to emphasize income, which we believe is the primary driver of return over the long run.
Michael C. Brilley
Debra A. Sit, CFA
Paul J. Jungquist, CFA
Senior Portfolio Managers
| | |
32 | | SIT MUTUAL FUNDS SEMI-ANNUAL REPORT |
COMPARATIVE RATES OF RETURNS
as of September 30, 2013
| | | | | | | | | | | | | | | |
| | | Sit | | Barclays | | Lipper |
| | | Minnesota | | 5-Year | | MN |
| | | Tax-Free | | Muni. Bond | | Muni. Bond |
| | | Income Fund | | Index1 | | Fund Index2 |
Six Months | | | | -4.50 | % | | | | -0.86 | % | | | | n/a | |
One Year | | | | -3.11 | | | | | -0.24 | | | | | -2.75 | % |
Five Years | | | | 5.78 | | | | | 4.90 | | | | | 5.52 | |
Ten Years | | | | 4.08 | | | | | 3.85 | | | | | 3.90 | |
Since Inception (12/1/93) | | | | 4.76 | | | | | 4.74 | | | | | 4.55 | |
Performance figures are historical and do not guarantee future results. Investment returns and principal value will vary, and you may have a gain or loss when you sell shares. Current performance may be lower or higher than the performance data quoted. Contact the Fund for performance data current to the most recent month-end. Returns include changes in share price as well as reinvestment of all dividends and capital gains. Returns do not reflect the deduction of taxes that a shareholder would pay on Fund distributions or the redemption of Fund shares. Management fees and administrative expenses are included in the Fund’s performance. Returns for periods greater than one year are compounded average annual rates of return.
1 The Barclays 5-Year Municipal Bond Index is the 5 year (4-6) component of the Municipal Bond Index, an unmanaged, rules-based, market-value-weighted index made for the long-term tax-exempt bond market. The index includes bonds with a minimum credit rating of BBB. The returns include the reinvestment of income and do not include any transaction costs, management fees or other costs. It is not possible to invest directly in an index.
2 The Lipper returns are obtained from Lipper Analytical Services, Inc., a large independent evaluator of mutual funds.
FUND DIVERSIFICATION
| | | | |
Multifamily Mortgage | | | 19.4% | |
Single Family Mortgage | | | 17.5% | |
Hospital/Health Care | | | 17.1% | |
Education/Student Loan | | | 13.4% | |
Other Revenue | | | 8.1% | |
Utility | | | 5.2% | |
Sectors less than 5.0% | | | 17.2% | |
Cash & Other Net Assets | | | 2.1% | |
Based on total net assets as of September 30, 2013. Subject to change.
PORTFOLIO SUMMARY
| | |
Net Asset Value 9/30/13: | | $9.95 Per Share |
Net Asset Value 3/31/13: | | $10.62 Per Share |
Total Net Assets: | | $366.8 Million |
30-day SEC Yield 3: | | 4.34% |
Tax Equivalent Yield 4: | | 8.51% |
12-month Distribution Rate 3: | | 3.36% |
Average Maturity: | | 16.7 Years |
Effective Duration 5: | | 5.8 Years |
3 The SEC Yield reflects the rate at which the Fund is earning income on its current portfolio of securities, while the distribution rate reflects the Fund’s past dividends paid to shareholders based on the net investment income distributed and the average NAV during the past 12 months. Accordingly, the Fund’s SEC yield and distribution rate may differ.
4 The tax-equivalent yield is based on an assumed federal tax rate of 43.4% and a Minnesota tax rate of 9.85%, for an effective combined tax rate of 49.0%.
5 Duration is a measure of estimated price sensitivity relative to changes in interest rates. Portfolios with longer durations are typically more sensitive to changes in interest rates. For example, if interest rates rise by 1%, the fair value of a security with an effective duration of 5 years would decrease by 5%, with all other factors being constant. The correlation between duration and price sensitivity is greater for securities rated investment-grade than it is for securities rated below investment-grade. Duration estimates are based on assumptions by the Adviser and are subject to a number of limitations. Effective duration is calculated based on historical price changes of securities held by the Fund, and therefore is a more accurate estimate of price sensitivity provided interest rates remain within their historical range.
QUALITY RATINGS (% of Total Net Assets)
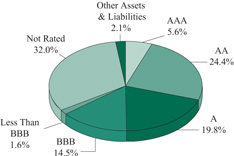
Lower of Moody’s, S&P, Fitch or Duff & Phelps ratings used.
Adviser’s Assessment of Non-Rated Securities:
| | |
AAA �� | | 0.0% |
AA | | 1.8 |
A | | 0.8 |
BBB | | 9.4 |
BB | | 19.8 |
<BB | | 0.2 |
Total | | 32.0% |
SCHEDULE OF INVESTMENTS (Unaudited)
September 30, 2013
Sit Minnesota Tax-Free Income Fund
| | | | | | | | | | | | | | | | | |
| Principal | | | | Coupon | | Maturity | | Fair |
| Amount ($) | | Name of Issuer | | Rate (%) | | Date | | Value ($) |
| | |
Municipal Bonds - 96.3% | | | | | | | | | | | |
Education/Student Loan - 13.4% | | | | | | | | | | | |
295,000 | | Anoka Co. Charter School Lease Rev. | | | | 5.00 | | | | | 6/1/27 | | | | | 284,504 | |
275,000 | | Anoka Co. Charter School Lease Rev. | | | | 5.00 | | | | | 6/1/32 | | | | | 250,968 | |
1,035,000 | | Anoka Co. Charter School Lease Rev. | | | | 5.00 | | | | | 6/1/43 | | | | | 875,931 | |
1,070,000 | | Brooklyn Park Lease Rev. (Prairie Seeds Academy Proj.) | | | | 8.00 | | | | | 3/1/20 | | | | | 1,157,858 | |
1,280,000 | | Deephaven Charter School Lease Rev. (Eagle Ridge Academy Proj.) | | | | 5.13 | | | | | 7/1/33 | | | | | 1,170,637 | |
875,000 | | Duluth Hsg. & Redev. Auth. (Edison Academy) | | | | 5.88 | | | | | 11/1/40 | | | | | 847,884 | |
2,500,000 | | Duluth Hsg. & Redev. Auth. Lease Rev. (Edison Academy) | | | | 5.00 | | | | | 11/1/21 | | | | | 2,547,675 | |
6,432,757 | | Intermediate School District 287 Lease Rev. | | | | 5.30 | | | | | 11/1/32 | | | | | 6,495,283 | |
420,000 | | Minneapolis Educational Fac. Lease Rev. (Seed/Harvest Preparatory Proj.) (LOC-U.S. Bank) | | | | 5.13 | | | | | 1/1/16 | | | | | 353,867 | |
875,000 | | Minneapolis Educational Fac. Lease Rev. (Seed/Harvest Preparatory Proj.) (LOC-U.S. Bank) | | | | 6.25 | | | | | 1/1/21 | | | | | 647,386 | |
600,000 | | MN Higher Education Fac. Auth. Rev. (Bethel Univ.) | | | | 5.50 | | | | | 5/1/22 | | | | | 615,048 | |
160,000 | | MN Higher Education Fac. Auth. Rev. (Bethel Univ.) | | | | 5.50 | | | | | 5/1/23 | | | | | 163,325 | |
1,000,000 | | MN Higher Education Fac. Auth. Rev. (Bethel Univ.) | | | | 5.50 | | | | | 5/1/37 | | | | | 998,640 | |
1,310,874 | | MN Higher Education Fac. Auth. Rev. (College of St. Benedict) | | | | 4.49 | | | | | 10/1/16 | | | | | 1,332,687 | |
400,000 | | MN Higher Education Fac. Auth. Rev. (College of St. Scholastica Inc.) | | | | 4.00 | | | | | 12/1/32 | | | | | 333,192 | |
750,000 | | MN Higher Education Fac. Auth. Rev. (Hamline Univ.) | | | | 6.00 | | | | | 10/1/32 | | | | | 790,372 | |
1,000,000 | | MN Higher Education Fac. Auth. Rev. (Hamline Univ.) | | | | 6.00 | | | | | 10/1/40 | | | | | 1,037,910 | |
1,000,000 | | MN Higher Education Fac. Auth. Rev. (Macalester College) | | | | 3.00 | | | | | 5/1/32 | | | | | 811,760 | |
500,000 | | MN Higher Education Fac. Auth. Rev. (Macalester College) | | | | 3.25 | | | | | 5/1/36 | | | | | 397,015 | |
310,000 | | MN Higher Education Fac. Auth. Rev. (Macalester College) | | | | 4.00 | | | | | 5/1/43 | | | | | 284,778 | |
750,000 | | MN Higher Education Fac. Auth. Rev. (Macalester College-Seven-I) | | | | 5.00 | | | | | 6/1/35 | | | | | 799,358 | |
1,400,000 | | MN Higher Education Fac. Auth. Rev. (St. Scholastica College) | | | | 5.00 | | | | | 12/1/27 | | | | | 1,418,816 | |
40,000 | | MN Higher Education Fac. Auth. Rev. (St. Scholastica College) | | | | 5.13 | | | | | 12/1/30 | | | | | 40,963 | |
500,000 | | MN Higher Education Fac. Auth. Rev. (St. Scholastica College) | | | | 5.25 | | | | | 12/1/35 | | | | | 506,530 | |
1,800,000 | | MN Higher Education Fac. Auth. Rev. (St. Scholastica College) | | | | 6.30 | | | | | 12/1/40 | | | | | 1,882,926 | |
1,250,000 | | MN Higher Education Fac. Auth. Rev. (Univ. of St. Thomas) | | | | 6.00 | | | | | 10/1/25 | | | | | 1,374,250 | |
67,820 | | MN Higher Education Fac. Auth. Rev. Lease Rev. (Concordia Univ.) | | | | 5.25 | | | | | 4/25/14 | | | | | 68,816 | |
2,420,000 | | MN Office of Higher Education Rev. (Suppl. Student Loan Prog.) | | | | 5.00 | | | | | 11/1/29 | | | | | 2,510,460 | |
686,770 | | Olmsted Co. Hsg. & Redev. Auth. (Schaeffer Academy Proj.) | | | | 4.98 | | | | | 4/25/27 | | | | | 607,277 | |
340,000 | | Pine City Lease Rev. (Lakes International Language Academy Proj.) | | | | 5.75 | | | | | 5/1/16 | | | | | 348,741 | |
830,000 | | Pine City Lease Rev. (Lakes International Language Academy Proj.) | | | | 6.00 | | | | | 5/1/26 | | | | | 823,443 | |
110,000 | | Ramsey Lease Rev. (Pact Charter School Proj.) | | | | 5.65 | | | | | 12/1/13 | | | | | 110,232 | |
2,575,000 | | Ramsey Lease Rev. (Pact Charter School Proj.) | | | | 6.50 | | | | | 12/1/22 | | | | | 2,587,180 | |
2,000,000 | | St. Paul Hsg. & Redev. Auth. (Community of Peace Academy Proj.) | | | | 5.00 | | | | | 12/1/36 | | | | | 1,744,460 | |
535,000 | | St. Paul Hsg. & Redev. Auth. (German Immersion School) | | | | 4.00 | | | | | 7/1/23 | | | | | 490,574 | |
855,000 | | St. Paul Hsg. & Redev. Auth. (German Immersion School) | | | | 5.00 | | | | | 7/1/33 | | | | | 755,846 | |
500,000 | | St. Paul Hsg. & Redev. Auth. (German Immersion School) | | | | 5.00 | | | | | 7/1/44 | | | | | 410,350 | |
1,250,000 | | St. Paul Hsg. & Redev. Auth. (Higher Ground Academy Proj.) | | | | 4.25 | | | | | 12/1/23 | | | | | 1,176,850 | |
1,000,000 | | St. Paul Hsg. & Redev. Auth. (Higher Ground Academy Proj.) | | | | 5.00 | | | | | 12/1/33 | | | | | 893,510 | |
1,150,000 | | St. Paul Hsg. & Redev. Auth. (St. Paul Conservatory for Performing Artists) | | | | 4.63 | | | | | 3/1/43 | | | | | 919,344 | |
1,500,000 | | St. Paul Hsg. & Redev. Auth. Lease Rev. (Community of Peace Academy Proj.) | | | | 5.00 | | | | | 12/1/18 | | | | | 1,534,245 | |
540,000 | | St. Paul Hsg. & Redev. Auth. Lease Rev. (Hmong Academy Proj.) | | | | 5.50 | | | | | 9/1/18 | | | | | 553,705 | |
295,000 | | St. Paul Hsg. & Redev. Auth. Lease Rev. (Hmong College Preparatory Academy) | | | | 4.75 | | | | | 9/1/22 | | | | | 288,283 | |
500,000 | | St. Paul Hsg. & Redev. Auth. Lease Rev. (Hmong College Preparatory Academy) | | | | 5.00 | | | | | 9/1/27 | | | | | 466,655 | |
1,000,000 | | St. Paul Hsg. & Redev. Auth. Lease Rev. (Hmong College Preparatory Academy) | | | | 5.25 | | | | | 9/1/32 | | | | | 911,580 | |
600,000 | | St. Paul Hsg. & Redev. Auth. Lease Rev. (Nova Classical Academy Proj.) | | | | 5.70 | | | | | 9/1/21 | | | | | 631,974 | |
1,000,000 | | University of Minnesota College and Univ. Rev. | | | | 4.00 | | | | | 2/1/24 | | | | | 1,090,360 | |
1,610,000 | | Victoria Private School Fac. Rev. (Holy Family Catholic High) | | | | 4.00 | | | | | 9/1/23 | | | | | 1,518,971 | |
215,000 | | Woodbury Charter School Lease Rev. (MSA Building) | | | | 5.00 | | | | | 12/1/27 | | | | | 207,161 | |
See accompanying notes to financial statements.
| | |
34 | | SIT MUTUAL FUNDS SEMI-ANNUAL REPORT |
| | | | | | | | | | | | | | |
| | |
| | | | |
| Principal | | | | | Coupon | | Maturity | | | Fair | |
| Amount ($) | | | Name of Issuer | | Rate (%) | | Date | | | Value ($) | |
| | |
| 225,000 | | | Woodbury Charter School Lease Rev. (MSA Building) | | 5.00 | | | 12/1/32 | | | | 205,535 | |
| | 885,000 | | | Woodbury Charter School Lease Rev. (MSA Building) | | 5.00 | | | 12/1/43 | | | | 758,941 | |
| | | | | | | | | | | | | | |
| | | | |
| | | | | | | | | | | | | 49,034,056 | |
| | | | | | | | | | | | | | |
| | | |
| Escrowed To Maturity/Prerefunded - 0.6% | | | | | | | | | | |
| | 1,000,000 | | | Sauk Rapids Health Care & Hsg. Facs. Rev. (Good Shepherd Lutheran Home Proj.) | | 6.75 | | | 1/1/24 | | | | 1,128,470 | |
| | 1,000,000 | | | Sauk Rapids Health Care & Hsg. Facs. Rev. (Good Shepherd Lutheran Home Proj.) | | 7.25 | | | 1/1/29 | | | | 1,139,580 | |
| | | | | | | | | | | | | | |
| | | | | | | | | | | | | 2,268,050 | |
| | | | | | | | | | | | | | |
| | | |
| General Obligation - 2.1% | | | | | | | | | | |
| | 1,000,000 | | | Bemidji Sales Tax G.O. | | 5.00 | | | 2/1/34 | | | | 1,057,770 | |
| | 1,350,000 | | | Bemidji Sales Tax G.O. | | 6.00 | | | 2/1/41 | | | | 1,521,032 | |
| | 550,000 | | | Brooklyn Center Independent School District No 286 (NATL-RE Insured) | | 4.50 | | | 2/1/31 | | | | 546,694 | |
| | 650,000 | | | Dakota Co. Community Dev. Agy. Sr. Hsg. Facs. G.O. | | 5.00 | | | 1/1/26 | | | | 696,787 | |
| | 1,000,000 | | | Puerto Rico Public Improvement G.O. 11 | | 5.75 | | | 7/1/36 | | | | 713,410 | |
| | 1,000,000 | | | Puerto Rico Public Improvement G.O. 11 | | 6.00 | | | 7/1/28 | | | | 794,700 | |
| | 1,500,000 | | | Puerto Rico Public Improvement G.O. 11 | | 6.50 | | | 7/1/40 | | | | 1,153,035 | |
| | 480,000 | | | Watkins G.O. | | 4.00 | | | 1/1/34 | | | | 421,507 | |
| | 735,000 | | | Watkins G.O. | | 4.00 | | | 1/1/38 | | | | 615,959 | |
| | | | | | | | | | | | | | |
| | | | |
| | | | | | | | | | | | | 7,520,894 | |
| | | | | | | | | | | | | | |
| | | |
| Hospital/Health Care - 17.1% | | | | | | | | | | |
| | 4,025,000 | | | Breckenridge Rev. (Catholic Health Initiatives Proj.) | | 5.00 | | | 5/1/30 | | | | 4,036,834 | |
| | 400,000 | | | Carlton Health Care & Hsg. Fac. Rev. Ref. (Faith Care Center Proj.) | | 5.20 | | | 4/1/16 | | | | 405,724 | |
| | 365,000 | | | Cold Spring Health Care Facs. Rev. (Assumption Home, Inc. Proj.) | | 7.25 | | | 3/1/23 | | | | 397,386 | |
| | 1,000,000 | | | Cuyuna Range Hosp. Dist. Health Facs. Rev. | | 5.20 | | | 6/1/25 | | | | 1,004,360 | |
| | 1,550,000 | | | Douglas Co. Gross Health Care Facs. Rev. (Douglas Co. Hospital Proj.) | | 6.00 | | | 7/1/28 | | | | 1,611,396 | |
| | 2,000,000 | | | Duluth Economic Dev. Auth. Rev. (St. Lukes Hospital Oblig. Group) | | 4.75 | | | 6/15/22 | | | | 1,948,380 | |
| | 1,600,000 | | | Duluth Economic Dev. Auth. Rev. (St. Lukes Hospital Oblig. Group) | | 5.75 | | | 6/15/32 | | | | 1,567,552 | |
| | 2,000,000 | | | Duluth Economic Dev. Auth. Rev. (St. Lukes Hospital Oblig. Group) | | 6.00 | | | 6/15/39 | | | | 1,979,100 | |
| | 1,000,000 | | | Fergus Falls Health Care Fac. Rev. (Lake Region Healthcare Proj.) | | 5.15 | | | 8/1/35 | | | | 969,340 | |
| | 1,000,000 | | | Fergus Falls Health Care Fac. Rev. (Lake Region Healthcare Proj.) | | 5.40 | | | 8/1/40 | | | | 977,750 | |
| | 200,000 | | | Glencoe Health Care Fac. Rev. (Glencoe Regional Health Services Proj.) | | 4.00 | | | 4/1/26 | | | | 191,860 | |
| | 375,000 | | | Glencoe Health Care Fac. Rev. (Glencoe Regional Health Services Proj.) | | 4.00 | | | 4/1/27 | | | | 352,376 | |
| | 1,860,000 | | | Glencoe Health Care Fac. Rev. (Glencoe Regional Health Services Proj.) | | 4.00 | | | 4/1/31 | | | | 1,664,774 | |
| | 970,000 | | | Hastings Health Care Fac. Rev. (Regina Medical Center) (ACA Insured) | | 5.25 | | | 9/15/18 | | | | 971,533 | |
| | 755,000 | | | Hastings Health Care Fac. Rev. (Regina Medical Center) (ACA Insured) | | 5.30 | | | 9/15/28 | | | | 732,237 | |
| | 780,000 | | | Maple Grove Health Care Fac. Rev. (North Memorial Health Care Proj.) | | 5.00 | | | 9/1/29 | | | | 771,537 | |
| | 100,000 | | | Maple Grove Health Care Fac. Rev. (North Memorial Health Care Proj.) | | 5.00 | | | 9/1/35 | | | | 96,008 | |
| | 1,200,000 | | | Maple Grove Health Care System Rev. (Maple Grove Hospital Corp.) | | 5.25 | | | 5/1/25 | | | | 1,226,004 | |
| | 1,500,000 | | | Maple Grove Health Care System Rev. (Maple Grove Hospital Corp.) | | 5.25 | | | 5/1/28 | | | | 1,514,070 | |
| | 600,000 | | | Minneapolis & St. Paul Hsg. & Redev. Auth. Rev. (Health Partners) | | 5.88 | | | 12/1/29 | | | | 604,116 | |
| | 255,000 | | | Minneapolis Health Care Fac. Rev. (Augustana Chapel View Homes Proj.) | | 5.00 | | | 6/1/15 | | | | 255,105 | |
| | 270,000 | | | Minneapolis Health Care Fac. Rev. (Augustana Chapel View Homes Proj.) | | 5.10 | | | 6/1/16 | | | | 270,092 | |
| | 105,000 | | | Minneapolis Pooled Rev. (Care Choice Member Proj.) | | 5.75 | | | 4/1/19 | | | | 103,568 | |
| | 2,705,000 | | | Minneapolis Rev. Ref. (Walker Campus) | | 4.50 | | | 11/15/20 | | | | 2,678,680 | |
| | 10,000 | | | MN Agricultural & Economic Dev. Board Rev. (Fairview Health Care System Proj.) | | 6.38 | | | 11/15/22 | | | | 10,042 | |
| | 130,000 | | | MN Agricultural & Economic Dev. Board Rev. (Fairview Health Care System Proj.) | | 6.38 | | | 11/15/29 | | | | 130,437 | |
| | 550,000 | | | Moorhead Economic Dev. Auth. Rev. | | 4.60 | | | 9/1/25 | | | | 516,428 | |
| | 1,300,000 | | | New Hope Health Care Facs. Rev. (MN Masonic Home North Ridge Proj.) | | 5.88 | | | 3/1/29 | | | | 1,241,604 | |
| | 1,175,000 | | | New Hope Health Care Facs. Rev. (MN Masonic Home North Ridge Proj.) | | 5.90 | | | 3/1/19 | | | | 1,175,505 | |
| | 1,500,000 | | | Oak Park Heights Nursing Home Rev. (Boutwells Landing Care Center) | | 5.50 | | | 8/1/28 | | | | 1,481,925 | |
| | 1,000,000 | | | Oak Park Heights Nursing Home Rev. (Boutwells Landing Care Center) | | 6.00 | | | 8/1/36 | | | | 998,670 | |
See accompanying notes to financial statements.
SCHEDULE OF INVESTMENTS (Unaudited)
September 30, 2013
Sit Minnesota Tax-Free Income Fund (Continued)
| | | | | | | | | | | | | | |
| | |
| | | | |
| Principal | | | | | Coupon | | Maturity | | | Fair | |
Amount ($) | | | Name of Issuer | | Rate (%) | | Date | | | Value ($) | |
| | |
| 575,000 | | | Owatonna Senior Hsg. Rev. (Senior Living Proj.) | | 5.80 | | | 10/1/29 | | | | 576,484 | |
| | 1,500,000 | | | Rochester Health Care Facs. Rev. (Olmsted Medical Center Proj.) | | 5.88 | | | 7/1/30 | | | | 1,621,560 | |
| | 3,475,000 | | | Shakopee Health Care Facs. Rev. (St. Francis Regional Medical Center Proj.) | | 5.25 | | | 9/1/34 | | | | 3,481,012 | |
| | 1,225,000 | | | St. Cloud Health Care Rev. (CentraCare Health System Proj.) (Assured Guaranty) | | 5.50 | | | 5/1/39 | | | | 1,281,166 | |
| | 4,240,000 | | | St. Cloud Health Care Rev. (CentraCare Health System) | | 5.00 | | | 5/1/25 | | | | 4,372,966 | |
| | 2,000,000 | | | St. Louis Park Health Care Facs. Rev. (Park Nicollet Health Proj.) | | 5.50 | | | 7/1/29 | | | | 2,082,740 | |
| | 350,000 | | | St. Paul Hsg. & Redev. Auth. Health Care Rev. (Gillette Childrens Specialty Proj.) | | 5.00 | | | 2/1/20 | | | | 353,490 | |
| | 4,200,000 | | | St. Paul Hsg. & Redev. Auth. Health Care Rev. (HealthPartners Oblig. Group Proj.) | | 5.25 | | | 5/15/36 | | | | 4,254,012 | |
| | 2,120,000 | | | St. Paul Hsg. & Redev. Auth. Health Care Rev. (Regions Hospital Proj.) | | 5.25 | | | 5/15/18 | | | | 2,125,279 | |
| | 525,000 | | | St. Paul Hsg. & Redev. Auth. Health Care Rev. (Senior Episcopal Homes Proj.) | | 4.25 | | | 11/1/25 | | | | 455,180 | |
| | 750,000 | | | St. Paul Hsg. & Redev. Auth. Health Care Rev. (Senior Episcopal Homes Proj.) | | 4.75 | | | 11/1/31 | | | | 632,692 | |
| | 260,000 | | | St. Paul Hsg. & Redev. Auth. Health Care Rev. (Senior Episcopal Homes Proj.) | | 5.00 | | | 5/1/33 | | | | 223,564 | |
| | 1,000,000 | | | St. Paul Hsg. & Redev. Auth. Health Care Rev. (Senior Episcopal Homes Proj.) | | 5.00 | | | 5/1/38 | | | | 821,280 | |
| | 2,333,056 | | | St. Paul Hsg. & Redev. Auth. Rev. (Nursing Home NTS-Episcopal) | | 5.63 | | | 10/1/33 | | | | 2,178,048 | |
| | 200,000 | | | St. Paul Hsg. & Redev. Auth. Rev. (Regions Hospital Proj.) | | 5.30 | | | 5/15/28 | | | | 200,128 | |
| | 2,500,000 | | | Stillwater Health Care Rev. (Health System Obligation Proj.) | | 5.00 | | | 6/1/25 | | | | 2,526,625 | |
| | 525,000 | | | West St. Paul Health Care (Walker Thompson Hill) | | 6.75 | | | 9/1/31 | | | | 535,967 | |
| | 500,000 | | | Winona Health Care Facs. Rev. (Winona Health Obligation) | | 5.00 | | | 7/1/34 | | | | 478,185 | |
| | 1,300,000 | | | Winsted Health Care Rev. (St. Mary’s Care Center Proj.) | | 6.00 | | | 9/1/25 | | | | 1,307,345 | |
| | 1,250,000 | | | Winsted Health Care Rev. (St. Mary’s Care Center Proj.) | | 6.50 | | | 9/1/34 | | | | 1,255,262 | |
| | | | | | | | | | | | | | |
| | | | |
| | | | | | | | | | | | | 62,647,378 | |
| | | | | | | | | | | | | | |
| | | |
| Industrial/Pollution Control - 1.2% | | | | | | | | | | |
| | 2,250,000 | | | Moorhead Rev. (Amer. Crystal Sugar Co. Recovery Zone Fac.) | | 5.65 | | | 6/1/27 | | | | 2,342,250 | |
| | 1,275,000 | | | St. Paul Port Auth. Solid Waste Disposal Rev. (Ecullet Proj.) | | 6.25 | | | 11/1/15 | | | | 1,330,246 | |
| | 1,000,000 | | | St. Paul Port Auth. Solid Waste Disposal Rev. (Gerdau St. Paul Steel Mill Proj.) 8 | | 4.50 | | | 10/1/37 | | | | 791,230 | |
| | | | | | | | | | | | | | |
| | | | |
| | | | | | | | | | | | | 4,463,726 | |
| | | | | | | | | | | | | | |
| | | |
| Insured - 1.8% | | | | | | | | | | |
| | 500,000 | | | Guam Power Auth. Rev. (AGM Insured) 11 | | 5.00 | | | 10/1/30 | | | | 518,340 | |
| | 1,025,000 | | | Minneapolis Health Care Facs. Rev. (Fairview Health Svcs.) (Assured Guaranty) | | 6.50 | | | 11/15/38 | | | | 1,171,503 | |
| | 350,000 | | | MN Governmental Agy. Fin. Group (Flex Terminal Prog.) (AGC Insured) | | 4.00 | | | 3/1/22 | | | | 354,522 | |
| | 600,000 | | | Puerto Rico Public Improvement G.O. (AGM Insured) 11 | | 5.13 | | | 7/1/30 | | | | 524,790 | |
| | 1,000,000 | | | Puerto Rico Public Improvement G.O. (AGM Insured) 11 | | 5.25 | | | 7/1/20 | | | | 963,060 | |
| | 1,000,000 | | | Puerto Rico Public Improvement G.O. (Assured Guaranty) 1, 11 | | 2.08 | | | 7/1/20 | | | | 855,460 | |
| | 1,800,000 | | | St. Paul Hsg. & Redev. Sales Tax Rev. Ref. (Civic Center) (AGM Insured) | | 7.10 | | | 11/1/23 | | | | 2,043,486 | |
| | | | | | | | | | | | | | |
| | | | |
| | | | | | | | | | | | | 6,431,161 | |
| | | | | | | | | | | | | | |
| | | |
| Multifamily Mortgage - 19.4% | | | | | | | | | | |
| | 785,000 | | | Anoka Co. Hsg. & Redev. Rev. (Recovery Zone Fac.-Park River Estates) | | 6.50 | | | 11/1/25 | | | | 810,151 | |
| | 250,000 | | | Bloomington Hsg. Rev. Sr. (Gideon Pond Commons LLC) | | 5.25 | | | 6/1/21 | | | | 257,705 | |
| | 300,000 | | | Bloomington Hsg. Rev. Sr. (Gideon Pond Commons LLC) | | 5.25 | | | 12/1/21 | | | | 308,265 | |
| | 375,000 | | | Bloomington Hsg. Rev. Sr. (Gideon Pond Commons LLC) | | 5.38 | | | 6/1/22 | | | | 387,844 | |
| | 385,000 | | | Bloomington Hsg. Rev. Sr. (Gideon Pond Commons LLC) | | 5.38 | | | 12/1/22 | | | | 397,220 | |
| | 1,000,000 | | | Bloomington Hsg. Rev. Sr. (Gideon Pond Commons LLC) | | 6.00 | | | 12/1/30 | | | | 1,022,790 | |
| | 940,000 | | | Champlin Multifamily Hsg. Rev. (Champlin Drive Apts.) | | 6.00 | | | 1/1/27 | | | | 954,561 | |
| | 750,000 | | | Chisago Hsg. and Health Care Rev. (CDL Homes LLC) | | 6.00 | | | 8/1/33 | | | | 732,938 | |
| | 1,000,000 | | | Cloquet Hsg. Fac. Rev. Ref. (HADC Cloquet LLC Proj.) | | 5.00 | | | 8/1/38 | | | | 908,760 | |
| | 205,000 | | | Columbia Heights Multifamily & Health Care Fac. Rev. (Crest View Corp Proj.) | | 5.30 | | | 7/1/17 | | | | 197,284 | |
| | 1,200,000 | | | Coon Rapids Multifamily Hsg. Rev. Ref. (Margaret Place Apartments) | | 6.50 | | | 5/1/25 | | | | 1,184,580 | |
| | 2,450,000 | | | Cottage Grove Sr. Hsg. Rev. (PHS, Inc. Proj.) | | 5.00 | | | 12/1/31 | | | | 2,249,492 | |
| | 3,710,000 | | | Cottage Grove Sr. Hsg. Rev. (PHS, Inc. Proj.) | | 6.00 | | | 12/1/46 | | | | 3,535,741 | |
| | 1,345,000 | | | Deephaven Hsg. & Healthcare Rev. (St. Therese Senior Living Proj.) | | 5.00 | | | 4/1/38 | | | | 1,134,064 | |
| | 80,000 | | | Eveleth Multifamily Hsg. Rev. Sr. (Manor House Woodland Proj.) | | 5.15 | | | 10/1/13 | | | | 79,996 | |
See accompanying notes to financial statements.
| | |
36 | | SIT MUTUAL FUNDS SEMI-ANNUAL REPORT |
| | | | | | | | | | | | | | |
Principal
Amount ($) | | | Name of Issuer | | Coupon
Rate (%) | | Maturity
Date | | | Fair Value ($) | |
| | |
| | 1,660,000 | | | Grand Rapids Hsg. & Redev. Auth. (Lakeshore Place & Forest Park West Apartments Proj.) | | 5.30 | | | 10/1/29 | | | | 1,582,528 | |
| | 250,000 | | | Inver Grove Heights Nursing Home Rev. Ref. (Presbyterian Homes) | | 5.38 | | | 10/1/26 | | | | 244,628 | |
| | 245,000 | | | Inver Grove Heights Nursing Home Rev. Ref. (Presbyterian Homes) | | 5.50 | | | 10/1/33 | | | | 232,478 | |
| | 1,355,000 | | | Maplewood Multifamily Hsg. Rev. (Park Edge Apartments Proj.) 8 | | 6.50 | | | 5/1/29 | | | | 1,299,892 | |
| | 2,765,000 | | | Minneapolis & St. Paul Hsg. & Redev. Auth. Multifamily Hsg. Rev. (GNMA Collateralized) 8 | | 4.75 | | | 1/20/42 | | | | 2,632,584 | |
| | 680,000 | | | Minneapolis Hsg. Rev. (Keeler Apartments Proj.) | | 5.00 | | | 10/1/37 | | | | 576,531 | |
| | 490,000 | | | Minneapolis Multifamily Hsg. Rev. (Blaisdell Apartments Proj.) 8 | | 5.10 | | | 4/1/17 | | | | 480,327 | |
| | 290,000 | | | Minneapolis Multifamily Hsg. Rev. (Garr Scott Loft Proj.) (LOC U.S. Bank) 1, 8 | | 5.95 | | | 5/1/30 | | | | 290,873 | |
| | 100,000 | | | Minneapolis Multifamily Hsg. Rev. (Seward Towers Proj.) (GNMA Collateralized) | | 5.00 | | | 5/20/36 | | | | 100,635 | |
| | 975,000 | | | Minnetonka Multifamily Hsg. Rev. Ref. (Archer Heights Apartments Proj.) (GNMA Collateralized) 8 | | 5.20 | | | 1/20/18 | | | | 976,901 | |
| | 1,750,000 | | | MN Hsg. Fin. Agy. Rental Hsg. 8 | | 5.10 | | | 8/1/47 | | | | 1,750,018 | |
| | 1,000,000 | | | MN Hsg. Fin. Agy. Rental Hsg. | | 5.20 | | | 8/1/43 | | | | 995,420 | |
| | 85,000 | | | MN Hsg. Fin. Agy. Rental Hsg. (GO of AGY. Insured) 8 | | 4.88 | | | 8/1/24 | | | | 85,010 | |
| | 250,000 | | | MN Hsg. Fin. Agy. Rental Hsg. (GO of AGY. Insured) | | 5.05 | | | 8/1/31 | | | | 255,830 | |
| | 2,560,000 | | | MN Hsg. Fin. Agy. Rental Hsg. (GO of AGY. Insured) | | 5.25 | | | 8/1/40 | | | | 2,609,843 | |
| | 1,660,000 | | | MN Hsg. Fin. Agy. Rental Hsg. (GO of AGY. Insured) | | 5.45 | | | 8/1/41 | | | | 1,716,955 | |
| | 1,135,000 | | | MN Hsg. Fin. Agy. Residential Hsg. Rev. (GO of AGY. Insured) 8 | | 5.00 | | | 7/1/21 | | | | 1,166,564 | |
| | 485,000 | | | Moorhead Economic Dev. Auth. Rev. Ref. (EverCare Sr. Living LLC) | | 4.55 | | | 9/1/24 | | | | 460,250 | |
| | 280,000 | | | Moorhead Economic Dev. Auth. Rev. Ref. (EverCare Sr. Living LLC) | | 4.65 | | | 9/1/26 | | | | 260,355 | |
| | 210,000 | | | Moorhead Economic Dev. Auth. Rev. Ref. (EverCare Sr. Living LLC) | | 4.70 | | | 9/1/27 | | | | 193,402 | |
| | 1,000,000 | | | Moorhead Health Care Rev. Ref. (EverCare Sr. Living LLC) | | 5.00 | | | 9/1/32 | | | | 860,390 | |
| | 250,000 | | | Moorhead Health Care Rev. Ref. (EverCare Sr. Living LLC) | | 5.13 | | | 9/1/37 | | | | 210,080 | |
| | 1,565,000 | | | North Oaks Sr. Hsg. Rev. (Presbyterian Homes North Oaks Proj.) | | 5.63 | | | 10/1/17 | | | | 1,623,609 | |
| | 1,000,000 | | | North Oaks Sr. Hsg. Rev. (Presbyterian Homes North Oaks Proj.) | | 6.00 | | | 10/1/33 | | | | 1,011,670 | |
| | 1,000,000 | | | Oak Park Heights Hsg. Rev. (Oakgreen Commons Proj.) | | 6.00 | | | 8/1/25 | | | | 984,950 | |
| | 260,000 | | | Oakdale Rev. (Sr. Hsg. Oak Meadows Proj.) | | 4.25 | | | 4/1/25 | | | | 232,669 | |
| | 875,000 | | | Oakdale Rev. (Sr. Hsg. Oak Meadows Proj.) | | 5.00 | | | 4/1/34 | | | | 774,445 | |
| | 430,000 | | | Red Wing Sr. Hsg. Rev. (Deer Crest Proj.) | | 5.00 | | | 11/1/27 | | | | 409,093 | |
| | 330,000 | | | Red Wing Sr. Hsg. Rev. (Deer Crest Proj.) | | 5.00 | | | 11/1/32 | | | | 292,093 | |
| | 1,000,000 | | | Red Wing Sr. Hsg. Rev. (Deer Crest Proj.) | | 5.00 | | | 11/1/42 | | | | 820,720 | |
| | 320,000 | | | Richfield Sr. Hsg. Rev. Ref. (Richfield Sr. Hsg., Inc. Proj.) | | 5.00 | | | 12/1/15 | | | | 314,570 | |
| | 430,000 | | | Rochester Health Care & Hsg. Rev. (Samaritan Bethany, Inc. Proj.) | | 5.25 | | | 12/1/17 | | | | 439,404 | |
| | 455,000 | | | Rochester Health Care & Hsg. Rev. (Samaritan Bethany, Inc. Proj.) | | 5.50 | | | 12/1/18 | | | | 469,169 | |
| | 475,000 | | | Rochester Health Care & Hsg. Rev. (Samaritan Bethany, Inc. Proj.) | | 5.75 | | | 12/1/19 | | | | 493,805 | |
| | 4,000,000 | | | Rochester Multifamily Hsg. Rev. (Essex Place Apartments Proj.) (FHLMC) | | 3.75 | | | 6/1/29 | | | | 3,781,480 | |
| | 2,200,000 | | | Sartell Health Care & Hsg. Fac. Rev. (Country Manor Campus LLC Proj.) | | 4.00 | | | 9/1/20 | | | | 2,057,858 | |
| | 1,135,000 | | | Sartell Health Care & Hsg. Fac. Rev. (Country Manor Campus LLC Proj.) | | 5.25 | | | 9/1/27 | | | | 1,067,615 | |
| | 2,000,000 | | | Sartell Health Care & Hsg. Fac. Rev. (Country Manor Campus LLC Proj.) | | 5.30 | | | 9/1/37 | | | | 1,747,300 | |
| | 1,705,000 | | | Sauk Rapids Health Care & Hsg. Facs. Rev. (Good Shepherd Lutheran Home Proj.) | | 5.13 | | | 1/1/39 | | | | 1,471,500 | |
| | 240,000 | | | St. Paul Hsg. & Redev. Auth. Health Care Rev. (Carondelet Village Proj.) | | 5.13 | | | 2/1/22 | | | | 244,867 | |
| | 275,000 | | | St. Paul Hsg. & Redev. Auth. Health Care Rev. (Carondelet Village Proj.) | | 5.13 | | | 8/1/22 | | | | 279,953 | |
| | 175,000 | | | St. Paul Hsg. & Redev. Auth. Health Care Rev. (Carondelet Village Proj.) | | 5.38 | | | 2/1/24 | | | | 178,178 | |
| | 150,000 | | | St. Paul Hsg. & Redev. Auth. Health Care Rev. (Carondelet Village Proj.) | | 5.38 | | | 8/1/24 | | | | 152,463 | |
| | 150,000 | | | St. Paul Hsg. & Redev. Auth. Health Care Rev. (Carondelet Village Proj.) | | 5.50 | | | 2/1/25 | | | | 152,508 | |
| | 3,000,000 | | | St. Paul Hsg. & Redev. Auth. Health Care Rev. (Carondelet Village Proj.) | | 6.25 | | | 8/1/30 | | | | 3,089,100 | |
| | 1,285,000 | | | St. Paul Hsg. & Redev. Auth. Multifamily Housing Rev. (Marian Center Proj.) | | 5.20 | | | 11/1/22 | | | | 1,291,464 | |
| | 1,000,000 | | | St. Paul Hsg. & Redev. Auth. Multifamily Housing Rev. (Marian Center Proj.) | | 5.30 | | | 11/1/30 | | | | 958,530 | |
| | 2,590,000 | | | St. Paul Hsg. & Redev. Auth. Multifamily Housing Rev. (Marian Center Proj.) | | 5.38 | | | 5/1/43 | | | | 2,384,561 | |
| | 4,900,000 | | | St. Paul Hsg. & Redev. Auth. Multifamily Housing Rev. (Univ. & Dale Proj.) (GNMA Collateralized) 8 | | 4.82 | | | 7/20/46 | | | | 4,826,696 | |
| | 1,265,000 | | | St. Paul Port Auth. Rev. (Energy Park Utility Company Proj.) 8 | | 5.70 | | | 8/1/36 | | | | 1,191,390 | |
| | 360,000 | | | Stillwater Multifamily Hsg. Rev. (Orleans Homes LP Proj.) 8 | | 5.00 | | | 2/1/17 | | | | 364,162 | |
| | 120,000 | | | Victoria Sr. Hsg. Rev. (Chanhassen, Inc. Proj.) | | 5.50 | | | 8/1/18 | | | | 119,996 | |
| | |
| See accompanying notes to financial statements. | | |
SEPTEMBER 30, 2013 | | 37 |
SCHEDULE OF INVESTMENTS (Unaudited)
September 30, 2013
Sit Minnesota Tax-Free Income Fund (Continued)
| | | | | | | | | | | | | | |
| | | | |
Principal
Amount ($) | | | Name of Issuer | | Coupon
Rate (%) | | Maturity
Date | | | Fair Value ($) | |
| | |
| 730,000 | | | Wayzata Sr. Hsg. Rev. (Folkestone Sr. Living Community) | | 5.20 | | | 5/1/25 | | | | 727,080 | |
| | 790,000 | | | Wayzata Sr. Hsg. Rev. (Folkestone Sr. Living Community) | | 5.25 | | | 11/1/26 | | | | 782,598 | |
| | 1,250,000 | | | Wayzata Sr. Hsg. Rev. (Folkestone Sr. Living Community) | | 5.50 | | | 11/1/32 | | | | 1,215,412 | |
| | 2,500,000 | | | Willmar Hsg. & Redev. Auth. Multifamily Rev. (Eagle Ridge Apartments) | | 4.63 | | | 4/1/30 | | | | 2,249,650 | |
| | | | | | | | | | | | | | |
| | | | | | | | | | | | | 71,343,443 | |
| | | | | | | | | | | | | | |
| Municipal Lease 9 - 4.0% | | | | | | | | | | |
| | 500,000 | | | Anoka Co. Hsg. & Redev. Rev. | | 5.63 | | | 5/1/22 | | | | 515,915 | |
| | 500,000 | | | Anoka Co. Hsg. & Redev. Rev. | | 6.63 | | | 5/1/30 | | | | 513,755 | |
| | 500,000 | | | Anoka Co. Hsg. & Redev. Rev. | | 6.88 | | | 5/1/40 | | | | 513,375 | |
| | 1,278,858 | | | Carver Scott Co. Lease Purchase Agreement | | 5.00 | | | 8/4/20 | | | | 1,278,922 | |
| | 3,000,000 | | | MN General Fund Rev. (Appropriation) | | 3.00 | | | 3/1/30 | | | | 2,572,740 | |
| | 4,000,000 | | | MN General Fund Rev. (Appropriation) | | 4.00 | | | 3/1/26 | | | | 4,180,400 | |
| | 2,000,000 | | | MN Hsg. Fin. Agy. Non-Profit Hsg. Rev. (St. Appropriation) | | 5.00 | | | 8/1/31 | | | | 2,090,840 | |
| | 1,250,000 | | | Virginia Hsg. & Redev. Auth. Health Care Fac. Lease Rev. | | 5.13 | | | 10/1/20 | | | | 1,287,862 | |
| | 400,000 | | | Virginia Hsg. & Redev. Auth. Health Care Fac. Lease Rev. | | 5.25 | | | 10/1/25 | | | | 404,120 | |
| | 340,000 | | | Virginia Hsg. & Redev. Auth. Health Care Fac. Lease Rev. | | 5.38 | | | 10/1/30 | | | | 343,818 | |
| | 1,059,034 | | | Winona School District 861 Lease Purchase | | 6.04 | | | 8/1/24 | | | | 1,060,019 | |
| | | | | | | | | | | | | | |
| | | | |
| | | | | | | | | | | | | 14,761,766 | |
| | | | | | | | | | | | | | |
| Other Revenue Bonds - 8.1% | | | | | | | | | | |
| | 1,030,000 | | | Bloomington Port Auth. Recovery Zone Fac. Rev. (Radisson Blu MOA LLC) | | 6.25 | | | 12/1/16 | | | | 1,039,589 | |
| | 510,000 | | | Columbia Heights Economic Dev. Auth. Tax Increment Rev. (Huset Park Area Redev.) | | 5.20 | | | 2/15/22 | | | | 473,566 | |
| | 621,317 | | | Crystal Governmental Fac. Rev. | | 5.10 | | | 12/15/26 | | | | 637,397 | |
| | 230,000 | | | McLeod Co. Commercial Dev. Rev. (Southwest MN Foundation) | | 5.13 | | | 12/1/31 | | | | 231,789 | |
| | 475,000 | | | Minneapolis Community Dev. Agy. Limited Tax Common Bond Fund (Discount Steel) 8 | | 5.25 | | | 6/1/19 | | | | 476,544 | |
| | 1,500,000 | | | Minneapolis National Marrow Donor Program Rev. | | 4.88 | | | 8/1/25 | | | | 1,502,685 | |
| | 400,000 | | | Minneapolis Tax Increment Rev. (Grant Park Proj.) | | 5.35 | | | 2/1/30 | | | | 355,560 | |
| | 200,000 | | | Minneapolis Tax Increment Rev. Ref. (East River/Unocal Site Proj.) | | 5.10 | | | 2/1/17 | | | | 203,188 | |
| | 240,000 | | | Minneapolis Tax Increment Rev. Ref. (East River/Unocal Site Proj.) | | 5.20 | | | 2/1/21 | | | | 240,720 | |
| | 1,000,000 | | | MN Development Rev. Limited Tax Supported Comm. Board | | 6.00 | | | 12/1/40 | | | | 1,081,430 | |
| | 2,000,000 | | | MN Development Rev. Limited Tax Supported Comm. Board | | 6.25 | | | 12/1/30 | | | | 2,264,640 | |
| | 1,175,000 | | | Mound Hsg. & Redev. Auth. Tax Increment Rev. Ref. (Metroplain Proj.) | | 5.00 | | | 2/15/27 | | | | 1,113,406 | |
| | 280,000 | | | Puerto Rico Infrastucture Financing Auth. Special Tax Rev. Ref. (AMBAC Insured) 6, 11 | | 8.40 | | | 7/1/28 | | | | 91,809 | |
| | 425,000 | | | St. Anthony Hsg. & Redev. Auth. Tax Increment Rev. (Silver Lake Village Hsg.) | | 4.75 | | | 2/1/17 | | | | 426,470 | |
| | 500,000 | | | St. Anthony Hsg. & Redev. Auth. Tax Increment Rev. (Silver Lake Village Hsg.) | | 4.90 | | | 2/1/22 | | | | 491,980 | |
| | 1,000,000 | | | St. Louis Park Economic Dev. Auth. Tax Increment Rev. (Hoigaard Vlg.) | | 5.00 | | | 2/1/23 | | | | 1,016,340 | |
| | 500,000 | | | St. Paul Hsg. & Redev. Auth. Rev. (Jimmy Lee Recreation Center Proj.) | | 4.75 | | | 12/1/26 | | | | 520,380 | |
| | 500,000 | | | St. Paul Hsg. & Redev. Auth. Rev. (Jimmy Lee Recreation Center Proj.) | | 5.00 | | | 12/1/32 | | | | 508,995 | |
| | 1,000,000 | | | St. Paul Hsg. & Redev. Auth. Rev. (Ordway Center Performing Arts Proj.) | | 2.20 | | | 7/1/18 | | | | 981,450 | |
| | 1,103,000 | | | St. Paul Hsg. & Redev. Auth. Tax Increment Rev. (9th St. Lofts Proj.) | | 6.38 | | | 2/15/28 | | | | 1,000,233 | |
| | 935,000 | | | St. Paul Hsg. & Redev. Auth. Tax Increment Rev. (Drake Marble Proj.) | | 6.75 | | | 3/1/28 | | | | 931,522 | |
| | 755,000 | | | St. Paul Hsg. & Redev. Auth. Tax Increment Rev. (Emerald Gardens Proj.) | | 6.50 | | | 3/1/29 | | | | 763,615 | |
| | 1,033,000 | | | St. Paul Hsg. & Redev. Auth. Tax Increment Rev. (North Quadrant Owner Occupied Proj.) | | 7.00 | | | 2/15/28 | | | | 993,157 | |
| | 876,000 | | | St. Paul Hsg. & Redev. Auth. Tax Increment Rev. (North Quadrant Owner Occupied Proj.) | | 7.50 | | | 2/15/28 | | | | 875,851 | |
| | 160,000 | | | St. Paul Hsg. & Redev. Auth. Tax Increment Rev. (Upper Landing Proj.) | | 5.00 | | | 3/1/17 | | | | 162,605 | |
| | 175,000 | | | St. Paul Hsg. & Redev. Auth. Tax Increment Rev. (Upper Landing Proj.) | | 5.00 | | | 3/1/19 | | | | 175,982 | |
| | 180,000 | | | St. Paul Hsg. & Redev. Auth. Tax Increment Rev. (Upper Landing Proj.) | | 5.00 | | | 9/1/19 | | | | 181,091 | |
| | 185,000 | | | St. Paul Hsg. & Redev. Auth. Tax Increment Rev. (Upper Landing Proj.) | | 5.00 | | | 3/1/20 | | | | 184,190 | |
| | 220,000 | | | St. Paul Hsg. & Redev. Auth. Tax Increment Rev. (Upper Landing Proj.) | | 5.00 | | | 9/1/20 | | | | 218,975 | |
| | 225,000 | | | St. Paul Hsg. & Redev. Auth. Tax Increment Rev. (Upper Landing Proj.) | | 5.00 | | | 3/1/21 | | | | 221,841 | |
| | 230,000 | | | St. Paul Hsg. & Redev. Auth. Tax Increment Rev. (Upper Landing Proj.) | | 5.00 | | | 9/1/21 | | | | 226,596 | |
| | |
| See accompanying notes to financial statements. |
38 | | SIT MUTUAL FUNDS SEMI-ANNUAL REPORT |
| | | | | | | | | | | | |
| | | | | | | | | | | |
| Principal | | | | Coupon | | Maturity | | | Fair | |
| Amount ($) | | Name of Issuer | | Rate (%) | | Date | | | Value ($) | |
135,000 | | St. Paul Hsg. & Redev. Auth. Tax Increment Rev. (Upper Landing Proj.) | | 5.00 | | | 3/1/22 | | | | 132,003 | |
245,000 | | St. Paul Hsg. & Redev. Auth. Tax Increment Rev. (Upper Landing Proj.) | | 5.00 | | | 9/1/22 | | | | 239,309 | |
1,000,000 | | St. Paul Hsg. & Redev. Auth. Tax Increment Rev. (Upper Landing Proj.) | | 5.00 | | | 9/1/26 | | | | 964,900 | |
930,000 | | St. Paul Hsg. & Redev. Auth. Tax Increment Rev. (Upper Landing Proj.) | | 5.00 | | | 3/1/29 | | | | 883,891 | |
2,525,000 | | St. Paul Port Auth. Lease Rev. (Regions Hospital Parking Ramp Proj.) | | 5.00 | | | 8/1/36 | | | | 2,337,039 | |
3,000,000 | | St. Paul Port Auth. Rev. (Amherst H. Wilder Fndtn.-3) | | 5.00 | | | 12/1/36 | | | | 3,076,080 | |
715,000 | | St. Paul Recreational Facs. Gross Rev. (Highland National Proj.) | | 5.00 | | | 10/1/25 | | | | 767,645 | |
2,000,000 | | Virgin Islands Public Fin. Auth. (Gross Receipts Taxes Loan Note) 11 | | 5.00 | | | 10/1/42 | | | | 1,875,100 | |
| | | | | | | | | | | | |
| | | | | | | | | | | 29,869,563 | |
| | | | | | | | | | | | |
| | | |
Public Facilities - 0.3% | | | | | | | | | | |
1,075,000 | | St. Paul Hsg. & Redev. Auth. Parking Rev. (Smith Ave. Proj.) | | 5.00 | | | 8/1/35 | | | | 1,092,136 | |
| | | | | | | | | | | | |
Sales Tax Revenue - 1.4% | | | | | | | | | | |
1,000,000 | | Guam Govt. Business Privilege Tax Rev. 11 | | 5.00 | | | 1/1/37 | | | | 1,006,650 | |
2,000,000 | | Hennepin Co. Sales Tax Rev. | | 4.75 | | | 12/15/37 | | | | 2,014,280 | |
500,000 | | Puerto Rico Sales Tax Financing Corp. Rev. 11 | | 6.00 | | | 8/1/39 | | | | 410,000 | |
1,500,000 | | Puerto Rico Sales Tax Financing Corp. Rev. 6, 11 | | 6.25 | | | 8/1/33 | | | | 845,280 | |
1,000,000 | | Virgin Islands Public Fin. Auth. (Gross Receipts Taxes Loan Note) 11 | | 5.00 | | | 10/1/32 | | | | 967,830 | |
| | | | | | | | | | | | |
| | | | | | | | | | | 5,244,040 | |
| | | | | | | | | | | | |
| | | |
Single Family Mortgage - 17.5% | | | | | | | | | | |
1,755,000 | | Dakota Co. Community Dev. Agy. Single Family Mtg. Rev. (GNMA) | | 4.45 | | | 12/1/32 | | | | 1,767,443 | |
915,000 | | Dakota Co. Community Dev. Agy. Single Family Mtg. Rev. (GNMA-FNMA-FHLMC) | | 4.63 | | | 12/1/30 | | | | 923,574 | |
1,155,000 | | Dakota Co. Community Dev. Agy. Single Family Mtg. Rev. (GNMA-FNMA-FHLMC) | | 4.88 | | | 12/1/33 | | | | 1,177,673 | |
340,116 | | Dakota Co. Community Dev. Agy. Single Family Mtg. Rev. (GNMA-FNMA-FHLMC) 8 | | 5.13 | | | 12/1/40 | | | | 341,320 | |
121,884 | | Dakota Co. Community Dev. Agy. Single Family Mtg. Rev. (GNMA-FNMA-FHLMC) 8 | | 5.15 | | | 12/1/38 | | | | 125,888 | |
744,617 | | Dakota Co. Community Dev. Agy. Single Family Mtg. Rev. (GNMA-FNMA-FHLMC) 8 | | 5.30 | | | 12/1/39 | | | | 770,820 | |
900,000 | | Minneapolis St. Paul Hsg. Fin. Board Single Family Mtg. Rev. (GNMA-FNMA) | | 4.45 | | | 12/1/27 | | | | 928,476 | |
68,796 | | Minneapolis St. Paul Hsg. Fin. Board Single Family Mtg. Rev. (GNMA-FNMA) 8 | | 5.00 | | | 12/1/38 | | | | 68,795 | |
78,844 | | Minneapolis St. Paul Hsg. Fin. Board Single Family Mtg. Rev. (GNMA-FNMA) | | 5.70 | | | 4/1/27 | | | | 82,130 | |
203,163 | | Minneapolis St. Paul Hsg. Fin. Board Single Family Mtg. Rev. (GNMA-FNMA-FHLMC) | | 5.10 | | | 4/1/27 | | | | 212,559 | |
898,881 | | Minneapolis St. Paul Hsg. Fin. Board Single Family Mtg. Rev. (GNMA-FNMA-FHLMC) 8 | | 5.25 | | | 12/1/40 | | | | 940,256 | |
515,449 | | Minneapolis St. Paul Hsg. Fin. Board Single Family Mtg. Rev. (GNMA-FNMA-FHLMC) | | 5.45 | | | 4/1/27 | | | | 545,453 | |
225,000 | | Minneapolis St. Paul Hsg. Fin. Board Single Family Mtg. Rev. (GNMA-FNMA-FHLMC) 8 | | 5.52 | | | 3/1/41 | | | | 240,185 | |
5,795,000 | | MN Hsg. Fin. Agy. Homeownership Fin. (GNMA-FNMA) | | 4.40 | | | 7/1/32 | | | | 6,195,550 | |
5,385,000 | | MN Hsg. Fin. Agy. Homeownership Fin. (GNMA-FNMA-FHLMC) | | 4.45 | | | 7/1/31 | | | | 5,396,578 | |
2,805,000 | | MN Hsg. Fin. Agy. Homeownership Fin. (GNMA-FNMA-FHLMC) | | 4.70 | | | 1/1/31 | | | | 2,930,384 | |
1,000,000 | | MN Hsg. Fin. Agy. Residental Hsg. Rev. 8 | | 3.00 | | | 7/1/31 | | | | 1,036,680 | |
2,890,000 | | MN Hsg. Fin. Agy. Residental Hsg. Rev. | | 3.60 | | | 7/1/33 | | | | 2,480,314 | |
6,735,000 | | MN Hsg. Fin. Agy. Residental Hsg. Rev. | | 3.80 | | | 7/1/38 | | | | 5,641,438 | |
5,455,000 | | MN Hsg. Fin. Agy. Residental Hsg. Rev. | | 3.90 | | | 7/1/43 | | | | 4,558,744 | |
575,000 | | MN Hsg. Fin. Agy. Residental Hsg. Rev. (GO of AGY. Insured) 8 | | 4.75 | | | 7/1/26 | | | | 580,014 | |
220,000 | | MN Hsg. Fin. Agy. Residental Hsg. Rev. (GO of AGY. Insured) 8 | | 5.10 | | | 7/1/31 | | | | 221,003 | |
1,880,000 | | MN Hsg. Fin. Agy. Residential Hsg. Rev. 8 | | 4.65 | | | 7/1/22 | | | | 1,929,726 | |
5,040,000 | | MN Hsg. Fin. Agy. Residential Hsg. Rev. | | 5.10 | | | 1/1/40 | | | | 5,092,114 | |
2,595,000 | | MN Hsg. Fin. Agy. Residential Hsg. Rev. (GO of AGY. Insured) | | 3.63 | | | 7/1/25 | | | | 2,575,304 | |
445,000 | | MN Hsg. Fin. Agy. Residential Hsg. Rev. (GO of AGY. Insured) | | 3.85 | | | 1/1/29 | | | | 442,116 | |
3,380,000 | | MN Hsg. Fin. Agy. Residential Hsg. Rev. (GO of AGY. Insured) | | 3.90 | | | 7/1/30 | | | | 3,251,628 | |
1,920,000 | | MN Hsg. Fin. Agy. Residential Hsg. Rev. (GO of AGY. Insured) 8 | | 5.10 | | | 7/1/38 | | | | 2,015,155 | |
695,000 | | MN Hsg. Fin. Agy. Rev. (GNMA-FNMA Collateralized) | | 5.00 | | | 1/1/31 | | | | 695,389 | |
250,000 | | MN Hsg. Fin. Agy. Single Family Mtg. Rev. | | 4.90 | | | 7/1/29 | | | | 256,532 | |
695,000 | | MN Hsg. Fin. Agy. Single Family Mtg. Rev. | | 5.00 | | | 7/1/38 | | | | 714,265 | |
See accompanying notes to financial statements.
SCHEDULE OF INVESTMENTS (Unaudited)
September 30, 2013
Sit Minnesota Tax-Free Income Fund (Continued)
| | | | | | | | | | | | |
| | | | | | | | | | | |
| Quantity/ | | | | | | | | | | |
| Principal | | | | Coupon | | Maturity | | | Fair | |
| Amount ($) | | Name of Issuer | | Rate (%) | | Date | | | Value ($) | |
1,665,000 | | MN Hsg. Fin. Agy. Single Family Mtg. Rev. | | 5.05 | | | 7/1/34 | | | | 1,750,331 | |
260,000 | | MN Hsg. Fin. Agy. Single Family Mtg. Rev. 8 | | 5.10 | | | 7/1/20 | | | | 260,330 | |
210,000 | | MN Hsg. Fin. Agy. Single Family Mtg. Rev. | | 5.20 | | | 1/1/23 | | | | 220,994 | |
715,000 | | MN Hsg. Fin. Agy. Single Family Mtg. Rev. | | 5.90 | | | 7/1/28 | | | | 744,036 | |
800,000 | | MN Hsg. Fin. Agy. Single Family Mtg. Rev. (GO of AGY. Insured) 8 | | 4.75 | | | 7/1/27 | | | | 810,448 | |
1,965,000 | | MN Hsg. Fin. Agy. Single Family Mtg. Rev. (GO of AGY. Insured) 8 | | 4.80 | | | 7/1/26 | | | | 1,992,628 | |
275,000 | | MN Hsg. Fin. Agy. Single Family Mtg. Rev. (GO of AGY. Insured) 8 | | 5.00 | | | 1/1/37 | | | | 281,672 | |
1,305,000 | | MN Hsg. Fin. Agy. Single Family Mtg. Rev. (GO of AGY. Insured) 8 | | 5.15 | | | 7/1/28 | | | | 1,335,485 | |
1,285,000 | | MN Hsg. Fin. Agy. Single Family Mtg. Rev. (GO of AGY. Insured) 8 | | 5.25 | | | 7/1/33 | | | | 1,303,221 | |
585,000 | | MN Hsg. Fin. Agy. Single Family Mtg. Rev. (GO of AGY. Insured) 8 | | 5.50 | | | 7/1/28 | | | | 599,303 | |
620,000 | | MN Hsg. Fin. Agy. Single Family Mtg. Rev. (GO of AGY. Insured) 8 | | 5.65 | | | 7/1/33 | | | | 646,530 | |
| | | | | | | | | | | | |
| | | | | | | | | | | 64,082,484 | |
| | | | | | | | | | | | |
| | | |
Transportation - 4.2% | | | | | | | | | | |
2,500,000 | | Minneapolis & St. Paul Metro Airport Commission Rev. Ref. 8 | | 5.00 | | | 1/1/22 | | | | 2,760,400 | |
2,010,000 | | Minneapolis & St. Paul Metro Airport Commission Rev. Ref. (NATL-RE FGIC Insured) | | 5.00 | | | 1/1/22 | | | | 2,104,912 | |
1,750,000 | | Minneapolis & St. Paul Metro Airport Commission Rev. Ref. (NATL-RE FGIC Insured) | | 5.00 | | | 1/1/25 | | | | 1,907,220 | |
500,000 | | Minneapolis & St. Paul Metro Airport Commission Sub. Rev. | | 5.00 | | | 1/1/30 | | | | 530,845 | |
500,000 | | Minneapolis & St. Paul Metro Airport Commission Sub. Rev. | | 5.00 | | | 1/1/31 | | | | 528,335 | |
3,500,000 | | Minneapolis & St. Paul Metro Airport Commission Sub. Rev. (AMBAC Insured) 8 | | 5.00 | | | 1/1/25 | | | | 3,646,930 | |
2,750,000 | | Minneapolis & St. Paul Metro Airport Commission Sub. Rev. (NATL-RE FGIC Insured) | | 5.00 | | | 1/1/22 | | | | 3,063,665 | |
400,000 | | MN Valley Transit Auth. Proj. Rev. | | 4.50 | | | 6/1/26 | | | | 410,236 | |
485,000 | | MN Valley Transit Auth. Proj. Rev. | | 4.50 | | | 6/1/27 | | | | 493,977 | |
| | | | | | | | | | | | |
| | | | | | | | | | | 15,446,520 | |
| | | | | | | | | | | | |
| | | |
Utility - 5.2% | | | | | | | | | | |
1,000,000 | | Chaska Electric Rev. Ref. (Generating Facs. Proj.) | | 5.25 | | | 10/1/25 | | | | 1,079,180 | |
2,000,000 | | MN Municipal Power Agy. Electric Rev. | | 5.00 | | | 10/1/25 | | | | 2,177,120 | |
1,000,000 | | MN Municipal Power Agy. Electric Rev. | | 5.00 | | | 10/1/30 | | | | 1,043,780 | |
50,000 | | MN Municipal Power Agy. Electric Rev. | | 5.00 | | | 10/1/34 | | | | 51,450 | |
1,465,000 | | MN Municipal Power Agy. Electric Rev. | | 5.00 | | | 10/1/35 | | | | 1,480,646 | |
2,000,000 | | MN Municipal Power Agy. Electric Rev. | | 5.25 | | | 10/1/24 | | | | 2,085,840 | |
700,000 | | MN Municipal Power Agy. Electric Rev. | | 5.25 | | | 10/1/27 | | | | 761,712 | |
1,000,000 | | MN Municipal Power Agy. Electric Rev. | | 5.25 | | | 10/1/35 | | | | 1,041,580 | |
500,000 | | North Branch Electric System Rev. | | 5.75 | | | 8/1/28 | | | | 521,300 | |
500,000 | | Puerto Rico Aqueduct & Sewer Auth. Rev. 11 | | 5.75 | | | 7/1/37 | | | | 368,570 | |
1,000,000 | | Puerto Rico Electric Power Auth. Rev. 11 | | 7.25 | | | 7/1/30 | | | | 865,290 | |
1,250,000 | | Puerto Rico Electric Power Auth. Rev. Ref. 1, 11 | | 0.86 | | | 7/1/25 | | | | 877,800 | |
1,250,000 | | Rochester Electric Utility Rev. | | 4.00 | | | 12/1/38 | | | | 1,156,075 | |
2,000,000 | | Southern MN Power Agy. Power Supply System Rev. | | 5.25 | | | 1/1/30 | | | | 2,110,480 | |
1,000,000 | | St. Paul Port Auth. Rev. (Energy Park Utility Company Proj.) 8 | | 5.45 | | | 8/1/28 | | | | 946,850 | |
680,000 | | Virgin Islands Water & Power Auth. Water System Rev. Ref. 11 | | 5.50 | | | 7/1/17 | | | | 681,482 | |
2,000,000 | | Western MN Municipal Power Agy. Rev. | | 3.00 | | | 1/1/28 | | | | 1,762,320 | |
| | | | | | | | | | | | |
| | | | | | | | | | | 19,011,475 | |
| | | | | | | | | | | | |
Total Municipal Bonds
(cost: $361,024,862) | | | | | | | | | 353,216,692 | |
| | | | | | | | | | | | |
Closed-End Mutual Funds - 1.6% | | | | | | | | | | |
276,400 | | Delaware Investments Minnesota Municipal Income Fund II (VMM) | | | | | | | | | 3,554,504 | |
43,696 | | First American Minnesota Municipal Income Fund II (MXN) | | | | | | | | | 596,450 | |
124,197 | | MN Municipal Income Portfolio (MXA) | | | | | | | | | 1,856,745 | |
| | | | | | | | | | | | |
Total Closed-End Mutual Funds
(cost: $6,510,891) | | | | | | | | | 6,007,699 | |
| | | | | | | | | | | | |
See accompanying notes to financial statements.
| | |
40 | | SIT MUTUAL FUNDS SEMI-ANNUAL REPORT |
| | | | |
| | | | |
| | | Fair | |
| | | Value ($) | |
| |
Total Investments in Securities - 97.9%
(cost: $367,535,753) | | | 359,224,391 | |
Other Assets and Liabilities, net - 2.1% | | | 7,579,417 | |
| | | | |
Total Net Assets - 100.0% | | $ | 366,803,808 | |
| | | | |
| 1 | Variable rate security. Rate disclosed is as of September 30, 2013. |
| 6 | Zero coupon or convertible capital appreciation bond, for which the rate disclosed is either the effective yield on purchase date or the coupon rate to be paid upon conversion to coupon paying, respectively. |
| 8 | Securities the income from which is treated as a tax preference that is included in alternative minimum taxable income for purposes of computing federal alternative minimum tax (AMT). At September 30, 2013, 10.7% of net assets in the Fund was invested in such securities. |
| 9 | Municipal Lease Security. The total value of such securities as of September 30, 2013 was $14,761,766 and represented 4.0% of net assets. These securities have been determined to be liquid by the Adviser in accordance with guidelines established by the Board of Directors. |
| 11 | The Fund may invest in obligations issued by U.S. territories, for example Guam, Puerto Rico, and Virgin Islands. The total value of such securities as of September 30, 2013 was $13,512,606 and represented 3.7% of net assets. |
Numeric footnotes not disclosed are not applicable to this Schedule of Investments.
A summary of the levels for the Fund’s investments as of September 30, 2013 is as follows (See Note 2 -significant accounting policies in the notes to the financial statements):
| | | | | | | | | | | | | | |
| | | Investment in Securities | |
| | | | |
| | | Level 1 | | | Level 2 | | | Level 3 | | | |
| | | Quoted | | | Other significant | | | Significant | | | |
| | | Price ($) | | | observable inputs ($) | | | unobservable inputs ($) | | Total ($) | |
| | | | |
Municipal Bonds | | | — | | | | 353,216,692 | | | — | | | 353,216,692 | |
Closed-End Mutual Funds | | | 6,007,699 | | | | — | | | — | | | 6,007,699 | |
| | | | |
Total: | | | 6,007,699 | | | | 353,216,692 | | | — | | | 359,224,391 | |
| | | | |
For the reporting period, there were no transfers between levels 1, 2 and 3.
See accompanying notes to financial statements.
STATEMENTS OF ASSETS AND LIABILITIES (Unaudited)
September 30, 2013
| | | | | | | | | | | | | | | | |
| | | Sit U.S. | | | | | | | | | Sit Minnesota | |
| | | Government | | | Sit Quality | | | Sit Tax-Free | | | Tax-Free | |
| | | Securities | | | Income | | | Income | | | Income | |
| | | Fund | | | Fund | | | Fund | | | Fund | |
ASSETS | | | | | | | | | | | | | | | | |
Investments in securities, at identified cost | | | $873,179,558 | | | | $73,670,469 | | | | $170,982,946 | | | | $367,535,753 | |
| | | | | | | | | | | | | | | | |
| | | | |
Investments in securities, at fair value - see accompanying schedule for detail | | | $875,321,990 | | | | $73,689,327 | | | | $146,230,834 | | | | $359,224,391 | |
Cash in bank on demand deposit | | | 57,820,561 | | | | 2,408,124 | | | | 25,228 | | | | 3,270,737 | |
Restricted cash | | | 18,000,000 | | | | 500,000 | | | | — | | | | — | |
Accrued interest and dividends receivable | | | 4,980,459 | | | | 349,412 | | | | 1,972,400 | | | | 5,188,473 | |
Receivable for principal paydowns | | | 136,474 | | | | 25,138 | | | | — | | | | — | |
Other receivables | | | — | | | | — | | | | — | | | | 18,000 | |
Receivable for Fund shares sold | | | 1,171,637 | | | | 19,060 | | | | 16,669 | | | | 327,796 | |
| | | | | | | | | | | | | | | | |
| | | | |
Total assets | | | 957,431,121 | | | | 76,991,061 | | | | 148,245,131 | | | | 368,029,397 | |
| | | | | | | | | | | | | | | | |
| | | | |
LIABILITIES | | | | | | | | | | | | | | | | |
Payable for investment securities purchased | | | — | | | | 1,311,167 | | | | 789,671 | | | | — | |
Payable for Fund shares redeemed | | | 4,336,022 | | | | 1,174 | | | | 467,985 | | | | 723,284 | |
Cash portion of dividends payable to shareholders | | | 27,340 | | | | 1,436 | | | | 107,768 | | | | 262,790 | |
Variation margin | | | — | | | | 124,375 | | | | — | | | | — | |
Other payables | | | 11,205 | | | | — | | | | — | | | | — | |
Accrued investment management fees | | | 637,089 | | | | 52,661 | | | | 95,264 | | | | 239,515 | |
Outstanding options written, at fair value (premiums received $5,163,656 and $11,345, respectively) | | | 12,172,032 | | | | 60,938 | | | | — | | | | — | |
| | | | | | | | | | | | | | | | |
| | | | |
Total liabilities | | | 17,183,688 | | | | 1,551,751 | | | | 1,460,688 | | | | 1,225,589 | |
| | | | | | | | | | | | | | | | |
| | | | |
Net assets applicable to outstanding capital stock | | | $940,247,433 | | | | $75,439,310 | | | | $146,784,443 | | | | $366,803,808 | |
| | | | | | | | | | | | | | | | |
| | | | |
Net assets consist of: | | | | | | | | | | | | | | | | |
Capital (par value and paid-in surplus) | | | $943,567,826 | | | | $75,702,298 | | | | $195,162,748 | | | | $383,064,917 | |
Accumulated net realized gain (loss) from security transactions, written options and futures | | | 1,545,551 | | | | (107,878 | ) | | | (23,626,193 | ) | | | (7,949,747 | ) |
Unrealized appreciation (depreciation) on investments, written options and futures | | | (4,865,944 | ) | | | (155,110 | ) | | | (24,752,112 | ) | | | (8,311,362 | ) |
| | | | | | | | | | | | | | | | |
| | | | |
| | | $940,247,433 | | | | $75,439,310 | | | | $146,784,443 | | | | $366,803,808 | |
| | | | | | | | | | | | | | | | |
| | | | |
Outstanding shares | | | 85,128,600 | | | | 7,574,454 | | | | 16,672,111 | | | | 36,852,218 | |
| | | | | | | | | | | | | | | | |
| | | | |
Net asset value per share of outstanding capital stock | | | $11.05 | | | | $9.96 | | | | $8.80 | | | | $9.95 | |
| | | | | | | | | | | | | | | | |
| | |
See accompanying notes to financial statements. |
42 | | SIT MUTUAL FUNDS SEMI-ANNUAL REPORT |
STATEMENTS OF OPERATIONS (Unaudited)
Six Months Ended September 30, 2013
| | | | | | | | | | | | | | | | |
| | | Sit U.S. | | | | | | | | | Sit Minnesota | |
| | | Government | | | Sit Quality | | | Sit Tax-Free | | | Tax-Free | |
| | | Securities | | | Income | | | Income | | | Income | |
| | | Fund | | | Fund | | | Fund | | | Fund | |
| | | | | | | | | | | | | | | | |
Investment income: | | | | | | | | | | | | | | | | |
Income: | | | | | | | | | | | | | | | | |
Dividends | | | — | | | | — | | | | $310,644 | | | | $157,405 | |
Interest | | | $10,138,616 | | | | $355,946 | | | | 3,873,531 | | | | 8,954,144 | |
| | | | | | | | | | | | | | | | |
Total income | | | 10,138,616 | | | | 355,946 | | | | 4,184,175 | | | | 9,111,549 | |
| | | | | | | | | | | | | | | | |
| | | | |
Expenses (note 4): | | | | | | | | | | | | | | | | |
Investment management fee | | | 4,938,147 | | | | 183,460 | | | | 658,161 | | | | 1,592,484 | |
| | | | | | | | | | | | | | | | |
Total expenses | | | 4,938,147 | | | | 183,460 | | | | 658,161 | | | | 1,592,484 | |
| | | | | | | | | | | | | | | | |
| | | | |
Net investment income | | | 5,200,469 | | | | 172,486 | | | | 3,526,014 | | | | 7,519,065 | |
| | | | | | | | | | | | | | | | |
| | | | |
Realized and unrealized gain (loss): | | | | | | | | | | | | | | | | |
Net realized gain (loss) on investments | | | 4,817,282 | | | | (89,549 | ) | | | (331,470 | ) | | | (540,103 | ) |
Net realized gain (loss) on written options | | | 1,199,430 | | | | 20,172 | | | | — | | | | — | |
Net realized gain (loss) on futures | | | — | | | | (35,837 | ) | | | — | | | | — | |
| | | | |
Net change in unrealized appreciation (depreciation) on investments | | | (28,469,017 | ) | | | 10,116 | | | | (13,811,432 | ) | | | (25,894,961 | ) |
Net change in unrealized appreciation (depreciation) on written options | | | (6,557,662 | ) | | | (49,389 | ) | | | — | | | | — | |
Net change in unrealized appreciation (depreciation) on futures | | | — | | | | (123,406 | ) | | | — | | | | — | |
| | | | | | | | | | | | | | | | |
| | | | |
Net gain (loss) | | | (29,009,967 | ) | | | (267,893 | ) | | | (14,142,902 | ) | | | (26,435,064 | ) |
| | | | | | | | | | | | | | | | |
| | | | |
Net increase (decrease) in net assets resulting from operations | | | ($23,809,498 | ) | | | ($95,407 | ) | | | ($10,616,888 | ) | | | ($18,915,999 | ) |
| | | | | | | | | | | | | | | | |
| | |
| See accompanying notes to financial statements. | | |
SEPTEMBER 30, 2013 | | 43 |
STATEMENTS OF CHANGES IN NET ASSETS
| | | | | | | | |
| | | Sit U.S. Government | |
| | | Securities Fund | |
| | | Six Months | | | Year | |
| | | Ended | | | Ended | |
| | | September 30, 2013 | | | March 31, | |
| | | (Unaudited) | | | 2013 | |
Operations: | | | | | | | | |
Net investment income | | | $5,200,469 | | | | $24,620,957 | |
Net realized gain (loss) on investments, written options and futures | | | 6,016,712 | | | | (1,627,378 | ) |
Net change in unrealized appreciation (depreciation) of investments, written options and futures | | | (35,026,679 | ) | | | (34,964 | ) |
| | | | | | | | |
| | |
Net increase (decrease) in net assets resulting from operations | | | (23,809,498 | ) | | | 22,958,615 | |
| | | | | | | | |
| | |
Distributions from: | | | | | | | | |
Net investment income | | | (5,153,569 | ) | | | (24,572,827 | ) |
Return of capital | | | — | | | | (899,593 | ) |
| | | | | | | | |
Total distributions | | | (5,153,569 | ) | | | (25,472,420 | ) |
| | | | | | | | |
| | |
Capital share transactions: | | | | | | | | |
Proceeds from shares sold | | | 138,402,966 | | | | 1,038,042,856 | |
Reinvested distributions | | | 4,828,590 | | | | 24,175,094 | |
Payments for shares redeemed | | | (694,080,109 | ) | | | (1,043,799,295 | ) |
| | | | | | | | |
| | |
Increase (decrease) in net assets from capital transactions | | | (550,848,553 | ) | | | 18,418,655 | |
| | | | | | | | |
| | |
Total increase (decrease) in net assets | | | (579,811,620 | ) | | | 15,904,850 | |
| | |
Net assets: | | | | | | | | |
Beginning of period | | | 1,520,059,053 | | | | 1,504,154,203 | |
| | | | | | | | |
End of period * | | | $940,247,433 | | | | $1,520,059,053 | |
| | | | | | | | |
| | |
Capital transactions in shares: | | | | | | | | |
Sold | | | 12,346,932 | | | | 91,393,593 | |
Reinvested distributions | | | 432,456 | | | | 2,128,853 | |
Redeemed | | | (62,180,044 | ) | | | (91,991,808 | ) |
| | | | | | | | |
| | |
Net increase (decrease) | | | (49,400,656 | ) | | | 1,530,638 | |
| | | | | | | | |
* Includes undistributed (distributions in excess of) net investment income | | | — | | | | ($46,900 | ) |
| | |
| See accompanying notes to financial statements. |
44 | | SIT MUTUAL FUNDS SEMI-ANNUAL REPORT |
| | | | | | | | | | | | | | | | | | | | | | | | | | |
| | | Sit Quality | | | Sit Tax-Free | | | Sit Minnesota Tax-Free | | | |
| | | Income Fund | | | Income Fund | | | Income Fund | | |
| | | Six Months | | | Year | | | Six Months | | | Year | | | Six Months | | | Year | | |
| | | Ended | | | Ended | | | Ended | | | Ended | | | Ended | | | Ended | | |
| | | September 30, 2013 | | | March 31, | | | September 30, 2013 | | | March 31, | | | September 30, 2013 | | | March 31, | | |
| | | (Unaudited) | | | 2013 | | | (Unaudited) | | | 2013 | | | (Unaudited) | | | 2013 | | |
| | | | | | | | | | | | | | | | | | | | | | | | | |
| | | $172,486 | | | | $14,409 | | | | $3,526,014 | | | | $6,928,948 | | | | $7,519,065 | | | | $13,544,962 | | |
| | | (105,214 | ) | | | (2,664 | ) | | | (331,470 | ) | | | (322,605 | ) | | | (540,103 | ) | | | 378,680 | | |
| | | | | | | | | | | | | | | | | | | | | | | | | |
| | | (162,679 | ) | | | 7,569 | | | | (13,811,432 | ) | | | 6,123,415 | | | | (25,894,961 | ) | | | 6,281,372 | | |
| | | | | | | | | | | | | | | | | | | | | | | | | |
| | | | | | | | | | | | | | | | | | | | | | | | | |
| | | | | | | | | | | | | | | | | | | | | | | | | |
| | | (95,407 | ) | | | 19,314 | | | | (10,616,888 | ) | | | 12,729,758 | | | | (18,915,999 | ) | | | 20,205,014 | | |
| | | | | | | | | | | | | | | | | | | | | | | | | |
| | | | | | | | | | | | | | | | | | | | | | | | | |
| | | | | | | | | | | | | | | | | | | | | | | | | |
| | | (172,486 | ) | | | (14,409 | ) | | | (3,530,611 | ) | | | (6,935,377 | ) | | | (7,507,728 | ) | | | (13,525,058 | ) | |
| | | — | | | | | | | | — | | | | — | | | | — | | | | — | | |
| | | | | | | | | | | | | | | | | | | | | | | | | |
| | | (172,486 | ) | | | (14,409 | ) | | | (3,530,611 | ) | | | (6,935,377 | ) | | | (7,507,728 | ) | | | (13,525,058 | ) | |
| | | | | | | | | | | | | | | | | | | | | | | | | |
| | | | | | | | | | | | | | | | | | | | | | | | | |
| | | | | | | | | | | | | | | | | | | | | | | | | |
| | | 85,910,715 | | | | 5,103,230 | | | | 13,520,640 | | | | 52,350,817 | | | | 49,763,350 | | | | 131,737,549 | | |
| | | 168,420 | | | | 13,470 | | | | 3,023,273 | | | | 5,748,024 | | | | 6,087,299 | | | | 10,558,334 | | |
| | | (15,493,537 | ) | | | — | | | | (31,092,340 | ) | | | (43,072,241 | ) | | | (78,767,834 | ) | | | (76,630,712 | ) | |
| | | | | | | | | | | | | | | | | | | | | | | | | |
| | | | | | | | | | | | | | | | | | | | | | | | | |
| | | | | | | | | | | | | | | | | | | | | | | | | |
| | | 70,585,598 | | | | 5,116,700 | | | | (14,548,427 | ) | | | 15,026,600 | | | | (22,917,185 | ) | | | 65,665,171 | | |
| | | | | | | | | | | | | | | | | | | | | | | | | |
| | | | | | | | | | | | | | | | | | | | | | | | | |
| | | 70,317,705 | | | | 5,121,605 | | | | (28,695,926 | ) | | | 20,820,981 | | | | (49,340,912 | ) | | | 72,345,127 | | |
| | | | | | | | | | | | | | | | | | | | | | | | | |
| | | | | | | | | | | | | | | | | | | | | | | | | |
| | | 5,121,605 | | | | — | | | | 175,480,369 | | | | 154,659,388 | | | | 416,144,720 | | | | 343,799,593 | | |
| | | | | | | | | | | | | | | | | | | | | | | | | |
| | | $75,439,310 | | | | $5,121,605 | | | | $146,784,443 | | | | $175,480,369 | | | | $366,803,808 | | | | $416,144,720 | | |
| | | | | | | | | | | | | | | | | | | | | | | | | |
| | | | | | | | | | | | | | | | | | | | | | | | | |
| | | | | | | | | | | | | | | | | | | | | | | | | |
| | | 8,598,098 | | | | 510,293 | | | | 1,431,256 | | | | 5,510,054 | | | | 4,799,942 | | | | 12,394,907 | | |
| | | 16,891 | | | | 1,347 | | | | 333,428 | | | | 601,779 | | | | 597,287 | | | | 993,393 | | |
| | | (1,552,175 | ) | | | — | | | | (3,432,444 | ) | | | (4,519,822 | ) | | | (7,718,981 | ) | | | (7,215,943 | ) | |
| | | | | | | | | | | | | | | | | | | | | | | | | |
| | | | | | | | | | | | | | | | | | | | | | | | | |
| | | 7,062,814 | | | | 511,640 | | | | (1,667,760 | ) | | | 1,592,011 | | | | (2,321,752 | ) | | | 6,172,357 | | |
| | | | | | | | | | | | | | | | | | | | | | | | | |
| | | — | | | | — | | | | — | | | | $4,597 | | | | — | | | | ($11,337 | ) | |
| | | | | | | | | | | | | | | | | | | | | | | | | |
FINANCIAL HIGHLIGHTS
Per share income and capital changes for a share outstanding throughout the period. See accompanying notes to financial statements.
Sit U.S. Government Securities Fund
| | | | | | | | | | | | | | | | | | | | | | | | |
| |
| | | Six Months Ended | | | | | | | | | | | | | | | | |
| | | September 30, 2013 | | | Years Ended March 31, | |
| | | (Unaudited) | | | 2013 | | | 2012 | | | 2011 | | | 2010 | | | 2009 | |
| |
Net Asset Value: | | | | | | | | | | | | | | | | | | | | | | | | |
Beginning of period | | | $11.30 | | | | $11.31 | | | | $11.29 | | | | $11.13 | | | | $10.84 | | | | $10.92 | |
| | | | |
Operations: | | | | | | | | | | | | | | | | | | | | | | | | |
Net investment income 1 | | | 0.05 | | | | 0.16 | | | | 0.31 | | | | 0.32 | | | | 0.44 | | | | 0.52 | |
Net realized and unrealized gains (losses) on investments and written options, written options and futures | | | (0.26) | | | | — | | | | 0.02 | | | | 0.16 | | | | 0.29 | | | | (0.08 | ) |
| | | | |
Total from operations | | | (0.21) | | | | 0.16 | | | | 0.33 | | | | 0.48 | | | | 0.73 | | | | 0.44 | |
| | | | |
Distributions from: | | | | | | | | | | | | | | | | | | | | | | | | |
Net investment income | | | (0.04) | | | | (0.16 | ) | | | (0.31 | ) | | | (0.32 | ) | | | (0.44 | ) | | | (0.52 | ) |
Return of capital | | | — | | | | (0.01 | ) | | | — | | | | — | | | | — | | | | — | |
Net realized gains | | | — | | | | — | | | | — | | | | (— | )2 | | | — | | | | — | |
| | | | |
Total Distributions | | | (0.04) | | | | (0.17 | ) | | | (0.31 | ) | | | (0.32 | ) | | | (0.44 | ) | | | (0.52 | ) |
| | | | |
Net Asset Value: | | | | | | | | | | | | | | | | | | | | | | | | |
End of period | | | $11.05 | | | | $11.30 | | | | $11.31 | | | | $11.29 | | | | $11.13 | | | | $10.84 | |
| | | | |
Total investment return 3 | | | (1.83%) | | | | 1.39% | | | | 2.98% | | | | 4.37% | | | | 6.88% | | | | 4.18% | |
| | | | |
Net assets at end of period (000’s omitted) | | | $940,247 | | | | $1,520,059 | | | | $1,504,154 | | | | $1,057,154 | | | | $768,720 | | | | $390,630 | |
| | | | | | |
Ratios: 4, 5 | | | | | | | | | | | | | | | | | | | | | | | | |
Expenses (without waiver) | | | 0.80% | | | | 0.80% | | | | 0.80% | | | | 0.81% | | | | 0.82% | | | | 0.83% | |
Expenses (with waiver) | | | 0.80% | | | | 0.80% | | | | 0.80% | | | | 0.75% | | | | 0.80% | | | | 0.80% | |
Net investment income (with waiver) | | | 0.84% | | | | 1.43% | | | | 2.73% | | | | 2.88% | | | | 3.85% | | | | 4.87% | |
| | | | | | |
Portfolio turnover rate (excluding short-term securities) | | | 3.37%6 | | | | 58.67% | | | | 33.82% | | | | 45.80% | | | | 66.89% | | | | 59.63% | |
| 1 | The net investment income per share is based on average shares outstanding for the period. |
| 2 | Amount represents less than $0.01 per share. |
| 3 | Total investment return is based on the change in net asset value of a share during the period (not annualized) and assumes reinvestment of distributions at net asset value. |
| 4 | Ratios are annualized for periods less than one year. In addition to fees and expenses which the Fund bears directly, the Fund indirectly bears a pro rata share of the fees and expenses of the acquired funds in which it invests. Such indirect expenses are not included in the above reported expense ratios. |
| 5 | Effective November 1, 2010, total Fund expenses are calculated at 0.80% of average daily net assets. Prior to this date, expenses were calculated at a higher rate and the investment adviser voluntarily waived expenses that were otherwise payable by the Fund. |
| | |
46 | | SIT MUTUAL FUNDS SEMI-ANNUAL REPORT |
FINANCIAL HIGHLIGHTS
Per share income and capital changes for a share outstanding throughout the period. See accompanying notes to financial statements.
Sit Quality Income Fund
| | | | | | | | |
| |
| | | | | | Three | |
| | | Six Months Ended | | | Months Ended | |
| | | September 30, 2013 | | | March 31, | |
| | | (Unaudited) | | | 2013 * | |
| |
Net Asset Value: | | | | | | | | |
Beginning of period | | | $10.01 | | | | $10.00 | |
| | | | |
Operations: | | | | | | | | |
Net investment income 1 | | | 0.05 | | | | 0.03 | |
Net realized and unrealized gains (losses) on investments, written options and futures | | | (0.05) | | | | 0.01 | |
| | | | |
Total from operations | | | — | | | | 0.04 | |
| | | | |
Distributions from: | | | | | | | | |
Net investment income | | | (0.05) | | | | (0.03) | |
| | | | |
Net Asset Value: | | | | | | | | |
End of period | | | $9.96 | | | | $10.01 | |
| | | | |
Total investment return 2 | | | (0.03%) | | | | 0.38% | |
| | | | |
Net assets at end of period (000’s omitted) | | | $75,439 | | | | $5,122 | |
| | |
Ratios: 3 | | | | | | | | |
Expenses | | | 0.90% | | | | 0.90% | |
Net investment income | | | 0.85% | | | | 1.25% | |
| | |
Portfolio turnover rate (excluding short-term securities) | | | 42.14%4 | | | | 37.44%4 | |
| * | The Fund commenced investment operations on December 31, 2012. |
| 1 | The net investment income per share is based on average shares outstanding for the period. |
| 2 | Total investment return is based on the change in net asset value of a share during the period (not annualized) and assumes reinvestment of distributions at net asset value. |
| 3 | Ratios are annualized for periods less than one year. In addition to fees and expenses which the Fund bears directly, the Fund indirectly bears a pro rata share of the fees and expenses of the acquired funds in which it invests. Such indirect expenses are not included in the above reported expense ratios. |
FINANCIAL HIGHLIGHTS
Per share income and capital changes for a share outstanding throughout the period. See accompanying notes to financial statements.
Sit Tax-Free Income Fund
| | | | | | | | | | | | | | | | | | | | | | | | |
| |
| | | Six Months Ended | | | | | | | | | | | | | | | | |
| | | September 30, 2013 | | | Years Ended March 31, | |
| | | (Unaudited) | | | 2013 | | | 2012 | | | 2011 | | | 2010 | | | 2009 | |
| |
Net Asset Value: | | | | | | | | | | | | | | | | | | | | | | | | |
Beginning of period | | | $9.57 | | | | $9.23 | | | | $8.52 | | | | $8.90 | | | | $7.93 | | | | $9.16 | |
| | | | |
| | | | | | |
Operations: | | | | | | | | | | | | | | | | | | | | | | | | |
Net investment income 1 | | | 0.20 | | | | 0.38 | | | | 0.41 | | | | 0.41 | | | | 0.41 | | | | 0.41 | |
Net realized and unrealized gains (losses) on investments | | | (0.77) | | | | 0.34 | | | | 0.71 | | | | (0.38 | ) | | | 0.97 | | | | (1.23 | ) |
| | | | |
Total from operations | | | (0.57) | | | | 0.72 | | | | 1.12 | | | | 0.03 | | | | 1.38 | | | | (0.82 | ) |
| | | | |
Distributions from: | | | | | | | | | | | | | | | | | | | | | | | | |
Net investment income | | | (0.20) | | | | (0.38 | ) | | | (0.41 | ) | | | (0.41 | ) | | | (0.41 | ) | | | (0.41 | ) |
| | | | |
| | | | | | |
Net Asset Value: | | | | | | | | | | | | | | | | | | | | | | | | |
End of period | | | $8.80 | | | | $9.57 | | | | $9.23 | | | | $8.52 | | | | $8.90 | | | | $7.93 | |
| | | | |
Total investment return 2 | | | (6.01%) | | | | 7.92% | | | | 13.41% | | | | 0.26% | | | | 17.71% | | | | (9.14% | ) |
| | | | |
Net assets at end of period (000’s omitted) | | | $146,784 | | | | $175,480 | | | | $154,659 | | | | $140,371 | | | | $153,495 | | | | $138,781 | |
| | | | | | |
Ratios: 3, 4 | | | | | | | | | | | | | | | | | | | | | | | | |
Expenses (without waiver) | | | 0.80% | | | | 0.80% | | | | 0.80% | | | | 0.80% | | | | 0.80% | | | | 0.80% | |
Expenses (with waiver) | | | 0.80% | | | | 0.80% | | | | 0.80% | | | | 0.80% | | | | 0.80% | | | | 0.79% | |
Net investment income (with waiver) | | | 4.29% | | | | 4.03% | | | | 4.62% | | | | 4.63% | | | | 4.79% | | | | 4.63% | |
| | | | | | |
Portfolio turnover rate (excluding short-term securities) | | | 15.86%5 | | | | 36.75% | | | | 37.18% | | | | 30.23% | | | | 27.30% | | | | 18.51% | |
| 1 | The net investment income per share is based on average shares outstanding for the period. |
| 2 | Total investment return is based on the change in net asset value of a share during the period (not annualized) and assumes reinvestment of distributions at net asset value. |
| 3 | Ratios are annualized for periods less than one year. In addition to fees and expenses which the Fund bears directly, the Fund indirectly bears a pro rata share of the fees and expenses of the acquired funds in which it invests. Such indirect expenses are not included in the above reported expense ratios. |
| 4 | Total Fund expenses are limited to 0.80% of average daily net assets. However, during the periods above, the investment adviser voluntarily absorbed expenses that were otherwise payable by the Fund. |
| | |
48 | | SIT MUTUAL FUNDS SEMI-ANNUAL REPORT |
FINANCIAL HIGHLIGHTS
Per share income and capital changes for a share outstanding throughout the period. See accompanying notes to financial statements.
Sit Minnesota Tax-Free Income Fund
| | | | | | | | | | | | | | | | | | | | | | | | |
| |
| | | Six Months Ended | | | | | | | | | | | | | | | | |
| | | September 30, 2013 | | | Years Ended March 31, | |
| | | (Unaudited) | | | 2013 | | | 2012 | | | 2011 | | | 2010 | | | 2009 | |
| |
Net Asset Value: | | | | | | | | | | | | | | | | | | | | | | | | |
Beginning of period | | | $10.62 | | | | $10.42 | | | | $9.67 | | | | $9.88 | | | | $8.97 | | | | $9.76 | |
| | | | |
| | | | | | |
Operations: | | | | | | | | | | | | | | | | | | | | | | | | |
Net investment income 1 | | | 0.19 | | | | 0.38 | | | | 0.44 | | | | 0.43 | | | | 0.43 | | | | 0.43 | |
Net realized and unrealized gains (losses) on investments | | | (0.67) | | | | 0.20 | | | | 0.75 | | | | (0.21 | ) | | | 0.91 | | | | (0.79 | ) |
| | | | |
Total from operations | | | (0.48) | | | | 0.58 | | | | 1.19 | | | | 0.22 | | | | 1.34 | | | | (0.36 | ) |
| | | | |
| | | | | | |
Distributions from: | | | | | | | | | | | | | | | | | | | | | | | | |
Net investment income | | | (0.19) | | | | (0.38 | ) | | | (0.44 | ) | | | (0.43 | ) | | | (0.43 | ) | | | (0.43 | ) |
| | | | |
| | | | | | |
Net Asset Value: | | | | | | | | | | | | | | | | | | | | | | | | |
End of period | | | $9.95 | | | | $10.62 | | | | $10.42 | | | | $9.67 | | | | $9.88 | | | | $8.97 | |
| | | | |
Total investment return 2 | | | (4.50%) | | | | 5.61% | | | | 12.48% | | | | 2.22% | | | | 15.22% | | | | (3.67% | ) |
| | | | |
Net assets at end of period (000’s omitted) | | | $366,804 | | | | $416,145 | | | | $343,800 | | | | $289,105 | | | | $290,806 | | | | $244,123 | |
| | | | | | |
Ratios: 3 | | | | | | | | | | | | | | | | | | | | | | | | |
Expenses | | | 0.80% | | | | 0.80% | | | | 0.80% | | | | 0.80% | | | | 0.80% | | | | 0.80% | |
Net investment income | | | 3.78% | | | | 3.58% | | | | 4.32% | | | | 4.35% | | | | 4.52% | | | | 4.65% | |
| | | | | | |
Portfolio turnover rate (excluding short-term securities) | | | 15.06%4 | | | | 17.13% | | | | 15.06% | | | | 24.48% | | | | 11.46% | | | | 15.68% | |
| 1 | The net investment income per share is based on average shares outstanding for the period. |
| 2 | Total investment return is based on the change in net asset value of a share during the period (not annualized) and assumes reinvestment of distributions at net asset value. |
| 3 | Ratios are annualized for periods less than one year. In addition to fees and expenses which the Fund bears directly, the Fund indirectly bears a pro rata share of the fees and expenses of the acquired funds in which it invests. Such indirect expenses are not included in the above reported expense ratios. |
NOTES TO FINANCIAL STATEMENTS (Unaudited)
Six Months Ended September 30, 2013
The Sit Mutual Funds (the Funds) are no-load funds, and are registered under the Investment Company Act of 1940 (as amended) as diversified (except Minnesota Tax-Free Income Fund which is non-diversified), open-end management investment companies, or series thereof. The Sit Quality Income Fund, Sit Tax-Free Income Fund and Minnesota Tax-Free Income Fund are series funds of Sit Mutual Funds II, Inc. Each fund has 10 billion authorized shares of capital stock. Shares in the U.S. Government Securities Fund have a par value of $0.01, and shares in other funds have a par value of $0.001. This report covers the bond funds of the Sit Mutual Funds.
The investment objective for each of these Funds is as follows:
| | | | | | |
| Fund | | | | Investment Objective | | |
|
U.S. Government Securities | | | | High level of current income and safety of principal. | | |
Quality Income Fund | | | | High level of current income and safety of principal. | | |
Tax-Free Income | | | | High level of current income that is exempt from federal income tax, consistent with the preservation of capital. | | |
Minnesota Tax-Free Income | | | | High level of current income that is exempt from federal regular income tax and Minnesota regular personal income tax, consistent with the preservation of capital. | | |
| (2) | Significant Accounting Policies |
Investments in Securities
Investment securities are carried at fair value based upon closing market quotations on the last business day of the period. Investments in securities traded on national or international securities exchanges are valued at the last reported sales price prior to the time when assets are valued. Securities traded on the over-the-counter market are valued at the last reported sales price or if the last sales price is not available, at the last reported bid price. The sale and bid prices or prices deemend best to reflect fair value quoted by dealers who make markets in these securities are obtained from independent pricing services. Consistent with the Funds’ valuation policies and procedures, the current fair value of certain fixed income securities is provided by an independent pricing service. Fixed income securities for which prices are not available from an independent pricing service but where an active market exists are valued using market quotations obtained from broker-dealers or quotation systems. Securities for which market quotations are not available, such as private placement securities, are valued at fair value according to methods selected in good faith by Sit Investment Associates, Inc. (the “Adviser”) and may include dealer-supplied valuations or other inputs and assumptions that pricing services would typically utilize. Short-term investments of sufficient credit quality with maturities of 60 days or less when acquired, or which subsequently are within 60 days of maturity, are valued at amortized cost, which approximates fair value. Option and future contracts entered into and held by the Funds are valued at the close of the securities and commodities exchange on which they are traded.
Security transactions are accounted for on the date the securities are purchased or sold. Gains and losses are calculated on the identified-cost basis. Interest, including level-yield amortization of long-term bond premium and discount, is recorded on the accrual basis. Dividends received from closed-end fund holdings are included in Dividend Income and distributions from capital gains, if any, are included in Net Realized Gain (Loss).
Delivery and payment for securities which have been purchased by the Funds on a forward commitment or when-issued basis can take place two weeks or more after the transaction date. During this period, such securities are subject to market fluctuations and may increase or decrease in value prior to delivery.
The Minnesota Tax-Free Income Fund concentrates its investments in Minnesota, and therefore may have more credit risk related to the economic conditions in the state of Minnesota than a portfolio with broader geographical diversification.
Derivative Instruments
The Funds apply derivative instrument disclosure standards in order to enable investors to understand how and why the Funds use derivatives, how derivatives are accounted for, and how derivative instruments affect the Funds’ financial statements.
| | |
50 | | SIT MUTUAL FUNDS SEMI-ANNUAL REPORT |
NOTES TO FINANCIAL STATEMENTS (Unaudited)
Six Months Ended September 30, 2013 (Continued)
To hedge interest rate risk, the U.S. Government Securities Fund purchased put options and wrote call option contracts traded on a U.S. exchange. To hedge interest rate risk, the Quality Income Fund entered into futures contracts and wrote call options on these future contracts traded on a U.S. exchange. Risks of entering into futures contracts and purchasing and writing options include the possibility of an illiquid market and that a change in the value of the option may not correlate with changes in the value of the underlying securities.
The premiums paid for the options represent the cost of the investment and the options are valued daily at their closing price. The Funds recognize a realized gain or loss when the option is sold or expired. Option holdings within the Funds, which may include put options and call options, are subject to loss of value with the passage of time, and may experience a total loss of value upon expiration. With options, there is minimal counterparty risk to the Funds since they are exchange traded.
Upon entering into a futures contract, the Quality Income Fund is required to deposit either cash or securities in an amount (initial margin) equal to a certain percentage of the contract value. Subsequent payments (variation margin) are made or received by the Fund each day. The variation margin payments are equal to the daily changes in the contract value and are recorded as unrealized gains and losses. The Fund recognizes a realized gain or loss when the contract is closed or expired. With futures contracts, there is minimal counterparty risk to the Fund since futures are exchange traded and the exchange’s clearinghouse, as counterparty to all exchange-traded futures, guarantees the futures against default.
During the six months ended September 30, 2013, the average volume of derivative activity was as follows:
| | | | | | | | | | | | | | | |
| | | | | Average | | Average |
| | | Average | | Premium | | Notional |
| | | Cost | | Received | | Amount |
| | | |
U.S. Government Securities Fund | | | | | | | | | | | | | | | |
Purchased Put Options | | | | $551,522 | | | | | — | | | | | $1,233,333 | |
Written Call Options | | | | — | | | | | $2,215,841 | | | | | 4,166,667 | |
| | | |
Quality Income Fund | | | | | | | | | | | | | | | |
Treasury Futures | | | | — | | | | | — | | | | | $24,952,813 | |
Written Call Options | | | | — | | | | | $4,068 | | | | | 52,667 | |
The number of open option contracts and open futures contracts outstanding as of September 30, 2013 also serve as indicators of the volume of activity for the Funds throughout the period.
Statement of Assets and Liabilities - Values of derivatives as of September 30, 2013
| | | | |
| | | Asset Derivatives Value 1 | | Liability Derivatives Value |
| | |
| | |
Interest rate risk: | | | | |
U.S. Government Securities Fund | | | | |
Purchased put options | | $96,095 | | — |
Written call options | | — | | $12,172,032 2 |
| | |
Quality Income Fund | | | | |
Treasury Futures | | — | | $124,375 3 |
Written call options | | — | | 60,938 2 |
| 1Statement | of Assets and Liabilities location: Investments in securities, at fair value. |
| 2Statement | of Assets and Liabilities location: Outstanding options written, at fair value. |
3Statementof Assets and Liabilities location: Variation margin receivable/payable. Includes cumulative appreciation(depreciation) of futures as reported in the Schedule of Investments.
NOTES TO FINANCIAL STATEMENTS (Unaudited)
Six Months Ended September 30, 2013 (Continued)
The effect of derivative instruments on the statement of operations for the six months ended September 30, 2013:
| | | | |
| | | Amount of Realized | | Change in Unrealized |
| | | Gain (Loss) on Derivatives 4 | | Appreciation (Depreciation) on Derivatives 5 |
Interest rate risk: | | | | |
U.S. Government Securities Fund | | | | |
Purchased put options | | $607,973 | | ($638,401) |
Written call options | | 1,199,430 | | (7,008,376) |
| | |
Quality Income Fund | | | | |
Written call options | | $20,172 | | ($49,389) |
Index Futures | | (35,837) | | (123,406) |
| | 4 | Statement of Operations location: Net realized gain (loss) on investments, net realized gain (loss) on written options and net realized gain (loss) on futures, respectively. |
| | 5 | Statement of Operations location: Net change in unrealized appreciation (depreciation) on investments, net change in unrealized appreciation (depreciation) on written options and net change in unrealized appreciation (depreciation) on futures, respectively. |
Transactions in written options for the six months ended September 30, 2013 were as follows:
| | | | |
| | | Number of
Contracts | | Premium |
U.S. Government Securities Fund | | | | |
Outstanding, March 31, 2013 | | 2,200 | | $536,786 |
Call options written | | 13,310 | | 8,698,824 |
Call options expired | | (800) | | (108,520) |
Call options closed | | (9,505) | | (3,963,434) |
Outstanding, September 30, 2013 | | 5,205 | | $5,163,656 |
| | |
Quality Income Fund | | | | |
Outstanding, March 31, 2013 | | 4 | | $858 |
Call options written | | 195 | | 45,789 |
Call options expired | | (4) | | (858) |
Call options closed | | (120) | | (34,444) |
Outstanding, September 30, 2013 | | 75 | | $11,345 |
Fair Value Measurements
The inputs and valuations techniques used to measure fair value of the Funds’ net assets are summarized into three levels as described in the hierarchy below:
| | • | | Level 1 – quoted prices for active markets for identical securities. An active market for the security is a market in which transactions occur with sufficient frequency and volume to provide pricing information on an ongoing basis. A quoted price in an active market provides the most reliable evidence of fair value. |
| | • | | Level 2 – debt securities are valued based on evaluated prices received from independent pricing services or from dealers who make markets in such securities. For corporate bonds, U.S. government and government agency obligations, and municipal securities the pricing services utilize matrix pricing which considers yield or price of bonds of comparable quality, coupon, maturity, and type as |
| | |
52 | | SIT MUTUAL FUNDS SEMI-ANNUAL REPORT |
NOTES TO FINANCIAL STATEMENTS (Unaudited)
Six Months Ended September 30, 2013 (Continued)
| | well as dealer supplied prices. For asset-backed securities and mortgage-backed securities, the pricing services utilize matrix pricing which considers prepayment speed assumptions, attributes of the collateral, yield or price of bonds of comparable quality, coupon, maturity, and type as well as dealer supplied prices. All of these inputs are derived principally from or corroborated by observable market data. An adjustment to any observable input that is significant to the fair value may render the measurement a Level 3 measurement. |
| | • | | Level 3 – significant unobservable inputs, including the Adviser’s own assumptions in determining the fair value of investments. |
The inputs or methodology used for valuing securities are not necessarily an indication of the risk associated with investing in those securities.
The fair value of the Funds’ bonds are generally based on quotes received from brokers or independent pricing services. Bonds with quotes that are based on actual trades with a sufficient level of activity on or near the measurement date are classified as Level 2 assets.
At the end of each calendar quarter, management evaluates the Level 2 and 3 assets and liabilities for changes in liquidity, including but not limited to: whether a broker is willing to execute at the quoted price, the depth and consistency of prices from third party services, and the existence of contemporaneous, observable trades in the market. Additionally, management evaluates the Level 1 and 2 assets and liabilities on a quarterly basis for changes in listings or delistings on national exchanges. Due to the inherent uncertainty of determining the fair value of investments that do not have a readily available market value, the fair value of the Funds’ investments may fluctuate from period to period. Additionally, the fair value of investments may differ significantly from the values that would have been used had a ready market existed for such investments and may differ materially from the values the Fund may ultimately realize. Further, such investments may be subject to legal and other restrictions on resale or otherwise are less liquid than publicly traded securities.
A summary of the levels for the Funds’ investments as of September 30, 2013 is included with the Funds’ schedules of investments.
Federal Taxes
The Funds’ policy is to comply with the requirements of the Internal Revenue Code applicable to regulated investment companies and to distribute all of its taxable income to shareholders. The Funds have recorded in their financial statements the full benefit of their tax positions taken in connection with the Registered Investment Company (RIC) qualification and distribution requirements of the RIC. Therefore, no income tax provision is required. Also, in order to avoid the payment of any federal excise taxes, the Funds will distribute substantially all of their net investment income and net realized gains on a calendar year basis.
Management has analyzed the Funds’ tax positions taken in federal tax returns for all open tax years and has concluded that as of September 30, 2013, no provision for income tax would be required in the Funds’ financial statements. The Funds’ federal and state income and federal excise returns for the 2010, 2011, and 2012 tax years for which the applicable statutes of limitations have not expired remain subject to examination by the Internal Revenue Service and state departments of revenue.
At September 30, 2013, the gross unrealized appreciation (depreciation) on investments and cost of securities on a tax basis for federal income tax purposes were as follows:
| | | | | | | | | | | | |
| | | Unrealized
Appreciation | | | Unrealized
Depreciation | | | Net Unrealized
Appreciation (Depreciation) | | Cost of Securities
on a Tax Basis |
U.S. Government Securities | | | $16,556,526 | | | | ($14,414,094) | | | $2,142,432 | | $873,179,558 |
Quality Income | | | 150,903 | | | | (132,045) | | | 18,858 | | 73,670,469 |
Tax-Free Income | | | 3,007,015 | | | | (27,759,127) | | | (24,752,112) | | 170,982,946 |
Minnesota Tax-Free Income | | | 7,293,743 | | | | (15,605,105) | | | (8,311,362) | | 367,535,753 |
NOTES TO FINANCIAL STATEMENTS (Unaudited)
Six Months Ended September 30, 2013 (Continued)
Net investment income and net realized gains may differ for financial statement and tax purposes. The character of distributions made during the year for net investment income or net realized gains may also differ from its ultimate characterization for tax purposes. The tax character of distributions paid during the fiscal years or period ended March 31, 2013 and 2012 were as follows:
| | | | | | | | | | | | | | | | | | | | |
Year or Period Ended March 31, 2013: | |
| | | | | |
| | | | | | Tax-Exempt | | | Long Term | | | | | | | |
| | | Ordinary Income | | | Income | | | Capital Gain | | | Return of Capital | | | Total | |
| | | | |
U.S. Government Securities | | | $24,620,957 | | | | — | | | | — | | | | $899,593 | | | | $25,520,550 | |
Quality Income | | | 13,470 | | | | — | | | | — | | | | — | | | | 13,470 | |
Tax-Free Income* | | | 75,807 | | | | $6,859,570 | | | | — | | | | — | | | | 6,935,377 | |
Minnesota Tax-Free Income* | | | 62,713 | | | | 13,462,345 | | | | — | | | | — | | | | 13,525,058 | |
* 98.9% and 99.5% of dividends were derived from interest on tax-exempt securities, on the Tax-Free Income and Minnesota Tax-Free Income Funds, respectively. | |
| | | | | | | | | | | | | | | | |
Year Ended March 31, 2012: | |
| | | | |
| | | | | | Tax-Exempt | | | Long Term | | | | |
| | | Ordinary Income | | | Income | | | Capital Gain | | | Total | |
| | | | |
U.S. Government Securities | | | $36,820,960 | | | | — | | | | — | | | | $36,820,960 | |
Tax-Free Income* | | | 83,152 | | | | $6,692,790 | | | | — | | | | 6,775,942 | |
Minnesota Tax-Free Income* | | | 83,224 | | | | 13,258,104 | | | | — | | | | 13,341,328 | |
* 98.8% and 99.4% of dividends were derived from interest on tax-exempt securities, on the Tax-Free Income and Minnesota Tax-Free Income Funds, respectively. | |
As of March 31, 2013 the components of distributable earnings on a tax basis were as follows:
| | | | | | | | | | | | | | | | |
| | | | | | | | | | | | Unrealized | |
| | | Undistributed | | | Undistributed | | | Accumulated | | | Appreciation | |
| | | Ordinary Income | | | Tax-Exempt Income | | | Gain (Loss) | | | (Depreciation) | |
| | | | |
U.S. Government Securities | | | — | | | | — | | | | ($5,042,051 | ) | | | $30,731,625 | |
Quality Income | | | $939 | | | | — | | | | (3,837 | ) | | | 8,742 | |
Tax-Free Income | | | — | | | | $146,311 | | | | (23,314,282 | ) | | | (10,921,121 | ) |
Minnesota Tax-Free Income | | | — | | | | 322,917 | | | | (7,528,006 | ) | | | 17,701,961 | |
Net capital loss carryovers and late year losses, if any, as of March 31, 2013, are available to offset future realized capital gains and thereby reduce future capital gains distributions. Under the Regulated Investment Company Modernization Act of 2010 (“Act”), the Funds’ are permitted to carry forward capital losses incurred in taxable years beginning after December 22, 2010 for an unlimited period. Any losses incurred during those future taxable years will be required to be utilized prior to any losses incurred in pre-enactment taxable years. Additionally, post-enactment capital losses that are carried forward will retain their character as either short-term or long-term capital losses, and will not be considered exclusively short-term as under previous law. The Funds’ first fiscal year end subject to the Modernization Act was March 31, 2012. The net capital loss carryovers and the expiration dates for capital losses carryover from pre-enactment taxable years and the late year losses deferred as of March 31, 2013, were as follows:
| | | | | | | | | | | | | | | | | | | | | | | | |
| | | Pre-Enactment | | | Post-Enactment | | | | |
| | | Net Capital Loss | | | Unlimited Period of Net | | | Late Year | | | Accumulated | |
| | | Carryover Expiring in: | | | Capital Loss Carryover | | | Losses | | | Capital and | |
| | | | | | | | | | | | |
| | | 2014 | | | 2015-2019 | | | Short-Term | | | Long-Term | | | Deferred | | | Other Losses | |
| | | | |
U.S. Government Securities | | | — | | | | — | | | $ | 1,543,618 | | | | — | | | $ | 3,498,433 | | | $ | 5,042,051 | |
Quality Income | | | — | | | | — | | | | 3,060 | | | $ | 777 | | | | — | | | | 3,837 | |
Tax-Free Income | | | — | | | $ | 19,109,911 | | | | — | | | | 4,204,371 | | | | — | | | | 23,314,282 | |
Minnesota Tax-Free Income | | $ | 1,709,459 | | | | 5,799,111 | | | | — | | | | — | | | | 19,436 | | | | 7,528,006 | |
| | |
54 | | SIT MUTUAL FUNDS SEMI-ANNUAL REPORT |
NOTES TO FINANCIAL STATEMENTS (Unaudited)
Six Months Ended September 30, 2013 (Continued)
For the year ended March 31, 2013, the Funds’ utilized capital losses and expired capital losses as follows:
| | | | | | | | | | |
| | | Utilized | | | Expiring In | | Expired | |
| | | | |
Tax-Free Income | | | — | | | 2013 | | | $3,741,370 | |
Minnesota Tax-Free Income | | | $204,074 | | | 2013 | | | 192,048 | |
Distributions
Distributions to shareholders are recorded as of the close of business on the record date. Such distributions are payable in cash or reinvested in additional shares of the Funds’ capital stock. Distributions from net investment income are declared daily and paid monthly for the Funds. Distributions from net realized gains, if any, will be made annually for each of the Funds.
Use of Estimates
The preparation of financial statements in conformity with U.S. generally accepted accounting principles requires management to make certain estimates and assumptions that affect the reported amounts of assets and liabilities and disclosure of contingent assets and liabilities at the date of the financial statements and the reported results for the respective periods. Actual results could differ from those estimates.
Guarantees and Indemnifications
Under each Fund’s organizational documents, its officers and directors are indemnified against certain liabilities arising out of the performance of their duties to each Fund. In addition, certain of each Fund’s contracts with its service providers contain general indemnification clauses. Each Fund’s maximum exposure under these arrangements is unknown since the amount of any future claims that may be made against each Fund cannot be determined and each Fund has no historical basis for predicting the likelihood of any such claims.
| (3) | Investment Security Transactions |
The cost of purchases of and proceeds from sales and maturities of investment securities, other than short-term securities, for the six months ended September 30, 2013, were as follows:
| | | | | | | | | | | | | | | | |
| | | Purchases | | | Proceeds | |
| | | | |
| | | U.S. Government | | | Other | | | U.S. Government | | | Other | |
| | | | |
U.S. Government Securities | | | $40,201,202 | | | | — | | | | $606,060,774 | | | | — | |
Quality Income | | | 44,950,648 | | | | $40,702,535 | | | | 11,239,648 | | | | $5,316,798 | |
Tax-Free Income | | | — | | | | 25,141,967 | | | | — | | | | 40,340,772 | |
Minnesota Tax-Free Income | | | — | | | | 57,519,774 | | | | — | | | | 58,626,160 | |
| (4) | Affiliated Fees and Transactions |
Investment Adviser
The Funds each have entered into an investment management agreement with Sit Investment Associates Inc. (SIA), under which SIA manages the Funds’ assets and provides research, statistical and advisory services, and pays related office rental, executive expenses and executive salaries. SIA also is obligated to pay all of the Funds’ expenses (excluding extraordinary expenses, stock transfer taxes, interest, brokerage commissions, and other transaction charges relating to investing activities). The fee for investment management and advisory services is based on the average daily net assets of the Funds at the annual rate of:
| | | | |
| | | Average Daily Net Assets | | |
| | | |
U.S. Government Securities | | 0.80% | |
Quality Income | | 0.90% | |
Tax-Free Income | | 0.80% | |
Minnesota Tax-Free Income | | 0.80% | |
NOTES TO FINANCIAL STATEMENTS (Unaudited)
Six Months Ended September 30, 2013 (Continued)
Transactions with affiliates
The investment adviser, affiliates of the investment adviser, directors and officers of the Funds as a whole owned the following shares as of September 30, 2013:
| | | | | | |
| | | Shares | | | % Shares Outstanding |
| | | |
U.S. Government Securities | | | 1,622,797 | | | 1.9 |
Quality Income | | | 3,117,094 | | | 41.2 |
Tax-Free Income | | | 3,717,440 | | | 22.3 |
Minnesota Tax-Free Income | | | 2,318,653 | | | 6.3 |
Management has evaluated the impact of all subsequent events on the Funds through the date the financial statements were issued, and has determined that there were no subsequent events that would require disclosure in or adjustments to the financial statements.
| | |
56 | | SIT MUTUAL FUNDS SEMI-ANNUAL REPORT |
EXPENSE EXAMPLE (Unaudited)
As a shareholder of the Funds, you incur two types of costs: (1) transaction costs, including redemption fees and (2) ongoing costs, including management fees; and other Fund expenses. This Example is intended to help you understand your ongoing costs (in dollars) of investing in the Funds and to compare these costs with the ongoing costs of investing in other mutual funds.
The Example is based on an investment of $1,000 invested at the beginning of the period and held for the entire period April 1, 2013 to September 30, 2013.
Actual Expenses
The first line of the following table provides information about actual account values and actual expenses. You may use the information in this line, together with the amount you invested, to estimate the expenses that you paid over the period. Simply divide your account value by $1,000 (for example, an $8,600 account value divided by $1,000 = 8.6), then multiply the result by the number in the first line under the heading entitled “Expenses Paid During Period” to estimate the expenses you paid on your account during this period.
Hypothetical Example for Comparison Purposes
The second line of the table provides information about hypothetical account values and hypothetical expenses based on the Fund’s actual expense ratio and an assumed rate of return of 5% per year before expenses, which is not the Fund’s actual return. The hypothetical account values and expenses may not be used to estimate the actual ending account balance or expenses you paid for the period. You may use this information to compare the ongoing costs of investing in the Fund and other funds. To do so, compare this 5% hypothetical example with the 5% hypothetical examples that appear in the shareholder reports of the other funds.
Please note that the expenses shown in the table are meant to highlight your ongoing costs only and do not reflect any transactional costs, such as redemption fees. Therefore, the second line of the table is useful in comparing ongoing costs only, and will not help you determine the relative total costs of owning different funds. In addition, if these transactional costs (redemption fees) were included, your costs would have been higher.
| | | | | | | | |
| | | Beginning
Account
Value
(4/1/13) | | Ending
Account
Value
(9/30/13) | | | Expenses
Paid During
Period
(4/1/13-
9/30/13)* |
|
| U.S. Government Securities Fund |
|
Actual | | $1,000 | | | $981.70 | | | $3.97 |
Hypothetical | | $1,000 | | | $1,021.06 | | | $4.05 |
|
| Quality Income Fund |
|
Actual | | $1,000 | | | $999.70 | | | $4.51 |
Hypothetical | | $1,000 | | | $1,020.56 | | | $4.56 |
|
| Tax-Free Income Fund |
|
Actual | | $1,000 | | | $939.90 | | | $3.89 |
Hypothetical | | $1,000 | | | $1,021.06 | | | $4.05 |
|
| Minnesota Tax-Free Income Fund |
|
Actual | | $1,000 | | | $955.00 | | | $3.92 |
Hypothetical | | $1,000 | | | $1,021.06 | | | $4.05 |
|
*Expenses are equal to the Funds’ annualized expense ratio of 0.80% for the U.S. Government Securities, Tax-Free Income and Minnesota Tax-Free Funds; and 0.90% for the Quality Income Fund, multiplied by the average account value over the period, multiplied by 183/365 (to reflect the one-half year period.)
ADDITIONAL INFORMATION (Unaudited)
PROXY VOTING
Each fund follows certain policies and procedures for voting proxies for securities held in each portfolio. A description of the Funds’ proxy voting policies and procedures is available without charge upon request by calling the Funds at 1-800-332-5580.
Information regarding how each Fund voted proxies relating to its portfolio securities during the most recent twelve-month period ended June 30 is available without charge upon request by calling the Funds at 1-800-332-5580, and is available on the U.S. Securities and Exchange Commission’s website at www.sec.gov.
AVAILABILITY OF QUARTERLY PORTFOLIO SCHEDULES
The Funds’ file their complete schedules of portfolio holdings with the U.S. Securities and Exchange Commission (SEC) for the first and third quarters of each fiscal year on Form N-Q. The Funds’ Form N-Qs are available without charge upon request by calling the Funds at 1-800-332-5580 and are available on the SEC’s website at www.sec.gov. In addition, the Funds’ Form N-Qs may be reviewed and copied at the SEC’s Public Reference Room in Washington, DC. Information on the operation of the Public Reference Room may be obtained by calling 1-202-551-8090.
| | |
58 | | SIT MUTUAL FUNDS SEMI-ANNUAL REPORT |
[This page intentionally left blank.]
[This page intentionally left blank.]
Semi-Annual Report September 30, 2013 INVESTMENT ADVISER INDEPENDENT REGISTERED PUBLIC Sit Investment Associates, Inc. ACCOUNTING FIRM 3300 IDS Center KPMG LLP Minneapolis, MN 55402 Minneapolis, MN CUSTODIAN LEGAL COUNSEL The Bank Of New York Mellon Dorsey & Whitney LLP One Wall Street Minneapolis, MN New York, NY 10286 TRANSFER AGENT AND DISBURSING AGENT BNY Mellon Investment Servicing (US) Inc. 4400 Computer Drive Westborough, MA 01581 Sit Mutual Funds 1-800-332-5580 www.sitfunds.com
Item 2: Code of Ethics. Not applicable to Semi-Annual Report.
Item 3: Audit Committee Financial Expert. Not applicable to Semi-Annual Report.
Item 4: Principal Accountant Fees and Services. Not applicable to Semi-Annual Report.
Item 5: Audit Committee of Listed Registrants.
Not applicable to open-end investment companies.
Item 6: Schedule of Investments.
The schedule of investments is included as part of the report to shareholders filed under Item 1 of this Form.
Item 7: Disclosure of Proxy Voting Policies and Procedures for Closed-End Management Investment Companies.
Not applicable to open-end investment companies.
Item 8: Portfolio Managers of Closed-End Management Companies.
Not applicable to open-end investment companies.
Item 9: Purchases of Equity Securities by Closed-End Management Investment Company and Affiliated Purchasers.
Not applicable to open-end investment companies.
Item 10. Submission of Matters to a vote of Security Holders.
There have been no material changes to the procedures by which shareholders may recommend nominees to the registrant’s board of directors.
Item 11: Controls and Procedures -
(a) Based on their evaluation of the Registrant’s Disclosure Controls and Procedures as of a date within 90 days of the Filing Date, the Registrant’s Chairman and Treasurer have determined that the Disclosure Controls and Procedures (as defined in Rule 30a-2(c) under the Act) are designed to ensure that information required to be disclosed by the Registrant is recorded, processed, summarized and reported by the filing Date, and that information required to be disclosed in the report is communicated to the Registrant’s management, as appropriate, to allow timely decisions regarding required disclosure.
b) There were no changes in the Registrant’s internal control over financial reporting as defined in Rule 30a-3(d) under the Act) that occurred during the Registrant’s last fiscal half-year that has materially affected, or is reasonably likely to materially affect, the Registrant’s internal control over financial reporting.
Item 12: Exhibits:
(a) The following exhibits are attached to this Form N-CSR:
(2) A separate certification for each principal executive and principal financial officer of the registrant as required by Rule 30a-2(a) under the Act (17 CFR 270.30a-2) (certification required by Section 302 of the Sarbanes-Oxley Act of 2002).
(b) Certification required by Rule 30a-2(b) under the Act (certification required by Section 906 of the Sarbanes-Oxley Act of 2002).
SIGNATURES
Pursuant to the requirements of the Securities Exchange Act of 1934 and the Investment Company Act of 1940, the registrant has duly caused this report to be signed on its behalf by the undersigned, thereunto duly authorized.
SIT U.S. GOVERNMENT SECURITIES FUND, INC.
| | | | |
| By (Signature and Title) | | /s/ Paul E. Rasmussen | | |
| | Paul E. Rasmussen | | |
| | Vice President, Treasurer | | |
| Date November 29, 2013 | | | | |
Pursuant to the requirements of the Securities Exchange Act of 1934 and the Investment Company Act of 1940, this report has been signed below by the following persons on behalf of the registrant and in the capacities and on the dates indicated.
| | | | |
| By (Signature and Title) | | /s/ Paul E. Rasmussen | | |
| | Paul E. Rasmussen | | |
| | Vice President, Treasurer | | |
| Date November 29, 2013 | | | | |
| | |
| By (Signature and Title) | | /s/ Roger J. Sit | | |
| | Roger J. Sit | | |
| | Chairman | | |
| Date November 29, 2013 | | | | |