Exhibit 99.5
Photronics, Inc. Q1 2018 Financial Results Conference CallFebruary 14, 2018
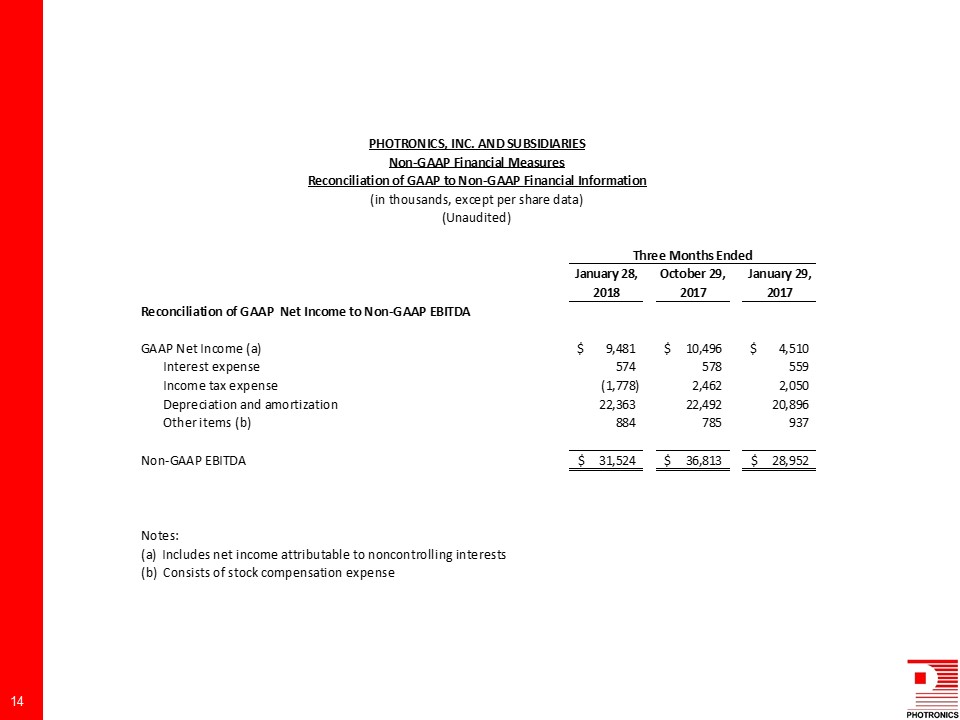
Safe Harbor Statement This presentation and some of our comments may contain projections or other forward-looking statements regarding future events, our future financial performance, and/or the future performance of the industry. These statements are predictions, and contain risks and uncertainties. Actual events or results may differ materially from those presented. These statements include words like “anticipate”, “believe”, “estimate”, “expect”, “forecast”, “may”, “should” or the negative thereto. We cannot guarantee the accuracy of any forecasts or estimates, and we are not obligated to update any forward-looking statements if our expectations change. If you would like more information on the risks involved in forward-looking statements, please see the documents we file from time to time with the Securities and Exchange Commission, specifically our most recent Form 10K and Form 10Q.Non-GAAP Financial MeasuresThis presentation and some of our comments may reference non-GAAP financial measures. These non-GAAP financial measures exclude certain income or expense items, and are consistent with another way management internally analyzes our results of operations. Non-GAAP information should be considered to be a supplement to, and not a substitute for, financial statements prepared in accordance with GAAP. Please see the “Reconciliation of GAAP to Non-GAAP Financial Information” in this presentation. 2
Revenue grew 2% Q/Q and 12% Y/Y; high-end growth achieved in both IC and FPDSequential drop in operating margin due to less than expected gross margin leverage and higher operating expensesNet income attributable to Photronics, Inc. shareholders of $5.9M ($0.09/share)Cash balance grew to $349M on operating cash flow generation and DNP contribution to PDMCX JVClosed China JV with DNP; working together to win merchant IC business Q1 2018 Summary Investing in long-term, profitable growth to increase shareholder value 3
Income Statement Summary $M (except EPS) Q1 2018 Q4 2017 Q/Q Q1 2017 Y/Y Revenue $ 123.4 $ 121.0 2% $ 109.8 12% Gross Margin 22.4% 21.9% 50 bps 20.9% 150 bps Operating Margin 9.6% 10.3% (70 bps) 7.9% 170 bps Net Income* $ 5.9 $ 5.4 10% $ 1.9 203% Diluted EPS* $ 0.09 $ 0.08 $ 0.01 $ 0.03 $ 0.06 Revenue up on FPD improvement and high-end IC growthGross margin leverage limited by unfavorable FPD product mixOpex increased sequentially as Q417 one-time favorable adjustments did not repeatQ118 tax expense includes $4.2M ($0.06/share) benefits, primarily for recognition of accumulated AMT credits resulting from the tax reform actNet income includes foreign exchange loss, net of tax and non-controlling interest, of $2.7M ($0.04/share) in Q118 and $1.4M ($0.02/share) in Q117 4 *Net income attributable to Photronics, Inc. shareholders
IC Photomask Revenue *NOTE: new high-end definition; now 28nm and smaller; total may differ due to rounding Strong high-end growth partially offset by seasonally-soft mainstreamHigh-end growth driven by logic demand, primarily in AsiaRecord revenue from PDMC (Taiwan JV)Memory down sequentiallyRevenue expectations mixed in Q2High-end memory up; logic mixed with high-end pauseIncrease in China revenue expected with PDMCX JV now establishedExpect to maintain or increase market share $M Q1 2018 Q4 2017 Q/Q Q1 2017 Y/Y High-End* $ 33.4 $ 30.5 10% $ 22.2 51% Mainstream $ 62.3 $ 65.6 (5%) $ 64.2 (3%) Total $ 95.7 $ 96.1 (0%) $ 86.4 11% 5
FPD Photomask Revenue *≥G8 and AMOLED; total may differ due to rounding Customers ramping new designs to improve fab utilization; expect trend to continue in Q2Plan to begin installing P-800 in Korea end of Q2 to drive technology leadership in rapidly growing AMOLED market $M Q1 2018 Q4 2017 Q/Q Q1 2017 Y/Y High-End* $ 18.8 $ 17.1 10% $ 17.2 9% Mainstream $ 9.0 $ 7.8 15% $ 6.2 45% Total $ 27.8 $ 24.9 11% $ 23.4 19% 6
Select Financial Data $M Q1 2018 Q4 2017 Q1 2017 Cash $ 349 $ 308 $ 330 Debt $ 61 $ 62 $ 66 Net Cash* $ 288 $ 246 $ 264 Operating Cash Flow $ 31 $ 23 $ 32 Capital Expenditures $ 11 $ 53 $ 10 LTM EBITDA $ 122 $ 119 $ 129 Cash balance grew on strong operating cash generation and $12M initial contribution from JV partner in China2018 capex expected to be ~$250M, primarily for China IC & FPD investmentsBalance sheet is able to fund planned investments and strategic M&A opportunities 7 *Net cash defined as cash and cash equivalents less long-term borrowings (including current portion), as reported in accordance with GAAP
Q2 2018 Guidance Revenue ($M) $120 - $128 Taxes ($M) $3 - $4 EPS $0.04 - $0.09 Diluted Shares (M) ~69 High-end demand expectations mixed in Q218More AMOLED display capacity coming online; mask demand improves as customers release new designs to maintain utilization ratesHigh-end memory up; logic likely downExpect margin headwinds in H218 as China operations begin to ramp ahead of production in early 2019 8
Thank you for your interest! For Additional Information:R. Troy Dewar, CFADirector, Investor Relations203.740.5610tdewar@photronics.com
Appendix
IC FPD Announced August 2016 August 2017 Location Xiamen Hefei Investment ($M) $160M $160M Structure Majority-owned JV Wholly-owned Investment time period 5 years 5 years Technology High-end, mainstream, logic, memory Up to G10.5+, AMOLED Production start Early 2019 Spring 2019 Projected sales $150M (total for both operations) Investing in China Operations 11 PLAB well positioned for these investmentsGlobal merchant market and technology leaderStrong footprint in AsiaBalance sheet to support investment
IC Photomask Revenue 12 Mainstream$249.3M69% High-End$110.2M31% High-End: 28nm and smaller; total may differ due to rounding
FPD Photomask Revenue 13 Mainstream$35.3M34% High-End$69.4M66% High-End: ≥G8 and AMOLED; total may differ due to rounding Mainstream$32.5M32% High-End$67.9M68%
14