Exhibit 99.5
Photronics, Inc. Q2 2020 Financial Results Conference CallMay 27, 2020
Safe Harbor Statement 2 This presentation and some of our comments may contain projections or other forward-looking statements regarding future events, our future financial performance, and/or the future performance of the industry. These statements are predictions, and contain risks and uncertainties. Actual events or results may differ materially from those presented. These statements include words like “anticipate”, “believe”, “estimate”, “expect”, “forecast”, “may”, “plan”, “project”, “in our view” or the negative thereto. We cannot guarantee the accuracy of any forecasts or estimates, and we are not obligated to update any forward-looking statements if our expectations change. If you would like more information on the risks involved in forward-looking statements, please see the documents we file from time to time with the Securities and Exchange Commission.

Employee healthHealth monitoringAdoption of best practicesGlobal visitor policyRaw material supplyWeekly meetings to monitor global supply chainConstant contact with suppliersCustomer supportOpen communications with customers to understand needsConstant contact with logistic partnersTool maintenanceEngagement with virtual service technicians where feasibleReliance on self-service expertise Response to COVID-19: Four Key Focus Areas 3
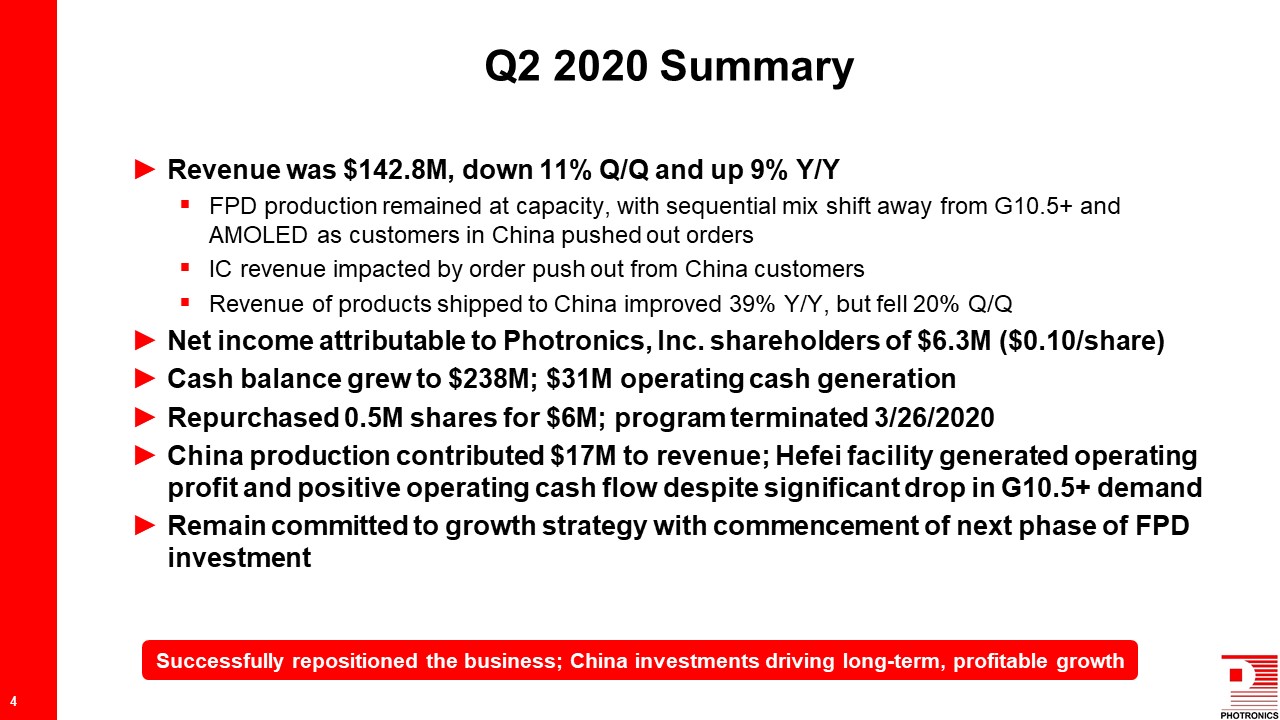
Revenue was $142.8M, down 11% Q/Q and up 9% Y/YFPD production remained at capacity, with sequential mix shift away from G10.5+ and AMOLED as customers in China pushed out ordersIC revenue impacted by order push out from China customersRevenue of products shipped to China improved 39% Y/Y, but fell 20% Q/QNet income attributable to Photronics, Inc. shareholders of $6.3M ($0.10/share)Cash balance grew to $238M; $31M operating cash generationRepurchased 0.5M shares for $6M; program terminated 3/26/2020China production contributed $17M to revenue; Hefei facility generated operating profit and positive operating cash flow despite significant drop in G10.5+ demandRemain committed to growth strategy with commencement of next phase of FPD investment Q2 2020 Summary 4 Successfully repositioned the business; China investments driving long-term, profitable growth
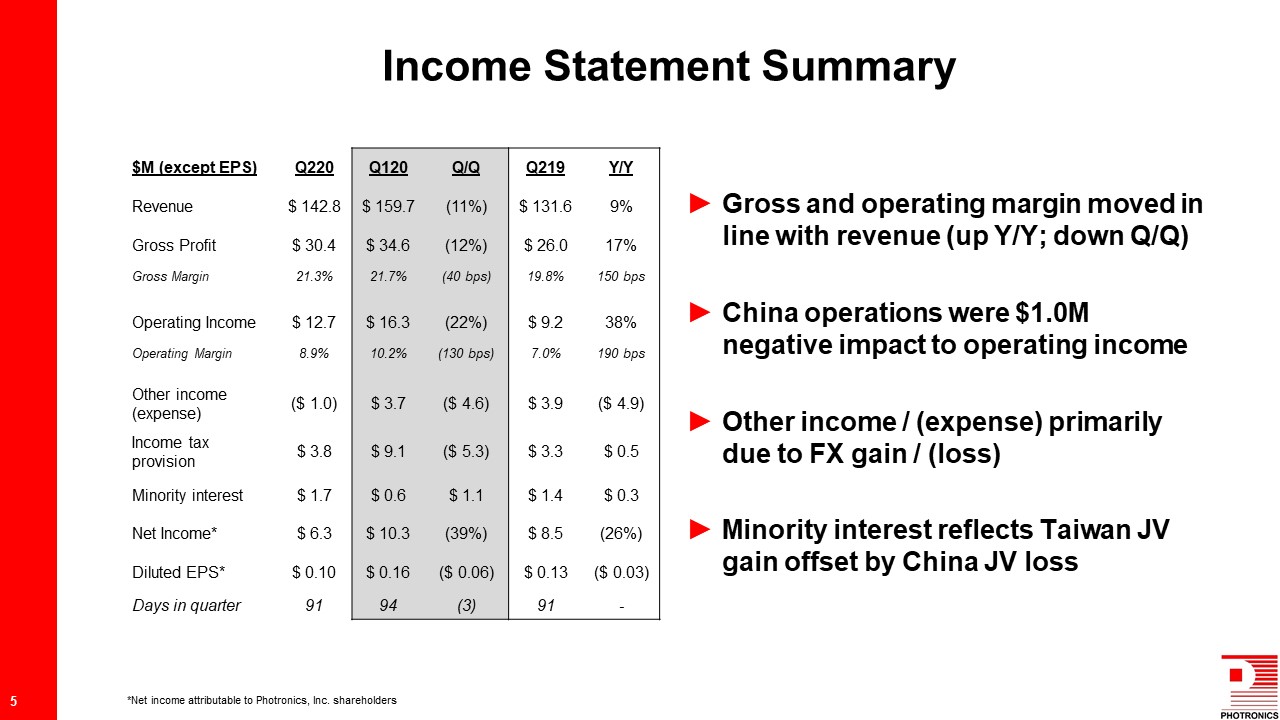
$M (except EPS) Q220 Q120 Q/Q Q219 Y/Y Revenue $ 142.8 $ 159.7 (11%) $ 131.6 9% Gross Profit $ 30.4 $ 34.6 (12%) $ 26.0 17% Gross Margin 21.3% 21.7% (40 bps) 19.8% 150 bps Operating Income $ 12.7 $ 16.3 (22%) $ 9.2 38% Operating Margin 8.9% 10.2% (130 bps) 7.0% 190 bps Other income (expense) ($ 1.0) $ 3.7 ($ 4.6) $ 3.9 ($ 4.9) Income tax provision $ 3.8 $ 9.1 ($ 5.3) $ 3.3 $ 0.5 Minority interest $ 1.7 $ 0.6 $ 1.1 $ 1.4 $ 0.3 Net Income* $ 6.3 $ 10.3 (39%) $ 8.5 (26%) Diluted EPS* $ 0.10 $ 0.16 ($ 0.06) $ 0.13 ($ 0.03) Days in quarter 91 94 (3) 91 - Gross and operating margin moved in line with revenue (up Y/Y; down Q/Q)China operations were $1.0M negative impact to operating incomeOther income / (expense) primarily due to FX gain / (loss)Minority interest reflects Taiwan JV gain offset by China JV loss Income Statement Summary 5 *Net income attributable to Photronics, Inc. shareholders
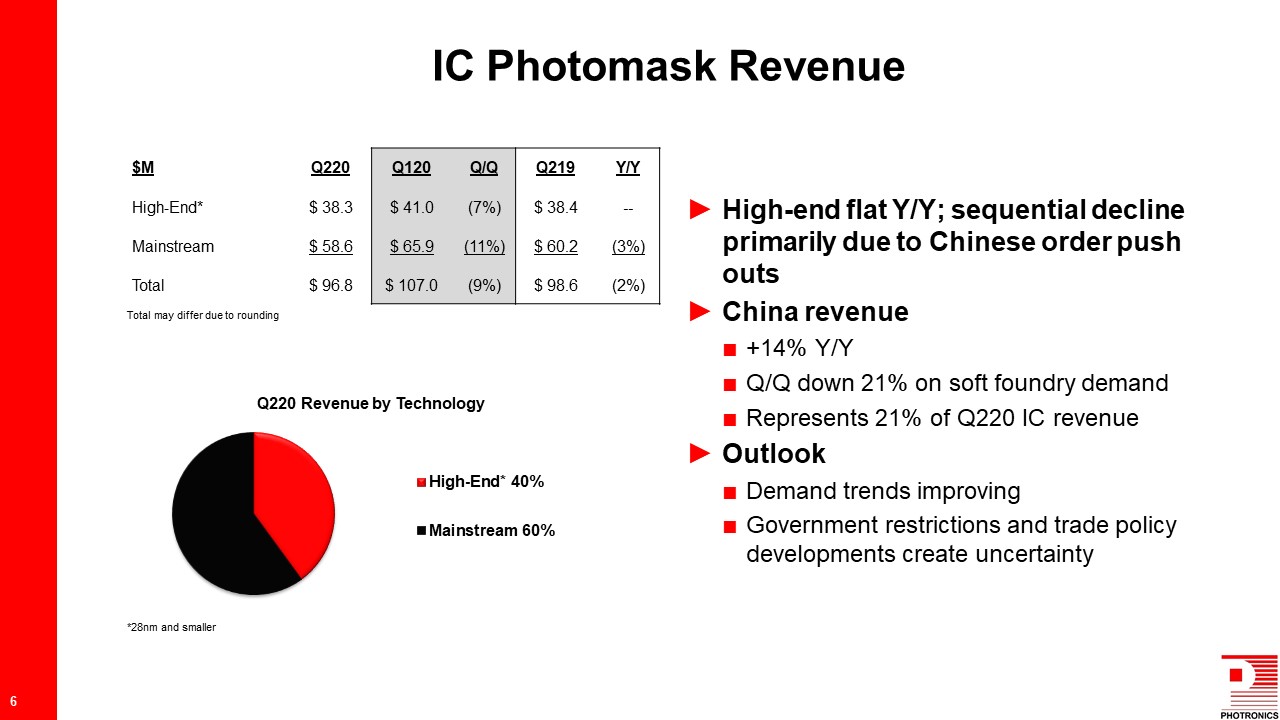
High-end flat Y/Y; sequential decline primarily due to Chinese order push outsChina revenue +14% Y/YQ/Q down 21% on soft foundry demandRepresents 21% of Q220 IC revenueOutlookDemand trends improvingGovernment restrictions and trade policy developments create uncertainty $M Q220 Q120 Q/Q Q219 Y/Y High-End* $ 38.3 $ 41.0 (7%) $ 38.4 -- Mainstream $ 58.6 $ 65.9 (11%) $ 60.2 (3%) Total $ 96.8 $ 107.0 (9%) $ 98.6 (2%) IC Photomask Revenue 6 *28nm and smaller Total may differ due to rounding

Y/Y growth due to production ramp in Hefei; Q/Q decline due to China order push out (G10.5+ & AMOLED)China revenue -20% Q/Q; +69% Y/YRepresents 57% of Q220 FPD revenueOutlookDemand trends improving for G10.5+ and AMOLEDGovernment restrictions create uncertainty, especially for mobile demandProduction should remain at capacity $M Q220 Q120 Q/Q Q219 Y/Y High-End* $ 31.8 $ 39.8 (20%) $ 22.1 44% Mainstream $ 14.1 $ 13.0 9% $ 10.9 29% Total $ 45.9 $ 52.8 (13%) $ 33.0 39% FPD Photomask Revenue 7 *≥G10.5, AMOLED and LTPS Total may differ due to rounding
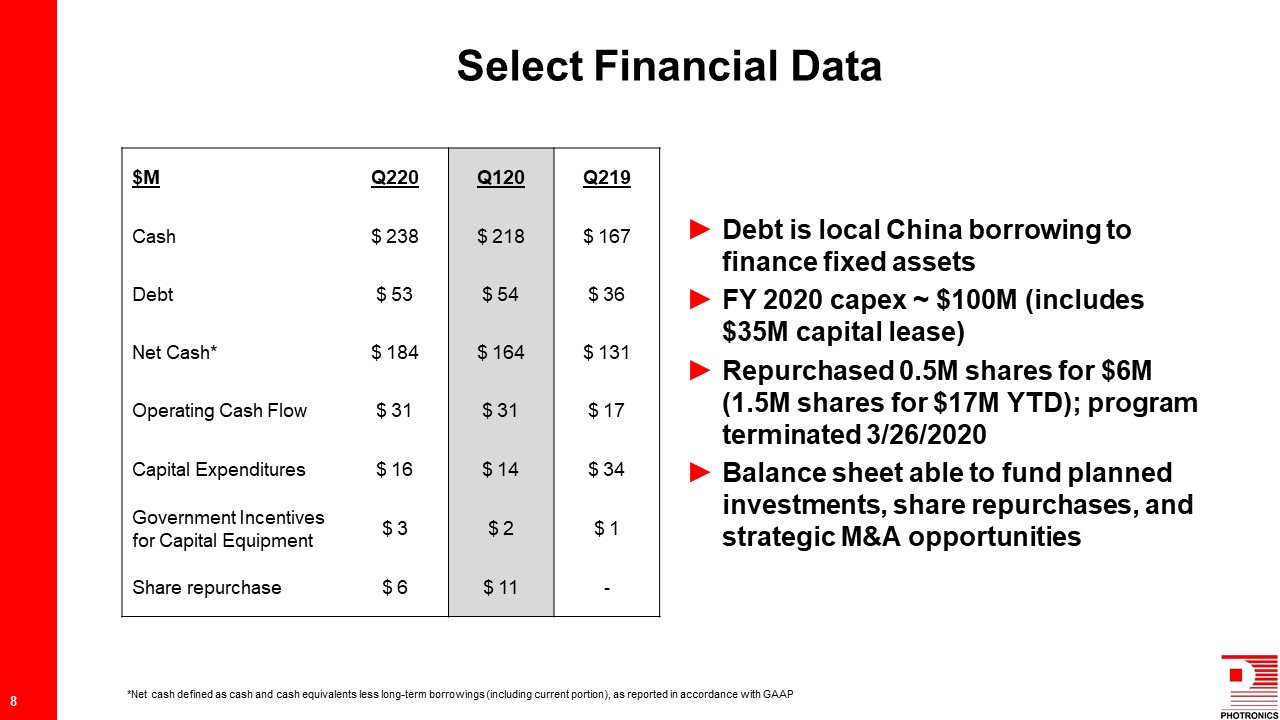
$M Q220 Q120 Q219 Cash $ 238 $ 218 $ 167 Debt $ 53 $ 54 $ 36 Net Cash* $ 184 $ 164 $ 131 Operating Cash Flow $ 31 $ 31 $ 17 Capital Expenditures $ 16 $ 14 $ 34 Government Incentives for Capital Equipment $ 3 $ 2 $ 1 Share repurchase $ 6 $ 11 - Debt is local China borrowing to finance fixed assetsFY 2020 capex ~ $100M (includes $35M capital lease)Repurchased 0.5M shares for $6M (1.5M shares for $17M YTD); program terminated 3/26/2020Balance sheet able to fund planned investments, share repurchases, and strategic M&A opportunities Select Financial Data 8 *Net cash defined as cash and cash equivalents less long-term borrowings (including current portion), as reported in accordance with GAAP
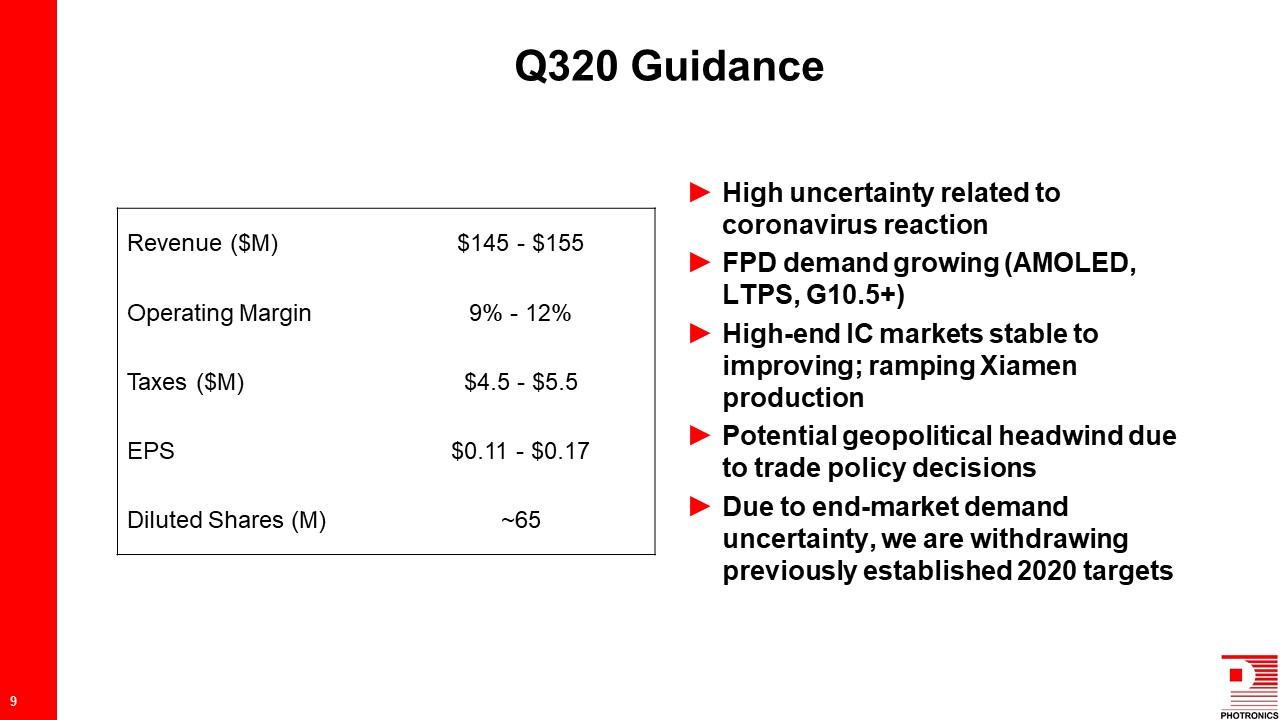
Revenue ($M) $145 - $155 Operating Margin 9% - 12% Taxes ($M) $4.5 - $5.5 EPS $0.11 - $0.17 Diluted Shares (M) ~65 High uncertainty related to coronavirus reactionFPD demand growing (AMOLED, LTPS, G10.5+)High-end IC markets stable to improving; ramping Xiamen productionPotential geopolitical headwind due to trade policy decisionsDue to end-market demand uncertainty, we are withdrawing previously established 2020 targets Q320 Guidance 9

Thank you for your interest! For Additional Information:R. Troy Dewar, CFAVice President, Investor Relations203.740.5610tdewar@photronics.com

Appendix
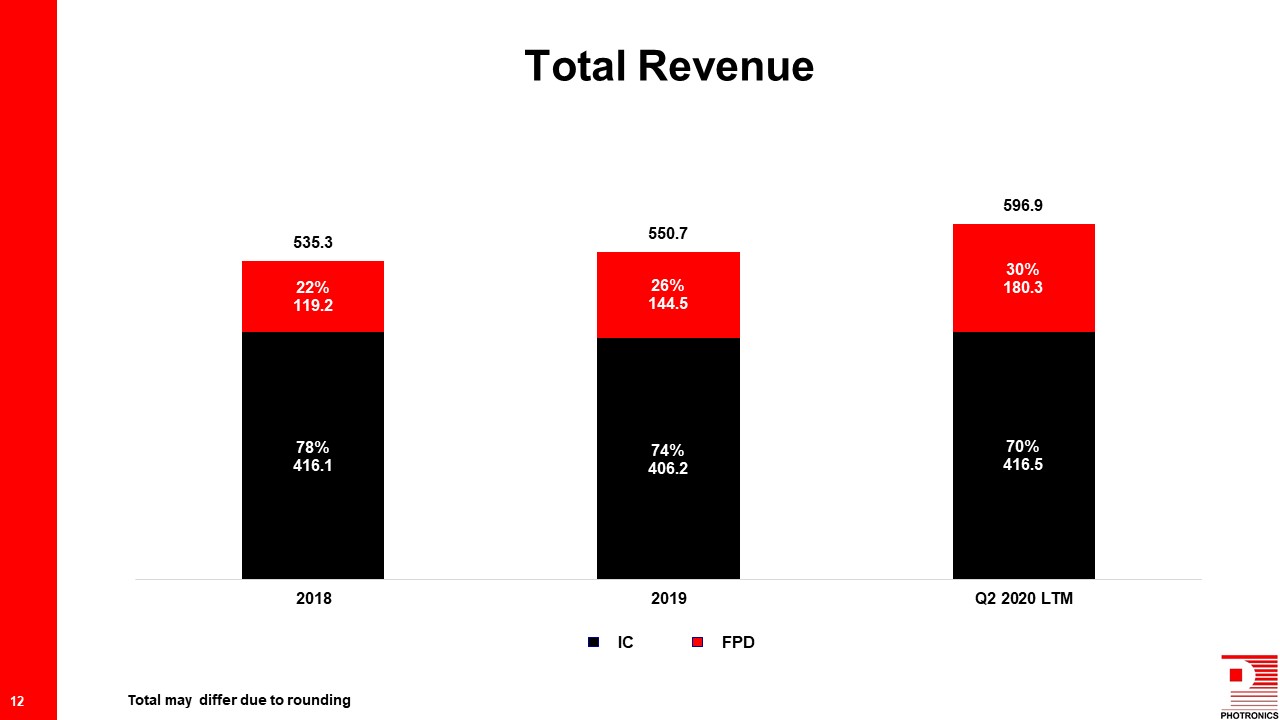
Total Revenue 12 IC FPD Total may differ due to rounding
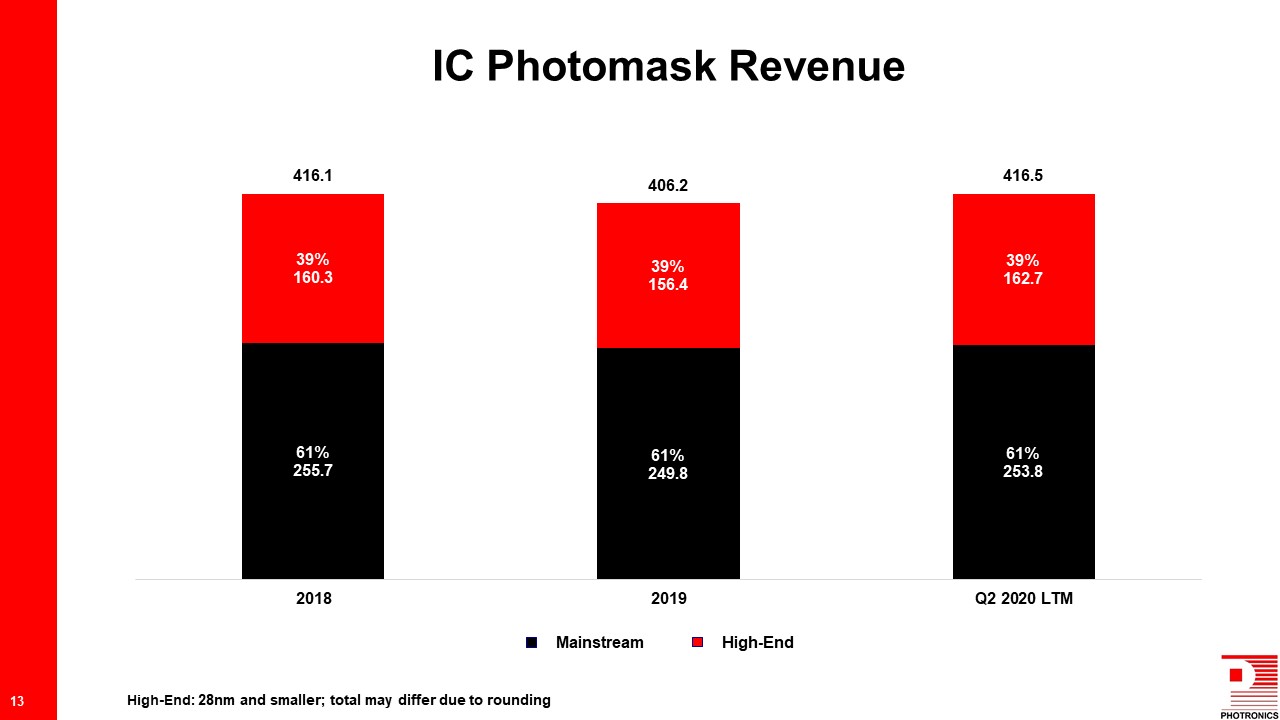
IC Photomask Revenue 13 Mainstream High-End High-End: 28nm and smaller; total may differ due to rounding
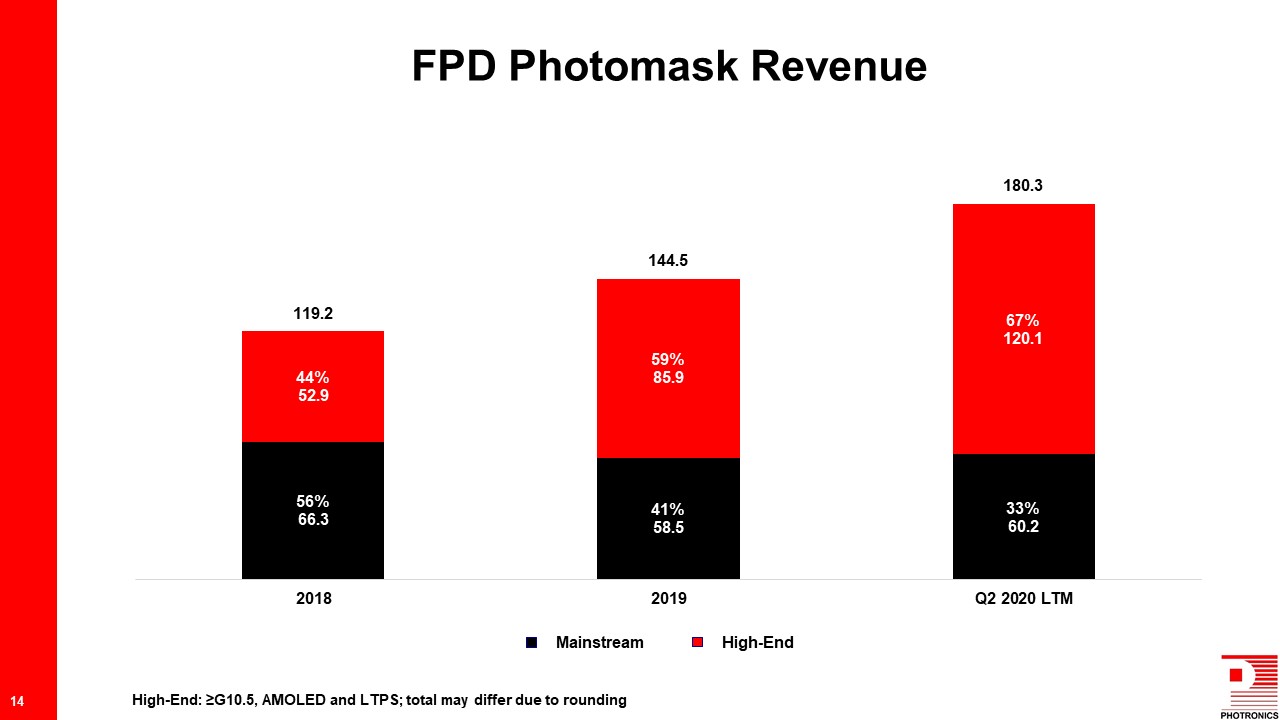
FPD Photomask Revenue 14 Mainstream High-End High-End: ≥G10.5, AMOLED and LTPS; total may differ due to rounding