Exhibit 99.1
.CN IS,C ION RHOTP .CN IS,C ION RHOTP .CN IS,C ION RHOTP PHOTRONICS, INC. 24th Annual Needham Growth Conference January 14, 2022 Global Merchant Photomask Leader


.CN IS,C ION RHOTP .CN IS,C ION RHOTP .CN IS,C ION RHOTP PHOTRONICS, INC. Safe Harbor Statement This presentation and some of our comments may contain projections or other forward-looking statements regarding future events, our future financial performance, and/or the future performance of the industry. These statements are predictions, and contain risks and uncertainties. Actual events or results may differ materially from those presented. These statements include words like “anticipate”, “believe”, “estimate”, “expect”, “forecast”, “may”, “plan”, “project”, “in our view” or the negative thereto. We cannot guarantee the accuracy of any forecasts or estimates, and we are not obligated to update any forward-looking statements if our expectations change. If you would like more information on the risks involved in forward-looking statements, please see the documents we file from time to time with the Securities and Exchange Commission. 1/14/22
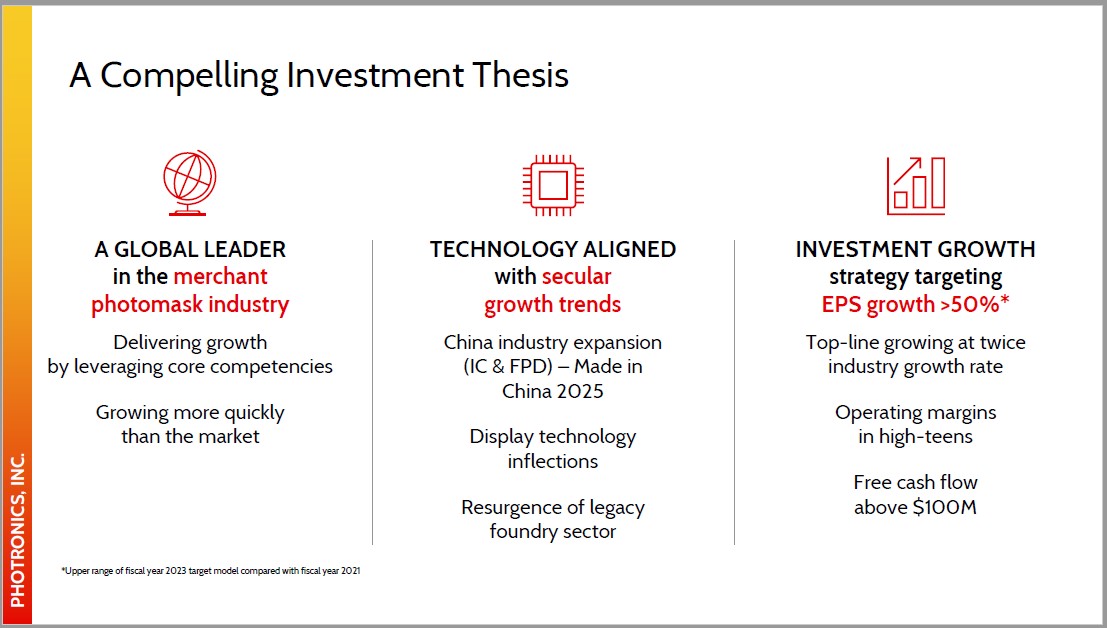
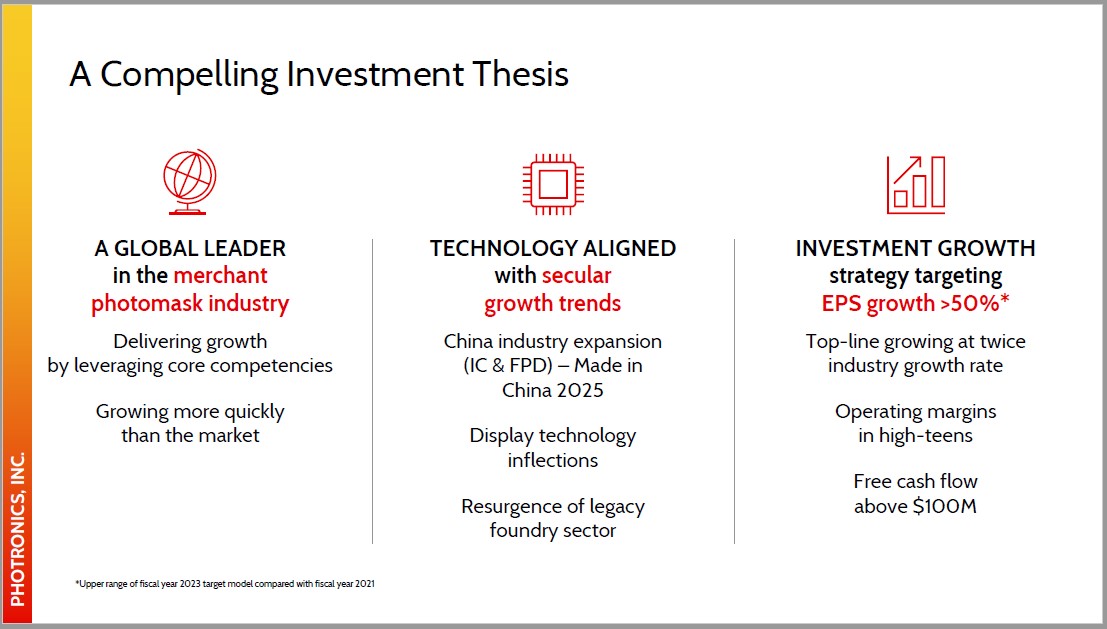
.CN IS,C ION RHOTP .CN IS,C ION RHOTP .CN IS,C ION RHOTP PHOTRONICS, INC. A Compelling Investment Thesis A GLOBAL LEADERin the merchant photomask industryDelivering growthby leveraging core competenciesGrowing more quickly than the market *Upper range of fiscal year 2023 target model compared with fiscal year 2021 INVESTMENT GROWTHstrategy targeting EPS growth >50%*Top-line growing at twice industry growth rateOperating margins in high-teensFree cash flow above $100M TECHNOLOGY ALIGNEDwith secular growth trendsChina industry expansion (IC & FPD) – Made in China 2025Display technology inflectionsResurgence of legacy foundry sector

.CN IS,C ION RHOTP .CN IS,C ION RHOTP .CN IS,C ION RHOTP PHOTRONICS, INC. Leading merchant with unmatched global presence PLAB A B CFPD D E Largest Merchant Photomask Manufacturer ($M) IC Sources: SEMI 2020 Photomask Characterization Study; internal estimates1/14/22 IC FPDIC & FPD Unmatched Global Footprint11 Strategically Located Manufacturing Facilities

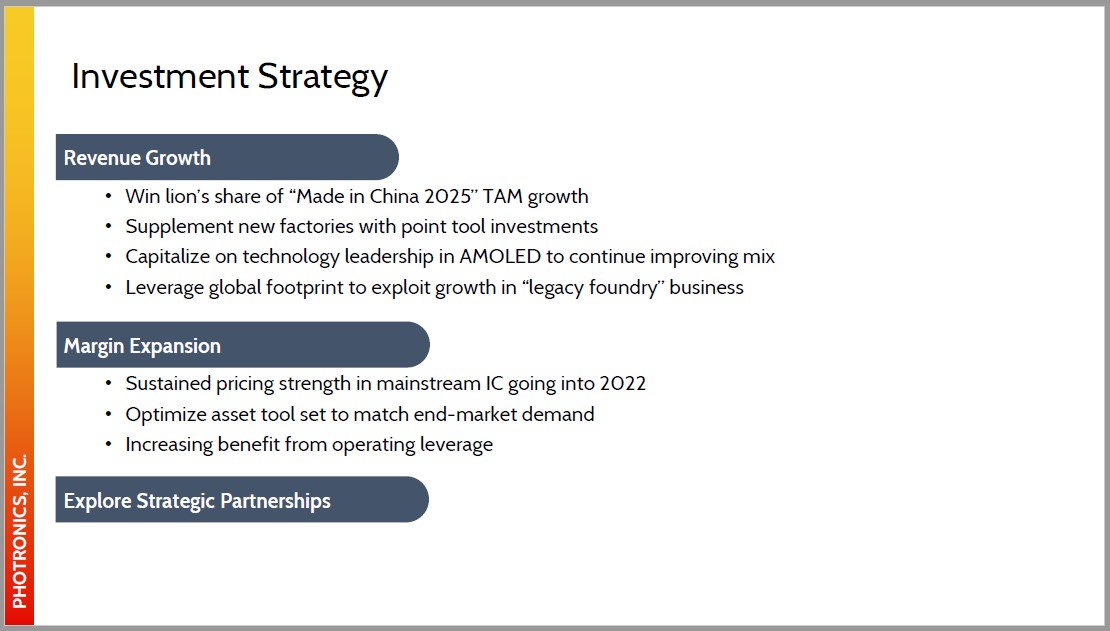
.CN IS,C ION RHOTP .CN IS,C ION RHOTP .CN IS,C ION RHOTP PHOTRONICS, INC. Investment Strategy Revenue GrowthWin lion’s share of “Made in China 2025” TAM growthSupplement new factories with point tool investmentsCapitalize on technology leadership in AMOLED to continue improving mixLeverage global footprint to exploit growth in “legacy foundry” businessMargin ExpansionSustained pricing strength in mainstream IC going into 2022Optimize asset tool set to match end-market demandIncreasing benefit from operating leverage Explore Strategic Partnerships

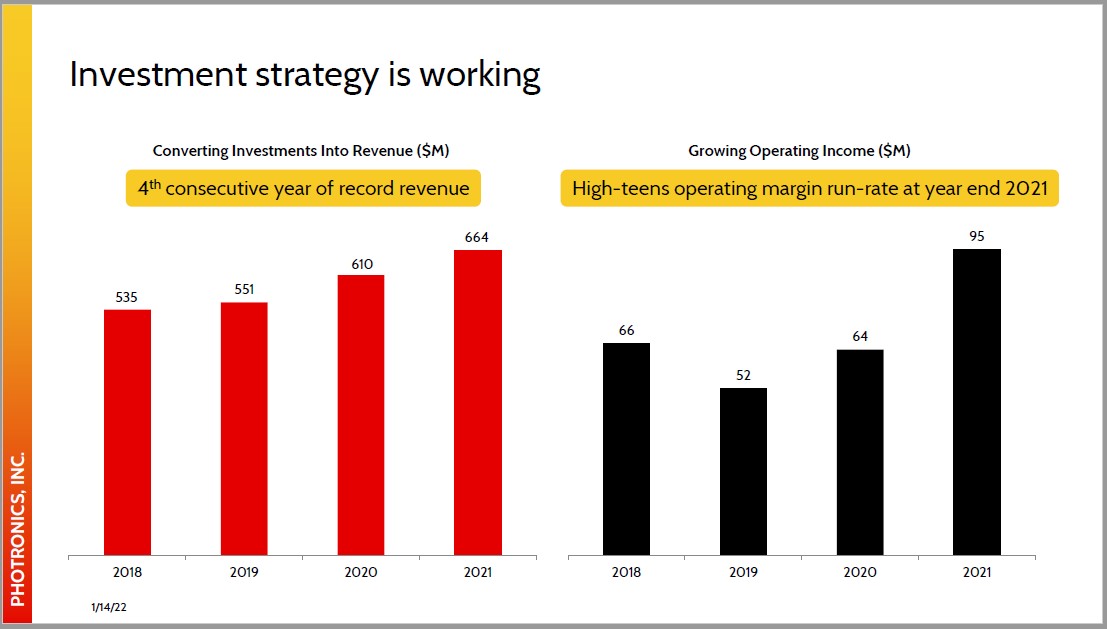
.CN IS,C ION RHOTP .CN IS,C ION RHOTP .CN IS,C ION RHOTP PHOTRONICS, INC. Investment strategy is working 535 551 610 664 2018 2019 2020 2021 66 52 64 95 2018 2019 2020 2021 1/14/22 Growing Operating Income ($M)High-teens operating margin run-rate at year end 2021 Converting Investments Into Revenue ($M)4th consecutive year of record revenue

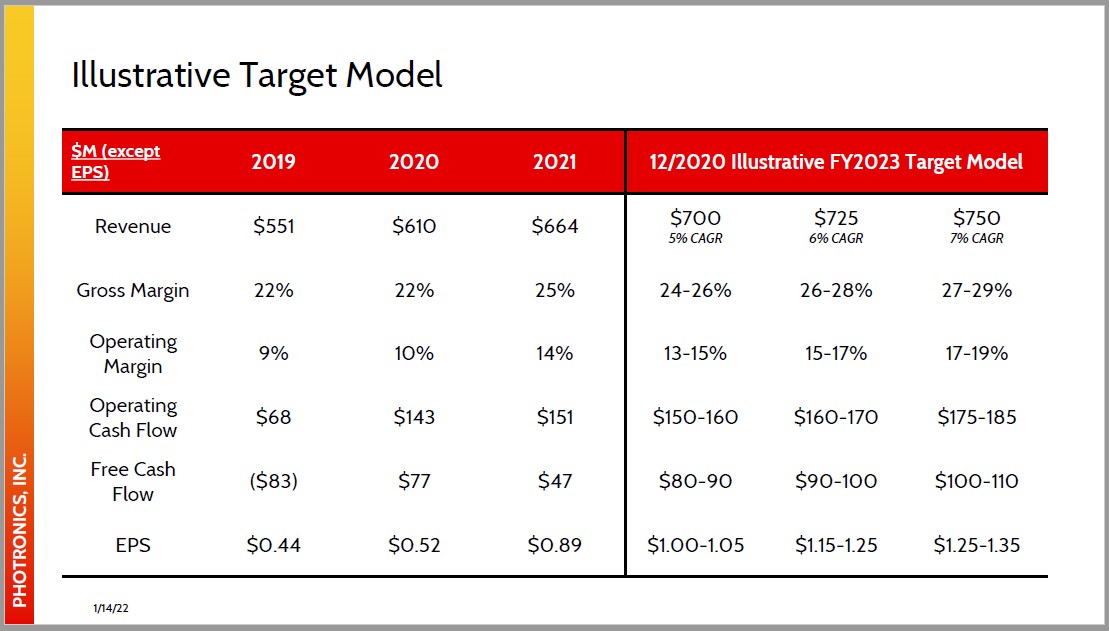
.CN IS,C ION RHOTP .CN IS,C ION RHOTP .CN IS,C ION RHOTP PHOTRONICS, INC. Illustrative Target Model $M (except EPS) 2019 2020 2021 12/2020 Illustrative FY2023 Target Model Revenue $551 $610 $664 $7005% CAGR $7256% CAGR $7507% CAGR Gross Margin 22% 22% 25% 24-26% 26-28% 27-29% Operating Margin 9% 10% 14% 13-15% 15-17% 17-19% Operating Cash Flow $68 $143 $151 $150-160 $160-170 $175-185 Free Cash Flow ($83) $77 $47 $80-90 $90-100 $100-110 EPS $0.44 $0.52 $0.89 $1.00-1.05 $1.15-1.25 $1.25-1.35 1/14/22

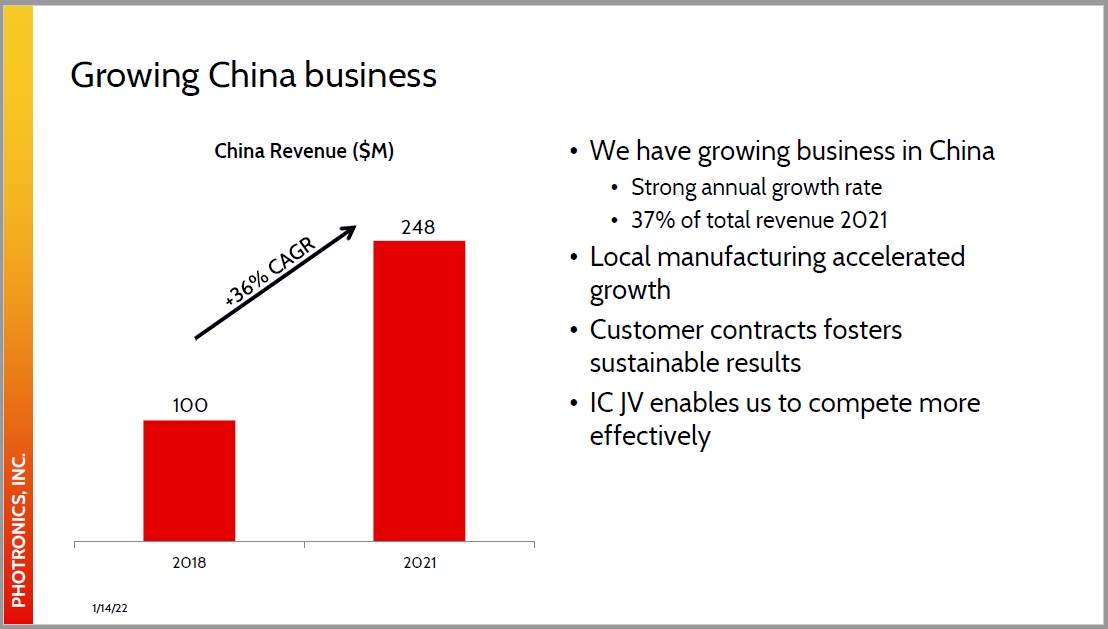
.CN IS,C ION RHOTP .CN IS,C ION RHOTP .CN IS,C ION RHOTP PHOTRONICS, INC. Growing China business 100 248 2018 2021 China Revenue ($M) We have growing business in ChinaStrong annual growth rate37% of total revenue 2021Local manufacturing accelerated growthCustomer contracts fosters sustainable resultsIC JV enables us to compete more effectively 1/14/22

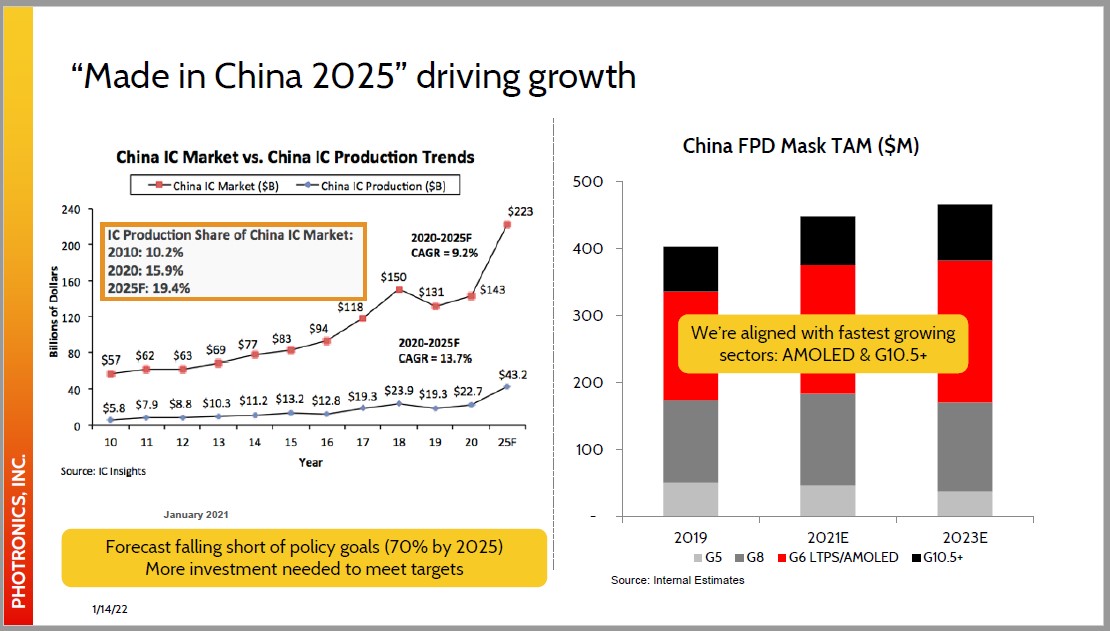
.CN IS,C ION RHOTP .CN IS,C ION RHOTP .CN IS,C ION RHOTP PHOTRONICS, INC. “Made in China 2025” driving growth - China FPD Mask TAM ($M)500400300We’re aligned with fastest growingsectors: AMOLED & G10.5+200100 2021E 2023EG8 G6 LTPS/AMOLED G10.5+ 2019G5Source: Internal Estimates 1/14/22 Forecast falling short of policy goals (70% by 2025) More investment needed to meet targets January 2021

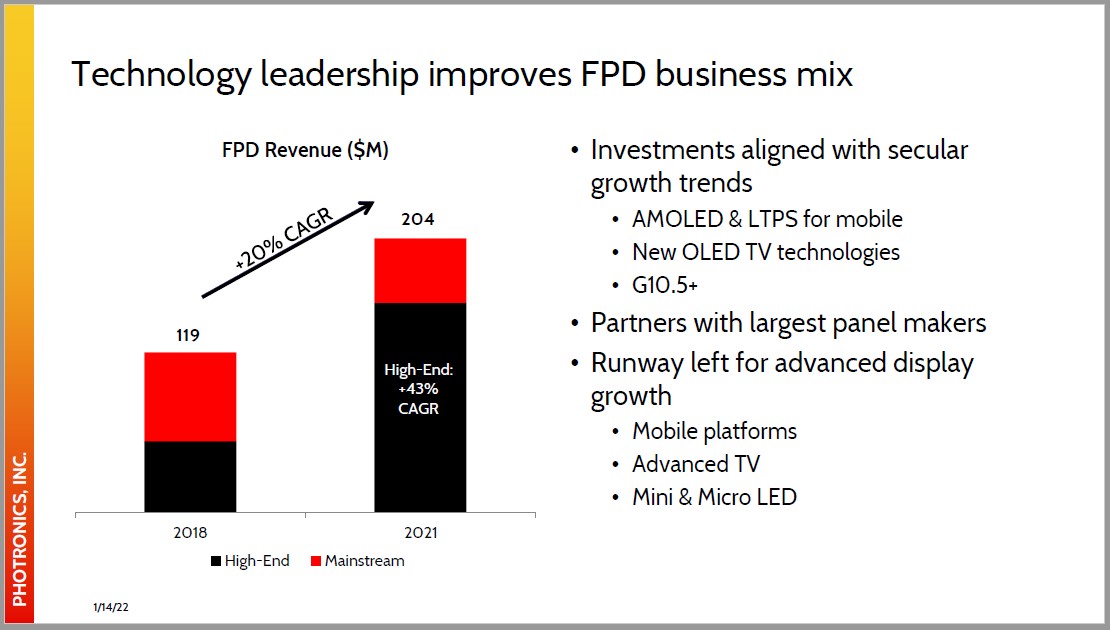
.CN IS,C ION RHOTP .CN IS,C ION RHOTP .CN IS,C ION RHOTP PHOTRONICS, INC. Technology leadership improves FPD business mix 119 204 2018 2021Mainstream FPD Revenue ($M) High-End Investments aligned with secular growth trendsAMOLED & LTPS for mobileNew OLED TV technologiesG10.5+Partners with largest panel makersRunway left for advanced display growthMobile platformsAdvanced TVMini & Micro LED 1/14/22 High-End:+43% CAGR


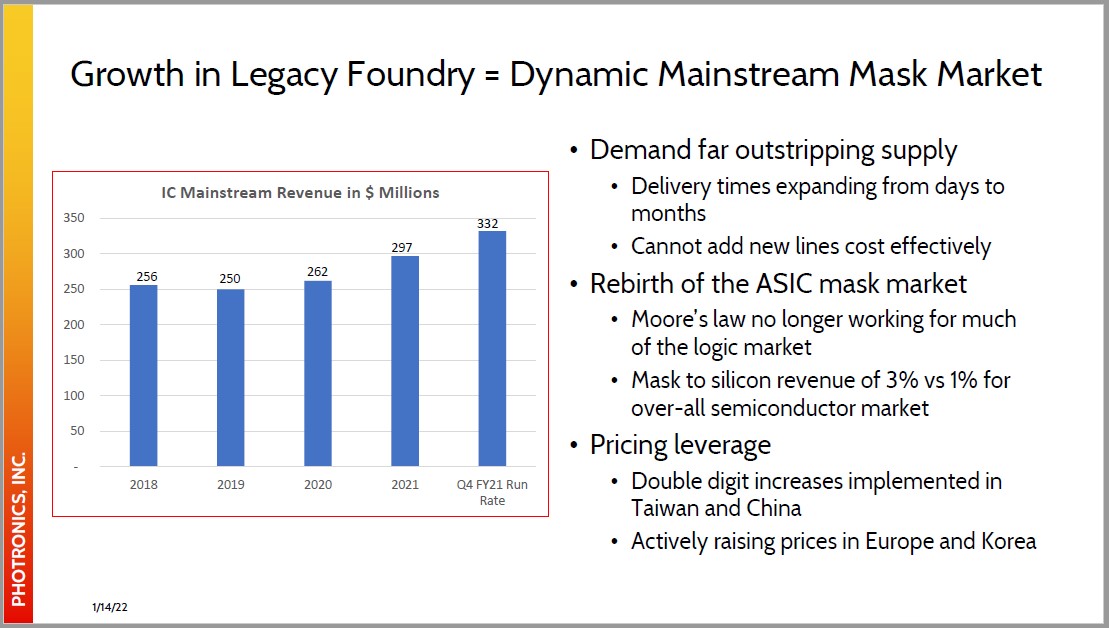
.CN IS,C ION RHOTP .CN IS,C ION RHOTP .CN IS,C ION RHOTP PHOTRONICS, INC. Growth in Legacy Foundry = Dynamic Mainstream Mask Market Demand far outstripping supplyDelivery times expanding from days to monthsCannot add new lines cost effectivelyRebirth of the ASIC mask marketMoore’s law no longer working for much of the logic marketMask to silicon revenue of 3% vs 1% for over-all semiconductor marketPricing leverageDouble digit increases implemented in Taiwan and ChinaActively raising prices in Europe and Korea 1/14/22 - 50 100 150 200 250 300 350 2018 2019 2020 2021 Q4 FY21 RunRate IC Mainstream Revenue in $ Millions 256 250 262 297 332
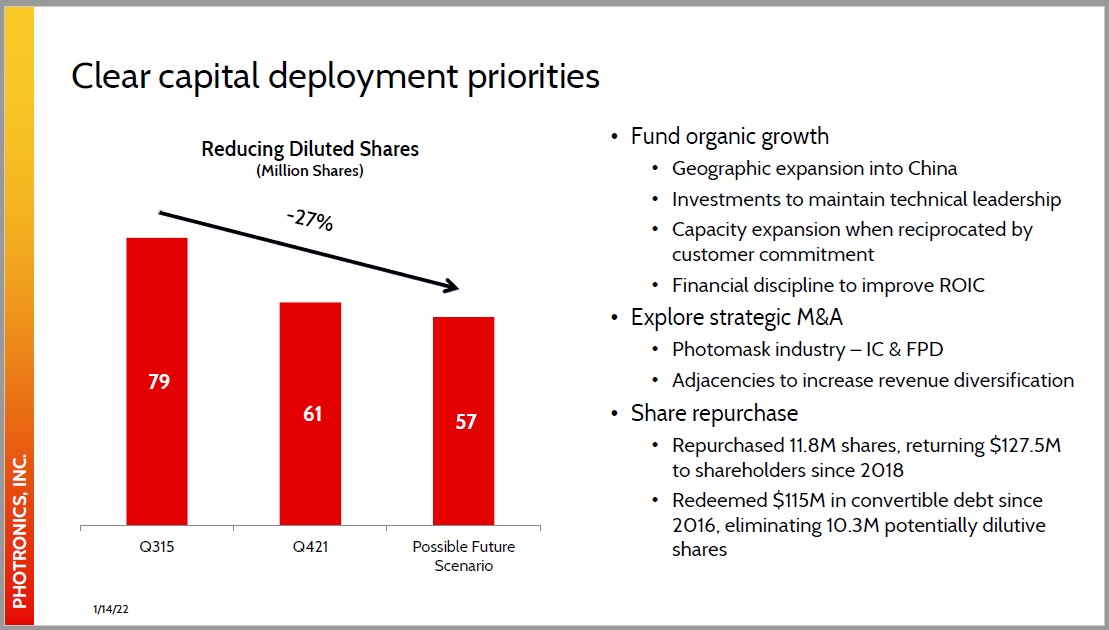
.CN IS,C ION RHOTP .CN IS,C ION RHOTP .CN IS,C ION RHOTP PHOTRONICS, INC. Clear capital deployment priorities Fund organic growthGeographic expansion into ChinaInvestments to maintain technical leadershipCapacity expansion when reciprocated by customer commitmentFinancial discipline to improve ROICExplore strategic M&APhotomask industry – IC & FPDAdjacencies to increase revenue diversificationShare repurchaseRepurchased 11.8M shares, returning $127.5M to shareholders since 2018Redeemed $115M in convertible debt since 2016, eliminating 10.3M potentially dilutive shares 79 61 57 Q315 Q421 Possible Future Scenario Reducing Diluted Shares(Million Shares) 1/14/22

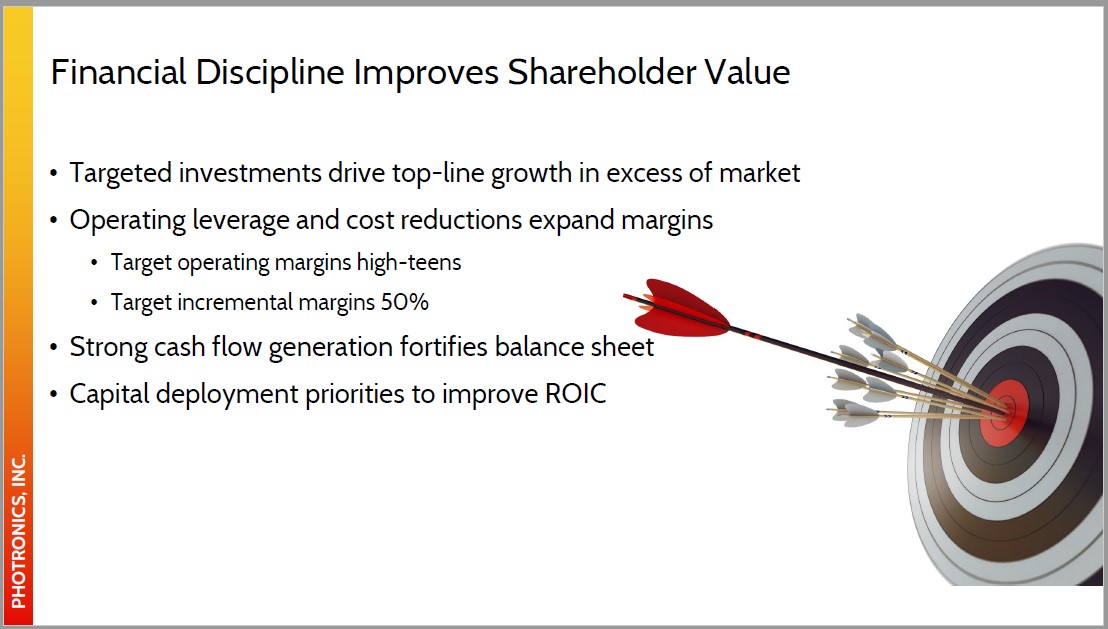
.CN IS,C ION RHOTP .CN IS,C ION RHOTP .CN IS,C ION RHOTP PHOTRONICS, INC. Financial Discipline Improves Shareholder Value Targeted investments drive top-line growth in excess of marketOperating leverage and cost reductions expand marginsTarget operating margins high-teensTarget incremental margins 50%Strong cash flow generation fortifies balance sheetCapital deployment priorities to improve ROIC

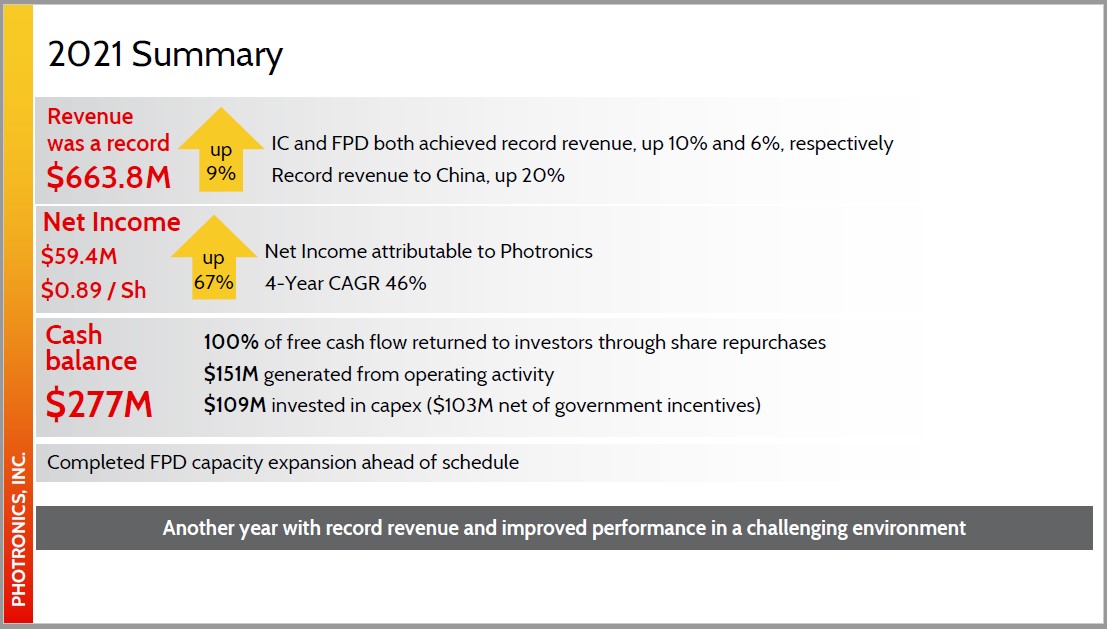
.CN IS,C ION RHOTP .CN IS,C ION RHOTP .CN IS,C ION RHOTP PHOTRONICS, INC. 2021 Summary Completed FPD capacity expansion ahead of schedule Another year with record revenue and improved performance in a challenging environment Revenue was a record$663.8M up 9% IC and FPD both achieved record revenue, up 10% and 6%, respectively Record revenue to China, up 20% Cash balance$277M 100% of free cash flow returned to investors through share repurchases$151M generated from operating activity$109M invested in capex ($103M net of government incentives) Net Income$59.4M$0.89 / Sh up 67% Net Income attributable to Photronics 4-Year CAGR 46%

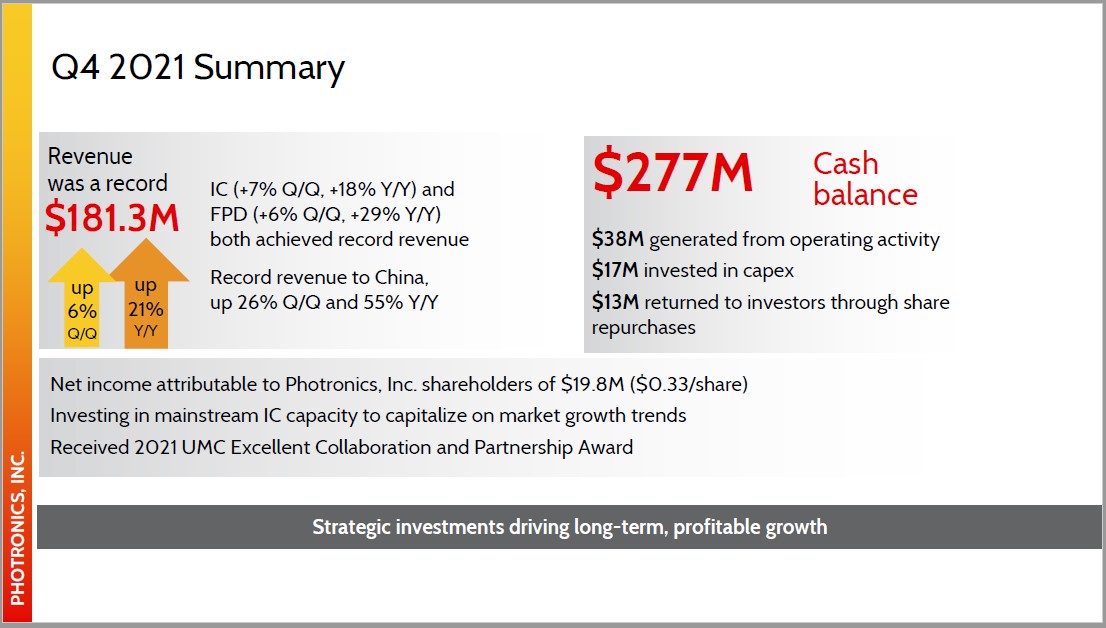
.CN IS,C ION RHOTP .CN IS,C ION RHOTP .CN IS,C ION RHOTP PHOTRONICS, INC. Q4 2021 Summary IC (+7% Q/Q, +18% Y/Y) andFPD (+6% Q/Q, +29% Y/Y)both achieved record revenueRecord revenue to China, up 26% Q/Q and 55% Y/Y Strategic investments driving long-term, profitable growth $38M generated from operating activity$17M invested in capex$13M returned to investors through share repurchases Net income attributable to Photronics, Inc. shareholders of $19.8M ($0.33/share) Investing in mainstream IC capacity to capitalize on market growth trends Received 2021 UMC Excellent Collaboration and Partnership Award Cash balance $277M Revenue was a record$181.3M up 6%Q/Q up 21%Y/Y

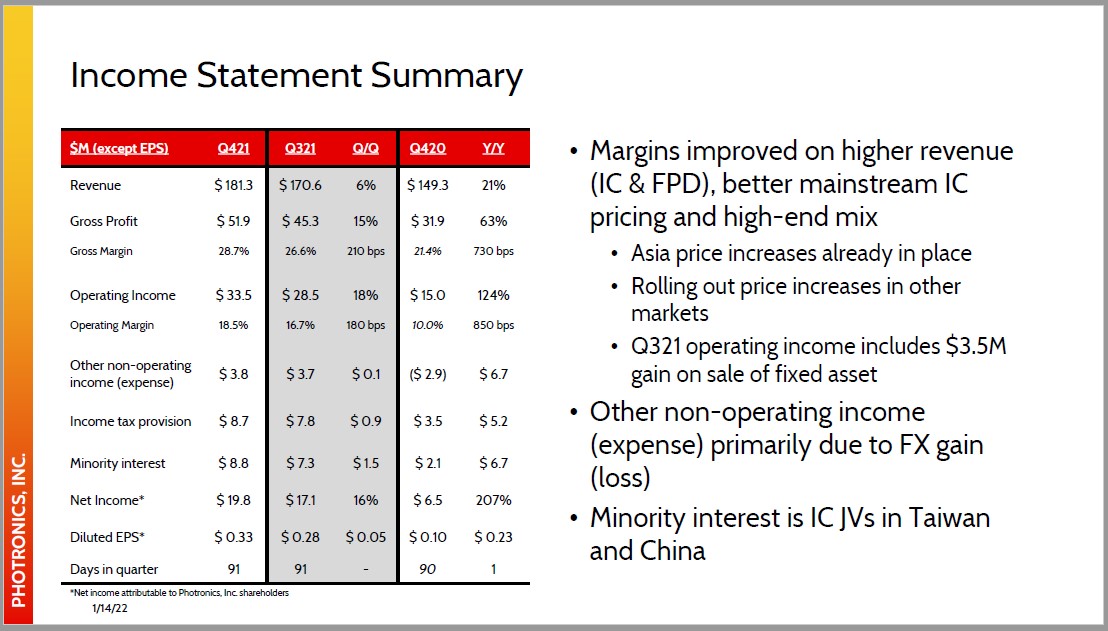
.CN IS,C ION RHOTP .CN IS,C ION RHOTP .CN IS,C ION RHOTP PHOTRONICS, INC. Income Statement Summary $M (except EPS) Q421 Q321 Q/Q Q420 Y/Y Revenue $ 181.3 $ 170.6 6% $ 149.3 21% Gross Profit $ 51.9 $ 45.3 15% $ 31.9�� 63% Gross Margin 28.7% 26.6% 210 bps 21.4% 730 bps Operating Income $ 33.5 $ 28.5 18% $ 15.0 124% Operating Margin 18.5% 16.7% 180 bps 10.0% 850 bps Other non-operating income (expense) $ 3.8 $ 3.7 $ 0.1 ($ 2.9) $ 6.7 Income tax provision $ 8.7 $ 7.8 $ 0.9 $ 3.5 $ 5.2 Minority interest $ 8.8 $ 7.3 $ 1.5 $ 2.1 $ 6.7 Net Income* $ 19.8 $ 17.1 16% $ 6.5 207% Diluted EPS* $ 0.33 $ 0.28 $ 0.05 $ 0.10 $ 0.23 Days in quarter 91 91 - 90 1 Margins improved on higher revenue (IC & FPD), better mainstream IC pricing and high-end mixAsia price increases already in placeRolling out price increases in other marketsQ321 operating income includes $3.5M gain on sale of fixed assetOther non-operating income (expense) primarily due to FX gain (loss)Minority interest is IC JVs in Taiwan and China *Net income attributable to Photronics, Inc. shareholders1/14/22

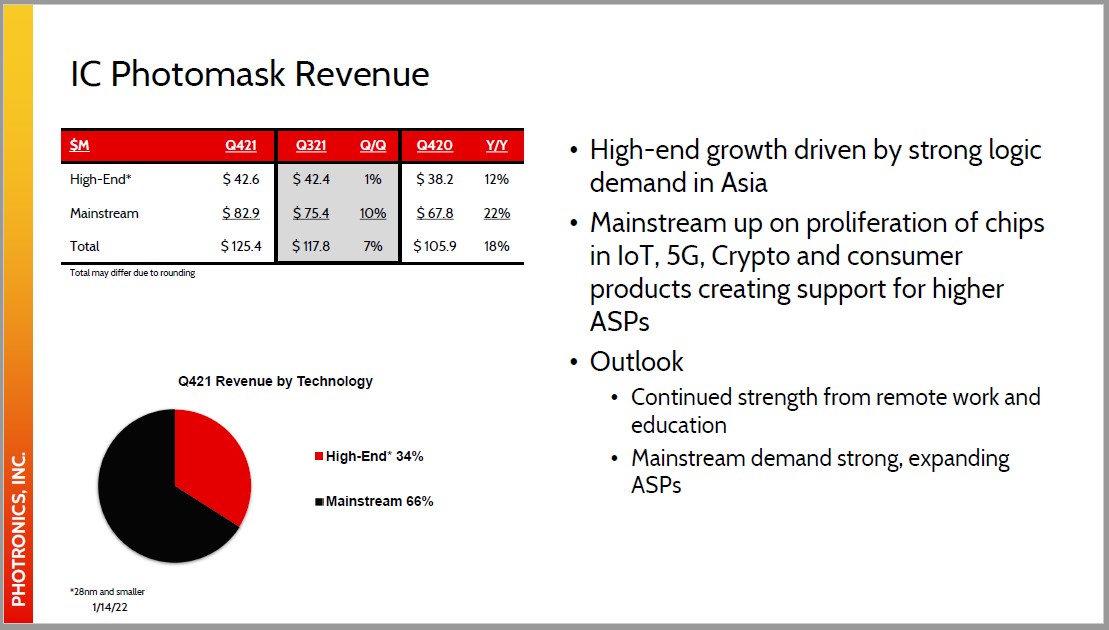
.CN IS,C ION RHOTP .CN IS,C ION RHOTP .CN IS,C ION RHOTP PHOTRONICS, INC. $M Q421 Q321 Q/Q Q420 Y/Y High-End* $ 42.6 $ 42.4 1% $ 38.2 12% Mainstream $ 82.9 $ 75.4 10% $ 67.8 22% Total $ 125.4 $ 117.8 7% $ 105.9 18% Q421 Revenue by Technology High-End* 34% Mainstream 66% IC Photomask Revenue *28nm and smaller1/14/22 High-end growth driven by strong logic demand in AsiaMainstream up on proliferation of chips in IoT, 5G, Crypto and consumer products creating support for higher ASPsOutlookContinued strength from remote work and educationMainstream demand strong, expanding ASPs Total may differ due to rounding

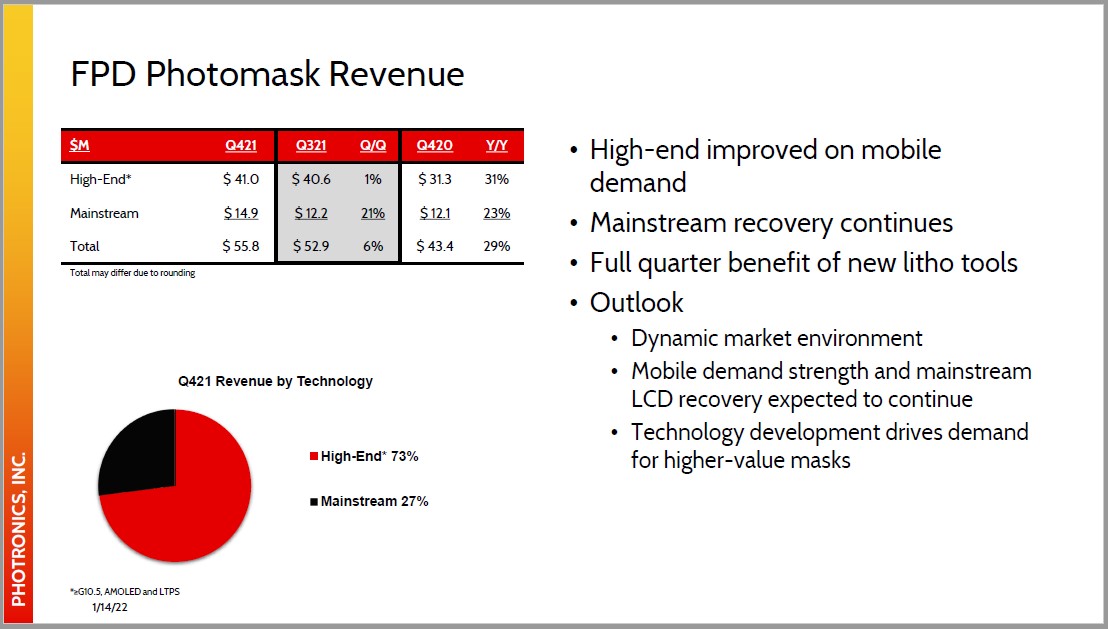
.CN IS,C ION RHOTP .CN IS,C ION RHOTP .CN IS,C ION RHOTP PHOTRONICS, INC. Q421 Revenue by Technology High-End* 73% Mainstream 27% FPD Photomask Revenue *≥G10.5, AMOLED and LTPS1/14/22 High-end improved on mobile demandMainstream recovery continuesFull quarter benefit of new litho toolsOutlookDynamic market environmentMobile demand strength and mainstream LCD recovery expected to continueTechnology development drives demand for higher-value masks $M Q421 Q321 Q/Q Q420 Y/Y High-End* $ 41.0 $ 40.6 1% $ 31.3 31% Mainstream $ 14.9 $ 12.2 21% $ 12.1 23% Total $ 55.8 $ 52.9 6% $ 43.4 29% Total may differ due to rounding

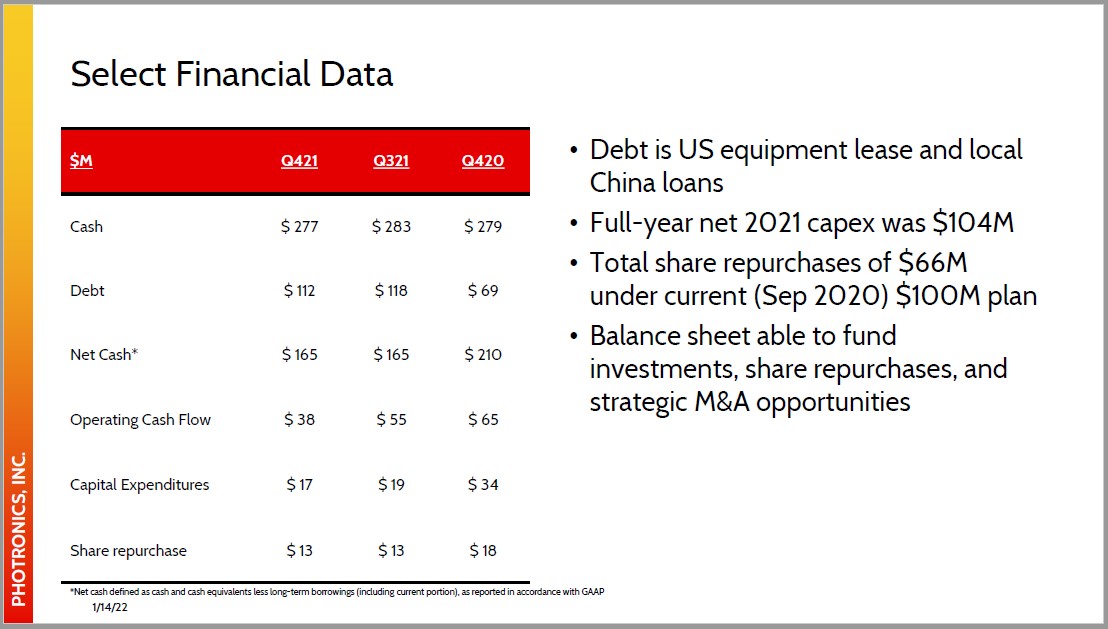
.CN IS,C ION RHOTP .CN IS,C ION RHOTP .CN IS,C ION RHOTP PHOTRONICS, INC. Select Financial Data $M Q421 Q321 Q420 Cash $ 277 $ 283 $ 279 Debt $ 112 $ 118 $ 69 Net Cash* $ 165 $ 165 $ 210 Operating Cash Flow $ 38 $ 55 $ 65 Capital Expenditures $ 17 $ 19 $ 34 Share repurchase $ 13 $ 13 $ 18 Debt is US equipment lease and local China loansFull-year net 2021 capex was $104MTotal share repurchases of $66M under current (Sep 2020) $100M planBalance sheet able to fund investments, share repurchases, and strategic M&A opportunities *Net cash defined as cash and cash equivalents less long-term borrowings (including current portion), as reported in accordance with GAAP1/14/22

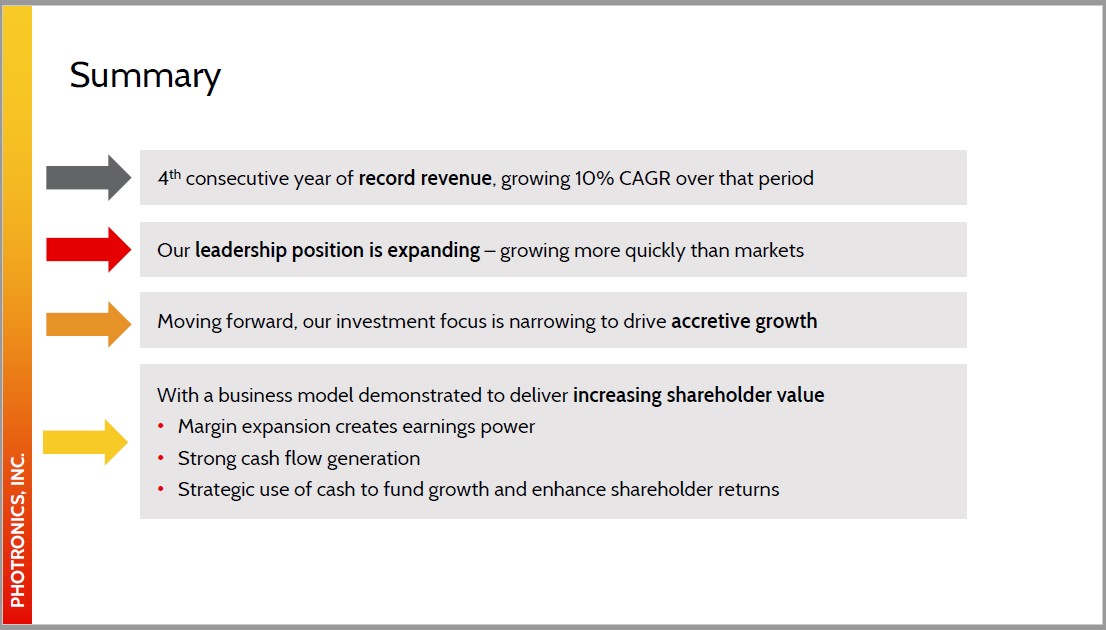
.CN IS,C ION RHOTP .CN IS,C ION RHOTP .CN IS,C ION RHOTP PHOTRONICS, INC. Summary 4th consecutive year of record revenue, growing 10% CAGR over that period Our leadership position is expanding – growing more quickly than markets With a business model demonstrated to deliver increasing shareholder valueMargin expansion creates earnings powerStrong cash flow generationStrategic use of cash to fund growth and enhance shareholder returns Moving forward, our investment focus is narrowing to drive accretive growth

.CN IS,C ION RHOTP .CN IS,C ION RHOTP .CN IS,C ION RHOTP PHOTRONICS, INC. A Compelling Investment Thesis A GLOBAL LEADERin the merchant photomask industryDelivering growthby leveraging core competenciesGrowing more quickly than the market *Upper range of fiscal year 2023 target model compared with fiscal year 2021 INVESTMENT GROWTHstrategy targeting EPS growth >50%*Top-line growing at twice industry growth rateOperating margins in high-teensFree cash flow above $100M TECHNOLOGY ALIGNEDwith secular growth trendsChina industry expansion (IC & FPD) – Made in China 2025Display technology inflectionsResurgence of legacy foundry sector

.CN IS,C ION RHOTP .CN IS,C ION RHOTP .CN IS,C ION RHOTP PHOTRONICS, INC. For Additional Information: John P. JordanExecutive Vice President & CFO 203.740.5671jjordan@photronics.com Thank you for your interest!