UNITED STATES
SECURITIES AND EXCHANGE COMMISSION
Washington, D.C. 20549
FORM N-CSR
CERTIFIED SHAREHOLDER REPORT OF REGISTERED
MANAGEMENT INVESTMENT COMPANIES
Investment Company Act file number 811-5018
Legg Mason Partners Investment Series
(Exact name of registrant as specified in charter)
| | |
| 125 Broad Street, New York, NY | | 10004 |
|
| (Address of principal executive offices) | | (Zip code) |
Robert I. Frenkel, Esq.
Legg Mason & Co., LLC
300 First Stamford Place, 4th Fl.
Stamford, CT 06902
(Name and address of agent for service)
Registrant’s telephone number, including area code: (800) 451-2010
Date of fiscal year end: October 31,
Date of reporting period: April 30, 2006
| ITEM 1. | REPORT TO STOCKHOLDERS. |
The Semi-Annual Report to Stockholders is filed herewith.
SEMI-ANNUAL
REPORT
APRIL 30, 2006


Legg Mason Partners
International Fund
INVESTMENT PRODUCTS: NOT FDIC INSURED Ÿ NO BANK GUARANTEE Ÿ MAY LOSE VALUE
Legg Mason Partners International Fund
Semi-Annual Report • April 30, 2006
What’s
Inside
Fund Objective
The Fund seeks long-term capital growth. Dividend income, if any, is incidental to this goal.
“Smith Barney”, “Salomon Brothers” and “Citi” are service marks of Citigroup, licensed for use by Legg Mason as the names of funds and investment managers. Legg Mason and its affiliates, as well as the Fund’s investment manager, are not affiliated with Citigroup.
Letter from the Chairman

R. JAY GERKEN, CFA
Chairman, President and Chief Executive Officer
Dear Shareholder,
The U.S. economy was mixed during the six-month reporting period. After a 4.1% advance in the third quarter of 2005, fourth quarter gross domestic product (“GDP”)i growth slipped to 1.7%. This marked the first quarter in which GDP growth did not surpass 3.0% since the first three months of 2003. However, as expected, the economy rebounded sharply in the first quarter of 2006, with GDP rising an estimated 5.3%. The economic turnaround was prompted by both strong consumer and business spending. In addition, the U.S. Labor Department reported that unemployment hit a five-year low in March.
Overseas, economic growth has been improving in many areas. After a lengthy period of weakness and deflation, Japan’s economy has gained momentum due, in part, to strong exports and improving consumer spending. Growth in the Eurozone has also been strengthening on the back of improved domestic spending in countries such as Germany. In addition, interest rates have remained low in the region.
For the six-month period ended April 30, 2006, the U.S. stock market generated strong results, with the S&P 500 Indexii returning 9.63%. While high oil and commodity prices, steadily rising interest rates, and geopolitical issues triggered periods of market volatility, investors generally remained focused on the strong corporate profit environment.
Investment returns were even stronger in the international equity markets. While these markets experienced many of the same issues as the U.S., they rallied on expectations for improving economic growth and solid corporate profits. During the six-month period ended April 30, 2006, the MSCI EAFE Indexiii rose 22.89%. This was surpassed by the emerging equity markets, as the MSCI Emerging Markets Indexiv surged 37.60% over the same period.
Legg Mason Partners International Fund I
Performance Review
For the six months ended April 30, 2006, Class A shares of the Legg Mason Partners International Fund excluding sales charges, returned 20.99%. These shares underperformed the Fund’s unmanaged benchmark, the MSCI EAFE Index, which returned 22.89% for the same period. The Lipper International Multi-Cap Growth Funds Category Average1 increased 24.52% over the same time frame.
| | | | |
| Performance Snapshot as of April 30, 2006 (excluding sales charges) (unaudited) |
| | |
| | | | | 6 months |
| | | | | |
International Fund — Class A Shares | | | | 20.99% |
|
MSCI EAFE Index | | | | 22.89% |
|
Lipper International Multi-Cap Growth Funds Category Average | | | | 24.52% |
|
| The performance shown represents past performance. Past performance is no guarantee of future results and current performance may be higher or lower than the performance shown above. Principal value and investment returns will fluctuate and investors’ shares, when redeemed, may be worth more or less than their original cost. To obtain performance data current to the most recent month-end, please visit our website at www.leggmason.com/InvestorServices. |
| Performance figures reflect reimbursements and/or fee waivers, without which the performance would have been lower. |
| Excluding sales charges, Class 1 shares returned 21.19%, Class B shares returned 20.55% and Class C shares returned 20.83% over the six months ended April 30, 2006. All share class returns assume the reinvestment of all distributions including returns of capital, if any, at net asset value and the deduction of all Fund expenses. Returns have not been adjusted to include sales charges that may apply when shares are purchased or the deduction of taxes that a shareholder would pay on Fund distributions. |
Special Shareholder Notices
On December 1, 2005, Citigroup Inc. (“Citigroup”) completed the sale of substantially all of its asset management business to Legg Mason, Inc. (“Legg Mason”). As a result, the Fund’s investment adviser (the “Manager”), previously an indirect wholly-owned subsidiary of Citigroup, has become a wholly-owned subsidiary of Legg Mason. Completion of the sale caused the Fund’s then existing investment management contract and sub-advisory contract to terminate. The Fund’s
| 1 | | Lipper, Inc. is a major independent mutual-fund tracking organization. Returns are based on the 6-month period ended April 30, 2006, including the reinvestment of distributions, including returns of capital, if any, calculated among the 175 funds in the Fund’s Lipper category, and excluding sales charges. |
II Legg Mason Partners International Fund
shareholders approved a new investment management contract between the Fund and the Manager and a new sub-advisory contract, which became effective on December 19, 2005. An interim management contract and sub-advisory contract took effect upon the closing of the sale and continued in effect until December 19, 2005.
Effective February 1, 2006, Smith Barney Fund Management LLC (“SBFM”), the Fund’s investment manager (the “Manager”), assumed portfolio management responsibility for the Fund. Charles Lovejoy, CFA, Guy Bennett, Christopher Floyd and John Vietz, who have been employed by SBFM since that time, were named as the Fund’s portfolio managers, responsible for the day-to-day management of the Fund. The sub-advisory contract with Citigroup Asset Management Limited, with respect to the Fund, was terminated.
Mr. Lovejoy is a Director and Senior Portfolio Manager of Batterymarch Financial Management, Inc., and Mr. Bennett, Mr. Floyd and Mr. Vietz are each Portfolio Managers of Batterymarch, which, like the Manager, is a subsidiary of Legg Mason, Inc.
Prior to April 7, 2006, the Fund operated under the name Smith Barney International Fund. The Fund’s investment strategy and objective have not changed.
Information About Your Fund
As you may be aware, several issues in the mutual fund industry have come under the scrutiny of federal and state regulators. The Fund’s Manager and some of its affiliates have received requests for information from various government regulators regarding market timing, late trading, fees, and other mutual fund issues in connection with various investigations. The regulators appear to be examining, among other things, the Fund’s response to market timing and shareholder exchange activity, including compliance with prospectus disclosure related to these subjects. The Fund has been informed that the Manager and its affiliates are responding to those information requests, but are not in a position to predict the outcome of these requests and investigations.
Legg Mason Partners International Fund III
Important information concerning the Fund and its Manager with regard to recent regulatory developments is contained in the Notes to Financial Statements included in this report.
As always, thank you for your confidence in our stewardship of your assets. We look forward to helping you continue to meet your financial goals.
Sincerely,

R. Jay Gerken, CFA
Chairman, President and Chief Executive Officer
May 25, 2006
The information provided is not intended to be a forecast of future events, a guarantee of future results or investment advice. Views expressed may differ from those of the firm as a whole.
RISKS: Keep in mind that the Fund is subject to risks associated with overseas investing, which could result in significant market fluctuations. These risks include currency fluctuations, changes in political and economic conditions, differing securities regulations and periods of illiquidity, and are heightened for investments in the securities of issuers located in emerging markets. The Fund may engage in active and frequent trading, resulting in increased transaction costs, which could detract from the Fund’s performance. The Fund may use derivatives, such as options and futures, which can be illiquid, may disproportionately increase losses, and have a potentially large impact on Fund performance. Please see the Fund’s prospectus for more information on these and other risks.
All index performance reflects no deduction for fees, expenses or taxes. Please note an investor cannot invest directly in an index.
| i | | Gross domestic product is a market value of goods and services produced by labor and property in a given country. |
| ii | | The S&P 500 Index is an unmanaged index of 500 stocks that is generally representative of the performance of larger companies in the U.S. |
| iii | | The MSCI EAFE Index is an unmanaged index of common stocks of companies located in Europe, Australasia and the Far East. |
| iv | | The MSCI Emerging Markets Free Index consists of emerging market companies with an average size of $800 million. The index measures the performance of emerging markets in South America, South Africa, Asia and Eastern Europe. |
IV Legg Mason Partners International Fund
Fund at a Glance (unaudited)
Legg Mason Partners International Fund 2006 Semi-Annual Report 1
Fund Expenses (unaudited)
Example
As a shareholder of the Fund, you may incur two types of costs: (1) transaction costs, including front-end and back-end sales charges (loads) on purchase payments; and (2) ongoing costs, including management fees; distribution and/or service (12b-1) fees; and other Fund expenses. This example is intended to help you understand your ongoing costs (in dollars) of investing in the Fund and to compare these costs with the ongoing costs of investing in other mutual funds.
This example is based on an investment of $1,000 invested on November 1, 2005 and held for the six months ended April 30, 2006.
Actual Expenses
The table below titled “Based on Actual Total Return” provides information about actual account values and actual expenses. You may use the information provided in this table, together with the amount you invested, to estimate the expenses that you paid over the period. To estimate the expenses you paid on your account, divide your ending account value by $1,000 (for example, an $8,600 ending account value divided by $1,000 = 8.6), then multiply the result by the number under the heading entitled “Expenses Paid During the Period”.
| | | | | | | | | | | | | | | |
| Based on Actual Total Return(1) |
| | | | | |
| | | Actual Total Return Without Sales Charges(2) | | | Beginning
Account
Value | | Ending
Account
Value | | Annualized
Expense
Ratio | | | Expenses Paid During the Period(3) |
Class 1 | | 21.19 | % | | $ | 1,000.00 | | $ | 1,211.90 | | 1.60 | % | | $ | 8.77 |
|
Class A | | 20.99 | | | | 1,000.00 | | | 1,209.90 | | 1.92 | | | | 10.52 |
|
Class B | | 20.55 | | | | 1,000.00 | | | 1,205.50 | | 2.61 | | | | 14.27 |
|
Class C | | 20.83 | | | | 1,000.00 | | | 1,208.30 | | 2.19 | | | | 11.99 |
|
| (1) | | For the six months ended April 30, 2006. |
| (2) | | Assumes reinvestment of all distributions, including returns of capital, if any, at net asset value and does not reflect the deduction of the applicable sales charges with respect to Class 1 and A shares or the applicable contingent deferred sales charges (“CDSC”) with respect to Class B and C shares. Total return is not annualized, as it may not be representative of the total return for the year. Performance figures may reflect voluntary fee waivers and/or expense reimbursements. Past performance is no guarantee of future results. In the absence of voluntary fee waivers and/or expense reimbursements, the total return would have been lower. |
| (3) | | Expenses (net of voluntary fee waivers and/or expense reimbursements) are equal to each class’ respective annualized expense ratio, multiplied by the average account value over the period, multiplied by the number of days in the most recent fiscal half-year, then divided by 365. |
2 Legg Mason Partners International Fund 2006 Semi-Annual Report
Fund Expenses (unaudited) (continued)
Hypothetical Example for Comparison Purposes
The table below titled “Based on Hypothetical Total Return” provides information about hypothetical account values and hypothetical expenses based on the actual expense ratio and an assumed rate of return of 5.00% per year before expenses, which is not the Fund’s actual return. The hypothetical account values and expenses may not be used to estimate the actual ending account balance or expenses you paid for the period. You may use the information provided in this table to compare the ongoing costs of investing in the Fund and other funds. To do so, compare the 5.00% hypothetical example relating to the Fund with the 5.00% hypothetical examples that appear in the shareholder reports of the other funds.
Please note that the expenses shown in the table below are meant to highlight your ongoing costs only and do not reflect any transactional costs, such as front-end or back-end sales charges (loads). Therefore, the table is useful in comparing ongoing costs only, and will not help you determine the relative total costs of owning different funds. In addition, if these transaction costs were included, your costs would have been higher.
| | | | | | | | | | | | | | | |
| Based on Hypothetical Total Return(1) |
| | | | | |
| | | Hypothetical
Annualized
Total Return | | | Beginning
Account
Value | | Ending
Account
Value | | Annualized
Expense
Ratio | | | Expenses
Paid During
the Period(2) |
Class 1 | | 5.00 | % | | $ | 1,000.00 | | $ | 1,016.86 | | 1.60 | % | | $ | 8.00 |
|
Class A | | 5.00 | | | | 1,000.00 | | | 1,015.27 | | 1.92 | | | | 9.59 |
|
Class B | | 5.00 | | | | 1,000.00 | | | 1,011.85 | | 2.61 | | | | 13.02 |
|
Class C | | 5.00 | | | | 1,000.00 | | | 1,013.93 | | 2.19 | | | | 10.94 |
|
| (1) | | For the six months ended April 30, 2006. |
| (2) | | Expenses (net of voluntary fee waivers and/or expense reimbursements) are equal to each class’ respective annualized expense ratio, multiplied by the average account value over the period, multiplied by the number of days in the most recent fiscal half-year, then divided by 365. |
Legg Mason Partners International Fund 2006 Semi-Annual Report 3
Schedule of Investments (April 30, 2006) (unaudited)
LEGG MASON PARTNERS INTERNATIONAL FUND
| | | | | |
| | |
| Shares | | Security | | Value |
| | | | | | |
| COMMON STOCKS — 99.0% | | | |
| Australia — 3.8% | | | |
| 75,550 | | BHP Billiton Ltd. | | $ | 1,680,466 |
| 130,400 | | Challenger Financial Services Group Ltd. | | | 351,426 |
| 12,700 | | CSL Ltd. | | | 556,297 |
| 73,100 | | Downer EDI Ltd. | | | 481,687 |
| 30,600 | | Leighton Holdings Ltd. | | | 388,405 |
| 52,550 | | QBE Insurance Group Ltd. | | | 892,813 |
| 14,000 | | Rio Tinto Ltd. | | | 835,900 |
|
| | | Total Australia | | | 5,186,994 |
|
| Austria — 0.7% | | | |
| 2,400 | | Boehler-Uddeholm AG | | | 544,760 |
| 6,300 | | OMV AG | | | 438,279 |
|
| | | Total Austria | | | 983,039 |
|
| Belgium — 0.3% | | | |
| 5,400 | | Delhaize Group | | | 389,233 |
|
| Bermuda — 0.6% | | | |
| 45,000 | | Esprit Holdings Ltd. | | | 360,434 |
| 123,000 | | Kerry Properties Ltd. | | | 436,274 |
|
| | | Total Bermuda | | | 796,708 |
|
| Canada — 2.5% | | | |
| 9,500 | | Bank of Montreal | | | 548,393 |
| 54,900 | | CAE Inc. | | | 450,844 |
| 6,600 | | Canadian Tire Corp., Ltd., Class A | | | 371,092 |
| 11,400 | | Industrial Alliance Insurance and Financial Services Inc. | | | 331,224 |
| 7,100 | | National Bank of Canada | | | 395,085 |
| 10,000 | | Royal Bank of Canada | | | 427,028 |
| 7,300 | | Toronto-Dominion Bank | | | 406,931 |
| 21,500 | | TransAlta Corp. | | | 448,309 |
|
| | | Total Canada | | | 3,378,906 |
|
| Cayman Islands — 0.3% | | | |
| 238,000 | | Hutchison Telecommunications International Ltd.* | | | 420,552 |
|
| Denmark — 0.7% | | | |
| 7,200 | | Danisco A/S | | | 611,615 |
| 14,600 | | Vestas Wind Systems AS* | | | 396,524 |
|
| | | Total Denmark | | | 1,008,139 |
|
| Finland — 0.8% | | | |
| 8,300 | | Metso Corp. | | | 330,042 |
| 31,811 | | Nokia Oyj | | | 724,827 |
|
| | | Total Finland | | | 1,054,869 |
|
| France — 6.8% | | | |
| 14,200 | | Air France-KLM | | | 330,723 |
| 3,600 | | Alstom RGPT* | | | 326,293 |
See Notes to Financial Statements.
4 Legg Mason Partners International Fund 2006 Semi-Annual Report
Schedule of Investments (April 30, 2006) (unaudited) (continued)
| | | | | |
| | |
| Shares | | Security | | Value |
| | | | | | |
| France — 6.8% (continued) | | | |
| 1,655 | | BNP Paribas* | | $ | 151,153 |
| 16,557 | | BNP Paribas SA | | | 1,565,465 |
| 9,800 | | Bouygues SA | | | 535,047 |
| 5,000 | | Cap Gemini SA* | | | 267,745 |
| 3,500 | | Ciments Francais SA | | | 592,484 |
| 11,690 | | European Aeronautic Defence & Space Co. | | | 461,595 |
| 1,500 | | Natexis Banques Populaires | | | 406,730 |
| 6,400 | | Nexity | | | 447,579 |
| 12,323 | | Pinault Printemps Redoute SA | | | 1,599,151 |
| 7,600 | | Sanofi-Aventis | | | 717,141 |
| 3,500 | | Societe Generale | | | 535,047 |
| 5,188 | | Total SA | | | 1,435,557 |
|
| | | Total France | | | 9,371,710 |
|
| Germany — 5.9% | | | |
| 4,701 | | Allianz AG | | | 787,483 |
| 21,850 | | Altana AG | | | 1,403,114 |
| 7,750 | | Bayerische Motoren Werke AG | | | 421,754 |
| 16,722 | | DaimlerChrysler AG | | | 917,398 |
| 14,603 | | Deutsche Bank AG | | | 1,794,007 |
| 24,650 | | Deutsche Lufthansa AG | | | 454,930 |
| 3,650 | | E.ON AG | | | 444,770 |
| 69,381 | | Epcos AG* | | | 933,636 |
| 3,400 | | MAN AG | | | 257,906 |
| 7,001 | | Siemens AG | | | 662,829 |
|
| | | Total Germany | | | 8,077,827 |
|
| Greece — 0.3% | | | |
| 12,400 | | Alpha Bank AE | | | 469,594 |
|
| Hong Kong — 1.0% | | | |
| 219,985 | | Hang Lung Properties Ltd. | | | 442,629 |
| 190,000 | | Li & Fung Ltd. | | | 450,913 |
| 286,000 | | Sino Land Co., Ltd. | | | 475,858 |
|
| | | Total Hong Kong | | | 1,369,400 |
|
| Italy — 4.9% | | | |
| 67,700 | | Banca Intesa SpA | | | 401,667 |
| 38,700 | | Banca Popolare di Milano Scarl | | | 489,507 |
| 12,300 | | Banca Popolare di Verona e Novara Scrl | | | 346,405 |
| 17,600 | | Banche Popolari Unite Scpa | | | 445,236 |
| 2,300 | | Cattolica di Assicurazioni Scrl | | | 128,476 |
| 30,526 | | Eni SpA | | | 932,535 |
| 41,026 | | Fondiaria Sai SpA | | | 1,618,930 |
| 49,182 | | Indesit Co. SpA | | | 650,650 |
| 25,700 | | Saipem SpA | | | 643,009 |
| 39,677 | | SanPaolo IMI SpA | | | 745,785 |
| 756,400 | | Seat Pagine Gialle SpA* | | | 360,930 |
|
| | | Total Italy | | | 6,763,130 |
|
See Notes to Financial Statements.
Legg Mason Partners International Fund 2006 Semi-Annual Report 5
Schedule of Investments (April 30, 2006) (unaudited) (continued)
| | | | | |
| | |
| Shares | | Security | | Value |
| | | | | | |
| Japan — 25.9% | | | |
| 19,700 | | Aeon Credit Service Co., Ltd. | | $ | 545,419 |
| 10,900 | | Aisin Seiki Co., Ltd. | | | 410,037 |
| 56,000 | | Asahi Kasei Corp. | | | 414,432 |
| 15,600 | | Astellas Pharma Inc. | | | 651,285 |
| 47,500 | | Bank of Yokohama Ltd. | | | 372,819 |
| 79,000 | | Chiba Bank Ltd. | | | 715,878 |
| 13,300 | | Credit Saison Co., Ltd. | | | 697,877 |
| 24,000 | | Daiwa House Industry Co., Ltd. | | | 409,440 |
| 35,000 | | Dowa Mining Co., Ltd. | | | 399,912 |
| 120,000 | | Fuji Electric Holdings Co., Ltd. | | | 696,111 |
| 108,000 | | Fujitsu Ltd. | | | 900,831 |
| 46,000 | | Gunma Bank Ltd. | | | 355,386 |
| 3,900 | | Honda Motor Co., Ltd. | | | 277,310 |
| 89,000 | | Itochu Corp | | | 808,842 |
| 58,000 | | JTEKT Corp. | | | 1,251,505 |
| 104,400 | | Kajima Corp. | | | 590,935 |
| 63,000 | | Kao Corp. | | | 1,694,397 |
| 173,000 | | Kawasaki Heavy Industries Ltd. | | | 627,985 |
| 61 | | KK DaVinci Advisors* | | | 68,090 |
| 26,000 | | Konica Minolta Holdings Inc.* | | | 342,782 |
| 16,700 | | Kyushu Electric Power Co. Inc. | | | 390,437 |
| 18,800 | | Leopalace21 Corp. | | | 733,659 |
| 117,000 | | Marubeni Corp. | | | 674,595 |
| 400 | | Matsui Securities Co., Ltd. | | | 5,354 |
| 39,000 | | Matsushita Electric Industrial Co., Ltd. | | | 942,650 |
| 64,000 | | Mazda Motor Corp. | | | 419,073 |
| 89,000 | | Minebea Co., Ltd. | | | 576,515 |
| 66,000 | | Mitsubishi Chemical Holdings Corp. | | | 417,666 |
| 284,000 | | Mitsubishi Electric Corp. | | | 2,473,689 |
| 60 | | Mitsubishi UFJ Financial Group Inc. | | | 943,968 |
| 36,000 | | Mitsubishi UFJ Securities Co., Ltd. | | | 567,647 |
| 61,000 | | Mitsui Mining & Smelting Co., Ltd. | | | 424,628 |
| 37,000 | | Mitsui Trust Holdings Inc. | | | 511,545 |
| 33 | | Mizuho Financial Group Inc. | | | 281,635 |
| 18,000 | | NGK Spark Plug Co., Ltd. | | | 395,517 |
| 88,000 | | NSK Ltd. | | | 796,660 |
| 43,000 | | NTN Corp. | | | 355,263 |
| 20,000 | | OMC Card Inc. | | | 316,941 |
| 89,000 | | Ricoh Co., Ltd. | | | 1,767,875 |
| 56,000 | | Sekisui Chemical Co., Ltd. | | | 484,324 |
| 106,000 | | Shinsei Bank Ltd. | | | 742,536 |
| 97,000 | | Showa Denko KK | | | 429,690 |
| 20,000 | | Stanley Electric Co., Ltd. | | | 465,832 |
| 11,000 | | Sumco Corp. | | | 658,405 |
| 90 | | Sumitomo Mitsui Financial Group Inc. | | | 988,794 |
| 15,300 | | Suzuki Motor Corp. | | | 373,843 |
| 98,000 | | Taiheiyo Cement Corp. | | | 477,187 |
| 5,250 | | Takeda Pharmaceutical Co., Ltd. | | | 321,160 |
See Notes to Financial Statements.
6 Legg Mason Partners International Fund 2006 Semi-Annual Report
Schedule of Investments (April 30, 2006) (unaudited) (continued)
| | | | | |
| | |
| Shares | | Security | | Value |
| | | | | | |
| Japan — 25.9% (continued) | | | |
| 57,000 | | Teijin Ltd. | | $ | 391,272 |
| 27,800 | | Tokyo Electric Power Co. Inc. | | | 714,700 |
| 3,000 | | Tokyo Seimitsu Co., Ltd. | | | 178,510 |
| 48,000 | | Toppan Printing Co., Ltd. | | | 641,688 |
| 45,200 | | Toyota Motor Corp. | | | 2,645,854 |
| 37,000 | | UFS NICOS Co., Ltd. | | | 327,154 |
| 18,000 | | Yamaha Motor Co., Ltd. | | | 496,770 |
|
| | | Total Japan | | | 35,564,309 |
|
| Luxembourg — 1.8% | | | |
| 58,848 | | Arcelor | | | 2,421,750 |
|
| Netherlands — 5.2% | | | |
| 18,050 | | ABN Amro Holding NV | | | 539,787 |
| 19,300 | | Buhrmann NV | | | 374,465 |
| 21,900 | | CSM | | | 665,979 |
| 82,800 | | Hagemeyer NV* | | | 450,492 |
| 20,500 | | Heineken NV | | | 830,948 |
| 4,000 | | Koninklijke BAM Groep NV | | | 429,957 |
| 93,073 | | Koninklijke KPN NV | | | 1,093,839 |
| 23,200 | | Koninklijke Philips Electronics NV | | | 800,987 |
| 38,700 | | Royal Dutch Shell PLC, Class A Shares | | | 1,327,824 |
| 22,800 | | Wolters Kluwer NV | | | 594,340 |
|
| | | Total Netherlands | | | 7,108,618 |
|
| Norway — 0.9% | | | |
| 7,600 | | Petroleum Geo-Services ASA* | | | 427,721 |
| 68,600 | | Telenor ASA | | | 795,514 |
|
| | | Total Norway | | | 1,223,235 |
|
| Singapore — 0.8% | | | |
| 176,000 | | CapitaLand Ltd. | | | 545,477 |
| 61,000 | | Keppel Corp. Ltd. | | | 590,323 |
|
| | | Total Singapore | | | 1,135,800 |
|
| Spain — 3.8% | | | |
| 28,700 | | Banco Bilbao Vizcaya Argentaria SA | | | 634,378 |
| 105,200 | | Banco Santander Central Hispano SA | | | 1,632,103 |
| 27,400 | | Corp. Mapfre SA | | | 579,702 |
| 36,084 | | Endesa SA | | | 1,198,893 |
| 72,625 | | Telefonica SA | | | 1,164,313 |
|
| | | Total Spain | | | 5,209,389 |
|
| Sweden — 1.4% | | | |
| 12,600 | | Alfa Laval AB | | | 409,963 |
| 33,700 | | Boliden AB* | | | 684,448 |
| 9,900 | | Nobia AB | | | 312,700 |
| 20,900 | | Skandinaviska Enskilda Banken AB | | | 526,695 |
|
| | | Total Sweden | | | 1,933,806 |
|
See Notes to Financial Statements.
Legg Mason Partners International Fund 2006 Semi-Annual Report 7
Schedule of Investments (April 30, 2006) (unaudited) (continued)
| | | | | |
| | |
| Shares | | Security | | Value |
| | | | | | |
| Switzerland — 8.0% | | | |
| 7,621 | | Credit Suisse Group | | $ | 478,289 |
| 8,300 | | Holcim Ltd. | | | 695,428 |
| 3,703 | | Nestle SA | | | 1,128,427 |
| 18,300 | | Novartis AG | | | 1,048,979 |
| 7,300 | | Roche Holding AG | | | 1,121,539 |
| 5,956 | | Swiss Life Holding* | | | 1,371,139 |
| 25,507 | | Swiss Reinsurance | | | 1,859,725 |
| 5,400 | | UBS AG | | | 639,517 |
| 11,076 | | Zurich Financial Services AG | | | 2,692,594 |
|
| | | Total Switzerland | | | 11,035,637 |
|
| United Kingdom — 22.6% | | | |
| 131,900 | | Amlin PLC | | | 676,450 |
| 28,700 | | Anglo American PLC | | | 1,220,903 |
| 18,030 | | AstraZeneca PLC | | | 995,292 |
| 125,283 | | Barclays PLC | | | 1,563,490 |
| 21,900 | | Barratt Developments PLC | | | 395,793 |
| 68,750 | | BG Group PLC | | | 923,108 |
| 211,963 | | BP PLC | | | 2,612,403 |
| 69,198 | | British American Tobacco PLC | | | 1,767,477 |
| 52,000 | | British Energy Group PLC* | | | 627,153 |
| 357,400 | | British Insurance Holdings PLC | | | 625,084 |
| 42,700 | | Drax Group PLC* | | | 614,564 |
| 23,500 | | Enterprise Inns PLC | | | 399,449 |
| 196,465 | | GKN PLC | | | 1,122,109 |
| 47,599 | | GlaxoSmithKline PLC | | | 1,349,335 |
| 58,082 | | HBOS PLC | | | 1,018,485 |
| 83,000 | | HSBC Holdings PLC | | | 1,432,747 |
| 75,300 | | Imperial Chemical Industries PLC | | | 490,437 |
| 6,100 | | Imperial Tobacco Group PLC | | | 189,370 |
| 941,900 | | Invensys PLC* | | | 407,550 |
| 12,500 | | Investec PLC | | | 710,066 |
| 117,450 | | Lloyds TSB Group PLC | | | 1,141,563 |
| 85,000 | | LogicaCMG PLC | | | 277,194 |
| 19,600 | | Man Group PLC | | | 902,347 |
| 128,581 | | National Grid PLC | | | 1,348,138 |
| 19,300 | | Northern Rock PLC | | | 372,714 |
| 174,200 | | Old Mutual PLC | | | 610,136 |
| 16,700 | | Persimmon PLC | | | 398,566 |
| 26,200 | | Punch Taverns PLC | | | 418,136 |
| 9,100 | | Resolution PLC | | | 103,783 |
| 16,600 | | Rio Tinto PLC | | | 912,120 |
| 2,566,260 | | Rolls Royce Group (a) | | | 4,881 |
| 47,700 | | Rolls-Royce Group PLC* | | | 414,089 |
| 48,155 | | Royal Bank of Scotland Group PLC | | | 1,571,265 |
| 23,300 | | Royal Dutch Shell PLC, Class B Shares | | | 832,426 |
| 86,000 | | Scottish Power PLC | | | 878,186 |
See Notes to Financial Statements.
8 Legg Mason Partners International Fund 2006 Semi-Annual Report
Schedule of Investments (April 30, 2006) (unaudited) (continued)
| | | | | | | |
| | |
| Shares | | Security | | Value | |
| | | | | | | | |
| | United Kingdom — 22.6% (continued) | | | | |
| | 37,920 | | Tesco PLC | | $ | 220,725 | |
| | 12,200 | | Vedanta Resources PLC | | | 350,735 | |
| | 324,343 | | Vodafone Group PLC | | | 765,221 | |
| | 33,500 | | WPP Group PLC | | | 413,186 | |
|
|
|
| | | | Total United Kingdom | | | 31,076,676 | |
|
|
|
| | | | TOTAL COMMON STOCKS
(Cost — $114,987,957) | | | 135,979,321 | |
|
|
|
| | RIGHT (a) — 0.0% | | | | |
| | Switzerland — 0.0% | | | | |
| | 25,507 | | Swiss Reinsurance (Cost — $0) | | | 0 | |
|
|
|
| | | | TOTAL INVESTMENTS BEFORE SHORT-TERM INVESTMENT
(Cost — $114,987,957) | | | 135,979,321 | |
|
|
|
| | |
Face
Amount | | | | | |
| | SHORT-TERM INVESTMENT — 1.1% | | | | |
| | Repurchase Agreement — 1.1% | | | | |
| $ | 1,450,000 | | Interest in $604,665,000 joint tri-party repurchase agreement dated 4/28/06 with Deutsche Bank Securities Inc., 4.790% due 5/1/06; Proceeds at maturity — $1,450,579; (Fully collateralized by various U.S. government agency obligations, 0.000% to 22.305% due 2/15/17 to 4/15/36; Market value - $1,479,000)
(Cost — $1,450,000) | | | 1,450,000 | |
|
|
|
| | | | TOTAL INVESTMENTS — 100.1% (Cost — $116,437,957#) | | | 137,429,321 | |
| | | | Liabilities in Excess of Other Assets — (0.1)% | | | (97,371 | ) |
|
|
|
| | | | TOTAL NET ASSETS — 100.0% | | $ | 137,331,950 | |
|
|
|
| * | | Non-income producing security. |
| (a) | | Security is valued in good faith at fair value by or under the direction of the Board of Trustees (See Note 1). |
| # | | Aggregate cost for federal income tax purposes is substantially the same. |
| | | |
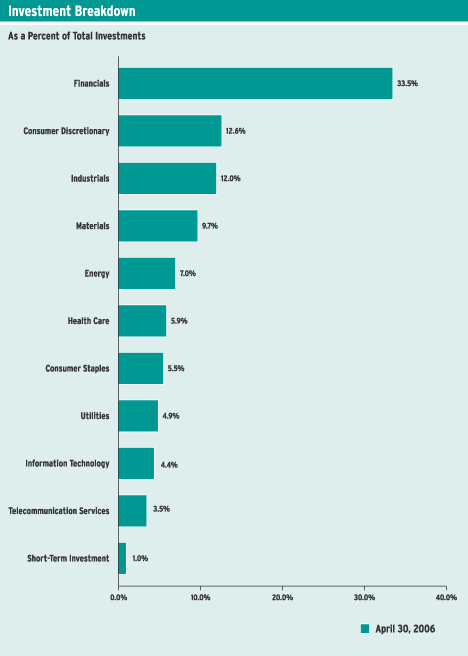
| Summary of Investments by Industry* (unaudited) | | | |
Financials | | 33.5 | % |
Consumer Discretionary | | 12.6 | |
Industrials | | 12.0 | |
Materials | | 9.7 | |
Energy | | 7.0 | |
Health Care | | 5.9 | |
Consumer Staples | | 5.5 | |
Utilities | | 4.9 | |
Information Technology | | 4.4 | |
Telecommunication Services | | 3.5 | |
Short-Term Investment | | 1.0 | |
|
|
| | | 100.0 | % |
|
|
| * | | As a percent of total investments. |
See Notes to Financial Statements.
Legg Mason Partners International Fund 2006 Semi-Annual Report 9
Statement of Assets and Liabilities (April 30, 2006) (unaudited)
| | | | |
| ASSETS: | | | | |
Investments, at value (Cost—$116,437,957) | | $ | 137,429,321 | |
Foreign currency, at value (Cost—$91,882) | | | 92,768 | |
Cash | | | 422 | |
Receivable for securities sold | | | 2,885,189 | |
Dividends and interest receivable | | | 591,553 | |
Receivable for Fund shares sold | | | 102,919 | |
Prepaid expenses | | | 50,247 | |
|
|
Total Assets | | | 141,152,419 | |
|
|
| LIABILITIES: | | | | |
Payable for securities purchased | | | 3,233,466 | |
Investment management fee payable | | | 108,693 | |
Payable for Fund shares repurchased | | | 49,880 | |
Trustees’ fees payable | | | 38,418 | |
Distribution fees payable | | | 21,098 | |
Accrued expenses | | | 368,914 | |
|
|
Total Liabilities | | | 3,820,469 | |
|
|
Total Net Assets | | $ | 137,331,950 | |
|
|
| NET ASSETS: | | | | |
Par value (Note 6) | | $ | 52 | |
Paid-in capital in excess of par value | | | 183,094,526 | |
Undistributed net investment income | | | 3,317 | |
Accumulated net realized loss on investments and foreign currency transactions | | | (66,784,427 | ) |
Net unrealized appreciation on investments and foreign currencies | | | 21,018,482 | |
|
|
Total Net Assets | | $ | 137,331,950 | |
|
|
Shares Outstanding: | | | | |
Class 1 | | | 136,410 | |
|
|
Class A | | | 2,728,986 | |
|
|
Class B | | | 2,268,419 | |
|
|
Class C | | | 68,103 | |
|
|
Net Asset Value: | | | | |
Class 1 (and redemption price) | | | $28.51 | |
|
|
Class A (and redemption price) | | | $27.30 | |
|
|
Class B* | | | $25.16 | |
|
|
Class C* | | | $27.57 | |
|
|
Maximum Public Offering Price Per Share: | | | | |
Class 1 (based on maximum sales charge of 8.50%) | | | $31.16 | |
|
|
Class A (based on maximum sales charge of 5.00%) | | | $28.74 | |
|
|
| * | | Redemption price is NAV of Class B and C shares reduced by a 5.00% and 1.00% CDSC, respectively, if shares are redeemed within one year from purchase payment (See Note 2). |
See Notes to Financial Statements.
10 Legg Mason Partners International Fund 2006 Semi-Annual Report
Statement of Operations (For the six months ended April 30, 2006) (unaudited)
| | | | |
| INVESTMENT INCOME: | | | | |
Dividends | | $ | 1,424,727 | |
Interest | | | 21,897 | |
Income from securities lending | | | 10,946 | |
Less: Foreign taxes withheld | | | (76,861 | ) |
|
|
Total Investment Income | | | 1,380,709 | |
|
|
| EXPENSES: | | | | |
Investment management fee (Note 2) | | | 530,014 | |
Transfer agent fees (Notes 2 and 4) | | | 507,133 | |
Distribution fees (Notes 2 and 4) | | | 357,002 | |
Custody fees | | | 30,312 | |
Legal fees | | | 29,012 | |
Registration fees | | | 20,800 | |
Shareholder reports (Note 4) | | | 17,599 | |
Audit and tax | | | 13,782 | |
Trustees’ fees (Note 2) | | | 4,653 | |
Insurance | | | 1,164 | |
Miscellaneous expenses | | | 3,154 | |
|
|
Total Expenses | | | 1,514,625 | |
Less: Fee waivers and/or expense reimbursements (Notes 2 and 8) | | | (137,232 | ) |
|
|
Net Expenses | | | 1,377,393 | |
|
|
Net Investment Income | | | 3,316 | |
|
|
REALIZED AND UNREALIZED GAIN (LOSS) ON
INVESTMENTS AND FOREIGN CURRENCY TRANSACTIONS
(NOTES 1 AND 3): | | | | |
Net Realized Gain (Loss) From: | | | | |
Investment transactions | | | 23,610,772 | |
Foreign currency transactions | | | (67,110 | ) |
|
|
Net Realized Gain | | | 23,543,662 | |
|
|
Change in Net Unrealized Appreciation/Depreciation From: | | | | |
Investments | | | 329,802 | |
Foreign currencies | | | 24,822 | |
|
|
Change in Net Unrealized Appreciation/Depreciation | | | 354,624 | |
|
|
Net Gain on Investments and Foreign Currency Transactions | | | 23,898,286 | |
|
|
Increase in Net Assets From Operations | | $ | 23,901,602 | |
|
|
See Notes to Financial Statements.
Legg Mason Partners International Fund 2006 Semi-Annual Report 11
Statements of Changes in Net Assets
| | | | | | | | |
For the six months ended April 30, 2006 (unaudited)
and the year ended October 31, 2005 | | | | | | | | |
| | |
| | | 2006 | | | 2005 | |
| OPERATIONS: | | | | | | | | |
Net investment income | | $ | 3,316 | | | $ | 1,067,235 | |
Net realized gain | | | 23,543,662 | | | | 9,077,225 | |
Change in net unrealized appreciation/depreciation | | | 354,624 | | | | 4,527,819 | |
|
|
Increase in Net Assets From Operations | | | 23,901,602 | | | | 14,672,279 | |
|
|
DISTRIBUTIONS TO SHAREHOLDERS
FROM (NOTES 1 AND 5): | | | | | | | | |
Net investment income | | | (984,447 | ) | | | — | |
|
|
Decrease in Net Assets From
Distributions to Shareholders | | | (984,447 | ) | | | — | |
|
|
| FUND SHARE TRANSACTIONS (NOTE 6): | | | | | | | | |
Net proceeds from sale of shares | | | 9,541,905 | | | | 14,961,550 | |
Reinvestment of distributions | | | 919,680 | | | | — | |
Cost of shares repurchased | | | (14,121,915 | ) | | | (22,888,590 | ) |
|
|
Decrease in Net Assets From Fund Share Transactions | | | (3,660,330 | ) | | | (7,927,040 | ) |
|
|
Increase in Net Assets | | | 19,256,825 | | | | 6,745,239 | |
| NET ASSETS: | | | | | | | | |
Beginning of period | | | 118,075,125 | | | | 111,329,886 | |
|
|
End of period* | | $ | 137,331,950 | | | $ | 118,075,125 | |
|
|
* Includes undistributed net investment income of: | | | $3,317 | | | | $984,448 | |
|
|
See Notes to Financial Statements.
12 Legg Mason Partners International Fund 2006 Semi-Annual Report
Financial Highlights
For a share of each class of beneficial interest outstanding throughout each year ended October 31, unless otherwise noted:
| | | | | | | | | | | | | | | | | | | | | | | | |
| | | | | | |
| Class 1 Shares(1) | | 2006(2) | | | 2005 | | | 2004 | | | 2003 | | | 2002 | | | 2001 | |
Net Asset Value, Beginning of Period | | $ | 23.84 | | | $ | 20.88 | | | $ | 17.50 | | | $ | 14.83 | | | $ | 20.58 | | | $ | 42.17 | |
|
|
Income (Loss) From Operations: | | | | | | | | | | | | | | | | | | | | | | | | |
Net investment income (loss) | | | 0.08 | | | | 0.35 | | | | 0.09 | | | | 0.00 | (3) | | | (0.19 | ) | | | (0.24 | ) |
Net realized and unrealized gain (loss) | | | 4.93 | | | | 2.61 | | | | 3.29 | | | | 2.67 | | | | (5.56 | ) | | | (21.35 | ) |
|
|
Total Income (Loss) From Operations | | | 5.01 | | | | 2.96 | | | | 3.38 | | | | 2.67 | | | | (5.75 | ) | | | (21.59 | ) |
|
|
Less Distributions From: | | | | | | | | | | | | | | | | | | | | | | | | |
Net investment income | | | (0.34 | ) | | | — | | | | — | | | | — | | | | — | | | | — | |
|
|
Total Distributions | | | (0.34 | ) | | | — | | | | — | | | | — | | | | — | | | | — | |
|
|
Net Asset Value, End of Period | | $ | 28.51 | | | $ | 23.84 | | | $ | 20.88 | | | $ | 17.50 | | | $ | 14.83 | | | $ | 20.58 | |
|
|
Total Return(4) | | | 21.19 | % | | | 14.18 | % | | | 19.31 | % | | | 18.00 | % | | | (27.94 | )% | | | (51.20 | )% |
|
|
Net Assets, End of Period (millions) | | | $4 | | | | $3 | | | | $3 | | | | $3 | | | | $3 | | | | $4 | |
|
|
Ratios to Average Net Assets: | | | | | | | | | | | | | | | | | | | | | | | | |
Gross expenses | | | 1.65 | %(5) | | | 1.71 | % | | | 1.99 | % | | | 2.45 | % | | | 2.02 | % | | | 1.54 | % |
Net expenses | | | 1.60 | (5)(6)(7) | | | 1.71 | (6) | | | 1.89 | (7) | | | 2.45 | | | | 2.02 | | | | 1.54 | |
Net investment income (loss) | | | 0.62 | (5) | | | 1.53 | | | | 0.47 | | | | (0.03 | ) | | | (1.00 | ) | | | (0.82 | ) |
|
|
Portfolio Turnover Rate | | | 77 | % | | | 30 | % | | | 56 | % | | | 153 | % | | | 24 | % | | | 24 | % |
|
|
| (1) | | Per share amounts have been calculated using the average shares method. |
| (2) | | For the six months ended April 30, 2006 (unaudited). |
| (3) | | Amount represents less than $0.01 per share. |
| (4) | | Performance figures may reflect voluntary fee waivers and/or expense reimbursements. Past performance is no guarantee of future results. In the absence of voluntary fee waivers and/or expense reimbursements, the total return would have been lower. Total returns for periods of less than one year are not annualized. |
| (6) | | As a result of a voluntary expense limitation, the ratio of expenses to average net assets of Class 1 shares will not exceed 1.75%. |
| (7) | | The investment manager voluntarily waived a portion of its fees and/or reimbursed expenses. |
See Notes to Financial Statements.
Legg Mason Partners International Fund 2006 Semi-Annual Report 13
Financial Highlights (continued)
For a share of each class of beneficial interest outstanding throughout each year ended October 31, unless otherwise noted:
| | | | | | | | | | | | | | | | | | | | | | | | |
| | | | | | |
| Class A Shares(1) | | 2006(2) | | | 2005 | | | 2004 | | | 2003 | | | 2002 | | | 2001 | |
Net Asset Value, Beginning of Period | | $ | 22.81 | | | $ | 20.03 | | | $ | 16.89 | | | $ | 14.42 | | | $ | 20.15 | | | $ | 41.57 | |
|
|
Income (Loss) From Operations: | | | | | | | | | | | | | | | | | | | | | | | | |
Net investment income (loss) | | | 0.04 | | | | 0.27 | | | | (0.02 | ) | | | (0.12 | ) | | | (0.30 | ) | | | (0.40 | ) |
Net realized and unrealized gain (loss) | | | 4.71 | | | | 2.51 | | | | 3.16 | | | | 2.59 | | | | (5.43 | ) | | | (21.02 | ) |
|
|
Total Income (Loss) From Operations | | | 4.75 | | | | 2.78 | | | | 3.14 | | | | 2.47 | | | | (5.73 | ) | | | (21.42 | ) |
|
|
Less Distributions From: | | | | | | | | | | | | | | | | | | | | | | | | |
Net investment income | | | (0.26 | ) | | | — | | | | — | | | | — | | | | — | | | | — | |
|
|
Total Distributions | | | (0.26 | ) | | | — | | | | — | | | | — | | | | — | | | | — | |
|
|
Net Asset Value, End of Period | | $ | 27.30 | | | $ | 22.81 | | | $ | 20.03 | | | $ | 16.89 | | | $ | 14.42 | | | $ | 20.15 | |
|
|
Total Return(3) | | | 20.99 | % | | | 13.88 | % | | | 18.59 | % | | | 17.13 | % | | | (28.44 | )% | | | (51.53 | )% |
|
|
Net Assets, End of Period (millions) | | | $74 | | | | $62 | | | | $56 | | | | $49 | | | | $40 | | | | $53 | |
|
|
Ratios to Average Net Assets: | | | | | | | | | | | | | | | | | | | | | | | | |
Gross expenses | | | 2.10 | %(4) | | | 2.33 | % | | | 2.59 | % | | | 3.21 | % | | | 2.72 | % | | | 2.17 | % |
Net expenses | | | 1.92 | (4)(5)(6) | | | 2.00 | (5)(6) | | | 2.49 | (6) | | | 3.21 | | | | 2.72 | | | | 2.17 | |
Net investment income (loss) | | | 0.30 | (4) | | | 1.23 | | | | (0.13 | ) | | | (0.77 | ) | | | (1.67 | ) | | | (1.44 | ) |
|
|
Portfolio Turnover Rate | | | 77 | % | | | 30 | % | | | 56 | % | | | 153 | % | | | 24 | % | | | 24 | % |
|
|
| (1) | | Per share amounts have been calculated using the average shares method. |
| (2) | | For the six months ended April 30, 2006 (unaudited). |
| (3) | | Performance figures may reflect voluntary fee waivers and/or expense reimbursements. Past performance is no guarantee of future results. In the absence of voluntary fee waivers and/or expense reimbursements, the total return would have been lower. Total returns for periods of less than one year are not annualized. |
| (5) | | As a result of a voluntary expense limitation, the ratio of expenses to average net assets of Class A shares will not exceed 2.00%. |
| (6) | | The investment manager voluntarily waived a portion of its fees and/or reimbursed expenses. |
See Notes to Financial Statements.
14 Legg Mason Partners International Fund 2006 Semi-Annual Report
Financial Highlights (continued)
For a share of each class of beneficial interest outstanding throughout each year ended October 31, unless otherwise noted:
| | | | | | | | | | | | | | | | | | | | | | | | |
| | | | | | |
| Class B Shares(1) | | 2006(2) | | | 2005 | | | 2004 | | | 2003 | | | 2002 | | | 2001 | |
Net Asset Value, Beginning of Period | | $ | 20.96 | | | $ | 18.54 | | | $ | 15.78 | | | $ | 13.60 | | | $ | 19.18 | | | $ | 39.86 | |
|
|
Income (Loss) From Operations: | | | | | | | | | | | | | | | | | | | | | | | | |
Net investment income (loss) | | | (0.07 | ) | | | 0.10 | | | | (0.19 | ) | | | (0.24 | ) | | | (0.44 | ) | | | (0.59 | ) |
Net realized and unrealized gain (loss) | | | 4.36 | | | | 2.32 | | | | 2.95 | | | | 2.42 | | | | (5.14 | ) | | | (20.09 | ) |
|
|
Total Income (Loss) From Operations | | | 4.29 | | | | 2.42 | | | | 2.76 | | | | 2.18 | | | | (5.58 | ) | | | (20.68 | ) |
|
|
Less Distributions From: | | | | | | | | | | | | | | | | | | | | | | | | |
Net investment income | | | (0.09 | ) | | | — | | | | — | | | | — | | | | — | | | | — | |
|
|
Total Distributions | | | (0.09 | ) | | | — | | | | — | | | | — | | | | — | | | | — | |
|
|
Net Asset Value, End of Period | | $ | 25.16 | | | $ | 20.96 | | | $ | 18.54 | | | $ | 15.78 | | | $ | 13.60 | | | $ | 19.18 | |
|
|
Total Return(3) | | | 20.55 | % | | | 13.05 | % | | | 17.49 | % | | | 16.03 | % | | | (29.09 | )% | | | (51.88 | )% |
|
|
Net Assets, End of Period (millions) | | | $57 | | | | $51 | | | | $50 | | | | $46 | | | | $43 | | | | $65 | |
|
|
Ratios to Average Net Assets: | | | | | | | | | | | | | | | | | | | | | | | | |
Gross expenses | | | 2.90 | %(4) | | | 3.13 | % | | | 3.53 | % | | | 4.15 | % | | | 3.60 | % | | | 2.90 | % |
Net expenses | | | 2.61 | (4)(5)(6) | | | 2.75 | (5)(6) | | | 3.43 | (6) | | | 4.15 | | | | 3.60 | | | | 2.90 | |
Net investment income (loss) | | | (0.40 | )(4) | | | 0.49 | | | | (1.07 | ) | | | (1.73 | ) | | | (2.57 | ) | | | (2.18 | ) |
|
|
Portfolio Turnover Rate | | | 77 | % | | | 30 | % | | | 56 | % | | | 153 | % | | | 24 | % | | | 24 | % |
|
|
| (1) | | Per share amounts have been calculated using the average shares method. |
| (2) | | For the six months ended April 30, 2006 (unaudited). |
| (3) | | Performance figures may reflect voluntary fee waivers and/or expense reimbursements. Past performance is no guarantee of future results. In the absence of voluntary fee waivers and/or expense reimbursements, the total return would have been lower. Total returns for periods of less than one year are not annualized. |
| (5) | | As a result of a voluntary expense limitation, the ratio of expenses to average net assets of Class B shares will not exceed 2.75%. |
| (6) | | The investment manager voluntarily waived a portion of its fees and/or reimbursed expenses. |
See Notes to Financial Statements.
Legg Mason Partners International Fund 2006 Semi-Annual Report 15
Financial Highlights (continued)
For a share of each class of beneficial interest outstanding throughout each year ended October 31, unless otherwise noted:
| | | | | | | | | | | | | | | | | | | | | | | | |
| | | | | | |
| Class C Shares(1) | | 2006(2) | | | 2005 | | | 2004 | | | 2003 | | | 2002 | | | 2001 | |
Net Asset Value, Beginning of Period | | $ | 22.98 | | | $ | 20.26 | | | $ | 17.03 | | | $ | 14.42 | | | $ | 20.13 | | | $ | 41.61 | |
|
|
Income (Loss) From Operations: | | | | | | | | | | | | | | | | | | | | | | | | |
Net investment income (loss) | | | 0.00 | (3) | | | 0.19 | | | | 0.02 | | | | (0.01 | ) | | | (0.30 | ) | | | (0.43 | ) |
Net realized and unrealized gain (loss) | | | 4.76 | | | | 2.53 | | | | 3.21 | | | | 2.62 | | | | (5.41 | ) | | | (21.05 | ) |
|
|
Total Income (Loss) From Operations | | | 4.76 | | | | 2.72 | | | | 3.23 | | | | 2.61 | | | | (5.71 | ) | | | (21.48 | ) |
|
|
Less Distributions From: | | | | | | | | | | | | | | | | | | | | | | | | |
Net investment income | | | (0.17 | ) | | | — | | | | — | | | | — | | | | — | | | | — | |
|
|
Total Distributions | | | (0.17 | ) | | | — | | | | — | | | | — | | | | — | | | | — | |
|
|
Net Asset Value, End of Period | | $ | 27.57 | | | $ | 22.98 | | | $ | 20.26 | | | $ | 17.03 | | | $ | 14.42 | | | $ | 20.13 | |
|
|
Total Return(4) | | | 20.83 | % | | | 13.43 | % | | | 18.97 | % | | | 18.10 | % | | | (28.37 | )% | | | (51.62 | )% |
|
|
Net Assets, End of Period (millions) | | | $2 | | | | $2 | | | | $2 | | | | $2 | | | | $2 | | | | $4 | |
|
|
Ratios to Average Net Assets: | | | | | | | | | | | | | | | | | | | | | | | | |
Gross expenses | | | 2.21 | %(5) | | | 2.36 | % | | | 2.34 | % | | | 2.41 | % | | | 2.63 | % | | | 2.49 | % |
Net expenses | | | 2.19 | (5)(6)(7) | | | 2.36 | (6) | | | 2.24 | (7) | | | 2.41 | | | | 2.63 | | | | 2.49 | |
Net investment income (loss) | | | 0.00 | (3)(5) | | | 0.84 | | | | 0.11 | | | | (0.06 | ) | | | (1.65 | ) | | | (1.60 | ) |
|
|
Portfolio Turnover Rate | | | 77 | % | | | 30 | % | | | 56 | % | | | 153 | % | | | 24 | % | | | 24 | % |
|
|
| (1) | | Per share amounts have been calculated using the average shares method. |
| (2) | | For the six months ended April 30, 2006 (unaudited). |
| (3) | | Amount represents less than $0.01 per share. |
| (4) | | Performance figures may reflect voluntary fee waivers and/or expense reimbursements. Past performance is no guarantee of future results. In the absence of voluntary fee waivers and/or expense reimbursements, the total return would have been lower. Total returns for periods of less than one year are not annualized. |
| (6) | | As a result of a voluntary expense limitation, the ratio of expenses to average net assets of Class C shares will not exceed 2.75%. |
| (7) | | The investment manager voluntarily waived a portion of its fees and/or reimbursed expenses. |
See Notes to Financial Statements.
16 Legg Mason Partners International Fund 2006 Semi-Annual Report
Notes to Financial Statements (unaudited)
| 1. | Organization and Significant Accounting Policies |
Legg Mason Partners International Fund (formerly known as Smith Barney International Fund) (the “Fund”) is a separate diversified investment fund of Legg Mason Partners Investment Series (formerly known as Smith Barney Investment Series) (the “Trust”). The Trust, a Massachusetts business trust, is registered under the Investment Company Act of 1940, as amended (the “1940 Act”), as an open-end management investment company.
The following are significant accounting policies consistently followed by the Fund and are in conformity with U.S. generally accepted accounting principles (“GAAP”). Estimates and assumptions are required to be made regarding assets, liabilities and changes in net assets resulting from operations when financial statements are prepared. Changes in the economic environment, financial markets and any other parameters used in determining these estimates could cause actual results to differ.
(a) Investment Valuation. Equity securities for which market quotations are available are valued at the last sale price or official closing price on the primary market or exchange on which they trade. Debt securities are valued at the mean between the bid and asked prices provided by an independent pricing service that are based on transactions in debt obligations, quotations from bond dealers, market transactions in comparable securities and various relationships between securities. When prices are not readily available, or are determined not to reflect fair value, such as when the value of a security has been significantly affected by events after the close of the exchange or market on which the security is principally traded, but before the Fund calculates its net asset value, the Fund may value these investments at fair value as determined in accordance with the procedures approved by the Fund’s Board of Trustees. Fair valuing of securities may be determined with the assistance of a pricing service using calculations based on indices of domestic securities and other appropriate indicators, such as prices of relevant ADRs and futures contracts. Short-term obligations maturing within 60 days are valued at amortized cost, which approximates market value.
(b) Repurchase Agreements. When entering into repurchase agreements, it is the Fund’s policy that its custodian or a third party custodian take possession of the underlying collateral securities, the market value of which at least equals the principal amount of the repurchase transaction, including accrued interest. To the extent that any repurchase transaction exceeds one business day, the value of the collateral is marked-to-market to ensure the adequacy of the collateral. If the seller defaults, and the market value of the collateral declines or if bankruptcy proceedings are commenced with respect to the seller of the security, realization of the collateral by the Fund may be delayed or limited.
(c) Lending of Portfolio Securities. The Fund has an agreement with its custodian whereby the custodian may lend securities owned by the Fund to brokers, dealers and other financial organizations. In exchange for lending securities under the terms of the agreement with its custodian, the Fund receives a lender’s fee. Fees earned by the Fund on securities lending are recorded as securities lending income. Loans of securities by the Fund are collateralized by cash, U.S. government securities or high quality money market instruments that are maintained at all times in an amount at least equal to the current market value of the loaned securities, plus a margin which varies depending on the type of
Legg Mason Partners International Fund 2006 Semi-Annual Report 17
Notes to Financial Statements (unaudited) (continued)
securities loaned. The custodian establishes and maintains the collateral in a segregated account. The Fund has the right under the lending agreement to recover the securities from the borrower on demand.
The Fund maintains the risk of any loss on the securities on loan as well as the potential loss on investments purchased with cash collateral received from securities lending.
(d) Security Transactions and Investment Income. Security transactions are accounted for on a trade date basis. Interest income, adjusted for amortization of premium and accretion of discount, is recorded on the accrual basis. Dividend income is recorded on the ex-dividend date. Foreign dividend income is recorded on the ex-dividend date or as soon as practical after the Fund determines the existence of a dividend declaration after exercising reasonable due diligence. The cost of investments sold is determined by use of the specific identification method. To the extent any issuer defaults on an expected interest payment, the Fund’s policy is to generally halt any additional interest income accruals and consider the realizability of interest accrued up to the date of default.
(e) Foreign Currency Translation. Investment securities and other assets and liabilities denominated in foreign currencies are translated into U.S. dollar amounts based upon prevailing exchange rates on the date of valuation. Purchases and sales of investment securities and income and expense items denominated in foreign currencies are translated into U.S. dollar amounts based upon prevailing exchange rates on the respective dates of such transactions.
The Fund does not isolate that portion of the results of operations resulting from changes in foreign exchange rates on investments from the fluctuations arising from changes in market prices of securities held. Such fluctuations are included with the net realized and unrealized gain or loss on investments.
Net realized foreign exchange gains or losses arise from sales of foreign currencies, including gains and losses on forward foreign currency contracts, currency gains or losses realized between the trade and settlement dates on securities transactions and the difference between the amounts of dividends, interest and foreign withholding taxes recorded on the Fund’s books and the U.S. dollar equivalent of the amounts actually received or paid. Net unrealized foreign exchange gains and losses arise from changes in the fair values of assets and liabilities, other than investments in securities, at the date of valuation, resulting from changes in exchange rates.
Foreign security and currency transactions may involve certain considerations and risks not typically associated with those of U.S. dollar denominated transactions as a result of, among other factors, the possibility of lower levels of governmental supervision and regulation of foreign securities markets and the possibility of political or economic instability.
(f) Foreign Risk. The Fund’s investments in foreign securities may involve risks not present in domestic investments. Since securities may be denominated in foreign currencies and may require settlement in foreign currencies and pay interest or dividends in foreign currencies, changes in the relationship of these foreign currencies to the U.S. dollar can significantly affect the value of the investments and earnings of the Fund. Foreign investments may also subject the Fund to foreign government exchange restrictions, expropriation, taxation or other political, social or economic developments, all of which affect the market and/or credit risk of the investments.
18 Legg Mason Partners International Fund 2006 Semi-Annual Report
Notes to Financial Statements (unaudited) (continued)
(g) Distributions to Shareholders. Distributions from net investment income and distributions of net realized gains, if any, are declared at least annually. Distributions to shareholders of the Fund are recorded on the ex-dividend date and are determined in accordance with income tax regulations, which may differ from GAAP.
(h) Class Accounting. Investment income, common expenses and realized/unrealized gain (loss) on investments are allocated to the various classes of the Fund on the basis of daily net assets of each class. Fees relating to a specific class are charged directly to that class.
(i) Federal and Other Taxes. It is the Fund’s policy to comply with the federal income and excise tax requirements of the Internal Revenue Code of 1986, as amended, applicable to regulated investment companies. Accordingly, the Fund intends to distribute substantially all of its income and net realized gains on investments, if any, to shareholders each year. Therefore, no federal income tax provision is required in the Fund’s financial statements. Under the applicable foreign tax laws, a withholding tax may be imposed on interest, dividends and capital gains at various rates.
(j) Reclassification. GAAP requires that certain components of net assets be adjusted to reflect permanent differences between financial and tax reporting. These reclassifications have no effect on net assets or net asset values per share.
| 2. | Investment Management Agreement and Other Transactions with Affiliates |
On December 1, 2005, Citigroup Inc. (“Citigroup”) completed the sale of substantially all of its asset management business to Legg Mason, Inc. (“Legg Mason”). As a result, the Fund’s investment manager, Smith Barney Fund Management LLC (“SBFM” or the “Manager”) and the Fund’s then sub-adviser, Legg Mason International Equities Ltd. (“LMIE”) (formerly “Citigroup Asset Management Ltd”) (“CAM Ltd”) previously indirect wholly-owned subsidiaries of Citigroup, became wholly-owned subsidiaries of Legg Mason. Completion of the sale caused the Fund’s then existing investment management agreement and sub-advisory agreement to terminate. The Fund’s shareholders approved a new investment management agreement between the Fund and the Manager and a new sub-advisory agreement between the Manager and LMIE, each of which became effective on December 19, 2005. An interim management agreement and sub-advisory agreement each took effect upon the closing of the sale and continued in effect until December 19, 2005.
Effective February 1, 2006, the sub-advisory agreement with LMIE with respect to the Fund was terminated.
Legg Mason, whose principal executive offices are in Baltimore, Maryland, is a financial services holding company.
Legg Mason Partners International Fund 2006 Semi-Annual Report 19
Notes to Financial Statements (unaudited) (continued)
Prior to the Legg Mason transaction and continuing under the new investment management agreement, the Fund pays the Manager an investment management fee calculated daily and paid monthly in accordance with the following breakpoint schedule:
| | | |
| |
| Average Daily Net Assets | | Annual Rate | |
First $1 billion | | 0.850 | % |
Next $1 billion | | 0.825 | |
Next $3 billion | | 0.800 | |
Next $5 billion | | 0.775 | |
Over $10 billion | | 0.750 | |
|
|
During the six months ended April 30, 2006, the Fund’s Class 1, A, B and C shares had voluntary expense limitations in place of 1.75%, 2.00%, 2.75% and 2.75%, respectively. For the six months ended April 30, 2006, the Manager waived a portion of its investment management fee amounting to $137,232. Such waivers and/or expense reimbursements are voluntary and may be reduced or terminated at any time.
The Fund’s Board has approved PFPC Inc. (“PFPC”) to serve as transfer agent for the Fund, effective January 1, 2006. The principal business office of PFPC is located at 4400 Computer Drive, Westborough, MA 01581. Prior to January 1, 2006, Citicorp Trust Bank, fsb. (“CTB”), a subsidiary of Citigroup, acted as the Fund’s transfer agent. Also, prior to January 1, 2006, PFPC and Primerica Shareholder Services (“PSS”), another subsidiary of Citigroup, acted as the Fund’s sub-transfer agents. CTB received account fees and asset-based fees that varied according to the size and type of account. PFPC and PSS were responsible for shareholder recordkeeping and financial processing for all shareholder accounts and were paid by CTB. For the period ended April 30, 2006, the Fund paid transfer agent fees of $702,606 to CTB. In addition, for the period ended April 30, 2006, the Fund also paid $102 to other Citigroup affiliates for shareholder recordkeeping services.
The Fund’s Board has appointed the Fund’s current distributor, Citigroup Global Markets Inc. (“CGM”), and PFS Investments Inc. (“PFS”), both subsidiaries of Citigroup, and Legg Mason Investor Services, LLC (“LMIS”), a wholly-owned broker-dealer subsidiary of Legg Mason, as co-distributors of the Fund. The Fund’s Board has also approved an amended and restated Rule 12b-1 Plan. CGM and other broker-dealers, financial intermediaries and financial institutions (each called a “Service Agent”) that currently offer Fund shares will continue to make the Fund’s shares available to their clients. Additional Service Agents may offer Fund shares in the future.
There is a maximum initial sales charge of 8.50% and 5.00% for Class 1 and A shares, respectively. There is a contingent deferred sales charge (“CDSC”) of 5.00% on Class B shares, which applies if redemption occurs within one year from purchase payment. This CDSC declines thereafter by 1.00% per year until no CDSC is incurred. Class C shares have a 1.00% CDSC, which applies if redemption occurs within one year from purchase payment. In certain cases, Class A shares have a 1.00% CDSC, which applies if redemption occurs within one year from purchase payment. This CDSC only applies to those purchases of Class A shares, which, when combined with current holdings of Class A
20 Legg Mason Partners International Fund 2006 Semi-Annual Report
Notes to Financial Statements (unaudited) (continued)
shares, equal or exceed $1,000,000 in the aggregate. These purchases do not incur an initial sales charge.
For the period ended April 30, 2006, LMIS, PFS, and CGM and its affiliates received sales charges of approximately $19,000 and $1,000 on sales of the Fund’s Class A shares and Class 1 shares, respectively. In addition, for the period ended April 30, 2006, CDSCs paid to LMIS, PFS, and CGM and its affiliates were approximately $6,000 for Class B shares.
The Trustees of the Fund have adopted a Retirement Plan (the “Plan”), for all Trustees who are not “interested persons” of the Fund, within the meaning of the 1940 Act. Under the Plan, each Trustee is required to retire from the Board as of the last day of the calendar year in which such applicable Trustee attains age 75. Trustees may retire under the Plan before attaining the mandatory retirement age. Trustees who have served as Trustee of the Trust or any of the investment companies associated with the Manager for at least ten years when they retire are eligible to receive the maximum retirement benefit under the Plan. The maximum retirement benefit is an amount equal to five times the amount of retainer and regular meeting fees payable to a Trustee during the entirety of the calendar year of the Trustee’s retirement (assuming no change in relevant facts for the balance of the year following the Trustee’s retirement). Amounts under the Plan may be paid in installments or in a lump sum (discounted to present value). Benefits under the Plan are unfunded. Two former Trustees are currently receiving payments under the Plan. In addition, three other Trustees received full payments under the Plan.
Certain of the Trustees also are covered by a prior retirement plan. Under the prior plan, retirement benefits are payable for a ten-year period following retirement, with the annual payment to be based upon the Trustee’s compensation from the Trust during calendar year 2000. Trustees with more than five but less than ten years of service at retirement will receive a prorated benefit. In order to receive benefits under the current Plan, a Trustee must waive all rights under the prior plan prior to receiving payment under either plan. The Fund’s allocated shares of the liability at April 30, 2006 was $38,418.
Certain officers and one Trustee of the Trust are employees of Legg Mason or its affiliates and do not receive compensation from the Trust.
During the six months ended April 30, 2006, the aggregate cost of purchases and proceeds from sales of investments (excluding short-term investments) were as follows:
| | | |
Purchases | | $ | 97,294,255 |
|
Sales | | | 103,729,620 |
|
At April 30, 2006, the aggregate gross unrealized appreciation and depreciation of investments for federal income tax purposes were substantially as follows:
| | | | |
Gross unrealized appreciation | | $ | 21,590,569 | |
Gross unrealized depreciation | | | (599,205 | ) |
|
|
Net unrealized appreciation | | $ | 20,991,364 | |
|
|
Legg Mason Partners International Fund 2006 Semi-Annual Report 21
Notes to Financial Statements (unaudited) (continued)
| 4. | Class Specific Expenses |
The Fund has adopted a Rule 12b-1 distribution Plan and under that plan the Fund pays a distribution/service fee with respect to its Class A, B and C shares calculated at an annual rate of 0.25% of the average daily net assets with respect to Class A and at the annual rate of 1.00% of the respective average daily net assets of Class B and C shares. Distribution fees are accrued daily and paid monthly.
For the six months ended April 30, 2006, class specific expenses were as follows:
| | | | | | | | | |
| | | |
| | | Distribution
Fees | | Transfer Agent
Fees | | Shareholder
Reports
Expenses |
Class 1 | | $ | — | | $ | 10,629 | | $ | 636 |
Class A | | | 82,977 | | | 268,642 | | | 8,427 |
Class B | | | 264,877 | | | 226,711 | | | 7,943 |
Class C | | | 9,148 | | | 1,151 | | | 593 |
|
Total | | $ | 357,002 | | $ | 507,133 | | $ | 17,599 |
|
| 5. | Distributions to Shareholders by Class |
| | | | | | |
| | | Six Months Ended
April 30, 2006 | | Year Ended
October 31, 2005 |
Net Investment Income | | | | | | |
Class 1 | | $ | 45,816 | | $ | — |
Class A | | | 701,136 | | | — |
Class B | | | 224,353 | | | — |
Class C | | | 13,142 | | | — |
|
Total | | $ | 984,447 | | $ | — |
|
| 6. | Shares of Beneficial Interest |
At April 30, 2006, the Fund had an unlimited number of shares of beneficial interest authorized with a par value of $0.00001 per share. The Fund has the ability to issue multiple classes of shares. Each share of a class represents an identical interest and has the same rights, except that each class bears certain direct expenses specifically related to the distribution of its shares.
22 Legg Mason Partners International Fund 2006 Semi-Annual Report
Notes to Financial Statements (unaudited) (continued)
Transactions in shares of each class were as follows:
| | | | | | | | | | | | | | |
| | |
| | | Six Months Ended
April 30, 2006
| | | Year Ended
October 31, 2005
| |
| | | Shares | | | Amount | | | Shares | | | Amount | |
Class 1 | | | | | | | | | | | | | | |
Shares sold | | 8,925 | | | $ | 232,260 | | | 12,231 | | | $ | 281,074 | |
Shares issued on reinvestment | | 1,827 | | | | 45,816 | | | — | | | | — | |
Shares repurchased | | (13,000 | ) | | | (334,703 | ) | | (35,497 | ) | | | (808,567 | ) |
|
|
Net Decrease | | (2,248 | ) | | $ | (56,627 | ) | | (23,266 | ) | | $ | (527,493 | ) |
|
|
Class A | | | | | | | | | | | | | | |
Shares sold | | 266,070 | | | $ | 6,687,488 | | | 454,284 | | | $ | 9,935,355 | |
Shares issued on reinvestment | | 28,615 | | | | 687,610 | | | — | | | | — | |
Shares repurchased | | (299,331 | ) | | | (7,382,205 | ) | | (528,425 | ) | | | (11,539,470 | ) |
|
|
Net Decrease | | (4,646 | ) | | $ | (7,107 | ) | | (74,141 | ) | | $ | (1,604,115 | ) |
|
|
Class B | | | | | | | | | | | | | | |
Shares sold | | 111,944 | | | $ | 2,583,595 | | | 233,692 | | | $ | 4,702,432 | |
Shares issued on reinvestment | | 7,894 | | | | 175,165 | | | — | | | | — | |
Shares repurchased | | (266,647 | ) | | | (6,094,837 | ) | | (491,729 | ) | | | (9,913,605 | ) |
|
|
Net Decrease | | (146,809 | ) | | $ | (3,336,077 | ) | | (258,037 | ) | | $ | (5,211,173 | ) |
|
|
Class C | | | | | | | | | | | | | | |
Shares sold | | 1,463 | | | $ | 38,562 | | | 1,915 | | | $ | 42,689 | |
Shares issued on reinvestment | | 457 | | | | 11,089 | | | — | | | | — | |
Shares repurchased | | (12,202 | ) | | | (310,170 | ) | | (28,577 | ) | | | (626,948 | ) |
|
|
Net Decrease | | (10,282 | ) | | $ | (260,519 | ) | | (26,662 | ) | | $ | (584,259 | ) |
|
|
| 7. | Capital Loss Carryforward |
As of October 31, 2005, the Fund had, for federal income tax purposes, a net capital loss carryforward of $90,270,935, of which $569,980 expires in 2008, $16,130,189 expires in 2009, $43,173,297 expires in 2010 and $30,397,469 expires in 2011. These amounts will be available to offset any future taxable capital gains.
On May 31, 2005, the U.S. Securities and Exchange Commission (“SEC”) issued an order in connection with the settlement of an administrative proceeding against SBFM and CGM relating to the appointment of an affiliated transfer agent for the Smith Barney family of mutual funds (the “Funds”).
The SEC order finds that SBFM and CGM willfully violated Section 206(1) of the Investment Advisers Act of 1940 (“Advisers Act”). Specifically, the order finds that SBFM and CGM knowingly or recklessly failed to disclose to the boards of the Funds in 1999 when proposing a new transfer agent arrangement with an affiliated transfer agent that: First Data Investors Services Group (“First Data”), the Funds’ then-existing transfer agent, had offered to continue as transfer agent and do the same work for substantially less money than before; and that Citigroup Asset Management (“CAM”), the Citigroup business unit
Legg Mason Partners International Fund 2006 Semi-Annual Report 23
Notes to Financial Statements (unaudited) (continued)
that, at the time, included the fund’s investment manager and other investment advisory companies, had entered into a side letter with First Data under which CAM agreed to recommend the appointment of First Data as sub-transfer agent to the affiliated transfer agent in exchange for, among other things, a guarantee by First Data of specified amounts of asset management and investment banking fees to CAM and CGM. The order also finds that SBFM and CGM willfully violated Section 206(2) of the Advisers Act by virtue of the omissions discussed above and other misrepresentations and omissions in the materials provided to the Funds’ boards, including the failure to make clear that the affiliated transfer agent would earn a high profit for performing limited functions while First Data continued to perform almost all of the transfer agent functions, and the suggestion that the proposed arrangement was in the Funds’ best interests and that no viable alternatives existed. SBFM and CGM do not admit or deny any wrongdoing or liability. The settlement does not establish wrongdoing or liability for purposes of any other proceeding.
The SEC censured SBFM and CGM and ordered them to cease and desist from violations of Sections 206(1) and 206(2) of the Advisers Act. The order requires Citigroup to pay $208.1 million, including $109 million in disgorgement of profits, $19.1 million in interest, and a civil money penalty of $80 million. Approximately $24.4 million has already been paid to the Funds, primarily through fee waivers. The remaining $183.7 million, including the penalty, has been paid to the U.S. Treasury and will be distributed pursuant to a plan submitted for the approval of the SEC. At this time, there is no certainty as to how the above-described proceeds of the settlement will be distributed, to whom such distributions will be made, the methodology by which such distributions will be allocated, and when such distributions will be made. The order also required that transfer agency fees received from the Funds since December 1, 2004 less certain expenses be placed in escrow and provided that a portion of such fees might be subsequently distributed in accordance with the terms of the order. On April 3, 2006, an aggregate amount of approximately $9 million was distributed to the affected Funds.
The order required SBFM to recommend a new transfer agent contract to the Fund boards within 180 days of the entry of the order; if a Citigroup affiliate submitted a proposal to serve as transfer agent or sub-transfer agent, SBFM and CGM would have been required, at their expense, to engage an independent monitor to oversee a competitive bidding process. On November 21, 2005, and within the specified timeframe, the Fund’s Board selected a new transfer agent for the Fund. No Citigroup affiliate submitted a proposal to serve as transfer agent. Under the order, SBFM also must comply with an amended version of a vendor policy that Citigroup instituted in August 2004.
Although there can be no assurance, SBFM does not believe that this matter will have a material adverse effect on the Funds.
On December 1, 2005, Citigroup completed the sale of substantially all of its global asset management business, including SBFM, to Legg Mason.
Beginning in August 2005, five class action lawsuits alleging violations of federal securities laws and state law were filed against CGM and SBFM, (collectively, the “Defendants”) based on the May 31, 2005 settlement order issued against the Defendants by the SEC
24 Legg Mason Partners International Fund 2006 Semi-Annual Report
Notes to Financial Statements (unaudited) (continued)
described in Note 8. The complaints seek injunctive relief and compensatory and punitive damages, removal of SBFM as the investment manager for the Smith Barney family of funds, rescission of the Funds’ management and other contracts with SBFM, recovery of all fees paid to SBFM pursuant to such contracts, and an award of attorneys’ fees and litigation expenses.
On October 5, 2005, a motion to consolidate the five actions and any subsequently filed, related action was filed. That motion contemplates that a consolidated amended complaint alleging substantially similar causes of action will be filed in the future.
As of the date of this report, SBFM believes that resolution of the pending lawsuit will not have a material effect on the financial position or results of operations of the Funds or the ability of the Fund’s investment manager and its affiliates to continue to render services to the Funds under their respective contracts.
* * *
Beginning in June 2004, class action lawsuits alleging violations of the federal securities laws were filed against CGM and a number of its affiliates, including SBFM and Salomon Brothers Asset Management Inc. (“SBAM”) (collectively, the “Advisers”), substantially all of the mutual funds managed by the Advisers, including the Fund (the “Funds”), and directors or trustees of the Funds (collectively, the “Defendants”). The complaints alleged, among other things, that CGM created various undisclosed incentives for its brokers to sell Smith Barney and Salomon Brothers funds. In addition, according to the complaints, the Advisers caused the Funds to pay excessive brokerage commissions to CGM for steering clients towards proprietary funds. The complaints also alleged that the Defendants breached their fiduciary duty to the Funds by improperly charging Rule 12b-1 fees and by drawing on fund assets to make undisclosed payments of soft dollars and excessive brokerage commissions. The complaints also alleged that the Funds failed to adequately disclose certain aspects of the allegedly wrongful conduct. The complaints sought injunctive relief and compensatory and punitive damages, rescission of the Funds’ contracts with the Advisers, recovery of all fees paid to the Advisers pursuant to such contracts and an award of attorneys’ fees and litigation expenses.
On December 15, 2004, a consolidated amended complaint (the “Complaint”) was filed alleging substantially similar causes of action. While the lawsuit is in its earliest stages, to the extent that the Complaint purports to state causes of action against the Funds, the Fund’s investment manager believes the Funds have significant defenses to such allegations, which the Funds intend to vigorously assert in responding to the Complaint.
Additional lawsuits arising out of these circumstances and presenting similar allegations and requests for relief may be filed against the Defendants in the future.
As of the date of this report, the Fund’s investment manager and the Funds believe that the resolution of the pending lawsuit will not have a material effect on the financial position or results of operations of the Funds or the ability of the Advisers and their affiliates to continue to render services to the Funds under their respective contracts.
The Defendants have moved to dismiss the Complaint. Those motions are pending before the court.
Legg Mason Partners International Fund 2006 Semi-Annual Report 25
Notes to Financial Statements (unaudited) (continued)
On September 16, 2005, the staff of the SEC informed SBFM and SBAM that the staff is considering recommending that the SEC institute administrative proceedings against SBFM and SBAM for alleged violations of Section 19(a) and 34(b) of the Investment Company Act (and related Rule 19a-1). The notification is a result of an industry wide inspection by the SEC and is based upon alleged deficiencies in disclosures regarding dividends and distributions paid to shareholders of certain funds. Section 19(a) and related Rule 19a-1 of the Investment Company Act generally require funds that are making dividend and distribution payments to provide shareholders with a written statement disclosing the source of the dividends and distributions, and, in particular, the portion of the payments made from each of net investment income, undistributed net profits and/or paid-in capital. In connection with the contemplated proceedings, the staff may seek a cease and desist order and/or monetary damages from SBFM or SBAM.
Although there can be no assurance, SBFM believes that this matter is not likely to have a material adverse effect on the Fund or SBFM’s ability to perform investment management services relating to the Fund.
26 Legg Mason Partners International Fund 2006 Semi-Annual Report
Additional Shareholder Information (unaudited)
Results of a Special Meeting of Shareholders
On December 19, 2005, a Special Meeting of Shareholders was held to approve a new management agreement and new sub-advisory agreement. The following table provides the number of votes cast for or against, as well as the number of abstentions and broker non-votes as to each matter voted on at the Special Meeting of Shareholders.
| | | | | | | | |
| Item Voted On | | Votes For | | Votes Against | | Abstentions | | Broker
Non-Votes |
New Management Agreement | | 2,496,123.114 | | 80,316.168 | | 233,521.718 | | 19,895.000 |
New Sub-Advisory Agreement | | 2,491,654.951 | | 85,436.155 | | 232,869.894 | | 19,895.000 |
|
Legg Mason Partners International Fund 2006 Semi-Annual Report 27
Legg Mason Partners International Fund
| | |
TRUSTEES Elliott J. Berv Donald M. Carlton A. Benton Cocanougher Mark T. Finn R. Jay Gerken, CFA Chairman Stephen R. Gross Diana R. Harrington Susan B. Kerley Alan G. Merten R. Richardson Pettit OFFICERS R. Jay Gerken, CFA President and Chief Executive Officer Andrew B. Shoup Senior Vice President and Chief Administrative Officer Frances M. Guggino Chief Financial Officer and Treasurer Ted P. Becker Chief Compliance Officer John Chiota Chief Anti-Money Laundering Compliance Officer Wendy S. Setnicka Controller | | OFFICERS (continued) Robert I. Frenkel Secretary and
Chief Legal Officer INVESTMENT MANAGER Smith Barney Fund
Management LLC DISTRIBUTORS Citigroup Global Markets Inc. Legg Mason Investor Services, LLC PFS Investments Inc. CUSTODIAN State Street Bank and
Trust Company TRANSFER AGENT PFPC Inc. 4400 Computer Drive Westborough, Massachussetts 01581 INDEPENDENT REGISTERED PUBLIC ACCOUNTING FIRM KPMG LLP 345 Park Avenue New York, New York 10154 |
This report is submitted for the general information of shareholders of Legg Mason Partners International Fund, but it may also be used as sales literature when preceded or accompanied by the current Prospectus.
This report must be preceded or accompanied by a free prospectus. Investors should consider the Fund’s investment objectives, risks, charges and expenses carefully before investing. The prospectus contains this and other important information about the Fund. Please read the prospectus carefully before investing.
www.leggmason.com/InvestorServices
©2006 Legg Mason Investor Services, LLC Member NASD, SIPC
Legg Mason Partners International Fund
The Fund is a separate investment fund of Legg Mason Partners Investment Series, a Massachusetts business trust.
LEGG MASON PARTNERS INTERNATIONAL FUND
Legg Mason Partners Funds
125 Broad Street
10th Floor, MF-2
New York, New York 10004
The Fund files its complete schedule of portfolio holdings with the Securities and Exchange Commission for the first and third quarters of each fiscal year on Form N-Q. The Fund’s Forms N-Q are available on the Commission’s website at www.sec.gov. The Fund’s Forms N-Q may be reviewed and copied at the Commission’s Public Reference Room in Washington, D.C., and information on the operation of the Public Reference Room may be obtained by calling 1-800-SEC-0330. To obtain information on Form N-Q from the Fund, shareholders can call 1-800-451-2010.
Information on how the Fund voted proxies relating to portfolio securities during the prior 12-month period ended June 30th of each year, and a description of the policies and procedures that the Fund uses to determine how to vote proxies relating to portfolio transactions is available (1) without charge, upon request, by calling 1-800-451-2010, (2) on the Fund’s website at www.leggmason.com/InvestorServices and (3) on the SEC’s website at www.sec.gov. Proxy voting reports for the period ending June 30, 2005 will continue to be listed under the Fund’s former Smith Barney Investment Series – Smith Barney International Fund name.
Not Applicable.
| ITEM 3. | AUDIT COMMITTEE FINANCIAL EXPERT. |
Not Applicable.
| ITEM 4. | PRINCIPAL ACCOUNTANT FEES AND SERVICES. |
Not applicable.
| ITEM 5. | AUDIT COMMITTEE OF LISTED REGISTRANTS. |
Not applicable.
| ITEM 6. | SCHEDULE OF INVESTMENTS. |
Included herein under Item 1.
| ITEM 7. | DISCLOSURE OF PROXY VOTING POLICIES AND PROCEDURES FOR CLOSED-END MANAGEMENT INVESTMENT COMPANIES. |
Not applicable.
| ITEM 8. | PORTFOLIO MANAGERS OF CLOSED-END MANAGEMENT INVESTMENT COMPANIES. |
Not applicable.
| ITEM 9. | PURCHASES OF EQUITY SECURITIES BY CLOSED-END MANAGEMENT INVESTMENT COMPANY AND AFFILIATED PURCHASERS. |
Not applicable.
| ITEM 10. | SUBMISSION OF MATTERS TO A VOTE OF SECURITY HOLDERS. |
Not applicable.
| ITEM 11. | CONTROLS AND PROCEDURES. |
| | (a) | The registrant’s principal executive officer and principal financial officer have concluded that the registrant’s disclosure controls and procedures (as defined in Rule 30a-3(c) under the Investment Company Act of 1940, as amended (the “1940 Act”)) are effective as of a date within 90 days of the filing date of this report that includes the disclosure required by this paragraph, based on their evaluation of the disclosure controls and procedures required by Rule 30a-3(b) under the 1940 Act and 15d-15(b) under the Securities Exchange Act of 1934. |
| | (b) | There were no changes in the registrant’s internal control over financial reporting (as defined in Rule 30a-3(d) under the 1940 Act) that occurred during the registrant’s last fiscal half-year (the registrant’s second fiscal half-year in the case of an annual report) that have materially affected, or are likely to materially affect the registrant’s internal control over financial reporting. |
| | |
| Exhibit 99.CERT | | Certifications pursuant to section 302 of the Sarbanes-Oxley Act of 2002 |
| |
| Exhibit 99.906CERT | | Certifications pursuant to Section 906 of the Sarbanes-Oxley Act of 2002 |
SIGNATURES
Pursuant to the requirements of the Securities Exchange Act of 1934 and the Investment Company Act of 1940, the registrant has duly caused this Report to be signed on its behalf by the undersigned, there unto duly authorized.
| | |
Legg Mason Partners Investment Series |
| |
By: | | /s/ R. Jay Gerken R. Jay Gerken Chief Executive Officer of Legg Mason Partners Investment Series |
| |
Date: | | July 10, 2006 |
Pursuant to the requirements of the Securities Exchange Act of 1934 and the Investment Company Act of 1940, this report has been signed below by the following persons on behalf of the registrant and in the capacities and on the dates indicated.
| | |
By: | | /s/ R. Jay Gerken |
| | R. Jay Gerken |
| | Chief Executive Officer of |
| | Legg Mason Partners Investment Series |
| |
Date: | | July 10, 2006 |
| |
By: | | /s/ Frances M. Guggino |
| | Frances M. Guggino |
| | Chief Financial Officer of |
| | Legg Mason Partners Investment Series |
| |
Date: | | July 10, 2006 |