UNITED STATES
SECURITIES AND EXCHANGE COMMISSION
Washington, D.C. 20549
FORM N-CSR
CERTIFIED SHAREHOLDER REPORT OF REGISTERED MANAGEMENT
INVESTMENT COMPANIES
| Investment Company Act file number | 811-05021 |
| | |
| | BNY Mellon Short-Intermediate Municipal Bond Fund | |
| | (Exact name of Registrant as specified in charter) | |
| | | |
| | c/o BNY Mellon Investment Adviser, Inc. 240 Greenwich Street New York, New York 10286 | |
| | (Address of principal executive offices) (Zip code) | |
| | | |
| | Bennett A. MacDougall, Esq. 240 Greenwich Street New York, New York 10286 | |
| | (Name and address of agent for service) | |
| |
| Registrant's telephone number, including area code: | (212) 922-6400 |
| | |
Date of fiscal year end: | 03/31 | |
| Date of reporting period: | 03/31/2021 | |
| | | | | | | |
FORM N-CSR
Item 1. Reports to Stockholders.
BNY Mellon Short-Intermediate Municipal Bond Fund
| |
ANNUAL REPORT March 31, 2021 |
| |
Save time. Save paper. View your next shareholder report online as soon as it’s available. Log into www.im.bnymellon.com and sign up for eCommunications. It’s simple and only takes a few minutes. |
| |
The views expressed in this report reflect those of the portfolio manager(s) only through the end of the period covered and do not necessarily represent the views of BNY Mellon Investment Adviser, Inc. or any other person in the BNY Mellon Investment Adviser, Inc. organization. Any such views are subject to change at any time based upon market or other conditions and BNY Mellon Investment Adviser, Inc. disclaims any responsibility to update such views. These views may not be relied on as investment advice and, because investment decisions for a fund in the BNY Mellon Family of Funds are based on numerous factors, may not be relied on as an indication of trading intent on behalf of any fund in the BNY Mellon Family of Funds. |
| |
Not FDIC-Insured • Not Bank-Guaranteed • May Lose Value |
Contents
T H E F U N D
F O R M O R E I N F O R M AT I O N
Back Cover
DISCUSSION OF FUND PERFORMANCE (Unaudited)
For the period from April 1, 2020 through March 31, 2021, as provided by Thomas Casey and Jeffrey Burger, Primary Portfolio Managers
Market and Fund Performance Overview
For the 12-month period ended March 31, 2021, BNY Mellon Short-Intermediate Municipal Bond Fund’s Class A shares produced a total return of 2.54%, Class D shares returned 2.70%, Class I shares returned 2.79% and Class Y shares returned 2.73%.1 In comparison, the fund’s benchmark, the Bloomberg Barclays Municipal Bond: 3 Year Index (2-4) (the “Index”), which is not subject to fees and expenses like a mutual fund, produced a total return of 3.50% for the same period.2
Municipal bonds performed well during the reporting period, recovering from the COVID-19 pandemic amid steady demand and improving economic fundamentals. The fund slightly underperformed the Index, largely because the fund includes a range of securities, including those of longer maturities than the Index, and longer maturities underperformed as interest rates rose during the reporting period.
The Fund’s Investment Approach
The fund seeks to maximize current income exempt from federal income tax to the extent consistent with the preservation of capital. To pursue its goal, the fund normally invests substantially all of its net assets in municipal bonds that provide income exempt from federal personal income tax. The fund invests only in municipal bonds rated investment grade or the unrated equivalent as determined by BNY Mellon Investment Adviser, Inc. at the time of purchase. The fund invests primarily in municipal bonds with remaining maturities of five years or less and generally maintains a dollar-weighted average portfolio maturity of two to three years.
The portfolio managers focus on identifying undervalued sectors and securities and minimizing the use of interest-rate forecasting. The portfolio managers select municipal bonds by using fundamental credit analysis to estimate the relative value and attractiveness of various sectors and securities and seek to exploit pricing inefficiencies in the municipal bond market. They also actively trade among various sectors, such as pre-refunded, general obligation and revenue, based on their apparent relative values. The fund seeks to invest in several of these sectors.
Policy Responses and Economic Recovery Enable Markets to Recover
The municipal bond market experienced unprecedented volatility during the reporting period, as the COVID-19 virus spread, and government shutdowns caused the economy to slow dramatically. Yields on municipal bonds had reached record lows before the pandemic hit, but large outflows from municipal bond mutual funds, combined with illiquidity, caused yields to soar.
Prior to the reporting period, the Federal Reserve (the “Fed”) responded to the pandemic with two emergency cuts in the federal funds target rate in March 2020, bringing it to 0.00-0.25%. The Fed also launched a $500 billion Municipal Liquidity Facility to purchase short-term municipal securities. This, combined with the $2 trillion Coronavirus Aid, Relief, and
2
Economic Security (CARES) Act, dramatically changed investor sentiment, which helped the municipal bond market to quickly rebound.
The supply of new bonds dried up during the height of the crisis in the first quarter of 2020. But with the market rebound in the second quarter, issuance also rebounded as issuers sought to take advantage of record-low funding costs. As in 2019, much of the new issuance was in taxable bonds. Tax-exempt issuance may have been inhibited by the absence of advance refunding, which was eliminated by the Tax Cuts and Jobs Act of 2017. In the past, advance refunding allowed issuers to replace higher-yielding, tax-exempt debt with lower-yielding, tax-exempt debt. Without advance refunding, some entities have taken advantage of low yields by issuing taxable debt instead of tax-exempt debt. New supply later in the reporting period was also driven by the desire of many issuers to secure financing ahead of the November 2020 election.
Early in the reporting period, less risky bonds outperformed. General obligation bonds outperformed revenue bonds, and AAA and AA rated bonds outperformed A and BBB rated bonds. In addition, the investment-grade market outperformed the high-yield market, and shorter-term issues performed better than longer issues.
As government-mandated lockdowns were eased, strong inflows to municipal bond funds late in 2020 bolstered the market. Approval of multiple COVID-19 vaccines and passage of a federal stimulus package also contributed further to demand. Although the stimulus package did not include direct relief for states and municipalities, the market took a favorable view of funding for hospitals and mass transit, among other segments, as well as for consumers and small businesses.
The results of the November 2020 election also added to demand. A Democrat-controlled Congress made federal support for state and local governments more likely. It also made income tax hikes more likely, adding to the appeal of tax-exempt municipal securities. The prospect of an increase in the corporate tax rate made municipal bonds more appealing to institutional buyers, and low interest rates overseas attracted foreign investors as well.
Investors were also encouraged by the fiscal health of municipal issuers, which turned out to be much stronger than expected. Tax revenues remained robust because real estate and income tax collections failed to decline as much as predicted. Progressive tax regimes proved advantageous because higher-earning, white-collar workers were largely unaffected by the pandemic. In addition, federal support to households, school systems, the transportation system and other segments bolstered the economy and prevented sales taxes from declining as much as originally feared.
3
DISCUSSION OF FUND PERFORMANCE (Unaudited) (continued)
Revenue bonds generally outperformed general obligation bonds late in the period as hard-hit market segments such as transportation and hospitals recovered, when investors became more confident that the end of the pandemic was likely. Yield spreads of municipal bonds over Treasury bonds compressed late in the reporting period. This was due to both a rise in long-term Treasury yields and to a decline in long-term municipal bond yields. Although the municipal bond market experienced some turmoil late in the period as the prospects of a stronger economy and an increase in inflation have grown, most of the volatility occurred among longer maturities.
Despite an increase in volatility, the municipal bond market has been a strong performer versus other segments of the fixed-income arena. This has been driven by strong fundamentals due in part to a $350 billion relief package from the federal government. In addition, inflows to municipal bond mutual funds in 2021 have been the strongest on record.
Longer Maturities Hindered Results
The fund’s performance versus the Index was hindered primarily by the composition of the Index, which focuses on securities with maturities of two to four years. The fund’s holdings include those as well as securities with longer maturities. So, although the fund’s duration was roughly the same as that of the Index, the fund’s holdings of longer maturities detracted from performance because that part of the municipal bond curve underperformed, particularly late in the reporting period. In addition, positions in essential services bonds, such as those in the water and sewer segment, also detracted from performance for the full reporting period despite proving beneficial for much of 2020 when investors sought out higher-quality securities. An underexposure to certain lower-quality securities, such as those from the state of Illinois and the city of Chicago, also detracted because they rebounded strongly late in the period as the economy improved.
On a more positive note, the fund’s exposure to certain segments of revenue bonds contributed positively to performance. Holdings in the airport, transportation and hospital segments, in particular, enhanced returns despite lagging early in the reporting period. These sectors were hurt by the impact of the pandemic but rebounded strongly late in the period. Positions in the Salt Lake City International Airport, Denver International Airport and the Port Authority of New York and New Jersey were especially positive contributors. The fund did not make use of derivatives during the reporting period.
Relief Programs, Improved Economy and Strong Demand Support Municipal Market
With the economy increasingly opening up, the municipal market has experienced some volatility at the longer end of the curve. We anticipate that over the medium term, volatility at the short-to-intermediate portion of the curve will be minimal, given the Fed’s commitment to low interest rates.
4
We believe the market will continue to benefit from ongoing economic recovery, which should result in improved finances among state and local issuers. The market has also been supported by strong demand, as flows into municipal bond mutual funds have been positive, and we anticipate that this will continue. Given these market conditions, we will continue to focus on yield as the primary driver of performance, consistent with the preservation of capital.
April 15, 2021
1 Total return includes reinvestment of dividends and any capital gains paid and does not take into consideration the maximum initial sales charge in the case of Class A shares. Class D, I and Y shares are not subject to any initial or deferred sales charge. Share price, yield and investment return fluctuate such that upon redemption, fund shares may be worth more or less than their original cost. Income may be subject to state and local taxes, and some income may be subject to the federal alternative minimum tax (AMT) for certain investors. Capital gains, if any, are taxable. Return figures provided reflect the absorption of certain fund expenses by BNY Mellon Investment Adviser, Inc. pursuant to an agreement in effect until July 31, 2021, at which time it may be extended, modified or terminated. Had these expenses not been absorbed, the fund’s returns would have been lower. Past performance is no guarantee of future results.
2 Source: Lipper Inc. — The Bloomberg Barclays Municipal Bond: 3 Year Index (2-4) covers the U.S.-dollar-denominated, 2-4 year, tax-exempt bond market. Investors cannot invest directly in any index.
Bonds are subject generally to interest-rate, credit, liquidity and market risks, to varying degrees, all of which are more fully described in the fund’s prospectus. Generally, all other factors being equal, bond prices are inversely related to interest-rate changes, and rate increases can cause price declines.
Recent market risks include pandemic risks related to COVID-19. The effects of COVID-19 have contributed to increased volatility in global markets and will likely affect certain countries, companies, industries and market sectors more dramatically than others. To the extent the fund may overweight its investments in certain countries, companies, industries or market sectors, such positions will increase the fund’s exposure to risk of loss from adverse developments affecting those countries, companies, industries or sectors.
5
FUND PERFORMANCE (Unaudited)
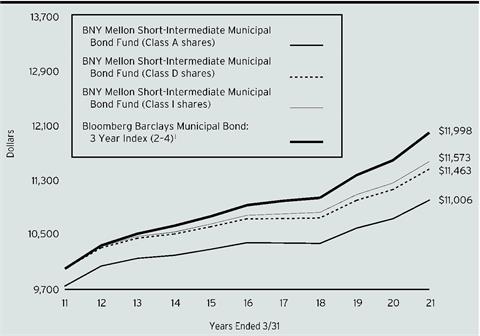
Comparison of change in value of a $10,000 investment in Class A shares, Class D shares and Class I shares of BNY Mellon Short-Intermediate Municipal Bond Fund with a hypothetical investment of $10,000 in the Bloomberg Barclays Municipal Bond: 3 Year Index (2-4) (the “Index”)
† Source: Lipper Inc.
Past performance is not predictive of future performance.
The above graph compares a hypothetical $10,000 investment made in Class A shares, Class D shares and Class I shares of BNY Mellon Short-Intermediate Municipal Bond Fund on 3/31/11 to a hypothetical investment of $10,000 made in the Index on that date. All dividends and capital gain distributions are reinvested.
The fund’s performance shown in the line graph above takes into account the maximum initial sales charge on Class A shares and all other applicable fees and expenses of the applicable classes. The Index covers the U.S. dollar denominated 2-4 year tax-exempt bond market. Unlike a mutual fund, the Index is not subject to charges, fees and other expenses. Investors cannot invest directly in any index. Further information relating to fund performance, including expense reimbursements, if applicable, is contained in the Financial Highlights section of the prospectus and elsewhere in this report.
6
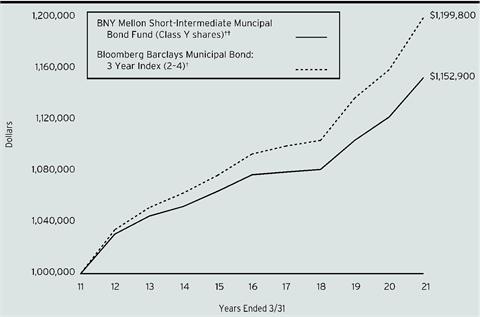
Comparison of change in value of a $1,000,000 investment in Class Y shares of BNY Mellon Short-Intermediate Municipal Bond Fund with a hypothetical investment of $1,000,000 in the Bloomberg Barclays Municipal Bond: 3 Year Index (2-4) (the “Index”)
† Source: Lipper Inc.
†† The total return figures presented for Class Y shares of the fund reflect the performance of the fund’s Class D shares for the period prior to 7/1/13 (the inception date for Class Y shares).
Past performance is not predictive of future performance.
The above graph compares a hypothetical $1,000,000 investment made in Class Y shares of BNY Mellon Short-Intermediate Municipal Bond Fund on 3/31/11 to a hypothetical investment of $1,000,000 made in the Index on that date. All dividends and capital gain distributions are reinvested.
The fund’s performance shown in the graph above takes into account all applicable fees and expenses of the fund’s Class Y shares. The Index covers the U.S. dollar denominated 2-4 year tax-exempt bond market. Unlike a mutual fund, the Index is not subject to charges, fees and other expenses. Investors cannot invest directly in any index. Further information relating to fund performance, including expense reimbursements, if applicable, is contained in the Financial Highlights section of the prospectus and elsewhere in this report.
7
FUND PERFORMANCE (Unaudited) (continued)
| | | | | |
Average Annual Total Returns as of 3/31/21 |
| Inception
Date | 1 Year | 5 Years | 10 Years |
Class A shares | | | | |
with maximum sales charge (2.5%) | 8/3/09 | -0.02% | 0.67% | 0.96% |
without sales charge | 8/3/09 | 2.54% | 1.17% | 1.22% |
Class D shares | 4/30/87 | 2.70% | 1.32% | 1.38% |
Class I shares | 12/15/08 | 2.79% | 1.42% | 1.47% |
Class Y shares | 7/1/13 | 2.73% | 1.37% | 1.43%† |
Bloomberg Barclays Municipal
Bond: 3 Year Index (2-4) | | 3.50% | 1.87% | 1.84% |
† The total return performance figures presented for Class Y shares of the fund reflect the performance of the fund’s Class D shares for the period prior to 7/1/13 (the inception date for Class Y shares).
The performance data quoted represents past performance, which is no guarantee of future results. Share price and investment return fluctuate and an investor’s shares may be worth more or less than original cost upon redemption. Current performance may be lower or higher than the performance quoted. Go to www.im.bnymellon.com for the fund’s most recent month-end returns.
The fund’s performance shown in the graphs and table does not reflect the deduction of taxes that a shareholder would pay on fund distributions or the redemption of fund shares. In addition to the performance of Class A shares shown with and without a maximum sales charge, the fund’s performance shown in the table takes into account all other applicable fees and expenses on all classes.
8
UNDERSTANDING YOUR FUND’S EXPENSES (Unaudited)
As a mutual fund investor, you pay ongoing expenses, such as management fees and other expenses. Using the information below, you can estimate how these expenses affect your investment and compare them with the expenses of other funds. You also may pay one-time transaction expenses, including sales charges (loads) and redemption fees, which are not shown in this section and would have resulted in higher total expenses. For more information, see your fund’s prospectus or talk to your financial adviser.
Review your fund’s expenses
The table below shows the expenses you would have paid on a $1,000 investment in BNY Mellon Short-Intermediate Municipal Bond Fund from October 1, 2020 to March 31, 2021. It also shows how much a $1,000 investment would be worth at the close of the period, assuming actual returns and expenses.
| | | | | | | |
Expenses and Value of a $1,000 Investment | |
Assume actual returns for the six months ended March 31, 2021 | |
| | | | | | |
| | Class A | Class D | Class I | Class Y | |
Expenses paid per $1,000† | $3.19 | $2.45 | $1.95 | $1.95 | |
Ending value (after expenses) | $1,001.50 | $1,003.00 | $1,002.70 | $1,002.70 | |
COMPARING YOUR FUND’S EXPENSES
WITH THOSE OF OTHER FUNDS (Unaudited)
Using the SEC’s method to compare expenses
The Securities and Exchange Commission (“SEC”) has established guidelines to help investors assess fund expenses. Per these guidelines, the table below shows your fund’s expenses based on a $1,000 investment, assuming a hypothetical 5% annualized return. You can use this information to compare the ongoing expenses (but not transaction expenses or total cost) of investing in the fund with those of other funds. All mutual fund shareholder reports will provide this information to help you make this comparison. Please note that you cannot use this information to estimate your actual ending account balance and expenses paid during the period.
| | | | | | | |
Expenses and Value of a $1,000 Investment | |
Assuming a hypothetical 5% annualized return for the six months ended March 31, 2021 | |
| | | | | | |
| | Class A | Class D | Class I | Class Y | |
Expenses paid per $1,000† | $3.23 | $2.47 | $1.97 | $1.97 | |
Ending value (after expenses) | $1,021.74 | $1,022.49 | $1,022.99 | $1,022.99 | |
† | Expenses are equal to the fund’s annualized expense ratio of ..64% for Class A, .49% for Class D, .39% for Class I and .39% for Class Y, multiplied by the average account value over the period, multiplied by 182/365 (to reflect the one-half year period). |
9
STATEMENT OF INVESTMENTS
March 31, 2021
| | | | | | | | | | |
| |
Description | Coupon
Rate (%) | | Maturity Date | | Principal Amount ($) | | Value ($) | |
Long-Term Municipal Investments - 97.2% | | | | | |
Alabama - 1.7% | | | | | |
Auburn University, Revenue Bonds, Refunding, Ser. A | | 5.00 | | 6/1/2024 | | 1,200,000 | | 1,375,577 | |
Black Belt Energy Gas District, Revenue Bonds (Project No. 4) Ser. A1 | | 4.00 | | 12/1/2025 | | 1,250,000 | | 1,426,019 | |
Jefferson County, GO, Refunding, Ser. A | | 5.00 | | 4/1/2022 | | 1,800,000 | | 1,884,576 | |
| | 4,686,172 | |
Arizona - 3.3% | | | | | |
Arizona, COP, Refunding, Ser. A | | 5.00 | | 10/1/2025 | | 5,000,000 | | 5,984,089 | |
Maricopa County Pollution Control Corp., Revenue Bonds, Refunding (Public Service Co. of New Mexico) | | 1.05 | | 6/1/2022 | | 1,000,000 | | 1,005,667 | |
Maricopa County Unified School District No. 4, GO, Ser. A | | 5.00 | | 7/1/2025 | | 1,840,000 | | 2,179,145 | |
| | 9,168,901 | |
California - 4.7% | | | | | |
California, GO, Refunding | | 5.00 | | 4/1/2025 | | 1,000,000 | | 1,182,446 | |
California, GO, Refunding | | 5.00 | | 4/1/2024 | | 1,500,000 | | 1,711,531 | |
California County Tobacco Securitization Agency, Revenue Bonds, Refunding, Ser. A | | 5.00 | | 6/1/2024 | | 400,000 | | 456,593 | |
California County Tobacco Securitization Agency, Revenue Bonds, Refunding, Ser. A | | 5.00 | | 6/1/2025 | | 500,000 | | 589,930 | |
California Infrastructure & Economic Development Bank, Revenue Bonds, Refunding (California Academy of Sciences Project) Ser. B, 1 Month LIBOR x.7 +.38% | | 0.46 | | 8/1/2021 | | 2,280,000 | a | 2,279,957 | |
California Pollution Control Financing Authority, Revenue Bonds (Waste Management Project) Ser. A | | 2.50 | | 5/1/2024 | | 2,625,000 | | 2,781,547 | |
Golden Tobacco Securitization Corp., Revenue Bonds, Refunding, Ser. A1 | | 5.00 | | 6/1/2021 | | 2,700,000 | | 2,719,537 | |
Port of Los Angeles, Revenue Bonds, Refunding, Ser. A | | 5.00 | | 8/1/2021 | | 1,400,000 | | 1,420,939 | |
| | 13,142,480 | |
10
| | | | | | | | | | |
| |
Description | Coupon
Rate (%) | | Maturity Date | | Principal Amount ($) | | Value ($) | |
Long-Term Municipal Investments - 97.2% (continued) | | | | | |
Colorado - 2.6% | | | | | |
Colorado Health Facilities Authority, Revenue Bonds, Refunding (Sisters of Charity of Leavenworth Health System Obligated Group) Ser. A | | 5.00 | | 1/1/2024 | | 2,145,000 | | 2,414,833 | |
Denver City & County Airport System, Revenue Bonds, Refunding, Ser. A | | 5.00 | | 11/15/2022 | | 3,000,000 | | 3,224,417 | |
Regional Transportation District, Revenue Bonds, Refunding (Denver Transit Partners) Ser. A | | 3.00 | | 1/15/2026 | | 600,000 | | 653,131 | |
Regional Transportation District, Revenue Bonds, Refunding (Denver Transit Partners) Ser. A | | 5.00 | | 1/15/2025 | | 650,000 | | 747,296 | |
Vauxmont Metropolitan District, GO, Refunding (Insured; Assured Guaranty Municipal Corp.) | | 5.00 | | 12/15/2024 | | 130,000 | | 148,640 | |
| | 7,188,317 | |
Connecticut - 2.0% | | | | | |
Connecticut, Revenue Bonds, Refunding, Ser. B | | 5.00 | | 9/1/2021 | | 2,000,000 | | 2,039,891 | |
Connecticut, Special Tax Bonds, Ser. A | | 5.00 | | 5/1/2025 | | 850,000 | | 999,313 | |
Connecticut Housing Finance Authority, Revenue Bonds, Refunding, Ser. C2 | | 5.00 | | 11/15/2025 | | 1,000,000 | | 1,171,102 | |
New Haven, GO (Insured; Assured Guaranty Municipal Corp.) Ser. A | | 5.00 | | 8/1/2024 | | 1,140,000 | | 1,305,994 | |
| | 5,516,300 | |
District of Columbia - 2.2% | | | | | |
Metropolitan Washington Airports Authority, Revenue Bonds, Refunding | | 5.00 | | 10/1/2022 | | 4,635,000 | | 4,955,500 | |
Metropolitan Washington Airports Authority, Revenue Bonds, Refunding, Ser. A | | 5.00 | | 10/1/2022 | | 1,200,000 | | 1,282,977 | |
| | 6,238,477 | |
Florida - 4.0% | | | | | |
Central Florida Expressway Authority, Revenue Bonds, Refunding | | 5.00 | | 7/1/2022 | | 1,750,000 | | 1,850,949 | |
Hillsborough County Solid Waste & Resource Recovery, Revenue Bonds, Refunding, Ser. A | | 5.00 | | 9/1/2021 | | 1,240,000 | | 1,263,600 | |
Jacksonville, Revenue Bonds, Refunding | | 5.00 | | 10/1/2024 | | 3,000,000 | | 3,213,508 | |
11
STATEMENT OF INVESTMENTS (continued)
| | | | | | | | | | |
| |
Description | Coupon
Rate (%) | | Maturity Date | | Principal Amount ($) | | Value ($) | |
Long-Term Municipal Investments - 97.2% (continued) | | | | | |
Florida - 4.0% (continued) | | | | | |
Lee County Solid Waste System, Revenue Bonds, Refunding | | 5.00 | | 10/1/2021 | | 3,150,000 | | 3,215,204 | |
Palm Beach County Health Facilities Authority, Revenue Bonds, Refunding (ACTS Retirement-Life Communities Obligated Group) | | 5.00 | | 11/15/2021 | | 1,500,000 | | 1,537,101 | |
| | 11,080,362 | |
Georgia - 1.1% | | | | | |
Clarke County Hospital Authority, Revenue Bonds, Refunding (Piedmont Healthcare Project) | | 5.00 | | 7/1/2021 | | 2,000,000 | | 2,022,421 | |
Savannah Economic Development Authority, Revenue Bonds, Refunding (International Paper Co.) | | 1.90 | | 8/1/2024 | | 1,000,000 | | 1,037,325 | |
| | 3,059,746 | |
Illinois - 7.6% | | | | | |
Chicago Board of Education, GO, Refunding (Insured; Assured Guaranty Municipal Corp.) Ser. A | | 5.00 | | 12/1/2023 | | 1,000,000 | | 1,112,143 | |
Chicago II Waterworks, Revenue Bonds, Refunding, Ser. 2017-2 | | 5.00 | | 11/1/2022 | | 1,200,000 | | 1,284,654 | |
Chicago II Waterworks, Revenue Bonds, Refunding, Ser. 2017-2 | | 5.00 | | 11/1/2021 | | 1,315,000 | | 1,349,151 | |
Chicago Park District, GO, Refunding, Ser. B | | 5.00 | | 1/1/2025 | | 1,000,000 | | 1,106,928 | |
Cook County II, GO, Refunding, Ser. A | | 5.00 | | 11/15/2026 | | 1,000,000 | | 1,225,115 | |
Illinois Finance Authority, Revenue Bonds, Refunding (OSF Healthcare System Obligated Group) Ser. B1 | | 5.00 | | 11/15/2024 | | 2,000,000 | | 2,268,934 | |
Illinois Toll Highway Authority, Revenue Bonds, Refunding, Ser. B | | 5.00 | | 1/1/2025 | | 1,500,000 | | 1,746,675 | |
Northern Illinois Municipal Power Agency, Revenue Bonds, Refunding, Ser. A | | 5.00 | | 12/1/2021 | | 4,800,000 | | 4,945,679 | |
Railsplitter Tobacco Settlement Authority, Revenue Bonds | | 5.00 | | 6/1/2022 | | 3,220,000 | | 3,389,252 | |
Sales Tax Securitization Corp., Revenue Bonds, Refunding, Ser. A | | 5.00 | | 1/1/2025 | | 1,000,000 | | 1,148,010 | |
University of Illinois, Revenue Bonds, Refunding (Auxiliary Facilities System) Ser. C | | 5.00 | | 4/1/2025 | | 1,470,000 | | 1,502,795 | |
| | 21,079,336 | |
Indiana - 5.5% | | | | | |
Indiana Finance Authority, Revenue Bonds (Green Bond) | | 5.00 | | 2/1/2024 | | 1,025,000 | | 1,161,238 | |
12
| | | | | | | | | | |
| |
Description | Coupon
Rate (%) | | Maturity Date | | Principal Amount ($) | | Value ($) | |
Long-Term Municipal Investments - 97.2% (continued) | | | | | |
Indiana - 5.5% (continued) | | | | | |
Indiana Finance Authority, Revenue Bonds, Refunding (Indianapolis Power & Light Co.) Ser. A | | 3.13 | | 12/1/2024 | | 3,000,000 | | 3,243,113 | |
Indiana Finance Authority, Revenue Bonds, Refunding (Parkview Health System Obligated Group) Ser. A | | 5.00 | | 11/1/2021 | | 1,000,000 | | 1,027,436 | |
Indiana Finance Authority, Revenue Bonds, Refunding (Parkview Health System Obligated Group) Ser. A | | 5.00 | | 11/1/2022 | | 1,135,000 | | 1,219,728 | |
Indiana Health Facility Financing Authority, Revenue Bonds (Ascension Health Credit Group) Ser. A | | 4.00 | | 10/1/2024 | | 865,000 | | 971,389 | |
Indiana Health Facility Financing Authority, Revenue Bonds (Ascension Health Credit Group) Ser. A | | 4.00 | | 11/1/2024 | | 800,000 | | 900,355 | |
Indiana Health Facility Financing Authority, Revenue Bonds (Ascension Health Credit Group) Ser. A | | 4.00 | | 11/1/2025 | | 1,295,000 | | 1,493,750 | |
Whiting, Revenue Bonds (BP Products North America) | | 5.00 | | 11/1/2022 | | 5,000,000 | | 5,359,281 | |
| | 15,376,290 | |
Louisiana - 1.7% | | | | | |
East Baton Rouge Sewerage Commission, Revenue Bonds, Refunding, Ser. B | | 5.00 | | 2/1/2025 | | 1,000,000 | | 1,167,160 | |
Louisiana Offshore Terminal Authority, Revenue Bonds, Refunding (Loop Project) | | 1.65 | | 12/1/2023 | | 2,500,000 | | 2,538,640 | |
Parish of St. John the Baptist, Revenue Bonds, Refunding (Marathon Oil Corp.) | | 2.10 | | 7/1/2024 | | 1,000,000 | | 1,028,499 | |
| | 4,734,299 | |
Maine - .4% | | | | | |
Maine Finance Authority, Revenue Bonds, Refunding (Insured; Assured Guaranty Municipal Corp.) Ser. A1 | | 5.00 | | 12/1/2024 | | 1,000,000 | | 1,144,466 | |
Maryland - 3.8% | | | | | |
Baltimore, Revenue Bonds, Refunding (Convention Center Hotel Project) | | 5.00 | | 9/1/2021 | | 1,000,000 | | 1,003,565 | |
13
STATEMENT OF INVESTMENTS (continued)
| | | | | | | | | | |
| |
Description | Coupon
Rate (%) | | Maturity Date | | Principal Amount ($) | | Value ($) | |
Long-Term Municipal Investments - 97.2% (continued) | | | | | |
Maryland - 3.8% (continued) | | | | | |
Maryland Health & Higher Educational Facilities Authority, Revenue Bonds, Refunding (University of Maryland Medical System Obligated Group) Ser. B | | 5.00 | | 7/1/2022 | | 1,600,000 | | 1,691,268 | |
Maryland Health & Higher Educational Facilities Authority, Revenue Bonds, Refunding (University of Maryland Medical System Obligated Group) Ser. B1 | | 5.00 | | 7/1/2025 | | 4,000,000 | | 4,623,978 | |
Maryland Transportation Authority, Revenue Bonds | | 5.00 | | 6/1/2023 | | 2,990,000 | | 3,282,535 | |
| | 10,601,346 | |
Massachusetts - 2.8% | | | | | |
Massachusetts Development Finance Agency, Revenue Bonds, Refunding (Northeastern University) Ser. A | | 5.00 | | 10/1/2024 | | 1,580,000 | | 1,829,566 | |
Massachusetts Development Finance Agency, Revenue Bonds, Refunding (Suffolk University) | | 5.00 | | 7/1/2021 | | 750,000 | | 758,243 | |
Massachusetts Port Authority, Revenue Bonds, Refunding, Ser. A | | 5.00 | | 7/1/2022 | | 2,770,000 | | 2,932,642 | |
Massachusetts Transportation Trust Fund Metropolitan Highway System, Revenue Bonds, Refunding, Ser. A | | 5.00 | | 1/1/2025 | | 1,950,000 | | 2,274,624 | |
| | 7,795,075 | |
Michigan - 2.5% | | | | | |
Lansing Board of Water & Light, Revenue Bonds, Ser. B | | 2.00 | | 7/1/2026 | | 2,000,000 | | 2,115,055 | |
Michigan Finance Authority, Revenue Bonds, Refunding (Henry Ford Health System Obligated Group) | | 5.00 | | 11/15/2021 | | 1,125,000 | | 1,157,608 | |
Michigan Strategic Fund, Revenue Bonds (I-75 Improvement Project) | | 5.00 | | 6/30/2024 | | 2,000,000 | | 2,273,513 | |
Saginaw Hospital Finance Authority, Revenue Bonds, Refunding (Covenant Healthcare System Obligated Group) | | 5.00 | | 7/1/2025 | | 625,000 | | 734,170 | |
Saginaw Hospital Finance Authority, Revenue Bonds, Refunding (Covenant Healthcare System Obligated Group) | | 5.00 | | 7/1/2024 | | 715,000 | | 814,594 | |
| | 7,094,940 | |
14
| | | | | | | | | | |
| |
Description | Coupon
Rate (%) | | Maturity Date | | Principal Amount ($) | | Value ($) | |
Long-Term Municipal Investments - 97.2% (continued) | | | | | |
Minnesota - .5% | | | | | |
Minneapolis-St. Paul Metropolitan Airports Commission, Revenue Bonds, Refunding, Ser. A | | 5.00 | | 1/1/2025 | | 150,000 | | 174,850 | |
Minneapolis-St. Paul Metropolitan Airports Commission, Revenue Bonds, Refunding, Ser. C | | 5.00 | | 1/1/2025 | | 1,000,000 | | 1,162,027 | |
| | 1,336,877 | |
Nebraska - 1.1% | | | | | |
University of Nebraska Facilities Corp., Revenue Bonds, Ser. A | | 5.00 | | 2/15/2024 | | 2,670,000 | | 3,035,884 | |
Nevada - 2.5% | | | | | |
Clark County, GO, Refunding, Ser. A | | 5.00 | | 11/1/2021 | | 1,000,000 | | 1,027,964 | |
Clark County School District, GO (Insured; Assured Guaranty Municipal Corp.) Ser. A | | 3.00 | | 6/15/2025 | | 1,300,000 | | 1,426,967 | |
Clark County School District, GO, Refunding, Ser. C | | 5.00 | | 6/15/2022 | | 1,050,000 | | 1,109,052 | |
Clark County School District, GO, Refunding, Ser. D | | 5.00 | | 6/15/2021 | | 3,500,000 | | 3,532,285 | |
| | 7,096,268 | |
New Jersey - 4.9% | | | | | |
New Jersey, GO, Ser. A | | 5.00 | | 6/1/2025 | | 2,000,000 | | 2,354,085 | |
New Jersey Economic Development Authority, Revenue Bonds, Refunding, Ser. XX | | 5.00 | | 6/15/2021 | | 1,300,000 | | 1,312,017 | |
New Jersey Educational Facilities Authority, Revenue Bonds, Refunding (Stockton University) Ser. A | | 5.00 | | 7/1/2021 | | 2,190,000 | | 2,212,678 | |
New Jersey Higher Education Student Assistance Authority, Revenue Bonds, Refunding, Ser. B | | 5.00 | | 12/1/2021 | | 2,430,000 | | 2,504,620 | |
New Jersey Housing & Mortgage Finance Agency, Revenue Bonds, Refunding, Ser. D | | 4.00 | | 4/1/2021 | | 1,410,000 | | 1,410,000 | |
Tobacco Settlement Financing Corp., Revenue Bonds, Refunding, Ser. A | | 5.00 | | 6/1/2024 | | 2,500,000 | | 2,846,160 | |
Tobacco Settlement Financing Corp., Revenue Bonds, Refunding, Ser. A | | 5.00 | | 6/1/2023 | | 1,040,000 | | 1,142,372 | |
| | 13,781,932 | |
New Mexico - 2.2% | | | | | |
New Mexico Severance Tax Permanent Fund, Revenue Bonds, Ser. A | | 5.00 | | 7/1/2027 | | 5,000,000 | | 6,296,903 | |
New York - 7.7% | | | | | |
Metropolitan Transportation Authority, BAN, Ser. A1 | | 5.00 | | 2/1/2023 | | 1,710,000 | | 1,839,534 | |
15
STATEMENT OF INVESTMENTS (continued)
| | | | | | | | | | |
| |
Description | Coupon
Rate (%) | | Maturity Date | | Principal Amount ($) | | Value ($) | |
Long-Term Municipal Investments - 97.2% (continued) | | | | | |
New York - 7.7% (continued) | | | | | |
Metropolitan Transportation Authority, Revenue Bonds, Refunding (Green Bond) Ser. B | | 5.00 | | 11/15/2022 | | 790,000 | | 847,118 | |
Metropolitan Transportation Authority, Revenue Bonds, Refunding, Ser. F | | 5.00 | | 11/15/2021 | | 1,000,000 | | 1,028,045 | |
New York City, GO, Refunding, Ser. A1 | | 5.00 | | 8/1/2025 | | 2,000,000 | | 2,374,094 | |
New York State Dormitory Authority, Revenue Bonds, Refunding (Insured; Assured Guaranty Municipal Corp.) Ser. A | | 5.00 | | 10/1/2025 | | 1,450,000 | | 1,727,567 | |
New York State Dormitory Authority, Revenue Bonds, Refunding, Ser. C | | 5.00 | | 3/15/2023 | | 3,425,000 | | 3,745,290 | |
New York State Dormitory Authority, Revenue Bonds, Refunding, Ser. D | | 5.00 | | 2/15/2025 | | 1,500,000 | | 1,760,179 | |
New York State Urban Development Corp., Revenue Bonds, Refunding (State of New York Personal Income Tax) | | 5.00 | | 3/15/2025 | | 2,000,000 | | 2,353,284 | |
New York Transportation Development Corp., Revenue Bonds, Refunding (JFK International Air Terminal) | | 5.00 | | 12/1/2025 | | 1,000,000 | | 1,173,993 | |
Port Authority of New York & New Jersey, Revenue Bonds, Refunding, Ser. 195th | | 5.00 | | 10/1/2021 | | 2,500,000 | | 2,558,358 | |
Port Authority of New York & New Jersey, Revenue Bonds, Refunding, Ser. 202nd | | 5.00 | | 10/15/2021 | | 2,000,000 | | 2,050,397 | |
| | 21,457,859 | |
North Carolina - 1.9% | | | | | |
North Carolina Medical Care Commission, Revenue Bonds (Caromont Health Obligated Group) Ser. B | | 5.00 | | 2/1/2026 | | 2,000,000 | | 2,412,701 | |
North Carolina Turnpike Authority, BAN | | 5.00 | | 2/1/2024 | | 2,500,000 | | 2,817,181 | |
| | 5,229,882 | |
Ohio - 3.7% | | | | | |
Cincinnati Water System, Revenue Bonds, Refunding, Ser. B | | 5.00 | | 12/1/2024 | | 1,020,000 | | 1,189,375 | |
Franklin County, Revenue Bonds, Refunding (OhioHealth Obligated Group) | | 5.00 | | 5/15/2021 | | 1,275,000 | | 1,281,793 | |
Ohio, Revenue Bonds, Ser. 2019-1 | | 5.00 | | 12/15/2024 | | 1,500,000 | | 1,751,355 | |
16
| | | | | | | | | | |
| |
Description | Coupon
Rate (%) | | Maturity Date | | Principal Amount ($) | | Value ($) | |
Long-Term Municipal Investments - 97.2% (continued) | | | | | |
Ohio - 3.7% (continued) | | | | | |
Sycamore Community School District, GO, Refunding | | 4.00 | | 12/1/2025 | | 2,845,000 | | 3,291,177 | |
Sycamore Community School District, GO, Refunding | | 4.00 | | 12/1/2024 | | 2,415,000 | | 2,723,807 | |
| | 10,237,507 | |
Oklahoma - .8% | | | | | |
Oklahoma Development Finance Authority, Revenue Bonds (Gilcrease Developers) | | 1.63 | | 7/6/2023 | | 1,000,000 | | 1,004,981 | |
Oklahoma Turnpike Authority, Revenue Bonds, Refunding, Ser. A | | 5.00 | | 1/1/2025 | | 1,000,000 | | 1,166,879 | |
| | 2,171,860 | |
Pennsylvania - 8.4% | | | | | |
Allegheny County Hospital Development Authority, Revenue Bonds, Refunding (Allegheny Health Network Obligated Group) Ser. A | | 5.00 | | 4/1/2024 | | 2,000,000 | | 2,261,539 | |
Commonwealth Financing Authority, Revenue Bonds | | 5.00 | | 6/1/2023 | | 1,000,000 | | 1,096,929 | |
Delaware River Joint Toll Bridge Commission, Revenue Bonds, Ser. A | | 5.00 | | 7/1/2025 | | 1,000,000 | | 1,185,241 | |
Delaware Valley Regional Finance Authority, Revenue Bonds, Ser. B, 1 Month MUNIPSA +.42% | | 0.47 | | 9/1/2022 | | 5,000,000 | a | 4,991,427 | |
Montgomery County Higher Education & Health Authority, Revenue Bonds (Thomas Jefferson University Obligated Group) Ser. C, 6 Month MUNIPSA +.72% | | 0.77 | | 9/1/2023 | | 2,000,000 | a | 2,000,076 | |
Pennsylvania Economic Development Financing Authority, Revenue Bonds (Waste Management Project) | | 2.15 | | 7/1/2024 | | 2,500,000 | | 2,624,101 | |
Pennsylvania Economic Development Financing Authority, Revenue Bonds, Refunding (University of Pittsburgh Medical Center Obligated Group) Ser. A | | 5.00 | | 2/1/2022 | | 1,665,000 | | 1,731,610 | |
Pennsylvania Turnpike Commission, Revenue Bonds, Refunding (Insured; Assured Guaranty Municipal Corp.) Ser. A | | 5.25 | | 7/15/2028 | | 185,000 | | 240,876 | |
Pennsylvania Turnpike Commission, Revenue Bonds, Refunding, Ser. B | | 5.00 | | 6/1/2021 | | 2,135,000 | | 2,150,075 | |
Philadelphia, GO, Refunding, Ser. A | | 5.00 | | 8/1/2024 | | 2,000,000 | | 2,291,930 | |
17
STATEMENT OF INVESTMENTS (continued)
| | | | | | | | | | |
| |
Description | Coupon
Rate (%) | | Maturity Date | | Principal Amount ($) | | Value ($) | |
Long-Term Municipal Investments - 97.2% (continued) | | | | | |
Pennsylvania - 8.4% (continued) | | | | | |
Philadelphia Gas Works, Revenue Bonds (Insured; Assured Guaranty Municipal Corp.) Ser. A | | 5.00 | | 8/1/2025 | | 500,000 | | 590,706 | |
Philadelphia Gas Works, Revenue Bonds, Refunding | | 5.00 | | 10/1/2021 | | 1,200,000 | | 1,227,952 | |
Southcentral Pennsylvania General Authority, Revenue Bonds, Refunding (WellSpan Health Obligated Group) | | 5.00 | | 6/1/2022 | | 1,000,000 | | 1,055,613 | |
| | 23,448,075 | |
Rhode Island - .8% | | | | | |
Rhode Island Health & Educational Building Corp., Revenue Bonds, Refunding (Lifespan Obligation Group) | | 5.00 | | 5/15/2021 | | 2,250,000 | | 2,261,219 | |
Tennessee - .7% | | | | | |
Tennessee Energy Acquisition Corp., Revenue Bonds, Ser. A | | 5.25 | | 9/1/2021 | | 2,000,000 | | 2,040,529 | |
Texas - 11.3% | | | | | |
Brazos Higher Education Authority, Revenue Bonds, Ser. 1A | | 5.00 | | 4/1/2025 | | 685,000 | | 779,305 | |
Brazos Higher Education Authority, Revenue Bonds, Ser. 1A | | 5.00 | | 4/1/2024 | | 600,000 | | 667,859 | |
Central Texas Regional Mobility Authority, BAN, Ser. F | | 5.00 | | 1/1/2025 | | 1,500,000 | | 1,702,047 | |
Clifton Higher Education Finance Corp., Revenue Bonds, Refunding (IDEA Public Schools) (Insured; Permanent School Fund Guarantee Program) | | 4.00 | | 8/15/2022 | | 1,600,000 | | 1,681,923 | |
Denton Utility System, Revenue Bonds | | 5.00 | | 12/1/2021 | | 1,250,000 | | 1,288,274 | |
Grand Parkway Transportation Corp., BAN | | 5.00 | | 2/1/2023 | | 5,000,000 | | 5,382,872 | |
Lower Colorado River Authority, Revenue Bonds, Refunding (LCRA Transmission Services Corp.) Ser. A | | 5.00 | | 5/15/2024 | | 1,040,000 | | 1,185,730 | |
North Texas Tollway Authority, Revenue Bonds, Refunding, Ser. A | | 5.00 | | 1/1/2022 | | 2,910,000 | | 3,012,628 | |
North Texas Tollway Authority, Revenue Bonds, Refunding, Ser. B | | 5.00 | | 1/1/2025 | | 2,500,000 | | 2,901,036 | |
Pflugerville Independent School District, GO (Insured; Permanent School Fund Guarantee Program) Ser. B | | 2.50 | | 8/15/2023 | | 3,500,000 | | 3,674,162 | |
Tarrant County College District, GO | | 5.00 | | 8/15/2025 | | 4,180,000 | | 4,991,940 | |
18
| | | | | | | | | | |
| |
Description | Coupon
Rate (%) | | Maturity Date | | Principal Amount ($) | | Value ($) | |
Long-Term Municipal Investments - 97.2% (continued) | | | | | |
Texas - 11.3% (continued) | | | | | |
Texas, GO | | 5.00 | | 8/1/2021 | | 4,115,000 | | 4,178,445 | |
| | 31,446,221 | |
Utah - 1.2% | | | | | |
Salt Lake City Airport, Revenue Bonds, Ser. A | | 5.00 | | 7/1/2022 | | 2,000,000 | | 2,112,799 | |
Utah, GO, Ser. B | | 5.00 | | 7/1/2025 | | 1,000,000 | | 1,192,660 | |
| | 3,305,459 | |
Virginia - 1.5% | | | | | |
Roanoke Economic Development Authority, Revenue Bonds, Refunding (Carilion Clinic Obligated Group) | | 5.00 | | 7/1/2024 | | 1,000,000 | | 1,142,411 | |
Virginia Public School Authority, Revenue Bonds, Ser. VIII | | 5.00 | | 4/15/2025 | | 2,500,000 | | 2,945,799 | |
| | 4,088,210 | |
Washington - 2.0% | | | | | |
Grant County Public Utility District No. 2, Revenue Bonds, Refunding, Ser. R | | 2.00 | | 12/1/2025 | | 2,000,000 | | 2,115,591 | |
Port of Seattle, Revenue Bonds | | 5.00 | | 4/1/2024 | | 2,000,000 | | 2,252,640 | |
Washington Health Care Facilities Authority, Revenue Bonds, Refunding (CommonSpirit Health Obligated Group) Ser. B1 | | 5.00 | | 8/1/2024 | | 1,040,000 | | 1,164,158 | |
| | 5,532,389 | |
Wisconsin - .1% | | | | | |
Wisconsin Department of Transportation, Revenue Bonds, Refunding, Ser. 1st | | 5.00 | | 7/1/2022 | | 330,000 | b | 350,015 | |
Total Long-Term Municipal Investments
(cost $266,301,941) | | 271,023,596 | |
| | | | | | | | | |
Short-Term Municipal Investments - 1.1% | | | | | |
New York - 1.1% | | | | | |
Erie County, RAN
(cost $3,017,169) | | 3.00 | | 6/24/2021 | | 3,000,000 | | 3,019,417 | |
Total Investments (cost $269,319,110) | | 98.3% | 274,043,013 | |
Cash and Receivables (Net) | | 1.7% | 4,646,699 | |
Net Assets | | 100.0% | 278,689,712 | |
a Variable rate security—Interest rate resets periodically and rate shown is the interest rate in effect at period end. Security description also includes the reference rate and spread if published and available.
b These securities are prerefunded; the date shown represents the prerefunded date. Bonds which are prerefunded are collateralized by U.S. Government securities which are held in escrow and are used to pay principal and interest on the municipal issue and to retire the bonds in full at the earliest refunding date.
19
STATEMENT OF INVESTMENTS (continued)
| | |
Portfolio Summary (Unaudited) † | Value (%) |
Transportation | 16.3 |
General | 13.4 |
Medical | 13.1 |
General Obligation | 10.7 |
Development | 8.4 |
School District | 6.8 |
Airport | 5.8 |
Education | 5.5 |
Tobacco Settlement | 4.4 |
Power | 3.0 |
Water | 2.2 |
Utilities | 1.9 |
Student Loan | 1.8 |
Facilities | 1.8 |
Pollution | 1.6 |
Single Family Housing | .9 |
Nursing Homes | .6 |
Prerefunded | .1 |
| | 98.3 |
† Based on net assets.
See notes to financial statements.
20
| | | | |
| |
Summary of Abbreviations (Unaudited) |
| |
ABAG | Association of Bay Area Governments | AGC | ACE Guaranty Corporation |
AGIC | Asset Guaranty Insurance Company | AMBAC | American Municipal Bond Assurance Corporation |
BAN | Bond Anticipation Notes | CIFG | CDC Ixis Financial Guaranty |
COP | Certificate of Participation | CP | Commercial Paper |
DRIVERS | Derivative Inverse Tax-Exempt Receipts | FGIC | Financial Guaranty Insurance Company |
FHA | Federal Housing Administration | FHLB | Federal Home Loan Bank |
FHLMC | Federal Home Loan Mortgage Corporation | FNMA | Federal National Mortgage Association |
GAN | Grant Anticipation Notes | GIC | Guaranteed Investment Contract |
GNMA | Government National Mortgage Association | GO | General Obligation |
IDC | Industrial Development Corporation | LIBOR | London Interbank Offered Rate |
LOC | Letter of Credit | LR | Lease Revenue |
NAN | Note Anticipation Notes | MFHR | Multi-Family Housing Revenue |
MFMR | Multi-Family Mortgage Revenue | MUNIPSA | Securities Industry and Financial Markets Association Municipal Swap Index Yield |
OBFR | Overnight Bank Funding Rate | PILOT | Payment in Lieu of Taxes |
PRIME | Prime Lending Rate | PUTTERS | Puttable Tax-Exempt Receipts |
RAC | Revenue Anticipation Certificates | RAN | Revenue Anticipation Notes |
RIB | Residual Interest Bonds | SFHR | Single Family Housing Revenue |
SFMR | Single Family Mortgage Revenue | SOFR | Secured Overnight Financing Rate |
TAN | Tax Anticipation Notes | TRAN | Tax and Revenue Anticipation Notes |
U.S. T-Bill | U.S. Treasury Bill Money Market Yield | XLCA | XL Capital Assurance |
| | | | |
See notes to financial statements.
21
STATEMENT OF ASSETS AND LIABILITIES
March 31, 2021
| | | | | | | |
| | | | | | |
| | | Cost | | Value | |
Assets ($): | | | | |
Investments in securities—See Statement of Investments | 269,319,110 | | 274,043,013 | |
Cash | | | | | 1,068,051 | |
Interest receivable | | 3,602,360 | |
Receivable for shares of Beneficial Interest subscribed | | 213,677 | |
Prepaid expenses | | | | | 38,079 | |
| | | | | 278,965,180 | |
Liabilities ($): | | | | |
Due to BNY Mellon Investment Adviser, Inc. and affiliates—Note 3(c) | | 96,170 | |
Payable for shares of Beneficial Interest redeemed | | 88,932 | |
Other accrued expenses | | | | | 90,366 | |
| | | | | 275,468 | |
Net Assets ($) | | | 278,689,712 | |
Composition of Net Assets ($): | | | | |
Paid-in capital | | | | | 274,743,374 | |
Total distributable earnings (loss) | | | | | 3,946,338 | |
Net Assets ($) | | | 278,689,712 | |
| | | | | | |
Net Asset Value Per Share | Class A | Class D | Class I | Class Y | |
Net Assets ($) | 29,784,176 | 185,908,623 | 62,980,846 | 16,067 | |
Shares Outstanding | 2,272,156 | 14,185,928 | 4,804,500 | 1,229 | |
Net Asset Value Per Share ($) | 13.11 | 13.11 | 13.11 | 13.07 | |
| | | | | |
See notes to financial statements. | | | | | |
22
STATEMENT OF OPERATIONS
Year Ended March 31, 2021
| | | | | | | |
| | | | | | |
| | | | | | |
Investment Income ($): | | | | |
Interest Income | | | 4,604,242 | |
Expenses: | | | | |
Management fee—Note 3(a) | | | 856,178 | |
Shareholder servicing costs—Note 3(c) | | | 193,042 | |
Service plan fees—Note 3(b) | | | 184,066 | |
Professional fees | | | 105,113 | |
Registration fees | | | 72,195 | |
Trustees’ fees and expenses—Note 3(d) | | | 20,227 | |
Prospectus and shareholders’ reports | | | 17,417 | |
Chief Compliance Officer fees—Note 3(c) | | | 14,822 | |
Loan commitment fees—Note 2 | | | 11,974 | |
Custodian fees—Note 3(c) | | | 5,992 | |
Miscellaneous | | | 39,389 | |
Total Expenses | | | 1,520,415 | |
Less—reduction in expenses due to undertaking—Note 3(a) | | | (131,451) | |
Less—reduction in fees due to earnings credits—Note 3(c) | | | (5,992) | |
Net Expenses | | | 1,382,972 | |
Investment Income—Net | | | 3,221,270 | |
Realized and Unrealized Gain (Loss) on Investments—Note 4 ($): | | |
Net realized gain (loss) on investments | 19,214 | |
Net change in unrealized appreciation (depreciation) on investments | 4,287,730 | |
Net Realized and Unrealized Gain (Loss) on Investments | | | 4,306,944 | |
Net Increase in Net Assets Resulting from Operations | | 7,528,214 | |
| | | | | | |
See notes to financial statements. | | | | | |
23
STATEMENT OF CHANGES IN NET ASSETS
| | | | | | | | | | |
| | | | Year Ended March 31, |
| | | | 2021 | | 2020 | |
Operations ($): | | | | | | | | |
Investment income—net | | | 3,221,270 | | | | 3,969,378 | |
Net realized gain (loss) on investments | | 19,214 | | | | 313,233 | |
Net change in unrealized appreciation
(depreciation) on investments | | 4,287,730 | | | | (441,957) | |
Net Increase (Decrease) in Net Assets
Resulting from Operations | 7,528,214 | | | | 3,840,654 | |
Distributions ($): | |
Distributions to shareholders: | | | | | | | | |
Class A | | | (309,452) | | | | (267,934) | |
Class D | | | (2,065,043) | | | | (2,683,978) | |
Class I | | | (845,890) | | | | (1,017,465) | |
Class Y | | | (195) | | | | (33) | |
Total Distributions | | | (3,220,580) | | | | (3,969,410) | |
Beneficial Interest Transactions ($): | |
Net proceeds from shares sold: | | | | | | | | |
Class A | | | 13,904,603 | | | | 17,375,297 | |
Class D | | | 31,703,162 | | | | 24,519,229 | |
Class I | | | 37,338,365 | | | | 31,179,895 | |
Class Y | | | - | | | | 14,875 | |
Distributions reinvested: | | | | | | | | |
Class A | | | 289,177 | | | | 242,513 | |
Class D | | | 1,895,045 | | | | 2,475,675 | |
Class I | | | 838,833 | | | | 1,015,449 | |
Class Y | | | 183 | | | | 17 | |
Cost of shares redeemed: | | | | | | | | |
Class A | | | (14,953,565) | | | | (6,871,206) | |
Class D | | | (33,162,132) | | | | (42,790,505) | |
Class I | | | (45,950,498) | | | | (32,562,706) | |
Increase (Decrease) in Net Assets
from Beneficial Interest Transactions | (8,096,827) | | | | (5,401,467) | |
Total Increase (Decrease) in Net Assets | (3,789,193) | | | | (5,530,223) | |
Net Assets ($): | |
Beginning of Period | | | 282,478,905 | | | | 288,009,128 | |
End of Period | | | 278,689,712 | | | | 282,478,905 | |
24
| | | | | | | | | | |
| | | | Year Ended March 31, |
| | | | 2021 | | 2020 | |
Capital Share Transactions (Shares): | |
Class A | | | | | | | | |
Shares sold | | | 1,063,127 | | | | 1,334,366 | |
Shares issued for distributions reinvested | | | 22,067 | | | | 18,652 | |
Shares redeemed | | | (1,143,038) | | | | (530,220) | |
Net Increase (Decrease) in Shares Outstanding | (57,844) | | | | 822,798 | |
Class Da | | | | | | | | |
Shares sold | | | 2,418,294 | | | | 1,885,378 | |
Shares issued for distributions reinvested | | | 144,658 | | | | 190,518 | |
Shares redeemed | | | (2,529,893) | | | | (3,303,982) | |
Net Increase (Decrease) in Shares Outstanding | 33,059 | | | | (1,228,086) | |
Class Ia | | | | | | | | |
Shares sold | | | 2,856,218 | | | | 2,400,207 | |
Shares issued for distributions reinvested | | | 64,018 | | | | 78,118 | |
Shares redeemed | | | (3,510,483) | | | | (2,509,308) | |
Net Increase (Decrease) in Shares Outstanding | (590,247) | | | | (30,983) | |
Class Y | | | | | | | | |
Shares sold | | | - | | | | 1,138 | |
Shares issued for distributions reinvested | | | 14 | | | | 1 | |
Net Increase (Decrease) in Shares Outstanding | 14 | | | | 1,139 | |
| | | | | | | | | |
a During the period ended March 31, 2020, 30,089 Class D shares representing $389,709 were exchanged for 30,089 Class I shares.
See notes to financial statements. | |
25
FINANCIAL HIGHLIGHTS
The following tables describe the performance for each share class for the fiscal periods indicated. All information (except portfolio turnover rate) reflects financial results for a single fund share. Net asset value total return is calculated assuming an initial investment made at the net asset value at the beginning of the period, reinvestment of all dividends and distributions at net asset value during the period, and redemption at net asset value on the last day of the period. Net asset value total return includes adjustments in accordance with accounting principles generally accepted in the United States of America and as such, the net asset value for financial reporting purposes and the returns based upon those net asset values may differ from the net asset value and returns for shareholder transactions. These figures have been derived from the fund’s financial statements.
| | | | | | | | |
| | | |
| | Year Ended March 31, |
Class A Shares | | 2021 | 2020 | 2019 | 2018 | 2017 |
Per Share Data ($): | | | | | | |
Net asset value, beginning of period | | 12.91 | 12.91 | 12.79 | 12.92 | 13.03 |
Investment Operations: | | | | | | |
Investment income—neta | | .13 | .16 | .15 | .12 | .09 |
Net realized and unrealized
gain (loss) on investments | | .20 | .01 | .12 | (.13) | (.10) |
Total from Investment Operations | | .33 | .17 | .27 | (.01) | (.01) |
Distributions: | | | | | | |
Dividends from
investment income—net | | (.13) | (.17) | (.15) | (.12) | (.09) |
Dividends from net realized
gain on investments | | - | - | - | - | (.01) |
Total Distributions | | (.13) | (.17) | (.15) | (.12) | (.10) |
Net asset value, end of period | | 13.11 | 12.91 | 12.91 | 12.79 | 12.92 |
Total Return (%)b | | 2.54 | 1.29 | 2.16 | (.06) | (.05) |
Ratios/Supplemental Data (%): | | | | | | |
Ratio of total expenses
to average net assets | | .67 | .68 | .66 | .67 | .86 |
Ratio of net expenses
to average net assets | | .64 | .64 | .64 | .65 | .74 |
Ratio of net investment income
to average net assets | | .97 | 1.27 | 1.19 | .95 | .70 |
Portfolio Turnover Rate | | 21.22 | 47.12 | 17.10 | 13.40 | 33.17 |
Net Assets, end of period ($ x 1,000) | | 29,784 | 30,087 | 19,457 | 43,209 | 58,714 |
a Based on average shares outstanding.
b Exclusive of sales charge.
See notes to financial statements.
26
| | | | | | | | |
| | | |
| | Year Ended March 31, |
Class D Shares | | 2021 | 2020 | 2019 | 2018 | 2017 |
Per Share Data ($): | | | | | | |
Net asset value, beginning of period | | 12.91 | 12.91 | 12.78 | 12.91 | 13.03 |
Investment Operations: | | | | | | |
Investment income—neta | | .15 | .18 | .17 | .14 | .11 |
Net realized and unrealized
gain (loss) on investments | | .20 | .01 | .13 | (.13) | (.11) |
Total from Investment Operations | | .35 | .19 | .30 | .01 | - |
Distributions: | | | | | | |
Dividends from
investment income—net | | (.15) | (.19) | (.17) | (.14) | (.11) |
Dividends from net realized
gain on investments | | - | - | - | - | (.01) |
Total Distributions | | (.15) | (.19) | (.17) | (.14) | (.12) |
Net asset value, end of period | | 13.11 | 12.91 | 12.91 | 12.78 | 12.91 |
Total Return (%) | | 2.70 | 1.44 | 2.40 | .08 | .02 |
Ratios/Supplemental Data (%): | | | | | | |
Ratio of total expenses
to average net assets | | .53 | .53 | .51 | .54 | .73 |
Ratio of net expenses
to average net assets | | .49 | .49 | .49 | .50 | .59 |
Ratio of net investment income
to average net assets | | 1.12 | 1.43 | 1.36 | 1.10 | .85 |
Portfolio Turnover Rate | | 21.22 | 47.12 | 17.10 | 13.40 | 33.17 |
Net Assets, end of period ($ x 1,000) | | 185,909 | 182,713 | 198,508 | 230,789 | 272,003 |
a Based on average shares outstanding.
See notes to financial statements.
27
FINANCIAL HIGHLIGHTS (continued)
| | | | | | | | | |
| | | |
| | Year Ended March 31, |
Class I Shares | | 2021 | 2020 | 2019 | 2018 | 2017 |
Per Share Data ($): | | | | | | |
Net asset value, beginning of period | | 12.91 | 12.91 | 12.79 | 12.92 | 13.03 |
Investment Operations: | | | | | | |
Investment income—neta | | .16 | .20 | .18 | .15 | .12 |
Net realized and unrealized
gain (loss) on investments | | .20 | - | .13 | (.13) | (.10) |
Total from Investment Operations | | .36 | .20 | .31 | .02 | .02 |
Distributions: | | | | | | |
Dividends from
investment income—net | | (.16) | (.20) | (.19) | (.15) | (.12) |
Dividends from net realized
gain on investments | | - | - | - | - | (.01) |
Total Distributions | | (.16) | (.20) | (.19) | (.15) | (.13) |
Net asset value, end of period | | 13.11 | 12.91 | 12.91 | 12.79 | 12.92 |
Total Return (%) | | 2.79 | 1.54 | 2.41 | .18 | .20 |
Ratios/Supplemental Data (%): | | | | | | |
Ratio of total expenses
to average net assets | | .47 | .49 | .43 | .46 | .63 |
Ratio of net expenses
to average net assets | | .39 | .39 | .39 | .40 | .49 |
Ratio of net investment income
to average net assets | | 1.22 | 1.53 | 1.44 | 1.20 | .96 |
Portfolio Turnover Rate | | 21.22 | 47.12 | 17.10 | 13.40 | 33.17 |
Net Assets, end of period ($ x 1,000) | | 62,981 | 69,664 | 70,043 | 103,960 | 157,049 |
a Based on average shares outstanding.
See notes to financial statements.
28
| | | | | | | | |
| | | |
| | Year Ended March 31, |
Class Y Shares | | 2021 | 2020 | 2019 | 2018 | 2017 |
Per Share Data ($): | | | | | | |
Net asset value, beginning of period | | 12.88 | 12.87 | 12.79 | 12.92 | 13.03 |
Investment Operations: | | | | | | |
Investment income—neta | | .16 | .20 | .19 | .16 | .12 |
Net realized and unrealized
gain (loss) on investments | | .19 | .01 | .08 | (.14) | (.10) |
Total from Investment Operations | | .35 | .21 | .27 | .02 | .02 |
Distributions: | | | | | | |
Dividends from
investment income—net | | (.16) | (.20) | (.19) | (.15) | (.12) |
Dividends from net realized
gain on investments | | - | - | - | - | (.01) |
Total Distributions | | (.16) | (.20) | (.19) | (.15) | (.13) |
Net asset value, end of period | | 13.07 | 12.88 | 12.87 | 12.79 | 12.92 |
Total Return (%) | | 2.73 | 1.64 | 2.10 | .19 | .20 |
Ratios/Supplemental Data (%): | | | | | | |
Ratio of total expenses
to average net assets | | .75 | 1.99 | .65 | .54 | .71 |
Ratio of net expenses
to average net assets | | .39 | .39 | .39 | .40 | .49 |
Ratio of net investment income
to average net assets | | 1.22 | 1.54 | 1.51 | 1.20 | .95 |
Portfolio Turnover Rate | | 21.22 | 47.12 | 17.10 | 13.40 | 33.17 |
Net Assets, end of period ($ x 1,000) | | 16 | 16 | 1 | 34 | 55 |
a Based on average shares outstanding.
See notes to financial statements.
29
NOTES TO FINANCIAL STATEMENTS
NOTE 1—Significant Accounting Policies:
BNY Mellon Short-Intermediate Municipal Bond Fund (the “fund”), which is registered under the Investment Company Act of 1940, as amended (the “Act”), is a non-diversified open-end management investment company. The fund’s investment objective is to seek to maximize current income exempt from federal income tax to the extent consistent with the preservation of capital. BNY Mellon Investment Adviser, Inc. (the “Adviser”), a wholly-owned subsidiary of The Bank of New York Mellon Corporation (“BNY Mellon”), serves as the fund’s investment adviser.
On February 10, 2021, BNY Mellon Investment Management announced its intention to realign several of its investment firms. As a result of this realignment, which is scheduled to occur, subject to regulatory requirements, in the third quarter of 2021 (the “Effective Date”), portfolio managers responsible for managing the fund’s investments who are employees of Mellon Investments Corporation (“Mellon”) in a dual employment arrangement with the Adviser, will become employees of Insight North America LLC (“INA”), which, like Mellon, is an affiliate of the Adviser, and will no longer be employees of Mellon. Consequently, effective as of the Effective Date and subject to the approval of the fund’s Board of Trustees (the “Board”), the Adviser will engage INA to serve as the fund’s sub-adviser, pursuant to a sub-investment advisory agreement between the Adviser and INA. As the fund’s sub-adviser, INA will provide the day-to-day management of the fund’s investments, subject to the Adviser’s supervision and approval. It is currently anticipated that the fund’s portfolio managers who are responsible for the day-to-day management of the fund’s investments will continue to manage the fund’s investments as of the Effective Date. It is also currently anticipated that there will be no material changes to the fund’s investment objective, strategies or policies, no reduction in the nature or level of services provided to the fund, and no increase in the management fee payable by the fund as a result of the engagement of INA as the fund’s sub-adviser. The Adviser (and not the fund) will pay INA for its sub-advisory services.
BNY Mellon Securities Corporation (the “Distributor”), a wholly-owned subsidiary of the Adviser, is the distributor of the fund’s shares. The fund is authorized to issue an unlimited number of $.001 par value shares of Beneficial Interest in each of the following classes of shares: Class A, Class D, Class I and Class Y. Class A shares generally are subject to a sales charge imposed at the time of purchase. Class A shares bought without an initial sales charge as part of an investment of $1 million or more may be charged a contingent deferred sales charge (“CDSC”) of 1.00% if
30
redeemed within one year. Class D shares are sold at net asset value per share directly by the Adviser and through certain banks and fund supermarkets, and as a part of certain wrap-fee programs. Class I and Class Y shares are sold at net asset value per share generally to institutional investors. Other differences between the classes include the services offered to and the expenses borne by each class, the allocation of certain transfer agency costs, and certain voting rights. Income, expenses (other than expenses attributable to a specific class), and realized and unrealized gains or losses on investments are allocated to each class of shares based on its relative net assets.
The Financial Accounting Standards Board (“FASB”) Accounting Standards Codification (“ASC”) is the exclusive reference of authoritative U.S. generally accepted accounting principles (“GAAP”) recognized by the FASB to be applied by nongovernmental entities. Rules and interpretive releases of the Securities and Exchange Commission (“SEC”) under authority of federal laws are also sources of authoritative GAAP for SEC registrants. The fund is an investment company and applies the accounting and reporting guidance of the FASB ASC Topic 946 Financial Services-Investment Companies. The fund’s financial statements are prepared in accordance with GAAP, which may require the use of management estimates and assumptions. Actual results could differ from those estimates.
The fund enters into contracts that contain a variety of indemnifications. The fund’s maximum exposure under these arrangements is unknown. The fund does not anticipate recognizing any loss related to these arrangements.
As of March 31, 2021, MBC Investments Corp., an indirect subsidiary of BNY Mellon, held 76 Class Y shares.
(a) Portfolio valuation: The fair value of a financial instrument is the amount that would be received to sell an asset or paid to transfer a liability in an orderly transaction between market participants at the measurement date (i.e., the exit price). GAAP establishes a fair value hierarchy that prioritizes the inputs of valuation techniques used to measure fair value. This hierarchy gives the highest priority to unadjusted quoted prices in active markets for identical assets or liabilities (Level 1 measurements) and the lowest priority to unobservable inputs (Level 3 measurements).
Additionally, GAAP provides guidance on determining whether the volume and activity in a market has decreased significantly and whether such a decrease in activity results in transactions that are not orderly.
31
NOTES TO FINANCIAL STATEMENTS (continued)
GAAP requires enhanced disclosures around valuation inputs and techniques used during annual and interim periods.
Various inputs are used in determining the value of the fund’s investments relating to fair value measurements. These inputs are summarized in the three broad levels listed below:
Level 1—unadjusted quoted prices in active markets for identical investments.
Level 2—other significant observable inputs (including quoted prices for similar investments, interest rates, prepayment speeds, credit risk, etc.).
Level 3—significant unobservable inputs (including the fund’s own assumptions in determining the fair value of investments).
The inputs or methodology used for valuing securities are not necessarily an indication of the risk associated with investing in those securities.
Changes in valuation techniques may result in transfers in or out of an assigned level within the disclosure hierarchy. Valuation techniques used to value the fund’s investments are as follows:
Investments in securities are valued each business day by an independent pricing service (the “Service”) approved by the Board. Investments for which quoted bid prices are readily available and are representative of the bid side of the market in the judgment of the Service are valued at the mean between the quoted bid prices (as obtained by the Service from dealers in such securities) and asked prices (as calculated by the Service based upon its evaluation of the market for such securities). Debt investments (which constitute a majority of the portfolio securities) are carried at fair value as determined by the Service, based on methods which include consideration of the following: yields or prices of municipal securities of comparable quality, coupon, maturity and type; indications as to values from dealers; and general market conditions. All of the preceding securities are generally categorized within Level 2 of the fair value hierarchy.
The Service is engaged under the general oversight of the Board.
When market quotations or official closing prices are not readily available, or are determined not to accurately reflect fair value, such as when the value of a security has been significantly affected by events after the close of the exchange or market on which the security is principally traded, but before the fund calculates its net asset value, the fund may value these investments at fair value as determined in accordance with the procedures
32
approved by the Board. Certain factors may be considered when fair valuing investments such as: fundamental analytical data, the nature and duration of restrictions on disposition, an evaluation of the forces that influence the market in which the securities are purchased and sold, and public trading in similar securities of the issuer or comparable issuers. These securities are either categorized within Level 2 or 3 of the fair value hierarchy depending on the relevant inputs used.
For securities where observable inputs are limited, assumptions about market activity and risk are used and such securities are generally categorized within Level 3 of the fair value hierarchy.
The following is a summary of the inputs used as of March 31, 2021 in valuing the fund’s investments:
| | | | | | | |
| | Level 1-Unadjusted Quoted Prices | Level 2- Other Significant Observable Inputs | | Level 3-Significant Unobservable Inputs | Total | |
Assets ($) | | |
Investments In Securities:† | | |
Municipal Securities | - | 274,043,013 | | - | 274,043,013 | |
† See Statement of Investments for additional detailed categorizations, if any.
(b) Securities transactions and investment income: Securities transactions are recorded on a trade date basis. Realized gains and losses from securities transactions are recorded on the identified cost basis. Interest income, adjusted for accretion of discount and amortization of premium on investments, is earned from settlement date and recognized on the accrual basis. Securities purchased or sold on a when issued or delayed delivery basis may be settled a month or more after the trade date.
(c) Risk: Certain events particular to the industries in which the fund’s investments conduct their operations, as well as general economic, political and public health conditions, may have a significant negative impact on the investee’s operations and profitability. In addition, turbulence in financial markets and reduced liquidity in equity, credit and/or fixed income markets may negatively affect many issuers, which could adversely affect the fund. Global economies and financial markets are becoming increasingly interconnected, and conditions and events in one country, region or financial market may adversely impact issuers in a different country, region or financial market. These risks may be magnified if certain events or developments adversely interrupt the global supply chain; in these and other circumstances, such risks might affect companies worldwide. Recent examples include pandemic risks related to COVID-19
33
NOTES TO FINANCIAL STATEMENTS (continued)
and aggressive measures taken world-wide in response by governments, including closing borders, restricting international and domestic travel, and the imposition of prolonged quarantines of large populations, and by businesses, including changes to operations and reducing staff. To the extent the fund may overweight its investments in certain countries, companies, industries or market sectors, such positions will increase the fund’s exposure to risk of loss from adverse developments affecting those countries, companies, industries or sectors.
(d) Dividends and distributions to shareholders: It is the policy of the fund to declare dividends daily from investment income-net. Such dividends are paid monthly. Dividends from net realized capital gains, if any, are normally declared and paid annually, but the fund may make distributions on a more frequent basis to comply with the distribution requirements of the Internal Revenue Code of 1986, as amended (the “Code”). To the extent that net realized capital gains can be offset by capital loss carryovers, it is the policy of the fund not to distribute such gains. Income and capital gain distributions are determined in accordance with income tax regulations, which may differ from GAAP.
(e) Federal income taxes: It is the policy of the fund to continue to qualify as a regulated investment company, which can distribute tax-exempt dividends, by complying with the applicable provisions of the Code, and to make distributions of income and net realized capital gain sufficient to relieve it from substantially all federal income and excise taxes.
As of and during the period ended March 31, 2021, the fund did not have any liabilities for any uncertain tax positions. The fund recognizes interest and penalties, if any, related to uncertain tax positions as income tax expense in the Statement of Operations. During the period ended March 31, 2021, the fund did not incur any interest or penalties.
Each tax year in the four-year period ended March 31, 2021 remains subject to examination by the Internal Revenue Service and state taxing authorities.
At March 31, 2021, the components of accumulated earnings on a tax basis were as follows: undistributed tax-exempt income $268,920, accumulated capital losses $1,046,715 and unrealized appreciation $4,724,621.
The fund is permitted to carry forward capital losses for an unlimited period. Furthermore, capital loss carryovers retain their character as either short-term or long-term capital losses.
The accumulated capital loss carryover is available for federal income tax purposes to be applied against future net realized capital gains, if any,
34
realized subsequent to March 31, 2021. The fund has $360,404 of short-term capital losses and $686,311 of long-term capital losses which can be carried forward for an unlimited period.
The tax character of distributions paid to shareholders during the fiscal periods ended March 31, 2021 and March 31, 2020 were as follows: tax-exempt income $3,220,580 and $3,969,410, respectively.
(f) New accounting pronouncements: In March 2020, the FASB issued Accounting Standards Update 2020-04, Reference Rate Reform (Topic 848): Facilitation of the Effects of Reference Rate Reform on Financial Reporting (“ASU 2020-04”), and in January 2021, the FASB issued Accounting Standards Update 2021-01, Reference Rate Reform (Topic 848): Scope (“ASU 2021-01”), which provides optional, temporary relief with respect to the financial reporting of contracts subject to certain types of modifications due to the planned discontinuation of the London Interbank Offered Rate (“LIBOR”) and other interbank offered rates as of the end of 2021. The temporary relief provided by ASU 2020-04 and ASU 2021-01 is effective for certain reference rate-related contract modifications that occur during the period from March 12, 2020 through December 31, 2022. Management is evaluating the impact of ASU 2020-04 and ASU 2021-01 on the fund’s investments, derivatives, debt and other contracts that will undergo reference rate-related modifications as a result of the reference rate reform. Management is also currently actively working with other financial institutions and counterparties to modify contracts as required by applicable regulation and within the regulatory deadlines.
NOTE 2—Bank Lines of Credit:
The fund participates with other long-term open-end funds managed by the Adviser in a $823.5 million unsecured credit facility led by Citibank, N.A. (the “Citibank Credit Facility”) and a $300 million unsecured credit facility provided by The Bank of New York Mellon (the “BNYM Credit Facility”), a subsidiary of BNY Mellon and an affiliate of the Adviser, each to be utilized primarily for temporary or emergency purposes, including the financing of redemptions (each, a “Facility”). The Citibank Credit Facility is available in two tranches: (i) Tranche A is in an amount equal to $688.5 million and is available to all long-term open-ended funds, including the fund, and (ii) Tranche B is an amount equal to $135 million and is available only to BNY Mellon Floating Rate Income Fund, a series of BNY Mellon Investment Funds IV, Inc. Prior to September 30, 2020, the Citibank Credit Facility was $927 million with Tranche A available in an amount equal to $747 million and Tranche B available in an amount equal to $180 million. In connection therewith, the fund has agreed to pay its pro rata portion of commitment fees for Tranche A of the Citibank Credit Facility
35
NOTES TO FINANCIAL STATEMENTS (continued)
and the BNYM Credit Facility. Interest is charged to the fund based on rates determined pursuant to the terms of the respective Facility at the time of borrowing. During the period ended March 31, 2021, the fund did not borrow under the Facilities.
NOTE 3—Management Fee and Other Transactions with Affiliates:
(a) Pursuant to a management agreement with the Adviser, the management fee is computed at the annual rate of .30% of the value of the fund’s average daily net assets and is payable monthly. The Adviser has contractually agreed, from April 1, 2020 through July 31, 2021, to waive receipt of its fees and/or assume the direct expenses of the fund, so that the direct expenses of none of its classes (excluding Rule 12b-1 fees, shareholder services fees, taxes, interest expense, brokerage commissions, commitment fees on borrowings and extraordinary expenses) exceed .39% of the value of the fund’s average daily net assets. On or after July 31, 2021, the Adviser may terminate this expense limitation at any time. The reduction in expenses, pursuant to the undertaking, amounted to $131,451 during the period ended March 31, 2021.
During the period ended March 31, 2021, the Distributor retained $584 from commissions earned on sales of the fund’s Class A shares.
(b) Under the Service Plan (the “Plan”) adopted pursuant to Rule 12b-1 under the Act, Class D shares pay the Distributor for distributing its shares at an annual rate of .10% of the value of its average daily net assets. The Distributor may pay one or more Service Agents in respect of shares owned by shareholders with whom the Service Agent has a servicing relationship or for whom the Service Agent is the dealer or holder of record and determines the amounts, if any, to be paid to Service Agents and the basis on which such payments are made. Pursuant to the Plan, Class D shares bear (i) the costs of preparing, printing and distributing prospectuses and statements of additional information used other than for regulatory purposes or distribution to existing shareholders, and (ii) the costs associated with implementing and operating the Plan (such as costs of printing and mailing service agreements), the aggregate of such amounts not to exceed in any fiscal year of the fund the greater of $100,000 or .005% of the value of its average daily net assets for any full fiscal year. During the period ended March 31, 2021, Class D shares were charged $184,066 pursuant to the Service Plan.
(c) Under the Shareholder Services Plan, Class A shares pay the Distributor at an annual rate of .25% of the value of its average daily net assets for the provision of certain services. The services provided may
36
include personal services relating to shareholder accounts, such as answering shareholder inquiries regarding the fund and providing reports and other information, and services related to the maintenance of shareholder accounts. The Distributor may make payments to Service Agents (securities dealers, financial institutions or other industry professionals) with respect to these services. The Distributor determines the amounts to be paid to Service Agents. During the period ended March 31, 2021, Class A shares were charged $79,845, pursuant to the Shareholder Services Plan.
The fund has arrangements with the transfer agent and the custodian whereby the fund may receive earnings credits when positive cash balances are maintained, which are used to offset transfer agency and custody fees. For financial reporting purposes, the fund includes transfer agent net earnings credits, if any, as shareholder servicing costs and includes custody net earnings credits, if any, as an expense offset in the in the Statement of Operations.
The fund compensates BNY Mellon Transfer, Inc., a wholly-owned subsidiary of the Adviser, under a transfer agency agreement for providing transfer agency and cash management services inclusive of earnings credits, if any, for the fund. The majority of transfer agency fees are comprised of amounts paid on a per account basis, while cash management fees are related to fund subscriptions and redemptions. During the period ended March 31, 2021, the fund was charged $39,172 for transfer agency services, inclusive of earnings credit, if any. These fees are included in Shareholder servicing costs in the Statement of Operations.
The fund compensates The Bank of New York Mellon under a custody agreement for providing custodial services for the fund. These fees are determined based on net assets, geographic region and transaction activity. During the period ended March 31, 2021, the fund was charged $5,992 pursuant to the custody agreement. These fees were offset by earnings credits of $5,992.
The fund compensates The Bank of New York Mellon under a shareholder redemption draft processing agreement for providing certain services related to the fund’s check writing privilege. During the period ended March 31, 2021, the fund was charged $1,870 pursuant to the agreement, which is included in Shareholder servicing costs in the Statement of Operations.
During the period ended March 31, 2021, the fund was charged $14,822 for services performed by the Chief Compliance Officer and his staff.
37
NOTES TO FINANCIAL STATEMENTS (continued)
These fees are included in Chief Compliance Officer fees in the Statement of Operations.
The components of “Due to BNY Mellon Investment Adviser, Inc. and affiliates” in the Statement of Assets and Liabilities consist of: management fees of $71,391, Service Plan fees of $15,820, Shareholder Services Plan fees of $6,369, custodian fees of $1,835, Chief Compliance Officer fees of $3,931 and transfer agency fees of $7,018, which are offset against expense reimbursement currently in effect in the amount of $10,194.
(d) Each Board member also serves as a Board member of other funds in the BNY Mellon Family of Funds complex. Annual retainer fees and attendance fees are allocated to each fund based on net assets.
NOTE 4—Securities Transactions:
The aggregate amount of purchases and sales of investment securities, excluding short-term securities, during the period ended March 31, 2021, amounted to $58,423,011 and $59,052,214, respectively.
At March 31, 2021, the cost of investments for federal income tax purposes was $269,318,392; accordingly, accumulated net unrealized appreciation on investments was $4,724,621, consisting of $4,972,824 gross unrealized appreciation and $248,203 gross unrealized depreciation.
38
REPORT OF INDEPENDENT REGISTERED PUBLIC ACCOUNTING FIRM
To the Shareholders and the Board of Trustees of BNY Mellon Short-Intermediate Municipal Bond Fund
Opinion on the Financial Statements
We have audited the accompanying statement of assets and liabilities of BNY Mellon Short-Intermediate Municipal Bond Fund (the “Fund”), including the statement of investments, as of March 31, 2021, and the related statement of operations for the year then ended, the statements of changes in net assets for each of the two years in the period then ended, the financial highlights for each of the five years in the period then ended and the related notes (collectively referred to as the “financial statements”). In our opinion, the financial statements present fairly, in all material respects, the financial position of the Fund at March 31, 2021, the results of its operations for the year then ended, the changes in its net assets for each of the two years in the period then ended and its financial highlights for each of the five years in the period then ended, in conformity with U.S. generally accepted accounting principles.
Basis for Opinion
These financial statements are the responsibility of the Fund’s management. Our responsibility is to express an opinion on the Fund’s financial statements based on our audits. We are a public accounting firm registered with the Public Company Accounting Oversight Board (United States) (“PCAOB”) and are required to be independent with respect to the Fund in accordance with the U.S. federal securities laws and the applicable rules and regulations of the Securities and Exchange Commission and the PCAOB.
We conducted our audits in accordance with the standards of the PCAOB. Those standards require that we plan and perform the audit to obtain reasonable assurance about whether the financial statements are free of material misstatement, whether due to error or fraud. The Fund is not required to have, nor were we engaged to perform, an audit of the Fund’s internal control over financial reporting. As part of our audits, we are required to obtain an understanding of internal control over financial reporting, but not for the purpose of expressing an opinion on the effectiveness of the Fund’s internal control over financial reporting. Accordingly, we express no such opinion.
Our audits included performing procedures to assess the risks of material misstatement of the financial statements, whether due to error or fraud, and performing procedures that respond to those risks. Such procedures included examining, on a test basis, evidence regarding the amounts and disclosures in the financial statements. Our procedures included confirmation of securities owned as of March 31, 2021, by correspondence with the custodian and others or by other appropriate auditing procedures where replies from others were not received. Our audits also included evaluating the accounting principles used and significant estimates made by management, as well as evaluating the overall presentation of the financial statements. We believe that our audits provide a reasonable basis for our opinion.

We have served as the auditor of one or more investment companies in the BNY Mellon Family of Funds since at least 1957, but we are unable to determine the specific year.
New York, New York
May 26, 2021
39
IMPORTANT TAX INFORMATION (Unaudited)
In accordance with federal tax law, the fund hereby reports all the dividends paid from investment income-net during the fiscal year ended March 31, 2021 as “exempt-interest dividends” (not generally subject to regular federal income tax). Where required by federal tax law rules, shareholders will receive notification of their portion of the fund’s taxable ordinary dividends (if any), capital gains distributions (if any) and tax-exempt dividends paid for the 2021 calendar year on Form 1099-DIV which will be mailed in early 2022.
40
BOARD MEMBERS INFORMATION (Unaudited)
INDEPENDENT BOARD MEMBERS
Joseph S. DiMartino (77)
Chairman of the Board (1995)
Principal Occupation During Past 5 Years:
· Director or Trustee of funds in the BNY Mellon Family of Funds and certain other entities (as described in the fund’s Statement of Additional Information) (1995-Present)
Other Public Company Board Memberships During Past 5 Years:
· CBIZ, Inc., a public company providing professional business services, products and solutions, Director (1997-Present)
No. of Portfolios for which Board Member Serves: 106
———————
Francine J. Bovich (69)
Board Member (2015)
Principal Occupation During Past 5 Years:
· Trustee, The Bradley Trusts, private trust funds (2011-Present)
Other Public Company Board Memberships During Past 5 Years:
· Annaly Capital Management, Inc., a real estate investment trust, Director (2014-Present)
No. of Portfolios for which Board Member Serves: 63
———————
J. Charles Cardona (65)
Board Member (2014)
Principal Occupation During Past 5 Years:
· President and Director of the Adviser (2008-2016)
· Chief Executive Officer of Dreyfus Cash Investment Strategies, a division of the Adviser (2009-2016)
· Chairman of the Distributor (2013–2016) Director (2005-2016)
Other Public Company Board Memberships During Past 5 Years:
· BNY Mellon ETF Trust, Chairman and Trustee (2020-Present)
· BNY Mellon Liquidity Funds, Director (2004-Present) and Chairman (2019-2021)
No. of Portfolios for which Board Member Serves: 37
———————
Gordon J. Davis (79)
Board Member (2012)
Principal Occupation During Past 5 Years:
· Partner in the law firm of Venable LLP (2012-Present)
No. of Portfolios for which Board Member Serves: 47
———————
41
BOARD MEMBERS INFORMATION (Unaudited) (continued)
INDEPENDENT BOARD MEMBERS (continued)
Andrew J. Donohue (70)
Board Member (2019)
Principal Occupation During Past 5 Years:
· Attorney, Solo Law Practice (2019-Present)
· Of Counsel, Shearman & Sterling LLP (2017-2019)
· Chief of Staff to the Chair of the SEC (2015-2017)
Other Public Company Board Memberships During Past 5 Years:
· Oppenheimer Funds (58 funds), Director (2017-2019)
No. of Portfolios for which Board Member Serves: 50
———————
Isabel P. Dunst (74)
Board Member (2014)
Principal Occupation During Past 5 Years:
· Hogan Lovells LLP, a law firm, Retired (2019-Present); Senior Counsel (2018-2019); Of Counsel (2015-2018); Partner (1990-2014)
· Member of the Board of Governors, Hebrew Union College Jewish Institute of Religion (2015-Present)
· Board Member, Bend the ARC, a civil rights organization, (2016-Present)
No. of Portfolios for which Board Member Serves: 29
———————
Nathan Leventhal (78)
Board Member (2009)
Principal Occupation During Past 5 Years:
· President Emeritus of Lincoln Center for the Performing Arts (2001-Present)
· President of the Palm Beach Opera (2016-Present)
Other Public Company Board Memberships During Past 5 Years:
· Movado Group, Inc., a public company that designs, sources, markets and distributes watches Director (2003-June 2020)
No. of Portfolios for which Board Member Serves: 42
———————
42
Robin A. Melvin (57)
Board Member (2014)
Principal Occupation During Past 5 Years:
· Trustee, Westover School, a private girls' boarding school in Middlebury, Connecticut (2019-Present)
· Co-Chair, Mentor Illinois, a non-profit organization dedicated to increasing the quality of mentoring services in Illinois (2014-2020); Board member, Mentor Illinois (2013-2020)
No. of Portfolios for which Board Member Serves: 85
———————
Roslyn M. Watson (71)
Board Member (2014)
Principal Occupation During Past 5 Years:
· Principal, Watson Ventures, Inc., a real estate investment company (1993-Present)
Other Public Company Board Memberships During Past 5 Years:
· American Express Bank, FSB, Director (1993-2018)
No. of Portfolios for which Board Member Serves: 50
———————
Benaree Pratt Wiley (74)
Board Member (2009)
Principal Occupation During Past 5 Years:
· Principal, The Wiley Group, a firm specializing in strategy and business development (2005-Present)
Other Public Company Board Memberships During Past 5 Years:
· CBIZ, Inc., a public company providing professional business services, products and solutions, Director (2008-Present)
· Blue Cross Blue Shield of Massachusetts, Director (2004-Present)
No. of Portfolios for which Board Member Serves: 68
———————
Once elected all Board Members serve for an indefinite term, but achieve Emeritus status upon reaching age 80. The address of the Board Members and Officers is c/o BNY Mellon Investment Adviser, Inc. 240 Greenwich Street, New York, New York 10286. Additional information about the Board Members is available in the fund’s Statement of Additional Information which can be obtained from the Adviser free of charge by calling this toll free number: 1-800-373-9387.
Clifford L. Alexander, Emeritus Board Member
Whitney I. Gerard, Emeritus Board Member
George L. Perry, Emeritus Board Member
43
OFFICERS OF THE FUND (Unaudited)
DAVID DIPETRILLO, President since January 2021.
Vice President and Director of the Adviser since February 2021, Head of North America Product, BNY Mellon Investment Management since January 2018, Director of Product Strategy, BNY Mellon Investment Management from January 2016 to December 2017; He is an officer of 61 investment companies (comprised of 114 portfolios) managed by the Adviser or an affiliate of the Adviser. He is 43 years old and has been an employee of BNY Mellon since 2005.
JAMES WINDELS, Treasurer since November 2001.
Vice President of the Adviser since September 2020, Director-BNY Mellon Fund Administration, and an officer of 62 investment companies (comprised of 137 portfolios) managed by the Adviser or an affiliate of the Adviser. He is 62 years old and has been an employee of the Adviser since April 1985.
BENNETT A. MACDOUGALL, Chief Legal Officer since October 2015.
Chief Legal Officer of the Adviser and Associate General Counsel and Managing Director of BNY Mellon. He is an officer of 62 investment companies (comprised of 137 portfolios) managed by the Adviser or an affiliate of the Adviser. He is 49 years old and has been an employee of the Adviser since June 2015.
JAMES BITETTO, Vice President since August 2005 and Secretary since February 2018.
Senior Managing Counsel of BNY Mellon since December 2019; Managing Counsel of BNY Mellon from April 2014 to December 2019; Secretary of the Adviser, and an officer of 62 investment companies (comprised of 137 portfolios) managed by the Adviser or an affiliate of the Adviser. He is 54 years old and has been an employee of the Adviser since December 1996.
DEIRDRE CUNNANE, Vice President and Assistant Secretary since March 2019.
Counsel of BNY Mellon since August 2018; Senior Regulatory Specialist at BNY Mellon Investment Management Services from February 2016 to August 2018. She is an officer of 62 investment companies (comprised of 137 portfolios) managed by the Adviser or an affiliate of the Adviser. She is 30 years old and has been an employee of the Adviser since August 2018.
SARAH S. KELLEHER, Vice President and Assistant Secretary since April 2014.
Managing Counsel of BNY Mellon since December 2017, Senior Counsel of BNY Mellon from March 2013 to December 2017. She is an officer of 62 investment companies (comprised of 137 portfolios) managed by the Adviser or an affiliate of the Adviser. She is 45 years old and has been an employee of the Adviser since March 2013.
JEFF PRUSNOFSKY, Vice President and Assistant Secretary since August 2005.
Senior Managing Counsel of BNY Mellon, and an officer of 62 investment companies (comprised of 137 portfolios) managed by the Adviser or an affiliate of the Adviser. He is 55 years old and has been an employee of the Adviser since October 1990.
AMANDA QUINN, Vice President and Assistant Secretary since March 2020.
Counsel of BNY Mellon since June 2019; Regulatory Administration Manager at BNY Mellon Investment Management Services from September 2018 to May 2019; Senior Regulatory Specialist at BNY Mellon Investment Management Services from April 2015 to August 2018. She is an officer of 62 investment companies (comprised of 137 portfolios) managed by the Adviser or an affiliate of the Adviser. She is 35 years old and has been an employee of the Adviser since June 2019.
PETER M. SULLIVAN, Vice President and Assistant Secretary since March 2019.
Senior Managing Counsel of BNY Mellon since December 2020; Managing Counsel of BNY Mellon from March 2009 to December 2020, and an officer of 62 investment companies (comprised of 137 portfolios) managed by the the Adviser or an affiliate of the the Adviser. He is 53 years old and has been an employee of BNY Mellon since April 2004.
NATALYA ZELENSKY, Vice President and Assistant Secretary since March 2017.
Managing Counsel of BNY Mellon since December 2019; Counsel of BNY Mellon from May 2016 to December 2019; Assistant Secretary of the Adviser since 2018; Attorney at Wildermuth Endowment Strategy Fund/Wildermuth Advisory, LLC from November 2015 to May 2016. She is an officer of 62 investment companies (comprised of 137 portfolios) managed by the Adviser or an affiliate of the Adviser. She is 35 years old and has been an employee of the Adviser since May 2016.
44
GAVIN C. REILLY, Assistant Treasurer since December 2005.
Tax Manager-BNY Mellon Fund Administration, and an officer of 62 investment companies (comprised of 137 portfolios) managed by the Adviser or an affiliate of the Adviser. He is 52 years old and has been an employee of the Adviser since April 1991.
ROBERT SALVIOLO, Assistant Treasurer since July 2007.
Senior Accounting Manager–BNY Mellon Fund Administration, and an officer of 62 investment companies (comprised of 137 portfolios) managed by the Adviser or an affiliate of the Adviser. He is 53 years old and has been an employee of the Adviser since June 1989.
ROBERT SVAGNA, Assistant Treasurer since August 2005.
Senior Accounting Manager–BNY Mellon Fund Administration, and an officer of 62 investment companies (comprised of 137 portfolios) managed by the Adviser or an affiliate of the Adviser. He is 54 years old and has been an employee of the Adviser since November 1990.
JOSEPH W. CONNOLLY, Chief Compliance Officer since October 2004.
Chief Compliance Officer of the Adviser, the BNY Mellon Family of Funds and BNY Mellon Funds Trust (61 investment companies, comprised of 129 portfolios). He is 63 years old and has served in various capacities with the Adviser since 1980, including manager of the firm’s Fund Accounting Department from 1997 through October 2001.
CARIDAD M. CAROSELLA, Anti-Money Laundering Compliance Officer since January 2016.
Anti-Money Laundering Compliance Officer of the BNY Mellon Family of Funds and BNY Mellon Funds Trust. She is an officer of 55 investment companies (comprised of 130 portfolios) managed by the Adviser or an affiliate of the Adviser. She is 52 years old and has been an employee of the Distributor since 1997.
45
BNY Mellon Short-Intermediate Municipal Bond Fund
240 Greenwich Street
New York, NY 10286
Adviser
BNY Mellon Investment Adviser, Inc.
240 Greenwich Street
New York, NY 10286
Custodian
The Bank of New York Mellon
240 Greenwich Street
New York, NY 10286
Transfer Agent &
Dividend Disbursing Agent
BNY Mellon Transfer, Inc.
240 Greenwich Street
New York, NY 10286
Distributor
BNY Mellon Securities Corporation
240 Greenwich Street
New York, NY 10286
| | |
Ticker Symbols: | Class A: DMBAX Class D: DSIBX Class I: DIMIX Class Y: DMYBX |
Telephone Call your financial representative or 1-800-373-9387
Mail The BNY Mellon Family of Funds, 144 Glenn Curtiss Boulevard, Uniondale, NY 11556-0144
E-mail Send your request to info@bnymellon.com
Internet Information can be viewed online or downloaded at www.im.bnymellon.com
The fund files its complete schedule of portfolio holdings with the Securities and Exchange Commission (“SEC”) for the first and third quarters of each fiscal year on Form N-PORT. The fund’s Forms N-PORT are available on the SEC’s website at www.sec.gov.
A description of the policies and procedures that the fund uses to determine how to vote proxies relating to portfolio securities and information regarding how the fund voted these proxies for the most recent 12-month period ended June 30 is available at www.im.bnymellon.com and on the SEC’s website at www.sec.gov and without charge, upon request, by calling 1-800-373-9387.
| | |
© 2021 BNY Mellon Securities Corporation
6219AR0321 | 
|
Item 2. Code of Ethics.
The Registrant has adopted a code of ethics that applies to the Registrant's principal executive officer, principal financial officer, principal accounting officer or controller, or persons performing similar functions. There have been no amendments to, or waivers in connection with, the Code of Ethics during the period covered by this Report.
Item 3. Audit Committee Financial Expert.
The Registrant's Board has determined that J. Charles Cardona, a member of the Audit Committee of the Board, is an audit committee financial expert as defined by the Securities and Exchange Commission (the "SEC”). Mr. Cardona is "independent" as defined by the SEC for purposes of audit committee financial expert determinations.
Item 4. Principal Accountant Fees and Services.
(a) Audit Fees. The aggregate fees billed for each of the last two fiscal years (the "Reporting Periods") for professional services rendered by the Registrant's principal accountant (the "Auditor") for the audit of the Registrant's annual financial statements or services that are normally provided by the Auditor in connection with the statutory and regulatory filings or engagements for the Reporting Periods, were $37,494 in 2020 and $35,494 in 2021.
(b) Audit-Related Fees. The aggregate fees billed in the Reporting Periods for assurance and related services by the Auditor that are reasonably related to the performance of the audit of the Registrant's financial statements and are not reported under paragraph (a) of this Item 4 were $9,875 in 2020 and $12,575 in 2021. These services consisted of one or more of the following: (i) agreed upon procedures related to compliance with Internal Revenue Code section 817(h), (ii) security counts required by Rule 17f-2 under the Investment Company Act of 1940, as amended, (iii) advisory services as to the accounting or disclosure treatment of Registrant transactions or events and (iv) advisory services to the accounting or disclosure treatment of the actual or potential impact to the Registrant of final or proposed rules, standards or interpretations by the Securities and Exchange Commission, the Financial Accounting Standards Boards or other regulatory or standard-setting bodies.
The aggregate fees billed in the Reporting Periods for non-audit assurance and related services by the Auditor to the Registrant's investment adviser (not including any sub-investment adviser whose role is primarily portfolio management and is subcontracted with or overseen by another investment adviser), and any entity controlling, controlled by or under common control with the investment adviser that provides ongoing services to the Registrant ("Service Affiliates"), that were reasonably related to the performance of the annual audit of the Service Affiliate, which required pre-approval by the Audit Committee were $0 in 2020 and $0 in 2021.
(c) Tax Fees. The aggregate fees billed in the Reporting Periods for professional services rendered by the Auditor for tax compliance, tax advice, and tax planning ("Tax Services") were $3,177 in 2020 and $5,369 in 2021. These services consisted of: (i) review or preparation of U.S. federal, state, local and excise tax returns; (ii) U.S. federal, state and local tax planning, advice and assistance regarding statutory, regulatory or administrative developments; (iii) tax advice regarding tax qualification matters and/or treatment of various financial instruments held or proposed to be acquired or held, and (iv) determination of Passive Foreign Investment Companies. The aggregate fees billed in the Reporting Periods for Tax Services by the Auditor to Service Affiliates, which required pre-approval by the Audit Committee were $0 in 2020 and $0 in 2021.
(d) All Other Fees. The aggregate fees billed in the Reporting Periods for products and services provided by the Auditor, other than the services reported in paragraphs (a) through (c) of this Item, were $531 in 2020 and $575 in 2021. These services consisted of a review of the Registrant's anti-money laundering program.
The aggregate fees billed in the Reporting Periods for Non-Audit Services by the Auditor to Service Affiliates, other than the services reported in paragraphs (b) through (c) of this Item, which required pre-approval by the Audit Committee, were $0 in 2020 and $0 in 2021.
(e)(1) Audit Committee Pre-Approval Policies and Procedures. The Registrant's Audit Committee has established policies and procedures (the "Policy") for pre-approval (within specified fee limits) of the Auditor's engagements for non-audit services to the Registrant and Service Affiliates without specific case-by-case consideration. The pre-approved services in the Policy can include pre-approved audit services, pre-approved audit-related services, pre-approved tax services and pre-approved all other services. Pre-approval considerations include whether the proposed services are compatible with maintaining the Auditor's independence. Pre-approvals pursuant to the Policy are considered annually.
(e)(2) Note. None of the services described in paragraphs (b) through (d) of this Item 4 were approved by the Audit Committee pursuant to paragraph (c)(7)(i)(C) of Rule 2-01 of Regulation S-X.
(f) None of the hours expended on the principal accountant's engagement to audit the registrant's financial statements for the most recent fiscal year were attributed to work performed by persons other than the principal accountant's full-time, permanent employees.
Non-Audit Fees. The aggregate non-audit fees billed by the Auditor for services rendered to the Registrant, and rendered to Service Affiliates, for the Reporting Periods were $753,594 in 2020 and $2,168,933 in 2021.
Auditor Independence. The Registrant's Audit Committee has considered whether the provision of non-audit services that were rendered to Service Affiliates, which were not pre-approved (not requiring pre-approval), is compatible with maintaining the Auditor's independence.
Item 5. Audit Committee of Listed Registrants.
Not applicable.
Item 6. Investments.
(a) Not applicable.
| Item 7. | Disclosure of Proxy Voting Policies and Procedures for Closed-End Management Investment Companies. |
Not applicable.
Item 8. Portfolio Managers of Closed-End Management Investment Companies.
Not applicable.
| Item 9. | Purchases of Equity Securities by Closed-End Management Investment Companies and Affiliated Purchasers. |
Not applicable.
| Item 10. | Submission of Matters to a Vote of Security Holders. |
There have been no material changes to the procedures applicable to Item 10.
| Item 11. | Controls and Procedures. |
(a) The Registrant's principal executive and principal financial officers have concluded, based on their evaluation of the Registrant's disclosure controls and procedures as of a date within 90 days of the filing date of this report, that the Registrant's disclosure controls and procedures are reasonably designed to ensure that information required to be disclosed by the Registrant on Form N-CSR is recorded, processed, summarized and reported within the required time periods and that information required to be disclosed by the Registrant in the reports that it files or submits on Form N-CSR is accumulated and communicated to the Registrant's management, including its principal executive and principal financial officers, as appropriate to allow timely decisions regarding required disclosure.
(b) There were no changes to the Registrant's internal control over financial reporting that occurred during the period covered by this report that have materially affected, or are reasonably likely to materially affect, the Registrant's internal control over financial reporting.
| Item 12. | Disclosure of Securities Lending Activities for Closed-End Management Investment Companies. |
Not applicable.
(a)(1) Code of ethics referred to in Item 2.
(a)(2) Certifications of principal executive and principal financial officers as required by Rule 30a-2(a) under the Investment Company Act of 1940.
(a)(3) Not applicable.
(b) Certification of principal executive and principal financial officers as required by Rule 30a-2(b) under the Investment Company Act of 1940.
SIGNATURES
Pursuant to the requirements of the Securities Exchange Act of 1934 and the Investment Company Act of 1940, the Registrant has duly caused this Report to be signed on its behalf by the undersigned, thereunto duly authorized.
BNY Mellon Short-Intermediate Municipal Bond Fund
By: /s/ David DiPetrillo
David DiPetrillo
President (Principal Executive Officer)
Date: May 26, 2021
Pursuant to the requirements of the Securities Exchange Act of 1934 and the Investment Company Act of 1940, this Report has been signed below by the following persons on behalf of the Registrant and in the capacities and on the dates indicated.
By: /s/ David DiPetrillo
David DiPetrillo
President (Principal Executive Officer)
Date: May 26, 2021
By: /s/ James Windels
James Windels
Treasurer (Principal Financial Officer)
Date: May 26, 2021
EXHIBIT INDEX
(a)(1) Code of ethics referred to in Item 2.
(a)(2) Certifications of principal executive and principal financial officers as required by Rule 30a-2(a) under the Investment Company Act of 1940. (EX-99.CERT)
(b) Certification of principal executive and principal financial officers as required by Rule 30a-2(b) under the Investment Company Act of 1940. (EX-99.906CERT)