
PSEG Overview
Electric Customers: 2.1M
Gas Customers: 1.7M
Nuclear Capacity: 3,500 MW
Total Capacity: 13,600 MW*
Traditional T&D
Leveraged
Leases
2007E Operating Earnings(4) : $1,170M - $1,295M
2007 EPS Guidance(4) : $4.60 - $5.00
Assets (as of 12/31/06): $28.6B
Market Capitalization (as of 2/23/07): $18.9B
Domestic/Int’l
Energy
Regional
Wholesale Energy
Operating Earnings = Earnings Available and Excludes:
(1) Merger Costs of $1M
(2) Loss from Discontinued Operations of $239M
(3) Loss on Sale of RGE of $178M and Income from Discontinued Operations of $226M
Includes Operating Earnings from Global of $166M, Resources of $63M and Energy Holdings of ($2M)
(4) Includes the parent impact of $(50-60)M
*After sale of Lawrenceburg
2006 Operating Earnings: $262M(1) $515M(2) $227M(3)
2007 Guidance: $330M - $350M $770M - $850M $130M - $145M

Operations
PSE&G consistently demonstrates top reliability performance
Significant improvement in nuclear operations
Regulatory
PSE&G settlement demonstrates return to constructive environment
Environmental – achieved NJ coal settlement
Energy Markets
Power benefiting from higher prices and lower risk through forward hedges
Utility customers benefit from staggered BGS – another auction complete
Financial
International – reduced exposure, improved stability
Improving cash flows and credit measures
Strong earnings growth in 2007 and 2008
We have made steady progress across a variety of areas.
Our objective is to build on these results to make a
strong company even stronger.

Much has been accomplished since the termination of
the merger…
September 2006
October
November
December
January 2007
9/14 – Merger
Termination
Announced
11/16–
PSE&G named
America’s Most
Reliable Electric
Utility
11/9 –
PSE&G Rate
Settlements
12/20– PSEG resumes direct
management of Nuclear stations
and Exelon’s senior management
team joins PSEG.
11/30- PSEG
Power Consent
Decree
1/31 - Operating Earnings at
upper end of guidance;
Confirmed strong ’07-’08
outlook; Improved Balance
Sheet
9/25 –
CEO
Succession
Announced
Regulatory
Operations
Management
Financial /
Asset
Rationalization
12/7 –
New Senior Team
Announced
1/16 –
Dividend
Increase
Organizational Design
& Staffing in progress
12/31 – Achieved
96% annual
nuclear capacity
factor
February
1/2 – Sale of
Lawrenceburg
announced
2/22 –
Election of
Chairman
and CEO

Power
Re-contracting &
Higher Margins
$.22
Depreciation,
Interest & Other
$.06
O&M $.03
Nuclear Operations
$.02
BGSS ($.11)
Turbine Impairment
($.10)
New Assets ($.06)
NDT ($.05)
MTM ($.05)
Shares O/S ($.01)
PSE&G
O&M & Other
$.02
Transmission
$.02
Demand $.02
Effective Tax
Rate $.02
Weather ($.06)
Expiration of
Depreciation
Credit ($.03)
4Q 2006
Operating
Earnings**
4Q 2005
Operating
Earnings*
*Excludes Merger Costs ($.02), Cumulative Effect of a Change in Accounting Principle ($.07) and Discontinued Operations ($.02)
**Excludes Discontinued Operations ($.87)
Holdings
Lower taxes $.08
Lower Interest &
Other $.04
Gain on sale of
Seminole lease in
2005 ($.18)
TIE – MTM &
Operations ($.08)
RGE Sale ($.04)
Turboven
Impairment ($.02)
Enterprise
Interest
Savings $.01
4Q 2006 Results - Earnings Variance
$0.94
(.01)
(.05)
(.20)
.01
$0.69

2006 Results - Earnings Variance
Power
Re-contracting &
Higher Margins
$.84
Nuclear
Operations $.20
Depreciation,
Interest & Other
$.04
New Assets ($.23)
BGSS ($.22)
NDT ($.13)
Turbine
Impairment ($.10)
Shares O/S ($.07)
Environmental
Reserve ($.06)
O&M ($.06)
PSE&G
Transmission
$.06
Other $.01
Weather ($.19)
Expiration of
Depreciation
Credit ($.15)
O&M ($.04)
Depr./Amort.
($.04)
Shares O/S
($.03)
2006
Operating
Earnings**
2005
Operating
Earnings*
Holdings
Texas Ops $.21,
including MTM of
$.13
Lower Interest &
Taxes $.18
2005 UAL Write-
off $.05
FX Gains/Losses
$.03
Prior Year Gains:
Eagle Point,
Seminole,
SEGS, MPC
($.31)
RGE Sale ($.06)
Turboven
Impairment
($.02)
Enterprise
Interest
Savings $.03
.21
.08
(.38)
.03
$3.77
$3.71
*Excludes Merger Costs ($.14), Cumulative Effect of a Change in Accounting Principle ($.07) and Discontinued Operations ($.85) &nb sp;
**Excludes Merger Costs ($.03), Loss on Sale of RGE ($.70) and Discontinued Operations ($.05)

PSEG 2007 Earnings Outlook & Drivers
$3.71
Excess of
10% Growth
Forward
Hedging
Re-contracting
- PJM/NE
Capacity
Market Design
Gas Rate
Case
Electric
Financial
Review
Weather
Texas
Asset Sales
New
Accounting
Standard
Increase/(Decrease) vs.
2006 Operating Earnings
2007 Forecast Operating
Earnings Ranges
$232 - $357
($97) – ($82)
$68 - $88
$255 - $335
$1170 - $1295
$130 - $145
$330 - $350
$770 - $850
$4.60 - $5.00
2006
Operating
Earnings:
$938M*
*Excludes Loss on Sale of RGE of $178M ($.70 per share), Merger Costs of $8M ($.03 per share) and Loss from Discontinued
Operations of $13M ($.05 per share)

PSE&G

PSE&G Overview
2.1M electric customers
1.7M gas customers
2,600 sq miles in service territory
Electric
Distribution
$3.2B
Gas
Distribution
$2.1B
Electric
Transmission
$0.7B
Rate Base
(As of December 31, 2006)
Capital Structure
(As of December 31, 2006)
Total Long-
term Debt*
49%
Total
Common
Equity
50%
*Excludes Securitization Debt
Preferred
Stock
1%

Fair outcome on recent gas and electric cases will
help ensure…
Settlement agreement with BPU staff, Public Advocate, and other parties
Gas Base Rate case provides for $79M of gas margin
$40M increase in rates
$39M decrease in non-cash expenses
Electric Distribution financial review provides $47M of additional annual
revenues
Base rates remain effective at least until November 2009
New Jersey regulatory climate providing a fair return to investors
Opportunity to earn a ROE of 10%
…our continued ability to provide safe, reliable service
to customers and fair returns to shareholders.

Rate relief and normal weather…
$262M
$30M - $40M
$20M - $25M
$330M
to
$350M
$20M - $30M
… provide opportunity to earn allowed returns.
*
*Excludes $1M of Merger Costs

$605
$628
$631
$560
$575
PSE&G Capital Requirements*
(2007 – 2011)
($ Millions)
*Excludes impact of NJ Energy Master Plan; Reflects completion of infrastructure improvement projects by 2010
**Excludes Securitization
PSE&G’s capital program supports current plans

Looking Forward PSE&G…
Is committed to meeting customer needs and expectations
Continues to invest in its assets for the future
Distribution System Reinforcements
Transmission Investments
Customer Service
Supports NJ’s Energy Master Plan process, which may
create opportunities for additional investments
Advanced Metering, Solar Installations/other renewables and Energy
Efficiency
Endeavors to maintain constructive regulatory relations

PSEG Power

PSEG Power Overview
Diverse asset mix mitigates risk
and provides strong returns
13,600* MW of nuclear, coal, gas,
oil and hydro facilities
Low-cost portfolio
Strong cash generator
Regional focus with demonstrated
BGS success
Assets favorably located
Many units east of PJM constraint
Southern NEPOOL/Connecticut
constraint
Near customers/load centers
Integrated generation and portfolio
management optimizes asset-
based revenues
18%
47 %
8 %
26 %
Fuel Diversity – 2007*
Coal
Gas
Oil
Nuclear
Pumped
Storage
1%
(MWs)
* After sale of Lawrenceburg
Energy Produced - 2006
(MWhrs)
55%
27%
16%
Oil 1%
Pumped
Storage
1%
Nuclear
Coal
Gas
Total MWhrs: 53,617

*Uprate of 127MW scheduled for Fall 2007
Strong operational performance
Capacity factors: Year-end ~96%
Summer ~100%
Outage management
Site records achieved, including most
recent 21 day refueling outage at
Salem 2
Nuclear Operating Services
Agreement (NOSA)
PSEG resuming direct management of
Salem and Hope Creek
Exelon’s senior management team has
joined PSEG
Hope Creek*
Salem
1 & 2
Peach Bottom
2 & 3
PSEG MW
Owned
1,061 MW*
1,323 MW
1,112 MW
Ownership
PSEG Owned
Jointly Owned
Jointly Owned
Operations
PSEG
Operated
(NOSA)
PSEG
Operated
(NOSA)
Exelon
Operated
Total
Fleet:
3,496 MW
Strong Nuclear Operations
NJ Fleet:
2,384 MW

Strong Fossil Operations round out a diverse portfolio…
Total Fossil Output (Gwh)
A Diverse 10,000 MW Fleet
2,400 MW coal
3,200 MW combined cycle
4,400 MW peaking and other
Strong Performance
Continued growth in output
Improved fleet performance
Achieved resolution regarding
Hudson / Mercer
…in which over 80% of fleet output is from low cost coal
and nuclear facilities.

Our Environmental Strategy…
$451
$703
2007 – 2010
Total
2010
$83
$110
$132
$126
Mercer
2010
$263
$229
$143
$68
Hudson Unit 2
Completion
Date
2010
2009
2008
2007
PSEG Power Environmental Capital Requirements
($ Millions)
*PSEG Fossil to notify USEPA and NJDEP by end of 2007 on decision to install emissions controls at Hudson Unit 2
…will help preserve the availability of our fossil fleet.
Emissions Control Technology Projects
- NOx control – SCR
- SO2 control – Scrubber
- Hg and particulate matter control - Baghouse
Hudson Unit 2* (608 MW)
NOx control – SCR installation complete
SO2 control – Scrubbers
Hg and particulate matter control – Baghouse
Mercer (648 MW) – Units 1&2

Strengthening of capacity market design…
PSEG Power
PJM
NY
NE
Total Capacity 13,600MW*
(1,500 MW under RMR)
…provides meaningful market signals, and enhances expected
margin for Power’s generating fleet.
January 2008
2010 – 2011
October 2007
2009 – 2010
July 2007
2008 – 2009
April 2007
2007 – 2008
Auction Date
Planning Year
New England
Forward Capacity Market (FCM) began 12/1/06
Transition period prices have been established
Grows from $37/kw-yr to $49/kw-yr through 2010
First auction scheduled in 2008 for June 2010 delivery
PJM
FERC Approved 12/22/06
Locational pricing
4 zones initially, 23 in 2010
Anticipated implementation 6/1/07
Auction schedule:
*After sale of Lawrenceburg

The 1st RPM-year spans June 2007 through May 2008, and will
cover similar one year (BGS) intervals thereafter. Recent market
activity has shown considerable price increases for the
2007/2008 year.
PJM’s Reliability Pricing Model
RPM reflects a change in
market design
- More structured, forward-
looking, transparent pricing model
- Gives prospective investors in
new generating facilities more
clarity on future value of capacity
- Sends pricing signal to
encourage expansion of capacity
where needed for future market
demands
Capacity revenues, driven by RPM, provide a meaningful increase in
Power’s expected margin - $100 - $150 million for 2007 - and is anticipated
to increase in future years due to full year PJM impact and as more capacity
comes off existing contracts.
Capacity Prices
2007
Range
Fall 2006
Increase of
recent prices
for ’07 – ’08
year

20,000
4,000
8,000
12,000
16,000
2002
2003
2004
2005
2006
2007
2008
2002 FP
Auction
1 Year
170
Tranches
2003 FP
Auction
10
months
104
Tranches
2003 FP Auction
34 months
51 Tranches
2004 FP
Auction - 1 Yr.
50 Tranches
2004 FP Auction - 3 Years
51 Tranches
2006 FP Auction Load
54 Tranches
2005 FP Auction Load
50 Tranches
2007 FP Auction Load
New Jersey BGS Auction Structure
The BGS structure in New Jersey successfully mitigates
risk for both suppliers and for customers.
51 Tranches
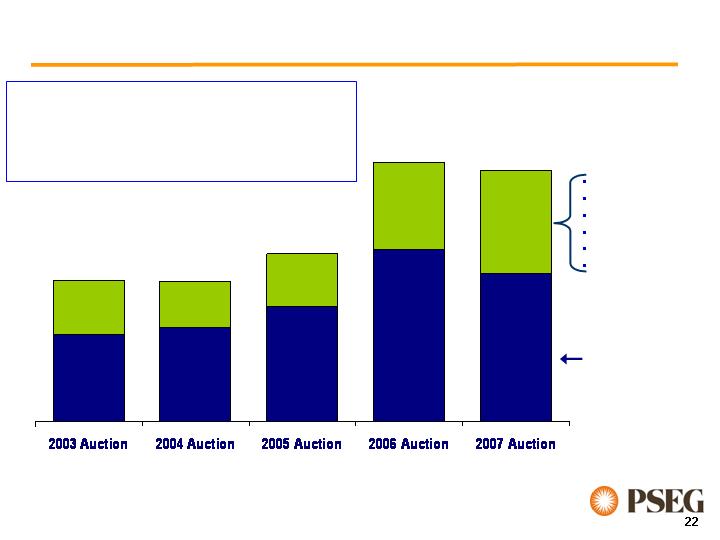
Market Viewpoint - BGS Auction Results
Capacity
Load shape
Transmission
Congestion
Ancillary services
Risk premium
Full Requirements
Round the Clock
PJM West
Forward Energy
Price
$33 - $34
$36 - $37
$55.59
$55.05
$65.91
$44 - $46
~ $21
~ $18
~ $21
$102.21
$67 - $70
~ $32
Increase in Full Requirements Component Due to:
Increased Congestion (East/West Basis)
Increase in Capacity Markets/RPM
Volatility in Market Increases Risk Premium
$98.88
~ $41
$58-$60
Power has been a successful participant in each BGS auction.

Strong electric prices support growth in margins…
…as Power secures a stable revenue stream through a
strategy of forward hedging
Average PJM West RTC Price
2006 = $50/MWh
2005 = $60/MWh
2004 = $42/MWh
2003 = $38/MWh
Sep ‘06
Feb ‘07
2007
2008
2009
2010
Calendar Forward Prices - PJM West RTC
$0.85 - $1.20
$0.45 - $0.80
$0.01 - $0.10
Estimated impact of $10/MWh PJM West RTC
price change*
0 – 20%
35 – 50%
90 – 100%
~100%
Percent of coal and nuclear energy output hedged
2010
2009
2008
2007
*Assuming normal market dynamics
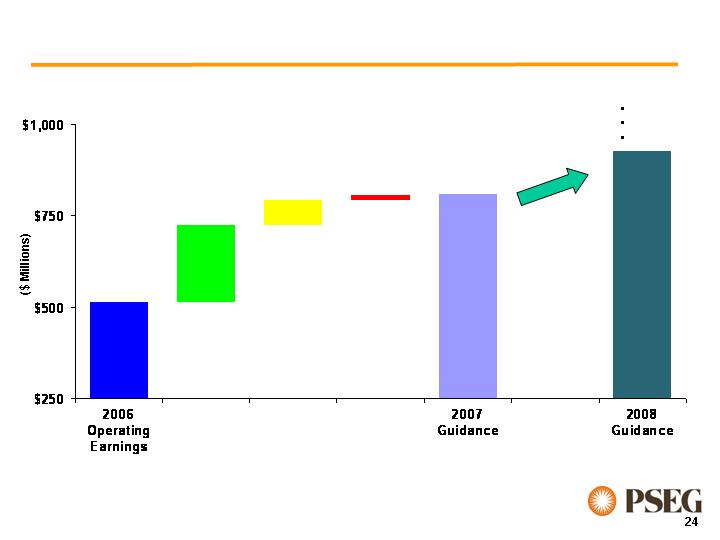
The year over year improvements…
Energy
Capacity
Other
…drive growth in PSEG’s 2007 earnings guidance
with further improvements in 2008.
$515M*
Power drives 2008 earnings
guidance in excess of 10%
Full year of capacity pricing
Recontracting of BGS
Hope Creek uprate
$200M - $240M
$50M - $80M
$770M
to
$850M
$5M - $15M
* Excludes Loss from Discontinued Operations of $239M

Looking Forward PSEG Power…
Transitions its New Jersey nuclear plants to independent
operations
Moves forward to enhance environmental profile through
Consent Decree compliance
Anticipates energy markets to provide attractive growth
Energy hedges roll with increased margin
Capacity markets increasing – RPM auctions will provide visibility
Positions balance sheet for growth

PSEG Energy Holdings
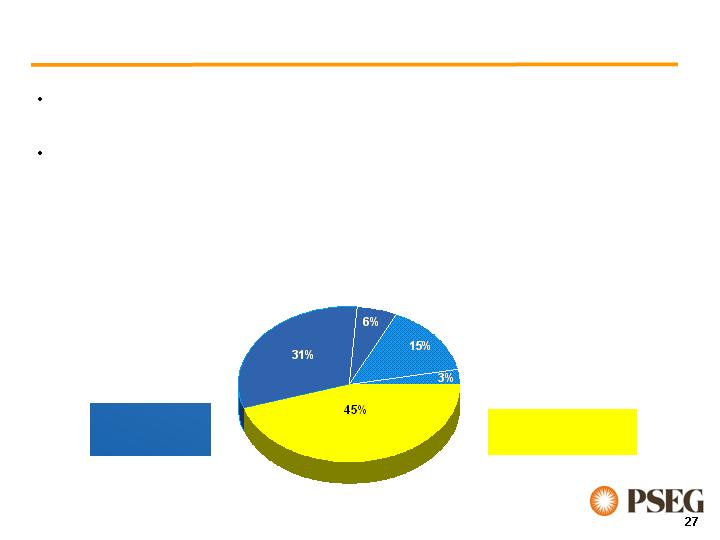
PSEG Energy Holdings Overview
Other Resources Investments
TOTAL ASSETS $6.2 B – 12/31/06
PSEG Global
Domestic
Generation
PSEG Resources
Leveraged Leases
Other International Generation
Chile & Peru
Distribution and
Generation
Two businesses with redirected strategy to maximize value of existing
investments
Balance and diversity: over 60 total investments; no single investment
more than 11% of Holdings assets
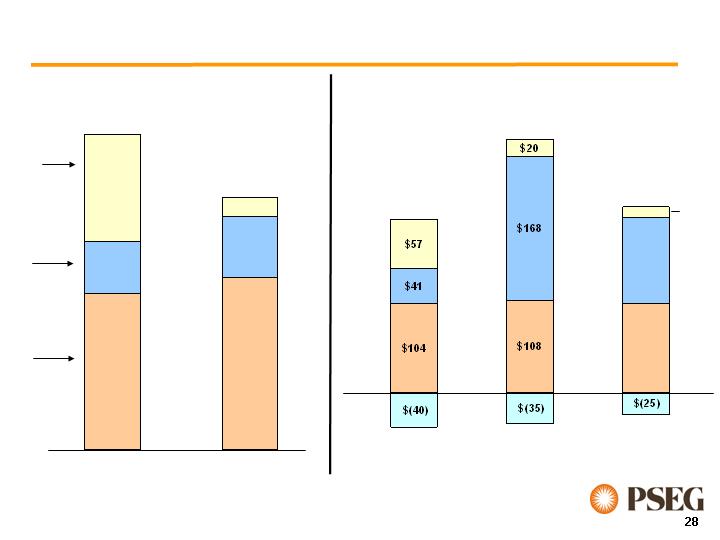
Improved risk profile by opportunistically reducing
capital invested in non-strategic assets…
…while increasing returns and sharpening focus on G&A.
2004
2006
$2.6B
$2.0B
Chile & Peru
US
Other
$900M
$400M
$1.3B
$160M
$500M
$1.4B
34%
16%
50%
8%
24%
68%
$296M**
48%
45%
2004
2006
2007 Est.
$202M**
$210M-$230M**
Composition of Global’s Pre-tax
Contribution by Region*
G&A
Chile
& Peru
US
Other
28%
20%
51%
6%
57%
37%
7%
Global’s Invested Capital
*Includes both consolidated and unconsolidated investments
**Excludes interest, taxes, G&A and other corporate items to arrive at Global’s Operating Earnings
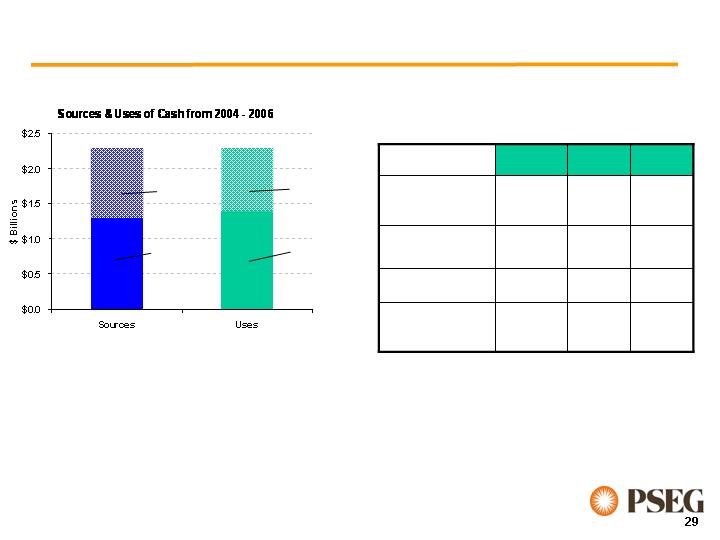
Holdings has provided meaningful earnings and
cash flow…
…which has supported debt reduction and return
of capital to PSEG.
Asset
Sales
Cash Ops/
Cash on
Hand
Reduced
Debt
Return
Capital/
Dividends
Significant de-capitalization
totaling $2.3B from 2004 -
2006
$609M
-
$311M
Net Debt
Reduction
47%
3.4x
$491M
2004
36%
41%
Recourse
Debt/Capital
4.5x
2.5x
FFO/Interest
$520M
$412M
Dividends & ROC
2006
2005
Debt Reduction & Dividends from 2004 - 2006
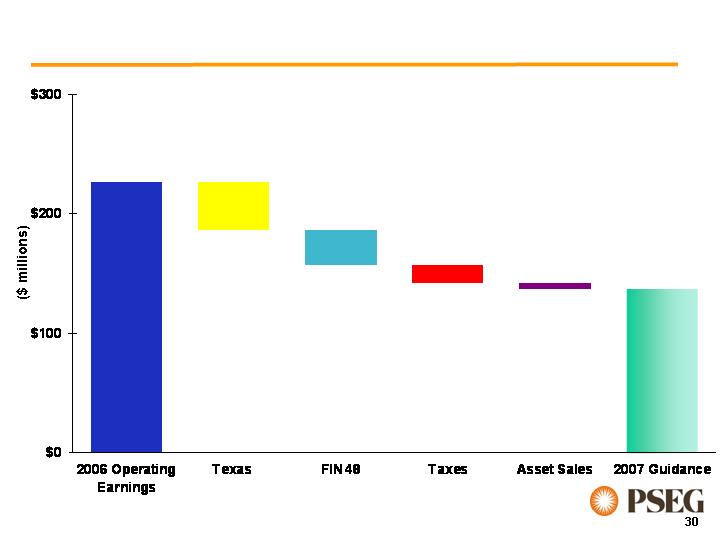
PSEG Energy Holdings – 2007 Drivers
$227M
$25M - $35M
$10M - $20M
$130M
to
$145M
$5M - $10M
$35M - $45M
*Excludes Loss on Sale of RGE of $178M and Income from Discontinued Operations of $226M
*

Looking Forward Energy Holdings…
Global’s Portfolio – Allocation of Invested Capital
Improved risk profile
Chile - Investment Grade; Peru - approaching
US – Texas is merchant; others are contracted
Stable earnings and cash distributions
Continue opportunistic monetization of non-strategic assets
Optimizes returns on Global’s current portfolio
Attractive market opportunities for Texas assets
Continue to seek increased returns in Chile and Peru
Other opportunities (eg. G&A)
Monitors Resources’ lease portfolio
Lessee credit risks exist, but have subsided
Current weighted average rating: A-/A3
Adoption of FIN 48 decreases earnings
Continue to monitor tax issues

Looking Forward PSEG…
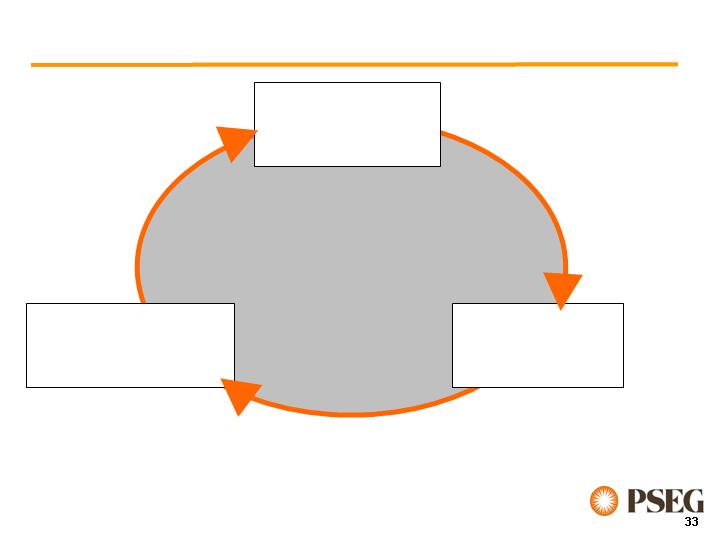
Financial
Strength
We will focus on the basics of operational excellence...
…to produce financial strength that will be deployed
through disciplined investment.
Operational
Excellence
Disciplined
Investment
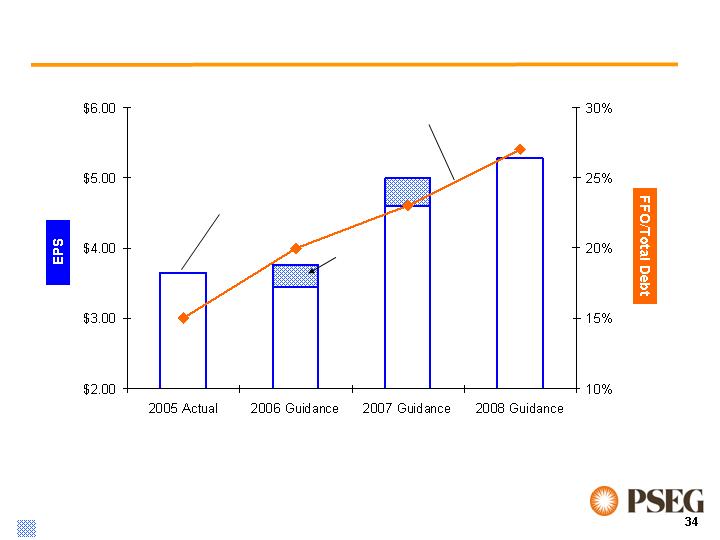
Strong earnings and cash flows will be used to
further de-lever the balance sheet.
Improving our credit profile will enable us to maximize
growth opportunities.
Excess
of 10%
Growth
FFO/
Total Debt
EPS
YE ‘06
EPS**:
$3.71
Guidance range: ’06: $3.45 - $3.75
’07: $4.60 - $5.00
YE ‘05
EPS*:
$3.77
*Excludes Merger Costs ($.14), Cumulative Effect of a Change in Accounting Principle ($.07) and Discontinued Operations ($.85) &nbs p;
**Excludes Merger Costs ($.03), Loss on Sale of RGE ($.70) and Discontinued Operations ($.05)

…and capitalize on multiple alternatives to grow the generation
and delivery business.
From a position of financial strength, we will make
disciplined investments…
Near-term:
Capitalize on opportunities for rate base growth
Distribution, transmission, customer service
Optimize our existing generation portfolio
Environmental improvements at NJ coal stations
Nuclear uprate
Continue to review Global’s portfolio
Focus on international investments
Longer-term:
Flexibility to pursue growth in core businesses and regions
PSE&G integrating with NJ Energy Master Plan initiatives
Advanced metering
Renewables
Demand side management
Power well positioned for growth in attractive Northeast markets
Strong and improving operations
Site expansion capability
Attractive cash flow
Consider a range of strategic alternatives
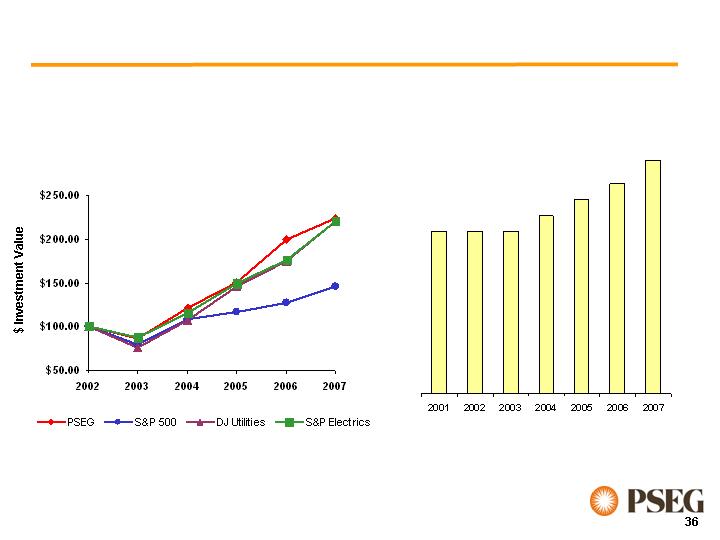
Creating Shareholder Value
5-Year Cumulative
Total Comparative Returns
(as of February 23, 2007)
Focused on producing superior shareholder return
Growing, Stable Dividends
(Annualized Quarterly Dividends)
$2.16
$2.20
$2.24
$2.28
$2.16
$2.16
$2.34


