
... which experience higher prices during periods of high demand.
Power’s assets are located in attractive markets near load
centers …
Current plant locations,
site expansion capability
Bethlehem Energy Center
(Albany)
New Haven
Bergen
Kearny
Essex
Sewaren
Edison
Linden
Mercer
Burlington
National Park
Hudson
Conemaugh
Keystone
Bridgeport
Peach Bottom
Hope Creek
Salem
System Interface
6

Baseload units:
- Very low variable cost, low
bid price into the energy
market
- Always, or almost always
called upon to provide
power to serve load
Load following units:
- Primarily gas-fired,
higher variable cost
- Intermittently called
upon to provide power
to serve load
Peaking units:
- Gas- and oil-fired, high variable cost,
leading to high bid price into the
energy market
- Called upon to provide power only
during periods of peak demand to
serve load
Salem
Hope
Creek
Keystone
Conemaugh
Hudson 2
Linden 1,2
Burlington
Edison
Essex
Bergen 1
Sewaren
Hudson 1
Megawatts (MW)
Mercer1, 2
Bergen 2
… position the company well to serve full requirement load contracts.
Sewaren
Kearny
Linden / Essex
Burlington 12 / Kearny 12
Peach
Bottom
Bridgeport
New
Haven
Nuclear
Coal
Combined Cycle
Steam
GT Peaking
Power’s assets along the dispatch curve …
BEC
Illustrative
7

Operated by PSEG Nuclear
PSEG Ownership: 100%
Technology:
Boiling Water Reactor
Total Capacity: 1,061MW*
Owned Capacity: 1,061MW
License Expiration: 2026
Operated by PSEG Nuclear
Ownership: PSEG - 57%,
Exelon – 43%
Technology:
Pressurized Water Reactor
Total Capacity: 2,304MW
Owned Capacity: 1,323MW
License Expiration: 2016 and
2020
Operated by Exelon
Ownership: PSEG 50%,
Exelon – 50%
Technology:
Boiling Water Reactor
Total Capacity: 2,224MW
Owned Capacity: 1,112MW
License Expiration: 2033
and 2034
Hope Creek
Salem Units 1 and 2
Peach Bottom Units 2 and 3
Our five-unit nuclear fleet …
… is a critical element of Power’s success.
*Uprate of 125MW scheduled for fall 2007
8

82.3%
65.6%
92.0%
82.8%
92.6%
97.2%
50%
60%
70%
80%
90%
100%
Salem
Hope Creek
Capacity Factor
6.5%
20.2%
0.9%
7.6%
0.7%
0.4%
0%
6%
12%
18%
24%
Salem
Hope Creek
Forced Loss Rate
81.0
64.8
95.2
65.0
99.2
91.4
60
70
80
90
100
Salem
Hope Creek
INPO Index
80.2%
97.4%
84.7%
99.9%
99.8%
100.0%
50%
60%
70%
80%
90%
100%
Salem
Hope Creek
Summer Capacity Factor
… and corresponds directly with improved regulatory relations and
financial outcomes.
Improvement in nuclear performance can be seen in
numerous measures of operations ...
2004
2005
2006
9

Complete Management Model
implementation
Maintain operational focus
Resume independent operation
Succession plan
Bill Levis appointed as President &
COO, PSEG Power; retains CNO
positon
Richard Lopriore appointed as
President, PSEG Fossil
Tom Joyce appointed as Senior VP –
Operations for Salem – Hope Creek
… which will strengthen Power’s results going forward.
Continuing efforts are focused on sustaining the
improving trend …
Maintain stakeholder
confidence
Preserve nuclear options
for Power
Ongoing Initiatives
Expected Results
10

0
5,000
10,000
15,000
20,000
25,000
2002
2003
2004
2005
2006
Coal
Combined Cycle
Peaking & Other
Total Fossil Output (GWh)
A Diverse 10,000 MW Fleet
2,400 MW coal
3,200 MW combined cycle
4,400 MW peaking and other
Strong Performance
Continued growth in output
Improved fleet performance
Achieved resolution regarding
Hudson / Mercer
… contribute to a low-cost fossil portfolio in which two-thirds of
fleet output is from coal facilities.
Strong Fossil operations …
11

$490
$600 - $750
2007 – 2010 Total
($ million)
2010
Mercer**
2010
Hudson
Unit 2
Completion
Date
Environmental Capital Requirements
Emissions Control Technology Projects
- NOx control – SCR
- SO2 control – Scrubber
- Hg and particulate matter control -
Baghouse
Hudson Unit 2* (608 MW)
NOx control – SCR installation complete
SO2 control – Scrubbers
Hg and particulate matter control –
Baghouse
Mercer (648 MW) – Units 1&2
Our environmental strategy…
… will help preserve the availability of our fossil fleet.
*PSEG Fossil to notify USEPA and NJDEP by end of 2007 on decision to install emissions controls at Hudson Unit 2
**Capital investment $40M above 2006 10-K disclosure -- EPC Contract signed
Power’s New Jersey coal units are
mid-merit, with capacity factors
averaging 50% to 60%
As markets tighten, increased
production is anticipated
12

$20
$30
$40
$50
$60
$70
2002
2003
2004
2005
2006
2007
Est
2008
Fwd
2009
Fwd
$0
$3
$6
$9
$12
$/mmbtu
$/MWh
… benefiting Power’s coal and nuclear fleet.
(1)
Central Appalachian coal
(2)
Forward prices as of May 18, 2007
Increases in fossil fuels have driven up energy prices …
Electricity
(left scale)
Coal(1)
(right
scale)
Natural Gas Henry Hub
(right scale)
(2)
(2)
(2)
13

$20
$30
$40
$50
$60
$70
$80
2002
2003
2004
2005
2006
2007 Est
2008
Fwd
2009
Fwd
PS Zone Basis
Historical spot basis
Forward basis
Large portion of sales are into forward market where forward basis has remained high.
Zonal prices in the eastern portions of PJM have
historically been higher than the Western Hub…
… allowing Power to realize higher prices due to its favorable
location.
(1) Forward prices as of May 18, 2007
(1)
(1)
(1)
14

-
50
100
150
200
250
300
1999
2000
2001
2002
2003
2004
2005
2006
-
50
100
150
200
250
300
1999
2000
2001
2002
2003
2004
2005
2006
Source: Data per PJM’s State of the Market report March 2007
*Annualized payment required to make an investment
-
50
100
150
200
250
300
1999
2000
2001
2002
2003
2004
2005
2006
… which may serve to tighten reserve margins.
Despite the recent run up, prices have not
consistently supported new capacity construction …
Economic Dispatch Net Revenue
20-year Levelized Fixed Cost*
Combustion Turbine ($/KW-yr)
Combined Cycle ($/KW-yr)
Pulverized Coal ($/KW-yr)
15

Regional Generation Balance 2007 - 2011
(Percent above or below target Reserve Margin)
7%
5%
5%
4%
3%
5%
2%
-1%
-2%
-3%
-1%
-1%
-4%
-7%
0%
-10%
-5%
0%
5%
10%
PJM (RM Target = 115%)
NY ISO (116.5%)
NE ISO (114.5% implied)
2011
2010
2009
2008
2007
Data Source: PJM, NY ISO and NE ISO
Reserve margins in the key Power markets are expected
to continue to decline …
… which should sustain higher energy prices as heat rates expand.
16

More structured, forward-
looking, transparent pricing
model
Gives prospective
investors in new
generating facilities more
clarity on future value of
capacity
Sends locational pricing
signal to encourage
expansion of capacity
where needed for future
market demands
… in which longer-term price signals are provided.
PJM’s Reliability Pricing Model (RPM) reflects a change
in market design …
$0
$20
$40
$60
2001
2002
2003
2004
2005
2006
2007
$80
2008
2009
Settled @ $72/kw-yr
’08 – ’09 Market
Trading
@ $40 -$45/kw-yr
’07 – ’08 Auction
Capacity Prices
$45/KW-yr = $123/MW-day
@ 50% load factor » $10/MWh
17

RPM Capacity Auction – April Results and Schedule
2007- 2008 Capacity Auction Results
($/ MW-day)
N/A
N/A
$40.80
Rest of
Pool
$48.38
$140.16
$188.54
Southwest
MAAC
$20.16
$177.51
$197.67
Eastern
MAAC
CTR
Value*
Load
Price
Unit
Price
PJM released results on April 13 from its
first capacity auction under the Reliability
Pricing Model (RPM) for the 2007-2008
delivery year.
Pricing in initial auction for Eastern MAAC
reflected “Cost of New Entry”: standard
simple cycle gas turbine adjusted for
location.
Future auction pricing could be influenced
by changes in demand and capacity
availability including transmission capability
between zones.
Market prices support our forecast year-
over-year improvement in capacity margin
of $125M - $175M in 2007 with further
improvement in 2008.
Auctions are scheduled throughout the
year to provide transition through the 2010-
2011 delivery year.
*CTR Value: Capacity Transfer Rights
Allocated to Load Serving Entities (LSE) in constrained zones to provide them with
access to supply from outside the zone.
May 2008
2011 – 2012
January 2008
2010 – 2011
Annual base auction in May of each subsequent year
October 2007
2009 – 2010
July 2007
2008 – 2009
Auction Date
Planning Year
(6/1 to 5/31)
Auction Schedule
18
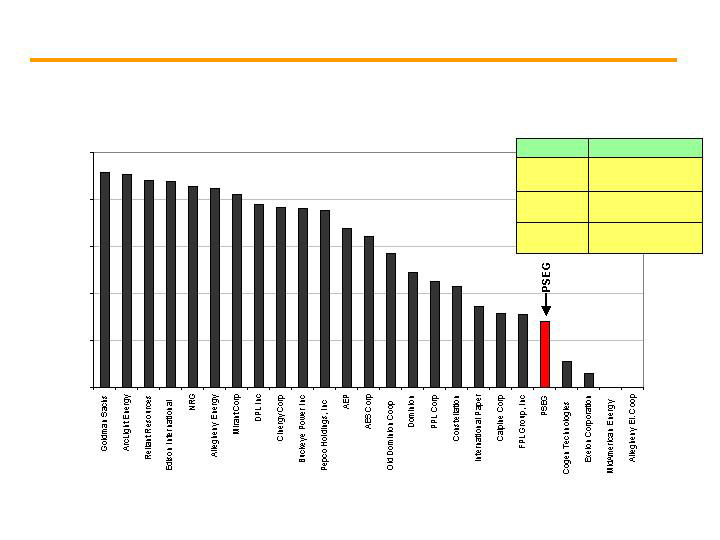
Policymakers are looking to cap and trade for the power
industry to reduce CO2 emissions.
PSEG’s generation carbon intensity is lower than many competitors and benefits from a
cap and trade program comparably applied to all competitors.
2004 CO2 Emission Rate Ranking
(25 Largest Generating Companies in PJM)
0
500
1,000
1,500
2,000
2,500
(lbs/MWh
all sources)
$8-$12/MWh gas
$20/MWh coal
$20/ton
$4-$6/MWh gas
$10/MWh coal
$10/ton
$0.40-$0.60/MWh gas
$1/MWh coal
$1/ton
Generator Impact
CO2 Cost
Potential Impact of CO2 on
Power Plant Costs
Note: Ranking data compiled by NRDC, CERES and PSEG Power
19

… as market fundamentals and regulatory policy impact market
conditions.
Looking ahead, Power is well positioned to benefit from
generation value improvement …
Tightening reserve margins should:
Put upward pressure on capacity prices, and
Drive heat rate expansion if baseload additions are insufficient
The implementation of carbon rules is becoming more likely
Anticipated to put upward pressure on prices
Nuclear generation stands to benefit from carbon constraints
20
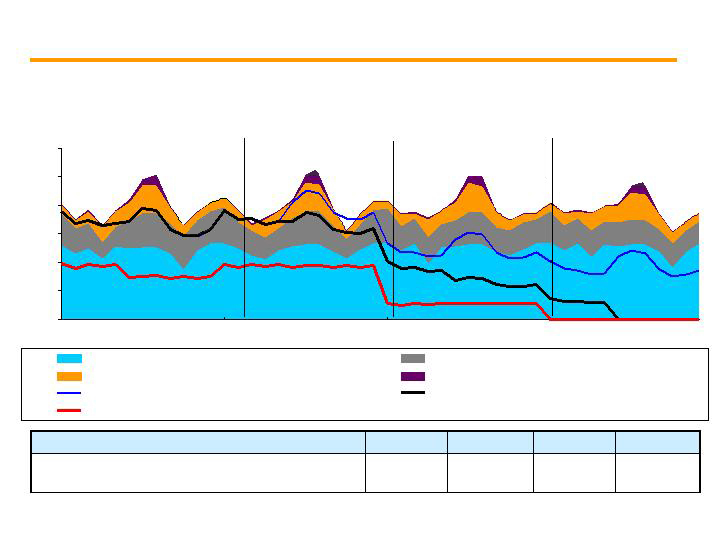
-
1,000
2,000
3,000
4,000
5,000
6,000
2007
2008
2009
2010
Nuclear / Pumped Storage
Coal
CC
Steam / CT
Existing Load + Hedges + Future BGS
Existing Load + Hedges
Existing Hedges
2007
2008
2009
2010
… while preserving market growth opportunities.
Power’s hedging strategy aims to balance stable
earnings …
0 – 20%
35 – 50%
90 – 100%
~100%
Percent of Power’s coal and nuclear energy output
hedged (total portfolio)*
2010
2009
2008
2007
PJM RTC (GWh)
*As of 1Q07
21
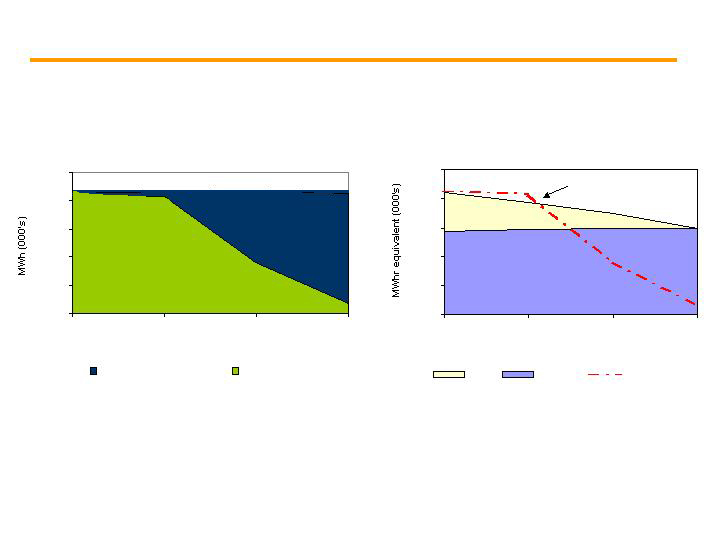
-
10,000
20,000
30,000
40,000
50,000
2007
2008
2009
2010
Year
Coal
Uranium
Contracted sales
… is aligned with its low-cost generating output and our hedging
strategies.
Power has contracted for 100% of its nuclear uranium fuel through 2011 and
approximately 70% of its coal needs through 2009.
Coal and Nuclear Fuel
Power’s hedging of coal and nuclear fuel …
Gas supply secured
based on sales of output
Coal and Nuclear Output
-
10,000
20,000
30,000
40,000
50,000
2007
2008
2009
2010
Year
Nuclear and Coal output
Contracted sales
22

2003 Auction
2004 Auction
2005 Auction
2006 Auction
2007 Auction
Capacity
Load shape
Transmission
Congestion
Ancillary services
Risk premium
Full Requirements
Round the Clock
PJM West
Forward Energy
Price
$33 - $34
$36 - $37
$55
$55
$66
$44 - $46
~ $21
~ $18
~ $21
$102
$67 - $70
~ $32
Increase in Full Requirements Component Due to:
Increased Congestion (East/West Basis)
Increase in Capacity Markets/RPM
Volatility in Market Increases Risk Premium
$99
~ $41
$58-$60
Market Perspective – BGS Auction Results
… has enabled successful participation in each BGS auction.
Power’s fleet diversity and location ...
23
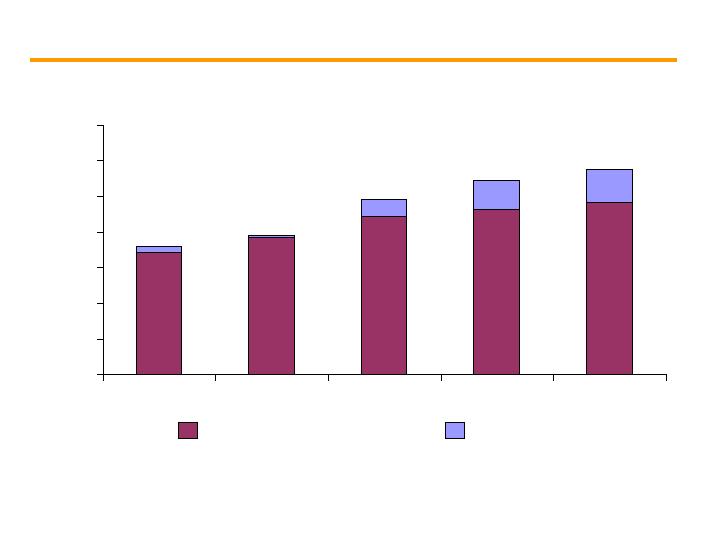
$0
$10
$20
$30
$40
$50
$60
$70
2005
2006
2007 Est
2008 Est
2009 Est
… are expected to drive significant increases in Power’s gross
margin.
Operational improvements and recontracting in
current markets …
Realized Gross Margin ($/MWh)
Energy
Capacity
(Energy prices based on recent forward markets;
Illustrative capacity prices based on recent market for 2007/2008 in all years)
24

Gas Asset Optimization
Large wholesale provider to PSE&G and others
Storage capacity of 80 Bcf (in the Gulf and market regions)
Firm transportation of 1.1 Bcf/Day (on ten pipelines)
Off-system sales margins shared with residential customers
Commercial & Industrial customers (C&I) sales priced monthly at market
Storage spreads capture Summer/Winter price differential on C&I sales
Weather and price volatility drive results
Colder than normal weather increases unitized fixed cost recovery
Ancillary Services
Emissions
… to round out a robust portfolio.
In addition to energy and capacity, Power has other
attractive sources of revenues …
25
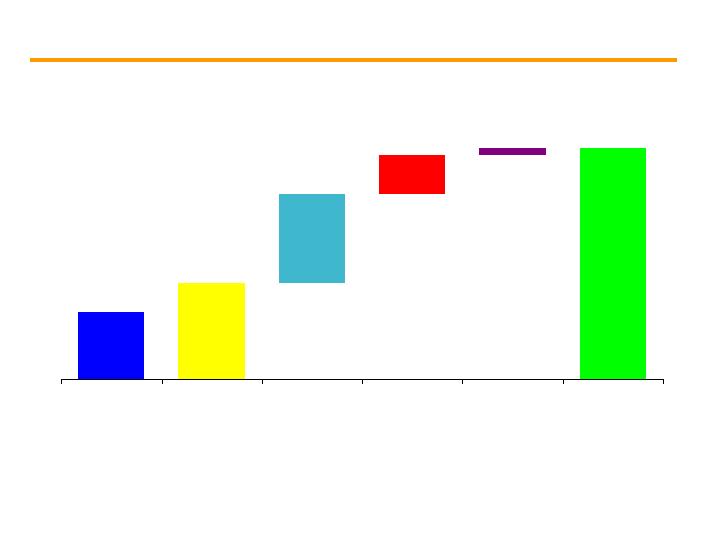
… drive the increase in PSEG’s 2007 earnings guidance.
*Excludes Merger costs of $12M in 2005, Cumulative Effect of a Change in Accounting Principle of $16M in 2005 and
Loss from Discontinued Operations of $226M and $239M in 2005 and 2006, respectively
2005 Operating
Earnings
2006 Operating
Earnings
Energy
Capacity
Other
2007 Guidance
$515M*
$446M*
$825M to
$905M
$15M - $25M
$220M - $260M
$75M - $105M
Improvements across the portfolio …
26

2007 Guidance
Energy
Capacity
Other
2008
Expectations
2009
Expectations
… drive PSEG’s earnings expectations for 2008 and beyond.
Drivers of 2009 Earnings
Recontracting
Operational excellence
Free cash flow
Growth opportunities
Further improvements at Power…
$825M to
$905M
27

Highest output ever from Nuclear
Highest output ever from Fossil
Balanced hedging strategy at ER&T
Strong, liquid markets
Sustainable BGS auction structure
Consent decree resolution
Rising energy prices
Favorable capacity market design
Diverse assets in constrained zones
Strong
Operations
Constructive
Regulatory and
Business
Environment
Positive Market
Fundamentals
Growth
Opportunities…
with Manageable
Risk
Near term – Hope Creek Uprate, RPM auctions
Longer term –
Tightening reserve margins
CO2 benefit to low carbon portfolio
Site expansion opportunities
Surrounding market opportunities
New nuclear investment potential
Manageable risk –
Enhanced operations
Balanced hedging strategy
Existing sites
Increasingly stable earnings base through
capacity market design
Positioned for growth in 2007 and beyond
28

Favorably Located Diverse Portfolio
Operational Improvements
Energy Market Improvements
Capacity Market Design Changes
Generation Value Improvement
Growth Opportunities
V
A
L
U
E
… fuel Power as the growth engine for PSEG.
Fundamental strengths and growth drivers …
29

196
227
347
262
446
515
130-145
130-145
340-360
330-350
825-905
770-850
(71)
(66)
(50)-(40)
(60)-(50)
2005
2006
2007 (Initial)
2007 (Revised)
2008
Strong earnings growth in 2007 for PSEG …
… a 37% increase over 2006 and expectations of 15% growth in 2008.
Holdings
Parent***
$5.60 - $6.10
$3.77*
$3.71**
$4.60 - $5.00
$4.90 - $5.30
PSE&G
Power
Operating Earnings by Subsidiary
37%
15%
68%
» 0
*Excludes ($.14) Merger Costs, ($.07) Cumulative Effect of an Accounting Change and ($.85) Discontinued Operations
**Excludes ($.03) Merger Costs, ($.70) Loss on Sale of RGE and ($.05) Discontinued Operations
***Primarily including financing activities at the parent and intercompany elimination
30


