Exhibit 99

Public Service Enterprise Group
California Investor Meetings
June 25-27, 2007

Forward-Looking Statement
The statements contained in this communication about our and our
subsidiaries’ future performance, including, without limitation, future
revenues, earnings, strategies, prospects and all other statements that
are not purely historical, are forward-looking statements for purposes of
the safe harbor provisions under The Private Securities Litigation
Reform Act of 1995. Although we believe that our expectations are
based on information currently available and on reasonable
assumptions, we can give no assurance they will be achieved. There
are a number of risks and uncertainties that could cause actual results to
differ materially from the forward-looking statements made herein. A
discussion of some of these risks and uncertainties is contained in our
Annual Report on Form 10-K and subsequent reports on Form 10-Q and
Form 8-K filed with the Securities and Exchange Commission (SEC),
and available on our website: http://www.pseg.com. These documents
address in further detail our business, industry issues and other factors
that could cause actual results to differ materially from those indicated in
this communication. In addition, any forward-looking statements included
herein represent our estimates only as of today and should not be relied
upon as representing our estimates as of any subsequent date. While
we may elect to update forward-looking statements from time to time, we
specifically disclaim any obligation to do so, even if our estimates
change, unless otherwise required by applicable securities laws.
1
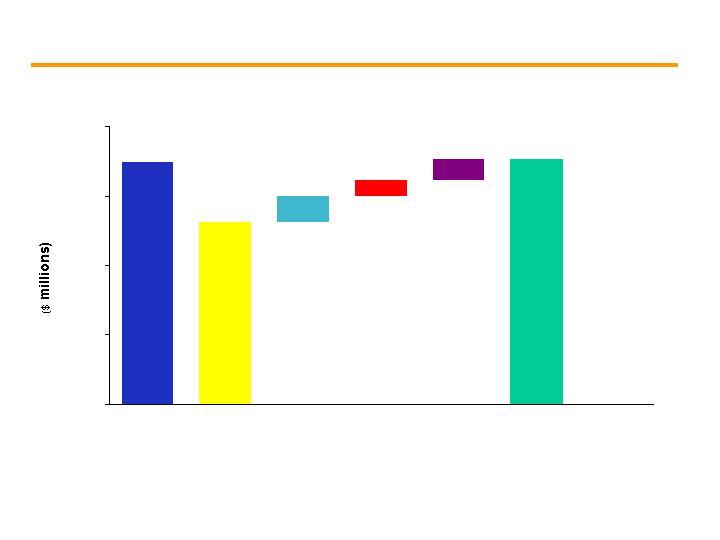
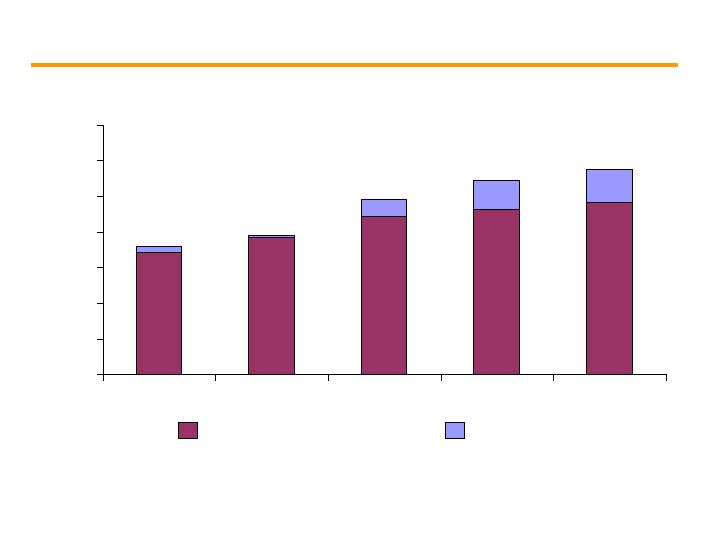
PSEG’s family of businesses consist of valuable assets
in attractive markets…
Domestic Generation
Regulated Transmission &
Distribution
- Domestic / International
T&D and Generation
- Leveraged Leases
… providing strong returns and significant opportunity for growth.
2

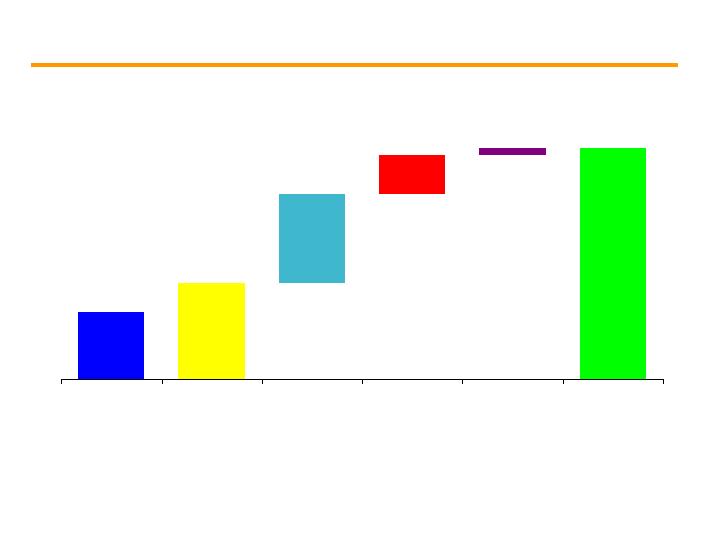
The current business environment …
Convergence of market forces and policy
creates the need to address:
Critical infrastructure requirements
Environmental requirements
Capacity requirements in constrained markets
… creates investment opportunities for PSEG’s businesses.
3

Carbon Reduction – A common focus across multiple
levels of government, …
International directives
- More support globally since adoption of Kyoto Agreement in
1997 for reduction in greenhouse gas
On the national level
Multiple carbon legislative proposals are currently under
consideration by Congress
Legislation probable by 2008
Regional Greenhouse Gas Initiative (RGGI)
A nine state collaborative calling for a 10% reduction in
carbon from 2000 – 2004 levels by 2019
In New Jersey, Governor Corzine has signed
Executive Order No. 54 and the Legislature has
introduced multi-sector carbon legislation with
aggressive reduction targets.
… an issue we support, and an opportunity for investment.
4

NJ Energy Master Plan …
Reduce projected energy use by 20% by 2020 and meet 20% of the State’s
electricity needs with renewable energy sources by 2020
Goal 1: Secure, safe, and reasonably priced energy supplies and services
Goal 2: Maintain economic growth and development
Goal 3: Promote environmental protection and impact
Provides PSEG the opportunity to:
Meet environmental goals that we have long supported
Expand PSE&G through broader investment opportunities
Support growth in the State’s urban areas through investment in the “Smart
Growth Initiative” program
Expand Power through carbon-free generation
Shape the debate, find the solution and implement the plan
PSEG expects to implement several proposals during 2007 to support the
Energy Master Plan (EMP), consistent with PSEG’s business interests
… an Intersection of Energy – the Environment – PSEG.
5

PSE&G – A consistent industry operations leader …
Continued top quartile/top decile performance
National ReliabilityOne Award winner – two years running
American Customer Satisfaction Index (ACSI) Customer
Satisfaction Survey
Regulatory agreements provide opportunity to earn
reasonable returns over 2007-2009
Energy Master Plan initiatives fuel long-term growth
New customer information system investment (2007 - 2009)
Advanced Metering technology investment (2008 - 2012)
Renewables and energy efficiency enhanced by utility
participation (2008 – 2020)
… providing stability and multiple platforms for growth.
6

PSEG Power – Solidly positioned in attractive markets …
Nuclear and fossil fleet operating at historically high
levels with opportunity for improvement
Near-term growth fueled by strong markets and roll-off
of below market contracts
Long-term growth influenced by
Tightening reserve margins
Expansion capability at existing sites
Carbon advantaged portfolio
Debate on energy policy will influence investment
Environmental compliance driving current investment
Meeting EMP objectives may require a look at new nuclear
investment
… to provide strong growth for PSEG.
7

PSEG Energy Holdings - Improving returns and reducing
risk …
Diverse asset base with improved stability
Distribution assets in stable Latin American economies
Gas-fired combined cycle generation in Texas
A source of capital
Asset sales have reduced risk and contributed to an improved
balance sheet at PSEG
A source of growth
Texas generating assets benefit from location, low cost
structure and opportunity for expansion
… to create opportunities to redeploy capital.
8

PSEG – Meeting challenges …
Staffing progress / leadership team in place
Balance sheet continues to improve; positioned to participate in
opportunities
Advocating integrated energy solutions as key to meeting
environmental challenges
Efficiency, renewables, advanced fossil, nuclear
Solar Initiative
50% of two-year goal
$100M investment
Support cap-and–trade mechanism to achieve greenhouse gas
emission restrictions
… successfully.
9

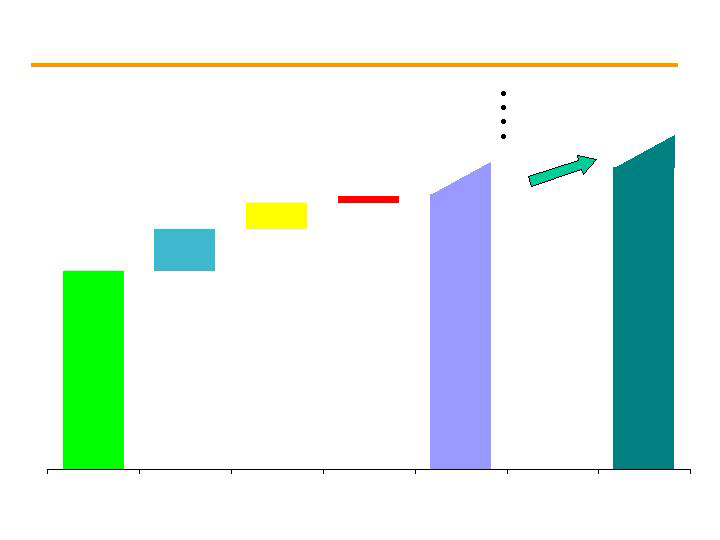
Right set of assets…
Large, diverse mix of low-cost, base-load, load-following generating assets
Reliable electric and gas distribution and transmission systems
Stable portfolio of investments in domestic generation, international distribution and leases
Right markets…
Generation assets operate in tightly constrained and growing markets
Nuclear and coal base-load capacity operate in markets where the price for power is set by
gas
Transmission and distribution assets provide service in a modest growth market with
reasonable regulation
At the right time…
Mid-Atlantic, New England and Texas recognizing the value of capacity in constrained areas
A move to control carbon benefits our nuclear-based fleet
Power has opportunity for brownfield development at existing sites
Values are improving for international assets
T&D set to benefit from implementing state’s energy plan
PSEG – Excellent position for today …
… ready for tomorrow.
10

($ 5)
($ 6)
Discontinued Operations, net of tax
$ 0.85
$ 1.32
EPS from Operating Earnings
$ 203
$ 329
Net Income
$ 208
$ 335
Income from Continuing Operations
($ 5)
-
Merger Costs
$ 213
$ 335
Operating Earnings
Q1 2006
Q1 2007
$ millions (except EPS)
… at the top of expectations.
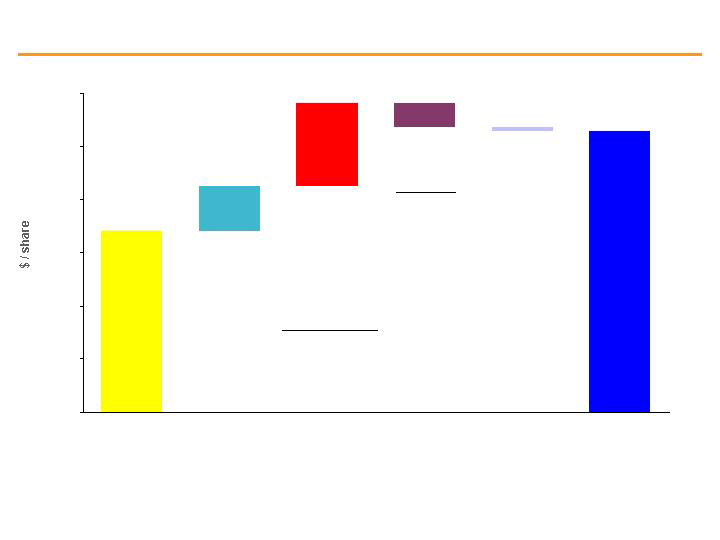
Attractive markets and solid operations producing EPS growth …
11

$ 213
(14)
28
121
$ 78
2006
$ 335
(18)
3
219
$ 131
2007
Operating Earnings
Earnings per Share
(0.06)
(0.08)
Enterprise
$ 0.85
$ 1.32
Operating Earnings
0.12
0.01
PSEG Energy Holdings
0.48
0.87
PSEG Power
$ 0.31
$ 0.52
PSE&G
2006
2007
YTD March 31, 2007
$ Millions (except EPS)
* 2006 excludes merger related costs of $1M at PSE&G, Losses from Discontinued Operations of $9M, or $0.04 per share at Power, Income
from Discontinued Operations of $4M, or $0.02 per share at Energy Holdings and merger related costs of $4M, or $0.02 per share at Enterprise
** 2007 excludes Losses from Discontinued Operations of $6M, or $0.02 per share at Power
**
*
Q1 Operating Earnings by Subsidiary
12
.85
.21
.39
(.11)
(.02)
1.32
0.00
0.25
0.50
0.75
1.00
1.25
1.50
Utility
Rate relief .09
Weather .06
Volume/ Demand .03
O&M/ Other .02
Transmission .01
EPS Reconciliation – Q1 2006 versus Q1 2007
Q1 2007
operating
earnings**
Q1 2006
operating
earnings*
Enterprise
Interest and
Donations (.02)
Power
Recontracting /
Strong
Operations .28
BGSS and Other
.11
Mark-to-Market
.04
Holdings
Other .01
Texas –
Mark-to-
Market (.06)
Texas –
Maintenance
(.04)
Lease Income
(.02)
* Excludes $0.02 of merger related costs and $0.02 Loss from Discontinued Operations
** Excludes $0.02 Loss from Discontinued Operations
O&M (.02)
Depreciation/
Interest/NDT
(.02)
13
$0.00
$1.00
$2.00
$3.00
$4.00
$5.00
$6.00
2006
Operating
Earnings
2007
Guidance
2008
Guidance
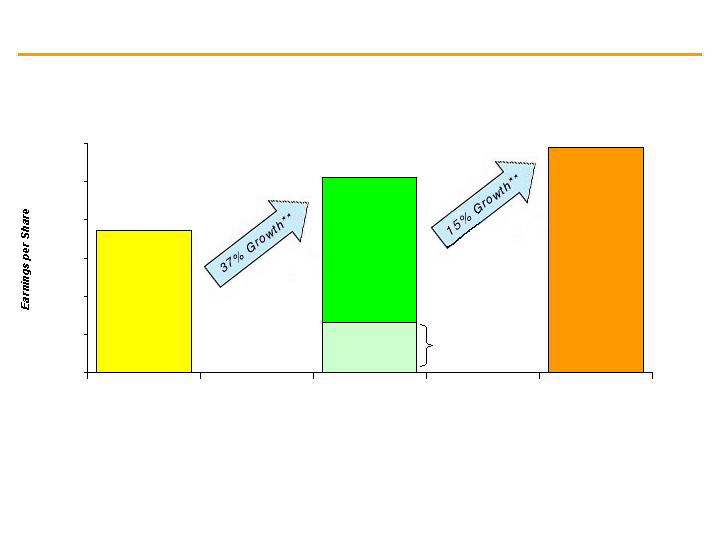
$4.90 - $5.30
$5.60 - $6.10
$3.71
*Excludes Loss on Sale of RGE of $0.70 per share, merger costs of $0.03 per share and Loss from Discontinued Operations of $0.05 per share
**Percentage change in growth based on mid-point of guidance
***Raised 2007 guidance on March 26, 2007 from $4.60-$5.00 to $4.90-$5.30
*
***
Q1 2007
Operating
Earnings:
$1.32
Earnings Outlook – On growth trajectory
14

PSE&G
Review and Outlook

Positioned for growth in 2007 and beyond
Strong
Operations
Constructive
Regulatory and
Business
Environment
Positive Market
Fundamentals
Growth
Opportunities…
with Manageable
Risk
At or approaching top decile
performance in key operating measures
Reasonable rate case outcome
Valued partner on State policy
Constructive State policies with reasonable
prices to customers
Baseline capital growth of 4-5% in near-term
with State energy policy providing potential
for longer-term growth
16

Fair outcome on recent gas and electric cases will help
ensure …
Settlement agreement with BPU staff, Public Advocate, and other
parties within weeks of merger failure
Gas Base Rate case provides for $79M of gas margin:
- $40M increase in rates
- $39M decrease in non-cash expenses
Electric Distribution financial review provides $47M of additional
annual revenues
Base rates remain effective at least until November 2009
New Jersey regulatory climate providing a fair return to investors
Opportunity to earn a ROE of 10%
… our continued ability to provide safe, reliable service to
customers and fair returns to shareholders.
17

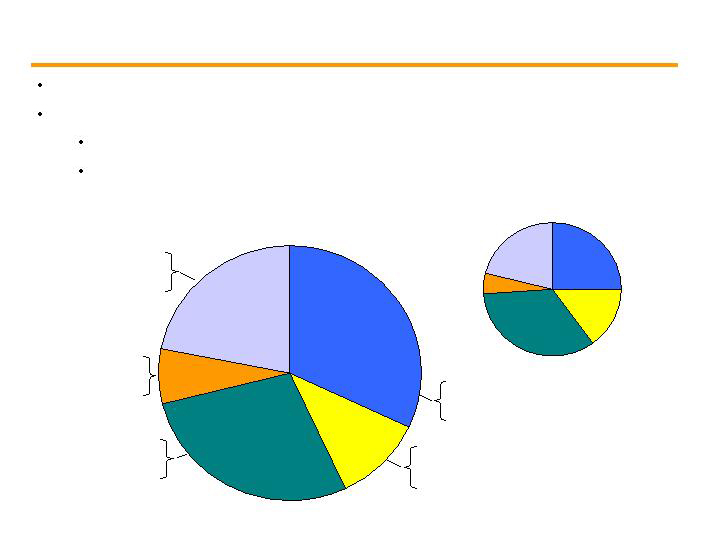
Regulated electric transmission, electric and gas distribution system
FERC regulation for electric transmission; NJ BPU regulation for electric and
gas distribution
PSE&G’s base investment plan …
Gas
Distribution
36%
Electric
Transmission
14%
Electric
Distribution
50%
Gas
Distribution
35%
Electric
Transmission
11%
Electric
Distribution
54%
2006 Actual
Rate Base = $6.0 B
2011 Base Plan
Rate Base = $7.5 B
Equity Ratio ~ 48%
… coupled with fair regulatory treatment provides a solid foundation
for future earnings growth.
PSE&G Rate Base
18

Three areas of additional potential growth for PSE&G …
T&D Expansion
Opportunities
PJM backbone transmission
and RTEP projects
Distribution system
reinforcements
PSEG EMP Strategies
Renewables/Emissions
Strategies
Solar initiative
Greenhouse gas offset
Demand-Side Strategies
Advanced Metering
Infrastructure
Residential energy efficiency
Commercial and Industrial
energy efficiency
PSE&G facility and system
efficiency
Integrated Customer
System Platform (ICSP)
Leveraging State of the Art
Technology – SAP CCS
Improving capabilities to
implement strategic
functionality
Enabling GPS technology to
improve dispatching
Creating new opportunities
through web-based
empowerment
Moving to a platform with full
AMI capability
… have preliminary annual earnings impacts in the $40M-$150M
range by 2015.
Potential Range of Capital Spending:
$150M - $1.5B
$150M - $175M
$500M - $1.5B
Aggregate $800M - $3.0B
19

PSE&G’s Solar Initiative Plan filed with BPU on 4/19/07…
PSE&G would invest $100M over 2008-2009 to help finance installation
of 30MW of solar photovoltaic systems on homes, businesses and
municipal buildings.
The solar initiative is designed to fulfill 50% of the renewable portfolio
standard (RPS) requirements over a two year period.
Program will provide loans to developers to cover 40-50% of the cost of
solar installation project. The remaining cost of the project will be
funded by an equity partner (or host customer) who would also own the
solar panels.
PSE&G will be repaid the principal plus interest over 15 year period in
the form of credits called Solar Renewable Energy Certificates (SRECs)
or, in cash. PSE&G will allocate SRECs to Load Serving Entities (LSE)
which will lower their renewable portfolio compliance cost standards
over time.
PSE&G would earn a return for the full cost of capital plus an incentive
for spurring the solar market.
… is the first step to meeting Energy Master Plan requirements.
20

PSE&G has identified major transmission paths …
New Freedom to Deans
An 80-mile line from Camden Co. (New
Freedom) north to Middlesex Co.
(Deans)
Will run parallel to existing transmission
where feasible
Branchburg to Roseland
A 30-mile line from Somerset Co.
(Branchburg) to Essex Co. (Roseland)
A reinforcement that would use the
same right of way as an existing circuit
that carries lower voltage
Susquehanna to Roseland
A 135-mile line from Luzerne Co., PA
(Susquehanna station) to Essex Co., NJ
(Roseland)
This project would include construction
of a new switching station on utility
owned property in Morris County
PSE&G endorsed construction of several new 500-kilovolt transmission lines
New Freedom
Deans
Branchburg
Roseland
Central NJ
Branchburg
to Roseland
Northern NJ
Susquehanna
to Roseland
Susquehanna Station (PA)
Southern NJ
New Freedom
to Deans
… to ease congestion and improve reliability.
21

Transmission expansion opportunities …
Represent potential investment of $1B for PSE&G
Must be approved by PJM as part of its Regional
Transmission Expansion Plan (RTEP)
Construction would take place over 5-8 years
beginning in 2008
Costs would be shared throughout PJM – including
PSE&G customers (7.5%)
… would more than double PSE&G investment in transmission.
22
EMP and additional T&D investments …
$0
$200
$400
$600
$800
$1,000
$1,200
2005
2006
2007
2008
2009
2010
2011
Representative Potential EMP
Potential Incremental T&D
Base CapEx
Potential PSE&G Capital Requirements
(2005 – 2011)
… provide upside growth potential to our base plan.
23
In the near-term, rate relief and normal weather …
$0
$100
$200
$300
$400
2005 Operating
Earnings
2006 Operating
Earnings
Gas Rate Relief
Electric
Financial
Review
Weather/Other
2007
Guidance
2008
Expectations
$262M*
$30M - $40M
$20M - $25M
$340M
to
$360M
$28M - $33M
… provide opportunity to earn allowed returns.
*Excludes $3M and $1M of Merger costs in 2005 and 2006, respectively
ROE Range: 10.5% - 11.5%
Consistent
with 2007
Modest
Sales
Growth
Offset by
O&M
Increases
$347M*
24

PSEG Power
Review and Outlook
Highest output ever from Nuclear
Highest output ever from Fossil
Balanced hedging strategy at ER&T
Strong, liquid markets
Sustainable BGS auction structure
Consent decree resolution
Rising energy prices
Favorable capacity market design
Diverse assets in constrained zones
Strong
Operations
Constructive
Regulatory and
Business
Environment
Positive Market
Fundamentals
Growth
Opportunities…
with Manageable
Risk
Near term – Hope Creek Uprate, RPM auctions
Longer term –
Tightening reserve margins
CO benefit to low carbon portfolio
2
Site expansion opportunities
Surrounding market opportunities
New nuclear investment potential
Manageable risk –
Enhanced operations
Balanced hedging strategy
Existing sites
Increasingly stable earnings base through
capacity market design
Positioned for growth in 2007 and beyond
26
Low-cost portfolio
Strong cash generator
Regional focus with demonstrated
BGS success
Assets favorably located
Many units east of PJM constraint
Southern NEPOOL/ Connecticut
constraint
Near customers/load centers
Integrated generation and portfolio
management optimizes asset-
based revenues
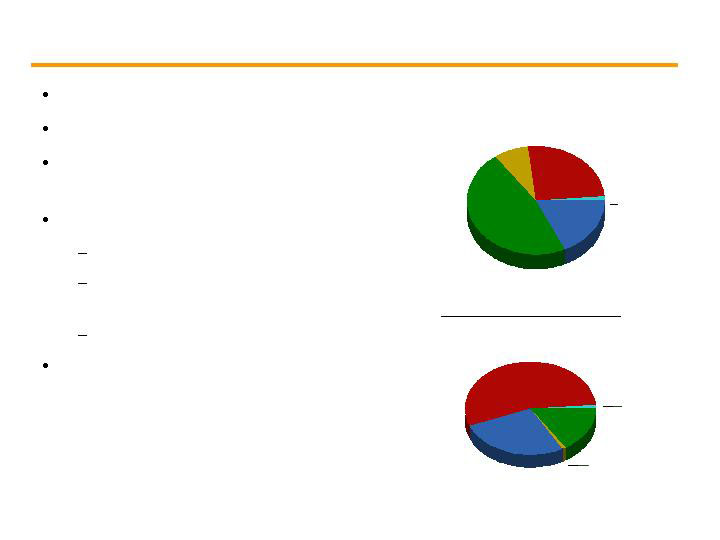
… which provides for risk mitigation and strong returns.
Power’s assets reflect a diverse blend of fuels and
technologies …
18%
47 %
8 %
26 %
Fuel Diversity – 2006
Coal
Gas
Oil
Nuclear
Pumped
Storage
1%
Energy Produced - 2006
55%
27%
16%
Oil 1%
Pumped
Storage
1%
Nuclear
Coal
Gas
Total GWh: 53,617
Total MW: 13,600
27
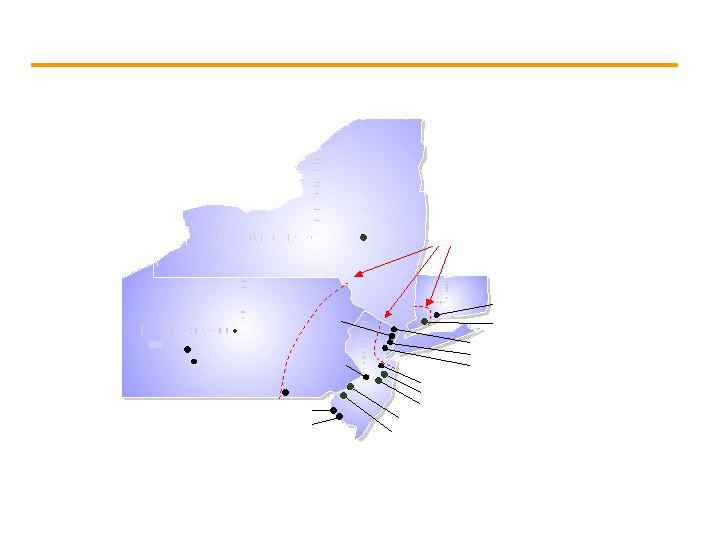
... which experience higher prices during periods of high demand.
Power’s assets are located in attractive markets near load
centers …
Current plant locations,
site expansion capability
Bethlehem Energy Center
(Albany)
New Haven
Bergen
Kearny
Essex
Sewaren
Edison
Linden
Mercer
Burlington
National Park
Hudson
Conemaugh
Keystone
Bridgeport
Peach Bottom
Hope Creek
Salem
System Interface
28
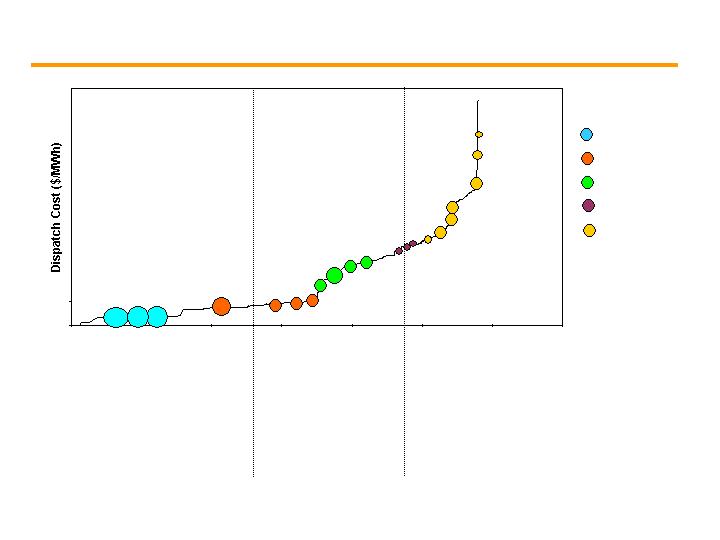
Baseload units:
- Very low variable cost, low
bid price into the energy
market
- Always, or almost always
called upon to provide
power to serve load
Load following units:
- Primarily gas-fired,
higher variable cost
- Intermittently called
upon to provide power
to serve load
Peaking units:
- Gas- and oil-fired, high variable cost,
leading to high bid price into the
energy market
- Called upon to provide power only
during periods of peak demand to
serve load
Salem
Hope
Creek
Keystone
Conemaugh
Hudson 2
Linden 1,2
Burlington
Edison
Essex
Bergen 1
Sewaren
Hudson 1
Megawatts (MW)
Mercer1, 2
Bergen 2
… position the company well to serve full requirement load contracts.
Sewaren
Kearny
Linden / Essex
Burlington 12 / Kearny 12
Peach
Bottom
Bridgeport
New
Haven
Nuclear
Coal
Combined Cycle
Steam
GT Peaking
Power’s assets along the dispatch curve …
BEC
Illustrative
29

Operated by PSEG Nuclear
PSEG Ownership: 100%
Technology:
Boiling Water Reactor
Total Capacity: 1,061MW*
Owned Capacity: 1,061MW
License Expiration: 2026
Operated by PSEG Nuclear
Ownership: PSEG - 57%,
Exelon – 43%
Technology:
Pressurized Water Reactor
Total Capacity: 2,304MW
Owned Capacity: 1,323MW
License Expiration: 2016 and
2020
Operated by Exelon
Ownership: PSEG 50%,
Exelon – 50%
Technology:
Boiling Water Reactor
Total Capacity: 2,224MW
Owned Capacity: 1,112MW
License Expiration: 2033
and 2034
Hope Creek
Salem Units 1 and 2
Peach Bottom Units 2 and 3
Our five-unit nuclear fleet …
… is a critical element of Power’s success.
*Uprate of 125MW scheduled for fall 2007
30
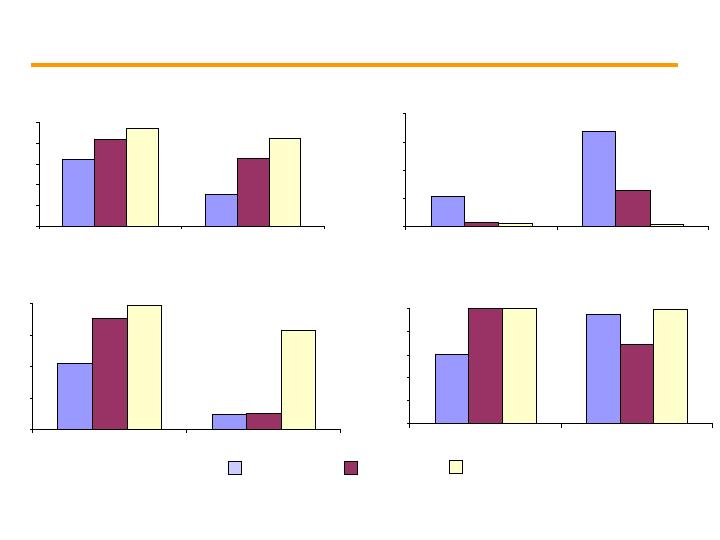
82.3%
65.6%
92.0%
82.8%
92.6%
97.2%
50%
60%
70%
80%
90%
100%
Salem
Hope Creek
Capacity Factor
6.5%
20.2%
0.9%
7.6%
0.7%
0.4%
0%
6%
12%
18%
24%
Salem
Hope Creek
Forced Loss Rate
81.0
64.8
95.2
65.0
99.2
91.4
60
70
80
90
100
Salem
Hope Creek
INPO Index
80.2%
97.4%
84.7%
99.9%
99.8%
100.0%
50%
60%
70%
80%
90%
100%
Salem
Hope Creek
Summer Capacity Factor
… and corresponds directly with improved regulatory relations and
financial outcomes.
Improvement in nuclear performance can be seen in
numerous measures of operations ...
2004
2005
2006
31

Complete Management Model
implementation
Maintain operational focus
Resume independent operation
Succession plan
Bill Levis appointed as President &
COO, PSEG Power; retains CNO
position
Tom Joyce appointed as Senior VP –
Operations for Salem – Hope Creek
… which will strengthen Power’s results going forward.
Continuing efforts are focused on sustaining the
improving trend …
Maintain stakeholder
confidence
Preserve nuclear options
for Power
Ongoing Initiatives
Expected Results
32
0
5,000
10,000
15,000
20,000
25,000
2002
2003
2004
2005
2006
Coal
Combined Cycle
Peaking & Other
Total Fossil Output (GWh)
A Diverse 10,000 MW Fleet
2,400 MW coal
3,200 MW combined cycle
4,400 MW peaking and other
Strong Performance
Continued growth in output
Improved fleet performance
Achieved resolution regarding
Hudson / Mercer
… contribute to a low-cost portfolio in which two-thirds of
fleet output is from coal facilities.
Strong Fossil operations …
33

$490
$600 - $750
2007 – 2010 Total
($ million)
2010
Mercer**
2010
Hudson
Unit 2
Completion
Date
Environmental Capital Requirements
Emissions Control Technology Projects
- NOx control – SCR
- SO2 control – Scrubber
- Hg and particulate matter control -
Baghouse
Hudson Unit 2* (608 MW)
NOx control – SCR installation complete
SO2 control – Scrubbers
Hg and particulate matter control –
Baghouse
Mercer (648 MW) – Units 1&2
Our environmental strategy…
… will help preserve the availability of our fossil fleet.
*PSEG Fossil to notify USEPA and NJDEP by end of 2007 on decision to install emissions controls at Hudson Unit 2
**Capital investment $40M above 2006 10-K disclosure -- EPC Contract signed
Power’s New Jersey coal units are
mid-merit, with capacity factors
averaging 50% to 60%
As markets tighten, increased
production is anticipated
34
$20
$30
$40
$50
$60
$70
2002
2003
2004
2005
2006
2007
Est
2008
Fwd
2009
Fwd
$0
$3
$6
$9
$12
$/mmbtu
$/MWh
… benefiting Power’s coal and nuclear fleet.
(1)
Central Appalachian coal
(2)
Forward prices as of May 18, 2007
Increases in fossil fuels have driven up energy prices …
Electricity
(left scale)
Coal(1)
(right
scale)
Natural Gas Henry Hub
(right scale)
(2)
(2)
(2)
35
$20
$30
$40
$50
$60
$70
$80
2002
2003
2004
2005
2006
2007 Est
2008
Fwd
2009
Fwd
PS Zone Basis
Historical spot basis
Forward basis
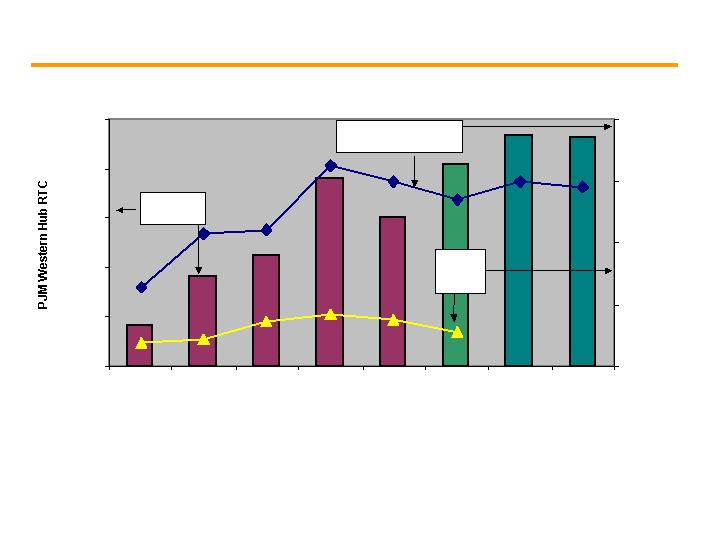
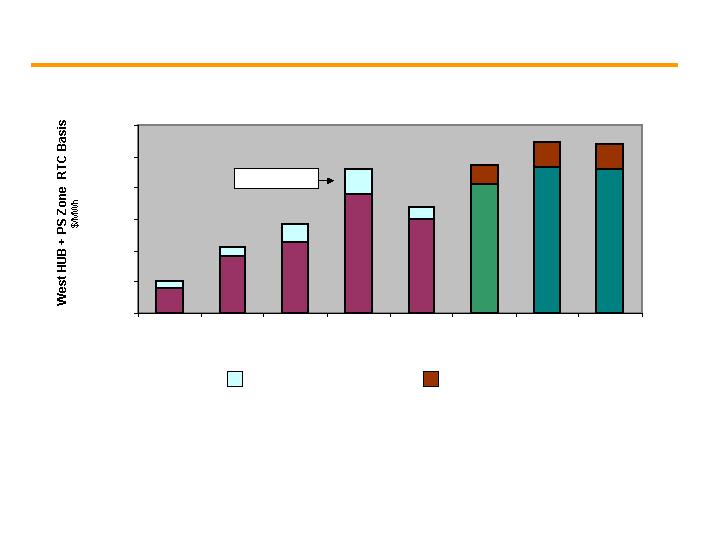
Large portion of sales are into forward market where forward basis has remained high.
Zonal prices in the eastern portions of PJM have
historically been higher than the Western Hub…
… allowing Power to realize higher prices due to its favorable
location.
(1) Forward prices as of May 18, 2007
(1)
(1)
(1)
36
-
50
100
150
200
250
300
1999
2000
2001
2002
2003
2004
2005
2006
-
50
100
150
200
250
300
1999
2000
2001
2002
2003
2004
2005
2006
Source: Data per PJM’s State of the Market report March 2007
*Annualized payment required to make an investment
-
50
100
150
200
250
300
1999
2000
2001
2002
2003
2004
2005
2006
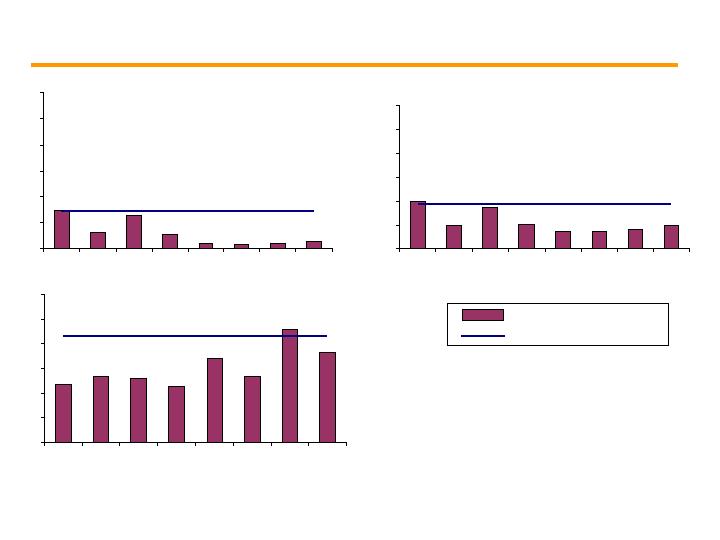
… which may serve to tighten reserve margins.
Despite the recent run up, prices have not
consistently supported new capacity construction …
Economic Dispatch Net Revenue
20-year Levelized Fixed Cost*
Combustion Turbine ($/KW-yr)
Combined Cycle ($/KW-yr)
Pulverized Coal ($/KW-yr)
37
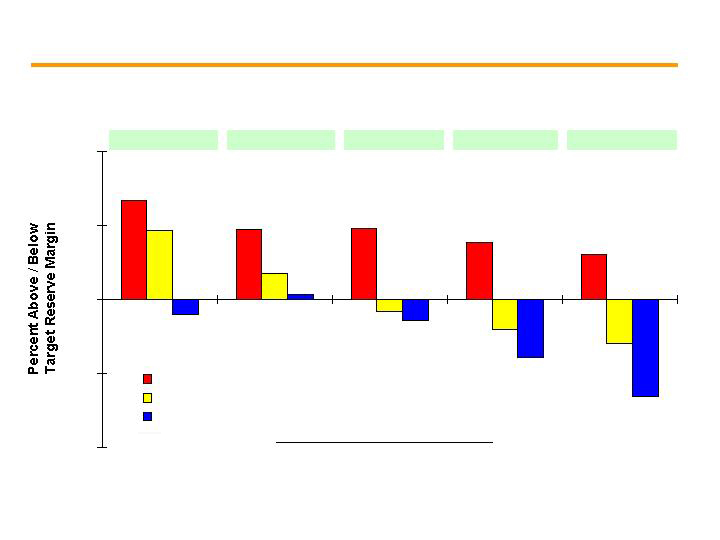
Regional Generation Balance 2007 - 2011
(Percent above or below target Reserve Margin)
7%
5%
5%
4%
3%
5%
2%
-1%
-2%
-3%
-1%
-1%
-4%
-7%
0%
-10%
-5%
0%
5%
10%
PJM (RM Target = 115%)
NY ISO (116.5%)
NE ISO (114.5% implied)
2011
2010
2009
2008
2007
Data Source: PJM, NY ISO and NE ISO
Reserve margins in the key Power markets are expected
to continue to decline …
… which should sustain higher energy prices as heat rates expand.
38
More structured, forward-
looking, transparent pricing
model
Gives prospective
investors in new
generating facilities more
clarity on future value of
capacity
Sends locational pricing
signal to encourage
expansion of capacity
where needed
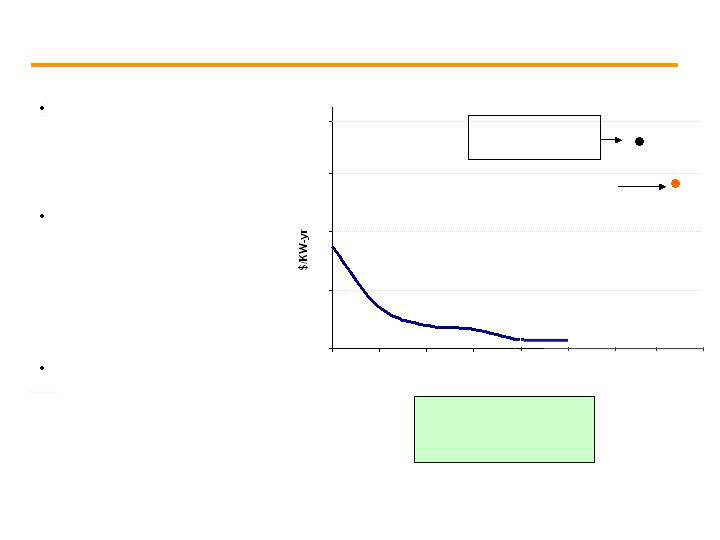
… in which longer-term price signals are provided.
PJM’s Reliability Pricing Model (RPM) reflects a change
in market design …
Capacity Prices
Frame of reference:
$45/KW-yr = $123/MW-day
@ 50% load factor » $10/MWh
$0
$20
$40
$60
2001
2002
2003
2004
2005
2006
2007
$80
2008
2009
’07 – ’08 Auction
Settled @ $72/kw-yr
’08 – ’09 Market Trading
39

RPM Capacity Auction – April Results and Schedule
2007- 2008 Capacity Auction Results
($/ MW-day)
N/A
N/A
$40.80
Rest of
Pool
$48.38
$140.16
$188.54
Southwest
MAAC
$20.16
$177.51
$197.67
Eastern
MAAC
CTR
Value*
Load
Price
Unit
Price
PJM released results on April 13 from its
first capacity auction under the Reliability
Pricing Model (RPM) for the 2007-2008
delivery year.
Pricing in initial auction for Eastern MAAC
reflected “Cost of New Entry”: standard
simple cycle gas turbine adjusted for
location.
Future auction pricing could be influenced
by changes in demand and capacity
availability including transmission capability
between zones.
Market prices support our forecast year-
over-year improvement in capacity margin
of $125M - $175M in 2007 with further
improvement in 2008.
Auctions are scheduled throughout the
year to provide transition through the 2010-
2011 delivery year.
*CTR Value: Capacity Transfer Rights
Allocated to Load Serving Entities (LSE) in constrained zones to provide them with
access to supply from outside the zone.
May 2008
2011 – 2012
January 2008
2010 – 2011
Annual base auction in May of each subsequent year
October 2007
2009 – 2010
July 2007
2008 – 2009
Auction Date
Planning Year
(6/1 to 5/31)
Auction Schedule
40

… as market fundamentals and regulatory policy impact market
conditions.
Looking ahead, Power is well positioned to benefit from
generation value improvement …
Tightening reserve margins should:
Put upward pressure on capacity prices, and
Drive heat rate expansion if baseload additions are insufficient
The implementation of carbon rules is becoming more likely
Anticipated to put upward pressure on prices
Nuclear generation stands to benefit from carbon constraints
41
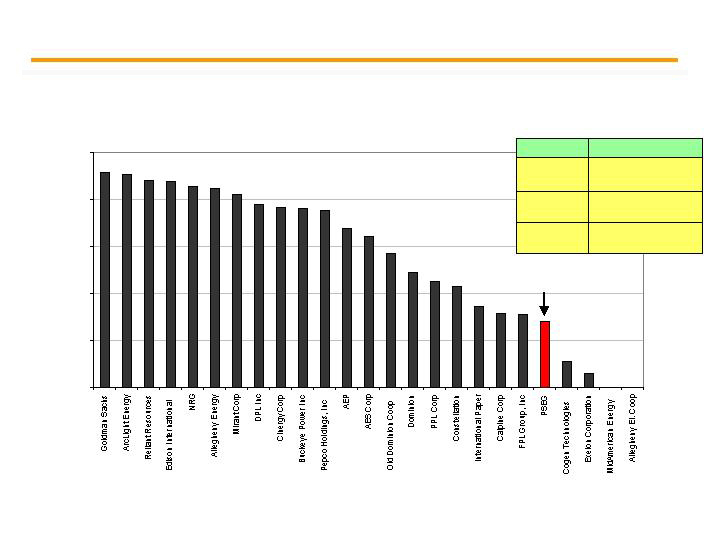
In addition to supply and demand fundamentals, electricity markets
will be affected by policies aimed at lowering CO2 emissions.
PSEG’s generation carbon intensity is lower than many competitors and benefits from a
cap and trade program comparably applied to all competitors.
2004 CO2 Emission Rate Ranking
(25 Largest Generating Companies in PJM)
0
500
1,000
1,500
2,000
2,500
(lbs/MWh
all sources)
$8-$12/MWh gas
$20/MWh coal
$20/ton
$4-$6/MWh gas
$10/MWh coal
$10/ton
$0.40-$0.60/MWh gas
$1/MWh coal
$1/ton
Generator Impact
CO2 Cost
Potential Impact of CO2on
Power Plant Costs
Note: Ranking data compiled by NRDC, CERES and PSEG Power
PSEG
42
-
1,000
2,000
3,000
4,000
5,000
6,000
2007
2008
2009
2010
Nuclear / Pumped Storage
Coal
CC
Steam / CT
Existing Load + Hedges + Future BGS
Existing Load + Hedges
Existing Hedges
2007
2008
2009
2010
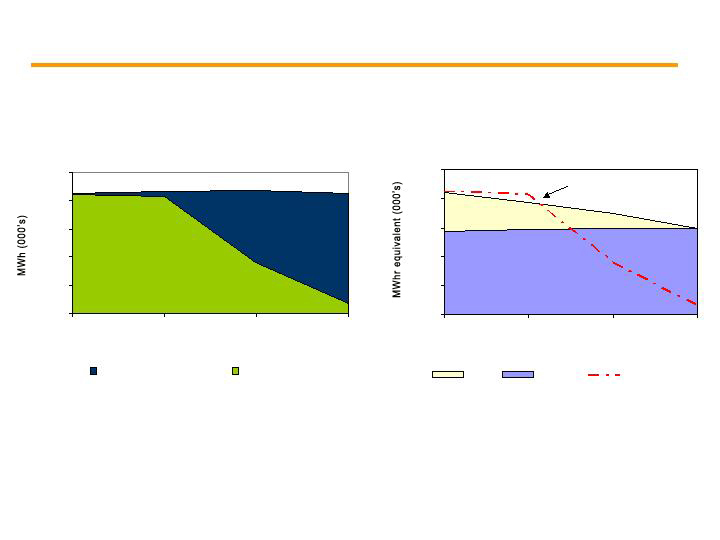
… while preserving market growth opportunities.
Power’s hedging strategy aims to balance stable
earnings …
0 – 20%
35 – 50%
90 – 100%
~100%
Percent of Power’s coal and nuclear energy output
hedged (total portfolio)*
2010
2009
2008
2007
PJM RTC (GWh)
*As of 1Q07
43
-
10,000
20,000
30,000
40,000
50,000
2007
2008
2009
2010
Year
Coal
Uranium
Contracted sales
… is aligned with its low-cost generating output and our hedging
strategies.
Power has contracted for 100% of its nuclear uranium fuel through 2011 and
approximately 70% of its coal needs through 2009.
Coal and Nuclear Fuel
Power’s hedging of coal and nuclear fuel …
Gas supply secured
based on sales of output
Coal and Nuclear Output
-
10,000
20,000
30,000
40,000
50,000
2007
2008
2009
2010
Year
Nuclear and Coal output
Contracted sales
44
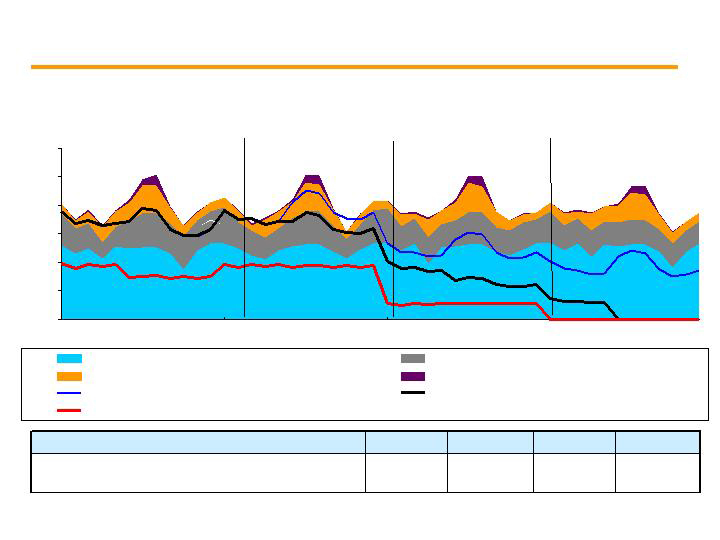
2003 Auction
2004 Auction
2005 Auction
2006 Auction
2007 Auction
Capacity
Load shape
Transmission
Congestion
Ancillary services
Risk premium
Full Requirements
Round the Clock
PJM West
Forward Energy
Price
$33 - $34
$36 - $37
$55
$55
$66
$44 - $46
~ $21
~ $18
~ $21
$102
$67 - $70
~ $32
Increase in Full Requirements Component Due to:
Increased Congestion (East/West Basis)
Increase in Capacity Markets/RPM
Volatility in Market Increases Risk Premium
$99
~ $41
$58-$60
Market Perspective – BGS Auction Results
… has enabled successful participation in each BGS auction.
Power’s fleet diversity and location ...
45
$0
$10
$20
$30
$40
$50
$60
$70
2005
2006
2007 Est
2008 Est
2009 Est
… are expected to drive significant increases in Power’s gross
margin.
Operational improvements and recontracting in
current markets …
Realized Gross Margin ($/MWh)
Energy
Capacity
(Energy prices based on recent forward markets;
Illustrative capacity prices based on recent market for 2007/2008 in all years)
46

Gas Asset Optimization
Large wholesale provider to PSE&G and others
Storage capacity of 80 Bcf (in the Gulf and market regions)
Firm transportation of 1.1 Bcf/Day (on ten pipelines)
Off-system sales margins shared with residential customers
Commercial & Industrial customers (C&I) sales priced monthly at market
Storage spreads capture Summer/Winter price differential on C&I sales
Weather and price volatility drive results
Colder than normal weather increases unitized fixed cost recovery
Ancillary Services
… to round out a robust portfolio.
In addition to energy and capacity, Power has other
attractive sources of revenues …
47
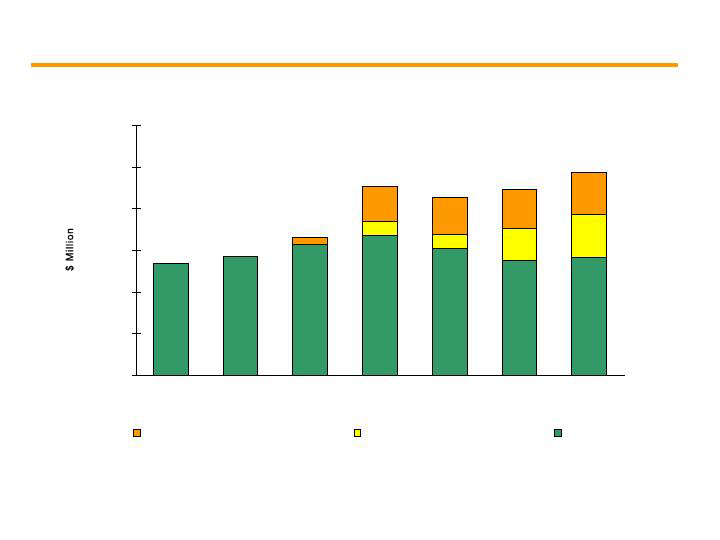
… drive the increase in PSEG’s 2007 earnings guidance.
*Excludes Merger costs of $12M in 2005, Cumulative Effect of a Change in Accounting Principle of $16M in 2005 and
Loss from Discontinued Operations of $226M and $239M in 2005 and 2006, respectively
2005 Operating
Earnings
2006 Operating
Earnings
Energy
Capacity
Other
2007 Guidance
$515M*
$446M*
$825M to
$905M
$15M - $25M
$220M - $260M
$75M - $105M
Improvements in operations and markets across the portfolio …
48
2007 Guidance
Energy
Capacity
Other
2008
Expectations
2009
Expectations
… drive PSEG’s earnings expectations for 2008 and beyond.
Drivers of 2009 Earnings
Recontracting
Operational excellence
Free cash flow
Growth opportunities
Further improvements at Power…
$825M to
$905M
49

PSEG Energy Holdings
Review and Outlook

Reducing risk in 2007 and beyond
Strong
Operations
Constructive
Regulatory and
Business
Environment
Positive
Market
Fundamentals
Growth
Opportunities…
with
Manageable
Risk
Global
Resources
International Distribution
Domestic Generation
Improving valuations
and debt capacity could
present opportunity to
redeploy capital
Opportunities for:
expansion, hedging
and debt capacity
Residual
value
upside
Stable F/X rates and
sovereign spreads
Tightening reserve
margins, gas-driven
market
Tax issues
monitored
closely
Reasonable rate case
outcomes
ERCOT – liquid and
transparent
Credit
ratings
Focus on safety,
reliability and line
losses
Forced outage
rates;
heat rates
51
Holdings’ Portfolio has …
Two businesses focused on maximizing value of existing investments
Represents 10% of PSEG’s total earnings
70% of earnings from Global (50% US Generation, 50% Chile & Peru Distribution)
30% from Resources
… a diverse asset base with improved stability.
PSEG
Resources
Chile & Peru
Distribution
Texas Merchant
Generation
(2,000 MW)
International
Generation
Other fully
contracted
US Generation
Two 1,000MW CCGT 7FA plants with record
2006 results in an attractive market
395MW owned primarily in California and
Hawaii fully contracted with utilities / state
agencies
1.9M customers served
by 3 company groups
Very modest
contributor in a sector
with decreased
investment
2006 Earnings Contribution
86% of the Resources
portfolio is in energy-related
leveraged leases
2007 Earnings Contribution
52

2006 benefited from open position
Open position sensitivity to market (Calendar 2008):
Natural Gas: +/- $1/MMBtu = +/- $13 M
Heat Rate: +/- 500 Btu/KWh = +/- $25 M
Potential growth opportunities:
Potential opportunity for reasonable return at appropriate valuations
Current debt levels offer additional leverage capacity
The Texas market has shown significant improvement …
$100
~19
15%
6.90
2007
$130
19.42
16%
10.82
2006
$93
16.50
17%
6.34
2005
$48
11.97
25%
5.42
2004
EBITDA
($M)
Spark
Spread
Reserve
Margin
NYMEX
Gas Prices and reserve margins have driven spark spreads higher, generating strong results:
… and with strong demand growth and uncertain future capacity
additions, reserve margins may be pressured, presenting
opportunities.
NYMEX = Forward curve at year-end
Reserve margin c/o ERCOT (both
actuals and June 06 report for
projections)
Spark Spread and EBITDA = actual
amount achieved and projected
(including ancillary revenues, but
excluding MTM gains)
53
$41
$168
$104
$108
$57
$20
$(40)
$(35)
$(25)
Improved risk profile by reducing capital invested in
non-strategic assets …
… while increasing returns and sharpening focus on G&A.
2004
2006
$2.6B
$2.0B
Chile &
Peru
US
Other
$900M
$400M
$1.3B
$150M
$500M
$1.4B
42%
16%
42%
15%
60%
25%
$296M**
48%
45%
2004
2006
2007
Projected
$202M**
$210M-$230M**
Composition of Global’s Pre-tax
Contribution by Region*
G&A
Chile &
Peru
US
Other
29%
51%
20%
8%
35%
57%
7%
Global’s Invested Capital
$500M
~$1 B
12/31/07
Projected
$1.6B
69%
31%
*Includes both consolidated and unconsolidated investments after project debt, before allocation of parent debt
**Excludes interest, taxes, G&A and other corporate items to arrive at Global’s Operating Earnings
54

Holdings has generated substantial operating cash
flow and monetized non-strategic assets …
… which has supported debt reduction and return of capital to
PSEG over the past three years.
36%
4.5x
$520
$609
$740
$159
2006
$1,423
$920
$1,617
$835
Total
$273
$403
Operating Cash
Flows
$435
$442
Asset Sale
Proceeds
41%
47%
Recourse
Debt / Capital
2.5x
3.4x
FFO/Interest
$412
$491
Dividends / Return
on Capital
-
$311
Net Recourse Debt
Reduction
2005
2004
Net after-tax gain of over
$50M on major asset sales
Improved returns on
recourse capital from 6% to
over 10% (using Operating
Earnings) from 2004 – 2006
Improved credit metrics
Improved risk profile of remaining portfolio - Global’s portfolio now comprised of:
$500M US generation companies in TX, CA and HI
$1.4B in distribution and generation companies in Chile & Peru
$150M in other international generation
55
PSEG Energy Holdings – 2007 Drivers
$0
$100
$200
$300
2005
Operating
Earnings
2006
Operating
Earnings
Texas
FIN 48 /
FSP 13-2
Taxes
Asset Sales
2007
Guidance
2008
Expectations
$227M*
$25M - $35M
$10M - $20M
$5M - $10M
$35M - $45M
*Excludes Loss on Sale of RGE of $178M in 2006 and Income from Discontinued Operations of $18M and $226M in 2005 and 2006, respectively
Underlying project results are stable, but Operating Earnings are lower driven by
absence of MTM gain on Texas contract and adoption of new accounting rule.
Consistent with
2007
Modest
increase due to
organic growth
at Distribution
Companies
$130M to
$145M
$196M*
56

PSEG
Financial Review and Outlook
196
227
347
262
446
515
130-145
340-360
825-905
(71)
(66)
(50)-(40)
2005
2006
2007
2008
$5.60 - $6.10
Strong earnings growth in 2007 resulting in …
$3.77*
$3.71**
$4.90 - $5.30
Holdings
PSE&G
Power
Parent
Operating Earnings by Subsidiary
37%***
15%***
»0
*Excludes ($.14) Merger Costs, ($.07) Cumulative Effect of an Accounting Change and ($.85) Discontinued Operations
**Excludes ($.03) Merger Costs, ($.70) Loss on Sale of RGE and ($.05) Discontinued Operations
***Percentage change in growth based on mid-point of guidance
… a 37% increase over 2006 and an additional 15% in 2008.
58
Holdings
$0.0
$0.5
$1.0
$1.5
$2.0
$2.5
2005
2006
2007
2008
2005
2006
2007
2008
Strong earnings generate Cash from Operations…
…exceeding our capital requirements.
Holdings
PSE&G
Power
$1.0B
$1.3B
$1.3B
Capital Expenditures (2)
Cash from Operations (1)
$1.8B
$1.9B
$2.4B
Power
PSE&G
(1) Non-GAAP view: excludes revenues collected for securitization
principal payment & taxes associated with asset sales.
(2) Excludes nuclear fuel & includes cost of removal
$1.0B
$0.7B
59
($3.0)
($2.0)
($1.0)
$0.0
$1.0
$2.0
$3.0
2005
2006
2007
2008
Represents a Non-GAAP view excluding revenues
collected for securitization principal repayments
Excess
Cash
Available
Asset Sales/
Return of Capital
Excess
Cash
Ops
Cash from
Ops
Net Dividends
Investment
incl. Nuclear
Fuel
…beginning in mid-2008, expect annual excess cash of
approximately $500M to be available for new investments and/or
repurchasing shares.
We are currently using excess cash to reduce debt
and...
BGS
Securitization
Offshore
Cash
Repatriation
60
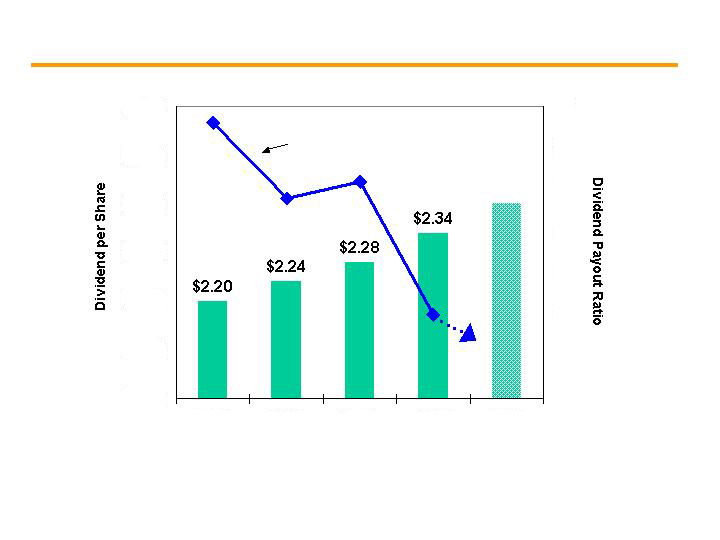
$2.20
$2.24
$2.28
$2.34
$2.00
$2.10
$2.20
$2.30
$2.40
$2.50
$2.60
2004
2005
2006
2007
2008
35
40
45
50
55
60
65
70
Improved earnings causes our dividend payout ratio to
quickly decline below 50% ...
… providing us the flexibility to raise our dividend at a rate
higher than prior increases.
Payout
Ratio
?
*
*Indicated annual dividend rate
61

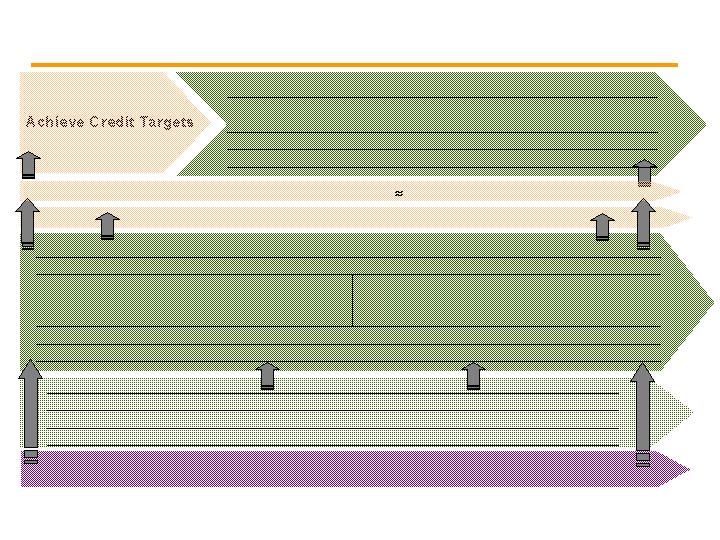
… enabling excess cash to be available for share repurchases and/or
new investments beginning in mid-2008.
During 2007/2008, PSEG expects to achieve key target
credit measures …
2006
Target
Achieved
PSEG Consolidated
Total Debt / Total Capitalization
52%
»
50%
2007
PSEG excl. EH
FFO/Total Debt
18%
Mid-20’s
2008
POWER
FFO/Total Debt
25%
Mid-30's
2007
PSE&G
Debt/Total Capitalization
50%
»
50%
Ö
HOLDINGS
FFO Coverage
4.5
3.0x - 4.0x
Ö
62
Growth opportunities …
… Near-Term, Long-Term, with Manageable Risk.
Sustainable and Growing Dividend Increases
Operational Excellence Builds Financial Strength
Power
PSE&G
Holdings
Manageable Risk
Hedging strategy adds stability and capacity auctions increases visibility of earnings
Solid regulatory relations and appropriate regulatory incentives for EMP investments
Reshaped portfolio and continuing to evaluate capital invested internationally
PSEG
Growing markets (PJM / NY / NEPOOL)
PSE&G
Holdings
Strong Earnings from Existing Assets and Base Capital Plan
Customer growth and network investment -->
Improving returns on existing investments and Texas assets benefit from low cost -->
Power
Attractive energy markets and recontracting
Generation value improvement (upward pressure on
capacity prices / heat rate expansion / carbon)
Guidance reflects strong growth
Implementing capacity market mechanisms
Annual Excess Cash $500M
PSE&G
Holdings
Share Repurchases and New Investments
Power
Expansion capability at existing sites
Preliminary consideration of nuclear expansion
EMP Initiatives (new CIS, advanced metering, renewables)
Opportunity to leverage Texas position for new acquisition / build
63

Summary

Positioned for growth in 2007 and beyond
Strong
Operations
Constructive
Regulatory and
Business
Environment
Positive Market
Fundamentals
Growth
Opportunities…
with Manageable
Risk
PSE&G named America’s most reliable
electric utility for second consecutive year
Generating fleet operating at record levels
NJ BPU approved rate changes providing
opportunity to earn authorized return
Natural gas setting price for generation
Capacity values recognized in tight markets
Potential for development at existing sites
Value for international assets improving
Free cash flow of $1.5B – $2.0B over
2007 – 2011 powers growth of incumbent
utility and generation businesses
65

Building the foundation for long-term growth
Solid earnings and operating performance
Attractive markets
Pricing signals remain strong
Assets well positioned
Meeting market challenges
Supporting carbon cap-and-trade
Solar initiative
Financial condition strengthening
Earnings growth on track
An Intersection of Energy -- the Environment -- PSEG
66

Public Service Enterprise Group

APPENDIX
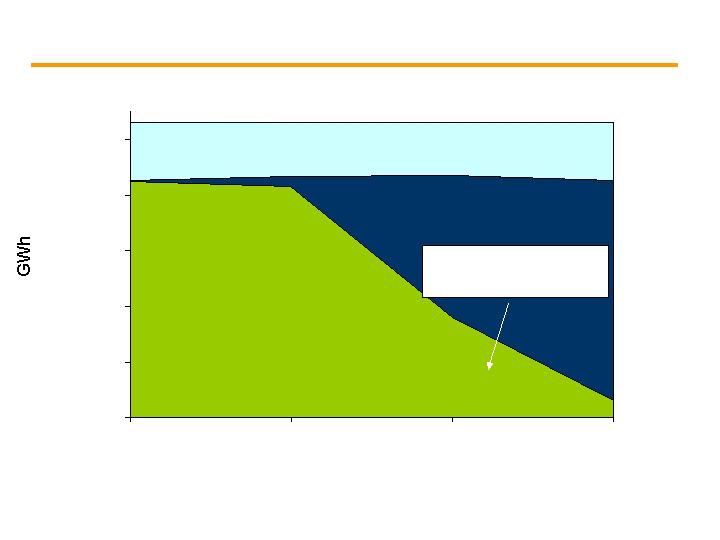
-
10,000
20,000
30,000
40,000
50,000
2007
2008
2009
2010
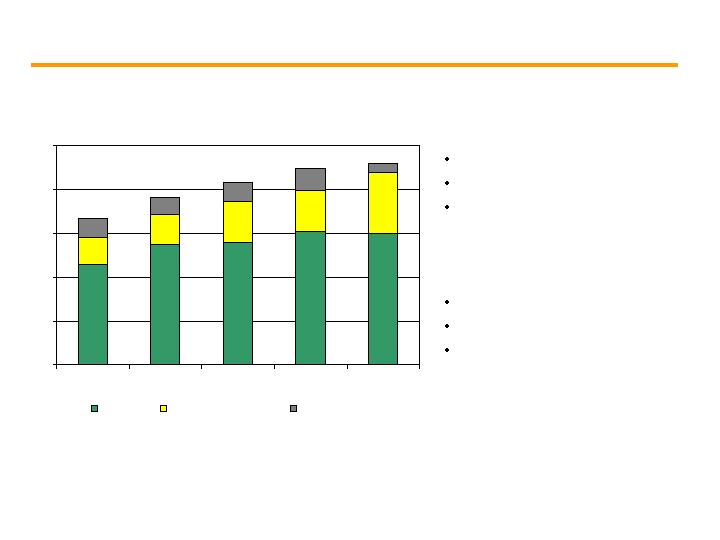
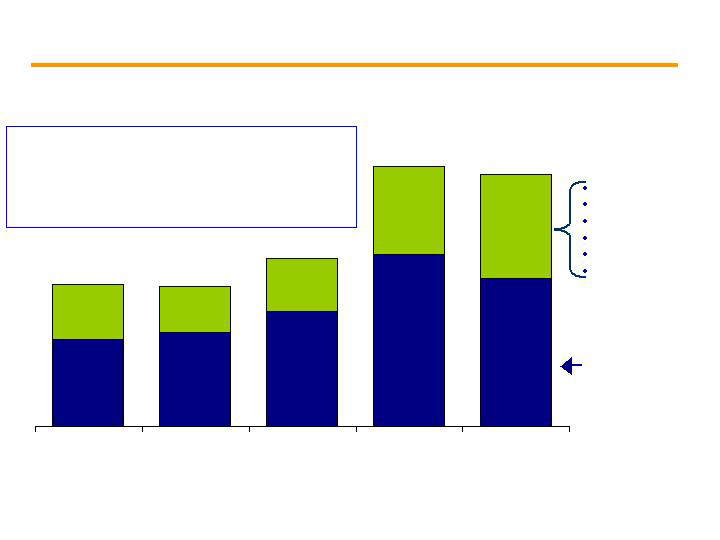
A significant portion of Power’s low-cost coal and nuclear
output has been sold at increasingly attractive rates …
… with remaining output available to capture future market opportunities.
2007
$63-65/MWh
2008
$65-67/MWh
2009
$72-75/MWh
Power’s Generation Output
Other output
Contracted coal & nuclear output
Open coal & nuclear output
Contracted Prices
Estimated impact of $10/MWh
PJM West RTC price change*
$0.01 - $0.10
$0.45 - $0.80
*Assuming normal market dynamics
Includes roll off of 4 year,
500MW RTC contract ($100M+)
and other recontracting
69
0%
20%
40%
60%
80%
100%
2007
2008
2009
2010
Power will realize increasing margin improvement …
… through the repricing of capacity at market prices.
2007
$20-24/KW-yr
2008
$30-34/KW-yr
2009
$39-43/KW-yr
Total Capacity
Contracted Capacity
Open Capacity
Contracted Prices
Estimated impact of $10/KW-yr
capacity price change
$0.05 - $0.10
$0.10 - $0.20
70

Energy Holdings’ Adjusted EBITDA
Adjusted EBITDA
2006
Global
465
$
Resources
147
Other
13
Total Energy Holdings
625
$
Debt Information
Holdings' Senior Notes
1,149
$
Global Project Debt
1,034
Resources Project Debt
40
EGDC Project Debt
19
Holdings Total Debt
2,242
$
2006 Global EBITDA Detail
Adj EBITDA**
Project Debt
PSEG Share
PSEG Share
Texas *
174
$
375
$
SAESA
73
178
Electroandes
36
105
Prisma
14
3
Chilquinta
47
162
Luz del Sur
51
77
GWF - QF
33
0
GWF - Energy
19
72
Kalaeloa
28
62
Other, including G&A
(10)
-
Total Global
465
$
1,034
$
* Texas EBITDA includes mark to market gains of $44 million.
**EBITDA is adjusted for Global’s share of depreciation, interest and other items
so as to include those investments accounted for under the equity method.
71