
Public Service Enterprise Group
Lehman Brothers
CEO Energy / Power Conference
New York City
September 6, 2007

Forward-Looking Statement
The statements contained in this communication about our and our
subsidiaries’ future performance, including, without limitation, future
revenues, earnings, strategies, prospects and all other statements that
are not purely historical, are forward-looking statements for purposes of
the safe harbor provisions under The Private Securities Litigation
Reform Act of 1995. Although we believe that our expectations are
based on information currently available and on reasonable
assumptions, we can give no assurance they will be achieved. There
are a number of risks and uncertainties that could cause actual results to
differ materially from the forward-looking statements made herein. A
discussion of some of these risks and uncertainties is contained in our
Annual Report on Form 10-K and subsequent reports on Form 10-Q and
Form 8-K filed with the Securities and Exchange Commission (SEC),
and available on our website: http://www.pseg.com. These documents
address in further detail our business, industry issues and other factors
that could cause actual results to differ materially from those indicated in
this communication. In addition, any forward-looking statements included
herein represent our estimates only as of today and should not be relied
upon as representing our estimates as of any subsequent date. While
we may elect to update forward-looking statements from time to time, we
specifically disclaim any obligation to do so, even if our estimates
change, unless otherwise required by applicable securities laws.
1

GAAP Disclaimer
PSEG presents Operating Earnings in addition to its Net Income reported
in accordance with accounting principles generally accepted in the United
States (GAAP). Operating Earnings is a non-GAAP financial measure that
differs from Net Income because it excludes the impact of the sale of
certain non-core domestic and international assets and costs stemming
from the terminated merger agreement with Exelon Corporation. PSEG
presents Operating Earnings because management believes that it is
appropriate for investors to consider results excluding these items in
addition to the results reported in accordance with GAAP. PSEG believes
that the non-GAAP financial measure of Operating Earnings provides a
consistent and comparable measure of performance of its businesses to
help shareholders understand performance trends. This information is
not intended to be viewed as an alternative to GAAP information. The last
slide in this presentation includes a list of items excluded from Net Income
to reconcile to Operating Earnings, with a reference to that slide included
on each of the slides where the non-GAAP information appears. These
slides are only intended to be reviewed in conjunction with the oral
presentation to which they relate.
2

PSEG Strategic Overview
Ralph Izzo
President and Chief Operating Officer
Chairman of the Board and Chief Executive Officer
Tom O’Flynn
Executive Vice President and Chief Financial Officer
President — PSEG Energy Holdings
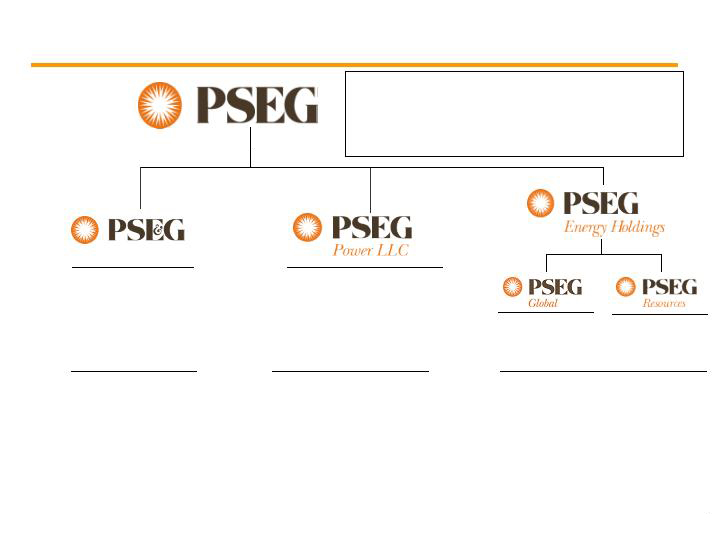
PSEG Overview
Electric Customers: 2.1M
Gas Customers: 1.7M
Nuclear Capacity: 3,500 MW
Total Capacity: 13,600 MW
Traditional T&D
Leveraged
Leases
2007E Operating Earnings(4): $1,245M - $1,370M
2007 EPS Guidance(4): $4.90 - $5.30
Assets (as of 06/30/07): $28.5B
Market Capitalization (as of 8/21/07): $22.1B
Domestic/Int’l
Energy
Regional
Wholesale Energy
Operating Earnings = Earnings Available and Excludes:
(1) Merger Costs of $1M
(2) Loss from Discontinued Operations of $239M
(3) Loss on Sale of RGE of $178M and Income from Discontinued Operations of $226M
Includes Operating Earnings from Global of $167M, Resources of $63M and Energy Holdings of $(3)M
(4) Includes the parent impact of $(55)M –$(45)M
2006 Operating Earnings: $262M(1) $515M(2) $227M(3)
2007 Guidance: $340M - $360M $840M - $920M $120M - $135M
4

PSEG over the past year …
… has positioned itself to be ready for the future.
Smooth transition in operations
Management in place
PSEG Power to resume operation of nuclear capacity by year-end
Partnering with NJ to meet environmental objectives in cost
effective manner
Redeploying capital at PSEG Energy Holdings
Balance sheet strengthened
5

The current business environment …
Convergence of market forces and policy creates
the need to address:
Critical infrastructure needs
Environmental challenges
Capacity requirements in constrained markets
… creates opportunities for PSEG’s long-term growth.
6

PSEG Power – Solidly positioned …
Nuclear and fossil fleet operating at historically high
levels with opportunity for incremental improvement
Near-term growth fueled by strong markets and roll-off
of below market contracts
Long-term growth influenced by:
Tightening reserve margins
Expansion capability at existing sites
Carbon advantaged portfolio
Debate on energy policy will influence investment
Environmental compliance driving current investment
New nuclear capacity represents a partial solution to carbon
reduction goals
… to provide strong growth for PSEG.
7
-
10,000
20,000
30,000
40,000
50,000
2007
2008
2009
2010
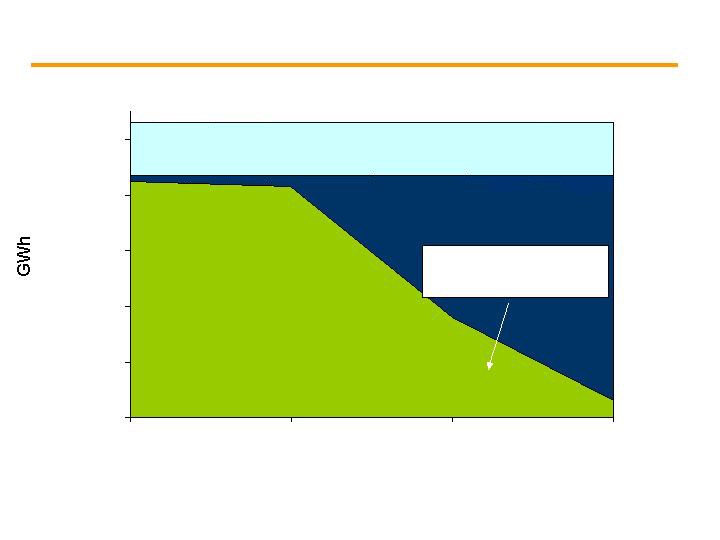
Hedging program provides near-term protection from
market volatility …
… while remaining open to long-term market forces.
2007
$63-65/MWh
2008
$65-67/MWh
2009
$72-75/MWh
Power’s Generation Output
Other output
Contracted coal & nuclear output
Open coal & nuclear output
Contracted Prices
Estimated impact of $10/MWh
PJM West RTC price change*
$0.01 - $0.10
$0.45 - $0.80
*Assuming normal market dynamics
Includes roll off of 4 year,
500MW RTC contract ($100M+)
and other recontracting
8

PSE&G – A consistent, strong performer …
Regulatory agreements provide opportunity to earn
reasonable returns over 2007-2009
Investment in transmission fuels long-term growth
Energy Master Plan (EMP) initiatives provide a secondary
source of growth
Continued top quartile/top decile performance
National ReliabilityOne Award winner – two years running
American Customer Satisfaction Index (ACSI) Customer
Satisfaction Survey
… providing financial stability and multiple platforms for growth.
9
Regulated electric transmission, electric and gas distribution system
Characteristics
FERC regulation for electric transmission; NJ BPU regulation for electric
and gas distribution
Electric and Gas distribution rates frozen through November 2009
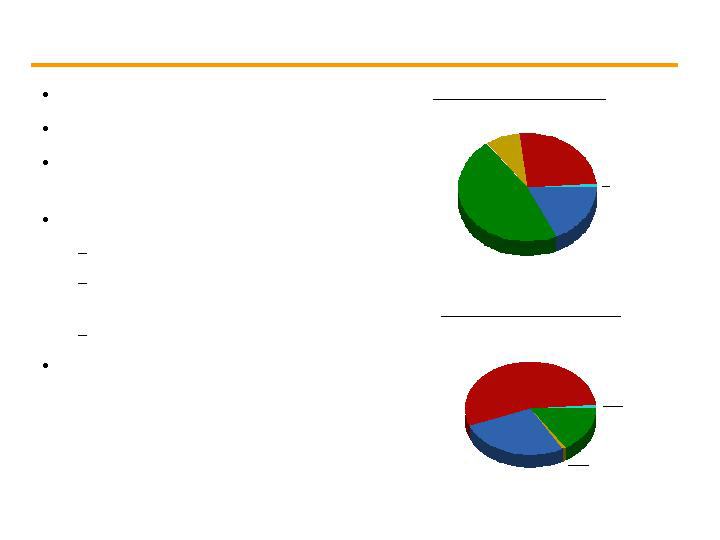
PSE&G’s base investment plan …
Gas
Distribution
31%
Electric
Transmission
22%
Electric
Distribution
47%
Gas
Distribution
34%
Electric
Transmission
12%
Electric
Distribution
54%
2006 Actual
Rate Base = $6.5 B
2011 Base Plan
Rate Base = $8.7 B
Equity Ratio ~ 48%
… coupled with fair regulatory treatment provides a solid base
for future earnings growth.
PSE&G Rate Base
10

PSEG Energy Holdings - Reducing risk …
Diverse asset base with improved stability and
growing markets
Latin American distribution assets in stable economies
Gas-fired combined cycle generation in Texas
A source of capital
Asset sales have reduced risk and contributed to an improved
balance sheet at PSEG
A source of growth
Texas generating assets benefit from location, low cost
structure and opportunity for expansion
Actively exploring strategic options for Latin American
investments
… with redeployment of capital.
11
$41
$175
$104
$129
$50
$13
$(40)
$(35)
$(22)
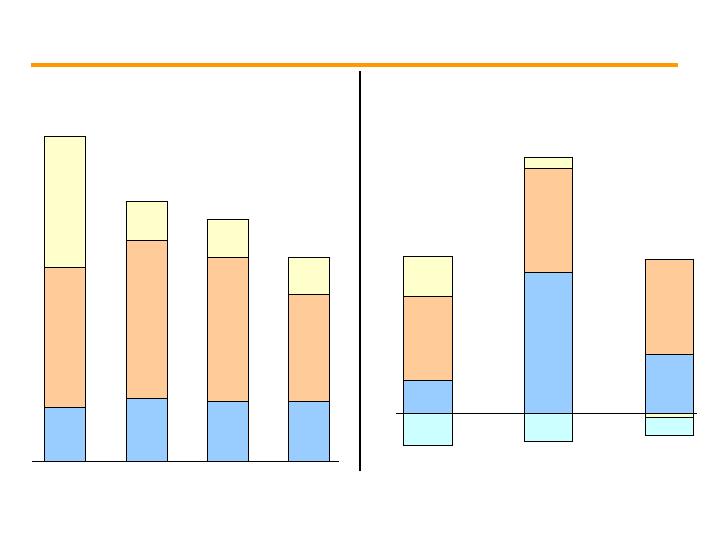
Improved risk profile by reducing capital invested in
non-strategic assets …
… while increasing returns and sharpening focus on G&A.
2004
2006
$2.6B
$2.0B
Chile &
Peru
US
Other
$900M
$400M
$1.3B
$150M
$500M
$1.4B
35%
15%
50%
7%
68%
25%
$317M**
63%
39%
2004
2006
2007
Projected
$195M**
$180M-$200M**
Composition of Global’s Pre-tax
Contribution by Region*
G&A
Chile &
Peru
US
Other
26%
53%
21%
4%
41%
55%
Global’s Invested Capital
$500M
$1.3 B
12/31/07
Projected
$1.6B
63%
30%
*Includes both consolidated and unconsolidated investments after project debt, before allocation of parent debt
**Excludes interest, taxes, G&A and other corporate items to arrive at Global’s Operating Earnings, includes Electroandes
06/30/07
$1.9B
$1B
$500M
67%
26%
$150M
7%
$100M
7%
-2%
12

Strong operations and markets …
$ 382
(32)
95
208
$ 111
2006
$ 627
(33)
61
406
$ 193
2007
Operating Earnings
Per Share
$ Millions (except EPS)
(0.12)
(0.13)
Enterprise
$ 1.52
$ 2.47
PSEG
0.38
0.24
PSEG Energy Holdings
0.82
1.60
PSEG Power
$ 0.44
$ 0.76
PSE&G
2006
2007
$ 382
(32)
95
208
$ 111
2006
$ 627
(33)
61
406
$ 193
2007
Operating Earnings
Per Share
$ Millions (except EPS)
(0.12)
(0.13)
Enterprise
$ 1.52
$ 2.47
PSEG
0.38
0.24
PSEG Energy Holdings
0.82
1.60
PSEG Power
$ 0.44
$ 0.76
PSE&G
2006
2007
Six months ended June 30,
* See page 35 for Items excluded from Net Income to reconcile to Operating Earnings
… supported first-half EPS growth of 63%.
13
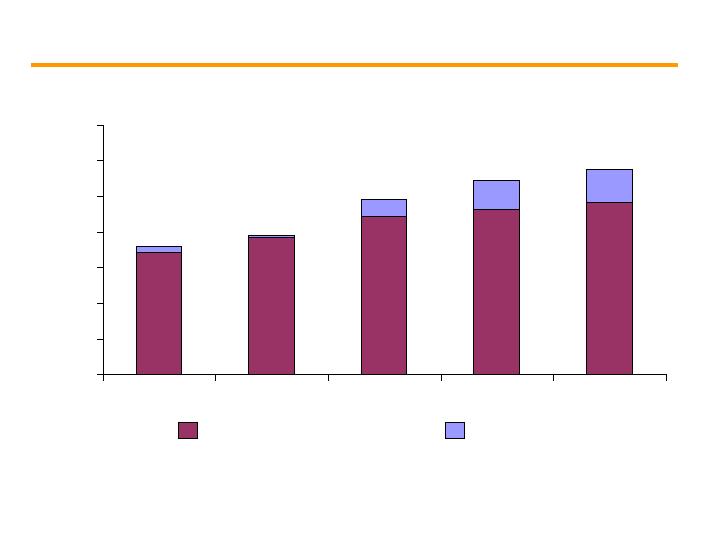
Strong earnings growth in 2007 and 2008 …
196
227
347
262
446
515
120-135
340-360
840-920
(71)
(66)
(55)-(45)
2005
2006
2007
2008
$5.60 - $6.10
$3.77*
$3.71**
$4.90 - $5.30
Holdings
PSE&G
Power
Parent
Operating Earnings by Subsidiary
37%
15%
» 0
* 2005, as reported: Excludes ($0.14) Merger Costs, ($0.07) Cumulative Effect of an Accounting Change and ($0.85) Discontinued Operations
** 2006, as reported: Excludes ($0.03) Merger Costs, ($0.70) Loss on Sale of RGE, and ($0.05) Discontinued Operations
… with reduced international risk.
14
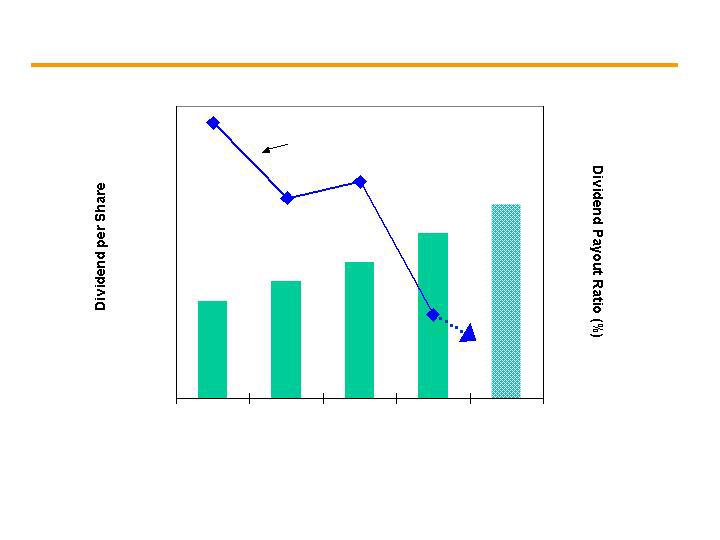
$2.20
$2.24
$2.28
$2.34
$2.00
$2.10
$2.20
$2.30
$2.40
$2.50
$2.60
2004
2005
2006
2007
2008
35
40
45
50
55
60
65
70
Improved earnings causes our dividend payout ratio to
quickly decline below 50% ...
… providing us the flexibility to raise our dividend above
recent levels.
Payout
Ratio
?
*
*Indicated annual dividend rate
15

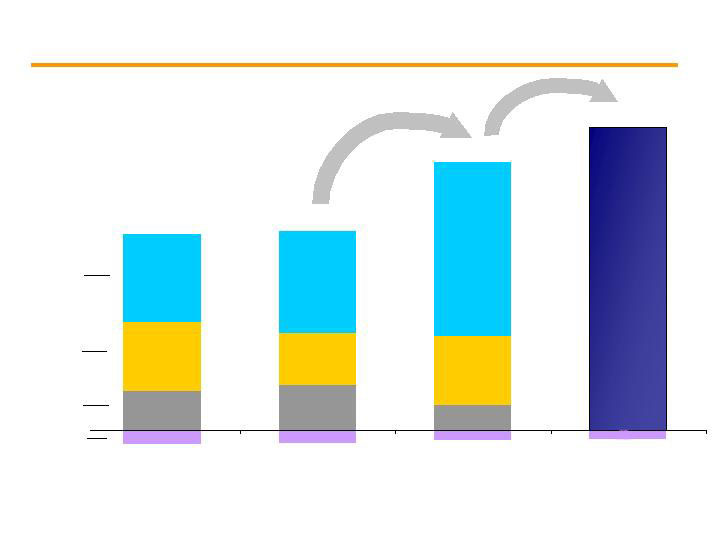
The capital program has been expanded …
($ Millions)
Capital Spending Update
$1,295
$375
$273
$197
$368
$82
TOTAL
2
1
-
(1)
3
(1)
Parent
1
-
-
-
-
1
PSEG Energy Holdings
217
(22)
(86)
64
190
71
PSEG Power*
$1,075
$396
$359
$134
$175
$11
PSE&G
Change from 2006 10-K
$7,047
$1,201
$1,414
$1,408
$1,681
$1,343
TOTAL
23
31
176
$971
2011
135
24
23
31
34
Parent
170
30
40
31
38
PSEG Energy Holdings
2,668
441
580
816
655
PSEG Power*
$4,074
$919
$765
$803
$616
PSE&G
TOTAL
2010
2009
2008
2007
… to support reliability, environmental commitments and growth.
* Figures for PSEG Power exclude Nuclear Fuel
16

Company
Facility
Expiration
Date
Total
Facility
Available
Liquidity
6/30/07
PSEG
5-year Credit Facility
Dec-11
1,000
$
949
$
PSE&G
5-year Credit Facility
Jun-11
600
330
Energy Holdings
5-year Credit Facility
Jun-10
150
135
Power
5-year Credit Facility
Dec-11
1,600
1,402
Bilateral Credit Facility
Mar-10
100
46
Bilateral Credit Facility
Mar-08
200
200
Total
3,650
$
3,062
$
Liquidity is available with favorable terms and
conditions …
… thereby supporting our credit profile.
($ Millions)
17

Our forecasted cash flows remain intact…
We remain comfortable with a forecast
improvement in cash
- Operating income in line with expectations
- Asset sales on schedule
- Planned rate mechanisms for transmission
investments would provide cash recovery during
construction
Excess cash between $1.5 billion and $2.0 billion
should be available through 2011
… with excess cash expected to be used to retire debt through
first half of 2008, thereafter for incremental growth and/or
share repurchase.
18

Right set of assets…
Large, diverse mix of low-cost, base-load, load-following generating assets
Reliable electric and gas distribution and transmission systems
Stable portfolio of investments in domestic generation, international distribution and leases
Right markets…
Generation assets operate in tightly constrained and growing markets
Nuclear and coal base-load capacity operate in markets where the price for power is set by
gas
Transmission and distribution assets provide service in a modest growth market with
reasonable regulation
At the right time…
Mid-Atlantic, New England and Texas recognizing the value of capacity in constrained areas
A move to control carbon benefits our nuclear-based fleet
Power has opportunity for brownfield development at existing sites
Values are improving for international assets
T&D set to benefit from capital investment for new infrastructure
PSEG – Excellent position for today …
… ready for tomorrow
19

Meeting commitments
Earnings on track to meet guidance
System reliability enhanced with expansion of transmission system
Turning challenges into opportunities
Addressing NJ’s Clean Energy goals
Solar initiative
PSE&G to use more energy efficient equipment and vehicles
NJ support for emissions portfolio standard
Building foundation for growth
Selling non-core assets
Meeting targets for debt reduction
Capital program expanded
Public Service Enterprise Group dedicated to …
… operational excellence, financial strength and disciplined
investment.
20
Why invest in PSEG?
Growing and visible stream of earnings
Hedging and RPM
Regulated utility operations
Strong balance sheet
Cash available for growth
Competitive dividend yield
Opportunities to invest in markets we know
… And, we still sell at a discount!
16.8
16.4
2007E
P/E
Earnings Per
Share*
3.1%
14.9
$3.40
$3.03
Merrill Lynch
Index**
2.8%
14.3
$5.85
$5.10
PSEG
Yield %
2008E
2008E
2007E
*Mid-point of guidance range
Priced as of August 27, 2007
**Merrill Lynch Index of Less-Regulated Utilities
21

Public Service Enterprise Group

APPENDIX
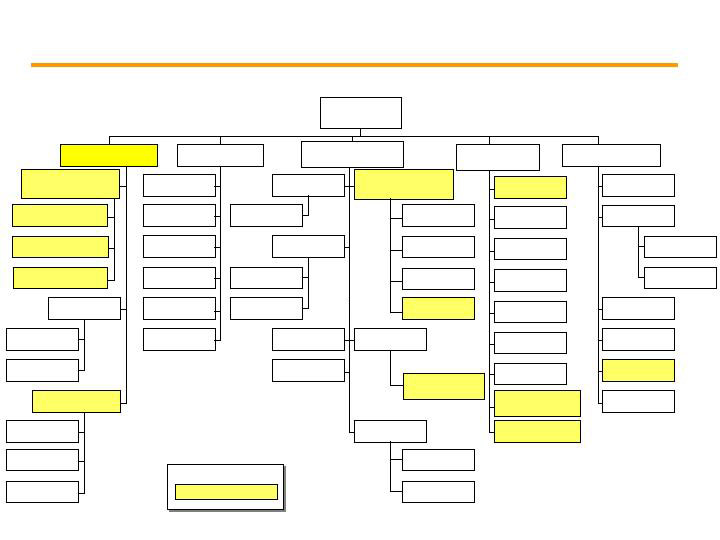
New Officers
Izzo – PSEG -
Chairman,
President & CEO
Levis – PSEG Power -
President, CNO, COO
LaRossa – PSE&G
– President & COO
O’Flynn – PSEG - EVP/
CFO, PSEG Holdings -
President
Simpson – PSEG Svcs
- President & COO
Selover – PSEG
Svcs - EVP & Gen
Counsel
Paszynsky
Pego
Hallerdin
Quinn
McLaughlin
Svenson
Frank – VP
Supply Chain
Chouthai
Falck – SVP
Law
McAuliffe
Leyden
Bonnifield
Black
Linde
Smith
Hoskins – VP –
Fed Affairs &Policy
Thigpen – VP –
State Gov Affairs
Byrd – SVP Finance,
Business Development
& Strategy / M&A
Kahrer
Jennings
Seabrook
VP – M&A
Cregg
Moran
MacDonald
Plawner
Lally – VP –
Investor Relations
McGrath
DiRisio
Krueger
Metzger
Brooks
Joyce – SVP
Operations –
Salem/Hope Creek
Barnes – Site VP –
Hope Creek
Fricker – VP –
Operations Support
Braun – Site VP -
Salem
Quinn
Wohlfarth
DePillo
Lopriore – President
– PSEG Fossil
VP Fossil
Ops
Ameo
Pastor
Latka
Dickens
Cardenas
Forline
Lark
Sundheim
Garcez
Matos
New Officers
KEY:
24
Low-cost portfolio
Strong cash generator
Regional focus with demonstrated
BGS success
Assets favorably located
Many units east of PJM constraint
Southern NEPOOL/ Connecticut
constraint
Near customers/load centers
Integrated generation and portfolio
management optimizes asset-
based revenues
… which provides for risk mitigation and strong returns.
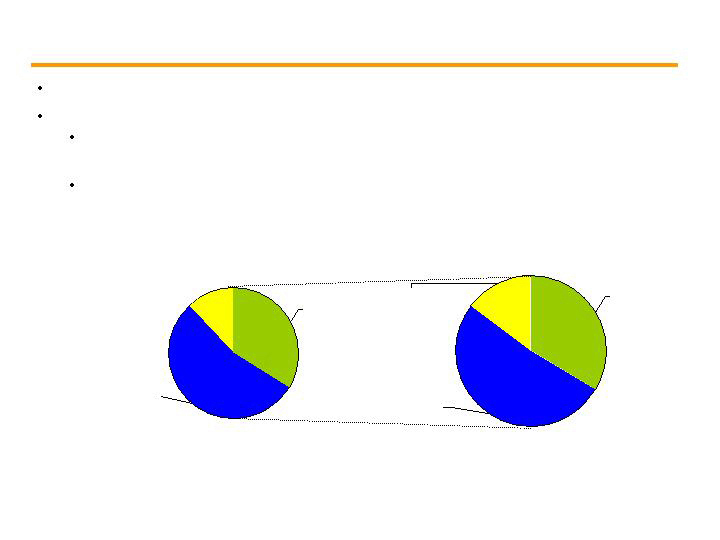
Power’s assets reflect a diverse blend of fuels and
technologies …
18%
47 %
8 %
26 %
Fuel Diversity – 2007
Coal
Gas
Oil
Nuclear
Pumped
Storage
1%
Energy Produced - 2006
55%
27%
16%
Oil 1%
Pumped
Storage
1%
Nuclear
Coal
Gas
Total GWh: 53,617
Total MW: 13,600
25
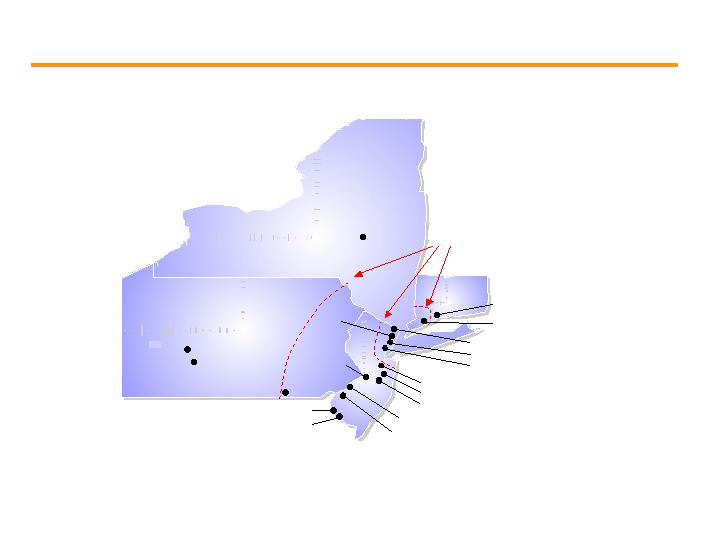
... which experience higher prices during periods of high demand.
Power’s assets are located in attractive markets near load
centers …
Current plant locations,
site expansion capability
Bethlehem Energy Center
(Albany)
New Haven
Bergen
Kearny
Essex
Sewaren
Edison
Linden
Mercer
Burlington
National Park
Hudson
Conemaugh
Keystone
Bridgeport
Peach Bottom
Hope Creek
Salem
System Interface
26

$490
$700 - $750
2007 – 2010
Total
($ million)
2010
Mercer
2010
Hudson Unit
2
Completion
Date
Environmental Capital Requirements
Emissions Control Technology Projects
- NOx control – SCR
- SO2 control – Scrubber
- Hg and particulate matter control -
Baghouse
Hudson Unit 2 (608 MW)
NOx control – SCR installation complete
SO2 control – Scrubbers
Hg and particulate matter control –
Baghouse
Mercer (648 MW) – Units 1&2
Our environmental strategy…
… will help preserve the availability of our fossil fleet.
Power’s New Jersey coal units are
mid-merit, with capacity factors
averaging 50% to 60%
As markets tighten, increased
production is anticipated
27
$20
$30
$40
$50
$60
$70
2002
2003
2004
2005
2006
2007
Est
2008
Fwd
2009
Fwd
$0
$3
$6
$9
$12
$/mmbtu
$/MWh
… unaffected by short-term volatility.
(1)
Central Appalachian coal
(2)
Forward prices as of August 20, 2007
Long-term market prices …
Electricity
(left scale)
Coal(1)
(right
scale)
Natural Gas Henry Hub
(right scale)
(2)
(2)
(2)
28
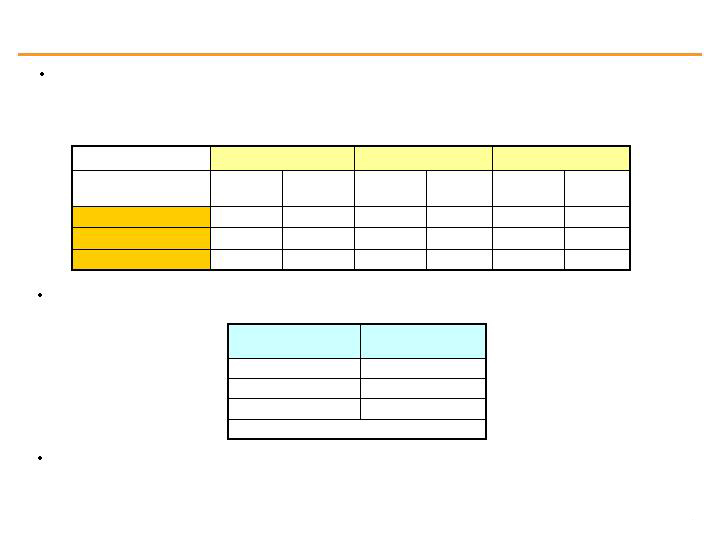
2007- 2009 Capacity Auction Results
N/A
N/A
$111.92
$29.53
$180.58
$210.11
$5.29
$143.51
$148.80
2008/
2009
2008/
2009
2008/
2009
2007/
2008
2007/
2008
2007/
2008
($/MW-day)
N/A
N/A
$40.80
Rest of Pool
$48.38
$140.16
$188.54
Southwest MAAC
$20.16
$177.51
$197.67
Eastern MAAC
CTR Value*
Load Price
Unit Price
Auctions scheduled in the next six months provide transition through the 2010-2011
delivery year.
Future auction pricing to be influenced by increase in number of zones (2010 – 2011
delivery year), load growth, avoided cost for units, and capacity available (unit capability,
retirements, new build).
* CTR Value: Capacity Transfer Rights
Allocated to Load Serving Entities (LSE) in constrained zones to provide them with access to supply from outside the zone
PJM released results on July 13 from its second capacity auction under the Reliability
Pricing Model (RPM) for the 2008-2009 delivery year.
May 2008
2011 – 2012
January 2008
2010 – 2011
Annual base auction in May of each subsequent year
October 2007
2009 – 2010
Auction Date
Planning Year
(6/1 to 5/31)
RPM Capacity Auction – Transparent Pricing Model
29

Capacity Position
* Delivery year runs from June 1 – May 31
Only a portion of PSEG Power’s capacity was open to realize prices in
the recent PJM-RPM auctions. Increasing amounts are open to realize
prices in future years.
A significant percent of Power’s capacity was contracted as part of
New Jersey’s 3-year BGS* auction (Power currently serving 11
tranches from the 2005 auction, 20 tranches from 2006 and 19
tranches from 2007), as well as other contracting activity.
The balance of Power’s PJM capacity has obtained price certainty
through May 31, 2009 from the first two RPM auctions.
All of Power’s New England capacity has obtained price certainty
through May 31, 2010 as a result of the fixed price nature of the
transitional FCM auction.
Existing capacity hedges support our forecast year-over-year
improvement in capacity margin for 2007 of $125 - $175 million with
similar improvement in 2008.
30

… while preserving market growth opportunities.
Power’s hedging strategy aims to balance stable
earnings …
~10%
~50%
~100%
~100%
Percent of Power’s coal and nuclear energy output
hedged (total portfolio)*
2010
2009
2008
2007
*As of August 2007
PJM RTC GWh
-
1,000
2,000
3,000
4,000
5,000
6,000
2007
2007
2007
2007
2007
2007
2007
2007
2007
2007
2007
2007
2008
2008
2008
2008
2008
2008
2008
2008
2008
2008
2008
2008
2009
2009
2009
2009
2009
2009
2009
2009
2009
2009
2009
2009
2010
2010
2010
2010
2010
2010
2010
2010
2010
2010
2010
2010
Nuclear / Pumped Storage
Coal
CC
Steam / CT
Existing Load + Hedges + Future BGS
Existing Load + Hedges
Existing Hedges
2007
2008
2009
2010
31

-
10,000
20,000
30,000
40,000
50,000
2007
2008
2009
2010
Year
Nuclear and Coal output
Contracted sales
… is aligned with its low-cost generating output and our
hedging strategies.
Power has contracted for 100% of its nuclear uranium fuel through 2011 and
approximately 90% of its coal needs through 2009.
Coal and Nuclear Fuel
Power’s hedging of coal and nuclear fuel …
Coal and Nuclear Output
-
10,000
20,000
30,000
40,000
50,000
2007
2008
2009
2010
Year
Coal
Uranium
Contracted sales
32

2003 Auction
2004 Auction
2005 Auction
2006 Auction
2007 Auction
Capacity
Load shape
Transmission
Congestion
Ancillary services
Risk premium
Full Requirements
Round the Clock
PJM West
Forward Energy
Price
$33 - $34
$36 - $37
$55
$55
$66
$44 - $46
~ $21
~ $18
~ $21
$102
$67 - $70
~ $32
Increase in Full Requirements Component Due to:
Increased Congestion (East/West Basis)
Increase in Capacity Markets/RPM
Volatility in Market Increases Risk Premium
$99
~ $41
$58-$60
Market Perspective – BGS Auction Results
… has enabled successful participation in each BGS auction.
Power’s fleet diversity and location ...
33
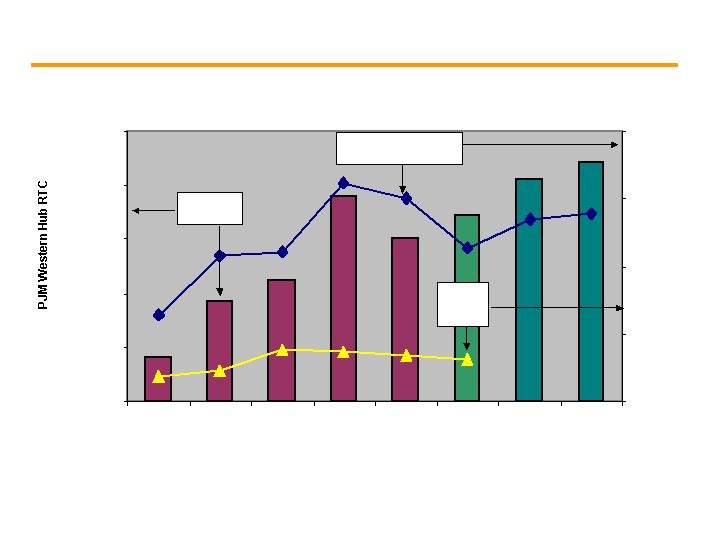
$0
$10
$20
$30
$40
$50
$60
$70
2005
2006
2007 Est
2008 Est
2009 Est
… are expected to drive significant increases in Power’s
gross margin.
Operational improvements and recontracting in
current markets …
Realized Gross Margin ($/MWh)
Energy
Capacity
(Energy prices based on recent forward markets;
Illustrative capacity prices based on recent market for 2007/2008 in all years)
34
Items excluded from Net Income to reconcile to Operating Earnings
Please see Slide 2 for an explanation of PSEG’s use of Operating Earnings as a non-GAAP financial measure and how
it differs from Net Income.
$ Millions (except EPS)
2007
2006
2007
2006
2007
2006
2007
2006
Merger related Costs:
PSE&G
-
$
(1)
$
-
$
(1)
$
Power
-
(1)
-
(2)
Enterprise
-
(1)
-
(5)
Total Merger Related Costs
-
$
(3)
$
-
$
(8)
$
-
$
(0.01)
$
-
$
(0.03)
$
Loss on sale of RGE (Holdings)
-
$
(177)
$
-
$
(177)
$
-
$
(0.70)
$
-
$
(0.70)
$
Discontinued Operations:
Power - Lawrenceburg
(3)
$
(8)
$
(9)
$
(17)
$
(0.02)
$
(0.03)
$
(0.04)
$
(0.07)
$
Holdings:
Elcho and Skawina
-
$
223
$
-
$
227
$
Electroandes
(15)
2
(14)
5
Total Holdings
(15)
$
225
$
(14)
$
232
$
(0.05)
$
0.89
$
(0.05)
$
0.92
$
Total Discontinued Operations
(18)
$
217
$
(23)
$
215
$
(0.07)
$
0.86
$
(0.09)
$
0.85
$
Quarter Ended June 30,
Six Months Ended June 30,
Impact to PSEG EPS
Quarter Ended June 30,
Six Months Ended June 30,
35