Exhibit 99

Public Service Enterprise Group
42nd EEI Financial Conference
Lake Buena Vista, Florida
November 6, 2007

Forward-Looking Statement
The statements contained in this communication about our and our
subsidiaries’ future performance, including, without limitation, future
revenues, earnings, strategies, prospects and all other statements that
are not purely historical, are forward-looking statements for purposes of
the safe harbor provisions under The Private Securities Litigation
Reform Act of 1995. Although we believe that our expectations are
based on information currently available and on reasonable
assumptions, we can give no assurance they will be achieved. There
are a number of risks and uncertainties that could cause actual results to
differ materially from the forward-looking statements made herein. A
discussion of some of these risks and uncertainties is contained in our
Annual Report on Form 10-K and subsequent reports on Form 10-Q and
Form 8-K filed with the Securities and Exchange Commission (SEC),
and available on our website: http://www.pseg.com. These documents
address in further detail our business, industry issues and other factors
that could cause actual results to differ materially from those indicated in
this communication. In addition, any forward-looking statements included
herein represent our estimates only as of today and should not be relied
upon as representing our estimates as of any subsequent date. While
we may elect to update forward-looking statements from time to time, we
specifically disclaim any obligation to do so, even if our estimates
change, unless otherwise required by applicable securities laws.
1

GAAP Disclaimer
PSEG presents Operating Earnings in addition to its Net Income reported
in accordance with accounting principles generally accepted in the United
States (GAAP). Operating Earnings is a non-GAAP financial measure that
differs from Net Income because it excludes the impact of the sale of
certain non-core domestic and international assets and costs stemming
from the terminated merger agreement with Exelon Corporation. PSEG
presents Operating Earnings because management believes that it is
appropriate for investors to consider results excluding these items in
addition to the results reported in accordance with GAAP. PSEG believes
that the non-GAAP financial measure of Operating Earnings provides a
consistent and comparable measure of performance of its businesses to
help shareholders understand performance trends. This information is
not intended to be viewed as an alternative to GAAP information. The last
slide in this presentation includes a list of items excluded from Net Income
to reconcile to Operating Earnings, with a reference to that slide included
on each of the slides where the non-GAAP information appears. These
slides are only intended to be reviewed in conjunction with the oral
presentation to which they relate.
2

PSEG Strategic Overview
Ralph Izzo
Chairman, President and Chief Executive Officer
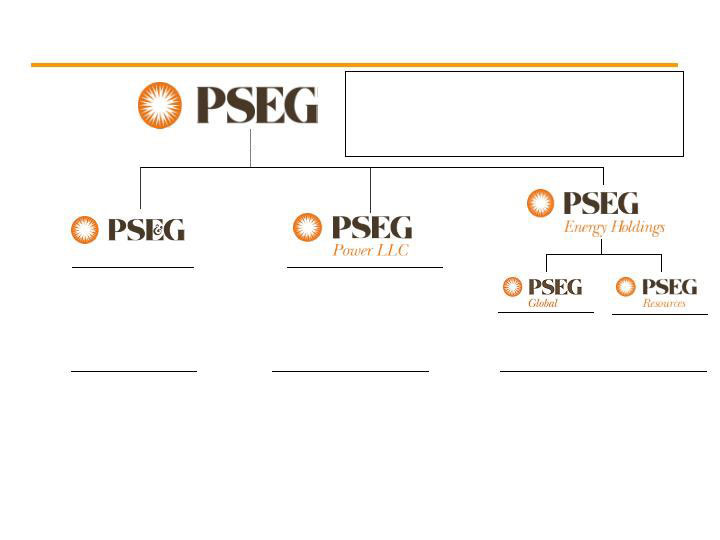
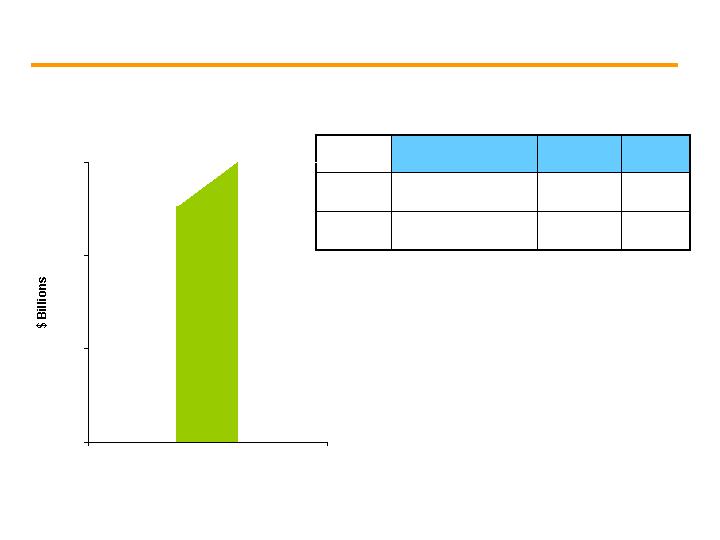
PSEG Overview
Electric Customers: 2.1M
Gas Customers: 1.7M
Nuclear Capacity: 3,500 MW
Total Capacity: 13,600 MW
Traditional T&D
Leveraged
Leases
2007E Operating Earnings(4) : $1,305M - $1,410M
2007 EPS Guidance(4) : $5.15 - $5.45
Assets (as of 09/30/07): $28.9B
Market Capitalization (as of 11/1/07): $23.9B
Domestic/Int’l
Energy
Regional
Wholesale Energy
Operating Earnings, as reported = Earnings Available and Excludes:
(1) Merger Costs of $1M
(2) Loss from Discontinued Operations of $239M
(3) Loss on Sale of RGE of $178M and Income from Discontinued Operations of $226M
(4) Includes the parent impact of $(55)M –$(45)M
2006 Operating Earnings: $262M(1) $515M(2) $227M(3)
2007 Guidance: $360M - $380M $890M - $940M $110M - $135M
4
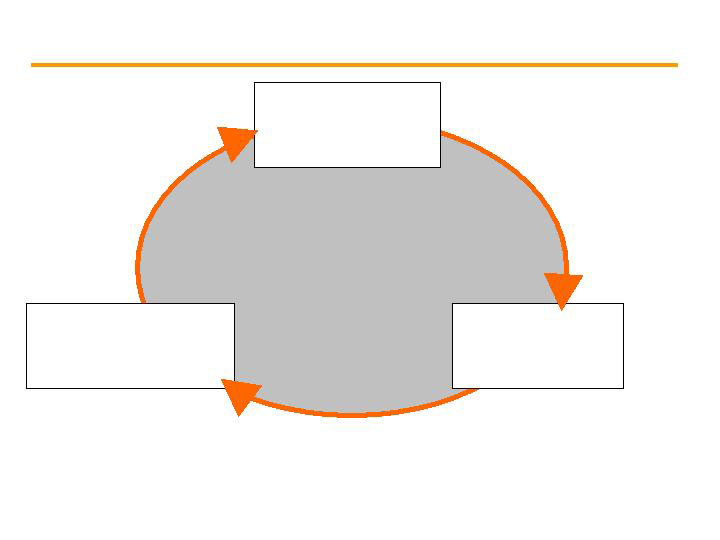
Financial
Strength
Operational excellence is our foundation for success …
… and this will yield financial strength that will be deployed
through disciplined investment.
Operational
Excellence
Disciplined
Investment
5
2007 Overview – Year-to-date update
Management team in place
PSE&G – Mid-Atlantic ReliabilityOne award for sixth
consecutive year
PSEG Power expects to be in a position to resume
independent operation of nuclear fleet
2007 earnings in excess of guidance
PSE&G expanding transmission
PSEG Power investing in new peaking capacity
Improved credit outlook
… meeting our objectives
Strong
Operations
Constructive
Regulatory and
Business
Environment /
Markets
Growth
Opportunities
with Manageable
Risk
Committed to working with the State to meet NJ’s
clean energy goals
Generating assets in attractive markets
Opportunistically monetizing assets
6
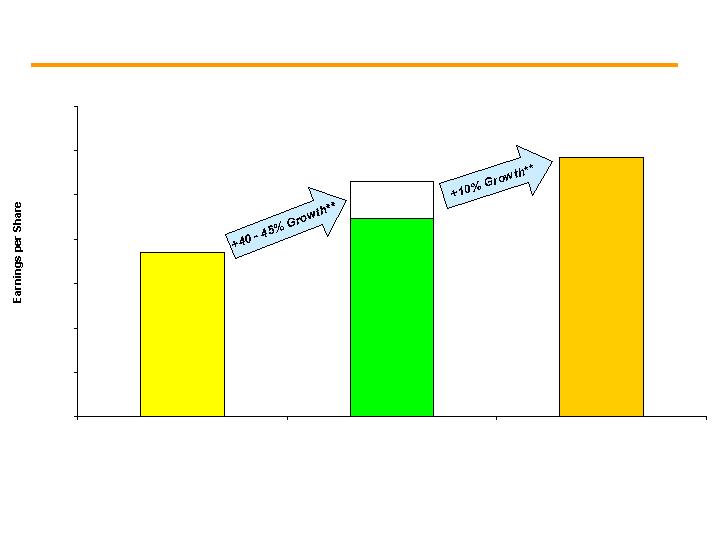
Announced increased earnings guidance for 2007 …
$0.00
$1.00
$2.00
$3.00
$4.00
$5.00
$6.00
$7.00
2006 Operating Earnings*
2007 Guidance
2008 Guidance
$5.60 - $6.10
$3.71
$5.15 - $5.45
* As reported: Excludes Loss on Sale of RGE of $0.70 per share, Merger costs of $0.03 per share and Loss from Discontinued Operations of $0.05 per share
** Percentage change in growth based on mid-point of guidance
9 Months
YTD
Operating
Earnings:
$4.47
… driven by strong power markets and operations.
7

Environmental position
A carbon constrained future
Critical infrastructure needs
Capacity requirements in
constrained markets
… creates opportunities for PSEG’s long-term growth.
The current business environment …
Well operating nuclear fleet with
growth potential
Back-end technology on Hudson &
Mercer ($1B - $1.2B)
Solar initiative proposed for $100M
Increased utility investment
Transmission investment of $1B
over 5-8 years
Pursuing 300 – 400MW expansion
of peaking capacity ($250M -
$350M) as part of a larger
1,000MW analysis
8

Climate change is the preeminent issue of our time …
The issue cuts across the PSEG group of companies
Three critical strategies are required to meet carbon
reduction goals:
Conservation
Renewables
Clean, zero and low-carbon central station electric
generating capacity
… with our response defining the future of the company.
9

Climate initiatives …
Regional Greenhouse Gas Initiative (RGGI) effective January 1, 2009
Energy Master Plan – No explicit CO2 target, but:
20% energy efficiency by 2020
Calls for 20% renewables by 2020
Draft Plan expected before year-end
NJ Global Warming Response Act:
Stabilization of economy-wide greenhouse gas emissions at 1990 levels
by 2020.
Reduction of economy-wide greenhouse gas emissions to 80% below
2006 levels by 2050.
Establishes emissions portfolio standard for suppliers of power into NJ
… present numerous opportunities for PSE&G and PSEG
Power.
10
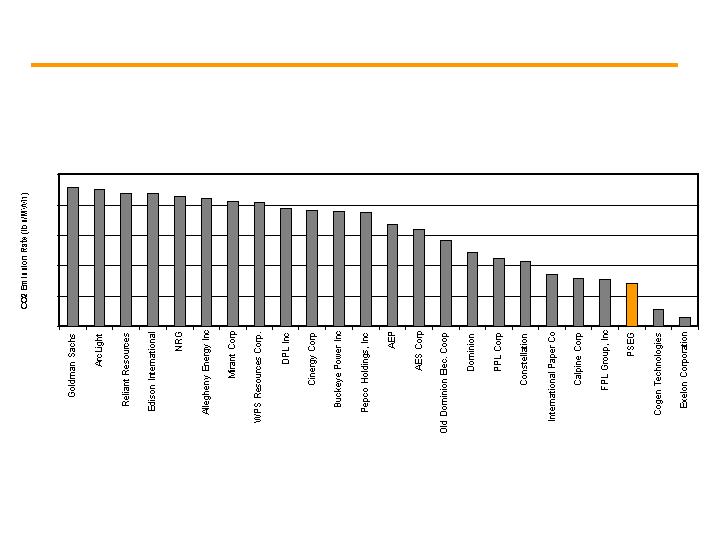
2004 Emission Rate Ranking
(24 largest Generating Companies in PJM)
0
500
1,000
1,500
2,000
2,500
Policymakers are looking to Cap and Trade for the power
industry to reduce CO2 emissions…
PSEG’s generation carbon intensity is lower than many
competitors and benefits from virtually any form of carbon
restrictions…
11

Right set of assets…
Large, diverse mix of low-cost, base-load, load-following generating assets
Reliable electric and gas distribution and transmission systems
Stable portfolio of investments in domestic generation, international distribution and leases
Right markets…
Generation assets operate in attractive and growing markets
Nuclear and coal base-load capacity operate in markets where the price for power is set by
gas
Transmission and distribution assets provide service in a modest growth market with
reasonable regulation
At the right time…
Mid-Atlantic, New England and Texas recognizing the value of capacity in constrained areas
A move to control carbon benefits our nuclear-based fleet
Power has opportunity for brownfield development at existing sites
Values are improving for international assets
T&D set to benefit from capital investment for new infrastructure
PSEG – Excellent position for today …
… ready for tomorrow
12

PSEG Power
Tom O’Flynn
Executive Vice President and Chief Financial Officer
President – PSEG Energy Holdings

Positioned for growth in 2007 and beyond – PSEG Power
Strong
Operations
Constructive
Regulatory and
Business
Environment /
Markets
Growth
Opportunities
with Manageable
Risk
Nuclear fleet has maintained strong performance
Expect to be in a position to resume independent
operations at year-end
Increased output from fossil fleet
NJ BGS model represents deep, liquid market
providing opportunity to contract output over multi-
year period
PJM’s capacity market supports reliability
Nuclear and coal base-load fleet sold in market with
power prices set by gas
Proposed construction of 300-400MW of new gas
fired peaking capacity as part of request for
feasibility study by PJM on potential for 1,000MW of
new gas-fired peaking capacity
Exploring new nuclear
14

0%
20%
40%
60%
80%
100%
2008
2009
2010
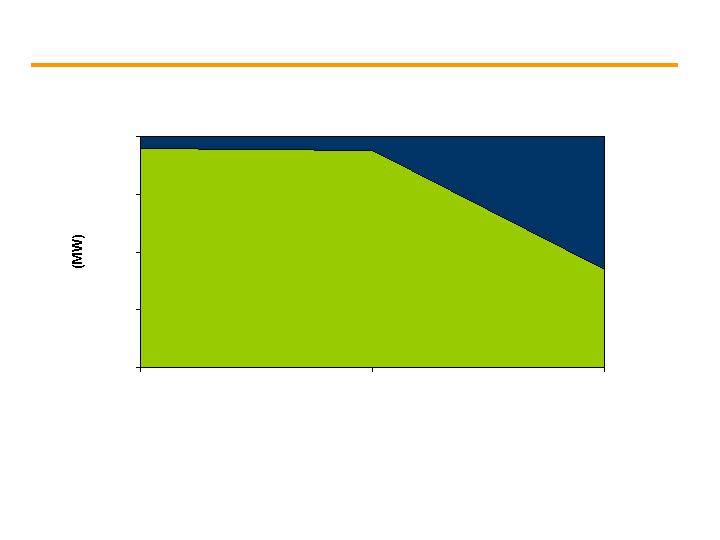
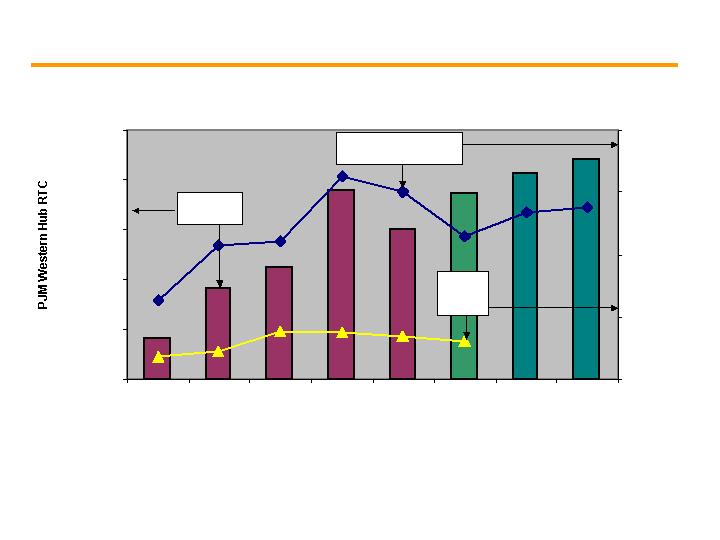
Hedging program provides near-term stability from market
volatility …
… while remaining open to long-term market forces.
Estimated impact
of $10/MWh PJM
West RTC price
change*
$0.01 - $0.05
$0.65 - $0.85
*Assuming normal market dynamics
2008
$64-67/MWh
2009
$70-73/MWh
Contracted Prices
2010
$68-72/MWh
Power’s Generation Output
Other output
Contracted coal and
nuclear output
Open coal and nuclear
output
Includes roll off of 4 year,
500MW RTC contract ($125M+)
and other recontracting
$0.35 - $0.50
15
0%
25%
50%
75%
100%
2008
2009
2010
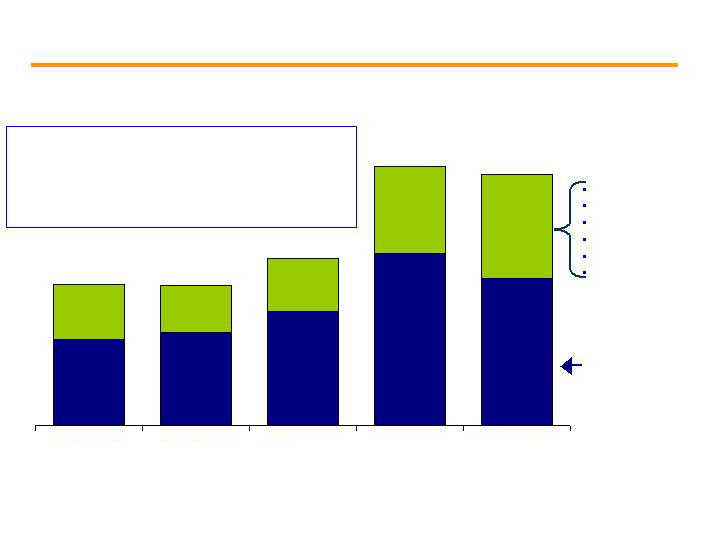
Power expects to realize increasing margin improvement …
… through the repricing of capacity at market prices.
Total Capacity
Contracted Capacity
Open Capacity
Estimated impact
of $10/KW-yr
capacity price
change
$0.01 - $0.02
$0.14 - $0.18
2008
$38-40/KW-yr
2009
$49-51/KW-yr
Contracted Prices
2010
$50-54/KW-yr
$0.01 - $0.02
16
PSEG Power
Total Generating Capacity
PJM
NY
NE
Total Capacity 13,600MW
(~ 1,000 - 1,500MW under RMR)
… with pricing secured through May of 2010 in PJM and New England.
Power’s capacity is located in three northeast markets …
17
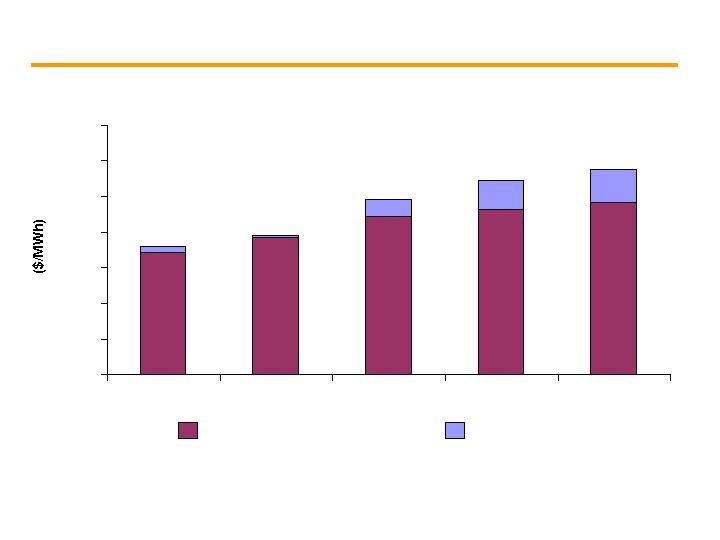
$0
$10
$20
$30
$40
$50
$60
$70
2005
2006
2007 Est
2008 Est
2009 Est
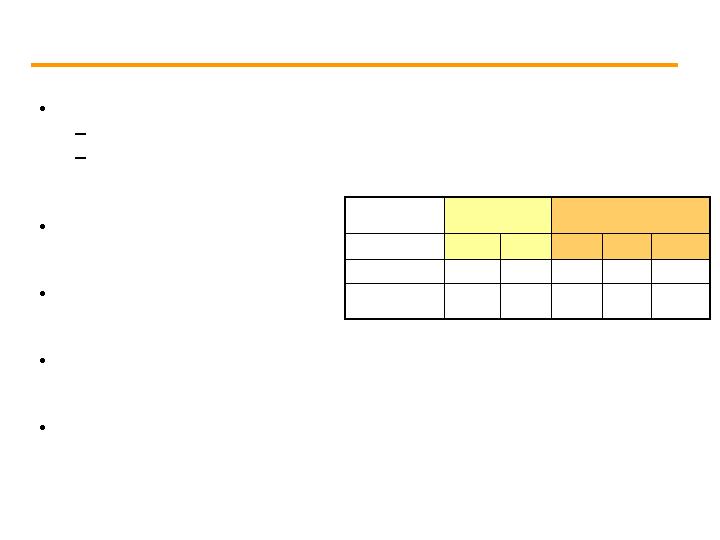
… are expected to drive significant increases in Power’s
gross margin.
Operational improvements and recontracting in current
markets …
Realized Gross Margin
Energy
Capacity
18
Power’s open EBITDA is approximately $2.4 - $2.6 billion…
… which will vary depending upon market drivers.
Energy
Capacity
~ $40M
$1/MWh
~ $63 - 67/MWh
(PJM-West)
~ $120M
$10/KW-yr
~ $60 - $65/KW-yr
(~ $165 - $175/MW-day)
Impact
EBITDA
Sensitivity
Assumption
$1.0
$1.5
$2.0
$2.5
19

PSE&G

Positioned for growth in 2007 and beyond – PSE&G
Strong
Operations
Constructive
Regulatory and
Business
Environment /
Markets
Growth
Opportunities
with Manageable
Risk
Mid-Atlantic ReliabilityOne award – six years
running
O&M growth less than inflation
Rate agreement provides opportunity to earn
authorized return
PSE&G advocated a strong role for utilities in
meeting the State’s energy efficiency goals
Proposed $100M solar initiative
NJ Energy Master Plan – draft proposal
expected before year-end
Transmission projects represent potential
$1 billion investment over 5-8 years beginning
in 2008
Opportunity for additional growth with EMP
initiatives
21

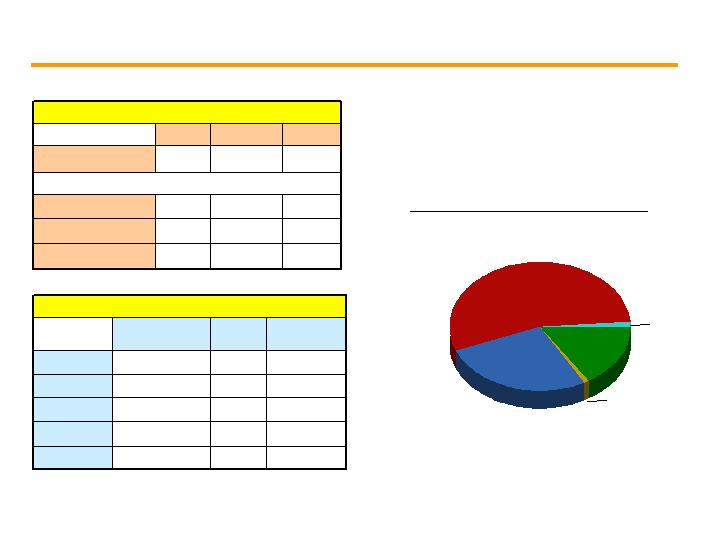
Regulated electric transmission, electric and gas distribution system
Characteristics
FERC regulation for electric transmission; NJ BPU regulation for electric
and gas distribution
Electric and Gas distribution rates frozen through November 2009
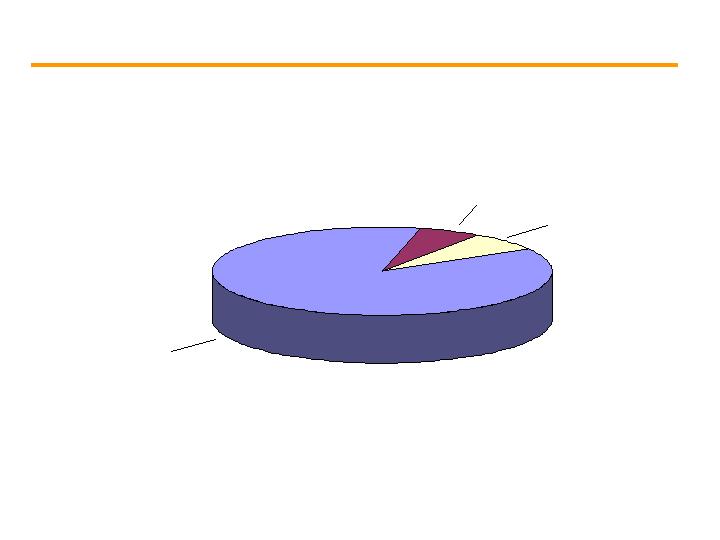
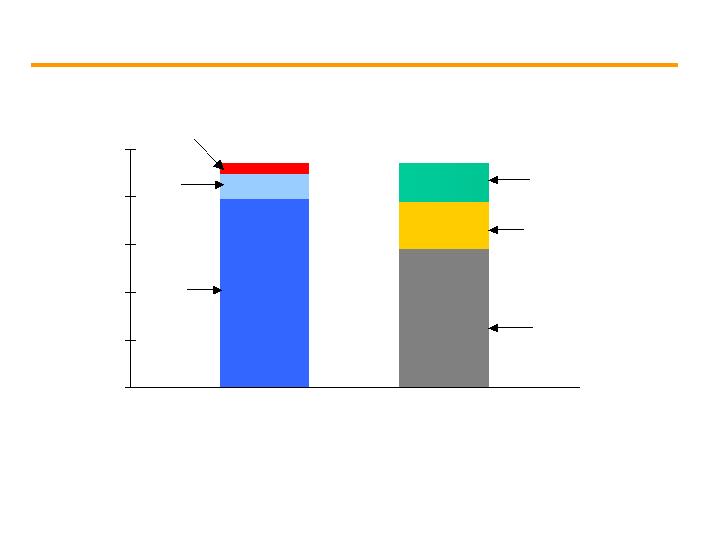
PSE&G’s base investment plan …
Gas
Distribution
31%
Electric
Transmission
22%
Electric
Distribution
47%
Gas
Distribution
34%
Electric
Transmission
12%
Electric
Distribution
54%
2006 Actual
Rate Base = $6.5 B
2011 Base Plan
Rate Base = $8.7 B
Equity Ratio ~ 48%
… coupled with fair regulatory treatment provides a solid base
for future earnings growth of 7-8% per year.
PSE&G Rate Base
22

PSEG Energy Holdings

A re-positioning of assets at PSEG Energy Holdings
Strong
Operations
Constructive
Regulatory and
Business
Environment /
Markets
Growth
Opportunities
with Manageable
Risk
Texas gas-fired assets – continued strong
performance
Improving performance from international
assets
Resources – focus on credit ratings
Strong economic growth and stable foreign
exchange rates have supported values for
Latin American assets
ERCOT represents a market with better than
average demand growth
Resources – tax issues monitored closely
Capitalized on attractive values for
international assets
Strong cash flow generation for debt
retirement and growth
24
$41
$175
$104
$129
$50
$13
$(40)
$(35)
$(24)
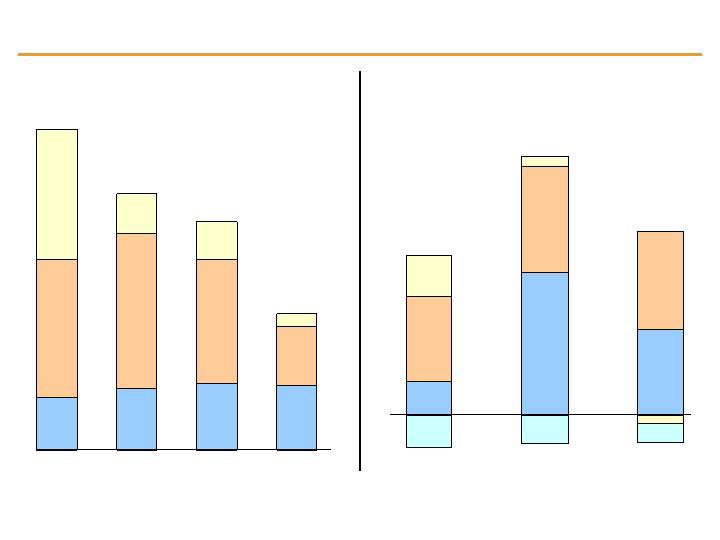
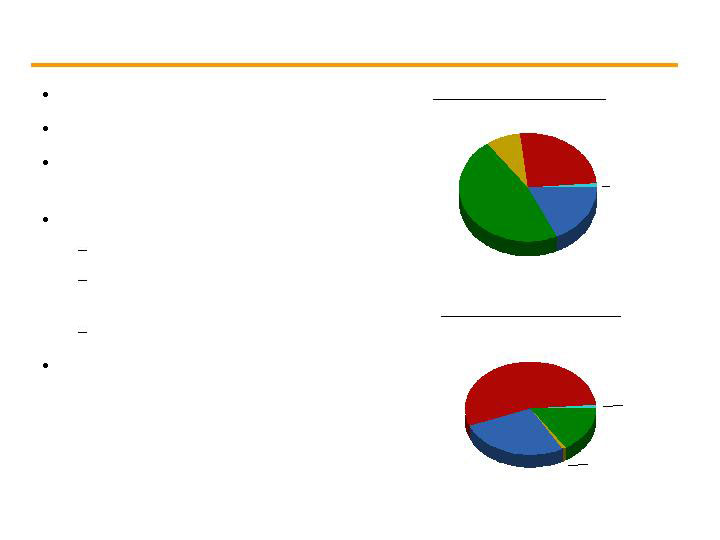
Improved risk profile by reducing capital invested in non-strategic
assets while increasing returns and sharpening focus on G&A
2004
2006
$2.6B
$2.0B
Chile
&
Peru
US
Other
$900M
$400M
$1.3B
$150M
$500M
$1.4B
35%
15%
50%
7%
68%
25%
$317M**
56%
49%
2004
2006
2007
Projected
$195M**
$205M-$225M**
Composition of Global’s Pre-tax
Contribution by Region*
G&A
Chile &
Peru
US
Other
26%
53%
21%
4%
41%
55%
Global’s Invested Capital
$500M
$1.2 B
12/31/07
Projected
$1.1B***
43%
47%
* Includes both consolidated and unconsolidated investments after project debt, before allocation of parent debt
** Excludes interest, taxes, G&A and other corporate items to arrive at Global’s Operating Earnings, as reported, includes Electroandes,Chilquinta and LDS (33%)
***Assumes the closing of Chilquinta and LDS prior to year end
09/30/07
$1.8B
$470M
$500M
64%
29%
$150M
7%
$100M
10%
-5%
25

$ 754
(50)
193
413
$ 198
2006
$ 1,134
(43)
134
744
$ 299
2007
Operating Earnings
Per Share
$ Millions (except EPS)
(0.20)
(0.17)
Enterprise
$ 2.99
$ 4.47
PSEG
0.76
0.53
PSEG Energy Holdings
1.64
2.93
PSEG Power
$ 0.79
$ 1.18
PSE&G
2006
2007
Nine months ended September 30,
* See page 44 for Items excluded from Net Income to reconcile to Operating Earnings
YTD Operating Earnings by Subsidiary
26
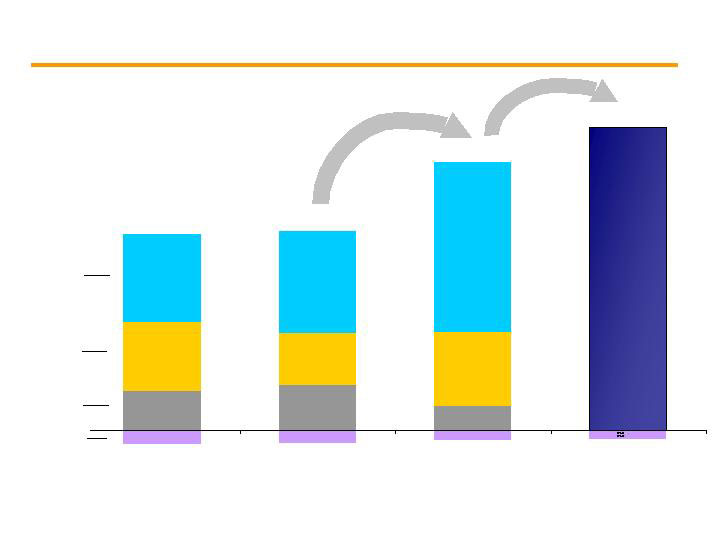
Strong earnings growth projected in 2007 and 2008 …
196
227
347
262
446
515
110-135
360-380
890-940
(71)
(66)
(55)-(45)
2005
2006
2007
2008
$5.60 - $6.10
$3.77*
$3.71**
$5.15 - $5.45
Holdings
PSE&G
Power
Parent
Operating Earnings by Subsidiary
+ 40 - 45%
10%
0
* 2005, as reported: Excludes ($0.14) Merger Costs, ($0.07) Cumulative Effect of an Accounting Change and ($0.85) Discontinued Operations
** 2006, as reported: Excludes ($0.03) Merger Costs, ($0.70) Loss on Sale of RGE, and ($0.05) Discontinued Operations
… with reduced international risk.
27
$0.0
$3.0
$6.0
$9.0
$12.0
$15.0
Sources
Uses
Cash
from
Ops
Net Shareholder
Dividend
Financing
Share Repurchases /
New Investments*
PSEG Sources and Uses
2007 - 2011
Asset
Sales
Excess cash between $2.0B and $2.5B expected to be
available through 2011…
…which could translate into approximately $5.0B of new
investment (50/50 capital structure) with asset sales by Holdings
providing upside potential.
Investment
$2.0 – $2.5
* Includes amounts for recently announced asset sales
28

Meeting commitments
2007 earnings in excess of guidance
System reliability enhanced with expansion of transmission system
Turning challenges into opportunities
Addressing NJ’s Clean Energy goals
Solar initiative
PSE&G to use more energy efficient equipment and vehicles
NJ support for emissions portfolio standard
Building foundation for growth
Selling non-core assets
Meeting targets for debt reduction
Capital program expanded
Public Service Enterprise Group dedicated to …
… operational excellence, financial strength and disciplined
investment.
29
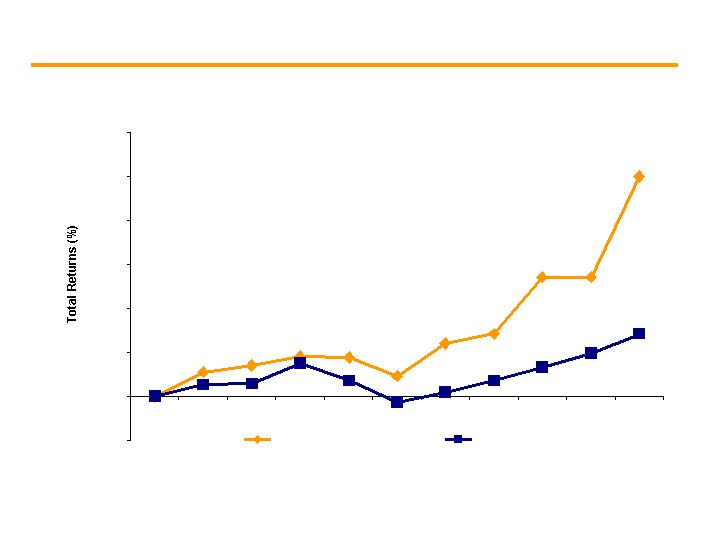
Creating shareholder value for the long-term …
… has been and will continue to be our focus.
-100
0
100
200
300
400
500
600
1997
1998
1999
2000
2001
2002
2003
2004
2005
2006
2007
PEG
S&P Electrics
Total Comparative Returns
(10/31/97 – 10/31/07)
30

Public Service Enterprise Group

APPENDIX

Regional Greenhouse Gas Initiative (RGGI) for the power
sector is real …
Agreement between 10 northeast states to cap CO2
emissions from power plants
Emissions capped at 2000-2004 baseline levels in 2009
- NJ cap = 22.9 million tons
Reduce CO2 emissions by a total of 10% during 2015 –
2018
Allowance distribution methodology, “Leakage”, and
harmonizing with a national program are major concerns
NJ RGGI legislation and regulations are planned for late
Nov 2007
… and on schedule to go into effect January 1, 2009.
33
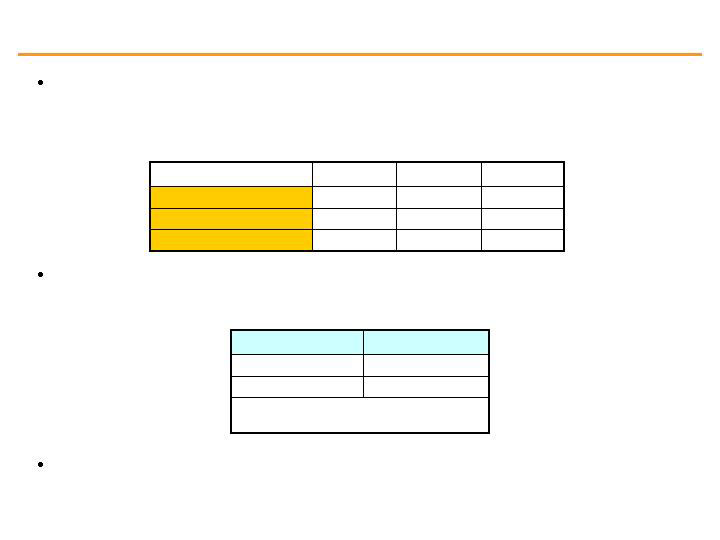
The potential impact of CO2 on PSEG Power…
$7.20
100%
Total
$0.00
$0.0
0%
Nuclear
$1.60
$4.0
40%
Gas CC
$0.60
$6.0
10%
CTs
$5.00
$10.0
50%
Coal
Impact
$/MWh
On margin
(approximate)
Dispatch curve implication @ $10/ton*
By Fuel Type
$12.0
$18.0
$30.0
@$30
$4.0
$6.0
$10.0
@$10
$2.0
$3.0
$5.0
@$5
Price ($/MWh)
0.4
0.6
1.0
Carbon tons/MWh
CC
CTs
Coal
PSEG Power Generation by Fuel
55%
27%
16%
Oil 1%
Pumped
Storage
1%
Nuclear
Coal
Gas
Total GWh: 53,617
… is mitigated by a low-carbon generation portfolio.
* For illustration purposes – potential impact of CO2 on power prices with current dispatch – not an indication of net effect on income.
34
Low-cost portfolio
Strong cash generator
Regional focus with demonstrated
BGS success
Assets favorably located
Many units east of PJM constraint
Southern NEPOOL/ Connecticut
constraint
Near customers/load centers
Integrated generation and portfolio
management optimizes asset-
based revenues
… which provides for risk mitigation and strong returns.
Power’s assets reflect a diverse blend of fuels and
technologies …
18%
47 %
8 %
26 %
Fuel Diversity – 2007
Coal
Gas
Oil
Nuclear
Pumped
Storage
1%
Energy Produced - 2006
55%
27%
16%
Oil 1%
Pumped
Storage
1%
Nuclear
Coal
Gas
Total GWh: 53,617
Total MW: 13,600
35
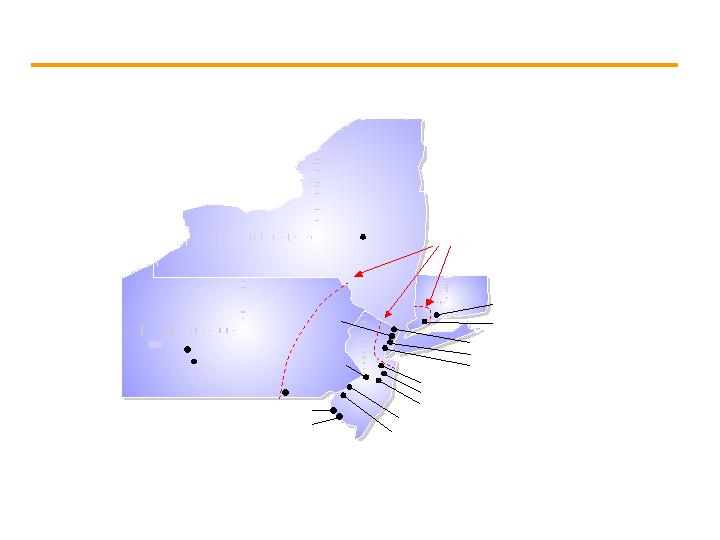
... which experience higher prices during periods of high demand.
Power’s assets are located in attractive markets near load
centers …
Current plant locations,
site expansion capability
Bethlehem Energy Center
(Albany)
New Haven
Bergen
Kearny
Essex
Sewaren
Edison
Linden
Mercer
Burlington
National Park
Hudson
Conemaugh
Keystone
Bridgeport
Peach Bottom
Hope Creek
Salem
System Interface
36

$490
$700 - $750
2007 – 2010
Total
($ million)
2010
Mercer
2010
Hudson Unit
2
Completion
Date
Environmental Capital Requirements
Emissions Control Technology Projects
- NOx control – SCR
- SO2 control – Scrubber
- Hg and particulate matter control -
Baghouse
Hudson Unit 2 (608 MW)
NOx control – SCR installation complete
SO2 control – Scrubbers
Hg and particulate matter control –
Baghouse
Mercer (648 MW) – Units 1&2
Our environmental response…
… will help preserve the availability of our fossil fleet.
Power’s New Jersey coal units are
mid-merit, with capacity factors
averaging 50% to 60%
As markets tighten, increased
production is anticipated
37
$20
$30
$40
$50
$60
$70
2002
2003
2004
2005
2006
2007
Est
2008
Fwd
2009
Fwd
$0
$3
$6
$9
$12
$/mmbtu
$/MWh
… influenced by market dynamics.
(1)
Central Appalachian coal
(2)
Forward prices as of September 21, 2007
Long-term market prices …
Electricity
(left scale)
Coal(1)
(right
scale)
Natural Gas Henry Hub
(right scale)
(2)
(2)
(2)
38
Delivery Year
($MW/Day)
$97.82
$111.92
$191.32
---
$191.32
$148.80
2009 / 2010
2008 / 2009
2007 / 2008
Zones
$40.80
Rest of Pool
---
MAAC & APS
$197.67
Eastern MAAC
Auctions scheduled in the next year provide transition through the
2011-2012 delivery year.
Results from PJM’s third capacity auction under the Reliability Pricing
Model for the 2009-2010 delivery year provided strong price signals.
May 2008
2011 – 2012
Annual base auction in May of each
subsequent year
January 2008
2010 – 2011
Auction Date
Planning Year
Future auction pricing to be influenced by increase in number of zones,
load growth, new transmission, avoided cost for units, and capacity
available.
RPM Capacity Auction – transparent pricing model
39
2003 Auction
2004 Auction
2005 Auction
2006 Auction
2007 Auction
Capacity
Load shape
Transmission
Congestion
Ancillary services
Risk premium
Full Requirements
Round the Clock
PJM West
Forward Energy
Price
$33 - $34
$36 - $37
$55
$55
$66
$44 - $46
~ $21
~ $18
~ $21
$102
$67 - $70
~ $32
Increase in Full Requirements Component Due to:
Increased Congestion (East/West Basis)
Increase in Capacity Markets/RPM
Volatility in Market Increases Risk Premium
$99
~ $41
$58-$60
Market Perspective – BGS Auction Results
… has enabled successful participation in each BGS auction.
Power’s fleet diversity and location ...
40

The capital program has been expanded …
($ Millions)
Capital Spending Update
$1,295
$375
$273
$197
$368
$82
TOTAL
2
1
-
(1)
3
(1)
Parent
1
-
-
-
-
1
PSEG Energy Holdings
217
(22)
(86)
64
190
71
PSEG Power*
$1,075
$396
$359
$134
$175
$11
PSE&G
Change from 2006 10-K
$7,047
$1,201
$1,414
$1,408
$1,681
$1,343
TOTAL
23
31
176
$971
2011
135
24
23
31
34
Parent
170
30
40
31
38
PSEG Energy Holdings
2,668
441
580
816
655
PSEG Power*
$4,074
$919
$765
$803
$616
PSE&G
TOTAL
2010
2009
2008
2007
… to support reliability, environmental commitments and growth.
* Figures for PSEG Power exclude Nuclear Fuel
41
Why invest in PSEG?
Growing and visible stream of earnings
Hedging and RPM
Regulated utility operations
Strong balance sheet
Cash available for growth
Competitive dividend yield
Opportunities to invest in markets we know
18.0
17.7
2007E
P/E
Earnings Per
Share*
3.3%
15.9
$3.58
$3.18
Merrill Lynch
Index**
2.5%
16.1
$5.85
$5.30
PSEG
Yield %
2008E
2008E
2007E
*Mid-point of guidance range
Priced as of November 1, 2007
**Merrill Lynch Index of Less-Regulated Utilities
42

New Officers
Izzo – PSEG -
Chairman,
President & CEO
Levis – PSEG Power -
President, CNO, COO
LaRossa – PSE&G
– President & COO
O’Flynn – PSEG - EVP/
CFO, PSEG Holdings -
President
Simpson – PSEG Svcs
- President & COO
Selover – PSEG
Svcs - EVP & Gen
Counsel
Paszynsky
Pego
Hallerdin
Quinn
McLaughlin
Svenson
Frank – VP
Supply Chain
Chouthai
Falck – SVP
Law
McAuliffe
Leyden
Bonnifield
Black
Linde
Smith
Hoskins – VP –
Fed Affairs &Policy
Thigpen – VP –
State Gov Affairs
Byrd – SVP Finance,
Business Development
& Strategy / M&A
Kahrer
Jennings
Seabrook
VP – M&A
Cregg
Moran
MacDonald
Plawner
Lally – VP –
Investor Relations
McGrath
DiRisio
Krueger
Metzger
Brooks
Joyce – SVP
Operations –
Salem/Hope Creek
Barnes – Site VP –
Hope Creek
Fricker – VP –
Operations Support
Braun – Site VP -
Salem
Quinn
Wohlfarth
DePillo
Lopriore – President
– PSEG Fossil
VP Fossil
Ops
Ameo
Pastor
Latka
Dickens
Cardenas
Forline
Lark
Sundheim
Garcez
Matos
New Officers
KEY:
43

Items Excluded from Net Income to Reconcile to Operating Earnings
Please see Slide 2 for an explanation of PSEG’s use of Operating Earnings as a non-GAAP financial measure and how
it differs from Net Income.
$ Millions (except EPS)
2007
2006
2007
2006
2007
2006
2007
2006
Merger related Costs:
PSE&G
-
$
1
$
-
$
(1)
$
Power
-
2
-
-
Enterprise
-
(1)
-
(6)
Total Merger Related Costs
-
$
2
$
-
$
(7)
$
-
$
-
$
-
$
(0.03)
$
Write Down of Assets (Holdings)
(7)
$
-
$
(7)
$
(178)
$
(0.03)
$
-
$
(0.03)
$
(0.70)
$
Discontinued Operations:
Power - Lawrenceburg
1
$
(2)
$
(8)
$
(19)
$
-
$
(0.01)
$
(0.03)
$
(0.08)
$
Holdings:
Elcho and Skawina
-
$
-
$
-
$
227
$
Electroandes
5
4
(9)
9
Total Holdings
5
$
4
$
(9)
$
236
$
0.02
$
0.02
$
(0.04)
$
0.94
$
Total Discontinued Operations
6
$
2
$
(17)
$
217
$
0.02
$
0.01
$
(0.07)
$
0.86
$
Quarter Ended Sept. 30,
Nine Months Ended Sept. 30,
Impact to PSEG EPS
Quarter Ended Sept. 30,
Nine Months Ended Sept. 30,
44