Exhibit 99
Public Service Enterprise Group
Lehman Brothers Global Warming Solutions Conference
New York City
June 3, 2008
Forward-Looking Statement
Readers are cautioned that statements contained in this presentation about our and our subsidiaries' future performance, including future revenues, earnings, strategies, prospects and all other statements that are not purely historical, are forward-looking statements for purposes of the safe harbor provisions under The Private Securities Litigation Reform Act of 1995. Although we believe that our expectations are based on reasonable assumptions, we can give no assurance they will be achieved. The results or events predicted in these statements may differ materially from actual results or events. Factors which could cause results or events to differ from current expectations include, but are not limited to:
Adverse changes in energy industry, policies and regulation, including market rules that may adversely affect our operating results.
Any inability of our energy transmission and distribution businesses to obtain adequate and timely rate relief and/or regulatory approvals from
federal and/or state regulators.
Changes in federal and/or state environmental regulations that could increase our costs or limit operations of our generating units.
Changes in nuclear regulation and/or developments in the nuclear power industry generally, that could limit operations of our nuclear
generating units.
Actions or activities at one of our nuclear units that might adversely affect our ability to continue to operate that unit or other units at the same
site.
Any inability to balance our energy obligations, available supply and trading risks.
Any deterioration in our credit quality.
Any inability to realize anticipated tax benefits or retain tax credits.
Increases in the cost of or interruption in the supply of fuel and other commodities necessary to the operation of our generating units.
Delays or cost escalations in our construction and development activities.
Adverse capital market performance of our decommissioning and defined benefit plan trust funds.
Changes in technology and/or increased customer conservation.
For further information, please refer to our Annual Report on Form 10-K, including Item 1A. Risk Factors, and subsequent reports on Form 10-Q and Form 8-K filed with the Securities and Exchange Commission. These documents address in further detail our business, industry issues and other factors that could cause actual results to differ materially from those indicated in this presentation. In addition, any forward-looking statements included herein represent our estimates only as of today and should not be relied upon as representing our estimates as of any subsequent date. While we may elect to update forward-looking statements from time to time, we specifically disclaim any obligation to do so, even if our estimates change, unless otherwise required by applicable securities laws.
2
Ralph LaRossa
President and Chief Operating Officer – PSE&G
Energy Efficiency, Demand Response and
Renewables: Opportunities for Growth
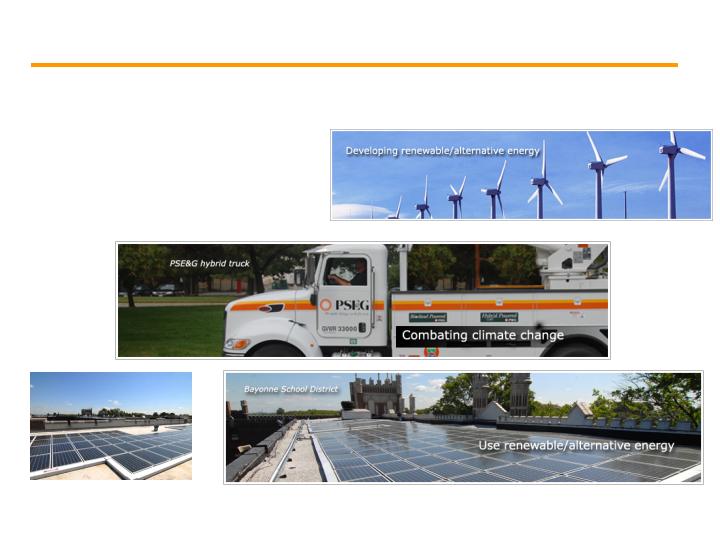
Climate Change
The science on Climate Change is real and not debatable.
Satisfying the world’s appetite for energy contributes to the growing crisis
of global climate change.
NJ can help lead the way in reducing the threat of climate change, and
position NJ to be as economically competitive as possible as the world
mobilizes to address that threat.
PSE&G is committed to apply its broad-based expertise and “patient”
capital in new ways to reduce energy demand, spur investment in
renewable resources and develop new sources of carbon-free supply.
PSE&G will continue to do its part as a leader in the energy industry and
responsible corporate citizen, working closely with other stakeholders to
tackle the most important environmental challenge of our time.
4
Energy Master Plan (EMP)
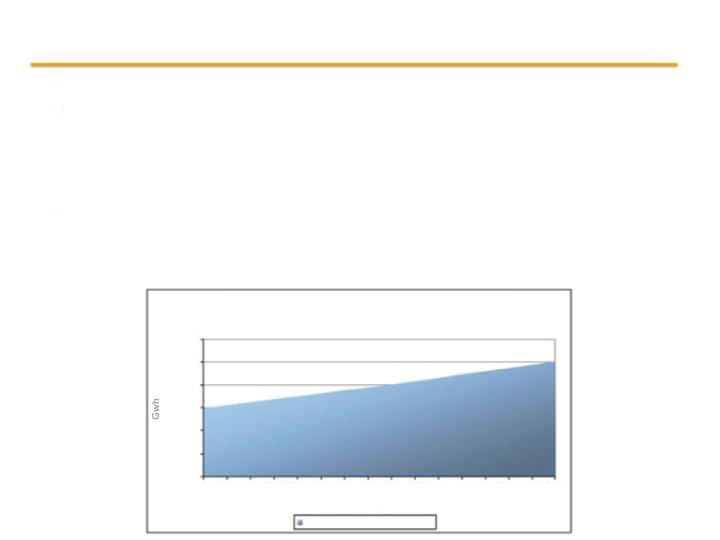
• Draft EMP released by Governor’s Office on April 17, 2008.
• Under a “business as usual” approach with no changes in State
policies or actions, New Jersey’s projected energy demand in 2020
will be about 100,000 GWh of electricity and over 590 trillion BTUs of
natural gas.
• In addition, greenhouse gas emissions from the electricity and heating
fuel sectors will increase to over 90 million metric tons of carbon
dioxide.
Projected Electricity Growth Rate in New Jersey for all Sectors
2005 - 2020
110,000
100,000
50,000
90,000
80,000
70,000
60,000
2005
2006
2019
2008
2007
2009
2010
2012
2017
2020
2016
2015
2014
2013
2011
2018
Source: Draft NJ EMP, 4.17.08
All Sectors (1.52% Annual Growth)
5
Energy Master Plan (EMP)
• Long-term planning of the electricity system typically is
based on projections that the highest peak demand will
increase year by year.
• Plans are implemented to expand the system’s capacity
to deliver electricity to keep up with the expected
increases in the highest peak demand.
Atlantic City Electric
Jersey Central Power & Light
Public Service Electric & Gas
Rockland Electric
TOTAL
2,829
6,478
10,967
435
20,709
3,866
8,216
12,978
497
25,557
2.60%
2.00%
1.40%
1.10%
1.75%
Utility
Summer 2008
Peak Demand
Forecast (MW)
Projected Annual
Growth Rate
Projected 2020
Peak Demand
(MW)
Source: Draft NJ EMP, 4.17.08
6
Energy Master Plan (EMP)
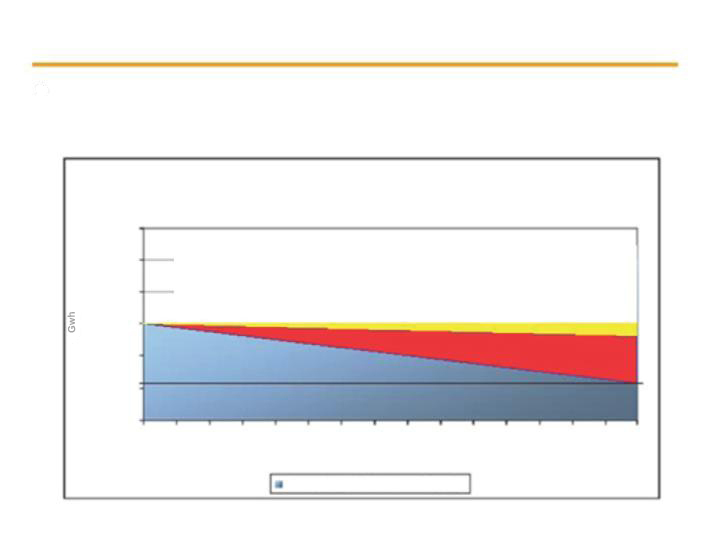
• GOAL 1:
Maximize the State’s energy conservation and energy efficiency to achieve reduction in energy consumption of at least 20% (20,000 GWhrs) by 2020.
• GOAL 2:
Reduce peak demand for electricity by 5,700 MW by 2020.
EE Related Peak
Load Reduction
24%
Appliance
Standards
11%
Demand
Response
Programs
39%
CHP
26%
Actions to Achieve
2020 Peak Load Reduction Target: 5,700 MW
7
This electricity is projected to come from 900 MW of biomass capacity, at
least 1000 MW of offshore wind capacity, 200 MW of onshore wind
capacity, and 1,700 MW of solar capacity
Energy Master Plan (EMP)
• GOAL 3:
Meet 22.5% (3,600 MW) of the State’s electricity
needs from renewable sources.
Projected Electricity Growth Rate in New Jersey for all Sectors
2005 - 2020
110,000
100,000
90,000
80,000
70,000
60,000
50,000
2006
2013
2014
2015
2016
2017
2018
2019
2020
2012
2011
2010
2009
2008
2005
2007
Year
All Sectors (1.52% Annual Growth)
Source: Draft NJ EMP, 4.17.08
8
Energy Master Plan (EMP)
GOAL 4:
Develop new low carbon emitting, efficient power plants and close the gap between the supply and demand of electricity.
GOAL 5:
Invest in innovative clean energy technologies and businesses to stimulate the industry’s growth in New Jersey.
9
PSE&G’s Role
“Green” initiatives include:
Campaigning for tougher power plant emission standards
Installing new electrical wires and state-of-the-art transformers
that are expected to reduce carbon emissions by almost 60,000
tons by year 2020
CFL Pledge Campaign
Replacing 1,300 corporate fleet vehicles with fuel-efficient hybrids
Advanced Metering Infrastructure BPU Filing
Carbon Abatement Pilot BPU Filing
Helping customers obtain the latest energy-saving technology, such as
programmable thermostats and high-efficiency lighting
EMP Working Group leadership and participation
Utility consensus position on utility participation in efficiency
RGGI legislation
10
PSE&G’s Blueprint for Sustainability – a challenge and an
opportunity
New Jersey has passed legislation that recognizes the
important role of utilities in promoting a sustainable energy
future.
In April, PSE&G received approval from the NJ BPU to
begin a $105 million investment in solar energy.
We are working hard to obtain approval of two other
initiatives:
Carbon abatement pilot
AMI pilot to deploy and test advanced metering infrastructure
11
Why did PSE&G initiate the Solar Loan Program?
At PSE&G, we’re committed to doing our part to save energy, slow global
warming, and reduce our dependence on foreign oil. As New Jersey’s largest
utility, PSE&G is uniquely positioned to provide the capital resources needed to
implement this program.
12
Overview – Innovative Program
In April, PSE&G received BPU approval of a 2-energy year program to
provide for the financing of solar panels and related equipment (Solar
Energy System) to properly qualified borrowers on a first come, first
served basis.
The Solar Energy System must be installed within PSE&G’s electric
distribution area and be eligible for net metering.
Each loan will be secured by a first priority lien on the solar
equipment, Solar Renewable Energy Certificates (SRECs) and project
documents collectively, the “Collateral”.
The borrower can repay the loan either in cash or by delivering
SRECs generated by the Solar Energy System to PSE&G as payment.
PSE&G estimates that the financing will represent approximately 40%
to 60% of total capital cost to purchase and install a Solar Energy
System.
The actual loan amount is based on the Solar Energy System
production capabilities (anticipated energy (mwh)).
13
PSE&G is exploring additional investments
* Plans not finalized and assumes that all regulatory approvals are obtained in the timeframe needed.
14
PV Solar:
PSE&G supplies 50% of the RPS requirements
Declining costs would increase % of RPS supplied with
same dollar today.
Energy
Efficiency:
50% of EMP goal (excluding portion met by code changes) in PSE&G service territory.
Demand
Response:
Retool current AC Cycling program to replace existing
equipment.
Onshore
Wind:
5MW on-shore wind; utility-owned
CHP:
Focus on the hospital segment to capture a % of the
total EMP load of 1500MW.
Other:
Consideration for emerging opportunities such as, green
collar jobs, geothermal, “Green Street Lights” and PHEV
Why PSE&G?
15
Throughout its 104-year history PSE&G has been committed to
providing safe, highly reliable energy as cost-effectively as possible.
PSE&G is part of the community it serves and its customers are its
neighbors. This close relationship puts the utility in a unique position
to promote energy efficiency, house- by-house, neighborhood-by-
neighborhood to all of its customers, including urban residents, low-
income customers, and renters.
PSE&G has staying power and can deploy capital over the long term to
ensure renewable sources and energy-efficiency gains are sustained.
We call that “patient” capital.
PSE&G is a national leader committed to reducing our collective
carbon footprint.
Innovative Energy Solutions
“We stand at the forefront in helping
society address the challenge of climate
change – the preeminent issue of our
time, with the power to transform both
our company and our industry.”
- Ralph Izzo, Chairman of the Board, President and Chief
Executive Officer, PSEG
www.pseg.com/solarloan
16
APPENDIX
Market Segments – Universal Access
PSE&G will provide loans to properly qualified borrowers in four different market
segments, on a first come, first served basis.
70 Experian
70 Experian
70 Experian
720 FICO
Minimum
Credit Score
9 MW
(hard cap)
12 MW
(hard cap)
3 MW
(soft cap first
year)
6 MW
(soft cap first
year)
Megawatts
Municipal
I&C
Multi-Family/
Affordable
Single Family/
Residential
Block
This innovative loan program also provides opportunities for tax equity players to
invest in solar installations on PSE&G customer facilities.
Program is now available to non-residential segment.
Residential segment should be ready in 2 - 4 months upon approval of Dept. of
Banking and Insurance and BPU stakeholder process.
18
Rates and Return
PSE&G will provide loans to four different market segments, with specific loan
characteristics:
11.11%
11.11%
11.11%
6.5%
Interest Rate
15 years
15 years
15 years
10 years
Term of Loan
Municipal
I&C
Multi-Family/
Affordable
Single Family/
Residential
Block
PSE&G’s pre-tax WACC is 11.11%. In the Residential segment, the interest rate
of 6.5% is supplemented with a charge to all ratepayers to provide PSE&G its
WACC on the loan.
The settlement also defines a guaranteed PSE&G ROE of 9.75% with recoverable
administrative costs not to exceed $1MM in any year and no lost revenue.
If loans are paid off early, PSE&G retains the right to purchase SRECs through a
call option. The call option price is 75% of the then current Market Value of
SRECs. The parties agreed that the call option provides benefits to ratepayers
after the loan has been repaid. The price will be determined at the time the
Company seeks to exercise the call option.
19
Key Loan Terms and Conditions
20
The borrower will fully repay the loans by providing PSE&G with
SRECs or cash, to repay principal and interest.
For every megawatt hour of energy produced by the Solar
Energy System, NJ’s Office of Clean Energy will credit the
borrower’s SREC account with one SREC (1mwh = 1 SREC).
Periodically, the SRECs will be transferred to PSE&G’s SREC
account as payment of the loan.
For repayment purposes, PSE&G will value the SRECs at the
greater of: the floor price of $475 per SREC, or the actual market
value at the time the SREC is credited.
Loan repayments are scheduled as fixed monthly payments
containing interest and principal.
Key Loan Terms and Conditions
PSE&G will conduct an annual true-up to compare the amount
due under the loan agreement with the sum of the value of all
SRECs generated that year.
The borrower will be required to pay any resulting shortfall (in
cash) to PSE&G. The owner of the Solar Energy System bears
the production risk.
If the value of the SRECs exceeds the amount due under the
loan agreement, such surplus will be credited toward the
outstanding balance to accelerate the amortization of the loan.
Each borrower will have a minimum credit score, no bankruptcy
in the preceding 3 years and a favorable PSE&G credit
assessment.
21
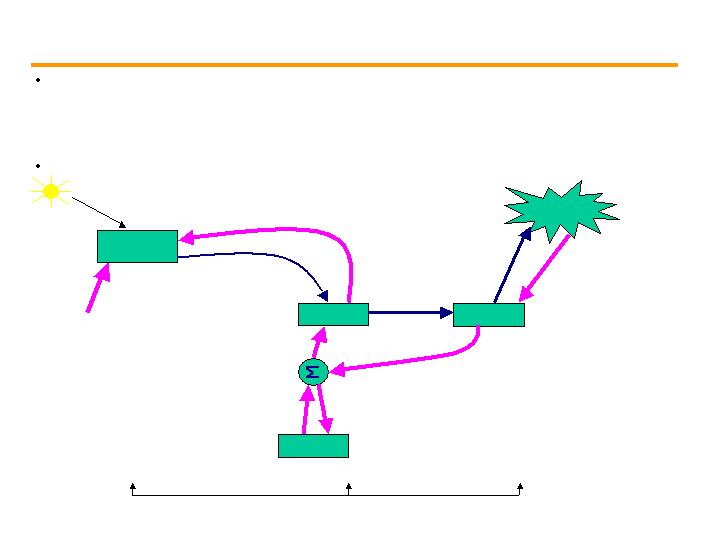
Cost Recovery
PSE&G will recover the net monthly revenue requirements associated
with the Program through a new Solar Pilot Recovery Charge (“SPRC”),
which will be applicable to all electric Rate Schedules.
PSE&G will defer costs to the SPRC for future recovery.
PV Owner
From Fed Gov’t
ITC
MACRS
PSE&G
PSE&G
SREC Auction
Rate Payer
Capital: PSE&G Loan
SRECs used as currency for
loan repayment of principle
and interest. SREC value >=
$475. SREC value set by Mkt
value on day of transaction.
At this point, the SREC
certificate is a paper product.
Year 1
Year 2
Ratepayer sends
cash to cover
repayment of
Loan with
WACC return +
recoverable Admin
cost.
Public Market
Net proceeds from SREC sale is
sent to Rate Payer. (net after admin
cost of auction)
PSE&G auctions its SRECs
to the market. It does not
make a gain or loss.
PSE&Gs SRECs
sent to its auction
process
PSE&Gs
SRECs sold at
market price
Proceeds from
SREC sold to
PSE&G
When SREC > $475, Ratepayer will realize a
benefit to the extent the loan is prepaid and the
call option for the SRECs are exercised. When
SREC < $475, Ratepayer will experience a
shortfall. When SREC = $475, Ratepayer is
neutral with regard to the non-residential
loans. The ratepayer is always out of
pocket with respect to the admin cost and to
cover the difference between WACC and the
6.5% coupon rate on the residential loans.
Ratepayer funds
repayment of loan.
The current SREC life is 1 year. A proposed change to the SREC life would change the SREC life to
2 energy year plus 3 months.
22
Public Service Enterprise Group