
Public Service Enterprise Group
European Investor Meetings
June 29, 2009 – July 2, 2009

Forward-Looking Statement
Readers are cautioned that statements contained in this presentation about our and our subsidiaries’ future performance, including future
revenues, earnings, strategies, prospects and all other statements that are not purely historical, are forward-looking statements for
purposes of the safe harbor provisions under The Private Securities Litigation Reform Act of 1995. Although we believe that our
expectations are based on reasonable assumptions, we can give no assurance they will be achieved. The results or events predicted in
these statements may differ materially from actual results or events. Factors which could cause results or events to differ from current
expectations include, but are not limited to:
Adverse changes in energy industry, policies and regulation, including market structures and rules.
New energy legislation.
Any inability of our energy transmission and distribution businesses to obtain adequate and timely rate relief and regulatory approvals from
federal and state regulators.
Changes in federal and state environmental regulations that could increase our costs or limit operations of our generating units.
Changes in nuclear regulation and/or developments in the nuclear power industry generally, that could limit operations of our nuclear
generating units.
Actions or activities at one of our nuclear units that might adversely affect our ability to continue to operate that unit or other units at the
same site.
Any inability to balance our energy obligations, available supply and trading risks.
Any deterioration in our credit quality.
Availability of capital and credit at reasonable pricing terms and our ability to meet cash needs.
Any inability to realize anticipated tax benefits or retain tax credits.
Increases in the cost of or interruption in the supply of fuel and other commodities necessary to the operation of our generating units.
Delays or cost escalations in our construction and development activities.
Adverse investment performance of our decommissioning and defined benefit plan trust funds, and changes in discount rates and funding
requirements.
Changes in technology and increased customer conservation.
For further information, please refer to our Annual Report on Form 10-K, including Item 1A. Risk Factors, and subsequent reports on Form
10-Q and Form 8-K filed with the Securities and Exchange Commission. These documents address in further detail our business, industry
issues and other factors that could cause actual results to differ materially from those indicated in this presentation. In addition, any
forward-looking statements included herein represent our estimates only as of today and should not be relied upon as representing our
estimates as of any subsequent date. While we may elect to update forward-looking statements from time to time, we specifically disclaim
any obligation to do so, even if our internal estimates change, unless otherwise required by applicable securities laws.
Delivering Value: Today and Tomorrow 2

GAAP Disclaimer
PSEG presents Operating Earnings in addition to its Net Income reported
in accordance with accounting principles generally accepted in the United
States (GAAP). Operating Earnings is a non-GAAP financial measure that
differs from Net Income because it excludes the impact of the sale of
certain non-core domestic and international assets and material
impairments and lease-transaction-related charges. PSEG presents
Operating Earnings because management believes that it is appropriate
for investors to consider results excluding these items in addition to the
results reported in accordance with GAAP. PSEG believes that the non-
GAAP financial measure of Operating Earnings provides a consistent and
comparable measure of performance of its businesses to help
shareholders understand performance trends. This information is
not intended to be viewed as an alternative to GAAP information. The last
slide in this presentation includes a list of items excluded from Net Income
to reconcile to Operating Earnings, with a reference to that slide included
on each of the slides where the non-GAAP information appears.
Delivering Value: Today and Tomorrow 3
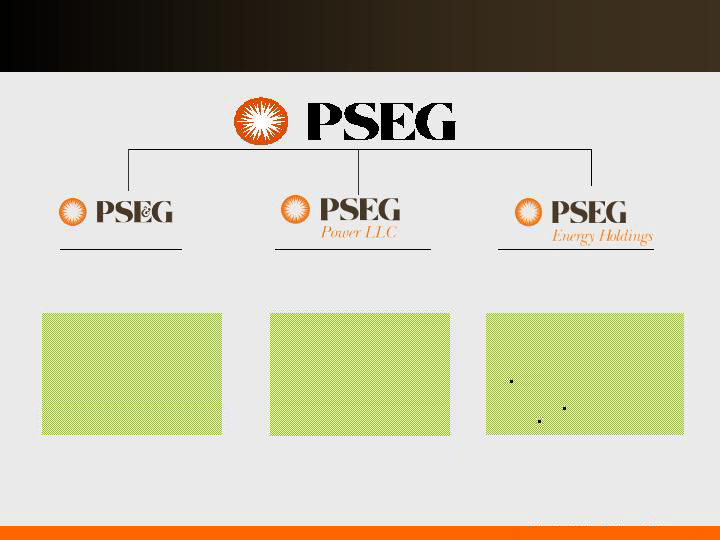
PSEG establishing a policy leadership position …
Electric and Gas
Delivery
Leveraged Leases and
Renewable Investments
Regional
Wholesale Energy
… in promoting a sustainable energy future.
PSE&G positioned to meet
NJ’s energy policy and
economic growth objectives
with $1.7 billion investment
program.
PSEG Power’s low-cost
baseload nuclear fleet well-
positioned in carbon
constrained environment.
PSEG Energy Holdings
positioned to pursue attractive
renewable generation
opportunities.
Compressed Air Energy
Storage (CAES)
Solar
Offshore wind
Delivering Value: Today and Tomorrow 4

Public Service Enterprise Group …
… an energy provider
meeting the needs of customers
and shareholders.
Meeting
Commitments
Delivering
Value Today
Positioned for
the Future
Delivering Value: Today and Tomorrow 5

PSEG: Establishing a foundation…
Meeting Commitments
Achieved 2008 earnings targets
Operational excellence drove results
Sharpened business focus; international assets
sold
Balance sheet strengthened; credit outlook
improved
Attractive dividend growth rate
… and building a record that sets us apart.
Delivering Value: Today and Tomorrow 6

Making decisions and achieving results…
… to strengthen operational and financial position.
Delivering Value Today
2009 earnings guidance represents continued
growth
Operational excellence improving results
Core business investments providing attractive
returns
Dividend increased – 6th consecutive year; 102nd
year of paying an annual dividend
Strong financial position – credit metrics, liquidity
Delivering Value: Today and Tomorrow 7

2007 Operating Earnings Per Share*
2008 Operating Earnings Per Share*
2009 Guidance
$2.68
$3.00 - $3.25
PSEG – 2009: Meeting the Challenge
$3.03
* See page 64 for Items excluded from Income from Continuing Operations to reconcile to Operating Earnings.
Delivering Value: Today and Tomorrow 8

Strong operations and risk controls…
… position us to meet challenges of today’s market.
Asset optimization yielding
results
7th successful BGS auction validates
hedging strategy
RPM capacity auction supports asset
values in constrained areas
Power’s dispatch profile provides
operating flexibility
PSE&G focused on reliability and
meeting energy goals
On track to achieve
earnings growth in 2009.
Guidance maintained at
$3.00 - $3.25.
Investment focus on projects
with attractive risk-adjusted
returns
iPower
Infrastructure
Energy Efficiency
Solar
Delivering Value: Today and Tomorrow 9

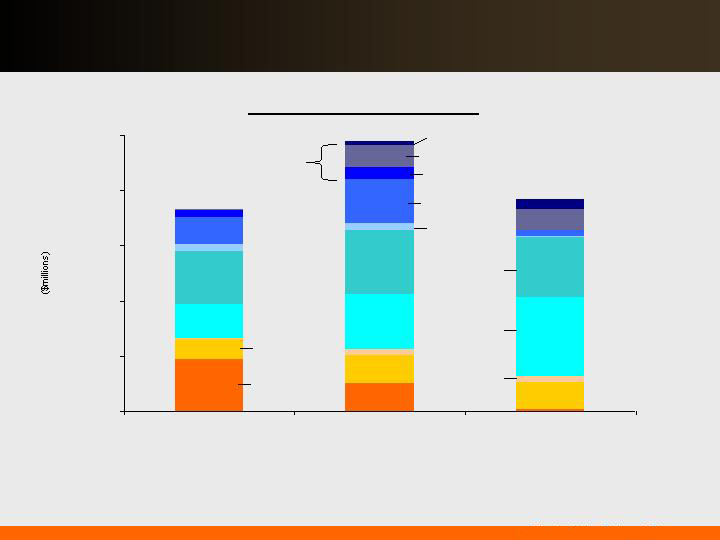
PSEG Consolidated
2008 Sources and Uses
Proceeds from asset sales provided further support for debt
reduction.
$0.0
$1.0
$2.0
$3.0
$4.0
Sources
Uses
Share Repurchases
Cash Ops*
(Non-GAAP)
Shareholder
Dividend
Investment
(includes
Nuclear Fuel)
Debt
Reduction
Net Asset
Sales
Internally generated cash in 2008 exceeded investment needs.
* Cash Ops (Non-GAAP) represents Cash Ops adjusted for securitization principal repayment, taxes associated with asset sales, and IRS deposits.
IRS Deposit
Delivering Value: Today and Tomorrow 10

Consolidated
PSE&G
Power
Holdings
Net Short Term Debt / (Investments)
(0.2)
(0.0)
-
-
Total Long-Term Debt
7.2
3.5
2.9
0.5
Preferred Stock
0.1
0.1
-
-
Common Equity
7.8
3.6
3.9
1.1
Total Capitalization
14.9
7.2
6.8
1.6
2008 Year-End Capital Structure*
$ Billions
45%
50%
55%
2007
2008
48%
50%
47%
50%
53%
2007
2008
PSE&G
Regulatory Equity Ratio
PSEG Consolidated
Total Debt to Total Capitalization
Our balance sheet has been strengthened …
… which provides us substantial financial flexibility.
*Excludes securitization and non-recourse debt
~$525M reduction in Net Debt
excluding PSE&G
~
~
Delivering Value: Today and Tomorrow 11

35%
40%
45%
50%
55%
2007
2008
2009
20%
25%
30%
35%
2007
2008
2009
PSEG
Funds from Operations / Total Debt
PSEG Power
Funds from Operations / Total Debt
Target Mid-20’s
~
~
Target Mid-30’s
~
~
We are meeting or exceeding key credit measures …
… maximizing financial flexibility in uncertain credit markets.
Delivering Value: Today and Tomorrow 12
… continues 102-year history of paying common dividends.
70%
44%
Payout
Ratio
41% - 44%
43%
66%
63%
$1.10
$1.12
$1.33*
$1.17
$1.29
$1.14
2004
2005
2006
2007
2008
2009E
*Indicated annual dividend rate
Dividends per Share
Sixth consecutive annual increase in common dividend …
Delivering Value: Today and Tomorrow 13

Operational excellence, financial strength and disciplined investment …
Positioned for the Future
… support shareholder value.
Balanced business mix
BGS: A demonstrated mechanism for meeting customer
supply at market prices for multi-year period
Federal and State policies provide opportunities for
growth – Leadership position in energy policy
T&D investments providing growth with minimal rate
impact
Strong financial position and cash flow provide flexibility
in volatile markets – No need to issue equity
Delivering Value: Today and Tomorrow 14
PSE&G’s investments in Energy Efficiency, Stimulus and Solar are
conditioned upon receiving reasonable rate treatment.
Future investments are weighted towards PSE&G and growth.
2009 - 2011 Capital Expenditures
$0
$500
$1,000
$1,500
$2,000
$2,500
2009
2010
2011
Power –
Sustainability
PSE&G -
Distribution
Infrastructure
Power – BET
Environmental
PSE&G -
Transmission
PSE&G - Other
Solar 4 All
Pending
Approval
Energy Efficiency
Solar II
Power –
Growth
Delivering Value: Today and Tomorrow 15

PSEG leadership recognized
Named one of the Most
Admired Companies,
2007 & 2008
One of 125 companies
named to DJSI North
America and one of only
10 U.S. electric
companies included
Corporation of the year 2007
One of the 400 best
big companies, 2008
PSE&G named America’s Most
Reliable Utility
Mid-Atlantic Region
winner for the 7th straight year
PSEG Chairman
Ralph Izzo named
CEO of the year
Carbon Disclosure
Leadership Index 2008
2008 Balanced Scorecard
Achievement Award
Delivering Value: Today and Tomorrow
16

Operational excellence, financial strength and disciplined investment…
… position us well in today’s market.
Low payout ratio and strong balance sheet provide support
Is dividend secure?
Strong balance sheet, credit metrics and liquidity
What is the impact of
credit market stress?
Strong cash flow well in excess of PSE&G’s equity
requirements
Do you need equity?
Carbon friendly
Federal and State Policy initiatives support capital plans
How is PSEG affected
by policy changes?
Multi-year hedging profile supported by core assets
Asset balance dampens relative fuel price volatility
Capacity markets provide stability
What’s the impact of
commodity volatility?
PSE&G current/pending rate needs equal 2-4% impact
BGS supply generally priced at market
What is impact on
customer from capital
programs?
PSEG Position
Market’s Questions
Delivering Value: Today and Tomorrow
17

PSEG – Delivering Value: Today and Tomorrow
Delivering
Value Today
Positioned for
the Future
Achieved 2008 earnings
targets
Operational excellence
drove results
Sharpened business focus;
international assets sold
Balance sheet
strengthened; credit
outlook improved
Attractive dividend growth
rate
2009 earnings guidance
represents continued
growth
Operational excellence
improving results
Core business
investments providing
attractive returns
Dividend increased – 6th
consecutive year; 102nd
year of paying an annual
dividend
Strong financial position
– credit metrics, liquidity
Balanced business mix
BGS: A demonstrated
mechanism for meeting
customer supply at market
prices for multi-year period
Federal and State policies
provide opportunities for
growth – Leadership position
in energy policy
T&D investments providing
growth with minimal rate
impact
Strong financial position and
cash flow provide flexibility in
volatile markets – No need to
issue equity
Meeting
Commitments
Delivering Value: Today and Tomorrow
18

PSEG Power – Overview

Delivering
Value Today
Positioned for
the Future
Meeting
Commitments
Achieved 2008 earnings
targets
Improved operating
performance of generation
fleet
Environmental
commitments met
$1 Billion capital expense
on budget, met specs
Disciplined hedging
strategies have managed
earnings volatility and
reduced risk
On target to meet 2009
earnings guidance of
$1,210M to $1,285M
Continued Operational
Excellence Model (OEM)
implementation with
demonstrated
improvements at Fossil
Sustained, strong nuclear
performance
Successful multi-year
hedging strategy
supported by BGS, RPM in
liquid markets
Effective management of
costs and capital programs
to drive value
Low-cost, baseload
nuclear fleet benefits in
carbon constrained world
BET installation improves
operating capability of coal
fleet and enables a wide
variety of coals
Expansion opportunities
through existing
experience and
infrastructure, including
peaker bids
Strong free cash flow
PSEG Power - Delivering Value: Today and Tomorrow
Delivering Value: Today and Tomorrow
20

Low-cost portfolio
Regional focus in competitive, liquid
markets
Assets favorably located near
customers/load centers
Many units east of PJM
constraints
Southern NEPOOL/ Connecticut
Market knowledge and experience
to maximize the value of our assets
… with low cost plants, in good locations, within solid markets.
Power’s assets support commitments in a dynamic environment…
18%
45 %
9 %
27 %
Fuel Diversity
Coal
Gas
Oil
Nuclear
Pumped
Storage
1%
Energy Produced – 2008
53%
23%
23%
Pumped Storage
& Oil 1%
Nuclear
Coal
Gas
Total GWh: 55,300
Total MW: 13,576
Delivering Value: Today and Tomorrow
21
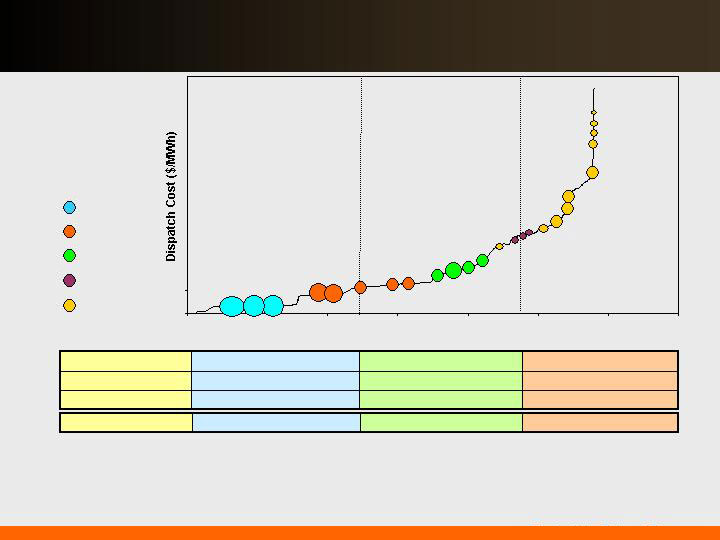
… of serving full requirement load contracts, while maintaining
optionality under a variety of conditions.
Power’s assets along the dispatch curve reduce the risk…
X
X
Ancillary Revenue
X
X
X
X
Capacity Revenue
X
X
Energy Revenue
X
X
Dual Fuel
Baseload units
Load following units
Peaking units
Illustrative
Salem
Hope
Creek
Keystone
Conemaugh
Hudson 2
Linden 1,2
Burlington 8-9-11
Edison 1-2-3
Essex 10-11-12
Bergen 1
Sewaren 1-4
Hudson 1
Mercer1, 2
Bergen 2
Sewaren 6
Mercer 3
Kearny 10-11
Linden 5-8 / Essex 9
Burlington 12 / Kearny 12
Peach
Bottom
Bridgeport
New
Haven
Nuclear
Coal
Combined Cycle
Steam
Peaking
BEC
Yards
Creek
National Park
Delivering Value: Today and Tomorrow
22
2003
2004
2005
2006
2007
2008
2009
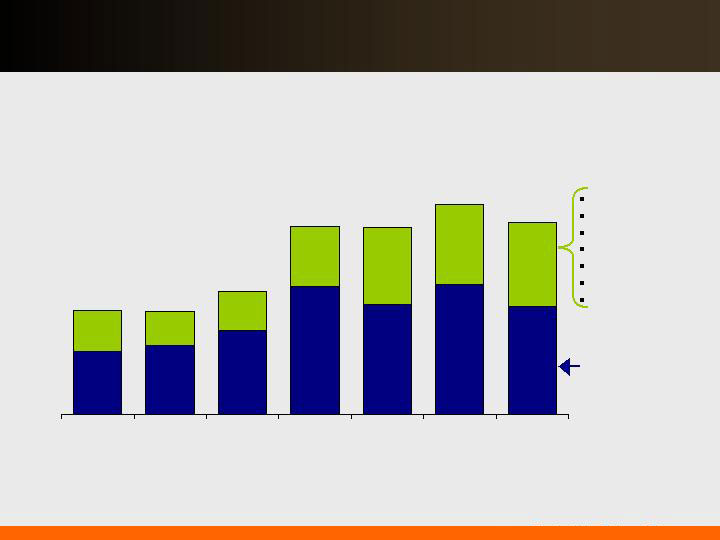
Increase in Full Requirements
Component Due to:
Increased Congestion (East/West Basis)
Increase in Capacity Markets/RPM
Volatility in Market Increases Risk
Premium
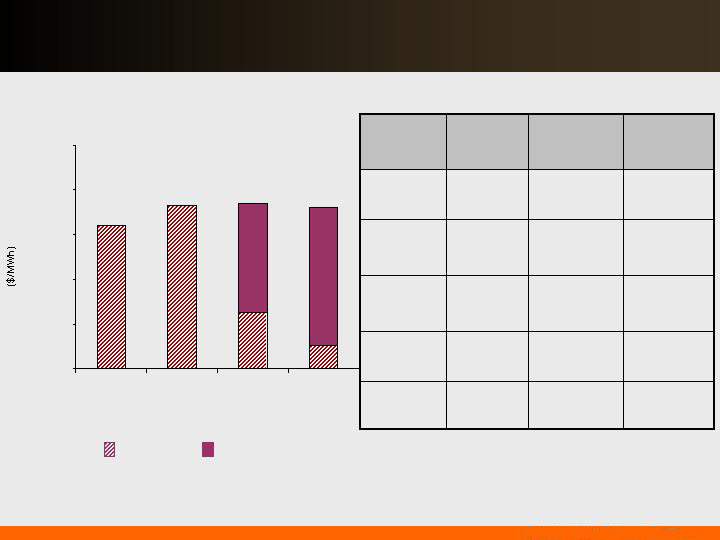
The recent successful completion of the seventh BGS auction...
Market Perspective – BGS Auction Results
… cushions the impact of volatile markets on customers.
Note: BGS prices reflect PSE&G Zone
Full Requirements
3 Year Average
Round the Clock
PJM West
Forward Energy
Price
$55.05
$65.41
~ $18
~ $21
$102.51
~ $32
$98.88
~ $41
~ $43
$111.50
~ $47
$103.72
$55.59
~ $21
Capacity
Load shape
Transmission
Congestion
Ancillary services
Risk premium
Green
$33 - $34
$36 - $37
$44 - $46
$67 - $70
$58-$60
$68 - $71
$56 - $58
*
*2009 RTC price was ~ $50/MWh at time of auction
Delivering Value: Today and Tomorrow
23
-
2,000
4,000
6,000
8,000
10,000
12,000
-
2,000
4,000
6,000
8,000
10,000
12,000
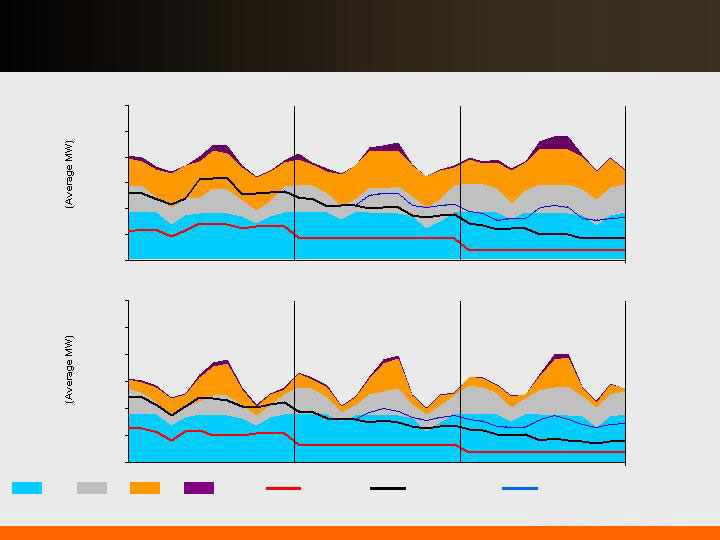
Power’s output is sold forward…
… through full requirement contracts and other hedging transactions.
2009 2010 2011
2009 2010 2011
Nuclear
Coal
CC
Steam / Pk
Existing Hedges
Existing Loads+ Hedges
Existing Loads+ Hedges + Potential Future BGS
Total Fleet On-Peak Average MW
Total Fleet Off-Peak Average MW
Delivering Value: Today and Tomorrow
24
$0
$20
$40
$60
$80
$100
2004
2005
2006
2007
2008
2009
Fwd *
2010
Fwd
2011
Fwd
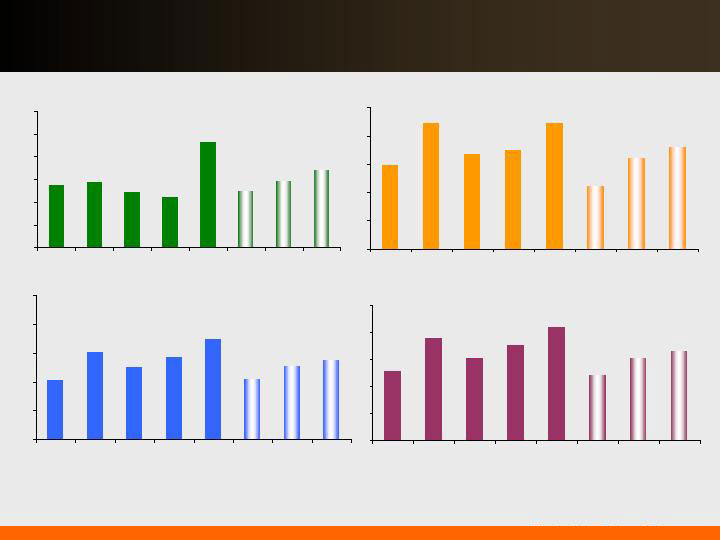
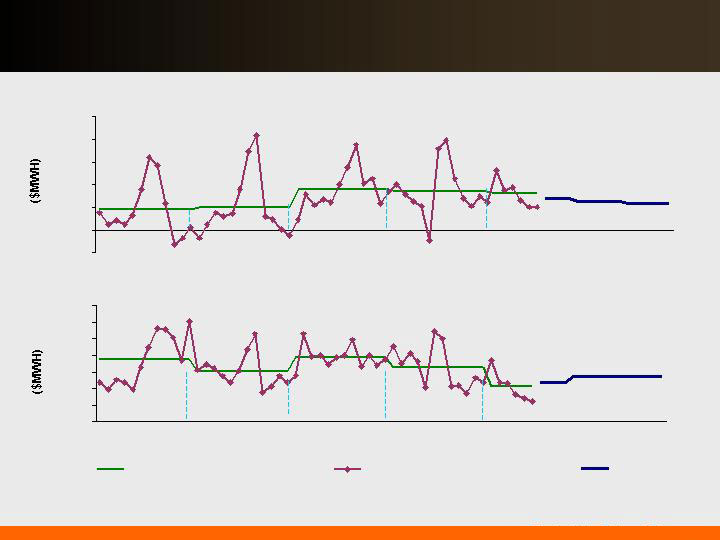
Commodity prices have been volatile…
*Average of 6 historical months and 6 forward months
… but Power’s diverse asset portfolio and hedging strategy has
mitigated the effect of volatility, providing strong results.
Henry Hub NYMEX
($/MMBTU)
Western Hub RTC
($/MWh)
West Hub On Peak
($/MWh)
Central Appalachian Coal
($/Ton)
Note: Forward prices as of 6/18/09
$0
$20
$40
$60
$80
$100
$120
2004
2005
2006
2007
2008
2009
Fwd *
2010
Fwd
2011
Fwd
$0
$2
$4
$6
$8
$10
2004
2005
2006
2007
2008
2009
Fwd *
2010
Fwd
2011
Fwd
$0
$20
$40
$60
$80
$100
2004
2005
2006
2007
2008
2009
Fwd *
2010
Fwd
2011
Fwd
Delivering Value: Today and Tomorrow
25
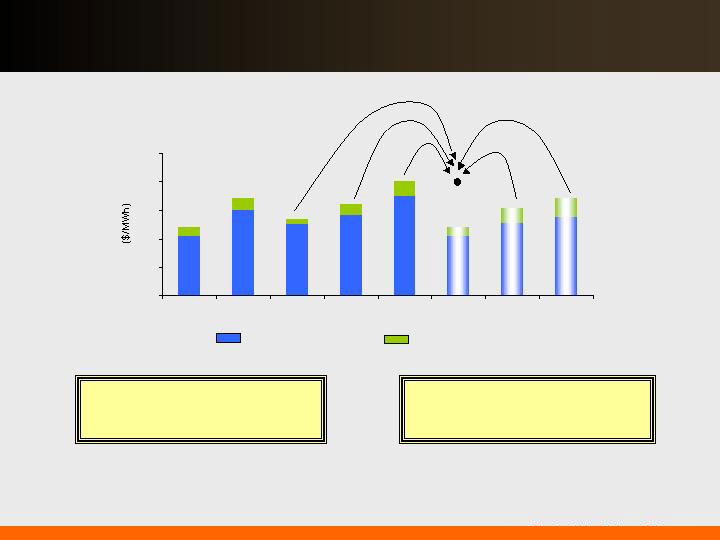
The effect of our hedging/forward sales strategy…
Power’s hedging strategy
secures pricing over a 2 - 3 year
future time horizon.
The 3 year BGS Auction period
has the effect of pulling forward
prices back.
… is to create a realized price that is a blend of prior and future pricing,
moderating volatility.
*PJM West Average of 6 historical months and 6 forward months
$0
$20
$40
$60
$80
$100
2004
2005
2006
2007
2008
2009 Fwd
2010 Fwd
2011 Fwd
PJM West
PS Zone vs PJM West Basis
2009 realized
price
*
Delivering Value: Today and Tomorrow
26
-$10
$0
$10
$20
$30
$40
$50
2005
2006
2007
2008
2009
2010
2011
$0
$10
$20
$30
$40
$50
$60
$70
2005
2006
2007
2008
2009
2010
2011
Annual Average
Historical Monthly
Forecast
Note: Forward prices as of 06/18/09
Spark spreads are in line with rising historical averages…
PJM Western Hub Spark Spread (On-Peak – Henry Hub * 7.5 Heat Rate)
PJM Western Hub Dark Spread (RTC – Central Appalachian Coal * 10 Heat Rate)
… but near term dark spreads have declined in response to weak demand.
Delivering Value: Today and Tomorrow
27
0%
25%
50%
75%
100%
2009
2010
2011
$40
$50
$60
$70
$80
$90
0%
25%
50%
75%
100%
2009
2010
2011
$0
$50
$100
$150
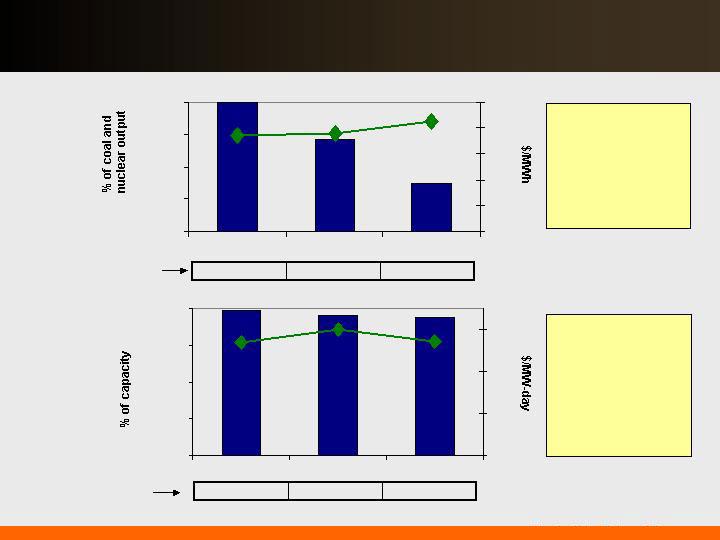
Power’s hedging program provides near-term stability from
market volatility…
… while remaining open to long-term market forces.
Estimated EPS impact of
$10/MWh PJM West around
the clock price change*
(~$2/mmbtu gas change)
Contracted Capacity
Estimated EPS impact of
$30/MW-day capacity
price change*
Price
(right
scale)
*As of June 2009; Assuming normal market commodity correlations
Power has
contracted at
attractive prices,
which includes
locational basis
and load shaping
premium.
The pricing for
most of Power’s
capacity has been
fixed through May
2013, with the
completion of
auctions in PJM
and NE.
% sold
(left
scale)
$0.25 - $0.45
$0.10 - $0.20
$0.01 - $0.02
$0.00 - $0.01
$0.00 - $0.01
$0.00 - $0.01
Contracted Energy
Price
(right
scale)
% sold
(left
scale)
Delivering Value: Today and Tomorrow
28
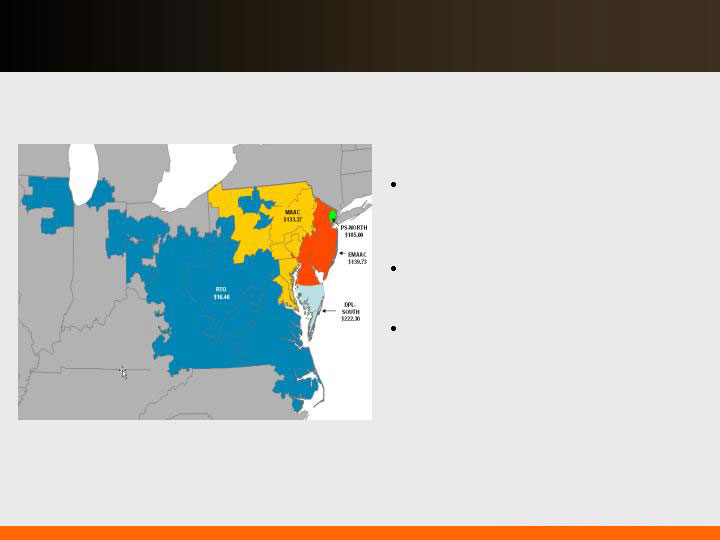
2012 / 2013 RPM Auction Results
PSEG Power’s assets are in
constrained zones, which
cleared at higher prices.
Power’s offer for 178MW of new
capacity was accepted by PJM.
Auction results reflect impact of
new transmission capability.
Delivering Value: Today and Tomorrow
29
… Power expects to see continued strong margins from PJM’s
Reliability Pricing Model.
Through the new capacity construct, and pricing at auction
prices…
$185.00
PSEG North Zone
$16.46
$110.00
$174.29
$102.04
$111.92
$40.80
Rest of Pool
$133.37
$110.00
$174.29
191.32
MAAC
$139.73
$110.00
$174.29
$191.32
$148.80
$197.67
Eastern MAAC
2012 / 2013
2011 / 2012
2010 / 2011
2009 / 2010
2008 / 2009
2007 / 2008
PJM Zones
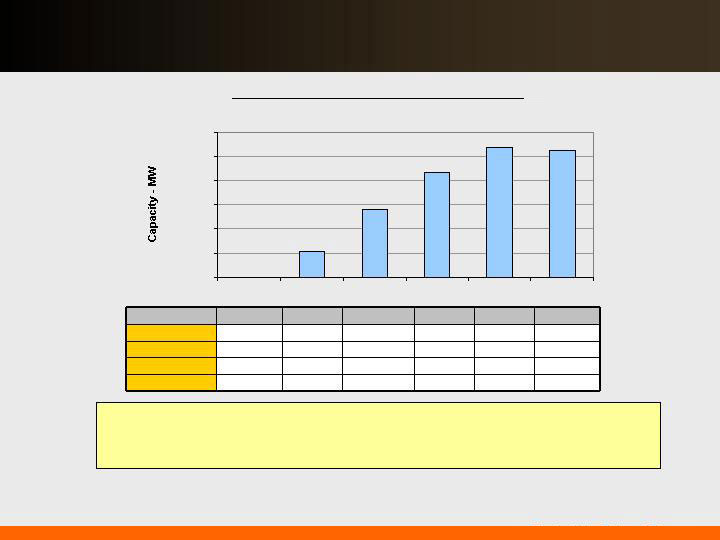
With nearly 1/3 of its capacity in PS North and nearly 2/3 of its capacity in
MAAC and EMAAC, Power’s assets in congested locations received higher
pricing in the 2012/2013 RPM Auction.
PJM Capacity Available to Receive Auction Pricing
0
2,000
4,000
6,000
8,000
10,000
12,000
07/08
08/09
09/10
10/11
11/12
12/13
Delivering Value: Today and Tomorrow
30
Power’s coal hedging strategy is matched up with generation…
…with hedged coal pricing aligned with coal output sold.
$0
$10
$20
$30
$40
$50
2008
2009
2010
2011
Anticipated Coal Cost
(Cost/MWh)
Hedged
Open
Mid $20’s
Mid $20’s
Low $40’s
High $40’s/$50
To
High $30’s
High $40’s/$50
Indicative
Pricing
($/MWh)
Prices lower,
moderating
Northern
Appalachian
Conemaugh
Prices lower,
moderating
Northern
Appalachian
Keystone
More limited
segment of
coal market
Metallurgical
Mercer
Flexibility after
BET in 2010
Adaro /
Domestic
Hudson
Higher price,
lower BTU,
enviro coal
Adaro
Bridgeport
Harbor
Comments
Coal Type
Station
Delivering Value: Today and Tomorrow 31
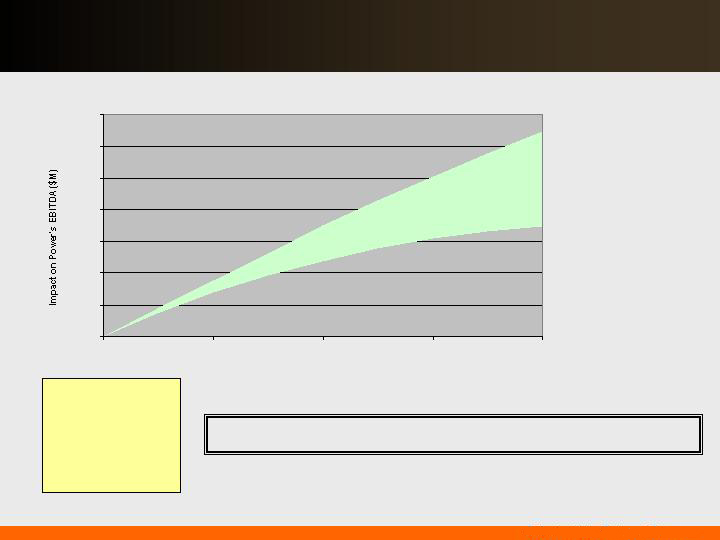
As national carbon regulation looks increasingly likely…
… Power should benefit based on its low carbon fleet.
The diversity of the portfolio makes Power well positioned to capture value in a
wide range of potential regulatory outcomes.
CO2 $/Ton Impact on PJM Prices and Power’s EBITDA
Illustration at $20 CO2:
(2008 Data)
55 TWh
x ~ $12 to $14/MWh
~ $660 – $770 M revenue
20M tons
x $20/ton
~ $400 M expense
The impact on electric
prices moderates at
higher CO2 prices as:
- the fleet dispatch
changes, and
- the CO2 intensity of
the grid goes down.
$0
$100
$200
$300
$400
$500
$600
$700
$0
$10
$20
$30
$40
CO2 Price ($/ton)
Delivering Value: Today and Tomorrow 32
2008 Operating
Earnings*
Energy
Capacity
Other Margin
Cost
2009 Guidance
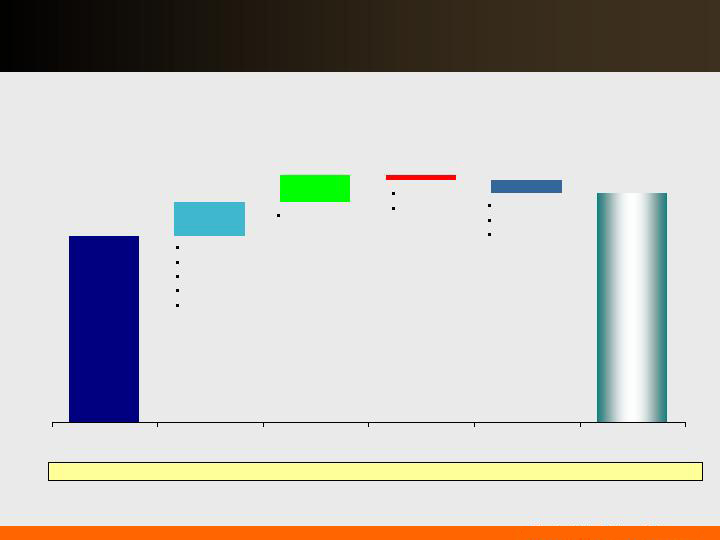
… with visible sources of value to achieve this result.
Power’s commitment in 2009 reflects continued earnings
growth…
$1,107M
$1,210 -
$1,285M
$90 – 100M
($25 – 15M)
$88 – 133M
O&M (pension)
Depreciation
Other
($50 – 40M)
Power’s 2008 Operating Earnings vs 2009 Guidance
Operations
Uprates
BGS
Recontracting
Fuel
More capacity
open to auction
BGSS
Other
$2,170M EBITDA $2,350 - $2,450M
* See page 64 for Items excluded from Income from Continuing Operations to reconcile to Operating Earnings.
Delivering Value: Today and Tomorrow 33

… including market and operational factors.
Power’s earnings for 2010 will be subject to many influences…
$1,210 – $1,285M
Revenue/Margin
Nuclear output largely contracted
Dark Spread change of $5/MWh at market – impact
of $0.05-$0.10/share
Spark Spread change of $5/MWh at market –
impact of $0.05-$0.10/share
Capacity change of $30/MW-day – impact of $0.00-
$0.01/share
Operations
Operational excellence – 1% change in nuclear
capacity factor – impact of $0.01-$0.03/share
O&M 1% change – impact of ~$0.01/share
Depreciation increase of ~$0.03/share due to capital
in service
2009 Guidance
2010+ Drivers
Delivering Value: Today and Tomorrow 34

PSE&G - Review and Outlook

2008 earnings targets met
Transmission formula rate
treatment received from
FERC
Strong O&M control
Reduced Distribution capital
expenditures
National ReliabilityOne Award
winner
Earnings on track to meet
2009 guidance
Distribution base rate case
filed mid-2009
Transmission investment
increasing
New customer information
system implemented at end of
1st quarter
Active participant in shaping
State energy policy
Prepared to meet NJ’s
stimulus and energy goals
Resolve Distribution base rate
case by mid-2010
Investment program
responsive to NJ’s economic
and energy-related goals
Transmission formula rates
provide current return on
invested capital
Earnings growth in line with
capital investment
Continue to lead the nation in
electric reliability
PSE&G – Delivering Value: Today and Tomorrow
Delivering
Value Today
Positioned for
the Future
Meeting
Commitments
Delivering Value: Today and Tomorrow 36

PSE&G regulatory strategy…
Earn authorized returns
Minimize regulatory lag
Support state energy goals
Maintain/enhance local relationships
…designed to support customer and shareholder requirements.
Delivering Value: Today and Tomorrow 37

New Jersey Electric & Gas Rate Case*
Filed: May 29, 2009
Test Year: 2009**
51.2%
Equity Ratio
11.5%
Return on Equity
*New Jersey BPU decision anticipated within 9-12 months.
**Test year can be updated for known changes.
$2.4 billion
$3.8 billion
Rate Base
$96.9 million
$133.7 million
Increase
Gas
Electric
Request
Delivering Value: Today and Tomorrow 38

PSE&G’s current investment plan including the
recently approved state capital stimulus …
34%
51%
15%
0%
31%
1%
19%
49%
33%
17%
1%
49%
… now provides for growth in rate base of 11%.
PSE&G Rate Base
29%
23%
1%
47%
Electric Transmission
Electric Distribution
Gas Distribution
Energy Master Plan
2008
Rate Base $6.9B
Equity Ratio ~ 50%
2009
Rate Base $7.6B
Equity Ratio ~ 51%*
2010
Rate Base $8.6B
Equity Ratio ~ 51%*
2011
Rate Base $9.4B
Equity Ratio ~ 51%*
*Pending regulatory approval
Delivering Value: Today and Tomorrow
39
$0
$100
$200
$300
$400
2009
2010
2011
Energy Efficiency Stimulus
Solar II
Solar 4 All
… would result in rate base growth of 12%.
PSE&G Annual Potential Capital Investments
Rate Base Including Potential Investments
31%
4%
18%
47%
28%
22%
5%
45%
Electric Transmission
Electric Distribution
Gas Distribution
Energy Master Plan
$9.8B
$8.8B
2011
2010
An additional ~$0.7B of
investments to be added
2009-2011 if appropriate
regulatory treatment is
received
Filed positions:
• 10.3% ROE
• 51% Equity Ratio
PSE&G’s additional investment proposals …
Delivering Value: Today and Tomorrow
40

Transmission Growth
PJM approved the $750M Susquehanna to
Roseland line in October 2007
Siting and permitting process underway
Incentives approved by FERC:
ROE: 12.93% (125 basis point adder)
100% CWIP in Rate Base
FERC approval of Sub-Transmission to
Transmission system reliability investments
represents about $340M through 2011, post-2011
~$60M per year
Other approved RTEP projects ~$250M also
contribute meaningfully to improved reliability and
earnings growth
PJM approved the Branchburg-Roseland-Hudson
line in November 2008. Additional 500 kV
investments brings potential capital expenditures to
approximately $1.0 -1.5B
These opportunities will require substantial deployment of capital with siting and
permitting as the major challenges.
Branchburg
Roseland
Jefferson
New Freedom
Smithburg
Deans
MAPP
Hope Creek
Salem
Project
I-765
Interstate
Project
PSE&G implemented fully-forecasted formula rates with an 11.68%
base ROE, which provides attractive current return on investments.
Delivering Value: Today and Tomorrow
41

2008 Regulatory Activities
A.
Solar Loan Program
($105M)
Approved April 2008
Up to 30MW
B.
Demand Response
($63M)
Filed August 2008. Decision
pending
Reduce demand by residential
and small commercial
customers by 150MW
C.
Carbon Abatement
Program ($47M)
Approved December 2008
Provides energy efficiency
programs
A
C
B
2009 Regulatory Activities
D.
Capital Economic Stimulus Infrastructure Investment
Program ($694M)
Filed January 2009, approved April 2009; 10.0% ROE
Accelerate capital investments to promote economic stimulus and
promote job growth in NJ
E.
Solar Loan Program – Phase II
Filed March 2009
F.
Electric and Gas Distribution base
rate case
Filed May 2009
G.
Energy Efficiency Economic Stimulus Program
($200M)
Filed January 2009, expected BPU decision by mid-year 2009
Promote job growth and stimulate NJ economy via energy
efficiency expenditures
H.
Solar 4 All ($800M)
Filed February 2009, expected BPU decision by August 2009
120MW of utility-owned solar generation
D
E
G
H
I
2010 Regulatory Activities
I.
Resolve Electric and
Gas Distribution
base rate case
Normal BPU schedule would
have resolution of rate
proceeding by mid-2010
2011 will be first full year of
rate relief
2008
2009
2010
May
Dec
Dec
Jan
Jan
Jun
F
… with a manageable rate increase of 2% - 4% to customers.
$215M Filed
PSE&G is well positioned to respond to NJ’s needs…
Delivering Value: Today and Tomorrow
42
18.5
0
2
4
6
8
10
12
14
16
18
20
PSE&G
Average
2011
Based on tariff rates in effect in Nov 2008, does not include effects of the BGSS decreases effective Jan 1, 2009 and March 1, 2009.
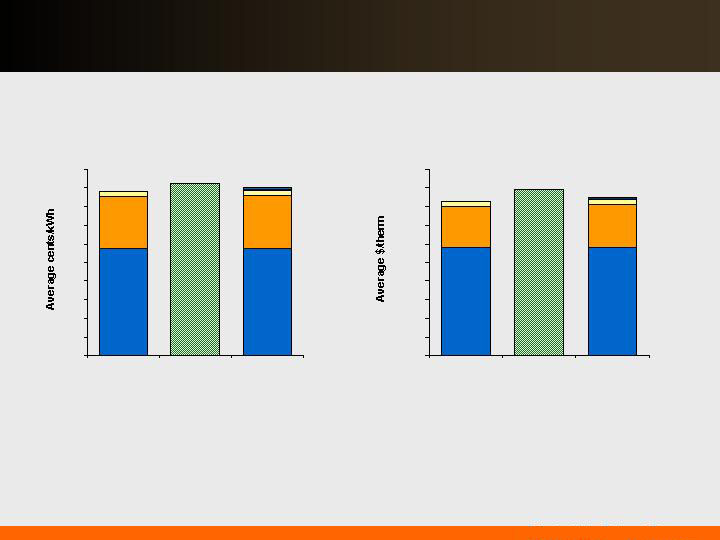
… produces superior value to our electric and gas customers.
Electricity
(500kWh/month bill)
BGS
Delivery
Clauses
17.7
1.79
0.00
0.20
0.40
0.60
0.80
1.00
1.20
1.40
1.60
1.80
2.00
PSE&G
Average
2011
Gas
(100 therm/month bill)
BGSS
Delivery
Clauses
1.65
Source: Rates from PSE&G, NYPSC and PAPUC
1.70
BGSS
Delivery *
Clauses
BGS***
Delivery *
Clauses
Potential
Investments**
18.1
* Includes base rate increases
** Includes NJ stimulus filing (Capital and EEE), Solar 4 All and Solar II
Potential
Investments**
*** Assumes BGS/BGSS pricing remains constant
Combining operational excellence with prices comparable to
regional competitors …
Delivering Value: Today and Tomorrow 43

2008 Operating
Earnings*
Weather
Transmission
Pension
Depreciation,
Interest and Other
2009 Guidance
$360M
$5 - 10M
$320 –
$345M
$10 - 15M
… increasing pension, depreciation and interest costs.
($40 - 35M)
($15 - 5M)
In 2009, controlling O&M will mitigate the effects of…
*See page 64 for Items excluded from Income from Continuing Operations to reconcile to Operating Earnings
Delivering Value: Today and Tomorrow 44

PSE&G – Business Drivers
Operational excellence and effective cost
management
Distribution rate case should improve 2009 ROE’s
of 8.0% - 8.8% to 9.0% - 9.5%
Addresses capital investment, O&M and sales
losses
1% change in Distribution rate case ROE for
2010 = ~$21M change in earnings
Transmission Investment under formula rates. ROE
~ 11.7%
Capital Stimulus could provide an additional 25 – 50
basis points to ROE
Energy Master Plan investments for Energy
Efficiency and Renewables could provide an
additional 5 – 10 basis points to ROE if approved as
planned.
A ±1% deviation in sales would result in a ±$15M
change to margin revenues
$320 – $345M
2009 Guidance
2010+ Drivers
Delivering Value: Today and Tomorrow 45

PSEG Energy Holdings -
Review and Outlook

PSEG Energy Holdings – Delivering Value: Today and Tomorrow
Exceeded 2008 earnings
targets
Strong 2008 Texas
performance well above
expectations
Stable earnings from
US contracted
generation assets
Sale of international assets
yielded $1.5B over 2007-
2008
Proactively reserved for
potential LILO/SILO liability
Earnings on track to meet
2009 guidance
Achieving predictable
performance from
contracted US generation
assets
Improving Texas
operations via asset
management agreement
with PSEG Power
Redeemed approximately
$280M of Texas project
debt in the first quarter of
2009
Managing risk by limiting
growth in lease tax liability
Sufficient liquidity and credit
strength to fund potential
LILO/SILO liability through
cash, asset value and debt
capacity
Exploring opportunities to
optimize other U.S. assets
Pursuing attractive
renewable generation
opportunities
Compressed Air Energy
Storage (CAES)
Solar
Offshore Wind
Meeting
Commitments
Delivering
Value Today
Positioned for
the Future
Delivering Value: Today and Tomorrow 47
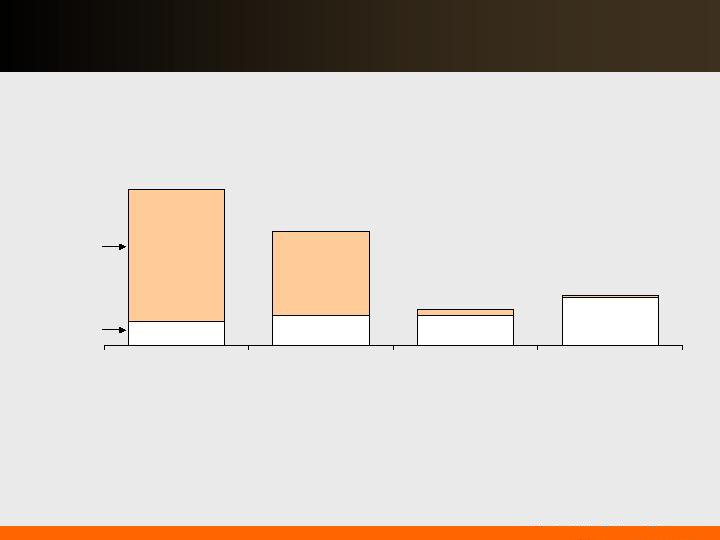
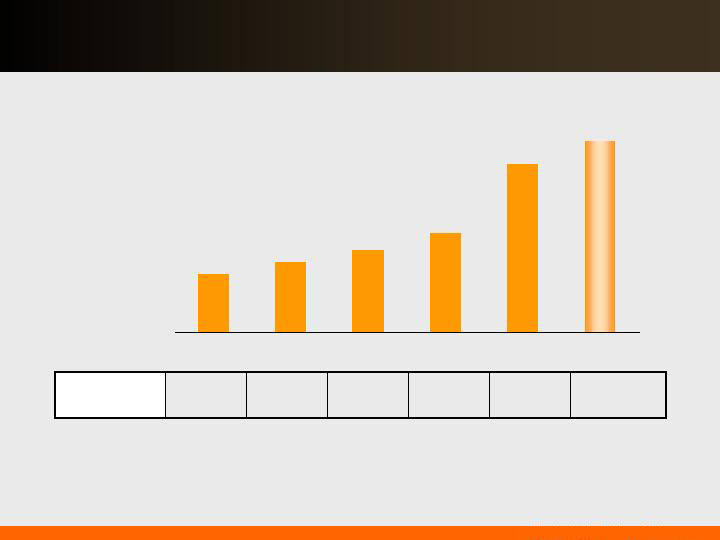
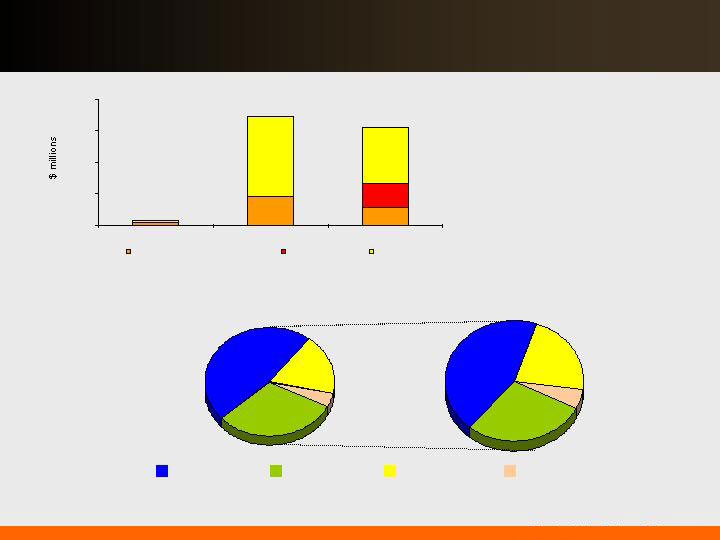
By reducing its investment in international assets …
… Holdings has decreased its risk profile and improved its
business focus.
$0.4
$0.5
$0.5
$0.8
$2.2
$1.4
$0.1
2004
2006
2008
2009 Projected*
PSEG Global Invested Capital
($ Billions)
$2.6B
$1.9B
$0.6B
$0.8B
*Investment Includes redemption of Texas debt in February 2009
International
Domestic
Delivering Value: Today and Tomorrow 48

Texas assets are the major driver of PSEG Global’s business
results…
…PSEG Texas projected EBITDA reflects higher maintenance costs and
market uncertainty.
Strong 2008 performance from favorable market in Spring 2008
Looking ahead to 2009:
Uncertainty on gross margin impact from new wind additions
Operations and maintenance costs approximately $20M higher in 2009 than 2007 as
plants enter periods of major maintenance
Longer-term:
Continued uncertainty from wind
Positive impact from transmission build-up and potential unit mothballing by other
generators
70 – 80
35 – 45%
135 – 145
16%
4.0 - 5.0
2009
PSEG
Market
214
162
$186
Gross
Margin ($M)
147
47.9%
14%
9.0
2008
104
48.7%
15%
6.9
2007
$130
54.4%
16%
$6.7
2006
EBITDA*
($M)
Capacity
Factors
Reserve
Margin
Nat. Gas
Henry Hub Spot
($/mmBtu)
*Excluding Mark-to-Market Accounting effects
Delivering Value: Today and Tomorrow 49

Holdings is focused on managing its current investment
portfolio.
Net Investment in lease portfolio of $0.3B*.
Book investment of $2.3B less deferred taxes of $2.0B
Assuming 100% litigation loss, the lease portfolio would generate
$2.1B* of after-tax cash over the remaining life of the portfolio.
Net present value of after tax cash flow using 8% discount rate
would be approximately $800M.
Reached agreement on termination of several international leases
reducing portfolio by $76M.
Redeemed $280M of non-recourse debt at Texas facilities;
repurchased $10M of Energy Holdings senior notes.
Projected earnings for 2009 reflect reduced LILO/SILO lease income
pending IRS resolution.
* As of 12/31/08
Delivering Value: Today and Tomorrow 50

2008 Operating
Earnings*
Texas Margin
and Major
Maintenance
Texas Project
Financing Paid
Off
Interest & Other
Global Taxes
Resources
Lease Income &
LILO/SILO
Interest
Resources
Interest, G&A,
Other & Taxes
2009 Guidance
PSEG Energy Holdings – 2009 Earnings Drivers
$99M
$0 – 20M
($50 - 40M)
($4 - 2M)
$17M
($20 - 16M)
($31 - 29M)
($11 - 9M)
Holdings 2008 Operating Earnings vs 2009 Guidance
* See page 64 for Items excluded from Income from Continuing Operations to reconcile to Operating Earnings.
Delivering Value: Today and Tomorrow 51

PSEG Energy Holdings – Business Drivers
$0 – 20M
2009 Guidance
2010+ Drivers
Sale of remaining international assets
(Book value $9M)
Continued defense of LILO/SILO lease
position with improved return post-
resolution
Focused management of domestic
contracted generation portfolio
Support of 2009 joint venture Energy
Storage & Power in efforts to license CAES
2 technology
Pursuit of renewable development with
focus on Solar and Offshore Wind
Texas Spark Spread change of ±$5/MWh at
market – impact of approximately
$0.03/share
Delivering Value: Today and Tomorrow 52

Appendix

Q1 2009 Earnings Summary
13
-
Discontinued Operations, Net of Tax
$ 0.86
$ 0.95
EPS from Operating Earnings*
448
444
Net Income
435
444
Income from Continuing Operations
(3)
(38)
Reconciling Items, Net of Tax
$ 438
$ 482
Operating Earnings
2008
2009
$ millions (except EPS)
Quarter ended March 31,
* See page 64 for Items excluded from Income from Continuing Operations to reconcile to Operating Earnings.
Delivering Value: Today and Tomorrow
54

Q1 Operating Earnings by Subsidiary
$ 438
(5)
28
136
$ 279
2008
$ 482
(4)
4
123
$ 359
2009
Operating Earnings
Earnings per Share
(0.01)
(0.01)
Enterprise
$ 0.86
$ 0.95
Operating Earnings*
0.06
0.01
PSEG Energy Holdings
0.26
0.24
PSE&G
$ 0.55
$ 0.71
PSEG Power
2008
2009
$ millions (except EPS)
Quarter ended March 31,
* See page 64 for Items excluded from Income from Continuing Operations to reconcile to Operating Earnings.
Delivering Value: Today and Tomorrow
55
PSEG Power’s asset mix and dispatch profile …
7,265
7,817
3,659
2,679
2,776
2,621
0
5,000
10,000
15,000
2008
2009
Quarter ended March 31,
Total Nuclear
Total Coal*
Total Oil &
Natural Gas
PSEG Power – Generation (GWh)
13,700
13,117
Generation declined 4.3%.
Nuclear fleet capacity factors:
NJ fleet operated at 99.3% in
Q1 2009 vs 91.0% in Q1
2008.
Nuclear fleet capacity factor
of 97.8% in Q1 2009 vs
94.1% in Q1 2008.
Nuclear generation increase
of 7.6% supported by
uprates in capacity at Hope
Creek and Salem.
Gas units displaced coal in Q1
2009 with decline in gas prices
and higher than expected
demand in January.
… supported Q1’s strong results.
* Includes figures for Pumped Storage
Delivering Value: Today and Tomorrow
56

$30.60
55,300
$1,693
129
$1,564
1,141
423
2008
$24.50
53,197
$1,305
122
$1,183
847
336
2007
Year ended December 31,
$ / MWh
Total Generation
(GWhr)
Total Fuel Cost
Nuclear
Total Fossil
Oil & Gas
Coal
($ millions)
174
242
94
115
$23.20
$28.30
13,117
13,700
$304
$388
36
31
$268
$357
2009
2008
Quarter ended March 31,
PSEG Power – Fuel Costs
Q1 2009 fuel costs reflect:
Dispatch flexibility
Decline in gas prices
Increase in nuclear generation
Delivering Value: Today and Tomorrow 57

Operated by PSEG Nuclear
PSEG Ownership: 100%
Technology:
Boiling Water Reactor
Total Capacity: 1,211MW
Owned Capacity: 1,211MW
License Expiration: 2026
Operated by PSEG Nuclear
Ownership: PSEG - 57%,
Exelon – 43%
Technology:
Pressurized Water Reactor
Total Capacity: 2,345MW
Owned Capacity: 1,346MW
License Expiration: 2016 and
2020
Operated by Exelon
PSEG Ownership: 50%
Technology:
Boiling Water Reactor
Total Capacity: 2,224MW
Owned Capacity: 1,112MW
License Expiration: 2033
and 2034
Hope Creek
Salem Units 1 and 2
Peach Bottom Units 2 and 3
Our five unit nuclear fleet …
… is a critical element of Power’s success.
Delivering Value: Today and Tomorrow 58

The implementation of carbon will address the critical issue of global
warming…
~$12.00 - ~$14.00
100%
Total
$0.00
$0.00
0%
Nuclear
$4.80 - $3.60
$8.00
60%- 45%
Gas CC
$1.20 - $0.60
$12.00
10% - 5%
CTs
$6.00 - $10.00
$20.00
30% - 50%
Coal
Impact
$/MWh
On margin
(approximate)
Dispatch curve implication @ $20/ton*
By Fuel Type
$12.0
$18.0
$30.0
@$30
$8.0
$12.0
$20.0
@$20
$4.0
$6.0
$10.0
@$10
Price ($/MWh)
0.4
0.6
1.0
Carbon tons/MWh
CC
CTs
Coal
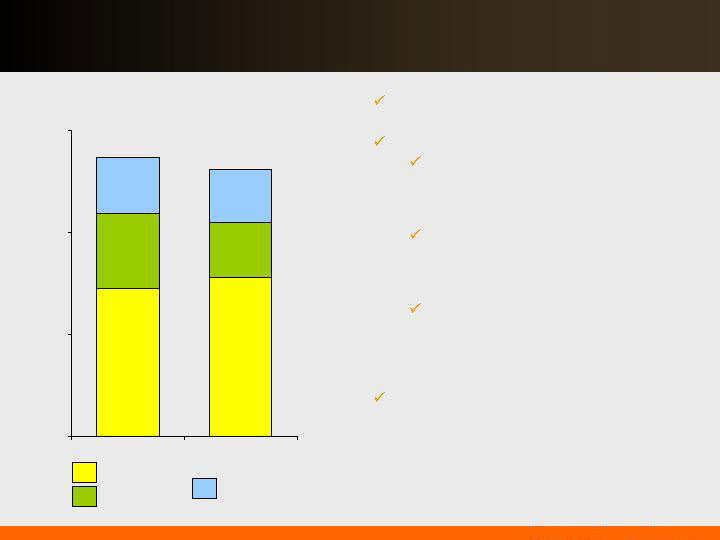
PSEG Power Generation by Fuel
… and activity continues in the direction of a national program.
*For illustration purposes – potential impact of CO2 on power prices with current dispatch – not an indication of net effect on income.
Energy Produced – 2008
53%
23%
23%
Nuclear
Coal
Gas
Total GWh: 55,300
Pumped Storage
& Oil 1%
Delivering Value: Today and Tomorrow 59
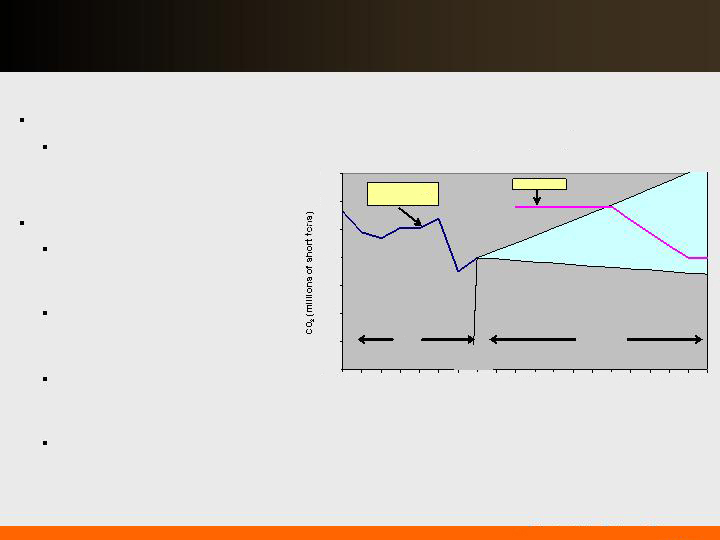
The RGGI cap on CO2 emission shows that headroom exists …
… compared to historical emission levels.
Affected Sources
Fossil-fired electric generating
units with a capacity of 25MW
and larger
Targets and Timing
Three-year compliance periods
with the first running from 2009-
2011
Stabilization of CO2 emissions at
recent levels through 2015
(~188 million tons per year)
Achieve a 10% reduction of CO2
emissions below recent levels by
2019
This translates into ~13%
reduction below 1990 levels or
~35% reduction from Business
as Usual (BAU) levels by 2020
CO
2
Emissions vs. RGGI Cap
(Actuals through 2007)
130
140
150
160
170
180
190
200
2000
2002
2004
2006
2008
2010
2012
2014
2016
2018
RGGI Cap
Projected
Actual &
Forecast CO
2
Actual
Delivering Value: Today and Tomorrow 60

Proposed energy efficiency investment and savings
Investment Timeline
2009 – 2011 (18 months)
Delivering Value: Today and Tomorrow 61
Category
Investment
Annual
Lifetime
Annual
Lifetime
Jobs
Residential
($ millions)
Whole House
$25
5,428
86,847
27,587
551,744
120
Multi-Family
25
5,428
86,847
27,587
551,744
60
10,856
173,694
55,174
1,103,488
180
Industrial & Commercial
Small Business
20
35,897
538,462
74,359
1,115,385
80
Muni/Local/State Government
35
49,595
743,927
82,186
1,232,794
143
Hospital Efficiency
35
73,200
1,098,000
748,466
11,226,994
140
Data Center
12
38,400
576,000
147,239
2,208,589
50
Tech Demo Sub-Program
12
18,947
284,210
192,000
2,880,000
50
Building
2
3,750
56,250
38,462
576,923
8
219,789
3,296,849
1,282,712
19,240,685
471
Admin Sales, Training, Evaluation, IT
24
TOTAL
$190
230,645
3,470,543
1,337,886
20,344,173
651
Savings (MWh)
Savings (Dtherms)

Rate Mechanism
PSE&G proposes to recover the costs of the program through
an annual adjustment to electric and gas rates which would
not exceed 1%.
The cost of capital would be based on a capital structure
consisting of 51.2% common equity with a return on common
equity of 10.3%--consistent with the return allowed NJNG in
its December 2008 base rate case decision.
The Energy Efficiency Program revenue requirements would
include the recovery of lost distribution margin.
Delivering Value: Today and Tomorrow 62

PSE&G Solar 4 All Proposal
Neighborhood Solar (40 megawatts) - $264M investment
Solar panels on utility poles and street lights in neighborhoods throughout
PSE&G’s service territory.
Local Government Solar (43 megawatts) - $273M investment
Solar, owned and operated by PSE&G, on municipal and public school district
facilities. Local governments will receive a credit on their utility bill equal to the
amount of energy generated by the system.
Centralized Solar (35 megawatts) – $221M investment
Solar systems on PSE&G land/buildings.
Solar energy farms on brownfields, non-profit-owned real estate, and
underdeveloped real estate
HMFA/Affordable Housing Solar (2 megawatts) - $15M investment
Solar on New Jersey Housing and Mortgage Finance Agency (HMFA)-financed
or other affordable housing communities
PSE&G is seeking a 10.3% ROE on its equity capital invested (51.2% common equity
in its capital structure). Customer rate impact mitigated by benefits associated with ITC
and the value of electricity and Solar Renewable Energy Certificates (SRECs)
generated by the projects
NJ BPU has 180 days to respond.
Delivering Value: Today and Tomorrow 63

Items Excluded from Income from Continuing Operations
to Reconcile to Operating Earnings
Please see Slide 3 for an explanation of PSEG’s use of Operating Earnings as a non-GAAP financial measure and how
it differs from Net Income.
Pro-forma Adjustments, net of tax
2009
2008
2008
2007
Earnings Impact (in Millions)
Impairment of PPN
-
$
-
$
(9)
$
(2)
$
Impairment of Turboven
-
-
(4)
(7)
Loss on Sale of Chilquinta and Luz del Sur
-
-
-
(23)
Nuclear Decommissioning Trust (NDT) Fund Related Activity
(23)
(7)
(71)
12
Mark-to-Market (MTM)
(15)
5
16
10
Premium on Bond Redemption
-
(1)
(1)
(28)
Lease Reserves
-
-
(490)
-
Total Pro-forma to Operating Earnings
(38)
$
(3)
$
(559)
$
(38)
$
Fully Diluted Average Shares Outstanding (in Millions)
507
510
508
509
Per Share Impact (Diluted)
Impairment of PPN
-
$
-
$
(0.02)
$
-
$
Impairment of Turboven
-
-
(0.01)
(0.01)
Loss on Sale of Chilquinta and Luz del Sur
-
-
-
(0.05)
Nuclear Decommissioning Trust (NDT) Fund Related Activity
(0.04)
(0.02)
(0.14)
0.02
Mark-to-Market (MTM)
(0.03)
0.01
0.03
0.02
Premium on Bond Redemption
-
-
-
(0.06)
Lease Reserves
-
-
(0.96)
-
Total Pro-forma to Operating Earnings
(0.07)
$
(0.01)
$
(1.10)
$
(0.08)
$
December 31,
For the Quarters Ended
March 31,
PUBLIC SERVICE ENTERPRISE GROUP INCORPORATED
Reconciling Items Excluded from Continuing Operations to Compute Operating Earnings
(Unaudited)
For the Twelve Months Ended
Delivering Value: Today and Tomorrow
64