Exhibit 99
 | Investor News | NYSE:PEG |
For further information, contact:
• Kathleen A. Lally, Vice President – Investor Relations | Phone: 973-430-6565 | |
• Carlotta Chan Lane, Manager – Investor Relations | Phone: 973-430-6596 |
October 27, 2010
PSEG ANNOUNCES 2010 THIRD QUARTER RESULTS
$1.12 PER SHARE FROM NET INCOME
$1.06 PER SHARE OF OPERATING EARNINGS
Company Maintains 2010 Operating Earnings Guidance of $3.00-$3.25 Per Share
Forward Power Prices Continue To Decline
Public Service Enterprise Group (PSEG) today reported third quarter 2010 net income and income from continuing operations of $567 million or $1.12 per share as compared to $488 million or $0.96 per share for the third quarter of 2009. Operating earnings for the third quarter of 2010 were $538 million or $1.06 per share compared to the third quarter of 2009 operating earnings of $464 million or $0.92 per share.
PSEG believes that the non-GAAP financial measure of “Operating Earnings” provides a consistent and comparable measure of performance of its businesses to help shareholders understand performance trends. Operating Earnings exclude the impact of returns/(losses) associated with Nuclear Decommissioning Trust (NDT), certain Mark-to-Market (MTM) accounting and other material one time items. The table below provides a reconciliation of PSEG’s Net Income to Operating Earnings (a non-GAAP measure) for the third quarter. See Attachment 12 for a complete list of items excluded from Income from Continuing Operations in the determination of Operating Earnings.
PSEG CONSOLIDATED EARNINGS (unaudited)
Third Quarter Comparative Results
2010 and 2009
| Income ($millions) | Diluted Earnings Per Share | |||||||||||||||
| 2010 | 2009 | 2010 | 2009 | |||||||||||||
Net Income/Income from Continuing Ops | $ | 567 | $ | 488 | $ | 1.12 | $ | 0.96 | ||||||||
Less: Excluded Items | 29 | 24 | 0.06 | 0.04 | ||||||||||||
Operating Earnings (Non-GAAP) | $ | 538 | $ | 464 | $ | 1.06 | $ | 0.92 | ||||||||
| Avg. Shares | 507M | 507M | ||||||||||||||
“Our financial results in the third quarter were strong” said Ralph Izzo, chairman, president and chief executive officer of PSEG. “Warmer than normal weather and higher electric delivery rates in effect at the start of the summer helped to offset the impact of a slow economic recovery and lower realized energy prices at Power. Our results for the quarter continue to support full year earnings of $3.00-$3.25 per share.” Operating Earnings guidance by company for the full year is as follows:
Operating Earnings
| 2010E | 2009A | |||
PSEG Power | $1,060 - $1,135 | $1,205 | ||
PSE&G | $425 - $455 | $321 | ||
PSEG Energy Holdings | $30 - $40 | $43 | ||
Parent | $5 - $15 | $10 | ||
Total | $1,520 - $1,645 | $1,579 | ||
Earnings Per Share | $3.00 - $3.25 | $3.12 |
Izzo indicated that the strong results “reflect the substantial efforts of our employees to reduce costs in the face of continuing decreases in energy prices. These efforts will play an important role in meeting our financial objectives as legacy hedges executed at higher prices roll off in 2011 and 2012.”
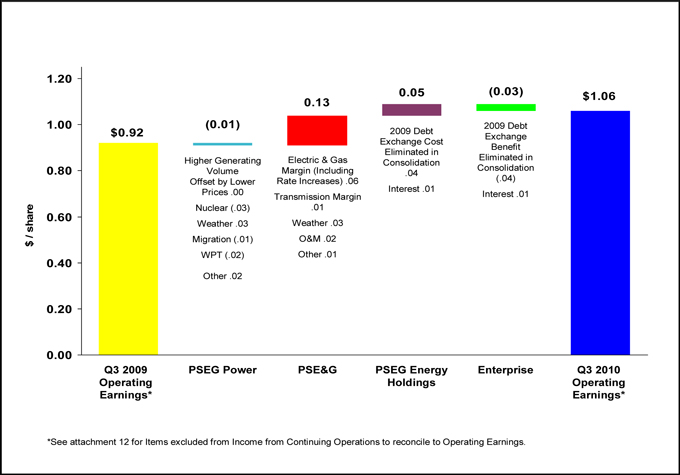
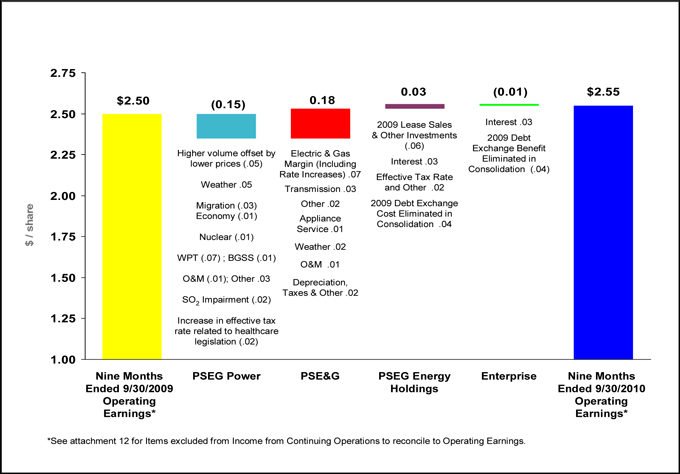
Operating Earnings Review and Outlook by Operating Subsidiary
See Attachment 6 for detail regarding the quarter-over-quarter reconciliations for each of PSEG’s businesses.
PSEG Power
PSEG Power reported operating earnings of $355 million ($0.70 per share) for the third quarter of 2010 compared with operating earnings of $358 million ($0.71 per share) for the third quarter of 2009.
PSEG Power’s results in the third quarter benefited from a 10% increase in output. The increase in output was experienced by PSEG Power’s fossil fleet, and improved earnings by $0.04 per share. This improvement was partially offset by a 17-day unplanned outage at the Salem 1 nuclear reactor early in the quarter. The lower nuclear output reduced earnings by $0.03 per share. Warmer than normal weather during the quarter added $0.03 per share to earnings. The recontracting of expiring hedges at lower prices reduced earnings by $0.05 per share including customer migration away from the BGS contract which reduced earnings in the quarter by $0.01 per share. In addition, the continued erosion in margin on certain wholesale electric energy supply contracts that Power supplies from the market reduced earnings by $0.02 per share. Realized gains on investments in Power’s Rabbi Trust Fund added $0.01 per share to earnings. A decline in the effective tax rate aided earnings by $0.01 per share.
The nuclear generating units operated by PSEG Power performed at an average capacity factor of 90.4% during the quarter resulting in a capacity factor of 91.8% for the nine months ended September 30, 2010. The results for the quarter include the effect of the unplanned outage at Salem 1. The outage is expected to reduce the full-year capacity factor for Power’s fleet by 0.6% to slightly better than 91%. The anticipated results for the full-year reflect the impact of a scheduled refueling outage at Hope Creek that began on October 15.
Power’s operating earnings for 2010 are forecasted at $1,060 - $1,135 million compared to operating earnings for 2009 of $1,205 million. Full year operating earnings will be affected by continued lower forward energy pricing.
Power’s full year earnings comparisons will be affected by erosion in margins from BGS customer migration as well as volume declines associated with other full requirement contracts. Our forecast for full-year 2010 assumes a year-over-year reduction in margin associated with customer migration of $0.04 per share, at the upper end of our prior guidance of a $0.02 - $0.04 per share impact for the year. New retail suppliers have entered the market for residential customers in the third quarter.
These items will be partially offset by an expected increase in generation volume, a decline in depreciation expense and continued focus on O&M. In addition, Power’s full year earnings will reflect the impact of a one-time increase in taxes related to the enactment of health care legislation recognized in March 2010 along with the impairment of sulfur-dioxide emissions allowances recognized in the second quarter.
Power continues to hedge its expected generation in future years consistent with past practice. At the end of September, approximately 68% of Power’s anticipated 2011 coal and nuclear generation is hedged at an average price of $71 per MWh with hedges. This compares with an average hedge price for energy in 2010 of $72 per MWh. These figures, however, don’t reflect the potential impact of increased levels of customer migration, which could reduce the level of power supplied under existing BGS contracts. Incremental migration equal to 5% of customer load would reduce earnings by approximately $0.015 per share at current market prices. An additional loss of 15% of load would reduce our average hedged price in 2011 to $67 per MWh.
PSE&G
PSE&G reported operating earnings of $155 million ($0.30 per share) for the third quarter of 2010 compared with operating earnings of $87 million ($0.17 per share) for the third quarter of 2009.
PSE&G’s results were driven by higher rates, abnormally warm weather and a reduction in operating and maintenance expenses. An annual increase in electric and gas rates of $73.5 million and $26.5 million that went into effect on June 7 and July 9 respectively added $0.05 per share to earnings. An increase in revenue associated with investments in capital infrastructure and renewables approved during 2009 improved earnings by $0.01 per share. Warmer than normal weather during the third quarter of 2010 in comparison to cooler than normal weather conditions in the year ago period improved electric demand and earnings by $0.03 per share. An increase in transmission revenues at the start of the year added $0.01 per share to quarterly earnings. A decline in operating and maintenance expenses during the quarter improved earnings by $0.02 per share. These items offset an increase in depreciation and interest expense associated with higher levels of capital investment ($0.02 per share). Realized gains on investments in PSE&G’s Rabbi Trust added $0.02 per share, and a decline in the effective tax rate added $0.01 per share to earnings.
PSE&G experienced an increase in demand from residential and commercial customers during the third quarter reflecting the favorable weather that more than offset the impact of a weak economy on demand. Economic data related to employment and housing in PSE&G’s service territory show signs of stability but, don’t yet indicate a return to growth in the economy.
PSE&G’s operating earnings for 2010 are forecast at $425 - $455 million compared to 2009’s operating earnings of $321 million. Operating earnings will be influenced by a full year of return on capital projects approved by the BPU in 2009, the increase in electric and gas distribution rates, an increase in transmission revenue and a decline in operating and maintenance expenses.
PSE&G has updated its forecast of capital spending for 2010-2012, and provided an initial forecast related to capital spending plans for 2013. The revised budget calls for spending $4.5 billion over 2010-2012 with spending of $1.6 billion for 2013 resulting in a $6.1 billion capital program over this four year period. The projections take into account the delay associated with the in-service date for the Susquehanna to Roseland transmission line, the reconfiguration of the Branchburg-Roseland-Hudson line as well as the previously announced reduction in distribution spending. Transmission related capital spending represents 50% of PSE&G’s forecast level of capital spending over 2010-2013. The implementation and timing of capital expenditures are subject to obtaining timely government approvals.
PSEG Energy Holdings
PSEG Energy Holdings reported operating earnings of $24 million ($0.05 per share) for the third quarter of 2010 versus an operating loss of $1 million during the third quarter of 2009.
The improvement in operating earnings for the quarter reflects the successful termination of two Lilo/Silo leveraged leases during the quarter that resulted in a gain of $0.03 per share which matched a similar level of termination related gains recorded in the year ago quarter. Results also benefited from the absence of a premium paid on the debt exchange with Power in 2009 ($0.04 per share) as well as a decline in interest expense ($0.01 per share).
The successful termination of two cross-border leases during the quarter reduced Holdings’ net cash exposure to $330 million at the end of September. Holdings has $320 million on deposit with the IRS to defray potential interest costs associated with this disputed tax matter.
Holdings’ operating earnings for 2010 are forecast at $30 – $40 million as compared to 2009’s operating earnings of $43 million. The loss of income on terminated leases, the absence of the debt exchange this year and a reduction in gains from the termination of leases will be partially offset by lower financing costs and tax benefits from the start-up of solar projects in Ohio and Florida.
Other Items
PSEG Power indicated during the quarter that it is exploring the potential sale of its two 1,000 MW combined cycle generating facilities in Texas through an auction process. The sale is dependent on the receipt of offers that reflect the appropriate value for the assets.
Holdings issued a call notice in October for the redemption in December 2010 of the remaining $127 million outstanding principal balance of its 8.5% Senior Notes due June 2011.
FORWARD-LOOKING STATEMENT
Readers are cautioned that statements contained in this presentation about our and our subsidiaries’ future performance, including future revenues, earnings, strategies, prospects, consequences and all other statements that are not purely historical, are forward-looking statements for purposes of the safe harbor provisions under The Private Securities Litigation Reform Act of 1995. When used herein, the words “anticipate”, “intend”, “estimate”, “believe”, “expect”, “plan”, “should”, “hypothetical”, “potential”, “forecast”, “project”, variations of such words and similar expressions are intended to identify forward-looking statements. Although we believe that our expectations are based on reasonable assumptions, they are subject to risks and uncertainties and we can give no assurance they will be achieved. The results or developments projected or predicted in these statements may differ materially from what may actually occur. Factors which could cause results or events to differ from current expectations include, but are not limited to:
| • | Adverse changes in energy industry law, policies and regulation, including market structures, transmission planning and cost allocation rules, including rules regarding who is permitted to build transmission going forward, and reliability standards. |
| • | Any inability of our transmission and distribution businesses to obtain adequate and timely rate relief and regulatory approvals from federal and state regulators. |
| • | Changes in federal and state environmental regulations that could increase our costs or limit operations of our generating units. |
| • | Changes in nuclear regulation and/or developments in the nuclear power industry generally that could limit operations of our nuclear generating units. |
| • | Actions or activities at one of our nuclear units located on a multi-unit site that might adversely affect our ability to continue to operate that unit or other units located at the same site. |
| • | Any inability to balance our energy obligations, available supply and trading risks. |
| • | Any deterioration in our credit quality. |
| • | Availability of capital and credit at commercially reasonable terms and conditions and our ability to meet cash needs. |
| • | Any inability to realize anticipated tax benefits or retain tax credits. |
| • | Changes in the cost of, or interruption in the supply of, fuel and other commodities necessary to the operation of our generating units. |
| • | delays in receipt of necessary permits and approvals for our construction and development activities, |
| • | Delays or unforeseen cost escalations in our construction and development activities. |
| • | Adverse changes in the demand for or price of the capacity and energy that we sell into wholesale electricity markets. |
| • | Increase in competition in energy markets in which we compete. |
| • | Adverse performance of our decommissioning and defined benefit plan trust fund investments and changes in discount rates and funding requirements. |
| • | Changes in technology and customer usage patterns. |
For further information, please refer to our Annual Report on Form 10-K, including Item 1A. Risk Factors, and subsequent reports on Form 10-Q and Form 8-K filed with the Securities and Exchange Commission. These documents address in further detail our business, industry issues and other factors that could cause actual results to differ materially from those indicated in this presentation. In addition, any forward-looking statements included herein represent our estimates only as of today and should not be relied upon as representing our estimates as of any subsequent date. While we may elect to update forward-looking statements from time to time, we specifically disclaim any obligation to do so, even if our internal estimates change, unless otherwise required by applicable securities laws.
Attachment 1
PUBLIC SERVICE ENTERPRISE GROUP INCORPORATED
Operating Earnings and Per Share Results by Subsidiary
(Unaudited)
| For the Three Months Ended September 30, | For the Nine Months Ended September 30, | |||||||||||||||
| 2010 | 2009 | 2010 | 2009 | |||||||||||||
| Earnings Results ($ Millions) | ||||||||||||||||
PSEG Power | $ | 355 | $ | 358 | $ | 892 | $ | 964 | ||||||||
PSE&G | 155 | 87 | 347 | 253 | ||||||||||||
PSEG Energy Holdings | 24 | (1 | ) | 43 | 30 | |||||||||||
PSEG | 4 | 20 | 12 | 17 | ||||||||||||
Operating Earnings | $ | 538 | $ | 464 | $ | 1,294 | $ | 1,264 | ||||||||
Reconciling Items(a) | 29 | 24 | (12 | ) | (21 | ) | ||||||||||
Net Income | $ | 567 | $ | 488 | $ | 1,282 | $ | 1,243 | ||||||||
Fully Diluted Average Shares Outstanding (in Millions) | 507 | 507 | 507 | 507 | ||||||||||||
| Per Share Results (Diluted) | ||||||||||||||||
PSEG Power | $ | 0.70 | $ | 0.71 | $ | 1.76 | $ | 1.91 | ||||||||
PSE&G | 0.30 | 0.17 | 0.68 | 0.50 | ||||||||||||
PSEG Energy Holdings | 0.05 | — | 0.09 | 0.06 | ||||||||||||
PSEG | 0.01 | 0.04 | 0.02 | 0.03 | ||||||||||||
Operating Earnings | $ | 1.06 | $ | 0.92 | $ | 2.55 | $ | 2.50 | ||||||||
Reconciling Items(a) | 0.06 | 0.04 | (0.02 | ) | (0.05 | ) | ||||||||||
Net Income | $ | 1.12 | $ | 0.96 | $ | 2.53 | $ | 2.45 | ||||||||
| (a) | See attachment 12 for details of items excluded from Income from Continuing Operations to compute Operating Earnings. Income from Continuing Operations for the three months and nine months ended September 30, 2010 and 2009 is equal to Net Income. |
Note:
Income from Continuing Operations includes preferred stock dividends relating to PSE&G of $1 million for the three months ended September 30, 2009.
Income from Continuing Operations includes preferred stock dividends relating to PSE&G of $1 million and $3 million for the nine months ended September 30, 2010 and 2009, respectively.
Attachment 2
PUBLIC SERVICE ENTERPRISE GROUP INCORPORATED
Consolidating Statements of Operations
(Unaudited, $ Millions)
| For the Three Months Ended September 30, 2010 | ||||||||||||||||||||
| PSEG | OTHER (a) | PSEG POWER | PSE&G | PSEG ENERGY HOLDINGS | ||||||||||||||||
OPERATING REVENUES | $ | 3,254 | $ | (474 | ) | $ | 1,663 | $ | 2,007 | $ | 58 | |||||||||
OPERATING EXPENSES | ||||||||||||||||||||
Energy Costs | 1,355 | (474 | ) | 714 | 1,115 | — | ||||||||||||||
Operation and Maintenance | 601 | 1 | 263 | 327 | 10 | |||||||||||||||
Depreciation and Amortization | 265 | 4 | 48 | 209 | 4 | |||||||||||||||
Taxes Other Than Income Taxes | 31 | — | — | 31 | — | |||||||||||||||
Total Operating Expenses | 2,252 | (469 | ) | 1,025 | 1,682 | 14 | ||||||||||||||
OPERATING INCOME | 1,002 | (5 | ) | 638 | 325 | 44 | ||||||||||||||
Income from Equity Method Investments | 4 | — | — | — | 4 | |||||||||||||||
Other Income and Deductions | 66 | 11 | 35 | 13 | 7 | |||||||||||||||
Other Than Temporary Impairments | (3 | ) | (1 | ) | (2 | ) | — | — | ||||||||||||
Interest Expense | (120 | ) | 3 | (37 | ) | (82 | ) | (4 | ) | |||||||||||
Preferred Stock Dividends | — | — | — | — | — | |||||||||||||||
INCOME FROM CONTINUING OPERATIONS BEFORE INCOME TAXES | 949 | 8 | 634 | 256 | 51 | |||||||||||||||
Income Tax Expense | (382 | ) | (4 | ) | (250 | ) | (101 | ) | (27 | ) | ||||||||||
NET INCOME | $ | 567 | $ | 4 | $ | 384 | $ | 155 | $ | 24 | ||||||||||
Reconciling Items Excluded from Continuing Operations(C): | 29 | — | 29 | — | — | |||||||||||||||
OPERATING EARNINGS | $ | 538 | $ | 4 | $ | 355 | $ | 155 | $ | 24 | ||||||||||
| For the Three Months Ended September 30, 2009 | ||||||||||||||||||||
| PSEG | OTHER (a) | PSEG POWER | PSE&G | PSEG ENERGY HOLDINGS | ||||||||||||||||
OPERATING REVENUES | $ | 3,040 | $ | (524 | ) | $ | 1,564 | $ | 1,943 | $ | 57 | |||||||||
OPERATING EXPENSES | ||||||||||||||||||||
Energy Costs | 1,241 | (525 | ) | 599 | 1,167 | — | ||||||||||||||
Operation and Maintenance | 621 | (9 | ) | 265 | 351 | 14 | ||||||||||||||
Depreciation and Amortization | 224 | 4 | 48 | 169 | 3 | |||||||||||||||
Taxes Other Than Income Taxes | 30 | — | — | 30 | — | |||||||||||||||
Total Operating Expenses | 2,116 | (530 | ) | 912 | 1,717 | 17 | ||||||||||||||
OPERATING INCOME | 924 | 6 | 652 | 226 | 40 | |||||||||||||||
Income from Equity Method Investments | 6 | — | — | — | 6 | |||||||||||||||
Other Income and Deductions | 24 | 33 | 23 | 2 | (34 | ) | ||||||||||||||
Interest Expense | (129 | ) | (5 | ) | (37 | ) | (77 | ) | (10 | ) | ||||||||||
Preferred Stock Dividends | — | 1 | — | (1 | ) | — | ||||||||||||||
INCOME FROM CONTINUING OPERATIONS BEFORE INCOME TAXES(b) | 825 | 35 | 638 | 150 | 2 | |||||||||||||||
Income Tax Expense | (337 | ) | (15 | ) | (256 | ) | (63 | ) | (3 | ) | ||||||||||
NET INCOME (LOSS) | $ | 488 | $ | 20 | $ | 382 | $ | 87 | $ | (1 | ) | |||||||||
Reconciling Items Excluded from Continuing Operations(C): | 24 | — | 24 | — | — | |||||||||||||||
OPERATING EARNINGS (LOSS) | $ | 464 | $ | 20 | $ | 358 | $ | 87 | $ | (1 | ) | |||||||||
| (a) | Primarily includes financing activities and donations at the parent and intercompany eliminations. |
| (b) | Income from Continuing Operations before Income Taxes includes preferred stock dividends relating to PSE&G of $1 million for the three months ended September 30, 2009. |
| (c) | See attachment 12 for details of items excluded from Income from Continuing Operations to compute Operating Earnings. Income from Continuing Operations for the three months ended September 30, 2010 and 2009 is equal to Net Income. |
Attachment 3
PUBLIC SERVICE ENTERPRISE GROUP INCORPORATED
Consolidating Statements of Operations
(Unaudited, $ Millions)
| For the Nine Months Ended September 30, 2010 | ||||||||||||||||||||
| PSEG | OTHER (a) | PSEG POWER | PSE&G | PSEG ENERGY HOLDINGS | ||||||||||||||||
OPERATING REVENUES | $ | 9,389 | $ | (2,036 | ) | $ | 5,324 | $ | 5,987 | $ | 114 | |||||||||
OPERATING EXPENSES | ||||||||||||||||||||
Energy Costs | 4,270 | (2,034 | ) | 2,732 | 3,572 | — | ||||||||||||||
Operation and Maintenance | 1,915 | (18 | ) | 817 | 1,084 | 32 | ||||||||||||||
Depreciation and Amortization | 730 | 13 | 144 | 563 | 10 | |||||||||||||||
Taxes Other Than Income Taxes | 101 | — | — | 101 | — | |||||||||||||||
Total Operating Expenses | 7,016 | (2,039 | ) | 3,693 | 5,320 | 42 | ||||||||||||||
OPERATING INCOME | 2,373 | 3 | 1,631 | 667 | 72 | |||||||||||||||
Income from Equity Method Investments | 12 | — | — | — | 12 | |||||||||||||||
Other Income and Deductions | 128 | 9 | 90 | 20 | 9 | |||||||||||||||
Other Than Temporary Impairments | (9 | ) | (1 | ) | (8 | ) | — | — | ||||||||||||
Interest Expense | (356 | ) | 10 | (119 | ) | (239 | ) | (8 | ) | |||||||||||
Preferred Stock Dividends | — | 1 | — | (1 | ) | — | ||||||||||||||
INCOME FROM CONTINUING OPERATIONS BEFORE INCOME TAXES(b) | 2,148 | 22 | 1,594 | 447 | 85 | |||||||||||||||
Income Tax Expense | (866 | ) | (10 | ) | (642 | ) | (172 | ) | (42 | ) | ||||||||||
NET INCOME | $ | 1,282 | $ | 12 | $ | 952 | $ | 275 | $ | 43 | ||||||||||
Reconciling Items Excluded from Continuing Operations(C): | (12 | ) | — | 60 | (72 | ) | — | |||||||||||||
OPERATING EARNINGS | $ | 1,294 | $ | 12 | $ | 892 | $ | 347 | $ | 43 | ||||||||||
| For the Nine Months Ended September 30, 2009 | ||||||||||||||||||||
| PSEG | OTHER (a) | PSEG POWER | PSE&G | PSEG ENERGY HOLDINGS | ||||||||||||||||
OPERATING REVENUES | $ | 9,520 | $ | (2,388 | ) | $ | 5,391 | $ | 6,321 | $ | 196 | |||||||||
OPERATING EXPENSES | ||||||||||||||||||||
Energy Costs | 4,376 | (2,386 | ) | 2,757 | 4,005 | — | ||||||||||||||
Operation and Maintenance | 1,922 | (25 | ) | 820 | 1,090 | 37 | ||||||||||||||
Depreciation and Amortization | 634 | 12 | 152 | 462 | 8 | |||||||||||||||
Taxes Other Than Income Taxes | 100 | — | — | 100 | — | |||||||||||||||
Total Operating Expenses | 7,032 | (2,399 | ) | 3,729 | 5,657 | 45 | ||||||||||||||
OPERATING INCOME | 2,488 | 11 | 1,662 | 664 | 151 | |||||||||||||||
Income from Equity Method Investments | 17 | — | — | — | 17 | |||||||||||||||
Other Income and Deductions | 87 | 26 | 85 | 5 | (29 | ) | ||||||||||||||
Other Than Temporary Impairments | (61 | ) | (1 | ) | (60 | ) | — | — | ||||||||||||
Interest Expense | (407 | ) | (11 | ) | (125 | ) | (236 | ) | (35 | ) | ||||||||||
Preferred Stock Dividends | — | 3 | — | (3 | ) | — | ||||||||||||||
INCOME FROM CONTINUING OPERATIONS BEFORE INCOME TAXES(b) | 2,124 | 28 | 1,562 | 430 | 104 | |||||||||||||||
Income Tax Expense | (881 | ) | (11 | ) | (619 | ) | (177 | ) | (74 | ) | ||||||||||
NET INCOME | $ | 1,243 | $ | 17 | $ | 943 | $ | 253 | $ | 30 | ||||||||||
Reconciling Items Excluded from Continuing Operations(C): | (21 | ) | — | (21 | ) | — | — | |||||||||||||
OPERATING EARNINGS | $ | 1,264 | $ | 17 | $ | 964 | $ | 253 | $ | 30 | ||||||||||
| (a) | Primarily includes financing activities and donations at the parent and intercompany eliminations. |
| (b) | Income from Continuing Operations before Income Taxes includes preferred stock dividends relating to PSE&G of $1 million and $3 million for the nine months ended September 30, 2010 and 2009, respectively. |
| (c) | See attachment 12 for details of items excluded from Income from Continuing Operations to compute Operating Earnings. Income from Continuing Operations for the nine months ended September 30, 2010 and 2009 is equal to Net Income. |
Attachment 4
PUBLIC SERVICE ENTERPRISE GROUP INCORPORATED
Capitalization Schedule
(Unaudited, $ Millions)
| September 30, 2010 | December 31, 2009 | |||||||
DEBT | ||||||||
Commercial Paper and Loans | $ | — | $ | 530 | ||||
Long-Term Debt | 7,898 | 6,781 | ||||||
Securitization Debt | 1,202 | 1,343 | ||||||
Project Level, Non-Recourse Debt | 56 | 42 | ||||||
Total Debt | 9,156 | 8,696 | ||||||
SUBSIDIARY’S PREFERRED STOCK WITHOUT MANDATORY REDEMPTION | — | 80 | ||||||
STOCKHOLDERS’ EQUITY | ||||||||
Common Stock | 4,796 | 4,788 | ||||||
Treasury Stock | (594 | ) | (588 | ) | ||||
Retained Earnings | 5,466 | 4,704 | ||||||
Accumulated Other Comprehensive Loss | (111 | ) | (116 | ) | ||||
Total Common Stockholders’ Equity | 9,557 | 8,788 | ||||||
Noncontrolling Interests - Equity Investments | 8 | 10 | ||||||
Total Equity | 9,565 | 8,798 | ||||||
Total Capitalization | $ | 18,721 | $ | 17,574 | ||||
Attachment 5
PUBLIC SERVICE ENTERPRISE GROUP INCORPORATED
CONDENSED CONSOLIDATED STATEMENTS OF CASH FLOWS
(Unaudited, $ Millions)
| For the Nine Months Ended September 30, | ||||||||
| 2010 | 2009 | |||||||
CASH FLOWS FROM OPERATING ACTIVITIES | ||||||||
Net Income | $ | 1,282 | $ | 1,243 | ||||
Adjustments to Reconcile Net Income to Net Cash Flows From Operating Activities | 57 | 98 | ||||||
NET CASH PROVIDED BY OPERATING ACTIVITIES | 1,339 | 1,341 | ||||||
NET CASH USED IN INVESTING ACTIVITIES | (1,096 | ) | (419 | ) | ||||
NET CASH USED IN FINANCING ACTIVITIES | (261 | ) | (1,113 | ) | ||||
Net Decrease in Cash and Cash Equivalents | (18 | ) | (191 | ) | ||||
Cash and Cash Equivalents at Beginning of Period | 350 | 321 | ||||||
Cash and Cash Equivalents at End of Period | $ | 332 | $ | 130 | ||||
Attachment 6
PUBLIC SERVICE ENTERPRISE GROUP INCORPORATED
Quarter-over-Quarter EPS Reconciliation
September 30, 2010 vs. September 30, 2009
(Unaudited)
Attachment 7
PUBLIC SERVICE ENTERPRISE GROUP INCORPORATED
Year-over-Year EPS Reconciliation
September 30, 2010 vs. September 30, 2009
(Unaudited)
Attachment 8
PSEG POWER LLC
Generation Measures
(Unaudited)
| GWhr Breakdown | GWhr Breakdown | |||||||||||||||
| Three Months Ended September 30, | Nine Months Ended September 30, | |||||||||||||||
| 2010 | 2009 | 2010 | 2009 | |||||||||||||
Nuclear - NJ | 5,146 | 5,555 | 15,517 | 15,782 | ||||||||||||
Nuclear - PA | 2,163 | 2,183 | 7,060 | 6,969 | ||||||||||||
Total Nuclear | 7,309 | 7,738 | 22,577 | 22,751 | ||||||||||||
Fossil - Coal - NJ* | 1,130 | 795 | 3,302 | 1,766 | ||||||||||||
Fossil - Coal - PA | 1,548 | 1,341 | 4,314 | 4,008 | ||||||||||||
Fossil - Coal - CT | 453 | 105 | 1,031 | 615 | ||||||||||||
Total Coal | 3,131 | 2,241 | 8,647 | 6,389 | ||||||||||||
Fossil - Oil & Natural Gas - NJ | 3,700 | 2,881 | 9,204 | 6,782 | ||||||||||||
Fossil - Oil & Natural Gas - NY | 1,272 | 1,028 | 3,366 | 2,537 | ||||||||||||
Fossil - Oil & Natural Gas - CT | 101 | 16 | 122 | 116 | ||||||||||||
Fossil - Oil & Natural Gas - TX | 2,336 | 2,328 | 5,879 | 5,861 | ||||||||||||
Total Oil & Natural Gas | 7,409 | 6,253 | 18,571 | 15,296 | ||||||||||||
| 17,849 | 16,232 | 49,795 | 44,436 | |||||||||||||
| % Generation by Fuel Type | % Generation by Fuel Type | |||||||||||||||
| Three Months Ended September 30, | Nine Months Ended September 30, | |||||||||||||||
| 2010 | 2009 | 2010 | 2009 | |||||||||||||
Nuclear - NJ | 29 | % | 34 | % | 31 | % | 35 | % | ||||||||
Nuclear - PA | 12 | % | 14 | % | 14 | % | 16 | % | ||||||||
Total Nuclear | 41 | % | 48 | % | 45 | % | 51 | % | ||||||||
Fossil - Coal - NJ* | 6 | % | 5 | % | 7 | % | 4 | % | ||||||||
Fossil - Coal - PA | 9 | % | 8 | % | 9 | % | 9 | % | ||||||||
Fossil - Coal - CT | 3 | % | 1 | % | 2 | % | 1 | % | ||||||||
Total Coal | 18 | % | 14 | % | 18 | % | 14 | % | ||||||||
Fossil - Oil & Natural Gas - NJ | 21 | % | 18 | % | 18 | % | 16 | % | ||||||||
Fossil - Oil & Natural Gas - NY | 7 | % | 6 | % | 7 | % | 6 | % | ||||||||
Fossil - Oil & Natural Gas - CT | 0 | % | 0 | % | 0 | % | 0 | % | ||||||||
Fossil - Oil & Natural Gas - TX | 13 | % | 14 | % | 12 | % | 13 | % | ||||||||
Total Oil & Natural Gas | 41 | % | 38 | % | 37 | % | 35 | % | ||||||||
| 100 | % | 100 | % | 100 | % | 100 | % | |||||||||
| * | Includes Pumped Storage. Pumped Storage accounted for <1% of total generation for the three and nine months ended September 30, 2010 and 2009. |
Attachment 9
PUBLIC SERVICE ELECTRIC & GAS COMPANY
Retail Sales and Revenues
(Unaudited)
September 30, 2010
Electric Sales and Revenues
| Three Months Ended | Change vs. 2009 | Nine Months Ended | Change vs. 2009 | |||||||||||||
Sales (millions kwh) | ||||||||||||||||
Residential | 4,769 | 19.1 | % | 11,300 | 11.9 | % | ||||||||||
Commercial & Industrial | 8,087 | 2.1 | % | 22,154 | 1.3 | % | ||||||||||
Street Lighting | 82 | 5.2 | % | 266 | 1.3 | % | ||||||||||
Other | 3 | 5.1 | % | 7 | 3.1 | % | ||||||||||
Total | 12,941 | 7.8 | % | 33,727 | 4.6 | % | ||||||||||
Revenue ($ millions) | ||||||||||||||||
Residential | $ | 827 | 15.5 | % | $ | 1,894 | 9.9 | % | ||||||||
Commercial & Industrial | 803 | -8.5 | % | 1,949 | -14.2 | % | ||||||||||
Street Lighting | 18 | 1.8 | % | 57 | 0.9 | % | ||||||||||
Other Operating Revenues* | 110 | 50.3 | % | 277 | 32.3 | % | ||||||||||
Total | $ | 1,758 | 4.3 | % | $ | 4,177 | -2.0 | % | ||||||||
| Three Months Ended | Change vs. 2009 | Nine Months Ended | Change vs. 2009 | |||||||||||||
Weather Data | ||||||||||||||||
THI Hours - Actual | 14,507 | 68.2 | % | 20,001 | 81.8 | % | ||||||||||
THI Hours - Normal | 11,130 | 15,055 | ||||||||||||||
| * | Primarily sales of Non-Utility Generator energy to PJM and Transmission related revenues. |
Attachment 10
PUBLIC SERVICE ELECTRIC & GAS COMPANY
Retail Sales and Revenues
(Unaudited)
September 30, 2010
Gas Sold and Transported
| Three Months Ended | Change vs. 2009 | Nine Months Ended | Change vs. 2009 | |||||||||||||
Sales (millions therms) | ||||||||||||||||
Residential Sales | 84 | -12.8 | % | 885 | -9.5 | % | ||||||||||
Commercial & Industrial - Firm Sales | 33 | -12.1 | % | 334 | -10.4 | % | ||||||||||
Commercial & Industrial - Interr. & Cogen | 62 | 12.9 | % | 138 | -6.3 | % | ||||||||||
Total | 179 | -5.2 | % | 1,357 | -9.4 | % | ||||||||||
Gas Transported - Firm Sales | 55 | 14.6 | % | 324 | 1.2 | % | ||||||||||
Gas Transported - Non-Firm | 287 | -29.8 | % | 729 | 2.8 | % | ||||||||||
Revenue ($ millions) | ||||||||||||||||
Residential Sales | $ | 64 | -27.5 | % | $ | 726 | -24.2 | % | ||||||||
Commercial & Industrial - Firm Sales | 21 | 11.1 | % | 236 | -5.2 | % | ||||||||||
Commercial & Industrial - Interr. & Cogen | 32 | 48.9 | % | 77 | 8.1 | % | ||||||||||
Other Operating Revenues* | 36 | 5.6 | % | 111 | 9.1 | % | ||||||||||
Total | $ | 153 | -5.9 | % | $ | 1,150 | -16.6 | % | ||||||||
Gas Transported | $ | 96 | 1.0 | % | $ | 661 | -3.1 | % | ||||||||
| Three Months Ended | Change vs. 2009 | Nine Months Ended | Change vs. 2009 | |||||||||||||
Weather Data | ||||||||||||||||
Degree Days - Actual | — | -100.0 | % | 2,146 | -13.8 | % | ||||||||||
Degree Days - Normal | 9 | 2,360 | ||||||||||||||
| * | Primarily Appliance Service. |
Attachment 11
PUBLIC SERVICE ENTERPRISE GROUP INCORPORATED
Statistical Measures
(Unaudited)
| For the Three Months Ended September 30 | For the Nine Months Ended September 30 | |||||||||||||||
| 2010 | 2009 | 2010 | 2009 | |||||||||||||
Weighted Average Common Shares Outstanding (000’s) | ||||||||||||||||
Basic | 505,945 | 505,982 | 506,001 | 505,986 | ||||||||||||
Diluted | 506,968 | 507,242 | 507,068 | 506,957 | ||||||||||||
Stock Price at End of Period | $ | 33.08 | $ | 31.44 | ||||||||||||
Dividends Paid per Share of Common Stock | $ | 0.3425 | $ | 0.3325 | $ | 1.0275 | $ | 0.9975 | ||||||||
Dividend Payout Ratio* | 42.9 | % | 42.3 | % | ||||||||||||
Dividend Yield | 4.1 | % | 4.2 | % | ||||||||||||
Price/Earnings Ratio* | 10.4 | 10.1 | ||||||||||||||
Rate of Return on Average Common Equity* | 17.7 | % | 19.4 | % | ||||||||||||
Book Value per Common Share | $ | 18.89 | $ | 17.16 | ||||||||||||
Market Price as a Percent of Book Value | 175 | % | 183 | % | ||||||||||||
Total Shareholder Return | 6.7 | % | -2.6 | % | 2.8 | % | 11.6 | % | ||||||||
| * | Calculation based on Operating Earnings for the 12 month period ended |
Attachment 12
PUBLIC SERVICE ENTERPRISE GROUP INCORPORATED
Reconciling Items Excluded from Continuing Operations(a) to Compute Operating Earnings
(Unaudited)
| For the Three Months Ended September 30, | For the Nine Months Ended September 30, | For the Twelve Months Ended December 31, | ||||||||||||||||||
Pro-forma Adjustments, net of tax | 2010 | 2009 | 2010 | 2009 | 2009 | |||||||||||||||
| Earnings Impact ($ Millions) | ||||||||||||||||||||
Gain (Loss) on Nuclear Decommissioning Trust (NDT) | $ | 10 | $ | 7 | $ | 30 | $ | 1 | $ | 9 | ||||||||||
Fund Related Activity (PSEG Power) | ||||||||||||||||||||
Gain (Loss) on Mark-to-Market (MTM) (PSEG Power) | 19 | 17 | 30 | (22 | ) | (25 | ) | |||||||||||||
Net Reversal of Lease Transaction Reserves (Energy Holdings) | — | — | — | — | 29 | |||||||||||||||
Market Transition Charge Refund (PSE&G) | — | — | (72 | ) | — | — | ||||||||||||||
Total Pro-forma adjustments | $ | 29 | $ | 24 | $ | (12 | ) | $ | (21 | ) | $ | 13 | ||||||||
Fully Diluted Average Shares Outstanding (in Millions) | 507 | 507 | 507 | 507 | 507 | |||||||||||||||
| Per Share Impact (Diluted) | ||||||||||||||||||||
Gain (Loss) on NDT Fund Related Activity (PSEG Power) | $ | 0.02 | $ | 0.01 | $ | 0.06 | $ | — | $ | 0.02 | ||||||||||
Gain (Loss) on MTM (PSEG Power) | 0.04 | 0.03 | 0.06 | (0.05 | ) | (0.05 | ) | |||||||||||||
Net Reversal of Lease Transaction Reserves (Energy Holdings) | — | — | — | — | 0.05 | |||||||||||||||
Market Transition Charge Refund (PSE&G) | — | — | (0.14 | ) | — | — | ||||||||||||||
Total Pro-forma adjustments | $ | 0.06 | $ | 0.04 | $ | (0.02 | ) | $ | (0.05 | ) | $ | 0.02 | ||||||||
| (a) | Income from Continuing Operations for the three and nine months ended September 30, 2010 and 2009 and the twelve months ended December 31, 2009 is equal to Net Income. |