 PSEG Public Service Enterprise Group Presentation to the Financial Community New York, New York March 7, 2011 Exhibit 99 |
 2 Forward-Looking Statement Readers are cautioned that statements contained in this presentation about our and our subsidiaries' future performance, including future revenues, earnings, strategies, prospects, consequences and all other statements that are not purely historical, are forward-looking statements for purposes of the safe harbor provisions under The Private Securities Litigation Reform Act of 1995. When used herein, the words “anticipate”, “intend”, “estimate”, “believe”, “expect”, “plan”, “should”, “hypothetical”, “potential”, “forecast”, “project”, variations of such words and similar expressions are intended to identify forward-looking statements. Although we believe that our expectations are based on reasonable assumptions, they are subject to risks and uncertainties and we can give no assurance they will be achieved. The results or developments projected or predicted in these statements may differ materially from what may actually occur. Factors which could cause results or events to differ from current expectations include, but are not limited to: • Adverse changes in energy industry law, policies and regulation, including market structures, and a potential shift away from competitive markets towards subsidized market mechanisms, transmission planning and cost allocation rules, including rules regarding how transmission is planned and who is permitted to build transmission going forward, and reliability standards. • Any inability of our transmission and distribution businesses to obtain adequate and timely rate relief and regulatory approvals from federal and state regulators. • Changes in federal and state environmental regulations that could increase our costs or limit operations of our generating units. • Changes in nuclear regulation and/or developments in the nuclear power industry generally that could limit operations of our nuclear generating units. • Actions or activities at one of our nuclear units located on a multi-unit site that might adversely affect our ability to continue to operate that unit or other units located at the same site. • Any inability to balance our energy obligations, available supply and trading risks. • Any deterioration in our credit quality. • Availability of capital and credit at commercially reasonable terms and conditions and our ability to meet cash needs. • Any inability to realize anticipated tax benefits or retain tax credits. • Changes in the cost of, or interruption in the supply of, fuel and other commodities necessary to the operation of our generating units. • Delays in receipt of necessary permits and approvals for our construction and development activities. • Delays or unforeseen cost escalations in our construction and development activities. • Adverse changes in the demand for or price of the capacity and energy that we sell into wholesale electricity markets. • Increase in competition in energy markets in which we compete. • Adverse performance of our decommissioning and defined benefit plan trust fund investments and changes in discount rates and funding requirements. • Changes in technology and customer usage patterns. For further information, please refer to our Annual Report on Form 10-K, including Item 1A. Risk Factors, and subsequent reports on Form 10-Q and Form 8-K filed with the Securities and Exchange Commission. These documents address in further detail our business, industry issues and other factors that could cause actual results to differ materially from those indicated in this presentation. In addition, any forward-looking statements included herein represent our estimates only as of today and should not be relied upon as representing our estimates as of any subsequent date. While we may elect to update forward-looking statements from time to time, we specifically disclaim any obligation to do so, even if our internal estimates change, unless otherwise required by applicable securities laws. |
 3 GAAP Disclaimer PSEG presents Operating Earnings in addition to its Net Income reported in accordance with accounting principles generally accepted in the United States (GAAP). Operating Earnings is a non-GAAP financial measure that differs from Net Income because it excludes gains or losses associated with Nuclear Decommissioning Trust (NDT), Mark-to-Market (MTM) accounting, and other material one-time items. PSEG presents Operating Earnings because management believes that it is appropriate for investors to consider results excluding these items in addition to the results reported in accordance with GAAP. PSEG believes that the non-GAAP financial measure of Operating Earnings provides a consistent and comparable measure of performance of its businesses to help shareholders understand performance trends. This information is not intended to be viewed as an alternative to GAAP information. The last slide in this presentation includes a list of items excluded from Income from Continuing Operations to reconcile to Operating Earnings, with a reference to that slide included on each of the slides where the non-GAAP information appears. |
 4 Agenda Presentation Presenter Welcome/Introduction Kathleen Lally PSEG – Defining the Future Ralph Izzo PSE&G – Review and Outlook Ralph LaRossa PSEG Energy Holdings – Review and Outlook Randall Mehrberg BREAK PSEG Power – Review and Outlook Dan Cregg Power ER&T – Market Overview Joe Hopf PSEG Financial Review and Outlook Caroline Dorsa Summary Ralph Izzo |
 PSEG – Defining the Future Ralph Izzo Chairman, President and Chief Executive Officer |
 6 PSEG Advantage: value to customers and investors… PSE&G positioned to meet NJ’s energy policy and economic growth objectives with a $4.5 billion investment program through 2013 Electric & Gas Delivery and Transmission PSEG Power’s low-cost, base load and load following fleet is geographically well positioned and environmentally responsible Regional Wholesale Energy PSEG Energy Holdings positioned to pursue attractive renewable generation opportunities Renewable Investments …with a track record for safeguarding shareholder interests. Right platform to deliver |
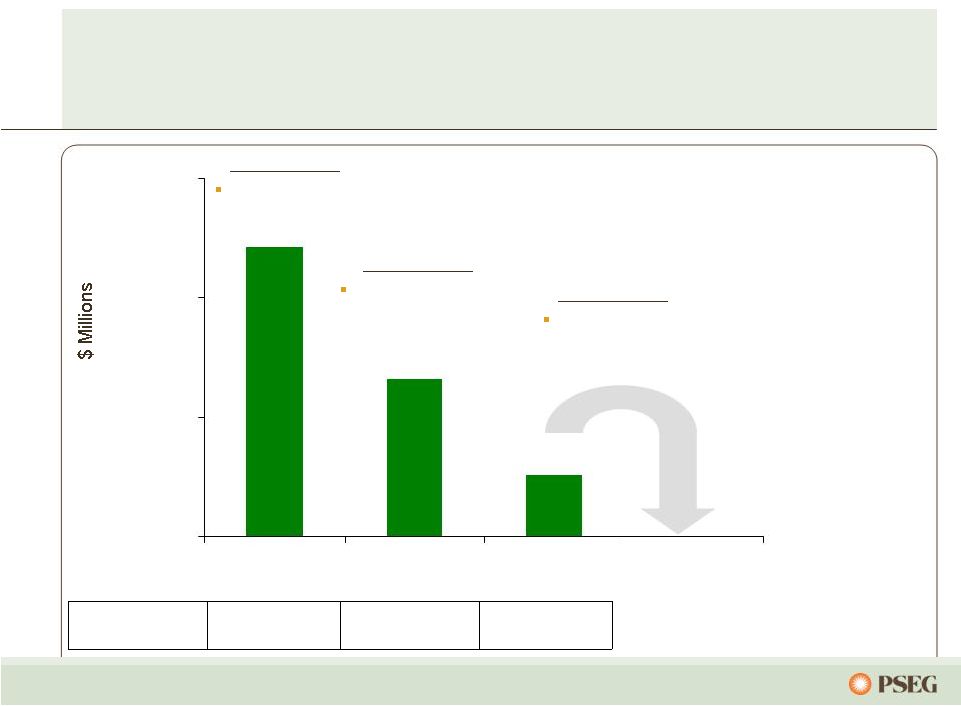
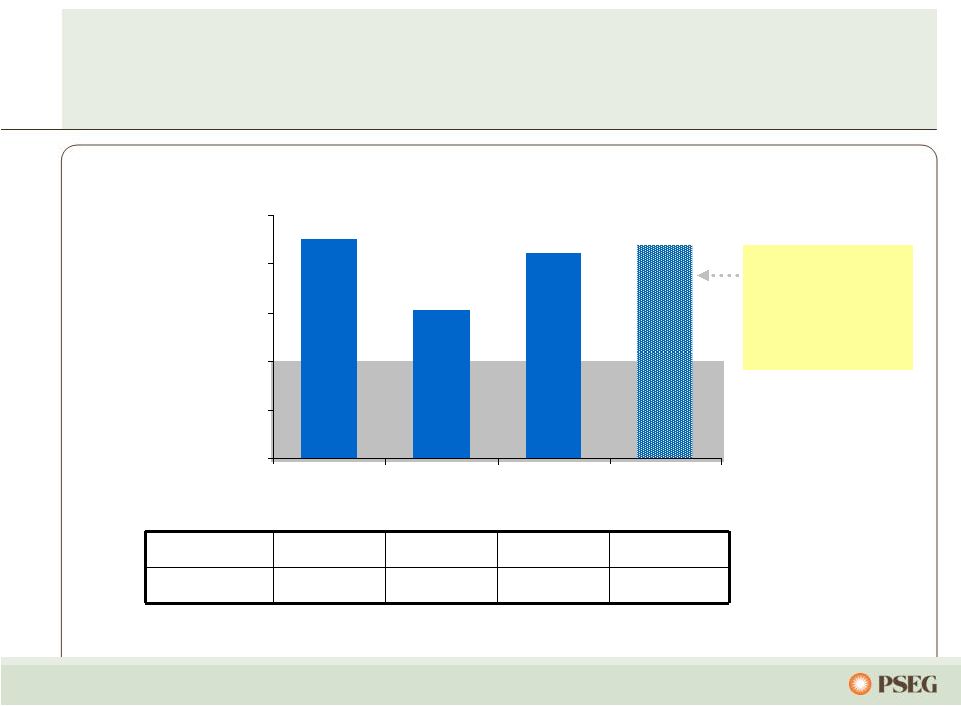
 7 Earnings growth achieved… … through increased investment, higher output and lower costs. * See page 120 for Items excluded from Income from Continuing Operations to reconcile to Operating Earnings. $2.91 $3.09 $3.12 2008 Operating Earnings* 2009 Operating Earnings* 2010 Operating Earnings* |
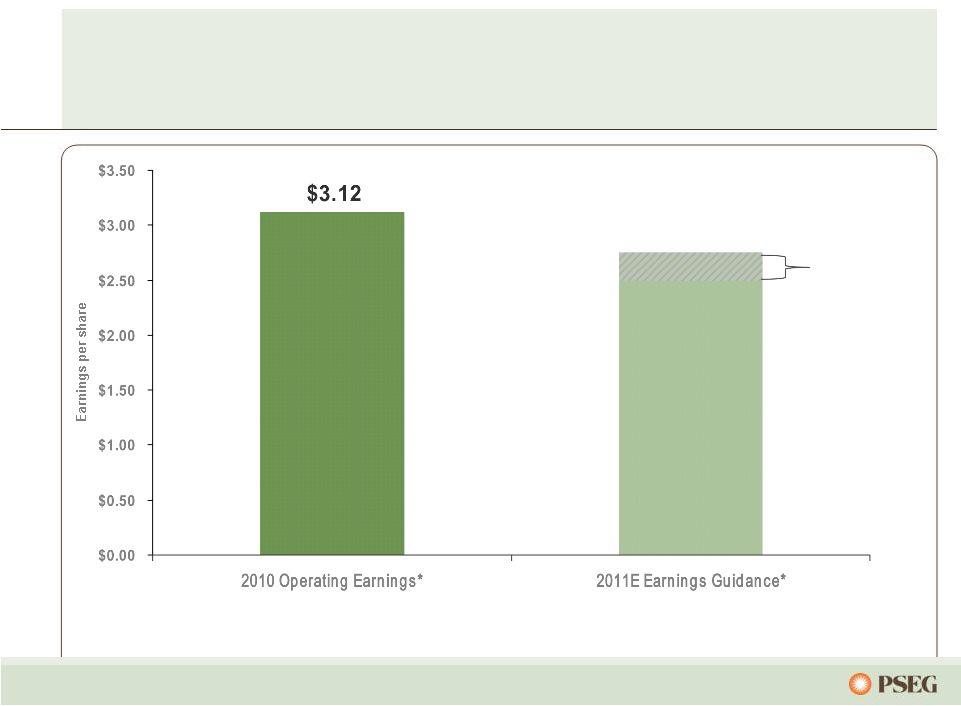 8 PSEG 2011 outlook influenced by lower market prices… * See page 120 for Items excluded from Income from Continuing Operations to reconcile to Operating Earnings. $2.75E $2.50E … offset by continuous improvement in operations, utility growth, and generating asset optionality. |
 9 Markets are responding to change in underlying fundamentals Gas/Power Prices Pre-2008 Now Influenced by availability of credit and consumer demand Influenced by increased availability of gas supply from low-cost shale deposits Economic Growth Environmental /Carbon Policy Supply Influenced by expectations of increased demand/ tight supply Government moves to control carbon and other pollutants Influenced by economic growth and focus on renewables Tight credit conditions after 2008 financial crisis leading to less growth Decline in economic growth, reduction in emissions, and increased supply of low-cost gas Oversupply due to economic slowdown |
 10 Market conditions continue to evolve Gas/Power Prices Now Beyond 2011 Tight credit conditions after 2008 financial crisis leading to less growth Price of gas range bound over the near-term; long-term to be influenced by cost of production Economic Growth Environmental /Carbon Policy Supply Influenced by increased availability of gas supply from low-cost shale deposits Decline in economic growth, reduction in emissions, and increased supply of low-cost gas Oversupply due to economic slowdown Recovery in corporate and consumer credit support economic growth Need to maintain economic competitiveness while complying with court mandated reductions in pollutants Availability of natural gas and increasingly stringent environmental requirements could restrict coal generation; State intrusion into market |
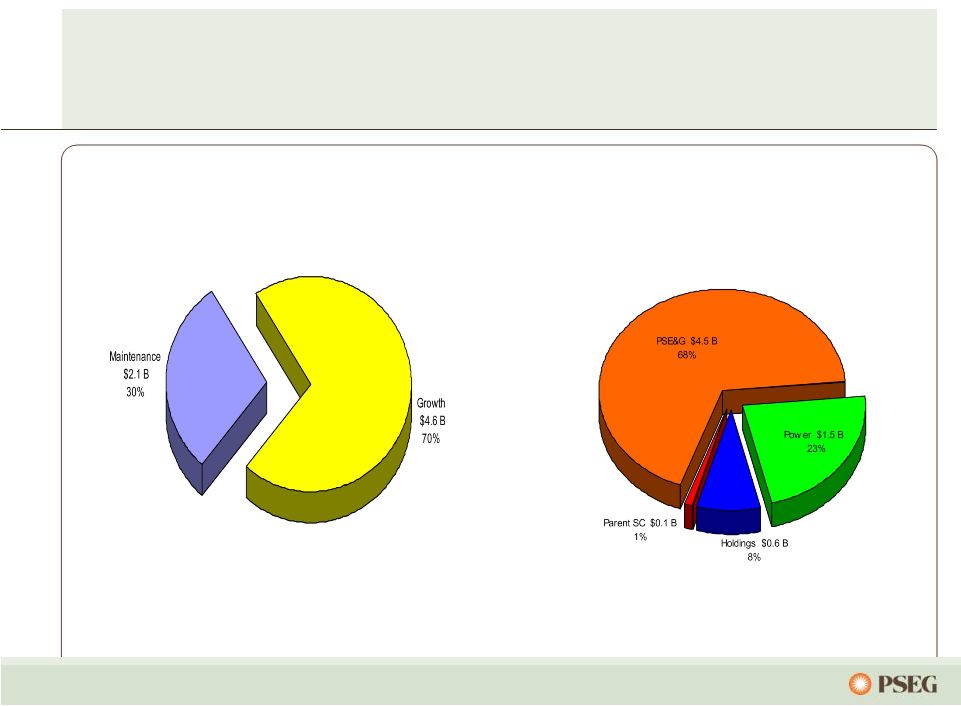
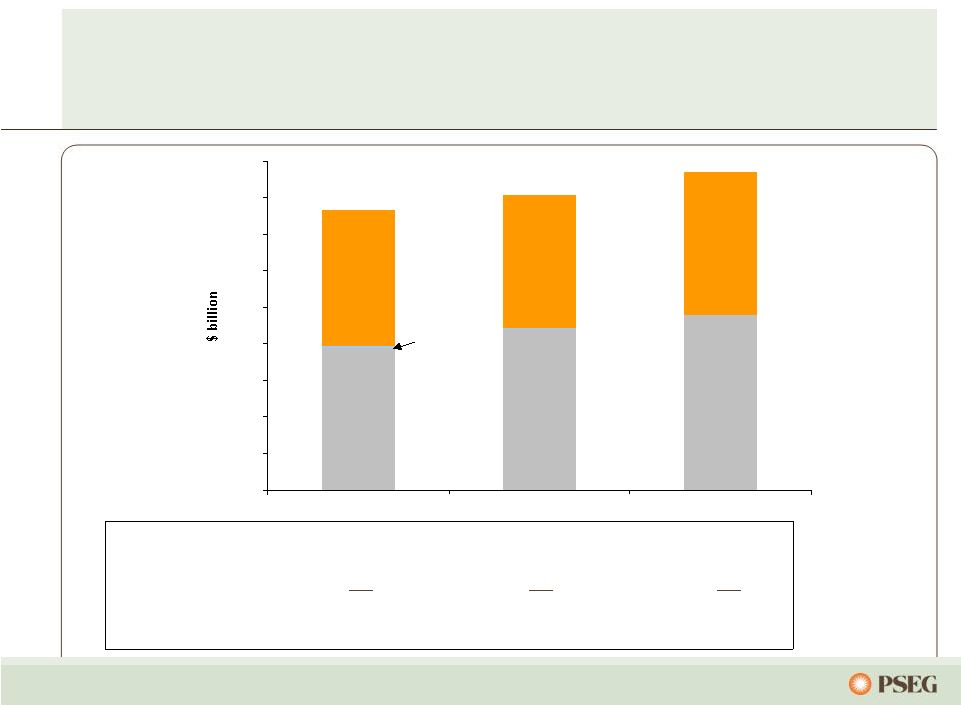
 11 PSEG Capital Spending 2011-2013 PSEG Capital Spending Program of $6.7 billion over the next 3 years is weighted toward growth investments, primarily at the utility PSEG 2011-2013 Capital Spending $6.7 billion Core 30% Growth 70% |
 12 PSEG - An active participant in market discussions •Contractual support for up to 2,000 MW of new generation to stimulate jobs and economic growth, and suppress wholesale power prices •PSEG Power, as part of P3, has filed a complaint at FERC to require that all new generators bid into the market at cost •PSEG has filed suit at Federal District Court asking that LCAPP be ruled unconstitutional PSEG Response NJ Position Long Term Capacity Agreement Pilot Program (LCAPP) |
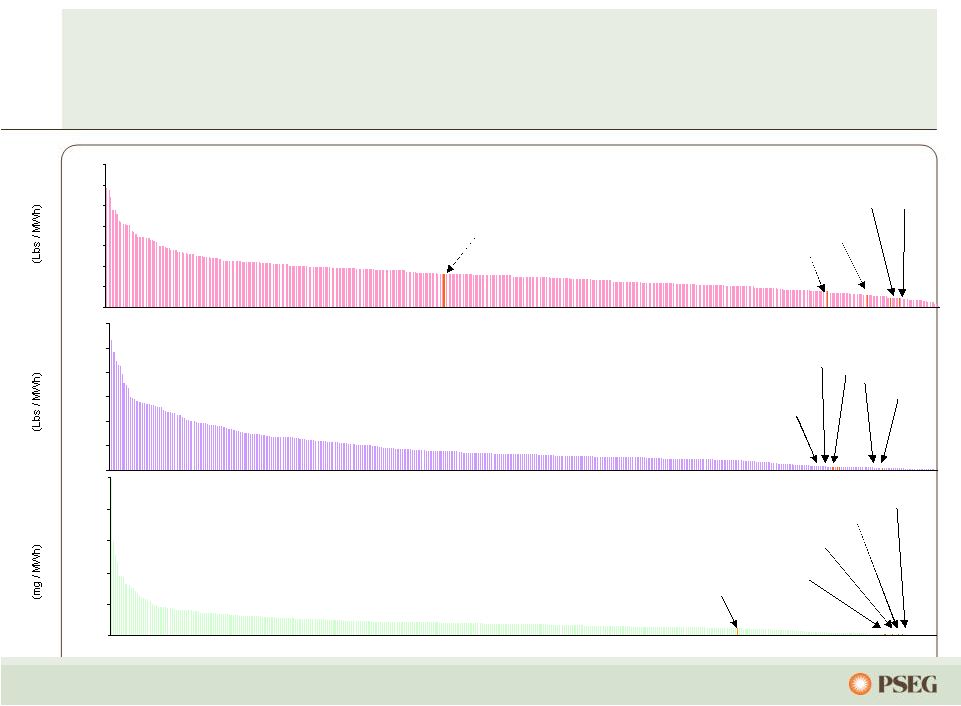
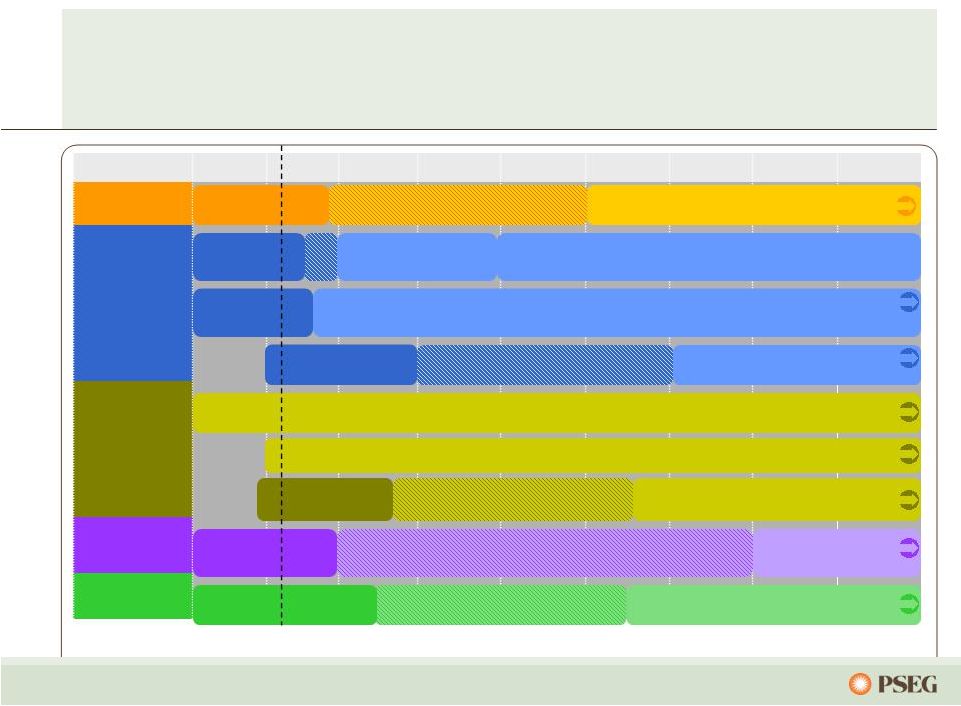 13 Source: MJ Bradley There are numerous upcoming EPA environmental regulations… 2010 2011 2012 2013 2014 2015 2016 2017 2018 Haz. Air Pollutants Criteria Pollutants Greenhouse Gases Coal Combustion By-Products 316(b) Compliance with Federal GHG Reporting Rule Compliance with PSD GHG BACT Compliance with Toxics Rule Pre-Compliance Period Develop Toxics Rule Develop Transport Rule SIP provisions developed in response to revised NAAQS Develop Revised O3 NAAQS Pre-Compliance Period Compliance with Federal CCB Regulations Dev. Coal Comb. By-Products Rule Pre-Compliance Period Develop 316(b) Regulations Develop O3 Transport Rule Estimated Compliance w/TR II Phase-In of Compliance Compliance w/GHG NSPS Pre-Compliance Period Develop GHG NSPS … and Power is well positioned to succeed under numerous outcomes. Today Phase I Compliance Phase II Compliance |
 14 PSEG Advantage: Asset mix, strong operations… Reliability One Award winner for Mid-Atlantic Region – 9 year in a row Regulatory agreements and cost control provide opportunity for improved returns Investment program focused on providing customer with clean, reliable, economic energy PSEG Power PSE&G …with balance sheet to support growth. Strong platform open to improvement in the market Low-cost generating fleet operating at historically high levels Fuel flexibility supports margins Hedging strategy mitigates near-term risk Major environmental compliance capital program completed Reducing risk Building a platform for renewables and investing through PPA-supported projects International lease investments terminated Holdings recourse debt paid down PSEG Energy Holdings th |
 15 Constructive working relationship with NJ vital to meeting customer, employee, and shareholder interests April 2010 – Susquehanna-Roseland transmission project siting approved by NJBPU. June/July 2010 – Electric and Gas rate settlements approved Market transition charge refund provided to customers over 2-year period December 2010 – Morris Energy dispute settled Settlement resolved a dispute over discounted gas rates and the application of the Societal Benefits Clause. April 2011 – PSE&G expects BPU decision on request to spend $400 million on Capital Infrastructure Program and Energy Efficiency supporting NJ economic recovery |
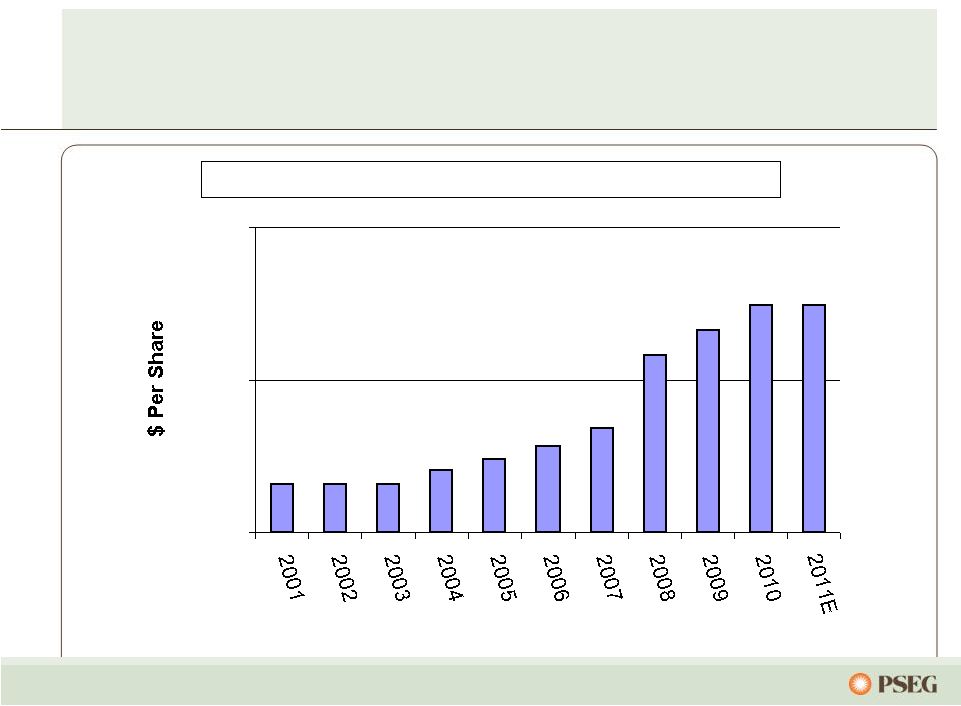 16 PSEG Dividend – A 104-year commitment to returning cash to shareholders PSEG Annual Common Dividend Per Share 2001-2011E $1.08 $1.08 $1.08 $1.10 $1.12 $1.14 $1.17 $1.29 $1.33 $1.37 $1.37 $1.00 $1.25 $1.50 |
 17 PSEG received a perfect score of 100 on the Corporate Equality Index and Best Places to Work 2010 Survey conducted by the Human Rights Campaign. The Edison Award. Presented annually by EEI and recognizes U.S. and international electric utilities for their innovation and role in advancing the industry. Our focus on customers, community and employees… PSE&G named America’s Most Reliable Utility 4 of past 6 years Mid-Atlantic Region winner for the 9 straight year Carbon Performance Leadership Index (CPLI) 2010. Named Maplecroft Climate Innovation Index (CII) utility sector Leader. First year in World Index, third year in the North American Index. Awarded Sustainability Leader Bronze Class. PSEG is one of only five U.S. electric companies included. … has been widely recognized. th |
 PSE&G – Review and Outlook Ralph LaRossa President and Chief Operating Officer, PSE&G |
 19 PSE&G is positioned for growth… …through investments in infrastructure, renewables and energy efficiency. Leader in reliability; focused on maintaining position by improving customer responsiveness and efficiency Economically meeting mandates for reliability, service quality and access to renewables Largest provider of electric and gas distribution services and transmission in NJ Focused on regulatory mechanisms that provide reasonable and current recovery of and return on capital |
 20 PSE&G is the largest utility in New Jersey providing electric, gas and transmission services… …and delivering renewable and energy efficiency solutions for customers. * Actual ** Weather normalized = estimated annual growth per year over forecast period *** Energy Efficiency Annualized Savings (75% Electric/25% Gas Equivalent) Electric Gas Customers Growth (2005 – 2010) 2.2 Million 4.0% 1.8 Million 4.0% Electric Sales and Gas Sold and Transported 43,645 GWh 3,465 M Therms Historical Annual Load Growth Distribution (0.5%)* (1.0%)* Historical Annual Peak Load Growth Transmission (0.1%) Projected Annual Load Growth 1.3%** 0.8%** Projected Annual Load Growth Transmission 1.4% Sales Mix Residential 33% 61% Commercial 57% 36% Industrial 10% 3% Transmission Electric Gas Approved Rate of Return 11.68% ROE 10.3% ROE 10.3% ROE Renewables and Energy Efficiency 2009-2010 Total Program Plan Solar Loan 19 MW 81 MW Solar 4 All 28 MW 80 MW Energy Efficiency Initiative (lifetime equivalent)*** 389 GWh 604 GWh (2006 - 2010) (2006 – 2010) (2011 – 2013) (2011 – 2013) |
 21 PSE&G is a nationally-recognized leader in delivering safe and reliable service Nine consecutive ReliabilityOne™ Awards for the Mid-Atlantic PSE&G nationally ranked third place in Solar Electric Power Association’s (SEPA) Top Ten Utility Solar Integration Rankings PSE&G ranked third on the American Customer Satisfaction Index which measures residential customer satisfaction PSE&G ranked second nationally for “Being a Company You Can Trust” and sixth for “Being Well-Managed” by Market Strategies International CS Week’s Best CIS Implementation at a Large Company iPower Project Wins SAP’s 2010 Best-Run Utilities Award – Innovation Reliability Performance Metrics compared to Peer Panel have been Top Quartile since: System Average Interruption Frequency Index* 2000 Momentary Average Interruption Frequency Index* 2004 Gas Leak Reports per Mile 2003 Leak Response Rate 2000 Damages per Locate 1,000 Requests 2006 Customer Average Interruption Duration Index 2004 * SAIFI and MAIFI excluding major storms. |
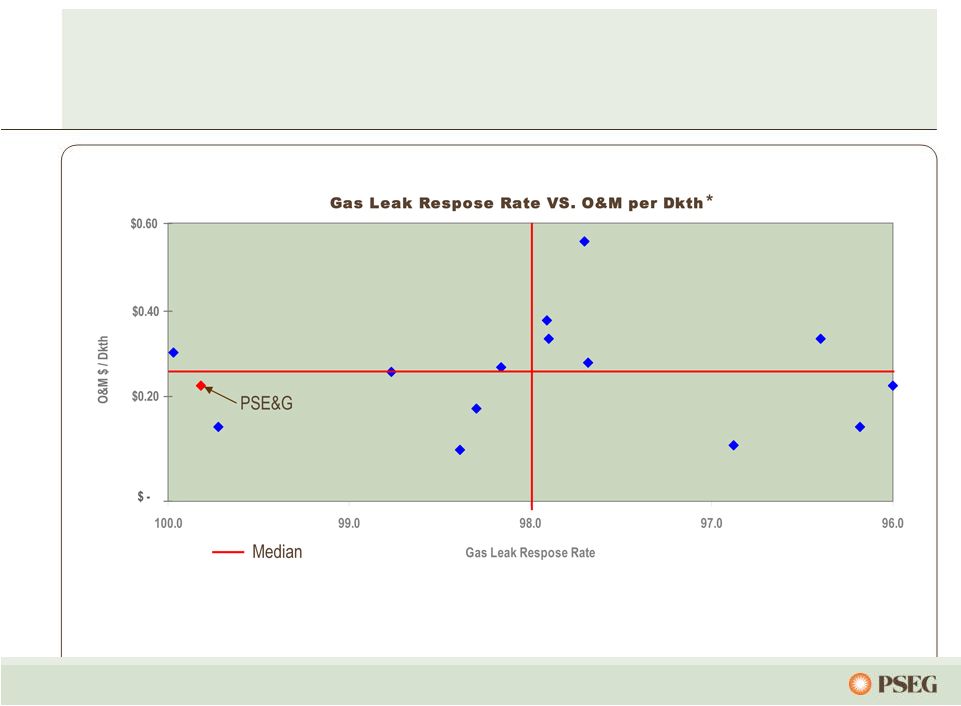
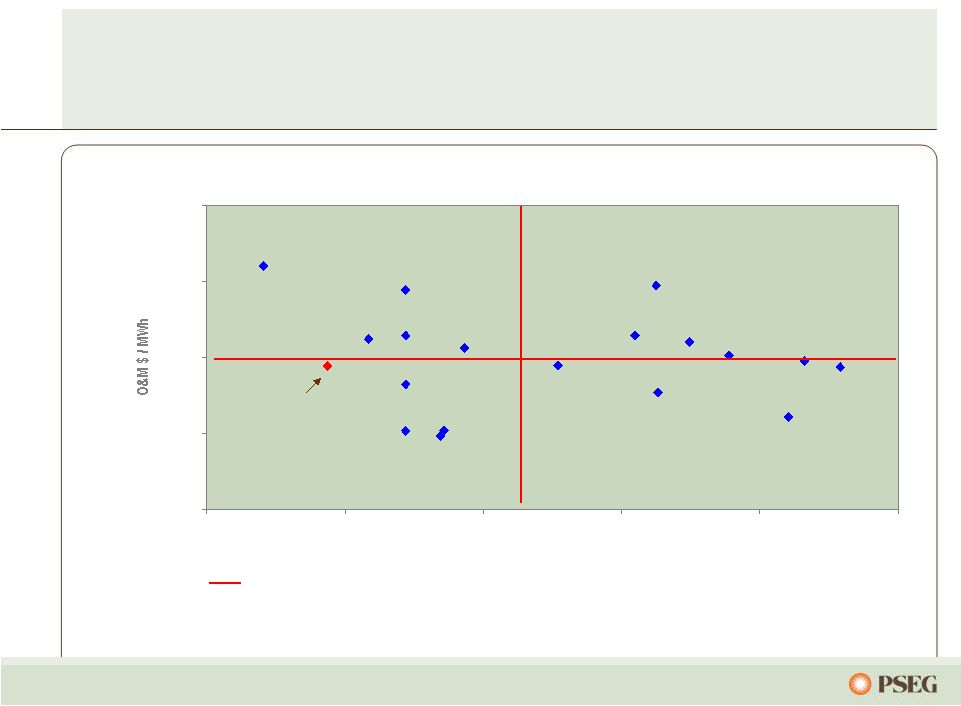 22 …which creates superior value to customers. PSE&G provides the highest reliability at below average cost... $0.00 $2.50 $5.00 $7.50 $10.00 0 50 100 150 200 250 System Average Interuption Duration Index Median PSE&G *PSE&G versus peer utility companies. SAIDI VS. O&M per MWh * |
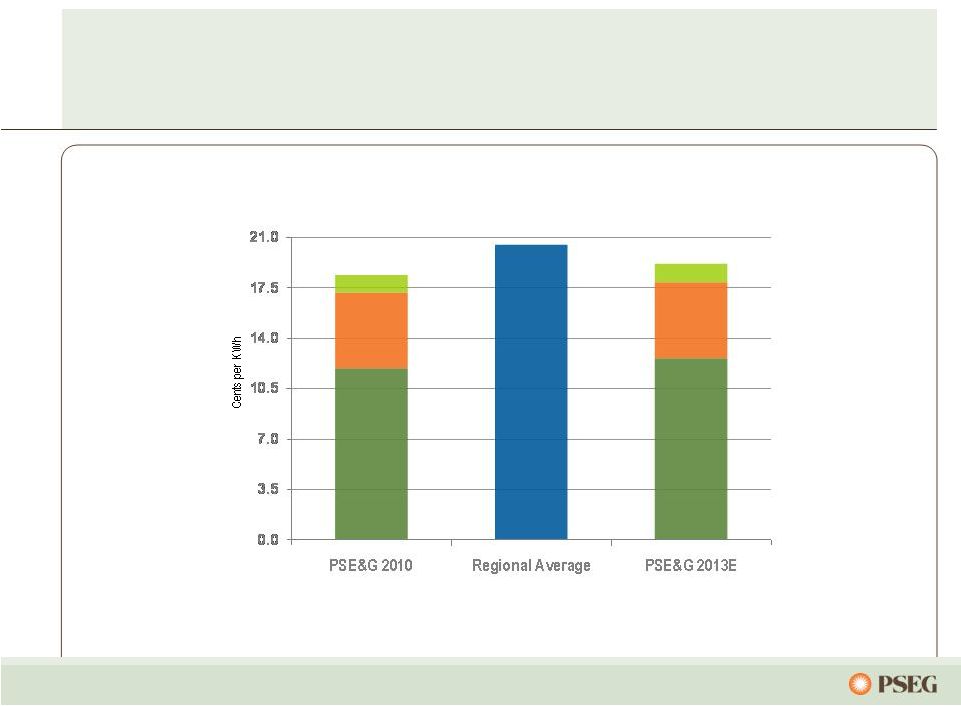 23 PSE&G continues to invest in reliability and green programs... Based on Residential electric rates effective September 2010 (summer month) …while managing electric rates below the regional average. Electricity (500kWh/month bill) BGS Delivery** Clauses and Other* 18.4 BGS*** Delivery** 20.5 19.2 Clauses and Other* * Other includes impact in Solar 4 All, Solar Loan I & II, Energy Efficiency Economic, Carbon Abatement and Demand Response ** Includes NJ Capital Infrastructure Program Stimulus impact *** 2013 BGS assumes same generation rate but includes estimated net Transmission impact |
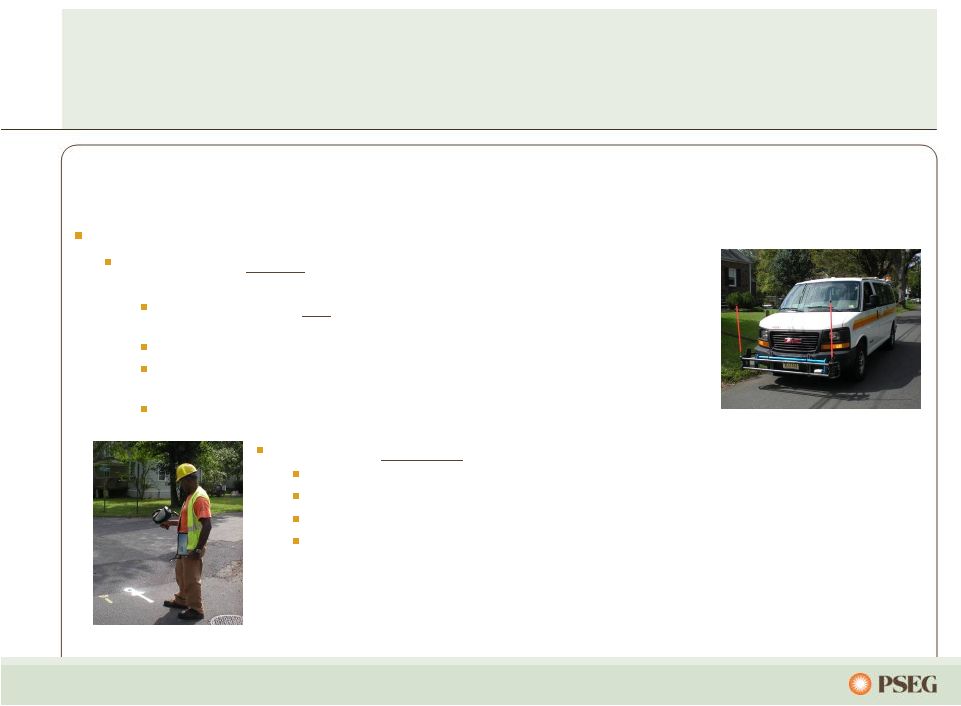 24 PSE&G provides top-quartile reliability in Gas Distribution Gas Integrity Management Plans Transmission: Proving the integrity of the pipeline through documentation of original construction details and inspection PSE&G maintains a very detailed set of records for all transmission facilities and their attributes Monitor construction activities onsite Patrol facilities every 2 weeks to look for signs of excavating or dumping and perform leak surveys bi-annually Perform integrity assessments on a 7-year cycle PSE&G is in full compliance with all Federal and State safety programs. Distribution: Monitoring the condition of the pipeline Leak survey all mains annually and all services every 3 years Perform corrosion control monitoring on all protected steel annually Perform inspections and maintenance on inside plant and outside plant annually Aggressive damage prevention and leak management programs PSE&G’s Gas system consists of 61 miles of transmission pipeline, 17,600 miles of distribution main and 17,000 miles of distribution service |
 25 …while maintaining value to customers. PSE&G prioritizes public safety… * PSE&G versus peer utility companies. |
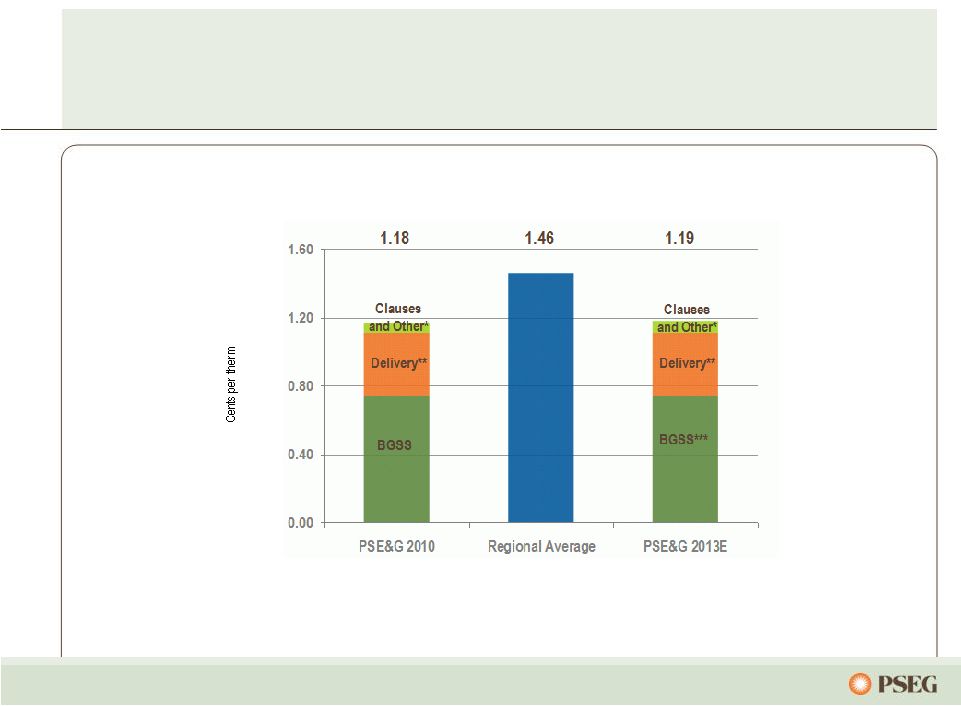 26 PSE&G continues to invest in reliability... Based on Residential gas rates effective December 2010 (winter month) …while managing gas rates below the regional average. Gas (100 therm/month bill) * Other includes impact in Energy Efficiency Economic and Carbon Abatement ** Includes NJ Capital Infrastructure Program Stimulus impact *** Assume BGSS rate constant |
 27 …while cost management initiatives have streamlined the organization. PSE&G O&M* * Excludes Regulatory Clauses PSE&G’s O&M growth has been driven by higher pension expense… 2008 – 2010 CAGR: 2.0% |
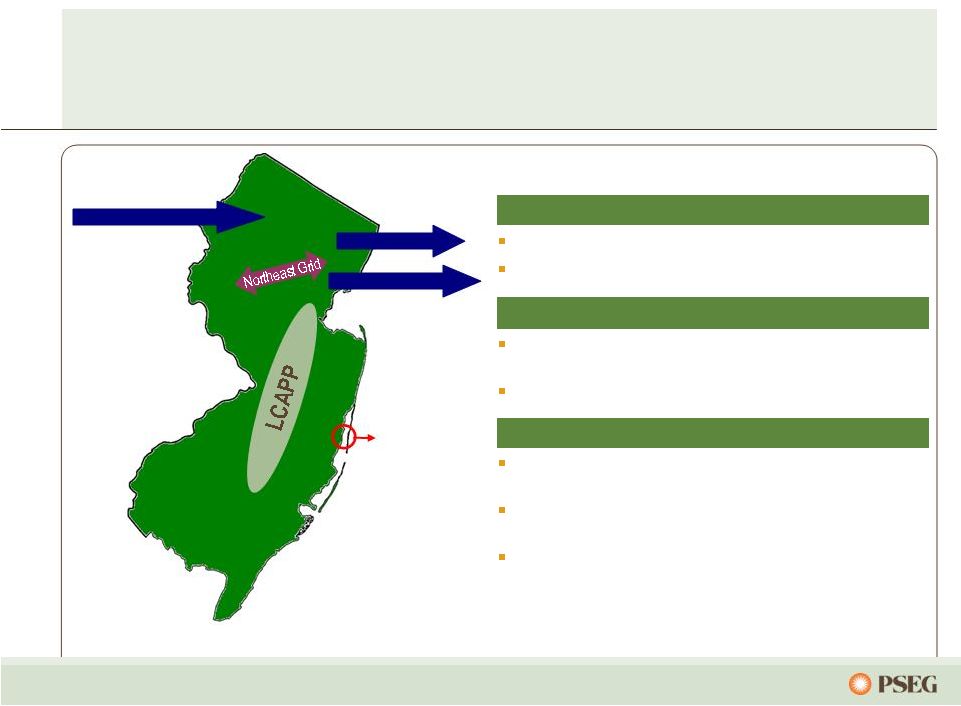 28 Oyster Creek New Jersey’s energy future requires continued investment to ensure reliability… Susquehanna-Roseland Bergen O66 Bergen U2-100 … while adapting to changes in resources. Transmission Capacity Growth Transmission Capacity Reductions Susquehanna-Roseland ~1,500 MW Northeast Grid (formerly BRH alternative) ~200 MW Bergen O66 - Bergen to ConEd's West 49th Street ~(670 MW*) Bergen U2-100 - Bergen to New York ~(800 MW**) Other Impacts to NJ Long-term Capacity Agreement Pilot Program (LCAPP) ~2,000MW Exelon has entered into an agreement with the state of New Jersey to close Oyster Creek in 2019 ~(700MW) 2010-2020 Demand growth of ~1% based on 2011 PJM Load Forecast report ~1,125MW * Project has firm contract for 320MW ** Project in queue – no firm contracts Sources: Imports: PSE&G Estimates; Exports: PJM 2009 RTEP; Load Growth: PJM 2011 Load Forecast Report Arrows are general indicators and not intended to represent actual route Impact is net reduction of ~400MW by 2020 |
 29 Transmission investment recovery is supported by formula rate treatment… ($ Millions) Phase In-Service Spending Up To Susquehanna-Roseland Engineering / Licensing 2014 East 2015 West $750 Northeast Grid (formerly BRH Alternative) Preliminary Design 2015 $700 Burlington – Camden 230kV Conversion Engineering / Licensing 2014 $381 West Orange 230kV Conversion Engineering / Licensing 2014 $336 Approved RTEP projects thru 2013 Various Various $440 69 kV Reliability projects thru 2013 Various Various $215 Transmission Life Cycle Various Various $350 … and CWIP in rate base* for certain projects. * CWIP in Rate Base and 1.25% ROE incentive treatment approved for the Susquehanna-Roseland project and seeking recovery of CWIP in Rate Base and abandonment for other major projects Future Transmission project spending will be influenced by PJM evaluation, potentially adding additional projects over 2011 – 2015 and revising required in-service dates. Transmission Projects Future Projects |
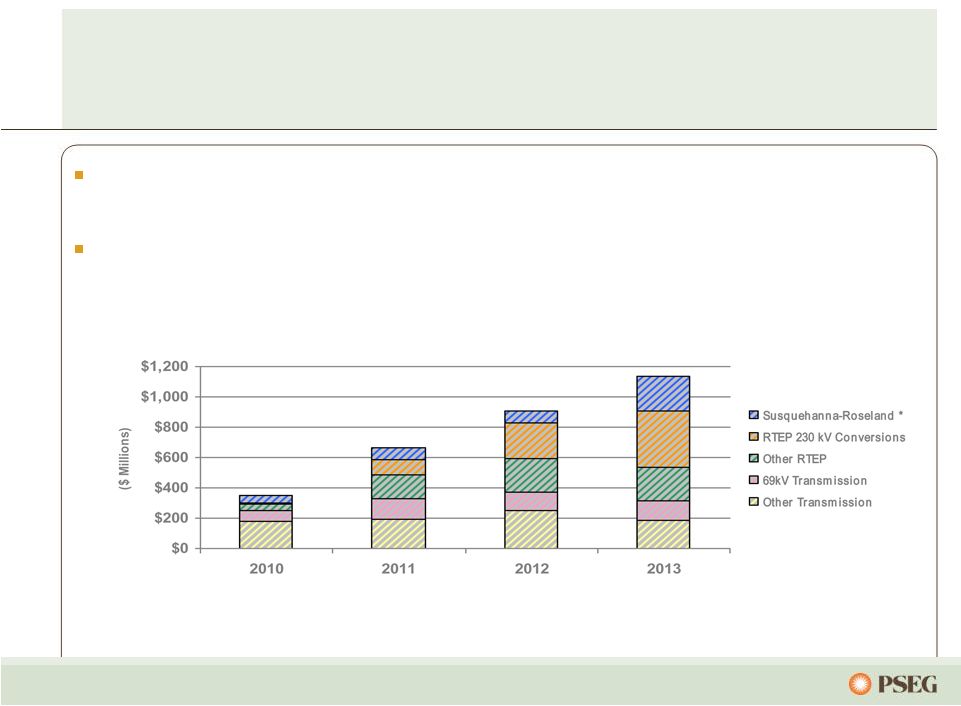 30 FERC’s Transmission formula rate order grants PSE&G an 11.68% ROE and a fully-forecasted cost of service Transmission represents approximately 60% of planned investment over the 2011-2013 plan and is expected to comprise ~31% of PSE&G rate base by 2013 Supportive regulatory treatment with contemporaneous recovery is key to align earnings growth with investment Transmission Investment by Major Category * Susquehanna-Roseland approved for 12.93% ROE. Execution of the Transmission plan is critical to achieving PSE&G’s future growth. |
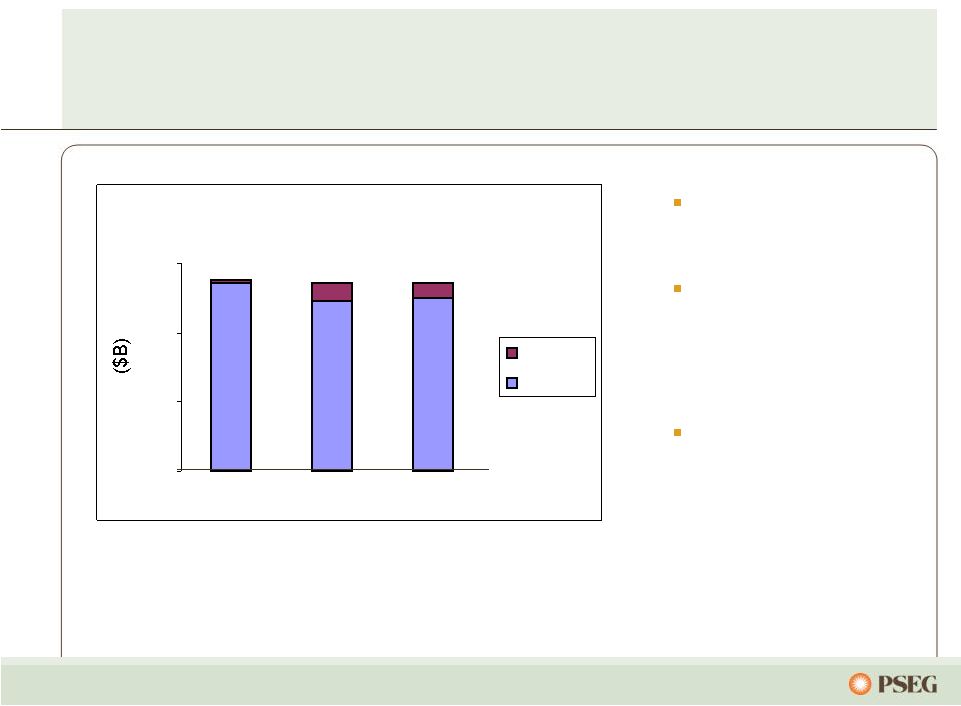
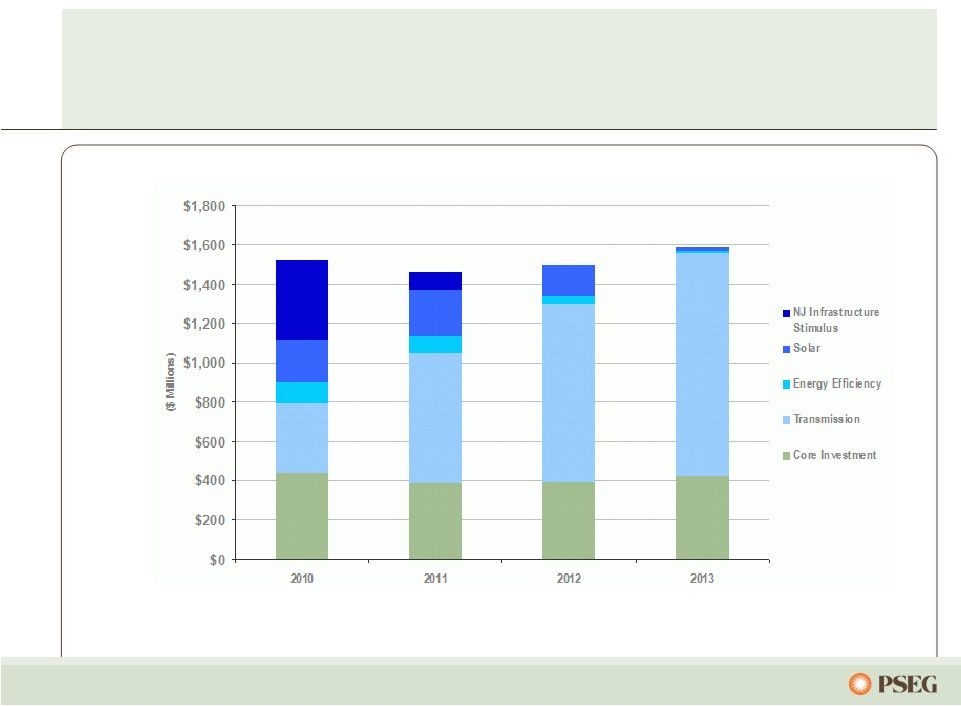 31 Our 2011 – 2013 capital plan calls for investing $4.5 billion… …with contemporaneous recovery mechanisms approved for ~$2.1 billion. PSE&G Capital Expenditures |
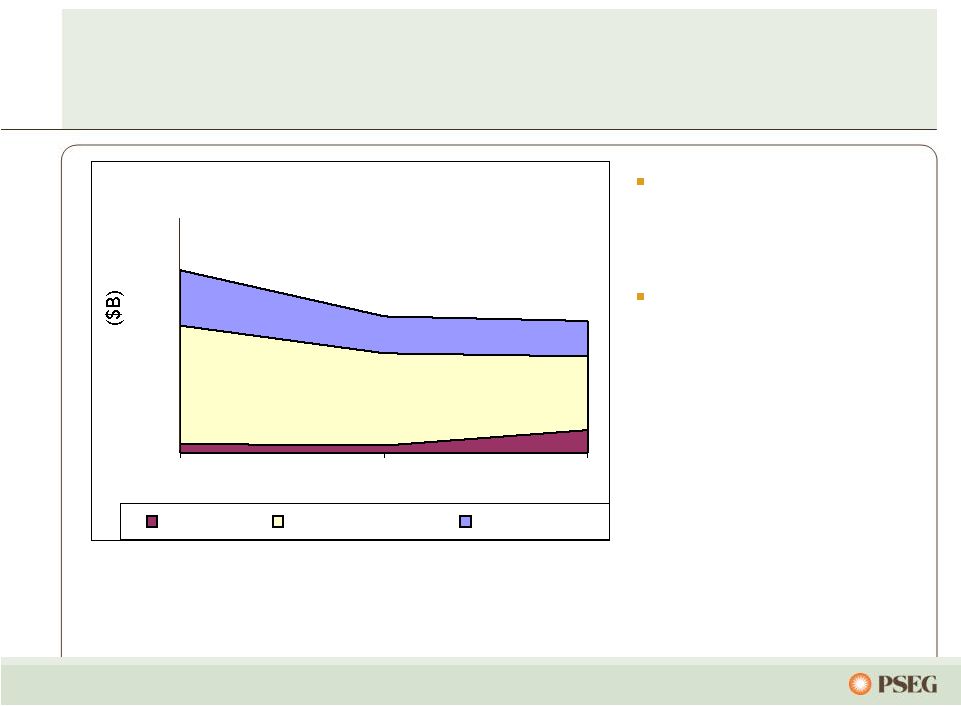
 32 PSE&G’s investment program provides opportunity for ~9% annualized growth in rate base PSE&G Projected Rate Base* *Starting from 2009 Rate Base of $7.3 billion |
 33 2010: Success in meeting State’s energy and economic development goals… …with reasonable contemporaneous returns. ($ Millions) Approval Date Total Amount Spending Thru 2010 2011-2013 Spending Solar Loan I & II April 2008/ November 2009 $248 $70 $174 Carbon Abatement December 2008 46 20 25 NJ Capital Infrastructure Stimulus April 2009 694 588 106 Solar 4 All * July 2009 465 203 260 Energy Efficiency Economic Stimulus ** July 2009 166 101 65 Demand Response July 2009 65 5 41 Total $1,684 $987 $671 * Filing amount based on installation of 80MW, total forecasted spend is lower due to a lower cost per watt to install ** Energy Efficiency Economic Stimulus totals exclude $24M of administrative costs |
 34 In addition, PSE&G is pursuing incremental growth opportunities… ($ Millions) Filing Date Requested Amount Duration Gas Distribution Capital Infrastructure Program II November 23, 2010 $78 2011-2012 Energy Efficiency Economic Stimulus Program January 24, 2011 95 2011-2014 Electric Distribution Capital Infrastructure Program II February 18, 2011 229 2011-2013 Total $402 … to support reliability, New Jersey’s EMP goals, and economic recovery. |
 35 PSE&G is advantaged… …as we focus on meeting the needs of our customers and shareholders. Right Assets, Right Markets Operational Flexibility Environmental Infrastructure Investment Creating renewable and energy efficiency solutions Focused on regulatory mechanisms that provide reasonable and current recovery of and return on capital Largest provider of electric and gas distribution services and transmission in NJ Leader in reliability; focused on customer responsiveness, efficiency and cost control 2011 |
 PSEG Energy Holdings - Review & Outlook Randy Mehrberg Executive Vice President Strategy and Development President and Chief Operating Officer, PSEG Energy Holdings |
 37 PSEG Energy Holdings… …continues to simplify the business and create sustainable growth opportunities. Transaction structures and partnerships mitigate financial risk Streamlined business and reduced financial risk Capitalizing on renewable opportunities Maximizing the value of the remaining portfolio |
 38 PSEG Energy Holdings has made significant reductions in size and risks International Energy: Global has disposed of all but one international asset Domestic Generation: Only 176 MW of Global domestic generation remain LILO/SILO: Resources terminated all 18 LILO/SILO leases Traditional Leases: Resources continues to carefully manage the remaining traditional leases and other investments with an eye towards opportunistic monetization |
 39 $320M on Deposit with IRS 12/31/2008 12/31/2009 12/31/2010 # of LILO/SILO Leases at Year-End 17 5 0 Exposure to our potential lease tax liability was reduced with aggressive asset management 2009 Activities Terminated 12 LILO/SILO leases 2010 Activities Terminated 5 LILO/SILO leases 2008 Activities Terminated 1 LILO/SILO lease $0 $500 $1,000 $1,500 ~$1,200 $660 $260 |
 40 $1,149 $127 $ 0 $1,752 $505 $1,137 $0 $200 $400 $600 $800 $1,000 $1,200 $1,400 $1,600 $1,800 2005 2006 2007 2008 2009 2010 2009 Activity Reduced $368M via Power debt exchange Redeemed $10M 2010 Activity Redeemed remaining $127M Senior recourse debt has been completely extinguished with proceeds from asset sales Year-end Energy Holdings Senior Recourse Debt Balance Outstanding 2006 Activity Redeemed $603M with proceeds from asset sales 2008 Activity Redeemed $632M with proceeds from asset sales |
 41 Energy Holdings is pursuing renewable energy alternatives with emphasis on solar • Solar is a good strategic fit for PSEG – Predictable and attractive returns through long-term Power Purchase Agreements with creditworthy counterparties – Improves geographic, technology, regulatory and market risk profile – Strong relationships established across the value chain – Favorable tax attributes, long-term earnings, short construction cycles and proven technology • Solar In-Service – Installed 29 MW at three locations; ~$117 million investment to date – Projects completed ahead of schedule and under budget; operating performance better than plan |
 42 Evaluating development of offshore wind and CAES technology • Offshore Wind Economic Development Act signed into law – Preparing for deployment of wind resource assessment tool – Expect NJ BPU RFP and Federal Lease applications in 2011 • Open key project development requirements – Revenue Mechanism; State net positive benefits test – Federal licensing (a multi-year process) • Energy Storage & Power (Compressed Air Energy Storage and Power Augmentation) – Low gas prices have reduced on-peak to off-peak spread |
 43 PSEG Energy Holdings… … creating sustainable growth opportunities for PSEG. Right Assets, Right Markets Operational Flexibility Environmental Investment Monetizing generation assets in non-core markets Reduced tax exposure through lease terminations; Achieving solid solar operating experience Pursuing investments in renewable energy Investing at attractive risk-adjusted returns to improve PSEG’s earnings base 2011 |
 Conference Break |
 PSEG Power – Review and Outlook Dan Cregg Vice President, PSEG Power Finance |
 46 PSEG Power – Right assets in the right markets… … with dispatch flexibility supporting returns in unpredictable markets. Investment program supported by strong cash flow and credit metrics Operationally flexible, low cost, environmentally responsible supply located in premium markets Portfolio approach to hedging over multi-year timeframe to derive market premiums Focus on operational excellence to maximize asset value |
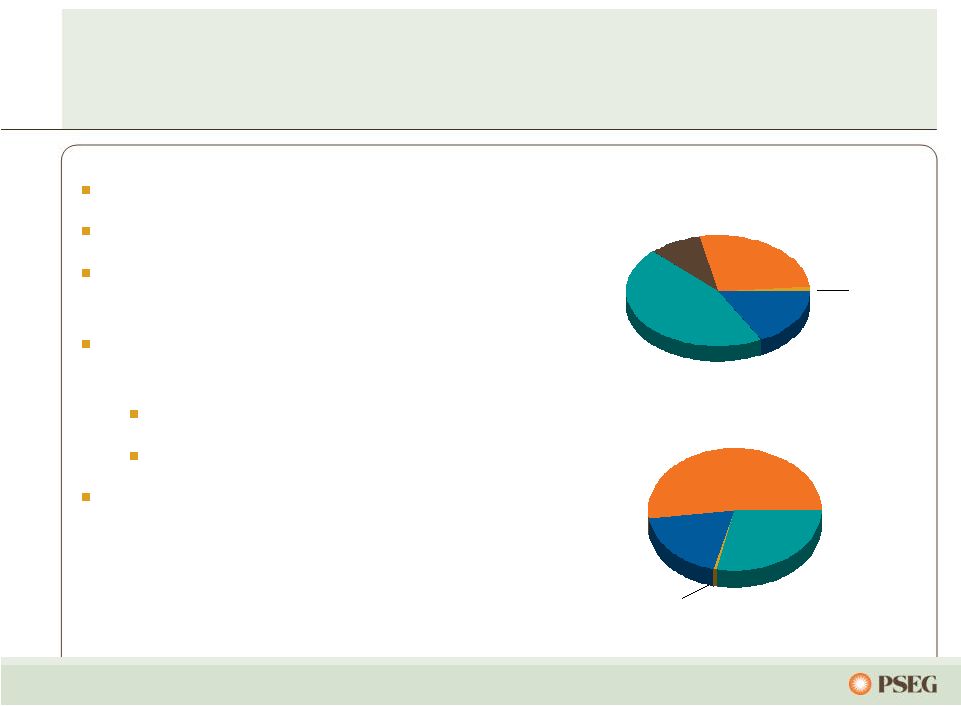 47 Low-cost portfolio Fuel flexibility Regional focus in competitive, liquid markets Assets favorably located near customers/load centers Many units east of PJM constraints Southern NEPOOL/ Connecticut Market knowledge and experience to maximize the value of our assets … with low cost plants, fuel flexibility, good locations and solid markets. Power’s diverse assets drive value in a dynamic environment… 18% 45% 8% Fuel Diversity Coal Gas Oil Nuclear Pumped Storage 1% Energy Produced (Twelve months ended December 31, 2010) Total GWh: 56,727 52% 19% 28% Pumped Storage & Oil <1% Nuclear Coal Gas Total MW: 13,538 27% 9% |
 Power’s Northeast assets are located in attractive markets near load centers… ... and the fleet produced record generation in 2010. 48 |
 49 … while maintaining fuel optionality under a variety of conditions. Power’s PJM assets along the dispatch curve reduce the risk of serving full requirement load contracts… Energy Revenue X X X Capacity Revenue X X X Ancillary Revenue X X Dual Fuel X X Peaking units Load following units Nuclear Coal Combined Cycle Steam Peaking Baseload units Illustrative Salem Hope Creek Keystone Conemaugh Hudson 2 Linden 1,2 Burlington 8-9-11 Edison 1-2-3 Essex 10-11-12 Bergen 1 Sewaren 1-4 Hudson 1 Mercer1, 2 Bergen 2 Sewaren 6 Mercer 3 Kearny 10-11 Linden 5-8 / Essex 9 Burlington 12 / Kearny 12 Peach Bottom Yards Creek National Park Salem 3 Bergen 3 |
 50 Our nuclear performance has improved… 11.1 3.1 0.6 2.1 1.0 0.9 3.0 0.7 0.7 0.6 0.7 0.6 0.6 0.6 0.7 0 2 4 6 8 10 12 2004 2005 2006 2007 2008 2009 2010 2011 E 24.7 27.3 29.1 28.4 29.3 30.3 29.6 30.0 0 5 10 15 20 25 30 35 2004 2005 2006 2007 2008 2009 2010 2011 E 79.0 85.0 97.097.0 94.0 91.7 99.0 93.9 90.3 96.0 96.0 96.0 97.0 98.0 98.5 0.0 10.0 20.0 30.0 40.0 50.0 60.0 70.0 80.0 90.0 100.0 2004 2005 2006 2007 2008 2009 2010 2011 E** Salem Unit 2 set a new all time generation record Five year average generation was 29 GWh Salem 1 transformer forced outage in 2010 impacted forced loss rate by ~ 60% … as we maintain our drive for excellence. Nuclear Generation Output* (000’s GWh) Forced Loss Rate ( ) (%) INPO Index ( ) NJ Units 1 Quartile NJ Units 1 Quartile * Total PS share nuclear generation **Index revised Jan 2011; average scores 4-7 points lower st st |
 51 Nuclear has seen consistent improvement in operating results... • Safety – 40% improvement in OSHA rate vs. 2009 • Uprates of 215 MWe completed since 2003 • 165 MWe additional uprates expected going forward • License renewal efforts underway for Salem and Hope Creek • New Nuclear Early Site Permitting effort continues … combined with a focus on growth opportunities. |
 52 Power’s coal fleet has seen significant efficiency improvements… 14 15 15 13 13 9 11 10 0 2 4 6 8 10 12 14 16 18 2004 2005 2006 2007 2008 2009 2010 2011 E 10.3 11.1 11.3 7.9 8.4 4.8 4.2 3.8 0 2 4 6 8 10 12 2004 2005 2006 2007 2008 2009 2010 2011 E 1.11 1.12 1.01 0.91 0.96 0.83 0.4 0.34 0.34 0.29 0.20 0.21 0.19 0.17 0.13 0.17 0 0.2 0.4 0.6 0.8 1 1.2 2004 2005 2006 2007 2008 2009 2010 2011 E Market conditions were beneficial to increased output in 2010 Forced outage rate continues to improve Environmental footprint upgraded with BET BET enables coal flexibility … as Back-End Technology investment has prepared us for the future. Output (000’s GWh) Forced Outage Rate ( ) (% EFORD) SO 2 and NO x Rates ( ) (lb/mmbtu) SO2 NO x |
 53 Power’s combined cycle fleet benefits from operating enhancements… 5 4 8 10 12 13 15 13 0 2 4 6 8 10 12 14 16 2004 2005 2006 2007 2008 2009 2010 2011 E 3.4 7 3.4 2.5 1.6 1.5 1.2 0.46 0 1 2 3 4 5 6 7 8 2004 2005 2006 2007 2008 2009 2010 2011 E 8079 7847 7928 7768 7810 7691 7533 7514 7200 7300 7400 7500 7600 7700 7800 7900 8000 8100 8200 2004 2005 2006 2007 2008 2009 2010 2011 E Output (000’s GWh) Forced Outage Rate ( ) (% EFORD) Period Heat Rate ( ) (mmbtu/KWh) Highest output ever in 2010 Continued improvement in forced outage rate Benefiting from heat rate improvement program …and continues to react to market dynamics. All data excludes Texas |
 54 Our peaking fleet rounds out a diverse generation portfolio… 13 17 23 19 13 14 15 12 0 5 10 15 20 25 2004 2005 2006 2007 2008 2009 2010 2011 E 85 86 76 77 91 92 95 98 0 10 20 30 40 50 60 70 80 90 100 2004 2005 2006 2007 2008 2009 2010 2011 E Peaking’s consistent record of start success provides opportunities in ancillary and real time markets Peaking adds flexibility in serving load and managing the needs of a diverse market environment Approximately 8,400 starts during 2010 HEDD is anticipated to reduce fleet size … and provides the ability to follow load during periods of high demand. % Start Success ( ) Forced Outage Rate ( ) (% EFORD) Equivalent Availability ( ) (%) 99.7 96.5 98.6 97.0 98.9 99.3 98.3 99.7 94 95 96 97 98 99 100 2004 2005 2006 2007 2008 2009 2010 2011 E |
 55 • Safety - 40% improvement in OSHA rate vs 2009 • All-time generation records were set by the fleet in 2010, paced by record combined cycle output • BET / environmental completed, better flexibility • Total output record set at each of Linden, Bergen and BEC • Combustion turbine Equivalent Availability best in years The Fossil fleet has shown consistent improvement in operating results... … and remains among the most flexible in the industry to succeed in dynamic markets. |
 56 Power's 3 Year O&M Spend $500 $700 $900 $1,100 Pension O&M $1.0B $0.5B Power’s focus on operational efficiency programs… Three year O&M spend declining and flat O&M cost control program and OEM implementation has resulted in cost savings CAGR (0.4%) … has resulted in a reduction in O&M over the last three years. 2008 2009 2010 |
 57 The completion of Power’s major environmental capital expenditure programs… Power’s three year historical capital spend of ~ $2B was largely focused on BET Looking forward from 2011 - 2013, Power’s total capital spend will drop to $1.5B with nearly half of the spend focused on growth – New generation in NJ and CT – Nuclear uprates … allows Power to focus on growth opportunities. Power's 3 Year Capital Spend 2008 2009 2010 Growth Environmental Maintenance $0.5B $1.0B |
 58 Source: MJ Bradley There are numerous upcoming EPA environmental regulations… 2010 2011 2012 2013 2014 2015 2016 2017 2018 Haz. Air Pollutants Criteria Pollutants Greenhouse Gases Coal Combustion By-Products 316(b) Compliance with Federal GHG Reporting Rule Compliance with PSD GHG BACT Compliance with Toxics Rule Pre-Compliance Period Develop Toxics Rule Develop Transport Rule SIP provisions developed in response to revised NAAQS Develop Revised O3 NAAQS Pre-Compliance Period Compliance with Federal CCB Regulations Dev. Coal Comb. By-Products Rule Pre-Compliance Period Develop 316(b) Regulations Develop O3 Transport Rule Estimated Compliance w/TR II Phase-In of Compliance Compliance w/GHG NSPS Pre-Compliance Period Develop GHG NSPS …and Power is well positioned to succeed under numerous outcomes. Today Phase I Compliance Phase II Compliance |
 59 The potential impacts to Power vary… …with Power generally well positioned for the relative near term. Hazardous Air Pollutants (HAPs) •MACT standard for Hg and other HAPs establishes emission limits •Uncontrolled coal/oil units to install expensive capital or retire •Potential for increased variable O&M cost •Potential for higher electric prices •Mercer and Hudson have BET •Bridgeport Harbor has Hg control •Keystone has scrubber, ESP and SCR •Conemaugh has scrubber, ESP and planned SCR Criteria Pollutants (CATR) •CATR will establish NO X and SO2 emission limits •Plant by plant, state and regional basis •Uncontrolled units to install expensive capital or retire •Potential for increased variable O&M cost •Potential for higher electric prices •The generation fleet as a whole is well positioned for CATR Greenhouse Gases (GHG) •Nationally, for the time being, carbon cap-and-trade not expected •EPA’s GHG BACT may delay or impede permitting of new and modified plant •EPA’s NSPS could potentially lead to emission trading •RGGI impact negligible, future uncertain •Power believes it has limited exposure to GHG BACT requirements •Power would potentially benefit by NSPS with trading Coal Combustion Byproduct •Facilities with wet ash ponds will need to spend capital to close or upgrade ponds (dam safety, liners, monitoring, etc) •Potential for increased variable O&M cost •Potential for higher electric prices •Already utilizes dry ash handling systems and disposal at Mercer, Hudson and BHS. No cost conversion at Key/Con •Coal ash scrubber waste tested as non-hazardous •Power has established option for beneficial use of all coal combustion residuals. 316(b) Cooling Water Regulations •Power plants with once through cooling system are at risk. Plants located on tidal rivers, estuaries or Great Lakes may face greater risk •Invest in capital, or potentially retire •Potential for higher electric prices •Lower plant output •Power shares general industry exposure •Prior permits judged that Salem has best technology available •Power has over $150M in estuary enhancement program •Depending on EPA final rule cost/benefit consideration may limit exposure Market Impact Power Impact |
 60 Mercer Generating Station 1996 |
 61 Mercer Generating Station 2010 |
 62 Power’s investment program to mitigate air pollutants… Current Regulations and Compliance Measures Description Hudson (NJ) Mercer (NJ) Keystone (PA) `Bridgeport (CT) Conemaugh (PA)* NO x SCR SCR SCR Low NO x Burners SCR 2014 SO 2 Scrubber Scrubber Scrubber Ultra-low Sulfur Coal Scrubber Mercury/ Particulate Baghouse & Activated Carbon Baghouse & Activated Carbon Scrubber & SCR, ESP Baghouse & Activated Carbon Scrubber & SCR, ESP …places it in good position to meet anticipated regulatory requirements. Capital Spend Planned No Additional Capital Spend Planned *Activated carbon under consideration. |
 63 0 50 100 150 200 250 Source: EPA (2009), EIA (2009), and PSEG Projections 0 2 4 6 8 10 12 14 0 10 20 30 40 50 60 PSEG Projected NOx Emission Rate for 2011 versus 2009 400 U.S. Coal Plants Conemaugh Hudson Bridgeport Mercer Keystone NOx Keystone Bridgeport Conemaugh Hudson Mercer SO 2 PSEG Projected SO2 Emission Rate for 2011 versus 2009 400 U.S. Coal Plants Keystone Conemaugh Bridgeport Mercer Mercury PSEG Projected HG Emission Rate for 2011 versus 2009 400 U.S. Coal Plants Hudson PSEG Power’s environmental program has resulted in dramatically lower emissions… …leaving Power’s coal fleet among the cleanest in the country. |
 64 0% 10% 20% 30% 40% 2011/2012 2012/2013 2013/2014 2014/2015 2015/2016 PJM has adequate reserves to meet near term demand… …but over the longer term, many influences will dictate sources of market sufficiency. Unforecasted influences that could increase capacity: =>Government interventions – for example LCAPP =>Load/demand rate of change => Demand response / Economic recovery Unforecasted influences that could decrease capacity: =>Government regulations – for example coal retirements (20-45 GW’s), HEDD =>Load/demand rate of change =>Demand response / Economic recovery PJM Forecasted Capacity Reserves - January 2011 PJM • Reserve margins to tighten going forward due to: – Load growth – Anticipated unit retirements driven by new EPA regulations (not reflected in PJM’s forecast) EMAAC • Most of Power’s assets located in EMAAC • Anticipated retirements driven by HEDD rule • Transmission projects expected to increase net imports into EMAAC, offsetting retirements • Local legislation (NJ LCAPP) could initially increase reserve margins but would discourage long-term merchant investment |
 PSEG Power – Market Overview Joe Hopf President, PSEG Energy Resources & Trade |
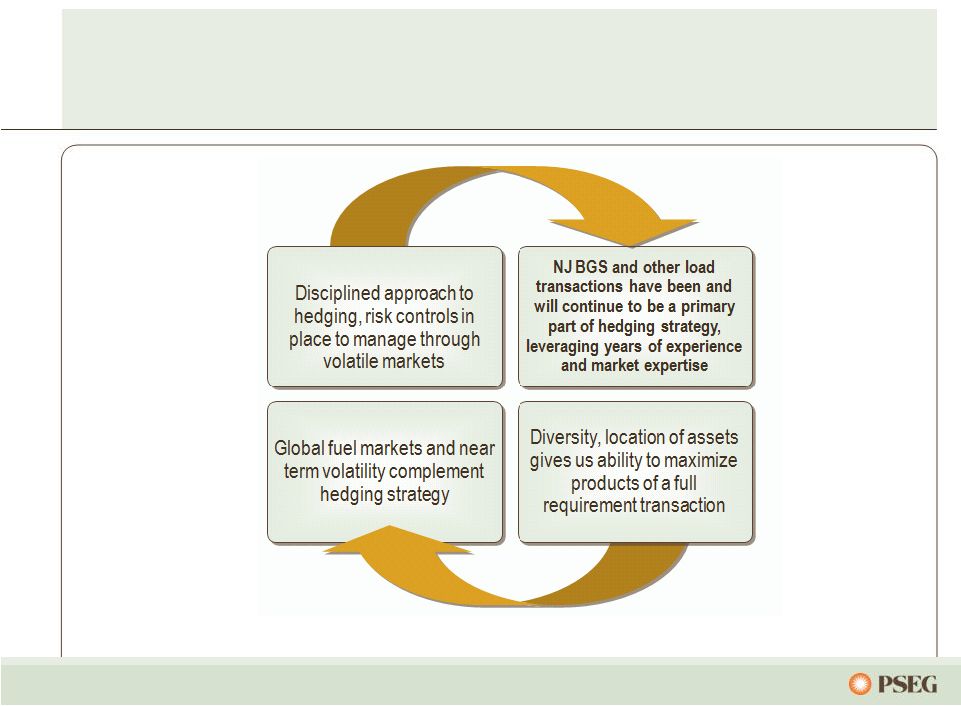 66 ER&T employs a disciplined approach to hedging… … designed to maximize profitability and reduce earnings volatility. |
 67 While market dynamics remain challenging… • Gas is range bound, with little volatility going forward due to gas supply • However near term volatility has brought market opportunities • Long term gas economics could improve • Coal as a global commodity is experiencing demand outpacing supply • Capacity • Continuing to work with PJM on refinement of long term market structures • PJM has established saturation targets for limited demand response • Transmission • Reassessing market impacts as conditions change • Basis impacts are changing but Power’s portfolio continues to be well positioned • Market supply tightening due to environmental regulation … Power has expertise to manage all products across the portfolio. |
 68 …through a balanced portfolio hedging strategy. Pricing in 2010 was impacted by low economic demand and low gas prices, offset by warmer summer and colder winter weather Power’s hedging strategy combined with strong operations enabled solid results 2011 forwards imply continued market challenges, but entities with the right assets in the right locations are best positioned Power will continue to utilize a hedging strategy that incorporates full requirement load contracts and contracting using other products to secure pricing over a 2-3 year forward horizon BGS continues to be an important part of our hedging strategy Balanced generation portfolio in ideal position to serve BGS Three year nature of BGS provides reduced volatility for customers and providers Power’s fleet is economically optimized… |
 69 Full Requirements Component Increase in Capacity Markets/RPM Growing Renewable Energy Requirements Component for Market Risk Through Power’s participation in each of the BGS auctions… Market Perspective – BGS Auction Results … we have developed an expertise in serving full-requirements contracts. 3 Year Average Round the Clock PJM West Forward Energy Price Capacity Load shape Transmission Congestion Ancillary services Risk premium Green Note: BGS prices reflect PSE&G Zone 2003 2004 2005 2006 2007 2008 2009 2010 2011 $55.59 $33 - $34 $36 - $37 $44 - $46 $67 - $70 $58 - $60 $68 - $71 $56 - $58 $48 - $50 ~ $21 $55.05 ~ $18 $65.41 ~ $21 $102.51 ~ $32 $98.88 ~ $41 $111.50 ~ $43 $103.72 ~ $47 $95.77 ~ $47 $45 - $47 ~ $48 $94.30 |
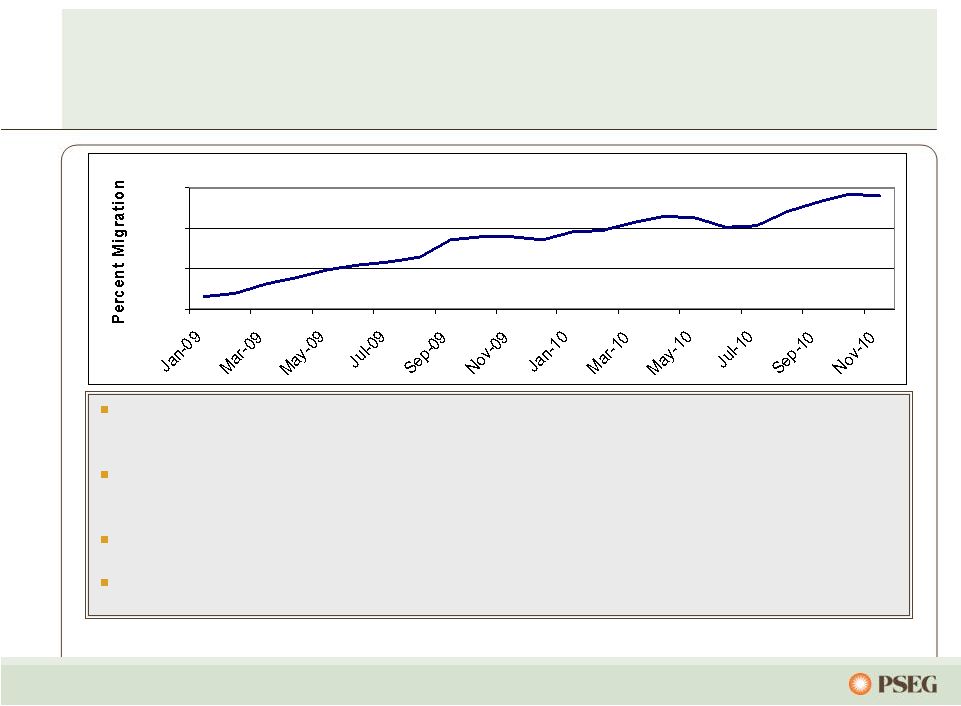 70 The market environment has prompted BGS customer migration… … and market conditions will impact future migration patterns. Gradual reset of BGS rates (one third per year), includes price component for volumetric risk of migration Energy prices lower than expected, but market prices strengthened during periods of high weather-related demand in summer and winter of 2010 Option strategies being employed to manage changes in load volume Supplying wholesale hedges to third party retail providers PSE&G BGS-FP Energy Migration Estimate 0% 10% 20% 30% |
 71 Migration and headroom are a function of market and BGS price differentials… …with impact on Power’s margin in 2010 limited by warm weather. •Migration has grown steadily from 2009 – 2011 –Market prices have been below BGS prices –Retail penetration has expanded beyond C&I to include residential customers –Approximate average migration of ~10% in 2009; ~24% in 2010; and forecasted to be ~35% in 2011, assuming 38% to 40% at year-end •Power margin is a direct function of headroom •Headroom has varied by year –2009 headroom was high, as mild weather resulted in low market prices –2010 headroom was low, as extreme weather resulted in high market prices –Retail providers are more likely to promote switching if headroom is seen as sustainable |
 72 The result of Power’s hedging strategy is a portfolio of contracted output… … which dampens the impact of market volatility on earnings in the near term. Power’s anticipated nuclear and base load coal output is contracted over the next few years: 2011: 100% 2012: 45-55% 2013: 20-30% Total Fleet RTC Average Nuclear / Pumped Storage Base load Coal Load Following Coal Combined Cycle (CC) Steam and Peakers Other Load Contracts + Hedges Existing BGS, Other Load Contracts, and Hedges 1,000 2,000 3,000 4,000 5,000 6,000 7,000 8,000 9,000 2011 2012 2013 - |
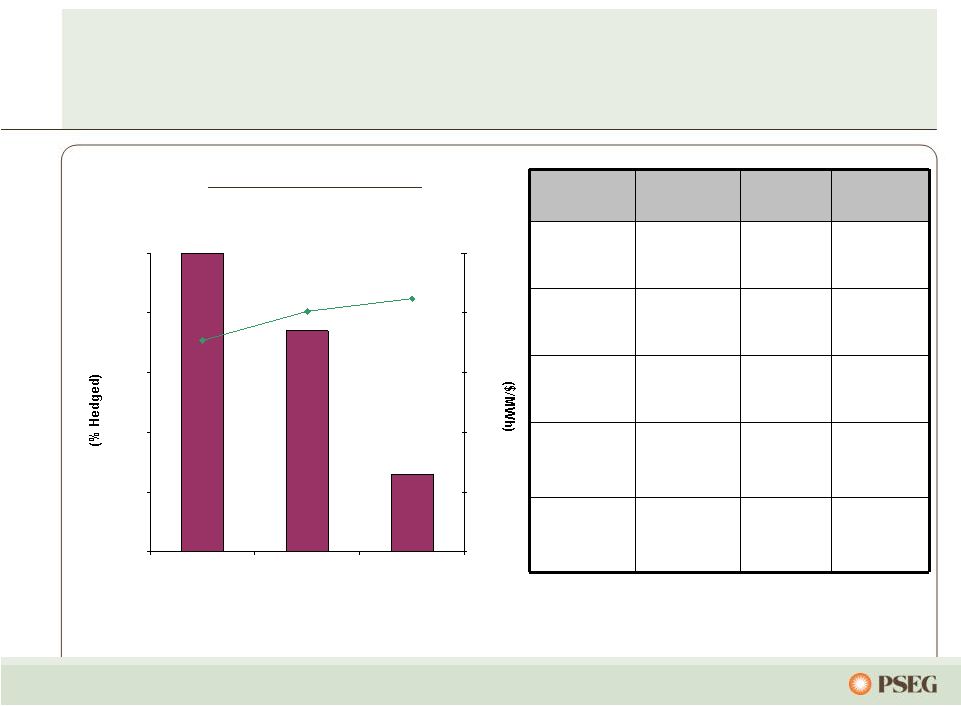
 73 With gas competing with coal at various times of the year… … our strategy is to hedge our base load generation long term. Contracted Energy 2011 2012 2013 Volume TWh 35 36 36 Base Load % Hedged 100% 45% - 55% 20% - 30% Price $/MWh $68 $68 $72 Volume TWh 18 18 20 % Hedged 10% - 15% Price $/MWh $68 Volume TWh 53 54 56 Total % Hedged 70% - 75% 30% - 40% 10% - 20% Price $/MWh $68 $68 $72 Intermediate Coal, Combined Cycle, Peaking (Nuclear and Base Load Coal) |
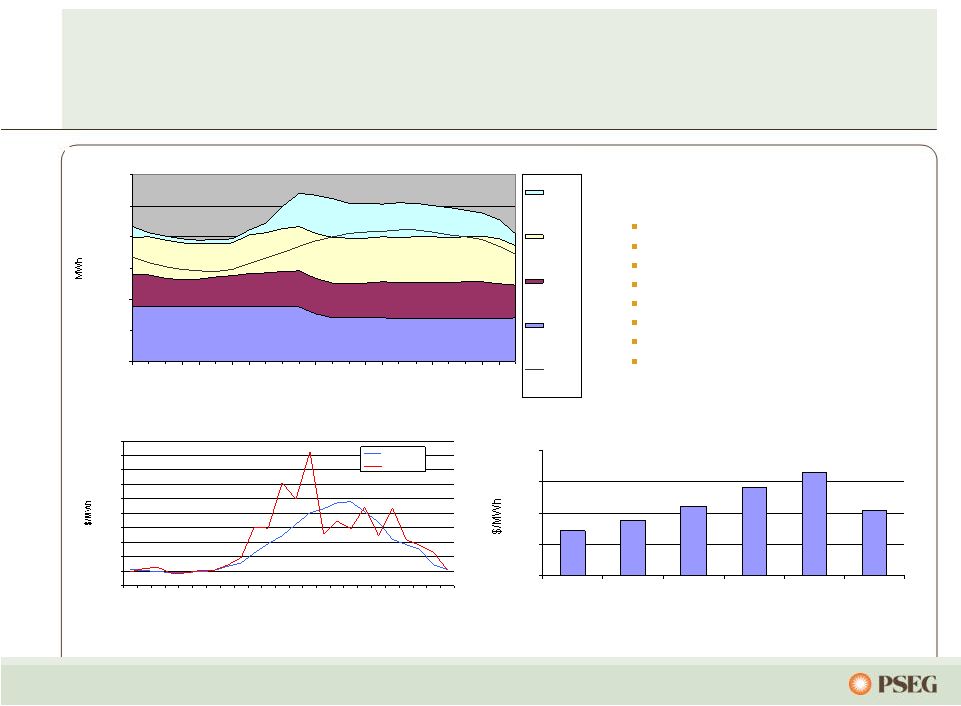 74 Power’s asset mix and fuel diversity provides optionality… July 7, 2010 Hourly Generation and Load - 2,000 4,000 6,000 8,000 10,000 12,000 1 2 3 4 5 6 7 8 9 10 11 12 13 14 15 16 17 18 19 20 21 22 23 24 Hour Pk/Steam CC Coal Nuclear Loads and Hedges …and locational diversity also captures market constraints. Generation Basis on July 7, 2010 On-Peak $0 $10 $20 $30 $40 Sa/HC Bus PB Bus Mercer Hudson Bergen Linden July 7, 2010 Circumstances- Temperature max = 101 degrees Gas = $6/MBtu Day ahead on peak avg > $170/MWh Salem tripped Real time LMP spiked to $450/MWh Risk mitigated Real time opportunity captured Customer reliability maintained July 7, 2010 LMPs PS Zone $0 $50 $100 $150 $200 $250 $300 $350 $400 $450 $500 1 2 3 4 5 6 7 8 9 10 11 12 13 14 15 16 17 18 19 20 21 22 23 24 Hour Day Ahead Real Time |
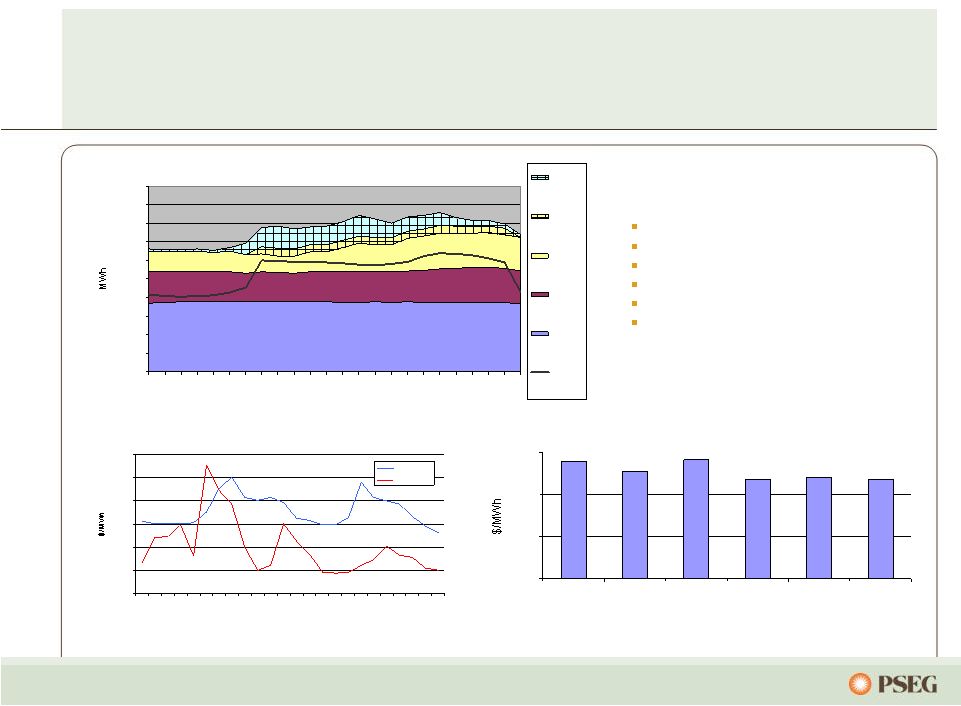 75 Power’s portfolio is positioned to take advantage of market volatility… January 24, 2011 Hourly Generation and Load - 1,000 2,000 3,000 4,000 5,000 6,000 7,000 8,000 9,000 10,000 1 2 3 4 5 6 7 8 9 10 11 12 13 14 15 16 17 18 19 20 21 22 23 24 Hour Pk/Steam Oil CC Oil Burned CC Coal Nuclear Loads and Hedges … and also mitigates operational risk. Generation Basis on January 24, 2011 On-Peak $0 $20 $40 $60 Sa/HC Bus PB Bus Mercer Hudson Bergen Linden January 24, 2011 Circumstances- Temperature min. = 5 degrees Gas = $18/MBtu Day ahead on peak avg > $180/MWh Partial gas curtailment Day ahead opportunity captured Customer reliability maintained January 24, 2011 LMPs PS Zone $0 $50 $100 $150 $200 $250 $300 1 2 3 4 5 6 7 8 9 10 11 12 13 14 15 16 17 18 19 20 21 22 23 24 Hour Day Ahead Real Time |
 76 Gas competed favorably with coal in 2010, with operational flexibility favoring gas… … and Power’s diverse fleet is positioned to compete under various market conditions. PJM Fleet Flexibility Base Coal Base Coal Base Coal CC/Coal CC/Coal CC PK PK PK Int Coal Int Coal Int Coal CC CC - 5,000 10,000 15,000 20,000 25,000 2008 2009 2010 Note: Forward prices as of February 2011 |
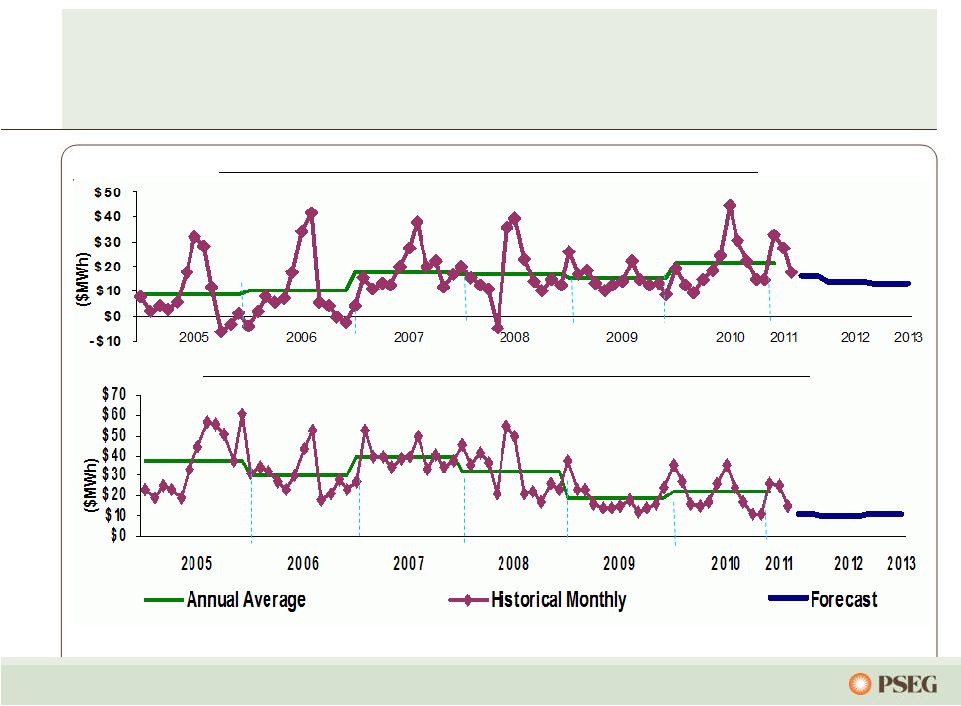
 77 $0 $20 $40 $60 $80 $100 2004 2005 2006 2007 2008 2009 2010 2011 Fwd $0 $20 $40 $60 $80 $100 2004 2005 2006 2007 2008 2009 2010 2011 Fwd $0 $20 $40 $60 $80 $100 2004 2005 2006 2007 2008 2009 2010 2011 Fwd Commodity prices have been volatile… Henry Hub NYMEX ($/MMBTU) Western Hub RTC ($/MWh) West Hub On Peak ($/MWh) Central Appalachian Coal ($/Ton) $0 $2 $4 $6 $8 $10 2004 2005 2006 2007 2008 2009 2010 2011 Fwd … but Power’s diverse asset portfolio and hedging strategy has mitigated the effects, providing strong results. Note: Forward prices as of February 2011 |
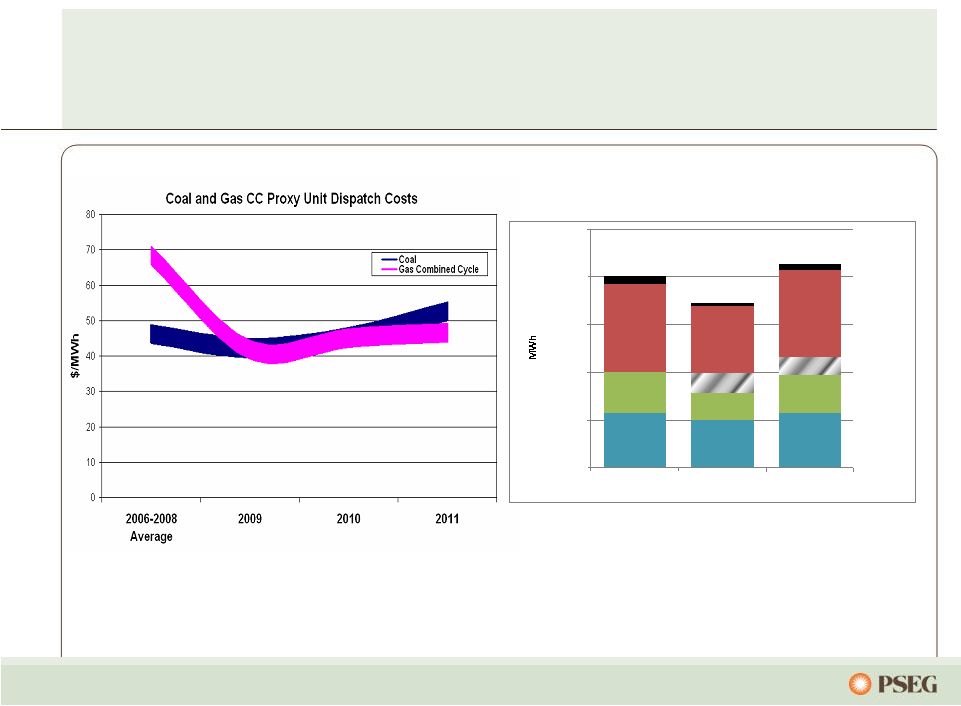
 78 Power’s coal hedging reflects 2011 supply matched with 2011 sales… … while maintaining flexibility on supply post BET installation. 0% 20% 40% 60% 80% 100% 2011 2012 2013 $0 $10 $20 $30 $40 $50 Contracted Coal Station Coal Type Pricing ($/MWh)* Comments Bridgeport Harbor Adaro High $40’s Higher price, lower BTU, enviro coal Hudson CAPP Mid $40’s Flexibility after BET in 2010 Mercer Metallurgical NAPP/CAPP Mid $40’s More limited segment of coal market Keystone NAPP Mid $20’s To High $20’s Prices moderating Conemaugh NAPP Mid $20’s To High $20’s Prices moderating % Hedged (left scale) $/MWh (right scale) *Commodity plus transportation |
 79 $0 $5 $10 2011 2012 2013 Anticipated Nuclear Fuel Cost Power has fully hedged its nuclear fuel needs through 2013… … with increased costs over that time horizon. Hedged |
 80 Note: Forward prices as of February 2011 Forward spark spreads indicate moderation from 2010 levels, and dark spreads continue to be challenged… PJM Western Hub Spark Spread (On-Peak – Henry Hub x 7.5 Heat Rate) PJM Western Hub Dark Spread (RTC – Central Appalachian Coal x 10 Heat Rate) … and both are expected to remain highly influenced by gas prices. |
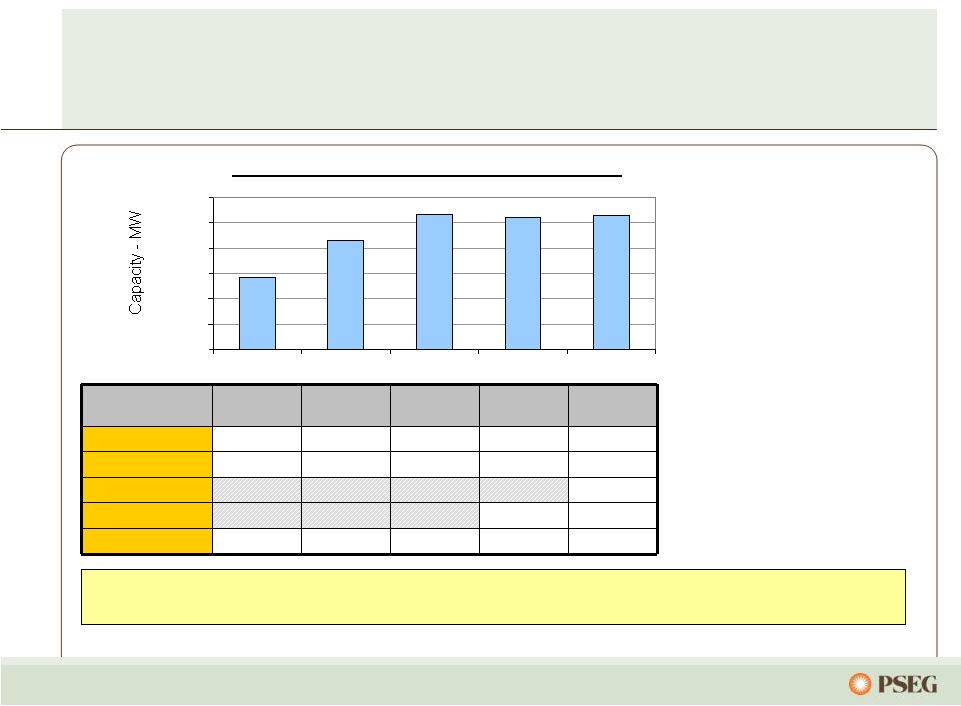 81 … with sites in the eastern part of PJM. The Reliability Pricing Model has recognized the locational value of Power’s generating fleet… With nearly 1/3 of its capacity in PS North and nearly 2/3 of its capacity in MAAC and EMAAC, Power’s assets in congested locations received higher pricing in the 2013/2014 RPM Auction PJM Capacity Available to Receive Auction Pricing 0 2,000 4,000 6,000 8,000 10,000 12,000 09/10 10/11 11/12 12/13 13/14 • Locational value of Power’s fleet recognized • Bid for 89 MW of new capacity accepted for 2013/2014 auction; in-service June 2012 • On schedule to complete 178 MW of previously cleared peaking capacity by June 2012 • Upcoming auction anticipated to be influenced by updated demand forecast, transfer capabilities, and LCAPP $/MW-day PJM Zones 2009 / 2010 2010 / 2011 2011 / 2012 2012 / 2013 2013/2014 Eastern MAAC $191.32 $174.29 $110.00 $139.73 $245.00 MAAC $191.32 $174.29 $110.00 $133.37 $226.15 PSEG $245.00 PSEG North Zone $185.00 $245.00 Rest of Pool $102.04 $174.29 $110.00 $16.46 $27.73 |
 82 Power is advantaged… … as we pursue a path to seize the opportunities of tomorrow. Right Assets, Right Markets Operational Flexibility Environmental Infrastructure investment Newly completed back end technology and a well positioned, environmentally sound fleet that compares favorably vs the industry Investing in various growth opportunities to prepare us for the future Diverse fleet of low cost units in competitive liquid markets located near customers/load centers Units along the dispatch curve with fuel flexibility and improved performance provide value in dynamic market 2011 |
 PSEG – Financial Review and Outlook Caroline Dorsa Executive Vice President and Chief Financial Officer |
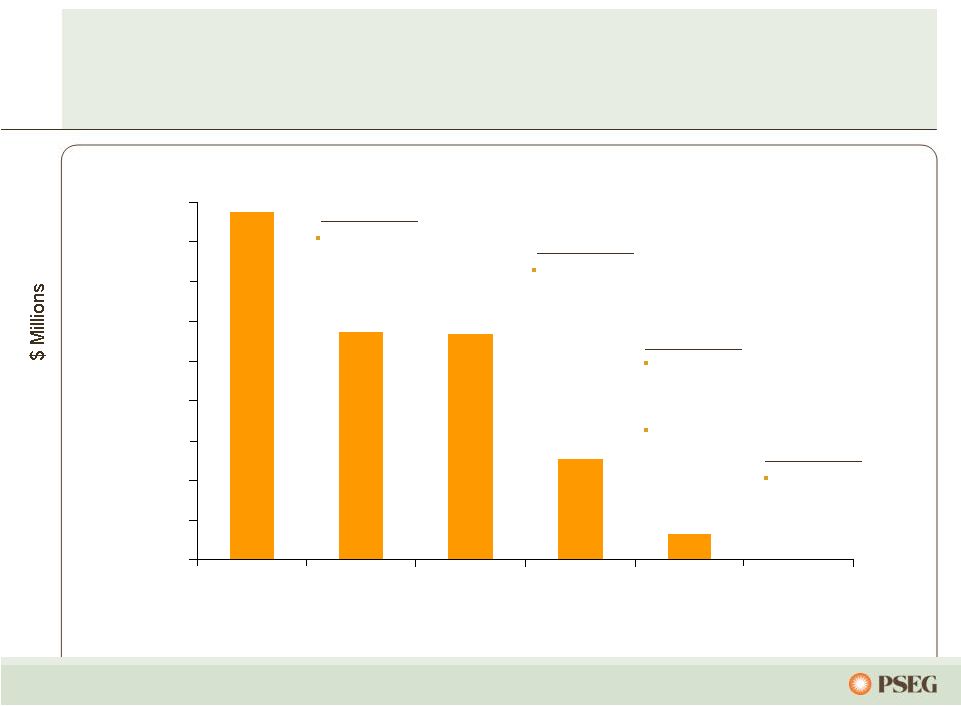
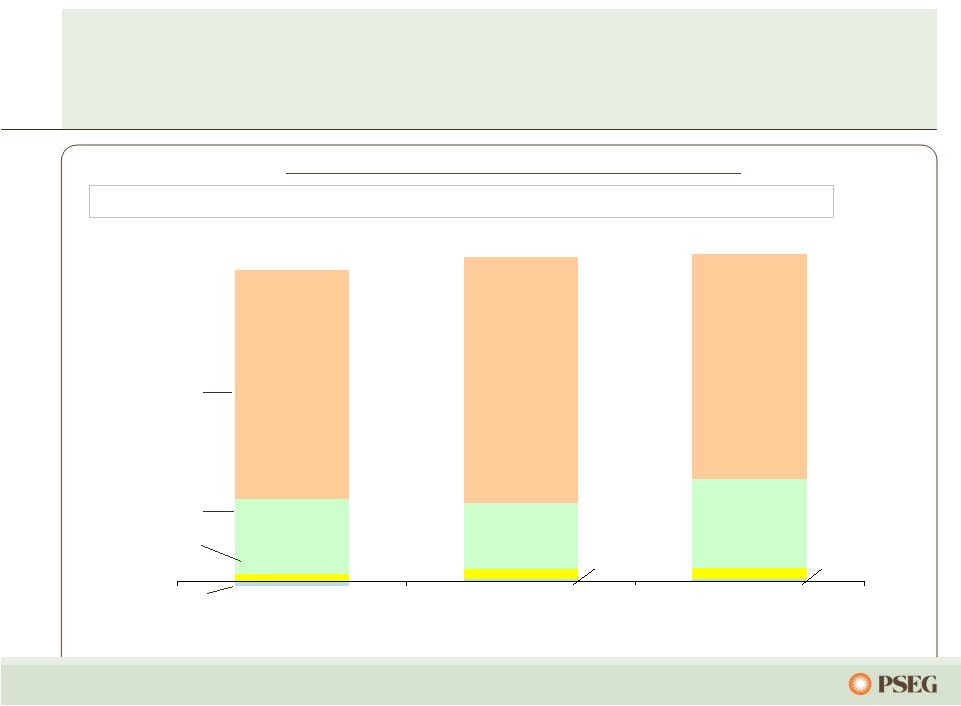 84 $0.71 $2.18 $(0.05) $0.02 $0.02 $0.07 $0.10 $0.09 $0.85 $0.63 $2.15 $2.35 2008 2009 2010 $3.12* We have consistently met our earnings objectives Holdings PSE&G Power Parent Operating Earnings per Share by Subsidiary* $2.91* *See page 120 for Items excluded from Income from Continuing Operations to reconcile to Operating Earnings; All periods reflect Texas in Discontinued Operations. Guidance Range $2.80 - $3.05 $3.00 - $3.25 $3.00 - $3.25 $3.09* |
 85 $3.09 (.20) .22 .01 .00 $3.12 $0.00 $0.65 $1.30 $1.95 $2.60 $3.25 In 2010, PSEG EPS benefited from growth at PSE&G – offset by the impacts of lower prices at Power 2010 operating earnings* 2009 operating earnings* 2009 Debt Exchange Benefit (Eliminated in Consolidation) (.04) Interest .04 Higher Volume offset by Lower Prices .00 WPT (.10) Migration (.04) Nuclear (.03) O&M (.01) Taxes (.04) Other .02 PSEG Power Electric & Gas Margin (including Rate Relief) .12 Transmission Margin .04 O&M .04 Weather .02 D&A (.03) Other .03 PSE&G PSEG Energy Holdings Enterprise Lower Lease Sales and Impairment (.09) 2009 Debt Exchange Costs (Eliminated in Consolidation) .04 Interest .03 Other .03 * See page 120 for Items excluded from Income from Continuing Operations to reconcile to Operating Earnings. |
 86 $1,000 $1,250 $1,500 $1,750 $2,000 $2,250 2010 2011 2012 2013 Pension O&M PSEG Consolidated O&M (1) C.A.G.R (’10-’13) = (0.0)% (1) Excludes O&M related to PSE&G clauses. Aggressive expense management… …should result in essentially no O&M growth. |
 87 PSEG’s 2011 earnings guidance reflects continued improvement at PSE&G… – Network transmission service revenue increase = ~ $0.05 per share – Full year of E&G Rate Relief = ~ $0.05 per share – Each 1% change in Load = ~ $0.02 per share – Each 1% change in O&M = ~ $0.01 per share – 2010 Distribution ROE 9.9%; Each 10 bp = $0.01 per share Revenue/Margin – Decline in average Hedge Price/Volume = ~ ($0.25-$0.30) per share – Decline in Capacity revenues = ~ ($0.15-$0.20) per share – Improvement in WPT/BGSS = ~ $0.03-$0.05 per share Other Expense – Higher O&M = ~ ($0.03) per share – Increase in Depreciation rate = ~ ($0.05) per share – Absence of LILO/SILO termination gains = ~ ($0.05) per share – Loss of Income from Asset Sales = ~ ($0.05) per share 2011 Drivers …offset by a decline in margins at Power and Holdings. Earnings Per Share * See page 120 for Items excluded from Income from Continuing Operations to reconcile to Operating Earnings. Guidance $2.75 $2.50 |
 88 PSEG’s long-term outlook is influenced by Power’s hedge position… 2012 2013 Each $1/mcf Change in Natural Gas Each $2/Mwh Change in Spark Spread Each $2/Mwh Change in Dark Spread Each 1% Change in Nuclear Capacity Factor Each 1% Change in Depreciation Rate $0.08 - $0.10 $0.03 $0.02 $0.01 $0.01 $0.15 - $0.20 $0.03 $0.03 $0.01 $0.01 Segment EPS Drivers Each $100 Million of Incremental Investment Each 1% Change in Sales: Electric Gas Each 1% Change in O&M Each 1% Change in ROE $0.01 $0.01 $0.01 $0.01 $0.01 $0.02 $0.01 $0.01 $0.01 $0.01 …and increased investment at PSE&G. |
 89 Our capital spending is focused on growth PSEG 2011-2013 Capital Spending $6.7 Billion by Subsidiary PSEG 2011-2013 Capital Spending $6.7 Billion Growth vs. Maintenance Spend |
  90 PSE&G’s capital program is directed at improving reliability… EMP $0.5 B 12% Electric Distribution $0.8 B 18% Transmission $2.7 B 60% Gas Utility $0.5 B 10% …through investment in transmission and distribution. *Forecast capital program does not include $400M of potential spending on distribution and energy efficiency. 2011-2013 Utility Capital Spending $4.5 Billion |
 91 Sources Uses In 2010, cash flow was sufficient to meet capital requirements… …providing further balance sheet strength. (1) Cash from Operations adjusts for securitization principal repayments of ~$0.2B. PSEG Consolidated 2010 Sources and Uses Power Cash from Ops Shareholder Dividend Gross Proceeds from Asset Sales and Lease Terminations PSE&G Investment Debt Redemptions Taxes on Asset Sales and Lease Terminations Debt Issuances PSE&G Cash from Ops (1) Power Investment Includes pension contributions of $0.4B $4.7B $4.7B |
 92 PSEG’s internally generated cash flow over 2011 – 2013… …supports our capital program and the shareholder dividend without the need for equity. * Cash from Operations adjusts for securitization principal repayments ~$0.7B ** 2011-2012 include bonus depreciation of ~$0.9B offset by ~$0.1B in 2013 Sources Uses Power Cash from Ops Debt Issued PSE&G Investment Debt Redeemed Shareholder Dividend PSEG Consolidated 2011 – 2013 Sources and Uses PSE&G Cash from Ops* Power Investment Texas Net Proceeds Includes: Bonus Depreciation = ~$0.8B** Pension Contribution = ~($0.5B) Other |
 93 25% 30% 35% 40% 45% 50% 2008 2009 2010 2011-2013 Average PSEG Power Funds from Operations / Total Debt Power’s credit metrics remain strong during challenging markets... Power free cash flow produces strong credit measures providing sufficient cushion for potential gas price volatility Free Cash Flow (1) ~750 ~950 ~750 Average: ~700 Dividends to Parent 500 850 (2) 550 Average: ~550 (in $Millions) (1) Free Cash Flow represents cash from operations less cash used for investing. (2) Excludes dividend to Parent associated with transfer of Texas assets to PSEG Power. …providing opportunities for incremental growth investments. |
 94 PSEG is responding to investors’ questions Investors’ Questions PSEG Position How is PSEG affected by policy changes? Commercial operation of Back-End Technology puts us in good position on potential Clean Air rules What’s the impact of commodity volatility? Multi-year hedging Asset balance dampens relative fuel price volatility Capacity markets provide stability How are you responding to State incursion into markets? We are participating with other generators in a challenge at FERC to assure competitive market mechanisms are upheld We are also challenging the constitutionality of NJ’s actions Do you need equity? Strong cash flow enables us to execute our strategy, with room for additional investment, without the need to issue equity How is management incented to deliver value to shareholders? Management’s long-term incentives are based on a combination of return on invested capital and total shareholder return relative to peers over a multi-year period of time |
 PSEG – Summary Ralph Izzo Chairman, President and Chief Executive Officer |
 96 PSEG Advantage: Investment focus supporting customer needs and shareholder returns Operational Excellence Environmental Position Financial Strength •Record Output •Hope Creek INPO 100 rating •Completed Back-End Technology installation •Strong balance sheet, credit metrics, and cash flow •Mid-Atlantic Reliability Leader •Investing in renewables to meet State policy goals •O&M focus and capital discipline to support returns •Installed 29 MW of solar on-time and under budget •Developing expertise for solar PPAs •Terminated international leases PSEG Power PSE&G Energy Holdings |
 Executive Profiles |
 98 Ralph Izzo Chairman, President and Chief Executive Officer Public Service Enterprise Group Incorporated Ralph Izzo was elected chairman and chief executive officer of Public Service Enterprise Group Incorporated (PSEG), in April 2007. He was also named as the company’s president and chief operating officer, and a member of the board of directors of PSEG, in October 2006. Prior, Mr. Izzo was president and chief operating officer of Public Service Electric and Gas Company (PSE&G). Since joining PSE&G in 1992 Mr. Izzo was elected to several executive positions within PSEG’s family of companies, including PSE&G senior vice president – utility operations, PSE&G vice president – appliance service, PSEG vice president - corporate planning, Energis Incorporated senior vice president – finance and information services, and PSE&G vice president - electric ventures. In these capacities, he broadened his experience in the areas of general management, strategic planning and finance. Mr. Izzo is a well-known leader within the utility industry, as well as the public policy arena. His public policy experience includes service as an American Physical Society Congressional Science Fellow, in the office of U.S. Senator Bill Bradley. He also served four years as a senior policy advisor in the Office of New Jersey Governor Thomas H. Kean, specializing in energy, science and technology. Mr. Izzo’s career began as a research scientist at the Princeton Plasma Physics Laboratory, performing numerical simulations of fusion energy experiments. He has published or presented over 35 papers on magnetohydrodynamic modeling. Mr. Izzo received his Bachelor of Science and Master of Science degrees in mechanical engineering and his Doctor of Philosophy degree in applied physics from Columbia University. He also received a Master of Business Administration degree, with a concentration in finance from the Rutgers Graduate School of Management. He is listed in numerous editions of Who’s Who and has been the recipient of national fellowships and awards. Mr. Izzo has received Honorary Degrees from the New Jersey Institute of Technology (Doctor of Science) and Thomas A. Edison State College (Doctor of Humane Letters). Mr. Izzo serves as chair of Rutgers University Board of Governors and on the board of directors for the New Jersey Chamber of Commerce, the New Jersey Utilities Association, the Edison Electric Institute (EEI), the Nuclear Energy Institute (NEI) and The Center for Energy Workforce Development. |
 99 J.A. “Lon” Bouknight, Jr. Executive Vice President and General Counsel Public Service Enterprise Group Incorporated J.A. Bouknight, Jr. (“Lon”) was named executive vice president and general counsel in January, 2010. He had been Executive Vice President – Law since November 2009. In his current position, he has general supervisory responsibilities for the law department, office of the corporate secretary, and business assurance and resilience. Mr. Bouknight was a partner in the Washington law office of Steptoe & Johnson, where he served as a member of the regulatory and industry affairs department and as former chairman of the firm. His practice focused on the electric power industry and on antitrust and competition issues in both regulated and unregulated industries. From 2005 to 2008, Mr. Bouknight served as executive vice president and general counsel of Edison International, a major electric company based in California. A graduate of Duke University School of Law, Mr. Bouknight has authored a number of articles and lectured extensively on energy industry and competition topics. |
 100 Daniel J. Cregg Vice President – Finance Power PSEG Services Corporation Daniel J. Cregg was named vice president – finance power for PSEG Services Corporation, in December 2006. Prior to this appointment he was director – financial reporting and communications at PSEG Power (Power), where he oversaw financial reporting and forecasting, investor communications, financings, rating agency interactions, external reporting, and cash forecasting. He previously held leadership positions with Power in the areas of financial valuations, competitive intelligence, and fundamental market modeling, with critical responsibilities in Power’s development and strategic planning activities. Previously, Mr. Cregg was director of PSEG corporate development. He joined PSEG in 1991 with overall responsibility for tax planning, strategy and compliance for PSEG Energy Holdings, including domestic and international tax structuring work for PSEG Global and PSEG Resources. Prior to joining PSEG Mr. Cregg spent five years with the accounting and consulting firm of Deloitte and Touche, providing consulting services to a wide array of clients with an emphasis on the energy industry. Mr. Cregg has been involved in raising awareness and funding for Sudden Infant Death Syndrome (SIDS) for the last ten years. He is also an executive sponsor for Power’s diversity council and is a member of PEGPAC, PSEG’s Political Action Committee. Mr. Cregg holds a Master of Business Administration degree from the Wharton School of the University of Pennsylvania and is a graduate of Lehigh University, where he received a bachelor’s degree in accounting. |
 101 Caroline Dorsa Executive Vice President and Chief Financial Officer Public Service Enterprise Group Incorporated Public Service Electric and Gas Company PSEG Services Corporation Caroline Dorsa was named executive vice president and chief financial officer for Public Service Enterprise Group Incorporated (PSEG) in April 2009. She is also the executive vice president and chief financial officer of Public Service Electric and Gas Company (PSE&G), and PSEG Services Corporation. Ms. Dorsa is responsible for all financial functions, including Internal Audit Services. She also leads the Information Technology and Procurement organizations. She is a member of PSEG’s corporate executive leadership team. Ms. Dorsa had been a Director of PSEG since 2003, and a member of PSEG's Audit, Corporate Governance and Finance Committees. Ms. Dorsa joined PSEG from Merck & Co., Inc. where she most recently served as senior vice president – global human health, strategy and integration. Immediately prior to her most recent role at Merck, Ms. Dorsa held positions as senior vice president and chief financial officer at both Avaya, Inc., and Gilead Sciences, Inc. Earlier in her career, she held a range of financial positions at Merck, including serving as vice president and treasurer of the company for over 12 years. She was also the Secretary of the Finance Committee of Merck's Board of Directors. Prior to joining Merck, Ms. Dorsa worked for Mayor Edward Koch of the City of New York promoting economic development in midtown Manhattan. Ms. Dorsa is a member of the Board of Trustees of the Newark Museum and a member of the Junior Achievement of New Jersey State Board of Directors in Princeton, NJ. She is also a member of the Board of Directors of Biogen Idec (NASDAQ: BIIB), a biopharmaceutical company located in Cambridge, MA. Ms. Dorsa holds a B.A. from Colgate University and an M.B.A from Columbia Business School. |
 102 Clarence (Joe) Hopf, Jr. President PSEG Energy Resources & Trade Clarence (Joe) Hopf, Jr. was named president of PSEG Energy Resources & Trade in June 2008. His responsibilities include management of PSEG Power’s generation portfolio and basic gas supply service, purchasing of fuel, mid- and back-office operations as well as trading and marketing activities. Prior to joining PSEG, Mr. Hopf was president of PPL EnergyPlus in Allentown, PA, since 2006. He was responsible for managing PPL’s wholesale/retail marketing and trading operation in the United States. Mr. Hopf has held a variety of posts with increasing responsibility in the electric generation and energy trading business since 1981. Prior to joining PPL in 2005 as a senior vice president, he served as a vice president at Goldman Sachs in New York and, before that, at AmerenEnergy in St. Louis. |
 103 Anne E. Hoskins was named senior vice president – public affairs and sustainability of PSEG Services Corporation, in January 2010. In this position, she is responsible for PSEG’s federal and state governmental affairs, corporate philanthropy and sustainability, and leads the development of public policy positions on issues affecting the company. Prior to this appointment she was vice president – federal affairs and policy where she was responsible for PSEG’s federal governmental affairs. Ms. Hoskins is also a member of PSEG’s Executive Officer Group. Prior to joining PSEG, Ms. Hoskins served as senior and regulatory counsel for Verizon Wireless, working from offices in Washington and New Jersey. She also served as an associate in the Newark law firm of McCarter and English, an attorney in the United States Office of the Comptroller of the Currency, and as policy adviser in the Governor’s Office of Policy and Planning in New Jersey. Ms. Hoskins holds a Doctor of Law degree from Harvard Law School, a Masters of Public Affairs degree from the Woodrow Wilson School at Princeton University, and a Bachelor of Science degree from Cornell University. Ms. Hoskins serves as a trustee for The Nature Conservancy of New Jersey and is on the board of trustees for New Jersey Future, the Children’s Specialized Hospital Foundation, Inc. and Clean Air, Cool Planet, a northeast environmental collaborative to address climate change. Anne E. Hoskins Senior Vice President – Public Affairs & Sustainability PSEG Services Corporation |
 104 Thomas P. Joyce President and Chief Nuclear Officer PSEG Nuclear Thomas P. Joyce was named president and chief nuclear officer of PSEG Nuclear (Nuclear), in October 2008. He had been senior vice president – operations of Salem/Hope Creek for Nuclear, since June 2007. Mr. Joyce was also vice president – Salem, since January 2007, and previously assumed the role of PSEG Nuclear’s site vice president as part of the Nuclear Operating Services Agreement between PSEG and Exelon Corporation. Mr. Joyce has more than 34 years of experience in commercial nuclear power operations, and led Salem through two successful reactor vessel head replacement outages. Salem Unit 1 completed its outage for the lowest station dose, while capturing the world record for shortest head replacement outage. Prior to joining PSEG, Mr. Joyce was site vice president at Exelon Nuclear’s Braidwood Station. During his tenure the station achieved overall performance improvements and retained its excellent INPO rating. The plant completed a refueling in 15 days, 14 hours – setting a record for outage efficiency among U.S. pressurized water reactors. Before serving at Braidwood he held leadership positions at Exelon’s Byron, Dresden, and Zion Stations, and in the corporate offices of both Exelon Corporation and Exelon Nuclear. Mr. Joyce holds a Bachelor of Science degree in nuclear engineering from the University of Missouri at Rolla, and a Master of Business Administration degree from the Keller Graduate School of Management. While at Byron, he earned his senior reactor operation (SRO) license. |
 105 Ralph A. LaRossa President and Chief Operating Officer Public Service Electric and Gas Company Ralph A. LaRossa was named president and chief operating officer of Public Service Electric and Gas Company (PSE&G), in October 2006. Prior to this position, he was vice president - electric delivery for PSE&G. Mr. LaRossa joined PSE&G in 1985 as an associate engineer and advanced through a variety of management positions in the utility’s gas and electric operations. In 1998 he received Gas Industry Magazine’s Outstanding Manager of the Year Award. PSE&G is New Jersey’s largest electric and gas utility. Mr. LaRossa is a graduate of Stevens Institute of Technology and has completed the Harvard Business School’s Program for Management Development. He serves on the board of directors for the American Gas Association (AGA), New Jersey Utilities Association (NJUA), New Jersey Performing Arts Center (NJPAC), Partnership for a Drug-Free NJ, Choose New Jersey, and Bergen County’s United Way. He also serves on the board of trustees for Montclair State University and the Newark Alliance, as well as on the corporate advisory board for the Boys & Girls Clubs of New Jersey. |
 106 William Levis President and Chief Operating Officer PSEG Power Previously, Mr. Levis was also senior vice president and chief nuclear officer, as part of the Nuclear Operating Services Agreement between PSEG and Exelon Corporation. Under his leadership Nuclear’s Salem and Hope Creek stations have advanced to the highest performance levels in the stations' history. Improvement in the stations' work environment has resulted in the closing of two long standing NRC cross-cutting issues - problem identification and resolution, and safety conscious work environment. Mr. Levis has more than 25 years of diversified experience in the nuclear power industry. Before coming to PSEG he was Exelon Nuclear’s vice president Mid-Atlantic operations, where he provided executive oversight of day-to-day operations of the Limerick, Peach Bottom, Three Mile Island and Oyster Creek Stations. He joined Exelon as the Byron Station Manager in 1998 and was promoted to site vice president the following year. In 2001 he was named site vice president at Limerick Generating Station. Prior to joining Exelon, Mr. Levis worked at Ontario Hydro's Pickering Plant and held several positions over a five-year period with Carolina Power & Light’s Brunswick facility. During this time the station was removed from the NRC Watch List and set new records in the areas of safety, production and cost. Mr. Levis’ background also includes experience with NRC, Westec Services, General Electric Nuclear Services and the U.S. Navy. He has a Bachelor of Science degree in marine engineering from the U.S. Naval Academy and holds an SRO (senior reactor operator) certification. Mr. Levis retired as a commander in the Naval Reserves and attained his professional engineer license in 1985. William Levis was elected president and chief operating officer of PSEG Power (Power), effective June 2007. He had been president and chief nuclear officer of PSEG Nuclear (Nuclear) since January 2007, while retaining his position as Power’s president and COO. Power is a major unregulated independent power producer in the U.S. with three main subsidiaries: PSEG Fossil, PSEG Nuclear, and PSEG Energy Resources and Trade. |
 107 Randall E. Mehrberg Executive Vice President, Strategy & Development PSEG Services Corporation President PSEG Energy Holdings Randall E. Mehrberg is president of PSEG Energy Holdings. PSEG Energy Holdings develops, manages and owns renewable energy solutions including solar, energy storage and off shore wind. PSEG Energy Holdings also owns power plants in the United States and energy and other investments in the United States and abroad. Mehrberg is also PSEG’s executive vice president responsible for corporate strategy, public affairs, policy, mergers and acquisitions, and corporate communications. He is a member of PSEG’s corporate executive leadership team and has responsibility for overseeing the corporate balanced scorecard. Mehrberg’s responsibilities include PSEG’s emergent technology and transfer group, ensuring development of a corporate strategy that includes a comprehensive assessment of the role of technology in the future of our industry. Mehrberg joined PSEG after serving for eight years in various executive leadership positions at Chicago-based Exelon Corp., most recently as executive vice president, chief administrative officer and chief legal officer. Prior to his tenure at Exelon, Mehrberg was an equity partner in the Chicago law firm of Jenner & Block, where he worked from 1980 to 1993 and again from 1997 to 2000. He represented corporations, individuals, not-for-profits and government entities in a broad range of matters. From 1993 to 1997 he served as lakefront director and general counsel for the City of Chicago’s Park District. Mehrberg holds a Doctor of Law degree from the University of Michigan Law School and a Bachelor of Science degree in economics magna cum laude from the University of Pennsylvania’s Wharton School of Business. He has been active in a number of business and civic organizations, including serving as vice chairman of the board of Nuclear Electric Insurance Limited. Mr. Mehrberg currently serves as a board member of the University of Pennsylvania Medical School and the University of Michigan Law School, NJN Television Foundation, Millennium Park and the Lincoln Park Zoo. Mehrberg has been the recipient of numerous awards, such as the AJC Judge Learned Hand Human Relations Award, the Mexican-American Legal Defense and Education Fund Legal Services Award, the Chicago Bar association David C. Hilliard Award, the Catholic Charities Award for Service to the Poor, and the H.O.P.E. for the People Award – Man of the Year. |
 108 Margaret M. Pego Senior Vice President – Human Resources and Chief Human Resources Officer PSEG Services Corporation Margaret M. Pego was named senior vice president – human resources and chief human resources officer of PSEG Services Corporation, in December 2006. Prior, she had been vice president – human resources. Ms. Pego joined PSEG in 1974, and has held a variety of management positions in the human resources department. Ms. Pego holds a Bachelor of Arts degree in business administration from William Paterson College, and a Master of Business Administration degree with a concentration in management and labor relations from Seton Hall University. In addition, she holds a certificate in EEO studies from Cornell University, and has also completed the Human Resources Executive Program at the University of Michigan. She is also certified as a senior professional in human resources. Ms. Pego is active in several local and national organizations including the EEI Chief HR Executives Policy Committee; the American Gas Association HR Policy Committee; The Conference Board Advisory Council of HR Management – Council of HR Executives; and the Society for Human Resources Management. She is the former Chair Center for Energy Workforce Development (CEWD) Executive Counsel. She is a former member of the Supreme Court of New Jersey Attorney Ethics Committee. Ms. Pego is a 2002 Leadership New Jersey graduate, a 1997 TWIN Honoree, 2006 Executive Woman of New Jersey Honoree and 2008 NJ Best 50 Women in Business Honoree. In addition, she is a member of the board of trustees of the American Conference on Diversity, the Boys and Girls Club Concert for Kids Committee, College of Saint Elizabeth, Rutgers Business School and the Children’s Specialized Hospital. |
 Appendix |
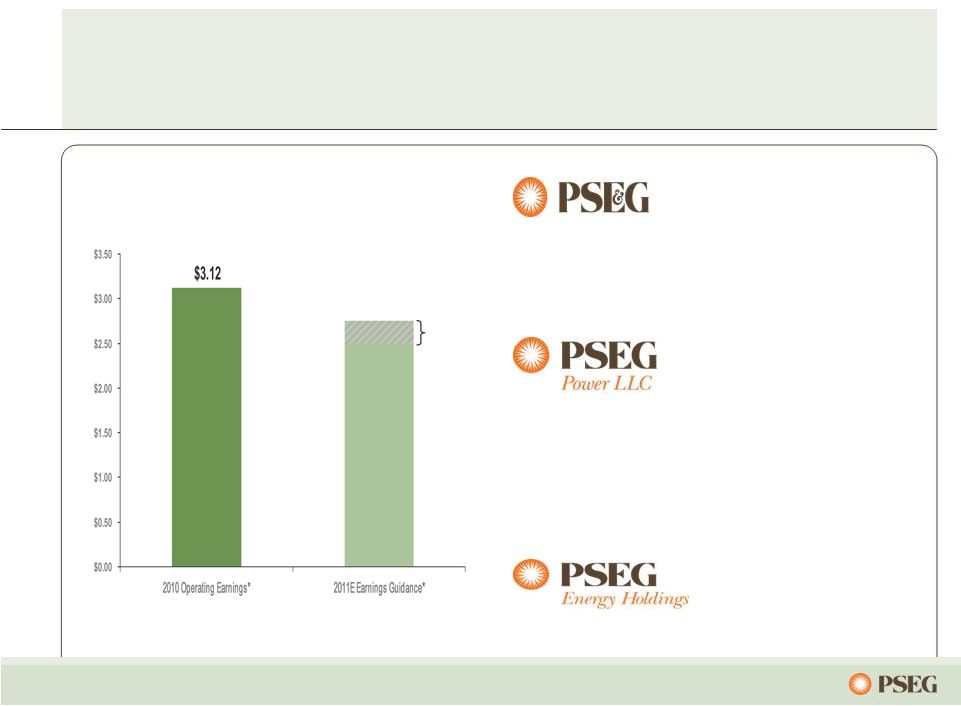
 110 PSEG 2011 Operating Earnings Guidance - by Subsidiary $ millions (except EPS) 2011E 2010A PSEG Power $ 765 – $ 855 $ 1,091 PSE&G $ 495 – $ 520 $ 430 PSEG Energy Holdings $ 0 – $ 5 $ 49 Enterprise $ 5 – $ 15 $ 14 Operating Earnings* $ 1,265 – $ 1,395 $ 1,584 Earnings per Share $ 2.50 – $ 2.75 $ 3.12 * See Page 120 for Items excluded from Income from Continuing Operations to reconcile to Operating Earnings. |
 111 PSEG Consolidated Debt / Capitalization (1) Includes debt due within one year and short-term debt; excludes Securitization Debt and Non-Recourse Debt. $0 $2 $4 $6 $8 $10 $12 $14 $16 $18 2008 2009 2010 Equity Debt (1) Preferred Stock Debt 7,480 7,311 7,812 Preferred Stock 80 80 0 Common Shareholders Equity 7,771 8,788 9,633 Debt plus Equity 15,331 16,179 17,445 Debt Ratio 48.8% 45.2% 44.8% (in $Millions) |
 112 PSEG Consolidated Debt / Capitalization (1) Long-Term Debt includes Debt due within one year; excludes Securitization Debt and Non-Recourse Debt. (2) Power includes Texas Non-recourse Debt PSEG Consolidated ($Millions) December 31, 2008 December 31, 2009 December 31, 2010 PSE&G Short-Term Debt 20 $ - $ - $ PSEG Money Pool Short-Term Debt - 530 64 Total Short-term Debt 20 530 64 Long-Term Debt (1) : Power (2) 3,183 3,121 3,455 PSE&G 3,523 3,571 4,283 Holdings 505 127 - Parent / Services 249 (38) 10 Total Long-Term Debt 7,460 6,781 7,748 Preferred Stock 80 80 - Total Common Stockholders' Equity 7,771 8,788 9,633 TOTAL CAPITALIZATION 15,331 $ 16,179 $ 17,445 $ December 31, 2008 December 31, 2009 December 31, 2010 Debt 7,480 7,311 7,812 Preferred Stock 80 80 - Total Common Stockholders' Equity 7,771 8,788 9,633 Debt Plus Equity 15,331 $ 16,179 $ 17,445 $ Debt Ratio 48.8% 45.2% 44.8% |
 113 At the end of 2010, Power and Parent available liquidity totals approximately $2.8 billion PSEG will refinance credit facilities well ahead of scheduled expirations. Expiration Total Available Company Facility Date Facility Usage Liquidity ($Millions) PSE&G 5-year Credit Facility Jun-12 $600 1 $0 $600 5-Year Credit Facility (Power) Dec-12 $1,600 2 $133 $1,467 2-Year Credit Facility (Power) Jul-11 $350 $0 $350 5-Year Bilateral - Credit Suisse (Power) Sep-15 $100 $90 $10 5-year Credit Facility (PSEG) Dec-12 $1,000 3 $77 $923 Total $3,650 $3,350 $0 PSE&G ST Investment $224 Total Liquidity Available $3,574 Total Parent / Power Liquidity $2,750 1 PSE&G Facility reduced by $28 million in 6/2011 2 Power Facility reduced by $75 million in 12/2011 3 PSEG Facility reduced by $47 million in 12/2011 PSEG / Power PSEG Money Pool ST Investment |
 114 Operated by PSEG Nuclear PSEG Ownership: 100% Technology: Boiling Water Reactor Total Capacity: 1,197MW Owned Capacity: 1,197MW License Expiration: 2026 Filed for license extension, August 2009 Next Refueling 2012 Operated by PSEG Nuclear Ownership: PSEG -- 57%, Exelon – 43% Technology: Pressurized Water Reactor Total Capacity: 2,337MW Owned Capacity: 1,342MW License Expiration: 2016 and 2020 Filed for license extension, August 2009 Next Refueling Unit 1 -- Fall 2011 Unit 2 – Spring 2011 Operated by Exelon PSEG Ownership: 50% Technology: Boiling Water Reactor Total Capacity: 2,245MW Owned Capacity: 1,122MW License Expiration: 2033 and 2034 Next Refueling Unit 2 – 2012 Unit 3 – Fall 2011 Hope Creek Salem Units 1 and 2 Peach Bottom Units 2 and 3 Our five unit nuclear fleet… … is a critical element of Power’s success. |
 115 The forward PJM capacity market provides an opportunity to recover costs… … which is incorporated in the full requirements BGS rate. Capacity Price per RPM Auction for PSEG Zone Capacity Price per BGS Tranche 2011-2012 110 $ Three Year Average ($/MW-day) 168 $ 2012-2013 154 $ MW per Tranch (varies by EDC) ~120 2013-2014 240 $ Days per Year 365 Three Year Average ($/MW-day) 168 $ Capacity Cost per Tranche 7,358,400 $ MWh per Tranche Energy MW per Tranche (varies by EDC) ~120 Hours per Year 8,760 Load Factor (varies by EDC) ~42% MWh per Tranche 400,000 Capacity Cost per MWh 18 $ |
 116 0% 25% 50% 75% 100% 2011 2012 2013 $0 $50 $100 $150 $200 $250 0% 25% 50% 75% 2011 2012 2013 $0 $10 $20 $30 $40 $50 $60 $70 $80 Power’s hedging program provides near- term stability from market volatility… … while remaining open to long-term market forces. Estimated EPS impact of $5/MWh PJM West around the clock price change* (~$1/mmbtu gas change) Contracted Capacity Price (right scale) * As of February 2011 assuming normal market commodity correlation and demand. Power has contracted for a considerable percentage of its future output over the next two years at attractive prices. The pricing for most of Power’s capacity has been fixed through May 2014, with the completion of auctions in PJM and NE. % sold (left scale) $0.05 - $0.15 $0.20 - $0.40 $0.30 - $0.50 Contracted Energy Price (right scale) % sold (left scale) * |
 117 New Jersey Board of Public Utilities (BPU) The Board of Public Utilities consists of five commissioners appointed by the Governor. These appointees are confirmed by the NJ Senate for six-year, staggered terms. The Governor appoints one of the five to serve as Commission President. There are currently four commissioners and one open position: Lee A. Solomon, Commission President Nicholas Asselta Joseph L. Fiordaliso Jeanne M. Fox Stefanie Brand, Director of Rate Counsel, appointed Acting Public Advocate |
 118 Key economic indicators forecast renewed growth… The New Jersey economy declined by 0.02% from 2008 to 2010 and is anticipated to grow 2.4% from 2010 to 2013 New Jersey total non-farm employment declined by 2.5% from 2008 to 2010 and is expected to grow 1.2% from 2010 to 2013 Real personal income in New Jersey declined by 0.9% from 2008 to 2010 and is expected to increase 2.6% from 2010 to 2013 Single family housing starts declined 10.7% from 2008 to 2010 and are expected to increase ~24% from 2010 to 2013 …over 2010 to 2013 timeframe. Source: HIS Global Insight January 2011 Forecast. NJ Total Employment 3,700 3,800 3,900 4,000 4,100 2008 2010 2013 NJ Real Gross State Product $420,000 $440,000 $460,000 $480,000 $500,000 2008 2010 2013 NJ Real Personal Income $380,000 $400,000 $420,000 $440,000 2008 2010 2013 NJ Single Family Housing Starts 0 5 10 15 20 2008 2010 2013 |
 119 PSEG Resources Leveraged Lease Portfolio Lessee Equipment 12/31/10 Invested ($millions) S&P Credit Rating* REMA (Reliant) Keystone, Conemaugh & Shawville (PA) 3 coal fired plants (4,025 MW Total Capacity) $325 B Dynegy Holdings Danskammer & Roseton Generating Station (NY) 370 MW coal-fired and 1,200 MW oil/gas fired 267 CCC Edison Mission Energy (EME) Powerton & Joliet Generating Stations (IL) 2 coal-fired facilities (2,582 MW Total Capacity) 218 B- Merrill Creek – (PECO, MetEd, Delmarva P&L) Reservoir in NJ 126 BBB, BBB-, BBB+ Grand Gulf Nuclear station in Mississippi (1,259 MW Capacity) 99 A+ US West/Qwest Qwest headquarters located in Denver, CO 109 BB Renaissance Center GM headquarters located in Detroit, MI 40 BB- Wal-Mart Portfolio of 27 WalMart stores 41 AA E-D Centers Portfolio of 8 shopping centers 23 NR Total Leveraged Leases $1,249 |
 120 Pro-forma Adjustments, net of tax 2010 2009 2008 Earnings Impact ($ Millions) Gain (Loss) on Nuclear Decommissioning Trust (NDT) Fund Related Activity (PSEG Power) 46 $ 9 $ (71) $ Gain (Loss) on Mark-to-Market (MTM) (PSEG Power) (1) (11) 14 Market Transition Charge Refund (PSE&G) (72) - - Net Reversal of Lease Transaction Reserves (Energy Holdings) - 29 - Lease Transaction Reserves (Energy Holdings) - - (490) Asset Impairments - - (13) Premium on Bond Redemption - - (1) Total Pro-forma adjustments (27) $ 27 $ (561) $ Fully Diluted Average Shares Outstanding (in Millions) 507 507 508 Per Share Impact (Diluted) Gain (Loss) on Nuclear Decommissioning Trust (NDT) Fund Related Activity (PSEG Power) 0.09 $ 0.02 $ (0.14) $ Gain (Loss) on Mark-to-Market (MTM) (PSEG Power) - (0.02) 0.03 Market Transition Charge Refund (PSE&G) (0.14) - - Net Reversal of Lease Transaction Reserves (Energy Holdings) - 0.05 - Lease Transaction Reserves (Energy Holdings) - - (0.96) Asset Impairments - - (0.03) Premium on Bond Redemption - - - Total Pro-forma adjustments (0.05) $ 0.05 $ (1.10) $ December 31, PUBLIC SERVICE ENTERPRISE GROUP INCORPORATED Reconciling Items Excluded from Continuing Operations to Compute Operating Earnings (Unaudited) For the Twelve Months Ended Please see Page 2 for an explanation of PSEG’s use of Operating Earnings as a non-GAAP financial measure and how it differs from Net Income. Items Excluded from Income from Continuing Operations to Reconcile to Operating Earnings |