 PSEG Public Service Enterprise Group European Investor Meetings Deutsche Bank October 1-5, 2012 EXHIBIT 99 |
 2 Forward-Looking Statement Readers are cautioned that statements contained in this presentation about our future performance, including future revenues, earnings, strategies, prospects, consequences and all other statements that are not purely historical, are forward-looking statements for purposes of the safe harbor provisions under The Private Securities Litigation Reform Act of 1995. When used herein, the words “anticipate”, “intend”, “estimate”, “believe”, “expect”, “plan”, “should”, “hypothetical”, “potential”, “forecast”, “project”, variations of such words and similar expressions are intended to identify forward-looking statements. Although we believe that our expectations are based on reasonable assumptions, they are subject to risks and uncertainties and we can give no assurance they will be achieved. The results or developments projected or predicted in these statements may differ materially from what may actually occur. Factors which could cause results or events to differ from current expectations include, but are not limited to: • adverse changes in the demand for or price of the capacity and energy that we sell into wholesale electricity markets, • adverse changes in energy industry law, policies and regulation, including market structures and a potential shift away from competitive markets toward subsidized market mechanisms, transmission planning and cost allocation rules, including rules regarding how transmission is planned and who is permitted to build transmission in the future, and reliability standards, • any inability of our transmission and distribution businesses to obtain adequate and timely rate relief and regulatory approvals from federal and state regulators, • changes in federal and state environmental regulations that could increase our costs or limit our operations, • changes in nuclear regulation and/or general developments in the nuclear power industry, including various impacts from any accidents or incidents experienced at our facilities or by others in the industry, that could limit operations of our nuclear generating units, • actions or activities at one of our nuclear units located on a multi-unit site that might adversely affect our ability to continue to operate that unit or other units located at the same site, • any inability to balance our energy obligations, available supply and trading risks, • any deterioration in our credit quality, or the credit quality of our counterparties, including in our leveraged leases, • availability of capital and credit at commercially reasonable terms and conditions and our ability to meet cash needs, • changes in the cost of, or interruption in the supply of, fuel and other commodities necessary to the operation of our generating units, • delays in receipt of necessary permits and approvals for our construction and development activities, • delays or unforeseen cost escalations in our construction and development activities, • any inability to achieve or continue to sustain, our expected levels of operating performance, • increase in competition in energy supply markets as well as competition for certain rate-based transmission projects, • any inability to realize anticipated tax benefits or retain tax credits, • challenges associated with recruitment and/or retention of a qualified workforce, • adverse performance of our decommissioning and defined benefit plan trust fund investments and changes in discount rates and funding requirements, and • changes in technology and customer usage patterns. For further information, please refer to our Annual Report on Form 10-K, including Item 1A. Risk Factors, and subsequent reports on Form 10-Q and Form 8-K filed with the Securities and Exchange Commission. These documents address in further detail our business, industry issues and other factors that could cause actual results to differ materially from those indicated in this presentation. In addition, any forward-looking statements included herein represent our estimates only as of today and should not be relied upon as representing our estimates as of any subsequent date. While we may elect to update forward-looking statements from time to time, we specifically disclaim any obligation to do so, even if our internal estimates change, unless otherwise required by applicable securities laws. |
 3 GAAP Disclaimer PSEG presents Operating Earnings in addition to its Net Income reported in accordance with generally accepted accounting principles in the United States (GAAP). Operating Earnings is a non-GAAP financial measure that differs from Net Income because it excludes gains or losses associated with Nuclear Decommissioning Trust (NDT), Mark-to-Market (MTM) accounting, and other material one-time items. PSEG presents Operating Earnings because management believes that it is appropriate for investors to consider results excluding these items in addition to the results reported in accordance with GAAP. PSEG believes that the non-GAAP financial measure of Operating Earnings provides a consistent and comparable measure of performance of its businesses to help shareholders understand performance trends. This information is not intended to be viewed as an alternative to GAAP information. The last page in this presentation (Page A) includes a list of items excluded from Income from Continuing Operations to reconcile to Operating Earnings, with a reference to that slide included on each of the slides where the non-GAAP information appears. |
 6 2012 – A year of significant accomplishment • NJBPU approved North Central Grid transmission line • Proposed up to $883 million solar energy investment • Improved to 2 nd place (from 10 ) on the 2012 J.D. Power Electric Utility Residential Customer Satisfaction Study-East Region • Improved availability of gas-fired CCGT fleet and strong nuclear performance • O&M under control • 400 MW of new peaking generation for summer 2012 • Continued de-risking of legacy portfolio • IRS settlement on LILO/SILO tax matters • IRS audit resolution • 25 MW Solar project in Arizona • 15 MW Solar project in Delaware th |
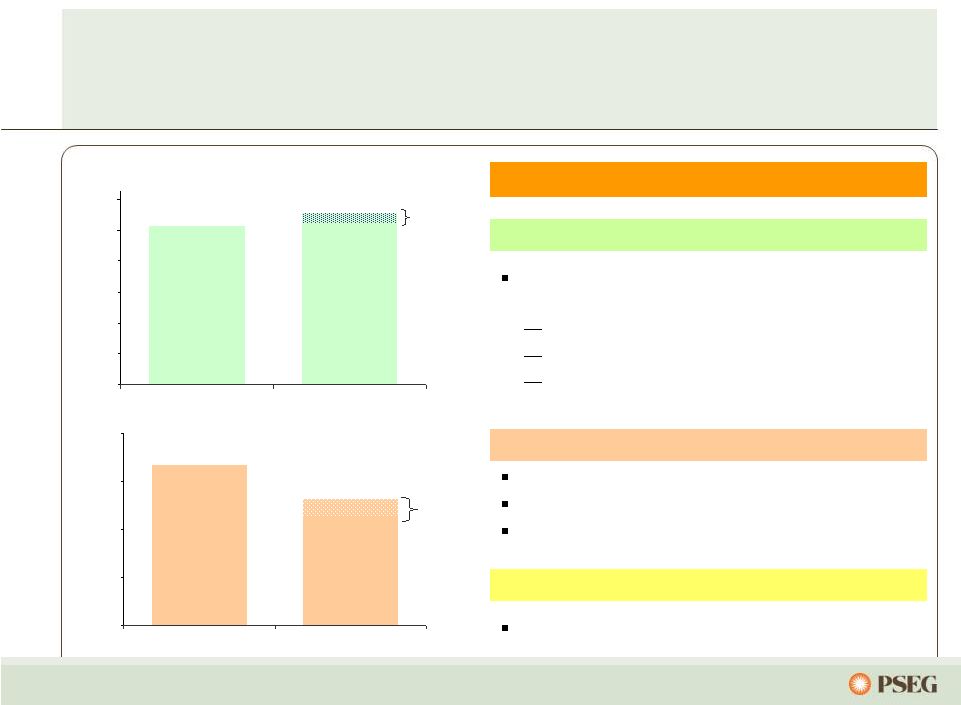 2012 Assumptions PSE&G Growth in investments that provide contemporaneous returns Transmission Distribution economic stimulus programs Programs supporting NJ’s Energy Master Plan Power Impacted by lower energy prices Near term effects minimized by hedges in place ~400MW new Peaking capacity in-service mid 2012 Energy Holdings / Parent Operating earnings guidance of $0.07 to $0.09 11 Guidance $1.31 $1.13 PSEG’s 2012 earnings guidance of $2.25 to $2.50 reflects continued improvement at PSE&G and a decline in margins at Power $0.00 $0.20 $0.40 $0.60 $0.80 $1.00 $1.20 2011 Operating Earnings* 2012E Earnings Guidance* PSE&G Earnings Per Share $0.00 $0.50 $1.00 $1.50 $2.00 2011 Operating Earnings* 2012E Earnings Guidance* Power Earnings Per Share Guidance $1.10 $1.05 *See page A for Items excluded from Income from Continuing Operations to reconcile to Operating Earnings; 2011 reflects Texas in Discontinued Operations. E = Estimate |
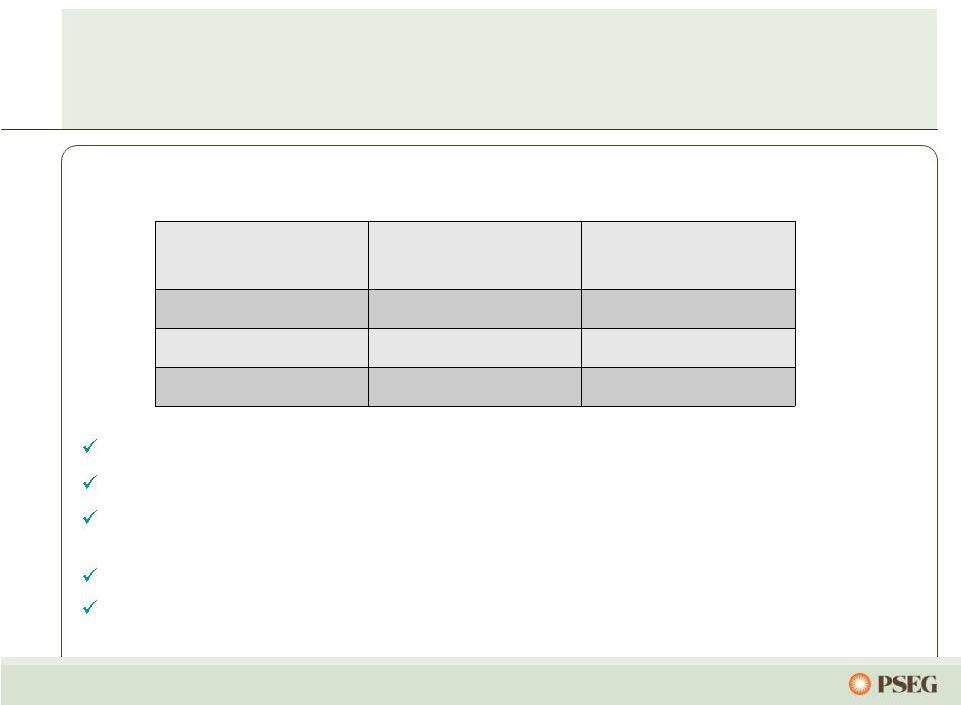
 15 A focus on operational excellence and a capital program that provides the opportunity for double digit operating earnings growth at PSE&G* PSEG Focus ($ millions, except as noted) *Refers to earnings growth opportunity from approved investment programs at PSE&G, excluding recently filed solar over 2011-2014. • 0.4% (actual) • $8,100 • $1,600 • $6,000 • $450 • 1.1% • 30.0TWh • $120 • $0 • 2.8% (forecast) • $11,600 • $4,600 • $6,400 • $630 • 1.1% • 30.3TWh • $195 • $10-$15 • O&M Growth per year • PSE&G Rate Base Transmission E&G Distribution EMP • EFORd Rate - CCGT • Nuclear Generation • Holdings Solar Assets • LIPA • 2.4% (planned) • $6,800 • $866 • $5,900 • $0 • 1.6% • 29.3TWh • $0 • $0 2014E 2011 2008 |
 46 PSEG 2012 Operating Earnings Guidance - By Subsidiary $ millions (except EPS) 2012E 2011 PSEG Power $575 – $665 $845 PSE&G $530 – $560 $521 PSEG Energy Holdings/Parent $35 – $45 $23 Operating Earnings* $1,140 – $1,270 $1,389 Earnings per Share $2.25 – $2.50 $2.74 * See page A for Items excluded from Income from Continuing Operations to reconcile to Operating Earnings. |
 PSEG’s strong financial position supports our program to invest in growth Credit Ratings (Moody’s/S&P/Fitch) Debt as a % of Capitalization Enterprise/Parent* Baa2/BBB/BBB+ 41% PSEG Power Baa1/BBB/BBB+ 34% Public Service E&G** A1/ A- /A+ 49% PSEG Credit Metrics PSEG cash position at June 30 was in excess of $750 million Power and Parent available liquidity totaled approximately $4.2 billion Moody’s upgraded PSE&G’s secured debt rating to A1 with a Stable outlook and affirmed ratings of PSEG (Baa2) and Power (Baa1) with Stable outlooks Standard & Poor’s has a positive outlook on all of PSEG’s credit ratings Fitch upgraded PSE&G’s secured debt rating to A+ with a Stable outlook and affirmed ratings of PSEG (BBB+) and Power (BBB+) with Stable outlooks * Corporate credit rating for S&P. **Senior secured rating for PSE&G. All data is as of June 30, 2012. 48 |
 Items Excluded from Income from Continuing Operations to Reconcile to Operating Earnings Public Service Enterprise Group A Pro-forma Adjustments, net of tax 2012 2011 2011 2010 2009 2008 Gain (Loss) on Nuclear Decommissioning Trust (NDT) Fund Related Activity (PSEG Power) 9 $ 42 $ 50 $ 46 $ 9 (71) $ Gain (Loss) on Mark-to-Market (MTM) (a) (PSEG Power) 42 8 107 (1) (11) 14 Lease Related Activity (PSEG Energy Holdings) 6 - (173) - 29 (490) Market Transition Charge Refund (PSE&G) - - - (72) - - Gain (Loss) on Asset Sales and Impairments (Energy Holdings) - - 34 - - (13) Total Pro-forma adjustments 57 $ 50 $ 18 $ (27) $ 27 $ (560) $ Fully Diluted Average Shares Outstanding (in Millions) 507 507 507 507 507 508 Per Share Impact (Diluted) Gain (Loss) on NDT Fund Related Activity (PSEG Power) 0.02 $ 0.08 $ 0.10 $ 0.09 $ 0.02 $ (0.14) $ Gain (Loss) on MTM (a) (PSEG Power) 0.08 0.02 0.21 - (0.02) 0.03 Lease Related Activity (PSEG Energy Holdings) 0.01 - (0.34) - 0.05 (0.96) Market Transition Charge Refund (PSE&G) - - - (0.14) - - Gain (Loss) on Asset Sales and Impairments (Energy Holdings) - - 0.06 - - (0.03) Total Pro-forma adjustments 0.11 $ 0.10 $ 0.03 $ (0.05) $ 0.05 $ (1.10) $ (a) Includes the financial impact from positions with forward delivery months. Years Ended December 31, Six Months Ended June 30, Reconciling Items Excluded from Continuing Operations to Compute Operating Earnings (Unaudited) Earnings Impact ($ Millions) Please see Page 3 for an explanation of PSEG’s use of Operating Earnings as a non-GAAP financial measure and how it differs from Net Income. |