EXHIBIT 99
| | | | | | |
 | | Investor News | | | | NYSE: PEG |
For further information, contact:
| | |
• Kathleen A. Lally, Vice President – Investor Relations | | Phone: 973-430-6565 |
| |
• Carlotta Chan, Manager – Investor Relations | | Phone: 973-430-6596 |
April 30, 2013
PSEG ANNOUNCES 2013 FIRST QUARTER RESULTS
Earnings from Continuing Operations of $0.63 Per Share; Operating Earnings of $0.85 Per Share
Results Reflect Increased Investment at PSE&G and Strong Performance from PSEG Power
PSE&G Reaches Agreement on Solar Investment
Company Maintains 2013 Guidance of $2.25 - $2.50 Per Share
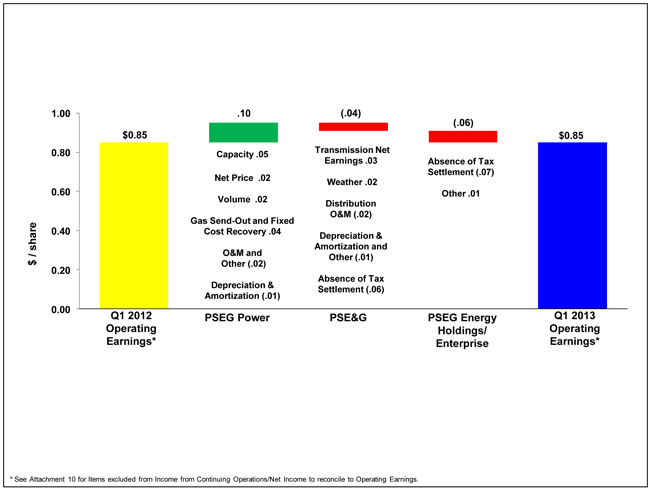
Public Service Enterprise Group (PSEG) reported today Income from Continuing Operations and Net Income for the first quarter of 2013 of $320 million or $0.63 per share as compared to Income from Continuing Operations and Net Income of $493 million or $0.97 per share in the first quarter of 2012. Operating Earnings for the first quarter of 2013 were $433 million or $0.85 per share compared to Operating Earnings for the first quarter of 2012 of $432 million or $0.85 per share.
“PSEG delivered for shareholders in the first quarter of 2013, and remains on track to meet its objectives for full year operating earnings of $2.25 - $2.50 per share” said Ralph Izzo, chairman, president and chief executive officer. He went on to say, “the results for the quarter demonstrate the locational value of Power’s assets which, along with the strong performance of PSEG Power’s nuclear fleet and Power’s open position on its intermediate and peaking generation, allowed us to take advantage of a favorable price environment in the energy marketplace while managing downside risk through the hedges on our base load fleet. Our results also reflect a contribution from PSE&G’s increased capital investment in transmission and the continued benefit from our focus on operational excellence. Our success, as always, is driven by the hard work and dedication of our employees.”
PSEG believes that the non-GAAP financial measure of “Operating Earnings” provides a consistent and comparable measure of performance of its businesses to help shareholders understand performance trends. Operating Earnings excludes gains or losses associated with Nuclear Decommissioning Trust (NDT), Mark-to-Market (MTM) accounting, and other material one-time items. The table below provides a reconciliation of PSEG’s Net Income to Operating Earnings (a non-GAAP measure) for the first quarter. See Attachment 10 for a complete list of items excluded from Income from Continuing Operations in the determination of Operating Earnings.
PSEG CONSOLIDATED EARNINGS (unaudited)
First Quarter Comparative Results
2013 and 2012
| | | | | | | | | | | | | | | | |
| | | Income | | | Diluted Earnings | |
| | | ($millions) | | | Per Share | |
| | | 2013 | | | 2012 | | | 2013 | | | 2012 | |
Operating Earnings | | $ | 433 | | | $ | 432 | | | $ | 0.85 | | | $ | 0.85 | |
Reconciling Items | | | (113 | ) | | | 61 | | | | (0.22 | ) | | | 0.12 | |
Income from Continuing Operations/Net Income | | $ | 320 | | | $ | 493 | | | $ | 0.63 | | | $ | 0.97 | |
| | | | | | | Avg. Shares | | | | 507M | | | | 507M | |
EXHIBIT 99
“We are very pleased with our results”, said Ralph Izzo. “We benefited from excellent operations this quarter, but, as focused as we are on meeting our short-term goals, we are just as committed to delivering on the long-term promise associated with our proposed 10-year $3.9 billion Energy Strong investment program. The program, along with plans to invest an additional $1.5 billion to harden our transmission system over this period, is a natural extension of our strategy to maintain PSE&G as one of the nation’s most reliable utilities, and would occur during a period of time when major charges on the electric bill are scheduled to expire. The combination of growth at PSE&G with PSEG Power’s free cash flow and our strong balance sheet provide the diversification and financial flexibility to help us weather various market conditions and meet the long-term goals of our customers and shareholders.”
The following table outlines continued expectations for operating earnings in 2013 by subsidiary:
2013 Operating Earnings Guidance
($ millions, except EPS)
| | |
| | | 2013E |
PSEG Power | | $535-$600 |
PSE&G | | 580-635 |
PSEG Energy Holdings/Parent | | 25-35 |
| |
PSEG Operating Earnings | | $1,140-$1,270 |
Earnings Per Share | | $2.25-$2.50 |
Operating Earnings Review by Subsidiary
See Attachment 5 for detail regarding the quarter-over-quarter reconciliations for each of PSEG’s businesses.
PSEG Power
PSEG Power reported operating earnings of $250 million ($0.49 per share) for the first quarter of 2013 compared with operating earnings of $196 million ($0.39 per share) for the first quarter of 2012. Power’s operating earnings exclude the impact of Super Storm Sandy related restoration costs given the unusual nature of the storm’s impact on Power.
Power’s first quarter operating earnings benefited from strong market prices for energy, higher capacity prices, and an increase in generation.
Normal winter weather conditions this year compared to abnormally mild weather conditions in the year-ago quarter, higher prices for natural gas and an improvement in basis all had a favorable influence on spot market prices for energy in the first quarter. Power’s results also benefited from higher market prices on its unhedged intermediate and peaking generation. The improvement in wholesale pricing quarter-over-quarter offset the impact of lower contract prices on energy hedged through the Basic
EXHIBIT 99
Generation Services Contract (BGS) and other wholesale contracts resulting in a net increase in earnings quarter-over-quarter of $0.02 per share. An increase in capacity prices on June 1, 2012 to $153 per MW-day from $110 per MW-day improved Power’s quarter-over-quarter earnings by $0.05 per share.
PSEG Power’s output increased 7.7% during the quarter as a result of higher pricing and more favorable weather which had a positive influence on the dispatch of Power’s fossil fleet. The increase in generation added $0.02 per share to earnings quarter-over-quarter. Normal weather conditions compared to abnormally warm conditions in the year-ago quarter also had a favorable impact on off-system gas sales. The improvement in send-out also supported recovery of Power’s fixed expenses associated with its gas supply and storage operations; these items together improved quarter-over-quarter earnings by $0.04 per share. An increase in operating and maintenance expense (exclusive of storm-related activity) and other items reduced earnings by $0.02 per share. An increase in depreciation related to the in-service of new peaking capacity and low pressure turbines at Peach Bottom reduced earnings by $0.01 per share.
PSEG Power expensed approximately $28 million pre-tax on storm recovery activity in the first quarter of 2013, bringing Power’s total pre-tax storm related expenditures to $113 million. Of this amount, Power has received $19 million in initial insurance proceeds to return its facilities to service.
The nuclear fleet operated slightly in excess of its rated capacity in the first quarter, or at 101%, and provided 57% of Power’s output. The fleet’s performance was enhanced by record quarterly generation from the Salem Station. An upgrade of the equipment and the design at Salem’s circulating water intake structure strongly aided plant performance. The economics of operating Power’s coal units improved in the first quarter. Performance was supported by higher demand under more normal winter weather conditions and higher gas prices. Generation from Power’s coal fleet nearly doubled from the year-ago quarter and provided approximately 16% of Power’s output. Power’s gas-fired combined cycle fleet operated at an average capacity factor in the quarter of 52% compared to 56% in the year-ago quarter. Output at the Linden facility was reduced due to repair activity following Super Storm Sandy. The facility was returned to full-service on January 11, 2013.
Power continues to forecast output for 2013 of 53 - 55 TWh. Output for the remainder of the year is approximately 70% - 75% hedged at an average price of $50 per MWh. For 2014, forecast output of 53 - 55 TWh is approximately 50% - 55% hedged at an average price of $50 per MWh. Power has hedged 25% - 30% of its forecast generation in 2015 of 52 - 54 TWh at an average price of $50 per MWh. The results include the impact of the February 2013 auction of Basic Generation Service (BGS) load in New Jersey. A price of $92 per MWh for the PSE&G zone in the latest auction will replace BGS auction prices of $96 per MWh for the three-year period beginning June 1, 2013. Average hedge prices also continue to reflect assumed BGS volumes of 12 TWh in 2013 and 10 TWh in 2014.
The forecast of Power’s operating earnings for 2013 remains unchanged at $535 million - $600 million.
PSE&G
PSE&G reported operating earnings of $179 million ($0.35 per share) for the first quarter of 2013 compared with operating earnings of $197 million ($0.39 per share) for the first quarter of 2012.
EXHIBIT 99
PSE&G’s first quarter results reflect the absence of the $0.06 per share tax settlement in the year-ago quarter which more than offset the contribution to earnings from the increased level of transmission investment.
The Federal Energy Regulatory Commission (FERC) authorized PSE&G’s request for an annual increase in transmission revenue under the company’s formula rate filing. The rate increase, which was effective on January 1, 2013, supported a quarter-over-quarter increase in the net earnings contribution from transmission of $0.03 per share. Electric and gas demand in the quarter was influenced by weather which was only slightly colder than normal, but significantly colder than a year ago. Electric and gas sales increased in the quarter by 0.9% and 23% respectively. We estimate weather normalized electric sales declined by 2.0% in the first quarter from year-ago levels as weather normalized gas deliveries increased by 0.6% quarter-over-quarter. The favorable weather comparison added $0.02 per share to earnings.
An increase in Distribution Operation and Maintenance (O&M) expense quarter-over-quarter was influenced by the continued impact of storm related repair, and the more normal weather experienced in the current period which resulted in O&M related work versus the warm weather in the year-ago period which supported an acceleration of capital related work. The increase in Distribution O&M reduced quarter-over-quarter earnings by $0.02 per share. The full year growth rate for O&M is expected to be lower than the rate of growth seen during the first quarter. An increase in depreciation expense and other miscellaneous items reduced earnings quarter-over-quarter by $0.01 per share.
The forecast of PSE&G’s operating earnings for 2013 remains unchanged at $580 - $635 million.
Solar Agreement
PSE&G has reached an agreement with the Staff of the New Jersey Board of Public Utilities (BPU) and certain other parties on its proposal to increase spending on renewable energy under its Solar Loan and Solar 4 All investment programs. Under the agreement, which will now be subject to comment by all parties, PSE&G will invest up to $199 million on new solar (97.5 MW) as part of the Solar Loan III program. The agreement also provides for PSE&G to invest approximately $247 million to develop new solar capacity (42 MW) on landfills, brownfields and 3 MW in smaller pilot programs as part of the Solar 4 All extension. The investment would represent 50% of PSE&G’s original request to invest up to $883 million on the two programs. The capital investment would occur over a 3-year period of time as compared to the original 5-year request. A decision by the New Jersey BPU is anticipated no later than May 31.
PSEG Energy Holdings/Enterprise
PSEG Energy Holdings/Enterprise reported operating earnings of $4 million ($0.01 per share) for the first quarter of 2013 compared with operating earnings of $39 million ($0.07 per share) during the first quarter of 2012. First quarter operating earnings reflect the absence of $0.07 per share of tax benefits received in the first quarter of 2012 related to the settlement of IRS tax audits.
The forecast of PSEG Energy Holdings/Parent full year operating earnings for 2013 is unchanged at $25 million - $35 million. The results will reflect the full year operation of the Milford and Queen Creek solar facilities (40 MW) which entered service in the fourth quarter of 2012 as well as the commercial operation of a 19MW solar facility located in Arizona expected to enter in-service in the fourth quarter at a cost of approximately $50 million.
EXHIBIT 99
Credit Ratings
Standard & Poor’s Ratings Services (S&P) raised its corporate credit ratings on PSEG, PSE&G and PSEG Power LLC to BBB+ from BBB on April 23, 2013. S&P also raised the rating on PSE&G’s senior secured debt to A from A-. The rating outlook on all three issuers is stable.
FORWARD-LOOKING STATEMENT
Certain of the matters discussed in this report constitute “forward-looking statements” within the meaning of the Private Securities Litigation Reform Act of 1995. Such forward-looking statements are subject to risks and uncertainties, which could cause actual results to differ materially from those anticipated. Such statements are based on management’s beliefs as well as assumptions made by and information currently available to management. When used herein, the words “anticipate,” “intend,” “estimate,” “believe,” “expect,” “plan,” “should,” “hypothetical,” “potential,” “forecast,” “project,” variations of such words and similar expressions are intended to identify forward-looking statements. Factors that may cause actual results to differ are often presented with the forward-looking statements themselves. Other factors that could cause actual results to differ materially from those contemplated in any forward-looking statements made by us herein are discussed in Item 1. Financial Statements - Note 8. Commitments and Contingent Liabilities, Item 2. Management’s Discussion and Analysis of Financial Condition and Results of Operations, and other factors discussed in filings we make with the United States Securities and Exchange Commission (SEC). These factors include, but are not limited to:
| | • | | adverse changes in the demand for or the price of the capacity and energy that we sell into wholesale electricity markets, |
| | • | | adverse changes in energy industry law, policies and regulation, including market structures and a potential shift away from competitive markets toward subsidized market mechanisms, transmission planning and cost allocation rules, including rules regarding how transmission is planned and who is permitted to build transmission in the future, and reliability standards, |
| | • | | any inability of our transmission and distribution businesses to obtain adequate and timely rate relief and regulatory approvals from federal and state regulators, |
| | • | | changes in federal and state environmental regulations that could increase our costs or limit our operations, |
| | • | | changes in nuclear regulation and/or general developments in the nuclear power industry, including various impacts from any accidents or incidents experienced at our facilities or by others in the industry, that could limit operations of our nuclear generating units, |
| | • | | actions or activities at one of our nuclear units located on a multi-unit site that might adversely affect our ability to continue to operate that unit or other units located at the same site, |
| | • | | any inability to balance our energy obligations, available supply and risks, |
| | • | | any deterioration in our credit quality or the credit quality of our counterparties, including in our leveraged leases, |
| | • | | availability of capital and credit at commercially reasonable terms and conditions and our ability to meet cash needs, |
| | • | | changes in the cost of, or interruption in the supply of, fuel and other commodities necessary to the operation of our generating units, |
| | • | | delays in receipt of necessary permits and approvals for our construction and development activities, |
| | • | | delays or unforeseen cost escalations in our construction and development activities, |
| | • | | any inability to achieve, or continue to sustain, our expected levels of operating performance, |
| | • | | any equipment failures, accidents, severe weather events or other incidents that impact our ability to provide safe and reliable service to our customers, and any inability to sufficiently obtain coverage or recover proceeds of insurance on such matters, |
| | • | | increase in competition in energy supply markets as well as competition for certain rate-based transmission projects, |
| | • | | any inability to realize anticipated tax benefits or retain tax credits, |
| | • | | challenges associated with recruitment and/or retention of a qualified workforce, |
| | • | | adverse performance of our decommissioning and defined benefit plan trust fund investments and changes in funding requirements, and |
| | • | | changes in technology and customer usage patterns. |
EXHIBIT 99
All of the forward-looking statements made in this report are qualified by these cautionary statements and we cannot assure you that the results or developments anticipated by management will be realized or even if realized, will have the expected consequences to, or effects on, us or our business prospects, financial condition or results of operations. Readers are cautioned not to place undue reliance on these forward-looking statements in making any investment decision. Forward-looking statements made in this report apply only as of the date of this report. While we may elect to update forward-looking statements from time to time, we specifically disclaim any obligation to do so, even if internal estimates change, unless otherwise required by applicable securities laws. The forward-looking statements contained in this report are intended to qualify for the safe harbor provisions of Section 27A of the Securities Act of 1933, as amended, and Section 21E of the Securities Exchange Act of 1934, as amended.
Attachment 1
PUBLIC SERVICE ENTERPRISE GROUP INCORPORATED
Operating Earnings and Per Share Results by Subsidiary
(Unaudited)
| | | | | | | | |
| | | Three Months Ended
March 31, | |
| | | 2013 | | | 2012 | |
| | |
| Earnings Results ($ Millions) | | | | | | | | |
PSEG Power | | $ | 250 | | | $ | 196 | |
PSE&G | | | 179 | | | | 197 | |
PSEG Energy Holdings/Enterprise | | | 4 | | | | 39 | |
| | | | | | | | |
Operating Earnings | | $ | 433 | | | $ | 432 | |
| | | | | | | | |
Reconciling Items(a) | | | (113 | ) | | | 61 | |
| | | | | | | | |
Income from Continuing Operations/Net Income | | $ | 320 | | | $ | 493 | |
| | | | | | | | |
| | |
| | | | | | | | |
Fully Diluted Average Shares Outstanding (in Millions) | | | 507 | | | | 507 | |
| | | | | | | | |
| | |
| Per Share Results (Diluted) | | | | | | | | |
PSEG Power | | $ | 0.49 | | | $ | 0.39 | |
PSE&G | | | 0.35 | | | | 0.39 | |
PSEG Energy Holdings/Enterprise | | | 0.01 | | | | 0.07 | |
| | | | | | | | |
Operating Earnings | | $ | 0.85 | | | $ | 0.85 | |
| | | | | | | | |
Reconciling Items(a) | | | (0.22 | ) | | | 0.12 | |
| | | | | | | | |
Income from Continuing Operations/Net Income | | $ | 0.63 | | | $ | 0.97 | |
| | | | | | | | |
| (a) | See attachment 10 for details of items excluded from Income from Continuing Operations/Net Income to compute Operating Earnings. |
Attachment 2
PUBLIC SERVICE ENTERPRISE GROUP INCORPORATED
Consolidating Statements of Operations
(Unaudited, $ Millions)
| | | | | | | | | | | | | | | | |
| | | Three Months Ended March 31, 2013 | |
| | | PSEG | | | PSEG
Energy Holdings/
Enterprise (a) | | | PSEG
POWER | | | PSE&G | |
| | | | |
OPERATING REVENUES | | $ | 2,786 | | | $ | (656 | ) | | $ | 1,447 | | | $ | 1,995 | |
| | | | |
OPERATING EXPENSES | | | | | | | | | | | | | | | | |
Energy Costs | | | 1,155 | | | | (672 | ) | | | 860 | | | | 967 | |
Operation and Maintenance | | | 710 | | | | 1 | | | | 282 | | | | 427 | |
Depreciation and Amortization | | | 290 | | | | 11 | | | | 64 | | | | 215 | |
Taxes Other Than Income Taxes | | | 21 | | | | — | | | | — | | | | 21 | |
| | | | | | | | | | | | | | | | |
Total Operating Expenses | | | 2,176 | | | | (660 | ) | | | 1,206 | | | | 1,630 | |
| | | | | | | | | | | | | | | | |
| | | | |
OPERATING INCOME | | | 610 | | | | 4 | | | | 241 | | | | 365 | |
| | | | |
Income from Equity Method Investments | | | 2 | | | | 2 | | | | — | | | | — | |
Other Income and (Deductions) | | | 32 | | | | 1 | | | | 19 | | | | 12 | |
Other Than Temporary Impairments | | | (2 | ) | | | — | | | | (2 | ) | | | — | |
Interest Expense | | | (102 | ) | | | 1 | | | | (30 | ) | | | (73 | ) |
| | | | | | | | | | | | | | | | |
INCOME FROM CONTINUING OPERATIONS BEFORE INCOME TAXES | | | 540 | | | | 8 | | | | 228 | | | | 304 | |
| | | | |
Income Tax Benefit (Expense) | | | (220 | ) | | | (4 | ) | | | (91 | ) | | | (125 | ) |
| | | | | | | | | | | | | | | | |
| | | | |
INCOME FROM CONTINUING OPERATIONS/NET INCOME | | $ | 320 | | | $ | 4 | | | $ | 137 | | | $ | 179 | |
| | | | | | | | | | | | | | | | |
| | | | |
OPERATING EARNINGS | | $ | 433 | | | $ | 4 | | | $ | 250 | | | $ | 179 | |
Reconciling Items Excluded from Continuing Operations (b) | | | (113 | ) | | | — | | | | (113 | ) | | | — | |
| | | | | | | | | | | | | | | | |
INCOME FROM CONTINUING OPERATIONS/NET INCOME | | $ | 320 | | | $ | 4 | | | $ | 137 | | | $ | 179 | |
| | | | | | | | | | | | | | | | |
| |
| | | Three Months Ended March 31, 2012 | |
| | | PSEG | | | PSEG
Energy Holdings/
Enterprise (a) | | | PSEG
POWER | | | PSE&G | |
| | | | |
OPERATING REVENUES | | $ | 2,875 | | | $ | (625 | ) | | $ | 1,561 | | | $ | 1,939 | |
| | | | |
OPERATING EXPENSES | | | | | | | | | | | | | | | | |
Energy Costs | | | 1,179 | | | | (645 | ) | | | 822 | | | | 1,002 | |
Operation and Maintenance | | | 628 | | | | 11 | | | | 241 | | | | 376 | |
Depreciation and Amortization | | | 256 | | | | 9 | | | | 57 | | | | 190 | |
Taxes Other Than Income Taxes | | | 29 | | | | — | | | | — | | | | 29 | |
| | | | | | | | | | | | | | | | |
Total Operating Expenses | | | 2,092 | | | | (625 | ) | | | 1,120 | | | | 1,597 | |
| | | | | | | | | | | | | | | | |
| | | | |
OPERATING INCOME | | | 783 | | | | — | | | | 441 | | | | 342 | |
| | | | |
Other Income and (Deductions) | | | 28 | | | | 3 | | | | 15 | | | | 10 | |
Other Than Temporary Impairments | | | (5 | ) | | | — | | | | (5 | ) | | | — | |
Interest Expense | | | (101 | ) | | | 2 | | | | (30 | ) | | | (73 | ) |
| | | | | | | | | | | | | | | | |
INCOME FROM CONTINUING OPERATIONS BEFORE INCOME TAXES | | | 705 | | | | 5 | | | | 421 | | | | 279 | |
| | | | |
Income Tax Benefit (Expense) | | | (212 | ) | | | 38 | | | | (168 | ) | | | (82 | ) |
| | | | | | | | | | | | | | | | |
| | | | |
INCOME FROM CONTINUING OPERATIONS/NET INCOME | | $ | 493 | | | $ | 43 | | | $ | 253 | | | $ | 197 | |
| | | | | | | | | | | | | | | | |
| | | | |
OPERATING EARNINGS | | $ | 432 | | | $ | 39 | | | $ | 196 | | | $ | 197 | |
Reconciling Items Excluded from Continuing Operations (b) | | | 61 | | | | 4 | | | | 57 | | | | — | |
| | | | | | | | | | | | | | | | |
INCOME FROM CONTINUING OPERATIONS/NET INCOME | | $ | 493 | | | $ | 43 | | | $ | 253 | | | $ | 197 | |
| | | | | | | | | | | | | | | | |
| (a) | Includes activities at Energy Holdings and the Parent as well as intercompany eliminations. |
| (b) | See attachment 10 for details of items excluded from Income from Continuing Operations/Net Income to compute Operating Earnings. |
Attachment 3
PUBLIC SERVICE ENTERPRISE GROUP INCORPORATED
Capitalization Schedule
(Unaudited, $ Millions)
| | | | | | | | |
| | | March 31,
2013 | | | December 31,
2012 | |
DEBT | | | | | | | | |
Long-Term Debt | | $ | 7,417 | | | $ | 7,173 | |
Securitization Debt | | | 671 | | | | 722 | |
Project Level, Non-Recourse Debt | | | 26 | | | | 44 | |
| | | | | | | | |
Total Debt | | | 8,114 | | | | 7,939 | |
| | |
STOCKHOLDERS’ EQUITY | | | | | | | | |
Common Stock | | | 4,833 | | | | 4,833 | |
Treasury Stock | | | (612 | ) | | | (607 | ) |
Retained Earnings | | | 7,080 | | | | 6,942 | |
Accumulated Other Comprehensive Loss | | | (355 | ) | | | (388 | ) |
| | | | | | | | |
Total Common Stockholders’ Equity | | | 10,946 | | | | 10,780 | |
Noncontrolling Interests - Equity Investments | | | 1 | | | | 1 | |
| | | | | | | | |
Total Equity | | | 10,947 | | | | 10,781 | |
| | | | | | | | |
Total Capitalization | | $ | 19,061 | | | $ | 18,720 | |
| | | | | | | | |
Attachment 4
PUBLIC SERVICE ENTERPRISE GROUP INCORPORATED
CONDENSED CONSOLIDATED STATEMENTS OF CASH FLOWS
(Unaudited, $ Millions)
| | | | | | | | |
| | | Three Months Ended March 31, | |
| | | 2013 | | | 2012 | |
CASH FLOWS FROM OPERATING ACTIVITIES | | | | | | | | |
Net Income | | $ | 320 | | | $ | 493 | |
Adjustments to Reconcile Net Income to Net Cash Flows From Operating Activities | | | 557 | | | | 595 | |
| | | | | | | | |
NET CASH PROVIDED BY OPERATING ACTIVITIES | | | 877 | | | | 1,088 | |
| | | | | | | | |
| | |
NET CASH USED IN INVESTING ACTIVITIES | | | (733 | ) | | | (706 | ) |
| | | | | | | | |
| | |
NET CASH USED IN FINANCING ACTIVITIES | | | (103 | ) | | | (285 | ) |
| | | | | | | | |
| | |
Net Change in Cash and Cash Equivalents | | | 41 | | | | 97 | |
| | |
Cash and Cash Equivalents at Beginning of Period | | | 379 | | | | 834 | |
| | | | | | | | |
Cash and Cash Equivalents at End of Period | | $ | 420 | | | $ | 931 | |
| | | | | | | | |
Attachment 5
PUBLIC SERVICE ENTERPRISE GROUP INCORPORATED
Quarter-over-Quarter EPS Reconciliation
March 31, 2013 vs. March 31, 2012
(Unaudited)
Attachment 6
PSEG POWER LLC
Generation Measures
(Unaudited)
| | | | | | | | |
| | | GWhr Breakdown | |
| | | Three Months Ended | |
| | | March 31, | |
| | | 2013 | | | 2012 | |
Nuclear - NJ | | | 5,588 | | | | 5,436 | |
Nuclear - PA | | | 2,549 | | | | 2,534 | |
| | | | | | | | |
Total Nuclear | | | 8,137 | | | | 7,970 | |
| | |
Fossil - Coal/Natural Gas - NJ* | | | 479 | | | | 44 | |
Fossil - Coal - PA | | | 1,419 | | | | 1,063 | |
Fossil - Coal - CT | | | 309 | | | | 23 | |
| | | | | | | | |
Total Coal | | | 2,207 | | | | 1,130 | |
| | |
Fossil - Oil & Natural Gas - NJ | | | 2,888 | | | | 2,840 | |
Fossil - Oil & Natural Gas - NY | | | 878 | | | | 1,211 | |
Fossil - Oil & Natural Gas - CT | | | 47 | | | | (8 | ) |
| | | | | | | | |
Total Oil & Natural Gas | | | 3,813 | | | | 4,043 | |
| | | | | | | | |
| | | 14,157 | | | | 13,143 | |
| |
| | | % Generation by Fuel Type | |
| | | Three Months Ended | |
| | | March 31, | |
| | | 2013 | | | 2012 | |
Nuclear - NJ | | | 39 | % | | | 42 | % |
Nuclear - PA | | | 18 | % | | | 19 | % |
| | | | | | | | |
Total Nuclear | | | 57 | % | | | 61 | % |
| | |
Fossil - Coal/Natural Gas - NJ* | | | 4 | % | | | 0 | % |
Fossil - Coal - PA | | | 10 | % | | | 8 | % |
Fossil - Coal - CT | | | 2 | % | | | 0 | % |
| | | | | | | | |
Total Coal | | | 16 | % | | | 8 | % |
| | |
Fossil - Oil & Natural Gas - NJ | | | 21 | % | | | 22 | % |
Fossil - Oil & Natural Gas - NY | | | 6 | % | | | 9 | % |
Fossil - Oil & Natural Gas - CT | | | 0 | % | | | 0 | % |
| | | | | | | | |
Total Oil & Natural Gas | | | 27 | % | | | 31 | % |
| | | | | | | | |
| | | 100 | % | | | 100 | % |
| * | Includes Pumped Storage. Pumped Storage accounted for <1% of total generation for the three months ended March 31, 2013 and 2012. Also includes natural gas fuel switching intervals. |
Attachment 7
PUBLIC SERVICE ELECTRIC & GAS COMPANY
Retail Sales and Revenues
(Unaudited)
March 31, 2013
Electric Sales and Revenues
| | | | | | | | |
| | | Three Months
Ended | | | Change vs.
2012 | |
Sales (millions kwh) | | | | | | | | |
Residential | | | 3,130 | | | | 4.7 | % |
Commercial & Industrial | | | 6,699 | | | | -0.8 | % |
Street Lighting | | | 91 | | | | 1.4 | % |
Interdepartmental | | | 3 | | | | 2.6 | % |
| | | | | | | | |
Total | | | 9,923 | | | | 0.9 | % |
| | | | | | | | |
| | |
Revenue (in millions) | | | | | | | | |
Residential | | $ | 470 | | | | -4.8 | % |
Commercial & Industrial | | | 436 | | | | -10.9 | % |
Street Lighting | | | 18 | | | | -13.5 | % |
Other Operating Revenues* | | | 105 | | | | 15.1 | % |
| | | | | | | | |
Total | | $ | 1,029 | | | | -6.0 | % |
| | | | | | | | |
| | |
| | | Three Months
Ended | | | Change vs.
2012 | |
Weather Data | | | | | | | | |
THI Hours - Actual | | | 0 | | | | -100.0 | % |
THI Hours - Normal | | | 24 | | | | | |
| * | Primarily sales of Non-Utility Generator energy to PJM and Transmission related revenues. |
Attachment 8
PUBLIC SERVICE ELECTRIC & GAS COMPANY
Retail Sales and Revenues
(Unaudited)
March 31, 2013
Gas Sold and Transported
| | | | | | | | |
| | | Three Months
Ended | | | Change vs.
2012 | |
Sales (millions therms) | | | | | | | | |
Residential Sales | | | 624 | | | | 18.1 | % |
Commercial & Industrial - Firm Sales | | | 219 | | | | 14.5 | % |
Commercial & Industrial - Interr. & Cogen | | | 28 | | | | 15.2 | % |
| | | | | | | | |
Total | | | 871 | | | | 17.1 | % |
| | | | | | | | |
| | |
Gas Transported - Firm Sales | | | 298 | | | | 41.2 | % |
Gas Transported - Non-Firm | | | 207 | | | | -25.5 | % |
| | |
Revenue (in millions) | | | | | | | | |
Residential Sales | | $ | 311 | | | | 14.8 | % |
Commercial & Industrial - Firm Sales | | | 119 | | | | 22.5 | % |
Commercial & Industrial - Interr. & Cogen | | | 13 | | | | 21.2 | % |
Other Operating Revenues* | | | 42 | | | | 10.8 | % |
| | | | | | | | |
Total | | $ | 485 | | | | 16.4 | % |
| | | | | | | | |
| | |
Gas Transported | | $ | 481 | | | | 13.6 | % |
| | |
| | | Three Months
Ended | | | Change vs.
2012 | |
Weather Data | | | | | | | | |
Degree Days - Actual | | | 2,550 | | | | 25.9 | % |
Degree Days - Normal | | | 2,539 | | | | | |
| * | Primarily Appliance Service. |
Attachment 9
PUBLIC SERVICE ENTERPRISE GROUP INCORPORATED
Statistical Measures
(Unaudited)
| | | | | | | | |
| | | Three Months Ended | |
| | | March 31, | |
| | | 2013 | | | 2012 | |
| | |
Weighted Average Common Shares Outstanding (000’s) | | | | | | | | |
Basic | | | 505,942 | | | | 506,010 | |
Diluted | | | 507,220 | | | | 507,029 | |
| | |
Stock Price at End of Period | | $ | 34.34 | | | $ | 30.61 | |
| | |
Dividends Paid per Share of Common Stock | | $ | 0.3600 | | | $ | 0.3550 | |
| | |
Dividend Payout Ratio* | | | 59.0 | % | | | 50.5 | % |
| | |
Dividend Yield | | | 4.2 | % | | | 4.6 | % |
| | |
Price/Earnings Ratio* | | | 14.1 | | | | 11.2 | |
| | |
Rate of Return on Average Common Equity* | | | 11.5 | % | | | 13.6 | % |
| | |
Book Value per Common Share | | $ | 21.64 | | | $ | 21.00 | |
| | |
Market Price as a Percent of Book Value | | | 159 | % | | | 146 | % |
| | |
Total Shareholder Return | | | 13.5 | % | | | -6.2 | % |
| * | Calculation based on Operating Earnings for the 12 month period ended. |
Attachment 10
PUBLIC SERVICE ENTERPRISE GROUP INCORPORATED
Reconciling Items Excluded from Income from Continuing Operations/Net Income to Compute Operating Earnings
(Unaudited)
| | | | | | | | | | | | | | | | |
Pro-forma Adjustments, net of tax | | Three Months Ended
March 31, | | | Year Ended
December 31, | |
| | 2013 | | | 2012 | | | 2012 | | | 2011 | |
| | | | |
| Earnings Impact ($ Millions) | | | | | | | | | | | | | | | | |
| | | | |
Gain (Loss) on Nuclear Decommissioning Trust (NDT) | | | | | | | | | | | | | | | | |
Fund Related Activity (PSEG Power) | | $ | 9 | | | $ | 5 | | | $ | 52 | | | $ | 50 | |
Gain (Loss) on Mark-to-Market (MTM)(a) (PSEG Power) | | | (105 | ) | | | 52 | | | | (10 | ) | | | 107 | |
Lease Related Activity (PSEG Energy Holdings) | | | — | | | | 4 | | | | 36 | | | | (173 | ) |
Storm O&M (PSEG Power) | | | (17 | ) | | | — | | | | (39 | ) | | | — | |
Gain on Sale of Qwest Building (PSEG Energy Holdings) | | | — | | | | — | | | | — | | | | 34 | |
| | | | | | | | | | | | | | | | |
| | | | |
Total Pro-forma adjustments | | $ | (113 | ) | | $ | 61 | | | $ | 39 | | | $ | 18 | |
| | | | | | | | | | | | | | | | |
| | | | |
Fully Diluted Average Shares Outstanding (in Millions) | | | 507 | | | | 507 | | | | 507 | | | | 507 | |
| | | | |
| Per Share Impact (Diluted) | | | | | | | | | | | | | | | | |
| | | | |
Gain (Loss) on NDT Fund Related Activity (PSEG Power) | | $ | 0.02 | | | $ | 0.01 | | | $ | 0.10 | | | $ | 0.10 | |
Gain (Loss) on MTM(a) (PSEG Power) | | | (0.21 | ) | | | 0.10 | | | | (0.02 | ) | | | 0.21 | |
Lease Related Activity (PSEG Energy Holdings) | | | — | | | | 0.01 | | | | 0.07 | | | | (0.34 | ) |
Storm O&M (PSEG Power) | | | (0.03 | ) | | | — | | | | (0.08 | ) | | | — | |
Gain on Sale of Qwest Building (PSEG Energy Holdings) | | | — | | | | — | | | | — | | | | 0.06 | |
| | | | | | | | | | | | | | | | |
| | | | |
Total Pro-forma adjustments | | $ | (0.22 | ) | | $ | 0.12 | | | $ | 0.07 | | | $ | 0.03 | |
| | | | | | | | | | | | | | | | |
| (a) | Includes the financial impact from positions with forward delivery months. |