 Forward Looking Statement EXHIBIT 99 Certain of the matters discussed in this communication about us and our subsidiaries future performance, including, without limitation, future revenues, earnings, strategies, prospects, consequences and all other statements that are not purely historical constitute “forward-looking statements” within the meaning of the Private Securities Litigation Reform Act of 1995. Such forward-looking statements are subject to risks and uncertainties, which could cause actual results to differ materially from those anticipated. Such statements are based on management's beliefs as well as assumptions made by and information currently available to management. When used herein, the words “anticipate,” “intend,” “estimate,” “believe,” “expect,” “plan,” “should,” “hypothetical,” “potential,” “forecast,” “project,” variations of such words and similar expressions are intended to identify forward-looking statements. Factors that may cause actual results to differ are often presented with the forward-looking statements themselves. Other factors that could cause actual results to differ materially from those contemplated in any forward looking statements made by us herein are discussed in filings we make with the United States Securities and Exchange Commission (SEC), including our Annual Report on Form 10-K and subsequent reports on Form 10-Q and Form 8-K and available on our website: http://www.pseg.com. These factors include, but are not limited to: • adverse changes in the demand for or the price of the capacity and energy that we sell into wholesale electricity markets, • adverse changes in energy industry law, policies and regulation, including market structures and a potential shift away from competitive markets toward subsidized market mechanisms, transmission planning and cost allocation rules, including rules regarding how transmission is planned and who is permitted to build transmission in the future, and reliability standards, • any inability of our transmission and distribution businesses to obtain adequate and timely rate relief and regulatory approvals from federal and state regulators, • changes in federal and state environmental regulations that could increase our costs or limit our operations, • changes in nuclear regulation and/or general developments in the nuclear power industry, including various impacts from any accidents or incidents experienced at our facilities or by others in the industry, that could limit operations of our nuclear generating units, • actions or activities at one of our nuclear units located on a multi-unit site that might adversely affect our ability to continue to operate that unit or other units located at the same site, • any inability to balance our energy obligations, available supply and risks, • any deterioration in our credit quality or the credit quality of our counterparties, including in our leveraged leases, • availability of capital and credit at commercially reasonable terms and conditions and our ability to meet cash needs, • changes in the cost of, or interruption in the supply of, fuel and other commodities necessary to the operation of our generating units, • delays in receipt of necessary permits and approvals for our construction and development activities, • delays or unforeseen cost escalations in our construction and development activities, • any inability to achieve, or continue to sustain, our expected levels of operating performance, • any equipment failures, accidents, severe weather events or other incidents that impact our ability to provide safe and reliable service to our customers, and any inability to obtain sufficient coverage or recover proceeds of insurance on such matters, • increases in competition in energy supply markets as well as competition from certain rate-based transmission projects, • any inability to realize anticipated tax benefits or retain tax credits, • challenges associated with recruitment and/or retention of a qualified workforce, • adverse performance of our decommissioning and defined benefit plan trust fund investments and changes in funding requirements, and • changes in technology, such as distributed generation and microgrids, and resultant changes in customer usage patterns, including energy efficiency and demand response. All of the forward-looking statements made in this report are qualified by these cautionary statements and we cannot assure you that the results or developments anticipated by management will be realized or even if realized, will have the expected consequences to, or effects on, us or our business prospects, financial condition or results of operations. Readers are cautioned not to place undue reliance on these forward-looking statements in making any investment decision. Forward-looking statements made in this report apply only as of the date of this report. While we may elect to update forward-looking statements from time to time, we specifically disclaim any obligation to do so, even if internal estimates change, unless otherwise required by applicable securities laws. The forward-looking statements contained in this report are intended to qualify for the safe harbor provisions of Section 27A of the Securities Act of 1933, as amended, and Section 21E of the Securities Exchange Act of 1934, as amended. 3 |
 GAAP Disclaimer PSEG presents Operating Earnings in addition to its Income from Continuing Operations/Net Income reported in accordance with accounting principles generally accepted in the United States (GAAP). Operating Earnings is a non- GAAP financial measure that differs from Net Income because it excludes gains or losses associated with Nuclear Decommissioning Trust (NDT), Mark-to-Market (MTM) accounting, and other material one-time items. PSEG presents Operating Earnings because management believes that it is appropriate for investors to consider results excluding these items in addition to the results reported in accordance with GAAP. PSEG believes that the non-GAAP financial measure of Operating Earnings provides a consistent and comparable measure of performance of its businesses to help shareholders understand performance trends. This information is not intended to be viewed as an alternative to GAAP information. Slides A and B at the end of this presentation include a list of items excluded from Income from Continuing Operations/Net Income to reconcile to Operating Earnings, with a reference to that slide included on each of the slides where the non-GAAP information appears. 4 |
 13 74 local NJ towns and 8 counties support • 74 municipalities and eight counties (Bergen, Essex, Hudson, Mercer, Passaic, Somerset, Union and Middlesex) have approved resolutions in support of Energy Strong, PSE&G’s infrastructure proposal to improve and fortify its electric and gas distribution systems • PSE&G is seeking BPU approval to implement the first five years of the Energy Strong proposal, an investment of $2.6 Billion • The Energy Strong proposal is currently being evaluated by the NJ Board of Public Utilities |
 17 PSEG Year to Date 2013 - Highlights Operating Earnings of $2.09 vs. $2.03 per share for YTD 2012 Delivered solid results in Q3 driven by Power’s locational value, and PSE&G’s continuing investment in transmission Raised 2013 full–year, operating earnings guidance from $2.25 - $2.50 to $2.40 - $2.55, per share Executing on operational goals Power met summer demand using diverse fleet Continued control of O&M supports full-year expectations Executing on capital program Transmission program of $3.4 billion, including construction of 5 major transmission projects, continues on schedule and on budget Review of Energy Strong proposal underway by NJBPU 74 NJ municipalities and 8 county governments have passed resolutions in support of the Energy Strong infrastructure proposal Market developments US District Courts in NJ and MD rendered decisions supportive of competitive markets and FERC’s rate-setting authority New LIPA agreement will broaden and extend original agreement when fully executed |
 Strength in YTD operating earnings supports increase in 2013 *SEE SLIDE A FOR ITEMS EXCLUDED FROM INCOME FROM CONTINUING OPERATIONS/NET INCOME TO RECONCILE TO OPERATING EARNINGS. Based on our performance year-to-date, we have raised guidance for full year operating earnings from $2.25-$2.50 to $2.40-$2.55 per share 18 PSEG Operating Earnings $ Millions (except EPS) PSEG Power PSE&G PSEG Energy Holdings/Parent Operating Earnings* 2013E $630 - $685 $585 - $600 $0 - $10 $1,215 - $1,295 2013 Earnings Guidance $2.40 - $2.55 operating earnings guidance E=ESTIMATE |
 PSE&G’s 2013 operating earnings benefiting from transmission growth and cost containment initiatives *SEE SLIDE A FOR ITEMS EXCLUDED FROM INCOME FROM CONTINUING OPERATIONS/NET INCOME TO RECONCILE TO OPERATING EARNINGS. 45 $528 2012 2013 Guidance PSE&G Operating Earnings* ($ Millions) $585 - $600E E=ESTIMATE |
 Investing in Power to expand CCGT capacity and improve efficiency PSEG Power - CCGT Uprate Project o Over 2014–2018, retrofit Bergen, Linden and BEC (GE CCGTs) with Advanced Gas Path (AGP) components o Expand Power’s CCGT fleet, one of the largest gas-fired portfolios in PJM, with incremental base and peaking MWs o Potential project investment of ~$120 million over the 5-year period AGP Project Benefits MWs: Base MW’s increase by 3.5% (112MW) with an additional 40 MWs of peak-firing capability (CC) heat rate improvement ~ 1.2% and upgrades technology 61 Expands CCGT capacity by over 150 Increases Efficiency - Combined Cycle Extends maintenance outage cycles |
 2012 2013 Guidance Power’s 2013 operating earnings benefiting from locational value and operational efficiency *SEE SLIDE A FOR ITEMS EXCLUDED FROM INCOME FROM CONTINUING OPERATIONS/NET INCOME TO RECONCILE TO OPERATING EARNINGS. PSEG Power Operating Earnings* ($ Millions) 65 $630 - $685E $644 E=ESTIMATE |
 Storage 0.7 bcf/d Tetco Gulf 0.2 bcf/d Transco Gulf 0.4 bcf/d Tetco M2 0.2 bcf/d Transco Leidy 0.5 bcf/d Tennessee 0.1 bcf/d PSEG’s locational advantage • PSEG is well positioned to realize supply cost advantages from the shale deposits in PA and OH • The majority of Power’s pipeline capacity goes through the shale regions or emanates from locations in the region • The lowest cost supplies have come from the Tennessee 300 line in northeast PA and the Transco Leidy line in central PA • Power also has significant Texas Eastern capacity in southwest PA, the next region to develop • Availability of a robust gas portfolio of storage and pipeline capacity primarily benefits PSE&G’s gas customers and then Power, as conditions permit • Power buys approximately 350BCF/year of gas PSEG Pipeline and Storage Capacity 75 Total Capacity 2.2 bcf/d |
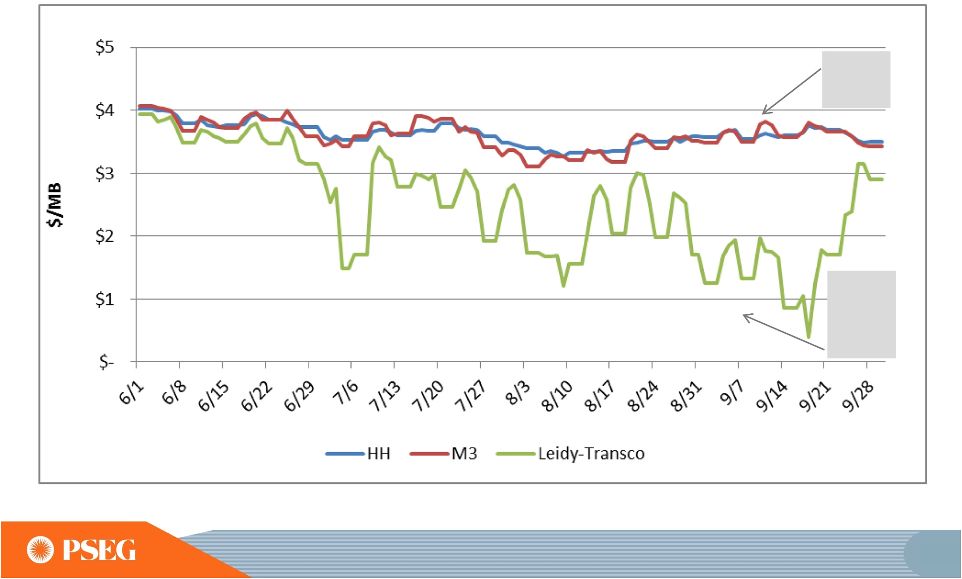 HH - Henry Hub M3 – Texas Eastern (TETCO) Access to lower cost shale supply an advantage for PSE&G’s gas customers and Power’s CCGT portfolio Spot Natural Gas Prices: Jun – Sep 2013 Access to Lower Cost Shale Gas in Marcellus and Utica Market Prices for Natural Gas 76 |
 PSEG Summary • Raised 2013 full-year operating earnings guidance to $2.40 - $2.55 per share – based on financial results year-to-date • Double digit operating earnings growth at PSE&G starting in 2013, and continuing through 2015 driven by transmission investments and approved programs • Power’s continued focus on operational excellence, market expertise and financial strength reduces risk in low price environment • Strong Balance Sheet and Cash Flow support full capital program without the need for equity • Long history of returning cash to the shareholder through the common dividend, with opportunity for future growth 98 |
 • Current market data indicates Leidy gas basis remains negative to Henry Hub into 2016 but market is illiquid the further out you go 111 Leidy Basis 2014 Leidy Basis 2015 Leidy Basis 2016 -1.6 -1.4 -1.2 -1 -0.8 -0.6 -0.4 -0.2 0 Leidy Gas Basis to Henry Hub |
 Items Excluded from Income from Continuing Operations/Net Income to Reconcile to Operating Earnings A PLEASE SEE PAGE 4 FOR AN EXPLANATION OF PSEG’S USE OF OPERATING EARNINGS AS A NON-GAAP FINANCIAL MEASURE AND HOW IT DIFFERS FROM INCOME FROM CONTINUING OPERATIONS/NET INCOME. 2012 2011 2010 2009 2008 Earnings Impact ($ Millions) Operating Earnings 1,236 $ 1,389 $ 1,584 $ 1,567 $ 1,478 $ Gain (Loss) on Nuclear Decommissioning Trust (NDT) Fund Related Activity (PSEG Power) 52 50 46 9 (71) Gain (Loss) on Mark-to-Market (MTM) (a) (PSEG Power) (10) 107 (1) (11) 14 Lease Transaction Activity (Energy Holdings) 36 (173) - 29 (490) Storm O&M (PSEG Power) (39) - - - - Market Transition Charge Refund (PSE&G) - - (72) - - Gain (Loss) on Asset Sales and Impairments (Energy Holdings) - 34 - - (13) Income from Continuing Operations 1,275 $ 1,407 $ 1,557 $ 1,594 $ 918 $ Discontinued Operations - 96 7 (2) 270 Net Income 1,503 $ 1,564 $ 1,592 $ 1,188 $ Fully Diluted Average Shares Outstanding (in Millions) 507 507 507 507 508 Per Share Impact (Diluted) Operating Earnings 2.44 $ 2.74 $ 3.12 $ 3.09 $ 2.91 $ Gain (Loss) on NDT Fund Related Activity (PSEG Power) 0.10 0.10 0.09 0.02 (0.14) Gain (Loss) on MTM (a) (PSEG Power) (0.02) 0.21 - (0.02) 0.03 Lease Transaction Activity (Energy Holdings) 0.07 (0.34) - 0.05 (0.96) Storm O&M (PSEG Power) (0.08) - - - - Market Transition Charge Refund (PSE&G) - - (0.14) - - Gain (Loss) on Asset Sales and Impairments (Energy Holdings) - 0.06 - - (0.03) Income from Continuing Operations 2.51 $ 2.77 $ 3.07 $ 3.14 $ 1.81 $ Discontinued Operations - 0.19 0.01 - 0.53 Net Income 2.51 $ 2.96 $ 3.08 $ 3.14 $ 2.34 $ (a) Includes the financial impact from positions with forward delivery months. (Unaudited) For the Year Ended December 31, PUBLIC SERVICE ENTERPRISE GROUP INCORPORATED Reconciling Items, net of tax 1,275 $ |
 Items Excluded from Income from Continuing Operations/Net Income to Reconcile to Operating Earnings B 2013 2012 2013 2012 Earnings Impact ($ Millions) Operating Earnings 385 $ 382 $ 1,061 $ 1,029 $ Gain (Loss) on Nuclear Decommissioning Trust (NDT) Fund Related Activity (PSEG Power) 12 40 29 49 Gain (Loss) on Mark-to-Market (MTM) (a) (PSEG Power) 3 (76) (22) (34) Lease Related Activity (PSEG Energy Holdings) - 1 - 7 Storm O&M, net of insurance recoveries (PSEG Power) (10) - (25) - Income from Continuing Operations 390 $ 347 $ 1,043 $ 1,051 $ Net Income 390 $ 347 $ 1,043 $ 1,051 $ Fully Diluted Average Shares Outstanding (in Millions) 508 507 507 507 Per Share Impact (Diluted) Operating Earnings 0.76 $ 0.75 $ 2.09 $ 2.03 $ Gain (Loss) on NDT Fund Related Activity (PSEG Power) 0.02 0.08 0.06 0.10 Gain (Loss) on MTM (a) (PSEG Power) 0.01 (0.15) (0.04) (0.07) Lease Related Activity (PSEG Energy Holdings) - - - 0.01 Storm O&M, net of insurance recoveries (PSEG Power) (0.02) - (0.05) - Income from Continuing Operations 0.77 $ 0.68 $ �� 2.06 $ 2.07 $ Net Income 0.77 $ 0.68 $ 2.06 $ 2.07 $ (a) Includes the financial impact from positions with forward delivery months. Three Months Ended Nine Months Ended PUBLIC SERVICE ENTERPRISE GROUP INCORPORATED (Unaudited) September 30, September 30, Reconciling Items, net of tax PLEASE SEE PAGE 4 FOR AN EXPLANATION OF PSEG’S USE OF OPERATING EARNINGS AS A NON-GAAP FINANCIAL MEASURE AND HOW IT DIFFERS FROM INCOME FROM CONTINUING OPERATIONS/NET INCOME. |