 We have the energy to make things better … for you, for our investors and for our stakeholders. Exhibit 99 |
 Forward-Looking Statement Certain of the matters discussed in this report about our and our subsidiaries' future performance, including, without limitation, future revenues, earnings, strategies, prospects, consequences and all other statements that are not purely historical constitute “forward-looking statements” within the meaning of the Private Securities Litigation Reform Act of 1995. Such forward-looking statements are subject to risks and uncertainties, which could cause actual results to differ materially from those anticipated. Such statements are based on management's beliefs as well as assumptions made by and information currently available to management. When used herein, the words “anticipate,” “intend,” “estimate,” “believe,” “expect,” “plan,” “should,” “hypothetical,” “potential,” “forecast,” “project,” variations of such words and similar expressions are intended to identify forward-looking statements. Factors that may cause actual results to differ are often presented with the forward-looking statements themselves. Other factors that could cause actual results to differ materially from those contemplated in any forward-looking statements made by us herein are discussed in filings we make with the United States Securities and Exchange Commission (SEC), including our Annual Report on Form 10-K and subsequent reports on Form 10- Q and Form 8-K and available on our website: http://www.pseg.com. These factors include, but are not limited to: • adverse changes in the demand for or the price of the capacity and energy that we sell into wholesale electricity markets, • adverse changes in energy industry law, policies and regulation, including market structures and a potential shift away from competitive markets toward subsidized market mechanisms, capacity market design, transmission planning and cost allocation rules, including how transmission projects are planned and who is permitted to build transmission in the future, and reliability standards, • any inability of our transmission and distribution businesses to obtain adequate and timely rate relief and regulatory approvals from federal and state regulators, • changes in federal and state environmental regulations and enforcement that could increase our costs or limit our operations, • changes in nuclear regulation and/or general developments in the nuclear power industry, including various impacts from any accidents or incidents experienced at our facilities or by others in the industry, that could limit operations of our nuclear generating units, • actions or activities at one of our nuclear units located on a multi-unit site that might adversely affect our ability to continue to operate that unit or other units located at the same site, • any inability to manage our energy obligations, available supply and risks, • adverse outcomes of any legal, regulatory or other proceeding, settlement, investigation or claim applicable to us and/or the energy industry, • any deterioration in our credit quality or the credit quality of our counterparties, • availability of capital and credit at commercially reasonable terms and conditions and our ability to meet cash needs, • changes in the cost of, or interruption in the supply of, fuel and other commodities necessary to the operation of our generating units, • delays in receipt of necessary permits and approvals for our construction and development activities, • delays or unforeseen cost escalations in our construction and development activities, • any inability to achieve, or continue to sustain, our expected levels of operating performance, • any equipment failures, accidents, severe weather events or other incidents that impact our ability to provide safe and reliable service to our customers, and any inability to obtain sufficient insurance coverage or recover proceeds of insurance with respect to such events, • acts of terrorism, cybersecurity attacks or intrusions that could adversely impact our businesses, • increases in competition in energy supply markets as well as competition for certain transmission projects, • any inability to realize anticipated tax benefits or retain tax credits, • challenges associated with recruitment and/or retention of a qualified workforce, • adverse performance of our decommissioning and defined benefit plan trust fund investments and changes in funding requirements, • changes in technology, such as distributed generation and micro grids, and greater reliance on these technologies, and • changes in customer behaviors, including increases in energy efficiency, net-metering and demand response. All of the forward-looking statements made in this report are qualified by these cautionary statements and we cannot assure you that the results or developments anticipated by management will be realized or even if realized, will have the expected consequences to, or effects on, us or our business prospects, financial condition or results of operations. Readers are cautioned not to place undue reliance on these forward-looking statements in making any investment decision. Forward-looking statements made in this report apply only as of the date of this report. While we may elect to update forward-looking statements from time to time, we specifically disclaim any obligation to do so, even if internal estimates change, unless otherwise required by applicable securities laws. The forward-looking statements contained in this report are intended to qualify for the safe harbor provisions of Section 27A of the Securities Act of 1933, as amended, and Section 21E of the Securities Exchange Act of 1934, as amended. 2 |
 3 GAAP Disclaimer These materials and other financial releases can be found on the pseg.com website under the investor tab, or at http://investor.pseg.com/ PSEG presents Operating Earnings in addition to its Net Income reported in accordance with accounting principles generally accepted in the United States (GAAP). Operating Earnings is a non-GAAP financial measure that differs from Net Income because it excludes gains or losses associated with Nuclear Decommissioning Trust (NDT), Mark-to-Market (MTM) accounting, and other material one-time items. PSEG presents Operating Earnings because management believes that it is appropriate for investors to consider results excluding these items in addition to the results reported in accordance with GAAP. PSEG believes that the non-GAAP financial measure of Operating Earnings provides a consistent and comparable measure of performance of its businesses to help shareholders understand performance trends. This information is not intended to be viewed as an alternative to GAAP information. The last slides in this presentation include a list of items excluded from Net Income to reconcile to Operating Earnings, with a reference to those slides included on each of the slides where the non-GAAP information appears. |
 PSEG OVERVIEW VICE PRESIDENT INVESTOR RELATIONS Kathleen Lally EXECUTIVE VICE PRESIDENT AND CHIEF FINANCIAL OFFICER Caroline Dorsa CHAIRMAN, PRESIDENT AND CHIEF EXECUTIVE OFFICER Ralph Izzo |
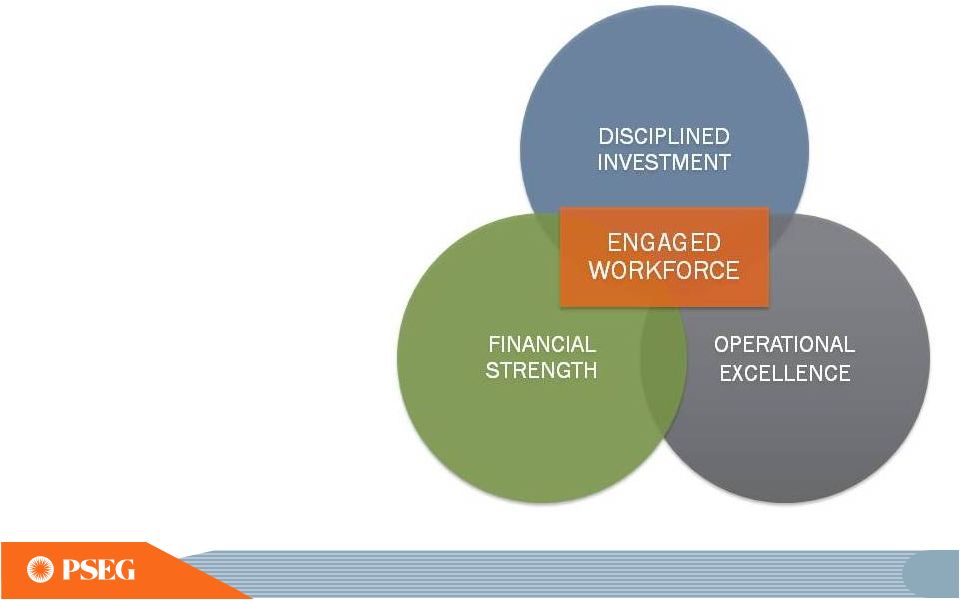 5 PSEG’s Strategy – delivering results Our businesses’ focus on cost- effective, reliable operations yields strong cash flow We are funding growth-oriented investments aligned with customer needs and state energy policies We are enhancing the competitiveness of our environmentally well-positioned generation business The results of our financial strategy support a credit profile capable of meeting our corporate objectives and providing sustained dividend growth for our shareholders |
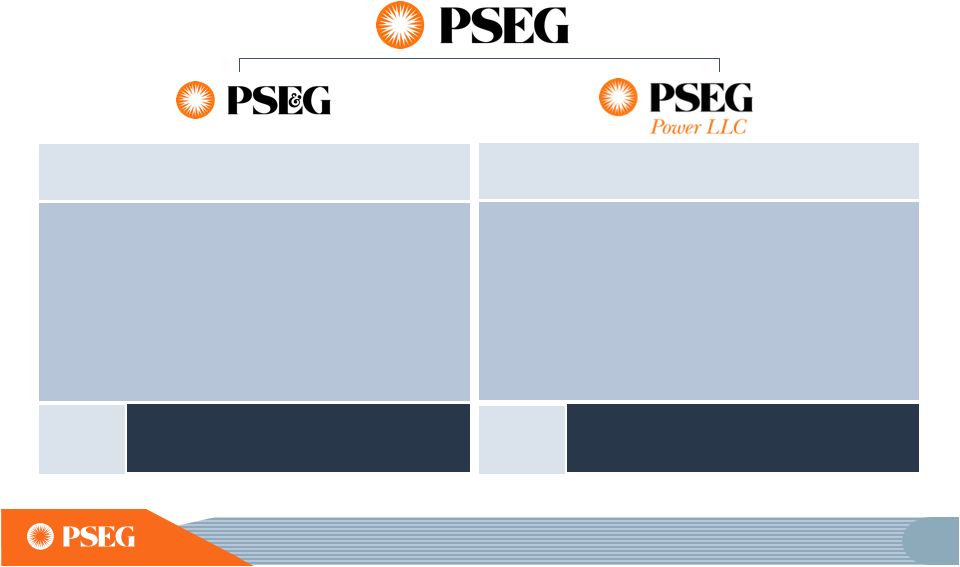 6 Two complementary businesses Strong asset platform, performing well and positioned for the future ASSETS AND OPERATING EARNINGS ARE FOR THE YEAR ENDED 12/31/2013. PSE&G AND POWER DO NOT ADD TO TOTAL DUE TO PARENT, PSEG LONG ISLAND AND ENERGY HOLDINGS ACTIVITY. SEE SLIDE A FOR ITEMS EXCLUDED FROM INCOME FROM CONTINUING OPERATIONS/NET INCOME TO RECONCILE TO OPERATING EARNINGS. . Strategy: Fuel diverse fleet is geographically and environmentally well positioned, with investments to enhance competitiveness Value Proposition: Provides substantial free cash flow in current environment and poised for price recovery Assets $12B Operating Earnings $710M Regional Competitive Generation Strategy: Positioned to meet customers’ needs as we respond to state and federal energy policy and economic growth objectives Value Proposition: An $11.3 billion infrastructure program – focused on transmission – that is expected to produce double-digit rate base growth through 2016 Assets $20B Operating Earnings $612M Electric & Gas Delivery and Transmission 2013 2013 |
 7 Delivering on commitments and pursuing opportunities for growth Operational Excellence • Power: Record 2013 output at Linden CCGT and Salem 2; nuclear capacity factor greater than 90% for 9 straight year • PSE&G: Mid-Atlantic Reliability Award (12 consecutive year) • PSEG Long Island: Went “live” on January 1, 2014 • PSEG: Cost-control benefits continue Financial Strength • Strong cash flows supported credit rating increases • Pension fully funded • Dividend increased Disciplined Investment • PSE&G Transmission capital program execution and growth Energy Strong infrastructure program underway Solar 4 All Extension and Solar Loan III programs • Power: Investments to enhance the fleet’s competitiveness – 130 MW Nuclear uprate, 150 MW CCGT uprate and efficiency improvement th th |
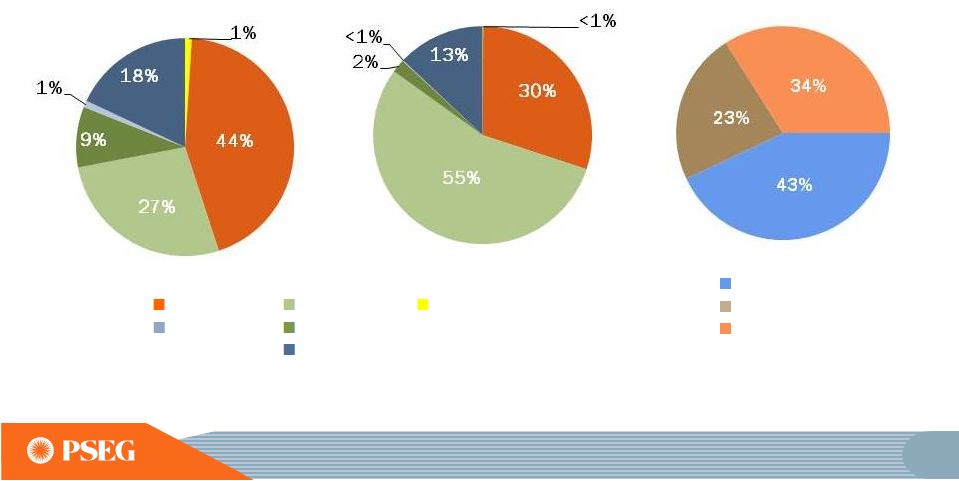
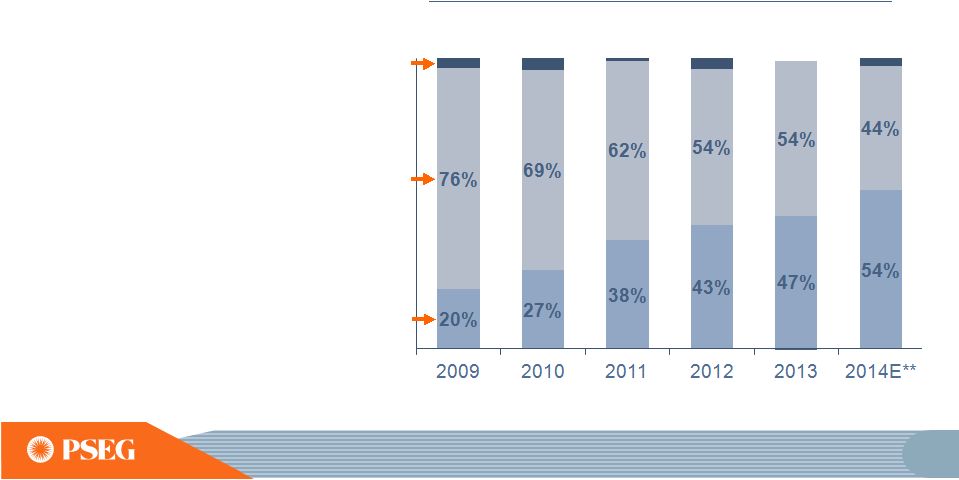 8 Operating Earnings Mix Long term investment program has driven increased earnings contribution from stable, regulated business *SEE SLIDE A FOR ITEMS EXCLUDED FROM INCOME FROM CONTINUING OPERATIONS/ NET INCOME TO RECONCILE TO OPERATING EARNINGS; DISCONTINUED OPERATIONS REFLECT TEXAS. E=ESTIMATE ** 2014 PERCENTS USE MIDPOINT OF EARNINGS GUIDANCE. Power’s diverse fuel mix and dispatch flexibility continues to generate earnings and free cash flow PSE&G’s investment in transmission has diversified its asset base and, coupled with other investments and cost controls, supported compound annual earnings growth of ~18% over 2009 – 2013 Operating Earnings* Contribution by Subsidiary (%) PSE&G Power Other $2.44 $2.58 $2.60 - $2.75E $3.12 $2.74 $3.09 |
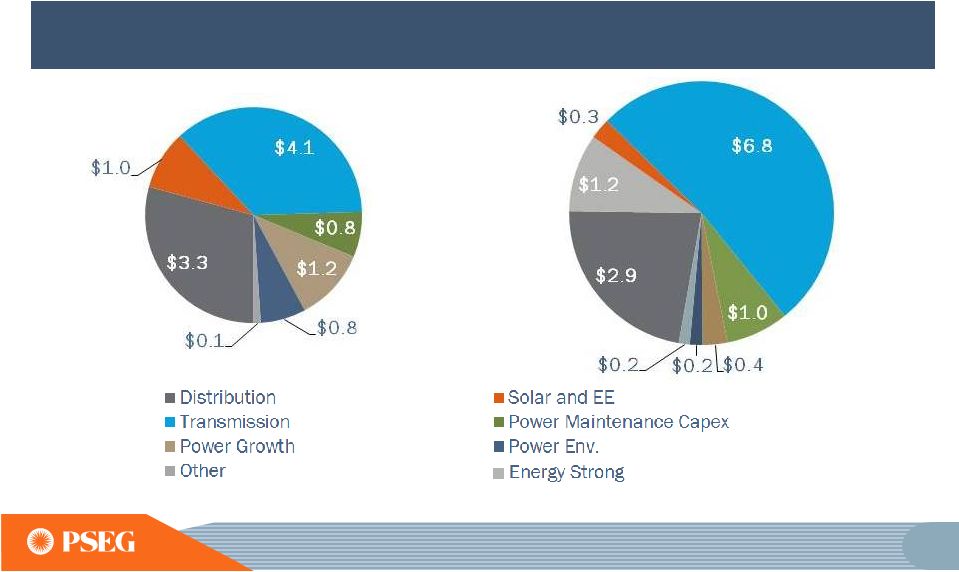 9 Maintaining a robust capital program focused on growth PSEG 2014 - 2018E Capital Spending $13.1 Billion PSEG 2009 - 2013 Capital Spending $11.3 Billion NOTE: POWER 2009–2013 ACTUALS ARE RESTATED TO INCLUDE SOLAR CAPITAL SPEND. POWER CAPITAL SPENDING EXCLUDES NUCLEAR FUEL. E=ESTIMATE. DATA AS OF MARCH 31, 2014. Power $1.6B PSE&G $11.3B Power $2.8B PSE&G $8.4B |
 10 PSEG’s business profile has been transformed through significant growth in utility capital spending, and we have consistently identified attractive opportunities for additional investment 3 YEAR AVERAGE PSE&G CAPITAL SPENDING GREW AT A RATE OF 23% PER YEAR FROM 2008 - 2013 AVERAGE PSE&G CAPITAL SPENDING FOR THE 3-YEAR PERIOD ENDING IN BASE YEAR. PSE&G TOTAL CAPITAL SPENDING IN BASE YEAR. |
 11 • Energy Strong Agreement reached with all parties Agreement recognizes the benefits of system investments that prevent or shorten outages Supports $1.22 billion capital program over several years on reasonable terms: $1 billion recovered through accelerated, rate recovery mechanism - $820 million Electric - $400 million Gas Allows PSE&G to earn a 9.75% ROE on the $1 billion recovered on accelerated basis Requires PSE&G to file a base rate case by November 2017 Approved by the NJBPU in May 2014 • Over 100 New Jersey municipalities supported Energy Strong • Energy Strong agreement clears path for PSE&G to begin the initial phase of this robust capital program Energy Strong Agreement recognizes benefits of system investments |
 12 PSEG Power – Value-advantaged through asset diversity, fuel flexibility, location and installed environmental controls 2013 PERIOD * INCLUDES NEW JERSEY COAL UNITS THAT FUEL SWITCH TO GAS. Fuel Diversity Total MW: 13,450 Energy Produced Total GWh: 54,264 Energy Market Served Total MW: 13,450 Load Following Peaking Base load Gas Pumped Storage Nuclear Oil Coal* Solar |
 13 PSEG – Year to Date 2014 Highlights Operating Earnings YTD up 9% to $2.27 per share from $2.09 for YTD 2013 PSE&G on track to record double-digit growth in earnings on expanded capital investment program PSEG Power expected to earn at upper level of expectations for the full year Narrowed 2014 full–year, operating earnings guidance to $2.60-$2.75 per share, from $2.55-$2.75 per share prior Executing on our capital program Replacement of PSE&G’s gas cast-iron pipe underway as part of $1.22 billion Energy Strong capital program Major transmission projects under $6.8 billion capital program are on-time and on-budget Market developments PJM proposed changes to its Reliability Price Mechanism, Demand Curve Adjustment |
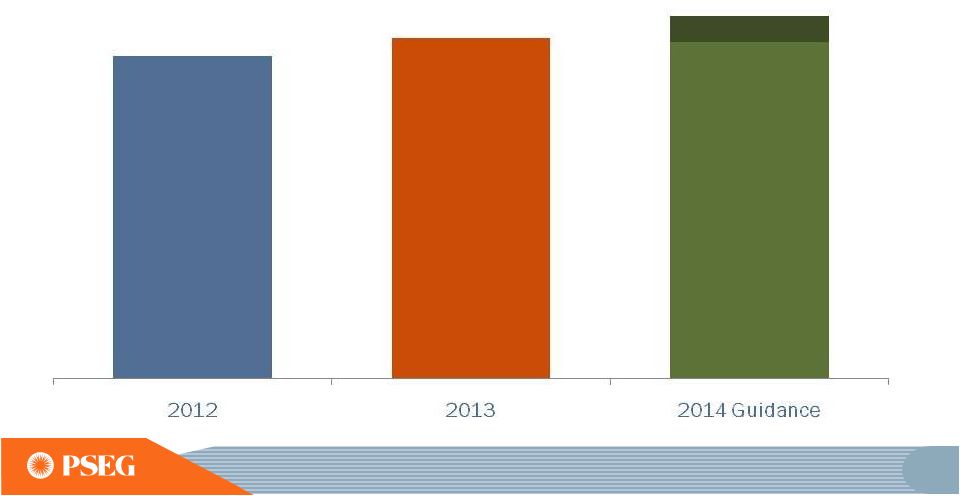 14 SEE SLIDE A FOR ITEMS EXCLUDED FROM INCOME FROM CONTINUING OPERATIONS/NET INCOME TO RECONCILE TO OPERATING EARNINGS. E = ESTIMATE. $2.44 $2.58 $2.60 - $2.75E 2014 operating earnings guidance narrowed; forecast full-year at upper end of range, assuming normal weather and unit operations for rest of year PSEG – 2014 Another Year of Growth |
 15 Balance Sheet Strength 2009 – 2013: Reduced risk profile and transformed business mix • Invested $8.4 billion in PSE&G • Improved credit ratings • Monetized and de-risked Holdings’ portfolio 2014 – Forward: Strong cash flows and increasingly regulated business mix fully support: • PSE&G’s $11.3 billion approved investment program through 2018 • Opportunity for consistent and sustainable dividend growth • Additional investment capacity to deploy in opportunities beyond those in the current capital plan • No need to issue equity |
 16 Investment opportunities exceeding $1 billion Focused on providing our customers with access to low-cost gas and cost-effective technologies that reduce emissions as they also improve system reliability Potential Investment Description Amount ($ Millions) Bridgeport Harbor Station New 450 MW CCGT Unit $500 -- $700 PSEG -- Long Island Utility 2.0 Energy Efficiency Filing $200 -- $345 Artificial Island FERC 1000 Project* $250 -- $300 PennEast Pipeline Equity Interest $100 -- $120 PSE&G Energy Efficiency Program Extension $100 -- $100 Total $1,150-$1,565 *Artificial Island Project includes amount for related compensator which has been assigned to PSE&G. INFORMATION AS OF NOVEMBER 11, 2014. |
 17 PSEG Annual Dividend – A long history of growth and returning cash to shareholders with a financial position that provides opportunity for consistent and sustained growth Payout Ratio 70% 63% 66% 43% 44% 43% 44% 50% 58% 56% 55%* PSEG Annual Dividend Rate *2014E PAYOUT RATIO REFLECTS THE MIDPOINT OF OPERATING EARNINGS GUIDANCE. E=ESTIMATE 10-YEAR COMPOUND ANNUAL RATE OF GROWTH 3.0% |
 18 Value Proposition PSEG is positioned to expand its investment in PSE&G projects that provide reasonable, risk-adjusted returns, in ways that meet customer needs and state goals, given strong cash flow of Power and growing cash contribution from PSE&G. PSEG will maintain a strong financial profile that provides the opportunity to achieve our growth objectives and maintains our track record of returning cash to shareholders. |
 PSE&G |
 20 PSE&G strategy Building a sustainable platform that balances reliability, customer rates and public policy to ensure growth at reasonable returns |
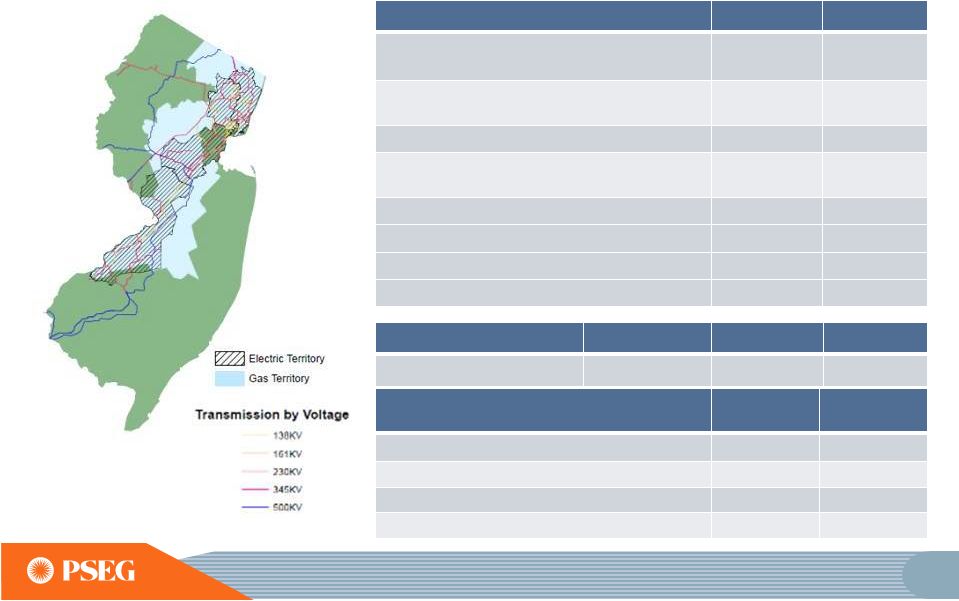 21 PSE&G is the largest electric and gas distribution and transmission utility company in New Jersey * WEATHER NORMALIZED - ESTIMATED ANNUAL GROWTH PER YEAR OVER FORECAST PERIOD. ** SPECIFIC PROJECTS APPROVED FOR INCENTIVE RATE TREATMENT WITH ADDITIONAL ROE. Electric Gas Customers Growth (2009 – 2013) 2.2 Million 0.6% 1.8 Million 0.6% Electric Sales and Gas Sold and Transported 41,286 GWh 3,813M Therms Projected Annual Load Growth (2014 – 2016) 0.6%* 0.5%* Projected Annual Load Growth Transmission (2014 – 2016) 1.1% Sales Mix Residential 33% 60% Commercial 57% 36% Industrial 10% 4% Transmission Electric Gas Approved Rate of Return 11.68% ROE** 10.3% ROE 10.3% ROE Renewables and Energy Efficiency Approved Programs 2009-2013 Total Program Plan Solar Loan Capacity 79 MW 178.5 MW Solar 4 All Capacity 79 MW 125 MW Energy Efficiency Annual Electric savings 182 GWh 204 GWh Energy Efficiency Annual Gas savings 5M Therms 6M Therms |
 22 12 time Mid-Atlantic ReliabilityOne award winner and Outstanding Response to a Major Event |
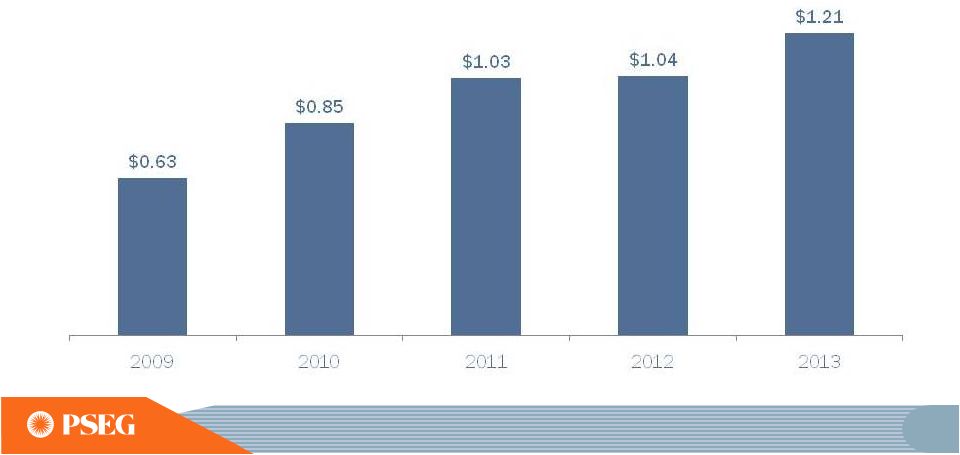 23 PSE&G’s operating earnings grew ~18% per year over the 5-year period with increased investment, cost control and supportive rate mechanisms *SEE SLIDE A FOR ITEMS EXCLUDED FROM INCOME FROM CONTINUING OPERATIONS/NET INCOME TO RECONCILE TO OPERATING EARNINGS. PSE&G Operating Earnings* Per Share |
 24 Growth in rate base is driven by investments with constructive recovery mechanisms PSE&G Rate Base PSE&G’s rate base has grown ~9% annualized with investment focused on meeting customers’ requirements |
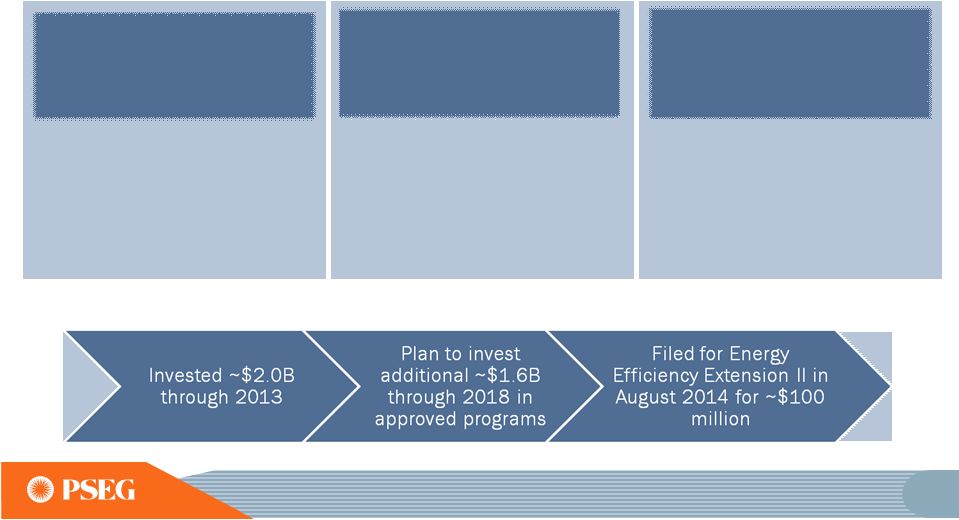 25 Successfully worked with regulators to develop multiple solutions for New Jersey’s energy and economic development goals • Solar Loan I – 2008 • Solar Loan II – 2009 • Solar 4 All – 2009 • Solar Loan III – 2013 • Solar 4 All Ext – 2013 RENEWABLES creative solutions to install solar generation: $0.7B • Carbon Abatement – 2008 • Energy Efficiency – 2009 • Demand Response – 2009 • Energy Efficiency Ext – 2011 ENERGY EFFICIENCY assisting customers with controlling energy usage: $0.3B • NJ Capital Infrastructure Program 1 (CIP 1) – 2009 • NJ Capital Infrastructure Program 2 (CIP 2) – 2011 • Energy Strong – 2014 DISTRIBUTION improving electric and gas delivery infrastructure: $1.0B NOTE: SPENDING THROUGH 2013 UNLESS INDICATED OTHERWISE |
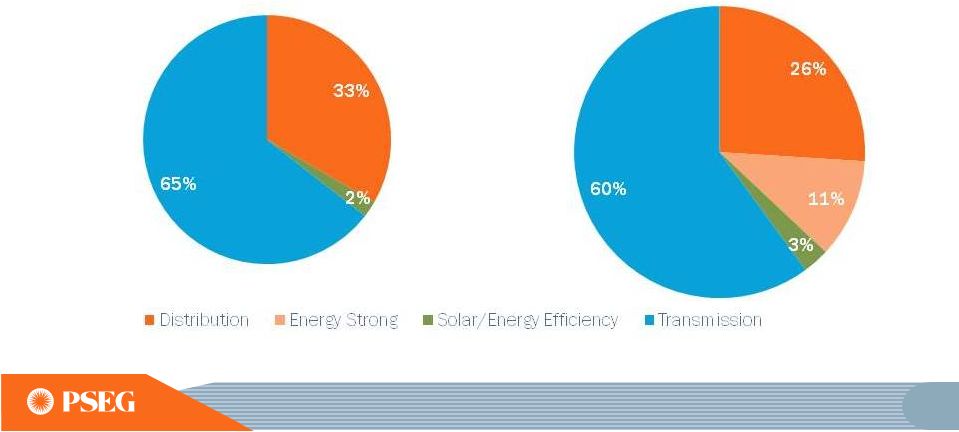 26 A 60% increase to $11.3 billion, in our 5-year investment program, including Energy Strong PSE&G’s Capital Expenditures 2013-2017E $7.0 Billion 2014-2018E $11.3 Billion E = ESTIMATE. DATA AS OF MARCH 31, 2014. |
 27 Energy Strong Agreement supports customers’ needs in the aftermath of Superstorm Sandy • Settled with NJBPU Staff and all other parties in May 2014 for $1.22 billion; approved by the NJBPU in May 2014 • Program addresses system resiliency and hardening by: $620 million to raise, relocate or protect 29 switching and substations that were damaged by water in recent storms $350 million to replace and modernize 250 miles of low-pressure, cast iron gas mains in or near flood areas $100 million to create redundancy in the electric system, reducing outages when damage occurs $100 million to deploy smart grid technologies to better monitor system operations to increase our ability to more swiftly deploy repair teams $50 million to protect five natural gas metering stations and a liquefied natural gas station affected by Sandy or located in flood zones |
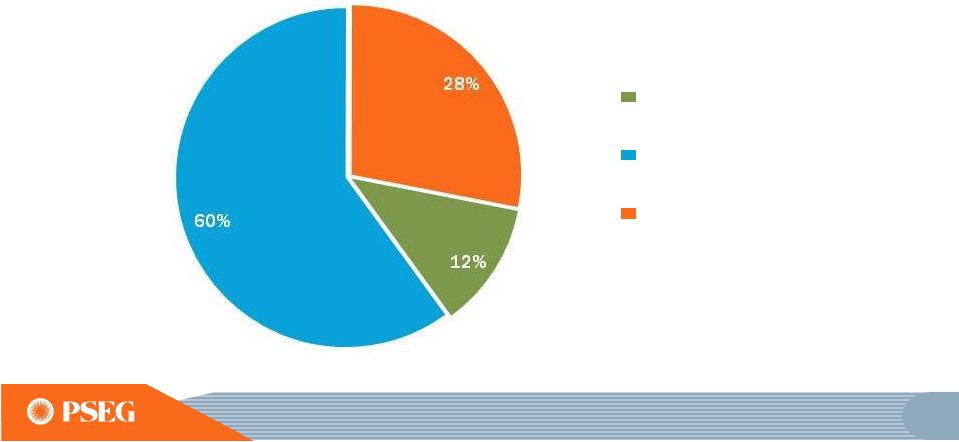 28 Over 70% of PSE&G’s $11.3 billion investment program will be recovered through contemporaneous mechanisms Clause Recovery Mechanisms Energy Strong / Solar / Energy Efficiency FERC Formula Rates Transmission Traditional Recovery Mechanisms Distribution Base Rates E = ESTIMATE. DATA AS OF MARCH 31, 2014. 2014-2018E PSE&G Capital Spending by Recovery Method $11.3 Billion |
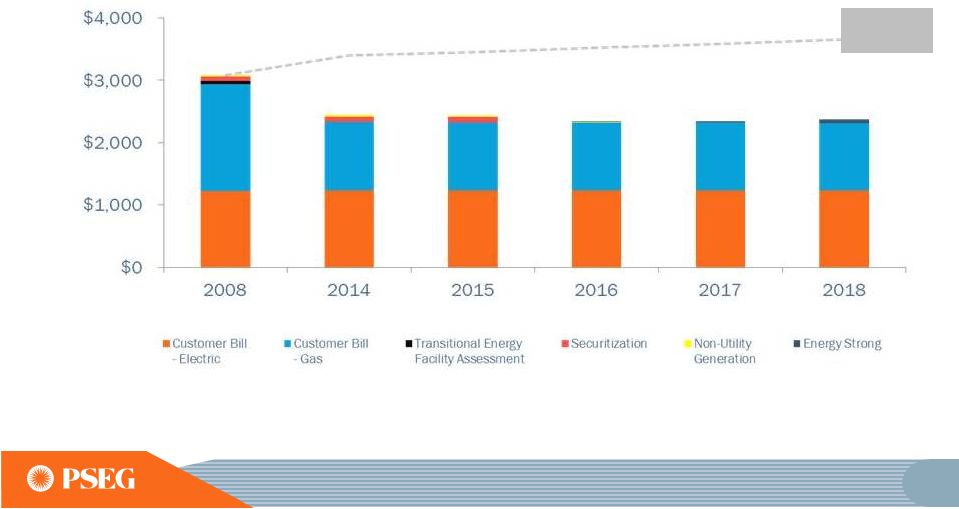 29 The Energy Strong impact to customer bills is expected to be fully offset OUT-YEAR BGS/BGSS, SBC, AND DISTRIBUTION RATES HELD CONSTANT AT CURRENT 2014 RATES. RATES RELATED TO ELECTRIC RESTRUCTURING: SECURITIZATION (STC), NON-UTILITY GENERATION CHARGE (NGC), & TRANSITIONAL ENERGY FACILITIES ASSESSMENT (TEFA), ARE REDUCED TO ZERO BY 2017. THE RGGI RECOVERY CHARGE (RRC), SOLAR PILOT RECOVERY CHARGE (SPRC), AND CAPITAL ECONOMIC STIMULUS INFRASTRUCTURE INVESTMENT PROGRAM EXTENSION (CIP II) BILL IMPACTS ARE INCLUDED IN THEIR RESPECTIVE GAS AND ELECTRIC BARS AND FORECASTED IN OUT- YEARS BASED UPON LATEST ESTIMATE. ENERGY STRONG BILL IMPACTS ARE BASED UPON SETTLEMENT. PSE&G’s Typical Average Residential Bill Consumer Price Index |
 PSE&G TRANSMISSION |
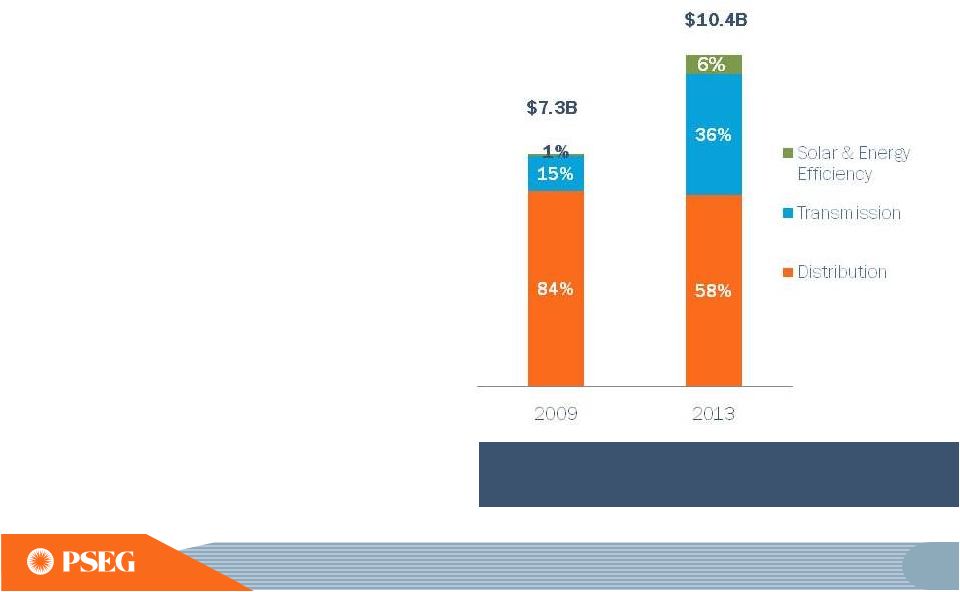
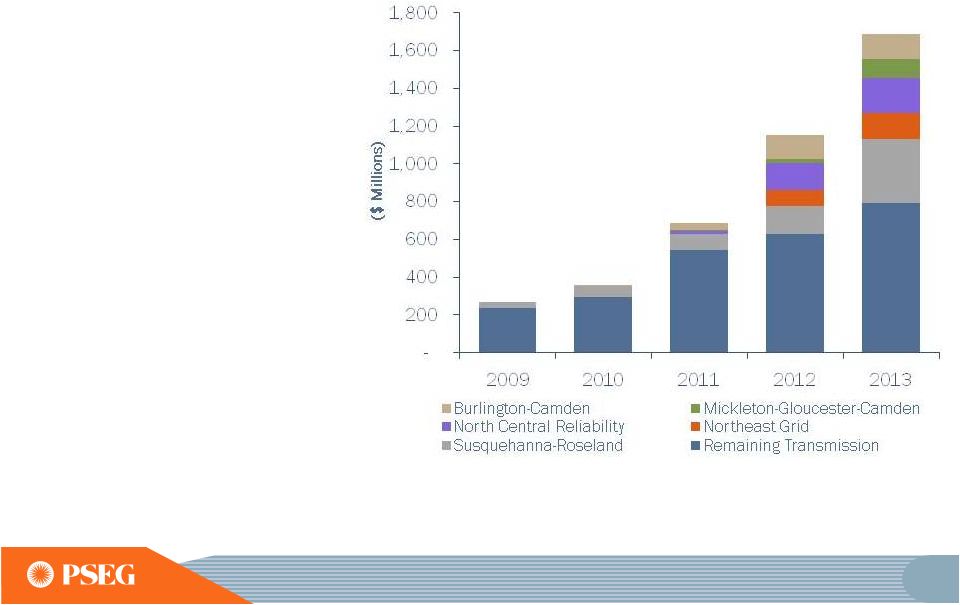  31 Transmission represented ~36% of rate base at YE 2013 up from ~15% at YE 2009 Transmission has delivered, and has grown to represent ~36% of rate base PSE&G’s Transmission Capital Expenditures |
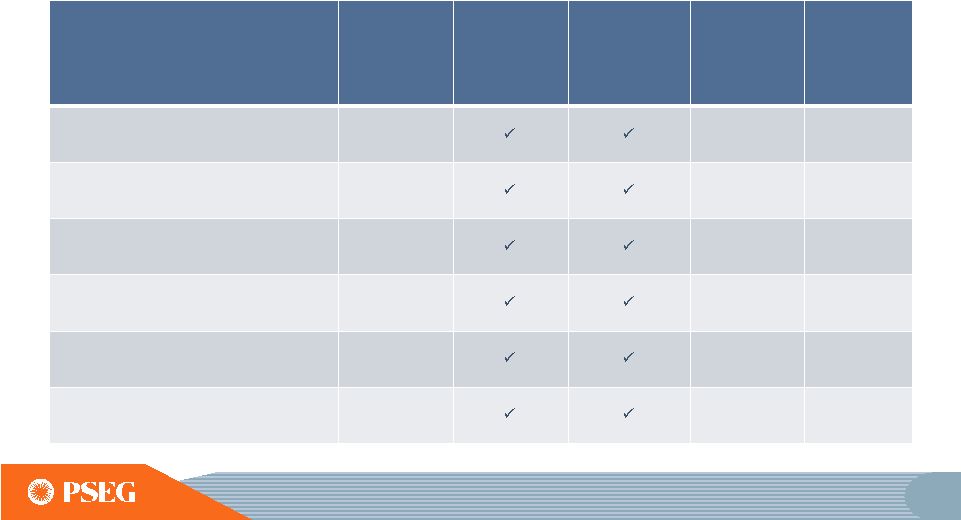 32 PSE&G’s existing major transmission investment program remains on schedule and on budget Major Transmission Projects Project Roster Approved ROE Inclusion of CWIP in Rate Base 100% Recovery of Costs Due to Abandonment Project Estimate Up To ($ Millions) Expected In-service Date Susquehanna-Roseland 12.93% $790 June 2014 / June 2015 Northeast Grid Reliability 11.93% $907 Jun-Dec 2015 North Central Reliability 11.68% $390 Completed Burlington–Camden 230kV 11.68% $399 Completed Mickleton–Gloucester–Camden 230kV 11.68% $435 June 2015 Bergen—Linden Corridor 345kV 11.68% $1,200 June 2018 |
 33 Susquehanna-Roseland consists of constructing 150 miles of 500kV circuit (46 miles in NJ) with two new 500kV GIS switching stations at Roseland and Hopatcong Project Estimate Up To* Through Year-end 2013 Expected In-service Date $790M $661M Phase 1 – Completed Phase 2 – June 2015 • PJM RTEP project b0489 • ROE of 12.93% (including 1.25% incentive) • 100% CWIP in rate base during development • 100% recovery of prudently incurred costs due to abandonment Customer Benefit: Improves reliability and reduces congestion *PROJECT IS SHARED WITH PPL. PROJECT ESTIMATE REPRESENTS PSE&G’S CONSTRUCTION RESPONSIBILITY FOR THE NJ PORTION. Project Status: The eastern part of line from Hopatcong to Roseland, NJ in service April 2014; NJ construction planned to be completed in Q3 2014. PA portion outside plant construction in progress. Western portion in NJ and the PA portion is planned to go in service June 2015. |
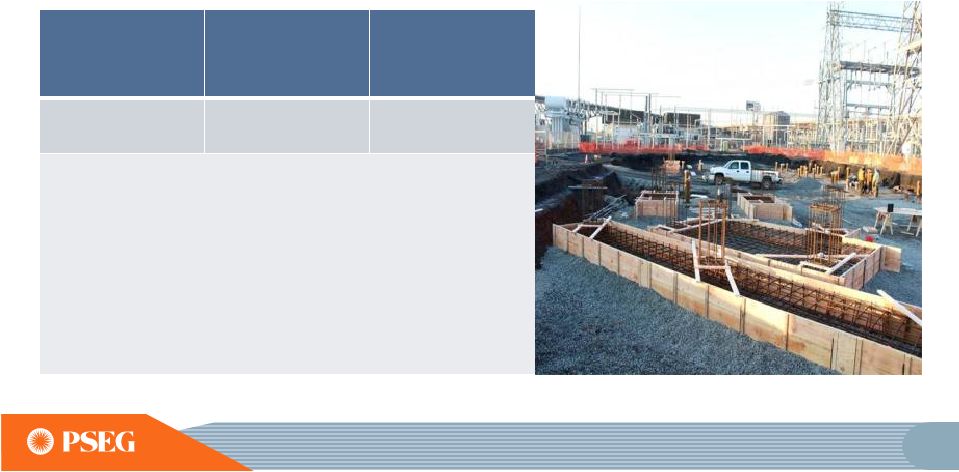 34 Northeast Grid Reliability consists of upgrading approximately 50 overhead circuit miles of 138kV transmission line to 230kV, constructing ~18 miles of new underground 230kV lines, and converting/upgrading 12 existing stations to 230kV operation Project Estimate Up To Through Year-end 2013 Expected In-service Date $907M $228M Jun - Dec 2015 • PJM RTEP project b1304 • ROE of 11.93% (including 0.25% incentive) • 100% CWIP in rate base during development • 100% recovery of prudently incurred costs due to abandonment • Project estimate has increased ~$12M associated with hardening related scope changes as a result of Superstorm Sandy Customer Benefit: Improves reliability and increases transfer capability Project Status: Nearing completion of engineering/design and licensing/permitting phase. Outside and inside plant construction are in progress |
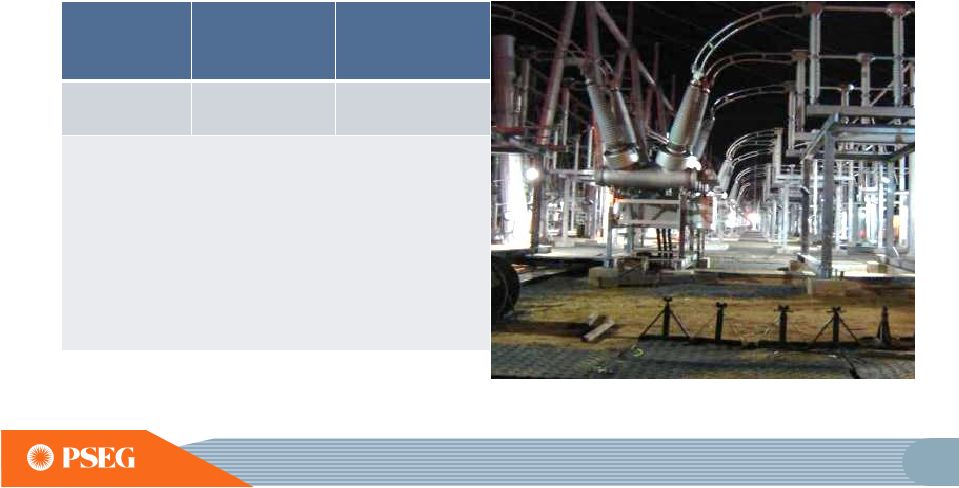
 35 North Central Reliability consists of upgrading 55 circuit miles of 138kV transmission line to 230kV, and converting six existing stations to 230kV operation Project Estimate Up To Through Year-end 2013 Expected In-service Date $390M $349M Completed • PJM RTEP project b1154 • ROE of 11.68% • 100% CWIP in rate base during development • 100% recovery of prudently incurred costs due to abandonment Project Status: In service April 2014 Customer Benefit: Improves power quality and increases transfer capability |
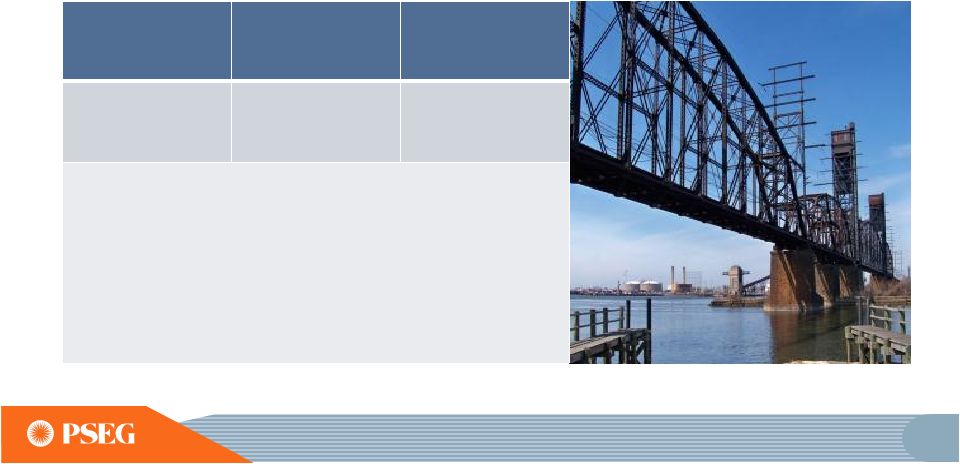
 36 Burlington-Camden 230kV consists of upgrading 37 circuit miles (30 miles of overhead and 7 miles of underground) of 138kV transmission line to 230kV, converting the existing stations to 230kV operation Project Estimate Up To Through Year-end 2013 Expected In-service Date $399M $301M Completed • PJM RTEP project b1156 • ROE of 11.68% • 100% CWIP in rate base during development • 100% recovery of prudently incurred costs due to abandonment Project Status: In service April 2014 Customer Benefit: Addresses voltage reliability and increases transfer capability |
 37 Mickleton-Gloucester-Camden 230kV consists of upgrading 10 circuit miles of overhead transmission, installing ~16 circuit miles of new 230kV underground, 10 circuit miles of new 230kV overhead, and modifications/upgrades at five existing stations Project Estimate Up To Through Year-end 2013 Expected In-service Date $435M $122M June 2015 • PJM RTEP project b1398 • ROE of 11.68% • 100% CWIP in rate base during development • 100% recovery of prudently incurred costs due to abandonment Customer Benefit: Addresses thermal reliability and increases transfer capability Project Status: Major permitting & siting complete, outside and inside plant construction in progress |
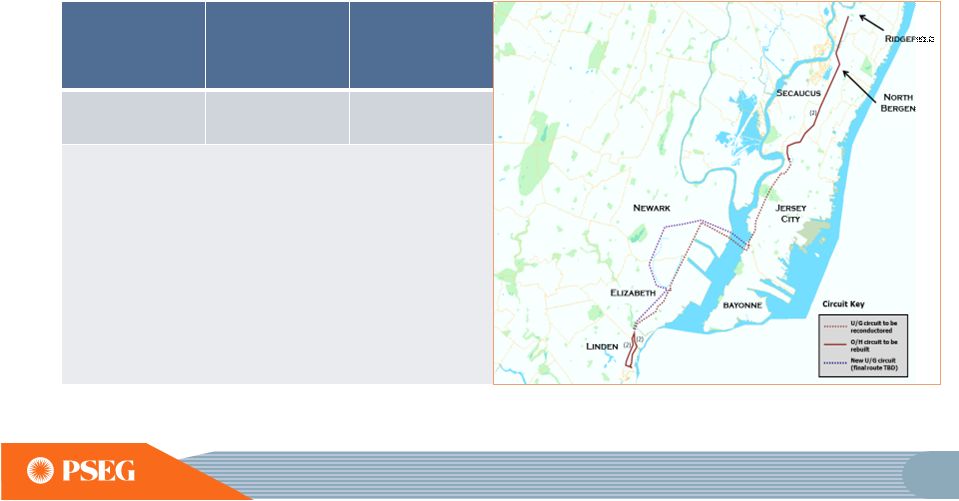 38 Bergen-Linden Corridor is a recently approved project which will provide a double-circuit 345kV line to maintain reliability Project Estimate Up To Through Year-end 2013 Expected Completion Date $1,200M - June 2018 • PJM RTEP project b2436 • 30 miles of underground cable • New ~ 23 miles • Reconductor (Upgrade of 138 to 345) ~7 miles • 13 miles of double circuit overhead conductor (replacing double circuit 138 with double circuit 345) • 11 station upgrades to 345kV Customer Benefit: Addresses thermal and short-circuit reliability Project Status: Engineering |
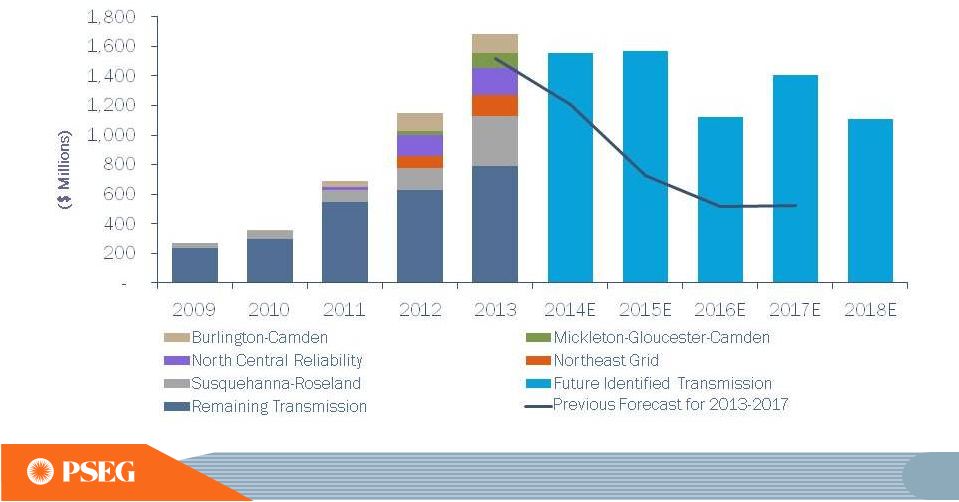 39 Planned transmission spend of $6.8 billion is driven by PJM reliability projects, 69kV conversions and life-cycle replacement projects PSE&G’s Transmission Capital Expenditures E= ESTIMATE. DATA AS OF MARCH 31, 2014. |
 40 PSE&G’s processes and culture are the foundation for project execution success Diverse, well-rounded team Culture with a focus for on-time, on-scope and on-budget execution Successful recruitment, development and retention strategies Strong unions and supplier relationships Cradle to grave project execution organization Processes designed to be scalable, repeatable and improvable Emphasis on best practices and lessons learned sharing Improvements driven by performance metric management Collaborative relationship with regulatory agencies Innovative design and construction practices to minimize environmental impacts Robust environmental compliance system |
 41 PSE&G’s demonstrated ability to successfully execute large projects leaves us well positioned to pursue new opportunities Future RTEP as identified by PJM Near-term participation in RTO competitive open planning windows PJM MISO NYISO Participating in competitive solicitations under FERC 1000 -- Artificial Island recommendation |
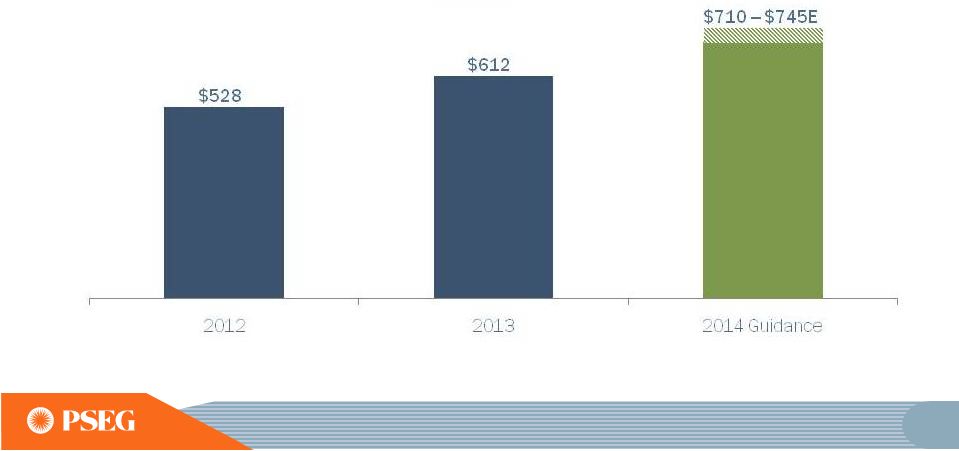 42 PSE&G’s 2014 operating earnings to benefit from increased investment in transmission and on-going cost control *SEE SLIDE A FOR ITEMS EXCLUDED FROM NET INCOME TO RECONCILE TO OPERATING EARNINGS. E =ESTIMATE. DATA AS OF MARCH 31, 2014. PSE&G Operating Earnings* ($ Millions) |
 PSEG LONG ISLAND |
 44 PSEG was selected to operate Long Island Power Authority’s (LIPA) electric transmission and distribution system for 12 years starting in 2014 Pursuant to the Operating Services Agreement (OSA), all expenses and capital costs to operate the system are pre-funded by LIPA and passed through to their customers Compensation consists of a fixed fee and an incentive fee Fixed compensation fee for 2014 with scheduled increases in 2015 and 2016 Starting in 2015 PSEG Energy Resources and Trading (ER&T) begins managing fuel/energy contracts PSEG Long Island expected to contribute $0.03 to operating earnings in 2014 increasing to $0.07 per share in 2016 including contribution at ER&T Potential for an 8-year extension of the OSA |
 45 PSEG Long Island commenced operations on January 1, 2014 Key elements of Operating Services Agreement Increased PSEG scope and control Performance metrics NY Department of Public Service oversight Utility 2.0 – Expanded program filed ~$345 million Use of PSEG brand as PSEG Long Island 3-Year rate freeze (2013-2015) Early performance Successful transition to PSEG Long Island Improved stakeholder communications Achieving reliability and customer satisfaction metrics |
 PSEG POWER |
 47 PSEG Power strategy Excellence in operating our units safely, reliably, cost- competitively and in an environmentally, responsible manner |
 48 PSEG Power creating value by responding to changing markets and regulations Safety/Environmental Focus Fleet Diversity/Efficiency Focus Financial/Economic Focus Regulatory Focus • Nuclear units operated at over 90% capacity factors for the 9 consecutive year through 2013 • Fleet diversity across the dispatch curve and fuel types provide flexibility to meet changing conditions • Linden CCGT and Salem 2 nuclear unit achieved record output in 2013 • “Getting the most out of existing fleet” • Locational advantage • O&M control programs have delivered a CAGR of 1.6% between 2009 and 2014 • Sites offer competitive advantage for expansion • Strong regulatory performance • Industry leadership in the changing business environment th |
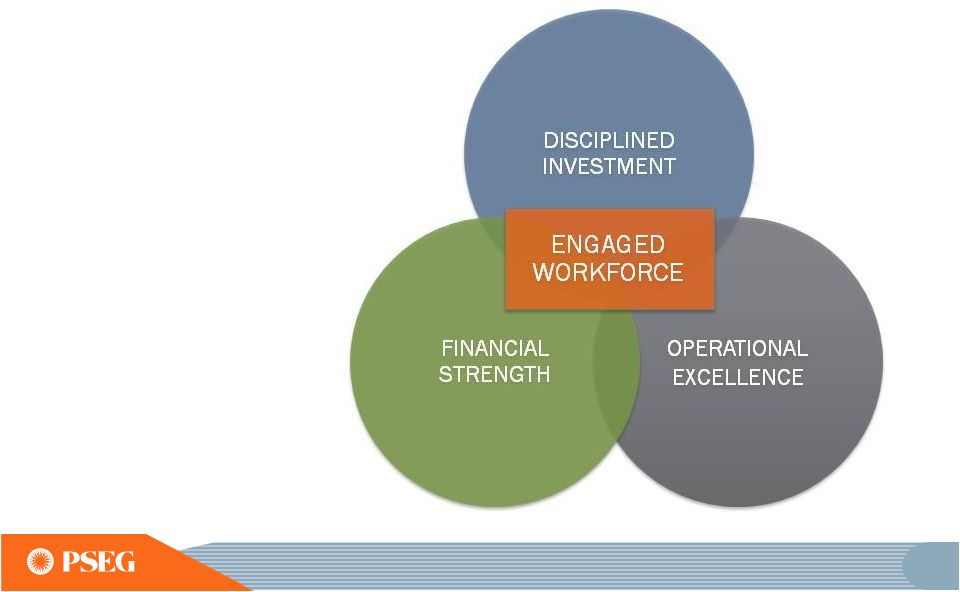
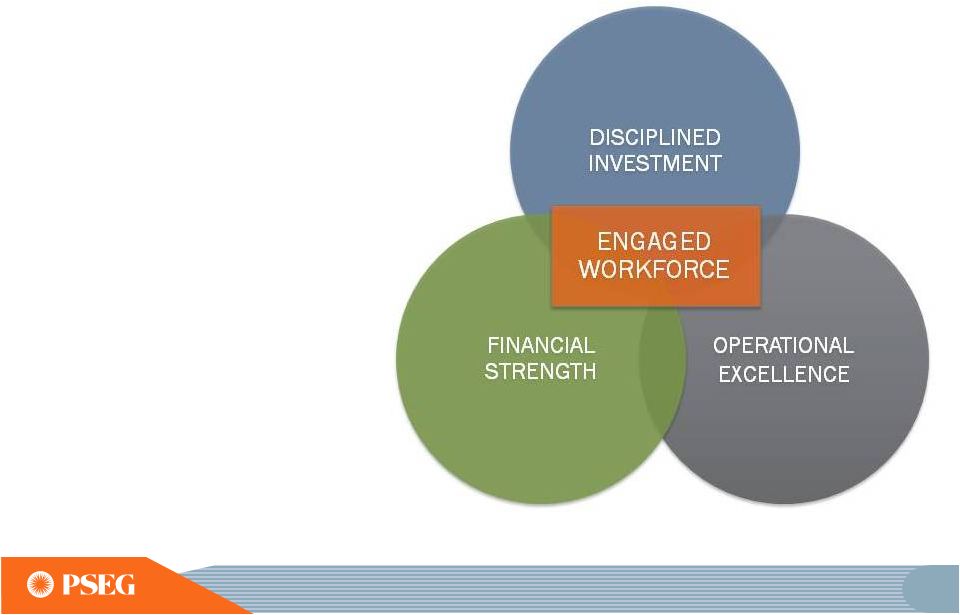
 49 Financial Strength Disciplined Investment Operational Excellence • Maximize value of existing generating plants through implementation of the Operational Excellence Model (OEM) • Workforce engagement and development • Deliver on Business Plan Commitments • Maintain competitive markets and improve constituent communication on issues important to Power • Successfully complete the Advanced Gas Path (AGP) uprates • Seek new opportunities in target markets (PJM, ISO-NE, NYISO) • Develop our renewables business (solar) • Maintain new nuclear option by successfully managing the Early Site Permit (ESP) process PSEG Power Delivering on priorities • OEM implemented and achieving measures • Resource sharing program initiated • Exceeded earnings guidance in 2013 • Ongoing effort in key markets showing success • Successful court outcome against subsidized generation • Accelerated schedule for AGP to maximize opportunity • LIPA contract for fuel and generation dispatch begins January 2015 • New 13 MW Rockfish solar project announced, established robust pipeline • Nuclear ESP is expected in 2015 |
 50 PSEG Power met 2013 challenges Storm and weather challenges • SuperStorm Sandy impacted our generating sites • Cold and hot weather extremes created challenging operating environment, but also presented opportunities Market challenges • Unit outages and planned transmission outages resulted in pressure on basis • Lower gas cost impacted dark spread pressuring coal unit dispatch • Load impacted by economy Value delivered • Optimized unit dispatch across fleet during storm recovery • Expedited return from storm outages, restored margin opportunities • High availability when needed • Achieved fuel cost savings • Captured value through coal/gas switching, unit flexibility • Coal & oil sales optimized inventory • Flexibility of portfolio captured real- time basis opportunities |
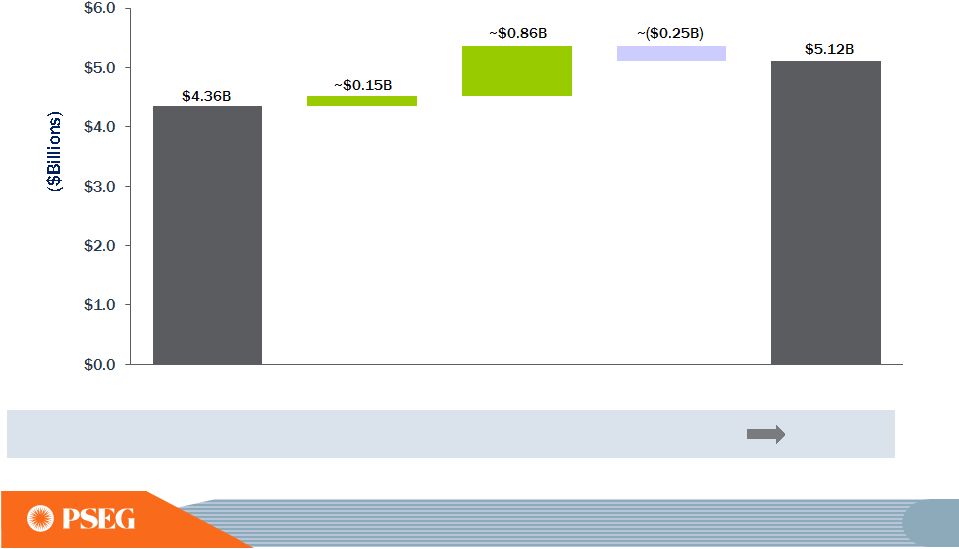
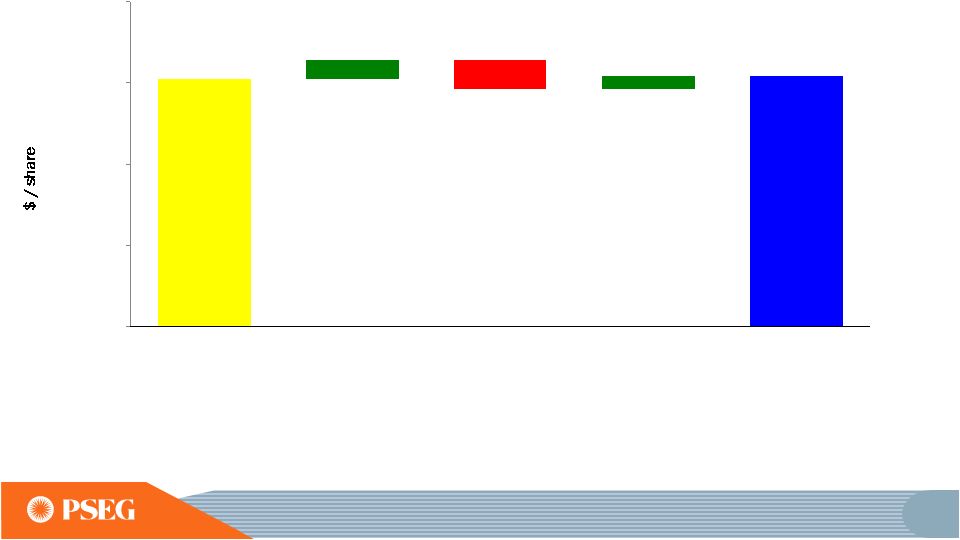
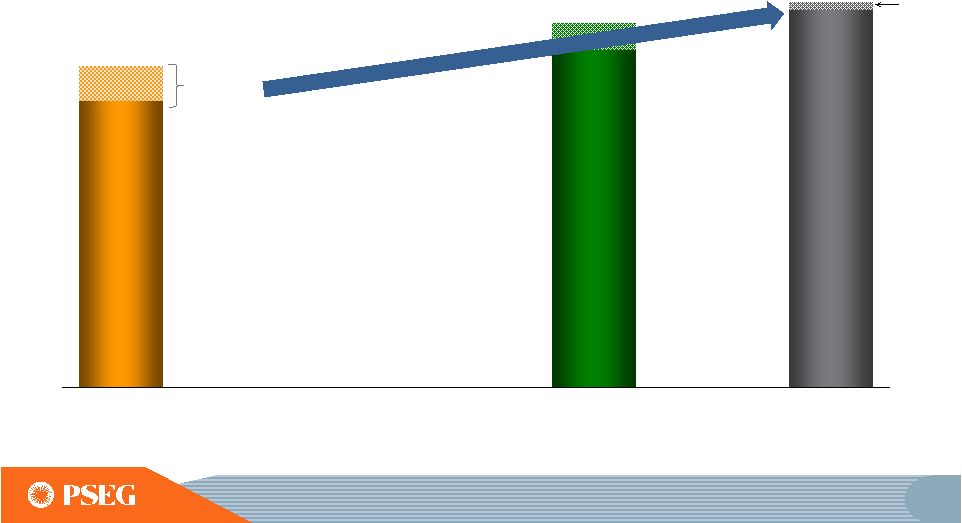 51 PSEG Power exceeded 2013’s earnings guidance $630-$685M $710M $535-$600M Winter/ Summer Volatility Lower Gas Cost Basis Volatility Spark/ Dark Spread Fuel Flexibility SOLAR/ KALAELOA $15M* GUIDANCE RANGE Over $100M of additional value gained from fleet flexibility, locational advantage and market volatility Initial Guidance Actual Revised Guidance OPERATING EARNINGS FOR PSEG POWER IN 2013; SEE SLIDE A FOR ITEMS EXCLUDED FROM INCOME FROM CONTINUING OPERATIONS/NET INCOME TO RECONCILE TO OPERATING EARNINGS. *ASSETS TRANSFERRED TO POWER AT YEAR-END 2013. |
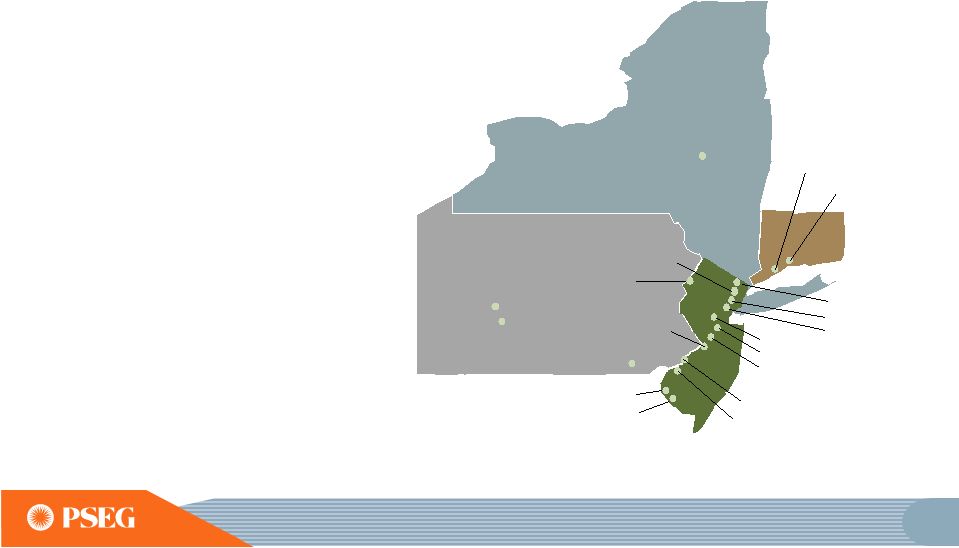 52 PSEG Power has generating assets in three competitive markets • Assets near loads • Low cost portfolio • Fuel flexibility with gas cost advantage • Poised to benefit from volatility in real-time markets • Fleet will maintain diversity and efficiency after HEDD • Most sites suitable for expansion ISO New England New Haven Bridgeport Bethlehem Energy Center (Albany) Conemaugh Keystone Peach Bottom Bergen Kearny Essex Sewaren Edison Linden Mercer Burlington National Park Hudson Hope Creek Salem Yards Creek New York ISO PJM |
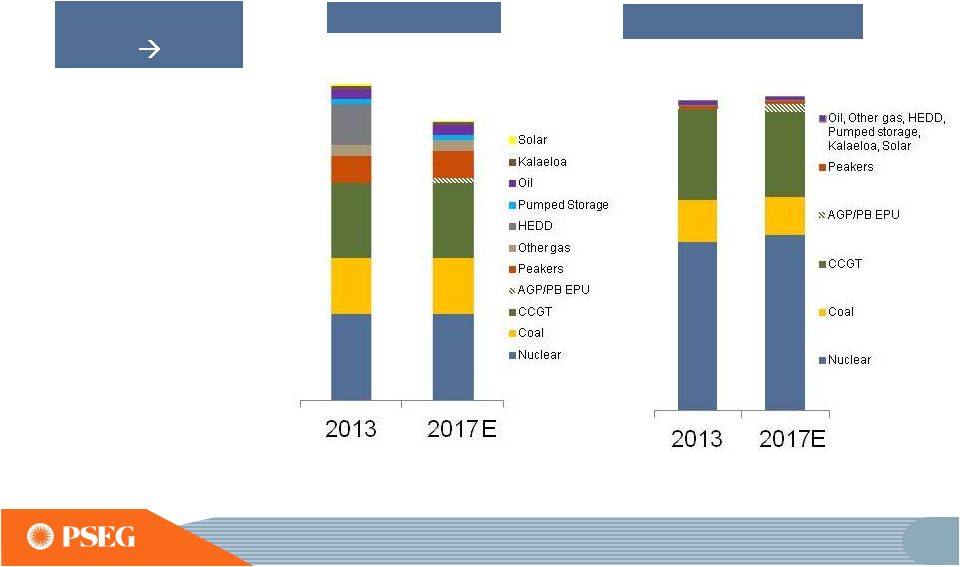 53 PSEG Power will maintain diversity and efficiency after a realignment of the fleet due to HEDD • Maintain fuel diversity • Maintain load-serving capability • Maintain low cost structure • Environmental improvement • Peach Bottom (PB) uprate • Advanced Gas Path (AGP) • Kalaeloa and Solar transfer adds ~200MW of capacity Objective 2013 2017 13,450 MW 11,900 MW Fuel Diversity Energy Produced 55 - 56 TWh 54 TWh E=ESTIMATE. |
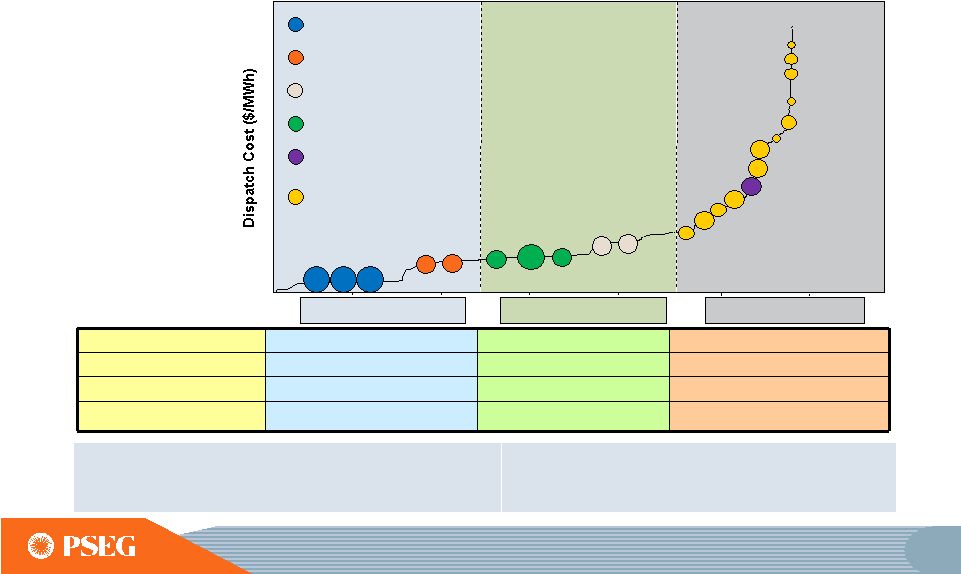 54 Power’s PJM assets along the dispatch curve reduce the risk of serving full requirement load contracts and can take advantage of volatile market conditions Energy Revenue X X X Capacity Revenue X X X Ancillary Revenue X X Dual Fuel X X Illustrative Salem Hope Creek Keystone Conemaugh Hudson 2 Linden 1,2 Bergen 1 Mercer 1, 2 Bergen 2 Peach Bottom Burlington 8-9-11 Edison 1-2-3 Essex 10-11-12 Sewaren 6 Linden 5-8 / Essex 9 National Park Salem 3 Bergen 3 Mercer 3 Sewaren 1-4 Burlington 12 Yards Creek Base Load Units Peaking Units Load Following Units Kearny 9-12-13-14 Nuclear Coal Coal/Gas Combined Cycle Steam Combustion Turbine / Pumped Storage • Base Load ensures cash flow certainty • Load Following provides ability to serve load shape • Peaking takes advantage of real-time prices and reduces operational risk • Dual fuel flexibility for >60% of fleet |
 55 PSEG Power Nuclear is a critical element of our success Hope Creek • Operated by PSEG Nuclear • PSEG Ownership: 100% • Technology: Boiling Water Reactor • Total Capacity: 1,178 MW • Owned Capacity: 1,178 MW • License Expiration: 2046 • Next Refueling Spring 2015 Salem Units 1 and 2 • Operated by PSEG Nuclear • PSEG Ownership: 57% • Technology: Pressurized Water Reactor • Total Capacity: 2,365 MW • Owned Capacity: 1,358 MW • License Expiration: 2036 and 2040 • Next Refueling Unit 1 – Spring 2016 Unit 2 -- Fall 2015 Peach Bottom Units 2 and 3 • Operated by Exelon • PSEG Ownership: 50% • Technology: Boiling Water Reactor • Total Capacity: 2,251 MW • Owned Capacity: 1,125 MW • License Expiration: 2033 and 2034 • Next Refueling Unit 2 – Spring 2016 Unit 3 – Fall 2015 • Uprate: 130 MW (PS Share) Unit 2 - 2015/Unit 3 - 2016 |
 56 PSEG Power Nuclear is core to the fleet and has competitive advantages *STRATEGY KNOWN AS THE “DIVERSE AND FLEXIBLE MITIGATION CAPABILITY” OR FLEX, ADDRESSES RECOMMENDATIONS OF THE NUCLEAR REGULATORY COMMISSION’S FUKUSHIMA TASK FORCE. • Continued strong nuclear operations: nine consecutive years of >90% capacity factor through 2013 • Significant earnings contributor • Top quartile of cost performance/MWh • One third new staff, recruitment of the best new and experienced talent, and attractive training program • Fukushima action plan in response to NRC staff review FLEX* plan submitted with implementation starting with Fall outage • Peach Bottom extended power uprate, 130 MW Power’s share, scheduled in service 2015/2016 • Active and influential participation at INPO, NEI, EPRI, USA Alliance |
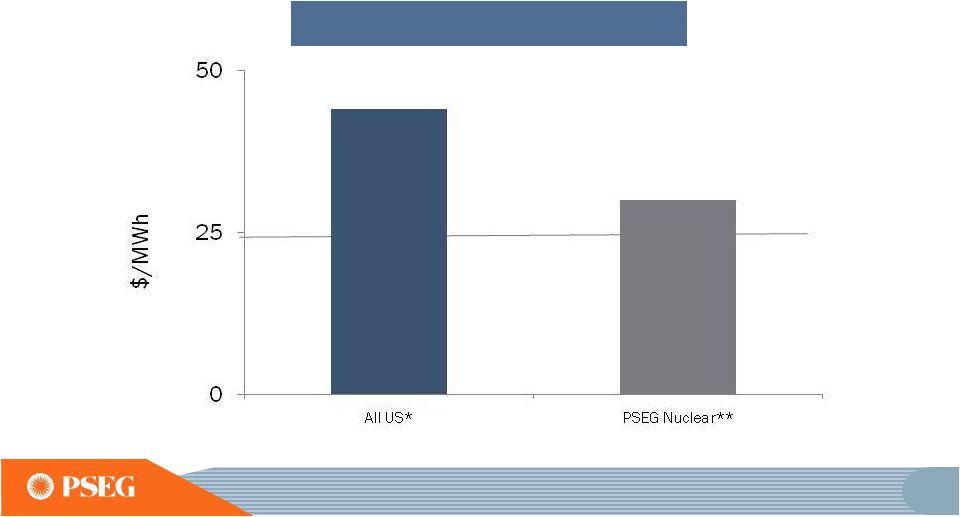 57 Power’s nuclear fleet is well positioned with significantly lower-than-average US cost structure *SOURCE: ELECTRIC UTILITY COST GROUP ** SOURCE: PSEG NUCLEAR Total Fuel, Capital and O&M Costs* 3 YEAR AVERAGE 2010 - 2012 |
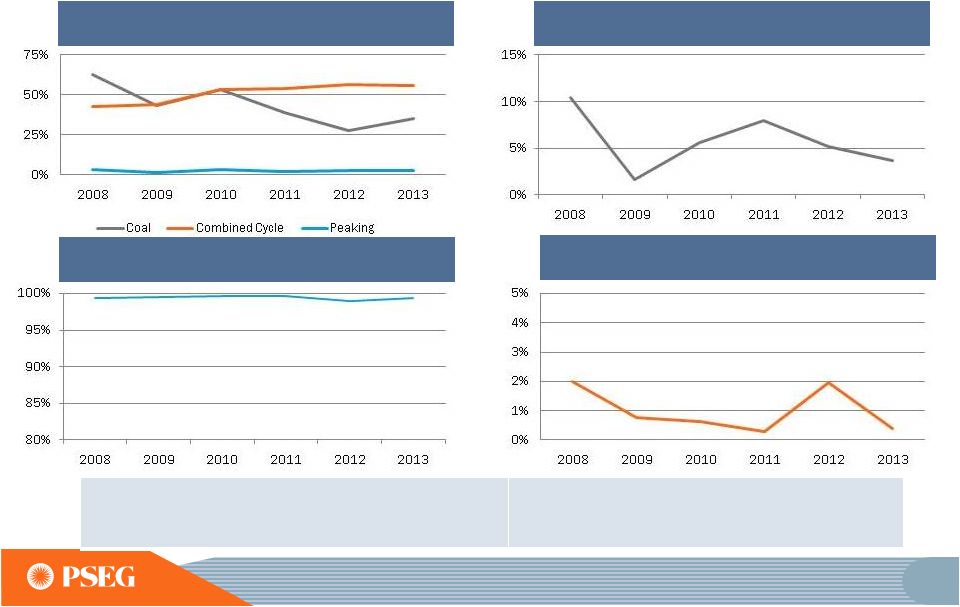 58 PSEG Power’s Fossil Fleet Performance has shown improvement *LM6000 AND 7EA UNITS Capacity Factor NJ Coal EFORp Peaking Start Success* NJ Combined Cycle EFORp • Fossil Capacity Factor rebounded with market • Peaking Units maintain high start success • Coal EFORp improving • CC EFORp less than 1% in 2013 • Consistent recipient of EFORp payments |
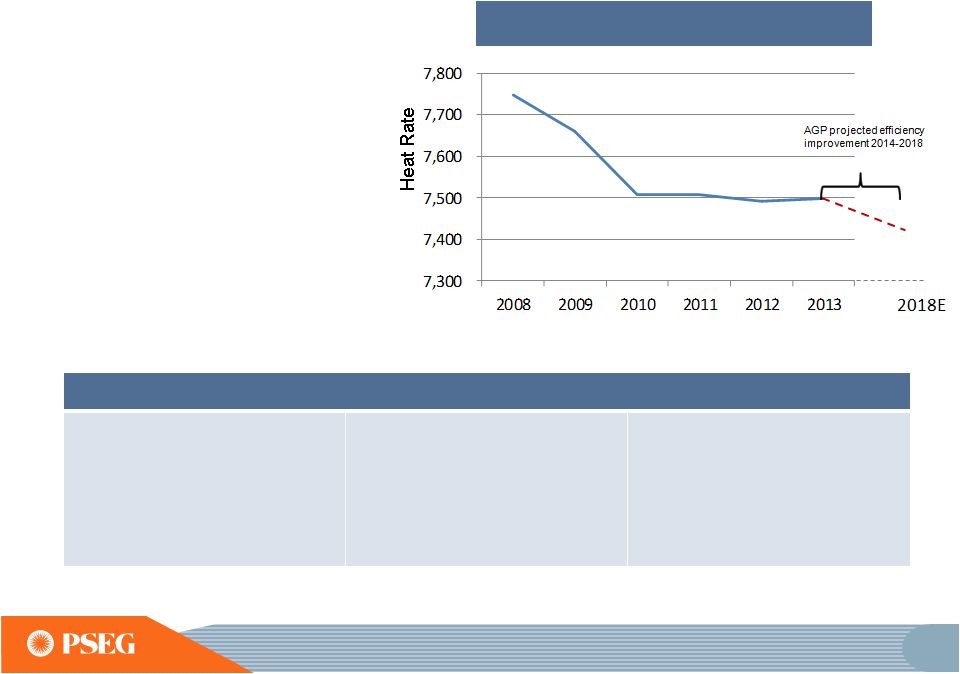 59 PSEG Power improvements achieved in combined cycle fleet efficiency Actions Taken to Create Value • Operational Excellence Model • Training programs • Unit testing initiative • Outage work to restore efficiency • Second gas line at BEC • Heat rate improvement 2008-2013 translates to meaningful fuel savings at current market prices • Advanced Gas Path (AGP) investments 2014 through 2018 to provide additional fuel savings Combined Cycle Operating Heat Rate *E= ESTIMATE. |
 60 Investing to expand CCGT capacity and improve efficiency o Expand Power’s CCGT fleet, one of the largest gas-fired portfolios in PJM, with incremental base and peaking MWs o Retrofit Bergen, Linden and BEC with Advanced Gas Path (AGP) components at cost of ~$120M over 2014 - 2018 AGP Project Benefits PSEG Power - CCGT Uprate Project CCGT capacity uprates of ~150 MW: - Linden (63 MW – Completed) - Bergen (31 MW – 2015) - BEC (58 MW – 2017-2018) Increases Efficiency - Combined Cycle (CC) heat rate improvement ~ 1.2% Upgrades technology and extends maintenance outage cycles |
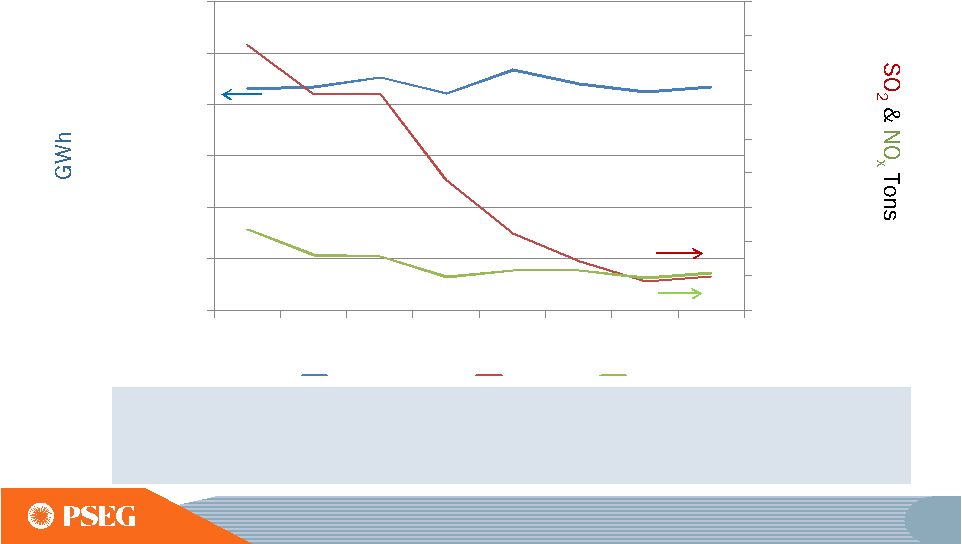 61 PSEG Power’s fleet is among the lowest emitting in the industry 0 10,000 20,000 30,000 40,000 50,000 60,000 70,000 80,000 90,000 10,000 20,000 30,000 40,000 50,000 60,000 70,000 2006 2007 2008 2009 2010 2011 2012 2013 Generation SO2 NOx • Mercury reduced 80% across the timeframe above • More efficient testing and improved operational flexibility through utilization of Continuous Emission Monitoring System testing • Cost control through testing coordination program |
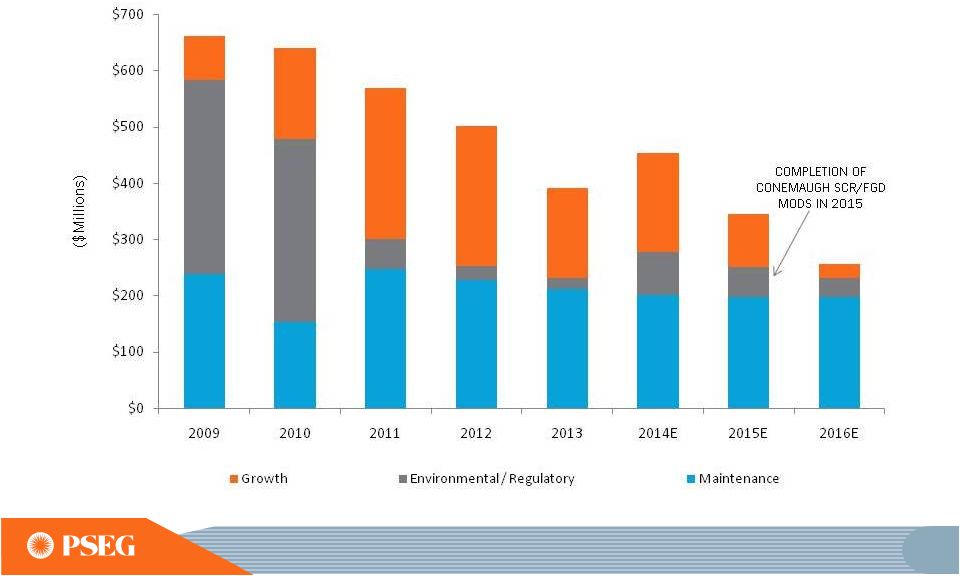 62 PSEG Power’s capital expenditures for environmental requirements are essentially complete* *BASED ON CURRENTLY KNOWN AND QUANTIFIABLE ENVIRONMENTAL REQUIREMENTS. E=ESTIMATE. DATA AS OF MARCH 31, 2014. |
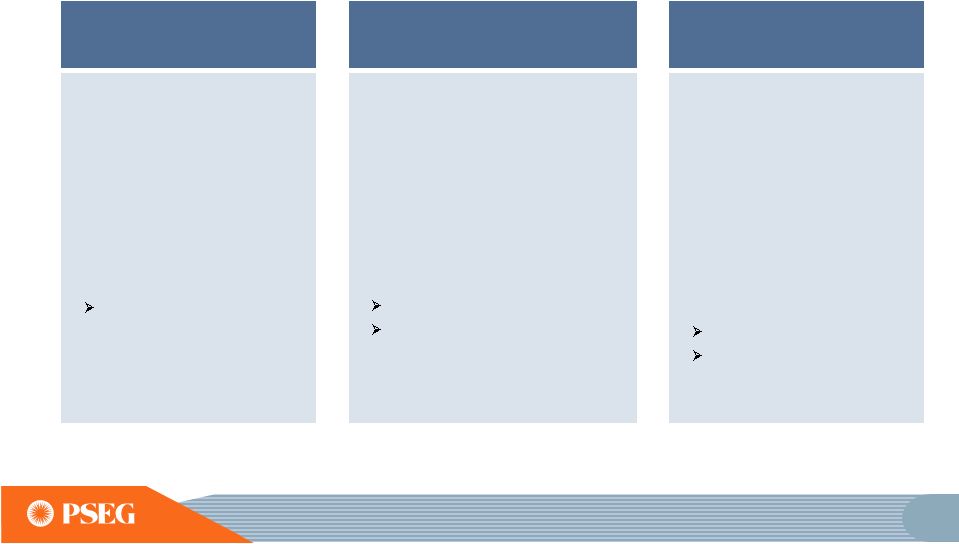
 63 PSEG Power is well-positioned for growth when market conditions warrant Available locations Our sites possess infrastructure advantages • Bergen • Burlington • Essex • Edison • Kearny • Hudson • Linden • Sewaren • Bridgeport Harbor • Electric Transmission Interconnections • Access to Gas Pipelines • Space • Emissions |
 64 Shasta A & B California (4 MW) COD March 2014 Polycrystalline - single axis Investment $13 million 20 year PPAs with PG&E Hackettstown (Mars) New Jersey (2 MW) COD September 2009 Thin film panels – fixed tilt Investment $13 million 15 year PPA with Mars, Inc. Wyandot Ohio (12 MW) COD May 2010 Thin film panels – fixed tilt Investment $45 million 20 year PPA with AEP JEA Florida (15 MW) COD September 2010 Thin film panels – fixed tilt Investment $59 million 30 year PPA with JEA Queen Creek Arizona (25 MW) COD October 2012 Polycrystalline - single axis Investment $79 million 20 year PPA with SRP Milford Delaware (15 MW) COD December 2012 Polycrystalline - fixed tilt Investment $49 million 20 year PPA with DEMEC Badger I Arizona (19 MW) COD November 2013 Polycrystalline - single axis Investment $50 million 30 year PPA with APS PSEG Solar Source owns ~123 MW of solar facilities with long term contracted revenues* Newman Texas (13 MW) COD December 2014 Polycrystalline - single axis Investment $22 million 30 year PPA with El Paso Elec. Whitcomb Vermont (4 MW) COD October 2014 Polycrystalline - single axis Investment $10 million 25 year PPA with VT Electric Power Producers, Inc. *PROJECT SIZE IN MEGAWATTS SHOWN IN DC (DIRECT CURRENT). E=ESTIMATE. In Construction – Rockfish Maryland (13 MW) COD - June 2015E Polycrystalline - single axis 20 year PPA with SMECO |
 PSEG POWER ER&T |
 66 Portfolio Management Strategy Optimize value of assets Manage risk vs. reward Directly engage with regulatory agencies |
 67 PSEG Power: Enjoys real and sustainable advantages in the merchant generation space Market Review • Gas, Power, Spark Spreads • Regulatory construct PSEG’s Competitive Advantage • Fuel flexibility • Heat Rate diversity • Access to Marcellus Shale gas • Asset flexibility PSEG’s Sustainable Advantage • Positive cash-flow hedging into the long-term • Robust capacity market pricing in most concentrated load pocket in US • Long-term access to discounted Marcellus gas |
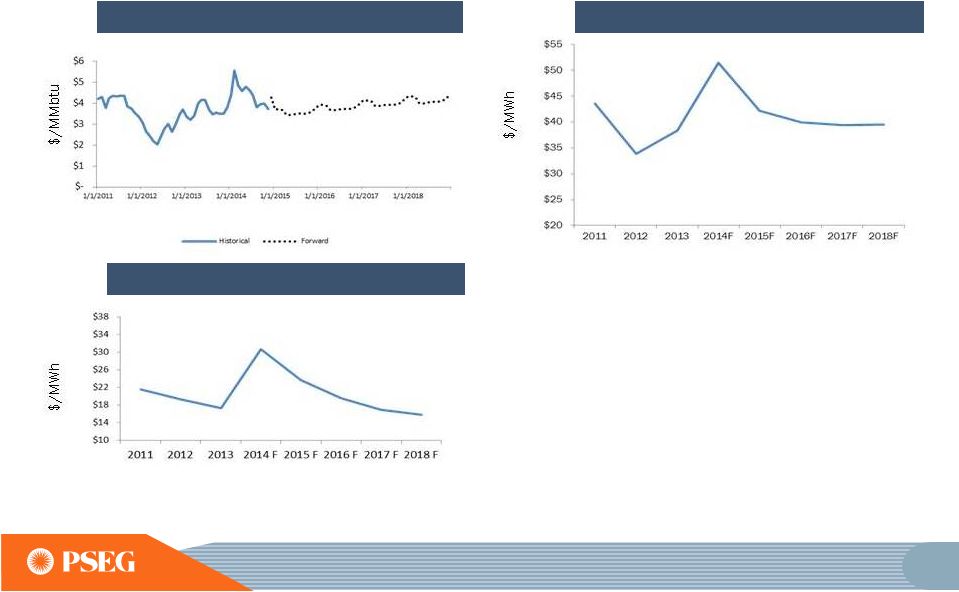 68 Market Review: Long-term fundamentals remain sound • Market influenced by increased gas supply and capacity retirements • Insufficient gas infrastructure continues to place upward pressure on fuel prices during seasonal peaks • Market liquidity remains weak beyond 2015 NYMEX Natural Gas Price PJM West RTC PJM West Spark Spreads F = FORWARDS AS OF DECEMBER 17, 2014; 2014F INCLUDES HISTORY AND FORWARDS. |
 69 Market Review: New generation in PJM not keeping pace with coal retirements Forecast Reserve Margin (PJM October 2014) • PJM forecasts a declining Reserve Margin through 2018, which may improve forward prices • Brattle estimates energy prices could rise at least $3-4/MWh from today’s prices *PJM AS OF DECEMBER 23, 2014 SOURCE OF CHART DATA: PJM Cumulative Generation Retirements* |
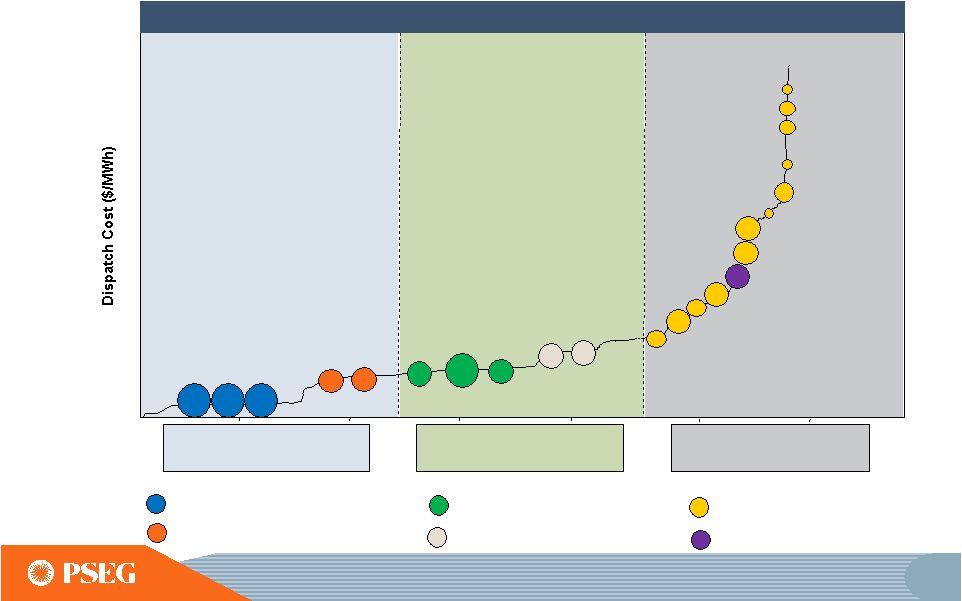 70 Competitive Advantage: Heat Rate Diversity & Flexible Dispatch Illustrative Salem Hope Creek Keystone Conemaugh Hudson 2 Linden 1,2 Bergen 1 Mercer 1, 2 Bergen 2 Peach Bottom Burlington 8-9-11 Edison 1-2-3 Essex 10-11-12 Sewaren 6 Linden 5-8 / Essex 9 National Park Salem 3 Bergen 3 Mercer 3 Sewaren 1-4 Burlington 12 Yards Creek Base Load Units Peaking Units Load Following Units Kearny 9-12-13-14 Nuclear Coal Coal/Gas Combined Cycle (gas/oil) Steam (gas/oil) Combustion Turbine / Pumped Storage (gas/oil) PJM Dispatch Curve |
 71 Competitive/Sustainable Advantage: PSEG expanding supply of low-cost Marcellus gas PSEG plans to invest $100 - $120 million in the to-be-constructed PennEast Pipeline, a 105.5 mile pipeline that would bring gas from eastern Pennsylvania to New Jersey PSEG ER&T would contract for approximately 125mmcf/day of PennEast’s 1 bcf/day capacity under a 15-year contract; other project sponsors have committed to offtake ~500mmcf/day PSEG and its customers would benefit from the displacement of higher-cost, Gulf Coast gas supply Targeted in-service date is November 2017 Proposed PennEast Pipeline Project |
 72 Industry infrastructure build through 2018 to meet demand growth New England 1.4 bcf/d Southeast 6.5 bcf/d Midwest 2.3 bcf/d Gulf Coast 2.8 bcf/d New investment will increase pipeline takeaway capacity from low-cost Marcellus and Utica shale basins to meet demand in the South and Midwest NJ/NY 1.4 bcf/d |
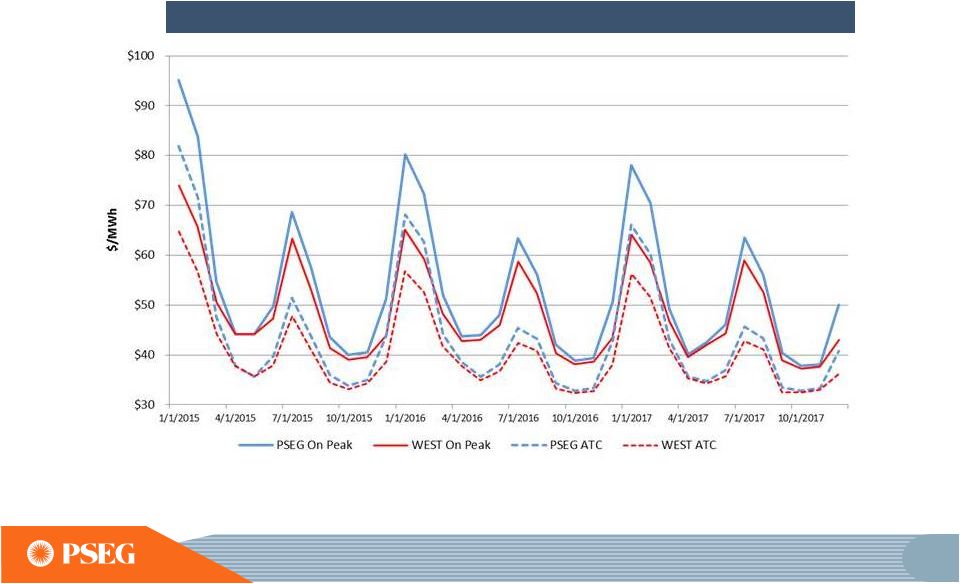 73 Sustainable Advantage: Forward power curves indicate PSEG Zone retains premium price * MARKET AS OF DECEMBER 17, 2014 SOURCE: ICE/BROKER QUOTES Growing importance of the winter peak has influenced PJM reliability planning … with supportive implications for price formation Monthly Power Price Summary* |
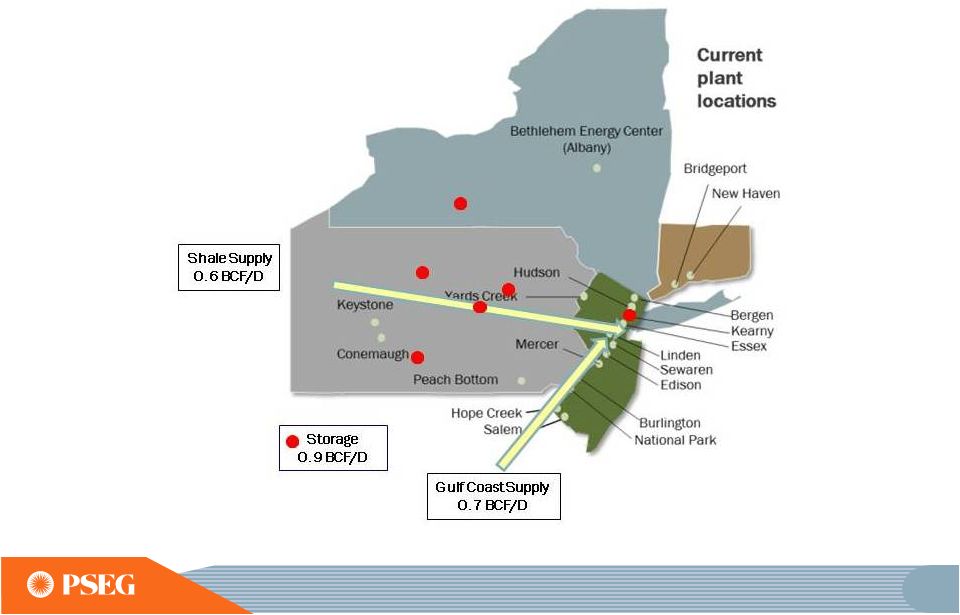 74 Competitive Advantage: PSEG’s extensive gas asset portfolio gives unparalleled access to Marcellus Shale gas |
 75 Competitive Advantage: In 2014, ~40% of Power’s gas for generation comes from Marcellus • Our Combined Cycle and Peaking assets have been able to take advantage of locational gas price volatility driven by production and logistical constraints • Lower cost shale supply provides additional savings during periods of lower residential gas demand Spot Natural Gas Prices: June 2013 – December 2014* * AS OF DECEMBER 17, 2014 |
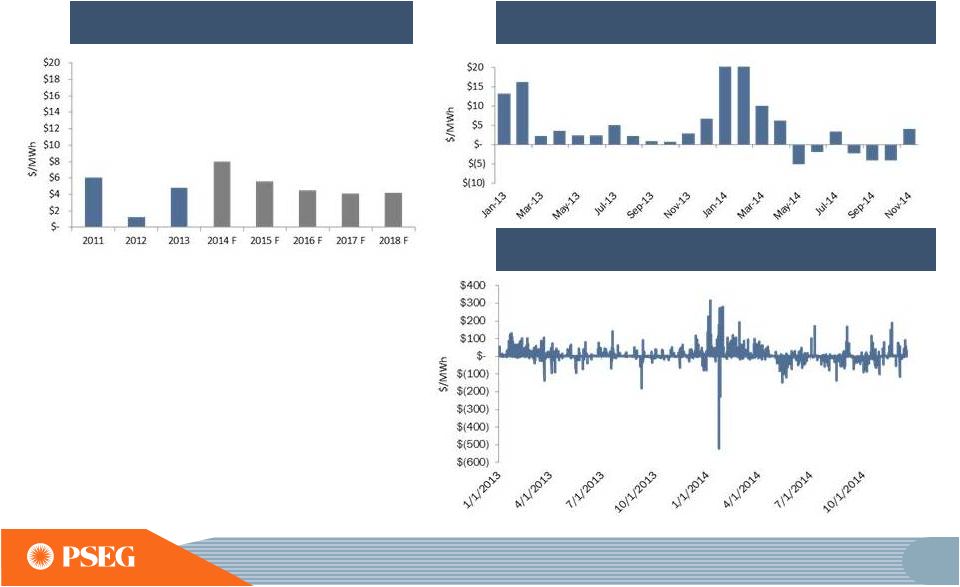 76 Competitive Advantage: Locational advantage from short term basis volatility $37 - $38 $39 - $40 ANNUAL FORWARD (F) BASIS TO PJM-WEST AS OF DECEMBER 17, 2014, 2014F INCLUDES HISTORY AND FORWARDS. • Annual basis benefits baseload units • Intermediate units flexible to seasonal opportunities • Combined Cycle and Peaking units positioned to optimize daily and hourly volatility PS Zone On Peak Annual Basis to PJM-W PS Zone Day Ahead On Peak Monthly Basis to PJM-W PS Zone Real Time On Peak Hourly Basis to PJM-W |
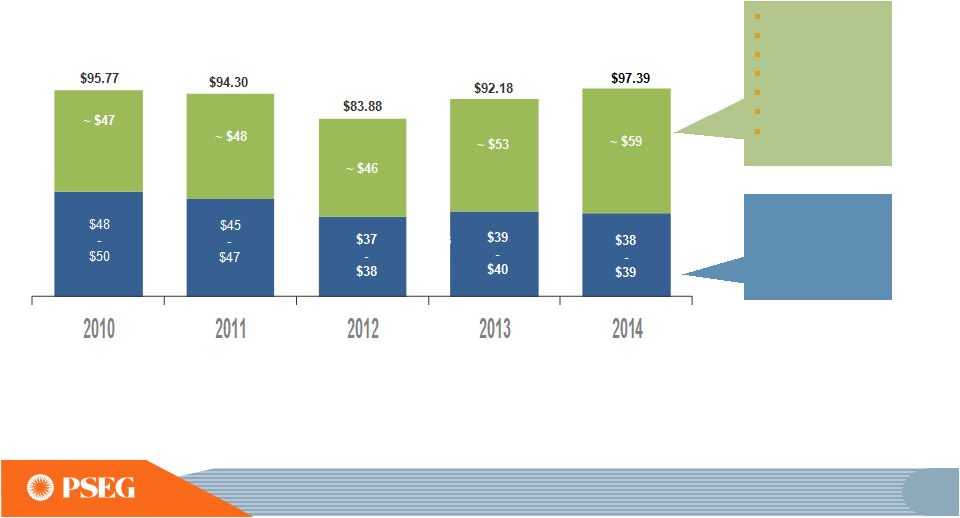 77 Sustainable Advantage: BGS Auction provides excellent opportunity to forward hedge our generation Capacity Load shape Transmission Congestion Ancillary services Risk premium Green BGS sales account for about a quarter of our forward portfolio of hedges 3 Year Average Round the Clock PJM West Forward Energy Price $/MWH; BGS PRICES REFLECT PSE&G ZONE; RESULTS FOR 2012-2014 ARE THE NEW BLENDED PRICES BEGINNING JUNE 1, 2014. |
 78 Oct-Dec 2014 2015 2016 Volume TWh 8 36 36 Base Load % Hedged 100% 100% 55-60% (Nuclear and Base Load Coal) Price $/MWh $49 $50 $49 Volume TWh 5 21 21 Intermediate Coal, Combined % Hedged 50-55% 5-10% 0% Cycle, Peaking Price $/MWh $49 $50 $49 Volume TWh 13 55-57 55-57 Total % Hedged 80-85% 65-70% 35-40% Price $/MWh $49 $50 $49 Sustainable Advantage: Hedging strategy designed to protect gross margin while leveraging the portfolio HEDGE PERCENTAGES AND PRICES AS OF SEPTEMBER 30, 2014. REVENUES OF FULL REQUIREMENT LOAD DEALS BASED ON CONTRACT PRICE, INCLUDING RENEWABLE ENERGY CREDITS, ANCILLARY, AND TRANSMISSION COMPONENTS BUT EXCLUDING CAPACITY. HEDGES INCLUDE POSITIONS WITH MTM ACCOUNTING TREATMENT AND OPTIONS. EXCLUDES SOLAR AND KALAELOA. |
 79 2017/2018 RPM Auction Influenced By: • Updated Demand Curve • Updated Transfer Capabilities • Environmental Retirements • New Build/Cost of New Entry • Minimum Offer Price Rule • Demand Response Sustainable Advantage: PJM’s capacity market continues to recognize locational value *PSEG POWER’S AVERAGE PRICES AND CLEARED CAPACITY (MW) REFLECT BASE AND INCREMENTAL RPM AUCTION RESULTS. DELIVERY YEAR RUNS FROM JUNE 1 TO MAY 31 OF THE NEXT CALENDAR YEAR. RPM Auction Results ($/MW-day) 2013 / 2014* 2014 / 2015* 2015 / 2016* 2016 / 2017* 2017 / 2018 Power’s Average Prices $242 $166 $166 $166 $165 Rest of Pool Prices $28 $126 $136 $59 $120 Power’s Cleared Capacity (MW) 10,890 10,710 9,210 8,610 ~8,700 |
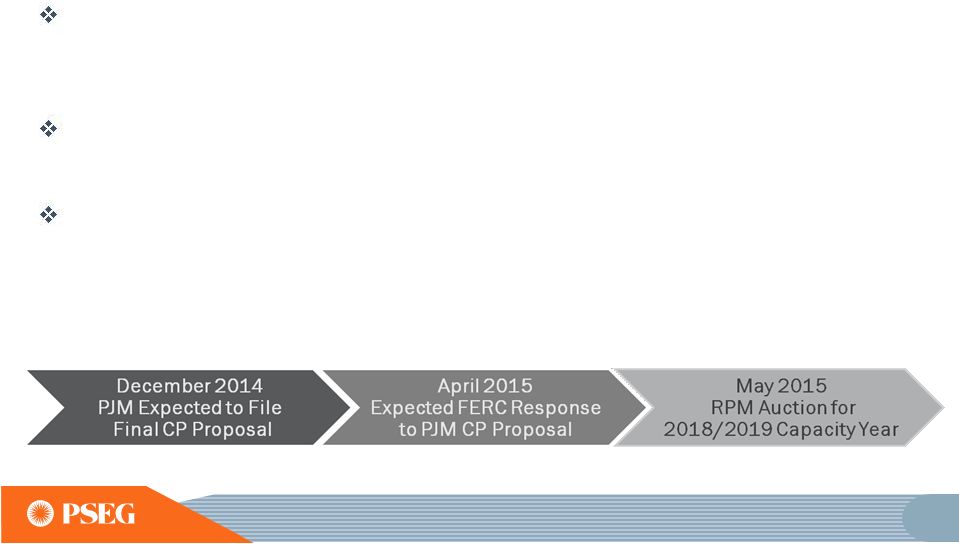 80 PJM Capacity Performance Proposal: aims to increase electric supply reliability Capacity performance (CP) proposal places emphasis on reliability given observed outages during times of extreme weather stress and anticipated retirements; Imposition of higher penalty structure to encourage availability Generator availability / flexibility is key objective for units with secure fuel supply capable of meeting operating standards Elimination of 2.5 % holdback, making all capacity resources annual products, net CONE bidding safe harbor, and the change in the demand curve (VRR) support price formation and improve resource adequacy |
 81 PSEG Power’s Value Proposition • Well-positioned fleet of merchant generating assets concentrated in PJM market • Advantaged by low cost structure, fuel diversity and dispatch flexibility • Low environmental capital requirements • Capacity uprates to enhance value of nuclear and combined cycle stations • Consistent hedging strategy recognizes asset flexibility • Continue to meet commitments and to provide free cash flow |
 PSEG FINANCIAL REVIEW & OUTLOOK |
 83 Strong financial position to support our business initiatives 2013 Financial Position Exceeded upwardly revised 2013 earnings guidance Pension fully funded Strong balance sheet and upgraded credit ratings 2014 and Beyond Continued positive earnings trend in 2014 Controlled O&M growth Balance Sheet and Cash Flow support investments without equity issuance Growth in PSE&G investments with contemporaneous returns Diversified Power assets with a balanced hedge profile Growth in PSE&G Cash from Operations, with continued significant Cash from Operations/FFO at Power Increased Dividend by $0.04 to annual rate of $1.48 per share for 2014 Opportunity for consistent and sustainable dividend growth |
 84 Exceeded upwardly revised guidance in both businesses PSEG Operating Earnings $ Millions (except EPS) 2012 2013 PSE&G $528 $612 PSEG Power $663 $710 Other $45 ($13) Operating Earnings $1,236 $1,309 Operating EPS* $2.44 $2.58 Upwardly Revised Earnings Guidance (Nov 2013) $2.40 - $2.55 Earnings Guidance (Feb 2013) $2.25 - $2.50 *SEE SLIDE A FOR ITEMS EXCLUDED FROM INCOME FROM CONTINUING OPERATIONS/NET INCOME TO RECONCILE TO OPERATING EARNINGS. NOTE: 2012 OPERATING EARNINGS RE-STATED FOR TRANSFER OF ASSETS FROM PSEG HOLDINGS TO PSEG POWER. |
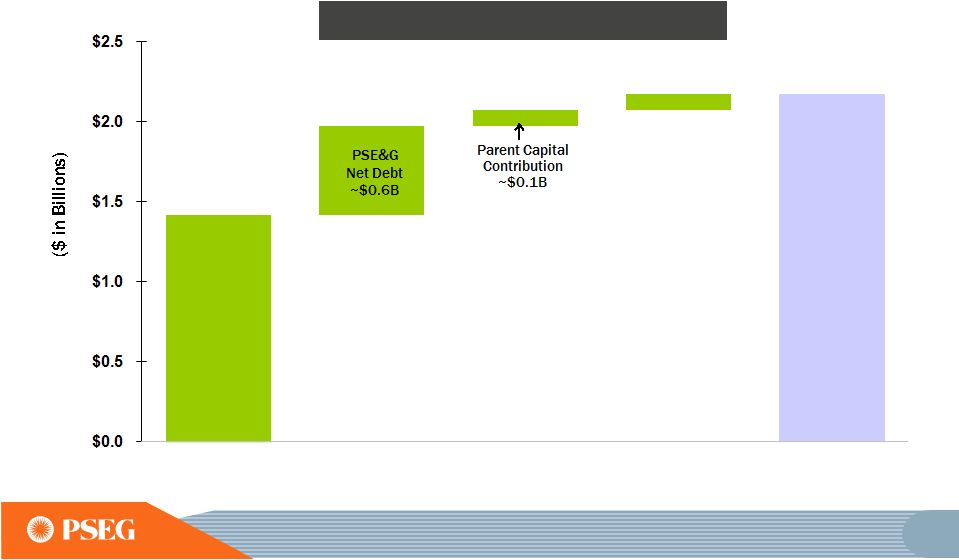 85 PSE&G Cash from Ops (1) ~$1.4B PSE&G Capital Investment ~$2.2B In 2013, PSE&G invested over $2B, using $1.4B of internally generated cash flow and debt, while maintaining its capital structure (1) PSE&G CASH FROM OPERATIONS ADJUSTS FOR SECURITIZATION PRINCIPAL REPAYMENTS OF ~$220 MILLION. Cash ~$0.1B PSE&G 2013 Cash Flows |
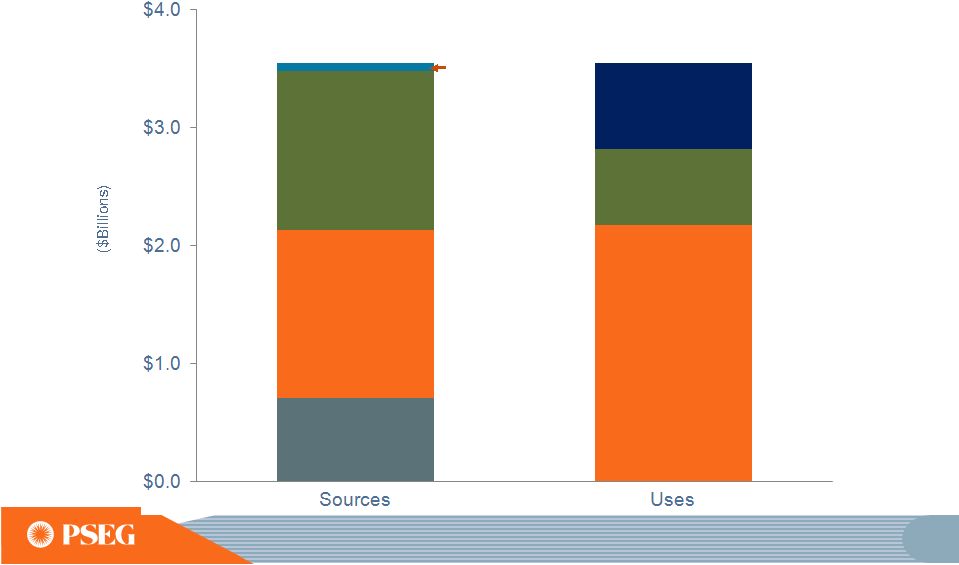 86 In 2013, Power’s Free Cash Flow supported PSE&G’s capital program and shareholder dividend Power Cash from Ops ~$1.3B PSE&G Cash from Ops (1) ~$1.4B PSE&G Capital Investment ~$2.2B Power Capital Investment ~$0.6B Shareholder Dividend ~$0.7B Net Debt Issuances ~$0.7B PSEG Consolidated 2013 Sources and Uses (1) PSE&G CASH FROM OPERATIONS ADJUSTS FOR SECURITIZATION PRINCIPAL REPAYMENTS OF ~$220 MILLION. (2) OTHER CASH FLOW INCLUDES HOLDINGS NET CASH FLOW AND PARENT CASH. Other Cash Flow (2) ~$0.1B |
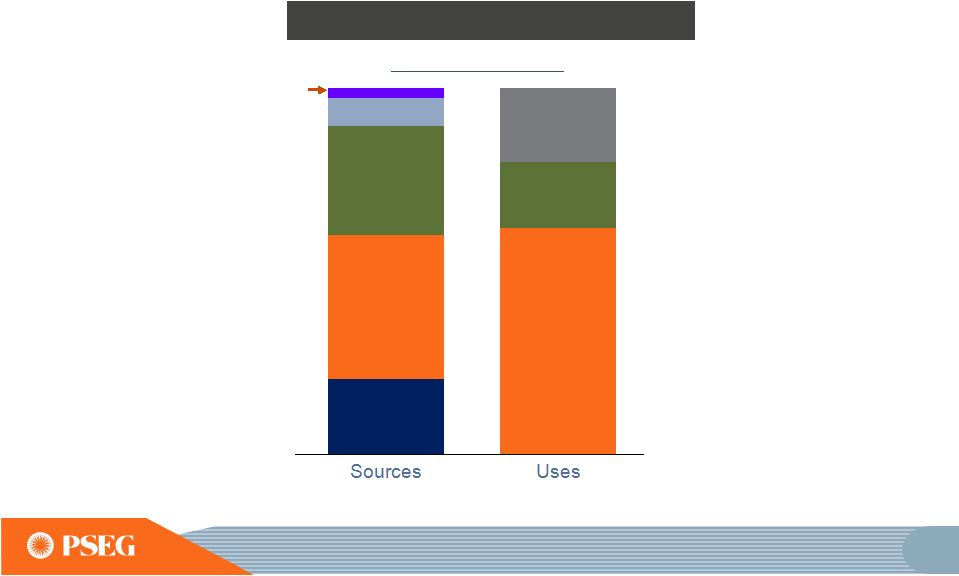
 87 PSEG growth spend, including Energy Strong, of ~$6.4B represents ~76% of total investment PSEG 2014 – 2016E Capital Investment Power & Other Maintenance PSE&G Distribution Maintenance Power Growth PSE&G Transmission Growth PSE&G Solar and New Business PSE&G Energy Strong Approved Growth Investment ~$6.4B E = ESTIMATE; CAPITAL INCLUDES AFUDC AND IDC. DATA AS OF MARCH 31, 2014. PSEG Planned Spend Maintenance ~$2B |
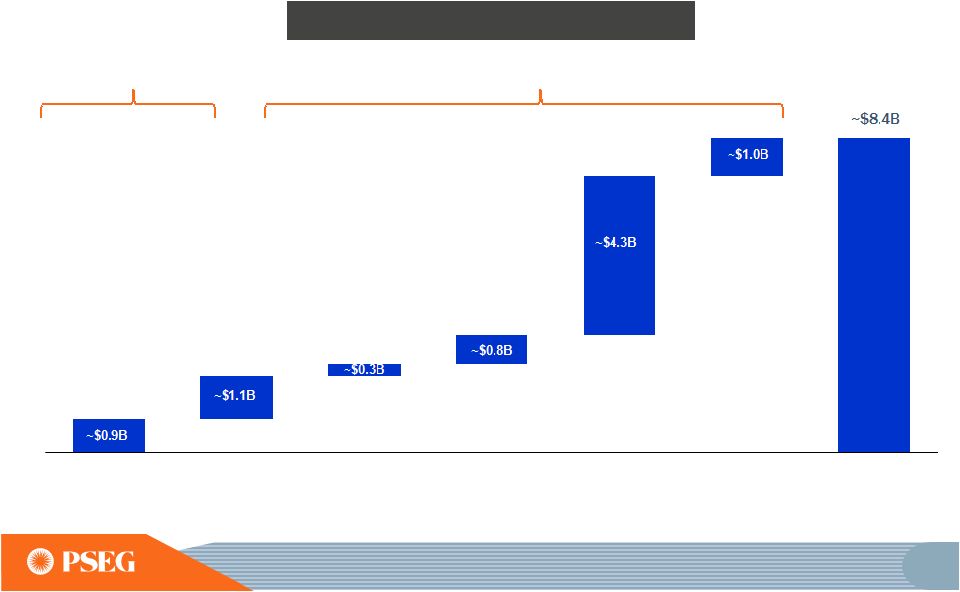
 88 PSE&G’s Capital Program drives double-digit growth in rate base and earnings over the 2013 to 2016 period 2013 – 2016E Rate Base CAGR Growth of ~12% Distribution Transmission ~$10.4B ~$14.6B ~$6.6B ~$3.8B ~$2.7B ~$6.5B ~$0.5B ~$1.0B ~$8.1B 2013 Rate Base 2016E Rate Base Transmission Growth Energy Strong Solar and New Business E = ESTIMATE. DATA AS OF MARCH 31, 2014. |
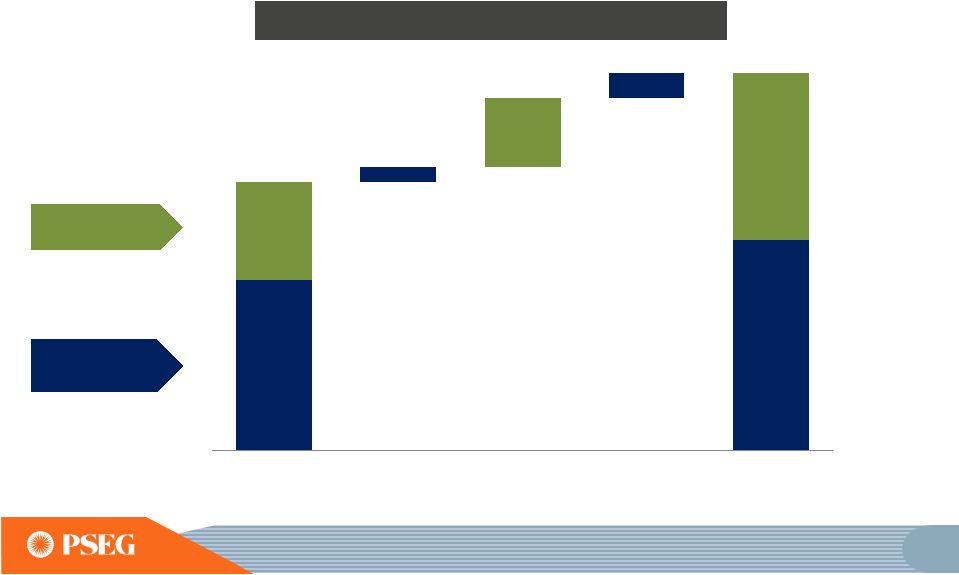
 89 PSE&G’s Cash from Operations and Power’s Free Cash Flow support growth investments without the need for new equity PSE&G Net Debt 2014 – 2016E PSEG Sources and Uses (1) PSE&G CASH FROM OPERATIONS ADJUSTS FOR SECURITIZATION PRINCIPAL REPAYMENTS OF ~$500M FROM 2014-2016 (2) OTHER CASH FLOW INCLUDES PSEG LI, HOLDINGS NET CASH FLOW, CASH, AND SHORT TERM DEBT PSE&G Cash from Ops (1) PSE&G Capital Investment With Energy Strong Shareholder Dividend Power Cash from Ops Other Cash Flow (2) Power Net Debt Power Capital Investment E = ESTIMATE. DATA AS OF MARCH 31, 2014. |
 90 Power’s key credit metric supports incremental investment opportunities PSEG Power Funds From Operations / Debt 2014-2016E Average Increased contribution to earnings from the more stable regulated business allows us to reset Power’s FFO/Debt threshold from 35% to 30%, providing additional financial flexibility Power’s annual Cash From Operations and Funds From Operations each average ~$1.1B over the 2014 to 2016 period supported by: - Capacity Revenues - Hedged Generation - O&M Control Financial strength can be used to pursue future growth in both businesses beyond current plans E = ESTIMATE. DATA AS OF MARCH 31, 2014. |
 91 Pension: Our Long Term Asset allocation strategy resulted in a ~17% increase in pension assets during 2013 Trust Assets 12/31/2012 Cash Contributions Investment Return Gross Benefits Paid Trust Assets 12/31/2013 PBO Funded Ratio 83% Fully Funded Pension 106% |
 92 Improving Operating Earnings and increased contribution from PSE&G PSEG Operating Earnings $ Millions (except EPS) 2012 2013 2014E PSE&G $528 $612 $710 - $745 PSEG Power $663 $710 $575 - $610 Enterprise/Other $45 ($13) $35 - $40 Operating Earnings* $1,236 $1,309 $1,320 - $1,395 Operating EPS* $2.44 $2.58 $2.60 - $2.75 Regulated % of Earnings 43% 47% 53% - 54% *SEE SLIDE A FOR ITEMS EXCLUDED FROM INCOME FROM CONTINUING OPERATIONS/NET INCOME TO RECONCILE TO OPERATING EARNINGS. NOTE: 2012 OPERATING EARNINGS RE-STATED FOR TRANSFER OF ASSETS FROM PSEG HOLDINGS TO PSEG POWER. E=ESTIMATE. |
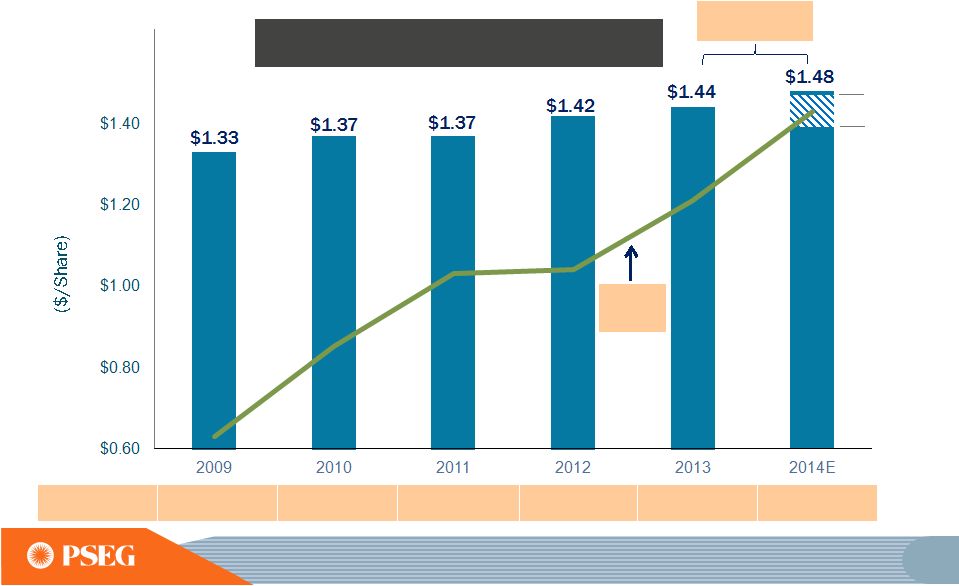 93 PSE&G EPS $1.47 $1.40 Annual Dividend Per Share (10 YEAR HISTORICAL CAGR ~3%) (1) THE 2014 PAYOUT RATIO IS BASED ON THE MIDPOINT OF PSEG'S 2014 OPERATING EARNINGS GUIDANCE OF $2.60-$2.75E PER SHARE. SEE SLIDE A FOR ITEMS EXCLUDED FROM INCOME FROM CONTINUING OPERATIONS/NET INCOME TO RECONCILE TO OPERATING EARNINGS. Opportunity for consistent and sustainable dividend growth supported by strong cash flow from both businesses 2.8% increase Payout Ratio 43% 44% 50% 58% 56% 55% (1) E = ESTIMATE $1.60 |
 94 PSEG’s longer-term outlook is influenced by Power’s hedge position and increased investment at PSE&G 2015E 2016E Each $0.75/mcf Change in Natural Gas Each $2/MWh Change in Spark Spread Each $5/MWh Change in Dark Spread Each 1% Change in Nuclear Capacity Factor Segment EPS Drivers Each $100 Million of Incremental Investment Each 1% Change in Sales Electric Gas Each 1% Change in O&M Each 10 basis point Change in Distribution ROE Each 10 basis point Change in Transmission ROE $0.01 $0.01 $0.01 $0.01 <$0.01 <$0.01 $0.07-$0.10 $0.05 $0.04 $0.01 $0.00-$0.02 $0.05 $0.02 $0.01 $0.01 $0.01 $0.01 $0.01 <$0.01 <$0.01 Sensitivities derived from typical annual market variability* * Estimated annual variability approximating one standard deviation based on 2011 – 2013 historical data and forward curve estimates applied to PSEG Power open positions. E = ESTIMATE. POWER EARNINGS SENSITIVITIES UPDATED FOR OCTOBER 31, 2014 PRICE CURVES. |
 PSE&G APPENDIX |
 96 PSE&G provides high reliability at below average cost which creates superior value to customers SAIDI = SYSTEM AVERAGE INTERRUPTION DURATION INDEX, A MEASURE OF AVERAGE OUTAGE DURATION FOR ALL CUSTOMERS SERVED. |
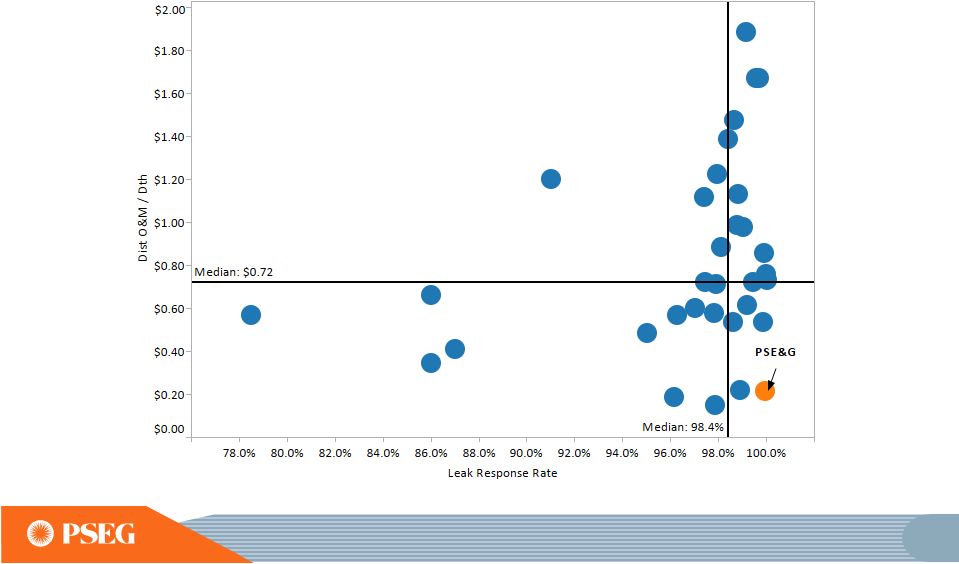 97 PSE&G prioritizes public safety while maintaining value to customers LEAK RESPONSE RATE = PERCENTAGE OF UTILITY RESPONSES TO REPORTED LEAKS WITHIN ONE HOUR. |
 PSEG POWER AND ER&T APPENDIX |
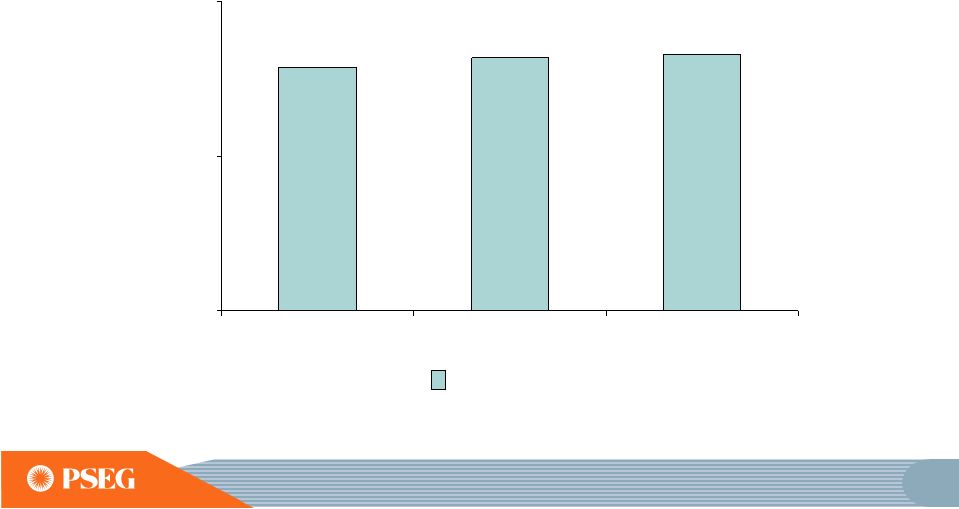 99 Nuclear fuel needs have been hedged through 2016 Anticipated Nuclear Fuel Cost Hedged $0 $5 $10 2014 2015 2016 ($/MWh) |
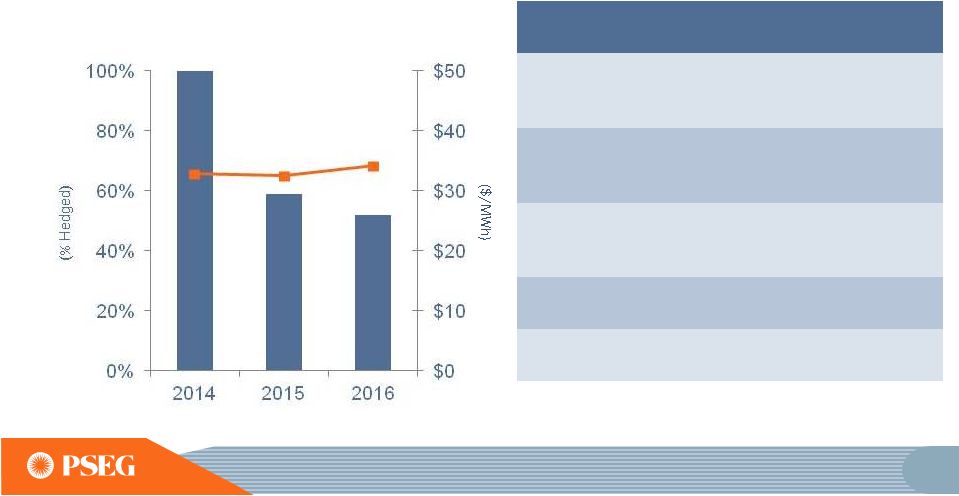 100 Power’s coal hedging reflects 2014 supply matched with 2014 sales Contracted Coal Station Coal Type Pricing ($/MWh)* Comments Bridgeport Harbor Adaro Low $40’s Higher price, lower BTU, enviro coal Hudson CAPP Mid $40’s Coal/Gas Fuel Flexibility Mercer Metallurgical CAPP/NAPP Low $40’s More limited segment of coal market Keystone NAPP Mid $20’s Prices steady Conemaugh NAPP Mid $20’s Prices steady % Hedged (left scale) $/MWh (right scale) *COMMODITY PLUS TRANSPORTATION. |
 101 The full requirements BGS rate recognizes the forward PJM capacity market price Capacity Price per RPM Auction for PSEG Zone Capacity Price per BGS Tranche 2014-2015 $172 Three Year Average ($/MW-day) $172 2015-2016 $166 MW per Tranche (varies by EDC) 109 2016-2017 $178 Days per Year 365 Three Year Average ($/MW-day) $172 Capacity Cost per Tranche 6,841,016 $ MWh per Tranche Energy MW per Tranche (varies by EDC) 109 Hours per Year 8,768 Load Factor (varies by EDC) ~37% MWh per Tranche, approx. 350,090 Capacity Cost per MWh $20 |
 PSEG FINANCIAL APPENDIX |
 103 Q3 Operating Earnings by Subsidiary Operating Earnings Earnings per Share $ millions (except EPS) 2014 2013 2014 2013 PSE&G $ 200 $ 168 $ 0.39 $ 0.33 PSEG Power 171 221 0.34 0.43 PSEG Enterprise/Other 22 (4) 0.04 - Operating Earnings* $ 393 $ 385 $ 0.77 $ 0.76 Quarter ended September 30 * SEE SLIDE B FOR ITEMS EXCLUDED FROM NET INCOME TO RECONCILE TO OPERATING EARNINGS. |
 104 $0.76 0.06 0.04 $0.77 (0.09) 0.00 0.25 0.50 0.75 1.00 Capacity (0.09) Re-Contracting & Market Pricing (0.04) Weather (0.03) O&M 0.06 Taxes & Other 0.01 Transmission 0.04 Electric Volume & Demand 0.01 Weather (0.02) Distribution O&M 0.02 Interest & Other 0.01 Q3 2014 Operating Earnings* Q3 2013 Operating Earnings* PSEG Power PSE&G Enterprise/ Other * SEE SLIDE B FOR ITEMS EXCLUDED FROM NET INCOME TO RECONCILE TO OPERATING EARNINGS. PSEG Long Island and Other PSEG EPS Reconciliation – Q3 2014 vs. Q3 2013 |
 105 Year to Date Operating Earnings by Subsidiary Operating Earnings Earnings per Share $ millions (except EPS) 2014 2013 2014 2013 PSE&G $ 565 $ 468 $ 1.11 $ 0.92 PSEG Power 551 595 1.09 1.17 PSEG Enterprise/Other 37 (2) 0.07 - Operating Earnings* $ 1,153 $ 1,061 $ 2.27 $ 2.09 Nine months ended September 30 * SEE SLIDE B FOR ITEMS EXCLUDED FROM NET INCOME TO RECONCILE TO OPERATING EARNINGS. |
 106 $2.09 0.19 0.07 $2.27 (0.08) 0.00 0.50 1.00 1.50 2.00 2.50 YTD 2014 Operating Earnings* YTD 2013 Operating Earnings* Capacity 0.05 Re-Contracting & Market Pricing (0.07) Weather (0.03) Lower Volume (0.01) O&M (0.02) D&A, Taxes and Other 0.00 PSEG Power** Transmission 0.10 Gas Volume, Demand & Other Revenue 0.03 Electric Volume & Demand 0.01 Weather (0.02) Distribution O&M 0.04 Lower Interest Expense & Other 0.03 PSE&G ** Enterprise/ Other PSEG Long Island And Other * SEE SLIDE B FOR ITEMS EXCLUDED FROM NET INCOME TO RECONCILE TO OPERATING EARNINGS. ** PRIOR QUARTER RESULTS FOR RECONCILING ITEMS MAY NOT ADD TO YEAR-TO-DATE (YTD) TOTALS DUE TO ROUNDING. PSEG EPS Reconciliation – YTD 2014 vs. YTD 2013 |
 107 September 30, 2014 $ Billions PSEG PSE&G Power Cash and Cash Equivalents $0.7 $0.3 $0.0 Short Term Debt $0.0 $0.0 N/A Long Term Debt (2) 8.6 6.1 2.5 Common Equity 12.1 6.6 5.5 Total Capitalization $20.7 $12.7 $8.0 Total Debt / Capitalization 42% 48% 32% PSE&G Regulated Equity Ratio (1) 51.8% Our balance sheet remains strong (1) REGULATED EQUITY RATIO INCLUDES CUSTOMER DEPOSITS OF ~$97 MILLION AND EXCLUDES SHORT-TERM DEBT. (2) INCLUDES L-T DEBT DUE WITHIN 1 YEAR; EXCLUDES SECURITIZATION DEBT OF $326 MILLION AND NON-RECOURSE DEBT OF $16 MILLION. |
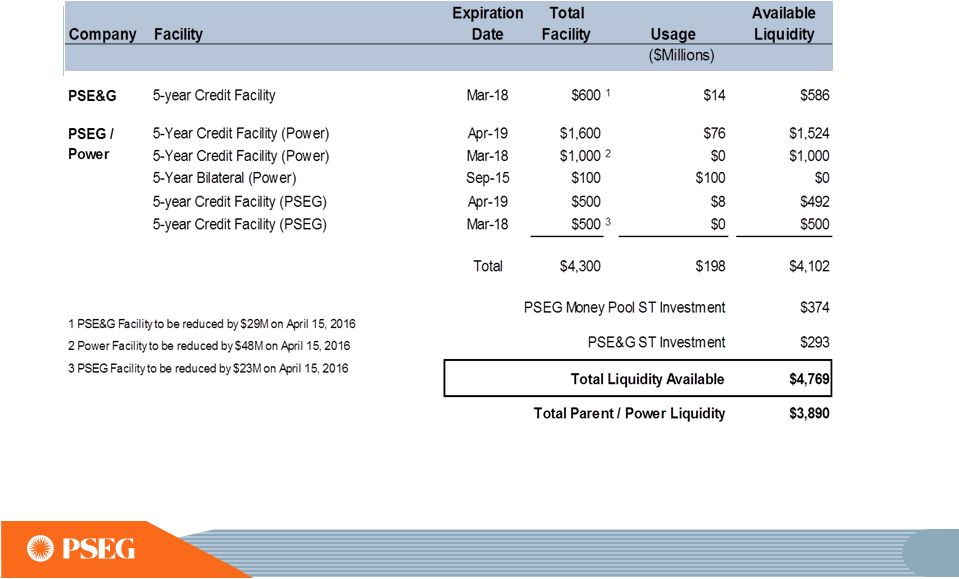 108 PSEG Liquidity as of September 30, 2014 |
 109 PSEG Energy Holdings Investment Portfolio Equipment Investment Balance* at 9/30/2014 ($ millions) Merchant Energy Leases NRG REMA Keystone, Conemaugh & Shawville (PA) 3 coal-fired plants (1,162 equity MW) $345 NRG Energy/Midwest Gen ** Powerton & Joliet Generating Stations (IL) 2 coal-fired generating facilities (1,640 equity MW) $218 Regulated Energy Leases Merrill Creek Reservoir in NJ (PECO, MetEd, Delmarva Power & Light) $197 Grand Gulf Nuclear station in Mississippi (175 equity MW) Real Estate Leveraged Leases GM Renaissance Center; Wal-Marts; E-D (shopping) Centers $73 Real Estate Operating Leases Office Towers, Shopping Centers - 28 properties $57 Generation Legacy Assets GWF (in wind down stage), Bridgewater, GSOE $3 Other Land & Receivables $5 Total Holdings Investments $898 *BOOK BALANCE EXCLUDING DEFERRED TAX ACCOUNTS. **EME AND ITS SUBSIDIARIES FILED CHAPTER 11 BANKRUPTCY ON 12/17/2012. ON APRIL 1,2014, EME WAS ACQUIRED BY NRG; ALL MONETARY DEFAULTS WERE CURED AT CLOSING WITH NO CHANGE TO HOLDINGS’ STATED EQUITY VALUE. |
 110 Strong, full year 2013 operating earnings delivered * SEE SLIDE A FOR ITEMS EXCLUDED FROM INCOME FROM CONTINUING OPERATIONS/NET INCOME TO RECONCILE TO OPERATING EARNINGS. Operating Earnings Earnings per Share $ millions (except EPS) 2013 2012 2013 2012 PSEG Power $ 710 $ 663 $ 1.40 $ 1.31 PSE&G 612 528 1.21 1.04 PSEG Enterprise/Other (13) 45 (0.03) 0.09 Operating Earnings* $ 1,309 $ 1,236 $ 2.58 $ 2.44 Twelve Months ended December 31 |
 A Items Excluded from Income from Continuing Operations/Net Income to Reconcile to Operating Earnings PLEASE SEE PAGE 3 FOR AN EXPLANATION OF PSEG’S USE OF OPERATING EARNINGS AS A NON-GAAP FINANCIAL MEASURE AND HOW IT DIFFERS FROM NET INCOME. 2013 2012 2011 2010 2009 2008 Earnings Impact ($ Millions) Operating Earnings 1,309 $ 1,236 $ 1,389 $ 1,584 $ 1,567 $ 1,478 $ Gain (Loss) on Nuclear Decommissioning Trust (NDT) Fund Related Activity (PSEG Power) 40 52 50 46 9 (71) Gain (Loss) on Mark-to-Market (MTM) (a) (PSEG Power) (74) (10) 107 (1) (11) 14 Lease Transaction Activity (PSEG Enterprise/Other) - 36 (173) - 29 (490) Storm O&M (PSEG Power) (32) (39) - - - - Market Transition Charge Refund (PSE&G) - - - (72) - - Gain (Loss) on Asset Sales and Impairments (PSEG Enterprise/Other) - - 34 - - (13) Income from Continuing Operations 1,243 $ 1,275 $ 1,407 $ 1,557 $ 1,594 $ 918 $ Discontinued Operations - - 96 7 (2) 270 Net Income 1,243 $ 1,275 $ 1,503 $ 1,564 $ 1,592 $ 1,188 $ Fully Diluted Average Shares Outstanding (in Millions) 508 507 507 507 507 508 Per Share Impact (Diluted) Operating Earnings 2.58 $ 2.44 $ 2.74 $ 3.12 $ 3.09 $ 2.91 $ Gain (Loss) on NDT Fund Related Activity (PSEG Power) 0.08 0.10 0.10 0.09 0.02 (0.14) Gain (Loss) on MTM (a) (PSEG Power) (0.14) (0.02) 0.21 - (0.02) 0.03 Lease Transaction Activity (PSEG Enterprise/Other) - 0.07 (0.34) - 0.05 (0.96) Storm O&M (PSEG Power) (0.07) (0.08) - - - - Market Transition Charge Refund (PSE&G) - - - (0.14) - - Gain (Loss) on Asset Sales and Impairments (PSEG Enterprise/Other) - - 0.06 - - (0.03) Income from Continuing Operations 2.45 $ 2.51 $ 2.77 $ 3.07 $ 3.14 $ 1.81 $ Discontinued Operations - - 0.19 0.01 - 0.53 Net Income 2.45 $ 2.51 $ 2.96 $ 3.08 $ 3.14 $ 2.34 $ For the Year Ended December 31, (Unaudited) Reconciling Items, net of tax (a) Includes the financial impact from positions with forward delivery months. PUBLIC SERVICE ENTERPRISE GROUP INCORPORATED |
 B 2014 2013 2014 2013 2013 2012 Earnings Impact ($ Millions) Operating Earnings 393 $ 385 $ 1,153 $ 1,061 $ 1,309 $ 1,236 $ Gain (Loss) on Nuclear Decommissioning Trust (NDT) Fund Related Activity (PSEG Power) 17 12 40 29 40 52 Gain (Loss) on Mark-to-Market (MTM) (a) (PSEG Power) 36 3 (138) (22) (74) (10) Lease Related Activity (PSEG Enterprise/Other) - - - - - 36 Storm O&M, net of insurance recoveries (PSEG Power) (2) (10) (13) (25) (32) (39) Net Income 444 $ 390 $ 1,042 $ 1,043 $ 1,243 $ 1,275 $ Fully Diluted Average Shares Outstanding (in Millions) 507 508 507 507 508 507 Per Share Impact (Diluted) Operating Earnings 0.77 $ 0.76 $ 2.27 $ 2.09 $ 2.58 $ 2.44 $ Gain (Loss) on NDT Fund Related Activity (PSEG Power) 0.04 0.02 0.08 0.06 0.08 0.10 Gain (Loss) on MTM (a) (PSEG Power) 0.07 0.01 (0.27) (0.04) (0.14) (0.02) Lease Related Activity (PSEG Enterprise/Other) - - - - - 0.07 Storm O&M, net of insurance recoveries (PSEG Power) (0.01) (0.02) (0.03) (0.05) (0.07) (0.08) Net Income 0.87 $ 0.77 $ 2.05 $ 2.06 $ 2.45 $ 2.51 $ (a) Includes the financial impact from positions with forward delivery months. PUBLIC SERVICE ENTERPRISE GROUP INCORPORATED Reconciling Items, net of tax Three Months Ended Nine Months Ended Year Ended September 30, September 30, December 31, (Unaudited) Items Excluded from Income from Continuing Operations/Net Income to Reconcile to Operating Earnings PLEASE SEE PAGE 3 FOR AN EXPLANATION OF PSEG’S USE OF OPERATING EARNINGS AS A NON-GAAP FINANCIAL MEASURE AND HOW IT DIFFERS FROM NET INCOME. |