 Forward-Looking Statement Certain of the matters discussed in this report about our and our subsidiaries' future performance, including, without limitation, future revenues, earnings, strategies, prospects, consequences and all other statements that are not purely historical constitute “forward-looking statements” within the meaning of the Private Securities Litigation Reform Act of 1995. Such forward-looking statements are subject to risks and uncertainties, which could cause actual results to differ materially from those anticipated. Such statements are based on management's beliefs as well as assumptions made by and information currently available to management. When used herein, the words “anticipate,” “intend,” “estimate,” “believe,” “expect,” “plan,” “should,” “hypothetical,” “potential,” “forecast,” “project,” variations of such words and similar expressions are intended to identify forward-looking statements. Factors that may cause actual results to differ are often presented with the forward-looking statements themselves. Other factors that could cause actual results to differ materially from those contemplated in any forward-looking statements made by us herein are discussed in filings we make with the United States Securities and Exchange Commission (SEC), including our Annual Report on Form 10-K and subsequent reports on Form 10-Q and Form 8-K and available on our website: http://www.pseg.com. These factors include, but are not limited to: • adverse changes in the demand for or the price of the capacity and energy that we sell into wholesale electricity markets, • adverse changes in energy industry law, policies and regulation, including market structures and transmission planning, • any inability of our transmission and distribution businesses to obtain adequate and timely rate relief and regulatory approvals from federal and state regulators, • changes in federal and state environmental regulations and enforcement that could increase our costs or limit our operations, • changes in nuclear regulation and/or general developments in the nuclear power industry, including various impacts from any accidents or incidents experienced at our facilities or by others in the industry, that could limit operations of our nuclear generating units, • actions or activities at one of our nuclear units located on a multi-unit site that might adversely affect our ability to continue to operate that unit or other units located at the same site, • any inability to manage our energy obligations, available supply and risks, • adverse outcomes of any legal, regulatory or other proceeding, settlement, investigation or claim applicable to us and/or the energy industry, • any deterioration in our credit quality or the credit quality of our counterparties, • availability of capital and credit at commercially reasonable terms and conditions and our ability to meet cash needs, • changes in the cost of, or interruption in the supply of, fuel and other commodities necessary to the operation of our generating units, • delays in receipt of necessary permits and approvals for our construction and development activities, • delays or unforeseen cost escalations in our construction and development activities, • any inability to achieve, or continue to sustain, our expected levels of operating performance, • any equipment failures, accidents, severe weather events or other incidents that impact our ability to provide safe and reliable service to our customers, and any inability to obtain sufficient insurance coverage or recover proceeds of insurance with respect to such events, • acts of terrorism, cybersecurity attacks or intrusions that could adversely impact our businesses, • increases in competition in energy supply markets as well as for transmission projects, • any inability to realize anticipated tax benefits or retain tax credits, • challenges associated with recruitment and/or retention of a qualified workforce, • adverse performance of our decommissioning and defined benefit plan trust fund investments and changes in funding requirements, • changes in technology, such as distributed generation and micro grids, and greater reliance on these technologies, and • changes in customer behaviors, including increases in energy efficiency, net-metering and demand response. All of the forward-looking statements made in this report are qualified by these cautionary statements and we cannot assure you that the results or developments anticipated by management will be realized or even if realized, will have the expected consequences to, or effects on, us or our business prospects, financial condition or results of operations. Readers are cautioned not to place undue reliance on these forward-looking statements in making any investment decision. Forward-looking statements made in this report apply only as of the date of this report. While we may elect to update forward-looking statements from time to time, we specifically disclaim any obligation to do so, even if internal estimates change, unless otherwise required by applicable securities laws. The forward-looking statements contained in this report are intended to qualify for the safe harbor provisions of Section 27A of the Securities Act of 1933, as amended, and Section 21E of the Securities Exchange Act of 1934, as amended. 2 EXHIBIT 99 |
 GAAP Disclaimer These materials and other financial releases can be found on the pseg.com website under the investor tab, or at http://investor.pseg.com/ PSEG presents Operating Earnings and Adjusted Earnings Before Interest, Taxes, Depreciation and Amortization (EBITDA) in addition to its Income from Continuing Operations/Net Income reported in accordance with accounting principles generally accepted in the United States (GAAP). Operating Earnings and Adjusted EBITDA are non-GAAP financial measures that differ from Income from Continuing Operations/Net Income. Operating Earnings exclude gains or losses associated with Nuclear Decommissioning Trust (NDT), Mark-to-Market (MTM) accounting, and other material one-time items. PSEG presents Operating Earnings because management believes that it is appropriate for investors to consider results excluding these items in addition to the results reported in accordance with GAAP. PSEG believes that the non-GAAP financial measure of Operating Earnings provides a consistent and comparable measure of performance of its businesses to help shareholders understand performance trends. PSEG is presenting Adjusted EBITDA because it provides investors with additional information to compare our business performance to other companies and understand performance trends. Adjusted EBITDA excludes the same items as our Operating Earnings measure as well as income tax expense, interest expense, depreciation and amortization and major maintenance expense costs at Power’s fossil generation facilities. This information is not intended to be viewed as an alternative to GAAP information. The last three slides in this presentation (Slides A, B and C) include a list of items excluded from Income from Continuing Operations/Net Income to reconcile to Operating Earnings and Adjusted EBITDA with a reference to that slide included on each of the slides where the non-GAAP information appears. 3 |
 Delivering on commitments and realizing growth Operational Excellence • PSE&G: Mid-Atlantic Reliability Award (13 th consecutive year), top ranked among eastern electric and gas utilities in business customer satisfaction • PSEG Power: Record output from combined cycle units • PSEG Long Island: Demonstrated management and integration capability through a successful transition in first year • PSEG: Cost-control benefits continue Financial Strength • Updated operating earnings guidance for 2015 to $2.80-$2.95 per share from $2.75-$2.95 per share • Cash flows and business mix support strong credit ratings and ability to fully fund robust investment pipeline without issuing new equity • Increased rate of dividend growth in 2015 Disciplined Investment • PSE&G Capital program = rate base growth of 11% over 5 years with increased investment in Transmission; Electric and Gas distribution; and Gas System Modernization Program • Power: Keys & Sewaren CCGTs, uprates, PennEast Pipeline, and Solar Source 7 |
 PSEG Power increased capital spending by $1.6 billion with addition of new generating capacity focused on improving efficiency and reliability *BASED ON CURRENTLY KNOWN AND QUANTIFIABLE ENVIRONMENTAL REQUIREMENTS. E=ESTIMATE. (Peach Bottom EPU, AGP, Solar) 13 |
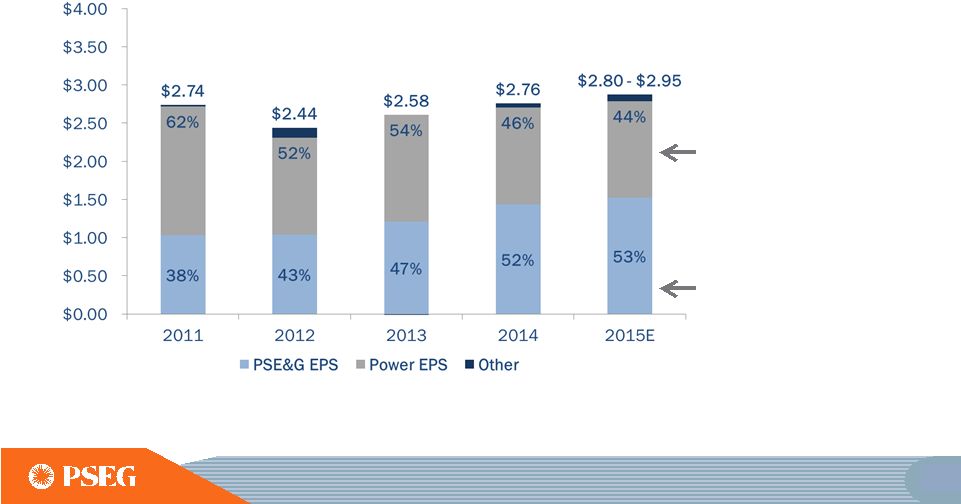 Operating Earnings Disciplined investment program and focus on operational excellence have supported growth Power’s diverse fuel mix and dispatch flexibility continue to generate strong earnings and free cash flow in low price environment PSE&G’s investment program has driven double digit compound annual earnings growth since 2010 Operating Earnings* Contribution by Subsidiary *SEE SLIDE A FOR ITEMS EXCLUDED FROM INCOME FROM CONTINUING OPERATIONS/ NET INCOME TO RECONCILE TO OPERATING EARNINGS. E=ESTIMATE ** 2015 PERCENTS USE MIDPOINT OF UPDATED EARNINGS GUIDANCE. ** ** 15 |
 Power – Growing value by improving market rules and developing investment opportunities Value Source Opportunities and Actions Taken Improving rules will better recognize value of our fleet • PJM’s Capacity market – 2014 limits on demand response and August 2015 Capacity Performance auction • Demand response treatment at U.S. Courts / FERC • Energy price formation at FERC • Increasing air quality standards via Federal and State regulations Our footprint provides growth opportunities • Nuclear and Combined Cycle plant uprates underway • New build Keys CCGT in SWMAAC* (MD) and Sewaren 7 in EMAAC* • Brownfield expansions at existing sites New peakers built at New Haven and Kearny sites Continue to explore further opportunities • PennEast pipeline - equity investment and gas portfolio enhancement • ~148 MW** of utility-scale solar, with significant project pipeline • Continue to seek opportunities to expand the fleet * SWMAAC = SOUTHWEST MID-ATLANTIC AREA COUNCIL \EMAAC = EASTERN MID-ATLANTIC AREA COUNCIL LOCATIONAL DELIVERABILITY AREA WITHIN PJM. **PROJECT SIZE IN MEGAWATTS SHOWN IN DC (DIRECT CURRENT), AC EQUIVALENT IS 115 MW. 16 |
 PSE&G’s 2015 operating earnings expected to benefit from increased investment in Transmission $612 $725 2013 2014 2015 Guidance PSE&G Operating Earnings* ($ Millions) $760 -- $775E** *SEE SLIDE A FOR ITEMS EXCLUDED FROM NET INCOME TO RECONCILE TO OPERATING EARNINGS. E =ESTIMATE. **UPDATED GUIDANCE ON JULY 31, 2015. 35 |
 PSEG Power has generating assets in three competitive markets • Assets located near load centers • Low cost portfolio Fuel flexibility with gas cost advantage • Positioned to benefit from volatility in real-time markets • Readiness for capacity performance (CP) in PJM • Fleet positioned to maintain diversity and efficiency after HEDD • Sites suitable for expansion ISO New England New Haven Bridgeport Bethlehem Energy Center (Albany) Conemaugh Keystone Peach Bottom Bergen Kearny Essex Sewaren Linden Mercer Burlington Hudson Hope Creek Salem Yards Creek New York ISO PJM Keys (Site) 43 |
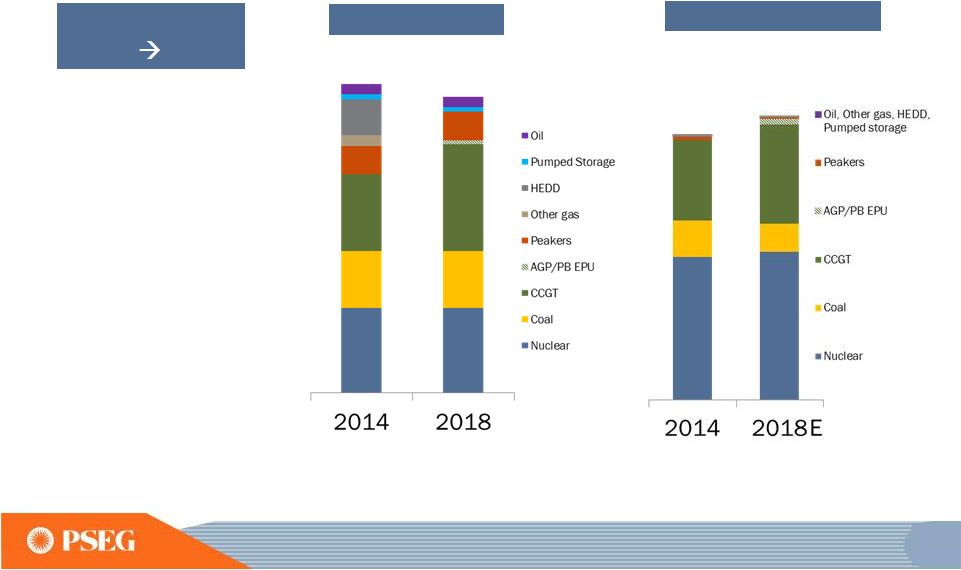 PSEG Power will improve diversity and efficiency as we invest in the fleet • Maintain fuel diversity • Maintain load-serving capability • Maintain low cost structure • Environmental improvement • Peach Bottom (PB) uprate • Advanced Gas Path (AGP) • Combined cycle units Keys and Sewaren operational in 2018 Objective 2015 2018 13,146 MW 12,600 MW Fuel Diversity 57 - 59 TWh 54 TWh E E=ESTIMATE. 46 Energy Produced |
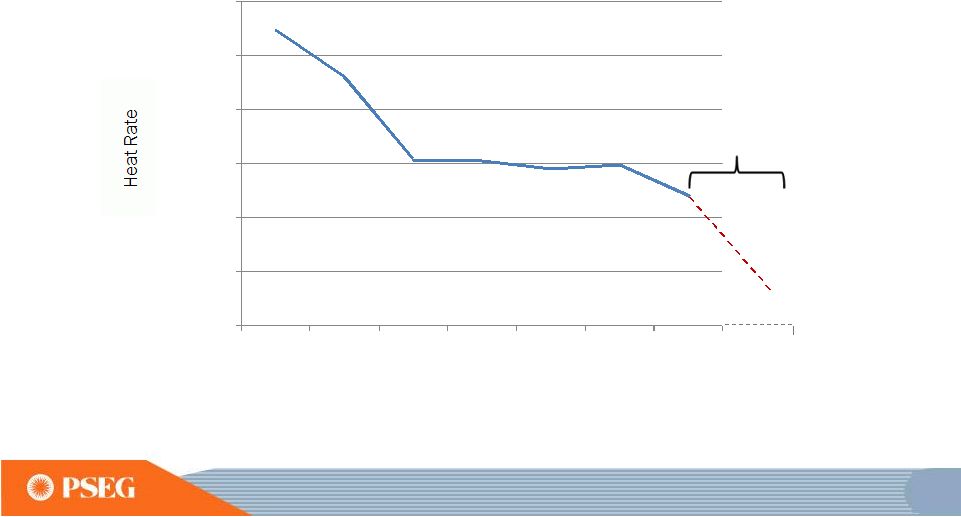 7,200 7,300 7,400 7,500 7,600 7,700 7,800 2008 2009 2010 2011 2012 2013 2014 PSEG Power initiatives result in continuing improvement in combined cycle heat rate AGP projected efficiency improvement 2015-2018 2018E* E= ESTIMATE. *The weighted average Combined Cycle Operating Heat Rate in 2018, with the addition of Sewaren 7 and Keys Energy Center, will be approximately 7,250 52 |
 PSEG Power developing 1,300 MW of new, efficient CCGT capacity in MD and NJ • Construction of 755 MW Keys Energy Center to begin this Fall on a new, natural gas fired power plant in Maryland (SWMAAC*) at an estimated cost of $825 to $875 million • Power cleared a new 540 MW CCGT unit, Sewaren 7 located in New Jersey (EMAAC*), in the recent 2018/2019 RPM auction; the unit is expected to cost ~$600 million and is targeted to be in service in 2018; older Sewaren units will be retired upon completion of the new unit • PSEG Fossil will oversee the construction and operation of both PSEG Keys Energy Center and Sewaren 7 PJM *SWMAAC = SOUTHWEST/EMAAC = EASTERN MID-ATLANTIC AREA COUNCIL LOCATIONAL DELIVERABILITY AREA WITHIN PJM. SEWAREN 7 SITE KEYS ENERGY CENTER SITE 54 |
 Power’s 2015 operating earnings maintain solid performance Power Operating Earnings* ($ Millions) 2013 2014 2015 Guidance $710 $642 $620 – $680E 2015 Observations • Increase in average hedge price for energy helps mitigate reset in capacity price and volume * SEE SLIDE A FOR ITEMS EXCLUDED FROM NET INCOME TO RECONCILE TO OPERATING EARNINGS. E = ESTIMATE. 61 |
 PSEG 2015 Updated Guidance for Operating Income – by Subsidiary, and PSEG Power Adjusted EBITDA Anticipates Another Year of Growth in Operating Earnings $ millions (except EPS) 2015E 2014 PSE&G $760 - $775 $725 PSEG Power $620 - $680 $642 PSEG Enterprise/Other $40 - $45 $33 Operating Earnings* $1,420 - $1,500 $1,400 Earnings per Share $2.80 - $2.95E $2.76 PSEG Power Adjusted EBITDA** $ millions (except EPS) 2015E 2014 PSEG Power $1,545 - $1,645 $1,584 * SEE SLIDE A FOR ITEMS EXCLUDED FROM NET INCOME TO RECONCILE TO OPERATING EARNINGS; INCLUDES THE FINANCIAL IMPACT FROM MARK-TO-MARKET POSITIONS WITH FORWARD DELIVERY MONTHS. ** SEE SLIDE B FOR A RECONCILIATION OF ADJUSTED EBITDA TO OPERATING EARNINGS AND NET INCOME. E = ESTIMATE. 75 |
 PSEG Summary • Continued third year of anticipated positive earnings trend in 2015 with updated operating earnings guidance of $2.80 to $2.95 per share • Continued 5 th straight year of expected double digit, 5-year growth in rate base • Anticipated high single digit earnings growth at PSE&G on a three-year basis from 2014 to 2017, driven by transmission investments and planned programs • Power’s continued focus on operational excellence, market expertise and financial strength delivers value in current price environment • Power realigning its portfolio with new, efficient CCGT investments in MD and NJ • Strong Balance Sheet and Cash Flow support PSE&G’s capital program and Power’s new investment opportunities without the need for equity • Our $0.08 per share dividend increase for 2015 is consistent with our long history of returning cash to the shareholder through the common dividend, with potential for consistent and sustainable growth 84 |
 PSEG Power’s Adjusted EBITDA - Q2 2015, YTD and Full-Year 2015 Guidance Three Months Ended June 30, Six Months (YTD) Ended June 30, Full-Year 2015 Guidance ($ in millions) 2015 2014 2015 2014 Low High Operating Earnings** $110 $87 $388 $380 $620 $680 Add: Fossil Major Maintenance, pre-tax 52 49 101 107 115 115 Depreciation & Amortization, pre-tax 75 73 152 146 305 305 Interest Expense, pre-tax 32 29 63 60 125 125 Income Taxes 32 38 223 234 380 420 Adjusted EBITDA $301 $276 $927 $927 $1,545E $1,645E PSEG Power - Adjusted EBITDA* * SEE SLIDE B FOR A RECONCILIATION OF ADJUSTED EBITDA TO OPERATING EARNINGS AND NET INCOME. E = ESTIMATE. ** SEE SLIDE A FOR ITEMS EXCLUDED FROM NET INCOME TO RECONCILE TO OPERATING EARNINGS; INCLUDES THE FINANCIAL IMPACT FROM MARK-TO-MARKET POSITIONS WITH FORWARD DELIVERY MONTHS. 94 |
 Items Excluded from Income from Continuing Operations/Net Income to Reconcile to Operating Earnings PLEASE SEE PAGE 3 FOR AN EXPLANATION OF PSEG’S USE OF OPERATING EARNINGS AS A NON-GAAP FINANCIAL MEASURE AND HOW IT DIFFERS FROM NET INCOME. 2014 2013 2012 2011 2010 2009 Earnings Impact ($ Millions) Operating Earnings 1,400 $ 1,309 $ 1,236 $ 1,389 $ 1,584 $ 1,567 $ Gain (Loss) on Nuclear Decommissioning Trust (NDT) Fund Related Activity (PSEG Power) 68 40 52 50 46 9 Gain (Loss) on Mark-to-Market (MTM) (a) (PSEG Power) 66 (74) (10) 107 (1) (11) Lease Transaction Activity (PSEG Enterprise/Other) - - 36 (173) - 29 Storm O&M (PSEG Power) (16) (32) (39) - - - Market Transition Charge Refund (PSE&G) - - - - (72) - Gain (Loss) on Asset Sales and Impairments (PSEG Enterprise/Other) - - - 34 - - Income from Continuing Operations 1,518 $ 1,243 $ 1,275 $ 1,407 $ 1,557 $ 1,594 $ Discontinued Operations - - - 96 7 (2) Net Income 1,518 $ 1,243 $ 1,275 $ 1,503 $ 1,564 $ 1,592 $ Fully Diluted Average Shares Outstanding (in Millions) 508 508 507 507 507 507 Per Share Impact (Diluted) Operating Earnings 2.76 $ 2.58 $ 2.44 $ 2.74 $ 3.12 $ 3.09 $ Gain (Loss) on NDT Fund Related Activity (PSEG Power) 0.13 0.08 0.10 0.10 0.09 0.02 Gain (Loss) on MTM (a) (PSEG Power) 0.13 (0.14) (0.02) 0.21 - (0.02) Lease Transaction Activity (PSEG Enterprise/Other) - - 0.07 (0.34) - 0.05 Storm O&M (PSEG Power) (0.03) (0.07) (0.08) - - - Market Transition Charge Refund (PSE&G) - - - - (0.14) - Gain (Loss) on Asset Sales and Impairments (PSEG Enterprise/Other) - - - 0.06 - - Income from Continuing Operations 2.99 $ 2.45 $ 2.51 $ 2.77 $ 3.07 $ 3.14 $ Discontinued Operations - - - 0.19 0.01 - Net Income 2.99 $ 2.45 $ 2.51 $ 2.96 $ 3.08 $ 3.14 $ (Unaudited) For the Year Ended December 31, PUBLIC SERVICE ENTERPRISE GROUP INCORPORATED Reconciling Items, net of tax (a) Includes the financial impact from positions with forward delivery months. A |
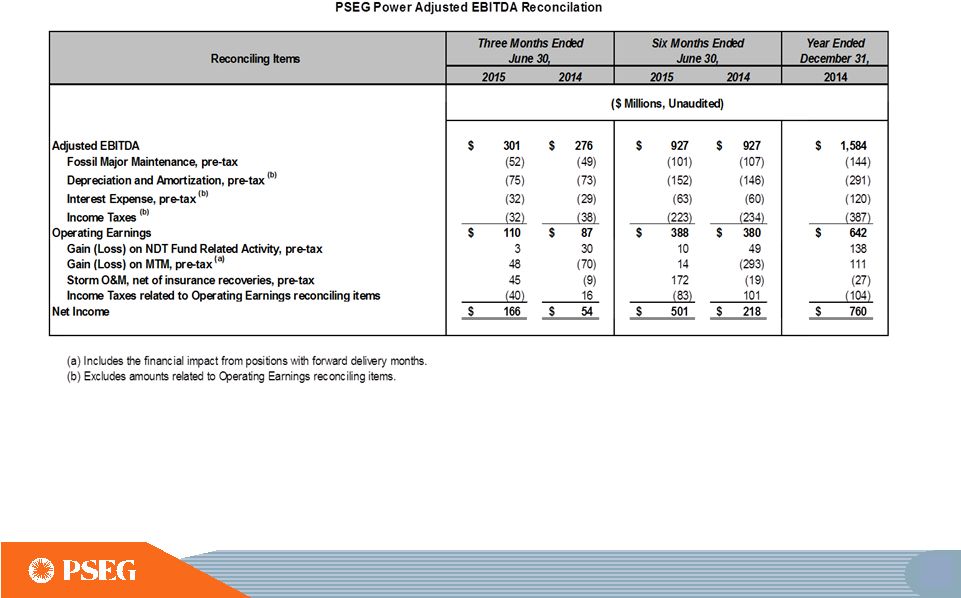 Items Excluded from Net Income to Reconcile to Operating Earnings and Adjusted EBITDA PLEASE SEE PAGE 3 FOR AN EXPLANATION OF PSEG’S USE OF OPERATING EARNINGS AND ADJUSTED EBITDA AS NON-GAAP FINANCIAL MEASURES AND HOW THEY DIFFER FROM NET INCOME. B |
 Items Excluded from Income from Continuing Operations/Net Income to Reconcile to Operating Earnings PLEASE SEE PAGE 3 FOR AN EXPLANATION OF PSEG’S USE OF OPERATING EARNINGS AS A NON-GAAP FINANCIAL MEASURE AND HOW IT DIFFERS FROM NET INCOME. C |